Embed Size (px)
Citation preview
ECS Journal of Solid State Science and Technology, 4 (7) R105-R113 (2015) R105
Symmetry-Related Transitions in the Spectrum of NanosizedCubic Y2O3:Tb3+
Daniel den Engelsen, Paul G. Harris, Terry G. Ireland,z George Fern, and Jack Silver
Centre for Phosphor and Display Materials, Wolfson Centre for Materials Processing, Brunel University London,Uxbridge, Middlesex, UB8 3PH, United Kingdom
Herein the preparation and cathodoluminescence of nanoparticles of cubic Y2O3:Tb3+ having Tb3+ concentration varying between0.1 and 10 Mol% are described. The cathodoluminescence spectra were recorded with a high resolution spectrometer, which enabledthe identification of Tb3+ lines with C2 and S6 symmetry: the lines at 542.8 nm and 544.4 nm were designated as 5D4→7F5 (C2) and5D4→7F5 (S6) respectively. The critical distance for energy transfer from Tb3+ ions at S6 lattice sites to Tb3+ ions at C2 lattice siteswas found to be >1.7 nm. At the greater distances which prevail at low Tb3+ concentration, this energy transfer virtually stops. Fromcathodoluminescence spectra recorded in a scanning transmission electron microscope it was concluded that this energy transferalso did not take place if the temperature was reduced below 102 K. The efficiency of the cathodoluminescence of 1% Y2O3:Tb3+was 6 lm/w at a beam voltage of 15 kV. The decay time of the 5D4→7F5 (C2) transition was substantially shorter than that of the5D4→7F5 (S6) transition at low Tb3+ concentrations. The decay behavior of the cathodoluminescence images in a field emissionscanning electron microscope has been explained in terms of phosphor saturation.© The Author(s) 2015. Published by ECS. This is an open access article distributed under the terms of the Creative CommonsAttribution 4.0 License (CC BY, http://creativecommons.org/licenses/by/4.0/), which permits unrestricted reuse of the work in anymedium, provided the original work is properly cited. [DOI: 10.1149/2.0251507jss] All rights reserved.
Manuscript submitted March 16, 2015; revised manuscript received April 16, 2015. Published May 12, 2015.
Recently we have published a study on the cathodoluminescence(CL) of nanosized Y2O3:Eu3+ particles.1 The methods described inthat report enabled a detailed analysis of the symmetry-related spectraltransitions in the CL spectrum of Y2O3:Eu3+. In the present report wedescribe a study on the cathodoluminescence of nanosized Y2O3:Tb3+
particles using the same methods as developed for analyzing the spec-tra of Y2O3:Eu3+. Although the industrial importance of Y2O3:Tb3+
is smaller than that of Y2O3:Eu3+, the strong green fluorescence ofTb3+ doped Y2O3 crystals has attracted much attention and many sci-entists studied the PL and CL spectra of Y2O3:Tb3+ particles, bothmicrometre and nanometre sized. The CL spectra of nine rare earthions in Y2O3 host crystals were published by Ozawa.2 The idiosyn-crasy of the luminescence spectra of Tb3+ doped phosphors was nicelysummarized by Blasse and Grabmaier: domination by the 5D4→7FJ
(J = 2, 3, 4, 5 and 6) transitions, contribution of (weak) 5D3→7FJ
transitions in the blue and a complicated structure of the crystal fieldsplitting because of the rather high J quantum numbers.3
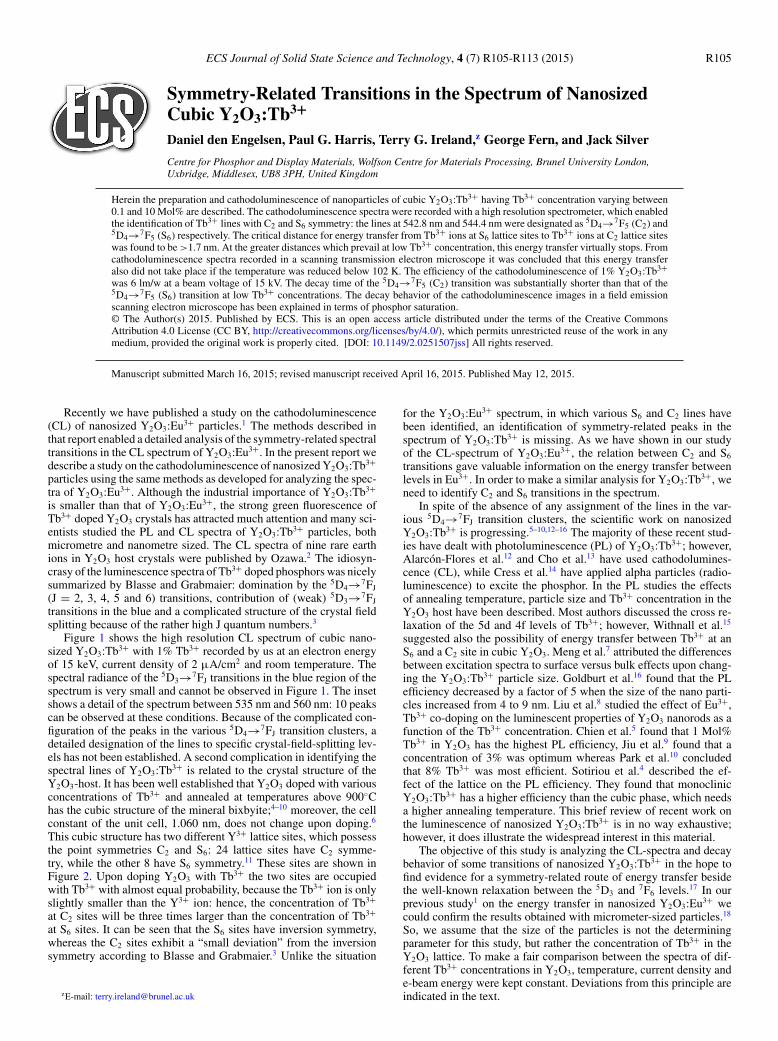
Figure 1 shows the high resolution CL spectrum of cubic nano-sized Y2O3:Tb3+ with 1% Tb3+ recorded by us at an electron energyof 15 keV, current density of 2 μA/cm2 and room temperature. Thespectral radiance of the 5D3→7FJ transitions in the blue region of thespectrum is very small and cannot be observed in Figure 1. The insetshows a detail of the spectrum between 535 nm and 560 nm: 10 peakscan be observed at these conditions. Because of the complicated con-figuration of the peaks in the various 5D4→7FJ transition clusters, adetailed designation of the lines to specific crystal-field-splitting lev-els has not been established. A second complication in identifying thespectral lines of Y2O3:Tb3+ is related to the crystal structure of theY2O3-host. It has been well established that Y2O3 doped with variousconcentrations of Tb3+ and annealed at temperatures above 900◦Chas the cubic structure of the mineral bixbyite;4–10 moreover, the cellconstant of the unit cell, 1.060 nm, does not change upon doping.6
This cubic structure has two different Y3+ lattice sites, which possessthe point symmetries C2 and S6: 24 lattice sites have C2 symme-try, while the other 8 have S6 symmetry.11 These sites are shown inFigure 2. Upon doping Y2O3 with Tb3+ the two sites are occupiedwith Tb3+ with almost equal probability, because the Tb3+ ion is onlyslightly smaller than the Y3+ ion: hence, the concentration of Tb3+
at C2 sites will be three times larger than the concentration of Tb3+
at S6 sites. It can be seen that the S6 sites have inversion symmetry,whereas the C2 sites exhibit a “small deviation” from the inversionsymmetry according to Blasse and Grabmaier.3 Unlike the situation
zE-mail: [email protected]
for the Y2O3:Eu3+ spectrum, in which various S6 and C2 lines havebeen identified, an identification of symmetry-related peaks in thespectrum of Y2O3:Tb3+ is missing. As we have shown in our studyof the CL-spectrum of Y2O3:Eu3+, the relation between C2 and S6
transitions gave valuable information on the energy transfer betweenlevels in Eu3+. In order to make a similar analysis for Y2O3:Tb3+, weneed to identify C2 and S6 transitions in the spectrum.
In spite of the absence of any assignment of the lines in the var-ious 5D4→7FJ transition clusters, the scientific work on nanosizedY2O3:Tb3+ is progressing.5–10,12–16 The majority of these recent stud-ies have dealt with photoluminescence (PL) of Y2O3:Tb3+; however,Alarcon-Flores et al.12 and Cho et al.13 have used cathodolumines-cence (CL), while Cress et al.14 have applied alpha particles (radio-luminescence) to excite the phosphor. In the PL studies the effectsof annealing temperature, particle size and Tb3+ concentration in theY2O3 host have been described. Most authors discussed the cross re-laxation of the 5d and 4f levels of Tb3+; however, Withnall et al.15
suggested also the possibility of energy transfer between Tb3+ at anS6 and a C2 site in cubic Y2O3. Meng et al.7 attributed the differencesbetween excitation spectra to surface versus bulk effects upon chang-ing the Y2O3:Tb3+ particle size. Goldburt et al.16 found that the PLefficiency decreased by a factor of 5 when the size of the nano parti-cles increased from 4 to 9 nm. Liu et al.8 studied the effect of Eu3+,Tb3+ co-doping on the luminescent properties of Y2O3 nanorods as afunction of the Tb3+ concentration. Chien et al.5 found that 1 Mol%Tb3+ in Y2O3 has the highest PL efficiency, Jiu et al.9 found that aconcentration of 3% was optimum whereas Park et al.10 concludedthat 8% Tb3+ was most efficient. Sotiriou et al.4 described the ef-fect of the lattice on the PL efficiency. They found that monoclinicY2O3:Tb3+ has a higher efficiency than the cubic phase, which needsa higher annealing temperature. This brief review of recent work onthe luminescence of nanosized Y2O3:Tb3+ is in no way exhaustive;however, it does illustrate the widespread interest in this material.
The objective of this study is analyzing the CL-spectra and decaybehavior of some transitions of nanosized Y2O3:Tb3+ in the hope tofind evidence for a symmetry-related route of energy transfer besidethe well-known relaxation between the 5D3 and 7F6 levels.17 In ourprevious study1 on the energy transfer in nanosized Y2O3:Eu3+ wecould confirm the results obtained with micrometer-sized particles.18
So, we assume that the size of the particles is not the determiningparameter for this study, but rather the concentration of Tb3+ in theY2O3 lattice. To make a fair comparison between the spectra of dif-ferent Tb3+ concentrations in Y2O3, temperature, current density ande-beam energy were kept constant. Deviations from this principle areindicated in the text.
R106 ECS Journal of Solid State Science and Technology, 4 (7) R105-R113 (2015)
Figure 1. High resolution CL spectrum of cubic nanosized Y2O3:Tb3+ with1 Mol% Tb3+ recorded at a beam energy of 15 keV, current density of2 μA/cm2 and room temperature. Inset: 5D4→7F4 transition cluster in widewavelength scale. The wavelengths (in nm) of the two strongest peaks in thespectrum are indicated.
Materials and Methods
Materials and synthesis.— Yttrium oxide (99.99%, Ampere In-dustrie, France) and terbium oxide (99.99%, Neo performance ma-terials, UK) were used to prepare the terbium-doped yttrium nitratestock solutions. Urea, nitric acid and isopropanol (IPA) were sup-plied by Fisher Scientific, UK; all chemicals were used as received.Glass substrates (1 cm2) coated with an indium tin oxide (ITO) film(85 �/sq) were obtained from Visiontek Ltd., UK. The ITO-coatedslides were carefully cleaned in de-ionized water and IPA using ul-trasonic cavitation. Conductive carbon tabs coated with adhesive onboth sides were used as substrate for recording the spectra and theimaging studies in the field emission scanning electron microscope(FESEM). For the transmission electron microscope (TEM) special C-grid substrates were used. The synthesis of Y2O3:Eu3+nanoparticlesby the urea method has been described extensively in our earlierwork;1,19–21 the synthesis of nanosized Y2O3:Tb3+ was done iden-tically. The aging of the turbid suspensions after the onset of pre-cipitation was continued for one hour at a temperature above 85◦C(which is the temperature at which urea slowly decomposes in aque-ous media). After this aging period the precipitate was filtered, washedthree times with de-ionized water and dried in an oven at 80◦C. Thephosphor precursor particles were then annealed at 980◦C in a fur-nace in air for four hours to yield cubic nanosized Y2O3:Tb3+ phos-phor particles. This annealing temperature guarantees cubic crystal-lites that yield optimum CL characteristics.20 The Y2O3:Tb3+ pow-ders after annealing looked slightly yellow-brown, due to the pres-ence of a small quantity of Tb4+.22 The possible reduction of thisvery small quantity of Tb4+ will be discussed in the CL spectrumsection.
Figure 2. C2 and S6 sites of the Y3+ cation in cubic Y2O3. S6 has inversionsymmetry, whereas C2 has 180◦ rotation symmetry.
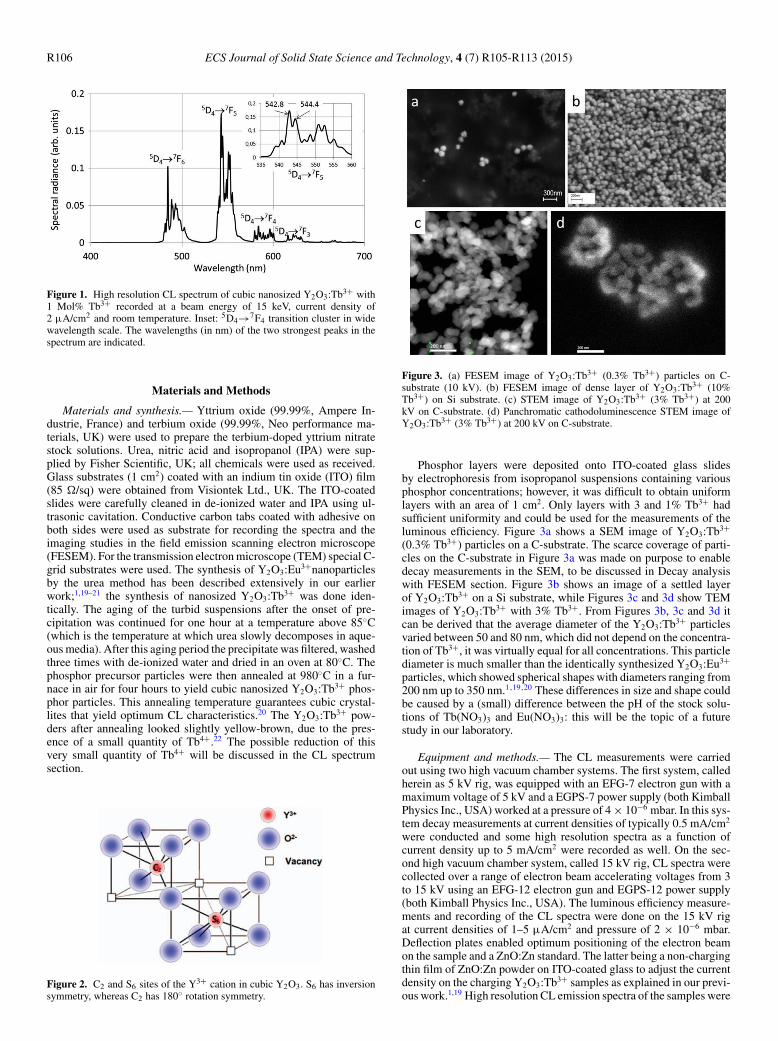
Figure 3. (a) FESEM image of Y2O3:Tb3+ (0.3% Tb3+) particles on C-substrate (10 kV). (b) FESEM image of dense layer of Y2O3:Tb3+ (10%Tb3+) on Si substrate. (c) STEM image of Y2O3:Tb3+ (3% Tb3+) at 200kV on C-substrate. (d) Panchromatic cathodoluminescence STEM image ofY2O3:Tb3+ (3% Tb3+) at 200 kV on C-substrate.
Phosphor layers were deposited onto ITO-coated glass slidesby electrophoresis from isopropanol suspensions containing variousphosphor concentrations; however, it was difficult to obtain uniformlayers with an area of 1 cm2. Only layers with 3 and 1% Tb3+ hadsufficient uniformity and could be used for the measurements of theluminous efficiency. Figure 3a shows a SEM image of Y2O3:Tb3+
(0.3% Tb3+) particles on a C-substrate. The scarce coverage of parti-cles on the C-substrate in Figure 3a was made on purpose to enabledecay measurements in the SEM, to be discussed in Decay analysiswith FESEM section. Figure 3b shows an image of a settled layerof Y2O3:Tb3+ on a Si substrate, while Figures 3c and 3d show TEMimages of Y2O3:Tb3+ with 3% Tb3+. From Figures 3b, 3c and 3d itcan be derived that the average diameter of the Y2O3:Tb3+ particlesvaried between 50 and 80 nm, which did not depend on the concentra-tion of Tb3+, it was virtually equal for all concentrations. This particlediameter is much smaller than the identically synthesized Y2O3:Eu3+
particles, which showed spherical shapes with diameters ranging from200 nm up to 350 nm.1,19,20 These differences in size and shape couldbe caused by a (small) difference between the pH of the stock solu-tions of Tb(NO3)3 and Eu(NO3)3: this will be the topic of a futurestudy in our laboratory.
Equipment and methods.— The CL measurements were carriedout using two high vacuum chamber systems. The first system, calledherein as 5 kV rig, was equipped with an EFG-7 electron gun with amaximum voltage of 5 kV and a EGPS-7 power supply (both KimballPhysics Inc., USA) worked at a pressure of 4 × 10⁻⁶ mbar. In this sys-tem decay measurements at current densities of typically 0.5 mA/cm2
were conducted and some high resolution spectra as a function ofcurrent density up to 5 mA/cm2 were recorded as well. On the sec-ond high vacuum chamber system, called 15 kV rig, CL spectra werecollected over a range of electron beam accelerating voltages from 3to 15 kV using an EFG-12 electron gun and EGPS-12 power supply(both Kimball Physics Inc., USA). The luminous efficiency measure-ments and recording of the CL spectra were done on the 15 kV rigat current densities of 1–5 μA/cm2 and pressure of 2 × 10⁻⁶ mbar.Deflection plates enabled optimum positioning of the electron beamon the sample and a ZnO:Zn standard. The latter being a non-chargingthin film of ZnO:Zn powder on ITO-coated glass to adjust the currentdensity on the charging Y2O3:Tb3+ samples as explained in our previ-ous work.1,19 High resolution CL emission spectra of the samples were

ECS Journal of Solid State Science and Technology, 4 (7) R105-R113 (2015) R107
Figure 4. Equipment for CL measurements using two spectrometers. Record-ing of high resolution spectra with the Bentham monochromator was only donein reflection mode.
collected using a Bentham phosphor spectrometer system (BenthamInstruments Ltd., Reading, UK.), configured with M300 excitationand emission monochromators, to which the emission monochroma-tor was connected via a fibre optic bundle positioned at the windowof the vacuum chamber. The absolute wavelength calibration of thisemission monochromator could be off by maximally 0.4 nm; however,relative wavelength values were accurate within 0.03 nm.
The electron gun set-up and viewing port geometries of the 15 kVrig are shown in Figure 4. The sample was positioned in the centre ofthe vacuum chamber. For the determination of the luminous efficiency,spectral radiance and luminance were recorded with two Spectrobos1200 spectroradiometers manufactured by JETI (Germany) between380 nm and 780 nm in reflection and transmission mode, indicated inFigure 4 by spectrometers 2 and 1 respectively. Spectrometer 2 wasreplaced with the Bentham fibre optic bundle for recording the highresolution CL spectra.
The shield is a high transmission grid (transmission > 99%) whichis biased at −50 V to collect all secondary electrons on the sampleplate. By blanking the e-beam of the Kimball electron gun of the5 kV rig we could measure the persistence of the luminescence of var-ious spectral transitions in Y2O3:Tb3+. The high resolution Benthammonochromator was used to adjust the wavelength to the maximum ofa spectral peak. This measuring method has been described in detailin our previous report.1
The morphology and particle size assessment of the phosphor pow-ders and CL-microscopy analyses were conducted in both a SEM andTEM. The SEM was a FESEM, Supra 35 VP, Carl Zeiss, Germany.Besides three detectors for secondary and backscattered electrons, thismicroscope was also equipped with a detector for CL. This facilityenabled luminescence decay studies of individual phosphor particles,as we have recently described.1,23 Image analysis of the panchro-matic CL-micrographs was performed using ImageJ (Public Domain)software.
The nanosized Y2O3:Tb3+ samples with 0.3 and 3% Tb3+ werealso analyzed with a TEM, model 2100F, JEOL, Japan. This micro-scope was operated in scanning mode with a spot size of 0.2 nm or1.5 nm. The TEM was equipped with a Vulcan CL detector, Gatan,USA, for imaging and spectroscopic purposes. This system used aCzerny-Turner spectrometer with back-illuminated CCD and a grat-ing with 1200 lines/mm (blazed at 500 nm) for collection of CLemission spectra. A cooled photo-multiplier tube (PMT) was utilizedfor collection of the total light flux from the sample. By collecting thevisible light with the Vulcan system simultaneously with the JEOLhigh angle annular dark field detector it was possible to observe thevisible light that was emitted from the particles. A small cryostatconnected to the sample holder enabled cooling of the samples in theTEM down to 103 K (−170◦C); adjustment of the sample temperatureanywhere between 102 K and 303 K could be made.
Results
CL spectrum.— Figure 1 is the high resolution CL spectrum ofnanosized Y2O3:Tb3+ with 1% Tb3+, recorded at the 15 kV rig atlow current density. The inset of this Figure shows the 5D4→7F4
transition cluster at a wide wavelength scale. The two strongest peaksreach their maximum values at 542.8 nm and 544.4 nm. Figure 5shows normalized CL spectra of nanosized Y2O3:Tb3+ with 0.3, 0.7,1 and 3% Tb3+, recorded at an electron energy of 15 keV, currentdensity of 2 μA/cm2 and room temperature For reasons of claritythe spectra of the 0.1, 0.6 and 10% Tb3+ have not been included inFigure 5; the spectra for 0.1 and 10% Tb3+ are presented in Figure6. Normalization was done versus the strongest peak in the spectra,viz. the 542.8 nm peak was set to unity in all spectra: this facilitatedthe comparison between the spectra. Figure 5a refers to the 5D4→7F5
the transition cluster, Figure 5b to 5D4→7F6, Figure 5c to 5D4→7F3
and Figure 5d to 5D4→7F4. It can be seen that only Figures 5a and5c show pronounced concentration effects; the concentration effectsin the 5D4→7F6 and 5D4→7F4 transitions clusters are rather small,but cannot be neglected either. The isolated peak at 637.8 nm inthe 5D4→7F3 transition cluster, indicated by an arrow in Fig. 5c,shows a particularly large effect: the 3% Tb3+ concentration has thelowest spectral radiance and the 0.3% Tb3+ the highest. The otherconcentrations have intermediate radiances. The same trend can beobserved in the 5D4→7F5 transition cluster notably for the peak at544.4 nm. Because of the low spectral radiance of the 5D4→7F3
transitions cluster we did not analyze this part of the spectrum indetail and focussed on the high radiance 5D4→7F5 peaks at 542.8 nmand 544.4 nm. The normalized spectra did not change between 5 and15 kV.
Figure 6 shows the CL spectra of the 5D4→7F5 the transition clus-ter of Y2O3:Tb3+ with 0.1 and 10% Tb3+. The radiance was smallfor these samples because of considerable concentration quenchingfor the 10% sample and low concentration for the 0.1% sample. Thespectra shown in Figure 6 are also normalized to unity at 542.8 nm.For the 0.1% sample the 544.4 nm peak is now larger than the542.8 nm peak. The spectrum of 6% Tb3+ is not shown, becauseit almost coincides with that of the 10% sample. The height differenceof the 544.4 nm peak between 0.1 and 10% Tb3+ is very pronouncedin this Figure. However, some peaks at λ > 544.4 nm show alsosubstantial concentration effects.
The spectra shown in Figures 5 and 6 were recorded at a low currentdensity between 2 μA/cm2 and 5 μA/cm2, in which the effect ofsaturation can be excluded. For the spectra shown in Figure 6 we used5 μA/cm2 to increase the signal to noise ratio. We have also recordedCL-spectra of Y2O3:Tb3+ at much higher current density on the 5 kVrig, in which the effect of current density becomes quite noticeable. Anexample is shown in Figure 7 for the 5D4→7F5 transition cluster of 1%Y2O3:Tb3+, in which the 542.8 nm peak has again been normalizedto unity. It can be seen that the peak at 544.4 nm suffers more fromsaturation than the peak at 542.8 nm.
Because of the substantial overlapping of peaks in the spectra,comparing the peak values at 542.8 nm and 544.4 nm may yieldinaccurate information; therefore, it was decided to calculate the ratioof the peaks at 542.8 nm and 544.4 nm, indicated by I542.8/I544.4, fromthe deconvoluted spectra. The deconvolution was done in the sameway as we did for the spectra of Y2O3:Eu3+ as described in Ref. 1. Itwas assumed that the spectral transitions have Gaussian shapes. Thespectral radiance SR(λ), where λ represents the wavelength, can bewritten as:
S R(λ) =∑
i
Ai e−(λ−λi )2
si , [1]
where Ai is the maximum spectral radiance of the ith peak, λi is thewavelength for the maximum and si is a parameter related to the widthof the ith peak. The full width at half maximum (FWHM) is
FW H Mi = 1.665√
si , [2]

R108 ECS Journal of Solid State Science and Technology, 4 (7) R105-R113 (2015)
Figure 5. Normalized CL spectra of Y2O3:Tb3+ at 0.3, 0.7, 1 and 3%Tb3+; a: 5D4→7F5 cluster; b: 5D4→7F6 cluster; c: 5D4→7F3 cluster; d: 5D4→7F4 cluster.Radiance of 542.8 nm peak set to unity for all spectra.
and the radiance of the ith transition is
Ri =∫ ∞
−∞Ai e
−(λ−λi )2
si dλ = Ai√
πsi . [3]
An example of the deconvolution of the 5D4→7F5 peaks at542.8 nm and 544.4 nm is depicted in Figure 8 for 0.3% Y2O3:Tb3+.In this deconvolution four Gaussian profiles were used; Lorentzianprofiles did not yield satisfactory results. These four Gaussians werefitted to the experimental spectrum with a least squares algorithmusing Microsoft’s Excel solver.
The radiance ratio I542.8/I544.4 is plotted in Figure 9a as function ofTb3+ concentration and as a function of the average distance betweenTb3+ ions in the Y2O3 lattice in Figure 9b. This average distance DTb
Figure 6. Normalized CL spectra of the 5D4→7F5 transition cluster of nano-sized Y2O3:Tb3+ with 0.1 and 10% Tb3+, recorded at 15 keV and 5 μA/cm2.
can be written as1:
DT b = 3
√100M
2ρNavc, [4]
where M is the molecular weight of Y2O3, ρ is the density of Y2O3,being 5.01 g/cm3, and Nav is Avogadro’s number. The factor 100appears in Eq. 4, because the concentration c is expressed in %.
The correspondence between Figure 9, derived from the spectrarecorded at low current density, and the equivalent Figure in our reporton Y2O3:Eu3+ is striking;1 so, we conclude that the 542.8 nm peakrefers to Tb3+ at a C2 site and the 544.4 nm peak refers to Tb3+ at
Figure 7. Normalized CL spectra of nanosized Y2O3:Tb3+ with 1% Tb3+at 5 kV of 5D4→7F5 the transition cluster at low (10 μA/cm2) and high(5 mA/cm2) current density.

ECS Journal of Solid State Science and Technology, 4 (7) R105-R113 (2015) R109
Figure 8. Deconvolution of a part of the 5D4→7F5 spectrum between 540and 546 nm with four Gaussian profiles.
an S6 site. The knee of the curve in Figure 9b is at 1.7 nm, whichimplies that the critical distance,DCrit
T b3+ , for interaction between the S6
and C2 sites is 1.7 nm. This value is identical to the critical distance inY2O3:Eu3+1. We have argued that DCrit
T b3+ is two times larger than thedistance R0, being the critical transfer distance for which the transferrate of energy from S6 to C2 is equal to the radiative decay rate;24
consequently, R0 for Y2O3:Tb3+ is 0.85 nm and the same as R0 forY2O3:Eu3+. Ozawa mentioned the change of the relative radianceof lines in the CL spectrum of Y2O3:Tb3+ upon varying the dopantconcentration,2 but he did not specify which peaks were changing.Without splitting the 5D4→7F5 transition into a doublet consisting ofa C2 and S6 part the concentration effects in the spectrum are modest,let alone that it would be possible to designate overlapping peaks in alow resolution spectrum.
Beside the high resolution spectra shown in Fig. 5 we have alsorecorded low resolution spectra at various e-beam voltages and acurrent density of 1 μA/cm2 with the Spectrobos 1200 spectrora-diometers, which enable a direct evaluation of the color coordinate ofthe emitted light. This measurement was primarily carried out for thedetermination of the lumen efficiency, to be discussed in Luminousefficiency section; however, it allowed also a check on the possiblereduction of Tb4+ ions in the Y2O3 lattice upon electron bombard-ment. Adjustment and measurement took about 2 minutes for eachspectrum; the spectra were recorded in succession with spectrometer2 at increasing e-beam voltages of 3, 6, 9, 12 and 15 kV. The colorcoordinates of the CL-spectra were constant, namely x = 0.3280 and y= 0.5750 (CIE-1931). These color coordinates have not been checkedvia a calibration procedure of the spectrometers; however, for thepresent purpose the comparison is justified, because spectrometer and
Figure 10. Lumen efficacy of nanosized Y2O3:Tb3+ versus beam voltage.
electron gun were not touched during the measurements. The invari-ance of the color coordinates versus time and beam voltage indicatesthat a possible reduction of a small quantity of Tb4+ ions to Tb3+ inthe Y2O3 lattice upon electron bombardment can be neglected. Thereis another reason why we assume that a possible reduction of Tb4+ canbe neglected in the present study, viz. the considerations on the ratioI542.8/I544.4, refer to wavelengths, which are so close, that an effect ofa small change in the absorption due to a variation in the Tb4+ wouldhave been detected in the deconvolutions discussed afore.
Luminous efficiency.— Thin layers of Y2O3:Tb3+ particles de-posited on ITO coated glass slides were used for measuring the lu-minance and spectral radiance. The weight of the Y2O3:Tb3+ layerswas 2 mg/cm2 for the 1% Tb3+ sample, yielding a layer thickness6.2 μm.1 In the case of 3% Tb3+ the weight of the layer was lessand the thickness was therefore smaller. The measurement methodof the luminance and the evaluation of the luminous efficiency havebeen described extensively in our previous papers;1,19 hence, we maysuffice in presenting the results only in Figure 10. The measurementswere conducted in the 15 kV rig at a current density of 1 μA/cm2. Itcan be seen that the luminous efficiency is almost constant between6 and 15 kV. Since it was impossible to prepare layers of sufficientuniformity for the other Tb3+ concentrations, the optimum Tb3+ con-centration could not be determined. Obviously, Y2O3:Tb3+ with 3%Tb3+ is already suffering from concentration quenching; so, the opti-mum concentration must be lower than 3%.
The lumen efficacy of Y2O3:Tb3+ is smaller than that Y2O3:Eu3+1.This result is contrary to luminance data published by Cho et al.13
Decay.— Thin layers of nanosized Y2O3:Tb3+ particles on C-substrates were excited with a partially focussed electron beam of5 kV rig and current densities between 100 μA/cm2 and 500 μA/cm2.
Figure 9. a. Plot of I542.8/I544.4 as a function of Tb3+ concentration. b. I542.8/I544.4 versus DTb.

R110 ECS Journal of Solid State Science and Technology, 4 (7) R105-R113 (2015)
Figure 11. Decay of radiance of 542.8 nm peak of Y2O3:Tb3+ (0.3%Tb3+);beam energy 5 keV, current density is ≈500 μA/cm2.
Figure 12. Decay times of 542.8 nm and 544.4 nm peaks of Y2O3:Tb3+versus Tb3+ concentration. Points: experimental values, curves are fitted tothe experimental results.
Some saturation of the 544.4 nm could occur at these conditions ascan be seen in Figure 7. Since we did not observe differences uponlowering the current density to 10 μA/cm2 for this peak, we did notinvestigate this issue in more detail. The high resolution Benthamspectrometer was used to adjust the wavelength to be analyzed, whichhelped to minimize the interference from partially overlapping tran-sitions. A typical decay curve for the 5D4→7F5 (C2) transition at542.8 nm is presented in Figure 11. These decay curves showed ex-ponential behavior in most cases; decay times, τ1/e, were calculatedfrom log plots as shown in Figure 11, including a small instrumentalcorrection.
Figure 12 is a plot of the decay times (τ1/e) as a function of theTb3+ concentration in Y2O3.
The decay times of the experimental points represented inFigure 12 are also listed in Table I.
Table I. τ1/e (ms) for 542.8 nm, 544.4 nm, 550.7 nm and 552.3 nmpeaks of Y2O3:Tb3+.
Conc. Tb3+ (Mol %) C2 542.8 nm S6 544.4 nm 550.7 nm 552.3 nm
0.1 1.8 5.6 2.0 2.70.3 1.7 5.2 2.1 2.60.7 1.7 5.8 2.0 2.31 1.6 4.13 1.7 2.26 1.0 1.210 0.8 0.9
Table II. Parameters for decay curves represented in Figure 11.
Parameter 542.8 nm (C2) 544.4 nm (S6)
τr (ms) 1.74 5.98A 0.020 0.353γ 1.83 1.36
The experimental results for 542.8 nm and 544.4 nm peaks shownin Fig. 12 were fitted to curves, which can be written as:1,18
τ1/e = τr
1 + Aτr cγ, [5]
where τr is the radiative decay time (in ms) and the second term inthe denominator representing the radiationless decay, in which c is theconcentration of Tb3+ in % and A and γ are parameters that were fittedto the measured time constants. The parameters that were obtained bya least squares fit are listed in Table II.
The results presented in Figure 12 and Tables I and II indicate thatthe radiative decay time of the 544.4 nm peak is 3.4 times longer thanthat for the 542.8 nm peak (at low Tb3+ concentrations). This is whatone might expect if the 544.4 nm peak refers to Tb3+ at an S6 siteand the 542.8 nm peak refers to Tb3+ at a C2 site. The S6 site hasinversion symmetry, which forbids direct electric dipole transitions,but magnetic dipole transitions are possible for this symmetry, whichyield usually longer decay times. We conclude therefore that the decaymeasurements support the assignment of the 542.8 nm and 544.4 nmpeaks to 5D4→7F5 (C2) and 5D4→7F5 (S6) transitions respectively.
Table I also lists decay times for the other two strong peaks inthe 5D4→7F5 transition cluster of Y2O3:Tb3+, viz. the doublet at550.7 nm and 552.3 nm. The decay times are between the valuesobtained for the peaks at 542.8 nm and 544.4 nm, indicating that thefirst mentioned doublet is a mixture of C2 and S6 type transitions. Thisis also confirmed in Figure 5a, showing that the concentration effectis stronger for the 552.3 nm peak than that for the 550.7 nm peak.So, the S6-content in the 552.3 nm peak is higher and thus leads to asomewhat longer decay time.
Analysis with STEM.— As mentioned in the Experimental sec-tion, the TEM in our laboratory has the possibility to record panchro-matic images as represented in Figure 3d and to measure CL spectra.These spectra can be recorded at temperatures from 102 K to 303 K.Figure 13 shows the CL spectra of 3% Y2O3:Tb3+ at 102 K and 303K recorded at 200 keV.
Figure 13 indicates that the spectrum at 102 K has sharper peaksbecause of less vibronic broadening; moreover, the ratio I542.8/I544.4
Figure 13. CL spectra of 3% Y2O3:Tb3+ at 102 K and 303 K in TEM. Spectrahave been normalized to unity at 542.8 nm. For reasons of clarity, spectra at173 K and 223 K with intermediate radiance values have been omitted: thepeak values of the 544.4 nm line were between those of 102 K and 303 K. Theinset is a plot of LOG(I542.8/I544.4) versus 1000/K.
ECS Journal of Solid State Science and Technology, 4 (7) R105-R113 (2015) R111
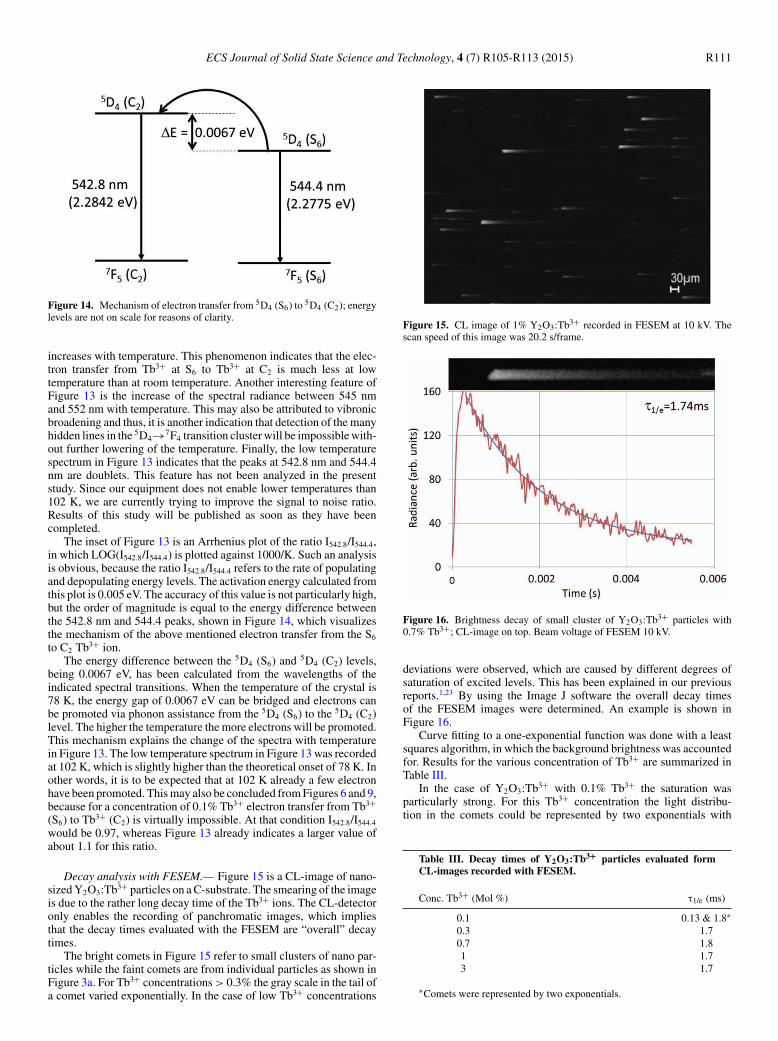
Figure 14. Mechanism of electron transfer from 5D4 (S6) to 5D4 (C2); energylevels are not on scale for reasons of clarity.
increases with temperature. This phenomenon indicates that the elec-tron transfer from Tb3+ at S6 to Tb3+ at C2 is much less at lowtemperature than at room temperature. Another interesting feature ofFigure 13 is the increase of the spectral radiance between 545 nmand 552 nm with temperature. This may also be attributed to vibronicbroadening and thus, it is another indication that detection of the manyhidden lines in the 5D4→7F4 transition cluster will be impossible with-out further lowering of the temperature. Finally, the low temperaturespectrum in Figure 13 indicates that the peaks at 542.8 nm and 544.4nm are doublets. This feature has not been analyzed in the presentstudy. Since our equipment does not enable lower temperatures than102 K, we are currently trying to improve the signal to noise ratio.Results of this study will be published as soon as they have beencompleted.
The inset of Figure 13 is an Arrhenius plot of the ratio I542.8/I544.4,in which LOG(I542.8/I544.4) is plotted against 1000/K. Such an analysisis obvious, because the ratio I542.8/I544.4 refers to the rate of populatingand depopulating energy levels. The activation energy calculated fromthis plot is 0.005 eV. The accuracy of this value is not particularly high,but the order of magnitude is equal to the energy difference betweenthe 542.8 nm and 544.4 peaks, shown in Figure 14, which visualizesthe mechanism of the above mentioned electron transfer from the S6
to C2 Tb3+ ion.The energy difference between the 5D4 (S6) and 5D4 (C2) levels,
being 0.0067 eV, has been calculated from the wavelengths of theindicated spectral transitions. When the temperature of the crystal is78 K, the energy gap of 0.0067 eV can be bridged and electrons canbe promoted via phonon assistance from the 5D4 (S6) to the 5D4 (C2)level. The higher the temperature the more electrons will be promoted.This mechanism explains the change of the spectra with temperaturein Figure 13. The low temperature spectrum in Figure 13 was recordedat 102 K, which is slightly higher than the theoretical onset of 78 K. Inother words, it is to be expected that at 102 K already a few electronhave been promoted. This may also be concluded from Figures 6 and 9,because for a concentration of 0.1% Tb3+ electron transfer from Tb3+
(S6) to Tb3+ (C2) is virtually impossible. At that condition I542.8/I544.4
would be 0.97, whereas Figure 13 already indicates a larger value ofabout 1.1 for this ratio.
Decay analysis with FESEM.— Figure 15 is a CL-image of nano-sized Y2O3:Tb3+ particles on a C-substrate. The smearing of the imageis due to the rather long decay time of the Tb3+ ions. The CL-detectoronly enables the recording of panchromatic images, which impliesthat the decay times evaluated with the FESEM are “overall” decaytimes.
The bright comets in Figure 15 refer to small clusters of nano par-ticles while the faint comets are from individual particles as shown inFigure 3a. For Tb3+ concentrations > 0.3% the gray scale in the tail ofa comet varied exponentially. In the case of low Tb3+ concentrations
Figure 15. CL image of 1% Y2O3:Tb3+ recorded in FESEM at 10 kV. Thescan speed of this image was 20.2 s/frame.
Figure 16. Brightness decay of small cluster of Y2O3:Tb3+ particles with0.7% Tb3+; CL-image on top. Beam voltage of FESEM 10 kV.
deviations were observed, which are caused by different degrees ofsaturation of excited levels. This has been explained in our previousreports.1,23 By using the Image J software the overall decay timesof the FESEM images were determined. An example is shown inFigure 16.
Curve fitting to a one-exponential function was done with a leastsquares algorithm, in which the background brightness was accountedfor. Results for the various concentration of Tb3+ are summarized inTable III.
In the case of Y2O3:Tb3+ with 0.1% Tb3+ the saturation wasparticularly strong. For this Tb3+ concentration the light distribu-tion in the comets could be represented by two exponentials with
Table III. Decay times of Y2O3:Tb3+ particles evaluated formCL-images recorded with FESEM.
Conc. Tb3+ (Mol %) τ1/e (ms)
0.1 0.13 & 1.8∗0.3 1.70.7 1.81 1.73 1.7
∗Comets were represented by two exponentials.

R112 ECS Journal of Solid State Science and Technology, 4 (7) R105-R113 (2015)
Table IV. Published decay times (τ1/e) of 5D4→7F5 transition of Y2O3:Tb3+.
τ 1/e (ms) Conc. Tb3+ (Mol %) Level/transition Excitation method Reference
2.19 0.1 5D4→7F5 PL: 266 nm 72.15 1 5D4→7F5 PL: 266 nm 72.67 1 545 nm PL: 276 nm 41.09 5 545 nm PL: 276 nm 41.16 1 549 nm laser 281.13 2 549 nm laser 280.85 4 549 nm laser 280.84 1 5D4 level PL: 270 nm 271.44 5 5D4 level PL: 270 nm 270.77 10 5D4 level PL: 270 nm 272.8 2 544.5 nm PL: 310 nm 260.8 6.8 544.5 nm PL: 310 nm 26
1.02 & 2.15 8 543 nm PL: 254 nm 100.92 3? 544 nm PL: 305 nm 91.11 3 542 nm Laser 29
decay times as indicated in Table III. The “overall” decay times inTable III determined from the FESEM-images match with the decaytimes determined for the 5D4→7F5 (C2) at 542.8 nm, listed in TableI. In other words, the contribution of the S6 transitions with longerpersistence can be neglected in the CL-images, because of the strongersaturation of the 5D4 (S6) level(s) in Y2O3:Tb3+. We shall discuss thisissue in more detail in the next section.
Discussion
In CL spectrum section we have already noticed that the variationof the Tb3+ concentration is clearly observable in the 5D4→7F5 (Fig-ure 5a) and 5D4→7F3 (Figure 5c) transition clusters, but hardly in the5D4→7F4 (Figure 5d) and 5D4→7F6 (Figure 5b) clusters. For the firsttwo transition clusters �J = +1 and �J = −1 respectively, whereas�J = 0 for 5D4→7F4 and �J = +2 for 5D4→7F6. The latter transitioncluster is a so-called forced electric-dipole transition, which is mag-netically forbidden.3 A small concentration effect is noticeable for thepeak at 583.2 nm in the 5D4→7F4 transition cluster (Figure 5d). WhenTb3+ is at an S6 site it may display magnetic dipole transitions with�J = 0, ±1. So, it can be concluded that assigning the 544.4 nm peakin the 5D4→7F5 cluster and the 630.1 nm and 637.8 nm peaks in the5D4→7F3 transitions cluster as S6 transitions and the virtual absenceof S6 transitions in the 5D4→7F6 transition cluster are in line with theselection rules. The 547.0 nm and 548.6 nm peaks in the 5D4→7F5
transition cluster (Figure 5a and Figure 6) may also be assigned asS6 transitions. Due to substantial overlapping of neighboring peaks,we did not investigate these peaks in detail. Figure 13 shows a pro-nounced sharpening of these peaks by lowering the temperature to102 K. As mentioned in Decay section the longer τ1/e decay time forthe S6 transition at 544.4 nm as compared to the C2 transition at 542.8nm is in line with what may be expected from magnetic- and electric-dipole transitions respectively. Further support for the above assign-ment can be deduced from Figure 7, which shows a stronger saturationeffect for the 544.4 nm peak than that for the 542.8 nm peak. From ourfindings, which are summarized in Figure 14, it can be concluded thatthe phonon assisted transition from 5D4 (S6) to 5D4 (C2) is symmetry-allowed, whereas the reverse route, which is energetically favorableand does not need phonon assistance, is symmetry-forbidden.
We mentioned in the introduction section that because of the equiv-alence of ion radii between Y3+ and Tb3+ it is obvious to assume thatthere are three times less Tb3+ ions at S6 than at C2 sites in the Y2O3
lattice. The saturation effect at continuous irradiance with an electronbeam having a current density j can be estimated by using a simpleequation that has been derived by Bril and Kroger25:
Ri = jηi
1 + jηiτi/Ni, [6]
where Ri is the radiance of transition i (= 5D4→7F5 (C2) or 5D4→7F5
(S6)), ηi is the efficiency of transition i at low current density and Ni
is the number of Tb3+ ions per cm3 at C2 or S6. If ηC2 ≈ ηS6 andbecause NC2 = 3NS6 and moreover τC2 < τS6, then it is clear from Eq.6 that the effect of saturation by increasing j is more pronounced forthe S6 transition. This consideration also explains that the CL imagesof the FESEM, in which effective current densities of about 1A/cm2
are rife,1 lack longer persistence S6-light.In spite of the extensive literature on the luminescence of
Y2O3:Tb3+, it is not easy to make a comparison between the re-sults of this work and those of other authors. An important reason isthe resolution of the spectrometer. The published spectra of bulk andnanosized Y2O3:Tb3+ show usually only two peaks for the various5D4→7FJ transition clusters.4–10,12–14,26,27 As can be seen in Figure 5afor the 5D4→7F5 cluster, these two peaks must be (1) a fusion betweenthe 542.8 nm and 544.4 nm peaks, being named here “peak A”, inthe literature sometimes indicated by wavelength (543 nm, 544 nm,545 nm or even 549 nm) or as the 5D4→7F5 transition, and (2) a fusionof the peaks at 551.0 nm and 552.6 nm, being named “peak B”. Theratio of the maximum radiance (A/B) of these fused peaks is foundto be 1.2–1.4 in the literature. The same ratio is found by us afterthe fusing procedure: this ratio decreases slightly upon increasing theTb3+ concentration. The fusion peak A is thus a mixture of the C2
and S4 transitions. Figure 5a and Table I indicate that there is also S6
content in the fusion peak B.Table IV summarizes decay times of the 5D4→7F5 transition of
Y2O3:Tb3+ published by other authors.The data listed in Table IV show that τ1/e decreases when the Tb3+
concentration is increased and that there are substantial deviationsbetween the various authors. The decrease of the decay time at largerconcentration is also shown in Figure 12: for the 544.4 nm peak morepronounced than for the 542.8 nm peak. The decay data of Table IV donot refer to the 542.8 nm or 544.4 nm peaks of Fig. 5a, but rather to thefusion peak A, defined above. The data can therefore not be compareddirectly to our results as summarized in Table I, but indirectly it ispossible. From Figure 9a it can be derived that I542.8/I544.4 is 1.6 for 3%Y2O3:Tb3+, which implies that when the peaks are fused together, theC2 content is 1.6 times larger than the S6 content. For 3% Y2O3:Tb3+
the overall decay time of this fusion peak would be 1.8 ms, whichagrees quite well with the data in Table IV.
Conclusions
Recording the CL spectra of nanosized cubic Y2O3:Tb3+ with ahigh resolution spectrometer enabled the identification of peaks thatare related to Tb3+ at C2 and S6 sites in the Y2O3 crystal. Fromour literature search we could not find that others have assigned thispreviously. The critical distance for energy transfer from Tb3+ ions

ECS Journal of Solid State Science and Technology, 4 (7) R105-R113 (2015) R113
at S6 lattice sites to Tb3+ ions at C2 lattice sites,DCritT b3+ , was found to
be 1.7 nm. This distance is identical to that in Y2O3:Eu3+, which isnot unexpected, because Eu3+ and Tb3+ have the same ion size andcorresponding 4f-4f and 4f-5d (in Tb3+) relaxations. At a temperature<78 K the phonon assisted transfer of energy from 5D4 (S6) to 5D4
(C2) stops in Y2O3:Tb3+ with a high concentration of Tb3+; whenthe temperature is >78 K, this transfer is enabled due to phononassistance.
The decay times of the 5D4→7F5 (C2) and the 5D4→7F5 (S6)transitions decrease at high Tb3+ concentration; this effect starts forS6 at lower concentrations than for C2. Decay times determined withthe FESEM at very high current density of about 1 A/cm2 are equal tothe decay times of the 5D4→7F5 C2 transition determined at a currentdensity of about 0.5 mA/cm2. The contribution of longer persistenceS6 transitions to CL-images in the FESEM is minimized because ofthe strong saturation of these transitions.
Finally, we would like to stress that the conclusions obtained fromthis study are of a preliminary character and need to be updated withmore detailed studies at low temperature, i.e. is the splitting of the linesat 542.8 nm and 544.4 nm at low temperature shown in Figure 13 real?Currently we are studying the PL and CL from nanosized Y2O3:Tb3+
particles at room temperature and low temperature to answer thisquestion and to get a better insight into the transfer of energy afterexcitation of the lattice (CL) or target levels (PL) in this phosphor.
Acknowledgments
We are grateful to the EPSRC and the Technology Strategy Board(TSB) for funding the PURPOSE (TP11/MFE/6/I/AA129F; EPSRCTS/G000271/1) and CONVERTED (JeS no. TS/1003053/1) pro-grams. We are also grateful to the TSB for funding the CONVERTprogram.
References
1. D. den Engelsen, P. G. Harris, T. G. Ireland, and J. Silver, ECS J. Solid State Sci.Technol., 4, R1 (2015).
2. L. Ozawa, Cathodoluminescence, Theory and Applications, p. 165, Kodansha & VCHVerlag, Tokyo (1990).
3. G. Blasse and B. C. Grabmaier, Luminescent Materials, p. 44, Springer-Verlag, Berlin(1994).
4. G. A. Sotiriou, M. Schneider, and S. E. Pratsini, J. Phys. Chem. C, 116, 4493 (2012).5. W. C. Chien, Y. Y. Yu, and C. C. Yang, Mater. Design, 31, 1737 (2010).6. S. Som, S. Dutta, Vijay Kumar, Vinod Kumar, H. C. Swart, and S. K. Sharma, J.
Lumin., 146, 162 (2014).7. Q. Meng, B. Chen, W. Xu, Y. Yang, X. Zhao, W. Di, S. Lu, X. Wang, J. Sun, L. Cheng,
T. Yu, and Y. Peng, J. Appl. Phys., 102, 093505 (2007).8. Z. Liu, L. Yu, Q. Wang, Y. Tao, and H. Yang, J. Lumin., 131, 12 (2011).9. H. Jiu, Y. Fu, L. Zhang, Y. Sun, Y. Wang, and T. Han, Micro Nano Lett., 7, 947
(2012).10. J. H. Park, N. G. Back, M. G. Kwak, B. E. Jun, B. C. Choi, B. K. Moon, J. H. Jeong,
S. S. Yi, and J. B. Kim, Mater. Sci. Eng. C, 27, 998 (2007).11. J. Heber, K. H. Hellwege, U. Kobler, H. Murmann, and Z. Physik, 237, 189
(1970).12. G. Alarcon-Flores, M. Garcıa-Hipolito, M. Aguilar-Frutis, S. Carmona-Tellez,
R. Martinez-Martinez, M. P. Campos-Arias, M. Jimenez-Estrada, and C. Falcon,ECS J. Solid State Sci. Technol., 3, R189 (2014).
13. J. Y. Cho, Y. D Huh, C. R. Park, and Y. R. Do, J. Electrochem Soc., 154, J272(2007).
14. C. D. Cress, C. S. Redino, B. J. Landi, and R. P. Raffaelle, J. Solid State Chem., 181,2041 (2008).
15. R. Withnall, M. I. Martinez-Rubio, G. R Fern, T. G. Ireland, and J. Silver, J. Opt. A:Pure Appl. Opt., 5, S81 (2003).
16. E. T. Goldburt, B. Kulkami, R. N. Bhargava, J. Taylor, and M. Libera, J. Lumin.,72–74, 190 (1997).
17. T. Kano in Phosphor Handbook, 2nd ed., W. Yen, S. Shionoya, and H. Yamamotoeds., p. 199 & 208, CRC Press, Boca Raton (2007).
18. D. B. M. Klaassen, R. A. M. van Ham, and T. G. M. van Rijn, J. Lumin., 43, 261(1989).
19. D. den Engelsen, P. G. Harris, T. G. Ireland, R. Withnall, and J. Silver, ECS J. SolidState Sci. Technol., 2, R201 (2013).
20. X. Jing, T. Ireland, C. Gibbons, D. J. Barber, J. Silver, A. Vecht, G. Fern, P. Trogwa,and D. C. Morton, J. Electrochem. Soc., 146, 4654 (1999).
21. J. Silver, T. G. Ireland, and R. Withnall, J. Electrochem. Soc., 151, H66 (2004).22. H. E. Hoefdraad, J. Inorg. Nucl. Chem., 37, 1917 (1975).23. D. den Engelsen, P. Harris, T. Ireland, G. Fern, and J. Silver, Ultramicroscopy, to be
published.24. M. Buijs, A. Meyerink, and G. Blasse, J. Lumin., 37, 9 (1987).25. A. Bril and F. A. Kroger, Philips Tech. Rev., 12, 120 (1950).26. L. Wang, N. Liao, L. Shi, H. Jia, P. Du, Z. Xi, and D. Jin, Electrochem. Solid State
Lett., 13, E7 (2010).27. R. S. Loitongbam, W. R. Singh, G. Phaomei, and N. S. Singh, J. Lumin., 140, 95
(2013).28. Q. Lu, Y. Wu, L. Ding, G. Zu, A. Li, Y. Zhao, and H. Cui, J. Alloys Comp., 496, 488
(2010).29. Z. Xu, J. Yang, Z. Hou, C. Li, C. Zhang, S. Huang, and J. Lin, Mater. Res. Bull., 44,
1850 (2009).


