Embed Size (px)
Citation preview

The Malawi Developmental Assessment Tool (MDAT):The Creation, Validation, and Reliability of a Tool toAssess Child Development in Rural African SettingsMelissa Gladstone1*, Gillian A. Lancaster2, Eric Umar3, Maggie Nyirenda1, Edith Kayira4, Nynke R. van
den Broek5, Rosalind L. Smyth6
1 Department of Paediatrics, College of Medicine, Blantyre, Malawi, 2 Postgraduate Statistics Centre, Department of Mathematics and Statistics, Lancaster University,
Lancaster, United Kingdom, 3 Department of Community Health, College of Medicine, Blantyre, Malawi, 4 Wellcome Trust Research Labs, Blantyre, Malawi, 5 Liverpool
School of Tropical Medicine, Liverpool, United Kingdom, 6 School of Reproductive and Developmental Medicine, Institute of Child Health, University of Liverpool,
Liverpool, United Kingdom
Abstract
Background: Although 80% of children with disabilities live in developing countries, there are few culturally appropriatedevelopmental assessment tools available for these settings. Often tools from the West provide misleading findings indifferent cultural settings, where some items are unfamiliar and reference values are different from those of Westernpopulations.
Methods and Findings: Following preliminary and qualitative studies, we produced a draft developmental assessment toolwith 162 items in four domains of development. After face and content validity testing and piloting, we expanded the drafttool to 185 items. We then assessed 1,426 normal rural children aged 0–6 y from rural Malawi and derived age-standardizednorms for all items. We examined performance of items using logistic regression and reliability using kappa statistics. Wethen considered all items at a consensus meeting and removed those performing badly and those that were unnecessary ordifficult to administer, leaving 136 items in the final Malawi Developmental Assessment Tool (MDAT). We validated the toolby comparing age-matched normal children with those with malnutrition (120) and neurodisabilities (80). Reliability wasgood for items remaining with 94%–100% of items scoring kappas .0.4 for interobserver immediate, delayed, and intra-observer testing. We demonstrated significant differences in overall mean scores (and individual domain scores) for childrenwith neurodisabilities (35 versus 99 [p,0.001]) when compared to normal children. Using a pass/fail technique similar to theDenver II, 3% of children with neurodisabilities passed in comparison to 82% of normal children, demonstrating goodsensitivity (97%) and specificity (82%). Overall mean scores of children with malnutrition (weight for height ,80%) were alsosignificantly different from scores of normal controls (62.5 versus 77.4 [p,0.001]); scores in the separate domains, excludingsocial development, also differed between malnourished children and controls. In terms of pass/fail, 28% of malnourishedchildren versus 94% of controls passed the test overall.
Conclusions: A culturally relevant developmental assessment tool, the MDAT, has been created for use in African settingsand shows good reliability, validity, and sensitivity for identification of children with neurodisabilities.
Please see later in the article for the Editors’ Summary.
Citation: Gladstone M, Lancaster GA, Umar E, Nyirenda M, Kayira E, et al. (2010) The Malawi Developmental Assessment Tool (MDAT): The Creation, Validation,and Reliability of a Tool to Assess Child Development in Rural African Settings. PLoS Med 7(5): e1000273. doi:10.1371/journal.pmed.1000273
Academic Editor: David Osrin, University College London, United Kingdom
Received October 26, 2009; Accepted March 30, 2010; Published May 25, 2010
Copyright: � 2010 Gladstone et al. This is an open-access article distributed under the terms of the Creative Commons Attribution License, which permitsunrestricted use, distribution, and reproduction in any medium, provided the original author and source are credited.
Funding: This study has been supported by a Wellcome Trust APPLe Trial Research Grant (065810/Z/01/Z), the Royal College of Paediatrics and Child HealthHeinz fellowship, St. Pauls Girls School Benevolent Fund, and the W.E. Gladstone Memorial Trust fund. MG and GL had full access to the data and all authors hadfinal responsibility for the decision to submit for publication. The funders had no role in study design, data collection and analysis, decision to publish, orpreparation of the manuscript.
Competing Interests: Rosalind L. Smyth is on the Board of Directors of Public Library of Science (http://www.plos.org/about/board.php).
Abbreviations: HAZ, height for age; MDAT, Malawi Developmental Assessment Tool; MDHS, Malawi Demographic Health Survey; SD, standard deviation; WAZ,weight for age.
* E-mail: [email protected]
PLoS Medicine | www.plosmedicine.org 1 May 2010 | Volume 7 | Issue 5 | e1000273

Introduction
Worldwide, poverty, poor health and nutrition are responsible for
more than 200 million children under 5 y of age failing to reach
their developmental potential [1]. We know that such outcomes
could be prevented if early intervention programmes were available
for these children [2]. However, the implementation of these
internationally funded programmes is critically dependent on tools
to assess child development, and there is a dearth of such tools for
use in non-Western settings. Programmes and studies using
development as an outcome measure in resource-limited countries
have tended to use Western assessment tools [3]. Many are simply
translated [4] or adapted [5], with limited validation [6] before use.
This approach may enable some comparison between groups, but it
will not provide robust outcome measures because these tools
contain many items alien to children of a non-Western culture [7].
More recently, some tools have been adapted and validated, and
normal reference ranges or scores for ages to assess attainment have
been developed. These tools have been created for children of a
limited age range, [8], have been based solely on urban children [9],
or have excluded important domains of development such as
language and social skills [10].
The aim of this study was to create a culturally appropriate
developmental assessment tool, the Malawi Developmental
Assessment Tool (MDAT), for use in rural Africa. In a preliminary
study we evaluated the use of Western developmental items in a
rural Malawian setting [11]. We discovered that a high proportion
of gross motor 33/34 (97%), language 32/35 (91%), and fine
motor 27/34 (79%) items were reliable and showed a good fit with
logistic regression. The social items 18/35 (51%), however,
performed less well and many were judged to be culturally
inappropriate. This stimulated us to conduct a qualitative study
addressing concepts and ideas of child development with ten focus
groups of villagers and two focus groups of professionals in Malawi
[12]. While all domains were discussed, gross motor and social
milestones were the main domains of interest. Concepts and ideas
from this study were then used to generate new items and modify
items from the preliminary study. Examples of concepts used were
Figure 1. Stages in creation of final MDAT tool. Draft MDAT I created out of 110 items from the preliminary study with the addition of 52 itemsfrom the qualitative study, as well as the modification of some items. Draft MDAT II created after face and content validity with addition of 13 itemsand eight items removed as well as the modification of some items. Draft MDAT III created after piloting where nine gross motor, six fine motor, ninelanguage, and four social items were added or modified, and one gross motor, five language, and three social items were removed. The Final MDATtool consisted of 136 items with 34 in each domain having had eight gross motor, nine fine motor, 23 language, and nine social items removed.doi:10.1371/journal.pmed.1000273.g001
Validation and Reliability of the MDAT
PLoS Medicine | www.plosmedicine.org 2 May 2010 | Volume 7 | Issue 5 | e1000273

‘‘carrying items on head,’’ ‘‘body healthy and flexible,’’ ‘‘carrying
out duties and chores,’’ ‘‘sharing,’’ and ‘‘taking up leadership
roles.’’ All items once created or modified from the preliminary
tool were tested in a large community study and normal reference
ranges were found for each item. Final items were subsequently
selected at a consensus meeting. By these methods we have created
the MDAT, a simple to use, reliable, valid, and easily accessible
tool for use by community health workers and researchers looking
at developmental outcomes of children in sub-Saharan Africa.
Methods
Creation of a Culturally Appropriate DevelopmentalAssessment Tool (Pilot Phase)
As shown in Figure 1, at the start of this study, MDAT Draft 1
contained 162 items. This draft was created from items in the
preliminary study as well as from the qualitative study [11,12]. We
ensured consistency and clarity of items by translating and back
translating the tool with the help of a language expert from the
University of Malawi. Many items were then illustrated with a
picture drawn by a Malawian artist (CZ) (Figure 2). We prepared a
small basket of props to be used with the questionnaire (Figure S1).
We then assessed face validity (where items were reviewed by
untrained judges to see whether they think the items look
acceptable) and content validity (the subjective measurement of
the comprehensiveness to which an instrument appears logically to
examine the characteristics or domains it is intended to measure)
[13] through group discussions with six research midwives and ten
Malawian medical students. In assessing face validity, individual
discussions were also carried out with two of the investigators (EU,
MN) and a language expert. These individuals commented on
each item and whether the items were understandable and
relevant to the Malawian population. At this phase of validation,
some items were removed and some added, producing MDAT
Draft II (Figure 1).
MDAT Draft II was then piloted on 80 children in two stages
over a 6-wk period. Pilot assessments were observed by three
investigators (MG, EU, and MN) and there were group discussions
every 2 wk with the research midwives. The three investigators
met three times during piloting and some items were added to
improve clarity or precision and other items were removed either
because they were not felt to be discriminatory enough in assessing
child development or they were difficult to carry out in the field
[14]. At this stage MDAT Draft III was produced with any new
items added having face and content validation and being re-
piloted. An example of the gross motor domain is shown in
Figure 2.
The study protocol complied with the principals of the Helsinki
Declaration [15]. The research midwives explained the purpose of
the developmental assessment to each child’s parent or carer and
obtained their informed consent to participation in the study. The
study received ethical approval from the College of Medicine
Figure 2. Example of the Draft MDAT III (gross motor domain).doi:10.1371/journal.pmed.1000273.g002
Validation and Reliability of the MDAT
PLoS Medicine | www.plosmedicine.org 3 May 2010 | Volume 7 | Issue 5 | e1000273

Research Ethics Committee in Malawi and the Liverpool School
of Tropical Medicine Research Ethics Committee in the UK as
well as each of the local health centres where the study took place.
Assessing the Performance of Items and EstablishingNormal Reference Ranges in a Large Sample
To test the performance of MDAT Draft III, we recruited and
assessed 1,513 children from four sites in the Southern region of
Malawi. These were three rural and one semi-urban site
(Namitambo, Mikolongwe, Nguludi, and Bangwe), which were
all taking part in an antenatal trial with the same research midwife
team [16]. Assessments occurred over a 1-y period from June 2006
until July 2007 using the team of six research midwives in local
antenatal clinics in each of these areas. Normal healthy children of
mothers attending clinic (one per family) between the ages of 0 and
6 y were included. Those with significant malnutrition (weight for
height Z score ,22 using WHO criteria [17]), significant medical
problems, prematurity of 32 wk or less (reported or measured on
antenatal ultrasound), or significant neurodisability were excluded.
In all cases, we ensured that they were receiving appropriate
medical support. A decision was made to exclude these children
from the ‘‘normal population’’ as the aim was to create a
developmental assessment tool that identified children with
developmental delay. We gathered sociodemographic character-
istics using the same questions as the Malawi Demographic Health
Survey (MDHS) [18]. We recruited children by asking one in
every three mothers in clinic to bring one child to their next
appointment. We used a quota sampling technique similar to that
used by the Denver II [19] where target numbers of children for
34 age groups were sought (Table S1). Children’s ages were
determined from available birth data or the ‘‘health passport’’ that
mothers in Malawi carry with them for all health appointments.
Once we had recruited enough children of a particular age range,
no more children of that age range were invited to participate. We
then targeted ages where there were inadequate numbers by
asking mothers to only bring children of those ages. We
approached 1,657 families (Figure 3). 82 families refused and 62
children were ineligible due to serious medical problems as listed
above, resulting in 1,513 children in the final assessment. 67
(4.4%) of these were then excluded prior to analysis (Figure 3)
leaving 1,446 children in the final analysis. A subsample from this
population were recruited for reliability testing.
The assessment using the new tool (MDAT Draft III with 185
items) took approximately 35 min in a quiet location, often
outdoors. Five to seven children were assessed in a morning session
by two to three research midwives at two of the four different sites
each day. Where possible, items were directly observed, but items
were accepted on report if the mother was very clear that the child
Figure 3. Flow diagram of the recruitment of families and children for the MDAT study.doi:10.1371/journal.pmed.1000273.g003
Validation and Reliability of the MDAT
PLoS Medicine | www.plosmedicine.org 4 May 2010 | Volume 7 | Issue 5 | e1000273

could do the item and there was no doubt when assessing
associated areas of development. We scored items as pass or fail,
and if the child was uncooperative or unwell, items were scored as
‘‘don’t know.’’ Items were assessed until the child failed seven
consecutive items [20,21]. The data for each item were then fitted
using logistic regression and normal reference ranges were
established (see statistical analysis section).
ReliabilityChildren were invited to participate in reliability testing as
follows. The first child on the testing day was assessed for
interobserver immediate reliability, the second child for interob-
server delayed reliability, and the third child for intra-observer
delayed reliability. We measured interobserver immediate reli-
ability by assessing the same child independently on the same
occasion by two observers (56 children). Interobserver delayed
reliability was measured by observing the same child indepen-
dently on the same day at different times by two observers (52
children). We measured intra-observer delayed reliability by the
same observer assessing the same child 2 wk apart (124 children).
Reliability testing was carried out on all 185 items in the Draft
MDAT III.
Final Evaluation of Items by ConsensusAn expert panel consisting of two Malawian paediatricians,
two British paediatricians, and a statistician (MN, Mac Mallewa,
MG, RLS, and GAL) reviewed the results and decided which
items should remain, which should be further modified, and
which removed as previously described [11]. Items were
evaluated at these meetings in terms of their fit in a logistic
regression, their reliability, subjective ratings, and the effect of
gender in the logistic regression. We wanted (as much as possible)
items with a good fit, good to excellent reliability (kappa .0.6),
few problems when rated subjectively, and no effect of gender. As
there were some items where the age ranges for attainment were
exactly the same, the consensus meeting used this forum to also
choose only one of these items in any one domain. The selection
procedure through consensus has been described elsewhere in
more detail [11].
ValidityOnce the final set of items was chosen, children were then
scored in two ways. Firstly a score was generated by a categorical
pass or fail assessment, and each score was used to validate the tool
in a series of tests. All items relevant to the age of testing were
scored in a similar way to the Denver II screening test [19]. If the
child failed two items or more in any one domain at the
chronological age at which 90% of the normal reference
population would be expected to pass, then they failed the test.
Secondly, a continuous score was obtained by adding up the total
number of items passed by the child per domain and in total.
These scores varied with the age of the child.
Figure 4. Normal reference values for gross motor milestones.doi:10.1371/journal.pmed.1000273.g004
Validation and Reliability of the MDAT
PLoS Medicine | www.plosmedicine.org 5 May 2010 | Volume 7 | Issue 5 | e1000273
Both sets of scores were then used to validate the tool by
comparing firstly with a group of children with neurodisability. We
recruited 80 children up to 6 y of age with known neurodisabilities
from the ‘‘Feed the Children’’ centre for children with disabilities
(previously Cheshire Homes) in Blantyre [22]. Exclusions from this
group were children unwell at time of examination, those with
severe malnutrition (as previously defined), and any blind or deaf
children. A second comparison group was 120 children up to 6 y
of age with marasmus (height/weight ,80% expected), as there is
good evidence that these children often have moderate develop-
mental delay [23,24]. Within this group, children with fevers or
other illnesses (including HIV sero-positivity) were excluded. HIV
testing was routinely performed in the malnutrition unit. Each of
these groups was compared with a subset of age- and sex-matched
children from the normal study population. This sample was
chosen because of practicality issues and time constraints. To
avoid bias, the comparison group was selected randomly (within
those of the same sex and age to one decimal place) by a
computer-generated random number list.
Data Entry and Statistical AnalysisAll data were double entered by a data entry team with any
discrepancies and outlying results reviewed. Data were analysed
using Microsoft Access version 7.0 and SPSS for Windows version
12, Stats-direct, STATA version 8 and Epi Info computer
programs for the analysis. We measured socioeconomic status in
quintiles through principal components analysis of multiple assets
following methods from the World Bank [25–27]. We determined
height and weight for age (HAZ and WAZ) through Epi Info using
US Centers for Disease Control reference data [28,29].
We constructed normal reference ranges for the children
passing items using logistic regression analysis with decimal age
as the explanatory variable. A logistic regression analysis is one
where a prediction is made about the probability of an event
taking place by fitting the data to a logistic curve. In this case, this
would be the probability of carrying out a certain item of
development e.g. ‘‘walks well’’ at certain decimal ages. The fitted
values from the model for each item were plotted against the
observed data and graphs were drawn for each item. To determine
whether or not the fitted curve was a sufficiently good
representation of the data, it was visually assessed for each graph
but also statistically assessed. The goodness-of-fit statistic was
calculated for each fitted curve and for any item where the fit was
significantly poor at the 5% significance level [30], refitting was
done using triple split spline regression [31,32]. To do this, the
ages corresponding to the 35th and 65th percentiles were
calculated from the original fit to determine the cut points, and
three logistic curves were then fitted, one for each region. This
calculation is described in more detail in a previous paper [11].
Using the predicted probabilities found from the logistic regression
analyses, the ages corresponding to 25%, 50%, 75%, and 90%
percent of the children passing were determined for each item.
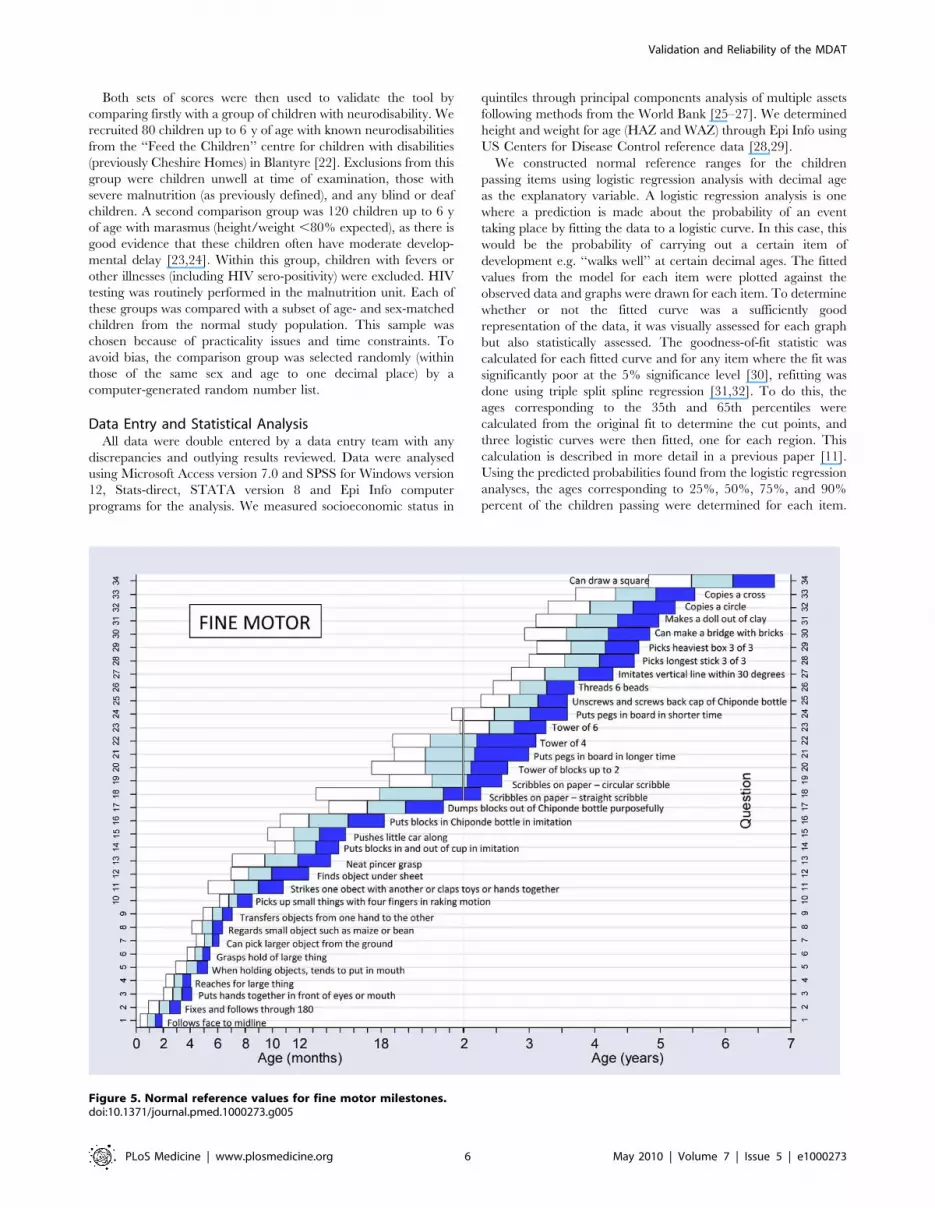
Figure 5. Normal reference values for fine motor milestones.doi:10.1371/journal.pmed.1000273.g005
Validation and Reliability of the MDAT
PLoS Medicine | www.plosmedicine.org 6 May 2010 | Volume 7 | Issue 5 | e1000273

These numbers were then used to plot the age norms of
achievement of each milestone in a box-type representation in
graphs similar to the procedure described for the Denver II (see
Figures 4–7). In a further exploratory analysis, we added other
explanatory variables (sex, socioeconomic status, and height for
age [HAZ] and weight for age [WAZ] Z scores) to assess their
effect on the probability of passing an item.
Reliability was measured using kappa (k) statistics as well as
percentage agreement to assess observer agreement for each
question. Positive values of 0 to ,0.2 indicate poor agreement,
.0.2 to 0.4 fair agreement, .0.4 to 0.6 moderate agreement,
.0.6 to 0.8 good, and .0.8 to 1 very good agreement [33].
To compare statistically the differences in numbers of pass/
fails achieved by the different groups in the construct validity
assessment, a paired McNemar’s test was used. We used paired
t-tests to compare the numerical scores. Sensitivity and
specificity were calculated for children with neurodisabilities in
comparison to normal children, as by definition, children with
neurodisabilities clearly should fail a test assessing normal
development.
Results
Characteristics of Population for MDATDemographic data (Table 1) demonstrate the MDAT popula-
tion was very similar in socioeconomic status to the national
average, although the MDAT population had a higher number of
mothers with some secondary education (23% versus 10%) and a
lower number with no education (11% versus 25%). The MDAT
population was nutritionally less stunted than the national average,
with a lower proportion of HAZ scores less than 2 or 3 standard
deviations (SDs) (,2 SD) below the norm (38% compared to 48%)
and for WAZ scores (15% compared to 21%) were ,2 or 3 SD
below the norm.
Face and Content Validity and PilotingInitial validation of the Draft MDAT I demonstrated good
content and face validity (Figure 1). At this stage, after comments
from discussants, 13 items were added to the gross motor,
language, and social domains as it was felt there were too few items
for certain age ranges. Eight items were also removed in the fine
motor and gross motor domains as they were not felt to be
culturally appropriate or suitable for testing. The MDAT
appeared to assess development in children in ways that were
felt to be important. Discussants were happy that the questionnaire
examined the various domains of development in a comprehensive
and logical fashion and that it was representative and relevant to
developmental milestones of children in a Malawian setting.
After face and content validation, the tool was piloted. At this
stage, nine language items were added or modified from the
previous version for clarity and consistency of items. Nine gross
motor items of increasing difficulty were added as it was found that
many of the older children were able to do all items in the gross
motor section earlier than expected. This was also the case with
Figure 6. Normal reference values for language milestones.doi:10.1371/journal.pmed.1000273.g006
Validation and Reliability of the MDAT
PLoS Medicine | www.plosmedicine.org 7 May 2010 | Volume 7 | Issue 5 | e1000273

four social items. Six fine motor items were also added at this
stage, often these were items that could be tested differently at
different ages and therefore were separated into subsections and
consequently different questions, to decrease ambiguity on testing.
For example, the item ‘‘puts pegs into board’’ was subdivided as
‘‘puts pegs into board in up to 30 secs’’ and ‘‘puts pegs into board
in up to 2 minutes.’’
Performance of Items and Normal Population ReferenceRanges
Information regarding the final items and how they performed
in terms of logistic regression as well as with the additional
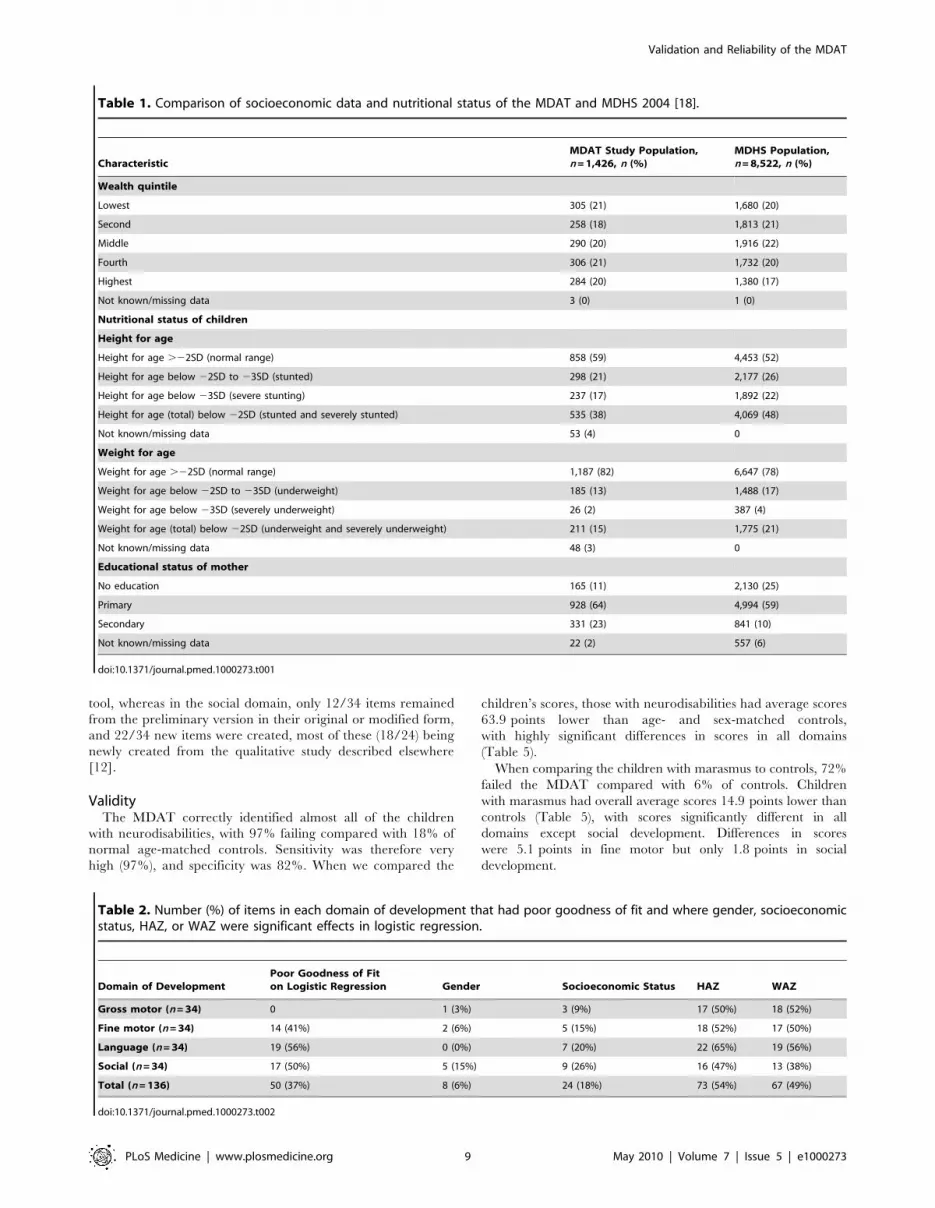
explanatory variables are shown in Table 2. There were no items
in the gross motor domain that had poor goodness of fit in the
logistic regression analysis, whereas 50% of items in the social
domain needing refitting using splines. A few items (eight) showed
gender differences in the analysis but were kept in the tool after
discussion at the consensus meeting. Five of these were in the
social domain and were considered relevant and useful in the
Malawian setting. These items are shown in Table S2.
Socioeconomic status had a significant effect in the logistic
regression analysis in up to 26% of items in some domains and
nutritional status had a similar effect in the analysis and attainment
of milestones in all developmental domains (HAZ score in 47%–
65% of items and WAZ in 38%–56% of items).
Figures 4–7 show the normal population reference ranges
displayed as graphs of age ranges of attainment of milestones.
There is one graph for each domain of development.
ReliabilityOverall, reliability was excellent (k.0.75) for 99% (134/136) of
interobserver immediate reliability (Table 3), for 89% (121/136)
interobserver delayed reliability, and 71% (96/136) of intra-
observer–delayed 2-wk assessments. The remaining assessments
had fair-to-very good reliability (k.0.4) with only two items having
poor reliability (k,0.4) in the interobserver immediate category. In
terms of the developmental domains, gross motor, fine motor, and
social items had good kappa values for reliability, whereas in the
language domain there were more moderate-to-good agreements.
Delayed intra-observer reliability performed less well than the other
forms of reliability in all the domains with excellent agreement in
only 47%–88% of items, depending upon the domain.
Final Developmental Tool after ConsensusAfter consensus, from the draft tool of 185 items, we created a
final version of the tool with 136 items, 34 in each domain of
development (see Figures S2–S5 for this final questionnaire).
Items removed at consensus and the reasons for this are outlined
in Table 4. In the gross motor domain, most items in the final
tool (27/34) were retained or modified from the preliminary
Figure 7. Normal reference values for social milestones.doi:10.1371/journal.pmed.1000273.g007
Validation and Reliability of the MDAT
PLoS Medicine | www.plosmedicine.org 8 May 2010 | Volume 7 | Issue 5 | e1000273
tool, whereas in the social domain, only 12/34 items remained
from the preliminary version in their original or modified form,
and 22/34 new items were created, most of these (18/24) being
newly created from the qualitative study described elsewhere
[12].
ValidityThe MDAT correctly identified almost all of the children
with neurodisabilities, with 97% failing compared with 18% of
normal age-matched controls. Sensitivity was therefore very
high (97%), and specificity was 82%. When we compared the
children’s scores, those with neurodisabilities had average scores
63.9 points lower than age- and sex-matched controls,
with highly significant differences in scores in all domains
(Table 5).
When comparing the children with marasmus to controls, 72%
failed the MDAT compared with 6% of controls. Children
with marasmus had overall average scores 14.9 points lower than
controls (Table 5), with scores significantly different in all
domains except social development. Differences in scores
were 5.1 points in fine motor but only 1.8 points in social
development.
Table 1. Comparison of socioeconomic data and nutritional status of the MDAT and MDHS 2004 [18].
CharacteristicMDAT Study Population,n = 1,426, n (%)
MDHS Population,n = 8,522, n (%)
Wealth quintile
Lowest 305 (21) 1,680 (20)
Second 258 (18) 1,813 (21)
Middle 290 (20) 1,916 (22)
Fourth 306 (21) 1,732 (20)
Highest 284 (20) 1,380 (17)
Not known/missing data 3 (0) 1 (0)
Nutritional status of children
Height for age
Height for age .22SD (normal range) 858 (59) 4,453 (52)
Height for age below 22SD to 23SD (stunted) 298 (21) 2,177 (26)
Height for age below 23SD (severe stunting) 237 (17) 1,892 (22)
Height for age (total) below 22SD (stunted and severely stunted) 535 (38) 4,069 (48)
Not known/missing data 53 (4) 0
Weight for age
Weight for age .22SD (normal range) 1,187 (82) 6,647 (78)
Weight for age below 22SD to 23SD (underweight) 185 (13) 1,488 (17)
Weight for age below 23SD (severely underweight) 26 (2) 387 (4)
Weight for age (total) below 22SD (underweight and severely underweight) 211 (15) 1,775 (21)
Not known/missing data 48 (3) 0
Educational status of mother
No education 165 (11) 2,130 (25)
Primary 928 (64) 4,994 (59)
Secondary 331 (23) 841 (10)
Not known/missing data 22 (2) 557 (6)
doi:10.1371/journal.pmed.1000273.t001
Table 2. Number (%) of items in each domain of development that had poor goodness of fit and where gender, socioeconomicstatus, HAZ, or WAZ were significant effects in logistic regression.
Domain of DevelopmentPoor Goodness of Fiton Logistic Regression Gender Socioeconomic Status HAZ WAZ
Gross motor (n = 34) 0 1 (3%) 3 (9%) 17 (50%) 18 (52%)
Fine motor (n = 34) 14 (41%) 2 (6%) 5 (15%) 18 (52%) 17 (50%)
Language (n = 34) 19 (56%) 0 (0%) 7 (20%) 22 (65%) 19 (56%)
Social (n = 34) 17 (50%) 5 (15%) 9 (26%) 16 (47%) 13 (38%)
Total (n = 136) 50 (37%) 8 (6%) 24 (18%) 73 (54%) 67 (49%)
doi:10.1371/journal.pmed.1000273.t002
Validation and Reliability of the MDAT
PLoS Medicine | www.plosmedicine.org 9 May 2010 | Volume 7 | Issue 5 | e1000273

Discussion
We have managed to develop a tool with normal reference values
to assess childhood development up to the age of 6 y for a rural
setting in Africa. We have demonstrated its sensitivity in the detection
of neurodisability but also more subtle neurodevelopmental delay as
seen in children with malnutrition. We have demonstrated good face
and content validity of the tool. This instrument is therefore culturally
appropriate for the rural sub-Saharan African setting of Malawi, and
is likely to be applicable in other similar settings. The tool is easy to
use, has good reliability, only requires a small basket of props, and
takes approximately 30 min to administer. It also has clear pictorial
representations of many of the items in the tool, making it
understandable to all who use it. The MDAT could be used by
local health workers with little training as well as by researchers
needing a tool to use as an outcome measure when assessing
development of children in these settings.
There is much evidence that the large scale problem of disability
and developmental delay in resource-poor settings has a high total
cost to societies and contributes to continuing cycles of poverty
preventing improvements in children’s achievement in these
settings [1]. The benefits of preventative measures and integrated
programmes to improve child development have been shown,
however, few robust developmental tools are available to assess the
outcome of these programmes [2]. The MDAT has demonstrated
good sensitivity in detecting children with neurodisabilities as well
the more subtle differences in development that would be expected
between children with marasmus and normal age-matched
controls [23]. To be able to use tools such as this to identify
disability and developmental delay is an exciting prospect when
there are few robust instruments for detection of disability,
especially for those children under 2 y and where tools such as the
‘‘ten question disability screen’’ are inadequate [34].
We have been fortunate to have access to a large population
of normal rural African children through antenatal clinics
allowing us the opportunity to create normal reference values
for a typical Malawian child population. The MDAT popula-
tion is very similar in economic status to the Malawian
childhood population. The percentages of children with stunting
and malnutrition in the MDAT population were a little lower
than those seen in the MDHS population, partly due to the fact
that we excluded any children who were severely malnourished
(,2 SD weight for height), but also because our population had
more semi-urban children in it than the national average. We
wanted a tool that reflected the normal population of Malawi,
however, we also wanted to reflect a population that was
clinically well. Although these conditions were difficult to
achieve and the population used was not an ‘‘ideal’’ population
(one in which health and development would be at its most
ideal), it was a population that we felt reflected the normal
population, but not including those with severe medical
problems and in need of specific support.
Previous literature makes it clear that malnutrition will affect the
achievement of developmental milestones [1,35]. We have found
that height for age and weight for age did affect the normal
reference values in approximately half of the items in the tool,
demonstrating that many of the developmental items are sensitive to
differences in nutritional status between children. Furthermore, as
expected, socioeconomic status within the groups studied does seem
to also play a role in attainment of some items, particularly in the
social domain. 85% of children in Malawi live in rural areas [18]
with half of children stunted, therefore we would argue that a
developmental tool should be appropriate for use in this type of
population. The normal reference ranges have therefore not been
adjusted for height for age, weight for age, or socioeconomic status.
We have developed a robust methodology for creating develop-
mental assessment tools that can be applied in any setting and that
could therefore be used in many different cultures worldwide. This
includes a systematic series of initial qualitative studies, piloting, and
translation to create a more culturally accessible tool that can then
be tested and analysed item by item to attain reference values
through logistic regression as well as to determine reliability. Before
Table 3. Reliability by area of development for final items in MDAT.
Domain of Development Reliability Kappa Score Percentage Agreement
Excellent, .0.75Fair to Good,0.4–0.75 Poor, ,0.4 .95% 85%–95% ,85%
Gross motor (34) Interobserver immediate 34 (100%) 0 0 34 (100%) 0 0
Interobserver delayed 34 (100%) 0 0 30 (88%) 4 (12%) 0
Intra-observer delayed 27 (79%) 7 (21%) 0 12 (35%) 22 (65%) 1(3%)
Fine motor (34) Interobserver immediate 34 (100%) 0 0 34 (100%) 0 0
Interobserver delayed 30 (88%) 4 (12%) 0 27 (79%) 7 (21%) 0
Intra-observer delayed 23 (68%) 11 (32%) 0 7(20.6%) 25 (74%) 2(6%)
Language (34) Interobserver immediate 32 (94%) 0 2 (6%) 32 (94%) 2 (6%) 0
Interobserver delayed 26(76%) 8 (24%) 0 6 (18%) 26 (76%) 2(6%)
Intra-observer delayed 30 (88%) 4 (12%) 0 25 (74%) 8 (24%) 1(3%)
Social (34) Interobserver immediate 34 (100%) 0 0 25 (74%) 9 (26%) 0
Interobserver delayed 31 (91%) 3 (9%) 0 28 (82%) 5 (15%) 1(3%)
Intra-observer delayed 16(47%) 18 (53%) 0 7(21%) 21(62%) 5(15%)
Totals (136) Interobserver immediate 134 (99%) 0 2 (1%) 125 (92%) 11 (8%) 0
Interobserver delayed 121 (89%) 15 (11%) 0 91(67%) 42(31%) 3(2%)
Intra-observer delayed 96 (71%) 38(29%) 0 51(38%) 76 (56%) 9(6%)
doi:10.1371/journal.pmed.1000273.t003
Validation and Reliability of the MDAT
PLoS Medicine | www.plosmedicine.org 10 May 2010 | Volume 7 | Issue 5 | e1000273

validation, a final consensus meeting with an appropriate group of
assessors can select items for the final tool.
We have found in our construct validity studies that the MDAT
is identifying 18% false positives. Our figures are, however, based
on a case control method of sampling that may influence our
results for sensitivity and specificity [36]. Although the tool is
sensitive enough to pick up children with known neurodisabilities
using the pass/fail scoring system that we have implemented, we
still need to determine how well it can identify those with more
subtle developmental delay. We have found that the MDAT can
identify the developmental delay present in a subgroup of children
with malnutrition. We identified 72% of children in this group
Table 4. Reasons for removal of items in the consensus meeting within each domain of development.
Domain ofDevelopment Items Removed Reason for Removal
Gross motor Head erect continuously when sat up or held Age range for item exactly the same as another item
Stands alone for a few seconds Age range for item exactly the same as another item
Walks backwards Poor fita. Reported as ‘‘difficult to get children to do this.’’
Jumps with both feet off the ground Age range for item exactly the same as another item
Jumps over rope 10 cm off ground Age range for item exactly the same as another itemthat involves jumping
Throws one or more balls into a basket (out of five) Poor interobserver and intra-observer reliability andpoor fit (difficult to be consistent with item)
Carries a cup on head with no hands Sex specific, girl’s task
Fine motor Plays with cup and spoon in purposeful manner Age range for item exactly the same as another item
Tower of blocks up to eight blocks Poor fit and age range exactly same as other item
Can do ‘‘Sharp’’ (put thumb up in specific way) Sex specific, boy’s item.
Is able to play Chipapa (clapping game) Sex specific, girl’s item.
Able to fold paper in two halves Not achieving 90% by 7 y. Found difficult for childrento do by examiners.
Makes a bridge with six bricks Poor reliability. Not achieving 90% by 7 y
Makes stairs with bricks Poor reliability. Not achieving 90% by 7 y
Copies row of bottle tops Poor reliability. Not achieving 90% by 7 y
Copies square pattern of bottle tops Poor reliability. Not achieving 90% by 7 y
Language Says four or more words Poor fit. Not easy to be so exact.
Says eight or more words Poor fit. Not easy to be so exact.
Identifies at least two objects Poor fit.
Uses many words .20 Poor fit
Points to body parts: at least 1 body part Age range for item exactly same as another item
Names two objects Poor fit.
Knows his or her father’s last name Poor fit. Subjectively many children don’t know father’s last name
Copies two lines of song well at home Poor fit. Subjectively not clear item
Number recall 1–4 Poor fit and age range same as another item
Knows quantities Poor reliability
Sings two lines of song clearly Poor fit and many missing
Retells stories in brief manner Poor fit and few achieving before 7 y
Knows how old they are Poor reliability. 90th centile not before 8 y
Knows materials Not achieving 90th centile by 7 y.
Social Drinks from a cup but may spill some Unclear question. Poor fit. Some normal children failing
Wants to be escorted to pit latrine/toilet Unclear what toilet is. Poor fit and reliability
Able to imitate household chores Poor logistic regression. Sex specific, girl’s task
Can do errands e.g., bring salt Poor logistic regression. Sex specific, girl’s task
Able to play singing games Sex specific, girl’s task.
Plays Masanje/house Sex specific, girl’s task.
Spends more time with specific friend Sex specific (boy’s task) and poor fit
Does housework properly useful round house Not achieved by 7 y
Knows how to take responsibility without being asked Not achieved by 7 y
aPoor goodness of fit in logistic regression.doi:10.1371/journal.pmed.1000273.t004
Validation and Reliability of the MDAT
PLoS Medicine | www.plosmedicine.org 11 May 2010 | Volume 7 | Issue 5 | e1000273

with a delay in one or more areas of development and with
average scores 14.9 points lower than the normal controls. This
finding is consistent with evidence demonstrating that children
with malnutrition have moderate developmental delay with overall
DQ (developmental quotients) 20 to 30 points lower than normal
children [23,24,35]. Despite these results, further research into
scoring of the tool, as well as validation in groups of children with
more subtle developmental delay, is necessary to provide further
evidence of how the tool works.
The MDAT has broad applications both as a clinical tool in
early identification of neurodevelopmental problems and as an
outcome measure, for example in clinical trials of perinatal
interventions. It is clear that settings such as Malawi have limited
services to support this population and at present this tool may be
more useful as an outcome measurement tool for research
practice. However, by being able to identify children with
neurodevelopmental delay, scarce government resources as well
as international intervention programmes can be directed most
effectively. Furthermore, without measures such as this, there will
be no evidence as to whether interventions to improve outcomes in
early childhood are effective in these settings.
Supporting Information
Figure S1 Basket of items used in the MDAT.
Found at: doi:10.1371/journal.pmed.1000273.s001 (5.17 MB
TIF)
Figure S2 Final MDAT questionnaire in four sections: (A) Gross
motor.
Found at: doi:10.1371/journal.pmed.1000273.s002 (0.65 MB
TIF)
Figure S3 Final MDAT questionnaire in four sections: (B) Fine
motor.
Found at: doi:10.1371/journal.pmed.1000273.s003 (0.57 MB
TIF)
Figure S4 Final MDAT questionnaire in four sections: (C)
Language.
Found at: doi:10.1371/journal.pmed.1000273.s004 (0.51 MB
TIF)
Figure S5 Final MDAT questionnaire in four sections: (D)
Social.
Found at: doi:10.1371/journal.pmed.1000273.s005 (0.66 MB
TIF)
Table S1 Numbers of children recruited in each age group for
item testing and creation of normal reference ranges for the
MDAT.
Found at: doi:10.1371/journal.pmed.1000273.s006 (0.07 MB
DOC)
Table S2 Gender-specific items in the MDAT.
Found at: doi:10.1371/journal.pmed.1000273.s007 (0.03 MB
DOC)
Text S1 MDAT instruction manual (in English and Chichewa).
Found at: doi:10.1371/journal.pmed.1000273.s008 (0.15 MB
PDF)
Acknowledgments
Our thanks to all the staff of the ‘‘APPLe’’ team at the Wellcome Trust
Research Laboratories, Blantyre, Malawi; to E. Molyneux, head of the
department of Paediatrics at the College of Medicine in Blantyre, Malawi;
to Mac Mallewa who gave much time to come to consensus meetings and
to review the results; and finally to all the mothers, fathers, and
grandparents in the villages around Nguludi, Namitambo, Bangwe, and
Mikolongwe, who took part in the focus groups for this study.
Author Contributions
ICMJE criteria for authorship read and met: MG GAL EU MN EK
NRvdB RLS. Agree with the manuscript’s results and conclusions: MG
GAL EU MN EK NRvdB RLS. Designed the experiments/the study: MG
Table 5. Comparison of scores for children with neurodisabilities or malnutrion and their age-matched controls using the MDAT.
Domain ofDevelopment
Childrenwith ND(n = 80)
NormalControls(n = 80) p-Value
Sensitivity(95% CI)
Specificity(95% CI)
Children with WHZ,80% (n = 120)
Normal Controls(n = 120) p-Value
Gross motor
n Passinga (%) 4/80 (5%) 79/80 (99%) ,0.001 0.95 (0.87–0.98) 0.99 (0.93–0.99) 75/120 (63%) 119/120(99%) ,0.001
Mean score (SD) 9.2 (6.9) 25.4 (6.1) ,0.001 — — 16.5 (5.23) 20.7 (5.5) ,0.001
Fine motor
n Passinga (%) 4/72 (6%) 66/72 (92%) ,0.001 0.94 (0.86–0.98) 0.91 (0.82–0.96) 55/116 (47%) 109/116(94%) ,0.001
Mean Score (SD) 7.9 (7.9) 25.2 (6.3) ,0.001 — — 15.6 (6.9) 20.5 (5.8) ,0.001
Language
n Passinga (%) 11/66 (17%) 62/66 (95%) ,0.001 0.85 (0.74–0.92) 0.95 (0.87–0.99) 81/109 (74%) 109/109 (100%) ,0.001
Mean score (SD) 7.4 (5.9) 22.7 (8.1) ,0.001 — — 11.9 (5.2) 16.2 (6.4) ,0.001
Social
n Passinga (%) 8/71 (11%) 68/71 (96%) ,0.001 0.89 (0.79–0.95) 0.96 (0.88–0.99) 75/113 (66%) 111/113(98%) ,0.001
Mean score (SD) 10.4 (7.5) 26.4 (7.1) ,0.001 — — 18.4 (7.1) 20.2 (6.8) 0.107
All domains
n passingb (%) 2/79 (3%) 65/79 (82%) ,0.001 0.98 (0.93–0.99) 0.82 (0.73–0.91) 33/118 (28%) 111/118(94%) ,0.001
Mean score (SD) 35 (20.4) 99.0 (25.9) ,0.001 — — 62.5 (22.4) 77.4 (23) ,0.001
CI, confidence interval; ND, neurodisability; WHZ (weight for height Z score).aPassing in each domain = one or no failures in any one domain (gross motor, fine motor, language, social) for the age of the child.bPassing for all domains = no failures in any domain of development.doi:10.1371/journal.pmed.1000273.t005
Validation and Reliability of the MDAT
PLoS Medicine | www.plosmedicine.org 12 May 2010 | Volume 7 | Issue 5 | e1000273

GAL EK NRvdB RLS. Analyzed the data: MG GAL EU EK RLS.
Collected data/did experiments for the study: EU MN EK. Enrolled
patients: EU MN EK. Wrote the first draft of the paper: MG GAL RLS.
Contributed to the writing of the paper: MG GAL EU NRvdB RLS.
Helped in data collection and transcription and clean-up of the data: EK.
Worked with MG throughout the study from the piloting up to the end:
EK. Technical oversight and ensured integrity of study: NRvdB.
References
1. Grantham-McGregor S, Cheung YB, Cueto S, Glewwe P, Richter L, et al.
(2007) Child development in developing countries 1: developmental potential inthe first 5 years for children in developing countries. Lancet 369: 60–70.
2. Engle PL, Black MM, Behrman JR, Cabral de Mello M, Gertler PJ, et al. (2007)
Strategies to avoid the loss of developmental potential in more than 200 millionchildren in the developing world. Lancet 369: 229–242.
3. Grantham-McGregor SM, Ani C (2001) A review of studies on the effect ofiron deficiency on cognitive development in children. J Nutr 131: 649S–
668S.4. Boivin MJ, Green SD, Davies AG, Giordani B, Mokili JK, et al. (1995) A
preliminary evaluation of the cognitive and motor effects of pediatric HIV
infection in Zairian children. Health Psychol 14: 13–21.5. Drotar D, Olness K, Wiznitzer M, Schatschneider C, Marum L, et al. (1999)
Neurodevelopmental outcomes of Ugandan infants with HIV infection: anapplication of growth curve analysis. Health Psychol 18: 114–121.
6. Holding PA, Taylor HG, Kazungu SD, Mkala T, Gona J, et al. (2004) Assessing
cognitive outcomes in a rural African population: development of aneuropsychological battery in Kilifi District, Kenya. J Int Neuropsychol Soc
10: 246–260.7. Geisinger K (2006) Cross-cultural normative assessment: translation and
adaptation issues influencing the normative interpretation of assessmentinstruments. Psychol Assess 6: 304–312.
8. Aina OF, Morakinyo O (2005) Normative data on mental and motor
development in Nigerian children. West Afr J Med 24: 151–156.9. Richter LM, Griesel R, Rose C (1992) The Bayley scales of infant development:
a South African standardization. South African Journal of OccupationalTherapy 22: 14–25.
10. Abubakar A, Holding PA, Van Baar A, Newton CRJC, Van de Vijver FJR
(2008) Monitoring psychomotor development in a resource limited setting: anevaluation of the Kilifi Developmental Inventory. Ann Trop Paediatr 28:
217–226.11. Gladstone M, Lancaster G, Jones A, Maleta K, Mtitimila E, et al. (2008) Can
Western developmental screening tools be modified for use in a rural Malawian
setting? Arch Dis Child 93: 23–29.12. Gladstone M, Lancaster G, Umar E, Nyirenda M, Kayira E, et al. (2010)
Creation of the MDAT (Malawi Developmental Assessment Tool): a qualitativeanalysis. Child Care Health Dev 36: 346–353.
13. Litwin M (1995) How to measure survey reliability and validity. Thousand Oaks(California): Sage Publications.
14. Mays N, Pope C (2000) Qualitative research in health care: Assessing quality in
qualitative research. British Medical Journal 320: 50–52.15. World Medical Association (2001) Declaration of Helsinki: ethical principles for
medical research involving human subjects. Bull World Health Organ 79:373–374.
16. Van den Broek N, White SA, Goodall M, Ntonya C, Kayira E, et al. (2009) The
APPLe study: a randomized, community based, placebo-controlled trial ofazithromycin for the prevention of preterm birth, with meta-analysis. PLoS Med
6: e1000191. doi:10.1371/journal.pmed.1000191.17. World Health Organization Department of Nutrition for Health and
Development. (2002) Principles of care. Training course on the managementof severe malnutrition. 2: Annexe B: Weight-for-Height Reference Card.
Geneva: World Health Organization.
18. National Statistics Office (Zomba, Malawi) (2005) Malawi Demographic andHealth Survey 2004, 0–40, Measure Demographic and Health Survey.
Calverton (Maryland): USAORC Macro.
19. Frankenburg WK, Dodds JB, Archer P, Shapiro H, Bresnick B (1990) Denver II
technical manual. Denver, Colorado: Denver Developmental Materials Inc.
20. Luiz D, Barnard A, Knoesen N, Kotras N, Horrocks S, et al. (2004) Griffiths
mental development scales - extended revised (GMDS-ER) administration
manual. Amersham (Bucks, UK): Association for Research in Child Develop-
ment.
21. Bayley N (1993) Bayley scales of infant development manual. 2nd edition.
Orlando(Florida): The Psychological Association, Harcourt, Brace and Compa-
ny.
22. Sim J, Wright C (2002) Validity, reliability and allied concepts (Chapter 9).
Research in health care, concepts, designs and methods. Cheltenham (UK):
Nelson-Thornes.
23. Grantham-McGregor S, Stewart ME, Desai P (1978) A new look at the
assessment of mental development in young children recovering from severe
malnutrition. Dev Med Child Neurol 20: 773–778.
24. Powell CA, Walker SP, Himes JH, Fletcher PD, Grantham-McGregor S (1995)
Relationships between physical growth, mental development and nutritional
supplementation in stunted children: the Jamaican study. Acta Paediatr 84:
22–29.
25. Filmer D, Pritchett L (2008) Estimating wealth effects without expenditure data -
or tears: an application to educational enrolments in states of India.
Demography 38: 115–132.
26. Demographic and Health Survey (2008) DHS comparative reports 6. The DHS
wealth index. 6, Calverton (Maryland): ORC Macro. Available: www.
measuredhs.com. Accessed 12 March 2010.
27. Gwatkin D, Rutstein S, Johnson K, Pande R, Wagstaff A (2000) Socioeconomic
differences in health, nutrition and population. health, nutrition and population
discussion paper, Washington (D.C.): The World Bank. Available: http://www.
worldbank.org/poverty/health/data/index.htm. Accessed 10 November 2009.
28. Kuczmarski RJ, Ogden CL, Guo, National Centre for Health Statistics (2002)
2000 CDC growth charts for the United States: methods and development. Vital
Health Stat 11: 1–190.
29. US Centers for Disease Control (2008) Epi Info version 6. Available: http://
www.cdc.gov/EpiInfo/. Accessed 3 April 2009.
30. Lemeshow S, Hosmer D (1982) A review of goodness of fit statistics for use in the
development of logistic regression models. Am J Epidemiol 115: 92–106.
31. Greenland S (1995) Dose-response and trend analysis in epidemiology:
alternatives to categorical analysis. Epidemiology 6: 356–364.
32. Pastor R, Guallar E (1998) Use of two-segmented logistic regression to estimate
change-points in epidemiological studies. Am J Epidemiol 148: 631–642.
33. Landis R, Koch G (1977) The measurement of observer agreement for
categorical data. Biometrics 33: 159–174.
34. Durkin MS, Davidson LL, Desai P, Hasan ZM, Khan N, et al. (2005) Validity of
the ten-question screen for childhood disability: results from population based
studies in Bangladesh, Jamaica and Pakistan. Epidemiology 5: 283–289.
35. Abubakar A, Van de Vijver FJR, Van Baar A, Mbonani L, Kalu R, et al. (2008)
Socioeconomic status, anthropometric status and psychomotor development of
Kenyan children from resource-limited settings: a path-analytic study. Early
Hum Dev 84: 613–621.
36. Lijmer JG, Mol BW, Heisterkamp S, Bonsel GJ, Prins MH, et al. (1999)
Empirical evidence of design related bias in studies of diagnostic tests. JAMA
282: 1061–1066.
Validation and Reliability of the MDAT
PLoS Medicine | www.plosmedicine.org 13 May 2010 | Volume 7 | Issue 5 | e1000273
Editors’ Summary
Background. Babies can do very little when they are firstborn. But, gradually, over the first few years of life, they learnto walk and run (gross motor skills), they learn to manipulateobjects with their hands (fine motor skills), they learn tocommunicate with words and gestures (language skills), andthey learn how to interact with other people (social skills).For each of these skill ‘‘domains,’’ experts have identified‘‘developmental milestones,’’ skills that are acquired by aspecific age if development is proceeding normally. So, forexample, by one year, a child should be able crawl, putobjects into a container, respond to simple verbal requests,and enjoy imitating people during play. Every child attainsthe various developmental milestones at a slightly differentage but their overall development can be monitored using aseries of simple tests (items) covering each of thedevelopmental domains. Clinicians and teachers can usethese ‘‘developmental assessment tools’’ to identify childrenwhose development deviates significantly from the norm. Itis important to identify these children as young as possiblebecause early intervention can help them reach their fulldevelopmental potential.
Why Was This Study Done? In developing countries,poverty, poor health, and malnutrition are responsible formillions of children failing to reach their developmentalpotential. But because developmental assessment tools havemainly been designed and validated in western, developedcountries, they contain many items that are alien to childrenin non-western cultures (for example, the use of knives andforks for eating and the use of specific gestures). Theycannot, therefore, accurately assess whether a child living in,for example, a rural area of Africa, is developing normally. Inthis study, the researchers describe the creation and testingof a culturally appropriate developmental assessment toolfor use in rural Africa—the Malawi DevelopmentalAssessment Tool (MDAT)—from a 162-item draft tool(MDAT Draft I) that they previously developed from DenverII, an assessment tool widely used in developed countries.
What Did the Researchers Do and Find? The researchersassessed the ‘‘face validity’’ (do the items look acceptable tountrained judges?) and ‘‘content validity’’ (does the toolexamine all the domains it is meant to measure?) of MDATDraft I and modified it to produce MDAT Draft II. Afterpiloting this version on 80 children in rural Malawi, theymodified it further to produce MDAT Draft III, which wasused to assess 1,426 normal children aged 0–6 years fromrural Malawi and to derive age-standardized norms for eachitem. After statistically analyzing the performance of eachitem in MDAT Draft III, all the items were considered at aconsensus meeting, and items that were badly performing,unnecessary, and difficult to administer were removed,leaving 136 items (MDAT). The researchers then validatedMDAT by using it to assess children with neurodisabilities(disorders of the nervous system that impair normalfunctioning) and children with delayed developmentbecause of malnutrition. The tool was reliable (differenttesters got similar results for individual children andindividual testers got similar results when they retested
specific children), sensitive (it correctly identified mostchildren with a neurodisability or delayed development),and specific (it correctly identified most children who weredeveloping normally; that is, it did not give false-positiveresults).
What Do These Findings Mean? These findings showthat MDAT is a culturally relevant assessment tool thatreliably identifies children with neurodisabilities and delayeddevelopment in rural Malawi. Importantly, they also providea detailed illustration of how to create and validate aculturally relevant assessment tool. Although MDAT is likelyto be applicable in other similar settings, further research isneeded to test its generalizability and to test whether it willwork in children with more subtle developmental problems.MDAT, the researchers note, should be useful as a clinicaltool for the early identification of neurodisabilities and as anoutcome measure in clinical trials of interventions designedto improve child development. However, they stress,because developing countries have limited resourcesavailable for screening and for helping children whosedevelopment is delayed or disrupted, for now tools likeMDAT are more likely to be used for research studies than forroutine developmental assessments in Malawi and otherAfrican countries.
Additional Information. Please access these Web sites viathe online version of this summary at http://dx.doi.org/10.1371/journal.pmed.1000273.
N The World Health Organization has information ondisability, prevention, and management in children andadults worldwide
N UNICEF has a site on early childhood and in particular,provides information on programming experiences forearly child intervention programs worldwide
N Disability World is a website for international views andperspectives on disability worldwide. It provides informa-tion and links about the worldwide state of disability inchildren and adults in developing countries
N Source, the International Information Support Centre has agood website of information about disability, inclusion,and development in children with links to many othersources of information
N Wikipedia has a page on child development (note thatWikipedia is a free online encyclopedia that anyone canedit; available in several languages)
N The US Centers for Disease Control and Preventionprovides information on developmental screening andon developmental milestones
N The American Academy of Pediatrics also providesinformation on developmental stages and on develop-mental milestones
N The UK National Health Service Choices site has aninteractive guide to child development
N MedlinePlus has links to further resources on infant andtoddler development (in English and Spanish)
Validation and Reliability of the MDAT
PLoS Medicine | www.plosmedicine.org 14 May 2010 | Volume 7 | Issue 5 | e1000273