Embed Size (px)
Citation preview
LETTER Communicated by Zoubin Ghahramani
Modeling Cross-Modal Enhancement and Modality-SpecicSuppression in Multisensory Neurons
Paul E PattonppattonuiuceduBeckman Institute University of Illinois at Urbana=ChampaignUrbana IL 61801 USA
Thomas J AnastasiotjauiuceduBeckman Institute and Department of Molecular and Integrative PhysiologyUniversity of Illinois at Urbana=Champaign Urbana IL 61801 USA
Cross-modal enhancement (CME) occurs when the neural response to astimulus of one modality is augmented by another stimulus of a differ-ent modality Paired stimuli of the same modality never produce supra-additive enhancement but may produce modality-specic suppression(MSS) in which the response to a stimulus of one modality is dimin-ished by another stimulus of the same modality Both CME and MSShave been described for neurons in the deep layers of the superior collicu-lus (DSC) but their neural mechanisms remain unknown Previous in-vestigators have suggested that CME involves a multiplicative amplierperhaps mediated by N-methyl D-aspartate (NMDA) receptors which isengaged by cross-modal but not modality-specic input We previouslypostulated that DSC neurons use multisensory input to compute the pos-terior probability of a target using Bayesrsquo rule The Bayesrsquo rule modelreproduces the major features of CME Here we use simple neural imple-mentations of our model to simulate both CME and MSS and to arguethat multiplicative processes are not needed for CME but may be neededto represent input variance and covariance Producing CME requires onlyweighted summation of inputs and the threshold and saturation proper-ties of simple models of biological neurons Multiplicative nodes allowaccurate computation of posterior target probabilities when the sponta-neous and driven inputs have unequal variances and covariances Neuralimplementations of the Bayesrsquo rule model account better than the multi-plicative amplier hypothesis for the effects of pharmacological blockadeof NMDA receptors on the multisensory responses of DSC neurons Theneural implementations also account for MSS given only the added hy-pothesis that input channels of the same modality have more spontaneouscovariance than those of different modalities
Neural Computation 15 783ndash810 (2003) cdeg 2003 Massachusetts Institute of Technology
784 P Patton and T Anastasio
1 Introduction
Multisensory integration occurs at numerous sites in the mammalian ner-vous system (Steinamp Meredith 1993) and has been studied extensively in thedeep layers of the superior colliculus (DSC) of cats and monkeys (Meredithamp Stein 1986b Wallace Wilkinson amp Stein 1996 Wallace Meredith amp Stein1998) Enhancement is a form of multisensory integration in which the re-sponse to a stimulus of one modality is augmented by a stimulus of anothermodality (Meredith amp Stein 1986b Stein amp Meredith 1993) Cross-modalenhancement (CME) was thought to be mediated by multiplicative inter-actions among inputs of different modalities perhaps through N-methylD-aspartate (NMDA) receptors present in DSC neurons (Meredith amp Stein1986b Stein Huneycutt amp Meredith 1988 Meredith Wallace amp Stein 1992Stein amp Meredith 1993 Binns amp Salt 1996 Binns 1999) CME contrastssharply with the responses of multisensory neurons to paired stimuli of thesame modality presented within their excitatory receptive elds Such pre-sentations never produce robust enhancement of the sort seen in CME andsometimes result in modality-specic suppression (MSS) in which the re-sponse to a stimulus of one modality is reduced by a second stimulus of thesame modality (Stein amp Meredith 1993) The neural mechanisms of CMEand MSS remain unknown Open questions concern whether CME requiresmultiplicative interactions the possible role of NMDA receptors and theparadox of MSS In previous work we modeled CME on an abstract levelusing Bayesrsquo rule (Anastasio Patton amp Belkacem-Boussaid 2000) Here weuse neural implementations of the Bayesrsquo rule model to exploremechanismsof multisensory integration in DSC and other neurons
The DSC receives visual auditory and somatosensory inputs organizedas a multimodal topographic map (Middlebrooks amp Knudsen 1984 Mered-ith amp Stein 1990 Clemo amp Stein 1991) Activation of cells at a particularlocation in this map can result in an orienting movement toward the corre-sponding location in space containing the stimulus source (Wurtz amp Gold-berg 1972 Peck 1990) Individual DSC neurons may receive input fromtwo or occasionally three different sensory modalities (Meredith et al1992 Wallace et al 1996) Receptive elds for multiple modalities are largeand spatially coincident CME in multisensory DSC neurons occurs whenstimuli of different modalities are presented together within their excita-tory receptive elds (Meredith amp Stein 1996 Kadunce Vaughan Wallaceamp Stein 2001) Enhancement can be expressed as a percentage of the largestsingle stimulus response SRmax
E D CR iexcl SRmax
SRmaxpound 100 (11)
where CR is the neural response to the combined stimuli CME exhibits theproperty of inverse effectiveness wherein weak unimodal stimuli when
A Neural Model of Cross-Modal Enhancement 785
combined produce a larger E than do stronger stimuli (Meredith amp Stein1986b Wallace amp Stein 1994 Wallace et al 1996) Multimodal neuronsexhibiting CME have also been described in cat extraprimary sensory cortex(Wallace Meredith amp Stein 1992 Jiang Lepore Ptito amp Guillemot 1994Stein amp Wallace 1996) and cross-modal enhancement phenomena havebeen noted in the behavioral responses of cats (Stein et al 1988 SteinMeredith Huneycutt amp McDade 1989) MSS observed for DSC neuronscan be expressed as negative percentage enhancement Modality-specicsuppressive interactions have also been reported for neurons in a numberof primate cortical visual structures (Sato 1989 1995 Reynolds Chelazziamp Desimone 1999)
We have proposed previously that DSC neurons use stochastic sensoryinput to compute the posterior probability of a target using Bayesrsquo rule(Anastasio et al 2000) We showed that CME and inverse effectivenessarise as straightforward consequences of this hypothesis The initial studydid not address the issue of how neurons might implement the neededcomputation That posterior probabilities are a natural outcome of neuralcomputation is well known to specialists in neural networks and patternclassication (Richard amp Lippmann 1991 Duda Hart amp Stork 2001) Weapply these results in a neurobiological context and extend them to accountfor experimental observations
To illustrate how the Bayesrsquo rule model of CME (Anastasio et al 2000)might be implemented by neurons we consider three simple perceptronmodels The simplest involves a single perceptron with sensory input chan-nels that are Poisson distributed and conditionally independent This modeldemonstrates that enhancement can be produced using only propertiesgenerically present in biological neurons and that no special multiplica-tive interactions are needed The second an augmented perceptron modelcomputes posterior probabilities under the more general circumstances inwhich inputs are multivariate gaussian We show that it accounts better thanthe multiplicative interaction hypothesis for experimental ndings on theeffects of NMDA receptor blockade on the responses of DSC neurons Thethird implementation extends the Bayesrsquo rule model to provide an explana-tion for the otherwise puzzling phenomenon of MSS The augmented per-ceptron produces suppression given neurobiologically plausible assump-tions that include covariance among inputs of like modality in the absenceof sensory stimulation
2 A Perceptron Model with Poisson Inputs Can Simulate CME
We rst consider a model in which the sensory input likelihoods are Pois-son distributed and conditionally independent given the target Under theseconditions a single perceptron is capable of computing the posterior prob-ability of a target and simulating CME The target is represented as binaryrandom variable T (target absent T D 0 target present T D 1) The prior
786 P Patton and T Anastasio
probability distribution of the target is assigned arbitrarily as PT D 1 D 01and PT D 0 D 09 According to the Bayesrsquo rule model (Anastasio et al2000) the posterior probability of a target is computed by using sensory in-put to modify this prior probability Input from each modality i is modeledas random variable Mii D 1 2 k which can assume any discrete non-negative value mi The mi represent numbers of neural impulses per unittime (ring rate) The input likelihoods which are conditional distributionsof the inputs given the target are modeled as Poisson densities
PMi D mi j T D t Dcedil
miit eiexclcedilit
mi (21)
The Poisson density was used in the original formulation of the Bayesrsquorule model (Anastasio et al 2000) because it requires the fewest assumptionsand reasonably approximates neuronal ring-rate distributions (Gabbianiamp Koch 1998) The mean and variance of a Poisson distribution are equaland are specied by parameter cedil The input likelihoods under spontaneous(target absent PMi D mi j T D 0) or driven (target present PMi D mi jT D 1) conditions are described using equation 21 with means cedili0 and cedili1respectively (cedili1 gt cedili0) (see Figure 1B) The posterior target probability is
Figure 1 Facing page (A) A perceptron model of multisensory integration Themodel receives two conditionally independent Poisson-distributed sensory in-puts M1 D V and M2 D A having synaptic weights wv and wa The bias inputb is xed and might represent tonic inhibitory input or biophysical propertiesintrinsic to a neuron The sigma node 6 computes the weighted sum u of theinputs (see equation 25) The output is passed through the logistic squashingfunction f u (see equation 26) (B) The likelihoods of observing discrete num-bers of impulses per unit time (025 s) are shown for sensory input Mi underspontaneous (PMi D mi j T D 0 spont dot-dashed line) and stimulus driven(PMi D mi j T D 1 driven solid line) conditions The likelihoods are given byPoisson distributions (see equation 21) with cedili0 D 2 and cedili1 D 6 (C)The bimodalperceptron model simulates CME The response is equal to the posterior prob-ability of a target as computed by the perceptron ( f u D PT D 1 j m) usingequations 25 26 and 28 For both modalities V and A the input likelihoodsare assigned spontaneous mean cedilv0 D cedila0 D 2 and driven mean cedilv1 D cedila1 D 6 Inthe cross-modal both-driven case (stars) both modalities are driven by a targetstimulus Inputs V D v and A D a are set equal and varied over a range of im-pulses per unit time In the modality-specic spontaneous-driven case (circles)one modality is driven while the other is xed at the spontaneous mean The dif-ference between the two plots represents CME The dashed line indicates priortarget probability PT D 1 The both-driven and spontaneous-driven plots rep-resent slices through the full 2D posterior (D) Cross-modal enhancement for theperceptron model is computed using equation 11 where CR and SRmax valuesare taken from the both-driven and spontaneous-driven curves of C
A Neural Model of Cross-Modal Enhancement 787
788 P Patton and T Anastasio
given using Bayesrsquo rule
PT D 1 j m D Pm j T D 1PT D 1
Pm (22)
In this equation m is a vector representing the activity mi of each sensorymodality Mi We assume initially that the likelihoods for the various modal-ities are conditionally independent given the target According to this sim-plifying assumption the visibility of a target indicates nothing about its au-dibility and vice versa The joint likelihoods Pm j T D 1 and Pm j T D 0
can then be computed as
Pm j T D t DkY
iD1PMi D mi j T D t (23)
The unconditional joint probability Pm is given by the principle of totalprobability
Pm D PT D 1Pm j T D 1 C PT D 0Pm j T D 0 (24)
We will use the perceptron as the basis for our model of a DSC neuronThe perceptron computes the weighted sum u of its inputs where each inputmi has an associated synaptic weight wi
u D b CkX
iD1wimi (25)
The constant bias input b might represent the biophysical properties of aneuron or a tonic input The weighted input sum is passed through thelogistic squashing function
f u D 11 C eiexclu (26)
which approximates the threshold and saturation propertiesof real neuronsWe seek a formula for u such that the value of the logistic function f u
is equal to the posterior probability of the target given inputs m f u DPT D 1 j m We substitute equation 26 for f u and substitute Poissondistributions 21 for the input likelihoods in equations 22 23 and 24 Insolving for u we obtain
u D lnmicro
PT D 1
PT D 0
paraC
kX
iD1
microsup3ln
sup3cedili1
cedili0
acuteacutemi C cedili0 iexcl cedili1
para (27)
A Neural Model of Cross-Modal Enhancement 789
Equation 27 is linear with respect to mi Thus given the basic neuronalnonlinearities of threshold and saturation as represented by the squashingfunction the posterior probability is computed by the weighted sum ofsensory inputs Multiplying inputs together is not necessary This ndingcontrasts with previous ideas about the neural basis of CME (see section 5)Equation 27 can be rearranged to yield the input weights wi and bias b fora simple perceptron (see Figure 1A)
wi D lnsup3
cedili1
cedili0
acuteand b D ln
microPT D 1
PT D 0
paraC
kX
iD1
cedili0 iexcl cedili1 (28)
The bias contains a term related to the target prior Because cedili1 gt cedili0 thebias term will be negative whenever PT D 1 lt PT D 0 This ndinghas interesting implications for how the target prior might be representedneurobiologically (see section 5)
We propose that the response of a DSC neuron is proportional to posteriortarget probability A perceptron with weights set according to equation 28was used to simulate the results of a bimodal CME experiment We con-sider visual V and auditory A inputs but the simulation is valid for anycombination of two sensory modalities To simulate the response of a bi-modal DSC neuron to cross-modal stimulation modalities M1 D V andM2 D A were set equal and varied from 0 to 25 impulses per unit time(both-driven) To simulate a bimodal DSC neuronrsquos response to modality-specic stimulation one input was varied from 0 to 25 impulses per unittime while the other was held xed at its spontaneous mean (spontaneous-driven) The results are illustrated in Figures 1C and 1D A single per-ceptron is thus sufcient to implement the Bayesrsquo rule model of CME forinputs that are Poisson distributed and conditionally independent giventhe target
3 An Augmented Perceptron Model and the Role of NMDA Receptors
As a more general form of our model we consider a case in which sensoryinputs are represented as gaussian distributions and we drop the assump-tion that inputs from different modalities are conditionally independentgiven the target Input to a DSC neuron from a single sensory modality isderived by combiningsignals from many different sensory neurons Accord-ing to the classical central limit theorem the distribution of the combinedinput will be gaussian provided that the individual signals are indepen-dent (Fristedt amp Gray 1997) We assume that input from a single modalitywill be approximatelygaussian despite possible dependencies between sig-nals carried by individual neurons of the same modality (see below) Wemodel the multimodal input and dependencies between inputs of different
790 P Patton and T Anastasio
modalities using a multivariate gaussian distribution (Duda et al 2001)
Pm j T D tD1
2frac14k=2jsecttj1=2exp
microiexcl
12
miexclsup1tTsectiexcl1
t miexclsup1t
para (31)
In this equation k is the number of modalities and sup1t is a vector containingthe means of the distributions associated with each modality when T D tThe symbol T denotes the transpose operation sectt is a k by k covariancematrix whose diagonal terms are the variances associated with individualmodalities and whose off-diagonal terms are the covariances among modal-ities
The model classies input patterns into two categories T D 0 and T D 1For this simple case u can be expressed as a discriminant function (Dudaet al 2001)
u D gmD lnsup3
PTD1 j m
PTD0 j m
acuteD ln
sup3Pm j TD1
Pm j TD0
acuteCln
sup3PTD1
PTD0
acute
D ln Pm j TD 1Cln PTD 1iexcl[ln Pm j T D0Cln PT D0] (32)
Substituting equation 31 and simplifying we obtain
u D 12
[mTsectiexcl11 iexcl sectiexcl1
0 m C 2mTsectiexcl11 sup11 iexcl 6iexcl1
0 sup10
iexcl sup1T1 sectiexcl1
1 sup11 C sup1T0 sectiexcl1
0 sup10]
C lnsup3 jsect0j1=2PT D 1
jsect1j1=2PT D 0
acute (33)
As before the subscript 1 refers to an input driven by the target stimulus(T D 1) and 0 to one active spontaneously in the absence of a stimulus(T D 0) Because of the quadratic and multiplicative terms involved thisformula cannot in general be implemented by a single perceptron
A multilayered perceptron is capable of approximating any continuousfunction (Cybenko 1989) Such a network given m as input and appropriatesynaptic weights should be capable of supplying an approximation of u inequation 33 to a logistic output node representing a DSC neuron Anotherplausible implementation involves the introduction of pi nodes or productunits (Rumelhart Hinton amp McClelland 1986 Durbin amp Rumelhart 1989)to create an augmented-perceptron model (see Figure 2A) Pi nodes multiplytheir inputs together just as sigma nodes add them Neurobiologically theyrepresent possible voltage-sensitive processes in the dendritic arbor of aneuron (Durbin amp Rumelhart 1989 Koch amp Poggio 1992) The augmented-perceptron model can be expressed as
u D b CkX
iD1
wimi CkX
iD1
kX
jDi
frac12ijmimj (34)
A Neural Model of Cross-Modal Enhancement 791
The rst two terms on the right-hand side are identical with those of thesimpleperceptron equation 25 The last term species the sigma-pi functionwith weights frac12ij For the case of two sensory inputs V D v and A D aequation 34 can be rewritten as
u D b C wvv C waa C frac12vv2 C frac12aa2 C frac12vava (35)
Using equation 33 the constants frac12v frac12a frac12va wv wa and b can be speciedas
frac12v D12
Aacutefrac34 2
a0
macr0iexcl
frac34 2a1
macr1
frac12a D12
Aacutefrac34 2
v0
macr0iexcl
frac34 2v1
macr1
frac12va DAacute
frac34 2va1
macr1iexcl
frac34 2va0
macr0
(36)
wv DAacute
sup1v1frac34 2a1 iexcl sup1a1frac34 2
va1
macr1
C
Aacutesup1a0frac34 2
va0 iexcl sup1v0frac34 2a1
macr0
(37)
wa DAacute
sup1a1frac34 2v1 iexcl sup1v1frac34 2
va1
macr1
C
Aacutesup1v0frac34 2
va0 iexcl sup1a0frac34 2v1
macr0
(38)
b D[iexclfrac34 2
a1sup12v1 C 2frac34 2
va1sup1v1sup1a1 iexcl frac34 2v1sup12
a1]2macr1
C[frac34 2
a0sup12v0 iexcl 2frac34 2
va0sup1v0sup1a0 C frac34 2v0sup12
a0]2macr0
C ln
Aacutesmacr0
macr1
PT D 1
PT D 0
(39)
In these equations macr0 D frac34 2v0frac34 2
a0 iexcl frac34 4vao and macr1 D frac34 2
v1frac34 2a1 iexcl frac34 4
va1 The termsfrac34 2
v0 frac34 2a0 frac34 2
v1 and frac34 2a1 are variances for the spontaneous and driven cases for
each modality and frac34 2va0 and frac34 2
va1 are the covariances for the spontaneousand driven conditions respectively
An augmented perceptron as specied by equations 35 through 39 cancompute posterior target probability and thereby simulate CME (see Fig-ures 2B and 2C) Note that as for the Poisson-input model CME arisesby summation in a nonlinear neuron When the spontaneous and drivenvariances and the spontaneous and driven covariances are equal (frac34 2
v0 Dfrac34 2
v1 frac34 2a0 D frac34 2
a1 and frac34 2va0 D frac34 2
va1 the pi-node terms disappear (frac12v D frac12a Dfrac12va D 0) and the computation can again be performed by a simple per-ceptron The multiplicative terms associated with the pi nodes compensatefor differences between spontaneous and driven variance and covariancerather than produce CME
Targets vary greatly in the efcacy with which they drive different sen-sory input neurons It seems likely that the variance of a sensory input ofany modality should be larger in the driven than in the spontaneous case
792 P Patton and T Anastasio
A Neural Model of Cross-Modal Enhancement 793
In the two-channel model we set the spontaneous variances frac34 2v0 D frac34 2
a0 D 5and the driven variances frac34 2
v1 D frac34 2a1 D 6 It also seems likely that two sensory
inputs of different modalities should covary more under driven than un-der spontaneous conditions Inputs of different modalities are segregatedin modality-specic pathways prior to their arrival in the DSC (Sparks ampHartwich-Young 1989 Wallace Meredith amp Stein 1993) Such input chan-nels are unlikely to interact under spontaneous conditions and sponta-
Figure 2 Facing page (A) An augmented-perceptron model of multisensory inte-gration Sensory inputs are gaussian distributed The model receives input fromtwo sensory modalities M1 D V and M2 D A Each provides weighted inputto summing node 6 with weights wv and wa The summing node also receivesa xed bias input b The set of three pi nodes 5 multiplies both modalities bythemselves and by each other The pi nodes provide inputs to the summingnode with weights frac12v frac12a and frac12va The output is passed through the squash-ing function f u (B) The augmented-perceptron model simulates CME Inputlikelihoods are gaussian distributed For both modalities V and A the spon-taneous likelihood mean is sup1v0 D sup1a0 D 2 and the driven likelihood meanis sup1v1 D sup1a1 D 6 Spontaneous and driven variances for both modalities arefrac34 2
v0 D frac34 2a0 D 5 and frac34 2
v1 D frac34 2a1 D 6 The spontaneous and driven covariances are
frac34 2va0 D 01 and frac34 2
va1 D 28 The responses are equal to posterior target probabil-ity computed using the augmented perceptron The cross-modal both-drivencurve (stars) simulates a case in which both modalities are driven by a stimulusInputs V D v and A D a are set equal and varied from 0 to 25 impulses per unittime The modality-specic spontaneous-driven curve (circles) simulates a casewhere only one modality is driven The driven input varies from 0 to 25 impulsesper unit time while the input representing the nondriven modality was heldxed at the mean of the spontaneous likelihood distribution The both-drivenand spontaneous-driven plots represent slices through the full 2D posterior Theno pi both-driven (asterisks) and no pi spontaneous-driven (triangles) curvesillustrate the inaccurate probability computation performed for the both-drivenand spontaneous-driven cases respectively by a network in which the pi nodeshave been removed by setting frac12v D frac12a D frac12va D 0 (C) Cross-modal enhancement(see equation 11) is plotted for the intact augmented perceptron (stars) and for aversion from which the pi nodes have been removed (asterisks) (D) The amountby which removal of the pi nodes reduces the augmented perceptron responseto input is illustrated for the both-driven (asterisks) and spontaneous-driven(circles) cases In each case reduction R is computed using
R D PT D 1 j m iexcl Lm
PT D 1 j mpound 100
where PT D 1 j m is computed using the intact network and Lm is thecorresponding value computed by the lesioned network following removal ofthe pi nodes
794 P Patton and T Anastasio
neous covariance between channels of different modalities should be lowIn contrast the sensory attributes of natural targets are likely to covary andchannels of different modalities will covary as they are driven by these tar-gets Accordingly in the two-channel model we set spontaneous covariancefrac34 2
va0 D 01 and driven covariance frac34 2va1 D 28
The specic variance and covariance values chosen are consistent withthese plausible assumptions and produce an accurate simulation of neu-rophysiological ndings on DSC neurons when used to parameterize thetwo-channel augmented perceptronAn augmented-perceptron model DSCneuron receiving inputs of two modalities (see Figure 2A) is studied in theboth-driven case in which both modalities are driven equally by a stimulusand in the spontaneous- driven case in which one modality is driven bya stimulus while the other is spontaneously active As the number of im-pulses increases target probability increases from nearly zero to nearly oneand it increases faster in the both-driven than in the spontaneous-drivencase (see Figure 2B) CME reaches its highest values in the region wherethe spontaneous-driven responses are still small (see Figures 2B and 2C)Presumably experimental effects on CME would be studied in this regionwhich will be referred to as the enhancement zone
Binns and Salt (1996) investigated the effects of pharmacologically block-ing NMDA receptors on the responses of DSC neurons to modality-specicand cross-modal stimuli We postulate that NMDA receptors may serve thefunctional role assigned to pi nodes in the augmented-perceptron model Toinvestigate this hypothesis the effects on the modelof removingthe pi nodes(ie setting frac12v D frac12a D frac12va D 0) were compared with the effects reported byBinns and Salt (1996) Following pi node removal the model no longer ac-curately computes the posterior probability of a target (see Figure 2B) Theeffect of pi node removal is to reduce the both-driven and spontaneous-driven responses to a given input below the values computed by the intactmodel (see Figures 2B and 2D) Removal of the pi nodes does not eliminateenhancement but reduces it within the enhancement zone (see Figure 2C)These effects are produced over a wide range of model variance and covari-ance parameters Binns and Salt (1996) also report that blockade of NMDAreceptors in DSC neurons produces reductions in both spontaneous-drivenand both-driven responses For the chosen parameters the percentage bywhich the model response is reduced is greater for both-driven than forspontaneous-driven input within the enhancement zone (see Figure 2D) asalso observed experimentally The experimental data are thus more consis-tent with our hypothesis than with the view that NMDA receptors functionas a multiplicative amplier for CME (see section 5)
4 Multiple Input Channels and Modality-Specic Suppression
The augmented-perceptron model can be extended to account for the factthat cross-modal stimuli produce robust enhancement of DSC neuron re-
A Neural Model of Cross-Modal Enhancement 795
sponses whereas paired modality-specic stimuli do not (Stein amp Mered-ith 1993) As an implementation of the Bayesrsquo rule model (Anastasio et al2000) the augmented perceptron accounts for CME as an increase in theposterior target probability computed by a DSC neuron due to integrationof a second input of a different modality The extension to MSS is basedon the intuition that a second input should increase target probability lessif it covaries more with the rst input and that spontaneous covariancein particular is likely to be stronger between inputs of the same modalityAnalysis shows this intuition to be correct Surprisingly given specic butneurobiologically plausible assumptions concerning the inputs it can evenaccount for the counterintuitive phenomenon of MSS Bayesrsquo rule can thusaccount for both CME and MSS and both can be implemented using thesame augmented perceptron For convenience we refer to visual and au-ditory modalities in what follows although the result also applies to othermodality combinations
A DSC neuronrsquos visual receptive eld is produced by combining inputfrom multiple sources many of which are known to have much smallerreceptiveelds than those of DSC neurons (Olson amp Graybiel 1987 SparksampHartwich-Young 1989 Meredith amp Stein 1990) These visual neurons wouldhave separate but overlapping receptive elds within the receptive eld ofthe DSC neuron We assume that the paired modality-specic stimuli used toproduce MSS will activate separate but overlapping sets of visual neuronsWe will refer to the set of visual neurons that can be activated by the rststimulus of the pair as channel V and those activated by the second stimulusas channel X Receptive eld overlap will cause the V and X channels tocovary under driven conditions Many of the neurons that provide visualinput to the DSC are spontaneously active (see the discussion in Anastasioet al 2000) Overlap in the sets of visual neurons that comprise channels Vand X will cause them to covary under spontaneous conditions Overlap ofspontaneously silent neurons will contribute additional covariance underdriven conditions
In addition to the two visual channels we assume a third channel Arepresenting auditory input This three-channel case is treated using anaugmented perceptron (see Figure 3A) The means variances and covari-ances for the multivariate gaussians equation 31 representing the spon-taneous and driven likelihoods of V X and A are set according to theassumptions made above which are that means variances and covari-ances are higher under driven than under spontaneous conditions andthat covariances especially spontaneous covariances are higher betweenmodality-specic than between cross-modal channels The parameters inthe augmented-perceptron model can be computed using equation 33 as forthe two-channel case above The model can simulate the nding that cross-modal input pairs (V and A) produce CME whereas modality-specic inputpairs (V and X) do not (see Figures 3B and 3C) To illustrate the explanatorypower of the model the modality-specic case simulated in Figures 3B and3C is actually one of suppression (MSS)
796 P Patton and T Anastasio
A Neural Model of Cross-Modal Enhancement 797
In the model MSS arises over a specic but neurobiologically plausiblerange of parameters Figure 4 shows the effects of varying spontaneous anddriven covariance between the V and X channels (frac34 2
vx0 and frac34 2vx1) on peak
CME and MSS For the simple case considered all three modalities haveequal spontaneous means (sup1v0 D sup1x0 D sup1a0 D 2) driven means (sup1v1 Dsup1x1 D sup1a1 D 6) spontaneous variances (frac34 2
v0 D frac34 2x0 D frac34 2
a0 D 2) and drivenvariances (frac34 2
v1 D frac34 2x1 D frac34 2
a1 D 6) Driven covariances between cross-modalchannels are larger than spontaneous covariances (frac34 2
va0 D frac34 2xa0 D 01 frac34 2
va1 Dfrac34 2
xa1 D 28) These parameters are the same as those of Figure 3A real-valued multivariate gaussian distribution equation 31 exists only
when j6tj gt 0 This condition is met whenever frac34 2v frac34 2
a frac34 2x C 2frac34 2
vafrac342vxfrac34 2
ax gt
Figure 3 Facing page (A) An augmented-perceptron model of multisensory in-tegration for a three-channel case M1 D V M2 D X and M3 D A Each channelprovides weighted input to summing node 6 with weights wv wx and wa Thesumming node also receives a xed bias input b Each modality multiplies itselfand each of the other modalities on the set of six pinodes 5 The pinodes provideinputs to the summing node with weights frac12v frac12x frac12a frac12vx frac12xa and frac12va The out-put of the summing node is passed through the squashing function f u (B) Athree-channel augmented-perceptron model is used to simulate both CME andMSS The input likelihoods are multivariate gaussians The spontaneous inputlikelihoods for all three channels have means sup1v0 D sup1x0 D sup1a0 D 2 and variancesfrac34 2
v0 D frac34 2x0 D frac34 2
a0 D 2 Driven input likelihoods have means sup1v1 D sup1x1 D sup1a1 D 6and variances frac34 2
v1 D frac34 2x1 D frac34 2
a1 D 6 Within-modality covariances frac34 2vx0 D 16 and
frac34 2vx1 D 36 are higher than the corresponding between-modality covariances
frac34 2va0 D frac34 2
xa0 D 01 and frac34 2va1 D frac34 2
xa1 D 28 The responses are equal to the posteriorprobability computed by the augmented perceptron Plots for four different in-put conditions are shown For each condition a driven channel is one where theinput varies over the range from 0 to 15 impulses per unit time (abscissa) anda spontaneous channel is one where the input is held xed at the spontaneousmean The V or X alone condition (circles) simulates an experiment in which asingle visual stimulus is presented One of the visual channels V or X is drivenwhile the other visual channel and the auditory channel are spontaneous The Aalone case (triangles) simulates an experiment in which an auditory stimulus ispresented alone Channel A is driven and V and X are spontaneous The V andX condition (squares) simulates an experiment in which two visual stimuli arepresented simultaneously in a DSC neuronrsquos visual receptive eld Channels Vand X are driven and A is spontaneous The V and A case (stars) simulates anexperiment in which a visual and an auditory stimulus are presented simultane-ously Channels V and A are driven and X is spontaneous Each plot constitutesa slice through the full 3D posterior (C) Percentage enhancement is computedas described for Figure 1D Presentation of two stimuli of different modalities(V and A) produces positive enhancement or CME while presentation of twostimuli of the same modality (V and X) produces negative enhancement or MSS
798 P Patton and T Anastasio
frac34 2v frac34 4
ax C frac34 2a frac34 4
vx C frac34 2x frac34 2
va The chart in Figure 4 is bounded at the right andon the bottom by a region for which no real-valued multivariate gaussiandistribution exists Peak CME (white bars) is always greater than 200 (as-terisks) for spontaneous covariance values less than 06 (not shown) Sup-pression (black bars) becomes evident when the spontaneous covariancefrac34 2
vx0 approaches the spontaneous variance frac34 2v0 D frac34 2
x0 D frac34 2a0 D 2 but is rel-
atively uninuenced by the driven covariance frac34 2vx1 Similar relationships
are observed when the variances for different modalities are unequal This
A Neural Model of Cross-Modal Enhancement 799
parametric analysis further implicates spontaneous covariance as a factorcausing suppression of one input channel by another
Graphical analysis illustrates how spontaneous covariance between in-put channels can lead to suppression It also shows that spontaneous co-variance is necessary for suppression but not sufcient because sponta-neous covariance leads to suppression only when driven variance is greaterthan spontaneous variance Multivariate gaussian input likelihood distri-butions (Pm j T D t see equation 31) for the three-channel model areplotted in Figure 5 for a series of different variance and covariance con-ditions Figure 6 plots posterior target probabilities (PT D 1 j m seeequation 22) for the same series of conditions The heavy dashed curve inFigure 5 indicates the intersection of the spontaneous and driven likelihooddistributions Pm j T D 0 D Pm j T D 1 For inputs falling on thiscurve the posterior probability of a target is equal to its prior probabilityPT D 1 j m D PT D 1 The same intersection curve is again shown inFigure 6 which plots posterior target probabilities In the white region ofFigure 6 PT D 1 j m is nearly 0 and in the gray region nearly 1 In eachpanel of Figures 5 and 6 the dotted diagonal line indicates the case wherechannels V and X are held equal and driven over the range from 0 to 15 asin Figure 3 The dot-dashed horizontal line indicates the case where V aloneis driven from 0 to 15 and X is held xed at its spontaneous mean Thedot-dashed vertical line indicates the case where X alone is driven from 0 to15 with V remaining xed at its spontaneous mean In all cases A channelinput is held xed at its spontaneous mean sup1a0 D 2
Figure 4 Facing page Spontaneous covariance is associated with MSS in thethree-channel augmented-perceptron model Spontaneous and driven covari-ance (frac34 2
vx0 and frac34 2vx1) between the V and X channels are varied while all other
parameters are as specied for Figure 3 Each of the rectangles corresponds toone combination of frac34 2
vx0 and frac34 2vx1 as indicated VX enhancement was computed
by comparing the combined response CR and the maximum single modalityresponse SRmax using equation 11 For CR V and X were both driven by astimulus over the range from 0 to 30 while A was held xed at its spontaneousmean For SRmax V alone was driven over the range from 0 to 30 and X andA were held xed at their spontaneous means The maximum percentage en-hancement over the range was computed and is indicated for each covariancecombination by the height of a white bar above the horizontal line representingzero enhancement Maximum enhancements exceeding 200 are indicated bya white bar with an asterisk Spontaneous covariances less than 06 (not shown)produced enhancements greater than 200The minimum enhancement is com-puted for inputs that are larger than those at which the maximum occurred Ifthe minimum observed was less than zero it is indicated as a black bar extend-ing downward from the horizontal zero enhancement line The depth of the barindicates suppression on a scale of 0 to iexcl200
800 P Patton and T Anastasio
Figure 5 Multivariate gaussian input likelihood distributions for the three-channel model under spontaneous and stimulus-driven conditions for differ-ent settings of variance and covariance In each panel spontaneous and drivenlikelihood is plotted as a function of V and X channel input A channel in-put is held xed at its spontaneous mean (a D sup1a0 D 2) Each plot representsa slice through a 3D likelihood distribution Likelihood value is indicated bycontour lines and shading where darker shading indicates a higher likelihoodIn each panel of Figures 5 and 6 the diagonal dotted line indicates v D xwhich corresponds to the V- and X-driven case of Figure 3 The horizontal dot-dashed line corresponds to the V-alone case where v varies from 0 to 15 andx D a D sup1x0 D sup1a0 D 2 The vertical dot-dashed line corresponds to the X-alonecase The heavy dashed curve in each panel indicates the points of intersectionof the spontaneous and driven likelihood distributions (Pm j T D 0 D Pm jT D 1) (A) The spontaneous and driven covariances between all channels
A Neural Model of Cross-Modal Enhancement 801
Figure 5 (cont) Facing page are zero (frac34 2va0 D frac34 2
xa0 D frac34 2vx0 D 0 frac34 2
va1 D frac34 2xa1 D
frac34 2vx1 D 0) All other parameters are as specied in Figure 3 The concentric
contour lines about the point v D 2 x D 2 indicate the spontaneous like-lihood distribution From outermost to innermost the contour lines indicatePm j T D 0 D 0005 001 0015 and 002 respectively The concentric contourlines about the point v D 6 x D 6 indicate the driven likelihood distributionFrom outermost to innermost Pm j T D 1 D 2pound10iexcl4 4pound10iexcl4 6pound10iexcl4 8pound10iexcl4 and 1 pound 10iexcl3 respectively The corresponding posterior target probability distri-bution is shown in Figure 6A (B) The spontaneous and driven covariances arenonzero and assigned the same values as for Figure 3 (frac34 2
va0 D frac34 2xa0 D 01 frac34 2
vx0 D16 frac34 2
va1 D frac34 2xa1 D 28 and frac34 2
vx1 D 36) All other parameters are also as speciedin Figure 3 The concentric contour lines centered about v D 2 x D 2 indicate thespontaneous likelihoods Pm j T D 0 D 0005 001 0015 002 0025 003 and0035 The second set of concentric contour lines indicates the driven likelihoodsPm j T D 1 D 2 pound 10iexcl4 4 pound 10iexcl4 6 pound 10iexcl4 8 pound 10iexcl4 0001 and 00012 Thecorresponding target posterior probability distribution is shown in Figure 6B(C) The spontaneous and driven covariances between the V X and A channelsare zero but the variances are larger for the V channel than for the X and Achannels (frac34 2
v0 D 8 frac34 2x0 D frac34 2
a0 D 2 frac34 2v1 D 16 frac34 2
x1 D frac34 2a1 D 6) Distribution means
are as in Figure 3 The concentric contour lines about v D 2 x D 2 indicate thespontaneous likelihoods Pm j T D 0 D 0002 0004 0006 0008 and 001The concentric contour lines centered about v D 6 x D 6 indicate the drivenlikelihoods Pm j T D 1 D 1 pound 10iexcl4 2 pound 10iexcl4 3 pound 10iexcl4 4 pound 10iexcl4 5 pound 10iexcl4
and 6 pound 10iexcl4 The corresponding target posterior probability distribution isshown in Figure 6C (D) The spontaneous and driven covariances are nonzeroas in Figures 3 and 5B (frac34 2
va0 D frac34 2xa0 D 01 frac34 2
vx0 D 16 frac34 2va1 D frac34 2
xa1 D 28 andfrac34 2
vx1 D 36) but the spontaneous variance is larger than the driven variance(frac34 2
v0 D frac34 2x0 D frac34 2
a0 D 8 frac34 2v1 D frac34 2
x1 D frac34 2a1 D 6) Distribution means are again
as for Figure 3 The concentric contour lines about v D 2 x D 2 indicatethe spontaneous likelihoods Pm j T D 0 D 00005 0001 00015 0002 and00025 The second set of concentric contour lines indicates the driven likeli-hoods Pm j T D 1 D 2pound10iexcl4 4pound10iexcl4 6pound10iexcl4 8pound10iexcl4 0001 00012 00014
and 00016The corresponding target posterior probability distribution is shownin Figure 6D
In Figure 5A the driven variances are equal the spontaneous variancesare equal in all three channels and driven variance is greater than spon-taneous variance as in Figure 3 Unlike Figure 3 there is no covariancebetween any of the channels in Figure 5A Under these circumstances thespontaneous (T D 0) and driven (T D 1) likelihoodcontours (see Figure 5A)and their associated posterior probability contours (see Figure 6A) are cir-cular The heavy vertical line in Figure 6A connects a point along the Vand X both-driven line with the corresponding point along the V-only
802 P Patton and T Anastasio
spontaneous-driven line The both-driven point has posterior probabilitynear one while the spontaneous-driven point has posterior probability nearzero indicating very large enhancement For the circular case Figure 6Aillustrates that both-driven posteriors will always be higher than the cor-responding spontaneous-driven posteriors and consequently suppressioncannot occur
In Figures 5B and 6B the driven variances are equal the spontaneousvariances are equal again in all three channels and driven variance is greaterthan spontaneous variance Cross-modal channels are assigned a very smallspontaneous covariance and a larger driven covariance The V and X chan-nels are assigned a much larger spontaneous covariance than the cross-modal channels and a larger driven covariance All parameters have the
A Neural Model of Cross-Modal Enhancement 803
same values as for Figure 3 Due to nonzero covariance the spontaneousand driven likelihood contours (see Figure 5B) are elliptical and elongatedin the diagonal direction The place of intersection of the spontaneous anddriven likelihoods and the posterior probability contours (see Figure 6B)are similarly elliptical and diagonally elongated This effect is due primarilyto the large VX spontaneous covariance The heavy vertical line in Figure 6Bconnects a both-driven point having posterior probability near zero with acorresponding spontaneous-driven point having posterior probability nearone indicating suppression Figure 6B illustrates how suppression can arisefrom the Bayesrsquo rule model and be simulated by a neural implementationof it when modality-specic channels exhibit spontaneous covariance anddriven variance exceeds spontaneous variance
Figure 6 Facing page Posterior target probability (PT D 1 j m) is plotted asa function of V and X channel input for the three-channel model described inFigure 3 Posterior target probability is indicated in each panel by shading andcontour lines White indicates PT D 1 j m values near zero and gray indicatesPT D 1 j m values near one Contour lines are at 01 unit intervals The heavydotted curve in each panel indicates the input values for which the posteriorand prior target probabilities are equal PT D 1 j m D PT D 1 D 01 whichis the same as the Pm j T D 0 D Pm j T D 1 curve in the corresponding pan-els of Figure 5 The dotted and dot-dashed lines are as described in Figure 5(A) The likelihood parameters are as given for Figure 5A An input parame-ter combination that produces enhancement of 1075 is shown by the heavyvertical line terminated with circular dots The V and X both-driven posteriorprobability PT D 1 j V D 6 X D 6 A D 2 D 094 (upper dot) and the V aloneposterior PT D 1 j V D 6 X D 2 A D 2 D 008 (lower dot) (B) The likelihoodparameters are as given for Figure 5B An input parameter combination that pro-duces enhancement of iexcl833 (suppression) is shown by the heavy vertical lineterminated with circular dots The V and X both-driven posterior probabilityPT D 1 j V D 58 X D 58 A D 2 D 016 (upper dot) and the V alone poste-rior PT D 1 j V D 58 X D 2 A D 2 D 096 (lower dot) (C) The likelihoodparameters are as given for Figure 5C with different variances for the V and Xchannels An input parameter combination that produces enhancement of only403 is shown by the heavy vertical line terminated with circular dots The Vand X both-driven posterior probability PT D 1 j V D 7 X D 7 A D 2 D 094(upper dot) and the V alone posterior PT D 1 j V D 7 X D 2 A D 2 D 067(lower dot) (D) The likelihood parameters are as described in Figure 5D inwhich the spontaneous variance is larger than the driven variance Here theV and X both-driven posterior probability reaches a maximum value of only027 and thus only two contour lines are visible An input parameter combina-tion that produces enhancement of 8337 is shown by the heavy vertical lineterminated with circular dots The V and X both-driven posterior probabilityPT D 1 j V D 10 X D 10 A D 2 D 027 (upper dot) and the V alone posteriorPT D 1 j V D 10 X D 2 A D 2 D 00032 (lower dot)
804 P Patton and T Anastasio
Covariance is necessary for suppression Elongation of the spontaneousor driven likelihoods by itself without covariance can decrease enhance-ment but cannot produce suppression The spontaneous and driven covari-ances are set to zero in Figure 5C but the likelihoods are elongated along theX channel axis (ordinate) by setting the V variance greater than the X vari-ance under both spontaneous and driven conditions The equal likelihood(see Figure 5C) and posterior probability (see Figure 6C) contours are alsoelongated along the X channel axis The heavy vertical line in Figure 6C con-nects a both-driven point with a corresponding spontaneous-driven pointthat have almost equal posteriorprobabilities indicating very little enhance-ment Increasing V variance further would bring the posterior probabilitycontours closer to parallel with the X channel axis This would further re-duce enhancement but never lead to suppression Suppression requires theelongation combined with diagonalization of likelihood distributions (seeFigures 5B and 6B) that can be produced only by covariance
Covariance is necessary but not sufcient for suppression Suppressionrequires spontaneous covariance (with or without driven covariance) andthat driven variance is greater than spontaneous variance In Figures 5D and6D channel covariances are as in Figures 5B and 6B and the spontaneousvariances are equal and the driven variances are equal for all three channelsUnlike the case of Figures 5B and 6B the driven variance in Figures 5Dand 6D is smaller than the spontaneous variance Now the heavy dashedcurve indicating equal spontaneous and driven likelihood (see Figure 5D)and equal prior and posterior probability (see Figure 6D) forms a closedellipse containing the point specied by the driven V and X means Thespontaneous-driven lines never intersect this ellipse Within the ellipse theposterior probability of a target never exceeds 027 The heavy vertical linein Figure 6D connects a both-driven point having posterior probability 027with a spontaneous-driven point having posterior probability near zeroproducing sizable enhancement only because of the small magnitude of thelatter value
In summary suppression can occur between two channels when drivenvariance is larger than spontaneous variance and spontaneous covarianceapproaches the value of spontaneous variance (with or without driven co-variance) These conditions are very likely to be met by channels of thesame modality that provide input to neurons in the DSC and elsewhere inthe brain (see above) It is very likely that driven variance will be higher thanspontaneous variance because driven variance reects the huge variabilityin stimulus effectiveness in addition to the stochastic properties of the ner-vous system that determine spontaneous variance It is also very likely thatinput channels of the same modality will covary under both spontaneousand driven conditions because they may share some of the same input ax-ons The seemingly paradoxical phenomenon of MSS arises naturally fromthe Bayesrsquo rule model of CME given these neurobiologically plausible con-ditions of input channel variance and covariance The three-channel neural
A Neural Model of Cross-Modal Enhancement 805
implementation presented in Figure 3 illustrates an example in which CMEand MSS can arise in the same model neuron The implementation can beextended to any number of cross-modal and modality-specic channels Atwo-channel single-modality model was also investigated and suppressionwas found to occur under similar parametric circumstances
5 Discussion
CME is often referred to as supra-additive or multiplicative since a neu-ronrsquos response to multimodal stimuli is often greater than the sum of theresponses to the single modality stimuli presented alone (Meredith amp Stein1986b Stein et al 1988 Meredith et al 1992 Stein amp Meredith 1993) It hasbeen suggested that CME requires a special nonlinear amplier such as anion channel that responds to multimodal but not unimodal input (Stein ampMeredith 1993 Binns amp Salt 1996 Binns 1999) The implementations wehave examined here suggest a different view of cross-modal enhancement
We have previously argued that CME arises as a consequence of DSCneurons computing the posterior probability of a target using Bayesrsquo rule(Anastasio et al 2000) Here we use neural implementations of the Bayesrsquorule model to address issues of neurobiological mechanism A single per-ceptron is capable of computing the target posterior when the inputs areconditionally independent and Poisson distributed or gaussian distributedwithout the assumption of conditional independence provided variancesand covariances for the spontaneous likelihood distribution are equal tothose for the driven likelihood distribution When the above equality is notsatised an augmented perceptron which allows inputs to be multipliedtogether is needed to compute the posterior probability of a target In eithercase CME itself is produced by weighted summation in a nonlinear modelneuron Multiplication of inputs is not needed to produce CME Instead itserves a function not envisioned by the multiplicative amplier hypothesisIt serves to compensate for differences between spontaneous and drivenvariance and covariance to allow computation of posterior target probabil-ity when these parameters are unequal
It has been suggested that NMDA-sensitive glutamate conductancespresent in DSC neurons might provide a multiplicative amplier for CME(Stein amp Meredith 1993 Binns amp Salt 1996 Binns 1999) Binns and Salt(1996) tested this hypothesis by applying the NMDA receptor antagonistAP5 to multisensory DSC neurons in the cat during cross-modal and modal-ity-specic stimulation The results were equivocal with respect to the am-plier hypothesis since AP5 did not selectively eliminate CME Instead ap-plication of AP5 resulted in a reduction of both modality-specic and cross-modal responses with the percentage reduction being greater for the latterIt is possible to reconcile these ndings with the multiplicative hypothesisby proposing for example that NMDA receptors involved in cross-modalresponses have different channel kinetics from those involved in modality-
806 P Patton and T Anastasio
specic responses (Binns 1999) Our model however can account for thendings without any such special assumptions
The function of the pinodes in the augmented perceptronmodel might beimplemented by dendritic voltage-sensitive conductances in DSC neurons(Koch amp Poggio 1992 Mel 1993) We propose that rather than serving asmultiplicative ampliers for CME NMDA receptors in DSC neurons mightperform the function of these pi nodes Simulations in which pi nodes wereremoved from the model over a suitable range of parameters yielded re-sults similar to those observed in the NMDA channel blockade studiesRemoving the pi nodes from the augmented-perceptron model similarlyproduced a reduction in response to both modality-specic and cross-modalstimuli with the percentage reduction being greater for the latter (see Fig-ure 2C) Our model provides a straightforward explanation for the NMDAchannel blockade ndings whereas the amplier model of CME does not
In addition to multimodal interactions Stein and Meredith (1993) haveexamined interactions between two stimuli of the same modality Giventhe assumptions that driven variances are greater than the spontaneousvariances and that signicant spontaneous covariance should occur be-tween modality-specic but not between cross-modal input channels theaugmented-perceptron implementation simulated the absence of enhance-ment for modality-specic stimuli and the presence of enhancement forcross-modal stimuli Furthermore our model proved capable of simulatingthe counterintuitive nding of modality-specic suppression For suppres-sion to occur in the model the spontaneous covariance between the V andX channels must be less than but close to the spontaneous variances Whenthese conditions are met the VX pi node invariably has a negative weightfrac12vx lt 0 Neurobiologically a pi node with a negative weight might corre-spond for example to an inhibitory interneuron with a nonlinear conduc-tance perhaps produced by NMDA receptors
Depressive interactions in which the neural response to a cross-modalstimulus is less than that elicited by a single stimulus can occur when thetwo stimuli are sufciently spatially disparate (Meredith amp Stein 1986a1986b 1996 Kadunce Vaughan Wallace Benedek amp Stein 1997 Kadunceet al 2001) Pairs of modality-specic stimuli can also produce such ef-fects when one of the two is outside the excitatory receptive eld (Kadunceet al 1997) This is distinct from the modality-specic suppression dis-cussed above in which both stimuli are presented within the excitatoryreceptive eld Depression due to spatial disparity appears to result fromcompetitive interactions involved in target selection (Munoz amp Istvan 1998Findlay amp Walker 1999) rather than target detection which is the focus ofthis study Our results do not preclude competitive interaction as a pos-sible explanation for modality-specic suppression They do demonstratethat modality-specic suppression can be simulated using the Bayesrsquo rulemodel of CME and neural implementations thereof and is therefore a plau-sible consequence of target detection processes
A Neural Model of Cross-Modal Enhancement 807
CME in the DSC apparently depends on cortical-descending input TheDSC of the cat receives descending cortical input from certain areas of ex-traprimary sensory cortex including the anterior ectosylvian cortex (AES)and the lateral suprasylvian sulcus (Berson amp McIlwain 1983 Harting Up-dyke amp Van Lieshout 1992 Wallace et al 1993) Inactivation of these areasand of AES in particular has been shown to selectively abolish CME whilepreserving multisensory responsiveness in DSC neurons (Wallace amp Stein1994 Jiang Wallace Jiang Vaughan amp Stein 2001) The model suggeststhat the cortical input could produce CME simply by adding a componentto the DSC response to subcortical input but it offers no insight into howthe cortical and subcortical contributions may be partitioned We are ex-ploring a new model that subsumes the implementations proposed herewithin a broader model of the development of CME using intrinsic Heb-bian mechanisms and both ascending and cortical-descending inputs tothe DSC
For the case of conditionally independent Poisson distributed inputsthe bias b is negative whenever PT D 1 lt PT D 0 and cedili0 lt cedili1 Forthe more general case the value of b is inuenced by all of the other pa-rameters in the model (see equation 39) A number of restricted cases wereexamined and it was found that b was negative for all but a small portionof parameter space (near asymptotes) whenever a set of plausible param-eter requirements was maintained The inhibitory bias might correspondto some biophysical mechanism intrinsic to DSC neurons or to an extrinsicsource of tonic inhibition The DSC contains inhibitory interneurons andreceives extrinsic inhibitory input from the substantia nigra zona incertacontralateral colliculus and a variety of brainstem structures (Karabelasamp Moschovakis 1985 Ficalora amp Mize 1989 Appell amp Behan 1990 Mize1992 May Sun amp Hall 1997) Both substantia nigra and zona incerta cellsare tonically active (Hikosaka amp Wurtz 1983 Ma 1996) Some substantianigra cells respond to visual or auditory stimulation with a decrease or ces-sation of ring Because the bias contains a term related to the target priorprobability it is possible that the sensory responses of nigral cells couldmodulate CME in the DSC according to changes in the prior expectation oftargets
Acknowledgments
We thank Jeffrey Bilmes Ehtibar Dzhafarov Jesse Reichler and LiudmilaYafremava for helpful discussions and comments on the manuscript priorto submission We also thank anonymous reviewers of previous versions ofthis article for useful comments This work was supported by NSF grantsIBN 92-21823 and IBN 00-80789 ONR grant N00014-01-0249 and a grantfrom the Critical Research Initiatives of the State of Illinois all to T J AThe code used to generate the results presented here will be made availableat our web site httpcsnbeckmanuiucedu
808 P Patton and T Anastasio
References
Anastasio T J Patton P E amp Belkacem-Boussaid K (2000) Using Bayesrsquorule to model multisensory enhancement in the superior colliculus NeuralComputation 12 997ndash1019
Appell P P amp Behan M (1990) Sources of subcortical GABAergic projectionsto the superior colliculus in the cat J Comp Neurol 302(1) 143ndash158
Berson D M amp McIlwain J T (1983) Visual cortical inputs to the deep layersof catrsquos superior colliculus J Neurophysiol 50 1143ndash1155
Binns K E (1999) The synaptic pharmacology underlying sensory processingin the superior colliculus Prog Neurobiol 59(2) 129ndash159
Binns K E amp Salt T E (1996) Importance of NMDA receptors for multimodalintegration in the deep layers of the cat superior colliculus J Neurophysiol75(2) 920ndash930
Clemo H R amp Stein B E (1991) Receptive eld properties of somatosensoryneurons in the cat superior colliculus J Comp Neurol 314(3) 534ndash544
Cybenko G (1989) Approximation by superpositions of a sigmoidal functionMathematics of Control Signals and Systems 2 303ndash314
Duda R O Hart P E amp Stork D G (2001)Pattern classication (2nd ed) NewYork Wiley
Durbin R amp Rumelhart D E (1989)Product units A computationally power-ful and biologically plausible extension to backpropagationnetworks NeuralComputation 1 133ndash142
Ficalora A S amp Mize R R (1989)The neurons of the substantia nigra and zonaincerta which project to the cat superior colliculus are GABA immunoreac-tive A double label study using GABA immunocytochemistry and lectinretrograde transport Neurosci 29 567ndash581
Findlay J M amp Walker R (1999) A model of saccade generation based onparallel processing and competitive inhibition Behav Brain Sci 22 661ndash721
Fristedt B amp Gray L (1997) A modern approach to probability theory BostonBirkhauser
Gabbiani F amp Koch C (1998) Principles of spike train analysis In C Kochamp I Segev (Eds) Methods in neuronal modeling (2nd ed pp 312ndash360) Cam-bridge MA MIT Press
Harting J K Updyke B V amp Van Lieshout D P (1992) Corticotectal projec-tions in the cat Anterograde transport studies of twenty-ve cortical areasJ Comp Neurol 324(3) 379ndash414
Hikosaka O amp Wurtz R H (1983) Visual and oculomotor functions of themonkey substantia nigra pars reticulata I Relation of visual and auditoryresponses to saccades J Neurophysiol 49 1254ndash1267
Jiang H Lepore F Ptito M amp Guillemot J-P (1994) Sensory interactions inthe anterior ectosylvian cortex of cats Exp Brain Res 101 385ndash396
Jiang W Wallace M T Jiang H Vaughan J W amp Stein B E (2001) Two cor-tical areas mediate multisensory integration in superior colliculus neuronsJ Neurophysiol 85 506ndash522
Kadunce D C Vaughan J W Wallace M T Benedek G amp Stein B E (1997)Mechanisms of within- and cross-modality suppression in the superior col-liculus J Neurophysiol 78(6) 2834ndash2847
A Neural Model of Cross-Modal Enhancement 809
Kadunce D C Vaughan J W Wallace M T amp Stein B E (2001) The in-uence of visual and auditory receptive eld organization on multisensoryintegration in the superior colliculus Exp Brain Res 139 303ndash310
Karabelas A B amp Moschovakis A K (1985) Nigral inhibitory terminationon efferent neurons of the superior colliculus An intracellular horseradishperoxidase study in the cat J Comp Neurol 239(3) 309ndash329
Koch C amp Poggio T (1992) Multiplying with synapses and neurons InT McKenna J L Davis amp S F Zornetzer (Eds) Single neuron computation(pp 315ndash345) San Diego CA Academic Press
Ma T P (1996) Saccade related omnivectorial pause neurons in the primatezona incerta NeuroReport 7 2713ndash2716
May P J Sun W amp Hall W C (1997) Reciprocal connections between thezona incerta and the pretectum and superior colliculus of the cat Neurosci77(4) 1091ndash1114
Mel B W (1993) Synaptic integration in an excitable dendritic tree J Neuro-physiol 70(3) 1086ndash1101
Meredith M A amp Stein B E (1986a) Spatial factors determine the activityof multisensory neurons in cat superior colliculus Brain Res 365(2) 350ndash354
Meredith M A amp Stein B E (1986b)Visual auditory and somatosensory con-vergence on cells in superior colliculus results in multisensory integrationJ Neurophysiol 56(3) 640ndash662
Meredith M A amp Stein B E (1990) The visuotopic component of the multi-sensory map in the deep laminae of the cat superior colliculus J Neurosci10(11) 3727ndash3742
Meredith M A amp Stein B E (1996) Spatial determinants of multisensoryintegration in cat superior colliculus neurons J Neurophysiol 75(5) 1843ndash1857
Meredith M A Wallace M T amp Stein B E (1992) Visual auditory andsomatosensory convergence in output neurons of the cat superior collicu-lus Multisensory properties of the tecto-reticulo-spinal projection Exp BrainRes 88(1) 181ndash186
Middlebrooks J C amp Knudsen E I (1984) A neural code for auditory spacein the catrsquos superior colliculus J Neurosci 4(10) 2621ndash2634
Mize R R (1992) The organization of GABAergic neurons in the mammaliansuperior colliculus Prog Brain Res 90 219ndash248
Munoz D P amp Istvan P J (1998) Lateral inhibitory interactions in the in-termediate layers of the monkey superior colliculus J Neurophysiol 79(3)1193ndash1209
Olson C R amp Graybiel A M (1987)Ectosylvian visual area of the cat Locationretinotopic organization and connections J Comp Neurol 261 277ndash294
Peck C K (1990) Neuronal activity related to head and eye movements in catsuperior colliculus J Physiol (Lond) 421 79ndash104
Reynolds J H Chelazzi L amp Desimone R (1999) Competitive mechanismssubserve attention in macaque areas V2 and V4 Journal of Neuroscience 19(5)1736ndash1753
Richard M D amp Lippmann R P (1991) Neural network classiers estimateBayesian a posteriori probabilities Neural Computation 3 461ndash483
810 P Patton and T Anastasio
Rumelhart D E Hinton G E amp McClelland J L (1986) A general frame-work for parallel distributed processing In D E Rumelhart amp J L McClel-land (Eds) Parallel distributed processing Explorations in the microstructure ofcognition (Vol 1 pp 45ndash76) Cambridge MA MIT Press
Sato T (1989) Interactions of visual stimuli in the receptive elds of inferiortemporal neurons in awake macaques Exp Brain Res 77 23ndash30
Sato T (1995) Interactions between two different visual stimuli in the receptiveelds of inferior temporal neurons in macaques during matching behaviorsExp Brain Res 105 209ndash219
Sparks D L amp Hartwich-Young R (1989) The deep layers of the superiorcolliculus In R H Wurtz amp M Goldberg (Eds) The neurobiology of saccadiceye movements (Vol 3 pp 213ndash255) Amsterdam Elsevier
Stein B E Huneycutt W S amp Meredith M A (1988) Neurons and behaviorThe same rules of multisensory integration apply Brain Res 448(2) 355ndash358
Stein B E amp Meredith M A (1993) The merging of the senses Cambridge MAMIT Press
Stein B E Meredith M A Huneycutt W S amp McDade L (1989) Behavioralindices of multisensory integration Orientation to visual cues is affected byauditory stimuli J Cog Neurosci 1(1) 12ndash24
Stein B E amp Wallace M T (1996) Comparisons of cross-modality integrationin midbrain and cortex Prog Brain Res 112 289ndash299
Wallace M T Meredith M A amp Stein B E (1992) Integration of multiplesensory modalities in cat cortex Exp Brain Res 91(3) 484ndash488
Wallace M T Meredith M A amp Stein B E (1993) Converging inuencesfrom visual auditory and somatosensory cortices onto output neurons ofthe superior colliculus J Neurophysiol 69(6) 1797ndash1809
Wallace M T Meredith M A amp Stein B E (1998) Multisensory integrationin the superior colliculus of the alert cat J Neurophysiol 20(2) 1006ndash1010
Wallace M T amp Stein B E (1994) Cross-modal synthesis in the midbraindepends on input from cortex J Neurophysiol 71(1) 429ndash432
Wallace M T Wilkinson L K amp Stein B E (1996)Representation and integra-tion of multiple sensory inputs in primate superior colliculus J Neurophysiol76(2) 1246ndash1266
Wurtz R Hamp Goldberg ME (1972)Activity of superior colliculus inbehavingmonkey III Cells discharging before eye movements J Neurophysiol 35(4)575ndash586
Received May 24 2000 accepted September 11 2002
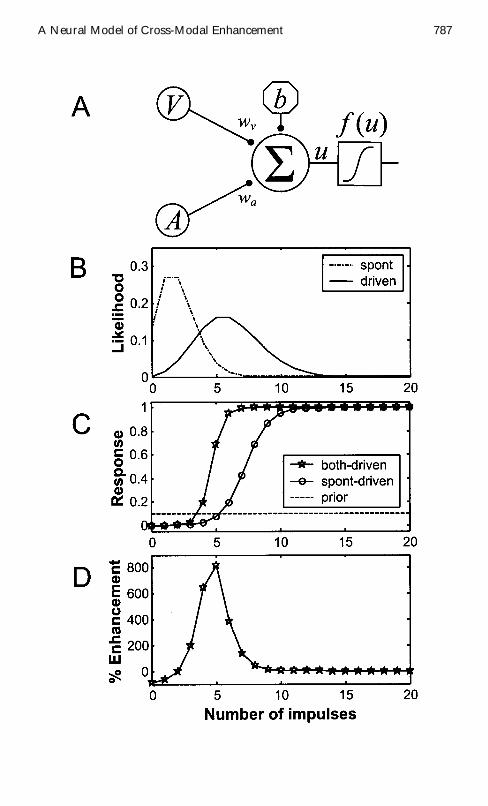
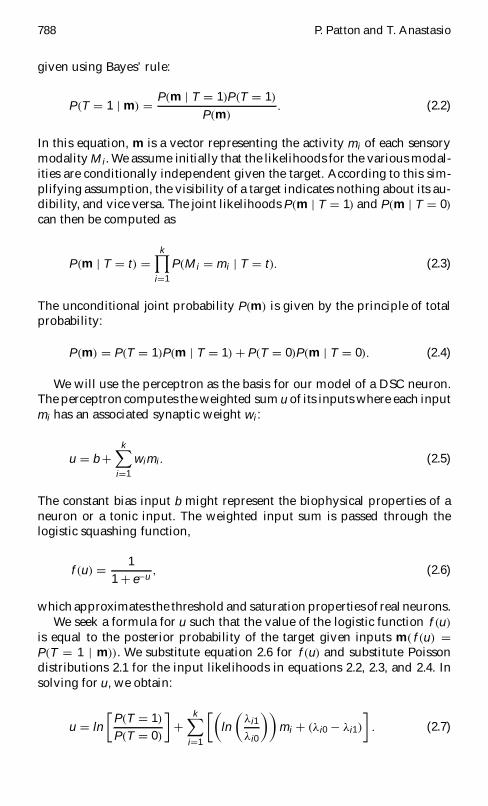
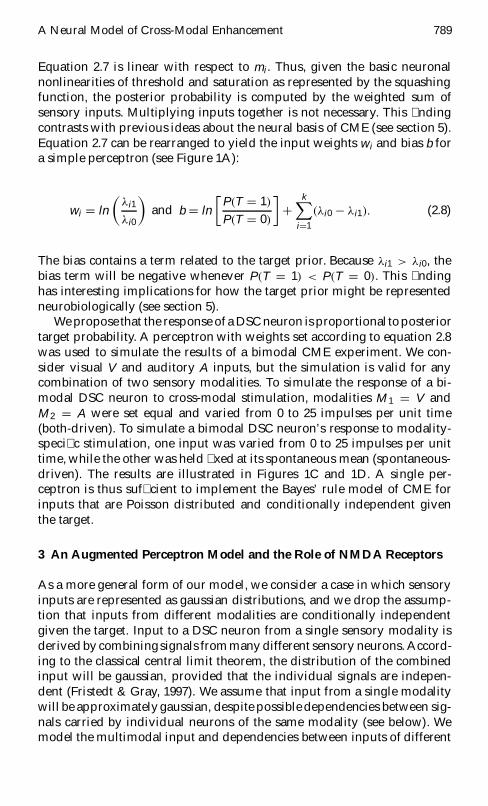
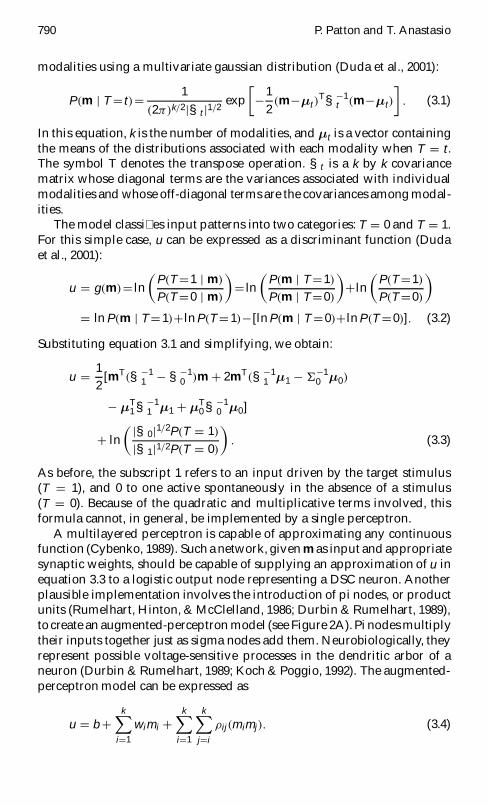
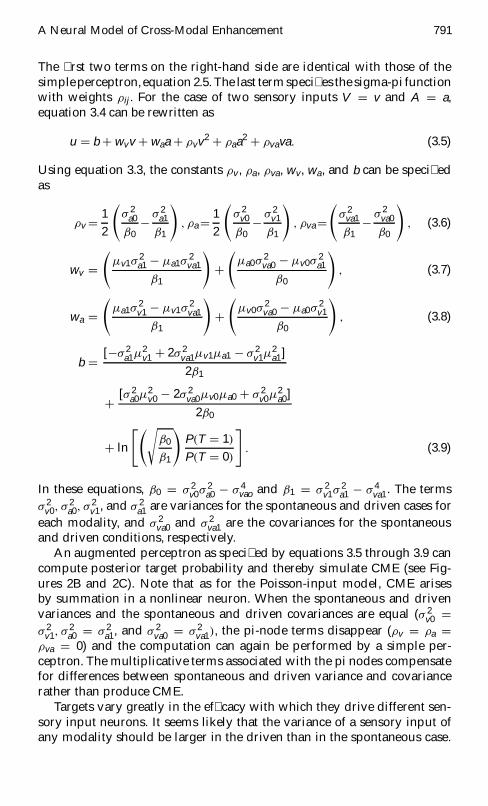
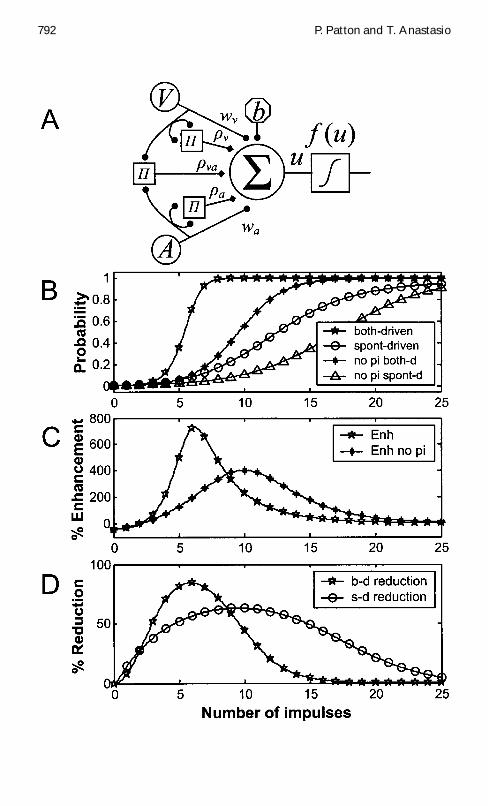
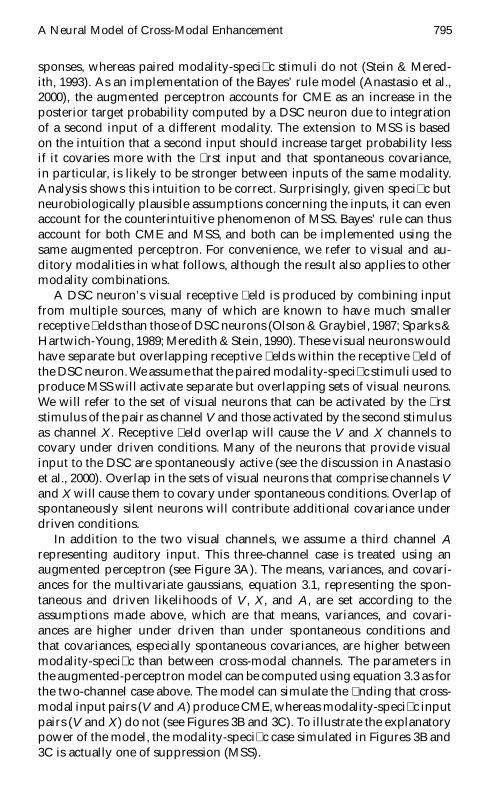
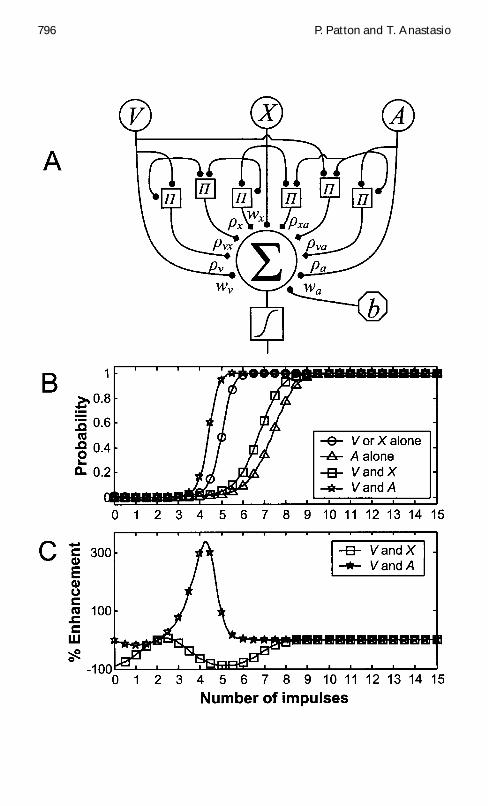
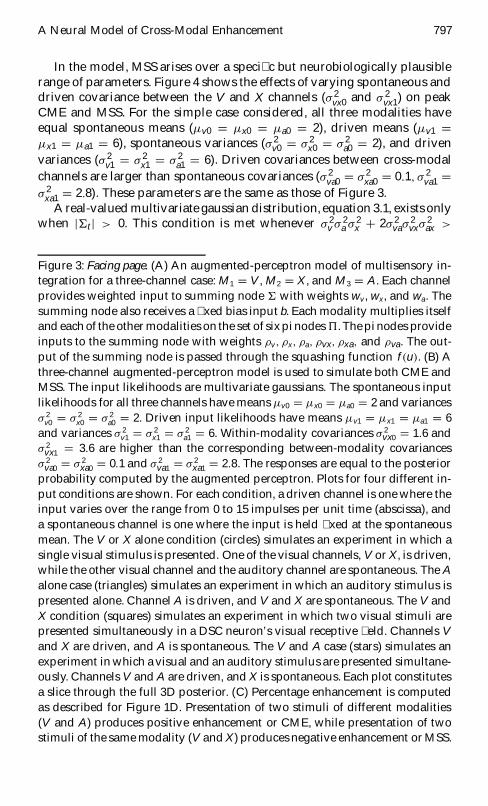
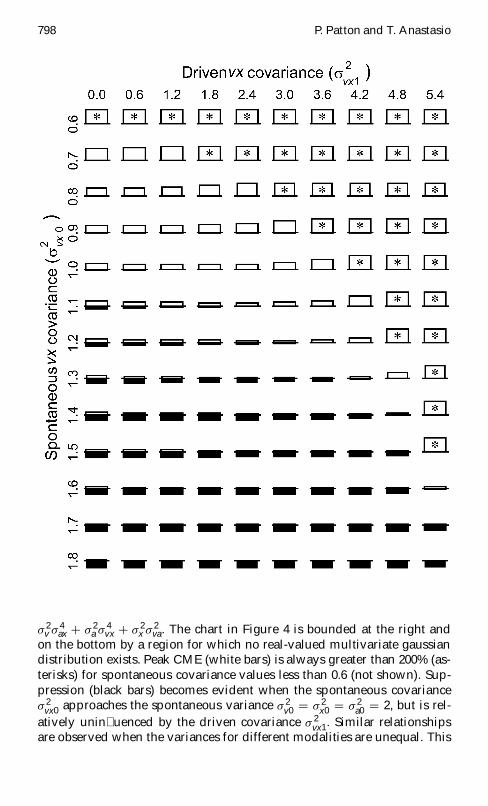
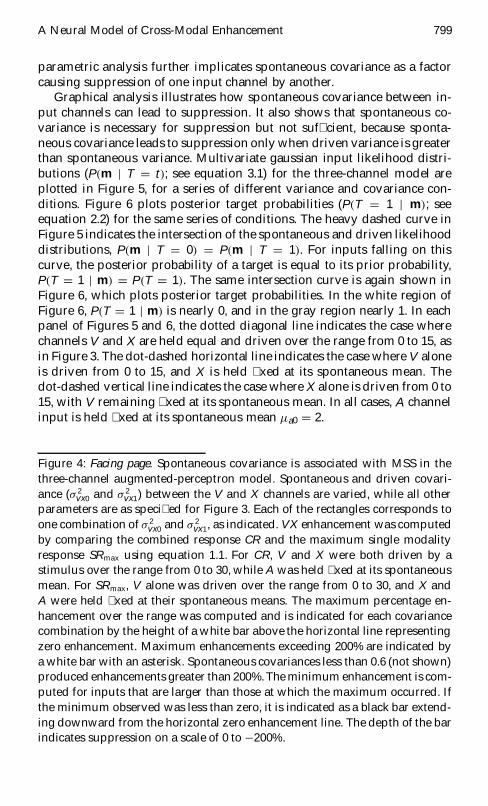
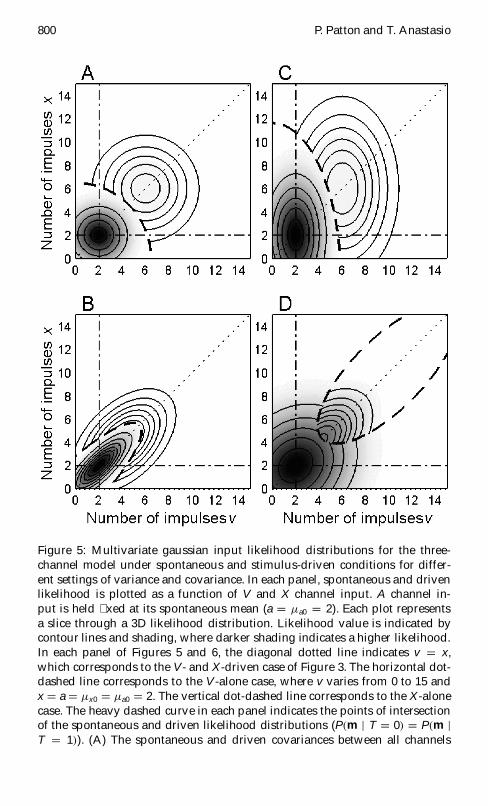
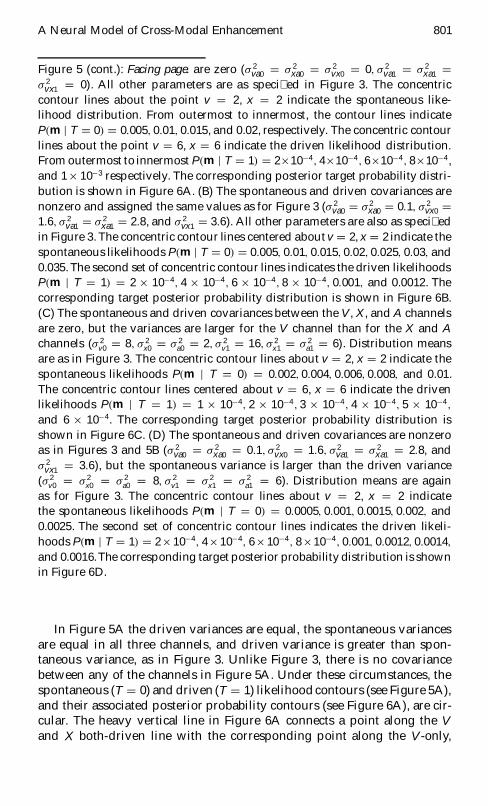
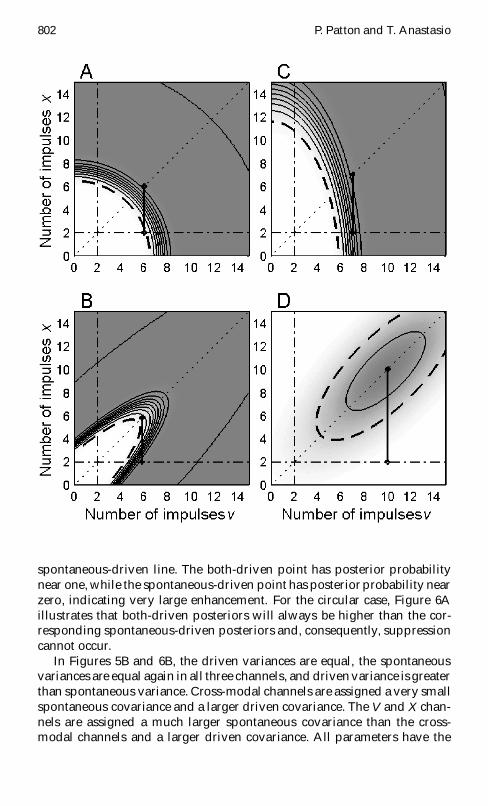
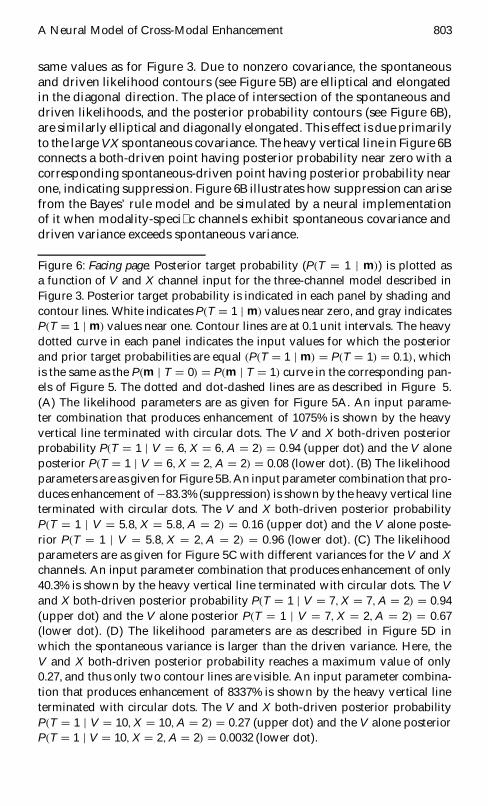
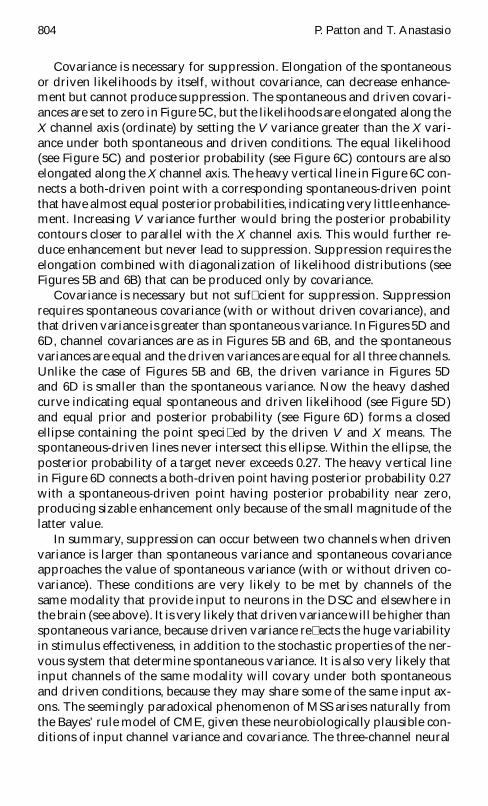
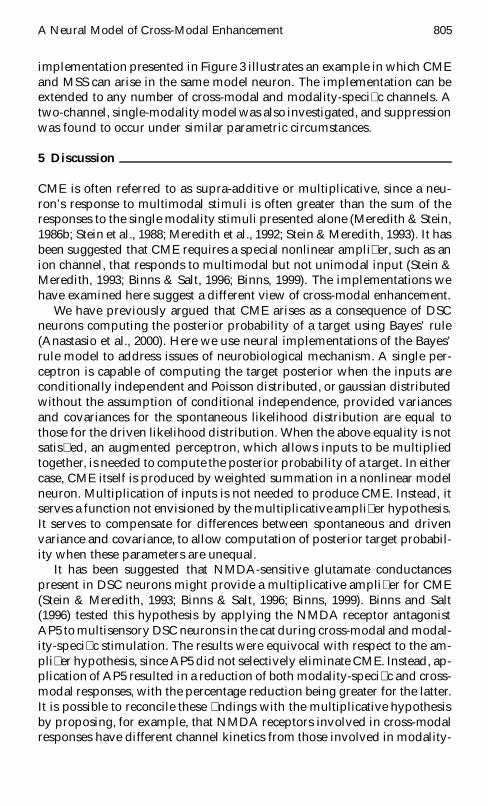
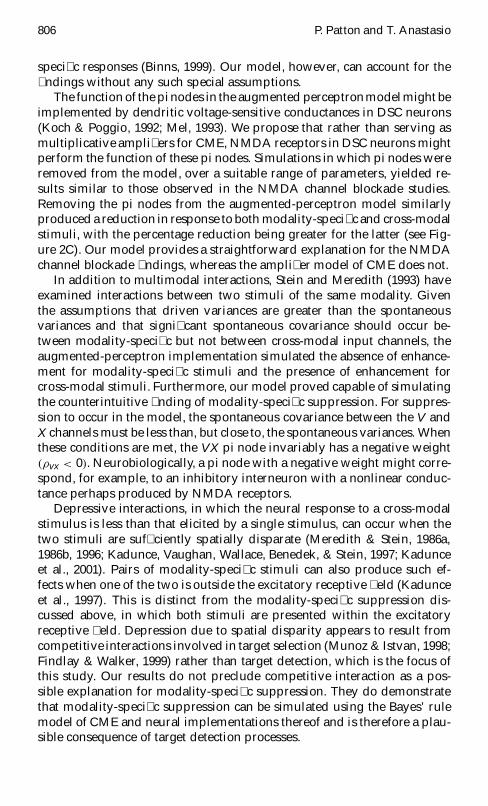


