Embed Size (px)
Citation preview
Available online at www.sciencedirect.com
www.elsevier.com/locate/jfoodeng
Journal of Food Engineering 85 (2008) 340–349
Modelling bulk density, porosity and shrinkage of quince duringdrying: The effect of drying method
Banu Koc�, _Ismail Eren *, Figen Kaymak Ertekin
Ege University, Faculty of Engineering, Department of Food Engineering, 35100 Bornova, Izmir, Turkiye
Received 11 July 2006; received in revised form 19 July 2007; accepted 20 July 2007Available online 24 August 2007
Abstract
The effect of drying method on bulk density, substance density, porosity, and shrinkage of quinces at various moisture contents wasinvestigated. Samples were dehydrated with four different drying methods: conventional drying in fluid bed and tray driers, infraredassisted air drying, osmotic dehydration combined with conventional air drying and freeze drying. All the properties except substancedensity were affected by drying method. Bulk density of freeze dried materials decreased with decreasing moisture content while forall other dehydration processes, bulk density and porosity increased with decreasing moisture content. Freeze dried materials developedthe highest porosity whereas the lowest was obtained using osmotic dehydration. Freeze dried samples had limited shrinkage. Simplemathematical models were used to correlate the above properties with the material moisture content. For the substance density, a singlenon-linear equation gave accurate predictions irrespective of drying methods. Although differences in shrinkage with the drying methodwere detected, the same model as a function of moisture content could be used for all drying methods but with different coefficients.� 2007 Elsevier Ltd. All rights reserved.
Keywords: Bulk density; Shrinkage; Porosity; Substance density; Quince; Drying methods
1. Introduction
Dehydration of foods is one of the most common pro-cesses used to improve food stability, since it decreasesthe water activity of the material, reduces microbiologicalactivity, and minimizes physical and chemical changes dur-ing its storage (Mayor & Sereno, 2004). Drying is a com-plex process involving simultaneous heat and masstransfer and it can result in significant changes in the chem-ical composition, structure, and physical properties of foodmaterial. Loss of water and heating cause stresses in thecellular structure of the food leading to change in micro-structure (e.g. formation of pores) and shrinkage. Thedevelopment of pores and shrinkage depend upon the var-iation in moisture transport mechanisms and the externalpressure. The strength of the solid matrix can also be
0260-8774/$ - see front matter � 2007 Elsevier Ltd. All rights reserved.
doi:10.1016/j.jfoodeng.2007.07.030
* Corresponding author. Tel.: +90 232 3884000/1311; fax: +90 2323427592.
E-mail address: [email protected] (_I. Eren).
affected (e.g. ice formation, case hardening, permeabilityof crust, and matrix reinforcement) (Rahman, 2003). Thus,the drying method and conditions applied has a significanteffect on product characteristics affected by porosity,shrinkage, and bulk density.
Several drying methods have been proposed in the liter-ature so that high quality products are produced efficiently.Conventional air drying (fluid bed drying or tray drying) isone of the most frequently used operations for food dehy-dration. Final products are characterised by low porosityand high apparent density values. Significant colourchanges often occur during air drying (Krokida, Maroulis,& Marinos-Kouris, 1998), while the final product often haspoor rehydration capacity (Maroulis, Tsami, Marinos-Kouris, & Saravacos, 1988). Osmotic dehydration mini-mizes the heat damage on colour and flavour, preventsenzymatic browning and thus limits the use of SO2 andincreases nutrient retention during subsequent air drying(Ponting, Walters, Forrey, Jackson, & Stanley, 1966). Dur-ing osmotic dehydration apparent density increases, while
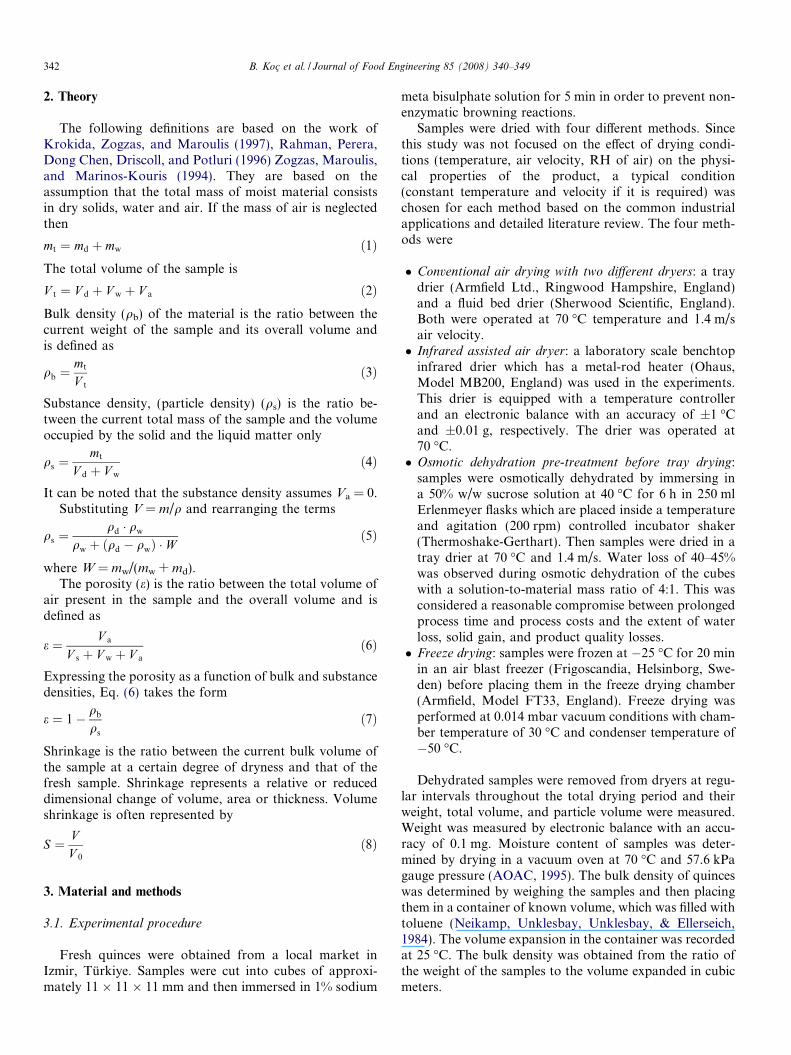
Nomenclature
ai numerical constants of empirical equations forbulk density
bi numerical constants of empirical equations forshrinkage
dm dry matterm mass, kgMexp measured value of dataMcal estimated value through fitting of the modelsS shrinkage coefficientR2 correlation coefficientRMS root mean squareV volume, m3
W moisture content, wet basis %X moisture content, kg water/kg dry matter
Subscripts
a airb bulkd solid0 initials substancet totalw water
Greek symbolse porosityq density, kg/m3
B. Koc� et al. / Journal of Food Engineering 85 (2008) 340–349 341
porosity of final product decreases due to solids gain(Krokida & Maroulis, 1997). Freeze drying is one of themost advanced dehydration methods, which provides adry product with porous structure and little or no shrink-age, superior taste and aroma retention, and better rehy-dration properties (Krokida et al., 1998). Infraredassisted air drying has been investigated as a potentialmethod for obtaining high quality dried foodstuffs includ-ing fruits, vegetables, and grains. Final products are char-acterised by low porosity and high apparent densityvalues like conventional drying (Baysal, Icier, Ersus, &Yıldız, 2003).
Experimental data reported in previous studies showedthat shrinkage and porosity could be related mainly as afunction of moisture content for a wide variety of foodproducts (Lozano, Rotstein, & Urbicain, 1983; Suzuki,Kubota, Hasegawa, & Hosaka, 1976). General empiricalshrinkage models have been proposed for fruits and vege-tables by Kilpatrick, Lower, and Van Arsdel (1955), Loz-ano, Rotstein, and Urbicain (1980, 1983) and Suzukiet al. (1976). Lozano et al. (1980) described the shrinkagebehaviour of apples as a function of moisture content dur-ing conventional drying with a linear model. However, itwas concluded that non-linear empirical models coulddescribe the shrinkage behaviour more adequately forfruits and vegetables in most studies (Lozano et al., 1983;Mayor & Sereno, 2004; Ratti, 1994).
Porosity is especially important in the reconstitution ofthe dried products, effectively controlling the speed of re-wetting as well as taste and appearance. Information onpore formation and their characteristics in foods duringprocessing is also essential in estimating transport proper-ties (i.e., thermal conductivity and diffusivity, mass diffusiv-ity) and characterising the quality of a dried product(Rahman, 2001). Porosity in fruits and vegetables increasesduring drying depending on the initial moisture content,composition, and size, as well as on the type of drying (Sar-avacos, 1967). Lozano et al. (1983) developed a general
equation to model the porosity for all foodstuffs valid forall moisture contents. However, this general equation failedto accurately predict the porosity of some foodstuffs (forexample, pear and carrots).
Bulk density may vary with water content in the driedfood product, and is dependent on the rate of shrinkage,which in turn is strongly affected by the drying method(Van Arsdel & Copley, 1964). Rahman and Potluri(1990) reported that the bulk density of squid flesh duringair drying correlated well with the model developed byLozano et al. (1983), while Marousis and Saravacos(1990) and Nelson (1980) found that a polynomial (thirdand fourth degree) model fitted their density data on corn,wheat and starch materials, respectively. Madamba, Dris-col, and Buckle (1993) found that a second order polyno-mial model fitted well for fruit and vegetables bulkdensity data. A linear relationship of bulk density withmoisture content was reported for fish (Balaban & Pigott,1986).
In food systems, shrinkage is rarely negligible and it isnecessary to take it into account when predicting moisturecontent profiles in the material undergoing dehydration.Modelling, design, and control of drying operations requirechanges in physical dimensions of the product, moisturecontent, shrinkage, porosity, bulk density, and volume.For such purposes, attempts at modelling shrinkage,porosity and bulk density during drying have been madeby several researches for different fruits and vegetables likeapple, banana, carrot, potato and garlic. However, noinformation has been reported on modelling shrinkage,porosity, and bulk density of quince during drying. Highdietary fibre content of nearly 12% (dry basis), makes driedquinces an excellent ingredient for cereals, cakes and des-serts. The objective of this study was to examine the effectof different drying methods on shrinkage, porosity, andbulk density of quinces and to propose simple mathemati-cal models to predict these properties as a function of mois-ture content.
342 B. Koc� et al. / Journal of Food Engineering 85 (2008) 340–349
2. Theory
The following definitions are based on the work ofKrokida, Zogzas, and Maroulis (1997), Rahman, Perera,Dong Chen, Driscoll, and Potluri (1996) Zogzas, Maroulis,and Marinos-Kouris (1994). They are based on theassumption that the total mass of moist material consistsin dry solids, water and air. If the mass of air is neglectedthen
mt ¼ md þ mw ð1ÞThe total volume of the sample is
V t ¼ V d þ V w þ V a ð2ÞBulk density (qb) of the material is the ratio between thecurrent weight of the sample and its overall volume andis defined as
qb ¼mt
V t
ð3Þ
Substance density, (particle density) (qs) is the ratio be-tween the current total mass of the sample and the volumeoccupied by the solid and the liquid matter only
qs ¼mt
V d þ V w
ð4Þ
It can be noted that the substance density assumes Va = 0.Substituting V = m/q and rearranging the terms
qs ¼qd � qw
qw þ ðqd � qwÞ � Wð5Þ
where W = mw/(mw + md).The porosity (e) is the ratio between the total volume of
air present in the sample and the overall volume and isdefined as
e ¼ V a
V s þ V w þ V a
ð6Þ
Expressing the porosity as a function of bulk and substancedensities, Eq. (6) takes the form
e ¼ 1� qb
qs
ð7Þ
Shrinkage is the ratio between the current bulk volume ofthe sample at a certain degree of dryness and that of thefresh sample. Shrinkage represents a relative or reduceddimensional change of volume, area or thickness. Volumeshrinkage is often represented by
S ¼ VV 0
ð8Þ
3. Material and methods
3.1. Experimental procedure
Fresh quinces were obtained from a local market inIzmir, Turkiye. Samples were cut into cubes of approxi-mately 11 � 11 � 11 mm and then immersed in 1% sodium
meta bisulphate solution for 5 min in order to prevent non-enzymatic browning reactions.
Samples were dried with four different methods. Sincethis study was not focused on the effect of drying condi-tions (temperature, air velocity, RH of air) on the physi-cal properties of the product, a typical condition(constant temperature and velocity if it is required) waschosen for each method based on the common industrialapplications and detailed literature review. The four meth-ods were
� Conventional air drying with two different dryers: a traydrier (Armfield Ltd., Ringwood Hampshire, England)and a fluid bed drier (Sherwood Scientific, England).Both were operated at 70 �C temperature and 1.4 m/sair velocity.� Infrared assisted air dryer: a laboratory scale benchtop
infrared drier which has a metal-rod heater (Ohaus,Model MB200, England) was used in the experiments.This drier is equipped with a temperature controllerand an electronic balance with an accuracy of ±1 �Cand ±0.01 g, respectively. The drier was operated at70 �C.� Osmotic dehydration pre-treatment before tray drying:
samples were osmotically dehydrated by immersing ina 50% w/w sucrose solution at 40 �C for 6 h in 250 mlErlenmeyer flasks which are placed inside a temperatureand agitation (200 rpm) controlled incubator shaker(Thermoshake-Gerthart). Then samples were dried in atray drier at 70 �C and 1.4 m/s. Water loss of 40–45%was observed during osmotic dehydration of the cubeswith a solution-to-material mass ratio of 4:1. This wasconsidered a reasonable compromise between prolongedprocess time and process costs and the extent of waterloss, solid gain, and product quality losses.� Freeze drying: samples were frozen at �25 �C for 20 min
in an air blast freezer (Frigoscandia, Helsinborg, Swe-den) before placing them in the freeze drying chamber(Armfield, Model FT33, England). Freeze drying wasperformed at 0.014 mbar vacuum conditions with cham-ber temperature of 30 �C and condenser temperature of�50 �C.
Dehydrated samples were removed from dryers at regu-lar intervals throughout the total drying period and theirweight, total volume, and particle volume were measured.Weight was measured by electronic balance with an accu-racy of 0.1 mg. Moisture content of samples was deter-mined by drying in a vacuum oven at 70 �C and 57.6 kPagauge pressure (AOAC, 1995). The bulk density of quinceswas determined by weighing the samples and then placingthem in a container of known volume, which was filled withtoluene (Neikamp, Unklesbay, Unklesbay, & Ellerseich,1984). The volume expansion in the container was recordedat 25 �C. The bulk density was obtained from the ratio ofthe weight of the samples to the volume expanded in cubicmeters.
B. Koc� et al. / Journal of Food Engineering 85 (2008) 340–349 343
The substance density of dried material was determinedby drying and grinding the material in a laboratory ham-mer mill to remove the air present in the sample. Sampleswere screened through a 65 mesh sieve, and the specificgravity of the dry solid was evaluated using 25 ml densitybottles and toluene as the fluid (Lewis, 1987). The relation-ship between substance density and moisture content calcu-lated from Eq. (5) in terms of the density of the dry solid,and assuming the volumes dry solid and water are additive.Shrinkage of the materials was determined by measuringthe three dimensions of the cubic particles by picnometerat various moisture contents. Average values for eachdimension were used to calculate the volume of the sam-ples. Two replications of each experiment were carriedout and the average values were used in the analysis.
3.2. Modelling
The experimental data of the samples for each dryingmethod was fitted to the equations proposed in the litera-ture for bulk density and shrinkage as shown in Tables 1and 2, respectively. Only Eq. (18) proposed by Lozanoet al. (1980) was used to fit the substance density data.The coefficients of the bulk density, substance density,and shrinkage models were estimated from the experimen-tal data using the non-linear regression analysis (SPSS 11.5for Windows, 2002) which minimizes the residual sum ofsquares. Best fitting equations were evaluated with the cor-relation coefficient (R2) and the percentage root meansquares (RMS), which is defined as:
RMS ¼ 100
ffiffiffiffiffiffiffiffiffiffiffiffiffiffiffiffiffiffiffiffiffiffiffiffiffiffiffiffiffiffiffiffiffiffiffiffiffiffiffiffiffiffiffiffiffiffiPðM cal �M expÞ2=M exp
N e
sð17Þ
Table 1Empirical equations describing the bulk density
Name of the equation Equation Eq. no.
Lozano et al. (1983) qb ¼ a1 þ a2 � XX 0þ a3 exp a4 � X
X 0
� �(9)
Madamba et al. (1994) qb ¼ a5 þ a6 � W þ a7 � W 2 (10)
Present study qb ¼ a8 þ a9 � X þ a10 � X 2 (11)
Table 2Empirical equations describing the shrinkage
Name of theequation
Equation Eq.no.
Lozano et al.(1980)
S ¼ b1 � X þ b2 (12)
Lozano et al.(1983)
S ¼ b3 þ b4 � XX 0þ b5 exp b6
b7þX
� �(13)
Ratti (1994) S ¼ b8 þ b9 � X þ b10 � X 2 þ b11 � X 3 (14)
Vazquez et al.(1999)
S ¼ b12 þ b13 � X þ b14 � X 3=2 þ b15 expðb16 � X Þ (15)
Mayor andSereno (2004)
S ¼ b17 þ b18 � XX 0þ b19 � X
X 0
� �2(16)
A model was considered acceptable if the RMS values wassimilar to or less than the experimental percentage uncer-tainty and R2 values are higher than 0.90 (Kennedy & Nev-ille, 1986). The 95% experimental uncertainty bounds wereestimated from the standard deviation of replicatemeasurements.
4. Results and discussion
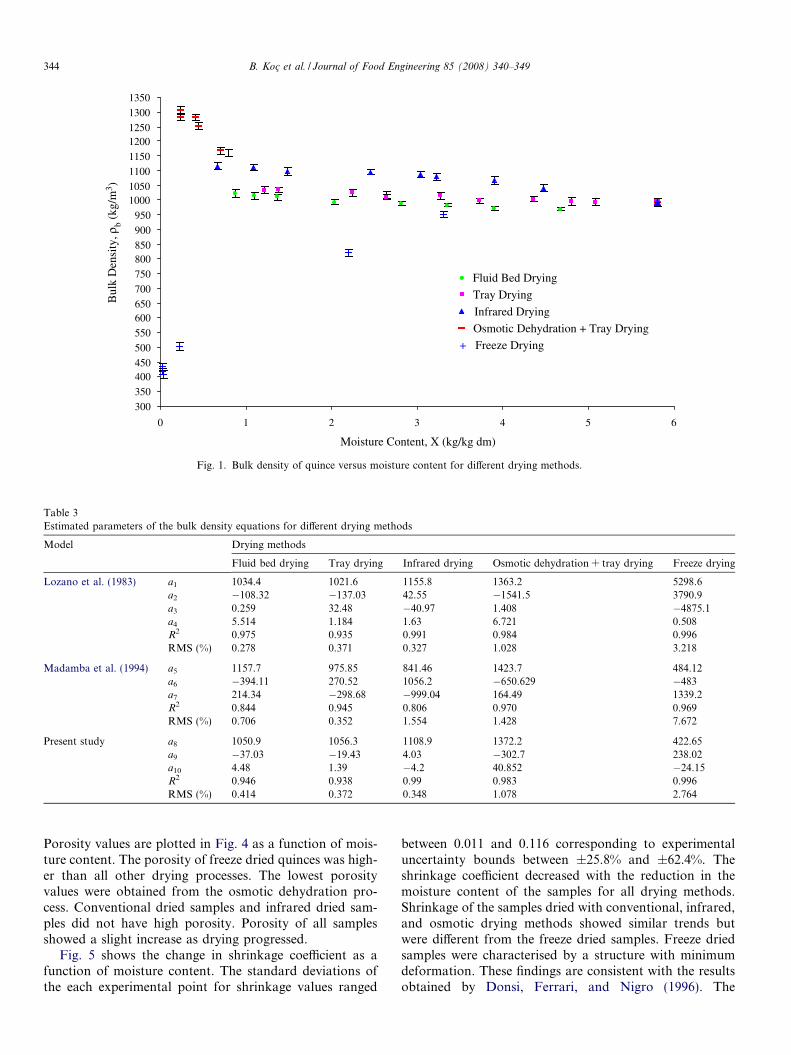
Data on the bulk density of quinces as a function ofmoisture content are shown in Fig. 1 for the different dry-ing methods. The standard deviation of the each experi-mental point for bulk density ranges between 1.6 and9.8 kg/m3 giving experimental uncertainty bounds ofbetween ±9.9% and ±26.9%. Bulk density was affectedby the drying process. The bulk density of thermallydried samples (conventional and infrared) steadilyincreased as drying proceeded while it decreased withreduction in the moisture content in the case of freezedrying. In contrast, osmotic dehydration increased thebulk density.
Freeze dried samples had the lowest bulk density valuesamong the samples since this process allows ice to sublime,leaving voids within the structure without significantshrinkage. The bulk density at high moisture contentapproximated the density of water while at low moisturecontent, except for the freeze dried samples, it tends tothe value of dry solids (Krokida & Maroulis, 1997).
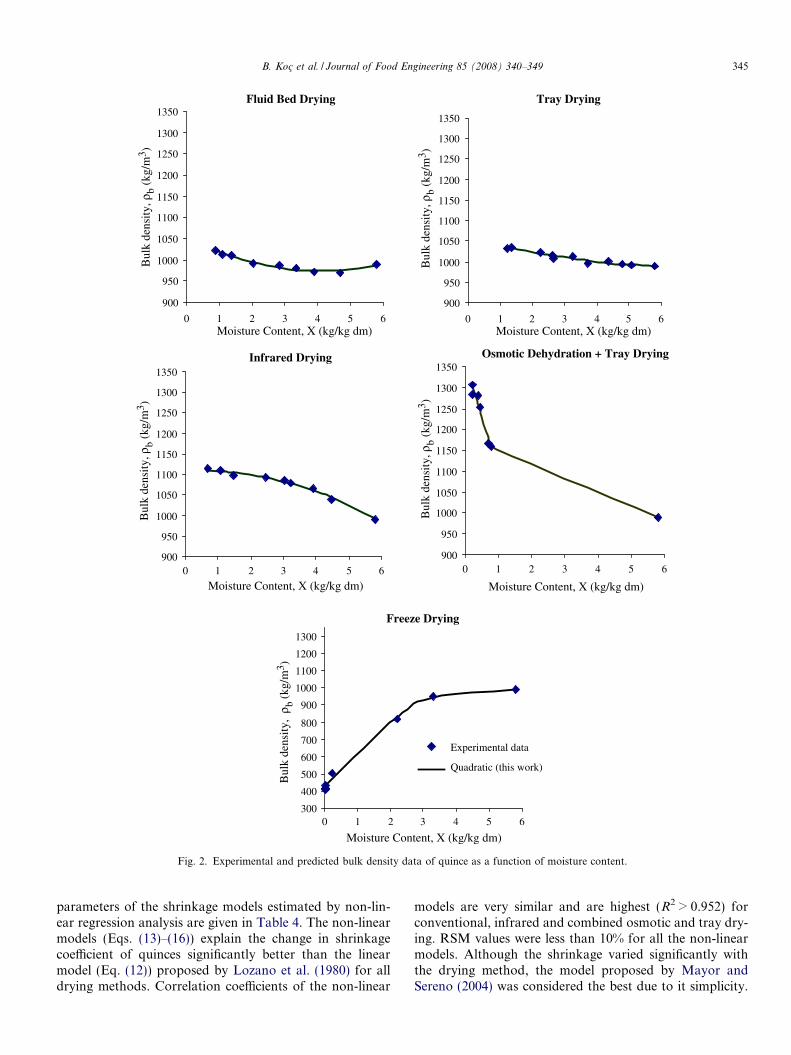
The results of non-linear regression fitting of the bulkdensity equations to the experimental data are shown inTable 3. The model proposed in this study (Eq. (11)), whichhas R2 values higher than 0.935 and RMS values slightlylower than the percentage experimental uncertainty accu-rately predict the experimental data. The model proposedby Lozano et al. (1983) also gave the good fit for all dryingmethods, but is significantly more complex. Eq. (10) (Mad-amba, Driscol, & Buckle, 1994) gave poorer predictions ofbulk density for most drying methods. A comparisonbetween experimental and predicted data using Eq. (11)for bulk density is shown in Fig. 2.
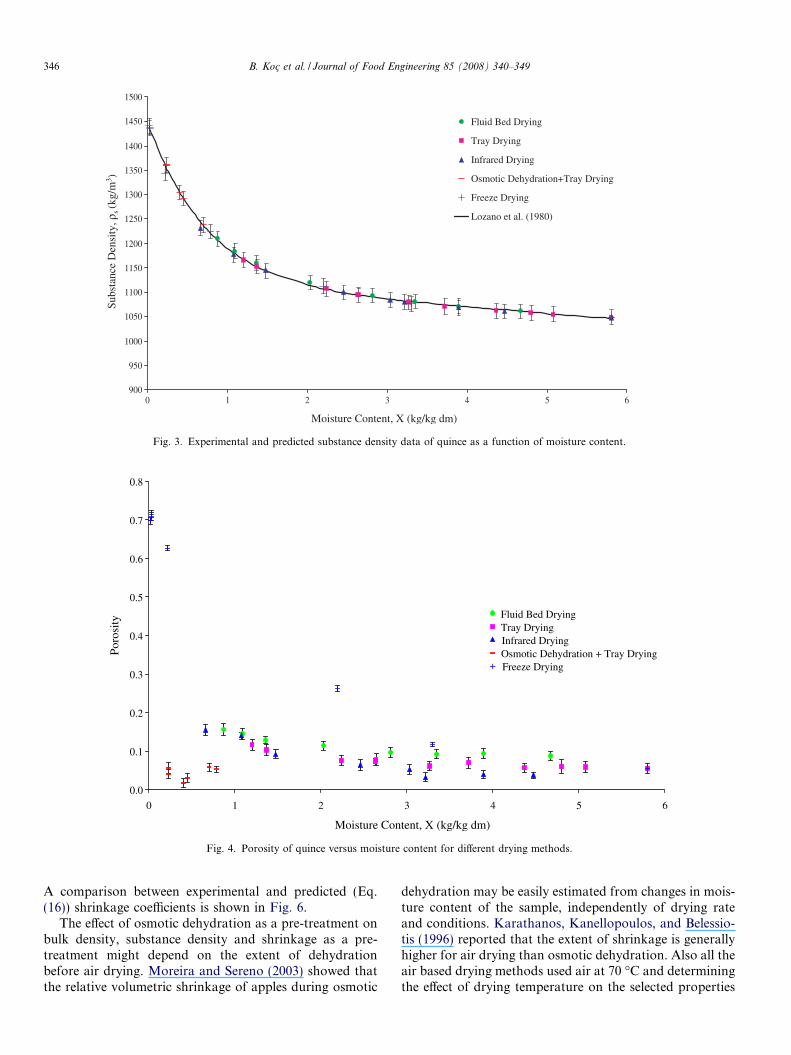
Fig. 3 shows the change in substance density of quincesas a function of moisture content and the predictions ofEq. (18). The standard deviation of the each experimentalpoint for substance density ranged between 2.11 and2.90 kg/m3 which corresponds to experimental uncertaintybounds of between ±6.7% and ±9.2%. Substance densityincreased as the moisture content decreased and was unaf-fected by the type of drying process. Several models weretested (results are not shown) but the model proposed byLozano et al. (1980) (Eq. (18)) gave the best fit(R2 = 0.999; RMS = 0.325) irrespective of the dryingmethod across the whole moisture content range. The fittedequation was:
qs ¼ 329:02 � expð�1:365 � X Þ þ 1119:1 � expð�0:12 � X Þð18Þ
300
350
400450
500
550
600650
700
750
800850
900
950
10001050
1100
1150
12001250
1300
1350
0 1 2 3 4 5 6
Moisture Content, X (kg/kg dm)
Bul
k D
ensi
ty, ρ
b (k
g/m
3 )
Fluid Bed Drying
Tray Drying
Infrared Drying
Osmotic Dehydration + Tray Drying
+ Freeze Drying
Fig. 1. Bulk density of quince versus moisture content for different drying methods.
Table 3Estimated parameters of the bulk density equations for different drying methods
Model Drying methods
Fluid bed drying Tray drying Infrared drying Osmotic dehydration + tray drying Freeze drying
Lozano et al. (1983) a1 1034.4 1021.6 1155.8 1363.2 5298.6a2 �108.32 �137.03 42.55 �1541.5 3790.9a3 0.259 32.48 �40.97 1.408 �4875.1a4 5.514 1.184 1.63 6.721 0.508R2 0.975 0.935 0.991 0.984 0.996RMS (%) 0.278 0.371 0.327 1.028 3.218
Madamba et al. (1994) a5 1157.7 975.85 841.46 1423.7 484.12a6 �394.11 270.52 1056.2 �650.629 �483a7 214.34 �298.68 �999.04 164.49 1339.2R2 0.844 0.945 0.806 0.970 0.969RMS (%) 0.706 0.352 1.554 1.428 7.672
Present study a8 1050.9 1056.3 1108.9 1372.2 422.65a9 �37.03 �19.43 4.03 �302.7 238.02a10 4.48 1.39 �4.2 40.852 �24.15R2 0.946 0.938 0.99 0.983 0.996RMS (%) 0.414 0.372 0.348 1.078 2.764
344 B. Koc� et al. / Journal of Food Engineering 85 (2008) 340–349
Porosity values are plotted in Fig. 4 as a function of mois-ture content. The porosity of freeze dried quinces was high-er than all other drying processes. The lowest porosityvalues were obtained from the osmotic dehydration pro-cess. Conventional dried samples and infrared dried sam-ples did not have high porosity. Porosity of all samplesshowed a slight increase as drying progressed.
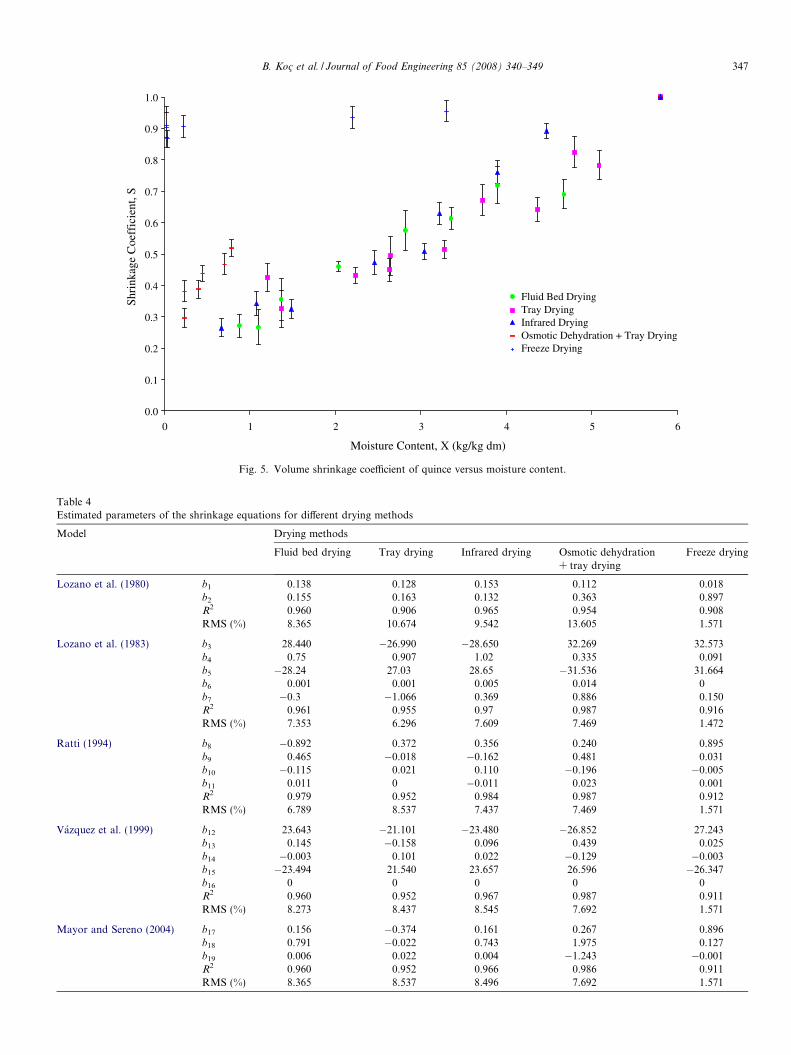
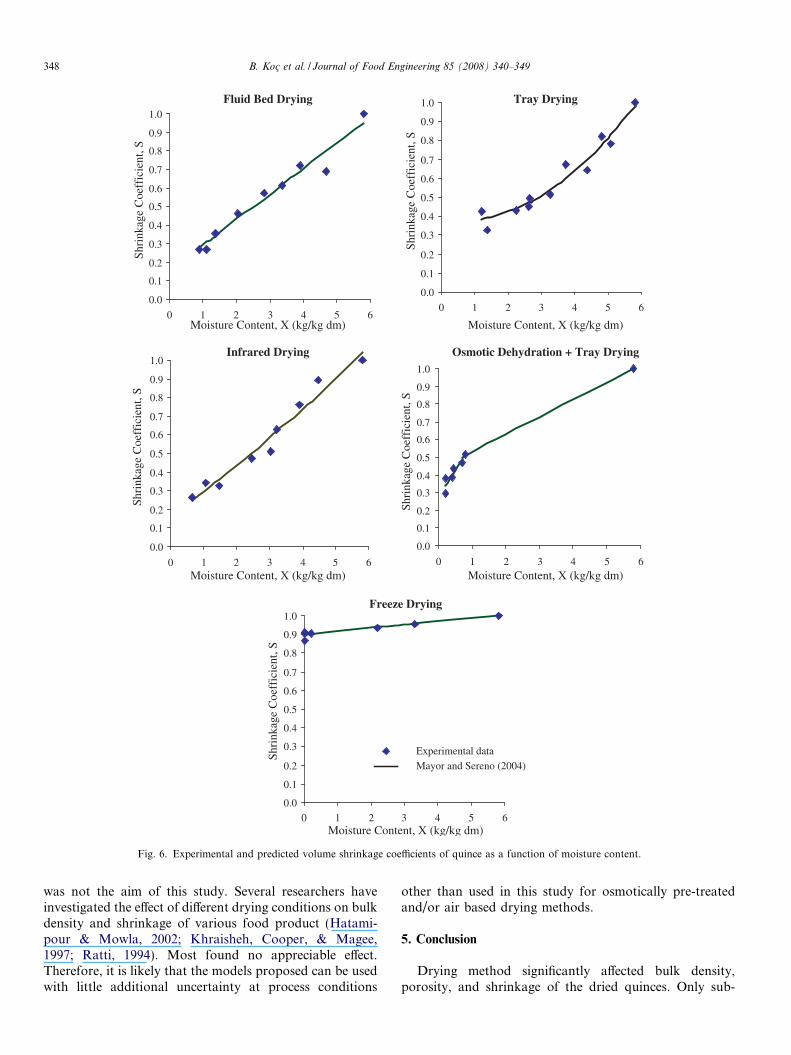
Fig. 5 shows the change in shrinkage coefficient as afunction of moisture content. The standard deviations ofthe each experimental point for shrinkage values ranged
between 0.011 and 0.116 corresponding to experimentaluncertainty bounds between ±25.8% and ±62.4%. Theshrinkage coefficient decreased with the reduction in themoisture content of the samples for all drying methods.Shrinkage of the samples dried with conventional, infrared,and osmotic drying methods showed similar trends butwere different from the freeze dried samples. Freeze driedsamples were characterised by a structure with minimumdeformation. These findings are consistent with the resultsobtained by Donsi, Ferrari, and Nigro (1996). The
Fluid Bed Drying
900
950
1000
1050
1100
1150
1200
1250
1300
1350
0 1 2 3 4 5 6Moisture Content, X (kg/kg dm)
Bul
k de
nsity
, ρb
(kg/
m3 )
Tray Drying
900
950
1000
1050
1100
1150
1200
1250
1300
1350
0 1 2 3 4 5 6Moisture Content, X (kg/kg dm)
Bul
k de
nsity
, ρb
(kg/
m3 )
Infrared Drying
900
950
1000
1050
1100
1150
1200
1250
1300
1350
0 1 2 3 4 5 6
Moisture Content, X (kg/kg dm)
Bul
k de
nsity
, ρb (
kg/m
3 )
Osmotic Dehydration + Tray Drying
900
950
1000
1050
1100
1150
1200
1250
1300
1350
0 1 2 3 4 5 6
Moisture Content, X (kg/kg dm)
Bul
k de
nsity
, ρb (
kg/m
3 )
Freeze Drying
300
400
500
600
700
800
900
1000
1100
1200
1300
0 1 2 3 4 5 6
Moisture Content, X (kg/kg dm)
Bul
k de
nsity
, ρ b (k
g/m
3 )
Experimental data
Quadratic (this work)
Fig. 2. Experimental and predicted bulk density data of quince as a function of moisture content.
B. Koc� et al. / Journal of Food Engineering 85 (2008) 340–349 345
parameters of the shrinkage models estimated by non-lin-ear regression analysis are given in Table 4. The non-linearmodels (Eqs. (13)–(16)) explain the change in shrinkagecoefficient of quinces significantly better than the linearmodel (Eq. (12)) proposed by Lozano et al. (1980) for alldrying methods. Correlation coefficients of the non-linear
models are very similar and are highest (R2 > 0.952) forconventional, infrared and combined osmotic and tray dry-ing. RSM values were less than 10% for all the non-linearmodels. Although the shrinkage varied significantly withthe drying method, the model proposed by Mayor andSereno (2004) was considered the best due to it simplicity.
900
950
1000
1050
1100
1150
1200
1250
1300
1350
1400
1450
1500
0 1 2 3 4 5 6
Moisture Content, X (kg/kg dm)
Subs
tanc
e D
ensi
ty, ρ
s (k
g/m
3 )Fluid Bed Drying
Tray Drying
Infrared Drying
Osmotic Dehydration+Tray Drying
Freeze Drying
Lozano et al. (1980)
Fig. 3. Experimental and predicted substance density data of quince as a function of moisture content.
0.0
0.1
0.2
0.3
0.4
0.5
0.6
0.7
0.8
0 1 2 3 4 5 6
Moisture Content, X (kg/kg dm)
Poro
sity
Fluid Bed DryingTray DryingInfrared DryingOsmotic Dehydration + Tray Drying
+ Freeze Drying
Fig. 4. Porosity of quince versus moisture content for different drying methods.
346 B. Koc� et al. / Journal of Food Engineering 85 (2008) 340–349
A comparison between experimental and predicted (Eq.(16)) shrinkage coefficients is shown in Fig. 6.
The effect of osmotic dehydration as a pre-treatment onbulk density, substance density and shrinkage as a pre-treatment might depend on the extent of dehydrationbefore air drying. Moreira and Sereno (2003) showed thatthe relative volumetric shrinkage of apples during osmotic
dehydration may be easily estimated from changes in mois-ture content of the sample, independently of drying rateand conditions. Karathanos, Kanellopoulos, and Belessio-tis (1996) reported that the extent of shrinkage is generallyhigher for air drying than osmotic dehydration. Also all theair based drying methods used air at 70 �C and determiningthe effect of drying temperature on the selected properties
0.0
0.1
0.2
0.3
0.4
0.5
0.6
0.7
0.8
0.9
1.0
0 1 2 3 4 5 6
Moisture Content, X (kg/kg dm)
Shri
nkag
e C
oeff
icie
nt, S
Fluid Bed DryingTray DryingInfrared DryingOsmotic Dehydration + Tray DryingFreeze Drying
Fig. 5. Volume shrinkage coefficient of quince versus moisture content.
Table 4Estimated parameters of the shrinkage equations for different drying methods
Model Drying methods
Fluid bed drying Tray drying Infrared drying Osmotic dehydration+ tray drying
Freeze drying
Lozano et al. (1980) b1 0.138 0.128 0.153 0.112 0.018b2 0.155 0.163 0.132 0.363 0.897R2 0.960 0.906 0.965 0.954 0.908RMS (%) 8.365 10.674 9.542 13.605 1.571
Lozano et al. (1983) b3 28.440 �26.990 �28.650 32.269 32.573b4 0.75 0.907 1.02 0.335 0.091b5 �28.24 27.03 28.65 �31.536 31.664b6 0.001 0.001 0.005 0.014 0b7 �0.3 �1.066 0.369 0.886 0.150R2 0.961 0.955 0.97 0.987 0.916RMS (%) 7.353 6.296 7.609 7.469 1.472
Ratti (1994) b8 �0.892 0.372 0.356 0.240 0.895b9 0.465 �0.018 �0.162 0.481 0.031b10 �0.115 0.021 0.110 �0.196 �0.005b11 0.011 0 �0.011 0.023 0.001R2 0.979 0.952 0.984 0.987 0.912RMS (%) 6.789 8.537 7.437 7.469 1.571
Vazquez et al. (1999) b12 23.643 �21.101 �23.480 �26.852 27.243b13 0.145 �0.158 0.096 0.439 0.025b14 �0.003 0.101 0.022 �0.129 �0.003b15 �23.494 21.540 23.657 26.596 �26.347b16 0 0 0 0 0R2 0.960 0.952 0.967 0.987 0.911RMS (%) 8.273 8.437 8.545 7.692 1.571
Mayor and Sereno (2004) b17 0.156 �0.374 0.161 0.267 0.896b18 0.791 �0.022 0.743 1.975 0.127b19 0.006 0.022 0.004 �1.243 �0.001R2 0.960 0.952 0.966 0.986 0.911RMS (%) 8.365 8.537 8.496 7.692 1.571
B. Koc� et al. / Journal of Food Engineering 85 (2008) 340–349 347
Fluid Bed Drying
0.0
0.1
0.2
0.3
0.4
0.5
0.6
0.7
0.8
0.9
1.0
0 1 2 3 4 5 6Moisture Content, X (kg/kg dm)
Shri
nkag
e C
oeff
icie
nt, S
Tray Drying
0.0
0.1
0.2
0.3
0.4
0.5
0.6
0.7
0.8
0.9
1.0
0 1 2 3 4 5 6
Moisture Content, X (kg/kg dm)
Shri
nkag
e C
oeff
icie
nt, S
Infrared Drying
0.0
0.1
0.2
0.3
0.4
0.5
0.6
0.7
0.8
0.9
1.0
0 1 2 3 4 5 6Moisture Content, X (kg/kg dm)
Shri
nkag
e C
oeff
icie
nt, S
Osmotic Dehydration + Tray Drying
0.0
0.1
0.2
0.3
0.4
0.5
0.6
0.7
0.8
0.9
1.0
0 1 2 3 4 5 6Moisture Content, X (kg/kg dm)
Shri
nkag
e C
oeff
icie
nt, S
Freeze Drying
0.0
0.1
0.2
0.3
0.4
0.5
0.6
0.7
0.8
0.9
1.0
0 1 2 3 4 5 6Moisture Content, X (kg/kg dm)
Shri
nkag
e C
oeff
icie
nt, S
Experimental data
Mayor and Sereno (2004)
Fig. 6. Experimental and predicted volume shrinkage coefficients of quince as a function of moisture content.
348 B. Koc� et al. / Journal of Food Engineering 85 (2008) 340–349
was not the aim of this study. Several researchers haveinvestigated the effect of different drying conditions on bulkdensity and shrinkage of various food product (Hatami-pour & Mowla, 2002; Khraisheh, Cooper, & Magee,1997; Ratti, 1994). Most found no appreciable effect.Therefore, it is likely that the models proposed can be usedwith little additional uncertainty at process conditions
other than used in this study for osmotically pre-treatedand/or air based drying methods.
5. Conclusion
Drying method significantly affected bulk density,porosity, and shrinkage of the dried quinces. Only sub-
B. Koc� et al. / Journal of Food Engineering 85 (2008) 340–349 349
stance density was not affected by drying method. Bulkdensity and porosity increased with decreasing moisturecontent for three drying methods (conventional fluid bedand tray drying, infrared drying and osmotic dehydra-tion + tray drying). However, bulk density of freeze driedquinces decreased with decreasing moisture content. Freezedried quinces had the lowest bulk density and the highestporosity whereas osmotically dehydrated ones had thehighest bulk density and the lowest porosity values. Theshrinkage coefficient decreased with decreasing moisturecontent. Only very limited shrinkages detected in freezedried quinces.
For all drying methods, the models proposed in thisstudy (Eq. (11)) and by Mayor and Sereno (2004) (Eq.(16)) satisfactorily related the changes in bulk density andshrinkage as a function of moisture content, respectivelybut had different coefficients for different drying methods.Eq. (18) accurately explained the variation of substancedensity of quinces with respect to moisture content irre-spective of the drying method.
References
AOAC. (1995). Official methods of analysis (16th ed.). Washington, DC:Association of Official Analytical Chemists.
Balaban, M., & Pigott, G. M. (1986). A research note: Shrinkage in fishmuscle during drying. Journal of Food Science, 51, 510–511.
Baysal, T., Icier, F., Ersus, S., & Yıldız, H. (2003). Effects of microwaveand infrared drying on the quality of carrot and garlic. European Food
Research and Technology, 218, 68–73.Donsi, G., Ferrari, G., & Nigro, R. (1996). The effect of process conditions
on the physical structure of dehydrated foods. Food and Bioproducts
Processing, 74(C2), 73–80.Hatamipour, M. S., & Mowla, D. (2002). Shrinkage of carrots during
drying in an inert medium fluidized bed. Journal of Food Engineering,
55(3), 247–252.Karathanos, V. T., Kanellopoulos, N. K., & Belessiotis, V. G. (1996).
Development of porous structure during air drying of agriculturalplant products. Journal of Food Engineering, 29, 167–183.
Kennedy, J. B., & Neville, A. M. (1986). Basic statistical methods for
engineers and scientists (3rd ed.). New York: Harpar and Row.Khraisheh, M. A. M., Cooper, T. J. R., & Magee, T. R. A. (1997).
Shrinkage characteristics of potatoes dehydrated under combinedmicrowave and convective air conditions. Drying Technology, 15(3/4),1003–1022.
Kilpatrick, P. W., Lower, E., & Van Arsdel, W. B. (1955). Tunneldehydrators for fruits and vegetables. In E. M. Mrak & G. F. Stewart(Eds.). Advances in food research (Vol. 6, pp. 313–372). New York:Academic Press.
Krokida, M. K., & Maroulis, Z. B. (1997). Effect of drying method onshrinkage and porosity. Drying Technology, 15, 2441–2458.
Krokida, M. K., Maroulis, Z. B., & Marinos-Kouris, D. (1998). Effect ofdrying method on physical properties of dehydrated products. InProceedings of the 11th International Drying Symposium (IDS’98),
Halkidiki, Greece.Krokida, M. K., Zogzas, N. P., & Maroulis, Z. B. (1997). Modelling
shrinkage and porosity during vacuum dehydration. International
Journal of Food Science and Technology, 32, 445–458.
Lewis, M. J. (1987). Physical properties of foods and food processing
systems. Chichester, UK: Ellis Horwood.Lozano, J. E., Rotstein, E., & Urbicain, M. J. (1980). Total porosity and
open porosity in the drying of fruits. Journal of Food Science, 45,1403–1407.
Lozano, J. E., Rotstein, E., & Urbicain, M. J. (1983). Shrinkage, porosityand bulk density of foodstuffs at changing moisture contents. Journal
of Food Science, 48, 1497–1502.Madamba, P. S., Driscol, R. H., & Buckle, K. A. (1993). Bulk density,
porosity and resistance to air flow of garlic slices. Drying Technology,
11, 1837–1854.Madamba, P. S., Driscol, R. H., & Buckle, K. A. (1994). Shrinkage,
density and porosity of garlic during drying. Journal of Food
Engineering, 23, 309–319.Maroulis, Z. B., Tsami, E., Marinos-Kouris, D., & Saravacos, E. D.
(1988). Application of the GAB model to the sorption isotherms ofdried fruits. Journal of Food Science, 7, 63–78.
Marousis, S. N., & Saravacos, G. D. (1990). Density and porosity indrying starch materials. Journal of Food Science, 55(5), 1367–1372.
Mayor, L., & Sereno, A. M. (2004). Modeling shrinkage during convectivedrying of food materials: A review. Journal of Food Engineering, 61,373–386.
Moreira, R., & Sereno, A. M. (2003). Evaluation of mass transfercoefficients and volumetric shrinkage during osmotic dehydration ofapple using sucrose solutions in static and non-static conditions.Journal of Food Engineering, 57, 25–31.
Neikamp, A., Unklesbay, K., Unklesbay, N., & Ellerseich, M. (1984).Thermal properties of bentonite water dispersions used for modelingfoods. Journal of Food Science, 49(1), 28–31.
Nelson, S. O. (1980). Moisture dependent kernel- and bulk-densityrelationships for wheat and corn. Transactions of the ASAE, 23,139–143.
Ponting, J. D., Walters, G. G., Forrey, R. R., Jackson, R., & Stanley, W.L. (1966). Osmotic dehydration of fruits. Food Technology, 20,150–152.
Rahman, M. S. (2001). Towards prediction of porosity in foods duringdrying: A brief review. Drying Technology, 19(1), 3–15.
Rahman, M. S. (2003). A theoretical model to predict the formation ofpores in foods during drying. International Journal of Food Properties,
6(1), 61–72.Rahman, M. S., Perera, C. O., Dong Chen, X., Driscoll, R. H., & Potluri,
P. L. (1996). Density, shrinkage and porosity of calamari mantle meatduring air drying in a cabinet dryer as a function of water content.Journal of Food Engineering, 30, 135–145.
Rahman, M. S., & Potluri, P. L. (1990). Shrinkage density of squid fleshduring air drying. Journal of Food Engineering, 12, 133–143.
Ratti, C. (1994). Shrinkage during drying of foodstuffs. Journal of Food
Engineering, 23, 91–105.Saravacos, G. D. (1967). Effect of the drying method on the water
sorption of dehydrated apple and potato. Journal of Food Engineer-
ing, 3, 81–84.Suzuki, K., Kubota, K., Hasegawa, T., & Hosaka, H. (1976). Shrinkage in
dehydration of root vegetables. Journal of Food Science, 41,1189–1194.
Van Arsdel, W. B., & Copley, M. J. (1964). Food dehydration. Practices
and Applications (Vol. 2, 2nd ed., pp. 83). Westport, CT: The AVIPublishing Co., Inc..
Vazquez, G., Chenlo, F., Moreira, R., & Costoyas, A. (1999). Thedehydration of garlic. 1. Desorption isotherms and modeling of dryingkinetics. Drying Technology, 17, 1095–1108.
Zogzas, N. P., Maroulis, Z. B., & Marinos-Kouris, D. (1994). Densities,shrinkage and porosity of some vegetables during air drying. Drying
Technology, 12, 1653–1666.


