Embed Size (px)
Citation preview

The Condor 87:484-493
? The Cooper Ornithological Society 1985
MORPHOMETRIC ASSESSMENT OF SEXUAL DIMORPHISM IN SKELETAL ELEMENTS OF CALIFORNIA GULLS
GARY D. SCHNELL GARY L. WORTHEN AND
MICHAEL E. DOUGLAS
ABSTRACT.- Using univariate and multivariate techniques, we evaluated sexual dimorphism in four external and 51 skeletal measures taken from 66 California Gulls (Larus californicus). Based on analyses of variance, all characters showed statistically significant sexual dimorphism. Skeletal measures of head and pectoral regions were closely correlated but-with elimination of geographic, temporal, and ontogenetic influences-we noted considerable independent variation among characters. Differences between sexes were greatest in the head region (average of 8.03%), with mandible depth being the most dimorphic head character. Differ- ences in the wing region were somewhat less (averaging 6.98%), although still greater than the overall size difference between sexes (i.e., 6.10%; based on the cube root of body weight). Principal components analysis of skeletal characters standardized on the basis of pooled, within-sex standard deviations provided complete separation of males and females. Four skeletal measures (i.e., skull width, mandible length, keel depth, and minimum synsacral width), when used in com- bination in a stepwise discriminant function, correctly identified to sex all spec- imens that we used and, it is expected, will do so for most other specimens of this species. Classification functions were developed from the total suite of char- acters to assign unknown specimens to one or the other sex. Most males and females could also be separated by using combinations of characteristics taken from only one of the five body regions studied (i.e., head, pectoral, wing, pelvic, and leg regions), indicating the widespread nature of sexual dimorphism in Cal- ifornia Gulls.
Sexual dimorphism in size and shape is almost universal in birds, and numerous theoretical constructs have been developed to explain its ecological and evolutionary significance (e.g., Verner and Willson 1966, Orians 1969, Selan- der 1972, Ralls 1977). Darwinian sexual se- lection is likely the most important single cause that generates dimorphism, but other influ- ences also have been considered to be signif- icant. For instance, Selander (1966) presented a case for a relationship between sexual di- morphism and differential niche utilization in birds (i.e., the niche segregation theory) and suggested reasons why such dimorphism would develop. In a number of cases, this explanation has been promoted (e.g., Earhart and Johnson 1970; Robins 1971, Williamson 1971, Wallace 1974); in others, workers have found it nec- essary to consider alternative hypotheses that take into account bioenergetic pressures, pre- dation pressures, non-monogamous mating systems, or various combinations of these fac- tors (see Sigurj6nsd6ttir 1981 and references therein). The evolutionary significance of sex- ual dimorphism is still being actively debated.
In a variety of studies, there are practical as
well as theoretical reasons for wanting to elu- cidate sexual differences. For instance, gull species are frequent subjects of ethological in- vestigations because gulls are highly colonial, have stereotyped displays, and are relatively easy to observe. Most gulls, however, are monomorphic in plumage, and investigators have difficulty in determining the sex of in- dividual birds. Consequently, a series of works has appeared that provide the basis of iden- tification to sex by using external morpho- metric characteristics. Studies of this type have been completed for Great Black-backed Gulls (Larus marinus; Harris 1964), Lesser Black- backed Gulls (L. fuscus; Harris and Hope Jones 1969), Herring Gulls (L. argentatus; Harris and Hope Jones 1969, Shugart 1977, Threlfall and Jewer 1978, Fox et al. 1981), Red-billed Gulls (L. scopulinus; Mills 1971), Ring-billed Gulls (L. delawarensis; Shugart 1977, Ryder 1978), Silver Gulls (L. novaehollandiae; Wooller and Dunlop 1981), and Kelp or Southern Black- backed Gulls (L. dominicanus; Nugent 1982).
Ingolfsson (1969), in a related but more de- tailed analysis, compared the degree of sexual dimorphism in five species of large gulls, in-
[484]
CALIFORNIA GULL SEXUAL DIMORPHISM 485
cluding Great Black-backed Gulls, Lesser Black-backed Gulls, Iceland Gulls (L. glau- coides), Glaucous Gulls (L. hyperboreus), and Herring/Glaucous Gull hybrids. He indicated that sexual dimorphism is usually greater in bill dimensions than in other body parts and is always more pronounced than the overall difference in general size. While stomach con- tents revealed marked differences among species, no intersexual differences were found. Based on these and other findings, Ingolfsson (1969) concluded that sexual dimorphism in gulls is related to sex recognition, territory de- fense, or some other factor that is unrelated to feeding habit.
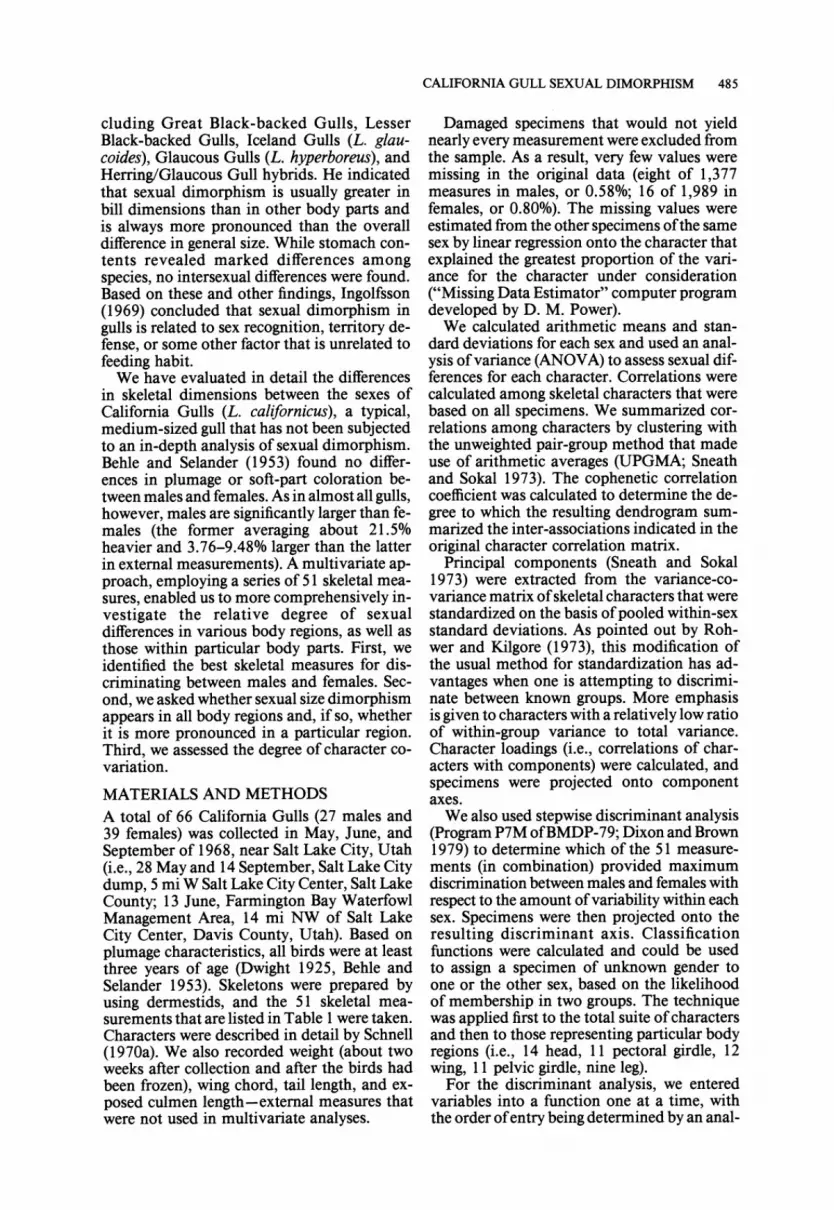
We have evaluated in detail the differences in skeletal dimensions between the sexes of California Gulls (L. californicus), a typical, medium-sized gull that has not been subjected to an in-depth analysis of sexual dimorphism. Behle and Selander (1953) found no differ- ences in plumage or soft-part coloration be- tween males and females. As in almost all gulls, however, males are significantly larger than fe- males (the former averaging about 21.5% heavier and 3.76-9.48% larger than the latter in external measurements). A multivariate ap- proach, employing a series of 51 skeletal mea- sures, enabled us to more comprehensively in- vestigate the relative degree of sexual differences in various body regions, as well as those within particular body parts. First, we identified the best skeletal measures for dis- criminating between males and females. Sec- ond, we asked whether sexual size dimorphism appears in all body regions and, if so, whether it is more pronounced in a particular region. Third, we assessed the degree of character co- variation.
MATERIALS AND METHODS A total of 66 California Gulls (27 males and 39 females) was collected in May, June, and September of 1968, near Salt Lake City, Utah (i.e., 28 May and 14 September, Salt Lake City dump, 5 mi W Salt Lake City Center, Salt Lake County; 13 June, Farmington Bay Waterfowl Management Area, 14 mi NW of Salt Lake City Center, Davis County, Utah). Based on plumage characteristics, all birds were at least three years of age (Dwight 1925, Behle and Selander 1953). Skeletons were prepared by using dermestids, and the 51 skeletal mea- surements that are listed in Table 1 were taken. Characters were described in detail by Schnell (1970a). We also recorded weight (about two weeks after collection and after the birds had been frozen), wing chord, tail length, and ex- posed culmen length-external measures that were not used in multivariate analyses.
Damaged specimens that would not yield nearly every measurement were excluded from the sample. As a result, very few values were missing in the original data (eight of 1,377 measures in males, or 0.58%; 16 of 1,989 in females, or 0.80%). The missing values were estimated from the other specimens of the same sex by linear regression onto the character that explained the greatest proportion of the vari- ance for the character under consideration ("Missing Data Estimator" computer program developed by D. M. Power).
We calculated arithmetic means and stan- dard deviations for each sex and used an anal- ysis of variance (ANOVA) to assess sexual dif- ferences for each character. Correlations were calculated among skeletal characters that were based on all specimens. We summarized cor- relations among characters by clustering with the unweighted pair-group method that made use of arithmetic averages (UPGMA; Sneath and Sokal 1973). The cophenetic correlation coefficient was calculated to determine the de- gree to which the resulting dendrogram sum- marized the inter-associations indicated in the original character correlation matrix.
Principal components (Sneath and Sokal 1973) were extracted from the variance-co- variance matrix of skeletal characters that were standardized on the basis of pooled within-sex standard deviations. As pointed out by Roh- wer and Kilgore (1973), this modification of the usual method for standardization has ad- vantages when one is attempting to discrimi- nate between known groups. More emphasis is given to characters with a relatively low ratio of within-group variance to total variance. Character loadings (i.e., correlations of char- acters with components) were calculated, and specimens were projected onto component axes.
We also used stepwise discriminant analysis (Program P7M ofBMDP-79; Dixon and Brown 1979) to determine which of the 51 measure- ments (in combination) provided maximum discrimination between males and females with respect to the amount of variability within each sex. Specimens were then projected onto the resulting discriminant axis. Classification functions were calculated and could be used to assign a specimen of unknown gender to one or the other sex, based on the likelihood of membership in two groups. The technique was applied first to the total suite of characters and then to those representing particular body regions (i.e., 14 head, 11 pectoral girdle, 12 wing, 11 pelvic girdle, nine leg).
For the discriminant analysis, we entered variables into a function one at a time, with the order of entry being determined by an anal-
486 G. D. SCHNELL, G. L. WORTHEN AND M. E. DOUGLAS
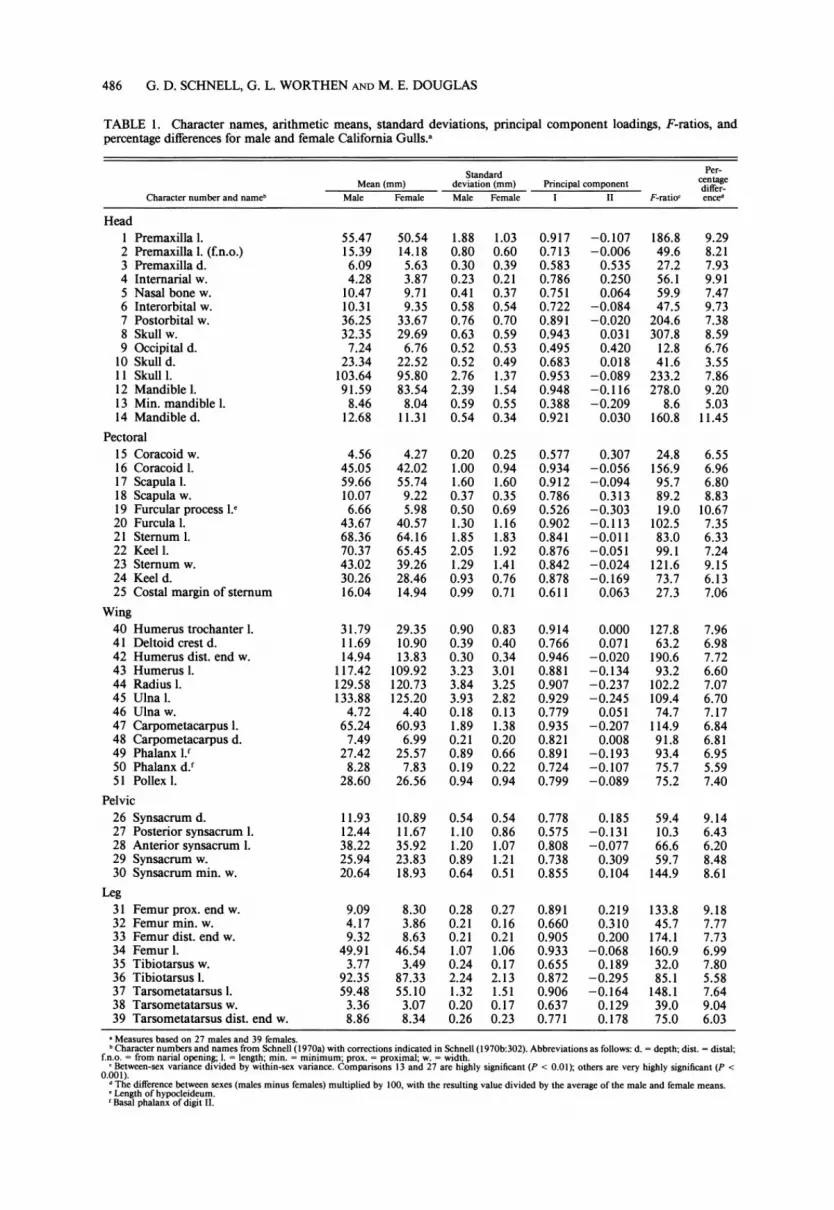
TABLE 1. Character names, arithmetic means, standard deviations, principal component loadings, F-ratios, and percentage differences for male and female California Gulls.a
Standard Per- centage Mean (mm) deviation (mm) Principal component differ-
Character number and nameb Male Female Male Female I II F-ratioc enced
Head 1 Premaxilla 1. 55.47 50.54 1.88 1.03 0.917 -0.107 186.8 9.29 2 Premaxilla 1. (f.n.o.) 15.39 14.18 0.80 0.60 0.713 -0.006 49.6 8.21 3 Premaxilla d. 6.09 5.63 0.30 0.39 0.583 0.535 27.2 7.93 4 Internarial w. 4.28 3.87 0.23 0.21 0.786 0.250 56.1 9.91 5 Nasal bone w. 10.47 9.71 0.41 0.37 0.751 0.064 59.9 7.47 6 Interorbital w. 10.31 9.35 0.58 0.54 0.722 -0.084 47.5 9.73 7 Postorbital w. 36.25 33.67 0.76 0.70 0.891 -0.020 204.6 7.38 8 Skull w. 32.35 29.69 0.63 0.59 0.943 0.031 307.8 8.59 9 Occipital d. 7.24 6.76 0.52 0.53 0.495 0.420 12.8 6.76
10 Skulld. 23.34 22.52 0.52 0.49 0.683 0.018 41.6 3.55 11 Skull 1. 103.64 95.80 2.76 1.37 0.953 -0.089 233.2 7.86 12 Mandible 1. 91.59 83.54 2.39 1.54 0.948 -0.116 278.0 9.20 13 Min. mandible 1. 8.46 8.04 0.59 0.55 0.388 -0.209 8.6 5.03 14 Mandible d. 12.68 11.31 0.54 0.34 0.921 0.030 160.8 11.45
Pectoral 15 Coracoid w. 4.56 4.27 0.20 0.25 0.577 0.307 24.8 6.55 16 Coracoid 1. 45.05 42.02 1.00 0.94 0.934 -0.056 156.9 6.96 17 Scapula 1. 59.66 55.74 1.60 1.60 0.912 -0.094 95.7 6.80 18 Scapula w. 10.07 9.22 0.37 0.35 0.786 0.313 89.2 8.83 19 Furcular process 1.e 6.66 5.98 0.50 0.69 0.526 -0.303 19.0 10.67 20 Furcula 1. 43.67 40.57 1.30 1.16 0.902 -0.113 102.5 7.35 21 Sternum 1. 68.36 64.16 1.85 1.83 0.841 -0.011 83.0 6.33 22 Keel 1. 70.37 65.45 2.05 1.92 0.876 -0.051 99.1 7.24 23 Sternum w. 43.02 39.26 1.29 1.41 0.842 -0.024 121.6 9.15 24 Keel d. 30.26 28.46 0.93 0.76 0.878 -0.169 73.7 6.13 25 Costal margin of sternum 16.04 14.94 0.99 0.71 0.611 0.063 27.3 7.06
Wing 40 Humerus trochanter 1. 31.79 29.35 0.90 0.83 0.914 0.000 127.8 7.96 41 Deltoid crest d. 11.69 10.90 0.39 0.40 0.766 0.071 63.2 6.98 42 Humerus dist. end w. 14.94 13.83 0.30 0.34 0.946 -0.020 190.6 7.72 43 Humerus 1. 117.42 109.92 3.23 3.01 0.881 -0.134 93.2 6.60 44 Radius 1. 129.58 120.73 3.84 3.25 0.907 -0.237 102.2 7.07 45 Ulna 1. 133.88 125.20 3.93 2.82 0.929 -0.245 109.4 6.70 46 Ulna w. 4.72 4.40 0.18 0.13 0.779 0.051 74.7 7.17 47 Carpometacarpus 1. 65.24 60.93 1.89 1.38 0.935 -0.207 114.9 6.84 48 Carpometacarpus d. 7.49 6.99 0.21 0.20 0.821 0.008 91.8 6.81 49 Phalanx 1.' 27.42 25.57 0.89 0.66 0.891 -0.193 93.4 6.95 50 Phalanx d.f 8.28 7.83 0.19 0.22 0.724 -0.107 75.7 5.59 51 Pollex 1. 28.60 26.56 0.94 0.94 0.799 -0.089 75.2 7.40
Pelvic 26 Synsacrum d. 11.93 10.89 0.54 0.54 0.778 0.185 59.4 9.14 27 Posterior synsacrum I. 12.44 11.67 1.10 0.86 0.575 -0.131 10.3 6.43 28 Anterior synsacrum 1. 38.22 35.92 1.20 1.07 0.808 -0.077 66.6 6.20 29 Synsacrum w. 25.94 23.83 0.89 1.21 0.738 0.309 59.7 8.48 30 Synsacrum min. w. 20.64 18.93 0.64 0.51 0.855 0.104 144.9 8.61
Leg 31 Femur prox. end w. 9.09 8.30 0.28 0.27 0.891 0.219 133.8 9.18 32 Femur min. w. 4.17 3.86 0.21 0.16 0.660 0.310 45.7 7.77 33 Femur dist. end w. 9.32 8.63 0.21 0.21 0.905 0.200 174.1 7.73 34 Femur 1. 49.91 46.54 1.07 1.06 0.933 -0.068 160.9 6.99 35 Tibiotarsus w. 3.77 3.49 0.24 0.17 0.655 0.189 32.0 7.80 36 Tibiotarsus 1. 92.35 87.33 2.24 2.13 0.872 -0.295 85.1 5.58 37 Tarsometatarsus 1. 59.48 55.10 1.32 1.51 0.906 -0.164 148.1 7.64 38 Tarsometatarsus w. 3.36 3.07 0.20 0.17 0.637 0.129 39.0 9.04 39 Tarsometatarsus dist. end w. 8.86 8.34 0.26 0.23 0.771 0.178 75.0 6.03
a Measures based on 27 males and 39 females. b Character numbers and names from Schnell (1970a) with corrections indicated in Schnell (1970b:302). Abbreviations as follows: d. = depth; dist. = distal;
f.n.o. = from narial opening; 1. = length; min. = minimum; prox. = proximal; w. = width. c Between-sex variance divided by within-sex variance. Comparisons 13 and 27 are highly significant (P < 0.01); others are very highly significant (P <
0.001). d The difference between sexes (males minus females) multiplied by 100, with the resulting value divided by the average of the male and female means. SLength of hypocleideum. ' Basal phalanx of digit II.

CALIFORNIA GULL SEXUAL DIMORPHISM 487
CORRELATION
0.4 0.6 0.8 1.0 I 1 I I i I I 1
1 Premaxilla 1.
r = .918 11 Skull I 12 Mandible I. 14 Mandible d 7 Postorbital w. 8 Skull w
16 Coracoid I
42 Humerus dist. end w.
40 Humerus trochanter I. 17 Scapula I.
20 Furcula I.
34 Femur I
37 Tarsometatarsus l
36 Tibiotarsus I. 44 Radius I
45 Ulna I. 47 Carpometacarpus I. 49 Phalanx I.
43 Humerus I.
24 Keel d. 31 Femur prox. end w. 33 Femur dist. end w.
21 Sternum I.
22 Keel I.
23 Sternum w. 48 Carpometacarpus d. 28 Anterior synsacrum I.
51 Pollex I. 29 Synsacrum w. 30 Synsacrum min. w. 46 Ulnaw.
26 Synsacrum d.
4 Internarial w. 41 Deltoid crest d. 39 Tarsometatarsus dist. end w.
5 Nasal bone w.
18 Scapulaw. 50 Phalanx d.
2 Premaxilla . (f.n.o.)
S6 Interorbital w. 10 Skull d. 32 Femur min. w.
25 Costal margin 15 Coracoidw. 38 Tarsometatarsus w.
3 Premaxilla d.
I 9 Occipital d. 35 Tibiotarsus w. 19 Furcular process I.
27 Posterior synsacrum I. 13 Min. mandible I.
I I I I I I I I 0.4 0.6 0.8 1.0
FIGURE 1. Dendrogram summarizing correlations among characters, based on 66 California Gulls. UPGMA clus- tering was used, and the cophenetic correlation (r) is indicated.
ysis of variance F-statistic (i.e., F-to-enter). The computed F-to-enter values are condi- tioned on the variables already present in the function (in a way similar to an analysis of covariance). After a variable is added, the function is re-computed to include the new variable, so as to maximize the separation be- tween the known groups (in our case, the two
sexes). The F-to-enter value indicates the con- tribution of a particular character to the overall separation of the predetermined groups. We set a minimum F-to-enter value of 4.0 for this analysis (i.e., a variable was not added to the classification function unless it provided this degree of separation).
Two of us (Schnell and Worthen) were in-

488 G. D. SCHNELL, G. L. WORTHEN AND M. E. DOUGLAS
TABLE 2. Mean external measurements (SD in paren- theses) for 27 male and 39 female California Gulls.
Measure Male Female
Weight (g) 671.6 (54.40) 558.8 (37.92) Cube root of
weight(g?)a 8.75 (0.236) 8.23 (0.186) Wing chord (mm) 382.0 (13.93) 361.5 (11.77) Tail length (mm) 149.1 (5.96) 145.4 (5.14) Exposed culmen
length (mm) 46.1 (2.39) 41.8 (2.32) ? For comparison with linear measures.
volved in specimen preparation and initial analyses. Schnell and Douglas conducted ad- ditional statistical analyses and developed the initial draft of the manuscript.
RESULTS CHARACTER COVARIATION AND DEGREE OF DIMORPHISM
All correlations among the 51 characters were positive, ranging from 0.167 (minimum man- dible length and anterior synsacrum length) to 0.976 (skull and mandible lengths). Character associations are summarized in Figure 1. The
cophenetic correlation of this dendrogram is relatively high (0.918), indicating that the dia- gram accurately portrays the original character correlations. At the top of the dendrogram, a relatively closely linked group of six measure- ments of the head (from premaxilla length through skull width) joins another set of 12 characters that includes mostly appendage lengths. While we found a few additional close associations-for instance, the correlation of proximal and distal end widths of the femur, as well as that for sternum and keel lengths- most of the other characters were not closely correlated with one another. The most diver- gent character was minimum mandible length, which is relatively short in California Gulls. The dendrogram suggests that, overall, there is considerable independent variation among skeletal measures in this species.
External measures for the 27 male and 39 female gulls are summarized in Table 2. Per- cent differences between males and females for these characters were: weight, 18.33%; cube root of weight, 6.10%; wing chord, 5.52%; tail length, 2.54%; exposed culmen length, 9.63%.
The results of the principal components
d* o r
0.5 0
o * 0 0 * o oo* 0 0
0 I
oo 0 0 0
0 00 0
0 0 0 I• oo
o o o
o 0
z 0 . .o 0*
--oo
-0.5 0@
Ug 0 I I
ps I
-2 -I I 2
COMPONENT I FIGURE 2. California Gulls plotted with respect to the first two principal components, based on 51 skeletal mea- surements. Characters were standardized on the basis of within-sex variances. The 27 males are represented by darkened circles and the 39 females by open circles.

CALIFORNIA GULL SEXUAL DIMORPHISM 489
TABLE 3. Statistics for stepwise discriminant analyses of male and female California Gulls, based on all characters, as well as on character subsets.
Order of Classification functionsb Character F-value to enter entry Coefficients" Male Female
All characters (51) 8 Skull w. 307.85 1 0.9853 63.656 57.773
12 Mandible 1. 17.55 2 0.4113 21.131 18.675 24 Keeld. 7.65 3 -0.7410 -23.731 -19.307 39 Synsacrum min. w. 11.29 4 0.8016 48.731 43.945 Constant -60.1401 -2,141.936 -1,779.571
Head (14) 8 Skullw. 307.85 1 1.0374 66.720 61.451
12 Mandible 1. 17.55 2 0.2872 15.669 14.211 Constant -56.8674 -1,797.546 -1,506.410
Pectoral (11) 16 Coracoid 1. 156.88 1 0.4925 36.584 34.642 18 Scapulaw. 13.03 2 1.3255 53.892 48.664 23 Sternum w. 10.62 3 0.3513 11.416 10.030 Constant -48.3157 -1,341.638 -1,149.659
Wing (12) 42 Humerus dist. end w. 190.62 1 2.2829 116.604 107.522 50 Phalanx d. 10.31 2 1.7784 149.441 142.366 51 Pollex 1. 4.24 3 0.3147 16.347 15.095 Constant -55.4882 -1,724.271 -1,502.075
Pelvic (5) 26 Synsacrum d. 13.34 2 0.8988 35.081 31.986 30 Synsacrum min. w. 144.93 1 1.4712 61.572 56.506 Constant -39.0491 -845.280 -709.737
Leg (9) 33 Femur dist. end w. 174.06 1 3.2073 172.560 159.669 37 Tarsometatarsus 1. 22.15 2 0.4097 22.465 20.818 Constant -51.890 -1,473.090 -1,263.062 * For canonical variable, which in the two-group case is equivalent to the discriminant function. b Used with original measurements. Add products of measurements and corresponding function values to constant; classify as male or female depending
on which results in the higher value for classification function.
analysis of skeletal measures indicated general trends in variation. Loadings for the first two components are given in Table 1, and the in- dividual specimens are projected onto these components in Figure 2. The first component, which explained 65.4% of the total character variation, provided complete separation be- tween males and females (Fig. 2). It had high correlations with essentially all characters (Ta- ble 1), suggesting that the component repre- sents a general size factor that is associated with differences between sexes. The largest an- imals are depicted to the right on Figure 2. The second component statistically explained rel- atively little variability (3.4%) and, except for premaxilla depth (0.535) and occipital depth (0.420), characters vary independently relative to this component. Birds that are large for these two characters are near the top of the diagram (Fig. 2), while the smaller ones are near the bottom. We found no indication of any asso- ciation of variation in this component with differences owing to age (i.e., among three-year- olds, four-year-olds, and older) or other ob- vious factors.
All characters showed statistically signifi- cant differences between the sexes, with males being larger (Table 1). The F-ratios from AN- OVAs ranged from 8.6 (minimum mandible length) to 307.8 (skull width). The percent dif- ference between males and females for the 51 characters averaged 7.56%, with the smallest difference being 3.55% (skull depth) and the largest 11.45% (mandible depth). Average per- centage differences for characters from differ- ent body regions were: head, 8.03%; pectoral, 7.55%; wing, 6.98%; pelvic, 7.77%; and leg, 7.53%.
DISCRIMINANT ANALYSES
When all characters were evaluated simulta- neously, the resulting function included four characters (top of Table 3). It reflected, as in- dicated in the ANOVAs for single characters (Table 1), that the best character for separating the sexes was skull width. The combination of this character with a head length character, as well as one each from the pectoral and pelvic regions, resulted in complete separation of males and females (Fig. 3A). Coefficients that

490 G. D. SCHNELL, G. L. WORTHEN AND M. E. DOUGLAS
DISCRIMINANT SCORE
-4 -3 -2 -1 0 I 2 3 4 5
A ALL 5
C PECTORAL
0
5
0
D B H WING
E PE LVIC
5- -
O -
5 -
0
-4 -3 -2 -I 0 I 2 3 4 5
DISCRIMINANT SCORE
FIGURE 3. Projections of 27 male (solid bars) and 39 female (lined bars) California Gulls onto discriminant function axes that are designed to separate the sexes. Discriminant plots are based on: (A) all 51 measurements; (B) 14 head characters; (C) 11 pectoral characters; (D) 12 wing characters; (E) five pelvic characters; and (F) nine leg characters. These provide the maximum separation of males and females that can be achieved by using skeletal measurements of the whole body, as well as those of separate body regions. Arrows indicate mean projection values for each sex.
can be used to place specimens of unknown gender onto the discriminant axis are provided in Table 3, along with coefficients for the two classification functions.
The classification functions are based on an
equal probability of a particular specimen being a male or female. Measurement values for the characters are multiplied by the indicated coef- ficients, and the resulting products are added to the constant. This calculation is completed

CALIFORNIA GULL SEXUAL DIMORPHISM 491
TABLE 4. Percentage of original specimens (27 males and 39 females), correctly identified as to sex, using classification functions (based on all specimens as well as jackknifed procedure) that were derived from characters that represented different body regions.
Regular procedure Jackknifed procedure Body region Male Female Total Male Female Total
All 100.0 100.0 100.0 100.0 100.0 100.0 Head 96.3 100.0 98.5 96.3 100.0 98.5 Pectoral 100.0 94.9 97.0 96.3 94.9 95.5 Wing 100.0 92.3 95.5 100.0 89.7 93.9 Pelvic 100.0 94.9 97.0 96.3 94.9 95.5 Leg 96.3 97.4 97.0 92.6 97.4 95.5
for both functions, and a specimen is assigned to that sex for which the resulting classification value is the greatest.
Of the 27 males and 39 females in the anal- ysis, all were correctly identified by using the classification function (Table 4). This was also the case when we used a pseudo-jackknifed classification procedure (see Dixon and Brown 1979), which effectively leaves out the indi- vidual specimen being considered, re-com- putes the coefficients of the functions, and then evaluates the specimen; typically, this proce- dure gives a better indication of the future be- havior of functions on new specimens.
As expected, given the results in the overall analysis, the discriminant function that was based on only the 14 head characters incor- porated skull width and mandible length (Ta- ble 3). While this function resulted in complete separation of males and females (Fig. 3B), the classification functions misclassified one of the males as a female, whether the regular or jack- knifed procedure was used.
For the pectoral and wing regions that were considered separately, we selected three char- acters as part of the respective discriminant functions (Table 3). While most specimens were separated by sex (Fig. 3C, D), there was slight overlap. The classification functions correctly identified a higher proportion of the males than females by using characters from these regions (Table 4), with over 93% of the total specimens being correctly identified with the regular and jackknifed procedures.
Similar percentages of correct identification were achieved by using the classification func- tions for the pelvic region and those for the leg region (Table 4). The discriminant func- tions for these two body regions incorporated two variables each (Table 3), and most spec- imens were separated into the appropriate male or female group (Fig. 3E, D).
DISCUSSION
In our evaluation of character covariation, we minimized the influence of geographic and temporal variation by collecting specimens
within a short time span and from a relatively small geographic area. We also largely elimi- nated variation due to age in our sample by selecting only adult specimens (i.e., those at least three years of age). Intercorrelations be- tween many of the characters were relatively low, often less than 0.80. This level of co- variation suggests that, while some birds are bigger than others, there are some proportional and shape differences among the birds as well.
The range of3.76-9.48% difference between male and female California Gulls reported by Behle and Selander (1953:249) for external measures is about the same as the range we found for these characteristics. It is also similar to the 3.55-11.45% differences found for our suite of 51 skeletal measures. The birds used in their and our studies are from essentially the same locality, but were taken 15 to 17 years apart (1950-1952, and 1968).
Ingolfsson (1969) noted that sexual dimor- phism in gulls is remarkably constant among species, with the males averaging 1.04-1.09 times as large as the females. He used the male/ female ratio of cube roots of body weights, rather than the difference divided by the av- erage male-female weights. Thus, his measure yields a somewhat higher proportional (or per- centage) difference than the one obtained with the coefficient we employed. In our sample, based on the cube root of body weight, males were 6.10% larger than females (or 1.063, using Ingolfsson's measure) indicating that, with re- spect to inter-sex differences, the California Gull is a typical larine. In most monogamous birds, males are slightly larger than females.
Selander (1966, 1972) pointed out that many species are more dimorphic in bill dimensions than in those from other body parts. He cited some particularly striking examples, including that for American White and Brown pelicans (Pelecanus erythrorhynchos and P. occidental- is), where the percentage sexual dimorphism in bill length (16% in the former and 8-10% in the latter) is about twice that of wing or tarsus length. Ingolfsson (1969) stated that, in the gulls he studied, sexual dimorphism in bill

492 G. D. SCHNELL, G. L. WORTHEN AND M. E. DOUGLAS
dimensions was invariably greater than it was in other body parts and was greater than the dimorphism in general size. Furthermore, he found dimorphism almost always greater in bill depth than in culmen length. The relatively greater bill depth in males is probably related to the importance and prominent use of the bill in courtship displays and territorial de- fense.
The relative differences that we found for various body parts of male and female Cali- fornia Gulls support the findings of previous investigators, although the differences are not marked. On the average, the greatest intersex- ual differences occurred in the head (8.03%), while the wing was the least variable (6.98%). Within the head region, the mandible depth clearly was the most dimorphic of the mea- sures taken (11.45%; Table 1). It is the lower part of the bill that was the major contributor to the relatively large difference in overall bill depth, since dimorphism in premaxilla depth (7.93%) was similar to that of other skull di- mensions. The greater depth difference on the head was restricted to the bill; the difference between males and females in skull depth was only 3.55% (Table 1).
The degree of sexual dimorphism was rel- atively uniform in characters from the pector- al, pelvic, and leg regions, although there are some exceptions (Table 1). For instance, the difference between sexes in the length of the furcular process (hypocleideum) was particu- larly marked (10.67%); the significance of this difference, if any, is unclear. It has been sug- gested (P. Stettenheim, pers. comm.) that the larger size of this process in males may be related to more or louder vocalizing by male gulls. The interclavicular air sac has a role as a resonating chamber for the syrinx, which it encloses. Since the furcular process (hypoclei- deum) crosses this sac, larger size of the process may reflect a larger resonating chamber.
Differences in wing length seem to be less marked than those for other linear measures. Ingolfsson (1969) reported that, for several gull species, the difference in wing length between sexes was less than that predicted on the basis of overall size. For the California Gull, the 6.98% average difference in wing dimensions was actually greater than we found for the cube root of body weight (6.10%). Wing length is likely to be closely linked with wing loading and other wing-body considerations that are related to aerodynamic properties. Thus, it is likely that selective and other constraints on wing dimensions are considerably different than those influencing other body regions.
We were able to separate and easily identify to sex all of the specimens that were employed
in our study with the use of four characteristics (two skull, one pectoral, and one pelvic) taken from the total of 51. Our analyses indicate that most, if not all, individual California Gulls can be identified to sex through this combination of skeletal characters. Nearly as complete a separation is achieved with measures from only one body region, because dimorphism per- vades all skeletal elements in California Gulls.
ACKNOWLEDGMENTS
We thank the following individuals for assistance in pre- paring specimens: J. A. Jackson; M. J. Jenkinson; D. L. Kilgore; R. M. Mengel; D. M. Niles; Y. Oniki; J. W. Par- ker; B. Rohwer; S. A. Rohwer; J. D. Rising; M. S. Schnell; and K. Worthen. C. W. White assisted in the obtaining of specimens, and D. J. Hough helped with manuscript prep- aration. R. F. Johnston, J. S. Quinn, and J. P. Ryder made useful suggestions on ways to improve the manuscript. Partial support for this work was provided by the Museum of Natural History at the University of Kansas.
LITERATURE CITED
BEHLE, W. H., AND R. K. SELANDER. 1953. The plumage cycle of the California Gull (Larus caftfornicus) with notes on color changes and soft parts. Auk 70:239- 260.
DIXON, W. D., AND M. B. BROWN [EDS.]. 1979. Biomed- ical computer programs. P-series. Univ. of California Press, Berkeley.
DWIGHT, J. 1925. The gulls (Laridae) of the world; their plumages, moults, variations, relationships and dis- tribution. Bull. Am. Mus. Nat. Hist. 52:63-401.
EARHART, C. M., AND N. K. JOHNSON. 1970. Size di- morphism and food habits of North American owls. Condor 72:251-264.
Fox, G. A., C. R. COOPER, AND J. P. RYDER. 1981. Pre- dicting the sex of Herring Gulls by using external measurements. J. Field Ornithol. 52:1-9.
HARRIS, M. P. 1964. Measurements and weights of Great Black-backed Gulls. Br. Birds 57:71-75.
HARRIS, M. P., AND P. HOPE JONES. 1969. Sexual dif- ferences in measurements of Herring and Lesser Black- backed gulls. Bird Study 62:129-133.
INGOLFSSON, A. 1969. Sexual dimorphism in large gulls (Larus spp.). Auk 86:732-737.
MILLS, J. A. 1971. Sexing Red-billed Gulls from standard measurements. New Zealand J. Mar. Freshwater Res. 5:326-328.
NUGENT, G. 1982. Sexing Black-backed Gulls from ex- ternal measurements. Notornis 29:37-40.
ORIANS, G. H. 1969. On the evolution of mating systems in birds and mammals. Am. Nat. 103:589-603.
RALLS, K. 1977. Sexual dimorphism in mammals: avian models and unanswered questions. Am. Nat. 111: 917-938.
ROBINS, J. D. 1971. Differential niche utilization in a grassland sparrow. Ecology 52:1065-1070.
ROHWER, S. A., AND D. L. KILCGORE, JR. 1973. Inter- breeding in the arid-land foxes, Vulpes velox and V. macrotis. Syst. Zool. 22:157-165.
RYDER, J. P. 1978. Sexing Ring-billed Gulls externally. Bird-Banding 49:218-222.
SCHNELL, G. D. 1970a. A phenetic study of the suborder Lari (Aves). I. Methods and results of principal com- ponents analyses. Syst. Zool. 19:35-57.
SCHNELL, G. D. 1970b. A phenetic study of the suborder Lari (Aves). II. Phenograms, discussion, and conclu- sions. Syst. Zool. 19:264-302.

CALIFORNIA GULL SEXUAL DIMORPHISM 493
SELANDER, R. K. 1966. Sexual dimorphism and differ- ential niche utilization in birds. Condor 68:113-151.
SELANDER, R. K. 1972. Sexual selection and dimorphism in birds, p. 180-230. In B. G. Campbell [ed.], Sexual selection and the descent of man, 1871-1971. Aldine, Chicago.
SHUGART, G. W. 1977. A method for externally sexing gulls. Bird-Banding 48:118-121.
SIGURJlNSDOTTIR, H. 1981. The evolution of sexual size dimorphism in gamebirds, waterfowl and raptors. Or- nis Scand. 12:249-260.
SNEATH, P. H. A., AND R. R. SOKAL. 1973. Numerical taxonomy. W. H. Freeman and Co., San Francisco.
THRELFALL, W., AND D. D. JEWER. 1978. Notes on the standard body measurements of two populations of Herring Gulls (Larus argentatus). Auk 95:749-753.
VERNER, J., AND M. F. WILLSON. 1966. The influence of habitats on mating systems of North American birds. Ecology 47:143-147.
WALLACE, R. A. 1974. Ecological and social implications of sexual dimorphism in five melanerpine woodpeck- ers. Condor 76:238-248.
WILLIAMSON, D. 1971. Feeding ecology of the Red-eyed Vireo (Vireo olivaceus) and associated foliage-glean- ing birds. Ecol. Monogr. 41:129-152.
WOOLLER, R. D., AND J. N. DUNLOP. 1981. The use of a single external measurement for determining sex in a population of Silver Gulls, Larus novaehollandiae. Austr. Wildl. Res. 8:679.
Department of Zoology and Oklahoma Biological Survey, University of Oklahoma, Norman, Oklahoma 73019; Biomedical Laboratory, Exceptional Child Center, Utah State University, Logan, Utah 84322; Department ofZo- ology and Museum of Natural and Cultural History, Okla- homa State University, Stillwater, Oklahoma 74078. Re- ceived 15 September 1984. Final acceptance 2 May 1985.
The Condor 87:493 ? The Cooper Ornithological Society 1985
RECENT PUBLICATIONS
Neotropical ornithology.-Edited by P. A. Buckley, Mercedes S. Foster, Eugene S. Morton, Robert S. Ridgely, and Francine G. Buckley. 1985. Ornithological Mono- graphs No. 36. American Ornithologists' Union, Wash- ington, DC. 1041 p. $70.00. Source: Frank R. Moore, Assistant to the Treasurer, A.O.U., Department of Biol- ogy, University of Southern Mississippi, Southern Station Box 5018, Hattiesburg, MS 39406. All orders must be prepaid and include a $1.00 handling charge. This volume is a collection of invited papers, prepared as a memorial to Eugene Eisenmann, one of the most influential and surely the most warmly esteemed worker on neotropical birds. It opens with a biographical sketch of Eisenmann by Thomas Howell and closes with an overview of the collection-with regard to the field itself-by Kenneth Parkes. In between are 61 papers grouped as to new taxa, zoogeography and distribution, systematics, evolution, community and population ecology, evolutionary and be- havioral ecology, breeding biology, and conservation. Commendably, they reflect the editors' efforts to obtain longer synthesizing review papers as well as shorter reports on significant new research. Thus, they tend to show a broader perspective and to contain more material of last- ing value than is customary in assembled volumes. The papers are each furnished with abstracts in English and Spanish, illustrations, and a list of references. Eight color plates (by various artists) depict new or reanalyzed taxa, or features of taxonomic significance. Despite the short- comings in the scope of the volume, acknowledged by the editors, this is the most inclusive monograph on neotrop- ical ornithology ever published. It brings honor to its au- thors and editors, as well as its dedicatee. Index.
Primer symposio de ornithologia neotropical.-Edited by F. Gary Stiles and Pedro G. Aguilar F. 1985. Asociaci6n Peruana para Conservaci6n de la Naturaleya, Lima, Peru. 126 p. Paper cover. No price given. Source: Pacific Press S.A., Los Negocios 219, Lima 34, Peru. This volume con- tains the proceedings of the first symposium on neotropical ornithology, held in October, 1983 at Arequipa, Peru. The 13 papers and 19 summaries of other presentations deal with a variety of species and ornithological problems in Latin America but do not focus on a common theme. They are written in Spanish, and the papers have summaries in English. In closing are recommendations for the investi- gation and protection of birds and their habitats in Latin America. A landmark publication. Illustrations, refer- ences.
Nidificacion de las aves argentinas (Dendrocolaptidae y Furnariidae).-S. Narosky, R. Fraga, and M. de la Pefia. 1983. Asociaci6n Ornithologica del Plata [Buenos Aires]. 98 p. Paper cover. $8.00. Source: Asociaci6n Omrnitholo- gica del Plata, 25 de May 749, 2* Piso, (1002) Buenos Aires, Argentina. This is a report, in Spanish, on the nest- ing habits of Argentine woodcreepers and ovenbirds. For each of 77 species, data on the nest and eggs are given, taken from the literature and original observations; com- ments on the validity of certain published records or on taxonomic implications are appended. Many of the ac- counts are illustrated with drawings that show the place- ment and structure of the nests. Basic information of this kind is hard to come by, yet is essential for sound research in systematics and ecology. Monochrome photographs, references, index.

Cooper Ornithological Society
Morphometric Assessment of Sexual Dimorphism in Skeletal Elements of California GullsAuthor(s): Gary D. Schnell, Gary L. Worthen, Michael E. DouglasSource: The Condor, Vol. 87, No. 4 (Nov., 1985), pp. 484-493Published by: University of California PressCooper Ornithological SocietyStable URL: http://www.jstor.org/stable/1367944Accessed: 12/10/2008 21:43
Your use of the JSTOR archive indicates your acceptance of JSTOR's Terms and Conditions of Use, available athttp://www.jstor.org/page/info/about/policies/terms.jsp. JSTOR's Terms and Conditions of Use provides, in part, that unlessyou have obtained prior permission, you may not download an entire issue of a journal or multiple copies of articles, and youmay use content in the JSTOR archive only for your personal, non-commercial use.
Please contact the publisher regarding any further use of this work. Publisher contact information may be obtained athttp://www.jstor.org/action/showPublisher?publisherCode=ucal.
Each copy of any part of a JSTOR transmission must contain the same copyright notice that appears on the screen or printedpage of such transmission.
JSTOR is a not-for-profit organization founded in 1995 to build trusted digital archives for scholarship. We work with thescholarly community to preserve their work and the materials they rely upon, and to build a common research platform thatpromotes the discovery and use of these resources. For more information about JSTOR, please contact [email protected].
University of California Press and Cooper Ornithological Society are collaborating with JSTOR to digitize,preserve and extend access to The Condor.
http://www.jstor.org


