Embed Size (px)
Citation preview

ORIGINAL ARTICLE
Morphometric measurements and sexual dimorphismof the piriform aperture in adults
Eric Moreddu • Laurent Puymerail • Justin Michel •
Michael Achache • Patrick Dessi • Pascal Adalian
Received: 4 November 2012 / Accepted: 29 March 2013
� Springer-Verlag France 2013
Abstract
Purpose The aim of this study was to evaluate the
dimensions (maximal width and length), the size and the
shape of the PA and their sexual dimorphism.
Methods Using 3D-CT scan reconstructions and land-
marks positioning around the piriform aperture and on the
face, a collective of 170 non-pathologic subjects (79
female, 91 male) from Marseille (France) was examined in
classical and geometric morphometrics methods.
Results The mean width of the piriform aperture was
24.00 mm in females and 25.32 mm in males, the mean
length was 32.54 mm in females and 36.35 mm in males.
The difference between males and females was significant,
and our data correlates well with the previously data
acquired from humans skulls. Facial measurements also
showed a statistically significant dimorphism. In morpho-
metric geometrics, the correlation between the centroıd size
and PC1 in the shape space was weak, while this correlation
was strong in the size and shape space. Visualization of
shape differences was achieved on 2D wireframes.
Conclusion Shape and size analysis of the piriform
aperture showed the existence of a significant sexual
dimorphism. These results encourage us to go further with
functional and imaging correlations.
Keywords Piriform aperture � Dimensions � Sexual
dimorphism � Nose � Geometric morphometrics � 3D-CT
reconstruction
Introduction
The piriform aperture (PA) is the skeletal aperture located
in the middle part of the face and limited by the frontal
processes of the maxillary bones, the nasal bones, and the
anterior nasal spine [8]. It corresponds to the anterior limit
of the skeletal nose, and a major component of the size of
the nose.
It is one of the upper respiratory passages, involved in
warming, filtration, moistening and guiding the incoming
air. A good knowledge of this element is fundamental in
understanding these nasal functions. However, the articles
published in the literature mainly correlate the functional
problems of the nose to the nasal mucosa or cartilages, but
few of them study the role of the PA, except for the well-
described pediatric stenosis of the PA [3].
Some data regarding the morphology and the dimen-
sions of the PA have already been published, but none have
used the techniques of geometric morphometrics. The
maximum width and height and sexual dimorphism of the
piriform aperture has yet been described on dry skulls [4,
12, 19]. The interalar width has been correlated with the
E. Moreddu (&) � L. Puymerail � P. Adalian
Unite d’Anthropologie Bio-Culturelle, Droit, Ethique et Sante
(ADES), UMR 7268, Universite d’Aix-Marseille-EFS-CNRS,
Boulevard Pierre-Dramard, 13344 Marseille, France
e-mail: [email protected]
L. Puymerail
e-mail: [email protected]
P. Adalian
e-mail: [email protected]
E. Moreddu � J. Michel � M. Achache � P. Dessi
Service ORL et Chirurgie Cervicofaciale, AP-HM, CHU
La Timone, 264 rue St-Pierre, 13385 Marseille cedex, France
e-mail: [email protected]
M. Achache
e-mail: [email protected]
P. Dessi
e-mail: [email protected]
123
Surg Radiol Anat
DOI 10.1007/s00276-013-1116-2
PA and its variations in function of the skin color in adult
male skulls [10]. The upper and lower width of the PA was
measured on 3D-CT reconstructions [11]. The shape of the
PA has been compared in Gorilla gorilla, Pan troglodytes,
and modern Homo sapiens by 2D Fourier analysis [17].
The nasal airflow has been correlated to external nasal
dimensions, but neither to the PA dimensions nor shape
[9].
From a clinical and surgical point of view, it is inter-
esting to perform in vivo PA measurements and shape
evaluation, with their sexual dimorphism. It is known that
surgical and traumatic modifications of this area lead to air
passage modifications, and we think that its morphological
variations may lead to functional variations.
In the following study, the question is to evaluate the
shape and the dimensions of the PA and their sexual
dimorphism on 3D-reconstructions of facial CT scans
performed on non-pathologic subjects using geometric
morphometrics [1, 14].
Materials and methods
Subjects
We collected 170 CT scan imaging of human adults aged
from 15 to 97 years (mean = 53 years), from La Timone
hospital, Marseille (France). These patients were selected
from non-traumatic patients, without any surgical treatment
on the nasal area, and had enhanced CT scans for non-
rhinologic problems: pulmonary embolism, stroke or
exploration of laryngeal carcinomas. 79 patients were
female, and 91 were male (Fig. 1). The examinations have
the following properties: pixel height and width between
312 and 529 lm, voxel depth between 300 and 1.25 mm.
The scans were anonymous when received by the authors,
with only sex and age data retained. Specific information
about ethnicity of the subjects was unavailable, but the
sample was taken as being representative of a typical
contemporary Mediterranean population.
3D reconstruction
As a basis for this imaging, computer tomography of head
and neck was used and was carried out in axial alignment.
Using the data of these examinations, a 3D reconstruction
of the face and skull could be generated with Avizo v.6.2
software package. To virtually isolate its cortical shell, and
reconstruct its entire volume, a semi-automatic threshold-
based segmentation with manual corrections was carried
out following the half-maximum height method [18]
(HMH) and the region of interest thresholding protocol [6]
and by taking repeated measurements on 20 different zones
of the virtual stack [5] by the Avizo v.6.2. (Visualization
Sciences Group Inc.) and ImageJ v.1.45 s packages.
Landmarks
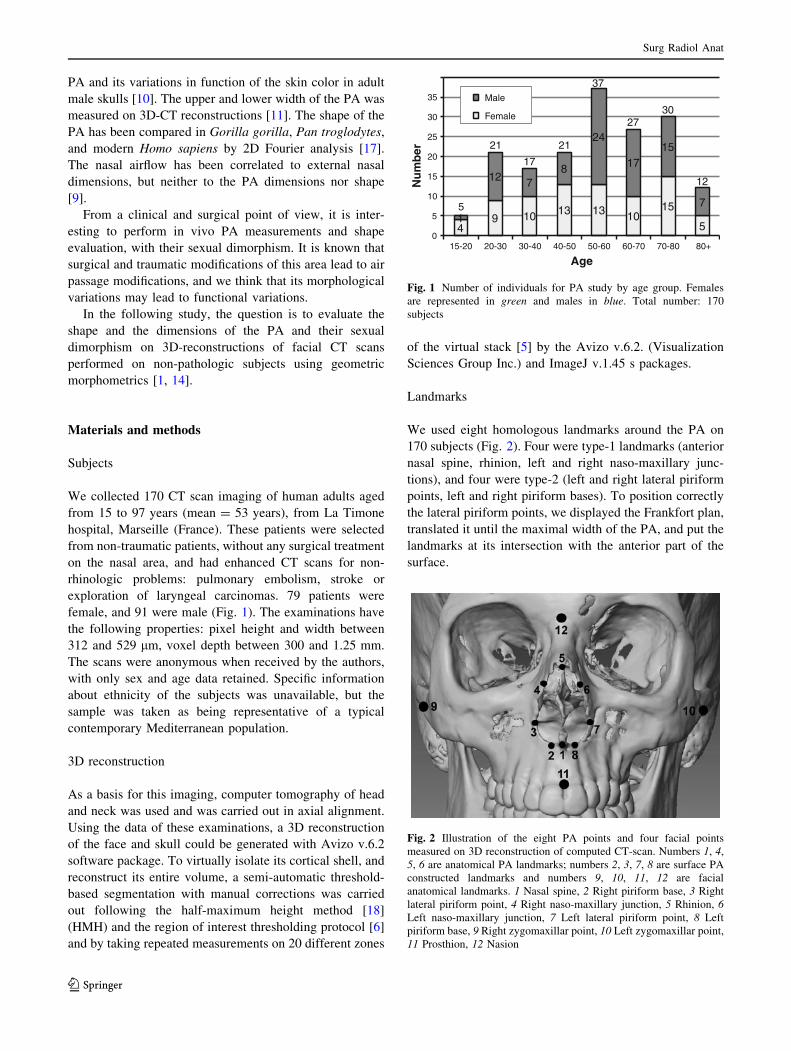
We used eight homologous landmarks around the PA on
170 subjects (Fig. 2). Four were type-1 landmarks (anterior
nasal spine, rhinion, left and right naso-maxillary junc-
tions), and four were type-2 (left and right lateral piriform
points, left and right piriform bases). To position correctly
the lateral piriform points, we displayed the Frankfort plan,
translated it until the maximal width of the PA, and put the
landmarks at its intersection with the anterior part of the
surface.
49 10 13 13 10
15
51
12 78
24
1715
7
0
5
10
15
20
25
30
35
15-20 20-30 30-40 40-50 50-60 60-70 70-80 80+
Nu
mb
er
Age
Male
Female
5
21
17
21
37
2730
12
Fig. 1 Number of individuals for PA study by age group. Females
are represented in green and males in blue. Total number: 170
subjects
Fig. 2 Illustration of the eight PA points and four facial points
measured on 3D reconstruction of computed CT-scan. Numbers 1, 4,
5, 6 are anatomical PA landmarks; numbers 2, 3, 7, 8 are surface PA
constructed landmarks and numbers 9, 10, 11, 12 are facial
anatomical landmarks. 1 Nasal spine, 2 Right piriform base, 3 Right
lateral piriform point, 4 Right naso-maxillary junction, 5 Rhinion, 6Left naso-maxillary junction, 7 Left lateral piriform point, 8 Left
piriform base, 9 Right zygomaxillar point, 10 Left zygomaxillar point,
11 Prosthion, 12 Nasion
Surg Radiol Anat
123

We added four type-1 landmarks on the face: nasion,
prosthion, left and right zygomaxillary points. These
landmarks could be added on 156 subjects (70 female, 86
male) of the sample. The 14 missing subjects had a cut
facial CT scan.
Analyses
Geometric linear distances were calculated to determine
the PA horizontal width (PAW) between the two lateral
piriform points (landmarks 3 and 7) and its vertical length
(PAL) between the rhinion and the anterior nasal spine
(landmarks 1 and 5). The same method was used for the
width of the face between the zygomaxillary points
(landmarks 9 and 10) and its height between nasion and
prosthion (landmarks 11 and 12). We did not consider the
study of asymmetry of the PA, which was not the objective
of this study.
All the geometric morphometrics procedures and sta-
tistical analysis were carried out with MORPHOJ v.1.05a
and R v.2.15.0 software packages. The homologous land-
marks were converted to shape coordinates by generalized
least squares Procrustes superimposition method [7, 16].
Principal component analysis (PCA) of shape [1, 2, 13, 15]
was computed separately from the covariance matrix of the
Procrustes coordinates of facial and PA landmarks.
Analyses were also computed separately from the Pro-
crustes coordinates of facial and PA shape for identifying
similarities and differences by gender.
The analysis of sexual dimorphism was carried out with
R v.2.15.0 package. Multivariate analysis of variance
(MANOVA) by a Wilks test allowed us to determine the
significance of the shape and size differences between the
genders, and Student t test was performed on the linear
measurements. The shape space and the size and shape
space were depicted from the first principal component
(PC1) and second principal component (PC2), which
explain most of the part of the original variance.
A wireframe representation of landmarks configuration
according to PC1 was carried out by MORPHOJ v.1.05a.
Intra-operator and inter-operator reproducibility of land-
marks positioning were performed on 50 CT scans ran-
domly selected among the list of subjects, using the
random function in Microsoft EXCEL v.12.0 software.
Shape and centroıd size (CS) of the data sets were com-
pared by a Wilks test MANOVA carried out by MORPHOJ
v.1.05a.
Repeatability was performed ten times on a randomly
selected CT scan on ten different days, to avoid memori-
zation bias. The maximum, minimal, and mean distance
between the positions of each landmark were calculated.
Repeatability of the whole procedure (HMH, oblique slice
and landmark positioning) was analyzed by a Wilks test
ANOVA of shape and CS on ten randomly selected
subjects.
Results
Reproducibility and repeatability
The intra-operator and inter-operator reproducibility tests
on 50 individuals showed no statistically significant
Table 1 Mean dimensions of PA (in mm)
Female Male p value
(Student t test)
PAW
(mean ± SD)
24.00 ± 1.77 25.32 ± 1.86 \0.001
PAW range [18.91–29.25] [21.27–30.53]
PAL
(mean ± SD)
32.54 ± 2.70 36.35 ± 3.07 \0.001
PAL range [26.29–38.83] [24.99–43.25]
female male
2022
2426
2830
a
female male
2530
3540
b
Fig. 3 Boxplots of median PA dimensions in females and males: PAW on the left (a) and PAL on the right (b)
Surg Radiol Anat
123

difference. The repeatability test on an individual showed a
good repeatability with a maximal difference of 1.51 mm
for a landmark and a maximal mean difference of
0.59 mm. Repeatability of the whole procedure showed no
statistically significant difference.
Piriform aperture measurements
Mean PAW measure was 24.00 mm (±1.77) in females
and 25.32 mm (±1.86) in males. Mean PAL measure was
32.54 mm (±2.70) in females and 36.35 mm (±3.07) in
males (Table 1). Student t test performed between the
values calculated in both genders was statistically signifi-
cant for PAW and PAL.
Figure 3 represents the boxplots of median dimensions
of the PA: PAW and PAL were superior in males, with few
outliers.
Table 2 shows Pearson’s product-moment correlation
between PAW and PAL, which was not statistically sig-
nificant for both females and males (p [ 0.05). Figure 4 is
a representation of PAW and PAL correlation with the
linear regression lines.
Facial measurements
Mean measurements of the facial width and height were
superior in males as showed in the Table 3. Student t test
performed between the values calculated in both genders
was statistically significant for facial width and height.
Figure 5 shows the boxplots of these facial dimensions.
Table 4 shows Pearson’s product-moment correlation
between the measurements of face and PA. The heights are
correlated in the two genders, while the widths are corre-
lated only in males.
Piriform aperture shape analyses
The PCA of Procrustes analysis for the eight landmarks
surrounding the piriform aperture yielded 17 PCs.
The shape space depicted from the first two PCs, which
jointly explained 46.32 % of the original variance, is
showed on Fig. 6. Wilk’s test MANOVA showed a sig-
nificant difference between males and females (Table 5),
despite the fact the ellipses merge.
Figure 7 is a wireframe 2D visualization of the modifi-
cations accounted by PC1 on the consensus individual from
three points of view. Both visualizations show an almost
constant length of the PA, the shape modifications being
brought by its width.
The CS was significantly superior in males (46.57 mm)
than in females (43.11 mm), as expected by the linear
measurements previously calculated (Table 6). The box-
plots depicting the CS are showed on Fig. 8.
The size and shape space depicted from the first two
PCs, which jointly explained 47.98 % of the original var-
iance, is showed on Fig. 9. The ellipses surrounding 95 %
of the variability of each gender are visually and statisti-
cally different (Table 5), corresponding to the size differ-
ence described above.
The correlation coefficients between CS and PC1
(Table 7) were significant, with a high value in size space:
0.89 (p \ 0.001) and a low value in shape space: -0.25
(p \ 0.001).
Table 2 Pearson’s product-moment correlation between PAW and
PAL
Female Male
Correlation -0.064 -0.014
p value 0.57 0.89
25 30 35 40
2022
2426
2830
PAL
PAW
femalemale
Fig. 4 Plot of PAW and PAL correlation with linear regression lines.
Female linear regression line is shown by the solid line, male linear
regression line is shown by the dotted line
Table 3 Mean facial dimensions (in mm)
Female Male p value
(Student t test)
Facial width
(mean ± SD)
117.06 ± 6.27 126.19 ± 4.97 \0.001
Facial width
range
[95.08–133.11] [114.77–137.25]
Facial height
(mean ± SD)
67.07 ± 4.84 71.68 ± 5.17 \0.001
Facial height
range
[57.02–77.68] [52.63–89.23]
Surg Radiol Anat
123

Discussion
Design of the study
Our study was the first to depict the shape and size of the
PA using geometric morphometrics on 3D-CT recon-
structions. This method was reliable and reproducible, with
a good quality of description of the PA with eight land-
marks: adding more landmarks would not have brought
more information on the sexual dimorphism.
The main difficulty and source of variability was to
position the lateral PA landmarks, because of the lack of
bone sutures or structure allowing an undeniable posi-
tioning. To get round this problem, the reconstruction of a
plan parallel to Frankfort plan allowed us to position the
landmarks 3 and 7 with a good reproducibility, their
position corresponding to the inflexion of the lateral side of
the PA.
Studying soft tissues was not the objective of this study,
although their evaluation in the anatomy of the nose could
be interesting for functional purpose. Developing a reliable
methodology for measuring the thickness of nasal soft
tissues using MRI and CT scan is still a challenge.
Linear measurements
Our results about the width of the PA were in the same
range of variation than the previous studies in the literature
[4, 10–12, 19]. This observation validates the HMH 3D
reconstruction method over the PA; our values were close
to those that were acquired with classical morphometric
methods on dry skulls, and did not overexpress the
dimensions of the PA.
In the literature, there is no study showing an ethnical
difference on PA dimensions. The PAW calculated in our
female male
6070
8090 b
female male
100
110
120
130
a
Fig. 5 Boxplots of median facial dimensions in females and males: facial width on the left (a) and height on the right (b)
Table 4 Pearson’s moment-product correlation of facial and PA
dimensions
Width correlation p value Height correlation p value
Male 0.32 0.003 0.35 0.001
Female 0.23 0.059 0.33 0.004
−0.1 0.0 0.1 0.2 0.3
−0.
2−
0.1
0.0
0.1
PC1 (27.3 %)
PC
2 (1
9.02
%)
FemaleMale
Fig. 6 Scatterplot of the placement of individuals on PC1 and PC2 in
the shape space (PC analysis of the Procrustes shape coordinates
using PA landmarks). Ellipses are showing 95 % of variability for
females (solid line) and males (dotted line)
Table 5 MANOVA of the shape space and of the size and shape
space in females and males (PC scores, sex)
Test Pillai Approx F Df Den Df p
Shape space Wilks 0.13138 3.044 8 161 0.003
Size and
shape space
Wilks 0.417 19.431 6 163 \0.001
Surg Radiol Anat
123

study were close to the values obtained in the other studies,
including Brazilian [4], American [10], German [11], and
Corean [12] samples. Concerning the PAL, only Cantin
3 7
4
2
5
8
6
11
2
3
4
5
6
7
8
12
8
7 3
4 6
5
1
2
3
4 6
7
8
5
PC1 -0.15
PC1 +0.15
Frontal view Lateral view Upper view
5
4 6
3 7
82 1
3 7
42 5
1
86
Fig. 7 Wireframe
representation of landmarks
configuration according to PC1:
consensus shape is shown in
gray and modifications on PC1
are shown in black
Table 6 Centroıd sizes in females and males
Female Male p value (Student t test)
Centroıd size 43.11 46.57 \0.001
female male
4045
50
Fig. 8 Boxplot showing female and male centroıd sizes
−0.1 0.0 0.1 0.2 0.3
−0.
2−
0.1
0.0
0.1
0.2
PC1 (29.58 %)
PC
2 (1
8.4
%)
FemaleMale
Fig. 9 Scatterplot of the placement of individuals on PC1 and PC2 in
the size and shape space. Ellipses are showing 95 % of variability for
females (solid line) and males (dotted line)
Table 7 Pearson’s product-moment correlation between centroıd
size and PC1 in the shape space and in the size and shape space
Correlation coef p value
CS and PC1 Shape space -0.25 [-0.39, -0.11] \0.001
CS and PC1 Size and shape space 0.89 [-0.92, -0.85] \0.001
Surg Radiol Anat
123

Lopez and co-workers [4] had a longer PA in their
Brazilian sample (Table 8), but this sample was composed
of mixed ethnicities (30 skulls of individuals with white
skin, 30 with black skin, and 30 with brown skin), and there
was no statistically significant difference between the
ethnicities.
In all the studies, there was a true dimorphism of PA
dimensions. Males had a larger and longer PA, which
means that the size of PA was correlated to the absolute
size of the individuals. The translation of this difference in
our study using morphometric geometrics was a higher CS
for males.
We could have thought that the facial development, and
especially its horizontal growth, explained the variations of
PA dimensions, but the correlations between facial and PA
dimensions were weak (Table 4). Furthermore, the width
and length of PA were not correlated (Table 2). All these
results are leading us to the conclusion of a non-harmoni-
ous growth of the PA and the face.
Size and shape analysis
The difference of PA shape between female and male
subjects was statistically significant, but the visualization
of this difference was not informative. This difference was
amplified by taking into consideration the CS of the indi-
viduals, which was the main factor of dimorphism as
explained by the size and shape space (Fig. 9) and shape
space (Fig. 6) and the correlation coefficient values
(Table 7).
Furthermore, we tested a discriminant analysis, which
was not conclusive for the PA, which cannot be used as a
good gender predictor.
Conclusion
Our results showed the existence of a significant sexual
dimorphism of the PA, not only in terms of dimensions, but
also in terms of shape.
We can make a connection with the physiologic nasal
airflow, which has been evaluated to be significantly lower
in females than in males, with a good correlation and with
nasal external measurements [9].
These results encourage us to investigate the correlation
between PA morphology and airflow: for example, is a
narrower PA correlated with a lower airflow? Furthermore,
some functional nasal problems are induced by the airflow
regime which can be turbulent or laminar, and the link
between the PA shape and the airflow regime has to be
investigated.
A further study would associate functional examination
and imaging to answer these questions.
Conflict of interest The authors declare that they have no conflict
of interest.
References
1. Bookstein FL (1991) Morphometric tools for landmark data :
geometry and biology. Cambridge University Press, Cambridge
England, New York
2. Bookstein FL (1996) Biometrics, biomathematics and the mor-
phometric synthesis. Bull Math Biol 58(2):313–365
3. Burstein FD, Cohen SR (1995) Piriform aperture stenosis: a rare
cause of neonatal airway obstruction. Ann Plast Surg 34(1):56–58
4. Cantin LM, Suazo GIC, Zavando MDA, Smith RL (2009) Sexual
dimorphism determination by piriform aperture morphometric
analysis in Brazilian human skulls. Int J Morphol 27(2):327–331
5. Coleman MN, Colbert MW (2007) Technical note: CT thres-
holding protocols for taking measurements on three-dimensional
models. Am J Phys Anthropol 133(1):723–725
6. Fajardo RJ, Ryan TM, Kappelman J (2002) Assessing the accu-
racy of high-resolution X-ray computed tomography of primate
trabecular bone by comparisons with histological sections. Am J
Phys Anthropol 118(1):1–10
7. Gower JC (1975) Generalized procrustes analysis. Psychometrika
40(1):33–51
8. Gray H, Standring S, Ellis H, Berkovitz BKB (2005) Gray’s
anatomy : the anatomical basis of clinical practice, 39th edn.
Elsevier Churchill Livingstone, Edinburgh
9. Hall RL (2005) Energetics of nose and mouth breathing, body size,
body composition, and nose volume in young adult males and
females. Am J Hum Biol Off J Hum Biol Counc 17(3):321–330
10. Hoffman BE, McConathy DA, Coward M, Saddler L (1991)
Relationship between the piriform aperture and interalar nasal
widths in adult males. J Forensic Sci 36(4):1152–1161
11. Hommerich CP, Riegel A (2002) Measuring of the piriform
aperture in humans with 3D-SSD-CT-Reconstructions. Ann Anat
Anatomischer Anzeiger 184(5):455–459
Table 8 Comparison of
mean ± SD PA dimensions
with previous studies [4, 10–12,
19]
Width Length
Female Male Female Male
Cantin Lopez 25.27 ± 2.61 26.87 ± 4.80 47.53 ± 3.30 50.83 ± 2.83
Hoffman 25.45 ± 2.53
Hommerich 22.6 23.6
Hwang 25.4 ± 1.7 25.7 ± 1.7 28.0 ± 2.8 30.1 ± 2.6
Vitte 24.1 ± 1.9 30.7 ± 3.8
Present study 24.00 ± 1.77 25.32 ± 1.86 32.54 ± 2.70 36.35 ± 3.07
Surg Radiol Anat
123

12. Hwang T-S, Song J, Yoon H, Cho B-P, Kang H-S (2005) Mor-
phometry of the nasal bones and piriform apertures in Koreans.
Ann Anat Anatomischer Anzeiger 187(4):411–414
13. Marcus LF, Bello E, Garcıa-Valdecasas A (1993) Contributions
to morphometrics. Monografıas/Museo Nacional de Ciencias
Naturales, Museo Nacional de Ciencias Naturales, Consejo
Superior de Investigaciones Cientıficas, CSIC, vol 8. Madrid
14. Mitteroecker P, Gunz P (2009) Advances in Geometric Mor-
phometrics. Evol Biol 36(2):235–247
15. Mitteroecker P, Gunz P, Bernhard M, Schaefer K, Bookstein FL
(2004) Comparison of cranial ontogenetic trajectories among
great apes and humans. J Hum Evol 46(6):679–698
16. Rohlf FJ, Slice D (1990) Extensions of the procrustes method for
the optimal superimposition of landmarks. Syst Zool 39(1):40–59
17. Schmittbuhl M, Le Minor JM, Allenbach B, Schaaf A (1998)
Shape of the piriform aperture in Gorilla gorilla, Pan troglodytes,
and modern Homo sapiens: characterization and polymorphism
analysis. Am J Phys Anthropol 106(3):297–310
18. Spoor CF, Zonneveld FW, Macho GA (1993) Linear measurements
of cortical bone and dental enamel by computed tomography:
applications and problems. Am J Phys Anthropol 91(4):469–484
19. Vitte E, Guerin-Surville H, Baulac M, Cabrol C (1983) Mor-
phometric study of the piririform aperture. Bulletin de l’Associ-
ation des anatomistes 67(198):347–354
Surg Radiol Anat
123


