Embed Size (px)
Citation preview
M u It if req u e cy SAR ob wake
K.Oumansour Y.Wang J. Sail lard
Indexing term: Synthetic apwture mdaav, Ship wakes
Abstract: The authors have developed a computer simulation to model SAR (synthetic aperture radar) images of ship wakes for various configurations. The model accounts for the surface perturbation produced by a moving ship and the influence of the sea background. Electromagnetic scattering from the surface is calculated by using a tilted Bragg theoretical model in which it is assumed that the small Bragg waves are modulated by the larger scale ambient sea waves and Kelvin wake fluctuations. The simulation combines the results of hydrodynamic and radar scatter calculations to provide SAR images of the backscattering of the ship’s wake. It is shown that, in general., a high resolution SAR should perform better than a low resolution system. The decreasing resolution is one of the reasons why so few Kelvin wake observations are made in the Seasat data (1992). So the authors’ simulation uses an airborne configuration with a spatial resolution achieving a resolution cell of a few square metres. Two frequency polarised responses (L- and X-band) to the Kelvin wake embedded in the sea clutter are presented. These images show that the features are clearly resolved for at least one frequency for different polarised channels. Some of these signatures may contribute to the detection of the ship and help to extract information about it.
1 Introduction
SAR ship wake images with meaningful forms were first observed from Seasat in 1978. Some images revealed long wakes extending several kilometers aft of the ships. Since then, attention has been focused on ship wake radar signatures as a means of detecting and classifying ships [l]. There are many reasons why it is advantageous to detect the wake pattern rather than the ship itself the wake pattern is larger and more dis- tinct than the ship signature and can yield the estimate of the ship’s true location. Additionally, the ship’s wake can also yield information about the ship such as speed, travel direction, length and perhaps hull config-
0 IEE, 1996 IEE Procec&zg,~ online no. I0060402 Paper first received 22nd June 1995 and in revised fomi 22nd February 1996 The authors are with Laboratoire SEI-EP CNRS 63. IRESTE, La Chantrerie - CP 3003, 44087 Nantes Cedex 03, France
uration, which can potentially be extracted from signa- tures measured by various types of remote sensors. Detection techniques have been applied to SAR images by methods such as Radon transform [2], Hough trans- form [3] and the Dempster-Shafer algorithm [4] in ordcr to perform automated detection.
The appearance of a ship wake pattern is extremely variable and seems to fall principally into four catego- ries [5]: the Kelvin wake, the turbulent wake, wakes from internal waves and narrow V wakes with a small measured angle. Some of these features may or may not be visible in the SAR images, depending on the radar parameters, environmental conditions and also the orientation of the SAR and the ship travel direc- tions [5]. In this study we deal only with the Kelvin wake.
In addition to the polarisation aspect, there are SAR systems which sense the surface at different frequencies, simultaneously permitting a variety of spectral compo- nents of the target and phenomena evidenced by vari- ous features to be imaged. As not all types of ship wakes are visible at a given frequency, the use of two simultaneous frequencies may increase the chances of getting the Kelvin wake component at one frequency.
Little has been published on the simulation of SAR ship wakes. The formation of oceanic and Kelvin waves, with their physical characteristics. electromag- netic scattering and signal response to a SAR, are all complex fields which require further study in this appli- cation. Minimal assumptions are necessary to inake a tractable solution to the problem A main simplifying approach is to consider the global resulting scenc as a frozen surface when it is sensed by the radar.
IEE Proc.-Ruclcir, Sonar NuviX., V d 14.7. No. 4, Auxiisr I996 215
2 Kelvin wake system
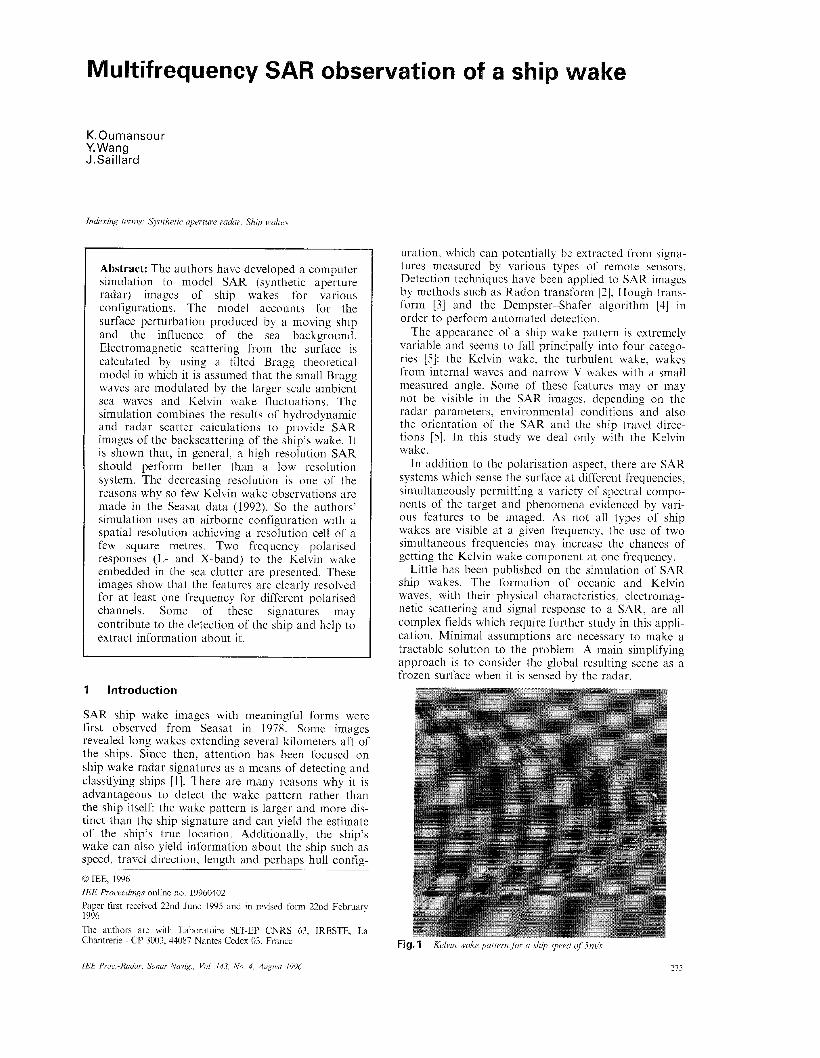
The Kelvin wake comprises a pattern of surface gravity waves astern of the ship where wave crests are oriented as in Fig. 1. The application of theory involves using Green's function to describe the flow about a point source of fluid. When combined with appropriate boundary conditions, this gives the velocity potential near the surface, and from this come the wave heights.
The free wave elevations produced by a ship travel- ling at speed V in the x direction may be written as [6]
T I 2
<(z, y) = Re A(0) exp[ko sec2 Q ( z cos Qz+i sin Qg)]dQ J' --71/2
(1) where ko = g/V2, g is the acceleration due to gravity. 8 is the direction of wave propagation with respect to the x direction, the symbol Re indicates the real part, and A(0) is the free spectrum of the ship which is a charac- teristic property of the ship. Using the thin ship approximation, the ship's hull is represented by a dis- tribution of sources located on the longitudinal cen- treplane of the vessel. According to this theory, the source strengths, proportional to the local slope of the hull, are given by [6]
wherej'is the hull equation of the ship.
is [7] Restricted to far field waves, the expression of A ( 8 )
A(Q) = - ( s e c O ) 3 H ( k o ( s e c Q ) 2 , Q ) 4k0 V ( 3 )
where H(k, 8) is the Kochin function and is expressed by [71
H ( k , 0) = o(z, y , 2) exp[k(irc cosQ+i sinQy+z)]dS (4) J S H
S,, is the ship's hull surface.
waterlines, and if it is wall-sided with draft d, then If we consider a simple hull shape with parabolic
b ( 1 ~ 2 / 1 2 ) ( -d < 2 < 0 ) ( - I < 5 < I ) ( Z < -d)
(5) where 17 is the half-beam and 1 is the half-length of the ship.
After some calculations, the resulting integral for <(x, y) is identifiable as due to the bow and stern parts of the ship. Taking into account the viscous drag effect in the generation of waves by the bow of the ship [8], the elevation expression becomes
a x , Y) = 50 ( % + I , Y ) G S o (. ~ 1 , Y) + 51 (%+ I . Y ) - Cil(. - I , Y (6)
where C is a drag coefficient and:
kol(1- exp[-kod(secO)2]) sin(h(z,y))dO
( 7 )
cos O ( I -exp[-kod(sec O)2])cos(h(m,y))d~
(8)
4b l2 -?TI2
46 l2 - n / 2
< & Y ) = w
Cl (z,y) = 7 l k p
with h(x, y) = ko(sec8)2(xcos8 + ysin8).
216
The implementation of the above theory into a usa- ble computational tool consists in finding an approxi- mation of the integral quantities. The stationary phase technique is applied to evaluate these integrals in the far field.
The calculations show the contribution of two sur- face directional waves which propagate furthest from the track, having a direction of propagation lower or higher than 8 = k 3 5 . 26" relative to the ship's heading. Waves with smaller values of 8 are referred to as trans- verse waves. They propagate in the ship's direction and have a longer and constant wavelength. The waves hav- ing larger values of 8 are called divergent waves and propagate in a direction perpendicular to the wake axis. The wavelength of these waves is a function of the half-wake angle. The area where the crests meet at the wake edge is a region of cusp waves which are of the highest amplitude in the Kelvin wake. The global resulting pattern is a function of thc hull paramctcrs and ship's speed, and is an area of interaction and pre- dominance between the transverse and divergent waves in the Kelvin system. Nevertheless, the entire wake pat- tern of the ship stays confined in a sector of -39 degrees.
A computer program has been developed which uses the analytical equations resulting from the stationary phase approximation and gives the wake pattern any- where in the (x, y ) plane. Fig. 1 illustrates the complex wave patterns that a ship travelling at speed of 5 mis will generate. One can see that, for this speed, the transverse system is predominant. We can also notice that the wavelength of the transverse waves is constant.
Slopes and the incidence provide inputs to the calcu- lation of the tilt modulation in the scattering model. The slopes are calculated by using the FFT (fast Fou- rier transform) technique.
3 Sea surface model
The classical model generally used to describe the back- scattering from the sea surface is the two-scale model; the sea surface is a superposition of two surfaces [9, lo]:
z = zg + zc (9) Surface zc(x, y ) is composed of short capillary waves
with a small wavelength, i.e. whose length is shorter than or of a size comparable to the electromagnetic wavelength used. Surface z,(x, y ) consists of gravity waves, whose dimensions are much larger. Actually, it can be demonstrated that the energy backscattered from the surface is generated solely by some of the Kb components of the sea spectrum corresponding to a sea wave which meets the following condition:
Arb = 2k sin 0 (10) where k is the electromagnetic wavenumber of the inci- dent field, and 8 is the incidence angle from the verti- cal.
This phenomenon is known as Bragg scattering and dominates between the incidence angles of 8 = 20" and 8 = 70". The two-scale model is defined such that the sea surface is made of facets tangential to the large scale structure. The backscattering is generated by the small scale structure modulated by the large scale struc- ture.
IEE Proc -Ruhr. Sonur Nuvig., Vol. 143, No 4, August 1996
3. I Small scale structure The surface zc(x, y ) is described by the spectro-angular distribution of the capillary waves. This distribution is defined by the two-dimensional Fourier transform of the surface height correlation function of the capillary wave structure; we use the Pierson spectrum for the short waves with [lo]
S C ( K 4 ) = ___ sc (K) (1 + b cos 24) 27r
where 0 is the wind direction, and SdK) and h are functions of the friction velocity of the wind.
3.2 Large scale structure There is a classical way to generate time and space real- isations as a double sum of sinusoidal components from a given energy spectrum of sea surface. A com- plete expression for a combined time-space realisation of a random sea would involve a triple sum over the wave number k, frequency CO and direction 0. However, if nonlinear interactions between wave components are neglected, the dispersion relation between wavenumber and frequency may be used to give the following dou- ble sum for the wave elevation [I 11:
zg ( T , y, f ) = y; A,, cos[lc, (x cos O3 +y sin 0,) -w,t+q5,,]
N M
z = t ,=1
(12) x and y are the horizontal directions parallel and nor- mal to the predominant wave direction, t is the time, A , is the amplitude of the (i, j ) component, 8 is the wave direction measured from the x-axis, k, is the wave number for deep water, and @q is a random phase angle uniformly distributed between (0, 2n).
For a frozen sea surface, the two-dimensional spatial realisation at a given instant is obtained by setting t = 0 in eqn. 12. The energy spectrum for the large scale adopted is that of Pierson-Moskowitz, where it is assumed to have the commonly used separable form [I 11
where G(0) is the spreading function and S,(co) is the Pierson-Moskowitz spectrum, which is a widely used one and is appropriate for fully developed seas. The expression is given by [11]:
S 9 - - -e( - -B/w") A 0.0081g2 B = (0.74g4)/U4
S,(4) = s,(@(B) (13)
A
(14) where U is the wind speed at an altitude of 19.5m above the mean sea level.
The spreading function used is the cosine squared given by [l 11:
2v Gg(6') = -[cos(Qv)]~
7r
71 IQ1
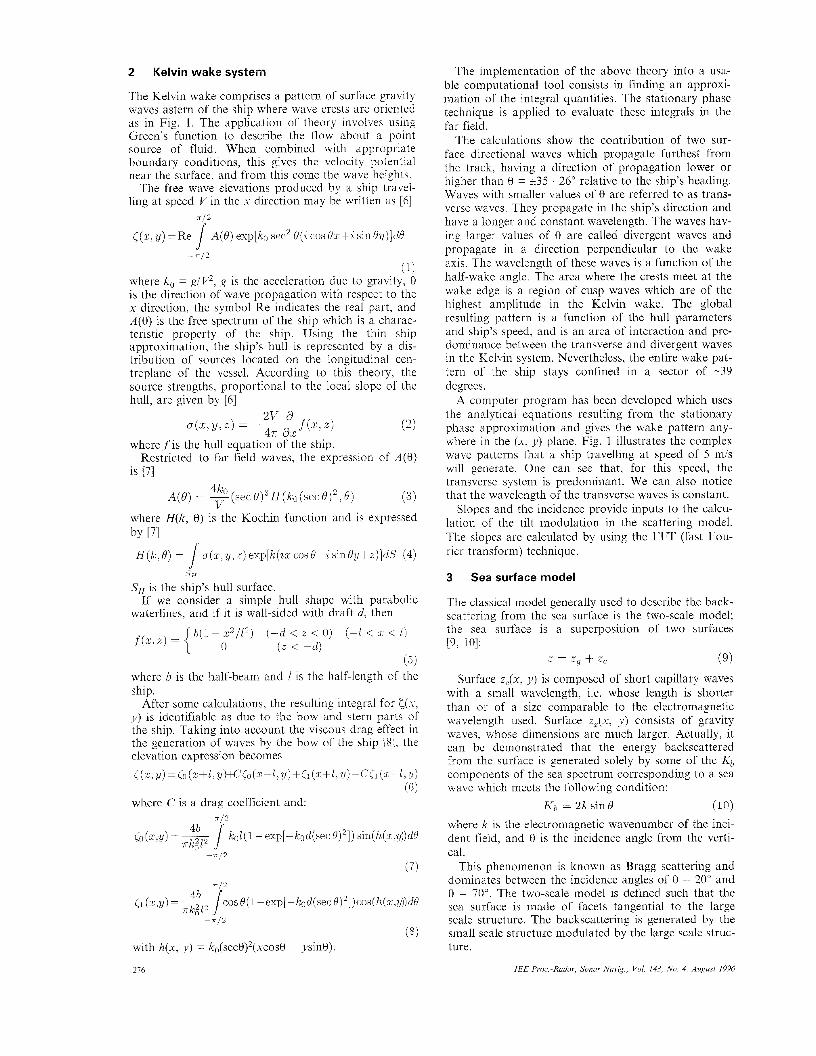
where v is a coefficient which determines the range of 0 over which the energy of the wind is spread. It seems that the simplest and most popular form of Gg(8) is with v = 1. In this case, the wind is assumed to gener- ate waves in all directions which are within 290" of the wind direction. In Fig. 2 we show a sea surface simula- tion plot for an area of 150m by 150m. The sea is at state 1 and the wind blows at 45 degrees. To take account simultaneously of the Kelvin wake and the ambient sea waves, we perform the superposition of the two height and slope distributions. To the first order,
IEC Proc -Radar. Sonar N a v g , Vol 143, No 4, August 1996
we have a linear addition of these fields. If we consider a nonstationary process, the problem consists in deal- ing with moving quantities: therefore we must consider the current-wave interactions [12].
Fig. 2 Simulated ocean surjuce for sea state I and wind direction of 45"
4 Radar scattering model
Scattering theories which are based on perturbation methods can only be applied to rough surfaces in which the amplitude of the irregularities on the surface is very small compared to the wavelength of the inci- dent electromagnetic radiation. Physical optics methods are applicable for surfaces in which the radius of curva- ture of the irregularities is very large compared with the emitted wavelength. Composite surface theory has been developed to deal with surfaces that require a hybrid theoretical approach.
A two scale Bragg scatter model is used where it is assumed that a small scale, due to a local wind, is rid- ing on the large scale waves of ocean and Kelvin wake fluctuations.
4. I Small perturbation model The following expression is used to predict the radar backscatter amplitude [ 131:
k is the radar wavelength, 0 is the angle of incidence, Kb is the water wavenumber responsible for the reso- nant scattering, of is the height variance of the small scale at resonant scattering wavenumber, and gpq are the first order scattering coefficients for horizontal and vertical polarisations. W (Kx, K,) is the two-dimen- sional normalised ocean wave spectrum density in Car- tesian co-ordinates and it is expressed in terms of ocean spectrum by [14]:
gPq = 8g,"k4(cos 1 9 ) ~ 1 g ~ ~ ( ~ W ( K b , 0) (16)
(17) Sc(K7 4) .,2W(K,fj) = -
K where SXK, @) is defined in eqn. 11.
tion are as follows [lo] The different expressions of mixed terms of polarisa-
ghh =Rh, gvv = R v + 1- - T,"- ( 3 ( tanQ)2 2
Shv == Svh = 0 (18) R, T are the Fresnel coefficients for reflection and transmission and E, is the relative dielectric constant of the sea surface.
This shows that, apart from the dielectric properties of the sea surface, the incident wavenumber, the angle of incidence, and the direction of the receiver with respect to the waves of the surface combine to settle the wave components on the surface responsible for the scattering.
211
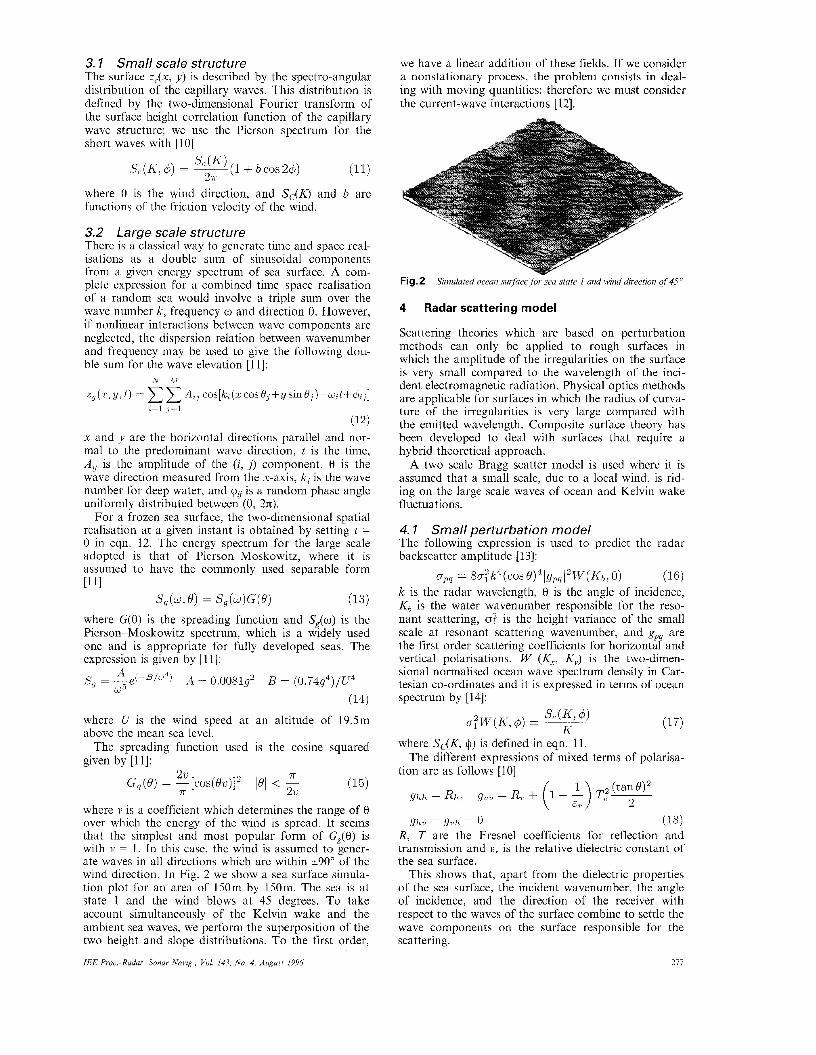
4.2 Two-scale model In this Section we present the theory concerning the tilt modulation of the small scale waves by the large scale ones. The small scale roughness is tilted in accordance with the slope distribution of the large scale roughness. This tilting effect can be accounted for by introducing one local co-ordinate system to represent the slightly rough surface scattering problem and another one for the two-scale problem as shown in Fig. 3. These two problems are related simply by a co-ordinate transfor- mation.
E’ Z
It is assumed that the two scales of roughness are generated by independent stationary processes. Let (x’. y’ , 2) be the local frame of incidence noted R‘ and (s, y , z ) the reference frame R.
The unit vector normal to the large scale surface is expressed in the R reference by
n = [-z,Do -z,Do D o ] ; (19) where Do = (1 + z: + z?)-’l2 and [AIT denotes the trans- position of [A].
Let the incidence plane wave lie in the (s, z) plane: then the incident unit vector of the propagation of the electromagnetic wave is
(20)
2’ f i 6’ = fi x f i L / l f i x iitl 2’ zz I’ x 2’ (21) and the unit vectors of polarisation are defined as: i= [O 1 01; 6 = [ - cos0 o - s i i i ~ ] ~
( 2 2 )
?‘ ii, = [ s ine O -cosQ], The unit vectors in the local frame are written:
T
h ’ = [ ~ 1 o],, 7‘ C = [ - C O S O ’ 0 - s i i i ~ ’ ] i ,
The incidence angle 0 in eqn. 16 becomes 0’ and the scattering coefficients become, after co-ordinate trans- formation [ 131:
U I l l f (0) = ( Q h J h h ( Q / ) ) + ( $ ( . % ( Q / ) )
+ (2Q;hQ;t,Reahhu, (0) ( 2 3 )
and ^ ^
Ckhiz = h.h‘ oliLv = 11.6‘ CL,), = 6.h’ CLvu = 6.6’ (27)
After some algebraic manipulations, simplifications occur and we obtain: O;h/, = act = (sine - z, cos8)Dl
with D, = [z; + (sin0 - Z , ~ C O S ~ ) ~ ] - ” ~ . The crosspolar terms are equal in the backscattering
case. because of reciprocity. It is understood that these expressions mean two averages, a statistical ensemble average over the small-scale roughness and an average over the large-scale surface waves’ slopes.
From the above results, we can understand that the tilt modulation would provide enough change in the backscatter to allow the radar to image the surface if a small roughness scale of surface waves is present, and that the crosspolar return will occur.
After simplification, the final equation is quite simple and is given by
ahv = -a,h = z,D1 ( 2 8 )
U P P ( Q ) = ( & % p ( Q ’ ) ) + (Q4hv%q(0’))
+ (2a:h&JRe%T4 (@)) (29) where p p is a mixing of copolarisation, with p p = hh, vv and PP = H H or VV,
gHL-(Q) = O \ ~ , H ( Q )
= ( ( ~ ~ h ~ ~ , , [ a h h (e’)+avv(8’) -2Recrhhuv(Q’) -2ahz,(@)])
+ (bh + 4,14@)) (30)
The integration limits of the slopes data are from -m to ~1 for zl. and from -cot0 to in the x direction, in order to avoid illuminating the rear of the tilted plane. In addition, it may happen that modulations such that K‘[, = 2ksin0’ may not satisfy the small perturbation requirements. So we ignoi-e the wavenumber contribu- tion below Kcf by setting the integrals equal to zero for K‘, lower than [15]. The value of Kd used in our simulation is K([ = Kl,13; Kh is defined in eqn. 10.
5 SAR simulation
A synthetic aperture radar which is carried by a con- stant velocity V moving platform can produce high res- olution two-dimensional images of mapped areas. The image orthogonal co-ordinates are range and cross- range (azimuth). The amplitude and phase of the received signals are collected for the duration of an integration time after which the signal is processed. High range resolution is achieved by the use of wide bandwidth transmitted pulses. High azimuth resolution is obtained by focusing, using a signal processing tech- nique, an extremely long antenna that is synthesised from the coherent phase history. By this technique, the signals collected transform the ocean surface into numerous small cells mapped in range and azimuth locus. This forms a two-dimensional SAR image which represents the electromagnetic reflectivity properties of the scene illuminated by the radar [16].
The choice of frequency of an SAR depends on many factors, some of which favour high and some low microwave frequencies. The X- and L-bands are regarded as approximate high and low frequency boundaries, respectively. The advantages and disadvan- tages depend on hardware and target reflection behav-
IEE Pro?.-Radar, Sonur Nuvig.. Vol. 143. No. 4, Augiisf 1996 218
iour to the radar frequency. However, airborne simultaneously X- and L-band SAR has been devel- oped.
To generate the appropriate wake images, the simula- tion requires the specification of a large number of radar, ship and ocean condition parameters. In simula- tion, the parameters chosen for the SAR system are for an airborne configuration.
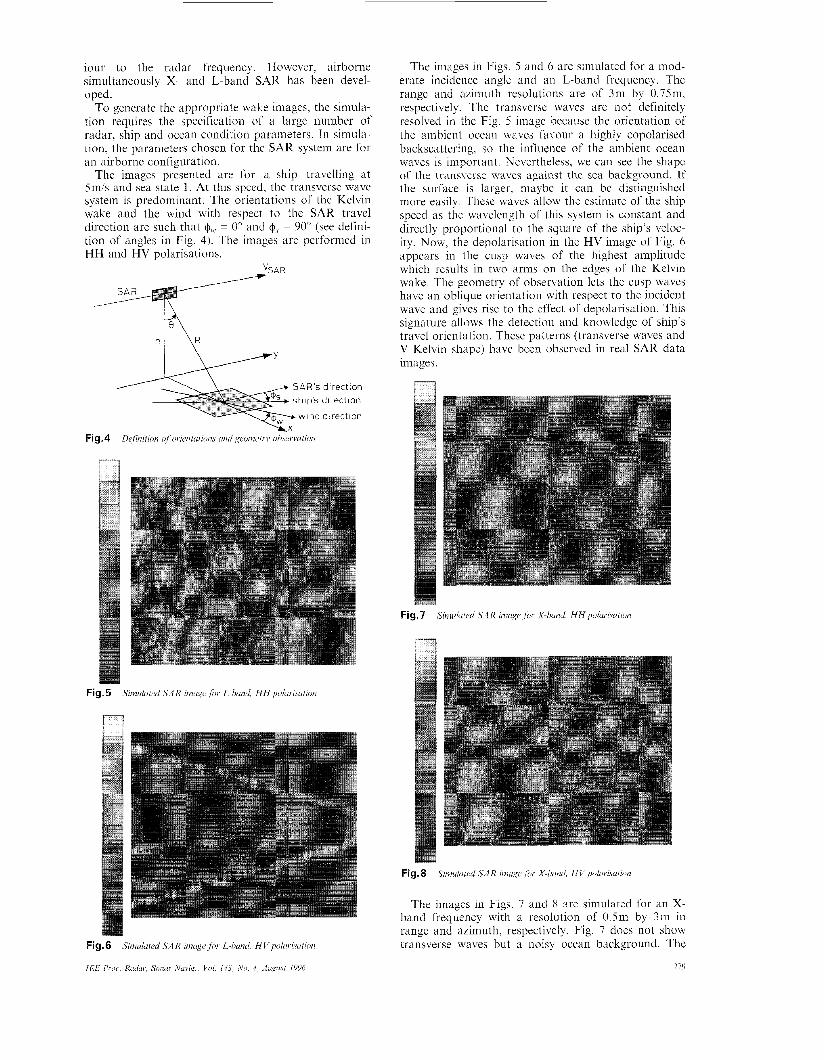
The images presented are for a ship travclling at 5m/s and sea state 1. At this speed, the transvcrse wave system is predominant. The orientations of the Kelvin wake and the wind with respect to the SAR travel direction are such that @,,. = 0" and & = 90" (see defini- tion of angles in Fig. 4). The images are performed in H H and HV polarisations.
VSAR
AR's direction hip's direction
wind direction
The images in Figs. 5 and 6 are simulated for a mod- erate incidence angle and an L-band frequency. The range and azimuth resolutions are of 3m by 0.75m, respectively. The transverse waves are not definitely resolved in the Fig. 5 image because the orientation of the ambient ocean waves favour a highly copolarised backscattering, so the influence of the ambient ocean waves is important. Nevertheless, we can see the shape of the transverse waves against the sea background. If the surface is larger, maybe it can be distinguished more easily. These waves allow the estimate of the ship speed as the wavelength of this system is constant and directly proportional to the square of the ship's veloc- ity. Now, the depolarisation in the HV image of Fig. 6 appears in the cusp waves of the highest amplitude which results in two arms on the edges of the Kelvin wake. The geometry of observation lets the cusp waves have an oblique orientation with respect to the incident wave and gives rise to the effect of depolarisation. This signature allows the detection and knowledge of ship's travel orientation. These patterns (transverse waves and V Kelvin shape) have been observed in real SAR data images.
' U X Fig. 4 Drfinition oj'orientritions and g e o / ~ t r j ' observation
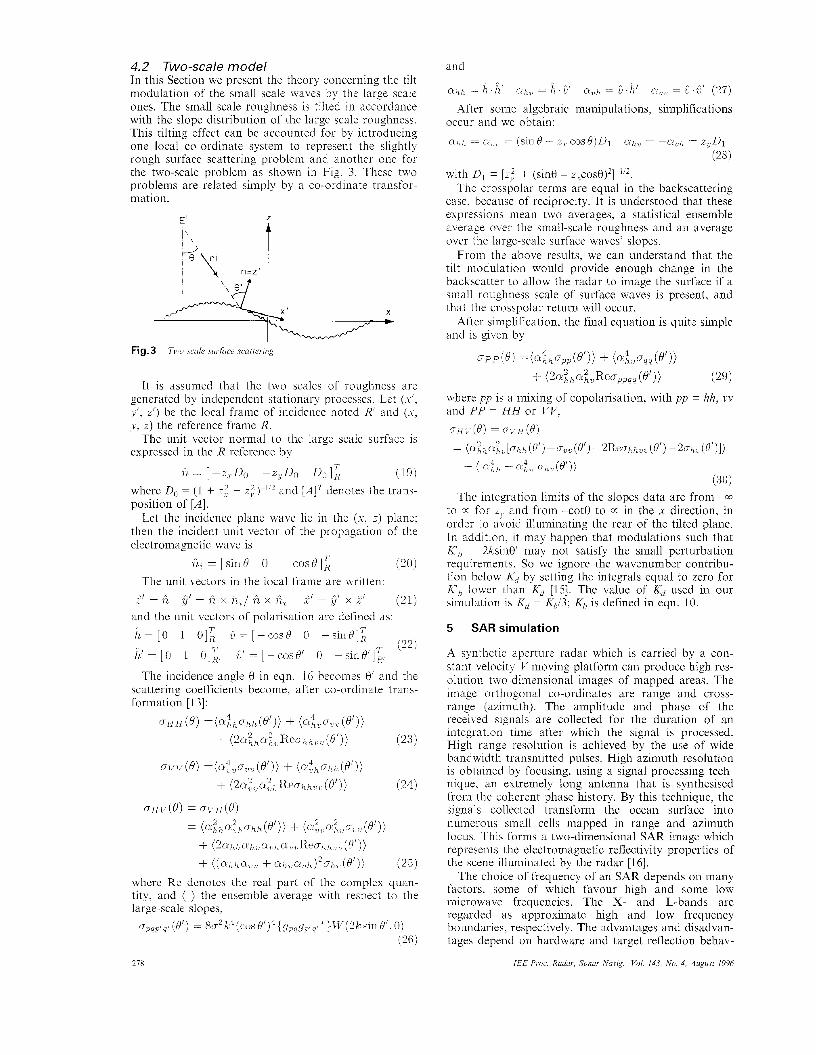
Fig. 7 Sinitdated S A X znzcige for X-bund, HIT polur iccition
The images in Figs. 7 and X are simulated for an X- band frequency with a resolution of 0.5m by 3m in range and azimuth, respectively. Fig. 7 does not show transverse waves but a noisy ocean background. The
21'1
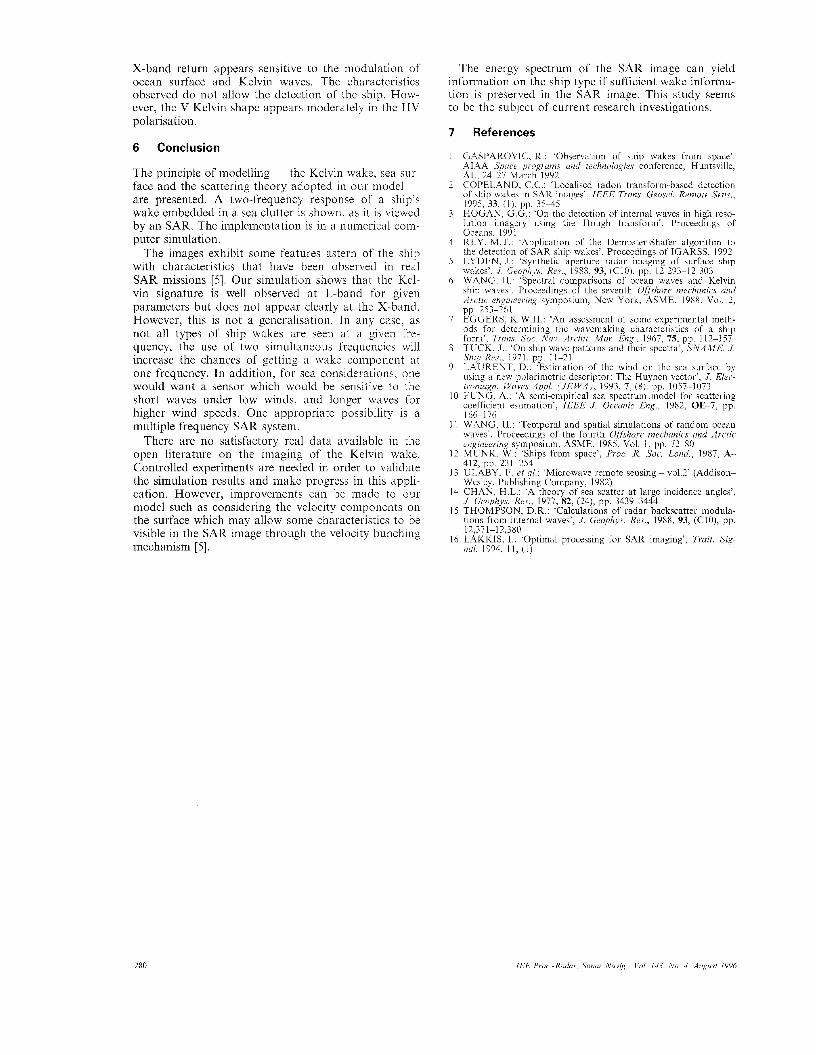
X-band return appears sensitive to the modulation of ocean surface and Kelvin waves. The characteristics observed do not allow the detection of the ship. How- ever, the V Kelvin shape appears moderately in the HV polarisation.
6 Conclusion
The principle of modelling - the Kelvin wake, sea sur- face and the scattering theory adopted in our model - are presented. A two-frequency response of a ship’s wake embedded in a sea clutter is shown, as it is viewed by an SAR. The implementation is in a numerical com- puter simulation.
The images exhibit some features astern of the ship with characteristics that have been observed in real SAR missions [5] . Our simulation shows that the Kel- vin signature is well observed at L-band for given parameters but does not appear clearly at the X-band. However, this is not a generalisation. In any case, as not all types of ship wakes are seen at a given fre- quency, the use of two simultaneous frequencies will increase the chances of getting a wake component at one frequency. In addition, for sea considerations, one would want a sensor which would be sensitive to the short waves under low winds, and longer waves for higher wind speeds. One appropriate possibility is a multiple frequency SAR system.
There are no satisfactory real data available in the open literature on the imaging of the Kelvin wake. Controlled experiments are needed in order to validate the simulation results and make progress in this appli- cation. However, improvements can be made to our model such as considering the velocity components on the surface which may allow some characteristics to be visible in the SAR image through the velocity bunching mechanism [5].
The energy spectrum or the SAR image can yield information on the ship type if sufficient wake informa- tion is preserved in the SAR image. This study seems to be the subject of current research investigations.
7
1
2
3
4
5
6
I
8
9
References
GASPAROVTC, R.: ‘Observation of ship wakes from space’. AIAA Spuce programs and technologies conference, Huntsville, AL. 2 4 2 7 March 1992 COPELAND, C.C.: ‘Localised radon ti-dnSfOrm-baSed detection of ship wakes in SAR images’, IEEE Trans. Geo.sc,i. Remoie ATens., 1995. 33. ( I ) , pp. 3 5 4 5 HOGAN, G.G.: ‘On the detection of internal waves in high reso- lution imagery using the Hough transform’. Proceedings of Oceans, 1991 REY, M.T.: ‘Application o f the Dempster-Shafer algorithm to the detection of SAR ship wakes’. Proceedings of IGARSS, 1992 LYDEN, J.: ‘Synthetic aperture radar imaging of surface ship wakes’, J . Geophys. Res., 1988, 93. (CIO), pp. 12 293-12 303 WANG. H.: ‘Spectral comparisons of ocean waves and Kelvin ship waves’. Proceedings of the seventh 0fl.khore mechanics and Arctic engineering symposium, New York, ASME, 1988, Vol. 2, pp. 253-261 EGGEKS, K.W.H.: ‘An assessment of some experimental nieth- ods for determining the wavemaking characteristics of a ship form’, Trans Soc. Nuv. Archil Mur. Eng., 1967, 75, pp. 112-157 TUCK. J.: ‘On ship wave patterns and their spectra’, S N A M E . J. Ship Res., 1971, pp. 1lL21 LAURENT, D.: ‘Estimation of the wind on the sea surface by using a new polarimetric descriptor: The Huynen vector’, J. Ebc- tromam. Wtrves Annl. f‘JEWAJ. 1993. 7 . (8). DO. 1057--1073
I O F U N 6 , A.: ‘A semi-empirical’sea spect coefficient estimation’, IEEE J. Oceanic Eng., 1982, OC7, pp. 166-1 76
11 WANG. H.: ‘Temporal and spatial simulations of random ocean waves’. Proceedings o f the fourth OjKshore mechanics und Arctic engineering symposium, ASME, 1985, Vol. I , pp, 72-80
12 MUNK, W.: ‘Ships from space’, Proc. R. Soc. Lund., 1987, A- 412, pp. 231 -254
13 ULABY, F. et al.: ‘Microwave remote sensing - vo1.2’ (Addison- Wesley, Publishing Company, 1982)
14 CHAN, H.L.: ‘A theory of sea scatter at large incidence angles’, J . Geophys. Res., 1977, 82, (24), pp. 3439-3444
15 THOMPSON, D.R.: ‘Calculations of radar backscatter modula- tions from internal waves’, J. Geophys. Res., 1988, 93, (CIO), pp. 12,371-12,380
16 LAKKIS, I.: ‘Optimal processing for SAR imaging’, Trait. Sig- nal, 1994, 11, (1)
280 IEE Proc.-Radar, Sonur Nuvig.. Vol 143, No. 4, August 1996


