Embed Size (px)
Citation preview
Robust Linearized Image Reconstruction for Multifrequency EITof the Breast
Gregory Boverman*,Member, IEEE
Tzu-Jen Kao,Member, IEEE
Rujuta Kulkarni, Bong Seok Kim,Member, IEEE
David Isaacson,Member, IEEE
Gary J. Saulnier, andSenior Member, IEEE
Jonathan C. NewellSenior Member, IEEE
AbstractElectrical impedance tomography (EIT) is a developing imaging modality that is beginning toshow promise for detecting and characterizing tumors in the breast. At Rensselaer PolytechnicInstitute, we have developed a combined EIT-tomosynthesis system that allows for thecoregistered and simultaneous analysis of the breast using EIT and X-ray imaging. A significantchallenge in EIT is the design of computationally efficient image reconstruction algorithms whichare robust to various forms of model mismatch. Specifically, we have implemented a scalingprocedure that is robust to the presence of a thin highly-resistive layer of skin at the boundary ofthe breast and we have developed an algorithm to detect and exclude from the imagereconstruction electrodes that are in poor contact with the breast. In our initial clinical studies, ithas been difficult to ensure that all electrodes make adequate contact with the breast, and thusprocedures for the use of data sets containing poorly contacting electrodes are particularlyimportant. We also present a novel, efficient method to compute the Jacobian matrix for ourlinearized image reconstruction algorithm by reducing the computation of the sensitivity for eachvoxel to a quadratic form. Initial clinical results are presented, showing the potential of ouralgorithms to detect and localize breast tumors.
© 2008 IEEE*G. Boverman is with the Information Sciences Institute, University of Southern California, 3811 N. Fairfax Drive, Arlington, VA22203 USA (e-mail: [email protected])..T.-J. Kao and J. C. Newell are with the Biomedical Engineering Department, Rensselaer Polytechnic Institute, Troy, NY 12180 USA(e-mail: [email protected]; [email protected]).R. Kulkarni and G. J. Saulnier are with the Electrical, Computer, and Systems Engineering Department, Rensselaer PolytechnicInstitute, Troy, NY 12180 USA.D. Isaacson is with the Department of Mathematical Sciences, Rensselaer Polytechnic Institute, Troy, NY 12180 USA.
NIH Public AccessAuthor ManuscriptIEEE Trans Med Imaging. Author manuscript; available in PMC 2008 October 16.
Published in final edited form as:IEEE Trans Med Imaging. 2008 October ; 27(10): 1439–1448. doi:10.1109/TMI.2008.922187.
NIH
-PA Author Manuscript
NIH
-PA Author Manuscript
NIH
-PA Author Manuscript
KeywordsBreast cancer screening; electrical impedance tomography; image reconstruction; inverseproblems
I. IntroductionTHERE has been considerable recent interest in the use of adjunctive technologies tomammography in screening for and diagnosing breast cancer. This interest is motivated bythe observation that X-ray mammography, while effective in reducing breast cancermortality [1], [2], fails to detect a considerable proportion of breast tumors [3], [4]. Inaddition, due to the relatively high false-positive rate of standard screening methods[5],many women are needlessly subjected to the physical and emotional trauma of biopsy.
Electrical impedance tomography (EIT) shows promise for a number of biomedicalapplications, including the noninvasive monitoring of pulmonary function [6], monitoring ofgastric emptying [7], functional brain imaging [8], and breast cancer detection [9]–[11], thesubject of the present study. To a great extent, current research in EIT of the breast has beenmotivated by ex vivo studies of freshly excised tissue [12] which showed significantdifferences between the impedance spectra of malignant carcinomas and those of normaltissue. Additionally, a handheld impedance-based scanning device has been developed andapproved for clinical use by the American Food and Drug Administration (FDA), withpromising initial clinical results [13].
Motivated by this work, we have developed a multifrequency impedance imaging system,the Adaptive Current Tomograph (ACT) 4 [14], [15], which operates in conjuction with anX-ray tomosynthesis instrument [16] currently being clinically evaluated at MassachusettsGeneral Hospital. Our system makes use of 60 radiolucent rectangular electrodes [17]attached to the mammography paddles on either side of the breast, in a transmissionconfiguration. We apply patterns of voltages to the electrodes and measure the resultingcurrents and voltages at each of six temporal frequencies logarithmically spaced between 3kHz and 1 MHz. Although the electrodes themselves are radiolucent, the connections to theelectrodes are visible at the edges of a number of slices of a breast’s tomosynthesisreconstruction, making it possible to accurately coregister the imaging results from thesetwo modalities. The Rensselaer ACT 4, attached to a digital tomosynthesis instrument isshown in Fig. 1(a). The radiolucent electrode arrays are detailed in Fig. 1(b).
The ACT 4 has been designed to either apply patterns of voltages to the electrodes,measuring the resulting currents, or to apply patterns of currents, measuring thecorresponding patterns of voltages. In fact, the instrument measures both the currents andvoltages on the electrodes in all instances. However, the capacitance of our radiolucentelectrode array [17] is such that it is very difficult to design current sources that willmaintain accuracy over a relatively wide range of frequencies. Thus, we instead applypatterns of voltages that maximize distinguishability [18], [19] for a rectangular,homogeneous medium. In the image reconstruction, we then synthesize the voltages that wewould have obtained, had we applied the canonical set of currents that maximizesdistinguishability. In this case, as opposed to computing the Jacobian matrix with respect tothe currents actually applied, we compute the Jacobian with respect to application of a singlecanonical set of current patterns. This canonical set, which can be precomputed, iscomprised of the eigenvectors of the Neumann-to-Dirichlet map for a rectangularparallelpiped. For measurements at each temporal frequency, we compute the best fit for thehomogeneous admittivity γ0 of the medium at that frequency, which is then the scalar
Boverman et al. Page 2
IEEE Trans Med Imaging. Author manuscript; available in PMC 2008 October 16.
NIH
-PA Author Manuscript
NIH
-PA Author Manuscript
NIH
-PA Author Manuscript
scaling factor applied to the Jacobian matrix for the measurements at the specifiedfrequency. Finally, the forward model which we use is much easier to implement if weconsider the mapping between a Neumann boundary condition and Dirichlet measurements.
If EIT of the breast is to have real clinical utility, then algorithms must be developed whichare computationally efficient and which are robust to the types of noise and modeling erroractually encountered in practice. Two specific forms of modeling error that we have foundto be of great importance in analyzing EIT data are: electrodes which make poor contactwith the breast and the reconstruction of objects embedded in a layered structure. For theformer problem, we have developed a data screening procedure to automatically detectelectrodes which make poor contact with the breast and exclude data from these electrodesfrom use in the image reconstruction. In order to mitigate the effect of a thin, highly resistiveskin layer, we make use of a scaling procedure which effectively calculates a differentcomplex admittivity for each current pattern. Since we use a canonical set of voltagepatterns, which probe the breast using patterns of varying spatial frequency, the proportionto which each pattern is influenced by the skin is different. Patterns of higher spatialfrequency tend to see the medium as being more resistive overall, particularly at lowertemporal frequencies, at which the skin is more resistive.
We have previously reported the use of the complete electrode model in the mammographyconfiguration [20], solving the forward problem using the Galerkin method. Here, however,we use the ave-gap mode [21]–[23] to model the voltages on the electrodes due to a givencurrent pattern. The motivation for the selection of the ave-gap model is that, in therectangular geometry, we are able to compute the potential inside of the medium and thevoltages on the electrodes extremely rapidly, suitable for a real-time implementation. Inaddition, in the complete electrode model it is necessary to estimate the surface impedanceof each electrode, a problem we will leave for a future publication.
Using the ave-gap model, then, we are then able to compute the forward model analytically.Likewise, we can analytically compute the Jacobian matrix relating the measurements to thespatial distribution of conductivity. We also present a novel approach which allows us tocompute this Jacobian matrix in a computationally efficient manner, as compared to thatpresented in [21], with the matrix element for each set of current patterns for a given voxelcomputed as a quadratic form. Experimental results from a homogeneous breast-shapedphantom containing an inclusion at several different locations clearly show the utility of ouranalytical approximation.
Finally, we have used our algorithms for the analysis of clinical EIT measurements fromhuman subjects. We present a novel multispectral parameter which shows promise fordetecting and localizing malignant carcinomas in a limited sample of subjects.
II. MethodsA. Forward Modeling
In the quasi-static approximation, Maxwell’s equations can be simplified such that thepotential, u satisfies the following condition in the interior of a source-free region with finitecomplex admittivity γ
(1)
We attach electrodes to the two plates used to apply pressure to the breast duringmammography. As the electrode array is generally smaller than the breast, we are able to
Boverman et al. Page 3
IEEE Trans Med Imaging. Author manuscript; available in PMC 2008 October 16.
NIH
-PA Author Manuscript
NIH
-PA Author Manuscript
NIH
-PA Author Manuscript
successfully model the breast as a homogeneous rectangular parallelpiped whose boundariesextend 2 cm beyond the boundaries of the electrode array, as depicted in Fig. 2.
The resulting partial differential equation which we solve is then
(2)
where and denote the current densities at the top and bottom planes, respectively, and vis the unit outward normal to the body.
Using separation of variables and assuming that γ is constant, it is easy to see that thesolution to (2) can be written as an infinite series, which we truncate to a finite number ofterms
(3)
where an,m = 0, bn,m = 0, N is the number of Fourier terms in our Fourier approximation,and
where n, m = 0, 1, 2,..., N.
In the ave-gap model [21], we assume that the current density is uniformly distributed overthe electrode region and that it is zero outside of the support of all of the electrodes
(4)
where is the area of the ℓth electrode, Iℓ is the current applied, and L is the number ofelectrodes.
We are then able to derive explicit formulas for the coefficients b0, an,m,, and bn,m in (3) forall current patterns, as described in [21].
B. Linearized Reconstruction and Measurement ScalingIn our image reconstruction, we make use of the approach taken in [24] and [21] where theassumption is made that the admittivity γ within the medium differs only slightly from aconstant admittivity γ0. The linearization method follows from the identity, which arises byan application of the divergence theorem
(5)
Boverman et al. Page 4
IEEE Trans Med Imaging. Author manuscript; available in PMC 2008 October 16.
NIH
-PA Author Manuscript
NIH
-PA Author Manuscript
NIH
-PA Author Manuscript

where η≡γ—γ0. The subscripts α and β denote pairs of current patterns. In order toreconstruct an image of the admittivity, we apply K linearly independent patterns, where it isgenerally true that K = L — 1. The term on the left-hand side of (5) represents the datamatrix
(6)
where Uℓ,α (γ0) is the forward solution for a homogeneous complex admittivity γ0 andVℓ,α(γ) is the experimental data, both corresponding to current pattern α. Alternatively, wecan write the data matrix as follows:
(7)
where Uℓ,α (1) is the voltage on electrode ℓ due to pattern β for a medium with conductivity 1S/m.
In order to estimate the optimal constant admittivity about which to perturb, we introduce
the residual, . We can find a closed-form expression for the value of γ0that minimizes E by differentiation.
In [25], a method was introduced to compensate for the different effective admittivities“seen” by each current pattern. In this method, we replace γ0 in (6) and (7) by a current-pattern-specific admittivity, γ0,β as follows:
(8)
It is still possible to compute a closed-form solution for the optimizing value of γ0,β foreach current pattern β by differentiation.
In the linearized reconstruction, we replace ∇uα (γ) in (5) with ∇uα (γ0). Discretizing by
setting where ϰs (p) is the characteristic function of ηs voxel, we than have
(9)
(10)
where J is the Jacobian of the forward model with respect to a small perturbation inadmittivity, Ωs is the spatial extent of voxel s, and Ns is the total number of voxels.
We then obtain the solution of the regularized linear inverse problem as
(11)
Boverman et al. Page 5
IEEE Trans Med Imaging. Author manuscript; available in PMC 2008 October 16.
NIH
-PA Author Manuscript
NIH
-PA Author Manuscript
NIH
-PA Author Manuscript

where r1 and r2 are regularization parameters for NOSER-type and Tikhonov regularization,respectively, and we have reordered Dα,β and Jsα,β into the vector D and the matrix J ofsizes K2 × 1 and K2 × Ns, respectively.
C. Efficient Computation of the Jacobian MatrixHere we are concerned with the efficient computation of the Jacobian matrix (10) used in theimage reconstruction. The approach described here is a simplification of the approach givenin [21]. In our experimental work, we decompose the region being reconstructed intorectangular voxels, but, with some modifications, the method described below is applicableto voxels with other shapes as well.
We rewrite (10) as
(12)
If we interchange the order of summation of integration, we can write the contributions tothe Jacobian matrix of the gradients in the x,y, and z directions, respectively
(13)
(14)
Boverman et al. Page 6
IEEE Trans Med Imaging. Author manuscript; available in PMC 2008 October 16.
NIH
-PA Author Manuscript
NIH
-PA Author Manuscript
NIH
-PA Author Manuscript
(15)
and
(16)
Next, we notice that each summation over n, m, n′, m′ is a quadratic form, and thus we canrewrite Jx (α, β, i, j, k), Jy (α, β, i, j, k), and Jz (α, β, i, j, k) as follows:
(17)
(18)
(19)
where
Boverman et al. Page 7
IEEE Trans Med Imaging. Author manuscript; available in PMC 2008 October 16.
NIH
-PA Author Manuscript
NIH
-PA Author Manuscript
NIH
-PA Author Manuscript
(20)
and:
(21)
(22)
For each voxel, we precompute the matrices Ac,c, Ac,s, As,c, As,s and the vectors Na and Nbwhere
(23)
(24)
(25)
(26)
These matrices and vectors can be quickly populated if we precompute the integrals, (16) forall i, j, k. Finally, we compute J(α, β, i, j, k) for voxel (i, j, k) and each pair of currentpatterns as
(27)
Thus, for each voxel, the Jacobian for a given pair of current patterns can be easilycomputed as a set of matrix-vector and scalar multiplies.
D. Detection of Poorly Contacting ElectrodesIn our initial clinical experiments, we found that it was quite difficult to ensure that allelectrodes make sufficiently good contact with the breast. Quite often it was the case thatsome subset of the electrodes experienced a relatively high impedance, perhaps due to localvariation in the pressure applied to different portions of the breast under compression. If thegap model is used, these high-impedance interfaces tend to produce low-admittivity artifactsin the reconstructed images.
Boverman et al. Page 8
IEEE Trans Med Imaging. Author manuscript; available in PMC 2008 October 16.
NIH
-PA Author Manuscript
NIH
-PA Author Manuscript
NIH
-PA Author Manuscript
Our approach is to use an automated criterion to detect poorly contacting electrodes, byconsidering the relative error of the voltages actually measured on these electrodes, ascompared to the voltages that would have been expected given a homogeneous medium andthe gap model. Those electrodes which meet or exceed a given threshold for the relativeerror are excluded from the image reconstruction, where the exclusion is accomplished byreplacing the measured data from these electrodes with data generated by the ave-gap modelapplied to a homogeneous medium.
In order to detect electrodes making insufficiently good contact with the breast, we computethe following error metric for each electrode:
(28)
where Uℓ,α (1) is the voltage on electrode ℓ for current pattern α for a region with aconductivity of 1 S/m, Vℓ,α is the measured on electrode ℓ, and where γ0 is chosen tominimize the numerator of this expression.
Our strategy in ameliorating errors from poorly contacting electrodes is to replace measureddata from these electrodes with values that we would have expected, given a homogeneousgap model. In order to accomplish this, we replace (5) with the following expression:
(29)
where B is the set of electrodes for which E(ℓ) is greater than a predetermined threshold,70%.
III. Electrical Impedance Spectroscopy of the BreastMotivated by previous research in the area of electrical impedance spectroscopy [12], wemade electrical impedance measurements of the breast at each of six discrete,logarithmically spaced, frequencies from 3 kHz to 1 MHz. Using the methods described inthis paper, we compute linearized reconstructions of the complex admittivity at each of thesefrequencies.
We plot the imaginary component of the admittivity versus the real component,parameterized by frequency, for each voxel within the breast, denoting the result as an “EISplot.” We have examined a number of derived parameters, which condense the informationwithin this EIS plot for each voxel into a single figure of merit. At present, a particularlypromising derived parameters is the linear correlation metric (LCM), which essentially is anonlinear transformation that quantifies the resemblance of the EIS plot to a straight line. Inorder to compute the LCM, we first compute the best least-squares fit for a linearrelationship between the conductivity σ and the absolute permittivity ∈ for each point inspace for which we compute a reconstruction
(30)
Boverman et al. Page 9
IEEE Trans Med Imaging. Author manuscript; available in PMC 2008 October 16.
NIH
-PA Author Manuscript
NIH
-PA Author Manuscript
NIH
-PA Author Manuscript

where σ is a vector composed of the reconstructed conductivities at all frequencies for whichwe collect data and 1 is the vector: [1 1 ... 1]T. Here, we are fitting for the parameters a andb. We then compute the LCM at each point in space by applying a nonlinear transformationof the correlation between the reconstructed and linearly predicted permittivities, ∈ being avector of the reconstructed permittivities
(31)
We display the LCM in the center layer of the reconstructed image alongside the centralslice of the tomosynthesis reconstruction.
IV. Results and DiscussionHere, we evaluate the algorithms presented for experimental data acquired in a breast-shaped tank filled with conductive saline solution and for a single clinical research subject.
A. Saline Phantom Experiments and Simulation StudyWe conducted simulation studies to examine whether the simplified linearized methods andgeometry described in this paper can compensate for significant sources of model mismatchlikely to be encountered in practice. To this end, we used the complete electrode model,generating the forward data using the Galerkin method [20]. We assumed the presence ofnontrivial electrode surface impedances (10-3 Ωm). We simulated a medium withbackground admittivity 1.0 S/m and containing a 1 cm3 inclusion with admittivity 10.0 S/m.We also assumed the presence of a thin layer of “skin” of thickness 2 mm directly beneaththe electrodes, with admittivity 0.1 S/m. The reconstruction in which we do not introduce anindividual effective impedance, γ0,β for each current pattern β [i.e., utilizing (6)], results ina wide dynamic range and nearly no evidence of the target [Fig. 4(a)]. In contrast, thereconstruction making use of (8) [Fig. 4(b)] reduces the dynamic range of the reconstructionand displays the target clearly and the true location of the inclusion and its contrast areshown in Fig. 4(c). We see that introducing an independent scaling factor for each currentpattern significantly reduces the image artifacts present in the reconstruction when we havemodel mismatch due to the presence of skin and the use of a less accurate electrode model.
We further explored this issue with an experimental study, using the ACT 4 to makemeasurements in a breast-shaped saline tank, shown in Fig. 3. The phantom is constructedfrom plexiglass with a shape intended to simulate the breast under compression. The planarelectrode arrays, each of which contains five rows of six electrodes each, are located on thefront and back side walls, which correspond to the top and bottom electrode arrays of themammography geometry model in Fig. 2(a). The size of each electrode is 10 × 10 mm, andthe width of the gap between adjacent electrodes is 1 mm. In our forward modeling, weassume a cube with the following dimensions: 75(h1) × 86(h2) × 42(h3) mm, where h3 is thedepth of the phantom, thus assuming a border of 10 mm at each edge of our electrode array.Here, we show reconstructions for data acquired at 10 kHz but the results for other temporalfrequencies in the saline tank are very similar. We placed a 1 cm3 conducting inclusion nearelectrode 8, which is the second electrode from the left in the second row of Fig. 2(b), at adepth of approximately 1 cm. The phanton was filled with saline solution with aconductivity of 64 mS/m. Fig. 5 illustrates the importance of data scaling in the imagereconstruction, where, by scaling, we mean the use of Dα,β in the image reconstructionobtained using (8), as opposed to using (6). Fig. 5(a) shows the image reconstruction withoutscaling applied, while Fig. 5(b) depicts that, when scaling is used, the target becomes muchmore clearly visible. For the purpose of comparison, a difference-imaging reconstruction,
Boverman et al. Page 10
IEEE Trans Med Imaging. Author manuscript; available in PMC 2008 October 16.
NIH
-PA Author Manuscript
NIH
-PA Author Manuscript
NIH
-PA Author Manuscript
using the saline tank without the presence of the inclusion as a reference, is shown in Fig.5(c). In all cases, the Jacobian matrix was created using the methods described in Section II-C, with N = 31 in the x and y directions, for a total of 2049 basis functions used to representthe potential resulting from the application of each current pattern. Thus, we observe thatintroducing a different scaling factor for each current pattern in the image reconstructionimproves our ability to detect and localize targets. A possible explanation for thisphenomenon is that we can compensate for electrode effects, which are not explicitlymodeled by the ave-gap formulation, by applying this scaling approach.
We next consider the problem of detecting and compensating for the presence of poorlycontacting electrodes. In order to test for this condition experimentally, we partiallyoccluded a single electrode, electrode 10, by covering a large portion of its surface withinsulating tape, as shown in Fig. 6. The effect of this electrode on the measured voltages isshown in Fig. 7. Fig. 7(a) shows the measured (depicted as a dashed line) and expected(depicted as a solid line) voltages corresponding to a current pattern which imposes the samepositive current on all of the bottom electrodes (electrodes 1–30) and the same negativecurrent on all of the top electrodes (electrodes 31–60). A significant discrepancy betweenthe two patterns of voltages is observed for electrode 10. In Fig. 7(b), we display E(ℓ) ascomputed for all electrodes, using (28). For electrode 10, the electrode norm error is greaterthan 90%, while for all other electrodes E(ℓ) is lees than 11%.
To experimentally validate our electrode contact compensation procedure, we partiallyoccluded electrode 10 and placed a 1 cm3 conducting inclusion into a homogeneous saline-filled tank at a depth of approximately 1 cm near electrode 13, at the center left of theelectrode array. The linearized reconstruction of the conductivity, using measurements madeat 30 kHz and utilizing all of the measurements, is shown in Fig. 8(a). We notice that thereconstruction is dominated by a large negative artifact near the occluded electrode 10. InFig. 8(b), we have computed the reconstruction using the compensation procedure in (29).We observe in this case that the artifact previously observed near electrode 10 is largelyabsent. The difference-imaging reonstruction shown in Fig. 8(c) is used to illustrate theactual target location and closely resembles the reconstruction in Fig. 8(b). Thus, we havedeveloped a technique for mitigating the effect of a partially noncontacting electrode, acondition which we have frequently observed in our clinical studies.
B. Clinical ResultsHere, we consider the use of the algorithms described in this paper for the analysis of humansubject electrical impedance measurements. First, Fig. 9 shows the significance of poorelectrode contact as a problem in the analysis of some data obtained in a clinical setting. Fig.9(a) compares the actual, measured voltages obtained as a result of a particular input currentpattern, to those expected given an gap model. A significant discrepancy is observed forelectrode 30, a discrepancy which is quantified as a large peak in the value of E(ℓ) for thiselectrode, shown in Fig. 9(b).
We made use of the algorithms described in this paper to analyze the electrical impedancedata from the left breast of a clinical imaging subject. Upon examination by biopsy, thisbreast was discovered to contain ductal carcinoma in situ (DCIS) as well as invasive ductalcarcinoma. The results for the electrical impedance spectral analysis are shown in Fig. 10. Aslice of the Tomosynthesis reconstruction, superimposed with the position of the electrodearrays, is depicted in Fig. 10(a). We display an image of the derived LCM spectralparameter for the region under the grid in Fig. 10(a) and (b). The region containing highvalues of the LCM parameter corresponds quite well to the region of the breast assessed asbeing abnormal by mammographic examination. Finally, the electrical impedance spectrafor two voxels, one within the region identified by the radiologist to contain an invasive
Boverman et al. Page 11
IEEE Trans Med Imaging. Author manuscript; available in PMC 2008 October 16.
NIH
-PA Author Manuscript
NIH
-PA Author Manuscript
NIH
-PA Author Manuscript
carcinoma and one within a presumed normal region of the breast are shown in Fig. 10(c). Astriking difference between the two spectra is noted, with the voxel within the abnormalregion of the breast having an EIS spectrum which much more closely resembles a straightline than that of the spectrum for the voxel within the presumably normal region.
V. Conclusion and Future WorkIn this paper, we have described and implemented algorithms for the linearizedreconstruction of conductivities within the breast given external measurements of thevoltage and currents on a discrete set of electrodes in direct contact with the surface of thebreast in a mammography configuration. An analytical forward model and an efficientmethod for computing the Jacobian matrix linking the measurements to the internalconductivities have been described. In addition, algorithms improving the robustness of thereconstruction to modeling error have been introduced and implemented. Specifically, weshow the utility of making use of a different effective conductivity for the reconstruction ofdata from each applied current pattern and develop an algorithm for the automatic detectionof poorly contacting electrodes as well as the mitigation of these electrodes’ effects on thereconstruction. Lastly, we demonstrate the utility of the methods described here for thereconstruction of data from a human subject found to have breast cancer. In the future, weplan to compare the methods described here to fully nonlinear reconstruction approaches, todetermine if the very high computational cost of the latter is justified. We also plan toinvestigate the use of the complete electrode model and spectral parameters other than theLCM.
AcknowledgmentsThis work was supported in part by the National Science Foundation under Grant EEC-9986821 and in part by theNational Institute of Biomedical Imaging and Bioengineering under Grant R01-EB000456-02. Asterisk indicatescorresponding author.
References[1]. Berry DA, Cronin KA, Plevritis SK, Fryback DG, Clarke L, Zelen M, Mandelblatt JS, Yakovlev
AY, Habbema J, Feuer EJ. Effect of screening and adjuvant therapy on mortality from breastcancer. New Eng. J. Med. 2005; 353:1784–1792. [PubMed: 16251534]
[2]. Olsen AH, Njor SH, Vejborg I, Schwartz W, Dalgaard P, Jensen MB, Tange UB, Blichert-Toft M,Rank F, Mouridsen H, Lynge E. Breast cancer mortality in copenhagen after introduction ofmammography screening: Cohort study. Br. Med. J. 2005; 330:220–224. [PubMed: 15649904]
[3]. Bird R, Wallace T, Yankaskas B. Analysis of cancer missed at screening mammography.Radiology. 1992; 184:613–617. [PubMed: 1509041]
[4]. Coveney EC, Geraghty JG, o’Laoide R, Hourihane JB, O’Higgins NJ. Reasons underlyingnegative mammography in patients with palpable breast cancer. Clin. Radiol. 1994; 49(2):123–125. [PubMed: 8124890]
[5]. Elmore JG, Barton MB, Moceri VM, Polk S, Arena PJ, Fletcher SW. Ten-year risk of falsepositive screening mammograms and clinical breast examinations. New England J. Med. 1998;338:1089–1096. [PubMed: 9545356]
[6]. Leathard AD, Brown BH, Campbell JH, Morice FZAH, Taylor D. A comparison of ventilatoryand cardiac related changes in EIT images of normal human lungs and of lungs with pulmonaryemboli. Physiol. Meas. 1994; 15(2A):A137–A146. [PubMed: 8087036]
[7]. Nour S, Mangnall YF, Dickson JA, Johnson AG, Pearse RG. Applied potential tomography in themeasurement of gastric emptying in infants. J. Pediatric Gastroenterol. Nutrition. 1995; 20(1):65–72.
[8]. Tidswell T, Gibson A, Bayford RH, Holder DS. Three-Dimensional electrical impedancetomography of human brain activity. NeuroImage. 2001; 13:283–294. [PubMed: 11162269]
Boverman et al. Page 12
IEEE Trans Med Imaging. Author manuscript; available in PMC 2008 October 16.
NIH
-PA Author Manuscript
NIH
-PA Author Manuscript
NIH
-PA Author Manuscript
[9]. Soni N, Hartov A, Kogel C, Poplack SP, Paulsen KD. Multifrequency electrical impedancetomography of the breast: New clinical results. Physiol. Meas. 2004; 25:301–314. [PubMed:15005324]
[10]. Kerner TE, Paulsen KD, Hartov A, Soho SK, Poplack SP. Electrical impedance spectroscopy ofthe breast: Clinical imaging results in 26 subjects. IEEE Trans. Med. Imag. 2006; 21(6):638–645.
[11]. Cherepenin V, Karpov A, Korjenevski A, Kornienko V, Mazaletskaya A, Mazourov D, MeisterD. A 3D electrical impedance tomography (EIT) system for breast cancer detection. Physiol.Meas. 2001; 22:9–18. [PubMed: 11236894]
[12]. Jossinet J. The impedivity of freshly excised human breast tissue. Physiol. Meas. 1998; 19:61–75.[PubMed: 9522388]
[13]. Malich A, Fritsch T, Anderson R, Boehm T, Freesmeyer MG, Fleck M, Kaiser WA. Electricalimpedance scanning for classifying suspicious breast lesions: First results. Eur. Radiol. 2000;10(10):1555–1561. [PubMed: 11044924]
[14]. Saulnier G, Liu N, Tamma CP, Xia H, Kao T-J, Newell J, Isaacson D. An electrical impedancespectroscopy system for breast cancer detection. Proc. 29th Int. Conf. IEEE Eng. Med. Biol. Soc.2007; (Aug.):4154–4157.
[15]. Liu, N.; Saulnier, GJ.; Newell, JC.; Isaacson, D.; Kao, T-J. ACT4: A high-precision, multi-frequency electrical impedance tomograph. presented at the 6th Conf. Biomed. Appl. ElectricalImpedance Tomogr.; London, U.K.. Jun. 2005;
[16]. Niklason LT. Digital tomosynthesis in breast imaging. Radiology. 1997; 205:399–406. [PubMed:9356620]
[17]. Kao T-J, Saulnier GJ, Xia H, Tamma C, Newell JC, Isaacson D. A compensated radiolucentelectrode array for combined EIT and mammography. Physiol. Meas. 2007; 28:S291–S299.[PubMed: 17664644]
[18]. Isaacson D. Distinguishability of conductivities by electric current computed tomography. IEEETrans. Med. Imag. 1986; MI-5(2):92–95.
[19]. Kao T-J, Newell JC, Saulnier GJ, Isaacson D. Distinguishability of inhomogeneities using planarelectrode arrays and different patterns of applied excitation. Physiol. Meas. 2003; 24:403–411.[PubMed: 12812425]
[20]. Kim BS, Boverman G, Newell JC, Saulnier GJ, Isaacson D. The complete electrode model forEIT in a mammography geometry. Physiol. Meas. 2007; 28(7):S57–S69. [PubMed: 17664648]
[21]. Choi MH, Kao T-J, Isaacson D, Saulnier GJ, Newell JC. A reconstruction algorithm for breastcancer imaging with electrical impedance tomography in mammography geometry. IEEE Trans.Biomed. Eng. 2007; 54(4):700–710. [PubMed: 17405377]
[22]. Somersalo E, Cheney M, Issacson D. Existence and uniqueness for electrode models for electriccurrent computed tomography. SIAM J. Appl. Math. 1992; 52:1023–1040.
[23]. Cheng K, Isaacson D, Newell J, Gisser D. Electrode models for electrical current computedtomography. IEEE Trans. Biomed. Eng. 1989; 36(9):918–924. [PubMed: 2777280]
[24]. Mueller JL, Isaacson D, Newell JC. A reconstruction algorithm for electrical impedancetomography data collected on rectangular electrode arrays. IEEE Trans. Biomed. Eng. 1999;46(11):1379–1386. [PubMed: 10582423]
[25]. Kao T-J, Kim BS, Isaacson D, Newell JC, Saulnier GJ. Reducing boundary effects in static EITimaging. Physiol. Meas. 2006; 27(May):S13–S23. [PubMed: 16636405]
Boverman et al. Page 13
IEEE Trans Med Imaging. Author manuscript; available in PMC 2008 October 16.
NIH
-PA Author Manuscript
NIH
-PA Author Manuscript
NIH
-PA Author Manuscript
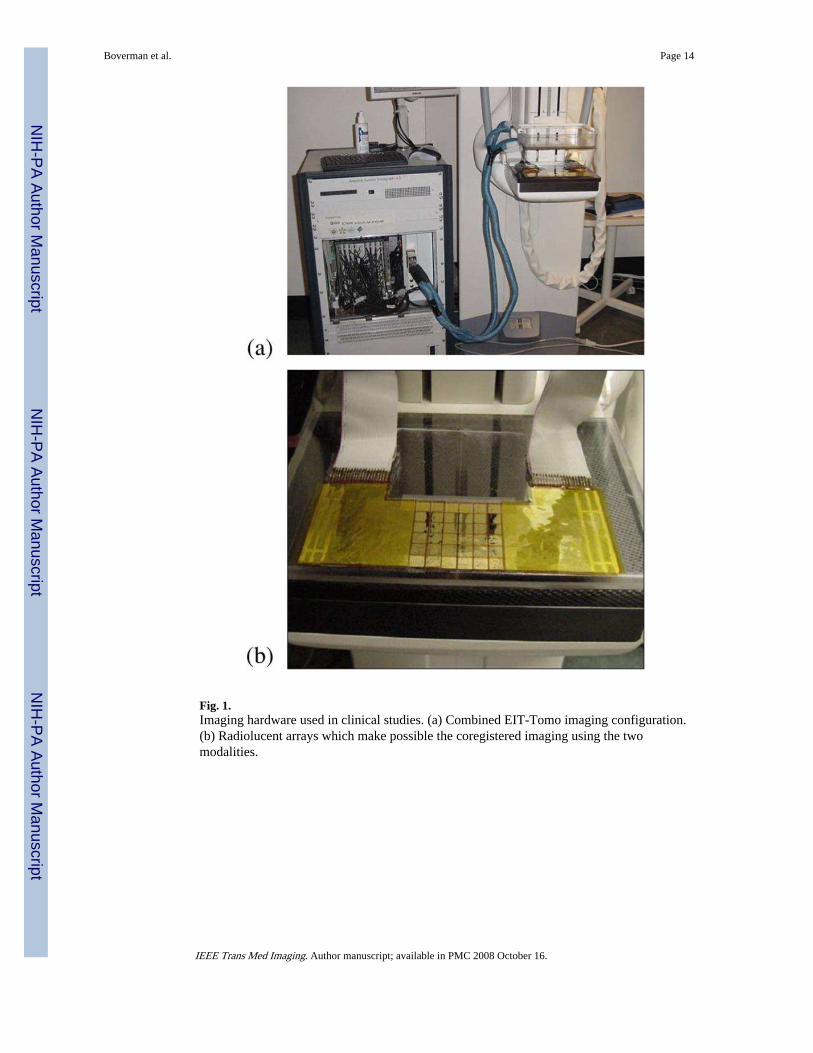
Fig. 1.Imaging hardware used in clinical studies. (a) Combined EIT-Tomo imaging configuration.(b) Radiolucent arrays which make possible the coregistered imaging using the twomodalities.
Boverman et al. Page 14
IEEE Trans Med Imaging. Author manuscript; available in PMC 2008 October 16.
NIH
-PA Author Manuscript
NIH
-PA Author Manuscript
NIH
-PA Author Manuscript
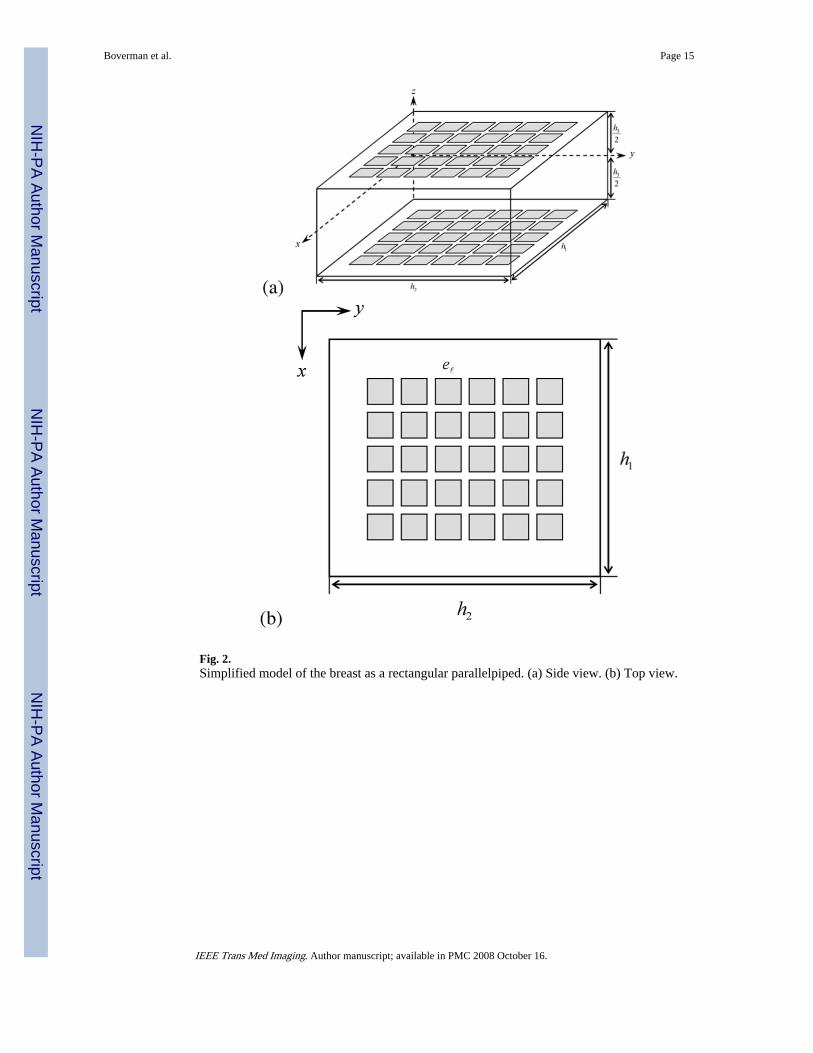
Fig. 2.Simplified model of the breast as a rectangular parallelpiped. (a) Side view. (b) Top view.
Boverman et al. Page 15
IEEE Trans Med Imaging. Author manuscript; available in PMC 2008 October 16.
NIH
-PA Author Manuscript
NIH
-PA Author Manuscript
NIH
-PA Author Manuscript
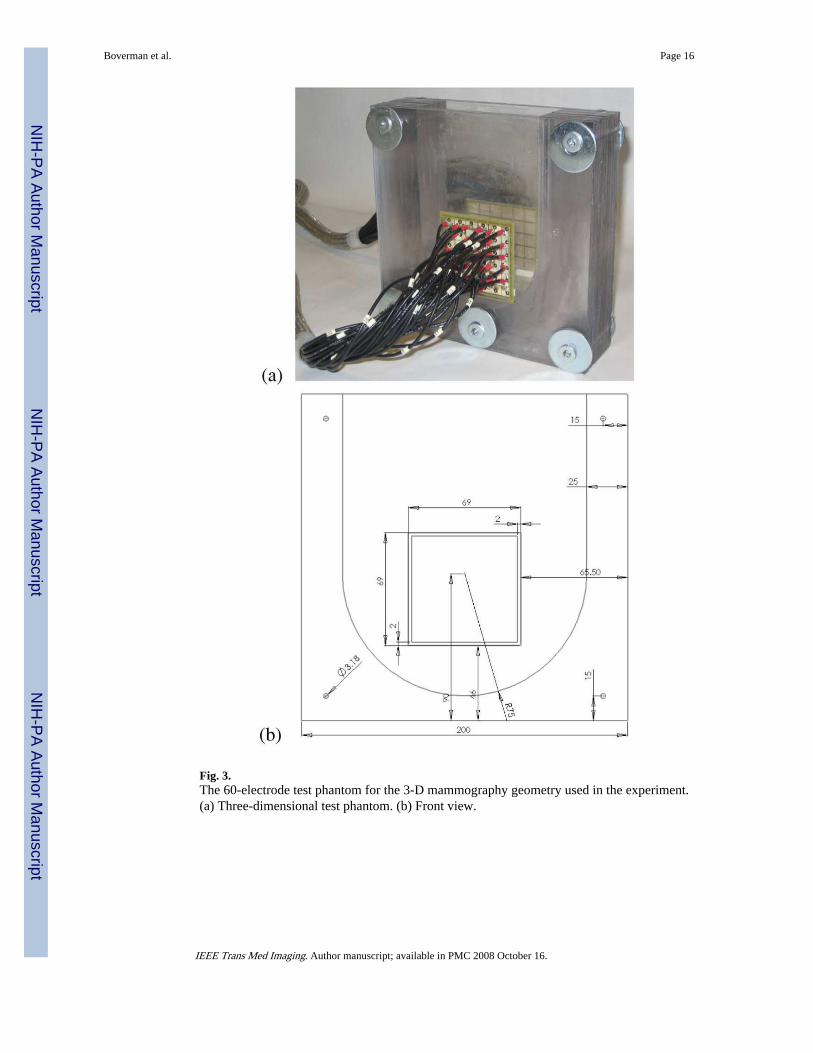
Fig. 3.The 60-electrode test phantom for the 3-D mammography geometry used in the experiment.(a) Three-dimensional test phantom. (b) Front view.
Boverman et al. Page 16
IEEE Trans Med Imaging. Author manuscript; available in PMC 2008 October 16.
NIH
-PA Author Manuscript
NIH
-PA Author Manuscript
NIH
-PA Author Manuscript
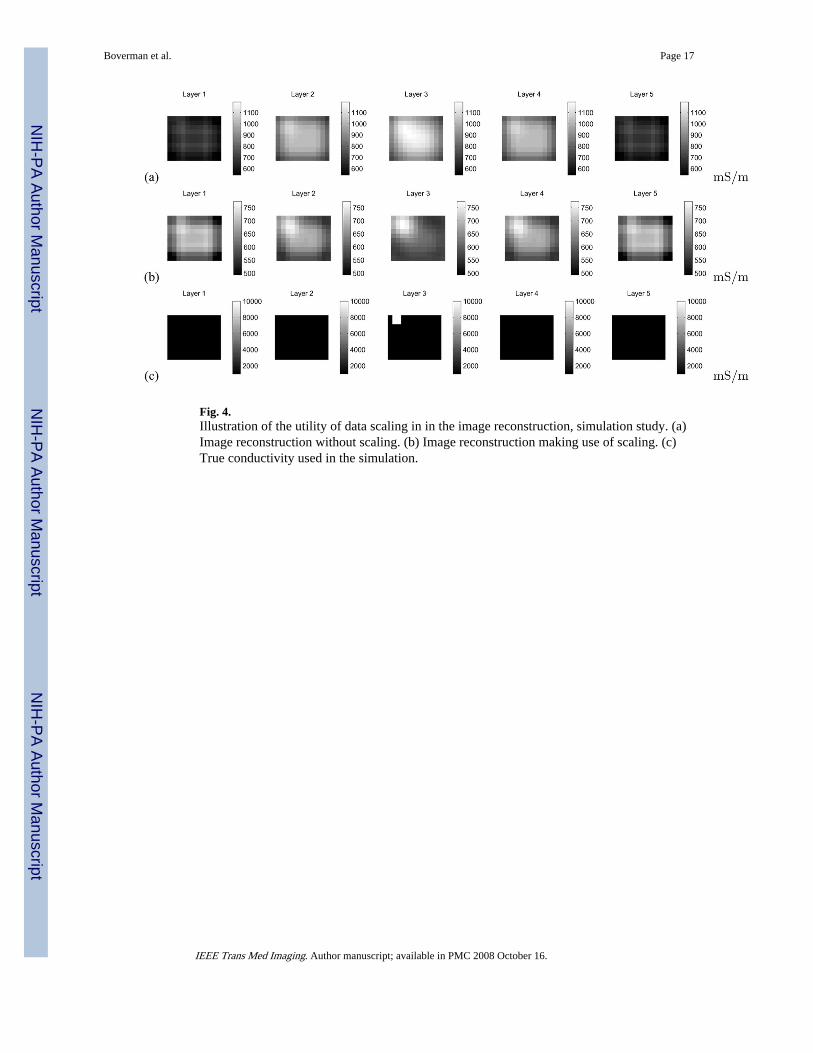
Fig. 4.Illustration of the utility of data scaling in in the image reconstruction, simulation study. (a)Image reconstruction without scaling. (b) Image reconstruction making use of scaling. (c)True conductivity used in the simulation.
Boverman et al. Page 17
IEEE Trans Med Imaging. Author manuscript; available in PMC 2008 October 16.
NIH
-PA Author Manuscript
NIH
-PA Author Manuscript
NIH
-PA Author Manuscript
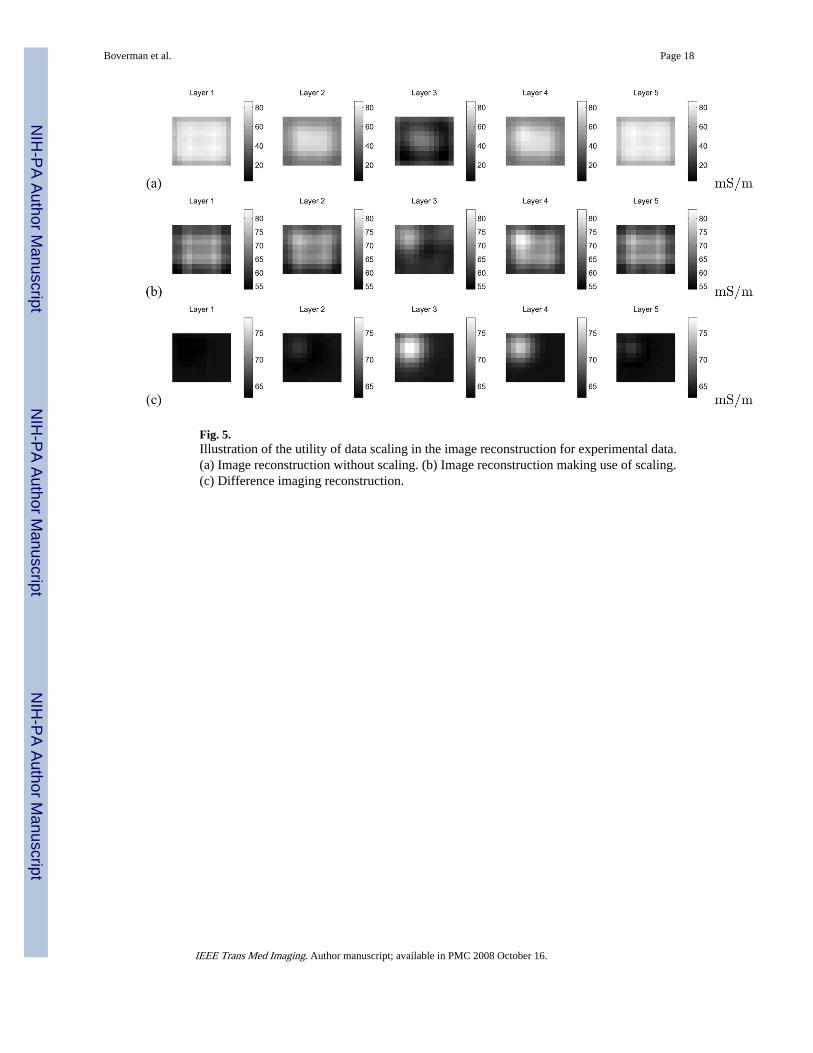
Fig. 5.Illustration of the utility of data scaling in the image reconstruction for experimental data.(a) Image reconstruction without scaling. (b) Image reconstruction making use of scaling.(c) Difference imaging reconstruction.
Boverman et al. Page 18
IEEE Trans Med Imaging. Author manuscript; available in PMC 2008 October 16.
NIH
-PA Author Manuscript
NIH
-PA Author Manuscript
NIH
-PA Author Manuscript

Fig. 6.Illustration of the occlusion of electrode 10, the fourth electrode in the second row from thetop, covered except for a circular hole about 5 mm in diameter.
Boverman et al. Page 19
IEEE Trans Med Imaging. Author manuscript; available in PMC 2008 October 16.
NIH
-PA Author Manuscript
NIH
-PA Author Manuscript
NIH
-PA Author Manuscript
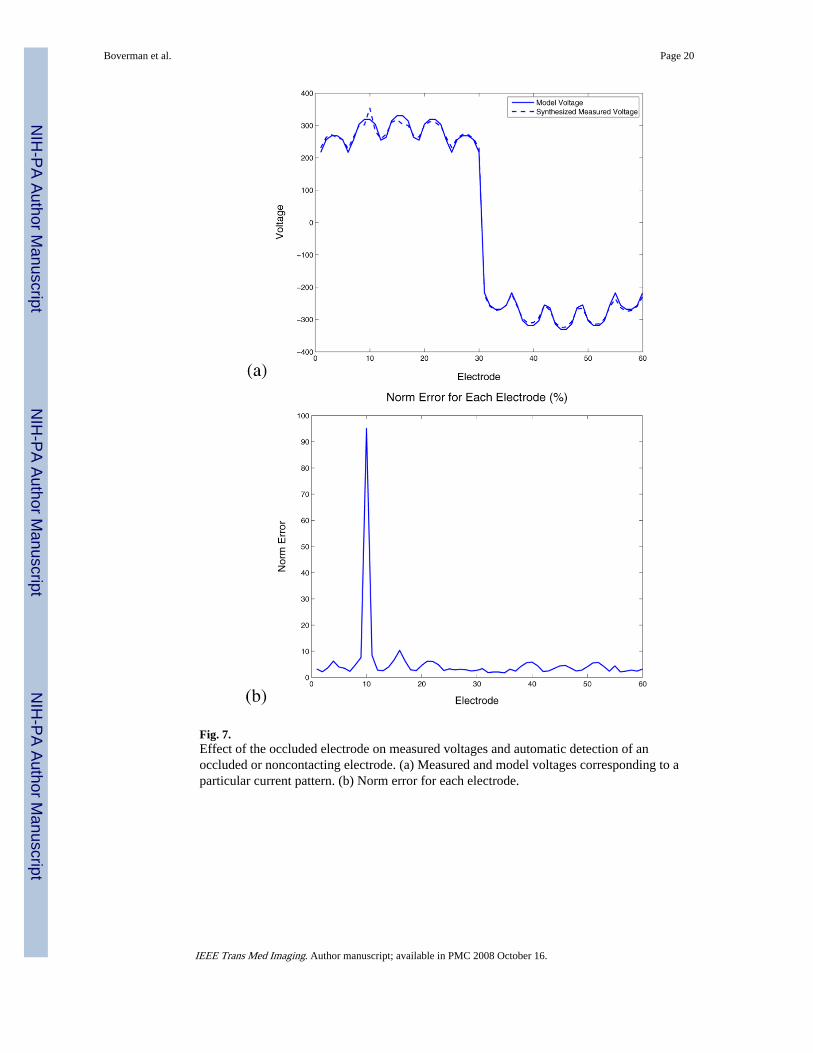
Fig. 7.Effect of the occluded electrode on measured voltages and automatic detection of anoccluded or noncontacting electrode. (a) Measured and model voltages corresponding to aparticular current pattern. (b) Norm error for each electrode.
Boverman et al. Page 20
IEEE Trans Med Imaging. Author manuscript; available in PMC 2008 October 16.
NIH
-PA Author Manuscript
NIH
-PA Author Manuscript
NIH
-PA Author Manuscript
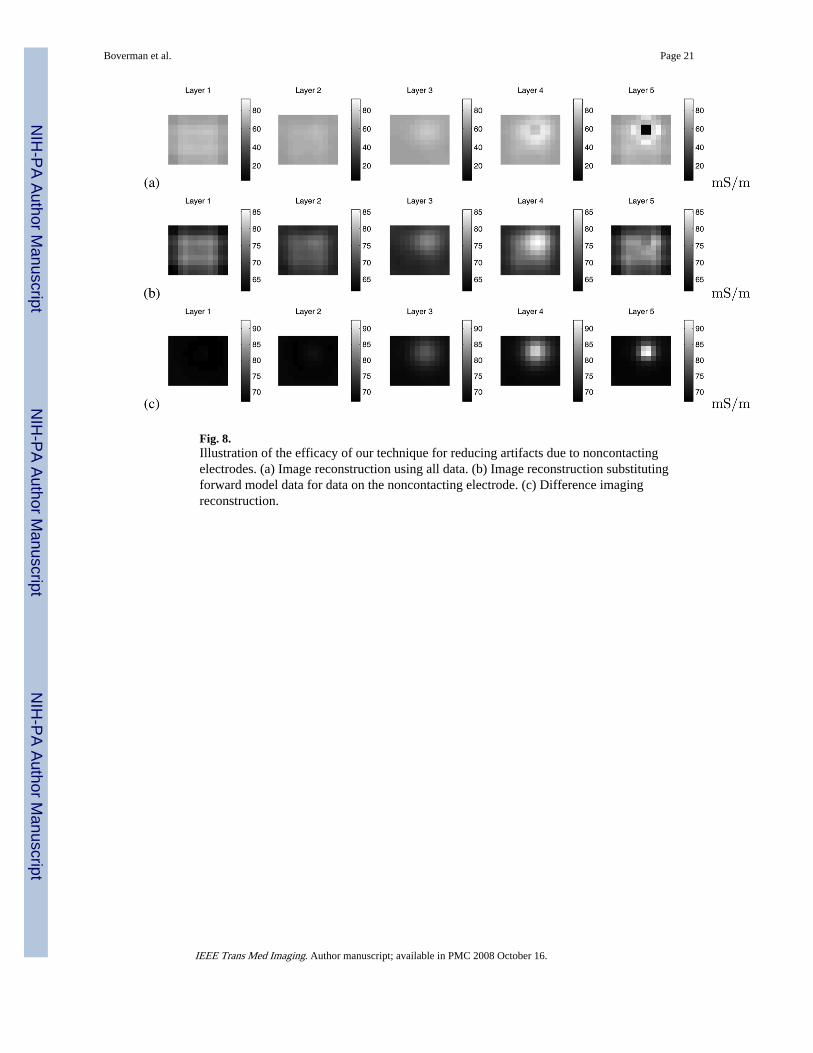
Fig. 8.Illustration of the efficacy of our technique for reducing artifacts due to noncontactingelectrodes. (a) Image reconstruction using all data. (b) Image reconstruction substitutingforward model data for data on the noncontacting electrode. (c) Difference imagingreconstruction.
Boverman et al. Page 21
IEEE Trans Med Imaging. Author manuscript; available in PMC 2008 October 16.
NIH
-PA Author Manuscript
NIH
-PA Author Manuscript
NIH
-PA Author Manuscript
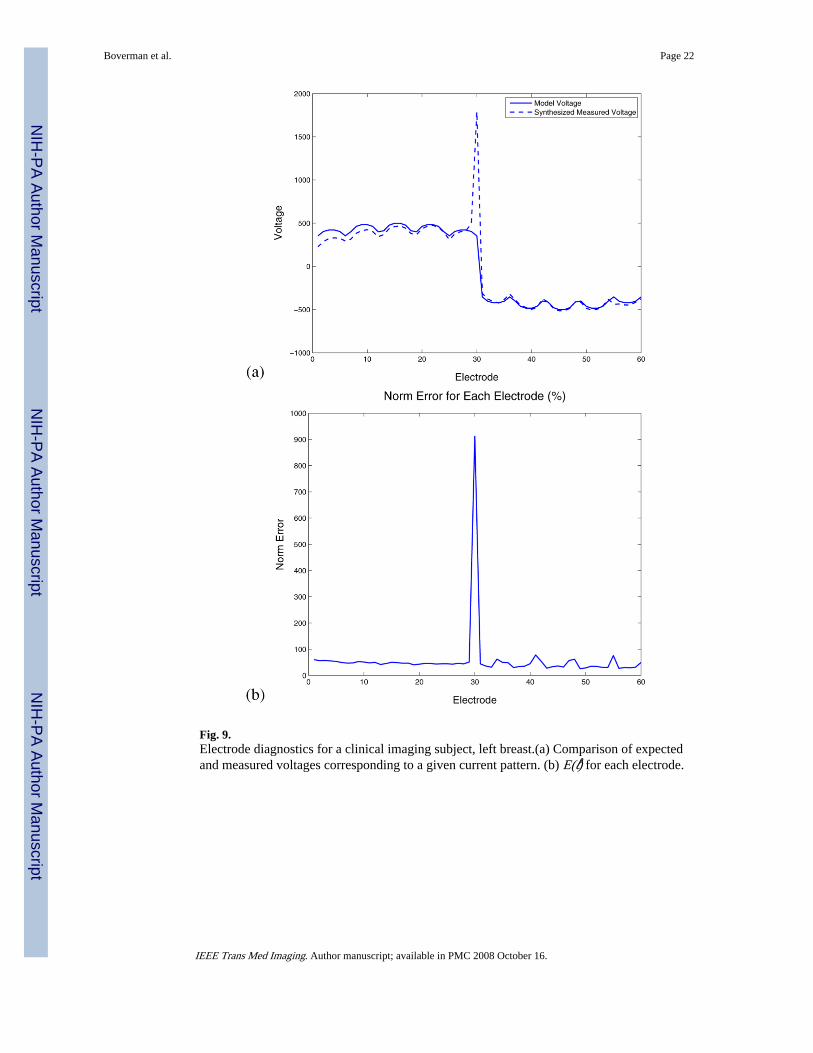
Fig. 9.Electrode diagnostics for a clinical imaging subject, left breast.(a) Comparison of expectedand measured voltages corresponding to a given current pattern. (b) E(ℓ) for each electrode.
Boverman et al. Page 22
IEEE Trans Med Imaging. Author manuscript; available in PMC 2008 October 16.
NIH
-PA Author Manuscript
NIH
-PA Author Manuscript
NIH
-PA Author Manuscript
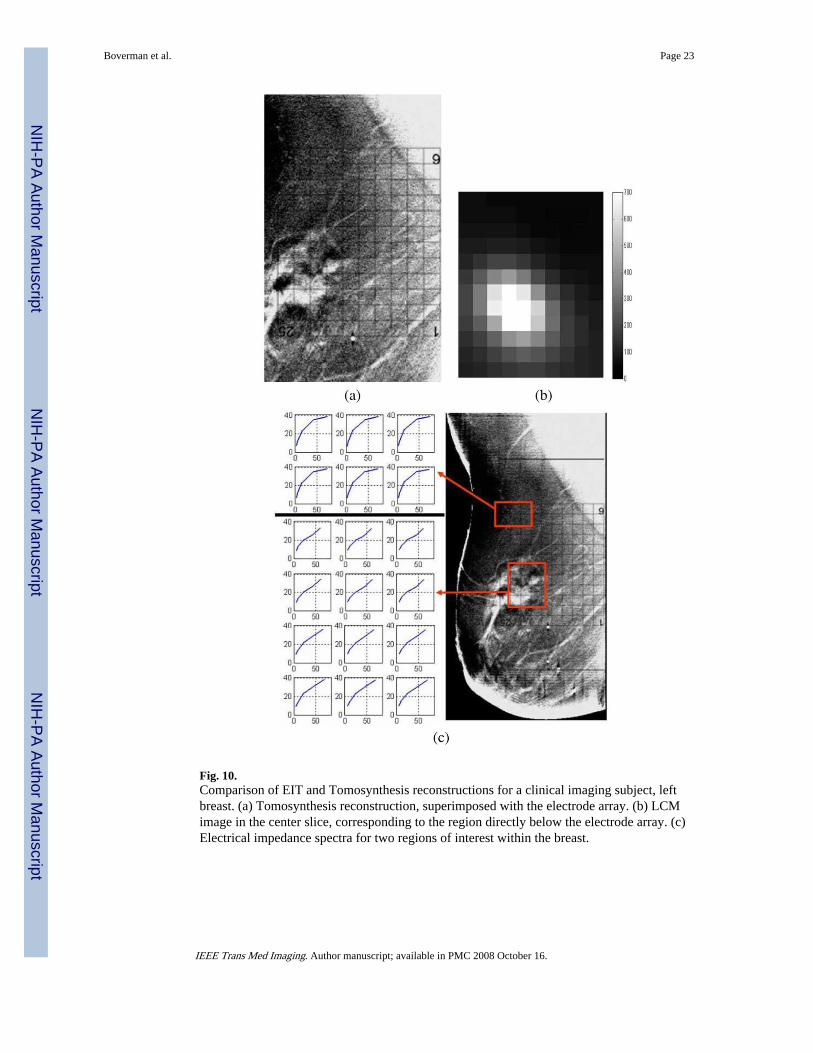
Fig. 10.Comparison of EIT and Tomosynthesis reconstructions for a clinical imaging subject, leftbreast. (a) Tomosynthesis reconstruction, superimposed with the electrode array. (b) LCMimage in the center slice, corresponding to the region directly below the electrode array. (c)Electrical impedance spectra for two regions of interest within the breast.
Boverman et al. Page 23
IEEE Trans Med Imaging. Author manuscript; available in PMC 2008 October 16.
NIH
-PA Author Manuscript
NIH
-PA Author Manuscript
NIH
-PA Author Manuscript


