Embed Size (px)
Citation preview

!∀#∃∀%&∀%&
∋()&∗+,!
!
∀#!∃ %
% & &
∋ #
(!

61st International Astronautical Congress, Prague, CZ. Copyright ©2010 by the International Astronautical Federation. All rights reserved.
IAC-10-C3.1.5 Page 1 of 10
IAC-10-C3.1.5
MULTIOBJECTIVE OPTIMISATION OF INTEGRATED SPACE-BASED AND TERRESTRIAL SOLAR ENERGY SYSTEMS
M. Vasile Senior lecturer, Space Advanced Research Team, University of Glasgow, UK, [email protected]
L. Summerer
ESA Advanced Concepts Team, Noordwijk, The Netherlands, [email protected]
This paper proposes the simultaneous optimisation of a combination of a number of ground solar power plants with a space-based solar plant (SPS) delivering electric power for European needs. A simplified mathematical model of the integrated space and ground system is developed and used to quantify the mass in space and the cost of the ground plants. The model takes into account the geographical location of the ground stations, the size of the power storage units as well as the orbital motion of the SPS. An evolutionary algorithm is then used to find the optimal trade-off between size and location of the space segment and cost of the ground segment. The results in this paper provide an insight in the usefulness of the support that an SPS system can provide to a ground-based solar power generation system.
I INTRODUCTION
Concepts for solar power from space have received renewed attention over the past few years. High costs for fossil fuel during most of 2007 and 2008 have contributed to increasing the interest in advanced green energy options usually considered to be at the fringes of current technological capabilities. Concepts based on delivering solar power from space, initially proposed under the term solar power satellite are among these advanced options.[1] Within the next 15-20 years a significant portion of the world power plants will need to be replaced and the discussion on which energy production system will be the most appropriate for the 21st century is still open and vibrant.[3]-[6] Following the maturation of wind power plants into commercial competitiveness, solar power plants are expected to reach this level soon at good locations. Thus far, the small percentage generated by solar power plants does not require delivery guarantees. The emergence of progressively more commercial solar thermal power plants in some south-European countries, and the recent plans to build large installations in North Africa and the Middle East to supply Europe are an important step forward in this direction.[7][8] Ongoing research and development in the design and operation of these plants, as well as into high efficiency energy storage and distribution systems promise further substantial cost reduction. Concepts for space-based solar power plants will benefit from these terrestrial developments, and their integration into terrestrial solar power infrastructures has the potential to become a win-win opportunity, especially if considered early in the building up of such a new renewable energy infrastructure.
This paper presents a multi-objective optimisation of a combined space and terrestrial-based solar power infrastructure. A simplified model of one and several space-based and terrestrial solar power plants is used to optimise the key parameters of the ground and space segments of the combined system. The goals are to minimise the cost of the overall system and to maximise the provision-reliability of electric power for an entire day. Load level needs are based on extrapolations of current, real electricity demand profiles. Given the current launch cost per kg of mass, particular attention is dedicated to the optimisation of the space segment. The attempt is to optimise the complex interaction between orbital parameters, architecture of the spacecraft, size of the terrestrial plant, size of the terrestrial storage system and coverage in order to provide a constant delivery and low cost per kW. The modular approach of the simulations allows extension to a more complex integrated space and terrestrial system with different power load profiles for different geographical regions.[9]
II MODEL DESCRIPTION
This section describes the simplified models of the space and of the ground segment.
II.I Solar Power Satellite Model
It is assumed that the SPS is made of three main elements: a solar power collection unit, a power transmission unit and a main bus. Developing a detailed model of the three elements would not add additional information for the purpose of this paper but introduce undue complexity at this stage but might be

61st International Astronautical Congress, Prague, CZ. Copyright ©2010 by the International Astronautical Federation. All rights reserved.
IAC-10-C3.1.5 Page 2 of 10
needed for a deeper analysis. The elements will be sized based on the conceptual designs that have been already proposed in the literature.[10][12]-[18] In particular, two alternative design concepts will be considered: the sail-tower concept with microwave emitter and rectenna receiver and the solar concentrator concept with laser emitter and solar panels receiver.[1][14][15] The power generated onboard the SPS is given by:
02
cosc SS
SSPS
SPS A
rP
ηη α= [1]
With cη the solar to electric power conversion
efficiency and Sη the power system effiency. 0S is the
specific power at 1AU, Sr is the distance from the Sun
(in AU) and α is the elevation angle of the Sun over the solar panels. For the purpose of this assessment the case of the sail tower concept is used, which rotates the solar panels to have continuous 90° irradiation. In the
sail-tower concept SPSA is the area of the solar arrays.
In the solar concentrator concept SPSA is the area of
the solar concentrator. The power is then collected and beamed to the ground through a microwave transmitter operating at 2.54 GHz. The ground station antenna is designed to collect all the power transmitted, therefore its size depends on the distance from SPS to ground station, on the divergence of the beam and the incident angle of the microwave beam. It is assumed that the divergence is 3.85 410−× radians, therefore the diameter
of the receiving antenna is 4max3.85 10rxd ρ−= × ,
where maxρ is the maximum distance between
transmitting and receiving antenna. The diameter txd
of the transmitting antenna is also a function of the distance through the relationship:
max81.25rx txd d
λρπ
= [2]
where λ is the wave length of the transmitted signal. The factor 1.25 is a safety margin. The received power can be expressed as:
r m SPSP Pη= (3)
where the efficiency ηm takes into account the path losses. The mass of the SPS is made of the following
contributions: the mass of the solar arrays SAm and
supporting structure, the mass of the microwave emitter
Mm , the mass of the main bus (including harness)
Bm . The total mass of the SPS is:
SPS SA H B M Pm m m m m m= + + + + [4]
The solar arrays are assumed to have an overall specific power at end of life (cells plus supporting structure) of 300 W/kg.[25] The mass of the transmitting antenna is computed from its diameter assuming that the density is 1.96 kg/m2. The mass of the bus plus the harness is considered to be 1.2 times the mass of the solar arrays, according to the model developed for the European sail tower.[10] The term mP accounts for the mass of propellant (and propulsion system) to place the SPS in the desired orbit. The SPS is transferred from an initial circular LEO to the destination orbit with a low-thrust spiral. It is assumed that the specific impulse is Isp=4500s and that the propulsion system mass is 10% of the mass of the propellant. The orbit of the solar satellite needs to be such that the SPS faces the Sun and the terrestrial plant when the terrestrial plant is in shadow. In order to optimize the delivery of power, the SPS should serve multiple terrestrial stations, therefore it should be within the direct line of sight of more than one terrestrial station a day. On the other hand it is assumed here that only one station at the time is served, and the SPS revisits the same station periodically at least once a day. This choice limits the value of the semi-major axis only to a set of discrete countable numbers. Relaxing this constraint may allow the SPS to serve different stations at different times and will be investigated in future works.
II.II Orbit Transfer Model
It is assumed that the SPS is assembled in a low Earth orbit at 200 km of altitude and then transferred to its final operational orbit. This might not necessary represent the best strategy but it is useful to assign a cost to different operational orbits. The transfer is assumed to be performed with a low-thrust system operating a set of electric propulsion. In order to minimise the cost of any change of inclination, the SPS is at first transferred to a higher altitude orbit and then its inclination is changed to the desired one. The total cost of the transfer is therefore given by ∆vor the total cost of the orbit raising plus ∆vin the total cost of the inclination change. The corresponding propellant consumption is then computed with:
01or in
sp
v v
g Ip SPSm m e
∆ +∆− = −
(5)
The ∆vor can be estimated as follows, assuming a slow spiral:

61st International Astronautical Congress, Prague, CZ. Copyright ©2010 by the International Astronautical Federation. All rights reserved.
IAC-10-C3.1.5 Page 3 of 10
0or
f
va a
µ µ∆ = − (6)
Where a0 and af are respectively the semi-major axis of the initial and final orbit. The cost of the change of inclination can be derived from the work of Wiesel and Alfano[26] and assuming a thrust vector perpendicular to the orbit plane. The mean variation of inclination along a low-thrust spiral is:
2
3
41 1 1( ) ( )
2thrusta adi
E u u K udt a u u
µπ µ
= + −
(7) Where E(u) and K(u) are the complete elliptic integral of the first and second kind respectively and u represents the thrust direction. More precisely, for u=1 the thrust is perpendicular to the orbital plane and for u=0 the thrust is in plane. The total ∆v for a given required change of inclination ∆i then is:
2in
ai v
π µ∆ = ∆ (8)
II.III Terrestrial Installation Model
The ground installation is made of four elements: a power generation unit, a power collection unit (collecting power from the SPS), a power storage unit and a power distribution unit. The concept proposed in this paper envisages the ground installation generating power through solar arrays, receiving, when available, power from the SPS and storing the power in excess in the form of compressed hydrogen. The stored hydrogen is then processed through fuel cells. While within the near future most likely not the most economic solution, the chosen concept has the advantage of being available and useable independent of the geographical specifications of the locations. The power is distributed through the standard power grid, however extra transmission lines are expected to transport the electric power from the ground base to the user grid. The total power generated by the ground installation is:
02
cosc TSeff r r T
S
S AP
rP
ηη η α= + (9)
where rP is the power coming from the SPS, rη is the
conversion efficiency on ground (for example the
rectenna conversion efficiency) and Tα is the elevation
angle of the Sun over the ground plant. The conversion efficiency of the solar cells and power system is assumed to be equal to the ones onboard the SPS. The
surface area TA of the solar arrays is one of the sizing
parameters of the ground installation. The solar arrays are assumed to have an efficiency of 35%. If the SPS transmits power in the form of microwave, the size of the rectenna is computed from the divergence of the beam and the distance from SPS to ground base so that over 90% of collection efficiency is realised. Furthermore, the size of the whole site is taken to be 5.2 times the size of the antenna, as for the sail tower example. The power difference between demand and power generation defines the power storage. The power storage will support the demand when the combined system of terrestrial plants and SPS cannot deliver enough energy.
T eff demP P Pη∆ = − (10)
where Pdem is the daily power load (or power demand) and ηT is the transmission efficiency. It is considered here that the power is transported from the ground plant to the user through standard power cables with an efficiency of 94% and a cost of 3M€ per kilometre (see Table 1). The stored energy given by:
Pst
dhP
dtη= ∆ (11)
where stη is the storing process efficiency. It is
considered here that the power in excess P∆ is used to produce hydrogen through electrolysis and the hydrogen is then stored in compressed tanks. The overall process efficiency is taken as 73%[19]. Furthermore, one can define the volume of stored hydrogen hH as follows:
H
H
dh P
dt η∆= (12)
where Hη is the power to hydrogen conversion
coefficient with value 4.8 kWh/Nm3 (Nm3 measure the volume of a gas at normal or standard conditions of pressure and temperature). When neither the Sun nor the SPS are available then the terrestrial plant supplies the demand with the stored hydrogen by converting it into power through fuel cells. Therefore, the stored power becomes:
demP
T g
Pdh
dt η η= − (13)
where ηg is the output efficiency of the storage system (here taken to be 73%). Eq. (13) implies that when the production is lower than the demand, i.e.
T eff demP Pη < , the terrestrial plant compensates with

61st International Astronautical Congress, Prague, CZ. Copyright ©2010 by the International Astronautical Federation. All rights reserved.
IAC-10-C3.1.5 Page 4 of 10
what is stored thus / 0Pdh dt < . Consequently the
volume of stored hydrogen decreases with the rate:
demH
T gH
Pdh
dt η η= − (14)
where gHη is the volumetric hydrogen to power
conversion coefficient that is here considered to be 3.0kWh/Nm3. The cost of the ground installation is related to its size. In particular, the cost of fuel cells is assumed to be 500€/kW, while the cost of the storage system is 1.9M€ per unit, where a unit can contain 49300 Nm3 of hydrogen. The total cost of the ground installation is:
T H r A S gc c c c c c= + + + + (15)
Where cH is the cost of the transmission unit, cr is the cost of the receiving rectenna, cA the cost of the solar arrays, cS the cost of the storage unit and cg is the cost of fuel cells. The cost of the receiving antenna is actually the cost of the whole site (or land that is covered by antenna and related infrastructure plus safety margin). It is estimated that the cost per square meter of the site is 0.5 euros, assuming desert-type land. Note that, if multiple stations are available, they all supply the user according to the percentage of available energy. For example, in the case of two available stations and a total energy of 100GWh: If one of the two stations stored 70% of the total and the other 30% of the total, they will support the user with respectively 70% and 30% of the required power if all of it came from storage. The availability of power depends on the relative position of Sun, SPS and terrestrial installation. The SPS-terrestrial plant vector can be expressed as
( , , , , , , , )a e i ω θ λ ϕΩd , while the SPS-Sun vector
and the terrestrial installation-Sun vectors can be
expressed respectively as ( , , , , , , )SPSS a e i tω θΩr and
( , , )GS tλ ϕr .
If the condition , G ε< ><d n is satisfied, where Gn is
the local normal to the terrestrial plant and ε is a minimum elevation angle, the SPS is below the horizon and cannot transmit to the terrestrial plant. Similarly if
the condition ,GS G ε< ><r n is satisfied, the Sun is
below the horizon and the terrestrial plant does not see the Sun. Finally, if the following condition is satisfied
,SPSS E ε< ><r r , the SPS is in the shadow cone of
the Earth and cannot generate power. The hourly load requirements for Europe are taken from the data for the European UCTE electricity grid for 2008 as provided by the European network of transmission system operators for electricity. To take into account the transmission losses and costs related to the transmission and storage of energy the following parameters are used as a basis. In general, three main means are commonly used to transmit energy over long distances on Earth (excluding the transport of fossil fuels): high voltage alternating current lines (HVAC), high voltage direct current lines (HVDC) and to a limited extent hydrogen.
Figure 1. Hourly power load in Europe in 2008
For the purpose of this work, HVDC lines were chosen due to the large distances, the point-to-point transmission configuration, their ability to connect various AC lines for further distribution and the recent substantial investments in such new lines in Europe, the US and China. Cost and transmission losses for HVDC lines are essentially composed of those of the transformer stations at each end and those of the lines. Table 1 contains the main parameters of such lines.

61st International Astronautical Congress, Prague, CZ. Copyright ©2010 by the International Astronautical Federation. All rights reserved.
IAC-10-C3.1.5 Page 5 of 10
Transmission and
Conversion losses
cost
800 kV HVDC Line 3% / 1000km 300 M€ / 100km
800 kV HVDC head-stations
0.7% / station 0.7 M€ / station
Table 1: Transmission system parameters
Both, space and terrestrial solar energy systems require the capacity to store large amounts of energy if they were to contribute a substantial percentage of energy to the grid. For the purpose of the current comparison, the following technologies are considered: hydrogen storage in spherical pressure vessels combined with fuel cells (Table 2).
Element Efficiency Cost
Hydrogen fuel cells
50% roundtrip efficiency
500 €/kWe
Storage System Efficiency (electrolysis +storage)
73% or 4.8 kWh/Nm3
1.92 M€/unit investment
(unit net storage capacity: 49300 Nm3H2)
Table 2: Energy Storage system parameters
III MULTIOBJECTIVE DESIGN PROBLEM The problem is to minimise both the overall installation investment and the overall electricity production cost, while satisfying the demands. The problem can be formulated as follows:
min ( )
( ) 0D
C∈
≥x
F x
x (16)
with the vector objective function [ ]TT SPSc c=F and
the constraints:
min ( )
( ) ( ) 0
7000
dt
H f cum
p
P t
C h t h
r
= − ≥ −
x (17)
where Pd(t) is the power delivered at time t, ( )P fh t is
the residual stored power at the end of one full day of operations. The low limit on the stored energy
( )1
0
3
14cum dem r T rh P P dtη η= −∫ is three times the integral
of the daily demand minus the SPS delivery divided by 14 days. In other words, the assumption is that at least every 14 days the ground segments have a total residual stored energy that is sufficient to sustain the demand for three days. The final stored energy is not optimised, therefore it can be that the three day storage is reached before the 14th day of operations. In that case, the hypothesis is that the plant operates at a reduced rate to limit storing further energy. The first constraint states that the difference between the demand and the delivered power can never be negative. The third constraint prevents the SPS from flying too low. The cost of the SPS, cSPS is computed by assuming a cost per kg of about 3000 Euros. This number is substantially lower than current reference space systems and higher than past SPS reference systems but assumes in any case a substantial advantage due to mass production and frequent launches.[23] The optimisations in this paper were run assuming that the semimajor axis of the orbit can vary between 8000 and 43000 km, however the orbit needs to be synchronous with the movement of the ground station, therefore the semimajor axis is actually considered to be a discrete parameter that can assume only value corresponding to synchronous orbits with a frequency that is an integer multiple of the rotation frequency of the Earth. The eccentricity was limited between 0 and 0.1, the inclination between 0 and 90 degrees and the other two parameter between 0 and 360 degrees. The position of the ground station was limited between the 0 and 40 degrees of latitude North and the 14 degrees of longitude West and 35 degrees of longitude East. These limitations cover the range of latitude and longitudes that can serve Europe. Although a further limitation should be imposed on the latitude, the 0 latitude constraint represent an interesting limit from an optimisation point of view because it allows two different types of solution: better insolation of the ground base with a higher cost of the SPS and lower insolation with lower cost of the SPS. The optimisation is performed with a multi-agent-based optimiser called EPIC.[24]
IV CASE STUDIES
The case study used in the present assessment consists of three ground stations and one space component transmitting power to the ground station locations via microwave. These results intend to form the basis for similar analysis the delivery of power to multiple regions with different power load curves as well as the extension of the analysis to systems based on laser power transmission.

61st International Astronautical Congress, Prague, CZ. Copyright ©2010 by the International Astronautical Federation. All rights reserved.
IAC-10-C3.1.5 Page 6 of 10
Element Value
Solar array specific mass EoL (including structure)
300 W/kg
Transmitting antenna specific mass
1.985kg/m2
Bus and harness mass 14% dry mass
Solar array efficiency 35%
Mass of the propulsion system 15% propellant
mass
Table 3. Basic properties of the SPS with microwave transmitter.
Length 15 km
Total mass 2140 t
Antenna mass 1600 t
Twin module solar panel mass
9 t (per twin module)
Power delivered on ground per SPS 275 MWe
Table 4. Basic properties of the European sailtower concept
Figure 2 represents the result of the multi-objective optimisation of the integrated SPS and ground system for one, two and three ground stations and for a maximum eccentricity of the SPS of 0.1. Each dotted curve represents a set of Pareto optimal solutions. Each set contains between 1000 and 2500 solutions ranging from the no-SPS solution (bottom right) and the no-ground base solution (upper left). A first interesting result is that an increase in the number of stations corresponds to a decrease of the total cost of the ground segment. The main motivation for this result is that in the model, the cost of the storage system is considerably high compared to the cost of other elements of the ground segment. Note that removing the restrictions on the geographical location of the stations would further improve the performance of the three station scenario. Within the range of longitudes used in this study the three station solutions is only marginally better than the two station solution. On the other hand the three station solution was run for a relatively small number of iterations compared to the two and one station scenarios. Therefore, a better Pareto front is expected if the optimiser is run for longer time. The sub-optimality of the three station solution can be seen also from the short portion of the Pareto front that is dominated by the two station solution.
0 1 2 3 4 5 6 7 8
x 106
0
2
4
6
8
10x 10
6
Cost of the Ground Segment [MEuros]
Cos
t of t
he S
pace
Seg
men
t [M
Eur
os]
Pareto fronts max e=0.01
3 stations
2 stations
1 station
Figure 2. Pareto fronts for different numbers of ground stations
0 1 2 3 4 5 6 7 8
x 106
6.5
7
7.5
8
8.5
9x 10
6
Cost of the Ground Segment [MEuros]
Cos
t of t
he S
pace
+G
roun
d S
egm
ent [
ME
uros
]
Pareto fronts max e=0.01
2 station 1 station
3 station
Figure 3. Sum of ground and space segment cost vs ground segment cost
Figure 4 represents the cost of the ground segment against the total cost of ground segment plus SPS. The plot shows that for the assumed cost of per kg of the two station solution and even more the three station solution can become competitive against a pure ground station solution. Figure 4 represents the solution with no SPS for the single ground station case.
10 15 20 25 30 35 40−1.5
−1
−0.5
0
0.5
1
1.5
2x 10
12
Time [h]
Pow
er [W
]
Europe
GeneratedRequiredDifferenceSPS
Figure 4. Single station, no SPS

61st International Astronautical Congress, Prague, CZ. Copyright ©2010 by the International Astronautical Federation. All rights reserved.
IAC-10-C3.1.5 Page 7 of 10
10 15 20 25 30 35 40−1
0
1
2
3
4
5x 10
11
Time [h]
Pow
er [W
]
Europe
GeneratedRequiredDifferenceSPS
Drop of power due to line losses
Figure 5. Only SPS is providing power.
The blue dotted line represents the power generated by the ground station. The peak power is during the European day. During the European night the station delivers power from the storage system. Figure 5 represents the opposite case in which there is no ground station and the whole power demand is satisfied by a single SPS. Note that the solution is at the limit of feasibility. In fact, during the peak power time the SPS cannot satisfy the demand because of the power losses along the distribution line. However, the stored energy works like a buffer and compensate for the deficit of power delivered from the SPS.
Figure 6. Example of SPS orbit.
Figure 7. SPS orbit with small inclination
10 15 20 25 30 35 400
2
4
6
8
10
12x 10
8
Time [h]
Vol
ume
[Nm3 ]
Figure 8. Single station storage without SPS
Figure 6 shows the orbit followed by the SPS. The SPS is on a geostationary orbit at zero degrees of inclination. The ground station is at the equator to maximize the intake from the SPS. The read lines indicate the beam of microwave from the SPS to the ground station. In some cases, as in Figure 7, instead, the SPS orbit has a small inclination. This is an artifact of the model that provides a lower storage and therefore a better overall solution. In fact, a small inclination although increases the propellant consumption, provides a lower power at ground level if the station is at the equator. This degraded state suggests that either the SPS or the ground segment would need to operate at lower production rate during the night to avoid storing excessive amounts of hydrogen.
61st International Astronautical Congress, Prague, CZ. Copyright ©2010 by the International Astronautical Federation. All rights reserved.
IAC-10-C3.1.5 Page 8 of 10
10 15 20 25 30 35 40−1
−0.5
0
0.5
1
1.5x 10
12
Time [h]
Pow
er [W
]
Europe
GeneratedRequiredDifferenceSPS
Figure 9. Two station solution without SPS
10 15 20 25 30 35 400
5
10
15x 10
11
Time [h]
Out
put P
ower
Station 1
Station 2
Cummulative output
Figure 10. Two station output power without SPS
10 15 20 25 30 35 400
1
2
3
4
5
6
7x 10
8
Time [h]
Vol
ume
[Nm3 ]
Europe
Station 2 Station 1
Figure 11. Two station storage without SPS
Figure 8 shows the storage profile for the single station solution with no SPS. Figure 9 shows the two station scenario without SPS. As it can be seen the peak power point is lower than for the single station solution. The optimizers tend to allocate the ground station at the extreme of the longitude interval to better follow the load profile. Figure 10 illustrates the output profile of each of the two stations plus the cumulative output experienced by the load. The peak of each station is about 4 hours apart because of the geographical location. Another interesting point is that one station is
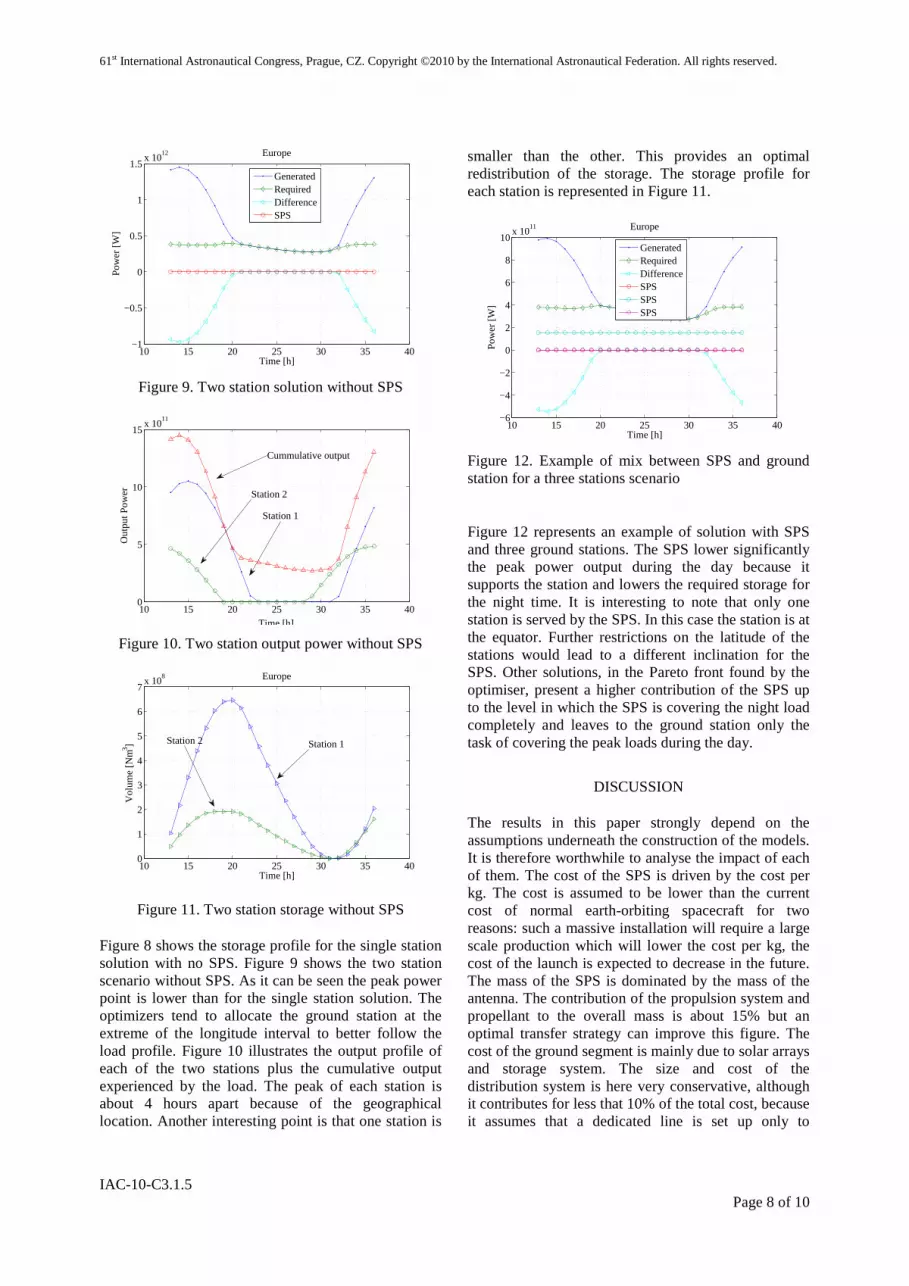
smaller than the other. This provides an optimal redistribution of the storage. The storage profile for each station is represented in Figure 11.
10 15 20 25 30 35 40−6
−4
−2
0
2
4
6
8
10x 10
11
Time [h]
Pow
er [W
]
Europe
GeneratedRequiredDifferenceSPSSPSSPS
Figure 12. Example of mix between SPS and ground station for a three stations scenario
Figure 12 represents an example of solution with SPS and three ground stations. The SPS lower significantly the peak power output during the day because it supports the station and lowers the required storage for the night time. It is interesting to note that only one station is served by the SPS. In this case the station is at the equator. Further restrictions on the latitude of the stations would lead to a different inclination for the SPS. Other solutions, in the Pareto front found by the optimiser, present a higher contribution of the SPS up to the level in which the SPS is covering the night load completely and leaves to the ground station only the task of covering the peak loads during the day.
DISCUSSION
The results in this paper strongly depend on the assumptions underneath the construction of the models. It is therefore worthwhile to analyse the impact of each of them. The cost of the SPS is driven by the cost per kg. The cost is assumed to be lower than the current cost of normal earth-orbiting spacecraft for two reasons: such a massive installation will require a large scale production which will lower the cost per kg, the cost of the launch is expected to decrease in the future. The mass of the SPS is dominated by the mass of the antenna. The contribution of the propulsion system and propellant to the overall mass is about 15% but an optimal transfer strategy can improve this figure. The cost of the ground segment is mainly due to solar arrays and storage system. The size and cost of the distribution system is here very conservative, although it contributes for less that 10% of the total cost, because it assumes that a dedicated line is set up only to

61st International Astronautical Congress, Prague, CZ. Copyright ©2010 by the International Astronautical Federation. All rights reserved.
IAC-10-C3.1.5 Page 9 of 10
transport the energy to the European grid from the location of the stations. The size and cost of the storage system is probably the most demanding part of the ground plant. Note that the cost of the ground plant includes the cost of the receiving antenna. A credible integrated system, therefore would have the sum of the cost of the SPS plus ground segment that is lower than the cost of the ground installation alone.
V CONCLUSION
The paper presented a multi-objective optimisation of an integrated SPS and ground based system for the support of the electricity demands of Europe. This preliminary study is based on a simplified model of both the SPS and the ground plants, however it gives some insight into where the ground bases should be located and on the actual role and contribution of the SPS.
The results show that a multi-station solution is optimal with respect to a single station solution. The stations have different size and different geographical location. An integrated system SPS plus ground segment is useful to support the stations during the night time and to lower the size of the storage system (one of the main drivers of the cost of the ground plant). On the other hand the cost per kg of the SPS limits it utility compared to a multiple ground installation. It has to be noted that in case of a fully integrated energy distribution system including North-Africa, the middle East and Europe, multiple station located over a wide range of longitudes could represent a very interesting solution. On the other hand if geographical barriers are included, then the SPS can be an appealing solution to provide power during the night time at different locations around the globe. The ongoing further research aims at looking into solutions with more realistic geographical restrictions and multiple stations serving multiple countries, not only Europe.
REFERENCES
[1] P. Glaser. Power from the sun: Its future. Science, 162:856–861, 1968. [2] Oda M., Ueno H., Mori M. Study of the Solar Power Satellite in NASDA. Proceeding of the 7th
International Symposium on Artificial Intelligence, Robotics and Automation in Space:i-SAIRAS 2003, NARA, Japan, May 19-23, 2003.
[3] F. Birol. World Energy Outlook 2009. Technical report, IEA/OECD, Paris, France, 2009. [4] IEA/OECD. Global gaps in clean energy RD&D - update and recommendations for international
collaboration. Technical report, IEA/OECD, Paris, France, 2010. [5] L. Summerer, T. Pipoli, A. Gálvez, F. Ongaro, and M. Vasile. Roles of solar power from space for
Europe: Space exploration and combinations with terrestrial solar power plant concepts. Journal of the British Interplanetary Society, 59, 2006.
[6] I. Duvaux-Béchon and I. Sabater. What can ’space’ bring to ’energy’? - ’Space & Energy’ - supporting EU policies. ESA Bulletin, (142):45–55, 2010.
[7] F. Trieb and H. Müller-Steinhagen. Sustainable Electricity and Water for Europe, Middle East and North Africa - DESERTEC. Whitebook of TREC and Club of Rome, DLR, 2007.
[8] “DESERTEC Foundation.” DESERTEC Foundation. Web. 7 Sept. 2010. <http://www.desertec.org/>. [9] Summerer, L., Vasile, M. und Ongaro, F., Assessment of an integrated space-terrestrial, solar-based Euro-
Asian energy system, ISTS 2004-r-39, Miyazaki, Japan, 2004. [10] Seboldt W.; Klimke M.; Leipold M.; Hanowski N. European Sail Tower SPS concept. Acta Astronautica,
Volume 48, Number 5, March 2001/June 2001, pp. 785-792(8) [11] Barbir F., Molter T., Dalton L. Efficiency and weight trade-off analysis of regenerative fuel cells as
energy storage for aerospace applications. International Journal of Hydrogen Energy 30 (2005) 351 – 357 [12] M. Zerta, V. Blandow, P. Collins, J. Guillet, T. Nordmann, P. Schmidt, W. Weindorf, and W. Zittel. Earth
and space-based power generation systems - a comparison study. In SPS’04 Conference - Solar Power from Space, Granada, Spain, June 2004.
[13] V. Quaschning, N. Geuder, P. Viehbahn, F. Steinsiek, and C. Hendriks. Comparison of solar terrestrial and space power generation for Europe. In ESA, editor, SPS’04 Conference - Solar Power from Space, Granada, Spain, 30 June - 2 July 2004. ESA.
[14] Shinohara N. Hisada Y. Mori M. and JAXA SSPS WG4 Team. Request and Roadmap for Microwave Power Transmission System of Space Solar Power System (SSPS). IAC-05-C3.2.08.
[15] Kaya N. A New Concept of SPS with a Power Generator /Transmitter of a Sandwich Structure and a Larger Solar Collector. Space Energy and Transportation Vol. 1, No.3, 1996.

61st International Astronautical Congress, Prague, CZ. Copyright ©2010 by the International Astronautical Federation. All rights reserved.
IAC-10-C3.1.5 Page 10 of 10
[16] J. Mankins, H. Feingold, M. Strancati, A. Friedlander, M. Jacobs, D. Cornstock, C. Christensen, G. Mary- niak, and S. Rix. Space solar power - a fresh look at the feasibility of generating solar power in space for use on Earth. Technical Report SIAC-97/1005, NASA, SAIC, Futron Corp., April 1997.
[17] F. Tatsuhito, H. Suzuki, and M. Mori. Demonstration missions of space solar power systems. In ISTS’08, number 2008-r-1-07, 2008.
[18] J. Mankins. Space solar power: A major new energy option? J. Aerosp. Engineering, 14(2):38–45, April 2001.
[19] Ivy J. Summary of Electrolytic Hydrogen Production Milestone Completion Report. September 2004, NREL/MP-560-36734.
[20] Alan Jones P., Spence B.R. Spacecraft Solar Array Technology Trends. Aerospace Conference, 1998. Proceedings., IEEE, 21-28 Mar 1998.
[21] Fatemi N. S., Pollard v, Hou H. Q., and Sharps P. R. Solar Array Trades Between Very High-Efficiency Multi-Junction and Si Space Solar Cells. Presented at the 28th IEEE PVSC, September 17-22, Anchorage, Alaska.
[22] Bents D. J., Scullin V. J., Chang B.-J., Johnson D. W., and Garcia C. P., Jakupca I. J.. Hydrogen-Oxygen PEM Regenerative Fuel Cell Development at the NASA Glenn Research Center. NASA/TM—2005-214032, December 2005.
[23] W. Seboldt, M. Klimke, M. Leipold, and N. Hanowski. European sail tower SPS concept. Acta Astro- nautica, 48(5-12):785–792, 2001.
[24] Vasile M., Hybrid Behavioural-Based Multiobjective Space Trajectory Optimization. on Multi-Objective Memetic Algorithms, Springer Series of Studies in Computational Intelligence, Series: Studies in Computational Intelligence , Vol. 171, Goh, Chi-Keong; Ong, Yew-Soon; Tan, Kay Chen (Eds.) 2009, XII, 404 p. 227 illus., Hardcover, ISBN: 978-3-540-88050-9.
[25] Brandhorst H.W., Rodiek J.A. and O’Neill, M.J., Stretched Lens Array: the Answer to Improving Solar Array Reliability, 33rd Photovoltaic Specialists Conference, 2008.
[26] Wiesel, W.E. and Alfano, S., 1985, Optimal many-revolution orbit transfer, Journal of Guidance, Control, and Dynamics, Vol. 8, pp. 155-157


