Embed Size (px)
Citation preview

Multiplex Detection of DNA Sequences Using theVolume-Amplified Magnetic Nanobead DetectionAssay
Mattias Stromberg,† Teresa Zardan Gomez de la Torre,† Jenny Goransson,§ Klas Gunnarsson,‡
Mats Nilsson,*,§ Peter Svedlindh,*,‡ and Maria Strømme*,†
Department of Engineering Sciences, Division of Nanotechnology and Functional Materials, Uppsala University, TheÅngstrom Laboratory, Box 534, SE-751 21 Uppsala, Sweden, Department of Engineering Sciences, Division of SolidState Physics, Uppsala University, The Ångstrom Laboratory, Box 534, SE-751 21 Uppsala, Sweden, and Departmentof Genetics and Pathology, Uppsala University, Rudbeck Laboratory, SE-751 85 Uppsala, Sweden
The possibility for conducting multiplex detection of DNA-sequences using the volume-amplified magnetic nanobeaddetection assay [Stromberg, M.; Goransson, J.; Gunnars-son, K.; Nilsson, M.; Svedlindh, P.; Strømme, M. NanoLett. 2008, 8, 816-821] was investigated. In this meth-odology, a batch consisting of a mixture of several sizesof probe-tagged magnetic beads was used for detectionof several types of targets in the same compartment.Furthermore, a nonlinear least-squares deconvolutionprocedure of the composite imaginary part of complexmagnetization vs frequency spectra based on the Cole-Colemodel was applied to analyze the data. The results of aquantitative biplex analysis experiment were comparedwith the corresponding separate single-target assays.Finally, triplex analysis was briefly demonstrated quali-tatively. Biplex and triplex detection were found to per-form well qualitatively. Biplex detection was found toenable a rough target quantification. Multiplex detectionmay become a complement to performing multiple sepa-rate single-target assays for, e.g., parallel detection ofmultiple infectious pathogens. Multiplex detection alsopermits robust relative quantification and inclusion of aninternal control to improve quantification accuracy.
Today, there is an increasing interest to develop new nano-technologies for clinical diagnostic applications, i.e., nanodiag-nostic tools or nanobiosensors.1,2 These should exhibit highsensitivity, specificity, and cost-effectiveness but also allow formultiplex analysis in order to meet the future needs from variousfields such as in vitro medical diagnostics, pharmaceuticaldiscovery, and pathogen detection.1,2 In particular, detection ofpathogenic bacteria is of great importance for prevention and
identification of health and safety problems.3 The former couldfor example be related to infectious diseases while the latter is ofimportance for, e.g., the food industry and to probe water andenvironment quality.3 Also, during recent years, the interest fordeveloping DNA biosensors for diagnostic testing has grownrapidly.4
Numerous biosensor platforms and nanodiagnostic strategiescurrently exist such as fluorescence-based DNA microarrays,5,6
electrochemical nanobiosensors,7,8 acoustic sensors,9,10 cantileverbiosensors,11 and various kinds of optical biosensors.12 Besidesthese bioassay technologies, the use of magnetic micro- ornanoparticles (beads) in biosensing offer a number of advantagessince there is no significant magnetic background in most samplesof interest.13 Furthermore, magnetic bead labels can be detectedby relatively noninvasive methods, and they have high physicaland chemical stability and are inexpensive to produce.13 Magneticbiosensing principles are roughly classified as being eithersubstrate-based or substrate-free. Giant magnetoresistance bio-sensors14 and micro-Hall devices15 belong to the former categorywhile the Brownian relaxation biosensor method belongs to thelatter. The Brownian relaxation biosensor method was theoreti-cally outlined by Connolly and St. Pierre16 and later experimentally
* To whom correspondence should be addressed. E-mail: [email protected] (M.N.); [email protected] (P.S.); [email protected] (M.S.). Phone: +46 18 471 0000.
† Department of Engineering Sciences, Division of Nanotechnology andFunctional Materials.
‡ Department of Engineering Sciences, Division of Solid State Physics.§ Department of Genetics and Pathology.
(1) Azzazy, H. M. E.; Mansour, M. M. H.; Kazmierczak, S. C. Clin. Chem. 2006,52, 1238–1246.
(2) Erickson, D.; Mandal, S.; Yang, A. H. J.; Cordovez, B. Microfluid. Nanofluid.2008, 4, 33–52.
(3) Lazcka, O.; Campo, F. J. D.; Munoz, F. X. Biosens. Bioelectron. 2007, 22,1205–1217.
(4) Sassolas, A.; Leca-Bouvier, B. D.; Blum, L. J. Chem. Rev. 2008, 108, 109–139.
(5) Park, H. G.; Song, J. Y.; Park, K. H.; Kim, M. H. Chem. Eng. Sci. 2006,61, 954–965.
(6) Petrik, J. Transfusion Med. 2006, 16, 233–247.(7) Wang, J. Biosens. Bioelectron. 2006, 21, 1887–1892.(8) Pumera, M.; Sanchez, S.; Ichinose, I.; Tang, J. Sens. Actuators, B 2007,
123, 1195–1205.(9) Gronewold, T. M. A. Anal. Chim. Acta 2007, 603, 119–128.
(10) Chivukula, V. S.; Shur, M. S.; Ciplys, D. Phys. Status Solidi A 2007, 204,3209–3236.
(11) Fritz, J. Analyst 2008, 133, 855–863.(12) Fan, X.; White, I. M.; Shopova, S. I.; Zhu, H.; Suter, J. D.; Sun, Y. Anal.
Chim. Acta 2008, 620, 8–26.(13) Tamanaha, C. R.; Mulvaney, S. P.; Rife, J. C.; Whitman, L. J. Biosens.
Bioelectron. 2008, 24, 1–13.(14) Wang, S. X.; Li, G. IEEE Trans. Magn. 2008, 44, 1687–1702.(15) Mihajlovic, G. Ph.D. Dissertation, The Florida State University, Tallahassee,
FL, 2006.(16) Connolly, J.; St. Pierre, T. G. J. Magn. Magn. Mater. 2001, 225, 156–160.
Anal. Chem. 2009, 81, 3398–3406
10.1021/ac900561r CCC: $40.75 2009 American Chemical Society3398 Analytical Chemistry, Vol. 81, No. 9, May 1, 2009Published on Web 03/31/2009
demonstrated by Astalan et al.17 and Hong et al.18 In this bioassayprinciple, probe biomolecules are coupled to suspended magneticbeads exhibiting Brownian relaxation behavior. Binding of targetmolecules to the bead surface causes a hydrodynamic sizeincrease and thereby a decreased Brownian relaxation frequencyof the beads.
Recently, we demonstrated a new substrate-free sensitive (lowpicomolar range) and highly specific magnetic biosensor principlesuitable as a potential platform for future development of low-cost diagnostic point-of-care and/or over-the-counter devices,the volume-amplified magnetic nanobead detection assay(VAM-NDA).19,20 To summarize the detection procedure of onesingle type of target-DNA, the assay begins with padlock probetarget recognition21,22 followed by a very specific ligation reaction.Rolling circle amplification (RCA)23,24 of the circularized probe-target complexes for a certain time gives an ensemble ofmacromolecular DNA-coils (RCA-coils), which in turn are detectedby letting detection probe oligonucleotide tagged magnetic nano-beads of one single size bind to the RCA-coils by base-pairhybridization (bead immobilization). This causes a strong decreaseof the bead Brownian relaxation frequency (fB) due to the stronglyincreased bead hydrodynamic volume, now essentially corre-sponding to the size of an RCA-coil. Upon immobilization, themagnitude of the imaginary part (m′′) of the frequency-dependent complex magnetization (m(f) ) m′(f) - im′′(f)) atthe Brownian relaxation frequency for nonimmobilized beads,the high-frequency peak (HFP) level, decreases, compared toa negative control sample (absence of RCA-coils). RCA-coilscontaining immobilized beads (strictly speaking single RCA-coils and/or clusters of RCA-coils bound together by beads)are associated with a relaxation process, which we denote thelow-frequency peak (LFP), and the magnitude of m′′ at theBrownian relaxation frequency associated with the LFP isdenoted the LFP level.
So far, we have demonstrated quantitative analysis of a singletype of target-DNA19,20 and biplex detection of bacterial DNA-sequences qualitatively.20 In the current work, we will in detailevaluate the possibility to conduct quantitative detection of twokinds of bacterial DNA-sequences simultaneously in the samecompartment using sequences from Vibrio vulnificus and V.cholerae, i.e., quantitative biplex detection. The results from thebiplex detection experiment will be compared with the corre-sponding single-target experiments conducted separately. We willalso demonstrate qualitative triplex detection of bacterial DNA-
sequences using sequences from V. vulnificus, V. cholerae, andEscherichia coli.
THEORYDynamic Magnetic Properties of Ferrofluids. The magnetic
beads used in this paper are composed of a clustered coreconsisting of single domain maghemite nanoparticles, each havinga diameter of ∼15 nm, held together by a dextran casing, wherethe nanoparticle magnetic moments are thermally blocked at roomtemperature and the beads are suspended in deionized water.
With only one relaxation time present in the system, the Debyetheory25 gives an expression for the complex low-field magnetiza-tion m(ω) for an ensemble of beads according to
where ω is the angular frequency of the applied ac magneticexcitation field, m∞ is the high-frequency magnetization, m0 isthe low-field static magnetization, and τ is the characteristicrelaxation time of the beads.
The magnetic bead relaxation is governed by either of tworelaxation mechanisms: The Neel relaxation,26 where the magneticmoment rotates within the nanoparticles, or the Brownian relax-ation,27 where the entire bead rotates in response to the acmagnetic field. The prevailing relaxation mechanism for beadsused in the present work is the Brownian relaxation mechanism.In the Brownian relaxation model,27 the characteristic relaxationtime is given by
where VB is the bead hydrodynamic volume, kT is the thermalenergy, and η is the dynamic viscosity of the carrier liquid.The Brownian relaxation frequency, fB ) (2πτB)-1, is thefrequency characterizing the position of the peak in the m′′ vsfrequency spectrum.
To account for relaxation time distributions, the Cole-Colemodel28 gives the following empirical expression for the complexmagnetization
where R (the Cole-Cole parameter), 0 < R < 1, is a measure ofthe relaxation time distribution width; the narrower the distribu-tion, the closer R is to zero. A more complete treatment of thetheory is presented elsewhere.19,20,29,30
Quantitative Analysis Using the VAM-NDA Bioassay.Quantitative analysis of a single type of target-DNA can either beof the turn-off or turn-on type,20 where the former is based onthe decrease of the HFP level while the latter refers to the increaseof the LFP level with increasing RCA-coil concentration. Withbeads having a bare physical diameter of 40 nm, both turn-offand turn-on detection have been shown to be possible while only
(17) Astalan, A. P.; Ahrentorp, F.; Johansson, C.; Larsson, K.; Krozer, A. Biosens.Bioelectron. 2004, 19, 945–951.
(18) Hong, C.-Y.; Chen, W. S.; Jian, Z. F.; Yang, S. Y.; Horng, H. E.; Yang, L. C.;Yang, H. C. Appl. Phys. Lett. 2007, 90, 074105.
(19) Stromberg, M.; Goransson, J.; Gunnarsson, K.; Nilsson, M.; Svedlindh, P.;Strømme, M. Nano Lett. 2008, 8, 816–821.
(20) Stromberg, M.; Zardan Gomez de la Torre, T.; Goransson, J.; Gunnarsson,K.; Nilsson, M.; Strømme, M.; Svedlindh, P. Biosens. Bioelectron. 2008,24, 696–703.
(21) Nilsson, M.; Malmgren, H.; Samiotaki, M.; Kwiatkowski, M.; Chowdhary,B. P.; Landegren, U. Science 1994, 265, 2085–2088.
(22) Landegren, U.; Dahl, F.; Nilsson, M.; Fredriksson, S.; Baner, J.; Gullberg,M.; Jarvius, J.; Gustafsdottir, S.; Soderberg, O.; Ericsson, O.; Stenberg, J.;Schallmeiner, E. Comp. Funct. Genomics 2003, 4, 525–530.
(23) Fire, A.; Xu, S.-Q. Proc. Natl. Acad. Sci. U.S.A. 1995, 92, 4641–4645.(24) Liu, D.; Daubendiek, S. L.; Zillman, M. A.; Ryan, K.; Kool, E. T. J. Am.
Chem. Soc. 1996, 118, 1587–1594.
(25) Debye, P. Polar Molecules; The Chemical Catalogue Company: New York,1929.
(26) Neel, L. Ann. Geophys. 1949, 5, 99–136.(27) Brown, W. F., Jr. J. Appl. Phys. 1963, 34, 1319–1320.(28) Cole, K. S.; Cole, R. H. J. Chem. Phys. 1941, 9, 341–351.(29) Stromberg, M.; Gunnarsson, K.; Valizadeh, S.; Svedlindh, P.; Strømme, M.
J. Appl. Phys. 2007, 101, 023911.(30) Stromberg, M.; Gunnarsson, K.; Johansson, H.; Nilsson, M.; Svedlindh, P.;
Strømme, M. J. Phys., D: Appl. Phys. 2007, 40, 1320–1330.
m(ω) ) (m0 - m∞)/(1 + iωτ) + m∞ (1)
τB ) 3ηVB/kT (2)
m(ω) ) (m0 - m∞)/(1 + (iωτB)1-R) + m∞ (3)
3399Analytical Chemistry, Vol. 81, No. 9, May 1, 2009

turn-off detection applies for bead sizes of 130 and 250 nm.20 Asingle-target assay exhibits high quantification accuracy. Toexemplify, for the single-target assay presented in ref 19 using130 nm beads with data given in Figure 2 in this reference, thecoefficient of variation (CV) values are 19%, 2.9%, 3.3%, 4.2%, and2.7% for 3.7, 11, 33, 100, and 300 pM target concentrations,respectively.
Assume now that k types of target-DNA are to be quantitativelydetected simultaneously in the same compartment. After targetrecognition, ligation, and RCA, the sample may contain k types ofRCA-coils for which k types of oligonucleotide detection probescan be designed where each probe matches, i.e., complementaryto, exactly one type of RCA-coil. Each type of detection probe is
attached to one specific bead size, and the k types of detectionprobe functionalized beads are thereafter mixed together andadded to the sample for probing the different concentrations ofRCA-coils simultaneously. Upon this, each type of detection probe-tagged bead will hybridize to the RCA-coil it matches. As aconsequence, the composite LFP will be the result of a cocktailof LFPs, including the individual contributions from the differentk types of separate RCA-coils containing beads as well ascontributions from coil clusters bound together by beads. It willbe advantageous to choose the largest bead size such that its freebead relaxation peak occurs well above the composite LFP. Withthe use of RCA-coils of about 1 µm size, the former species haverelaxation frequencies around 1 Hz whereas the latter species
Figure 1. Illustrations of the single- and biplex target recognition, amplification, and detection reactions. (a) Padlock probes are mixed with asample containing the target sequence (target 1). The probes are circularized guided by target 1, and the juxtaposed probe ends are joined ina highly specific ligation reaction. The DNA circles are amplified by RCA, which creates a single-stranded concatemer product that collapsesinto a micrometer-sized coil of DNA (RCA-coil). Magnetic beads functionalized with oligonucleotides complementary to the RCA-coils are added,and the beads are hybridized to the RCA-coils. This strongly affects the Brownian relaxation behavior of the beads. The peak response for freebeads in the imaginary part of complex magnetization (m′′) vs frequency spectrum is referred to as the high-frequency peak (HFP), whereasbeads incorporated in the RCA-coils respond by a low-frequency peak (LFP). The presence of a target is detected as a decrease in the proportionof free beads reflected as a decrease of the HFP amplitude (HFP level, turn-off detection) and sometimes an increase of the LFP amplitude(LFP level, turn-on detection). The diagram axes are m′′ (y-axis) and log(f) (x-axis) where f is the frequency of the applied ac magnetic field. (b)The absence of the correct target sequence does not give rise to DNA circles and RCA-coils, and all beads remain free; therefore, the HFPexhibits high amplitude in the diagram and the LFP is absent. (c) Biplex detection is enabled by applying a cocktail of padlock probes targetingdifferent sequences. The RCA-coils are distinguished by the use of differently sized magnetic beads, which are equipped with target-specificoligonucleotides. The m′′ vs frequency curve corresponds to a composite curve that has been resolved into two HFPs, each belonging to onespecific bead size, using a Cole-Cole model fit (deconvolution). The composite LFP, i.e., the total response from RCA-coils with hybridizedbeads, is neglected in the deconvolution model and therefore not illustrated in the diagram. (d) The absence of the correct target sequencesdoes not give rise to DNA circles and RCA-coils, and all beads remain free. As in panel c, the composite curve has been resolved into its twoHFP contributions using the Cole-Cole model.
3400 Analytical Chemistry, Vol. 81, No. 9, May 1, 2009

exhibit a relaxation frequency far below 1 Hz. For frequencieswell above the composite LFP region, the composite m′′ vsfrequency spectrum can to a good approximation to be expressedas a sum of k free bead Cole-Cole distributions, i.e., a sum of kHFPs
which can be deconvoluted to its k HFP contributions by fittingthe experimental data to eq 4 by a nonlinear least-squaresprocedure. Thereby, the k HFP levels can be obtained andcompared with the corresponding k negative control HFP levels.Figure 1 provides a schematic illustration of single-target detection(left) and biplex detection (right) using the VAM-NDA biosensorprinciple.
EXPERIMENTAL SECTIONDetection Probe Functionalization of Magnetic Beads and
Characterization of Probe-Tagged Bead Batches. Three aque-ous suspensions of relatively monodisperse amine-functionalized
cluster-type magnetic beads (nanomag-D NH2 ferrofluids) havingphysical mean diameters of 80, 130, and 250 nm were suppliedfrom Micromod Partikeltechnologie GmbH. For the 80, 130,and 250 nm ferrofluids, the polydispersity indexes were 0.378,0.067, and 0.115, respectively, as determined from photoncorrelation spectroscopy by the manufacturer. The 130 and 250nm beads were used for quantitative biplex detection whereasall three sizes were used for a qualitative demonstration oftriplex detection. Detection probe coupled single-sized beadbatches were synthesized as described elsewhere;20 oligonucle-otide surface coverages were determined by a fluorescence-based method,19 and detection batches were obtained bymixing single-sized batches in specific volume amounts.Measurements of the saturation magnetic moment at 310 Kon 30 µL of each of batches I, II, and IV using a superconduct-ing quantum interference device (SQUID) magnetometer (QDMPMS XL, Quantum Design) were performed in order tocalculate the bead concentration (in units of picomolar) andthe solid content of beads (in units of milligrams of beads permilliliter) in each batch. Properties of the batches are given inTable 1. For clarity, each target and detection probe, respectively,is abbreviated by “T” and “D” followed by the size of the beadused for the detection of the target, e.g., “T250” and “D250”,respectively.
Padlock Probe Target Recognition, Ligation, and RCA.For biplex and triplex detection, padlock probe target recognitionand ligation were performed separately for each bacterial DNA-sequence target (target T250 recognized by padlock probe P250and so forth) and the circularized complexes were thereaftermixed followed by RCA for 1 h, creating a mixture of either T250and T130 coils (biplex detection) or of T250, T130, and T80 coils(triplex detection). Different amounts of the circularized com-plexes were used for obtaining samples with different RCA-coilconcentrations. For T250 and T130 single-target assays, only onesingle type of circularized complex was RCA amplified, creatingsamples containing only RCA-coils corresponding to the T250 andT130 target, respectively. Detailed procedures of ligation and RCAare given in refs 19 and 20. Additionally, after RCA, genomicbackground material derived from blood belonging to a humanmale individual was added so that each magnetically characterizedsample (see below) contained 150 ng of genomic backgroundmaterial. This was implemented in order to achieve similarsedimentation/adsorption conditions in all samples.20 Sequencesare listed in Table 1 where T250, T130, and T80 denote the V.vulnificus, V. cholerae, and E. coli target sequences, respectively.
Magnetic Probing of RCA-Coils. For probing the targetconcentrations in a biplex or triplex sample, 25 µL of the detectionbatch (batch III for biplex detection and batch V for triplexdetection) was gently mixed at room temperature with 25 µL ofsolution containing RCA-coils or no coils in the case of a negativecontrol sample, and 30 µL of the mixture was extracted forimmediate characterization in the SQUID magnetometer. Thecharacterization began with 30 min of incubation at 343 K followedby an ac magnetic moment (in units of electromagnetic unit, emu)measurement at 310 K in the frequency range 1000-0.5 Hz (acexcitation field amplitude 2 Oe). Finally, the saturation magneticmoment (in units of emu) was determined at the same temper-ature in order to calculate the magnetic bead content in the sample
Figure 2. m′′ vs frequency at 310 K for different concentrations ofT250 (panel a, batch Ib used) and T130 (panel b, batch IIb used)visualizing the outcome of the T250 and T130 single-target assays.Sample preparation was incubation for 30 min at 343 K, and beadconcentrations were the same as in the biplex assay. All samplesinclude genomic background material. The lines are guides for theeye.
m''composite(f) )
∑j)1
k (m0,j - m∞,j)(f/fB,j)1-Rj sin((1 - Rj)
π2 )
1 + (f/fB,j)2(1-Rj) + 2(f/fB,j)
1-Rj cos((1 - Rj)π2 )
(4)
3401Analytical Chemistry, Vol. 81, No. 9, May 1, 2009

(the diamagnetic contribution from the sample holder wassubtracted). In the case of biplex detection, the correspondingsingle-target experiments, using batch Ib for T250 detection andbatch IIb for T130 detection, were performed in the same manner.The corrected composite complex magnetization (in units of emuper gram of beads) profile for a biplex or triplex sample wascalculated as
where mcomposite(f) is the measured complex magnetic moment,Ms is the saturation magnetic moment for the compositesample, Ms,NC is the saturation magnetic moment for thenegative control sample, and massbeads,NC is the total mass ofbeads in the negative control. In this expression, the factorMs,NC/Ms appears in order to compensate for small variationsin the amount of magnetic material from sample to sample andto ensure that each corrected composite complex magnetizationspectrum corresponds to the same amount of magnetic materialas in the negative control sample. In the case of biplex analysis,each corrected composite complex magnetization spectrum wasdeconvoluted as described below for simultaneous targetquantification.
RESULTS AND DISCUSSIONSingle-Target Assays. Figure 2 shows m′′ vs frequency
spectra at 310 K for different concentrations of T250 (panel a, batchIb used) and T130 (panel b, batch IIb used). m′ vs frequencyspectra belonging to the data presented in Figure 2 can be foundin the Supporting Information, Figure S1. These two single-targetassays were designed to closely correspond to the T250 and T130assays occurring in the same compartment (biplex detection), i.e.,the same bead concentrations, sample preparation, and contentof genomic background material were used. As concluded in ref20, the presence of genomic background material impedes beadsedimentation and/or adsorption to the sample container walls.In Figure 2, for both the T250 and T130 cases, the HFP leveldecreases with increasing RCA-coil concentration whereas the LFPlevels show no clear correlation with the RCA-coil concentration,i.e., the behavior is of turn-off type as observed in earlier work.19,20
Note that LFPs are visible in the T130 case (at about 1 Hz), mostpronounced for 100 pM target concentration, a fact which will bediscussed further below in connection with the deconvolutionprocedure of the composite m′′ vs frequency biplex spectra.
Fits according to the Cole-Cole model, see eq 3, wereperformed on the HFPs in Figure 2, and detailed results can befound in the Supporting Information, Table S1 and Figure S2.Figure 3 displays the HFP Brownian relaxation frequency (a), theHFP Cole-Cole parameter (b), and the HFP level (c) vs targetconcentration for the single-target assays. The inset in Figure 3cshows HFP levels vs target concentration normalized with respectto the negative control HFP level from which it follows that thetwo kinds of probe-tagged beads have similar immobilizationefficiencies with that of the 250 nm beads being somewhat higherfor higher RCA-coil concentrations. In Figure 3a, it can beobserved that the HFP Brownian relaxation frequency increasesslightly with increasing RCA-coil concentration for the T250T
ab
le1
.Pro
pe
rtie
so
fD
ete
cti
on
Pro
be
Fu
nc
tio
na
lize
dB
ea
dB
atc
he
s(U
pp
er
Ha
lf)
an
dS
eq
ue
nc
es
of
Ta
rge
ts,P
ad
loc
kP
rob
es,
an
dD
ete
cti
on
Pro
be
s(L
ow
er
Ha
lf)
batc
hba
reph
ysic
albe
addi
amet
er(n
m)
dete
ctio
npr
obe
bead
conc
entr
atio
n(p
M)
solid
cont
ent
ofbe
ads
(mg/
mL)
aver
age
num
ber
ofde
tect
ion
prob
espe
rbe
ad
I25
0D
250
672
8.26
186
Iba
10µL
ofI
and
110
µLof
PBS
mix
edII
130
D13
028
825.
9814
IIbb
30µL
ofII
and
90µL
ofPB
Sm
ixed
IIIc
40µL
ofI,
120
µLof
II,a
nd32
0µL
ofPB
Sm
ixed
IV80
D80
3561
1.72
3V
d25
µLof
I,35
µLof
II,4
0µL
ofIV
,and
50µL
ofPB
Sm
ixed
nam
ese
quen
ce
T25
05′
-TT
GT
AA
AG
CA
CT
TT
CA
GT
TG
TG
AG
GA
AG
GT
-3′(
Vib
rio
vuln
ificu
sse
quen
ce)
padl
ock
prob
efo
rT
250
(P25
0)5′
-AC
TG
AA
AG
TG
CT
TT
AC
AA
CT
TC
TA
GA
GT
GT
AC
CG
AC
CT
CA
GT
AG
CC
GT
GA
CT
AT
CG
AC
TC
TG
GA
CC
TT
AA
TC
GT
GT
GC
GA
CC
TT
CC
TC
AC
A-3
′de
tect
ion
prob
efo
rT
250
(D25
0)SH
-5′-T
TT
TT
TT
TT
TT
TT
TT
TT
TT
TC
TG
GA
CC
TT
AA
TC
GT
GT
GC
G-3
′-FIT
CT
130
5′-C
CC
TG
GG
CT
CA
AC
CT
AG
GA
AT
CG
CA
TT
TG
-3′(
Vib
rio
chol
erae
sequ
ence
)pa
dloc
kpr
obe
for
T13
0(P
130)
5′-T
AG
GT
TG
AG
CC
CA
GG
GA
CT
TC
TA
GA
GT
GT
AC
CG
AC
CT
CA
GT
AG
CC
GT
GA
CT
AT
CG
AC
TT
GT
TG
AT
GT
CA
TG
TG
TC
GC
AC
CA
AA
TG
CG
AT
TC
C-3
′de
tect
ion
prob
efo
rT
130
(D13
0)SH
-5′-T
TT
TT
TT
TT
TT
TT
TT
TT
TT
TG
TT
GA
TG
TC
AT
GT
GT
CG
CA
C-3
′-FIT
CT
805′
-AC
GT
CG
CA
AG
AC
CA
AA
GA
GG
GG
GA
CC
T-3
′(E
sche
rich
iaco
lise
quen
ce)
padl
ock
prob
efo
rT
80(P
80)
5′-C
TT
TG
GT
CT
TG
CG
AC
GT
CA
GT
GG
AT
AG
TG
TC
TT
AC
AC
GA
TT
TA
GA
GT
GT
AC
CG
AC
CT
CA
GT
AG
CC
GT
GA
CT
AT
CG
AC
TA
GG
TC
CC
CC
T-3
′de
tect
ion
prob
efo
rT
80(D
80)
SH-5
′-TT
TT
TT
TT
TT
TT
TT
TT
TT
TT
GT
GG
AT
AG
TG
TC
TT
AC
AC
GA
-3′-F
ITC
aU
sed
for
the
T25
0as
say.
bU
sed
for
the
T13
0as
say.
cU
sed
for
the
quan
titat
ive
bipl
exas
say
(T25
0an
dT
130)
.dU
sed
for
the
qual
itativ
etr
iple
xas
say
(T25
0,T
130,
and
T80
).
mcomposite,corrected(f)[emu/g] )
mcomposite(f)[emu]Ms,NC[emu]
Ms[emu]massbeads,NC[g](5)
3402 Analytical Chemistry, Vol. 81, No. 9, May 1, 2009

experiment (250 nm beads) whereas it decreases slightly in theT130 experiment (130 nm beads) and the trends are welldescribed by linear expressions. These observations suggest thatin the case of 250 nm mean bead size (T250 experiment), thereis preferential immobilization of larger beads in the size distribu-tion and/or bead aggregates whereas the opposite holds for thecase with 130 nm beads (T130 experiment). These observations
are consistent with results (unpublished) obtained from experi-ments where the size distribution of the nonimmobilized beadpopulation for a number of different RCA-coil concentrations wasanalyzed by dynamic light scattering. Detailed investigations ofthese phenomena are however beyond the scope of this paperand require further studies. Using beads with a narrower sizedistribution would most likely give smaller variations in the HFPBrownian relaxation frequency values when varying the RCA-coilconcentration. As can be seen in Figure 3b, the HFP Cole-Coleparameter increases slightly with increasing RCA-coil concentra-tion in both the T250 and T130 cases and also these trends arewell described by linear expressions. In other words, a higherRCA-coil concentration gives a broader distribution of relaxationtimes for the remaining nonimmobilized bead population. Areasonable explanation for this is that positively charged (proto-nated) amine groups on the surface of the nonimmobilized beads(pH ∼ 7) interact electrostatically with the negatively chargedRCA-coil DNA chains. This implies that a bead interacting with acoil electrostatically, without immobilization via base-pair hybrid-ization, exhibits a slightly different Brownian relaxation behaviorcompared to a completely free bead, something which gives riseto a slight HFP broadening. For clarity, because of the particularoligonucleotide coupling chemistry used, the amine groups aresituated either on iodoacetamide alkylated surface sites or appearas nonreacted functionalities on the dextran surface of the beads(see ref 30). It should also be mentioned that a detection probeon a bead in close vicinity of an RCA-coil has to be in a veryspecific position with respect to the RCA-coil DNA chain in orderto hybridize. This implies that a probe-tagged bead in close vicinityof a coil is able to interact electrostatically with the coil withoutnecessarily immobilizing.
Biplex Detection. Figure 4 shows corrected composite m′′vs frequency spectra at 310 K visualizing the outcome of thequantitative T250, T130 biplex experiment (batch III used). m′ vsfrequency spectra belonging to the data presented in Figure 4are shown in the Supporting Information, Figure S3. A total of 12different T250, T130 concentration combinations were evaluated.In Figure S3 in the Supporting Information, it can be observedthat the magnitude of m′ tends to decrease when the sum of thetarget concentrations increases, which is reasonable since thisquantity correlates with the total amount of immobilized beads.19
In this biplex experiment, the two HFPs, one corresponding to
Figure 3. Panels a, b, and c show Brownian relaxation frequencies,Cole-Cole parameters (R), and HFP levels, respectively, for the HFPsin Figure 2. The first two parameters were obtained from Cole-Colefits whereas the third represents the maximum values of the HFPs.Linear fits to the data are displayed in panels a and b. The inset inpanel c shows HFP levels normalized with respect to the negativecontrols.
Figure 4. Corrected composite m′′ vs frequency curves at 310 Kvisualizing the outcome of the T250, T130 biplex experiment (batchIII used, sample preparation was incubation for 30 min at 343 K).The lines are guides for the eye.
3403Analytical Chemistry, Vol. 81, No. 9, May 1, 2009
free 250 nm beads (T250 detection) and the other to free 130 nmbeads (T130 detection), are separated only by one decade offrequency implying a rather large HFP overlap.
For the case k ) 2 in eq 4, we have in total six fittingparameters, i.e., m0,T250 - m∞,T250, fB,T250, RT250, m0,T130 - m∞,T130,fB,T130, and RT130. To improve on accuracy in the fittingprocedure, i.e., the deconvolution of the composite biplexspectra in Figure 4, some parameters should be locked atpredetermined values. First, it is reasonable to assume that fB,T250
and fB,T130 are close to the Brownian relaxation frequenciesdetermined in the corresponding single-target experimentsperformed separately, see Figure 3a, since these parameters arerelated to the mean hydrodynamic size of the nonimmobilizedmagnetic beads. It should be mentioned that it was carefullychecked that there was no cross-hybridization between the T250and T130 detection probes and the T250 and T130 RCA-coils. Thiswas established in experiments excluding magnetic beads byattaching RCA-coils (∼1 µm size), derived from T250 sequence/T250 padlock probe (T130 sequence/T130 padlock probe) circu-larized complexes, on glass-substrates followed by hybridizationby T130 (T250) detection probes while studying the surfaces usingfluorescence microscopy. Here, hybridization reactions betweencoils and detection probes would have given rise to micrometersized bright spots in the fluorescence microscope, i.e., confinedclusters of fluorophores (see, e.g., ref 31). Second, from similararguments as above in connection to the single-target experiments,it is reasonable to assume that the presence of T250 RCA-coilsmay affect the broadening of the T130 HFP and vice versa, i.e.,RT250 and RT130 should be free fitting parameters.
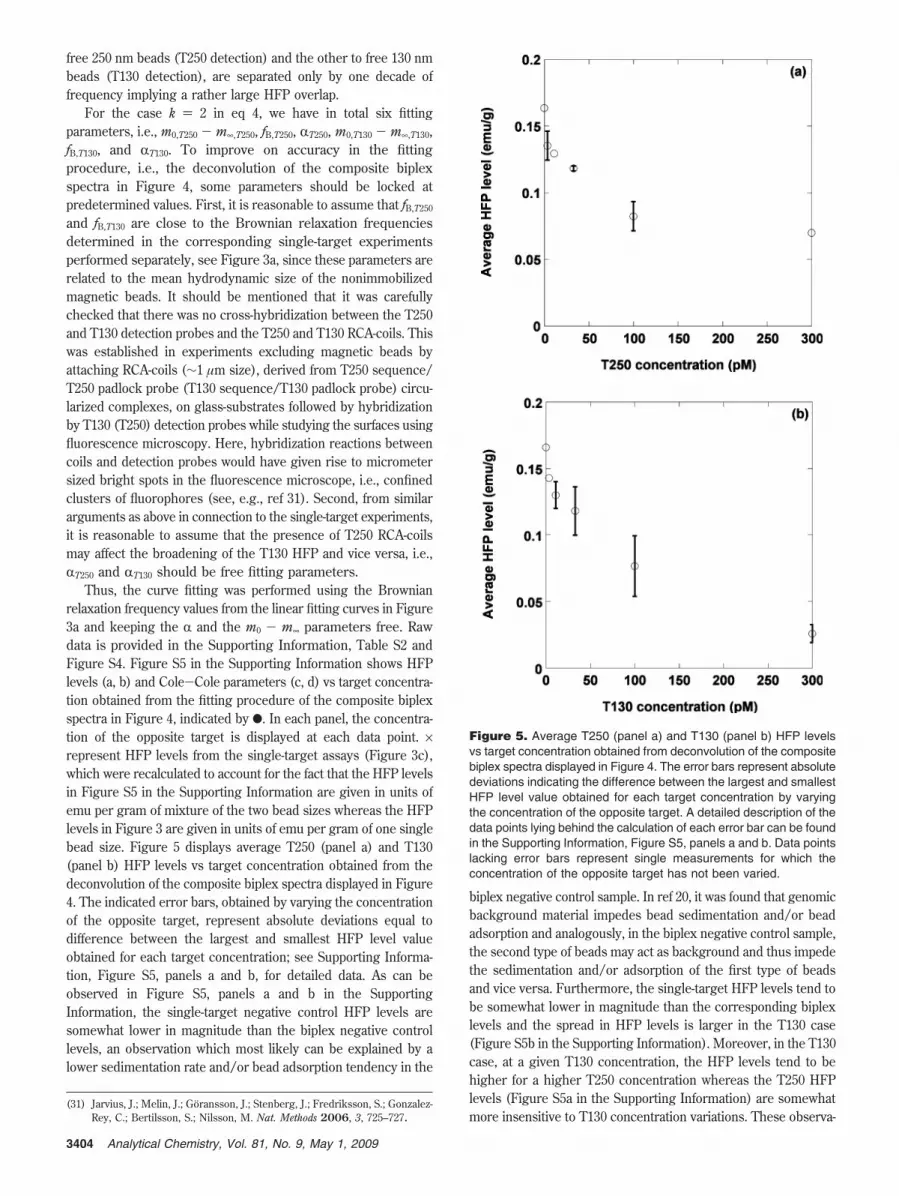
Thus, the curve fitting was performed using the Brownianrelaxation frequency values from the linear fitting curves in Figure3a and keeping the R and the m0 - m∞ parameters free. Rawdata is provided in the Supporting Information, Table S2 andFigure S4. Figure S5 in the Supporting Information shows HFPlevels (a, b) and Cole-Cole parameters (c, d) vs target concentra-tion obtained from the fitting procedure of the composite biplexspectra in Figure 4, indicated by b. In each panel, the concentra-tion of the opposite target is displayed at each data point. ×represent HFP levels from the single-target assays (Figure 3c),which were recalculated to account for the fact that the HFP levelsin Figure S5 in the Supporting Information are given in units ofemu per gram of mixture of the two bead sizes whereas the HFPlevels in Figure 3 are given in units of emu per gram of one singlebead size. Figure 5 displays average T250 (panel a) and T130(panel b) HFP levels vs target concentration obtained from thedeconvolution of the composite biplex spectra displayed in Figure4. The indicated error bars, obtained by varying the concentrationof the opposite target, represent absolute deviations equal todifference between the largest and smallest HFP level valueobtained for each target concentration; see Supporting Informa-tion, Figure S5, panels a and b, for detailed data. As can beobserved in Figure S5, panels a and b in the SupportingInformation, the single-target negative control HFP levels aresomewhat lower in magnitude than the biplex negative controllevels, an observation which most likely can be explained by alower sedimentation rate and/or bead adsorption tendency in the
biplex negative control sample. In ref 20, it was found that genomicbackground material impedes bead sedimentation and/or beadadsorption and analogously, in the biplex negative control sample,the second type of beads may act as background and thus impedethe sedimentation and/or adsorption of the first type of beadsand vice versa. Furthermore, the single-target HFP levels tend tobe somewhat lower in magnitude than the corresponding biplexlevels and the spread in HFP levels is larger in the T130 case(Figure S5b in the Supporting Information). Moreover, in the T130case, at a given T130 concentration, the HFP levels tend to behigher for a higher T250 concentration whereas the T250 HFPlevels (Figure S5a in the Supporting Information) are somewhatmore insensitive to T130 concentration variations. These observa-
(31) Jarvius, J.; Melin, J.; Goransson, J.; Stenberg, J.; Fredriksson, S.; Gonzalez-Rey, C.; Bertilsson, S.; Nilsson, M. Nat. Methods 2006, 3, 725–727.
Figure 5. Average T250 (panel a) and T130 (panel b) HFP levelsvs target concentration obtained from deconvolution of the compositebiplex spectra displayed in Figure 4. The error bars represent absolutedeviations indicating the difference between the largest and smallestHFP level value obtained for each target concentration by varyingthe concentration of the opposite target. A detailed description of thedata points lying behind the calculation of each error bar can be foundin the Supporting Information, Figure S5, panels a and b. Data pointslacking error bars represent single measurements for which theconcentration of the opposite target has not been varied.
3404 Analytical Chemistry, Vol. 81, No. 9, May 1, 2009

tions are possibly related to the bead/coil attractive electrostaticinteraction discussed in connection to the single-target assaysabove. More precisely, since probe-tagged beads may interactelectrostatically with matching RCA-coils as well as with non-matching RCA-coils, the presence of nonmatching coils may affectthe hybridization between the probe-tagged beads and theirmatching RCA-coils. This interpretation is supported by the factthat the 130 nm beads are affected more by the presence ofnonmatching coils than the 250 nm beads, where the latter kindof beads have a considerably larger amount of oligonucleotidesper surface area unit, see Table 1, where the oligonucleotides“screen” the positively charged amine groups. From the Support-ing Information, Figure S4, for the “T250 300 pM, T130 300 pM”sample, it is obvious that the curve fit is rather poor, most likelybecause the composite LFP contributes significantly to thecomposite m′′ vs frequency spectrum, implying that three relax-ation peaks have to be taken into account in order to obtain areliable deconvolution. Therefore, 300 pM data points, especiallyfor 300 pM T130 concentration, should be considered with caution.As can be seen in Figure S5, panels c and d in the SupportingInformation, for a given concentration of one target, the Cole-Coleparameter increases slightly with increasing concentration of theopposite target. The interpretation of this is similar to the one ofthe HFP broadening effects in the single-target experiments.
In summary, the T250 HFP levels (Figure 5a), are found to berather insensitive to variations of T130 target concentration in thebiplex detection experiment. Roughly, a doubling of the T250target concentration in the concentration range between 10 and100 pM can be assessed. As well, since the spread in T130 HFPlevels exhibits a systematic pattern (see Figure S5b in theSupporting Information), a T130 HFP level adjustment proceduremay be implemented after deconvolution to improve the T130quantification accuracy. In this, the obtained T130 HFP levelshould be adjusted downward if the T250 concentration is foundto be 100 pM or higher. Additionally, with the use of beads witha more narrow size distribution, the spread in HFP levels may befurther decreased. A more accurate deconvolution could probablybe achieved by increasing the separation of the HFPs. This couldin turn be accomplished by using beads of as large size differenceas possible, which would require a magnetometer with a largerfrequency window. Furthermore, a higher coverage of detectionprobes should be used in order to screen unwanted electrostaticinteractions between beads and nonmatching coils. Also, a bufferof a higher pH would decrease the strength of the electrostaticbead/coil interactions. For clarity, it should be mentioned thatthe observed spread in T250 and T130 HFP levels in Figure S5,panels a and b in the Supporting Information, mainly appear as aconsequence of that the presence of the other kind of RCA-coilinterferes with the detection of the first kind of RCA-coil and viceversa. Thus, biplex detection performed with the particular beadsused in this study needs to be optimized further to give as goodquantitative results as obtained in a single target assay,19 but theresults presented above show that the procedure in principle canbe used to quantify biomolecules in multiplex assays. However,in its current format, biplex detection is able to give qualitativeinformation. This becomes obvious by comparing the m′′ vsfrequency spectra for the T250 0 pM, T130 0 pM (negative control)and T250 300 pM, T130 300 pM samples in Figure 4.
Brief Qualitative Demonstration of Triplex Detection.Figure 6 shows the corrected composite m′′ vs frequency spectraat 310 K visualizing the outcome of a brief qualitative demonstra-tion of T250, T130, T80 triplex detection (batch V used). Thecorresponding corrected composite m′ vs frequency spectra aregiven in the Supporting Information, Figure S6. Five differentT250, T130, T80 concentration combinations were evaluated. Thedetection batch was prepared by choosing the relative amount ofthe different beads so that in the “T250 0 pM, T130 0 pM, T80 0pM” sample (negative control), the T250 HFP is roughly twice ashigh as the T130 and T80 HFPs. This resulted in a single broadplateaulike composite m′′ vs frequency spectrum for the negativecontrol. In Figure S6 in the Supporting Information, as expected,it can be observed that the magnitude of m′ decreases when thesum of the target concentrations increases. Also, the “T250 0 pM,T130 0 pM, T80 300 pM” m′ curve is situated above the “T250 0pM, T130 300 pM, T80 0 pM” curve which mainly can be explainedby the fact that the 80 nm beads have a lower immobilizationefficiency than the 130 nm beads due to a considerably lowerdetection probe surface coverage (Table 1), consistent with earlierobservations.20 In Figure 6, it can be seen that the “T250 300 pM,T130 300 pM, T80 300 pM” sample exhibits a much suppressedand weakly frequency dependent m′′ vs frequency spectrum wherethe T250 and T130 HFPs almost have disappeared and only a smallT80 HFP is visible around 130 Hz. For the “T250 300 pM, T130 0pM, T80 300 pM” sample, the T250 and T80 HFPs have stronglydiminished in height compared to the negative control and a peakis visible around 100 Hz, mainly corresponding to free 130 nmbeads but a small contribution from nonimmobilized 80 nm beadscannot be ruled out. For the “T250 0 pM, T130 300 pM, T80 0pM” sample, the T130 HFP has strongly diminished in heightcompared to the negative control and the composite m′′ vsfrequency spectrum is essentially a superposition of two HFPs,each corresponding to free 250 and 80 nm beads, respectively.The interpretation of the composite m′′ vs frequency spectrumfor the “T250 0 pM, T130 0 pM, T80 300 pM” sample is similar.From similar arguments as presented above for biplex detection,triplex detection performs well qualitatively.
SUMMARY AND CONCLUDING REMARKSThe possibility to perform quantitative biplex detection of V.
vulnificus and V. cholerae DNA-sequences using 250 and 130 nmmagnetic beads by using the VAM-NDA bioassay was investigated.
Figure 6. Corrected composite m′′ vs frequency curves at 310 Kvisualizing the outcome of the T250, T130, T80 triplex experiment(batch V used, sample preparation was incubation for 30 min at 343K). The lines are guides for the eye.
3405Analytical Chemistry, Vol. 81, No. 9, May 1, 2009

In summary, k-plex detection using the VAM-NDA methodinvolves the simultaneous detection of k types of RCA-coils in onecompartment. This is accomplished by choosing k types ofoligonucleotide detection probes and k different sizes of magneticbeads exhibiting Brownian relaxation behavior. Each type ofdetection probe is attached to one specific bead size, and the ktypes of detection probe functionalized beads are mixed together.We have demonstrated the detailed methodology for biplexdetection which includes the use of a detection batch consistingof two bead sizes and a nonlinear least-squares deconvolutionmethod of the composite m′′ vs frequency spectra based on theCole-Cole model. The results have been compared with theresults obtained from the corresponding single-target assaysperformed separately. We have also given a brief qualitativedemonstration of triplex detection of V. vulnificus, V. cholerae, andE. coli DNA-sequences using a detection batch consisting of amixture of detection probe functionalized 250, 130, and 80 nmbeads. Contrary to single-target assays which exhibit very highquantification accuracy, we found that the biplex assay gives arather large spread in HFP levels when keeping one targetconcentration constant while varying the other, possibly due toattractive electrostatic interactions between positively chargedamine groups on the bead surface and negatively charged DNAin nonmatching RCA coils.
In this study, for biplex and triplex detection, padlock probetarget recognition and ligation were performed separately for eachtarget and the circularized padlock probes were thereafter mixedfollowed by RCA. By this, samples consisting of mixtures ofseveral types of RCA-coils were obtained. Alternatively, forsimultaneous selective analysis of several sequence species, amixture of padlock probes designed to detect different targets canbe applied to the ligation reaction.31
The quantification accuracy may be improved by using beadswith a more narrow size distribution and higher detection probecoverage on bead surfaces in order to screen the above-mentionedelectrostatic interactions. A more alkaline buffer environment maybe used in order to decrease the number of protonated aminegroups on the beads, thereby decreasing the strength of theattractive electrostatic bead/coil interaction. Additionally, choosingbeads that differ more in size in order to obtain HFPs more
separated in frequency would give a more accurate deconvolution.For this a magnetometer with a larger frequency window isrequired. Conclusively, biplex detection performed with the VAM-NDA method needs to be optimized further to give as goodquantitative results as obtained in single target assays, but theresults presented here show that the procedure is promising andmay become a valuable tool for, e.g., multiplex detection ofinfectious pathogens and for multiplex quantification of biomol-ecules detected with probing techniques that generate DNAcircles, permitting inclusion of an internal control for improvedquantification accuracy. Also, the biplex and triplex assays performwell qualitatively in their current formats, i.e., they are able toprovide yes/no answers concerning the presence of targets.Finally, it should be mentioned that the SQUID magnetometerused in this paper has to be replaced by a low-cost miniaturizedsensor device able to measure the complex magnetization in orderto achieve a commercial biosensor device. The complete deviceshould also include units such as microfluidic channels andcompartments for reagent storage. Nevertheless, we have pro-vided a proof-of-principle of multiplex detection using the VAM-NDA biosensor principle which is a major step in the biosensordevelopment.
ACKNOWLEDGMENTThe Knut and Alice Wallenberg Foundation (KAW), the
Swedish Foundation for Strategic Research (SSF), the SwedishDefense Nanotechnology Programme, and the Swedish ResearchCouncil (VR) are gratefully acknowledged for their financialsupport.
SUPPORTING INFORMATION AVAILABLEDetailed curve fit results for the T250 and T130 single-target
experiments and for the T130, T250 biplex experiment; m′ vsfrequency spectra belonging to the data presented in Figures 2,4, and 6. This material is available free of charge via the Internetat http://pubs.acs.org.
Received for review December 17, 2008. Accepted March20, 2009.
AC900561R
3406 Analytical Chemistry, Vol. 81, No. 9, May 1, 2009


