Embed Size (px)
Citation preview

ORIGINAL RESEARCHpublished: 14 June 2016
doi: 10.3389/fphar.2016.00157
Frontiers in Pharmacology | www.frontiersin.org 1 June 2016 | Volume 7 | Article 157
Edited by:
Hugo Geerts,
In Silico Biosciences, USA
Reviewed by:
Gaute T. Einevoll,
Norwegian University of Life Sciences,
Norway
Christian Meisel,
University Hospital Carl Gustav Carus
Dresden, Germany
James B. Aimone,
Sandia National Laboratories, USA
*Correspondence:
Samuel A. Neymotin
Specialty section:
This article was submitted to
Experimental Pharmacology and Drug
Discovery,
a section of the journal
Frontiers in Pharmacology
Received: 17 February 2016
Accepted: 30 May 2016
Published: 14 June 2016
Citation:
Neymotin SA, Dura-Bernal S,
Lakatos P, Sanger TD and Lytton WW
(2016) Multitarget Multiscale
Simulation for Pharmacological
Treatment of Dystonia in Motor
Cortex. Front. Pharmacol. 7:157.
doi: 10.3389/fphar.2016.00157
Multitarget Multiscale Simulation forPharmacological Treatment ofDystonia in Motor CortexSamuel A. Neymotin 1, 2*, Salvador Dura-Bernal 1, Peter Lakatos 3, Terence D. Sanger 4, 5 and
William W. Lytton 1, 6, 7, 8
1Department Physiology and Pharmacology, SUNY Downstate Medical Center, State University of New York, Brooklyn, NY,
USA, 2Department Neuroscience, Yale University School of Medicine, New Haven, CT, USA, 3Nathan S. Kline Institute for
Psychiatric Research, Orangeburg, NY, USA, 4Department Biomedical Engineering, University of Southern California, Los
Angeles, CA, USA, 5Division Neurology, Child Neurology and Movement Disorders, Children’s Hospital Los Angeles, Los
Angeles, CA, USA, 6Department Neurology, SUNY Downstate Medical Center, Brooklyn, NY, USA, 7Department Neurology,
Kings County Hospital Center, Brooklyn, NY, USA, 8 The Robert F. Furchgott Center for Neural and Behavioral Science,
Brooklyn, NY, US
A large number of physiomic pathologies can produce hyperexcitability in cortex.
Depending on severity, cortical hyperexcitability may manifest clinically as a hyperkinetic
movement disorder or as epilpesy. We focus here on dystonia, a movement disorder
that produces involuntary muscle contractions and involves pathology in multiple brain
areas including basal ganglia, thalamus, cerebellum, and sensory and motor cortices.
Most research in dystonia has focused on basal ganglia, while much pharmacological
treatment is provided directly at muscles to prevent contraction. Motor cortex is
another potential target for therapy that exhibits pathological dynamics in dystonia,
including heightened activity and altered beta oscillations. We developed a multiscale
model of primary motor cortex, ranging from molecular, up to cellular, and network
levels, containing 1715 compartmental model neurons with multiple ion channels and
intracellular molecular dynamics. We wired the model based on electrophysiological
data obtained from mouse motor cortex circuit mapping experiments. We used the
model to reproduce patterns of heightened activity seen in dystonia by applying
independent random variations in parameters to identify pathological parameter sets.
These models demonstrated degeneracy, meaning that there were many ways of
obtaining the pathological syndrome. There was no single parameter alteration which
would consistently distinguish pathological from physiological dynamics. At higher
dimensions in parameter space, we were able to use support vector machines to
distinguish the two patterns in different regions of space and thereby trace multitarget
routes from dystonic to physiological dynamics. These results suggest the use of in silico
models for discovery of multitarget drug cocktails.
Keywords: dystonia, multiscale modeling, computer simulation, motor cortex, beta oscillations, corticospinal
neurons, multitarget pharmacology, support vector machines

Neymotin et al. Multiscale Modeling for Dystonia Therapies
1. INTRODUCTION
A large number of physiomic pathologies can producehyperexcitability in cortex. In motor cortex, this hyperexcitabilitywill manifest as alterations in movement and muscle tone.At the most extreme, hyperexcitability leads to a seizure withuncontrolled movement, as seen in epilepsia partialis continuans.Lesser hyperexcitability produces a variety of hyperactivemovement disorders, including tics, chorea, tremor, etc, whosepathophysiology is not restricted to cortex, but involves multiplebrain areas including basal ganglia, thalamus, cerebellum, andothers. We focus here on dystonia, a movement disorder thatproduces prolonged involuntary muscle contractions (Neychevet al., 2008; Crowell et al., 2012).
The large variety of dystonias of different etiologies maypresent with involvement of one or several parts of thebody. Pediatric causes of dystonia include cerebral palsy andare generally distinct from adult-onset cases. Common adultdystonias are torticollis, causing involuntary head turning, andmovement-overuse dystonias such as writers cramp. Despitethese differences, dystonias in different patient populations areprimarily treated with the same therapies. While most researchin dystonia has focused on basal ganglia, much pharmacologicaltreatment is provided directly at muscles. Similarly, we proposethat treatment could be targeted elsewhere in the motorpathway, here focusing on motor cortex as a potential target fortherapy.
As with many other movement disorders, the dystoniasgenerally lack a reliable biomarker and are diagnosed bysemiology, the assessment of signs and symptoms. However, alldystonias feature excessive muscle activation that is associatedwith hyperactivity in multiple motor areas associated withmovement activation. Electrophysiological studies of dystoniapatients confirms a pattern of hyperactivation in cortex. Healthyindividuals show low beta oscillations (∼15–20 Hz) in motorcortical local field potential (LFP). This beta is reduced inamplitude and synchrony duringmovement (Jasper and Penfield,1949; Pfurtscheller and Aranibar, 1979; Crone et al., 1998; Milleret al., 2007). In dystonia patients, motor cortex shows increasesin neuronal activity levels (Nobrega et al., 1995; Pratt et al.,1995), with relatively high beta amplitude and high functionalconnectivity at the beta frequency (Schnitzler and Gross, 2005;Jin et al., 2011). There is also excessive neural synchrony bothat rest and in certain phases of movement (Toro et al., 1994;Kristeva et al., 2005; Mallet et al., 2008; Crowell et al., 2012).
Some dystonias, in common with several other movementdisorders, are thought to have their origin in the basal ganglia.Other dystonias, such as those associated with cerebral palsyand with movement overuse, probably have a strong corticalcomponent. In all cases, however, the interconnections of brainmotor systems makes it clear that multiple brain areas will be “inthe loop” of abnormal activity. Following some primary insultor insults to a brain area, a secondarily-involved brain area willcontribute further to the disorder by reacting to the alterationsin input activity through its own homeostatic responses. In somecases these homeostatic changes may be compensatory so as toreduce the severity of the symptoms. However, in other cases,
plasticity may actually exacerbate the abnormal movements(Sanger et al., 2003; Neychev et al., 2008; Casellato et al., 2014).
There are at least two, and perhaps more, cerebello-thalamo-striato-cortical loops that play a role in movement disorders.There may also be additional contributions from still longerloops involving recurrent connections from spinal cord or frommuscle spindles. One or more of these sites may have associatedpathology. Regardless of the locus of primary pathology,multiple sites are potential targets where therapy could interruptpathophysiological dynamics. Currently, brain pharmacotherapyoften fails and patients are treated with botulinum toxin topartially paralyze muscles by blocking nicotinic cholinergictransmission at the affected muscle. Another treatment is deepbrain stimulation using implanted electrodes. In this paper, wetake two or three steps back from the level of muscle treatmentby proposing interventions at the level of motor cortex.
Complex multifocal diseases may require complex multitargettreatments (Viayna et al., 2013). In the context of brain disease,multitarget therapy can hit multiple brain regions or multiplereceptors in a region or both. High-level models that includemany brain areas can assist in understanding how differentbrain areas contribute to a disorder (Sanger and Merzenich,2000; Sanger, 2003; Hendrix and Vitek, 2012; Kerr et al.,2013). However, these models typically lack biological detail,making them unsuitable for assessing the impact of specificpharmacological manipulations. Detailed models are not yetelaborated to the point of handling multiple brain areas but doprovide the details needed to assess pharmacological interventionmore directly.
Single agent treatments for disease are traditionally testedin vitro or in vivo. As noted above, single agent treatmentsfor dystonia have not had much success. There is, however,the potential for success with multitarget drug cocktails thatcould target multiple locations in the brain, or multiple drugreceptor targets at a single location, or both (Delnooz andvan de Warrenburg, 2012). Due to combinatorial explosion,evaluating combinations of drugs in different dosages in thisway can not be readily done in tissue and is most feasible insilico (Viceconti et al., 2008; Kohl and Noble, 2009; Lytton et al.,2014; Action, 2016; Viceconti et al., 2016). In this study, we useour detailed multiscale model of primary motor cortex to assesspotential multitarget pharmacological therapies for treatment ofdystonia. The model contains 6 cortical layers with multipleclasses of excitatory and inhibitory neurons, using wiring basedon mouse microconnectomic data (Shipp, 2005; Weiler et al.,2008; Kiritani et al., 2012; Hooks et al., 2013). Excitatory neuronscontain intracellular molecular mechanisms that contribute topersistent activity and hyperexcitability (Neymotin et al., 2016).These mechanisms include endoplasmic reticulum associatedcalcium stores released by activation of IP3Rs, and ryanodinereceptors, both with affinity for caffeine, an agent that canexacerbate dystonia symptoms (Richter and Hamann, 2001).Plasmamembrane calcium, sodium, and potassium channels alsocontribute to cellular excitability.
Since our model does not include spinal cord and muscle, wedefined dystonia pathology as a state of cortical hyperactivationcharacterized by increased beta oscillations with excessive and
Frontiers in Pharmacology | www.frontiersin.org 2 June 2016 | Volume 7 | Article 157

Neymotin et al. Multiscale Modeling for Dystonia Therapies
hypersynchronous firing in layer 5 corticospinal neurons. Theselayer 5 neurons project downward to brainstem and spinal cord,and their sustained firing would lead to the increased musclecontractions of dystonia. We distinguished the hyperexcitabilityof dystonia from the still greater hyperexcitability of a seizure byexcluding simulations that showed higher levels of activity withhigher frequency oscillation and a strong tendency to “latch-up”through multicell depolarization blockade (Lytton and Omurtag,2007). Classification in 11-dimensional space demonstrated thatwe could identify different regions in parameter space for thesedifferent states—baseline normal, dystonia, epileptiform—andpredict pharmacological combinations that would lead frompathology back to the physiological activity state. As in ourprevious investigations of epilepsy (Lytton and Omurtag, 2007),we found multiple parameter combinations that were consistentwith the pathological state, as well as multiple parametercombinations to produce our baseline physiological state. Suchparameter degeneracy is typical of complex neural systems(Edelman and Gally, 2001; Golowasch et al., 2002).
2. MATERIALS AND METHODS
Network simulations consisted of 1715 reduced compartmentalcell models with single compartments for inhibitory cellsand five compartments for pyramidal cells, arrayed by layerwith connectivity taken from experimental results on motorcortex (Weiler et al., 2008; Figures 1A,B). Parallel-conductanceelectrophysiological simulation in the pyramidal cells wascomplemented by chemophysiological simulation focused onCa2+ handling, based on our prior models (Neymotin et al., 2015,2016; Figure 1C).
Simulations were run in the NEURON (version 7.4)simulation environment (Carnevale and Hines, 2006) utilizingthe reaction-diffusion (RxD) Python module (McDougal et al.,2013a,b) and NMODL (Hines and Carnevale, 2000). Twoseconds of simulation time took ∼3 min using 24 nodeson a Linux cluster with parallel NEURON, run with afixed time-step of 0.1 ms. The full model is available onModelDB (https://senselab.med.yale.edu/ModelDB/ShowModel.cshtml?model=189154).
We briefly describe the scales of the multiscale model fromsmaller to larger in the following sections (Table 1). For moredetails, readers are referred to our previous papers (Neymotinet al., 2015, 2016).
2.1. Intracellular Molecular ScaleOur Ca2+ dynamics (Figure 1C), are based on (Neymotinet al., 2016). We modeled a one-dimensional RxD system ofintracellular neuronal Ca2+ signaling in all compartmentsof neocortical pyramidal (PYR) neurons. Within eachcompartment, we modeled cytosolic and endoplasmic reticulum(ER) sub-compartments by using a fractional volume for each.
IP3 was produced through a reaction sequence initiatedby glutamate binding to the metabotropic glutamate receptor(mGluR), based on a reaction scheme developed by Ashhad andNarayanan (2013) (ModelDB #150551). IP3 diffused outwardfrom the synapse location and decayed following first-order
kinetics (τIP3 of 1 s). Baseline mGluR synaptic weight wasnormalized to represent the increase in the amount of glutamatebound to mGluR. Extracellular glutamate did not diffuse butwas represented by a local Glu value that was incremented inresponse to an event delivered due to a presynaptic spike. Glushowed bind/unbind kinetics on mGluR and was eliminated byfirst-order degradation (lower left of Figure 1C).
The ER Ca2+ model involves IP3 receptors (IP3Rs), ryanodinereceptors (RYR) (Sneyd et al., 2003), SERCA pumps, and a Ca2+
leak. IP3R dynamics involved a slow Ca2+ inactivation bindingsite state (De Young and Keizer, 1992; Li and Rinzel, 1994).The SERCA pump is a pump rather than a channel and so ismodeled with Hill-type dynamics. Calcium buffering followed
Ca + B5
−−−−⇀↽−−−−9.5·10−4
CaB where B is diffusible buffer with diffusion
coefficients D = 0.043 µm2/ms for both B and CaB, about halfthe rate of Ca2+diffusion (Anwar et al., 2012). Calcium extrusionacross the plasma membrane was modeled by first-order decaywith τex = 5 ms.
2.2. SynapsesAMPA/NMDA synapses were modeled by standard NEURONdouble-exponential mechanisms (Table 2). All excitatoryprojections were mixed AMPA (rise,decay τ : 0.05, 5.3 ms) andNMDA (rise,decay τ : 15, 150 ms). NMDARs were scaled by1/(1+ 0.28 ·Mg · exp(−0.062 · V)); Mg = 1mM (Jahr andStevens, 1990). 13% of INMDA was carried by Ca2+(Sprustonet al., 1995). AMPA and NMDA receptors had reversal potentialsof 0 mV.
Inhibitory synapses were mediated by GABAA and GABAB
receptors. GABAA synapses were modeled with a double-exponential mechanism. The GABAB synapse had secondmessenger connectivity to a G protein-coupled inwardly-rectifying potassium channel (GIRK). LTS cells connected toapical dendrites of PYR cells using GABAA receptors (GABAAR;rise,decay τ : 0.2, 20 ms) and GABAB receptors (GABABR) andonto somata of FS and other LTS cells with GABAA Rs (rise,decayτ : 20, 40 ms). GABAARs had reversal potentials of −80 mV, andGABABRs −95 mV. GABABRs provide longer-lasting activationcompared to GABAARs.
2.3. Cell ScaleThe network consisted of pyramidal cells (PYR; 3 apicaldendrite compartments, 1 basal dendrite compartment, 1 somaticcompartment), fast spiking soma-targeting interneurons (FS; onecompartment) , and dendrite-targeting low-threshold spikinginterneurons (LTS; one compartment; Wang and Buzsaki,1996; Wang, 2002; Monyer and Markram, 2004; Bartos et al.,2007; Neymotin et al., 2011a,b; Tables 3, 4). Reaction-diffusionmechanisms (Ca2+,IP3,buffer) were restricted to the PYR cellsin this network. Properties of pyramidal neurons in the differentlayers were identical except for apical dendrite length which islonger in deep pyramidal neurons than in superficial (Hay et al.,2011; Castro-Alamancos, 2013): 900 µm in L5-6; 450 µm in L2/3and L4.
Voltage-gated ionic current models were based on priormodels of our own and others (McCormick and Huguenard,
Frontiers in Pharmacology | www.frontiersin.org 3 June 2016 | Volume 7 | Article 157

Neymotin et al. Multiscale Modeling for Dystonia Therapies
FIGURE 1 | Model schematics. (A,B) Motor cortex architecture. Circles represent neuronal populations (red: excitatory cells; green: fast-spiking interneurons; blue:
low-threshold firing interneurons). Circle size denotes number of cells in population. Lines (with arrows) indicate connections between the populations. Thickness of
lines proportional to synaptic weights. E cells synapse with AMPAR/NMDARs; I cells synapse with GABAAR / GABABRs. Circles with self-connects denotes recurrent
connectivity. (A) Excitatory connections. E5P projects to spinal cord (not modeled). (B) Inhibitory connections. (C) Chemical signaling in pyramidal cells showing fluxes
(black arrows) and second- (and third- etc) messenger modulation (red back-beginning arrows). We distinguish membrane-associated ionotropic and metabotropic
receptors and ion channels involved in reaction schemes in red (in reality, it is likely that almost every membrane-bound protein is modulated). External events are
represented by yellow lightning bolts—there is no extracellular diffusion; the only extracellular reaction is glutamate binding, unbinding, and degradation on mGluR1
after an event. Ca2+ is shown redundantly in blue—note that there is only one Ca2+ pool for extracellular, 1 pool for cytoplasmic, and 1 pool for ER (PLC,
phospholipase C; DAG, diacyl-glycerol; cAMP, cyclic adenosine monophosphate; PIP2, phosphatidylinositol 4,5-bisphosphate). Adapted from Figure 1 of Neymotin
et al. (2016).
1992; Migliore et al., 2004; Stacey et al., 2009; Neymotin et al.,2011b,a, 2013). Voltage sensitive channels generally followedthe Hodgkin-Huxley parameterization, whereby x = (x∞ −
x)/τx (x = m for activation particle and h for inactivationparticle). Steady-state x∞ and time constant τx are either relatedto channel opening α(V) and closing kinetics β(V) as x∞ =
α/(α + β), τx = 1/(α + β), or are directly parameterized:x∞(V), τx(V). Kinetics for channels were scaled by Q10 froman experimental temperature (where available) to simulation
temperature of 37◦C. Q10 = 3 was used when no experimentalvalue was available. All cells contained leak current, transientsodium current INa, and delayed rectifier current IK−DR, to allowfor action potential generation. Additionally, PYR cells containedin all compartments IK−A, IK−M providing firing-rate adaptation(McCormick et al., 1993). Pyramidal cells also had Ih, voltage-gated calcium channels (VGCCs) in all compartments: IL, IT ,IN (Kay and Wong, 1987; McCormick and Huguenard, 1992;Safiulina et al., 2010; Neymotin et al., 2015), and SK and BK
Frontiers in Pharmacology | www.frontiersin.org 4 June 2016 | Volume 7 | Article 157

Neymotin et al. Multiscale Modeling for Dystonia Therapies
TABLE 1 | Summary of model.
Property Description
Populations 13; 7 E and 6 I, corresponding to layer 2/3, 4, 5A, 5B, and 6
of M1
Topology 3D with cortical depth (y) based on M1 laminar distribution,
horizontal location (x,z) randomly distributed
Connectivity Probability of connection and weight depends on layer and
cell type
Neuron model Multichannel multicompartment (E cells also RxD
mechanisms)
Synapse model AMPA, NMDA, GABAA, GABAB, mGluR
Plasticity –
Input Independent random Poisson spike trains with fixed rate
depending on cell type/synapse
Measurements Membrane potential, spiking activity, synchronization, firing
vector correlations
E (I) denote excitatory (inhibitory) neurons. No plasticity modeled (Table format based on
Nordlie et al., 2009).
TABLE 2 | Summary of synapse models used to connect neurons.
Label Description
AMPA Double exponential
NMDA Double exponential with voltage dependence
GABAA Double exponential
GABAB 2nd messenger connectivity to a G protein-coupled inwardly-rectifying
potassium channel (GIRK)
mGluR 2nd messenger signaling producing IP3
TABLE 3 | Summary of neuron models.
Label Description
Dynamics Multichannel compartmental Hodgkin-Huxley (plus RxD
mechanisms)
Compartments E: 5 (soma, basal dendrite, 3 apical dendrites)
Compartments I: 1 (soma)
Ion channels E: leak, Naf , Kdr , Ka, KD, KM, HCN, CaL, CaN, CaT, SK,
BK
Ion channels I: leak, Naf , Kdr , HCN, CaL, KM
RxD molecules E: Ca2+, IP3, B (Ca2+ buffer), CaB (Ca2+-bound
Ca2+-buffer)
RxD compartments E: endoplasmic reticulum, cytosol
RxD channels E: leak, RyR, IP3R, SERCA
E (I) denote excitatory (inhibitory) neurons. Reaction-diffusion (RxD) mechanisms/
compartments described more fully in intracellular scale.
calcium-activated potassium currents (IKCa). LTS cells containedIL, non-Ca
2+-dependent Ih, SK, and Ca2+ decay.HCN channels in different cell types have somewhat different
voltage dependence and different kinetics (Hagiwara and Irisawa,1989; Schwindt et al., 1992; Chen et al., 2001; Wang et al.,2002; Robinson and Siegelbaum, 2003). The hyperpolarization-activated HCN current Ih used in pyramidal cells was modeledwith second messenger and calcium dependence taken from
Winograd et al. (2008) (ModelDB #113997), and modified toprovide the faster voltage-sensitivity time constants found incortex (Harnett et al., 2015), and provides PYR cells longer-lasting firing activity via augmentation of the HCN channelconductance. The mechanism for Ca2+ regulation of HCNchannels in PYR cells in Winograd et al. (2008) is modeledempirically in order to produce the relationship betweencytosolic Ca2+ levels and Ih activation without simulating thedetails of Ca2+ effects on adenyl cyclase (see schematic for HCNchan in Figure 1C).
gh was 0.0025 S/cm2 in PYR soma, basal dendrites andexponentially-increasing in apical dendrites with distance fromsomawith 325µm space constant, hence e-fold augmented at 325microns as described by Kole et al. (2006). Apical dendrite IK−DR,IK−A, IK−M density also increased with the same length constant,based on data showing HCN and Kv channel colocalization(Harnett et al., 2015, 2013).
2.4. Network ScaleThe network consisted of 1715 cells (Table 4). The networkcontained 157,507 synapses for an overall connection densityof ∼5% (see Table 6). PYR cells synapsed onto each-other’sdendrites. PYR-to-PYR synaptic locations on the dendrite wererandomized between basal and apical compartments (Markramet al., 1997). PYR cells synapsed onto somata of FS and LTS cells(single-compartment models).
Neuronal populations were arranged by cortical layer basedon our prior models (Neymotin et al., 2011a,c; Chadderdonet al., 2014; Neymotin et al., 2016), with additional data fromdirect measurements from mouse motor cortex (Shipp, 2005;Weiler et al., 2008; Kiritani et al., 2012; Hooks et al., 2013), andrecent experiments which demonstrate a thin layer 4 in mousemotor cortex (Yamawaki et al., 2014). The network consistedof 13 populations of 3 excitatory cell types, intratelencephalic(IT), pyramidal-tract (PT), and corticothalamic (CT), and 2inhibitory cell types, low-threshold spiking (LTS) and fast-spiking (FS). These were distributed across cortical layers 2/3,4, 5a, 5b, and 6 (Harris and Shepherd, 2015), with cell numbersfor each population based on estimated cell densities andvolume (Table 4). The volume of each population was calculatedassuming a horizontal area (x and z dimensions) of 120 × 120µm, and a layer-dependent cortical depth range (y dimension).
Connection probabilities pij (Tables 5, 6) of presynapticexcitatory populations were dependent on pre- and pothst-synaptic type and layer. For presynaptic inhibitory populations,connection probabilities inversely scaled based on distance
pij = pij · exp(−√
(dx2 + dz2)/15), in x, z plane perpendicularto the y-direction of layering. Connection probabilities andweights are based on data from rodent motor cortex mapping(Weiler et al., 2008; Lefort et al., 2009; Anderson et al., 2010;Fino and Yuste, 2011; Apicella et al., 2012; Kiritani et al.,2012). Individual neurons were placed randomly with uniformdistribution. Weights from E cells displayed in Table 6 are forthe AMPA synapses, with colocalized NMDA weights at 10% ofAMPA weights. Synaptic delays were randomized between 1.8and 5 ms with additional delay based on distance.
Frontiers in Pharmacology | www.frontiersin.org 5 June 2016 | Volume 7 | Article 157

Neymotin et al. Multiscale Modeling for Dystonia Therapies
TABLE 4 | Network Population, including normalized and nominal cortical depth range (ynormRange, yRange, neuron density, and number of cells).
Label Description ynormRange yRange (um) Density (cells/mm3) numCells
E2 Layer 2/3 PYR IT excitatory neurons 0.12–0.31 160–420 80,000 300
E4 Layer 4 PYR IT excitatory neurons 0.31–0.42 420–570 80,000 173
I2 Layers 2/3 FS interneurons 0.12–0.31 160–420 10,000 37
I2L Layers 2/3 LTS interneurons 0.12–0.31 160–420 10,000 37
E5a Layer 5a PYR IT excitatory neurons 0.42–0.52 570–700 80,000 150
E5b Layer 5b PYR IT excitatory neurons 0.52–0.77 700–1040 40,000 196
E5P Layer 5b PYR PT excitatory neurons 0.52–0.77 700–1040 40,000 196
I5 Layers 4 and 5 FS interneurons 0.31–0.77 420–1040 10,000 89
I5L Layers 4 and 5 LTS interneurons 0.31–0.77 420–1040 10,000 89
E6 Layer 6 PYR IT excitatory neurons 0.77–1.0 1040–1350 40,000 179
E6C Layer 6 PYR CT excitatory neurons 0.77–1.0 1040–1350 40,000 179
I6 Layer 6 FS interneurons 0.77–1.0 1040–1350 10,000 45
I6L Layer 6 LTS interneurons 0.77–1.0 1040–1350 10,000 45
PYR, pyramidal; IT, intratelencephalic; PT, pyramidal tract; CT, corticothalamic; FS, fast spiking, LTS, low-threshold spiking.
TABLE 5 | Summary of network connectivity rules.
Property Description
E to E pij , wij dependent on pre-/post-synaptic cell type/layer
E to I pij , wij dependent on pre-synaptic cell layer, and post-synaptic cell
type/layer
I to E/I pij decreases exponentially with x,z plane distance between
pre-/post-synaptic neurons; fixed wij
All delays Randomized 1.8–5 ms with additional delay based on distance
pij denotes probability of connection between type i and j; wij denotes weight. Parameters
by pre- and post-synaptic type in Table 6.
Background activity was simulated by excitatory andinhibitory synaptic inputs following a Poisson process, sentto all cells, representing ongoing drive from other corticalareas and other inputs. These inputs were selected to maintainlow-frequency firing of neurons within the model, which wouldnot fire otherwise, due to small network size and the requirementfor multiple synaptic inputs to trigger a postsynaptic spike(Neymotin et al., 2011a). The strength of these backgroundinputs was not based on the full source of inputs from allupstream brain areas, since these inputs are not completelymapped.
2.5. Simulation VariationsWe ran over 5800 simulations, randomly varying each of thefollowing parameters using an independent normal distribution:1. E neuron mGluR density (mGluR); 2. E neuron ER RYRdensity (RYR); 3. E and I neuron HCN channel density; 4.E and I neuron fast Na+ channel density (Naf ); 5. E neuronKdr channel density; 6. E neuron Ka channel density; 7. Eneuron KD channel density; 8. E neuron KM channel density;9. E neuron SK calcium-activated potassium channel density;10. E neuron BK calcium-activated potassium channel density;11. E and LTS neuron voltage-gated calcium channel (VGCC)density.
Means and standard deviations differed for the differentparameters and were selected to allow each simulation tomaintain activity. A subset of the simulations was used for theanalyses described (Table 7).
We ran simulations with initial calcium concentration in theER set to 1.25 mM (Bygrave and Benedetti, 1996), to mimicthe effects of ER calcium priming via prior excitatory synapticstimulation (Ross et al., 2005; Hong and Ross, 2007; Fitzpatricket al., 2009; Neymotin et al., 2016).
We categorized the simulations into distinct groups by notingmajor differences in activity across parameter sets (Table 8).From the full set of 5867 simulations, 1505 did not displayany firing due to random variations in ion channel densitieswhich led to low neuronal activity (Table 7). The remaining4341 simulations were Active due to higher neuronal activity,e.g., partially caused by the higher average Naf density in thesesimulations. Of these 4341 Active simulations, 1077 exhibitedepileptic latch-up dynamics—periods of intense activity whichled to depolarization blockade (Na+ channel inactivation; Lyttonand Omurtag, 2007). These periods where neurons did notfire lasted 200–300 ms (gaps between E5P spikes: E5P gap inTable 8). We categorized the top and bottom 2nd percentile ofthe Active/non-latch-up simulations ranked by E5P firing rateinto dystonia (n = 65) and physiological (n = 65) sub-sets.We used E5P firing rate as a criterion for dystonia classificationbecause E5P neurons project downward to brainstem spinal cord,and sustained overactive E5P firing can lead to the tonic musclecontractions symptomatic of dystonia.
2.6. Data AnalysisWe formed multiunit activity (MUA) time-series, which countthe number of spikes in each bin (10 ms) for a givenpopulation. To calculate neuronal population rhythms, wetook the power spectral density (PSD) of the mean-subtractedMUA time-series; we then calculated the peak frequencies andamplitudes in the PSD. We used the average Kendall’s τ non-parametric rank-correlation coefficient (Kendall, 1938; Knight,
Frontiers in Pharmacology | www.frontiersin.org 6 June 2016 | Volume 7 | Article 157

Neymotin et al. Multiscale Modeling for Dystonia Therapies
TABLE 6 | Network Connectivity Parameters.
Pre Post pij wij (nS) Pre Post pij wij (nS) Pre Post pij wij (nS)
I2L I2L 1.00 0.150 I2L I2 1.00 0.150 I2L E2 1.00 0.225
I2L E2 1.00 1.688 I2 I2L 1.00 0.150 I2 I2 1.00 0.150
I2 E2 1.00 0.225 E2 I2L 0.19 0.117 E2 I2 0.19 0.117
E2 E2 0.15 0.160 E2 E4 0.11 0.092 E2 I5L 0.22 0.151
E2 I5 0.02 0.017 E2 E5a 0.05 0.126 E2 E5b 0.01 0.111
E2 E5P 0.07 0.111 E4 I2L 0.02 0.054 E4 I2 0.02 0.054
E4 E2 0.05 0.184 E4 E4 0.15 0.160 E4 I5L 0.03 0.018
E4 I5 0.19 0.162 E4 E5a 0.04 0.160 E4 E5b 0.01 0.225
E4 E5P 0.01 0.225 E4 I6L 0.02 0.066 E4 I6 0.02 0.066
E4 E6C 0.00 0.477 E4 E6 0.00 0.477 I5L E4 1.00 0.225
I5L E4 1.00 1.688 I5L I5L 1.00 0.150 I5L I5 1.00 0.150
I5L E5a 1.00 0.225 I5L E5a 1.00 1.688 I5L E5b 1.00 0.225
I5L E5b 1.00 1.688 I5L E5P 1.00 0.225 I5L E5P 1.00 1.688
I5 E4 1.00 0.225 I5 I5L 1.00 0.150 I5 I5 1.00 0.150
I5 E5a 1.00 0.225 I5 E5b 1.00 0.225 I5 E5P 1.00 0.225
E5a I2L 0.02 0.054 E5a I2 0.02 0.054 E5a E2 0.04 0.131
E5a E4 0.03 0.104 E5a I5L 0.03 0.018 E5a I5 0.19 0.162
E5a E5a 0.18 0.143 E5a E5b 0.01 0.208 E5a E5P 0.02 0.208
E5a I6L 0.02 0.066 E5a I6 0.02 0.066 E5a E6C 0.01 0.081
E5a E6 0.01 0.081 E5b I2L 0.02 0.054 E5b I2 0.02 0.054
E5b E2 0.02 0.059 E5b E4 0.03 0.043 E5b I5L 0.03 0.018
E5b I5 0.19 0.162 E5b E5a 0.05 0.080 E5b E5b 0.18 0.171
E5b E5P 0.04 0.171 E5b I6L 0.02 0.066 E5b I6 0.02 0.066
E5b E6C 0.02 0.122 E5b E6 0.02 0.122 E5P I2L 0.02 0.054
E5P I2 0.02 0.054 E5P I5L 0.03 0.018 E5P I5 0.19 0.162
E5P E5P 0.18 0.171 E5P I6L 0.02 0.066 E5P I6 0.02 0.066
I6L I6L 1.00 0.150 I6L I6 1.00 0.150 I6L E6C 1.00 0.225
I6L E6C 1.00 1.688 I6L E6 1.00 0.225 I6L E6 1.00 1.688
I6 I6L 1.00 0.150 I6 I6 1.00 0.150 I6 E6C 1.00 0.225
I6 E6 1.00 0.225 E6C I5L 0.02 0.037 E6C I5 0.02 0.037
E6C E5a 0.03 0.034 E6C E5b 0.03 0.077 E6C E5P 0.03 0.077
E6C I6L 0.02 0.080 E6C I6 0.02 0.080 E6C E6C 0.03 0.133
E6C E6 0.02 0.133 E6 I5L 0.02 0.037 E6 I5 0.02 0.037
E6 E5a 0.03 0.034 E6 E5b 0.03 0.077 E6 E5P 0.03 0.077
E6 I6L 0.02 0.080 E6 I6 0.02 0.080 E6 E6C 0.02 0.133
E6 E6 0.03 0.133
pij and wij are distance-independent probability of connections from Pre to Post neuronal types and synaptic weights, respectively.
1966) between pairs of neuron binned spike train time-seriesfor calculating the synchronization of populations of neurons(denoted population-synchrony). Kendall’s τ non-parametricrank correlation, defined as:
τ =nc − nd12n(n− 1)
,
is used with these data. Kendall’s τ is a normalized differencebetween concordant (nc) and discordant pairs (nd); ties aretaken into account by the normalizing term, 1
2n(n − 1) ,which represents the total number of ordered pairs in the
time-series. We used the Python scikit-learn library (Pedregosaet al., 2011) for performing principal component analysis (PCA)and support-vector machine (SVM) classification (Cortes andVapnik, 1995; Orrù et al., 2012). Dystonia and physiologicalsimulation classes were characterized on the basis of layer5 corticospinal pyramidal neuron (E5P) firing rates. Theclearest examples of both classes (bottom/top 2nd percentilesas physiological/dystonia classes) were used for the majorityof the analyses described in the Results (Figures 3–8). TheNuSVC variant of SVMs was used to classify physiological anddystonia simulations and to find which simulation parameterscontributed the most to classification accuracy. SVM inputs
Frontiers in Pharmacology | www.frontiersin.org 7 June 2016 | Volume 7 | Article 157

Neymotin et al. Multiscale Modeling for Dystonia Therapies
TABLE 7 | Parameter ranges (average ± standard deviation) for all simulations (n = 5867), active simulations (n = 4341), latch-up simulations (n = 1077),
active/non-Latch-up simulations (n = 3264), physiological simulations (n = 65), and dystonia simulations (n = 65).
Parameter All Active Latch-up
mGluR 8.06± 6.44 8.02± 6.43 8.04±6.34
RYR 108.54± 86.99 109.74± 86.74 112.03±86.98
HCN 0.0025± 0.0003 0.0026± 0.0002 0.0026±0.0002
Naf 0.0809± 0.0081 0.0829± 0.0074 0.0856±0.0072
Kdr 0.0209± 0.0053 0.0202± 0.0052 0.0216±0.0054
Ka 0.3000± 0.0150 0.2977± 0.0147 0.2967±0.0144
Kd 0.0009± 0.0002 0.0008± 0.0002 0.0008±0.0002
Km 1.002e-05± 2.48e-06 1e-05± 2.49e-06 1.001e-05±2.51e-06
SK 0.0001± 6.163e-05 0.0001± 6.18e-05 0.0001±6.296e-05
BK 0.0030± 0.0015 0.0030± 0.0015 0.0031±0.0015
VGCC 0.0052± 0.0035 0.0053± 0.0035 0.0051±0.0035
Parameter Active/Non-Latch-up Physiological Dystonia
mGluR 8.02± 6.45 8.42± 6.54 8.12±5.74
RYR 108.99± 86.66 105.1± 82.9 116.64±77.11
HCN 0.0026± 0.0002 0.0026± 0.0002 0.0026±0.0003
Naf 0.0820± 0.0073 0.0787± 0.0053 0.0879±0.0076
Kdr 0.0198± 0.0051 0.0226± 0.0041 0.0195±0.0054
Ka 0.2981± 0.0148 0.3029± 0.0144 0.2992±0.0136
Kd 0.0008± 0.0002 0.0008± 0.0002 0.0008±0.0002
Km 1e-05± 2.48e-06 1.034e-05± 2.42e-06 1.021e-05±2.81e-06
SK 0.0001± 6.135e-05 0.0001± 6.797e-05 0.0001±6.604e-05
BK 0.0030± 0.0015 0.0034± 0.0013 0.0025±0.0015
VGCC 0.0054± 0.0035 0.0058± 0.0032 0.0046±0.0031
Plasma membrane ion channel conductance density values are in S/cm2. mGluR and RYR density are in arbitrary units used to scale channel conductance.
TABLE 8 | Dynamic measures (average ± standard deviation) for All simulations (n = 5867), Active simulations (n = 4341), Latch-up simulations (n = 1077),
Active/Non-Latch-up (n = 3264), physiological simulations (n = 65), and dystonia simulations (n = 65).
Dynamic measure All Active Latch-up Active/non-latch-up Physiological Dystonia
E5a rate (Hz) 0.65± 0.52 0.88± 0.41 1.09± 0.37 0.81±0.40 1.34± 0.51 0.85± 0.39
E5b rate (Hz) 1.68± 1.21 2.27± 0.79 2.45± 0.66 2.22±0.82 1.18± 0.28 3.74± 2.08
E5P rate (Hz) 7.10± 5.62 9.59± 4.32 7.77± 2.68 10.19±4.59 1.77± 0.26 22.59± 2.67
I5 rate (Hz) 11.46± 6.99 15.49± 1.89 15.14± 1.28 15.61±2.04 11.47± 0.72 17.67± 0.90
I5L rate (Hz) 5.81± 3.71 7.85± 1.61 7.13± 1.19 8.09±1.66 5.37± 0.76 13.42± 1.82
E5P synchrony 0.35± 0.25 0.47± 0.16 0.47± 0.12 0.47±0.17 0.07± 0.06 0.75± 0.05
E5P MUA freq. (Hz) 14.78± 8.91 19.97± 1.94 19.72± 1.79 20.05±1.99 20.91± 3.11 20.55± 0.88
E5P MUA amp. (AU) 83.0± 100.1 112.1± 101.4 59.8± 48.1 129.4±108.1 1.9± 1.2 527.0± 161.7
E5P MUA beta amp. (AU) 21.0± 26.4 28.3± 27.1 15.9± 11.9 32.4±29.4 0.8± 0.7 111.2± 64.9
E5P gap 79.13± 70.95 106.94± 61.87 190.23± 32.94 79.46±41.10 62.77± 24.85 21.75± 32.11
E5P FV sim 0.20± 0.14 0.27± 0.09 0.24± 0.06 0.28±0.09 0.13± 0.03 0.44± 0.08
E5P gap measures number of 300 ms gaps between individual E5P neuron firing times; E5P MUA amplitude and E5P MUA beta amplitude in arbitrary units; E5P FV sim measures
similarity between E5P population firing rate vectors using average pairwise Pearson correlation.
were vectors consisting of normalized parameter values. Eachof these input vectors was labeled into either of two distinctbinary classes: physiological (0) or dystonia (1). SVM parameters,including kernel type (linear, polynomial, radial-basis function),γ , tolerance, ν, and polynomial degree were selected using
a grid search with N-fold cross validation run 10 times foreach combination of parameters. SVM classification accuracysurpassed the accuracy of other machine learning methods,including logistic regression (not shown). Figures were drawnwith Matplotlib (Hunter, 2007).
Frontiers in Pharmacology | www.frontiersin.org 8 June 2016 | Volume 7 | Article 157
Neymotin et al. Multiscale Modeling for Dystonia Therapies
3. RESULTS
3.1. Simulation OverviewWe ran over 5800 network simulations, randomizing 11ion channel/receptor densities independently. A typical 2 ssimulation took ∼3 min using 24 cores on Linux with parallelNEURON. After running simulations, we calculated neuronalpopulation firing rates, synchronization, and power spectra.
3.2. Characterization of DystoniaPathophysiologySimulations were grouped into physiological and pathologicalbased on differences in firing patterns (Table 8, Figure 2).1505 of 5867 simulations produced no activity. The remainingsimulations were characterized as physiological or pathological.Pathological simulations showed increased activity. Highactivity alternating with latch-up condition was definedas an epileptiform simulation with periods of >200 ms ofdepolarization blockade across multiple cells (1077 simulations).1077 simulations were classified as epileptiform based on activitylatch-up resulting in sustained periods. The different classesof simulations formed distinct clusters in multiple slices ofexcitatory corticospinal (ESP) activity feature-space (Figure 2).Physiological simulations showed E5P rates ≤2 Hz with lowto intermediate E5P firing vector (FV) similarity. Dystoniasimulations primarily occupied the upper-right quadrant of thescatterplot in Figure 2A, but displayed either high or low FVsimilarity which overlapped with the range of values displayedby the physiological simulations. Epileptiform simulations hadintermediate average E5P rates due to high activity alternatingwith periods of quiescence caused by depolarization blockade.Across simulation types, higher E5P firing increased theexcitatory drive to I5 neurons, causing increased I5 neuron firing(Table 8). Higher I5 and E5P neuron firing then caused higherE5P synchronization via recurrent E5P excitation and feedbackinhibition (Figure 2B). Stronger E5P and I5 interactions then
increased beta rhythm amplitude (Figure 2B), however withsubstantial variability. Peak oscillatory frequency was heldrelatively stable across simulations (Table 8). Physiologicaland epileptiform simulations had lower overall E5P synchronyand beta power compared to the dystonia simulations, whichoccupied the upper-right quadrant of Figure 2B.
E5P FV similarity showed temporal recurrences whichfurther distinguished the three simulation types (Figure 2C).The physiological simulation showed intermediate self-similarity(0.17) due to sparse firing of different subsets of pyramidal cellsat different times. In contrast, the dystonia simulation firingpatterns showed strong self-similarity (0.56) and recurrenceover time (recurring orange/red blobs in Figure 2C), indicatingstereotyped dynamics. The example epileptiform simulationshowed relatively weak self-similarity (0.16) due to its twodistinct firing patterns: high E5P synchrony alternating withE5P silence produced by depolarization blockade. Epileptiformand dystonia simulations showed a brief period of highsimilarity when the epileptiform simulation showed strongoscillations during the initial period. There was weak similaritybetween epileptiform and physiological (0.12) and dystoniaand physiological (0.22) simulations, indicating that bothpathological dynamics were distinct from the physiological.
E5P neurons in a representative physiological model firedsparsely with low synchrony (population-synchrony = 0.01;Figures 3A,D; Supplementary Figure 1 has all physiologicalrasters), with multiple downstream effects. Low excitatory drivefrom E5P to I5 and I5L neurons caused them to fire slowly. Thislow L5 inhibition allowed E5a neurons to fire quickly. The weakE5P and L5 interneuron interactions produced only weak betarhythms which were confined to layer 5 (Figure 4A).
In a representative dystonia simulation, E5P neuronshad sustained, synchronous, rapid firing (Figures 3B,D;Supplementary Figure 2 shows all dystonia simulation rasters).This promoted strong, continuous layer 5 interneuron activation.The L5 interneurons then suppressed E5a intratelencephalic
FIGURE 2 | Distinct dynamics in in physiological, dystonia, and latch-up simulations. (A) Average E5P firing rate vector (FV) similarity vs. average E5P firing
rate for individual simulations. (B) E5P MUA Beta oscillation amplitude vs. E5P synchrony for individual simulations. (A,B) [light blue: physiological, purple: dystonia,
orange: epileptiform, black: remaining Active simulations, large circles represent simulations shown in (C) and Figure 3]. (C) Pearson correlations between all pairs of
E5P FVs. Solid black lines demarcate FVs from example physiological, dystonia, and epileptiform simulations. All FVs used 50 ms intervals, forming 40 FVs per 2 s of
simulation.
Frontiers in Pharmacology | www.frontiersin.org 9 June 2016 | Volume 7 | Article 157

Neymotin et al. Multiscale Modeling for Dystonia Therapies
FIGURE 3 | Distinct firing patterns in physiological, dystonia, and epileptiform (epileptic) simulations. (A) Physiological model has sparse, asynchronous
E5P firing, relatively low I5 firing, and activated E5a/E5b populations. (B) Pathological model shows high-frequency, synchronous activity in E5P neurons, causing
higher I5 firing, which suppresses E5a activity. (C) “Epileptiform” (epileptic) model shows high-frequency, synchronous activity with intermittent 200–300 ms gaps in
firing of E neurons, caused by depolarization blockade (Na+ channel inactivation). (A–C) Left Dots represent individual neuron spike times (red: E cells, blue: LTS cells,
green: FS cells). Cells arranged from layer 2/3 (top) to layer 6 (bottom). Scale-bar: 100 ms. (A–C) Right Population firing rates (25 ms bins) arranged vertically to
roughly correspond to position on raster plot to the left. Scale-bar: 40 Hz (Same color code as raster; apparently flat lines indicate low variation in firing rate). (D)
Population firing rates from simulations in (A–C) (Average ± standard error of the mean).
neurons, which fired at reduced rates. In contrast, E5b firingincreased with the faster E5P firing, due to excitation spreadingin the network. The relatively high recurrent connectivity(18% density) and strong synaptic weights between E5Pneurons allowed the E5P neurons to remain activated despitestrong feedback inhibition. The strong feedback inhibitionalso activated the E5P HCN channels, which producedrebound excitation. The strong E5P activation coupled with thefeedback inhibition also enabled E5P neurons to synchronize
(population-synchrony= 0.83; vertical stripes in Figure 3B) ata strong beta rhythm (∼20 Hz; Figure 4B). These synchronousbeta rhythms also spread to other populations and layers (E2, I5,I5L, E5b, and E6).
Epileptiform simulation also displayed strong intermittentbeta oscillations and strong synchrony (population-synchrony= 0.05; Figures 3C, 4C), but this activity alternated withlengthy periods (200–300 ms) where E neurons were not firingdue to depolarization blockade. Even with these periods of
Frontiers in Pharmacology | www.frontiersin.org 10 June 2016 | Volume 7 | Article 157

Neymotin et al. Multiscale Modeling for Dystonia Therapies
FIGURE 4 | Motor cortex models produce different beta oscillations. Power spectrum of multiunit activity vectors of examples in Figure 3. Power (y-axis) in
arbitrary units. (A) Physiological model shows weak beta (22 Hz) oscillations with power of <0.1% of the pathological model. (B) Pathological model produces strong
beta (20 Hz) oscillations with additional harmonic at 40 Hz. (C) Epileptiform model produces strong beta (19 Hz) oscillations with additional harmonic at 38 Hz.
depolarization blockade, most E neurons fired at higher averagerate than in the physiological simulations (Figure 3D). Suchincreased synchrony with high excitatory cell activity is seen inepilepsy patients (Meisel et al., 2015). In contrast to the dystoniasimulations, the synchronous periods of epileptiform oscillationswere largely confined to layer 5 and did not spread to other layers.
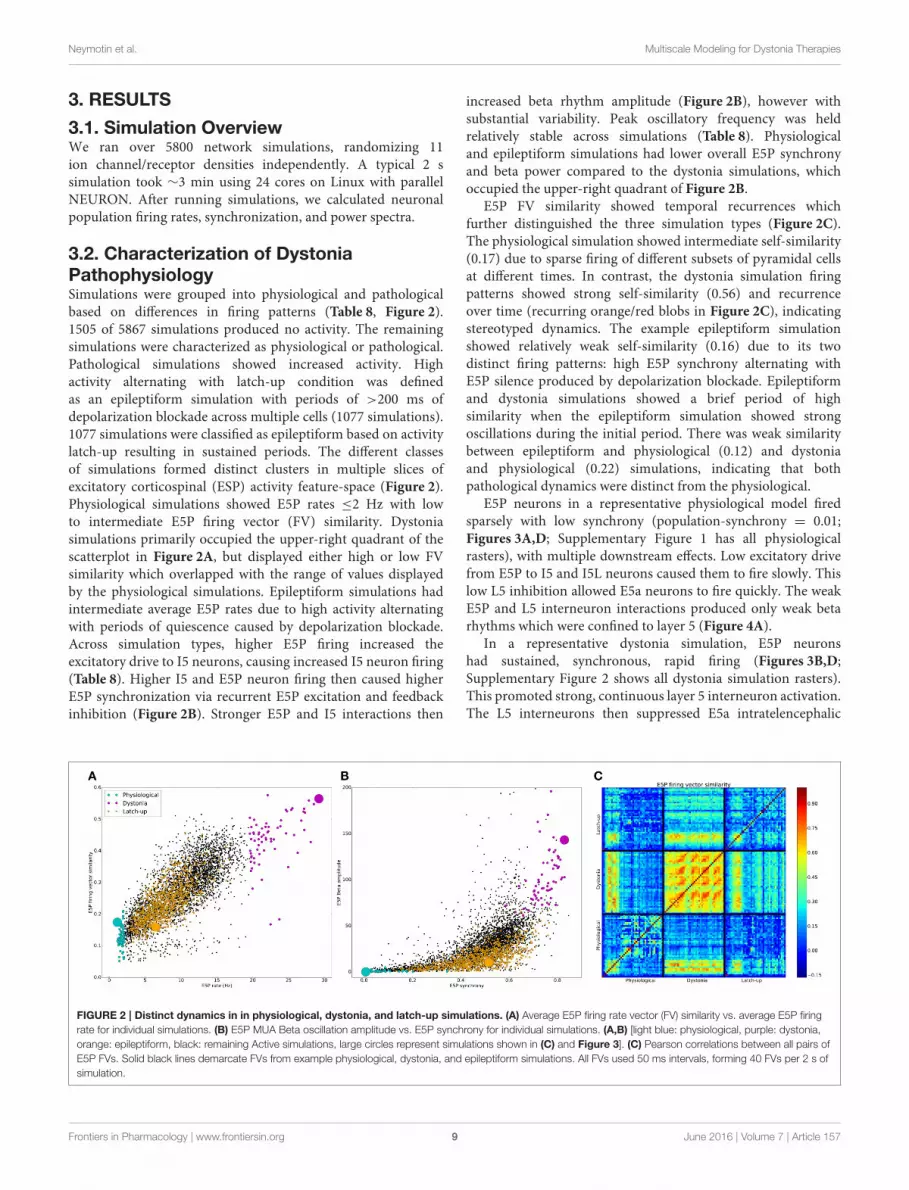
3.3. Need for Multitarget ApproachNo individual parameter determined physiological vs. dystonia-dynamical-condition in the network (Figure 5). Therefore, nosingle parameter adjustment would routinely provide an effective“treatment” that would reliably restore physiological activity inmost pathological models. We therefore went on to explorewhether multitarget manipulation would be able to find suchtreatment routes.
Although no single parameter could predict physiologicalvs. pathological dynamics, the outliers of certain individualparameters were predictive. At the pathological margin,simulations had parameters which are expected to produce highactivity: high Na+ or Ca2+ channels promoting inward currents,high HCN channel densities providing high resting membranepotential (RMP), and low K+ channel densities again producingdepolarization and reduced repolarization with spiking.
Further evidence for lack of predictability of dynamicsbased on parameters, comes from viewing the parametersin all 11 dimensions organized into 2 classes by dynamics.The parameter space showed substantial heterogeneity in thepatterns producing pathology (Figure 6A), with weak intra-classclustering (Figure 6B). Correlation between parameter vectorsof each simulation averaged 0.06 for physiological simulations,0.07 for pathological simulations, with weak -0.05 anticorrelationbetween pathological and physiological simulations. The lowcorrelations in both the physiological simulations (lower-left
corner of Figure 6B) and the pathological simulations (upper-right corner of Figure 6B) demonstrate that there is widespreaddegeneracy in the parameter sets that produce either thephysiological or pathological states. Some of this degeneracy isunsurprising: for example K+ channels with similar time coursesof activation can substitute for one another to some extent. Otherdegeneracy is more complex and involves higher-order dynamiccompensation.
3.4. High Dimensional Separation ofPhysiological and Pathological ParametersBecause of the difficulty of separating pathological fromphysiological with these high dimensional parameter sets,we used a SVM classification to create a separation (termeda maximum margin hyperplane) separating parameter setsproducing physiological dynamics from parameter setsproducing pathological dynamics. We started by trainingSVMs using only two parameters in combination (Figure 7). Inorder to test the efficiency of this separation, we separated outour target sets (physiological vs. pathological) into two subsetsof each to serve as training and testing sets to evaluate theadequacy of the separation. By trying various random trainingand testing sets we got a mean and standard error for eachcase. Many two-parameter predictions were below chance (0.5)indicating that the SVM could not separate physiological frompathological based on that parameter pair. Two-parameter SVMscould accurately classify when the parameter pair includedNaf density—the strongest predictor of excitability. The bestprediction came with high Naf and low Kdr . Logistic regressionmethods were also tried to perform this two-dimensionalseparation but did not perform as well as SVM.
Going beyond 2 parameters, SVM classification accuracyincreased regularly with the number of parameters used
Frontiers in Pharmacology | www.frontiersin.org 11 June 2016 | Volume 7 | Article 157
Neymotin et al. Multiscale Modeling for Dystonia Therapies
FIGURE 5 | Individual parameters do not distinguish physiological from dystonia activity. (A) Dystonia (purple) vs. physiological (light blue) simulations. of
simulations sorted by E5P firing rate (N = 65 for each group). (B) Cumulative probability distributions for each parameter in the dystonia (purple) and physiological
(light blue) simulations. Parameter values normalized to a distribution with zero mean and unit variance (zero mean does not indicate zero density of a given ion
channel/receptor). Simulations shown are obtained from bottom and top 2nd percentile based on dynamic measures.
(Figure 8), suggesting that a multi-target drug approach beyondtwo targets might produce greater effect. Moving to higher andhigher dimensional spaces, we checked all possible parametercombinations at each dimensionality. In Figure 8, we reportthe parameter combination that was most predictive—e.g., at 6dimensions we report just one of the 462 combinations of sixfrom 11 parameters. Looking at the red blocks below, we canidentify that the six dimensions that provide best prediction areNaf , four of the K
+ channels, and VGCC. Predictability increasesup through six parameters, then plateaus, and then falls off dueto the extreme sparseness of data. This sparseness was due tothe so-called curse of dimensionality: given a constant numberof data points n, the density falls off #bin-fold with each increasein dimension, where #bin is the binning of the space in one
dimension. Because of this, any high-dimensional method willtend to underestimate predictive strength given a limited amountof data (Bishop, 2006; Noble, 2006).
This multi-target SVM approach revealed the parametersthat had the highest contribution to producing or preventingdystonia. Naf density was the most predictive parameter acrossall numbers of parameters used (horizontal red stripe at topof Figure 8B), as had been also shown using 2 dimensionsalone (Figure 7). Again confirming the 2-dimensional result, thenext most predictive parameters was Kdr . Following these cameKa, Kd, BK, SK, and VGCC densities which also significantlycontributed to accurate predictions, due to their strong influenceon E neuron excitability. mGLUR, RYR, and Km densities showedlesser contributions.
Frontiers in Pharmacology | www.frontiersin.org 12 June 2016 | Volume 7 | Article 157

Neymotin et al. Multiscale Modeling for Dystonia Therapies
FIGURE 6 | All parameters of pathological and physiological simulations reveals weak intra-class clustering. (A) 11-dimensional parameters for
physiological and pathological simulations. Colorbar is normalized parameter values as in Figure 5. (B) Pearson correlations between all pairs of parameter vectors.
FIGURE 7 | Support vector machine classification accuracy of pathological vs. physiological simulations using two parameter values has high levels
for certain parameter combinations (e.g., including Naf channel density) but overall accuracy is often below chance (0.5). (A) Accuracy as a function of
specific parameter combinations [indicated at same horizontal location in (B) (Red indicates parameter (param) was used for classification; blue indicates the
parameter was not used)] (solid line: mean cross-validation accuracy (n = 10); dotted line: standard error of cross-validation accuracies).
Increasing the percentile cutoffs for categorizing physiologicalfrom pathological simulations from the 2nd percentile to 7thpercentile decreased prediction accuracy but still demonstratedthe value of multitarget changes (Figure 9). The left column
shows the same result as Figure 8: accuracy increased (colormap)as one goes from fewer to more parameters (bottom to top).By including more exemplars on both the physiological andpathological sides, we moved away from the best exemplars
Frontiers in Pharmacology | www.frontiersin.org 13 June 2016 | Volume 7 | Article 157

Neymotin et al. Multiscale Modeling for Dystonia Therapies
FIGURE 8 | SVM classification accuracy generally increases when using 1–10 parameters, indicating utility of multitarget pharmacy approach to
treating dystonia. (A) Best classification accuracy from all combinations of x parameters (solid line: mean cross-validation accuracy (n = 10); dotted line: standard
error). (B) Best parameter (param) combinations (red: parameter used; blue: parameter not used). x-axis in (A,B) indicates number of parameters used.
and obtained less distinction between the two parameter sets.However, at all percentiles, there was an initial increase inclassification accuracy with continued increase up to or beyond3 parameters. This increase then declined as the numberof parameters increased further due to the aforementionedsparseness at high dimensionality.
4. DISCUSSION
We developed a multiscale model of primary motor cortexto explore multitarget pharmacological therapies for dystonia.We searched parameter space—channel and receptor densities—to create a set of models to contrast dystonia dynamics withphysiological dynamics. Dystonia simulations displayed highexcitability and synchrony in layer 5 corticospinal neurons(E5P), and strong beta oscillations which spread betweencortical layers (Figures 3B, 4B). Dystonia simulations could bedistinguished from epileptiform simulations primarily by thepresence of periods of latch-up with depolarization blockadein the epileptiform simulations. Physiological simulationshad low excitability, asynchronous firing, and weak betaoscillations (Figures 3C, 4C). Attempts to use high-dimensionalvisualization techniques to find potential therapeutic directionsin the parameter space were limited by the solution degeneracyin the 11-dimensional parameter space with scattered parameter
vectors with low correlation (Figure 6). We therefore turned to aSVM classification to identify hyperplanes in high-dimensionalspace that would separate the two populations. As expected,the major spike generating channels, Naf and Kdr were theprimary determinants of excitability, followed by additionalpotassium channels and calcium channels. We did not assesspharmacological effects on synapses, which would be useful todo in the future.
4.1. Biological Degeneracy andPersonalized TherapyDegeneracy of mechanism is a major theme in biology (Edelmanand Gally, 2001), meaning that there are many different waysthat a biological system can produce a particular shape in thecase of an immunoglobulin, or a particular dynamics in the caseof a neural system. Such degeneracy has been shown directly inthe stomatogastric ganglion of lobster, where a particular celltype produces its stereotyped dynamics using many differentcombinations of ion channel densities (Golowasch et al.,2002). Associated with this degeneracy is failure of averaging—averaging across parameter sets that produce the dynamicsgives a set of parameter values that do not produce the samedynamics.
In the context of brain physiology, this means that wecan expect that individuals differ in the details of how their
Frontiers in Pharmacology | www.frontiersin.org 14 June 2016 | Volume 7 | Article 157

Neymotin et al. Multiscale Modeling for Dystonia Therapies
FIGURE 9 | SVM classification accuracy increases with more
parameters then decreases due to “curse of
dimensionality”—sparseness of parameter vectors relative to
dimension. Best classification accuracy from all combinations of y
parameters (params) using bottom/top SPI firing rate percentiles on x-axis.
motor cortex produces oscillations and contributes tomovement.Similarly, we can expect that individuals differ in the details oftheir pathology. From a pharmacological perspective this arguesthat we may see greater benefit from personalized medicine—identifying the high-dimensional complex of pathologicalparameters in a particular patient in order to treat them withtheir own individualized cocktail of multitarget drugs to producea dynamics that falls somewhere in the physiological regime. Tothis might also be added complementary individualized, perhapsmulti-locus, brain stimulation (Kerr et al., 2012; Song et al.,2013; Chadderdon et al., 2014; Hiscott, 2014; Nelson and Tepe,2014; Dura-Bernal et al., 2016). Such a personalized approachwould require much more intensive, and more costly, diagnosticprocedures of a type that is currently only used by epilepsysurgery centers, which typically require invasive methods toperform their diagnostic tests.
Due to the degeneracy, parameter averaging failed in ourdataset—using the average of all parameters sets that producepathological simulations does not give a pathological simulation.However, the ability of the SVMmethod to separate pathologicalfrom physiological populations in high dimensional parameterspace does suggest that there may be some benefit to pushing allpatients in that direction through a multitarget pharamacologicalcocktail. In future studies, we plan to test this explicitly in thesimulations in order to determine what percentage improve,what percentage worsen and what percentage remain essentiallyunchanged with such an average treatment. This assessment will
require a larger number of simulated patients than we have thusfar accumulated.
4.2. Multilocus, Multitarget, MultiscaleApproaches for Treating DystoniaIn general, single target pharmacology has not been effective indystonia (Fahn, 1987). As in other complex diseases, many ofthe treatments for dystonia have highly variable effectiveness andmust be used at high doses that produce side-effects (Jankovic,2006). For these reasons, botulinum toxin, targeting the finalendpoint —the muscle movement—is commonly used as atreatment (Jankovic, 2006; Sanger et al., 2007; Bragg and Sharma,2014). Deep-brain stimulation, an invasive procedure, is alsoused to partially restore normal brain dynamics (Tarsy, 2007;Johnson et al., 2008; Air et al., 2011; Bhanpuri et al., 2014).
Multilocus, multitarget approaches may be particularlyuseful in movement disorders because movement producescoordination by utilizing coordination among multiple brainareas including the basal ganglia, thalamus, cerebellum, sensory,and motor cortices (Neychev et al., 2008; Crowell et al., 2012;Delnooz and van de Warrenburg, 2012). Pathology within anyone region, or disturbances in communication between any ofthe regions can potentially lead to disorders. To begin to addressthese multiple challenges, we focused our computer modelinghere on a multiscale model of motor cortex and multitargetpharmacology based in this one area. In the future, thismodel willbe expanded to encompass more areas and will include synapticreceptor targets in each area.
AUTHOR CONTRIBUTIONS
All authors listed, have made substantial, direct and intellectualcontribution to the work, and approved it for publication.
ACKNOWLEDGMENTS
The authors would like to thank Ben Suter and GordonMG Shepherd (Northwestern University) for help with themodel; Tom Morse (Yale) for ModelDB support; R.A.N. forhelpful suggestions. The authors declare no competing financialinterests. Research supported by NIH grant R01 MH086638,NIH grant U01 EB017695, NIH grant R01 NS064046, NIH grantR01 DC012947. The NIH had no role in study design; in thecollection, analysis and interpretation of data; in the writingof the report; and in the decision to submit the article forpublication.
SUPPLEMENTARY MATERIAL
The Supplementary Material for this article can be foundonline at: http://journal.frontiersin.org/article/10.3389/fphar.2016.00157
Frontiers in Pharmacology | www.frontiersin.org 15 June 2016 | Volume 7 | Article 157

Neymotin et al. Multiscale Modeling for Dystonia Therapies
REFERENCES
Action, A. C. S. (2016). In silico Clinical Trials: How Computer Simulation will
Transform the Biomedical Industry. Available online at: http://avicenna-
isct.org/wp-content/uploads/2016/01/AvicennaRoadmapPDF-27-01-16.pdf
(Accessed May 2, 2016).
Air, E., Ostrem, J., Sanger, T., and Starr, P. (2011). Deep brain stimulation in
children: experience and technical pearls: clinical article. J. Neurosurg. Pediatr.
8, 566–574. doi: 10.3171/2011.8.PEDS11153
Anderson, C. T., Sheets, P. L., Kiritani, T., and Shepherd, G.M. G. (2010). Sublayer-
specific microcircuits of corticospinal and corticostriatal neurons in motor
cortex. Nat. Neurosci. 13, 739–744. doi: 10.1038/nn.2538
Anwar, H., Hong, S., and De Schutter, E. (2012). Controlling Ca2+-activated
k+ channels with models of Ca2+ buffering in purkinje cells. Cerebellum 11,
681–693. doi: 10.1007/s12311-010-0224-3
Apicella, A. J., Wickersham, I. R., Seung, H. S., and Shepherd, G. M. (2012).
Laminarly orthogonal excitation of fast-spiking and low-threshold-spiking
interneurons in mouse motor cortex. J. Neurosci. 32, 7021–7033. doi:
10.1523/JNEUROSCI.0011-12.2012
Ashhad, S., and Narayanan, R. (2013). Quantitative interactions between the A-
type K+ current and inositol trisphosphate receptors regulate intraneuronal
Ca2+ waves and synaptic plasticity. J. Physiol. 591, 1645–1669. doi:
10.1113/jphysiol.2012.245688
Bartos, M., Vida, I., and Jonas, P. (2007). Synaptic mechanisms of synchronized
gamma oscillations in inhibitory interneuron networks. Nat. Rev. Neurosci. 8,
45–56. doi: 10.1038/nrn2044
Bhanpuri, N. H., Bertucco, M., Ferman, D., Young, S. J., Liker, M. A., Krieger,
M. D., et al. (2014). Deep brain stimulation evoked potentials may relate
to clinical benefit in childhood dystonia. Brain Stimul. 7, 718–726. doi:
10.1016/j.brs.2014.06.003
Bishop, C. (2006). Pattern Recognition and Machine Learning. New York, NY:
Springer.
Bragg, D. C., and Sharma, N. (2014). Update on treatments for dystonia. Curr.
Neurol. Neurosci. Rep. 14, 1–5. doi: 10.1007/s11910-014-0454-8
Bygrave, F. L., and Benedetti, A. (1996). What is the concentration of calcium ions
in the endoplasmic reticulum? Cell Calcium 19, 547–551. doi: 10.1016/S0143-
4160(96)90064-0
Carnevale, N., and Hines, M. (2006). The NEURON Book. New York, NY:
Cambridge University Press.
Casellato, C., Maggioni, S., Lunardini, F., Bertucco, M., Pedrocchi, A., and Sanger,
T. (2014). “Dystonia: altered sensorimotor control and vibro-tactile emg-
based biofeedback effects,” in XIII Mediterranean Conference on Medical and
Biological Engineering and Computing 2013 (Seville: Springer), 1742–1746.
Castro-Alamancos, M. (2013). The motor cortex: a network tuned to 7-14 Hz.
Front. Neural Circuits 7:21. doi: 10.3389/fncir.2013.00021
Chadderdon, G. L., Mohan, A., Suter, B. A., Neymotin, S. A., Kerr, C. C., Francis,
J. T., et al. (2014). Motor cortex microcircuit simulation based on brain activity
mapping. Neural Comput. 26, 1239–1262. doi: 10.1162/NECO_a_00602
Chen, S., Wang, J., and Siegelbaum, S. (2001). Properties of hyperpolarization-
activated pacemaker current defined by coassembly of HCN1 and HCN2
subunits and basal modulation by cyclic nucleotide. J. Gen. Physiol. 117,
491–504. doi: 10.1085/jgp.117.5.491
Cortes, C., and Vapnik, V. (1995). Support-vector networks. Mach. Learn. 20,
273–297. doi: 10.1007/BF00994018
Crone, N. E., Miglioretti, D. L., Gordon, B., Sieracki, J. M., Wilson, M. T.,
Uematsu, S., et al. (1998). Functional mapping of human sensorimotor cortex
with electrocorticographic spectral analysis. i. alpha and beta event-related
desynchronization. Brain 121, 2271–2299. doi: 10.1093/brain/121.12.2271
Crowell, A. L., Ryapolova-Webb, E., Ostrem, J. L., Galifianakis, N. B., Shimamoto,
S., Lim, D. A., et al. (2012). Oscillations in sensorimotor cortex in
movement disorders: an electrocorticography study. Brain 135, 615–630. doi:
10.1093/brain/awr332
De Young, G. W., and Keizer, J. (1992). A single-pool inositol 1, 4, 5-
trisphosphate-receptor-based model for agonist-stimulated oscillations in
Ca2+ concentration. Proc. Natl. Acad. Sci. U.S.A. 89, 9895–9899.
Delnooz, C., and van de Warrenburg, B. (2012). Current and future medical
treatment in primary dystonia. Ther. Adv. Neurol. Disord. 5, 221–240. doi:
10.1177/1756285612447261
Dura-Bernal, S., Li, K., Neymotin, S., Francis, J., Principe, J., and Lytton,
W. (2016). Restoring behavior via inverse neurocontroller in a lesioned
cortical spiking model driving a virtual arm. Front. Neurosci. 10:28. doi:
10.3389/fnins.2016.00028
Edelman, G. M., and Gally, J. A. (2001). Degeneracy and complexity in
biological systems. Proc. Natl. Acad. Sci. U.S.A. 98, 13763–13768. doi:
10.1073/pnas.231499798
Fahn, S. (1987). Systemic therapy of dystonia. Can. J. Neurol. Sci. 14, 528–532.
Fino, E., and Yuste, R. (2011). Dense inhibitory connectivity in neocortex. Neuron
69, 1188–1203. doi: 10.1016/j.neuron.2011.02.025
Fitzpatrick, J. S., Hagenston, A. M., Hertle, D. N., Gipson, K. E., Bertetto-
D’Angelo, L., and Yeckel, M. F. (2009). Inositol-1,4,5-trisphosphate receptor-
mediated Ca2+ waves in pyramidal neuron dendrites propagate through hot
spots and cold spots. J. Physiol. 587, 1439–1459. doi: 10.1113/jphysiol.2009.
168930
Golowasch, J., Goldman,M., Abbott, L., andMarder, E. (2002). Failure of averaging
in the construction of a conductance-based neuron model. J. Neurophysiol. 87,
1129–1131. doi: 10.1152/jn.00412.2001
Hagiwara, N., and Irisawa, H. (1989). Modulation by intracellular Ca2+ of the
hyperpolarization-activated inward current in rabbit single sino-atrial node
cells. J. Physiol. 409, 121–141.
Harnett, M. T., Magee, J. C., and Williams, S. R. (2015). Distribution and function
of HCN channels in the apical dendritic tuft of neocortical pyramidal neurons.
J. Neurosci. 35, 1024–1037. doi: 10.1523/JNEUROSCI.2813-14.2015
Harnett, M., Xu, N., Magee, J. C., and Williams, S. R. (2013). Potassium
channels control the interaction between active dendritic integration
compartments in layer 5 cortical pyramidal neurons. Neuron 79, 516–529. doi:
10.1016/j.neuron.2013.06.005
Harris, K. D., and Shepherd, G. M. (2015). The neocortical circuit: themes and
variations. Nat. Neurosci. 18, 170–181. doi: 10.1038/nn.3917
Hay, E., Hill, S., Schürmann, F., Markram, H., and Segev, I. (2011). Models
of neocortical layer 5b pyramidal cells capturing a wide range of dendritic
and perisomatic active properties. PLoS Comput. Biol. 7:e1002107. doi:
10.1371/journal.pcbi.1002107
Hendrix, C., and Vitek, J. L. (2012). Toward a network model of dystonia. Ann.
N.Y. Acad. Sci. 1265, 46–55. doi: 10.1111/j.1749-6632.2012.06692.x
Hines, M. L., and Carnevale, N. T. (2000). Expanding NEURON’s repertoire
of mechanisms with NMODL. Neural Comput. 12, 995–1007. doi:
10.1162/089976600300015475
Hiscott, R. (2014). Darpa: on the hunt for neuroprosthetics to enhance memory.
Neurol. Today 14, 8–10. doi: 10.1097/01.NT.0000456276.47073.51
Hong, M., and Ross, W. (2007). Priming of intracellular calcium
stores in rat ca1 pyramidal neurons. J. Physiol. 584, 75–87. doi:
10.1097/01.NT.0000458810.78790.d8
Hooks, B. M., Mao, T., Gutnisky, D. A., Yamawaki, N., Svoboda, K., and
Shepherd, G. M. (2013). Organization of cortical and thalamic input to
pyramidal neurons in mouse motor cortex. J. Neurosci. 33, 748–760. doi:
10.1523/JNEUROSCI.4338-12.2013
Hunter, J. (2007). Matplotlib: a 2d graphics environment. Comput. Sci. Eng. 9,
90–95. doi: 10.1109/MCSE.2007.55
Jahr, C. E., and Stevens, C. F. (1990). Voltage dependence of NMDA-activated
macroscopic conductances predicted by single-channel kinetics. J. Neurosci. 10,
3178–3182.
Jankovic, J. (2006). Treatment of dystonia. Lancet Neurol. 5, 864–872. doi:
10.1016/S1474-4422(06)70574-9
Jasper, H., and Penfield,W. (1949). Electrocorticograms in man: effect of voluntary
movement upon the electrical activity of the precentral gyrus. Arch. Psychiatr.
Nervenkr. 183, 163–174.
Jin, S. H., Lin, P., Auh, S., andHallett, M. (2011). Abnormal functional connectivity
in focal hand dystonia: mutual information analysis in EEG. Mov. Disord. 26,
1274–1281. doi: 10.1002/mds.23675
Johnson, M. D., Miocinovic, S., McIntyre, C. C., and Vitek, J. L. (2008).
Mechanisms and targets of deep brain stimulation in movement disorders.
Neurotherapeutics 5, 294–308. doi: 10.1016/j.nurt.2008.01.010
Kay, A. R., and Wong, R. K. (1987). Calcium current activation kinetics in isolated
pyramidal neurones of the CA1 region of the mature guinea-pig hippocampus.
J. Physiol. (Lond.) 392, 603–616.
Kendall, M. (1938). A new measure of rank correlation. Biometrika 30, 81–93.
Frontiers in Pharmacology | www.frontiersin.org 16 June 2016 | Volume 7 | Article 157

Neymotin et al. Multiscale Modeling for Dystonia Therapies
Kerr, C. C., Neymotin, S. A., Chadderdon, G. L., Fietkiewicz, C. T., Francis, J.
T., and Lytton, W. (2012). Electrostimulation as a prosthesis for repair of
information flow in a computer model of neocortex. IEEE Trans. Neural Syst.
Rehabil. Eng. 20, 153–160. doi: 10.1109/TNSRE.2011.2178614
Kerr, C. C., van Albada, S. J., Neymotin, S. A., Chadderdon, G. L., Robinson,
P. A., and Lytton, W. W. (2013). Cortical information flow in Parkinson’s
disease: a composite network/field model. Front. Comput. Neurosci. 7:39. doi:
10.3389/fncom.2013.00039
Kiritani, T., Wickersham, I. R., Seung, H. S., and Shepherd, G. M. (2012).
Hierarchical connectivity and connection-specific dynamics in the
corticospinal-corticostriatal microcircuit in mouse motor cortex. J. Neurosci.
32, 4992–5001. doi: 10.1523/JNEUROSCI.4759-11.2012
Knight, W. (1966). A computer method for calculating kendall’s tau with
ungrouped data. J. Am. Stat. Assoc. 61, 436–439.
Kohl, P., and Noble, D. (2009). Systems biology and the Virtual Physiological
Human.Mol. Syst. Biol. 5, 292. doi: 10.1038/msb.2009.51
Kole, M. H., Hallermann, S., and Stuart, G. J. (2006). Single Ih channels in
pyramidal neuron dendrites: properties, distribution, and impact on action
potential output. J. Neurosci. 26, 1677–1687. doi: 10.1523/JNEUROSCI.3664-
05.2006
Kristeva, R., Chakarov, V., Losch, F., Hummel, S., Popa, T., and Schulte-Mönting,
J. (2005). Electroencephalographic spectral power in writer’s cramp patients:
evidence for motor cortex malfunctioning during the cramp. Neuroimage 27,
706–714. doi: 10.1016/j.neuroimage.2005.05.004
Lefort, S., Tomm, C., Floyd-Sarria, J. C., and Petersen, C. C. (2009). The excitatory
neuronal network of the C2 barrel column in mouse primary somatosensory
cortex. Neuron 61, 301–316. doi: 10.1016/j.neuron.2008.12.020
Li, Y. X., and Rinzel, J. (1994). Equations for InsP3 receptor-mediated [Ca2+]ioscillations derived from a detailed kinetic model: a Hodgkin-Huxley like
formalism. J. Theor. Biol. 166, 461–473.
Lytton, W. W., Neymotin, S. A., and Kerr, C. C. (2014). Multiscale modeling for
clinical translation in neuropsychiatric disease. J. Comput. Surgery 1:7. doi:
10.1186/2194-3990-1-7
Lytton, W. W., and Omurtag, A. (2007). Tonic-clonic transitions
in computer simulation. J. Clin. Neurophys. 24, 175–181. doi:
10.1097/WNP.0b013e3180336fc0
Mallet, N., Pogosyan, A., Sharott, A., Csicsvari, J., Bolam, J. P., Brown, P., et al.
(2008). Disrupted dopamine transmission and the emergence of exaggerated
beta oscillations in subthalamic nucleus and cerebral cortex. J. Neurosci. 28,
4795–4806. doi: 10.1523/JNEUROSCI.0123-08.2008
Markram, H., Lübke, J., Frotscher, M., Roth, A., and Sakmann, B. (1997).
Physiology and anatomy of synaptic connections between thick tufted
pyramidal neurones in the developing rat neocortex. J. Physiol. 500, 409–440.
McCormick, D., and Huguenard, J. (1992). A model of the electrophysiological
properties of thalamocortical relay neurons. J. Neurophysiol. 68, 1384–1400.
McCormick, D., Wang, Z., and Huguenard, J. (1993). Neurotransmitter control of
neocortical neuronal activity and excitability. Cereb. Cortex 3, 387–398.
McDougal, R., Hines, M., and Lytton, W. (2013a). Reaction-diffusion in
the NEURON simulator. Front. Neuroinform. 7:28. doi: 10.3389/fninf.2013.
00028
McDougal, R., Hines, M., and Lytton, W. (2013b). Water-tight membranes
from neuronal morphology files. J. Neurosci. Methods 220, 167–178. doi:
10.1016/j.jneumeth.2013.09.011
Meisel, C., Schulze-Bonhage, A., Freestone, D., Cook, M. J., Achermann, P., and
Plenz, D. (2015). Intrinsic excitability measures track antiepileptic drug action
and uncover increasing/decreasing excitability over the wake/sleep cycle. Proc.
Natl. Acad. Sci. U.S.A. 112, 14694–14699. doi: 10.1073/pnas.1513716112
Migliore, M., Messineo, L., and Ferrante, M. (2004). Dendritic Ih
selectively blocks temporal summation of unsynchronized distal
inputs in CA1 pyramidal neurons. J. Comput. Neurosci. 16, 5–13. doi:
10.1023/B:JCNS.0000004837.81595.b0
Miller, K. J., Leuthardt, E. C., Schalk, G., Rao, R. P., Anderson, N. R., Moran,
D. W., et al. (2007). Spectral changes in cortical surface potentials during
motor movement. J. Neurosci. 27, 2424–2432. doi: 10.1523/JNEUROSCI.3886-
06.2007
Monyer, H., and Markram, H. (2004). Interneuron diversity series: molecular and
genetic tools to study gabaergic interneuron diversity and function. Trends
Neurosci. 27, 90–97. doi: 10.1016/j.tins.2003.12.008
Nelson, J. T., and Tepe, V. (2014). Neuromodulation research and application
in the us department of defense. Brain Stimul. 8, 247–252. doi:
10.1016/j.brs.2014.10.014
Neychev, V. K., Fan, X., Mitev, V. I., Hess, E. J., and Jinnah, H. A. (2008). The basal
ganglia and cerebellum interact in the expression of dystonic movement. Brain
131, 2499–2509. doi: 10.1093/brain/awn168
Neymotin, S. A., Hilscher, M. M, Moulin, T., Skolnick, Y., Lazarewicz, M. T.,
and Lytton, W. W. (2013). Ih tunes theta/gamma oscillations and cross-
frequency coupling in an in silico CA3 model. PLoS ONE 8:e76285. doi:
10.1371/journal.pone.0076285
Neymotin, S., Jacobs, K., Fenton, A., and Lytton, W. (2011a). Synaptic information
transfer in computer models of neocortical columns. J. Comput. Neurosci. 30,
69–84. doi: 10.1007/s10827-010-0253-4
Neymotin, S., Lazarewicz, M., Sherif, M., Contreras, D., Finkel, L., and Lytton, W.
(2011b). Ketamine disrupts theta modulation of gamma in a computer model
of hippocampus. J. Neurosci. 31, 11733–11743. doi: 10.1523/JNEUROSCI.0501-
11.2011
Neymotin, S., Lee, H., Park, E., Fenton, A., and Lytton, W. (2011c). Emergence of
physiological oscillation frequencies in a computer model of neocortex. Front.
Comput. Neurosci. 5:19. doi: 10.3389/fncom.2011.00019
Neymotin, S. A., McDougal, R. A., Bulanova, A. S., Zeki, M., Lakatos, P., Terman,
D., et al. (2016). Calcium regulation of HCN channels supports persistent
activity in a multiscale model of neocortex. Neuroscience 316, 344–366. doi:
10.1016/j.neuroscience.2015.12.043
Neymotin, S. A, McDougal, R. A., Sherif, M. A., Fall, C. P., Hines, M. L., and
Lytton, W. W. (2015). Neuronal calcium wave propagation varies with changes
in endoplasmic reticulum parameters: a computer model. Neural Comput. 27,
898–924. doi: 10.1162/NECO_a_00712
Noble, W. (2006). What is a support vector machine? Nat. Biotechnol. 24, 1565–
1567. doi: 10.1038/nbt1206-1565
Nobrega, J. N., Richter, A., Burnham, W. M., and Lôscher, W. (1995). Alterations
in the brain GABAA/benzodiazepine receptor-chloride ionophore complex in a
genetic model of paroxysmal dystonia: a quantitative autoradiographic analysis.
Neuroscience 64, 229–239. doi: 10.1016/0306-4522(94)00334-2
Nordlie, E., Gewaltig, M. O., and Plesser, H. E. (2009). Towards reproducible
descriptions of neuronal network models. PLoS Comput. Biol. 5:e1000456. doi:
10.1371/journal.pcbi.1000456
Orrù, G., Pettersson-Yeo,W.,Marquand, A. F., Sartori, G., andMechelli, A. (2012).
Using support vector machine to identify imaging biomarkers of neurological
and psychiatric disease: a critical review. Neurosci. Biobehav. Rev. 36, 1140–
1152. doi: 10.1016/j.neubiorev.2012.01.004
Pedregosa, F., Varoquaux, G., Gramfort, A., Michel, V., Thirion, B., Grisel, O.,
et al. (2011). Scikit-learn: machine learning in Python. J. Mach. Learn. Res. 12,
2825–2830.
Pfurtscheller, G., and Aranibar, A. (1979). Evaluation of event-related
desynchronization (ERD) preceding and following voluntary self-paced
movement. Electroencephalogr. Clin. Neurophysiol. 46, 138–146.
Pratt, D., Richter, A., Möhler, H., and Löscher, W. (1995). Regionally selective and
age-dependent alterations in benzodiazepine receptor binding in the genetically
dystonic hamster. J. Neurochem. 64, 2153–2158.
Richter, A., and Hamann, M. (2001). Effects of adenosine receptor agonists and
antagonists in a genetic animal model of primary paroxysmal dystonia. Br. J.
Pharmacol. 134, 343–352. doi: 10.1038/sj.bjp.0704268
Robinson, R. B., and Siegelbaum, S. A. (2003). Hyperpolarization-activated cation
currents: from molecules to physiological function. Annu. Rev. Physiol. 65,
453–480. doi: 10.1146/annurev.physiol.65.092101.142734
Ross, W. N., Nakamura, T., Watanabe, S., Larkum, M., and Lasser-Ross, N. (2005).
Synaptically activated Ca2+ release from internal stores in CNS neurons. Cell
Mol. Neurobiol. 25, 283–295. doi: 10.1007/s10571-005-3060-0
Safiulina, V. F., Caiati, M. D., Sivakumaran, S., Bisson, G., Migliore, M.,
and Cherubini, E. (2010). Control of GABA release at mossy fiber-CA3
connections in the developing hippocampus. Front. Synaptic Neurosci. 2:1. doi:
10.3389/neuro.19.001.2010
Sanger, T. (2003). Childhood onset generalised dystonia can be modelled by
increased gain in the indirect basal ganglia pathway. J. Neurol. Neurosurg.
Psychiatry 74, 1509–1515. doi: 10.1136/jnnp.74.11.1509
Sanger, T., Delgado, M., Gaebler-Spira, D., Hallett, M., Mink, J., and on Childhood
Motor Disorders, T. F. (2003). Classification and definition of disorders
Frontiers in Pharmacology | www.frontiersin.org 17 June 2016 | Volume 7 | Article 157

Neymotin et al. Multiscale Modeling for Dystonia Therapies
causing hypertonia in childhood. Pediatrics 111, e89–e97. doi: 10.1542/peds.
111.1.e89
Sanger, T. D., Kukke, S. N., and Sherman-Levine, S. (2007). Botulinum toxin
type B improves the speed of reaching in children with cerebral palsy and
arm dystonia: an open-label, dose-escalation pilot study. J. Child Neurol. 22,
116–122. doi: 10.1177/0883073807299975
Sanger, T. D., and Merzenich, M. M. (2000). Computational model of the role
of sensory disorganization in focal task-specific dystonia. J. Neurophysiol. 84,
2458–2464.
Schnitzler, A., and Gross, J. (2005). Normal and pathological oscillatory
communication in the brain. Nat. Rev. Neurosci. 6, 285–296. doi:
10.1038/nrn1650
Schwindt, P. C., Spain, W. J., and Crill, W. E. (1992). Effects of intracellular
calcium chelation on voltage-dependent and calcium-dependent currents
in cat neocortical neurons. Neuroscience 47, 571–578. doi: 10.1016/0306-
4522(92)90166-Y
Shipp, S. (2005). The importance of being agranular: a comparative account of
visual and motor cortex. Philos. Trans. R. Soc. Lond. B Biol. Sci. 360, 797–814.
doi: 10.1098/rstb.2005.1630
Sneyd, J., Tsaneva-Atanasova, K., Bruce, J. I., Straub, S. V., Giovannucci, D. R., and
Yule, D. I. (2003). A model of calcium waves in pancreatic and parotid acinar
cells. Biophys. J. 85, 1392–1405. doi: 10.1016/S0006-3495(03)74572-X
Song, W., Kerr, C. C., Lytton, W. W., and Francis, J. T. (2013). Cortical plasticity
induced by spike-triggered microstimulation in primate somatosensory cortex.
PLoS ONE 8:e57453. doi: 10.1371/journal.pone.0057453
Spruston, N., Schiller, Y., Stuart, G., and Sakmann, B. (1995). Activity-dependent
action potential invasion and calcium influx into hippocampal CA1 dendrite.
Science 8, 297–300. doi: 10.1126/science.7716524
Stacey, W., Lazarewicz, M., and Litt, B. (2009). Synaptic noise and physiological
coupling generate high-frequency oscillations in a hippocampal computational
model. J. Neurophysiol. 102, 2342–2357. doi: 10.1152/jn.00397.2009
Tarsy, D. (2007). Deep-brain stimulation for dystonia: new twists in assessment.
Lancet Neurol. 6, 201–202. doi: 10.1016/S1474-4422(07)70040-6
Toro, C., Deuschl, G., Thatcher, R., Sato, S., Kufta, C., and Hallett, M. (1994).
Event-related desynchronization and movement-related cortical potentials on
the ECoG and EEG. Electroencephalogr. Clin. Neurophysiol. 93, 380–389.
Viayna, E., Sola, I., Di Pietro, O., and Muñoz-Torrero, D. (2013). Human disease
and drug pharmacology, complex as real life. Curr. Med. Chem. 20, 1623–1634.
doi: 10.2174/0929867311320130002
Viceconti, M., Clapworthy, G., and Jan, S. (2008). The Virtual Physiological
Human - a European initiative for in silico human modelling. J. Physiol. Sci.
58, 441–446. doi: 10.2170/physiolsci.RP009908
Viceconti, M., Edwin Morley-Fletcher, M., and Henney, A. (2016). In silico
Clinical Trials: How Computer Simulation will Transform the Biomedical
Industry. Available online at: http://avicenna-isct.org/wp-content/uploads/
2016/01/AvicennaRoadmapPDF-27-01-16.pdf (Accessed May 2, 2016).
Wang, J., Chen, S., Nolan, M. F., and Siegelbaum, S. A. (2002). Activity-
dependent regulation of HCN pacemaker channels by cyclic AMP: signaling
through dynamic allosteric coupling. Neuron 36, 451–461. doi: 10.1016/S0896-
6273(02)00968-6
Wang, X. (2002). Pacemaker neurons for the theta rhythm and their
synchronization in the septohippocampal reciprocal loop. J. Neurophysiol. 87,
889–900. doi: 10.1152/jn.00135.2001
Wang, X. J., and Buzsáki, G. (1996). Gamma oscillation by synaptic
inhibition in a hippocampal interneuronal network model. J. Neurosci. 16,
6402–6413.
Weiler, N., Wood, L., Yu, J., Solla, S. A., and Shepherd, G. M. (2008). Top-down
laminar organization of the excitatory network in motor cortex. Nat. Neurosci.
11, 360–366. doi: 10.1038/nn2049
Winograd, M., Destexhe, A., and Sanchez-Vives, M. (2008). Hyperpolarization-
activated graded persistent activity in the prefrontal cortex. Proc.
Natl. Acad. Sci. U.S.A. 105, 7298–7303. doi: 10.1073/pnas.08003
60105
Yamawaki, N., Borges, K., Suter, B. A., Harris, K. D., and Shepherd, G. M. (2014). A
genuine layer 4 in motor cortex with prototypical synaptic circuit connectivity.
Elife 3:e05422. doi: 10.7554/elife.05422
Conflict of Interest Statement: The authors declare that the research was
conducted in the absence of any commercial or financial relationships that could
be construed as a potential conflict of interest.
Copyright © 2016 Neymotin, Dura-Bernal, Lakatos, Sanger and Lytton. This is an
open-access article distributed under the terms of the Creative Commons Attribution
License (CC BY). The use, distribution or reproduction in other forums is permitted,
provided the original author(s) or licensor are credited and that the original
publication in this journal is cited, in accordance with accepted academic practice.
No use, distribution or reproduction is permitted which does not comply with these
terms.
Frontiers in Pharmacology | www.frontiersin.org 18 June 2016 | Volume 7 | Article 157