Embed Size (px)
Citation preview

HAL Id: hal-00805756https://hal.archives-ouvertes.fr/hal-00805756
Submitted on 28 Mar 2013
HAL is a multi-disciplinary open accessarchive for the deposit and dissemination of sci-entific research documents, whether they are pub-lished or not. The documents may come fromteaching and research institutions in France orabroad, or from public or private research centers.
L’archive ouverte pluridisciplinaire HAL, estdestinée au dépôt et à la diffusion de documentsscientifiques de niveau recherche, publiés ou non,émanant des établissements d’enseignement et derecherche français ou étrangers, des laboratoirespublics ou privés.
Wavelet-Based Multiscale Texture Segmentation:Application to Stromal Compartment Characterization
on Virtual Slides.Nicolas Signolle, Marinette Revenu, Benoît Plancoulaine, Paulette Herlin
To cite this version:Nicolas Signolle, Marinette Revenu, Benoît Plancoulaine, Paulette Herlin. Wavelet-Based MultiscaleTexture Segmentation: Application to Stromal Compartment Characterization on Virtual Slides..Signal Processing, Elsevier, 2010, 90 (8), pp.2412-2422. �10.1016/j.sigpro.2009.11.008�. �hal-00805756�

Wavelet-Based Multiscale Texture Segmentation: Application to StromalCompartment Characterization on Virtual Slides.
Nicolas Signolle a,b,∗, Marinette Revenu a, Benoıt Plancoulaine b, Paulette Herlin b
aGREYC UMR CNRS 6072 14050 Caen FrancebGRECAN EA 1772, IFR 146 ICORE, Universite de Caen, CLCC Francois Baclesse 3, Avenue du General Harris 14076 Caen cedex 5 France
Abstract
We aim at segmenting very large images of histopathology virtual slides with an heterogeneous and complex content. To this end,we propose a multiscale framework for texture-based color image segmentation. The core of the method is based on a wavelet-domain hidden Markov tree model and a pairwise classifiers design and selection. The classifier selection is based on a study of theinfluence of the hyper-parameters of the method used. Over the testing set, majority vote was found to be the best way of combiningoutputs of the selected classifiers. The method is applied to the segmentation of various types of ovarian carcinoma stroma, onvery large virtual slides. This is the first time such a segmentation is tested. The segmentation results are presented and discussed.
Key words: Segmentation, Texture, Hidden Markov Model, Wavelets, Pairwise classifier combination, Virtual slides
Introduction
To estimate the potential of evolution of cancer lesions,it is often necessary to identify and quantify cell and tis-sue compartments on histological sections. To perform au-tomatically this measurement in an objective way, an im-age of the whole tissue preparation must be recorded andfully analyzed, as structures of interest are often heteroge-neously spread all over the slide. ”Virtual microscopy” de-vices allow the acquisition and storage of digital images ofmicroscopic structures. When the whole tissue slice is ac-quired, the recorded image is named ”Virtual Slide” (VS ).Once they have been acquired, virtual slides can then beviewed through the screen of a monitor without using amicroscope (Rojo et al., 2006) or automatically analyzed.
It is also mandatory to adapt the working resolution tothe size of the structures to be measured. The high reso-lution VS which are recorded for the identification of tinymicroscopical structures occupy a considerable volume inmemory (several GigaBytes) and cannot be processed atonce. Special techniques have to be used to overcome thisproblem. Recent works suggest to use multi-resolution
∗ Nicolas Signolle GREYC - ENSICAEN 6 Boulevard Marechal Juin14050 CAEN cedex FRANCE tel : +33 (0)2 31 45 29 20, Fax : +33(0)2 31 45 26 98
Email address: [email protected] (NicolasSignolle).
approaches. The method our team chose is a multiscaleanalysis of high resolution VS, allowing to adapt the work-ing resolution to the various structures to be segmented(i.e. cancer lesion, intra-tumoral tissue compartments, cellsand intra-cellular structures).
The present study addresses the segmentation of the var-ious types of stromal compartments on ovarian carcinomavirtual slides. It aims first at partitioning cancer cells andintra-tumoral connective tissue, and then at differentiatingthe various stromal compartments (fibrous tissue, loosemesenchymatous connective tissue, inflammatory cell ac-cumulation). This work is pioneering in this field.Each stromal compartment can be identified mainly by itscell shape and organization. This individual pattern canbe exploited by a texture-based analysis. It is the way ourwork focuses on. Furthermore, in order to be easily appliedin the anatomopathology laboratories, the method shouldhave a rather low calculation time.
Many studies have already been conducted on the seg-mentation of textured images. Several categories of meth-ods may be distinguished : the statistical methods whichexploit the spatial distribution of the gray levels, the meth-ods based on the construction of a texture model, and themethods which mimic the mechanism of the human vision,integrating several levels of resolution (Xie, 2008, e.g.).
Preprint submitted to Elsevier July 28, 2009

We chose to use the Hidden Markov Tree (HMT) pro-posed by Crouse (Crouse et al., 1998) as a descriptorbecause it combines these different approaches. It enablesus to make a statistical modeling of intra-scale and inter-scale properties of the coefficients of the wavelet transform(WT ) (Mallat, 1999), and it exploits the decorrelationpower of this transform. The goal is to capture the inter-scale dependency factor and the non-gaussian distributionof the coefficients computed at each scale. We also usethe segmentation proposed by Choi (Choi and Baraniuk,2001) as a classifier because it allows us to perform textureclassification at a range of different scales. Thereby, infor-mation collected at coarser-scales guide the segmentationat finer-scale quite in the way the pathologists do.These tools are used in a framework for the segmention ofthe various compartments of stroma identified inside VS ofovarian carcinomas, recorded at a high resolution (0.5 µm).
The paper is organized as follows : in section 1, we firstdiscuss previous works in the field of large VS segmentationand classification, then, in section 2, due to the complex-ity and variability of the structures to be segmented, weprecisely described the ”domain objects” of our images. Insection 3, the mathematical background of the used toolsis detailed and the results are presented and discussed insection 4 before concluding on the offered prospects.
1. Related work
The analysis of restricted fields of histological slides haslong been practiced, but it has been applied only withinthe past ten years to virtual slides. We will review somesolutions proposed in the literature for the segmentation ofvirtual slides.
One of the first teams that investigated to segment im-ages larger than just a microscopic field is Hamilton’s one(Hamilton et al., 1997). They wanted to automaticallydistinguish the dysplastic tissue from the normal mucosalin colorectal cancer by analyzing texture (using a vectorof features, consisting of co-occurrence matrix, run-lengthmatrix, gray level histograms, and then applying a clas-sification rule). The processed images (which size was3040x2048 pixels) did not yet covered the whole histologi-cal slide.
Other teams managed to process an image of the entireslice. The strategies may be grouped into 4 classes: lowresolution processing, block processing, multiscale analysisand use of dedicated architectures. These strategies havebeen used separately or jointly.
1.1. Processing of the whole image recorded at lowresolution
An image of the whole slice can be obtained at low res-olution (from 4000 to 5000 dots per inch). The size of theresulting image (40MB to 100MB) is small enough to al-low loading and processing of the whole VS in memory.This strategy was applied to images of the whole histologi-cal slide to detect and quantify : blood vessels (Tran et al.,2003; Chantrain et al., 2003), immunolabeled cells (Elieet al., 2003; Mesker et al., 2003) and stromal compartment(Elie et al., 2005). However, low resolution acquisition maybe not sufficient to detect tiny structures. This is the reasonwhy high resolution image processing has to be performed.
1.2. Image processing by blocks
To avoid to overload the memory, it is possible to cut theimage into smaller images and to process them indepen-dently. This approach, however, must take into account theassociated edge effects. Indeed, structures, cut by the edgesof one image, can be detected and counted on several im-ages. An overlapping adapted to the size of the objects tobe detected and/or dedicated counting strategies, such asthe forbidden line of Gundersen (Gundersen et al., 1988),must be implemented.The Aperio company, for example, has developed algo-rithms to quantify nuclear and membrane immunolabelingon 20x recorded images. The image is divided in smallerimages of size 1000x1000 with an overlapping of 100 pixelsin every direction and forbidden line correction. Althoughthe processing is theoretically possible on the whole image,it is generally applied to areas of interest (Olson, 2006).This approach, however, does not reflect the distributionheterogeneity of structures of interest that is very frequenton tumor sections.Mete et al. used images of 128x128 with an overlapping of64 pixels to automatically detect tumor foci on 40x vir-tual slides of malignant cancers of the head and neck (Meteet al., 2007). Mosaliganti et al. chose to make a classifica-tion of different structures on a slice of mouse embryo from20x20 pixel patches of a 20X image (Mosaliganti et al.,2008).Image processing by blocks solves the problem of imagesize but it doesn’t solve the problem of the computing timerequired when the algorithms get more complex. This iswhy processing by blocks is often coupled with a multi-resolution analysis.
1.3. Multi-resolution analysis
The multi-resolution analysis is based upon the state-ment that all the details are not essential for the identifi-cation of a structure. It is sometimes necessary to reach acertain level of abstraction to process a good segmentation(Signolle et al., 2008). Thus, Ficsor et al. proposed to seg-
2
ment at full resolution the epithelial nuclei of colon cancer,while the glands are detected on an eight time subsampledvirtual slide (Ficsor et al., 2008).He and his team have proposed a multi-resolution strategyin which data are classified at low resolution. The regionborders are then refined at a higher resolution (He et al.,2005). Wang and his team have applied a similar methodto the segmentation of the squamous epithelium in cancerof the cervix (Wang et al., 2007). The processing time isabout 3 hours for a slice of 152,000x42,000 pixels (recordedat 40x) processed by a PC with a 3.4 GHz Pentium IVand 2 GB of RAM. Within the epithelium, areas of intra-epithelial neoplasia are then analyzed (area, density anddistribution of the nuclei) at full resolution to classify im-ages of size 250x250 (Wang, 2008).To separate stroma rich and stroma poor areas in neurob-lastoma, Sertel and his team used a weighted k -nearestneighbor classifier at each level of subsampling (Sertel et al.,2009). If an area is classified at any resolution with a confi-dence index below a chosen threshold, the classification isrevised at a higher scale. The more the resolution increases,the more the required level of threshold of the confidenceindex decreases. This makes the classification fitted to thecontent of the image and saves about 85 % of computingtime.Kong et al. also proposed to use the optimum resolution forclassification according to the degree of differentiation ofneuroblastoma images (Kong et al., 2007b). If the charac-teristics calculated for the classification at a given resolu-tion are outside a confidence level predetermined by learn-ing, the analysis is carried on at a higher resolution. Theauthors noticed that this approach had enabled them tohalve the computing time. Kong et al., concerning the sameproblem, adopted another rule to control the transition be-tween resolutions (Kong et al., 2007a). They determine theclass of an area by combining seven different classifiers.Each classifier has a previously learnt confidence index. Ifthe sum of the confidence index of classifiers who voted forthe majority class is below a threshold, the analysis is con-ducted at a higher resolution.
1.4. Using dedicated architectures
To reduce the computing time, some authors use a dedi-cated hardware. A grid of computers (Hastings et al., 2005;Gortler et al., 2006) can be used. Those who cannot affordthese devices can use Graphic Processing Units (Hong andWang, 2004; Ujaldon and Saltz, 2005), of the joint useof processor and GPU (Sertel et al., 2008) or even of aPlayStation 3 (Hartley et al., 2007). Other authors haveproposed to employ the specific processor instructions orto create cards dedicated to time consuming operations(Diou et al., 2002).Among the studies presented above, Kong et al. use agrid consisting of 64 nodes for parallel calculations (Konget al., 2007b; Sertel et al., 2008; Kong et al., 2009). A
75,000x68,000 pixel image is segmented in half an hour,using only 32 of the 64 nodes (Kong et al., 2007a).By using a grid of 16 multi-processor nodes (Opteron X22218) with multi GPU (Quadro FX 5600), Hartley et al.obtained the record processing time of 4 seconds for animage of size 33,000x66,000 and 11 seconds for an imageof size 110,000x80,000 (both 40x recorded) (Hartley et al.,2007).Despite these record processing time, beyond the price ofthe equipment required for a routine pathology depart-ment, the major problem of the use of GPU is their low”programmability” (there are few development tools, andthey require a good knowledge of the architecture of thecard) and the low portability of the written code becauseof frequent changes in the architecture of the cards.
To summarize, the main approach to tackle large virtualslide segmentation and classification is to process multi-scale analysis. This multiscale analysis should be applied tosplitted images (tiles) when necessary, but attention has tobe paid to the management of tile overlapping. The strat-egy we adopted takes into account these two points. Weprocess 2048x2048 pixel tiles of the original image with anoverlapping of 24 pixels in every direction (these sizes aresuited to the resolution and to the size of structures). Wechose to use the framework of wavelets to perform a multi-scale texture analysis on these tiles.
2. Material
An image can be described considering three levels ofdescription (Renouf et al., 2007):
(i) the physical level that focuses on the characterizationof the acquisition system effects on the images.
(ii) the perceptive level that focuses on the description ofthe visual primitives (regions, lines, ...) without anyreference to business objects.
(iii) the semantic level that focuses on the identificationof the business objects visualized in the images.
To lay clearly the problem, and to guide the choice of im-age representation and of segmentation parameters, we willdescribe the images according to these three levels.
When a patient undergoes surgery for tumour resection,the excised biopsy is fixed in formalin, paraffin embeddedand splitted off in 5 µm thick slices. Slices are then affixedon a glass slide prior to be stained. The special stainingusing immunohistochemistry or histochemistry aims at re-vealing particular cell types or proteins which amount canthen be estimated in order to assess the potential evolu-tion of the tumour and to help choosing the best therapyprotocol. In the case of ovarian carcinoma [Fig.1] the prog-nostic impact of the proportion of stroma is demonstrated(Elie et al., 2005). The researchers need to further clarifythe participation of the various stromal compartments inthe evolution of tumours and their response to therapy.
3

a)
b)
c)
Figure 1. a) Image of an histological section of ovarian carcinomaafter DAB immunostaining of proliferation cells (brown) and hema-toxylin counterstaining of non proliferating nuclei (blue). The orig-inal size of the recorded image is 62000x41404 pixels (acquisitionresolution 0.5 µm). b) Detail image. c) Manual drawing of the idealsegmentation of three compartments which can be identified on thisdetail (1 is loose connective tissue, 2 is cancer cell foci and 3 is in-flammatory stromal compartment).
The ovarian carcinoma is made of two types of tissue:cancer epithelial cells and stroma. Stroma refers to the con-nective tissue which provides supportive framework andnutriments to epithelial cancer cells.After hematoxylin staining, several types of stromal tissuecan be identified inside tumours, some of which correspond-ing to various maturation degrees: loose connective tissue,cellular stroma and fibrous connective tissue. Inflammatorycell riched foci can also be found [Fig.2].– The loose connective tissue is an immature stroma. It
is made of an abundant extracellular matrix and starshaped mesenchymatous cells. The density of these cellsis low. Cell nuclei are small and round.
– The cellular stroma is a young connective tissue. It con-sists mainly of myofibroblasts organized in sheets andbundles with a high density of cells. The cell nuclei areelongated and plump.
– The fibrous connective tissue is a mature stroma with adensity of cells which is somewhat lower than the cellu-lar stroma and a large number of extra-cellular collagenfibers. The nuclei are very thin and elongated. Their op-tical density is high, due to chromatin condensation.
– The inflammatory stromal compartment is characterizedby small round nuclei with a high optical density (lym-phocytes and plasma cells) and clover shaped dense nu-clei (polymorphonuclear cells).
Extravased red blood cells, necrosis foci and mucus sheetscan also be found inside the tumor [Fig.2].After immunohistochemical staining of proteins associatedto cell proliferation (Cyclin A for example), Diaminoben-zidin (DAB) labelling of the antibody-antigen reaction andMayer hematoxylin counterstaining, epithelium appears asblue (non proliferating) and brown (proliferating) cells withlarge size nucleus [Fig.2]. Nevertheless, with such a stainingprotocol, the various types of stroma can only be identi-fied thanks to the morphology of their nuclei. Extracellularfibers and matrix are not stained as well.Finally, we decided to take into account 5 classes : back-ground, epithelial cancer cells, loose connective tissue, cel-
lular stroma and inflammatory stroma.These descriptions give us valuable information. We can,
to some extent, help us with color of the nuclei. Severalcolor components have to be tested to select the best seg-mentation space(s).We said that we wanted to use the wavelet framework.The fact that stromal compartments have various densityindicates that we should use wavelet filters with varioussupport to characterize them. The various morphology ofnucleus will lead us to try wavelets specialists in the detec-tion of details.
Tiled tiff VS were recorded at a resolution of 0, 5 µmthanks to a microscopic slide scanner (ScanScope CS fromAperio Technologies) provided with a 20x objective. A 30%loss Jpeg compression was applied to each tile when record-ing images. Uncompressed Images are 3 to 10 GigaBytesfiles, depending on the scanned tissue area. Images are60000x40000 pixels large on average.
3. Method description
Our contribution is the design of an operational process-ing chain based on:– A multiscale approach,– The design of specialist classifiers,– The merging of classification results.
3.1. Multiscale strategy
Previous works of our team, based on low resolutionanalysis strategy (6.3 µm), already allowed to segmentand quantify tissue components (quantification of stainednucleus, of epithelium, of blood vessels, of stroma (Tranet al., 2003; Elie et al., 2003)). However, the fine analysisof stroma compartments, which needs a cell to cell dis-crimination, is impossible at this scale as a cell nucleus isrepresented by only two or four pixels.
For this purpose, we propose a high resolution analysisstrategy. As we have seen previously, the image volume (3to 10 GB) prevents to process VS at once. The tempting so-lution is to process tiles of a splitted image. But this implieshard constraints on elementary image edges, especiallywhen managing large structures that can be spread overseveral tiles. Furthermore, large scale structure segmenta-tion can imply local as well as global characteristics whichare difficult to take into account. The proposed multiscaleapproach consists in selecting, at various scales, regions ofinterest containing objects to be further segmented. Thisallows the user to adjust the decomposition of the image toits contents. A large structure will be segmented at a lowresolution (subsampled image size is then small enough tobe held in memory, so that there will be no edge effect tomanage). The result of this segmentation will serve as amask to segment a smaller structure at a higher resolution.
4

Figure 2. First row (from the left to the right), various types of stroma: loose connective tissue, cellular stroma, inflammatory stroma, andfibrous connective tissue (surrounded area). Second row: other types of tissue compartments encountered in an image of ovarian carcinoma:Epithelial cancer cells, Background, Red Blood Cells, Mucus.
The procedure can be reiterated until the localization oftiny structures inside the full resolution virtual slide.
We use wavelet transform (WT ) to subsample the im-ages because we observed that it better preserves thestructures and colors than bilinear or bicubic subsampling.A first partitioning between background and tissue canbe done at a very low resolution (32 µm) [Fig.3]. For thispurpose, the image histogram was regarded as a mixtureof three gaussian curves (one mode for background, andtwo closer modes for stroma and epithelium). The param-eters of these three gaussian curves are estimated by anhistogram analysis. The likelihood of a pixel to belongto a class (background or tissue) is computed and theimage is then segmented by maximum of likelihood. Theresulting binary mask of tissue compartment is improvedthanks to mathematical morphology operations (hole filland geodesic opening).
Preliminary tests have been conducted to find the bestmethod to segment the various stromal compartments. Thefirst try aimed at detecting each cell and to analyze the mor-phology of its nucleus. The difficulty lies in the followingfact: at this acquisition resolution, the cells can’t be individ-ualized. Therefore, nuclei can’t be analyzed. That’s why weopted for a more global, texture-based, method. Based tex-ture segmentation methods (such as JSEG criterion (Dengand Manjunath, 2001) or active region based segmentation(Lecellier et al., 2006)) were not able to provide good resultsof segmentation. Then we choose a method that could com-bine texture and multiscale analysis : the HMT method.
3.2. Hidden Markov Tree (HMT) model
At each scale, the value of coefficients of a wavelet trans-form depends on the regularity of the signal. A singularitywould yield a large coefficient of wavelets that could cas-cade through scales, while an area with small variationvalues would produce a series of small coefficients. Theseproperties of the wavelet transform mean that there is asmall number of large coefficients bringing most of theenergy of the signal, and many small coefficients. To ap-proximate both the marginal and joint wavelet coefficientsstatistics, Crouse (Crouse et al., 1998) proposed to use amodel of Gaussian mixture applied to wavelet coefficientsin each sub-band, and a hidden Markov tree (HMT). Toeach wavelet coefficient, the HMT model associates a (hid-den) state variable that controls whether it is Large (L) orSmall (S). The joint density of each coefficient is then mod-eled as a gaussian mixture with a high variance and nullaverage gaussian for the L state and with a low variance onefor the S state. The model captures inter-scale dependen-cies between the wavelet coefficients using a Markov chain,with one dependency between the resolution levels [Fig.4].This model has been used by Choi (Choi and Baraniuk,2001) to achieve the segmentation of textured images.The method consists in three phases: a learning phase,a phase of segmentation at each level and a phase ofinter-scales merging. During the learning phase, the modelparameters M are learnt for each texture, through anEM (Expectation Maximization) algorithm suited to HMT(Crouse et al., 1998): for each state (L or S), each level
5

Figure 3. Segmentation of background: a) Original image subsampled 6 times (up to a resolution of 32 µm), b) histogram of the red componentof the original coloured image c) segmented background
Figure 4. Drawing from (Choi and Baraniuk, 2001) a) The father-son dependencies of WT sub-bands. (b) The quad-tree structure of themodel, detailed for a sub-band. (c) The HMT model, detailed for a sub-band. Each wavelet coefficient (black node) is modeled by a gaussianmixture controlled by a hidden state (white node).
and each sub-band, the parameters of the representativeGaussian curves (mean, variance and probability of occur-rence) are learnt, as well as the parameters of transitionfrom one state to another, between two resolutions levels: εf=S
s=S εf=Ss=L
εf=Ls=S εf=L
s=L
=
εf=S
s=S 1− εf=Ss=S
1− εf=Ls=L εf=L
s=L
where εf=a
s=b rep-
resents the probability that the father is in state a whilethe son is in state b. Details on the implementation of EMalgorithm and a proof of convergence are mentioned in(Crouse et al., 1998).During the phase of segmentation, the likeness between thedata of the wavelet transform of the observed image andthe HMT model of learnt images is assessed by calculatinga likelihood function :
f(Ti|M) =∏
orientations
∑
m=S,L
f(Ti|Si = m,Mo)× p(Si = m |Mo)
where Ti is a sub-tree of root wi in one of the sub-bands,Mo represents the model parameters for a particular ori-entation and Si is the hidden state of wi.Each pixel is then affected, with the Maximum of Likeli-hood method, to the more similar texture. This yields to a“raw” segmentation at each level.
To improve this first segmentation, the segmentations atdifferent resolutions are subsequently merged. This merg-
ing is achieved by maximizing the likelihood of a pixel tobelong to a class, taking into account both its value inthe raw segmentation and a context vector. This contextvector can correspond to the value of the father and of theneighbors of the father (Choi and Baraniuk, 2001), of theneighbors of the son, or a combination of several contextvectors (Fan and Xia, 2001) [Fig.5].
3.3. Design of classifiers
The HMT parameters are calculated through a learn-ing set of pure class images, for each combination of themethod hyper-parameters. Indeed, the HMT model itselfcan be parameterized : one has to choose the wavelet base(and possibly its order), the color image component onwhich the WT is applied and the number of resolutionlevels on which the analysis is focused. These four hyper-parameters can greatly affect the HMT model results.Each set of hyper-parameters allows us to generate a dif-ferent segmentation.
Each set of hyper-parameters corresponds to a classifier,and the best of them have to be selected thanks to anevaluation of their performances.Rather than comparing them for all classes together,we transformed the multiclass problem into a set of bi-
6

Figure 5. Drawing from (Fan and Xia, 2001). The context vectors V used: a) neighbors of the son (b) neighbors of the father and the fathersvalue (c) neighbors of the father, sons and fathers value.
nary ones by decomposing it in one-against-one problems(Hastie and Tibshirani, 1998).
To evaluate the classifiers, each one is trained to becomea discriminative specialist (a dichotomizer) in two classes.For this purpose, we employed a learning base containingimages with two classes solely on each image.HMT segmentation is then performed by suggesting exclu-sively these two classes as a possible result of segmentation.The classifier which has been kept to distinguish the twoclasses is the one that maximizes the proportion of wellsegmented pixels on the two classes compared to the man-ual drawn ”ground truth”. This procedure is performedfor each pair of classes.The proportion of well segmented pixels, for each class, rep-resents the confidence attached to the classifier thereafter.
There is so N = n ∗ (n − 1)/2 binary classifiers (wheren is the number of classes). Each classifier uses parameterslearnt by the HMT model for one set of hyper-parameters.
3.4. Merging of each classifier segmentation
To merge the outputs of the N classifiers, many com-bination rules can be applied to couple the estimates ofeach binary classifier in order to obtain class membershipestimates for the multi-class problem.The most commonly used combination rule is probablythe Majority Vote (Friedman, 1996). Class membershipestimates are computed according to the formula:
p(ω = ωi|x) =1N
N∑
j=0,j 6=i
I(Ψωi,ωj |x) × Cf(ωi, Ψωi,ωj )
where Ψωi,ωj |x is the probability of segmentation re-sult (class ωi or ωj) with classifier Ψωi,ωj at pixelx. I(Ψωi,ωj |x)=1 if Ψωi,ωj |x = ωi and 0 otherwise.Cf(ωi, Ψωi,ωj ) is the confidence in Ψωi,ωj for class ωi. Theresulting label is computed as argmax(p(ω|x)).One can also use combination rule based on Error Correct-ing Output Codes (ECOC ) (Dietterich and Bakiri, 1995).Each class is represented by its own output code in theoutput vector space. The chosen class is the one that isthe closest to the 0/1 prediction vector obtained from theclassifiers.
The Loss Based Decoding (LBD) (Allwein et al., 2000) isan improvement of ECOC because it allows us to use di-rectly the outputs of the binary classifiers instead of theirhard 0/1 predictions.The comparison of segmentation results with these combi-nation rules is presented below.
To summarize, the method involves two phases. First,large areas of background are discarded at low resolution.Then, the remaining parts of the image are processed asfollows (cf. figure 6):– Parameters and hyperparameters of the HMT method
have been learnt for each pair of the K classes, forminga classifier for the classes ωi and ωj .
– For each pair of the K classes, the image is segmented,with the HMT method.
– The resulting segmentations are then merged, taking intoaccount the neighborhood of each pixel and the confi-dence in each one of the classifier.
4. Experimentation and Results
The tests have been conducted with several waveletbases having various regularity, vanishing moments, sup-port, and symmetry (Haar, Battle Lemarie, Daubechiesand bi-orthogonal Splines wavelets were used). Two or-ders of wavelets (a low one and a high one) are used whenpossible and one to five levels of HMT subsampling arecomputed (resulting in four levels of segmentation).WT is computed on the components of several color spaces([RGB], normalized [RGB], Excess [RGB] – it is twice redminus green and blue for red component and the sameapplies for green and blue component–, [HSI], [AC1C2]–Garbay’s space– [wbrgby] –Ballard’s space–, [YCh1Ch2]–Caron’s space– [I1I2I3] –Ohta’s space– and PCA com-ponents computed from original [RGB]). Scheunders rep-resentation is also used. Scheunders (Scheunders, 2003)proposed a method to construct a wavelet representationcombining the color plans by computing a coefficient, basedon the three values, reflecting their relative importance.These parameters constitute a total of 576 different seg-mentations.
7

Figure 6. Global schema of the HMT based segmentation method.
HMT training set consists of five 512x512 images of eachclass. Classifiers are selected on another training set of four1024x1024 images per pair of classes (i.e. 40 images).The training set has been improved several times, to takeinto account some variability within the same class, untilits images were well segmented by the process.The resulting hyper-parameters (wavelet base and order,colour component and number of decimation levels takeninto account) obtained after selection of the best ones foreach pair of classes are summarized in Table 1. Confidencein each classifier for each compartment is indicated too.
To select the best combination rule, a third image set isemployed. This testing set is composed of fifteen 2048x2048images containing all classes in various proportion.
Several combination rules have been tested to merge thebinary classifiers : Error Correcting Output Codes, LossBased Decoding, but we found that they don’t provide anysignificant improvement over Majority Vote (cf. Table 2).
Compared to the reference manual segmentation, 60.05to 89.67 percent of well labeled pixels are obtained to-gether with correctly localized borders [Fig.7] over the testset using hyper-parameters of table 1 and majority vote.Average is 71.50%. The segmentation result has been im-proved with further spatial regularization to ban tiny area.The main default is that in some cases, epithelium maybe confused with cellular and inflammatory stroma (theclosest compartments regarding the texture).
Once the parameters and hyper-parameters of the
8
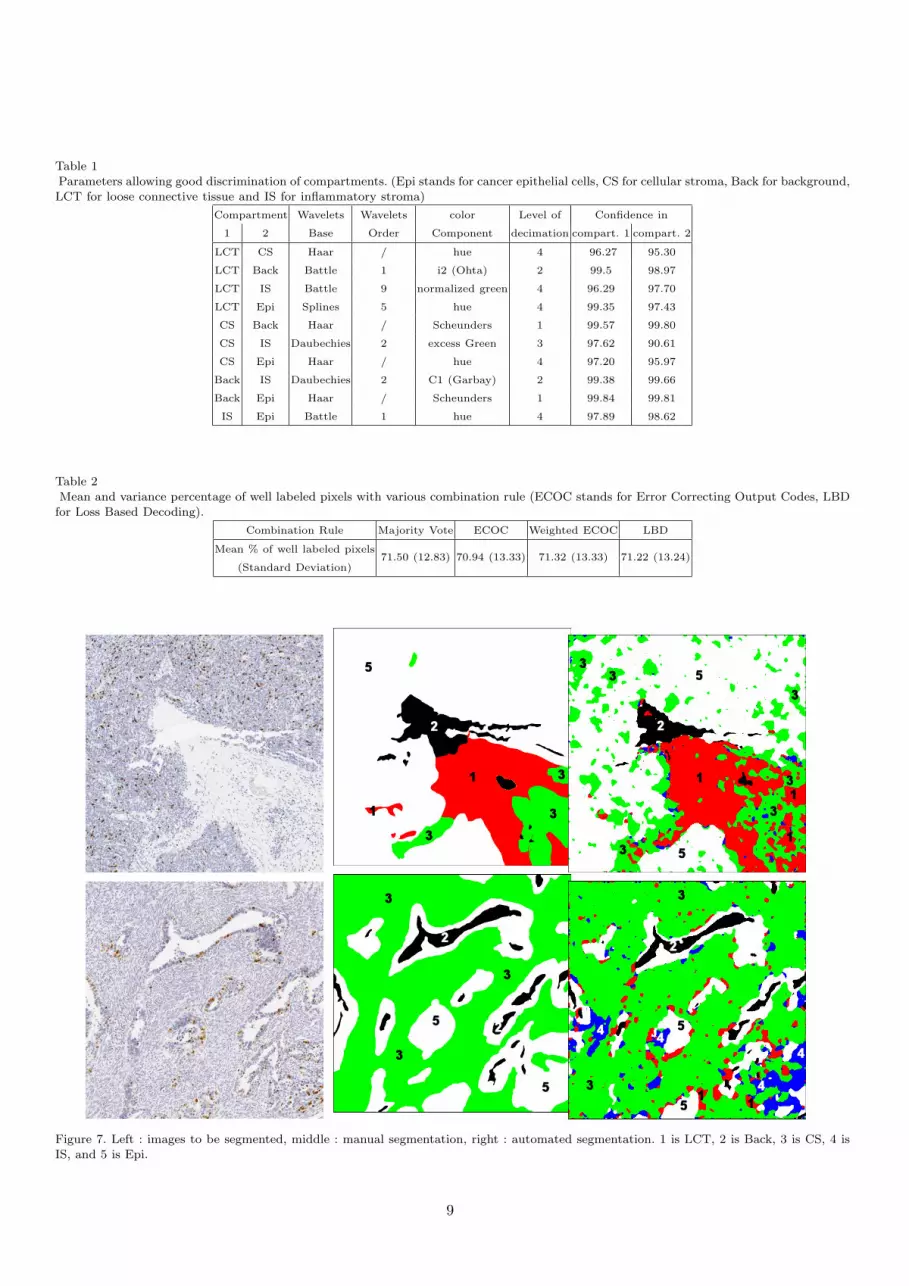
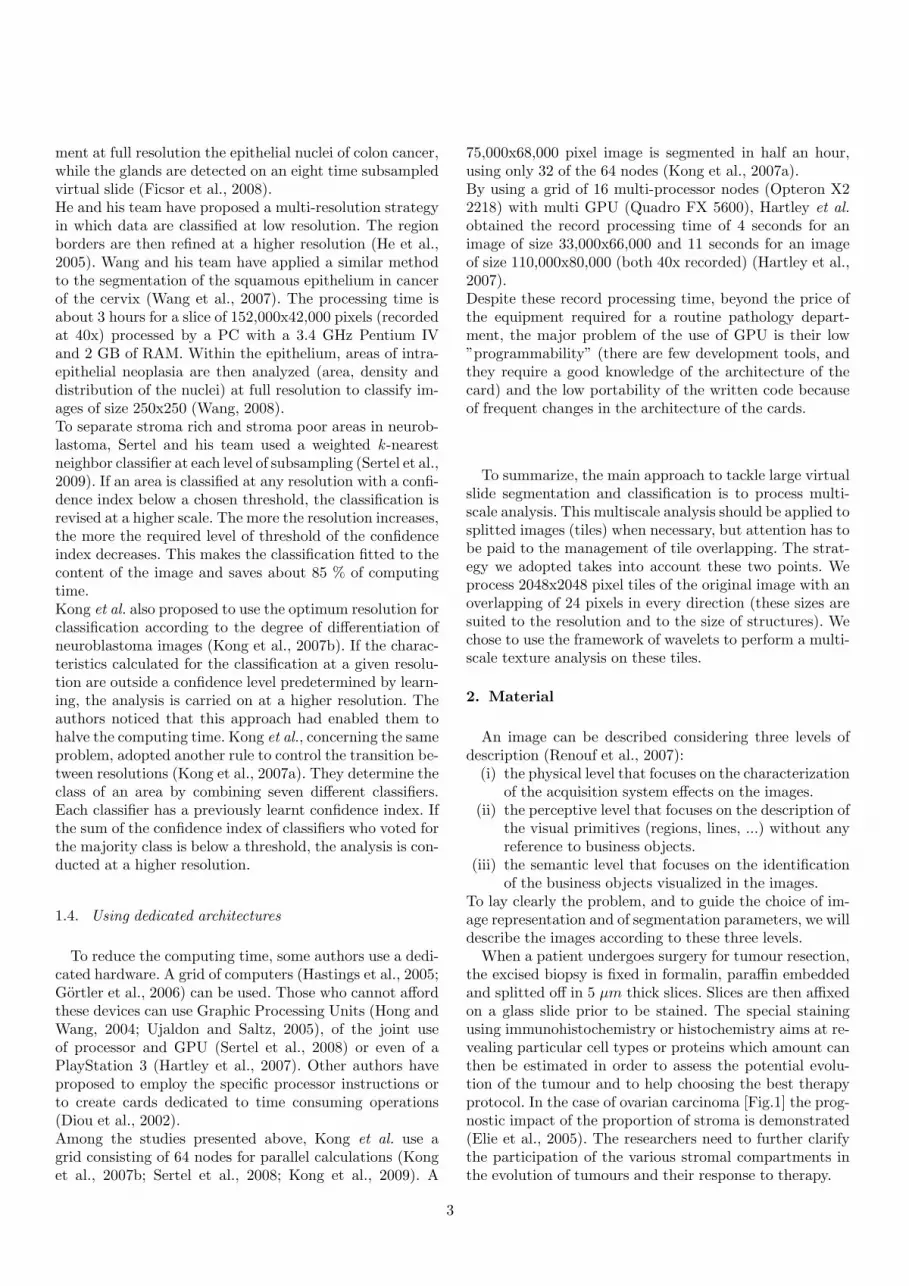
Table 1Parameters allowing good discrimination of compartments. (Epi stands for cancer epithelial cells, CS for cellular stroma, Back for background,LCT for loose connective tissue and IS for inflammatory stroma)
Compartment Wavelets Wavelets color Level of Confidence in
1 2 Base Order Component decimation compart. 1 compart. 2
LCT CS Haar / hue 4 96.27 95.30
LCT Back Battle 1 i2 (Ohta) 2 99.5 98.97
LCT IS Battle 9 normalized green 4 96.29 97.70
LCT Epi Splines 5 hue 4 99.35 97.43
CS Back Haar / Scheunders 1 99.57 99.80
CS IS Daubechies 2 excess Green 3 97.62 90.61
CS Epi Haar / hue 4 97.20 95.97
Back IS Daubechies 2 C1 (Garbay) 2 99.38 99.66
Back Epi Haar / Scheunders 1 99.84 99.81
IS Epi Battle 1 hue 4 97.89 98.62
Table 2Mean and variance percentage of well labeled pixels with various combination rule (ECOC stands for Error Correcting Output Codes, LBDfor Loss Based Decoding).
Combination Rule Majority Vote ECOC Weighted ECOC LBD
Mean % of well labeled pixels71.50 (12.83) 70.94 (13.33) 71.32 (13.33) 71.22 (13.24)
(Standard Deviation)
Figure 7. Left : images to be segmented, middle : manual segmentation, right : automated segmentation. 1 is LCT, 2 is Back, 3 is CS, 4 isIS, and 5 is Epi.
9

method were fixed, tests have then been conducted over 21images of the whole histological slide [Fig.8]. The size ofthese images ranges from 38, 000x40, 000 to 78, 000x48, 000pixels. Since drawing manually a ground truth over thewhole histological slide is intractable, we chose an othermethod to validate our results: the stereology (Elias andHyde, 1983, e.g.). Experts classify the slide exclusively be-low points regularly spaced. The step between two pointsis related to the size of structures and is calculated insuch a way that the estimated proportions are statisticallyequivalent to the real proportions. Results of automaticsegmentation are compared to this ground truth. First,overall proportions of each compartment of the groundtruth and of the calculated image are compared. Thenthe class of each stereology point of the ground truth iscompared to the value of class at the same location on theprocessed image. The study of results of the automaticsegmentation is still going on, but early results seem to bewell correlated to the ground truth identified by expertsthanks to the stereology test point grid. The results rangefrom 1.14% to 27.72% with an average difference of 8.84%between expert stromal proportion evaluation and the au-tomatic one. These results can currently not be comparedto other method results because it is the first time the seg-mentation of the various types of stromal compartmentson ovarian carcinoma virtual slides is tested.
The tests were conducted on a single processor of a 3GHzXeon quadriprocessor PC. Processing time is from two min-utes to one hour per 2048x2048 image, depending on thehomogeneity of the image (an image containing only back-ground will be classified quickly while an image with manydifferent regions and singularities will be classified moreslowly). Mean time is ten minutes. That is about fifty hoursfor the processing of a whole 65, 000x40, 000 Virtual Slide,depending on the amount of background.
Conclusion and Prospects
In the present study, we have investigated a strategy tosegment various stromal compartments on ovarian carci-noma virtual slides. No work had ever been published onthis topic. The method we proposed is general and couldapply to other types of images showing different textures.We suggested to use a wavelet-domain hidden Markov treemodel to get classifiers. Selection among these classifiers isdone with a one against one approach. Classifiers outputscombination is performed thanks to a Majority Vote rule.Promising results are obtained on some selected test im-ages and should be confirmed on a larger test set. The ratioof well classified pixels obtained must be appraised takinginto account the fact that the transitions between regionsof stroma are not clearcut and sometimes difficult to iden-tify even by an expert. Some mislabeling of the epitheliummay happen, and the processing time (about fifty hours fora 65, 000x40, 000 image) due to Expectation Maximization
algorithm’s convergence (from less than 10 to 2000 itera-tions until convergence, depending on the homogeneity ofthe processed image) is prohibitive for any clinical use.To answer the problem of cancer cells foci detection, weplan to use, first, previously described methods (Elie et al.,2003) to locate epithelium at a low resolution and to elim-inate it from the higher resolution analysis. We could alsoemploy this low resolution segmentation as an a priori forthe higher resolution segmentation.To cope with the processing time, we have to optimize ourcode and consider replacing EM part with a faster converg-ing method. We plan also to study other segmentation ap-proaches including image patch exemplar based methods.Finally, our algorithm (or parts of it) could be implementedin specific hardware for parallelisation.
Acknowledgments
This work is funded by a BDI grant cofinanced by theCNRS and the Regional Council of Lower Normandy.
References
Allwein, E. L., Schapire, R. E., Singer, Y., 2000. Reduc-ing multiclass to binary: A unifying approach for mar-gin classifiers. Journal of Machine Learning Research 1,113–141.
Chantrain, C. F., Declerck, Y. A., Groshen, S., Mcnamara,G., February 2003. Computerized quantification of tis-sue vascularization using high-resolution slide scanningof whole tumor sections. The Journal of Histochemistry& Cytochemistry 51 (2), 151–158.
Choi, H., Baraniuk, R., 2001. Multiscale image segmenta-tion using wavelet-domain hidden Markov models. IEEETransactions on Image Processing 10 (9), 1309–1321.
Crouse, M. S., Nowak, R., Baraniuk, R., 1998. Wavelet-based statistical signal processing using hidden Markovmodels. IEEE Transactions on Signal Processing 46, 886–902.
Deng, Y., Manjunath, b., 2001. Unsupervised segmenta-tion of color-texture regions in images and video. IEEETransactions on Pattern Analysis and Machine Intelli-gence 23 (8), 800–810.
Dietterich, T. G., Bakiri, G., 1995. Solving multiclass learn-ing problems via error-correcting output codes. Journalof Artificial Intelligence Research 2, 263–286.
Diou, C., Torres, L., Robert, M., Sassatelli, G., Juillet 2002.Intgration d’une architecture rcursive sur silicium pourla transforme en ondelettes 2D. Traitement du Signal19 (2), 101–117.
Elias, H., Hyde, D. M., 1983. A guide to practical stereology.Karger Continuing Education Series, 305 pages.
Elie, N., Labiche, A., Michels, J.-J., Herlin, P., June 2005.Control of low-resolution scanning of ovarian tumor stro-
10

Figure 8. Automated segmentation of two whole slides
mal compartment. Image Analysis and Stereology 24,85–93.
Elie, N., Plancoulaine, B., Signolle, J.-P., Herlin, P.,November 2003. A simple way of quantifying immunos-tained cell nuclei on the whole histologic section. Cytom-etry 56A, 37–45.
Fan, G., Xia, X.-G., 2001. A joint multicontext and multi-scale approach to bayesian segmentation. IEEE Transac-tions on Geoscience and Remote Sensing 39 (12), 2680–2688.
Ficsor, L., Varga, V. S., Tagscherer, A., Tulassay, Z., Mol-nar, B., March 2008. Automated classification of inflam-mation in colon histological sections based on digital mi-croscopy and advanced image analysis. Cytometry PartA 73A (3), 230–237.
Friedman, J. H., 1996. Another approach to polychotomousclassification. Tech. rep., Department of Statistics, Stan-ford University.
Gortler, J., Berghoff, M., Kayser, G., Kayser, K., August2006. Grid technology in tissue-based diagnosis: Funda-mentals and potential developments. Diagnostic Pathol-ogy 1 (1), 23.
Gundersen, H. J., Bendtsen, T. F., Korbo, L., Marcussen,N., Nyengaard, J. R., Pakkenberg, B., Sørensen, F. B.,Vesterby, A., 1988. Some new, simple and efficient stere-ological methods and their use in pathological researchand diagnosis. Acta Pathologica, Microbiologica et Im-munologica Scandinavica 96 (5), 379–394.
Hamilton, P. W., Bartels, P. H., Thompson, D., Anderson,N. H., Montironi, R., Sloan, J. M., May 1997. Automatedlocation of dysplastic fields in colorectal histology usingimage texture analysis. The Journal of Pathology 182 (1),68–75.
Hartley, T. D., Sertel, O., Khan, M., Catalyurek, U. V.,Saltz, J. H., Gurcan, M. N., 2007. Neuroblastoma stromaclassification on the Sony PlayStation 3. In: APIII07, TheAdvancing Practice, Instruction, and Innovation throughInformatics Conference on Anatomic Pathology Infor-matics and Imaging Support for Translational Medicine.Pittsburgh, United States.
Hastie, T., Tibshirani, R., 1998. Classification by pairwisecoupling. Annals of statistics 26 (2), 451–471.
Hastings, S., Oster, S., Langella, S., Kurc, T. M., Pan, T.,Catalyurek, U. V., Saltz, J. H., May 2005. A grid-based
11

image archival and analysis system. Journal of the Amer-ican Medical Informatics Association 12 (3), 286–295.
He, Y., Zhang, B., Li, J., 2005. A new multiresolution clas-sification model based on partitioning of feature space.In: IEEE International Conference on Granular Comput-ing. Vol. 3. Beijing, China, pp. 462–467.
Hong, J. Y., Wang, M. D., 2004. High speed processing ofbiomedical images using programmable GPU. In: ICIP04: Proceedings of the International Conference on ImageProcessing. Singapore, pp. 2455–2458.
Kong, J., Sertel, O., Shimada, H., Boyer, K. L., Saltz,J. H., Gurcan, M. N., 2007a. Computer-aided grading ofneuroblastic differentiation: Multi-resolution and multi-classifier approach. In: ICIP07, International Conferenceon Image Processing. Vol. 5. San Antonio, Texas, USA,pp. 525–528.
Kong, J., Sertel, O., Shimada, H., Boyer, K. L., Saltz, J. H.,Gurcan, M. N., 2009. Computer-aided evaluation of neu-roblastoma on whole-slide histology images: Classifyinggrade of neuroblastic differentiation. Pattern Recogni-tion 42 (6), 1080–1092, digital Image Processing and Pat-tern Recognition Techniques for the Detection of Cancer.
Kong, J., Shimada, H., Boyer, K. L., Saltz, J. H., Gurcan,M. N., 2007b. A new multi-resolution analysis frameworkfor classifying grade of neuroblastic differentiation. Tech.rep., Ohio State University.
Lecellier, F., Jehan-Besson, S., Fadili, J., Aubert, G.,Revenu, M., Saloux, E., 2006. Region-based active con-tour with noise and shape priors. In: ICIP06, Proceed-ings of the International Conference on Image Process-ing. Atlanta, Georgia, USA, pp. 1649–1652.
Mallat, S., 1999. A wavelet tour of signal processing. Aca-demic Press, 620 pages.
Mesker, W. E., Doekhie, F. S., Vrolijk, H., Keyzer, R.,Sloos, W. C. R., Morreau, H., O’Kelly, P. S., de Bock,G. H., Tollenaar, R. A. E. M., Tanke, H. J., 2003. Au-tomated analysis of multiple sections for the detectionof occult cells in lymph nodes. Clinical Cancer Research9 (13), 4826–4834.
Mete, M., Xu, X., Fan, C.-Y., Shafirstein, G., 2007. Au-tomatic delineation of malignancy in histopathologicalhead and neck slides. In: MCBBS07, Proceedings ofthe Fourth Annual MidSouth Computational Biologyand Bioinformatics Society : Conference. ComputationalFrontiers in Biomedicine. Vol. 8, Supplment 7 of BMCBioinformatics. New Orleans, United States, abstractS17.
Mosaliganti, K., Pan, T., Ridgway, R., Sharp, R., Cooper,L., Gulacy, A., Sharma, A., Irfanoglu, O., Machiraju,R., Kurc, T., de Bruin, A., Wenzel, P., Leone, G., Saltz,J. H., Huang, K., December 2008. An imaging workflowfor characterizing phenotypical change in large histolog-ical mouse model datasets. Journal of Biomedical Infor-matics 41 (6), 863–873.
Olson, A. H., 2006. Image analysis using the AperioScanScope. Tech. rep., Aprio Technologies.
Renouf, A., Clouard, R., Revenu, M., 2007. How to formu-
late image processing applications ? In: ICCVS07, Pro-ceedings of the International Conference on ComputerVision Systems. Bielefeld, Germany, p. 10.
Rojo, M. G., Garca, G. B., Mateos, C. P., Garca, J. G.,Vicente, M. C., October 2006. Critical comparison of 31commercially available digital slide systems in pathology.International Journal of Surgical Pathology 14 (4), 285–205.
Scheunders, P., 2003. An orthogonal wavelet representa-tion of multivalued images. IEEE Transactions on ImageProcessing 12 (6), 718–725.
Sertel, O., Kong, J., Lozanski, G., Shana’ah, A.,Catalyurek, U. V., Saltz, J. H., Gurcan, M. N., 2008.Texture classification using nonlinear color quantiza-tion: Application to histopathological image analysis. In:ICASSP08, Procedings of the IEEE International Con-ference on Acoustics, Speech and Signal Processing. LasVegas, United States, pp. 597–600.
Sertel, O., Kong, J., Shimada, H., Catalyurek, U. V., Saltz,J. H., Gurcan, M. N., 2009. Computer-aided prognosisof neuroblastoma on whole-slide images: Classification ofstromal development. Pattern Recognition 42 (6), 1093–1103, digital Image Processing and Pattern RecognitionTechniques for the Detection of Cancer.
Signolle, N., Plancoulaine, B., Herlin, P., Revenu, M., 2008.Texture-based multiscale segmentation: Application tostromal compartment characterization on ovarian carci-noma virtual slides. In: 3rd International Conference onImage and Signal Processing. Vol. 5099 of Lecture Notesin Computer Science. Springer, pp. 173–182.
Tran, K., Elie, N., Plancoulaine, B., Herlin, P., Coster, M.,2003. An original approach for quantification of bloodvessels on the whole tumour section. Analytical CellularPathology 25 (2), 63–75.
Ujaldon, M., Saltz, J. H., 2005. The GPU on irregular com-puting: Performance issues and contributions. In: CAD-CG05, Proceedings of the Ninth International Confer-ence on Computer Aided Design and Computer Graph-ics. Hong Kong, pp. 442–450.
Wang, Y., April 2008. Computer assisted diagnosis of cer-vical intraepithelial neoplasia (cin) using histological vir-tual slides. Ph.D. thesis, School of Electronics, ElectricalEngineering and Computer Science, Queen’s University,Belfast, United Kingdom.
Wang, Y., Turner, R., Crookes, D., Diamond, J., Hamilton,P., 2007. Investigation of methodologies for the segmen-tation of squamous epithelium from cervical histologicalvirtual slides. In: IMVIP07, Proceedings of the 7th Inter-national Machine Vision and Image Processing Confer-ence. Maynooth, Ireland, pp. 83–90.
Xie, X., 2008. A review of recent advances in surface defectdetection using texture analysis techniques. ElectronicLetters on Computer Vision and Image Analysis 7 (3),1–22.
12


