Embed Size (px)
Citation preview

December 2010 Public Document
MyMedia ICT-2008-215006 Page | 1
ICT MyMedia Project
2008-215006
Deliverable 5.3
Future IPTV Services Field Trial Report
Public Document

December 2010 Public Document
MyMedia ICT-2008-215006 Page | 2
Contents 1 Executive Summary ......................................................................................................................... 6
2 Introduction .................................................................................................................................... 8
3 Glossary ......................................................................................................................................... 11
4 Target Environment ....................................................................................................................... 13
5 Motivation for the Field Trial ......................................................................................................... 14
6 Research Strategy and Design ........................................................................................................ 16
6.1 Research Questions ................................................................................................................ 16
6.2 User Sampling ........................................................................................................................ 16
6.3 Data Collection Methods ........................................................................................................ 17
6.4 Data Analysis Techniques ....................................................................................................... 17
7 Field Trial Development ................................................................................................................. 19
7.1 Content Catalogue ................................................................................................................. 19
7.2 User Feedback ....................................................................................................................... 21
7.3 User Interface ........................................................................................................................ 21
7.4 System Architecture ............................................................................................................... 24
7.5 Recommender Algorithms ...................................................................................................... 27
7.6 Filters ..................................................................................................................................... 27
7.7 Metadata Enrichment ............................................................................................................ 28
8 Field Trial Execution ....................................................................................................................... 29
8.1 Evaluation System .................................................................................................................. 29
8.2 Field Trial Execution ............................................................................................................... 30
8.3 Field Trial Results ................................................................................................................... 30
9 Conclusions ................................................................................................................................... 41
10 References ..................................................................................................................................... 44

December 2010 Public Document
MyMedia ICT-2008-215006 Page | 3
11 Acknowledgements ....................................................................................................................... 44

December 2010 Public Document
MyMedia ICT-2008-215006 Page | 4
Project acronym: MyMedia
Project full title: Dynamic Personalization of Multimedia
Work Package: 5
Document title: Deliverable D5.3 Future IPTV Services Field Trial
Report
Version: 1.1
Official delivery date: 31 December 2010
Actual publication date: 10 December 2010
Type of document: Report
Nature: Public
Authors: Paul Marrow, BT
Tim Stevens, BT
Ian Kegel, BT
Joshan Meenowa, BT
Craig McCahill, BT
Approved by:
Hakan Soncu, EMIC
Lydia Meesters, TU/e

December 2010 Public Document
MyMedia ICT-2008-215006 Page | 5
Version Date Sections Affected
0.1
1.0
6 December 2010
10 December 2010
All: initial draft for review.
All: revision following review.
1.1 18 March 2011 Minor corrections following review report.

December 2010 Public Document
MyMedia ICT-2008-215006 Page | 6
1 Executive Summary BT Vision is BT’s TV On Demand service in the UK. It offers consumers video content for rental (Video-
on-Demand, VoD), which is then delivered to their TV via BT’s Broadband network and a Set-Top-Box
(STB). Prior to the start of the MyMedia project BT had researched the use of recommender systems
with BT Vision for stimulating customer uptake, and thus increase in revenue of Video-on-Demand.
Positive results from previous trials led to BT’s involvement in the MyMedia collaborative project.
The BT field trial within the MyMedia project has tested the MyMedia recommender system on BT
Vision. It is thus distinct from the other field trials carried out in the MyMedia project in delivering
recommendations to TV rather than to web browsers on a PC. In comparison with one of the other sets
of trials, executed by Microgenesis in Spain, the BT field trial has been carried out on a commercial
service, but on a much larger scale than Microgenesis’ study, involving up to 100000 customers.
This deliverable reports on the design of the field trial, which compares two groups of customers, 50000
receiving MyMedia recommendations and 50000 receiving recommendations provided by the editorial
(marketing) team of BT Vision. The BT development and implementation of the MyMedia system
required extension of the MyMedia recommendation framework in order to integrate it into the live BT
Vision service. Because of this a number of changes were required before the field trial could begin in
August 2010.
Data about user purchasing behaviour was recorded automatically by the BT Vision management
system, for billing and royalties payment purposes, and it involved no recording of personal details since
triallists were distinguished by STB ID only. Based on this information it was possible to compare the
VoD purchasing activity in the two groups over two months of the trial period.
Overall summaries of the two groups activity did not show much difference: the mean number of items
purchased was similar, and the distribution of purchasing activity was very negatively skewed, with
many triallists purchasing no items in one month, and a few purchasing very many. In fact it was
discovered that only a small number of triallists had viewed the BT Vision recommendation page during
the trial (<1% in each group.) The visibility of the recommendation page was beyond our control.
However it was discovered that of those triallists that did view the recommendation page, irrespective
of trial group, and did click-through to particular items, about 30% followed up with purchasing and
viewing activity. So the MyMedia recommender algorithm, drawing upon only very sparse implicit
feedback, could compete effectively with the professionals in BT Vision who had a much wider view of
the market and customer response upon which to base their recommendations.
Further analysis looked at the potential for the MyMedia recommender algorithm to predict user
preferences even when triallists had not seen those recommendations, in comparison to the editorial
group. A hit-rate based evaluation metric was used. The results suggested either that there was little

December 2010 Public Document
MyMedia ICT-2008-215006 Page | 7
difference between the two types of recommendation or that in some cases editorial recommendations
performed better. This suggested that editorial recommendations do have some advantage in a
situation where most users do not see the output of a recommender algorithm, because the
recommendations suggested by the editorial team are more likely to integrate well with other forms of
marketing.
This trial demonstrated that it was possible to extend a general-purpose recommender framework to
support a very large scale trial on a commercial IPTV service. The trial did not show a clear benefit to the
service through increasing VoD sales by recommendation, but the reasons for this were made clear in
the discussion of the user interface: only implicit feedback was possible, and that only sparse. Despite
this for those triallists who did view recommendations and did click through to view items, the MyMedia
recommender compared well the editorial recommendations.
Overall, the involvement of BT in this trial and the project demonstrated the importance of
recommendation in a commercial IPTV context, providing it is delivered and managed correctly in
relation to other forms of marketing. These insights were taken on board by the BT Vision team for
future services.

December 2010 Public Document
MyMedia ICT-2008-215006 Page | 8
2 Introduction The BT MyMedia field trial was distinctive from the others in the MyMedia project in that it was
targeted towards customers of the BT Vision IPTV service, delivered by broadband and STB to TV in the
UK. It was also distinctive in taking place in the context of a large-scale commercial service, which had
been running (subject to changes) for some time prior to the MyMedia project started, and will continue
running after the project finishes.
Because the BT MyMedia field trial took place in a commercial context, its motivation was centered on
understanding the commercial benefits of recommender systems in stimulating purchasing activity of
VoD (Video-on-Demand) by BT Vision customers. To enable an efficient comparison a representative
group of BT Vision customers receiving recommendations from the MyMedia system was compared
with a group receiving recommendations from the editorial (marketing) team within BT Vision.
The main research question was whether recommendations generated by algorithms (in this case one
from the MyMedia recommender algorithm library) could stimulate greater purchasing activity of BT
Vision VoD than recommendations generated by the editorial team. Initially it was also proposed to look
at the user experience of customers receiving the MyMedia recommendation service, but this turned
out to be not possible because of the difficulty of maintaining a group of volunteers for a fixed period of
time when changes to the business requirements for the integration and deployment of the trial meant
that its start had to be delayed. Two later research questions arose after the trial had been planned:
how did MyMedia recommendation of individual VoD items compare with subscription (sVoD) packages
as a marketing incentive, and how well did MyMedia recommendations compare with editorial
recommendations as predictors of user preferences even when viewers had not seen the recommender
pages.
The trials were closed, with users selected by pseudo-random sampling from among the BT Vision
customer base. No personal identification of users was required, because they could be identified via
STB ID. Because BT does not produce its own digital content, but purchases rights to distribute it from
content providers, data about BT Vision customers purchasing of VoD is automatically logged for billing
and royalties payment purposes. These logs could be used in collecting data for analysis. It was originally
planned to use a variety of statistical techniques to compare the groups in the field trials, but not all the
originally planned techniques were used, due to the nature of the data gathered and of the comparisons
that were feasible to make. In particular, an evaluation metric based on hit-rate was introduced late in
the field trial because it had previously proved useful with similar datasets in evaluating recommender
performance.
The BT MyMedia field trial was developed in the context of a live and changing IPTV service. Customers
can search among a large catalogue of content items and choose items of VoD to watch. The nature of
the BT Vision user interface meant that no explicit feedback was possible by users during the MyMedia
field trial, but implicit feedback could be detected in that triallists had to pay for their choices and this
suggested positive implicit feedback. The user interface presented images representing five

December 2010 Public Document
MyMedia ICT-2008-215006 Page | 9
recommended items. This did not represent the only user interface on BT Vision, which offers a variety
of different means of interacting with the service.
The BT MyMedia field trial required a system architecture that integrated the MyMedia software
framework with the existing BT Vision system. This was done via a series of data inputs, that provided
information about the BT Vision content catalogue and changes to it, to identify what could be
recommended, and initially also inputs in terms of customer identity (as identified by STB ID) to define
where the recommendations would go.
The application of a recommender algorithm selected from the MyMedia recommender algorithm
library, or the choice of a number of items to recommend from the editorial team, enabled a set of
recommendations associated with triallists to be exported and thus distributed to the recommender
user interface on the triallist’s BT Vision service. Pre-filters were applied to the content to be
recommended to ensure that only appropriate content was recommended.
Prior to the BT MyMedia field trial a sample of BT data was supplied to Novay in order to evaluate
whether Novay’s keyword extraction (KWE) metadata enrichment modules could improve the
performance of recommender algorithms when applied in BT’s field trial. The conclusion of this
evaluation was that the type of metadata supplied was not appropriate for the keyword extraction
techniques developed, in particular the textual synopses were too short and not sufficiently diverse, and
so metadata enrichment was not used.
For the purposes of data analysis, a further data import and processing task was required: data had to
be imported from an Oracle server that recorded customers’ viewing behaviour, and then reformatted
to allow data analysis with the software tools available.
In the context of the MyMedia recommender system evaluation framework (chapter 3 of MyMedia D1.5
[1] and Knijnenburg et al. (2010) [2]) the BT MyMedia field trial focused mainly on value choices made
about recommended items, due to its commercial context, but also investigates objective features of
recommender algorithms in evaluating the accuracy of recommendation via a hit-rate metric.
Although the BT MyMedia field trial was originally planned to start in January 2010, its start was delayed
until August 2010 due to the need to respond to business requirements and changes. Despite this, due
to its very large scale, a large amount of data was gathered upon which analysis could be carried out and
results obtained.
This deliverable goes on to report on the results derived from the field trial, and carry out analysis on
them where feasible. Although overall analysis showed little difference between the behaviour of the
different trial groups, when the behaviour of those triallists who had viewed the recommendation page
were considered, about 30% in each group followed this up by purchasing and viewing an item. This was
a very important finding for the field trial and the MyMedia project. Using only sparse implicit feedback
the MyMedia recommender algorithm could compete with professional recommendations, suggesting
that it could perform much better under improved conditions, with more frequent and ideally explicit
feedback.

December 2010 Public Document
MyMedia ICT-2008-215006 Page | 10
The BT MyMedia field trial showed that it was possible to deploy the MyMedia recommendation
framework on a live commercial IPTV service, different from the other field trials, and on a very large
scale, without either disrupting the existing service or intruding on customers’ privacy. Although it did
not show that the MyMedia recommendation algorithm used stimulated greater customer activity, this
was clearly because of the way in which the recommendations were accessible in the BT Vision service.
It did show that the MyMedia recommendation algorithm was comparable with professional
recommendations in customer uptake, and in the context of sparse implicit feedback this suggested that
the MyMedia system could perform better under alternative circumstances. Insights from the project
have been used to inform future versions of the service. The past and present potential of
recommendation as a means of anticipating user preferences and thus generating customer activity has
stimulated business decisions within the company that will see recommendation further used in the
future.

December 2010 Public Document
MyMedia ICT-2008-215006 Page | 11
3 Glossary Term or Phrase Definition
BPRMF Bayesian Personalised Ranking Matrix Factorisation: recommender algorithm
used in the BT MyMedia field trial, selected from the MyMedia recommender
algorithm library.
BT Broadband BT’s brandname for its consumer ISP service, which links BT’s UK IP network
to consumers.
BT Vision BT’s IPTV service in the UK upon which BT’s MyMedia field trial is based.
Catalogue The set of items on which the recommender makes predictions for the user.
Editorial Recommendations made by the Editorial (marketing) team at BT Vision.
Engine The recommender system component responsible for making predictions for
the user. An Engine implements the algorithms to consume user preference
information and produce predictions.
Feedback A specific user behaviour associated with a measurement of interest, such as
a rating, to a specific catalogue item.
Implicit Data Data retrieved by monitoring the user behaviour only.
IP Internet Prococol: standard for digital networks
IPTV Internet Protocol Television: TV services provided by connection to an IP
network.
ISP Internet Service Provider: company providing services via an IP network.
Metadata Enrichment The process of augmenting existing metadata in order to make it more useful
or meaningful.
Prediction The assignment of value to a content item, predicting the expected utility of
the item for a user.
Preference Model An abstract model of the user preference information.
Profile A grouping of information on a user or set of users.
pVoD Preview VoD: BT-specific acronym: Video-on-Demand content previewing an
item for purchase. Short, and free-of-charge.

December 2010 Public Document
MyMedia ICT-2008-215006 Page | 12
Term or Phrase Definition
Rating 1. A measurement of user interest, typically applied to a catalogue item.
2. In relation to content in BT field trial: legal definition of the age at
which an asset can be viewed (British Board of Film Censors
categorisation.)
Recommender A system for finding personalized content for a user.
STB Set Top Box (or Set-Top-Box): device providing hardware to process digitally
streamed content and deliver to TV. Provided with BT Vision service.
sVoD Subscription VoD: BT-specific acronym: Video-on-Demand content available
as part of a subscription package
tVoD Transaction VoD: BT-specific acronym: Video-on-Demand content available as
a result of an individual purchasing decision from the BT Vision catalogue
User Behaviour User interaction with the system, which is relevant for consideration in finding
personalized content.
VoD Video-on-Demand: video content items that can be delivered (usually by
streaming over an IP network) to a viewer when required

December 2010 Public Document
MyMedia ICT-2008-215006 Page | 13
4 Target Environment The target environment for the trial is the recommendation of items delivered by IP over broadband to
consumers’ TV sets via a set-top box (STB). The BT Vision service requires the customer’s broadband
line to support a certain minimum bandwidth. The content-streaming part of the service reserves part
of the line’s available bandwidth when streaming is in progress. Content is streamed from the network
through the BT Home Hub to the BT Vision box. The BT Vision platform is based on Microsoft’s
Mediaroom product.
Customers interact with BT Vision via a conventional multi-function STB remote control, and menus are
displayed on the television. The BT MyMedia trial was displayed in a sub-section devoted to marketing.
The trial involved adding an additional sub-menu, and populating it with five recommendations, these
recommendations being tailored specifically for each BT Vision customer.
Because the trial involves BT’s BT Vision service, it only includes existing customers of that service,
currently only available in the UK. In order to have BT Vision they must also have a BT phone service and
have subscribed to BT Broadband. The trial was closed in the sense that participants were selected by
the BT MyMedia research team trial organisers, and participants were not able to add themselves to the
trial.
Research into recommendation through the BT MyMedia field trial offered significant potential benefit
to BT’s BT Vision customers both within and outside the field trial. The BT Vision service offers a wide
catalogue of VoD content, but searching it using a STB remote control is demanding. Recommendation
can ease the path of the customer to content that they prefer and reduce their search effort, improving
the user experience.

December 2010 Public Document
MyMedia ICT-2008-215006 Page | 14
5 Motivation for the Field Trial BT Retail Consumer operates the BT Vision IPTV service for BT. They are interested in learning about
how recommender services can improve the take up of VoD, in particular in the movie or film category
(which is the most active, see in Field Trial Results section 8.3 below), and thus increase revenue in a
commercial context.
They are also interested in how the user experience of recommendation can affect customer loyalty and
reduce churn (erosion of customer base). Churn is important because the BT Vision service is an
important differentiator to help retain BT’s broadband ISP customers.
Since the original field trial plans were developed, a further motivation has been expressed by BT Retail
Consumer in understanding how recommender algorithms perform in recommending individual VoD
items, in comparison to recommendation of regular subscription items for VoD.
At this point it is worth clarifying the three types of VoD viewing activity that are recorded on the BT
Vision management system:
- pVoD refers to the viewing of previews of content. Previews are brief, and free to view, and may
give advance viewing of either of the other two types of VoD. Because the viewer does not have
to pay any charge for viewing pVoD they are not the topic of the BT MyMedia recommender
trial, although some of the Field Trial Results reported in section 8.3 report on them.
- sVoD refers to the viewing of content items that are part of packages. Access to packages is
acquired by paying a monthly subscription, after which any item that is in that package at the
time the viewer wishes to view can be watched at no extra charge. Packages cover a range of
themes designed to cover broad ranges of the BT Vision audience. Because there is no
additional revenue generated when a customer views an individual sVoD item, sVoD was not
originally planned to be studied in the BT MyMedia field trial. After the field trial was planned,
an additional query from BT Retail Consumer about the relation between a film-themed
package, FilmClub and recommendations of individual film items, led to an additional research
question described below. Some aspects of sVoD viewing activity are reported in section 8.3 as a
result.
- tVoD refers to the viewing of content items that are purchased individually. These are identified
by searching the overall BT Vision catalogue, and making the decision to purchase. After
purchase the viewer has 24 hours in which to watch the item. In the original plan for the BT
MyMedia field trial, it was intended to focus only on tVoD, and on the recommendation and
viewing of tVoD films/movies, this being the most active area of tVoD purchase (see section 8.3
for more information.)
So the motivation of the BT MyMedia field trial was originally to compare how recommender algorithms
generated by the project could stimulate BT Vision film tVoD purchase, and then a later motivation

December 2010 Public Document
MyMedia ICT-2008-215006 Page | 15
arose to compare recommendation effect on film tVoD purchasing activity with film sVoD viewing
activity.

December 2010 Public Document
MyMedia ICT-2008-215006 Page | 16
6 Research Strategy and Design
6.1 Research Questions In a business context, the marketing of content is always important. Conventional marketing techniques
have not attempted to anticipate user preferences in a systematic way using algorithms. The BT field
trial within the MyMedia project focuses on investigating the use of recommender algorithms as a
marketing tool for transaction Video on Demand items (tVoD), versus more conventional Editorial
marketing, where the content to be recommended is chosen by the editorial team based on their
knowledge of the content, the customer base, and competing services in the market.
The first research question then is: do recommender services offered through the MyMedia system
stimulate more purchasing activity of tVoD by BT Vision customers than editorial recommendations?
Two further questions arose during the development and operation of the field trial, after the field trial
was originally planned. The BT MyMedia team was asked to include in the field trial an examination of
the effect of recommendation on tVoD purchasing versus the effect of the film package, Film Club,
(sVoD). The films included in the package (sVoD) were not as wide a catalogue as those included in the
general (tVoD) catalogue, but purchasing the package enabled the viewing of multiple films with only
one purchasing action.
The final question related to the performance of the recommender algorithm in predicting user
behaviour. How closely did the recommendations delivered to viewers match viewers’ decisions to
purchase tVoD, irrespective of whether they had looked at the recommendations and taken the decision
to view the item from there?
6.1.1 Qualitative study
A more subtle research question planned for the BT MyMedia field trial was to do with the user
experience of the presentation of recommendation. Do users enjoy the experience of receiving
recommendations, and does this lead to greater customer loyalty and reduced churn?
This required a study involving detailed interaction with a small group of volunteer customers and their
families. An agreement was made with such a group and a timescale identified for this study to be
carried out, however the dependency of the BT MyMedia field trial on the BT Vision service meant that
the trial could not take place during the timescale agreed and the group of volunteers could not be
maintained beyond this time, so this question was not addressed.
6.2 User Sampling BT participated along with the other project partners in the preparation of personas and use cases as
reported in deliverable D1.1. Since BT’s field trial took place in the UK, the UK-based personas and use

December 2010 Public Document
MyMedia ICT-2008-215006 Page | 17
cases are most relevant. However the nature of BT’s field trials, which were closed, involving sampling of
users by the field trial organisers from among a large customer base, means that it is difficult to match
users in trials to specific personas and use cases. This does not make the development of the personas
and use cases irrelevant – it is likely that among the large number of users included in the BT field trial
that there are some who fit closely to the personas and use cases proposed. The nature of the user
sampling and data collection methods used will make this clearer.
Customers were selected for the trial by pseudo-random sampling from the total customer base. Initially
two equally –sized groups of 50000 customers were selected, one to receive recommendations from the
MyMedia system, and one to receive recommendations chosen by the BT Vision Editorial (marketing)
team. Because BT Vision is a live commercial service, customers were allocated to the trial without their
knowledge and the service that they were offered did not vary as a result, except in the case of the
customers in the MyMedia recommender group receiving recommendations generated by an algorithm
from the MyMedia recommender algorithm library, if they accessed the page on the BT Vision service
where recommendations were displayed. All other customers whether in the Editorial group or outside
it, would receive the Editorial recommendations if they accessed this page. The inclusion of the
MyMedia recommendations was not distinguishable by customers in the design of the user interface,
and did not affect the terms of their contract with BT, nor require them to pay any additional charges to
receive the recommendations.
At no point was personal information about the users taken, nor was it needed for analysis. Since
customers of the BT Vision service could only be matched to a STB, customers in the trial could not be
linked to personas, and their association with particular use cases could not be confirmed.
6.3 Data Collection Methods Data was collected for the field trial in the form of logs of user viewing behaviour, which recorded the
date and time of viewing events, the STB ID, the BT Vision customer ID, the nature of the item viewed,
and the cost of the item, as well as other various business-specific items which were recorded for the
purposes of billing customers and supporting royalty payment to suppliers, but are not relevant to the
trial. This data was collected for the purposes of management of the BT Vision system irrespective of the
BT MyMedia trial. This data could be used to study both the original research question of the BT
MyMedia quantitative trial comparing the MyMedia recommender system with editorial
recommendations, and the later questions comparing MyMedia tVoD recommendations with an sVoD
package, and investigating the accuracy of MyMedia recommendations in predicting items viewed by
users.
6.4 Data Analysis Techniques The basis of the quantitative trial was to build up a lot of information about BT Vision customers’
response to recommendation by drawing upon a large, closed, sample of the BT Vision customer base. It
was possible to extract information about the customers involved in the trial by using the viewing log
files which were generated automatically on behalf of the BT Vision service, so that customers could be
billed for VoD that they had purchased, and royalties could be paid to the owners of the content viewed

December 2010 Public Document
MyMedia ICT-2008-215006 Page | 18
where appropriate. These files contained no personal information about the customers receiving the BT
Vision service or their families, but it was possible to distinguish different households involved in the
trial through the STB ID. From the STB ID it was not possible to map back to the precise location or name
of the customers involved in the files used, nor was that required for the analysis.
The accumulation of a large amount of numerical data about the number of VoD items viewed and the
value of the purchases made in order to view them allowed statistical techniques to be used to
investigate for statistical significance between the groups. Descriptive statistics were generated to
describe overall behaviour. Non-parametric statistical tests [3] were used to perform comparisons
between groups, avoiding the assumptions of distributions of the data needed for many other statistical
tests.
As the field trial was being developed a request was made for a study of the effect of the MyMedia
recommender system in comparison with the Film Club package as a marketing tool. The Film Club
package is one of a range of packages available to BT Vision users. It focuses specifically on films.
Subscribers pay by monthly direct debit and can watch any of the films in the Film Club catalogue for
free as many times as they want, during the time that those films are available in the Film Club
catalogue. The Film Club content does not overlap with the wider VoD content, although a particular
film may move from one to another at some stage.
A small group of users (250) was moved from the main BT field trial, and divided into five groups, each
of which received five recommended films when they accessed the recommendation page (the same
page which any user could access). The difference in this case was that the users in the five groups
received different combinations of recommendations generated by the recommender algorithm used on
the MyMedia trial, and by pseudo-random sampling from the Film Club catalogue. So there were
different levels of MyMedia recommendation and Film Club recommendation. It was intended to use
Analysis of Variance [4] to test for differences between the different levels of recommendation of
MyMedia versus Film Club recommendation, but since analysis of viewing of the recommendation
pages showed that none of the triallists that were in this part of the trial had viewed the pages, this was
not followed up.
Near the conclusion of the field trial additional data was provided logging BT MyMedia triallists’ access
to the recommendation page on the BT Vision service. It was discovered that few of the triallists had
accessed the page (see section 8.3 below). However the viewing results for those that had accessed the
page were of interest.
Finally, it was thought worthwhile at the conclusion of the trial to investigate the performance of the
MyMedia recommender algorithm in predicting users’ purchases, whether or not they had made the
decision based on viewing the recommendation page. A hit-rate metric [5] was used to do this.

December 2010 Public Document
MyMedia ICT-2008-215006 Page | 19
7 Field Trial Development The BT MyMedia field trial needed to handle tens of millions of viewing records, one hundred thousand
customers, and thousands of items of content. Content items and viewing records were updated
throughout the trial. Input data was supplied from parts of BT external to the BT MyMedia team, and
the output recommendations supplied to third-party companies who are responsible for transferring the
items to the BT Vision platform. Iterative development was used, since the input format of the data was
changed for reasons outside the team’s control, and additionally performance and integrity issues
arising from the very large data sets had to be overcome. The final version of the system performed
satisfactorily for the duration of the trial, and is envisaged to remain operating after the project is
complete. Further detailed information on the system architecture may be found in Section 7.4.
7.1 Content Catalogue BT Vision customers may access content items as part of different catalogues, depending upon whether
they are subscribers to an sVoD package, whether they are viewing a free preview (pVoD), or whether
they have purchased an individual tVoD item. However all types of content have a similar format of
metadata associated with them, although since the content is provided by a variety of suppliers, BT not
being a content provider itself, not all fields of metadata associated with content items may be
complete or in a consistent format with other items.
The following table shows the most important fields and examples of metadata associated with content
items (referred to by BT Vision as assets). Many fields should be self-explanatory. Window Start and
Window End are worth explaining, because they are critically important for the BT Vision service and for
successful recommendations. Because BT acquires the rights to distribute digital content from content
owners, these rights are licensed for fixed periods. The Window Start and Window End fields are derived
from these licence terms, indicating when a particular asset can be purchased by a user under the terms
of the licence. In order to implement the BT MyMedia field trial it was essential to check that every
recommendation was delivered to a triallist during the time window when that recommended item
could be purchased.

December 2010 Public Document
MyMedia ICT-2008-215006 Page | 20
Field Example
Asset ID Ah_AGR400_1150811224590_926368967
Title Planet Earth-s1, ep7:Planet Earth
Summary With a budget if over 13 million UK Pounds and over 200 locations, Planet Earth is
a truly epic nature documentary. The treeless grasslands... .
Short Summary The BBC’s Bafta nominated documentary
Continues with the grasslands of the world’s ...
APPROX 35 WORDS
Series Planet Earth, Series 1
(Stored relationally by Series and Programme)
Episode Title Great Plains
Episode Number 7
Language en
Subtitle Language en
Rating U
Screen Format 16x9
Runtime 50
Release Year 2006
Price 0.99
Currency GBP
Window Start 2007-12-04T18:10:36
Window End 2008-11-01T23:59:59
Categorization TV/Documentaries
(Stored relationally. Genre under one of TV, Film, Kids, Music, Sport)
Table 1 Content data structure

December 2010 Public Document
MyMedia ICT-2008-215006 Page | 21
7.2 User Feedback
Two forms of user feedback have been used in the MyMedia project. The first is explicit feedback,
where the user explicitly expresses or records a choice. A typical example is a user rating an item on a
recommendation page. The second kind of feedback is implicit feedback. In this case, the viewer does
not actively record an opinion or action, and a record of their interaction with the system is the only
means of establishing their behaviour. For example, if a viewer selected a film, then that could be
considered implicit positive feedback.
The nature of the BT Vision user interface as deployed in the BT MyMedia field trial means that
collecting explicit feedback is not possible. Data is recorded about the viewing activity that BT Vision
customers make, in order that they can be billed for VoD purchase, and in order that royalties can be
paid to content providers. These records are particularly important for analysing the effects of
recommendation. Table 2 above shows the format that this takes. This is a form of implicit feedback,
where the user does not take any direct action for the information to be recorded.
7.3 User Interface
Field Description
Event Datetime Date/Time of viewing event
STB ID Set Top Box ID
Customer ID BT Vision Customer ID
Asset ID Asset ID
Various Subscription
Flags
Whether the view was made as part of a subscription
Sub or Charge View Subscription of charged view
Customer Bitmask Subscription bitmask for customer at time of view
Table 2 Viewing data structure.

December 2010 Public Document
MyMedia ICT-2008-215006 Page | 22
Viewers interact with the BT Vision UI, and hence with recommendations provided through it, via a
dedicated remote control provided with the BT Vision set top box. The left/right/up/down buttons allow
movement over a screen, including to a “back” button which will move to a previous screen. The
“select” button selects a choice. The User Interface used in the field trial can be summarised as a user
journey shown in the following set of images. The BT MyMedia field trial is presented through the Try
This interface menu of BT Vision, an area devoted to marketing on-demand content. The Figures below
show the user journey towards selecting a particular item. It is worth mentioning that there are a
number of routes possible through the Try This user journey: all sub-pages of the Entertainment page
will lead to the green button allowing access to the recommendation page.
Figure 1 “Try This” user journey, part 1. Try This menu
Selected.
Figure 2 “Try This” user journey, part 2. UI process starts.
Figure 3 “Try This” user journey, part 3. Entertainment
screen opens by default.
Figure 4 “Try This” user journey, part 4. Family Ties option
selected from Entertainment screen.

December 2010 Public Document
MyMedia ICT-2008-215006 Page | 23
Figure 5 “Try This” user journey, part 5. User selects Try This!
Recommends, using green button as highlighted on bottom
of previous screen.
Figure 6 “Try This” user journey, part 6. User selects
“Awaydays” from recommendations. Information is
provided about movie and cost of purchase.
Figure 7 “Try This” user journey, part 7. User decides to
purchase “Awaydays”. A final choice is available before
ordering.

December 2010 Public Document
MyMedia ICT-2008-215006 Page | 24
7.4 System Architecture
A simplified schematic is shown in Figure 8. Components inside the dashed line are directly part of the
MyMedia system, and comprise the code framework with its database, additional tables within the
same database, plus the developed software. These components all run on a single 8-core computer
running 32 bit Windows 7, with SQL Server Developer Edition 2008 R2. Most of the core components
are written in C-sharp within .NET3.5 (the core MyMedia framework, the application logic and the
algorithm code). The code to handle the daily email feed is written in C++, and called directly from the
C-sharp application.
Figure 8 System Architecture.
Components outside the dashed line are not part of the core system, but are required in order for the
trial to operate. These components and their data formats are not under the direct control of the BT
MyMedia software team. They are described in the following subsections.
7.4.1 BT Vision Data Input (external to MyMedia)
Viewing records are supplied to MyMedia by the Vision operational team within BT. During the course
of the software development for the trial, the external database was changed from SQL Server, to
Oracle; these changes being made for operational reasons outside the scope of the MyMedia trial.

December 2010 Public Document
MyMedia ICT-2008-215006 Page | 25
7.4.2 Input Processing (within MyMedia)
Software was written to support all the database formats described in section 7.4.1, to import the
records directly into the MyMedia core database for the trial. This involved using standard C-sharp and
other .NET3.5 software components, which allowed the remote databases to be opened and queried as
though they were local, and for their contents to be imported into the MyMedia system. However this
approach proved problematical owing to the speed of import (SQL queries were made over a network,
and the connector speed was often slow. Additionally, cross-checking had to be performed in order to
eliminate minor inconsistencies with the data). With imports of historical data taking several weeks in
certain cases, the system proved sensitive to short-term network problems. The impact of these issues
was reduced by software redesign. Consequently, the technique adopted for the trial is to obtain a
delimited text dump from the live Oracle database of customer viewing records, manually transferred
once each month via FTP to the MyMedia computer by the Vision team. This file is approximately 4GB
in size each month, and contains millions of (sometimes >10 million) viewing events.
The MyMedia software operates on this large text file, with as much of the processing as possible being
performed on memory-resident data structures, rather than by making database queries: based upon
experience during development, this approach gave the best speed of import. The process was as
follows:
• Process text file, selecting only views that actually do fit within the current month time window.
• Read those views, selecting only the fields of interest
• Retrieve the trial customers and list of video assets from the MyMedia database
• For each view, verify that the user and asset can be located. If so, create a new viewing record
in the MyMedia database and associate it with the user and asset.
This monthly import and filtering takes several hours on a fast, multi-core computer, and has proved
reliable.
An example line from the import file is shown below (this example refers to a music video, and the
customer ID and asset IDs have been changed). The fields are delimited by the | symbol. The example
has been artificially broken over multiple lines for clarity:
20100505|2010-05|2010-05-07|2010-05-05|10:00 - 10:5 9|00000012342012|Unknown| ah_AGR603_1472482815221_240987196|Music Videos| Spring 2010: Vol 5 – Sleeping With A Broken Heart - Alicia Keys|Music|
Sony BMG|1|0|0|0|> 500|Unknown|Music|Music Video|20 08-05|None
These fields variously contain date information, textual description and flags relating to the type of
content. The field beginning 0000 contains the customer ID, and the ah_AGR… field uniquely identifies
the video on the system.
The field trial software processes the input data file to:

December 2010 Public Document
MyMedia ICT-2008-215006 Page | 26
• Identify viewed assets (movies, programmes etc.) that are currently in the MyMedia system.
Those identified assets are subsequently filtered to exclude those which are not of interest (such
as trailers and free content). Viewing events that relate to items not known to the MyMedia
system are discarded.
• Import viewing events for users who are currently known to the MyMedia system. In order to
keep customers’ personal information private, various identifiers are used to represent users
within BT Vision, and data checking is performed as part of the trial in order to verify that an
(anonymised) billing ID corresponds to an appropriate (anonymised) Vision Set Top Box.
In addition to the monthly viewing records, the system also receives an automatically-generated email
daily, with changes to the asset content on the Vision platform. This email contains a compressed
attachment, with each asset’s metadata as an XML file, plus optionally images which are used for
publicity (analogous to the pictures that are printed on DVD cases).
These emails are automatically processed: The system verifies that the asset is indeed new, and if so,
adds it to the database, and saves the images if present. The images are not specifically required for the
recommendation generation, but are used later in the workflow, when the recommendations are sent
for distribution.
7.4.3 Recommender Output
The recommender produces a daily feed which is ultimately displayed on the BT Vision customer’s TV as
part of the ‘Try This’ page (see Figure 8 above). This recommendation list is generated as a delimited
text file, with one line of 5 recommendations per customer. The customer ID is a numeric value, which
cannot be used in isolation to identify an individual person or address, and the five recommendations
are alpha-numeric identifiers.
An example of the output is shown below. There is one of these lines per customer. The example below
has been artificially split across multiple lines for clarity.
cffd4268-8a20-4ae3-84bc-dbbf5ccc34d7|CC50209E-E8D1- 421C-95F2-D63D4EC8E873| 3F9C3014-3909-475A-A152-DABCB6A92148|8216EDA4-79F4- 4857-A4C6-2464117BFFFC| 598991D1-47E9-47E5-B29C-79053F5230FB|00ABEB3B-6D53- 4C54-A3E4-33C7020672E1
The first identifier (begins with cff above) is the STB ID. Note that this is a different format to the
customer ID in the (input) viewing records, thus further increasing anonymity. The remaining five values
are the identifiers of the items to be recommended for that customer.
The daily recommendations file is sent automatically from the MyMedia software via FTP to an external
company, who manage the Try This marketing pages for BT Vision.
The daily nature of recommendations required that the BT MyMedia recommender system generated
new sets of recommendations within 24 hours. It also necessitated checking the new sets of
recommendations against the the daily email input from BT Vision providing information about changes
in the asset list as well as additional images where required.

December 2010 Public Document
MyMedia ICT-2008-215006 Page | 27
7.4.4 System Architecture Conclusions
The BT field trial required additional database tables to store data and relationships that could not be
expressed in the core MyMedia framework. Several iterations of the schema were required, since the
storage format of the BT data was changed by operational parts of BT (outside the control of the BT
MyMedia researchers). Additionally, data validation was required, since (with a large data set, evolving
over two years), certain data inconsistencies were discovered in the records. This cross-checking was
performed during data input, verifying that users, assets and viewing records are all referring to the
same set of data. This required several re-imports of large historical data, since some problems only
came to light part way through the workflow.
The schema and queries also required optimisation as experience was gained. For example, the BT
Vision customer ID is numeric, although too large to be stored in a 32-bit integer. Initial designs
therefore stored the ID as a string; however the effect of this was to slow the queries such that data
import could take an unacceptably long time (importing 12 months of viewing data with more than 10
million views per month would have taken two months). Additionally, a small proportion of the
‘numeric’ IDs were actually found to contain non-numeric characters. Discovering these issues and
resolving them contributed to delays in starting the trial.
The current trial system performs satisfactorily, although parts of the workflow can still take several
hours to complete, and this makes stopping and debugging the software more difficult. There are still
occasions when “out of memory” exceptions are thrown due to the extremely large datasets handled by
this very large-scale trial. However, a daily manual check and restart of the software if necessary is
sufficient for the trial.
7.5 Recommender Algorithms The BT MyMedia field trial was based on use of the MyMedia software framework, and the
recommender algorithm library developed for use with this. In order to ensure that the most
appropriate algorithm was selected for use in the BT field trial, a sample set of BT Vision data,
incorporating viewing records and content catalogue data was supplied to UHI. UHI, leading the
development of recommender algorithms for the project, were able to evaluate which recommender
algorithm in the MyMedia recommender algorithm library performed best for data of the form that
would be used in BT’s field trial. The conclusion of this evaluation by UHI was that the BPRMF (Bayesian
Personalised Ranking Matrix Factorisation) algorithm, reported in MyMedia D4.1.2 [7] performed best.
This algorithm was therefore selected, although the design of the MyMedia software framework as
produced in WP2 could have allowed others to be substituted.
7.6 Filters In order to limit the amount of data processing required, filters were applied to the data. The core
MyMedia framework supports filters as software components, which can be loaded into the system to
filter out items not required for the recommendation process. The framework supports two types of
filters: pre- and post-filters. Four types of pre-filters were used in the BT MyMedia field trial:
• A pre-filter restricting the content category to tVoD film

December 2010 Public Document
MyMedia ICT-2008-215006 Page | 28
• A pre-filter removing any items that were out of the time window which had been agreed with
the content provider within which they could be viewed
• A pre-filter removing items that had been previously viewed by viewers using the same STB
during the trial
• A pre-filter removing any items that although consistent with the previous pre-filtering actions
were not retained through changes introduced by the daily live report (reporting changes in the
content catalogue).
As a result of these pre-filters, it turned out that the use of post-filters was not required, although the
capability to introduce them was retained.
7.7 Metadata Enrichment Metadata enrichment is an important area of research in recommender systems, because the
availability of substantial metadata associated with content is often important for the effective
performance of recommender algorithms. Another area of the MyMedia project, WP3 focuses on this
area. A deliverable produced by WP3 simultaneously with this one, deliverable D3.1.3 [7], provides
information about the achievements of WP3 in more detail.
The content catalogue used in the BT MyMedia field trial contains a considerable amount of metadata,
as described in section 7.1 above. However since the content is provided by a variety of content
providers, who may have different standards in populating the metadata fields, and since some of the
metadata may be amended by BT Vision schedulers following import to the BT Vision system, it may not
always be consistent. Accordingly it was thought worthwhile to investigate whether some of the
metadata enrichment modules developed in WP3 could improve the existing metadata in BT’s content
catalogue in order to use them in conjunction with the recommender algorithms developed in WP4.
Of the various techniques available, the Keyword Extraction (KWE) approach researched by Novay was
studied due to being most advanced. In order to test whether KWE could improve the usefulness of the
recommendations in this specific case, a sample set of 70,000 viewing records and programme data was
extracted from the full BT Vision dataset. All personal data was anonymised, with each user being
reduced to a unique number, so that whilst it was possible to determine the items that each user
watched, it was impossible to identify the user by name or personal details. This sample was supplied to
Novay. Novay’s Statistical KWE modules were investigated as potential means of metadata enrichment
for the BT Vision content dataset. Results suggested that the form of textual synopses provided with the
content did not lead to any advantage when Novay’s techniques were applied. Therefore on the advice
of Novay, the technique was not adopted for the BT field trial.
Other techniques for metadata enrichment were researched as part of WP3, but were either not in a
sufficiently advanced state when the BT field trial was being developed, or depended on explicit user
feedback, something, as described above, not possible in the context of the BT MyMedia field trial.
Accordingly it was not possible to use Metadata Enrichment in the context of the BT MyMedia field trial.

December 2010 Public Document
MyMedia ICT-2008-215006 Page | 29
8 Field Trial Execution
8.1 Evaluation System Work reported in deliverable D1.5 of the MyMedia project [1], and summarised in a paper by
Knijnenburg et al. (2010) [2], led to the development of a conceptual framework for evaluating
recommender systems intended to be sufficiently general as to be able to cover all the field trials in the
MyMedia project, as well as other recommender systems as well. For the sake of rapid comparison, the
a simplified version of the framework as shown in Figure 10 of deliverable D1.5 is reproduced in Figure 9
below.
Figure 9. MyMedia evaluation framework
From this diagram we can see that most of the focus of the BT MyMedia field trial is on a small
subsection of the issues described here, on the Purchase/view sub-category within the Interaction
category within the Behaviour box. The use of only implicit feedback from users of the system within the
BT MyMedia field trial, and the deliberate lack of direct contact with users, means that most of the
aspects of recommender system usage described here cannot be studied. However this does not reduce
the importance of the study, which focuses on the use of the MyMedia system in the context of a live
commercial service, where purchasing behaviour must necessarily be of most importance.
During the field trial information was gathered not just about viewers’ viewing and thus purchasing
behaviour, but information also became available about which households (designated by STBs) had

December 2010 Public Document
MyMedia ICT-2008-215006 Page | 30
viewed the BT MyMedia recommendation page described in section 7.3 above. This information did not
expose personal information about viewers, but it did allow the evaluation of objective aspects of
performance of the recommender algorithm used in relation to prediction of the preferences of viewers
proceeding to choose to purchase and view items, thus focusing on a more widely explored aspect of
recommender system evaluation, falling within the Objective system aspects box in Figure 9 above.
8.2 Field Trial Execution BT’s quantitative field trial involved no direct interaction with customers. A large number of customers
were involved, 50000 receiving MyMedia recommendations compared with 50000 receiving Editorial
recommendations (recommendations selected by the Editorial [marketing] team with the BT Vision
management). This large quantitative trial was thus the largest in terms of participants in the MyMedia
project, as well as differing in delivering the recommendations which ultimately originated from the
same MyMedia software via a Microsoft Mediaroom-based IPTV interface rather than a computer-based
browser.
The BT field trials were originally planned to commence in January 2010. This was dependent on
decisions made within the BT Retail Consumer business, the operators of BT Vision and host of the field
trial. One delay was caused by a requirement for more detailed preparation for customer relationship
management in the context of the new recommendation pages. Once this was dealt with, another delay
was generated by a change to the the format of data recording of customer viewing history. This
necessitated rewriting much of the software designed to import and parse customer viewing records so
that the data could be ready for analysis and for training the recommender algorithm.
Accordingly, while the BT MyMedia recommender service was ready to run over the BT Vision service
somewhat earlier, it was not possible to collect data for the field trial until August 2010. Data was
recorded on an Oracle database managed in another part of BT, and then imported to the BT MyMedia
research team’s machines through a number of security barriers posed by different firewalls. Software
was written to convert the Oracle format data into formats that could be used by a variety of data
analysis programs. For the purposes of this report data from August and September 2010 was used,
although the field trial continued running beyond the completion of this report.
8.3 Field Trial Results
8.3.1 General user behaviour
To investigate the first research question: do recommender services offer through the MyMedia system
stimulate more purchasing activity of tVoD by BT Vision customers, we first investigated how customers
in the two field trial groups (MyMedia recommender and Editorial) differ in their purchasing of tVoD film
content. Summary statistics are shown in Table 3 below.

December 2010 Public Document
MyMedia ICT-2008-215006 Page | 31
Month and
Group
Number of
customers
viewing
items
Mean
number of
items
viewed
Median
number of
items
viewed
Modal
number of
items
viewed
Mean
cumulative
purchase
value (GBP)
Median
cumulative
purchase
value (GBP)
Modal
cumulative
purchase
value (GBP)
August
Editorial
27927 1.5500 1 0 3.4388 0.418 0.00
August
MyMedia
27699 1.5284 1 0 3.4259 0.664 0.00
September
Editorial
26136 1.2070 0 0 2.7763 0.00 0.00
September
MyMedia
25985 1.2131 0 0 2.7552 0.00 0.00
Table 3. Summary statistics for the two groups in the BT MyMedia quantitative trial for the months of
August and September 2010.
This table refers to triallists in the two groups of the main BT MyMedia field trial, one receiving Editorial
recommendations from the BT Vision Editorial team, and one receiving recommendations generated by
the MyMedia recommender system. After a group of triallists were removed to support the FilmClub
trial, there were 49750 customers in each group.
A large proportion of customers (between 43.9% and 47.8%), irrespective of group and month, did not
view any VoD. This may reflect the availability of many free-to-air digital TV channels which can be
viewed and recorded via the BT Vision STB.
But the focus of the trial is on the recommendation of tVoD film items, and the mean, median and
modal number of items viewed and purchase value refers to tVoD items. The modal number of items
viewed being 0 irrespective of group or month is explained by the distribution of tVoD viewing being
extremely skewed, with a long tail of many viewers not viewing any tVoD items (but likely to viewing
pVoD or sVoD), and a few viewers being much more active in their purchasing of tVoD items. The
skewed nature of this distribution is confirmed by the failure of the mean, median and mode statistics to
match.
The numbers of triallists that did view items were very similar between the groups, and although they
did differ between months, this was also not significantly different. The mean number of items viewed
was also very similar between groups, although differing between months. In neither case was there a
significant difference.
December 2010 Public Document
MyMedia ICT-2008-215006 Page | 32
The cumulative purchase value refers to the purchase value of all tVoD items purchased during that time
period. The mean, median and modal cumulative purchase values are thus dependent on the mean,
median and modal numbers of tVoD items viewed.
Although there are differences between the two groups in terms of mean cumulative purchase value of
tVoD film items during both months, they are not significantly different. There are more differences
between the two months, but this is also not significantly different.
Although the conclusions of this overall summary would seem to show no effect of the MyMedia
recommender system on user behaviour, what it necessitates is further investigation of which users
(only identified by STB identifier) actually viewed the MyMedia and Editorial recommendations through
the Try This page, and the consequences that this has on viewer click-through to particular items and
viewing behaviour.
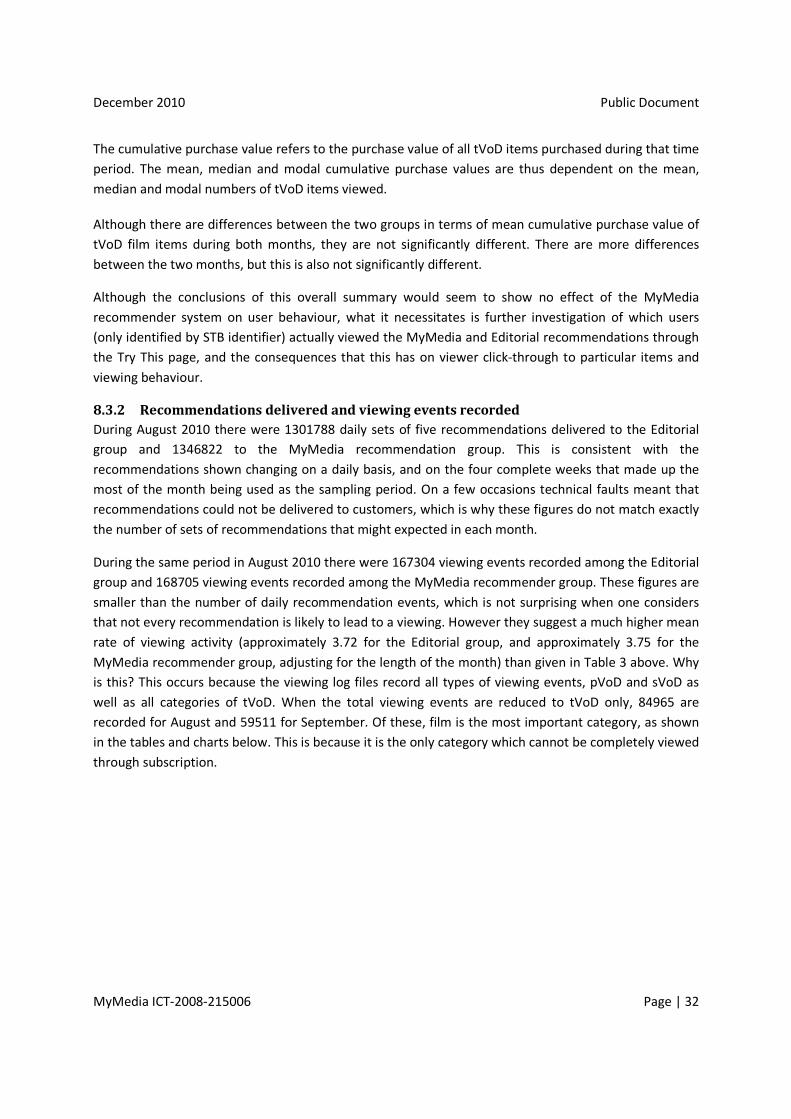
8.3.2 Recommendations delivered and viewing events recorded
During August 2010 there were 1301788 daily sets of five recommendations delivered to the Editorial
group and 1346822 to the MyMedia recommendation group. This is consistent with the
recommendations shown changing on a daily basis, and on the four complete weeks that made up the
most of the month being used as the sampling period. On a few occasions technical faults meant that
recommendations could not be delivered to customers, which is why these figures do not match exactly
the number of sets of recommendations that might expected in each month.
During the same period in August 2010 there were 167304 viewing events recorded among the Editorial
group and 168705 viewing events recorded among the MyMedia recommender group. These figures are
smaller than the number of daily recommendation events, which is not surprising when one considers
that not every recommendation is likely to lead to a viewing. However they suggest a much higher mean
rate of viewing activity (approximately 3.72 for the Editorial group, and approximately 3.75 for the
MyMedia recommender group, adjusting for the length of the month) than given in Table 3 above. Why
is this? This occurs because the viewing log files record all types of viewing events, pVoD and sVoD as
well as all categories of tVoD. When the total viewing events are reduced to tVoD only, 84965 are
recorded for August and 59511 for September. Of these, film is the most important category, as shown
in the tables and charts below. This is because it is the only category which cannot be completely viewed
through subscription.
December 2010 Public Document
MyMedia ICT-2008-215006 Page | 33
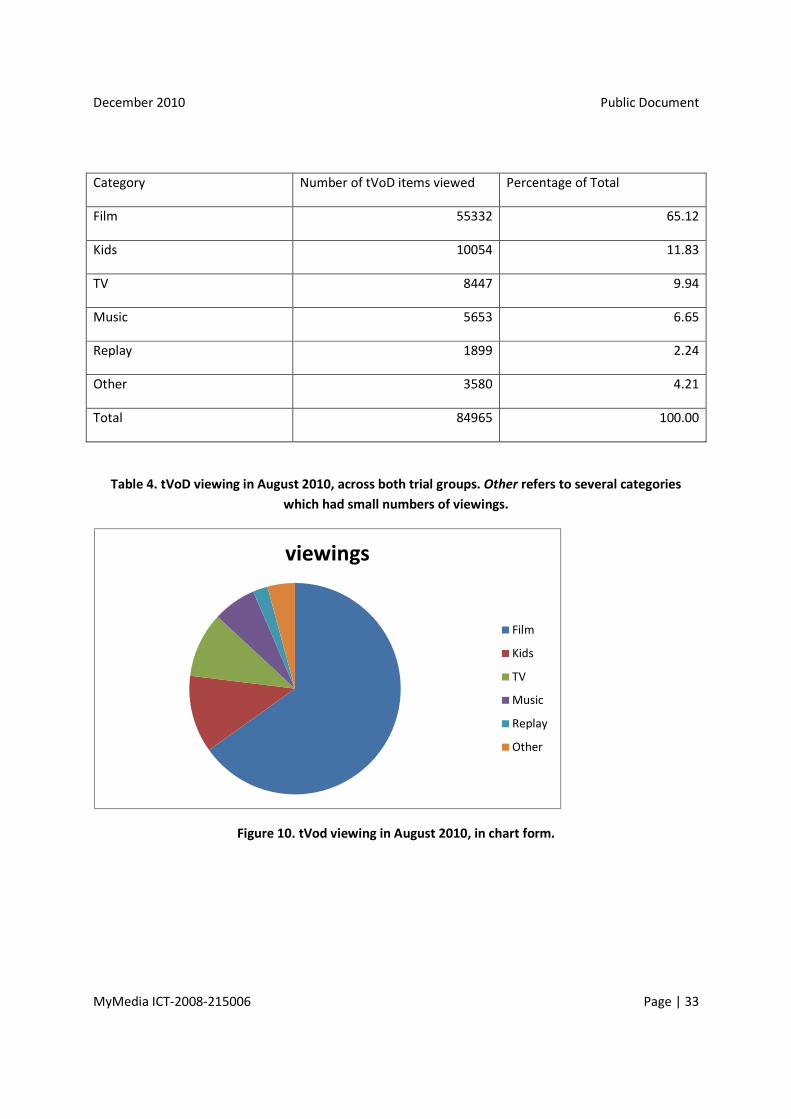
Category Number of tVoD items viewed Percentage of Total
Film 55332 65.12
Kids 10054 11.83
TV 8447 9.94
Music 5653 6.65
Replay 1899 2.24
Other 3580 4.21
Total 84965 100.00
Table 4. tVoD viewing in August 2010, across both trial groups. Other refers to several categories
which had small numbers of viewings.
Figure 10. tVod viewing in August 2010, in chart form.
viewings
Film
Kids
TV
Music
Replay
Other
December 2010 Public Document
MyMedia ICT-2008-215006 Page | 34
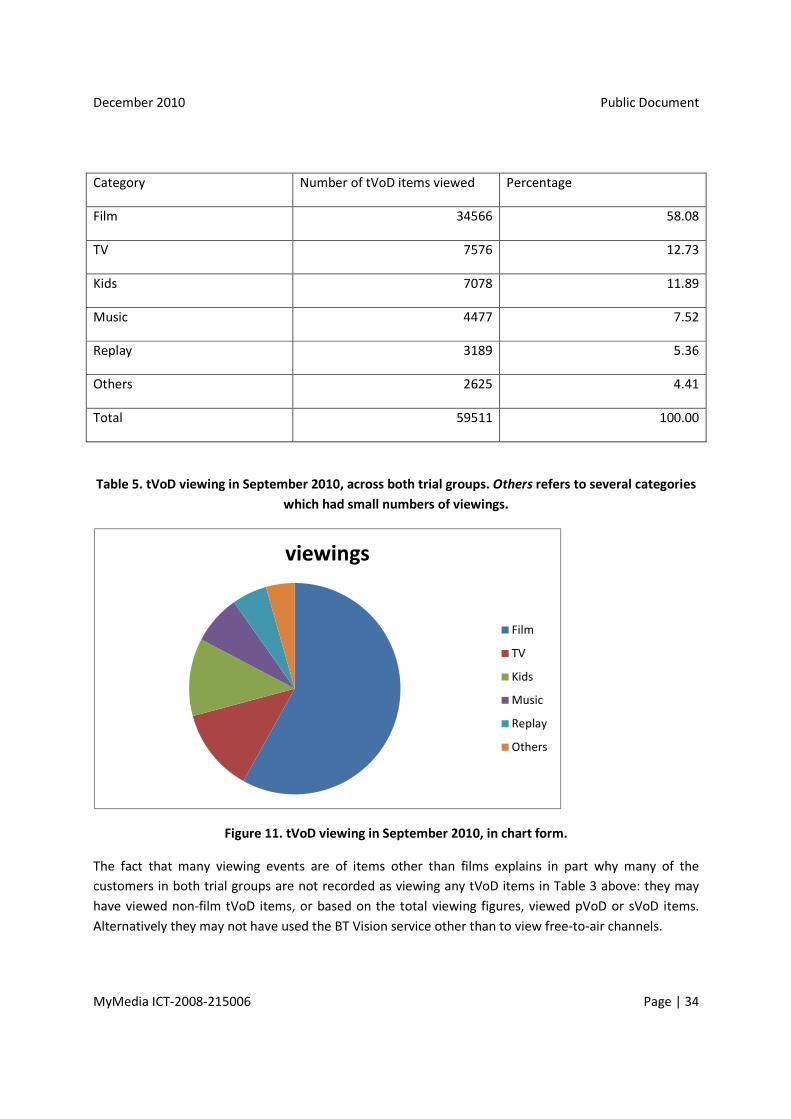
Category Number of tVoD items viewed Percentage
Film 34566 58.08
TV 7576 12.73
Kids 7078 11.89
Music 4477 7.52
Replay 3189 5.36
Others 2625 4.41
Total 59511 100.00
Table 5. tVoD viewing in September 2010, across both trial groups. Others refers to several categories
which had small numbers of viewings.
Figure 11. tVoD viewing in September 2010, in chart form.
The fact that many viewing events are of items other than films explains in part why many of the
customers in both trial groups are not recorded as viewing any tVoD items in Table 3 above: they may
have viewed non-film tVoD items, or based on the total viewing figures, viewed pVoD or sVoD items.
Alternatively they may not have used the BT Vision service other than to view free-to-air channels.
viewings
Film
TV
Kids
Music
Replay
Others

December 2010 Public Document
MyMedia ICT-2008-215006 Page | 35
However this does not prevent further exploration of the response of the BT MyMedia triallists to
recommendation since we also have information about which triallists (as defined by STB rather than by
personal information) viewed the recommendation page, and whether this led to a click-through to a
particular content page. This can be linked with viewing records to identify whether the
recommendation page was effective in stimulating user purchasing and viewing of tVoD films.
8.3.3 Viewing the BT MyMedia recommendation page and its consequences for tVoD
viewing
The BT MyMedia research team were able to obtain late in the field trial, information about which
customers had accessed the Try This page where the MyMedia and Editorial recommendations were
displayed.
Group Number of
viewers
Number of
viewing events
Viewing of
recommendation
page without click-
through
Click-through to
asset
Editorial 50 106 70 18
MyMedia
recommendation
74 199 109 45
Table 6. Viewing of the MyMedia Try This recommendation pages, during the BT MyMedia field trial,
August-September 2010.
This represents a very small proportion of the trial population (<1% in each case) which makes basing
the analysis of the whole trial on the behaviour of the whole population inappropriate. Instead it is
necessary to focus more on the triallists that viewed the recommendation pages and their behaviour in
viewing items. Although the triallists in the Editorial group viewed the recommender page less than
expected, and clicked through to assets less than expected, there was no significant difference in
viewing events or click-through activity (Χ2
test, 1 d.f., in both cases) it is possible to make further
observations based on these smaller number of viewers in the trial.
For each of the triallists who were recorded as having accessed the Try This page at least once during
the evaluation period (August and September 2010), a complete history of Video on Demand viewing
was extracted and compared chronologically with the Try This page access logs.

December 2010 Public Document
MyMedia ICT-2008-215006 Page | 36
Customer: 062B023D-D1FF-4EE1-AC6B-E452E6F944BE
Date Time Event Type Asset ID Asset Title
03/08/2010 16:00 Preview ah_AGR603_1279211753364_682168968 Trailer: Ben 10: Kids Take Over
13/08/2010 12:00 tVoD view ah_AGR603_1195657549425_653658463 Scooby Doo 2: Monsters Unleashed
13/08/2010 12:53 Viewed Recs
13/08/2010 12:54 Click Through ah_AGR603_1195657549425_653658463
09/09/2010 23:00 Preview ah_AGR603_1273589912469_816189450 Trailer: Grouchy Young Men -s1
12/09/2010 16:00 Preview ah_AGR603_1274733959690_241005256 Trailer: Kick Buttowski
13/09/2010 18:00 tVoD view ah_AGR603_1213279450125_205990313 Chronicles of Narnia: The Lion, the Witch & the Wardrobe
25/09/2010 14:00 Preview ah_AGR603_1274733959690_241005256 Trailer: Kick Buttowski
26/09/2010 11:00 Preview ah_AGR603_1274733959690_241005256 Trailer: Kick Buttowski
Table 7: Example of a combined customer viewing history compared with access to the MyMedia
recommendations.
Table 7 shows an example of a chronological history for a typical BT Vision customer during August and
September. This particular customer was also a BT Vision package subscriber and made extensive use of
the Kids’ TV package during this period. For clarity, Subscription viewing events are omitted.
On 13th
August the table shows (highlighted in green) how an interaction with the Try This
recommendation page led to the customer purchasing a film on demand (tVoD). It should be noted that
VoD viewing information is recorded in hourly ‘buckets’, and so the time at which the film was
purchased (event type ‘tVoD view’) is marked as 1200, but actually fell between 1200 and 1300 on 13th
August. It can be clearly seen that at the same time the customer viewed the recommendations page
(12:53) and then clicked through to an asset (12:54) which had the same ID as the film they
subsequently purchased (‘Scooby Doo 2: Monsters Unleashed’).
In order to observe the effectiveness of recommendations on the Try This pages for the small number of
triallists who viewed them, the chronological history for each customer was examined and events similar
to the one described above were counted. Using objective data such as this, it is impossible to be
certain when a particular pattern of events could be attributed to a recommendation, and so some
flexibility was necessary when reading the event sequences. In some cases, a click-through event would
lead to the customer watching a preview, or paying for something else instead.
Group Total sVoD events
Mean sVoD events per customer
Total tVoD events
Mean tVoD events per customer
Click-through events leading to tVoD viewing
Editorial
3473 69.46 148 2.96 28%
MyMedia Recommendation
11672 157.73 255 3.45 29%
Table 8: Viewing behaviour related to click-through events for triallists who viewed the Try This
recommendations.
Table 8 shows comparative statistics for each trial group with respect to sVoD events, tVoD events and
click-through events resulting from viewing the Try This recommendations page. It is notable that for

December 2010 Public Document
MyMedia ICT-2008-215006 Page | 37
both groups just under one third of click-through events led to a viewing action. In spite of the very
small numbers involved, this is an encouraging rate of response. In this case, the MyMedia
recommendation system equals the performance of professionally-compiled editorial
recommendations, and given the context that the recommender is being driven by infrequent, implicit
feedback it could be argued that a higher level of performance would be difficult to achieve.
Examination of the combined event data for customers who accessed the Try This recommendations
page also yields some ‘weak signals’ which cannot reasonably be attributed directly to recommendation,
but in whose explanation recommendation may be a contributing factor:
• It can be seen from Table 8 that the group receiving MyMedia recommendations showed a
greater rate of tVoD viewing and a much greater rate of sVoD viewing. A simple statistical
summary of customer viewing frequency in each group shows that the standard deviation for
the MyMedia group is very high (250) compared with the Editorial group (78), suggesting that a
few high-volume users may be skewing the data for the MyMedia group. However, most
subscription customers in the MyMedia group did view recommendations prior to their
subscription viewing, and could have been influenced by this.
• In addition to click-through events influencing customer behaviour, there is evidence of tVoD
viewing events taking place immediately after customers have viewed the recommendations
page, suggesting that the recommendations have prompted them to choose a film using a
different part of the BT Vision system.
8.3.4 Comparing MyMedia recommendation with the FilmClub package
Because the evidence in terms of access of the MyMedia and Editorial recommendations through the
Try This page (User Interface described in section 7.3 above) showed that none of the triallists in the five
groups receiving both MyMedia and FilmClub recommendations had actually accessed the page during
the period of the trial described here, it was not possible to test the intended research question.
8.3.5 Predictability of MyMedia recommendation in the BT Vision trial
Since logging of the users viewing the BT MyMedia recommendation page had shown that only a very
small proportion of the triallists actually viewed the pages (see section 8.3.3 above), the analysis of the
performance of the MyMedia recommender system used here was carried out to investigate the ability
for the MyMedia recommender system or the Editorial recommendation choices to predict user
preferences, irrespective of whether users of the BT Vision service in the BT MyMedia trial had viewed
the Try This page or not. This is different from the usual use of recommender evaluation metrics (see
e.g. [1, 6]) where the metric is used to compare the performance of the recommender with observed
behaviour of users in responding to it.
The metric used was based on hit-rate. We used the Top-5-Hit-Rate-Normalised metric. It is referred to
as Top-5-Hit-Rate-Normalised because the top five recommendations as generated by the recommender
algorithm for a particular customer are the only ones that they have the possibility of receiving. It was
calculated in the following way:

December 2010 Public Document
MyMedia ICT-2008-215006 Page | 38
• For each day, during the field trial, calculate the total number of unique assets watched by a
user. (So omit multiple viewings of an asset if viewed during the same day. For a film, which is
what we are considering here, this is likely to be rare.)
• On each day when a user in the field trial has watched one or more assets, check how many of
the five recommendations corresponded to what the user has watched, this is the daily hit rate
for that user.
• Generate the total unique assets watched for each user over the trial period by summing the
total unique assets for that user each day.
• Generate the total hit rate for each user over the trial period by summing the daily hit hit for
that user for every day.
• Calculate the Top-5-Hit-Rate-Normalised as
�����_���_��
�����_��� �_�����_����ℎ�
for each user, and display the results as means according to the number of items viewed in the trial
period. The higher the hit-rate, the more effective the recommendation is, since the hit-rate
measures the accuracy of the recommendation algorithm in matching what the user has watched.
For the BT MyMedia field trial the following results were obtained in the months of August and
September:

December 2010 Public Document
MyMedia ICT-2008-215006 Page | 39
Month Group
Aug Editorial Assets1 >500 >200-
500
>100-
200
>50-
100
>20-
50
>10-
20
>5-10 1-5 All2
Hit-rate3 - - - - 0.0424 0.0223 0.0244 0.0290 0.0283
Viewers4 0 0 0 0 10 157 1386 10538 12091
MyMedia
BPRMF
Assets >500 >200-
500
>100-
200
>50-
100
>20-
50
>10-
20
>5-10 1-5 All
Hit-rate - - - - 0.0074 0.0098 0.0093 0.0080 0.0081
Viewers 0 0 0 0 14 152 1393 10470 12029
Sept Editorial Assets >500 >200-
500
>100-
200
>50-
100
>20-
50
>10-
20
>5-10 1-5 All
Hit-rate - - - 0 0.0161 0.0136 0.0062 0.0083 0.0082
Viewers 0 0 0 2 5 79 787 9245 10118
MyMedia
BPRMF
Assets >500 >200-
500
>100-
200
>50-
100
>20-
50
>10-
20
>5-10 1-5 All
Hit-rate - - - - 0.0267 0.0163 0.0089 0.0085 0.0086
Viewers 0 0 0 0 5 74 773 9453 10305
Table 9. Predictive capability of the Editorial recommendations versus the MyMedia BPRMF
recommendations in the BT field trial, evaluated by hit-rate.
1 Upper and lower boundary on the total number of unique assets viewed by a user (identified by STB ID) during
that month.
2 Total number of viewers that viewed at least 1 tVoD film item during that month. Thus smaller than the total
number of viewers who viewed all tVoD, and smaller than the number of users who viewed all VoD. Does not
include all triallists because not all triallists viewed at least 1 tVoD film during that month.
3 Hit-rate as calculated by the method described above.
4 Number of viewiers in a group viewing a total number of unique assets within the boundaries defined by Assets
during that month.

December 2010 Public Document
MyMedia ICT-2008-215006 Page | 40
What conclusions can we draw from this? It confirms evidence from earlier analysis that a lot of BT
Vision customers, irrespective of their trial group status, do not watch very many items, but a few watch
somewhat more.
Overall, the hit-rate results are not high for any group, during any month, at any level of activity in terms
of number of unique items viewed. The highest hit-rate, 0.0424, for a few participants in the Editorial
group who viewed over 20 unique items during August 2010, does not show a very good level of
prediction of user preferences, nor is it representative of any group in the trial, since there were only 10
viewers (identified by STB IDs) in that category.
It is better to look at the categories in which most users are found, those with lower numbers of
viewings per month. The results for the lower categories converge to the results for the overall group.
Looking at the groups overall, it is clear that the Editorial group produces higher hit-rates in August,
while the MyMedia BPRMF group produces slightly higher hit-rates in September, although in fact the
rates are very similar across the categories of lower numbers of viewings and more users, and converge
towards values for the MyMedia BPRMF group for August.
The MyMedia BPRMF recommender algorithm does not in itself appear to be a better means of
predicting user preferences in comparison to the expertise of the editorial (marketing) team, when the
recommendations are not displayed to the majority of the viewers (the majority of viewers do not take
up the opportunity to view recommendations, although they do have it.)
In this context the presentation of editorial recommendations does have an advantage, which may
explain the substantial difference between the groups in August, where the hit-rate recorded for the
Editorial group is higher. August is a month for holidays, and as Table 4 and Figure 10 above show, is a
time for higher levels of tVoD viewing on the BT Vision service. Accordingly it is a time for considerable
marketing effort, and the recommendations provided by the editorial team for the BT MyMedia field
trial Editorial recommendations are consistent with those marketed by other means. So even if
members of the Editorial trial group have not viewed the recommendations page, and the evidence
from section 8.3.3 suggests that that is the case for most members of the group, they may have seen
similar items marketed by other means. By contrast the MyMedia recommender algorithm does not
drive any additional marketing activities.

December 2010 Public Document
MyMedia ICT-2008-215006 Page | 41
9 Conclusions
The BT MyMedia field trial was different from other field trials in the project in that:
• it was offered via an IPTV service
• it was offered via a live commercial service (BT Vision) and thus
• in order not to disrupt the planned marketing of this which predated the trial it had to be
delivered in a manner consistent with business requirements
• triallists were not made aware of their participation in the trial
• there was no form of explicit feedback available due to the user interaction available with the
trial system
• the overall trial involved many more participants than any of the trials.
However, despite these differences it was similar in respect of
• testing users’ response to items recommended by the MyMedia software framework and
recommender algorithms developed within the project added on to it
• testing users’ response to recommendation in an interactive commercial service, as with the
Microgenesis trial, although in a very different commercial context and in a different language in
a different European country.
• Providing means of comparing trial results with the conclusions of the other work packages of
the MyMedia project in the context of recommender systems.
The BT MyMedia field trial was originally planned to take place in two components, a large quantitative
field trial involving many thousands of participants, and a small qualitative trial involving much smaller
numbers of volunteer participants, describing their user experience of the MyMedia recommender
system in much more detail. Because of the challenges involved in developing the field trial for
execution on the BT Vision system, which involved a deployment later than originally planned, it was not
possible to retain the volunteer group for the qualitative trial, so that did not take place.
However, the quantitative trial, which involved closed pseudo-random sampling of triallists from among
the whole BT Vision customer base, without any direct contact with the customers, did take place, and
was carried out on a very large scale with 50000 customers receiving recommendations from the
MyMedia recommender system, and a control group of 50000 customers receiving recommendations

December 2010 Public Document
MyMedia ICT-2008-215006 Page | 42
from the BT Vision editorial (marketing) team. The focus of the trial was on the purchasing and viewing
of film content (tVoD) items.
This was the basis for the analysis reported on in this deliverable. Overall descriptive statistics showed
little difference between the two trial groups: many of the customers did not purchase any film VoD
items during each month of the trial, and the distribution of purchasing activity was very skewed, with a
few customers being very active. There was no significant difference between the groups when
considered at this overall level.
However this did not demonstrate a failure of the MyMedia recommender algorithm to successfully
recommend items. When the number of instances of viewing the page on the BT Vision service where
the MyMedia or editorial recommendations were displayed was investigated, it was found that only a
very small number of triallists, less than 1% of either group, had actually viewed the page during the
period of the trial.
This clearly demonstrated the importance of designing the user interface of recommendation system so
that it was very prominent and access to users accessing the system for the first time, confirming the
results of studies reported on in deliverable D1.4 [8] of the MyMedia project. As can be seen in section
7.3 above, the user of the BT Vision system has to pass through a number of pages before reaching the
page on which recommendations are displayed.
However further analysis of the actions of those minority of triallists that viewed the trial
recommendation pages and clicked through to particular items, showed that a substantial proportion
went on to purchase and view (if tVoD) or view (if sVoD), items (see Table 8). Although there was little
difference between the group receiving the MyMedia BPRMF algorithm-generated recommendations
and the group receiving the Editorial recommendations for tVoD viewing, it showed that a
recommender algorithm using only very sparse implicit feedback could compete with the expertise of
the professional Editorial marketing team. Interestingly the triallists viewing the pages from the
MyMedia recommendation group had a higher rate of sVoD viewing activity, suggesting that the
algorithm-generated recommendations could generate greater engagement with other aspects of the
BT Vision service, even if they were not recommending those aspects directly.
Additonal tests of the ability of the MyMedia algorithm and the editorial recommendations to predict
user preferences for purchasing and viewing items were carried out, to see whether they could still do
this well when viewers had not accessed the pages. An evaluation metric based on hit-rate was used.
The results confirmed the skewed level of purchasing and viewing activity identified earlier, with most
users only viewing a few items. All levels of hit-rate were low (not higher than 0.05), although it was
interesting that in one month (September) hit-rate showed no difference between the editorial and
recommendation groups, while in August the editorial group produced higher hit-rates. This appeared to
be a result of the context in which the editorial recommendations were chosen, where the editorial
team also marketed the same items by other means, allowing triallists to learn about them even if they
had not viewed the recommendation pages.

December 2010 Public Document
MyMedia ICT-2008-215006 Page | 43
The BT MyMedia field trial demonstrated the importance of a clear and accessible user interface for a
recommender system, something now being focused upon in the BT Vision system. It also showed the
importance of recommender systems as marketing tools being integrated with other forms of marketing
in a business context (in this case the editorial recommendations), and it demonstrated the need for
understanding the user experience in more detail at an individual level in addition to doing so at a high-
level quantitative study. Because of the very large scale of the BT MyMedia field trial and its need to
align with BT Vision business decisions it was not possible to carry out data analysis in a form consistent
with the other field trials carried out in the MyMedia project, but the information that was obtained
supported the findings of the other field trials of the importance of recommendation systems in
appropriate contexts, user interfaces and with means of interaction and feedback.
The BT MyMedia field trial, BT’s involvement in the MyMedia project, and the various “pre-trials” that
have been carried out in BT prior to this trial, have indicated the importance of recommendation as a
tool towards personalisation of consumer services to BT’s business, and have established worthwhile
links between a necessarily application-focused organisation and other partners in the recommendation
area who have research expertise and a relevant longer-term view. The overall product of this
collaboration has not just been the outcome of several field trials but also the release of the MyMedia
software framework, which offers the potential for other researchers to carry out other experiments
and field trials in the future.

December 2010 Public Document
MyMedia ICT-2008-215006 Page | 44
10 References
[1] Meesters, L., Marrow, P., Knijnenburg, B., et al. (2009) MyMedia project deliverable D1.5 End-user
recommendation evaluation metrics. Downloadable from
http://www.mymediaproject.org/Deliverables.aspx
[2] Knijnenburg, B., Meesters, L., Marrow, P. & Bouwhuis, D. (2010) User-centric evaluation framework
for multimedia recommender systems. User Centric Media (Akan, O., Bellavista, P., Cao, J., Dressler, F.,
Ferrari, D., Gerla, M., Kobayashi, H., Palazzo, S., Sahni, S., Shen, X., Stan, M., Xiaohua, J., Zomaya, A.,
Coulson, G. , Daras, P. & Ibarra, O.M., eds.) Lecture Notes of the Institute for Computer Sciences, Social
Informatics and Telecommunications Engineering 40, 366-369. Springer: Berlin Heidelberg.
[3] Siegel, S. & Castellan, N.J. (1988) Nonparametric statistics for the Behavioural Sciences. McGraw-Hill:
New York.
[4] Maindonald, J. & Braun, J. (2003) Data Analysis and Graphics Using R – an Example-based Approach.
Cambridge University Press: Cambridge.
[5]Deshpande, M. & Karypis, G. (2004) Item-based Top-N recommendation algorithms. ACM Trans. Inf.
Sys. 22(1), 143-177.
[6] Rendle, S., Tso-Sutter, K., Huijsen, W., et al. (2009) MyMedia project deliverable D4.1.2 State-of-the-
Art Recommender Algorithms. Downloadable from http://www.mymediaproject.org/Deliverables.aspx
[7] Wartena, C., Gazendam, L., Brusee, R., et al. (2010) MyMedia project deliverable D3.1.3 Metadata
Enrichment Modules Documentation and Software. Downloadable from
http://www.mymediaproject.org/Deliverables.aspx
[8] Meesters, L., Marrow, P., Matthews, I., et al. (2009) MyMedia project deliverable D1.4 User Control
Design Specification. User Control Test Results Report. Downloadable from
http://www.mymediaproject.org/Deliverables.aspx
11 Acknowledgements
We thank Tamas Jambor, a BT-funded PhD student at University College London, for his assistance with
the hit-rate metric described above, developed in the context of his PhD research.

December 2010 Public Document
MyMedia ICT-2008-215006 Page | 45


