Embed Size (px)
Citation preview
Ultrasound in Med. & BioL Vol. 19, No. 8, pp. 619-633, 1993 0301-5629/93 $6.00 + .00 Printed in the USA © 1993 Pergamon Press Ltd.
OOriginal Contribution i
M Y O C A R D I A L R E G I O N A L B L O O D F L O W : Q U A N T I T A T I V E M E A S U R E M E N T BY C O M P U T E R A N A L Y S I S O F C O N T R A S T
E N H A N C E D E C H O C A R D I O G R A P H I C I M A G E S
V I C T O R MoR-AVI,* D A N I E L DAVID,* SOLANGE AKSELROD, t YVES BITTON ~ a n d ITZHAK CHOSHNIAK*
*Medical Physics Laboratory, School of Physics, Tel Aviv University, tDepartment of Cardiology, Meir General Hospital, Kfar Saba, and *Department of Zoology, Faculty of Life Sciences, Tel Aviv University, Israel
(Received 12 October 1992; in final form 17 May 1993)
Abstrnct--Quantitation of regional myocardial blood flow constitutes the missing link between the anatomy of coronary obstruction and its physiological effect on regional oxygensupply. Microscopic air bubbles, introduced into the coronary circulation, were shown to produce a transitory enhancement of the myocardial tissue contrast, easily detectable with standard ultrasonic imaging equipment. This study presents a new approach linking the tissue blood flow with the time-dependent changes in the intensity of the ultrasonic reflections produced by the microbubbles. The tissue blood flow is evaluated using the well-known indicator dilution relation, according to which flow equals the ratio between the intravascular fraction of the tissue sample volume and the mean transit time of the contrast agent. We derive these two parameters from the time curves representing the contrast induced variations in the mean videointensity measured in two regions of interest, a reference region in the left ventricular cavity and the region of interest within the myocardial tissue. The intravascular volume fraction is computed as the ratio of the total power of the above two intensity curves, as each of these is assumed to be proportional to the total amount of tracer traversing the corresponding region of interest. The mean transit time is computed using com- bined time- and frequency-domain processing, involving Fourier deconvolution of the response function of the myocardial tissue sample. This approach was validated in an in vivo model in a series of animal experiments involving left atrial injection of albumin coated air microhuhbles (Alhunex®). Videointensity curves obtained during contrast enhancement of the myocardium were analyzed to provide values of regional myocardial blood flow (in mL/min]100 g) in 45 myocardial regions of interest defined in 7 experiments performed on 4 animals. The values obtained with our approach correlated well (r = 0.77, p < 0.001) with standard reference measurements based on radiolabeled microspberes. The interteclmique variability was found to be smaller than the intersegment variability characterizing our technique. The difference between the mean flow values obtained with microspheres for segments of the entire heart and the mean flow obtained with our technique for all regions of interest ranged between 1 to 19% in the 7 experiments. In its present form, based on left atrial or left ventricnlar injection of contrast solution, this method may allow, for the first time, quantitative evaluation of myocardial regional blood supply in the cardiac catheterization laboratory or the operation theater. With further development of contrast agents suitable for transpulmonary enhancement of the myocardium by peripheral intravenous injection, this technique may provide the basis for the noninvasive quantitative measurement of myocardial tissue blood flow.
Key Words: Myocardial perfusion, Regional tissue blood flow, Echocardiographic contrast media, Indicator dilution, Mean transit time.
INTRODUCTION
The need for fast, reliable and noninvasive methods for the early detection of coronary heart disease may hardly be overestimated. The most important parame- ters in the assessment of the physiological impact of coronary disease is the blood supply to various re-
Address correspondence to: Prof. S. Akselrod, School of Phys- ics, Tel Aviv University, Tel Aviv 69978, Israel.
619
gions of the heart muscle (Braunwald and Sobel 1984). Reduced blood flow in the coronary capillary bed leads to insufficient blood supply and causes im- pairment of myocardial function. To date, there is no readily available method for the quantitative assess- ment of myocardial tissue blood flow, either invasive or noninvasive (Armstrong 1986; Feinstein 1986; Marcus et al. 1987; Martin 1989). Most of the current techniques allow only the assessment of relative changes in regional myocardial blood flow (Marcus et
620 Ultrasound in Medicine and Biology
al. 1987), and none is sufficiently sensitive and accu- rate to supply a reliable absolute quantitative measure- ment in vivo. It is agreed that a reliable method for the quantitation of regional myocardial perfusion would provide the means for early detection of myocardial ischemia and possibly lessen the threat of coronary heart diseases (Armstrong 1986; Feinstein 1986; Mar- cus et al. 1987; Martin 1989).
One of the developments which has the potential to satisfy the clinical need for direct assessment of regional myocardial blood flow is associated with the use of contrast materials in ultrasonic imaging of the heart (Armstrong 1986; Braunwald and Sobel 1984; Feinstein 1986; Feinstein and Shah 1986; Feinstein et al. 1986; Marcus et al. 1987; Martin 1989). Different solutions have been suggested as carriers of relatively stable reproducible microscopic air bubbles compara- ble in size with the red blood cells (about 5 #m in diameter), and therefore suitable for echocardio- graphic enhancement in humans (Berwing and Schlepper 1988; Cheirifet al. 1988; Keller et al. 1986, 1989; Reisner et al. 1989; Rovai et al. 1987; Vander- berg et al. 1989). An indirect qualitative assessment of myocardial tissue blood flow has been achieved by visual examination of the differences in time depen- dence of the ultrasonic intensity reflected from various regions of the myocardium, following intra- coronary or aortic root injection of contrast media (Armstrong et al. 1982, 1983; Feinstein et al. 1988; Kaul et al. 1984, 1987a; Kemper et al. 1985; Lang et al. 1986; Tei et al. 1983). This allowed the differentia- tion between underperfused and normally perfused myocardial tissue. There have been several sugges- tions for providing quantitative markers related to re- gional blood flow, such as the peak gray level (Fein- stein and Shah 1986; Vanderberg et al. 1988), the time of peak contrast (Reisner et al. 1989), the width of the contrast appearance and washout curves (Keller et al. 1988), the area under these curves (Keller et al. 1988a), the time constants of best fit gamma-variate functions (Kaul et al. 1989; Shapiro et al. 1990a), etc. However, a method for direct quanti- tative measurement of regional blood flow based on contrast echocardiography has yet to be presented.
The aim of our study is the in vivo quantitation of regional myocardial perfusion by the analysis ofecho- cardiographic data acquired during contrast enhance- ment of the myocardium. This enhancement is achieved by injecting a contrast solution at a distant site (the left atrial cavity in the present study). Our approach was designed to be independent of the con- figuration of the contrast inflow reaching myocardial tissue, as well as on the dose of contrast solution.
Volume 19, Number 8, 1993
BASIC PRINCIPLES
Assumptions 1. The intravascular volume fraction fwithin a spe-
cific myocardial tissue sample is assumed to be constant during the time of measurement, apart from the intracyclic variations induced by cardiac contractions.
2. Total blood flow through the tissue sample is as- sumed to be invariant during measurement time. This assumption may be considered fairly true as measurement time is made short enough.
3. A nearly linear relation is assumed between the echocardiographic videointensity and the concen- tration of the bubbles in a sample volume. This is a very rough approximation for several reasons. First, the relation between concentration and backscatter intensity may be considered nearly lin- ear only at low concentrations (Powsner et al. 1986). Also, nonlinear gray maps and dynamic range compression are widely used in the ultra- sound equipment. Besides, as long as the time-gain compensation (TGC) function of the echo equip- ment is insensitive to variations in the acoustic properties of the structures more proximal to the transducer, it is not even evident that local varia- tions in videointensity reflect local variations in the acoustic properties of the corresponding tissues and organs.
4. Tracer inflow reaching the sample is not assumed to be instantaneous. This assumption gives our ap- proach its greatest advantage, since the ultimate goal is to allow the measurement of regional myo- cardial perfusion using peripheral intravenous in- jection of contrast material.
A more careful and detailed discussion of the above assumptions is provided in the Discussion section below. However, already at this point, we would like to stress that the severity of the difficul- ties posed by these assumptions should not be un- derestimated.
Indicator dilution The approach is based on the application of the
basic principles of indicator dilution theory (Gonza- lez-Fernandez 1962; Meier and Zierler 1954; Traut- man and Newbower 1984; Zeirler 1958, 1962) to flow dynamics in the microvasculature of a selected area of myocardial tissue. According to this theory, the amount of fluid flowing through a hydrodynamic sys- tem of a known volume in unit time (i.e., the flow) may be evaluated by introducing into the system
Myocardial perfusion measurement by contrast echocardiography • V. MOR-AVI el al. 621
small inert particles that can be traced by appropriate means.
The dynamics of the ideal tracer must be identi- cal to those of the fluid in the system, which was shown to be a good approximation in the case of soni- cated Albumin microbubbles (Keller et al. 1989). Thus, the mean transit time of the tracer particles may represent the time for the entire volume to be replaced by the inflow of fresh fluid. Therefore, pro- vided the volume of fluid in the system and the mean time of transit of the tracer particles through the sys- tem are known, the flow equals the ratio between these two parameters (Gonzalez-Fernandez 1962; Meier and Zieder 1954; Trautman and Newbower 1984; Zeirler 1958, 1962). Thus, in a tissue sample of volume V, containing microvasculature of volume iV, the knowledge of the mean transit time of the tracer, (t), allows to obtain the regional flow in the sample, J:
f V J - (1) ( t ) "
Evaluation of the mean transit time The evaluation of the mean transit time, (t),
under conditions of noninstantaneous hand-injection of contrast solution, has been achieved by frequency domain deconvolution of the characteristic response function. We have described the procedure in detail elsewhere (Mor-Avi et al. 1993). The computational aspects of this technique were validated by an exten- sive computer simulation study, and the optimization of the related parameters was achieved. The proce- dure was shown to yield reliable values of the mean transit time, (t), in a wide range of contrast inflow configurations and noise levels.
Evaluation of the blood volume Blood volume in the microscopic blood vessels
supplying the sample tissue may be evaluated by the analysis of the time dependence of echo intensity curves obtained from the different regions of the heart. The amount of tracer, Mp(t), in volume V of blood in a homogeneous blood pool upstream of the myocardial region of interest (such as the left ventricu- lar cavity or the aortic root), may be expressed as:
M~(t) = Vep(t). (2)
Similarly, the amount of tracer in the tissue sample, Ms(t), may be expressed as the product of blood vol- ume of the capillary bed of the sample tissue,f V, and the concentration of the tracer in the capillaries, cs(t):
Ms(t) = fVG(t). (3)
Dividing eqn (3) by eqn (2) and integrating with re- spect to time we obtain:
f ~ oo I +~ G(t)dt- +~ Ms(t)dt _ f
f_~ Mp(t)dt cp(t)dt (4)
It should be noted that the tracer concentration, cs(t), reaches its maximum value with some delay relative to the concentration in the pool, cp(t). Also, due to the different pathways used by the tracer particles in the sample tissue, a certain mixing takes place. Thus, the maximal tracer concentration in the blood entering the sample tissue, Cs(t), does not reach the same level as that in the reference region, cp(t). However, since bubbles flow with blood from the left ventricular cav- ity to the myocardium, the concentration of bubbles per unit volume of blood reaching myocardial tissue is similar to that in blood leaving the left ventricular cavity. Therefore, the conservation of mass requires that:
G(t)dt = cp(t)dt; o o oO
(5)
and therefore eqn (4) is immediately reduced to:
f•o• Ms(t)dt f = ~o (6)
f f oo Mp( t)dt o o
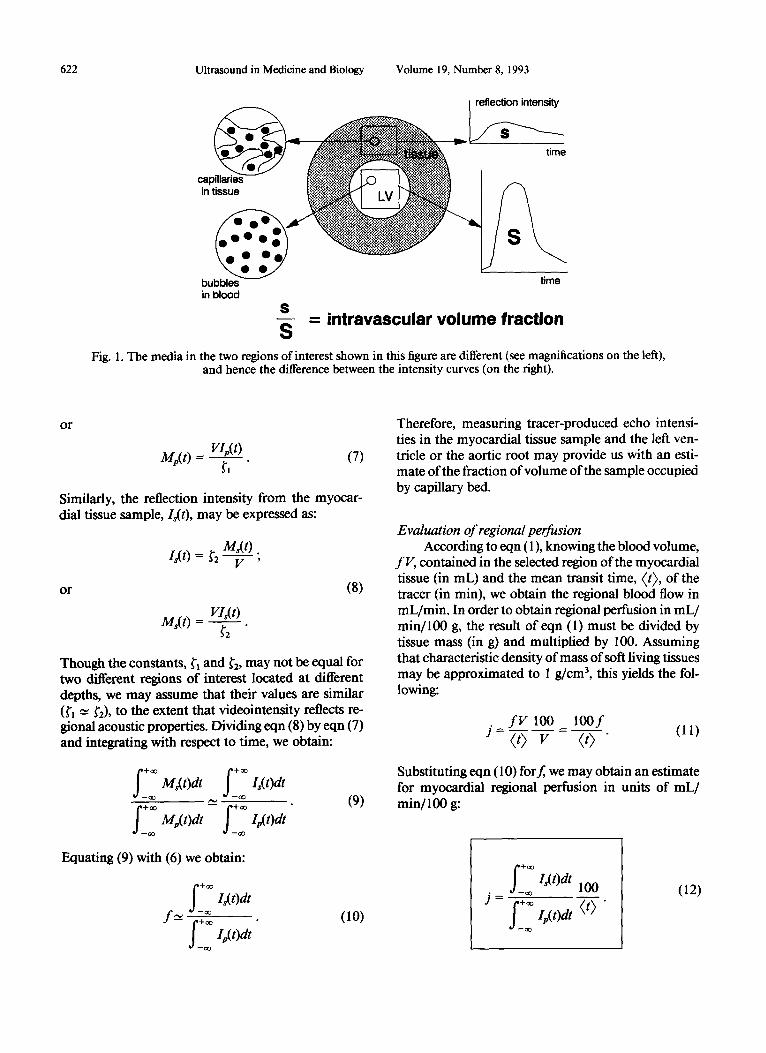
The result of eqn (6) promises to provide an estimate off(Fig. 1). However, Ms(t) and Mp(t) are not directly measurable, and they must be replaced by the ultra- sonic reflection intensities, Is(t) and Ip(t) as explained below.
As already mentioned above, we assume a linear relationship between tracer-produced intensity of the ultrasonic reflection from a certain region of interest and the amount oftracer per unit volume in that spe- cific region. The validity of this approximation is dis- cussed later on. This assumption allows us, however, to express the intensity of the reflection from the blood pool, Ip(t), as:
Mp(t) . Ip(t)= ~, V '
622 Ultrasound in Medicine and Biology Volume 19, Number 8, 1993
cal: in
bubbleS umu in b lood
$ = intravascular vo lume fraction
S Fig. 1. The media in the two regions of interest shown in this figure are different (see magnifications on the left),
and hence the difference between the intensity curves (on the right).
o r
VI.(t) M p ( t ) = ~1 ( 7 )
Similarly, the reflection intensity from the myocar- dial tissue sample, Is(t), may be expressed as:
M,(t) . 6 ( 0 = ~2 V '
or (8)
VI~(t) M~(t ) =
Though the constants, ~'~ and g'2, may not be equal for two different regions of interest located at different depths, we may assume that their values are similar (fl -~ ~'2), to the extent that videointensity reflects re- gional acoustic properties. Dividing eqn (8) by eqn (7) and integrating with respect to time, we obtain:
+= M~(t)dt I~(t)dt
oo oo
(9)
Equating (9) with (6) we obtain:
f _ ~ I~( Odt f~_ =
f ~o~ /p(t)dt oo
( lO)
Therefore, measuring tracer-produced echo intensi- ties in the myocardial tissue sample and the left ven- tricle or the aortic root may provide us with an esti- mate of the fraction of volume of the sample occupied by capillary bed.
Evaluation of regional perfusion According to eqn (1), knowing the blood volume,
fV , contained in the selected region of the myocardial tissue (in mL) and the mean transit time, (t), of the tracer (in min), we obtain the regional blood flow in mL/min. In order to obtain regional perfusion in mL/ min/100 g, the result of eqn (1) must be divided by tissue mass (in g) and multiplied by 100. Assuming that characteristic density of mass of soft living tissues may be approximated to 1 g/cm 3, this yields the fol- lowing:
f V 100 lOO f J= } v-t = %5- (ll)
Substituting eqn (10) for f, we may obtain an estimate for myocardial regional perfusion in units of mL/ min/1 O0 g:
j = ~ oo
I~(t)dt lO0 oo
f • • I , , ( t )d t ( t ) " oo
(12)
Myocardial perfusion measurement by contrast echocardiography • V. MOR-AW et al. 623
M E T H O D S
The experimentation was carried out in two phases. Phase I experiments were conducted on 14 mongrel dogs (weight, 17-23 kg). These experiments were aimed at the optimization of the measurement conditions, including the handling of the contrast agent, the dosage of contrast solution and its composi- tion, the preferred site and rate of injection, the ultra- sonic imaging parameters (such as acoustic power, gain, TGC, transducer location and orientation), breathing conditions, definition of regions of interest, etc. Phase II experiments were designed for the valida- tion of our echo contrast technique with the standard reference technique based on radiolabeled micro- spheres. Seven phase II experiments were performed in 4 animals (weight, 19-22 kg) according to the con- ditions defined by the observations and conclusions in phase I experiments.
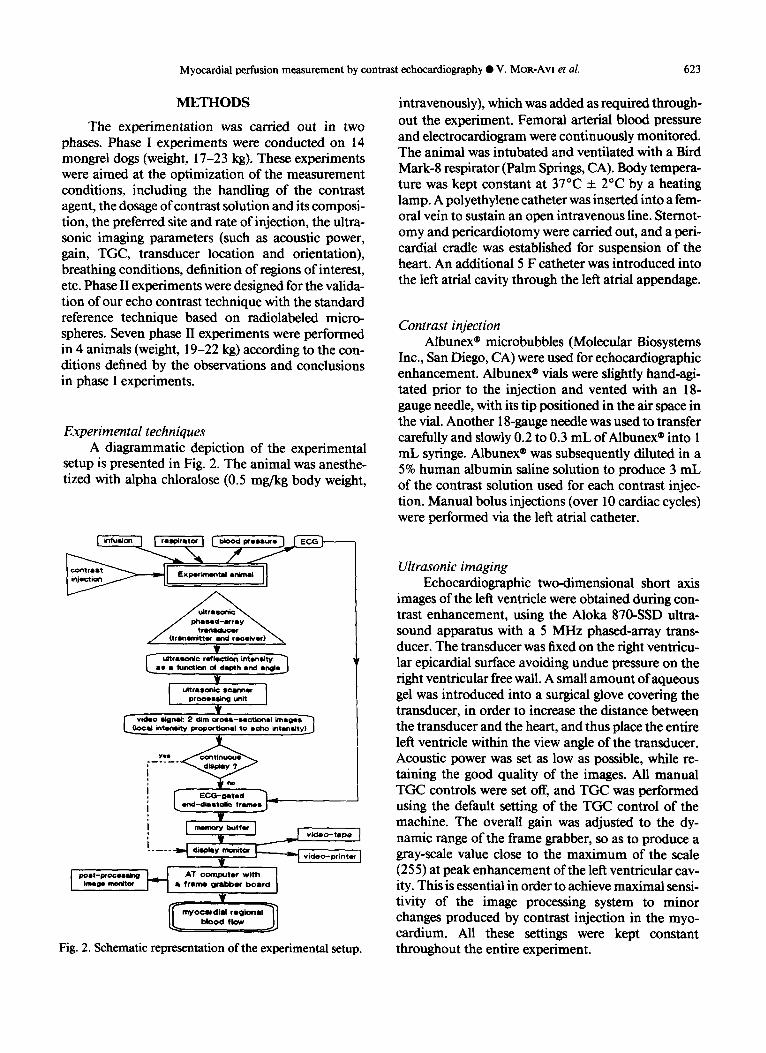
Experimental techniques A diagrammatic depiction of the experimental
setup is presented in Fig. 2. The animal was anesthe- tized with alpha chloralose (0.5 mg/kg body weight,
¥
I~'~o s~ng unit I ¥
ideo stgnld: 2 ~lim cros t -sectk~a l im.ges~ ' ] e! intenshy proportional to echo intens~ty)J
~.nd_ SC~r'O*ted ~1 dia Iltolie f r m s . . J - -
¥
V __---7--] v~ ,o -~ . , . I . . . . . ---I *"~y ~ t ~ ] video-prlnter
Image monitor Ik f r m grabber board
T ff oo.rd,-, "o a' 7
Fig. 2. Schematic representation of the experimental setup.
intravenously), which was added as required through- out the experiment. Femoral arterial blood pressure and electrocardiogram were continuously monitored. The animal was intubated and ventilated with a Bird Mark-8 respirator (Palm Springs, CA). Body tempera- ture was kept constant at 37°C +_ 2°C by a heating lamp. A polyethylene catheter was inserted into a fem- oral vein to sustain an open intravenous line. Sternot- omy and pericardiotomy were carried out, and a peri- cardial cradle was established for suspension of the heart. An additional 5 F catheter was introduced into the left atrial cavity through the left atrial appendage.
Contrast injection Albunex ® microbubbles (Molecular Biosystems
Inc., San Diego, CA) were used for echocardiographic enhancement. Albunex ® vials were slightly hand-agi- tated prior to the injection and vented with an 18- gauge needle, with its tip positioned in the air space in the vial. Another 18-gauge needle was used to transfer carefully and slowly 0.2 to 0.3 mL ofAlbunex ® into 1 mL syringe. Albunex ® was subsequently diluted in a 5% human albumin saline solution to produce 3 mL of the contrast solution used for each contrast injec- tion. Manual bolus injections (over 10 cardiac cycles) were performed via the left atrial catheter.
Ultrasonic imaging Echocardiographic two-dimensional short axis
images of the left ventricle were obtained during con- trast enhancement, using the Aloka 870-SSD ultra- sound apparatus with a 5 MHz phased-array trans- ducer. The transducer was fixed on the right ventricu- lar epicardial surface avoiding undue pressure on the right ventricular free wall. A small amount of aqueous gel was introduced into a surgical glove covering the transducer, in order to increase the distance between the transducer and the heart, and thus place the entire left ventricle within the view angle of the transducer. Acoustic power was set as low as possible, while re- taining the good quality of the images. All manual TGC controls were set off, and TGC was performed using the default setting of the TGC control of the machine. The overall gain was adjusted to the dy- namic range of the frame grabber, so as to produce a gray-scale value close to the maximum of the scale (255) at peak enhancement of the left ventricular cav- ity. This is essential in order to achieve maximal sensi- tivity of the image processing system to minor changes produced by contrast injection in the myo- cardium. All these settings were kept constant throughout the entire experiment.
624 Ultrasound in Medicine and Biology
Data acquisition The respiration was stopped for the short period
of image acquisition (64 heartbeats, less than l min), in order to minimize cardiac translation due to respi- ratory chest movements. A series of end-diastolic images of 64 successive heart beats was selectively ac- quired for each contrast injection by a cine-memory of the ultrasonic scanner using ECG gating. These in- cluded l 0 preinjection frames, followed by additional 54 postinjection frames. All images were transferred to an AT compatible personal computer equipped with a frame grabber (DT-2851 model, Data Transla- tion Co., Marlboro, MA) for further analysis.
Experimental protocols
Phase I experiments. The aim of these experi- ments was to acquire the skills necessary for perform- ing the validation of the measurement of regional flow in phase II. Each of these experiments was de- signed for a specific purpose, and each was conducted according to a predetermined protocol, different from one experiment to another. This extensive learning period determined the conditions for performing phase II.
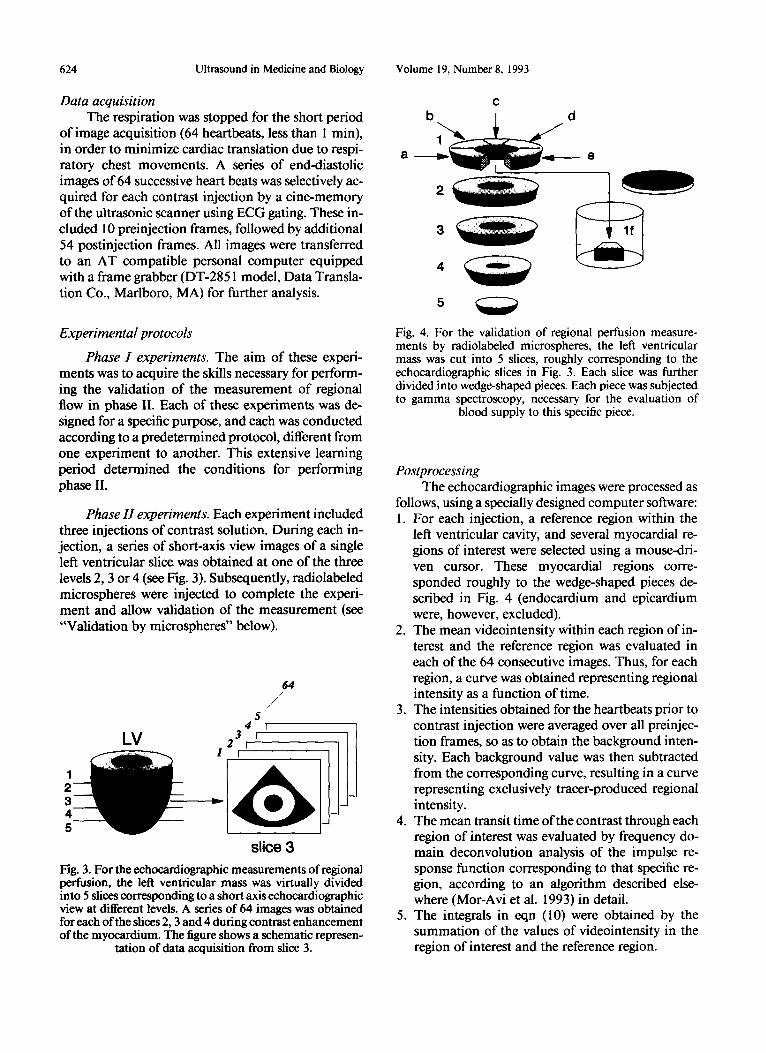
Phase H experiments. Each experiment included three injections of contrast solution. During each in- jection, a series of short-axis view images of a single left ventricular slice was obtained at one of the three levels 2, 3 or 4 (see Fig. 3). Subsequently, radiolabeled microspheres were injected to complete the experi- ment and allow validation of the measurement (see "'Validation by microspheres" below).
5 4
3 i 2 r
64 /
, / '
Lv II 1 1 2 3 4 5
slice 3
Fig. 3. For the echocardiographic measurements of regional perfusion, the left ventricular mass was virtually divided into 5 slices corresponding to a short axis echocardiographic view at different levels. A series of 64 images was obtained for each of the slices 2, 3 and 4 during contrast enhancement of the myocardium. The figure shows a schematic represen-
tation of data acquisition from slice 3.
Volume 19, Number 8, 1993
t2
2
d
- - O
Fig. 4. For the validation of regional perfusion measure- ments by radiolabeled microspheres, the left ventricular mass was cut into 5 slices, roughly corresponding to the echocardiographic slices in Fig. 3. Each slice was further divided into wedge-shaped pieces. Each piece was subjected to gamma spectroscopy, necessary for the evaluation of
blood supply to this specific piece.
Postprocessing The echocardiographic images were processed as
follows, using a specially designed computer software: 1. For each injection, a reference region within the
left ventricular cavity, and several myocardial re- gions of interest were selected using a mouse-dri- ven cursor. These myocardial regions corre- sponded roughly to the wedge-shaped pieces de- scribed in Fig. 4 (endocardium and epicardium were, however, excluded).
2. The mean videointensity within each region of in- terest and the reference region was evaluated in each of the 64 consecutive images. Thus, for each region, a curve was obtained representing regional intensity as a function of time.
3. The intensities obtained for the heartbeats prior to contrast injection were averaged over all preinjec- tion frames, so as to obtain the background inten- sity. Each background value was then subtracted from the corresponding curve, resulting in a curve representing exclusively tracer-produced regional intensity.
4. The mean transit time of the contrast through each region of interest was evaluated by frequency do- main deconvolution analysis of the impulse re- sponse function corresponding to that specific re- gion, according to an algorithm described else- where (Mor-Avi et al. 1993) in detail.
5. The integrals in eqn (10) were obtained by the summation of the values of videointensity in the region of interest and the reference region.
Myocardial perfusion measurement by contrast echocardiography • V. MOR-AVl et al. 625
6. Regional perfusion was finally computed from the results of the latter two phases according to eqn (12).
Validation by radiolabeled microspheres Seven experiments, including measurements of
regional myocardial blood flow by the standard refer- ence technique (Heymann et al. 1977; Kaul et al. 1989; Kerber et al. 1975; Marcus et al. 1975), based on radiolabeled microspheres were performed. In each experiment, microspheres (10-12 #m diameter) labeled with 46Sc (889.2 keV and 1120.5 keV), or SSSr (514.0 keV) isotopes (Dupont, New England Nuclear Co.) were injected following the acquisition of echo- cardiographic data. During each injection of micro- spheres, a reference arterial blood sample was ob- tained for 60 s, using a withdrawal pump (Harvard, Model 644) with a 8 F catheter placed in the right femoral artery. Withdrawal of reference blood was ini- tiated just prior to injection of the microspheres, and the withdrawal rate was determined by weighing the collected reference blood.
At the end of each experiment, the animal was sacrificed. The heart was excised and the left ventricu- lar myocardium was separated from other tissues. It was subsequently cut into 5 horizontal slices about 1 cm thick. Each slice was divided into 5 to 6 wedge- shaped segments. Each segment was sealed in a 20 mL plastic vial for activity counting (Fig. 4). All tissue samples were weighed immediately upon sealing. Ref- erence blood was transferred into separate vials, in- cluding the saline used for the thorough flushing of the syringe, so that each vial contained up to 10 mL of fluid.
The activity of each wedge-shaped myocardial tissue sample and reference blood sample was mea- sured using a high resolution Ge detector and a multi- channel analyzer PC board, operated by a commer- cial software package (System-100, Canberra Indus- tries Inc., Meriden, CT). Spectral resolution was set so as to produce complete separation between the above three spectral peaks characteristic to the gamma emis- sion spectra of the above isotopes.
Each sample was counted, so as to produce statis- tical error of not more than 15%. Count rates were obtained for each sample by dividing total counts by counting time. For each isotope, count rate of the ref- erence blood was evaluated by the summation of the count rates of all blood vials. Blood flow to each tissue sample (in mL/min) was evaluated as follows:
tissue CR J - reference CR WR, (13)
where CR denotes count rate, and WR stands for the withdrawal rate (in mL/min). Regional perfusion, j, in each tissue sample (in mL/min/100 g) was evalu- ated by dividing the flow, J, by the sample mass (in g) and multiplying by 100.
Statistical analysis The correlation between the values of regional
myocardial blood flow obtained by our method for the different regions of interest and with microspheres for the different myocardial segments was evaluated by computing the Pearson product moment correla- tion coefficient (Glantz 1981). The hypothesis that there is no trend relating these two variables was tested using the t test (Glantz 1981).
RESULTS
Phase I experiments: Evaluation of conditions Phase I experiments resulted in the determina-
tion of the conditions (handling of contrast agent and its dose, respiratory movements, selection of regions of interest, etc.) for the optimization of the assessment of regional myocardial perfusion. Some of the obser- vations made during these experiments were previ- ously reported by other investigators. Therefore, we briefly present below only those results necessary to justify the experimental techniques used in phase II experiments.
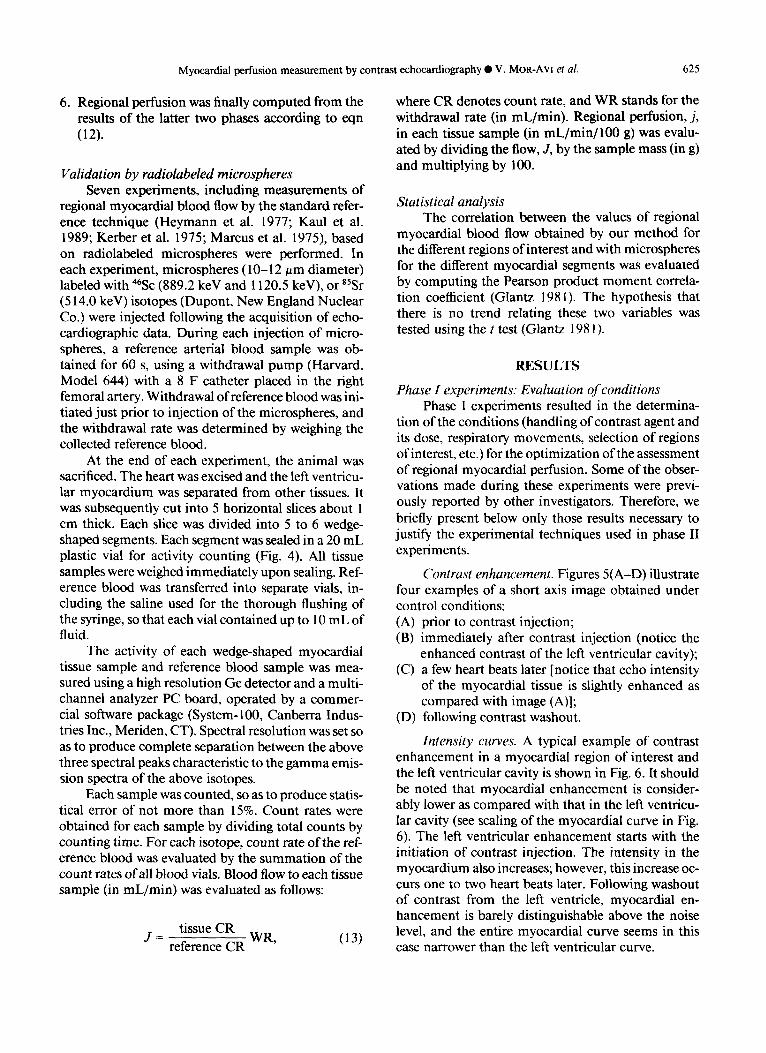
Contrast enhancement. Figures 5(A-D) illustrate four examples of a short axis image obtained under control conditions: (A) prior to contrast injection; (B) immediately after contrast injection (notice the
enhanced contrast of the left ventricular cavity); (C) a few heart beats later [notice that echo intensity
of the myocardial tissue is slightly enhanced as compared with image (A)];
(D) following contrast washout.
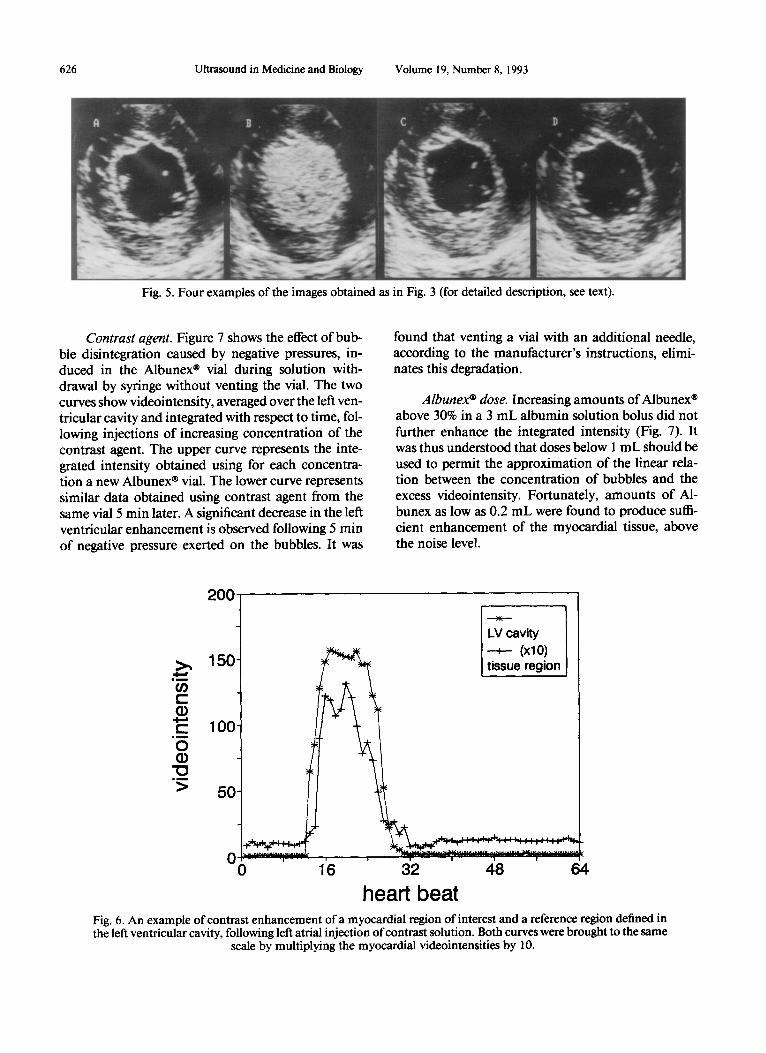
Intensity curves. A typical example of contrast enhancement in a myocardial region of interest and the left ventricular cavity is shown in Fig. 6. It should be noted that myocardial enhancement is consider- ably lower as compared with that in the left ventrieu- lar cavity (see scaling of the myocardial curve in Fig. 6). The left ventricular enhancement starts with the initiation of contrast injection. The intensity in the myocardium also increases; however, this increase oc- curs one to two heart beats later. Following washout of contrast from the left ventricle, myocardial en- hancement is barely distinguishable above the noise level, and the entire myocardial curve seems in this case narrower than the left ventricular curve.
626 Ultrasound in Medicine and Biology Volume 19, Number 8, 1993
Fig. 5. Four examples of the images obtained as in Fig. 3 (for detailed description, see text).
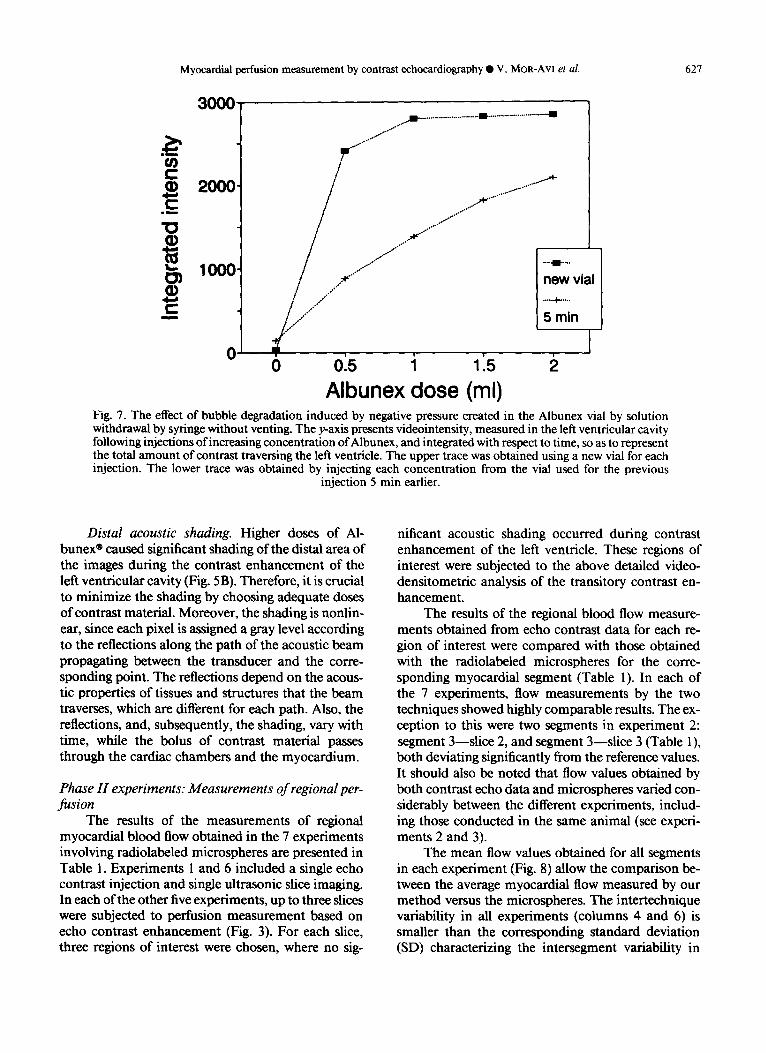
Contrast agent. Figure 7 shows the effect of bub- ble disintegration caused by negative pressures, in- duced in the Albunex ® vial during solution with- drawal by syringe without venting the vial. The two curves show videointensity, averaged over the left ven- tricular cavity and integrated with respect to time, fol- lowing injections of increasing concentration of the contrast agent. The upper curve represents the inte- grated intensity obtained using for each concentra- tion a new Albunex ® vial. The lower curve represents similar data obtained using contrast agent from the same vial 5 min later. A significant decrease in the left ventricular enhancement is observed following 5 min of negative pressure exerted on the bubbles. It was
found that venting a vial with an additional needle, according to the manufacturer's instructions, elimi- nates this degradation.
Albunex* dose. Increasing amounts ofAlbunex ® above 30% in a 3 mL albumin solution bolus did not further enhance the integrated intensity (Fig. 7). It was thus understood that doses below 1 m L should be used to permit the approximation of the linear rela- tion between the concentration of bubbles and the excess videointensity. Fortunately, amounts of AI- bunex as low as 0.2 mL were found to produce suffi- cient enhancement of the myocardial tissue, above the noise level.
200
>.,
¢-
¢.. m ~
0
" 0 , m
>
150
100
50
0 i i
16
LV cavity , (xl O)
tissue region
' ' 4 8 ' 32 64
h e a r t b e a t
Fig. 6. An example of contrast enhancement of a myocardial re#on of interest and a reference re#on defined in the left ventricular cavity, following left atrial injection of contrast solution. Both curves were brought to the same
scale by multiplying the myocardial videointensities by 10.
Myocardial perfusion measurement by contrast echocardiography • V. MOR-AVI et al. 627
3000'
t - 2000
¢ -
10
looo
r - m
0
../.-'°"
°~,e..~ "~°" / t . o o''
n e w vial
5 rain
I '5 o o15 i 1.
A lbunex close (ml) Fig. 7. The effect of bubble degradation induced by negative pressure created in the Albunex vial by solution withdrawal by syringe without venting. The y-axis presents videointensity, measured in the left ventricular cavity following injections of increasing concentration of Albunex, and integrated with respect to time, so as to represent the total amount of contrast traversing the left ventricle. The upper trace was obtained using a new vial for each injection. The lower trace was obtained by injecting each concentration from the vial used for the previous
injection 5 min earlier.
Distal acoustic shading. Higher doses of A1- bunex ® caused significant shading of the distal area of the images during the contrast enhancement of the left ventricular cavity (Fig. 5B). Therefore, it is crucial to minimize the shading by choosing adequate doses of contrast material. Moreover, the shading is nonlin- ear, since each pixel is assigned a gray level according to the reflections along the path of the acoustic beam propagating between the transducer and the corre- sponding point. The reflections depend on the acous- tic properties of tissues and structures that the beam traverses, which are different for each path. Also, the reflections, and, subsequently, the shading, vary with time, while the bolus of contrast material passes through the cardiac chambers and the myocardium.
Phase H experiments: Measurements of regional per- fusion
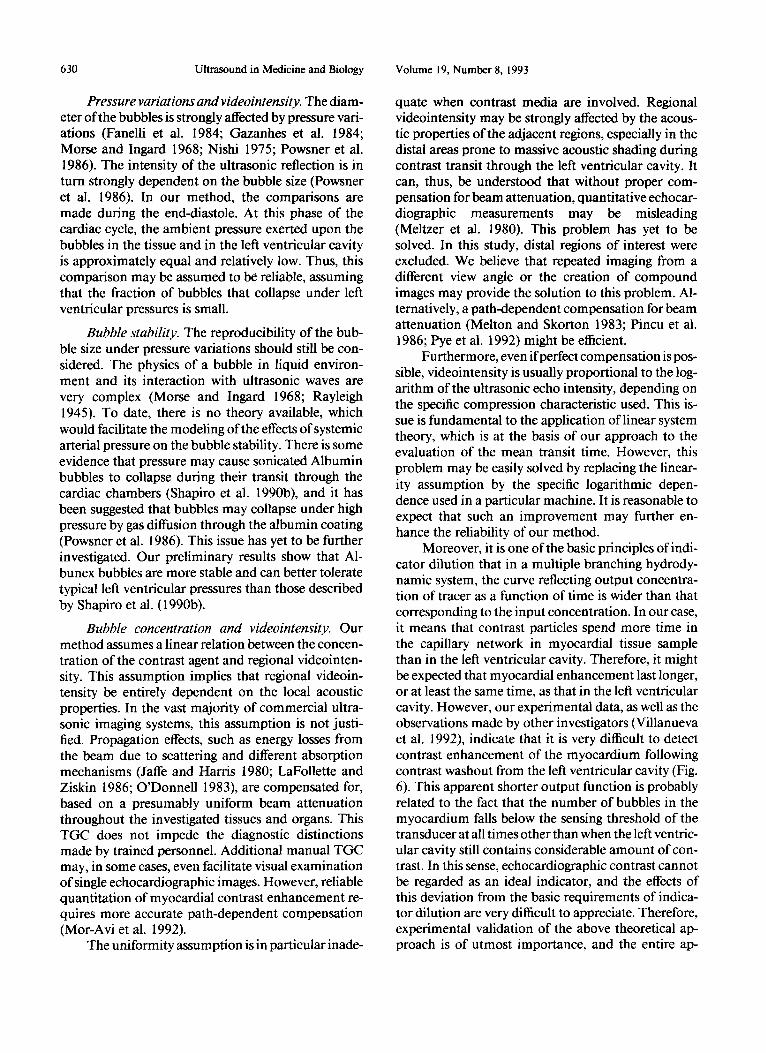
The results of the measurements of regional myocardial blood flow obtained in the 7 experiments involving radiolabeled microspheres are presented in Table 1. Experiments 1 and 6 included a single echo contrast injection and single ultrasonic slice imaging. In each of the other five experiments, up to three slices were subjected to perfusion measurement based on echo contrast enhancement (Fig. 3). For each slice, three regions of interest were chosen, where no sig-
nificant acoustic shading occurred during contrast enhancement of the left ventricle. These regions of interest were subjected to the above detailed video- densitometric analysis of the transitory contrast en- hancement.
The results of the regional blood flow measure- ments obtained from echo contrast data for each re- gion of interest were compared with those obtained with the radiolabeled microspheres for the corre- sponding myocardial segment (Table 1). In each of the 7 experiments, flow measurements by the two techniques showed highly comparable results. The ex- ception to this were two segments in experiment 2: segment 3--slice 2, and segment 3--slice 3 (Table 1), both deviating significantly from the reference values. It should also be noted that flow values obtained by both contrast echo data and microspheres varied con- siderably between the different experiments, includ- ing those conducted in the same animal (see experi- ments 2 and 3).
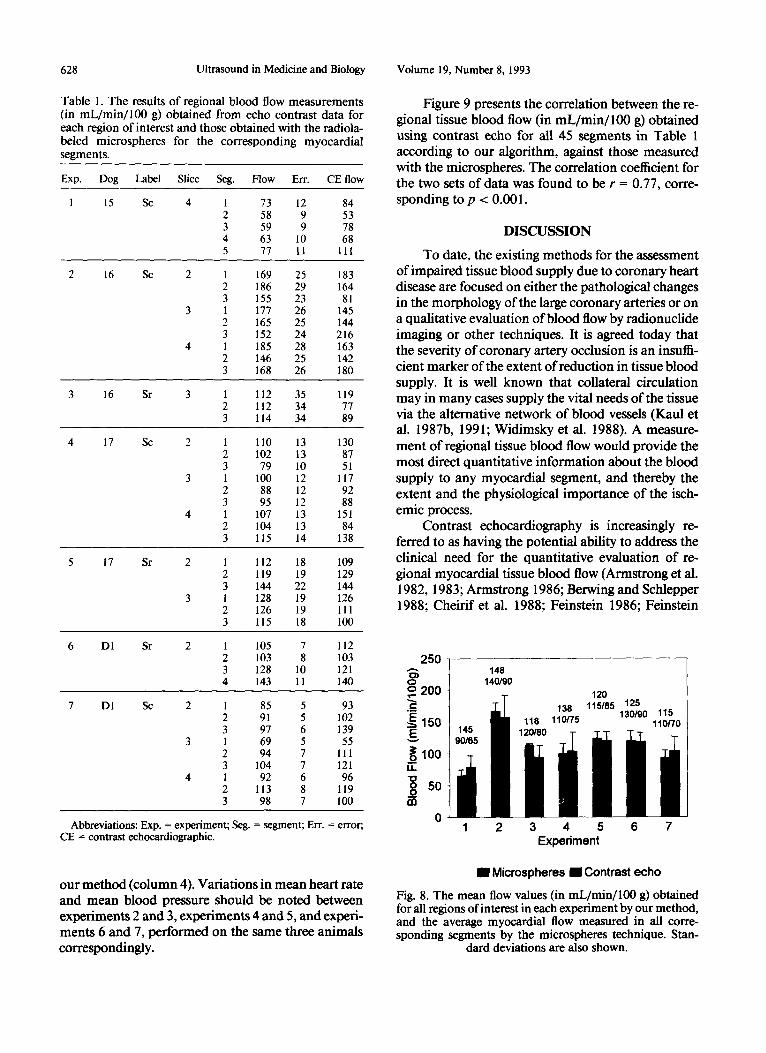
The mean flow values obtained for all segments in each experiment (Fig. 8) allow the comparison be- tween the average myocardial flow measured by our method versus the microspheres. The intertechnique variability in all experiments (columns 4 and 6) is smaller than the corresponding standard deviation (SD) characterizing the intersegment variability in
628 Ultrasound in Medicine and Biology Volume 19, Number 8, 1993
Table 1. The results of regional blood flow measurements (in m L / m i n / l O 0 g) obtained from echo contrast data for each region of interest and those obtained with the radio|a- beled microspheres for the corresponding myocardial segments.
Exp. Dog Label Slice Seg. Flow Err. CE flow
1 15 Sc 4 1 73 12 84 2 58 9 53 3 59 9 78 4 63 I0 68 5 77 11 111
2 16 Sc 2 1 169 25 183 2 186 29 164 3 155 23 81
3 1 177 26 145 2 165 25 144 3 152 24 216
4 1 185 28 163 2 146 25 142 3 168 26 180
3 16 Sr 3 1 112 35 119 2 112 34 77 3 114 34 89
4 17 Sc 2 1 110 13 130 2 102 13 87 3 79 10 51
3 1 100 12 117 2 88 12 92 3 95 12 88
4 1 107 13 151 2 104 13 84 3 115 14 138
5 17 Sr 2 1 112 18 109 2 119 19 129 3 144 22 144 1 128 19 126 2 126 19 111 3 115 18 100
6 DI Sr 2 1 105 7 112 2 103 8 103 3 128 10 121 4 143 11 140
7 DI Sc 2 1 85 5 93 2 91 5 102 3 97 6 139
3 1 69 5 55 2 94 7 111 3 104 7 121
4 1 92 6 96 2 113 8 119 3 98 7 100
Abbreviations: Exp. = experiment; Seg. = segment; Err. = error; CE = contrast echocardiographic.
our method (column 4). Variations in mean heart rate and mean blood pressure should be noted between experiments 2 and 3, experiments 4 and 5, and exper i - m e n t s 6 and 7, performed on the same three animals correspondingly.
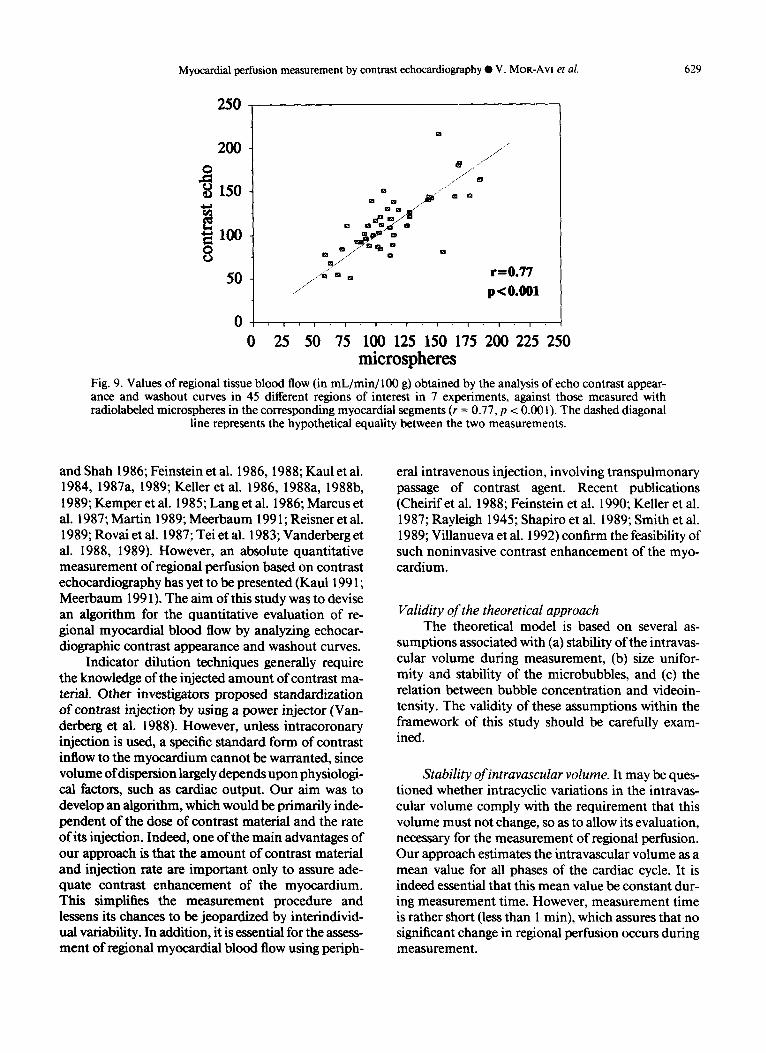
Figure 9 presents the correlation between the re- gional tissue blood flow (in mL/min/100 g) obtained using contrast echo for all 45 segments in Table 1 according to our algorithm, against those measured with the microspheres. The correlation coefficient for the two sets of data was found to be r = 0 .77, corre- sponding to p < 0 .001.
DISCUSSION
To date, the existing methods for the assessment of impaired tissue blood supply due to coronary heart disease are focused on either the pathological changes in the morphology of the large coronary arteries or on a qualitative evaluation of blood flow by radionuclide imaging or other techniques. It is agreed today that the severity of coronary artery occlusion is an insuffi- cient marker of the extent of reduction in tissue blood supply. It is well known that collateral circulation may in many cases supply the vital needs of the tissue via the alternative network of blood vessels (Kaul et al. 1987b, 1991; Widimsky et al. 1988). A measure- ment of regional tissue blood flow would provide the most direct quantitative information about the blood supply to any myocardial segment, and thereby the extent and the physiological importance of the isch- emic process.
Contrast echocardiography is increasingly re- ferred to as having the potential ability to address the clinical need for the quantitative evaluation of re- gional myocardial tissue blood flow (Armstrong et al. 1982, 1983; Armstrong 1986; Berwing and Schlepper 1988; Cheirif ct al. 1988; Feinstein 1986; Feinstein
250
o 200 "2
~150
Eo~lO0 I . I . "1=1 _~ so m
1 2 3 4 5 6 7 Experiment
[ ] Microspheres [ ] Contrast echo
Fig. 8. The mean flow values (in mL/min/100 g) obtained for all regions of interest in each experiment by our method, and the average myocardial flow measured in all corre- sponding segments by the microspheres technique. Stan-
dard deviations are also shown.
Myocardial perfusion measurement by contrast echocardiography • V. MOR-Avl et al. 629
250
200
"~150
8 50
0
m
B ...... ~ _
. . / ~ " D la
....'"
..I~"
0
. . . . / / ~
..,.:" ~ Q
r=0.77 p<O.O01
I I 1 I I I I I I
0 25 50 75 11~ 125 150 175 2110 225 250 mierospheres
Fig. 9. Values of regional tissue blood flow (in mL/min/100 g) obtained by the analysis of echo contrast appear- ance and washout curves in 45 different regions of interest in 7 experiments, against those measured with radiolabeled microspheres in the corresponding myocardial segments (r = 0.77, p < 0.001). The dashed diagonal
line represents the hypothetical equality between the two measurements.
and Shah 1986; Feinstein et al. 1986, 1988; Kaul et al. 1984, 1987a, 1989, Keller et al. 1986, 1988a, 1988b, 1989; Kemper et al. 1985; Lang et al. 1986; Marcus et al. 1987; Martin 1989; Meerbaum 1991; Reisner et al. 1989; Rovai et al. 1987; Tei et al. 1983; Vanderberg et al. 1988, 1989). However, an absolute quantitative measurement of regional perfusion based on contrast echocardiography has yet to be presented (Kaul 1991; Meerbaum 1991). The aim of this study was to devise an algorithm for the quantitative evaluation of re- gional myocardial blood flow by analyzing echocar- diographic contrast appearance and washout curves.
Indicator dilution techniques generally require the knowledge of the injected amount of contrast ma- terial. Other investigators proposed standardization of contrast injection by using a power injector (Van- derberg et al. 1988). However, unless intracoronary injection is used, a specific standard form of contrast inflow to the myocardium cannot be warranted, since volume of dispersion largely depends upon physiologi- cal factors, such as cardiac output. Our aim was to develop an algorithm, which would be primarily inde- pendent of the dose of contrast material and the rate ofits injection. Indeed, one of the main advantages of our approach is that the amount of contrast material and injection rate are important only to assure ade- quate contrast enhancement of the myocardium. This simplifies the measurement procedure and lessens its chances to be jeopardized by interindivid- ual variability. In addition, it is essential for the assess- ment of regional myocardial blood flow using periph-
eral intravenous injection, involving transpulmonary passage of contrast agent. Recent publications (Cheirif et al. 1988; Feinstein et al. 1990; Keller et al. 1987; Rayleigh 1945; Shapiro et al. 1989; Smith et al. 1989; Villanueva et al. 1992) confirm the feasibility of such noninvasive contrast enhancement of the myo- cardium.
Validity of the theoretical approach The theoretical model is based on several as-
sumptions associated with (a) stability of the intravas- cular volume during measurement, (b) size unifor- mity and stability of the microbubbles, and (c) the relation between bubble concentration and videoin- tensity. The validity of these assumptions within the framework of this study should be carefully exam- ined.
Stability ofintravascular volume. It may be ques- tioned whether intracyclic variations in the intravas- cular volume comply with the requirement that this volume must not change, so as to allow its evaluation, necessary for the measurement of regional perfusion. Our approach estimates the intravascular volume as a mean value for all phases of the cardiac cycle. It is indeed essential that this mean value be constant dur- ing measurement time. However, measurement time is rather short (less than 1 min), which assures that no significant change in regional perfusion occurs during measurement.
630 Ultrasound in Medicine and Biology Volume 19, Number 8, 1993
Pressure variations and videointensity. The diam- eter of the bubbles is strongly affected by pressure vari- ations (Fanelli et al. 1984; Gazanhes et al. 1984; Morse and Ingard 1968; Nishi 1975; Powsner et al. 1986). The intensity of the ultrasonic reflection is in turn strongly dependent on the bubble size (Powsner et al. 1986). In our method, the comparisons are made during the end-diastole. At this phase of the cardiac cycle, the ambient pressure exerted upon the bubbles in the tissue and in the left ventricular cavity is approximately equal and relatively low. Thus, this comparison may be assumed to be reliable, assuming that the fraction of bubbles that collapse under left ventricular pressures is small.
Bubble stability. The reproducibility of the bub- ble size under pressure variations should still be con- sidered. The physics of a bubble in liquid environ- ment and its interaction with ultrasonic waves are very complex (Morse and Ingard 1968; Rayleigh 1945). To date, there is no theory available, which would facilitate the modeling of the effects of systemic arterial pressure on the bubble stability. There is some evidence that pressure may cause sonicated Albumin bubbles to collapse during their transit through the cardiac chambers (Shapiro et al. 1990b), and it has been suggested that bubbles may collapse under high pressure by gas diffusion through the albumin coating (Powsner et al. 1986). This issue has yet to be further investigated. Our preliminary results show that A1- bunex bubbles are more stable and can better tolerate typical left ventricular pressures than those described by Shapiro et al. (1990b).
Bubble concentration and videointensity. Our method assumes a linear relation between the concen- tration of the contrast agent and regional videointen- sity. This assumption implies that regional videoin- tensity be entirely dependent on the local acoustic properties. In the vast majority of commercial ultra- sonic imaging systems, this assumption is not justi- fied. Propagation effects, such as energy losses from the beam due to scattering and different absorption mechanisms (Jaffe and Harris 1980; LaFollette and Ziskin 1986; O'Donnell 1983), are compensated for, based on a presumably uniform beam attenuation throughout the investigated tissues and organs. This TGC does not impede the diagnostic distinctions made by trained personnel. Additional manual TGC may, in some cases, even facilitate visual examination of single echocardiographic images. However, reliable quantitation of myocardial contrast enhancement re- quires more accurate path-dependent compensation (Mor-Avi et al. 1992).
The uniformity assumption is in particular inade-
quate when contrast media are involved. Regional videointensity may be strongly affected by the acous- tic properties of the adjacent regions, especially in the distal areas prone to massive acoustic shading during contrast transit through the left ventricular cavity. It can, thus, be understood that without proper com- pensation for beam attenuation, quantitative echocar- diographic measurements may be misleading (Meltzer et al. 1980). This problem has yet to be solved. In this study, distal regions of interest were excluded. We believe that repeated imaging from a different view angle or the creation of compound images may provide the solution to this problem. Al- ternatively, a path-dependent compensation for beam attenuation (Melton and Skorton 1983; Pincu et al. 1986; Pye et al. 1992) might be efficient.
Furthermore, even if perfect compensation is pos- sible, videointensity is usually proportional to the log- arithm of the ultrasonic echo intensity, depending on the specific compression characteristic used. This is- sue is fundamental to the application of linear system theory, which is at the basis of our approach to the evaluation of the mean transit time. However, this problem may be easily solved by replacing the linear- ity assumption by the specific logarithmic depen- dence used in a particular machine. It is reasonable to expect that such an improvement may further en- hance the reliability of our method.
Moreover, it is one of the basic principles of indi- cator dilution that in a multiple branching hydrody- namic system, the curve reflecting output concentra- tion of tracer as a function of time is wider than that corresponding to the input concentration. In our case, it means that contrast particles spend more time in the capillary network in myocardial tissue sample than in the left ventricular cavity. Therefore, it might be expected that myocardial enhancement last longer, or at least the same time, as that in the left ventricular cavity. However, our experimental data, as well as the observations made by other investigators (Villanueva et al. 1992), indicate that it is very difficult to detect contrast enhancement of the myocardium following contrast washout from the left ventricular cavity (Fig. 6). This apparent shorter output function is probably related to the fact that the number of bubbles in the myocardium falls below the sensing threshold of the transducer at all times other than when the left ventric- ular cavity still contains considerable amount of con- trast. In this sense, echocardiographic contrast cannot be regarded as an ideal indicator, and the effects of this deviation from the basic requirements of indica- tor dilution are very difficult to appreciate. Therefore, experimental validation of the above theoretical ap- proach is of utmost importance, and the entire ap-
Myocardial perfusion measurement by contrast echocardiography • V. MoR-Avl et al. 631
proach should be judged based on the experimental results.
Experimental validation Radiolabeled microspheres provide a "gold stan-
dard" method for experimental validation of measure- ments of regional tissue blood flow (Heymann et al. 1977; Kerber et al. 1975; Marcus et al. 1975). Re- gional perfusion can be determined with very high precision in a series of consecutive states, using differ- ent radioisotopes. However, this technique requires the experimental animal to be sacrificed.
The basis of our approach was to use a homoge- neous blood pool upstream of the myocardial tissue sample, such as the left ventricular cavity or the aortic root, as the reference for the evaluation of the intravas- cular volume fraction of the tissue sample. The con- trast transit curve obtained from the above pool served also as a first approximation of the contrast inflow function reaching the sample tissue. The re- suits obtained using this approximation were shown to correlate well with the microspheres measurements under conditions of this study, in spite of the limita- tions detailed below.
The credibility of this correlation is strengthened by the low intersegment variability of the results in each experiment, both in microspheres and contrast echo methods (see SDs in Fig. 8). Even more convinc- ing is the fact that the intertechnique variability in all experiments is smaller than the intersegment variabil- ity (Fig. 8). The variations in flow measured in two subsequent experiments performed on the same ani- mal reflect the hemodynamic changes between exper- iments, as evidenced by changes in blood pressure and heart rate (Fig. 8).
Limitations of the experimental study
Transducer fixation. For the adequate evaluation of transitory contrast enhancement in a myocardial region of interest, the transducer has to be as stable as possible to produce images of the same tissue segment in every consecutive heart beat. Such a stability is dif- ficult to obtain from the epicardial surface of a beat- ing heart. Though the variations in transducer loca- tion and orientation relative to the heart may be effec- tively reduced by firmly attaching the transducer to the epicardial surface, occasional translocation can- not be excluded.
Breathing movements. Chest movements present a major interference, as the heart and the transducer are translocated through the different phases of the breathing movements. Thus, different tissue seg- ments may be scanned during the different phases of
the breathing cycle. For this reason, in this study the respirator was stopped during the image acquisition. In the future use in the clinical setup, the number of sampled heart beats will have to be reduced from 64 to 32 to minimize breathing effects.
Regions of interest. One of the major difficulties was the choice of fixed regions of interest. Sometimes, even a minor displacement of the heart during image acquisition may introduce very high amplitude noise, due to occasional overlapping between the region of interest and the adjacent highly echogenic structures, such as the endo- and epicardium. In this study, shift- ing the regions of interest according to the movement of a specific, interactively marked, distinct echocardio- graphic detail, was performed in each of the consecu- tive images. An automatic tracking algorithm would probably efficiently resolve this difficulty.
Anatomy and echocardiography. It is important to understand that a full alignment between the echo- cardiographic regions of interest superimposed on the images of a beating heart and the myocardial seg- ments used for gamma spectroscopy is extremely dif- ficult to achieve. T.he alignment was based on the myocardial anatomy, which permits only a rather rough overlap. The regions of interest used in our study could be described as subsamples of the physical wedge-shaped segments. However, homogeneous flow was assumed during each experiment, and there- fore accurate alignment was not crucial. Nevertheless, the cross validation of our measurements by radiola- beled microspheres resulted in very good correlation.
Summary To summarize, the positive results of the present
study provide strong evidence that regional myocar- dial tissue blood flow can be measured quantitatively based on the analysis of myocardial echo contrast en- hancement using our algorithm. The results of this study are even more impressive if one considers the inherent difficulties posed by the physics of the con- trast agents and technical limitations of the echocar- diographic imaging techniques. Since the measure- ment of myocardial perfusion is undoubtedly one of the most sought after in medicine, it is of great impor- tance for the manufacturers of both the ultrasound equipment and the contrast agents to direct the neces- sary efforts towards the resolution of these difficulties, so that these measurements could actually be made in the clinical setting. The need for further validation of our method under various hemodynamic conditions is obvious. Following further experimental valida- tion, we anticipate that clinical estimation of regional myocardial blood flow using direct left ventricular in-
632 Ultrasound in Medicine and Biology Volume 19, Number 8, 1993
jection of contrast media will be practical. In this in- vasive form, the method may be a useful tool for the intraoperative evaluation of blood supply during by- pass surgery (Goldman and Mindich 1987; Keller et al. 1990) or for the evaluation of the effects of coro- nary angioplasty (Grill et al. 1990). However, the mea- surement in its final noninvasive form, based on a peripheral intravenous injection of contrast material, promises to be suitable for mass screening, aimed at detecting coronary artery disease during its early asymptomatic stages.
Acknowledgements--V. M. is a recipient of the Levi-Eshkol Fel- lowship of the Israel Ministry of Science and Technology. The proj- ect was supported by the Elizabeth and Nikolas Slezak Foundation, The Abramson Center of Medical Physics, and the Ministry of Health.
REFERENCES
Armstrong, W. F.; Mueler, T. M.; Kinney, E. L.; Tickner, E. G.; Dillion, J. C.; Feigenbaum, H. Assessment ofmyoeardial perfu- sion abnormalities with contrast enhanced two dimensional eehoeardiography. Circulation 66:166-179; 1982.
Armstrong, W. F.; West, S. R.; Mueller, T. M.; Dillion, J. C.; Fei- genbaum, H. Assessment of location and size of myocardial infarction with contrast enhanced echocardiography. J. Am. Coil. Cardiol. 2:63-72; 1983.
Armstrong, W. F. Assessment of myocardial perfusion with Con- trast enhanced echoeardiography. Echocardiography 3:355- 370; 1986.
Berwing, K.; Schlepper, M. Echoeardiographic imaging of the left ventricle by the peripheral intravenous injection of echo con- trast agent. Am. Heart J. 115:399-408; 1988.
Braunwald, E.; Sobel, B. E. Coronary blood flow and myocardial ischemia. In: Braunwald, E., ed. Heart disease--A textbook of cardiovascular medicine, 2nd ed. Philadelphia: W. B. Saunders Co.; 1984:1235-1261.
Cheirif, J.; Zoghbi, W. A.; Raizner, A. E.; Minor, S. T.; Winters, W. L.; Klein, M. S.; De Bauche, T. L.; Lewis, J. M.; Roberts, R.; Quinones, M. A. Assessment of myocardial perfusion in hu- mans by contrast echocardiography. I. Evaluation of regional coronary reserve by peak contrast intensity. J. Am. Coil. Car- diol. 11:735-743; 1988.
Fanelli, M.; Prosperetti, A.; Reali, M. Shape oscillations ofgas-va- pour bubbles in liquids. Part I: Mathematical formulation. Acustiea 55:213-223; 1984.
Feinstein, S. B. Myocardial perfusion imaging: Contrast echocardi- ography today and tomorrow. J. Am. Coll. Cardiol. 8:251-253; 1986.
Feinstein, S. B.; Shah, P. M. Advances in contrast two-dimensional echoeardiography. Cardiovasc. Clin. 17:95-102; 1986.
Feinstein, S. B.; Lang, R. M.; Dick, C.; Neuman, A.; AI-Sadir, J.; Chua, K. G.; Carrol, J.; Feldman, T.; Borow, K. M. Contrast eehocardiographic perfusion studies in humans. Am. J. Cardiac Imaging 1:29-42; 1986.
Feinstein, S. B.; Lang, R. M.; Dick, C.; Neuman, A.; A1-Sadir, J.; Chua, K. G.; Carroll, J.; Feldman, T.; Borow, K. M. Contrast eehocardiography during coronary arteriography in humans: Perfusion and anatomic studies. J. Am. Coll. Cardiol. 11:59-65; 1988.
Feinstein, S. B.; Cheirif, J.; ten Cate, F. J.; Silverman, P. R.; Hei- denreich, P. A.; Dick, C.; Desir, R. M.; Armstrong, W. F.; Quin- ones, M. A.; Shah, P. M. Safety and efficacy of a new transpul- monary ultrasound contrast agent: Initial multicenter clinical results. J. Am. Coil. Cardiol. 16:316-324; 1990.
Gazanhes, C.; Arzelies, P.; Leandre, J. Propagation acoustique dans un miliue diphasique eau-bulles d'air. Application ~t la earacter-
isation d'un miliue diphasique par voie acoustique. Acustica 55:113-122; 1984.
Glantz, S. A. Primer ofbiostatistics. New York: McGraw-Hill Book Company; 1981.
Goldman, M.; Mindich, B. Intraoperative cardioplegia contrast echocardiography for assessing of myocardial perfusion during heart surgery. J. Am. Coll. Cardiol. 4:1029-1043; 1987.
Gonzalez-Fernandez, J. M. Theory of the measurement of the dis- persion of an indicator in indicator dilution studies. Circ. Res. 10:409-428; 1962.
Grill, H. P.; Brinker, J. A.; Taube, J. C.; Walford, J. D.; Midei, M. G.; Flaherty, J. T.; Weiss, J. L. Contrast echocardiographic mapping of collateralized myocardium in humans before and after coronary angioplasty. J. Am. Coll. Cardiol. 16:1594-1600; 1990.
Heymann, M.; Payne, B. D.; Hoffman, J. I.; Rudolph, A. M. Blood flow measurements with radionuclide-labeled particles. Prog. Cardiovasc. Dis. 20:55-78; 1977.
Jaffe, C. C.; Harris, D. J. Physical factors influencing numerical echo-amplitude data extracted from B-scan ultrasonic images. J. Clin. Ultrasound 8:327-333; 1980.
Kaul, S.; Pandian, N. G.; Okada, R. D.; Pohost, G. M.; Weyman, A. E. Contrast echocardiography in acute myocardial ischemia: In vivo determination of total left ventricular area at risk. J. Am. Coll. Cardiol. 4:1274-1291 ; 1984.
Kaul, S.; Glasheen, W.; Ruddy, T. D.; Pandian, N. G.; Weyman, A. E.; Okada, R. D. The importance of defining left ventricular area at risk in vivo during acute myocardial infarction: An exper- imental evaluation with myocardial contrast two-dimensional echocardiography. Circulation 75:1249-1260; 1987a.
Kaul, S.; Pandian, N. G.; Guerrero, J. C.; Gillam, L. D.; Okada, R. D.; Weyman, A. E. Effects of selectively altering the collat- eral pressure on regional perfusion and function in the coronary bed in the dog. Circ. Res. 61:77-85; 1987b.
Kaul, S.; Kelly, P.; Oiiner, J. D.; Glasheen, W. P.; Keller, M. W.; Watson, D. D. Assessment of regional myocardial blood flow with myocardial contrast two-dimensional echocardiography. J. Am. Coll. Cardiol. 13:468-482; 1989.
Kaul, S. Quantitation of myocardial perfusion with contrast echo- cardiography. Am. J. Cardiac Imaging 5:200-216; 1991.
Kaul, S.; Glasheen, W. P.; Oliner, J. D.; Kelly, P.; Gascho, J. A. Relation between anterograde blood flow through a coronary artery and the size of the perfusion bed it supplies: Experimental and clinical implications. J. Am. Coll. Cardiol. 17:1403-1413; 1991.
Keller, M. W.; Feinstein, S. B.; Briller, R. A.; Powsner, S. M. Auto- mated production and analysis of echo contrast agents. J. Ultra- sound Med. 5:493-498; 1986.
Keller, M. W.; Feinstein, S. B.; Watson, D. D. Successful left ventric- ular opacification following peripheral venous injection ofsoni- eated contrast agent: An experimental evaluation. Am. Heart J. 114:570-575; 1987.
Keller, M. W.; Giasheen, W.; Smucker, M. L.; Burwell, L. R.; Wat- sonn, D. D.; Kaul, S. Myocardial contrast eehocardiography in humans. II. Assessment of coronary blood flow reserve. J. Am. Coll. Cardioi. 12:925-934; 1988a.
Keller, M. W.; Glasheen, W.; Teja, K.; Gear, A.; Kaul, S. Myocar- dial contrast eehoeardiography without significant hemody- namic effects or reactive hyperemia: A major advantage in the imaging of regional myocardial perfusion. J. Am. Coll. Cardiol. 12:1039-1047; 1988b.
Keller, M. W.; Segal, S. S.; Kaul, S.; Duling, B. The behavior of sonieated albumin microbubbles within the microcirculation: A basis for their use during myocardial contrast echocardiogra- phy. Circ. Res. 65:458-467; 1989.
Keller, M. W.; Spotnitz, W. D.; Matthew, T. L.; Glasheen, W. P.; Watson, D. D.; Kaul, S. Intraoperative assessment of regional myocardial peffusion using quantitative myocardial contrast echoeardiography: An experimental evaluation. J. Am. Coll. Cardiol. 16:1267-1279; 1990.
Kemper, A. J.; Force, T.; Kloner, R. A.; Gilfoil, M.; Perkins, L.; Hale, S.; Alker, K.; Parisi, A. F. Contrast echocardiographic
Myocardial perfusion measurement by contrast echocardiography • V. MoR-Av] et al. 633
estimation of regional myocardial blood flow after acute coro- nary occlusion. Circulation 72:1115-1124; 1985.
Kerber, R. E.; Marcus, M. L.; Ehrhardt, J.; Wilson, R.; Abboud, F. M. Correlation between echocardiographically demonstrated segmental dyskinesis and myocardial perfusion. Circulation 52:1097-1104; 1975.
LaFollette, P. S.; Ziskin, M. C. Geometric and intensity distortion in echography. Ultrasound Med. Biol. 12:953-963; 1986.
Lang, R. M.; Feinstein, S. B.; Feldman, T.; Neuman, A.; Chua, K. G.; Borow, K. M. Contrast echocardiography for evaluation of myocardial peffusion: Effects of coronary angioplasty. J. Am. Coll. Cardiol. 8:232-235; 1986.
Marcus, M. L.; Kerber, R. E.; Ehrhardt, J.; Abboud, F. M. Three dimensional geometry of acutely ischemic myocardium. Circu- lation 52:254-263; 1975.
Marcus, M. L.; Wilson, R. F.; White, C. W. Methods for measure- ment of myocardial blood flow in patients: A critical review. Circulation 76:245; 1987.
Martin, R. P. Myocardial contrast echocardiography: A light in the heart of darkness. J. Am. Coll. Cardiol. 13:857-859; 1989.
Meerbaum, S. Can contrast echocardiography elucidate myocar- dial physiology? J. Am. Coll. Cardiol. 17:1414-1415; 1991.
Meier, P.; Zierler, K. L. On the theory of the indicator dilution method for measurement of blood flow and volume. J. Appl. Physiol. 6:731-744; 1954.
Melton, H. E.; Skorton, D. J. Rational gain compensation for atten- uation in cardiac ultrasonography. Ultrason. Imaging 5:214- 228; 1983.
Meltzer, R. S.; Tickner, E. G.; Sahines, T. P.; Popp, R. L. The source of ultrasound contrast effect. J. Clin. Ultrasound 8:121- 127; 1980.
Mor-Avi, V.; Akselrod, S.; David, D.; Keselbrener, L. Digital path- dependent recompensation of contrast-enhanced echocardio- graphic images. Ultrasound Med. Biol. 18:831-842; 1992.
Mor-Avi, V.; Akselrod, S.; David, D.; Keselbrener, L.; Bitton, Y. Myocardial transit time of the echocardiographic contrast me- dia. Ultrasound Meal. Biol. 19:635-648, 1993.
Morse, P. M.; Ingard, K. U. Theoretical acoustics. New York: McGraw-Hill Book Co.; 1968:400-441.
Nishi, R. Y. The scattering and absorption of sound waves by a gas bubble in a viscous liquid. Acustica 33:65-74; 1975.
O'Donnell, M. Quantitative volume backscatter imaging. IEEE Trans. Sonics Ultrasonics 30:26-36; 1983.
Pincu, M.; Schwartz, G.; Corday, S. R.; Fujibayashi, Y.; Meer- baum, S. Attenuation correction in echocardiography. Ultra- son. Imaging 8:86-106; 1986.
Powsner, S. M.; Keller, M. W.; Saniie, J.; Feinstein, S. B. Quantita- tion of echo-contrast effects. Am. J. Physiol. Imaging 1:124- 128; 1986.
Pye, S. D.; Wild, S. R.; McDicken, W. N. Adaptive time gain com- pensation for ultrasonic imaging. Ultrasound Med. Biol. 18:205-212; 1992.
Rayleigh, J. W. S. The theory of sound, 2nd ed. New York: Dover Publishers; 1945.
Reisner, S. A.; Ong, L. O.; Lichtenberg, G. S.; Amico, A. F.; Sha- piro, J. R.; Allen, M. N.; Meltzer, R. S. Myocardial perfusion imaging by contrast echocardiography with use ofintracoronary sonicated albumin in humans. J. Am. Coll. Cardiol. 14:660- 665; 1989.
Rovai, D. R.; Nissen, S. E.; Elion, J.; Smith, M.; L'Abbate, A.; Kwan, O. L.; DeMaria, A. N. Contrast echo washout curves from the left ventricle: Application of basic principles of indica- tor dilution theory and calculation of ejection fraction. J. Am. Coll. Cardiol. 10:125-134; 1987.
Shapiro, J. R.; Reisner, S. A.; Meltzer, R. S. Prospects of transpul- monary contrast echocardiography. J. Am. Coll. Cardiol. 13:1629-1630; 1989.
Shapiro, J. R.; Reisner, S. A.; Amieo, A. F.; Kelly, P. F.; Meltzer, R. S. Reproducibility of quantitative myocardial contrast echo- cardiography. J. Am. Coll. Cardiol. 15:602-609; 1990a.
Shapiro, J. R.; Reisner, S. A.; Lichtenberg, G. S.; Meltzer, R. S. Intravenous contrast echocardiography with use of sonicated
albumin in humans: Systolic disappearance of left ventricular contrast after transpulmonary transmission. J. Am. Coll. Car- diol. 16:1603-1607; 1990b.
Smith, M. D.; Elion, J. L.; McClure, R. R.; Kwan, O. L.; DeMaria, A. N.; Evans, J.; Fritzsch, T. H. Left heart opacification with peripheral venous injection of a new saccharide echo contrast agent in dogs. J. Am. Coll. Cardiol. 13:1622-1628; 1989.
Tei, C.; Sakamaki, T.; Shah, P. M.; Meerbaum, S.; Shimoura, K.; Kondo, S.; Corday, E. Myocardial contrast echocardiography: A reproducible technique of myocardial opacification for iden- tifying regional perfusion defects. Circulation 67:585-594; 1983.
Trautman, E. D.; Newbower, R. S. The development of indicator dilution techniques. IEEE Trans. Biomed. Eng. 31:800-807; 1984.
Vanderberg, B. F.; Feinstein, S. B.; Kieso, R. A.; Hunt, M.; Kerber, R. E. Myocardial risk area and peak gray level measurement by contrast echocardiography: Effect of microbubble size and con- centration, injection rate, and coronary vasodilation. Am. Heart J. 115:733-739; 1988.
Vanderberg, B. F.; Kieso, R.; Fox-Eastham, K.; Chilian, W.; Kerber, R. E. Quantitation of myocardial perfusion by contrast echocardiography: Analysis of contrast gray level appearance variables and intracyclic variability. J. Am. Coll. Cardiol. 13:200-206; 1989.
Villanueva, F. S.; Glasheen, W. P.; Sklenar, J.; Jayaweera, A. R.; Kaul, S. Successful and reproducible myocardial opacification during two-dimensional echocardiography from right heart in- jection of contrast. Circulation 85:1557-1564; 1992.
Widimsky, P.; Cornel, J. H.; Ten Care, F. J. Evaluation of collateral blood flow by myocardial contrast enhanced echocardiography. Br. Heart J. 59:20-22; 1988.
Zierler, K. L. A simplified explanation of the indicator dilution for measurement of fluid flow and volume and other distributive phenomena. In: The John Hopkins Proceedings; 1958:199- 217.
Zierler, K. L Theoretical basis of indicator dilution methods for measuring flow and volume. Circ. Res. 10:393-407; 1962.
V ~
f= ( t ) =
cp( t ) =
M~( t ) =
J =
j=
N O M E N C L A T U R E
v o l u m e of a sample of myocard ia l tissue; in t ravascular fract ion of v o l u m e V;
m e a n t ransi t t ime of mic robubb les th rough the tissue sample; concen t ra t ion o f bubbles in the capillaries in tissue sample; concen t ra t ion of bubbles in a homoge- neous b lood pool ups t ream the tissue sam- ple, such as the left ven t r icu la r cavity or the aortic root; t racer-produced u l t rasonic reflection in- tensi ty f rom the tissue sample; t racer-produced reflection in tens i ty from the b lood pool; total n u m b e r of bubbles in v o l u m e V o f t h e tissue sample; total n u m b e r of bubb les in v o l u m e V of b lood in the pool; total b lood flow th rough the tissue sample (in m L / m i n ) ; perfus ion in the sample tissue (in m L / m i n / lO0 g); arbi t rary constants .


