Embed Size (px)
Citation preview

P a g e | 1 U.S. Department of Health and Human Services ● Centers for Disease Control and Prevention ● National Center for Health Statistics ● Released 05/2022
National Health Interview Survey Early Release ProgramN ATION AL CEN TER FOR H EA LTH STAT IST ICS
Health Insurance Coverage: Early Release of Estimates From the National Health Interview Survey, 2021
by Robin A. Cohen, Ph.D., Amy E. Cha, Ph.D., M.P.H., Emily P. Terlizzi, M.P.H., and Michael E. Martinez, M.P.H., M.H.S.A. Division of Health Interview Statistics, National Center for Health Statistics
What’s New
Estimates of health insurance coverage based on data from 2021 are provided, along with selected trends from 2019–2021.
Highlights
In 2021, 30.0 million people of all ages (9.2%) were uninsured at the time of interview. This was lower than, but not significantly different from 2020, when 31.6 million people of all ages (9.7%) were uninsured.
In 2021, among adults aged 18–64, 13.5% were uninsured at the time of interview, 21.7% had public coverage, and 66.6% had private health insurance coverage.
Among children aged 0–17 years, 4.1% were uninsured, 44.3% had public coverage, and 53.8% had private health insurance coverage.
Among non-Hispanic White adults aged 18–64, the percentage who were uninsured decreased from 10.5% in 2019 to 8.7% in 2021.
The percentage of people under age 65 with exchange-based coverage increased from 3.7% in 2019 to 4.3% in 2021.
This report presents estimates of health insurance coverage for the civilian noninstitutionalized U.S. population based on data from the 2021 National Health Interview Survey (NHIS). These estimates are being published before final editing and final weighting to provide access to the most recent information from NHIS. Estimates are disaggregated by age group, sex, family income (as a percentage of the federal poverty level [FPL]), race and ethnicity, and state Medicaid expansion status. Detailed appendix tables contain all estimates presented in the figures and additional estimates for selected population characteristics. With 3 years of comparable data available starting with the redesigned NHIS in 2019, this report is now able to provide data on trends, similar to reports using 2018 and earlier data. Quarterly estimates by age group and family income, and more information about NHIS and the Early Release (ER) Program, are available from the NHIS website.
In 2021, among people of all ages, 9.2% were uninsured, 39.5% had public coverage, and 60.4% had private coverage at the time of interview (Figure 1).
Adults aged 18–64 were the most likely to be uninsured (13.5%), followed by children aged 0–17 years (4.1%) and adults aged 65 and over (0.6%).
Adults aged 65 and over were the most likely to have public coverage (96.1%), followed by children aged 0–17 years (44.3%) and adults aged 18–64 (21.7%).
Figure 1. Percentages of people who were uninsured or had public or private coverage, by age group: United States, 2021
NOTES: People were defined as uninsured if they did not have any private health insurance, Medicare, Medicaid, Children’s Health Insurance Program (CHIP), state-sponsored or other government plan, or military plan. People also were defined as uninsured if they had only Indian Health Service coverage or had only a private plan that paid for one type of service, such as accidents or dental care. Public coverage includes Medicaid, CHIP, state-sponsored or other government-sponsored health plan, Medicare, and military plans. Private coverage includes any comprehensive private insurance plan (including health maintenance and preferred provider organizations). These plans include those obtained through an employer, purchased directly, purchased through local or community programs, or purchased through the HealthInsurance Marketplace or a state-based exchange. Private coverage excludes plans that pay for only one type of service, such as accidents or dental care. A small number of people were covered by both public and private plans and were included in both categories. Data are based on household interviews of a sample of the civilian noninstitutionalized population.SOURCE: National Center for Health Statistics, National Health Interview Survey, 2021.
66.653.8
47.1
60.4
Private coverage
96.121.7
44.339.5
Public coverage
13.50.6
4.19.2
Uninsured
0 20 40 60 80 100
Percent
Adults 65 and over
Adults 18–64
Children 0–17
All people

Health Insurance Coverage: Early Release of Estimates From the National Health Interview Survey, 2021
P a g e | 2 U.S. Department of Health and Human Services ● Centers for Disease Control and Prevention ● National Center for Health Statistics ● Released 05/2022
Adults aged 18–64 were the most likely to have private coverage (66.6%), followed by children aged 0–17 years (53.8%) and adults aged 65 and over (47.1%).
• Among adults aged 18–64, the percentage who were uninsured did not change significantly between 2020 (13.9%) and 2021 (13.5%) (Figure 2).
• Among adults aged 18–64, the percentage who had public coverage in 2021 (21.7%) was higher than the percentage who had public coverage in 2020 (20.5%).
• Among adults aged 18–64, the percentage who had private coverage in 2021 (66.6%) was lower than, but not significantly different from, the percentage who had private coverage in 2020 (67.5%).
• Among adults aged 18–64, the percentage who were uninsured decreased from 14.7% in 2019 to 13.5% in 2021. Public coverage increased from 2019 (20.4%) through 2021 (21.7%). No significant trend in private coverage was observed between 2019 and 2021.
14.7
20.4
66.8
13.9
20.5
67.5
13.5
21.7
66.6
0
20
40
60
80
Uninsured Public Private
Perc
ent
20202019 2021
Figure 2. Percentages of adults aged 18–64 who were uninsured or had public or private coverage, by year: United States, 2019–2021
NOTES: People were defined as uninsured if they did not have any private health insurance, Medicare, Medicaid, Children’s Health Insurance Program (CHIP), state-sponsored or other government plan, or military plan. People also were defined as uninsured if they had only Indian Health Service coverage or had only a private plan that paid for one type of service, such as accidents or dental care. Public coverage includes Medicaid, CHIP, state-sponsored or other government-sponsored health plan, Medicare, and military plans. Private coverage includes any comprehensive private insurance plan (including health maintenance and preferred provider organizations). These plans include those obtained through an employer, purchased directly, purchased through local or community programs, or purchased through the Health Insurance Marketplace or a state-based exchange. Private coverage excludes plans that pay for only one type of service, such as accidents or dental care. A small number of people were covered by both public and private plans and were included in both categories. Due to the COVID-19 pandemic, National Health Interview Survey (NHIS) data collection switched to a telephone-only mode beginning on March 19, 2020. Personal visits (with telephone attempts first) resumed in all areas in September 2020. In addition, from August through December 2020, a subsample of adult respondents who completed NHIS in 2019 were recontacted by telephone and asked to participate again. Response rates were lower and respondent characteristics were different in April–December 2020. Differences observed in estimates between April and December 2020 and other time periods may have been impacted by these differences in respondent characteristics. Data are based on household interviews of a sample of the civilian noninstitutionalized population.SOURCE: National Center for Health Statistics, National Health Interview Survey, 2019–2021.

Health Insurance Coverage: Early Release of Estimates From the National Health Interview Survey, 2021
P a g e | 3 U.S. Department of Health and Human Services ● Centers for Disease Control and Prevention ● National Center for Health Statistics ● Released 05/2022
Among children aged 0–17, the percentage who were uninsured in 2021 (4.1%) was lower than the percentage who were uninsured in 2020 (5.1%) (Figure 3).
Among children aged 0–17, the percentage who had public coverage in 2021 (44.3%) was higher than, but not significantly different from, the percentage who had public coverage in 2020 (42.2%).
Among children aged 0–17, the percentage who had private coverage in 2021 (53.8%) was lower than, but not significantly different from, the percentage who had private coverage in 2020 (54.9%).
Among children aged 0–17, the percentage who were uninsured decreased from 5.1% in 2019 to 4.1% in 2021. Public coverage increased from 2019 (41.4%) through 2021 (44.3%); the observed decrease among children aged 0–17 with private coverage between 2019 and 2021 was not significant.
20202019 2021
0
20
40
60
80
Uninsured Public Private
Perc
ent
5.1
41.4
55.2
5.1
42.2
54.9
4.1
44.3
53.8
Figure 3. Percentages of children aged 0–17 who were uninsured or had public or private coverage, by year: United States, 2019–2021
NOTES: People were defined as uninsured if they did not have any private health insurance, Medicare, Medicaid, Children’s Health Insurance Program (CHIP), state-sponsored or other government plan, or military plan. People also were defined as uninsured if they had only Indian Health Service coverage or had only a private plan that paid for one type of service, such as accidents or dental care. Public coverage includes Medicaid, CHIP, state-sponsored or other government-sponsored health plan, Medicare, and military plans. Private coverage includes any comprehensive private insurance plan (including health maintenance and preferred provider organizations). These plans include those obtained through an employer, purchased directly, purchased through local or community programs, or purchased through the Health Insurance Marketplace or a state-based exchange. Private coverage excludes plans that pay for only one type of service, such as accidents or dental care. A small number of people were covered by both public and private plans and were included in both categories. Due to the COVID-19 pandemic, National Health Interview Survey (NHIS) data collection switched to a telephone-only mode beginning on March 19, 2020. Personal visits (with telephone attempts first) resumed in all areas in September 2020. In addition, from August through December 2020, a subsample of adult respondents who completed NHIS in 2019 were recontacted by telephone and asked to participate again. Response rates were lower and respondent characteristics were different in April–December 2020. Differences observed in estimates between April and December 2020 and other time periods may have been impacted by these differences in respondent characteristics. Data are based on household interviews of a sample of the civilian noninstitutionalized population.SOURCE: National Center for Health Statistics, National Health Interview Survey, 2019–2021.

Health Insurance Coverage: Early Release of Estimates From the National Health Interview Survey, 2021
P a g e | 4 U.S. Department of Health and Human Services ● Centers for Disease Control and Prevention ● National Center for Health Statistics ● Released 05/2022
In 2021, among adults aged 18–64, the percentage who were uninsured was higher among those with family incomes less than 100% FPL (24.5%) and those with family incomes from 100% to less than 200% FPL (23.7%) compared with those with family incomes at or above 200% FPL (8.4%) (Figure 4).
No significant differences were observed in the percentage of adults who were uninsured between 2020 and 2021 for any of the family income subgroups shown.
Among adults aged 18–64 with family incomes from 100% to less than 200% FPL, the percentage who were uninsured decreased from 2019 through 2021; the observed decreases in the percentage of uninsured adults aged 18–64 with family incomes less than 100% FPL or family incomes at or above 200% FPL, between 2019 and 2021 were not significant.
20202019 2021
Less than 100% FPL 100% to less than 200% FPL 200% and greater FPL0
Perc
ent
25.826.8
9.0
25.3 25.0
8.7
24.5 23.7
8.410
20
30
40
Figure 4. Percentage of adults aged 18–64 who were uninsured, by family income as a percentage of the federal poverty level and year: United States, 2019–2021
NOTES: FPL is federal poverty level. People were defined as uninsured if they did not have any private health insurance, Medicare, Medicaid, Children’s Health Insurance Program (CHIP), state-sponsored or other government plan, or military plan. People also were defined as uninsured if they had only Indian Health Service coverage or had only a private plan that paid for one type of service, such as accidents or dental care. Public coverage includes Medicaid, CHIP, state-sponsored or other government-sponsored health plan, Medicare, and military plans. Due to the COVID-19 pandemic, National Health Interview Survey (NHIS) data collection switched to a telephone-only mode beginning on March 19, 2020. Personal visits (with telephone attempts first) resumed in all areas in September 2020. In addition, from August through December 2020, a subsample of adult respondents who completed NHIS in 2019 were recontacted by telephone and asked to participate again. Response rates were lower and respondent characteristics were different in April–December 2020. Differences observed in estimates between April and December 2020 and other time periods may have been impacted by these differences in respondent characteristics. Data are based on household interviews of a sample of the civilian noninstitutionalized population.SOURCE: National Center for Health Statistics, National Health Interview Survey, 2019–2021.

Health Insurance Coverage: Early Release of Estimates From the National Health Interview Survey, 2021
P a g e | 5 U.S. Department of Health and Human Services ● Centers for Disease Control and Prevention ● National Center for Health Statistics ● Released 05/2022
In 2021, among children aged 0–17, the percentage who were uninsured was higher among those with family incomes less than 100% FPL (6.1%) and those with family incomes from 100% to less than 200% FPL (5.6%) compared with those with family incomes at or above 200% FPL (2.7%) (Figure 5).
No significant differences were observed in the percentage of uninsured children between 2020 and 2021 for any of the family income subgroups shown.
Among children aged 0–17, the percentage who were uninsured decreased among those with family incomes at or above 200% FPL, from 4.3% in 2019 to 2.7% in 2021; the observed increase in the percentage of uninsured children with family incomes less than 100% FPL —from 5.1% in 2019 to 6.1% in 2021— was not significant. Among children with family incomes from 100% to less than 200% FPL, no trends were observed between 2019 and 2021.
20202019 2021
2.7
Less than 100% FPL 100% to less than 200% FPL 200% and greater FPL0
Perc
ent
10
20
30
40
5.16.5
4.3
7.1 7.3
3.5
6.1 5.6
Figure 5. Percentage of children aged 0–17 who were uninsured, by family income as a percentage of the federal poverty level and year: United States, 2019–2021
NOTES: FPL is federal poverty level. People were defined as uninsured if they did not have any private health insurance, Medicare, Medicaid, Children’s Health Insurance Program (CHIP), state-sponsored or other government plan, or military plan. People also were defined as uninsured if they had only Indian Health Service coverage or had only a private plan that paid for one type of service, such as accidents or dental care. Public coverage includes Medicaid, CHIP, state-sponsored or other government-sponsored health plan, Medicare, and military plans. Due to the COVID-19 pandemic, National Health Interview Survey (NHIS) data collection switched to a telephone-only mode beginning on March 19, 2020. Personal visits (with telephone attempts first) resumed in all areas in September 2020. In addition, from August through December 2020, a subsample of adult respondents who completed NHIS in 2019 were recontacted by telephone and asked to participate again. Response rates were lower and respondent characteristics were different in April–December 2020. Differences observed in estimates between April and December 2020 and other time periods may have been impacted by these differences in respondent characteristics. Data are based on household interviews of a sample of the civilian noninstitutionalized population.SOURCE: National Center for Health Statistics, National Health Interview Survey, 2019–2021.

Health Insurance Coverage: Early Release of Estimates From the National Health Interview Survey, 2021
P a g e | 6 U.S. Department of Health and Human Services ● Centers for Disease Control and Prevention ● National Center for Health Statistics ● Released 05/2022
In 2021, Hispanic adults were the most likely to lack health insurance coverage (30.1%), followed by non-Hispanic Black (14.1%),
non-Hispanic White (8.7%), and non-Hispanic Asian (6.3%) adults (Figure 6).
No significant differences were observed in the percentage of adults aged 18–64 who were uninsured between 2020 and 2021 for any of the race and ethnicity subgroups shown.
Among non-Hispanic White adults aged 18–64, the percentage who were uninsured decreased from 10.5% in 2019 to 8.7% in 2021; no significant trends were observed for Hispanic, non-Hispanic Black, or non-Hispanic Asian adults aged 18–64.
20202019 2021
29.7 29.3 30.1
10.59.2 8.7
14.7 14.6 14.1
7.58.8
6.3
Hispanic Non-Hispanic White Non-Hispanic Black Non-Hispanic Asian0
Perc
ent
10
20
30
40
Figure 6. Percentage of adults aged 18–64 who were uninsured, by race and ethnicity and year: United States, 2019–2021
NOTES: People were defined as uninsured if they did not have any private health insurance, Medicare, Medicaid, Children’s Health Insurance Program (CHIP), state-sponsored or other government plan, or military plan. People also were defined as uninsured if they had only Indian Health Service coverage or had only a private plan that paid for one type of service, such as accidents or dental care. Public coverage includes Medicaid, CHIP, state-sponsored or other government-sponsored health plan, Medicare, and military plans. Due to the COVID-19 pandemic, National Health Interview Survey (NHIS) data collection switched to a telephone-only mode beginning on March 19, 2020. Personal visits (with telephone attempts first) resumed in all areas in September 2020. In addition, from August through December 2020, a subsample of adult respondents who completed NHIS in 2019 were recontacted by telephone and asked to participate again. Response rates were lower and respondent characteristics were different in April–December 2020. Differences observed in estimates between April and December 2020 and other time periods may have been impacted by these differences in respondent characteristics. Data are based on household interviews of a sample of the civilian noninstitutionalized population.SOURCE: National Center for Health Statistics, National Health Interview Survey, 2019–2021.

Health Insurance Coverage: Early Release of Estimates From the National Health Interview Survey, 2021
P a g e | 7 U.S. Department of Health and Human Services ● Centers for Disease Control and Prevention ● National Center for Health Statistics ● Released 05/2022
In 2021, among adults aged 18–64, those living in Medicaid expansion states (23.8%) were more likely than those living in non-Medicaid expansion states (17.4%) to have public coverage (Figure 7).
Among adults aged 18–64 living in Medicaid expansion states, no significant difference was observed in the percentage of those with public coverage between 2019 and 2021.
Among adults aged 18–64 living in non-Medicaid expansion states, the percentage with public coverage increased from 15.1% in 2019 to 17.4% in 2021.
Among adults aged 18–64 living in non-Medicaid expansion states, no significant difference was observed in the percentage with public coverage between 2020 and 2021.
20202019 2021
23.4
0
20
10
30
40
22.523.8
Expansion states
15.116.7 17.4
Nonexpansion states
Perc
ent
Figure 7. Percentage of adults aged 18–64 who had public coverage, by year and state Medicaid expansion status: United States, 2019–2021
NOTES: Public coverage includes Medicaid, CHIP, state-sponsored or other government-sponsored health plan, Medicare, and military plans. Due to the COVID-19 pandemic, National Health Interview Survey (NHIS) data collection switched to a telephone-only mode beginning on March 19, 2020. Personal visits (with telephone attempts first) resumed in all areas in September 2020. In addition, from August through December 2020, a subsample of adult respondents who completed NHIS in 2019 were recontacted by telephone and asked to participate again. Response rates were lower and respondent characteristics were different in April–December 2020. Differences observed in estimates between April and December 2020 and other time periods may have been impacted by these differences in respondent characteristics. Data are based on household interviews of a sample of the civilian noninstitutionalized population.SOURCE: National Center for Health Statistics, National Health Interview Survey, 2019–2021.

Health Insurance Coverage: Early Release of Estimates From the National Health Interview Survey, 2021
P a g e | 8 U.S. Department of Health and Human Services ● Centers for Disease Control and Prevention ● National Center for Health Statistics ● Released 05/2022
In 2021, 4.3% of people under age 65 had exchange-based coverage (Figure 8).
Males (3.9%) were less likely than females (4.8%) to have exchange-based coverage.
Exchange-based coverage was higher among those with family incomes from 100% to less than 200% FPL (6.4%) compared with those with family incomes less than 100% FPL (3.6%) and family incomes at or above 200% FPL (3.8%).
The observed differences by race and ethnicity were not significant.
0 2 4 6 8 10
3.9
4.2
4.4
Non-Hispanic Black
Non-Hispanic White
Hispanic
3.8
6.4
3.6
200% and greater FPL
100% to less than 200% FPL
Less than 100% FPL
4.8
3.9
Female
Male
4.3Total
Percent
Figure 8. Percentage of people under age 65 who had exchange-based private health insurance coverage, by selected characteristics: United States, 2021
NOTES: FPL is federal poverty level. Exchange-based coverage is a private health insurance plan purchased through the Health Insurance Marketplace or state-based exchanges that were established as part of the Affordable Care Act (ACA) of 2010 (P.L. 111–148, P.L. 111–152). Data are based on household interviews of a sample of the civilian noninstitutionalized population.SOURCE: National Center for Health Statistics, National Health Interview Survey, 2021.

Health Insurance Coverage: Early Release of Estimates From the National Health Interview Survey, 2021
P a g e | 9 U.S. Department of Health and Human Services ● Centers for Disease Control and Prevention ● National Center for Health Statistics ● Released 05/2022
Overall, the percentage of people under age 65 with exchange-based coverage increased from 3.7% in 2019 to 4.3% in 2021 (Figure 9).
3.7 3.84.3
0
2
4
6
8
10Pe
rcen
t
20202019 2021
Figure 9. Percentage of people under age 65 who had exchange-based private health insurance coverage, by year: United States, 2019–2021
NOTES: Exchange-based coverage is a private health insurance plan purchased through the Health Insurance Marketplace or state-based exchanges that were established as part of the Affordable Care Act (ACA) of 2010 (P.L. 111–148, P.L. 111–152). Due to the COVID-19 pandemic, National Health Interview Survey (NHIS) data collection switched to a telephone-only mode beginning on March 19, 2020. Personal visits (with telephone attempts first) resumed in all areas in September 2020. In addition, from August through December 2020, a subsample of adult respondents who completed NHIS in 2019 were recontacted by telephone and asked to participate again. Response rates were lower and respondent characteristics were different in April–December 2020. Differences observed in estimates between April and December 2020 and other time periods may have been impacted by these differences in respondent characteristics. Data are based on household interviews of a sample of the civilian noninstitutionalized population.SOURCE: National Center for Health Statistics, National Health Interview Survey, 2019–2021.

Health Insurance Coverage: Early Release of Estimates From the National Health Interview Survey, 2021
P a g e | 10 U.S. Department of Health and Human Services ● Centers for Disease Control and Prevention ● National Center for Health Statistics ● Released 05/2022
Technical Notes
All estimates in this report are based on preliminary data. The 2021 estimates are being released before final data editing and final weighting to provide access to the most recent information from NHIS. Previously, differences between estimates calculated using preliminary data files and final data files were typically less than 0.1 percentage point.
Data source Data used to produce this ER report were derived from the Sample Adult and Sample Child components from the 2019–2021
NHIS. NHIS is a nationally representative household survey conducted throughout the year to collect information on health status, health-related behaviors, and health care access and utilization. The NHIS interview begins by identifying everyone who usually lives or stays in the household. Then, one “sample adult” aged 18 and over and one “sample child” aged 17 years and under (if any children live in the household) are randomly selected. Information about the sample adults is collected from the sample adults themselves unless they are physically or mentally unable to report, in which case a knowledgeable proxy can answer for them. Information about the sample child is collected from a parent or adult who is knowledgeable about and responsible for the health care of the sample child. This respondent may or may not also be the sample adult. Data analysis for the 2021 NHIS was based on information collected on 29,696 sample adults and 8,293 sample children. Visit the NHIS website at: https://www.cdc.gov/nchs/nhis.htm for more information about the design, content, and use of NHIS.
Estimation procedures The National Center for Health Statistics (NCHS) creates survey sampling weights to produce representative national estimates.
The base weight is equal to the inverse of the probability of selection of the sample address. These weights are adjusted for household and person-level nonresponse using multilevel models predictive of response propensity. Nonresponse-adjusted weights are further calibrated to U.S. Census Bureau population projections and American Community Survey 1-year estimates for age, sex, race and ethnicity, educational attainment, housing tenure, census division, and metropolitan statistical area status. Point estimates and estimates of their variances were calculated using SUDAAN software (RTI International, Research Triangle Park, N.C.) to account for the complex sample design of NHIS, considering stratum and primary sampling unit identifiers. The Taylor series linearization method was chosen for variance estimation. Trends were evaluated using logistic regression analysis.
Impact of COVID-19 on NHIS sampling and longitudinal follow-up Due to the COVID-19 pandemic, NHIS data collection switched to a telephone-only mode beginning March 19, 2020.
Personal visits (with telephone attempts first) resumed in all areas in September 2020. In addition, from August through December 2020, a subsample of adult respondents who completed NHIS in 2019 were recontacted by telephone and asked to participate again. Response rates were lower and respondent characteristics were different in April through December 2020. Differences observed in estimates between April through December 2020 and other time periods may have been impacted by these differences in respondent characteristics.
All estimates shown meet NCHS standards of reliability as specified in “National Center for Health Statistics data presentation standards for proportions” (1). All differences discussed are statistically significant unless otherwise noted. Differences between percentages were evaluated using two-sided significance tests at the 0.05 level. Lack of comment regarding the difference between any two estimates does not necessarily mean that the difference was tested and found to be not significant. As noted above, the 2020 estimates in this report include approximately 10,000 sample adult respondents who participated in the 2019 NHIS and who also participated in the 2020 NHIS. The tests used to evaluate differences between the 2020 and 2021 estimates are conservative, and do not account for the potential covariance that may be introduced by having a subset of respondents participate in both the 2019 and 2020 NHIS surveys.
2019 questionnaire redesign and comparison of estimates to earlier years
In 2019, the NHIS questionnaire was redesigned to better meet the needs of data users. Due to changes in weighting and design methodology, direct comparisons between estimates for 2019 and earlier years should be made with caution, as the impact of these changes has not been fully evaluated. A working paper entitled, “Preliminary evaluation of the impact of the 2019 National Health Interview Survey questionnaire redesign and weighting adjustments on Early Release Program estimates,” available from the Early Release Program homepage, discusses both of these issues in greater detail for three indicators of insurance coverage (lack of health insurance [uninsured], public health plan coverage, and private health insurance coverage). However, the discussion of these health insurance indicators is limited to adults aged 18–64.
Health Insurance Coverage: Early Release of Estimates From the National Health Interview Survey, 2021
P a g e | 11 U.S. Department of Health and Human Services ● Centers for Disease Control and Prevention ● National Center for Health Statistics ● Released 05/2022
Reference
1. Parker JD, Talih M, Malec DJ, Beresovsky V, Carroll M, Gonzalez Jr JF, et al. National Center for Health Statistics data presentation standards for proportions. National Center for Health Statistics. Vital Health Stat 2(175). 2017. Available from: https://www.cdc.gov/nchs/data/series/sr_02/sr02_175.pdf.
Suggested citation Cohen RA, Cha AE, Terlizzi EP, Martinez ME. Health insurance coverage: Early release of estimates from the National Health Interview Survey, 2021. National Center for Health Statistics. May 2022. DOI: https://dx.doi.org/10.15620/cdc:115983.

Health Insurance Coverage: Early Release of Estimates From the National Health Interview Survey, 2021
P a g e | 12 U.S. Department of Health and Human Services ● Centers for Disease Control and Prevention ● National Center for Health Statistics ● Released 05/2022
Table I. Percentage (and 95% confidence interval) of people who lacked health insurance coverage, had public health plan coverage, and had private health insurance coverage at the time of interview, by age group and year: United States, 2019–2021
Age group (years), year, and 6-month interval Uninsured1 Public health plan
coverage2 Private health insurance
coverage3
All ages 2019 10.3 (9.7–10.8) 37.4 (36.6–38.3) 61.3 (60.2–62.4) 2020 9.7 (9.2–10.3) 38.0 (37.2–38.9) 61.8 (60.8–62.7) 2021 (full year) 9.2 (8.7–9.7) 39.5 (38.8–40.3) 60.4 (59.4–61.3)
2021 (Jan–Jun) 9.6 (8.9–10.3) 39.5 (38.4–40.6) 60.1 (58.9–61.3) 2021 (Jul–Dec) 8.8 (8.3–9.5) 39.6 (38.6–40.6) 60.6 (59.5–61.8)
Under 65 2019 12.1 (11.4–12.8) 26.0 (25.1–26.9) 63.7 (62.5–64.8) 2020 11.5 (10.9–12.2) 26.4 (25.4–27.3) 64.1 (63.0–65.2) 2021 (full year) 11.0 (10.4–11.6) 27.7 (26.9–28.6) 63.2 (62.1–64.2)
2021 (Jan–Jun) 11.4 (10.6–12.3) 27.8 (26.7–29.0) 62.8 (61.4–64.1) 2021 (Jul–Dec) 10.6 (9.9–11.3) 27.6 (26.6–28.7) 63.5 (62.2–64.8)
0–17 2019 5.1 (4.5–5.7) 41.4 (39.8–43.0) 55.2 (53.4–57.0) 2020 5.1 (4.3–6.0) 42.2 (40.1–44.3) 54.9 (52.8–57.0) 2021 (full year) 4.1 (3.7–4.6) 44.3 (42.8–45.9) 53.8 (52.1–55.5)
2021 (Jan–Jun) 4.4 (3.7–5.3) 44.7 (42.6–46.8) 53.1 (50.9–55.4) 2021 (Jul–Dec) 3.8 (3.2–4.6) 44.0 (42.3–45.6) 54.4 (52.5–56.4)
18–64 2019 14.7 (13.9–15.4) 20.4 (19.6–21.2) 66.8 (65.7–67.9) 2020 13.9 (13.2–14.7) 20.5 (19.7–21.4) 67.5 (66.5–68.5) 2021 (full year) 13.5 (12.8–14.3) 21.7 (20.8–22.5) 66.6 (65.6–67.6)
2021 (Jan–Jun) 14.0 (13.0–15.1) 21.6 (20.6–22.7) 66.3 (65.0–67.6) 2021 (Jul–Dec) 13.0 (12.2–13.9) 21.7 (20.6–22.8) 66.9 (65.6–68.2)
65 and over 2019 0.9 (0.6–1.3) 96.0 (95.5–96.5) 49.1 (47.6–50.7) 2020 0.8 (0.5–1.1) 95.9 (95.3–96.4) 50.2 (48.7–51.7) 2021 (full year) 0.6 (0.4–0.9) 96.1 (95.5–96.5) 47.1 (45.5–48.6)
2021 (Jan–Jun) 0.6 (0.3–1.0) 96.0 (95.1–96.7) 47.4 (45.2–49.7) 2021 (Jul–Dec) 0.6 (0.4–1.0) 96.2 (95.3–96.9) 46.7 (44.9–48.5)
1People were defined as uninsured if they did not have any private health insurance, Medicare, Medicaid, Children’s Health Insurance Program (CHIP), state-sponsored or other government-sponsored health plan, or military plan. People also were defined as uninsured if they had only Indian Health Service coverage or had only a private plan that paid for one type of service, such as accidents or dental care. 2Public health plan coverage includes Medicaid, CHIP, state-sponsored or other government-sponsored health plan, Medicare, and military plans. A small number of people were covered by both public and private plans and were included in both categories. 3Private health insurance coverage includes any comprehensive private insurance plan (including health maintenance and preferred provider organizations). These plans include those obtained through an employer, purchased directly, purchased through local or community programs, or purchased through the Health Insurance Marketplace or a state-based exchange. Private coverage excludes plans that pay for only one type of service, such as accidents or dental care. A small number of people were covered by both public and private plans and were included in both categories.
NOTES: Due to the COVID-19 pandemic, data collection switched to a telephone-only mode beginning on March 19, 2020. Personal visits (with telephone attempts first) resumed in all areas in September 2020. In addition, from August–December 2020, a subsample of adult respondents who completed NHIS in 2019 were recontacted by telephone and asked to participate again. Response rates were lower and respondent characteristics were different in April–December 2020. Differences observed in estimates between April–December 2020 and other time periods may have been impacted by these differences in respondent characteristics. Data are based on household interviews of a sample of the civilian noninstitutionalized population.
SOURCE: National Center for Health Statistics, National Health Interview Surveys, 2019–2021.

Health Insurance Coverage: Early Release of Estimates From the National Health Interview Survey, 2021
P a g e | 13 U.S. Department of Health and Human Services ● Centers for Disease Control and Prevention ● National Center for Health Statistics ● Released 05/2022
Table II. Number (millions) of people who lacked health insurance coverage, had public health plan coverage, and had private health insurance coverage at the time of interview, by age group and year: United States, 2019–2021
Age group (years), year, and 6-month interval Uninsured1 Public health plan
coverage2 Private health insurance
coverage3
All ages 2019 33.2 121.4 198.7 2020 31.6 123.5 200.6 2021 (full year) 30.0 128.6 196.5
2021 (Jan–Jun) 31.1 128.4 195.5 2021 (Jul–Dec) 28.8 128.8 197.4
Under 65 2019 32.8 70.6 172.7 2020 31.2 71.2 173.2 2021 (full year) 29.6 74.7 170.1
2021 (Jan–Jun) 30.8 75.0 169.1 2021 (Jul–Dec) 28.5 74.4 171.0
0–17 2019 3.7 30.3 40.4 2020 3.7 30.7 39.9 2021 (full year) 3.0 32.0 38.9
2021 (Jan–Jun) 3.2 32.3 38.5 2021 (Jul–Dec) 2.8 31.7 39.3
18–64 2019 29.0 40.3 132.3 2020 27.5 40.5 133.3 2021 (full year) 26.6 42.7 131.2
2021 (Jan–Jun) 27.6 42.6 130.6 2021 (Jul–Dec) 25.7 42.7 131.7
65 and over 2019 0.5 50.8 26.0 2020 0.4 52.3 27.4 2021 (full year) 0.4 53.9 26.4
2021 (Jan–Jun) 0.3 53.4 26.4 2021 (Jul–Dec) 0.4 54.4 26.4
1People were defined as uninsured if they did not have any private health insurance, Medicare, Medicaid, Children’s Health Insurance Program (CHIP), state-sponsored or other government-sponsored health plan, or military plan. People also were defined as uninsured if they had only Indian Health Service coverage or had only a private plan that paid for one type of service, such as accidents or dental care. 2Public health plan coverage includes Medicaid, CHIP, state-sponsored or other government-sponsored health plan, Medicare, and military plans. A small number of people were covered by both public and private plans and were included in both categories. 3Private health insurance coverage includes any comprehensive private insurance plan (including health maintenance and preferred provider organizations). These plans include those obtained through an employer, purchased directly, purchased through local or community programs, or purchased through the Health Insurance Marketplace or a state-based exchange. Private coverage excludes plans that pay for only one type of service, such as accidents or dental care. A small number of people were covered by both public and private plans and were included in both categories.
NOTES: Due to the COVID-19 pandemic, data collection switched to a telephone-only mode beginning on March 19, 2020. Personal visits (with telephone attempts first) resumed in all areas in September 2020. In addition, from August–December 2020, a subsample of adult respondents who completed NHIS in 2019 were recontacted by telephone and asked to participate again. Response rates were lower and respondent characteristics were different in April–December 2020. Differences observed in estimates between April–December 2020 and other time periods may have been impacted by these differences in respondent characteristics. Data are based on household interviews of a sample of the civilian noninstitutionalized population.
SOURCE: National Center for Health Statistics, National Health Interview Surveys, 2019–2021.

Health Insurance Coverage: Early Release of Estimates From the National Health Interview Survey, 2021
P a g e | 14 U.S. Department of Health and Human Services ● Centers for Disease Control and Prevention ● National Center for Health Statistics ● Released 05/2022
Table III. Percentage (and 95% confidence interval) of people under age 65 who lacked health insurance coverage, had public health plan coverage, and had private health insurance coverage at the time of interview, by sex, age group, and year: United States, 2019–2021
Sex, age group (years), year, and 6-month interval Uninsured1 Public health plan
coverage2 Private health
insurance coverage3
Male Under 65
2019 13.2 (12.3–14.1) 24.7 (23.6–25.9) 63.9 (62.4–65.4) 2020 12.3 (11.5–13.2) 25.1 (23.8–26.3) 64.6 (63.2–66.0) 2021 (full year) 12.5 (11.7–13.4) 25.9 (24.9–26.9) 63.5 (62.3–64.7)
2021 (Jan–Jun) 12.7 (11.5–14.0) 26.2 (24.9–27.4) 62.9 (61.4–64.5) 2021 (Jul–Dec) 12.3 (11.3–13.3) 25.6 (24.3–27.0) 64.1 (62.6–65.5)
0–17 2019 5.1 (4.4–5.8) 42.1 (40.1–44.2) 54.5 (52.2–56.7) 2020 5.8 (4.6–7.3) 42.1 (39.4–44.8) 54.6 (51.8–57.3) 2021 (full year) 3.9 (3.3–4.6) 45.5 (43.5–47.6) 52.9 (50.5–55.2)
2021 (Jan–Jun) 3.8 (2.9–4.9) 45.4 (42.6–48.3) 52.7 (49.8–55.6) 2021 (Jul–Dec) 4.1 (3.1–5.1) 45.6 (43.4–47.8) 53.0 (50.3–55.7)
18–64 2019 16.3 (15.1–17.4) 18.1 (17.0–19.2) 67.5 (66.1–69.0) 2020 14.8 (13.8–15.9) 18.6 (17.5–19.7) 68.4 (67.1–69.8) 2021 (full year) 15.8 (14.7–16.9) 18.4 (17.5–19.4) 67.5 (66.2–68.8)
2021 (Jan–Jun) 16.1 (14.6–17.8) 18.9 (17.7–20.0) 66.8 (65.1–68.5) 2021 (Jul–Dec) 15.4 (14.1–16.8) 18.0 (16.6–19.5) 68.3 (66.7–69.9)
Female Under 65
2019 11.0 (10.4–11.7) 27.3 (26.2–28.4) 63.4 (62.2–64.7) 2020 10.7 (10.0–11.6) 27.6 (26.4–28.9) 63.6 (62.3–65.0) 2021 (full year) 9.5 (8.9–10.1) 29.6 (28.4–30.8) 62.8 (61.6–64.0)
2021 (Jan–Jun) 10.1 (9.2–11.1) 29.5 (27.9–31.1) 62.6 (60.9–64.3) 2021 (Jul–Dec) 8.9 (8.1–9.8) 29.7 (28.0–31.3) 63.0 (61.4–64.6)
0–17 2019 5.1 (4.4–6.0) 40.6 (38.5–42.8) 56.0 (53.8–58.2) 2020 4.4 (3.4–5.6) 42.3 (39.5–45.2) 55.2 (52.4–58.0) 2021 (full year) 4.3 (3.7–5.1) 43.1 (40.8–45.4) 54.8 (52.3–57.2)
2021 (Jan–Jun) 5.1 (4.0–6.3) 43.9 (41.0–46.9) 53.5 (50.3–56.8) 2021 (Jul–Dec) 3.6 (2.7–4.7) 42.2 (39.3–45.2) 56.0 (52.8–59.1)
18–64 2019 13.1 (12.4–13.9) 22.6 (21.6–23.6) 66.1 (64.9–67.3) 2020 13.0 (12.0–14.0) 22.4 (21.3–23.5) 66.6 (65.3–67.9) 2021 (full year) 11.3 (10.6–12.1) 24.8 (23.5–26.1) 65.7 (64.5–66.9)
2021 (Jan–Jun) 11.9 (10.8–13.1) 24.3 (22.7–26.1) 65.8 (64.1–67.5) 2021 (Jul–Dec) 10.8 (9.9–11.7) 25.2 (23.6–26.9) 65.5 (64.0–67.1)
1People were defined as uninsured if they did not have any private health insurance, Medicare, Medicaid, Children’s Health Insurance Program (CHIP), state-sponsored or other government-sponsored health plan, or military plan. People also were defined as uninsured if they had only Indian Health Service coverage or had only a private plan that paid for one type of service, such as accidents or dental care. 2Public health plan coverage includes Medicaid, CHIP, state-sponsored or other government-sponsored health plan, Medicare, and military plans. A small number of people were covered by both public and private plans and were included in both categories. 3Private health insurance coverage includes any comprehensive private insurance plan (including health maintenance and preferred provider organizations). These plans include those obtained through an employer, purchased directly, purchased through local or community programs, or purchased through the Health Insurance Marketplace or a state-based exchange. Private coverage excludes plans that pay for only one type of service, such as accidents or dental care. A small number of people were covered by both public and private plans and were included in both categories.
NOTES: Due to the COVID-19 pandemic, data collection switched to a telephone-only mode beginning on March 19, 2020. Personal visits (with telephone attempts first) resumed in all areas in September 2020. In addition, from August–December 2020, a subsample of adult respondents who completed NHIS in 2019 were recontacted by telephone and asked to participate again. Response rates were lower and respondent characteristics were different in April–December 2020. Differences observed in estimates between April–December 2020 and other time periods may have been impacted by these differences in respondent characteristics. Data are based on household interviews of a sample of the civilian noninstitutionalized population.
SOURCE: National Center for Health Statistics, National Health Interview Surveys, 2019–2021.

Health Insurance Coverage: Early Release of Estimates From the National Health Interview Survey, 2021
P a g e | 15 U.S. Department of Health and Human Services ● Centers for Disease Control and Prevention ● National Center for Health Statistics ● Released 05/2022
Table IV. Percentage (and 95% confidence intervals) of people under age 65 who lacked health insurance coverage, had public health plan coverage, and had private health insurance coverage at the time of interview, by family income as a percentage of the federal poverty level, age group, and year: United States, 2019–2021
Family income as a percentage of FPL1, age group (years), year, and 6-month interval Uninsured2
Public health plan coverage3
Private health insurance coverage4
Less than 100% FPL1
Under 65 2019 18.3 (16.2–20.5) 65.3 (63.0–67.5) 18.2 (16.3–20.3) 2020 18.4 (16.0–20.9) 68.3 (65.5–71.1) 15.6 (13.7–17.7) 2021 (full year) 17.8 (15.8–20.0) 66.1 (63.1–69.1) 17.5 (14.9–20.3)
2021 (Jan–Jun) 19.5 (16.5–22.9) 66.0 (62.4–69.4) 16.1 (13.5–18.9) 2021 (Jul–Dec) 16.0 (13.6–18.7) 66.3 (62.1–70.3) 18.9 (15.2–23.1)
0–17 2019 5.1 (3.8–6.8) 87.8 (85.3–90.1) 8.9 (7.1–11.1) 2020 7.1 (4.2–11.0) 88.0 (84.0–91.4) 7.3 (5.1–10.0) 2021 (full year) 6.1 (4.5–8.0) 87.3 (84.6–89.6) 7.8 (6.1–9.9)
2021 (Jan–Jun) 6.9 (4.5–10.1) 87.3 (83.3–90.6) 7.4 (5.1–10.3) 2021 (Jul–Dec) 5.2 (3.3–7.7) 87.2 (83.9–90.1) 8.3 (5.9–11.3)
18–64 2019 25.8 (23.0–28.9) 52.3 (49.4–55.1) 23.6 (20.9–26.5) 2020 25.3 (22.3–28.4) 56.3 (52.9–59.7) 20.7 (18.2–23.4) 2021 (full year) 24.5 (21.5–27.6) 54.1 (50.3–57.9) 22.9 (19.3–27.0)
2021 (Jan–Jun) 26.9 (22.7–31.5) 53.4 (48.7–58.1) 21.2 (17.6–25.1) 2021 (Jul–Dec) 22.0 (18.4–25.8) 54.8 (49.9–59.6) 24.8 (19.7–30.4)
100% to less than 200% FPL1 Under 65
2019 20.1 (18.6–21.6) 47.0 (45.1–48.9) 35.4 (33.6–37.2) 2020 18.9 (17.1–20.9) 50.5 (48.3–52.6) 33.6 (31.6–35.7) 2021 (full year) 17.6 (16.3–19.0) 51.5 (49.6–53.3) 34.1 (32.2–36.0)
2021 (Jan–Jun) 17.8 (15.6–20.1) 52.4 (49.9–54.9) 33.2 (30.5–35.9) 2021 (Jul–Dec) 17.4 (15.5–19.4) 50.5 (48.1–52.9) 35.0 (32.3–37.8)
0–17 2019 6.5 (5.2–8.0) 70.3 (67.7–72.8) 25.8 (23.1–28.5) 2020 7.3 (5.3–9.8) 72.8 (69.2–76.2) 23.3 (20.2–26.6) 2021 (full year) 5.6 (4.4–7.0) 75.8 (73.3–78.2) 22.3 (20.0–24.8)
2021 (Jan–Jun) 6.2 (4.5–8.4) 77.1 (73.9–80.1) 20.3 (17.3–23.5) 2021 (Jul–Dec) 4.9 (3.3–7.1) 74.4 (70.8–77.8) 24.5 (21.0–28.3)
18–64 2019 26.8 (24.9–28.8) 35.4 (33.3–37.5) 40.1 (38.3–42.0) 2020 25.0 (22.7–27.4) 38.8 (36.5–41.1) 39.0 (36.7–41.4) 2021 (full year) 23.7 (22.0–25.5) 39.0 (37.1–41.0) 40.1 (38.0–42.2)
2021 (Jan–Jun) 23.8 (21.0–26.6) 39.6 (36.9–42.3) 39.9 (36.8–43.1) 2021 (Jul–Dec) 23.7 (21.2–26.3) 38.4 (35.7–41.3) 40.3 (37.3–43.4)
200% and greater FPL1 Under 65
2019 7.9 (7.3–8.4) 11.8 (11.2–12.5) 82.0 (81.1–82.8) 2020 7.5 (6.9–8.1) 12.2 (11.5–13.0) 82.0 (81.1–82.9) 2021 (full year) 7.0 (6.6–7.5) 13.0 (12.4–13.7) 81.5 (80.8–82.3)
2021 (Jan–Jun) 7.2 (6.6–7.9) 12.7 (11.8–13.6) 81.8 (80.9–82.7) 2021 (Jul–Dec) 6.8 (6.3–7.5) 13.4 (12.5–14.2) 81.3 (80.2–82.4)
0–17 2019 4.3 (3.6–5.1) 16.3 (14.9–17.8) 80.7 (79.1–82.2) 2020 3.5 (2.8–4.4) 17.9 (16.2–19.7) 80.2 (78.4–82.0) 2021 (full year) 2.7 (2.3–3.2) 19.0 (17.7–20.4) 80.3 (78.8–81.7)
2021 (Jan–Jun) 2.9 (2.1–3.8) 17.9 (16.2–19.6) 81.2 (79.3–83.0) 2021 (Jul–Dec) 2.6 (2.0–3.4) 20.1 (18.3–22.0) 79.4 (77.3–81.4)
See footnotes at the end of table.
Health Insurance Coverage: Early Release of Estimates From the National Health Interview Survey, 2021
P a g e | 16 U.S. Department of Health and Human Services ● Centers for Disease Control and Prevention ● National Center for Health Statistics ● Released 05/2022
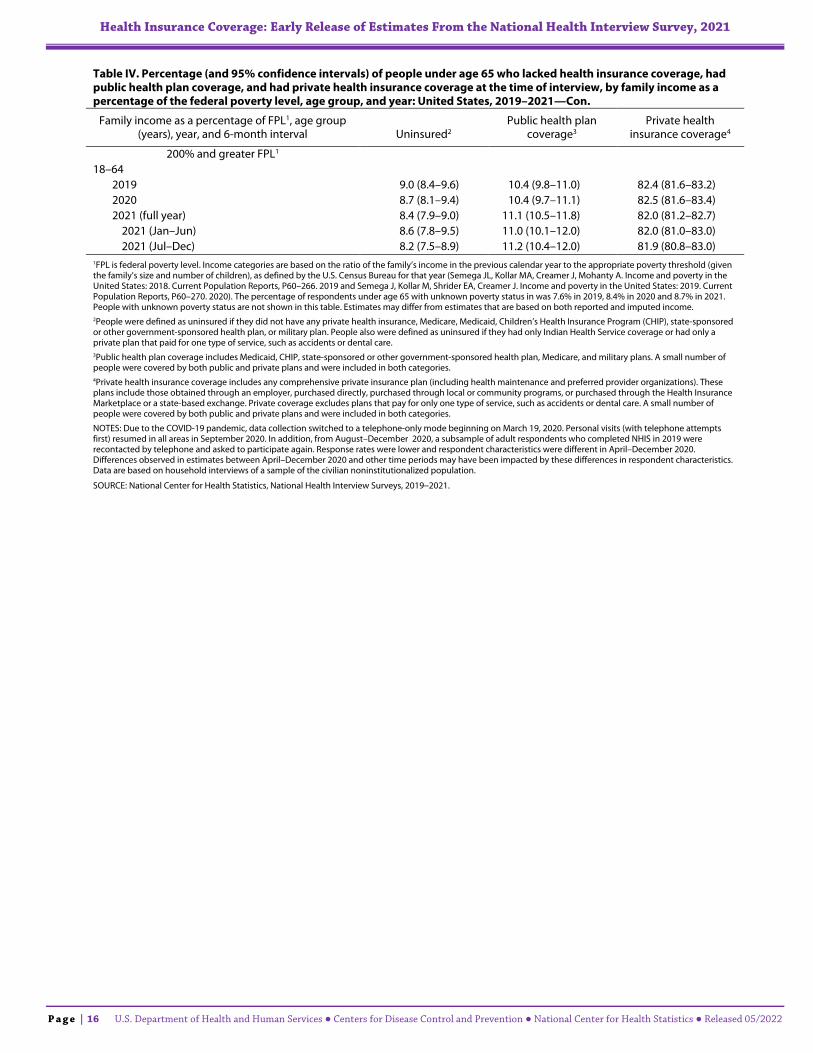
Table IV. Percentage (and 95% confidence intervals) of people under age 65 who lacked health insurance coverage, had public health plan coverage, and had private health insurance coverage at the time of interview, by family income as a percentage of the federal poverty level, age group, and year: United States, 2019–2021—Con.
Family income as a percentage of FPL1, age group (years), year, and 6-month interval Uninsured2
Public health plan coverage3
Private health insurance coverage4
200% and greater FPL1 18–64
2019 9.0 (8.4–9.6) 10.4 (9.8–11.0) 82.4 (81.6–83.2) 2020 8.7 (8.1–9.4) 10.4 (9.7–11.1) 82.5 (81.6–83.4) 2021 (full year) 8.4 (7.9–9.0) 11.1 (10.5–11.8) 82.0 (81.2–82.7)
2021 (Jan–Jun) 8.6 (7.8–9.5) 11.0 (10.1–12.0) 82.0 (81.0–83.0) 2021 (Jul–Dec) 8.2 (7.5–8.9) 11.2 (10.4–12.0) 81.9 (80.8–83.0)
1FPL is federal poverty level. Income categories are based on the ratio of the family’s income in the previous calendar year to the appropriate poverty threshold (given the family’s size and number of children), as defined by the U.S. Census Bureau for that year (Semega JL, Kollar MA, Creamer J, Mohanty A. Income and poverty in the United States: 2018. Current Population Reports, P60–266. 2019 and Semega J, Kollar M, Shrider EA, Creamer J. Income and poverty in the United States: 2019. Current Population Reports, P60–270. 2020). The percentage of respondents under age 65 with unknown poverty status in was 7.6% in 2019, 8.4% in 2020 and 8.7% in 2021. People with unknown poverty status are not shown in this table. Estimates may differ from estimates that are based on both reported and imputed income. 2People were defined as uninsured if they did not have any private health insurance, Medicare, Medicaid, Children’s Health Insurance Program (CHIP), state-sponsored or other government-sponsored health plan, or military plan. People also were defined as uninsured if they had only Indian Health Service coverage or had only a private plan that paid for one type of service, such as accidents or dental care. 3Public health plan coverage includes Medicaid, CHIP, state-sponsored or other government-sponsored health plan, Medicare, and military plans. A small number of people were covered by both public and private plans and were included in both categories. 4Private health insurance coverage includes any comprehensive private insurance plan (including health maintenance and preferred provider organizations). These plans include those obtained through an employer, purchased directly, purchased through local or community programs, or purchased through the Health Insurance Marketplace or a state-based exchange. Private coverage excludes plans that pay for only one type of service, such as accidents or dental care. A small number of people were covered by both public and private plans and were included in both categories.
NOTES: Due to the COVID-19 pandemic, data collection switched to a telephone-only mode beginning on March 19, 2020. Personal visits (with telephone attempts first) resumed in all areas in September 2020. In addition, from August–December 2020, a subsample of adult respondents who completed NHIS in 2019 were recontacted by telephone and asked to participate again. Response rates were lower and respondent characteristics were different in April–December 2020. Differences observed in estimates between April–December 2020 and other time periods may have been impacted by these differences in respondent characteristics. Data are based on household interviews of a sample of the civilian noninstitutionalized population.
SOURCE: National Center for Health Statistics, National Health Interview Surveys, 2019–2021.

Health Insurance Coverage: Early Release of Estimates From the National Health Interview Survey, 2021
P a g e | 17 U.S. Department of Health and Human Services ● Centers for Disease Control and Prevention ● National Center for Health Statistics ● Released 05/2022
Table V. Percentage (and 95% confidence intervals) of people under age 65 who lacked health insurance coverage, had public health plan coverage, and had private health insurance coverage at the time of interview, by race and ethnicity, age group, and year: United States, 2019–2021
Race and ethnicity1, age group (years), year, and 6-month interval Uninsured2
Public health plan coverage3
Private health insurance coverage4
Hispanic Under 65
2019 22.1 (20.3–23.9) 34.7 (32.7–36.7) 44.3 (42.1–46.4) 2020 22.1 (20.3–24.1) 34.5 (32.4–36.6) 44.7 (42.4–47.0) 2021 (full year) 22.8 (21.0–24.6) 36.1 (34.6–37.5) 42.5 (40.8–44.3)
2021 (Jan–Jun) 23.6 (21.1–26.3) 35.9 (33.8–38.1) 42.0 (39.5–44.6) 2021 (Jul–Dec) 21.9 (19.6–24.5) 36.2 (34.1–38.3) 43.0 (40.6–45.5)
0–17 2019 7.2 (6.0–8.6) 58.7 (55.9–61.5) 35.4 (32.7–38.1) 2020 7.8 (6.0–10.0) 57.3 (53.7–60.8) 37.0 (33.5–40.7) 2021 (full year) 7.8 (6.6–9.1) 61.2 (59.1–63.3) 32.5 (30.3–34.9)
2021 (Jan–Jun) 7.8 (6.1–9.7) 62.2 (59.1–65.2) 31.6 (28.4–35.0) 2021 (Jul–Dec) 7.8 (6.3–9.6) 60.2 (57.3–63.1) 33.5 (30.1–37.0)
18–64 2019 29.7 (27.4–32.0) 22.5 (20.4–24.7) 48.8 (46.5–51.1) 2020 29.3 (26.9–31.9) 23.0 (21.0–25.1) 48.6 (46.2–51.0) 2021 (full year) 30.1 (27.9–32.4) 23.7 (22.1–25.4) 47.4 (45.6–49.3)
2021 (Jan–Jun) 31.4 (28.1–34.9) 23.0 (20.3–25.7) 47.2 (44.3–50.1) 2021 (Jul–Dec) 28.8 (25.6–32.2) 24.5 (22.0–27.1) 47.7 (45.0–50.4)
Non-Hispanic White Under 65
2019 9.0 (8.4–9.7) 19.6 (18.7–20.7) 73.3 (72.2–74.3) 2020 7.9 (7.3–8.6) 19.9 (18.9–21.0) 74.3 (73.2–75.5) 2021 (full year) 7.2 (6.7–7.8) 21.6 (20.6–22.6) 73.3 (72.1–74.4)
2021 (Jan–Jun) 7.5 (6.8–8.3) 22.0 (20.6–23.5) 72.7 (71.3–74.1) 2021 (Jul–Dec) 7.0 (6.2–7.8) 21.2 (20.1–22.4) 73.8 (72.3–75.2)
0–17 2019 4.5 (3.7–5.4) 27.9 (26.1–29.8) 69.3 (67.4–71.1) 2020 3.8 (2.8–5.1) 29.4 (26.9–31.9) 69.1 (66.5–71.6) 2021 (full year) 2.7 (2.1–3.3) 31.5 (29.4–33.7) 68.5 (66.3–70.6)
2021 (Jan–Jun) 2.9 (2.1–4.0) 31.9 (29.1–34.7) 67.9 (65.0–70.7) 2021 (Jul–Dec) 2.4 (1.7–3.4) 31.1 (28.9–33.5) 69.1 (66.8–71.3)
18–64 2019 10.5 (9.8–11.2) 17.0 (16.1–18.0) 74.5 (73.5–75.5) 2020 9.2 (8.6–10.0) 16.9 (16.0–17.8) 76.0 (75.0–77.1) 2021 (full year) 8.7 (8.0–9.4) 18.5 (17.6–19.4) 74.8 (73.7–75.8)
2021 (Jan–Jun) 9.0 (8.1–9.9) 18.8 (17.5–20.2) 74.3 (72.9–75.6) 2021 (Jul–Dec) 8.4 (7.5–9.4) 18.1 (17.0–19.3) 75.3 (73.8–76.7)
Non-Hispanic Black Under 65
2019 11.6 (10.2–13.0) 42.8 (40.0–45.6) 48.5 (46.0–50.9) 2020 12.0 (10.4–13.8) 42.1 (39.2–45.0) 48.3 (45.3–51.4) 2021 (full year) 11.2 (9.9–12.5) 41.5 (38.7–44.4) 49.4 (46.8–52.0)
2021 (Jan–Jun) 11.8 (9.9–13.8) 40.2 (37.4–43.1) 50.2 (47.2–53.1) 2021 (Jul–Dec) 10.5 (8.7–12.5) 42.8 (39.2–46.5) 48.6 (45.3–51.9)
0–17 2019 3.5 (2.5–4.9) 64.5 (60.1–68.7) 35.1 (31.1–39.3) 2020 5.1 (2.9–8.1) 65.8 (60.6–70.8) 30.7 (25.9–35.8) 2021 (full year) 3.0 (1.8–4.8) 66.1 (61.4–70.5) 32.6 (28.2–37.4)
2021 (Jan–Jun) * 66.0 (60.8–70.9) 32.6 (27.4–38.2) 2021 (Jul–Dec) 2.5 (1.2–4.5) 66.3 (60.6–71.6) 32.6 (27.1–38.6)
See footnotes at the end of table.

Health Insurance Coverage: Early Release of Estimates From the National Health Interview Survey, 2021
P a g e | 18 U.S. Department of Health and Human Services ● Centers for Disease Control and Prevention ● National Center for Health Statistics ● Released 05/2022
Table V. Percentage (and 95% confidence intervals) of people under age 65 who lacked health insurance coverage, had public health plan coverage, and had private health insurance coverage at the time of interview, by race and ethnicity, age group, and year: United States, 2019–2021—Con.
Race and ethnicity1, age group (years), year, and 6-month interval Uninsured2
Public health plan coverage3
Private health insurance coverage4
Non-Hispanic Black
18–64 2019 14.7 (12.9–16.7) 34.3 (31.5–37.1) 53.7 (51.3–56.0) 2020 14.6 (12.7–16.7) 33.1 (30.5–35.9) 54.9 (51.9–57.9) 2021 (full year) 14.1 (12.5–15.7) 32.6 (29.9–35.5) 55.4 (52.8–58.1)
2021 (Jan–Jun) 14.7 (12.5–17.1) 31.0 (28.3–33.9) 56.4 (53.4–59.4) 2021 (Jul–Dec) 13.4 (11.3–15.9) 34.3 (30.7–38.1) 54.4 (51.1–57.8)
Non-Hispanic Asian
Under 65 2019 6.6 (5.0–8.7) 17.5 (15.1–20.2) 76.6 (73.5–79.5) 2020 7.7 (5.9–9.9) 19.3 (16.4–22.5) 73.9 (70.5–77.1) 2021 (full year) 5.2 (4.0–6.8) 20.4 (18.1–22.8) 74.9 (72.2–77.4)
2021 (Jan–Jun) 5.1 (3.3–7.4) 21.0 (18.4–23.8) 74.7 (71.2–78.0) 2021 (Jul–Dec) 5.4 (4.0–7.1) 19.8 (16.1–24.0) 75.0 (70.8–78.9)
0–17 2019 3.2 (1.6–5.7) 24.1 (19.6–29.1) 73.2 (68.2–77.8) 2020 3.4 (1.5–6.3) 29.6 (23.5–36.3) 68.2 (61.5–74.4) 2021 (full year) 1.3 (0.6–2.5) 29.0 (24.0–34.4) 70.9 (65.6–75.7)
2021 (Jan–Jun) 1.3 (0.3–3.5) 30.5 (23.6–38.0) 70.3 (62.9–76.9) 2021 (Jul–Dec) 1.3 (0.4–3.2) 27.6 (21.5–34.4) 71.4 (64.7–77.5)
18–64 2019 7.5 (5.6–9.9) 15.8 (13.2–18.7) 77.5 (74.2–80.5) 2020 8.8 (6.7–11.4) 16.7 (13.8–20.0) 75.4 (71.8–78.8) 2021 (full year) 6.3 (4.8–8.2) 18.0 (16.0–20.2) 76.0 (73.6–78.2)
2021 (Jan–Jun) 6.1 (3.9–8.9) 18.4 (15.4–21.8) 75.9 (72.1–79.4) 2021 (Jul–Dec) 6.6 (4.8–8.8) 17.6 (14.0–21.7) 76.0 (71.9–79.8)
Non-Hispanic, other races and multiple races
Under 65 2019 14.6 (11.4–18.2) 34.5 (28.9–40.3) 52.9 (46.7–59.0) 2020 13.0 (10.1–16.3) 39.2 (34.1–44.6) 51.3 (45.1–57.5) 2021 (full year) 11.0 (8.6–13.8) 40.2 (35.1–45.5) 51.9 (46.3–57.4)
2021 (Jan–Jun) 11.7 (8.1–16.3) 40.1 (34.1–46.3) 50.8 (43.8–57.8) 2021 (Jul–Dec) 10.4 (7.2–14.3) 40.3 (34.0–46.9) 52.9 (46.0–59.8)
0–17 2019 5.9 (3.5–9.3) 45.3 (38.0–52.8) 50.4 (42.6–58.3) 2020 6.1 (3.0–10.9) 48.5 (41.5–55.6) 49.2 (42.2–56.3) 2021 (full year) 5.0 (2.6–8.6) 49.3 (42.9–55.7) 48.8 (43.8–53.9)
2021 (Jan–Jun) * 46.3 (39.1–53.6) 48.6 (41.5–55.7) 2021 (Jul–Dec) * 52.4 (43.3–61.4) 49.1 (41.2–57.0)
18–64 2019 21.1 (17.0–25.8) 26.2 (20.6–32.5) 54.8 (48.1–61.3) 2020 17.6 (13.7–22.1) 32.9 (25.7–40.9) 52.7 (44.3–61.0) 2021 (full year) 15.5 (12.3–19.3) 33.5 (27.2–40.1) 54.1 (46.1–62.0)
2021 (Jan–Jun) 15.5 (11.1–20.9) 35.4 (27.2–44.3) 52.5 (42.5–62.4) 2021 (Jul–Dec) 15.6 (10.5–21.9) 31.5 (24.5–39.1) 55.8 (46.9–64.4)
* Estimate is not shown, as it does not meet National Center for Health Statistics standards of reliability. 1Hispanic origin and race are two separate and distinct categories. People of Hispanic or Latino origin may be of any race or combination of races. Hispanic or Latino origin includes people of Mexican, Puerto Rican, Cuban, Central and South American, or Spanish origin. Race is based on respondents’ descriptions of their own racial background. More than one race may be reported. For conciseness, the text, tables, and figures in this report use shorter versions of the 1997 Office of Management and Budget terms for race and Hispanic or Latino origin. For example, the category “not Hispanic, Black or African American, single race” is referred to as “non-Hispanic Black” in the text, tables, and figures. Estimates for non-Hispanic people of races other than White only, Black only, and Asian only, or of multiple races, are combined into the “non-Hispanic, other races and multiple races” category. 2People were defined as uninsured if they did not have any private health insurance, Medicare, Medicaid, Children’s Health Insurance Program (CHIP), state-sponsored or other government-sponsored health plan, or military plan. People also were defined as uninsured if they had only Indian Health Service coverage or had only a private plan that paid for one type of service, such as accidents or dental care.

Health Insurance Coverage: Early Release of Estimates From the National Health Interview Survey, 2021
P a g e | 19 U.S. Department of Health and Human Services ● Centers for Disease Control and Prevention ● National Center for Health Statistics ● Released 05/2022
3Public health plan coverage includes Medicaid, CHIP, state-sponsored or other government-sponsored health plan, Medicare, and military plans. A small number of people were covered by both public and private plans and were included in both categories. 4Private health insurance coverage includes any comprehensive private insurance plan (including health maintenance and preferred provider organizations). These plans include those obtained through an employer, purchased directly, purchased through local or community programs, or purchased through the Health Insurance Marketplace or a state-based exchange. Private coverage excludes plans that pay for only one type of service, such as accidents or dental care. A small number of people were covered by both public and private plans and were included in both categories.
NOTES: Due to the COVID-19 pandemic, data collection switched to a telephone-only mode beginning on March 19, 2020. Personal visits (with telephone attempts first) resumed in all areas in September 2020. In addition, from August–December 2020, a subsample of adult respondents who completed NHIS in 2019 were recontacted by telephone and asked to participate again. Response rates were lower and respondent characteristics were different in April–December 2020. Differences observed in estimates between April–December 2020 and other time periods may have been impacted by these differences in respondent characteristics. Data are based on household interviews of a sample of the civilian noninstitutionalized population.
SOURCE: National Center for Health Statistics, National Health Interview Surveys, 2019–2021.

Health Insurance Coverage: Early Release of Estimates From the National Health Interview Survey, 2021
P a g e | 20 U.S. Department of Health and Human Services ● Centers for Disease Control and Prevention ● National Center for Health Statistics ● Released 05/2022
Table VI. Percentage (and 95% confidence intervals) of people under age 65 who lacked health insurance coverage, had public health plan coverage, and had private health insurance coverage at the time of interview, by state Medicaid expansion status, age group, and year: United States, 2019–2021
State Medicaid expansion status1, age group (years), year, and 6-month interval Uninsured2
Public health plan coverage3
Private health insurance coverage4
Medicaid expansion states5 Under 65
2019 9.1 (8.6–9.7) 27.8 (26.7–28.9) 65.0 (63.8–66.2) 2020 8.5 (7.8–9.2) 27.5 (26.3–28.8) 66.0 (64.7–67.4) 2021 (full year) 8.1 (7.5–8.7) 28.9 (27.8–30.0) 65.0 (63.7–66.3)
2021 (Jan–Jun) 8.5 (7.6–9.4) 29.2 (27.8–30.6) 64.4 (62.8–66.0) 2021 (Jul–Dec) 7.7 (7.0–8.5) 28.5 (27.2–29.9) 65.6 (64.1–67.1)
0–17 2019 3.9 (3.3–4.6) 40.3 (38.3–42.2) 57.6 (55.5–59.7) 2020 3.6 (2.7–4.7) 41.3 (38.9–43.8) 57.3 (54.8–59.8) 2021 (full year) 2.6 (2.1–3.1) 42.7 (40.9–44.6) 57.3 (55.3–59.3)
2021 (Jan–Jun) 2.6 (1.8–3.6) 43.2 (40.7–45.8) 56.7 (54.1–59.4) 2021 (Jul–Dec) 2.5 (1.9–3.3) 42.2 (40.1–44.3) 57.8 (55.5–60.2)
18–64 2019 11.0 (10.4–11.6) 23.4 (22.3–24.5) 67.6 (66.4–68.8) 2020 10.2 (9.5–11.1) 22.5 (21.5–23.6) 69.2 (68.0–70.4) 2021 (full year) 10.1 (9.3–10.9) 23.8 (22.8–24.9) 67.8 (66.6–69.0)
2021 (Jan–Jun) 10.6 (9.5–11.7) 24.1 (22.7–25.5) 67.2 (65.7–68.7) 2021 (Jul–Dec) 9.6 (8.7–10.6) 23.5 (22.3–24.8) 68.4 (67.0–69.9)
Non-Medicaid expansion states6 Under 65
2019 17.1 (15.8–18.5) 23.0 (21.5–24.6) 61.4 (59.0–63.8) 2020 17.2 (16.0–18.5) 24.1 (22.5–25.8) 60.5 (58.6–62.4) 2021 (full year) 16.8 (15.6–18.1) 25.5 (24.2–26.8) 59.4 (57.6–61.3)
2021 (Jan–Jun) 17.1 (15.5–18.8) 25.2 (23.7–26.8) 59.6 (57.3–61.9) 2021 (Jul–Dec) 16.5 (15.0–18.0) 25.8 (23.8–27.8) 59.3 (56.5–62.0)
0–17 2019 7.0 (6.0–8.1) 43.2 (40.1–46.3) 51.5 (47.9–55.0) 2020 7.8 (6.3–9.5) 43.7 (40.0–47.5) 50.5 (46.8–54.3) 2021 (full year) 7.2 (6.1–8.4) 47.5 (44.8–50.2) 46.9 (43.9–49.8)
2021 (Jan–Jun) 7.8 (6.3–9.5) 47.4 (44.0–50.9) 46.4 (42.5–50.3) 2021 (Jul–Dec) 6.5 (5.0–8.4) 47.6 (44.3–50.9) 47.4 (43.6–51.3)
18–64 2019 21.2 (19.6–22.8) 15.1 (14.0–16.3) 65.3 (63.2–67.3) 2020 20.8 (19.3–22.3) 16.7 (15.3–18.2) 64.3 (62.6–66.0) 2021 (full year) 20.4 (18.9–21.9) 17.4 (16.2–18.5) 64.1 (62.3–65.9)
2021 (Jan–Jun) 20.6 (18.6–22.7) 16.9 (15.7–18.2) 64.5 (62.2–66.8) 2021 (Jul–Dec) 20.1 (18.3–22.0) 17.8 (16.0–19.7) 63.7 (60.9–66.4)
1Under provisions of the Affordable Care Act of 2010 (P.L. 111–148, P.L. 111–152), states have the option to expand Medicaid eligibility to cover adults who have incomes up to and including 138% of the federal poverty level. There is no deadline for states to choose to implement the Medicaid expansion, and they may do so at any time. As of January 1, 2019, 33 states and the District of Columbia moved forward with Medicaid expansion.
2People were defined as uninsured if they did not have any private health insurance, Medicare, Medicaid, Children’s Health Insurance Program (CHIP), state-sponsored or other government-sponsored health plan, or military plan. People also were defined as uninsured if they had only Indian Health Service coverage or had only a private plan that paid for one type of service, such as accidents or dental care. 3Public health plan coverage includes Medicaid, CHIP, state-sponsored or other government-sponsored health plan, Medicare, and military plans. A small number of people were covered by both public and private plans and were included in both categories. 4Private health insurance coverage includes any comprehensive private insurance plan (including health maintenance and preferred provider organizations). These plans include those obtained through an employer, purchased directly, purchased through local or community programs, or purchased through the Health Insurance Marketplace or a state-based exchange. Private coverage excludes plans that pay for only one type of service, such as accidents or dental care. A small number of people were covered by both public and private plans and were included in both categories. 5For 2019, states moving forward with Medicaid expansion included: Alaska, Arizona, Arkansas, California, Colorado, Connecticut, Delaware, Hawaii, Illinois, Indiana, Iowa, Kentucky, Louisiana, Maine, Maryland, Massachusetts, Michigan, Minnesota, Montana, Nevada, New Hampshire, New Jersey, New Mexico, New York, North Dakota, Ohio, Oregon, Pennsylvania, Rhode Island, Vermont, Virginia, Washington, and West Virginia. The District of Columbia also moved forward with Medicaid expansion. Beginning with 2020, two states were added to this grouping: Idaho and Utah. Beginning with 2021, Nebraska was added to this grouping. 6For 2019, states not moving forward with Medicaid expansion included: Alabama, Florida, Georgia, Idaho, Kansas, Mississippi, Missouri, Nebraska, North Carolina, Oklahoma, South Carolina, South Dakota, Tennessee, Texas, Utah, Wisconsin, and Wyoming. Beginning with 2020, two states have been removed from this grouping: Idaho and Utah. Beginning with 2021, Nebraska was removed from this grouping.

Health Insurance Coverage: Early Release of Estimates From the National Health Interview Survey, 2021
P a g e | 21 U.S. Department of Health and Human Services ● Centers for Disease Control and Prevention ● National Center for Health Statistics ● Released 05/2022
NOTES: Due to the COVID-19 pandemic, data collection switched to a telephone-only mode beginning on March 19, 2020. Personal visits (with telephone attempts first) resumed in all areas in September 2020. In addition, from August–December 2020, a subsample of adult respondents who completed NHIS in 2019 were recontacted by telephone and asked to participate again. Response rates were lower and respondent characteristics were different in April–December 2020. Differences observed in estimates between April–December 2020 and other time periods may have been impacted by these differences in respondent characteristics. Data are based on household interviews of a sample of the civilian noninstitutionalized population.
SOURCE: National Center for Health Statistics, National Health Interview Surveys, 2019–2021.

Health Insurance Coverage: Early Release of Estimates From the National Health Interview Survey, 2021
P a g e | 22 U.S. Department of Health and Human Services ● Centers for Disease Control and Prevention ● National Center for Health Statistics ● Released 05/2022
Table VII. Percentage and number of people under age 65 who had exchange-based private health insurance coverage at the time of interview, by year and selected characteristics: United States, 2019–2021
Year and selected characteristics Percent (95% confidence interval) Number in millions
2019
Age group (years) Under 65 3.7 (3.4–4.0) 10.0
0–17 1.7 (1.4–2.1) 1.3 18–64 4.4 (4.0–4.8) 8.7
Sex Male 3.5 (3.1–3.9) 4.7 Female 3.9 (3.5–4.4) 5.3
Family income as a percentage of FPL1 Less than 100% FPL 3.0 (2.2–4.0) 1.1 100% to less than 200% FPL 5.3 (4.6–6.1) 2.8 200% and greater FPL 3.2 (2.9–3.5) 5.8
Race and ethnicity2 Hispanic 3.8 (3.1–4.6) 2.1 Non-Hispanic White 3.6 (3.2–4.0) 5.5 Non-Hispanic Black 2.9 (2.2–3.9) 1.0
Medicaid expansion status3 Medicaid expansion states4 3.3 (3.0–3.8) 5.7 Non-Medicaid expansion states5 4.3 (3.8–4.9) 4.3
2020
Age group (years) Under 65 3.8 (3.5–4.1) 10.1
0–17 2.1 (1.7–2.5) 1.5 18–64 4.4 (4.0–4.7) 8.6
Sex Male 3.1 (2.8–3.5) 4.2 Female 4.4 (4.0–4.8) 5.9
Family income as a percentage of FPL1 Less than 100% FPL 1.9 (1.3–2.6) 0.6 100% to less than 200% FPL 4.8 (4.1–5.7) 2.4 200% and greater FPL 3.7 (3.3–4.1) 6.9
Race and ethnicity2 Hispanic 4.2 (3.5–5.0) 2.4 Non-Hispanic White 3.7 (3.3–4.1) 5.7 Non-Hispanic Black 2.6 (1.9–3.3) 0.9
Medicaid expansion status3 Medicaid expansion states4 3.5 (3.2–3.9) 6.2 Non-Medicaid expansion states5 4.1 (3.6–4.7) 3.9
See footnotes at the end of table.

Health Insurance Coverage: Early Release of Estimates From the National Health Interview Survey, 2021
P a g e | 23 U.S. Department of Health and Human Services ● Centers for Disease Control and Prevention ● National Center for Health Statistics ● Released 05/2022
Table VII. Percentage and number of people under age 65 who had exchange-based private health insurance coverage at the time of interview, by year and selected characteristics: United States, 2019–2021—Con.
Year and selected characteristics Percent (95% confidence interval) Number in millions
2021
Age group (years) Under 65 4.3 (4.0–4.7) 11.6
0–17 2.1 (1.7–2.6) 1.5 18–64 5.1 (4.7–5.5) 10.1
Sex Male 3.9 (3.5–4.2) 5.2 Female 4.8 (4.3–5.2) 6.5
Family income as a percentage of FPL1 Less than 100% FPL 3.6 (2.7–4.7) 1.2 100% to less than 200% FPL 6.4 (5.5–7.4) 3.3 200% and greater FPL 3.8 (3.4–4.1) 6.9
Race and ethnicity2 Hispanic 4.4 (3.6–5.3) 2.5 Non-Hispanic White 4.2 (3.8–4.6) 6.4 Non-Hispanic Black 3.9 (3.2–4.8) 1.3
Medicaid expansion status3 Medicaid expansion states4 4.0 (3.6–4.5) 7.2 Non-Medicaid expansion states5 4.9 (4.4–5.5) 4.4
Jan–Jun 2021
Age group (years) Under 65 4.3 (3.8–4.8) 11.6
0–17 2.1 (1.5–2.9) 1.5 18–64 5.1 (4.6–5.7) 10.0
Sex Male 4.0 (3.5–4.5) 5.3 Female 4.6 (4.0–5.3) 6.2
Family income as a percentage of FPL1 Less than 100% FPL 3.6 (2.5–4.9) 1.3 100% to less than 200% FPL 6.0 (4.7–7.5) 3.2 200% and greater FPL 3.8 (3.3–4.5) 7.0
Race and ethnicity2 Hispanic 4.8 (3.8–6.0) 2.7 Non-Hispanic White 4.1 (3.6–4.6) 6.3 Non-Hispanic Black 3.5 (2.5–4.6) 1.2
Medicaid expansion status3 Medicaid expansion states4 4.1 (3.5–4.8) 7.3 Non-Medicaid expansion states5 4.6 (3.8–5.5) 4.3
See footnotes at the end of table.

Health Insurance Coverage: Early Release of Estimates From the National Health Interview Survey, 2021
P a g e | 24 U.S. Department of Health and Human Services ● Centers for Disease Control and Prevention ● National Center for Health Statistics ● Released 05/2022
Table VII. Percentage and number of people under age 65 who had exchange-based private health insurance coverage at the time of interview, by year and selected characteristics: United States, 2019–2021—Con.
Year and selected characteristics Percent (95% confidence interval) Number in millions
Jul–Dec 2021 Age group (years)
Under 65 4.4 (3.9–4.8) 11.7 0–17 2.1 (1.6–2.8) 1.5 18–64 5.2 (4.6–5.7) 10.2
Sex Male 3.8 (3.3–4.3) 5.0 Female 4.9 (4.3–5.6) 6.7
Family income as a percentage of FPL1 Less than 100% FPL 3.6 (2.4–5.2) 1.2 100% to less than 200% FPL 6.8 (5.6–8.1) 3.4 200% and greater FPL 3.7 (3.2–4.2) 6.8
Race and ethnicity2 Hispanic 4.0 (3.2–5.0) 2.3 Non-Hispanic White 4.3 (3.7–4.9) 6.6 Non-Hispanic Black 4.4 (3.2–6.0) 1.4
Medicaid expansion status3 Medicaid expansion states4 3.9 (3.3–4.5) 7.1 Non-Medicaid expansion states5 5.3 (4.7–6.0) 4.6
1FPL is federal poverty level. Income categories are based on the ratio of the family’s income in the previous calendar year to the appropriate poverty threshold (given the family’s size and number of children), as defined by the U.S. Census Bureau for that year (Semega JL, Kollar MA, Creamer J, Mohanty A. Income and poverty in the United States: 2018. Current Population Reports, P60–266. 2019 and Semega J, Kollar M, Shrider EA, Creamer J. Income and poverty in the United States: 2019. Current Population Reports, P60–270. 2020). The percentage of respondents under age 65 with unknown poverty status was 7.6% in 2019, 8.4% in 2020, and 8.7% in 2021. People with unknown poverty status are not shown in this table. Estimates may differ from estimates that are based on both reported and imputed income. 2Hispanic origin and race are two separate and distinct categories. People of Hispanic origin may be of any race or combination of races. Hispanic origin includes people of Mexican, Puerto Rican, Cuban, Central and South American, or Spanish origin. Race is based on respondents’ descriptions of their own racial background. More than one race may be reported. For conciseness, the text, tables, and figures in this report use shorter versions of the 1997 Office of Management and Budget terms for race and Hispanic or Latino origin. For example, the category “not Hispanic, Black or African American, single race” is referred to as “non-Hispanic Black” in the text, tables, and figures. 3Under provisions of the Affordable Care Act of 2010 (P.L. 111–148, P.L. 111–152), states have the option to expand Medicaid eligibility to cover adults who have income up to and including 138% of the FPL. There is no deadline for states to choose to implement the Medicaid expansion, and they may do so at any time. As of January 1, 2019, 33 states and the District of Columbia moved forward with Medicaid expansion. 4For 2019, states moving forward with Medicaid expansion included: Alaska, Arizona, Arkansas, California, Colorado, Connecticut, Delaware, Hawaii, Illinois, Indiana, Iowa, Kentucky, Louisiana, Maine, Maryland, Massachusetts, Michigan, Minnesota, Montana, Nevada, New Hampshire, New Jersey, New Mexico, New York, North Dakota, Ohio, Oregon, Pennsylvania, Rhode Island, Vermont, Virginia, Washington, and West Virginia. The District of Columbia also moved forward with Medicaid expansion. Beginning with 2020, two states were added to this grouping: Idaho and Utah. Beginning with 2021 Nebraska was added to this grouping. 5For 2019, states not moving forward with Medicaid expansion included: Alabama, Florida, Georgia, Idaho, Kansas, Mississippi, Missouri, Nebraska, North Carolina, Oklahoma, South Carolina, South Dakota, Tennessee, Texas, Utah, Wisconsin, and Wyoming. Beginning with 2020, two states have been removed from this grouping: Idaho and Utah. Beginning with 2021, Nebraska was removed from this grouping.
NOTES: Exchange-based coverage is a private health insurance plan purchased through the Health Insurance Marketplace or state-based exchanges that were established as part of the Affordable Care Act of 2010 (P.L. 111–148, P.L. 111–152). Due to the COVID-19 pandemic, data collection switched to a telephone-only mode beginning on March 19, 2020. Personal visits (with telephone attempts first) resumed in all areas in September 2020. In addition, from August–December 2020, a subsample of adult respondents who completed NHIS in 2019 were recontacted by telephone and asked to participate again. Response rates were lower and respondent characteristics were different in April–December 2020. Differences observed in estimates between April–December 2020 and other time periods may have been impacted by these differences in respondent characteristics. Data are based on household interviews of a sample of the civilian noninstitutionalized population.
SOURCE: National Center for Health Statistics, National Health Interview Surveys, 2019–2021.