Embed Size (px)
Citation preview
Edited by
Natural Additives
in Food
Lillian Barros and Isabel C.F.R. Ferreira
Printed Edition of the Special Issue Published in Molecules
www.mdpi.com/journal/molecules

Natural Additives in Food

Natural Additives in Food
Editors
Lillian Barros
Isabel C.F.R. Ferreira
MDPI ‚ Basel ‚ Beijing ‚ Wuhan ‚ Barcelona ‚ Belgrade ‚ Manchester ‚ Tokyo ‚ Cluj ‚ Tianjin
Isabel C.F.R. Ferreira Centro de Investigac ao de Montanha
Instituto Politecnico de Braganca
Braganca
Portugal
Editors
Lillian Barros
Centro de Investigac ao de Montanha (CIMO) Instituto Politecnico de Braganca
Braganca
Portugal
Editorial Office
MDPI
St. Alban-Anlage 66 4052 Basel, Switzerland
This is a reprint of articles from the Special Issue published online in the open access journal
Molecules (ISSN 1420-3049) (available at: www.mdpi.com/journal/molecules/special issues/
natural additives).
For citation purposes, cite each article independently as indicated on the article page online and as
indicated below:
LastName, A.A.; LastName, B.B.; LastName, C.C. Article Title. Journal Name Year, Volume Number,
Page Range.
ISBN 978-3-0365-4106-8 (Hbk)
ISBN 978-3-0365-4105-1 (PDF)
© 2022 by the authors. Articles in this book are Open Access and distributed under the Creative
Commons Attribution (CC BY) license, which allows users to download, copy and build upon
published articles, as long as the author and publisher are properly credited, which ensures maximum
dissemination and a wider impact of our publications.
The book as a whole is distributed by MDPI under the terms and conditions of the Creative Commons
license CC BY-NC-ND.
Contents
About the Editors . . . . . . . . . . . . . . . . . . . . . . . . . . . . . . . . . . . . . . . . . . . . . . vii
Preface to ”Natural Additives in Food” . . . . . . . . . . . . . . . . . . . . . . . . . . . . . . . . . ix
Margarida Faustino, Mariana Veiga, Pedro Sousa, Eduardo M. Costa, Sara Silva and ManuelaPintadoAgro-Food Byproducts as a New Source of Natural Food AdditivesReprinted from: Molecules 2019, 24, 1056, doi:10.3390/molecules24061056 . . . . . . . . . . . . . . 1
Isabel Viera, Antonio Perez-Galvez and Marıa RocaGreen Natural ColorantsReprinted from: Molecules 2019, 24, 154, doi:10.3390/molecules24010154 . . . . . . . . . . . . . . 25
Dorota Kregiel, Ewelina Pawlikowska and Hubert AntolakUrtica spp.: Ordinary Plants with Extraordinary PropertiesReprinted from: Molecules 2018, 23, 1664, doi:10.3390/molecules23071664 . . . . . . . . . . . . . . 43
Imen Tarchoune, Cristina Sgherri, Jamel Eddouzi, Angela Zinnai, Mike Frank Quartacci andMokhtar ZarroukOlive Leaf Addition Increases Olive Oil Nutraceutical PropertiesReprinted from: Molecules 2019, 24, 545, doi:10.3390/molecules24030545 . . . . . . . . . . . . . . 65
Wanying He, Xiaoyan Li, Ying Peng, Xiaoyan He and Siyi PanAnti-Oxidant and Anti-Melanogenic Properties of Essential Oil from Peel of Pomelo cv. Guan XiReprinted from: Molecules 2019, 24, 242, doi:10.3390/molecules24020242 . . . . . . . . . . . . . . 81
Elena Rosello-Soto, Francisco J. Martı-Quijal, Antonio Cilla, Paulo E. S. Munekata, Jose M.Lorenzo and Fabienne Remize et al.Influence of Temperature, Solvent and pH on the Selective Extraction of Phenolic Compoundsfrom Tiger Nuts by-Products: Triple-TOF-LC-MS-MS CharacterizationReprinted from: Molecules 2019, 24, 797, doi:10.3390/molecules24040797 . . . . . . . . . . . . . . 95
Maria G. Leichtweis, Carla Pereira, M.A. Prieto, Maria Filomena Barreiro, Ilton Jose Baraldiand Lillian Barros et al.Ultrasound as a Rapid and Low-Cost Extraction Procedure to Obtain Anthocyanin-BasedColorants from Prunus spinosa L. Fruit Epicarp: Comparative Study with ConventionalHeat-Based ExtractionReprinted from: Molecules 2019, 24, 573, doi:10.3390/molecules24030573 . . . . . . . . . . . . . . 109
Filipa Fernandes, Eliana Pereira, Miguel A. Prieto, Ricardo C. Calhelha, Ana Ciric andMarina Sokovic et al.Optimization of the Extraction Process to Obtain a Colorant Ingredient from Leaves ofOcimum basilicum var. purpurascensReprinted from: Molecules 2019, 24, 686, doi:10.3390/molecules24040686 . . . . . . . . . . . . . . 127
Guillermo Espinosa-Acosta, Ana L. Ramos-Jacques, Gustavo A. Molina, Jose Maya-Cornejo,Rodrigo Esparza and Angel R. Hernandez-Martinez et al.Stability Analysis of Anthocyanins Using Alcoholic Extracts from Black Carrot (Daucus Carotassp. Sativus Var. Atrorubens Alef.)Reprinted from: Molecules 2018, 23, 2744, doi:10.3390/molecules23112744 . . . . . . . . . . . . . . 145
v
Davi Vieira Teixeira da Silva, Diego dos Santos Baiao, Fabrıcio de Oliveira Silva, GeniltonAlves, Daniel Perrone and Eduardo Mere Del Aguila et al.Betanin, a Natural Food Additive: Stability, Bioavailability, Antioxidant and PreservativeAbility AssessmentsReprinted from: Molecules 2019, 24, 458, doi:10.3390/molecules24030458 . . . . . . . . . . . . . . 161
Gong-Liang Zhang, Hong-Yan Wu, Ying Liang, Jie Song, Wei-Qi Gan and Hong-Man HouInfluence of Oxygen-Containing Sulfur Flavor Molecules on the Stability of -Carotene underUVA IrradiationReprinted from: Molecules 2019, 24, 318, doi:10.3390/molecules24020318 . . . . . . . . . . . . . . 177
Mohamed A. Farag, Ahmed F. Tawfike, Marwa S. Donia, Anja Ehrlich and Ludger A.WessjohannInfluence of Pickling Process on Allium cepa and Citrus limon Metabolome as Determined viaMass Spectrometry-Based MetabolomicsReprinted from: Molecules 2019, 24, 928, doi:10.3390/molecules24050928 . . . . . . . . . . . . . . 189
Constantin Croitoru, Claudia Mures, an, Mihaela Turturica, Nicoleta Stanciuc, DoinaGeorgeta Andronoiu and Loredana Dumitras, cu et al.Improvement of Quality Properties and Shelf Life Stability of New Formulated Muffins Basedon Black RiceReprinted from: Molecules 2018, 23, 3047, doi:10.3390/molecules23113047 . . . . . . . . . . . . . . 205
Hongliang Li, Chang Yang, Chong Chen, Fazheng Ren, Yuan Li and Zhishen Mu et al.The Use of Trisodium Citrate to Improve the Textural [-15]Properties of Acid-Induced,Transglutaminase-Treated Micellar Casein GelsReprinted from: Molecules 2018, 23, 1632, doi:10.3390/molecules23071632 . . . . . . . . . . . . . . 221
Minerva Bautista Villarreal, Claudia T. Gallardo Rivera, Eristeo Garcıa Marquez, JoseRodrıguez Rodrıguez, Marıa Adriana Nunez Gonzalez and Abelardo Chavez Montes et al.Comparative Reduction of Egg Yolk Cholesterol Using Anionic Chelating AgentsReprinted from: Molecules 2018, 23, 3204, doi:10.3390/molecules23123204 . . . . . . . . . . . . . . 233
Leocadio Alonso, Patrick F. Fox, Marıa V. Calvo and Javier FontechaEffect of Beta Cyclodextrin on the Reduction of Cholesterol in Ewe’s Milk Manchego CheeseReprinted from: Molecules 2018, 23, 1789, doi:10.3390/molecules23071789 . . . . . . . . . . . . . . 245
Kaixin Li, Jianjun Yang, Qigen Tong, Wei Zhang and Fang WangEffect of Enzyme Modified Soymilk on Rennet Induced Gelation of Skim MilkReprinted from: Molecules 2018, 23, 3084, doi:10.3390/molecules23123084 . . . . . . . . . . . . . . 257
Herbenya Peixoto, Mariana Roxo, Emerson Silva, Karla Valente, Markus Braun and XiaojuanWang et al.Bark Extract of the Amazonian Tree Endopleura uchi (Humiriaceae) Extends Lifespan andEnhances Stress Resistance in Caenorhabditis elegansReprinted from: Molecules 2019, 24, 915, doi:10.3390/molecules24050915 . . . . . . . . . . . . . . 267
vi
About the Editors
Lillian Barros
Lillian Barros is an assistant researcher at the Centro de Investigacao de Montanha (CIMO),
Instituto Politecnico de Braganca and vice-coordinator of CIMO. She obtained her Ph.D. in Pharmacy
(Nutrition and Bromatology) at the University of Salamanca (2008). She has published more than 515
indexed papers in the Food Science and Technology area (61 h-index), edited 4 books, written several
book chapters, registered 8 national patents, is principal investigator of several research projects and
has supervision several post-doc, Ph.D. and master students. She has reached top positions in the
world rankings, such as Highly Cited Researcher Clarivate, since 2016. Her research targets are
mainly in the identification, separation and recovery of functional molecules from different natural
products.
Isabel C.F.R. Ferreira
Isabel Ferreira is currently the Secretary of State for Inland Enhancement of Portugal. She was a
Vice-President at the Polytechnic Institute of Braganca, the Director of the Mountain Research Centre
and Mentor of the Collaborative Laboratory Mountains of Research. She is a Full Professor at the
IPB, with a Ph.D. in Biochemistry and one of the world’s most cited scientists (top 1%) since 2015
by Clarivate Analytics in the Essencial Science Indicators index. She has published more than 700
papers in the Food Science and Technology area (61h-index), edited 4 books, written 60 book chapters,
registered several national and international patents, most focusing on the transfer of technology to
the industry.
vii

Preface to ”Natural Additives in Food”
The controversy and ambiguity related with chemical additives, allied to sporadic scares, have
paved the way for natural additives to gain interest and funding. Today, most consumers prefer
foods added with natural additives, rather than artificial ones, which is seen by the food industry as
an opportunity to find new and more efficient natural-based solutions, while fighting to reduce the
overall use of additives, producing minimally processed goods. The benefits of natural additives are
endless, their synergy and effectiveness are a great leap over artificial additives that carry out, in most
cases, only one effect over the food.
The plant and fungi kingdoms are great sources of bioactive compounds, that can be
used to develop natural food ingredients. These natural compounds can be added as extracts,
taking advantage of the synergistic effects between compounds, or as individual molecules, after
purification, thus adding the most bioactive ones to the foodstuff. Although quite promising, natural
additives still face some drawbacks and limitations, availability of natural resources, exhaustive
and not very efficient extraction methods, and several intrinsic and extrinsic factors that can affect
the stability, availability, and bioactivity of natural compounds. Therefore, an important research
topic is the discovery of new alternative sources of natural additives fulfilling the different classes:
preservatives (antimicrobials, antioxidants, and anti-brownings), nutritional additives, coloring
agents, flavoring agents, texturizing agents, and miscellaneous agents.
In order to address the advantages and challenges the use of natural additives in foods, an
enormous amount of work, divided into three review and 15 original articles, involving diverse
expert teams of from different parts of the world, embodied this book “Natural Additives in Foods”,
where current issues on natural additives are discussed and explored. Briefly, topics on alternatives
for sustainable obtaining of bioactive molecules from agro-food byproducts, an important cheap
source of added value compounds, which can contribute to total exploration of natural source, and
for reduction of environmental impact, are presented and discussed in some studies. Likewise,
optimized extraction techniques, aiming at greater extraction efficiency with less use of natural
resources, are proposed by for some authors. Several potential natural colorants to replace artificial
ones are covered in topics that discuss their main sources and bioactivities; and the sustainable
production methods and the chemical stability of these compounds for later commercial use. In
addition, interesting studies approach the valorization of wild species to obtain molecules with
biological proprieties, both for human health and for addition in foods. And, finally, the production
of foodstuff healthier than the traditional, is proposed through the use of natural ingredients rich in
phytochemicals and through processes that aim to minimize the absorption of compounds harmful
to health.
Lillian Barros and Isabel C.F.R. Ferreira
Editors
ix

molecules
Review
Agro-Food Byproducts as a New Source of NaturalFood Additives
Margarida Faustino, Mariana Veiga , Pedro Sousa, Eduardo M. Costa , Sara Silva and
Manuela Pintado *
CBQF–Centro de Biotecnologia e Química Fina–Laboratório Associado, Escola Superior de Biotecnologia,Universidade Católica Portuguesa, Rua Arquiteto Lobão Vital 172, 4200-374 Porto, Portugal;[email protected] (M.F.); [email protected] (M.V.); [email protected] (P.S.);[email protected] (E.M.C.); [email protected] (S.S.)* Correspondence: [email protected]; Tel.: +351-225-580-097
Academic Editors: Lillian Barros and Isabel C.F.R. FerreiraReceived: 4 February 2019; Accepted: 12 March 2019; Published: 18 March 2019
Abstract: Nowadays, the agro-food industry generates high amounts of byproducts that may possessadded value compounds with high functionality and/or bioactivity. Additionally, consumers’demand for healthier foodstuffs has increased over the last years, and thus the food industry hasstrived to answer this challenge. Byproducts are generally secondary products derived from primaryagro-food production processes and represent an interesting and cheaper source of potentiallyfunctional ingredients, such as peptides, carotenoids, and phenolic compounds, thus promoting acircular economy concept. The existing body of work has shown that byproducts and their extractsmay be successfully incorporated into foodstuffs, for instance, phenolic compounds from eggplantcan be potentially used as a mulfitunctional food additive with antimicrobial, antioxidant, and foodcolorant properties. As such, the aim of this review is to provide insights into byproducts and theirpotential as new sources of foodstuffs additives.
Keywords: byproducts; food additives; antimicrobial; antioxidant; colorants; texturizing agents;foaming capacity and emulsifiers
1. Introduction
Food functionalization is an ever-increasing market that requires new bioactive ingredients that canbe used by the food industry for the development of innovative functional products with scientificallysustained claims. In this regard, much attention has been paid in recent years to natural compounds andtheir associated bioactivities. However, natural sources are finite, and new alternatives have to be soughtto sustain the ever-growing needs for ingredients and additives of the food industry [1,2].
The European Union (EU) action plan for the circular economy to reduce food waste includesa strategic approach based on the reduction, reuse, recovery, and recycling of materials and energy,enhancing the value and consequently the useful life of products, materials, and resources in theeconomy. The reuse of agro-industrial byproducts can represent a renewable source for some alreadyin use food additives or even originate new added-value ingredients with functional compoundsand properties, which will benefit the entire food system [3]. For instance, byproducts containpolysaccharides, organic acids, proteins, and other compounds, which, at no additional productioncost and at a reduced industrial cost, make them a rich source of natural compounds that can potentiallybe applied in the food industry as food additives sources (summarized in Table 1) [4].
Furthermore, these natural compounds may also be regarded as nutraceutical ingredients orcomplements, allowing for the development of products with enhanced nutritional value, potentialhealth benefits, longer shelf-life, as well as a good sensory profile [5–7].
1
Molecules 2019, 24, 1056
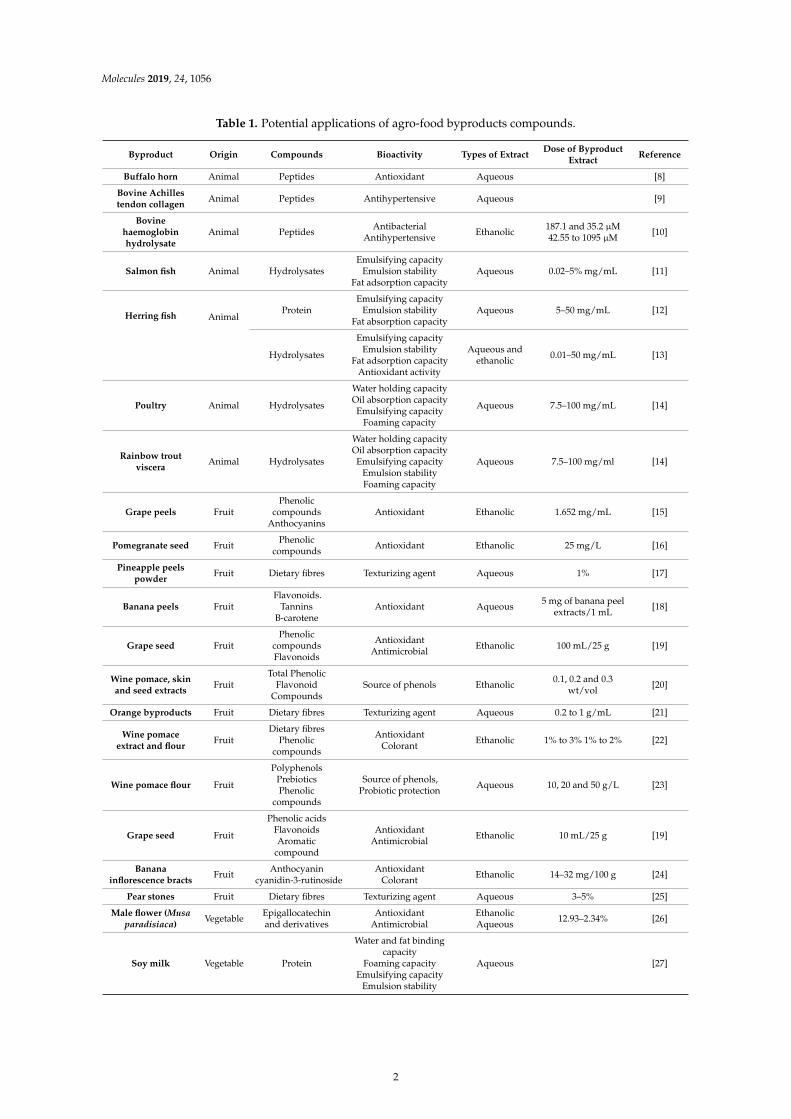
Table 1. Potential applications of agro-food byproducts compounds.
Byproduct Origin Compounds Bioactivity Types of ExtractDose of Byproduct
ExtractReference
Buffalo horn Animal Peptides Antioxidant Aqueous [8]
Bovine Achillestendon collagen
Animal Peptides Antihypertensive Aqueous [9]
Bovinehaemoglobinhydrolysate
Animal PeptidesAntibacterial
AntihypertensiveEthanolic
187.1 and 35.2 µM42.55 to 1095 µM
[10]
Salmon fish Animal HydrolysatesEmulsifying capacity
Emulsion stabilityFat adsorption capacity
Aqueous 0.02–5% mg/mL [11]
Herring fish AnimalProtein
Emulsifying capacityEmulsion stability
Fat absorption capacityAqueous 5–50 mg/mL [12]
Hydrolysates
Emulsifying capacityEmulsion stability
Fat adsorption capacityAntioxidant activity
Aqueous andethanolic
0.01–50 mg/mL [13]
Poultry Animal Hydrolysates
Water holding capacityOil absorption capacityEmulsifying capacity
Foaming capacity
Aqueous 7.5–100 mg/mL [14]
Rainbow troutviscera
Animal Hydrolysates
Water holding capacityOil absorption capacityEmulsifying capacity
Emulsion stabilityFoaming capacity
Aqueous 7.5–100 mg/ml [14]
Grape peels FruitPhenolic
compoundsAnthocyanins
Antioxidant Ethanolic 1.652 mg/mL [15]
Pomegranate seed FruitPhenolic
compoundsAntioxidant Ethanolic 25 mg/L [16]
Pineapple peelspowder
Fruit Dietary fibres Texturizing agent Aqueous 1% [17]
Banana peels FruitFlavonoids.
TanninsB-carotene
Antioxidant Aqueous5 mg of banana peel
extracts/1 mL[18]
Grape seed FruitPhenolic
compoundsFlavonoids
AntioxidantAntimicrobial
Ethanolic 100 mL/25 g [19]
Wine pomace, skinand seed extracts
FruitTotal Phenolic
FlavonoidCompounds
Source of phenols Ethanolic0.1, 0.2 and 0.3
wt/vol[20]
Orange byproducts Fruit Dietary fibres Texturizing agent Aqueous 0.2 to 1 g/mL [21]
Wine pomaceextract and flour
FruitDietary fibres
Phenoliccompounds
AntioxidantColorant
Ethanolic 1% to 3% 1% to 2% [22]
Wine pomace flour Fruit
PolyphenolsPrebioticsPhenolic
compounds
Source of phenols,Probiotic protection
Aqueous 10, 20 and 50 g/L [23]
Grape seed Fruit
Phenolic acidsFlavonoidsAromatic
compound
AntioxidantAntimicrobial
Ethanolic 10 mL/25 g [19]
Bananainflorescence bracts
FruitAnthocyanin
cyanidin-3-rutinosideAntioxidant
ColorantEthanolic 14–32 mg/100 g [24]
Pear stones Fruit Dietary fibres Texturizing agent Aqueous 3–5% [25]
Male flower (Musaparadisiaca)
VegetableEpigallocatechinand derivatives
AntioxidantAntimicrobial
EthanolicAqueous
12.93–2.34% [26]
Soy milk Vegetable Protein
Water and fat bindingcapacity
Foaming capacityEmulsifying capacity
Emulsion stability
Aqueous [27]
2
Molecules 2019, 24, 1056
Table 1. Cont.
Byproduct Origin Compounds Bioactivity Types of ExtractDose of Byproduct
ExtractReference
Tiger nut milk Vegetable Dietary fibres
Water and oil holdingcapacity
Water and oilabsorption capacity
Emulsifying capacityEmulsion stability
Aqueous 1.5% mg/mL [28]
Tomato byproducts Vegetable
Dietary fibres,Proteins,
Carotenoids,Tocopherols,Polyphenols
Lycopene
Anti-inflammatory,Antiallergenic,Antimicrobial,Vasodilatory,
Antithrombotic,Cardioprotective
AntioxidantColorant
Ethanolic55.70 to 28.64
mg/100 g[29,30]
Overly ripe berries VegetablePhenolic
compoundsDietary fibres
AntioxidantAnti-inflammatory
AntimicrobialAntidiabetic
Neuroprotective
Ethanolic [31]
Pomegranate peel Vegetable
Phenoliccompounds
ProanthocyanidinsTannins
FlavonoidsOligomeric
ellagitannins
AntimicrobialAntioxidant
Aqueous-methanolic
5-g portions in 80%methanol
Antimicrobialactivity tested at
0.1% (v/v)
[32,33]
Tomato processingbyproduct
VegetableLycopenePhenolic
compoundsAntioxidant Ethanolic 400 and 800 mg/kg [34]
Rice bran Cereal
γ-oryzanolAnthocyanins
Phenoliccompounds
Colorant Ethanolic 0.2–0.6% [35]
Whey proteinDairy
productsCaseinates
Texturizing agentSource of protein
Aqueous 2% [36]
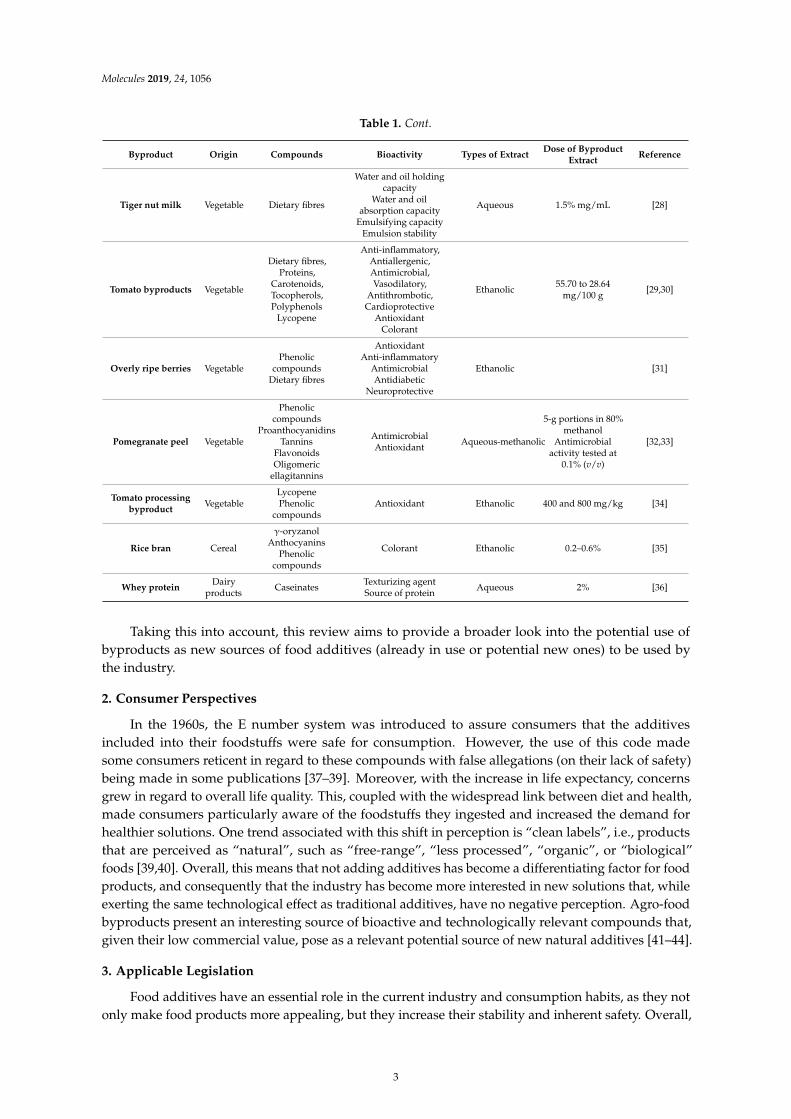
Taking this into account, this review aims to provide a broader look into the potential use ofbyproducts as new sources of food additives (already in use or potential new ones) to be used bythe industry.
2. Consumer Perspectives
In the 1960s, the E number system was introduced to assure consumers that the additivesincluded into their foodstuffs were safe for consumption. However, the use of this code madesome consumers reticent in regard to these compounds with false allegations (on their lack of safety)being made in some publications [37–39]. Moreover, with the increase in life expectancy, concernsgrew in regard to overall life quality. This, coupled with the widespread link between diet and health,made consumers particularly aware of the foodstuffs they ingested and increased the demand forhealthier solutions. One trend associated with this shift in perception is “clean labels”, i.e., productsthat are perceived as “natural”, such as “free-range”, “less processed”, “organic”, or “biological”foods [39,40]. Overall, this means that not adding additives has become a differentiating factor for foodproducts, and consequently that the industry has become more interested in new solutions that, whileexerting the same technological effect as traditional additives, have no negative perception. Agro-foodbyproducts present an interesting source of bioactive and technologically relevant compounds that,given their low commercial value, pose as a relevant potential source of new natural additives [41–44].
3. Applicable Legislation
Food additives have an essential role in the current industry and consumption habits, as they notonly make food products more appealing, but they increase their stability and inherent safety. Overall,
3
Molecules 2019, 24, 1056
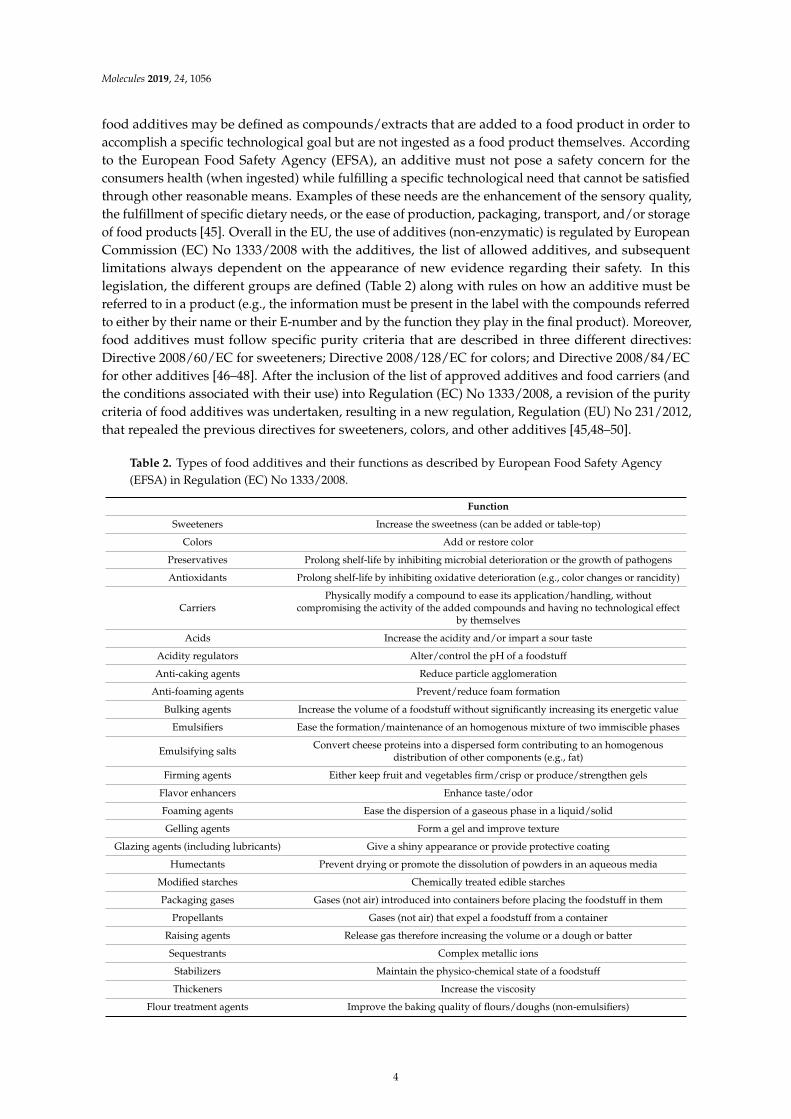
food additives may be defined as compounds/extracts that are added to a food product in order toaccomplish a specific technological goal but are not ingested as a food product themselves. Accordingto the European Food Safety Agency (EFSA), an additive must not pose a safety concern for theconsumers health (when ingested) while fulfilling a specific technological need that cannot be satisfiedthrough other reasonable means. Examples of these needs are the enhancement of the sensory quality,the fulfillment of specific dietary needs, or the ease of production, packaging, transport, and/or storageof food products [45]. Overall in the EU, the use of additives (non-enzymatic) is regulated by EuropeanCommission (EC) No 1333/2008 with the additives, the list of allowed additives, and subsequentlimitations always dependent on the appearance of new evidence regarding their safety. In thislegislation, the different groups are defined (Table 2) along with rules on how an additive must bereferred to in a product (e.g., the information must be present in the label with the compounds referredto either by their name or their E-number and by the function they play in the final product). Moreover,food additives must follow specific purity criteria that are described in three different directives:Directive 2008/60/EC for sweeteners; Directive 2008/128/EC for colors; and Directive 2008/84/ECfor other additives [46–48]. After the inclusion of the list of approved additives and food carriers (andthe conditions associated with their use) into Regulation (EC) No 1333/2008, a revision of the puritycriteria of food additives was undertaken, resulting in a new regulation, Regulation (EU) No 231/2012,that repealed the previous directives for sweeteners, colors, and other additives [45,48–50].
Table 2. Types of food additives and their functions as described by European Food Safety Agency(EFSA) in Regulation (EC) No 1333/2008.
Function
Sweeteners Increase the sweetness (can be added or table-top)
Colors Add or restore color
Preservatives Prolong shelf-life by inhibiting microbial deterioration or the growth of pathogens
Antioxidants Prolong shelf-life by inhibiting oxidative deterioration (e.g., color changes or rancidity)
CarriersPhysically modify a compound to ease its application/handling, without
compromising the activity of the added compounds and having no technological effectby themselves
Acids Increase the acidity and/or impart a sour taste
Acidity regulators Alter/control the pH of a foodstuff
Anti-caking agents Reduce particle agglomeration
Anti-foaming agents Prevent/reduce foam formation
Bulking agents Increase the volume of a foodstuff without significantly increasing its energetic value
Emulsifiers Ease the formation/maintenance of an homogenous mixture of two immiscible phases
Emulsifying saltsConvert cheese proteins into a dispersed form contributing to an homogenous
distribution of other components (e.g., fat)
Firming agents Either keep fruit and vegetables firm/crisp or produce/strengthen gels
Flavor enhancers Enhance taste/odor
Foaming agents Ease the dispersion of a gaseous phase in a liquid/solid
Gelling agents Form a gel and improve texture
Glazing agents (including lubricants) Give a shiny appearance or provide protective coating
Humectants Prevent drying or promote the dissolution of powders in an aqueous media
Modified starches Chemically treated edible starches
Packaging gases Gases (not air) introduced into containers before placing the foodstuff in them
Propellants Gases (not air) that expel a foodstuff from a container
Raising agents Release gas therefore increasing the volume or a dough or batter
Sequestrants Complex metallic ions
Stabilizers Maintain the physico-chemical state of a foodstuff
Thickeners Increase the viscosity
Flour treatment agents Improve the baking quality of flours/doughs (non-emulsifiers)
4
Molecules 2019, 24, 1056
Some of the additives currently allowed under the scope of Regulation (EC) No 133/2008 may befound in agro-food byproducts. Namely, anthocyanins (E163) may be found in grape/winemakingbyproducts, chlorophylls (E140) may be found in almost all green leaf vegetable byproducts ormango peels along with all green leaf wastes that result from pruning during agricultural production,and lycopene (E160d) can be found in tomato wastes [51–57]. There is a consensus that as long as theadditive compound/molecule is already part of the list of authorized compounds, it can be used [58].However, if the production process is varied significantly (by using a significantly different rawmatter or using new production procedures), the “new” additive must be evaluated again by EFSA.This means that the focus given to the development of new and more efficient green technologiesto attain additives from agro-food byproducts may result in potential new additives that must besubjected to a new evaluation in order to ensure their safety. This path starts with a thorough safety(short and long term) evaluation of any potential metabolic, genotoxic, reproductive, and chronic orcarcinogenic side effects [59]. Following this, it is possible to define a no observable effect level (NOEL)and then an allowable/acceptable daily intake (ADI). Once all the relevant information is gathered,EFSA or other similar organizations (like the Food and Drug Administration—FDA) can be petitionedto validate the introduction of the additive through an amendment of the legislation in order to addthe substance to the list of authorized food additives. If this authorization is granted, the additivewill be eligible to be used on the market under direct supervision of the agency that granted thepermission [49,59,60]. In the EU, the submission of a potential new additive for validation must startwith an application submitted to the EC, who will verify it. If valid, EFSA must then give an opinionwithin a timeframe of nine months, a period that may be extended if further information is requiredfrom whoever submitted the application (for risk management purposes, EC may also require furtherelucidation). If EFSA gives a positive opinion, EC has nine months to submit a regulatory draft aimedat the inclusion of the substance in the allowed additives list, whose approval is dependent on thevotes of member states. If approved, as with all decisions of the EU, it must then pass a three monthlong period of scrutiny. Overall, this process is very long and, in the new era of circular economywhere food byproducts valorization is of the upmost importance, legislation approaches should bereanalyzed to facilitate and speed up the process of new additives approval while still guaranteeingthe safety of the final additive [49,61].
4. Preservatives
Microbiological processes can adversely affect the quality of food, leading to its spoilage. For thisto occur, conditions that favor the growth and development of spoilage microorganisms must bemet, such as bioavailable nutrients, favorable water activity, adequate pH value, presence/absenceof oxygen, and redox potential [62]. The term “food spoilage” is only applied if the changes in thefoodstuffs due to the microorganisms’ potentially harmful metabolic products become recognizable,thus making the product unsafe for consumption and augmenting the risk of foodborne illness [62–65].However, not all microbiological change in food is considered harmful (for example, fermentation ofgrape juice in order to produce wine) [66].
Taking this into account, preservatives are widely used in the food industry in order to preventmicrobial contaminations, demonstrating a significant impact upon a product’s shelf-life as well asfood safety [58,66–68]. There are different antimicrobial compounds that can potentially be usedas preservatives ranging from enzymes, bacteriocins, fungicides, and salts to essential oils andother components, some of which may be found agro-food byproducts [7,69–76]. The use of naturalcompounds to replace traditional additives is an emerging trend that has been driven by the consumer’spreferences for “clean labels”, with the scientific community striving to provide natural alternatives,some of which may be attained from agro-food byproducts (e.g., phenolic compounds) [7,44,77].Nitrates (E240-E259) and nitrites (E249-E250) are the most commonly used preservatives in foodstuffs.Both have been associated with the formation of nitrosamine (a carcinogenic compound responsiblefor the development of gastric and other types of cancer). Therefore, actions have been taken to
5
Molecules 2019, 24, 1056
reduce their intake [the current daily intake for nitrates is 3.7 milligrams per kilogram of bodyweight (mg/kg bw/day), while for nitrites it was re-established to 0.07 mg/kg bw/day] [78–80].However, EFSA determined that there was insufficient evidence to ban the use of nitrates andnitrites as food additives due to health concerns, particularly with them being the only additivescapable of exerting antimicrobial activity against Clostridium botulinum and preventing botulinic toxinproduction/accumulation [81].
Agro-food byproducts, particularly fruit peels and seeds, have been regarded as a potential sourceof preservatives with several reports reporting on the potential antimicrobial activity of different fruitand vegetable byproduct extracts, which could potentially be translated into an industrial application ifthe appropriate regulatory body gives a positive opinion [7,41,67,82]. For instance, Gul and Bakht [83]reported how an ethanolic turmeric extract possessed antibacterial activity against Escherichia coli andStaphylococcus aureus, an effect that has been attributed to its phenolic content [84–86]. Additionally,turmeric oil, a byproduct from curcumin manufacture, has also been described as possessing antibacterialand antifungal activity [86–88]. Berries are fruits with high phenolic content, particularly anthocyanins.While by themselves they possess an interesting commercial value, if the fruits fall from the bushes(overly ripe berries), they will not be commercialized [89–91]. However, they remain a phenolic richfruit that can be used as a source of potential antimicrobial additives. For instance, blueberry andcranberry anthocyanin-rich extracts have been reported as possessing vast antimicrobial activity andcould potentially be exploited as new natural food additives [92–97]. Olive leaves are also a good sourceof phenolic compounds and have been reported as possessing some antimicrobial activity against Bacillus
cereus, E. coli, S. aureus, and some fungi such as Candida albicans and Cryptococcus neoformans [98–101].Wang, et al. [102] reported how the addition of green tea polyphenols (mainly constituted by catechins)and tocopherol to dry-cured bacon resulted in significantly lower Enterobacteriaceae content. Green teaand black tea wastes have been studied for their potential nutritive, antimicrobial, and antioxidant valuesdue to their high tannin and catechin content [103,104].
Wine pomace, a well-known byproduct, also showcases some potential as a new source ofantimicrobial food additives, as its activity has also been associated with its high phenolic contentand anthocyanins in particular [22,105]. Pomegranate peel extracts, reported to be natural inhibitorsof food-borne pathogens such as Listeria monocytogenes, E. coli, and Yersinia enterocolitica, have beenadded to poultry products with the results showing good antimicrobial activity against S. aureus and B.
cereus and permitting the increase of shelf-life by two weeks [32,33,106–109]. Avocado, a tropical fruit,has also been described as possessing a relevant antimicrobial activity, with several reports focusing onthe biological activity of its peel and seed [110,111]. For instance, Calderón-Oliver et al. [112] reportedhow a nisin (an antimicrobial peptide) avocado peel mixture resulted in an enhancement of nisin’santimicrobial activity against food-borne pathogens such as Listeria sp. Overall, the reported resultsfavor the use of natural byproduct extracts as potential new preservatives at an industrial level, helpingto reduce costs and environmental impact, although the leap to an industrial setting is limited by alack of regulatory framework for their use.
Currently, the only animal derived antimicrobial additive used in the EU and United States (US) islysozyme (E1105). Lysozyme originates from eggs, and while it is mainly used in cheese conservation,studies concerning eggs, milk, and beef have been carried out. However, it does not exert any actionagainst yeasts or fungi [113–115].
5. Antioxidant Additives
Oxidation is a not a process exclusive to the human body. It occurs in every living organism andbiological system, such as food products. Food oxidation may result in altered flavor, color, nutritionalvalue, and texture, as well as create toxic compounds [82,116,117]. As such, antioxidant compounds areone of the most important conservation technologies used by the food industry with their main functionbeing the prevention of oxidative induced degradation of foods, therefore allowing for extended shelf
6
Molecules 2019, 24, 1056
times [82,117,118]. These additives help stabilize lipids (avoiding lipidic peroxidation) as well as othercompounds and can neutralize free radicals, avoiding a cascade of oxidative reactions. [117,119].
As previously mentioned, due to a shift in consumer preferences, in recent years there has beenan increase in the demand for more natural (i.e., with less additives) food products [120]. As such,there have been studies comparing synthetic and natural antioxidants with results showing thatnatural phenolic antioxidants are capable of inhibiting oxidation and toxin formation, meaning thatthey present an interesting natural alternative to the traditionally used antioxidant additives [117,121].Butylated hydroxy anisole (BHA), butylated hydroxytoluene, ethoxyquin, tert-butylhydroquinone, andpropyl gallate are the most common synthetic antioxidants used in foods. Reports on their potentialhealth impact are divided [121–124].
Since plants are one of the main sources of antioxidants compounds, agricultural byproductsare among the most relevant potential sources of natural antioxidants that could be exploited forproduct quality preservation. Phenolic compounds, besides being associated with antimicrobialactivity, are known for their high antioxidant capacity. They are ubiquitous to plants and thereforepresent one interesting class of antioxidant compounds to be exploited, although other compoundswith a strong antioxidant capacity can also be found, such as some vitamins (vitamin C, E, and A),bioactive peptides, polysaccharides, some minerals, and enzymes. Any byproduct with a high contentof any of these compounds may be regarded as a possible source of new antioxidant food additives,e.g., overly ripe berries, or citric and exotic fruits, peels, and seeds [77,116,121,125]. Meat byproducts(including blood, bones, meat trimmings, and viscera) can result in protein hydrolysates with a relevantbioactivity, namely antioxidant bioactive peptides [126,127]. Onion byproducts (namely onion peelsand stems) have been regarded as potential food additives due to their antioxidant and anti-browningproperties [128]. Larrosa et al. [129] reported that adding an artichoke byproduct extract (namelyartichoke blanching waters) to a tomato juice resulted in higher antioxidant activity (measured by theDPPH• and ABTS•+ methods) and consequently a longer shelf life for this product. Similarly, eggplantaqueous acetone extracts have also been studied, with reports describing a high antioxidant potentialof its peels (evaluated by FRAP and TEAC) likely due to its rich anthocyanin content [130]. Mangobyproducts are an example of a vastly studied tropical fruit with a high antioxidant capacity and awide range of potential applications [54,131]. An example is the inclusion of mango peel powder inmacaroni and bakery products (such as biscuits) to provide some added functional value as well asfunction as a natural antioxidant (as the supplemented products exhibit a higher capacity to quenchDPPH•) [54,132,133].
The potential for the use of natural alternatives to antioxidant additives has been supported by thework of Caleja, Barros, Antonio, Oliveira, and Ferreira [121], who reported no significant differencesbetween the use of natural extracts (chamomile and fennel) and a synthetic (BHA) antioxidant additivein biscuits, with no significant changes in color or nutritional value observed after 60 days of storage.Similarly, there have been reports on the successful addition of natural antioxidant extracts to bakery,dairy, and meat products, which also confer some added functionality to the foodstuffs [79,121,134–137].Overall, byproducts of industrial fruit processing consist mainly of seeds, peels, and unused flesh.Some of these residues have been reported as possessing a higher concentration of bioactive compoundsthan the used fruit flesh [108,111,132,138–140]. Furthermore, the antioxidant compounds of naturalorigin, when attained using adequate solvents, are considered as generally recognized as safe (GRAS).Moreover, some of the antioxidant compounds naturally found in these byproducts are alreadyapproved for use as antioxidant additives and possess an E number, namely ascorbic acid (E300),tocopherol (E306), and β-carotene (E160a) [68,102,113].
6. Food Colorants
Although the flavor and nutritional value tend to be the most studied and appreciated componentsof a food product, its appearance is also an important sensory aspect [141,142]. Colorants arefood additives used to impart color to foodstuffs to make them look more appetizing and/or help
7
Molecules 2019, 24, 1056
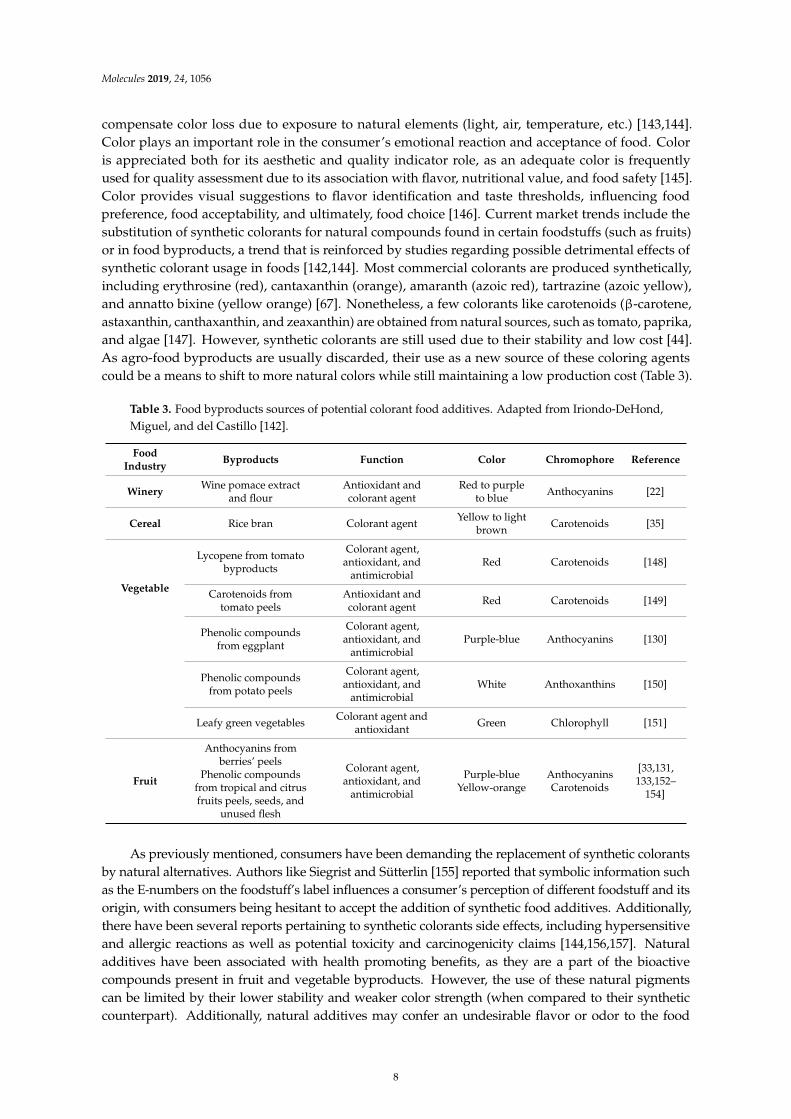
compensate color loss due to exposure to natural elements (light, air, temperature, etc.) [143,144].Color plays an important role in the consumer’s emotional reaction and acceptance of food. Coloris appreciated both for its aesthetic and quality indicator role, as an adequate color is frequentlyused for quality assessment due to its association with flavor, nutritional value, and food safety [145].Color provides visual suggestions to flavor identification and taste thresholds, influencing foodpreference, food acceptability, and ultimately, food choice [146]. Current market trends include thesubstitution of synthetic colorants for natural compounds found in certain foodstuffs (such as fruits)or in food byproducts, a trend that is reinforced by studies regarding possible detrimental effects ofsynthetic colorant usage in foods [142,144]. Most commercial colorants are produced synthetically,including erythrosine (red), cantaxanthin (orange), amaranth (azoic red), tartrazine (azoic yellow),and annatto bixine (yellow orange) [67]. Nonetheless, a few colorants like carotenoids (β-carotene,astaxanthin, canthaxanthin, and zeaxanthin) are obtained from natural sources, such as tomato, paprika,and algae [147]. However, synthetic colorants are still used due to their stability and low cost [44].As agro-food byproducts are usually discarded, their use as a new source of these coloring agentscould be a means to shift to more natural colors while still maintaining a low production cost (Table 3).
Table 3. Food byproducts sources of potential colorant food additives. Adapted from Iriondo-DeHond,Miguel, and del Castillo [142].
FoodIndustry
Byproducts Function Color Chromophore Reference
WineryWine pomace extract
and flourAntioxidant andcolorant agent
Red to purpleto blue
Anthocyanins [22]
Cereal Rice bran Colorant agentYellow to light
brownCarotenoids [35]
Vegetable
Lycopene from tomatobyproducts
Colorant agent,antioxidant, and
antimicrobialRed Carotenoids [148]
Carotenoids fromtomato peels
Antioxidant andcolorant agent
Red Carotenoids [149]
Phenolic compoundsfrom eggplant
Colorant agent,antioxidant, and
antimicrobialPurple-blue Anthocyanins [130]
Phenolic compoundsfrom potato peels
Colorant agent,antioxidant, and
antimicrobialWhite Anthoxanthins [150]
Leafy green vegetablesColorant agent and
antioxidantGreen Chlorophyll [151]
Fruit
Anthocyanins fromberries’ peels
Phenolic compoundsfrom tropical and citrusfruits peels, seeds, and
unused flesh
Colorant agent,antioxidant, and
antimicrobial
Purple-blueYellow-orange
AnthocyaninsCarotenoids
[33,131,133,152–
154]
As previously mentioned, consumers have been demanding the replacement of synthetic colorantsby natural alternatives. Authors like Siegrist and Sütterlin [155] reported that symbolic information suchas the E-numbers on the foodstuff’s label influences a consumer’s perception of different foodstuff and itsorigin, with consumers being hesitant to accept the addition of synthetic food additives. Additionally,there have been several reports pertaining to synthetic colorants side effects, including hypersensitiveand allergic reactions as well as potential toxicity and carcinogenicity claims [144,156,157]. Naturaladditives have been associated with health promoting benefits, as they are a part of the bioactivecompounds present in fruit and vegetable byproducts. However, the use of these natural pigmentscan be limited by their lower stability and weaker color strength (when compared to their syntheticcounterpart). Additionally, natural additives may confer an undesirable flavor or odor to the food
8
Molecules 2019, 24, 1056
products, which will negatively impact the consumer’s acceptance [142,145,158]. Nonetheless, fruitand vegetable byproducts have become an important potential source of natural pigments, as they arecolored by green chlorophylls, yellow-orange-red carotenoids, red-blue-purple anthocyanins, and redbetanins [158]. Overall, the main groups of coloring substances found in nature are carotenoids,anthocyanins, porphyrins, and chlorophylls [145,158–160].
Anthocyanins are a good example of natural color additives. These compounds are a group ofnatural pigments responsible for the blue, red, purple, violet, and magenta coloration of several speciesin the plant kingdom. They can also be found in extracts of their byproducts. Some examples arewinery byproducts, radishes, red potatoes, red cabbage, black carrots, purple sweet potatoes, coffeehusks, and berries, among others [106,161].
Carotenoids stand as the major group of compounds used as color additives. These natural pigmentsare responsible for many of the colors seen in edible fruits, vegetables, mushrooms, flowers, and evenlobster and trout hues from the animal kingdom [158]. Much like anthocyanins, carotenoids are producedsynthetically (β-carotene, astaxanthin, canthaxanthin, and zeaxanthin), although some are obtained fromnatural sources, namely annatto, marigold, tomato, algae, and microbial fermentation [157]. In addition,these compounds function as sources of provitamin A and are capable of absorbing solar light, oxygentransporters, powerful quenchers of singlet oxygen, as well as other functions not yet studied [160].
The natural pigments were defined in the Regulation (EC) No 1333/2008 of the EuropeanParliament and of the Council of 16 December 2008 and are listed in the Annexes of said regulation [161].This document includes detailed information on the application of individual pigments in definedfood products, their doses, and limitations of use. Presently, 16 natural pigments are permitted:betalains–betanin, quinones–cochineal, flavonoids–anthocyanins, isoprenoids–carotene, annatto(bixin, norbixin), paprika extract, lutein, canthaxanthin, porphyrins–chlorophylls and chlorophyllins,and copper complexes of these compounds, among others, like caramels, curcumin, or plant coal.According to the Regulation (EC) No 1129/2011 [162] of the European Parliament, in the EU, there are40 color additives legislated for food use.
New technologies such as pulsed-light, high pressure, pulsed-electric, magnetic fields highpressure processing, ionizing radiation, and ultraviolet radiation are being studied and could allowfor the use of byproducts as natural source pigments, which could then be exploited as potential newfood colorants in the food industry with the advantage of imparting potential health benefits to theconsumer as well as contributing to an economical valorization of residues and avoiding waste [163].For instance, there have been studies regarding the addition of banana peels to biscuits, which resultedin a product with low calories and high dietary fiber content without any significant differences incolor, aroma, and taste observed. The banana peel was incorporated at a 10% and 20% concentrationinto the biscuits [164–166]. The peel is the main byproduct of the banana, rich in phytochemicalcompounds with high antioxidant capacity, such as phenolic compounds, anthocyanins (delphinidinand cyanidin), carotenoids (β-carotenoids, α-carotenoid, and xanthophylls), catecholamines, sterols,and triterpenes, which, as previously mentioned, could provide different functions as potential foodadditives besides coloring, namely as antioxidant and antimicrobial components [18,167]. Mango isanother example of a fruit with biologically interesting compounds (including phenolic compounds,carotenoids, and dietary fiber) that could be used in the food industry. Most mango byproducts resultfrom the epicarp and endocarp, but it is the mango seed kernel residue with the highest amountof carotenoids in its composition, which is likely due to the amount of fruit pulp left around thekernel by the chopping machine. The carotenoid content was found to be four to eight times higherin ripe mango peels compared to raw fruit peels [133,165]. The high levels of bioactive compoundsin the mango peel makes this byproduct a potentially valuable raw material for the formulation ofadditives and supplements for the food industry [168]. Likewise, tomato peel is the main byproductresulting from the tomato processing industry [169]. The carotenoid pigment lycopene present is thecompound responsible for its red color. Tomato lycopene extract and tomato lycopene concentratefrom tomato peels have been approved for use as colorants exempt from certification [170]. Oleoresins,
9
Molecules 2019, 24, 1056
powders, and water-dispersible preparations that can impart colors from yellow to orange to red arecommercially available. An example of the utilization of lycopene from tomato byproducts includesdairy foods, where this compound is applied in the coloring of butter and ice-cream, maintaining astable reddish color for up to four months [146,148,149].
Even though the use of the aforementioned compounds as food colorants could present anecological solution to current production issues in addition to possessing an added advantage ofpotential health benefits, their use has been limited. Regulated colorants from natural sourcesinclude anthocyanins (E163), betanin (E162), and carotenoids (E160), including β-carotene (E160a),lycopene (E160d) (its obtention from tomato processing byproducts has been optimized), lutein (E161b),canthaxanthin (E161g), chlorophyll and chlorophyllin (E140 and E141), and curcumin (E100) [accordingto Regulation (EC) No 1129/2011] [163]. However, the list of anthocyanin colorants in the CodexAlimentarius includes only grape skin extract (E163), and in the FDA, “grape color extract” and “grapeskin extract” (enocyanin) [146,148,149].
Regardless, to include a new pigment as a food colorant additive according to Regulation (EC)No 1333/2008 of the European Parliament and of the Council of 16 December 2008 [162], these newpigments need to be capable of restoring the original appearance of food whose color has been affected byprocessing, storage, packaging, and distribution, leading to impaired visual acceptability. Thus, colorantsneed to make food more visually appealing as well as give color to food that is otherwise colorless.
7. Texturizing Agents
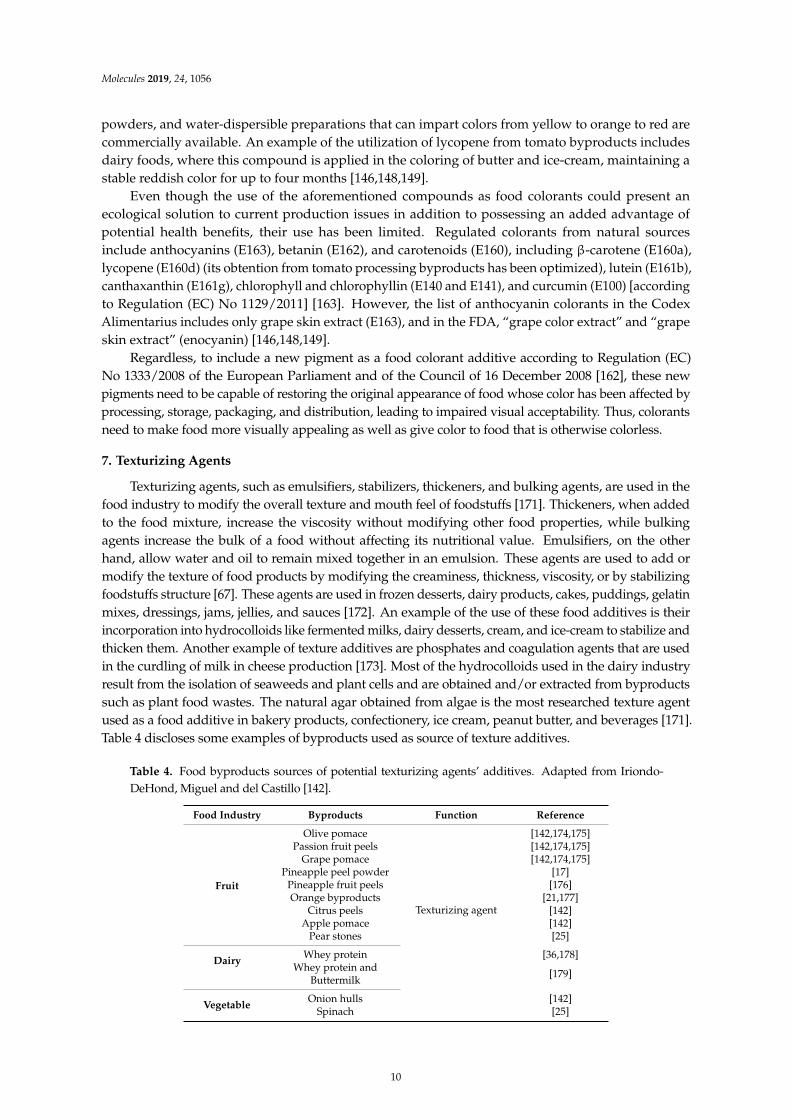
Texturizing agents, such as emulsifiers, stabilizers, thickeners, and bulking agents, are used in thefood industry to modify the overall texture and mouth feel of foodstuffs [171]. Thickeners, when addedto the food mixture, increase the viscosity without modifying other food properties, while bulkingagents increase the bulk of a food without affecting its nutritional value. Emulsifiers, on the otherhand, allow water and oil to remain mixed together in an emulsion. These agents are used to add ormodify the texture of food products by modifying the creaminess, thickness, viscosity, or by stabilizingfoodstuffs structure [67]. These agents are used in frozen desserts, dairy products, cakes, puddings, gelatinmixes, dressings, jams, jellies, and sauces [172]. An example of the use of these food additives is theirincorporation into hydrocolloids like fermented milks, dairy desserts, cream, and ice-cream to stabilize andthicken them. Another example of texture additives are phosphates and coagulation agents that are usedin the curdling of milk in cheese production [173]. Most of the hydrocolloids used in the dairy industryresult from the isolation of seaweeds and plant cells and are obtained and/or extracted from byproductssuch as plant food wastes. The natural agar obtained from algae is the most researched texture agentused as a food additive in bakery products, confectionery, ice cream, peanut butter, and beverages [171].Table 4 discloses some examples of byproducts used as source of texture additives.
Table 4. Food byproducts sources of potential texturizing agents’ additives. Adapted from Iriondo-DeHond, Miguel and del Castillo [142].
Food Industry Byproducts Function Reference
Fruit
Olive pomace
Texturizing agent
[142,174,175]Passion fruit peels [142,174,175]
Grape pomace [142,174,175]Pineapple peel powder [17]
Pineapple fruit peels [176]Orange byproducts [21,177]
Citrus peels [142]Apple pomace [142]
Pear stones [25]
DairyWhey protein [36,178]
Whey protein andButtermilk
[179]
VegetableOnion hulls [142]
Spinach [25]
10
Molecules 2019, 24, 1056
Citrus fruits and their byproducts (such as peels and seed powders) have been studied as possiblesources of texturizing agents due to their natural high pectin content and dietary fiber [142,176,180].Currently, there are some examples of citrus byproducts being used in the industry. Oranges are being usedas a texturizing agents in yogurts and/or ice creams [21,179,181], and lemon byproducts are being usedas thickening, texturizing, gelling, and stabilizing agents [182]. Furthermore, citrus byproducts have theadded advantage of being rich in bioactive compounds, which possess nutritional and functional benefitsincluding reducing the risk of certain pathologies such as obesity, cardiovascular disease, and coloncancer, as well as preventing neurodegenerative diseases and osteoporosis [139,182–185]. Additionally,their high dietary fiber content is an added bonus, as it can be used as fat replacers and thus functionsas a food additive to impart texture to the final product [186–188]. In fact, Crizel et al. [189] showedthat incorporation of fiber from orange byproducts into yogurts allowed for the manufacture of low-fatyogurts, and Dervisoglu and Yazici [190] reported that while citrus fiber as a single stabilizer did notimprove the viscosity, overrun, and sensory properties of ice cream, it improved the melting resistance ofthese foodstuffs. Similarly, the industrial processing of tomato leads to high amounts of unused matter(mostly peels and seeds), which are byproducts rich in lycopene and dietary fiber. These byproductshave been incorporated in tomato sauce as a food texturizer, with sensorial tasting panels deeming itas acceptable [149,191]. Another example is the ß-glucans resulting from cereals such as oat and barley,which have also been used as fat replacers in a variety of foodstuff ranging from baked goods and pastato beverages and soups with promising results [192–194]. Additionally, the presence of β-glucans infoods has also been shown to lead to an increase in fiber intake, which in turn prevents constipation,reduces intestinal transit time, reduces the risk of colorectal cancer, and promotes the growth of beneficialintestinal bacteria [195].
Other potential sources of dietary fiber and pectin are cocoa (Theobroma cacao L.) pod husk (anabundant industrial waste with potential application in the food industry), and oat bran. Studies haveshown that cocoa byproducts can be used as a texturizing agents after drying and grinding, while juiceresulting from the pods can be used to prepare hydrocolloids [196]. On the other hand, oat bran extracthas also been studied as a natural emulsifier, with results showing stability through a different rangeof pH values, heat treatments, and storage life up to 40 days [197].
On a different note, fat plays an important role in the structural integrity and mouth feelingof foodstuffs (ice-cream and yogurt in particular) due to its interaction with casein micelles [198].Many different types of fat replacers have been explored in bovine and goat milk yogurts, includingthe addition of inulin, β-glucan, high milk protein powder, and whey protein concentrates [199–204].Whey proteins, obtained as a byproduct of the dairy industry, have many functional propertiesincluding gelation, thickening, and water-holding capacity [205]. In the study by Wang et al. [206],whey protein isolate was used to produce a goat’s milk yogurt of acceptable quality. Milk fortificationwith whey protein improved the textural and microstructural characteristics and some sensorycharacteristics of yogurts. In addition, whey protein concentrates caused some interactions betweenglobular proteins and caseins, which led to an improved texture of goat’s milk yogurt and higherwater retention capacity [36,206–208]. Whey proteins are also present in high amounts in a byproductof butter-making—buttermilk. This product is now considered valuable because of its high contentin fragments of milk fat globule membrane in addition to phospholipids [209,210]. Studies indicatedthat the moisture content of cheese supplemented with buttermilk remained high due largely tophospholipids improving its texture [211,212].
8. Foaming Capacity
Foam is a colloidal dispersion in which a gaseous phase is dispersed in a liquid or solid phase.Food foams are dependent on the surface activity and film-forming properties of specific proteincompounds [213,214]. Proteins have to be either very hydrophobic or hydrophilic to possess goodfoaming properties, and therefore their chemical or enzymatic modification can make them moreactive on the surface. As such, most foaming agents commonly used in the food industry are mainly
11
Molecules 2019, 24, 1056
natural modified food proteins such as soy, casein, egg white, whey, serum proteins isolated fromlactoglobulins, and lysozyme [214–216]. Globulins are excellent foaming agents, but their foaming issignificantly affected by interactions of the proteins with ovomucine, lysozyme, and, to a lesser extent,ovomucoid, ovotransferrin, and ovalbumin [217]. A novel source of possible foaming agents is thefishery industry, as fish processing leads to high amounts of byproducts rich in collagen and gelatin.This gelatin foaming capacity has been studied, with reports showing that gelatin from shark cartilagepossessed foaming properties similar to those of porcine skin [218]. According to Muzaifa et al. [219],fish byproducts (dark muscle, cut offs, viscera, skin, scales, small bones, and fins) could potentiallybe used to obtain protein hydrolysates through an enzymatic hydrolysis using Alcalase® 2.4 L andFlavourzyme® 500 L, leading to compounds with foaming capacity. Protein hydrolysates obtainedfrom poultry byproducts (head and leg) and rainbow trout (Onchorhynchus mykiss) viscera after anenzymatic hydrolysis using Alcalase® 2.4 L also demonstrated foaming capacity [14]. On anotherwork, Kotlar et al. [220] reported on the use of brewer’s spent grain (BSG) hydrolysates (attained usinga B. cereus extracellular peptidase) to improve the foaming expansion in brewery products. Okara,a byproduct obtained from the soy milk production, was also analyzed for its functional properties,with the authors observing that the isolated proteins from this byproduct could potentially be used as afoaming agent [27]. When it comes to slaughter byproducts, there are several residues, including skin,bones, hooves, muscles, and blood. Blood represents up to 4% of the animal live weight. However,the direct use of blood in foods is not useful due to the dark color given to the food. In practice,blood is separated by centrifugation into cellular and plasma fractions. Plasma proteins have relevantand interesting properties for food processing [221], e.g., they contribute to cross-link proteins andgelling [222], proteins enrichment [223], as well as emulsifying and foaming agents [224].
9. Emulsifiers
Emulsifiers, molecules such as polysaccharides (e.g., gum arabic) or phospholipids (e.g., lecithins)with a surface activity capable of mixing and stabilizing two immiscible phases like water and oil,are largely used in food technology [225,226].
Emulsifier additives can be obtained from a variety of food products (e.g., milk proteinisolates) [227] and byproducts (e.g., okara) [27]. Gbogouri, Linder, Fanni, and Parmentier [11]suggested that salmon (Salmo salar) head hydrolysates treated with the commercial enzyme Alcalase®
2.4 L could potentially be a new source of compounds with great emulsifying capacity and stability.Using the same enzyme mix, Sathivel et al. [13] analyzed the potential of herring (Clupea harengus)byproducts hydrolysates. Although the emulsifying capacity was lower than that of egg albumin andsoy protein, the hydrolysates still demonstrated some emulsifying capacity and stability, an effect thatwas also observed for the protein extracts before hydrolysis [12]. A potential emulsifier additivecould be obtained from okara, a byproduct obtained from soymilk production. Even thoughokara protein isolates had poor solubility, they exhibited other functional properties (emulsification,foaming, and binding properties) that were comparable to those of a commercial soy isolate, furtherdemonstrating the potential use of these isolates as a food ingredient [27]. The Horchata production,a vegetable milk obtained from tiger nuts (Cyperus esculentus), also originates a solid waste byproductrich in dietary fiber that could potentially be used as a new ingredient for its emulsifying capacityand high emulsifying stability [28]. Emulsifiers can also be found in meat industry byproducts.For example, bovine blood derivate products (plasma and globulin) may be used as a potential newemulsifier agents additive in meat products and others [28,228,229]. As such, compounds obtaineddirectly or indirectly from byproducts could potentially be used as new emulsifying agents in thefood industry.
10. Conclusions
Given the consumer’s demand for “clean label” products and the environmental constraints thatreinforce the need to change the traditional industrial raw matters with renewable sources, agro-food
12
Molecules 2019, 24, 1056
byproducts have appeared as one of the most relevant potential solutions. In fact, some of the additivesused nowadays (like anthocyanins and carotenes) can be found in these materials, which makestheir extracts interesting from a consumer’s perspective (some would prefer a tomato extract insteadof traditional lycopene), particularly when considering the possibilities opened up by green, safe,new extraction methodologies like high pressure extraction, ohmic extraction, pulsed electric field,or supercritical extraction. However, their direct inclusion into commercial products may depend onthe limitations posed by the legislation itself because, even if the additive itself is already approvedfor use, should its production process or raw material differ significantly from the one currently used,its future as an additive will be dependent on a new safety evaluation.
Overall, it is possible to see the potential of byproducts derived food additives and potentialnew additives for application in the food industry. They are an integrated solution with low cost andreduced environmental impact capable of providing alternatives for an industry that relies heavilyupon the chemical synthesis compounds. Thus, the use of byproducts as a source of food additivesstands out as an economically and environmentally conscious choice and will promote the new era ofcircular economy.
Author Contributions: M.V., M.F. and P.S. carried out the research and wrote the document, E.M.C. and S.S.were responsible for defining the paper’s scope, structure and contributed to its writing and, along with M.P.,were responsible for the overall definition and reviewing of the document. All authors reviewed and agreed onthe final version.
Funding: This work was supported by National Funds from FCT (grant number UID/Multi/50016/2013,POCI-01-0145-FEDER-016403) from FEDER (grant number PDR2020-101-030775) and from QREN-ANI (grantnumber 17819).
Conflicts of Interest: The authors declare no conflict of interest.
References
1. Herrero, M.; Sánchez-Camargo, A.d.P.; Cifuentes, A.; Ibáñez, E. Plants, seaweeds, microalgae and foodby-products as natural sources of functional ingredients obtained using pressurized liquid extraction andsupercritical fluid extraction. TrAC Trends Anal. Chem. 2015, 71, 26–38. [CrossRef]
2. Fleuri, L.F. Orange and mango by-products: Agro-industrial waste as source of bioactive compounds andbotanical versus commercial description—A review AU-Okino Delgado, Clarissa Hamaio. Food Rev. Int.
2016, 32, 1–14. [CrossRef]3. European Commission. Closing the Loop—An EU Action Plan for the Circular Economy; European Commission:
Brussels, Belgium, 2015.4. Szabo, K.; Cătoi, A.-F.; Vodnar, D.C. Bioactive Compounds Extracted from Tomato Processing by-Products
as a Source of Valuable Nutrients. Plant Foods Hum. Nutr. 2018, 73, 268–277. [CrossRef] [PubMed]5. Abuajah, C.I.; Ogbonna, A.C.; Osuji, C.M. Functional components and medicinal properties of food: A review.
J. Food Sci. Technol. 2015, 52, 2522–2529. [CrossRef] [PubMed]6. Mohamed, S. Functional foods against metabolic syndrome (obesity, diabetes, hypertension and
dyslipidemia) and cardiovasular disease. Trends Food Sci. Technol. 2014, 35, 114–128. [CrossRef]7. Carocho, M.; Morales, P.; Ferreira, I.C. Natural food additives: Quo vadis? Trends Food Sci. Technol. 2015, 45,
284–295. [CrossRef]8. Liu, R.; Wang, M.; Duan, J.-A. Antipyretic and antioxidant activities of the aqueous extract of Cornu bubali
(water buffalo horn). Am. J. Chin. Med. 2010, 38, 293–306. [CrossRef]9. Banerjee, P.; Shanthi, C. Isolation of novel bioactive regions from bovine Achilles tendon collagen having
angiotensin I-converting enzyme-inhibitory properties. Process Biochem. 2012, 47, 2335–2346. [CrossRef]10. Adje, E.Y.; Balti, R.; Kouach, M.; Dhulster, P.; Guillochon, D.; Nedjar-Arroume, N. Obtaining antimicrobial
peptides by controlled peptic hydrolysis of bovine hemoglobin. Int. J. Biol. Macromol. 2011, 49, 143–153.[CrossRef]
11. Gbogouri, G.; Linder, M.; Fanni, J.; Parmentier, M. Influence of hydrolysis degree on the functional propertiesof salmon byproducts hydrolysates. J. Food Sci. 2004, 69, C615–C622. [CrossRef]
13
Molecules 2019, 24, 1056
12. Sathivel, S.; Bechtel, P.J.; Babbitt, J.; Prinyawiwatkul, W.; Negulescu, I.I.; Reppond, K.D. Properties of Protein Powdersfrom Arrowtooth Flounder (Atheresthes stomias) and Herring (Clupea harengus) Byproducts. J. Agric. Food Chem. 2004,52, 5040–5046. [CrossRef]
13. Sathivel, S.; Bechtel, P.J.; Babbitt, J.; Smiley, S.; Crapo, C.; Reppond, K.D.; Prinyawiwatkul, W. Biochemicaland Functional Properties of Herring (Clupea harengus) Byproduct Hydrolysates. J. Food Sci. 2003, 68,2196–2200. [CrossRef]
14. Taheri, A.; Anvar, S.; Ahari, H.; Fogliano, V. Comparison the functional properties of protein hydrolysatesfrom poultry by-products and rainbow trout (Onchorhynchus mykiss) viscera. Iran. J. Fish. Sci. 2013, 12,154–169.
15. Ghafoor, K.; Park, J.; Choi, Y.-H. Optimization of supercritical fluid extraction of bioactive compounds fromgrape (Vitis labrusca B.) peel by using response surface methodology. Innov. Food Sci. Emerg. Technol. 2010, 11,485–490. [CrossRef]
16. Ersouml, E.; Yerlikaya, O.; Accedil, M. Effect of phenolic compounds on characteristics of strained yoghurtsproduced from sheep milk. Afr. J. Agric. Res. 2011, 6, 5351–5359.
17. Sah, B.; Vasiljevic, T.; McKechnie, S.; Donkor, O. Physicochemical, textural and rheological properties of probioticyogurt fortified with fibre-rich pineapple peel powder during refrigerated storage. LWT-Food Sci. Technol. 2016, 65,978–986. [CrossRef]
18. Someya, S.; Yoshiki, Y.; Okubo, K. Antioxidant compounds from bananas (Musa cavendish). Food Chem. 2002,79, 351–354. [CrossRef]
19. Shan, B.; Cai, Y.-Z.; Brooks, J.D.; Corke, H. Potential application of spice and herb extracts as naturalpreservatives in cheese. J. Med. Food 2011, 14, 284–290. [CrossRef]
20. da Silva, D.F.; Matumoto-Pintro, P.T.; Bazinet, L.; Couillard, C.; Britten, M. Effect of commercial grape extractson the cheese-making properties of milk. J. Dairy Sci. 2015, 98, 1552–1562. [CrossRef]
21. Sendra, E.; Kuri, V.; Fernandez-Lopez, J.; Sayas-Barbera, E.; Navarro, C.; Perez-Alvarez, J. Viscoelasticproperties of orange fiber enriched yogurt as a function of fiber dose, size and thermal treatment. LWT-Food
Sci. Technol. 2010, 43, 708–714. [CrossRef]22. Tseng, A.; Zhao, Y. Wine grape pomace as antioxidant dietary fibre for enhancing nutritional value and
improving storability of yogurt and salad dressing. Food Chem. 2013, 138, 356–365. [CrossRef] [PubMed]23. Frumento, D.; do Espirito Santo, A.P.; Aliakbarian, B.; Casazza, A.A.; Gallo, M.; Converti, A.; Perego, P.
Development of milk fermented with Lactobacillus acidophilus fortified with Vitis vinifera marc flour.Food Technol. Biotechnol. 2013, 51, 370.
24. Pazmiño, A.; Giusti, M.; Wrolstad, R.; Gloria, M.B.A. Anthocyanins from banana bracts (Musa X Paradisiaca)as potential food colorants. Food Chem. 2001, 73, 327–332.
25. Saraç, M.G.; Dogan, M. Incorporation of dietary fiber concentrates from fruit and vegetable wastes in butter:Effects on physicochemical, textural, and sensory properties. Eur. Food Res. Technol. 2016, 242, 1331–1342.[CrossRef]
26. Padam, B.; Tin, H.; Chye, F.; Abdullah, M. Antibacterial and Antioxidative Activities of the Various SolventExtracts of Banana (Musa paradisiaca cv. Mysore) Inflorescences. J. Biol. Sci. 2012, 12, 62–73.
27. Ma, C.-Y.; Liu, W.-S.; Kwok, K.C.; Kwok, F. Isolation and characterization of proteins from soymilk residue(okara). Food Res. Int. 1996, 29, 799–805. [CrossRef]
28. Sanchez-Zapata, E.; Fuentes-Zaragoza, E.L.; Fernandez-Lopez, J.; Sendra, E.; Sayas, E.; Navarro, C.;Pérez-Álvarez, J.A. Preparation of dietary fiber powder from tiger nut (Cyperus esculentus) milk (“Horchata”)byproducts and its physicochemical properties. J. Agric. Food Chem. 2009, 57, 7719–7725. [CrossRef]
29. Ciurlia, L.; Bleve, M.; Rescio, L. Supercritical carbon dioxide co-extraction of tomatoes (Lycopersicum
esculentum L.) and hazelnuts (Corylus avellana L.): A new procedure in obtaining a source of natural lycopene.J. Supercrit. Fluids 2009, 49, 338–344. [CrossRef]
30. Viuda-Martos, M.; Sanchez-Zapata, E.; Sayas-Barberá, E.; Sendra, E.; Pérez-Álvarez, J.; Fernández-López, J.Tomato and tomato byproducts. Human health benefits of lycopene and its application to meat products:A review. Crit. Rev. Food Sci. Nutr. 2014, 54, 1032–1049. [CrossRef]
31. Jurikova, T.; Skrovankova, S.; Mlcek, J.; Balla, S.; Snopek, L. Bioactive Compounds, Antioxidant Activity, andBiological Effects of European Cranberry (Vaccinium oxycoccos). Molecules 2018, 24, 24. [CrossRef]
32. Al-Zoreky, N. Antimicrobial activity of pomegranate (Punica granatum L.) fruit peels. Int. J. Food Microbiol.
2009, 134, 244–248. [CrossRef]
14
Molecules 2019, 24, 1056
33. Akhtar, S.; Ismail, T.; Fraternale, D.; Sestili, P. Pomegranate peel and peel extracts: Chemistry and foodfeatures. Food Chem. 2015, 174, 417–425. [CrossRef]
34. Abid, Y.; Azabou, S.; Jridi, M.; Khemakhem, I.; Bouaziz, M.; Attia, H. Storage stability of traditional Tunisianbutter enriched with antioxidant extract from tomato processing by-products. Food Chem. 2017, 233, 476–482.[CrossRef]
35. Nontasan, S.; Moongngarm, A.; Deeseenthum, S. Application of Functional Colorant Prepared from BlackRice Bran in Yogurt. APCBEE Procedia 2012, 2, 62–67. [CrossRef]
36. Akalın, A.; Unal, G.; Dinkci, N.; Hayaloglu, A. Microstructural, textural, and sensory characteristics ofprobiotic yogurts fortified with sodium calcium caseinate or whey protein concentrate. J. Dairy Sci. 2012, 95,3617–3628. [CrossRef]
37. Peters, H. M. Hanssen und J. Marschen: E for Additives. 223 Seiten. Thorsons Publishers Limited, Wellingborough,Northamptonshire. 1984. Preis: 2.95 £. Food Nahr. 1986, 30, 204. [CrossRef]
38. Saltmarsh, M. Recent trends in the use of food additives in the United Kingdom. J. Sci. Food Agric. 2015, 95,649–652. [CrossRef]
39. Aschemann-Witzel, J.; Varela, P.; Peschel, A.O. Consumers’ categorization of food ingredients: Do consumersperceive them as ‘clean label’ producers expect? An exploration with projective mapping. Food Qual. Prefer.
2019, 71, 117–128. [CrossRef]40. Asioli, D.; Aschemann-Witzel, J.; Caputo, V.; Vecchio, R.; Annunziata, A.; Næs, T.; Varela, P. Making sense of
the “clean label” trends: A review of consumer food choice behavior and discussion of industry implications.Food Res. Int. 2017, 99, 58–71. [CrossRef]
41. Ayala-Zavala, J.; Vega-Vega, V.; Rosas-Domínguez, C.; Palafox-Carlos, H.; Villa-Rodriguez, J.; Siddiqui, M.W.;Dávila-Aviña, J.; González-Aguilar, G. Agro-industrial potential of exotic fruit byproducts as a source offood additives. Food Res. Int. 2011, 44, 1866–1874. [CrossRef]
42. Ofori, J.A.; Hsieh, Y.-H.P. The use of blood and derived products as food additives. In Food Additive;IntechOpen: Rijeka, Croatia, 2012.
43. Schieber, A.; Stintzing, F.; Carle, R. By-products of plant food processing as a source of functionalcompounds—Recent developments. Trends Food Sci. Technol. 2001, 12, 401–413. [CrossRef]
44. Gowe, C. Review on potential use of fruit and vegetables by-products as a valuable source of natural foodadditives. Food Sci. Qual. Manag. 2015, 45, 47–61.
45. EU. Regulation (EC) No 1333/2008 of the European Parliament and of the Council of 16 December 2008 onfood additives (1). Off. J. Eur. Union 2009, 51, 16–33.
46. EU. Commission Directive 2008/60/EC of 17 June 2008 laying down specific purity criteria concerningsweeteners for use in foodstuffs (Codified version). Off. J. Eur. Union 2008, 158, 17–40.
47. EU. Commission Directive 2008/128/EC of 22 December 2008 laying down specific purity criteria concerningcolours for use in foodstuffs (Codified version). Off. J. Eur. Union 2009, 52, 20–63.
48. EU. Commission Directive 2008/84/EC of 27 August 2008 laying down specific purity criteria on foodadditives other than colours and sweeteners (Codified version). Off. J. Eur. Union 2009, 51, 1–175.
49. Saltmarsh, M. Essential Guide to Food Additives; Royal Society of Chemistry: London, UK, 2013.50. EU. Commission Regulation (EU) No 231/2012 of 9 March 2012 laying down specifications for food additives
listed in Annexes II and III to Regulation (EC) No 1333/2008. Off. J. Eur. Union 2012, 55, 1–295. [CrossRef]51. Rajha, H.N.; El Darra, N.; Hobaika, Z.; Boussetta, N.; Vorobiev, E.; Maroun, R.G.; Louka, N. Extraction of
total phenolic compounds, flavonoids, anthocyanins and tannins from grape byproducts by response surfacemethodology. Influence of solid-liquid ratio, particle size, time, temperature and solvent mixtures on theoptimization process. Food Nutr. Sci. 2014, 5, 397. [CrossRef]
52. Corrales, M.; Toepfl, S.; Butz, P.; Knorr, D.; Tauscher, B. Extraction of anthocyanins from grape by-productsassisted by ultrasonics, high hydrostatic pressure or pulsed electric fields: A comparison. Innov. Food Sci.
Emerg. Technol. 2008, 9, 85–91. [CrossRef]53. Kalogeropoulos, N.; Chiou, A.; Pyriochou, V.; Peristeraki, A.; Karathanos, V.T. Bioactive phytochemicals in
industrial tomatoes and their processing byproducts. LWT-Food Sci. Technol. 2012, 49, 213–216. [CrossRef]54. Ajila, C.; Naidu, K.; Bhat, S.; Rao, U.P. Bioactive compounds and antioxidant potential of mango peel extract.
Food Chem. 2007, 105, 982–988. [CrossRef]55. Dabbou, S.; Dabbou, S.; Flamini, G.; Pandino, G.; Gasco, L.; Helal, A.N. Phytochemical compounds from the
crop byproducts of Tunisian globe artichoke cultivars. Chem. Biodivers. 2016, 13, 1475–1483. [CrossRef]
15
Molecules 2019, 24, 1056
56. Gapor, A.; Kato, A.; Ong, A. Tocopherol content in oil palm leaflet. J. Am. Oil Chem. Soc. 1986, 63, 330–331.[CrossRef]
57. Baysal, T.; Ersus, S.; Starmans, D. Supercritical CO2 extraction of β-carotene and lycopene from tomato pastewaste. J. Agric. Food Chem. 2000, 48, 5507–5511. [CrossRef]
58. Gherezgihier, B.A.; Mahmud, A.; Admassu, H.; Shui, X.W.; Fang, Y.; Tsighe, N.; Mohammed, J.K. Foodadditives: Functions, effects, regulations, approval and safety evaluation. J. Acad. Ind. Res. 2017, 6, 62–68.
59. Millstone, E. A. Larry Branen, P. Michael Davidson, Seppe Salminen and John H. ThorngateIII (editors). Food
Additives, 2nd ed. New York and Basel: Marcel Dekker Inc.. 2001. US$225. pp. XV + 938, ISBN 0 8247 9343 9.Br. J. Nutr. 2007, 89, 157–158. [CrossRef]
60. Food and Drug Administration Center for Food Safety and Applied Nutrition. Guidance for Industry
Considerations Regarding Substances Added to Foods, Including Beverages and Dietary Supplements; Food andDrug Administration Center for Food Safety and Applied Nutrition, U.S. Department of Health and HumanServices: College Park, MD, USA, 2014.
61. EFSA Panel on Food Additives and Nutrient Sources added to Food (ANS). Guidance for submission forfood additive evaluations. EFSA J. 2012, 10, 2760. [CrossRef]
62. Gram, L.; Ravn, L.; Rasch, M.; Bruhn, J.B.; Christensen, A.B.; Givskov, M. Food spoilage—Interactionsbetween food spoilage bacteria. Int. J. Food Microbiol. 2002, 78, 79–97. [CrossRef]
63. Perumalla, A.; Hettiarachchy, N.S. Green tea and grape seed extracts—Potential applications in food safetyand quality. Food Res. Int. 2011, 44, 827–839. [CrossRef]
64. McCabe-Sellers, B.J.; Beattie, S.E. Food safety: Emerging trends in foodborne illness surveillance andprevention. J. Am. Diet. Assoc. 2004, 104, 1708–1717. [CrossRef]
65. Pitt, J.I.; Hocking, A.D. The ecology of fungal food spoilage. In Fungi and Food Spoilage; Springer: New York,NY, USA, 2009; pp. 3–9.
66. Lück, E.; Jager, M. Antimicrobial Food Additives: Characteristics, Uses, Effects; Springer Science & BusinessMedia: New York, NY, USA, 1997; Volume 2.
67. Abdulmumeen, H.A.; Risikat, A.N.; Sururah, A.R. Food: Its preservatives, additives and applications.Int. J. Pharm. Chem. Biol. Sci. 2012, 1, 36–47.
68. Smith, J.; Hong-Shum, L. Food Additives Data Book; John Wiley & Sons: New York, NY, USA, 2011.69. O’sullivan, L.; Ross, R.; Hill, C. Potential of bacteriocin-producing lactic acid bacteria for improvements in
food safety and quality. Biochimie 2002, 84, 593–604. [CrossRef]70. Burt, S. Essential oils: Their antibacterial properties and potential applications in foods—A review.
Int. J. Food Microbiol. 2004, 94, 223–253. [CrossRef]71. Ohtsu, N.; Kohari, Y.; Gotoh, M.; Yamada, R.; Nagata, Y.; Murata, M. Utilization of the Japanese Peppermint
Herbal Water Byproduct of Steam Distillation as an Antimicrobial Agent. J. Oleo Sci. 2018, 67, 1227–1233.[CrossRef]
72. Sanz-Puig, M.; Pina-Pérez, M.C.; Criado, M.N.; Rodrigo, D.; Martínez-López, A. Antimicrobial potentialof cauliflower, broccoli, and okara byproducts against foodborne bacteria. Foodborne Pathog. Dis. 2015, 12,39–46. [CrossRef]
73. Li, C.; Li, X.; Bai, C.; Zhang, Y.; Wang, Z. A chitinase with antifungal activity from naked oat (Avena chinensis)seeds. J. Food Biochem. 2018, e12713. [CrossRef]
74. Kirbaslar, F.G.; Tavman, A.; Dülger, B.; Türker, G. Antimicrobial activity of Turkish citrus peel oils. Pak. J. Bot.
2009, 41, 3207–3212.75. Smith-Palmer, A.; Stewart, J.; Fyfe, L. Antimicrobial properties of plant essential oils and essences against
five important food-borne pathogens. Lett. Appl. Microbiol. 1998, 26, 118–122. [CrossRef]76. Fisher, K.; Phillips, C. Potential antimicrobial uses of essential oils in food: Is citrus the answer? Trends Food
Sci. Technol. 2008, 19, 156–164. [CrossRef]77. Ayala-Zavala, J.F.; González-Aguilar, G.A. Use of additives to preserve the quality of fresh-cut fruits and
vegetables. In Advances in Fresh-Cut Fruits and Vegetables Processing; CRC Press: Boca Raton, FL, USA, 2010;pp. 233–256.
78. Correa, P. Diet and gastric cancer. In Diet, Nutrition and Cancer: A Critical Evaluation; CRC Press: Boca Raton,FL, USA, 2018; pp. 1–10.
79. Gassara, F.; Kouassi, A.P.; Brar, S.K.; Belkacemi, K. Green alternatives to nitrates and nitrites in meat-basedproducts—A review. Crit. Rev. Food Sci. Nutr. 2016, 56, 2133–2148. [CrossRef]
16
Molecules 2019, 24, 1056
80. Keeton, J.T. History of nitrite and nitrate in food. In Nitrite and Nitrate in Human Health and Disease; Springer:New York, NY, USA, 2017; pp. 85–97.
81. Adam, A.H.B.; Mustafa, N.E.M.; Rietjens, I.M. Nitrite in processed meat products in Khartoum, Sudan anddietary intake. Food Addit. Contam. Part B 2017, 10, 79–84. [CrossRef] [PubMed]
82. Jiang, J.; Xiong, Y.L. Natural antioxidants as food and feed additives to promote health benefits and qualityof meat products: A review. Meat Sci. 2016, 120, 107–117. [CrossRef]
83. Gul, P.; Bakht, J. Antimicrobial activity of turmeric extract and its potential use in food industry. J. Food Sci. Technol.
2015, 52, 2272–2279. [CrossRef]84. Veiga, R.; De Mendonça, S.; Mendes, P.; Paulino, N.; Mimica, M.; Lagareiro Netto, A.; Lira, I.; López, B.C.;
Negrão, V.; Marcucci, M. Artepillin C and phenolic compounds responsible for antimicrobial and antioxidantactivity of green propolis and Baccharis dracunculifolia DC. J. Appl. Microbiol. 2017, 122, 911–920. [CrossRef][PubMed]
85. Cueva, C.; Moreno-Arribas, M.V.; Martín-Álvarez, P.J.; Bills, G.; Vicente, M.F.; Basilio, A.; Rivas, C.L.;Requena, T.; Rodríguez, J.M.; Bartolomé, B. Antimicrobial activity of phenolic acids against commensal,probiotic and pathogenic bacteria. Res. Microbiol. 2010, 161, 372–382. [CrossRef] [PubMed]
86. Maizura, M.; Aminah, A.; Wan Aida, W. Total phenolic content and antioxidant activity of kesum (Polygonum
minus), ginger (Zingiber officinale) and turmeric (Curcuma longa) extract. Int. Food Res. J. 2011, 18.87. Negi, P.; Jayaprakasha, G.; Jagan Mohan Rao, L.; Sakariah, K. Antibacterial activity of turmeric oil:
A byproduct from curcumin manufacture. J. Agric. Food Chem. 1999, 47, 4297–4300. [CrossRef] [PubMed]88. Hu, Y.; Zhang, J.; Kong, W.; Zhao, G.; Yang, M. Mechanisms of antifungal and anti-aflatoxigenic properties
of essential oil derived from turmeric (Curcuma longa L.) on Aspergillus flavus. Food Chem. 2017, 220, 1–8.[CrossRef]
89. Nile, S.H.; Park, S.W. Edible berries: Bioactive components and their effect on human health. Nutrition 2014,30, 134–144. [CrossRef]
90. Paredes-López, O.; Cervantes-Ceja, M.L.; Vigna-Pérez, M.; Hernández-Pérez, T. Berries: Improving humanhealth and healthy aging, and promoting quality life—A review. Plant Foods Hum. Nutr. 2010, 65, 299–308.[CrossRef]
91. Nicoue, E.E.; Savard, S.; Belkacemi, K. Anthocyanins in wild blueberries of Quebec: Extraction andidentification. J. Agric. Food Chem. 2007, 55, 5626–5635. [CrossRef] [PubMed]
92. Veiga, M.; Costa, E.M.; Silva, S.; Pintado, M. Impact of plant extracts upon human health: A review. Crit. Rev.
Food Sci. Nutr. 2018, 1–14. [CrossRef] [PubMed]93. Silva, S.; Costa, E.M.; Mendes, M.; Morais, R.; Calhau, C.; Pintado, M. Antimicrobial, antiadhesive and
antibiofilm activity of an ethanolic, anthocyanin-rich blueberry extract purified by solid phase extraction.J. Appl. Microbiol. 2016, 121, 693–703. [CrossRef] [PubMed]
94. Silva, S.; Costa, E.M.; Costa, M.R.; Pereira, M.F.; Pereira, J.O.; Soares, J.C.; Pintado, M.M. Aqueous extracts ofVaccinium corymbosum as inhibitors of Staphylococcus aureus. Food Control 2015, 51, 314–320. [CrossRef]
95. Puupponen-Pimiä, R.; Nohynek, L.; Meier, C.; Kähkönen, M.; Heinonen, M.; Hopia, A.;Oksman-Caldentey, K.M. Antimicrobial properties of phenolic compounds from berries. J. Appl. Microbiol.
2001, 90, 494–507. [CrossRef] [PubMed]96. Ross, K.; Ehret, D.; Godfrey, D.; Fukumoto, L.; Diarra, M. Characterization of Pilot Scale Processed Canadian
Organic Cranberry (Vaccinium macrocarpon) and Blueberry (Vaccinium angustifolium) Juice Pressing Residuesand Phenolic-Enriched Extractives. Int. J. Fruit Sci. 2017, 17, 202–232. [CrossRef]
97. Neto, C.C. Cranberry and blueberry: Evidence for protective effects against cancer and vascular diseases.Mol. Nutr. Food Res. 2007, 51, 652–664. [CrossRef] [PubMed]
98. Talhaoui, N.; Taamalli, A.; Gómez-Caravaca, A.M.; Fernández-Gutiérrez, A.; Segura-Carretero, A. Phenoliccompounds in olive leaves: Analytical determination, biotic and abiotic influence, and health benefits.Food Res. Int. 2015, 77, 92–108. [CrossRef]
99. Sahin, S.; Samli, R.; Tan, A.S.B.; Barba, F.J.; Chemat, F.; Cravotto, G.; Lorenzo, J.M. Solvent-freemicrowave-assisted extraction of polyphenols from olive tree leaves: Antioxidant and antimicrobialproperties. Molecules 2017, 22, 1056. [CrossRef]
100. Paiva-Martins, F.; Correia, R.; Félix, S.; Ferreira, P.; Gordon, M.H. Effects of enrichment of refined olive oilwith phenolic compounds from olive leaves. J. Agric. Food Chem. 2007, 55, 4139–4143. [CrossRef]
17
Molecules 2019, 24, 1056
101. Pereira, A.P.; Ferreira, I.C.; Marcelino, F.; Valentão, P.; Andrade, P.B.; Seabra, R.; Estevinho, L.; Bento, A.;Pereira, J.A. Phenolic compounds and antimicrobial activity of olive (Olea europaea L. Cv. Cobrançosa) leaves.Molecules 2007, 12, 1153–1162. [CrossRef] [PubMed]
102. Wang, Y.; Li, F.; Zhuang, H.; Chen, X.; Li, L.; Qiao, W.; Zhang, J. Effects of plant polyphenols and α-tocopherolon lipid oxidation, residual nitrites, biogenic amines, and N-nitrosamines formation during ripening andstorage of dry-cured bacon. LWT-Food Sci. Technol. 2015, 60, 199–206. [CrossRef]
103. Kondo, M.; Kita, K.; Yokota, H.-O. Feeding value to goats of whole-crop oat ensiled with green tea waste.Anim. Feed Sci. Technol. 2004, 113, 71–81. [CrossRef]
104. Farhoosh, R.; Golmovahhed, G.A.; Khodaparast, M.H. Antioxidant activity of various extracts of old tealeaves and black tea wastes (Camellia sinensis L.). Food Chem. 2007, 100, 231–236. [CrossRef]
105. García-Lomillo, J.; Gonzalez-SanJose, M.L.; Del Pino-García, R.; Rivero-Perez, M.D.; Muniz-Rodriguez, P.Antioxidant and antimicrobial properties of wine byproducts and their potential uses in the food industry.J. Agric. Food Chem. 2014, 62, 12595–12602. [CrossRef]
106. Teixeira, A.; Baenas, N.; Dominguez-Perles, R.; Barros, A.; Rosa, E.; Moreno, A.D.; Garcia-Viguera, C. NaturalBioactive Compounds from Winery By-Products as Health Promoters: A Review. Int. J. Mol. Sci. 2014, 15,15638–15678. [CrossRef]
107. Çam, M.; Içyer, N.C.; Erdogan, F. Pomegranate peel phenolics: Microencapsulation, storage stability andpotential ingredient for functional food development. LWT-Food Sci. Technol. 2014, 55, 117–123. [CrossRef]
108. Li, Y.; Guo, C.; Yang, J.; Wei, J.; Xu, J.; Cheng, S. Evaluation of antioxidant properties of pomegranate peelextract in comparison with pomegranate pulp extract. Food Chem. 2006, 96, 254–260. [CrossRef]
109. Kanatt, S.R.; Chander, R.; Sharma, A. Antioxidant and antimicrobial activity of pomegranate peel extractimproves the shelf life of chicken products. Int. J. Food Sci. Technol. 2010, 45, 216–222. [CrossRef]
110. Rodríguez-Carpena, J.-G.; Morcuende, D.; Andrade, M.-J.; Kylli, P.; Estévez, M. Avocado (Persea americana
Mill.) phenolics, in vitro antioxidant and antimicrobial activities, and inhibition of lipid and protein oxidationin porcine patties. J. Agric. Food Chem. 2011, 59, 5625–5635. [CrossRef]
111. Raymond Chia, T.W.; Dykes, G.A. Antimicrobial activity of crude epicarp and seed extracts from matureavocado fruit (Persea americana) of three cultivars. Pharm. Biol. 2010, 48, 753–756. [CrossRef]
112. Calderón-Oliver, M.; Escalona-Buendía, H.B.; Medina-Campos, O.N.; Pedraza-Chaverri, J.; Pedroza-Islas, R.;Ponce-Alquicira, E. Optimization of the antioxidant and antimicrobial response of the combined effect ofnisin and avocado byproducts. LWT-Food Sci. Technol. 2016, 65, 46–52. [CrossRef]
113. Baines, D.; Seal, R. Natural Food Additives, Ingredients and Flavourings; Elsevier: Amsterdam, The Netherlands, 2012.114. Sung, K.; Khan, S.A.; Nawaz, M.S.; Cerniglia, C.E.; Tamplin, M.L.; Phillips, R.W.; Kelley, L.C. Lysozyme as a
barrier to growth of Bacillus anthracis strain Sterne in liquid egg white, milk and beef. Food Microbiol. 2011,28, 1231–1234. [CrossRef]
115. Barbiroli, A.; Bonomi, F.; Capretti, G.; Iametti, S.; Manzoni, M.; Piergiovanni, L.; Rollini, M. Antimicrobialactivity of lysozyme and lactoferrin incorporated in cellulose-based food packaging. Food Control 2012, 26,387–392. [CrossRef]
116. Lorenzo, J.M.; Munekata, P.E.; Gómez, B.; Barba, F.J.; Mora, L.; Pérez-Santaescolástica, C.; Toldrá, F. Bioactivepeptides as natural antioxidants in food products—A review. Trends Food Sci. Technol. 2018, 79, 136–147.[CrossRef]
117. Carocho, M.; Morales, P.; Ferreira, I.C. Antioxidants: Reviewing the chemistry, food applications, legislationand role as preservatives. Trends Food Sci. Technol. 2018, 71, 107–120. [CrossRef]
118. Roca-Saavedra, P.; Mendez-Vilabrille, V.; Miranda, J.M.; Nebot, C.; Cardelle-Cobas, A.; Franco, C.M.;Cepeda, A. Food additives, contaminants and other minor components: Effects on human gut microbiota—Areview. J. Physiol. Biochem. 2017, 1–15. [CrossRef]
119. Pisoschi, A.M.; Pop, A. The role of antioxidants in the chemistry of oxidative stress: A review. Eur. J. Med. Chem.
2015, 97, 55–74. [CrossRef]120. Di Pasquale, J.; Adinolfi, F.; Capitanio, F. Analysis of consumer attitudes and consumers’ willingness to pay
for functional foods. Int. J. Food Syst. Dyn. 2011, 2, 181–193.121. Caleja, C.; Barros, L.; Antonio, A.L.; Oliveira, M.B.P.; Ferreira, I.C. A comparative study between natural and
synthetic antioxidants: Evaluation of their performance after incorporation into biscuits. Food Chem. 2017,216, 342–346. [CrossRef]
18
Molecules 2019, 24, 1056
122. Williams, G.; Iatropoulos, M.; Whysner, J. Safety assessment of butylated hydroxyanisole and butylatedhydroxytoluene as antioxidant food additives. Food Chem. Toxicol. 1999, 37, 1027–1038. [CrossRef]
123. Wu, D.; Yan, J.; Tang, P.; Li, S.; Xu, K.; Li, H. Binding properties and structure–affinity relationships of foodantioxidant butylated hydroxyanisole and its metabolites with lysozyme. Food Chem. 2015, 188, 370–376.[CrossRef]
124. Taghvaei, M.; Jafari, S.M. Application and stability of natural antioxidants in edible oils in order to substitutesynthetic additives. J. Food Sci. Technol. 2015, 52, 1272–1282. [CrossRef]
125. McCusker, M.M.; Durrani, K.; Payette, M.J.; Suchecki, J. An eye on nutrition: The role of vitamins,essential fatty acids, and antioxidants in age-related macular degeneration, dry eye syndrome, and cataract.Clin. Dermatol. 2016, 34, 276–285. [CrossRef]
126. Toldrá, F.; Mora, L.; Reig, M. New insights into meat by-product utilization. Meat Sci. 2016, 120, 54–59.[CrossRef]
127. Ryder, K.; Ha, M.; Bekhit, A.E.-D.; Carne, A. Characterisation of novel fungal and bacterial proteasepreparations and evaluation of their ability to hydrolyse meat myofibrillar and connective tissue proteins.Food Chem. 2015, 172, 197–206. [CrossRef]
128. Roldán, E.; Sánchez-Moreno, C.; de Ancos, B.; Cano, M.P. Characterisation of onion (Allium cepa L.)by-products as food ingredients with antioxidant and antibrowning properties. Food Chem. 2008, 108,907–916. [CrossRef]
129. Larrosa, M.; Llorach, R.; Espín, J.C.; Tomás-Barberán, F.A. Increase of antioxidant activity of tomato juice uponfunctionalisation with vegetable byproduct extracts. LWT-Food Sci. Technol. 2002, 35, 532–542. [CrossRef]
130. Sadilova, E.; Stintzing, F.C.; Carle, R. Anthocyanins, colour and antioxidant properties of eggplant (Solanum
melongena L.) and violet pepper (Capsicum annuum L.) peel extracts. Z. Nat. C 2006, 61, 527–535. [CrossRef]131. Kim, H.; Moon, J.Y.; Kim, H.; Lee, D.-S.; Cho, M.; Choi, H.-K.; Kim, Y.S.; Mosaddik, A.; Cho, S.K. Antioxidant
and antiproliferative activities of mango (Mangifera indica L.) flesh and peel. Food Chem. 2010, 121, 429–436.[CrossRef]
132. Vega-Vega, V.; Silva-Espinoza, B.A.; Cruz-Valenzuela, M.R.; Bernal-Mercado, A.T.; Gonzalez-Aguilar, G.A.;Ruiz-Cruz, S.; Moctezuma, E.; Siddiqui, M.W.; Ayala-Zavala, J.F. Antimicrobial and antioxidant properties ofbyproduct extracts of mango fruit. J. Appl. Bot. Food Qual. 2013, 86. [CrossRef]
133. Ajila, C.M.; Aalami, M.; Leelavathi, K.; Rao, U.J.S.P. Mango peel powder: A potential source of antioxidantand dietary fiber in macaroni preparations. Innov. Food Sci. Emerg. Technol. 2010, 11, 219–224. [CrossRef]
134. Caleja, C.; Barros, L.; Antonio, A.L.; Ciric, A.; Barreira, J.C.; Sokovic, M.; Oliveira, M.B.P.; Santos-Buelga, C.;Ferreira, I.C. Development of a functional dairy food: Exploring bioactive and preservation effects ofchamomile (Matricaria recutita L.). J. Funct. Foods 2015, 16, 114–124. [CrossRef]
135. Caleja, C.; Barros, L.; Antonio, A.L.; Ciric, A.; Sokovic, M.; Oliveira, M.B.P.; Santos-Buelga, C.; Ferreira, I.C.Foeniculum vulgare Mill. as natural conservation enhancer and health promoter by incorporation in cottagecheese. J. Funct. Foods 2015, 12, 428–438. [CrossRef]
136. Shah, M.A.; Bosco, S.J.D.; Mir, S.A. Plant extracts as natural antioxidants in meat and meat products. Meat Sci.
2014, 98, 21–33. [CrossRef]137. Bajaj, S.; Urooj, A.; Prabhasankar, P. Effect of incorporation of mint on texture, colour and sensory parameters
of biscuits. Int. J. Food Prop. 2006, 9, 691–700. [CrossRef]138. He, B.; Zhang, L.-L.; Yue, X.-Y.; Liang, J.; Jiang, J.; Gao, X.-L.; Yue, P.-X. Optimization of ultrasound-assisted
extraction of phenolic compounds and anthocyanins from blueberry (Vaccinium ashei) wine pomace.Food Chem. 2016, 204, 70–76. [CrossRef]
139. Guimarães, R.; Barros, L.; Barreira, J.C.; Sousa, M.J.; Carvalho, A.M.; Ferreira, I.C. Targeting excessive freeradicals with peels and juices of citrus fruits: Grapefruit, lemon, lime and orange. Food Chem. Toxicol. 2010,48, 99–106. [CrossRef]
140. Prakash, C.V.S.; Prakash, I. Bioactive chemical constituents from pomegranate (Punica granatum) juice, seedand peel—A review. IJRCE 2011, 1, 1–18.
141. Verbeke, W. Functional foods: Consumer willingness to compromise on taste for health? Food Qual. Prefer.
2006, 17, 126–131. [CrossRef]142. Iriondo-DeHond, M.; Miguel, E.; del Castillo, M. Food Byproducts as Sustainable Ingredients for Innovative
and Healthy Dairy Foods. Nutrients 2018, 10, 1358. [CrossRef]
19
Molecules 2019, 24, 1056
143. Codex Alimentarius General Standard for Food Additives; Food and Agriculture Organization of the UnitedNations: Rome, Italy, 1995; Volume 192.
144. Amchova, P.; Kotolova, H.; Ruda-Kucerova, J. Health safety issues of synthetic food colorants. Regul. Toxicol. Pharmacol.
2015, 73, 914–922. [CrossRef] [PubMed]145. Sigurdson, G.T.; Tang, P.; Giusti, M.M. Natural colorants: Food colorants from natural sources. Annu. Rev.
Food Sci. Technol. 2017, 8, 261–280. [CrossRef] [PubMed]146. Bridle, P.; Timberlake, C.F. Anthocyanins as natural food colours—Selected aspects. Food Chem. 1997, 58,
103–109. [CrossRef]147. Rodriguez-Amaya, D.B. Natural food pigments and colorants. Curr. Opin. Food Sci 2016, 7, 20–26. [CrossRef]148. Kaur, D.; Wani, A.A.; Singh, D.P.; Sogi, D.S. Shelf Life Enhancement of Butter, Ice-Cream, and Mayonnaise
by Addition of Lycopene. Int. J. Food Prop. 2011, 14, 1217–1231. [CrossRef]149. Rizk, E.M.; El-Kady, A.T.; El-Bialy, A.R. Characterization of carotenoids (lyco-red) extracted from tomato
peels and its uses as natural colorants and antioxidants of ice cream. Ann. Agric. Sci. 2014, 59, 53–61.[CrossRef]
150. De Ancos, B.; Colina-Coca, C.; González-Peña, D.; Sánchez-Moreno, C. Bioactive compounds from vegetableand fruit by-products. Biotechnol. Bioact. Compd. Sources Appl. 2015, 1–36. [CrossRef]
151. Chaitanya Lakshmi, G. Food coloring: The natural way. Res. J. Chem. Sci. 2014, 2231, 606X.152. Ajila, C.; Leelavathi, K.; Rao, U.P. Improvement of dietary fiber content and antioxidant properties in soft
dough biscuits with the incorporation of mango peel powder. J. Cereal Sci. 2008, 48, 319–326. [CrossRef]153. Tung, Y.-C.; Chang, W.-T.; Li, S.; Wu, J.-C.; Badmeav, V.; Ho, C.-T.; Pan, M.-H. Citrus peel extracts attenuated
obesity and modulated gut microbiota in mice with high-fat diet-induced obesity. Food Funct. 2018.[CrossRef]
154. Ghasemi, K.; Ghasemi, Y.; Ebrahimzadeh, M.A. Antioxidant activity, phenol and flavonoid contents of 13citrus species peels and tissues. Pak. J. Pharm. Sci. 2009, 22, 277–281.
155. Siegrist, M.; Sütterlin, B. Importance of perceived naturalness for acceptance of food additives and culturedmeat. Appetite 2017, 113, 320–326. [CrossRef]
156. Vojdani, A.; Vojdani, C. Immune reactivity to food coloring. Altern. Ther. 2015, 21, 1–100.157. Bézu, C.; Coutant, C.; Salengro, A.; Daraï, E.; Rouzier, R.; Uzan, S. Anaphylactic response to blue dye during
sentinel lymph node biopsy. Surg. Oncol. 2011, 20, e55–e59. [CrossRef]158. Rodriguez-Amaya, D.B. Natural Food Pigments and Colorants. In Bioactive Molecules in Food; Mérillon, J.-M.,
Ramawat, K.G., Eds.; Springer International Publishing: Cham, Switzerland, 2017; pp. 1–35.159. Gordon, H.T.; Bauernfeind, J.C.; Furia, T.E. Carotenoids as food colorants. Crit. Rev. Food Sci. Nutr. 1983, 18,
59–97. [CrossRef]160. Wissgott, U.; Bortlik, K. Prospects for new natural food colorants. Trends Food Sci. Technol. 1996, 7, 298–302.
[CrossRef]161. Prata, E.R.B.A.; Oliveira, L.S. Fresh coffee husks as potential sources of anthocyanins. LWT-Food Sci. Technol.
2007, 40, 1555–1560. [CrossRef]162. European Commission. Commission Regulation (EU) No 1129/2011 of 11 November 2011 amending Annex II to
Regulation (EC) No 1333/2008 of the European Parliament and of the Council by Establishing a Union List of Food
Additives Text with EEA Relevance; European Commission: Brussels, Belgium, 2011.163. Gesundheitsamt, S.E.; Commission du Manuel Suisse des Denrées Alimentaires. Manuel Suisse des Denrées
Alimentaires: Méthodes d’Analyse et d’Appréciation des Denrées Alimentaires et des Objets Usuels; Office CentralFédéral des Imprimés et du Matériel: Berne, Switzerland, 1969.
164. Carocho, M.; Barreiro, M.F.; Morales, P.; Ferreira, I.C. Adding molecules to food, pros and cons: A review onsynthetic and natural food additives. Compr. Rev. Food Sci. Food Saf. 2014, 13, 377–399. [CrossRef]
165. Kodagoda, K.; Marapana, R. Utilization of fruit processing by-products for industrial applications: A review.Int. J. Food Sci. Nutr. 2017, 2, 24–30.
166. Joshi, R.V. Low calorie biscuits from banana peel pulp. J. Solid Waste Technol. Manag. 2007, 33, 142–147.167. Kanazawa, K.; Sakakibara, H. High Content of Dopamine, a Strong Antioxidant, in Cavendish Banana.
J. Agric. Food Chem. 2000, 48, 844–848. [CrossRef]168. Serna-Cock, L.; García-Gonzales, E.; Torres-León, C. Agro-industrial potential of the mango peel based on its
nutritional and functional properties. Food Rev. Int. 2016, 32, 364–376. [CrossRef]
20
Molecules 2019, 24, 1056
169. Nobre, B.P.; Palavra, A.F.; Pessoa, F.L.; Mendes, R.L. Supercritical CO2 extraction of trans-lycopene fromPortuguese tomato industrial waste. Food Chem. 2009, 116, 680–685. [CrossRef]
170. Wrolstad, R.E.; Culver, C.A. Alternatives to Those Artificial FD&C Food Colorants. Annu. Rev. Food Sci. Technol.
2012, 3, 59–77. [CrossRef]171. Saha, D.; Bhattacharya, S. Hydrocolloids as thickening and gelling agents in food: A critical review. J. Food
Sci. Technol. 2010, 47, 587–597. [CrossRef]172. Pressman, P.; Clemens, R.; Hayes, W.; Reddy, C. Food additive safety: A review of toxicologic and regulatory
issues. Toxicol. Res. 2017, 1, 1–22. [CrossRef]173. Mudgil, D.; Barak, S. Composition, properties and health benefits of indigestible carbohydrate polymers as
dietary fiber: A review. Int. J. Biol. Macromol. 2013, 61, 1–6. [CrossRef]174. Müller-Maatsch, J.; Bencivenni, M.; Caligiani, A.; Tedeschi, T.; Bruggeman, G.; Bosch, M.; Petrusan, J.; Van
Droogenbroeck, B.; Elst, K.; Sforza, S. Pectin content and composition from different food waste streams.Food Chem. 2016, 201, 37–45. [CrossRef]
175. Jeong, H.-S.; Kim, H.-Y.; Ahn, S.H.; Oh, S.C.; Yang, I.; Choi, I.-G. Optimization of enzymatic hydrolysisconditions for extraction of pectin from rapeseed cake (Brassica napus L.) using commercial enzymes.Food Chem. 2014, 157, 332–338. [CrossRef]
176. Espírito-Santo, A.P.; Lagazzo, A.; Sousa, A.L.O.P.; Perego, P.; Converti, A.; Oliveira, M.N. Rheology,spontaneous whey separation, microstructure and sensorial characteristics of probiotic yoghurts enrichedwith passion fruit fiber. Food Res. Int. 2013, 50, 224–231. [CrossRef]
177. Yi, T.; Huang, X.; Pan, S.; Wang, L. Physicochemical and functional properties of micronized jincheng orangeby-products (Citrus sinensis Osbeck) dietary fiber and its application as a fat replacer in yogurt. Int. J. Food Sci. Nutr.
2014, 65, 565–572. [CrossRef]178. Zhang, T.; McCarthy, J.; Wang, G.; Liu, Y.; Guo, M. Physiochemical Properties, Microstructure, and Probiotic
Survivability of Nonfat Goats’ Milk Yogurt Using Heat-Treated Whey Protein Concentrate as Fat Replacer.J. Food Sci. 2015, 80, M788–M794. [CrossRef]
179. Saffon, M.; Richard, V.; Jiménez-Flores, R.; Gauthier, F.S.; Britten, M.; Pouliot, Y. Behavior of Heat-DenaturedWhey: Buttermilk Protein Aggregates during the Yogurt-Making Process and Their Influence on Set-TypeYogurt Properties. Foods 2013, 2, 444–459. [CrossRef]
180. Sundar Raj, A.; Rubila, S.; Jayabalan, R.; Ranganathan, T. A review on pectin: Chemistry due to generalproperties of pectin and its pharmaceutical uses. Sci. Rep. 2012, 1, 550–551.
181. Crizel, T.D.M.; Araujo, R.R.D.; Rios, A.D.O.; Rech, R.; Flôres, S.H. Orange fiber as a novel fat replacer inlemon ice cream. J. Food Sci. Technol. 2014, 34, 332–340. [CrossRef]
182. M’hiri, N.; Ghali, R.; Nasr, I.B.; Boudhrioua, N. Effect of different drying processes on functional propertiesof industrial lemon byproduct. Process Saf. Environ. Prot. 2018, 116, 450–460. [CrossRef]
183. Beecher, G.R. Phytonutrients’ Role in Metabolism: Effects on Resistance to Degenerative Processes. Nutr. Rev.
1999, 57, 3–6. [CrossRef]184. Desmedt, A.; Jacobs, H. Soluble fiber. In Guide to Functional Foods; Young, J.E., Ed.; Leatherhead Publishing:
Leatherhead, UK, 2001; pp. 112–132.185. Santos, B.A.; Campagnol, P.C.B.; Pacheco, M.T.B.; Pollonio, M.A.R. Fructooligosaccharides as a fat replacer
in fermented cooked sausages. Int. J. Food Sci. Technol. 2012, 47, 1183–1192. [CrossRef]186. Brennan, C.S.; Tudorica, C.M. Carbohydrate-based fat replacers in the modification of the rheological,
textural and sensory quality of yoghurt: Comparative study of the utilisation of barley beta-glucan, guargum and inulin. Int. J. Food Sci. Technol. 2008, 43, 824–833. [CrossRef]
187. Radi, M.; Niakousari, M.; Amiri, S. Physicochemical, Textural and Sensory Properties of Low-Fat YogurtProduced by Using Modified Wheat Starch as a Fat Replacer. J. Appl. Sci. Res. 2009, 9, 2194–2197.
188. Raftani, A.Z.; Mahmudi, M.; Alimi, M. Effect of maltodextrin as a fat replacer on the quality of non-fatyogurt. J. Food Res. 2013, 23, 133–142.
189. Crizel, T.D.M.; Jablonski, A.; Rios, A.D.O.; Rech, R.; Flôres, S.H. Dietary fiber from orange byproducts as apotential fat replacer. LWT-Food Sci. Technol. 2013, 53, 9–14. [CrossRef]
190. Dervisoglu, M.; Yazici, F. Note. The Effect of Citrus Fibre on the Physical, Chemical and Sensory Propertiesof Ice Cream. Int. J. Food Sci. Technol. 2006, 12, 159–164. [CrossRef]
21
Molecules 2019, 24, 1056
191. Guerrero García Ortega, M.; Riballo Ruiz-Roso, M.; Crespo Bermejo, A. Obtaining enriched fried tomatosauce using tomato byproducts. In Proceedings of the XIV International Symposium on Processing Tomato 1159;ISHS: Leuven, Belgium, 2017; pp. 167–174.
192. Nussinovitch, A.; Hirashima, M. More Cooking Innovations: Novel Hydrocolloids for Special Dishes; CRC Press:Boca Raton, FL, USA, 2018.
193. Lee, S.; Inglett, G.E.; Palmquist, D.; Warner, K. Flavor and texture attributes of foods containing β-glucan-richhydrocolloids from oats. LWT-Food Sci. Technol. 2009, 42, 350–357. [CrossRef]
194. Domagała, J.; Sady, M.; Grega, T.; Bonczar, G. Rheological properties and texture of yoghurts whenoat-maltodextrin is used as a fat substitute. Int. J. Food Prop. 2006, 9, 1–11. [CrossRef]
195. Ahmad, A.; Munir, B.; Abrar, M.; Bashir, S.; Adnan, M.; Tabassum, T. Perspective of β-glucan as functionalingredient for food industry. J. Nutr. Food Sci. 2012, 2, 133. [CrossRef]
196. Campos-Vega, R.; Nieto-Figueroa, K.H.; Oomah, B.D. Cocoa (Theobroma cacao L.) pod husk: Renewablesource of bioactive compounds. Trends Food Sci. Technol. 2018, 81, 172–184. [CrossRef]
197. Ralla, T.; Salminen, H.; Edelmann, M.; Dawid, C.; Hofmann, T.; Weiss, J. Oat bran extract (Avena sativa L.)from food by-product streams as new natural emulsifier. Food Hydrocoll. 2018, 81, 253–262. [CrossRef]
198. Everett, D.W.; McLeod, R.E. Interactions of polysaccharide stabilisers with casein aggregates in stirredskim-milk yoghurt. Int. Dairy J. 2005, 15, 1175–1183. [CrossRef]
199. Aryana, K.; Plauche, S.; Rao, R.; McGrew, P.; Shah, N. Fat-free plain yogurt manufactured with inulins ofvarious chain lengths and Lactobacillus acidophilus. J. Food Sci. 2007, 72, M79–M84. [CrossRef]
200. Sahan, N.; Yasar, K.; Hayaloglu, A.A. Physical, chemical and flavour quality of non-fat yogurt as affected bya β-glucan hydrocolloidal composite during storage. Food Hydrocoll. 2008, 22, 1291–1297. [CrossRef]
201. Mistry, V.V.; Hassan, H.N. Manufacture of Nonfat Yogurt from a High Milk Protein Powder. J. Dairy Sci.
1992, 75, 947–957. [CrossRef]202. Guzmán-González, M.; Morais, F.; Ramos, M.; Amigo, L. Influence of skimmed milk concentrate replacement
by dry dairy products in a low fat set-type yoghurt model system. I: Use of whey protein concentrates, milkprotein concentrates and skimmed milk powder. J. Sci. Food Agric. 1999, 79, 1117–1122. [CrossRef]
203. Lobato-Calleros, C.; Martínez-Torrijos, O.; Sandoval-Castilla, O.; Pérez-Orozco, J.P.; Vernon-Carter, E.J. Flowand creep compliance properties of reduced-fat yoghurts containing protein-based fat replacers. Int. Dairy J.
2004, 14, 777–782. [CrossRef]204. Sandoval-Castilla, O.; Lobato-Calleros, C.; Aguirre-Mandujano, E.; Vernon-Carter, E.J. Microstructure and
texture of yogurt as influenced by fat replacers. Int. Dairy J. 2004, 14, 151–159. [CrossRef]205. Bryant, C.M.; McClements, D.J. Molecular basis of protein functionality with special consideration of cold-set
gels derived from heat-denatured whey. Trends Food Sci. Technol. 1998, 9, 143–151. [CrossRef]206. Wang, W.; Bao, Y.; Hendricks, G.M.; Guo, M. Consistency, microstructure and probiotic survivability of
goats’ milk yoghurt using polymerized whey protein as a co-thickening agent. Int. Dairy J. 2012, 24, 113–119.[CrossRef]
207. Lin, Y.; Kelly, A.L.; O’Mahony, J.A.; Guinee, T.P. Fortification of milk protein content with different dairyprotein powders alters its compositional, rennet gelation, heat stability and ethanol stability characteristics.Int. Dairy J. 2016, 61, 220–227. [CrossRef]
208. Bruzantin, F.; Daniel, J.; da Silva, P.; Spoto, M. Physicochemical and sensory characteristics of fat-free goatmilk yogurt with added stabilizers and skim milk powder fortification. J. Dairy Sci. 2016, 99, 3316–3324.[CrossRef]
209. Jiménez-Flores, R.; Brisson, G. The milk fat globule membrane as an ingredient: Why, how, when? Dairy Sci. Technol.
2008, 88, 5–18. [CrossRef]210. Singh, H. The milk fat globule membrane—A biophysical system for food applications. Curr. Opin. Colloid
Interface Sci. 2006, 11, 154–163. [CrossRef]211. Mistry, V.V.; Metzger, L.E.; Maubois, J.L. Use of Ultrafiltered Sweet Buttermilk in the Manufacture of Reduced
Fat Cheddar Cheese 1. J. Dairy Sci. 1996, 79, 1137–1145. [CrossRef]212. Turcot, S.; St-Gelais, D.; Turgeon, S.L. Affinage de fromages allégés de type Cheddar fabriqués à partir de
laits enrichis en phospholipides. Le Lait 2002, 82, 209–223. [CrossRef]213. Kinsella, J. Relationships between structure and functional properties of food proteins. Food Proteins 1982, 1,
51–103.
22
Molecules 2019, 24, 1056
214. Yavuz, H.Z.; Ozcan, M.M.; Lemiasheuski, V.K. The Effect of Some Chemical Additives on the FoamingPerformance of the Pasteurized Liquid Egg White. J. Nutr. Metab. 2018, 5, 1054.
215. Mita, T.; Ishida, E.; Matsumoto, H. Physicochemical studies on wheat protein foams. II. Relationship betweenbubble size and stability of foams prepared with gluten and gluten components. J. Colloid Interface Sci. 1978,64, 143–153. [CrossRef]
216. Kralova, I.; Sjöblom, J. Surfactants Used in Food Industry: A Review. J. Dispers. Sci. Technol. 2009, 30,1363–1383. [CrossRef]
217. Johnson, T.M.; Zabik, M.E. Ultrastructural examination of egg albumen protein foams. J. Food Sci. 1981, 46,1237–1240. [CrossRef]
218. Karayannakidis, P.D.; Zotos, A. Fish processing by-products as a potential source of gelatin: A review.J. Aquat. Food Prod. Technol. 2016, 25, 65–92. [CrossRef]
219. Muzaifa, M.; Safriani, N.; Zakaria, F. Production of protein hydrolysates from fish by-product prepared byenzymatic hydrolysis. Aquac. Aquar. Conserv. Legis. 2012, 5, 36–39.
220. Kotlar, C.E.; Ponce, A.G.; Roura, S.I. Improvement of functional and antimicrobial properties of brewerybyproduct hydrolysed enzymatically. LWT-Food Sci. Technol. 2013, 50, 378–385. [CrossRef]
221. Hsieh, Y.; Ofori, J.A. Food-grade proteins from animal by-products. Their usage and detection methods.In Handbook of Analysis of Edible Animal by-Products; CRC Press: Boca Raton, FL, USA, 2011; pp. 3–11.
222. Kang, I.S.; Lanier, T.C. Bovine Plasma Protein Functions in Surimi Gelation Compared with Cysteine ProteaseInhibitors. J. Food Sci. 1999, 64, 842–846. [CrossRef]
223. Yousif, A.M.; Cranston, P.; Deeth, H.C. Incorporation of bovine dry blood plasma into biscuit flour for theproduction of pasta. LWT-Food Sci. Technol. 2003, 36, 295–302. [CrossRef]
224. Del Hoyo, P.; Rendueles, M.; Díaz, M. Effect of processing on functional properties of animal blood plasma.Meat Sci. 2008, 78, 522–528. [CrossRef]
225. Whitehurst, R.J. Emulsifiers in Food Technology; John Wiley & Sons: New York, NY, USA, 2008.226. Ozturk, B.; McClements, D.J. Progress in natural emulsifiers for utilization in food emulsions. Curr. Opin. Food Sci.
2016, 7, 1–6. [CrossRef]227. Imafidon, G.I.; Farkye, N.Y.; Spanier, A.M. Isolation, purification, and alteration of some functional groups
of major milk proteins: A review. Crit. Rev. Food Sci. Nutr. 1997, 37, 663–689. [CrossRef]228. Toldrà, M.; Lynch, S.A.; Couture, R.; Álvarez, C. Blood Proteins as Functional Ingredients. In Sustainable
Meat Production and Processing; Elsevier: Amsterdam, The Netherlands, 2019; pp. 85–101.229. Leoci, R. Animal by-Products (ABPs): Origins, Uses, and European Regulations; Universitas Studiorum S.r.l.:
Mantova, Italy, 2014.
© 2019 by the authors. Licensee MDPI, Basel, Switzerland. This article is an open accessarticle distributed under the terms and conditions of the Creative Commons Attribution(CC BY) license (http://creativecommons.org/licenses/by/4.0/).
23

molecules
Review
Green Natural Colorants
Isabel Viera, Antonio Pérez-Gálvez and María Roca *
Food Phytochemistry Department, Instituto de la Grasa (CSIC), University Campus, Building 46,Carretera de Utrera km. 1, 41013 Sevilla, Spain; [email protected] (I.V.); [email protected] (A.P.-G.)* Correspondence: [email protected]; Tel.: +34-954-611-550
Academic Editors: Lillian Barros and Isabel C. F. R. FerreiraReceived: 6 November 2018; Accepted: 30 November 2018; Published: 2 January 2019
Abstract: Although there is no legal and clear definition of the term “natural food colorant”,the market trends, and consequently industrial and commercial interest, have turned to foods withadded natural pigments. This progressive substitution of artificial colorants has faced chemicalcomplications with some colors, with a lack of stable green hues being one of them. Severalstrategies have been applied for green color stabilization in processed foods, from the formation ofmetallochlorophylls to the microencapsulation of green pigments. However, at present, the utilizationof green coloring foodstuffs, which are considered an ingredient in the EU, seems to be the moresuccessful solution for the market. Besides those topics, the present review aims to clarify the currentconfusion between the different chlorophyll compounds that form part of the authorized greenfood colorants. In this sense, legislations from different countries are compared. Finally, and inline with current concerns, the knowledge gathered so far in relation to the absorption, distribution,metabolism and excretion of all green natural food colorants is reviewed.
Keywords: ADME; absorption; chlorophylls; chlorophyllin; green colorant; zinc-chlorophylls;copper-chlorophyll; coloring foodstuff; natural colorants; food colors
1. Introduction
The first moment of truth is a term coined by Procter & Gamble [1] to describe the 3–7-s gap thatmakes a customer select a product over the rest of its competitors. It has been established that color isresponsible for 62–90% of the consumer’s assessment [2]. This fact makes expertise in food colorantsa very profitable activity. Specifically, some market research companies have prognosticated a globalfood colors market size of USD 2.97 billion by 2025, with an estimated USD 1.79 billion in 2016 [3].In this sense, consumer claims are responsible for the progressive strengthening of the food industry.We want food products to be more delightful, nutritive, attractive and healthy, with “fun-foods” asthe maximum expression of this appeal [4]. The response to this worldwide trend is the unavoidableapplication of food colorants.
Before going further in this review, several concepts should be defined. Colorants can be classifiedfollowing different parameters [5]. For example, in the USA, food colorants are categorized intowhether they require or not the batch certification carried out by the US Food and Drug Administration(FDA). The list with the approved colorants that require certification is published in Title 21 CFR(Code of Federal Regulations) 74, where a Foods, Drugs and Cosmetics (FD & C) number is assigned.Hence, the certified colors commonly defined as synthetic could be classified as dyes (food-gradewater soluble colorant [6]) or lakes (oil-dispersible; generally, dye extended on alumina). On theother hand, the list of the colorants exempted from certification is published in the Title 21 CFR 73document [7]. Colorants within this category are mainly natural, although a few of them are producedby synthesis, but considered “nature-identical”. On the other hand, authorized food colorants in the
25
Molecules 2019, 24, 154
EU are mainly legislated by the Regulation (EU) No. 1333/2008 [8], which is amended by Regulation(EC) No. 1129/2011. EU legislation includes indistinctly natural or artificial colorants.
Food colorants can be allocated following their origin (vegetal, animal, bacterial, fungal, etc.),their hue (red, yellow, purple, blue, green, etc.) or their chemical structure: flavonoid derivatives(anthocyanins), isoprenoid derivatives (carotenoids), nitrogen–heterocyclic derivatives (betalains),and the subject of this review, pyrrole derivatives or chlorophylls, which are responsible for blue andgreen hues.
At this point, it is relevant to distinguish between natural colorants and artificial ones. Althoughwe could have an intuitive and clear conception about what each term means, the truth is that thereis no official or definitive definition of what a natural or an artificial colorant is [9]. Only naturalflavorings, another class of food additives, have a specific definition given by the FDA and EU [10].Although there have been suggestions to extend the distinction of natural flavorings to food colorants,it seems difficult to reach a consensus between the different interested parties. In fact, neither in theUS nor in the EU is there a recognized legal advertisement for “natural color” [11]. Indeed, the limitscould be even more ambiguous if we consider, for example, the food colorant copper chlorophyllin,which is considered as natural. As will be noted below, this colorant is extracted from a natural source(generally from edible green leaves), but its manufacture requires additional chemical batch processing.Consequently, the question is as follows: where do we set the limit between natural and syntheticcolorants? However, even realizing the hurdle of setting a frontier between natural and artificialcolorants, the consumer increasingly demands more information, transparency, naturalness, clarityand trustworthiness in food label specifications. Thus, it is evident that there is an increasing globaltrend towards the natural side of foods.
Although previous studies linked the consumption of artificial food colorants with behavioraldisorders, the inflection point was probably the well-known “Southampton study” [12]. This randomized,double-blinded trial test was performed with 137 3-year-old and 130 8/9-year-old children andconcluded that the intake of dietary artificial food colorants increased the hyperactivity of children.Since then, many other research works and meta-analysis studies have confirmed and even amplifiedthe disorders which probably originated from artificial food colors, although the precise physiologicalmechanism is unknown to date. In any case, the food industry and food legislative authorities haveimplemented some actions. The consumers’ concern about the safety of artificial food colorants,reinforced by the possible health benefits of natural pigments, have induced the food industry towithdraw artificial colorants. In fact, artificial food colorants represent only 16% in the EU and 29% inthe North America of the food colorants portfolio [13].
The progressive substitution of synthetic colorants by natural ones faces the challenge of the lowstability of some colorants. Probably, green is one of the most complicated colors to both naturallyset-up and counteract. The aim of the present review is to specifically address the current statusof natural green food colorants, including the legal issues, the chemistry of chlorophylls and theexisting alternatives for the stabilization of green color in foods, as well as the acclaimed “coloringfoodstuff”. For a general study of other food colorants, high-quality reviews have recently beenpublished [4,10,11,13–17].
2. Legal Aspects on Green Natural Colorants
As has been noted elsewhere [16], one of the main problems affecting food additives is the lack ofa globally harmonized legislation. This fact creates problems for wholesalers in this globalized foodmarket. Even the concepts “natural” and “artificial additives” are country-dependent. Consequently,although this review only deals with the natural green colorants, whose main legal considerations arefirstly described, a brief outline also shows the authorized synthetic green food colorants in differentcountries at the end of this section. Generally, the regulations of food additives include the list ofauthorized standards, their specifications, as well as the conditions of use (limitations on specific foodsand maximum amounts). In addition, other requirements that should be considered are the schemes
26
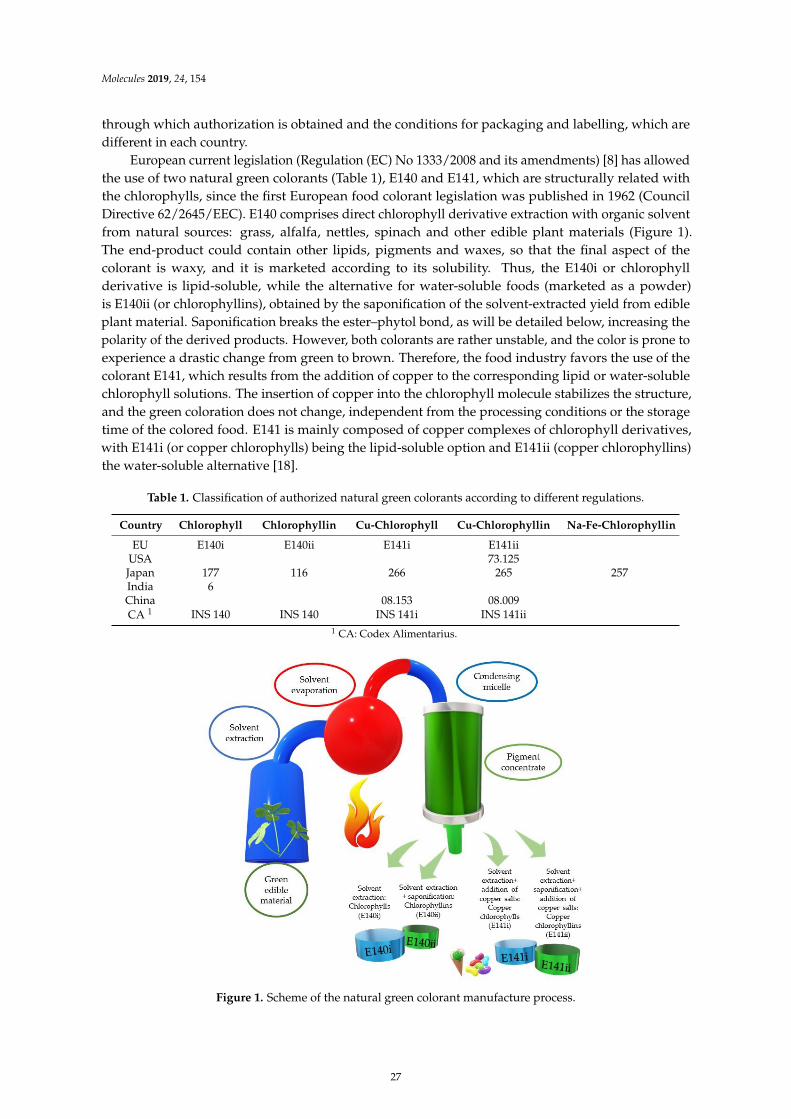
Molecules 2019, 24, 154
through which authorization is obtained and the conditions for packaging and labelling, which aredifferent in each country.
European current legislation (Regulation (EC) No 1333/2008 and its amendments) [8] has allowedthe use of two natural green colorants (Table 1), E140 and E141, which are structurally related withthe chlorophylls, since the first European food colorant legislation was published in 1962 (CouncilDirective 62/2645/EEC). E140 comprises direct chlorophyll derivative extraction with organic solventfrom natural sources: grass, alfalfa, nettles, spinach and other edible plant materials (Figure 1).The end-product could contain other lipids, pigments and waxes, so that the final aspect of thecolorant is waxy, and it is marketed according to its solubility. Thus, the E140i or chlorophyllderivative is lipid-soluble, while the alternative for water-soluble foods (marketed as a powder)is E140ii (or chlorophyllins), obtained by the saponification of the solvent-extracted yield from edibleplant material. Saponification breaks the ester–phytol bond, as will be detailed below, increasing thepolarity of the derived products. However, both colorants are rather unstable, and the color is prone toexperience a drastic change from green to brown. Therefore, the food industry favors the use of thecolorant E141, which results from the addition of copper to the corresponding lipid or water-solublechlorophyll solutions. The insertion of copper into the chlorophyll molecule stabilizes the structure,and the green coloration does not change, independent from the processing conditions or the storagetime of the colored food. E141 is mainly composed of copper complexes of chlorophyll derivatives,with E141i (or copper chlorophylls) being the lipid-soluble option and E141ii (copper chlorophyllins)the water-soluble alternative [18].
Table 1. Classification of authorized natural green colorants according to different regulations.
Country Chlorophyll Chlorophyllin Cu-Chlorophyll Cu-Chlorophyllin Na-Fe-Chlorophyllin
EU E140i E140ii E141i E141iiUSA 73.125Japan 177 116 266 265 257India 6China 08.153 08.009CA 1 INS 140 INS 140 INS 141i INS 141ii
1 CA: Codex Alimentarius.
–
Figure 1. Scheme of the natural green colorant manufacture process.
27
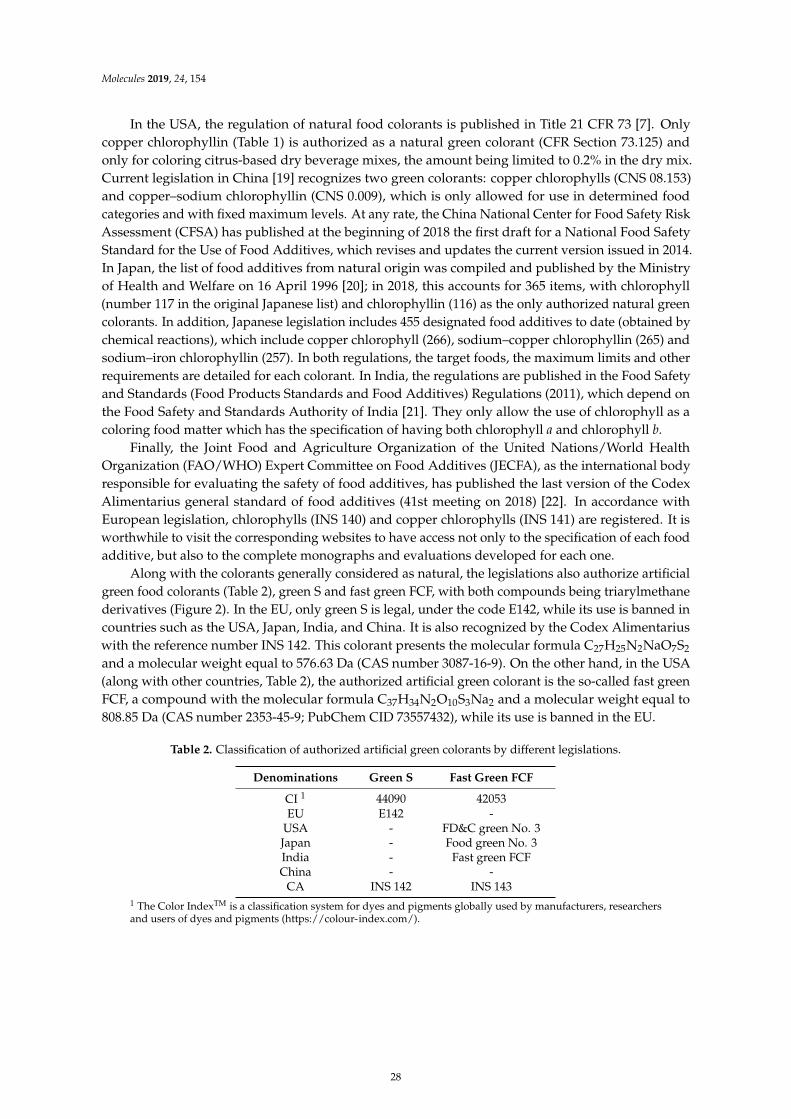
Molecules 2019, 24, 154
In the USA, the regulation of natural food colorants is published in Title 21 CFR 73 [7]. Onlycopper chlorophyllin (Table 1) is authorized as a natural green colorant (CFR Section 73.125) andonly for coloring citrus-based dry beverage mixes, the amount being limited to 0.2% in the dry mix.Current legislation in China [19] recognizes two green colorants: copper chlorophylls (CNS 08.153)and copper–sodium chlorophyllin (CNS 0.009), which is only allowed for use in determined foodcategories and with fixed maximum levels. At any rate, the China National Center for Food Safety RiskAssessment (CFSA) has published at the beginning of 2018 the first draft for a National Food SafetyStandard for the Use of Food Additives, which revises and updates the current version issued in 2014.In Japan, the list of food additives from natural origin was compiled and published by the Ministryof Health and Welfare on 16 April 1996 [20]; in 2018, this accounts for 365 items, with chlorophyll(number 117 in the original Japanese list) and chlorophyllin (116) as the only authorized natural greencolorants. In addition, Japanese legislation includes 455 designated food additives to date (obtained bychemical reactions), which include copper chlorophyll (266), sodium–copper chlorophyllin (265) andsodium–iron chlorophyllin (257). In both regulations, the target foods, the maximum limits and otherrequirements are detailed for each colorant. In India, the regulations are published in the Food Safetyand Standards (Food Products Standards and Food Additives) Regulations (2011), which depend onthe Food Safety and Standards Authority of India [21]. They only allow the use of chlorophyll as acoloring food matter which has the specification of having both chlorophyll a and chlorophyll b.
Finally, the Joint Food and Agriculture Organization of the United Nations/World HealthOrganization (FAO/WHO) Expert Committee on Food Additives (JECFA), as the international bodyresponsible for evaluating the safety of food additives, has published the last version of the CodexAlimentarius general standard of food additives (41st meeting on 2018) [22]. In accordance withEuropean legislation, chlorophylls (INS 140) and copper chlorophylls (INS 141) are registered. It isworthwhile to visit the corresponding websites to have access not only to the specification of each foodadditive, but also to the complete monographs and evaluations developed for each one.
Along with the colorants generally considered as natural, the legislations also authorize artificialgreen food colorants (Table 2), green S and fast green FCF, with both compounds being triarylmethanederivatives (Figure 2). In the EU, only green S is legal, under the code E142, while its use is banned incountries such as the USA, Japan, India, and China. It is also recognized by the Codex Alimentariuswith the reference number INS 142. This colorant presents the molecular formula C27H25N2NaO7S2
and a molecular weight equal to 576.63 Da (CAS number 3087-16-9). On the other hand, in the USA(along with other countries, Table 2), the authorized artificial green colorant is the so-called fast greenFCF, a compound with the molecular formula C37H34N2O10S3Na2 and a molecular weight equal to808.85 Da (CAS number 2353-45-9; PubChem CID 73557432), while its use is banned in the EU.
Table 2. Classification of authorized artificial green colorants by different legislations.
Denominations Green S Fast Green FCF
CI 1 44090 42053EU E142 -
USA - FD&C green No. 3Japan - Food green No. 3India - Fast green FCFChina - -
CA INS 142 INS 1431 The Color IndexTM is a classification system for dyes and pigments globally used by manufacturers, researchersand users of dyes and pigments (https://colour-index.com/).
28
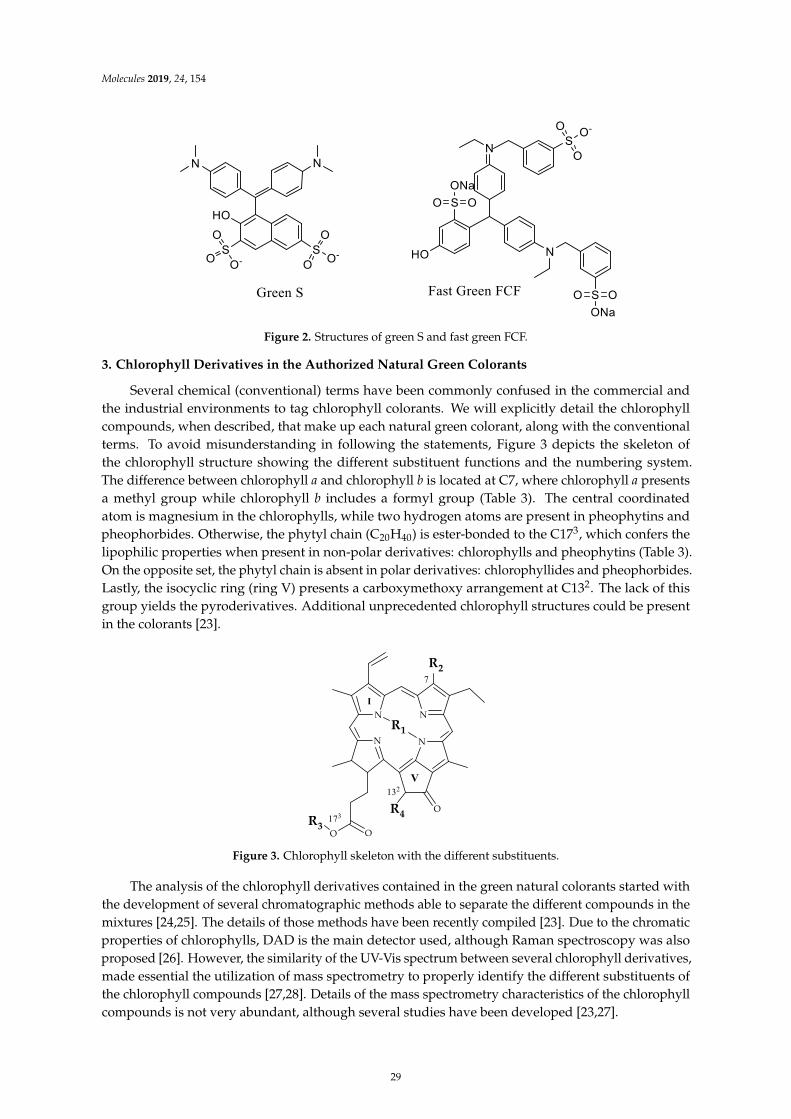
Molecules 2019, 24, 154
.
Figure 2. Structures of green S and fast green FCF.
3. Chlorophyll Derivatives in the Authorized Natural Green Colorants
Several chemical (conventional) terms have been commonly confused in the commercial andthe industrial environments to tag chlorophyll colorants. We will explicitly detail the chlorophyllcompounds, when described, that make up each natural green colorant, along with the conventionalterms. To avoid misunderstanding in following the statements, Figure 3 depicts the skeleton ofthe chlorophyll structure showing the different substituent functions and the numbering system.The difference between chlorophyll a and chlorophyll b is located at C7, where chlorophyll a presentsa methyl group while chlorophyll b includes a formyl group (Table 3). The central coordinatedatom is magnesium in the chlorophylls, while two hydrogen atoms are present in pheophytins andpheophorbides. Otherwise, the phytyl chain (C20H40) is ester-bonded to the C173, which confers thelipophilic properties when present in non-polar derivatives: chlorophylls and pheophytins (Table 3).On the opposite set, the phytyl chain is absent in polar derivatives: chlorophyllides and pheophorbides.Lastly, the isocyclic ring (ring V) presents a carboxymethoxy arrangement at C132. The lack of thisgroup yields the pyroderivatives. Additional unprecedented chlorophyll structures could be presentin the colorants [23].
Figure 3. Chlorophyll skeleton with the different substituents.
The analysis of the chlorophyll derivatives contained in the green natural colorants started withthe development of several chromatographic methods able to separate the different compounds in themixtures [24,25]. The details of those methods have been recently compiled [23]. Due to the chromaticproperties of chlorophylls, DAD is the main detector used, although Raman spectroscopy was alsoproposed [26]. However, the similarity of the UV-Vis spectrum between several chlorophyll derivatives,made essential the utilization of mass spectrometry to properly identify the different substituents ofthe chlorophyll compounds [27,28]. Details of the mass spectrometry characteristics of the chlorophyllcompounds is not very abundant, although several studies have been developed [23,27].
29
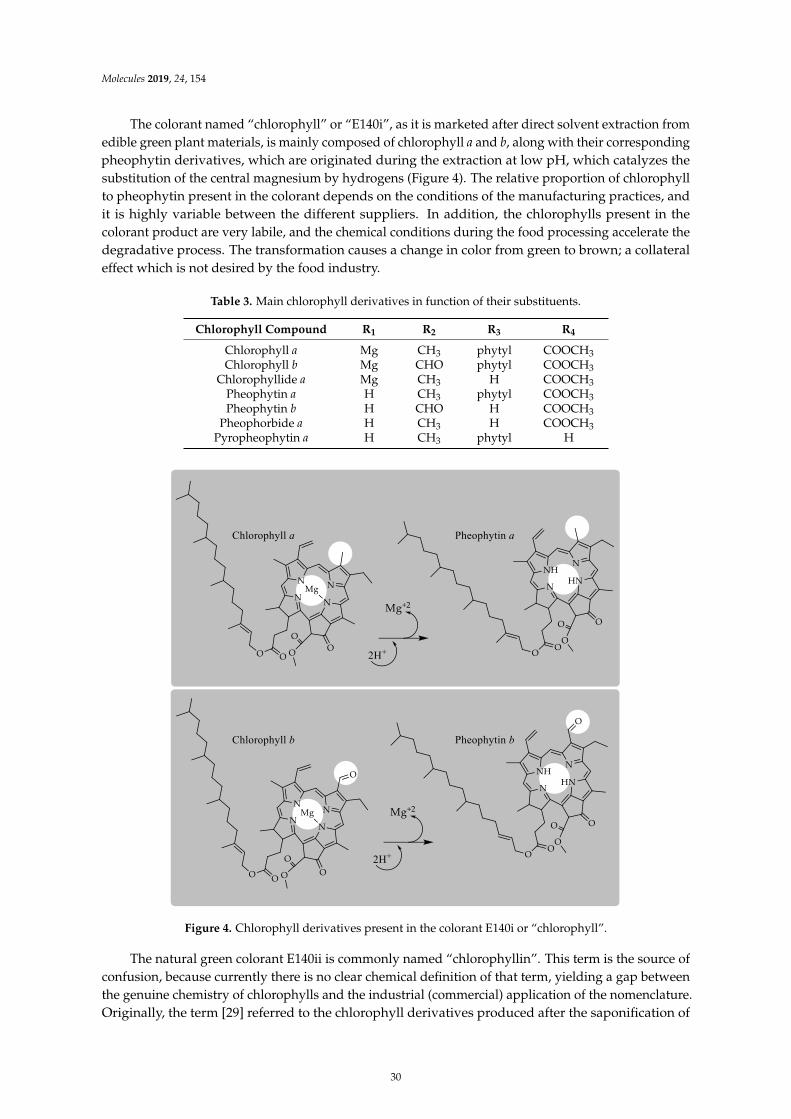
Molecules 2019, 24, 154
The colorant named “chlorophyll” or “E140i”, as it is marketed after direct solvent extraction fromedible green plant materials, is mainly composed of chlorophyll a and b, along with their correspondingpheophytin derivatives, which are originated during the extraction at low pH, which catalyzes thesubstitution of the central magnesium by hydrogens (Figure 4). The relative proportion of chlorophyllto pheophytin present in the colorant depends on the conditions of the manufacturing practices, andit is highly variable between the different suppliers. In addition, the chlorophylls present in thecolorant product are very labile, and the chemical conditions during the food processing accelerate thedegradative process. The transformation causes a change in color from green to brown; a collateraleffect which is not desired by the food industry.
Table 3. Main chlorophyll derivatives in function of their substituents.
Chlorophyll Compound R1 R2 R3 R4
Chlorophyll a Mg CH3 phytyl COOCH3Chlorophyll b Mg CHO phytyl COOCH3
Chlorophyllide a Mg CH3 H COOCH3Pheophytin a H CH3 phytyl COOCH3Pheophytin b H CHO H COOCH3
Pheophorbide a H CH3 H COOCH3Pyropheophytin a H CH3 phytyl H
The colorant named “chlorophyll” or “E140i”, as it is
Chlorophyll derivatives present in the colorant E140i or “chlorophyll”.Figure 4. Chlorophyll derivatives present in the colorant E140i or “chlorophyll”.
The natural green colorant E140ii is commonly named “chlorophyllin”. This term is the source ofconfusion, because currently there is no clear chemical definition of that term, yielding a gap betweenthe genuine chemistry of chlorophylls and the industrial (commercial) application of the nomenclature.Originally, the term [29] referred to the chlorophyll derivatives produced after the saponification of
30
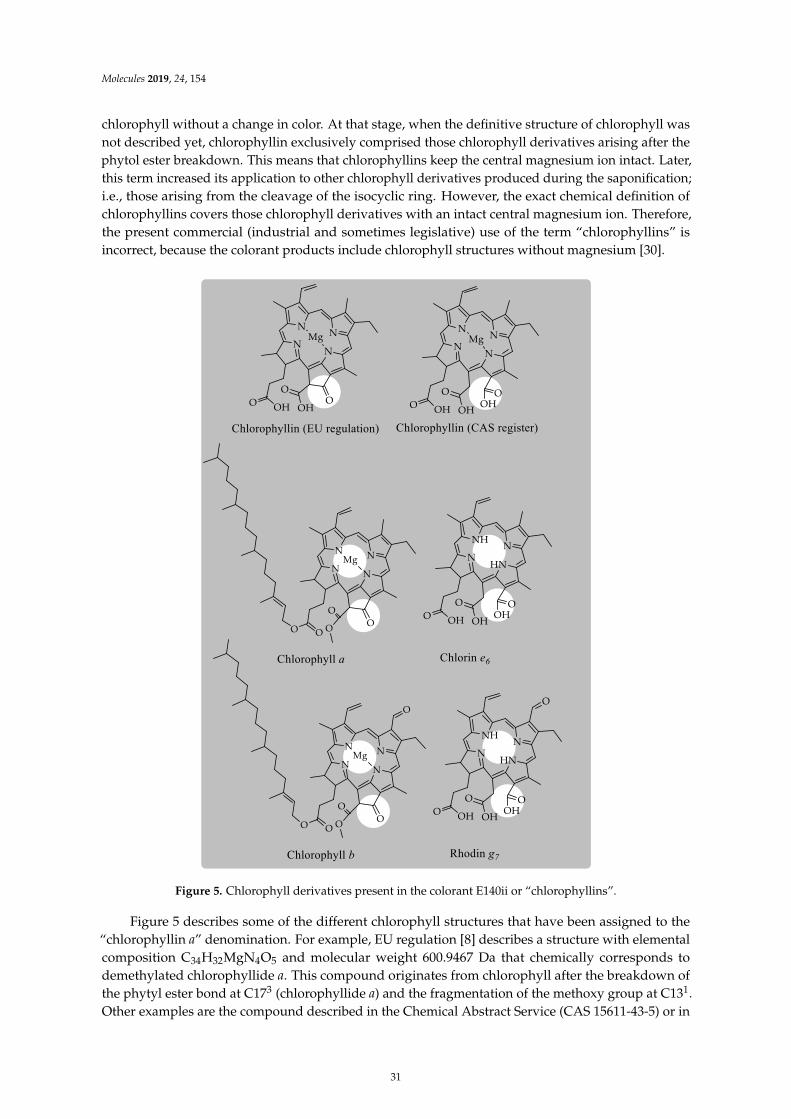
Molecules 2019, 24, 154
chlorophyll without a change in color. At that stage, when the definitive structure of chlorophyll wasnot described yet, chlorophyllin exclusively comprised those chlorophyll derivatives arising after thephytol ester breakdown. This means that chlorophyllins keep the central magnesium ion intact. Later,this term increased its application to other chlorophyll derivatives produced during the saponification;i.e., those arising from the cleavage of the isocyclic ring. However, the exact chemical definition ofchlorophyllins covers those chlorophyll derivatives with an intact central magnesium ion. Therefore,the present commercial (industrial and sometimes legislative) use of the term “chlorophyllins” isincorrect, because the colorant products include chlorophyll structures without magnesium [30].
colorant E140ii is commonly named “chlorophyllin”. This term
“chlorophyllins” is incorrect,
derivatives present in the colorant E140ii or “chlorophyllins”.Figure 5. Chlorophyll derivatives present in the colorant E140ii or “chlorophyllins”.
Figure 5 describes some of the different chlorophyll structures that have been assigned to the“chlorophyllin a” denomination. For example, EU regulation [8] describes a structure with elementalcomposition C34H32MgN4O5 and molecular weight 600.9467 Da that chemically corresponds todemethylated chlorophyllide a. This compound originates from chlorophyll after the breakdown ofthe phytyl ester bond at C173 (chlorophyllide a) and the fragmentation of the methoxy group at C131.Other examples are the compound described in the Chemical Abstract Service (CAS 15611-43-5) or in
31
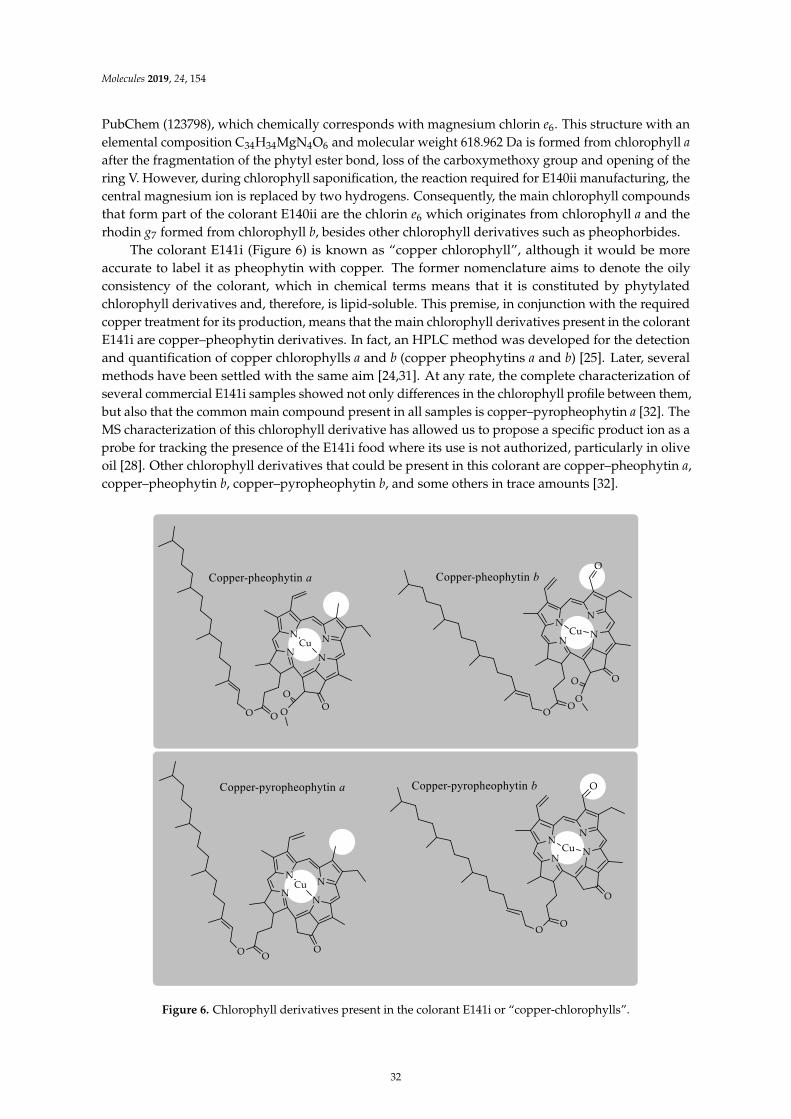
Molecules 2019, 24, 154
PubChem (123798), which chemically corresponds with magnesium chlorin e6. This structure with anelemental composition C34H34MgN4O6 and molecular weight 618.962 Da is formed from chlorophyll a
after the fragmentation of the phytyl ester bond, loss of the carboxymethoxy group and opening of thering V. However, during chlorophyll saponification, the reaction required for E140ii manufacturing, thecentral magnesium ion is replaced by two hydrogens. Consequently, the main chlorophyll compoundsthat form part of the colorant E140ii are the chlorin e6 which originates from chlorophyll a and therhodin g7 formed from chlorophyll b, besides other chlorophyll derivatives such as pheophorbides.
The colorant E141i (Figure 6) is known as “copper chlorophyll”, although it would be moreaccurate to label it as pheophytin with copper. The former nomenclature aims to denote the oilyconsistency of the colorant, which in chemical terms means that it is constituted by phytylatedchlorophyll derivatives and, therefore, is lipid-soluble. This premise, in conjunction with the requiredcopper treatment for its production, means that the main chlorophyll derivatives present in the colorantE141i are copper–pheophytin derivatives. In fact, an HPLC method was developed for the detectionand quantification of copper chlorophylls a and b (copper pheophytins a and b) [25]. Later, severalmethods have been settled with the same aim [24,31]. At any rate, the complete characterization ofseveral commercial E141i samples showed not only differences in the chlorophyll profile between them,but also that the common main compound present in all samples is copper–pyropheophytin a [32]. TheMS characterization of this chlorophyll derivative has allowed us to propose a specific product ion as aprobe for tracking the presence of the E141i food where its use is not authorized, particularly in oliveoil [28]. Other chlorophyll derivatives that could be present in this colorant are copper–pheophytin a,copper–pheophytin b, copper–pyropheophytin b, and some others in trace amounts [32].
“chlorophyllin ” denomination. For example, EU regulation [8] describes a structure with elemen
Chlorophyll derivatives present in the colorant E141i or “copper chlorophylls”.
The colorant E141i (Figure 6) is known as “copper chlorophyll”, although it would be mor
–
Figure 6. Chlorophyll derivatives present in the colorant E141i or “copper-chlorophylls”.
32
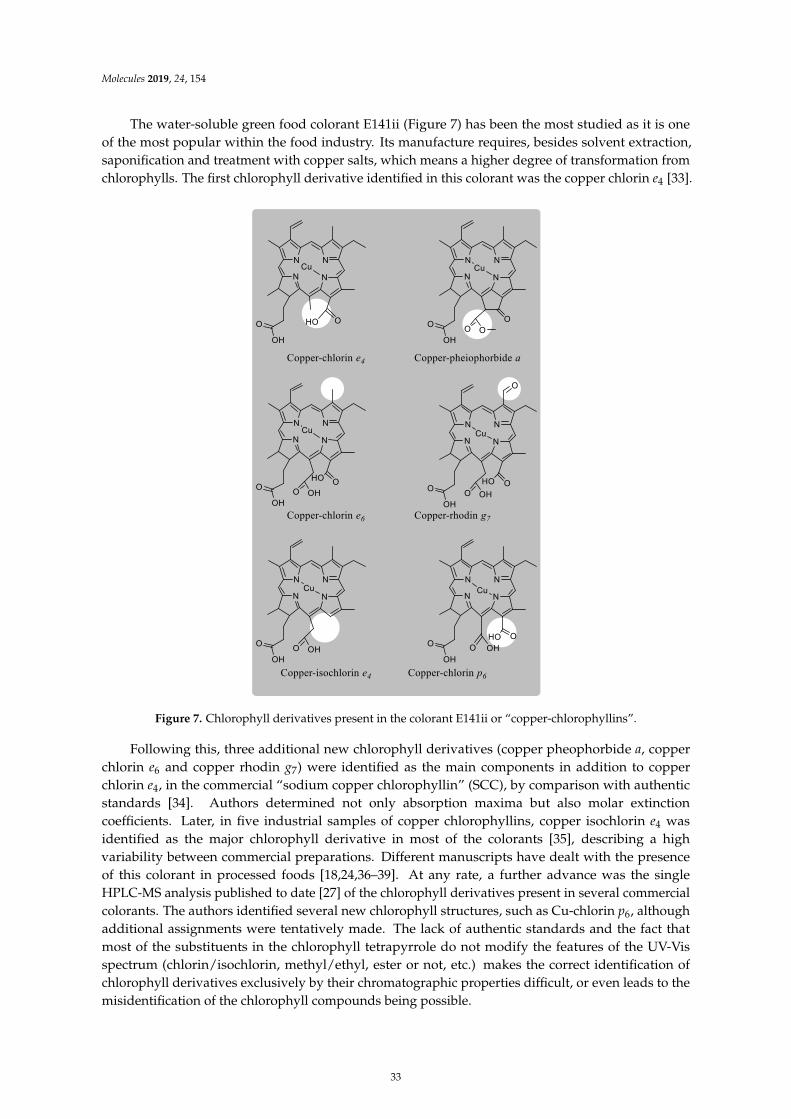
Molecules 2019, 24, 154
The water-soluble green food colorant E141ii (Figure 7) has been the most studied as it is oneof the most popular within the food industry. Its manufacture requires, besides solvent extraction,saponification and treatment with copper salts, which means a higher degree of transformation fromchlorophylls. The first chlorophyll derivative identified in this colorant was the copper chlorin e4 [33].
–
– – –
derivatives present in the colorant E141ii or “copper chlorophyllins”.
, in the commercial “sodium copper chlorophyllin” (SCC), by comparison with authentic standards
Figure 7. Chlorophyll derivatives present in the colorant E141ii or “copper-chlorophyllins”.
Following this, three additional new chlorophyll derivatives (copper pheophorbide a, copperchlorin e6 and copper rhodin g7) were identified as the main components in addition to copperchlorin e4, in the commercial “sodium copper chlorophyllin” (SCC), by comparison with authenticstandards [34]. Authors determined not only absorption maxima but also molar extinctioncoefficients. Later, in five industrial samples of copper chlorophyllins, copper isochlorin e4 wasidentified as the major chlorophyll derivative in most of the colorants [35], describing a highvariability between commercial preparations. Different manuscripts have dealt with the presenceof this colorant in processed foods [18,24,36–39]. At any rate, a further advance was the singleHPLC-MS analysis published to date [27] of the chlorophyll derivatives present in several commercialcolorants. The authors identified several new chlorophyll structures, such as Cu-chlorin p6, althoughadditional assignments were tentatively made. The lack of authentic standards and the fact thatmost of the substituents in the chlorophyll tetrapyrrole do not modify the features of the UV-Visspectrum (chlorin/isochlorin, methyl/ethyl, ester or not, etc.) makes the correct identification ofchlorophyll derivatives exclusively by their chromatographic properties difficult, or even leads to themisidentification of the chlorophyll compounds being possible.
33
Molecules 2019, 24, 154
4. In Vivo and In Vitro Adsorption, Distribution, Metabolism and Excretion (ADME)
In spite of the widespread presence of natural green colorants in foodstuffs, there is a generallack of information regarding their ADME. Although few studies have been developed eitherin vitro or in vivo with the aim of stablishing the ADME of E140i (chlorophylls) and E141ii (“copperchlorophyllin”), there are no data regarding the bioavailability of E140ii (chlorophyllins) and E141i(copper chlorophylls). Consequently, there are still several open questions about the in vivo ADME ofnatural green colorants.
4.1. ADME of E140i
At the in vitro level, the first study dealing with the digestion of green vegetables and subsequentabsorption of the micellarized pigments by human intestinal Caco-2 cells was reported in 2001 [40].The tested foods included fresh spinach puree, heat and acid-treated spinach puree, and spinach pureetreated with ZnCl2. The original chlorophylls were transformed into pheophytins during digestion asa consequence of the gastric pH. However, pheophytins with zinc were relatively stable during thesimulated digestion. The authors demonstrated that around 5–10% of the micellarized pheophytinswere absorbed by the cells and that micellarization and uptake changed significantly between thedifferent kinds of chlorophyll derivatives. This was the first hint at determining that micellarizationand absorption are greatly influenced by the lipophilicity of the compounds. Specifically, the morelipophilic molecules showed the highest accumulation in the intestinal cells.
Subsequently, these results were confirmed by applying the same in vitro protocol to peapreparations [41], pure standards of chlorophyll derivatives isolated from natural sources [42],and seaweeds [43]. Specifically, it has been shown in vitro that pheophorbides (dephytylatedchlorophylls) are preferentially absorbed over pheophytins (phytylated chlorophylls) [42,43]. At thispoint, and by means of comparative absorption experiments with the Caco-2 cellular model at differentconcentrations of pheophytins, it was hypothesized that the absorption process could correlate with apassive facilitated mechanism [42]. On the contrary, to decipher the kind of cellular transport processfor pheophorbides, Viera et al. [44] described the production of micelles rich in pheophorbide a toreach physiological micellar concentrations (7 µm). Pre-incubations of cell monolayers with differentamounts of one specific inhibitor of the Scavenger Receptor class B type I (SR-BI) transporter (BLT1),significantly inhibited the uptake of pheophorbide a, which strongly suggests that SR-BI is involvedin the transport of pheophorbide a. Consequently, the protein-mediated absorption of pheophorbideexplains the preferential absorption of this chlorophyll derivative.
At the in vivo level, the pioneering studies on chlorophyll assimilation were based on thequantification of chlorophyll derivatives (E140i) in the feces of animals and by applying a balancematter (ingested against excreted) approach. Therefore, it has been historically assumed thatchlorophylls were not absorbed by the organism, since almost all ingested chlorophylls were excreted.In this line, Brugsch and Sheard [45] estimated the quantitative decomposition of chlorophylls inthe human body. Researchers supplied encapsulated crystalline chlorophyll to humans (100 mg perday for 4 days), showing that the highest percentage of degraded chlorophylls matched with fecalpheophytin [46]. Additional experiments [47] found scarce evidence of the subsequent hydrolysisof pheophytin to the water-soluble pheophorbide. The release of phytol by the colonic microflora inhumans fed with pheophytin or spinach labelled with 14C led to the conclusion that the main finaldigestive products of the ingested chlorophylls were the pheophytins. The significance of this findinglies in the fact that chlorophylls are the single source of phytanic acid, which accumulates in theRefsum disease [47].
After a great period of time, the in vivo absorption of chlorophyll derivatives was investigated indogs fed with a diet containing 73 mg of chlorophyll (spinach)/kg of diet for 10 days [48], obtainingan apparent absorption of 3.4% of chlorophylls (determination of ingested against excreted). A secondexperiment was also carried out increasing the dose of chlorophyll; that is, the dogs consumed a dietcontaining 10% of dried spinach for 10 days. Under these conditions, no chlorophyll derivatives could
34
Molecules 2019, 24, 154
be detected in the peripheral blood until 150 min after consumption, which suggests to the authorsthat chlorophylls were hardly absorbed and/or readily metabolized and excreted through the bile.In addition, chlorophylls a and b were transformed into their corresponding pheophytin derivatives inthe gastrointestinal tract, and the authors concluded that beyond pheophytins, no other degradationproducts were produced.
However, opposite to the classical hypothesis, the in vivo ADME experiments of E140i developedwith 30 mice fed with a diet supplemented with spirulina for four weeks [42] showed for the first timethe existence of a first-pass chlorophyll metabolism in animals. The analyzed livers accumulated adiverse profile of chlorophyll derivatives, which were identified by HPLC-MS2. The study highlightedthat chlorophyll derivatives that retain the phytyl chain in their structure (apolar derivatives) areavailable for absorption from a dietary source and accumulate in the liver. Nevertheless, the explicitenrichment of the liver with pheophorbide a is particularly significant. Two possible mechanisms areproposed: that phytylated chlorophylls can be further metabolized in the liver to pheophorbide, or theexistence of an intestinal transporter for this metabolite. If the pheophytin is de-esterified in the liver toyield pheophorbide, the authors reveal the enigmatic origin of phytol in the liver [49]. Indeed, as wasmentioned above, the authors also presented data on the implication of the intestinal brush bordertransporter SR-BI in the absorption of pheophorbide. Therefore, independent of the exact mechanism,the present chlorophylls in the colorant E140i are at least absorbed, metabolized, accumulated andexcreted in mammals.
4.2. ADME of E140ii and E141i
There are no scientific data regarding the in vitro or in vivo absorption, distribution, metabolism,excretion and toxicity of chlorophyllins (E140ii) or copper chlorophylls (E141i). This lack of relevantdata was also revealed through different Scientific Opinions [50–52] by the European Food SafetyAgency (EFSA). According to the conclusions of the panel of experts of the EFSA and in the sight ofthe great interest of business operators, the European Commission launched on October 2017 a call forscientific and technical data requested by EFSA to complete the risk assessment. The collected datawithin a three–four-year timeframe will be assessed by the EFSA, and later the European Commissionwill take the final decision on the status of the revised colorants [53].
4.3. ADME of E141ii
Following an experimental design similar to the analysis of the ADME of E140i, the Schwartzgroup [54] showed that part of the chlorophylls present in the E141ii colorant was absorbed throughthe human intestine. In detail, four chlorophyll derivatives—copper rhodin g7, copper chlorin e6,copper chlorin e4 and copper pheophorbide a—from a commercial-grade sodium copper chlorophyllinwere assayed. The copper chlorin e4 (the main component of E141ii) was highly stable to the simulatedin vitro digestion process while most of the copper chlorin e6 was lost. However, the integrationof the colorant in applesauce significantly improved the recovery of chlorin e6, demonstrating theprotective role of the food matrix. Moreover, copper chlorophyll derivatives were efficiently absorbedby the intestinal epithelium cells, probably through an active transport. Part of these chlorophyllcompounds were even detectable in the basolateral compartment, which means that they are ready tobe transported to peripheral tissues.
The first in vivo studies of E141ii were carried out by Henderson and Long in 1941 [55], whoorally administered natural chlorophyll and SCC to rats, discovering the existence of uncharacterizedderivatives dispersed throughout the liver, lymph nodes and the spleen. Reber and Willigan (in1954) [56] obtained with their studies the first in vivo indications about the absorption of E141ii. Ratsfed with 1% of copper chlorophyllins in their diet for 15 weeks showed, after euthanasia, a greenishtone throughout the skeletal muscle of the body, indicating a systemic distribution of the chlorophyllderivatives. In the same year [57], a study with different doses of copper chlorophyllin in the diet ofrats resulted in the transport through the gastrointestinal membrane and accumulation in plasma of
35
Molecules 2019, 24, 154
copper chlorophyllins in the µg range. The authors did not detect any copper derivative in the organs,and they assumed that copper chlorophyllins are excreted in the feces. Later, the chemopreventiveactivity against tumorigenesis of copper chlorophyllin was tested in female mice [58]. In this study, thesodium salt of copper chlorophyllin administered orally was rapidly distributed to the heart, liver,skin, kidneys, and lungs. A subsequent study estimated the accumulation of dietary E141ii (10 or30 mg/kg) in different organs of 30 Wistar rats [59]. The results showed that while copper chlorine4 was effectively absorbed and accumulated in serum, liver and kidneys, copper chlorin e6 was notdetected by HPLC analysis in sera or tissues, according to the data published by Ferruzzi et al. [54].
Indirect evidence in humans suggests that any type of absorption could take place followinga copper chlorophyllin diet. For example, urine discoloration has been described with incontinentpatients subjected to an oral copper chlorophyllin intake (100–200 mg/day) [60,61]. However, the singleevidence of the in vivo absorption and accumulation of E141ii in humans was provided by the studiesof Egner et al. [62]. Thus, 182 volunteers ingested 100 mg of copper chlorophyllins for 16 weeks andthree times per day (copper chlorin e4, copper chlorin e6 and copper chlorin e4 ethyl ester). The studydescribed for the first time the presence of copper chlorin e4 ethyl ester as well as copper chlorin e4,but not copper chlorin e6, in the sera of all the participants. Therefore, certain components are able tobe absorbed through the gastrointestinal membrane. Probably, the instability of copper chlorin e6 todigestion could be responsible for the lack of appearance of this compound in human serum [63].
5. “Coloring Foodstuff”
The global trend of the replacement of synthetic colors with natural ones has created a newcategory in the market known as “coloring foodstuffs”. This class includes food ingredients such asfruits or vegetables whose secondary effect is coloring. This new conception is bringing regulatoryproblems as these substances are not covered by the current regulation on food additives in the EU.As the situation is rather unclear and there is an ongoing debate on the distinction between coloradditives and coloring foodstuffs [16], the European Commission (Standing Committee on the FoodChain and Animal Health) endorsed the Guidance notes providing a tool for classification for whena substance should be considered a color additive or not [64]. The distinction in this guidance isbased on the extraction methodology: if the method is a non-selective extraction procedure, thenthe obtained product is a food ingredient, not a food additive. On the contrary, if the extraction isselective for obtaining a pigment, the compound is considered to be a color additive and consequentlycovered by the regulation on food additives. Previous to this guidance, nettles and spinach were thepreferred coloring foodstuff to provide green hues to foods. However, now these color solutions nolonger satisfy the criteria of EU guidelines. Otherwise, blends with spirulina are the alternative tocreate brilliant shades of green for confectionary products and ice creams; for example, with safflower.Specifically, in the USA, spirulina derived from Arthrospira platensis has been recently added to thelist of approved color additives exempt from certification in response to a Mars Inc. petition [16].In relation to spirulina extract, the Joint FAO/WHO Expert Committee has requested, in the meetingheld in June 2018, information on the products on the market by December 2019 in order to removethe tentative designation from the specifications. Specifically, it is necessary to provide data on thefull compositional characterization of commercial products and regarding the validated analyticalmethods applied for the identification of the substance and for the determination of the purity ofthe substance.
In any case, there is a new growing sector in the market, with several different extracts sold bydifferent suppliers. Table 4 list the coloring foodstuffs authorized in the EU and USA, describing themaximum amounts and the foods allowed. As they are considered “natural”, to date, no amountlimitations have been defined, and in the EU, as they are classified as ingredients, there are norestrictions for their use in any food category.
As a consequence of the natural trend in the coloring food market, recent research has developedlooking for new strategies to develop new “natural” green colorants. For example, the utilization
36
Molecules 2019, 24, 154
of an extract from the leaves of Centella asiatica L. after steaming and metal complexations hasbeen proposed [15]. The authors assessed the stability and cytotoxicity in different beverages andfood models as an alternative to synthetic colorants. Following the same aim, the properties ofspray-dried microalgae have been analyzed (color, sensory and textural qualities) as a natural coloringagent in chewing gum [65]. Although positive results have been obtained with Isochrysis galbana
and Nannochloropsis oculata, the spray-dryer technique requires an optimization in the base of thecharacteristics of each microalgae specie.
Table 4. Classification of “coloring foodstuff” in EU and USA.
Vegetable Juice Fruit Juice Spirulina Extract
European Union
+ + +Allowed foods Foods in general Foods in general Foods in generalMaximum limit Quantum satis Quantum satis Quantum satis
United States
Denomination 73,260 73,250 73,530
Allowed foods Foods generally Foods generally
Confections (including candy and chewing gum), frostings, icecream and frozen desserts, dessert coatings and toppings,
beverage mixes and powders, yogurts, custards, puddings,cottage cheese, gelatin, breadcrumbs, ready-to-eat cereals
(excluding extruded cereals), coating formulations applied todietary supplement tablets and capsules
Maximum limit GMP 1 GMP GMP1 GMP: good manufacturing practices.
6. Stabilization of Green Color
Chlorophylls are stable pigments in their natural environment in physiological conditions.However, once extracted or processed with changes in pH value and temperature during the processingand storage of green foods, chlorophylls are prone to experience modifications in their structure, whichconsequently change their chromatic properties. Probably, the main reaction that affects chlorophyllsis the substitution of the central magnesium ion by two hydrogens. The significance of the reactionfor the food industry is related with the drastic change in color, because magnesium-derivativesare green, while magnesium-free derivatives (mainly pheophytins and pheorphorbides) are brown.Consequently, this easy and fast reaction is the principal cause of the loss of the original green colorduring the processing and storage of green foods. As has been stated before, the reduction or evenwithdrawal of the original green color is associated by the consumer with a decrease in the qualityof the product. Therefore, the food industry has developed several strategies to preserve the initialgreen coloration. The early attempts consisted of the addition (even in-the-can coating) of alkalinizingagents, but the appearance of negative secondary effects such as a softening of the edible material oran off-flavor release [6] made them to fall into disuse.
A second historical approach has been the substitution of the central hydrogen atoms by zinc orcopper ions to form the more stable green metallochlorophylls which consequently “re-green” thecorresponding food product. The conditions for the production of zinc and copper complexes ofchlorophyll derivatives in vegetables during processing have been optimized through the years [66–68].Due to the industrial and commercial importance of this process, numerous patents have beenpublished, with the most known being the so-called “Veri-green” method [69]. This patent wasdeveloped by the former Continental Can Company and consisted of the blanching of vegetables inbrine solutions with some amounts of Zn+2 or Cu+2 salts to form mainly zinc or copper pheophytins [70]and make the processed vegetables greener. However, the patent was unproductive because themaximum limit for zinc concentrations established by the FDA is 75 ppm, and higher amounts ofzinc are required to yield an acceptable and desirable green color. To overcome this limitation, newstrategies for the encapsulation of zinc-chlorophylls are currently under development using differentmatrices such as gum Arabic, maltodextrin and OSA modified starch [71] or whey proteins [72]. Indeed,
37
Molecules 2019, 24, 154
different techniques are being set up to microencapsulate raw chlorophyll extractions from ediblevegetables without any salt treatment. For example, spray drying is a dehydration process which hasbeen successfully applied to encapsulate other food compounds, and recently, the physicochemicalproperties of the process have been optimized to form whey protein isolate–kale leaf chlorophyllmicrocapsules [73]. A further step in the use of this procedure as an available alternative for thefood industry is the enhancement of the stability of green pigments for heated foods. For example,the stability of alfalfa leaves microencapsulated towards temperature regimes and pH conditions hasbeen determined [74], obtaining optimal conditions.
7. Conclusions
The market of the food colorants is evolving to more natural formulations, which means theappearance of new definitions and consequently, the necessity of new legislations. Green food colorantsare one of the most affected. First, because natural green colorants are very labile and secondly, becauseit is not easy to reproduce green hues naturally. Consequently, in the near future the consumerwill face new compounds responsible of the green color in foods. At present, independently of theexistence of serious problems due to different legislations and different definitions between countries,authorized green natural colorants are incompletely characterized. This review has summarized thepresent knowledge of the compounds comprised the authorized green colorants, highlighting thecommon errors in their daily management. Finally, the scarce research developed on the ADME ofgreen authorized food colorants is also considered but with the confidence that new advances will beshortly achieved.
Author Contributions: I.V., A.P.-G. and M.R. have contributed equally to the conceptualization, investigation,writing, review, and editing of this manuscript.
Funding: This research was funded by MINECO-CICYT, grant numbers ALI2018-R. The APC was partiallyfunded by CSIC.
Conflicts of Interest: The authors declare no conflict of interest.
References
1. First Moment of Truth by Procter and Gamble. Available online: https://news.pg.com/video/first-moment-truth-30-s-reel (accessed on 5 November 2018).
2. Singh, S. Impact of color on marketing. Manag. Decis. 2006, 44, 783–789. [CrossRef]3. Food Colors Market Size, Share & Trend Analysis Report by Product (Synthetic, Natural), by Application
(Non-Dairy Food, CSD & Non-Alcoholic Beverages), and Segment Forecasts, 2018–2025. Available online:https://www.grandviewresearch.com/industry-analysis/food-colorants-market (accessed on 24 September 2018).
4. Martins, N.; Roriz, C.L.; Morales, P.; Barros, L.; Ferreira, I.C.F.R. Food colorants: Challenges, opportunitiesand current desires of agroindustries to ensure consumer expectations and regulatory practices.Trends Food Sci. 2016, 52, 1–15. [CrossRef]
5. Delgado-Vargas, F.; Paredes-López, O. Natural Colorants for Food and Nutraceultical Uses; CRC Press:Boca Raton, FL, USA, 2003; pp. 27–34.
6. Schwartz, S.J.; Cooperstone, J.L.; Cichon, M.J.; Von Elbe, J.H.; Giusti, M.M. Colorants. In Fennema’s Food
Chemistry; CRC Press: Boca Raton, FL, USA, 2017; pp. 681–752.7. US FDA Electronic Code of Federal Regulations (eCFR) Listing of Color Additives Exempt from Certification
Title 21, Chapter I, Subchapter A, Part 73. Available online: https://www.ecfr.gov/cgi-bin/retrieveECFR?gp=&SID=3463c48f55ae08efd099682901bb9500&r=PART&n=pt21.1.73 (accessed on 25 September 2018).
8. Regulation (EC) No 1333/2008 of the European Parliament and of the Council of 16 December 2008 on FoodAdditives (OJ L 354 31.12.2008, p. 16). Available online: https://eur-lex.europa.eu/eli/reg/2008/1333/2016-05-25 (accessed on 25 September 2018).
9. Wrolstad, R.E.; Culver, C.A. Alternatives to Those Artificial FD&C Food Colorants. Annu. Rev. Food
Sci. Technol. 2012, 3, 59–77.
38
Molecules 2019, 24, 154
10. Carocho, M.; Morales, P.; Ferreira, I.C.F.R. Natural food additives: Quo vadis? Trends Food Sci. Technol. 2015,45, 284–295. [CrossRef]
11. Lehto, S.; Buchweitz, M.; Klimm, A.; Straßburger, R.; Bechtold, C.; Ulberth, F. Comparison of food colourregulations in the EU and the US: A review of current provisions. Food Addit. Contam. 2017, 34, 335–355.[CrossRef] [PubMed]
12. McCann, D.; Barrett, A.; Cooper, A.; Crumpler, D.; Dalen, L.; Grimshaw, K.; Kitchen, E.; Lok, K.; Porteous, L.;Prince, E.; et al. Food additives and hyperactive behaviour in 3-year-old and 8/9-year-old children in thecommunity: A randomised, double-blinded, placebo controlled trial. Lancet 2007, 370, 1560–1567. [CrossRef]
13. Simon, J.E.; Decker, E.A.; Ferruzzi, M.G.; Giusti, M.; Mejia, C.D.; Goldschmidt, M.; Talcott, S.T. Establishingstandards on color from natural sources. J. Food Sci. 2017, 82, 2539–2553. [CrossRef] [PubMed]
14. Rodriguez-Amaya, D. Natural food pigments and colorants. Curr. Opin. Food Sci. 2016, 7, 20–26. [CrossRef]15. Ngamwonglumlert, L.; Devahastin, S.; Chiewchan, N. Natural colorants: Pigment stability and extraction
yield enhancement via utilization of appropriate pretreatment and extraction methods. Crit. Rev. Food
Sci. Nutr. 2017, 57, 3243–3259. [CrossRef] [PubMed]16. Oplatowska-Stachowiak, M.; Elliott, C.T. Food colors: Existing and emerging food safety concerns. Crit. Rev.
Food Sci. Nutr. 2017, 57, 524–548. [CrossRef] [PubMed]17. Sigurdson, G.T.; Tang, P.; Giusti, M.M. Natural Colorants: Food Colorants from Natural Sources. Annu. Rev.
Food Sci. Technol. 2017, 8, 261–280. [CrossRef] [PubMed]18. Gandul-Rojas, B.; Roca, M.; Gallardo-Guerrero, L. Detection of the color adulteration of green table olives
with copper chlorophyllin complexes (E-141ii colorant). LWT Food Sci. Technol. 2012, 1, 311–318. [CrossRef]19. China Food Additive Regulation. Available online: http://www.cfsa.net.cn/Article/News.aspx?id=
4486BF3709A8E32BE89BDD2A36733D3CD2A97E8CE2A3F2E2 (accessed on 26 September 2018).20. Japanese Food Additives Regulations. Available online: https://www.mhlw.go.jp/english/topics/
foodsafety/foodadditives/index.html (accessed on 25 September 2018).21. The Indian Food Safety and Standards Regulations. Available online: https://www.fssai.gov.in/home/fss-
legislation/fss-regulations.html (accessed on 25 September 2018).22. The Codex Alimentarius General Standard of Food Additives. Available online: http://www.fao.org/
gsfaonline/additives/index.html#S (accessed on 25 September 2018).23. Roca, M.; Chen, K.; Pérez-Gálvez, A. Chlorophylls. In Handbook on Natural Pigments in Food and Beverages:
Industrial Applications for Improving Food Color; Woodhead Publishing: Cambridge, UK, 2016; pp. 125–158.24. Scotter, M.J.; Castle, L.; Roberts, D. Method development and HPLC analysis of retail foods and beverages
for copper chlorophyll (E141[i]) and chlorophyllin (E141[ii]) food colouring materials. Food Addit. Contam. A
2005, 12, 1163–1175. [CrossRef] [PubMed]25. Inoue, H.; Furuya, K.; Watanabe, K.; Tanaka, K.; Shirai, T.; Miyoshi, E. Separation and determination of
copper (II) chlorophylls by reversed-phase high performance liquid chromatography. Anal. Sci. 1988, 4,599–603. [CrossRef]
26. Lian, W.; Shiuec, J.; Wang, H.; Hong, W.; Shih, P.H.; Hsu, C.K.; Huang, C.Y.; Hsing, C.R.; Wei, C.M.;Wang, J.K.; et al. Rapid detection of copper chlorophyll in vegetable oils based on surface-enhanced Ramanspectroscopy. Food Addit. Contam. 2015, 32, 627–634.
27. Mortensen, A.; Geppel, A. HPLC–MS analysis of the green food colorant sodium copper chlorophyllin.Innov. Food Sci. Emerg. Technol. 2007, 8, 419–425. [CrossRef]
28. Pérez-Gálvez, A.; Ríos, J.J.; Roca, M. A new probe for tracking the presence of E141i food colorant. Food Control
2015, 51, 240–243. [CrossRef]29. Willstätter, R. Chlorophyll. J. Am. Chem. Soc. 1915, 37, 323–345. [CrossRef]30. Humphrey, A.M. Chlorophyll. Food Chem. 1980, 5, 57–67. [CrossRef]31. Del Giovine, L.; Fabietti, F. Copper chlorophyll in olive oils: Identification and determination by LIF capillary
electrophoresis. Food Control 2005, 16, 267–272. [CrossRef]32. Roca, M.; Gallardo-Guerrero, L.; Mínguez-Mosquera, M.I.; Gandul-Rojas, B. Control of Olive Oil Adulteration
with Copper-Chlorophyll Derivatives. J. Agric. Food Chem. 2010, 58, 51–56. [CrossRef] [PubMed]33. Yasuda, K.; Tadano, K.; Ushiyama, H.; Ogawa, H.; kawai, Y.; Nishima, T. Investigation to find an indicator
substance for the analysis of sodium copper chlorophyllin in foods. J. Food Hyg. Soc. Jpn. 1995, 36, 710–716.[CrossRef]
39
Molecules 2019, 24, 154
34. Inoue, H.; Yamashita, H.; Furuya, K.; Nonomura, Y.; Yoshioka, N.; Li, S. Determination of copper (II)chlorophyllin by reversed-phase high-performance liquid chromatography. J. Chromatogr. A 1994, 679,99–104. [CrossRef]
35. Chernomorsky, S.; Rancourt, R.; Sahai, D.; Poretz, R. Evaluation of commercial chlorophyllin copper complexpreparations by liquid chromatography with photodiode array detection. J. AOAC Int. 1997, 80, 433–435.
36. Aparicio-Ruiz, R.; Riedl, K.M.; Schwartz, S.J. Identification and quantification of metallo-chlorophyllcomplexes in bright green table olives by high-performance liquid chromatography-mass spectrometryquadrupole/time-of-flight. J. Agric. Food Chem. 2011, 59, 11100–11108. [CrossRef] [PubMed]
37. Suzuki, I.; Kubota, H.; Terami, S.; Hara, T.; Hirakawa, Y.; Iizuka, T.; Tatebe, C.; Ohtsuki, T.; Yano, T.;Sato, K.; et al. Development of an analytical method for copper chlorophyll and sodium copper chlorophyllinin processed foods. Jpn. J. Food Chem. Saf. 2016, 23, 55–62.
38. Negro, C.; De Bellis, L.; Sabella, E.; Nutricati, E.; Luvisi, A.; Micelli, A. Detection of not allowedfood-coloring additives (copper chlorophyllin, copper-sulphate) in Green table olives sold on the Italianmarket. Adv. Hort. Sci. 2017, 31, 225–233.
39. Delpino-Rius, A.; Cosovanu, D.; Eras, J.; Vilaró, F.; Balcells, M.; Canela-Garayoa, R. A fast and reliableultrahigh-performance liquid chromatography method to assess the fate of chlorophylls in teas and processedvegetable foodstuff. J. Chromatogr. 2018, 1568, 69–79. [CrossRef] [PubMed]
40. Ferruzzi, M.G.; Failla, M.L.; Schwartz, S.J. Assessment of degradation and intestinal cell uptake of carotenoidsand chlorophyll derivatives from spinach puree using an in vitro digestion and Caco-2 human cell model.J. Agric. Food Chem. 2001, 49, 2082–2089. [CrossRef] [PubMed]
41. Gallardo-Guerrero, L.; Gandul-Rojas, B.; Minguez-Mosquera, M.I. Digestive stability, micellarization, anduptake by Caco-2 human intestinal cells of chlorophyll derivatives from different preparations of pea (Pisumsativum). J. Agric. Food Chem. 2008, 56, 8379–8386. [CrossRef] [PubMed]
42. Gandul-Rojas, B.; Gallardo-Guerrero, L.; Minguez-Mosquera, M.I. Influence of the chlorophyll pigmentstructure on its transfer from an oily food matrix to intestinal epithelium cells. J. Agric. Food Chem. 2009, 57,5306–5314. [CrossRef] [PubMed]
43. Chen, K.; Roca, M. In vitro bioavailability of chlorophyll pigments from edible seaweeds. J. Funct. Foods
2018, 41, 25–33. [CrossRef]44. Viera, I.; Chen, K.; Ríos, J.J.; Benito, I.; Pérez-Gálvez, A.; Roca, M. First-Pass Metabolism of Chlorophylls in
Mice. Mol. Nutr. Food Res. 2018, 62. [CrossRef] [PubMed]45. Brugsch, J.T.; Sheard, C. Chlorophyll, determination and quantitative estimation of decomposition of
chlorophyll in the human body. J. Lab. Clin. Med. 1938, 24, 230–234.46. Fisher, H.; Hendschel, A. Isolation of chlorophyll derivatives from the feces of elephants and human beings.
Hoppe Seylers Z. Physiol. Chem. 1993, 216, 56–59.47. Baxter, H. Absorption of chlorophyll phytol in normal man and in patients with Refsum’s disease. J. Lipid Res.
1968, 9, 636–641. [PubMed]48. Fernandes, T.M.; Gomes, B.B.; Lanfer-Marquez, U.M. Apparent absorption of chlorophyll from spinach in an
assay with dogs. Innov. Food Sci. Emerg. Technol. 2007, 8, 426–432. [CrossRef]49. Brink, D.M.; Wanders, R.J.A. Phytanic acid: Production from phytol, its breakdown and role in human
disease. Cell Mol. Life Sci. 2006, 63, 1752–1765. [CrossRef]50. EFSA Panel on Food Additives and Nutrient Sources added to Food (ANS). Scientific Opinion on the
Re-Evaluation of Chlorophylls (E 140 (i)) as Food Additives. EFSA J. 2015, 13, 4089. Available online:https://www.efsa.europa.eu/en/efsajournal/pub/4089 (accessed on 2 November 2018).
51. EFSA Panel on Food Additives and Nutrient Sources added to Food (ANS). Scientific Opinion on theRe-Evaluation of Chlorophylls (E 140 (ii)) as Food Additives. EFSA J. 2015, 13, 4081. Available online:https://www.efsa.europa.eu/en/efsajournal/pub/4085 (accessed on 2 November 2018).
52. EFSA Panel on Food Additives and Nutrient Sources added to Food (ANS). Scientific Opinion on theRe-Evaluation of Chlorophylls (E 141 (i and ii)) as Food Additives. EFSA J. 2015, 13, 4151. Available online:https://www.efsa.europa.eu/en/efsajournal/pub/4151 (accessed on 2 November 2018).
53. EU Call for Scientific and Technical Data on the Permitted Food Additives E 140 (i) Chlorophylls, E 140(ii) Chlorophyllins, E 141 (i) Copper Complexes of Chlorophylls and E 141 (ii) Copper Complexes ofChlorophyllins. Available online: https://ec.europa.eu/food/safety/food_improvement_agents/additives/re-evaluation_en. (accessed on 2 November 2018).
40
Molecules 2019, 24, 154
54. Ferruzzi, M.G.; Failla, M.L.; Schwartz, S.J. Sodium copper chlorophyllin: In vitro digestive stability andaccumulation by Caco-2 human intestinal cells. J. Agric. Food Chem. 2002, 50, 2173–2179. [CrossRef][PubMed]
55. Henderson, H.J.; Long, E.R. Accumulation of Chlorophyll Pigments in Visceral Organs and their Elimination.Exp. Biol. Med. 1941, 48, 438–439. [CrossRef]
56. Reber, E.F.; Willigan, D.A. The effects of a chlorophyll derivative when included in a ration fed rats. II.Reproduction, blood, and tissue studies. Am. J. Vet. Res. 1954, 15, 643–646. [PubMed]
57. Harrisson, J.W.E.; Levin, S.E.; Trabin, B. The safety and fate of potassium sodium copper chlorophyllin andother copper compounds. J. Am. Pharm. Assoc. 1954, 43, 722–737. [CrossRef]
58. Park, K.K.; Surh, Y.J. Chemopreventive activity of chlorophyllin against mouse skin carcinogenesis bybenzoapyrene and benzoapyrene-7,8-dihydrodiol-9,10-epoxide. Cancer Lett. 1996, 102, 143–149. [CrossRef]
59. Gomes, B.; Barro, S.; Andrade-Wartha, E.; Silva, A.; Silva, V.V.; Lanfer-Marquez, U.L. Bioavailability ofdietary sodium copper chlorophyllin and its effect on antioxidant defense parameters of Wistar rats. J. Sci.
Food Agric. 2009, 89, 2003–2010. [CrossRef]60. Chernomorsky, S.A.; Segelman, A.B. Biological activities of chlorophyll derivatives. J. Med. 1988, 85, 669–673.61. Young, R.W.; Beregi, J.S. Use of chlorophyllin in the treatment of geriatric patients. J. Am. Geriatr. Soc. 1980,
28, 46–47. [CrossRef]62. Egner, P.A.; Stanbubury, K.H.; Snyder, E.P.; Rogers, M.E.; Hintz, P.A.; Kensler, T.W. Identification
and characterisation of chlorine e4 ethyl ester in sera of individuals participating in chlorophyllinchemoprevention trial. Chem. Res. Toxicol. 2000, 13, 900–906. [CrossRef]
63. Ferruzzi, M.G.; Blakeslee, J. Digestion, absorption and cancer preventive activity of dietary chlorophyllderivatives. Nutr. Res. 2007, 27, 1–12. [CrossRef]
64. Guidance Notes on the Classification of Food Extracts with Colouring Properties. Availableonline: https://ec.europa.eu/food/sites/food/files/safety/docs/fs_food-improvement-agents_guidance_additive-eu-rules.pdf. (accessed on 6 November 2018).
65. Palabiyik, I.; Durmaz, Y.; Öner, B.; Toker, O.S.; Coksari, G.; Konar, N.; Tamtürk, F. Using spray-driedmicroalgae as a natural coloring agent in chewing gum: Effects on color, sensory, and textural properties.J. Appl. Phycol. 2018, 30, 1031–1039. [CrossRef]
66. Jones, I.; White, R.; Gibbs, E.; Butler, L.; Nelson, L. Experimental formation of zinc and copper complexes ofchlorophyll derivatives in vegetable tissue by thermal processing. J. Agric. Food Chem. 1977, 25, 149–153.[CrossRef]
67. Schanderl, S.H.; Marsh, G.; Chichester, C. Color reversion in processed I. Studies on regreened vegetablespea purges. J. Food Sci. 1965, 30, 312–316. [CrossRef]
68. LaBorde, F.F.; von Elbe, J.H. Zinc complex formation in heated vegetables purees. J. Agric. Food Chem. 1990,38, 484–487. [CrossRef]
69. Segner, W.P.; Ragusa, T.J.; Nank, W.K.; Hoyle, W.C. Process for the Preservation of Green Color in CannedVegetables. U.S. Patent No. 4473591, 25 September 1984.
70. Von Elbe, J.H.; Huang, A.S.; Attoe, E.L.; Nank, W.K. Pigment composition and color of conventional andVeri-Green canned beans. J. Agric. Food Chem. 1986, 34, 52–54. [CrossRef]
71. Porraud, S.; Pranee, A. Microencapsulation of Zn-chlorophyll pigment from Pandan leaf. Int. Food Res. 2010,17, 1031–1042.
72. Bilek, S.E.; Özkan, G. Encapsulation of zinc-chlorophyll derivatives in whey protein matrix byemulsion/cold-set gelation. J. Food 2018, 43, 174–183.
73. Zhang, Z.; Peng, H.; Ma, H.; Zeng, X. Effect of inlet air drying temperatures on the physicochemicalproperties and antioxidant activity of whey protein isolate-kale leaves chlorophyll (WPI-CH) microcapsules.J. Food Eng. 2019, 245, 149–156. [CrossRef]
74. Afsaneh Raei, A.; Ali Yasini Ardakani, S.; Daneshi, M. Microencapsulation of the green pigment of alfalfaand its applications on heated food. J. Food Process. Eng. 2017, 40. [CrossRef]
© 2019 by the authors. Licensee MDPI, Basel, Switzerland. This article is an open accessarticle distributed under the terms and conditions of the Creative Commons Attribution(CC BY) license (http://creativecommons.org/licenses/by/4.0/).
41

molecules
Review
Urtica spp.: Ordinary Plants withExtraordinary Properties
Dorota Kregiel ID , Ewelina Pawlikowska and Hubert Antolak *
Institute of Fermentation Technology and Microbiology, Faculty of Biotechnology and Food Science, LodzUniversity of Technology, 171/173 Wolczanska, 90-924 Lodz, Poland; [email protected] (D.K.);[email protected] (E.P.)* Correspondence: [email protected]; Tel.: +48-42-631-3475
Received: 5 June 2018; Accepted: 6 July 2018; Published: 9 July 2018
Abstract: Nettles (genus Urtica, family Urticaceae) are of considerable interest as preservativesin foods for both human and animal consumption. They have also been used for centuries intraditional medicine. This paper reviews the properties of nettles that make them suitable forwider applications in the food and pharmaceutical industries. Nettles contain a significant number ofbiologically-active compounds. For example, the leaves are rich sources of terpenoids, carotenoids andfatty acids, as well as of various essential amino acids, chlorophyll, vitamins, tannins, carbohydrates,sterols, polysaccharides, isolectins and minerals. Extracts from the aerial parts of nettles are richsources of polyphenols, while the roots contain oleanol acid, sterols and steryl glycosides. Due tothe variety of phytochemicals and their proportions they contain, nettles show noticeable activityagainst both Gram-positive and Gram-negative bacteria. These properties make nettles suitable fora range of possible applications, including functional food, dietary supplements and pharmacologicalformulations. Despite these benefits, the nettle is still an underestimated plant source. This paperprovides a unique overview of the latest research on nettle plants focusing on the possibilities fortransforming a common weed into a commercial plant with a wide range of applications. Specialattention is paid to the antimicrobial activity of the active compounds in nettles and to possible usesof these valuable plants in food and feed formulations.
Keywords: Urtica spp.; bioactive compounds; antioxidant activity; antimicrobial activity; traditionalmedicine; food industry; animal breeding
1. Habitats of Urtica spp. Plants
The genus Urtica belongs to the family Urticaceae in the major group Angiosperms (floweringplants). There are 46 species of flowering plant of the genus Urtica [1] (Table 1). The most prominentmembers of the genus are the stinging nettle Urtica dioica L. and the small nettle U. urens L., which arenative to Europe, Africa, Asia and North America. Plants belonging to the genus Urtica are herbaceousperennials and can grow up to 2 m tall. Serrated leaves are attached in pairs opposite each other to thestem. The soft leaves and the rest of the plant are coated in hairs, some of which sting. The serrated,hairy leaves and sting are generally recognized characteristics of this plant [2]. However, the Europeanvariety U. galeopsifolia does not have stinging hairs [3]. The underground roots by which the plantspreads are noticeably yellow. Small flowers, each with four greenish-white petals, sit in dense clusterson elongated inflorescences towards the top of the stem.
The word “nettle” is said to derive from the Anglo-Saxon word “noedl” meaning “needle”,while its Latin name “urtica” means “to burn”. This refers to the stinging effects of the tiny hairs onthe stems and leaves, which when rubbed against the skin cause a burning sensation and temporaryrash. The hairs, so small they are almost invisible to the naked eye, are referred to as “trichomes”.
43
Molecules 2018, 23, 1664
When touched by the skin, the bulbous tips of the trichomes break off, leaving sharp, needle-liketubes [4]. These can pierce the skin and inject a fluid-containing substances including formic acid,the same chemical in ant and bee stings. Other compounds contained in the fluid include histamine,acetylcholine and serotonin. When these toxins are delivered into the skin, a painful itching andburning sensation occurs that may last up to 12 h. The hairs are naturally designed to protect the plantfrom insects.
Nettles grow all over the world in mild to temperate climates. They prefer open or partly shadyhabitats with plenty of moisture and are often found in forests, by rivers or streams and on roadsides.Urtica spp. are widespread throughout Europe and North America, North Africa and in parts of Asia.Both species of stinging nettle (U. dioica L. and U. urens L.) prefer to grow in nitrogen-rich soil andare commonly found in soils high in inorganic nitrates and heavy metals. Heavy metals are poorlyprocessed by the plant and tend to accumulate in the leaves. Long vegetation seasons lead to on-goinggrowth, while harsh winters cause destruction of the plants [5].
Nettles are considered weeds due to their rapid growth and soil coverage. However, there areeconomic and ecological reasons for cultivating stinging nettles. According to Dreyer and Müssing,nettles can improve soils over-fertilized with nitrogen and phosphate [5]. They can also promotethe biodiversity of local flora and fauna [6,7]. Over 40 species of insect are supported by nettles [8].U. dioica can reduce heavy metal content in soil [9]. Urtica spp. can be used to produce new high-qualityagricultural raw materials for the dyeing, textile and energy sectors [7]. Due to their content of toughfibers, nettles were used in Germany and Austria to make textiles during the First World War [10].Despite these benefits, most stinging nettles are wild harvested. Primary producers of stinging nettlesinclude Eastern Germany, the former USSR, Bulgaria, the former Yugoslavia, Hungary and Albania [5].
44
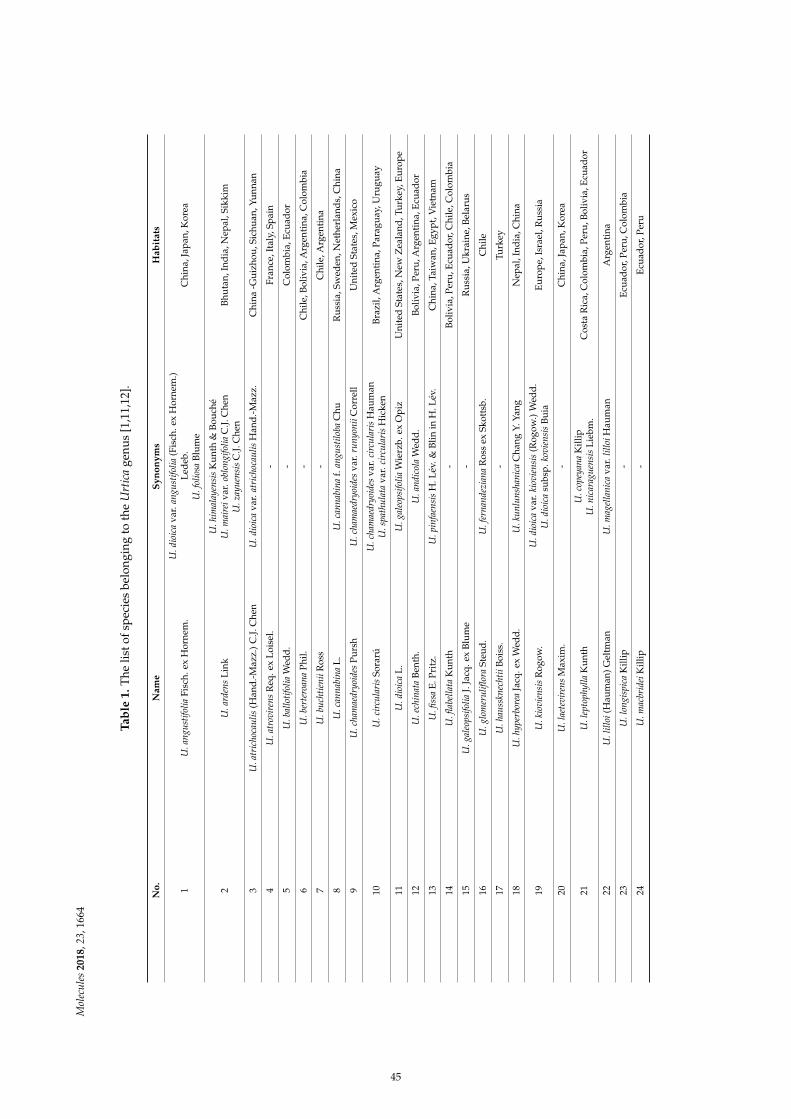
Mol
ecu
les
20
18,2
3,16
64
Ta
ble
1.
The
listo
fsp
ecie
sbe
long
ing
toth
eU
rtic
age
nus
[1,1
1,12
].
No
.N
am
eS
yn
on
ym
sH
ab
itats
1U
.an
gust
ifol
iaFi
sch.
exH
orne
m.
U.d
ioic
ava
r.an
gust
ifol
ia(F
isch
.ex
Hor
nem
.)L
edeb
.U
.fol
iosa
Blu
me
Chi
na,J
apan
,Kor
ea
2U
.ard
ens
Lin
kU
.him
alay
ensi
sK
unt
h&
Bou
ché
U.m
aire
iva
r.ob
lon
gifo
lia
C.J.
Che
nU
.zay
uen
sis
C.J.
Che
nB
huta
n,In
dia
,Nep
al,S
ikki
m
3U
.atr
icho
cau
lis
(Han
d.-M
azz.
)C
.J.C
hen
U.d
ioic
ava
r.at
rich
ocau
lis
Han
d.-M
azz.
Chi
na-G
uiz
hou
,Sic
huan
,Yu
nnan
4U
.atr
ovir
ens
Req
.ex
Loi
sel.
-Fr
ance
,Ita
ly,S
pai
n
5U
.bal
loti
foli
aW
edd
.-
Col
ombi
a,E
cuad
or
6U
.ber
tero
ana
Phi
l.-
Chi
le,B
oliv
ia,A
rgen
tina
,Col
ombi
a
7U
.bu
chti
enii
Ros
s-
Chi
le,A
rgen
tina
8U
.can
nab
ina
L.
U.c
ann
abin
af.
angu
stil
oba
Chu
Ru
ssia
,Sw
eden
,Net
herl
and
s,C
hina
9U
.cha
mae
dryo
ides
Pu
rsh
U.c
ham
aedr
yoid
esva
r.ru
nyo
nii
Cor
rell
Uni
ted
Stat
es,M
exic
o
10U
.cir
cula
ris
Sora
rúU
.cha
mae
dryo
ides
var.
circ
ula
ris
Hau
man
U.s
path
ula
tava
r.ci
rcu
lari
sH
icke
nB
razi
l,A
rgen
tina
,Par
agu
ay,U
rugu
ay
11U
.dio
ica
L.
U.g
aleo
psif
olia
Wie
rzb.
exO
piz
Uni
ted
Stat
es,N
ewZ
eala
nd,T
urk
ey,E
uro
pe
12U
.ech
inat
aB
enth
.U
.an
dico
laW
edd
.B
oliv
ia,P
eru
,Arg
enti
na,E
cuad
or
13U
.fiss
aE
.Pri
tz.
U.p
infa
ensi
sH
.Lév.
&B
linin
H.L
év.
Chi
na,T
aiw
an,E
gyp
t,V
ietn
am
14U
.flab
ella
taK
unt
h-
Bol
ivia
,Per
u,E
cuad
or,C
hile
,Col
ombi
a
15U
.gal
eops
ifol
iaJ.
Jacq
.ex
Blu
me
-R
uss
ia,U
krai
ne,B
elar
us
16U
.glo
mer
uli
flor
aSt
eud
.U
.fer
nan
dezi
ana
Ros
sex
Skot
tsb.
Chi
le
17U
.hau
sskn
echt
iiB
oiss
.-
Turk
ey
18U
.hyp
erbo
rea
Jacq
.ex
Wed
d.
U.k
un
lun
shan
ica
Cha
ngY.
Yang
Nep
al,I
ndia
,Chi
na
19U
.kio
vien
sis
Rog
ow.
U.d
ioic
ava
r.ki
ovie
nsi
s(R
ogow
.)W
edd
.U
.dio
ica
subs
p.k
ovie
nsi
sB
uia
Eu
rop
e,Is
rael
,Ru
ssia
20U
.lae
tevi
ren
sM
axim
.-
Chi
na,J
apan
,Kor
ea
21U
.lep
toph
ylla
Ku
nth
U.c
opey
ana
Kill
ipU
.nic
arag
uen
sis
Lie
bm.
Cos
taR
ica,
Col
ombi
a,P
eru
,Bol
ivia
,Ecu
ador
22U
.lil
loi
(Hau
man
)Gel
tman
U.m
agel
lan
ica
var.
lill
oiH
aum
anA
rgen
tina
23U
.lon
gisp
ica
Kill
ip-
Ecu
ador
,Per
u,C
olom
bia
24U
.mac
brid
eiK
illip
-E
cuad
or,P
eru
45
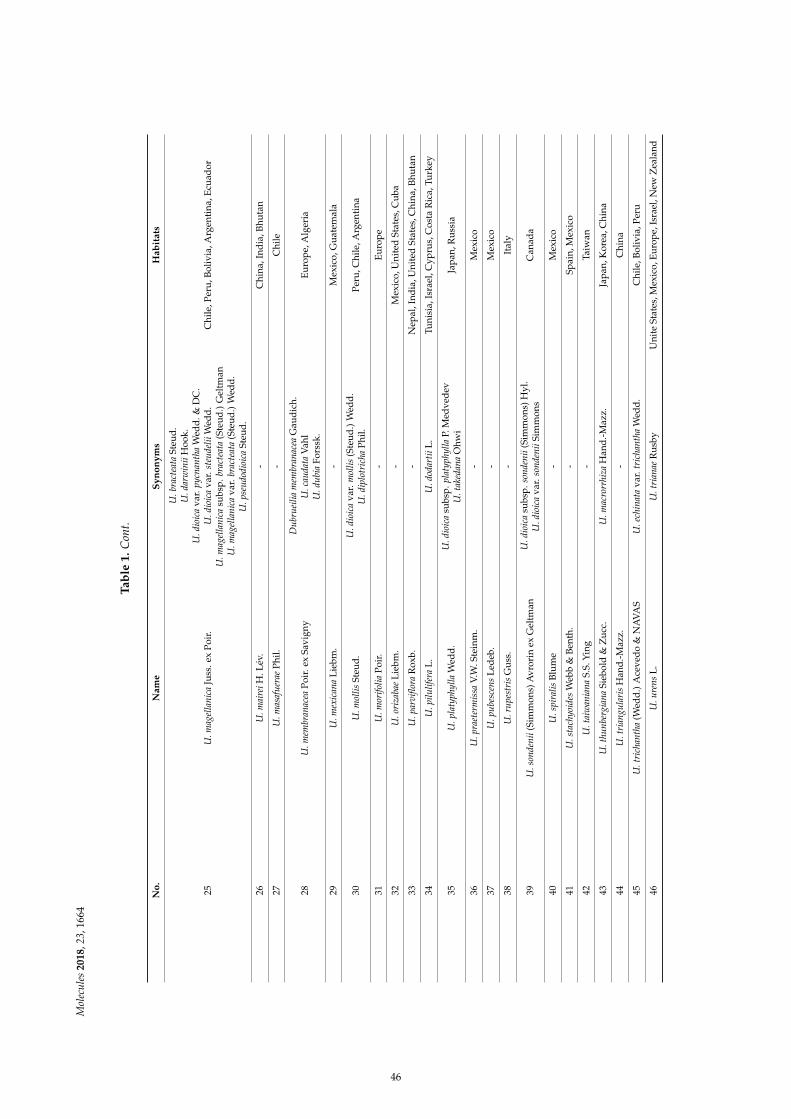
Mol
ecu
les
20
18,2
3,16
64
Ta
ble
1.
Con
t.
No
.N
am
eS
yn
on
ym
sH
ab
itats
25U
.mag
ella
nic
aJu
ss.e
xP
oir.
U.b
ract
eata
Steu
d.
U.d
arw
inii
Hoo
k.U
.dio
ica
var.
pycn
anth
aW
edd
.&D
C.
U.d
ioic
ava
r.st
eude
lii
Wed
d.
U.m
agel
lan
ica
subs
p.b
ract
eata
(Ste
ud
.)G
eltm
anU
.mag
ella
nic
ava
r.br
acte
ata
(Ste
ud
.)W
edd
.U
.pse
udo
dioi
caSt
eud
.
Chi
le,P
eru
,Bol
ivia
,Arg
enti
na,E
cuad
or
26U
.mai
rei
H.L
év.
-C
hina
,Ind
ia,B
huta
n
27U
.mas
afu
erae
Phi
l.-
Chi
le
28U
.mem
bran
acea
Poi
r.ex
Savi
gny
Du
bru
eili
am
embr
anac
eaG
aud
ich.
U.c
auda
taV
ahl
U.d
ubi
aFo
rssk
.E
uro
pe,
Alg
eria
29U
.mex
ican
aL
iebm
.-
Mex
ico,
Gu
atem
ala
30U
.mol
lis
Steu
d.
U.d
ioic
ava
r.m
olli
s(S
teu
d.)
Wed
d.
U.d
iplo
tric
haP
hil.
Per
u,C
hile
,Arg
enti
na
31U
.mor
ifol
iaP
oir.
-E
uro
pe
32U
.ori
zaba
eL
iebm
.-
Mex
ico,
Uni
ted
Stat
es,C
uba
33U
.par
vifl
ora
Rox
b.-
Nep
al,I
ndia
,Uni
ted
Stat
es,C
hina
,Bhu
tan
34U
.pil
uli
fera
L.
U.d
odar
tii
L.
Tuni
sia,
Isra
el,C
ypru
s,C
osta
Ric
a,Tu
rkey
35U
.pla
typh
ylla
Wed
d.
U.d
ioic
asu
bsp
.pla
typh
ylla
P.M
edve
dev
U.t
aked
ana
Ohw
iJa
pan
,Ru
ssia
36U
.pra
eter
mis
saV.
W.S
tein
m.
-M
exic
o
37U
.pu
besc
ens
Led
eb.
-M
exic
o
38U
.ru
pest
ris
Gu
ss.
-It
aly
39U
.son
den
ii(S
imm
ons)
Avr
orin
exG
eltm
anU
.dio
ica
subs
p.s
onde
nii
(Sim
mon
s)H
yl.
U.d
ioic
ava
r.so
nde
nii
Sim
mon
sC
anad
a
40U
.spi
rali
sB
lum
e-
Mex
ico
41U
.sta
chyo
ides
Web
b&
Ben
th.
-Sp
ain,
Mex
ico
42U
.tai
wan
ian
aS.
S.Y
ing
-Ta
iwan
43U
.thu
nbe
rgia
na
Sieb
old
&Z
ucc
.U
.mac
rorr
hiza
Han
d.-M
azz.
Jap
an,K
orea
,Chi
na
44U
.tri
angu
lari
sH
and
.-Maz
z.-
Chi
na
45U
.tri
chan
tha
(Wed
d.)
Ace
ved
o&
NA
VA
SU
.ech
inat
ava
r.tr
icha
nth
aW
edd
.C
hile
,Bol
ivia
,Per
u
46U
.ure
ns
L.
U.t
rian
aeR
usb
yU
nite
Stat
es,M
exic
o,E
urop
e,Is
rael
,New
Zea
land
46
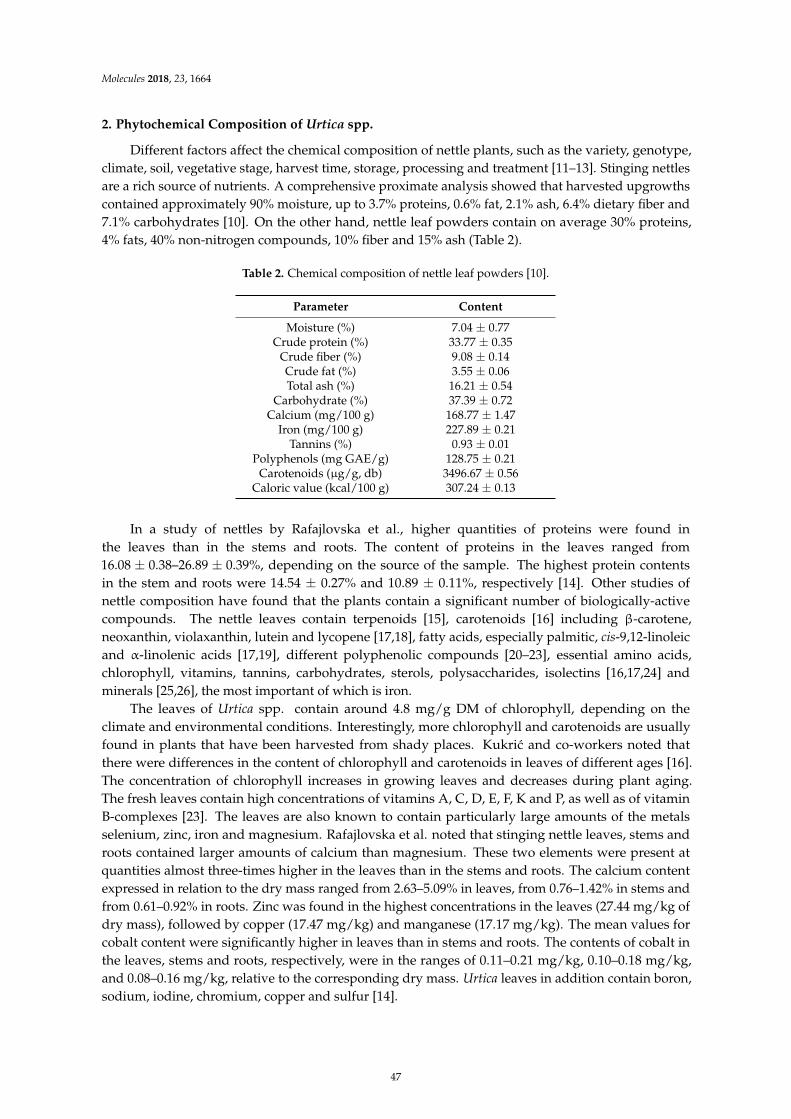
Molecules 2018, 23, 1664
2. Phytochemical Composition of Urtica spp.
Different factors affect the chemical composition of nettle plants, such as the variety, genotype,climate, soil, vegetative stage, harvest time, storage, processing and treatment [11–13]. Stinging nettlesare a rich source of nutrients. A comprehensive proximate analysis showed that harvested upgrowthscontained approximately 90% moisture, up to 3.7% proteins, 0.6% fat, 2.1% ash, 6.4% dietary fiber and7.1% carbohydrates [10]. On the other hand, nettle leaf powders contain on average 30% proteins,4% fats, 40% non-nitrogen compounds, 10% fiber and 15% ash (Table 2).
Table 2. Chemical composition of nettle leaf powders [10].
Parameter Content
Moisture (%) 7.04 ± 0.77Crude protein (%) 33.77 ± 0.35
Crude fiber (%) 9.08 ± 0.14Crude fat (%) 3.55 ± 0.06Total ash (%) 16.21 ± 0.54
Carbohydrate (%) 37.39 ± 0.72Calcium (mg/100 g) 168.77 ± 1.47
Iron (mg/100 g) 227.89 ± 0.21Tannins (%) 0.93 ± 0.01
Polyphenols (mg GAE/g) 128.75 ± 0.21Carotenoids (µg/g, db) 3496.67 ± 0.56
Caloric value (kcal/100 g) 307.24 ± 0.13
In a study of nettles by Rafajlovska et al., higher quantities of proteins were found inthe leaves than in the stems and roots. The content of proteins in the leaves ranged from16.08 ± 0.38–26.89 ± 0.39%, depending on the source of the sample. The highest protein contentsin the stem and roots were 14.54 ± 0.27% and 10.89 ± 0.11%, respectively [14]. Other studies ofnettle composition have found that the plants contain a significant number of biologically-activecompounds. The nettle leaves contain terpenoids [15], carotenoids [16] including β-carotene,neoxanthin, violaxanthin, lutein and lycopene [17,18], fatty acids, especially palmitic, cis-9,12-linoleicand α-linolenic acids [17,19], different polyphenolic compounds [20–23], essential amino acids,chlorophyll, vitamins, tannins, carbohydrates, sterols, polysaccharides, isolectins [16,17,24] andminerals [25,26], the most important of which is iron.
The leaves of Urtica spp. contain around 4.8 mg/g DM of chlorophyll, depending on theclimate and environmental conditions. Interestingly, more chlorophyll and carotenoids are usuallyfound in plants that have been harvested from shady places. Kukric and co-workers noted thatthere were differences in the content of chlorophyll and carotenoids in leaves of different ages [16].The concentration of chlorophyll increases in growing leaves and decreases during plant aging.The fresh leaves contain high concentrations of vitamins A, C, D, E, F, K and P, as well as of vitaminB-complexes [23]. The leaves are also known to contain particularly large amounts of the metalsselenium, zinc, iron and magnesium. Rafajlovska et al. noted that stinging nettle leaves, stems androots contained larger amounts of calcium than magnesium. These two elements were present atquantities almost three-times higher in the leaves than in the stems and roots. The calcium contentexpressed in relation to the dry mass ranged from 2.63–5.09% in leaves, from 0.76–1.42% in stems andfrom 0.61–0.92% in roots. Zinc was found in the highest concentrations in the leaves (27.44 mg/kg ofdry mass), followed by copper (17.47 mg/kg) and manganese (17.17 mg/kg). The mean values forcobalt content were significantly higher in leaves than in stems and roots. The contents of cobalt inthe leaves, stems and roots, respectively, were in the ranges of 0.11–0.21 mg/kg, 0.10–0.18 mg/kg,and 0.08–0.16 mg/kg, relative to the corresponding dry mass. Urtica leaves in addition contain boron,sodium, iodine, chromium, copper and sulfur [14].
47
Molecules 2018, 23, 1664
The total phenolic content of one gram of nettle powder has been reported as 129 mg GAE(Gaelic Acid Equivalent), which is two-times higher than the phenolic content in 100 mL of cranberryjuice (66.61 mg GAE) [27]. Stinging nettles have been shown to be richer in individual polyphenolsthan other wild plants [13]. Ghaima and co-workers found that the content of phenolic compounds instinging nettle leaves was significantly higher than in dandelion leaves [28]. Vajic et al. reported thatthe predominant phenolic compound in stinging nettle leaves is rutin [29]. Ðurovic and co-workersstudied the chemical composition of stinging nettle leaves using different analytical approaches.Soxhlet extraction was performed and qualitative analysis of Ultrasound-Assisted (UA) extractsusing the UHPLC-DAD technique with MS/MS. Differences in the chemical profiles were found.For example, after Soxhlet extraction, syringic, cinnamic and protocatechuic acids were detected in theproducts, which was not the case with the UA extract. On the other hand, ferulic, caffeic, chlorogenicand sinapic acids were detected only after ultrasound-assisted extraction [30].
Orcic and co-workers quantified various plant phenolics in methanol extracts of U. dioica,for flowers, roots, stems and leaves separately, harvested from different locations in Serbia [20].The polyphenol profiles were dependent not only on the parts of the plants, but also on the locationof their acquisition. The researchers found that inflorescence extracts were the richest in phenolics.The most abundant compound was 5-O-caffeoylquinic acid (chlorogenic acid), followed by quercetin3-O-rhamnosylglucoside (rutin) and 3-O-glucoside (isoquercetin).
The quantitative and qualitative composition of the roots differs from that of the aerial partsof the plants [22]. The content of the majority of the phenols in the root extracts is significantlylower, and the only prominent compound is secoisolariciresinol. Therefore, the roots of stingingnettles are considered to be the poorest part in terms of bioactive compounds. The root extractscontain only a few acids and derivatives in significant amounts (Table 3) [20]. They contain starch,gum, albumen, sugars and resins, as well as neurotransmitters and receptors, such as histamine,acetylcholine, choline or serotonin. Methanolic extracts of nettle roots have an inhibitory effect onaromatase, a key enzyme in the biosynthesis of estrogens. The lipophilic fractions usually containphytosterols, pentacyclic triterpenoids, coumarins, ceramides and hydroxyl fatty acids. In turn,isolectins and some polysaccharides have been isolated from the hydrophilic fractions [31]. Krauss andSpitteler identified eighteen phenolic compounds (including homovanillyl alcohol, vanillin, vanillicacid and phenylpropanes) and nineteen ligands (including isolaric, iresinol, secoisolariciresinol andneoolivil) in root extracts [32]. Scopoletin, a coumarin derivative, has also been identified in nettleroots [24]. All these compounds are considered to be very important in medicine and pharmacology.For example, homovanillyl alcohol has been shown to protect against cardiovascular disease [33],while histamine influences the complex physiology of brain systems, affecting cognitive processes,including learning and memory [34], as well as neurotransmitters involved in neuromodulationprocesses [35]. Phytosterols reduce the absorption of cholesterol in the gut and thereby lower bloodcholesterol levels [36]. Scopoletin is a stimulator of lipoprotein lipase activity and protects againstcardiovascular diseases [37]. Lignans improve immune responses [38].
48
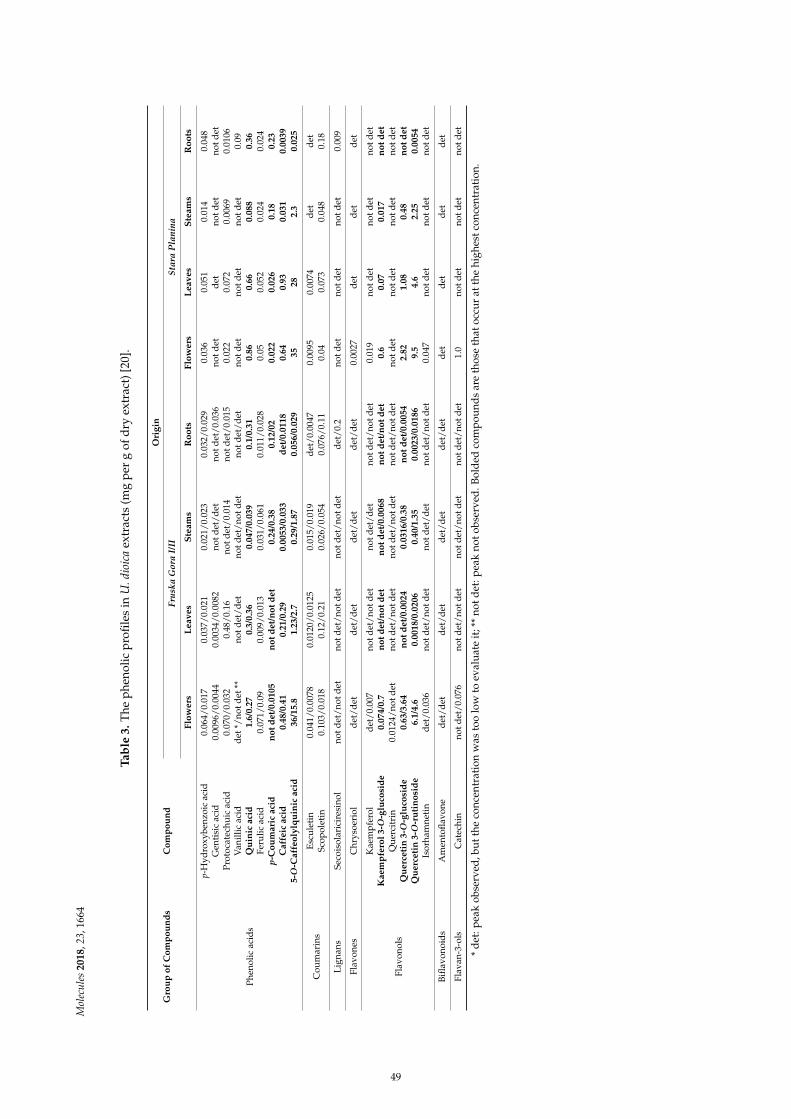
Mol
ecu
les
20
18,2
3,16
64
Ta
ble
3.
The
phe
nolic
pro
file
sin
U.d
ioic
aex
trac
ts(m
gp
erg
ofd
ryex
trac
t)[2
0].
Gro
up
of
Co
mp
ou
nd
sC
om
po
un
dO
rig
in
Fru
ska
Go
raI/
IIS
tara
Pla
nin
a
Flo
we
rsL
ea
ve
sS
tea
ms
Ro
ots
Flo
we
rsL
ea
ve
sS
tea
ms
Ro
ots
Phe
nolic
acid
s
p-H
ydro
xybe
nzoi
cac
id0.
064/
0.01
70.
037/
0.02
10.
021/
0.02
30.
032/
0.02
90.
036
0.05
10.
014
0.04
8G
enti
sic
acid
0.00
96/
0.00
440.
0034
/0.
0082
notd
et/
det
notd
et/
0.03
6no
tdet
det
notd
etno
tdet
Pro
toca
tech
uic
acid
0.07
0/0.
032
0.48
/0.
16no
tdet
/0.
014
notd
et/
0.01
50.
022
0.07
20.
0069
0.01
06V
anill
icac
idd
et*/
notd
et**
notd
et/
det
notd
et/
notd
etno
tdet
/d
etno
tdet
notd
etno
tdet
0.09
Qu
inic
aci
d1
.6/0
.27
0.3
/0.3
60
.04
7/0
.03
90
.1/0
.31
0.8
60
.66
0.0
88
0.3
6Fe
rulic
acid
0.07
1/0.
090.
009/
0.01
30.
031/
0.06
10.
011/
0.02
80.
050.
052
0.02
40.
024
p-C
ou
ma
ric
aci
dn
ot
de
t/0
.01
05
no
td
et/
no
td
et
0.2
4/0
.38
0.1
2/0
20
.02
20
.02
60
.18
0.2
3C
aff
eic
aci
d0
.48
/0.4
10
.21
/0.2
90
.00
53
/0.0
33
de
t/0
.01
18
0.6
40
.93
0.0
31
0.0
03
95
-O-C
aff
eo
lylq
uin
ica
cid
36
/15
.81
.23
/2.7
0.2
9/1
.87
0.0
56
/0.0
29
35
28
2.3
0.0
25
Cou
mar
ins
Esc
ule
tin
0.04
1/0.
0078
0.01
20/
0.01
250.
015/
0.01
9d
et/
0.00
470.
0095
0.00
74d
etd
etSc
opol
etin
0.10
3/0.
018
0.12
/0.
210.
026/
0.05
40.
076/
0.11
0.04
0.07
30.
048
0.18
Lig
nans
Seco
isol
aric
ires
inol
notd
et/
notd
etno
tdet
/no
tdet
notd
et/
notd
etd
et/
0.2
notd
etno
tdet
notd
et0.
009
Flav
ones
Chr
ysoe
riol
det
/d
etd
et/
det
det
/d
etd
et/
det
0.00
27d
etd
etd
et
Flav
onol
s
Kae
mp
fero
ld
et/
0.00
7no
tdet
/no
tdet
notd
et/
det
notd
et/
notd
et0.
019
notd
etno
tdet
notd
etK
ae
mp
fero
l3
-O-g
luco
sid
e0
.07
4/0
.7n
ot
de
t/n
ot
de
tn
ot
de
t/0
.00
68
no
td
et/
no
td
et
0.6
0.0
70
.01
7n
ot
de
tQ
uer
citr
in0.
0124
/no
tdet
notd
et/
notd
etno
tdet
/no
tdet
notd
et/
notd
etno
tdet
notd
etno
tdet
notd
etQ
ue
rce
tin
3-O
-glu
cosi
de
0.6
3/3
.64
no
td
et/
0.0
02
40
.03
16
/0.3
8n
ot
de
t/0
.00
54
2.8
21
.08
0.4
8n
ot
de
tQ
ue
rce
tin
3-O
-ru
tin
osi
de
6.1
/4.6
0.0
01
8/0
.02
06
0.4
0/1
.35
0.0
02
3/0
.01
86
9.5
4.6
2.2
50
.00
54
Isor
ham
neti
nd
et/
0.03
6no
tdet
/no
tdet
notd
et/
det
notd
et/
notd
et0.
047
notd
etno
tdet
notd
et
Bifl
avon
oid
sA
men
tofl
avon
ed
et/
det
det
/d
etd
et/
det
det
/d
etd
etd
etd
etd
et
Flav
an-3
-ols
Cat
echi
nno
tdet
/0.
076
notd
et/
notd
etno
tdet
/no
tdet
notd
et/
notd
et1.
0no
tdet
notd
etno
tdet
*d
et:p
eak
obse
rved
,bu
tthe
conc
entr
atio
nw
asto
olo
wto
eval
uat
eit
;**
notd
et:p
eak
noto
bser
ved
.Bol
ded
com
pou
nds
are
thos
eth
atoc
cur
atth
ehi
ghes
tcon
cent
rati
on.
49
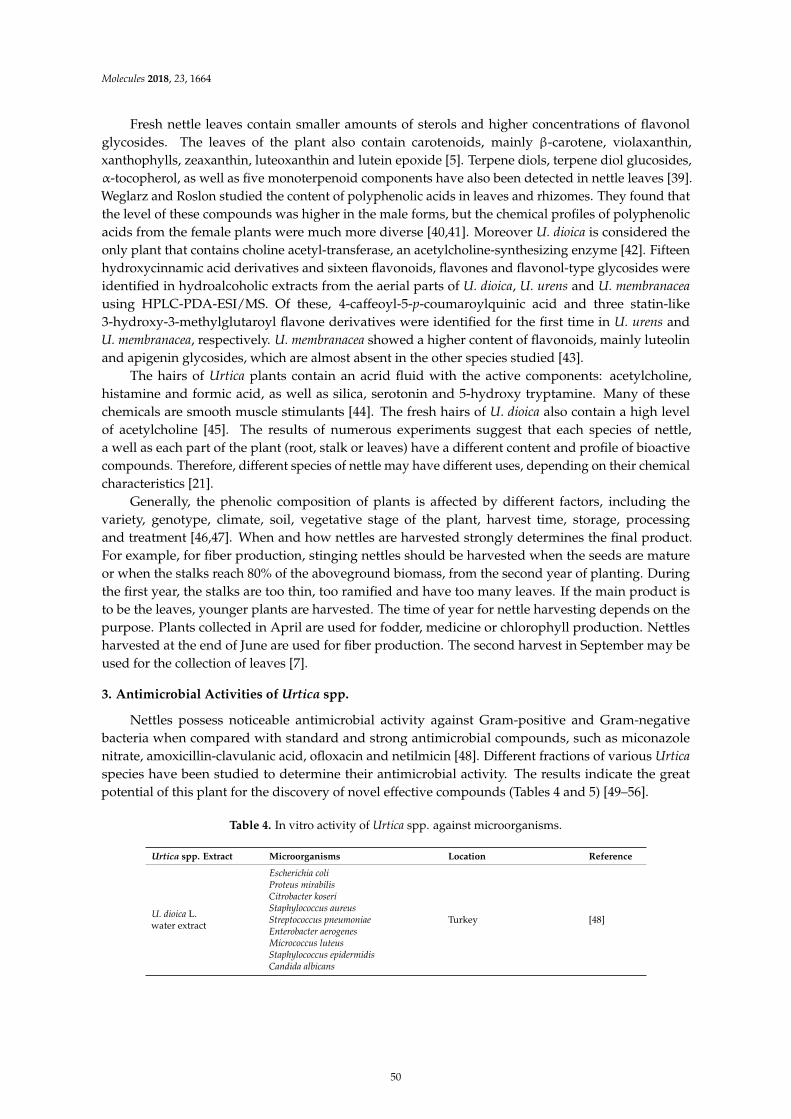
Molecules 2018, 23, 1664
Fresh nettle leaves contain smaller amounts of sterols and higher concentrations of flavonolglycosides. The leaves of the plant also contain carotenoids, mainly β-carotene, violaxanthin,xanthophylls, zeaxanthin, luteoxanthin and lutein epoxide [5]. Terpene diols, terpene diol glucosides,α-tocopherol, as well as five monoterpenoid components have also been detected in nettle leaves [39].Weglarz and Roslon studied the content of polyphenolic acids in leaves and rhizomes. They found thatthe level of these compounds was higher in the male forms, but the chemical profiles of polyphenolicacids from the female plants were much more diverse [40,41]. Moreover U. dioica is considered theonly plant that contains choline acetyl-transferase, an acetylcholine-synthesizing enzyme [42]. Fifteenhydroxycinnamic acid derivatives and sixteen flavonoids, flavones and flavonol-type glycosides wereidentified in hydroalcoholic extracts from the aerial parts of U. dioica, U. urens and U. membranacea
using HPLC-PDA-ESI/MS. Of these, 4-caffeoyl-5-p-coumaroylquinic acid and three statin-like3-hydroxy-3-methylglutaroyl flavone derivatives were identified for the first time in U. urens andU. membranacea, respectively. U. membranacea showed a higher content of flavonoids, mainly luteolinand apigenin glycosides, which are almost absent in the other species studied [43].
The hairs of Urtica plants contain an acrid fluid with the active components: acetylcholine,histamine and formic acid, as well as silica, serotonin and 5-hydroxy tryptamine. Many of thesechemicals are smooth muscle stimulants [44]. The fresh hairs of U. dioica also contain a high levelof acetylcholine [45]. The results of numerous experiments suggest that each species of nettle,a well as each part of the plant (root, stalk or leaves) have a different content and profile of bioactivecompounds. Therefore, different species of nettle may have different uses, depending on their chemicalcharacteristics [21].
Generally, the phenolic composition of plants is affected by different factors, including thevariety, genotype, climate, soil, vegetative stage of the plant, harvest time, storage, processingand treatment [46,47]. When and how nettles are harvested strongly determines the final product.For example, for fiber production, stinging nettles should be harvested when the seeds are matureor when the stalks reach 80% of the aboveground biomass, from the second year of planting. Duringthe first year, the stalks are too thin, too ramified and have too many leaves. If the main product isto be the leaves, younger plants are harvested. The time of year for nettle harvesting depends on thepurpose. Plants collected in April are used for fodder, medicine or chlorophyll production. Nettlesharvested at the end of June are used for fiber production. The second harvest in September may beused for the collection of leaves [7].
3. Antimicrobial Activities of Urtica spp.
Nettles possess noticeable antimicrobial activity against Gram-positive and Gram-negativebacteria when compared with standard and strong antimicrobial compounds, such as miconazolenitrate, amoxicillin-clavulanic acid, ofloxacin and netilmicin [48]. Different fractions of various Urtica
species have been studied to determine their antimicrobial activity. The results indicate the greatpotential of this plant for the discovery of novel effective compounds (Tables 4 and 5) [49–56].
Table 4. In vitro activity of Urtica spp. against microorganisms.
Urtica spp. Extract Microorganisms Location Reference
U. dioica L.water extract
Escherichia coliProteus mirabilisCitrobacter koseriStaphylococcus aureusStreptococcus pneumoniaeEnterobacter aerogenesMicrococcus luteusStaphylococcus epidermidisCandida albicans
Turkey [48]
50
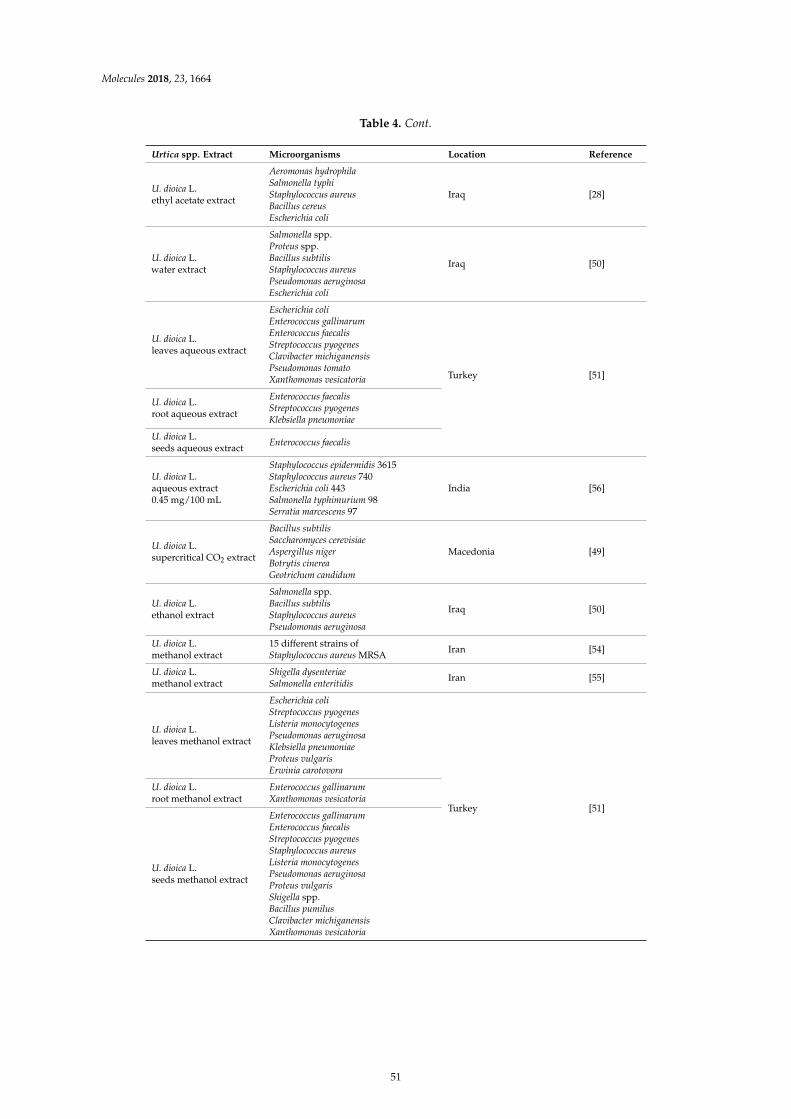
Molecules 2018, 23, 1664
Table 4. Cont.
Urtica spp. Extract Microorganisms Location Reference
U. dioica L.ethyl acetate extract
Aeromonas hydrophilaSalmonella typhiStaphylococcus aureusBacillus cereusEscherichia coli
Iraq [28]
U. dioica L.water extract
Salmonella spp.Proteus spp.Bacillus subtilisStaphylococcus aureusPseudomonas aeruginosaEscherichia coli
Iraq [50]
U. dioica L.leaves aqueous extract
Escherichia coliEnterococcus gallinarumEnterococcus faecalisStreptococcus pyogenesClavibacter michiganensisPseudomonas tomatoXanthomonas vesicatoria Turkey [51]
U. dioica L.root aqueous extract
Enterococcus faecalisStreptococcus pyogenesKlebsiella pneumoniae
U. dioica L.seeds aqueous extract
Enterococcus faecalis
U. dioica L.aqueous extract0.45 mg/100 mL
Staphylococcus epidermidis 3615Staphylococcus aureus 740Escherichia coli 443Salmonella typhimurium 98Serratia marcescens 97
India [56]
U. dioica L.supercritical CO2 extract
Bacillus subtilisSaccharomyces cerevisiaeAspergillus nigerBotrytis cinereaGeotrichum candidum
Macedonia [49]
U. dioica L.ethanol extract
Salmonella spp.Bacillus subtilisStaphylococcus aureusPseudomonas aeruginosa
Iraq [50]
U. dioica L.methanol extract
15 different strains ofStaphylococcus aureus MRSA
Iran [54]
U. dioica L.methanol extract
Shigella dysenteriaeSalmonella enteritidis
Iran [55]
U. dioica L.leaves methanol extract
Escherichia coliStreptococcus pyogenesListeria monocytogenesPseudomonas aeruginosaKlebsiella pneumoniaeProteus vulgarisErwinia carotovora
Turkey [51]
U. dioica L.root methanol extract
Enterococcus gallinarumXanthomonas vesicatoria
U. dioica L.seeds methanol extract
Enterococcus gallinarumEnterococcus faecalisStreptococcus pyogenesStaphylococcus aureusListeria monocytogenesPseudomonas aeruginosaProteus vulgarisShigella spp.Bacillus pumilusClavibacter michiganensisXanthomonas vesicatoria
51
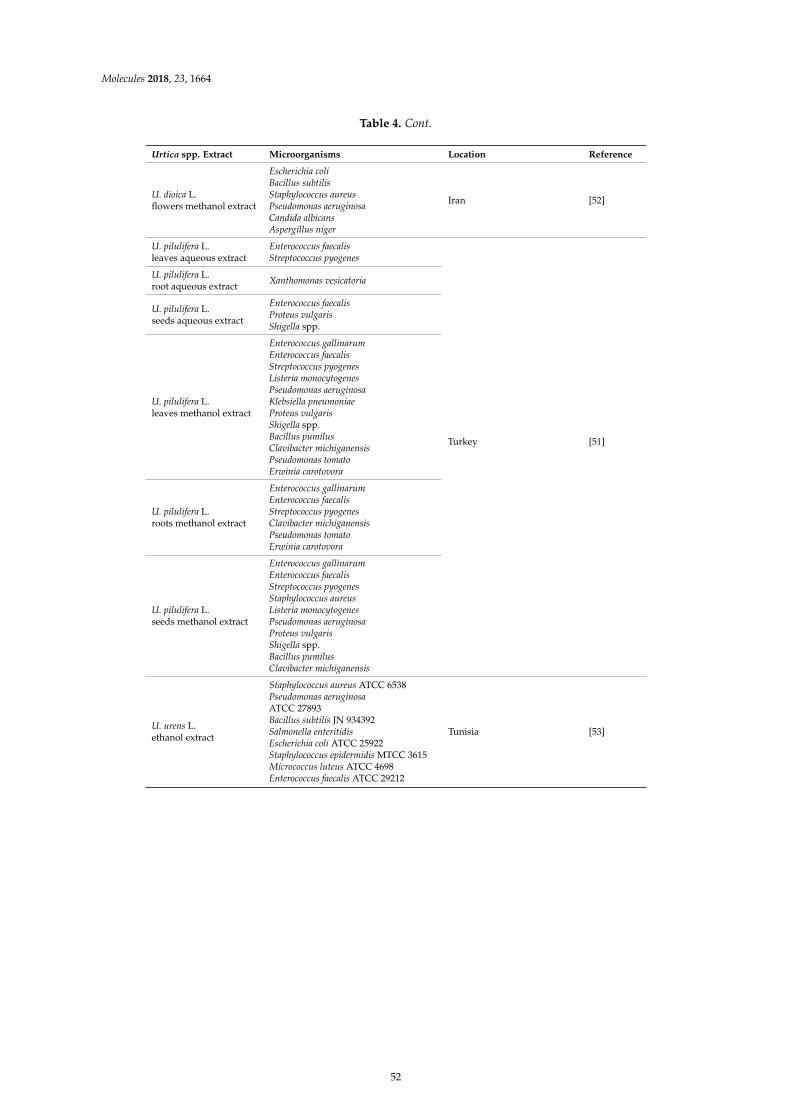
Molecules 2018, 23, 1664
Table 4. Cont.
Urtica spp. Extract Microorganisms Location Reference
U. dioica L.flowers methanol extract
Escherichia coliBacillus subtilisStaphylococcus aureusPseudomonas aeruginosaCandida albicansAspergillus niger
Iran [52]
U. pilulifera L.leaves aqueous extract
Enterococcus faecalisStreptococcus pyogenes
Turkey [51]
U. pilulifera L.root aqueous extract
Xanthomonas vesicatoria
U. pilulifera L.seeds aqueous extract
Enterococcus faecalisProteus vulgarisShigella spp.
U. pilulifera L.leaves methanol extract
Enterococcus gallinarumEnterococcus faecalisStreptococcus pyogenesListeria monocytogenesPseudomonas aeruginosaKlebsiella pneumoniaeProteus vulgarisShigella spp.Bacillus pumilusClavibacter michiganensisPseudomonas tomatoErwinia carotovora
U. pilulifera L.roots methanol extract
Enterococcus gallinarumEnterococcus faecalisStreptococcus pyogenesClavibacter michiganensisPseudomonas tomatoErwinia carotovora
U. pilulifera L.seeds methanol extract
Enterococcus gallinarumEnterococcus faecalisStreptococcus pyogenesStaphylococcus aureusListeria monocytogenesPseudomonas aeruginosaProteus vulgarisShigella spp.Bacillus pumilusClavibacter michiganensis
U. urens L.ethanol extract
Staphylococcus aureus ATCC 6538Pseudomonas aeruginosaATCC 27893Bacillus subtilis JN 934392Salmonella enteritidisEscherichia coli ATCC 25922Staphylococcus epidermidis MTCC 3615Micrococcus luteus ATCC 4698Enterococcus faecalis ATCC 29212
Tunisia [53]
52
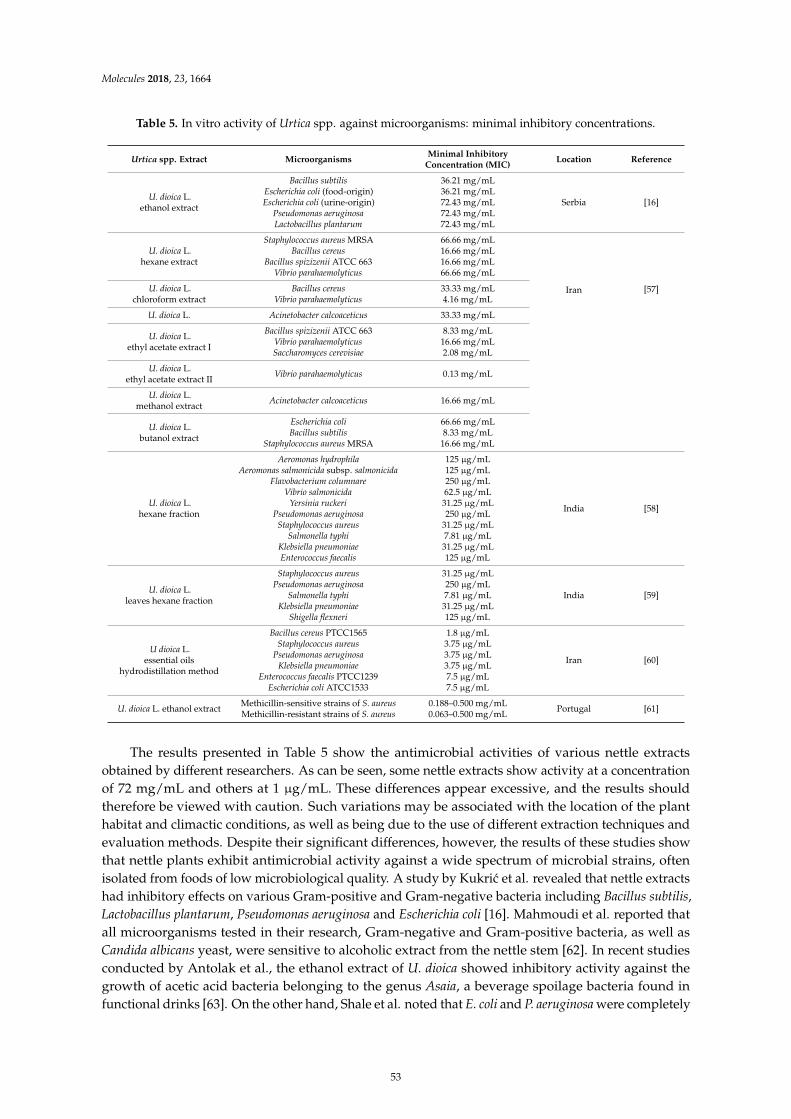
Molecules 2018, 23, 1664
Table 5. In vitro activity of Urtica spp. against microorganisms: minimal inhibitory concentrations.
Urtica spp. Extract MicroorganismsMinimal Inhibitory
Concentration (MIC)Location Reference
U. dioica L.ethanol extract
Bacillus subtilisEscherichia coli (food-origin)Escherichia coli (urine-origin)
Pseudomonas aeruginosaLactobacillus plantarum
36.21 mg/mL36.21 mg/mL72.43 mg/mL72.43 mg/mL72.43 mg/mL
Serbia [16]
U. dioica L.hexane extract
Staphylococcus aureus MRSABacillus cereus
Bacillus spizizenii ATCC 663Vibrio parahaemolyticus
66.66 mg/mL16.66 mg/mL16.66 mg/mL66.66 mg/mL
Iran [57]U. dioica L.chloroform extract
Bacillus cereusVibrio parahaemolyticus
33.33 mg/mL4.16 mg/mL
U. dioica L. Acinetobacter calcoaceticus 33.33 mg/mL
U. dioica L.ethyl acetate extract I
Bacillus spizizenii ATCC 663Vibrio parahaemolyticusSaccharomyces cerevisiae
8.33 mg/mL16.66 mg/mL2.08 mg/mL
U. dioica L.ethyl acetate extract II
Vibrio parahaemolyticus 0.13 mg/mL
U. dioica L.methanol extract
Acinetobacter calcoaceticus 16.66 mg/mL
U. dioica L.butanol extract
Escherichia coliBacillus subtilis
Staphylococcus aureus MRSA
66.66 mg/mL8.33 mg/mL
16.66 mg/mL
U. dioica L.hexane fraction
Aeromonas hydrophilaAeromonas salmonicida subsp. salmonicida
Flavobacterium columnareVibrio salmonicida
Yersinia ruckeriPseudomonas aeruginosa
Staphylococcus aureusSalmonella typhi
Klebsiella pneumoniaeEnterococcus faecalis
125 µg/mL125 µg/mL250 µg/mL62.5 µg/mL
31.25 µg/mL250 µg/mL
31.25 µg/mL7.81 µg/mL
31.25 µg/mL125 µg/mL
India [58]
U. dioica L.leaves hexane fraction
Staphylococcus aureusPseudomonas aeruginosa
Salmonella typhiKlebsiella pneumoniae
Shigella flexneri
31.25 µg/mL250 µg/mL7.81 µg/mL
31.25 µg/mL125 µg/mL
India [59]
U dioica L.essential oils
hydrodistillation method
Bacillus cereus PTCC1565Staphylococcus aureus
Pseudomonas aeruginosaKlebsiella pneumoniae
Enterococcus faecalis PTCC1239Escherichia coli ATCC1533
1.8 µg/mL3.75 µg/mL3.75 µg/mL3.75 µg/mL7.5 µg/mL7.5 µg/mL
Iran [60]
U. dioica L. ethanol extractMethicillin-sensitive strains of S. aureusMethicillin-resistant strains of S. aureus
0.188–0.500 mg/mL0.063–0.500 mg/mL
Portugal [61]
The results presented in Table 5 show the antimicrobial activities of various nettle extractsobtained by different researchers. As can be seen, some nettle extracts show activity at a concentrationof 72 mg/mL and others at 1 µg/mL. These differences appear excessive, and the results shouldtherefore be viewed with caution. Such variations may be associated with the location of the planthabitat and climactic conditions, as well as being due to the use of different extraction techniques andevaluation methods. Despite their significant differences, however, the results of these studies showthat nettle plants exhibit antimicrobial activity against a wide spectrum of microbial strains, oftenisolated from foods of low microbiological quality. A study by Kukric et al. revealed that nettle extractshad inhibitory effects on various Gram-positive and Gram-negative bacteria including Bacillus subtilis,Lactobacillus plantarum, Pseudomonas aeruginosa and Escherichia coli [16]. Mahmoudi et al. reported thatall microorganisms tested in their research, Gram-negative and Gram-positive bacteria, as well asCandida albicans yeast, were sensitive to alcoholic extract from the nettle stem [62]. In recent studiesconducted by Antolak et al., the ethanol extract of U. dioica showed inhibitory activity against thegrowth of acetic acid bacteria belonging to the genus Asaia, a beverage spoilage bacteria found infunctional drinks [63]. On the other hand, Shale et al. noted that E. coli and P. aeruginosa were completely
53
Molecules 2018, 23, 1664
resistant to the ethanol and methanol extracts from stems and leaves of U. dioica [64]. Differentantimicrobial properties may be the result of the isolation of different compounds in different solvents,of different extraction efficiencies and possibly of chemical degradation by polar and non-polar solvents.The extraction method, the plant type, the geographical and ecological status, the climate, seasonaland experimental conditions, the age of the plant, environmental stress factors, as well as inter-speciesdifferences all play a role and may explain the diversity of results in different studies [21,65,66].
4. Urtica spp. in Traditional and Modern Medicine
Nettles are one of the most commonly-used medicinal plants in the world, due to theirhealth-enhancing qualities. Because of their high content of nutritive substances, nettles are alsoused in folk veterinary medicine [48,67,68]. There are many dietary supplements based on Urtica
spp. now on the market. Their popularity can be explained by their non-toxic chemical composition,relatively low cost and wide availability. The most recognized health benefit of using stinging nettlesis activity against Benign Prostatic Hyperplasia (BPH), also known as an enlarged prostate, as well asurinary tract infections. Clinical studies suggest that Urtica spp. contain compounds that affect thehormones responsible for BPH. In addition, nettle root extract shows activity against prostate cancercells. In therapy, nettles are usually used in combination with saw palmetto (Serenoa repens) [69,70].They are also used as a home remedy for bladder infections.
Nettles can help alleviate the symptoms of osteoarthritis and joint pain, typically in the case ofhands, knees, hips and spine. Nettles can work in combination with nonsteroidal anti-inflammatorydrugs (NSAIDs), allowing patients to decrease their use of NSAIDs. The prolonged use of NSAIDs canincrease the risk of heart attack or stroke. In a study by Randall and co-workers, nettles were able todecrease osteoarthritic pain in the base of the thumb when applied to the painful area. In a clinical trialof 37 people with acute arthritis, 50 g of stewed nettle leaves consumed daily, combined with 50 mgof diclofenac, were shown to be as effective as the full 200-mg dose of diclofenac over a two-weekperiod [71]. Studies have also shown that applying nettle leaves directly decreases joint pain and cantreat arthritis. In a study by Christensen and Bliddal, it was found that a combination of nettles, fish oiland vitamin E reduced the need for analgesics and other drugs for the symptoms of osteoarthritis [72].
Another study conducted by Klingelhoefer et al. showed the anti-inflammatory benefits ofstinging nettles against other autoimmune diseases, such as rheumatoid arthritis [73]. Nettle leavescontain histamine, which may seem inadvisable for allergy medication. However, histamine has beenalready used to treat strong allergy symptoms [74]. Histamine production causes unwanted allergicreactions, associated with unpleasant nasal congestion, sneezing or itching. Stinging nettles affectnumerous receptors and/or enzymes involved in allergic reactions [75]. In addition, because of theiranti-histamine and anti-inflammatory properties, stinging nettles can be used as a natural component ineczema medications. Infusions of the plant can be used for nasal and menstrual hemorrhage, diabetes,anemia, asthma, hair loss and to promote lactation [76]. Terpenes and phenols are major groupsassociated with the inhibition of cancers, as well as with the treatment of headache, rheumatism andsome skin diseases [58,77,78]. Phenols also have been associated with the inhibition of atherosclerosisand cancer, as well as age-related degenerative brain disorders [79,80].
The combination of U. dioica with common thyme (Thymus vulgaris), liquorice (Glycyrrhiza glabra),common grape (Vitis vinifera) and lesser galangal (Alpinia officinarum) has been known in Turkey asan Ankaferd Blood Stopper (ABS). This traditional medicine works on endothelium, blood cells,angiogenesis, cellular proliferation, vascular dynamics and cell mediators to stop bleeding [81].In a study conducted by Bourgeois et al., nettles were used for cosmetic applications as an anti-agingcomplex, involving the inhibition of collagenase and elastase activities. These properties could beascribed to the ursolic acid and quercetin present in the nettle extracts [82].
Herb extract of Urtica plants is useful for bladder disorders, reduces postoperative blood lossand prevents hemorrhagic and purulent inflammation following adenomectomy. Aqueous infusionsof U. dioica exhibit antioxidant activity towards iron-promoted oxidation of phospholipids, linoleic
54
Molecules 2018, 23, 1664
acid and deoxyribose [83]. For a long time, the hypoglycemic effects of U. dioica were only speculative.Recent studies show that nettles possess anti-diabetic properties [84]. Thus, nettles could serveas good adjuvant to other oral hypoglycemic agents and seem promising for the development ofphytomedicines for diabetes mellitus. In addition, as organic nitrogenous compounds, amino acidsfrom nettles are building blocks in the process of protein biosynthesis [85]. The safety of aqueousextracts of U. dioica and their antidiabetic effects have been confirmed with mice models [86].
5. Food and Feed Applications
Nettles have traditionally been used as a nutritious food, particularly in spring time in ruralareas. The Romans are said to have consumed nettles, and a recipe for Saint Columba’s broth survivesto this day. In Greek and Roman times, nettle roots were used for meat tenderization. Nowadays,nettles are used in a large number of recipes. Urtica spp. are blended with fromage blanc, potatoes andnutmeg to make nettle nouvelle [39]. Stinging nettles remain popular, especially in poor countries andamong the lower socioeconomic classes [87]. For example, amino acids from dehydrated nettle mealare nutritionally better in comparison to those of alfalfa meal [88]. These plants may be consumedprimarily as a boiled or cooked fresh vegetable, which is added to soups, cooked as a pot herb orused in vegetable salads [10]. In the temperate region of the Himalayas, U. plaviflora leaves are cookedand eaten as a green vegetable. Upgrowths and leaves are collected with the help of bamboo or ironpincers and cooked as soup. The plants are boiled with maize, millet or wheat flour, with the additionof salt and chili to make a kind of porridge. Due to their seasonality, U. plaviflora plants are preservedby lactic acid fermentation [4].
In European countries, nettles are used in soup or as a steamed or wilted vegetable. Since it hasa similar flavor and texture, cooked nettle can be used as a substitute for spinach. Raw nettles afterblending can be also used in pesto sauces, salad dressings or dips. Boiled nettles with walnuts isa common dish in Georgia, while Romanians make sour soup using fermented wheat bran, vegetablesand young nettle leaves [89]. Mature leaves are used in the production of semi-hard Cornish cheese,made from grass-rich milk and wrapped in stinging nettles. The nettle changes the acidity of theoutside of the cheese, affecting the way the curd breaks down and matures. It has also been documentedthat nettle leaves can be used to coagulate milk in the process of fresh cheese making [90]. In someEuropean countries, for example in Serbia and Poland, bread with nettle leaves (up to 1%) is sold asa commercial product [30]. Compared to barley and wheat flour, nettle flour has a much higher contentof proteins, crude fibers, fats, ash, calcium and iron and has a low glycemic index. As compared tobarley and wheat, nettles have much higher levels of tannins and total polyphenols [10].
Nettle leaves can also be used to make an herbal tea, which is rich in vitamins and minerals.Depending on the amount used, nettle tea has a mild to strong flavor and tastes similar to vegetablebroth. Concentrated nettle tea can be used as a soup base or as a component in drinks or green cocktails.Nettle tea can also be used as a nutritional replacement for water. Nettle roots can be used as liquid orpowdered extracts, as well as in special decoctions. Nettles are also used in herbal liquors [91]. In theBritish Isles, Urtica plants are used in an alcoholic beverage, which is similar to ginger beer and brewedin the same way. Nettle and oat extracts are the subject of a U.S. Patent describing the use of plantpowders as additives in beverages or fruit juice to provide nutritional drinks [92]. Aqueous infusionsof U. dioica exhibit antioxidant activity towards iron-promoted oxidation of phospholipids, linoleic acidand deoxyribose [83]. The use of such antioxidant and antimicrobial compounds is of considerableinterest for the preservation of foods, as well as for improving the shelf-life of food products [53,93].
Despite their beneficial properties, the consumption of nettle teas or juices may cause a skin rashin individual cases. Although it is rare, there have been reports of allergic reactions after ingesting rawnettle leaves in the form of puree or juice [94]. Therefore, stinging nettles need to be correctly preparedby hot water infusion, maceration, drying or tincturing. This pretreatment deactivates the formic acid,allowing safe consumption of this valuable plant.
55
Molecules 2018, 23, 1664
Oxidation is a serious problem in the food industry. Meat products are particularly susceptibleto changes in the oxidation of lipids and heme pigments during storage. Along with meat spoilagebacteria, the oxidation of lipids and myoglobin has a major effect on reducing the shelf-life of meatand meat products. Lipid oxidation decreases the nutritional value of meat through the deteriorationof essential fatty acids, causing an unacceptable flavor, generating potentially toxic products andpromoting the oxidation of other important molecules, such as myoglobin [95]. Although syntheticantioxidants are available, in recent years, the demand for natural antioxidants has increased, mainlybecause of the adverse effects of synthetic antioxidants [96]. Iron, the most abundant ion in meat,is released from heme pigments and ferritin and may be an important catalyst in the oxidation of lipidsand proteins. Studies have demonstrated that commercially-available polyphenols and extracts rich inpolyphenols can inhibit myoglobin oxidation.
Inai et al. studied the inhibition of myoglobin oxidation by some plant polyphenols with activityfor flavonols (kaempferol, myricetin and quercetin) [97]. Slightly weaker activity was observed forother polyphenols: sinapic acid, catechin, nordihydroguaiaretic acid, taxifolin, morin and ferulic acid.The use of natural antioxidants from U. dioica water extract and dried leaves as a functional ingredientsignificantly decreased the level of lipid deterioration and increased color stability during storage.Therefore, nettle water extract can be successfully used to reduce lipid oxidation and to enhance thefunctionality of the final products. Other studies have investigated the use of U. dioica water extract insucuk, a Turkish dry-fermented sausage [98–100], in ground beef [101], meatballs [102], in super-chilledminced meat [103], vacuum-packed beef steaks [104] and in cooked pork sausage [105].
The use of Urtica spp. as a dietary supplement may positively affect the health and productivity ofpoultry and cows. The large number of active compounds in this plant may show stronger antibacterialactivities than synthetic antimicrobials. It has been suggested that extracts of Urtica spp. may alsopossess appetite- and digestion-stimulating properties [106–110], which stimulate the growth ofbeneficial bacteria in the gastrointestinal tract of poultry [111]. In some parts of Europe, fresh leavesare traditionally fed to pigs and poultry. Safamehr and co-workers showed that nettles had no effecton the percentage of breast, thigh and abdominal fat [68]. However, chickens fed with 1% nettles hadthe highest carcass yield. In contrast, Alçiçek, Bozkurt and Çabuk observed an improvement in thecarcass yield of broilers supplemented with a combination of essential oils [109]. This can be explainedby more intense protein anabolism [112]. The relative weights of most organs were not affected by theinclusion of nettles to the diet, which is in agreement with the findings by Nobakht [113].
It has been suggested that the antioxidant activity of nettles may induce a decrease in the relativeweight of the liver [114]. A study conducted by Safamehr and co-workers showed that 1%–2%supplementation with nettles had a positive effect on the performance, carcass traits and bloodbiochemical parameters of broilers [68]. A study by Humphries and Reynolds confirmed the usefulnessof nettles as a forage crop for cows. Production of milk was maintained when nettles were used toreplace dry grass silage in the diet of lactating dairy cows [115]. The addition of nettle haylage tothe diet caused changes in rumen pH that were potentially beneficial to lactating dairy cows onhigh grain diets. It is worth noting that diets based on plant material, rich in immune-promotingbioactive compounds, can avoid the need for antibiotic growth promoters. There is increasing publicand government pressure in several countries of the EU and some non-EU nations to find naturalalternatives to antibiotics [116,117].
Sandru and co-workers noted that U. dioica alcoholic extract increased cell-mediated innateimmune potential in chickens. Alcoholic nettle plant extract significantly increased total leukocytenumbers, from 15,400–17,125 cells/mm3 [118]. Similarly, nettle extract treatment significantly enhancedthe in vitro functional capacity of phagocytes. This could lead to a higher resistance to diseases andimprove the post-vaccination response of broilers, thus reducing economic losses. It was noted that theglucose and total protein content, as well as the heterophil and lymphocyte levels in chickens were notinfluenced by different quantities of nettle, while the concentrations of cholesterol and triglycerides inthe blood were affected significantly. The effect on lowering cholesterol in blood serum may be because
56
Molecules 2018, 23, 1664
of the presence of plant sterols, such as stigmasterol and campesterol. These decrease the cholesterolconcentration in micelles [119,120]. Fermont and co-workers and Visioli and co-workers report that thecholesterol levels in blood serum and meat are probably lowered by phenolic compounds [121,122].However, Khosravi et al. found that the addition of nettle extract to the diet of boilers had no significantpositive effect on their total cholesterol [123].
Urtica spp. provide animals with nutrients and bioactive components, which supportantimicrobial activity, immune enhancement and stress reduction. However, the phytochemicalcomposition is complex, and the mode of action is unclear [124]. Further studies are needed toinvestigate the bioactive components of nettles and their modes of action. It is worth noting that theWorld Health Organization (WHO), in its monographs on ‘Selected medicinal plants’, describes Urticae
as valuable herbs for many medicinal uses [125]. The European Commission Directorate-Generalfor Health and Food Safety showed that Urtica spp. fulfils the criteria of a foodstuff, as defined inRegulation (EC) No. 178/2002. This opinion is supported by the European Food Safety Authority(EFSA). It concluded that Urtica spp. has neither an immediate nor delayed harmful effect on humanor animal health and has no negative effect on the environment [126].
6. Conclusions
Stinging nettles can be found all over the world. Plant hairs located on the leaves and stemscontain a number of chemicals, which can cause a stinging reaction and uncomfortable irritation whenbrought into contact with human skin. Nevertheless, stinging nettles have a number of health benefitsand have been used medicinally since at least the times of Ancient Greece. Studies have shown that allparts of the nettle have antioxidant, antimicrobial and pro-health capabilities. Most nettle medicinesare made from the flowers, stems and leaves, but roots are also used in pharmacology. This valuableplant has been used most commonly as a diuretic and for treating painful muscles and joints, eczema,gout and anemia. Nettles may be used as a vegetable, in juice, tea and as an ingredient in many dishes.The use of Urtica spp. as a feed component could also positively affect the health of poultry and animalproductivity. However, despite these proven benefits, the nettle is still an undervalued plant.
Research is continuing into this ordinary plant with unique pharmacological and dietaryproperties. It is worth investigating the possible wider inclusion of nettles in the daily diet to promotewell-being and prevent diseases.
Funding: This research received no external funding.
Conflicts of Interest: The authors declare no conflicts of interest.
References
1. The Plant List. A Working List of All Plant Species. Available online: http://www.theplantlist.org/tpl1.1/search?q=Urtica+ (accessed on 5 April 2018).
2. Jiarui, C.; Qi, L.; Friis, I.; Wilmot-Dear, C.M.; Monro, A.K. Urticaceae. In Flora of China; Missouri BotanicalGarden Press: St. Louis, MO, USA, 2003; pp. 76–189.
3. Geltman, D.V. Urtica galeopsifolia Wierzb. ex Opiz (Urticaceae) in Wicken Fen (E. England). Watsonia 1992, 19,127–129.
4. Mishra, A.; Kharel, G.P. Preservation and Quality Evaluation of Sisnu (Urtica plaviflora) by making Gundruklike fermented product. J. Food Sci. Technol. Nepal. 2010, 6, 114–117. [CrossRef]
5. Upton, R. Stinging nettles leaf (Urtica dioica L.): Extraordinary vegetable medicine. J. Herb. Med. 2013, 3,9–38.
6. Dreyer, J.; Müssig, J. New Horizons in Natural Fibre Production: Separation of Hemp and Nettle withEnzymes. Presented at the 3th International Symposium Biorohstoff Hanf & Andere Faserpflanzen,Wolfsburg, Germany, 13–16 September 2000.
7. Di Virgilio, N.; Papazoglou, E.G.; Jankauskiene, Z.; Di Lonardo, S.; Pralczyk, M.; Wilegusz, K. The potentialof stinging nettle (Urtica dioica L.) as a crop with multiple uses. Ind. Crops Prod. 2015, 68, 42–49. [CrossRef]
57
Molecules 2018, 23, 1664
8. Lang, A.; Otto, M. Feeding behaviour on host plants may influence potential exposure to Bt maize pollen ofaglais Urticae larvae (Lepidoptera, Nymphalidae). Insects 2015, 6, 760–771. [CrossRef] [PubMed]
9. Viktorova, J.; Jandova, Z.; Madlenakova, M.; Prouzova, P.; Bartunek, V.; Vrchotova, B.; Lovecka, P.;Musilova, L.; Macek, T. Native phytoremediation potential of Urtica dioica for removal of PCBs and heavymetals can be improved by genetic manipulations using constitutive CaMV 35S promoter. PLoS ONE 2016,11, e0167927. [CrossRef] [PubMed]
10. Adhikari, B.M.; Bajracharya, A.; Shrestha, A.K. Comparison of nutritional properties of stinging nettle(Urtica dioica) flour with wheat and barley flours. Food Sci. Nutr. 2016, 4, 119–124. [CrossRef] [PubMed]
11. eFloras.org. Available online: http://www.efloras.org/browse.aspx?flora_id=0&name_str=urtica&btnSearch=Search (accessed on 5 April 2018).
12. Plants for a Future. Earth. Plants. People. Available online: https://www.pfaf.org/user/DatabaseSearhResult.aspx (accessed on 5 April 2018).
13. Augspole, I.; Duma, M.; Ozola, B.; Cinkmanis, I. Phenolic Profile of Fresh and Frozen Nettle, Goutweed,Dandelion and Chickweed Leaves. In Proceedings of the 11th Baltic Conference on Food Science andTechnology “Food Science and Technology in a Changing World”, Jelgava, Latvia, 27–28 April 2017.
14. Rafajlovska, V.; Kavrakovski, Z.; Simonovska, J.; Srbinoska, M. Determination of protein and mineralcontents in stinging nettle. Qual. Life 2013, 4, 26–30. [CrossRef]
15. Gül, S.; Demirci, B.; Baser, K.H.C.; Akpulat, H.A.; Aksu, P. Chemical composition and in vitro cytotoxic,genotoxic effects of essential oil from Urtica dioica L. Bull. Environ. Contam. Toxicol. 2012, 88, 666–671.[CrossRef] [PubMed]
16. Kukric, Z.Z.; Topalic-Trivunovic, L.N.; Kukavica, B.M.; Matoš, S.B.; Pavicic, S.S.; Boroja, M.M.; Savic, A.V.Characterization of antioxidant and antimicrobial activities of nettle leaves (Urtica dioica L.). APPTEF 2012,43, 1–342. [CrossRef]
17. Guil-Guerrero, J.L.; Rebolloso-Fuentes, M.M.; Isasa, M.E.T. Fatty acids and carotenoids from stinging nettle(Urtica dioica L.). J. Food. Compos. Anal. 2003, 16, 111–119. [CrossRef]
18. Kudritsata, S.E.; Filman, G.M.; Zagorodskaya, L.M.; Chikovanii, D.M. Carotenoids of Urtica dioica.Chem. Nat. Compd. 1986, 22, 604–605. [CrossRef]
19. Bagci, E. Fatty Acid Composition of the Aerial Parts of Urtica Dioica (Stinging Nettle) L. (Urticaceae).In Biodiversity; Sener, B., Ed.; Springer: Boston, MA, USA, 2002; pp. 323–327.
20. Orcic, D.; Franciškovic, M.; Bekvalac, K.; Svircev, E.; Beara, I.; Lesjak, M.; Mimica-Dukic, N. Quantitativedetermination of plant phenolics in Urtica dioica extracts by high-performance liquid chromatographycoupled with tandem mass spectrometric detection. Food Chem. 2014, 143, 48–53. [CrossRef] [PubMed]
21. Otles, S.; Yalcin, B. Phenolic compounds analysis of root, stalk, and leaves of nettle. Sci. World J. 2012, 564367.[CrossRef] [PubMed]
22. Pinelli, P.; Ieri, F.; Vignolini, P.; Bacci, L.; Baroni, S.; Romani, A. Extraction and HPLC analysis of phenoliccompounds in leaves, stalks, and textile fibers of Urtica dioica L. J Agric. Food Chem. 2008, 56, 9127–9132.[CrossRef] [PubMed]
23. Rutto, L.K.; Xu, Y.; Ramirez, E.; Brandt, M. Mineral properties and dietary value of raw and processedstinging nettle (Urtica dioica L.). Int. J. Food Sci. 2013, 857120. [CrossRef]
24. Sajfrtová, M.; Sovová, H.; Opletal, L.; Bártlová, M. Near-critical extraction of β-sitosterol and scopoletin fromstinging nettle roots. J. Supercrit. Fluid 2005, 35, 111–118. [CrossRef]
25. Kara, D. Evaluation of trace metal concentrations in some herbs and herbal teas by principal componentanalysis. Food Chem. 2009, 114, 347–354. [CrossRef]
26. Tack, F.M.; Verloo, M.G. Metal contents in stinging nettle (Urtica dioica L.) as affected by soil characteristics.Sci. Total Environ. 1996, 192, 31–39. [CrossRef]
27. Keskin-Šašic, I.; Tahirovic, A.; Topcagic, A.; Klepo, L.; Salihovic, M.; Ibragic, S.; Toromanovic, J.; Ajanovic, A.;Velispahic, E. Total phenolic content and antioxidant capacity of fruit juices. Bull. Chem. Technol. Bosnia Herzeg.
2012, 39, 25–28.28. Ghaima, K.K.; Hashim, N.M.; Ali, S.A. Antibacterial and antioxidant activities of ethyl acetate extract of
nettle (Urtica dioica) and dandelion (Taraxacum officinale). J. Pharm. Sci. 2013, 3, 96–99.29. Vajic, U.J.; Grujic-Milanovic, J.; Živkovic, J.; Šavikin, K.; Gođevac, D.; Miloradovic, Z.; Bugarski, B.;
Mihailovic-Stanojevic, N. Optimization of extraction of stinging nettle leaf phenolic compounds usingresponse surface methodology. Ind. Crop. Prod. 2015, 74, 912–917. [CrossRef]
58
Molecules 2018, 23, 1664
30. Ðurovic, S.; Pavlic, B.; Šorgic, S.; Popov, S.; Savic, S.; Pertonijevic, M.; Radojkovic, M.; Cvetanovic, A.;Zekovic, Z. Chemical composition of stinging nettle leaves obtained by different analytical approaches.J. Funct. Food. 2017, 32, 18–26. [CrossRef]
31. Van Damme, E.J.M.; Peumans, W.J. Isolectin composition of individual clones of Urtica dioica: Evidence forphenotypic differences. Physiol. Plant. 1987, 71, 328–334. [CrossRef]
32. Krauss, R.; Spitteler, G. Phenolic compounds from roots of Urtica dioica. Phytochemistry 1990, 29, 1653–1659.[CrossRef]
33. De la Torre, R.; Corella, D.; Castañer, O.; Martínez-González, M.A.; Salas-Salvador, J.; Vila, J.; Estruch, R.;Sorli, J.V.; Arós, F.; Fiol, M.; et al. Protective effect of homovanillyl alcohol on cardiovascular disease andtotal mortality: Virgin olive oil, wine, and catechol-methylathion. Am. J. Clin. Nutr. 2017, 105, 1297–1304.[CrossRef] [PubMed]
34. Blandina, P.; Efoudebe, M.; Cenni, G.; Mannaioni, P.; Passani, M.B. Acetylcholine, histamine, and cognition:Two sides of the same coin. Learn. Mem. 2004, 11, 1–8. [CrossRef] [PubMed]
35. Aquino, G.; Arias-Montano, J.-A. Neuromodulation and histamine: Regulation of neurotransmitter releaseby H 3 receptors. Salud Ment. 2012, 35, 345–352.
36. Salo, P.; Hopia, A.; Ekblom, J.; Lahtinen, R.; Laakso, P. Plant Stanol Ester as a Cholesterol Lowering Ingredientof Benecol® Foods. In Healthful Lipids; Akoh, C., Lai, O.-M., Eds.; AOCS Press: Urbana, IL, USA, 2005;pp. 335–360.
37. Yang, J.-Y.; Koo, J.-H.; Yoon, H.-Y.; Lee, J.-H.; Park, B.-H.; Kim, J.-S.; Chi, M.S.; Park, J.-W. Effect of scopoletinon lipoprotein lipase activity in 3T3-L1 adipocytes. Int. J. Mol. Med. 2007, 20, 527–531. [CrossRef] [PubMed]
38. Franciškovic, M.; Gonzalez-Pérez, R.; Orcic, D.; Sánchez de Medina, F.; Martínez-Augustin, O.; Svircev, E.;Simin, N.; Mimica-Dukic, N. Chemical composition and immuno-modulatory effects of Urtica dioica L.(stinging nettle) extracts. Phytother. Res. 2017, 31, 1183–1191. [CrossRef] [PubMed]
39. Kavalali, G.M. Urtica: The Genus Urtica; CRC Press: Boca Raton, FL, USA, 2004.40. Rosłon, W.; Weglarz, Z. Polyphenolic acids of female and male forms of Urtica dioica. Presented at the
International Conference on Medicinal and Aromatic Plants (Part II), Budapest, Hungary, 8 July 2001;pp. 101–104.
41. Weglarz, Z.; Rosłon, W. Developmental and chemical variation in aboveground organs in the male andfemale forms of common nettle (Urtica dioica L.). Herb. Polonica 2000, 46, 324–331.
42. Nasiri, S.; Nobakht, A.; Safamehr, A. The effect of different levels of nettle Urtica dioica L. (Urticaceae) medicalplant in starter and grower feeds on performance, carcass traits, blood biochemical and immunity parametersof broilers. Iran. J. Appl. Anim. Sci. 2011, 1, 177–181.
43. Carvalho, A.R.; Costab, G.; Figueirinha, A.; Liberal, J.; Prior, J.A.V.; Lopes, M.C.; Cruz, M.T.; Batista, M.T.Urtica spp.: Phenolic composition, safety, antioxidant and anti-inflammatory activities. Food Res. Int. 2017,99, 485–494. [CrossRef] [PubMed]
44. Oliver, F.; Amon, E.U.; Breathnach, A.; Francis, D.M.; Sarathchandra, P.; Black, A.K.; Greaves, M.W. Contacturticaria due to the common stinging nettle (Urtica dioica)-histological, ultrastructural and pharmacologicalstudies. Clin. Exp. Dermatol. 1991, 16, 1–7. [CrossRef] [PubMed]
45. Emmelin, N.; Feldberg, W. Systemic effect of adenosine triphosphate. Br. J. Pharmacol. 1948, 3, 273–284.[CrossRef]
46. Angela, M.; Meireles, A. Extracting Bioactive Compounds for Food Products: Theory and Applications; CRC Press:Boca Raton, FL, USA, 2009.
47. Marrelli, M.; Menichini, F.; Statti, G.A.; Bonesi, M.; Duez, P.; Menichini, F.; Conforti, F. Changes in thephenolic and lipophilic composition, in the enzyme inhibition and antiproliferative activity of Ficus carica L.cultivar Dottato fruits during maturation. Food Chem. Toxicol. 2012, 50, 726–733. [CrossRef] [PubMed]
48. Gülçin, I.; Küfrevioglu, O.I.; Oktay, M.; Büyükokuroglu, M.E. Antioxidant, antimicrobial, antiulcer andanalgesic activities of nettle (Urtica dioica L.). J. Ethnopharmacol. 2004, 90, 205–215. [CrossRef] [PubMed]
49. Rafajlovska, V.; Djarmati, Z.; Najdenova, V.; Cvetkov, L. Extraction of stinging nettle (Urtica dioica L.) withsupercritical carbon dioxide. Presented at the 1st Black Sea Basin Conference on Analytical Chemistry,Odessa, Ukraine, 11–15 September 2001.
50. Salih, N.A.; Arif Edh, D.J. Antibacterial effect of nettle (Urtica dioica). AL-Qadisiyah J. Vet. Med. Sci. 2014, 13,1–6.
59
Molecules 2018, 23, 1664
51. Körpe, D.A.; Iseri, O.D.; Sahin, F.I.; Cabi, E.; Haberal, M. High-antibacterial activity of Urtica spp. seedextracts on food and plant pathogenic bacteria. Int. J. Food Sci. Nutr. 2013, 64, 355–362. [CrossRef] [PubMed]
52. Ghaedi, M.; Naghiha, R.; Jannesar, R.; Dehghanian, N.; Mirtamizdoust, B.; Pezeshkpour, V. Antimicrobialand antifungal activity of flower extract of Urtica dioica, Chamaemelum nobile and Salvia officinalis: Effect ofZn[OH]2 nanoparticles and Hp-2-minh on their property. J. Ind. Eng. Chem. 2015, 32, 353–359. [CrossRef]
53. Mzid, M.; Khedir, S.B.; Salem, M.B.; Regaieg, W.; Rebai, T. Antioxidant and antimicrobial activities of ethanoland aqueous extracts from Urtica urens. Pharm. Biol. 2017, 55, 775–781. [CrossRef] [PubMed]
54. Salehzadeh, A.; Asadpour, L.; Naeemi, A.S.; Houshmand, E. Antimicrobial activity of methanolic extracts ofSambucus ebulus and Urtica dioica against clinical isolates of methicillin resistant Staphylococcus aureus. Afr. J.
Tradit. Complement. Altern. Med. 2014, 11, 38–40. [CrossRef] [PubMed]55. Ranjbar, R.; Shamami, K.S. Evaluation of antimicrobial activity of Eucalyptus essential oil and Urtica alcoholic
extract on Salmonella enteritidis and Shigella dysenteriae in vitro conditions. Bull. Environ. Pharmacol. Life Sci.
2015, 4, 56–59.56. Jyoti, K.; Baunthiyal, M.; Singh, A. Characterization of silver nanoparticles synthesized using Urtica dioica
Linn. leaves and their synergistic effects with antibiotics. J. Radiat. Res. Appl. Sci. 2016, 9, 217–227. [CrossRef]57. Modarresi-Chahardehi, A.; Ibrahim, D.; Sulaiman, S.F.; Mousavi, L. Screening antimicrobial activity of
various extracts of Urtica dioica. Rev. Biol. Trop. 2012, 60, 1567–1576. [CrossRef] [PubMed]58. Dar, S.A.; Ganai, F.A.; Yousuf, A.R.; Balkhi, M.U.; Bhat, T.M.; Sharma, P. Pharmacological and toxicological
evaluation of Urtica dioica. Pharm. Biol. 2013, 51, 170–180. [CrossRef] [PubMed]59. Singh, R.; Dar, S.A.; Sharma, P. Antibacterial activity and toxicological evolution of semi purified hexane
extract of Urtica dioica leaves. Res. J. Med. Plant. 2012, 6, 123–135.60. Ramtin, M.; Massiha, A.; Khoshkholgh-Pahlaviani, M.R.M.; Issazadeh, K.; Assmar, M.; Zarrabi, S. In vitro
antimicrobial activity of Iris pseudacorus and Urtica dioica. Zahedan J. Res. Med. Sci. 2013, 16, 35–39.61. Zenão, S.; Aires, A.; Dias, C.; Saavedra, M.J.; Fernandes, C. Antibacterial potential of Urtica dioica and
Lavandula angustifolia extracts against methicillin resistant Staphylococcus aureus isolated from diabetic footulcers. J. Herb. Med. 2017, 10, 53–58. [CrossRef]
62. Mahmoudi, R.; Amini, K.; Fakhri, O.; Alem, M. Aroma profile and antimicrobial properties of alcoholic andaqueous extracts from root, leaf and stalk of nettle (Urtica dioica L.). J. Microbiol. Biotechnol. Food Sci. 2014, 4,220–224. [CrossRef]
63. Antolak, H.; Czyzowska, A.; Kregiel, D. Antibacterial and antiadhesive activities of extracts from edibleplants against soft drink spoilage by Asaia spp. J. Food Protect. 2017, 80, 5–34. [CrossRef] [PubMed]
64. Shale, T.; Stirk, W.; Van Standen, J. Screening of medicinal plants used in Lesotho for anti-bacterial andanti-inflammatory activity. J. Ethnopharmacol. 1999, 67, 347–354. [CrossRef]
65. Özkan, A.; Yumrutas, Ö.; Saygideger, S.D.; Kulak, M. Evaluation of antioxidant activities and phenoliccontents of some edible and medicinal plants from Turkey’s flora. Adv. Environ. Biol. 2011, 5, 231–236.
66. Pourmorad, F.; Hosseinimehr, S.J.; Shahabimajd, N. Antioxidant activity, phenol and flavonoid contents ofsome selected Iranian medicinal plants. Afr. J. Biotechnol. 2006, 5, 1142–1145.
67. Viegi, L.; Pieroni, A.; Guarrera, P.M.; Vangelisti, R. A review of plants used in folk veterinary medicine inItaly as basis for a databank. J. Ethnopharmacol. 2003, 89, 221–244. [CrossRef] [PubMed]
68. Safamehr, A.; Mirahmadi, M.; Nobakht, A. Effect of nettle (Urtica dioica) medicinal plant on growthperformance, immune responses, and serum biochemical parameters of broiler chickens. Int. Res. J.
Appl. Basic Sci. 2012, 3, 721–728.69. Sökeland, J. Combined sabal and Urtica extract compared with finasteride in men with benign prostatic
hyperplasia: Analysis of prostate volume and therapeutic outcome. BJU Int. 2000, 86, 439–442. [CrossRef][PubMed]
70. Koch, E. Extracts from fruits of saw palmetto (Sabal serrulata) and roots of stinging nettle (Urtica dioica):Viable alternatives in the medical treatment of benign prostatic hyperplasia and associated lower urinarytracts symptoms. Plant Med. 2001, 67, 489–500. [CrossRef] [PubMed]
71. Randall, C.; Randall, H.; Dobbs, F.; Hutton, C.; Sanders, H. Randomized controlled trial of nettle sting fortreatment of base-of-thumb pain. J. R. Soc. Med. 2000, 93, 305–309. [CrossRef] [PubMed]
72. Christensen, R.; Bliddal, H. Is Phytalgic® a goldmine for osteoarthritis patients or is there something fishyabout this nutraceutical? A summary of findings and risk-of-bias assessment. Arthritis Res. Ther. 2010,12, 105. [CrossRef] [PubMed]
60
Molecules 2018, 23, 1664
73. Klingelhoefer, S.; Obertreis, B.; Quast, S.; Behnke, B. Antirheumatic effect of IDS 23, a stinging nettle leafextract, on in vitro expression of T helper cytokines. J. Rheumatol. 1999, 26, 2517–2522. [PubMed]
74. Roschek, B., Jr.; Fink, R.C.; McMichael, M.; Alberte, R.S. Nettle extract (Urtica dioica) affects key receptorsand enzymes associated with allergic rhinitis. Phytother. Res. 2009, 23, 920–926. [CrossRef] [PubMed]
75. D’Amato, G. Pollen Allergy in Europe. The UCB Institute of Allergy. Available online: https://www.ucb.com/_up/tuioa_com/images/PollenAllergy-DAmato-simplified-V2-070910_PP.pdf (accessedon 5 April 2018).
76. Khare, V.; Kushwaha, P.; Verma, S.; Gupta, A.; Srivastava, S.; Rawat, A.K.S. Pharmacognostic evaluation andantioxidant activity of Urtica dioica L. Chin. Med. UK 2012, 3, 128–135. [CrossRef]
77. Lalitharani, S.; Mohan, V.R.; Regini, G.S. GC-MS analysis of ethanolic extract of Zanthoxylum rhetsa (roxb.) dcspines. J. Herb. Med. Toxicol. 2010, 4, 191–192.
78. Taylor, R.S.; Edel, F.; Manandhar, N.P.; Towers, G.H. Antimicrobial activities of southern Nepalese medicinalplants. J. Ethnopharmacol. 1996, 50, 97–102. [CrossRef]
79. Cheung, L.M.; Cheung, P.C.K.; Ooi, V.E.C. Antioxidant activity and total phenolics of edible mushroomextracts. Food Chem. 2003, 81, 249–255. [CrossRef]
80. Wang, T.; Jónsdóttir, R.; Ólafsdóttir, G. Total phenolic compounds, radical scavenging and metal chelation ofextracts from Icelandic seaweeds. Food Chem. 2009, 116, 240–248. [CrossRef]
81. Fisgin, N.S.; Cayci, Y.T.; Coban, A.Y.; Ozatli, D.; Tanyel, E.; Durupinar, B.; Tulek, N. Antimicrobial activity ofplant extract Ankaferd Blood Stopper®. Fiterapia 2009, 80, 48–50. [CrossRef] [PubMed]
82. Bourgeois, C.; Leclerc, É.A.; Corbin, C.; Doussot, J.; Serrano, V.; Vanier, J.R.; Seigneuret, J.-M.; Auguina, D.;Pichon, C.; Lainé, É.; Hano, C. Nettle (Urtica dioica L.) as a source of antioxidant and anti-agingphytochemicals for cosmetic applications. C. R. Chim. 2016, 16, 1090–1100. [CrossRef]
83. Matsingou, T.C.; Kapsokefalou, M.; Salifoglou, A. Aqueous infusions of Mediterranean herbs exhibitantioxidant activity towards iron promoted oxidation of phospholipids, linoleic acid, and deoxyribose.Free Radic. Res. 2001, 35, 593–605. [CrossRef] [PubMed]
84. Sharafetdinov, Kh.Kh; Kiseleva, T.L; Kochetkova, A.A.; Mazo, V.K. Promising plant sources of anti-diabeticmicronutrients. J. Diabetes Metab. 2017, 8, 778.
85. Wahba, H.E.; Motawe, H.M.; Ibrahim, A.Y. Growth and chemical composition of Urtica pilulifera L. plant asinfluenced by foliar application of some amino acids. J. Mater. Environ. Sci. 2015, 6, 499–506.
86. Mukundi, M.J.; Mwaniki, N.E.N.; Piero, N.M.; Murugi, N.J.; Kelvin, J.K.; Yusuf, A.A.; Mwonjoria, K.J.;Ngetich, K.A.; Agyirifo, S.D.; Gathumbi, K.P.; et al. Potential anti-diabetic effects and safety of aqueousextracts of Urtica dioica collected from Narok County, Kenya. Pharm. Anal. Acta 2017, 7, 548. [CrossRef]
87. Uprety, Y.; Poudel, R.C.; Shrestha, K.K.; Rajbhandary, S.; Tiwari, N.N.; Shrestha, U.B.; Asselin, H. Diversityof use and local knowledge of wild edible plant resources in Nepal. J. Ethnobiol. Ethnomed. 2012, 8, 16.[CrossRef] [PubMed]
88. Bekele, B.; Melesse, A.; Beyan, M.; Berihun, K. The effect of feeding stinging nettle (Urtica simensis S.) leafmeal on feed intake, growth performance and carcass characteristics of hubbard broiler chickens. Glob. J.
Sci. Front. Res. 2015, 15. Available online: https://globaljournals.org/GJSFR_Volume15/1-The-Effect-of-Feeding.pdf (accessed on 15 June 2018).
89. Costa, H.S.; Albuquerque, T.G.; Sanches-Silva, A.; Vasilopoulou, E.; Trichopoulou, A.; D’Antuono, L.F.;Alexieva, I.; Boyko, N.; Costea, C.; Fedosova, K.; et al. New nutritional composition data on selectedtraditional foods consumed in Black Sea Area countries. J. Sci. Food Agric. 2013, 93, 3524–3534. [CrossRef][PubMed]
90. Fiola, C.; Prado, D.; Mora, M.; Alava, J.I. Nettle cheese: Using nettle leaves (Urtica dioica) to coagulate milk inthe fresh cheese making process. Int. J. Gastronomy Food Sci. 2016, 4, 19–24. [CrossRef]
91. Sánchez-Mata, M.; Tardio, J. Mediterranean Wild Edible Plants; Springer: New York, NY, USA, 2016.92. Kovacs, J. Compositions of Oats and Nettle Extracts to be Used as a Food Additive or Pharmaceutical
Preparation in Human Health Care. U.S. Patent 4886665, 12 December 1989.93. Antolak, H.; Kregiel, D. Food preservatives from plants. In Food Additives; Karunaratne, D.N., Pamunuwa, G.,
Eds.; InTech: Berlin, Germany, 2017; pp. 45–85.94. Johnson, A.; Johnson, S. Garden plants poisonous to people. Primefact 2006, 359. Available
online: https://www.dpi.nsw.gov.au/__data/assets/pdf_file/0008/112796/garden-plants-poisonous-to-people.pdf (accessed on 25 June 2018).
61
Molecules 2018, 23, 1664
95. Papuc, C.; Goran, G.V.; Predescu, C.N.; Nicorescu, V. Mechanisms of oxidative processes in meat and toxicityinduced by postprandial degradation products: A review. Compr. Rev. Food Sci. Food Saf. 2017, 16, 96–123.[CrossRef]
96. Shah, M.A.; Bosco, S.J.D.; Mir, S.A. Plant extracts as natural antioxidants in meat and meat products. Meat Sci.
2014, 98, 21–33. [CrossRef] [PubMed]97. Inai, M.; Miura, Y.; Honda, S.; Masuda, A.; Masuda, T. Metmyoglobin reduction by polyphenols and
mechanism of the conversion of metmyoglobin to oxymyoglobin by quercetin. J. Agric. Food Chem. 2014, 62,893–901. [CrossRef] [PubMed]
98. Aksu, M.I.; Kaya, M. Effect of usage Urtica dioica L. on microbiological properties of sucuk, a Turkishdry-fermented sausage. Food Control 2004, 8, 591–595. [CrossRef]
99. Kaban, G.; Aksu, M.I.; Kaya, M. Behaviour of Staphylococcus aureus in sucuk with nettle (Urtica dioica L.).J. Food Saf. 2007, 27, 400–410. [CrossRef]
100. Karabacak, S.; Bozkurt, H. Effects of Urtica dioica and Hibiscus sabdariffa on the quality and safety of sucuk(Turkish dry-fermented sausage). Meat Sci. 2007, 78, 288–296. [CrossRef] [PubMed]
101. Alp-Erbay, E.; Aksu, M.I. Effects of water extract of Urtica dioica L. and modified atmosphere packaging onthe shelf life of ground beef. Meat Sci. 2010, 86, 468–473.
102. Oz, F. Effects of water extract of Urtica dioica L. on the quality of meatballs. J. Food Process. Pres. 2014, 38,1356–1363. [CrossRef]
103. Ahmadi, M.; Razavilar, V.; Motallebi, A.A.; Esmailzadeh Kenari, R.; Khanipour, A.A. Effects of hydroalcoholicand water extracts of nettle leaf (Urtica dioica L.) on chemical properties of superchilled minced meat ofcommon Kilka (Clupeonella cultriventris caspia). J. Food Qual. Hazards Control 2014, 1, 85–88.
104. Aksu, M.I.; Alinezhad, H.; Erdemir, E. Effect of lyophilized water extract of Urtica dioica L. on the shelf life ofvacuum-packaged beef steaks. J. Food Process Pres. 2015, 39, 3059–3066. [CrossRef]
105. Latoch, A.; Stasiak, D.M. Effect of water extract of Urtica dioica L. on lipid oxidation and color of cooked porksausage. J. Food Process Pres. 2017, 41, e12818. [CrossRef]
106. Gill, C. Herbs and plant extracts as growth enhancers. Feed Int. 1999, 20, 20–23.107. Langhout, P. New additives for broiler chickens. J. World’s Poult. Sci. J. 2000, 16, 22–27.108. Madrid, J.; Hernández, F.; García, V.; Orengo, J.; Megías, M.D.; Sevilla, V. Effect of plant extracts on ileal
apparent digestibility and carcass yield in broilers at level of farm. Presented at the 14th European Symp onPoultry Nutrition, Lillehammer, Norway, 10–14 August 2003; p. 187.
109. Alçiçek, A.; Bozkurt, M.; Çabuk, M. The effects of an essential oil combination derived from selected herbsgrowing wild in Turkey on broiler performance. S. Afr. J. Anim. Sci. 2004, 33, 89–94.
110. Zhang, K.Y.; Yan, F.; Keen, C.A.; Waldroup, P.W. Evaluation of microencapsulated essential oils and organicacids in diets for broiler chickens. Int. J. Poult. Sci. 2005, 4, 612–619.
111. Wenk, C. Why all the discussion about herbs? In Feed Industry, Proceedings of the Alltech’s 16th Anniversary
Symposium Biotechnology; Lyons, T.P., Ed.; Alltech Tech.: Nottingham, UK; University Press: Nicholasvile, KY,USA, 2000; pp. 79–96.
112. Szewczyk, A.; Hanczakowska, E.; Swiatkiewicz, M. The effect of nettle (Urtica dioica) extract on fatteningperformance and fatty acid profile in the meat and serum lipids of pigs. J. Anim. Feed Sci. 2006, 15, 81–84.[CrossRef]
113. Nobakht, A. Effects of different levels of chicory (Cichorium intybus L.), zizaphora (Zizaphora tenuior L.),nettle (Urtica dioica L.) and savoury (Satureja hortensis L.) medicinal plants on carcass characteristics of malebroilers. J. Med. Plants Res. 2011, 5, 4354–4359.
114. Toldy, A.; Stadler, K.; Sasvari, M.; Jakus, J.; Jung, K.J.; Chung, H.Y.; Berkes, I.; Nyakas, C.; Radák, Z. The effectof exercise and nettle supplementation on oxidative stress markers in the rat brain. Brain Res. Bull. 2005, 65,487–493. [CrossRef] [PubMed]
115. Humphries, D.J.; Reynolds, C.K. The effect of adding stinging nettle (Urtica dioica) haylage to a total mixedration on performance and rumen function of lactating dairy cows. Anim. Feed Sci. Technol. 2014, 189, 72–81.[CrossRef]
116. Williams, P.; Losa, R. The use of essential oils and their compounds in poultry nutrition. J. World’s Poult.
Sci. J. 2001, 17, 14–15.117. McCartney, E. The natural empire strikes back. Poult. Int. 2002, 41, 36–42.
62
Molecules 2018, 23, 1664
118. Sandru, C.D.; Niculae, M.; Popescu, S.; Pastiu, A.I.; Páll, E.; Spînu, M. Urtica dioica alcoholic extract increasesthe cell-mediated innate. Ind. Crop Prod. 2016, 88, 48–50. [CrossRef]
119. Avci, G.; Kupeli, E.; Eryavuz, A.; Yesilada, E.; Kucukkurt, I. Antihypercholesterolaemic and antioxidantactivity assess ment of some plants used as remedy in Turkish folk medicine. J. Ethnopharmacol. 2006, 107,418–423. [CrossRef] [PubMed]
120. Mavi, A.; Terzi, Z.; Ozgen, U.; Yildirin, A.; Coskun, M. Antioxidant properties of some medicinal plants:Prangos ferulacea (Apiaceae), Sedum (Crassulaceae), Malva neglecta (Malvaceae), Cruciata taurica (Rubiaceae),Rosa pimpinellifolia (Rosaceae), Galium verum subsp. verum (Rubiaceae), Urtica dioica (Urticaceae). Biol. Pharm.
Bull. 2004, 27, 702–705. [CrossRef] [PubMed]121. Fermont, L.; Gozzelino, M.T.; Linard, A. Response of plasma lipids to dietary cholesterol and wine
polyphenols in rats fed polyunsaturated fat diets. Lipids 2000, 35, 991–999. [CrossRef]122. Visioli, F.; Galli, C.; Galli, G.; Caruso, D. Biological activities and metabolic fate of olive oil phenols. J. Lipid
Sci. Technol. 2002, 104, 677–684. [CrossRef]123. Khosravi, A.; Boldaji, F.; Dastar, B.; Hasani, S. The use of some feed additives as growth promoter in broilers
nutrition. Int. J. Poult. Sci. 2008, 7, 1095–1099. [CrossRef]124. Wang, R.J.; Li, D.F.; Bourne, S.; Wang, R.J.; Li, D.F. Can 2000 years of herbal medicine history help us solve
problems in the year 2000? Presented at the Alltech’s 14th Annual Symposium on Biotechnology in the FeedIndustry, Nicholasville, KY, USA, 1998; pp. 273–292.
125. World Health Organization. WHO Monographs on Selected Medicinal Plants; WHO: Geneva, Switzerland, 2004;Volume 2, pp. 1–358.
126. European Commission. Directorate—General for Health and Food Safety; Final Review Report for the BasicSubstance Urtica spp.; European Commission: Brussels, Belgium, 2017.
© 2018 by the authors. Licensee MDPI, Basel, Switzerland. This article is an open accessarticle distributed under the terms and conditions of the Creative Commons Attribution(CC BY) license (http://creativecommons.org/licenses/by/4.0/).
63

molecules
Article
Olive Leaf Addition Increases Olive OilNutraceutical Properties
Imen Tarchoune 1, Cristina Sgherri 2,* , Jamel Eddouzi 3, Angela Zinnai 2,4,
Mike Frank Quartacci 2,4,* and Mokhtar Zarrouk 1
1 Laboratoire de Biotechnologie d’Olivier, Centre de Biotechnologie de Borj-Cedria, B.P. 901,2050 Hammam-Lif, Tunisia; [email protected] (I.T.); [email protected] (M.Z.)
2 Department of Agriculture, Food and Environment (DAFE), Via del Borghetto 80, 56124 Pisa, Italy;[email protected]
3 Laboratoire de Biotechnologie Appliquée à l’Agriculture, INRA Tunis, Université de Carthage, El Menzah,1004 Tunis, Tunisia; [email protected]
4 Interdepartmental Research Centre “Nutraceuticals and Food for Health”, University of Pisa,Via del Borghetto 80, 56124 Pisa, Italy
* Correspondence: [email protected] (C.S.); [email protected] (M.F.Q.);Tel.: +39-050-2216609 (C.S.); +39-050-2216612 (M.F.Q.)
Academic Editor: Lillian BarrosReceived: 17 January 2019; Accepted: 1 February 2019; Published: 2 February 2019
Abstract: The aim of the present research was to study the effects of olive leaf addition (0 and 3%) onthe major antioxidants and the antioxidant activity of Neb Jmel and Oueslati olive oils. Olives andleaves of the two Tunisian varieties were harvested during the 2016/2017 crop season. Both leavesand oils were characterised for their concentrations in phenolics, tocopherols and antioxidant power.Other parameters such as free acidity, peroxide value, chlorophyll and carotenoid concentrations werealso taken into consideration. Compared to Oueslati, the Neb Jmel oil showed a lower free acidity(50%) and peroxide value (5.6-fold), and higher chlorophyll (1.6-fold), total phenolics (1.3-fold),flavonoid (3-fold) and oleuropein derivative (1.5-fold) concentrations, in addition to an increasedantioxidant activity (1.6-fold). Leaf addition promoted a significant increment in total chlorophyll,α-tocopherol and phenolics in both varieties, above all in Oueslati oil, due to a higher abundanceof bioactive constituents in the corresponding leaves. In particular, chlorophyll and carotenoidconcentrations reached values twice higher than in Neb Jmel leaves, and flavonoids and oleouperinderivatives were three-fold higher. This prevented the oxidation and the formation of peroxides,reducing the peroxide value of the fortified oil to the half. The results provide evidence on theperformance of the Tunisian Neb Jmel and Oueslati varieties, showing that their oils present achemical profile corresponding to the extra virgin olive oil category and that, after leaf addition, theirnutritional value was improved.
Keywords: extra virgin olive oil; leaf addition; Tunisian varieties; phenolics; tocopherols; antioxidantactivity
1. Introduction
In the Mediterranean area, the olive tree is so economically important that oliviculture is one ofthe most widespread agricultural activities. It is estimated that about 8 million ha are cultivated witholive trees [1,2]. In particular, in Tunisia, an area of 1.7 million ha is covered by olive trees, whichresults in the production of more than 4% of the global olive oil amount. Due to the 170,000 tonsproduced per year, Tunisia is the fourth largest producer and exporter of olive oil in the world [3].
The nutritional and health-promoting effects of olives and olive oils are more and morerecognized [4]. Indeed, it is well known that olive oil is a potential antioxidant [5–7] showing
65
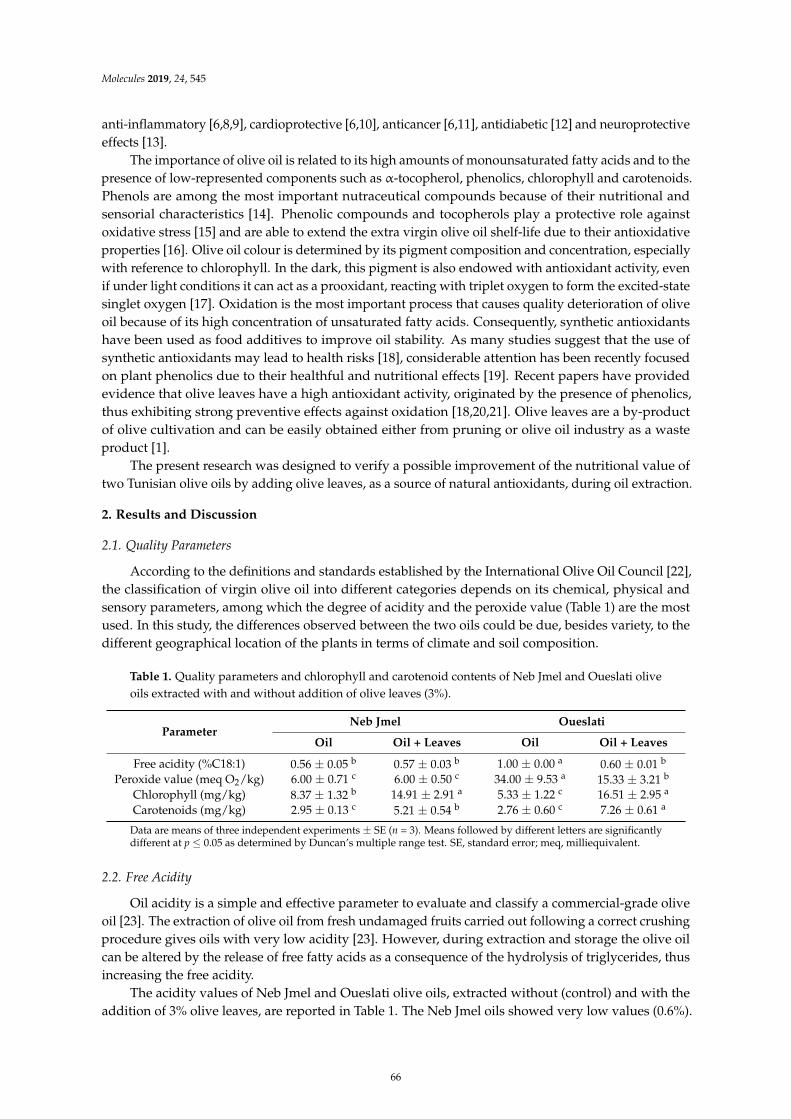
Molecules 2019, 24, 545
anti-inflammatory [6,8,9], cardioprotective [6,10], anticancer [6,11], antidiabetic [12] and neuroprotectiveeffects [13].
The importance of olive oil is related to its high amounts of monounsaturated fatty acids and to thepresence of low-represented components such as α-tocopherol, phenolics, chlorophyll and carotenoids.Phenols are among the most important nutraceutical compounds because of their nutritional andsensorial characteristics [14]. Phenolic compounds and tocopherols play a protective role againstoxidative stress [15] and are able to extend the extra virgin olive oil shelf-life due to their antioxidativeproperties [16]. Olive oil colour is determined by its pigment composition and concentration, especiallywith reference to chlorophyll. In the dark, this pigment is also endowed with antioxidant activity, evenif under light conditions it can act as a prooxidant, reacting with triplet oxygen to form the excited-statesinglet oxygen [17]. Oxidation is the most important process that causes quality deterioration of oliveoil because of its high concentration of unsaturated fatty acids. Consequently, synthetic antioxidantshave been used as food additives to improve oil stability. As many studies suggest that the use ofsynthetic antioxidants may lead to health risks [18], considerable attention has been recently focusedon plant phenolics due to their healthful and nutritional effects [19]. Recent papers have providedevidence that olive leaves have a high antioxidant activity, originated by the presence of phenolics,thus exhibiting strong preventive effects against oxidation [18,20,21]. Olive leaves are a by-productof olive cultivation and can be easily obtained either from pruning or olive oil industry as a wasteproduct [1].
The present research was designed to verify a possible improvement of the nutritional value oftwo Tunisian olive oils by adding olive leaves, as a source of natural antioxidants, during oil extraction.
2. Results and Discussion
2.1. Quality Parameters
According to the definitions and standards established by the International Olive Oil Council [22],the classification of virgin olive oil into different categories depends on its chemical, physical andsensory parameters, among which the degree of acidity and the peroxide value (Table 1) are the mostused. In this study, the differences observed between the two oils could be due, besides variety, to thedifferent geographical location of the plants in terms of climate and soil composition.
Table 1. Quality parameters and chlorophyll and carotenoid contents of Neb Jmel and Oueslati oliveoils extracted with and without addition of olive leaves (3%).
ParameterNeb Jmel Oueslati
Oil Oil + Leaves Oil Oil + Leaves
Free acidity (%C18:1) 0.56 ± 0.05 b 0.57 ± 0.03 b 1.00 ± 0.00 a 0.60 ± 0.01 b
Peroxide value (meq O2/kg) 6.00 ± 0.71 c 6.00 ± 0.50 c 34.00 ± 9.53 a 15.33 ± 3.21 b
Chlorophyll (mg/kg) 8.37 ± 1.32 b 14.91 ± 2.91 a 5.33 ± 1.22 c 16.51 ± 2.95 a
Carotenoids (mg/kg) 2.95 ± 0.13 c 5.21 ± 0.54 b 2.76 ± 0.60 c 7.26 ± 0.61 a
Data are means of three independent experiments ± SE (n = 3). Means followed by different letters are significantlydifferent at p ≤ 0.05 as determined by Duncan’s multiple range test. SE, standard error; meq, milliequivalent.
2.2. Free Acidity
Oil acidity is a simple and effective parameter to evaluate and classify a commercial-grade oliveoil [23]. The extraction of olive oil from fresh undamaged fruits carried out following a correct crushingprocedure gives oils with very low acidity [23]. However, during extraction and storage the olive oilcan be altered by the release of free fatty acids as a consequence of the hydrolysis of triglycerides, thusincreasing the free acidity.
The acidity values of Neb Jmel and Oueslati olive oils, extracted without (control) and with theaddition of 3% olive leaves, are reported in Table 1. The Neb Jmel oils showed very low values (0.6%).
66
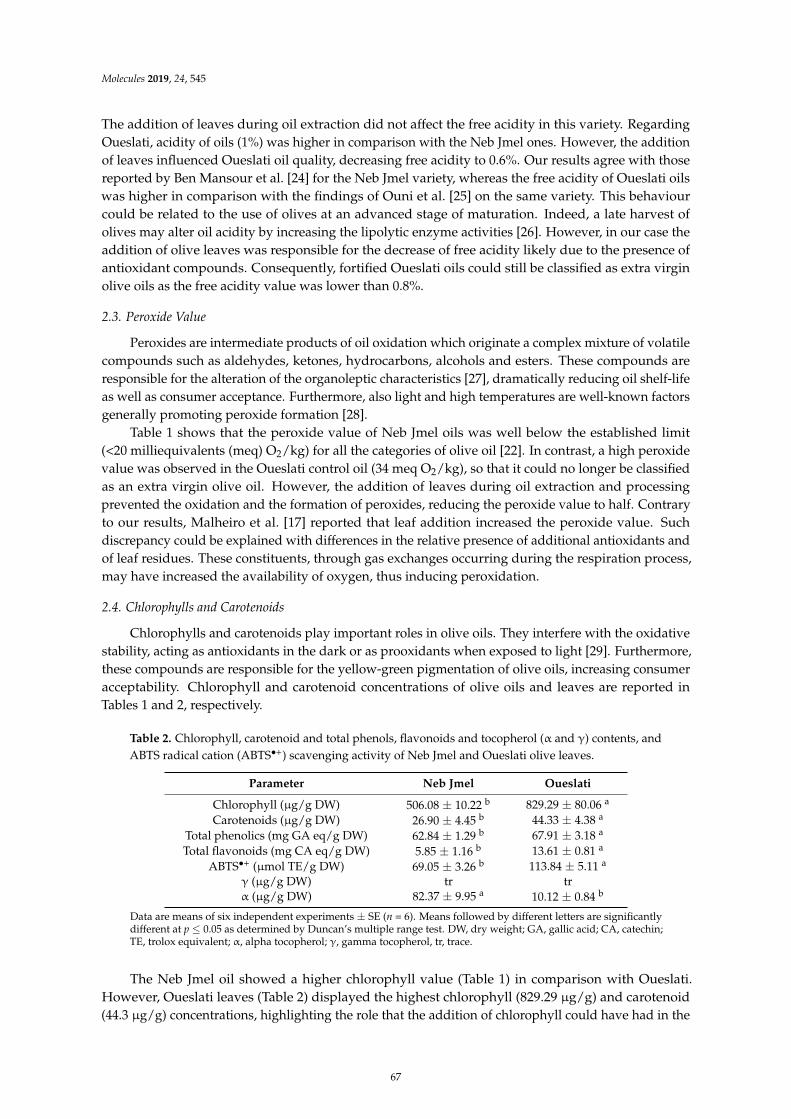
Molecules 2019, 24, 545
The addition of leaves during oil extraction did not affect the free acidity in this variety. RegardingOueslati, acidity of oils (1%) was higher in comparison with the Neb Jmel ones. However, the additionof leaves influenced Oueslati oil quality, decreasing free acidity to 0.6%. Our results agree with thosereported by Ben Mansour et al. [24] for the Neb Jmel variety, whereas the free acidity of Oueslati oilswas higher in comparison with the findings of Ouni et al. [25] on the same variety. This behaviourcould be related to the use of olives at an advanced stage of maturation. Indeed, a late harvest ofolives may alter oil acidity by increasing the lipolytic enzyme activities [26]. However, in our case theaddition of olive leaves was responsible for the decrease of free acidity likely due to the presence ofantioxidant compounds. Consequently, fortified Oueslati oils could still be classified as extra virginolive oils as the free acidity value was lower than 0.8%.
2.3. Peroxide Value
Peroxides are intermediate products of oil oxidation which originate a complex mixture of volatilecompounds such as aldehydes, ketones, hydrocarbons, alcohols and esters. These compounds areresponsible for the alteration of the organoleptic characteristics [27], dramatically reducing oil shelf-lifeas well as consumer acceptance. Furthermore, also light and high temperatures are well-known factorsgenerally promoting peroxide formation [28].
Table 1 shows that the peroxide value of Neb Jmel oils was well below the established limit(<20 milliequivalents (meq) O2/kg) for all the categories of olive oil [22]. In contrast, a high peroxidevalue was observed in the Oueslati control oil (34 meq O2/kg), so that it could no longer be classifiedas an extra virgin olive oil. However, the addition of leaves during oil extraction and processingprevented the oxidation and the formation of peroxides, reducing the peroxide value to half. Contraryto our results, Malheiro et al. [17] reported that leaf addition increased the peroxide value. Suchdiscrepancy could be explained with differences in the relative presence of additional antioxidants andof leaf residues. These constituents, through gas exchanges occurring during the respiration process,may have increased the availability of oxygen, thus inducing peroxidation.
2.4. Chlorophylls and Carotenoids
Chlorophylls and carotenoids play important roles in olive oils. They interfere with the oxidativestability, acting as antioxidants in the dark or as prooxidants when exposed to light [29]. Furthermore,these compounds are responsible for the yellow-green pigmentation of olive oils, increasing consumeracceptability. Chlorophyll and carotenoid concentrations of olive oils and leaves are reported inTables 1 and 2, respectively.
Table 2. Chlorophyll, carotenoid and total phenols, flavonoids and tocopherol (α and γ) contents, andABTS radical cation (ABTS•+) scavenging activity of Neb Jmel and Oueslati olive leaves.
Parameter Neb Jmel Oueslati
Chlorophyll (µg/g DW) 506.08 ± 10.22 b 829.29 ± 80.06 a
Carotenoids (µg/g DW) 26.90 ± 4.45 b 44.33 ± 4.38 a
Total phenolics (mg GA eq/g DW) 62.84 ± 1.29 b 67.91 ± 3.18 a
Total flavonoids (mg CA eq/g DW) 5.85 ± 1.16 b 13.61 ± 0.81 a
ABTS•+ (µmol TE/g DW) 69.05 ± 3.26 b 113.84 ± 5.11 a
γ (µg/g DW) tr trα (µg/g DW) 82.37 ± 9.95 a 10.12 ± 0.84 b
Data are means of six independent experiments ± SE (n = 6). Means followed by different letters are significantlydifferent at p ≤ 0.05 as determined by Duncan’s multiple range test. DW, dry weight; GA, gallic acid; CA, catechin;TE, trolox equivalent; α, alpha tocopherol; γ, gamma tocopherol, tr, trace.
The Neb Jmel oil showed a higher chlorophyll value (Table 1) in comparison with Oueslati.However, Oueslati leaves (Table 2) displayed the highest chlorophyll (829.29 µg/g) and carotenoid(44.3 µg/g) concentrations, highlighting the role that the addition of chlorophyll could have had in the
67
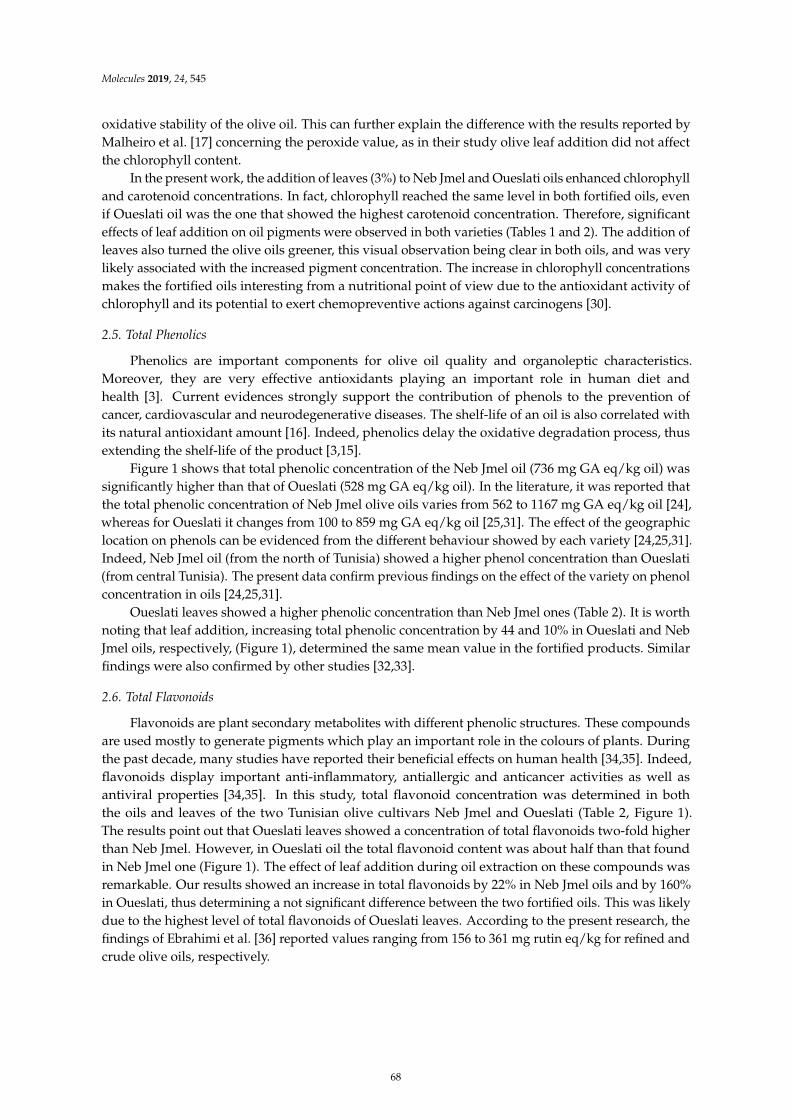
Molecules 2019, 24, 545
oxidative stability of the olive oil. This can further explain the difference with the results reported byMalheiro et al. [17] concerning the peroxide value, as in their study olive leaf addition did not affectthe chlorophyll content.
In the present work, the addition of leaves (3%) to Neb Jmel and Oueslati oils enhanced chlorophylland carotenoid concentrations. In fact, chlorophyll reached the same level in both fortified oils, evenif Oueslati oil was the one that showed the highest carotenoid concentration. Therefore, significanteffects of leaf addition on oil pigments were observed in both varieties (Tables 1 and 2). The addition ofleaves also turned the olive oils greener, this visual observation being clear in both oils, and was verylikely associated with the increased pigment concentration. The increase in chlorophyll concentrationsmakes the fortified oils interesting from a nutritional point of view due to the antioxidant activity ofchlorophyll and its potential to exert chemopreventive actions against carcinogens [30].
2.5. Total Phenolics
Phenolics are important components for olive oil quality and organoleptic characteristics.Moreover, they are very effective antioxidants playing an important role in human diet andhealth [3]. Current evidences strongly support the contribution of phenols to the prevention ofcancer, cardiovascular and neurodegenerative diseases. The shelf-life of an oil is also correlated withits natural antioxidant amount [16]. Indeed, phenolics delay the oxidative degradation process, thusextending the shelf-life of the product [3,15].
Figure 1 shows that total phenolic concentration of the Neb Jmel oil (736 mg GA eq/kg oil) wassignificantly higher than that of Oueslati (528 mg GA eq/kg oil). In the literature, it was reported thatthe total phenolic concentration of Neb Jmel olive oils varies from 562 to 1167 mg GA eq/kg oil [24],whereas for Oueslati it changes from 100 to 859 mg GA eq/kg oil [25,31]. The effect of the geographiclocation on phenols can be evidenced from the different behaviour showed by each variety [24,25,31].Indeed, Neb Jmel oil (from the north of Tunisia) showed a higher phenol concentration than Oueslati(from central Tunisia). The present data confirm previous findings on the effect of the variety on phenolconcentration in oils [24,25,31].
Oueslati leaves showed a higher phenolic concentration than Neb Jmel ones (Table 2). It is worthnoting that leaf addition, increasing total phenolic concentration by 44 and 10% in Oueslati and NebJmel oils, respectively, (Figure 1), determined the same mean value in the fortified products. Similarfindings were also confirmed by other studies [32,33].
2.6. Total Flavonoids
Flavonoids are plant secondary metabolites with different phenolic structures. These compoundsare used mostly to generate pigments which play an important role in the colours of plants. Duringthe past decade, many studies have reported their beneficial effects on human health [34,35]. Indeed,flavonoids display important anti-inflammatory, antiallergic and anticancer activities as well asantiviral properties [34,35]. In this study, total flavonoid concentration was determined in boththe oils and leaves of the two Tunisian olive cultivars Neb Jmel and Oueslati (Table 2, Figure 1).The results point out that Oueslati leaves showed a concentration of total flavonoids two-fold higherthan Neb Jmel. However, in Oueslati oil the total flavonoid content was about half than that foundin Neb Jmel one (Figure 1). The effect of leaf addition during oil extraction on these compounds wasremarkable. Our results showed an increase in total flavonoids by 22% in Neb Jmel oils and by 160%in Oueslati, thus determining a not significant difference between the two fortified oils. This was likelydue to the highest level of total flavonoids of Oueslati leaves. According to the present research, thefindings of Ebrahimi et al. [36] reported values ranging from 156 to 361 mg rutin eq/kg for refined andcrude olive oils, respectively.
68
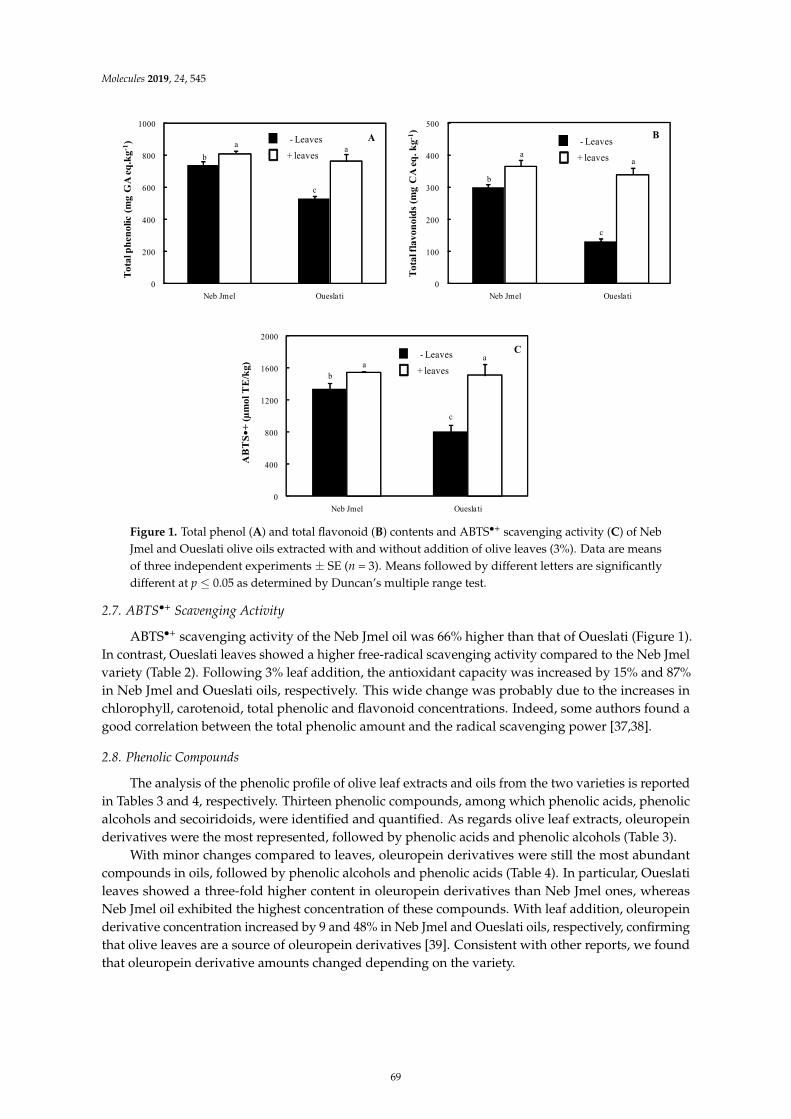
Molecules 2019, 24, 545
≤
0
Neb Jmel Oueslati
To
tal p
hen
oli
c(m
g G
A e
q.k
g-1
)
200
400
600
800
1000
Aa
a
b
c
To
tal fl
avo
no
ids
(mg
CA
eq
. k
g-1
)
- Leaves
+ leaves
0
100
200
300
400
500
Neb Jmel Oueslati
aa
b
c
B
0
400
800
1200
1600
2000
Neb Jmel Oueslati
aa
b
c
AB
TS�
+ (
µm
ol
TE
/kg)
C
- Leaves
+ leaves
- Leaves
+ leaves
Figure 1. Total phenol (A) and total flavonoid (B) contents and ABTS•+ scavenging activity (C) of NebJmel and Oueslati olive oils extracted with and without addition of olive leaves (3%). Data are meansof three independent experiments ± SE (n = 3). Means followed by different letters are significantlydifferent at p ≤ 0.05 as determined by Duncan’s multiple range test.
2.7. ABTS•+ Scavenging Activity
ABTS•+ scavenging activity of the Neb Jmel oil was 66% higher than that of Oueslati (Figure 1).In contrast, Oueslati leaves showed a higher free-radical scavenging activity compared to the Neb Jmelvariety (Table 2). Following 3% leaf addition, the antioxidant capacity was increased by 15% and 87%in Neb Jmel and Oueslati oils, respectively. This wide change was probably due to the increases inchlorophyll, carotenoid, total phenolic and flavonoid concentrations. Indeed, some authors found agood correlation between the total phenolic amount and the radical scavenging power [37,38].
2.8. Phenolic Compounds
The analysis of the phenolic profile of olive leaf extracts and oils from the two varieties is reportedin Tables 3 and 4, respectively. Thirteen phenolic compounds, among which phenolic acids, phenolicalcohols and secoiridoids, were identified and quantified. As regards olive leaf extracts, oleuropeinderivatives were the most represented, followed by phenolic acids and phenolic alcohols (Table 3).
With minor changes compared to leaves, oleuropein derivatives were still the most abundantcompounds in oils, followed by phenolic alcohols and phenolic acids (Table 4). In particular, Oueslatileaves showed a three-fold higher content in oleuropein derivatives than Neb Jmel ones, whereasNeb Jmel oil exhibited the highest concentration of these compounds. With leaf addition, oleuropeinderivative concentration increased by 9 and 48% in Neb Jmel and Oueslati oils, respectively, confirmingthat olive leaves are a source of oleuropein derivatives [39]. Consistent with other reports, we foundthat oleuropein derivative amounts changed depending on the variety.
69
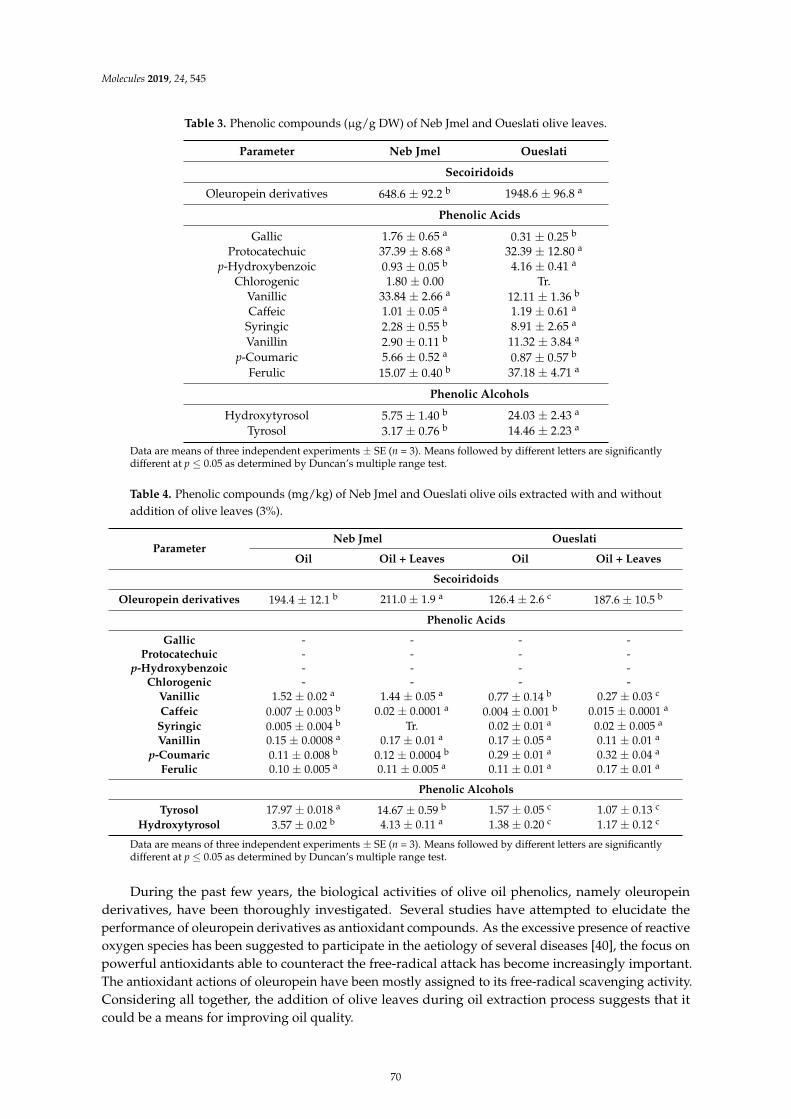
Molecules 2019, 24, 545
Table 3. Phenolic compounds (µg/g DW) of Neb Jmel and Oueslati olive leaves.
Parameter Neb Jmel Oueslati
Secoiridoids
Oleuropein derivatives 648.6 ± 92.2 b 1948.6 ± 96.8 a
Phenolic Acids
Gallic 1.76 ± 0.65 a 0.31 ± 0.25 b
Protocatechuic 37.39 ± 8.68 a 32.39 ± 12.80 a
p-Hydroxybenzoic 0.93 ± 0.05 b 4.16 ± 0.41 a
Chlorogenic 1.80 ± 0.00 Tr.Vanillic 33.84 ± 2.66 a 12.11 ± 1.36 b
Caffeic 1.01 ± 0.05 a 1.19 ± 0.61 a
Syringic 2.28 ± 0.55 b 8.91 ± 2.65 a
Vanillin 2.90 ± 0.11 b 11.32 ± 3.84 a
p-Coumaric 5.66 ± 0.52 a 0.87 ± 0.57 b
Ferulic 15.07 ± 0.40 b 37.18 ± 4.71 a
Phenolic Alcohols
Hydroxytyrosol 5.75 ± 1.40 b 24.03 ± 2.43 a
Tyrosol 3.17 ± 0.76 b 14.46 ± 2.23 a
Data are means of three independent experiments ± SE (n = 3). Means followed by different letters are significantlydifferent at p ≤ 0.05 as determined by Duncan’s multiple range test.
Table 4. Phenolic compounds (mg/kg) of Neb Jmel and Oueslati olive oils extracted with and withoutaddition of olive leaves (3%).
ParameterNeb Jmel Oueslati
Oil Oil + Leaves Oil Oil + Leaves
Secoiridoids
Oleuropein derivatives 194.4 ± 12.1 b 211.0 ± 1.9 a 126.4 ± 2.6 c 187.6 ± 10.5 b
Phenolic Acids
Gallic - - - -Protocatechuic - - - -
p-Hydroxybenzoic - - - -Chlorogenic - - - -
Vanillic 1.52 ± 0.02 a 1.44 ± 0.05 a 0.77 ± 0.14 b 0.27 ± 0.03 c
Caffeic 0.007 ± 0.003 b 0.02 ± 0.0001 a 0.004 ± 0.001 b 0.015 ± 0.0001 a
Syringic 0.005 ± 0.004 b Tr. 0.02 ± 0.01 a 0.02 ± 0.005 a
Vanillin 0.15 ± 0.0008 a 0.17 ± 0.01 a 0.17 ± 0.05 a 0.11 ± 0.01 a
p-Coumaric 0.11 ± 0.008 b 0.12 ± 0.0004 b 0.29 ± 0.01 a 0.32 ± 0.04 a
Ferulic 0.10 ± 0.005 a 0.11 ± 0.005 a 0.11 ± 0.01 a 0.17 ± 0.01 a
Phenolic Alcohols
Tyrosol 17.97 ± 0.018 a 14.67 ± 0.59 b 1.57 ± 0.05 c 1.07 ± 0.13 c
Hydroxytyrosol 3.57 ± 0.02 b 4.13 ± 0.11 a 1.38 ± 0.20 c 1.17 ± 0.12 c
Data are means of three independent experiments ± SE (n = 3). Means followed by different letters are significantlydifferent at p ≤ 0.05 as determined by Duncan’s multiple range test.
During the past few years, the biological activities of olive oil phenolics, namely oleuropeinderivatives, have been thoroughly investigated. Several studies have attempted to elucidate theperformance of oleuropein derivatives as antioxidant compounds. As the excessive presence of reactiveoxygen species has been suggested to participate in the aetiology of several diseases [40], the focus onpowerful antioxidants able to counteract the free-radical attack has become increasingly important.The antioxidant actions of oleuropein have been mostly assigned to its free-radical scavenging activity.Considering all together, the addition of olive leaves during oil extraction process suggests that itcould be a means for improving oil quality.
70
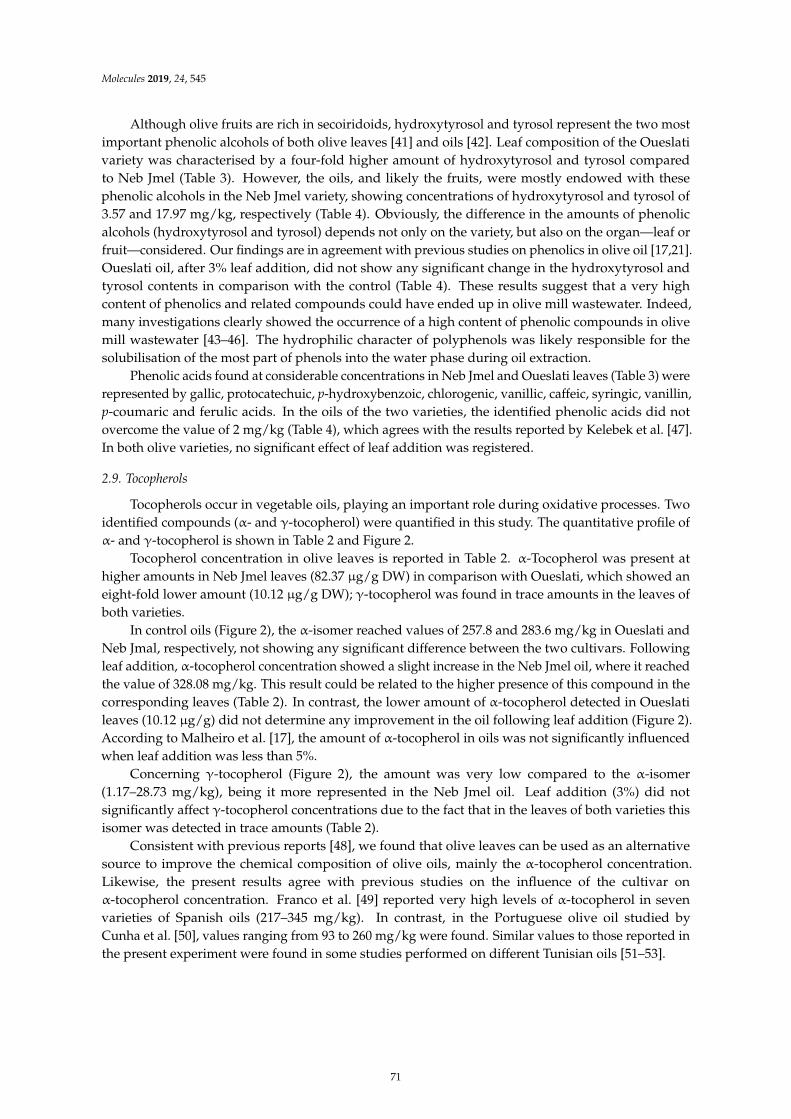
Molecules 2019, 24, 545
Although olive fruits are rich in secoiridoids, hydroxytyrosol and tyrosol represent the two mostimportant phenolic alcohols of both olive leaves [41] and oils [42]. Leaf composition of the Oueslativariety was characterised by a four-fold higher amount of hydroxytyrosol and tyrosol comparedto Neb Jmel (Table 3). However, the oils, and likely the fruits, were mostly endowed with thesephenolic alcohols in the Neb Jmel variety, showing concentrations of hydroxytyrosol and tyrosol of3.57 and 17.97 mg/kg, respectively (Table 4). Obviously, the difference in the amounts of phenolicalcohols (hydroxytyrosol and tyrosol) depends not only on the variety, but also on the organ—leaf orfruit—considered. Our findings are in agreement with previous studies on phenolics in olive oil [17,21].Oueslati oil, after 3% leaf addition, did not show any significant change in the hydroxytyrosol andtyrosol contents in comparison with the control (Table 4). These results suggest that a very highcontent of phenolics and related compounds could have ended up in olive mill wastewater. Indeed,many investigations clearly showed the occurrence of a high content of phenolic compounds in olivemill wastewater [43–46]. The hydrophilic character of polyphenols was likely responsible for thesolubilisation of the most part of phenols into the water phase during oil extraction.
Phenolic acids found at considerable concentrations in Neb Jmel and Oueslati leaves (Table 3) wererepresented by gallic, protocatechuic, p-hydroxybenzoic, chlorogenic, vanillic, caffeic, syringic, vanillin,p-coumaric and ferulic acids. In the oils of the two varieties, the identified phenolic acids did notovercome the value of 2 mg/kg (Table 4), which agrees with the results reported by Kelebek et al. [47].In both olive varieties, no significant effect of leaf addition was registered.
2.9. Tocopherols
Tocopherols occur in vegetable oils, playing an important role during oxidative processes. Twoidentified compounds (α- and γ-tocopherol) were quantified in this study. The quantitative profile ofα- and γ-tocopherol is shown in Table 2 and Figure 2.
Tocopherol concentration in olive leaves is reported in Table 2. α-Tocopherol was present athigher amounts in Neb Jmel leaves (82.37 µg/g DW) in comparison with Oueslati, which showed aneight-fold lower amount (10.12 µg/g DW); γ-tocopherol was found in trace amounts in the leaves ofboth varieties.
In control oils (Figure 2), the α-isomer reached values of 257.8 and 283.6 mg/kg in Oueslati andNeb Jmal, respectively, not showing any significant difference between the two cultivars. Followingleaf addition, α-tocopherol concentration showed a slight increase in the Neb Jmel oil, where it reachedthe value of 328.08 mg/kg. This result could be related to the higher presence of this compound in thecorresponding leaves (Table 2). In contrast, the lower amount of α-tocopherol detected in Oueslatileaves (10.12 µg/g) did not determine any improvement in the oil following leaf addition (Figure 2).According to Malheiro et al. [17], the amount of α-tocopherol in oils was not significantly influencedwhen leaf addition was less than 5%.
Concerning γ-tocopherol (Figure 2), the amount was very low compared to the α-isomer(1.17–28.73 mg/kg), being it more represented in the Neb Jmel oil. Leaf addition (3%) did notsignificantly affect γ-tocopherol concentrations due to the fact that in the leaves of both varieties thisisomer was detected in trace amounts (Table 2).
Consistent with previous reports [48], we found that olive leaves can be used as an alternativesource to improve the chemical composition of olive oils, mainly the α-tocopherol concentration.Likewise, the present results agree with previous studies on the influence of the cultivar onα-tocopherol concentration. Franco et al. [49] reported very high levels of α-tocopherol in sevenvarieties of Spanish oils (217–345 mg/kg). In contrast, in the Portuguese olive oil studied byCunha et al. [50], values ranging from 93 to 260 mg/kg were found. Similar values to those reported inthe present experiment were found in some studies performed on different Tunisian oils [51–53].
71
Molecules 2019, 24, 545
γ α
≤
γ α
γ
αα
α
γ(mg/kg)
0
10
20
30
40
50
a
a
b
b
- Leaves
+ leaves
A
α(mg/kg)
0
50
100
150
200
250
300
350
400
Neb Jmel Oueslati
aB
b
b b
Figure 2. γ-Tocopherol (A) and α-tocopherol (B) content of Neb Jmel and Oueslati olive oils extractedwith and without addition of olive leaves (3%). Data are means of three independent experiments ±SE (n = 3). Means followed by different letters are significantly different at p ≤ 0.05 as determined byDuncan’s multiple range test.
Antioxidants, such as vitamin E (tocopherols), may prevent the detrimental effects of free radicals.In the Mediterranean diet, olive oil substantially contributes to the daily intake of these antioxidants.The health benefits of vitamin E are evidenced by the fact that the ingestion of fresh fruits andvegetables is inversely related to the extent of some cancers as well as to plasma lipid peroxidation [54].It should be highlighted that the two vitamin E isoforms have different health-related properties. In fact,γ-tocopherol is the less powerful antioxidant, although being capable of trapping peroxynitrites. Forthis reason, γ-tocopherol has been acknowledged as the “other” vitamin E important for humanhealth [54].
3. Materials and Methods
3.1. Olive Leaves and Fruit Sampling
The olives of two varieties were collected from different regions: Oueslati, in the centre (KhitEl Oued), and Neb Jmel, in the north (Borj El Amri) of Tunisia. The harvest was performed at thesame stage of maturity, considering a colour maturity index of about three. The maturity index wasevaluated taking into consideration the changes in skin and pulp colours. Samples of 100 fruits were
72
Molecules 2019, 24, 545
taken randomly and classified into eight groups or categories: green intense (category 0), yellow oryellowish green (category 1), green with reddish spots (category 2), reddish or light violet (category 3),black with white pulp (category 4), black with <50% purple flesh (category 5), black with ≥50% purpleflesh (category 6) and black with 100% purple flesh (category 7). The maturity index was calculated asA × 0 + B × 1 + C × 2 + D × 3 + E × 4 + F × 5 + G × 6 + H × 7/100, where A, B, C, D, E, F, G and Hare the number of fruits in each class.
The olives were picked by hand from three trees during the 2016/2017 crop season (November).Olive leaves were also collected from the same trees at harvest. The following percentages of oliveleaves were added to fruits (w/w) prior to crushing: 0% (control) and 3% (fortified). The choice of thepercentage of olive leaves was based on previous reports [32,33]. According the above studies, 3% wasthe optimal percentage of olive leaves which can be added to improve oil quality without any negativeeffects. Only healthy fruits without any kind of infection or physical damage were processed. Afterharvesting, fresh olives (2.5–3.0 kg) were washed and crushed with a hammer crusher, and the paste,mixed at 25 ◦C for 30 min, was centrifuged without the addition of warm water. The oil yield fromeach extraction was 200–250 mL/kg. The oil produced was then transferred into dark glass bottles andstored in the dark at 4 ◦C until analysis.
3.2. Methods
3.2.1. Quality Parameters
Determination of physicochemical quality parameters (free acidity and peroxide values) wascarried out following the analytical methods described by Regulation EEC/2568/91 and EEC/1429/92of the European Union Commission (European Union Commission Regulation, 1991, 1992).
Free acidity, given as percentage of oleic acid, was determined by titration of the oil dissolved inan ethanol–ether solution (1:1, v/v) with a 0.1 M potassium hydroxide ethanolic solution. The peroxidevalue, expressed in milliequivalents of active oxygen per kg oil (meq/kg), was determined as follows:a mixture of oil and chloroform–acetic acid was left to react with a solution of potassium iodide (10.5 M)in the darkness. The free iodine was then titrated with a sodium thiosulfate solution (0.01 N).
3.2.2. Pigment Concentration
Oil Pigment Determination
One millilitre of oil was diluted ten-fold in n-hexane. Chlorophylls and carotenoids weredetermined colourimetrically as previously described [55]. The maximum absorption at 670 nmwas related to the chlorophyll fraction and that at 470 nm to the carotenoid one. The specificextinction coefficients considered for calculation were 613 for pheophytin, as a major componentof the chlorophyll fraction, and 2000 for lutein, as a major component of the carotenoid fraction.The pigment concentrations were calculated as follows:
Chlorophyll (mg/kg) = (A670 × 106)/(613 × 100 × d)
Carotenoids (mg/kg) = (A470 × 106)/(2000 × 100 × d)
where A is the absorbance and d is the spectrophotometer cell thickness (1 cm).
Leaf Pigment Determination
Fresh leaf tissue (0.1 g) was ground in a mortar with sand and 70% ethanol solution.The homogenates were then filtered and washed with 70% ethanol (up to 5 mL). After centrifugationfor 10 min at 12,100× g, absorbance was read at 646.6 and 663.6 nm for chlorophylls and at 480 nm forcarotenoids. Concentrations of total chlorophylls and total carotenoids (µg/g DW) were calculatedaccording to Porra et al. [56].
73
Molecules 2019, 24, 545
3.3. Extraction of Phenolic Compounds
3.3.1. Fresh Leaves
Leaf samples (0.2 g) were ground in a mortar at room temperature with 70% methanol containing1% HCl. The homogenates were sonicated for 30 min and centrifuged at 12,100× g for 30 min at4 ◦C. The supernatants were stored at −20 ◦C and used to determine both phenolic compounds andantioxidant activity.
3.3.2. Olive Oils
Phenolic compounds of olive oils were extracted according to Rotondi et al. [57]. Two grams ofoil were added to 1 mL of n-hexane and 2 mL of a methanol/water (70:30, v/v) solution in a 10 mLcentrifuge tube. After vigorous mixing, tubes were centrifuged for 10 min. The hydroalcoholic phasewas collected, and the hexane phase was re-extracted twice with 2 mL of a methanol/water (70:30,v/v) solution. The hydroalcoholic fractions were combined, washed with 2 mL of n-hexane to removethe residual oil and vacuum-dried.
3.4. Total Polyphenol and Flavonoid Concentrations
Total phenolic content was estimated by the Folin Ciocalteu method as described by Singletonand Rossi [58]. To the extract, diluted with distilled water, 1 mL of sodium carbonate (20%) and1 mL of Folin Ciocalteu reagent were added. The mixture was allowed to stand in a water bath for30 min at 40 ◦C. The concentration of the total phenolic compounds was expressed as mg of gallic acidequivalents. The absorbance was measured at 765 nm using a UV–vis spectrophotometer (VARIAN,Milan, Italy). The experiments were performed in triplicate, and mean values and standard deviationswere calculated using the Microsoft Excel software (Microsoft Corporation, Redmond, WA, USA).
The total flavonoid concentration was determined by the aluminium trichloride method usingcatechin as reference compound [59]. A 5% NaNO2 solution was added to the extract, followed after6 min by 10% aluminium trichloride. The mixture was incubated for further 5 min and then 1 M NaOHwas added. The final volume was 2.5 mL. After 15 min of incubation, the absorbance at 510 nm wasdetected. Total flavonoid concentration was expressed as mg of catechin equivalents.
3.5. Free-Radical Scavenging Ability
The free-radical scavenging activity of samples was determined by the ABTS radical cationdecolourisation assay described by Pellegrini et al. [60]. The radical solution was generated by adding7 mM ABTS solution to 4.9 mM potassium persulfate. Before use, the radical solution was dilutedwith ethanol to obtain an absorbance of 0.700 at 734 nm. A control containing ethanol and ABTS•+
solution was also prepared, and the absorbance was taken as the initial. After a 15 min incubationperiod at room temperature, the final absorbance was read at 734 nm. Calculations were performed bypercentage of inhibition of the ABTS cation radical as follows:
% of inhibition = ((initial Abs − final Abs)/initial Abs) × 100
To quantify antioxidant capacity, a calibration curve of the percentage of inhibition against Troloxin the range 2–20 nmol was used.
3.6. HPLC Analysis of Phenolic Compounds
Qualitative and quantitative analysis were performed by reverse-phase HPLC (RP-HPLC) [61].Twenty microlitres of extract were injected into a Waters model 515 HPLC system fitted with a 3.9 mm× 150 mm Nova-Pak C18 column (Waters, Milford, MA, USA). Detection was conducted at 280 nmusing a Waters 2487 dual λ UV–visible detector. Mobile phase A contained 98% water and 2% aceticacid, and mobile phase B contained 68% water, 30% acetonitrile and 2% acetic acid. A linear gradient
74
Molecules 2019, 24, 545
of 10 to 95% mobile phase B was run for 90 min at 1 mL/min. The identity of the phenolic acids wasconfirmed by cochromatography on HPLC with authentic standards (Sigma Chemical Co., St. Louis,MO, USA), and quantification was performed using a standard curve in the range of 20 to 200 ng ofstandard mixtures containing gallic, protocatechuic, p-hydroxybenzoic, chorogenic, vanillic, caffeic,syringic, p-coumaric, ferulic, tyrosol, hydroxytyrosol, vanillin and oleuropein. Chromatogram analysiswas performed by the software Millennium 32 (Waters).
3.7. Extraction and Detection of Tocopherols (Vitamin E)
Tocopherols were determined in the lipid extracts from olive leaves and in oils. Extractions wereperformed in the dark as previously reported [54] and according to the method of Gimeno et al. [62].Tocopherol isoforms (α and γ) were determined by isocratic RP-HPLC using a Shimadzu apparatus(model LC-20AD) with an electrochemical detector (Metrohm model 791, Varese, Italy) equipped witha glassy carbon electrode and LC Solution software (Shimadzu) for the integration of peaks. Detectionwas performed according to Galatro et al. [63] at +0.6 V at 25 ◦C with a Nova Pak C-18 4 µm column(3.9 × 150 mm). The extracts were eluted with 95% methanol containing 20 mM LiClO4 at a flow rateof 1 mL min−1. For identification and quantification of peaks, a calibration curve was prepared usingstandard mixtures of α-, β-, γ- and δ- tocopherol provided by Sigma (Milan, Italy) in the range of 25 to75 ng.
3.8. Statistical Analysis
The results are means from three replicates. All data are reported as mean values ± SE.The significance of differences among mean values was determined by one-way ANOVA. Comparisonsamong means were performed using Duncan’s multiple range test. Means in tables and figuresaccompanied by different letters are significantly different at p ≤ 0.05.
4. Conclusions
The present study confirms the dependence of olive oil quality on the cultivar, besidesgeographical location, climate and soil characteristics. The Neb Jmel oil showed the best chemicalcomposition with the lowest free acidity and peroxide values, the highest chlorophyll, total phenoland total flavonoid concentrations as well as antioxidant activity. The addition of olive leaves (3%) toNeb Jmel and Oueslati oils affected both their quality and chemical composition, mainly conferringan increased resistance to oxidation as well as improving the nutritional qualities. In particular,a remarkable increase in oleuropein derivatives was observed, which was responsible for theenhancement in total phenolic amounts. As Oueslati leaves are particularly enriched in chlorophyll,carotenoids, flavonoids and oleouperin derivatives, their addition during oil extraction may haveprevented the oxidation and the formation of peroxides. Thus, in the Oueslati variety leaf additionreduced both peroxide values and free acidity of oils, allowing them to be still classified as extravirgin olive oils. The enrichment of the oils with antioxidant compounds from the leaves also led to aremarkable increase in the nutritional quality of the Oueslati oil, which became similar to the Neb Jmelone. In conclusion, the addition of a small percentage of olive leaves could improve the nutraceuticalproperties of extra virgin olive oil by increasing the phenolic compound content. These compounds,together with tocopherols, play a protective role against oxidative stress, being also able to extend theextra virgin olive oil shelf-life due to their antioxidative properties.
Author Contributions: I.T. conceived the experiments. I.T., C.S., and M.F.Q. performed the experiments andwrote the paper. A.Z. analysed and interpreted the data. A.Z., M.F.Q., M.Z. and J.E. revised the paper.
Funding: This study was financially supported by the University of Pisa (Fondi di Ateneo, 2017).
Conflicts of Interest: The authors declare no conflict of interest.
75
Molecules 2019, 24, 545
References
1. Boudhrioua, N.; Bahloul, N.; Ben Slimen, I.; Kechaou, N. Comparison on the total phenol concentrations andthe color of fresh and infrared dried olive leaves. Ind. Crops Prod. 2009, 29, 412–419. [CrossRef]
2. Zinnai, A.; Venturi, F.; Andrich, L.; Silvestri, S.; Andrich, G. A kinetic method to evaluate the effect ofenvironmental variability on the quality of an extra virgin olive oil. Agrochimica 2014, 58, 35–50.
3. Bouaziz, M.; Chamkha, M.; Sayadi, S. Comparative study on phenolic concentration and antioxidant activityduring maturation of the olive cultivar Chemlali from Tunisia. J. Agric. Food Chem. 2004, 52, 5476–5481.[CrossRef] [PubMed]
4. Harwood, J.L.; Yaqoob, P. Nutritional and health aspects of olive oil. Eur. J. Lipid Sci. Technol. 2002, 104,685–697. [CrossRef]
5. Turner, R.; Etiene, N.; Garcia-Alonso, M.; de Pascual-Teresa, S.; Minihane, A.M.; Weinberg, P.D.; Rimbach, G.Antioxidant and anti-atherogenic activities of olive oil phenolics. Int. J. Vitaminol. Nutr. Res. 2010, 75, 61–70.[CrossRef] [PubMed]
6. Boss, A.; Bishop, K.S.; Marlow, G.; Barnett, M.P.G.; Ferguson, L.R. Evidence to Support the Anti-CancerEffect of Olive Leaf Extract and Future Directions. Nutrients 2016, 8, 513. [CrossRef] [PubMed]
7. Zinnai, A.; Venturi, F.; Quartacci, M.F.; Sanmartin, C.; Favati, F.; Andrich, G. Solid carbon dioxide to promotethe extraction of extra-virgin olive oil. Grasas y Aceites 2016, 67, e121. [CrossRef]
8. Zhang, X.; Cao, J.; Zhong, L. Hydroxytyrosol inhibits pro-inflammatory cytokines, iNOS, and COX-2expression in human monocytic cells. Naunyn Schmiedebergs Arch. Pharmacol. 2009, 379, 581–586. [CrossRef]
9. Venturi, F.; Sanmartin, C.; Taglieri, I.; Nari, A.; Andrich, G.; Terzuoli, E.; Donnini, S.; Nicolella, C.; Zinnai, A.Development of Phenol-Enriched Olive Oil with Phenolic Compounds Extracted from Wastewater Producedby Physical Refining. Nutrients 2017, 9, 916. [CrossRef]
10. Bayram, B.; Ozcelik, B.; Grimm, S.; Roeder, T.; Schrader, C.; Ernst, I.M.; Wagner, A.E.; Grune, T.; Frank, J.;Rimbach, G. A diet rich in olive oil phenolics reduces oxidative stress in the heart of SAMP8 mice byinduction of Nrf 2-dependent gene expression. Rejuvenation Res. 2012, 15, 71–81. [CrossRef]
11. Gill, C.I.R.; Boyd, A.; McDermott, E.; McCann, M.; Servili, M.; Selvaggini, R.; Taticchi, A.; Esposto, S.;Montedoro, G.; McGlynn, H.; et al. Potential anti-cancer effects of virgin olive oil phenols on colorectalcarcinogenesis models in vitro. Int. J. Cancer 2005, 117, 1–7. [CrossRef] [PubMed]
12. Rigacci, S.; Guidotti, V.; Bucciantina, M.; Parri, M.; Nediani, C.; Cerbai, E.; Stefani, M.; Berti, A. Oleuropeinaglycon prevents cytotoxic amyloid aggregation of human amylin. J. Nutr. Biochem. 2010, 21, 725–726.[CrossRef] [PubMed]
13. Schaffer, S.; Podstawa, M.; Visioli, F.; Bogani, P.; Muller, W.E.; Eckert, G.P. Hydroxytyrosol-rich olive millwastewater extract protects brain cells in vitro and ex vivo. J. Agric. Food Chem. 2007, 55, 5043–5049.[CrossRef] [PubMed]
14. Beltran, G.; Aguilera, M.P.; Del Rio, C.; Sanchez, S.; Martinez, L. Influence of fruit ripening process on thenatural antioxidant concentration of Hojiblanca virgin olive oils. Food Chem. 2005, 89, 207–215. [CrossRef]
15. Gambacorta, G.; Faccia, M.; Previtali, M.A.; Pati, S.; La Notte, E.; Bioano, A. Effects of olive maturation andstoning on quality indices and antioxidant concentration of extra virgin oils (cv. Coratina) during storage.J. Food Sci. 2010, 75, 229–235. [CrossRef] [PubMed]
16. Cinquanta, L.; Esti, M.; Notte, E. Evaluation of phenolic compounds in virgin olive oil during storage. J. Am.
Oil Chem. Soc. 1997, 74, 1259–1264. [CrossRef]17. Malheiro, R.; Casal, S.; Teixeira, H.; Bento, A.; Pereira, J.A. Effect of Olive Leaves Addition during the
Extraction Process of Overmature Fruits on Olive Oil Quality. Food Bioprocess Technol. 2013, 6, 509–521.[CrossRef]
18. Bouaziz, M.; Fki, I.; Jemai, H.; Ayadi, M.; Sayadi, S. Effect of storage on refined and husk olive oilscomposition: Stabilization by addition of natural antioxidants from Chemlali olive leaves. Food Chem.
2008, 108, 253–262. [CrossRef]19. Bubonja-Sonje, M.; Giacometti, J.; Abram, M. Antioxidant and antilisterial activity of olive oil, cocoa and
rosemary extract polyphenols. Food Chem. 2011, 127, 1821–1827. [CrossRef]20. Kiritsakis, K.; Kontominas, M.G.; Kontogiorgis, C.; Litina, D.H.; Moustakas, A.; Kiritsakis, A. Composition
and Antioxidant Activity of Olive Leaf Extracts from Greek Olive Cultivars. J. Am. Oil Chem. Soc. 2010, 87,369–376. [CrossRef]
76
Molecules 2019, 24, 545
21. Paiva-Martins, F.; Correia, R.; Félix, S.; Ferreira, P.; Gordon, M.H. Effects of enrichment of refined olive oilwith phenolic compounds from olive leaves. J. Agric. Food Chem. 2007, 55, 4139–4143. [CrossRef] [PubMed]
22. IOC. Norme Commercial Applicable Aux Huiles D’olive Et Aux Huiles De Grignon D’olive; COI/NCn◦3 Rev.4;Conseil Olèicole International: Madrid, Spain, 2009.
23. Gutierrez, F.; Varona, I.; Albi, M.A. Relation of acidity and sensory quality with sterol concentration of oliveoil from stored fruit. J. Agric. Food Chem. 2000, 48, 1106–1110. [CrossRef] [PubMed]
24. Ben Mansour, A.; Gargouri, B.; Flamini, G.; Bouaziz, M. Effect of Agricultural Sites on Differentiationbetween Chemlali and Neb Jmel Olive Oils. J. Oleo Sci. 2015, 64, 381–392. [CrossRef] [PubMed]
25. Ouni, Y.; Flamini, G.; Issaoui, M.; Ben Youssef, N.; Luigi, C.P.; Hammami, M.; Daoud, D.; Mokhta, Z. Volatilecompounds and compositional quality of virgin olive oil from Oueslati variety: Influence of geographicalorigin. Food Chem. 2011, 124, 1770–1776.
26. Martinéz-Suárez, J.M. Recientes estúdios de la almazara experimental del instituto de la grasa. Rivista Italiana
delle Sostanze Grasse 1973, 50, 325–330.27. Matthaüs, B.; Guillaume, D.; Gharby, S.; Haddad, A.; Harhar, H.; Charrouf, Z. Effect of processing on the
quality of edible argan oil. Food Chem. 2010, 120, 426–432. [CrossRef]28. Gharby, S.; Harhar, H.; Guillaume, D.; Haddad, A.; Matthäus, B.; Charrouf, Z. Oxidative Stability of Edible
Argan Oil: A TwoYear Period Study. LWT Food Sci. Technol. 2011, 44, 1–8. [CrossRef]29. Gutiérrez, F.; Perdiguero, S.; Gutiérrez, R.; Olías, J.M. Evaluation of the bitter taste in virgin olive oil. J. Am.
Oil Chem. Soc. 1992, 69, 394–395. [CrossRef]30. Sgherri, C.; Perez-Lopez, U.; Pinzino, C. Antioxidant properties of food products containing lycopene
are increased by the presence of chlorophyll. In Lycopene: Food Sources, Potential Role in Human
Health and Antioxidant Effects; Baily, J.R., Ed.; Nova Publisher: Hauppauge, NY, USA, 2015; pp. 39–89,ISBN 978-1-63117-927-3.
31. Abaza, L.; Taamalli, W.; Ben Temime, S.; Daoud, D.; Gutierrez, F.; Zarrouk, M. Natural antioxidantcomposition as correlated to stability of some Tunisian virgin olive oils. Rivista Italiano delle Sostanze
Gresse 2005, 132, 12–18.32. Giovacchino, L.D.; Angerosa, F.; Giacinto, L.D. Effect of mixing leaves with olives on organoleptic quality of
oil obtained by centrifugation. J. Am. Oil Chem. Soc. 1996, 73, 371–374. [CrossRef]33. Sevim, D.; Tuncay, O. Effect of Olive Leaves Addition before Extraction of Turkish Olive Cultivars on Olive
Oil Minor Components and Antioxidant Activity. Open Access Sci. Rep. 2013, 2, 2–8.34. Kandaswami, C.; Lee, L.T.; Lee, P.P.; Hwang, J.J.; Ke, F.C.; Huang, Y.T.; Lee, M.T. The antitumor activities of
flavonoids. In Vivo 2005, 19, 895–909. [PubMed]35. Crozier, A.; Ashihara, H. Plant Secondary Metabolites and the Human Diet; Blackwell Publishing: Oxford,
UK, 2006.36. Ebrahimi, N.; Khanikia, G.J.; Keshavarz, S.A.; Shariatifar, N.; Nabizadeh, R.; Sadighara, P. Spectrophotometric
method for quantification of flavonoids in olive oil supplied from Tehran market of Iran. J. Food Saf. Hyg.
2015, 1, 21–24.37. Gorinstein, S.; Martin-Belloso, O.; Katrich, E.; Lojek, A.; Cíz, M.; Gligelmo-Miguel, N.; Haruenkit, R.;
Park, Y.S.; Jung, S.T.; Trakhtenberg, S. Comparison of the concentrations of the main biochemical compoundsand the antioxidant activity of some Spanish olive oils as determined by four different radical scavengingtests. J. Nutr. Biochem. 2003, 14, 154–159. [CrossRef]
38. Samaniego, S.C.; Troncoso González, A.M.; García-Parrilla, M.C.; Quesada Granados, J.J.; López García de laSerrana, H.; López Martínez, M.C. Different radical scavenging tests in virgin olive oil and their relation tothe total phenol content. Anal. Chim. Acta 2007, 593, 103–107. [CrossRef] [PubMed]
39. Ben Salah, M.; Abdelmelek, H.; Abderraba, M. Study of Phenolic Composition and Biological ActivitiesAssessment of Olive Leaves from different Varieties Grown in Tunisia. J. Med. Chem. 2012, 2, 107–111.[CrossRef]
40. Chin, K.Y.; Ima-Nirwana, S. The Role of Vitamin E in Preventing and Treating Osteoarthritis—A Review ofthe Current Evidence. Front. Pharmacol. 2018, 9, 946. [CrossRef]
41. Sedef, N.; Karakaya, S. Olive tree (Olea europaea) leaves: Potential beneficial effects on human health.Nutr. Rev. 2009, 67, 632–638.
77
Molecules 2019, 24, 545
42. Cortesi, N.; Rovellini, P.; Fusari, P. Dosaggio dei biofenoli degli oli vergini di oliva: Idrossitirosolo, tirosolo,agliconi secoiridoidi, acidi secoridoidi, lignani e flavonoidi. Rivista Italiana delle Sostanze Grasse 2002, 79,145–150.
43. De Leonardis, A.; Macciola, V.; Lembo, G.; Aretini, A.; Nag, A. Studies on oxidative stabilisation of lard bynatural antioxidants recovered from olive-oil mill wastewater. Food Chem. 2007, 100, 998–1004. [CrossRef]
44. Khoufi, S.; Aloui, F.; Sayadi, S. Extraction of antioxidants from olive mill wastewater and electro-coagulationof exhausted fraction to reduce its toxicity on anaerobic digestion. J. Hazard. Mater. 2008, 151, 531–539.[CrossRef] [PubMed]
45. El-Abbassi, A.; Kiai, H.; Hafidi, A. Phenolic profile and antioxidant activities of olive mill wastewater.Food Chem. 2012, 132, 406–412. [CrossRef] [PubMed]
46. Azaizeh, H.; Halahlih, F.; Najami, N.; Brunner, D.; Faulstich, M.; Tafesh, A. Antioxidant activity of phenolicfractions in olive mill wastewater. Food Chem. 2012, 134, 2226–2234. [CrossRef] [PubMed]
47. Kelebek, H.; Selli, S.; Kol, O. Quantitative determination of phenolic compounds using LC-DAD-ESI-MS/MSin cv. Ayvalik olive oils as affected by harvest time. J. Food Meas. Charact. 2017, 11, 226–235. [CrossRef]
48. Lucas, A.; Martinez, E.; Rincón, J.; Blanco, M.A.; Garcia, I. Supercritical fluid extraction of tocopherolconcentrates from olive tree leaves. J. Supercrit. Fluids 2002, 22, 221–228. [CrossRef]
49. Franco, M.N.; Galeano-Diaz, T.; Sanchez, J.; De Miguel, C.; Martin-Vertedor, D. Total phenolic compoundsand tocopherols profiles of seven olive oil varieties grown in the south-west of Spain. J. Oleo Sci. 2014, 63,115–125. [CrossRef] [PubMed]
50. Cunha, S.S.; Fernandes, J.O.; Oliveira, M.B. Quantification of free and esterified sterols in Portuguese oliveoils by solid-phase extraction and gas chromatography-mass spectrometry. J. Chromatogr. A 2006, 1128,220–227. [CrossRef] [PubMed]
51. Baccouri, O.; Guerfel, M.; Baccouri, B.; Cerretani, L.; Bendini, A.; Lercker, G.; Zarrouk, M.; Daoud BenMiled, D. Chemical composition and oxidative stability of Tunisian monovarietal virgin olive oils withregard to fruit ripening. Food Chem. 2008, 109, 743–754. [CrossRef]
52. Krichene, D.; Taamalli, W.; Daoud, D.; Salvador, M.D.; Fregapane, G.; Zarrouk, M. Phenolic Compounds,Tocopherols and others minor components in virgin olive oils of some Tunisian Varieties. J. Food Biochem.
2007, 31, 179–194. [CrossRef]53. Manai-Djebali, H.; Krichène, D.; Ouni, Y.; Gallardo, L.; Sánchez, J.; Osorio, E.; Daoud, D.; Guido, F.;
Zarrouk, M. Chemical profiles of five minor olive oil varieties grown in central Tunisia. J. Food Compos. Anal.
2012, 27, 109–119. [CrossRef]54. Sgherri, C.; Kadlecova, Z.; Prdossi, A.; Navari-Izzo, F.; Izzo, R. Irrigation with Diluted Seawater Improves
the Nutritional Value of Cherry Tomatoes. J. Agric. Food Chem. 2008, 56, 3391–3397. [CrossRef] [PubMed]55. Mínguez-Mosquera, M.I.; Rejano-Navarro, L.; Gandul-Rojas, B.; Sánchez-Gómez, A.H.; Garrido-Fernández, J.
Color–Pigment Correlation in Virgin Olive Oil. J. Am. Oil Chem. Soc. 1991, 69, 332–336. [CrossRef]56. Porra, R.J.; Thompson, W.A.; Kriedemann, P.E. Determination of accurate extinction coefficients and
simultaneous equations for assaying chlorophylls a and b extracted with four different solvents: Verificationof the concentration of chlorophyll standards by atomic absorption spectrometry. Biochim. Biophys. Acta
1989, 975, 384–394. [CrossRef]57. Rotondi, A.; Bendini, A.; Cerretani, L.; Mari, M.; Lercker, G.; Gallina-Toschi, G.T. Effect of Olive Ripening
Degree on the Oxidative Stability and Organoleptic Properties of Cv. Nostrana di Brisighella Extra VirginOlive Oil. J. Agric. Food Chem. 2004, 52, 3649–3654. [CrossRef]
58. Singleton, V.L.; Rossi, J.A., Jr. Colorimentry of total phenolics with phosphomolybdic phosphotungstic acidreagents. Am. J. Enol. Vitic. 1965, 16, 144–158.
59. Zhishen, J.; Mengcheng, T.; Jianming, W. The determination of flavonoid contents in mulberry and theirscavenging effects on superoxide radicals. Food Chem. 1999, 64, 555–559. [CrossRef]
60. Pellegrini, N.; Re, R.; Yang, M.; Rice-Evans, C. Screening of dietary carotenoids and carotenoid-rich fruitextracts for antioxidant activities applying 2,2′-azinobis (3-ethylbenzothiazolyne-6-sulfonic acid) radicalcation decolorization assay. Methods Enzymol. 1999, 299, 379–389.
61. Talcott, S.T.; Howard, L.R. Phenolic autoxidation is responsible for color degradation in processed carrotpuree. J. Agric. Food Chem. 1999, 47, 2109–2115. [CrossRef]
78
Molecules 2019, 24, 545
62. Gimeno, E.; Castellote, A.I.; Lamuela-Raventós, R.M.; de la Torre, M.C.; López-Sabater, M.C. Rapiddetermination of vitamin E in vegetable oils by reversed-phase high-performance liquid chromatography.J. Chromatogr. A 2000, 9, 251–254. [CrossRef]
63. Galatro, A.; Simontacchi, M.; Puntarulo, S. Free radical generation and antioxidant content in chloroplastsfrom soybean leaves exposed to ultraviolet-B. Physiol. Plant. 2001, 113, 564–570. [CrossRef]
Sample Availability: Not available.
© 2019 by the authors. Licensee MDPI, Basel, Switzerland. This article is an open accessarticle distributed under the terms and conditions of the Creative Commons Attribution(CC BY) license (http://creativecommons.org/licenses/by/4.0/).
79

molecules
Article
Anti-Oxidant and Anti-Melanogenic Properties ofEssential Oil from Peel of Pomelo cv. Guan Xi
Wanying He 1,2, Xiaoyan Li 1,2, Ying Peng 1,2, Xiaoyan He 1,2 and Siyi Pan 1,2,*
1 College of Food Science and Technology, Huazhong Agricultural University, Wuhan 430070, Hubei, China;[email protected] (W.H.); [email protected] (X.L.);[email protected] (Y.P.); [email protected] (X.H.)
2 Key Laboratory of Environment Correlative Dietology, Ministry of Education, Huazhong AgriculturalUniversity, Wuhan 430070, Hubei, China
* Correspondence: [email protected]
Received: 20 November 2018; Accepted: 7 January 2019; Published: 10 January 2019
Abstract: Here, we investigated the anti-oxidant and anti-melanogenic effects of pomelo peel essentialoil (PPEO) from pomelo cv. Guan Xi. The volatile chemical composition of PPEO was analyzedwith gas chromatography–mass spectrometry (GC/MS). The most abundant component of PPEOwas limonene (55.92%), followed by β-myrcene (31.17%), and β-pinene (3.16%). PPEO showed stronganti-oxidant activities against 2,2-diphenyl-2-picryhydrazyl (DPPH), 2,2′-azinobis-(3-ethylbenzthiazoline-6-sulphonate (ABTS) and superoxide anion free radicals. Based on the B16 melanoma cell system,the effects of PPEO on the viability and morphology of B16 cells and the production of melanin wereevaluated. The results revealed that PPEO at concentrations below 50 µg/mL could decrease the melanincontent without affecting cell viability and morphology. Intracellular tyrosinase (TYR) activity andWestern blot analysis showed that PPEO could down-regulate the expression level of TYR in B16 cellsand dose-dependently inhibit TYR activity (by a maximum of 64.54%). In conclusion, PPEO has goodanti-oxidant and anti-melanogenic activity, and thus can be widely used as a natural antioxidant in thefood, pharmaceutical, and cosmetic industries.
Keywords: pomelo peel; essential oil; anti-oxidant; anti-melanogenic; B16 melanoma cell
1. Introduction
Pomelo, a citrus fruit belonging to the genus Rutaceae, is grown and consumed worldwide dueto its unique flavor and high nutritional value [1]. In the production of pomelo juice, jam and otherproducts, pomelo peel (PP) is a major by-product accounting for about 50% of the total weight of thefruit. However, most of the PP is disposed of in landfills, resulting in environmental pollution and lossof economic value [2,3]. Pomelo peel contains many natural chemical ingredients, making it a goodsource of valuable extracts. Compared with the peel of other fruits, PP has a higher concentration ofessential oil (EO). Citrus EO is generally considered to be safe with a broad spectrum of biologicalactivities such as anti-inflammatory and anxiolytic effects [4]. Due to its high content of activesubstances such as terpenes, sesquiterpene, aldehydes, ketones, and esters, pomelo EO has strongaromatic, antioxidant, bacteriostatic, and antiviral properties [4,5], and thus can be used as a functionalingredient and premium fragrance in the food, cosmetic and pharmaceutical industries. Therefore,the high value-added utilization of PP has important research significance and economic prospects.
Oxidative stress can produce reactive oxygen such as superoxide (O2), hydrogen peroxide (H2O2),and hydroxyl radical (HO). These reactive oxygen species can disrupt the balance of normal metabolicactivity in the human body and are associated with many chronic diseases such as aging, cancer,atherosclerosis, and inflammation [6]. As a result, research of natural antioxidants has gradually
81
Molecules 2019, 24, 242
become a hot spot. These antioxidants can remove excess free radicals from the body and relieveconditions caused by excessive free radicals [7,8]. There has been extensive research on the antioxidantactivities of plant EOs. Most current research on antioxidants is focused on citrus EOs. For example,the antioxidant properties of 34 kinds of citrus EOs have been tested. The results showed that most ofthe EOs have good inhibitory effects on 2,2-diphenyl-2-picryhydrazyl (DPPH), which are significantlybetter than the effects of water-soluble vitamin E [9]. Extract of sweet orange peel have significantinhibitory effects on DPPH, with 50% inhibitory concentrations (IC50) of 600 µL/mL [10]. Moreover,the EOs extracted with a cold pressing method also have high antioxidant activity, because coldpressing can better preserve the active ingredients in EOs [11]. However, the above studies are limitedto the antioxidant activities of EO mixtures as a whole, while there have been few studies of theantioxidant activities of specific components in EOs.
Melanin is a pigment widely distributed on the surface of skin, hair, retina, and adrenalmedulla. It is synthesized from tyrosine under the enzymatic oxidation of tyrosinase (TYR) [12].However, excessive production and accumulation of melanin can cause pigmentation spots and skindiscoloration such as chloasma, freckles, and age spots. Tyrosinase is associated with a variety ofdiseases and may be a key factor of dopamine neurotoxicity and neurodegeneration associated withParkinson’s disease [13]. Besides, it is also a key rate-limiting enzyme in the initial reaction of melaninproduction. At present, the application of EOs as a natural enzyme inhibitor has become a researchhotspot. Plant EOs have strong biological activities and great application potentials in biology andmedicine [14]. Cinnamon EO and clove EO can inhibit the TYR activity in B16 cells by 37% and10%, respectively [7]. Lemon EO was observed to have significant inhibitory effects on TYR activity,and its major components were determined to be monoterpenoids and oxindoles [15], which arealso the main components of pomelo EO. Hence, it can be speculated that pomelo EO might alsohave inhibitory effects on TYR activity. Mint leaf EO could reduce the synthesis rate of melaninin B16-F10 cells, and β-caryophyllene (main component) can also decrease melanin production bydown-regulating the expression of microphthalmia-associated transcription factor protein (MITF),tyrosinase-related protein-1 (Trp-1), tyrosinase-related protein-2 (Trp-2), and TYR [16]. Aromatic oraliphatic compounds such as anisaldehyde and cuminaldehyde are effective TYR inhibitors [13]. CitrusEOs contain a large amount of fatty aldehyde compounds, indicating their potential inhibitory activityagainst TYR. However, the current research on pomelo mostly focuses on the storage and preservationof fresh fruit and the extraction of pectin from the peel, while little research attention has been paid tothe antioxidant and anti-melanogenic effects of pomelo peel EO (PPEO). Therefore, clarifying the effectof PPEO on melanin synthesis is of great significance for improving the high value-added utilizationof PP and expanding its application in the health food, pharmaceutical and cosmetics fields.
In this study, we extracted PPEO from pomelo cv. Guan Xi by a cold pressing method and analyzedits main components using gas chromatography–mass spectrometry (GC/MS). The anti-oxidant activitieswere examined with 2,2-diphenyl-1-picrylhydrazyl (DPPH); 2,2′-azino-bis(3-ethylbenzothiazoline-6-sulfonic acid) diammonium salt (ABTS), and superoxide anion radical scavenging. Furthermore,based on the B16 melanoma cell system, the effect of PPEO on the viability and morphology of B16 cellsand the production of melanin was evaluated. Finally, intracellular TYR activity assay and Western blotanalysis were performed to validate the inhibitory effect of PPEO on TYR.
2. Results and Discussion
2.1. Chemical Composition of Pomelo Peel Essential Oil
The extraction rate of PPEO by the method of cold pressing was 0.82%, which was higher thanthat in a previous study of citrus essential oils (0.25%) [17]. The obtained PPEO was pale yellowand a clear liquid with a natural aroma. Figure 1 shows the total ion chromatogram obtained fromGC/MS analysis of the PPEO 10-fold diluted with absolute ethanol. A total of 21 compounds weredetected (Table 1). Among these compounds, 13 were terpenes, which accounted for 94.15% of the
82
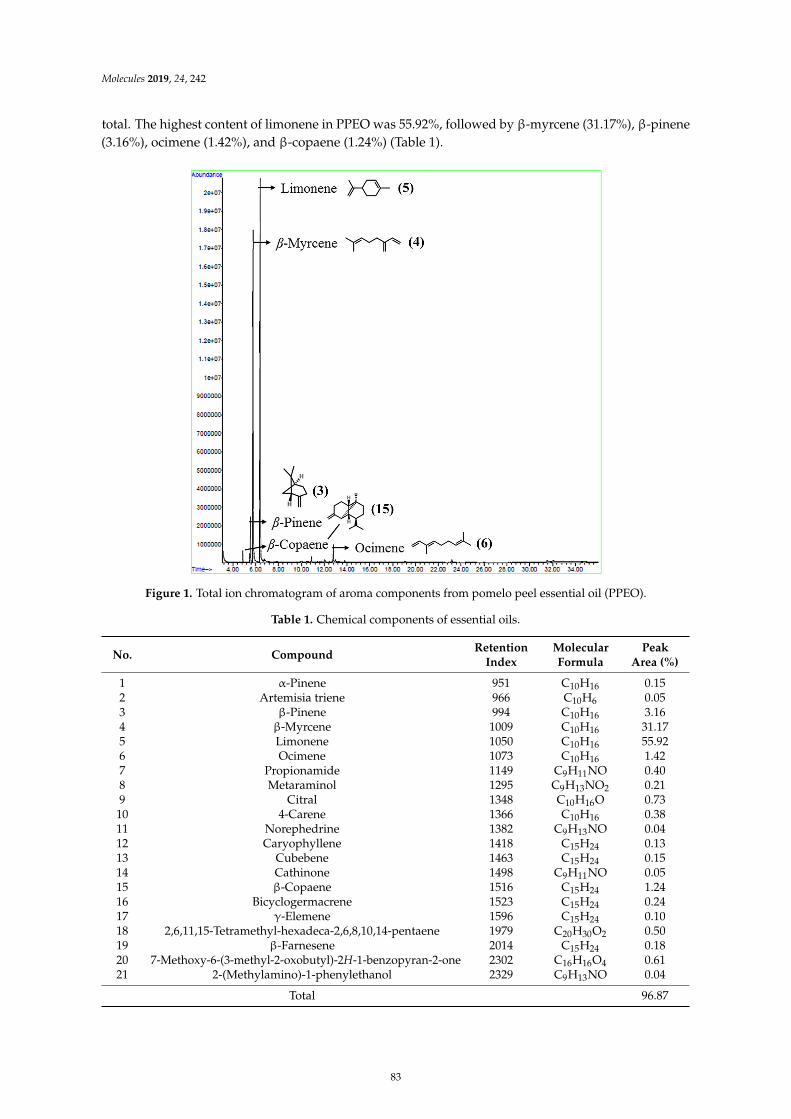
Molecules 2019, 24, 242
total. The highest content of limonene in PPEO was 55.92%, followed by β-myrcene (31.17%), β-pinene(3.16%), ocimene (1.42%), and β-copaene (1.24%) (Table 1).
β ββ
α
ββ
β
γ
Figure 1. Total ion chromatogram of aroma components from pomelo peel essential oil (PPEO).
Table 1. Chemical components of essential oils.
No. CompoundRetention
IndexMolecularFormula
PeakArea (%)
1 α-Pinene 951 C10H16 0.152 Artemisia triene 966 C10H6 0.053 β-Pinene 994 C10H16 3.164 β-Myrcene 1009 C10H16 31.175 Limonene 1050 C10H16 55.926 Ocimene 1073 C10H16 1.427 Propionamide 1149 C9H11NO 0.408 Metaraminol 1295 C9H13NO2 0.219 Citral 1348 C10H16O 0.7310 4-Carene 1366 C10H16 0.3811 Norephedrine 1382 C9H13NO 0.0412 Caryophyllene 1418 C15H24 0.1313 Cubebene 1463 C15H24 0.1514 Cathinone 1498 C9H11NO 0.0515 β-Copaene 1516 C15H24 1.2416 Bicyclogermacrene 1523 C15H24 0.2417 γ-Elemene 1596 C15H24 0.1018 2,6,11,15-Tetramethyl-hexadeca-2,6,8,10,14-pentaene 1979 C20H30O2 0.5019 β-Farnesene 2014 C15H24 0.1820 7-Methoxy-6-(3-methyl-2-oxobutyl)-2H-1-benzopyran-2-one 2302 C16H16O4 0.6121 2-(Methylamino)-1-phenylethanol 2329 C9H13NO 0.04
Total 96.87
83
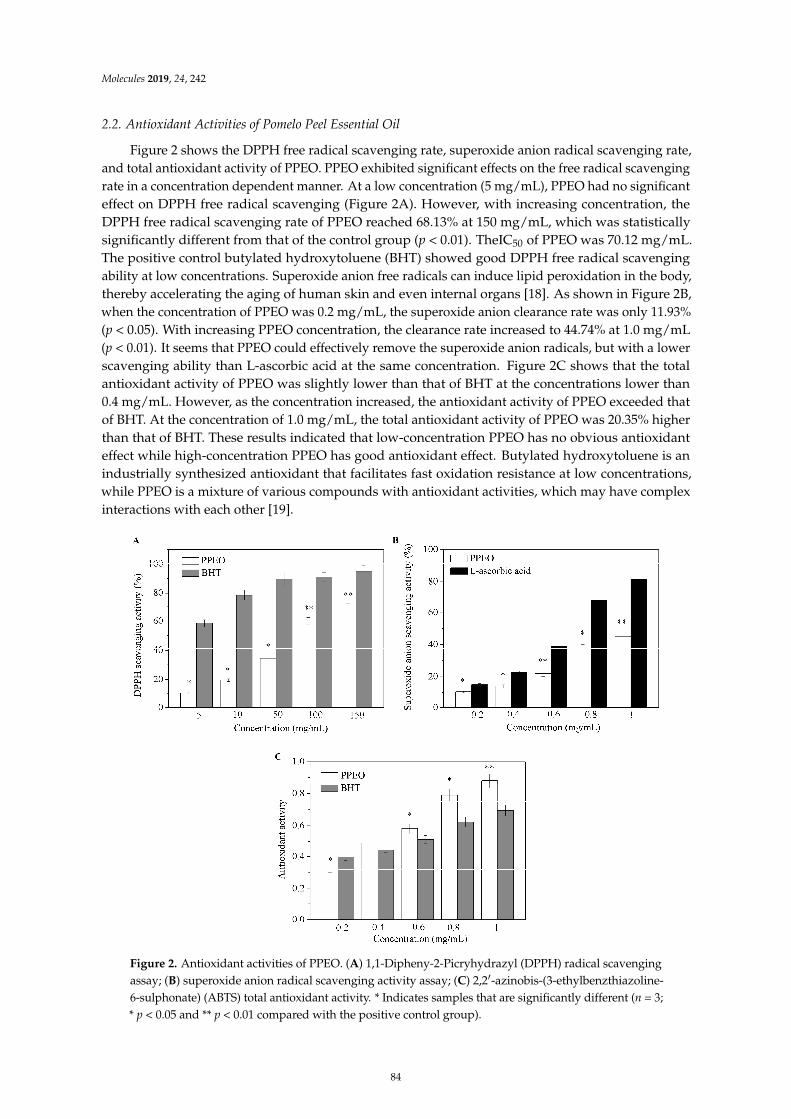
Molecules 2019, 24, 242
2.2. Antioxidant Activities of Pomelo Peel Essential Oil
Figure 2 shows the DPPH free radical scavenging rate, superoxide anion radical scavenging rate,and total antioxidant activity of PPEO. PPEO exhibited significant effects on the free radical scavengingrate in a concentration dependent manner. At a low concentration (5 mg/mL), PPEO had no significanteffect on DPPH free radical scavenging (Figure 2A). However, with increasing concentration, theDPPH free radical scavenging rate of PPEO reached 68.13% at 150 mg/mL, which was statisticallysignificantly different from that of the control group (p < 0.01). TheIC50 of PPEO was 70.12 mg/mL.The positive control butylated hydroxytoluene (BHT) showed good DPPH free radical scavengingability at low concentrations. Superoxide anion free radicals can induce lipid peroxidation in the body,thereby accelerating the aging of human skin and even internal organs [18]. As shown in Figure 2B,when the concentration of PPEO was 0.2 mg/mL, the superoxide anion clearance rate was only 11.93%(p < 0.05). With increasing PPEO concentration, the clearance rate increased to 44.74% at 1.0 mg/mL(p < 0.01). It seems that PPEO could effectively remove the superoxide anion radicals, but with a lowerscavenging ability than L-ascorbic acid at the same concentration. Figure 2C shows that the totalantioxidant activity of PPEO was slightly lower than that of BHT at the concentrations lower than0.4 mg/mL. However, as the concentration increased, the antioxidant activity of PPEO exceeded thatof BHT. At the concentration of 1.0 mg/mL, the total antioxidant activity of PPEO was 20.35% higherthan that of BHT. These results indicated that low-concentration PPEO has no obvious antioxidanteffect while high-concentration PPEO has good antioxidant effect. Butylated hydroxytoluene is anindustrially synthesized antioxidant that facilitates fast oxidation resistance at low concentrations,while PPEO is a mixture of various compounds with antioxidant activities, which may have complexinteractions with each other [19].
μ
μμ
μ
Figure 2. Antioxidant activities of PPEO. (A) 1,1-Dipheny-2-Picryhydrazyl (DPPH) radical scavengingassay; (B) superoxide anion radical scavenging activity assay; (C) 2,2′-azinobis-(3-ethylbenzthiazoline-6-sulphonate) (ABTS) total antioxidant activity. * Indicates samples that are significantly different (n = 3;* p < 0.05 and ** p < 0.01 compared with the positive control group).
84
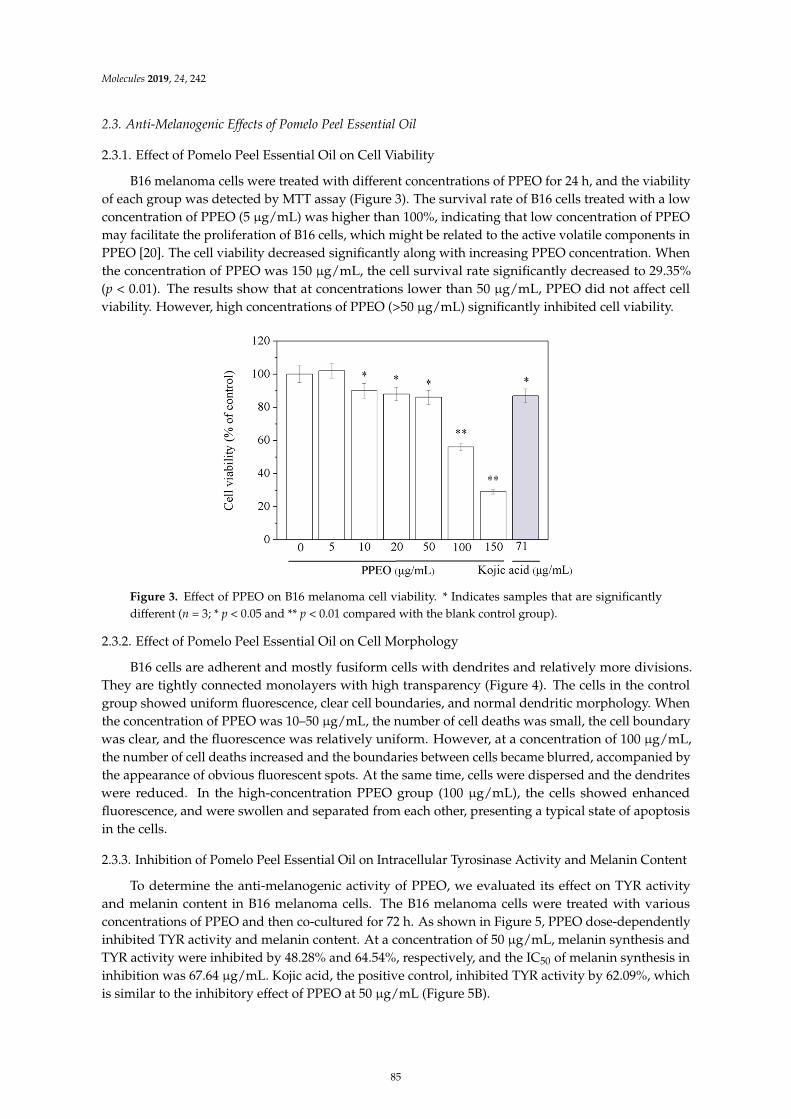
Molecules 2019, 24, 242
2.3. Anti-Melanogenic Effects of Pomelo Peel Essential Oil
2.3.1. Effect of Pomelo Peel Essential Oil on Cell Viability
B16 melanoma cells were treated with different concentrations of PPEO for 24 h, and the viabilityof each group was detected by MTT assay (Figure 3). The survival rate of B16 cells treated with a lowconcentration of PPEO (5 µg/mL) was higher than 100%, indicating that low concentration of PPEOmay facilitate the proliferation of B16 cells, which might be related to the active volatile components inPPEO [20]. The cell viability decreased significantly along with increasing PPEO concentration. Whenthe concentration of PPEO was 150 µg/mL, the cell survival rate significantly decreased to 29.35%(p < 0.01). The results show that at concentrations lower than 50 µg/mL, PPEO did not affect cellviability. However, high concentrations of PPEO (>50 µg/mL) significantly inhibited cell viability.
μμ
μ
Figure 3. Effect of PPEO on B16 melanoma cell viability. * Indicates samples that are significantlydifferent (n = 3; * p < 0.05 and ** p < 0.01 compared with the blank control group).
2.3.2. Effect of Pomelo Peel Essential Oil on Cell Morphology
B16 cells are adherent and mostly fusiform cells with dendrites and relatively more divisions.They are tightly connected monolayers with high transparency (Figure 4). The cells in the controlgroup showed uniform fluorescence, clear cell boundaries, and normal dendritic morphology. Whenthe concentration of PPEO was 10–50 µg/mL, the number of cell deaths was small, the cell boundarywas clear, and the fluorescence was relatively uniform. However, at a concentration of 100 µg/mL,the number of cell deaths increased and the boundaries between cells became blurred, accompanied bythe appearance of obvious fluorescent spots. At the same time, cells were dispersed and the dendriteswere reduced. In the high-concentration PPEO group (100 µg/mL), the cells showed enhancedfluorescence, and were swollen and separated from each other, presenting a typical state of apoptosisin the cells.
2.3.3. Inhibition of Pomelo Peel Essential Oil on Intracellular Tyrosinase Activity and Melanin Content
To determine the anti-melanogenic activity of PPEO, we evaluated its effect on TYR activityand melanin content in B16 melanoma cells. The B16 melanoma cells were treated with variousconcentrations of PPEO and then co-cultured for 72 h. As shown in Figure 5, PPEO dose-dependentlyinhibited TYR activity and melanin content. At a concentration of 50 µg/mL, melanin synthesis andTYR activity were inhibited by 48.28% and 64.54%, respectively, and the IC50 of melanin synthesis ininhibition was 67.64 µg/mL. Kojic acid, the positive control, inhibited TYR activity by 62.09%, whichis similar to the inhibitory effect of PPEO at 50 µg/mL (Figure 5B).
85
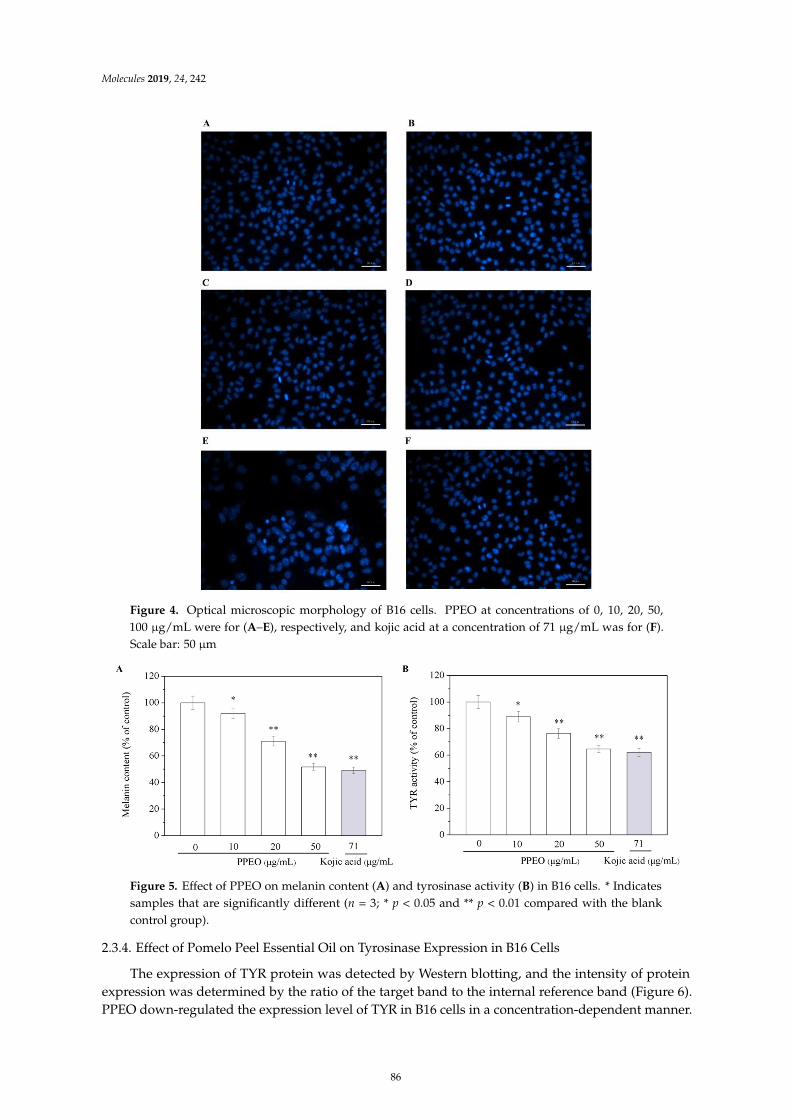
Molecules 2019, 24, 242
μ μμ
μ
μμ
Figure 4. Optical microscopic morphology of B16 cells. PPEO at concentrations of 0, 10, 20, 50,100 µg/mL were for (A–E), respectively, and kojic acid at a concentration of 71 µg/mL was for (F).Scale bar: 50 µm
μ
Figure 5. Effect of PPEO on melanin content (A) and tyrosinase activity (B) in B16 cells. * Indicatessamples that are significantly different (n = 3; * p < 0.05 and ** p < 0.01 compared with the blankcontrol group).
2.3.4. Effect of Pomelo Peel Essential Oil on Tyrosinase Expression in B16 Cells
The expression of TYR protein was detected by Western blotting, and the intensity of proteinexpression was determined by the ratio of the target band to the internal reference band (Figure 6).PPEO down-regulated the expression level of TYR in B16 cells in a concentration-dependent manner.
86
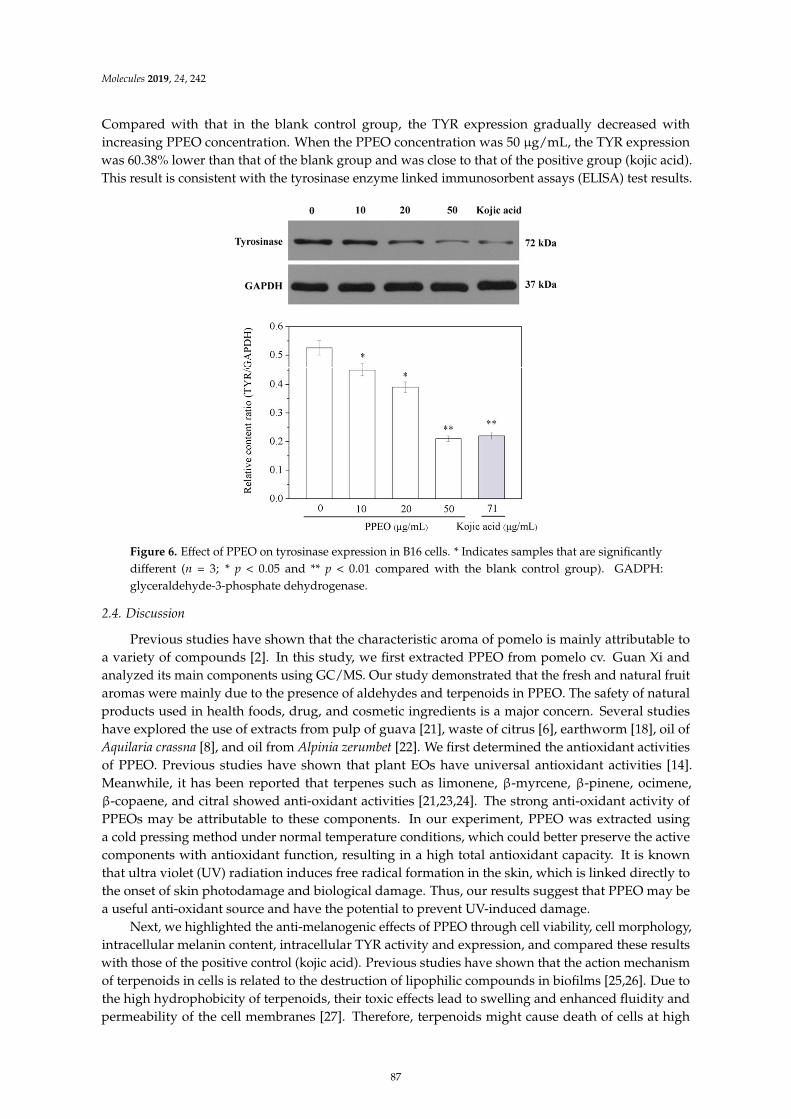
Molecules 2019, 24, 242
Compared with that in the blank control group, the TYR expression gradually decreased withincreasing PPEO concentration. When the PPEO concentration was 50 µg/mL, the TYR expressionwas 60.38% lower than that of the blank group and was close to that of the positive group (kojic acid).This result is consistent with the tyrosinase enzyme linked immunosorbent assays (ELISA) test results.
μ
Figure 6. Effect of PPEO on tyrosinase expression in B16 cells. * Indicates samples that are significantlydifferent (n = 3; * p < 0.05 and ** p < 0.01 compared with the blank control group). GADPH:glyceraldehyde-3-phosphate dehydrogenase.
2.4. Discussion
Previous studies have shown that the characteristic aroma of pomelo is mainly attributable toa variety of compounds [2]. In this study, we first extracted PPEO from pomelo cv. Guan Xi andanalyzed its main components using GC/MS. Our study demonstrated that the fresh and natural fruitaromas were mainly due to the presence of aldehydes and terpenoids in PPEO. The safety of naturalproducts used in health foods, drug, and cosmetic ingredients is a major concern. Several studieshave explored the use of extracts from pulp of guava [21], waste of citrus [6], earthworm [18], oil ofAquilaria crassna [8], and oil from Alpinia zerumbet [22]. We first determined the antioxidant activitiesof PPEO. Previous studies have shown that plant EOs have universal antioxidant activities [14].Meanwhile, it has been reported that terpenes such as limonene, β-myrcene, β-pinene, ocimene,β-copaene, and citral showed anti-oxidant activities [21,23,24]. The strong anti-oxidant activity ofPPEOs may be attributable to these components. In our experiment, PPEO was extracted usinga cold pressing method under normal temperature conditions, which could better preserve the activecomponents with antioxidant function, resulting in a high total antioxidant capacity. It is knownthat ultra violet (UV) radiation induces free radical formation in the skin, which is linked directly tothe onset of skin photodamage and biological damage. Thus, our results suggest that PPEO may bea useful anti-oxidant source and have the potential to prevent UV-induced damage.
Next, we highlighted the anti-melanogenic effects of PPEO through cell viability, cell morphology,intracellular melanin content, intracellular TYR activity and expression, and compared these resultswith those of the positive control (kojic acid). Previous studies have shown that the action mechanismof terpenoids in cells is related to the destruction of lipophilic compounds in biofilms [25,26]. Due tothe high hydrophobicity of terpenoids, their toxic effects lead to swelling and enhanced fluidity andpermeability of the cell membranes [27]. Therefore, terpenoids might cause death of cells at high
87
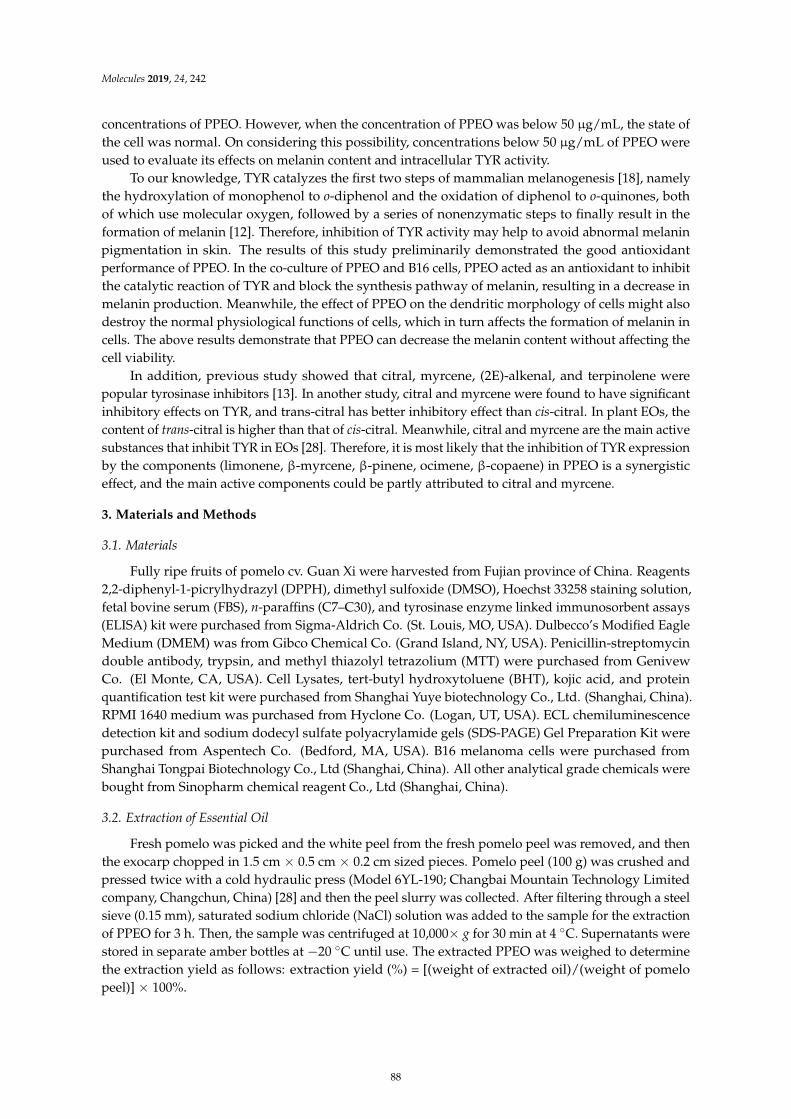
Molecules 2019, 24, 242
concentrations of PPEO. However, when the concentration of PPEO was below 50 µg/mL, the state ofthe cell was normal. On considering this possibility, concentrations below 50 µg/mL of PPEO wereused to evaluate its effects on melanin content and intracellular TYR activity.
To our knowledge, TYR catalyzes the first two steps of mammalian melanogenesis [18], namelythe hydroxylation of monophenol to o-diphenol and the oxidation of diphenol to o-quinones, bothof which use molecular oxygen, followed by a series of nonenzymatic steps to finally result in theformation of melanin [12]. Therefore, inhibition of TYR activity may help to avoid abnormal melaninpigmentation in skin. The results of this study preliminarily demonstrated the good antioxidantperformance of PPEO. In the co-culture of PPEO and B16 cells, PPEO acted as an antioxidant to inhibitthe catalytic reaction of TYR and block the synthesis pathway of melanin, resulting in a decrease inmelanin production. Meanwhile, the effect of PPEO on the dendritic morphology of cells might alsodestroy the normal physiological functions of cells, which in turn affects the formation of melanin incells. The above results demonstrate that PPEO can decrease the melanin content without affecting thecell viability.
In addition, previous study showed that citral, myrcene, (2E)-alkenal, and terpinolene werepopular tyrosinase inhibitors [13]. In another study, citral and myrcene were found to have significantinhibitory effects on TYR, and trans-citral has better inhibitory effect than cis-citral. In plant EOs, thecontent of trans-citral is higher than that of cis-citral. Meanwhile, citral and myrcene are the main activesubstances that inhibit TYR in EOs [28]. Therefore, it is most likely that the inhibition of TYR expressionby the components (limonene, β-myrcene, β-pinene, ocimene, β-copaene) in PPEO is a synergisticeffect, and the main active components could be partly attributed to citral and myrcene.
3. Materials and Methods
3.1. Materials
Fully ripe fruits of pomelo cv. Guan Xi were harvested from Fujian province of China. Reagents2,2-diphenyl-1-picrylhydrazyl (DPPH), dimethyl sulfoxide (DMSO), Hoechst 33258 staining solution,fetal bovine serum (FBS), n-paraffins (C7–C30), and tyrosinase enzyme linked immunosorbent assays(ELISA) kit were purchased from Sigma-Aldrich Co. (St. Louis, MO, USA). Dulbecco’s Modified EagleMedium (DMEM) was from Gibco Chemical Co. (Grand Island, NY, USA). Penicillin-streptomycindouble antibody, trypsin, and methyl thiazolyl tetrazolium (MTT) were purchased from GenivewCo. (El Monte, CA, USA). Cell Lysates, tert-butyl hydroxytoluene (BHT), kojic acid, and proteinquantification test kit were purchased from Shanghai Yuye biotechnology Co., Ltd. (Shanghai, China).RPMI 1640 medium was purchased from Hyclone Co. (Logan, UT, USA). ECL chemiluminescencedetection kit and sodium dodecyl sulfate polyacrylamide gels (SDS-PAGE) Gel Preparation Kit werepurchased from Aspentech Co. (Bedford, MA, USA). B16 melanoma cells were purchased fromShanghai Tongpai Biotechnology Co., Ltd (Shanghai, China). All other analytical grade chemicals werebought from Sinopharm chemical reagent Co., Ltd (Shanghai, China).
3.2. Extraction of Essential Oil
Fresh pomelo was picked and the white peel from the fresh pomelo peel was removed, and thenthe exocarp chopped in 1.5 cm × 0.5 cm × 0.2 cm sized pieces. Pomelo peel (100 g) was crushed andpressed twice with a cold hydraulic press (Model 6YL-190; Changbai Mountain Technology Limitedcompany, Changchun, China) [28] and then the peel slurry was collected. After filtering through a steelsieve (0.15 mm), saturated sodium chloride (NaCl) solution was added to the sample for the extractionof PPEO for 3 h. Then, the sample was centrifuged at 10,000× g for 30 min at 4 ◦C. Supernatants werestored in separate amber bottles at −20 ◦C until use. The extracted PPEO was weighed to determinethe extraction yield as follows: extraction yield (%) = [(weight of extracted oil)/(weight of pomelopeel)] × 100%.
88
Molecules 2019, 24, 242
3.3. Gas Chromatography-Mass Spectrometry Analysis
The extracted PPEO was filtered through a 0.45 µm microporous organic membrane. Volatilecompounds were analyzed using an Agilent 7890A GC coupled to an Agilent 5975C mass spectrometer(Palo Alto, CA, USA). The components of PPEO were identified using HP-5Ms phenylmethylsiloxanecapillary column (30 m × 0.25 mm i.d., 0.25 µm; Agilent Technologies, J & W Scientific Products,Folsom, CA, USA) [24]. The helium was used as a carrier gas with a flow rate of 1 mL/min. Injectortemperature was 250 ◦C. The split ratio was 10:1. The temperature program was 45 ◦C (hold for 1 min),increase at 10 ◦C/min to 165 ◦C (hold for 2 min), increase at 1.5 ◦C/min to 180 ◦C (hold for 2 min),and then increase at 10 ◦C/min to 250 ◦C (hold for 2 min). The temperature of both injector anddetector was set at 250 ◦C. Mass spectra were scanned from m/z 35–350 amu. The electron impactionization energy was 70 eV. Identification of compounds detected by GC/MS analysis was performedby comparing mass spectra and retention indices (RIs) with published data obtained under similarconditions, as well as by comparing their mass spectra with the MS library of Wiley 7.0 and Nist 05 [29].A mixture of n-paraffins (C7–C30) as standards was used for calculating RIs. Samples were analyzedand identified using an available Retention Time Locked (RTL) database with Deconvolution ReportingSoftware (DRS) and a database of 926 DRS compounds.
3.4. Antioxidant Activities
3.4.1. DPPH Radical Scavenging Assay
The DPPH radical scavenging assay was performed according to Boskou et al. [23]. The samplePPEO was prepared with different concentrations with absolute ethanol. A mixture of 50 µL sampleand 150 µL 0.1 mmol/L DPPH free radical ethanol solution was taken and placed in a 96-well plate.After vigorous shaking, the mixture was incubated at room temperature in the dark for 30 min. Theabsorbance at 517 nm was measured. Pomelo peel essential oil was replaced with absolute ethanol toserve as the blank control, and BHT was used as positive control.
3.4.2. Superoxide Anion Radical Scavenging Activity Assay
The superoxide anion radical scavenging activity was measured as described by Zhang et al. [30].The reaction mixture consisted of 4.5 mL 50 mM Tris-HCl buffer (pH 8.2) and 1 mL sample solution atdifferent concentrations. The mixed solution was pre-incubated at 25 ◦C for 10 min, and then initiatedby the addition of 0.45 mL 2.5 mM pyrogallol. After vigorous shaking for 5 min, the reaction wasterminated by the addition of 8 mol/L HCl. The absorbance was read at 517 nm.
3.4.3. ABTS Radical Scavenging Assay
The ABTS radical scavenging assay was conducted following the method previously described byRe et al. [31]. Diluted radical solution was prepared by mixing 7 mM ABTS and 2 mM K2S2O8 in equalamounts, followed by reaction in the dark overnight at room temperature. The samples were preparedin different concentrations with ultrapure water. Aliquots of 10 µL of samples were mixed with 200 µLof the diluted radical solution in 96-well plate and the absorbance was measured at 734 nm after 5 minusing an M200 pro enzyme-labeled instrument (Tecan, Ltd., Männedorf, Switzerland). BHT was usedas the positive control.
3.5. Cell Culture and Treatment
The murine metastatic melanoma cell line B16 was cultured in sterile cell culture flasks withRPMI 1640 medium supplemented with 100 U/mL penicillin, 100 U/mL streptomycin, and 10% heatinactivated FBS at 37 ◦C in a humidified incubator containing 5% CO2. Cells in logarithmic growthphase were selected for subsequent experiments [32]. The extracted PPEO was dissolved in Tween 80
89
Molecules 2019, 24, 242
and filtered through a 0.45 µm microporous organic membrane. The PPEO was diluted to differentconcentrations and then was added to the medium.
3.6. MTT Assay for Cell Viability
Cell viability was evaluated by 3-[4, 5-dimethylthiazol-2-yl]-2, 5-diphenyl tetrazolium bromide(MTT) assay according to the method of Satooka et al. [33]. The cell density was 7 × 10⁴ cells/mLand the cells were seeded on 96-well cell culture plates at 100 µL per well. After 24 h of culture, theoriginal culture solution was aspirated. Cells were exposed to various concentrations of PPEO orkojic acid (71 µg/mL), with 6 replicates for each concentration (500 µmol/L of kojic acid is equal to71 µg/mL). After culture for another 24 h, 100 µL of 0.5 mg/mL MTT was added to each well, followedby inoculation for 4 h at 37 ◦C. The liquid was carefully aspirated from the well, and then 150 µL ofDMSO was added to each well. After 10 min of shaking, the absorbance was measured at 490 nmusing an M200 pro enzyme-labeled instrument (Tecan, Ltd.).
3.7. Immunofluorescence Analysis and Hoechst Staining
A sterilized coverslip was placed into each hole of the six-hole plate on an ultra-clean workbench.The cell suspension was added to each coverslip and placed in an incubator with a CO2 concentrationof 5% at 37 ◦C until cell fixation (2 h). After the addition of 2 mL culture medium, the culture wascontinued for about 6 h. The medium was decanted and the cells were washed for 5 min with PBSfor 3 times. The cells were fixed with 4% paraformaldehyde for 30 min, and then paraformaldehydewas removed by PBS buffer washing. After the addition of appropriate amounts of Hoechst stain, thecoverslips were incubated at room temperature for 15 min in the dark. The coverslips were then rinsed3 times with PBS for 5 min each time, and the side with the cells was observed under a confocal laserscanning microscope [34].
3.8. Determination of Melanin Content
Melanin content was determined as described by Huang et al. [35]. B16 cells were plated at adensity of 7 × 10⁴ cells/well in a 6-well plate. The experimental group was added with 0.2 µmol/Lα-MSH (melanocyte-stimulating hormone) to construct a cell model with high melanin expression.After 12 h of culture, cells were exposed to various concentrations of PPEO (10–100 µg/mL). Kojic acidat a concentration of 71 µg/mL was used as a positive control. After 48 h of culture, the supernatantwas discarded and the cells were washed 3 times with PBS buffer. After the addition of 200 µmol/LNaOH solution (containing 10% DMSO) to each well, the cells were fully lysed at 80 ◦C for 1 h,and the absorbance was measured at 492 nm. The amount of protein was measured by Micro BCAprotein assay kit (Shanghai Yuye biotechnology Co., Ltd, Shanghai, China). The melanin content wascalculated by normalization to the total cellular protein (1 g of melanin/mg of protein) and reported asa percentage of the control.
3.9. Intracellular Tyrosinase Activity
B16 cells were plated at a density of 7 × 10⁴ cells/well in a 6-well plate. After 24 h of culture,cells were exposed to various concentrations of PPEO (10–100 µg/mL) or kojic acid (71 µg/mL), andincubated for additional 48 h. The cells were then washed with ice-cold phosphate buffer. The plateswere frozen at −80 ◦C for 30 min. After thawing and mixing, the tyrosinase activity was measured byELISA kit [36].
3.10. Protein Extraction and Western Blot Analysis
Total protein was extracted from cells lysed by RIPA Lysis buffer with 1% phenylmethylsulfonylfluoride (PMSF). The amount of protein was measured by Micro BCA protein assay kit (Shanghai Yuyebiotechnology Co., Ltd.). The samples were loaded on 10% sodium dodecyl sulfate polyacrylamide
90
Molecules 2019, 24, 242
gels (SDS-PAGE) and transferred onto polyvinylidene difluoride (PVDF) membranes. The membraneswere then placed in blocking solution and blocked at room temperature for 1 h. The membranes wereincubated overnight at 4 ◦C with appropriate concentrations of specific antibodies, including rabbitmonoclonal antibodies glyceraldehyde-3-phosphate dehydrogenase (GAPDH, 1:10000 dilution) andrabbit monoclonal antibodies TYR (1:1000 dilution). After five or six times of washing, the blots werethen incubated with secondary antibody (HRP-Goat anti Rabbit). BandScan was used to analyze theintegrated density of bands.
3.11. Statistical Analysis
All the experiments were performed with freshly prepared samples in triplicate. The resultswere expressed as means ± standard deviation (SD) and analyzed by one-way analysis of variance(ANOVA) test using SPSS 19.0 (IBM Corporation, Armonk, NY, USA). Differences were considered asstatistically significant at the level of p < 0.05.
4. Conclusions
Our study is the first to extract essential oil from the peel of pomelo cv. Guan Xi by a cold pressingmethod and analyze its main components of limonene, β-myrcene, β-pinene, ocimene, and β-copaene.Our results reveal that PPEO has strong antioxidant activities against DPPH, ABTS, and superoxideanion radicals and the main active components responsible for the effect are terpenes. Besides, theeffects of PPEO on the viability of B16 cells and the production of melanin were evaluated based onthe B16 melanoma cell system. The results indicate that PPEO down-regulates the expression levelof TYR in B16 cells, which inhibits the catalytic reaction of TYR and blocks the synthesis pathway ofmelanin; and it further reduces melanin production without affecting the cell viability. This studyprovides data support for expanding the potential application of essential oil from pomelo peel as anatural antioxidant in the food, pharmaceutical and cosmetic industries. Further research in vivo isneeded to fully evaluate the potential anti-melanogenic effect of PPEO.
Author Contributions: S.P. provided the initial idea for research. W.H. and Y.P. designed the research. X.L.conducted the experimental work and W.H. drafted the manuscript. X.H. edited the paper. All authors discussedand approved the final manuscript.
Funding: This work was financially supported by National Natural Science Foundation of China (No. 31571847)and Modern Agricultural Industry Technology System Post Scientist Project of China (No. CARS-26).
Conflicts of Interest: The authors declare no conflict of interest.
References
1. Liu, Y.; Liu, A.; Ibrahim, S.A.; Yang, H.; Huang, W. Isolation and characterization of microcrystalline cellulosefrom pomelo peel. Int. J. Biol. Macromol. 2018, 111, 717–721. [CrossRef] [PubMed]
2. Guo, X.; Zhao, W.; Liao, X.; Hu, X.; Wu, J.; Wang, X. Extraction of pectin from the peels of pomelo byhigh-speed shearing homogenization and its characteristics. LWT Food Sci. Technol. 2017, 79, 640–646.[CrossRef]
3. Zhu, L.; Wang, Y.; Wang, Y.; You, L.; Shen, X.; Li, S. An environmentally friendly carbon aerogels derivedfrom waste pomelo peels for the removal of organic pollutants/oils. Microporous Mesoporous Mater. 2018, 241,285–292. [CrossRef]
4. Hosni, K.; Zahed, N.; Chrif, R.; Abid, I.; Medfei, W.; Kallel, M.; Brahim, N.B.; Sebei, H. Composition of peelessential oils from four selected Tunisian Citrus species: Evidence for the genotypic influence. Food Chem.
2010, 123, 1098–1104. [CrossRef]5. Wu, F.; Jin, Y.; Xu, X.; Yang, N. Electrofluidic pretreatment for enhancing essential oil extraction from citrus
fruit peel waste. J. Clean. Prod. 2017, 159, 85–94. [CrossRef]6. Akhtar, M.; Iqbal, L.; Lateef, M.; Nawab, B.; Saleem, M.; Afza, N. Bio-reactive properties of citrus waste: An
investigation of antioxidant and tyrosinase inhibitory activities. Pak. J. Bot. 2011, 43, 2881–2883.
91
Molecules 2019, 24, 242
7. Fiocco, D.; Arciuli, M.; Arena, M.P.; Benvenuti, S.; Gallone, A. Chemical composition and the anti-melanogenic potential of different essential oils. Flavour Fragr. J. 2016, 31, 255–261. [CrossRef]
8. Dahham, S.S.; Tabana, Y.M.; Iqbal, M.A.; Ahamed, M.B.; Ezzat, M.O.; Majid, A.S.; Majid, A.M. The Anticancer,Antioxidant and Antimicrobial Properties of the Sesquiterpene β-Caryophyllene from the Essential Oil ofAquilaria crassna. Molecules 2015, 20, 11808–11829. [CrossRef]
9. Choi, H.S.; Song, H.S.; Ukeda, H.; Sawamura, M. Radical-Scavenging Activities of Citrus Essential Oils andTheir Components: Detection Using 1,1-Diphenyl-2-picrylhydrazyl. J. Agric. Food Chem. 2000, 48, 4156–4161.[CrossRef]
10. Dayanand, D.; Balamurugan, K.; Agrawal, R.C.; Rahul, V.; Rahi, J. Evalution of antioxidant activity ofmethanolic and hydromethanolic extract of sweet orange peels. Recent Res. Sci. Technol. 2011, 3, 22–25.
11. Asikin, Y.; Maeda, G.; Tamaki, H.; Mizu, M.; Oku, H.; Wada, K. Cultivation line and fruit ripeningdiscriminations of Shiikuwasha (Citrus depressa Hayata) peel oils using aroma compositional, electronic nose,and antioxidant analyses. Food Res. Int. 2015, 67, 102–110. [CrossRef]
12. Seo, S.Y.; Sharma, V.K.; Sharma, N. Mushroom tyrosinase: Recent Prospects. J. Agric. Food Chem. 2003, 51,2837–2853. [CrossRef] [PubMed]
13. Ritaro, M.; Hiroyuki, U.; Masayoshi, S. Tyrosinase inhibitory activity of citrus essential oils. J. Agric. Food
Chem. 2006, 54, 2309–2313.14. Proestos, C.; Lytoudi, K.; Mavromelanidou, O.K.; Zoumpoulakis, P.; Sinanoglou, V.J. Antioxidant Capacity
of Selected Plant Extracts and Their Essential Oils. Antioxidants 2013, 2, 11–22. [CrossRef] [PubMed]15. Hu, J.J.; Li, X.; Liu, X.H. Inhibitory effect of lemon essential oil on mushroom tyrosinase activity in vitro.
Mod. Food Sci. Technol. 2015, 31, 97–105.16. Yang, C.H.; Huang, Y.C.; Tsai, M.L.; Chen, Y.C.; Li, L.L.; Ya, W.Y. Inhibition of melanogenesis by
β-caryophyllene from lime mint essential oil in mouse B16 melanoma cells. Int. J. Cosmet. Sci. 2015,37, 550–554. [CrossRef] [PubMed]
17. Phi, N.T.L.; Hung, P.V.; Chi, P.T.L.; Dung, N.H. Impact of Extraction Methods on Antioxidant andAntimicrobial Activities of Citrus Essential Oils. J. Essent. Oil Bear. Plants 2015, 18, 806–817. [CrossRef]
18. Azmi, N.; Hashim, P.; Hashim, D.M.; Halimoon, N.; Majid, N.M. Anti-elastase, anti-tyrosinase and matrixmetalloproteinase-1 inhibitory activity of earthworm extracts as potential new anti-aging agent. Asian Pac. J.
Trop. Biomed. 2014, 4 (Suppl. 1), S348–S352. [CrossRef]19. Dong, H.; Zhang, Q.; Li, L.; Liu, J.; Shen, L.; Li, H.; Qin, W. Antioxidant activity and chemical compositions
of essential oil and ethanol extract of Chuanminshen violaceum. Ind. Crops Prod. 2015, 76, 290–297. [CrossRef]20. Guo, J.J.; Gao, Z.P.; Xia, J.L.; Ritenour, M.A.; Li, G.Y.; Shan, Y. Comparative analysis of chemical composition,
antimicrobial and antioxidant activity of citrus essential oils from the main cultivated varieties in China.LWT Food Sci. Technol. 2018, 97, 825–839. [CrossRef]
21. Almulaiky, Y.; Zeyadi, M.; Saleh, R.; Baothman, O.; Al-shawafi, W.; Al-Talhi, H. Assessment of antioxidantand antibacterial properties in two types of Yemeni guava cultivars. Biocatal. Agric. Biotechnol. 2018, 16,90–97. [CrossRef]
22. Tu, P.T.; Tawata, S. Anti-oxidant, anti-aging, and anti-melanogenic properties of the essential oils from twovarieties of Alpinia zerumbet. Molecules 2015, 20, 16723–16740. [CrossRef] [PubMed]
23. Boskou, G.; Salta, F.N.; Chrysostomou, S.; Mylona, A.; Chiou, A.; Andrikopoulos, N.K. Antioxidant capacityand phenolic profile of table olives from the Greek market. Food Chem. 2006, 94, 558–564. [CrossRef]
24. Roberto, D.; Micucci, P.; Sebastian, T.; Graciela, F.; Anesini, C. Antioxidant activity of limonene on normalmurine lymphocytes: Relation to H2O2 modulation and cell proliferation. Basic Clin. Pharmacol. Toxicol. 2010,106, 38–44. [CrossRef] [PubMed]
25. Sall, C.; Dombrowsky, L.; Bottzeck, O.; Praud-Tabaries, A.; Blache, Y. Targeting bacterial biofilms: Design ofa terpenoid-like library as non-toxic anti-biofilm compounds. Bioorg. Med. Chem. Lett. 2011, 21, 1493–1497.[CrossRef] [PubMed]
26. Tepe, B.; Donmez, E.; Unlu, M.; Candan, F.; Daferera, D.; Vardar-Unlu, G.; Polissiou, M.; Sokmen, A.Antimicrobial and antioxidative activities of the essential oils and methanol extracts of Salvia cryptantha
(Montbret et Aucher ex Benth.) and Salvia multicaulis (Vahl). Food Chem. 2004, 84, 519–525. [CrossRef]27. Turina, A.V.; Nolan, M.V.; Zygadlo, J.A.; Perillo, M.A. Natural terpenes: Self-assembly and membrane
partitioning. Biophys. Chem. 2006, 122, 101–113. [CrossRef]
92
Molecules 2019, 24, 242
28. Zhang, Y.; Wu, L.; Yao, Z.; Ma, Z.; Liu, J. Hypolipidemic effects of hickory nut oil using cold pressureextraction. Food Sci. Biotechnol. 2016, 25 (Suppl. 1), 41–46. [CrossRef]
29. Yao, Y.Y.; Pan, S.Y.; Fan, G.; Dong, L.; Ren, J.N.; Zhu, Y. Evaluation of volatile profile of Sichuan dongcai,a traditional salted vegetable, by SPME-GC-MS and E-nose. LWT Food Sci. Technol. 2015, 64, 528–535.[CrossRef]
30. Zhang, Q.A.; Wang, X.; Song, Y.; Fan, X.H.; Garcia Martin, J.F. Optimization of Pyrogallol AutoxidationConditions and Its Application in Evaluation of Superoxide Anion Radical Scavenging Capacity for FourAntioxidants. J. AOAC Int. 2016, 99, 504–511. [CrossRef]
31. Roberta, E.N.; Annap, R.; Ananth, P.; Annala, M.; Catherine, R.E. Antioxidant activity applying an improvedABTS radical cation decolorization assay. Free Radic. Biol. Med. 1999, 26, 1231–1237.
32. Meira, W.V.; Heinrich, T.A.; Cadena, S.; Martinez, G.R. Melanogenesis inhibits respiration in B16-F10melanoma cells whereas enhances mitochondrial cell content. Exp. Cell Res. 2017, 350, 62–72. [CrossRef][PubMed]
33. Satooka, H.; Cerda, P.; Kim, H.J.; Wood, W.F.; Kubo, I. Effects of matsutake mushroom scent compoundson tyrosinase and murine B16-F10 melanoma cells. Biochem. Biophys. Res. Commun. 2017, 487, 840–846.[CrossRef] [PubMed]
34. Monika, P.; Claus, R.; Gudrun, M.; Donat, K.; Jochen, H.M. Ceramide-induced apoptosis of D283medulloblastoma cells requires mitochondrial respiratory chain activity but occurs independently of caspasesand is not sensitive to Bcl-Xl overexpression. J. Neurochem. 2002, 82, 424–494.
35. Huang, Y.C.; Liu, K.C.; Chiou, Y.L.; Yang, C.H.; Chen, T.H.; Li, T.T.; Liu, L.L. Fenofibrate suppressesmelanogenesis in B16-F10 melanoma cells via activation of the p38 mitogen-activated protein kinase pathway.Chem. Biol. Interact. 2013, 205, 157–164. [CrossRef] [PubMed]
36. Li, X.; Guo, L.; Sun, Y.; Zhou, J.; Gu, Y.; Li, Y. Baicalein inhibits melanogenesis through activation of the ERKsignaling pathway. Int. J. Mol. Med. 2010, 25, 923–927. [CrossRef] [PubMed]
Sample Availability: Not available.
© 2019 by the authors. Licensee MDPI, Basel, Switzerland. This article is an open accessarticle distributed under the terms and conditions of the Creative Commons Attribution(CC BY) license (http://creativecommons.org/licenses/by/4.0/).
93

molecules
Article
Influence of Temperature, Solvent and pH on theSelective Extraction of Phenolic Compounds fromTiger Nuts by-Products:Triple-TOF-LC-MS-MS Characterization
Elena Roselló-Soto 1 , Francisco J. Martí-Quijal 1 , Antonio Cilla 1 , Paulo E. S. Munekata 2,
Jose M. Lorenzo 2 , Fabienne Remize 3 and Francisco J. Barba 1,*1 Nutrition and Food Science Area, Preventive Medicine and Public Health, Food Science, Toxicology and
Forensic Medicine Department, Universitat de València, Faculty of Pharmacy, Avda; Vicent Andrés Estellés,s/n, Burjassot, 46100 València, Spain; [email protected] (E.R.-S.); [email protected] (F.J.M.-Q.);[email protected] (A.C.)
2 Centro Tecnológico de la Carne de Galicia, Avda. Galicia No. 4, Parque Tecnológico de Galicia, San Cibraodas Viñas, 32900 Ourense, Spain; [email protected] (P.E.S.M.); [email protected] (J.M.L.)
3 QualiSud, Université de La Réunion, CIRAD, Université Montpellier, Montpellier SupAgro,Université d’Avignon, 2 rue J. Wetzell, F-97490 Sainte Clotilde, France; [email protected]
* Correspondence: [email protected]; Tel.: +34-963-54-4972; Fax: +34-963-54-4954
Academic Editors: Lillian Barros and Isabel C.F.R. FerreiraReceived: 26 January 2019; Accepted: 18 February 2019; Published: 22 February 2019
Abstract: The aim of this study was to assess the effect of temperature, solvent (hydroethanolicmixtures) and pH on the recovery of individual phenolic compounds from “horchata” by-products.These parameters were optimized by response surface methodology and triple-TOF-LC-MS-MS wasselected as the analytical tool to identify and quantify the individual compounds. The optimumextraction conditions were 50% ethanol, 35 ◦C and pH 2.5, which resulted in values of 222.6 mg gallicacid equivalents (GAE)/100 g dry matter and 1948.1 µM trolox equivalent (TE)/g of dry matterfor total phenolic content (TPC) and trolox equivalent antioxidant capacity (TEAC), respectively.The extraction of phenolic compounds by the conventional solvent method with agitation wasinfluenced by temperature (p = 0.0073), and more strongly, by the content of ethanol in theextraction solution (p = 0.0007) while the pH did not show a great impact (p = 0.7961). On theother hand, the extraction of phenolic acids was affected by temperature (p = 0.0003) and by ethanolamount (p < 0.0001) but not by the pH values (p = 0.53). In addition, the percentage of ethanolinfluenced notably the extraction of both 4-vinylphenol (p = 0.0002) and the hydroxycinnamic acids(p = 0.0039). Finally, the main individual phenolic extracted with hydroethanolic mixtures was4-vinylphenol (303.3 µg/kg DW) followed by spinacetin3-O-glucosyl-(1→6)-glucoside (86.2 µg/kgDW) and sinensetin (77.8 µg/kg DW).
Keywords: polyphenols; tiger nut; by-products; solvent extraction; horchata de chufa; tripleTOF-LC-MS-MS
1. Introduction
“Horchata de chufa” is a typical beverage from the Valencian Community. It is obtained fromtiger nuts (Cyperus esculentus), which are tuberous rhizomes that protrude from the tips of the plant’sroots under the ground [1]. During “horchata” preparation a large amount of waste and by-productsare obtained, representing “horchata” by-products ~60% of the total amount of the raw material usedto obtain the beverage [2]. These by-products are a source of polysaccharides, fiber, oil (rich in oleicacid) and antioxidant compounds (e.g., vitamin E and polyphenols), among others [3].
95
Molecules 2019, 24, 797
Some previous studies have evaluated the potential application of “horchata” by-products for thepreparation of new meat products, due to their high content in fiber [4–6]. However, the exploitationof “horchata” by-products as a source of phenolic compounds for food industries, nutraceuticals andcosmetics has not been widely explored. Some existing studies have evaluated the impact of the use ofenzyme pre-treatments alone or combined with high-pressure to extract phenolic compounds fromtiger nuts [7]. In this line, a previous study conducted by our research group evaluated the impactof conventional solvent extraction using a combination of binary mixtures consisting of ethanol andwater at different percentages, at different temperatures and extraction times to recover total phenoliccompounds and total flavonoids with antioxidant capacity from “horchata” by-products, obtainingpromising results, particularly with the use of mild heating (up to 60 ◦C) and hydroethanolic solvents(0%–50% ethanol) [8]. Another relevant aspect of phenolic compound extraction is the selection of anappropriate pH that can influence the yield and stability of phenolic compounds. Acidic conditions areassociated with higher extraction yields (higher interaction of phenolic compounds with the solvent)on different vegetable sources of phenolic compounds [9,10].
However, only spectrophotometric methods were used, as it was a preliminary study. It iswell known that it is not only important to evaluate the total amount of polyphenols but alsoto characterize their profile as the biological activity differs according to the targeted compound.Accordingly, the use of chromatographic techniques is currently encouraged to establish the structureand activity of bioactive compounds (that can be complemented by less specific but informativespectrophotometric methodologies) to estimate the impact of conventional and non-conventionalextraction processes, processing and bioaccessibility outcomes [11]. Therefore, in the present study,the impact of temperature, solvent (hydroethanolic mixtures) and pH on the recovery of individualphenolic compounds from “horchata” by-products was evaluated. For this purpose, a response surfacemethodology (RSM) approach was used to optimize the extraction. Moreover, triple-TOF-LC-MS-MSwas selected as the analytical tool to identify and quantify the individual compounds. In addition,the results were compared to those obtained after using supercritical carbon dioxide and Folchextraction methodology.
2. Results and Discussion
2.1. Impact of Temperature, Solvent and pH on the Selective Extraction of Total Phenolic Compounds (TPC) andTrolox Equivalent Antioxidant Capacity (TEAC) from Tiger Nuts by-Products
The conventional extraction with hydroethanolic mixtures was optimized according to aBox-Behnken design in order to maximize the TEAC and TPC values. The TPC and TEAC values foreach extraction are shown in Table 1.
The TPC and TEAC values ranged from 186.52 to 222.58 mg GAE/100 g of dry matter and 617.80to 1948.07 µM TE/g of dry matter, respectively. The best condition according to the factorial designfor TPC and TEAC was 35 ◦C, 50% ethanol and pH 2.5. Our TPC values were higher than thoseobtained by Ogunlade et al. [12] who found values of 115.70 mg GAE/100 g of tiger nut in roastedtubers. In addition, Oladele et al. [13] noticed TPC values of 351 and 134 mg/100 g for yellow andbrown tiger nuts, respectively. Koubaa et al. [14] obtained TPC values of 4.53–6.21 mg GAE/100 g ofoil and 4.71–5.29 GAE/100 g of oil, for supercritical fluids (SC-CO2) and mechanical expression (ME)extractions, respectively. Parker et al. [15] found TPC values ranging from 5.63 to 64.9 mg/100 g fortiger nut, whereas Badejo et al. [16] obtained TPC values of 21.67 mg/100 mL for a tiger nut aqueousextract drink.
Moreover, Roselló-Soto et al. [8] reported that TPC values obtained from “horchata” by-productsaccording to the solvent used, temperature and extraction time, showing that the highest TPC valueswere obtained using 25% ethanol (v/v), at 60 ◦C with an extraction time of 3 h. The difference in theTPC values could be due to raw material studied but also to the methods of extraction and analysis.
96
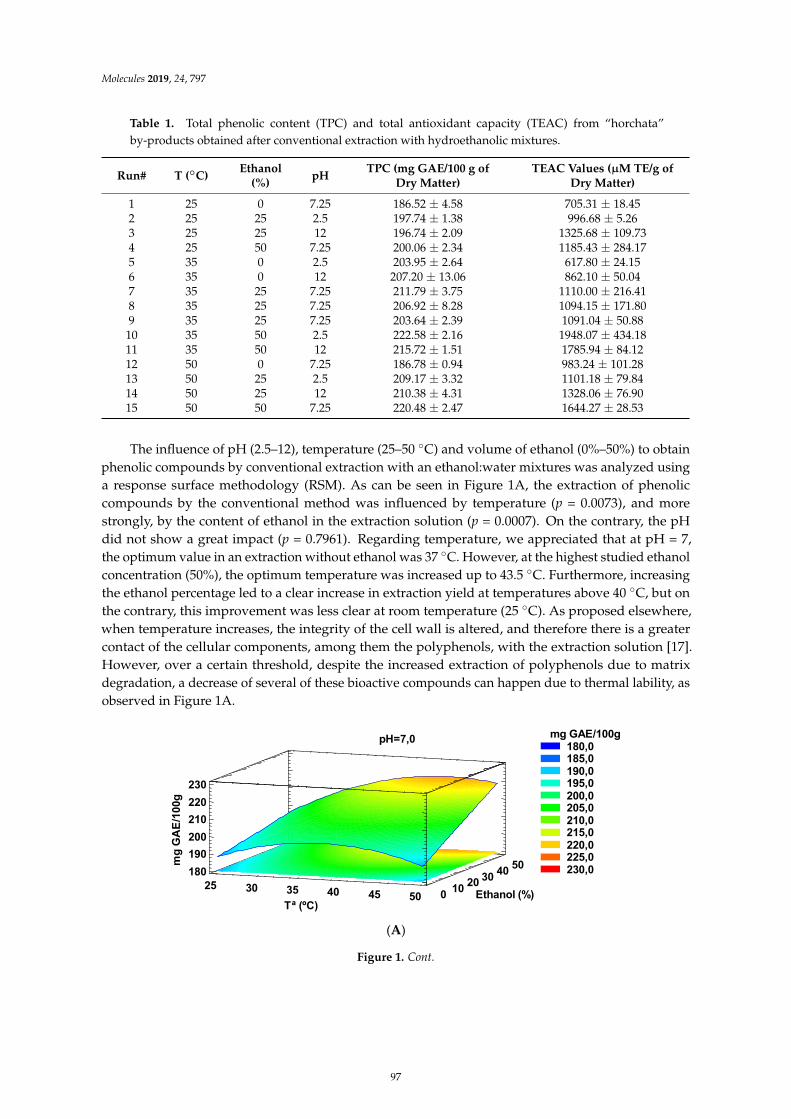
Molecules 2019, 24, 797
Table 1. Total phenolic content (TPC) and total antioxidant capacity (TEAC) from “horchata”by-products obtained after conventional extraction with hydroethanolic mixtures.
Run# T (◦C)Ethanol
(%)pH
TPC (mg GAE/100 g ofDry Matter)
TEAC Values (µM TE/g ofDry Matter)
1 25 0 7.25 186.52 ± 4.58 705.31 ± 18.452 25 25 2.5 197.74 ± 1.38 996.68 ± 5.263 25 25 12 196.74 ± 2.09 1325.68 ± 109.734 25 50 7.25 200.06 ± 2.34 1185.43 ± 284.175 35 0 2.5 203.95 ± 2.64 617.80 ± 24.156 35 0 12 207.20 ± 13.06 862.10 ± 50.047 35 25 7.25 211.79 ± 3.75 1110.00 ± 216.418 35 25 7.25 206.92 ± 8.28 1094.15 ± 171.809 35 25 7.25 203.64 ± 2.39 1091.04 ± 50.88
10 35 50 2.5 222.58 ± 2.16 1948.07 ± 434.1811 35 50 12 215.72 ± 1.51 1785.94 ± 84.1212 50 0 7.25 186.78 ± 0.94 983.24 ± 101.2813 50 25 2.5 209.17 ± 3.32 1101.18 ± 79.8414 50 25 12 210.38 ± 4.31 1328.06 ± 76.9015 50 50 7.25 220.48 ± 2.47 1644.27 ± 28.53
The influence of pH (2.5–12), temperature (25–50 ◦C) and volume of ethanol (0%–50%) to obtainphenolic compounds by conventional extraction with an ethanol:water mixtures was analyzed usinga response surface methodology (RSM). As can be seen in Figure 1A, the extraction of phenoliccompounds by the conventional method was influenced by temperature (p = 0.0073), and morestrongly, by the content of ethanol in the extraction solution (p = 0.0007). On the contrary, the pHdid not show a great impact (p = 0.7961). Regarding temperature, we appreciated that at pH = 7,the optimum value in an extraction without ethanol was 37 ◦C. However, at the highest studied ethanolconcentration (50%), the optimum temperature was increased up to 43.5 ◦C. Furthermore, increasingthe ethanol percentage led to a clear increase in extraction yield at temperatures above 40 ◦C, but onthe contrary, this improvement was less clear at room temperature (25 ◦C). As proposed elsewhere,when temperature increases, the integrity of the cell wall is altered, and therefore there is a greatercontact of the cellular components, among them the polyphenols, with the extraction solution [17].However, over a certain threshold, despite the increased extraction of polyphenols due to matrixdegradation, a decrease of several of these bioactive compounds can happen due to thermal lability, asobserved in Figure 1A.
‐
μ
‐ ‐
(A)
Ethanol (%)
pH=7,0
25 30 35 40 45 50Tª (ºC)
0 10 20 30 40 50180190200210220230
mg
GA
E/10
0g
mg GAE/100g180,0185,0190,0195,0200,0205,0210,0215,0220,0225,0230,0
Figure 1. Cont.
97
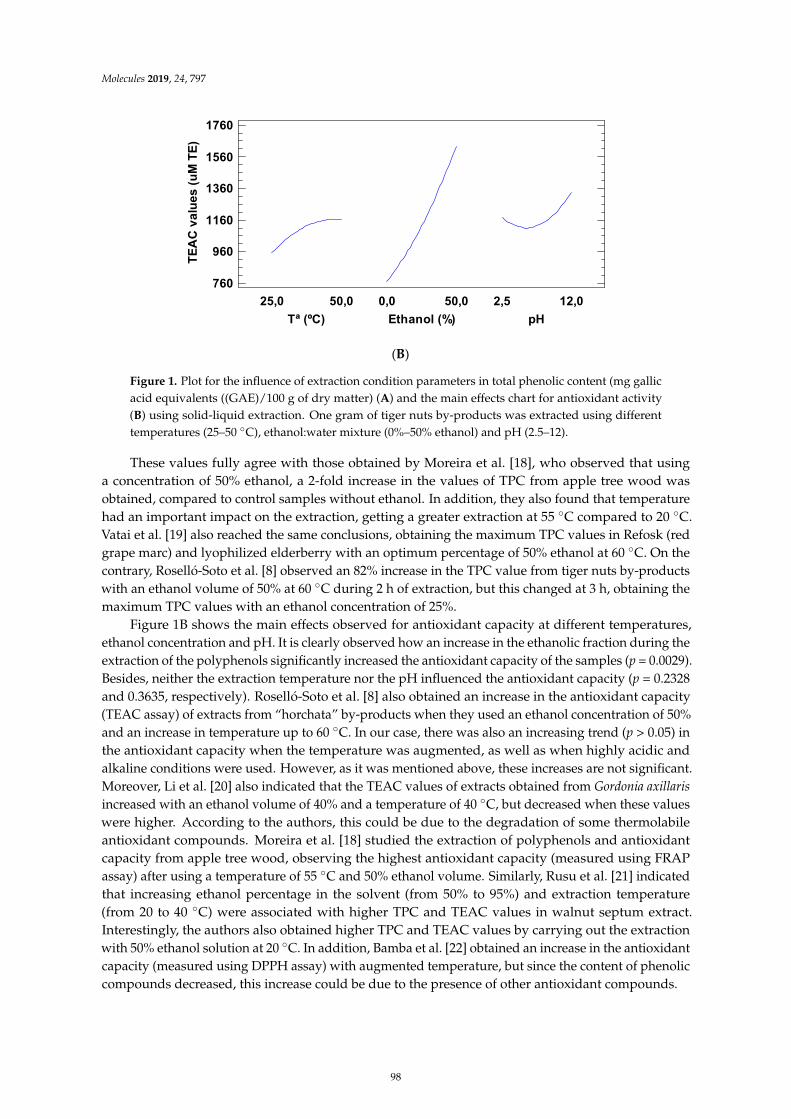
Molecules 2019, 24, 797
(B)
‐ ‐
‐
‐
‐
‐ ‐
25,0Ethanol (%)
50,0 12,0
TEA
C v
alue
s (u
M T
E)
760
960
1160
1360
1560
1760
Tª (ºC)50,0 0,0
pH2,5
Figure 1. Plot for the influence of extraction condition parameters in total phenolic content (mg gallicacid equivalents ((GAE)/100 g of dry matter) (A) and the main effects chart for antioxidant activity(B) using solid-liquid extraction. One gram of tiger nuts by-products was extracted using differenttemperatures (25–50 ◦C), ethanol:water mixture (0%–50% ethanol) and pH (2.5–12).
These values fully agree with those obtained by Moreira et al. [18], who observed that usinga concentration of 50% ethanol, a 2-fold increase in the values of TPC from apple tree wood wasobtained, compared to control samples without ethanol. In addition, they also found that temperaturehad an important impact on the extraction, getting a greater extraction at 55 ◦C compared to 20 ◦C.Vatai et al. [19] also reached the same conclusions, obtaining the maximum TPC values in Refosk (redgrape marc) and lyophilized elderberry with an optimum percentage of 50% ethanol at 60 ◦C. On thecontrary, Roselló-Soto et al. [8] observed an 82% increase in the TPC value from tiger nuts by-productswith an ethanol volume of 50% at 60 ◦C during 2 h of extraction, but this changed at 3 h, obtaining themaximum TPC values with an ethanol concentration of 25%.
Figure 1B shows the main effects observed for antioxidant capacity at different temperatures,ethanol concentration and pH. It is clearly observed how an increase in the ethanolic fraction during theextraction of the polyphenols significantly increased the antioxidant capacity of the samples (p = 0.0029).Besides, neither the extraction temperature nor the pH influenced the antioxidant capacity (p = 0.2328and 0.3635, respectively). Roselló-Soto et al. [8] also obtained an increase in the antioxidant capacity(TEAC assay) of extracts from “horchata” by-products when they used an ethanol concentration of 50%and an increase in temperature up to 60 ◦C. In our case, there was also an increasing trend (p > 0.05) inthe antioxidant capacity when the temperature was augmented, as well as when highly acidic andalkaline conditions were used. However, as it was mentioned above, these increases are not significant.Moreover, Li et al. [20] also indicated that the TEAC values of extracts obtained from Gordonia axillaris
increased with an ethanol volume of 40% and a temperature of 40 ◦C, but decreased when these valueswere higher. According to the authors, this could be due to the degradation of some thermolabileantioxidant compounds. Moreira et al. [18] studied the extraction of polyphenols and antioxidantcapacity from apple tree wood, observing the highest antioxidant capacity (measured using FRAPassay) after using a temperature of 55 ◦C and 50% ethanol volume. Similarly, Rusu et al. [21] indicatedthat increasing ethanol percentage in the solvent (from 50% to 95%) and extraction temperature(from 20 to 40 ◦C) were associated with higher TPC and TEAC values in walnut septum extract.Interestingly, the authors also obtained higher TPC and TEAC values by carrying out the extractionwith 50% ethanol solution at 20 ◦C. In addition, Bamba et al. [22] obtained an increase in the antioxidantcapacity (measured using DPPH assay) with augmented temperature, but since the content of phenoliccompounds decreased, this increase could be due to the presence of other antioxidant compounds.
98
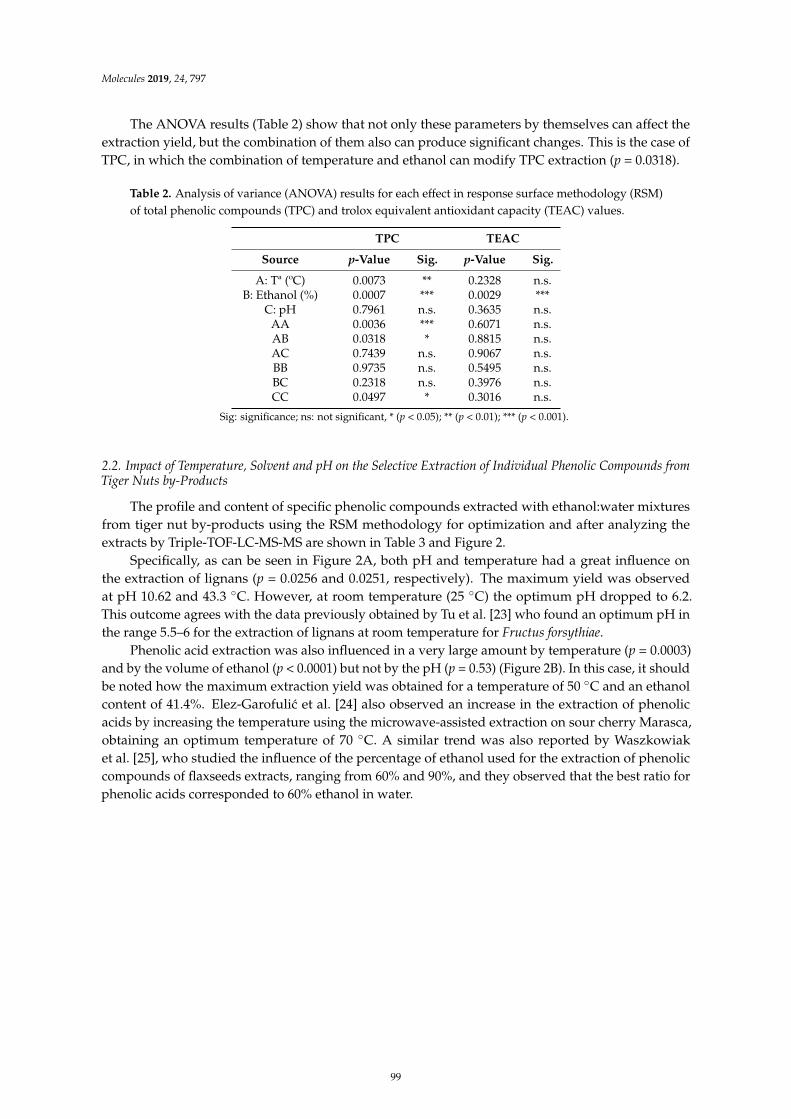
Molecules 2019, 24, 797
The ANOVA results (Table 2) show that not only these parameters by themselves can affect theextraction yield, but the combination of them also can produce significant changes. This is the case ofTPC, in which the combination of temperature and ethanol can modify TPC extraction (p = 0.0318).
Table 2. Analysis of variance (ANOVA) results for each effect in response surface methodology (RSM)of total phenolic compounds (TPC) and trolox equivalent antioxidant capacity (TEAC) values.
TPC TEAC
Source p-Value Sig. p-Value Sig.
A: Tª (ºC) 0.0073 ** 0.2328 n.s.B: Ethanol (%) 0.0007 *** 0.0029 ***
C: pH 0.7961 n.s. 0.3635 n.s.AA 0.0036 *** 0.6071 n.s.AB 0.0318 * 0.8815 n.s.AC 0.7439 n.s. 0.9067 n.s.BB 0.9735 n.s. 0.5495 n.s.BC 0.2318 n.s. 0.3976 n.s.CC 0.0497 * 0.3016 n.s.
Sig: significance; ns: not significant, * (p < 0.05); ** (p < 0.01); *** (p < 0.001).
2.2. Impact of Temperature, Solvent and pH on the Selective Extraction of Individual Phenolic Compounds fromTiger Nuts by-Products
The profile and content of specific phenolic compounds extracted with ethanol:water mixturesfrom tiger nut by-products using the RSM methodology for optimization and after analyzing theextracts by Triple-TOF-LC-MS-MS are shown in Table 3 and Figure 2.
Specifically, as can be seen in Figure 2A, both pH and temperature had a great influence onthe extraction of lignans (p = 0.0256 and 0.0251, respectively). The maximum yield was observedat pH 10.62 and 43.3 ◦C. However, at room temperature (25 ◦C) the optimum pH dropped to 6.2.This outcome agrees with the data previously obtained by Tu et al. [23] who found an optimum pH inthe range 5.5–6 for the extraction of lignans at room temperature for Fructus forsythiae.
Phenolic acid extraction was also influenced in a very large amount by temperature (p = 0.0003)and by the volume of ethanol (p < 0.0001) but not by the pH (p = 0.53) (Figure 2B). In this case, it shouldbe noted how the maximum extraction yield was obtained for a temperature of 50 ◦C and an ethanolcontent of 41.4%. Elez-Garofulic et al. [24] also observed an increase in the extraction of phenolicacids by increasing the temperature using the microwave-assisted extraction on sour cherry Marasca,obtaining an optimum temperature of 70 ◦C. A similar trend was also reported by Waszkowiaket al. [25], who studied the influence of the percentage of ethanol used for the extraction of phenoliccompounds of flaxseeds extracts, ranging from 60% and 90%, and they observed that the best ratio forphenolic acids corresponded to 60% ethanol in water.
99
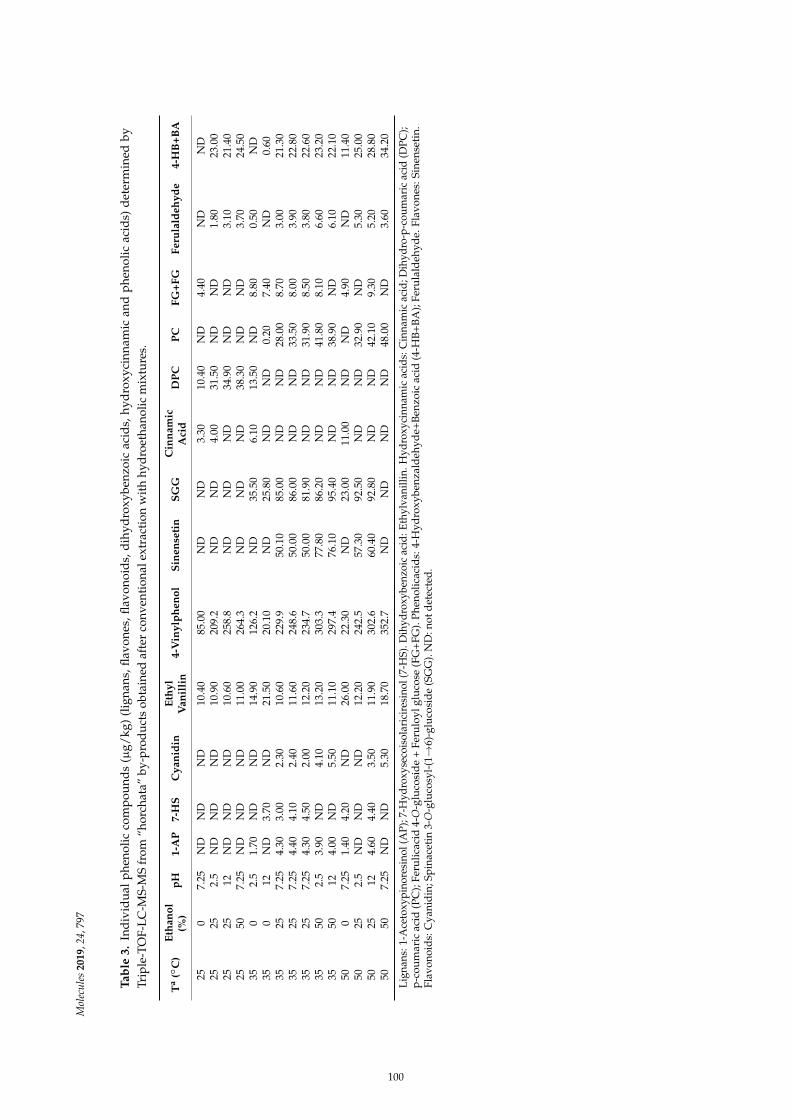
Mol
ecu
les
20
19,2
4,79
7
Ta
ble
3.
Ind
ivid
ual
phe
nolic
com
pou
nds
(µg/
kg)
(lig
nans
,flav
ones
,flav
onoi
ds,
dih
ydro
xybe
nzoi
cac
ids,
hyd
roxy
cinn
amic
and
phe
nolic
acid
s)d
eter
min
edby
Trip
le-T
OF-
LC
-MS-
MS
from
“hor
chat
a”by
-pro
du
cts
obta
ined
afte
rco
nven
tion
alex
trac
tion
wit
hhy
dro
etha
nolic
mix
ture
s.
Ta
(◦C
)E
tha
no
l(%
)p
H1
-AP
7-H
SC
ya
nid
inE
thy
lV
an
illi
n4
-Vin
ylp
he
no
lS
ine
nse
tin
SG
GC
inn
am
icA
cid
DP
CP
CF
G+
FG
Fe
rula
lde
hy
de
4-H
B+
BA
250
7.25
ND
ND
ND
10.4
085
.00
ND
ND
3.30
10.4
0N
D4.
40N
DN
D25
252.
5N
DN
DN
D10
.90
209.
2N
DN
D4.
0031
.50
ND
ND
1.80
23.0
025
2512
ND
ND
ND
10.6
025
8.8
ND
ND
ND
34.9
0N
DN
D3.
1021
.40
2550
7.25
ND
ND
ND
11.0
026
4.3
ND
ND
ND
38.3
0N
DN
D3.
7024
.50
350
2.5
1.70
ND
ND
14.9
012
6.2
ND
35.5
06.
1013
.50
ND
8.80
0.50
ND
350
12N
D3.
70N
D21
.50
20.1
0N
D25
.80
ND
ND
0.20
7.40
ND
0.60
3525
7.25
4.30
3.00
2.30
10.6
022
9.9
50.1
085
.00
ND
ND
28.0
08.
703.
0021
.30
3525
7.25
4.40
4.10
2.40
11.6
024
8.6
50.0
086
.00
ND
ND
33.5
08.
003.
9022
.80
3525
7.25
4.30
4.50
2.00
12.2
023
4.7
50.0
081
.90
ND
ND
31.9
08.
503.
8022
.60
3550
2.5
3.90
ND
4.10
13.2
030
3.3
77.8
086
.20
ND
ND
41.8
08.
106.
6023
.20
3550
124.
00N
D5.
5011
.10
297.
476
.10
95.4
0N
DN
D38
.90
ND
6.10
22.1
050
07.
251.
404.
20N
D26
.00
22.3
0N
D23
.00
11.0
0N
DN
D4.
90N
D11
.40
5025
2.5
ND
ND
ND
12.2
024
2.5
57.3
092
.50
ND
ND
32.9
0N
D5.
3025
.00
5025
124.
604.
403.
5011
.90
302.
660
.40
92.8
0N
DN
D42
.10
9.30
5.20
28.8
050
507.
25N
DN
D5.
3018
.70
352.
7N
DN
DN
DN
D48
.00
ND
3.60
34.2
0
Lig
nans
:1-A
ceto
xypi
nore
sino
l(A
P);7
-Hyd
roxy
seco
isol
aric
ires
inol
(7-H
S).D
ihyd
roxy
benz
oic
acid
:Eth
ylva
nilli
n.H
ydro
xyci
nnam
icac
ids:
Cin
nam
icac
id;D
ihyd
ro-p
-cou
mar
icac
id(D
PC);
p-c
oum
aric
acid
(PC
);Fe
rulic
acid
4-O
-glu
cosi
de
+Fe
rulo
ylgl
uco
se(F
G+
FG).
Phe
nolic
acid
s:4-
Hyd
roxy
benz
ald
ehyd
e+B
enzo
icac
id(4
-HB
+B
A);
Feru
lald
ehyd
e.Fl
avon
es:S
inen
seti
n.Fl
avon
oid
s:C
yani
din
;Sp
inac
etin
3-O
-glu
cosy
l-(1→
6)-g
luco
sid
e(S
GG
).N
D:n
otd
etec
ted
.
100
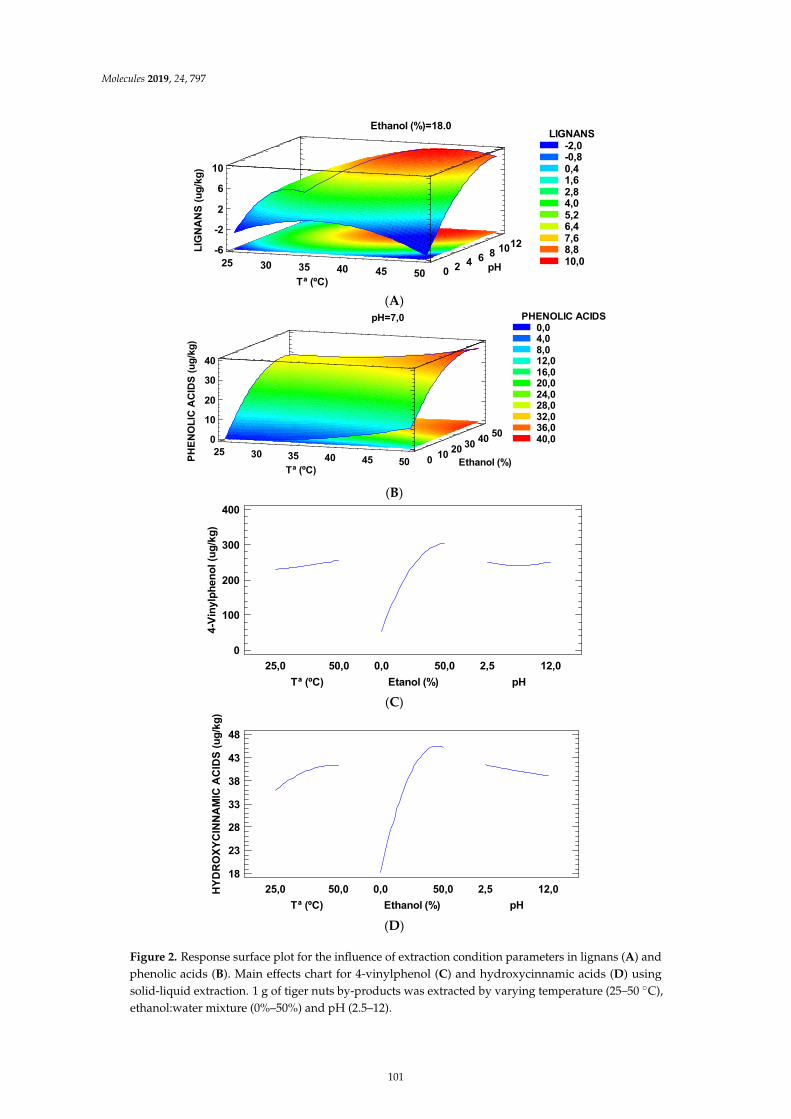
Molecules 2019, 24, 797
(A)
(B)
(C)
(D)
‐
‐ ‐
Ethanol (%)=18.0
LIG
NA
NS
(ug/
kg)
25 30 35 40 45 50Tª (ºC)
0 2 4 6 8 1012
pH-6
-2
2
6
10
LIGNANS-2,0-0,80,41,62,84,05,26,47,68,810,0
Ethanol (%)PHEN
OLI
C A
CID
S (u
g/kg
)
pH=7,0
25 30 35 40 45 50Tª (ºC)
0 10 20 30 40 500
10
20
30
40
PHENOLIC ACIDS0,04,08,012,016,020,024,028,032,036,040,0
25,0Etanol (%)
50,0 12,0
4-Vi
nylp
heno
l (ug
/kg)
0
100
200
300
400
Tª (ºC)50,0 0,0
pH2,5
25,0Ethanol (%)
50,0 12,0HYD
RO
XYC
INN
AM
IC A
CID
S (u
g/kg
)
18
23
28
33
38
43
48
Tª (ºC)50,0 0,0
pH2,5
Figure 2. Response surface plot for the influence of extraction condition parameters in lignans (A) andphenolic acids (B). Main effects chart for 4-vinylphenol (C) and hydroxycinnamic acids (D) usingsolid-liquid extraction. 1 g of tiger nuts by-products was extracted by varying temperature (25–50 ◦C),ethanol:water mixture (0%–50%) and pH (2.5–12).
101
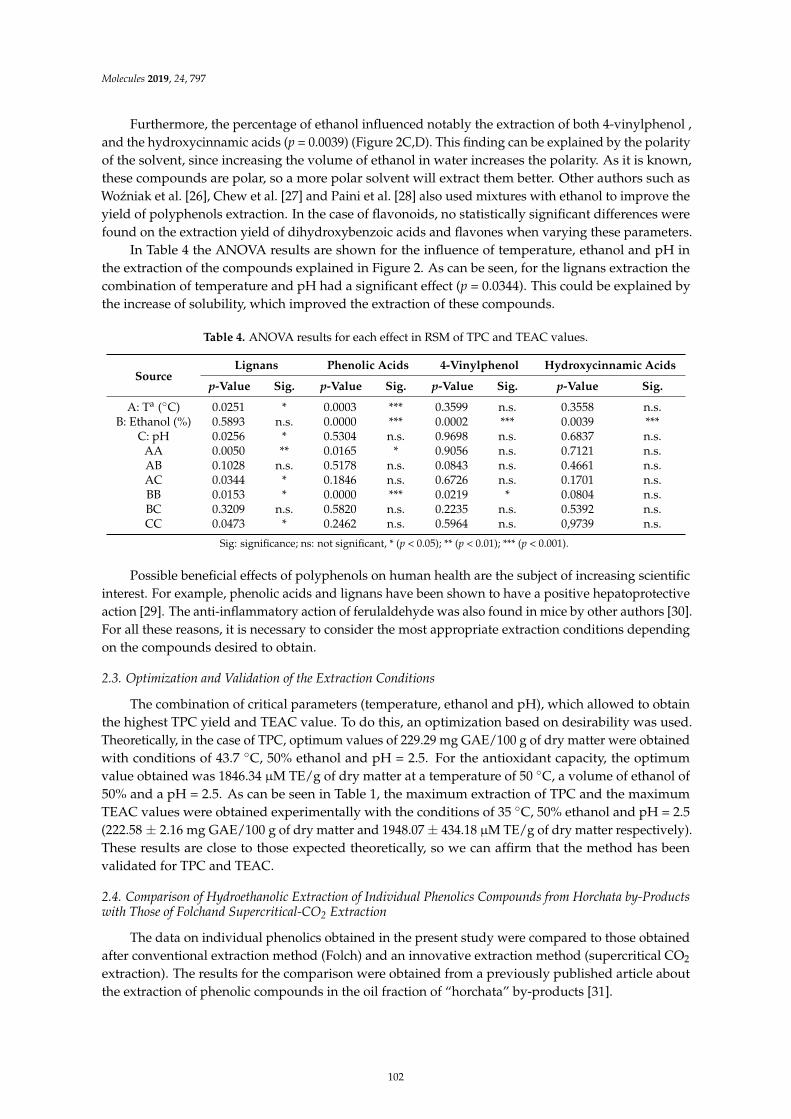
Molecules 2019, 24, 797
Furthermore, the percentage of ethanol influenced notably the extraction of both 4-vinylphenol ,and the hydroxycinnamic acids (p = 0.0039) (Figure 2C,D). This finding can be explained by the polarityof the solvent, since increasing the volume of ethanol in water increases the polarity. As it is known,these compounds are polar, so a more polar solvent will extract them better. Other authors such asWozniak et al. [26], Chew et al. [27] and Paini et al. [28] also used mixtures with ethanol to improve theyield of polyphenols extraction. In the case of flavonoids, no statistically significant differences werefound on the extraction yield of dihydroxybenzoic acids and flavones when varying these parameters.
In Table 4 the ANOVA results are shown for the influence of temperature, ethanol and pH inthe extraction of the compounds explained in Figure 2. As can be seen, for the lignans extraction thecombination of temperature and pH had a significant effect (p = 0.0344). This could be explained bythe increase of solubility, which improved the extraction of these compounds.
Table 4. ANOVA results for each effect in RSM of TPC and TEAC values.
SourceLignans Phenolic Acids 4-Vinylphenol Hydroxycinnamic Acids
p-Value Sig. p-Value Sig. p-Value Sig. p-Value Sig.
A: Ta (◦C) 0.0251 * 0.0003 *** 0.3599 n.s. 0.3558 n.s.B: Ethanol (%) 0.5893 n.s. 0.0000 *** 0.0002 *** 0.0039 ***
C: pH 0.0256 * 0.5304 n.s. 0.9698 n.s. 0.6837 n.s.AA 0.0050 ** 0.0165 * 0.9056 n.s. 0.7121 n.s.AB 0.1028 n.s. 0.5178 n.s. 0.0843 n.s. 0.4661 n.s.AC 0.0344 * 0.1846 n.s. 0.6726 n.s. 0.1701 n.s.BB 0.0153 * 0.0000 *** 0.0219 * 0.0804 n.s.BC 0.3209 n.s. 0.5820 n.s. 0.2235 n.s. 0.5392 n.s.CC 0.0473 * 0.2462 n.s. 0.5964 n.s. 0,9739 n.s.
Sig: significance; ns: not significant, * (p < 0.05); ** (p < 0.01); *** (p < 0.001).
Possible beneficial effects of polyphenols on human health are the subject of increasing scientificinterest. For example, phenolic acids and lignans have been shown to have a positive hepatoprotectiveaction [29]. The anti-inflammatory action of ferulaldehyde was also found in mice by other authors [30].For all these reasons, it is necessary to consider the most appropriate extraction conditions dependingon the compounds desired to obtain.
2.3. Optimization and Validation of the Extraction Conditions
The combination of critical parameters (temperature, ethanol and pH), which allowed to obtainthe highest TPC yield and TEAC value. To do this, an optimization based on desirability was used.Theoretically, in the case of TPC, optimum values of 229.29 mg GAE/100 g of dry matter were obtainedwith conditions of 43.7 ◦C, 50% ethanol and pH = 2.5. For the antioxidant capacity, the optimumvalue obtained was 1846.34 µM TE/g of dry matter at a temperature of 50 ◦C, a volume of ethanol of50% and a pH = 2.5. As can be seen in Table 1, the maximum extraction of TPC and the maximumTEAC values were obtained experimentally with the conditions of 35 ◦C, 50% ethanol and pH = 2.5(222.58 ± 2.16 mg GAE/100 g of dry matter and 1948.07 ± 434.18 µM TE/g of dry matter respectively).These results are close to those expected theoretically, so we can affirm that the method has beenvalidated for TPC and TEAC.
2.4. Comparison of Hydroethanolic Extraction of Individual Phenolics Compounds from Horchata by-Productswith Those of Folchand Supercritical-CO2 Extraction
The data on individual phenolics obtained in the present study were compared to those obtainedafter conventional extraction method (Folch) and an innovative extraction method (supercritical CO2
extraction). The results for the comparison were obtained from a previously published article aboutthe extraction of phenolic compounds in the oil fraction of “horchata” by-products [31].
102
Molecules 2019, 24, 797
It can be noticed that there was a great difference in the compounds obtained with the threedifferent extraction techniques. As for conventional extraction with Folch method, the major compoundobtained by far was 4-vinylphenol (216.9 µg/kg DW), followed by p-coumaric acid (25.35 µg/kgDW) and benzoic acid (13.54 µg/kg DW). In contrast, the main compounds extracted by SC-CO2,especially at 40 MPa, were isohydroxymatairesinol (399.44 µg/kg DW), scopoletin (93.24 µg/kgDW) and caffeic acid (30.66 µg/kg DW). In the present study (see Table 2), the main individualphenolic extracted with hydroethanolic mixtures was 4-vinylphenol (303.3 µg/kg DW) followed byspinacetin3-O-glucosyl-(1→6)-glucoside (86.2 µg/kg DW) and sinensetin (77.8 µg/kg DW).
It is worth noting that 4-vinylphenol was the predominant phenolic compound obtained,after using both conventional methods, despite the different polarity of solvents employed, thoughhigher extraction is accomplished with hydroethanolic mixtures. Moreover, a great difference was alsoobserved between the compounds obtained after conventional extraction (Folch and hydroethanolicmixtures) and those obtained by SC-CO2. As already mentioned, a more polar solvent facilitates theextraction of more phenolic compounds, therefore the low yield obtained in the SC-CO2 extraction isnot surprising. We should also keep in mind that the way to prepare the sample is different. In the caseof conventional extraction, homogenization is carried out at 10,000× rpm, while for SC-CO2 extractionthe sample is only milled. This protocol differences greatly modify the accessibility of the solvents to theintracellular compounds, since in the case of conventional extraction the samples were homogenizedwith the solvent, breaking the cellular structures, whereas in the SC-CO2 extraction only the particlesize of the samples was reduced.
These findings agree with the data previously reported by Parker et al. [15] who demonstratedthat tiger nuts skins are richer in p-coumaric acid than tiger nuts tubers, being this compound thefourth most important (48 µg/kg DW) in “horchata” by-products after hydroethanolic extraction.In addition, Ezeh et al. [7] studied the polyphenols present in tiger nuts, finding mainly trans-cinnamicacid. Oladele et al. [13] also determined the phenolic profile of tiger nuts, considering the yellowand brown varieties. They obtained differences between both species, since in yellow tiger nutsthe main compounds were ferulic acid (~58 mg/100 g), p-hydroxybenzoic acid (~29 mg/100 g),p-hydroxybenzaldehyde (~16 mg/100 g) and vanillic acid (~6 mg/100 g), whereas in brown tiger nut,vanillic (~15 mg/100 g), p-coumaric (~17 mg/100 g), caffeic (~15 mg/100 g), ferulic (~34 mg/100 g)and sinapinic acids (~21 mg/100 g) were predominant.
3. Material and Methods
3.1. Chemicals and Reagents
Sodium hydroxide (NaOH), sodium carbonate (Na2CO3), and acetone were obtained fromJ.T.Baker (Deventer, Holland). ABTS radical (2,2′-azino-bis(3-ethylbenzothiazoline-6-sulphonic acid),Trolox (6-hydroxy-2,5,7,8-tetramethylchroman-2-carboxylic acid), Folin-Ciocalteau phenol reagent 1N,gallic acid, sodium nitrite (NaNO2), formic acid (HPLC grade), potassium persulfate (K2S2O8) andethanol p.a. (99.5%) were purchased from Sigma-Aldrich (Steinheim, Germany). Sodium hydrogencarbonate (reagent grade; 99.7%) and methanol (reagent grade; 99.9%) were purchased from Scharlau(Barcelona, Spain). Deionized water was obtained from Millipore (Bedfore, MA, USA).
3.2. Samples
A conventional process was used for obtaining “horchata” from tiger nuts with a denominationof origin “Chufa de Valencia” (Cyperus esculentus). Then “horchata” by-products were taken andprovided by the “Consejo Regulador D.O. Chufa de Valencia” (Valencia, Spain). Afterwards, theywere dried at 60 ◦C for 72 h using a Memmert UFP 600 air-circulating oven (Schwabach, Germany)and ground for obtaining uniform particle size. Finally, they were vacuum packed until needed.
103
Molecules 2019, 24, 797
3.3. Extraction at Different Temperatures, Ethanol:Water Mixtures and pH
The conditions for solid–liquid extraction were selected based on a previous study [32]. First, onegram of dehydrated “horchata” by-product was weighed and fifteen milliliter of the hydroethanolicmixtures at different ethanol concentrations (0%, 25% and 50%, v/v) and different pH (2.5, 7.25 and 12),adjusted with NaOH or HCl was used for the extraction. The beakers with the samples were thenplaced and stirred on a plate with a magnetic stirrer. To avoid the evaporation of the solvent during theextraction, the samples were covered with aluminum foil. The temperature was adjusted to 25, 35 and50 ◦C in each of the stirring plate’s rows. The extraction was carried out for 3 h. The obtained sampleswere filtered through Whatman No. 1 and used for the determination of phenolic compounds.
3.4. Total Antioxidant Capacity
TEAC (Trolox equivalent antioxidant capacity) assay was used for the determination of the totalantioxidant capacity [8]. Twenty-five milliliter of ABTS (7 mM) was mixed with 440 µL of K2S2O8
(140 mM) and kept at room temperature for 12–16 h under darkness. For the determination, theabsorbance of ABTS•+ working solution was measured at a wavelength of 734 nm on a Perkin-ElmerUV/Vis Lambda 2 spectrophotometer (Perkin-Elmer, Jügesheim, Germany) to obtain the initialabsorbance (A0). When the absorbance of the mixture was 0.700 ± 0.020, 100 µL of the extractsappropriately diluted were added, and the absorbance was measured at 20 min (Af). The followingequation was used to calculate the inhibition percentage (%) of the samples:
% Inhibition = (1 − Af/A0) × 100,
where A0 is the absorbance at the initial time and Af is the absorbance obtained after 20 min.The results were expressed as micromolar Trolox equivalent (µM TE)/g of dry matter.
3.5. Determination of Total Phenolic Content (TPC)
The method previously reported [33], with some modifications [34] was used. To sum up, 500 µLof extract was mixed with 4.5 mL of distilled water and then 1 mL of the 2% Na2CO3 solution (w/v),and 0.25 mL of the Folin-Ciocalteau reagent (1N) were added. The mixture was left to stand for onehour under darkness at room temperature. Afterwards, the absorbance was measured at 765 nm.TPC was determined by interpolating the absorbance values in a calibration curve using gallic acidstandard (10 µg/mL) at different concentrations between 0 and 5 µg/mL. The results were expressedas mg equivalents of gallic acid (GAE)/100 g of dry matter.
3.6. Triple TOF–LC–MS–MS Characterization of Phenolic Compounds
The phenolic profile characterization and quantification was performed according to thepreviously described method [31], using an Agilent 1260 Infinity (Agilent, Waldbronn, Germany)with a Waters UPLC C18 column 1.7 µm (2.1 × 50 mm) Acquity UPLC BEH.C18 (Waters, Cerdanyoladel Vallès, Spain) for the separation of the main phenolic compounds in the samples. Moreover,a TripleTOF™ 5600 LC/MS/MS system (AB SCIEX, Foster City, CA, USA) was utilized for theidentification. For that purpose, a mobile phase consisting of solvent A (water, 0.1% formic acid) andsolvent B (methanol, 0.1% formic acid) was used as follows: 0 min 90% A; 13 min 100% (B); 15 min 90%A. Five microliter and 0.4 mL/min were the injection volume and flow rate, respectively.
MS data were obtained between 80 and 1200 m/z on negative mode, and the IDA acquisitionmethod was carried out in the survey scan type (TOF-MS) using the dependent scan type (production). Ion spray voltage (−4500 V); declustering potential (90 V); collision energy (−50 V); temperaturewith 25 psi curtain gas (400 ◦C); 50 psi for both ion source gas 1 (GC1) and ion source gas 2 (GS2) wereused as the main parameters for the MS analysis.
The IDA MS/MS analysis was carried out with ion tolerance of 50 mDa, 25 V collision energyand activated dynamic background subtract. The software analyst PeakView1.1 (AB SCIEX, Foster
104
Molecules 2019, 24, 797
City, CA, USA) and its applications (XIC Manager and Formula Finder) were used for data acquisitionand processing. Finally, an external calibration curve using resveratrol as standard was prepared forthe quantification of phenolic compounds.
3.7. Experimental Design and Statistical Analyses
Box-Behnken design with three levels (maximum, minimum, and central) of each independentvariable, temperature (25–50 ◦C), the concentration of ethanol (0%–50%), and pH (2.5–12), leadingto 15 combinations of these variables. Independent variable levels were selected accounting for thesample and the potential degradation of thermolabile antioxidant compounds after high temperatures(>50 ◦C). The combinations included temperature–ethanol–pH conditions with an intermediate level(central point) of the three variables replicated three times, which was used to check the reproducibilityand stability of the results. Experiments were randomized to minimize the systematic bias in theobserved responses due to extraneous factors and for higher precision. In addition, we studied whetherthere were correlations between a pair of variables. The significant differences (p < 0.05) betweenthe results were calculated by analysis of variance (ANOVA), using the least significant difference(LSD) test to indicate the samples between which there were differences. All statistical analyses wereperformed using the software Statgraphics® Centurion XV (Statpoint Technologies, Inc., The Plains,VA, USA).
4. Conclusions
The optimization of phenolic compounds extraction by response surface methodology, followedby Triple-TOF-LC-MS-MS characterization, indicated that temperature and ethanol content are moreimportant variables than pH. The optimum extraction conditions for total phenolic content andantioxidant activity were 50% ethanol, 35 ◦C and pH 2.5, which could obtain values of 222.6 mgGAE/100 g of dry matter and 1948.1 µM TE/g of dry matter for TPC and TEAC, respectively.The optimized extraction condition also positively influenced the extraction of the main individualphenolic compounds of tiger nuts by-products, particularly 4-vinylphenol and hydroxycinnamic acids.Therefore, tiger nuts by-products can be explored as a valuable source of phenolic compounds withpotential applications in food industries, nutraceuticals and cosmetics.
Author Contributions: E.R.-S., F.J.B. and J.M.L. conceived, designed and carried out the experiments. E.R.-S.,F.J.B., J.M.L., and P.E.S.M. analysed the data and wrote the paper. E.R.-S., F.J.M.-Q., A.C., F.J.B., J.M.L., P.E.S.M.and F.R. wrote and reviewed the paper before submitting.
Funding: This work was supported by the project GV/2018/040 “Implementación y optimización de procesosinnovadores para la valorización de los subproductos obtenidos a partir del proceso de elaboración de la horchata”for emerging research groups from the Generalitat Valenciana.
Acknowledgments: Paulo E. Munekata acknowledges the postdoctoral fellowship support from the Ministry ofEconomy and Competitiveness (MINECO, Spain) “Juan de la Cierva” program (FJCI-2016-29486). The authorswould like to thank the Regulatory Council D.O. Tiger nut of Valencia (Valencia, Spain) for providing“horchata” by-products. Moreover, we are also grateful for the technical support from the “Central Servicefor Experimental Research (SCSIE)” at the Universitat de València for the help provided in the analysis using theTriple TOF-LC-MS-MS.
Conflicts of Interest: The authors have no conflict of interest to disclose.
References
1. Roselló-Soto, E.; Poojary, M.M.; Barba, F.J.; Koubaa, M.; Lorenzo, J.M.; Mañes, J.; Moltó, J.C. Thermal andnon-thermal preservation techniques of tiger nuts’ beverage “horchata de chufa”. Implications for foodsafety, nutritional and quality properties. Food Res. Int. 2018, 105, 945–951. [CrossRef]
2. Roselló-Soto, E.; Poojary, M.M.; Barba, F.J.; Lorenzo, J.M.; Mañes, J.; Moltó, J.C. Tiger nut and its by-productsvalorization: From extraction of oil and valuable compounds to development of new healthy products. Innov.
Food Sci. Emerg. Technol. 2018, 45, 306–312. [CrossRef]
105
Molecules 2019, 24, 797
3. Sánchez-Zapata, E.; Fernández-López, J.; Angel Pérez-Alvarez, J. Tiger nut (Cyperus esculentus)commercialization: Health aspects, composition, properties, and food applications. Compr. Rev. Food
Sci. Food Saf. 2012, 11, 366–377. [CrossRef]4. Sánchez-Zapata, E.; Díaz-Vela, J.; Pérez-Chabela, M.L.; Pérez-Alvarez, J.A.; Fernández-López, J. Evaluation
of the effect of tiger nut fibre as a carrier of unsaturated fatty acids rich oil on the quality of dry-curedsausages. Food Bioprocess Technol. 2013, 6, 1181–1190. [CrossRef]
5. Sánchez-Zapata, E.; Fuentes-Zaragoza, E.; Viuda-Martos, M.; Fernández-López, J.; Sendra, E.; Sayas, E.;Pérez-Alvarez, J.A. Reclaim of the by-products from “Horchata” elaboration process. Food Bioprocess Technol.
2012, 5, 954–963. [CrossRef]6. Sánchez-Zapata, E.; Zunino, V.; Pérez-Alvarez, J.A.; Fernández-López, J. Effect of tiger nut fibre addition on
the quality and safety of a dry-cured pork sausage “Chorizo” during the dry-curing process. Meat Sci. 2013,95, 562–568. [CrossRef] [PubMed]
7. Ezeh, O.; Niranjan, K.; Gordon, M.H. Effect of enzyme pre-treatments on bioactive compounds in extracted tigernut oil and sugars in residual meals. JAOCS J. Am. Oil Chem. Soc. 2016, 93, 1541–1549. [CrossRef] [PubMed]
8. Roselló-Soto, E.; Barba, F.J.; Putnik, P.; Bursac Kovacevic, D.; Lorenzo, J.M.; Cantavella-Ferrero, Y. Enhancingbioactive antioxidants’ extraction from “Horchata de Chufa” by-products. Foods 2018, 7, 161. [CrossRef][PubMed]
9. Wang, C.; Shi, L.; Fan, L.; Ding, Y.; Zhao, S.; Liu, Y.; Ma, C. Optimization of extraction and enrichment ofphenolics from pomegranate (Punica granatum L.) leaves. Ind. Crop. Prod. 2013, 42, 587–594. [CrossRef]
10. Friedman, M.; Jürgens, H.S. Effect of pH on the stability of plant phenolic compounds. J. Agric. Food Chem.
2000, 48, 2101–2110. [CrossRef] [PubMed]11. Granato, D.; Shahidi, F.; Wrolstad, R.; Kilmartin, P.; Melton, L.D.; Hidalgo, F.J.; Miyashita, K.; Camp, J.V.;
Alasalvar, C.; Ismail, A.B.; et al. Antioxidant activity, total phenolics and flavonoids contents: Should we banin vitro screening methods? Food Chem. 2018, 264, 471–475. [CrossRef] [PubMed]
12. Ogunlade, I.; Adeyemi Bilikis, A.; Aluko Olanrewaju, G. Chemical compositions, antioxidant capacity ofTigernut (Cyperus esculentus) and potential health benefits. Eur. Sci. J. 2015, 11.
13. Oladele, A.; Adebowale, J.; Bamidele, O. Phenolic Profile and Antioxidant Activity of Brown and YellowVarieties of Tigernut (Cyperus esculentus L.). Niger. Food J. 2017, 35, 51–59.
14. Koubaa, M.; Barba, F.J.; Mhemdi, H.; Grimi, N.; Koubaa, W.; Vorobiev, E. Gas assisted mechanical expression(GAME) as a promising technology for oil and phenolic compound recovery from tiger nuts. Innov. Food Sci.
Emerg. Technol. 2015, 32, 172–180. [CrossRef]15. Parker, M.L.; Ng, A.; Smith, A.C.; Waldron, K.W. Esterified phenolics of the cell walls of chufa (Cyperus
esculentus L.) tubers and their role in texture. J. Agric. Food Chem. 2000, 48, 6284–6291. [CrossRef] [PubMed]16. Badejo, A.A.; Damilare, A.; Ojuade, T.D. Processing effects on the antioxidant activities of beverage blends
developed from Cyperus esculentus, Hibiscus sabdariffa, and Moringa oleifera extracts. Prev. Nutr. Food Sci. 2014,19, 227–233. [CrossRef] [PubMed]
17. Yang, L.; Jiang, J.-G.; Li, W.-F.; Chen, J.; Wang, D.-Y.; Zhu, L. Optimum extraction process of polyphenols fromthe bark of Phyllanthus emblica L. based on the response surface methodology. J. Sep. Sci. 2009, 32, 1437–1444.[CrossRef] [PubMed]
18. Moreira, M.M.; Barroso, M.F.; Boeykens, A.; Withouck, H.; Morais, S.; Delerue-Matos, C. Valorization of appletree wood residues by polyphenols extraction: Comparison between conventional and microwave-assistedextraction. Ind. Crop. Prod. 2017, 104, 210–220. [CrossRef]
19. Vatai, T.; Škerget, M.; Knez, Ž. Extraction of phenolic compounds from elder berry and different grapemarc varieties using organic solvents and/or supercritical carbon dioxide. J. Food Eng. 2009, 90, 246–254.[CrossRef]
20. Li, Y.; Li, S.; Lin, S.J.; Zhang, J.J.; Zhao, C.N.; Li, H. Bin Microwave-assisted extraction of natural antioxidantsfrom the exotic Gordonia axillaris fruit: Optimization and identification of phenolic compounds. Molecules
2017, 22, 1481. [CrossRef] [PubMed]21. Rusu, M.E.; Gheldiu, A.-M.; Mocan, A.; Moldovan, C.; Popa, D.-S.; Tomuta, I.; Vlase, L. Process optimization
for improved phenolic compounds recovery from walnut (Juglans regia L.) septum: Phytochemical profileand biological activities. Molecules 2018, 23, 2814. [CrossRef] [PubMed]
106
Molecules 2019, 24, 797
22. Bamba, B.S.B.; Shi, J.; Tranchant, C.C.; Xue, S.J.; Forney, C.F.; Lim, L.T. Influence of extraction conditions onultrasound-assisted recovery of bioactive phenolics from blueberry pomace and their antioxidant activity.Molecules 2018, 23, 1685. [CrossRef] [PubMed]
23. Tu, Q.-Y.; Zhou, C.-S.; Tang, J.-P. Microwave assisted-semi bionic extraction of lignan compounds fromFructus Forsythiae by orthogonal design. J. Cent. South Univ. Technol. 2008, 15, 59–63. [CrossRef]
24. Elez Garofulic, I.; Dragovic-Uzelac, V.; Režek Jambrak, A.; Jukic, M. The effect of microwave assistedextraction on the isolation of anthocyanins and phenolic acids from sour cherry Marasca (Prunus cerasus var.Marasca). J. Food Eng. 2013, 117, 437–442. [CrossRef]
25. Waszkowiak, K.; Gliszczynska-Swigło, A. Binary ethanol–water solvents affect phenolic profile andantioxidant capacity of flaxseed extracts. Eur. Food Res. Technol. 2016, 242, 777–786. [CrossRef]
26. Wozniak, Ł.; Marszałek, K.; Skapska, S.; Jedrzejczak, R.; Wozniak, Ł.; Marszałek, K.; Skapska, S.;Jedrzejczak, R. The application of supercritical carbon dioxide and ethanol for the extraction of phenoliccompounds from chokeberry pomace. Appl. Sci. 2017, 7, 322. [CrossRef]
27. Chew, K.K.; Khoo, M.Z.; Ng, S.Y.; Thoo, Y.Y.; Wan Aida, W.M.; Ho, C.W. Effect of ethanol concentration,extraction time and extraction temperature on the recovery of phenolic compounds and antioxidant capacityof Orthosiphon stamineus extracts. Int. Food Res. J. 2011, 18, 1427–1435.
28. Paini, M.; Casazza, A.A.; Aliakbarian, B.; Perego, P.; Binello, A.; Cravotto, G. Influence of ethanol/water ratioin ultrasound and high-pressure/high-temperature phenolic compound extraction from agri-food waste.Int. J. Food Sci. Technol. 2016, 51, 349–358. [CrossRef]
29. Pereira, C.; Barros, L.; Ferreira, I.C. Extraction, identification, fractionation and isolation of phenoliccompounds in plants with hepatoprotective effects. J. Sci. Food Agric. 2016, 96, 1068–1084. [CrossRef]
30. Radnai, B.; Tucsek, Z.; Bognar, Z.; Antus, C.; Mark, L.; Berente, Z.; Gallyas, F.; Sumegi, B.; Veres, B.Ferulaldehyde, a water-soluble degradation product of polyphenols, inhibits the lipopolysaccharide-inducedinflammatory response in mice. J. Nutr. 2009, 139, 291–297. [CrossRef]
31. Roselló-Soto, E.; Barba, F.J.; Lorenzo, J.M.; Munekata, P.E.S.; Gómez, B.; Moltó, J.C. Phenolic profile of oilsobtained from “horchata” by-products assisted by supercritical-CO2 and its relationship with antioxidantand lipid oxidation parameters: Triple TOF-LC-MS-MS characterization. Food Chem. 2019, 274, 865–871.[CrossRef] [PubMed]
32. Franco, D.; Rodríguez-Amado, I.; Agregán, R.; Munekata, P.E.S.; Vázquez, J.A.; Barba, F.J.; Lorenzo, J.M.Optimization of antioxidants extraction from peanut skin to prevent oxidative processes during soybean oilstorage. LWT 2018, 88, 1–8. [CrossRef]
33. Roselló-Soto, E.; Barba, F.J.; Parniakov, O.; Galanakis, C.M.; Lebovka, N.; Grimi, N.; Vorobiev, E. Highvoltage electrical discharges, pulsed electric field, and ultrasound assisted extraction of protein and phenoliccompounds from olive kernel. Food Bioprocess Technol. 2015, 8, 885–894. [CrossRef]
34. Singleton, V.L.; Orthofer, R.; Lamuela-Raventós, R.M. Analysis of total phenols and other oxidation substratesand antioxidants by means of Folin-Ciocalteu reagent. In Methods in Enzymology; Packer, L., Ed.; Oxidantsand Antioxidants Part A Academic Press: Cambridge, MA, USA, 1999; Volume 299, pp. 152–178.
Sample Availability: Samples of the compounds are available from the authors.
© 2019 by the authors. Licensee MDPI, Basel, Switzerland. This article is an open accessarticle distributed under the terms and conditions of the Creative Commons Attribution(CC BY) license (http://creativecommons.org/licenses/by/4.0/).
107

molecules
Article
Ultrasound as a Rapid and Low-Cost ExtractionProcedure to Obtain Anthocyanin-Based Colorantsfrom Prunus spinosa L. Fruit Epicarp: ComparativeStudy with Conventional Heat-Based Extraction
Maria G. Leichtweis 1, Carla Pereira 1, M.A. Prieto 1,2 , Maria Filomena Barreiro 1,3 ,
Ilton José Baraldi 4 , Lillian Barros 1,* and Isabel C.F.R. Ferreira 1,*
1 Centro de Investigação de Montanha (CIMO), Instituto Politécnico de Bragança, Campus de Santa Apolónia,5300-253 Bragança, Portugal; [email protected] (M.G.L.); [email protected] (C.P.);[email protected] (M.A.P.); [email protected] (M.F.B.)
2 Nutrition and Food Science Group, Department of Analytical and Food Chemistry, CITACA, CACTI,University of Vigo-Vigo Campus, 36310 Vigo, Spain
3 Laboratory of Separation and Reaction Engineering—Laboratory of Catalysis and Materials (LSRE-LCM),Polytechnic Institute of Bragança, Campus Santa Apolónia, 5300-253 Bragança, Portugal
4 Departamento Acadêmico de Alimentos (DAALM), Universidade Tecnológica Federal do Paraná,Campus Medianeira, 85884-000 Paraná, Brasil; [email protected]
* Correspondence: [email protected] (L.B.); [email protected] (I.C.F.R.F); Tel.: +351-273-303285 (L.B.);+351-273-303219 (I.C.F.R.F); Fax: +351-273-325405 (L.B.); +351-273-325405 (I.C.F.R.F)
Academic Editor: Marcello LocatelliReceived: 13 December 2018; Accepted: 1 February 2019; Published: 5 February 2019
Abstract: An ultrasound rapid and low-cost procedure for anthocyanin-based colorants fromPrunus spinosa L. fruit epicarp was developed, and the advantages were compared with conventionalheat-based extraction. To obtain the conditions that maximize anthocyanins’ extraction, a responsesurface methodology was applied using the variables of time, temperature, and ethanol content,in the case of heat extraction, whereas for ultrasound assisted extraction, temperature was replaced byultrasound power. Two anthocyanin compounds were identified by HPLC-DAD-ESI/MS—namely,cyanidin 3-rutinoside and peonidin 3-rutinoside. The responses used were the extraction yield andthe content of the identified anthocyanins. Ultrasound extraction was the most effective methodat 5.00 ± 0.15 min, 400.00 ± 32.00 W, and 47.98% ± 2.88% of ethanol obtaining 68.60% ± 2.06% ofextracted residue, with an anthocyanin content of 18.17 mg/g (extract-basis) and 11.76 mg/g(epicarp-basis). Overall, a viable green process was achieved that could be used to support pilot-scalestudies for industrial production of anthocyanin-based colorants from P. spinosa fruit epicarp.
Keywords: Prunus spinosa L. fruit epicarp; wild fruit valorization; cyanidin 3-rutinoside; peonidin3-rutinoside; heat and ultrasound assisted extraction; response surface methodology
1. Introduction
Prunus spinosa L. (blackthorn) is a spontaneous wild shrub found in Portugal, Spain, and otherEuropean countries. Its fruits are commonly used for liqueur and jam preparations, as well as formedicinal purposes [1]. Nevertheless, no reports were found regarding the industrial, or large scale,use of these fruits, probably because of their bitter and astringent taste.
The valorization of agricultural products has gained much attention in the late years as amean for a sustainable management, which can concomitantly increase the profit of local economies.In this regard, P. spinosa constitutes an underexploited source and can serve as a raw material for
109
Molecules 2019, 24, 573
the recovery/production of compounds for food applications [2]. As with other Prunus species,anthocyanin compounds can be found in blackthorn fruits at high levels, being responsible fortheir typical coloration [3,4]. In fact, a complex profile of anthocyanins was previously identifiedin P. spinosa fruits, among which cyanidin 3-rutinoside and peonidin 3-rutinoside were found to bepredominant [5,6].
Anthocyanins are natural pigments belonging to the phenolic compounds group and, withinthat, to the flavonoids class, presenting a range of colors between red, blue, and violet that arecharacteristic of various fruits and vegetables [7]. Beyond their various physiological benefits, whichinclude effects against cardiovascular diseases, atherosclerosis, and cancer, recently, an increasinginterest in these compounds began to arise because of their colorant properties [8,9].
The industrial production of natural-based colorants has been established for years and consistsmainly of obtaining colorant-rich extracts through conventional heat assisted extraction (HAE,or maceration) using water as a solvent followed by several isolation/drying steps. This type ofconventional process, although used at large-scale, is known for requiring high-energy consumptionand long extraction times [10–12]. Alternative extraction processes, able to replace traditionalones, have been established to shorten the needed time, decrease energy requirements, and reducesolvent consumption. Among the non-conventional procedures applied to anthocyanins’ extraction,ultrasound, microwave, and supercritical fluid assisted extraction techniques have attracted, in therecent years, the attention of industrials and researchers [10,13]. Regarding ultrasound assistedextraction (UAE), it is considered an inexpensive, simple, and efficient alternative to conventionaltechniques [14]. The extraction capability of UAE is attributed to mechanical and cavitation phenomena,which lead to cells’ disruption, particle size reduction, and enhanced mass transfer across the cellmembrane [11,13].
To obtain anthocyanin-rich extracts, it is crucial to consider the factors affecting the stability ofthese compounds, including structure and concentration, pH, temperature, light exposure, oxygenlevels, and used extraction solvents [15]. Thus, the choice of the extraction method, along withthe optimization of relevant extraction variables, are essential to guarantee a maximum recoveryefficiency [16]. Additionally, the efficiency is also strongly affected by the variability observed amongdifferent matrices [17]. Through response surface methodology (RSM), it is possible to optimize therelevant variables simultaneously, obtaining polynomial models capable of describing, within thetested experimental interval, the ideal conditions that maximize the used response criteria [13].
In the present study, the goal was to explore blackthorn anthocyanin composition and promotea higher commercial value of these wild fruits through the development of an anthocyanin-basedcoloring extract. For that purpose, the fruit epicarp was used because it has a much more intense colorthan the pulp, and thus a higher concentration of anthocyanins and less interfering compounds in theextraction process (e.g., sugars). To the best of our knowledge, and according to a thorough literaturesurvey, no reference or report on the optimization of anthocyanin compounds extraction from fruitepicarps of P. spinose was found. Therefore, the present study aimed to optimize the extraction of thesecompounds from P. spinosa fruit epicarps through HAE and UAE techniques, evaluating the followingvariables: i) type of solvent (water and green organic solvents); ii) extraction time; iii) solid-to-liquidratio; and iv) temperature (for HAE) or pressure (for UAE). The most efficient parameters were obtainedby response surface methodology (RSM). The identification and quantification of the anthocyanincompounds present in the extracts was assessed by HPLC-DAD-ESI/MS.
2. Results
2.1. Development of RSM Models to Optimize Responses and Conditions
The RSM is a valuable instrument to assess the impact of the main extraction factors and theirinteractions on one or more responses. The technique uses fixed experimental designs with themajor goals of minimizing the experimental labor and finding optimal solutions. In this regard,
110
Molecules 2019, 24, 573
the work presented here uses the circumscribed central composite design (CCCD) design plan, which is apopular design among researchers when trying to optimize food processing methods [18], such as theextraction of anthocyanin compounds.
In a previous study [5], authors identified, using HPLC-DAD-ESI/MS, the anthocyanincompounds of cyanidin 3-rutinoside ([M + H]+ at m/z 595) and peonidin 3-rutinoside ([M + H]+
at m/z 609) in P. spinosa fruits, and highlighted that the colorant capacity of these fruits is mainlyattributed to these compounds. Although authors quantify the content of those anthocyanincompounds in P. spinosa fruits, the conditions of extraction were not optimized. Therefore, based onthose preliminary findings, it seems logical to continue to explore the potential of P. spinosa fruits as asource of anthocyanin compounds. In this regard, the study applies a RSM technique under a CCCD
to optimize the operating conditions of the extraction of two common techniques in the industrialenvironment (HAE and UAE) with the intention of maximizing their extraction. However, because themajor quantity of anthocyanin compounds in P. spinosa fruits is located in the fruit epicarp, in this study,we ignored the inside parts of the fruit and focused the attention on the fruit epicarps. Additionally,by focusing on the epicarps, we are avoiding a high content of interfering compounds in the extractionprocess (e.g., sugars) that would require further purification steps. Figure S1 (supplemental material)shows a complete summary of all the steps used for the optimization procedure in order to recoverthe anthocyanin compounds from the epicarps of P. spinosa fruits. Figure S2 (supplementary material)shows a chromatographic example of HPLC-DAD-ESI/MS results for the quantification of anthocyanincompounds in the epicarps of P. spinosa fruits.
Table 1 shows the experimental results derived from the CCCD used to optimize the extraction ofanthocyanins from the fruits epicarps (Y1, mg C/g R; Y2, mg C/g E dw; and Yield, %) for each one ofthe computed extraction techniques (HAE and UAE). As described, the CCCD experimental results aresubjected to the mathematical analysis of Equation (1), by applying a fitting procedure coupled withnon-linear least-squares estimations. The parametric values of Equation (1) derived from this analyticalprocedure, the corresponding confidence interval of the parameters (α = 0.05) found after modellingthe extraction response values, and basic statistical information of the mathematical procedure arepresented in Table 2. The parametric values considered non-significant (ns) values were excluded frommodel construction and the final equations for describing the responses assessed using significantterms are presented in Table S1 (supplementary material).
The significant parametric values in Table 2 are presented as a function of the codificationcriteria of the CCCD. Although they could be presented as the real numerical ranges of the variablesassessed (X1 to X3), such information would not provide any additional insights of the regressionanalysis performed or the possible effects that may occur. The key information is the weight of thenumerical values of the significant parameters; therefore, it seems logical to present them under acodification mode that allows us to compare the values between them effortlessly. Therefore, based onthe numerical values derived, some global conclusions can be deduced as follows:
• For the HAE technique: In global terms, the significant parametric values within the linear effect(LE) group have a far more relevant contribution to the description of the responses than theinteractive effect (IE), with the quadratic effect (QE) group being the less representative one(LE > IE >> QE). In the extraction Yield response, the three variables assessed (t, T, and S) showedsimilar contributions to its description. Regarding the response values of Y1 (mg CT/g R) and Y2
(mg CT/g E dw), the contribution of the variables is S >> T > t.• For the UAE technique: The contribution to the description of effects of the responses by the
significant parametric values is distributed as LE > QE >> IE. In all the responses assessed(extraction yield, Y1 and Y2 values), the contribution of the variables is S >> P > t.
111
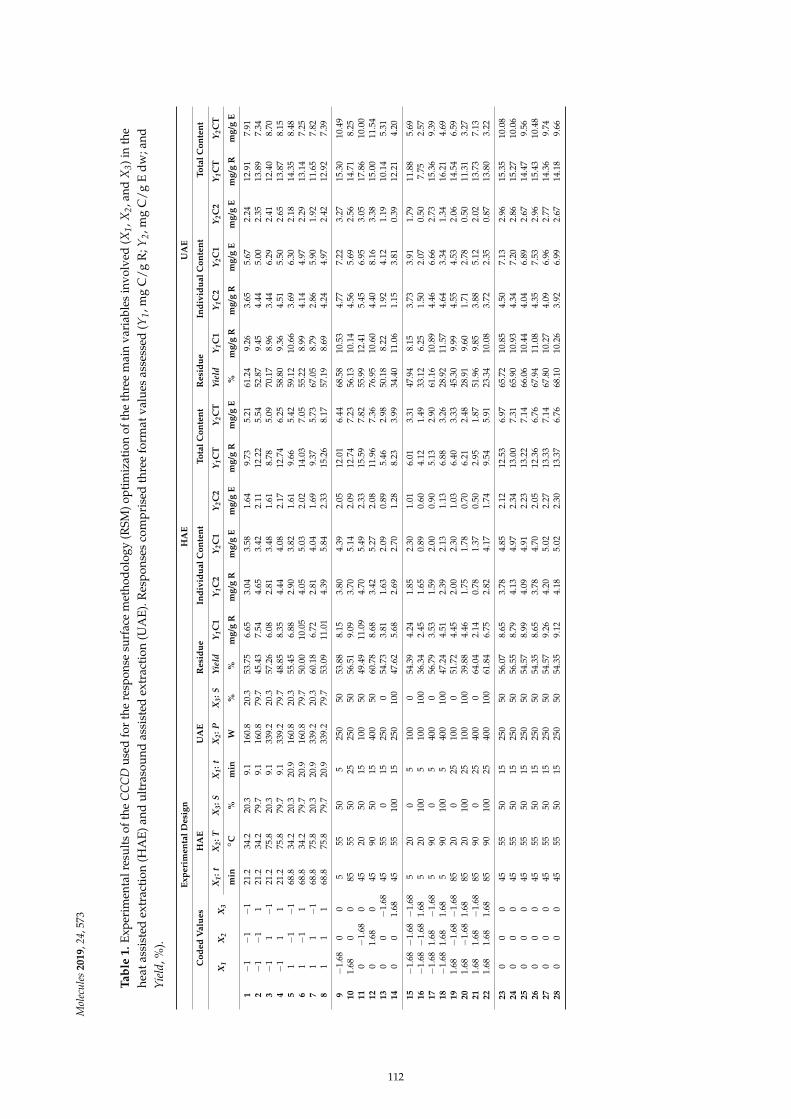
Mol
ecu
les
20
19,2
4,57
3
Ta
ble
1.
Exp
erim
enta
lres
ults
ofth
eC
CC
Dus
edfo
rth
ere
spon
sesu
rfac
em
etho
dol
ogy
(RSM
)opt
imiz
atio
nof
the
thre
em
ain
vari
able
sin
volv
ed(X
1,X
2,a
ndX
3)i
nth
ehe
atas
sist
edex
trac
tion
(HA
E)a
ndu
ltra
sou
ndas
sist
edex
trac
tion
(UA
E).
Res
pon
ses
com
pri
sed
thre
efo
rmat
valu
esas
sess
ed(Y
1,m
gC
/g
R;Y
2,m
gC
/g
Ed
w;a
ndY
ield
,%).
Exp
eri
men
tal
Desi
gn
HA
EU
AE
Co
ded
Valu
es
HA
EU
AE
Resi
du
eIn
div
idu
al
Co
nte
nt
To
tal
Co
nte
nt
Resi
du
eIn
div
idu
al
Co
nte
nt
To
tal
Co
nte
nt
X1
X2
X3
X1:
tX
2:
TX
3:
SX
1:
tX
2:
PX
3:
SY
ield
Y1C
1Y
1C
2Y
2C
1Y
2C
2Y
1C
TY
2C
TY
ield
Y1C
1Y
1C
2Y
2C
1Y
2C
2Y
1C
TY
2C
T
min
◦C
%m
inW
%%
mg
/gR
mg
/gR
mg
/gE
mg
/gE
mg
/gR
mg
/gE
%m
g/g
Rm
g/g
Rm
g/g
Em
g/g
Em
g/g
Rm
g/g
E
1−
1−
1−
121
.234
.220
.39.
116
0.8
20.3
53.7
56.
653.
043.
581.
649.
735.
2161
.24
9.26
3.65
5.67
2.24
12.9
17.
912
−1
−1
121
.234
.279
.79.
116
0.8
79.7
45.4
37.
544.
653.
422.
1112
.22
5.54
52.8
79.
454.
445.
002.
3513
.89
7.34
3−
11
−1
21.2
75.8
20.3
9.1
339.
220
.357
.26
6.08
2.81
3.48
1.61
8.78
5.09
70.1
78.
963.
446.
292.
4112
.40
8.70
4−
11
121
.275
.879
.79.
133
9.2
79.7
48.8
58.
354.
444.
082.
1712
.74
6.25
58.8
09.
364.
515.
502.
6513
.87
8.15
51
−1
−1
68.8
34.2
20.3
20.9
160.
820
.355
.45
6.88
2.90
3.82
1.61
9.66
5.42
59.1
210
.66
3.69
6.30
2.18
14.3
58.
486
1−
11
68.8
34.2
79.7
20.9
160.
879
.750
.00
10.0
54.
055.
032.
0214
.03
7.05
55.2
28.
994.
144.
972.
2913
.14
7.25
71
1−
168
.875
.820
.320
.933
9.2
20.3
60.1
86.
722.
814.
041.
699.
375.
7367
.05
8.79
2.86
5.90
1.92
11.6
57.
828
11
168
.875
.879
.720
.933
9.2
79.7
53.0
911
.01
4.39
5.84
2.33
15.2
68.
1757
.19
8.69
4.24
4.97
2.42
12.9
27.
39
9−
1.68
00
555
505
250
5053
.88
8.15
3.80
4.39
2.05
12.0
16.
4468
.58
10.5
34.
777.
223.
2715
.30
10.4
910
1.68
00
8555
5025
250
5056
.51
9.09
3.70
5.14
2.09
12.7
47.
2356
.13
10.1
44.
565.
692.
5614
.71
8.25
11
0−
1.68
045
2050
1510
050
49.4
911
.09
4.70
5.49
2.33
15.5
97.
8255
.99
12.4
15.
456.
953.
0517
.86
10.0
012
01.
680
4590
5015
400
5060
.78
8.68
3.42
5.27
2.08
11.9
67.
3676
.95
10.6
04.
408.
163.
3815
.00
11.5
413
00
−1.
6845
550
1525
00
54.7
33.
811.
632.
090.
895.
462.
9850
.18
8.22
1.92
4.12
1.19
10.1
45.
3114
00
1.68
4555
100
1525
010
047
.62
5.68
2.69
2.70
1.28
8.23
3.99
34.4
011
.06
1.15
3.81
0.39
12.2
14.
20
15
−1.
68−
1.68
−1.
685
200
510
00
54.3
94.
241.
852.
301.
016.
013.
3147
.94
8.15
3.73
3.91
1.79
11.8
85.
6916
−1.
68−
1.68
1.68
520
100
510
010
036
.34
2.45
1.65
0.89
0.60
4.12
1.49
33.1
26.
251.
502.
070.
507.
752.
5717
−1.
681.
68−
1.68
590
05
400
056
.79
3.53
1.59
2.00
0.90
5.13
2.90
61.1
610
.89
4.46
6.66
2.73
15.3
69.
3918
−1.
681.
681.
685
9010
05
400
100
47.2
44.
512.
392.
131.
136.
883.
2628
.92
11.5
74.
643.
341.
3416
.21
4.69
19
1.68
−1.
68−
1.68
8520
025
100
051
.72
4.45
2.00
2.30
1.03
6.40
3.33
45.3
09.
994.
554.
532.
0614
.54
6.59
20
1.68
−1.
681.
6885
2010
025
100
100
39.8
84.
461.
751.
780.
706.
212.
4828
.91
9.60
1.71
2.78
0.50
11.3
13.
2721
1.68
1.68
−1.
6885
900
2540
00
64.0
42.
140.
781.
370.
502.
951.
8751
.96
9.85
3.88
5.12
2.02
13.7
37.
1322
1.68
1.68
1.68
8590
100
2540
010
061
.84
6.75
2.82
4.17
1.74
9.54
5.91
23.3
410
.08
3.72
2.35
0.87
13.8
03.
22
23
00
045
5550
1525
050
56.0
78.
653.
784.
852.
1212
.53
6.97
65.7
210
.85
4.50
7.13
2.96
15.3
510
.08
24
00
045
5550
1525
050
56.5
58.
794.
134.
972.
3413
.00
7.31
65.9
010
.93
4.34
7.20
2.86
15.2
710
.06
25
00
045
5550
1525
050
54.5
78.
994.
094.
912.
2313
.22
7.14
66.0
610
.44
4.04
6.89
2.67
14.4
79.
5626
00
045
5550
1525
050
54.3
58.
653.
784.
702.
0512
.36
6.76
67.9
411
.08
4.35
7.53
2.96
15.4
310
.48
27
00
045
5550
1525
050
54.5
79.
264.
205.
022.
2713
.33
7.14
67.8
010
.27
4.09
6.96
2.77
14.3
69.
7428
00
045
5550
1525
050
54.3
59.
124.
185.
022.
3013
.37
6.76
68.1
010
.26
3.92
6.99
2.67
14.1
89.
66
112
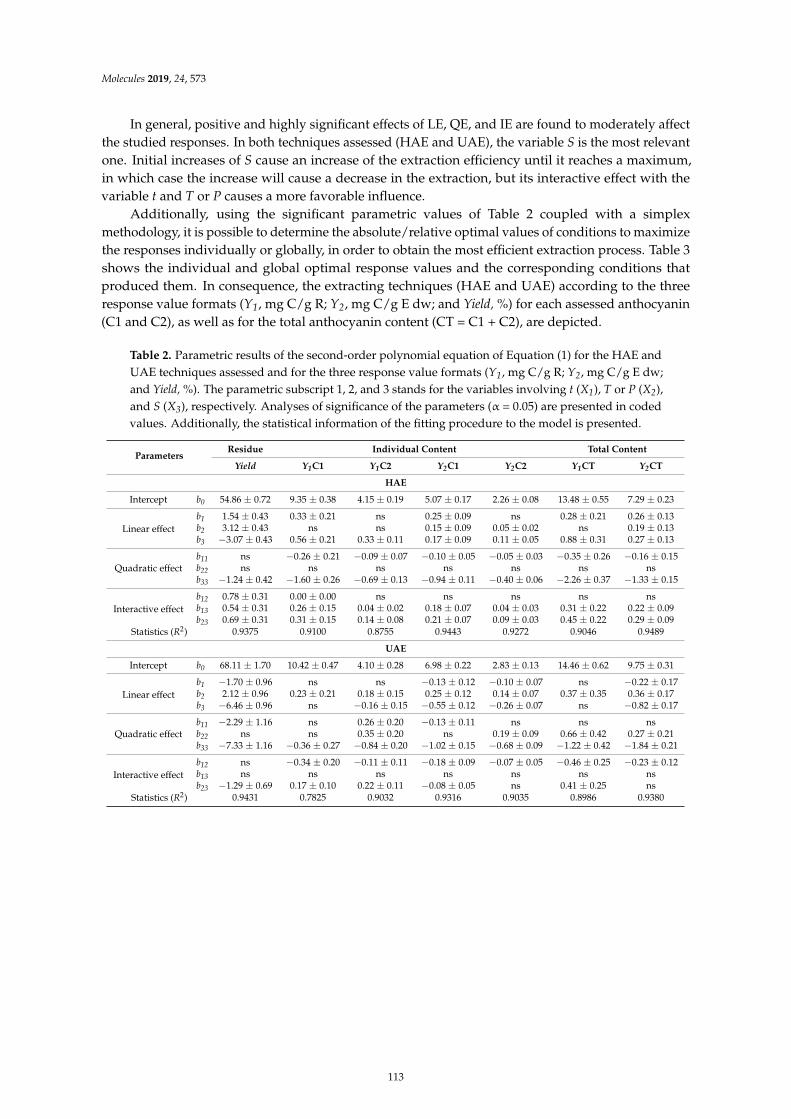
Molecules 2019, 24, 573
In general, positive and highly significant effects of LE, QE, and IE are found to moderately affectthe studied responses. In both techniques assessed (HAE and UAE), the variable S is the most relevantone. Initial increases of S cause an increase of the extraction efficiency until it reaches a maximum,in which case the increase will cause a decrease in the extraction, but its interactive effect with thevariable t and T or P causes a more favorable influence.
Additionally, using the significant parametric values of Table 2 coupled with a simplexmethodology, it is possible to determine the absolute/relative optimal values of conditions to maximizethe responses individually or globally, in order to obtain the most efficient extraction process. Table 3shows the individual and global optimal response values and the corresponding conditions thatproduced them. In consequence, the extracting techniques (HAE and UAE) according to the threeresponse value formats (Y1, mg C/g R; Y2, mg C/g E dw; and Yield, %) for each assessed anthocyanin(C1 and C2), as well as for the total anthocyanin content (CT = C1 + C2), are depicted.
Table 2. Parametric results of the second-order polynomial equation of Equation (1) for the HAE andUAE techniques assessed and for the three response value formats (Y1, mg C/g R; Y2, mg C/g E dw;and Yield, %). The parametric subscript 1, 2, and 3 stands for the variables involving t (X1), T or P (X2),and S (X3), respectively. Analyses of significance of the parameters (α = 0.05) are presented in codedvalues. Additionally, the statistical information of the fitting procedure to the model is presented.
ParametersResidue Individual Content Total Content
Yield Y1C1 Y1C2 Y2C1 Y2C2 Y1CT Y2CT
HAE
Intercept b0 54.86 ± 0.72 9.35 ± 0.38 4.15 ± 0.19 5.07 ± 0.17 2.26 ± 0.08 13.48 ± 0.55 7.29 ± 0.23
Linear effectb1 1.54 ± 0.43 0.33 ± 0.21 ns 0.25 ± 0.09 ns 0.28 ± 0.21 0.26 ± 0.13b2 3.12 ± 0.43 ns ns 0.15 ± 0.09 0.05 ± 0.02 ns 0.19 ± 0.13b3 −3.07 ± 0.43 0.56 ± 0.21 0.33 ± 0.11 0.17 ± 0.09 0.11 ± 0.05 0.88 ± 0.31 0.27 ± 0.13
Quadratic effectb11 ns −0.26 ± 0.21 −0.09 ± 0.07 −0.10 ± 0.05 −0.05 ± 0.03 −0.35 ± 0.26 −0.16 ± 0.15b22 ns ns ns ns ns ns nsb33 −1.24 ± 0.42 −1.60 ± 0.26 −0.69 ± 0.13 −0.94 ± 0.11 −0.40 ± 0.06 −2.26 ± 0.37 −1.33 ± 0.15
Interactive effectb12 0.78 ± 0.31 0.00 ± 0.00 ns ns ns ns nsb13 0.54 ± 0.31 0.26 ± 0.15 0.04 ± 0.02 0.18 ± 0.07 0.04 ± 0.03 0.31 ± 0.22 0.22 ± 0.09b23 0.69 ± 0.31 0.31 ± 0.15 0.14 ± 0.08 0.21 ± 0.07 0.09 ± 0.03 0.45 ± 0.22 0.29 ± 0.09
Statistics (R2) 0.9375 0.9100 0.8755 0.9443 0.9272 0.9046 0.9489
UAE
Intercept b0 68.11 ± 1.70 10.42 ± 0.47 4.10 ± 0.28 6.98 ± 0.22 2.83 ± 0.13 14.46 ± 0.62 9.75 ± 0.31
Linear effectb1 −1.70 ± 0.96 ns ns −0.13 ± 0.12 −0.10 ± 0.07 ns −0.22 ± 0.17b2 2.12 ± 0.96 0.23 ± 0.21 0.18 ± 0.15 0.25 ± 0.12 0.14 ± 0.07 0.37 ± 0.35 0.36 ± 0.17b3 −6.46 ± 0.96 ns −0.16 ± 0.15 −0.55 ± 0.12 −0.26 ± 0.07 ns −0.82 ± 0.17
Quadratic effectb11 −2.29 ± 1.16 ns 0.26 ± 0.20 −0.13 ± 0.11 ns ns nsb22 ns ns 0.35 ± 0.20 ns 0.19 ± 0.09 0.66 ± 0.42 0.27 ± 0.21b33 −7.33 ± 1.16 −0.36 ± 0.27 −0.84 ± 0.20 −1.02 ± 0.15 −0.68 ± 0.09 −1.22 ± 0.42 −1.84 ± 0.21
Interactive effectb12 ns −0.34 ± 0.20 −0.11 ± 0.11 −0.18 ± 0.09 −0.07 ± 0.05 −0.46 ± 0.25 −0.23 ± 0.12b13 ns ns ns ns ns ns nsb23 −1.29 ± 0.69 0.17 ± 0.10 0.22 ± 0.11 −0.08 ± 0.05 ns 0.41 ± 0.25 ns
Statistics (R2) 0.9431 0.7825 0.9032 0.9316 0.9035 0.8986 0.9380
113
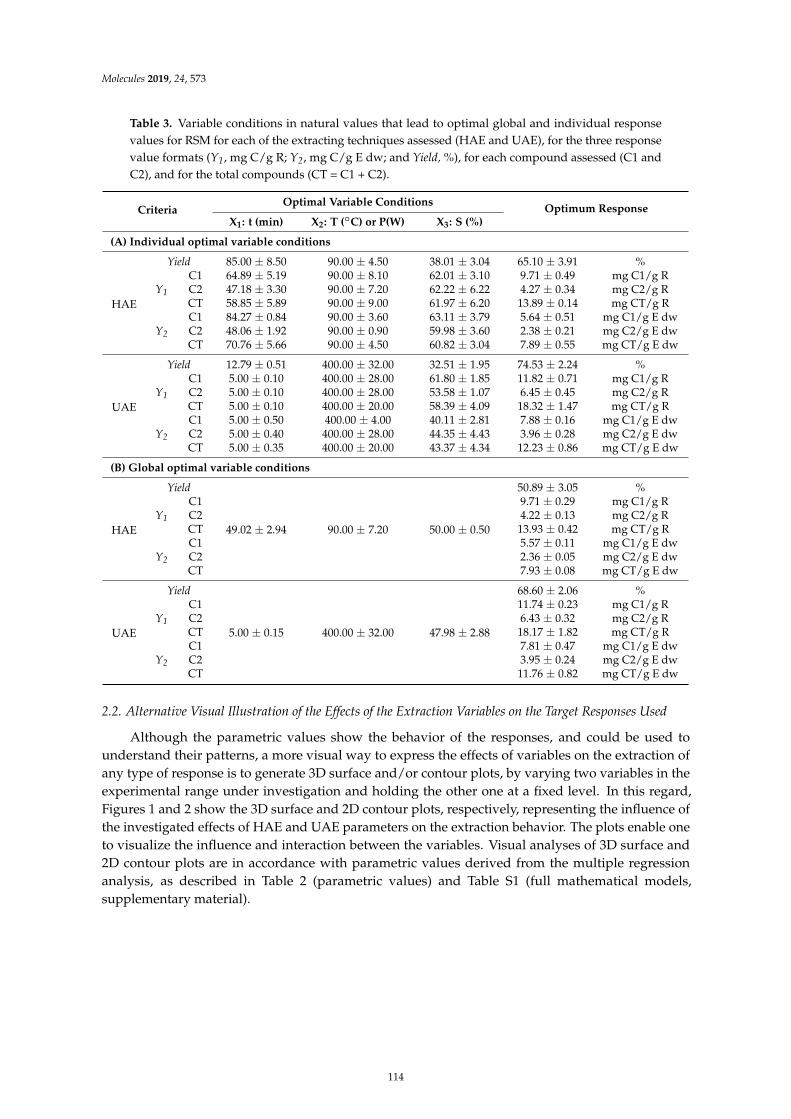
Molecules 2019, 24, 573
Table 3. Variable conditions in natural values that lead to optimal global and individual responsevalues for RSM for each of the extracting techniques assessed (HAE and UAE), for the three responsevalue formats (Y1, mg C/g R; Y2, mg C/g E dw; and Yield, %), for each compound assessed (C1 andC2), and for the total compounds (CT = C1 + C2).
CriteriaOptimal Variable Conditions
Optimum ResponseX1: t (min) X2: T (◦C) or P(W) X3: S (%)
(A) Individual optimal variable conditions
HAE
Yield 85.00 ± 8.50 90.00 ± 4.50 38.01 ± 3.04 65.10 ± 3.91 %
Y1
C1 64.89 ± 5.19 90.00 ± 8.10 62.01 ± 3.10 9.71 ± 0.49 mg C1/g RC2 47.18 ± 3.30 90.00 ± 7.20 62.22 ± 6.22 4.27 ± 0.34 mg C2/g RCT 58.85 ± 5.89 90.00 ± 9.00 61.97 ± 6.20 13.89 ± 0.14 mg CT/g R
Y2
C1 84.27 ± 0.84 90.00 ± 3.60 63.11 ± 3.79 5.64 ± 0.51 mg C1/g E dwC2 48.06 ± 1.92 90.00 ± 0.90 59.98 ± 3.60 2.38 ± 0.21 mg C2/g E dwCT 70.76 ± 5.66 90.00 ± 4.50 60.82 ± 3.04 7.89 ± 0.55 mg CT/g E dw
UAE
Yield 12.79 ± 0.51 400.00 ± 32.00 32.51 ± 1.95 74.53 ± 2.24 %
Y1
C1 5.00 ± 0.10 400.00 ± 28.00 61.80 ± 1.85 11.82 ± 0.71 mg C1/g RC2 5.00 ± 0.10 400.00 ± 28.00 53.58 ± 1.07 6.45 ± 0.45 mg C2/g RCT 5.00 ± 0.10 400.00 ± 20.00 58.39 ± 4.09 18.32 ± 1.47 mg CT/g R
Y2
C1 5.00 ± 0.50 400.00 ± 4.00 40.11 ± 2.81 7.88 ± 0.16 mg C1/g E dwC2 5.00 ± 0.40 400.00 ± 28.00 44.35 ± 4.43 3.96 ± 0.28 mg C2/g E dwCT 5.00 ± 0.35 400.00 ± 20.00 43.37 ± 4.34 12.23 ± 0.86 mg CT/g E dw
(B) Global optimal variable conditions
HAE
Yield
49.02 ± 2.94 90.00 ± 7.20 50.00 ± 0.50
50.89 ± 3.05 %
Y1
C1 9.71 ± 0.29 mg C1/g RC2 4.22 ± 0.13 mg C2/g RCT 13.93 ± 0.42 mg CT/g R
Y2
C1 5.57 ± 0.11 mg C1/g E dwC2 2.36 ± 0.05 mg C2/g E dwCT 7.93 ± 0.08 mg CT/g E dw
UAE
Yield
5.00 ± 0.15 400.00 ± 32.00 47.98 ± 2.88
68.60 ± 2.06 %
Y1
C1 11.74 ± 0.23 mg C1/g RC2 6.43 ± 0.32 mg C2/g RCT 18.17 ± 1.82 mg CT/g R
Y2
C1 7.81 ± 0.47 mg C1/g E dwC2 3.95 ± 0.24 mg C2/g E dwCT 11.76 ± 0.82 mg CT/g E dw
2.2. Alternative Visual Illustration of the Effects of the Extraction Variables on the Target Responses Used
Although the parametric values show the behavior of the responses, and could be used tounderstand their patterns, a more visual way to express the effects of variables on the extraction ofany type of response is to generate 3D surface and/or contour plots, by varying two variables in theexperimental range under investigation and holding the other one at a fixed level. In this regard,Figures 1 and 2 show the 3D surface and 2D contour plots, respectively, representing the influence ofthe investigated effects of HAE and UAE parameters on the extraction behavior. The plots enable oneto visualize the influence and interaction between the variables. Visual analyses of 3D surface and2D contour plots are in accordance with parametric values derived from the multiple regressionanalysis, as described in Table 2 (parametric values) and Table S1 (full mathematical models,supplementary material).
114
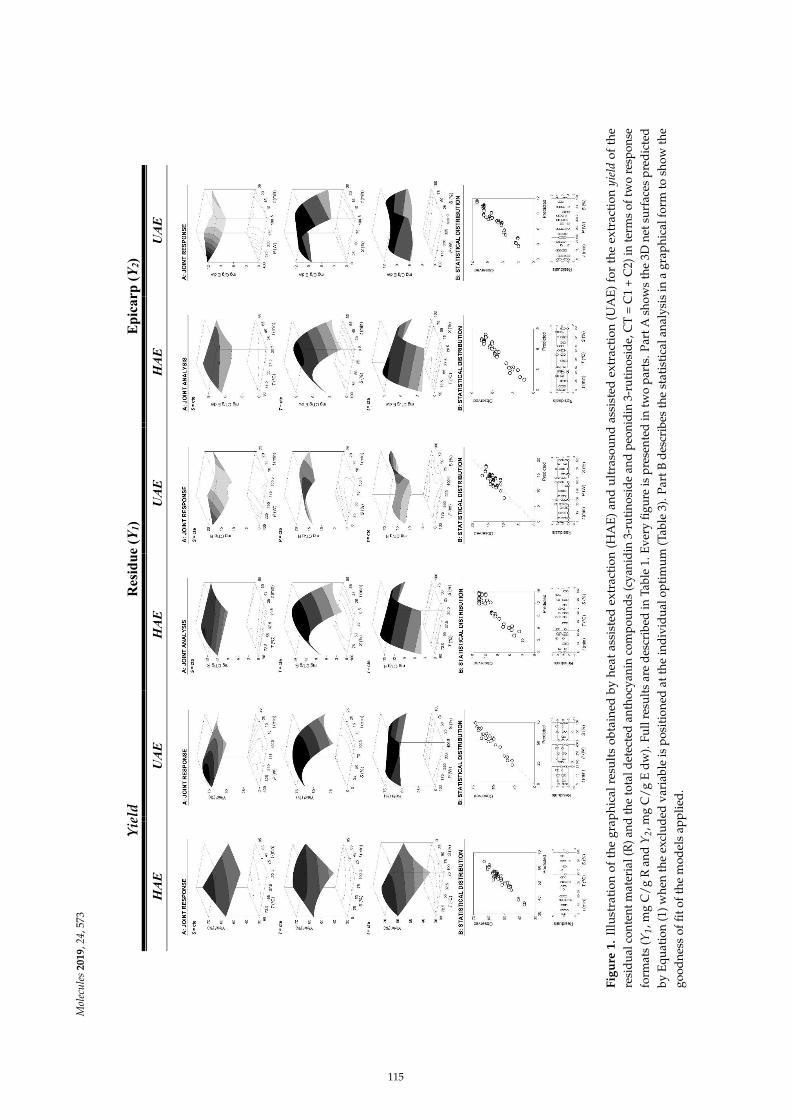
Mol
ecu
les
20
19,2
4,57
3
Yie
ld
Res
idue
(Y1)
Epic
arp
(Y2)
HA
E
UA
E
HA
E
UA
E
HA
E
UA
E
Fig
ure
1.
Illu
stra
tion
ofth
egr
aphi
calr
esu
lts
obta
ined
byhe
atas
sist
edex
trac
tion
(HA
E)
and
ult
raso
und
assi
sted
extr
acti
on(U
AE
)fo
rth
eex
trac
tion
yie
ldof
the
resi
dua
lcon
tent
mat
eria
l(R
)and
the
tota
ldet
ecte
dan
thoc
yani
nco
mpo
und
s(c
yani
din
3-ru
tino
sid
ean
dpe
onid
in3-
ruti
nosi
de,
CT
=C
1+
C2)
inte
rms
oftw
ore
spon
sefo
rmat
s(Y
1,m
gC
/g
Ran
dY
2,m
gC
/g
Ed
w).
Full
resu
lts
are
des
crib
edin
Tabl
e1.
Eve
ryfig
ure
ispr
esen
ted
intw
opa
rts.
Part
Ash
ows
the
3Dne
tsur
face
spr
edic
ted
byE
quat
ion
(1)w
hen
the
excl
ud
edva
riab
leis
pos
itio
ned
atth
ein
div
idu
alop
tim
um
(Tab
le3)
.Par
tBd
escr
ibes
the
stat
isti
cala
naly
sis
ina
grap
hica
lfor
mto
show
the
good
ness
offi
toft
hem
odel
sap
plie
d.
115
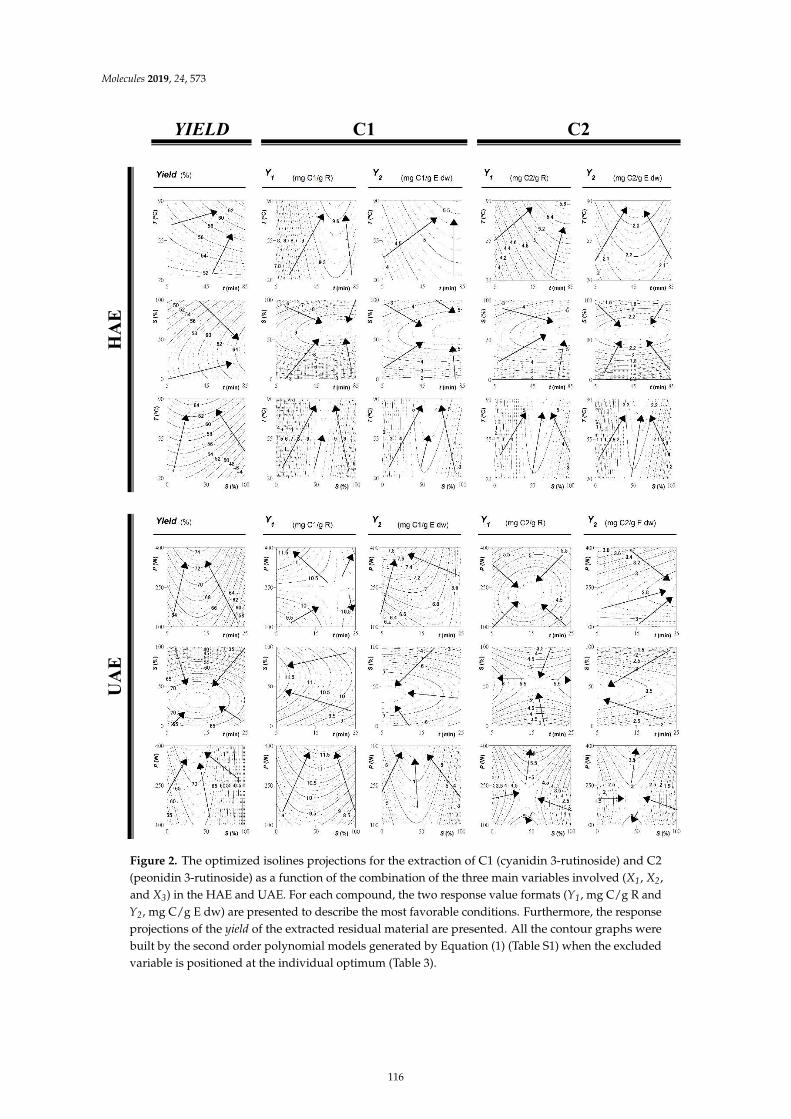
Molecules 2019, 24, 573
YIELD C1 C2
HA
E
UA
E
Figure 2. The optimized isolines projections for the extraction of C1 (cyanidin 3-rutinoside) and C2(peonidin 3-rutinoside) as a function of the combination of the three main variables involved (X1, X2,and X3) in the HAE and UAE. For each compound, the two response value formats (Y1, mg C/g R andY2, mg C/g E dw) are presented to describe the most favorable conditions. Furthermore, the responseprojections of the yield of the extracted residual material are presented. All the contour graphs werebuilt by the second order polynomial models generated by Equation (1) (Table S1) when the excludedvariable is positioned at the individual optimum (Table 3).
116
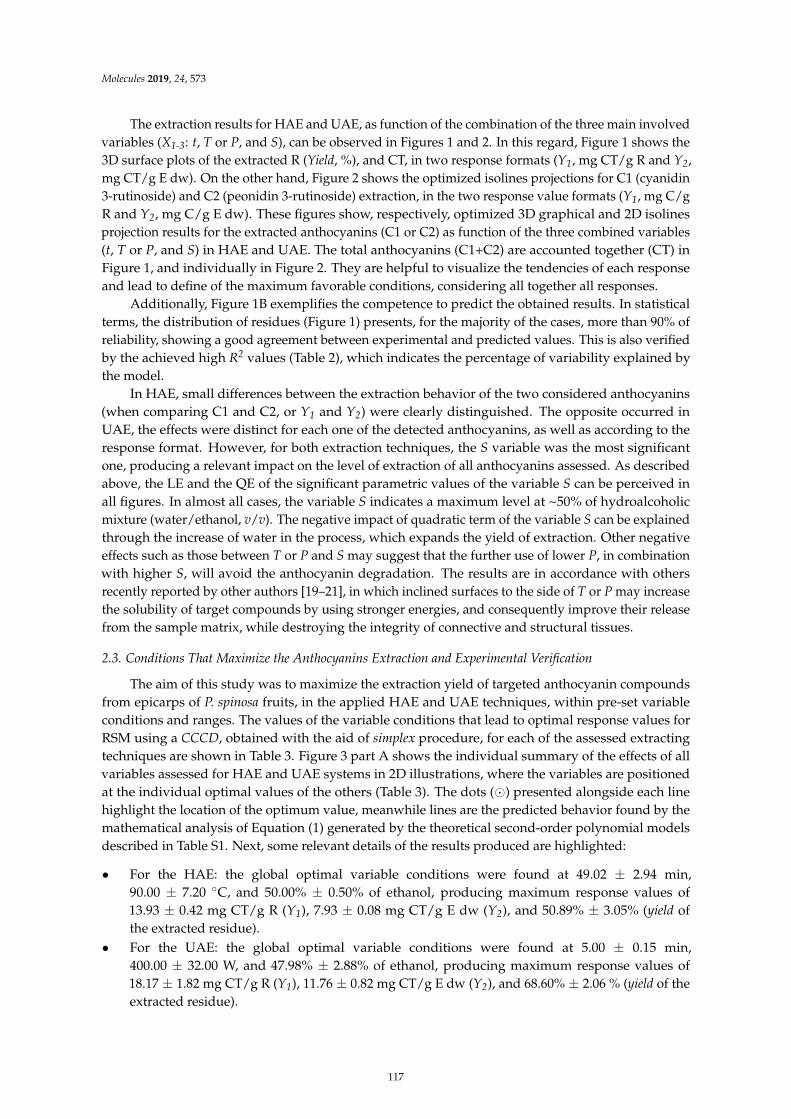
Molecules 2019, 24, 573
The extraction results for HAE and UAE, as function of the combination of the three main involvedvariables (X1-3: t, T or P, and S), can be observed in Figures 1 and 2. In this regard, Figure 1 shows the3D surface plots of the extracted R (Yield, %), and CT, in two response formats (Y1, mg CT/g R and Y2,mg CT/g E dw). On the other hand, Figure 2 shows the optimized isolines projections for C1 (cyanidin3-rutinoside) and C2 (peonidin 3-rutinoside) extraction, in the two response value formats (Y1, mg C/gR and Y2, mg C/g E dw). These figures show, respectively, optimized 3D graphical and 2D isolinesprojection results for the extracted anthocyanins (C1 or C2) as function of the three combined variables(t, T or P, and S) in HAE and UAE. The total anthocyanins (C1+C2) are accounted together (CT) inFigure 1, and individually in Figure 2. They are helpful to visualize the tendencies of each responseand lead to define of the maximum favorable conditions, considering all together all responses.
Additionally, Figure 1B exemplifies the competence to predict the obtained results. In statisticalterms, the distribution of residues (Figure 1) presents, for the majority of the cases, more than 90% ofreliability, showing a good agreement between experimental and predicted values. This is also verifiedby the achieved high R2 values (Table 2), which indicates the percentage of variability explained bythe model.
In HAE, small differences between the extraction behavior of the two considered anthocyanins(when comparing C1 and C2, or Y1 and Y2) were clearly distinguished. The opposite occurred inUAE, the effects were distinct for each one of the detected anthocyanins, as well as according to theresponse format. However, for both extraction techniques, the S variable was the most significantone, producing a relevant impact on the level of extraction of all anthocyanins assessed. As describedabove, the LE and the QE of the significant parametric values of the variable S can be perceived inall figures. In almost all cases, the variable S indicates a maximum level at ~50% of hydroalcoholicmixture (water/ethanol, v/v). The negative impact of quadratic term of the variable S can be explainedthrough the increase of water in the process, which expands the yield of extraction. Other negativeeffects such as those between T or P and S may suggest that the further use of lower P, in combinationwith higher S, will avoid the anthocyanin degradation. The results are in accordance with othersrecently reported by other authors [19–21], in which inclined surfaces to the side of T or P may increasethe solubility of target compounds by using stronger energies, and consequently improve their releasefrom the sample matrix, while destroying the integrity of connective and structural tissues.
2.3. Conditions That Maximize the Anthocyanins Extraction and Experimental Verification
The aim of this study was to maximize the extraction yield of targeted anthocyanin compoundsfrom epicarps of P. spinosa fruits, in the applied HAE and UAE techniques, within pre-set variableconditions and ranges. The values of the variable conditions that lead to optimal response values forRSM using a CCCD, obtained with the aid of simplex procedure, for each of the assessed extractingtechniques are shown in Table 3. Figure 3 part A shows the individual summary of the effects of allvariables assessed for HAE and UAE systems in 2D illustrations, where the variables are positionedat the individual optimal values of the others (Table 3). The dots (⊙) presented alongside each linehighlight the location of the optimum value, meanwhile lines are the predicted behavior found by themathematical analysis of Equation (1) generated by the theoretical second-order polynomial modelsdescribed in Table S1. Next, some relevant details of the results produced are highlighted:
• For the HAE: the global optimal variable conditions were found at 49.02 ± 2.94 min,90.00 ± 7.20 ◦C, and 50.00% ± 0.50% of ethanol, producing maximum response values of13.93 ± 0.42 mg CT/g R (Y1), 7.93 ± 0.08 mg CT/g E dw (Y2), and 50.89% ± 3.05% (yield ofthe extracted residue).
• For the UAE: the global optimal variable conditions were found at 5.00 ± 0.15 min,400.00 ± 32.00 W, and 47.98% ± 2.88% of ethanol, producing maximum response values of18.17 ± 1.82 mg CT/g R (Y1), 11.76 ± 0.82 mg CT/g E dw (Y2), and 68.60% ± 2.06 % (yield of theextracted residue).
117
Molecules 2019, 24, 573
Considering both the individual and global values, the higher amount of extracted compoundswas obtained for the UAE technique. The ideal solvent composition was almost the same, and thetwo techniques required high energy values, where the highest values of T and P proposed by theexperimental design were the optimal, but the UAE needed less t than HAE (~90% less). The obtainedresults are in accordance with similar conclusions found previously [10,17,22], in which UAE provedto consume less energy because of the lower t needed, and provide higher extraction values whileincreasing the purity and, additionally, aiding to meet the requirements of a green extraction concept.
Figure 3. Final graphical effects of all variables assessed for HAE and UAE systems. Part A showsthe individual 2D responses as a function of all the variables assessed that were positioned at theindividual optimal values of the others (Table 2). The points (⊙) presented alongside each line highlightthe location of the optimum value. Lines and dots are generated by the theoretical second orderpolynomial models generated by Equation (1) (Table S1). Part B shows the dose response of S/L atthe global optimal values of the other three variables (Table 3). The limit value (~150 g/L) showsthe maximum achievable experimental concentration until the sample cannot be physically stirred atlaboratory scale. RSM—response surface methodology.
2.4. Dose-Response Analysis of the Solid-to-Liquid Ratio Effect at the Optimal Conditions
The study of S/L effect was performed at the optimal conditions (Table 3) predicted by thepolynomial models obtained for each extraction technique (HAE and UAE) using the total anthocyanincontent (CT), as quantified by HPLC analysis, as the response factor. The individual S/L study for eachindividual anthocyanin (C1 or C2) was not presented because the behavior was similar to the pattern ofthe total amount. In both processes, the S/L was designed to verify the behavior between 5 and 250g/L. The maximum value of 250 g/L was used as a limit condition because of the impossibility ofproducing a homogenized extraction when higher values were used.
The obtained dose responses of the S/L were consistent for both HAE and UAE systems, andcould be described by a simple linear relationship (shown in Part B of Figure 3). All experimentalpoints are distributed around the linear equation; consequently, the dose response is explained by
118
Molecules 2019, 24, 573
the slope (m) of the linear relationship. None of the cases showed positive m values (the extractionefficiency increases as the S/L rate increases), and two cases showed non-significant values or a zerovalue of m (the efficiency doesn’t change as the S/L increases). In all the other cases, the m showednegative values (the efficiency decreases as the S/L increases). The responses from the Y1 value format,for HAE and UAE, were the ones that showed non-significant m values, whereas all other responsesshowed significant negative values of m (Y1 and Yield for HAE and UAE). The conclusions derivedfrom this analysis are described below:
• For the Y1 value format, the response of the parametric m value in HAE and UAE presentsa non-significant interval of confidence, which means that the changes in the response arenot statistically supported and, therefore, the parameter must be considered equal to zero.In other words, the amount of anthocyanins in the extracted residue does not vary as a function ofthe S/L increase. The extraction values were defined numerically by the intercept parametric value(b) of the linear equation as 14.85 ± 2.29 and 18.25 ± 3.95 mg CT/g R for HAE (R2 = 0.9920) andUAE (R2 = 0.9817), respectively.
• For the Y2 value format, the parametric values for HAE were b = 9.21 ± 1.37 mg CT/g E dw andm = −0.0113 ± 0.0051, with R2 = 0.9566; while for UAE, b = 10.32 ± 1.48 mg CT/g E dw andm = −0.0143 ± 0.0038, with R2 = 0.9244. Negative m values show that the S/L increase leads toa decrease in the extraction ability, obtaining a maximum value of extraction at 5 g/L and aminimum at 250 g/L. However, the observed decrease is slight (less than −0.02), which meansthat the increase of 1 g/L implies the loss of 0.0113 ± 0.0051 mg CT/g E dw for the HAE processand 0.0143 ± 0.0038 mg CT/g E dw for UAE. Such values produce losses at the maximum testedexperimental value (250 g/L) of ~15%, comparative with the one extracted at 5 g/L. Nevertheless,the economic advantages of working at 250 g/L are far more superior than the possible benefits ofextracting at the optimal S/L value.
• For the Yield value format, the parametric values for HAE were b = 54.62% ± 4.87% andm = −0.0636 ± 0.0123, with R2 = 0.9516; whereas for UAE, b = 58.90% ± 7.77% andm = −0.0491 ± 0.0116, with R2 = 0.9618. Although, at the initial S/L values, the results obtained forHAE and UAE conducted to similar extraction yields, these values decreased as the S/L increased.The m parametric value is significantly lower for the UAE process, resulting in higher extractionyield values at 250 g/L. These results are in accordance with the conclusions highlighted in theliterature, where UAE is reported as enhancing the extraction process by increasing the masstransfer between the plant material and the solvent [23]. The UAE leads to better cell disruption,facilitating the release of the extractable compounds by increasing the contact surface area betweenthe solid and liquid phases [22,23].
2.5. Comparison with Other Studies Involving the Extraction of Anthocyanins
There are few works in the literature dealing with anthocyanins in P. spinosa fruits. In one ofthese studies with P. spinosa fruits, Guimarães et al. [5] performed the extraction using methanolwith 0.5% TFA added as solvent, and identified eight different anthocyanins, predominantly peonidin3-rutinoside and cyanidin 3-rutinoside, with 34.47 ± 0.03 µg/100 g fruits dw and 31.12 ± 0.11 µg/100 gfruits dw, respectively. Other authors [6], found 3.5 ± 0.5 mg of anthocyanins/100 g dw of P. spinosa
fruits. Both authors used the whole fruit, while in this study, only the epicarp was used as theextraction material, a fact that may justify the significant differences between the encountered results,when compared with the present study. Compared with the pulp, the fruit epicarp presents a greaterintensity of color and, therefore, a higher concentration of anthocyanins, in addition to less interferingcompounds, is obtained. Moreover, another fact that aided the production of large amounts ofanthocyanins from the extracted material was the optimization of the extraction process, which led toincreased extraction efficiency and yield. In another study that used P. spinosa fruits as a source ofanthocyanins [6], the total content was quantified by spectrophotometric methods, presenting valuesthat cannot be compared with those found in the present study.
119
Molecules 2019, 24, 573
Some examples of other plant-based sources of anthocyanins are Oryza sativa L. (var. Glutinosa)bran, which shows 42.00 mg/g [24]; Phaseolus vulgaris L. (common beans) fruit coat, presenting32.00 mg/g [25]; and Rubus fruticosus L. (blackberries) fruit, which possess 17.10 mg/g [26]. Althoughthese values are slightly higher than those presented by P. spinosa fruits, in general, the referredfruits and vegetables already have a high commercial value and other industrial purposes, unlike P.
spinosa fruits. On the other hand, residues such as grape vine (Vitis vinifera L.) pomace, and mango(Mangifera indica) skin presented lower anthocyanin amounts, that is, 6.33 mg/g [27] and 2.03 to 3.60mg/g [28], respectively. Thus, these wild fruits revealed to be an excellent source of anthocyanins,serving as a base raw-material for the production of natural colorant additives for commercial purposes.
3. Discussion
The minimalism of using conventional methods (HAE or maceration) versus the compensations ofnew non-conventional technologies (microwave, ultrasound, cold pressing, squeezing, etc.) to recovercompounds from plant materials, as well as by-products, is a principal topic in the list of manyindustries in order to increase profitability by decreasing energy costs and reducing greenhouse gasemissions to meet legal requirements. Additionally, non-conventional technologies favor the safety ofprocesses and the quality of products, as well as the functionality and product standardization.
Scientific literature shows clear evidence that extraction procedures of target compounds fromplant-based products must be assessed individually. Therefore, a nonstop effort needs to be performed,as agro-industrial and food sectors are looking for by-products’ valorization into added-value products.However, in order to take full advantage of the technological advances, the extraction conditionsneed to be optimized. Mathematical solutions, such as RSM tools, could increase the efficiency andprofitability of the process and help to change conventional extraction approaches.
Colorants are one of the most important additives in terms of marketing because their presence infood products is considered to influence customers’ perceptions, choices, and preferences. P. spinosa
fruit epicarps have been scarcely explored and, to the best of the authors knowledge, the potentialindustrial use of their anthocyanin compounds has not been previously investigated. In such a context,the present work presents a new rapid method to extract anthocyanin compounds from P. spinosa
fruit epicarps. RSM and other mathematical strategies were successfully employed to optimize theextraction conditions that maximize the anthocyanin compounds’ recovery to produce a rich extractwith potential industrial application as a natural coloring additive.
4. Materials and Methods
4.1. Plant Material
Ripe P. spinosa fruits were harvested in Bragança (Trás-os-Montes, Northeast Portugal) inSeptember 2017, the epicarp was separated from the rest of the fruit body, frozen, and lyophilized.They were then triturated, to be reduced to a fine powder (~20 mesh), and stored under refrigeration,protected from light until further use.
4.2. Extraction Procedures for P. Spinosa Fruit Epicarps
4.2.1. Heat Assisted Extraction (HAE)
HAE was performed in a water reactor agitated internally with a CimarecTM Magnetic Stirrer at aconstant speed (~500 rpm, Thermo Scientific, San Jose, CA, USA), following a procedure previouslyperformed [13]. The powdered epicarp samples of P. spinosa (1.0 g) were extracted with 20 mL ofsolvent (ethanol/water) acidified with citric acid (pH = 3), under diverse conditions, as previouslydefined by the established RSM plan (Table 1). The ranges of the experimental design were as follows:time (t or X1, 5 to 85 min), temperature (T or X2, 20 to 90 ◦C), and ethanol content (S or X3, 0% to 100%).The solid-to-liquid ratio (S/L or X4) was kept at 50 g/L for all conditions.
120
Molecules 2019, 24, 573
4.2.2. Ultrasound-Assisted Extraction (UAE)
An ultrasonic device (QSonica sonicators, model CL-334, Newtown, CT, USA) equipped witha water reactor (EUP540A, Euinstruments, France) at a fixed frequency (40 kHz) was used for UAEprocedure. The variables considered were as follows: ultrasonic power (P, in watts), S, and t, whichwere programmed according to the defined RSM plan (Table 1), following a procedure previouslyperformed [29]. The powdered epicarp samples (2.5 g) were placed in a reactor with 50 mL of solvent(ethanol/water) acidified with citric acid (pH = 3), and extracted under diverse conditions, maintainingthe S/L constant at 50 g/L. The ranges of the experimental design were as follows: t (X1, 5 to 25 min),P (or X2, 100 to 400 W), and S (or X3, 0% to 100%).
4.2.3. Post-Extraction Sample Processing
When all the individual extraction conditions were carried out (for HAE and UAE), the sampleswere immediately centrifuged (6000 rpm during 20 min at 10 ◦C) and filtered (paper filter Whatmannº 4) to eliminate the non-dissolved material. The supernatant was collected and divided into twoportions for HPLC and extraction yield analysis. The portion separated for HPLC analysis (3 mL) wasdried at 35 ◦C, re-dissolved in acidified water (citric acid solution with pH 3), and filtered through anLC filter disk (0.22 µm), whereas the portion for the extraction yield determination (5 mL) was dried at105 ◦C during 48 h and thereafter weighted.
4.3. Identification and Quantification of Anthocyanins by HPLC
The extract was analyzed using an HPLC-DAD-ESI/MSn (Dionex Ultimate 3000 UPLC, ThermoScientific, San Jose, CA, USA) system, previously described [30]. The detection was carried outusing a DAD (520 nm as the preferred wavelength) and mass spectrometer (Linear Ion Trap LTQXL mass spectrometer, Thermo Finnigan, San Jose, CA, USA) equipped with an ESI source. Theanthocyanins present in the samples were characterized according to their UV and mass spectra.The anthocyanins cyanidin 3-rutinoside (C1) and peonidin 3-rutinoside (C2) were the most relevantcompounds found, and were, therefore, quantified using a five-level calibration curve of knownconcentrations (200–20 µg/mL) of cyanidin 3-glucoside (y = 243287 x − 1000000; R2 = 0.9953,Polyphenols, Sandnes, Norway) and peonidin 3-glucoside (y = 122417 x − 447974; R2 = 0.9965,Polyphenols, Sandnes, Norway).
4.4. Response Value Formats for Results Presentation
The two anthocyanin compounds (C, either C1 or C2) and their sum (C total, CT) were used asresponses in each applied technique. The results were presented according to two response formats(Y): Y1, in mg of C per gram of extracted residue (mg C/g R), which was specifically used to evaluatethe C purity in the extracts; and Y2, in mg of C per g of fruit epicarp dry weight (mg C/g E dw),which was specifically used to analyses the C extraction yield. Both responses were equally analyzed,but additional considerations regarding the last one (Y2, mg C/g E dw) were taken in the resultspresentation, becuse it is considered as an important guiding response when dealing in terms ofoptimization for industrial transference. Note that by dividing those responses, Y2/Y1, the extractedresidue quantity (g R/g E dw) is obtained, which provides information regarding the third responsecriterion expressed (Yield, %).
4.5. Experimental Design, Model Analysis, and Statistical Evaluation
4.5.1. RSM Experimental Design
Trials based on one-at-the-time analysis (analysis of each of the variables for each one of theselected techniques) were conducted, the ranges originating significant changes were selected (Table 1).The joint effects of the three defined variables were studied using a circumscribed central composite
121
Molecules 2019, 24, 573
design (CCCD), using five levels for each one with twenty eight response combinations, as describedpreviously [31].
4.5.2. Mathematical Model
The experimental data produced by the RSM design were analyzed mathematically by means ofleast-squares calculation, using the following second-order polynomial equation with interactiveterms [32]:
Y = b0 +n
∑i=1
biXi +n−1
∑i = 1j > i
n
∑j=2
bijXiXj +n
∑i=1
biiX2i (1)
where Y is the dependent variable (response variable) modelled, Xi and Xj define the independentvariables, b0 is the constant coefficient, bi is the coefficient of linear effect, bij is the coefficient ofinteraction effect, bii the coefficient of quadratic effect, and n is the number of variables. As responses,the following three value formats were used: Y1 (mg C/g R), Y2 (C/g E dw), and Yield (%).
4.5.3. Procedure to Optimize the Variables to a Maximum Response
A simplex algorithm method was used to find the optimum values by solving nonlinear problemsin order to maximize the extraction yield and the recovery of anthocyanin compounds, as explainedpreviously [33]. Certain limitations were imposed (i.e., times cannot be lower than 0) to avoid variableswith unnatural and unrealistic physical conditions.
4.5.4. Dose-Response Analysis of the Solid-to-Liquid Ratio
Once the optimal conditions (X1, X2, and X3) were found, the following natural optimization stepwas used to describe the pattern of the S/L (or X4, expressed in g/L). The objective was to achievemore productive conditions as required by industrial applications. In all cases, experimental points aredistributed following linear patterns as the S/L increases, consequently, linear models with interceptswere used to evaluate the responses. The parametric value of the slope (m) was used to assess the doseresponse. Positive values will indicate an increase in the extraction responses, whereas negative valueswill designate a decrease in the extraction efficiency, as the S/L increases.
4.6. Mathematical Procedures
The analytical procedures to model the data, to determine the parametric values, confidenceintervals, and statistical calculations, were obtained following the descriptions of other authors [34].In brief, (a) the parametric values were obtained using the quasi-Newton algorithm (least-square)by running the integrated macro ‘Solver’ in Microsoft Excel; (b) the coefficient significance of theparameters produced (α = 0.05) was assessed using the ‘SolverAid’ macro to conclude their confidenceintervals; and c) the model consistency was proven by means of several statistical criteria, such as (i)the Fisher F-test (α = 0.05); (ii) the ‘SolverStat’ macro; and (iii) the R2 coefficient.
5. Conclusions
The efficiency of the UAE was higher than that obtained with HAE. The main anthocyaninsidentified were cyanidin 3-rutinoside and peonidin 3-rutinoside, being the ones quantified. Throughthe optimization of the extraction process, it was possible to reach by UAE 18.17 ± 1.82 mg CT/g R(Y1), 11.76 ± 0.82 mg CT/g E dw (Y2), and 68.60% ± 2.06% (yield of the extracted residue), with theoptimal parameters of extraction being 5.00 ± 0.15 min, 400.00 ± 32.00 W, and 47.98% ± 2.88% ofethanol. The used mathematical models (RSM and dose-response models) were statistically significantand allowed the optimization of the anthocyanins extraction. For the S/L effects, inspected at the
122
Molecules 2019, 24, 573
optimum conditions, the responses for all assessed criteria followed a decreasing linear relation until250 g/L.
In conclusion, the present study contributed to the valorization of the wild fruits of P. spinosa byexploring anthocyanin-rich extracts that can find potential application as natural colorants in differentindustrial fields. For that purpose, an optimized extraction method was obtained using advanced andefficient extraction systems.
Supplementary Materials: The supplementary materials are available online.
Author Contributions: Formal analysis, M.A.P.; Investigation, M.G.L.; Methodology, C.P. and L.B.; Resources,M.F.B.; Supervision, I.J.B. and I.C.F.R.F.
Funding: The authors are grateful to the Foundation for Science and Technology (FCT, Portugal) andFEDER under Programme PT2020 for financial support to CIMO (UID/AGR/00690/2013), L. Barros andC. Pereira research contract; to FEDER-Interreg España-Portugal programme for financial support throughthe project 0377_Iberphenol_6_E.; to European Regional Development Fund (ERDF) through the RegionalOperational Program North 2020, within the scope of Project NORTE-01-0145-FEDER-023289: DeCodE andproject Mobilizador Norte-01-0247-FEDER-024479: ValorNatural®. This work was also financially supportedby the following: Project POCI-01-0145-FEDER-006984, Associate Laboratory LSRE-LCM funded by FEDERthrough COMPETE2020, Programa Operacional Competitividade e Internacionalização (POCI), and nationalfunds through FCT. The authors thank the GAIN (Xunta de Galicia) for financial support (P.P. 0000 421S 140.08) toM.A. Prieto by a post-doctoral (modality B) grant.
Conflicts of Interest: The authors declare no conflict of interest.
References
1. Morales, P.; Ferreira, I.C.F.R.; Carvalho, A.M.; Fernández-Ruiz, V.; Sánchez-Mata, M.S.O.S.C.C.; Cámara, M.;Morales, R.; Tardío, J. Wild edible fruits as a potential source of phytochemicals with capacity to inhibit lipidperoxidation. Eur. J. Lipid Sci. Technol. 2013, 115, 176–185. [CrossRef]
2. Naziri, E.; Nenadis, N.; Mantzouridou, F.T.; Tsimidou, M.Z. Valorization of the major agrifood industrialby-products and waste from Central Macedonia (Greece) for the recovery of compounds for food applications.Food Res. Int. 2014, 65, 350–358. [CrossRef]
3. Usenik, V.; Fabcic, J.; Štampar, F. Sugars, organic acids, phenolic composition and antioxidant activity ofsweet cherry (Prunus avium L.). Food Chem. 2008, 107, 185–192. [CrossRef]
4. Ieri, F.; Pinelli, P.; Romani, A. Simultaneous determination of anthocyanins, coumarins and phenolic acids infruits, kernels and liqueur of Prunus mahaleb L. Food Chem. 2012, 135, 2157–2162. [CrossRef]
5. Guimarães, R.; Barros, L.; Dueñas, M.; Carvalho, A.M.; Queiroz, M.J.R.P.; Santos-Buelga, C.; Ferreira, I.C.F.R.Characterisation of phenolic compounds in wild fruits from Northeastern Portugal. Food Chem. 2013, 141,3721–3730. [CrossRef]
6. Pinacho, R.; Cavero, R.Y.; Astiasarán, I.; Ansorena, D.; Calvo, M.I. Phenolic compounds of blackthorn(Prunus spinosa L.) and influence of in vitro digestion on their antioxidant capacity. J. Funct. Foods 2015, 19,49–62. [CrossRef]
7. Hernández-Herrero, J.A.; Frutos, M.J. Degradation kinetics of pigment, colour and stability of the antioxidantcapacity in juice model systems from six anthocyanin sources. Int. J. Food Sci. Technol. 2011, 46, 2550–2557.[CrossRef]
8. Olivas-Aguirre, F.J.; Rodrigo-García, J.; Martínez-Ruiz, N.D.R.; Cárdenas-Robles, A.I.; Mendoza-Dïaz, S.O.;Álvarez-Parrilla, E.; González-Aguilar, G.A.; De La Rosa, L.A.; Ramos-Jiménez, A.; Wall-Medrano, A.Cyanidin-3-O-glucoside: Physical-chemistry, foodomics and health effects. Molecules 2016, 21, 264. [CrossRef]
9. Dahmoune, F.; Nayak, B.; Moussi, K.; Remini, H.; Madani, K. Optimization of microwave-assistedextraction of polyphenols from Myrtus communis L. leaves. Food Chem. 2015, 166, 585–595. [CrossRef]
10. Zhu, Z.; He, J.; Liu, G.; Barba, F.J.; Koubaa, M.; Ding, L.; Bals, O.; Grimi, N.; Vorobiev, E. Recent insightsfor the green recovery of inulin from plant food materials using non-conventional extraction technologies:A review. Innov. Food Sci. Emerg. Technol. 2016, 33, 1–9. [CrossRef]
11. Wang, X.; Wu, Y.; Chen, G.; Yue, W.; Liang, Q.; Wu, Q. Optimisation of ultrasound assisted extraction ofphenolic compounds from Sparganii rhizoma with response surface methodology. Ultrason. Sonochem. 2013,20, 846–854. [CrossRef]
123
Molecules 2019, 24, 573
12. Wang, W.; Jung, J.; Tomasino, E.; Zhao, Y. Optimization of solvent and ultrasound-assisted extraction fordifferent anthocyanin rich fruit and their effects on anthocyanin compositions. LWT Food Sci. Technol. 2016,72, 229–238. [CrossRef]
13. Roriz, C.L.; Barros, L.; Prieto, M.A.; Morales, P.; Ferreira, I.C.F.R. Floral parts of Gomphrena globosa L. as anovel alternative source of betacyanins: Optimization of the extraction using response surface methodology.Food Chem. 2017, 229, 223–234. [CrossRef]
14. Agcam, E.; Akyıldız, A.; Balasubramaniam, V.M. Optimization of anthocyanins extraction from black carrotpomace with thermosonication. Food Chem. 2017, 237, 461–470. [CrossRef]
15. Rodriguez-Amaya, D.B. Natural food pigments and colorants. In Current Opinion in Food Science; ElsevierLtd.: Amsterdam, The Netherlands, 2016; Volume 7, pp. 20–26. ISBN 2214-7993.
16. Jiménez, L.C.; Caleja, C.; Prieto, M.A.; Barreiro, M.F.; Barros, L.; Ferreira, I.C.F.R. Optimization andcomparison of heat and ultrasound assisted extraction techniques to obtain anthocyanin compounds fromArbutus unedo L. fruits. Food Chem. 2018, 264, 81–91.
17. Montesano, D.; Fallarino, F.; Cossignani, L.; Simonetti, M.S.; Puccetti, P.; Damiani, P. Innovative extractionprocedure for obtaining high pure lycopene from tomato. Eur. Food Res. Technol. 2008, 226, 327–335.[CrossRef]
18. Bezerra, M.A.; Santelli, R.E.; Oliveira, E.P.; Villar, L.S.; Escaleira, E.A.; Escaleira, L.A. Response surfacemethodology (RSM) as a tool for optimization in analytical chemistry. Talanta 2008, 76, 965–977. [CrossRef]
19. Pinela, J.; Prieto, M.A.; Carvalho, A.M.; Barreiro, M.F.; Oliveira, M.B.P.; Barros, L.; Ferreira, I.C.F.R.Microwave-assisted extraction of phenolic acids and flavonoids and production of antioxidant ingredientsfrom tomato: A nutraceutical-oriented optimization study. Sep. Purif. Technol. 2016, 164, 114–124. [CrossRef]
20. Roriz, C.L.; Barros, L.; Prieto, M.A.; Barreiro, M.F.; Morales, P.; Ferreira, I.C.F.R. Modern extraction techniquesoptimized to extract betacyanins from Gomphrena globosa L. Ind. Crops Prod. 2017, 105, 29–40. [CrossRef]
21. Oludemi, T.; Barros, L.; Prieto, M.A.; Heleno, S.A.; Barreiro, M.F.; Ferreira, I.C.F.R. Extraction of triterpenoidsand phenolic compounds from: Ganoderma lucidum: Optimization study using the response surfacemethodology. Food Funct. 2018, 9, 209–226. [CrossRef]
22. Chemat, F.; Rombaut, N.; Sicaire, A.G.; Meullemiestre, A.; Fabiano-Tixier, A.S.; Abert-Vian, M. Ultrasoundassisted extraction of food and natural products. Mechanisms, techniques, combinations, protocols andapplications. A review. Ultrason. Sonochem. 2017, 34, 540–560. [CrossRef]
23. Tomšik, A.; Pavlic, B.; Vladic, J.; Ramic, M.; Vidovic, S. Optimization of ultrasound-assisted extraction ofbioactive compounds from wild garlic (Allium ursinum L.). Ultrason. Sonochem. 2016, 29, 502–511.
24. Chen, M.H.; McClung, A.M.; Bergman, C.J. Phenolic content, anthocyanins and antiradical capacity ofdiverse purple bran rice genotypes as compared to other bran colors. J. Cereal Sci. 2017, 77, 110–119.[CrossRef]
25. Mojica, L.; Berhow, M.; Gonzalez de Mejia, E. Black bean anthocyanin-rich extracts as food colorants:Physicochemical stability and antidiabetes potential. Food Chem. 2017, 229, 628–639. [CrossRef]
26. Elisia, I.; Hu, C.; Popovich, D.G.; Kitts, D.D. Antioxidant assessment of an anthocyanin-enriched blackberryextract. Food Chem. 2006, 101, 1052–1058. [CrossRef]
27. Bosiljkov, T.; Dujmic, F.; Cvjetko Bubalo, M.; Hribar, J.; Vidrih, R.; Brncic, M.; Zlatic, E.; RadojcicRedovnikovic, I.; Jokic, S. Natural deep eutectic solvents and ultrasound-assisted extraction: Greenapproaches for extraction of wine lees anthocyanins. Food Bioprod. Process. 2017, 102, 195–203. [CrossRef]
28. Ajila, C.M.; Naidu, K.A.; Bhat, S.G.; Rao, U.J.S.P. Bioactive compounds and antioxidant potential of mangopeel extract. Food Chem. 2007, 105, 982–988. [CrossRef]
29. Backes, E.; Pereira, C.; Barros, L.; Prieto, M.A.; Kamal, A.; Filomena, M.; Ferreira, I.C.F.R. Recovery ofbioactive anthocyanin pigments from Ficus carica L. peel by heat, microwave, and ultrasound based extractiontechniques. Food Res. Int. 2018, 113, 197–209. [CrossRef]
30. Gonçalves, G.A.; Soares, A.A.; Correa, R.C.G.; Barros, L.; Haminiuk, C.W.I.; Peralta, R.M.; Ferreira, I.C.F.R.;Bracht, A. Merlot grape pomace hydroalcoholic extract improves the oxidative and inflammatory states ofrats with adjuvant-induced arthritis. J. Funct. Foods 2017, 33, 408–418. [CrossRef]
31. Heleno, S.A.; Prieto, M.A.; Barros, L.; Rodrigues, A.A.; Barreiro, M.F.; Ferreira, I.C.F.R. Optimization ofmicrowave-assisted extraction of ergosterol from Agaricus bisporus L. by-products using response surfacemethodology. Food Bioprod. Process. 2016, 100, 25–35. [CrossRef]
124
Molecules 2019, 24, 573
32. Pinela, J.; Prieto, M.A.; Barros, L.; Carvalho, A.M.; Oliveira, M.B.P.P.; Saraiva, J.A.; Ferreira, I.C.F.R. Coldextraction of phenolic compounds from watercress by high hydrostatic pressure: Process modelling andoptimization. Sep. Purif. Technol. 2018, 192, 501–512. [CrossRef]
33. Vieira, V.; Prieto, M.A.; Barros, L.; Coutinho, J.A.P.; Ferreira, O.; Ferreira, I.C.F.R. Optimization andcomparison of maceration and microwave extraction systems for the production of phenolic compoundsfrom Juglans regia L. for the valorization of walnut leaves. Ind. Crops Prod. 2017, 107, 341–352. [CrossRef]
34. Caleja, C.; Barros, L.; Prieto, M.A.; Barreiro, F.M.F.; Oliveira, M.B.P.; Ferreira, I.C.F.R. Extraction ofrosmarinic acid from Melissa officinalis L. by heat-, microwave- and ultrasound-assisted extraction techniques:A comparative study through response surface analysis. Sep. Purif. Technol. 2017, 186, 297–308. [CrossRef]
Sample Availability: Samples of the plant and extracts are available from the authors.
© 2019 by the authors. Licensee MDPI, Basel, Switzerland. This article is an open accessarticle distributed under the terms and conditions of the Creative Commons Attribution(CC BY) license (http://creativecommons.org/licenses/by/4.0/).
125

molecules
Article
Optimization of the Extraction Process to Obtain aColorant Ingredient from Leaves ofOcimum basilicum var. purpurascens
Filipa Fernandes 1 , Eliana Pereira 1, Miguel A. Prieto 1,2 , Ricardo C. Calhelha 1 ,
Ana Ciric 3 , Marina Sokovic 3 , Jesus Simal-Gandara 2 , Lillian Barros 1,*
and Isabel C. F. R. Ferreira 1,*
1 Centro de Investigação de Montanha (CIMO), Instituto Politécnico de Bragança, Campus de Santa Apolónia,5300-253 Bragança, Portugal; [email protected] (F.F.); [email protected] (E.P.);[email protected] (M.A.P.); [email protected] (R.C.C.)
2 Nutrition and Bromatology Group, Department of Analytical and Food Chemistry, Faculty of Food Scienceand Technology, University of Vigo—Ourense Campus, E-32004 Ourense, Spain; [email protected]
3 University of Belgrade, Department of Plant Physiology, Institute for Biological Research “Siniša Stankovic”,Bulevar Despota Stefana 142, 11000 Belgrade, Serbia; [email protected] (A.C.); [email protected] (M.S.)
* Correspondence: [email protected] (L.B.); [email protected] (I.C.F.R.F.);Tel.: +351-273-303285 (L.B.); +351-273-303219 (I.C.F.R.F.)
Academic Editor: Derek J. McPheeReceived: 22 January 2019; Accepted: 13 February 2019; Published: 14 February 2019
Abstract: Heat-Assisted Extraction (HAE) was used for the optimized production of an extract richin anthocyanin compounds from Ocimum basilicum var. purpurascens leaves. The optimization wasperformed using the response surface methodology employing a central composite experimentaldesign with five-levels for each of the assessed variables. The independent variables studied werethe extraction time (t, 20–120 min), temperature (T, 25–85 ◦C), and solvent (S, 0–100% of ethanol,v/v). Anthocyanin compounds were analysed by HPLC-DAD-ESI/MS and the extraction yields wereused as response variables. Theoretical models were developed for the obtained experimental data,then the models were validated by a selected number of statistical tests, and finally, those modelswere used in the prediction and optimization steps. The optimal HAE conditions for the extractionof anthocyanin compounds were: t = 65.37 ± 3.62 min, T = 85.00 ± 1.17 ◦C and S = 62.50 ± 4.24%,and originated 114.74 ± 0.58 TA mg/g of extract. This study highlighted the red rubin basil leavesas a promising natural matrix to extract pigmented compounds, using green solvents and reducedextraction times. The extract rich in anthocyanins also showed antimicrobial and anti-proliferativeproperties against four human tumor cell lines, without any toxicity on a primary porcine livercell line.
Keywords: natural colorants; anthocyanins; Ocimum basilicum var. purpurascens leaves; red rubinbasil; Heat-Assisted Extraction; extraction optimization
1. Introduction
Consumers’ interest in food quality has been increasing, selecting foods with health benefits.Colour is the main organoleptic attribute in the selection and acceptance of foods [1,2]. Some vegetablematrices are composed by natural pigments, attracting much attention from the scientific communityand leading to studies to characterize these compounds and explore their subsequent application, notonly in the food industry as natural colorants, but also in the pharmaceutical sector, as antioxidants [3–5].
Anthocyanins are natural pigment studied worldwide; however, when these compounds areincorporated in food products, there are several intrinsic and extrinsic factors that affect and influence
127
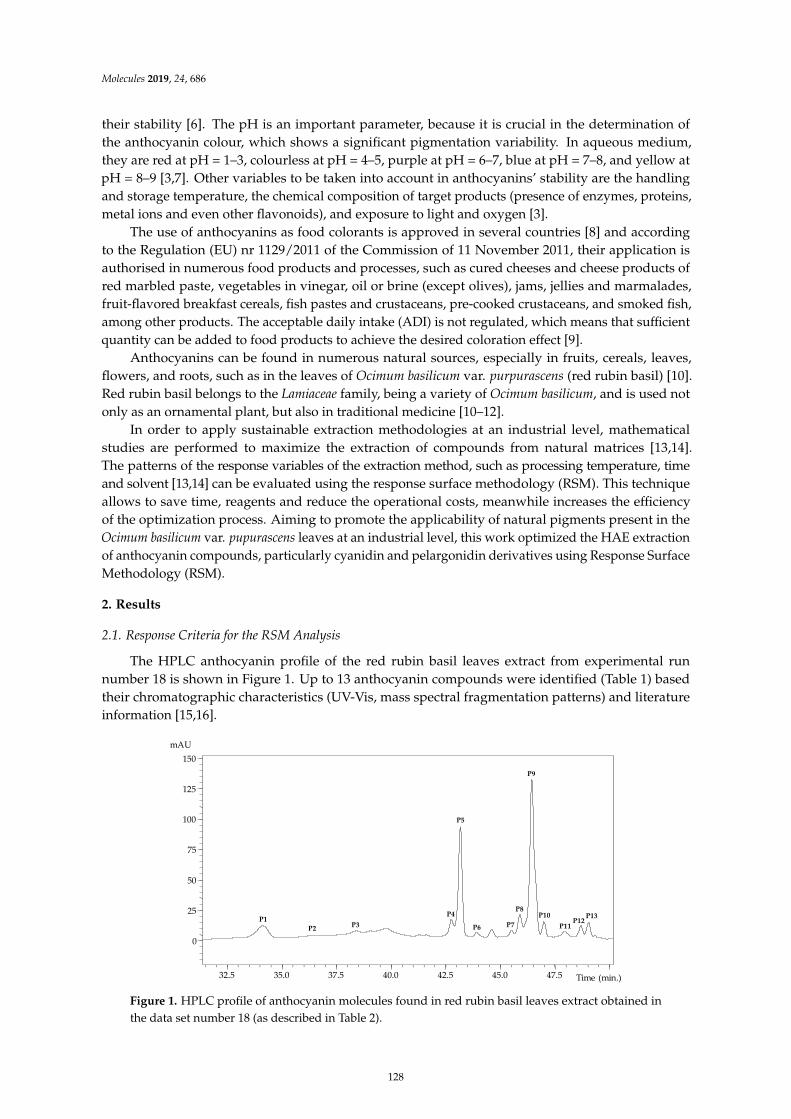
Molecules 2019, 24, 686
their stability [6]. The pH is an important parameter, because it is crucial in the determination ofthe anthocyanin colour, which shows a significant pigmentation variability. In aqueous medium,they are red at pH = 1–3, colourless at pH = 4–5, purple at pH = 6–7, blue at pH = 7–8, and yellow atpH = 8–9 [3,7]. Other variables to be taken into account in anthocyanins’ stability are the handlingand storage temperature, the chemical composition of target products (presence of enzymes, proteins,metal ions and even other flavonoids), and exposure to light and oxygen [3].
The use of anthocyanins as food colorants is approved in several countries [8] and accordingto the Regulation (EU) nr 1129/2011 of the Commission of 11 November 2011, their application isauthorised in numerous food products and processes, such as cured cheeses and cheese products ofred marbled paste, vegetables in vinegar, oil or brine (except olives), jams, jellies and marmalades,fruit-flavored breakfast cereals, fish pastes and crustaceans, pre-cooked crustaceans, and smoked fish,among other products. The acceptable daily intake (ADI) is not regulated, which means that sufficientquantity can be added to food products to achieve the desired coloration effect [9].
Anthocyanins can be found in numerous natural sources, especially in fruits, cereals, leaves,flowers, and roots, such as in the leaves of Ocimum basilicum var. purpurascens (red rubin basil) [10].Red rubin basil belongs to the Lamiaceae family, being a variety of Ocimum basilicum, and is used notonly as an ornamental plant, but also in traditional medicine [10–12].
In order to apply sustainable extraction methodologies at an industrial level, mathematicalstudies are performed to maximize the extraction of compounds from natural matrices [13,14].The patterns of the response variables of the extraction method, such as processing temperature, timeand solvent [13,14] can be evaluated using the response surface methodology (RSM). This techniqueallows to save time, reagents and reduce the operational costs, meanwhile increases the efficiencyof the optimization process. Aiming to promote the applicability of natural pigments present in theOcimum basilicum var. pupurascens leaves at an industrial level, this work optimized the HAE extractionof anthocyanin compounds, particularly cyanidin and pelargonidin derivatives using Response SurfaceMethodology (RSM).
2. Results
2.1. Response Criteria for the RSM Analysis
The HPLC anthocyanin profile of the red rubin basil leaves extract from experimental runnumber 18 is shown in Figure 1. Up to 13 anthocyanin compounds were identified (Table 1) basedtheir chromatographic characteristics (UV-Vis, mass spectral fragmentation patterns) and literatureinformation [15,16].
32.5 35.0 37.5 40.0 42.5 45.0 47.5
0
25
50
75
100
125
150
mAU
P1
Time (min.)
P2P3
P4
P5
P6 P7
P8
P9
P10
P11P12
P13
Figure 1. HPLC profile of anthocyanin molecules found in red rubin basil leaves extract obtained inthe data set number 18 (as described in Table 2).
128
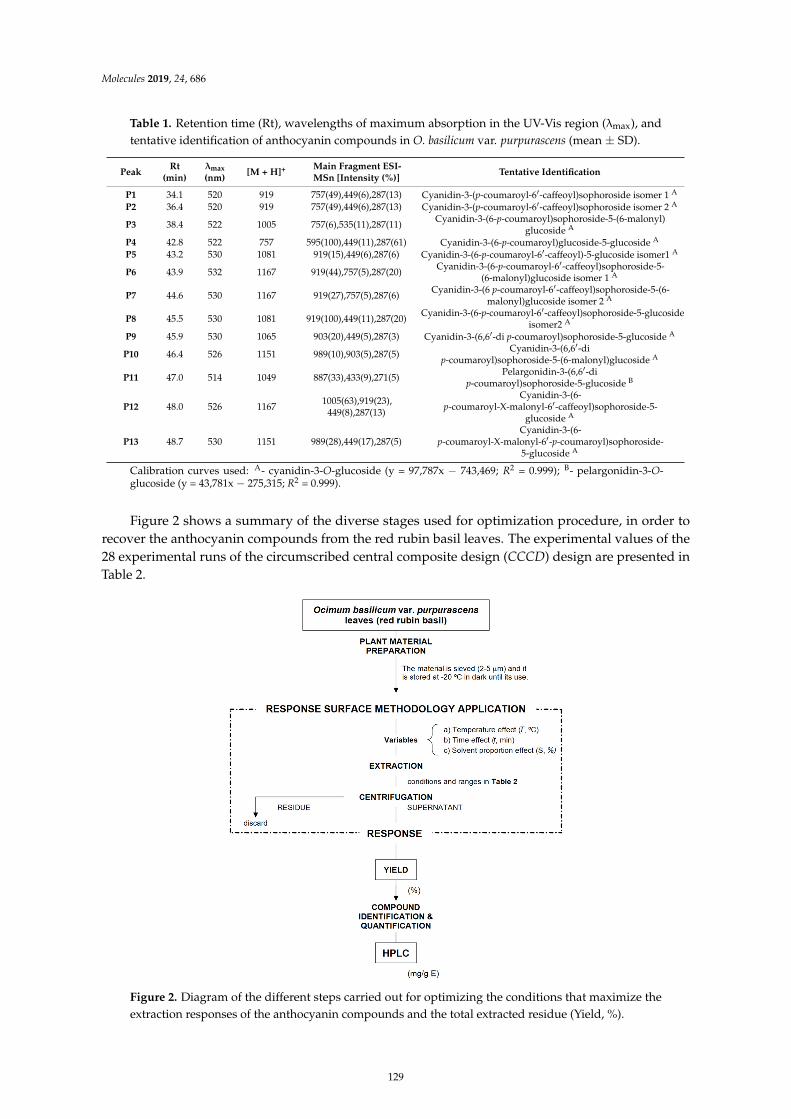
Molecules 2019, 24, 686
Table 1. Retention time (Rt), wavelengths of maximum absorption in the UV-Vis region (λmax), andtentative identification of anthocyanin compounds in O. basilicum var. purpurascens (mean ± SD).
PeakRt
(min)λmax
(nm)[M + H]+ Main Fragment ESI-
MSn [Intensity (%)]Tentative Identification
P1 34.1 520 919 757(49),449(6),287(13) Cyanidin-3-(p-coumaroyl-6′-caffeoyl)sophoroside isomer 1 A
P2 36.4 520 919 757(49),449(6),287(13) Cyanidin-3-(p-coumaroyl-6′-caffeoyl)sophoroside isomer 2 A
P3 38.4 522 1005 757(6),535(11),287(11)Cyanidin-3-(6-p-coumaroyl)sophoroside-5-(6-malonyl)
glucoside A
P4 42.8 522 757 595(100),449(11),287(61) Cyanidin-3-(6-p-coumaroyl)glucoside-5-glucoside A
P5 43.2 530 1081 919(15),449(6),287(6) Cyanidin-3-(6-p-coumaroyl-6′-caffeoyl)-5-glucoside isomer1 A
P6 43.9 532 1167 919(44),757(5),287(20)Cyanidin-3-(6-p-coumaroyl-6′-caffeoyl)sophoroside-5-
(6-malonyl)glucoside isomer 1 A
P7 44.6 530 1167 919(27),757(5),287(6)Cyanidin-3-(6 p-coumaroyl-6′-caffeoyl)sophoroside-5-(6-
malonyl)glucoside isomer 2 A
P8 45.5 530 1081 919(100),449(11),287(20)Cyanidin-3-(6-p-coumaroyl-6′-caffeoyl)sophoroside-5-glucoside
isomer2 A
P9 45.9 530 1065 903(20),449(5),287(3) Cyanidin-3-(6,6′-di p-coumaroyl)sophoroside-5-glucoside A
P10 46.4 526 1151 989(10),903(5),287(5)Cyanidin-3-(6,6′-di
p-coumaroyl)sophoroside-5-(6-malonyl)glucoside A
P11 47.0 514 1049 887(33),433(9),271(5)Pelargonidin-3-(6,6′-di
p-coumaroyl)sophoroside-5-glucoside B
P12 48.0 526 11671005(63),919(23),
449(8),287(13)
Cyanidin-3-(6-p-coumaroyl-X-malonyl-6′-caffeoyl)sophoroside-5-
glucoside A
P13 48.7 530 1151 989(28),449(17),287(5)Cyanidin-3-(6-
p-coumaroyl-X-malonyl-6′-p-coumaroyl)sophoroside-5-glucoside A
Calibration curves used: A- cyanidin-3-O-glucoside (y = 97,787x − 743,469; R2 = 0.999); B- pelargonidin-3-O-glucoside (y = 43,781x − 275,315; R2 = 0.999).
Figure 2 shows a summary of the diverse stages used for optimization procedure, in order torecover the anthocyanin compounds from the red rubin basil leaves. The experimental values of the28 experimental runs of the circumscribed central composite design (CCCD) design are presented inTable 2.
-coumaroyl caffeoyl sophoroside-coumaroyl caffeoyl sophoroside-coumaroyl sophoroside malonyl glucoside
-coumaroyl glucoside glucoside-coumaroyl ′ caffeoyl glucoside
-coumaroyl ′ caffeoyl sophorosidemalonyl glucoside
-coumaroyl ′ caffeoyl sophorosidemalonyl glucoside-coumaroyl ′ caffeoyl sophoroside glucoside
′ -coumaroyl sophoroside glucoside ′ -coumaroyl sophoroside
malonyl glucoside ′ -coumaroyl sophoroside glucoside
-coumaroyl malonyl ′ caffeoyl sophorosideglucoside -coumaroyl malonyl ′ -
coumaroyl sophoroside glucoside
−−
Figure 2. Diagram of the different steps carried out for optimizing the conditions that maximize theextraction responses of the anthocyanin compounds and the total extracted residue (Yield, %).
129
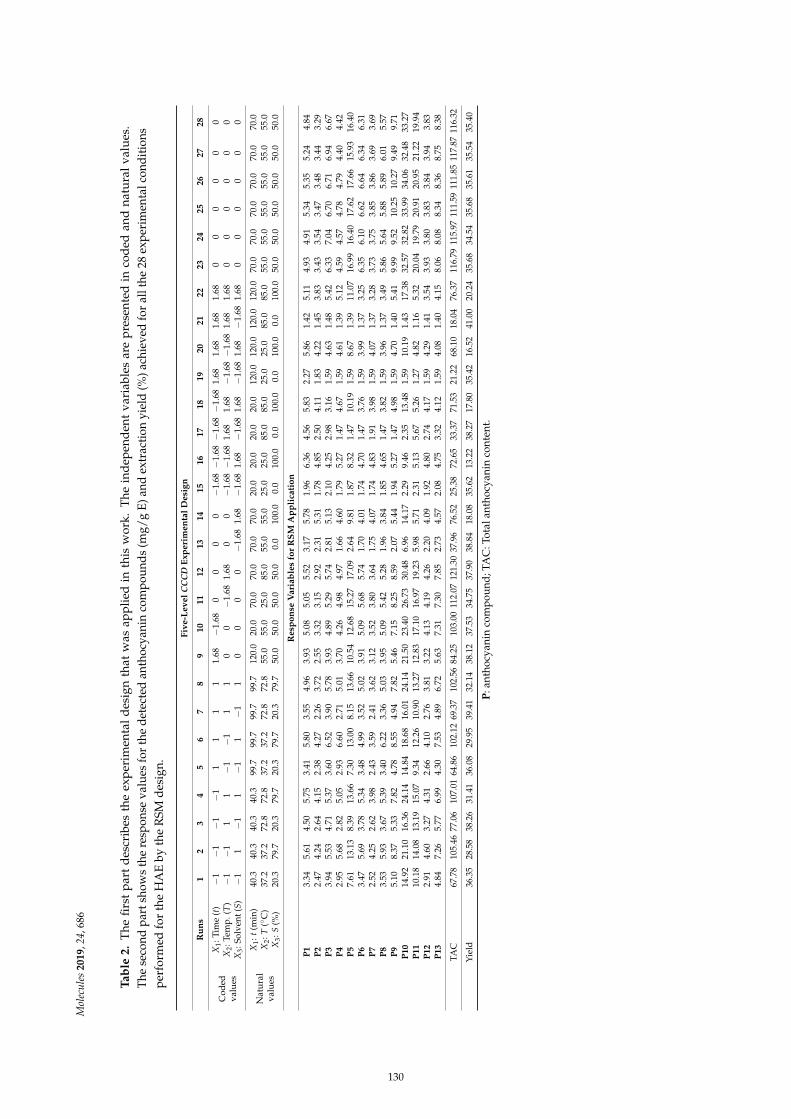
Mol
ecu
les
20
19,2
4,68
6
Ta
ble
2.
The
firs
tp
art
des
crib
esth
eex
per
imen
tal
des
ign
that
was
app
lied
inth
isw
ork.
The
ind
epen
den
tva
riab
les
are
pre
sent
edin
cod
edan
dna
tura
lva
lues
.T
hese
cond
part
show
sth
ere
spon
seva
lues
for
the
det
ecte
dan
thoc
yani
nco
mpo
und
s(m
g/g
E)a
ndex
trac
tion
yiel
d(%
)ach
ieve
dfo
ral
lthe
28ex
peri
men
talc
ond
itio
nsp
erfo
rmed
for
the
HA
Eby
the
RSM
des
ign.
Fiv
e-L
ev
el
CC
CD
Exp
eri
men
tal
Desi
gn
Ru
ns
12
34
56
78
910
11
12
13
14
15
16
17
18
19
20
21
22
23
24
25
26
27
28
Cod
edva
lues
X1:
Tim
e(t
)−
1−
1−
1−
11
11
11.
68−
1.68
00
00
−1.
68−
1.68
−1.
68−
1.68
1.68
1.68
1.68
1.68
00
00
00
X2:
Tem
p.(
T)
−1
−1
11
−1
−1
11
00
−1.
681.
680
0−
1.68
−1.
681.
681.
68−
1.68
−1.
681.
681.
680
00
00
0X
3:So
lven
t(S
)−
11
−1
1−
11
−1
10
00
0−
1.68
1.68
−1.
681.
68−
1.68
1.68
−1.
681.
68−
1.68
1.68
00
00
00
Nat
ura
lva
lues
X1:
t(m
in)
40.3
40.3
40.3
40.3
99.7
99.7
99.7
99.7
120.
020
.070
.070
.070
.070
.020
.020
.020
.020
.012
0.0
120.
012
0.0
120.
070
.070
.070
.070
.070
.070
.0X
2:T
(◦C
)37
.237
.272
.872
.837
.237
.272
.872
.855
.055
.025
.085
.055
.055
.025
.025
.085
.085
.025
.025
.085
.085
.055
.055
.055
.055
.055
.055
.0X
3:S
(%)
20.3
79.7
20.3
79.7
20.3
79.7
20.3
79.7
50.0
50.0
50.0
50.0
0.0
100.
00.
010
0.0
0.0
100.
00.
010
0.0
0.0
100.
050
.050
.050
.050
.050
.050
.0
Resp
on
seV
ari
ab
les
for
RS
MA
pp
lica
tio
n
P1
3.34
5.61
4.50
5.75
3.41
5.80
3.55
4.96
3.93
5.08
5.05
5.52
3.17
5.78
1.96
6.36
4.56
5.83
2.27
5.86
1.42
5.11
4.93
4.91
5.34
5.35
5.24
4.84
P2
2.47
4.24
2.64
4.15
2.38
4.27
2.26
3.72
2.55
3.32
3.15
2.92
2.31
5.31
1.78
4.85
2.50
4.11
1.83
4.22
1.45
3.83
3.43
3.54
3.47
3.48
3.44
3.29
P3
3.94
5.53
4.71
5.37
3.60
6.52
3.90
5.78
3.93
4.89
5.29
5.74
2.81
5.13
2.10
4.25
2.98
3.16
1.59
4.63
1.48
5.42
6.33
7.04
6.70
6.71
6.94
6.67
P4
2.95
5.68
2.82
5.05
2.93
6.60
2.71
5.01
3.70
4.26
4.98
4.97
1.66
4.60
1.79
5.27
1.47
4.67
1.59
4.61
1.39
5.12
4.59
4.57
4.78
4.79
4.40
4.42
P5
7.61
13.1
38.
3913
.66
7.30
13.0
08.
1513
.66
10.5
412
.68
15.2
717
.09
2.64
9.81
1.87
8.32
1.47
10.1
91.
598.
671.
3911
.07
16.9
916
.40
17.6
217
.66
15.9
316
.40
P6
3.47
5.69
3.78
5.34
3.48
4.99
3.52
5.02
3.91
5.09
5.68
5.74
1.70
4.01
1.74
4.70
1.47
3.76
1.59
3.99
1.37
3.25
6.35
6.10
6.62
6.64
6.34
6.31
P7
2.52
4.25
2.62
3.98
2.43
3.59
2.41
3.62
3.12
3.52
3.80
3.64
1.75
4.07
1.74
4.83
1.91
3.98
1.59
4.07
1.37
3.28
3.73
3.75
3.85
3.86
3.69
3.69
P8
3.53
5.93
3.67
5.39
3.40
6.22
3.36
5.03
3.95
5.09
5.42
5.28
1.96
3.84
1.85
4.65
1.47
3.82
1.59
3.96
1.37
3.49
5.86
5.64
5.88
5.89
6.01
5.57
P9
5.10
8.37
5.33
7.82
4.78
8.55
4.94
7.82
5.46
7.15
8.25
8.59
2.07
5.44
1.94
5.27
1.47
4.98
1.59
4.70
1.40
5.41
9.99
9.52
10.2
510
.27
9.49
9.71
P10
14.9
221
.10
16.3
624
.14
14.8
418
.68
16.0
124
.14
21.5
023
.40
26.7
330
.48
6.96
14.1
72.
299.
462.
3513
.48
1.59
10.1
91.
4317
.38
32.5
732
.82
33.9
934
.06
32.4
833
.27
P11
10.1
814
.08
13.1
915
.07
9.34
12.2
610
.90
13.2
712
.83
17.1
016
.97
19.2
35.
985.
712.
315.
135.
675.
261.
274.
821.
165.
3220
.04
19.7
920
.91
20.9
521
.22
19.9
4P
12
2.91
4.60
3.27
4.31
2.66
4.10
2.76
3.81
3.22
4.13
4.19
4.26
2.20
4.09
1.92
4.80
2.74
4.17
1.59
4.29
1.41
3.54
3.93
3.80
3.83
3.84
3.94
3.83
P13
4.84
7.26
5.77
6.99
4.30
7.53
4.89
6.72
5.63
7.31
7.30
7.85
2.73
4.57
2.08
4.75
3.32
4.12
1.59
4.08
1.40
4.15
8.06
8.08
8.34
8.36
8.75
8.38
TAC
67.7
810
5.46
77.0
610
7.01
64.8
610
2.12
69.3
710
2.56
84.2
510
3.00
112.
0712
1.30
37.9
676
.52
25.3
872
.65
33.3
771
.53
21.2
268
.10
18.0
476
.37
116.
7911
5.97
111.
5911
1.85
117.
8711
6.32
Yie
ld36
.35
28.5
838
.26
31.4
136
.08
29.9
539
.41
32.1
438
.12
37.5
334
.75
37.9
038
.84
18.0
835
.62
13.2
238
.27
17.8
035
.42
16.5
241
.00
20.2
435
.68
34.5
435
.68
35.6
135
.54
35.4
0
P:a
ntho
cyan
inco
mp
ound
;TA
C:T
otal
anth
ocya
nin
cont
ent.
130
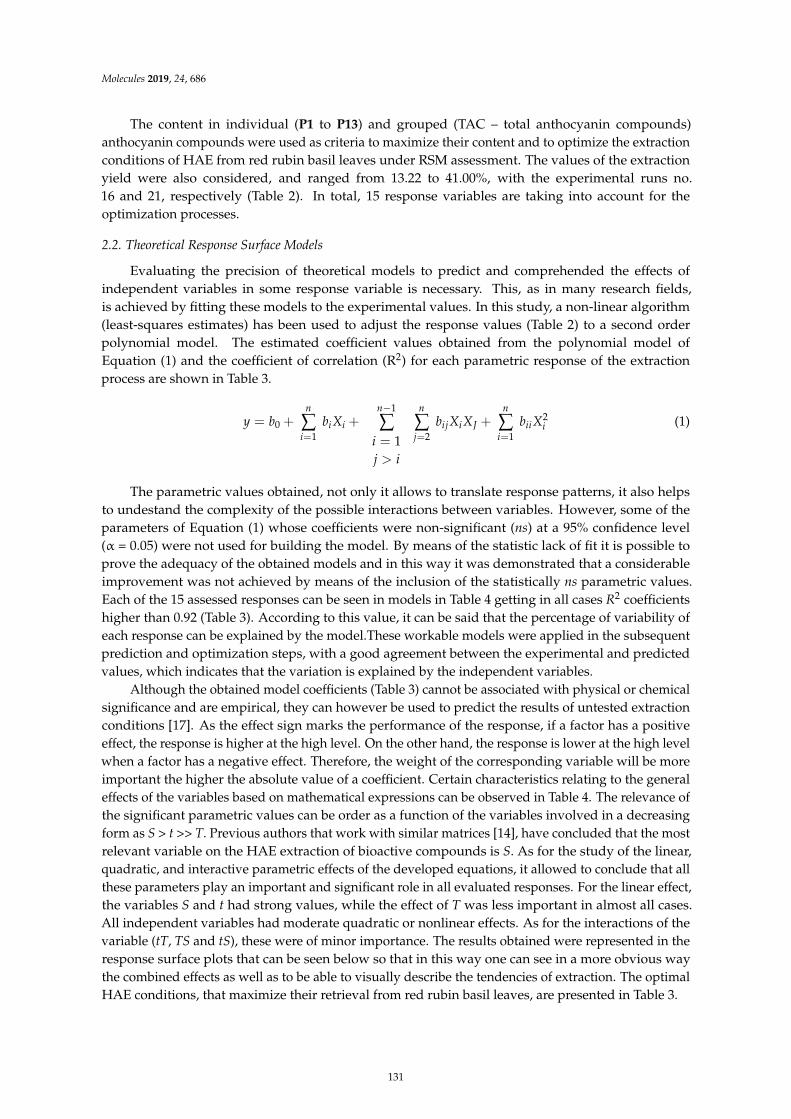
Molecules 2019, 24, 686
The content in individual (P1 to P13) and grouped (TAC – total anthocyanin compounds)anthocyanin compounds were used as criteria to maximize their content and to optimize the extractionconditions of HAE from red rubin basil leaves under RSM assessment. The values of the extractionyield were also considered, and ranged from 13.22 to 41.00%, with the experimental runs no.16 and 21, respectively (Table 2). In total, 15 response variables are taking into account for theoptimization processes.
2.2. Theoretical Response Surface Models
Evaluating the precision of theoretical models to predict and comprehended the effects ofindependent variables in some response variable is necessary. This, as in many research fields,is achieved by fitting these models to the experimental values. In this study, a non-linear algorithm(least-squares estimates) has been used to adjust the response values (Table 2) to a second orderpolynomial model. The estimated coefficient values obtained from the polynomial model ofEquation (1) and the coefficient of correlation (R2) for each parametric response of the extractionprocess are shown in Table 3.
y = b0 +n
∑i=1
biXi +n−1
∑i = 1j > i
n
∑j=2
bijXiXJ +n
∑i=1
biiX2i (1)
The parametric values obtained, not only it allows to translate response patterns, it also helpsto undestand the complexity of the possible interactions between variables. However, some of theparameters of Equation (1) whose coefficients were non-significant (ns) at a 95% confidence level(α = 0.05) were not used for building the model. By means of the statistic lack of fit it is possible toprove the adequacy of the obtained models and in this way it was demonstrated that a considerableimprovement was not achieved by means of the inclusion of the statistically ns parametric values.Each of the 15 assessed responses can be seen in models in Table 4 getting in all cases R2 coefficientshigher than 0.92 (Table 3). According to this value, it can be said that the percentage of variability ofeach response can be explained by the model.These workable models were applied in the subsequentprediction and optimization steps, with a good agreement between the experimental and predictedvalues, which indicates that the variation is explained by the independent variables.
Although the obtained model coefficients (Table 3) cannot be associated with physical or chemicalsignificance and are empirical, they can however be used to predict the results of untested extractionconditions [17]. As the effect sign marks the performance of the response, if a factor has a positiveeffect, the response is higher at the high level. On the other hand, the response is lower at the high levelwhen a factor has a negative effect. Therefore, the weight of the corresponding variable will be moreimportant the higher the absolute value of a coefficient. Certain characteristics relating to the generaleffects of the variables based on mathematical expressions can be observed in Table 4. The relevance ofthe significant parametric values can be order as a function of the variables involved in a decreasingform as S > t >> T. Previous authors that work with similar matrices [14], have concluded that the mostrelevant variable on the HAE extraction of bioactive compounds is S. As for the study of the linear,quadratic, and interactive parametric effects of the developed equations, it allowed to conclude that allthese parameters play an important and significant role in all evaluated responses. For the linear effect,the variables S and t had strong values, while the effect of T was less important in almost all cases.All independent variables had moderate quadratic or nonlinear effects. As for the interactions of thevariable (tT, TS and tS), these were of minor importance. The results obtained were represented in theresponse surface plots that can be seen below so that in this way one can see in a more obvious waythe combined effects as well as to be able to visually describe the tendencies of extraction. The optimalHAE conditions, that maximize their retrieval from red rubin basil leaves, are presented in Table 3.
131
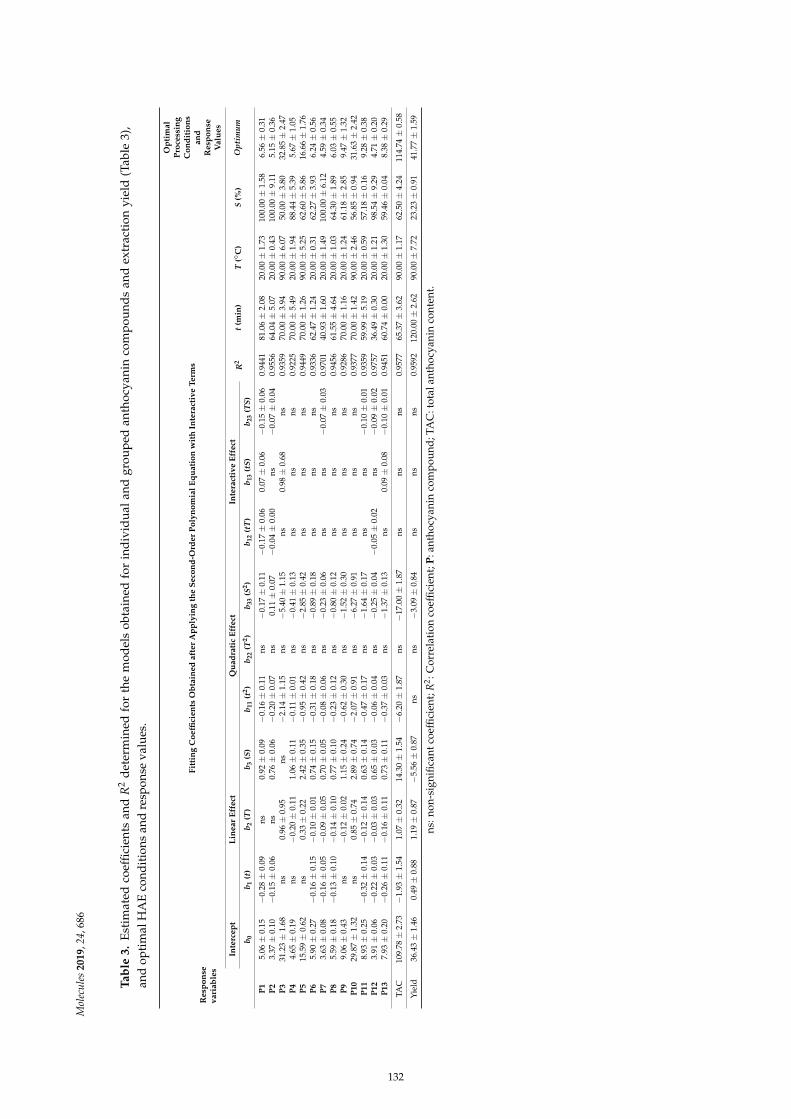
Mol
ecu
les
20
19,2
4,68
6
Ta
ble
3.
Est
imat
edco
effi
cien
tsan
dR
2d
eter
min
edfo
rth
em
odel
sob
tain
edfo
rin
div
idu
alan
dgr
oup
edan
thoc
yani
nco
mp
ound
san
dex
trac
tion
yiel
d(T
able
3),
and
opti
mal
HA
Eco
ndit
ions
and
resp
onse
valu
es.
Re
spo
nse
va
ria
ble
s
Fit
tin
gC
oe
ffici
en
tsO
bta
ine
da
fte
rA
pp
lyin
gth
eS
eco
nd
-Ord
er
Po
lyn
om
ial
Eq
ua
tio
nw
ith
Inte
ract
ive
Te
rms
Op
tim
al
Pro
cess
ing
Co
nd
itio
ns
an
dR
esp
on
seV
alu
es
Inte
rce
pt
Lin
ea
rE
ffe
ctQ
ua
dra
tic
Eff
ect
Inte
ract
ive
Eff
ect
R2
t(m
in)
T(◦
C)
S(%
)O
pti
mu
mb
0b
1(t
)b
2(T
)b
3(S
)b
11
(t2)
b22
(T2)
b33
(S2)
b12
(tT
)b
13
(tS
)b
23
(TS
)
P1
5.06
±0.
15−
0.28
±0.
09ns
0.92
±0.
09−
0.16
±0.
11ns
−0.
17±
0.11
−0.
17±
0.06
0.07
±0.
06−
0.15
±0.
060.
9441
81.0
6±
2.08
20.0
0±
1.73
100.
00±
1.58
6.56
±0.
31P
23.
37±
0.10
−0.
15±
0.06
ns0.
76±
0.06
−0.
20±
0.07
ns0.
11±
0.07
−0.
04±
0.00
ns−
0.07
±0.
040.
9556
64.0
4±
5.07
20.0
0±
0.43
100.
00±
9.11
5.15
±0.
36P
331
.23±
1.68
ns0.
96±
0.95
ns−
2.14
±1.
15ns
−5.
40±
1.15
ns0.
98±
0.68
ns0.
9359
70.0
0±
3.94
90.0
0±
6.07
50.0
0±
3.80
32.8
5±
2.47
P4
4.65
±0.
19ns
−0.
20±
0.11
1.06
±0.
11−
0.11
±0.
01ns
−0.
41±
0.13
nsns
ns0.
9225
70.0
0±
5.49
20.0
0±
1.94
88.4
4±
5.39
5.67
±1.
05P
515
.59±
0.62
ns0.
33±
0.22
2.42
±0.
35−
0.95
±0.
42ns
−2.
85±
0.42
nsns
ns0.
9449
70.0
0±
1.26
90.0
0±
5.25
62.6
0±
5.86
16.6
6±
1.76
P6
5.90
±0.
27−
0.16
±0.
15−
0.10
±0.
010.
74±
0.15
−0.
31±
0.18
ns−
0.89
±0.
18ns
nsns
0.93
3662
.47±
1.24
20.0
0±
0.31
62.2
7±
3.93
6.24
±0.
56P
73.
63±
0.08
−0.
16±
0.05
−0.
09±
0.05
0.70
±0.
05−
0.08
±0.
06ns
−0.
23±
0.06
nsns
−0.
07±
0.03
0.97
0140
.93±
1.60
20.0
0±
1.49
100.
00±
6.12
4.59
±0.
34P
85.
59±
0.18
−0.
13±
0.10
−0.
14±
0.10
0.77
±0.
10−
0.23
±0.
12ns
−0.
80±
0.12
nsns
ns0.
9456
61.5
5±
4.64
20.0
0±
1.03
64.3
0±
1.89
6.03
±0.
55P
99.
06±
0.43
ns−
0.12
±0.
021.
15±
0.24
−0.
62±
0.30
ns−
1.52
±0.
30ns
nsns
0.92
8670
.00±
1.16
20.0
0±
1.24
61.1
8±
2.85
9.47
±1.
32P
10
29.8
7±
1.32
ns0.
85±
0.74
2.89
±0.
74−
2.07
±0.
91ns
−6.
27±
0.91
nsns
ns0.
9377
70.0
0±
1.42
90.0
0±
2.46
56.8
5±
0.94
31.6
3±
2.42
P1
18.
93±
0.25
−0.
32±
0.14
−0.
12±
0.14
0.63
±0.
14−
0.47
±0.
17ns
−1.
64±
0.17
nsns
−0.
10±
0.01
0.93
5959
.99±
5.19
20.0
0±
0.59
57.1
8±
0.16
9.28
±0.
38P
12
3.91
±0.
06−
0.22
±0.
03−
0.03
±0.
030.
65±
0.03
−0.
06±
0.04
ns−
0.25
±0.
04−
0.05
±0.
02ns
−0.
09±
0.02
0.97
5736
.49±
0.30
20.0
0±
1.21
98.5
4±
9.29
4.71
±0.
20P
13
7.93
±0.
20−
0.26
±0.
11−
0.16
±0.
110.
73±
0.11
−0.
37±
0.03
ns−
1.37
±0.
13ns
0.09
±0.
08−
0.10
±0.
010.
9451
60.7
4±
0.00
20.0
0±
1.30
59.4
6±
0.04
8.38
±0.
29
TAC
109.
78±
2.73
−1.
93±
1.54
1.07
±0.
3214
.30±
1.54
−6.
20±
1.87
ns−
17.0
0±
1.87
nsns
ns0.
9577
65.3
7±
3.62
90.0
0±
1.17
62.5
0±
4.24
114.
74±
0.58
Yie
ld36
.43±
1.46
0.49
±0.
881.
19±
0.87
−5.
56±
0.87
nsns
−3.
09±
0.84
nsns
ns0.
9592
120.
00±
2.62
90.0
0±
7.72
23.2
3±
0.91
41.7
7±
1.59
ns:n
on-s
igni
fica
ntco
effi
cien
t;R
2 :Cor
rela
tion
coef
fici
ent;
P:a
ntho
cyan
inco
mp
ound
;TA
C:t
otal
anth
ocya
nin
cont
ent.
132
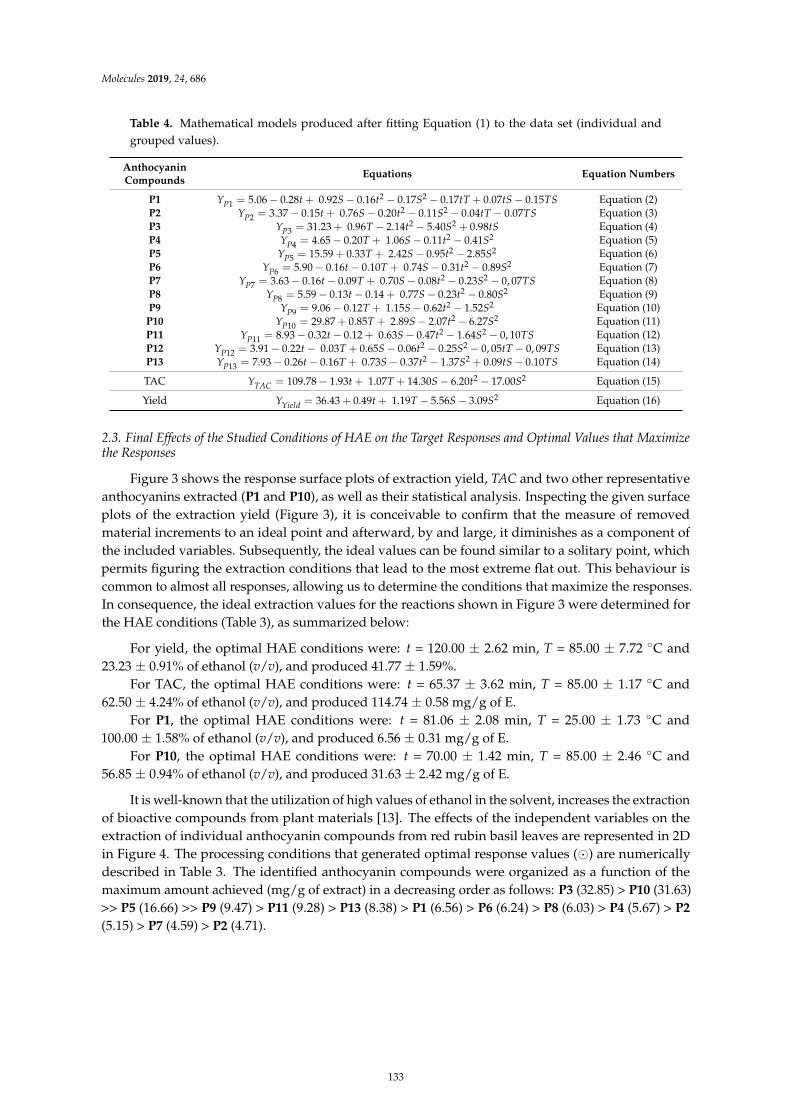
Molecules 2019, 24, 686
Table 4. Mathematical models produced after fitting Equation (1) to the data set (individual andgrouped values).
AnthocyaninCompounds
Equations Equation Numbers
P1 YP1 = 5.06 − 0.28t + 0.92S − 0.16t2 − 0.17S2 − 0.17tT + 0.07tS − 0.15TS Equation (2)P2 YP2 = 3.37 − 0.15t + 0.76S − 0.20t2 − 0.11S2 − 0.04tT − 0.07TS Equation (3)P3 YP3 = 31.23 + 0.96T − 2.14t2 − 5.40S2 + 0.98tS Equation (4)P4 YP4 = 4.65 − 0.20T + 1.06S − 0.11t2 − 0.41S2 Equation (5)P5 YP5 = 15.59 + 0.33T + 2.42S − 0.95t2 − 2.85S2 Equation (6)P6 YP6 = 5.90 − 0.16t − 0.10T + 0.74S − 0.31t2 − 0.89S2 Equation (7)P7 YP7 = 3.63 − 0.16t − 0.09T + 0.70S − 0.08t2 − 0.23S2 − 0, 07TS Equation (8)P8 YP8 = 5.59 − 0.13t − 0.14 + 0.77S − 0.23t2 − 0.80S2 Equation (9)P9 YP9 = 9.06 − 0.12T + 1.15S − 0.62t2 − 1.52S2 Equation (10)
P10 YP10 = 29.87 + 0.85T + 2.89S − 2.07t2 − 6.27S2 Equation (11)P11 YP11 = 8.93 − 0.32t − 0.12 + 0.63S − 0.47t2 − 1.64S2 − 0, 10TS Equation (12)P12 YP12 = 3.91 − 0.22t − 0.03T + 0.65S − 0.06t2 − 0.25S2 − 0, 05tT − 0, 09TS Equation (13)P13 YP13 = 7.93 − 0.26t − 0.16T + 0.73S − 0.37t2 − 1.37S2 + 0.09tS − 0.10TS Equation (14)
TAC YTAC = 109.78 − 1.93t + 1.07T + 14.30S − 6.20t2 − 17.00S2 Equation (15)
Yield YYield = 36.43 + 0.49t + 1.19T − 5.56S − 3.09S2 Equation (16)
2.3. Final Effects of the Studied Conditions of HAE on the Target Responses and Optimal Values that Maximizethe Responses
Figure 3 shows the response surface plots of extraction yield, TAC and two other representativeanthocyanins extracted (P1 and P10), as well as their statistical analysis. Inspecting the given surfaceplots of the extraction yield (Figure 3), it is conceivable to confirm that the measure of removedmaterial increments to an ideal point and afterward, by and large, it diminishes as a component ofthe included variables. Subsequently, the ideal values can be found similar to a solitary point, whichpermits figuring the extraction conditions that lead to the most extreme flat out. This behaviour iscommon to almost all responses, allowing us to determine the conditions that maximize the responses.In consequence, the ideal extraction values for the reactions shown in Figure 3 were determined forthe HAE conditions (Table 3), as summarized below:
For yield, the optimal HAE conditions were: t = 120.00 ± 2.62 min, T = 85.00 ± 7.72 ◦C and23.23 ± 0.91% of ethanol (v/v), and produced 41.77 ± 1.59%.
For TAC, the optimal HAE conditions were: t = 65.37 ± 3.62 min, T = 85.00 ± 1.17 ◦C and62.50 ± 4.24% of ethanol (v/v), and produced 114.74 ± 0.58 mg/g of E.
For P1, the optimal HAE conditions were: t = 81.06 ± 2.08 min, T = 25.00 ± 1.73 ◦C and100.00 ± 1.58% of ethanol (v/v), and produced 6.56 ± 0.31 mg/g of E.
For P10, the optimal HAE conditions were: t = 70.00 ± 1.42 min, T = 85.00 ± 2.46 ◦C and56.85 ± 0.94% of ethanol (v/v), and produced 31.63 ± 2.42 mg/g of E.
It is well-known that the utilization of high values of ethanol in the solvent, increases the extractionof bioactive compounds from plant materials [13]. The effects of the independent variables on theextraction of individual anthocyanin compounds from red rubin basil leaves are represented in 2Din Figure 4. The processing conditions that generated optimal response values (⊙) are numericallydescribed in Table 3. The identified anthocyanin compounds were organized as a function of themaximum amount achieved (mg/g of extract) in a decreasing order as follows: P3 (32.85) > P10 (31.63)>> P5 (16.66) >> P9 (9.47) > P11 (9.28) > P13 (8.38) > P1 (6.56) > P6 (6.24) > P8 (6.03) > P4 (5.67) > P2
(5.15) > P7 (4.59) > P2 (4.71).
133
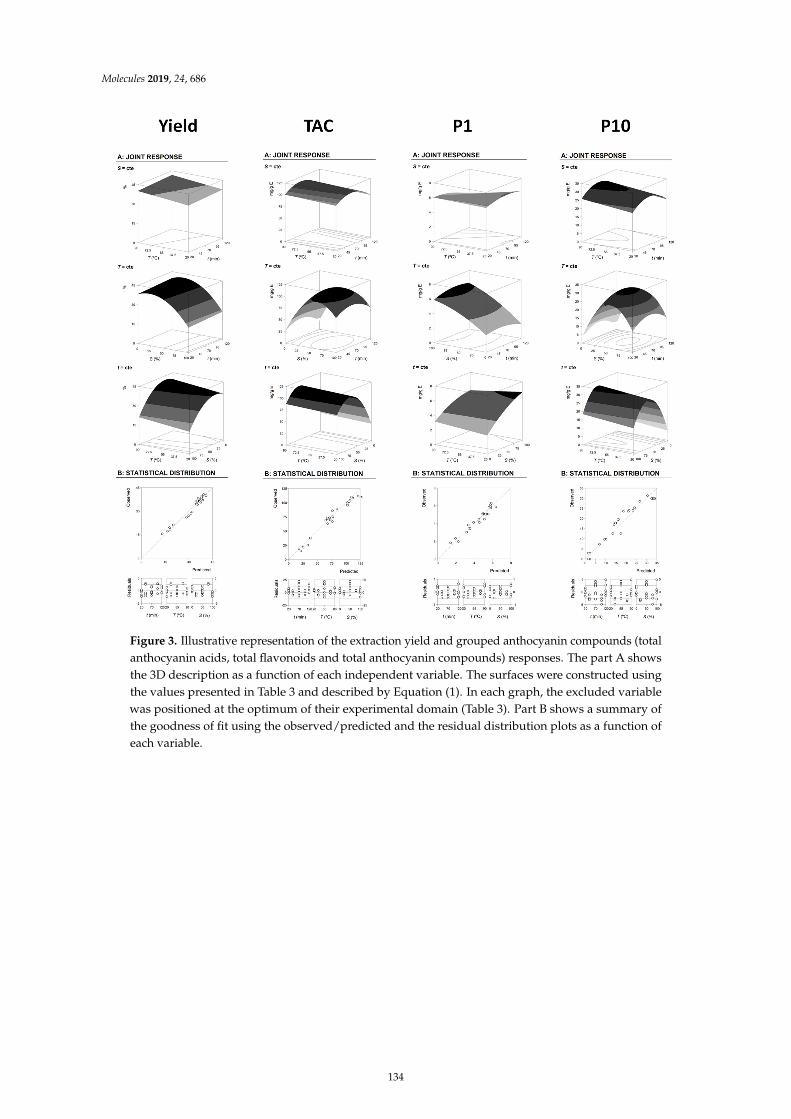
Molecules 2019, 24, 686
Figure 3. Illustrative representation of the extraction yield and grouped anthocyanin compounds (totalanthocyanin acids, total flavonoids and total anthocyanin compounds) responses. The part A showsthe 3D description as a function of each independent variable. The surfaces were constructed usingthe values presented in Table 3 and described by Equation (1). In each graph, the excluded variablewas positioned at the optimum of their experimental domain (Table 3). Part B shows a summary ofthe goodness of fit using the observed/predicted and the residual distribution plots as a function ofeach variable.
134
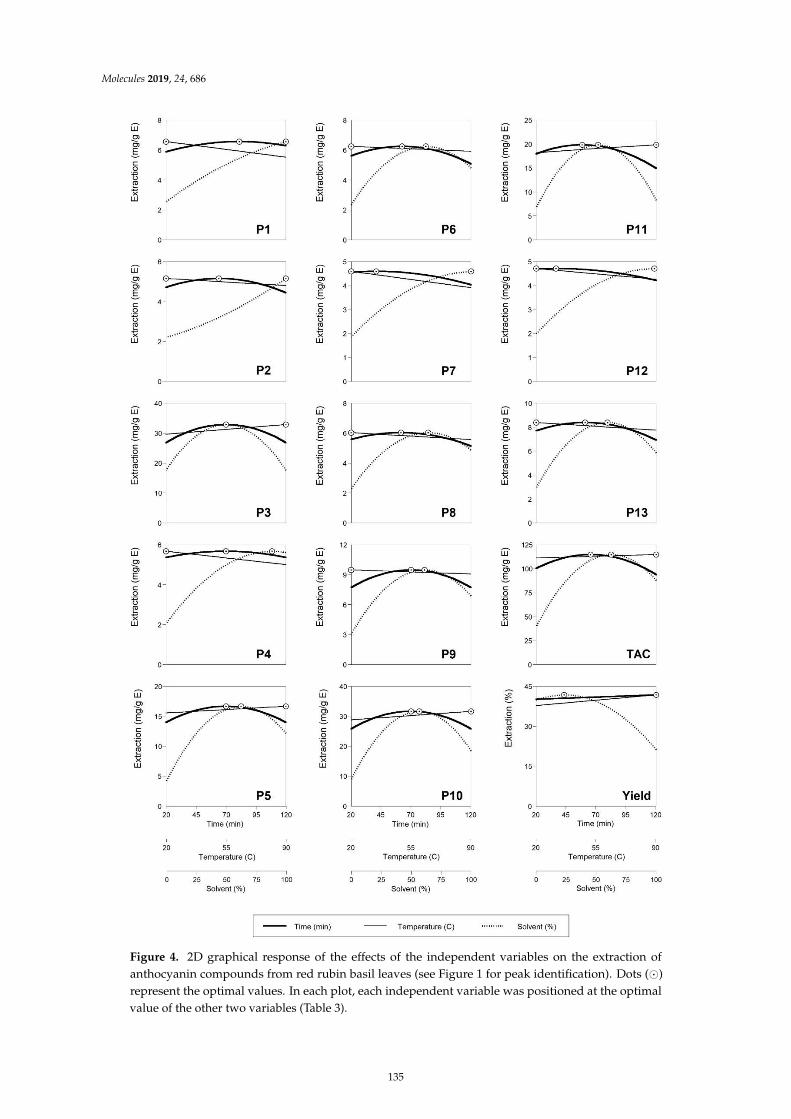
Molecules 2019, 24, 686
Figure 4. 2D graphical response of the effects of the independent variables on the extraction ofanthocyanin compounds from red rubin basil leaves (see Figure 1 for peak identification). Dots (⊙)represent the optimal values. In each plot, each independent variable was positioned at the optimalvalue of the other two variables (Table 3).
135
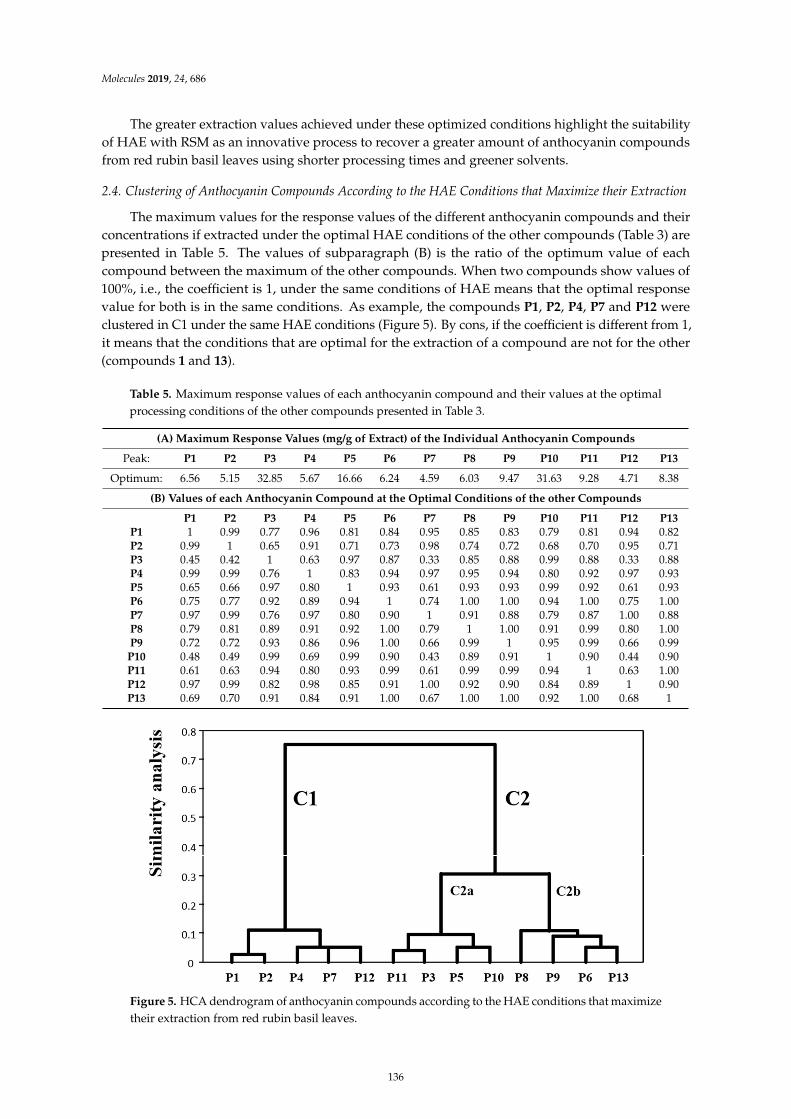
Molecules 2019, 24, 686
The greater extraction values achieved under these optimized conditions highlight the suitabilityof HAE with RSM as an innovative process to recover a greater amount of anthocyanin compoundsfrom red rubin basil leaves using shorter processing times and greener solvents.
2.4. Clustering of Anthocyanin Compounds According to the HAE Conditions that Maximize their Extraction
The maximum values for the response values of the different anthocyanin compounds and theirconcentrations if extracted under the optimal HAE conditions of the other compounds (Table 3) arepresented in Table 5. The values of subparagraph (B) is the ratio of the optimum value of eachcompound between the maximum of the other compounds. When two compounds show values of100%, i.e., the coefficient is 1, under the same conditions of HAE means that the optimal responsevalue for both is in the same conditions. As example, the compounds P1, P2, P4, P7 and P12 wereclustered in C1 under the same HAE conditions (Figure 5). By cons, if the coefficient is different from 1,it means that the conditions that are optimal for the extraction of a compound are not for the other(compounds 1 and 13).
Table 5. Maximum response values of each anthocyanin compound and their values at the optimalprocessing conditions of the other compounds presented in Table 3.
(A) Maximum Response Values (mg/g of Extract) of the Individual Anthocyanin Compounds
Peak: P1 P2 P3 P4 P5 P6 P7 P8 P9 P10 P11 P12 P13
Optimum: 6.56 5.15 32.85 5.67 16.66 6.24 4.59 6.03 9.47 31.63 9.28 4.71 8.38
(B) Values of each Anthocyanin Compound at the Optimal Conditions of the other Compounds
P1 P2 P3 P4 P5 P6 P7 P8 P9 P10 P11 P12 P13P1 1 0.99 0.77 0.96 0.81 0.84 0.95 0.85 0.83 0.79 0.81 0.94 0.82P2 0.99 1 0.65 0.91 0.71 0.73 0.98 0.74 0.72 0.68 0.70 0.95 0.71P3 0.45 0.42 1 0.63 0.97 0.87 0.33 0.85 0.88 0.99 0.88 0.33 0.88P4 0.99 0.99 0.76 1 0.83 0.94 0.97 0.95 0.94 0.80 0.92 0.97 0.93P5 0.65 0.66 0.97 0.80 1 0.93 0.61 0.93 0.93 0.99 0.92 0.61 0.93P6 0.75 0.77 0.92 0.89 0.94 1 0.74 1.00 1.00 0.94 1.00 0.75 1.00P7 0.97 0.99 0.76 0.97 0.80 0.90 1 0.91 0.88 0.79 0.87 1.00 0.88P8 0.79 0.81 0.89 0.91 0.92 1.00 0.79 1 1.00 0.91 0.99 0.80 1.00P9 0.72 0.72 0.93 0.86 0.96 1.00 0.66 0.99 1 0.95 0.99 0.66 0.99P10 0.48 0.49 0.99 0.69 0.99 0.90 0.43 0.89 0.91 1 0.90 0.44 0.90P11 0.61 0.63 0.94 0.80 0.93 0.99 0.61 0.99 0.99 0.94 1 0.63 1.00P12 0.97 0.99 0.82 0.98 0.85 0.91 1.00 0.92 0.90 0.84 0.89 1 0.90P13 0.69 0.70 0.91 0.84 0.91 1.00 0.67 1.00 1.00 0.92 1.00 0.68 1
α
−−
Figure 5. HCA dendrogram of anthocyanin compounds according to the HAE conditions that maximizetheir extraction from red rubin basil leaves.
136
Molecules 2019, 24, 686
In Table 5 it can be observed the formation of different groups of compounds of anthocyanin withmaximum response values in conditions of HAE extraction similar. The division in these groups wasmade possible by the complete data set of Table 5 and by performing a multi objective optimizationproblem using an appropriate clustering algorithm. The results of Hierarchical Cluster Analysis (HCA)are presented in Figure 5. In the HCA dendrogram, the shorter distance between compounds, thehigher similarity in terms of conditions that favour their extraction. Moreover, compounds belongingto the same group are better extracted under similar HAE conditions. Two significant clusters (C1 andC2), being the C2 divided in turn into 2 subgroups (a and b). Other less important subgroups werecreated, but they can be considered as a residual noise produced by the algorithm.
Cluster C1 included the compounds P1, P2, P4, P7 and P12. The extraction of these compoundsfor maximize by medium t, high S and low/high T (Table 3 and Figure 3). The subgroups were mainlydifferentiated by the T values.
Cluster C2 included all other compounds P11, P3, P5, P10, P8, P9, P6 and P13, which weresubdivided in C2a and C2b. For maximizing the extraction of the compounds in C2a low T andmedium S was used. On the other hand, the compounds in C2b was maximized when using high T
and medium S.Although it was expected that if the compounds have similar chemical characteristics also would
have similar HAE conditions, the HCA analysis was an interesting and innovative approach in thefield of extraction of high added-value compound from natural sources since this analysis highlightedsuitable HAE conditions for maximize the simultaneous recovery of specific groups of compoundsfrom red rubin basil leaves.
2.5. Dose-Response Analysis of the Solid-to-Liquid Effect at the Optimum Conditions
Thanks to the precise results obtained by HPLC, the S/L effect was tested under the optimalconditions provided for each extractive technique by the polynomial models, using the amount ofanthocyanin as response. As confirmed by the preliminary results (data not shown), the maximumexperimental value is close to 30 g/L, since at higher values of S/L it is observed experimental stirring,so an experiment was designed for each extractive process in which to check the S/L behaviour atvalues between 1 and 30 g/L. The obtained results are consistent with previous responses. It wasobserved that the effect caused by the S/L ratio follows a simple linear model with an intercept, andthat this model follows a slightly decreasing pattern proportional to the increase of S/L in all the assays.However, that pattern, explained by the parametric coefficient of the slope, was non-significant with aconfidence interval level of 95 % (α = 0.05) and the decreasing effect was not taken into account forfurther analysis. In conclusion, it can be affirmed that the increase in the S/L ratio has very little effecton the TAC extraction, besides that saturation effects were not observed at any value below 30 g/L.
2.6. Evaluation of the Colorant Potential of the Extract Rich in Anthocyanin Compounds Obtained underOptimum Conditions from Leaves of O. basilicum var. purpurascens
The results of the chromatic analysis in the CIE L*a*b* colour space of the extract rich in anthocyaninspresent in the leaves of O. basilicum var. purpurascens are shown in Table 6. The colour of the pigmentedextract showed an L* value, lightness (0 to 100), of 20.5 ± 0.5; and in parameters a* (colour intensityfrom green to red (−120 to 120)) and b* (colour is evaluated at the intensity level from blue to yellow(−120 to 120)), the values were 33.0 ± 0.1 and 8.2 ± 0.4, respectively.
For a better understanding of the colour values, these were converted to RGB values and thecolour obtained from the extract, red-berry, can be visualized. These results can be justified by thepresence of anthocyanin compounds in the extract, which, in addition to having darker shades, are alsocharacterized by blue, red and purple tones. The concentration of total anthocyanin compounds,obtained in the optimized extract, was similar to that predicted by the model.
137
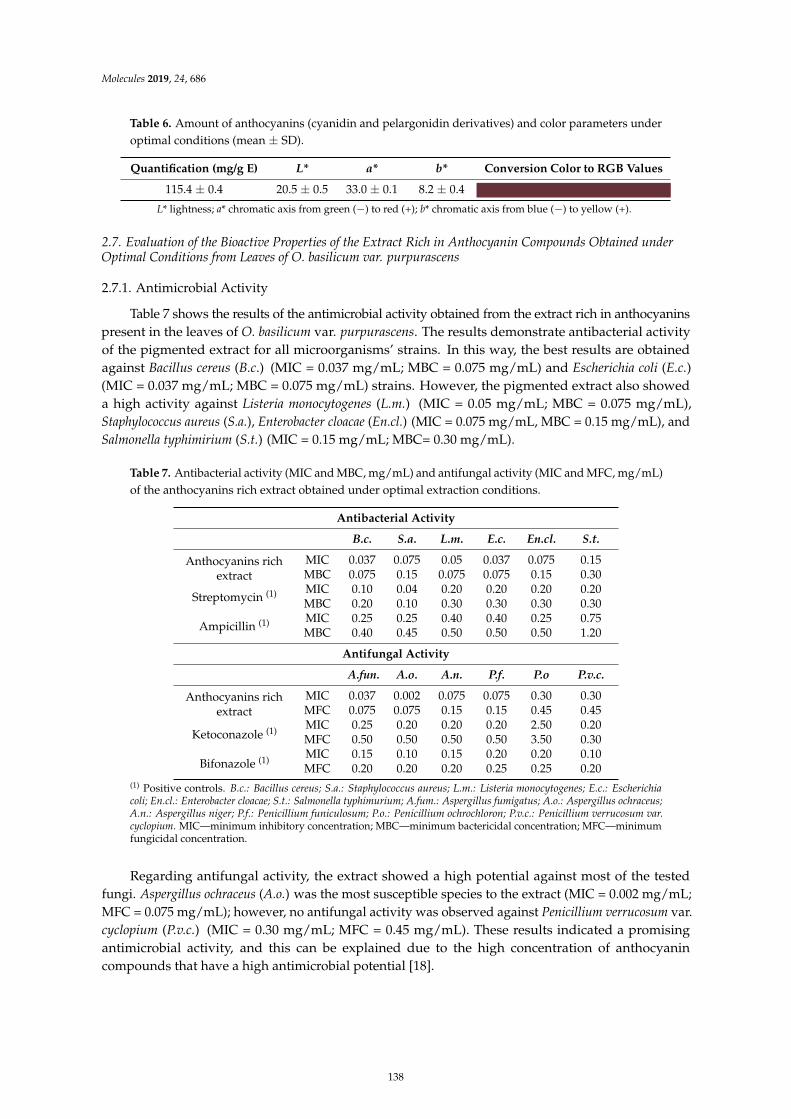
Molecules 2019, 24, 686
Table 6. Amount of anthocyanins (cyanidin and pelargonidin derivatives) and color parameters underoptimal conditions (mean ± SD).
Quantification (mg/g E) L* a* b* Conversion Color to RGB Values
115.4 ± 0.4 20.5 ± 0.5 33.0 ± 0.1 8.2 ± 0.4
L* lightness; a* chromatic axis from green (−) to red (+); b* chromatic axis from blue (−) to yellow (+).
2.7. Evaluation of the Bioactive Properties of the Extract Rich in Anthocyanin Compounds Obtained underOptimal Conditions from Leaves of O. basilicum var. purpurascens
2.7.1. Antimicrobial Activity
Table 7 shows the results of the antimicrobial activity obtained from the extract rich in anthocyaninspresent in the leaves of O. basilicum var. purpurascens. The results demonstrate antibacterial activityof the pigmented extract for all microorganisms’ strains. In this way, the best results are obtainedagainst Bacillus cereus (B.c.) (MIC = 0.037 mg/mL; MBC = 0.075 mg/mL) and Escherichia coli (E.c.)(MIC = 0.037 mg/mL; MBC = 0.075 mg/mL) strains. However, the pigmented extract also showeda high activity against Listeria monocytogenes (L.m.) (MIC = 0.05 mg/mL; MBC = 0.075 mg/mL),Staphylococcus aureus (S.a.), Enterobacter cloacae (En.cl.) (MIC = 0.075 mg/mL, MBC = 0.15 mg/mL), andSalmonella typhimirium (S.t.) (MIC = 0.15 mg/mL; MBC= 0.30 mg/mL).
Table 7. Antibacterial activity (MIC and MBC, mg/mL) and antifungal activity (MIC and MFC, mg/mL)of the anthocyanins rich extract obtained under optimal extraction conditions.
Antibacterial Activity
B.c. S.a. L.m. E.c. En.cl. S.t.
Anthocyanins richextract
MIC 0.037 0.075 0.05 0.037 0.075 0.15MBC 0.075 0.15 0.075 0.075 0.15 0.30
Streptomycin (1) MIC 0.10 0.04 0.20 0.20 0.20 0.20MBC 0.20 0.10 0.30 0.30 0.30 0.30
Ampicillin (1) MIC 0.25 0.25 0.40 0.40 0.25 0.75MBC 0.40 0.45 0.50 0.50 0.50 1.20
Antifungal Activity
A.fun. A.o. A.n. P.f. P.o P.v.c.
Anthocyanins richextract
MIC 0.037 0.002 0.075 0.075 0.30 0.30MFC 0.075 0.075 0.15 0.15 0.45 0.45
Ketoconazole (1) MIC 0.25 0.20 0.20 0.20 2.50 0.20MFC 0.50 0.50 0.50 0.50 3.50 0.30
Bifonazole (1) MIC 0.15 0.10 0.15 0.20 0.20 0.10MFC 0.20 0.20 0.20 0.25 0.25 0.20
(1) Positive controls. B.c.: Bacillus cereus; S.a.: Staphylococcus aureus; L.m.: Listeria monocytogenes; E.c.: Escherichiacoli; En.cl.: Enterobacter cloacae; S.t.: Salmonella typhimurium; A.fum.: Aspergillus fumigatus; A.o.: Aspergillus ochraceus;A.n.: Aspergillus niger; P.f.: Penicillium funiculosum; P.o.: Penicillium ochrochloron; P.v.c.: Penicillium verrucosum var.cyclopium. MIC—minimum inhibitory concentration; MBC—minimum bactericidal concentration; MFC—minimumfungicidal concentration.
Regarding antifungal activity, the extract showed a high potential against most of the testedfungi. Aspergillus ochraceus (A.o.) was the most susceptible species to the extract (MIC = 0.002 mg/mL;MFC = 0.075 mg/mL); however, no antifungal activity was observed against Penicillium verrucosum var.cyclopium (P.v.c.) (MIC = 0.30 mg/mL; MFC = 0.45 mg/mL). These results indicated a promisingantimicrobial activity, and this can be explained due to the high concentration of anthocyanincompounds that have a high antimicrobial potential [18].
138
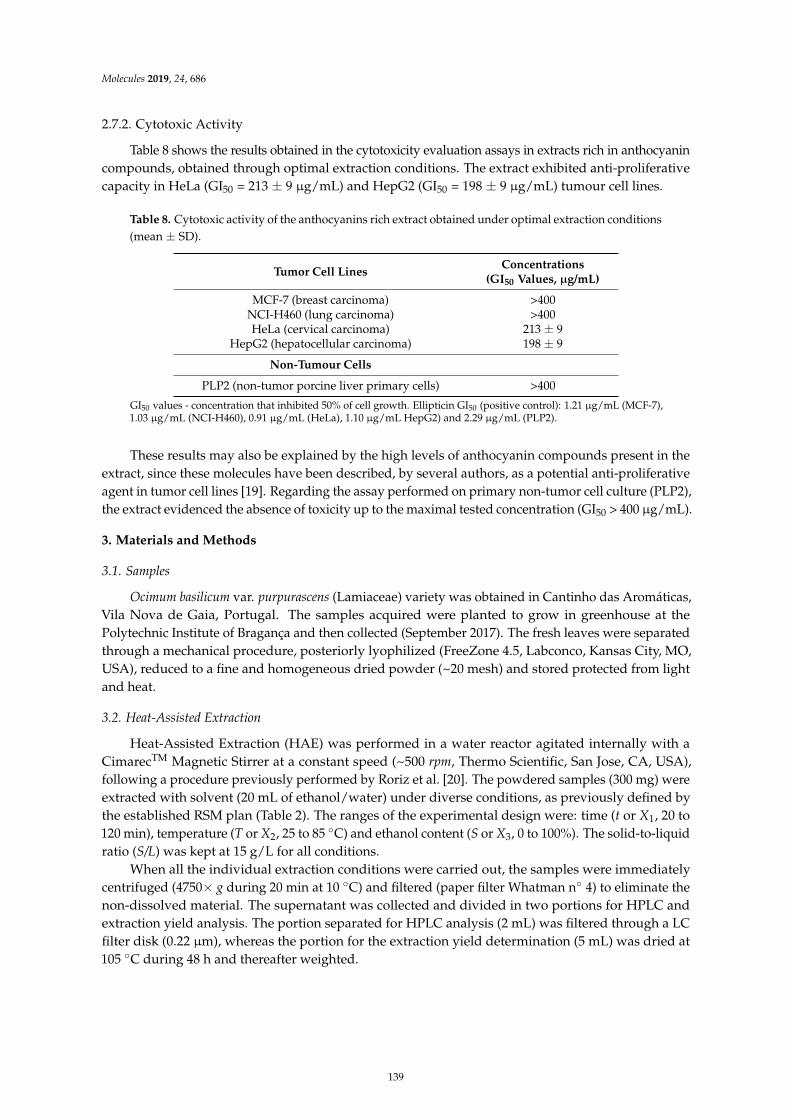
Molecules 2019, 24, 686
2.7.2. Cytotoxic Activity
Table 8 shows the results obtained in the cytotoxicity evaluation assays in extracts rich in anthocyanincompounds, obtained through optimal extraction conditions. The extract exhibited anti-proliferativecapacity in HeLa (GI50 = 213 ± 9 µg/mL) and HepG2 (GI50 = 198 ± 9 µg/mL) tumour cell lines.
Table 8. Cytotoxic activity of the anthocyanins rich extract obtained under optimal extraction conditions(mean ± SD).
Tumor Cell LinesConcentrations
(GI50 Values, µg/mL)
MCF-7 (breast carcinoma) >400NCI-H460 (lung carcinoma) >400HeLa (cervical carcinoma) 213 ± 9
HepG2 (hepatocellular carcinoma) 198 ± 9
Non-Tumour Cells
PLP2 (non-tumor porcine liver primary cells) >400
GI50 values - concentration that inhibited 50% of cell growth. Ellipticin GI50 (positive control): 1.21 µg/mL (MCF-7),1.03 µg/mL (NCI-H460), 0.91 µg/mL (HeLa), 1.10 µg/mL HepG2) and 2.29 µg/mL (PLP2).
These results may also be explained by the high levels of anthocyanin compounds present in theextract, since these molecules have been described, by several authors, as a potential anti-proliferativeagent in tumor cell lines [19]. Regarding the assay performed on primary non-tumor cell culture (PLP2),the extract evidenced the absence of toxicity up to the maximal tested concentration (GI50 > 400 µg/mL).
3. Materials and Methods
3.1. Samples
Ocimum basilicum var. purpurascens (Lamiaceae) variety was obtained in Cantinho das Aromáticas,Vila Nova de Gaia, Portugal. The samples acquired were planted to grow in greenhouse at thePolytechnic Institute of Bragança and then collected (September 2017). The fresh leaves were separatedthrough a mechanical procedure, posteriorly lyophilized (FreeZone 4.5, Labconco, Kansas City, MO,USA), reduced to a fine and homogeneous dried powder (~20 mesh) and stored protected from lightand heat.
3.2. Heat-Assisted Extraction
Heat-Assisted Extraction (HAE) was performed in a water reactor agitated internally with aCimarecTM Magnetic Stirrer at a constant speed (~500 rpm, Thermo Scientific, San Jose, CA, USA),following a procedure previously performed by Roriz et al. [20]. The powdered samples (300 mg) wereextracted with solvent (20 mL of ethanol/water) under diverse conditions, as previously defined bythe established RSM plan (Table 2). The ranges of the experimental design were: time (t or X1, 20 to120 min), temperature (T or X2, 25 to 85 ◦C) and ethanol content (S or X3, 0 to 100%). The solid-to-liquidratio (S/L) was kept at 15 g/L for all conditions.
When all the individual extraction conditions were carried out, the samples were immediatelycentrifuged (4750× g during 20 min at 10 ◦C) and filtered (paper filter Whatman n◦ 4) to eliminate thenon-dissolved material. The supernatant was collected and divided in two portions for HPLC andextraction yield analysis. The portion separated for HPLC analysis (2 mL) was filtered through a LCfilter disk (0.22 µm), whereas the portion for the extraction yield determination (5 mL) was dried at105 ◦C during 48 h and thereafter weighted.
139
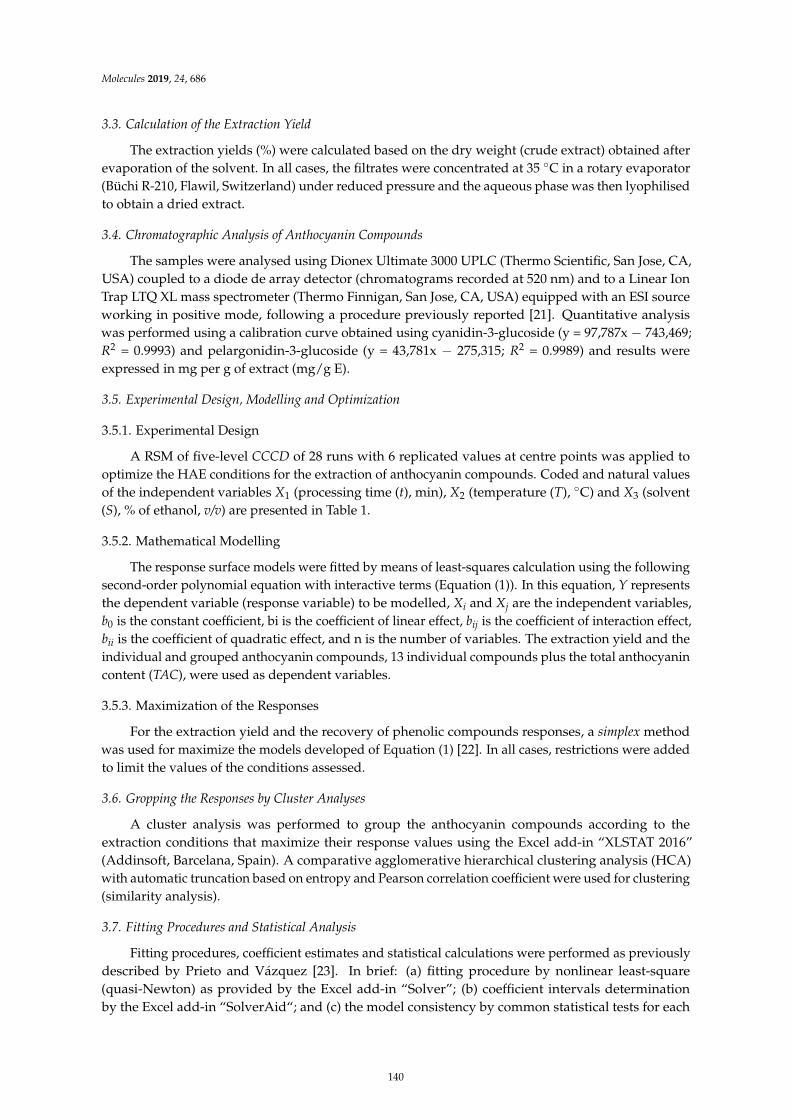
Molecules 2019, 24, 686
3.3. Calculation of the Extraction Yield
The extraction yields (%) were calculated based on the dry weight (crude extract) obtained afterevaporation of the solvent. In all cases, the filtrates were concentrated at 35 ◦C in a rotary evaporator(Büchi R-210, Flawil, Switzerland) under reduced pressure and the aqueous phase was then lyophilisedto obtain a dried extract.
3.4. Chromatographic Analysis of Anthocyanin Compounds
The samples were analysed using Dionex Ultimate 3000 UPLC (Thermo Scientific, San Jose, CA,USA) coupled to a diode de array detector (chromatograms recorded at 520 nm) and to a Linear IonTrap LTQ XL mass spectrometer (Thermo Finnigan, San Jose, CA, USA) equipped with an ESI sourceworking in positive mode, following a procedure previously reported [21]. Quantitative analysiswas performed using a calibration curve obtained using cyanidin-3-glucoside (y = 97,787x − 743,469;R2 = 0.9993) and pelargonidin-3-glucoside (y = 43,781x − 275,315; R2 = 0.9989) and results wereexpressed in mg per g of extract (mg/g E).
3.5. Experimental Design, Modelling and Optimization
3.5.1. Experimental Design
A RSM of five-level CCCD of 28 runs with 6 replicated values at centre points was applied tooptimize the HAE conditions for the extraction of anthocyanin compounds. Coded and natural valuesof the independent variables X1 (processing time (t), min), X2 (temperature (T), ◦C) and X3 (solvent(S), % of ethanol, v/v) are presented in Table 1.
3.5.2. Mathematical Modelling
The response surface models were fitted by means of least-squares calculation using the followingsecond-order polynomial equation with interactive terms (Equation (1)). In this equation, Y representsthe dependent variable (response variable) to be modelled, Xi and Xj are the independent variables,b0 is the constant coefficient, bi is the coefficient of linear effect, bij is the coefficient of interaction effect,bii is the coefficient of quadratic effect, and n is the number of variables. The extraction yield and theindividual and grouped anthocyanin compounds, 13 individual compounds plus the total anthocyanincontent (TAC), were used as dependent variables.
3.5.3. Maximization of the Responses
For the extraction yield and the recovery of phenolic compounds responses, a simplex methodwas used for maximize the models developed of Equation (1) [22]. In all cases, restrictions were addedto limit the values of the conditions assessed.
3.6. Gropping the Responses by Cluster Analyses
A cluster analysis was performed to group the anthocyanin compounds according to theextraction conditions that maximize their response values using the Excel add-in “XLSTAT 2016”(Addinsoft, Barcelana, Spain). A comparative agglomerative hierarchical clustering analysis (HCA)with automatic truncation based on entropy and Pearson correlation coefficient were used for clustering(similarity analysis).
3.7. Fitting Procedures and Statistical Analysis
Fitting procedures, coefficient estimates and statistical calculations were performed as previouslydescribed by Prieto and Vázquez [23]. In brief: (a) fitting procedure by nonlinear least-square(quasi-Newton) as provided by the Excel add-in “Solver”; (b) coefficient intervals determinationby the Excel add-in “SolverAid“; and (c) the model consistency by common statistical tests for each
140
Molecules 2019, 24, 686
model developed: (i) the Fisher F-test (α = 0.05); (ii) parametric assessment by the Excel add-in“;SolverStat“; (iii) the determination of R2.
3.8. Preparation of the Extract Rich in Anthocyanin Compounds Obtained under Optimum Conditions from theLeaves of O. basilicum var. purpurascens
For the preparation of an extract rich in anthocyanin compounds, extraction from the leaves ofO. basilicum var. purpurascens was performed, following the previously optimized procedure (Table 1).The samples (300 mg) were placed together ethanol/water (20 mL, 55:45, v/v) acidified with 0.25%citric acid (pH = 3) in a glass vial with a stopper. The extraction followed established conditions oftemperature (T = 72 ◦C) and time (60 min). After the procedure described, the sample was centrifuged(Centurion K24OR, West Sussex, UK) at 5000 rpm for 5 min at 10 ◦C. They were then filtered throughfilter paper (Whatman n◦ 4) to remove suspended solids. The ethanol fraction was removed at atemperature of 35 ◦C and the aqueous fraction obtained was frozen and lyophilized (FreeZone 4.5),affording an extract rich in anthocyanin compounds. The lyophilized extract was stored away fromthe light for further analysis.
3.9. Evaluation of the Colorant Potential of the Extract Rich in Anthocyanin Compounds Obtained underOptimum Conditions from the Leaves of O. basilicum var. purpurascens
The evaluation of the colorant potential of the extract was carried out by measuring the colourand the measurement of the colouring compounds by chromatography, in order to corroborate the dataprovided by the MRS. The colour was measured using a colorimeter (model CR-400, Konica MinoltaSensing, Inc., Osaka, Japan) with an adapter for granular materials (model CR-A50), according to aprocedure described by Pereira et al. [24]. The measurements were made in the CIE L*a*b* colour space,using the illuminant C and a diaphragm aperture of 8 mm. Data were processed with the “SpectraMagic Nx” (version CM-S100W 2.03.0006 software, Konica Minolta). Quantitation of anthocyanincompounds was accomplished by chromatography using an HPLC-DAD-ESI/MS system as describedin Section 3.4.
3.10. Evaluation of the Bioactive Properties of the Extract Rich in Anthocyanin Compounds Obtained underOptimal Conditions from the Leaves of O. basilicum var. purpurascens.
3.10.1. Antimicrobial Activity
The antimicrobial activity was evaluated using the methodology described by Carocho et al. [25].Gram-negative (Enterobacter cloacae (American Type Culture Collection (ATCC) 35030), Escherichia coli
(ATCC 35210) and Salmonella typhimurium (ATCC 13311)) and Gram-positive (Bacillus cereus
(clinical isolate), Listeria monocytogenes (NCTC (National collection of type cultures) 7973) andStaphylococcus aureus (ATCC 6538)) bacteria strains were used. For the calculation of the minimuminhibitory (MIC) and minimum bactericidal (MBC) concentrations, the microdilution method wasapplied and the results were expressed in mg/mL.
For the antifungal activity, a procedure previously described by Carocho et al. [25] was followed.Aspergillus fumigatus (ATCC 1022), Aspergillus niger (ATCC 6275), Aspergillus ochraceus (ATCC 12066),Penicillium funiculosum (ATCC 36839), Penicillium ochrochloron (ATCC 9112) and Penicillium verrucosum
var. cyclopium (food isolate) were used. Minimum inhibitory concentration (MIC) and minimumfungicidal concentration (MFC) were also determined by using the microdilution method and theresults were also expressed in mg/mL.
3.10.2. Cytotoxic Activity
The evaluation of the cytotoxic potential of the extract rich in anthocyanin compounds wasperformed by the Sulfarodamine B (SRB) assay previously described by Barros et al. [26] MCF-7(breast carcinoma), NCI-H460 (lung carcinoma), HeLa (cervical carcinoma) and HepG2 (hepatocellular
141
Molecules 2019, 24, 686
carcinoma) were used as human tumor cell lines. For the hepatotoxicity assay, the extract rich inanthocyanin compounds was tested in a primary non-tumor cell culture obtained from porcineliver (PLP2).
Ellipticine (Sigma-Aldrich, St. Louis, MO, USA) was used as the positive control and the resultswere expressed as GI50 values (sample concentration that inhibits the growth of cells by 50%), andexpressed in µg/mL.
4. Conclusions
Colorants are one of the most important additives in terms of marketing, because their presencein food products is considered the principal factor influencing customer choice. To the authors’ bestknowledge, the potential industrial use of the anthocyanin compounds from red rubin basil leaveshave not been explored previously. In such a context, the present work presents a new rapid methodto extract anthocyanin compounds from red rubin basil leaves. RSM and other mathematical strategieswere successfully employed to optimize extraction conditions that maximize the anthocyanin recoveryto produce a rich extract with potential for industrial application as a natural colouring additive.
The scientific literature shows clear evidence that extraction procedures of target compounds fromplant-based products, must be assessed individually. Therefore, a nonstop effort needs to be performed,because agro-industrial and food sectors are looking for byproduct valorisation into added-valueproducts. However, in order to take full advantage of the technological advances, the extractionconditions need to be optimized. Mathematical solutions, such as RSM tools, could increase theefficiency and profitability of the process and help to change conventional extraction approaches.
In this study, the suitability of HAE for extracting anthocyanin compounds from red rubin basilleaves was demonstrated and the variables of t, T and S were combined in a five-level CCCD designcoupled to RSM for optimization. According to the results, a good agreement between experimentaland theoretical results was observed. In general, the recovery of anthocyanin compounds wasmaximized when high temperatures, high ethanol concentrations and medium extraction times wereapplied, validating this Heat-Assisted Extraction.
The colour analysis in the pigmented extract revealed interesting values, showing dark tones, moredirected to a red tonality. It was also evident the antimicrobial and anti-proliferative potential againstseveral strains and tumour cell lines, respectively, without presenting toxicity for non-tumor cells.
These results should promote interest in conducting further studies on O. basilicum varieties,highlighting the potential of ruby red basil as a potential source of natural and bioactive ingredientswith application in several industrial factors, namely in the food and pharmaceutical areas.
Author Contributions: Conceptualization, L.B. and I.C.F.R.F.; Methodology, F.F., E.P., M.A.P., R.C.C., A.C., M.S.,L.B. and I.C.F.R.F.; Writing—original draft, F.F., E.P., M.A P., M.S., J.S.-G., L.B. and I.C.F.R.F.
Funding: The authors are grateful to the Foundation for Science and Technology (FCT, Portugal) and FEDER underProgram PT2020 for financial support to CIMO (UID/AGR/00690/2013), Lillian Barros and Ricardo C. Calhelhacontracts. The authors are also grateful to the Interreg España-Portugal for financial support through the project0377_Iberphenol_6_E). This work is funded by the European Regional Development Fund (ERDF) through theRegional Operational Program North 2020, within the scope of Project Mobilizador Norte-01-0247-FEDER-024479:ValorNatural®. Authors are also grateful to Ministry of Education, Science and Technological Development,Republic of Serbia, grant No. 173032. The authors thank the GAIN (Xunta de Galicia) for financial support(P.P. 0000 421S 140.08) to Miguel A. Prieto by a post-doctoral (modality B) grant.
Conflicts of Interest: The authors declare they have no conflict of interest.
References
1. Hoefkens, C.; Verbeke, W. Consumers’ health-related motive orientations and reactions to claims aboutdietary calcium. Nutrients 2013, 5, 82–96. [CrossRef] [PubMed]
2. Martins, N.; Roriz, C.L.; Morales, P.; Barros, L.; Ferreira, I.C.F.R. Food colorants: Challenges, opportunitiesand current desires of agro-industries to ensure consumer expectations and regulatory practices. Trends Food
Sci. Technol. 2016, 52, 1–15. [CrossRef]
142
Molecules 2019, 24, 686
3. Rodriguez-Amaya, D.B. Natural food pigments and colorants. Curr. Opin. Food Sci. 2016, 7, 20–26. [CrossRef]4. Neri-Numa, I.A.; Pessoa, M.G.; Paulino, B.N.; Pastore, G.M. Genipin: A natural blue pigment for food and
health purposes. Trends Food Sci. Technol. 2017, 67, 271–279. [CrossRef]5. Almeida, H.H.S.; Barros, L.; Barreira, J.C.M.; Calhelha, R.C.; Heleno, S.A.; Sayer, C.; Miranda, C.G.;
Leimann, F.V.; Barreiro, M.F.; Ferreira, I.C.F.R. Bioactive evaluation and application of different formulationsof the natural colorant curcumin (E100) in a hydrophilic matrix (yogurt). Food Chem. 2018, 261, 224–232.[CrossRef] [PubMed]
6. Sigurdson, G.T.; Tang, P.; Giusti, M.M. Natural Colorants: Food Colorants from Natural Sources. Annu. Rev.
Food Sci. Technol 2017, 8, 261–280. [CrossRef] [PubMed]7. Ananga, A.; Georgiev, V.; Ochieng, J.; Phills, B.; Tsolov, V. Production of Anthocyanins in Grape Cell Cultures:
A Potential Source of Raw Material for Pharmaceutical, Food, and Cosmetic Industries. In The Mediterranean
Genetic Code—Grapevine and Olive; IntechOpen: London, UK, 2013; pp. 247–287.8. Gerardi, C.; Tommasi, N.; Albano, C.; Blando, F.; Rescio, L.; Pinthus, E.; Mita, G. Prunus mahaleb L. fruit
extracts: a novel source for natural food pigments. Eur Food Res. Technol. 2015, 241, 683–695. [CrossRef]9. Jornal Oficial da União Europeia. Regulamento (UE) N◦1129/2011. Eur. Food Res. Technol. 2011, 25.10. Flanigan, P.M.; Niemeyer, E.D. Effect of cultivar on phenolic levels, anthocyanin composition, and antioxidant
properties in purple basil (Ocimum basilicum L.). Food Chem. 2014, 164, 518–526. [CrossRef]11. Da Silva, F.J.; Nascimento, A.B.; Barbosa, L.N.; Magalhães, H.M. In vitro cultivation of purple basil
Ocimum basilicum L. ‘red rubin’ at different levels of salts, charcoal, sucrose and potassium iodine. Aust. J.
Crop Sci. 2017, 11, 1137–1145. [CrossRef]12. El-Ziat, R.A.; Swaefy, H.M.; Esmail, S.E.A. The Response of Red Rubin Basil Plant to Organic Fertilizer and
Humic Acid versus Chemical Fertilizers. Middle East. J. Agric. Res. 2018, 7, 740–751.13. Alexandre, E.M.C.; Araújo, P.; Duarte, M.F.; de Freitas, V.; Pintado, M.; Saraiva, J.A. High-pressure assisted
extraction of bioactive compounds from industrial fermented fig by-product. Int. J. Food Sci. Technol. 2017,54, 2519–2531. [CrossRef]
14. Alexandre, E.M.C.; Araújo, P.; Duarte, M.F.; de Freitas, V.; Pintado, M.; Saraiva, J.A. Experimental design,modeling, and optimization of high-pressure-assisted extraction of bioactive compounds from pomegranatepeel. Food Bioprocess Tech. 2017, 10, 886–900. [CrossRef]
15. Luna, M.C.; Bekhradi, F.; Ferreres, F.; Jordán, M.J.; Delshad, M.; Gil, M.I. Effect of Water Stress and StorageTime on Anthocyanins and Other Phenolics of Different Genotypes of Fresh Sweet Basil. J. Agric. Food Chem
2015, 63, 9223–9231. [CrossRef] [PubMed]16. Phippen, W.B.; Simon, J.E. Anthocyanins in Basil (Ocimum basilicum L.). J. Agric. Food Chem. 1998, 46,
1734–1738. [CrossRef]17. Ranic, M.; Nikolic, M.; Pavlovic, M.; Buntic, A.; Siler-Marinkovic, S.; Dimitrijevic-Brankovic, S. Optimization
of microwave-assisted extraction of natural antioxidants from spent espresso coffee grounds by responsesurface methodology. J. Clean. Prod. 2014, 80, 69–79. [CrossRef]
18. Sun, X.-H.; Zhou, T.-T.; Wei, C.-H.; Lan, W.-Q.; Zhao, Y.; Pan, Y.-J.; Wu, V.C.H. Antibacterial effect andmechanism of anthocyanin rich Chinese wild blueberry extract on various foodborne pathogens. Food Control
2018, 94, 155–161. [CrossRef]19. Zhou, L.; Wang, H.; Yi, J.; Yang, B.; Li, M.; He, D.; Yang, W.; Zhang, Y.; Ni, H. Anti-tumor properties of
anthocyanins from Lonicera caerulea ‘Beilei’ fruit on human hepatocellular carcinoma: In vitro and in vivostudy. Biomed. Pharmacother. 2018, 104, 520–529. [CrossRef]
20. Roriz, C.L.; Barros, L.; Prieto, M.A.; Morales, P.; Ferreira, I.C.F.R. Floral parts of Gomphrena globosa L. as anovel alternative source of betacyanins: Optimization of the extraction using response surface methodology.Food Chem. 2017, 229, 223–234. [CrossRef]
21. Gonçalves, G.A.; Soares, A.A.; Correa, R.C.G.; Barros, L.; Haminiuk, C.W.I.; Peralta, R.M.; Ferreira, I.C.F.R.;Bracht, A. Merlot grape pomace hydroalcoholic extract improves the oxidative and inflammatory states ofrats with adjuvant-induced arthritis. J. Funct. Foods 2017, 33, 408–418. [CrossRef]
22. Vieira, V.; Prieto, M.A.; Barros, L.; Coutinho, J.A.P.; Ferreira, O.; Ferreira, I.C.F.R. Optimization andcomparison of maceration and microwave extraction systems for the production of phenolic compoundsfrom Juglans regia L. for the valorization of walnut leaves. Ind. Crops Prod. 2017, 107, 341–352. [CrossRef]
143
Molecules 2019, 24, 686
23. Prieto, M.A.; Vázquez, J.A. In vitro determination of the lipophilic and hydrophilic antioxidant capacityof unroasted coffee bean extracts and their synergistic and antagonistic effects. Food Res. Int. 2014, 62,1183–1196. [CrossRef]
24. Pereira, E.; Antonio, A.L.; Barreira, J.C.M.; Barros, L.; Bento, A.; Ferreira, I.C.F.R. Gamma irradiation as apractical alternative to preserve the chemical and bioactive wholesomeness of widely used aromatic plants.Food Res. Int. 2015, 67, 338–348. [CrossRef]
25. Carocho, M.; Barros, L.; Calhelha, R.C.; Ciric, A.; Sokovic, M.; Santos-Buelga, C.; Morales, P.; Ferreira, I.C.F.R.Melissa officinalis L. decoctions as functional beverages: a bioactive approach and chemical characterization.Food Funct. 2015, 6, 2240–2248. [CrossRef] [PubMed]
26. Barros, L.; Pereira, E.; Calhelha, R.C.; Dueñas, M.; Carvalho, A.M.; Santos-Buelga, C.;Ferreira, I.C.F.R. Bioactivity and chemical characterization in hydrophilic and lipophilic compounds ofChenopodium ambrosioides L. J. Funct. Foods 2013, 5, 1732–1740. [CrossRef]
Sample Availability: Samples are available from the authors.
© 2019 by the authors. Licensee MDPI, Basel, Switzerland. This article is an open accessarticle distributed under the terms and conditions of the Creative Commons Attribution(CC BY) license (http://creativecommons.org/licenses/by/4.0/).
144
molecules
Article
Stability Analysis of Anthocyanins Using AlcoholicExtracts from Black Carrot (Daucus Carota ssp.Sativus Var. Atrorubens Alef.)
Guillermo Espinosa-Acosta 1, Ana L. Ramos-Jacques 2, Gustavo A. Molina 1 ,
Jose Maya-Cornejo 3, Rodrigo Esparza 3 , Angel R. Hernandez-Martinez 3 ,
Itari Sánchez-González 4 and Miriam Estevez 3,*
1 Posgrado en Ciencia e Ingeniería de Materiales, Centro de Física Aplicada y Tecnología Avanzada (CFATA),Universidad Nacional Autónoma de México (UNAM), Blvd. Juriquilla 3000, Querétaro, Mexico;[email protected] (G.E.-A.); [email protected] (G.A.M.)
2 Independent Researcher, El Canto, Zibatá 76269, Querétaro, Mexico; [email protected] Centro de Física Aplicada y Tecnología Avanzada (CFATA), Universidad Nacional Autónoma de
México (UNAM), Blvd. Juriquilla 3000, Querétaro, México; [email protected] (J.M.-C.);[email protected] (R.E.); [email protected] (A.R.H.-M.)
4 Licenciatura en Tecnología, Centro de Física Aplicada y Tecnología Avanzada (CFATA), UniversidadNacional Autónoma de México (UNAM), Blvd. Juriquilla 3000, Querétaro, México; [email protected]
* Correspondence: [email protected]; Tel.: +52-442-238-1157
Received: 29 August 2018; Accepted: 22 October 2018; Published: 24 October 2018
Abstract: Anthocyanins are used for food coloring due their low toxicity and health benefits. They areextracted from different sources, but black carrot has higher anthocyanin content compared withcommon fruits and vegetables. Here, we study alcoholic anthocyanin extracts from black carrotto enhance their stability. The objective of our research is to determine if microencapsulation withtetraethyl orthosilicate (TEOS) is a feasible option for preventing black carrot anthocyanin degradation.Extraction solvents were solutions of (1) ethanol/acetic acid and (2) ethanol/citric acid. Samples werepurified through a resin column and microencapsulated using TEOS. Fourier Transformed InfraredSpectroscopy (FTIR) spectra of samples were obtained, and degradation studies were performedunder different conditions of UV radiation, pH and temperature. Antioxidant activity was evaluatedwith radical 2,2-diphenyl-1-picrylhydrazyl (DPPH) scavenging and electrochemical cupric reducingantioxidant capacity (CUPRAC). Color evaluation on food models were performed with CIE Lab at thebeginning of experiments and after 25 days of storage. Results indicate that the more stable extractsagainst pH media changes are samples obtained with ethanol/acetic acid solution as extractionsolvent. Extract purification through resin and TEOS microencapsulation had no significant effecton extract stability. In conclusion, although TEOS microencapsulation has proven to be effective forsome dried materials from natural extracts in our previous research, we do not recommend its use forblack carrot extracts considering our results in this particular case.
Keywords: anthocyanin; natural extract; tetraethyl orthosilicate; black carrot; antioxidant activity
1. Introduction
The use of extracts from natural sources as food coloring is an ongoing trend because, in general,they are Generally Recognized as Safe (GRAS) substances and bring health benefits for consumers [1].A variety of natural colorants are used in the food industry, but there is still a concern about theirproduction costs and stability and their performance had been studied for the past decade [2–6].
145
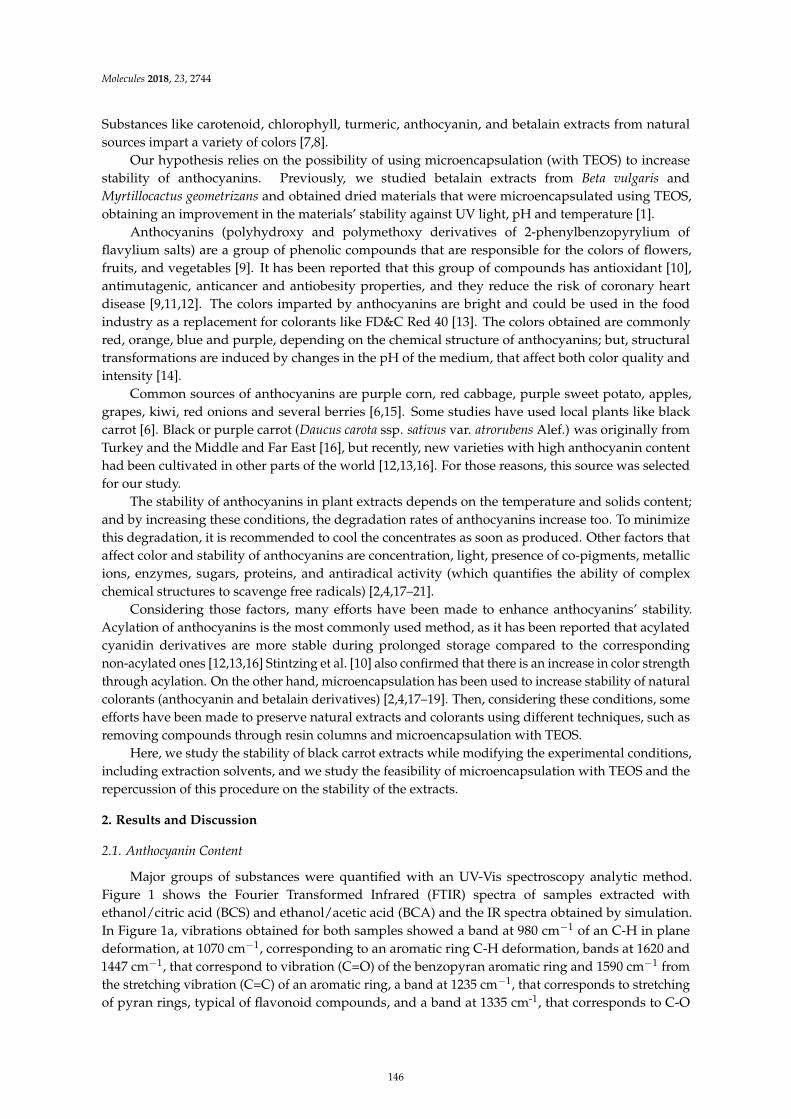
Molecules 2018, 23, 2744
Substances like carotenoid, chlorophyll, turmeric, anthocyanin, and betalain extracts from naturalsources impart a variety of colors [7,8].
Our hypothesis relies on the possibility of using microencapsulation (with TEOS) to increasestability of anthocyanins. Previously, we studied betalain extracts from Beta vulgaris andMyrtillocactus geometrizans and obtained dried materials that were microencapsulated using TEOS,obtaining an improvement in the materials’ stability against UV light, pH and temperature [1].
Anthocyanins (polyhydroxy and polymethoxy derivatives of 2-phenylbenzopyrylium offlavylium salts) are a group of phenolic compounds that are responsible for the colors of flowers,fruits, and vegetables [9]. It has been reported that this group of compounds has antioxidant [10],antimutagenic, anticancer and antiobesity properties, and they reduce the risk of coronary heartdisease [9,11,12]. The colors imparted by anthocyanins are bright and could be used in the foodindustry as a replacement for colorants like FD&C Red 40 [13]. The colors obtained are commonlyred, orange, blue and purple, depending on the chemical structure of anthocyanins; but, structuraltransformations are induced by changes in the pH of the medium, that affect both color quality andintensity [14].
Common sources of anthocyanins are purple corn, red cabbage, purple sweet potato, apples,grapes, kiwi, red onions and several berries [6,15]. Some studies have used local plants like blackcarrot [6]. Black or purple carrot (Daucus carota ssp. sativus var. atrorubens Alef.) was originally fromTurkey and the Middle and Far East [16], but recently, new varieties with high anthocyanin contenthad been cultivated in other parts of the world [12,13,16]. For those reasons, this source was selectedfor our study.
The stability of anthocyanins in plant extracts depends on the temperature and solids content;and by increasing these conditions, the degradation rates of anthocyanins increase too. To minimizethis degradation, it is recommended to cool the concentrates as soon as produced. Other factors thataffect color and stability of anthocyanins are concentration, light, presence of co-pigments, metallicions, enzymes, sugars, proteins, and antiradical activity (which quantifies the ability of complexchemical structures to scavenge free radicals) [2,4,17–21].
Considering those factors, many efforts have been made to enhance anthocyanins’ stability.Acylation of anthocyanins is the most commonly used method, as it has been reported that acylatedcyanidin derivatives are more stable during prolonged storage compared to the correspondingnon-acylated ones [12,13,16] Stintzing et al. [10] also confirmed that there is an increase in color strengththrough acylation. On the other hand, microencapsulation has been used to increase stability of naturalcolorants (anthocyanin and betalain derivatives) [2,4,17–19]. Then, considering these conditions, someefforts have been made to preserve natural extracts and colorants using different techniques, such asremoving compounds through resin columns and microencapsulation with TEOS.
Here, we study the stability of black carrot extracts while modifying the experimental conditions,including extraction solvents, and we study the feasibility of microencapsulation with TEOS and therepercussion of this procedure on the stability of the extracts.
2. Results and Discussion
2.1. Anthocyanin Content
Major groups of substances were quantified with an UV-Vis spectroscopy analytic method.Figure 1 shows the Fourier Transformed Infrared (FTIR) spectra of samples extracted withethanol/citric acid (BCS) and ethanol/acetic acid (BCA) and the IR spectra obtained by simulation.In Figure 1a, vibrations obtained for both samples showed a band at 980 cm−1 of an C-H in planedeformation, at 1070 cm−1, corresponding to an aromatic ring C-H deformation, bands at 1620 and1447 cm−1, that correspond to vibration (C=O) of the benzopyran aromatic ring and 1590 cm−1 fromthe stretching vibration (C=C) of an aromatic ring, a band at 1235 cm−1, that corresponds to stretchingof pyran rings, typical of flavonoid compounds, and a band at 1335 cm-1, that corresponds to C-O
146
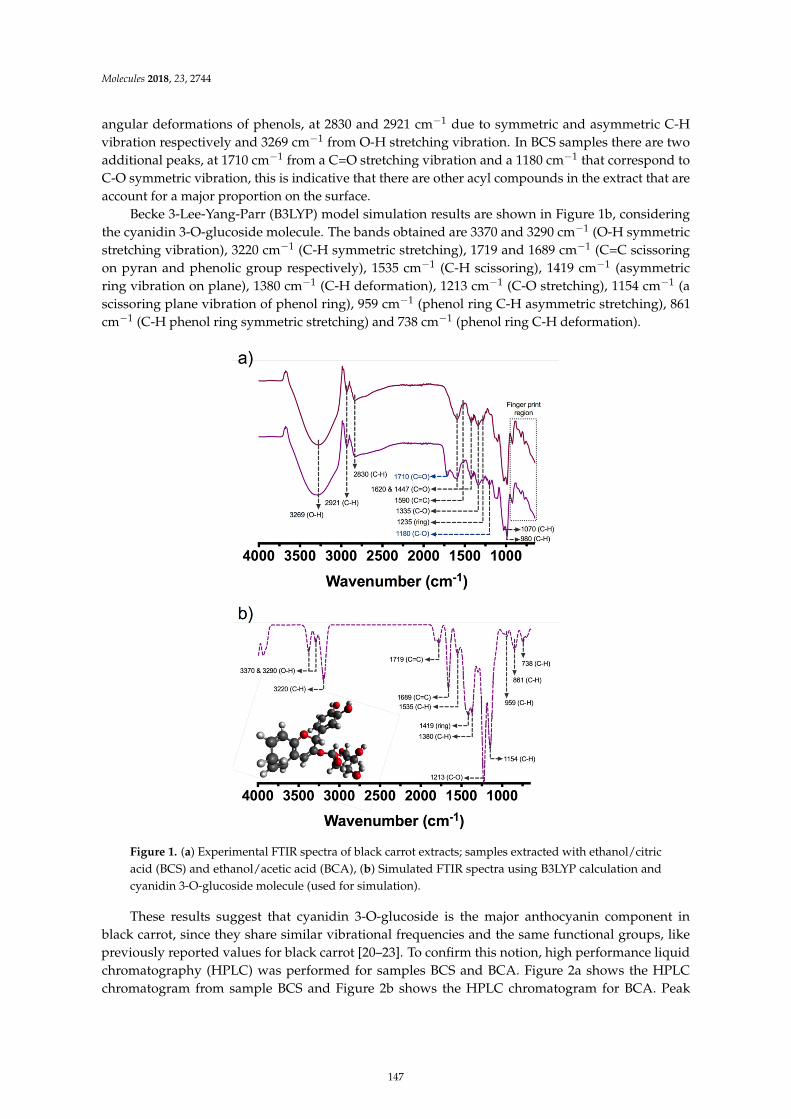
Molecules 2018, 23, 2744
angular deformations of phenols, at 2830 and 2921 cm−1 due to symmetric and asymmetric C-Hvibration respectively and 3269 cm−1 from O-H stretching vibration. In BCS samples there are twoadditional peaks, at 1710 cm−1 from a C=O stretching vibration and a 1180 cm−1 that correspond toC-O symmetric vibration, this is indicative that there are other acyl compounds in the extract that areaccount for a major proportion on the surface.
Becke 3-Lee-Yang-Parr (B3LYP) model simulation results are shown in Figure 1b, consideringthe cyanidin 3-O-glucoside molecule. The bands obtained are 3370 and 3290 cm−1 (O-H symmetricstretching vibration), 3220 cm−1 (C-H symmetric stretching), 1719 and 1689 cm−1 (C=C scissoringon pyran and phenolic group respectively), 1535 cm−1 (C-H scissoring), 1419 cm−1 (asymmetricring vibration on plane), 1380 cm−1 (C-H deformation), 1213 cm−1 (C-O stretching), 1154 cm−1 (ascissoring plane vibration of phenol ring), 959 cm−1 (phenol ring C-H asymmetric stretching), 861cm−1 (C-H phenol ring symmetric stretching) and 738 cm−1 (phenol ring C-H deformation).
Molecules 2018, 23, x FOR PEER REVIEW 3 of 16
O symmetric vibration, this is indicative that there are other acyl compounds in the extract that are account for a major proportion on the surface.
Becke 3-Lee-Yang-Parr (B3LYP) model simulation results are shown in Figure 1b, considering the cyanidin 3-O-glucoside molecule. The bands obtained are 3370 and 3290 cm−1 (O-H symmetric stretching vibration), 3220 cm−1 (C-H symmetric stretching), 1719 and 1689 cm−1 (C=C scissoring on pyran and phenolic group respectively), 1535 cm−1 (C-H scissoring), 1419 cm−1 (asymmetric ring vibration on plane), 1380 cm−1 (C-H deformation), 1213 cm−1 (C-O stretching), 1154 cm−1 (a scissoring plane vibration of phenol ring), 959 cm−1 (phenol ring C-H asymmetric stretching), 861 cm−1 (C-H phenol ring symmetric stretching) and 738 cm−1 (phenol ring C-H deformation).
Figure 1. (a) Experimental FTIR spectra of black carrot extracts; samples extracted with ethanol/citric acid (BCS) and ethanol/acetic acid (BCA), (b) Simulated FTIR spectra using B3LYP calculation and cyanidin 3-O-glucoside molecule (used for simulation).
These results suggest that cyanidin 3-O-glucoside is the major anthocyanin component in black carrot, since they share similar vibrational frequencies and the same functional groups, like previously reported values for black carrot [20–23]. To confirm this notion, high performance liquid chromatography (HPLC) was performed for samples BCS and BCA. Figure 2a shows the HPLC chromatogram from sample BCS and Figure 2b shows the HPLC chromatogram for BCA. Peak identification was made using previous reports [22–24]. Table 1 shows the retention times of the characteristic peaks and compounds identified.
Figure 1. (a) Experimental FTIR spectra of black carrot extracts; samples extracted with ethanol/citricacid (BCS) and ethanol/acetic acid (BCA), (b) Simulated FTIR spectra using B3LYP calculation andcyanidin 3-O-glucoside molecule (used for simulation).
These results suggest that cyanidin 3-O-glucoside is the major anthocyanin component inblack carrot, since they share similar vibrational frequencies and the same functional groups, likepreviously reported values for black carrot [20–23]. To confirm this notion, high performance liquidchromatography (HPLC) was performed for samples BCS and BCA. Figure 2a shows the HPLCchromatogram from sample BCS and Figure 2b shows the HPLC chromatogram for BCA. Peak
147
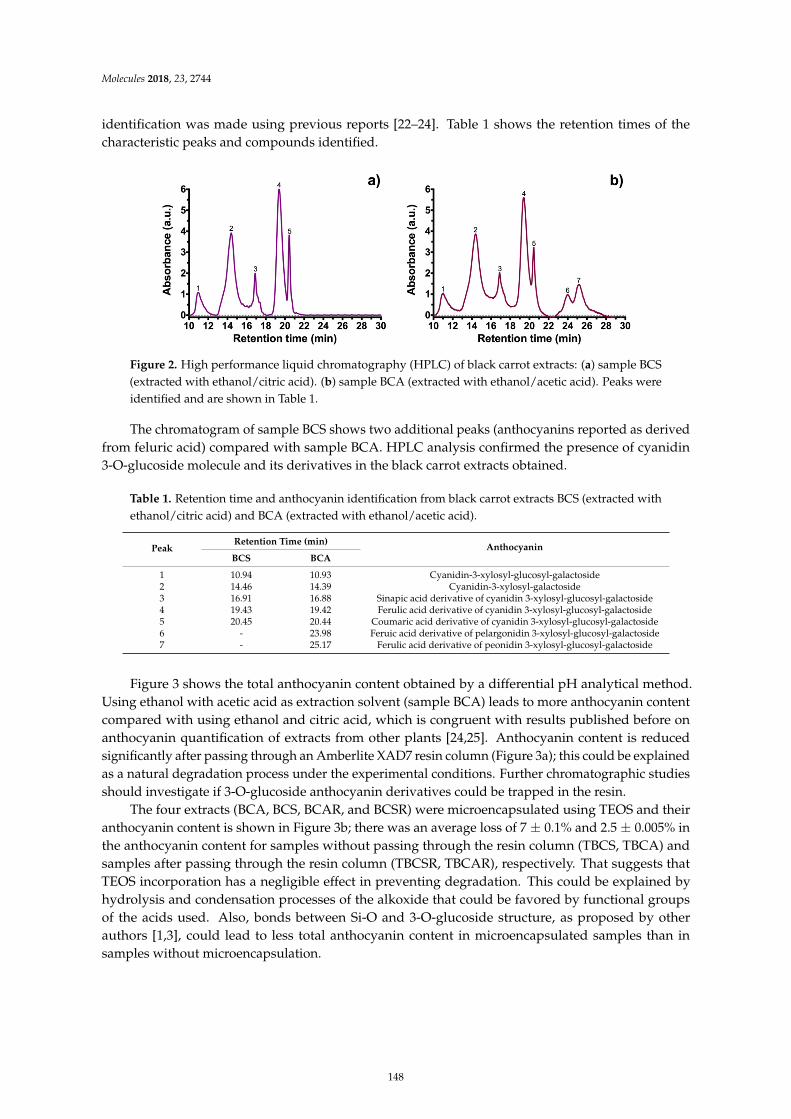
Molecules 2018, 23, 2744
identification was made using previous reports [22–24]. Table 1 shows the retention times of thecharacteristic peaks and compounds identified.Molecules 2018, 23, x FOR PEER REVIEW 4 of 16
Figure 2. High performance liquid chromatography (HPLC) of black carrot extracts: (a) sample BCS (extracted with ethanol/citric acid). (b) sample BCA (extracted with ethanol/acetic acid). Peaks were identified and are shown in Table 1.
The chromatogram of sample BCS shows two additional peaks (anthocyanins reported as derived from feluric acid) compared with sample BCA. HPLC analysis confirmed the presence of cyanidin 3-O-glucoside molecule and its derivatives in the black carrot extracts obtained.
Table 1. Retention time and anthocyanin identification from black carrot extracts BCS (extracted with ethanol/citric acid) and BCA (extracted with ethanol/acetic acid).
Peak Retention Time (min)
Anthocyanin BCS BCA
1 10.94 10.93 Cyanidin-3-xylosyl-glucosyl-galactoside 2 14.46 14.39 Cyanidin-3-xylosyl-galactoside 3 16.91 16.88 Sinapic acid derivative of cyanidin 3-xylosyl-glucosyl-galactoside 4 19.43 19.42 Ferulic acid derivative of cyanidin 3-xylosyl-glucosyl-galactoside 5 20.45 20.44 Coumaric acid derivative of cyanidin 3-xylosyl-glucosyl-galactoside 6 - 23.98 Feruic acid derivative of pelargonidin 3-xylosyl-glucosyl-galactoside 7 - 25.17 Ferulic acid derivative of peonidin 3-xylosyl-glucosyl-galactoside
Figure 3 shows the total anthocyanin content obtained by a differential pH analytical method. Using ethanol with acetic acid as extraction solvent (sample BCA) leads to more anthocyanin content compared with using ethanol and citric acid, which is congruent with results published before on anthocyanin quantification of extracts from other plants [24,25]. Anthocyanin content is reduced significantly after passing through an Amberlite XAD7 resin column (Figure 3a); this could be explained as a natural degradation process under the experimental conditions. Further chromatographic studies should investigate if 3-O-glucoside anthocyanin derivatives could be trapped in the resin.
Figure 3. Anthocyanin content in black carrot extracts. (a) Samples extracted with ethanol/citric acid (BCS) and ethanol/acetic acid (BCA), and samples after resin column (BCSR and BCAR). (b) Microencapsulated samples using TEOS (TBCS, TBCA, TBCSR, TBCAR).
Figure 2. High performance liquid chromatography (HPLC) of black carrot extracts: (a) sample BCS(extracted with ethanol/citric acid). (b) sample BCA (extracted with ethanol/acetic acid). Peaks wereidentified and are shown in Table 1.
The chromatogram of sample BCS shows two additional peaks (anthocyanins reported as derivedfrom feluric acid) compared with sample BCA. HPLC analysis confirmed the presence of cyanidin3-O-glucoside molecule and its derivatives in the black carrot extracts obtained.
Table 1. Retention time and anthocyanin identification from black carrot extracts BCS (extracted withethanol/citric acid) and BCA (extracted with ethanol/acetic acid).
PeakRetention Time (min)
AnthocyaninBCS BCA
1 10.94 10.93 Cyanidin-3-xylosyl-glucosyl-galactoside2 14.46 14.39 Cyanidin-3-xylosyl-galactoside3 16.91 16.88 Sinapic acid derivative of cyanidin 3-xylosyl-glucosyl-galactoside4 19.43 19.42 Ferulic acid derivative of cyanidin 3-xylosyl-glucosyl-galactoside5 20.45 20.44 Coumaric acid derivative of cyanidin 3-xylosyl-glucosyl-galactoside6 - 23.98 Feruic acid derivative of pelargonidin 3-xylosyl-glucosyl-galactoside7 - 25.17 Ferulic acid derivative of peonidin 3-xylosyl-glucosyl-galactoside
Figure 3 shows the total anthocyanin content obtained by a differential pH analytical method.Using ethanol with acetic acid as extraction solvent (sample BCA) leads to more anthocyanin contentcompared with using ethanol and citric acid, which is congruent with results published before onanthocyanin quantification of extracts from other plants [24,25]. Anthocyanin content is reducedsignificantly after passing through an Amberlite XAD7 resin column (Figure 3a); this could be explainedas a natural degradation process under the experimental conditions. Further chromatographic studiesshould investigate if 3-O-glucoside anthocyanin derivatives could be trapped in the resin.
The four extracts (BCA, BCS, BCAR, and BCSR) were microencapsulated using TEOS and theiranthocyanin content is shown in Figure 3b; there was an average loss of 7 ± 0.1% and 2.5 ± 0.005% inthe anthocyanin content for samples without passing through the resin column (TBCS, TBCA) andsamples after passing through the resin column (TBCSR, TBCAR), respectively. That suggests thatTEOS incorporation has a negligible effect in preventing degradation. This could be explained byhydrolysis and condensation processes of the alkoxide that could be favored by functional groupsof the acids used. Also, bonds between Si-O and 3-O-glucoside structure, as proposed by otherauthors [1,3], could lead to less total anthocyanin content in microencapsulated samples than insamples without microencapsulation.
148
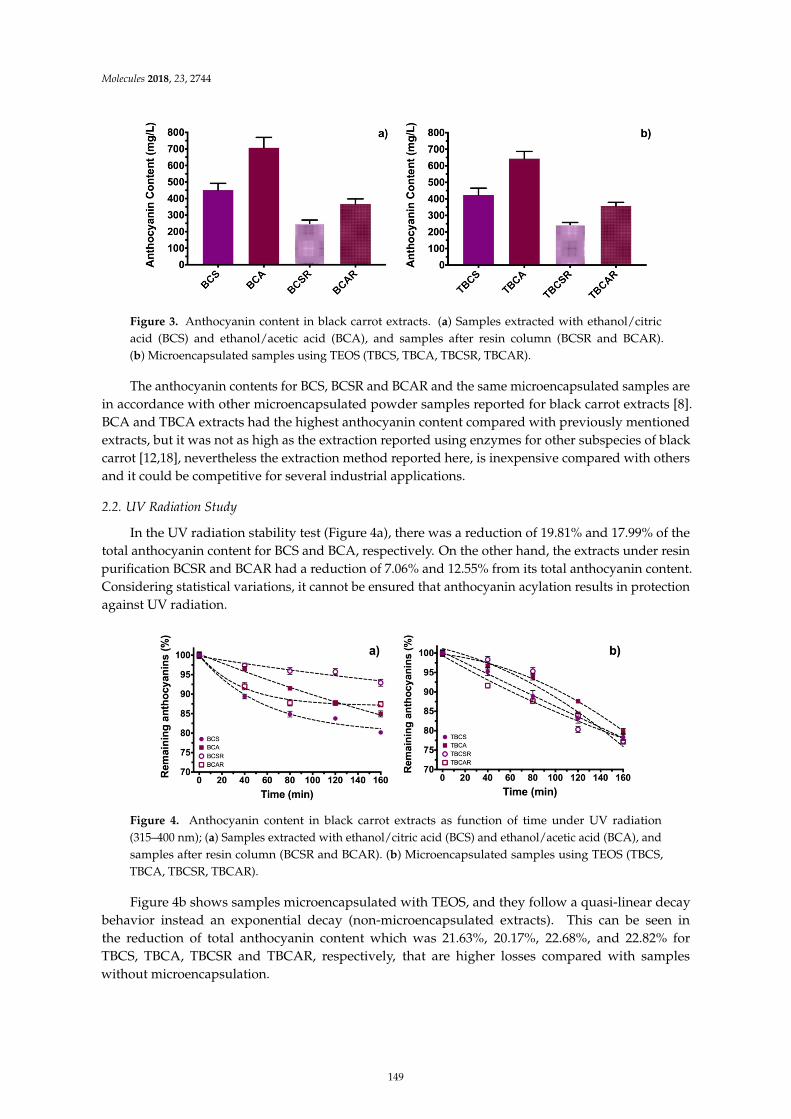
Molecules 2018, 23, 2744
Molecules 2018, 23, x FOR PEER REVIEW 4 of 16
Figure 2. High performance liquid chromatography (HPLC) of black carrot extracts: (a) sample BCS (extracted with ethanol/citric acid). (b) sample BCA (extracted with ethanol/acetic acid). Peaks were identified and are shown in Table 1.
The chromatogram of sample BCS shows two additional peaks (anthocyanins reported as derived from feluric acid) compared with sample BCA. HPLC analysis confirmed the presence of cyanidin 3-O-glucoside molecule and its derivatives in the black carrot extracts obtained.
Table 1. Retention time and anthocyanin identification from black carrot extracts BCS (extracted with ethanol/citric acid) and BCA (extracted with ethanol/acetic acid).
Peak Retention Time (min)
Anthocyanin BCS BCA
1 10.94 10.93 Cyanidin-3-xylosyl-glucosyl-galactoside 2 14.46 14.39 Cyanidin-3-xylosyl-galactoside 3 16.91 16.88 Sinapic acid derivative of cyanidin 3-xylosyl-glucosyl-galactoside 4 19.43 19.42 Ferulic acid derivative of cyanidin 3-xylosyl-glucosyl-galactoside 5 20.45 20.44 Coumaric acid derivative of cyanidin 3-xylosyl-glucosyl-galactoside 6 - 23.98 Feruic acid derivative of pelargonidin 3-xylosyl-glucosyl-galactoside 7 - 25.17 Ferulic acid derivative of peonidin 3-xylosyl-glucosyl-galactoside
Figure 3 shows the total anthocyanin content obtained by a differential pH analytical method. Using ethanol with acetic acid as extraction solvent (sample BCA) leads to more anthocyanin content compared with using ethanol and citric acid, which is congruent with results published before on anthocyanin quantification of extracts from other plants [24,25]. Anthocyanin content is reduced significantly after passing through an Amberlite XAD7 resin column (Figure 3a); this could be explained as a natural degradation process under the experimental conditions. Further chromatographic studies should investigate if 3-O-glucoside anthocyanin derivatives could be trapped in the resin.
Figure 3. Anthocyanin content in black carrot extracts. (a) Samples extracted with ethanol/citric acid (BCS) and ethanol/acetic acid (BCA), and samples after resin column (BCSR and BCAR). (b) Microencapsulated samples using TEOS (TBCS, TBCA, TBCSR, TBCAR).
Figure 3. Anthocyanin content in black carrot extracts. (a) Samples extracted with ethanol/citricacid (BCS) and ethanol/acetic acid (BCA), and samples after resin column (BCSR and BCAR).(b) Microencapsulated samples using TEOS (TBCS, TBCA, TBCSR, TBCAR).
The anthocyanin contents for BCS, BCSR and BCAR and the same microencapsulated samples arein accordance with other microencapsulated powder samples reported for black carrot extracts [8].BCA and TBCA extracts had the highest anthocyanin content compared with previously mentionedextracts, but it was not as high as the extraction reported using enzymes for other subspecies of blackcarrot [12,18], nevertheless the extraction method reported here, is inexpensive compared with othersand it could be competitive for several industrial applications.
2.2. UV Radiation Study
In the UV radiation stability test (Figure 4a), there was a reduction of 19.81% and 17.99% of thetotal anthocyanin content for BCS and BCA, respectively. On the other hand, the extracts under resinpurification BCSR and BCAR had a reduction of 7.06% and 12.55% from its total anthocyanin content.Considering statistical variations, it cannot be ensured that anthocyanin acylation results in protectionagainst UV radiation.
Molecules 2018, 23, x FOR PEER REVIEW 5 of 16
The four extracts (BCA, BCS, BCAR, and BCSR) were microencapsulated using TEOS and their anthocyanin content is shown in Figure 3b; there was an average loss of 7 ± 0.1% and 2.5 ± 0.005% in the anthocyanin content for samples without passing through the resin column (TBCS, TBCA) and samples after passing through the resin column (TBCSR, TBCAR), respectively. That suggests that TEOS incorporation has a negligible effect in preventing degradation. This could be explained by hydrolysis and condensation processes of the alkoxide that could be favored by functional groups of the acids used. Also, bonds between Si-O and 3-O-glucoside structure, as proposed by other authors [1,3], could lead to less total anthocyanin content in microencapsulated samples than in samples without microencapsulation.
The anthocyanin contents for BCS, BCSR and BCAR and the same microencapsulated samples are in accordance with other microencapsulated powder samples reported for black carrot extracts [8]. BCA and TBCA extracts had the highest anthocyanin content compared with previously mentioned extracts, but it was not as high as the extraction reported using enzymes for other subspecies of black carrot [12,18], nevertheless the extraction method reported here, is inexpensive compared with others and it could be competitive for several industrial applications.
2.2. UV Radiation Study
In the UV radiation stability test (Figure 4a), there was a reduction of 19.81% and 17.99% of the total anthocyanin content for BCS and BCA, respectively. On the other hand, the extracts under resin purification BCSR and BCAR had a reduction of 7.06% and 12.55% from its total anthocyanin content. Considering statistical variations, it cannot be ensured that anthocyanin acylation results in protection against UV radiation.
Figure 4. Anthocyanin content in black carrot extracts as function of time under UV radiation (315–400 nm); (a) Samples extracted with ethanol/citric acid (BCS) and ethanol/acetic acid (BCA), and samples after resin column (BCSR and BCAR). (b) Microencapsulated samples using TEOS (TBCS, TBCA, TBCSR, TBCAR).
Figure 4b shows samples microencapsulated with TEOS, and they follow a quasi-linear decay behavior instead an exponential decay (non-microencapsulated extracts). This can be seen in the reduction of total anthocyanin content which was 21.63%, 20.17%, 22.68%, and 22.82% for TBCS, TBCA, TBCSR and TBCAR, respectively, that are higher losses compared with samples without microencapsulation.
2.3. Thermal Stability
Sample BCA presents same trend compared with BCAR in thermal stability at different temperatures (Figure 5a–c). The same behavior was obtained for BCS and BCSR, therefore purifying extracts through resin column does not have a significant improvement in thermal stability. There is a difference in the behavior of the decay between extracts obtained with ethanol/acetic acid and ethanol/citric acid as extraction solvent; the first ones have a greater decay rate because their graphs (Figure 5) have a greater slope. This slope difference is more visible at high temperatures. On the other hand, considering anthocyanin content loss percentages of 9.28% and 9.31% at 40 °C, 20.08%
Figure 4. Anthocyanin content in black carrot extracts as function of time under UV radiation(315–400 nm); (a) Samples extracted with ethanol/citric acid (BCS) and ethanol/acetic acid (BCA), andsamples after resin column (BCSR and BCAR). (b) Microencapsulated samples using TEOS (TBCS,TBCA, TBCSR, TBCAR).
Figure 4b shows samples microencapsulated with TEOS, and they follow a quasi-linear decaybehavior instead an exponential decay (non-microencapsulated extracts). This can be seen inthe reduction of total anthocyanin content which was 21.63%, 20.17%, 22.68%, and 22.82% forTBCS, TBCA, TBCSR and TBCAR, respectively, that are higher losses compared with sampleswithout microencapsulation.
149
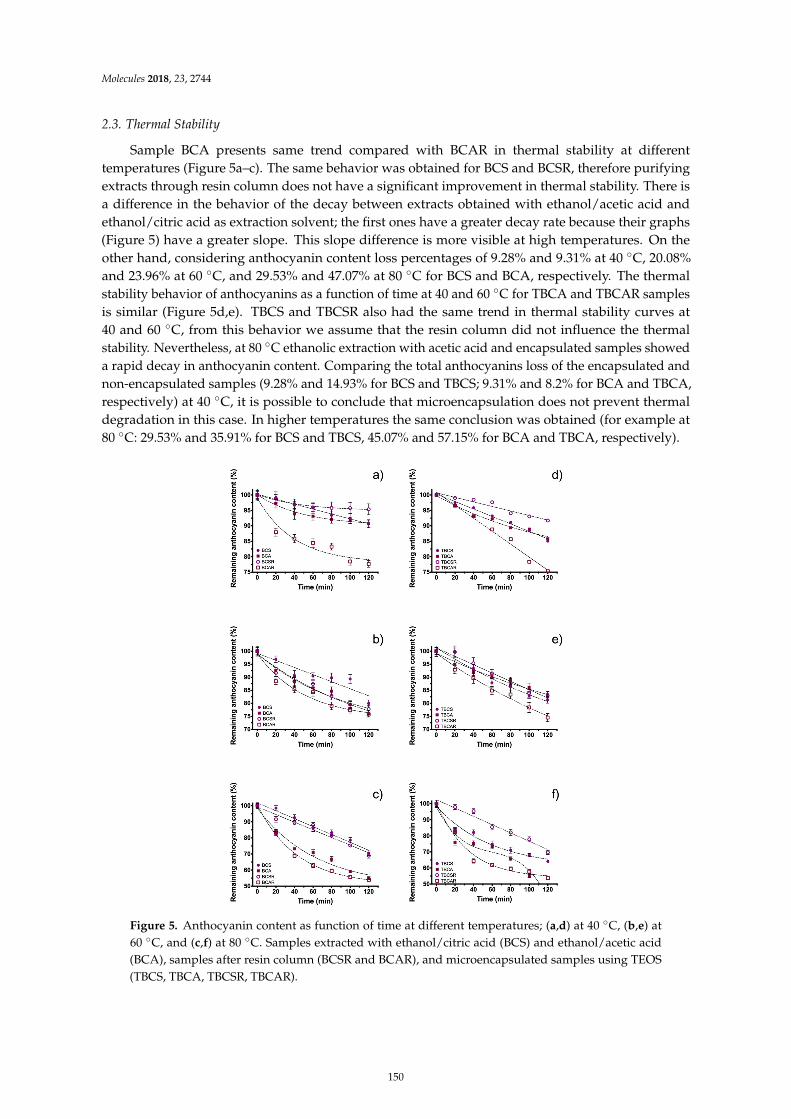
Molecules 2018, 23, 2744
2.3. Thermal Stability
Sample BCA presents same trend compared with BCAR in thermal stability at differenttemperatures (Figure 5a–c). The same behavior was obtained for BCS and BCSR, therefore purifyingextracts through resin column does not have a significant improvement in thermal stability. There isa difference in the behavior of the decay between extracts obtained with ethanol/acetic acid andethanol/citric acid as extraction solvent; the first ones have a greater decay rate because their graphs(Figure 5) have a greater slope. This slope difference is more visible at high temperatures. On theother hand, considering anthocyanin content loss percentages of 9.28% and 9.31% at 40 ◦C, 20.08%and 23.96% at 60 ◦C, and 29.53% and 47.07% at 80 ◦C for BCS and BCA, respectively. The thermalstability behavior of anthocyanins as a function of time at 40 and 60 ◦C for TBCA and TBCAR samplesis similar (Figure 5d,e). TBCS and TBCSR also had the same trend in thermal stability curves at40 and 60 ◦C, from this behavior we assume that the resin column did not influence the thermalstability. Nevertheless, at 80 ◦C ethanolic extraction with acetic acid and encapsulated samples showeda rapid decay in anthocyanin content. Comparing the total anthocyanins loss of the encapsulated andnon-encapsulated samples (9.28% and 14.93% for BCS and TBCS; 9.31% and 8.2% for BCA and TBCA,respectively) at 40 ◦C, it is possible to conclude that microencapsulation does not prevent thermaldegradation in this case. In higher temperatures the same conclusion was obtained (for example at80 ◦C: 29.53% and 35.91% for BCS and TBCS, 45.07% and 57.15% for BCA and TBCA, respectively).
Molecules 2018, 23, x FOR PEER REVIEW 6 of 16
and 23.96% at 60 °C, and 29.53% and 47.07% at 80 °C for BCS and BCA, respectively. The thermal stability behavior of anthocyanins as a function of time at 40 and 60 °C for TBCA and TBCAR samples is similar (Figures 5d,e). TBCS and TBCSR also had the same trend in thermal stability curves at 40 and 60 °C, from this behavior we assume that the resin column did not influence the thermal stability. Nevertheless, at 80 °C ethanolic extraction with acetic acid and encapsulated samples showed a rapid decay in anthocyanin content. Comparing the total anthocyanins loss of the encapsulated and non-encapsulated samples (9.28% and 14.93% for BCS and TBCS; 9.31% and 8.2% for BCA and TBCA, respectively) at 40 °C, it is possible to conclude that microencapsulation does not prevent thermal degradation in this case. In higher temperatures the same conclusion was obtained (for example at 80 °C: 29.53% and 35.91% for BCS and TBCS, 45.07% and 57.15% for BCA and TBCA, respectively).
Figure 5. Anthocyanin content as function of time at different temperatures; (a,d) at 40 °C, (b,e) at 60 °C, and (c,f) at 80 °C. Samples extracted with ethanol/citric acid (BCS) and ethanol/acetic acid (BCA), samples after resin column (BCSR and BCAR), and microencapsulated samples using TEOS (TBCS, TBCA, TBCSR, TBCAR).
These results showed that the anthocyanins were more stable using ethanol with citric acid (as extraction solvent) and purified with resin at 40 °C (BCSR) and the stability can be slightly enhanced when TEOS microencapsulation is used at high temperatures. In this experiment, BCAR (extraction of ethanol acidified with acetic acid after purification) had the highest value of degradation and it is
Figure 5. Anthocyanin content as function of time at different temperatures; (a,d) at 40 ◦C, (b,e) at60 ◦C, and (c,f) at 80 ◦C. Samples extracted with ethanol/citric acid (BCS) and ethanol/acetic acid(BCA), samples after resin column (BCSR and BCAR), and microencapsulated samples using TEOS(TBCS, TBCA, TBCSR, TBCAR).
150
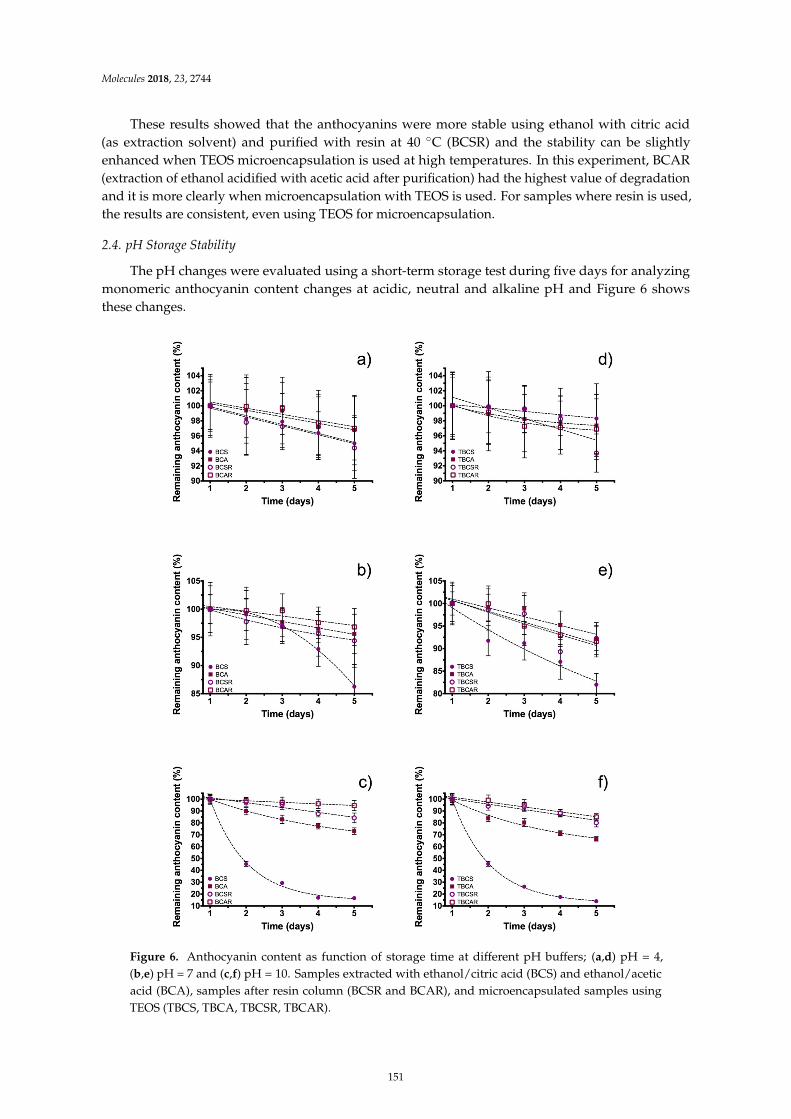
Molecules 2018, 23, 2744
These results showed that the anthocyanins were more stable using ethanol with citric acid(as extraction solvent) and purified with resin at 40 ◦C (BCSR) and the stability can be slightlyenhanced when TEOS microencapsulation is used at high temperatures. In this experiment, BCAR(extraction of ethanol acidified with acetic acid after purification) had the highest value of degradationand it is more clearly when microencapsulation with TEOS is used. For samples where resin is used,the results are consistent, even using TEOS for microencapsulation.
2.4. pH Storage Stability
The pH changes were evaluated using a short-term storage test during five days for analyzingmonomeric anthocyanin content changes at acidic, neutral and alkaline pH and Figure 6 showsthese changes.
Molecules 2018, 23, x FOR PEER REVIEW 7 of 16
more clearly when microencapsulation with TEOS is used. For samples where resin is used, the results are consistent, even using TEOS for microencapsulation.
2.4. pH Storage Stability
The pH changes were evaluated using a short-term storage test during five days for analyzing monomeric anthocyanin content changes at acidic, neutral and alkaline pH and Figure 6 shows these changes.
Figure 6. Anthocyanin content as function of storage time at different pH buffers; (a,d) pH = 4, (b,e) pH = 7 and (c,f) pH = 10. Samples extracted with ethanol/citric acid (BCS) and ethanol/acetic acid (BCA), samples after resin column (BCSR and BCAR), and microencapsulated samples using TEOS (TBCS, TBCA, TBCSR, TBCAR).
At acid pH (pH = 4, Figure 6a) there was an anthocyanin content loss of 4.98% and 3.22% for BCS and BCA, respectively, and for resin purified extracts (BCSR and BCAR) the losses were 5.58% and 3.01%. At neutral pH (pH = 7, Figure 6b), the content loss was BCS 13.76%, BCA 4.39%, BCSR 5.60% and BCAR 3.17%, and the major changes for the extracts were at alkaline pH (pH = 10, Figure 6c), since the samples with a higher loss from its initial value were 83.38% and 26.98% for BCS and BCA;
Figure 6. Anthocyanin content as function of storage time at different pH buffers; (a,d) pH = 4,(b,e) pH = 7 and (c,f) pH = 10. Samples extracted with ethanol/citric acid (BCS) and ethanol/aceticacid (BCA), samples after resin column (BCSR and BCAR), and microencapsulated samples usingTEOS (TBCS, TBCA, TBCSR, TBCAR).
151
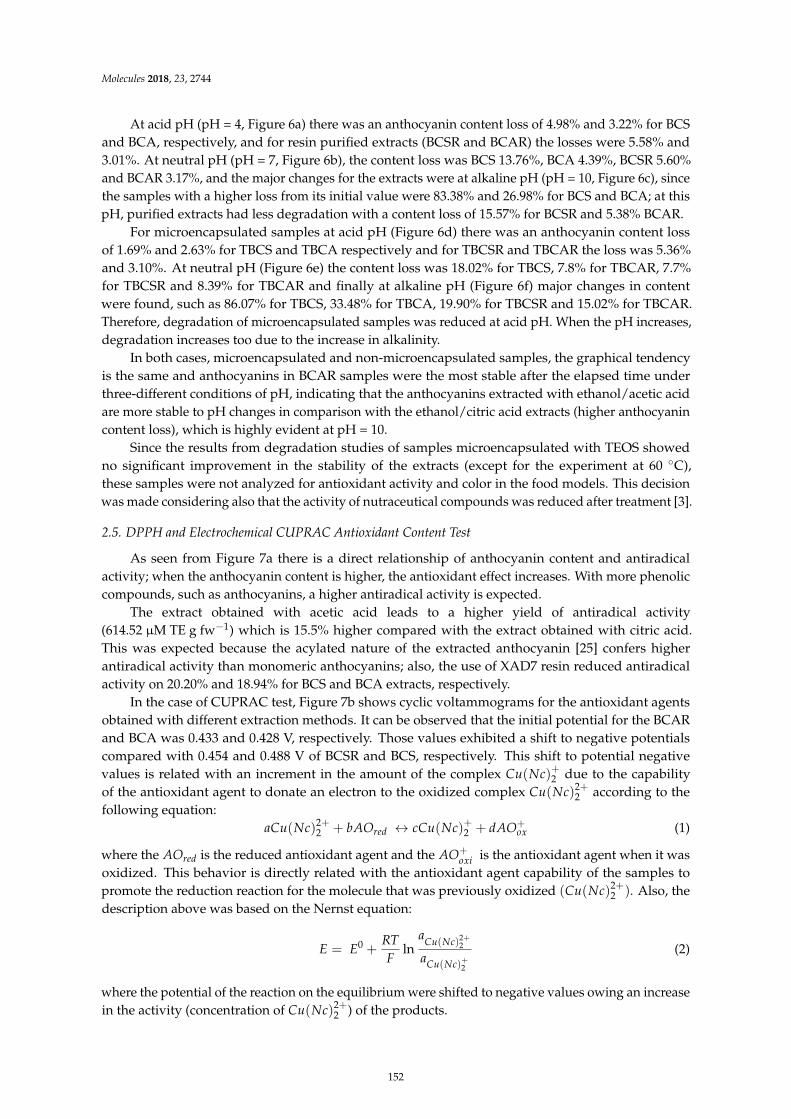
Molecules 2018, 23, 2744
At acid pH (pH = 4, Figure 6a) there was an anthocyanin content loss of 4.98% and 3.22% for BCSand BCA, respectively, and for resin purified extracts (BCSR and BCAR) the losses were 5.58% and3.01%. At neutral pH (pH = 7, Figure 6b), the content loss was BCS 13.76%, BCA 4.39%, BCSR 5.60%and BCAR 3.17%, and the major changes for the extracts were at alkaline pH (pH = 10, Figure 6c), sincethe samples with a higher loss from its initial value were 83.38% and 26.98% for BCS and BCA; at thispH, purified extracts had less degradation with a content loss of 15.57% for BCSR and 5.38% BCAR.
For microencapsulated samples at acid pH (Figure 6d) there was an anthocyanin content lossof 1.69% and 2.63% for TBCS and TBCA respectively and for TBCSR and TBCAR the loss was 5.36%and 3.10%. At neutral pH (Figure 6e) the content loss was 18.02% for TBCS, 7.8% for TBCAR, 7.7%for TBCSR and 8.39% for TBCAR and finally at alkaline pH (Figure 6f) major changes in contentwere found, such as 86.07% for TBCS, 33.48% for TBCA, 19.90% for TBCSR and 15.02% for TBCAR.Therefore, degradation of microencapsulated samples was reduced at acid pH. When the pH increases,degradation increases too due to the increase in alkalinity.
In both cases, microencapsulated and non-microencapsulated samples, the graphical tendencyis the same and anthocyanins in BCAR samples were the most stable after the elapsed time underthree-different conditions of pH, indicating that the anthocyanins extracted with ethanol/acetic acidare more stable to pH changes in comparison with the ethanol/citric acid extracts (higher anthocyanincontent loss), which is highly evident at pH = 10.
Since the results from degradation studies of samples microencapsulated with TEOS showedno significant improvement in the stability of the extracts (except for the experiment at 60 ◦C),these samples were not analyzed for antioxidant activity and color in the food models. This decisionwas made considering also that the activity of nutraceutical compounds was reduced after treatment [3].
2.5. DPPH and Electrochemical CUPRAC Antioxidant Content Test
As seen from Figure 7a there is a direct relationship of anthocyanin content and antiradicalactivity; when the anthocyanin content is higher, the antioxidant effect increases. With more phenoliccompounds, such as anthocyanins, a higher antiradical activity is expected.
The extract obtained with acetic acid leads to a higher yield of antiradical activity(614.52 µM TE g fw−1) which is 15.5% higher compared with the extract obtained with citric acid.This was expected because the acylated nature of the extracted anthocyanin [25] confers higherantiradical activity than monomeric anthocyanins; also, the use of XAD7 resin reduced antiradicalactivity on 20.20% and 18.94% for BCS and BCA extracts, respectively.
In the case of CUPRAC test, Figure 7b shows cyclic voltammograms for the antioxidant agentsobtained with different extraction methods. It can be observed that the initial potential for the BCARand BCA was 0.433 and 0.428 V, respectively. Those values exhibited a shift to negative potentialscompared with 0.454 and 0.488 V of BCSR and BCS, respectively. This shift to potential negativevalues is related with an increment in the amount of the complex Cu(Nc)+2 due to the capabilityof the antioxidant agent to donate an electron to the oxidized complex Cu(Nc)2+
2 according to thefollowing equation:
aCu(Nc)2+2 + bAOred ↔ cCu(Nc)+2 + dAO+
ox (1)
where the AOred is the reduced antioxidant agent and the AO+oxi is the antioxidant agent when it was
oxidized. This behavior is directly related with the antioxidant agent capability of the samples topromote the reduction reaction for the molecule that was previously oxidized (Cu(Nc)2+
2 ). Also, thedescription above was based on the Nernst equation:
E = E0 +RT
Fln
aCu(Nc)2+
2
aCu(Nc)+2
(2)
where the potential of the reaction on the equilibrium were shifted to negative values owing an increasein the activity (concentration of Cu(Nc)2+
2 ) of the products.
152
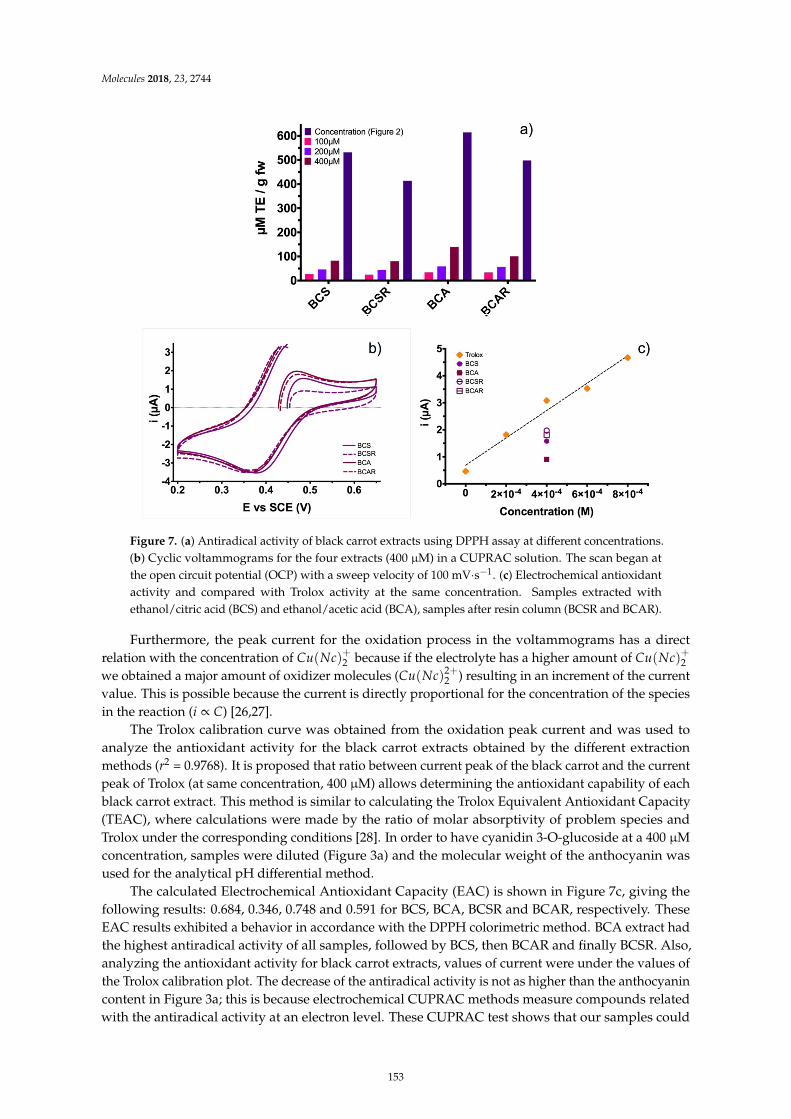
Molecules 2018, 23, 2744
Molecules 2018, 23, x FOR PEER REVIEW 8 of 16
at this pH, purified extracts had less degradation with a content loss of 15.57% for BCSR and 5.38% BCAR.
For microencapsulated samples at acid pH (Figure 6d) there was an anthocyanin content loss of 1.69% and 2.63% for TBCS and TBCA respectively and for TBCSR and TBCAR the loss was 5.36% and 3.10%. At neutral pH (Figure 6e) the content loss was 18.02% for TBCS, 7.8% for TBCAR, 7.7% for TBCSR and 8.39% for TBCAR and finally at alkaline pH (Figure 6f) major changes in content were found, such as 86.07% for TBCS, 33.48% for TBCA, 19.90% for TBCSR and 15.02% for TBCAR. Therefore, degradation of microencapsulated samples was reduced at acid pH. When the pH increases, degradation increases too due to the increase in alkalinity.
In both cases, microencapsulated and non-microencapsulated samples, the graphical tendency is the same and anthocyanins in BCAR samples were the most stable after the elapsed time under three-different conditions of pH, indicating that the anthocyanins extracted with ethanol/acetic acid are more stable to pH changes in comparison with the ethanol/citric acid extracts (higher anthocyanin content loss), which is highly evident at pH = 10.
Since the results from degradation studies of samples microencapsulated with TEOS showed no significant improvement in the stability of the extracts (except for the experiment at 60 °C), these samples were not analyzed for antioxidant activity and color in the food models. This decision was made considering also that the activity of nutraceutical compounds was reduced after treatment [3].
2.5. DPPH and Electrochemical CUPRAC Antioxidant Content Test
As seen from Figure 7a there is a direct relationship of anthocyanin content and antiradical activity; when the anthocyanin content is higher, the antioxidant effect increases. With more phenolic compounds, such as anthocyanins, a higher antiradical activity is expected.
Figure 7. (a) Antiradical activity of black carrot extracts using DPPH assay at different concentrations. (b) Cyclic voltammograms for the four extracts (400 µM) in a CUPRAC solution. The scan began at the open circuit potential (OCP) with a sweep velocity of 100 mV·s−1. (c) Electrochemical antioxidant activity and compared with Trolox activity at the same concentration. Samples extracted with ethanol/citric acid (BCS) and ethanol/acetic acid (BCA), samples after resin column (BCSR and BCAR).
Figure 7. (a) Antiradical activity of black carrot extracts using DPPH assay at different concentrations.(b) Cyclic voltammograms for the four extracts (400 µM) in a CUPRAC solution. The scan began atthe open circuit potential (OCP) with a sweep velocity of 100 mV·s−1. (c) Electrochemical antioxidantactivity and compared with Trolox activity at the same concentration. Samples extracted withethanol/citric acid (BCS) and ethanol/acetic acid (BCA), samples after resin column (BCSR and BCAR).
Furthermore, the peak current for the oxidation process in the voltammograms has a directrelation with the concentration of Cu(Nc)+2 because if the electrolyte has a higher amount of Cu(Nc)+2we obtained a major amount of oxidizer molecules (Cu(Nc)2+
2 ) resulting in an increment of the currentvalue. This is possible because the current is directly proportional for the concentration of the speciesin the reaction (i ∝ C) [26,27].
The Trolox calibration curve was obtained from the oxidation peak current and was used toanalyze the antioxidant activity for the black carrot extracts obtained by the different extractionmethods (r2 = 0.9768). It is proposed that ratio between current peak of the black carrot and the currentpeak of Trolox (at same concentration, 400 µM) allows determining the antioxidant capability of eachblack carrot extract. This method is similar to calculating the Trolox Equivalent Antioxidant Capacity(TEAC), where calculations were made by the ratio of molar absorptivity of problem species andTrolox under the corresponding conditions [28]. In order to have cyanidin 3-O-glucoside at a 400 µMconcentration, samples were diluted (Figure 3a) and the molecular weight of the anthocyanin wasused for the analytical pH differential method.
The calculated Electrochemical Antioxidant Capacity (EAC) is shown in Figure 7c, giving thefollowing results: 0.684, 0.346, 0.748 and 0.591 for BCS, BCA, BCSR and BCAR, respectively. TheseEAC results exhibited a behavior in accordance with the DPPH colorimetric method. BCA extract hadthe highest antiradical activity of all samples, followed by BCS, then BCAR and finally BCSR. Also,analyzing the antioxidant activity for black carrot extracts, values of current were under the values ofthe Trolox calibration plot. The decrease of the antiradical activity is not as higher than the anthocyanincontent in Figure 3a; this is because electrochemical CUPRAC methods measure compounds relatedwith the antiradical activity at an electron level. These CUPRAC test shows that our samples could
153
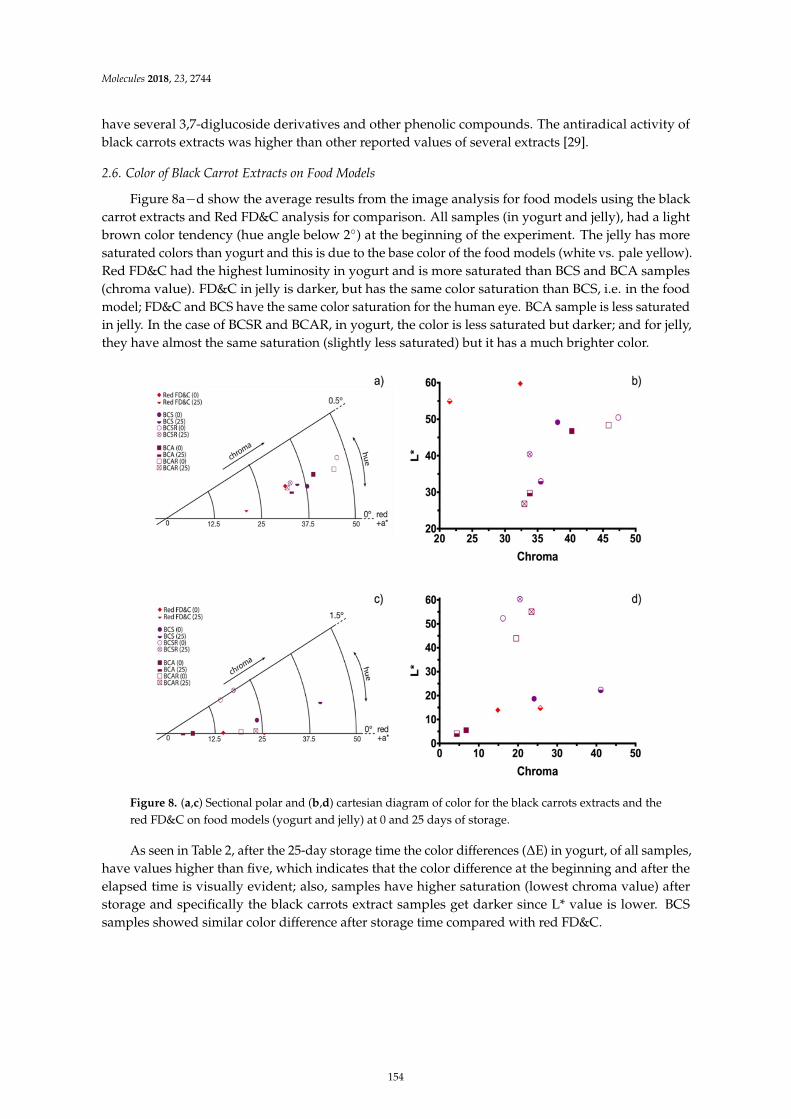
Molecules 2018, 23, 2744
have several 3,7-diglucoside derivatives and other phenolic compounds. The antiradical activity ofblack carrots extracts was higher than other reported values of several extracts [29].
2.6. Color of Black Carrot Extracts on Food Models
Figure 8a−d show the average results from the image analysis for food models using the blackcarrot extracts and Red FD&C analysis for comparison. All samples (in yogurt and jelly), had a lightbrown color tendency (hue angle below 2◦) at the beginning of the experiment. The jelly has moresaturated colors than yogurt and this is due to the base color of the food models (white vs. pale yellow).Red FD&C had the highest luminosity in yogurt and is more saturated than BCS and BCA samples(chroma value). FD&C in jelly is darker, but has the same color saturation than BCS, i.e. in the foodmodel; FD&C and BCS have the same color saturation for the human eye. BCA sample is less saturatedin jelly. In the case of BCSR and BCAR, in yogurt, the color is less saturated but darker; and for jelly,they have almost the same saturation (slightly less saturated) but it has a much brighter color.
Molecules 2018, 23, x FOR PEER REVIEW 10 of 16
brown color tendency (hue angle below 2°) at the beginning of the experiment. The jelly has more saturated colors than yogurt and this is due to the base color of the food models (white vs. pale yellow). Red FD&C had the highest luminosity in yogurt and is more saturated than BCS and BCA samples (chroma value). FD&C in jelly is darker, but has the same color saturation than BCS, i.e. in the food model; FD&C and BCS have the same color saturation for the human eye. BCA sample is less saturated in jelly. In the case of BCSR and BCAR, in yogurt, the color is less saturated but darker; and for jelly, they have almost the same saturation (slightly less saturated) but it has a much brighter color.
Figure 8. (a,c) Sectional polar and (b,d) cartesian diagram of color for the black carrots extracts and the red FD&C on food models (yogurt and jelly) at 0 and 25 days of storage.
As seen in Table 2, after the 25-day storage time the color differences (ΔE) in yogurt, of all samples, have values higher than five, which indicates that the color difference at the beginning and after the elapsed time is visually evident; also, samples have higher saturation (lowest chroma value) after storage and specifically the black carrots extract samples get darker since L* value is lower. BCS samples showed similar color difference after storage time compared with red FD&C.
For jelly samples, only sample BCA has a value lower than five, which indicates that the color difference could be distinguished but was not as evident as the rest of the samples; also, BCA samples are the only ones with different saturation and luminosity trends, they had lower chroma values and are darker. The rest of the samples are less saturated (higher chroma value) and brighter. The samples with resin purification (BCSR and BCAR) had a similar color difference compared to red FD&C, except BCA.
Table 2. Color comparison between food models (yogurt and jelly) using black carrot extracts after 25 days in storage.
Sample ΔE Yogurt ΔE Jelly Red FD&C 12.62 10.92
BCS 16.45 17.61 BCSR 24.27 9.21 BCA 18.31 2.82
BCAR 25.12 12.71
For yogurt, BCSR and BCAR samples have the highest color change indicating that cyanidin-3-glucoside derivative anthocyanins are not suitable to be used in this food model, because the acetate
Figure 8. (a,c) Sectional polar and (b,d) cartesian diagram of color for the black carrots extracts and thered FD&C on food models (yogurt and jelly) at 0 and 25 days of storage.
As seen in Table 2, after the 25-day storage time the color differences (∆E) in yogurt, of all samples,have values higher than five, which indicates that the color difference at the beginning and after theelapsed time is visually evident; also, samples have higher saturation (lowest chroma value) afterstorage and specifically the black carrots extract samples get darker since L* value is lower. BCSsamples showed similar color difference after storage time compared with red FD&C.
154
Molecules 2018, 23, 2744
Table 2. Color comparison between food models (yogurt and jelly) using black carrot extracts after 25days in storage.
Sample ∆E Yogurt ∆E Jelly
Red FD&C 12.62 10.92BCS 16.45 17.61
BCSR 24.27 9.21BCA 18.31 2.82
BCAR 25.12 12.71
For jelly samples, only sample BCA has a value lower than five, which indicates that the colordifference could be distinguished but was not as evident as the rest of the samples; also, BCA samplesare the only ones with different saturation and luminosity trends, they had lower chroma valuesand are darker. The rest of the samples are less saturated (higher chroma value) and brighter. Thesamples with resin purification (BCSR and BCAR) had a similar color difference compared to redFD&C, except BCA.
For yogurt, BCSR and BCAR samples have the highest color change indicating thatcyanidin-3-glucoside derivative anthocyanins are not suitable to be used in this food model, becausethe acetate group caused important appearance differences under these conditions; for jelly, BCS andBCAR had the highest color changes but BCSR and BCA the lowest compared with Red FD&C. Pigmentconcentration of the samples must change for the specific commercial use, for instance, strawberryyogurt samples have different L*, a* and b* values [3].
3. Materials and Methods
Fresh black carrot (Daucus Carota var. L. ssp. sativus var. atrorubens Alef.) were cultivated inTlaxcala, Mexico and donated by a local cultivator, then were washed with tap water and storedin 3 kg perforated plastics bags and kept at −20 ◦C until further use. All reactants used wereanalytical grade. Ethanol 99.5%, citric acid 99.5%, Amberlite XAD7 resin, tetraethyl orthosilicate(TEOS) 98%, potassium chloride, 6-hydroxy-2,5,7,8-tetramethylchromane-2-carboxylic acid (Trolox),and 2,2-diphenyl-1-picrylhydrazyl (DPPH), CuCl2·2H2O (99%), neocuproine, and ammonium acetate(98.0%) were supplied by Sigma Aldrich (Toluca, Mexico). Acetic acid, sodium acetate, hydrochloricacid, buffer solutions (pH: 4, 7 & 10) and potassium hydroxide were supplied by J.T. Baker (Mexico City,Mexico). Methanol was supplied by Macron (Hamilton, PA, USA). All experiments were carried outusing distilled water obtained from an Elix Advantage Water Purification System (Queretaro, Mexico).
3.1. Anthocyanins Extraction and TEOS Microencapsulation
Acidified ethanol was used as extraction solvent for all samples. Anthocyanins were obtainedby blending 150 mL of acidified ethanol (citric/acetic acid solution 85:15 v/v) and 150 g of slicedfrozen carrots (without thawing) with a Grinder 6807 blender Oster (Mexico) for 20 min. Solids wereremoved by filtration using a 100-mesh sieve filter. The liquid phase (extract) was labeled as BCS(acidified with citric acid) and BCA (acidified with acetic acid). Extracts BCS and BCA were introduced,separately, to a resin column containing Amberlite XAD7 resin for removing non-aromatic compoundsfrom the extract. Flow rate was 32 mL/min (20BV/h) and a solution of 95 mL of ethanol and 5 mLof acidic water (pH = 1.4) was used as eluent. Finally, solvent excess was evaporated at 40 ◦C usingvacuum (R-100, Büchi, Mexico). Samples obtained after this procedure were labeled BCSR and BCAR.All samples were stored in sealed amber glass vials at 4 ◦C until further use. Then samples weresubmitted to microencapsulation using TEOS with a procedure reported elsewhere [1,3]. The samplesafter microencapsulation were labeled as TBCS, TBCA, TBCSR and TBCAR. A flow diagram is shownin Figure 9.
155
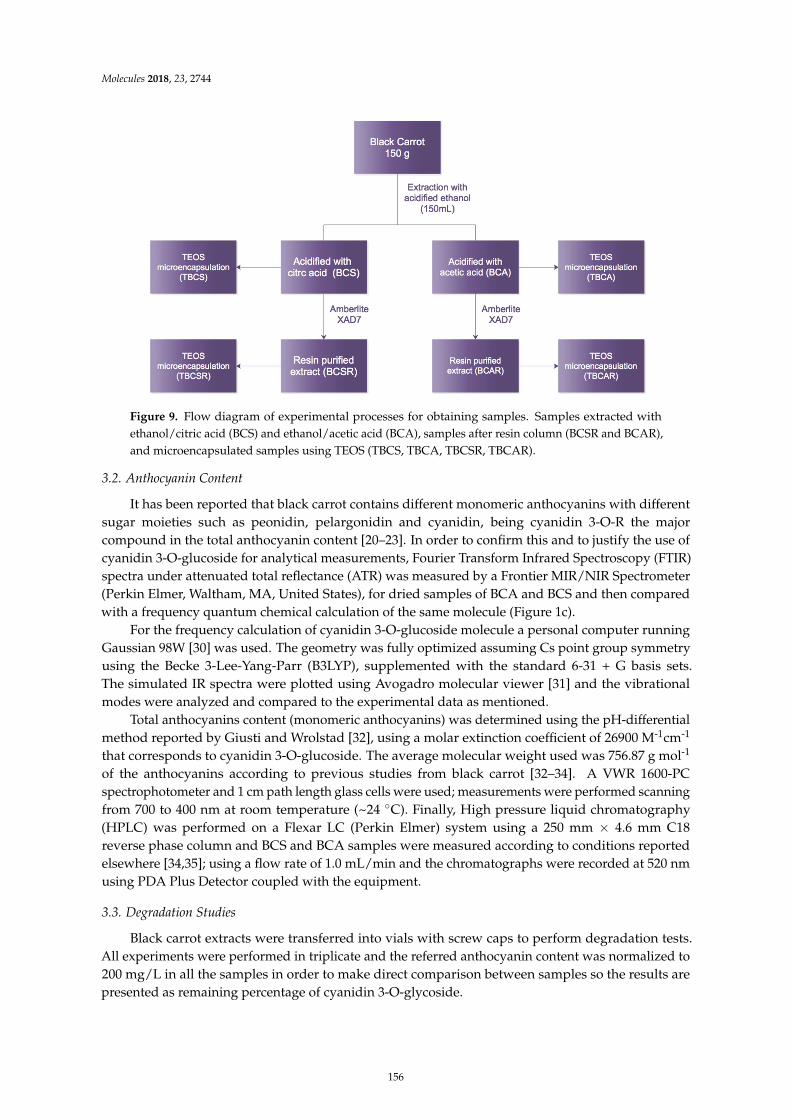
Molecules 2018, 23, 2744
Molecules 2018, 23, x FOR PEER REVIEW 11 of 16
group caused important appearance differences under these conditions; for jelly, BCS and BCAR had the highest color changes but BCSR and BCA the lowest compared with Red FD&C. Pigment concentration of the samples must change for the specific commercial use, for instance, strawberry yogurt samples have different L*, a* and b* values [3].
3. Materials and Methods
Fresh black carrot (Daucus Carota var. L. ssp. sativus var. atrorubens Alef.) were cultivated in Tlaxcala, Mexico and donated by a local cultivator, then were washed with tap water and stored in 3 kg perforated plastics bags and kept at −20 °C until further use. All reactants used were analytical grade. Ethanol 99.5%, citric acid 99.5%, Amberlite XAD7 resin, tetraethyl orthosilicate (TEOS) 98%, potassium chloride, 6-hydroxy-2,5,7,8-tetramethylchromane-2-carboxylic acid (Trolox), and 2,2-diphenyl-1-picrylhydrazyl (DPPH), CuCl2·2H2O (99%), neocuproine, and ammonium acetate (98.0%) were supplied by Sigma Aldrich (Toluca, Mexico). Acetic acid, sodium acetate, hydrochloric acid, buffer solutions (pH: 4, 7 & 10) and potassium hydroxide were supplied by J.T. Baker (Mexico City, Mexico). Methanol was supplied by Macron (Hamilton, PA, USA). All experiments were carried out using distilled water obtained from an Elix Advantage Water Purification System (Queretaro, Mexico).
3.1. Anthocyanins Extraction and TEOS Microencapsulation
Acidified ethanol was used as extraction solvent for all samples. Anthocyanins were obtained by blending 150 mL of acidified ethanol (citric/acetic acid solution 85:15 v/v) and 150 g of sliced frozen carrots (without thawing) with a Grinder 6807 blender Oster (Mexico) for 20 min. Solids were removed by filtration using a 100-mesh sieve filter. The liquid phase (extract) was labeled as BCS (acidified with citric acid) and BCA (acidified with acetic acid). Extracts BCS and BCA were introduced, separately, to a resin column containing Amberlite XAD7 resin for removing non-aromatic compounds from the extract. Flow rate was 32 mL/min (20BV/h) and a solution of 95 mL of ethanol and 5 mL of acidic water (pH = 1.4) was used as eluent. Finally, solvent excess was evaporated at 40 °C using vacuum (R-100, Büchi, Mexico). Samples obtained after this procedure were labeled BCSR and BCAR. All samples were stored in sealed amber glass vials at 4 °C until further use. Then samples were submitted to microencapsulation using TEOS with a procedure reported elsewhere [1,3]. The samples after microencapsulation were labeled as TBCS, TBCA, TBCSR and TBCAR. A flow diagram is shown in Figure 9.
Figure 9. Flow diagram of experimental processes for obtaining samples. Samples extracted with ethanol/citric acid (BCS) and ethanol/acetic acid (BCA), samples after resin column (BCSR and BCAR), and microencapsulated samples using TEOS (TBCS, TBCA, TBCSR, TBCAR).
Figure 9. Flow diagram of experimental processes for obtaining samples. Samples extracted withethanol/citric acid (BCS) and ethanol/acetic acid (BCA), samples after resin column (BCSR and BCAR),and microencapsulated samples using TEOS (TBCS, TBCA, TBCSR, TBCAR).
3.2. Anthocyanin Content
It has been reported that black carrot contains different monomeric anthocyanins with differentsugar moieties such as peonidin, pelargonidin and cyanidin, being cyanidin 3-O-R the majorcompound in the total anthocyanin content [20–23]. In order to confirm this and to justify the use ofcyanidin 3-O-glucoside for analytical measurements, Fourier Transform Infrared Spectroscopy (FTIR)spectra under attenuated total reflectance (ATR) was measured by a Frontier MIR/NIR Spectrometer(Perkin Elmer, Waltham, MA, United States), for dried samples of BCA and BCS and then comparedwith a frequency quantum chemical calculation of the same molecule (Figure 1c).
For the frequency calculation of cyanidin 3-O-glucoside molecule a personal computer runningGaussian 98W [30] was used. The geometry was fully optimized assuming Cs point group symmetryusing the Becke 3-Lee-Yang-Parr (B3LYP), supplemented with the standard 6-31 + G basis sets.The simulated IR spectra were plotted using Avogadro molecular viewer [31] and the vibrationalmodes were analyzed and compared to the experimental data as mentioned.
Total anthocyanins content (monomeric anthocyanins) was determined using the pH-differentialmethod reported by Giusti and Wrolstad [32], using a molar extinction coefficient of 26900 M-1cm-1
that corresponds to cyanidin 3-O-glucoside. The average molecular weight used was 756.87 g mol-1
of the anthocyanins according to previous studies from black carrot [32–34]. A VWR 1600-PCspectrophotometer and 1 cm path length glass cells were used; measurements were performed scanningfrom 700 to 400 nm at room temperature (~24 ◦C). Finally, High pressure liquid chromatography(HPLC) was performed on a Flexar LC (Perkin Elmer) system using a 250 mm × 4.6 mm C18reverse phase column and BCS and BCA samples were measured according to conditions reportedelsewhere [34,35]; using a flow rate of 1.0 mL/min and the chromatographs were recorded at 520 nmusing PDA Plus Detector coupled with the equipment.
3.3. Degradation Studies
Black carrot extracts were transferred into vials with screw caps to perform degradation tests.All experiments were performed in triplicate and the referred anthocyanin content was normalized to200 mg/L in all the samples in order to make direct comparison between samples so the results arepresented as remaining percentage of cyanidin 3-O-glycoside.
156
Molecules 2018, 23, 2744
The ASTM D 4320 method was used to determine anthocyanin stability against UV radiation.Black carrot extracts were exposed to UV lamp irradiation (315–400 nm) for 160 min; samples wereplaced within 15 cm from the source. Measurements were taken every 40 minand the temperature waskept constant at 25 ◦C under a working area of 3.5 m2 isolated from other light sources [1,3].
For thermal stability studies, samples were placed in a preheated water bath at 80 ◦C, 60 ◦C and40 ◦C. Samples were removed from water bath every 20 min, up to 120 minand rapidly cooled to roomtemperature. Anthocyanin content was analyzed immediately [35].
The anthocyanin stability in storage was also studied at three different pH conditions (4, 7 and10) at room temperature (~24 ◦C). For this purpose, 3 mL of phosphate buffer solution were preparedat the required pH conditions and then colored with 500 µL of black carrot extract concentrate; thesecolored solutions were used without further treatment. Finally, anthocyanin storage stability wasdetermined every 24 h during 5 days for each of the black carrot extracts [12].
3.4. Antioxidant Activity
The DPPH radical scavenging activity assay was performed according to several methodsdescribed previously [22,36–38] in which radical scavenging activities were determined by testingthe extracts with the free radical DPPH and monitoring their absorbance decrease at 515 nm usinga 1600-PC spectrophotometer (VWR, Graumanngasse, Vienna) with a 1 cm path length glass cells.Control assays using the black carrot extracts were performed in order to obtain their absorbancecontributions. A solution of 50 µM DPPH was prepared using buffered methanol, which was preparedby mixing methanol with acetic acid buffer solution (0.1 M, pH 5.5) [36]. Then, 2.85 mL of DPPHsolution were mixed with 150 µL of each extract and were left reacting 30 minat room temperature(~24 ◦C). Antiradical activity was expressed as Trolox equivalents per gram of fresh weight (µM TEg·fw−1), which was calculated from the equation obtained using a linear regression after plotting theknown absorbance with different Trolox concentrations, from 1 to 800 µM and r2 = 0.9657.
A cupric reducing antioxidant capacity (CUPRAC) solution [24,26] was prepared to determineantioxidant capacity via electrochemical tests using CuCl2 with a concentration of 3 mM in distilledwater. Also, a solution of neocuproin at 6 mM in ethanol was prepared. In order to control pH ofthe main solution, a 1.2 M ammonium acetate buffer solution was prepared (pH = 7), then pH wasadjusted adding 1.2 M HCl and 1.2 M NaOH as required. Concentrations of Trolox were variedfrom 1 to 800 µM in ethanol for obtaining a Trolox standard curve. 2 mL of each CuCl2, neocuproin,ammonium acetate buffer, Trolox and distilled water solutions were prepared and mixed. The 10 mLsolution was stirred for 15 minand N2 was bubbled into it for 5 min. The same procedure was followedto evaluate antioxidant capacity adding anthocyanins extracts instead of Trolox solution and thevalues are reported as a comparison between the analytical response vs. concentration plot during theantioxidant quantification because the slope is dependent on the stochiometric relationship betweenthe antioxidant-oxidant species involved, which is related to the electron transfer per molecule pair.
The electrochemical tests were performed in a three-electrode electrochemical cell. A calomelHg/Hg2Cl2 (saturated with KCl) was used as reference electrode, a graphite bar was used ascounter electrode and a glassy carbon (3 mm) electrode was used as working electrode. Beforeeach electrochemical measurement, the working electrode was polished with aluminum oxide powderfollowed by ultrasonic stirring during 10 min; this process was repeated 3 times. The voltammogramswere obtained in a Bio-LogicVP-50 potentiostat (Bio-Logic Science Instruments, Seyssinet-Pariset,France) with a sweep velocity of 100 mV s−1, starting the voltammograms from the open circuitpotential (OCP) that was determined when the potential did not show a variation higher than 1 mVper second.
3.5. Extract and Food Models Color Determination
A custom MATLAB script (Mathworks Inc., Natick, MA, USA) was used to measure lightness andchromaticity coordinates in the L* a* b* color space (CIELAB) according to CIE standard illuminant A
157
Molecules 2018, 23, 2744
(typical, domestic, tungsten-filament lighting with correlated color temperature of 2856 K). L* indicateslightness, a* and b* are chromaticity coordinates, h (hue), c (chroma) and ∆E (color change) werecalculated from a* and b* values. Digital images from samples were taken using a Sony digital cameraα99II coupled with a Vario Sonnar T* 24–70 mm lens (Sony Corporation, Tokyo, Japan) under thesame light conditions; the images were cropped to 1024 × 1024 pixels and then processed with theafore mentioned script. Additionally, samples were measured in two different colored food models:yogurt and jelly. For yogurt food model, 10 g of commercial yogurt (Yoplait natural yogurt, SigmaAlimentos Lácteos México, Queretaro, Mexico) were colored using 10 mg of calculated anthocyaninsfrom each extract and jelly was prepared using jelly powder (Coloidales Duche, Ciudad de México,Mexico) dissolved in boiling water (1:3 ratio) and 10 g of the mixture were colored using the samecalculated amount of anthocyanins from each extract. Samples were measured at the beginning of theexperiment and after 25 days, and compared with a colored yogurt/jelly with 10 mg of Red FD&C(Red Currant 12.5%, Colores Duche, Ciudad de México, Mexico) under the same conditions.
4. Conclusions
Anthocyanins were extracted from black carrot with ethanol/citric acid and ethanol/acetic acid forcomparison between total anthocyanin content, and stability against media changes and antioxidantcapacity was obtained to analyze samples in food models. Microencapsulation with TEOS wasperformed with the objective of enhancing anthocyanin stability. Extracts had the highest degradationin alkaline pH, and BCAR was the most stable sample to pH media changes. The antiradical activityof black carrots extracts was higher than other reported values, and when anthocyanin content ishigher, the antioxidant effect increases. Results of UV radiation and thermal stability tests indicate thatTEOS microencapsulation provides a negligible improvement in anthocyanins’ stability. In conclusion,extraction with ethanol/acetic acid is the most convenient and stable treatment against pH mediachanges. Purification with resin and TEOS microencapsulation did not increase stability of the blackcarrot extracts. TEOS microencapsulation has proven to be effective (enhancing stability) for somedried materials from natural extracts in our previous research, but we do not recommend its use formaterials obtained from black carrot extracts. Even though anthocyanins are already used in the foodindustry in beverages, our samples were not suitable for the yogurt or jelly model selected exceptfor BCA sample in jelly that has the highest antioxidant activity, this gives it potential for being afunctional natural colorant in this specific food model.
Author Contributions: Data and experimentation, G.A.M. and A.R.H.-M.; Formal analysis, R.E., A.R.H.-M. andM.E.; Funding acquisition, M.E.; Investigation, G.E.-A., I.S.-G. and J.M.-C.; Methodology, J.M.-C. and A.R H.-M.;Supervision, A.R.H.-M. and M.E.; Validation, A.L.R.-J.; Writing—original draft, G.A.M., A.R.H.-M. and M.E.;Writing—review & editing, A.L.R.-J.
Funding: This research received no external funding.
Acknowledgments: Authors would like to acknowledge the grant obtained from the Dirección General deAsuntos del Personal Académico (DGAPA) of Universidad Nacional Autónoma de México (UNAM) through“Programa de Apoyo a Proyectos de Investigación e Innovación Tecnológica” (PAPIIT No. IN209517). One of theauthors, MSc Guillermo Espinosa-Acosta—fellow number 388907-; acknowledges the financial support receivedfrom CONACYT at the first period of the 2015 National Scholarships Call. Also, the authors are especially gratefulto Perkin Elmer Mexico for obtaining the chromatograms shown in Figure 2 of this manuscript. Finally, authorsare grateful to Bernardino Rodriguez-Morales and Adrian Hendrik Oskam Voorduin for their technical support;and also, to Gerardo Fonseca, and José Antonio Pérez Guzman, for their valuable comments about the manuscript,and to Angel Luis Rodríguez for his support on the development of the MATLAB script used for color analysis.
Conflicts of Interest: The authors declare no conflict of interest
References
1. Hernández-Martínez, A.R.; Torres, D.; Molina, G.A.; Esparza, R.; Quintanilla, F.; Martínez-Bustos, F.;Estevez, M. Stability comparison between microencapsulated red-glycosidic pigments and commercialfd&c red 40 dye for food coloring. J. Mater. Sci. 2017, 52, 5014–5026. [CrossRef]
158
Molecules 2018, 23, 2744
2. García-Tejeda, Y.V.; Salinas-Moreno, Y.; Hernández-Martínez, Á.R.; Martínez-Bustos, F. Encapsulation ofpurple maize anthocyanins in phosphorylated starch by spray drying. Cereal Chem. J. 2015, 93, 130–137.[CrossRef]
3. Molina, A.G.; Hernández-Martínez, R.A.; Cortez-Valadez, M.; García-Hernández, F.; Estevez, M. Effects oftetraethyl orthosilicate (teos) on the light and temperature stability of a pigment from Beta vulgaris and itspotential food industry applications. Molecules 2014, 19. [CrossRef] [PubMed]
4. Mahdavi, S.A.; Jafari, S.M.; Ghorbani, M.; Assadpoor, E. Spray-drying microencapsulation of anthocyaninsby natural biopolymers: A review. Dry. Technol. 2014, 32, 509–518. [CrossRef]
5. Shahid, M.; Mohammad, F. Recent advancements in natural dye applications: A review. J. Clean. Prod.
2013, 53, 310–331. [CrossRef]6. He, J.; Giusti, M.M. Anthocyanins: Natural colorants with health-promoting properties. Annu. Rev. Food Sci.
Technol. 2010, 1, 163–187. [CrossRef] [PubMed]7. Rohring, B. Eating with Your Eyes: The Chemistry of Food Colorings. 2015. Available
online: https://www.acs.org/content/acs/en/education/resources/highschool/chemmatters/past-issues/2015-2016/october-2015/food-colorings.html (accessed on 25 August 2018).
8. Ersus, S.; Yurdagel, U. Microencapsulation of anthocyanin pigments of black carrot (Daucus carota L.) byspray drier. J. Food Eng. 2007, 80, 805–812. [CrossRef]
9. Moldovan, B.; David, L.; Chisbora, C.; Cimpoiu, C. Degradation kinetics of anthocyanins from europeancranberrybush (Viburnum opulus L.) fruit extracts. Effects of temperature, ph and storage solvent.Molecules 2012, 17. [CrossRef] [PubMed]
10. Stintzing, F.C.; Stintzing, A.S.; Carle, R.; Frei, B.; Wrolstad, R.E. Color and antioxidant properties ofcyanidin-based anthocyanin pigments. J. Agric. Food Chem. 2002, 50, 6172–6181. [CrossRef] [PubMed]
11. Blando, F.; Calabriso, N.; Berland, H.; Maiorano, G.; Gerardi, C.; Carluccio, M.; Andersen, Ø. Radicalscavenging and anti-inflammatory activities of representative anthocyanin groupings from pigment-richfruits and vegetables. Int. J. Mol. Sci. 2018, 19, 169. [CrossRef] [PubMed]
12. Lee, J.; Koo, N.; Min, D.B. Reactive oxygen species, aging, and antioxidative nutraceuticals. Compr. Rev. Food
Sci. Food Saf. 2004, 3, 21–33. [CrossRef]13. Valko, M.; Leibfritz, D.; Moncol, J.; Cronin, M.T.D.; Mazur, M.; Telser, J. Free radicals and antioxidants in
normal physiological functions and human disease. Int. J. Biochem. Cell Biol. 2007, 39, 44–84. [CrossRef][PubMed]
14. Braga, A.R.C.; Murador, D.C.; de Souza Mesquita, L.M.; de Rosso, V.V. Bioavailability of anthocyanins: Gapsin knowledge, challenges and future research. J. Food Compos. Anal. 2018. [CrossRef]
15. Akhavan Mahdavi, S.; Jafari, S.M.; Assadpoor, E.; Dehnad, D. Microencapsulation optimization of naturalanthocyanins with maltodextrin, gum arabic and gelatin. Int. J. Biol. Macromol. 2016, 85, 379–385. [CrossRef][PubMed]
16. Gandomi, H.; Abbaszadeh, S.; Misaghi, A.; Bokaie, S.; Noori, N. Effect of chitosan-alginate encapsulationwith inulin on survival of Lactobacillus rhamnosus GG during apple juice storage and under simulatedgastrointestinal conditions. LWT Food Sci. Technol. 2016, 69, 365–371. [CrossRef]
17. Kırca, A.; Özkan, M.; Cemeroglu, B. Effects of temperature, solid content and ph on the stability of blackcarrot anthocyanins. Food Chem. 2007, 101, 212–218. [CrossRef]
18. Khandare, V.; Walia, S.; Singh, M.; Kaur, C. Black carrot (Daucus carota ssp. Sativus) juice: Processing effectson antioxidant composition and color. Food Bioprod. Process. 2011, 89, 482–486. [CrossRef]
19. Kırca, A.; Özkan, M.; Cemeroglu, B. Stability of black carrot anthocyanins in various fruit juices and nectars.Food Chem. 2006, 97, 598–605. [CrossRef]
20. Türkyılmaz, M.; Yemis, O.; Özkan, M. Clarification and pasteurisation effects on monomeric anthocyaninsand percent polymeric colour of black carrot (Daucus carota L.) juice. Food Chem. 2012, 134, 1052–1058.[CrossRef] [PubMed]
21. Montilla, E.C.; Arzaba, M.R.; Hillebrand, S.; Winterhalter, P. Anthocyanin composition of black carrot (Daucus
carota ssp. sativus var. atrorubens Alef.) cultivars antonina, beta sweet, deep purple, and purple haze. J. Agric.
Food Chem. 2011, 59, 3385–3390. [CrossRef] [PubMed]22. Algarra, M.; Fernandes, A.; Mateus, N.; de Freitas, V.; Esteves da Silva, J.C.G.; Casado, J. Anthocyanin profile
and antioxidant capacity of black carrots (Daucus carota L. ssp. sativus var. atrorubens Alef.) from cuevasbajas, spain. J. Food Compos. Anal. 2014, 33, 71–76. [CrossRef]
159
Molecules 2018, 23, 2744
23. Kammerer, D.; Carle, R.; Schieber, A. Detection of peonidin and pelargonidin glycosides in black carrots(Daucus carota ssp. sativus var. atrorubens Alef.) by high-performance liquid chromatography/electrosprayionization mass spectrometry. Rapid Commun. Mass Spectrom. 2003, 17, 2407–2412. [CrossRef] [PubMed]
24. Castañeda-Ovando, A.; Pacheco-Hernández, M.d.L.; Páez-Hernández, M.E.; Rodríguez, J.A.;Galán-Vidal, C.A. Chemical studies of anthocyanins: A review. Food Chem. 2009, 113, 859–871. [CrossRef]
25. Gerardi, C.; Tommasi, N.; Albano, C.; Blando, F.; Rescio, L.; Pinthus, E.; Mita, G. Prunus mahaleb L. Fruitextracts: A novel source for natural food pigments. Eur. Food Res. Technol. 2015, 241, 683–695. [CrossRef]
26. Cárdenas, A.; Gómez, M.; Frontana, C. Relationship between the chemical structures of antioxidants andthe differences in their cupric ion reducing antioxidant capacity (CUPRAC) by electrochemical methods.J. Electroanal. Chem. 2014, 729, 116–120. [CrossRef]
27. Pletcher, D.; Greff, R.; Peat, R.; Peter, L.M.; Robinson, J. Instrumental Methods in Electrochemistry;Woodhead Publishing: Cambridge, UK, 2001.
28. Arts, M.J.T.J.; Haenen, G.R.M.M.; Voss, H.-P.; Bast, A. Antioxidant capacity of reaction products limits theapplicability of the Trolox Equivalent Antioxidant Capacity (TEAC) assay. Food Chem. Toxicol.. 2004, 42,45–49. [CrossRef] [PubMed]
29. Seeram, N.P.; Aviram, M.; Zhang, Y.; Henning, S.M.; Feng, L.; Dreher, M.; Heber, D. Comparison ofantioxidant potency of commonly consumed polyphenol-rich beverages in the united states. J. Agric.
Food Chem. 2008, 56, 1415–1422. [CrossRef] [PubMed]30. Gaussian 09, revision A. 02; Gaussian, Inc.: Wallingford, CT, USA, 2009.31. Hanwell, M.D.; Curtis, D.E.; Lonie, D.C.; Vandermeersch, T.; Zurek, E.; Hutchison, G.R. Avogadro: An
advanced semantic chemical editor, visualization, and analysis platform. J. Cheminform. 2012, 4, 17.[CrossRef] [PubMed]
32. Giusti, M.M.; Wrolstad, R.E. Characterization and measurement of anthocyanins by uv-visible spectroscopy.In Current Protocols in Food Analytical Chemistry; John Wiley & Sons, Inc.: Hoboken, NJ, USA, 2001.
33. Wrolstad, R.E.; Durst, R.W.; Lee, J. Tracking color and pigment changes in anthocyanin products. Trends Food
Sci. Technol. 2005, 16, 423–428. [CrossRef]34. Alasalvar, C.; Al-Farsi, M.; Quantick, P.C.; Shahidi, F.; Wiktorowicz, R. Effect of chill storage and modified
atmosphere packaging (MAP) on antioxidant activity, anthocyanins, carotenoids, phenolics and sensoryquality of ready-to-eat shredded orange and purple carrots. Food Chem. 2005, 89, 69–76. [CrossRef]
35. Dai, Y.; Rozema, E.; Verpoorte, R.; Choi, Y.H. Application of natural deep eutectic solvents to the extraction ofanthocyanins from Catharanthus roseus with high extractability and stability replacing conventional organicsolvents. J. Chromatogr. A 2016, 1434, 50–56. [CrossRef] [PubMed]
36. Sharma, O.P.; Bhat, T.K. DPPH antioxidant assay revisited. Food Chem. 2009, 113, 1202–1205. [CrossRef]37. Thaipong, K.; Boonprakob, U.; Crosby, K.; Cisneros-Zevallos, L.; Hawkins Byrne, D. Comparison of abts,
dpph, frap, and orac assays for estimating antioxidant activity from guava fruit extracts. J. Food Compos. Anal.
2006, 19, 669–675. [CrossRef]38. Molyneux, P. The use of the stable free radical diphenylpicrylhydrazyl (DPPH) for estimating antioxidant
activity. Songklanakarin J. Sci. Technol. 2004, 26, 211–219.
Sample Availability: Samples of the compounds are available from the authors.
© 2018 by the authors. Licensee MDPI, Basel, Switzerland. This article is an open accessarticle distributed under the terms and conditions of the Creative Commons Attribution(CC BY) license (http://creativecommons.org/licenses/by/4.0/).
160
molecules
Article
Betanin, a Natural Food Additive: Stability,Bioavailability, Antioxidant and PreservativeAbility Assessments
Davi Vieira Teixeira da Silva, Diego dos Santos Baião, Fabrício de Oliveira Silva, Genilton Alves,
Daniel Perrone, Eduardo Mere Del Aguila and Vania M. Flosi Paschoalin *
Instituto de Química, Universidade Federal do Rio de Janeiro, Av. Athos da Silveira Ramos 149, 21941-909 Riode Janeiro, Brazil; [email protected] (D.V.T.d.S.); [email protected] (D.d.S.B.);[email protected] (F.d.O.S.); [email protected] (G.A.); [email protected] (D.P.);[email protected] (E.M.D.A.)* Correspondence: [email protected]; Tel.: +55-21-3938-7362; Fax: +55-21-3938-7266
Academic Editors: Lillian Barros and Isabel C.F.R. FerreiraReceived: 11 January 2019; Accepted: 27 January 2019; Published: 28 January 2019
Abstract: Betanin is the only betalain approved for use in food and pharmaceutical productsas a natural red colorant. However, the antioxidant power and health-promoting properties ofthis pigment have been disregarded, perhaps due to the difficulty in obtaining a stable chemicalcompound, which impairs its absorption and metabolism evaluation. Herein, betanin was purifiedby semi-preparative HPLC-LC/MS and identified by LC-ESI(+)-MS/MS as the pseudomolecularion m/z 551.16. Betanin showed significant stability up to −30 ◦C and mild stability at chillingtemperature. The stability and antioxidant ability of this compound were assessed during a humandigestion simulation and ex vivo colon fermentation. Half of the betanin amount was recoveredin the small intestine digestive fluid and no traces were found after colon fermentation. Betaninhigh antioxidant ability was retained even after simulated small intestine digestion. Betanin, besidesdisplaying an inherent colorant capacity, was equally effective as a natural antioxidant displayingperoxy-radical scavenger ability in pork meat. Betanin should be considered a multi-functionalmolecule able to confer an attractive color to frozen or refrigerated foods, but with the capacity toavoid lipid oxidation, thereby preserving food quality. Long-term supplementation by beetroot, a richsource of betanin, should be stimulated to protect organisms against oxidative stress.
Keywords: beetroot; betalains; semi-preparative RP-HPLC; in vitro human gastrointestinal digestion;ex vivo colon fermentation; antioxidant ability; malonildialdehyde
1. Introduction
Beetroot (Beta vulgaris L.) is a vegetable presenting significant scientific interest, mainly because itis a rich source of nitrate (NO3
−), a compound with beneficial cardiovascular health effects, throughthe endogen production of nitric oxide (NO) [1]. Moreover, beetroots are the main source of betalains,a heterocyclic compound and water-soluble nitrogen pigment, which can be subdivided into twoclasses according to their chemical structure: betacyanins, such as betanin, prebetanin, isobetaninand neobetanin, responsible for red-violet coloring, and betaxanthins, responsible for orange-yellowcoloring, comprising vulgaxanthin I and II and indicaxanthin [2,3]. Betalains are present in the tuberouspart of beetroots, conferring its red-purple coloration.
Betanin (betanidin 5-O-β-D-glucoside) is the most abundant betacyanin and the only one approvedfor use as a natural colorant in food products, cosmetics and pharmaceuticals, under code EECNo. E 162 by the European Union and under Section 73.40 in Title 21 of the Code of Federal
161
Molecules 2019, 24, 458
Regulations (CFR) stipulated by the Food and Drug Administration (FDA) in the United States [4–6](Supplementary File—Figure S1A).
In the food industry, synthetic antioxidants are added to foods containing fat, especially meats,with the purpose of delaying oxidative processes that result in undesirable sensorial changes, decreasedshelf life and nutritional value and the formation of secondary compounds potentially harmful tohealth [7,8]. However, data in the literature have associated the synthetic antioxidants BHT (butylatedhydroxytoluene) and BHA (butylated hydroxyanisole) with possible deleterious health effects, as theyhave been reported as potential tumor promoters, following the chronic administration of thesecompounds to animals [9,10]. This has motivated the replacement of synthetic antioxidants withnatural antioxidants extracted from foodstuffs [11,12].
Betanin can be used as a powerful antioxidant in the food industry in extract or powder form,and is also applied as a natural pigment. Its antioxidant activity in biological lipid environmentshas been demonstrated in human macromolecules, such as low density lipoproteins, membranesand whole cells [13]. Furthermore, betanin has attracted attention due to its anti-inflammatory andhepatic protective functions in human cells. This compound is able to modulate redox-mediated signaltransduction pathways involved in inflammation responses in cultured endothelia cells, and has alsodisplayed antiproliferative effects on human tumor cell lines [14,15]. In both healthy and tumoralhuman hepatic cell lines, betanin can induce the translocation of the erythroid 2-related factor 2 (Nrf2)antioxidant response element (ARE) from the cytosol to the nuclear compartment, which controlsthe mRNA and protein levels of detoxifying/antioxidant enzymes, including GSTP, GSTM, GSTT,GSTA (glutathione S-transferases), NQO1 (NAD(P)H quinone dehydrogenase 1) and HO– (hemeoxygenase-1), in these cells, exerting hepatoprotective and anticarcinogenic effects [16].
Several betanin purification techniques have been reported, involving distinct steps andmethodologies in order to purify this compound from vegetal sources, including complex foodmatrices such as beetroot. Among the methods employed for betanin purification, high-performanceliquid chromatography (HPLC) and other chromatographic methods using reverse phase columnsseem to provide the best balance between speed and efficiency [17]. However, no other studies haveevaluated the stability of this molecule during storage conditions and its antioxidant capability afterpurification and during storage with the aim of use as a food additive.
In this context, the aim of the present study was to optimize a methodology applied for betaninpurification in large amounts, using fresh juice obtained from red beetroot (Beta vulgaris L. species).In addition, the chemical stability and bioactivity of the purified molecule were also assessed, throughtwo different viewpoints: (i) as a food preservative and (ii) as a in natura or processed food matrixcomponent after consumption and simulated gastrointestinal and ex vivo colon fermentation processes.
2. Results and Discussion
2.1. Betanin Purification
The chromatographic profile of betanin and isobetanin in fresh beetroot juice was compared to acommercial standard (Figure 1A,B). In the fresh juice chromatogram, betanin corresponds to the majorpeak (RT = 18.17 min), followed by its isomer, isobetanin (RT = 19.27 min). Betanin is found in largeamounts relative to its isobetanin isomer in fresh beetroot juice, which is similar to the ratio betweenbetanin and isobetanin previously reported by Gonçalves et al. [17]. The betanin concentrations infresh juice and in purified samples were calculated in comparison to a standard curve, described by theequation y = 5077078x − 370531 (R2 = 0.9993). Linearity was obtained at betanin concentration rangingfrom 0 to 500 mg·mL−1. After purification an HPLC-diode array detector (DAD) analysis indicateda single peak at the maximum absorption λ (535–540 nm), characteristic for betacyanins (Figure 1C).Purified betanin can be preserved at 4 ◦C for at least 20 days and for 275 days if maintained at −30 ◦C(Figure 1D). On the contrary of what has been described previously [17], betanin preparations turnedbrown during shelf life, due to the possible action of polyphenol oxidases (PPO enzymes) in the
162
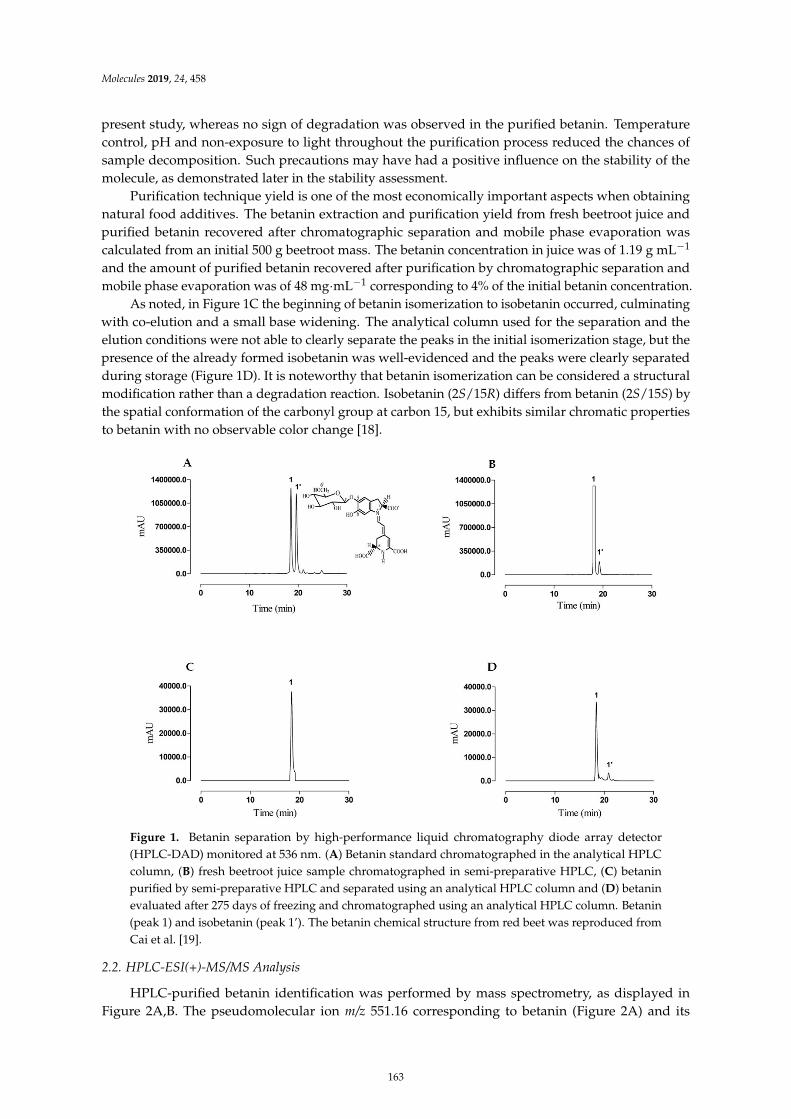
Molecules 2019, 24, 458
present study, whereas no sign of degradation was observed in the purified betanin. Temperaturecontrol, pH and non-exposure to light throughout the purification process reduced the chances ofsample decomposition. Such precautions may have had a positive influence on the stability of themolecule, as demonstrated later in the stability assessment.
Purification technique yield is one of the most economically important aspects when obtainingnatural food additives. The betanin extraction and purification yield from fresh beetroot juice andpurified betanin recovered after chromatographic separation and mobile phase evaporation wascalculated from an initial 500 g beetroot mass. The betanin concentration in juice was of 1.19 g mL−1
and the amount of purified betanin recovered after purification by chromatographic separation andmobile phase evaporation was of 48 mg·mL−1 corresponding to 4% of the initial betanin concentration.
As noted, in Figure 1C the beginning of betanin isomerization to isobetanin occurred, culminatingwith co-elution and a small base widening. The analytical column used for the separation and theelution conditions were not able to clearly separate the peaks in the initial isomerization stage, but thepresence of the already formed isobetanin was well-evidenced and the peaks were clearly separatedduring storage (Figure 1D). It is noteworthy that betanin isomerization can be considered a structuralmodification rather than a degradation reaction. Isobetanin (2S/15R) differs from betanin (2S/15S) bythe spatial conformation of the carbonyl group at carbon 15, but exhibits similar chromatic propertiesto betanin with no observable color change [18].
−
∙ −
Figure 1. Betanin separation by high-performance liquid chromatography diode array detector(HPLC-DAD) monitored at 536 nm. (A) Betanin standard chromatographed in the analytical HPLCcolumn, (B) fresh beetroot juice sample chromatographed in semi-preparative HPLC, (C) betaninpurified by semi-preparative HPLC and separated using an analytical HPLC column and (D) betaninevaluated after 275 days of freezing and chromatographed using an analytical HPLC column. Betanin(peak 1) and isobetanin (peak 1’). The betanin chemical structure from red beet was reproduced fromCai et al. [19].
2.2. HPLC-ESI(+)-MS/MS Analysis
HPLC-purified betanin identification was performed by mass spectrometry, as displayed inFigure 2A,B. The pseudomolecular ion m/z 551.16 corresponding to betanin (Figure 2A) and its
163
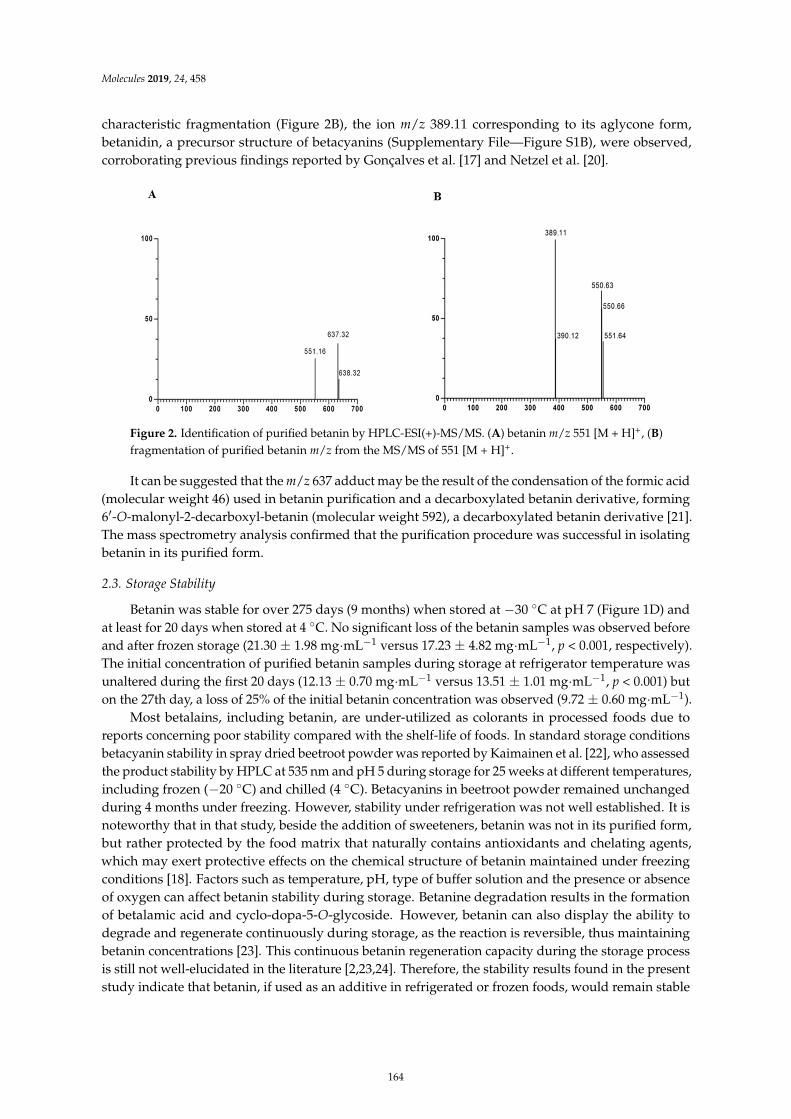
Molecules 2019, 24, 458
characteristic fragmentation (Figure 2B), the ion m/z 389.11 corresponding to its aglycone form,betanidin, a precursor structure of betacyanins (Supplementary File—Figure S1B), were observed,corroborating previous findings reported by Gonçalves et al. [17] and Netzel et al. [20].
′
−
∙ − ∙ −
∙ −
∙ −
∙ −
ff −
Figure 2. Identification of purified betanin by HPLC-ESI(+)-MS/MS. (A) betanin m/z 551 [M + H]+, (B)fragmentation of purified betanin m/z from the MS/MS of 551 [M + H]+.
It can be suggested that the m/z 637 adduct may be the result of the condensation of the formic acid(molecular weight 46) used in betanin purification and a decarboxylated betanin derivative, forming6′-O-malonyl-2-decarboxyl-betanin (molecular weight 592), a decarboxylated betanin derivative [21].The mass spectrometry analysis confirmed that the purification procedure was successful in isolatingbetanin in its purified form.
2.3. Storage Stability
Betanin was stable for over 275 days (9 months) when stored at −30 ◦C at pH 7 (Figure 1D) andat least for 20 days when stored at 4 ◦C. No significant loss of the betanin samples was observed beforeand after frozen storage (21.30 ± 1.98 mg·mL−1 versus 17.23 ± 4.82 mg·mL−1, p < 0.001, respectively).The initial concentration of purified betanin samples during storage at refrigerator temperature wasunaltered during the first 20 days (12.13 ± 0.70 mg·mL−1 versus 13.51 ± 1.01 mg·mL−1, p < 0.001) buton the 27th day, a loss of 25% of the initial betanin concentration was observed (9.72 ± 0.60 mg·mL−1).
Most betalains, including betanin, are under-utilized as colorants in processed foods due toreports concerning poor stability compared with the shelf-life of foods. In standard storage conditionsbetacyanin stability in spray dried beetroot powder was reported by Kaimainen et al. [22], who assessedthe product stability by HPLC at 535 nm and pH 5 during storage for 25 weeks at different temperatures,including frozen (−20 ◦C) and chilled (4 ◦C). Betacyanins in beetroot powder remained unchangedduring 4 months under freezing. However, stability under refrigeration was not well established. It isnoteworthy that in that study, beside the addition of sweeteners, betanin was not in its purified form,but rather protected by the food matrix that naturally contains antioxidants and chelating agents,which may exert protective effects on the chemical structure of betanin maintained under freezingconditions [18]. Factors such as temperature, pH, type of buffer solution and the presence or absenceof oxygen can affect betanin stability during storage. Betanine degradation results in the formationof betalamic acid and cyclo-dopa-5-O-glycoside. However, betanin can also display the ability todegrade and regenerate continuously during storage, as the reaction is reversible, thus maintainingbetanin concentrations [23]. This continuous betanin regeneration capacity during the storage processis still not well-elucidated in the literature [2,23,24]. Therefore, the stability results found in the presentstudy indicate that betanin, if used as an additive in refrigerated or frozen foods, would remain stable
164
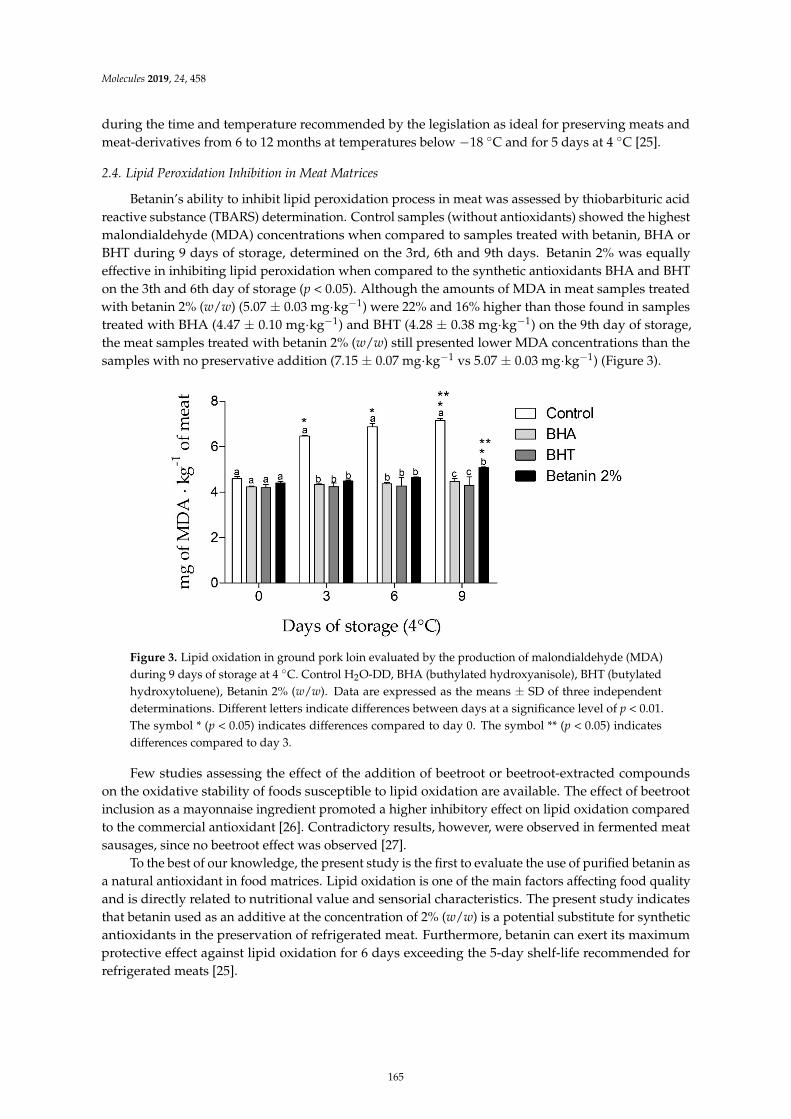
Molecules 2019, 24, 458
during the time and temperature recommended by the legislation as ideal for preserving meats andmeat-derivatives from 6 to 12 months at temperatures below −18 ◦C and for 5 days at 4 ◦C [25].
2.4. Lipid Peroxidation Inhibition in Meat Matrices
Betanin’s ability to inhibit lipid peroxidation process in meat was assessed by thiobarbituric acidreactive substance (TBARS) determination. Control samples (without antioxidants) showed the highestmalondialdehyde (MDA) concentrations when compared to samples treated with betanin, BHA orBHT during 9 days of storage, determined on the 3rd, 6th and 9th days. Betanin 2% was equallyeffective in inhibiting lipid peroxidation when compared to the synthetic antioxidants BHA and BHTon the 3th and 6th day of storage (p < 0.05). Although the amounts of MDA in meat samples treatedwith betanin 2% (w/w) (5.07 ± 0.03 mg·kg−1) were 22% and 16% higher than those found in samplestreated with BHA (4.47 ± 0.10 mg·kg−1) and BHT (4.28 ± 0.38 mg·kg−1) on the 9th day of storage,the meat samples treated with betanin 2% (w/w) still presented lower MDA concentrations than thesamples with no preservative addition (7.15 ± 0.07 mg·kg−1 vs 5.07 ± 0.03 mg·kg−1) (Figure 3).
−
∙ −
∙ − ∙ −
∙ − ∙ −
Figure 3. Lipid oxidation in ground pork loin evaluated by the production of malondialdehyde (MDA)during 9 days of storage at 4 ◦C. Control H2O-DD, BHA (buthylated hydroxyanisole), BHT (butylatedhydroxytoluene), Betanin 2% (w/w). Data are expressed as the means ± SD of three independentdeterminations. Different letters indicate differences between days at a significance level of p < 0.01.The symbol * (p < 0.05) indicates differences compared to day 0. The symbol ** (p < 0.05) indicatesdifferences compared to day 3.
Few studies assessing the effect of the addition of beetroot or beetroot-extracted compoundson the oxidative stability of foods susceptible to lipid oxidation are available. The effect of beetrootinclusion as a mayonnaise ingredient promoted a higher inhibitory effect on lipid oxidation comparedto the commercial antioxidant [26]. Contradictory results, however, were observed in fermented meatsausages, since no beetroot effect was observed [27].
To the best of our knowledge, the present study is the first to evaluate the use of purified betanin asa natural antioxidant in food matrices. Lipid oxidation is one of the main factors affecting food qualityand is directly related to nutritional value and sensorial characteristics. The present study indicatesthat betanin used as an additive at the concentration of 2% (w/w) is a potential substitute for syntheticantioxidants in the preservation of refrigerated meat. Furthermore, betanin can exert its maximumprotective effect against lipid oxidation for 6 days exceeding the 5-day shelf-life recommended forrefrigerated meats [25].
165
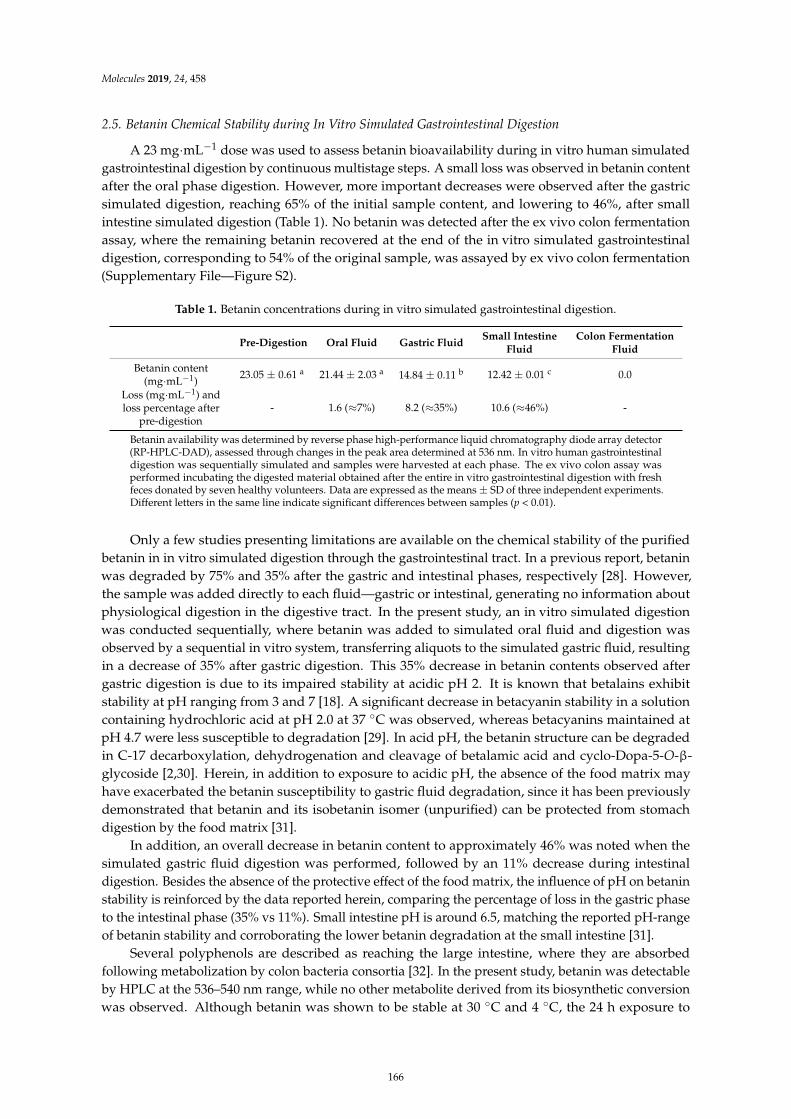
Molecules 2019, 24, 458
2.5. Betanin Chemical Stability during In Vitro Simulated Gastrointestinal Digestion
A 23 mg·mL−1 dose was used to assess betanin bioavailability during in vitro human simulatedgastrointestinal digestion by continuous multistage steps. A small loss was observed in betanin contentafter the oral phase digestion. However, more important decreases were observed after the gastricsimulated digestion, reaching 65% of the initial sample content, and lowering to 46%, after smallintestine simulated digestion (Table 1). No betanin was detected after the ex vivo colon fermentationassay, where the remaining betanin recovered at the end of the in vitro simulated gastrointestinaldigestion, corresponding to 54% of the original sample, was assayed by ex vivo colon fermentation(Supplementary File—Figure S2).
Table 1. Betanin concentrations during in vitro simulated gastrointestinal digestion.
Pre-Digestion Oral Fluid Gastric FluidSmall Intestine
FluidColon Fermentation
Fluid
Betanin content(mg·mL−1)
23.05 ± 0.61 a 21.44 ± 2.03 a 14.84 ± 0.11 b 12.42 ± 0.01 c 0.0
Loss (mg·mL−1) andloss percentage after
pre-digestion- 1.6 (≈7%) 8.2 (≈35%) 10.6 (≈46%) -
Betanin availability was determined by reverse phase high-performance liquid chromatography diode array detector(RP-HPLC-DAD), assessed through changes in the peak area determined at 536 nm. In vitro human gastrointestinaldigestion was sequentially simulated and samples were harvested at each phase. The ex vivo colon assay wasperformed incubating the digested material obtained after the entire in vitro gastrointestinal digestion with freshfeces donated by seven healthy volunteers. Data are expressed as the means ± SD of three independent experiments.Different letters in the same line indicate significant differences between samples (p < 0.01).
Only a few studies presenting limitations are available on the chemical stability of the purifiedbetanin in in vitro simulated digestion through the gastrointestinal tract. In a previous report, betaninwas degraded by 75% and 35% after the gastric and intestinal phases, respectively [28]. However,the sample was added directly to each fluid—gastric or intestinal, generating no information aboutphysiological digestion in the digestive tract. In the present study, an in vitro simulated digestionwas conducted sequentially, where betanin was added to simulated oral fluid and digestion wasobserved by a sequential in vitro system, transferring aliquots to the simulated gastric fluid, resultingin a decrease of 35% after gastric digestion. This 35% decrease in betanin contents observed aftergastric digestion is due to its impaired stability at acidic pH 2. It is known that betalains exhibitstability at pH ranging from 3 and 7 [18]. A significant decrease in betacyanin stability in a solutioncontaining hydrochloric acid at pH 2.0 at 37 ◦C was observed, whereas betacyanins maintained atpH 4.7 were less susceptible to degradation [29]. In acid pH, the betanin structure can be degradedin C-17 decarboxylation, dehydrogenation and cleavage of betalamic acid and cyclo-Dopa-5-O-β-glycoside [2,30]. Herein, in addition to exposure to acidic pH, the absence of the food matrix mayhave exacerbated the betanin susceptibility to gastric fluid degradation, since it has been previouslydemonstrated that betanin and its isobetanin isomer (unpurified) can be protected from stomachdigestion by the food matrix [31].
In addition, an overall decrease in betanin content to approximately 46% was noted when thesimulated gastric fluid digestion was performed, followed by an 11% decrease during intestinaldigestion. Besides the absence of the protective effect of the food matrix, the influence of pH on betaninstability is reinforced by the data reported herein, comparing the percentage of loss in the gastric phaseto the intestinal phase (35% vs 11%). Small intestine pH is around 6.5, matching the reported pH-rangeof betanin stability and corroborating the lower betanin degradation at the small intestine [31].
Several polyphenols are described as reaching the large intestine, where they are absorbedfollowing metabolization by colon bacteria consortia [32]. In the present study, betanin was detectableby HPLC at the 536–540 nm range, while no other metabolite derived from its biosynthetic conversionwas observed. Although betanin was shown to be stable at 30 ◦C and 4 ◦C, the 24 h exposure to
166
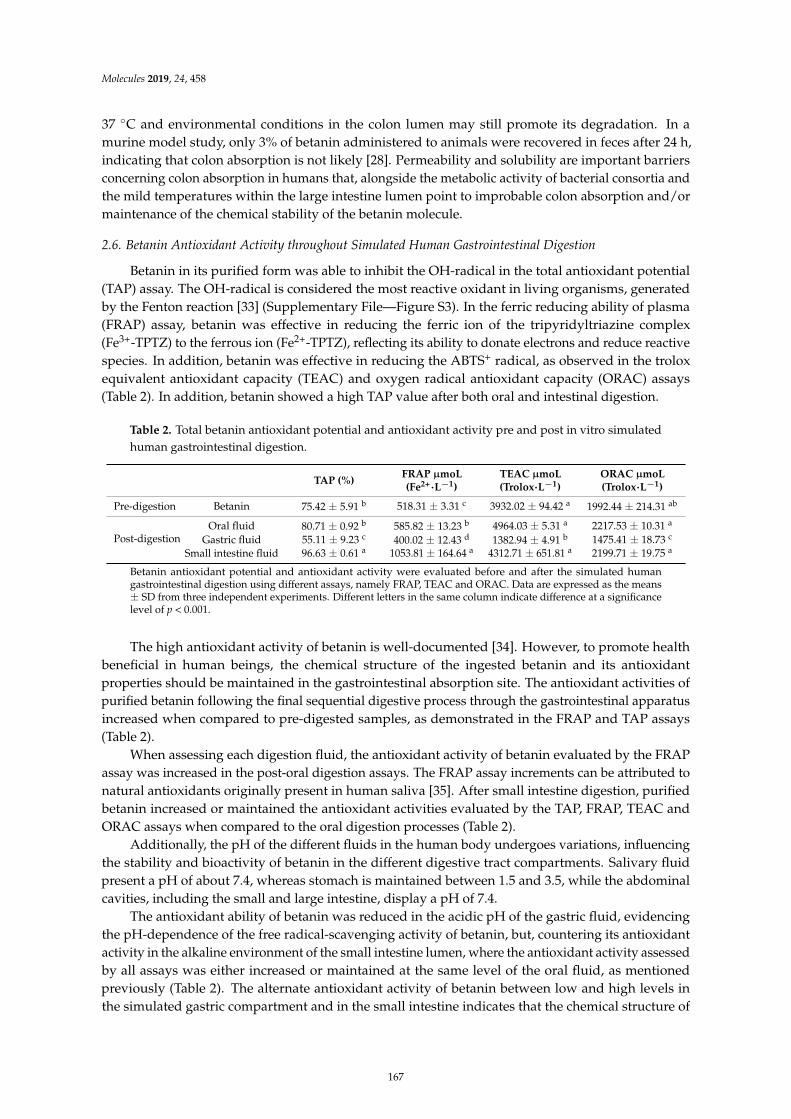
Molecules 2019, 24, 458
37 ◦C and environmental conditions in the colon lumen may still promote its degradation. In amurine model study, only 3% of betanin administered to animals were recovered in feces after 24 h,indicating that colon absorption is not likely [28]. Permeability and solubility are important barriersconcerning colon absorption in humans that, alongside the metabolic activity of bacterial consortia andthe mild temperatures within the large intestine lumen point to improbable colon absorption and/ormaintenance of the chemical stability of the betanin molecule.
2.6. Betanin Antioxidant Activity throughout Simulated Human Gastrointestinal Digestion
Betanin in its purified form was able to inhibit the OH-radical in the total antioxidant potential(TAP) assay. The OH-radical is considered the most reactive oxidant in living organisms, generatedby the Fenton reaction [33] (Supplementary File—Figure S3). In the ferric reducing ability of plasma(FRAP) assay, betanin was effective in reducing the ferric ion of the tripyridyltriazine complex(Fe3+-TPTZ) to the ferrous ion (Fe2+-TPTZ), reflecting its ability to donate electrons and reduce reactivespecies. In addition, betanin was effective in reducing the ABTS+ radical, as observed in the troloxequivalent antioxidant capacity (TEAC) and oxygen radical antioxidant capacity (ORAC) assays(Table 2). In addition, betanin showed a high TAP value after both oral and intestinal digestion.
Table 2. Total betanin antioxidant potential and antioxidant activity pre and post in vitro simulatedhuman gastrointestinal digestion.
TAP (%)FRAP µmoL(Fe2+·L−1)
TEAC µmoL(Trolox·L−1)
ORAC µmoL(Trolox·L−1)
Pre-digestion Betanin 75.42 ± 5.91 b 518.31 ± 3.31 c 3932.02 ± 94.42 a 1992.44 ± 214.31 ab
Post-digestionOral fluid 80.71 ± 0.92 b 585.82 ± 13.23 b 4964.03 ± 5.31 a 2217.53 ± 10.31 a
Gastric fluid 55.11 ± 9.23 c 400.02 ± 12.43 d 1382.94 ± 4.91 b 1475.41 ± 18.73 c
Small intestine fluid 96.63 ± 0.61 a 1053.81 ± 164.64 a 4312.71 ± 651.81 a 2199.71 ± 19.75 a
Betanin antioxidant potential and antioxidant activity were evaluated before and after the simulated humangastrointestinal digestion using different assays, namely FRAP, TEAC and ORAC. Data are expressed as the means± SD from three independent experiments. Different letters in the same column indicate difference at a significancelevel of p < 0.001.
The high antioxidant activity of betanin is well-documented [34]. However, to promote healthbeneficial in human beings, the chemical structure of the ingested betanin and its antioxidantproperties should be maintained in the gastrointestinal absorption site. The antioxidant activities ofpurified betanin following the final sequential digestive process through the gastrointestinal apparatusincreased when compared to pre-digested samples, as demonstrated in the FRAP and TAP assays(Table 2).
When assessing each digestion fluid, the antioxidant activity of betanin evaluated by the FRAPassay was increased in the post-oral digestion assays. The FRAP assay increments can be attributed tonatural antioxidants originally present in human saliva [35]. After small intestine digestion, purifiedbetanin increased or maintained the antioxidant activities evaluated by the TAP, FRAP, TEAC andORAC assays when compared to the oral digestion processes (Table 2).
Additionally, the pH of the different fluids in the human body undergoes variations, influencingthe stability and bioactivity of betanin in the different digestive tract compartments. Salivary fluidpresent a pH of about 7.4, whereas stomach is maintained between 1.5 and 3.5, while the abdominalcavities, including the small and large intestine, display a pH of 7.4.
The antioxidant ability of betanin was reduced in the acidic pH of the gastric fluid, evidencingthe pH-dependence of the free radical-scavenging activity of betanin, but, countering its antioxidantactivity in the alkaline environment of the small intestine lumen, where the antioxidant activity assessedby all assays was either increased or maintained at the same level of the oral fluid, as mentionedpreviously (Table 2). The alternate antioxidant activity of betanin between low and high levels inthe simulated gastric compartment and in the small intestine indicates that the chemical structure of
167
Molecules 2019, 24, 458
betanin was maintained unaltered following acidic pH exposure during the simulated gastric digestion,but should be attributed to the protonation of the betanin molecule, favoring the maintenance of freeradical-scavenging activity until absorption in the gastrointestinal tract.
Changes in pH fluids induce changes in the chemical structure of betanin along the gastroentericapparatus. Betanin presents its cationic form at pH < 2, zwitterionic form at pH = 2, anionic monoat 2 < pH < 3 with deprotonated C2-COOH and C15-COOH groups, anionic bis at 3.5 < pH <7 with C2-COOH, C15-COOH and C17-COOH groups deprotonated and anionic tris at 7.5 < pH< 9 with all carboxyl deprotonated groups, in addition to the C6-OH group on the phenolic ring(Supplementary File—Figure S4) [36]. The increase in betanin bioactivity, when in an alkaline pHenvironment, as found in the simulated small intestine fluid, can be ascribed to its ability to donate H+
and electrons when altering from the cationic to the mono, bis and tri deprotonated states. The freeradical scavenging activity of betanin at different pH (from 2 to 9) was previously determined throughthe TEAC assay, phenolic O–H homolytic bond dissociation energy (OH BDE), ionization potential(IP) and deprotonation energy (DE) [37]. The TEAC assay indicated that the antioxidant activity ofbetanin is dependent on pH, and very high above pH > 4. Moreover, with the gradual increase ofthe deprotonation of the betanin molecule (mono, bi- and tri-deprotonated) according to increasingpH, BDE and PI values decreased. This implies that, at slightly alkaline pH, betanin becomes a betterhydrogen and electron donor, increasing its radical-scavenger ability as observed in the antioxidantassays in the simulated small intestine fluid when compared to the gastric fluid.
Although almost 46% (11 mg) of betanin content were chemically modified in the gastric tract,the antioxidant power of the remaining betanin, 54% of the original amount, corresponding to 12 mgfound in the small intestine fluid (21 µmol) seems to be enough to promote lipid oxidation inhibition,since betanin in the range of 0.3–1.9 µmol has been found to inhibit lipid peroxidation in biologicalmembranes, in a linoleate emulsion catalyzed by the “free iron” redox cycle, in H2O2-activatedmetmyoglobin and in lipoxygenase activity [38].
3. Material and Methods
3.1. Standards and Reagents
The betanin standard (C24H26N2O13), sulfuric acid (H2SO4), boric acid (H3BO3), formic acid(CH2O2), hydrochloric acid (HCL), terephthalic acid (TPA, C8H6O4), ethylenediaminetetraaceticacid (EDTA), 6-hydroxy-2-5-7-8-tetramethylchromo-2-carboxylic acid (Trolox), ascorbic acid (C6H8O6),sodium hydroxide (NaOH), potassium permanganate (KMnO4), hydrogen peroxide (H2O2), potassiumsulphate (K2SO4), ferrous sulphate (FeSO4), methyl red, bromocresol green, petroleum ether,anhydrous sodium acetate (CH3COONa), tetrabutylammonium perchlorate (C16H36N.H2PO4),vanillin, tripyridyltriazine (TPTZ, C18H12N6), iron chloride (FeCl3), dibasic sodium phosphate(NaH2PO4.H2O), monobasic sodium phosphate (NaH2PO4.H2O), sodium chloride (NaCl), anhydrousmonobasic sodium phosphate (Na2HPO4), sodium bicarbonate (NaHCO3) C-211,2,2′-Azobis(2-methylpropionamidine), dihydrochloride (AAPH), 2,2′-azinobis [3-ethylbenzothiazoline-6-sulfonicacid]-diammonium salt (ABTS, C18H24N6O6S4), sodium fluorescein (C20H12O5), potassium hydroxide(KOH), ammonium thiocyanate (NH4SCN), trichloroacetic acid (Cl3CCOOH) were purchasedfrom Sigma-Aldrich Chemical Co. (São Paulo, SP, Brazil). Methanol (MeOH), ethanol,acetone, and acetonitrile were purchased from Tedia Company Inc. (Rio de Janeiro, RJ, Brazil).Buthylated hydroxyanisole (BHA), butylated hydroxytoluene (BHT), 1,1,3,3-tetramethoxypropane((CH3O)2CHCH2CH(OCH3)2) and 2-thiobarbituric acid (C4H4N2O2S) were purchased fromSigma-Aldrich Co. HPLC grade Milli-Q water (Merck Millipore, Burlington, MA, USA) was usedthroughout the experiments.
168
Molecules 2019, 24, 458
3.2. Betanin Purification
3.2.1. Sample Preparation
Red beetroot was peeled, sliced and homogenized using a centrifuge food processor EC 700(Black and Decker, São Paulo, Brazil). The homogenates were centrifuged at 15,000× g for 30 minat 25 ◦C and filtered through a PTFE filter membrane 25 mm, pore size 0.45 µm (Merck-Millipore).The supernatants (4 mL) were concentrated under reduced pressure (18 mbar, 25 ◦C) and resuspendedin 2 mL deionized water.
3.2.2. HPLC Betanin Purification
Concentrated beetroot juice was purified by RP-HPLC. The HPLC apparatus consisted in anLC-20A Prominence, (Shimadzu®, Kyoto, Japan) equipped with a quaternary pump and a DADmodel SPD-M20A (Shimadzu®, Kyoto, Japan). A 15 µm Phenomenex C18 column (250 × 21.2 mmI.D., Torrance, California, USA) connected to an FRC-10A fraction collector (Shimadzu®) was usedin the semi-preparative HPLC. The elution conditions were performed according to Cai et al. [39]with modifications. Solvent A was 1% formic acid, and solvent B was 80% methanol at a lineargradient (0–25 min, 11–55%). The injection volume was 100 µL and a flow rate of 5.5 mLmin−1 wasused. Separations were monitored at 536 nm and, after purification, magenta fractions, containingbetanin, were concentrated by a rotary evaporator (Rotavapor® R-215, Buchi, São Paulo, Brazil) at24 ◦C, 150 rpm and a water bath at 40 ◦C. The extracts were then suspended in 1 mL deionizedwater and stored at −30 ◦C under an N2 atmosphere for further analysis. The purified betanin wasanalyzed using a Nucleosil 100-C18 column (250 × 4.6 mm I.D., 5 µm) with 30 µL injection volumeand a flow rate of 1.0 mL min−1. The mobile phase and gradient conditions were similar to thepurification step and betanin concentrations were quantified in comparison to a betanin standardsolution (Sigma-Aldrich Co.).
3.3. Betanin Identification by Liquid Chromatography Positive Ion Electrospray Ionization Tandem MassSpectrometry (LC-ESI(+)-MS/MS)
Mass spectrometry was performed as described by Gonçalves et al. [17]. The RP-HPLC purifiedfraction was ionized in the positive mode and ions were monitored in the full scan mode (range ofm/z 50–1500). The ESI(+)-MS/MS analysis was carried out on a Bruker Esquire 3000 Plus Ion TrapMass Spectrometer (Bruker Co., Billerica, MA, USA) equipped with an electrospray source in thepositive ion mode. Nitrogen was used as the nebulizing (45 psi) and drying gas (6 L·min−1, 300 ◦C)and helium as the buffer gas (4 × 10⁻⁶ mbar). The high capillary voltage was set to 3500 V. To avoidspace–charge effects, smart ion charge control (ICC) was set to an arbitrary value of 50.000. Betaninidentification was based on its mass (550 g·mol−1) and by similarity with the commercial standardand literature-available spectra [39].
3.4. Storage Stability
The stability of purified betanin during refrigeration (4 ◦C) and freezing (−30 ◦C) was evaluated byRP-HPLC-DAD (Shimadzu®, Kyoto, Japan), monitoring changes in the area under the chromatogrampeak obtained at 536 nm, in similar conditions as those described for the betanin analysis.
3.5. Betanin Ability to Inhibit Lipid Peroxidation in Meat
Betanin ability to inhibit lipid peroxidation was evaluated by MDA determination in meat TBARSassay, as described previously [40] with modifications. A sample of ground pork loin (500 g) from alocal butcher shop in Rio de Janeiro, Brazil and divided into 4 portions and treated as follow: (i) groundpork loin non-treated by antioxidants; (ii) ground pork loin treated with betanin (2%; w/w); (iii) groundpork loin treated with BHT (0.01%); (iv) ground pork loin treated with BHA (0.01%). MDA extractionwas performed in 3.0 g of each meat sample homogenized with 9 mL of 7.5% TCA. The homogenate
169
Molecules 2019, 24, 458
was centrifuged at 3000× g for 15 min at 25 ◦C and filtered through Whatman n◦ 4 paper (MerckMillipore Co). TMP (the MDA standard) at 3.2 mM in 0.1 M HCl (stock solution) was kept for 2 h atroom temperature in the dark. After hydrolysis, the TMP solution was diluted with 7.5% TCA to theconcentrations of 1, 2, 4, 8, 16 and 32 µM. After, 1 mL of MDA at different concentrations or 7.5% TCAsolution (blank) was transferred into a screw-cap tube and 1 mL of 20 mM TBA solution was added.The tubes were heated in a boiling water bath at 90 ◦C for 30 min and cooled in tap water for 10 min.Absorbance of the MDA-TBA adducts were measured at 532 nm on a spectrophotometer DU®530(Beckman Coulter Inc., Brea, CA, USA). Because betanin absorbs light in the range of 530–540 nm,additional blanks containing betanin (1 or 2%), TCA or TBA (no meat) were used to correct theoverestimation of the TBA-MDA adduct absorbance. The concentration of MDA was expressed in mgof MDA per kg of meat (mg of MDA·kg−1 meat) at each treatment along the 9 days storage at 4 ◦C.
3.6. TAP Determination
Betanin samples were analyzed as described previously [41]. Samples were diluted (1:10) andcentrifuged at 4500× g for 10 min, and the supernatants were then filtered through 0.45 µm cellulosemembranes (Merck Millipore Co). The resulting samples were transferred to amber vials and incubatedat 37 ◦C for 10 min with a solution containing 1 mM Fe2+, 10 mM H2O2 and 1 mM terephthalic acid(TPA) in 50 mM phosphate buffer pH 7.4. Hydroxyterephthalic acids (HTPA) were detected by HPLC.TAP measurements were obtained by the difference between the chromatogram surface area generatedin the Fenton reaction with and without the sample.
3.7. Antioxidant Activity Determination by Different Assays
3.7.1. FRAP Determination
FRAP assays were performed using a modification of the method described by Benzie andStrain [42]. Betanin samples were diluted (1:10) and then mixed thoroughly with the FRAP reagent.Standard FeSO4 solutions were used and absorbances at 593 nm were determined on a V–530 UV/VISspectrophotometer (Jasco®, Easton, PA, USA). The FRAP results for each sample were evaluated intriplicate and expressed as µmol of Fe2+·L−1.
3.7.2. TEAC Determination
TEAC assays were performed using a modification of the method described by Re et al. [43].The ABTS radical cation (ABTS•+) was generated by chemical reaction of ABTS with K2S2O8 in thedark at room temperature for 12–16 h. Each betanin sample was mixed with the ABTS•+ reagentand absorbances at 720 nm were determined using a V–530 UV/VIS spectrophotometer (Jasco®).TEAC results were determined in triplicate and were associated to the ABTS•+ inhibition percentageby antioxidants present in the samples. The TEAC results for each beetroot sample were evaluated intriplicate and expressed as µmol of Trolox·L−1.
3.7.3. ORAC Determination
The ORAC assay was performed according to Zuleta et al. [44], with modifications. Sampleabsorbances were determined on a Wallac 1420 VICTOR multilabel counter (Perkin–Elmer Inc,Waltham, MA, USA) with fluorescence filters at an excitation wavelength of 485 nm and emissionwavelength of 535 nm. A fluorescein stock solution was prepared by weighing 3 mg of fluoresceinfollowed by dissolution in 100 mL of phosphate buffer (75 mM, pH 7.4). The fluorescein stock solutionwas stored in complete darkness under refrigeration. The fluorescein working solution (78 nM) wasprepared daily by dilution of 0.100 mL of the fluorescein stock solution in 100 mL of phosphate buffer.The AAPH radical (221 mM) was prepared daily by mixing 600 mg of AAPH in 10 mL phosphatebuffer. A 25 µM Trolox solution was used as reference standard, prepared daily in phosphate bufferfrom a 4 mM stock standard solution kept in a freezer at 20 ◦C. A total of 100 µL of fluorescein (78 nM)
170
Molecules 2019, 24, 458
and 100 µL of the samples, blanks (phosphate buffer), or standards (25 µM of Trolox) were added toeach well, followed by 50 µL of AAPH (221 mM). ORAC values, expressed as µM Trolox equivalentswere calculated by applying the following formula:
ORAC (µM Trolox equivalents) = CTrolox·(AUCSample − AUCBlank)·k
(AUCTrolox − AUCBlank)
where CTrolox is the Trolox concentration (µM), k is the sample dilution factor, and AUC is thearea below the fluorescence decay curve of the samples, blanks and Trolox, respectively, calculatedusing the GraphPad Prism v.5 software package (GraphPad Software Inc., San Diego, CA, USA).ORAC determinations were performed in triplicate and expressed as mmol Trolox equivalents·100 g−1.
3.8. Simulated Betanin In Vitro Human Gastrointestinal Digestion and Ex Vivo Colon Fermentation(Supplementary File—Figure S5)
Betanin concentrations after in vitro oral, gastric and small intestine digestion and ex vivo colonfermentation were evaluated by RP-HPLC while antioxidant activity was evaluated by TAP, FRAP,TEAC and ORAC assays, as described previously. Samples were analyzed in triplicate.
The in vitro human simulated gastrointestinal digestion, including the oral, gastric andsmall intestine phases, was performed according to Oomen et al., [45] and Sagratini et al. [46],with modifications. For the OD simulation, 1 mL betanin aliquots at 23 mg·mL−1 were placedin a glass jar followed by the addition of 3 mL of human saliva, and incubated at 37 ◦C for 1 min underorbital agitation at 260 rpm in a Sorvall ST 16R centrifuge (Thermo ScientificTM, Waltham, MA, USA)to complete the OD.
A 2.5 mL aliquot of artificial gastric fluid containing 2.75 g of NaCl, 0.27 g of NaH2PO4, 0.82 g ofKCl, 0.42 g of CaCl2, 0.31 g of NH4Cl, 0.65 g of glucose, 0.085 g of urea, 3.0 g of mucine, 2.64 g of swinegastric pepsin, 1.0 g of bovine albumin, 8.3 mL of HCl was added to the oral fluid sample to a finalvolume of 500 mL and the pH was adjusted to 2.0 with 5 M HCl. The glass jars were then resealedwith a rubber septum and the atmosphere was saturated with N2 and incubated at 37 ◦C for 2 h underorbital shaking at 260 rpm to complete the GD.
The gastric fluid had its pH adjusted to 6.0 with NaHCO3 and 2.0 mL of artificial small intestinefluid containing 6.75 g of NaCl, 0.517 g of KCl, 0.205 g of CaCl2, 3.99 g of NaHCO3, 0.06 g of KH2PO4,0.0375 g of MgCl2, 0.1375 g of urea, 25.0 g of swine bile, 4.0 g of swine pancreatin, 1.2 g of albuminbovine and 0.185 mL HCl were added to a final volume of 500 mL. The glass jars were then resealedand the atmosphere was saturated with N2 and incubated at 37 ◦C for 2 h under orbital shaking at260 rpm to complete the ID. At the end of each simulated gastrointestinal step (oral, gastric and smallintestine), aliquots were collected and centrifuged (3000× g, 15 min, 25 ◦C). The supernatants werethen filtered through 0.45 and 0.22 µm membranes, followed by Amicon ultra filtration using 10 kDacut-off membranes.
Ex vivo Colon Fermentation
The ex vivo colon fermentation assay was performed according to Hu et al. [47] with modifications,in accordance to the ethical standards of the declaration of Helsinki after approval by the HospitalUniversitário Clementino Fraga Filho/Universidade Federal do Rio de Janeiro Education and ResearchCommittee, under No. 512.84.
The ex vivo assay was performed using fresh feces donated by seven healthy volunteers (4 menand 3 women), recruited according to the following criteria: age between 18 and 50, eutrophic (BMIbetween 18.5 and 24.9 kg m2), absence of gastrointestinal diseases, displaying one bowel movementevery two days and up two bowel movements per day, with no medication and/or food supplementsused 90 days prior to the feces collection.
171
Molecules 2019, 24, 458
The feces were homogenized in a nutrient-rich medium (0.5 g·10 mL−1), prepared according toMcDonald et al. [48], where the medium was autoclaved and saturated with CO2 in an anaerobicchamber for 48 h. A 5 mL aliquot of this mixture was added to the digested material after the in vitrogastrointestinal digestion. The mixture was then incubated at 37 ◦C, under orbital shaking at 50 rpmfor 48 h. The ex vivo colon fermentation assay was independently repeated three times.
3.9. Statistical Analyses
A one-way analysis of variance (ANOVA) with repeated measurements were performed toidentify differences in TAP and antioxidant activities (FRAP, TEAC and ORAC) before and after thesimulated gastrointestinal digestion (pre-digestion, oral, gastric, small intestine and colon phases).In addition, a two-way analysis of variance (ANOVA) with repeated measurements was performedto identify differences in MDA concentrations in the lipid peroxidation assay between each type ofantioxidant and between each experiment day, evaluated by TBARS assay. When a significant F wasfound, an additional post hoc analysis was performed by a Bonferroni correction. Data were expressedas means ± standard deviation (SD). The statistical analyses were performed using Graphpad Prismsoftware version 5 for Windows® (GraphPad Software, San Diego, CA, USA).
4. Conclusions
The decomposition of food components and bioactive or additive compounds along thegastrointestinal trait is a helpful tool to assess their potential positive and negative effects on health,as well as to evaluate possible toxicity and/or safety usage. The prediction of the in vivo absorption ofsuch compounds can aid in compound usage regulation, establishing safety dosages in food.
Betanin in its purified form can be very stable during storage at low temperature and alkalinepH, so it may be useful as food colorant and antioxidant additive in meat and meat derivatives asa substitute for synthetic antioxidants. According to the chemical stability at both refrigerator andfreezer temperatures, betanin can be used as a food colorant or preservative in almost all foodstuffs,including those stored at −30 ◦C, such as bacon, sausages, vegetables, ham, corned beef, ice cream andsherbet (www.fda.gov/food/guidance/regulation) and those preserved at 4–8 ◦C, including mincedmeat and fresh meat, yogurts and desserts, since their shelf life is lower than the 20 days in whichbetanin is stable.
In addition, betanin maintained its bioactivity during the simulated digestive process, presentinghigh TAP, FRAP, TEAC and ORAC values in the intestinal phase. Although the exact parts of thegastrointestinal tract in where betanin is absorbed still require elucidation, it can be suggested thatabsorption may occur in the small intestine. The chemical integrity of betanin and its antioxidantactivity can be considered potential aid against diseases caused by oxidative stress.
These novel findings reinforce the importance of the regular uptake of red beetroot and itsderivative products. The formulation of new dietary supplements or processed foods can includepurified betanin, not only as a natural food colorant or preservative, but also as a bioactive compoundthat may act as an adjuvant in the treatment and prevention of chronic diseases related to oxidativestress in humans.
Supplementary Materials: Figure S1: Chemical structure of betanin (A) and betanid in (B); Figure S2: Betaninchromatograms before and after each in vitro digestion phase assessed by RP-HPLC equipped with DAD detector(536 nm). Purified betanin (A), after oral digestion (B), after gastric digestion (C), after small intestine digestion(D); Figure S3: Betanin total antioxidant potential (TAP) assessed by RP-HPLC equipped with a fluorescencedetector (312/428 nm). Hydroxyterephthalic acid (HTPA) chromatograms of generated in the Fenton reactionwithout any sample (A), after betanin addition (B), after oral digestion (C), after gastric digestion (D), after smallintestine digestion (E); Figure S4: Influence of pH on betanin chemical structure charge changes in an aqueoussolution according to Frank et al. [35]. Figure S5: Simulated digestion scheme.
Author Contributions: D.V.T.d.S., E.M.D.A. and V.M.F.P. conceptualized and designed the research; D.V.T.d.S.,D.d.S.B., F.d.O.S., G.A. and D.P. compiled, quantified and performed all experiments; D.V.T.d.S., D.d.S.B.,E.M.D.A. and V.M.F.P. evaluated and interpreted all the results; D.V.T.d.S. and D.d.S.B. prepared the figures;D.V.T.d.S and V.M.F.P. wrote the manuscript; D.V.T.S., D.d.S.B. and V.M.F.P. edited and revised the manuscript.
172
Molecules 2019, 24, 458
All authors critically revised the manuscript concerning important intellectual content, and read and approvedthe final manuscript.
Funding: The authors acknowledge financial support from CNPq (Conselho Nacional de DesenvolvimentoCientífico e Tecnológico), CAPES (Coordenação de Aperfeiçoamento de Pessoal de Nível Superior) and FAPERJ(Fundação Carlos Chagas Filho de Amparo à Pesquisa do Estado do Rio de Janeiro).
Conflicts of Interest: This article does not report any studies with human or animal subjects. The authors declareno conflicts of interest.
References
1. Baião, D.S.; da Silva, D.V.; Del Aguila, E.M.; Paschoalin, V.M.F. Nutritional, Bioactive and PhysicochemicalCharacteristics of Different Beetroot Formulations, Food Additives. 6 September 2017. Availableonline: https://www.intechopen.com/books/food-additives/nutritional-bioactive-and-physicochemical-characteristics-of-different-beetroot-formulations (accessed on 3 December 2018).
2. Azeredo, M.C. Betalains: Properties, sources, applications, and stability—A review. Int. J. Food Sci. Technol.
2009, 44, 2365–2376. [CrossRef]3. Saponjac, V.T.; Canadanovic-Brunet, J.; Cetkovic, G.; Jakisic, M.; Djilas, S.; Vulic, J.; Stajcic, S. Encapisulation
of beetroot pomace extract: Rsm optimization, storage and gastrointestinal stability. Molecules 2016, 21, 584.[CrossRef] [PubMed]
4. European Food Safety Authority. Scientific opinion on the re-evaluation of beetroot red (E 162) as a foodadditive. EFSA J. 2015, 13, 4318. [CrossRef]
5. US Food and Drug Administration (FDA). Code of Federal Regulations. 2009. Available online:https://www.accessdata.fda.gov/scripts/cdrh/cfdocs/cfcfr/CFRSearch.cfm?fr=73.260 (accessed on 28January 2019).
6. Nemzer, B.; Pietrzkowski, Z.; Sporna, A.; Stalica, P.; Thresher, W.; Michałowski, T.; Wybraniec, S. Betalainicand nutritional profiles of pigment-enriched red beet root (Beta vulgaris L.) dried extracts. Food Chem. 2011,127, 42–53. [CrossRef]
7. Gómez, M.; Lorenzo, J.M. Effect of packaging conditions on shelf-life of foal fresh meat. Meat Sci. 2012,91, 513–520. [CrossRef] [PubMed]
8. Falowo, A.B.; Fayemi, P.O.; Muchenje, V. Natural antioxidants against lipid-protein oxidative deteriorationin meat and meat products: A review. Food Res. Int. 2014, 64, 171–181. [CrossRef]
9. Ito, N.; Fukushima, S.; Tsuda, H.; Shirai, T.; Tatematsu, M.; Imaida, K. Modification of chemical carcinogenesisby antioxidants. Princess Takamatsu Symp. 1983, 14, 381–389. [CrossRef]
10. Williams, G.M.; Wang, C.X.; Iatropoulos, M.J. Toxicity studies of butylated hydroxanisole and butylatedhydroxytoluene. II. Chronic feeding studies. Food Chem. Toxicol. 1990, 28, 799–806. [CrossRef]
11. Cunha, L.C.M.; Monteiro, M.L.G.; Costa-Lima, B.R.C.; Guedes-Oliveira, J.M.; Alves, V.H.M.; Almeida, A.L.;Tonon, R.V.; Rosenthal, A.; Conte-Junior, C.A. Effect of microencapsulated extract of pitaya(Hylocereuscostaricensis) peel on color, texture and oxidative stability of refrigerated ground pork pattiessubmitted to high pressure processing. Innov. Food Sci. Emerg. Technol. 2018, 49, 136–145. [CrossRef]
12. Muíño, I.; Fuente, J.; Pérez, C.; Apeleo, E.; Pérez-Santaescolástica, C.; Cañeque, V.; Lauzurica, S.;Bermejo-Poza, R.; Díaz, A.M.T. Use of red wine polyphenols as a natural preservative in health-promotingomega-3 fatty acids-enriched lamb patties. Molecules 2018, 23, 3080. [CrossRef] [PubMed]
13. Khan, M.I. Plant betalain: Safety, antioxidant activity, clinical efficacy, and bioavailability. Compr. Rev. Food
Sci. Food Saf. 2015, 15, 316–330. [CrossRef]14. Gentile, C.; Tesoriere, L.; Allegra, M.; Livrea, M.A.; D’Alessio, P. Antioxidant betalains from cactus pear
(Opuntiaficus-indica) inhibit endothelial ICAM-1 expression. Ann. N. Y. Acad. Sci. 2004, 1028, 481–486.[CrossRef] [PubMed]
15. Kapadia, G.J.; Azuine, M.A.; Rao, G.S.; Arai, T.; Lida, A.; Tokuda, H. Cytotoxic effect of the red beetroot (Beta
vulgaris L.) extract compared to doxorubicin (Adriamycin) in the human prostate (PC-3) and breast (MCF-7)cancer cell lines. Anticancer Agents Med. Chem. 2011, 11, 280–284. [CrossRef] [PubMed]
16. Krajka-Kuzniak, V.; Paluszczak, J.; Szaefer, H.; Baer-Dubowska, W. Betanin, a beetroot component, inducesnuclear factor erythroid-2-related factor 2-mediated expression of detoxifying/antioxidant enzymes inhuman liver cell lines. Br. J. Nutr. 2013, 110, 2138–2149. [CrossRef] [PubMed]
173
Molecules 2019, 24, 458
17. Gonçalves, L.C.P.; Trassi, M.A.S.; Lopes, N.B.; Dör, F.A.; dos Santos, M.T.; Baader, J.W.; Oliveira Jr, V.X.;Bastos, E.L. A comparative study of the purification of betanin. Food Chem. 2012, 131, 231–238. [CrossRef]
18. Herbach, K.M.; Stintzing, F.C.; Carle, R. Betalain stability and degradation—Structural and chromatic aspects.J. Food Sci. 2006, 71, R41–R50. [CrossRef]
19. Cai, Y.; Sun, M.; Corke, H. Antioxidant activity of betalains from plants of the Amaranthaceae. J. Agric.
Food Chem. 2003, 51, 2288–2294. [CrossRef]20. Netzel, M.; Stintzing, F.C.; Quaas, D.; Stra, B.G.; Carle, R.; Bitsch, R.; Bitsch, I.; Frank, T. Renal excretion of
antioxidative constituents from red beet in humans. Food Res. Int. 2005, 38, 1051–1058. [CrossRef]21. Belhadj, S.I.; Najar, T.; Abderrabba, M. Chemical and antioxidant properties of betalains. J. Agric. Food Chem.
2017, 65, 675–689. [CrossRef]22. Kaimainen, M.; Laaksonen, O.; Järvenpää, E.; Sandell, M.; Huopalahti, R. Consumer acceptance and stability
of spray dried betanin in model juices. Food Chem. 2015, 187, 398–406. [CrossRef] [PubMed]23. Han, D.; Kim, S.J.; Kim, S.H.; Kim, D.M. Repeated regeneration of degraded red beet juice pigments in the
presence of antioxidants. J. Food Sci. 1998, 63, 69–72. [CrossRef]24. Kujala, T.S.; Loponen, J.M.; Klika, K.D.; Pihlaja, K. Phenolics and betacyanins in red beetroot (Beta vulgaris)
root: Distribution and effect of cold storage on the content of total phenolics and three individual compounds.J. Agric. Food Chem. 2000, 48, 5338–5342. [CrossRef] [PubMed]
25. FDA (US Food and Drug Administration)—Refrigerator & Freezer Storage Chart. Available online:Chttps://www.fda.gov/downloads/food/resourcesforyou/healtheducators/ucm109315.pdf. (accessedon 2 December 2018).
26. Raikos, V.; McDonagh, A.; Ranawana, V.; Duthie, G. Processed beetroot (Beta vulgaris L.) as a naturalantioxidant in mayonnaise: Effects on physical stability, texture and sensory attributes. Food Sci.
Hum. Wellness 2016, 5, 191–198. [CrossRef]27. Sucu, C.; Yildiz, G.T. The investigation of the use of beetroot powder in Turkish fermented beef sausage
(sucuk) as nitrite alternative. Meat Sci. 2018, 140, 158–166. [CrossRef] [PubMed]28. Krantz, C.; Monier, M.; Wahlström, B. Absorption, excretion, metabolism and cardiovascular effects of
beetroot extract in the rat. Food Cosmet. Toxicol. 1980, 18, 363–366. [CrossRef]29. Watts, A.R.; Lennard, M.S.; Mason, S.L.; Tucker, G.T.; Woods, H.F. Beeturia and the biological fate of beetroot
pigments. Pharmacogenetics 1993, 3, 302–311. [CrossRef]30. Herbach, K.M.; Stintzing, R.C. Impact of thermal treatment on color and pigment pattern of Red beet (Beta
vulgaris L.) preparations. J. Food Sci. 2004, 69, 491–498. [CrossRef]31. Tesoriere, L.; Fazzari, M.; Angileri, F.; Gentile, C.; Livrea, M.A. In vitro digestion of betalainic foods. Stability
and bioaccessibility of betaxanthins and betacyanins and antioxidative potential of food digesta. J. Agric.
Food Chem. 2008, 56, 10487–11092. [CrossRef]32. Williamson, G.; Clifford, M.N. Role of the small intestine, colon and microbiota in determining the metabolic
fate of polyphenols. Biochem. Pharmacol. 2017, 139, 24–39. [CrossRef]33. Birben, E.; Sahiner, U.M.; Sackesen, C.; Erzurum, S.; Kalayci, O. Oxidative stress and antioxidant defense.
World Allergy Organ. J. 2012, 5, 9–19. [CrossRef] [PubMed]34. Esatbeyoglu, T.; Wagner, A.E.; Schini-Kerth, V.B.; Rimbach, G. Betanin—A food colorant with biological
activity. Mol. Nutr. Food Res. 2015, 59, 36–47. [CrossRef] [PubMed]35. Nagler, R.M.; Klein, I.; Zarzhevsky, N.; Drigues, N.; Reznick, A.Z. Characterization of the differentiated
antioxidant profile of human saliva. Free Rad. Biol. Med. 2002, 32, 268–277. [CrossRef]36. Frank, T.; Stintzing, F.C.; Carle, R.; Bitsch, I.; Quaas, D.; Strass, G.; Bitsch, R.; Netzel, M. Urinary
pharmacokinetics of betalains following consumption of red beet juice in healthy humans. Pharmacol. Res.
2005, 52, 290–297. [CrossRef] [PubMed]37. Gliszczynska-Swigło, A.; Szymusiak, H.; Malinowska, P. Betanin, the main pigment of red beet: Molecular
origin of its exceptionally high free radical-scavenging activity. Food Addit. Contam. 2006, 23, 1079–1087.[CrossRef] [PubMed]
38. Kanner, J.; Harel, S.; Granit, R. Betalains–A new class of dietary cationized antioxidants. J. Agric. Food Chem.
2001, 49, 5178–5185. [CrossRef] [PubMed]39. Cai, Y.; Sun, H.; Corke, H. HPLC Characterization of betalains from plants in the Amaranthaceae.
J. Chromatogr. Sci. 2005, 43, 454–460. [CrossRef]
174
Molecules 2019, 24, 458
40. Jung, S.; Nam, K.C.; Jo, C. Detection of malondialdehyde in processed meat products without interferencefrom the ingredients. Food Chem. 2016, 209, 90–94. [CrossRef]
41. Silva, D.V.; Silva, F.O.; Perrone, D.; Pierucci, A.P.T.R.; Conte-Junior, C.A.; Alvares, T.S.; Del Aguila, E.M.;Paschoalin, V.M.F. Physicochemical, nutritional, and sensory analyses of a nitrate-enriched beetroot gel andits effects on plasmatic nitric oxide and blood pressure. Food Nut. Res. 2016, 60, 29909. [CrossRef]
42. Benzie, I.F.; Strain, J.J. The ferric reducing ability of plasma (FRAP) as a measure of “antioxidant power”:The FRAP assay. Ana. Biochem. 1996, 239, 70–76. [CrossRef]
43. Re, R.; Pellegrini, N.; Proteggente, A.; Pannala, A.; Yang, M.; Rice-Evans, C. Antioxidant activity applying animproved ABTS radical cation decolorization assay. Free Rad. Biol. Med. 1999, 26, 1231–1237. [CrossRef]
44. Zuleta, A.; Esteve, M.J.; Frígola, A. ORAC and TEAC assays comparison to measure the antioxidant capacityof food products. Food Chem. 2009, 114, 310–316. [CrossRef]
45. Oomen, A.G.; Rompelberg, C.J.; Bruil, M.A.; Dobbe, C.J.; Pereboom, D.P.; Sips, A.J. Development of an in vitrodigestion model for estimating the bioaccessibility of soil contaminants. Arch. Environ. Contam. Toxicol. 2003,44, 281–287. [CrossRef] [PubMed]
46. Sagratini, G.; Caprioli, G.; Maggi, F.; Font, G.; Giardinà, D.; Mañes, J.; Meca, G.; Ricciutelli, M.; Sirocchi, V.;Torregiani, E.; Vittori, S. Determination of soya saponins I and βg in raw and cooked legumes by solidphase extraction (SPE) coupled to liquid chromatography (LC)-mass spectrometry (MS) and assessment oftheir bioaccessibility by an in vitro digestion model. J. Agric. Food Chem. 2013, 61, 1702–1709. [CrossRef][PubMed]
47. Hu, J.; Zheng, Y.L.; Hyde, W.; Hendrich, S.; Murphy, P.A. Human fecal metabolism of soya saponin I. J. Agric.
Food Chem. 2004, 52, 2689–2696. [CrossRef] [PubMed]48. McDonald, J.A.; Schroeter, K.; Fuentes, S.; Heikamp-Dejong, I.; Khursigara, C.M.; de Vos, W.M.;
Allen-Vercoe, E. Evaluation of microbial community reproducibility, stability and composition in a humandistal gut chemostat model. J. Microbiol. Methods 2013, 95, 167–174. [CrossRef]
Sample Availability: Samples of the compounds are available from the authors.
© 2019 by the authors. Licensee MDPI, Basel, Switzerland. This article is an open accessarticle distributed under the terms and conditions of the Creative Commons Attribution(CC BY) license (http://creativecommons.org/licenses/by/4.0/).
175

molecules
Article
Influence of Oxygen-Containing Sulfur FlavorMolecules on the Stability of β-Carotene underUVA Irradiation
Gong-Liang Zhang 1 , Hong-Yan Wu 2, Ying Liang 2, Jie Song 1, Wei-Qi Gan 1 and
Hong-Man Hou 1,*
1 School of Food Science and Technology, Dalian Polytechnic University, Dalian 116034, China;[email protected] (G.-L.Z.); [email protected] (J.S.); [email protected] (W.-Q.G.)
2 Graduate School of Environmental and Life Science, Okayama University, Okayama 700-8530, Japan;[email protected] (H.-Y.W.); [email protected] (Y.L.)
* Correspondence: [email protected]; Tel.: +86-411-86322020
Academic Editor: Lillian BarrosReceived: 28 December 2018; Accepted: 13 January 2019; Published: 16 January 2019
Abstract: The influence of 11 kinds of oxygen-containing sulfur flavor molecules was examinedon β-carotene stability under UVA irradiation in ethanol system. Both the effects of sulfides ondynamic degradation of β-carotene and the relation between structure and effect were investigated.The oxidation products of β-carotene accelerated by sulfides under UVA irradiation were alsoidentified. The results indicated that the disulfides had more obvious accelerative effects on thephotodegradation of β-carotene than mono sulfides. The degradation of β-carotene after methyl(2-methyl-3-furyl) disulfide (MMFDS), methyl furfuryl disulfide (MFDS) and bis(2-methyl-3-furyl)disulfide (BMFDS) exposure followed first-order kinetics. Furan-containing sulfides such asMMFDS and BMFDS showed more pronounced accelerative effects than their correspondingisomers. The oxidation products were identified as 13-cis-β-carotene, 9,13-di-cis-β-carotene andall-trans-5,6-epoxy-β-carotene. These results suggest that both the sulfur atom numbers and the furangroup in oxygen-containing sulfides play a critical role in the photooxidation of β-carotene.
Keywords: oxygen-containing sulfur flavor molecules; β-carotene; bis(2-methyl-3-furyl) disulfide(BMFDS); oxidation products
1. Introduction
Carotenoids are natural pigments of the isoprenoid family, commonly biosynthesized in fruits andvegetables [1], presenting potential physiological benefits, such as antioxidants in food and pro-vitaminA activity [2]. As one of the most commonly used carotenoids, β-carotene is expected to be conduciveto health because of its valuable nutritional properties and antioxidant capacities, which confer onthis compound an important role in lowering the risk of cataracts [3], inhibiting age-related maculardegeneration [4], and enhancing the prevention of cardiovascular diseases [5].
However, due to its poor water solubility [6] and low bioavailability [7,8] during food processingand storage, widespread applications of β-carotene in food matrices normally suffer considerablechallenges. Moreover, the restriction of β-carotene utilization as a nutritional ingredient in the foodindustry is currently also attributed to the existence of numerous unsaturated groups, resulting inhigh vulnerability to degradation reaction when exposed to light, heat and other external factors [9,10].It has been reported that strong illumination can influence the stability of β-carotene extracted frompalm oil, unveiling the formation of cis isomers [11]. The in-depth study carried out by Ayu et al. [12],who investigated interactive influence of tocopherols, tocotrienols, and β-carotene in the process of
177
Molecules 2019, 24, 318
photooxidation of red palm oil, suggesting that the degradation of β-carotene easily occurs underthe irradiation of light. Apart from that, a comparison of β-carotene degradation under different UVstresses was conducted by Chen et al. [13], which showed that the longer the wavelength applied,the faster the degradation rate.
Several reports have also focused on the effects of chemical substances and their stability.The presence of 1,4-dimethylnaphthalene-1,4-endoperoxide and lycopene had the potential to inducethe generation of (9Z)-, (13Z)- and (15Z)-β-carotene, which was associated with the formation ofsinglet oxygen [14]. Lewis acids, including titanium tetrachloride and ferric chloride, can catalyze thedegradation of β-carotene to form an intermediate radical carbocation [15].
Currently, more than 300 sulfides have been registered as Generally Recognized as Safe (GRAS)substances with various threshold limits, making them the critical food flavors [16]. Biological functionsincluding antithrombotic [17], antimicrobial [18], anticancer [19], and anti-inflammatory activities [20]in combination with their attractive odor characteristics such as garlic, onion, meat and nut flavors,have increased their feasibility of acting as food additives. In our previous studies, we discoveredthat dimethyl sulfides exerted apoptosis-inducing effects in leukemia cell lines via the generation ofreactive oxygen species, especially for dimethyl trisulfide(Me2S3) and dimethyl tetrasulfide(Me2S4) [21].Furthermore, β-carotene combined with Me2S4 under UVA irradiation presented a synergistic action ininhibiting the viability of HL-60 cells viability, and elevating caspase-3 levels [22], mostly like probablyraising the possibility of the reaction between sulfides and β-carotene assisted by UVA.
In this study, we selected 11 kinds of oxygen-containing sulfur flavor molecules, commonly usedin the food industry, as experimental materials to examine their influence on β-carotene stability underUVA irradiation. Moreover, both the dynamic analysis of β-carotene degradation and the structuraleffects of sulfides that accelerated the degradation of β-carotene were investigated to provide aclearer and better comprehension of their acceleration effects. Furthermore, the oxidation products ofβ-carotene under UVA irradiation were also analyzed in order to elucidate its degradation mechanism.
2. Results
2.1. The Effects of Oxygen-Containing Sulfur Flavor Molecules on β-Carotene Degradation underUVA Irradiation
The structures of 11 kinds of oxygen-containing sulfur flavor molecules are shown in Table 1.Most of the sulfides contain furan or furfuryl group, such as 2-methyl-3-(methylthio) furan (MMTF)and methyl furfuryl disulfide (MFDS). Some sulfides contain different numbers of sulfur atoms buthave the same side chain groups, such as MMTF and methyl (2-methyl-3-furyl) disulfide (MMFDS),difurfuryl sulfide (DFS) and difurfuryl disulfide (DFDS). Furthermore, it is worth noting the existenceof isomers, such as bis(2-methyl-3-furyl) disulfide (BMFDS) and DFDS, MMFDS and MFDS.
The effects of 11 kinds of oxygen-containing sulfur flavor molecules assisted by UVA irradiationon β-carotene stability are shown in Figure 1A. After irradiating under UVA for 60 min in which thelight intensity was 2.5 mW/cm2, the contents of β-carotene in all groups showed a reducing trend.To gain more knowledge about the correlation between the structure of coexistent sulfides and thedegradation ratios of β-carotene, the remaining amounts of β-carotene were compared according tothe structural characteristics of coexistent sulfides. The amounts of β-carotene treated with MMFDSand BMFDS were dramatically decreased by approximately 96.05% and 99.70%, respectively (p < 0.05).Likewise, the remaining amount of β-carotene in the presence of MFDS declined approximately 43.64%.These findings proved the fact that natural sulfur substance may affect β-carotene stability.
2.2. The Effects of Furan-Containing Sulfides on β-Carotene Degradation under UVA Irradiation
The order of the reaction with respect to the photodegradation of β-carotene was acquiredaccording to Equation (2) to examine the changes of β-carotene concentration with time afterUVA irradiation.
178
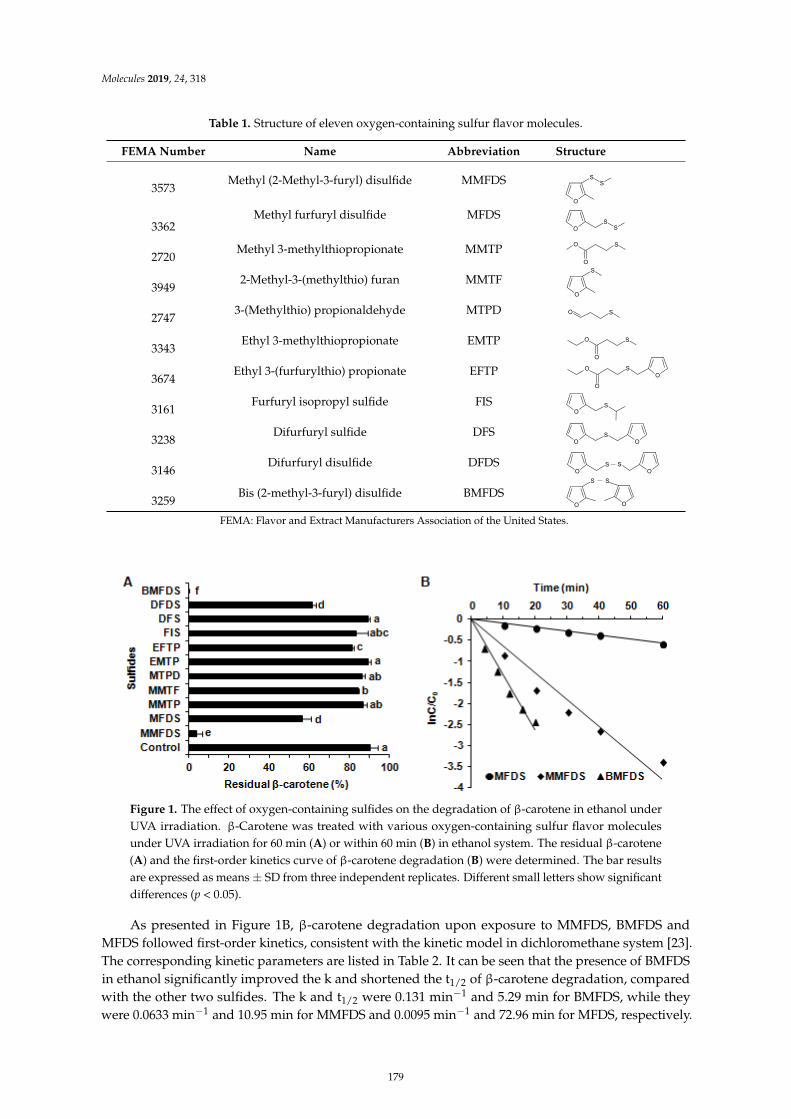
Molecules 2019, 24, 318
Table 1. Structure of eleven oxygen-containing sulfur flavor molecules.
FEMA Number Name Abbreviation Structure
3573Methyl (2-Methyl-3-furyl) disulfide MMFDS
ββ
MMTP
MMTF
EMTP
DFS
DFDS
ββ
ββ
S
O
S
O
O
OS
O
OS
O
SS
OS
S
S
O
O
O
S
OSO
O
O
S
O
SO
SO
S
3362Methyl furfuryl disulfide MFDS
2720Methyl 3-methylthiopropionate MMTP
39492-Methyl-3-(methylthio) furan MMTF
27473-(Methylthio) propionaldehyde MTPD
3343Ethyl 3-methylthiopropionate EMTP
3674Ethyl 3-(furfurylthio) propionate EFTP
3161Furfuryl isopropyl sulfide FIS
3238Difurfuryl sulfide DFS
3146Difurfuryl disulfide DFDS
3259Bis (2-methyl-3-furyl) disulfide BMFDS
FEMA: Flavor and Extract Manufacturers Association of the United States.
ββ
ββ
ββ
S
O
S
O
O
OS
O
OS
O
SS
OS
S
S
O
O
O
S
OSO
O
O
S
O
SO
SO
S
Figure 1. The effect of oxygen-containing sulfides on the degradation of β-carotene in ethanol underUVA irradiation. β-Carotene was treated with various oxygen-containing sulfur flavor moleculesunder UVA irradiation for 60 min (A) or within 60 min (B) in ethanol system. The residual β-carotene(A) and the first-order kinetics curve of β-carotene degradation (B) were determined. The bar resultsare expressed as means ± SD from three independent replicates. Different small letters show significantdifferences (p < 0.05).
As presented in Figure 1B, β-carotene degradation upon exposure to MMFDS, BMFDS andMFDS followed first-order kinetics, consistent with the kinetic model in dichloromethane system [23].The corresponding kinetic parameters are listed in Table 2. It can be seen that the presence of BMFDSin ethanol significantly improved the k and shortened the t1/2 of β-carotene degradation, comparedwith the other two sulfides. The k and t1/2 were 0.131 min−1 and 5.29 min for BMFDS, while theywere 0.0633 min−1 and 10.95 min for MMFDS and 0.0095 min−1 and 72.96 min for MFDS, respectively.
179
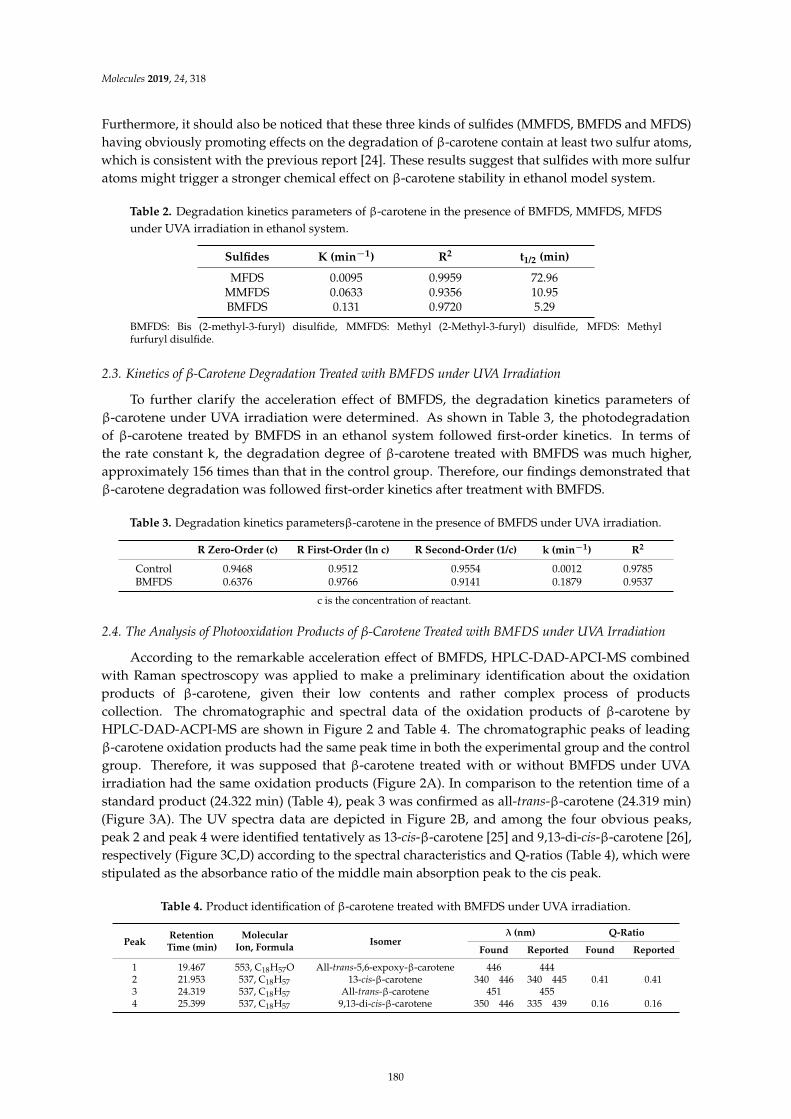
Molecules 2019, 24, 318
Furthermore, it should also be noticed that these three kinds of sulfides (MMFDS, BMFDS and MFDS)having obviously promoting effects on the degradation of β-carotene contain at least two sulfur atoms,which is consistent with the previous report [24]. These results suggest that sulfides with more sulfuratoms might trigger a stronger chemical effect on β-carotene stability in ethanol model system.
Table 2. Degradation kinetics parameters of β-carotene in the presence of BMFDS, MMFDS, MFDSunder UVA irradiation in ethanol system.
Sulfides K (min−1) R2 t1/2 (min)
MFDS 0.0095 0.9959 72.96MMFDS 0.0633 0.9356 10.95BMFDS 0.131 0.9720 5.29
BMFDS: Bis (2-methyl-3-furyl) disulfide, MMFDS: Methyl (2-Methyl-3-furyl) disulfide, MFDS: Methylfurfuryl disulfide.
2.3. Kinetics of β-Carotene Degradation Treated with BMFDS under UVA Irradiation
To further clarify the acceleration effect of BMFDS, the degradation kinetics parameters ofβ-carotene under UVA irradiation were determined. As shown in Table 3, the photodegradationof β-carotene treated by BMFDS in an ethanol system followed first-order kinetics. In terms ofthe rate constant k, the degradation degree of β-carotene treated with BMFDS was much higher,approximately 156 times than that in the control group. Therefore, our findings demonstrated thatβ-carotene degradation was followed first-order kinetics after treatment with BMFDS.
Table 3. Degradation kinetics parametersβ-carotene in the presence of BMFDS under UVA irradiation.
R Zero-Order (c) R First-Order (ln c) R Second-Order (1/c) k (min−1) R2
Control 0.9468 0.9512 0.9554 0.0012 0.9785BMFDS 0.6376 0.9766 0.9141 0.1879 0.9537
c is the concentration of reactant.
2.4. The Analysis of Photooxidation Products of β-Carotene Treated with BMFDS under UVA Irradiation
According to the remarkable acceleration effect of BMFDS, HPLC-DAD-APCI-MS combinedwith Raman spectroscopy was applied to make a preliminary identification about the oxidationproducts of β-carotene, given their low contents and rather complex process of productscollection. The chromatographic and spectral data of the oxidation products of β-carotene byHPLC-DAD-ACPI-MS are shown in Figure 2 and Table 4. The chromatographic peaks of leadingβ-carotene oxidation products had the same peak time in both the experimental group and the controlgroup. Therefore, it was supposed that β-carotene treated with or without BMFDS under UVAirradiation had the same oxidation products (Figure 2A). In comparison to the retention time of astandard product (24.322 min) (Table 4), peak 3 was confirmed as all-trans-β-carotene (24.319 min)(Figure 3A). The UV spectra data are depicted in Figure 2B, and among the four obvious peaks,peak 2 and peak 4 were identified tentatively as 13-cis-β-carotene [25] and 9,13-di-cis-β-carotene [26],respectively (Figure 3C,D) according to the spectral characteristics and Q-ratios (Table 4), which werestipulated as the absorbance ratio of the middle main absorption peak to the cis peak.
Table 4. Product identification of β-carotene treated with BMFDS under UVA irradiation.
PeakRetention
Time (min)
MolecularIon, Formula
Isomerλ (nm) Q-Ratio
Found Reported Found Reported
1 19.467 553, C18H57O All-trans-5,6-expoxy-β-carotene 446 4442 21.953 537, C18H57 13-cis-β-carotene 340 446 340 445 0.41 0.413 24.319 537, C18H57 All-trans-β-carotene 451 4554 25.399 537, C18H57 9,13-di-cis-β-carotene 350 446 335 439 0.16 0.16
180
Molecules 2019, 24, 318
β β
ββ
Figure 2. The products of β-carotene treated with BMFDS under UVA irradiation. HPLCchromatograms (A) and UV-Vis spectra (B) of β-carotene oxidation products induced by BMFDStreatment for 5 min in ethanol under UVA irradiation. The blue line in HPLC chromatograms is referredto standard β-carotene. Peak identification for (A) and (B): Peak 1, all-trans-5,6-expoxy-β-carotene;Peak 2, 13-cis-β-carotene; Peak 3, all-trans-β-carotene; Peak 4, 9,13-di-cis-β-carotene. Raman spectra (C)at different wave number corresponded to β-carotene under UVA irradiation for 5 min with BMFDS (a)and without BMFDS (b), respectively.
181
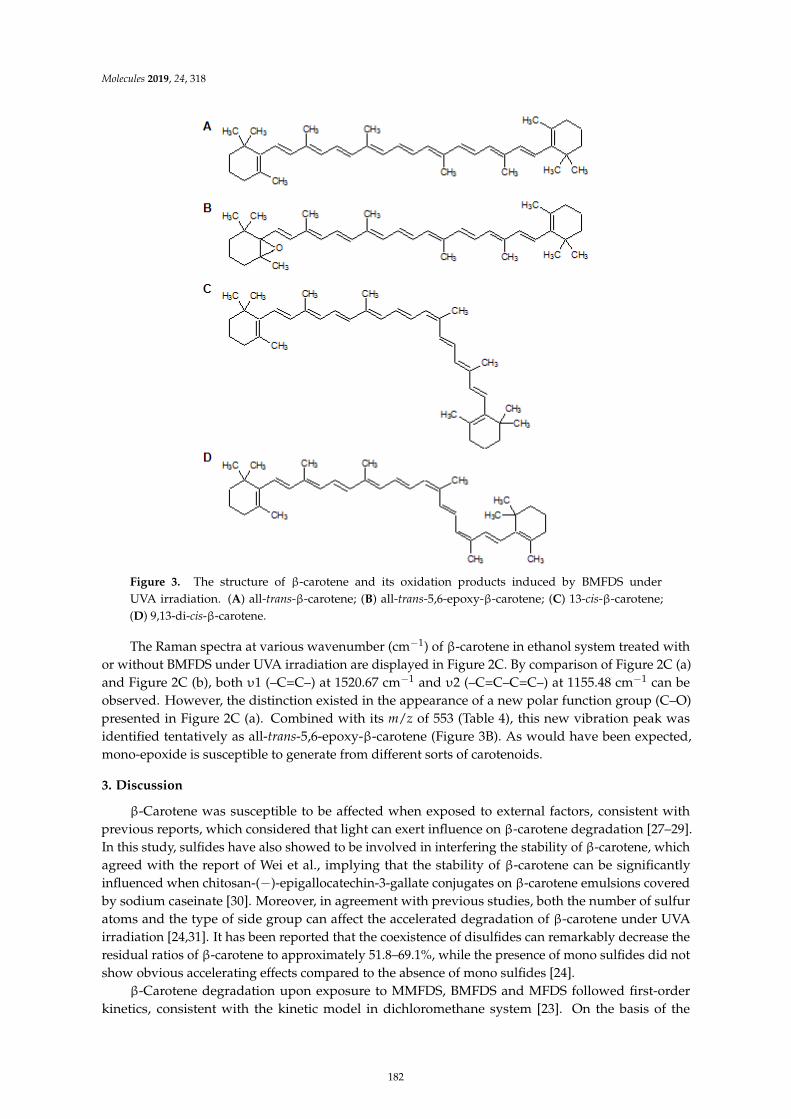
Molecules 2019, 24, 318
β ββ β β
β
β
λ
β
β
β
β
ββ β β
β
− β
υ − υ −
Figure 3. The structure of β-carotene and its oxidation products induced by BMFDS underUVA irradiation. (A) all-trans-β-carotene; (B) all-trans-5,6-epoxy-β-carotene; (C) 13-cis-β-carotene;(D) 9,13-di-cis-β-carotene.
The Raman spectra at various wavenumber (cm−1) of β-carotene in ethanol system treated withor without BMFDS under UVA irradiation are displayed in Figure 2C. By comparison of Figure 2C (a)and Figure 2C (b), both υ1 (–C=C–) at 1520.67 cm−1 and υ2 (–C=C–C=C–) at 1155.48 cm−1 can beobserved. However, the distinction existed in the appearance of a new polar function group (C–O)presented in Figure 2C (a). Combined with its m/z of 553 (Table 4), this new vibration peak wasidentified tentatively as all-trans-5,6-epoxy-β-carotene (Figure 3B). As would have been expected,mono-epoxide is susceptible to generate from different sorts of carotenoids.
3. Discussion
β-Carotene was susceptible to be affected when exposed to external factors, consistent withprevious reports, which considered that light can exert influence on β-carotene degradation [27–29].In this study, sulfides have also showed to be involved in interfering the stability of β-carotene, whichagreed with the report of Wei et al., implying that the stability of β-carotene can be significantlyinfluenced when chitosan-(−)-epigallocatechin-3-gallate conjugates on β-carotene emulsions coveredby sodium caseinate [30]. Moreover, in agreement with previous studies, both the number of sulfuratoms and the type of side group can affect the accelerated degradation of β-carotene under UVAirradiation [24,31]. It has been reported that the coexistence of disulfides can remarkably decrease theresidual ratios of β-carotene to approximately 51.8–69.1%, while the presence of mono sulfides did notshow obvious accelerating effects compared to the absence of mono sulfides [24].
β-Carotene degradation upon exposure to MMFDS, BMFDS and MFDS followed first-orderkinetics, consistent with the kinetic model in dichloromethane system [23]. On the basis of the
182
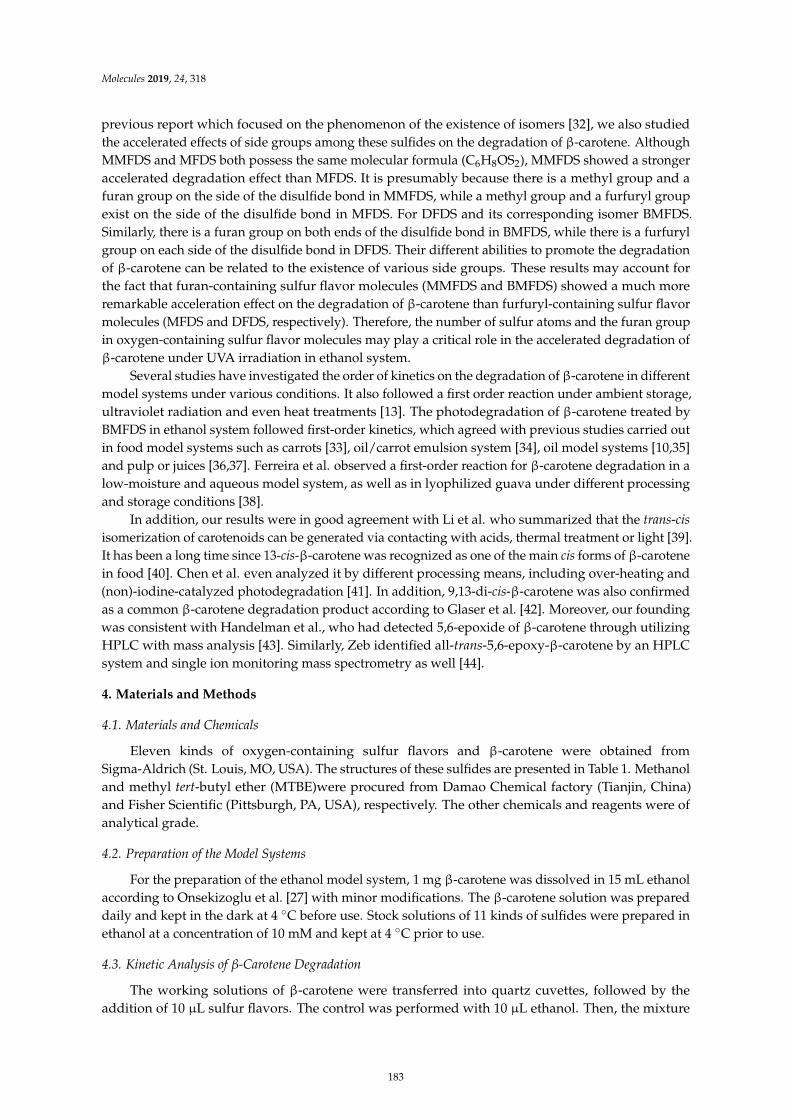
Molecules 2019, 24, 318
previous report which focused on the phenomenon of the existence of isomers [32], we also studiedthe accelerated effects of side groups among these sulfides on the degradation of β-carotene. AlthoughMMFDS and MFDS both possess the same molecular formula (C6H8OS2), MMFDS showed a strongeraccelerated degradation effect than MFDS. It is presumably because there is a methyl group and afuran group on the side of the disulfide bond in MMFDS, while a methyl group and a furfuryl groupexist on the side of the disulfide bond in MFDS. For DFDS and its corresponding isomer BMFDS.Similarly, there is a furan group on both ends of the disulfide bond in BMFDS, while there is a furfurylgroup on each side of the disulfide bond in DFDS. Their different abilities to promote the degradationof β-carotene can be related to the existence of various side groups. These results may account forthe fact that furan-containing sulfur flavor molecules (MMFDS and BMFDS) showed a much moreremarkable acceleration effect on the degradation of β-carotene than furfuryl-containing sulfur flavormolecules (MFDS and DFDS, respectively). Therefore, the number of sulfur atoms and the furan groupin oxygen-containing sulfur flavor molecules may play a critical role in the accelerated degradation ofβ-carotene under UVA irradiation in ethanol system.
Several studies have investigated the order of kinetics on the degradation of β-carotene in differentmodel systems under various conditions. It also followed a first order reaction under ambient storage,ultraviolet radiation and even heat treatments [13]. The photodegradation of β-carotene treated byBMFDS in ethanol system followed first-order kinetics, which agreed with previous studies carried outin food model systems such as carrots [33], oil/carrot emulsion system [34], oil model systems [10,35]and pulp or juices [36,37]. Ferreira et al. observed a first-order reaction for β-carotene degradation in alow-moisture and aqueous model system, as well as in lyophilized guava under different processingand storage conditions [38].
In addition, our results were in good agreement with Li et al. who summarized that the trans-cis
isomerization of carotenoids can be generated via contacting with acids, thermal treatment or light [39].It has been a long time since 13-cis-β-carotene was recognized as one of the main cis forms of β-carotenein food [40]. Chen et al. even analyzed it by different processing means, including over-heating and(non)-iodine-catalyzed photodegradation [41]. In addition, 9,13-di-cis-β-carotene was also confirmedas a common β-carotene degradation product according to Glaser et al. [42]. Moreover, our foundingwas consistent with Handelman et al., who had detected 5,6-epoxide of β-carotene through utilizingHPLC with mass analysis [43]. Similarly, Zeb identified all-trans-5,6-epoxy-β-carotene by an HPLCsystem and single ion monitoring mass spectrometry as well [44].
4. Materials and Methods
4.1. Materials and Chemicals
Eleven kinds of oxygen-containing sulfur flavors and β-carotene were obtained fromSigma-Aldrich (St. Louis, MO, USA). The structures of these sulfides are presented in Table 1. Methanoland methyl tert-butyl ether (MTBE)were procured from Damao Chemical factory (Tianjin, China)and Fisher Scientific (Pittsburgh, PA, USA), respectively. The other chemicals and reagents were ofanalytical grade.
4.2. Preparation of the Model Systems
For the preparation of the ethanol model system, 1 mg β-carotene was dissolved in 15 mL ethanolaccording to Onsekizoglu et al. [27] with minor modifications. The β-carotene solution was prepareddaily and kept in the dark at 4 ◦C before use. Stock solutions of 11 kinds of sulfides were prepared inethanol at a concentration of 10 mM and kept at 4 ◦C prior to use.
4.3. Kinetic Analysis of β-Carotene Degradation
The working solutions of β-carotene were transferred into quartz cuvettes, followed by theaddition of 10 µL sulfur flavors. The control was performed with 10 µL ethanol. Then, the mixture
183
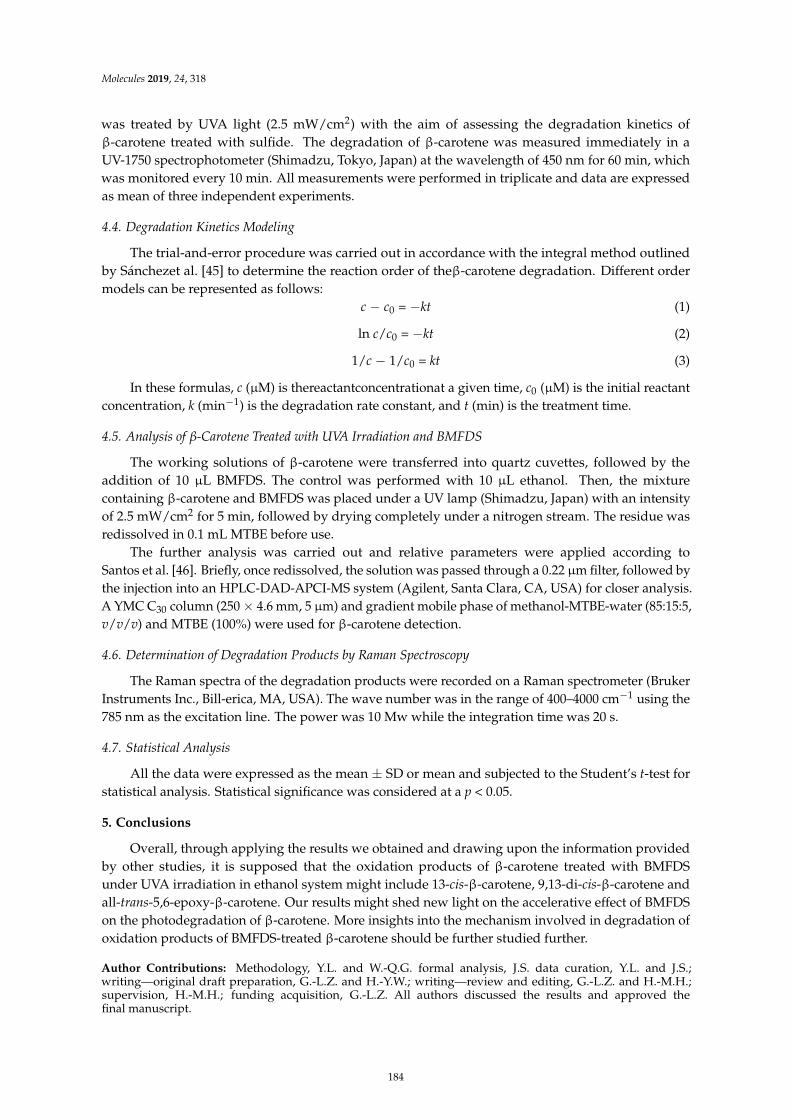
Molecules 2019, 24, 318
was treated by UVA light (2.5 mW/cm2) with the aim of assessing the degradation kinetics ofβ-carotene treated with sulfide. The degradation of β-carotene was measured immediately in aUV-1750 spectrophotometer (Shimadzu, Tokyo, Japan) at the wavelength of 450 nm for 60 min, whichwas monitored every 10 min. All measurements were performed in triplicate and data are expressedas mean of three independent experiments.
4.4. Degradation Kinetics Modeling
The trial-and-error procedure was carried out in accordance with the integral method outlinedby Sánchezet al. [45] to determine the reaction order of theβ-carotene degradation. Different ordermodels can be represented as follows:
c − c0 = −kt (1)
ln c/c0 = −kt (2)
1/c − 1/c0 = kt (3)
In these formulas, c (µM) is thereactantconcentrationat a given time, c0 (µM) is the initial reactantconcentration, k (min−1) is the degradation rate constant, and t (min) is the treatment time.
4.5. Analysis of β-Carotene Treated with UVA Irradiation and BMFDS
The working solutions of β-carotene were transferred into quartz cuvettes, followed by theaddition of 10 µL BMFDS. The control was performed with 10 µL ethanol. Then, the mixturecontaining β-carotene and BMFDS was placed under a UV lamp (Shimadzu, Japan) with an intensityof 2.5 mW/cm2 for 5 min, followed by drying completely under a nitrogen stream. The residue wasredissolved in 0.1 mL MTBE before use.
The further analysis was carried out and relative parameters were applied according toSantos et al. [46]. Briefly, once redissolved, the solution was passed through a 0.22 µm filter, followed bythe injection into an HPLC-DAD-APCI-MS system (Agilent, Santa Clara, CA, USA) for closer analysis.A YMC C30 column (250 × 4.6 mm, 5 µm) and gradient mobile phase of methanol-MTBE-water (85:15:5,v/v/v) and MTBE (100%) were used for β-carotene detection.
4.6. Determination of Degradation Products by Raman Spectroscopy
The Raman spectra of the degradation products were recorded on a Raman spectrometer (BrukerInstruments Inc., Bill-erica, MA, USA). The wave number was in the range of 400–4000 cm−1 using the785 nm as the excitation line. The power was 10 Mw while the integration time was 20 s.
4.7. Statistical Analysis
All the data were expressed as the mean ± SD or mean and subjected to the Student’s t-test forstatistical analysis. Statistical significance was considered at a p < 0.05.
5. Conclusions
Overall, through applying the results we obtained and drawing upon the information providedby other studies, it is supposed that the oxidation products of β-carotene treated with BMFDSunder UVA irradiation in ethanol system might include 13-cis-β-carotene, 9,13-di-cis-β-carotene andall-trans-5,6-epoxy-β-carotene. Our results might shed new light on the accelerative effect of BMFDSon the photodegradation of β-carotene. More insights into the mechanism involved in degradation ofoxidation products of BMFDS-treated β-carotene should be further studied further.
Author Contributions: Methodology, Y.L. and W.-Q.G. formal analysis, J.S. data curation, Y.L. and J.S.;writing—original draft preparation, G.-L.Z. and H.-Y.W.; writing—review and editing, G.-L.Z. and H.-M.H.;supervision, H.-M.H.; funding acquisition, G.-L.Z. All authors discussed the results and approved thefinal manuscript.
184
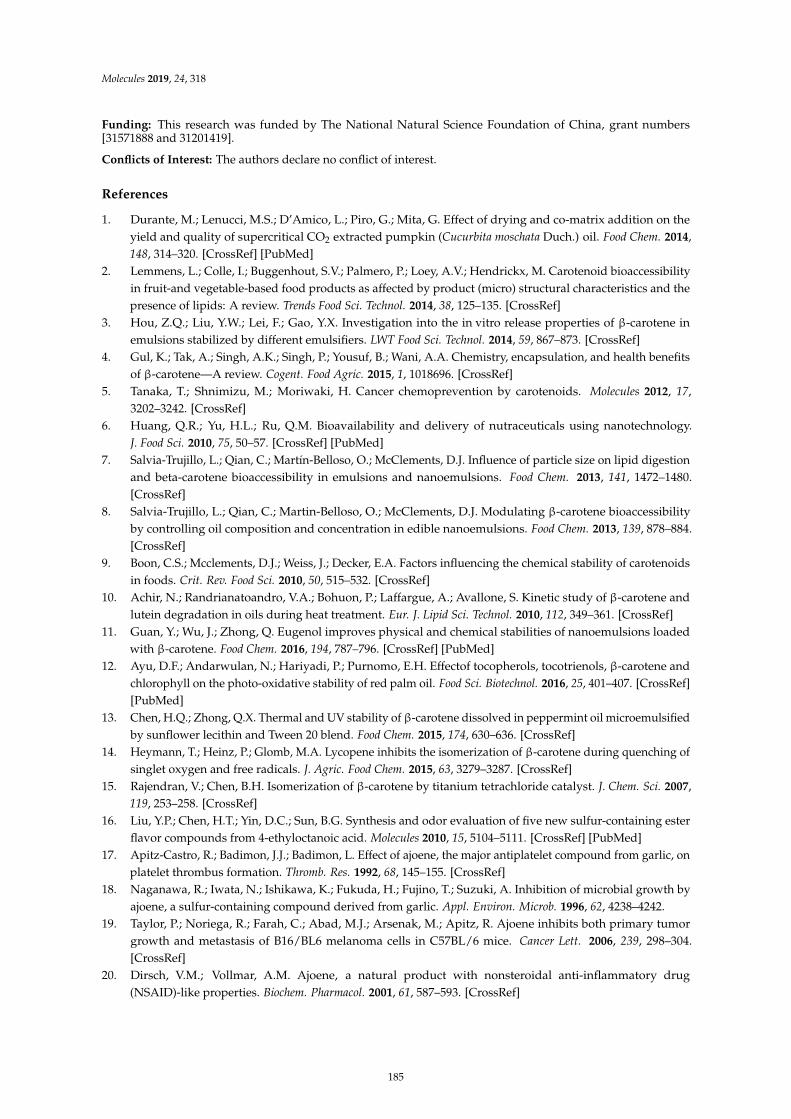
Molecules 2019, 24, 318
Funding: This research was funded by The National Natural Science Foundation of China, grant numbers[31571888 and 31201419].
Conflicts of Interest: The authors declare no conflict of interest.
References
1. Durante, M.; Lenucci, M.S.; D’Amico, L.; Piro, G.; Mita, G. Effect of drying and co-matrix addition on theyield and quality of supercritical CO2 extracted pumpkin (Cucurbita moschata Duch.) oil. Food Chem. 2014,148, 314–320. [CrossRef] [PubMed]
2. Lemmens, L.; Colle, I.; Buggenhout, S.V.; Palmero, P.; Loey, A.V.; Hendrickx, M. Carotenoid bioaccessibilityin fruit-and vegetable-based food products as affected by product (micro) structural characteristics and thepresence of lipids: A review. Trends Food Sci. Technol. 2014, 38, 125–135. [CrossRef]
3. Hou, Z.Q.; Liu, Y.W.; Lei, F.; Gao, Y.X. Investigation into the in vitro release properties of β-carotene inemulsions stabilized by different emulsifiers. LWT Food Sci. Technol. 2014, 59, 867–873. [CrossRef]
4. Gul, K.; Tak, A.; Singh, A.K.; Singh, P.; Yousuf, B.; Wani, A.A. Chemistry, encapsulation, and health benefitsof β-carotene—A review. Cogent. Food Agric. 2015, 1, 1018696. [CrossRef]
5. Tanaka, T.; Shnimizu, M.; Moriwaki, H. Cancer chemoprevention by carotenoids. Molecules 2012, 17,3202–3242. [CrossRef]
6. Huang, Q.R.; Yu, H.L.; Ru, Q.M. Bioavailability and delivery of nutraceuticals using nanotechnology.J. Food Sci. 2010, 75, 50–57. [CrossRef] [PubMed]
7. Salvia-Trujillo, L.; Qian, C.; Martín-Belloso, O.; McClements, D.J. Influence of particle size on lipid digestionand beta-carotene bioaccessibility in emulsions and nanoemulsions. Food Chem. 2013, 141, 1472–1480.[CrossRef]
8. Salvia-Trujillo, L.; Qian, C.; Martin-Belloso, O.; McClements, D.J. Modulating β-carotene bioaccessibilityby controlling oil composition and concentration in edible nanoemulsions. Food Chem. 2013, 139, 878–884.[CrossRef]
9. Boon, C.S.; Mcclements, D.J.; Weiss, J.; Decker, E.A. Factors influencing the chemical stability of carotenoidsin foods. Crit. Rev. Food Sci. 2010, 50, 515–532. [CrossRef]
10. Achir, N.; Randrianatoandro, V.A.; Bohuon, P.; Laffargue, A.; Avallone, S. Kinetic study of β-carotene andlutein degradation in oils during heat treatment. Eur. J. Lipid Sci. Technol. 2010, 112, 349–361. [CrossRef]
11. Guan, Y.; Wu, J.; Zhong, Q. Eugenol improves physical and chemical stabilities of nanoemulsions loadedwith β-carotene. Food Chem. 2016, 194, 787–796. [CrossRef] [PubMed]
12. Ayu, D.F.; Andarwulan, N.; Hariyadi, P.; Purnomo, E.H. Effectof tocopherols, tocotrienols, β-carotene andchlorophyll on the photo-oxidative stability of red palm oil. Food Sci. Biotechnol. 2016, 25, 401–407. [CrossRef][PubMed]
13. Chen, H.Q.; Zhong, Q.X. Thermal and UV stability of β-carotene dissolved in peppermint oil microemulsifiedby sunflower lecithin and Tween 20 blend. Food Chem. 2015, 174, 630–636. [CrossRef]
14. Heymann, T.; Heinz, P.; Glomb, M.A. Lycopene inhibits the isomerization of β-carotene during quenching ofsinglet oxygen and free radicals. J. Agric. Food Chem. 2015, 63, 3279–3287. [CrossRef]
15. Rajendran, V.; Chen, B.H. Isomerization of β-carotene by titanium tetrachloride catalyst. J. Chem. Sci. 2007,119, 253–258. [CrossRef]
16. Liu, Y.P.; Chen, H.T.; Yin, D.C.; Sun, B.G. Synthesis and odor evaluation of five new sulfur-containing esterflavor compounds from 4-ethyloctanoic acid. Molecules 2010, 15, 5104–5111. [CrossRef] [PubMed]
17. Apitz-Castro, R.; Badimon, J.J.; Badimon, L. Effect of ajoene, the major antiplatelet compound from garlic, onplatelet thrombus formation. Thromb. Res. 1992, 68, 145–155. [CrossRef]
18. Naganawa, R.; Iwata, N.; Ishikawa, K.; Fukuda, H.; Fujino, T.; Suzuki, A. Inhibition of microbial growth byajoene, a sulfur-containing compound derived from garlic. Appl. Environ. Microb. 1996, 62, 4238–4242.
19. Taylor, P.; Noriega, R.; Farah, C.; Abad, M.J.; Arsenak, M.; Apitz, R. Ajoene inhibits both primary tumorgrowth and metastasis of B16/BL6 melanoma cells in C57BL/6 mice. Cancer Lett. 2006, 239, 298–304.[CrossRef]
20. Dirsch, V.M.; Vollmar, A.M. Ajoene, a natural product with nonsteroidal anti-inflammatory drug(NSAID)-like properties. Biochem. Pharmacol. 2001, 61, 587–593. [CrossRef]
185
Molecules 2019, 24, 318
21. Zhang, G.L.; Wu, H.T.; Zhu, B.W.; Shimoishi, Y.; Nakamura, Y.; Murata, Y. Effect of dimethyl sulfides on theinduction of apoptosis in human leukemia Jurkat cells and HL-60 cells. Biosci. Biotechnol. Biochem. 2008, 72,2966–2972. [CrossRef] [PubMed]
22. Zhang, G.L.; Wu, H.T.; Zhu, B.W.; Shimoishi, Y.; Nakamura, Y.; Murata, Y. Induction of apoptosis bybeta-carotene and dimethyl tetrasulfide assisted by UVA irradiation in HL-60 cells. Biosci. Biotechnol. Biochem.
2009, 73, 1014–1020. [CrossRef] [PubMed]23. Sun, Y.; Ma, G.; Ye, X.; Kakuda, Y.; Meng, R. Stability of all-trans-beta-carotene under ultrasound treatment
in a model system: Effects of different factors, kinetics and newly formed compounds. Ultrason. Sonochem.
2010, 17, 654–661. [CrossRef] [PubMed]24. Arita, S.; Ando, S.; Hosoda, H.; Sakaue, K.; Nagata, T.; Murata, Y.; Shimoishi, Y.; Tada, M. Acceleration effect
of sulfides on photodegradation of carotenoids by UVA irradiation. Biosci. Biotechnol. Biochem. 2005, 69,1786–1789. [CrossRef] [PubMed]
25. Lowe, G.M.; Vlismas, K.; Graham, D.L.; Carail, M.; Caris-Veyrat, C.; Young, A.J. The degradation of(all-E)-β-carotene by cigarette smoke. Free Radic. Res. 2009, 43, 280–286. [CrossRef] [PubMed]
26. Dan, Q.; Chen, Z.R.; Li, H.R. Effect of heating on solidβ-carotene. Food Chem. 2009, 112, 344–349.27. Onsekizoglu, P.; Gökmen, V.; Acar, J. Degradation of β-carotene with the effects of light and sulfur dioxide
may be responsible for the formation of white spot in dried apricots. Eur. Food. Res. Technol. 2005, 221,357–360. [CrossRef]
28. Spada, J.C.; Noreña, C.P.Z.; Marczak, L.D.F.; Tessaro, I.C. Study on the stability of β-carotenemicroencapsulated with pinhão (Araucaria angustifolia seeds) starch. Carbohydr. Polym. 2012, 89, 1166–1173.[CrossRef]
29. Chen, B.H.; Chen, T.M.; Chien, J.T. Kinetic model for studying the isomerization of alpha- and beta-caroteneduring heating and illumination. J. Agric. Food Chem. 1994, 42, 2391–2397. [CrossRef]
30. Wei, Z.H.; Gao, Y.X. Physicochemical properties of β-carotene bilayer emulsions coated by milk proteins andchitosan–EGCG conjugates. Food Hydrocoll. 2016, 52, 590–599. [CrossRef]
31. Zhang, G.L.; Zhu, B.W.; Nakamura, Y.; Shimoishi, Y.; Murata, Y. Structure-dependent photodegradation ofcarotenoids accelerated by dimethyl tetrasulfide under UVA irradiation. Biosci. Biotechnol. Biochem. 2008, 72,2176–2183. [CrossRef]
32. Zhang, G.L.; Liang, Y.; Zhu, J.Y.; Jia, Q.; Gan, W.Q.; Sun, L.M.; Hou, H.M. Oxidative stress-mediatedantiproliferative effects of furan-containing sulfur flavors in human leukemia Jurkat cells. Food Chem. 2015,180, 1–8. [CrossRef] [PubMed]
33. Lavelli, V.; Zanoni, B.; Zaniboni, A. Effect of water activity on carotenoid degradation in dehydrated carrots.Food Chem. 2007, 104, 1705–1711. [CrossRef]
34. Knockaert, G.; Pulissery, S.K.; Lemmens, L.; Van, B.S.; Hendrickx, M.; Van, L.A. Carrot beta-carotenedegradation and isomerization kinetics during thermal processing in the presence of oil. J. Agric. Food Chem.
2012, 60, 10312–10319. [CrossRef]35. Aparicio-Ruiz, R.; Mínguez-Mosquera, M.I.; Gandul-Rojas, B. Thermal degradation kinetics of lutein,
β-carotene and β-cryptoxanthin in virgin olive oils. J. Food Compos. Anal. 2011, 24, 811–820. [CrossRef]36. Ahmed, J.; Shivhare, U.S.; Sandhu, K.S. Thermal degradation kinetics of carotenoids and visual color of
papaya puree. J. Food Sci. 2002, 67, 2692–2695. [CrossRef]37. Saxena, A.; Maity, T.; Raju, P.S.; Bawa, A.S. Degradation kinetics of colour and total carotenoids in jackfruit
(Artocarpus heterophyllus) bulb slices during hot air drying. Food Bioprocess Technol. 2012, 5, 672–679. [CrossRef]38. Ferreira, J.E.M.; Rodriguez-Amaya, D.B. Degradation of lycopene and β-carotene in model systems and
in lyophilized guava during ambient storage: Kinetics, structure, and matrix effects. J. Food Sci. 2008, 73,589–594. [CrossRef]
39. Li, D.J.; Xiao, Y.D.; Zhang, Z.Y.; Liu, C. Light-induced oxidation and isomerization of all-trans-β-cryptoxanthinin a model system. J. Photochem. Photobiol. B 2015, 142, 51–58. [CrossRef]
40. Chen, B.H.; Chen, Y.Y. Stability of chlorophylls and carotenoids in sweet potato leaves during microwavecooking. J. Agric. Food Chem. 1993, 41, 1315–1320. [CrossRef]
41. Chen, B.H.; Huang, J.H. Degradation and isomerization of chlorophyll a and β-carotene as affected byvarious heating and illumination treatments. Food Chem. 1998, 62, 299–307. [CrossRef]
186
Molecules 2019, 24, 318
42. Glaser, T.; Lienau, A.; Zeeb, D.; Krucker, M.; Dachtler, M.; Albert, K. Qualitative and quantitativedetermination of carotenoid stereoisomers in a variety of spinach samples by use of MSPD before HPLC-UV,HPLC-APCI-MS, and HPLC-NMR online coupling. Chromatographia 2003, 57, S19–S25. [CrossRef]
43. Handelman, G.J.; Kuijk, F.J.G.M.V.; Chatterjee, A.; Krinsky, N.I. Characterization of products formed duringthe autoxidation of β-carotene. Free Radic. Biol. Med. 1991, 10, 427–437. [CrossRef]
44. Zeb, A. Oxidation and formation of oxidation products of β-carotene at boiling temperature. Chem. Phys. Lipids
2012, 165, 277–281. [CrossRef] [PubMed]45. Sánchez, A.M.; Carmona, M.; Ordoudi, S.A.; Tsimidou, M.Z.; Alonso, G.L. Kinetics of individual crocetin
ester degradation in aqueous extracts of saffron (Crocus sativus L.) upon thermal treatment in the dark.J. Agric. Food Chem. 2008, 56, 1627–1637. [CrossRef]
46. Santos, J.; Herrero, M.; Mendiola, J.A.; Oliva-Teles, M.T.; Ibáñez, E.; Delerue-Matos, C.; Oliveira, M.B.P.P.Assessment of nutritional and metabolic profiles of pea shoots: The new ready-to-eat baby-leaf vegetable.Food Res. Int. 2014, 58, 105–111. [CrossRef]
Sample Availability: Samples of the compounds are not available from the authors.
© 2019 by the authors. Licensee MDPI, Basel, Switzerland. This article is an open accessarticle distributed under the terms and conditions of the Creative Commons Attribution(CC BY) license (http://creativecommons.org/licenses/by/4.0/).
187

molecules
Article
Influence of Pickling Process on Allium cepa andCitrus limon Metabolome as Determined via MassSpectrometry-Based Metabolomics
Mohamed A. Farag 1,2,*, Ahmed F. Tawfike 3,4 , Marwa S. Donia 5, Anja Ehrlich 6 and
Ludger A. Wessjohann 6,*
1 Pharmacognosy Department, College of Pharmacy, Cairo University, Kasr el Aini St., Cairo 11562, Egypt2 Department of Chemistry, School of Sciences & Engineering, The American University in Cairo,
New Cairo 11835, Egypt3 Department of Computational and Analytical Science, Rothamsted Research, Harpenden AL5 2JQ, UK;
[email protected] Department of Pharmacognosy, Faculty of Pharmacy, Helwan University, Cairo 11795, Egypt5 Pharmacognosy Department, College of Pharmacy, Suez Canal University, Ismailia 41522, Egypt;
[email protected] Leibniz Institute of Plant Biochemistry, Department of Bioorganic Chemistry, Weinberg 3,
D-06120 Halle (Saale), Germany; [email protected]* Correspondence: [email protected] (M.A.F.); [email protected] (L.A.W.);
Tel.: +20-100-4142567 (M.A.F.); Fax: +0202-25320005 (M.A.F.)
Academic Editors: Lillian Barros and Isabel C.F.R. FerreiraReceived: 4 January 2019; Accepted: 17 February 2019; Published: 7 March 2019
Abstract: Brine, the historically known food additive salt solution, has been widely used as a picklingmedia to preserve flavor or enhance food aroma, appearance, or other qualities. The influence of pickling,using brine, on the aroma compounds and the primary and secondary metabolite profile in onion bulbAllium cepa red cv. and lemon fruit Citrus limon was evaluated using multiplex metabolomics technologies.In lemon, pickling negatively affected its key odor compound “citral”, whereas monoterpenehydrocarbons limonene and γ-terpinene increased in the pickled product. Meanwhile, in onion sulphurrearrangement products appeared upon storage, i.e., 3,5-diethyl-1,2,4-trithiolane. Profiling of the polarsecondary metabolites in lemon fruit via ultra-performance liquid chromatography coupled to MSannotated 37 metabolites including 18 flavonoids, nine coumarins, five limonoids, and two organic acids.With regard to pickling impact, notable and clear separation among specimens was observed with anorthogonal projections to least squares-discriminant analysis (OPLS-DA) score plot for the lemon fruitmodel showing an enrichment of limonoids and organic acids and that for fresh onion bulb showing anabundance of flavonols and saponins. In general, the pickling process appeared to negatively impactthe abundance of secondary metabolites in both onion and lemon, suggesting a decrease in their foodhealth benefits.
Keywords: Allium cepa red cv.; Citrus limon; pickling; volatiles; SPME; chemometrics
1. Introduction
Pickling—using food additives, i.e., a highly concentrated salt solution (brine)—is a well-knownmethod for preserving foods including vegetables that has been used for thousands of years andremains in use today. Undoubtedly, the most unambiguous role of pickling for human nutritionis to make the nutrients naturally present in the original food materials more palatable while alsopreserving their quality. Nevertheless, pickling processes can have several effects on food nutritionalqualities [1]. The effect of the pickling preservation method and storage time on vitamins and amino
189
Molecules 2019, 24, 928
acid composition in garlic was reported by Montano et al., 2004 [2]. In addition, the influence ofpickling with and without fermentation was revealed, with fermented products showing higherα-tocopherol, riboflavin, and total amino acid levels except for thiamine and arginine. Another studyon Chinese cabbage reported that the nitrogenous content, viz. nitrate and nitrite, in vegetables wasdramatically affected by fermentation [3]. Other studies [4,5] demonstrated a decrease in the level ofnitrates during the natural fermentation of cabbage and radish. The risk of the reduction of nitratesto nitrite lies in the possible induction of methemoglobinemia [6]. The metabolic changes associatedwith pickling may thus develop some distinctive properties related to its organoleptic characters, shelflife, and/or safety [7,8]. In terms of human health benefits, pickled foods produced by fermentationhave been recognized as protective for the gut [9] via the microbial and enzymatic processing of foodingredients. Fermentation can improve protein and fiber digestibility by improving micronutrientbioavailability and decaying anti-nutritional factors [10]. Fermentation processes can also reduce toxiccompounds such as aflatoxins concurrent with the production of antimicrobial factors such lactic acid,bacteriocins, carbon dioxide, and ethanol, which prevent the growth of food-borne pathogens [11,12].
Citrus fruits are enriched in polyphenols which mainly include flavanones and, to a lesser extent,flavones, flavonols, coumarins, and phenolic acids, viz. ferulic, p-coumaric, sinapic, and caffeicacids [13]. Phenolic compounds are well known for their myriad health benefits, as they exhibitantioxidant, anticancer, and anti-inflammatory properties, mostly attributed to their remarkable freeradical scavenging activities [14]. A study on four Tunisian Citrus varieties revealed the abundanceof phenolic acids (73.13–86.40%) [15] among their secondary metabolite profiles, whereas camphenewas found to be a major component in C. limon. Citrus fruit is also abundant in coumarins, limonoids,sterols, and flavonoids, which all exhibit various bioactivities [16].
Onion bulbs (Allium cepa) encompass a myriad of bioactive natural product classes which arelinked to its health benefits, i.e., anticancer or chemo-preventive agents [17]; antimicrobial [18],antiviral [19], and antioxidant activities [20]; protective activities against cardiovascular diseases [21],diabetes [22], neurodegenerative disorders, and cataract formation [23,24]. Among the secondarymetabolites found in onion, flavonoids, fructans, and organosulphur compounds were mainly foundto mediate its health benefits [25–27]. We have previously reported on the flavor makeup of A. cepa redcv. grown in the Siwa Oasis, Egypt, revealing its enrichment in sulphur compounds [28]. Solid-phasemicroextraction (SPME) is regarded as a powerful analytical tool for volatiles extraction withoutsolvent consumption and with no heat application, which aids in maintaining the original food aromawithout the formation of artifacts as compared to steam distillation [29]. Further, confined direct MSanalysis with real-time ion source and its applications in the analysis of volatile organic compounds ofCitrus limon (lemon) and Allium cepa (onion) was reported [30]. In terms the secondary non-volatilemetabolite composition of A. cepa, flavonols and acylated amino acids were the major forms as analyzedvia UPLC-QTOFMS [28]. Metabolomics provides a holistic overview for the chemical profile of anorganism (set of metabolites) exposed to different conditions. It can provide a shorter and moreaccessible route for visualizing metabolic difference in food matrices [31]. Significant strides havebeen made in the analysis of plant foods, mostly using different metabolomics platforms data [32].The application of mass spectrometry (MS) coupled to an array of separation techniques [33,34]helps to simultaneously analyze a relatively large number of metabolites in a high-throughput,reproducible, and sensitive manner [35]. This study aims to explore the impact of pickling as apreservation method on the metabolite profile. Onion and lemon were employed as two differentmodels considering their different compositional profiles, as these represent major food crops preservedusing pickling. The effect of pickling, with and without fermentation, in terms of processing andstorage time on organosulphur compounds of garlic has been previously reported [36]. This studyreported the drawbacks of fermentation on the bioactive sulphur compounds, namely γ-glutamylpeptides and S-alk(en)yl-L-cysteine sulfoxides. For the comprehensive analysis of metabolites,solid-phase microextraction (SPME) coupled with GC-MS was employed for volatiles profiling,whereas UPLC-QTOFMS was used to capture the polar non-volatile secondary metabolites. Results
190
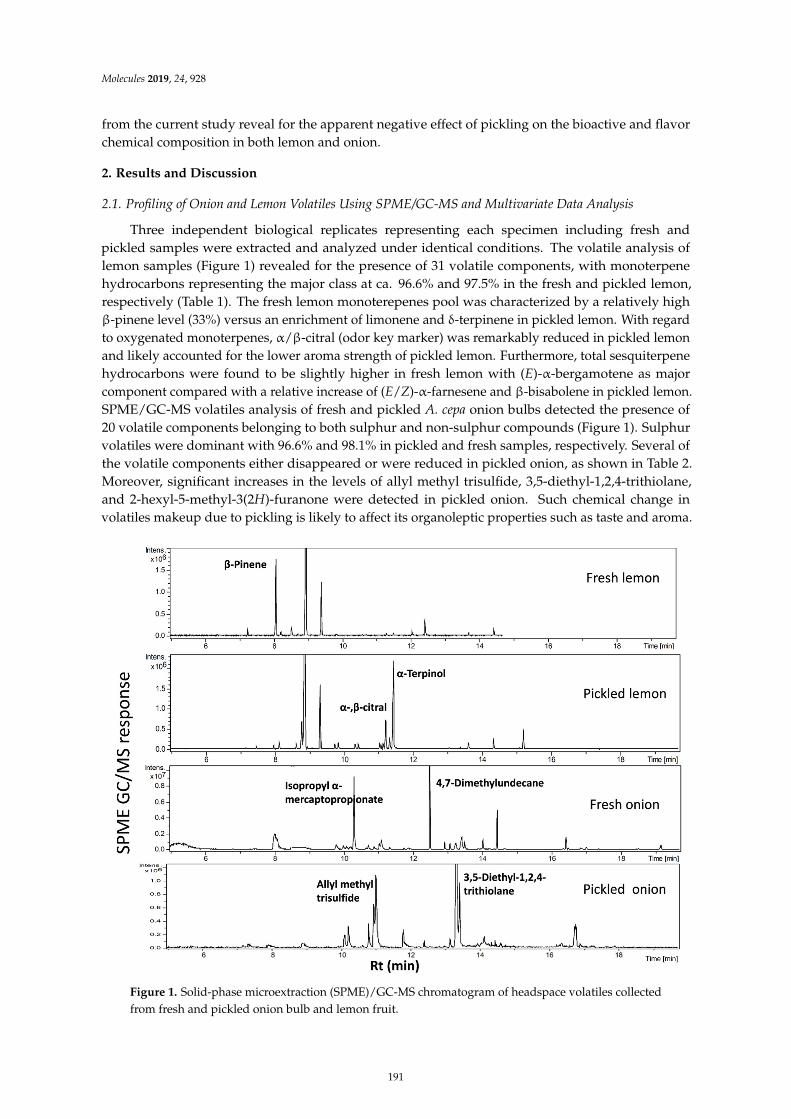
Molecules 2019, 24, 928
from the current study reveal for the apparent negative effect of pickling on the bioactive and flavorchemical composition in both lemon and onion.
2. Results and Discussion
2.1. Profiling of Onion and Lemon Volatiles Using SPME/GC-MS and Multivariate Data Analysis
Three independent biological replicates representing each specimen including fresh andpickled samples were extracted and analyzed under identical conditions. The volatile analysis oflemon samples (Figure 1) revealed for the presence of 31 volatile components, with monoterpenehydrocarbons representing the major class at ca. 96.6% and 97.5% in the fresh and pickled lemon,respectively (Table 1). The fresh lemon monoterepenes pool was characterized by a relatively highβ-pinene level (33%) versus an enrichment of limonene and δ-terpinene in pickled lemon. With regardto oxygenated monoterpenes, α/β-citral (odor key marker) was remarkably reduced in pickled lemonand likely accounted for the lower aroma strength of pickled lemon. Furthermore, total sesquiterpenehydrocarbons were found to be slightly higher in fresh lemon with (E)-α-bergamotene as majorcomponent compared with a relative increase of (E/Z)-α-farnesene and β-bisabolene in pickled lemon.SPME/GC-MS volatiles analysis of fresh and pickled A. cepa onion bulbs detected the presence of20 volatile components belonging to both sulphur and non-sulphur compounds (Figure 1). Sulphurvolatiles were dominant with 96.6% and 98.1% in pickled and fresh samples, respectively. Several ofthe volatile components either disappeared or were reduced in pickled onion, as shown in Table 2.Moreover, significant increases in the levels of allyl methyl trisulfide, 3,5-diethyl-1,2,4-trithiolane,and 2-hexyl-5-methyl-3(2H)-furanone were detected in pickled onion. Such chemical change involatiles makeup due to pickling is likely to affect its organoleptic properties such as taste and aroma.
βδ
α β
αα β
Figure 1. Solid-phase microextraction (SPME)/GC-MS chromatogram of headspace volatiles collectedfrom fresh and pickled onion bulb and lemon fruit.
191
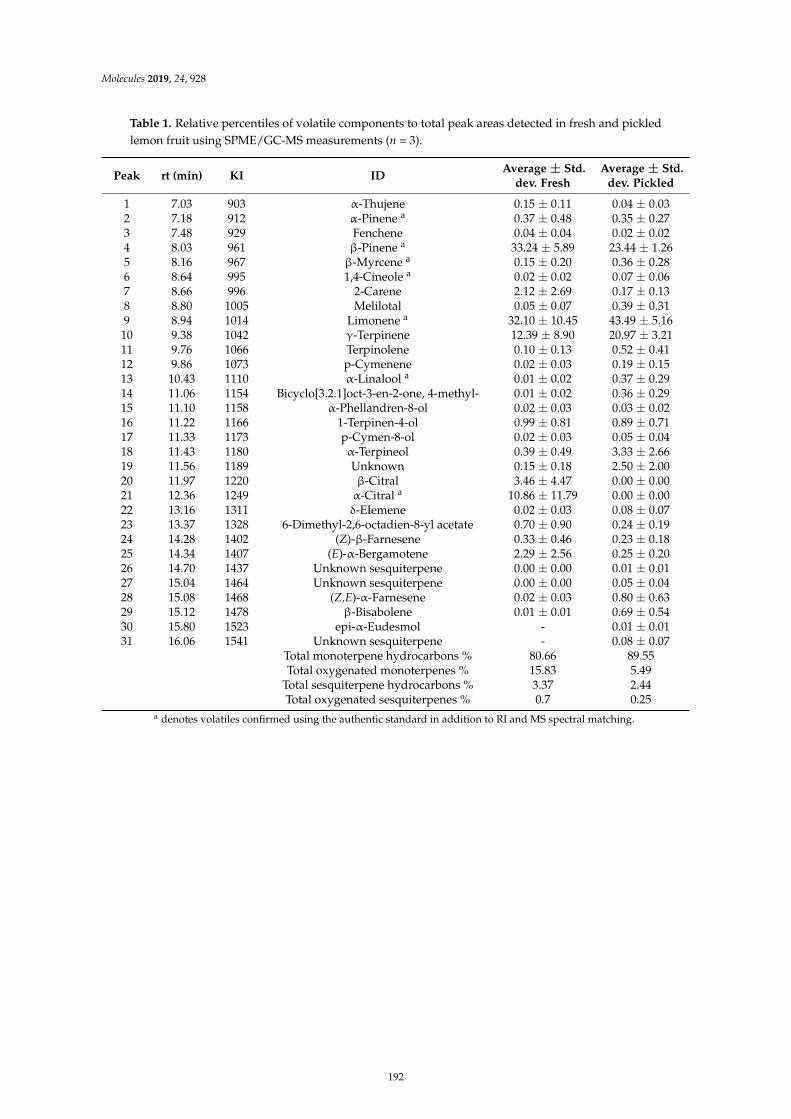
Molecules 2019, 24, 928
Table 1. Relative percentiles of volatile components to total peak areas detected in fresh and pickledlemon fruit using SPME/GC-MS measurements (n = 3).
Peak rt (min) KI IDAverage ± Std.
dev. FreshAverage ± Std.
dev. Pickled
1 7.03 903 α-Thujene 0.15 ± 0.11 0.04 ± 0.032 7.18 912 α-Pinene a 0.37 ± 0.48 0.35 ± 0.273 7.48 929 Fenchene 0.04 ± 0.04 0.02 ± 0.024 8.03 961 β-Pinene a 33.24 ± 5.89 23.44 ± 1.265 8.16 967 β-Myrcene a 0.15 ± 0.20 0.36 ± 0.286 8.64 995 1,4-Cineole a 0.02 ± 0.02 0.07 ± 0.067 8.66 996 2-Carene 2.12 ± 2.69 0.17 ± 0.138 8.80 1005 Melilotal 0.05 ± 0.07 0.39 ± 0.319 8.94 1014 Limonene a 32.10 ± 10.45 43.49 ± 5.16
10 9.38 1042 γ-Terpinene 12.39 ± 8.90 20.97 ± 3.2111 9.76 1066 Terpinolene 0.10 ± 0.13 0.52 ± 0.4112 9.86 1073 p-Cymenene 0.02 ± 0.03 0.19 ± 0.1513 10.43 1110 α-Linalool a 0.01 ± 0.02 0.37 ± 0.2914 11.06 1154 Bicyclo[3.2.1]oct-3-en-2-one, 4-methyl- 0.01 ± 0.02 0.36 ± 0.2915 11.10 1158 α-Phellandren-8-ol 0.02 ± 0.03 0.03 ± 0.0216 11.22 1166 1-Terpinen-4-ol 0.99 ± 0.81 0.89 ± 0.7117 11.33 1173 p-Cymen-8-ol 0.02 ± 0.03 0.05 ± 0.0418 11.43 1180 α-Terpineol 0.39 ± 0.49 3.33 ± 2.6619 11.56 1189 Unknown 0.15 ± 0.18 2.50 ± 2.0020 11.97 1220 β-Citral 3.46 ± 4.47 0.00 ± 0.0021 12.36 1249 α-Citral a 10.86 ± 11.79 0.00 ± 0.0022 13.16 1311 δ-EIemene 0.02 ± 0.03 0.08 ± 0.0723 13.37 1328 6-Dimethyl-2,6-octadien-8-yl acetate 0.70 ± 0.90 0.24 ± 0.1924 14.28 1402 (Z)-β-Farnesene 0.33 ± 0.46 0.23 ± 0.1825 14.34 1407 (E)-α-Bergamotene 2.29 ± 2.56 0.25 ± 0.2026 14.70 1437 Unknown sesquiterpene 0.00 ± 0.00 0.01 ± 0.0127 15.04 1464 Unknown sesquiterpene 0.00 ± 0.00 0.05 ± 0.0428 15.08 1468 (Z,E)-α-Farnesene 0.02 ± 0.03 0.80 ± 0.6329 15.12 1478 β-Bisabolene 0.01 ± 0.01 0.69 ± 0.5430 15.80 1523 epi-α-Eudesmol - 0.01 ± 0.0131 16.06 1541 Unknown sesquiterpene - 0.08 ± 0.07
Total monoterpene hydrocarbons % 80.66 89.55Total oxygenated monoterpenes % 15.83 5.49
Total sesquiterpene hydrocarbons % 3.37 2.44Total oxygenated sesquiterpenes % 0.7 0.25
a denotes volatiles confirmed using the authentic standard in addition to RI and MS spectral matching.
192
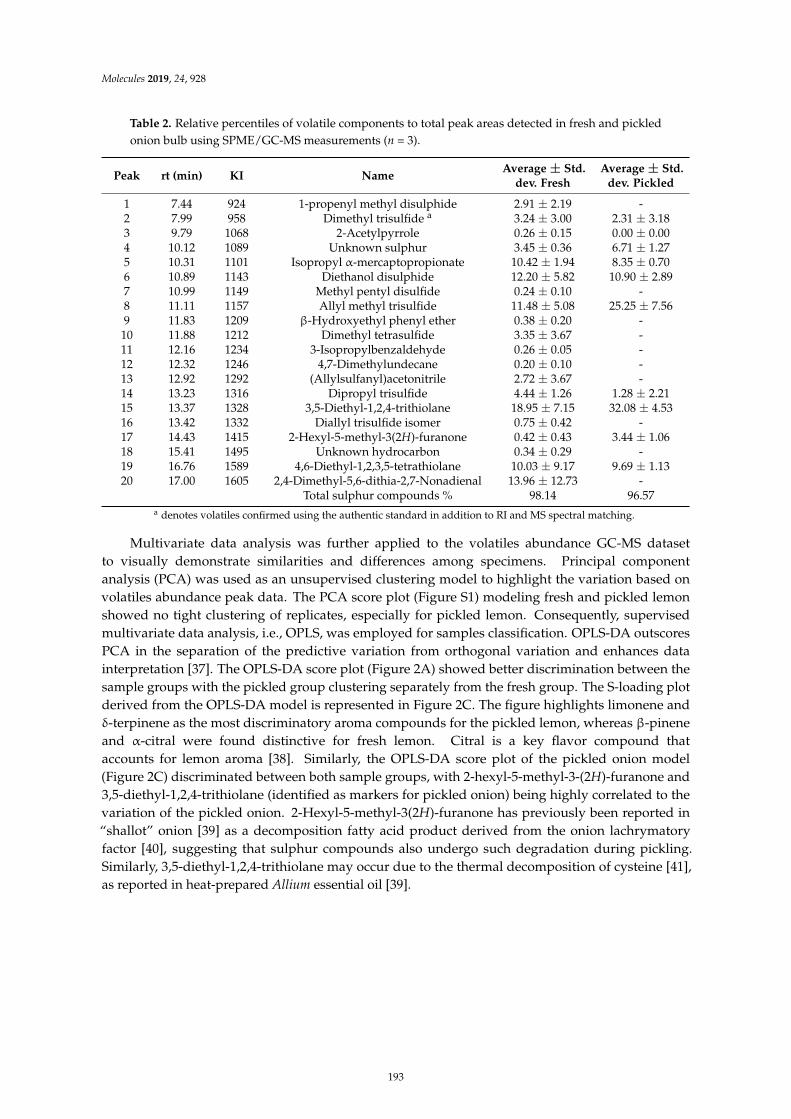
Molecules 2019, 24, 928
Table 2. Relative percentiles of volatile components to total peak areas detected in fresh and pickledonion bulb using SPME/GC-MS measurements (n = 3).
Peak rt (min) KI NameAverage ± Std.
dev. FreshAverage ± Std.
dev. Pickled
1 7.44 924 1-propenyl methyl disulphide 2.91 ± 2.19 -2 7.99 958 Dimethyl trisulfide a 3.24 ± 3.00 2.31 ± 3.183 9.79 1068 2-Acetylpyrrole 0.26 ± 0.15 0.00 ± 0.004 10.12 1089 Unknown sulphur 3.45 ± 0.36 6.71 ± 1.275 10.31 1101 Isopropyl α-mercaptopropionate 10.42 ± 1.94 8.35 ± 0.706 10.89 1143 Diethanol disulphide 12.20 ± 5.82 10.90 ± 2.897 10.99 1149 Methyl pentyl disulfide 0.24 ± 0.10 -8 11.11 1157 Allyl methyl trisulfide 11.48 ± 5.08 25.25 ± 7.569 11.83 1209 β-Hydroxyethyl phenyl ether 0.38 ± 0.20 -
10 11.88 1212 Dimethyl tetrasulfide 3.35 ± 3.67 -11 12.16 1234 3-Isopropylbenzaldehyde 0.26 ± 0.05 -12 12.32 1246 4,7-Dimethylundecane 0.20 ± 0.10 -13 12.92 1292 (Allylsulfanyl)acetonitrile 2.72 ± 3.67 -14 13.23 1316 Dipropyl trisulfide 4.44 ± 1.26 1.28 ± 2.2115 13.37 1328 3,5-Diethyl-1,2,4-trithiolane 18.95 ± 7.15 32.08 ± 4.5316 13.42 1332 Diallyl trisulfide isomer 0.75 ± 0.42 -17 14.43 1415 2-Hexyl-5-methyl-3(2H)-furanone 0.42 ± 0.43 3.44 ± 1.0618 15.41 1495 Unknown hydrocarbon 0.34 ± 0.29 -19 16.76 1589 4,6-Diethyl-1,2,3,5-tetrathiolane 10.03 ± 9.17 9.69 ± 1.1320 17.00 1605 2,4-Dimethyl-5,6-dithia-2,7-Nonadienal 13.96 ± 12.73 -
Total sulphur compounds % 98.14 96.57a denotes volatiles confirmed using the authentic standard in addition to RI and MS spectral matching.
Multivariate data analysis was further applied to the volatiles abundance GC-MS datasetto visually demonstrate similarities and differences among specimens. Principal componentanalysis (PCA) was used as an unsupervised clustering model to highlight the variation based onvolatiles abundance peak data. The PCA score plot (Figure S1) modeling fresh and pickled lemonshowed no tight clustering of replicates, especially for pickled lemon. Consequently, supervisedmultivariate data analysis, i.e., OPLS, was employed for samples classification. OPLS-DA outscoresPCA in the separation of the predictive variation from orthogonal variation and enhances datainterpretation [37]. The OPLS-DA score plot (Figure 2A) showed better discrimination between thesample groups with the pickled group clustering separately from the fresh group. The S-loading plotderived from the OPLS-DA model is represented in Figure 2C. The figure highlights limonene andδ-terpinene as the most discriminatory aroma compounds for the pickled lemon, whereas β-pineneand α-citral were found distinctive for fresh lemon. Citral is a key flavor compound thataccounts for lemon aroma [38]. Similarly, the OPLS-DA score plot of the pickled onion model(Figure 2C) discriminated between both sample groups, with 2-hexyl-5-methyl-3-(2H)-furanone and3,5-diethyl-1,2,4-trithiolane (identified as markers for pickled onion) being highly correlated to thevariation of the pickled onion. 2-Hexyl-5-methyl-3(2H)-furanone has previously been reported in“shallot” onion [39] as a decomposition fatty acid product derived from the onion lachrymatoryfactor [40], suggesting that sulphur compounds also undergo such degradation during pickling.Similarly, 3,5-diethyl-1,2,4-trithiolane may occur due to the thermal decomposition of cysteine [41],as reported in heat-prepared Allium essential oil [39].
193
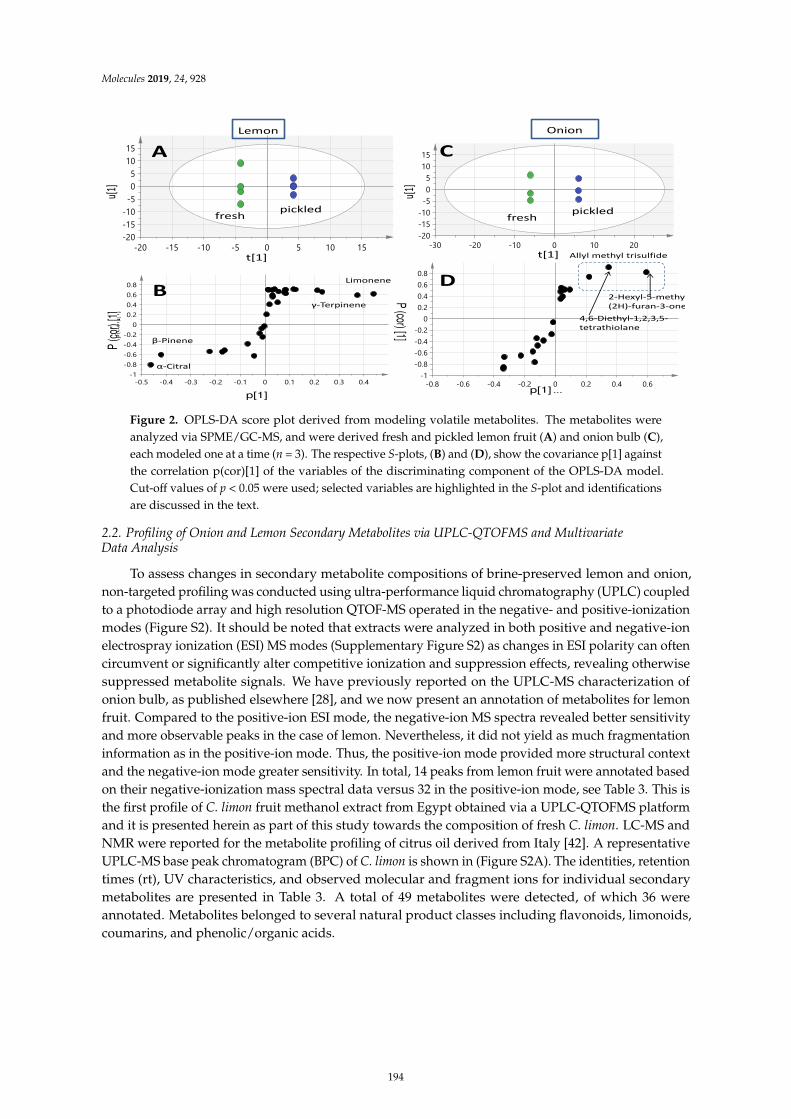
Molecules 2019, 24, 928
limonene and δwhereas β pinene and α
“shallot”
p[1]
P (c
or) [
1]u[
1]
t[1]
A
B
u[1]
t[1]
p[1]P (cor) [1]
C
D
Lemon
pickledfresh
β-Pinene
α-Citral
Limonene
γ-Terpinene
B
Onion
2-Hexyl-5-methyl-
(2H)-furan-3-one
4,6-Diethyl-1,2,3,5-
tetrathiolane
Allyl methyl trisulfide
pickledfresh
Figure 2. OPLS-DA score plot derived from modeling volatile metabolites. The metabolites wereanalyzed via SPME/GC-MS, and were derived fresh and pickled lemon fruit (A) and onion bulb (C),each modeled one at a time (n = 3). The respective S-plots, (B) and (D), show the covariance p[1] againstthe correlation p(cor)[1] of the variables of the discriminating component of the OPLS-DA model.Cut-off values of p < 0.05 were used; selected variables are highlighted in the S-plot and identificationsare discussed in the text.
2.2. Profiling of Onion and Lemon Secondary Metabolites via UPLC-QTOFMS and MultivariateData Analysis
To assess changes in secondary metabolite compositions of brine-preserved lemon and onion,non-targeted profiling was conducted using ultra-performance liquid chromatography (UPLC) coupledto a photodiode array and high resolution QTOF-MS operated in the negative- and positive-ionizationmodes (Figure S2). It should be noted that extracts were analyzed in both positive and negative-ionelectrospray ionization (ESI) MS modes (Supplementary Figure S2) as changes in ESI polarity can oftencircumvent or significantly alter competitive ionization and suppression effects, revealing otherwisesuppressed metabolite signals. We have previously reported on the UPLC-MS characterization ofonion bulb, as published elsewhere [28], and we now present an annotation of metabolites for lemonfruit. Compared to the positive-ion ESI mode, the negative-ion MS spectra revealed better sensitivityand more observable peaks in the case of lemon. Nevertheless, it did not yield as much fragmentationinformation as in the positive-ion mode. Thus, the positive-ion mode provided more structural contextand the negative-ion mode greater sensitivity. In total, 14 peaks from lemon fruit were annotated basedon their negative-ionization mass spectral data versus 32 in the positive-ion mode, see Table 3. This isthe first profile of C. limon fruit methanol extract from Egypt obtained via a UPLC-QTOFMS platformand it is presented herein as part of this study towards the composition of fresh C. limon. LC-MS andNMR were reported for the metabolite profiling of citrus oil derived from Italy [42]. A representativeUPLC-MS base peak chromatogram (BPC) of C. limon is shown in (Figure S2A). The identities, retentiontimes (rt), UV characteristics, and observed molecular and fragment ions for individual secondarymetabolites are presented in Table 3. A total of 49 metabolites were detected, of which 36 wereannotated. Metabolites belonged to several natural product classes including flavonoids, limonoids,coumarins, and phenolic/organic acids.
194
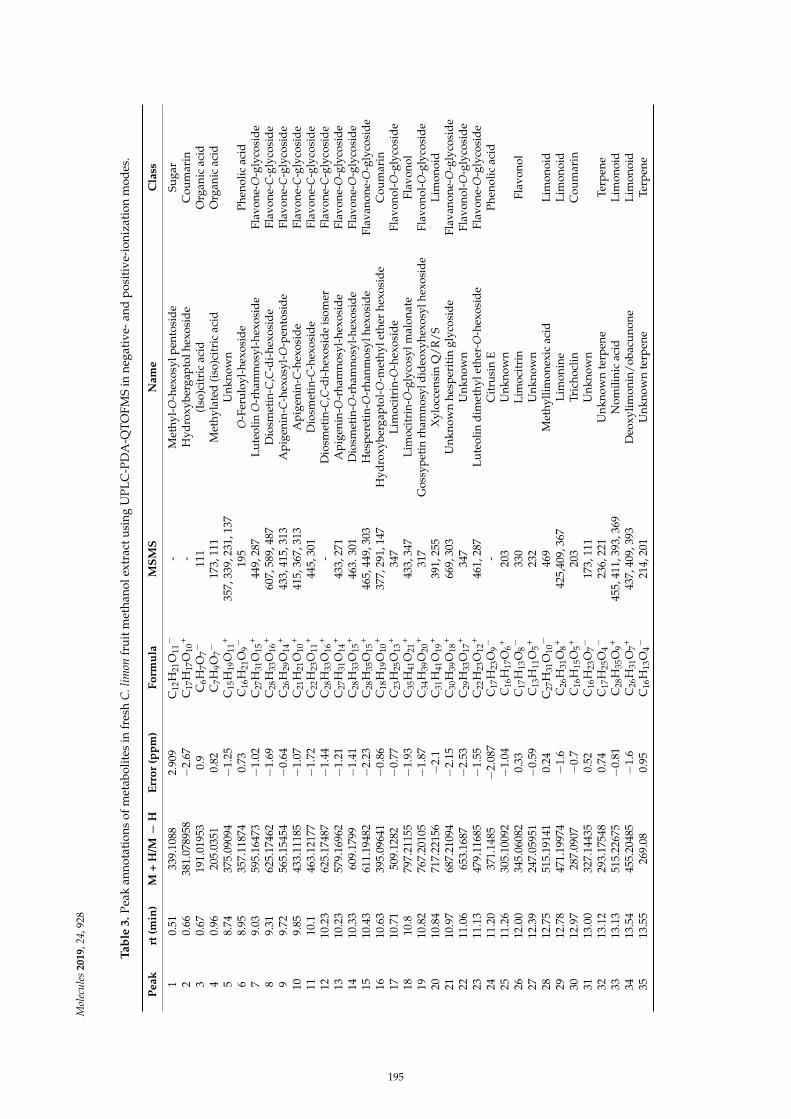
Mol
ecu
les
20
19,2
4,92
8
Ta
ble
3.
Pea
kan
nota
tion
sof
met
abol
ites
infr
esh
C.l
imon
fru
itm
etha
nole
xtra
ctu
sing
UP
LC
-PD
A-Q
TOFM
Sin
nega
tive
-and
pos
itiv
e-io
niza
tion
mod
es.
Pe
ak
rt(m
in)
M+
H/M
−H
Err
or
(pp
m)
Fo
rmu
laM
SM
SN
am
eC
lass
10.
5133
9.10
882.
909
C12
H21
O11
−-
Met
hyl-
O-h
exos
ylp
ento
sid
eSu
gar
20.
6638
1.07
8958
−2.
67C
17H
17O
10+
-H
ydro
xybe
rgap
tolh
exos
ide
Cou
mar
in3
0.67
191.
0195
30.
9C
6H7O
7−11
1(I
so)c
itri
cac
idO
rgan
icac
id4
0.96
205.
0351
0.82
C7H
9O7−
173,
111
Met
hyla
ted
(iso
)cit
ric
acid
Org
anic
acid
58.
7437
5.09
094
−1.
25C
15H
19O
11+
357,
339,
231,
137
Unk
now
n6
8.95
357.
1187
40.
73C
16H
21O
9−19
5O
-Fer
ulo
yl-h
exos
ide
Phe
nolic
acid
79.
0359
5.16
473
−1.
02C
27H
31O
15+
449,
287
Lu
teol
inO
-rha
mno
syl-
hexo
sid
eFl
avon
e-O
-gly
cosi
de
89.
3162
5.17
462
−1.
69C
28H
33O
16+
607,
589,
487
Dio
smet
in-C
,C-d
i-he
xosi
de
Flav
one-
C-g
lyco
sid
e9
9.72
565.
1545
4−
0.64
C26
H29
O14
+43
3,41
5,31
3A
pig
enin
-C-h
exos
yl-O
-pen
tosi
de
Flav
one-
C-g
lyco
sid
e10
9.85
433.
1118
5−
1.07
C21
H21
O10
+41
5,36
7,31
3A
pig
enin
-C-h
exos
ide
Flav
one-
C-g
lyco
sid
e11
10.1
463.
1217
7−
1.72
C22
H23
O11
+44
5,30
1D
iosm
etin
-C-h
exos
ide
Flav
one-
C-g
lyco
sid
e12
10.2
362
5.17
487
−1.
44C
28H
33O
16+
-D
iosm
etin
-C,C
-di-
hexo
sid
eis
omer
Flav
one-
C-g
lyco
sid
e13
10.2
357
9.16
962
−1.
21C
27H
31O
14+
433,
271
Ap
igen
in-O
-rha
mno
syl-
hexo
sid
eFl
avon
e-O
-gly
cosi
de
1410
.33
609.
1799
−1.
41C
28H
33O
15+
463.
301
Dio
smet
in-O
-rha
mno
syl-
hexo
sid
eFl
avon
e-O
-gly
cosi
de
1510
.43
611.
1948
2−
2.23
C28
H35
O15
+46
5,44
9,30
3H
esp
eret
in-O
-rha
nmos
ylhe
xosi
de
Flav
anon
e-O
-gly
cosi
de
1610
.63
395.
0964
1−
0.86
C18
H19
O10
+37
7,29
1,14
7H
ydro
xybe
rgap
tol-
O-m
ethy
leth
erhe
xosi
de
Cou
mar
in17
10.7
150
9.12
82−
0.77
C23
H25
O13
+34
7L
imoc
itri
n-O
-hex
osid
eFl
avon
ol-O
-gly
cosi
de
1810
.879
7.21
155
−1.
93C
35H
41O
21+
433,
347
Lim
ocit
rin-
O-g
lyco
sylm
alon
ate
Flav
onol
1910
.82
767.
2010
5−
1.87
C34
H39
O20
+31
7G
ossy
peti
nrh
amno
syld
ideo
xyhe
xosy
lhex
osid
eFl
avon
ol-O
-gly
cosi
de
2010
.84
717.
2215
6−
2.1
C31
H41
O19
+39
1,25
5X
yloc
cens
inQ
/R
/S
Lim
onoi
d21
10.9
768
7.21
094
−2.
15C
30H
39O
18+
669,
303
Unk
now
nhe
sper
itin
glyc
osid
eFl
avan
one-
O-g
lyco
sid
e22
11.0
665
3.16
87−
2.53
C29
H33
O17
+34
7U
nkno
wn
Flav
onol
-O-g
lyco
sid
e23
11.1
347
9.11
685
−1.
55C
22H
23O
12+
461,
287
Lu
teol
ind
imet
hyle
ther
-O-h
exos
ide
Flav
one-
O-g
lyco
sid
e24
11.2
037
1.14
85−
2.08
7C
17H
23O
9−-
Cit
rusi
nE
Phe
nolic
acid
2511
.26
305.
1009
2−
1.04
C16
H17
O6+
203
Unk
now
n26
12.0
034
5.06
082
0.33
C17
H13
O8−
330
Lim
ocit
rin
Flav
onol
2712
.39
247.
0595
1−
0.59
C13
H11
O5+
232
Unk
now
n28
12.7
551
5.19
141
0.24
C27
H31
O10
−46
9M
ethy
llim
onex
icac
idL
imon
oid
2912
.78
471.
1997
4−
1.6
C26
H31
O8+
425,
409,
367
Lim
onin
eL
imon
oid
3012
.97
287.
0907
−0.
7C
16H
15O
5+20
3Tr
icho
clin
Cou
mar
in31
13.0
032
7.14
435
0.52
C16
H23
O7−
173,
111
Unk
now
n32
13.1
229
3.17
548
0.74
C17
H25
O4−
236,
221
Unk
now
nte
rpen
eTe
rpen
e33
13.1
351
5.22
675
−0.
81C
28H
35O
9+45
5,41
1,39
3,36
9N
omili
nic
acid
Lim
onoi
d34
13.5
445
5.20
485
−1.
6C
26H
31O
7+43
7,40
9,39
3D
eoxy
limon
in/
obac
uno
neL
imon
oid
3513
.55
269.
080.
95C
16H
13O
4−21
4,20
1U
nkno
wn
terp
ene
Terp
ene
195
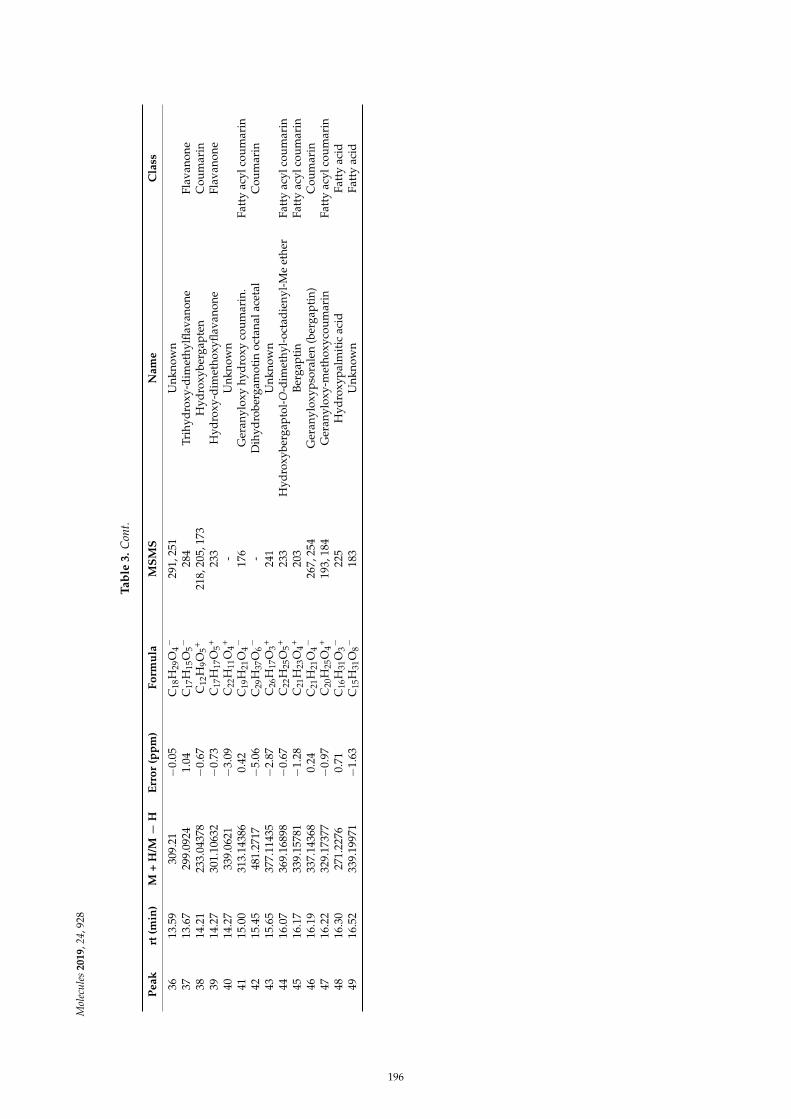
Mol
ecu
les
20
19,2
4,92
8
Ta
ble
3.
Con
t.
Pe
ak
rt(m
in)
M+
H/M
−H
Err
or
(pp
m)
Fo
rmu
laM
SM
SN
am
eC
lass
3613
.59
309.
21−
0.05
C18
H29
O4−
291,
251
Unk
now
n37
13.6
729
9.09
241.
04C
17H
15O
5−28
4Tr
ihyd
roxy
-dim
ethy
lflav
anon
eFl
avan
one
3814
.21
233.
0437
8−
0.67
C12
H9O
5+21
8,20
5,17
3H
ydro
xybe
rgap
ten
Cou
mar
in39
14.2
730
1.10
632
−0.
73C
17H
17O
5+23
3H
ydro
xy-d
imet
hoxy
flav
anon
eFl
avan
one
4014
.27
339.
0621
−3.
09C
22H
11O
4+-
Unk
now
n41
15.0
031
3.14
386
0.42
C19
H21
O4−
176
Ger
anyl
oxy
hyd
roxy
cou
mar
in.
Fatt
yac
ylco
um
arin
4215
.45
481.
2717
−5.
06C
29H
37O
6−-
Dih
ydro
berg
amot
inoc
tana
lace
tal
Cou
mar
in43
15.6
537
7.11
435
−2.
87C
26H
17O
3+24
1U
nkno
wn
4416
.07
369.
1689
8−
0.67
C22
H25
O5+
233
Hyd
roxy
berg
apto
l-O
-dim
ethy
l-oc
tad
ieny
l-M
eet
her
Fatt
yac
ylco
um
arin
4516
.17
339.
1578
1−
1.28
C21
H23
O4+
203
Ber
gap
tin
Fatt
yac
ylco
um
arin
4616
.19
337.
1436
80.
24C
21H
21O
4−26
7,25
4G
eran
ylox
ypso
rale
n(b
erga
pti
n)C
oum
arin
4716
.22
329.
1737
7−
0.97
C20
H25
O4+
193,
184
Ger
anyl
oxy-
met
hoxy
cou
mar
inFa
tty
acyl
cou
mar
in48
16.3
027
1.22
760.
71C
16H
31O
3−22
5H
ydro
xyp
alm
itic
acid
Fatt
yac
id49
16.5
233
9.19
971
−1.
63C
15H
31O
8−18
3U
nkno
wn
Fatt
yac
id
196
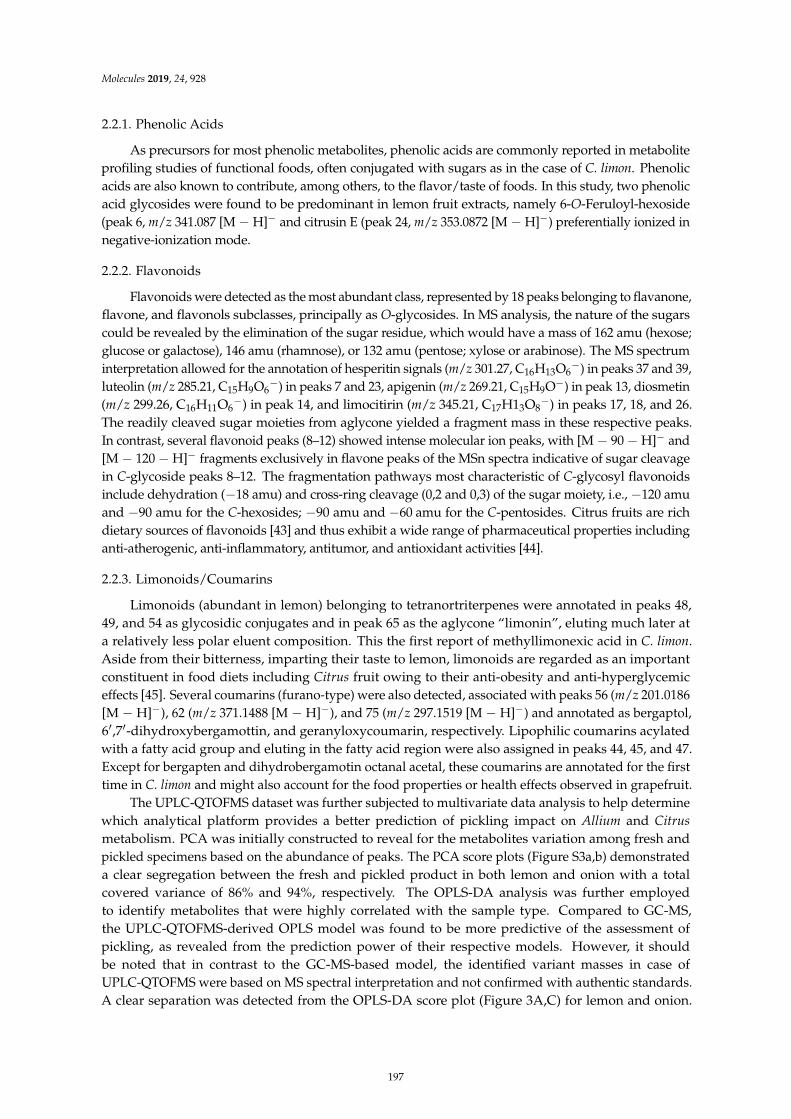
Molecules 2019, 24, 928
2.2.1. Phenolic Acids
As precursors for most phenolic metabolites, phenolic acids are commonly reported in metaboliteprofiling studies of functional foods, often conjugated with sugars as in the case of C. limon. Phenolicacids are also known to contribute, among others, to the flavor/taste of foods. In this study, two phenolicacid glycosides were found to be predominant in lemon fruit extracts, namely 6-O-Feruloyl-hexoside(peak 6, m/z 341.087 [M − H]− and citrusin E (peak 24, m/z 353.0872 [M − H]−) preferentially ionized innegative-ionization mode.
2.2.2. Flavonoids
Flavonoids were detected as the most abundant class, represented by 18 peaks belonging to flavanone,flavone, and flavonols subclasses, principally as O-glycosides. In MS analysis, the nature of the sugarscould be revealed by the elimination of the sugar residue, which would have a mass of 162 amu (hexose;glucose or galactose), 146 amu (rhamnose), or 132 amu (pentose; xylose or arabinose). The MS spectruminterpretation allowed for the annotation of hesperitin signals (m/z 301.27, C16H13O6
−) in peaks 37 and 39,luteolin (m/z 285.21, C15H9O6
−) in peaks 7 and 23, apigenin (m/z 269.21, C15H9O−) in peak 13, diosmetin(m/z 299.26, C16H11O6
−) in peak 14, and limocitirin (m/z 345.21, C17H13O8−) in peaks 17, 18, and 26.
The readily cleaved sugar moieties from aglycone yielded a fragment mass in these respective peaks.In contrast, several flavonoid peaks (8–12) showed intense molecular ion peaks, with [M − 90 − H]− and[M − 120 − H]− fragments exclusively in flavone peaks of the MSn spectra indicative of sugar cleavagein C-glycoside peaks 8–12. The fragmentation pathways most characteristic of C-glycosyl flavonoidsinclude dehydration (−18 amu) and cross-ring cleavage (0,2 and 0,3) of the sugar moiety, i.e., −120 amuand −90 amu for the C-hexosides; −90 amu and −60 amu for the C-pentosides. Citrus fruits are richdietary sources of flavonoids [43] and thus exhibit a wide range of pharmaceutical properties includinganti-atherogenic, anti-inflammatory, antitumor, and antioxidant activities [44].
2.2.3. Limonoids/Coumarins
Limonoids (abundant in lemon) belonging to tetranortriterpenes were annotated in peaks 48,49, and 54 as glycosidic conjugates and in peak 65 as the aglycone “limonin”, eluting much later ata relatively less polar eluent composition. This the first report of methyllimonexic acid in C. limon.Aside from their bitterness, imparting their taste to lemon, limonoids are regarded as an importantconstituent in food diets including Citrus fruit owing to their anti-obesity and anti-hyperglycemiceffects [45]. Several coumarins (furano-type) were also detected, associated with peaks 56 (m/z 201.0186[M − H]−), 62 (m/z 371.1488 [M − H]−), and 75 (m/z 297.1519 [M − H]−) and annotated as bergaptol,6′,7′-dihydroxybergamottin, and geranyloxycoumarin, respectively. Lipophilic coumarins acylatedwith a fatty acid group and eluting in the fatty acid region were also assigned in peaks 44, 45, and 47.Except for bergapten and dihydrobergamotin octanal acetal, these coumarins are annotated for the firsttime in C. limon and might also account for the food properties or health effects observed in grapefruit.
The UPLC-QTOFMS dataset was further subjected to multivariate data analysis to help determinewhich analytical platform provides a better prediction of pickling impact on Allium and Citrus
metabolism. PCA was initially constructed to reveal for the metabolites variation among fresh andpickled specimens based on the abundance of peaks. The PCA score plots (Figure S3a,b) demonstrateda clear segregation between the fresh and pickled product in both lemon and onion with a totalcovered variance of 86% and 94%, respectively. The OPLS-DA analysis was further employedto identify metabolites that were highly correlated with the sample type. Compared to GC-MS,the UPLC-QTOFMS-derived OPLS model was found to be more predictive of the assessment ofpickling, as revealed from the prediction power of their respective models. However, it shouldbe noted that in contrast to the GC-MS-based model, the identified variant masses in case ofUPLC-QTOFMS were based on MS spectral interpretation and not confirmed with authentic standards.A clear separation was detected from the OPLS-DA score plot (Figure 3A,C) for lemon and onion.
197
Molecules 2019, 24, 928
The S-loading plot of lemon (Figure 3B) revealed the presence of xyloccensin, citric acid, and its methylester as the most distinctive markers for fresh lemon. In contrast, onion fresh bulb was discriminatedfrom the pickled one by the abundance of steroidal saponins in addition to quercetin glycosidicconjugates (Figure 3D). Xyloccensin exhibits an anti-hyperglycemic activity [46] and a decrease inits levels could ultimately affect lemon benefits. Moreover, the benefits of Allium’s polyphenols,i.e., quercetin glycoside and diglycoside, are well recognized [47] and a decrease in their levels wasalso observed in the case of A. cepa red cv. examined herein. Whether these metabolites get solubilizedin the brine solution surrounding the bulb or get degraded has yet to be determined.
’s
p[1]
P (
cor)
[1
]u
[1]
t[1]
A
B
u[1
]
t[1]
p[1]
C
D
Lemon
pickledfresh
Onion
Allyl methyl trisulfide
pickledfresh
Xyloccensin Q/R/S
Citric acid & its methyl ester
P (
cor)
[1
] Quercetin di-hexoside
Quercetin hexoside
Steroidal saponin
0 0
0 0
0
0
0
0
+ve
+ve
+ve
+ve
-ve
-ve-ve
Figure 3. OPLS-DA score plot derived from modeling primary and secondary metabolites analyzedusing UPLC-QTOFMS. Metabolites were derived fresh and pickled lemon fruit (A) and onion bulb (C),each modeled one at a time. The respective S-plots, (B) and (D), show the covariance p[1] against thecorrelation p(cor)[1] of the variables of the discriminating component of the OPLS-DA model. Cut-offvalues of p < 0.05 were used; selected variables are highlighted in the S-plot and identifications arediscussed in the text.
To assess the validity of the UPLC-MS based models, Q2 and R2 values of all calculated modelswere found to be larger than 0.5 and close to 1. The permutation diagnostic analysis of 20 iterationsprovided a reference distribution of R2/Q2 values and hence indicated the statistical significance ofthese parameters, with most models showing a regression line crossing zero, with negative Q2 and R2values close to 1, which signifies the model validation. Also, the p-value for each OPLS-DA model wascalculated using CV-ANOVA and all p-value were below 0.005 in the pickled models of lemon andonion (Supplementary Figures S4 and S5). Nevertheless, the models derived from the volatiles GC-MSdataset exhibited lower model validation, showing smaller R2 and Q2 values and with p-values higherthan 0.05, suggesting that the UPLC-MS-derived models provided a better assessment of the picklingimpact on both foods
2.3. Onion and Lemon Primary Metabolite Profiling Using GC-MS
Although UPLC-QTOFMS revealed the variation in organic acids, viz. citric acid and its methylderivative, as a major contributor to the segregation of pickled lemon from fresh ones, such a platformis not optimized for primary metabolite profiling [48]. To provide a more sensitive analysis of primary
198
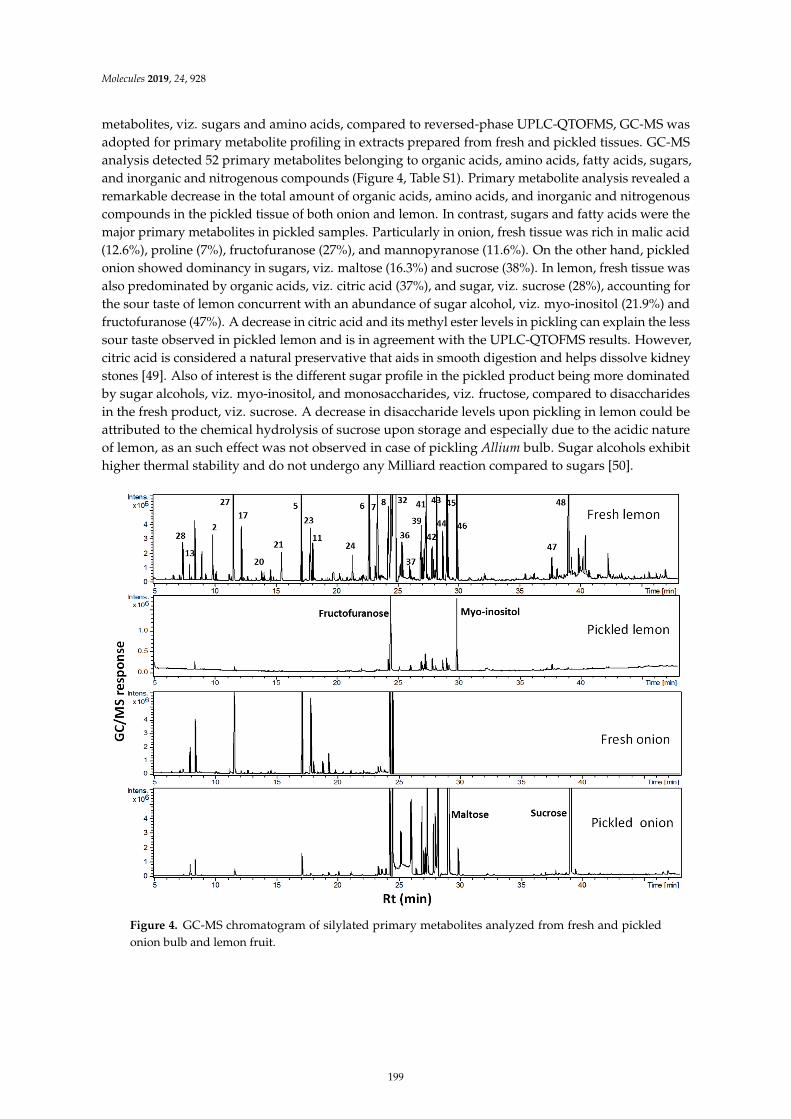
Molecules 2019, 24, 928
metabolites, viz. sugars and amino acids, compared to reversed-phase UPLC-QTOFMS, GC-MS wasadopted for primary metabolite profiling in extracts prepared from fresh and pickled tissues. GC-MSanalysis detected 52 primary metabolites belonging to organic acids, amino acids, fatty acids, sugars,and inorganic and nitrogenous compounds (Figure 4, Table S1). Primary metabolite analysis revealed aremarkable decrease in the total amount of organic acids, amino acids, and inorganic and nitrogenouscompounds in the pickled tissue of both onion and lemon. In contrast, sugars and fatty acids were themajor primary metabolites in pickled samples. Particularly in onion, fresh tissue was rich in malic acid(12.6%), proline (7%), fructofuranose (27%), and mannopyranose (11.6%). On the other hand, pickledonion showed dominancy in sugars, viz. maltose (16.3%) and sucrose (38%). In lemon, fresh tissue wasalso predominated by organic acids, viz. citric acid (37%), and sugar, viz. sucrose (28%), accounting forthe sour taste of lemon concurrent with an abundance of sugar alcohol, viz. myo-inositol (21.9%) andfructofuranose (47%). A decrease in citric acid and its methyl ester levels in pickling can explain the lesssour taste observed in pickled lemon and is in agreement with the UPLC-QTOFMS results. However,citric acid is considered a natural preservative that aids in smooth digestion and helps dissolve kidneystones [49]. Also of interest is the different sugar profile in the pickled product being more dominatedby sugar alcohols, viz. myo-inositol, and monosaccharides, viz. fructose, compared to disaccharidesin the fresh product, viz. sucrose. A decrease in disaccharide levels upon pickling in lemon could beattributed to the chemical hydrolysis of sucrose upon storage and especially due to the acidic natureof lemon, as an such effect was not observed in case of pickling Allium bulb. Sugar alcohols exhibithigher thermal stability and do not undergo any Milliard reaction compared to sugars [50].
Figure 4. GC-MS chromatogram of silylated primary metabolites analyzed from fresh and pickledonion bulb and lemon fruit.
199
Molecules 2019, 24, 928
3. Materials and Methods
3.1. Plant Material
Allium sativum and A. cepa red cv. bulbs were collected fresh from the field at Siwa Oasis, Egyptduring the month of May 2016. Lemon fruit was collected at the ripe stage from trees grown in Behiragovernorate, Egypt during the month of May 2016.
3.2. Pickling Protocol
Preparing pickled lemon and onion was made by packing directly with acidified brine afterblanching. Before processing, defective fruits or bulbs were discarded. Lemon fruit and pealed onionbulbs were blanched separately in water at 90 ◦C for 5 min and immediately packed in dark glass jarsthat were closed tight, containing acidified brine solution using 5% acetic acid. Brine was prepared bydissolving NaCl in water at a concentration of 15%. Both pickled products were stored in a dark placeaway of light at room temperature for four weeks.
3.3. Chemicals and Fibers
SPME fiber of stableflex coated with divinylbenzene/carboxen/polydimethylsiloxane(DVB/CAR/PDMS, 50/30 µm) was purchased from Supelco (Oakville, ON, Canada). All chemicalsand standards were purchased from Sigma Aldrich (St. Louis, MO, USA). Acetonitrile and formicacid (LC–MS grade) were obtained from J.T. Baker (Avantor, Netherlands). MilliQ water was used forUPLC-PDA-ESI-TOF-MS analysis.
3.4. Headspace Volatiles Analysis of C. limon and A. cepa Bulbs
The headspace-solid phase microextraction (HS-SPME) volatile analysis was carried out asmentioned previously [28]. (Z)-3-hexneyl acetate, dissolved in water to make a final concentration of2 µg per 1.5-mL SPME screw cap vial, was used to spike 100 mg of dried, finely ground peeled bulbsof onion and lemon fruit placed in 1.5-mL glass vials. The SPME fiber was soaked in a vial containingplant material and placed in an oven of 50 ◦C for 30 min. The fiber was successively withdrawn into theneedle and then injected into the injection port of the gas chromatography-mass spectrometer (GC-MS).A system blank containing no plant material was run as a control. SPME fibers were desorbed at210 ◦C for 1 min in the injection port of a Shimadzu Model GC-17A gas chromatograph interfaced witha Shimadzu model QP-5000 mass spectrometer (Kyoto, Japan). Volatiles were separated on a DB5-MScolumn (30 m length, 0.25 mm inner diameter, and 0.25 µm film) (J & W Scientific, Santa Clara, CA,USA). Injections were made in the splitless mode for 30 s. The gas chromatograph was operated underthe following conditions: injector 220 ◦C, column oven 38 ◦C for 3 min, then programmed at a rate of12 ◦C/min to 180 ◦C, maintained at 180 ◦C for 5 min, and finally ramped at a rate of 40 ◦C min−1 to220 ◦C and maintained for 2 min. He was used as the carrier gas at 1 mL/min−1. The transfer line andion-source temperatures were adjusted to be 230 and 180 ◦C, respectively. The HP quadrupole massspectrometer was operated in the electron ionization mode at 70 eV. The scan range was set at m/z
40–500. Peaks were deconvoluted using AMDIS software (Gaithersburg, MD, USA www.amdis.net).Volatile components were identified by matching their retention indices (RI) relative to n-alkanes(C6–C20), as well as mass comparison to NIST and WILEY library databases and with standards.
3.5. GC-MS Analysis of Silylated Primary Metabolites in Fruit Pulp and Skin
Freeze-dried fruit or bulb powders (100 mg) were extracted by adding 5 mL 50% MeOH. Then,100 µL of this 50% aqueous extract was evaporated under nitrogen until dryness was reached. Next,150 µL of N-methyl-N-(trimethylsilyl)-trifluoroacetamide (MSTFA) was added and incubated at 60 ◦Cfor 45 min for derivatization. The primary metabolites were analyzed using GC-MS. Silylated productswere purified on an Rtx-5MS (30 m length, 0.25 mm inner diameter, and 0.25 µm film) column.
200
Molecules 2019, 24, 928
Injections were made in a (1:15) split mode with the following conditions: injector 280 ◦C, columnoven 80 ◦C for 2 min, rate 5 ◦C/min to 315 ◦C, maintained at 315 ◦C for 12 min. He was used as thecarrier gas at 1 mL/min−1. The transfer line and ion-source temperatures were set to 280 and 180 ◦C,respectively. Compounds were identified as described in [51].
3.6. Extraction Procedure and Sample Preparation for UPLC-PDA-MS Analysis
Dried lyophilized food material was grounded separately in a mortar with liquid nitrogen.A powdered aliquot (ca. 30 mg) was then homogenized with 2.5 mL 70% MeOH containing 5 mg/mLumbelliferone (internal standard) with sonication for 30 min. Extracts were vortexed, centrifugedat 3000× g for 30 min to remove debris, and stored. Chromatographic separation was performedon an Acquity UPLC system (Waters Corp., Milford, MA, USA) equipped with an HSS T3 column(100 × 1.0 mm, particle size 1.8 mm; Waters Corp.) applying the following binary gradient at a flow rateof 150 mL/min: 0 to 1 min, isocratic 95% A (water:formic acid, 99.9:0.1, v/v), 5% B (acetonitrile:formicacid, 99.9:0.1, v/v); 1 to 16 min, linear from 5 to 95% B; 16 to 18 min, isocratic 95% B; 18 to 20 min,isocratic 5% B.
3.7. GC-MS and UPLC-QTOFMS Data Processing for Multivariate Analysis
MS peak abundance of volatiles and secondary metabolites were extracted using MET-IDEAsoftware with default parameter settings for GC-MS and LC-MS files [52]. The aligned peak abundancedata table was normalized to a spiked internal standard and further exported to principal componentanalysis (PCA) and partial least squares-discriminant analysis (OPLS-DA) using SIMCA-P version13.0 software package (Umetrics, Umeå, Sweden). All variables were mean-centered and scaled toPareto variance.
4. Conclusions
Pickling using brine, an old traditional process used to preserve food products, was investigatedfor the first time using an MS-based metabolomics approach in two food materials—lemon andonion. Metabolomics was effectively implemented to highlight the similarities and differencesbetween fresh and pickled products. Chemical analysis revealed a decline in lemon sensory volatiles,i.e., α,β-citral, as well as the degradation and rearrangement of sulphur compounds in onionto generate 2-hexyl-5-methyl-3(2H)-furanone and 3,5-diethyl-1,2,4-trithiolane, which are sulphurrearrangement products. A marked decrease in citric acid levels in lemon is likely to account forthe less sour taste of its fruit. Nevertheless, it should be noted that the chemical changes observedin this study need to be further complemented with a sensory analysis to prove whether they areultimately reflected in changes in aroma or taste. The impact of pickling on the non-volatile polarbioactive metabolites was revealed via UPLC-QTOFMS analysis and suggested for a lower healthvalue of pickled product relative to the fresh specimens. The effect of blanching as part of the picklingwas also not separately assessed, as samples were only analyzed after the pickling step.
Supplementary Materials: The followings are available online, Table S1: Relative percentiles of silylated primarymetabolites detected in fresh and pickled onion bulb and lemon fruit using GC-MS measurements; Figure S1:SPME/GC-MS-based PCA score plot derived from modeling the pickling effect on lemon fruit to assess theeffect of pickling on metabolite composition; Figure S2. UPLC-QTOFMS chromatogram of metabolites analyzedfrom fresh and pickled lemon fruit (A) and onion bulb (B) in negative- and positive-ionization modes, showingqualitative differences upon pickling in each examined food; Figure S3: UPLC-QTOFMS-based PCA score plotderived from modeling the pickling effect on lemon fruit (A) and onion bulb red cv. (B) separately to assess theeffect of pickling on metabolite composition.
Author Contributions: M.A.F. and L.A.W. conceived and designed the experiments; M.A.F. and A.E. performedthe experiments and the measurements; A.F.T. wrote the manuscript, M.S.D. performed the data analysis; M.A.F.revised the paper.
Funding: Mohamed A. Farag wishes to thank the Alexander von Humboldt foundation, Germany for the financialsupport and the American University of Cairo Internal Research Support Grant (RSG1-18).
201
Molecules 2019, 24, 928
Conflicts of Interest: The authors declare no conflict of interest. The founding sponsors had no role in the designof the study; in the collection, analyses, or interpretation of data; in the writing of the manuscript, and in thedecision to publish the results.
References
1. McFeeters, R.F. Effects of Fermentation on the Nutritional Properties of Food. In Nutritional Evaluation of
Food Processing; Karmas, E., Harris, R.S., Eds.; Springer Netherlands: Dordrecht, The Netherlands, 1988;pp. 423–446.
2. Montano, A.; Casado, F.J.; de Castro, A.; Sanchez, A.H.; Rejano, L. Vitamin content and amino acidcomposition of pickled garlic processed with and without fermentation. J. Agric. Food Chem. 2004, 52,7324–7330. [CrossRef] [PubMed]
3. Ji, F.-D.; Ji, B.-P.; Li, B.O.; Lu, F.E.I. Effect of fermentation on nitrate, nitrite and organic acid contents intraditional pickled chinese cabbage. J. Food Process. Preserv. 2009, 33, 175–186. [CrossRef]
4. Guo, X.H.; Yang, J.S.; Zhang, J.J. The study of nitrite peakvalue change mechanism and inhibition methodsduring Chinese cabbage fermentation. Chin. Food Ferment. Ind. 1989, 15, 26–34.
5. He, S.L.; Li, B.; Ji, B.P. Study on nitrate reductase activityduring the fermentation of pickled vegetable.Chin. Food Technol. 2005, 1, 94–97.
6. Chan, T.Y.K. Vegetable-borne nitrate and nitrite and the risk of methaemoglobinaemia. Toxicol. Lett. 2011,200, 107–108. [CrossRef] [PubMed]
7. Holzapfel, W. Use of starter cultures in fermentation on a household scale. Food Control 1997, 8, 241–258.[CrossRef]
8. Leroy, F.; De Vuyst, L. Lactic acid bacteria as functional starter cultures for the food fermentation industry.Trends Food Sci. Technol. 2004, 15, 67–78. [CrossRef]
9. Con, A.H.; Karasu, N. Determination of Antagonistic Starter Cultures for Pickle and Olive FermentationProcesses. Czech J. Food Sci. 2009, 27, 185–193.
10. Giraffa, G. Studying the dynamics of microbial populations during food fermentation. FEMS Microbiol. Rev.
2004, 28, 251–260. [CrossRef] [PubMed]11. Holzapfel, W.H. Appropriate starter culture technologies for small-scale fermentation in developing
countries. Int. J. Food Microbiol. 2002, 75, 197–212. [CrossRef]12. Hansen, E.B. Commercial bacterial starter cultures for fermented foods of the future. Int. J. Food Microbiol.
2002, 78, 119–131. [CrossRef]13. Abad-García, B.; Garmón-Lobato, S.; Sánchez-Ilárduya, M.B.; Berrueta, L.A.; Gallo, B.; Vicente, F.; Alonso-Salces, R.M.
Polyphenolic contents in Citrus fruit juices: Authenticity assessment. Eur. Food Res. Technol. 2014, 238,803–818. [CrossRef]
14. Spinola, V.; Pinto, J.; Castilho, P.C. Identification and quantification of phenolic compounds of selected fruitsfrom Madeira Island by HPLC-DAD-ESI-MS(n) and screening for their antioxidant activity. Food Chem. 2015,173, 14–30. [CrossRef] [PubMed]
15. Tounsi, M.S.; Wannes, W.A.; Ouerghemmi, I.; Jegham, S.; Ben Njima, Y.; Hamdaoui, G.; Zemni, H.; Marzouk, B.Juice components and antioxidant capacity of four Tunisian Citrus varieties. J. Sci. Food Agric. 2011, 91, 142–151.[CrossRef] [PubMed]
16. Hamdan, D.; El-Readi, M.Z.; Tahrani, A.; Herrmann, F.; Kaufmann, D.; Farrag, N.; El-Shazly, A.; Wink, M.Secondary metabolites of ponderosa lemon (Citrus pyriformis) and their antioxidant, anti-inflammatory,and cytotoxic activities. Zeitschrift fur Naturforschung C J. Biosci. 2011, 66, 385–393. [CrossRef]
17. Guyonnet, D.; Siess, M.H.; Le Bon, A.M.; Suschetet, M. Modulation of Phase II Enzymes by OrganosulfurCompounds from Allium Vegetables in Rat Tissues. Toxicol. Appl. Pharmacol. 1999, 154, 50–58. [CrossRef][PubMed]
18. Rose, P.; Whiteman, M.; Moore, P.K.; Zhu, Y.Z. Bioactive S-alk(en)yl cysteine sulfoxide metabolites in thegenus Allium: The chemistry of potential therapeutic agents. Nat. Prod. Rep. 2005, 22, 351–368. [CrossRef][PubMed]
19. Wu, C.P.; Calcagno, A.M.; Hladky, S.B.; Ambudkar, S.V.; Barrand, M.A. Modulatory effects of plant phenolson human multidrug-resistance proteins 1, 4 and 5 (ABCC1, 4 and 5). FEBS J. 2005, 272, 4725–4740. [CrossRef][PubMed]
202
Molecules 2019, 24, 928
20. Gülsen, A.; Makris, D.P.; Kefalas, P. Biomimetic oxidation of quercetin: Isolation of a naturally occurringquercetin heterodimer and evaluation of its in vitro antioxidant properties. Food Res. Int. 2007, 40, 7–14.[CrossRef]
21. Liu, L.; Yeh, Y.Y. S-alk(en)yl cysteines of garlic inhibit cholesterol synthesis by deactivating HMG-CoAreductase in cultured rat hepatocytes. J. Nutr. 2002, 132, 1129–1134. [CrossRef] [PubMed]
22. Babu, P.S.; Srinivasan, K. Influence of dietary capsaicin and onion on the metabolic abnormalities associatedwith streptozotocin induced diabetes mellitus. Mol. Cell. Biochem. 1997, 175, 49–57. [CrossRef] [PubMed]
23. Kaur, C.; Joshi, S.; Kapoor, H.C. Antioxidants in onion (Allium cepa L.) cultivars grown in India. J. Food Biochem.
2009, 33, 184–200. [CrossRef]24. Corzo-Martínez, M.; Corzo, N.; Villamiel, M. Biological properties of onions and garlic. Trends Food Sci. Technol.
2007, 18, 609–625. [CrossRef]25. Ames, B.N.; Shigenaga, M.K.; Hagen, T.M. Oxidants, antioxidants, and the degenerative diseases of aging.
Proc. Natl. Acad. Sci. USA 1993, 90, 7915–7922. [CrossRef] [PubMed]26. Paganga, G.; Miller, N.; Rice-Evans, C.A. The polyphenolic content of fruit and vegetables and their
antioxidant activities. What does a serving constitute? Free Radic. Res. 1999, 30, 153–162. [CrossRef][PubMed]
27. Rice-Evans, C.; Miller, N.; Paganga, G. Antioxidant properties of phenolic compounds. Trends Plant Sci. 1997,2, 152–159. [CrossRef]
28. Farag, M.A.; Ali, S.E.; Hodaya, R.H.; El-Seedi, H.R.; Sultani, H.N.; Laub, A.; Eissa, T.F.; Abou-Zaid, F.O.F.;Wessjohann, L.A. Phytochemical Profiles and Antimicrobial Activities of Allium cepa Red cv. and A. sativumSubjected to Different Drying Methods: A Comparative MS-Based Metabolomics. Molecules 2017, 22, 761.[CrossRef] [PubMed]
29. Marsili, R. Analysis of musty microbial metabolites by stir bar sorptive extraction. In Flavor, Fragrance,
and Odor Analysis, 2nd ed.; CRC Press: Boca Raton, FL, USA, 2011; pp. 63–92.30. Li, Y. Confined direct analysis in real time ion source and its applications in analysis of volatile organic
compounds of Citrus limon (lemon) and Allium cepa (onion). Rapid Commun. Mass Spectrom. 2012, 26,1194–1202. [CrossRef] [PubMed]
31. Tawfike, A.F.; Viegelmann, C.; Edrada-Ebel, R. Metabolomics and dereplication strategies in natural products.Methods Mol. Biol. 2013, 1055, 227–244. [PubMed]
32. Farag, M.A. Comparative mass spectrometry & nuclear magnetic resonance metabolomic approaches fornutraceuticals quality control analysis: A brief review. Recent Pat. Biotechnol. 2014, 8, 17–24. [PubMed]
33. Wolfender, J.L.; Marti, G.; Thomas, A.; Bertrand, S. Current approaches and challenges for the metaboliteprofiling of complex natural extracts. J. Chromatogr. A 2015, 1382, 136–164. [CrossRef] [PubMed]
34. Wolfender, J.L.; Rudaz, S.; Choi, Y.H.; Kim, H.K. Plant metabolomics: From holistic data to relevantbiomarkers. Curr. Med. Chem. 2013, 20, 1056–1090.
35. Villas-Boas, S.G.; Mas, S.; Akesson, M.; Smedsgaard, J.; Nielsen, J. Mass spectrometry in metabolome analysis.Mass Spectrom. Rev. 2005, 24, 613–646. [CrossRef] [PubMed]
36. Beato, V.M.; Sanchez, A.H.; de Castro, A.; Montano, A. Effect of processing and storage time on the contentsof organosulfur compounds in pickled blanched garlic. J. Agric. Food Chem. 2012, 60, 3485–3491. [CrossRef][PubMed]
37. Song, H.H.; Kim, D.Y.; Woo, S.; Lee, H.K.; Oh, S.R. An approach for simultaneous determination forgeographical origins of Korean Panax ginseng by UPLC-QTOF/MS coupled with OPLS-DA models.J. Ginseng Res. 2013, 37, 341–348. [CrossRef] [PubMed]
38. McGorrin, R. Character-impact flavor and off-flavor compounds in foods. In Flavor, Fragrance, and Odor
Analysis, 2nd ed.; CRC Press: Boca Raton, FL, USA, 2011; pp. 207–262.39. Tocmo, R.; Lin, Y.; Huang, D. Effect of processing conditions on the organosulfides of shallot (Allium cepa L.
Aggregatum group). J. Agric. Food Chem. 2014, 62, 5296–5304. [CrossRef] [PubMed]40. Mondy, N.; Duplat, D.; Christides, J.P.; Arnault, I.; Auger, J. Aroma analysis of fresh and preserved onions
and leek by dual solid-phase microextraction-liquid extraction and gas chromatography-mass spectrometry.J. Chromatogr. A 2002, 963, 89–93. [CrossRef]
41. Yu, A.-N.; Tan, Z.-W.; Wang, F.-S. Mechanism of formation of sulphur aroma compounds from l-ascorbicacid and l-cysteine during the Maillard reaction. Food Chem. 2012, 132, 1316–1323. [CrossRef] [PubMed]
203
Molecules 2019, 24, 928
42. Marti, G.; Boccard, J.; Mehl, F.; Debrus, B.; Marcourt, L.; Merle, P.; Delort, E.; Baroux, L.; Sommer, H.;Rudaz, S.; et al. Comprehensive profiling and marker identification in non-volatile citrus oil residues bymass spectrometry and nuclear magnetic resonance. Food Chem. 2014, 150, 235–245. [CrossRef] [PubMed]
43. Wang, S.C.; Yang, C.K.; Tu, H.; Zhou, J.J.; Liu, X.Q.; Cheng, Y.J.; Luo, J.; Deng, X.X.; Zhang, H.Y.; Xu, J.Characterization and Metabolic Diversity of Flavonoids in Citrus Species. Sci. Rep. 2017, 7. [CrossRef][PubMed]
44. Kumar, S.; Singh, A.K.; Verma, S.K.; Misra, R.; Seniya, C. Antibacterial and Phyto-chemical Analysis ofSome Medicinal Plants and their Efficacy on Multidrug Resistant Bacteria. J. Pure Appl. Microbiol. 2013, 7,2191–2204.
45. Gualdani, R.; Cavalluzzi, M.M.; Lentini, G.; Habtemariam, S. The Chemistry and Pharmacology of CitrusLimonoids. Molecules 2016, 21, 1530. [CrossRef] [PubMed]
46. Zhou, Z.-F.; Kong, L.-Y.; Kurtán, T.; Liu, H.-L.; Mándi, A.; Li, J.; Gu, Y.-C.; Guo, Y.-W. Four PhragmalinOrthoesters from the Chinese Mangrove Xylocarpus granatum. Planta Med. 2014, 80, 949–954. [CrossRef][PubMed]
47. Quideau, S.; Deffieux, D.; Douat-Casassus, C.; Pouysegu, L. Plant polyphenols: Chemical properties,biological activities, and synthesis. Angew. Chem. 2011, 50, 586–621. [CrossRef] [PubMed]
48. Farag, M.A.; Porzel, A.; Wessjohann, L.A. Comparative metabolite profiling and fingerprinting of medicinallicorice roots using a multiplex approach of GC-MS, LC-MS and 1D NMR techniques. Phytochemistry 2012,76, 60–72. [CrossRef] [PubMed]
49. Gonzalez-Molina, E.; Dominguez-Perles, R.; Moreno, D.A.; Garcia-Viguera, C. Natural bioactive compoundsof Citrus limon for food and health. J. Pharm. Biomed. Anal. 2010, 51, 327–345. [CrossRef] [PubMed]
50. Neumann, H.; Niedermaier, S.; Gschwander, S.; Schossig, P. Cycling stability of D-mannitol when used asphase change material for thermal storage applications. Thermochim. Acta 2018, 660, 134–143. [CrossRef]
51. Farag, M.A.; Rasheed, D.M.; Kamal, I.M. Volatiles and primary metabolites profiling in two Hibiscussabdariffa (roselle) cultivars via headspace SPME-GC-MS and chemometrics. Food Res. Int. 2015, 78, 327–335.[CrossRef] [PubMed]
52. Broeckling, C.D.; Reddy, I.R.; Duran, A.L.; Zhao, X.C.; Sumner, L.W. MET-IDEA: Data extraction tool formass spectrometry-based metabolomics. Analyt. Chem. 2006, 78, 4334–4341. [CrossRef] [PubMed]
Sample Availability: Samples of the compounds are not available from the authors.
© 2019 by the authors. Licensee MDPI, Basel, Switzerland. This article is an open accessarticle distributed under the terms and conditions of the Creative Commons Attribution(CC BY) license (http://creativecommons.org/licenses/by/4.0/).
204
molecules
Article
Improvement of Quality Properties and Shelf LifeStability of New Formulated Muffins Based onBlack Rice
Constantin Croitoru 1, Claudia Mures, an 2, Mihaela Turturică 3, Nicoleta Stănciuc 3,
Doina Georgeta Andronoiu 3, Loredana Dumitras, cu 3, Vasilica Barbu 3, Elena Enachi (Ionit,ă) 3,
Georgiana Horincar (Parfene) 3 and Gabriela Râpeanu 3,*
1 Academy of Agricultural and Forestry Sciences, 61 Marasti Blvd, 011464 Bucharest, Romania;[email protected]
2 Faculty of Food Engineering, Tourism and Environmental Protection, Aurel Vlaicu University of Arad,2 Elena Dragoi Street, 310330 Arad, Romania; [email protected]
3 Integrated Center for Research, Expertise and Technological Transfer in Food Industry,Faculty of Food Science and Engineering, Dunarea de Jos University of Galati, 111 Domnească Street,800201 Galati, Romania; [email protected] (M.T.); [email protected] (N.S.);[email protected] (D.G.A.); [email protected] (L.D.); [email protected] (V.B.);[email protected] (E.E.); [email protected] (G.H.)
* Correspondence: [email protected] or [email protected]; Tel.: +4-0336-130177; Fax: +4-0236-460165
Received: 25 October 2018; Accepted: 19 November 2018; Published: 21 November 2018
Abstract: Effects of partial (50%) and total replacement of wheat flour with black rice flour on thephytochemical, physico-chemical, sensorial, and textural properties of muffins were studied. Partial ortotal replacement of wheat flour with black rice flour in muffins improved their nutritional andantioxidative properties with a positive effect on microbiological and color stability during the storageperiod in accelerated conditions. The low gluten muffins had an anthocyanin content of 27.54 ± 2.22 mgcyanidin-3-glucoside (C3G)/100 g dry weight (DW), whereas the gluten free muffins had 46.11 ± 3.91mg C3G/100 g DW, with significant antioxidant values. Retention of 60% and 64% for anthocyanins and72% and 80% for antioxidant activity after baking was found. The fracturability and hardness scoresincreased with the addition of black rice flour, whereas firmness and chewiness increased for gluten freemuffins. The confocal analysis revealed a tendency of glucidic components to aggregate, with gathersof small bunches of black rice starch granules comprising anthocyanin. The results allowed designingtwo new value added bakery products, low and free gluten muffins, with significant high amounts ofbioactive compounds, suggesting the functional potential of black rice flour.
Keywords: black rice flour; anthocyanins; antioxidant activity; low gluten muffins; added value products
1. Introduction
Muffins are sweet baked products highly appreciated by consumers due to their good taste andsoft texture, perfect for breakfast, brunch and snacks. Muffin composition is a fat in water emulsionobtained from an egg-sugar-water-fat mixture as a continuous phase, and air bubbles represent adiscontinuous phase where the flour is dispersed. Muffins are generally associated with a high porousspongy texture [1,2]. Traditionally, a muffin recipe is composed of wheat flour, vegetable oil, eggs andmilk [3]. For this reason, many people with celiac disease are unable to consume this type of productsince they are made with wheat flour.
The demand for low gluten and gluten-free products is increasing because it is well known thatceliac disease is a common lifelong disorder, affecting 1% of the world’s population [4–6]. The reaction
205
Molecules 2018, 23, 3047
to gluten ingestion for those who sufferer from celiac disease is the inflammation of the small intestineleading to malabsorption of the nutrients [7,8]. However, a gluten free diet is characterized by lowdaily energy intake combined, with an unbalanced macronutrient content, compared to a balancednormal daily diet [9]. In avoiding the use of gluten in foods, significant technological and qualityproblems will have to be solved. Their sensorial properties are still different from similar productscontaining gluten. The main ingredients of gluten free cereal products are gluten-free flours, corn,rice and potato starches and different hydrocolloids that slow down the gluten viscoelastic properties.Recent studies were performed to improve the nutritional profile of gluten-free products by usingpseudo-cereals as functional gluten-free ingredients [10–12]. In recent years, there have been manyresearch projects for the development of gluten free sweet bakery products aimed to improve theorganoleptic properties of the finished products [13,14].
Rice is a suitable cereal for developing gluten free products because it has a low level of prolamineand is hypoallergenic [15]. The main ingredient of the gluten free muffins, cake or cupcakes recipes isthe rice flour [13,14,16], or different starch sources, such as corn, potato and wheat [17].
Rice flour has a big potential to be a wheat flour substitute in muffins because it has been usedbefore to prepare gluten free bakery products, such as breads and cakes, which are traditionallymade with wheat flour [8]. However, less information is available on the use of rice flour forgluten free products such as muffins. Several researchers have developed gluten free products usingstarches, dairy products, probiotics, gums and hydrocolloids to improve the structure and taste of theproducts [8,18].
Black rice was grown at a small scale in the early history of agriculture. In fact, black rice isconsidered to have the highest nutritional profile of all the cereals. The interest in black rice is growingbecause is gluten free, cholesterol-free, and low in sugar, salt and fat. Among these properties italso contains anthocyanins, antioxidants, B and E vitamins, iron, thiamine, magnesium, niacin andphosphorous and high fiber content. There are a lot of scientific studies showing that black rice powderis one of nature’s most well-balanced foods [19]. Black rice anthocyanins are about 26.3% and themost effective constituents in a percentage of 90% are represented by the cyanidin-3-O-glucoside andpeonidin-3-O-glucosid anthocyanin [20]. Anthocyanins represent the flavonoid pigments of the blackrice and they are a source of antioxidants that have the ability to inhibit the formation or to reduce theconcentrations of reactive cell damaging free radicals [21].
The aim of the present study was to obtain value added low gluten and gluten-free black ricebased muffins. In order to demonstrate the added-value of the products, the muffins were tested fortotal phyto-chemical, physico-chemical and microbiological properties, textural and sensorial analysis.An accelerated storage test for phytochemicals and microbiological stability was performed over21 days at a temperature of 25 ◦C.
2. Results and Discussion
2.1. Black Rice Flour, Batter and Muffin Characterization
The black rice flours were characterized in terms of anthocyanins content using thechromatographic technique. Figure 1 shows a typical HPLC chromatogram, where the majoranthocyanin found was cyanidin-3-glucoside. Four compounds were found in the black rice flourextract among which only three of them were identified as follows: Peak 1, cyanidin-3,5-diglucoside(1.08 mg/100 g dry weight (DW)); peak 2, cyanidin-3-glucoside (176.83 mg/100 g DW); peak 3,peonidin-3-glucoside (7.08 mg/100 g DW); and peak 4, unidentified. The total anthocyanin contentin black rice flour was 192.36 ± 1.14 mg (C3G)/100 g DW. The results are similar with onesreported by Bordiga et al. [22] and Melini et al. [23] who studied the same variety of black rice.Bolea et al. [24] reported significant lower quantities of 21.00 µg/g cyanidin-3-glucoside and 0.10 µg/gpeonidin-3-glucoside in the whole black rice flour.
206
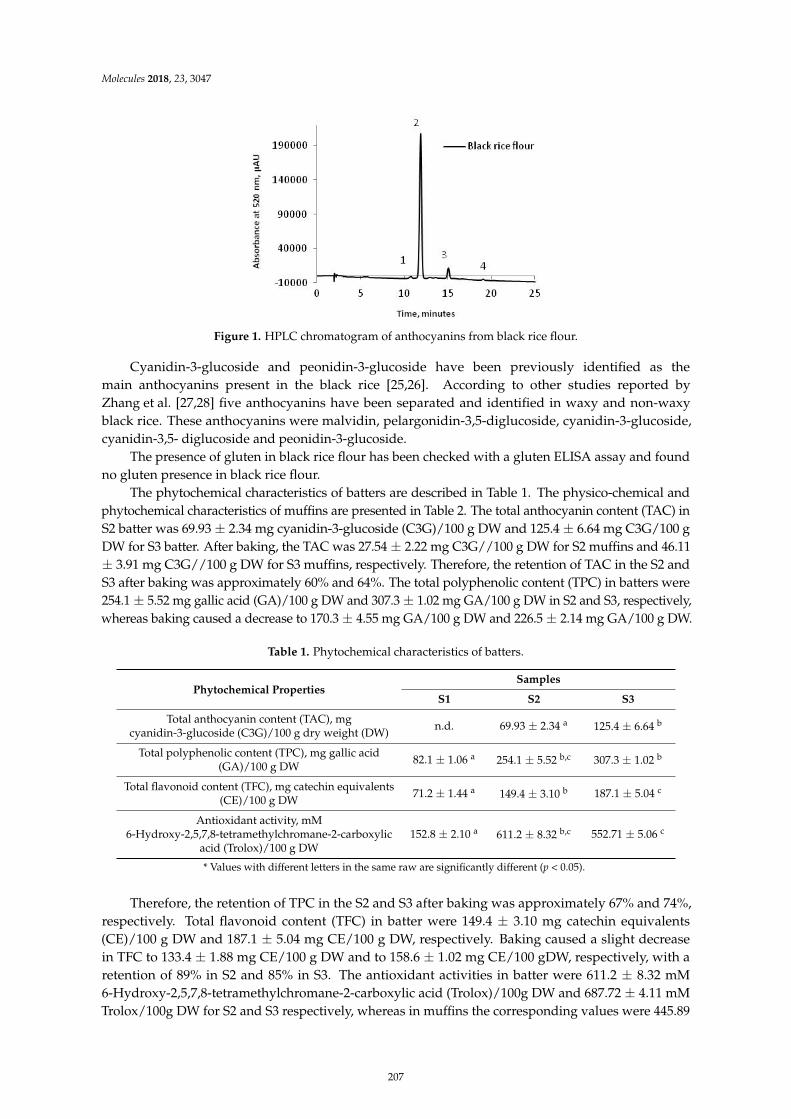
Molecules 2018, 23, 3047
8
82.1
187.1
2,5,7,8152.8
8.32
and 187.11.88 and to 158.6
retention of 89% in S2 and 85% in S3. 8.322,5,7,8 /100g DW and 687.72
Figure 1. HPLC chromatogram of anthocyanins from black rice flour.
Cyanidin-3-glucoside and peonidin-3-glucoside have been previously identified as themain anthocyanins present in the black rice [25,26]. According to other studies reported byZhang et al. [27,28] five anthocyanins have been separated and identified in waxy and non-waxyblack rice. These anthocyanins were malvidin, pelargonidin-3,5-diglucoside, cyanidin-3-glucoside,cyanidin-3,5- diglucoside and peonidin-3-glucoside.
The presence of gluten in black rice flour has been checked with a gluten ELISA assay and foundno gluten presence in black rice flour.
The phytochemical characteristics of batters are described in Table 1. The physico-chemical andphytochemical characteristics of muffins are presented in Table 2. The total anthocyanin content (TAC) inS2 batter was 69.93 ± 2.34 mg cyanidin-3-glucoside (C3G)/100 g DW and 125.4 ± 6.64 mg C3G/100 gDW for S3 batter. After baking, the TAC was 27.54 ± 2.22 mg C3G//100 g DW for S2 muffins and 46.11± 3.91 mg C3G//100 g DW for S3 muffins, respectively. Therefore, the retention of TAC in the S2 andS3 after baking was approximately 60% and 64%. The total polyphenolic content (TPC) in batters were254.1 ± 5.52 mg gallic acid (GA)/100 g DW and 307.3 ± 1.02 mg GA/100 g DW in S2 and S3, respectively,whereas baking caused a decrease to 170.3 ± 4.55 mg GA/100 g DW and 226.5 ± 2.14 mg GA/100 g DW.
Table 1. Phytochemical characteristics of batters.
Phytochemical PropertiesSamples
S1 S2 S3
Total anthocyanin content (TAC), mgcyanidin-3-glucoside (C3G)/100 g dry weight (DW)
n.d. 69.93 ± 2.34 a 125.4 ± 6.64 b
Total polyphenolic content (TPC), mg gallic acid(GA)/100 g DW
82.1 ± 1.06 a 254.1 ± 5.52 b,c 307.3 ± 1.02 b
Total flavonoid content (TFC), mg catechin equivalents(CE)/100 g DW
71.2 ± 1.44 a 149.4 ± 3.10 b 187.1 ± 5.04 c
Antioxidant activity, mM6-Hydroxy-2,5,7,8-tetramethylchromane-2-carboxylic
acid (Trolox)/100 g DW152.8 ± 2.10 a 611.2 ± 8.32 b,c 552.71 ± 5.06 c
* Values with different letters in the same raw are significantly different (p < 0.05).
Therefore, the retention of TPC in the S2 and S3 after baking was approximately 67% and 74%,respectively. Total flavonoid content (TFC) in batter were 149.4 ± 3.10 mg catechin equivalents(CE)/100 g DW and 187.1 ± 5.04 mg CE/100 g DW, respectively. Baking caused a slight decreasein TFC to 133.4 ± 1.88 mg CE/100 g DW and to 158.6 ± 1.02 mg CE/100 gDW, respectively, with aretention of 89% in S2 and 85% in S3. The antioxidant activities in batter were 611.2 ± 8.32 mM6-Hydroxy-2,5,7,8-tetramethylchromane-2-carboxylic acid (Trolox)/100g DW and 687.72 ± 4.11 mMTrolox/100g DW for S2 and S3 respectively, whereas in muffins the corresponding values were 445.89
207
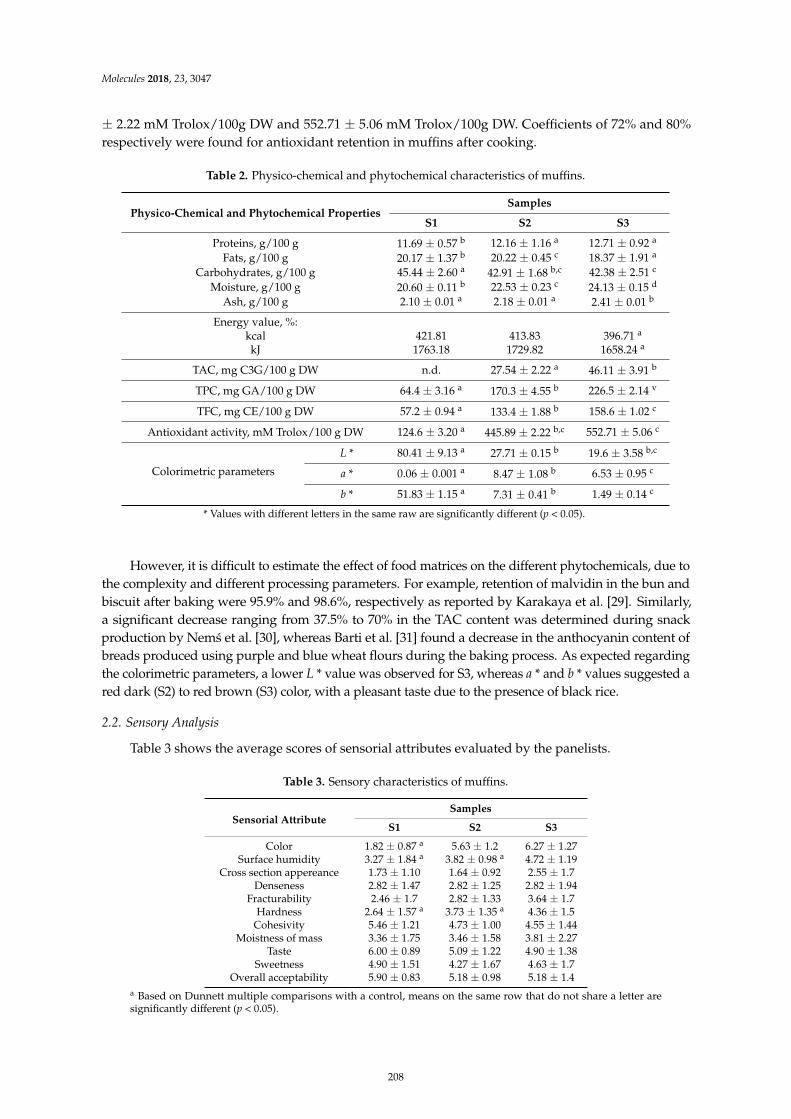
Molecules 2018, 23, 3047
± 2.22 mM Trolox/100g DW and 552.71 ± 5.06 mM Trolox/100g DW. Coefficients of 72% and 80%respectively were found for antioxidant retention in muffins after cooking.
Table 2. Physico-chemical and phytochemical characteristics of muffins.
Physico-Chemical and Phytochemical PropertiesSamples
S1 S2 S3
Proteins, g/100 g 11.69 ± 0.57 b 12.16 ± 1.16 a 12.71 ± 0.92 a
Fats, g/100 g 20.17 ± 1.37 b 20.22 ± 0.45 c 18.37 ± 1.91 a
Carbohydrates, g/100 g 45.44 ± 2.60 a 42.91 ± 1.68 b,c 42.38 ± 2.51 c
Moisture, g/100 g 20.60 ± 0.11 b 22.53 ± 0.23 c 24.13 ± 0.15 d
Ash, g/100 g 2.10 ± 0.01 a 2.18 ± 0.01 a 2.41 ± 0.01 b
Energy value, %:kcal 421.81 413.83 396.71 a
kJ 1763.18 1729.82 1658.24 a
TAC, mg C3G/100 g DW n.d. 27.54 ± 2.22 a 46.11 ± 3.91 b
TPC, mg GA/100 g DW 64.4 ± 3.16 a 170.3 ± 4.55 b 226.5 ± 2.14 v
TFC, mg CE/100 g DW 57.2 ± 0.94 a 133.4 ± 1.88 b 158.6 ± 1.02 c
Antioxidant activity, mM Trolox/100 g DW 124.6 ± 3.20 a 445.89 ± 2.22 b,c 552.71 ± 5.06 c
Colorimetric parameters
L * 80.41 ± 9.13 a 27.71 ± 0.15 b 19.6 ± 3.58 b,c
a * 0.06 ± 0.001 a 8.47 ± 1.08 b 6.53 ± 0.95 c
b * 51.83 ± 1.15 a 7.31 ± 0.41 b 1.49 ± 0.14 c
* Values with different letters in the same raw are significantly different (p < 0.05).
However, it is difficult to estimate the effect of food matrices on the different phytochemicals, due tothe complexity and different processing parameters. For example, retention of malvidin in the bun andbiscuit after baking were 95.9% and 98.6%, respectively as reported by Karakaya et al. [29]. Similarly,a significant decrease ranging from 37.5% to 70% in the TAC content was determined during snackproduction by Nems et al. [30], whereas Barti et al. [31] found a decrease in the anthocyanin content ofbreads produced using purple and blue wheat flours during the baking process. As expected regardingthe colorimetric parameters, a lower L * value was observed for S3, whereas a * and b * values suggested ared dark (S2) to red brown (S3) color, with a pleasant taste due to the presence of black rice.
2.2. Sensory Analysis
Table 3 shows the average scores of sensorial attributes evaluated by the panelists.
Table 3. Sensory characteristics of muffins.
Sensorial AttributeSamples
S1 S2 S3
Color 1.82 ± 0.87 a 5.63 ± 1.2 6.27 ± 1.27Surface humidity 3.27 ± 1.84 a 3.82 ± 0.98 a 4.72 ± 1.19
Cross section appereance 1.73 ± 1.10 1.64 ± 0.92 2.55 ± 1.7Denseness 2.82 ± 1.47 2.82 ± 1.25 2.82 ± 1.94
Fracturability 2.46 ± 1.7 2.82 ± 1.33 3.64 ± 1.7Hardness 2.64 ± 1.57 a 3.73 ± 1.35 a 4.36 ± 1.5
Cohesivity 5.46 ± 1.21 4.73 ± 1.00 4.55 ± 1.44Moistness of mass 3.36 ± 1.75 3.46 ± 1.58 3.81 ± 2.27
Taste 6.00 ± 0.89 5.09 ± 1.22 4.90 ± 1.38Sweetness 4.90 ± 1.51 4.27 ± 1.67 4.63 ± 1.7
Overall acceptability 5.90 ± 0.83 5.18 ± 0.98 5.18 ± 1.4a Based on Dunnett multiple comparisons with a control, means on the same row that do not share a letter aresignificantly different (p < 0.05).
208
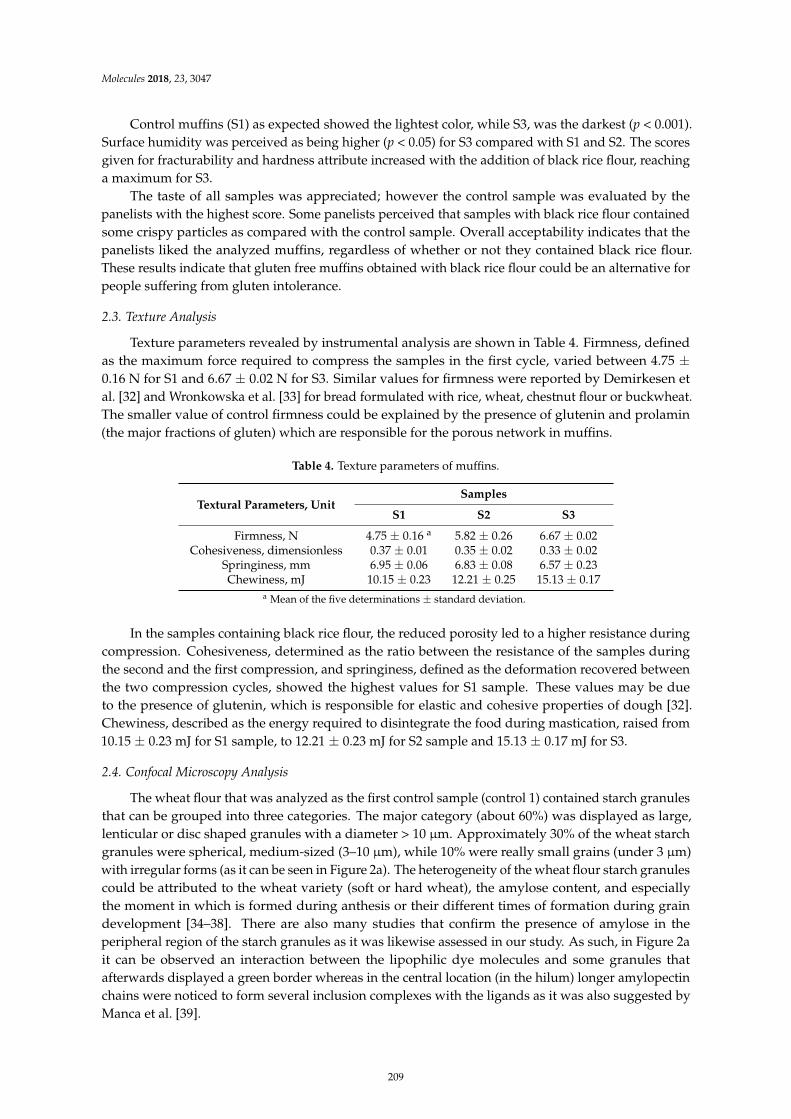
Molecules 2018, 23, 3047
Control muffins (S1) as expected showed the lightest color, while S3, was the darkest (p < 0.001).Surface humidity was perceived as being higher (p < 0.05) for S3 compared with S1 and S2. The scoresgiven for fracturability and hardness attribute increased with the addition of black rice flour, reachinga maximum for S3.
The taste of all samples was appreciated; however the control sample was evaluated by thepanelists with the highest score. Some panelists perceived that samples with black rice flour containedsome crispy particles as compared with the control sample. Overall acceptability indicates that thepanelists liked the analyzed muffins, regardless of whether or not they contained black rice flour.These results indicate that gluten free muffins obtained with black rice flour could be an alternative forpeople suffering from gluten intolerance.
2.3. Texture Analysis
Texture parameters revealed by instrumental analysis are shown in Table 4. Firmness, definedas the maximum force required to compress the samples in the first cycle, varied between 4.75 ±
0.16 N for S1 and 6.67 ± 0.02 N for S3. Similar values for firmness were reported by Demirkesen etal. [32] and Wronkowska et al. [33] for bread formulated with rice, wheat, chestnut flour or buckwheat.The smaller value of control firmness could be explained by the presence of glutenin and prolamin(the major fractions of gluten) which are responsible for the porous network in muffins.
Table 4. Texture parameters of muffins.
Textural Parameters, UnitSamples
S1 S2 S3
Firmness, N 4.75 ± 0.16 a 5.82 ± 0.26 6.67 ± 0.02Cohesiveness, dimensionless 0.37 ± 0.01 0.35 ± 0.02 0.33 ± 0.02
Springiness, mm 6.95 ± 0.06 6.83 ± 0.08 6.57 ± 0.23Chewiness, mJ 10.15 ± 0.23 12.21 ± 0.25 15.13 ± 0.17
a Mean of the five determinations ± standard deviation.
In the samples containing black rice flour, the reduced porosity led to a higher resistance duringcompression. Cohesiveness, determined as the ratio between the resistance of the samples duringthe second and the first compression, and springiness, defined as the deformation recovered betweenthe two compression cycles, showed the highest values for S1 sample. These values may be dueto the presence of glutenin, which is responsible for elastic and cohesive properties of dough [32].Chewiness, described as the energy required to disintegrate the food during mastication, raised from10.15 ± 0.23 mJ for S1 sample, to 12.21 ± 0.23 mJ for S2 sample and 15.13 ± 0.17 mJ for S3.
2.4. Confocal Microscopy Analysis
The wheat flour that was analyzed as the first control sample (control 1) contained starch granulesthat can be grouped into three categories. The major category (about 60%) was displayed as large,lenticular or disc shaped granules with a diameter > 10 µm. Approximately 30% of the wheat starchgranules were spherical, medium-sized (3–10 µm), while 10% were really small grains (under 3 µm)with irregular forms (as it can be seen in Figure 2a). The heterogeneity of the wheat flour starch granulescould be attributed to the wheat variety (soft or hard wheat), the amylose content, and especiallythe moment in which is formed during anthesis or their different times of formation during graindevelopment [34–38]. There are also many studies that confirm the presence of amylose in theperipheral region of the starch granules as it was likewise assessed in our study. As such, in Figure 2ait can be observed an interaction between the lipophilic dye molecules and some granules thatafterwards displayed a green border whereas in the central location (in the hilum) longer amylopectinchains were noticed to form several inclusion complexes with the ligands as it was also suggested byManca et al. [39].
209
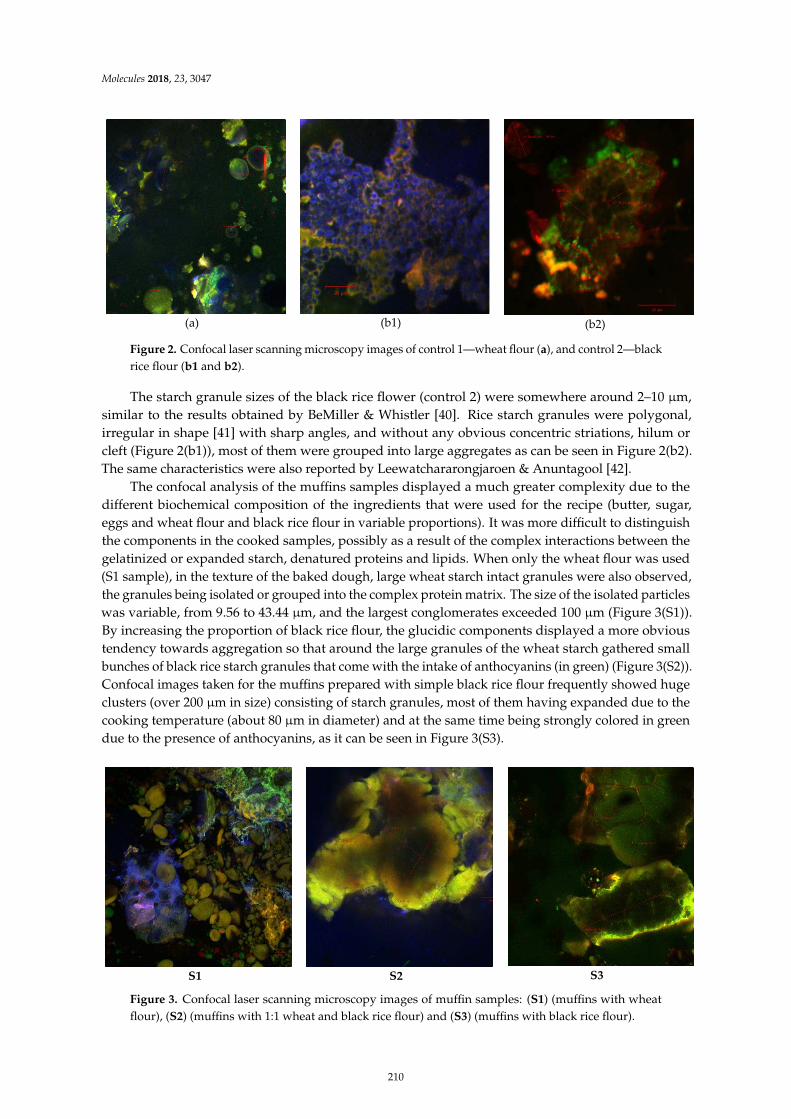
Molecules 2018, 23, 3047
(a) (b1) (b2)
most of them having expanded due to the cooking temperature (about 80 μm in diameter) and at the
Figure 2. Confocal laser scanning microscopy images of control 1—wheat flour (a), and control 2—blackrice flour (b1 and b2).
The starch granule sizes of the black rice flower (control 2) were somewhere around 2–10 µm,similar to the results obtained by BeMiller & Whistler [40]. Rice starch granules were polygonal,irregular in shape [41] with sharp angles, and without any obvious concentric striations, hilum orcleft (Figure 2(b1)), most of them were grouped into large aggregates as can be seen in Figure 2(b2).The same characteristics were also reported by Leewatchararongjaroen & Anuntagool [42].
The confocal analysis of the muffins samples displayed a much greater complexity due to thedifferent biochemical composition of the ingredients that were used for the recipe (butter, sugar,eggs and wheat flour and black rice flour in variable proportions). It was more difficult to distinguishthe components in the cooked samples, possibly as a result of the complex interactions between thegelatinized or expanded starch, denatured proteins and lipids. When only the wheat flour was used(S1 sample), in the texture of the baked dough, large wheat starch intact granules were also observed,the granules being isolated or grouped into the complex protein matrix. The size of the isolated particleswas variable, from 9.56 to 43.44 µm, and the largest conglomerates exceeded 100 µm (Figure 3(S1)).By increasing the proportion of black rice flour, the glucidic components displayed a more obvioustendency towards aggregation so that around the large granules of the wheat starch gathered smallbunches of black rice starch granules that come with the intake of anthocyanins (in green) (Figure 3(S2)).Confocal images taken for the muffins prepared with simple black rice flour frequently showed hugeclusters (over 200 µm in size) consisting of starch granules, most of them having expanded due to thecooking temperature (about 80 µm in diameter) and at the same time being strongly colored in greendue to the presence of anthocyanins, as it can be seen in Figure 3(S3).
most of them having expanded due to the cooking temperature (about 80 μm in diameter) and at the
S1 S2 S3
Figure 3. Confocal laser scanning microscopy images of muffin samples: (S1) (muffins with wheatflour), (S2) (muffins with 1:1 wheat and black rice flour) and (S3) (muffins with black rice flour).
210
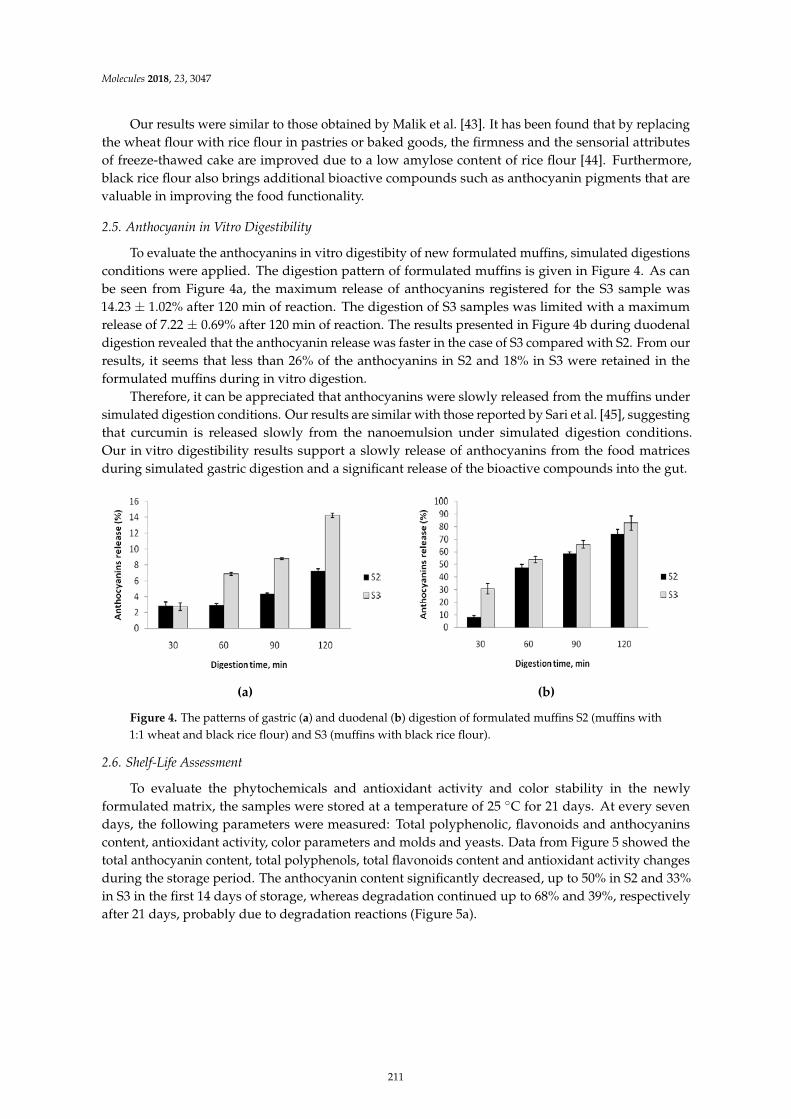
Molecules 2018, 23, 3047
Our results were similar to those obtained by Malik et al. [43]. It has been found that by replacingthe wheat flour with rice flour in pastries or baked goods, the firmness and the sensorial attributesof freeze-thawed cake are improved due to a low amylose content of rice flour [44]. Furthermore,black rice flour also brings additional bioactive compounds such as anthocyanin pigments that arevaluable in improving the food functionality.
2.5. Anthocyanin in Vitro Digestibility
To evaluate the anthocyanins in vitro digestibity of new formulated muffins, simulated digestionsconditions were applied. The digestion pattern of formulated muffins is given in Figure 4. As canbe seen from Figure 4a, the maximum release of anthocyanins registered for the S3 sample was14.23 ± 1.02% after 120 min of reaction. The digestion of S3 samples was limited with a maximumrelease of 7.22 ± 0.69% after 120 min of reaction. The results presented in Figure 4b during duodenaldigestion revealed that the anthocyanin release was faster in the case of S3 compared with S2. From ourresults, it seems that less than 26% of the anthocyanins in S2 and 18% in S3 were retained in theformulated muffins during in vitro digestion.
Therefore, it can be appreciated that anthocyanins were slowly released from the muffins undersimulated digestion conditions. Our results are similar with those reported by Sari et al. [45], suggestingthat curcumin is released slowly from the nanoemulsion under simulated digestion conditions.Our in vitro digestibility results support a slowly release of anthocyanins from the food matricesduring simulated gastric digestion and a significant release of the bioactive compounds into the gut.
than 26% of the anthocyanins in S2 and 18% in S3 were
(a) (b)
and 33% in S3 in the first 14 days of storage, whereas degradation continued up to 68% and 39%,
Figure 4. The patterns of gastric (a) and duodenal (b) digestion of formulated muffins S2 (muffins with1:1 wheat and black rice flour) and S3 (muffins with black rice flour).
2.6. Shelf-Life Assessment
To evaluate the phytochemicals and antioxidant activity and color stability in the newlyformulated matrix, the samples were stored at a temperature of 25 ◦C for 21 days. At every sevendays, the following parameters were measured: Total polyphenolic, flavonoids and anthocyaninscontent, antioxidant activity, color parameters and molds and yeasts. Data from Figure 5 showed thetotal anthocyanin content, total polyphenols, total flavonoids content and antioxidant activity changesduring the storage period. The anthocyanin content significantly decreased, up to 50% in S2 and 33%in S3 in the first 14 days of storage, whereas degradation continued up to 68% and 39%, respectivelyafter 21 days, probably due to degradation reactions (Figure 5a).
211
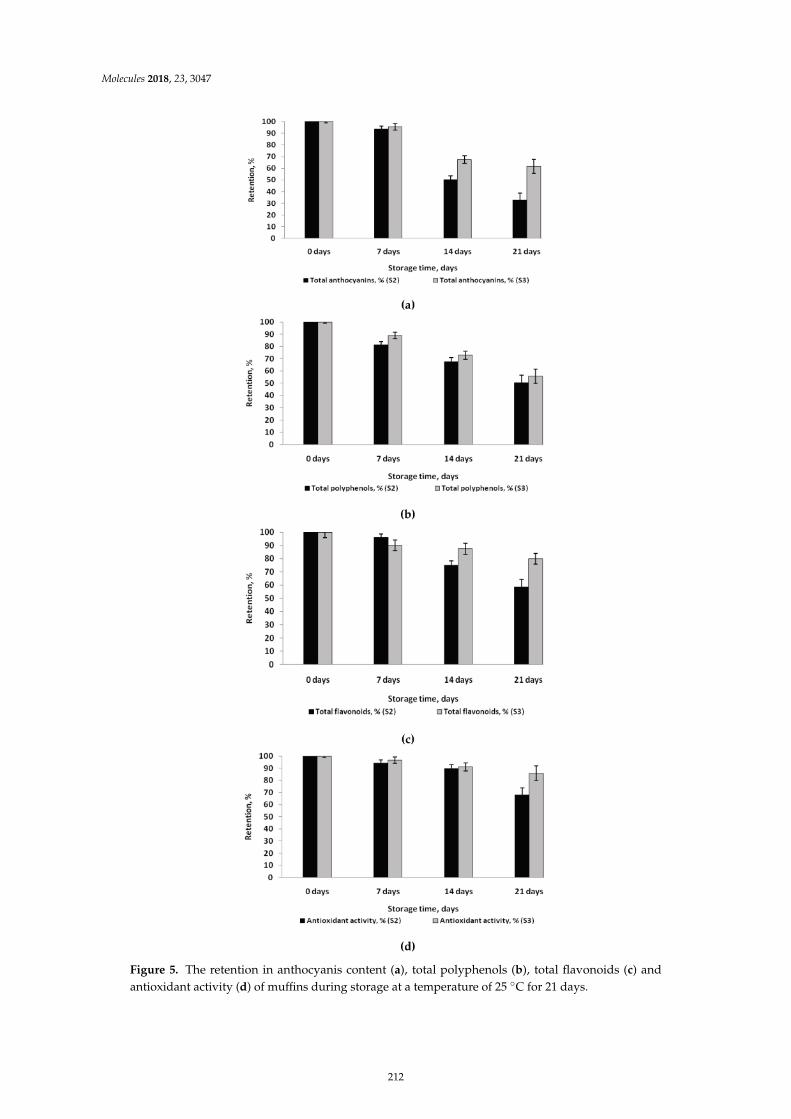
Molecules 2018, 23, 3047
Figure 5. The retention in anthocyanis content (a), total polyphenols (b), total flavonoids (c) andantioxidant activity (d) of muffins during storage at a temperature of 25 ◦C for 21 days.
212
Molecules 2018, 23, 3047
It can be noticed that the anthocyanin’s degradation was more significant in S2 compared to S3,probably due to the higher concentration of the polyphenolic compounds, which exhibited a protectiveaction. Regarding the total polyphenolic content in muffins during storage, the decreases were upto 50% (S2) and 45% (S3), and for flavonoids, up to 42% (S2) and 22% (S3) (Figure 5b,c). However,a slow decrease in antioxidant activity was found in all samples (Figure 5d). Therefore, after 14 daysof storage, antioxidant activity decreases by 11% and 9% in S2 and S3, respectively, and by 33% and15% after 21 days of storage. As expected, the decrease in antioxidant activity was lower in S3 whencompared with S2, due to the higher concentration of polyphenolic compounds. However, it seemsthat the anthocyanin degradation does not significantly affect the antioxidant activity in all testedsamples. Malvidin stability in the anthocyanin enriched bun after 21 days at room temperature wassignificantly lower than those of buns stored for 7 days. However, Karakaya et al. [29] reported thatstorage of 21 days at room temperature did not cause huge losses in anthocyanin contents of the bunand biscuits.
Table 5 shows the variation of color parameters. A slight increase in L * values can be observedwith increasing storage time for all samples, likely due to anthocyanin degradation. Significantdifferences in brightness (p < 0.05) can also noticed, both in terms of samples and period of storage.The control sample (S1) had a * value close to 0 with no variation during storage time, while for S2 andS3 samples the a * value increased. Our results are in line with ones reported by Ursache et al. [46].
Table 5. Colorimetric analysis of muffins.
Storage Period,Days
S1 S2 S3
Colorimetric Parameters
L * a * b * L * a * b * L * a * b *
080.41 ±
9.13 c,d0.06 ± 0.001
b,c51.83 ±
1.15 a,b27.71 ±
0.15 b,c,d8.47 ± 1.08
a,b,c,d7.31 ± 0.41
a,b,c19.6 ± 3.58
c6.53 ± 0.95
a b1.49 ± 0.14
a,b,c
788.02 ±
0.83 a0.10 ± 0.001
b60.11 ±
4.96 b,c29.42 ±
0.30 d9.10 ± 1.63
a,b8.40 ± 0.83
a23.9 ± 1.96
b,c7.30 ± 1.30
a,b,d1.71 ± 0.26
a,b,c
14110.41 ±
5.25 a,b,c,d0.18 ± 0.011
b73.25 ±
2.49 d35.80 ±
73.74 a,b10.30 ±
1.84 a9.20 ± 0.94
c28.8 ± 2.49
d11.6 ± 0.22
c2.25 ± 0.66
a
21119.63
±4.60 b,c,d0.21 ±
0.057 b75.53 ± 4.31
a,b38.51 ± 1.41
a,b,c11.11 ±
1.10 a,b,c,d9.62 ± 0.31
b,c30.1 ± 3.63
a,b13.2 ± 0.95
a,b3.51 ± 0.51
b,c,d
Values with different letters in the same column are significantly different (p < 0.05) (L *—lightness, a *—redness,b *—yellowness).
The b * values which denote a yellow color of the samples, had higher values for S1 and lower S3baked with only black rice flour.
From microbiological point of view the results suggested that value-added muffins aremicrobiologically satisfactory during the accelerated storage test compared to control (Table 6).
Table 6. Yeasts and molds during storage (colony forming unit CFU/g).
SamplesStorage Period, Days
0 7 14 21
S1 <10 1.33·× 102 ± 0.13 2.59 × 10³ ± 0.08 5.16 × 10⁵ ± 1.10S2 <10 <10 <100 <100S3 <10 <10 <10 <100
3. Materials and Methods
3.1. Materials and Chemicals
2,2-Diphenyl-1-picrylhydrazyl (DPPH), 6-Hydroxy-2,5,7,8-tetramethylchromane-2-carboxylicacid (Trolox), Folin-Ciocalteu reagent, sodium carbonate, sodium hydroxide, sodium acetate, sodiumnitrite, potassium chloride, aluminum chloride, gallic acid, catehine, potassium persulfate, formicacid, ethanol and methanol (HPLC grade), cyanidin and peonidin standards were obtained from
213
Molecules 2018, 23, 3047
Sigma Aldrich Steinheim, Germany. For muffin preparation, coconut butter with 80% fat content,brown sugar, hen eggs, wheat flour and black rice (Oryza sativa L. ssp. Japonica, Nerone variety, Italy)were purchased from the local supermarket, Galati, Romania.
3.2. Batters and Muffins Preparation
Preparation of the muffin batter was performed with the following steps: The coconut butterwas mixed continuously with salt and brown sugar until the sugar is dissolved and a foam is formed;then the eggs were added, alternately with wheat flour (S1 sample, considered as control), wheat andblack rice flour (1:1) (S2 sample), black rice flour (S3 sample), and finally the baking powder wasadded. The batter was mixed for 10 min at 300 rpm in order to get a uniform composition. Finally,the batter was filled in paper cups and baked at 185 ◦C for 25 min in a convection oven with forcedair circulation. Products from each recipe were produced, baked and analyzed in two independentbatches. The muffins were packed in vacuum bags at 800 mbar and stored at a temperature of 25 ◦Cfor 21 days.
3.3. HPLC Technique
The chromatographic analysis of the anthocyanins from black rice flour was performed asdescribed earlier by Bolea et al. [24]. HPLC analysis was performed using a Surveyor HPLC system,controlled by an Xcalibur software system (Finnigan Surveyor LC, Thermo Scientific, Waltham, MA,USA). The anthocyanins detected in black rice flour were analyzed at a wavelength of 520 nm.The column used for this analysis was a C18 BDS Hypersil (150 mm × 4.6 mm, 5 mm). The gradientused for the elution of the anthocyanins was: 0–20 min: 9–35% (A), 20–30 min: 35% (A), 30–40 min:35–50% (A), 40–45 min: 50–9% (A), with an injection volume of 10 µL, and the flow rate maintained at1.000 mL/min.
3.4. Sensorial Analysis
A panel consisting of 11 different panelists aged between 29–50 years old performed thesensorial analysis of gluten free and added value muffins according to seven point hedonic scale.The panelists assessed the muffins samples for color (light to dark), surface humidity (none to veryhigh), cross section appearance (non uniform to uniform), denseness (dense to airy), fracturability(low to very high), hardness (low to very hard), cohesiveness (none to tight mass), moistness of mass(low to very high), taste (dislike very much to like extremely), and overall likeability of the product(dislike to like extremely). Muffins samples were served in random order to panelists on white papers.Water was used for mouth rising before and between samples.
3.5. Physico-Chemical, Phytochemical and Microbiological Analysis of Muffins
Standardized and validated laboratory methods were used to determine the physico-chemicalcharacteristics of muffins, in terms of moisture, fat, protein, carbohydrates, ash and energy value.
The phytochemical content of extract (total polyphenols, total flavonoids, total monomericanthocyanins) and antioxidant activity were determined as described by Turturică et al. [47]. In brief,1 g of muffin was crushed and then mixed with 8 mL of 70% ethanol and 1 mL HCl 1N. The mixturewas stirred for 8 h at room temperature on an orbital shaker at 150 rpm. After centrifugation at6000 rpm for 10 min, the supernatant was collected and concentrated at 40 ◦C to dryness underreduced pressure (AVC 2-18, Christ, UK). The extracts were redissolved in 2 mL of MiliQ water andused for phytochemical analysis.
3.6. Microbiological Assessment
The microbiological shelf life of muffins was evaluated by monitoring fungal growth over 1, 7,14 and 21 days of storage. The standard pour plate method described by Ursache et al. [46] was used to
214
Molecules 2018, 23, 3047
count the number of yeasts and molds. The results were expressed as CFU/g of sample. Each samplewas analysed in duplicate on each day of storage.
3.7. Textural Analysis of Muffins
The textural analysis was achieved by the Texture Profile Analysis (TPA) Method, using theBrookfield CT3-1000 analyzer. The sample preparation consisted of removing the rind of the muffinsand cutting the core in cube shapes with the sight length of 15 mm. Then, a double compressionwas applied at a distance of 10 mm, at a speed of 1 mm/s, with no holding time between the twocompression cycles. The trigger load was 0.02 N and the load cell was 1000 g. The compression wasperformed using an acrylic cylinder (diameter ~ 24.5 mm, height ~ 35 mm) (TA11/1000). The datawere recorded and processed using the TexturePro CT V1.5 software. For each sample, five tests wereperformed. The textural parameters determined by TPA were firmness, cohesiveness, springinessand chewiness.
3.8. Confocal Microscopy Analysis
The comparative confocal analysis of the samples was performed in order to capture the structural,textural and compositional changes of the experimental variants, while for the control samples simplewheat flour and black rice flour were used. The confocal microscope that was used for the analysisis a Zeiss Axio Observer Z1 inverted microscope model (LSM 710) equipped with a laser scanningsystem: Diode laser (405 nm), Ar laser (458 nm, 488 nm and 514 nm), DPSS (561 nm pumped solidstate diodes), and HeNe-laser (633 nm). The strong anthocyanin absorption in the visible range wasregistered between 465 nm and 550 nm [48] with an in vivo peak, between 537 nm and 542 nm [49].The distribution of the pigments into the protein matrix was observed at the excitation wavelengthof 488 nm and by applying the FS38 filter, whereas the emission was collected between 500–600 nm.The powder that was stained with two dyes, DAPI (1 µg/mL) and Red Congo (40 µM), in a ratio of3:1:1, was observed using a 40x apochromatic objective (numerical aperture 1.4) and the FS49 and FS15filters. The 3D images were rendered and analyzed with ZEN 2012 SP1 software (Black Edition).
3.9. In Vitro Digestibility
In vitro digestibility was performed by using a method described by Oancea et al. [50]. Briefly,1 g of muffins (S2 and S3) was mixed with Tris-HCl buffer (10 mM, pH 7.7). The gastric digestionwas performed by the addition of a simulated gastric fluid (SGF), which consisted of porcine pepsin(40 mg/mL in 0.1 M HCl) that was added to the initial mixtures in a ratio of 0.5 g of pepsin per100 g of sample and the pH was adjusted to 2.0 with 6 M HCl. Regarding the enteric digestionstep, the simulated intestinal fluid (SIF) consisted of a mixture containing pancreatin (2 mg/mL)and afterwards the resulting mixture was neutralized to pH 5.3 with 0.9 M sodium bicarbonate.The pH of the system was adjusted to 7.0 with 0.1M NaOH, prior to the incubation of the samplesfor 2 h. The incubation was performed in an SI—300R orbital shaking incubator (Medline Scientific,Oxfordshire, UK), at 100 rpm and 37 ◦C. The total anthocyanin’s content of the samples was measuredat every 30 min during the in vitro digestion.
3.10. Colorimetric Study
The color parameter values of the muffins were measured using the Minolta CR-410 ChromaMeter (Konica Minolta, Osaka, Japan) as described by Ursache et al. [46]. The results were expressed asL * (a lower value indicates a darker color, black: L * = 0 and white: L * = 100), a * (indicate the balancebetween red (>0), green (0) and blue (<0) color), and b * (the balance between yellow (>0) and blue (<0)color). All the measurements were performed in triplicates.
215
Molecules 2018, 23, 3047
3.11. Storage Stability
No preservatives were used in the recipe formulation of the gluten free and added valuemuffins. Therefore, an accelerated storage stability test was performed during a period of 21 days attemperature of 25 ◦C. Duplicate samples were considered for determination of the molds and yeast,total polyphenolic content, total flavonoids and anthocyanins content, antioxidant activity and color atevery 7 days.
3.12. Statistical Analysis of Data
Minitab 18 statistical processing software was employed to perform the statistical evaluation ofthe sensorial data. First, the data were checked for normality and homoscedasticity using the RyanJoiner test and the Bartlett test. Then, one-way ANOVA was used to identify if panelists detect anydifferences between samples considering a significance level of 0.05. Post-hoc analysis via Dunnettmultiple comparisons with a control were performed when appropriate. All data reported in this studyrepresent the averages of duplicate analyses and is reported as mean ± standard error of the mean.
4. Conclusions
The muffins baked with black rice flour presented a high anthocyanin content and antioxidantactivity compared with the control sample baked with wheat flour. The textural analysis suggestedthat the addition of black rice caused the increase of firmness, springiness and chewiness, while thecohesiveness was lower compared with the control sample and was related to a weaker bindingbetween the constituents. Confocal images taken for the muffins baked with black rice flour showedhuge clusters (over 200 µm in size) consisting of starch granules, most of them having expanded dueto the cooking temperature (about 80 µm in diameter) and at the same time being strongly colored ingreen due to the presence of anthocyanins. Sensorial analysis showed that all samples were appreciated;some panelists even perceived that samples with black rice flour contain pleasant crispy particlescompared with the control sample.
Storage stability of muffins revealed a decrease of anthocyanins, antioxidant activity and colorparameters. The added value products showed a microbiological stability during the acceleratedstorage period, probably due to the presence of polyphenolic compounds. These results indicated thatvalue added muffins obtained with black rice flour could be an alternative for people suffering fromgluten intolerance, whereas proving a significant amount of polyphenolic content, with potentiallybeneficial effects on human health.
Author Contributions: G.R. and N.S. conceived and designed the experiments and reviewed the final manuscript;C.C.; C.M.; D.G.A.; L.D. and G.H. performed the experiments, analyzed the data and prepared the manuscript;M.T. performed the HPLC analysis; E.E. and V.B. performed the confocal microscopy analysis; G.R. reviewed thefinal manuscript.
Funding: This research received no external funding.
Acknowledgments: The Integrated Center for Research, Expertise and Technological Transfer in Food Industryis acknowledged for providing technical support (www.bioaliment.ugal.ro). The authors are grateful for thetechnical support offered by the Grant POSCCE ID 1815, cod SMIS 48745 (www.moras.ugal.ro).
Conflicts of Interest: The authors declare no conflict of interest.
References
1. Matos, M.E.; Sanz, T.; Rosell, C.M. Establishing the function of proteins on the rheological and qualityproperties of rice based gluten free muffins. Food Hydrocoll. 2014, 35, 150–158. [CrossRef]
2. Martínez-Cervera, S.; Sanz, T.; Salvador, A.; Fiszman, S.M. Rheological, textural and sensorial properties oflow-sucrose muffins reformulated with sucralose/polydextrose. LWT Food Sci. Technol. 2012, 45, 213–220.[CrossRef]
216
Molecules 2018, 23, 3047
3. Sanz, T.; Salvador, A.; Baixauli, R.; Fiszman, S.M. Evaluation of four types of resistant starch in muffins. II.Effects in texture, colour and consumer response. Eur. Food Res. Technol. 2009, 229, 197–204. [CrossRef]
4. Gujral, N.; Freeman, J.H.; Thomson, A. Celiac disease: Prevalence, diagnosis, pathogenesis and treatment.World J. Gastroenterol. 2012, 18, 6036–6059. [CrossRef] [PubMed]
5. Rai, S.; Kaur, A.; Singh, B. Quality characteristics of gluten free cookies prepared from different flourcombinations. J. Food Sci. Technol. 2014, 51, 785–789. [CrossRef] [PubMed]
6. Shevkani, K.; Singh, N. Influence of kidney bean, field pea and amaranth protein isolates on the characteristicsof starch-based gluten-free muffins. Int. J. Food Sci. Technol. 2014, 49, 2237–2244. [CrossRef]
7. Feighery, C.F. Coeliac disease. Br. Med. J. 1999, 319, 236–239. [CrossRef]8. Man, S.; Păucean, A.; Muste, S.; Pop, A. Studies on the formulation and quality characteristics of gluten free
muffins. J. Agroaliment. Process. Technol. 2014, 20, 122–127.9. Bardella, M.T.; Fredella, C.; Prampolini, L.; Molteni, N.; Giunta, A.M.; Bianchi, P.A. Body composition and
dietary intakes in adult celiac disease patients consuming a strict gluten-free diet. Am. J. Clin. Nutr. 2000, 72,937–939. [CrossRef] [PubMed]
10. Islas-Rubio, A.R.; De la Barca, A.C.; Cabrera-Chávez, F.; Cota-Gastélum, A.G.; Beta, T. Effect of semolinareplacement with a raw: Popped amaranth flour blend on cooking quality and texture of pasta. LWT Food
Sci. Technol. 2014, 57, 217–222. [CrossRef]11. Sakac, M.; Torbica, A.; Sedej, I.; Hadnađev, M. Influence of breadmaking on antioxidant capacity of gluten
free breads based on rice and buckwheat flours. Food Res. Int. 2011, 44, 2806–2813. [CrossRef]12. Sedej, I.; Sakac, M.; Mandic, A.; Mišan, A.; Pestoric, M.; Šimurina, O.; Canadanovic-Brunet, J. Quality
assessment of gluten-free crackers based on buckwheat flour. LWT Food Sci. Technol. 2011, 44, 694–699.[CrossRef]
13. Gularte, M.A.; de la Hera, E.; Gómez, M.; Rosell, C.M. Effect of different fibers on the enrichment ofgluten-free layer cake. LWT Food Sci. Technol. 2012, 48, 209–214. [CrossRef]
14. Gularte, M.A.; Gómez, M.; Rosell, C.M. Impact of legume flours on quality and in vitro digestibility of starchand protein from gluten-free cakes. Food Bioprocess Technol. Int. J. 2012, 5, 3142–3150. [CrossRef]
15. Omary, M.B.; Fong, C.; Rothschild, J.; Finney, P. Effects of germination on the nutritional profile of gluten-freecereals and pseudocereals: A review. Cereal Chem. 2012, 89, 1–14. [CrossRef]
16. Park, S.J.; Ha, K.-Y.; Shin, M. Properties and qualities of rice flours and gluten-free cupcakes made withhigher-yield rice varieties in Korea. Food Sci. Biotechnol. 2012, 21, 365–372. [CrossRef]
17. Ronda, F.; Oliete, B.; Gómez, M.; Caballero, P.A.; Pando, V. Rheological study of layer cake batters madewith soybean protein isolate and different starch sources. J. Food Eng. 2011, 102, 272–277. [CrossRef]
18. Schamne, C.; Dutcosky, S.D.; Demiate, I.M. Obtention and characterization of gluten free baked products.Ciênc. Tecnol. Aliment. 2010, 30, 741–750. [CrossRef]
19. Ujjawal, K.; Kushwaha, S. Black rice. In Black Rice Research, History and Development; Springer InternationalPublishing AG: Basel, Switzerland, 2016; pp. 21–47, ISBN 978-3-319-30153-2.
20. Chang, K.K.; Kikuchi, S.; Kim, Y.K.; Park, S.H.; Yoon, U.; Lee, G.S.; Choi, J.W.; Kim, Y.H.; Park, S.C.Computational identification of seed specific transcription factors involved in anthocyanin production inblack rice. Biochip. J. 2010, 4, 247–255. [CrossRef]
21. Adom, K.K.; Liu, R.H. Antioxidant activity of grains. J. Agric. Food. Chem. 2002, 50, 6170–6182. [CrossRef]22. Bordiga, M.; Gomez-Alonso, S.; Locatelli, M.; Travaglia, F.; Coïsson, J.D.; Hermosin-Gutierrez, I.; Arlorio, M.
Phenolics characterization and antioxidant activity of six different pigmented Oryza sativa L. cultivarsgrown in Piedmont (Italy). Food Res. Int. 2014, 65, 282–290. [CrossRef]
23. Melinia, V.; Panfilib, G.; Fratiannib, A.; Acquistuccia, R. Bioactive compounds in rice on Italian market:Pigmented varieties as a source of carotenoids, total phenolic compounds and anthocyanins, before andafter cooking. Food Chem. 2019, 277, 119–127. [CrossRef]
24. Bolea, C.; Turturica, M.; Stanciuc, N.; Vizireanu, C. Thermal degradation kinetics of bioactive compoundsfrom black rice flour (Oryza sativa L.) extracts. J. Cereal Sci. 2016, 71, 160–166. [CrossRef]
25. Yawadio, R.; Morita, N. Color enhancing effect of carboxylic acids on anthocyanins. Food Chem. 2007, 105,421–427. [CrossRef]
26. Hou, Z.; Qin, P.; Zhang, Y.; Cui, S.; Ren, G. Identification of anthocyanins isolated from black rice(Oryza sativa L.) and their degradation kinetics. Food Res. Int. 2013, 50, 691–697. [CrossRef]
217
Molecules 2018, 23, 3047
27. Zhang, M.W.; Guo, B.J.; Zhang, R.F.; Chi, J.W.; Wei, Z.C.; Xu, Z.H.; Zhang, Y.; Tang, X.J. Separation,purification and identification of antioxidant compositions in black rice. Agr. Sci. China 2006, 39, 153–160.[CrossRef]
28. Zhang, M.W.; Zhang, R.F.; Guo, B.J.; Chi, J.W.; Wei, Z.C.; Xu, Z.H. The hypolipidemic and antioxidativeeffects of black rice pericarp anthocyanin in rats. Acta Nutrimenta Sin. 2006, 28, 404–408.
29. Karakaya, S.; Simsek, S.; Tolga Eker, A.; Pineda-Vadillo, C.; Dupont, D.; Perez, B.; Viadel, B.;Sanz-Buenhombre, M.; Guadarrama Rodriguez, A.; Kertész, Z.; et al. Stability and bioaccessibility ofanthocyanins in bakery products enriched with anthocyanins. Food Funct. 2016, 7, 3488–3496. [CrossRef][PubMed]
30. Nems, A.; Peksa, A.; Kucharska, A.Z.; Sokół-Łetowska, A.; Kita, A.; Drozdz, W.; Hamouz, K. Anthocyaninand antioxidant activity of snacks with coloured potato. Food Chem. 2015, 172, 175–182. [CrossRef] [PubMed]
31. Barti, P.; Albreht, A.; Skrt, M.; Tremlová, B.; Ošt’ádalová, M.; Šmejkal, K.; Vovk, I.; Ulrih Poklar, N.Anthocyanins in purple and blue wheat grains and in resulting bread: Quantity, composition, and thermalstability. Int. J. Food Sci. Nutr. 2015, 66, 514–519. [CrossRef] [PubMed]
32. Demirkesen, I.; Mert, B.; Sumnu, G.; Sahin, S. Rheological properties of gluten-free bread formulations.J. Food Eng. 2010, 96, 295–303. [CrossRef]
33. Wronkowska, M.; Troszynska, A.; Soral-Smietana, M.; Wolejszo, A. Effects of buckwheat flour (Fagopyrum
esculentum moench) on the quality of gluten-free bread. Pol. J. Food Nutr. Sci. 2008, 58, 211–216.34. Langeveld, S.M.J.; Van, W.R.; Stuurman, N.; Kijne, J.W.; de Pater, S. B-type granule containing protrusions and
interconnections between amyloplasts in developing wheat endosperm revealed by transmission electronmicroscopy and GFP expression. J. Exp. Bot. 2000, 51, 1357–1361. [CrossRef] [PubMed]
35. Bechtel, D.B.; Wilson, J.D. Amyloplast formation and starch granule development in hard red winter wheat.Cereal Chem. 2003, 80, 175–183. [CrossRef]
36. Wilson, J.D.; Bechtel, D.B.; Todd, T.C.; Seib, P.A. Measurement of wheat starch granule size distribution usingimage analysis and laser diffraction technology. Cereal Chem. 2006, 83, 259–268. [CrossRef]
37. Xie, X.J.; Cui, S.W.; Li, W.; Tsao, R. Isolation and characterization of wheat bran starch. Food Res. Int. 2008, 41,882–887. [CrossRef]
38. Kumar, R.; Kumar, A.; Sharma, N.K.; Kaur, N.; Chunduri, V.; Chawla, M.; Sharma, S.; Singh, K.; Garg, M.Soft and hard textured wheat differ in starch properties as indicated by trimodal distribution, morphology,thermal and crystalline properties. PLoS ONE 2016, 11, e0147622. [CrossRef] [PubMed]
39. Manca, M.; Woortman, A.J.J.; Mura, A.; Loos, K.; Loi, M.A. Localization and dynamics of amylose–lipophilicmolecules inclusion complex formation in starch granules. Phys. Chem. Chem. Phys. 2015, 17, 7864–7871.[CrossRef] [PubMed]
40. BeMiller, J.N.; Whisler, R.L. Starch: Chemistry and Technology, 3rd ed.; Academic Press: New York, NY, USA,2009; ISBN 9780080926551.
41. Li, W.H.; Bai, Y.F.; Mousaa-Saleh, A.S.; Zhang, Q.; Shen, Q. Effect of high hydrostatic pressure onphysicochemical and structural properties of rice starch. Food Bioproc. Technol. 2011, 5, 2233–2241. [CrossRef]
42. Leewatchararongjaroen, J.; Anuntagool, J. Effects of Dry-Milling and Wet-Milling on Chemical, Physical andGelatinization Properties of Rice Flour. Rice Sci. 2016, 23, 274–281. [CrossRef]
43. Malik, A.N.; Gaiani, C.; Fukai, S.; Bhandari, B. X-ray photoelectron spectroscopic analysis of rice kernels andflours: Measurement of surface chemical composition. Food Chem. 2016, 212, 349–357. [CrossRef]
44. Jongsutjarittam, N.; Charoenrein, S. Influence of waxy rice flour substitution for wheat flour on characteristicsof batter and freeze-thawed cake. Carbohydr. Polym. 2013, 97, 306–314. [CrossRef] [PubMed]
45. Sari, T.P.; Mann, B.; Kumar, R.; Singh, R.R.B.; Sharma, R.; Bhardwaj, M.; Athira, S. Preparation andcharacterization of nanoemulsion encapsulating curcumin. Food Hydrocoll. 2015, 43, 540–546. [CrossRef]
46. Ursache, F.M.; Andronoiu, D.G.; Ghinea, I.O.; Barbu, V.; Ionită, E.; Cotârlet, M.; Dumitrascu, L.; Botez, E.;Râpeanu, G.; Stănciuc, N. Valorizations of carotenoids from sea buckthorn extract by microencapsulationand formulation of value-added food products. J. Food Eng. 2018, 219, 16–24. [CrossRef]
47. Turturică, M.; Stănciuc, N.; Bahrim, G.; Râpeanu, R. Effect of thermal treatment on phenolic compoundsfrom plum (Prunus domestica) extracts—A kinetic study. J. Food Eng. 2016, 171, 200–207. [CrossRef]
48. Glover, B.J.; Martin, C. Anthocyanins. Curr. Biol. 2012, 22, 147–150. [CrossRef] [PubMed]
218
Molecules 2018, 23, 3047
49. Merzlyak, M.N.; Chivkunova, O.B.; Solovchenko, A.E.; Naqvi, K.R. Light absorption by anthocyanins injuvenile, stressed, and senescing leaves. J. Exp. Bot. 2008, 59, 3903–3911. [CrossRef] [PubMed]
50. Oancea, A.M.; Aprodu, I.; Ghinea, I.O.; Barbu, V.; Ionită, E.; Bahrim, G.; Rapeanu, G.; Stanciuc, N.A bottom-up approach for encapsulation of sour cherries anthocyanins by using β-lactoglobulin as matrices.J. Food Eng. 2017, 210, 83–90. [CrossRef]
Sample Availability: Samples of the compounds are available from the authors.
© 2018 by the authors. Licensee MDPI, Basel, Switzerland. This article is an open accessarticle distributed under the terms and conditions of the Creative Commons Attribution(CC BY) license (http://creativecommons.org/licenses/by/4.0/).
219

molecules
Article
The Use of Trisodium Citrate to Improve the TexturalProperties of Acid-Induced, Transglutaminase-TreatedMicellar Casein Gels
Hongliang Li 1, Chang Yang 2, Chong Chen 3, Fazheng Ren 1, Yuan Li 1, Zhishen Mu 2 and
Pengjie Wang 1,4,*
1 Beijing Advanced Innovation Center for Food Nutrition and Human Health, College of Food Science &Nutritional Engineering, China Agricultural University, Beijing 100083, China; [email protected] (H.L.);[email protected] (F.R.); [email protected] (Y.L.)
2 Inner Mongolia Mengniu Dairy (Group) CO., Ltd., Hohhot 750306, China; [email protected] (C.Y.);[email protected] (Z.M.)
3 Key Laboratory of Functional Dairy, Co-Constructed by Ministry of Education and Beijing Government,Beijing 100083, China; [email protected]
4 Beijing Laboratory of Food Quality and Safety, Beijing Higher Institution Engineering Research Center ofAnimal Product, Beijing 100083, China
* Correspondence: [email protected]; Tel.: +86-010-6273-7644
Academic Editor: Lillian Barros
Received: 3 June 2018; Accepted: 1 July 2018; Published: 4 July 2018
Abstract: In this study, the effect of trisodium citrate on the textural properties and microstructure ofacid-induced, transglutaminase-treated micellar casein gels was investigated. Various concentrationsof trisodium citrate (0 mmol/L, 10 mmol/L, 20 mmol/L, and 30 mmol/L) were added to micellarcasein dispersions. After being treated with microbial transglutaminase (mTGase), all dispersionswere acidified with 1.3% (w/v) gluconodelta-lactone (GDL) to pH 4.4–4.6. As the concentration oftrisodium citrate increased from 0 mmol/L to 30 mmol/L, the firmness and water-holding capacityincreased significantly. The final storage modulus (G′) of casein gels was positively related tothe concentration of trisodium citrate prior to mTGase treatment of micellar casein dispersions.Cryo-scanning electron microscopy images indicated that more interconnected networks and smallerpores were present in the gels with higher concentrations of trisodium citrate. Overall, when micellarcasein dispersions are treated with trisodium citrate prior to mTGase crosslinking, the resultedacid-induced gels are firmer and the syneresis is reduced.
Keywords: trisodium citrate; microbial transglutaminase; casein gels; texturalproperties; microstructures
1. Introduction
Yogurt is a very popular fermented milk-based product worldwide due to its nutritional andsensory properties [1]. However, the acid-induced milk gels often have textural defects such as lowfirmness (fragile structure) and syneresis (low water holding capacity) during storage or followingmechanical damage [2], which greatly reduce their sensory properties. Therefore, the development ofacid-induced milk gels with greater firmness and water holding capacity is an important issue.
The firmness and water-holding capacity of acid-induced milk gels are closely related to theirnetwork structures. The primary building blocks of acid-induced milk gel network structures areproteins. Microbial transglutaminase (mTGase) is an enzyme widely used to form covalent linksbetween individual protein molecules [3–6]. The textural properties of acid-induced gels prepared
221
Molecules 2018, 23, 1632
from mTGase-treated milk proteins can be significantly enhanced [2,7]. Unfortunately, even thoughplenty of work has been carried out regarding the effect of mTGase on the textural properties ofacid-induced milk gels, the gel defects including low firmness (fragile structure) and syneresis havenot been completely prevented.
The related mechanism of the mTGase-induced changes in the texture of acidified milk proteingels is summarized below [8,9]. The primary building blocks of acid-induced milk gel networkstructures are caseins [10–12], which are cross-linked with calcium phosphate to form associationcolloids known as casein micelles [12–14]. Schorsch and others [15] investigated the effect of themTGase treatment on the acid gelation of micellar caseins. The mTGase generated covalent bondsbetween the individual casein molecules on the micellar surface or within the micelles. This inhibitedthe division of casein micelles even though the solubilization of calcium phosphate upon acidificationoccurred [16]. In this case, the casein particles could not be adequately rearranged to form moreinterconnected gel networks.
The addition of calcium-chelating agents (for example, trisodium citrate, sodium phosphate) tomicellar casein dispersions has been reported to dissociate the native casein micelles into smaller caseinaggregates [12,17,18]. This may change the rearrangement of casein particles during gel formationand the contact between mTGase and caseins, which would alter the crosslink bonds between caseinmolecules before or during acidification. Therefore, the mTGase-treated smaller casein particles mightcreate different gel network structures compared with the gels from acidified mTGase-treated nativecasein micelles.
In this study, the effect of the calcium-chelating agent, which is trisodium citrate (TSC), on thetextural properties and microstructure of acid-induced, transglutaminase-treated micellar casein gelswas investigated with special reference to the related mechanisms of action.
2. Results and Discussion
The building blocks of the acid-induced milk gel network structures are proteins, which includeapproximately 80% of caseins and 20% of whey proteins [10]. Whey proteins were susceptible tomTGase only after being denatured by heat treatment [19]. In addition, the denatured whey proteinsplay an important role in the textural properties of yogurt, but some denatured whey proteins formparticles [20–22]. The particle diameters range from about 80 nm to 500 nm [23,24], which was inthe particle size range of casein micelles. Therefore, in the complex system consisting of both caseinmicelles and denatured whey proteins, it would be difficult to distinguish the changes of caseinmicelles with different treatments. Due to the primary role of casein micelles in the formation ofacid-induced milk gels, the whey proteins were not included in the present study, as reported inprevious papers [6,15,25,26].
The preparation of micellar casein gels can be divided into three routes which are described in theMaterials and Methods section.
In route 1, various amounts of trisodium citrate were added to the casein micelle dispersionsbefore mTGase treatment, which was followed by acidified with GDL. For convenience, the dispersionswere first treated with various amounts of trisodium citrate and then treated with mTGase, which aredefined as TG, 10-TG, 20-TG, and 30-TG, respectively, where the numbers refer to 0 mmol/L trisodiumcitrate, 10 mmol/L trisodium citrate, 20 mmol/L trisodium citrate, and 30 mmol/L trisodiumcitrate, respectively.
In route 2, various amounts of trisodium citrate were added to the casein micelle dispersions aftermTGase treatment, which was followed by acidification with GDL. For convenience, the dispersionsare first treated with mTGase and then treated with various amounts of trisodium citrate, which aredefined as TG, TG-10, TG-20, and TG-30, respectively, where the numbers refer to 10 mmol/L trisodiumcitrate, 20 mmol/L trisodium citrate, and 30 mmol/L trisodium citrate, respectively. TG refers tosamples with no trisodium citrate added.
222
Molecules 2018, 23, 1632
In route 3, micellar casein dispersions treated with 0 mmol/L trisodium citrate, 10 mmol/Ltrisodium citrate, 20 mmol/L trisodium citrate, and 30 mmol/L trisodium citrate (in the absence ofmTGase) were directly acidified with GDL.
2.1. Particle Size of Casein Micelles and Soluble Calcium Contents
Table 1 shows the effects of trisodium citrate and routes on the average diameter of caseinparticles. Two-way ANOVA revealed that there was a significant effect of routes on the particlesizes. In route 1 or route 3, with increasing trisodium citrate concentrations, the average diameter ofparticles exhibited an obvious decreasing trend. This suggested that the particle size in casein micelledispersions became smaller with increasing trisodium citrate concentrations. The soluble calciumconcentrations in casein micelle dispersions containing 0 mM trisodium citrate, 10 mM trisodiumcitrate, 20 mM trisodium citrate, and 30 mM trisodium citrate were 8.6 ± 0.5 mM, 13.3 ± 0.8 mM,23.7 ± 0.6 mM, and 23.6 ± 0.6 mM, respectively. Similar results can be also found in Reference [27].It is well-established that calcium-chelating agents can disrupt the micellar framework by removingcalcium from the micelles, which leads to the dissociation of casein micelles [17]. Therefore, it wasexpected that the presence of citrate ions would reduce the particle size of native casein micelles.However, in route 2, the diameter of particles in TG, TG-5, TG-10, TG-20, and TG-30 showed littlevariation. This may be due to cross-linking of caseins within the particles by mTGase-generatedcovalent casein networks. Although the colloidal calcium phosphate dissociated from the caseinmicelles in the presence of citrate ions, this did not disrupt the stability of the mTGase-treatedmicelles [4,28].
Table 1. The effects of trisodium citrate on the average diameter (nm) of casein particles 1.
TreatmentTrisodium Citrate Concentration (mM)
0 10 20 30
Route 1 144.0 ± 6.0 a,A 88.3 ± 2.9 b,A 24.7 ± 1.7 c,A 18.8 ± 1.8 c,A
Route 2 144.0 ± 6.0 a,A 129.7 ± 0.8 a,B 130.3 ± 1.2 a,B 137.4 ± 2.2 a,B
Route 3 (Without mTGase) 142.2 ± 2.2 a,A 79.4 ± 9.5 b,A 20.3 ± 2.9 c,A 13.6 ± 1.6 c,A
1 Superscripts with different letters (a–c) and (A, B) for the same row and column, respectively, indicate significantdifferences (p ≤ 0.05).
2.2. Gelation Kinetics
The effect of trisodium citrate on the storage modulus (G′) as a function of time after the additionof GDL is shown in Figure 1. As expected, the G′ increased after gelation, followed by a plateauduring the gel stage. Similar results have been reported elsewhere [29,30]. It can be seen that trisodiumcitrate had a significant influence on the acid-induced gelation kinetics of mTGase-treated micellarcaseins. In the three routes, gelation time (when G′ ≥ 1) was positively related to the trisodium citrateconcentration. This may be because trisodium citrate could dissolve the colloid calcium phosphate inthe micelles, which leads to the liberation of phosphate into the soluble phase. Due to the bufferingcapacity of phosphate, with the increasing concentrations of trisodium citrate, a slower acidificationrate of the dispersions occurred [27]. It can also be observed that, in the same trisodium citrateconcentration, the final G′ values of gels prepared in route 1 were significantly higher than route 3.This indicated the mTGase-crosslinking played a crucial role in the gel structure. In route 1, the finalG′ of the gels was positively related to the trisodium citrate concentrations. As mentioned above,when the amount of trisodium citrate was increased, the native casein micelles dissociated into smallercasein particles. This increased the flexibility of the casein particles, which favored the rearrangementof caseins during gel formation. In addition, the surface area of the smaller casein particles waslarger than the native casein micelles, which favored contact between mTGase and caseins. Thisenhanced the crosslink bonds between casein molecules before or during acidification [31]. Dueto these two reasons, in route 1, the final G′ of gels increased with trisodium citrate concentration.
223
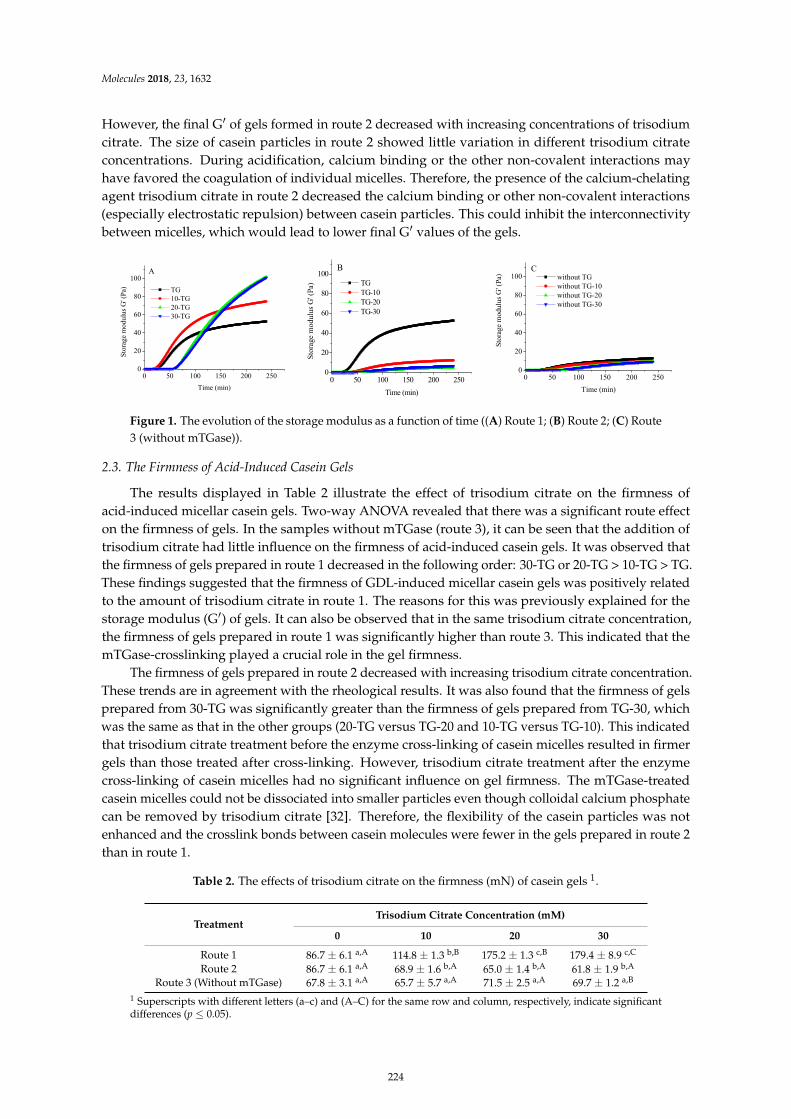
Molecules 2018, 23, 1632
However, the final G′ of gels formed in route 2 decreased with increasing concentrations of trisodiumcitrate. The size of casein particles in route 2 showed little variation in different trisodium citrateconcentrations. During acidification, calcium binding or the other non-covalent interactions mayhave favored the coagulation of individual micelles. Therefore, the presence of the calcium-chelatingagent trisodium citrate in route 2 decreased the calcium binding or other non-covalent interactions(especially electrostatic repulsion) between casein particles. This could inhibit the interconnectivitybetween micelles, which would lead to lower final G′ values of the gels.
′
0 50 100 150 200 2500
20
40
60
80
100A
Stor
age
mod
ulus
G' (
Pa)
Time (min)
TG 10-TG 20-TG 30-TG
0 50 100 150 200 250
0
20
40
60
80
100B
Stor
age
mod
ulus
G' (
Pa)
Time (min)
TG TG-10 TG-20 TG-30
0 50 100 150 200 2500
20
40
60
80
100C
Stor
age
mod
ulus
G' (
Pa)
Time (min)
without TG without TG-10 without TG-20 without TG-30
′
≤
Figure 1. The evolution of the storage modulus as a function of time ((A) Route 1; (B) Route 2; (C) Route3 (without mTGase)).
2.3. The Firmness of Acid-Induced Casein Gels
The results displayed in Table 2 illustrate the effect of trisodium citrate on the firmness ofacid-induced micellar casein gels. Two-way ANOVA revealed that there was a significant route effecton the firmness of gels. In the samples without mTGase (route 3), it can be seen that the addition oftrisodium citrate had little influence on the firmness of acid-induced casein gels. It was observed thatthe firmness of gels prepared in route 1 decreased in the following order: 30-TG or 20-TG > 10-TG > TG.These findings suggested that the firmness of GDL-induced micellar casein gels was positively relatedto the amount of trisodium citrate in route 1. The reasons for this was previously explained for thestorage modulus (G′) of gels. It can also be observed that in the same trisodium citrate concentration,the firmness of gels prepared in route 1 was significantly higher than route 3. This indicated that themTGase-crosslinking played a crucial role in the gel firmness.
The firmness of gels prepared in route 2 decreased with increasing trisodium citrate concentration.These trends are in agreement with the rheological results. It was also found that the firmness of gelsprepared from 30-TG was significantly greater than the firmness of gels prepared from TG-30, whichwas the same as that in the other groups (20-TG versus TG-20 and 10-TG versus TG-10). This indicatedthat trisodium citrate treatment before the enzyme cross-linking of casein micelles resulted in firmergels than those treated after cross-linking. However, trisodium citrate treatment after the enzymecross-linking of casein micelles had no significant influence on gel firmness. The mTGase-treatedcasein micelles could not be dissociated into smaller particles even though colloidal calcium phosphatecan be removed by trisodium citrate [32]. Therefore, the flexibility of the casein particles was notenhanced and the crosslink bonds between casein molecules were fewer in the gels prepared in route 2than in route 1.
Table 2. The effects of trisodium citrate on the firmness (mN) of casein gels 1.
TreatmentTrisodium Citrate Concentration (mM)
0 10 20 30
Route 1 86.7 ± 6.1 a,A 114.8 ± 1.3 b,B 175.2 ± 1.3 c,B 179.4 ± 8.9 c,C
Route 2 86.7 ± 6.1 a,A 68.9 ± 1.6 b,A 65.0 ± 1.4 b,A 61.8 ± 1.9 b,A
Route 3 (Without mTGase) 67.8 ± 3.1 a,A 65.7 ± 5.7 a,A 71.5 ± 2.5 a,A 69.7 ± 1.2 a,B
1 Superscripts with different letters (a–c) and (A–C) for the same row and column, respectively, indicate significantdifferences (p ≤ 0.05).
224
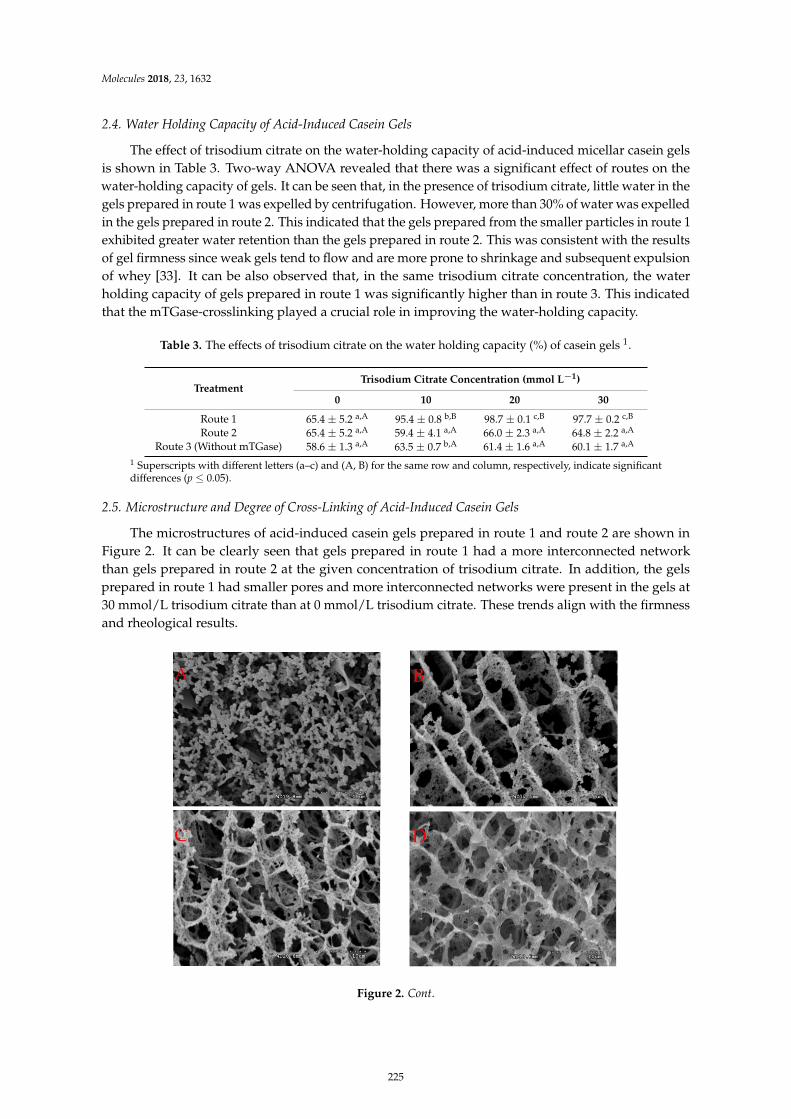
Molecules 2018, 23, 1632
2.4. Water Holding Capacity of Acid-Induced Casein Gels
The effect of trisodium citrate on the water-holding capacity of acid-induced micellar casein gelsis shown in Table 3. Two-way ANOVA revealed that there was a significant effect of routes on thewater-holding capacity of gels. It can be seen that, in the presence of trisodium citrate, little water in thegels prepared in route 1 was expelled by centrifugation. However, more than 30% of water was expelledin the gels prepared in route 2. This indicated that the gels prepared from the smaller particles in route 1exhibited greater water retention than the gels prepared in route 2. This was consistent with the resultsof gel firmness since weak gels tend to flow and are more prone to shrinkage and subsequent expulsionof whey [33]. It can be also observed that, in the same trisodium citrate concentration, the waterholding capacity of gels prepared in route 1 was significantly higher than in route 3. This indicatedthat the mTGase-crosslinking played a crucial role in improving the water-holding capacity.
Table 3. The effects of trisodium citrate on the water holding capacity (%) of casein gels 1.
TreatmentTrisodium Citrate Concentration (mmol L−1)
0 10 20 30
Route 1 65.4 ± 5.2 a,A 95.4 ± 0.8 b,B 98.7 ± 0.1 c,B 97.7 ± 0.2 c,B
Route 2 65.4 ± 5.2 a,A 59.4 ± 4.1 a,A 66.0 ± 2.3 a,A 64.8 ± 2.2 a,A
Route 3 (Without mTGase) 58.6 ± 1.3 a,A 63.5 ± 0.7 b,A 61.4 ± 1.6 a,A 60.1 ± 1.7 a,A
1 Superscripts with different letters (a–c) and (A, B) for the same row and column, respectively, indicate significantdifferences (p ≤ 0.05).
2.5. Microstructure and Degree of Cross-Linking of Acid-Induced Casein Gels
The microstructures of acid-induced casein gels prepared in route 1 and route 2 are shown inFigure 2. It can be clearly seen that gels prepared in route 1 had a more interconnected networkthan gels prepared in route 2 at the given concentration of trisodium citrate. In addition, the gelsprepared in route 1 had smaller pores and more interconnected networks were present in the gels at30 mmol/L trisodium citrate than at 0 mmol/L trisodium citrate. These trends align with the firmnessand rheological results.
−
≤
Figure 2. Cont.
225
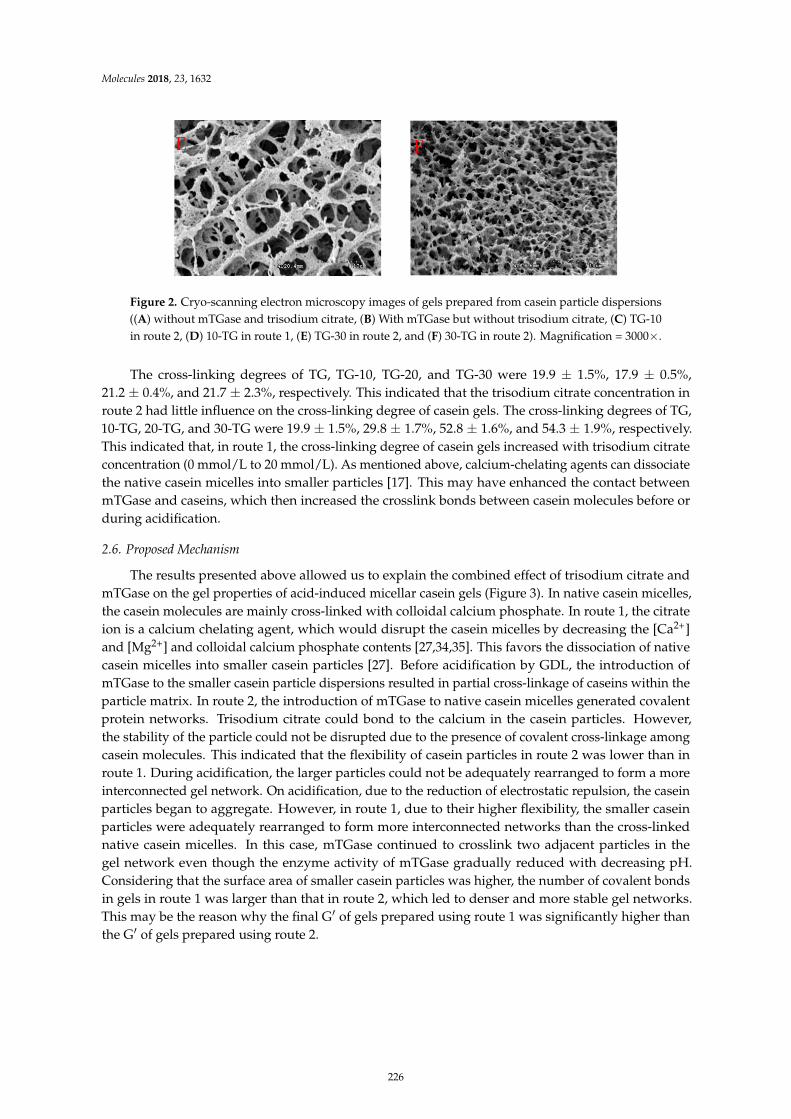
Molecules 2018, 23, 1632
Figure 2. Cryo-scanning electron microscopy images of gels prepared from casein particle dispersions((A) without mTGase and trisodium citrate, (B) With mTGase but without trisodium citrate, (C) TG-10in route 2, (D) 10-TG in route 1, (E) TG-30 in route 2, and (F) 30-TG in route 2). Magnification = 3000×.
The cross-linking degrees of TG, TG-10, TG-20, and TG-30 were 19.9 ± 1.5%, 17.9 ± 0.5%,21.2 ± 0.4%, and 21.7 ± 2.3%, respectively. This indicated that the trisodium citrate concentration inroute 2 had little influence on the cross-linking degree of casein gels. The cross-linking degrees of TG,10-TG, 20-TG, and 30-TG were 19.9 ± 1.5%, 29.8 ± 1.7%, 52.8 ± 1.6%, and 54.3 ± 1.9%, respectively.This indicated that, in route 1, the cross-linking degree of casein gels increased with trisodium citrateconcentration (0 mmol/L to 20 mmol/L). As mentioned above, calcium-chelating agents can dissociatethe native casein micelles into smaller particles [17]. This may have enhanced the contact betweenmTGase and caseins, which then increased the crosslink bonds between casein molecules before orduring acidification.
2.6. Proposed Mechanism
The results presented above allowed us to explain the combined effect of trisodium citrate andmTGase on the gel properties of acid-induced micellar casein gels (Figure 3). In native casein micelles,the casein molecules are mainly cross-linked with colloidal calcium phosphate. In route 1, the citrateion is a calcium chelating agent, which would disrupt the casein micelles by decreasing the [Ca2+]and [Mg2+] and colloidal calcium phosphate contents [27,34,35]. This favors the dissociation of nativecasein micelles into smaller casein particles [27]. Before acidification by GDL, the introduction ofmTGase to the smaller casein particle dispersions resulted in partial cross-linkage of caseins within theparticle matrix. In route 2, the introduction of mTGase to native casein micelles generated covalentprotein networks. Trisodium citrate could bond to the calcium in the casein particles. However,the stability of the particle could not be disrupted due to the presence of covalent cross-linkage amongcasein molecules. This indicated that the flexibility of casein particles in route 2 was lower than inroute 1. During acidification, the larger particles could not be adequately rearranged to form a moreinterconnected gel network. On acidification, due to the reduction of electrostatic repulsion, the caseinparticles began to aggregate. However, in route 1, due to their higher flexibility, the smaller caseinparticles were adequately rearranged to form more interconnected networks than the cross-linkednative casein micelles. In this case, mTGase continued to crosslink two adjacent particles in thegel network even though the enzyme activity of mTGase gradually reduced with decreasing pH.Considering that the surface area of smaller casein particles was higher, the number of covalent bondsin gels in route 1 was larger than that in route 2, which led to denser and more stable gel networks.This may be the reason why the final G′ of gels prepared using route 1 was significantly higher thanthe G′ of gels prepared using route 2.
226
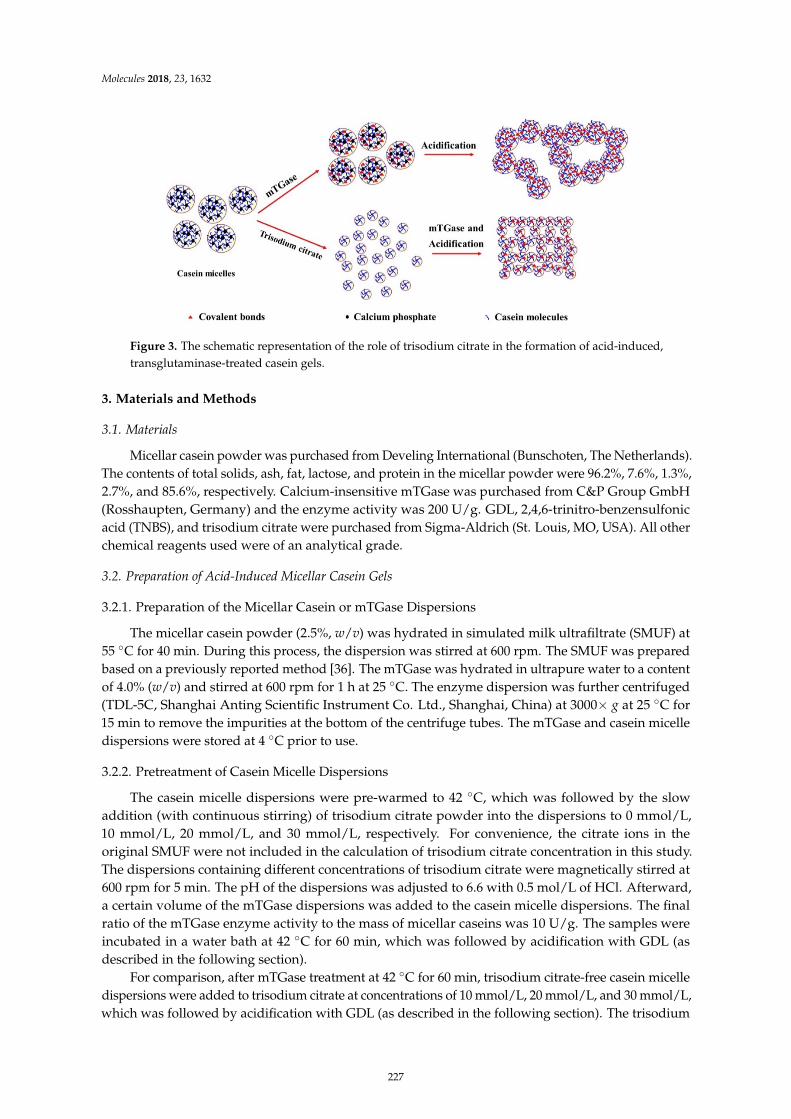
Molecules 2018, 23, 1632
Figure 3. The schematic representation of the role of trisodium citrate in the formation of acid-induced,transglutaminase-treated casein gels.
3. Materials and Methods
3.1. Materials
Micellar casein powder was purchased from Develing International (Bunschoten, The Netherlands).The contents of total solids, ash, fat, lactose, and protein in the micellar powder were 96.2%, 7.6%, 1.3%,2.7%, and 85.6%, respectively. Calcium-insensitive mTGase was purchased from C&P Group GmbH(Rosshaupten, Germany) and the enzyme activity was 200 U/g. GDL, 2,4,6-trinitro-benzensulfonicacid (TNBS), and trisodium citrate were purchased from Sigma-Aldrich (St. Louis, MO, USA). All otherchemical reagents used were of an analytical grade.
3.2. Preparation of Acid-Induced Micellar Casein Gels
3.2.1. Preparation of the Micellar Casein or mTGase Dispersions
The micellar casein powder (2.5%, w/v) was hydrated in simulated milk ultrafiltrate (SMUF) at55 ◦C for 40 min. During this process, the dispersion was stirred at 600 rpm. The SMUF was preparedbased on a previously reported method [36]. The mTGase was hydrated in ultrapure water to a contentof 4.0% (w/v) and stirred at 600 rpm for 1 h at 25 ◦C. The enzyme dispersion was further centrifuged(TDL-5C, Shanghai Anting Scientific Instrument Co. Ltd., Shanghai, China) at 3000× g at 25 ◦C for15 min to remove the impurities at the bottom of the centrifuge tubes. The mTGase and casein micelledispersions were stored at 4 ◦C prior to use.
3.2.2. Pretreatment of Casein Micelle Dispersions
The casein micelle dispersions were pre-warmed to 42 ◦C, which was followed by the slowaddition (with continuous stirring) of trisodium citrate powder into the dispersions to 0 mmol/L,10 mmol/L, 20 mmol/L, and 30 mmol/L, respectively. For convenience, the citrate ions in theoriginal SMUF were not included in the calculation of trisodium citrate concentration in this study.The dispersions containing different concentrations of trisodium citrate were magnetically stirred at600 rpm for 5 min. The pH of the dispersions was adjusted to 6.6 with 0.5 mol/L of HCl. Afterward,a certain volume of the mTGase dispersions was added to the casein micelle dispersions. The finalratio of the mTGase enzyme activity to the mass of micellar caseins was 10 U/g. The samples wereincubated in a water bath at 42 ◦C for 60 min, which was followed by acidification with GDL (asdescribed in the following section).
For comparison, after mTGase treatment at 42 ◦C for 60 min, trisodium citrate-free casein micelledispersions were added to trisodium citrate at concentrations of 10 mmol/L, 20 mmol/L, and 30 mmol/L,which was followed by acidification with GDL (as described in the following section). The trisodium
227
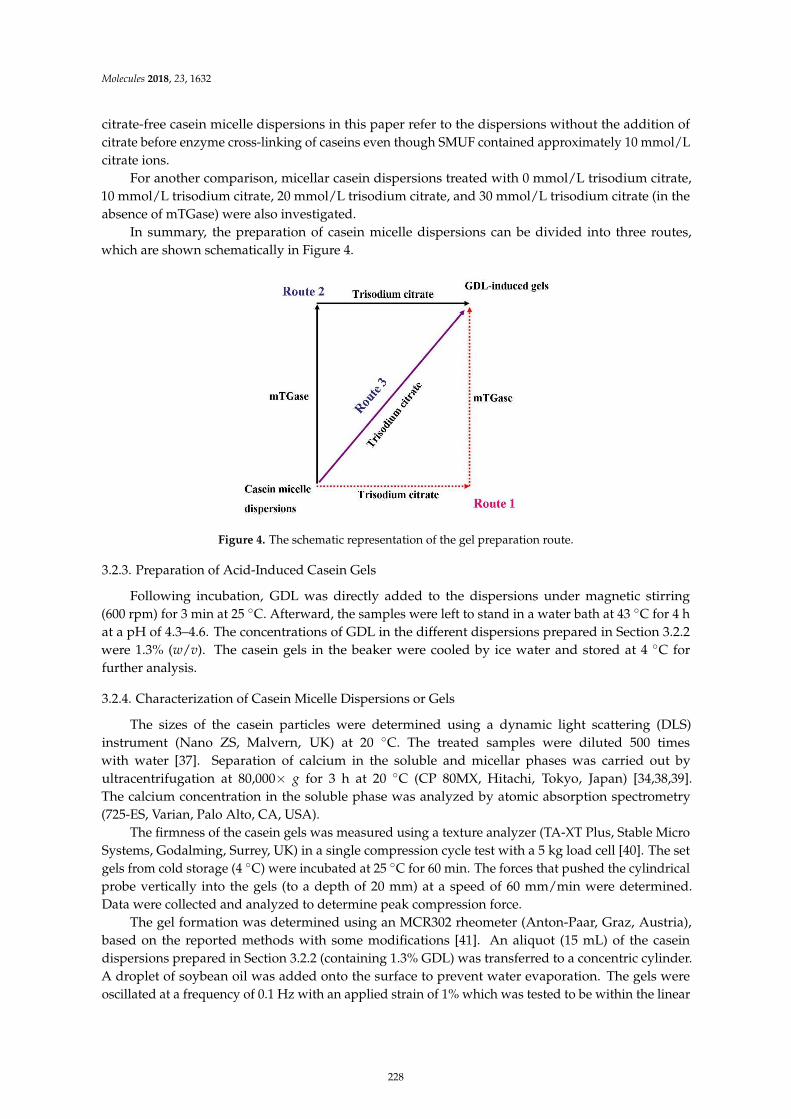
Molecules 2018, 23, 1632
citrate-free casein micelle dispersions in this paper refer to the dispersions without the addition ofcitrate before enzyme cross-linking of caseins even though SMUF contained approximately 10 mmol/Lcitrate ions.
For another comparison, micellar casein dispersions treated with 0 mmol/L trisodium citrate,10 mmol/L trisodium citrate, 20 mmol/L trisodium citrate, and 30 mmol/L trisodium citrate (in theabsence of mTGase) were also investigated.
In summary, the preparation of casein micelle dispersions can be divided into three routes,which are shown schematically in Figure 4.
≥
−
Figure 4. The schematic representation of the gel preparation route.
3.2.3. Preparation of Acid-Induced Casein Gels
Following incubation, GDL was directly added to the dispersions under magnetic stirring(600 rpm) for 3 min at 25 ◦C. Afterward, the samples were left to stand in a water bath at 43 ◦C for 4 hat a pH of 4.3–4.6. The concentrations of GDL in the different dispersions prepared in Section 3.2.2were 1.3% (w/v). The casein gels in the beaker were cooled by ice water and stored at 4 ◦C forfurther analysis.
3.2.4. Characterization of Casein Micelle Dispersions or Gels
The sizes of the casein particles were determined using a dynamic light scattering (DLS)instrument (Nano ZS, Malvern, UK) at 20 ◦C. The treated samples were diluted 500 timeswith water [37]. Separation of calcium in the soluble and micellar phases was carried out byultracentrifugation at 80,000× g for 3 h at 20 ◦C (CP 80MX, Hitachi, Tokyo, Japan) [34,38,39].The calcium concentration in the soluble phase was analyzed by atomic absorption spectrometry(725-ES, Varian, Palo Alto, CA, USA).
The firmness of the casein gels was measured using a texture analyzer (TA-XT Plus, Stable MicroSystems, Godalming, Surrey, UK) in a single compression cycle test with a 5 kg load cell [40]. The setgels from cold storage (4 ◦C) were incubated at 25 ◦C for 60 min. The forces that pushed the cylindricalprobe vertically into the gels (to a depth of 20 mm) at a speed of 60 mm/min were determined.Data were collected and analyzed to determine peak compression force.
The gel formation was determined using an MCR302 rheometer (Anton-Paar, Graz, Austria),based on the reported methods with some modifications [41]. An aliquot (15 mL) of the caseindispersions prepared in Section 3.2.2 (containing 1.3% GDL) was transferred to a concentric cylinder.A droplet of soybean oil was added onto the surface to prevent water evaporation. The gels wereoscillated at a frequency of 0.1 Hz with an applied strain of 1% which was tested to be within the linear
228
Molecules 2018, 23, 1632
viscoelastic region. The test temperature was kept at 43 ◦C. Gelation time was defined as the pointwhen the storage modulus (G′) of acid-induced gels ≥ 1 Pa [42].
The water holding capacity (WHC) of casein gels was determined based on a modifiedprocedure [43]. A total of 8 mL of the pretreated casein micelle dispersions was poured into a10 mL centrifuge tube and was acidified, which is described in Section 3.2.3. After acidification, the gels(Y) were centrifuged at 2800× g for 3 min at 25 ◦C. The mass of expelled water (W) was carefullycollected and weighed. The WHC was calculated based on the formula below.
WHC = (Y − W)/Y × 100% (1)
The cross-linking degree of casein gels was measured based on a previously reported methodwith some modifications [44]. The final gels were mashed and washed with ultrapure water four timesand then the samples were freeze-dried to a constant weight. One mL of 4 % (w/v) NaHCO3 solutionand 1 mL of 0.1% (w/v) TNBS solution were added to the freeze-dried casein gels (5 mg). Followingincubation at 40 ◦C for 3 h, 6 mol/L HCl (2 mL) was added to the samples and the temperature wasraised to 60 ◦C. After reacting for 1.5 h, the samples were diluted with water (5 mL). The absorbance ofthe samples was determined at 345 nm using a U-2900 spectrometer (Hitachi, Ltd., Tokyo, Japan). Thecross-linking degree (DE) was calculated based on the formula below.
DE% = (1 − (AS/ms)/(ANS/mNs)) × 100% (2)
where AS and ANS represent the absorbance of samples and non-cross-linked casein micelles,respectively. ms and mNs represent the mass of samples and non-cross-linked casein micelles,respectively. To remove the ions, the non-cross-linked casein micelles were acidified at a pH of4.6 and freeze-dried to a constant weight.
The microstructures of the gels were observed by using S-3000N cryo-scanning electronmicroscopy (Hitachi Co., Tokyo, Japan), which was described in previous reports [45] with somemodifications. Gels were deposited in the cryo-specimen holder (Quorum PP3000T, East Grinstead,UK) and fixed in slush nitrogen (<180 ◦C). After being fractured, the gels were sublimated at −85 ◦Cfor 35 min and sputter-coated with gold.
3.2.5. Statistical Analysis
The experiments were carried out in triplicate. The means and standard deviations were calculatedfrom these measurements. Data were tested using a two-way analysis of variance in order to determinethe differences in particle size, firmness, and water-holding capacity induced by routes and trisodiumcitrate concentrations. SPSS 18 software for Windows (IBM, Ehningen, Germany) was used as thestatistical analysis software. Duncan’s test was applied to determine the statistical differences betweenthe means.
4. Conclusions
In this study, the effect of trisodium citrate on the textural properties and microstructure ofacid-induced, transglutaminase-treated micellar casein gels was investigated. It was concluded thatthe casein micelles that were first treated by trisodium citrate (10–30 mmol/L) and then cross-linkedwith mTGase (route 1) resulted in more stable acid gels than those directly cross-linked with mTGase(route 2) or without mTGase (route 3). The trisodium citrate (10–30 mmol/L) could dissociate thenative casein micelles into smaller casein particles. In the presence of mTGase, the smaller particlesformed acid-induced gels with greater firmness, higher water-holding capacity, more interconnectednetworks, and smaller pores than native casein micelles.
At the present time, mTGase is listed as a food ingredient in several commercial acid-inducedmilk gel products sold in many countries. It is used to improve the textural properties of acid-inducedgel products. However, textural defects such as low firmness (fragile structure) and syneresis cannot
229
Molecules 2018, 23, 1632
be completely avoided. The method proposed in route 1 provides a novel strategy for improving thetextural properties of acid-induced milk gel products.
Author Contributions: H.L. and P.W. conducted the conceptualization. F.R. managed the methodology. Z.M.handled the software. Y.L. validated the results. H.L. conducted the formal analysis. C.C. took part in datacuration. H.L. wrote and prepared the original draft. P.W. reviewed and edited the manuscript. P.W. supervisedthe project. C.Y. conducted the ultracentrifugation and gelation kinetics experiments. P.W. took part in projectadministration and funding acquisition.
Funding: This study was supported by the Supported by the Open Project Program of Beijing Key Laboratory ofFlavor Chemistry (No. SPFW-2018-YB01), Beijing Technology and Business University (BTBU), and 111 projectfrom the Education Ministry of China (No. B18053).
Acknowledgments: We thank Yanbao Tian for help in cryo-SEM sample preparation and observation at theInstitute of Genetics and Developmental Biology Chinese Academy of Sciences.
Conflicts of Interest: The authors declare no conflict of interest.
References
1. Nguyen, P.T.M.; Kravchuk, O.; Bhandari, B.; Prakash, S. Effect of different hydrocolloids on texture, rheology,tribology and sensory perception of texture and mouthfeel of low-fat pot-set yoghurt. Food Hydrocoll. 2017,72, 90–104. [CrossRef]
2. Faergemand, M.; Qvist, K.B. Transglutaminase: Effect on rheological properties, microstructure andpermeability of set style acid skim milk gel. Food Hydrocoll. 1997, 11, 287–292. [CrossRef]
3. Raak, N.; Rohm, H.; Jaros, D. Enzymatic cross-linking of casein facilitates gel structure weakening inducedby overacidification. Food Biophys. 2017, 12, 261–268. [CrossRef]
4. Raak, N.; Rohm, H.; Jaros, D. Cross-linking with microbial transglutaminase: Isopeptide bonds and polymersize as drivers for acid casein gel stiffness. Int. Dairy J. 2016, 66, 49–55. [CrossRef]
5. Jaros, D.; Schwarzenbolz, U.; Raak, N.; Lobner, J.; Henle, T.; Rohm, H. Cross-linking with microbialtransglutaminase: Relationship between polymerisation degree and stiffness of acid casein gels. Int. Dairy J.
2014, 38, 174–178. [CrossRef]6. Schorsch, C.; Carrie, H.; Clark, A.H.; Norton, I.T. Cross-linking casein micelles by a microbial
transglutaminase conditions for formation of transglutaminase-induced gels. Int. Dairy J. 2000, 10, 519–528.[CrossRef]
7. Vasbinder, A.J.; Rollema, H.S.; Bot, A.; de Kruif, C.G. Gelation mechanism of milk as influenced bytemperature and pH; studied by the use of transglutaminase cross-linked casein micelles. J. Dairy Sci.
2003, 86, 1556–1563. [CrossRef]8. Hinz, K.; Huppertz, T.; Kelly, A.L. Susceptibility of the individual caseins in reconstituted skim milk to
cross-linking by transglutaminase: Influence of temperature, pH and mineral equilibria. J. Dairy Res. 2012,79, 414–421. [CrossRef] [PubMed]
9. Smiddy, M.A.; Martin, J.; Kelly, A.L.; de Kruif, C.G.; Huppertz, T. Stability of casein micelles cross-linked bytransglutaminase. J. Dairy Sci. 2006, 89, 1906–1914. [CrossRef]
10. Bijl, E.; van Valenberg, H.J.F.; Huppertz, T.; van Hooijdonk, A.C.M. Protein, casein, and micellar salts in milk:Current content and historical perspectives. J. Dairy Sci. 2013, 96, 5455–5464. [CrossRef] [PubMed]
11. Huppertz, T. Chemistry of the Caseins. In Advanced Dairy Chemistry; Springer: Boston, MA, USA, 2013.12. De Kruif, C.G.; Huppertz, T.; Urban, V.S.; Petukhov, A.V. Casein micelles and their internal structure.
Adv. Colloid Interface Sci. 2012, 171, 36–52. [CrossRef] [PubMed]13. Gonzalez-Jordan, A.; Thomar, P.; Nicolai, T.; Dittmer, J. The effect of pH on the structure and phosphate
mobility of casein micelles in aqueous solution. Food Hydrocoll. 2015, 51, 88–94. [CrossRef]14. Thorn, D.C.; Ecroyd, H.; Carver, J.A.; Holt, C. Casein structures in the context of unfolded proteins. Int. Dairy J.
2015, 46, 2–11. [CrossRef]15. Schorsch, C.; Carrie, H.; Norton, I.T. Cross-linking casein micelles by a microbial transglutaminase: Influence
of cross-links in acid-induced gelation. Int. Dairy J. 2000, 10, 529–539. [CrossRef]16. Boenisch, M.P.; Lauber, S.; Kulozik, U. Effect of ultra-high temperature treatment on the enzymatic
cross-linking of micellar casein and sodium caseinate by transglutaminase. J. Food Sci. 2004, 69, E398–E404.[CrossRef]
230
Molecules 2018, 23, 1632
17. Thomar, P.; Nicolai, T. Dissociation of native casein micelles induced by sodium caseinate. Food Hydrocoll.
2015, 49, 224–231. [CrossRef]18. Silva, N.F.; Casanova, F.; Gaucheron, F.; de Carvalho Teixeira, A.V.; da Silva, G.M.; Minim, L.A.;
de Carvalho, A.F. Combined effect of transglutaminase and sodium citrate on the microstructure andrheological properties of acid milk gel. Food Hydrocoll. 2018, 82, 304–311. [CrossRef]
19. Sharma, R.; Lorenzen, P.C.; Qvist, K.B. Influence of transglutaminase treatment of skim milk on the formationof ε-(γ-glutamyl)lysine and the susceptibility of individual proteins towards crosslinking. Int. Dairy J. 2001,11, 785–793. [CrossRef]
20. Anema, S.G. Effect of whey protein addition and pH on the acid gelation of heated skim milk. Int. Dairy J.
2018, 79, 5–14. [CrossRef]21. Morand, M.; Guyomarc’h, F.; Pezennec, S.; Famelart, M.H. On how kappa-casein affects the interactions
between the heat-induced whey protein/kappa-casein complexes and the casein micelles during the acidgelation of skim milk. Int. Dairy J. 2011, 21, 670–678. [CrossRef]
22. Chai, J.; Jiang, P.; Wang, P.; Jiang, Y.; Li, D.; Bao, W.; Liu, B.; Liu, B.; Zhao, L.; Norde, W.; et al. Theintelligent delivery systems for bioactive compounds in foods: Physicochemical and physiological conditions,absorption mechanisms, obstacles and responsive strategies. Trends Food Sci. Technol. 2018, 78, 144–154.[CrossRef]
23. Destribats, M.; Rouvet, M.; Gehin-Delval, C.; Schmitt, C.; Binks, B.P. Emulsions stabilised by whey proteinmicrogel particles: Towards food-grade Pickering emulsions. Soft Matter 2014, 10, 6941–6954. [CrossRef][PubMed]
24. Sarkar, A.; Kanti, F.; Gulotta, A.; Murray, B.S.; Zhang, S. Aqueous lubrication, structure and rheologicalproperties of whey protein microgel particles. Langmuir 2017, 33, 14699–14708. [CrossRef] [PubMed]
25. Khanji, A.N.; Michaux, F.; Salameh, D.; Rizk, T.; Banon, S.; Jasniewski, J. The study of curcumin interactionwith micellar casein and lactic acid bacteria cell envelope. LWT 2018, 91, 293–302. [CrossRef]
26. Gastaldi, E.; Lagaude, A. Micellar Transition State in Casein Between pH 5.5 and 5.0. J. Food Sci. 1996, 61,59–64. [CrossRef]
27. Ozcan-Yilsay, T.; Lee, W.J.; Horne, D.; Lucey, J.A. Effect of trisodium citrate on rheological and physicalproperties and microstructure of yogurt. J. Dairy Sci. 2007, 90, 1644–1652. [CrossRef] [PubMed]
28. Kruif, C.G.D.; Anema, S.G.; Zhu, C.; Havea, P.; Coker, C. Water holding capacity and swelling of caseinhydrogels. Food Hydrocoll. 2015, 44, 372–379. [CrossRef]
29. Zouari, A.; Marchesseau, S.; Chevalier-Lucia, D.; Raffard, G.; Ayadi, M.A.; Picart-Palmade, L. Acid gelationof raw and reconstituted spray-dried dromedary milk: A dynamic approach of gel structuring. Int. Dairy J.
2018, 81, 95–103. [CrossRef]30. Pang, Z.; Deeth, H.; Sharma, R.; Bansal, N. Effect of addition of gelatin on the rheological and microstructural
properties of acid milk protein gels. Food Hydrocoll. 2015, 43, 340–351. [CrossRef]31. Lee, C.H.; Rha, C. Microstructure of soybean protein aggregates and its relation to the physical and textural
properties of the curd. J. Food Sci. 2010, 43, 79–84. [CrossRef]32. Nieuwland, M.; Bouwman, W.G.; Bennink, M.L.; Silletti, E.; de Jongh, H.H. Characterizing length scales that
determine the mechanical behavior of gels from crosslinked casein micelles. Food Biophys. 2015, 10, 416–427.[CrossRef]
33. Serra, M.; Trujillo, A.J.; Jaramillo, P.D.; Guamis, B.; Ferragut, V. Ultra-high pressure homogenization-inducedchanges in skim milk: Impact on acid coagulation properties. J. Dairy Res. 2008, 75, 69–75. [CrossRef][PubMed]
34. Franzoi, M.; Niero, G.; Penasa, M.; Cassandro, M.; De Marchi, M. Technical note: Development and validationof a new method for the quantification of soluble and micellar calcium, magnesium, and potassium in milk.J. Dairy Sci. 2018, 101, 1883–1888. [CrossRef] [PubMed]
35. Dumpler, J.; Kieferle, I.; Wohlschläger, H.; Kulozik, U. Milk ultrafiltrate analysis by ion chromatography andcalcium activity for SMUF preparation for different scientific purposes and prediction of its supersaturation.Int. Dairy J. 2017, 68, 60–69. [CrossRef]
36. Jenness, R. Preparation and properties of a salt solution which simulated milk ultrafiltrate. Neth. Milk Dairy J.
1962, 16, 153–164.
231
Molecules 2018, 23, 1632
37. Zang, J.; Chen, H.; Zhao, G.; Wang, F.; Ren, F. Ferritin cage for encapsulation and delivery of bioactivenutrients: From structure, property to applications. Crit. Rev. Food Sci. Nutr. 2017, 57, 3673–3683. [CrossRef][PubMed]
38. Wang, P.; Liu, H.; Wen, P.; Zhang, H.; Guo, H.; Ren, F. The composition, size and hydration of yak caseinmicelles. Int. Dairy J. 2013, 31, 107–110. [CrossRef]
39. Wang, P.; Jin, S.; Guo, H.; Zhao, L.; Ren, F. The pressure-induced, lactose-dependent changes in thecomposition and size of casein micelles. Food Chem. 2015, 173, 468–474. [CrossRef] [PubMed]
40. Chua, D.; Deeth, H.C.; Oh, H.E.; Bansal, N. Altering the casein to whey protein ratio to enhance structuralcharacteristics and release of major yoghurt volatile aroma compounds of non-fat stirred yoghurts.Int. Dairy J. 2017, 74, 63–73. [CrossRef]
41. Harbourne, N.; Jacquier, J.C.; O’Riordan, D. Effects of addition of phenolic compounds on the acid gelationof milk. Int. Dairy J. 2011, 21, 185–191. [CrossRef]
42. Lucey, J.A.; Teo, C.T.; Munro, P.A.; Singh, H. Rheological properties at small (dynamic) and large (yield)deformations of acid gels made from heated milk. J. Dairy Res. 1997, 64, 591–600. [CrossRef]
43. Mahomud, M.S.; Katsuno, N.; Zhang, L.; Nishizu, T. Physical, rheological, and microstructural properties ofwhey protein enriched yogurt influenced by heating the milk at different pH values. J. Food Process. Preserv.
2017, 41, e13236. [CrossRef]44. Kim, Y.J.; Uyama, H. Biocompatible hydrogel formation of gelatin from cold water fish via enzymatic
networking. Polym. J. 2007, 39, 1040–1046. [CrossRef]45. Zhao, J.; Chen, Z.; Zou, R.; Zhang, X. The application of agar oligosaccharides in directly acidified milk
drinks. Food Hydrocoll. 2017. [CrossRef]
Sample Availability: Samples of the compounds mTGase and micellar casein powder are available/not availablefrom the authors.
© 2018 by the authors. Licensee MDPI, Basel, Switzerland. This article is an open accessarticle distributed under the terms and conditions of the Creative Commons Attribution(CC BY) license (http://creativecommons.org/licenses/by/4.0/).
232
molecules
Article
Comparative Reduction of Egg Yolk CholesterolUsing Anionic Chelating Agents
Minerva Bautista Villarreal 1 , Claudia T. Gallardo Rivera 1 , Eristeo García Márquez 2 ,
José Rodríguez Rodríguez 3 , María Adriana Núñez González 1 , Abelardo Chávez Montes 4
and Juan G. Báez González 1,*
1 Departamento de Alimentos, Facultad de Ciencias Biológicas, Universidad Autónoma de Nuevo León,Av. Pedro de Alba s/n, Cd. Universitaria, C.P. 66455 San Nicolás de los Garza, Mexico;[email protected] (M.B.V.); [email protected] (C.T.G.R.);[email protected] (M.A.N.G.)
2 Centro de Investigación y Asistencia en Tecnología y Diseño del Estado de Jalisco, A.C. Unidad Noreste,Parque PIIT, vía de la innovación 404, C.P. 66600 Apodaca, Mexico; [email protected]
3 Instituto Tecnológico de Estudios Superiores de Monterrey (ITESM), Escuela de Ingeniería y Ciencias,Av. Eugenio Garza Sada 2501 Sur, Col. Tecnológico, C.P. 64849 Monterrey, Mexico; [email protected]
4 Departamento de Química, Facultad de Ciencias Biológicas, Universidad Autónoma de Nuevo León,Av. Pedro de Alba s/n, Cd. Universitaria, C.P. 66455 San Nicolás de los Garza, Mexico;[email protected]
* Correspondence: [email protected]; Tel.: +011-52-81-83-29-4000 (ext. 3654)
Academic Editors: Lillian Barros and Isabel C.F.R. FerreiraReceived: 1 November 2018; Accepted: 2 December 2018; Published: 5 December 2018
Abstract: Egg yolk is used as an emulsifying agent. Nevertheless, its high concentration of cholesterolis linked to chronic degenerative diseases that cause cardiovascular disease. In this study, threemethods for reducing the level of cholesterol in egg yolks were studied. The first method consisted ofphysical separation of the granules contained in the yolk (NaG). The second method applied was theuse of anionic chelating biopolymers, such as arabic gum solution (AG) and mesquite gum solution(MG), and the third method was extraction with a solvent (SA). For this purpose, the cholesterolpresent in egg yolks, the microstructure, particle size, zeta potential, and its emulsifying capacitywere determined. The amount of cholesterol removed was 97.24% using 1% mesquite gum (MG1%),and 93.26% using 1% Arabic gum (AG1%). The zeta potential was determined, and the isoelectricpoint (ζ = 0) of egg yolk was identified as pH 4.6. While, at this pH, the zeta potential of mesquitegum was −14.8 mV, the zeta potential for the arabic gum was −16 mV. The emulsifying capacity ofMG1% was 62.95%, while the emulsifying capacity of AG1% was 63.57%. The complex obtained canbe used in the development of functional foods reduced in cholesterol.
Keywords: egg yolk; cholesterol extraction; granules extraction; anionic chelating biopolymers
1. Introduction
Egg yolk is a good source of lutein, zeaxanthin, proteins, lipids, and vitamins in human nutritionand is made up of practically 50% solids. The major constituents of the solid matter are lipids (65–70%on dry basis) and proteins (30% on dry basis). The proteins present are livetins, lipoproteins [1],and some particles including high-density lipoproteins (HDLs), low-density lipoproteins (LDLs),and phosvitin [2,3].
Egg yolk is an efficient ingredient in many food products, and its functional properties includeemulsifying, coagulating, foaming, and gelling properties [4]. Moreover, it contains proteins, vitamins,minerals, essential fatty acids, phospholipids, and other compounds. However, it has high cholesterol
233
Molecules 2018, 23, 3204
content; one simple egg contains between 200 mg and 300 mg of cholesterol/100 g; therefore, it almostmeets the dietary intake limit set by the American Heart Association of <300 mg/day [3,5]. Consumingproducts with a high amount of cholesterol can result in cardiovascular disease. Clinical studiesdemonstrate that dietary cholesterol may increase serum LDL in certain individuals (hyper-responders).This is generally accompanied by an increase in HDLs [6]. Sichittiano et al. [7] undertook a review ofnutraceuticals and functional food ingredients that are beneficial to vascular health. Grape seeds canreduce blood lipid levels, since it includes proanthocyanidins (polyphenols), which seem to play themain role in this process. Proanthocyanidins reduce the levels of triacylglycerol in chylomicrons andin very-low-density lipoproteins (VLDLs) [8]. Other functional ingredients are anthocyanins, whichact on LDLs and HDLs. The influence on the lipid profile of anthocyanin supplements obtained fromberries was evaluated in dyslipidemic patients. A decrease in LDLs was observed in patients after12 weeks of treatment [9]. Mesquite gum has some phenolic compounds that are trapped in the gummatrix, and these substances are involved in the defense of the plant; in addition, the polymerizationof these compounds produces polyphenols, resulting in brown or yellow gum [10].
Several researchers worked on different ways of decreasing the amount of cholesterol present inegg yolks. Warren et al. [11] used solvents such as hexane. Hexane forms a blend with egg yolk solids,but it requires a process of filtering to remove the solvent and a prolonged drying period. The yieldreported was 62.2% cholesterol. Borges et al. [12] used a ratio of 1:12 w/w (yolk/acetone), and theemulsifying properties were maintained.
Paraskevopoulou et al. [13] extracted cholesterol from egg yolk with ethanol/water 20:80 (v/v),and 1.5% (w/v) polysorbate 80; after that, the dispersion was then centrifuged, and the yolk precipitatehad 7.1 ± 0.3 mg of cholesterol. Laca et al. [14] worked on the extraction of egg yolk granules.In this process, egg yolk was mixed with water (1:15 v/v), the pH was adjusted to 7, and it waskept overnight at 4 ◦C; the granules had a concentration of 291 mg of cholesterol/100 g of egg yolk,equivalent to a reduction of 77% cholesterol. Another method involved the reduction of cholesterolusing β-cyclodextrin (β-CD) due to its affinity for non-polar molecules such as cholesterol [15].Jeong et al. [16] reported that cholesterol removal was 92.76% when using 25% crosslinked β-CDat 40 ◦C. Chiu et al. [17] used the immobilization of β-cyclodextrin in chitosan beads (Ch-BCD) bycross-linking with 1,6 hexamethylene diisocyanate (HMDI) reagent for cholesterol absorption fromegg yolk, removing 92% of the cholesterol. That cholesterol was removed using 1% w/v Ch-BCD for 2h at a proportion 1:30 yolk to water, and a mixture of β-cyclodextrins with chitosan. Garcia et al. [18]used high-methoxyl pectin at a concentration of 3% w/w, ionic strength 0.39 M, and pH equal to 9.2,and subsequently obtained a reduction of 88.6% cholesterol. Hsieh et al. [19] developed a complexof egg yolk and acacia gum applying the following concentrations: 1%, 3%, 5%, and 10% (w/w) withcholesterol extraction rates of 70%, 86%, 79%, and 59%, respectively.
Meanwhile, anionic biopolymers, such as gum ghatti, gum tragacanth, gum karaya, xanthan gum,and especially, Arabic gum (AG), are chelating agents, forming complexes with lipoproteins in theyolk. Lipoprotein molecules are positively charged, and anionic polysaccharides are used as chelatingagents, controlling pH and temperature [20].
The methods mentioned above for removing cholesterol are complicated because solvents are used,thus prolonging the extraction time. It was shown that the use of biopolymers, including commercialarabic gum, decreases the concentration of cholesterol present in the egg yolk. However, the shortageof arabic gum, due to drought in the regions where it is produced, stimulated the search for otherbotanical sources that offer greater security of supply and costs [21]. Therefore, the use of mesquitegum as an alternative to arabic gum is proposed in this study. Mesquite gum (MG) has an ability tostabilize colloidal particles (1–100 µm), which it disperses or emulsifies. This property is manifesteddue to protein arabinogalactans, which allow adsorption in liquid–liquid interfaces [22,23]. The aimof this work was to reduce the amount of cholesterol present in egg yolk by preparing a complex ofbiopolymer mesquite gum–yolk and arabic gum–yolk, before comparing the results with cholesterolextraction using a solvent, and with physical separation of the granule using sodium chloride.
234
Molecules 2018, 23, 3204
2. Materials and Methods
2.1. Materials
Eggs were purchased from the local market (commercial brand name “El Dorado”; a boxcontaining 30 white eggs, expiration date 9 April 2018, batch 043501). Salt, sugar, and vinegar werepurchased at the supermarket. The separation of the yolk from albumen was undertaken manually.The vitelline membrane was then cut with a scalpel blade, and the content of the yolk was collected ina glass vessel. The yolk was then mixed gently with a glass rod. The solution was maintained at 4 ◦Cin refrigeration (pH 7). The arabic gum and mesquite gum were purchased from Natural Products ofMexico (Yautepec, Morelos, México), and the gum was purified according to the method of Vernon etal. [23]. Sodium chloride, acetone, ethanol, and hexane reagent-grade chemicals were purchased fromDesarrollo de Especialidades Químicas (Monterrey, Nuevo León, México); the cholesterol standardwas obtained from Sigma-Aldrich Chemical (Toluca, México). Deionized water was used in allthe experiments.
2.2. Cholesterol Reduction in Egg Yolk
The egg yolk was treated with physical separation, polysaccharides (arabic gum and mesquitegum), and a solvent for reducing the cholesterol content. The first process was the physicalseparation of the granules contained in the yolk (NaG) using aqueous salt solution and separationthrough centrifugation. Another process was the separation of cholesterol using complexation withbiopolymers, arabic gum (AG) and mesquite gum (MG). In the third method, acetone extraction (SA)was used.
2.2.1. Egg Yolk Granule Extraction (NaG)
The cholesterol was removed using the method of Laca et al. [14], with a few modifications; 8.5 gof egg yolk and 11.4 g of 0.15 M NaCl solution (1:1.34) was mixed with a vortex for 1 min at 25 ◦C.The content was centrifuged (Hermle Labnet Z326, Labnet International, Inc., Wehingen, Germany)at 10,000× g for 45 min at 25 ◦C. Finally, the compounds were separated carefully from the aqueousfraction through decantation. The product obtained was lyophilized, and was stored at −20 ◦C untilanalysis with GC.
2.2.2. Anionic Polysaccharide/Egg Yolk Complexes
Complex formation was obtained based on the methodology reported by Hsieh et al. [19]. Stocksolutions of arabic gum were prepared at 1% (AG1%), 3% (AG3%), and 10% (AG10%), in addition to1% (MG1%), 3% (MG3%), and 10% (MG10%) mesquite gum. All solutions were maintained in constantagitation all night long. All concentrations are given in ratios of weight/weight (w/w).
Firstly, 3 g of egg yolk was mixed with 1 g of gum solution (at the concentrations mentioned above)and 4 g of water. The solution was mixed for 1 min in a vortex (Mixer Labnet International, Edison, NJ,USA); it was then centrifuged (Hermle Labnet Z326, Labnet International, Inc., Wehingen, Germany) at6000× g for 15 min at 25 ◦C. After that, the supernatant was decanted, and then aggregated with 0.5 gof solution (0.9 M NaCl); this was mixed for 1 min in the vortex. Then, 6 g of ethanol was poured andmixed in the vortex for 1 min at 25 ◦C, and centrifuged at 6000× g for 15 min. After that, the solutionwas decanted; 6 g of ethanol was added to the lipoprotein/anionic biopolymer complexes, and thesolution was mixed, before being carefully decanted. The precipitate complex was quantified [19].Samples were lyophilized and stored at −20 ◦C until analysis with GC.
2.2.3. Solvent Extraction
Extraction of cholesterol with a solvent (SA) was performed using the method described byBorges et al. [12] using a ratio (w/w) of 1:12 (yolk/acetone), and mixing at 100 rpm for 2 min in the
235
Molecules 2018, 23, 3204
stirrer (EURO-ST 60 D S001, IKA, Wilmington, NC, USA). This permitted the separation of the sampleafter 10 min, and the solvent of the precipitate was carefully decanted. Finally, the precipitate waswashed with water. The samples were lyophilized and stored at −20 ◦C until analysis with GC.
2.3. Quantification of Cholesterol Using Gas Chromatography
Method 26.052 of the Association of Official Agricultural Chemists (AOAC) [24] was used. Forthe acid hydrolysis, 0.2 g of the sample was mixed with 2 mL of methanol, and 7% H2SO4 (v/v). Next,the sample was heated for 90 min at 80 ◦C; after that, the sample was cooled at 25 ◦C. Then, 3 mLof hexane was added and mixed for 1 min in the vortex (Mixer Labnet International, Inc., Edison,NJ, USA). The solution was kept for 15 min until the formation of two phases was completed; theprocess was performed twice. The supernatant recovered was mixed and diluted into a 10-mL flaskwith hexane. Subsequently, the solution was analyzed with GC (7890B, Agilent Technologies, SantaClara, CA, USA), coupled to a mass spectrometer (5977A, Agilent Technologies, Santa Clara, CA, USA),and equipped with an HP-5MS capillary column (length: 30 m; inner diameter (ID): 0.25 mm; filmthickness: 0.25 µm). The injected sample was 1 µL on split mode. The chromatographic conditions wereas follows: column temperature 70 ◦C, kept for 1 min; increased to 200 ◦C at 10 ◦C/min, maintainedfor 2 min; increased to 300 ◦C at 10 ◦C/min, maintained for 7 min. The temperature of the injector was250 ◦C, and the temperatures of the ion source and quadruple were 230 ◦C and 150 ◦C, respectively.The carrier gas helium flow rate was 1 mL/min. The ionization with electron impact was 70 eV and thescan acquisition mode had a range of 30 to 400 UMA. The calibration curve was done with a cholesterolstandard of 20 to 120 ppm.
2.4. Particle Size Measurement
The particle size distribution of the samples (AG1%, AG3%, AG10%, MG1%, MG3%, MG10%, SA,and NaG), and the yolk were monitored using a Malvern Mastersizer 3000 (Malvern Instruments,Ltd, Worcestershire, UK) particle size analyzer with a unit of Hydro LV with water as a dispersant.The angular scattering intensity data were analyzed to calculate the size of the particles, creating ascattering pattern using the Mie theory of light scattering. The software calculated the particle sizedistribution (D(3,2)). Optical properties of the sample were defined as a refractive index 1.460 and anabsorption of 0.1.
2.5. Zeta Potential (ζ)
The zeta potential was determined using dynamic light scattering equipment Zetasizer NanoZS90 (Malvern Instruments, Worcestershire, England, UK). The measurements were carried outusing a universal dip cell (ZEN 1002, Malvern Instrument, Worcestershire, UK) at 25 ◦C, using thediluted solutions. The zeta potential is related to the velocity of the solutions in an electric field. Theequipment software converts the electrophoretic mobility measurements into zeta potential valuesusing the Smoluchowski model [25]. The zeta potential of egg yolk/polysaccharide solutions atdifferent pH levels was measured with the method of Navidghasemizad et al. [26]. About 0.1 g ofsample was diluted to a final volume of 20 mL using distilled water, and the pH was adjusted to valuesof 2.0, 3.0, 4.0, 5.0, 6.0, 7.0, 8.0, 9.0, and 10.0 using 0.1 M HCl or 0.1 M NaOH solution while stirring thesamples. Both complexes, yolk/AG and yolk/MG, were monitored for the zeta potential. The zetapotential was calculated from the average of three measurements of the diluted solutions.
2.6. Emulsifying Capacity
Samples were prepared individually, and 10 g of sample was mixed (NaG, SA, AG1%, and MG1%,
samples with high yield) with salt (1.59%), sugar (1.06%), and water (11%), separately. Then, the vinegar(3.17%) was added and kept under constant stirring at 300 rpm in the stirrer (IKA Eurostar 60 digital)for 10 min. The test ended when it was not possible to integrate more oil contained in the burette (Voil),
236
Molecules 2018, 23, 3204
and a layer was observed on the surface of the emulsion (VEmulsion) [27]. The values were estimated aspercentage of emulsified oil (%EC) in total emulsion using Equation (1).
%EC =Voil
VEmulsion× 100 (1)
2.7. Microstructure Analysis
The topology was analyzed employing scanning electron microscopy (SEM) obtained withthe methodology reported by Valverde et al. [28]. Briefly, the samples were fixed overnight in 3%glutaraldehyde in 25 mM phosphate buffer (pH 3.25). After that, the samples were consecutivelydehydrated with 20%, 40%, 60%, 80%, and 100% ethanol. Then, the ethanol was consecutively removedwith 20%, 40%, 60%, 80%, and 100% acetone, and the samples were analyzed. Finally, they were driedat a pressure of 1 × 10⁻² Torr (soft vacuum) in a vacuum desiccator. The dried sample was placedon aluminum SEM stubs and coated with gold/palladium. The microscope used was a JSM-6490LV(JEOL, Tokyo, Japan).
2.8. Color Analysis
The granules were measured for color in the lightness L*, redness (a*), and yellowness (b*)system. Measurements were carried out using a ColorFlex EZ (Hunter Lab, Reston, VA, USA). A fixedamount of sample was poured into the measurement cell, and analyses were conducted in specularexclusion mode.
The color changes are expressed as ∆E with the color of the egg yolk as a reference sample [29];hence, ∆E is the total color change due to the different contributions calculated using Equation (2).
∆E =
√
(∆L∗)2 + (∆a∗)2 + (∆b∗)2 (2)
2.9. Statistical Analysis
All tmeasurements were performed in triplicate, and ANOVA was performed with a confidencelevel of 95% (p < 0.05) using SPSS 20 software (IBM, SPSS Inc, Chicago, IL, USA). To determinethe statistically significant difference between values, a one-way variance analysis and a Tukey testwere performed.
3. Results and Discussion
3.1. Cholesterol Removal in Egg Yolk
The process of extracting egg yolk granules, and chelating with arabic gum and mesquite gumwas used as an alternative to preparing yolk with a high concentration of protein and low cholesterolas a functional ingredient in the food industry, especially due to its functional attributes, such asfoaming capacity, high level of phosvitin and high-density lipoprotein, and emulsifying and bindingproperties [28,30]. Notwithstanding the process, other properties, such as the emulsifying of oil,are reduced. In order of importance, the removal of cholesterol from lower to highest was NaG < SA <AG < MG. The cholesterol removed from the egg yolk with NaG (Table 1) was the least effective method(51.43%). It was previously reported that the NaG method with ionic solvent removed cholesterol andincreased the protein content. The method is relatively fast and inexpensive. The results obtained inthe laboratory were compared with those obtained by Strixner and Kulozik [31]. Based on our data,the removal of cholesterol with solvent was the second best method for cholesterol removal (64.15%).However, Martucci and Borges [32] reported a six-stage extraction system of 92% cholesterol removalin a computer simulation study.
237
Molecules 2018, 23, 3204
Table 1. Cholesterol removal, efficiency, and emulsifying capacity of the different methods.
Method% CholesterolReduction (pH 7)
% CholesterolReduction (pH 3)
% Efficiency(pH 7)
% Efficiency(pH 3)
EmulsifyingCapacity (% w/w)
NaG 51.43 ± 1.86 e − 15.48 ± 1.31 d − 79.52 ± 2.01 b
AG1% 93.26 ± 0.55 ab 74.74 ± 1.10 ab 29.72 ± 0.29 c 3.72 ± 0.67 d 63.57 ± 1.43 d
AG3% 83.85 ± 3.80 c 56.34 ± 0.57 b 44.17 ± 3.35 ab 4.38 ± 0.44 d −
AG10% 89.93±2.31 b 86.33 ± 1.45 a 37.37 ± 1.88 b 16.42 ± 0.84 bc −
MG1% 97.24 ± 1.81 a 87.75 ± 1.25 a 13.50 ± 0.5 de 12.14 ± 0.41 c 62.95 ± 0.84 d
MG3% 96.68±1.01 a 92.55 ± 1.20 a 14.85 ± 1.06 de 19 ± 2.14 b −
MG10% 96.60 ± 2.04 a 80.31 ± 2.30 a 11.17 ± 0.72 e 46.54 ± 3.38 a −
SA 64.15 ± 1.29 d − 44.51 ± 0.7 a − 72.33 ± 1.02 c
Egg yolk - − − − 85.06 ± 0.051 a
Note: Differing letters within a column are significantly different (p < 0.05) ± standard deviation (n = 3).NaG—physical separation of granules; AG—arabic gum; MG—mesquite gum; SA—solvent extraction.
The removal of cholesterol using acetone in the laboratory was lower than the 81%, as reportedby Borges et al. [12]. The removal of cholesterol was lower due to the concentration of water in thefresh yolk, the extraction time, and the acetone ratio. It was reported that the use of non-polar organicsolvents prevents protein denaturation, especially in emulsifying activity, which is related to thesolubility of the protein. Meanwhile, polar organic solvents reduce the emulsifying activity becausethey break the hydrophobic interactions between lipids and proteins. Even so, the use of solvents isnot completely accepted due to the residues that may remain in the product [33].
The use of arabic gum allowed cholesterol removal between 83.85% and 93.26% (Table 1). Theconcentrations AG3% and AG10% show significant differences (p < 0.05). The removal of cholesterolwas greater when 1% arabic gum was used. Meanwhile, when 3% and 10% arabic gum was used,the cholesterol removal was almost 83.85% and 89.93%, respectively, despite the fact that pH valueswere similar to neutral. The structure of arabic gum is a branched heteropolysaccharide with anionicproperties. The quantity of arabic gum–yolk depends on the polyanionic properties of the gum,especially of residues of D-glucuronic acid (~2%) and D-glucuronic acid (~21%) [2,34]. The arabic gumhas properties of anionic polysaccharides, which may be used as chelating agents, forming insolubleelectrostatic complexes (chelating agent/lipoprotein) [18]. Navidghsemizad et al. [35] used a ratio of50 g of fresh yolk per gram of arabic gum to observe the separation of phases at different pH levels.They concluded that the nature of the polysaccharide and pH had important effects, resulting in thephase separation behavior.
Other anionic polysaccharides were used as chelating agents [19]; however, their low solubilityand high viscosity reduce their practical applications. Mesquite gum is a polysaccharide whichcontains acidic residues of β-D-glucuronic and 4-O-methyl-β-D-glucuronic, bound to mono-sugarsor oligosaccharide chains [36,37]. The removal of high cholesterol levels when the mesquite gumsolution was used was 1% w/w (p < 0.05). From mesquite gum MG1%, MG3%, and MG10%, extractionsof cholesterol of 97.24%, 96.68%, and 96.60%, respectively, were obtained. No significant differenceswere observed in the different concentrations where mesquite gum was used.
In light of our results, it can be stated that sodium chloride or acetone have a lower capacity toremove cholesterol compared to both anionic polysaccharides. The greater efficiency in cholesterolremoval was obtained with mesquite gum at 25 ◦C. Nonetheless, obtaining complexes from mesquitegum–yolk allowed a high removal of bound cholesterol. We think that the complex obtained can beused as functional supplement, necessary for reducing the unwanted effects of cholesterol. Scicchitanoet al. [7] mentioned the importance of reducing lipid levels, especially for coronary artery disease.
3.2. Particle Size Measurement
In natural conditions, the yolk is a supramolecular assembly of lipids and proteins, and a highlyorganized system with approximate size between 0.8 µm and 10 µm [38]. The insoluble structureof yolk has a size range between 0.3 µm and 2 µm [14]. Molecular assembly can be disorganized
238
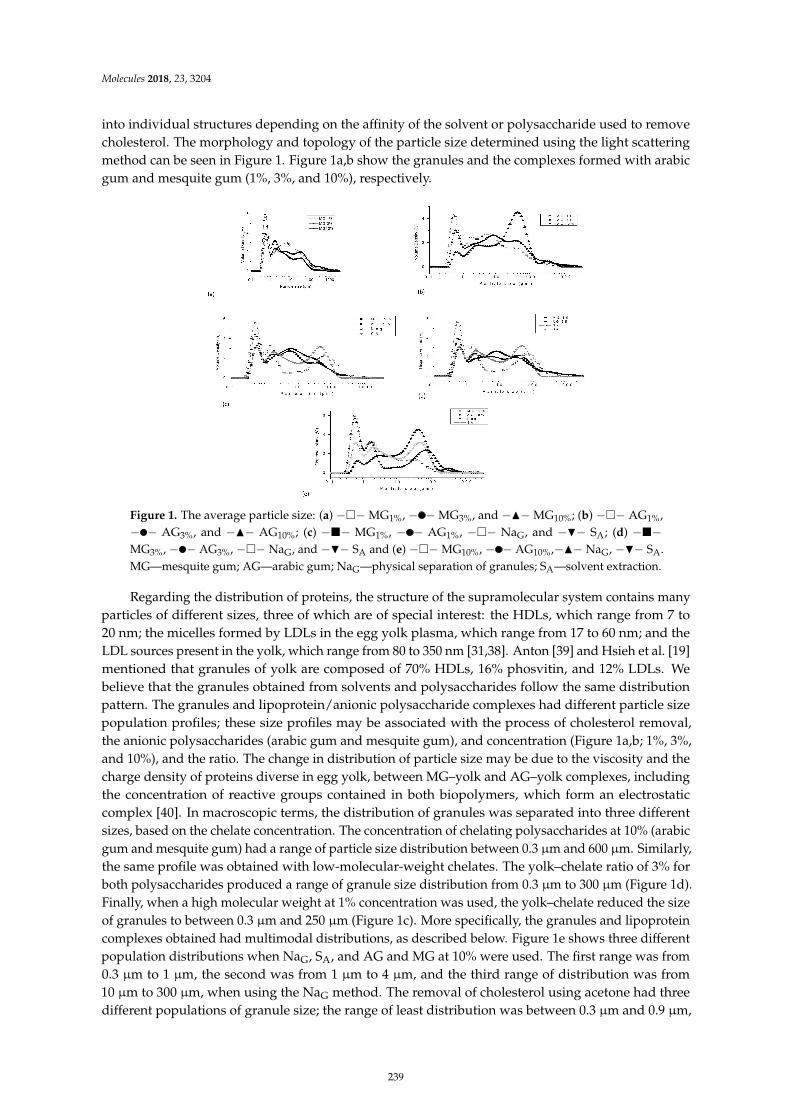
Molecules 2018, 23, 3204
into individual structures depending on the affinity of the solvent or polysaccharide used to removecholesterol. The morphology and topology of the particle size determined using the light scatteringmethod can be seen in Figure 1. Figure 1a,b show the granules and the complexes formed with arabicgum and mesquite gum (1%, 3%, and 10%), respectively.
−− −− −− −− −−−− − − −− −− −− − − −− −−−− −− −− −− −−
Figure 1. The average particle size: (a) −�− MG1%, − − MG3%, and −N− MG10%; (b) −�− AG1%,− − AG3%, and −N− AG10%; (c) −�− MG1%, − − AG1%, −�− NaG, and −H− SA; (d) −�−
MG3%, − − AG3%, −�− NaG, and −H− SA and (e) −�− MG10%, − − AG10%,−N− NaG, −H− SA.MG—mesquite gum; AG—arabic gum; NaG—physical separation of granules; SA—solvent extraction.
Regarding the distribution of proteins, the structure of the supramolecular system contains manyparticles of different sizes, three of which are of special interest: the HDLs, which range from 7 to20 nm; the micelles formed by LDLs in the egg yolk plasma, which range from 17 to 60 nm; and theLDL sources present in the yolk, which range from 80 to 350 nm [31,38]. Anton [39] and Hsieh et al. [19]mentioned that granules of yolk are composed of 70% HDLs, 16% phosvitin, and 12% LDLs. Webelieve that the granules obtained from solvents and polysaccharides follow the same distributionpattern. The granules and lipoprotein/anionic polysaccharide complexes had different particle sizepopulation profiles; these size profiles may be associated with the process of cholesterol removal,the anionic polysaccharides (arabic gum and mesquite gum), and concentration (Figure 1a,b; 1%, 3%,and 10%), and the ratio. The change in distribution of particle size may be due to the viscosity and thecharge density of proteins diverse in egg yolk, between MG–yolk and AG–yolk complexes, includingthe concentration of reactive groups contained in both biopolymers, which form an electrostaticcomplex [40]. In macroscopic terms, the distribution of granules was separated into three differentsizes, based on the chelate concentration. The concentration of chelating polysaccharides at 10% (arabicgum and mesquite gum) had a range of particle size distribution between 0.3 µm and 600 µm. Similarly,the same profile was obtained with low-molecular-weight chelates. The yolk–chelate ratio of 3% forboth polysaccharides produced a range of granule size distribution from 0.3 µm to 300 µm (Figure 1d).Finally, when a high molecular weight at 1% concentration was used, the yolk–chelate reduced the sizeof granules to between 0.3 µm and 250 µm (Figure 1c). More specifically, the granules and lipoproteincomplexes obtained had multimodal distributions, as described below. Figure 1e shows three differentpopulation distributions when NaG, SA, and AG and MG at 10% were used. The first range was from0.3 µm to 1 µm, the second was from 1 µm to 4 µm, and the third range of distribution was from10 µm to 300 µm, when using the NaG method. The removal of cholesterol using acetone had threedifferent populations of granule size; the range of least distribution was between 0.3 µm and 0.9 µm,
239
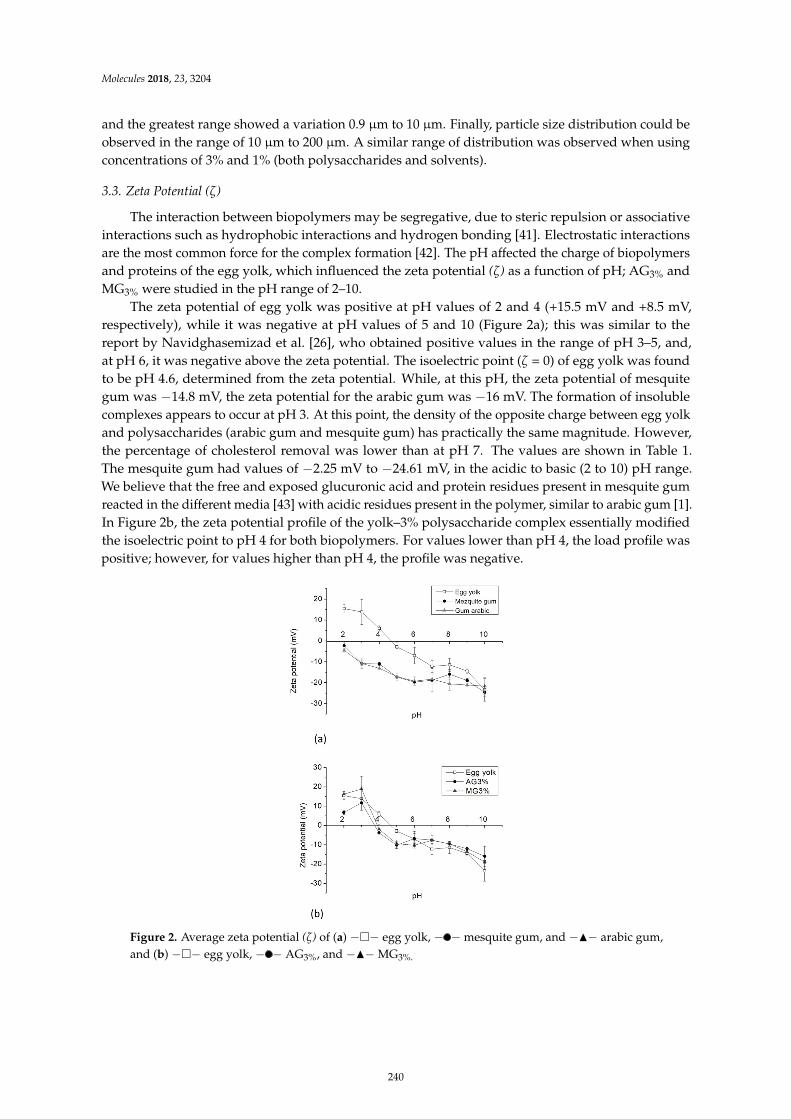
Molecules 2018, 23, 3204
and the greatest range showed a variation 0.9 µm to 10 µm. Finally, particle size distribution could beobserved in the range of 10 µm to 200 µm. A similar range of distribution was observed when usingconcentrations of 3% and 1% (both polysaccharides and solvents).
3.3. Zeta Potential (ζ)
The interaction between biopolymers may be segregative, due to steric repulsion or associativeinteractions such as hydrophobic interactions and hydrogen bonding [41]. Electrostatic interactionsare the most common force for the complex formation [42]. The pH affected the charge of biopolymersand proteins of the egg yolk, which influenced the zeta potential (ζ) as a function of pH; AG3% andMG3% were studied in the pH range of 2–10.
The zeta potential of egg yolk was positive at pH values of 2 and 4 (+15.5 mV and +8.5 mV,respectively), while it was negative at pH values of 5 and 10 (Figure 2a); this was similar to thereport by Navidghasemizad et al. [26], who obtained positive values in the range of pH 3–5, and,at pH 6, it was negative above the zeta potential. The isoelectric point (ζ = 0) of egg yolk was foundto be pH 4.6, determined from the zeta potential. While, at this pH, the zeta potential of mesquitegum was −14.8 mV, the zeta potential for the arabic gum was −16 mV. The formation of insolublecomplexes appears to occur at pH 3. At this point, the density of the opposite charge between egg yolkand polysaccharides (arabic gum and mesquite gum) has practically the same magnitude. However,the percentage of cholesterol removal was lower than at pH 7. The values are shown in Table 1.The mesquite gum had values of −2.25 mV to −24.61 mV, in the acidic to basic (2 to 10) pH range.We believe that the free and exposed glucuronic acid and protein residues present in mesquite gumreacted in the different media [43] with acidic residues present in the polymer, similar to arabic gum [1].In Figure 2b, the zeta potential profile of the yolk–3% polysaccharide complex essentially modifiedthe isoelectric point to pH 4 for both biopolymers. For values lower than pH 4, the load profile waspositive; however, for values higher than pH 4, the profile was negative.
ζ
ζ
ζ
− −
− −
Figure 2. Average zeta potential (ζ) of (a) −�− egg yolk, − − mesquite gum, and −N− arabic gum,and (b) −�− egg yolk, − − AG3%, and −N− MG3%.
240
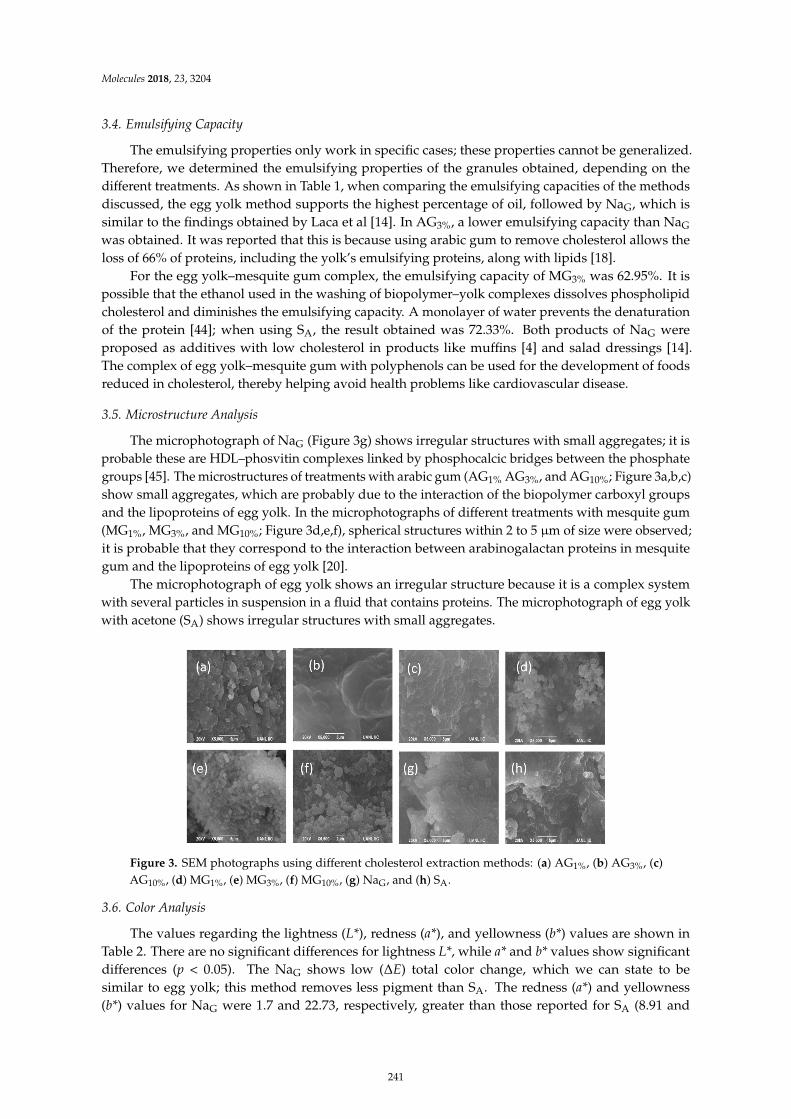
Molecules 2018, 23, 3204
3.4. Emulsifying Capacity
The emulsifying properties only work in specific cases; these properties cannot be generalized.Therefore, we determined the emulsifying properties of the granules obtained, depending on thedifferent treatments. As shown in Table 1, when comparing the emulsifying capacities of the methodsdiscussed, the egg yolk method supports the highest percentage of oil, followed by NaG, which issimilar to the findings obtained by Laca et al [14]. In AG3%, a lower emulsifying capacity than NaG
was obtained. It was reported that this is because using arabic gum to remove cholesterol allows theloss of 66% of proteins, including the yolk’s emulsifying proteins, along with lipids [18].
For the egg yolk–mesquite gum complex, the emulsifying capacity of MG3% was 62.95%. It ispossible that the ethanol used in the washing of biopolymer–yolk complexes dissolves phospholipidcholesterol and diminishes the emulsifying capacity. A monolayer of water prevents the denaturationof the protein [44]; when using SA, the result obtained was 72.33%. Both products of NaG wereproposed as additives with low cholesterol in products like muffins [4] and salad dressings [14].The complex of egg yolk–mesquite gum with polyphenols can be used for the development of foodsreduced in cholesterol, thereby helping avoid health problems like cardiovascular disease.
3.5. Microstructure Analysis
The microphotograph of NaG (Figure 3g) shows irregular structures with small aggregates; it isprobable these are HDL–phosvitin complexes linked by phosphocalcic bridges between the phosphategroups [45]. The microstructures of treatments with arabic gum (AG1% AG3%, and AG10%; Figure 3a,b,c)show small aggregates, which are probably due to the interaction of the biopolymer carboxyl groupsand the lipoproteins of egg yolk. In the microphotographs of different treatments with mesquite gum(MG1%, MG3%, and MG10%; Figure 3d,e,f), spherical structures within 2 to 5 µm of size were observed;it is probable that they correspond to the interaction between arabinogalactan proteins in mesquitegum and the lipoproteins of egg yolk [20].
The microphotograph of egg yolk shows an irregular structure because it is a complex systemwith several particles in suspension in a fluid that contains proteins. The microphotograph of egg yolkwith acetone (SA) shows irregular structures with small aggregates.
ζ −− −− −−−− −− −−
Δ
Figure 3. SEM photographs using different cholesterol extraction methods: (a) AG1%, (b) AG3%, (c)AG10%, (d) MG1%, (e) MG3%, (f) MG10%, (g) NaG, and (h) SA.
3.6. Color Analysis
The values regarding the lightness (L*), redness (a*), and yellowness (b*) values are shown inTable 2. There are no significant differences for lightness L*, while a* and b* values show significantdifferences (p < 0.05). The NaG shows low (∆E) total color change, which we can state to besimilar to egg yolk; this method removes less pigment than SA. The redness (a*) and yellowness(b*) values for NaG were 1.7 and 22.73, respectively, greater than those reported for SA (8.91 and
241
Molecules 2018, 23, 3204
49.65, respectively). The color of egg yolk is attributed to carotenoids (xanthophylls, including lutein,zeaxanthin, β-cryptoxanthin, and β-carotene) [46]. We suggest that, if a large amount of cholesterol isremoved, more carotenoids are also removed.
Table 2. Color measurements of different methods for cholesterol reduction.
Method L* a* b* ∆E
Egg yolk 56.48 ± 0.01 a 19.98 ± 0.01 e 53.57 ± 0.05 d −
AG1% 79.76 ± 0.09 d 4.7 ± 0.03 b 35.29 ± 0.23 b 33.32 ± 0.18 b
AG3% 75.13 ± 3.94 bc 6.73 ± 1.74 c 41.29 ± 5.04 c 26.03 ± 6.13 a
AG10% 73.41 ± 0.01 b 1.95 ± 0.00 a 21.58 ± 0.05 a 40.44 ± 0.08 c
MG1% 75.12 ± 0.01 bc 1.99 ± 0.01 a 18.63 ± 0.01 a 43.50 ± 0.05 c
MG3% 81.92 ± 0.02 d 1.43 ± 0.01 a 19.28 ± 0.03 a 46.56 ± 0.00 c
MG10% 78.73 ± 0.04 cd 4.64 ± 0.02 b 33.21 ± 0.08 b 33.84 ± 0.03 b
SA 82.47 ± 0.01 d 1.70 ± 0.01 a 22.73 ± 0.02 a 42.99 ± 2.20 c
NaG 79.55 ± 0.01 d 8.91 ± 0.01 d 49.65 ± 0.01 d 25.89 ± 0.01 a
Note: Letters varying within a column are significantly different (p < 0.05) ± standard deviation (n = 3). L*—lightness;a*—redness; b*—yellowness; ∆E—total color change.
4. Conclusions
Separation efficiency of complex lipoproteins (HDLs)–mesquite gum shows a strong dependenceon pH. The greatest cholesterol reduction was seen at pH 7.0. The amount of cholesterol removedwas 97.24% using 1% mesquite gum (MG1%), and 93.26% using 1% arabic gum (AG1%). This is aconsequence of the chemical composition in the chelate (mesquite gum or arabic gum) and yolk. Theuse of mesquite gum shows structural changes in the form of definite spheres with a low size incomparison with arabic gum, observed using SEM. The high removal of cholesterol contained in theegg yolk using mesquite gum or arabic gum reduced the primary emulsifying capacity of the egg yolk.The use of mesquite gum to remove cholesterol is an alternative method that does not require organicsolvents. The use of 3% mesquite gum removed 12.83% more cholesterol than the same concentrationof arabic gum. The complex obtained can be used in the development of functional foods reducedin cholesterol.
Author Contributions: M.B.V., J.G.B.G., and E.G.M. designed and led the research, and wrote the paper. M.A.N.G.collaborated in the experimental phase of research. J.R.R. collaborated in the experimental phase of research.A.C.M. collaborated in the experimental phase of research. C.T.G.R. collaborated in the experimental phaseof research.
Funding: The authors would like to thank the “Consejo Nacional de Ciencia y Tecnología” (CONACyT) ofMexico for partial financing of this project through grant #277814, as well as through the grant Problemasnacionales-2015-01-1470 and the grant CONACyT CB-157511.
Conflicts of Interest: The authors declare no conflicts of interest.
References
1. Sarika, P.; Pavithran, A.; James, N.R. Cationized gelatin/gum arabic polyelectrolyte complex: Study ofelectrostatic interactions. Food Hydrocolloids 2015, 49, 176–182. [CrossRef]
2. Islam, A.; Phillips, G.; Sljivo, A.; Snowden, M.; Williams, P. A review of recent developments on the regulatory,structural and functional aspects of gum arabic. Food Hydrocolloids 1997, 11, 493–505. [CrossRef]
3. Miranda, J.M.; Anton, X.; Valbuena, C.R.; Saavedra, P.R.; Rodríguez, J.A.; Lamas, A.; Franco, C.M.; Cepeda, A.Egg and egg-derived foods: Effects on human health and use as functional foods. Nutrients 2015, 7, 706–729.[CrossRef]
4. Marcet, I.; Collado, S.; Paredes, B.; Díaz, M. Rheological and textural properties in a bakery product as afunction of the proportions of the egg yolk fractions: Discussion and modelling. Food Hydrocolloids 2015, 54,119–129. [CrossRef]
242
Molecules 2018, 23, 3204
5. Sun, Y.; Yang, H.; Zhong, X.; Zhang, L.; Wang, W. Ultrasonic-assisted enzymatic degradation of cholesterolin egg yolk. Innovative Food Sci. Emerg. Technol. 2011, 12, 505–508. [CrossRef]
6. Lordan, R.; Tsoupras, A.; Mitra, B.; Zabetakis, I. Dairy fats and cardiovascular disease: Do we really need tobe concerned? Foods 2018, 7, 29. [CrossRef]
7. Scicchitano, P.; Cameli, M.; Maiello, M.; Modesti, P.A.; Muiesan, M.L.; Novo, S.; Palmiero, P.; Saba, P.S.;Pedrinelli, R.; Ciccone, M.M. Nutraceuticals and dyslipidaemia: Beyond the common therapeutics.J. Funct. Foods 2014, 6, 11–32. [CrossRef]
8. Quesada, H.; Díaz, S.; Pajuelo, D.; Fernández, A.; Garcia, S.; Pujadas, G.; Salvadó, M.J.; Arola, L.; Bladé, C.The lipid-lowering effect of dietary proanthocyanidins in rats involves both chylomicron-rich and VLDL-richfractions. Br. J. Nutr. 2012, 108, 208–217. [CrossRef]
9. Qin, Y.; Xia, M.; Ma, J.; Hao, Y.; Liu, J.; Mou, H.; Cao, L.; Ling, W. Anthocyanin supplementation improvesserum LDL- and HDL-cholesterol concentrations associated with the inhibition of cholesteryl ester transferprotein in dyslipidemic subjects. Am. J. Clin. Nutr. 2009, 90, 485–492. [CrossRef]
10. Trejo, J.L. Establecimiento de un cultivo de células en suspensión de Prosopis laevigata (Humb. & Bonpl.ex Willd.) M. C. Johnst. para la producción de goma de mezquite. Ph.D. Thesis; Universidad AutónomaMetropolitana, Unidad Iztapalapa: Cd. de México, México, December 2010.
11. Warren, M.; Brown, H.; Davis, D. Solvent extraction of lipid components from egg yolk solids. J. Am. Oil
Chem. Soc. 1988, 65, 1136–1139. [CrossRef]12. Borges, S.; Martucci, E.; Müller, C. Optimization of the extraction of cholesterol from dehydrated egg yolk
using acetone. LWT-Food Sci. Technol. 1996, 29, 687–690. [CrossRef]13. Paraskevopoulou, A.; Kiosseoglou, V. Texture profile analysis of heat-formed gels and cakes prepared with
low cholesterol egg yolk concentrates. J. Food Sci. 1997, 62, 208–211. [CrossRef]14. Laca, A.; Sáenz, M.; Paredes, B.; Díaz, M. Rheological properties, stability and sensory evaluation of
low-cholesterol mayonnaises prepared using egg yolk granules as emulsifying agent. J. Food Eng. 2010, 97,243–252. [CrossRef]
15. Alonso, L.; Fox, P.; Calvo, M.V.; Fontecha, J. Effect of beta cyclodextrin on the reduction of cholesterol inewe´s milk manchego cheese. Molecules 2018, 23, 1789. [CrossRef] [PubMed]
16. Jeong, H.; Sun, H.; Chogsom, C.; Kwak, H. Cholesterol removal from whole egg by crosslinked β-cyclodextrin.Asian-Australasian J. Anim. Sci. 2014, 27, 537–542. [CrossRef] [PubMed]
17. Chiu, S.H.; Chung, T.W.; Giridhar, R.; Wu, W.T. Immobilization of β-cyclodextrin in chitosan beads forseparation of cholesterol from egg yolk. Food Res. Inter. 2004, 37, 217–223. [CrossRef]
18. García, E.E.; Reis, J.S.; Minim, L.A.; Freitas, J. Cholesterol removal in liquid egg yolk using high methoxylpectins. Carbohydr. Polym. 2007, 69, 72–78. [CrossRef]
19. Hsieh, R.J.; Snyder, D.P.; Ford, E.W. Method for Removing Cholesterol and Fat from Egg Yolk by Chelationand Reduced-Cholesterol Egg Product. U.S. Patent 5,302,405, 12 April 1994.
20. López, Y.L.; Goycoolea, F.M.; Valdez, M.A.; Calderón, A.M. Goma de mezquite: Una alternativa de usoindustrial. Interciencia 2006, 3, 183–189.
21. Pérez, J.; Barrios, E.; Róman, A.; Pedroza, R. Interacción goma de mezquite-quitosano en la interfase y suinfluencia en la estabilidad de emulsiones múltiples W1/O/W2. Revista Mexicana de Ingeniería Química 2011,10, 487–499.
22. Moreno, M.B.; Sánchez, M. Mesquite gum as a novel reducing and stabilizing agent for modified tollenssynthesis of highly concentrated Ag nanoparticles. Materials 2016, 9, 817. [CrossRef]
23. Vernon, E.J.; Sherman, P. Rheological properties and applications of mesquite tree (prosopis Juliflora) gum. 1.Rheologycal properties of aqueous mesquite gum solutions. J. Texture stud. 1980, 11, 339–349. [CrossRef]
24. Liu, K.S. Preparation of fatty acid methyl esters for gas-chromatographic analysis of lipids in biologicalmaterials. J. Am. Oil Chem. Soc. 1994, 71, 1179–1187. [CrossRef]
25. García, E.; Higuera, I.; Espinosa, H. Design of fish oil-in-water nanoemulsion by microfluidization.Innovative Food Sci. Emerg. Technol. 2017, 40, 87–91. [CrossRef]
26. Navidghasemizad, S.; Temelli, F.; Wu, J. Phase separation behavior of egg yolk suspensions after anionicpolysaccharides addition. Carbohydr. Polym. 2015, 117, 297–303. [CrossRef] [PubMed]
27. McClements, D.J. Characterization of emulsion properties. In Food Emulsions: Principles, Practice, and
Technique, 3rd ed.; CRC Press: Boca Raton, FL, USA, 2016; pp. 624–625. ISBN 978-1-4987-2669-6.
243
Molecules 2018, 23, 3204
28. Valverde, D.; Laca, A.; Estrada, L.N.; Paredes, B.; Rendueles, M.; Díaz, M. Egg yolk and egg yolk fractionsas key ingredient for the development of a new type of gels. Int. J. Gastronomy Food Sci. 2016, 3, 30–37.[CrossRef]
29. Santipanichwong, R.; Suphantharika, M. Carotenoids as colorants in reduced-fat mayonnaise containingspent brewer’s yeast β-glucan as a fat replacer. Food Hydrocolloids 2007, 21, 565–574. [CrossRef]
30. Laca, A.; Paredes, B.; Rendueles, M.; Díaz, M. Egg yolk granules: Separation, characteristics and applicationsin food industry. LWT-Food Sci. Technol. 2014, 59, 1–5. [CrossRef]
31. Strixner, T.; Kulozik, U. Continuous centrifugal fractionation of egg yolk granules and plasma constituentsinfluenced by process conditions and product characteristics. J. Food Eng. 2013, 117, 89–98. [CrossRef]
32. Martucci, E.; Borges, S. Extraction of cholesterol from dehydrated egg yolk with acetone: Determinationof the practical phase equilibrium and simulation of the extraction process. J. Food Eng. 1997, 32, 365–373.[CrossRef]
33. Puertas, G.; Vázquez, M. Advances in techniques for reducing cholesterol in egg yolk: A review. Crit. Rev.
Food Sci. Nutr. 2018, 1–11. [CrossRef]34. Gils, P.S.; Ray, D.; Sahoo, P.K. Designing of silver nanoparticles in gum arabic based semi-IPN hydrogel.
Int. J. Biol. Macromol. 2010, 46, 237–244. [CrossRef] [PubMed]35. Navidghasemizad, S.; Temelli, F.; Wu, J. Physicochemical properties of leftover egg yolk after livetins
removal. LWT-Food Sci. Technol. 2014, 55, 170–175. [CrossRef]36. Beristain, C.I.; Azuara, E.; Garcia, H.S.; Vernon, E.J. Kinetic model for water/oil absorption of mesquite gum
(Prosopis juliflora) and gum arabic (Acacia senegal). Int. J. Food Sci. Technol. 1996, 31, 379–386. [CrossRef]37. Zuidam, N.C.; Nedovic, V.A. Encapsulation Technologies for Active Food Ingredients and Food Processing; Springer:
New York, NY, USA, 2010; pp. 31–100. ISBN 978-1-4419-1007-3.38. Strixner, T.; Sterr, J.; Kulozik, U.; Gebhardt, R. Structural study on hen-egg yolk high density lipoprotein
(HDL) granules. Food Biophys. 2014, 9, 314–321. [CrossRef]39. Anton, M. Recent Advances Concerning the Functional Properties of Egg Yolk Low-Density Lipoproteins. In
Proceedings of the EPC Proceedings of 12th European Poultry Conference, Verona, Italy, 10–14 September 2006.40. Turgeon, S.L.; Schmitt, C.; Sanchez, C. Protein–polysaccharide complexes and coacervates. Curr. Opin.
Colloid Interface Sci. 2007, 12, 166–178. [CrossRef]41. De Kruif, C.; Tuinier, R. Polysaccharide protein interactions. Food Hydrocolloids 2001, 15, 555–563. [CrossRef]42. Samant, S.; Singhal, R.; Kulkarni, P.; Rege, D. Protein-polysaccharide interactions: A new approach in food
formulations. Int. J. Food Sci. Technol. 1993, 28, 547–562. [CrossRef]43. Orozco, J.; Cruz, F.; Ponce, E.; Vernon, E. Mesquite gum: Fractionation and characterization of the gum
exuded from Prosopis laevigata obtained from plant tissue culture and from wild trees. Carbohydr. Polym.
2003, 54, 327–333. [CrossRef]44. Beyer, J.D. The Development of a Cholesterol-Reduced Egg Yolk Using Solvent Extraction. Ph.D. Thesis,
University of Wisconsin-Madison, Madison, WI, USA, 19 August 1991.45. Huopalahti, R.; Anton, M.; López-Fandiño, R.; Schade, R. Bioactive Egg Compounds; Springer: New York, NY,
USA, 2007; pp. 5–6. ISBN 978-3-540-37883-9.46. Li-Chan, E.C.; Kim, H.O. Structure and Chemical Composition of Eggs. Egg Bioscience and Biotechnology; John
Wiley and Sons Inc.: Vancuber, BC, Canada, 2007; pp. 1–96. ISBN 9780470181249.
Sample Availability: Not available.
© 2018 by the authors. Licensee MDPI, Basel, Switzerland. This article is an open accessarticle distributed under the terms and conditions of the Creative Commons Attribution(CC BY) license (http://creativecommons.org/licenses/by/4.0/).
244
molecules
Article
Effect of Beta Cyclodextrin on the Reduction ofCholesterol in Ewe’s Milk Manchego Cheese
Leocadio Alonso 1,*, Patrick F. Fox 2, María V. Calvo 3 ID and Javier Fontecha 3
1 Instituto de Productos Lácteos de Asturias (CSIC), Paseo Río Linares s/n. 33300 Villaviciosa, Asturias, Spain2 School of Food and Nutritional Sciences, University College Cork (UCC), T12 Y337 Cork, Ireland; [email protected] Instituto de Investigación en Ciencias de la Alimentación (CSIC-UAM), 28049 Madrid, Spain;
[email protected] (M.V.C.); [email protected] (J.F.)* Correspondence: [email protected]; Tel.: +34-985-893-206; Fax: +34-985-892-233
Academic Editors: Lillian Barros and Isabel C. F. R. Ferreira
Received: 21 June 2018; Accepted: 18 July 2018; Published: 20 July 2018
Abstract: Beta-cyclodextrin (β-CD) is a cyclic oligosaccharide consisting of seven glucose units andis produced from starch using cyclodextrin glycotransferase enzymes to break the polysaccharidechain and forming a cyclic polysaccharide molecule. The use of β-CD in food research for reductionof cholesterol is increasing due to its affinity for non-polar molecules such as cholesterol. The aimof this study was to evaluate the feasibility of using β-CD in cholesterol removal from pasteurizedewe’s milk Manchego cheese and evaluate the effect on the main components of the milk, lipids,and flavor characteristics. Approximately 97.6% cholesterol reduction was observed in the cheese thatwas treated using β-CD. Physicochemical properties (fat, moisture and protein) were not changedby the β-CD treatment, except the soluble nitrogen and non-protein nitrogen that showed slightdifferences after the treatment. The amount of the different components of the lipid fraction (fattyacids, triglycerides and phospholipids) were similar in cheeses treated and not treated with β-CD.Flavor compound and short chain free fatty acids were not mostly significantly influenced by theeffect of the β-CD. β-CD molecules are edible and nontoxic and as a result they can be used safelyfor cholesterol removal processing in cheese manufacturing. Therefore, the present study suggeststhat β-CD treatment is an effective process for cholesterol removal from Manchego cheese whilepreserving its properties.
Keywords: beta cyclodextrin; ewe’s milk; cheese; Manchego; lipids; cholesterol
1. Introduction
Although dairy products in general have the image of being healthy foods, this is often not the casefor products with a high fat content such as butter, cream and cheeses. The World Health Organizationand the American Heart Association have recommended that consumers reduce their consumption ofsaturated fatty acids and cholesterol to lower the risk of coronary heart disease. This advice, coupledwith radical opinions, have created a demand for low-cholesterol products [1]. Nowadays, thereis a growing interest in the manufacture of cholesterol-reduced dairy products. Food companieshave developed many methods to reduce cholesterol, however, most of these methods are relativelynonselective and remove flavor and nutritional components when cholesterol is removed. Moreover,some methods require high investment and operation costs. Methods for reducing cholesterol infoods have been developed including blending with vegetable oils [2,3], extraction by distillation andcrystallization [4,5], adsorption with saponin and digitonin [6,7], assimilation of cholesterol by enzymesfrom microorganisms [8,9] and removal by supercritical carbon dioxide extraction [10,11]. In the lastyears, several studies have been published describing the use of β-CD in food applications [12–14].
245
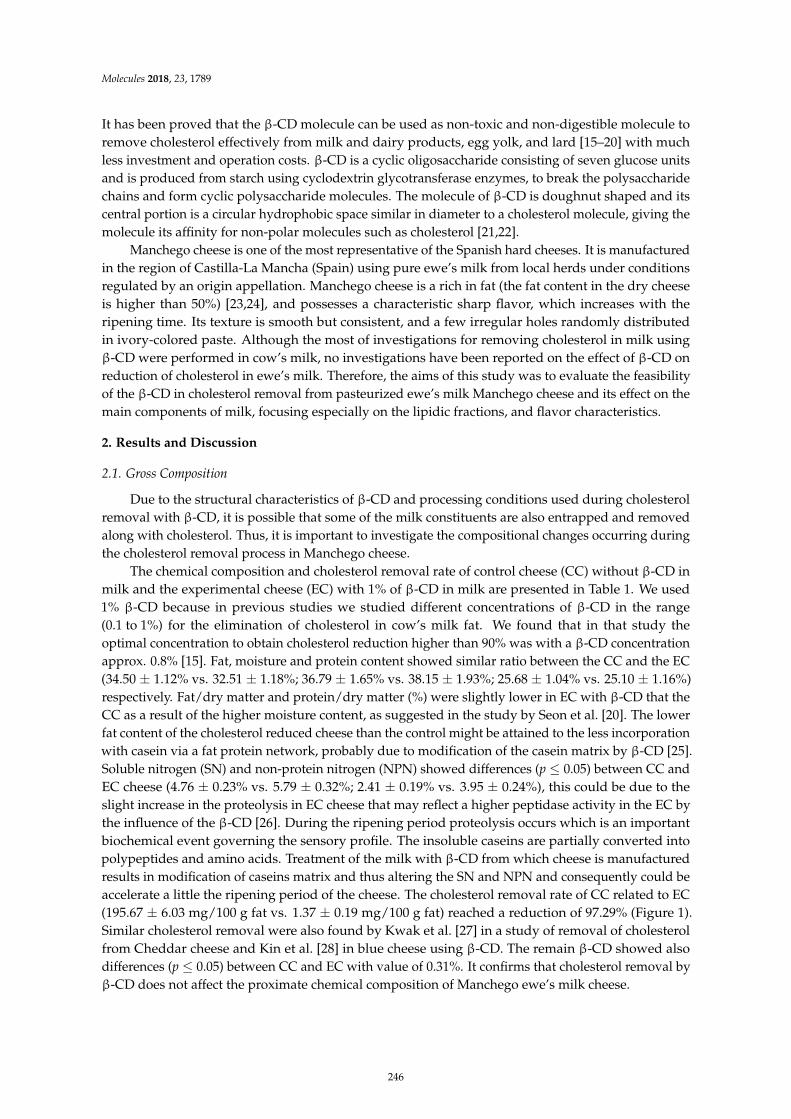
Molecules 2018, 23, 1789
It has been proved that the β-CD molecule can be used as non-toxic and non-digestible molecule toremove cholesterol effectively from milk and dairy products, egg yolk, and lard [15–20] with muchless investment and operation costs. β-CD is a cyclic oligosaccharide consisting of seven glucose unitsand is produced from starch using cyclodextrin glycotransferase enzymes, to break the polysaccharidechains and form cyclic polysaccharide molecules. The molecule of β-CD is doughnut shaped and itscentral portion is a circular hydrophobic space similar in diameter to a cholesterol molecule, giving themolecule its affinity for non-polar molecules such as cholesterol [21,22].
Manchego cheese is one of the most representative of the Spanish hard cheeses. It is manufacturedin the region of Castilla-La Mancha (Spain) using pure ewe’s milk from local herds under conditionsregulated by an origin appellation. Manchego cheese is a rich in fat (the fat content in the dry cheeseis higher than 50%) [23,24], and possesses a characteristic sharp flavor, which increases with theripening time. Its texture is smooth but consistent, and a few irregular holes randomly distributedin ivory-colored paste. Although the most of investigations for removing cholesterol in milk usingβ-CD were performed in cow’s milk, no investigations have been reported on the effect of β-CD onreduction of cholesterol in ewe’s milk. Therefore, the aims of this study was to evaluate the feasibilityof the β-CD in cholesterol removal from pasteurized ewe’s milk Manchego cheese and its effect on themain components of milk, focusing especially on the lipidic fractions, and flavor characteristics.
2. Results and Discussion
2.1. Gross Composition
Due to the structural characteristics of β-CD and processing conditions used during cholesterolremoval with β-CD, it is possible that some of the milk constituents are also entrapped and removedalong with cholesterol. Thus, it is important to investigate the compositional changes occurring duringthe cholesterol removal process in Manchego cheese.
The chemical composition and cholesterol removal rate of control cheese (CC) without β-CD inmilk and the experimental cheese (EC) with 1% of β-CD in milk are presented in Table 1. We used1% β-CD because in previous studies we studied different concentrations of β-CD in the range(0.1 to 1%) for the elimination of cholesterol in cow’s milk fat. We found that in that study theoptimal concentration to obtain cholesterol reduction higher than 90% was with a β-CD concentrationapprox. 0.8% [15]. Fat, moisture and protein content showed similar ratio between the CC and the EC(34.50 ± 1.12% vs. 32.51 ± 1.18%; 36.79 ± 1.65% vs. 38.15 ± 1.93%; 25.68 ± 1.04% vs. 25.10 ± 1.16%)respectively. Fat/dry matter and protein/dry matter (%) were slightly lower in EC with β-CD that theCC as a result of the higher moisture content, as suggested in the study by Seon et al. [20]. The lowerfat content of the cholesterol reduced cheese than the control might be attained to the less incorporationwith casein via a fat protein network, probably due to modification of the casein matrix by β-CD [25].Soluble nitrogen (SN) and non-protein nitrogen (NPN) showed differences (p ≤ 0.05) between CC andEC cheese (4.76 ± 0.23% vs. 5.79 ± 0.32%; 2.41 ± 0.19% vs. 3.95 ± 0.24%), this could be due to theslight increase in the proteolysis in EC cheese that may reflect a higher peptidase activity in the EC bythe influence of the β-CD [26]. During the ripening period proteolysis occurs which is an importantbiochemical event governing the sensory profile. The insoluble caseins are partially converted intopolypeptides and amino acids. Treatment of the milk with β-CD from which cheese is manufacturedresults in modification of caseins matrix and thus altering the SN and NPN and consequently could beaccelerate a little the ripening period of the cheese. The cholesterol removal rate of CC related to EC(195.67 ± 6.03 mg/100 g fat vs. 1.37 ± 0.19 mg/100 g fat) reached a reduction of 97.29% (Figure 1).Similar cholesterol removal were also found by Kwak et al. [27] in a study of removal of cholesterolfrom Cheddar cheese and Kin et al. [28] in blue cheese using β-CD. The remain β-CD showed alsodifferences (p ≤ 0.05) between CC and EC with value of 0.31%. It confirms that cholesterol removal byβ-CD does not affect the proximate chemical composition of Manchego ewe’s milk cheese.
246
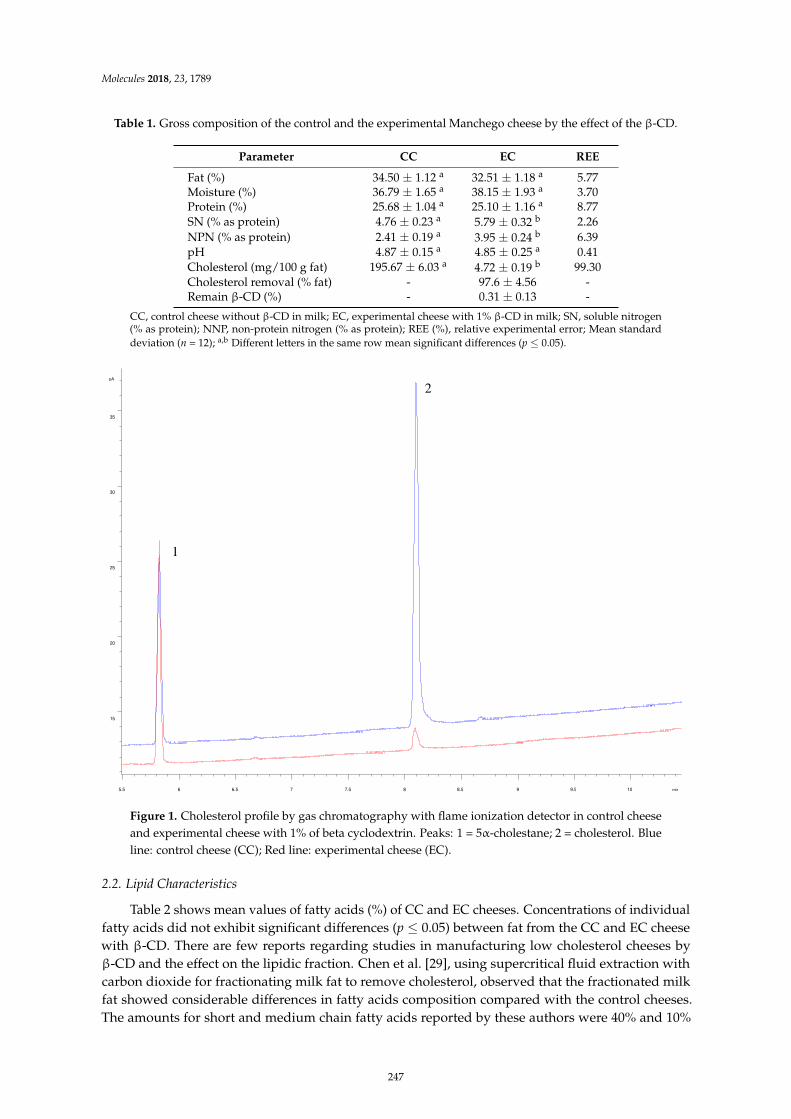
Molecules 2018, 23, 1789
Table 1. Gross composition of the control and the experimental Manchego cheese by the effect of the β-CD.
Parameter CC EC REE
Fat (%) 34.50 ± 1.12 a 32.51 ± 1.18 a 5.77Moisture (%) 36.79 ± 1.65 a 38.15 ± 1.93 a 3.70Protein (%) 25.68 ± 1.04 a 25.10 ± 1.16 a 8.77SN (% as protein) 4.76 ± 0.23 a 5.79 ± 0.32 b 2.26NPN (% as protein) 2.41 ± 0.19 a 3.95 ± 0.24 b 6.39pH 4.87 ± 0.15 a 4.85 ± 0.25 a 0.41Cholesterol (mg/100 g fat) 195.67 ± 6.03 a 4.72 ± 0.19 b 99.30Cholesterol removal (% fat) - 97.6 ± 4.56 -Remain β-CD (%) - 0.31 ± 0.13 -
CC, control cheese without β-CD in milk; EC, experimental cheese with 1% β-CD in milk; SN, soluble nitrogen(% as protein); NNP, non-protein nitrogen (% as protein); REE (%), relative experimental error; Mean standarddeviation (n = 12); a,b Different letters in the same row mean significant differences (p ≤ 0.05).
2
min 5.5 6 6.5 7 7.5 8 8.5 9 9.5 10
pA
15
20
25
30
35
1
Figure 1. Cholesterol profile by gas chromatography with flame ionization detector in control cheeseand experimental cheese with 1% of beta cyclodextrin. Peaks: 1 = 5α-cholestane; 2 = cholesterol. Blueline: control cheese (CC); Red line: experimental cheese (EC).
2.2. Lipid Characteristics
Table 2 shows mean values of fatty acids (%) of CC and EC cheeses. Concentrations of individualfatty acids did not exhibit significant differences (p ≤ 0.05) between fat from the CC and EC cheesewith β-CD. There are few reports regarding studies in manufacturing low cholesterol cheeses byβ-CD and the effect on the lipidic fraction. Chen et al. [29], using supercritical fluid extraction withcarbon dioxide for fractionating milk fat to remove cholesterol, observed that the fractionated milkfat showed considerable differences in fatty acids composition compared with the control cheeses.The amounts for short and medium chain fatty acids reported by these authors were 40% and 10%
247
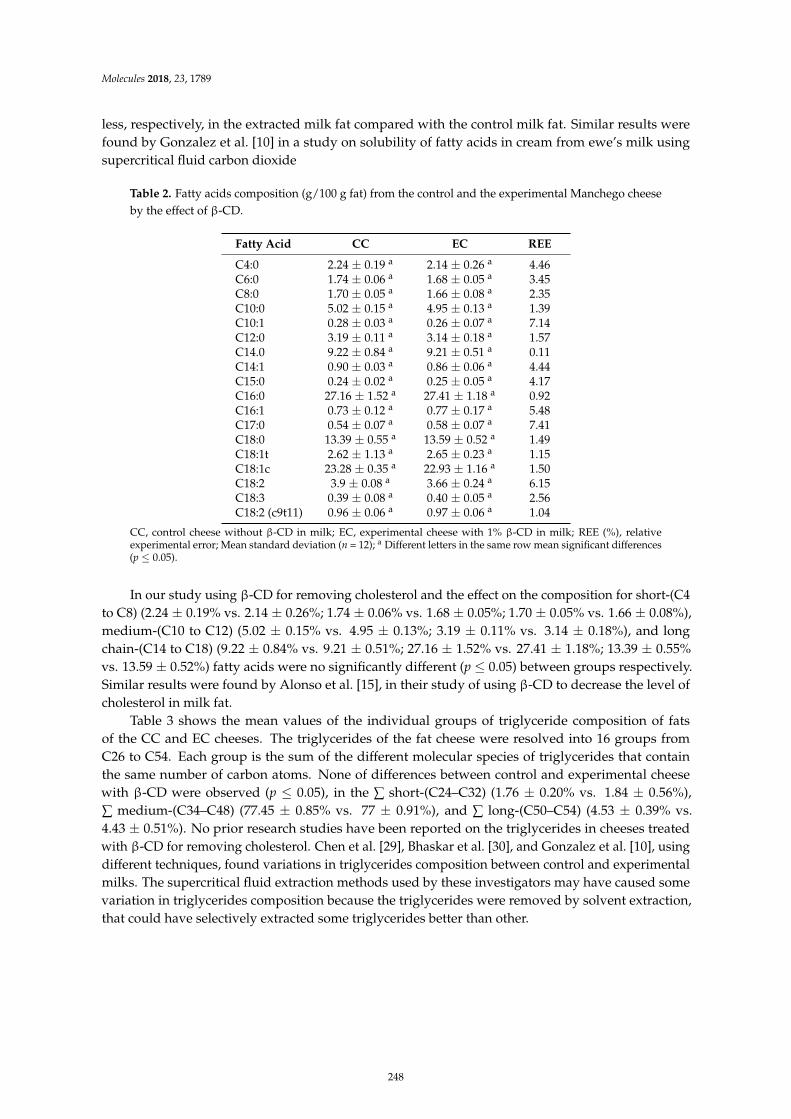
Molecules 2018, 23, 1789
less, respectively, in the extracted milk fat compared with the control milk fat. Similar results werefound by Gonzalez et al. [10] in a study on solubility of fatty acids in cream from ewe’s milk usingsupercritical fluid carbon dioxide
Table 2. Fatty acids composition (g/100 g fat) from the control and the experimental Manchego cheeseby the effect of β-CD.
Fatty Acid CC EC REE
C4:0 2.24 ± 0.19 a 2.14 ± 0.26 a 4.46C6:0 1.74 ± 0.06 a 1.68 ± 0.05 a 3.45C8:0 1.70 ± 0.05 a 1.66 ± 0.08 a 2.35C10:0 5.02 ± 0.15 a 4.95 ± 0.13 a 1.39C10:1 0.28 ± 0.03 a 0.26 ± 0.07 a 7.14C12:0 3.19 ± 0.11 a 3.14 ± 0.18 a 1.57C14.0 9.22 ± 0.84 a 9.21 ± 0.51 a 0.11C14:1 0.90 ± 0.03 a 0.86 ± 0.06 a 4.44C15:0 0.24 ± 0.02 a 0.25 ± 0.05 a 4.17C16:0 27.16 ± 1.52 a 27.41 ± 1.18 a 0.92C16:1 0.73 ± 0.12 a 0.77 ± 0.17 a 5.48C17:0 0.54 ± 0.07 a 0.58 ± 0.07 a 7.41C18:0 13.39 ± 0.55 a 13.59 ± 0.52 a 1.49C18:1t 2.62 ± 1.13 a 2.65 ± 0.23 a 1.15C18:1c 23.28 ± 0.35 a 22.93 ± 1.16 a 1.50C18:2 3.9 ± 0.08 a 3.66 ± 0.24 a 6.15C18:3 0.39 ± 0.08 a 0.40 ± 0.05 a 2.56C18:2 (c9t11) 0.96 ± 0.06 a 0.97 ± 0.06 a 1.04
CC, control cheese without β-CD in milk; EC, experimental cheese with 1% β-CD in milk; REE (%), relativeexperimental error; Mean standard deviation (n = 12); a Different letters in the same row mean significant differences(p ≤ 0.05).
In our study using β-CD for removing cholesterol and the effect on the composition for short-(C4to C8) (2.24 ± 0.19% vs. 2.14 ± 0.26%; 1.74 ± 0.06% vs. 1.68 ± 0.05%; 1.70 ± 0.05% vs. 1.66 ± 0.08%),medium-(C10 to C12) (5.02 ± 0.15% vs. 4.95 ± 0.13%; 3.19 ± 0.11% vs. 3.14 ± 0.18%), and longchain-(C14 to C18) (9.22 ± 0.84% vs. 9.21 ± 0.51%; 27.16 ± 1.52% vs. 27.41 ± 1.18%; 13.39 ± 0.55%vs. 13.59 ± 0.52%) fatty acids were no significantly different (p ≤ 0.05) between groups respectively.Similar results were found by Alonso et al. [15], in their study of using β-CD to decrease the level ofcholesterol in milk fat.
Table 3 shows the mean values of the individual groups of triglyceride composition of fatsof the CC and EC cheeses. The triglycerides of the fat cheese were resolved into 16 groups fromC26 to C54. Each group is the sum of the different molecular species of triglycerides that containthe same number of carbon atoms. None of differences between control and experimental cheesewith β-CD were observed (p ≤ 0.05), in the ∑ short-(C24–C32) (1.76 ± 0.20% vs. 1.84 ± 0.56%),∑ medium-(C34–C48) (77.45 ± 0.85% vs. 77 ± 0.91%), and ∑ long-(C50–C54) (4.53 ± 0.39% vs.4.43 ± 0.51%). No prior research studies have been reported on the triglycerides in cheeses treatedwith β-CD for removing cholesterol. Chen et al. [29], Bhaskar et al. [30], and Gonzalez et al. [10], usingdifferent techniques, found variations in triglycerides composition between control and experimentalmilks. The supercritical fluid extraction methods used by these investigators may have caused somevariation in triglycerides composition because the triglycerides were removed by solvent extraction,that could have selectively extracted some triglycerides better than other.
248
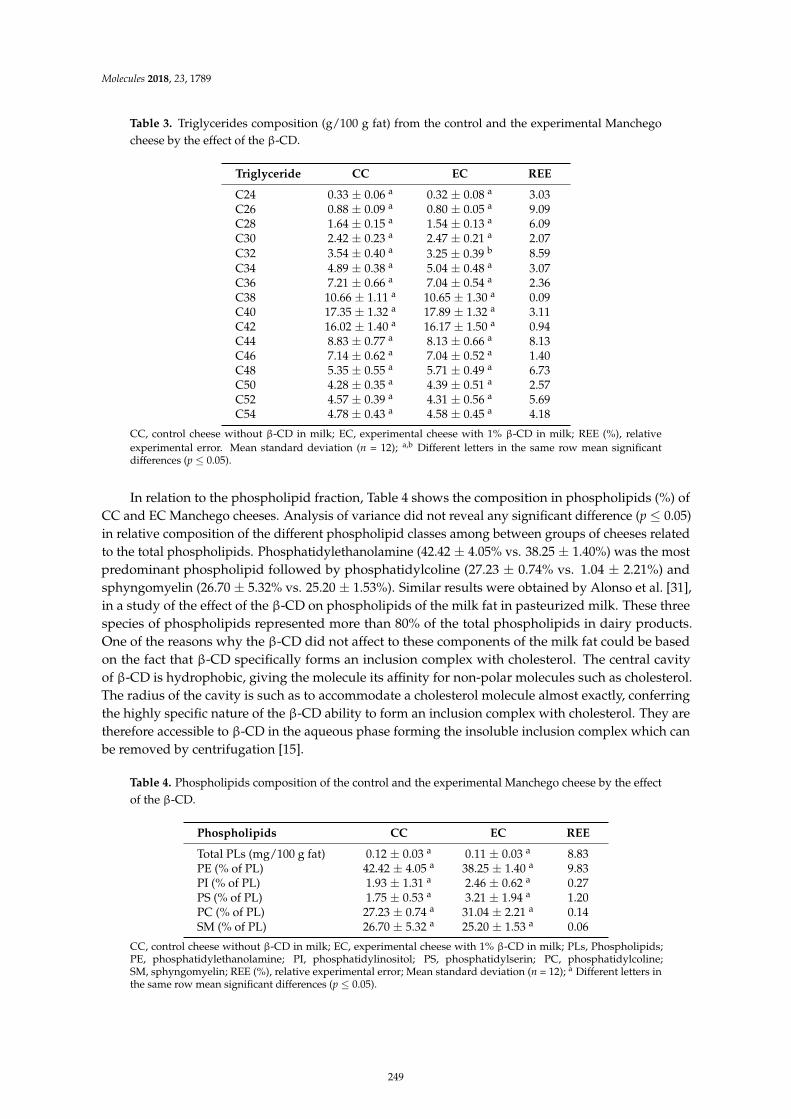
Molecules 2018, 23, 1789
Table 3. Triglycerides composition (g/100 g fat) from the control and the experimental Manchegocheese by the effect of the β-CD.
Triglyceride CC EC REE
C24 0.33 ± 0.06 a 0.32 ± 0.08 a 3.03C26 0.88 ± 0.09 a 0.80 ± 0.05 a 9.09C28 1.64 ± 0.15 a 1.54 ± 0.13 a 6.09C30 2.42 ± 0.23 a 2.47 ± 0.21 a 2.07C32 3.54 ± 0.40 a 3.25 ± 0.39 b 8.59C34 4.89 ± 0.38 a 5.04 ± 0.48 a 3.07C36 7.21 ± 0.66 a 7.04 ± 0.54 a 2.36C38 10.66 ± 1.11 a 10.65 ± 1.30 a 0.09C40 17.35 ± 1.32 a 17.89 ± 1.32 a 3.11C42 16.02 ± 1.40 a 16.17 ± 1.50 a 0.94C44 8.83 ± 0.77 a 8.13 ± 0.66 a 8.13C46 7.14 ± 0.62 a 7.04 ± 0.52 a 1.40C48 5.35 ± 0.55 a 5.71 ± 0.49 a 6.73C50 4.28 ± 0.35 a 4.39 ± 0.51 a 2.57C52 4.57 ± 0.39 a 4.31 ± 0.56 a 5.69C54 4.78 ± 0.43 a 4.58 ± 0.45 a 4.18
CC, control cheese without β-CD in milk; EC, experimental cheese with 1% β-CD in milk; REE (%), relativeexperimental error. Mean standard deviation (n = 12); a,b Different letters in the same row mean significantdifferences (p ≤ 0.05).
In relation to the phospholipid fraction, Table 4 shows the composition in phospholipids (%) ofCC and EC Manchego cheeses. Analysis of variance did not reveal any significant difference (p ≤ 0.05)in relative composition of the different phospholipid classes among between groups of cheeses relatedto the total phospholipids. Phosphatidylethanolamine (42.42 ± 4.05% vs. 38.25 ± 1.40%) was the mostpredominant phospholipid followed by phosphatidylcoline (27.23 ± 0.74% vs. 1.04 ± 2.21%) andsphyngomyelin (26.70 ± 5.32% vs. 25.20 ± 1.53%). Similar results were obtained by Alonso et al. [31],in a study of the effect of the β-CD on phospholipids of the milk fat in pasteurized milk. These threespecies of phospholipids represented more than 80% of the total phospholipids in dairy products.One of the reasons why the β-CD did not affect to these components of the milk fat could be basedon the fact that β-CD specifically forms an inclusion complex with cholesterol. The central cavityof β-CD is hydrophobic, giving the molecule its affinity for non-polar molecules such as cholesterol.The radius of the cavity is such as to accommodate a cholesterol molecule almost exactly, conferringthe highly specific nature of the β-CD ability to form an inclusion complex with cholesterol. They aretherefore accessible to β-CD in the aqueous phase forming the insoluble inclusion complex which canbe removed by centrifugation [15].
Table 4. Phospholipids composition of the control and the experimental Manchego cheese by the effectof the β-CD.
Phospholipids CC EC REE
Total PLs (mg/100 g fat) 0.12 ± 0.03 a 0.11 ± 0.03 a 8.83PE (% of PL) 42.42 ± 4.05 a 38.25 ± 1.40 a 9.83PI (% of PL) 1.93 ± 1.31 a 2.46 ± 0.62 a 0.27PS (% of PL) 1.75 ± 0.53 a 3.21 ± 1.94 a 1.20PC (% of PL) 27.23 ± 0.74 a 31.04 ± 2.21 a 0.14SM (% of PL) 26.70 ± 5.32 a 25.20 ± 1.53 a 0.06
CC, control cheese without β-CD in milk; EC, experimental cheese with 1% β-CD in milk; PLs, Phospholipids;PE, phosphatidylethanolamine; PI, phosphatidylinositol; PS, phosphatidylserin; PC, phosphatidylcoline;SM, sphyngomyelin; REE (%), relative experimental error; Mean standard deviation (n = 12); a Different letters inthe same row mean significant differences (p ≤ 0.05).
249
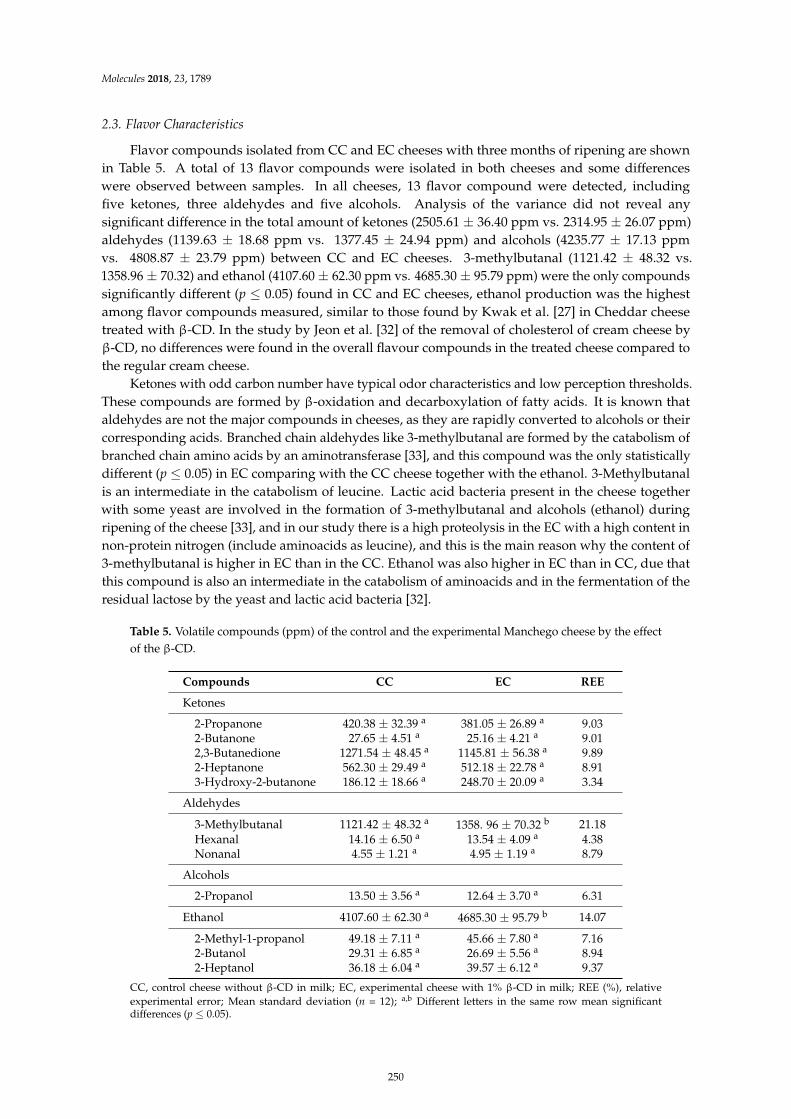
Molecules 2018, 23, 1789
2.3. Flavor Characteristics
Flavor compounds isolated from CC and EC cheeses with three months of ripening are shownin Table 5. A total of 13 flavor compounds were isolated in both cheeses and some differenceswere observed between samples. In all cheeses, 13 flavor compound were detected, includingfive ketones, three aldehydes and five alcohols. Analysis of the variance did not reveal anysignificant difference in the total amount of ketones (2505.61 ± 36.40 ppm vs. 2314.95 ± 26.07 ppm)aldehydes (1139.63 ± 18.68 ppm vs. 1377.45 ± 24.94 ppm) and alcohols (4235.77 ± 17.13 ppmvs. 4808.87 ± 23.79 ppm) between CC and EC cheeses. 3-methylbutanal (1121.42 ± 48.32 vs.1358.96 ± 70.32) and ethanol (4107.60 ± 62.30 ppm vs. 4685.30 ± 95.79 ppm) were the only compoundssignificantly different (p ≤ 0.05) found in CC and EC cheeses, ethanol production was the highestamong flavor compounds measured, similar to those found by Kwak et al. [27] in Cheddar cheesetreated with β-CD. In the study by Jeon et al. [32] of the removal of cholesterol of cream cheese byβ-CD, no differences were found in the overall flavour compounds in the treated cheese compared tothe regular cream cheese.
Ketones with odd carbon number have typical odor characteristics and low perception thresholds.These compounds are formed by β-oxidation and decarboxylation of fatty acids. It is known thataldehydes are not the major compounds in cheeses, as they are rapidly converted to alcohols or theircorresponding acids. Branched chain aldehydes like 3-methylbutanal are formed by the catabolism ofbranched chain amino acids by an aminotransferase [33], and this compound was the only statisticallydifferent (p ≤ 0.05) in EC comparing with the CC cheese together with the ethanol. 3-Methylbutanalis an intermediate in the catabolism of leucine. Lactic acid bacteria present in the cheese togetherwith some yeast are involved in the formation of 3-methylbutanal and alcohols (ethanol) duringripening of the cheese [33], and in our study there is a high proteolysis in the EC with a high content innon-protein nitrogen (include aminoacids as leucine), and this is the main reason why the content of3-methylbutanal is higher in EC than in the CC. Ethanol was also higher in EC than in CC, due thatthis compound is also an intermediate in the catabolism of aminoacids and in the fermentation of theresidual lactose by the yeast and lactic acid bacteria [32].
Table 5. Volatile compounds (ppm) of the control and the experimental Manchego cheese by the effectof the β-CD.
Compounds CC EC REE
Ketones
2-Propanone 420.38 ± 32.39 a 381.05 ± 26.89 a 9.032-Butanone 27.65 ± 4.51 a 25.16 ± 4.21 a 9.012,3-Butanedione 1271.54 ± 48.45 a 1145.81 ± 56.38 a 9.892-Heptanone 562.30 ± 29.49 a 512.18 ± 22.78 a 8.913-Hydroxy-2-butanone 186.12 ± 18.66 a 248.70 ± 20.09 a 3.34
Aldehydes
3-Methylbutanal 1121.42 ± 48.32 a 1358. 96 ± 70.32 b 21.18Hexanal 14.16 ± 6.50 a 13.54 ± 4.09 a 4.38Nonanal 4.55 ± 1.21 a 4.95 ± 1.19 a 8.79
Alcohols
2-Propanol 13.50 ± 3.56 a 12.64 ± 3.70 a 6.31
Ethanol 4107.60 ± 62.30 a 4685.30 ± 95.79 b 14.07
2-Methyl-1-propanol 49.18 ± 7.11 a 45.66 ± 7.80 a 7.162-Butanol 29.31 ± 6.85 a 26.69 ± 5.56 a 8.942-Heptanol 36.18 ± 6.04 a 39.57 ± 6.12 a 9.37
CC, control cheese without β-CD in milk; EC, experimental cheese with 1% β-CD in milk; REE (%), relativeexperimental error; Mean standard deviation (n = 12); a,b Different letters in the same row mean significantdifferences (p ≤ 0.05).
250
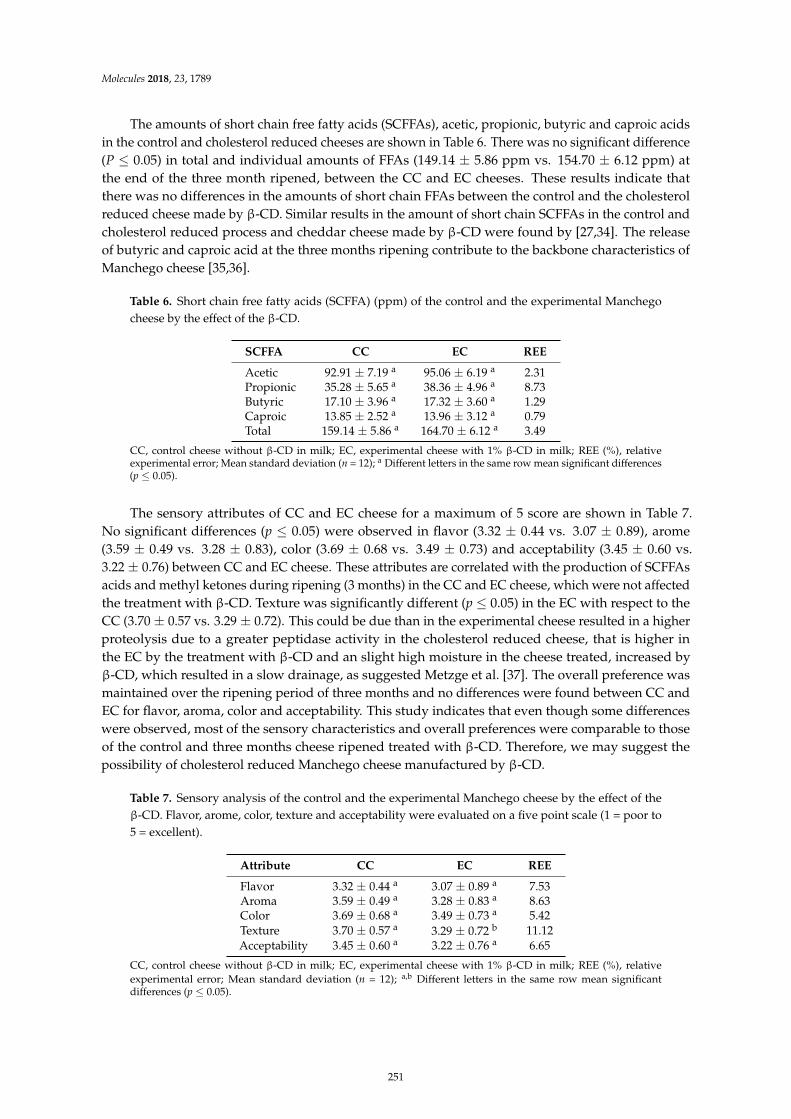
Molecules 2018, 23, 1789
The amounts of short chain free fatty acids (SCFFAs), acetic, propionic, butyric and caproic acidsin the control and cholesterol reduced cheeses are shown in Table 6. There was no significant difference(P ≤ 0.05) in total and individual amounts of FFAs (149.14 ± 5.86 ppm vs. 154.70 ± 6.12 ppm) atthe end of the three month ripened, between the CC and EC cheeses. These results indicate thatthere was no differences in the amounts of short chain FFAs between the control and the cholesterolreduced cheese made by β-CD. Similar results in the amount of short chain SCFFAs in the control andcholesterol reduced process and cheddar cheese made by β-CD were found by [27,34]. The releaseof butyric and caproic acid at the three months ripening contribute to the backbone characteristics ofManchego cheese [35,36].
Table 6. Short chain free fatty acids (SCFFA) (ppm) of the control and the experimental Manchegocheese by the effect of the β-CD.
SCFFA CC EC REE
Acetic 92.91 ± 7.19 a 95.06 ± 6.19 a 2.31Propionic 35.28 ± 5.65 a 38.36 ± 4.96 a 8.73Butyric 17.10 ± 3.96 a 17.32 ± 3.60 a 1.29Caproic 13.85 ± 2.52 a 13.96 ± 3.12 a 0.79Total 159.14 ± 5.86 a 164.70 ± 6.12 a 3.49
CC, control cheese without β-CD in milk; EC, experimental cheese with 1% β-CD in milk; REE (%), relativeexperimental error; Mean standard deviation (n = 12); a Different letters in the same row mean significant differences(p ≤ 0.05).
The sensory attributes of CC and EC cheese for a maximum of 5 score are shown in Table 7.No significant differences (p ≤ 0.05) were observed in flavor (3.32 ± 0.44 vs. 3.07 ± 0.89), arome(3.59 ± 0.49 vs. 3.28 ± 0.83), color (3.69 ± 0.68 vs. 3.49 ± 0.73) and acceptability (3.45 ± 0.60 vs.3.22 ± 0.76) between CC and EC cheese. These attributes are correlated with the production of SCFFAsacids and methyl ketones during ripening (3 months) in the CC and EC cheese, which were not affectedthe treatment with β-CD. Texture was significantly different (p ≤ 0.05) in the EC with respect to theCC (3.70 ± 0.57 vs. 3.29 ± 0.72). This could be due than in the experimental cheese resulted in a higherproteolysis due to a greater peptidase activity in the cholesterol reduced cheese, that is higher inthe EC by the treatment with β-CD and an slight high moisture in the cheese treated, increased byβ-CD, which resulted in a slow drainage, as suggested Metzge et al. [37]. The overall preference wasmaintained over the ripening period of three months and no differences were found between CC andEC for flavor, aroma, color and acceptability. This study indicates that even though some differenceswere observed, most of the sensory characteristics and overall preferences were comparable to thoseof the control and three months cheese ripened treated with β-CD. Therefore, we may suggest thepossibility of cholesterol reduced Manchego cheese manufactured by β-CD.
Table 7. Sensory analysis of the control and the experimental Manchego cheese by the effect of theβ-CD. Flavor, arome, color, texture and acceptability were evaluated on a five point scale (1 = poor to5 = excellent).
Attribute CC EC REE
Flavor 3.32 ± 0.44 a 3.07 ± 0.89 a 7.53Aroma 3.59 ± 0.49 a 3.28 ± 0.83 a 8.63Color 3.69 ± 0.68 a 3.49 ± 0.73 a 5.42Texture 3.70 ± 0.57 a 3.29 ± 0.72 b 11.12Acceptability 3.45 ± 0.60 a 3.22 ± 0.76 a 6.65
CC, control cheese without β-CD in milk; EC, experimental cheese with 1% β-CD in milk; REE (%), relativeexperimental error; Mean standard deviation (n = 12); a,b Different letters in the same row mean significantdifferences (p ≤ 0.05).
251
Molecules 2018, 23, 1789
3. Materials and Methods
3.1. Chemicals
α-Cyclodextrin (α-CD), β-cyclodextrin (β-CD) and all reagents grade were supplied by Sigma(St. Louis MO, USA). Deionized water was prepared by a water purification system (Millipore Co.,Burlington, MA, USA).
3.2. Manchego Manufacture
Ewe’s milk was previously treated with 1% β-CD by the method described by Alonso et al. [15].One hundred L volumes of whole pasteurized milk (74 ◦C for 15 s) milk containing 1.0% wt/vol ofβ-CD were placed in a cold room at 4 ◦C and mixed by a stirrer (430 rcf) during 30 min. After mixing,the treated milk was left standing overnight at 4 ◦C (to allow time for binding the cholesterol) andprecipitate the cholesterol-β-CD complex at the bottom of the tank. The upper layer without thecomplex was separated for making the cheeses. Manchego cheese was made by the proceduredescribed by Fernández-García et al. [35]. Cheeses were ripened at a temperature of 12–14 ◦C withrelative humidity of 85–90% during 3 months. The cheese-making experiment was carried out intriplicate for control and cheeses treated with 1% of β-CD.
3.3. Gross Composition
Fat, moisture and protein contents and nitrogen fractions were determined using the method byAlonso et al. [38].
3.4. Beta Cyclodextrin Analysis
β-CD was analysed by the method proposed by Alonso et al. [39]. Ten g of cheese was mixed with5 mg of α-CD dissolved in one mL of water (internal standard for quantitative analysis). After shakingfor 2 min at 40 ◦C it was centrifuged at room temperature for 40,000 rpm for 30 min, the upper layerwas separated and filtered through a 0.45 µm membrane (Millipore Co.). A 30 µL aliquot of thesupernatant spiked with the internal standard were transferred to the autosampler. A 10 µL aliquot ofthe supernatant was injected onto column for HPLC analysis.
The apparatus used for HPLC analysis was a Waters Alliance 2695 separation module coupled toa 410 refractive index (RI) detector, data acquisition and analysis were performed using the Empower2 chromatography data software (Waters, Milford, MA, USA). Separation was carried out on YMCODS-AQ column (Teknochroma, Miami, FL, USA). The mobile phase composition was a mixture ofmethanol and water (7:93) in isocratic condition at a flow rate 1 mL/min. The standard solutionswere prepared in water to establish elution time and the quantification of β-CD was conducted bycomparing sample peak area of β-CD with α-CD as the internal standard.
3.5. Lipid Extraction
Lipids were extracted from samples following a procedure described by an International StandardMethod for milk and milk products [40]. Briefly, it consisted of an addition of an ammonia-ethanolsolution to a test portion followed by lipid extraction using diethyl ether and hexane. Then, the upperlayer was removed, and the solvent completely evaporated. The lipid extracts obtained were placedinto amber glass vials, flushed with a stream of nitrogen and stored at −20 ◦C until analyzed.
3.6. Determination of Cholesterol
The technique chosen for cholesterol determination was as described by Alonso et al. [41] usingdirect injection of milk fat by capillary gas chromatography (GC). Approximately 30 mg anhydrousmilk fat and 0.1 mL 5-α-cholestane as internal standard (3.5 mg/mL in hexane) was dissolved in1 mL of hexane; 0.5 µL of the resulting solution was injected for GC analysis. For GC analysis for
252
Molecules 2018, 23, 1789
free cholesterol by this direct method we used an Agilent Technology 6890 chromatograph (Palo Alto,CA, USA) equipped with flame ionization detector. Analyses were performed using a HP-5 fusedsilica capillary column (30 m × 0.32 mm i.d. 0.25 µm thickness). Experimental chromatographicconditions were: He carrier gas at 17 psi head pressure; initial column temperature 280 ◦C, held for1 min, increased to 355 ◦C at 3 ◦C/min. Injector temperature 350 ◦C and detector temperature was360 ◦C. Peak identification was done by comparison of relative retention times with retention times ofstandards. Quantification of cholesterol was conducted by comparing sample peak area with of the 5α-cholestane internal standard. The percentage of cholesterol reduction in milk fat was calculated bythe formula [(100 − amount of cholesterol in milk fat) × 100]/amount of cholesterol in untreated milk).
3.7. Fatty Acids and Triglycerides Analysis
Fatty acids methyl esters (FAMES) were prepared by alkaline catalyzed methanolysis of theextracted lipids using 2 N KOH in methanol. The FAMES were analyzed on an Agilent Technology6890 chromatograph (Palo Alto, CA, USA) with FID detector. Fatty acids were separated using CP-Sil88 fused-silica capillary column (50 m × 0.25 mm i.d. × 0.2 µm film thickness, Chrompack, CA, USA)using the method described by Alonso et al. [42]. GC analysis of triglycerides by direct injectionwas performed on an Agilent gas chromatograph 6890 (Palo Alto, CA, USA) equipped with flameionization detector. Analyses were performed using a WCOT fused silica capillary column (25 m ×
0.25 mm × 0.1 µm film thickness) coated with OV 17 TRI (J.W. Scientific, Polson, CA, USA) using themethod described by Alonso [43].
3.8. Phospholipids Analysis
Extractions of cheese fat were carried out with an Accelerated Solid Extraction ASE-200 extractor(Dionex Corp., Sunnyvale, CA, USA) using 2 g of freeze-dried cheese sample that was well mixedwith 2 g of sea sand and loaded into a stainless steel extraction cell covered with filters on both sides.For the maximum cheese fat yield, the extraction included the use of dichloromethane-methanolsolution (2:1, vol/vol) as solvent mixture and 10.3 MPa of pressure as fixed conditions described byCastro-Gómez et al. [44].
Separation of lipid classes was accomplished in an HPLC system (model 1260; AgilentTechnologies Inc., Santa Clara, CA, USA) coupled with an evaporative light scattering detector (SEDEX85 model; Sedere SAS, Alfortville CEDEX, France) using prefiltered compressed air as the nebulizinggas at a pressure of 350 kPa at 60 ◦C; the gain was set at 3. Two columns in series (250 × 4.5 mmZorbax Rx-SIL column with 5-µm particle diameter; Agilent Technologies Inc.) and a precolumn withthe same packing were used [44].
3.9. Analysis of Volatile Compounds
Analysis of volatile fraction was performed by headspace gas chromatographic mass spectrometric(GC-MS) method described by Alonso et al. [45]. To 10 g of previously homogenized cheese, 80 µLof aqueous solution of propionic acid ethyl methyl ester (1.14 mg/mL) as internal standard andanhydrous sodium sulphate (10 g) to retain water 176 were added. Individual standard dilutions inaqueous solution were prepared and were stored hermetically in sealed vials at 20 ◦C until their use.Prior to be analyzed in a static headspace apparatus (Model HSS 19395; Hewlett Packard), the sampleswere maintained at 80 ◦C for 60 min until the sample and gaseous phase reached the thermodynamicequilibrium. Apparatus was programmed as follows: 5 s pressurization, 18 equilibrium and filling and2 min for injection. Helium was employed as carrier gas at a flow 18 rate of 17.5 mL/min. A HewlettPackard GC Model 5890 coupled to selective MS Model 5972 was employed for volatile compoundsanalysis. Samples were injected in the split mode (split 18 rate of 7:1) on a capillary silica columnwith polyethylene glycol (HP Innovas, 60 m, 0.25 mm 18 ID, 0.25 µm film thickness, Hewlett Packard).Helium was used as carrier gas, at a flow rate of 18 36.5 cm/s. The column temperature program was:33 ◦C for 5 min, increase at 1 ◦C/min up to 38 ◦C and then at 7 ◦C/min up to 210 ◦C, and held for
253
Molecules 2018, 23, 1789
10 min. Injection was carried out at 200 ◦C and the interface line of MS at 280 ◦C. Electronic ionisationenergy and photomultiplier voltage 18 were 70 eV and 1647 V, respectively.
3.10. Short Chain Free Fatty Acids
For the analysis of SCFFAs, cheese sample (1 g) was homogenized in 20 mL of distilled water,centrifuge at 10,000 rpm for 10 min and filtered by 0.40 µm filter. A Hewlett-Packard model 5890 Aequipped with a flame ionization detector on a capillary silica column (HP FFAP, 30 m, 0.25 mm ID,0.25 µm film thickness, Agilent J & W) was used for analysis. Quantitative analysis were done using2-ethylbutanoic acid as internal standard.
3.11. Sensory Analysis
Samples of Manchego cheese were cut in slices of approximately 8 × 8 cm of a thickness of approx.1 cm and placed on white plates. Samples were tempered at ambient temperature (20 ± 2 ◦C) and thenpresented to the panelists. Twenty two trained sensory panelists from the members of the researchInstitute which, trained in sensory analysis of cheese, evaluated randomly coded cheeses. The testingconditions of the room for the sensory analysis were in conformity with the ISO requirements [46].Flavor, aroma, color, texture and acceptability were evaluated on a five point scale (1 = poor to5 = excellent).
3.12. Statistical Analysis
Experimental data were treated by analysis of variance (ANOVA) using the statistical softwareSAS (version 8.02, SAS Institute Inc., Cary, NC, USA). Differences among treatments were determinedby statistical analysis using a Student t-test where p ≤ 0.05 was considered statiscally significant.
4. Conclusions
Approximately 97.6% cholesterol reduction was observed in the cheese that was treated usingβ-CD. Physicochemical properties (fat, moisture and protein) were not changed by the β-CD treatment,except the NS and NNP that showed slight differences attributed to the treatment. The amount of thedifferent components of the lipid fraction (fatty acids, triglycerides and phospholipids) were similarin both, treated and untreated cheese with β-CD. Flavor compounds and short chain free fatty acidswere mostly not significantly influenced by the β-CD. Although, the β-CD molecules are edible andnontoxic and a results they can be used safely for cholesterol removal processing. Therefore, the presentstudy suggested that the treatment with the β-CD was an effective process for cholesterol removalfrom Manchego cheese, while preserving its nutritional properties. Further studies to evaluate theeffect of the intake of the control and low cholesterol Manchego cheeses on the concentration of serumcholesterol would be of interest.
Author Contributions: L.A. conceived, designed the experimental and performed the experiments. P.F.F. revisedthe manuscript. M.V.C. designed the experimental and performed the experiments. J.F. designed the experimentaland performed the experiments.
Funding: Authors thank to the Ministry of Economy and Competitiveness from Spain (grant numberAGL-2014-56464; AGL-2017-84878).
Acknowledgments: The authors thanks to the Monte Toledo dairy cheese factory (Toledo, Castilla-LaMancha. Spain).
Conflicts of Interest: The authors declare that there are no conflicts of interest.
References
1. Hansel, B.; Nicolle, C.; Lalanne, F.F.; Brucket, E. Effect of low-fat, fermented milk enriched with plant sterolson serum lipid profile and oxidative stress in moderate hypercholesterolemia. Am. J. Clin. Nutr. 2007, 86,790–796. [CrossRef] [PubMed]
254
Molecules 2018, 23, 1789
2. Hariharan, K.; Kurien, S.; Rao, S.V. Effect of supplementation of milk fat with peanut oil on blood lipids andlipoproteins in infants. Int. J. Food Sci. Nutr. 1995, 46, 309–317. [CrossRef] [PubMed]
3. Krause, A.J.; Lopetcharat, K.; Drake, M.A. Identification of the characteristics that drive consumer liking ofbutter. J. Dairy Sci. 2007, 90, 2091–2102. [CrossRef] [PubMed]
4. Arul, J.; Boudreau, A.; Makhlouf, J.; Tardif, R.; Bellavia, T. Fractionation of anhydrous milk fat by short pathdestillation. J. Am. Oil Chem. Soc. 1988, 65, 1642–1646. [CrossRef]
5. Arul, J.; Boudreau, A.; Makhlouf, J.; Tardif, R.; Bellavia, T. Distribution of cholesterol in milk fat fractions.J. Dairy Res. 1988, 55, 361–371. [CrossRef] [PubMed]
6. Micich, T.J. Behaviours of polymers supported digitonin with cholesterol in the absence and presence ofbutter oil. J. Agric. Food Chem. 1990, 38, 1839–1843. [CrossRef]
7. Micich, T.J.; Foglia, T.A.; Holsinger, V.H. In vitro studies on saponin-vitamin complexation. J. Agric.
Food Chem. 1992, 40, 1321–1325. [CrossRef]8. Gilliland, S.E.; Nelson, C.R.; Maxwell, C. Assimilation of cholesterol by Lactobacillus acidophilus.
Appl. Environ. Microbiol. 1985, 49, 377–389. [PubMed]9. Walkek, K.W.; Gilliland, S.E. Relationships among bile tolerance, bile salt deconjugation, and assimilation of
cholesterol by Lactobacills acidophilus. J. Dairy Sci. 1993, 76, 956–961. [CrossRef]10. Gonzalez-Hierro, M.T.; Ruiz-Sala, P.; Alonso, L.; Santamaria, G. Extraction of ewe’s milk cream with
supercritical carbon dioxide. Z. Lebensm. Unters. Forsch. 1995, 200, 297–300. [CrossRef] [PubMed]11. Sangbin, L.; Mi-Kyung, J.; Hae-Soo, K. Cholesterol removal from milk fat by supercritical carbon dioxide
extraction in coupled with adsorption. Korean J. Food Sci. Technol. 1998, 30, 574–580.12. Kwak, H.S.; Ahn, J. Optimization cholesterol removal in cream using β-cyclodextrin and response surface
methodology. J. Food Sci. 1999, 64, 629–632.13. Lee, D.K.; Ahn, J.; Kwak, H.S. Cholesterol removal from homogenized milk with β-cyclodextrin. J. Dairy Sci.
1999, 82, 2327–2330. [CrossRef]14. Byung-Sung, P.; Aera, J. Dietary β-cyclodextrin reduces the cholesterol levels in meats and backfat of
fibishing pigs. J. Sci. Food Agric. 2008, 88, 813–818.15. Alonso, L.; Cuesta, P.; Fontecha, J.; Juárez, M.; Gilliland, S.E. Use of beta cyclodextrin to decrease the level of
cholesterol in milk fat. J. Dairy Sci. 2009, 92, 1941–1946. [CrossRef] [PubMed]16. Park, B.S.; Kang, H.K.; Jang, A. Influence of feeding β-cyclodextrin hens on the egg production and
cholesterol content of egg yolk. Asian Australas. J. Anim. Sci. 2005, 18, 835–840. [CrossRef]17. Yen, G.C.; Tsui, L.T. Cholesterol removal from a lard water mixture with β-cyclodextrin. J. Food Sci. 1995, 60,
561–564. [CrossRef]18. Alonso, L.; Fontecha, J.; Cuesta, P.; Juárez, M.; Gilliland, S.E. Industrial application of beta-cyclodextrin for
manufacturing low colesterol butter. Milchwiss.-Milk Sci. Int. 2010, 65, 36–37.19. Lee, S.J.; Hwang, J.H.; Lee, S.; Ahn, J.; Kwak, H.S. Property changes and cholesterol lowering effects
in evening primose oil-enriched and cholesterol-reduced yoghurt. Int. J. Dairy Technol. 2007, 60, 22–30.[CrossRef]
20. Seon, K.H.; Ahn, J.; Kwak, H.S. The accelerated ripening of cholesterol-reduced Cheddar cheese bycross-linked β-cyclodextrin. J. Dairy Sci. 2009, 92, 49–57. [CrossRef] [PubMed]
21. Reineccius, T.A.; Reineccius, G.A.; Peppard, T.L. Potential for β-cyclodextrin as partial fat replacer in low-fatfoods. J. Food Sci. 2004, 69, 334–341. [CrossRef]
22. Szente, L.; Szejtli, J. Cyclodextrin as food ingredients. Trends Foods Sci. Technol. 2004, 15, 137–142. [CrossRef]23. Haenlein, G.F.W. The nutritional value of sheep milk. Int. J. Anim. Sci. 2001, 16, 253–268.24. Park, Y.W.; Juárez, M.; Ramos, M.; Haenlein, G.F.W. Physico-chemical characteristeics of goat and sheep milk.
Small Rumin. Res. 2007, 68, 88–113. [CrossRef]25. Ibrahim, A.H.; Soryal, K.A. Effect of using cross linked β-cyclodextrin on physicochemical properties of
Domiati goat’s cheese. J. Food Dairy Sci. 2014, 5, 581–600.26. Smit, G.; Verheul, A.; van Kranenburg, R.; Ayad, E.; Siezen, R.; Engels, W. Cheese flavor development by
enzymatic conversions of peptides and amino acids. Food Res. Int. 2000, 33, 153–160. [CrossRef]27. Kwak, H.S.; Jung, C.S.; Seok, J.S.; Ahn, J. Cholesterol removal and flavor development in cheddar cheese.
Asian Australas. J. Anim. Sci. 2003, 16, 409–416. [CrossRef]28. Kim, H.Y.; Bae, H.Y.; Kwak, H.S. Development of cholesterol-reduced Blue cheese made by crosslinked
β-cyclodextrin. Milchwiss 2008, 63, 53–56.
255
Molecules 2018, 23, 1789
29. Chen, H.; Schwartz, S.; Spanos, G.A. Fractionation of butter oil by supercrital carbon dioxide. J. Dairy Sci.
1992, 75, 2659–2669. [CrossRef]30. Bhashar, A.R.; Rizvi, S.S.H.; Sherbon, J.W. Anhydrous milk fat fractionation with continous countercurrent
supercritical carbon dioxide. J. Food Sci. 1993, 56, 748–752. [CrossRef]31. Alonso, L.; Fontecha, J.; Cuesta, P. Effect of beta-cyclodextrin on phospholipids and cholesterol of the milk
fat globule membrane. J. Adv. Dairy Res. 2015, 3, 3–7.32. Jeon, S.S.; Joo, S.; Ganesan, P.; Kwak, H.S. Comparative study of flavor, texture, and sensory in cream cheese
and cholesterol removed cream cheese. Food Sci. Biotechnol. 2012, 21, 159–165. [CrossRef]33. Smit, G.; Smit, B.A.; Engel, J.M. Flavour formation by lactic acid bacteria and biochemical flavour profiling
of cheese products. FEMS Microbiol. Rev. 2005, 29, 591–610. [CrossRef] [PubMed]34. Kim, S.Y.; Park, S.Y.; Ahn, J.; Kwak, H.S. Properties of cholesterol reduced block type process cheese made
by crosslinked β-CD-cyclodextrin. Korean J. Food Anim. Resour. 2008, 28, 463–469. [CrossRef]35. Fernández García, E.; López Fandiño, R.; Alonso, L. Effect of food grade enzyme preparation from Aspergillus
oryzae on free fatty acid realease in Manchego type cheese from ovine and bovine milk. Eur. Food Res. Tecnol.
1994, 199, 262–264.36. Fernández-García, E.; López-Fandiño, R.; Alonso, L.; Ramos, M. The use of lipolytic and proteolytic enzymes
in the manufacture of Manchego cheese type cheese from ovine and bovine milk. J. Dairy Sci. 1994, 77,2139–2149. [CrossRef]
37. Metzge, N.S.; Mistry, V.V. A new approch using homogenization of cream in the manufacture of reducedCheddar cheese. Manufacture, composition, and yield. J. Dairy Sci. 1994, 77, 3506–3515. [CrossRef]
38. Alonso, L.; Juárez, M.; Ramos, M.; Martín Alvarez, P.J. Overall composition, nitrogen fraction and fatcharacteristics of Cabrales cheese during ripening. Eur. Food Res. Technol. 1987, 185, 481–486. [CrossRef]
39. Alonso, L.; Cuesta, P.; Gilliland, S.G. Development of a HPLC method for determining residualbeta-cyclodextrin in milk, cream and butter as a novel prebiotic in dairy foods. Chromatographia 2008,69, 1089–1092.
40. ISO-IDF. Milk and Milk Products. Extraction Methods for Lipids and Liposoluble Compounds; ISO 14152;International Dairy Federation Standard: Brussels, Belgium, 2001; p. 172.
41. Alonso, L.; Lozada, L.; Fontecha, J.; Juarez, M. Determination of cholesterol in milk fat by gas chromatographywith direct injection and sample saponification. Chromatographia 1995, 41, 23–25. [CrossRef]
42. Alonso, L.; Fontecha, J.; Lozada, L.; Fraga, M.J.; Juárez, M. Fatty acid composition of caprine milk: Major,branched-chain and trans fatty acids. J. Dairy Sci. 1999, 82, 878–884. [CrossRef]
43. Alonso, L. Capillary gas chromatography of some triglycerides in cheese using programmed temperatureinjection. Chromatographia 1993, 35, 9–12. [CrossRef]
44. Castro-Gómez, M.; Rodriguez Alcalá, L.M.; Calvo, M.V.; Romero, J.; Mendiola, J.A.; Ibáñez, E.; Fontecha, J.Total milk fat extraction and quantification of polar and neutral lipids of cow, goat, and ewe milk usinga pressurized liquid system and chromatographic techniques. J. Dairy Sci. 2014, 97, 6719–6728. [CrossRef][PubMed]
45. Alonso, L.; Fontecha, J.; Juárez, M. Development of a headspace gas chromatographic mass spectrometricmethod for determining methyl-ketones and secondary alcohols in blue cheese. J. Chromatogr. Sci. 1999, 37,108–112. [CrossRef]
46. International Organization for Standardization. Sensory Analysis. General Guidance for the Design of Test Rooms;ISO 8589; International Organization for Standardization: Brussels, Belgium, 2007.
Sample Availability: Samples of the compounds are not available from the authors.
© 2018 by the authors. Licensee MDPI, Basel, Switzerland. This article is an open accessarticle distributed under the terms and conditions of the Creative Commons Attribution(CC BY) license (http://creativecommons.org/licenses/by/4.0/).
256
molecules
Article
Effect of Enzyme Modified Soymilk on RennetInduced Gelation of Skim Milk
Kaixin Li 1,2, Jianjun Yang 1,2, Qigen Tong 1,2, Wei Zhang 1,2 and Fang Wang 1,2,*
1 Beijing Laboratory for Food Quality and Safety, Food Science and Engineering College, Beijing Universityof Agriculture, Beijing 102206, China; [email protected] (K.L.); [email protected] (J.Y.);[email protected] (Q.T.); [email protected] (W.Z.)
2 Beijing Key Laboratory of Agricultural Product Detection and Control for Spoilage Organisms andPesticides, Food Science and Engineering College, Beijing University of Agriculture, Beijing 102206, China
* Correspondence: [email protected]; Tel.: +86-010-8079-9170
Academic Editors: Lillian Barros and Isabel C.F.R. FerreiraReceived: 29 October 2018; Accepted: 23 November 2018; Published: 26 November 2018
Abstract: In this study, soymilk was hydrolyzed to different degrees with flavourzyme, and thensoymilk and enzyme modified soymilk at various levels were added to skim milk respectively,to generate a mixed gel using rennet. Rheological properties, scanning electron microscopy imaging,and physical and chemical indexes were examined to reveal the effect of enzyme modified soymilkon rennet induced gelation of skim milk. Results showed that soymilk inhibited the aggregation ofskim milk, led to a decrease in storage modulus (G’), significantly increased moisture content andcurd yield, and the resulting network was coarse. Enzyme modified soymilk with a molecular weightbelow 20 kDa led to a more uniform curd distribution, which counteracted the reduction of G’ andallowed for the formation of a stronger gel. Both the moisture content and the curd yield increasedwith the addition of soymilk and enzyme modified soymilk, and overall the effect of adding a highdegree of hydrolysis of enzyme modified soymilk was superior. Compared to untreated soymilk,the addition of a certain amount of enzyme modified soymilk resulted in a new protein structure,which would improve the texture of blend cheese.
Keywords: soymilk; enzyme modified soymilk; skim milk; rennet induced gelation; cheese;rheological properties
1. Introduction
In recent years, with rising food price levels, increased dietary awareness and health concerns,people are becoming more interested in soy products and novel value-added food products.Consuming foods that contain casein and soy protein has many beneficial health effects, and gels madefrom these two proteins can achieve dual health effects of two products [1].
The gelation of milk often occurs in two ways. In the first mechanism, during acidification,colloidal calcium phosphate is dissolved, and caseins formed a self-supporting network neartheir isoelectric point [2]. In the other mechanism, rennet specifically hydrolyzes k-casein atthe Phe105–Met106 bond, decreasing steric and electrostatic stabilization and resulting in caseinaggregation [3,4]. Soymilk gels are typically prepared by heating soymilk, and gelation can also beinduced by adding magnesium chloride or glucono-δ-lactone [5].
Many studies have focused on mixed skim milk and soymilk gels. Previous studies have shownthat under acidification conditions, the viscoelastic properties and microstructure of generated proteingels of skim milk and soymilk mixtures are dependent on the concentration of skim milk powder andsoy protein concentrate [6]. In addition, adding rennet to skim milk and soymilk systems, rennet will
257
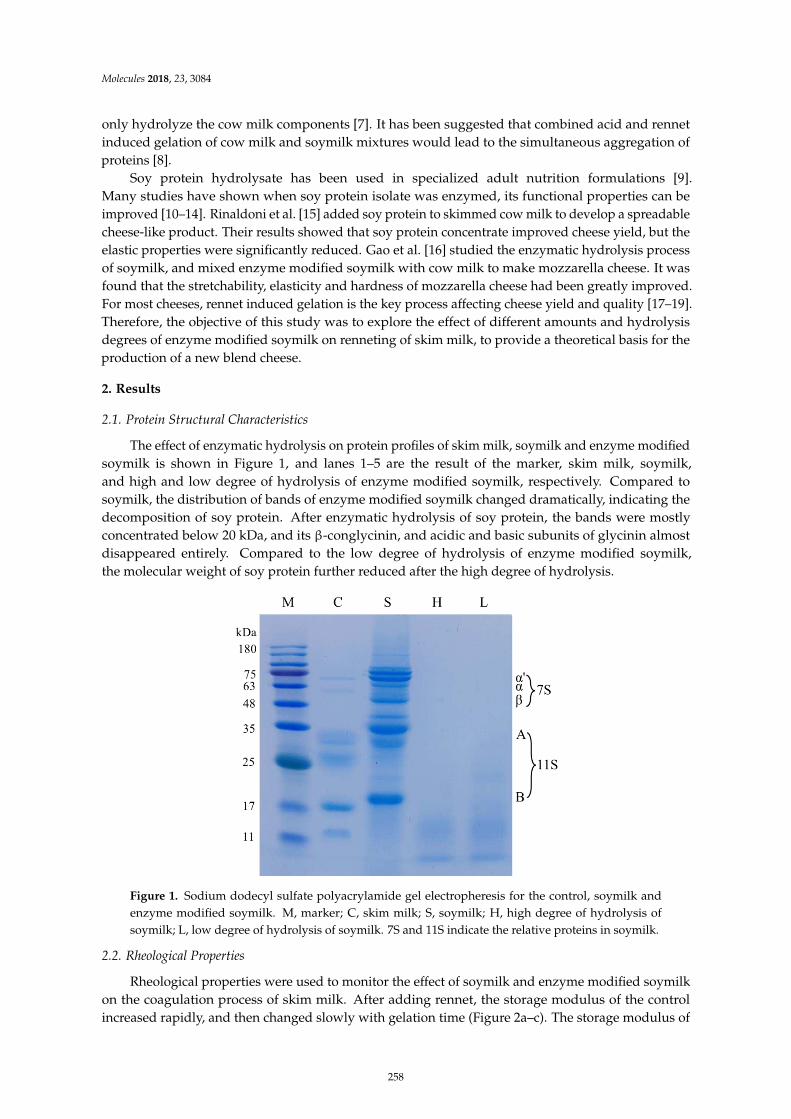
Molecules 2018, 23, 3084
only hydrolyze the cow milk components [7]. It has been suggested that combined acid and rennetinduced gelation of cow milk and soymilk mixtures would lead to the simultaneous aggregation ofproteins [8].
Soy protein hydrolysate has been used in specialized adult nutrition formulations [9].Many studies have shown when soy protein isolate was enzymed, its functional properties can beimproved [10–14]. Rinaldoni et al. [15] added soy protein to skimmed cow milk to develop a spreadablecheese-like product. Their results showed that soy protein concentrate improved cheese yield, but theelastic properties were significantly reduced. Gao et al. [16] studied the enzymatic hydrolysis processof soymilk, and mixed enzyme modified soymilk with cow milk to make mozzarella cheese. It wasfound that the stretchability, elasticity and hardness of mozzarella cheese had been greatly improved.For most cheeses, rennet induced gelation is the key process affecting cheese yield and quality [17–19].Therefore, the objective of this study was to explore the effect of different amounts and hydrolysisdegrees of enzyme modified soymilk on renneting of skim milk, to provide a theoretical basis for theproduction of a new blend cheese.
2. Results
2.1. Protein Structural Characteristics
The effect of enzymatic hydrolysis on protein profiles of skim milk, soymilk and enzyme modifiedsoymilk is shown in Figure 1, and lanes 1–5 are the result of the marker, skim milk, soymilk,and high and low degree of hydrolysis of enzyme modified soymilk, respectively. Compared tosoymilk, the distribution of bands of enzyme modified soymilk changed dramatically, indicating thedecomposition of soy protein. After enzymatic hydrolysis of soy protein, the bands were mostlyconcentrated below 20 kDa, and its β-conglycinin, and acidic and basic subunits of glycinin almostdisappeared entirely. Compared to the low degree of hydrolysis of enzyme modified soymilk,the molecular weight of soy protein further reduced after the high degree of hydrolysis.
–
–
–
β
Figure 1. Sodium dodecyl sulfate polyacrylamide gel electropheresis for the control, soymilk andenzyme modified soymilk. M, marker; C, skim milk; S, soymilk; H, high degree of hydrolysis ofsoymilk; L, low degree of hydrolysis of soymilk. 7S and 11S indicate the relative proteins in soymilk.
2.2. Rheological Properties
Rheological properties were used to monitor the effect of soymilk and enzyme modified soymilkon the coagulation process of skim milk. After adding rennet, the storage modulus of the controlincreased rapidly, and then changed slowly with gelation time (Figure 2a–c). The storage modulus of
258
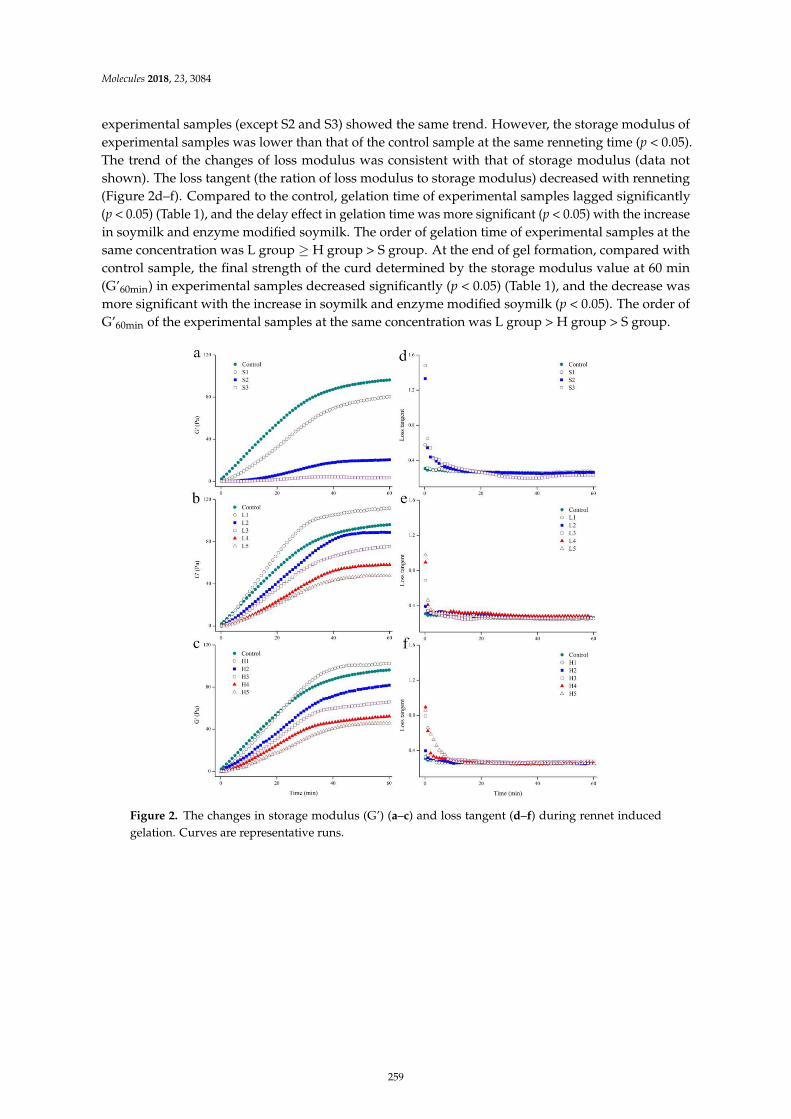
Molecules 2018, 23, 3084
experimental samples (except S2 and S3) showed the same trend. However, the storage modulus ofexperimental samples was lower than that of the control sample at the same renneting time (p < 0.05).The trend of the changes of loss modulus was consistent with that of storage modulus (data notshown). The loss tangent (the ration of loss modulus to storage modulus) decreased with renneting(Figure 2d–f). Compared to the control, gelation time of experimental samples lagged significantly(p < 0.05) (Table 1), and the delay effect in gelation time was more significant (p < 0.05) with the increasein soymilk and enzyme modified soymilk. The order of gelation time of experimental samples at thesame concentration was L group ≥ H group > S group. At the end of gel formation, compared withcontrol sample, the final strength of the curd determined by the storage modulus value at 60 min(G’60min) in experimental samples decreased significantly (p < 0.05) (Table 1), and the decrease wasmore significant with the increase in soymilk and enzyme modified soymilk (p < 0.05). The order ofG’60min of the experimental samples at the same concentration was L group > H group > S group.
–
–
was L group ≥ H group > S group. At the end of
G’
G’
G’) – –
G’
Figure 2. The changes in storage modulus (G’) (a–c) and loss tangent (d–f) during rennet inducedgelation. Curves are representative runs.
259
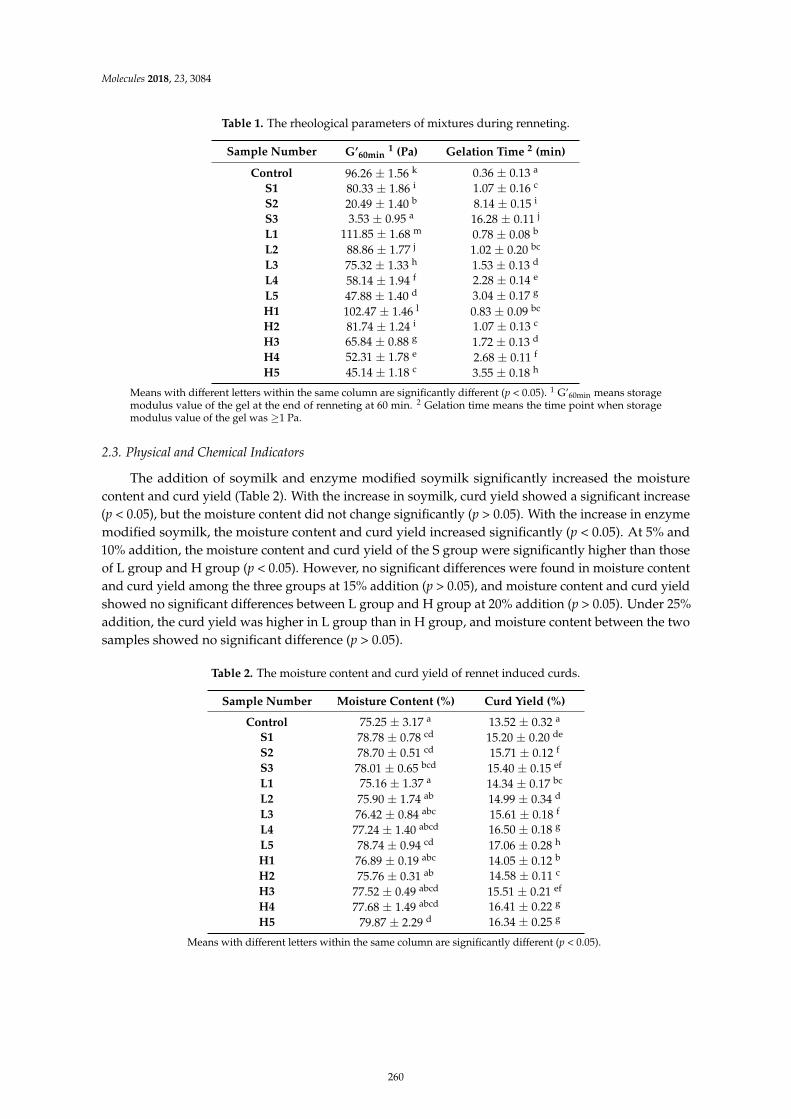
Molecules 2018, 23, 3084
Table 1. The rheological parameters of mixtures during renneting.
Sample Number G’60min1 (Pa) Gelation Time 2 (min)
Control 96.26 ± 1.56 k 0.36 ± 0.13 a
S1 80.33 ± 1.86 i 1.07 ± 0.16 c
S2 20.49 ± 1.40 b 8.14 ± 0.15 i
S3 3.53 ± 0.95 a 16.28 ± 0.11 j
L1 111.85 ± 1.68 m 0.78 ± 0.08 b
L2 88.86 ± 1.77 j 1.02 ± 0.20 bc
L3 75.32 ± 1.33 h 1.53 ± 0.13 d
L4 58.14 ± 1.94 f 2.28 ± 0.14 e
L5 47.88 ± 1.40 d 3.04 ± 0.17 g
H1 102.47 ± 1.46 l 0.83 ± 0.09 bc
H2 81.74 ± 1.24 i 1.07 ± 0.13 c
H3 65.84 ± 0.88 g 1.72 ± 0.13 d
H4 52.31 ± 1.78 e 2.68 ± 0.11 f
H5 45.14 ± 1.18 c 3.55 ± 0.18 h
Means with different letters within the same column are significantly different (p < 0.05). 1 G’60min means storagemodulus value of the gel at the end of renneting at 60 min. 2 Gelation time means the time point when storagemodulus value of the gel was ≥1 Pa.
2.3. Physical and Chemical Indicators
The addition of soymilk and enzyme modified soymilk significantly increased the moisturecontent and curd yield (Table 2). With the increase in soymilk, curd yield showed a significant increase(p < 0.05), but the moisture content did not change significantly (p > 0.05). With the increase in enzymemodified soymilk, the moisture content and curd yield increased significantly (p < 0.05). At 5% and10% addition, the moisture content and curd yield of the S group were significantly higher than thoseof L group and H group (p < 0.05). However, no significant differences were found in moisture contentand curd yield among the three groups at 15% addition (p > 0.05), and moisture content and curd yieldshowed no significant differences between L group and H group at 20% addition (p > 0.05). Under 25%addition, the curd yield was higher in L group than in H group, and moisture content between the twosamples showed no significant difference (p > 0.05).
Table 2. The moisture content and curd yield of rennet induced curds.
Sample Number Moisture Content (%) Curd Yield (%)
Control 75.25 ± 3.17 a 13.52 ± 0.32 a
S1 78.78 ± 0.78 cd 15.20 ± 0.20 de
S2 78.70 ± 0.51 cd 15.71 ± 0.12 f
S3 78.01 ± 0.65 bcd 15.40 ± 0.15 ef
L1 75.16 ± 1.37 a 14.34 ± 0.17 bc
L2 75.90 ± 1.74 ab 14.99 ± 0.34 d
L3 76.42 ± 0.84 abc 15.61 ± 0.18 f
L4 77.24 ± 1.40 abcd 16.50 ± 0.18 g
L5 78.74 ± 0.94 cd 17.06 ± 0.28 h
H1 76.89 ± 0.19 abc 14.05 ± 0.12 b
H2 75.76 ± 0.31 ab 14.58 ± 0.11 c
H3 77.52 ± 0.49 abcd 15.51 ± 0.21 ef
H4 77.68 ± 1.49 abcd 16.41 ± 0.22 g
H5 79.87 ± 2.29 d 16.34 ± 0.25 g
Means with different letters within the same column are significantly different (p < 0.05).
260
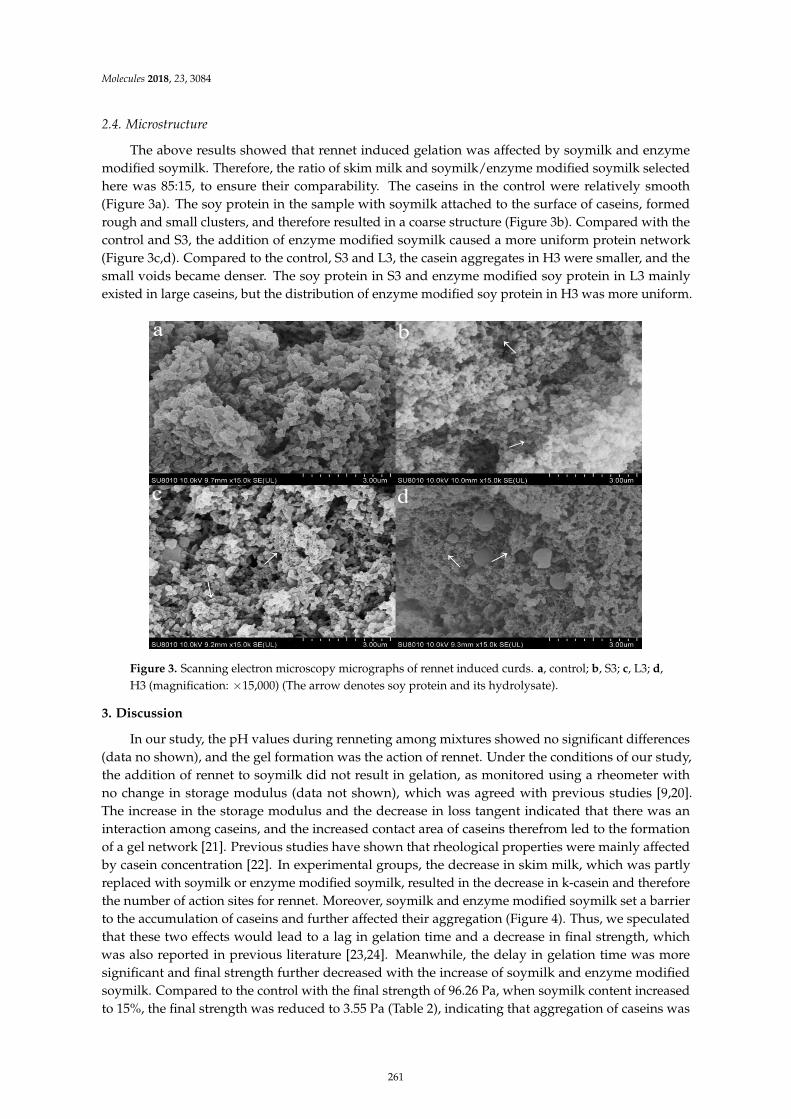
Molecules 2018, 23, 3084
2.4. Microstructure
The above results showed that rennet induced gelation was affected by soymilk and enzymemodified soymilk. Therefore, the ratio of skim milk and soymilk/enzyme modified soymilk selectedhere was 85:15, to ensure their comparability. The caseins in the control were relatively smooth(Figure 3a). The soy protein in the sample with soymilk attached to the surface of caseins, formedrough and small clusters, and therefore resulted in a coarse structure (Figure 3b). Compared with thecontrol and S3, the addition of enzyme modified soymilk caused a more uniform protein network(Figure 3c,d). Compared to the control, S3 and L3, the casein aggregates in H3 were smaller, and thesmall voids became denser. The soy protein in S3 and enzyme modified soy protein in L3 mainlyexisted in large caseins, but the distribution of enzyme modified soy protein in H3 was more uniform.
ĸ
Figure 3. Scanning electron microscopy micrographs of rennet induced curds. a, control; b, S3; c, L3; d,H3 (magnification: ×15,000) (The arrow denotes soy protein and its hydrolysate).
3. Discussion
In our study, the pH values during renneting among mixtures showed no significant differences(data no shown), and the gel formation was the action of rennet. Under the conditions of our study,the addition of rennet to soymilk did not result in gelation, as monitored using a rheometer withno change in storage modulus (data not shown), which was agreed with previous studies [9,20].The increase in the storage modulus and the decrease in loss tangent indicated that there was aninteraction among caseins, and the increased contact area of caseins therefrom led to the formationof a gel network [21]. Previous studies have shown that rheological properties were mainly affectedby casein concentration [22]. In experimental groups, the decrease in skim milk, which was partlyreplaced with soymilk or enzyme modified soymilk, resulted in the decrease in k-casein and thereforethe number of action sites for rennet. Moreover, soymilk and enzyme modified soymilk set a barrierto the accumulation of caseins and further affected their aggregation (Figure 4). Thus, we speculatedthat these two effects would lead to a lag in gelation time and a decrease in final strength, whichwas also reported in previous literature [23,24]. Meanwhile, the delay in gelation time was moresignificant and final strength further decreased with the increase of soymilk and enzyme modifiedsoymilk. Compared to the control with the final strength of 96.26 Pa, when soymilk content increasedto 15%, the final strength was reduced to 3.55 Pa (Table 2), indicating that aggregation of caseins was
261
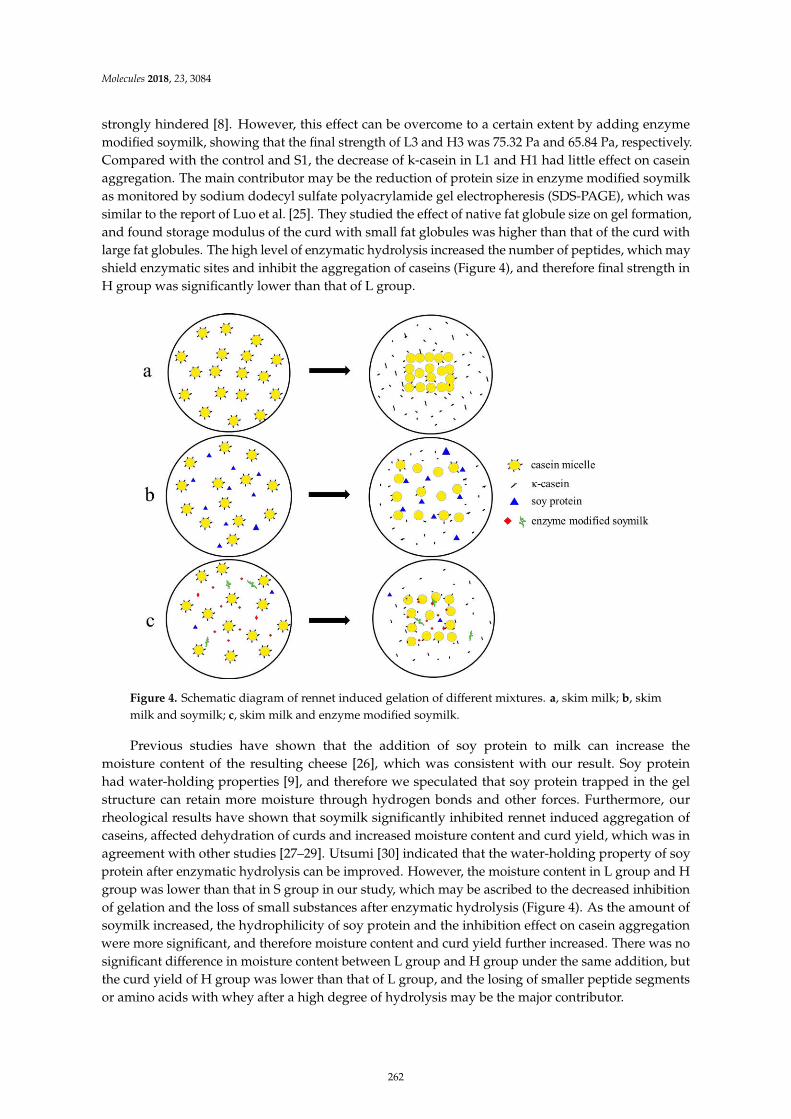
Molecules 2018, 23, 3084
strongly hindered [8]. However, this effect can be overcome to a certain extent by adding enzymemodified soymilk, showing that the final strength of L3 and H3 was 75.32 Pa and 65.84 Pa, respectively.Compared with the control and S1, the decrease of k-casein in L1 and H1 had little effect on caseinaggregation. The main contributor may be the reduction of protein size in enzyme modified soymilkas monitored by sodium dodecyl sulfate polyacrylamide gel electropheresis (SDS-PAGE), which wassimilar to the report of Luo et al. [25]. They studied the effect of native fat globule size on gel formation,and found storage modulus of the curd with small fat globules was higher than that of the curd withlarge fat globules. The high level of enzymatic hydrolysis increased the number of peptides, which mayshield enzymatic sites and inhibit the aggregation of caseins (Figure 4), and therefore final strength inH group was significantly lower than that of L group.
ĸ
–
Figure 4. Schematic diagram of rennet induced gelation of different mixtures. a, skim milk; b, skimmilk and soymilk; c, skim milk and enzyme modified soymilk.
Previous studies have shown that the addition of soy protein to milk can increase themoisture content of the resulting cheese [26], which was consistent with our result. Soy proteinhad water-holding properties [9], and therefore we speculated that soy protein trapped in the gelstructure can retain more moisture through hydrogen bonds and other forces. Furthermore, ourrheological results have shown that soymilk significantly inhibited rennet induced aggregation ofcaseins, affected dehydration of curds and increased moisture content and curd yield, which was inagreement with other studies [27–29]. Utsumi [30] indicated that the water-holding property of soyprotein after enzymatic hydrolysis can be improved. However, the moisture content in L group and Hgroup was lower than that in S group in our study, which may be ascribed to the decreased inhibitionof gelation and the loss of small substances after enzymatic hydrolysis (Figure 4). As the amount ofsoymilk increased, the hydrophilicity of soy protein and the inhibition effect on casein aggregationwere more significant, and therefore moisture content and curd yield further increased. There was nosignificant difference in moisture content between L group and H group under the same addition, butthe curd yield of H group was lower than that of L group, and the losing of smaller peptide segmentsor amino acids with whey after a high degree of hydrolysis may be the major contributor.
262
Molecules 2018, 23, 3084
The control curd showed a compact protein matrix, which was composed of thick chains andlarge clusters of caseins (Figure 3a), and it was consistent with previous report [31]. The soy proteinadhered or was bound to the surface of caseins, formed a clustered structure and therefore inhibitedthe aggregation of caseins, causing the increased moisture content and curd yield. The research ofIngrassia et al. showed a similar phenomenon [32]. Both glycinin and β-conglycinin in soymilk can beeffectively degraded by flavourzyme [33], which may decrease the inhibition of gelation and thereforecontribute to a more compact and orderly gel structure. The increase in the number of small substancesafter a high degree of hydrolysis further inhibited the aggregation of caseins, and thus decreased thesize of casein aggregates.
4. Materials and Methods
4.1. Skim Milk Preparation
Fresh milk was supplied by a local farm (Fuchun Farm, Beijing Sanyuan Food Co., Ltd., Beijing,China) and sodium azide (0.02%) was added immediately. The milk was centrifuged at 4000× g for20 min at 4 ◦C (LYNX 2000, Thermo Scientific, Waltham, MA, USA) and then filtered three timesthrough filters (Fisher Scientific, Whitby, ON, Canada), as far as possible to remove fat. The resultingskim milk was pasteurized at 63 ◦C for 30 min, cooled to room temperature, and stored in a refrigeratoruntil use. The fat content of skim milk was 0.04 ± 0.01% by the AOAC method [34], and proteincontent was 3.21 ± 0.05% measured using the Kjeldahl method [19].
4.2. Enzyme Modified Soymilk Preparation
Soybeans (Helen soybean, Heilongjiang Black Soil Town Modern Agriculture Development Co.,Ltd., Haerbin, Heilongjiang, China) containing 36% protein and 16% fat were obtained from a localmarket. Soymilk was prepared as previously reported [35], with slight modifications. Soybeans weresoaked overnight in deionized water for hydration and mixed with a certain amount of deionizedwater to obtain the desired protein content. Subsequently, samples were passed through a householdsoymilk maker (RM-125, Ruimei, Wuxi, Jiangsu, China). After soymilk maker cycle was completed,soymilk was passed through a filter (Fisher Scientific, Whitby, ON, Canada) and passed throughcheesecloth to remove okara. Then soymilk was boiled at 100 ◦C for 10 min and rapidly cooled toroom temperature. The protein content of the obtained soymilk was 3.32 ± 0.07% measured using theKjeldahl method [19].
Flavourzyme (0.28%; HP202474, Novozymes, Tianjin, China) was added to soymilk for 2 h and 4 hat 45 ◦C, respectively. The subsequent degree of hydrolysis of soymilk was 5.92% and 9.88% accordingto the Ninhydrin method [36]. L and H were used to represent the low (L) and high (H) degreeof hydrolysis. The enzyme modified soymilk was then incubated at 85 ◦C for 15 min to inactivatethe enzyme. When samples were cooled to room temperature, sodium azide (0.02%) was added.The obtained samples were stored at 4 ◦C until use.
4.3. Electrophoresis
The effect of enzyme treatments on protein profiles of soymilk and enzyme modified soymilkwas determined using SDS-PAGE with separating and stacking gels containing 15 and 4% acrylamide,respectively. A molecular weight marker ranging from 11 to 180 kDa (PR1910, Solarbio, Beijing, China)was used as a standard. Skim milk, soymilk and enzyme modified soymilk were dissolved with samplebuffer (10 mM DTT, pH 6.8, 1 mM EDTA, 1% SDS, 10% glycerol, and 0.01% bromphenol blue) andthen boiled for 5 min. After centrifugation, the electrophoresis was carried out following the methodof Lamsal et al. [37].
263
Molecules 2018, 23, 3084
4.4. Mixture Preparation
The mixtures were prepared according to Table 3, and skim milk was selected as the control.For convenient reading, samples with different ratios of skim milk and soymilk/enzyme modifiedsoymilk are indicated by S1–S3, L1–L5 and H1–H5. The mass ratio selected were to ensure that rennetinduced gelation would occur. After the mixtures of skim milk and soymilk/enzyme modified soymilkhad been prepared, the samples were stirred at room temperature for 30 min, and the pH was adjustedto 6.7 with 0.1 M NaOH. All the samples were stored in a refrigerator until use.
Table 3. The mixtures with different mass ratios of skim milk and soymilk/enzyme modified soymilk.
Mass Ratio SoymilkLow Degree of
Hydrolysis of SoymilkHigh Degree of
Hydrolysis of Soymilk
95:5 S1 L1 H190:10 S2 L2 H285:15 S3 L3 H380:20 - L4 H475:25 - L5 H5
4.5. Curd Making
All samples (weighed and recorded as W1) were first warmed at 32 ◦C for 30 min and thenincubated with rennet (0.01%). Rennet (CHY-MAX powder Extra) was got from Chr. Hansen (Beijing,China) and the coagulation strength was ~2235 IMCU/g. After 1 h of incubation, the resulting gelswere cut manually into small pieces (1 × 1 × 1 cm), and then set for 5 min to promote syneresis.Curds were subsequently centrifuged at 4000× g for 15 min at room temperature. The upper wheywas removed and the curd was collected carefully and weighed (recorded as W2). The curd yield wascalculated using following Equation:
Curd yield = W2/W1 × 100%
The moisture content of the curds was analyzed using an oven method [34]. All measurementswere obtained in triplicate.
4.6. Rheological Properties
The coagulation process of the mixtures was monitored as described previously [38]. All sampleswere first maintained at 32 ◦C for 30 min. The gelation time was defined as the time point when storagemodulus value of the gel was ≥1 Pa [6]. All measurements were determined in triplicate.
4.7. Microstructure Determination
The samples for microstructure determination were prepared as described earlier [39].Then samples were critical point dried in a Technics Critical Point Dryer (CPD030, Leica MikrosystemeGmbH, Wien, Austria), fixed on the sample table (MC1000, Hitachi, Ibarakiken, Japan) for sprayingoperation and then examined using a scanning electron microscope (SU8010, Hitachi, Ibarakiken,Japan) operated at 25 kV. Representative micrographs were selected for presentation.
4.8. Statistical Analysis
Statistical analysis of the data was performed using SPSS 18.0 (SPSS Inc., Armonk, NY, USA).The differences were compared at a significance level of p < 0.05.
5. Conclusions
Soymilk and enzyme modified soymilk have a significant effect on renneting of skim milk.Compared to skim milk, a certain proportion of soymilk and enzyme modified soymilk would
264
Molecules 2018, 23, 3084
decrease storage modulus of the mixed gel, and significantly increase moisture content and curd yield.In addition, with the increase in soymilk and enzyme modified soymilk, the inhibition of gel formationwas stronger, and moisture content and curd yield further increased. Compared to soymilk, enzymemodified soymilk with more small molecular substances decreased the impediment of rennet inducedgelation, improved storage modulus of the gel, and the resulting curd had a more uniform structure.
Author Contributions: Data curation, K.L.; Funding acquisition, F.W.; Investigation, K.L., J.Y. and W.Z.; Projectadministration, Q.T. and F.W.; Writing—original draft, K.L.; Writing—review and editing, F.W.
Funding: This project was financially supported by the Beijing Municipal Commission of Education ResearchProgram (KM201710020013).
Acknowledgments: We would like to thank Donghua Yu for assisting with the scanning electron micrographs atthe Institute of Atomic Energy Utilization, Chinese Academy of Agricultural Sciences.
Conflicts of Interest: The authors declare no conflict of interest.
References
1. Schaafsma, G. The protein digestibility-corrected amino acid score (pdcaas)—A concept for describingprotein quality in foods and food ingredients: A critical review. J. Aoac Int. 2005, 88, 988–994. [PubMed]
2. Lucey, J.A.; Singh, H. Formation and physical properties of acid milk gels: A review. Food Res. Int. 1997, 30,529–542. [CrossRef]
3. Dalgleish, D.G. Proteolysis and aggregation of casein micelles treated with immobilized or soluble chymosin.J. Dairy Res. 1979, 46, 653–661. [CrossRef]
4. Alexander, M.; Dalgleish, D.G. Application of transmission diffusing wave spectroscopy to the study ofgelation of milk by acidification and rennet. Colloid. Surface B 2004, 38, 83–90. [CrossRef] [PubMed]
5. Poysa, V.; Woodrow, L. Stability of soybean seed composition and its effect on soymilk and tofu yield andquality. Food Res. Int. 2002, 35, 337–345. [CrossRef]
6. Roesch, R.; Juneja, M.; Monagle, C.; Corredig, M. Aggregation of soy/milk mixes during acidification.Food Res. Int. 2004, 37, 209–215. [CrossRef]
7. Grygorczyk, A.; Alexander, M.; Corredig, M. Combined acid- and rennet-induced gelation of a mixed soyamilk–cow’s milk system. Int. J. Food Sci. Technol. 2013, 48, 2306–2314. [CrossRef]
8. Lin, C.; Hill, A.; Corredig, M. Gelation of mixtures of soymilk and reconstituted skim milk subjected tocombined acid and rennet. J. Texture Stud. 2012, 43, 468–476. [CrossRef]
9. Mahnoud, M.I. Physicochemical and functional properties of protein hydrolysates in nutritional products.Food Technol. 1994, 48, 89–94.
10. Ortiz, S.E.M.; Wagner, J.R. Hydrolysates of native and modified soy protein isolates: Structural characteristics,solubility and foaming properties. Food Res. Int. 2001, 35, 511–518. [CrossRef]
11. Achouri, A.; Zhang, W. Effect of succinylation on the physicochemical properties of soy protein hydrolysate.Food Res. Int. 2001, 34, 507–514. [CrossRef]
12. Tsumura, K.; Saito, T.; Tsuge, K.; Ashida, N.; Kugimiya, W.; Inouye, K. Functional properties of soy proteinhydrolysates obtained by selective proteolysis. LWT-Food Sci. Technol. 2005, 38, 255–261. [CrossRef]
13. Were, L.; Hettiarachchy, N.S.; Kalapathy, U. Modified soy proteins with improved foaming and waterhydration properties. J. Food Sci. 1997, 62, 821–824. [CrossRef]
14. Suro´wka, K.; Zmudzin´ski, D.; Suro´wka, J. Enzymic modification of extruded soy protein concentrates asa method of obtaining new functional food components. Trends Food Sci. Tech. 2004, 15, 153–160. [CrossRef]
15. Rinaldoni, A.N.; Palatnik, D.R.; Zaritzky, N.; Campderrós, M.E. Soft cheese-like product developmentenriched with soy protein concentrates. LWT-Food Sci. Technol. 2014, 55, 139–147. [CrossRef]
16. Gao, Y.; Fang, Z.; Cao, X.; Lin, J.; Xie, J.; Xu, X. Optimization of process of analog Mozzarella cheesecontaining limit hydrolyzed soy milk. Food Sci Technol. 2010, 35, 94–100.
17. Ikonen, T.; Ruottinen, O.; Syväoja, E.L.; Saarinen, K.; Pahkala, E.; Ojala, M. Effect of milk coagulationproperties of herd bulk milks on yield and composition of Emmental cheese. Agric. Food Sci. 1999, 8, 411–422.[CrossRef]
18. Pandey, P.K.; Ramaswamy, H.S.; Stgelais, D. Water-holding capacity and gel strength of rennet curd asaffected by high-pressure treatment of milk. Food Res. Int. 2000, 33, 655–663. [CrossRef]
265
Molecules 2018, 23, 3084
19. Wang, F.; Tong, Q.; Luo, J.; Xu, Y.; Ren, F. Effect of carrageenan on physicochemical and functional propertiesof low-fat colby cheese. J. Food Sci. 2016, 81, E1949–E1955. [CrossRef] [PubMed]
20. Stanley, D.W.; Deman, J.M. Structural and mechanical properties of textured proteins. J. Texture Stud. 1978, 9,59–76. [CrossRef]
21. Lucey, J.A. Formation and physical properties of milk protein gels. J. Dairy Sci. 2002, 85, 281–294. [CrossRef]22. Ferrer, M.A.; Hill, A.R.; Corredig, M. Rheological properties of rennet gels containing milk protein
concentrates. J. Dairy Sci. 2008, 91, 959–969. [CrossRef] [PubMed]23. Haratifar, S.; Corredig, M. Interactions between tea catechins and casein micelles and their impact on
renneting functionality. Food Chem. 2014, 143, 27–32. [CrossRef] [PubMed]24. Logan, A.; Leis, A.; Li, D.; Øiseth, S.K.; Puvanenthiran, A.; Augustin, M.A. Rennet gelation properties of
milk: Influence of natural variation in milk fat globule size and casein micelle size. Int. Dairy J. 2014, 46,71–77. [CrossRef]
25. Luo, J.; Wang, Y.; Guo, H.; Ren, F. Effects of size and stability of native fat globules on the formation of milkgel induced by rennet. J. Food Sci. 2017, 82, 670–678. [CrossRef] [PubMed]
26. Mahdy, A.; Xia, W.; Zhang, G. Effect of soy protein supplementation on the quality of ripening Cheddar-typecheese. J. Dairy Sci. 2004, 57, 209–214.
27. Robinson, R.K.; Tamime, A.Y. The role of protein in yoghurt. In Developments in Food Proteins; Hudson, B.J.F.,Ed.; Elsevier Applied Science Publishers LTD: London, UK, 1986; pp. 1–35.
28. Martindiana, A.B.; Janer, C.; Pelaez, C.; Requena, T. Development of a fermented goat’s milk containingprobiotic bacteria. Int. Dairy J. 2003, 13, 827–833. [CrossRef]
29. Herrero, A.M.; Requena, T. The effect of supplementing goats milk with whey protein concentrate on texturalproperties of set-type yoghurt. Int. J. Food Sci Tech. 2006, 41, 87–92. [CrossRef]
30. Utsumi, S.; Matsumura, Y.; Mori, T. Structure-function relationships of soy proteins. In Food Proteins and
Their Applications; Damodaran, S., Paraf, A., Eds.; Marcel Dekker: New York, NY, USA, 1997; pp. 257–291.31. Domagała, J.; Najgebauer-Lejko, D.D.; Wieteska-Sliwa, I.; Sady, M.; Wszołek, M.; Bonczar, G.;
Filipczak-Fiutak, M. The influence of milk protein cross-linking by transglutaminase on the rennetcoagulation time and the gel properties. J. Sci. Food Agric. 2015, 96, 3500–3507. [CrossRef] [PubMed]
32. Ingrassia, R.; Costa, J.P.; Hidalgo, M.E.; Canales, M.M.; Castellini, H.; Riquelme, B.; Risso, P. Applicationof a digital image procedure to evaluate microstructure of caseinate and soy protein acid gels.LWT-Food Sci. Technol. 2013, 53, 120–127. [CrossRef]
33. Hrckova, M.; Rusnakova, M.; Zemanovic, J. Enzymatic hydrolysis of defatted soy flour by three differentproteases and their effect on the functional properties of resulting protein hydrolysates. Czech. J. Food Sci.
2002, 20, 7–14. [CrossRef]34. Wang, F.; Zhang, X.; Luo, J.; Guo, H.; Zeng, S.; Ren, F. Effect of proteolysis and calcium equilibrium
on functional properties of natural cheddar cheese during ripening and the resultant processed cheese.J. Food Sci. 2011, 76, E248–E253. [CrossRef] [PubMed]
35. Mullin, W.J.; Fregeau-Reid, J.A.; Butler, M.; Poysa, V.; Woodrow, L.; Jessop, D.B.; Raymond, D. Aninterlaboratory test of a procedure to assess soybean quality for soymilk and tofu production. Food Res. Int.
2001, 34, 669–677. [CrossRef]36. Awolumate, E.O. Accumulation and quality of storage protein in developing cowpea, mung bean and soya
bean seeds. J. Sci. Food Agric. 2010, 34, 1351–1357. [CrossRef]37. Lamsal, B.P.; Jung, S.; Johnson, L.A. Rheological properties of soy protein hydrolysates obtained from limited
enzymatic hydrolysis. LWT-Food Sci. Technol. 2007, 40, 1215–1223. [CrossRef]38. Wang, F.; Liu, X.; Hu, Y.; Luo, J.; Lv, X.; Guo, H.; Ren, F. Effect of carrageenan on the formation of
rennet-induced casein micelle gels. Food Hydrocolloid. 2014, 36, 212–219. [CrossRef]39. Lobato-Calleros, C.; Robles-Martinez, J.C.; Caballero-Perez, J.F.; Vernon-Carter, E.J.; Aguirre-Mandujano, E.
Fat replacers in low-fat mexican manchego cheese. J. Texture Stud. 2001, 32, 1–14. [CrossRef]
Sample Availability: Samples of skim milk and soymilk/enzyme modified soymilk are available from the authors.
© 2018 by the authors. Licensee MDPI, Basel, Switzerland. This article is an open accessarticle distributed under the terms and conditions of the Creative Commons Attribution(CC BY) license (http://creativecommons.org/licenses/by/4.0/).
266
molecules
Article
Bark Extract of the Amazonian Tree Endopleura uchi(Humiriaceae) Extends Lifespan and Enhances StressResistance in Caenorhabditis elegans
Herbenya Peixoto 1 , Mariana Roxo 1, Emerson Silva 2, Karla Valente 2, Markus Braun 1,
Xiaojuan Wang 1 and Michael Wink 1,*
1 Institute of Pharmacy and Molecular Biotechnology, Heidelberg University, INF 364,D-69120 Heidelberg, Germany; [email protected] (H.P.); [email protected] (M.R.);[email protected] (M.B.); [email protected] (X.W.)
2 Faculty of Pharmaceutical Science, Federal University of Amazonas (UFAM), 6200 General Rodrigo,Manaus 69077-000, Brazil; [email protected] (E.S.); [email protected] (K.V.)
* Correspondence: [email protected]; Tel.: +49-62-2154-4880
Academic Editors: Lillian Barros and Isabel C.F.R. FerreiraReceived: 6 February 2019; Accepted: 1 March 2019; Published: 6 March 2019
Abstract: Endopleura uchi (Huber) Cuatrec (Humiriaceae), known as uxi or uxi-amarelo in Brazil,is an endemic tree of the Amazon forest. In traditional medicine, its stem bark is used to treata variety of health disorders, including cancer, diabetes, arthritis, uterine inflammation, andgynecological infections. According to HPLC analysis, the main constituent of the bark extractis the polyphenol bergenin. In the current study, we demonstrate by in vitro and in vivo experimentsthe antioxidant potential of a water extract from the stem bark of E. uchi. When tested in the modelorganism Caenorhabditis elegans, the extract enhanced stress resistance via the DAF-16/FOXO pathway.Additionally, the extract promoted an increase in the lifespan of the worms independent from caloricrestriction. It also attenuated the age-related muscle function decline and formation of polyQ40plaques, as a model for Huntington’s disease. Thus, these data support anti-aging and anti-oxidantproperties of E. uchi, which has not yet been described. More studies are needed to assess the realbenefits of E. uchi bark for human health and its toxicological profile.
Keywords: Caenorhabditis elegans; antioxidants; bergenin; stress resistance; lifespan; Huntington; uxi;Endopleura uchi
1. Introduction
Endopleura uchi (Huber) Cuatrec, popularly known in Brazil as uxi or uxi-amarelo, is an endemictree found throughout the entire Brazilian part of the Amazon basin [1]. The species belongs to thefamily Humiriaceae and is the only member of its genus. This valuable tree is locally used for its wood,bark, fruit, and seeds [2].
Traditional medicinal applications of the stem bark of E. uchi include the treatment and preventionof cancer, diabetes, high cholesterol, arthritis, diarrhea, and genitourinary disorders, especially uterineinflammations and infections [3]. A recent ethnobotanical survey has reported a high demand foruxi bark in regional markets due to its popular therapeutic claims [4–7]. However, few studies haveinvestigated the bioactivities of E. uchi.
Silva and Teixeira [8] reported the in vitro antioxidant and antibacterial activity of the bark, as wellas inhibition of cholinesterase (AChE, BuChE) and α-glucosidase. The authors associated the inhibitionof α-glucosidase with the traditional use of the bark to treat diabetes. Additionally, no cytotoxic effectwas observed when tested in human colorectal adenocarcinoma cells (Caco-2). When tested in HeLa
267
Molecules 2019, 24, 915
cells, a polysaccharide fraction of E. uchi barks significantly reduced proliferation and cell viability [9].Sá et al. [10] demonstrated that the subchronic administration of E. uchi bark extract has no toxic effectson male and female Wistar rats. Politi et al. [11] also assessed the safety profile of E. uchi bark andreported the absence of oral acute toxicity.
Previous phytochemical investigations of E. uchi bark have revealed the presence of tannins,terpenoids (saponins and steroids), and coumarins [12–14]. The isocumeric secondary metabolitebergenin has been reported by several researchers as the major compound in E. uchi bark [8,15–17].
In the current study, we investigated a water extract from the stem bark of E. uchi regardingits potential antioxidant and anti-aging properties using the nematode Caenorhabditis elegans as anexperimental model, which is widely used in this context.
2. Material and Methods
2.1. Plant Material and Extract
Endopleura uchi extract (EU) was obtained from stem bark purchased from a local trader inManaus-AM (Brazil). The bark material was weighed, milled, and exhaustively extracted with distilledwater (5 × 1 L) at room temperature during an overall extraction period of 5 days. Using a rotaryevaporator, the water extract was concentrated at low pressure at 40 ◦C, frozen at −80 ◦C, and finallylyophilized to obtain a fine dried powder. The plant material used in this study is deposited inthe sample collection of IPMB (Institut für Pharmazie und Molekulare Biotechnologie, Heidelberg,Germany) under the accession number IPMB P8636.
2.2. Antioxidant Activity
In a 96-well microplate, 100 µL of sample were added to 100 µL of 200 µM DPPH. After 30 min,the absorbance was measured in a microplate reader (Tecan Trading AG, Männedorf, Switzerland) at517 nm [18]. All measurements were performed in triplicate. The EC50 is presented in µg/mL.
2.3. Total Phenolic Content
In a 96-well microplate, 20 µL of sample were added to 100 µL of Folin-Ciocalteu reagent; after5 min, 80 µL of sodium carbonate (7.5% solution) were added to the wells. The reaction ran for 2 hprotected from the light and at room temperature; the absorbance was measured at 750 nm. The assaywas carried out in triplicate and repeated three times. The phenolic content is expressed as gallic acidequivalents (GAE/g of sample).
2.4. Chemical Characterization and Quantification of Bergenin
Bergenin content of the uchi extract was determined by high performance liquid chromatography(HPLC) in a Shimadzu Proeminence Chromatograph with a UV-Vis detector SPD-10A. The methodused was adapted from Tacon and Nunomura [17,19]. The chromatography was run in gradientmode with methanol: formic acid 0.1% as the mobile phase A, and aqueous formic acid 0.1% as themobile phase B. The column C-18 SphereClone 5 µ ODS (150 × 4.60 mm and particle size 5 µm) andthe detector was set to wavelength of 272 nm. The flow rate of the mobile phase was 0.8 mL/min.The calibration curve was constructed using bergenin (Sigma, St Louis, MO, USA), ranging from 0.04to 1.5 mg/mL, obtaining a linear correlation coefficient of 0.9995.
2.5. C. elegans Strains and Maintenance
The worms were cultivated on NGM plates inoculated with living E. coli OP50 as food source andincubated at 20 ◦C, except when mentioned. For the current work we used the strains N2 (wt), CF1038(daf-16(mu86)), GR1307 (daf-16(mgDf50)), CF1553 (muIs84 [(pAD76) sod-3p::GFP + rol-6]), AM141(rmIs133[P(unc-54)Q40::YFP]), TJ375 (gpIs1[hsp-16-2::GFP]), and BA17 [fem-1(hc17) IV)].
268
Molecules 2019, 24, 915
Age synchronous cultures were obtained by treating the adult hermaphrodites with a lysissolution (5 M NaOH and 5% NaOCl) for 5 min and separating the eggs from the debris by densitygradient centrifugation using 60% sucrose solution [20]. The collected eggs were allowed to hatch inM9 buffer [21].
2.6. Survival Assay under Oxidative Stress
For this assay, age synchronized L1 larvae (N2, CF1038, and GR1307 strains) were grown inS-medium. The larvae were sorted into groups of 75 individuals and treated with the extract for 48 h.Subsequently, 80 µM of the pro-oxidant juglone (5-hydroxy-1,4-naphthalenedione) were added to eachgroup and 24 h later the number of live and dead worms were scored. We considered a worm to bedead when it did not respond to a gentle touch with a platinum wire [20]. The assay was carried out intriplicate and is presented as mean ± SEM compared by one-way ANOVA followed by Bonferroni(post-hoc).
2.7. Intracellular ROS Accumulation
For this assay, we used age synchronized L1 larvae (N2 strain) grown in S-medium. The larvaewere sorted into groups and treated with the extract for 48 h. Subsequently, the ROS-sensitivefluorescent dye H2DCFDA (50 µM) was added to each group. The staining took 1 h, protected fromthe light, at 20 ◦C; afterwards the worms were mounted onto a glass slide and paralyzed with a dropof 10 mM sodium azide. Using a BIOREVO BZ-9000 fluorescence microscope (Keyence DeutschlandGmbH, Neu-Isenburg, Germany), live images of at least 30 worms per group were captured with anexcitation filter set to 480/20 nm and emission filter set to 510/38 nm [20]. The relative fluorescencewas determined densitometrically using the software Image J (National Institute of Health, Bethesda,Bethesda, MD, USA). The results are presented as mean fluorescence intensity (mean ± SEM) andcompared by one-way ANOVA followed by Bonferroni (post-hoc). The assay was repeated three times.
2.8. Quantification of Gene Expression Using GFP Reporter
For this assay, we used age-synchronized worms grown in S-medium. To evaluate sod-3:GFPexpression, L1 larvae (CF1553 strain) were treated with the extract for 48 h and analyzed under afluorescence microscope, as described above. To evaluate hsp-16.2::GFP expression, L4 larvae (TJ375strain) were treated with the extract for 48 h and subsequently exposed to 20 µM juglone; 24 h later,the worms were analyzed by fluorescence microcopy, as described. The assays were repeated threetimes and the results are presented as fluorescence intensity (mean ± SEM) compared by one-wayANOVA followed by Bonferroni (post-hoc).
2.9. Longevity Assay
For this assay, we used age-synchronized worms at day 1 of adulthood (BA17 strain) grownin S-medium. The adults were treated with the extract, except the control group. Throughout theentire period of observation, the worms were incubated at 25 ◦C and transferred every second day tofresh medium supplemented with extract following their treatment groups. Dead worms were scoredduring the transfer and removed from the assay. Worms exhibiting extruded gonads or internallyhatched progeny were scored as censored and removed from the assay. We considered a worm to bedead when it did not respond to a gentle touch with a platinum wire [22]. The assay was repeatedthree times and the results are presented as percentage of survival. The statistical significance wasdetermined by Log-rank (Mantel-Cox) tests followed by Gehan-Breslow-Wilcoxon Test.
2.10. Quantification of PolyQ40::GFP Aggregate Formation
For this assay, we used age synchronized L1 larvae (AM141 strain) grown in S-medium. Thisstrain serves as a model for Huntington disease. The larvae were treated with the extract for 48 h and
269
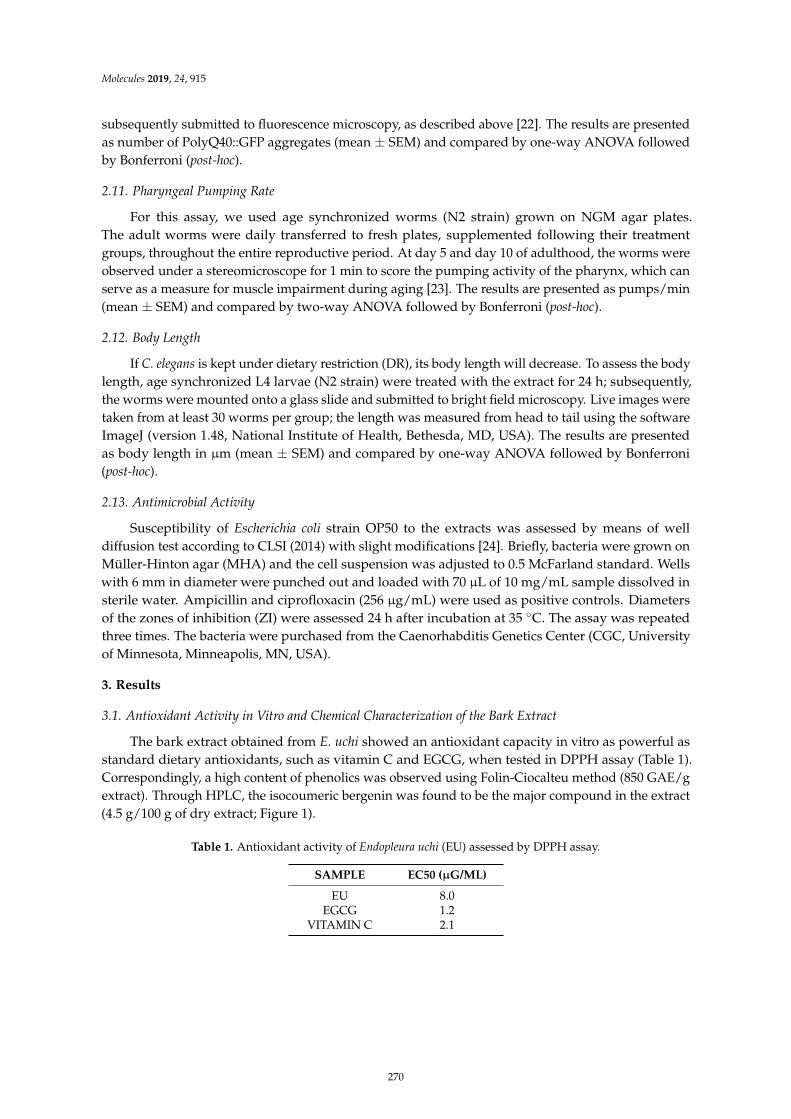
Molecules 2019, 24, 915
subsequently submitted to fluorescence microscopy, as described above [22]. The results are presentedas number of PolyQ40::GFP aggregates (mean ± SEM) and compared by one-way ANOVA followedby Bonferroni (post-hoc).
2.11. Pharyngeal Pumping Rate
For this assay, we used age synchronized worms (N2 strain) grown on NGM agar plates.The adult worms were daily transferred to fresh plates, supplemented following their treatmentgroups, throughout the entire reproductive period. At day 5 and day 10 of adulthood, the worms wereobserved under a stereomicroscope for 1 min to score the pumping activity of the pharynx, which canserve as a measure for muscle impairment during aging [23]. The results are presented as pumps/min(mean ± SEM) and compared by two-way ANOVA followed by Bonferroni (post-hoc).
2.12. Body Length
If C. elegans is kept under dietary restriction (DR), its body length will decrease. To assess the bodylength, age synchronized L4 larvae (N2 strain) were treated with the extract for 24 h; subsequently,the worms were mounted onto a glass slide and submitted to bright field microscopy. Live images weretaken from at least 30 worms per group; the length was measured from head to tail using the softwareImageJ (version 1.48, National Institute of Health, Bethesda, MD, USA). The results are presentedas body length in µm (mean ± SEM) and compared by one-way ANOVA followed by Bonferroni(post-hoc).
2.13. Antimicrobial Activity
Susceptibility of Escherichia coli strain OP50 to the extracts was assessed by means of welldiffusion test according to CLSI (2014) with slight modifications [24]. Briefly, bacteria were grown onMüller-Hinton agar (MHA) and the cell suspension was adjusted to 0.5 McFarland standard. Wellswith 6 mm in diameter were punched out and loaded with 70 µL of 10 mg/mL sample dissolved insterile water. Ampicillin and ciprofloxacin (256 µg/mL) were used as positive controls. Diametersof the zones of inhibition (ZI) were assessed 24 h after incubation at 35 ◦C. The assay was repeatedthree times. The bacteria were purchased from the Caenorhabditis Genetics Center (CGC, Universityof Minnesota, Minneapolis, MN, USA).
3. Results
3.1. Antioxidant Activity in Vitro and Chemical Characterization of the Bark Extract
The bark extract obtained from E. uchi showed an antioxidant capacity in vitro as powerful asstandard dietary antioxidants, such as vitamin C and EGCG, when tested in DPPH assay (Table 1).Correspondingly, a high content of phenolics was observed using Folin-Ciocalteu method (850 GAE/gextract). Through HPLC, the isocoumeric bergenin was found to be the major compound in the extract(4.5 g/100 g of dry extract; Figure 1).
Table 1. Antioxidant activity of Endopleura uchi (EU) assessed by DPPH assay.
SAMPLE EC50 (µG/ML)
EU 8.0EGCG 1.2
VITAMIN C 2.1
270
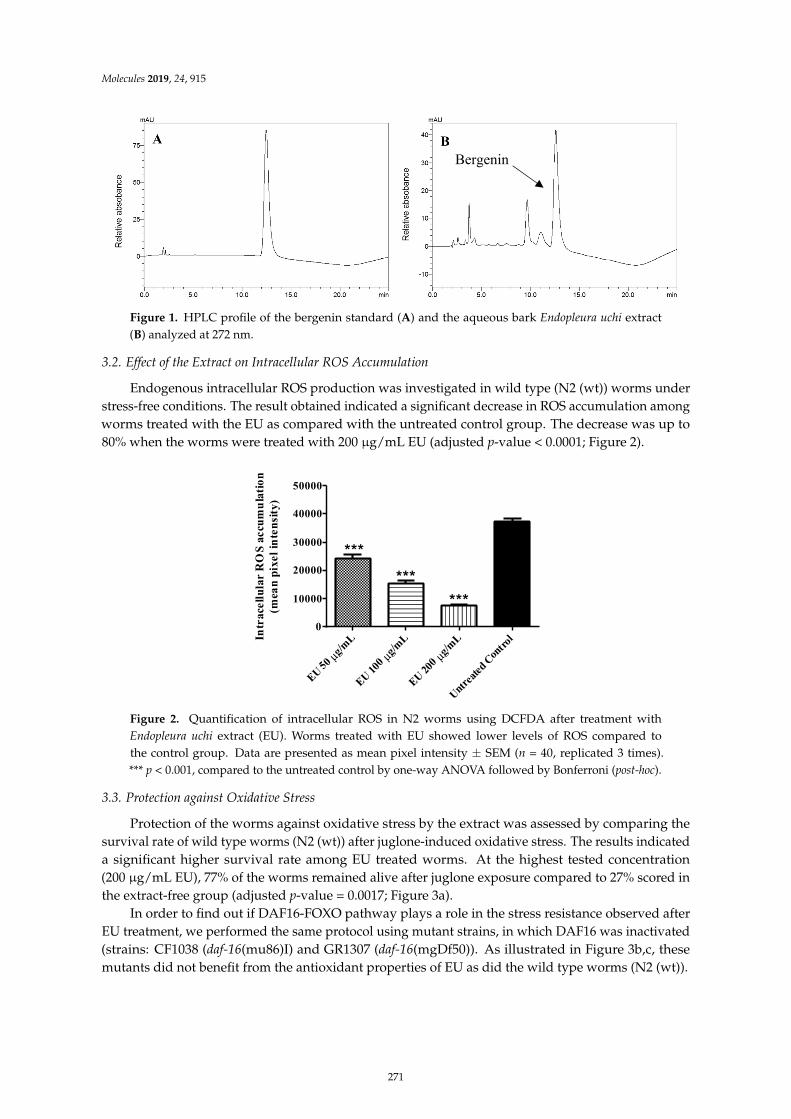
Molecules 2019, 24, 915
μ
EU 50 g/m
L
EU 100
g/mL
EU 200
g/mL
Untreate
d Contro
l0
10000
20000
30000
40000
50000
******
***
Intr
acel
lula
r RO
S ac
cum
ulat
ion
(mea
n pi
xel i
nten
sity)
μ
Bergenin
Figure 1. HPLC profile of the bergenin standard (A) and the aqueous bark Endopleura uchi extract(B) analyzed at 272 nm.
3.2. Effect of the Extract on Intracellular ROS Accumulation
Endogenous intracellular ROS production was investigated in wild type (N2 (wt)) worms understress-free conditions. The result obtained indicated a significant decrease in ROS accumulation amongworms treated with the EU as compared with the untreated control group. The decrease was up to80% when the worms were treated with 200 µg/mL EU (adjusted p-value < 0.0001; Figure 2).
μ
EU 50 µg/m
L
EU 100 µ
g/mL
EU 200 µ
g/mL
Untreate
d Contro
l0
10000
20000
30000
40000
50000
******
***
Intr
acel
lula
r RO
S ac
cum
ulat
ion
(mea
n pi
xel i
nten
sity)
μ
Bergenin
Figure 2. Quantification of intracellular ROS in N2 worms using DCFDA after treatment withEndopleura uchi extract (EU). Worms treated with EU showed lower levels of ROS compared tothe control group. Data are presented as mean pixel intensity ± SEM (n = 40, replicated 3 times).*** p < 0.001, compared to the untreated control by one-way ANOVA followed by Bonferroni (post-hoc).
3.3. Protection against Oxidative Stress
Protection of the worms against oxidative stress by the extract was assessed by comparing thesurvival rate of wild type worms (N2 (wt)) after juglone-induced oxidative stress. The results indicateda significant higher survival rate among EU treated worms. At the highest tested concentration(200 µg/mL EU), 77% of the worms remained alive after juglone exposure compared to 27% scored inthe extract-free group (adjusted p-value = 0.0017; Figure 3a).
In order to find out if DAF16-FOXO pathway plays a role in the stress resistance observed afterEU treatment, we performed the same protocol using mutant strains, in which DAF16 was inactivated(strains: CF1038 (daf-16(mu86)I) and GR1307 (daf-16(mgDf50)). As illustrated in Figure 3b,c, thesemutants did not benefit from the antioxidant properties of EU as did the wild type worms (N2 (wt)).
271
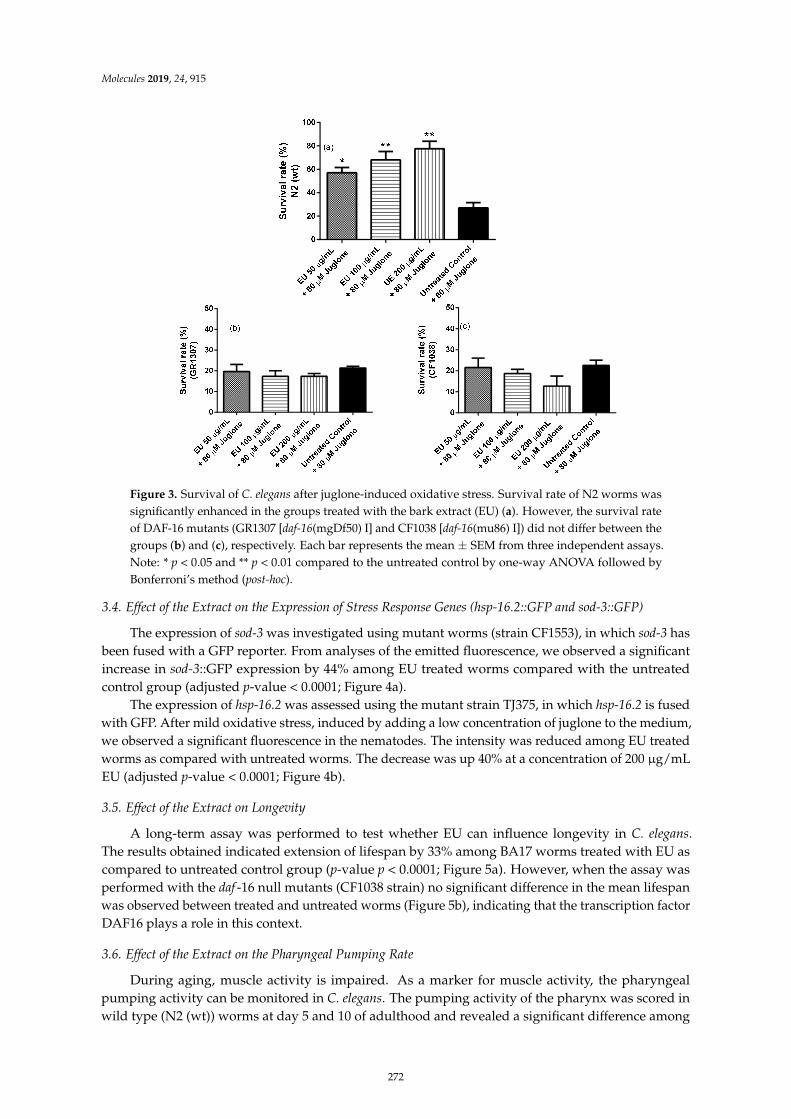
Molecules 2019, 24, 915
μ
Figure 3. Survival of C. elegans after juglone-induced oxidative stress. Survival rate of N2 worms wassignificantly enhanced in the groups treated with the bark extract (EU) (a). However, the survival rateof DAF-16 mutants (GR1307 [daf-16(mgDf50) I] and CF1038 [daf-16(mu86) I]) did not differ between thegroups (b) and (c), respectively. Each bar represents the mean ± SEM from three independent assays.Note: * p < 0.05 and ** p < 0.01 compared to the untreated control by one-way ANOVA followed byBonferroni’s method (post-hoc).
3.4. Effect of the Extract on the Expression of Stress Response Genes (hsp-16.2::GFP and sod-3::GFP)
The expression of sod-3 was investigated using mutant worms (strain CF1553), in which sod-3 hasbeen fused with a GFP reporter. From analyses of the emitted fluorescence, we observed a significantincrease in sod-3::GFP expression by 44% among EU treated worms compared with the untreatedcontrol group (adjusted p-value < 0.0001; Figure 4a).
The expression of hsp-16.2 was assessed using the mutant strain TJ375, in which hsp-16.2 is fusedwith GFP. After mild oxidative stress, induced by adding a low concentration of juglone to the medium,we observed a significant fluorescence in the nematodes. The intensity was reduced among EU treatedworms as compared with untreated worms. The decrease was up 40% at a concentration of 200 µg/mLEU (adjusted p-value < 0.0001; Figure 4b).
3.5. Effect of the Extract on Longevity
A long-term assay was performed to test whether EU can influence longevity in C. elegans.The results obtained indicated extension of lifespan by 33% among BA17 worms treated with EU ascompared to untreated control group (p-value p < 0.0001; Figure 5a). However, when the assay wasperformed with the daf -16 null mutants (CF1038 strain) no significant difference in the mean lifespanwas observed between treated and untreated worms (Figure 5b), indicating that the transcription factorDAF16 plays a role in this context.
3.6. Effect of the Extract on the Pharyngeal Pumping Rate
During aging, muscle activity is impaired. As a marker for muscle activity, the pharyngealpumping activity can be monitored in C. elegans. The pumping activity of the pharynx was scored inwild type (N2 (wt)) worms at day 5 and 10 of adulthood and revealed a significant difference among
272
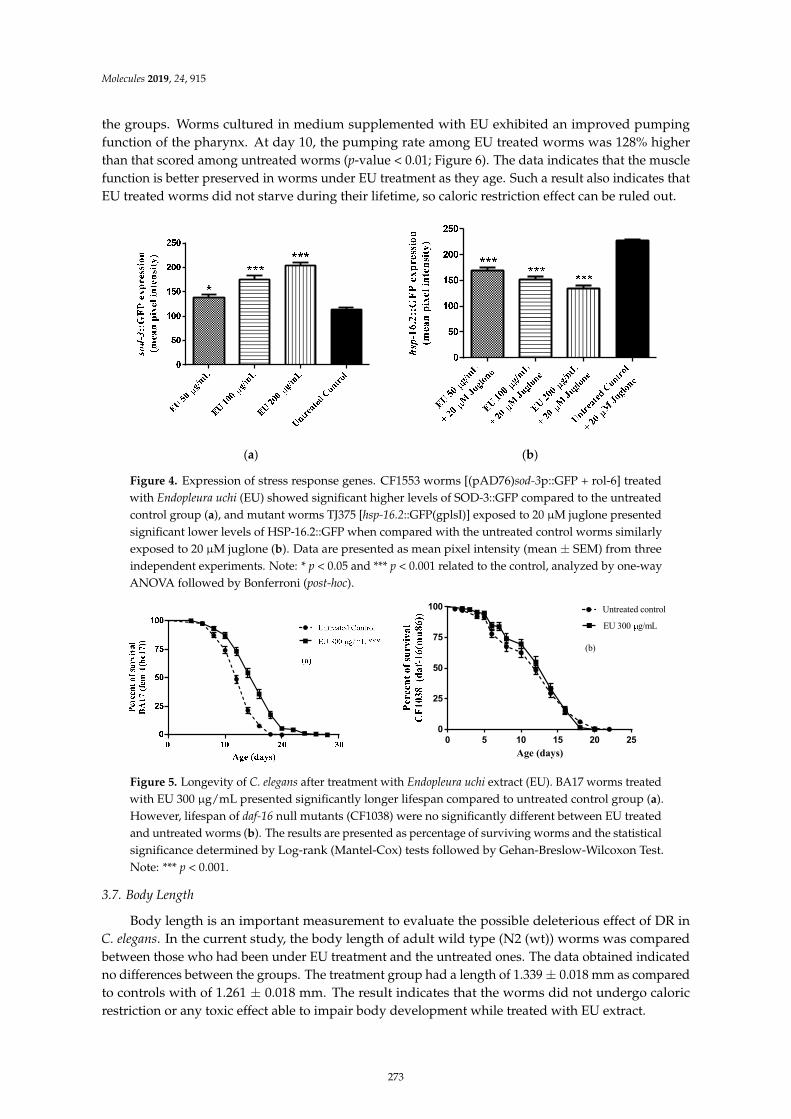
Molecules 2019, 24, 915
the groups. Worms cultured in medium supplemented with EU exhibited an improved pumpingfunction of the pharynx. At day 10, the pumping rate among EU treated worms was 128% higherthan that scored among untreated worms (p-value < 0.01; Figure 6). The data indicates that the musclefunction is better preserved in worms under EU treatment as they age. Such a result also indicates thatEU treated worms did not starve during their lifetime, so caloric restriction effect can be ruled out.
(a) (b)
μ
μ
μ
0 5 10 15 20 250
25
50
75
100
Age (days)
EU 300 g/mL
Untreated control
(b)
Figure 4. Expression of stress response genes. CF1553 worms [(pAD76)sod-3p::GFP + rol-6] treatedwith Endopleura uchi (EU) showed significant higher levels of SOD-3::GFP compared to the untreatedcontrol group (a), and mutant worms TJ375 [hsp-16.2::GFP(gplsI)] exposed to 20 µM juglone presentedsignificant lower levels of HSP-16.2::GFP when compared with the untreated control worms similarlyexposed to 20 µM juglone (b). Data are presented as mean pixel intensity (mean ± SEM) from threeindependent experiments. Note: * p < 0.05 and *** p < 0.001 related to the control, analyzed by one-wayANOVA followed by Bonferroni (post-hoc).
μ
μ
μ
0 5 10 15 20 250
25
50
75
100
Age (days)
EU 300 g/mL
Untreated control
(b)
Figure 5. Longevity of C. elegans after treatment with Endopleura uchi extract (EU). BA17 worms treatedwith EU 300 µg/mL presented significantly longer lifespan compared to untreated control group (a).However, lifespan of daf-16 null mutants (CF1038) were no significantly different between EU treatedand untreated worms (b). The results are presented as percentage of surviving worms and the statisticalsignificance determined by Log-rank (Mantel-Cox) tests followed by Gehan-Breslow-Wilcoxon Test.Note: *** p < 0.001.
3.7. Body Length
Body length is an important measurement to evaluate the possible deleterious effect of DR inC. elegans. In the current study, the body length of adult wild type (N2 (wt)) worms was comparedbetween those who had been under EU treatment and the untreated ones. The data obtained indicatedno differences between the groups. The treatment group had a length of 1.339 ± 0.018 mm as comparedto controls with of 1.261 ± 0.018 mm. The result indicates that the worms did not undergo caloricrestriction or any toxic effect able to impair body development while treated with EU extract.
273
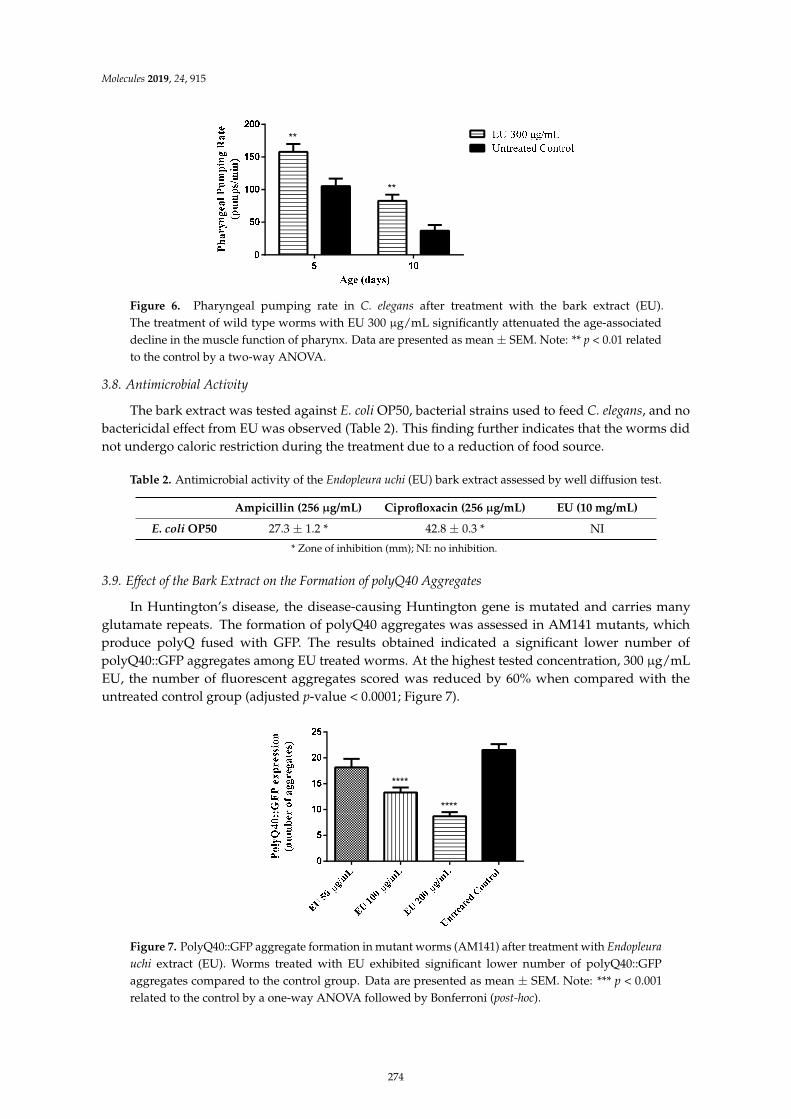
Molecules 2019, 24, 915
**
**
μ
μ
Figure 6. Pharyngeal pumping rate in C. elegans after treatment with the bark extract (EU).The treatment of wild type worms with EU 300 µg/mL significantly attenuated the age-associateddecline in the muscle function of pharynx. Data are presented as mean ± SEM. Note: ** p < 0.01 relatedto the control by a two-way ANOVA.
3.8. Antimicrobial Activity
The bark extract was tested against E. coli OP50, bacterial strains used to feed C. elegans, and nobactericidal effect from EU was observed (Table 2). This finding further indicates that the worms didnot undergo caloric restriction during the treatment due to a reduction of food source.
Table 2. Antimicrobial activity of the Endopleura uchi (EU) bark extract assessed by well diffusion test.
Ampicillin (256 µg/mL) Ciprofloxacin (256 µg/mL) EU (10 mg/mL)
E. coli OP50 27.3 ± 1.2 * 42.8 ± 0.3 * NI
* Zone of inhibition (mm); NI: no inhibition.
3.9. Effect of the Bark Extract on the Formation of polyQ40 Aggregates
In Huntington’s disease, the disease-causing Huntington gene is mutated and carries manyglutamate repeats. The formation of polyQ40 aggregates was assessed in AM141 mutants, whichproduce polyQ fused with GFP. The results obtained indicated a significant lower number ofpolyQ40::GFP aggregates among EU treated worms. At the highest tested concentration, 300 µg/mLEU, the number of fluorescent aggregates scored was reduced by 60% when compared with theuntreated control group (adjusted p-value < 0.0001; Figure 7).
****
****
Figure 7. PolyQ40::GFP aggregate formation in mutant worms (AM141) after treatment with Endopleura
uchi extract (EU). Worms treated with EU exhibited significant lower number of polyQ40::GFPaggregates compared to the control group. Data are presented as mean ± SEM. Note: *** p < 0.001related to the control by a one-way ANOVA followed by Bonferroni (post-hoc).
274
Molecules 2019, 24, 915
4. Discussion
The Folin-Ciocalteu assay indicated a high phenolic content in EU water extract. HPLCUV/VIS analyses of our extract identified the phenolic bergenin as a major component, in linewith the literature [17,19]. Bergenin has been reported as an antioxidant, anti-HIV, gastroprotective,neuroprotective, hepatoprotective, and immunomodulatory agent [25–29], effects that could explainthe traditional uses of the barks of uxi by the locals in Amazonia.
The high antioxidant activity in vitro was also observed in vivo using C. elegans as a modelorganism. Notably, wild type worms treated with EU exhibited a higher survival rate after inducedoxidative stress as compared to untreated worms submitted to identical conditions. These datademonstrate the capacity of the extract to counteract oxidative damage promoted by exogenoussources such as the pro-oxidant juglone [30]. In agreement, in EU treated worms we found loweraccumulation of endogenous cellular ROS and lower pattern of expression for hsp-16.2, the gene thatcodes for HSP-16.2, a small heat shock protein whose expression is induced in response to harshcellular conditions such as heat stress and oxidative damage [31,32].
Polyphenolic rich extracts are proposed to enhance cellular stress resistance through modulationof stress response genes in addition to free radical scavenging activities [33]. In the current study, sod-3,the gene coding for the mitochondrial antioxidant enzyme superoxide dismutase 3, showed higherexpression among worms treated with EU. The upregulation of sod-3 suggests the participation ofthe transcription factor DAF-16, the C. elegans orthologue for the mammalian FOXO transcriptionfactor, whose target genes are mainly involved in stress resistance, metabolism, and longevity [34,35].When testing EU in DAF-16 null mutants (CF1038 and GR1307 strains), we noticed that the protectingeffect of the extract, previously demonstrated in wild type worms submitted to the survival assay,was absent. The data, therefore, confirms the requirement of DAF-16 transcription factor to promotethe antioxidant effect of EU.
Plant extracts with a high content of polyphenolic compounds, such as those obtained fromCamellia sinensis, Calycophyllum spruceanum, and Paullinia cupana, have been shown to extend lifespan inC. elegans due to their capacity to modulate molecular mechanisms that drive cellular stress resistanceand metabolism, in line with the free radical theory of aging [22,23,36]. Considering the pronouncedin vivo antioxidant activity of EU elicited by its capacity to modulate stress response genes in DAF-16pathway, we also investigated whether this extract could affect longevity in C. elegans and have founda positive result. The mean lifespan of the EU treated worms was increased by 33%, an effect that wasabsent in DAF-16 null mutants, indicating a molecular basis underlying it.
However, lifespan extension is not essentially followed by an extension of healthspan, the periodof life free from diseases. The fundamental mechanisms underlying both are distinct and complex.Authors highlight that the sole extension of lifespan might not be desirable if it represents just anextended period of frailty, where individuals are vulnerable to aging-related diseases [37,38].
In literature, the role of oxidative stress on the onset of aging-related diseases is well documented,thus several antioxidant compounds are claimed to be capable of attenuating or preventing the impactof aging [39]. In agreement, we obtained evidence for an anti-aging effect of EU in C. elegans bystudying its muscle function, which works as marker of aging [40,41]. Analyzing the results, weobserved a higher contraction rate among worms treated with the extract at all scored timepoints.This data indicates that the treatment can attenuate the age-related muscle function decline, which isconsidered one important aspect of the healthspan to be maintained to achieve the so-called successfulaging [42].
Caloric restriction is a well-known pro-longevity stimulus [43]. To investigate whether the wormscould have faced caloric restriction during the period when they were under treatment, we tested theextract against E. coli OP50 and did not find a bactericidal effect. Moreover, the pharyngeal contractilecapacity of the treated worms was higher as compared to untreated worms, and when we measuredthe body length we found no differences between treated and untreated worms. The data indicate that
275
Molecules 2019, 24, 915
the worms did not starve at any timepoint of their lifespan. Thus, we assume that EU can effectivelyextend lifespan in C. elegans by molecular mechanisms other than caloric restriction.
Neurodegenerative diseases are more prevalent in elderly and dramatically impair life quality. Inthis context, we decided to treat mutant worms expressing polyQ40, an expanded series of glutamineresidues involved in the pathophysiology of Huntington’s disease [44,45]. Our data indicate that EUtreatment is able to attenuate the formation of polyQ40 aggregates, another result supporting theanti-aging properties of EU which needs to be studied in more detail.
In conclusion, the polyphenol-rich water extract from the stem bark of Endopleura uchi exhibitedsubstantial antioxidant activity in vitro and in vivo. The extract was able to enhance the stressresistance in C. elegans through the modulation of the DAF-16/FOXO pathway. Additionally, the extractexhibited anti-aging properties being able to extend lifespan and to attenuate markers of aging, suchas age-related muscle function decline and the formation of polyQ40 aggregates. Considering thetraditional application of the bark of uxi and its extensive use by the local population, more studies areneeded to elucidate the biological activities as well as its toxicological profile in detail.
Author Contributions: H.P. and M.R. were responsible for designing and performing the methods, analyzingdata and writing the manuscript. M.B. was responsible for testing the antimicrobial properties of the extract.E.S. and K.V. were responsible for identifying and quantifying bergenin in the extract. X.W. participated in thecorrection and formatting of the manuscript. M.W. was the supervisor of this work, corrected data analyses andthe manuscript.
Funding: This work was supported by the Brazilian National Counsel of Technological and Scientific Development(CNPq) through the program Science Without Borders (CsF). The authors received financial support from theDeutsche Forschungsgemeinschaft and Ruprecht-Karls-Universität Heidelberg within the funding program OpenAccess Publishing.
Conflicts of Interest: The authors declare no conflict of interest.
References
1. Food and Fruit-Bearing Forest Species, 3: Examples from Latin America/F2911; Food and Agriculture Organization:Rome, Italy, 1986; p. 44.
2. Shanley, P. Fruit Trees and Useful Plants in Amazonian Life; Food and Agriculture Organization of the UnitedNations (FAO): Rome, Italy, 2011.
3. Correa, M.; Penna, L.d.A. Dicionario das plantas uteis do Brasil e das exoticas cultivadas: Volume 5. MR. Rio deJaneiro: Instituto Brasiliero de Desenvolvimento Florestal 687p.-illus. Por Icones. Geog 1974, 4.
4. Rodrigues, E. Plants and animals utilized as medicines in the Jaú National Park (JNP), Brazilian Amazon.Phytother. Res. 2006, 20, 378–391. [CrossRef] [PubMed]
5. Scudeller, V.V.; Veiga, J.B.d.; Araújo-Jorge, L.d. Etnoconhecimento de plantas de uso medicinal nas comunidades São
João do Tupé e Central (Reserva de Desenvolvimento Sustentável do Tupé); UEA: Manaus, Brazil, 2009; pp. 185–199.6. Pinto, A.Z.d.L.; De Assis, A.F.S.; Pereira, A.G.; Pasa, M.C. Levantamento etnobotânico de plantas medicinais
comercializadas no mercado do porto em Cuiabá, Mato Grosso, Brasil. FLOVET-Boletim do Grupo de Pesquisa
da Flora, Vegetação e Etnobotânica 2013, 1.7. Caetano, R.S.; de Souza, A.C.R.; Feitoza, L.F. O Uso de plantas medicinais utilizadas por frequentadores dos
ambulatórios Santa Marcelina, Porto Velho-RO. Saúde e Pesquisa 2014, 7.8. Silva, L.R.; Teixeira, R. Phenolic profile and biological potential of Endopleura uchi extracts. Asian Pac. J.
Trop. Med. 2015, 8, 889–897. [CrossRef] [PubMed]9. Bento, J.F. Caracterização de polissacarídeos e metabólicos secundários da casca de Endopleura uchi (Huber)
cuatrec: Avaliação dos efeitos do decocto e de frações polissacarídicas em células hela e macrófagos. Ph.D.Thesis, Federal University of Paraná, Curitiba, PR, Brazil, November 2013.
10. Sá, B.M.; Lima, C.S.; Silva, U.D.A.; Carvalho, H.O.; Fernandes, C.P.; Resque, R.L.; de Oliveria, T.T.;Carvalho, J.C.T. Subchronic toxicity evaluation of the hydroethanolic extract from Endopleura uchi (Huber)Cuatrec in Wistar rats. Afr. J. Pharm. Pharmacol. 2015, 9, 223–229.
11. Politi, F.A.S.; Moreira, R.R.D.; Salgado, H.R.N.; Pietro, R. Preliminary tests on acute oral toxicity andintestinal motility with extract of pulverized bark of Endopleura uchi (Huber) Cuatrec. (Humiriaceae) in mice.Rev. Pan-Amaz. Saude 2010, 1, 187–189. [CrossRef]
276
Molecules 2019, 24, 915
12. Luna, J.; Silva, T.; Bento, E.; Santana, A. Isolamento e identificação estrutural dos constituintes químicos deEndopleura uchi (Humiriaceae). Reunião Anual da Sociedade Brasileira de Química, Minas Gerais, Brasil 2000,2, 123.
13. Politi, F.A.S. Estudos farmacognósticos e avaliação de atividades biológicas de extratos obtidos das cascaspulverizadas de Endopleura uchi (Huber) Cuatrec. (Humiriaceae). Master’s Thesis, Universidade EstadualPaulista, Araraquara, SP, Brazil, February 2009.
14. Abreu, V.G.d.C.; Corrêa, G.M.; Lagos, I.A.d.S.; Silva, R.R.; Alcântara, A.F.d.C. Pentacyclic triterpenes andsteroids from the stem bark of uchi (Sacoglottis uchi, Humiriaceae). Acta Amazonica 2013, 43, 525–528.[CrossRef]
15. De Abreu, H.A.; Lago, I.A.d.S.; Souza, G.P.; Piló-Veloso, D.; Duarte, H.A.; Alcântara, A.F.d.C. Antioxidantactivity of (+)-bergenin—a phytoconstituent isolated from the bark of Sacoglottis uchi Huber (Humireaceae).Org. Biomol. Chem. 2008, 6, 2713–2718. [CrossRef] [PubMed]
16. Borges, J.C.; Ripardo Filho, H.d.S.; Guilhon, G.; Carvalho, J.C.; Santos, L.S.; Sousa, P.J. Antinociceptiveactivity of acetylbergenin in mice. Lat. Am. J. Pharm. 2011, 30, 1303–1308.
17. Tacon, L.A.; Freitas, L.A. Box-Behnken design to study the bergenin content and antioxidant activity ofEndopleura uchi bark extracts obtained by dynamic maceration. Revista Brasileira de Farmacognosia 2013, 23,65–71. [CrossRef]
18. Blois, M.S. Antioxidant determinations by the use of a stable free radical. Nature 1958. [CrossRef]19. Nunomura, R.; Oliveira, V.G.; Da Silva, S.L.; Nunomura, S.M. Characterization of bergenin in Endopleura
uchi bark and its anti-inflammatory activity. J. Braz. Chem. Soc. 2009, 20, 1060–1064. [CrossRef]20. Peixoto, H.; Roxo, M.; Krstin, S.; Röhrig, T.; Richling, E.; Wink, M. An anthocyanin-rich extract of acai
(Euterpe precatoria Mart.) increases stress resistance and retards aging-related markers in Caenorhabditis
elegans. J. Agric. Food Chem. 2016, 64, 1283–1290. [CrossRef] [PubMed]21. Stiernagle, T. Maintenance of C. elegans. WormBook 2005. [CrossRef] [PubMed]22. Peixoto, H.; Roxo, M.; Röhrig, T.; Richling, E.; Wang, X.; Wink, M. Anti-Aging and antioxidant potential of
Paullinia cupana var. sorbilis: Findings in Caenorhabditis elegans indicate a new utilization for roasted seeds ofGuarana. Medicines 2017, 4, 61. [CrossRef] [PubMed]
23. Peixoto, H.; Roxo, M.; Koolen, H.; da Silva, F.; Silva, E.; Braun, M.S.; Wang, X.; Wink, M.J.M. Calycophyllum
spruceanum (Benth.), the amazonian “tree of youth” prolongs longevity and enhances stress resistance inCaenorhabditis elegans. Molecules 2018, 23, 534. [CrossRef] [PubMed]
24. Ashour, M.L.; El-Readi, M.Z.; Hamoud, R.; Eid, S.Y.; El Ahmady, S.H.; Nibret, E.; Herrmann, F.; Youns, M.;Tahrani, A.; Kaufmann, D. Anti-infective and cytotoxic properties of Bupleurum marginatum. Chin. Med. 2014,9, 1–10. [CrossRef] [PubMed]
25. Piacente, S.; Pizza, C.; De Tommasi, N.; Mahmood, N. Constituents of Ardisia japonica and their in vitroanti-HIV activity. J. Nat. Prod. 1996, 59, 565–569. [CrossRef] [PubMed]
26. Goel, R.; Maiti, R.; Manickam, M.; Ray, A. Antiulcer activity of naturally occurring pyrano-coumarin andisocoumarins and their effect on prostanoid synthesis using human colonic mucosa. Ind. J. Exp. Biol. 1997,35, 1080–1083.
27. Takahashi, H.; Kosaka, M.; Watanabe, Y.; Nakade, K.; Fukuyama, Y. Synthesis and neuroprotective activityof bergenin derivatives with antioxidant activity. Bioorg. Med. Chem. 2003, 11, 1781–1788. [CrossRef]
28. Lim, H.-K.; Kim, H.-S.; Choi, H.-S.; Oh, S.; Choi, J. Hepatoprotective effects of bergenin, a major constituent ofMallotus japonicus, on carbon tetrachloride-intoxicated rats. J. Ethnopharmacol. 2000, 72, 469–474. [CrossRef]
29. Nazir, N.; Koul, S.; Qurishi, M.A.; Taneja, S.C.; Ahmad, S.F.; Bani, S.; Qazi, G.N. Immunomodulatory effectof bergenin and norbergenin against adjuvant-induced arthritis—A flow cytometric study. J. Ethnopharmacol.
2007, 112, 401–405. [CrossRef] [PubMed]30. Aithal, B.K.; Kumar, M.S.; Rao, B.N.; Udupa, N.; Rao, B.S. Juglone, a naphthoquinone from walnut, exerts
cytotoxic and genotoxic effects against cultured melanoma tumor cells. Cell Biol. Int. 2009, 33, 1039–1049.[CrossRef] [PubMed]
31. Strayer, A.; Wu, Z.; Christen, Y.; Link, C.D.; Luo, Y. Expression of the small heat-shock protein HSP 16-2 inCaenorhabditis elegans is suppressed by Ginkgo biloba extract EGb 761. FASEB J. 2003, 17, 2305–2307. [CrossRef][PubMed]
32. Swindell, W.R. Heat shock proteins in long-lived worms and mice with insulin/insulin-like signalingmutations. Aging 2009, 1, 573. [CrossRef] [PubMed]
277
Molecules 2019, 24, 915
33. Scalbert, A.; Johnson, I.T.; Saltmarsh, M. Polyphenols: Antioxidants and beyond. Am. J. Clin. Nutr. 2005, 81,215–217. [CrossRef] [PubMed]
34. Braeckman, B.P.; Vanfleteren, J.R. Genetic control of longevity in C. elegans. Exp. Gerontol. 2007, 42, 90–98.[CrossRef] [PubMed]
35. Mukhopadhyay, A.; Oh, S.W.; Tissenbaum, H.A. Worming pathways to and from DAF-16/FOXO.Exp. Gerontol. 2006, 41, 928–934. [CrossRef] [PubMed]
36. Abbas, S.; Wink, M. Epigallocatechin gallate from green tea (Camellia sinensis) increases lifespan and stressresistance in Caenorhabditis elegans. Planta Med. 2009, 75, 216–221. [CrossRef] [PubMed]
37. Hansen, M.; Kennedy, B.K. Does longer lifespan mean longer healthspan? Trends Cell Biol. 2016, 26, 565–568.[CrossRef] [PubMed]
38. Bansal, A.; Zhu, L.J.; Yen, K.; Tissenbaum, H.A. Uncoupling lifespan and healthspan in Caenorhabditis elegans
longevity mutants. Proc. Natl. Acad. Sci. USA 2015, 112, 277–286. [CrossRef] [PubMed]39. Cui, H.; Kong, Y.; Zhang, H. Oxidative stress, mitochondrial dysfunction, and aging. J. Signal Transduct. 2011,
2012. [CrossRef] [PubMed]40. Peixoto, H.; Roxo, M.; Krstin, S.; Wang, X.; Wink, M. Anthocyanin-rich extract of Acai (Euterpe precatoria Mart.)
mediates neuroprotective activities in Caenorhabditis elegans. J. Funct. Foods 2016, 26, 385–393. [CrossRef]41. Collins, J.J.; Huang, C.; Hughes, S.; Kornfeld, K. The measurement and analysis of age-related changes in
Caenorhabditis elegans. WormBook 2005. [CrossRef]42. Anton, S.D.; Woods, A.J.; Ashizawa, T.; Barb, D.; Buford, T.W.; Carter, C.S.; Clark, D.J.; Cohen, R.A.;
Corbett, D.B.; Cruz-Almeida, Y.; et al. Successful aging: Advancing the science of physical independence inolder adults. Ageing Res. Rev. 2015, 24, 304–327. [CrossRef] [PubMed]
43. Fontana, L.; Partridge, L.; Longo, V.D. Extending healthy life span—from yeast to humans. Science 2010, 328,321–326. [CrossRef] [PubMed]
44. Finkbeiner, S. Huntington’s disease. Cold Spring Harb Perspect. Biol. 2011, 3, 7476. [CrossRef] [PubMed]45. Cohen, E.; Dillin, A. The insulin paradox: Aging, proteotoxicity and neurodegeneration. Nat. Rev. Neurosci.
2008, 9, 759–767. [CrossRef] [PubMed]
Sample Availability: Samples of the compounds are available from the authors.
© 2019 by the authors. Licensee MDPI, Basel, Switzerland. This article is an open accessarticle distributed under the terms and conditions of the Creative Commons Attribution(CC BY) license (http://creativecommons.org/licenses/by/4.0/).
278
MDPI
St. Alban-Anlage 66
4052 Basel
Switzerland
Tel. +41 61 683 77 34
Fax +41 61 302 89 18
www.mdpi.com
Molecules Editorial Office
E-mail: [email protected]
www.mdpi.com/journal/molecules


MDPI
St. Alban-Anlage 66
4052 Basel
Switzerland
Tel: +41 61 683 77 34
Fax: +41 61 302 89 18
www.mdpi.com ISBN 978-3-0365-4105-1