Embed Size (px)
Citation preview

AUTHORS
Jon E. Olson � Petroleum and Geosystems En-gineering, Cockrell School of Engineering, Univer-sity of Texas at Austin, 1 University Station C0300,Austin, Texas 78712; [email protected]
Jon Olson is an associate professor in the Depart-ment of Petroleum and Geosystems Engineering.He joined the faculty in 1995. He has six years ofindustrial experience. He specializes in the appli-cations of rock fracture and continuum mechanics
Natural fracturecharacterization in tight gassandstones: Integratingmechanics and diagenesisJon E. Olson, Stephen E. Laubach, and Robert H. Lander
to fractured reservoir characterization, hydraulicfracturing, and reservoir geomechanics. He was adistinguished lecturer for AAPG in 2007–2008.
Stephen E. Laubach � Bureau of EconomicGeology, John A. and Katherine G. Jackson Schoolof Geosciences, University of Texas at Austin, Aus-tin, Texas 78713-8924;[email protected]
Steve Laubach is a senior research scientist at theBureau Economic Geology where he conducts re-search on unconventional and fractured reservoirs.His interests include fluid inclusion and cathodolu-minescence studies and application of borehole-imaging geophysical logs to stress and fractureevaluation. He was a distinguished lecturer for theSociety of Petroleum Engineers in 2003–2004.
Robert H. Lander � Geocosm LLC, 3311 SanMateo Drive, Austin, Texas 78738;[email protected]
Rob Lander develops diagenetic models for Geo-cosm LLC. He obtained his Ph.D. in geology fromthe University of Illinois in 1991, was a researchgeologist at Exxon Production Research from 1991to 1993, and worked for Rogaland Research andGeologica AS from 1993 to 2000. He is also a re-search fellow at the Bureau of Economic Geology.
ABSTRACT
Accurate predictions of natural fracture flow attributes in sand-stones require an understanding of the underlying mechanisms re-sponsible for fracture growth and aperture preservation. Poroelasticstress calculations combined with fracture mechanics criteria showthat it is possible to sustain opening-mode fracture growth with sub-lithostatic pore pressure without associated or preemptive shearfailure. Crack-seal textures and fracture aperture to length ratios sug-gest that preserved fracture apertures reflect the loading state thatcaused propagation. This implies that, for quartz-rich sandstones,the synkinematic cement in the fractures and in the rock mass propsfracture apertures open and reduces the possibility of aperture loss onunloading and relaxation. Fracture pattern development caused bysubcritical fracture growth for a limited range of strain histories is dem-onstrated to result in widely disparate fracture pattern geometries.Substantial opening-mode growth can be generated by very small ex-tensional strains (on the order of 10−4); consequently, fracture arraysare likely to form in the absence of larger scale structures. The effec-tive permeabilities calculated for these low-strain fracture patterns areconsiderable. To replicate the lower permeabilities that typify tightgas sandstones requires the superimposition of systematic cementfilling that preferentially plugs fracture tips and other narrower partsof the fracture pattern.
ACKNOWLEDGEMENTS
Our research on structural diagenesis is supportedby the Chemical Sciences, Geosciences and Bio-sciences Division, Office of Basic Energy Sciences,Office of Science, U.S. Department of Energy grantDE-FG02-03ER15430 (Predicting fracture porosityevolution in sandstone), by industrial associates
INTRODUCTION
The characterization of naturally fractured reservoirs continues tochallenge geoscientists. Although a variety of diagnostic techniquesdepend on the wellbore for data, ranging from conventional fractured
of the Fracture Research and Application Consor-tium and by Geocosm’s Consortium for QuantitativePrediction of Sandstone Reservoir Quality. We aregrateful to L. M. Bonnell for discussion and to TriciaF. Allwardt and Laird B. Thompson for reviews.The AAPG Editor thanks the following reviewersfor their work on this paper: Tricia F. Allwardtand Laird B. Thompson.
Copyright ©2009. The American Association of Petroleum Geologists. All rights reserved.
Manuscript received June 9, 2009; provisional acceptance July 21, 2009; revised manuscript receivedAugust 4, 2009; final acceptance August 11, 2009.DOI:10.1306/08110909100
AAPG Bulletin, v. 93, no. 11 (November 2009), pp. 1535– 1549 1535

core description (Nelson, 1985) to the use of microfrac-tures observed in thin sections from core (Laubach, 1997;Laubach and Gale, 2006) to the imaging of large frac-tures with resistivity or acoustic image logs (Zemaneket al., 1970; Asquith and Krygowski, 2004; Barton et al.,2009, this issue), wellbore fracture observations are bytheir nature incomplete and, for some key attributes suchas fracture length distribution, inadequate (Wu and Pol-lard, 2002). Geophysical techniques, which infer frac-ture attributes from their effects on wave propagation,sample a larger volume but have limited capability forunambiguously delineating fractures (e.g., Sayers, 2007).Outcrop analogs are opportunities to make more com-plete observations of fracture network geometry inat least two dimensions (e.g., Hennings et al., 2000;Laubach and Ward, 2006) but require extrapolatingresults to subsurface structural and diagenetic condi-tions. In some cases, quantifying the stress state (magni-tudes and directions) is used as a proxy for fractureobservations, with the assumption that opening-modefractures parallel to SHmax (the most compressive hori-zontal stress) are most likely to be conductive (Hefferand Lean, 1993), or faults that are critically stressed arethe key to reservoir deliverability (Barton et al., 1995),but this is apparently not generally the case for tightgas sandstones, where open and conductive fracturesare found at a wide range of angles to SHmax (Laubachet al., 2004a).
Using data collected typically from wellbores oroutcrops, geostatistical models, and mechanical stratig-raphy arewidely employed to infer fracture network attri-butes away from the wellbore (Datta-Gupta et al., 1995;Ortega et al., 2006; Laubach et al., 2009, this issue;McLennan et al., 2009, this issue; Zahm and Hennings,2009, this issue). Interwell fracture geometry can also bepredicted using geomechanical models of varying com-plexity, which are constrained by stress state, preexist-ing large-scale structures, and rock properties (CamacandHunt, 2009, this issue; Smart et al., 2009, this issue).Finally, in addition to the mechanically generated frac-ture porosity creation and flowpathway connectivity, si-multaneously acting diagenetic processes modify the flowcapability of the fracture network (Laubach, 2003; Philipet al., 2005; Laubach and Diaz-Tushman, 2009).
In this article, we analyze the creation of permeablenetworks of opening-mode fractures from the perspec-tive of fracture mechanics and the modification of me-chanically generated aperture by diagenesis, and howthese results are applicable to tight gas sandstones. Welook at the pore pressure and strain conditions that
1536 Fractures in Tight Gas Sandstones
can generate fractures, and how stress states controlwhether rocks fail in tension or shear. The results showthat opening-mode fracturing can occur at pore pres-sures substantially below the overburden stress magni-tude and at very small extensional strains, creatingfracture networks with considerable flow capacity andlow fracture porosity. This propensity of rocks to fail eas-ily in the tensile mode highlights the challenges of pre-dictive natural fracture characterization. Analyses andobservations suggest that fracturesmay form in responseto minor geologic events that would be mostly unno-ticed if it were not for the fractures that were left behind.Moreover, whether these fractures remain open, and howtheir capacity to transmit fluids varies with time dependstrongly on the mostly thermally driven precipitation re-actions of diagenesis, not necessarily the more readilymeasured present-day stress state.
INSIGHTS FROM THE MECHANICS OF FRACTURE
Linear elastic fracture mechanics (LEFM) provide aframework from which fracture propagation can be de-scribed as a function of loading, fracture geometry, andmaterial properties (Lawn and Wilshaw, 1975). Onekey parameter with regard to propagation is the stressintensity factor, Ki (where i = I, II, or III), which is ameasure of the magnitude of the stress singularity at thecrack tip that drives propagation. For pure opening mode(or mode I), the displacement discontinuity across thefracture is normal to the fracture face. Shearing can bedescribing as mode II sliding (shear is perpendicular tothe crack front) or mode III scissoring (shear is parallelto the crack front). Joints and veins are typically a resultof mode I or mixed mode I-II or I-III. As described byPollard and Aydin (1988), pure mode I propagationleads to straight propagation paths (Figure 1a). A combi-nation of mode I and II will result in kinked or curvingpaths (Olson and Pollard, 1989) (Figure 1b), whereasmodes I and III will cause the crack plane to twist orbreak down into en echelon segments (Pollard et al.,1982) (Figure 1c).
The magnitude of the mode I stress intensity factorfor an isolated, uniformly loaded, straight crack undertwo-dimensional (2-D), plane strain conditions can bewritten as (Lawn and Wilshaw, 1975)
KI ¼ DsIffiffiffiffiffipa
p ð1Þ

where DsI is called the mode I driving stress, given by(Olson, 2003)
DsI ¼ ðPf � SnÞ ð2Þ
where Pf is the fluid pressure acting inside the crack, Sn isthe normal stress acting perpendicular to the crack plane(compression assumed positive), and 2a is the dimen-sion of the crack in the plane of analysis (the x-z plane,Figure 2). Because it is expected that the remote princi-
pal stresses are all compressive in the subsurface (Zoback,2007), the fluid pressure in the fracture, Pf, must begreater than Sn to generate a positive opening-mode driv-ing stress (Segall, 1984). Engelder and Lacazette (1990),in describing the concept of natural hydraulic fractur-ing, showed that over long periods in a porous media,the fluid pressure in the fracture could be equated withthe pore pressure of the formation, Pf = Pp. Opening-mode fractures typically propagate as planes perpen-dicular to the least compressive principal stress, S3 (LawnandWilshaw, 1975; Pollard and Aydin, 1988). Vertical
Figure 1. Examples of typicalfracture propagation modes forjoints and veins. (a) Straightfracture geometry indication ofpure mode I propagation sand-stone, Muddy Gap, Wyoming.(b) Mixed mode I-II curving pat-tern for overlapping en echelonfractures in sandstone, Oil Moun-tain, Wyoming. (c) Mixed mode I-IIIparent crack and en echelonfringe cracks in limestone, BristolChannel, England. Dotted linesindicate representative fractureplanes (a–c), and solid arrowsindicate inferred loading con-ditions (c: opening and right-lateral shear).
Olson et al. 1537

opening-mode fractures consequently imply Sn = S3 =Shmin (where Shmin is the least compressive horizontalstress) indicative of normal faulting (Svert > SHmax >Shmin) or strike-slip faulting (SHmax > Svert > Shmin) stressregimes (where Svert is the vertical stress). Propagationdirections can vary from this simple relationship becauseof local stress heterogeneities caused by crack to crackinteraction (Gross, 1993; Bai et al., 2002; Olson, 2007),stress perturbation caused by fault slip (Rawnsley et al.,1992), or other geologic structures and heterogeneitiesof local influence.
Crack propagation can be divided into critical andsubcritical regimes based on the magnitude of the stressintensity factor, KI, relative to fracture toughness, KIc.Critical (commonly termed dynamic) propagation oc-curs whenKI ≥KIc, and under sustained loading, propa-gation will accelerate to rupture velocity, kinetic energyeffects become significant, and crack-tip branching mayoccur (Lawn and Wilshaw, 1975). Subcritical growthoccurs at stress intensity factors below fracture tough-ness,KI <KIc, aided by the action of corrosive fluids thatreduce the fracture strength of the material (Andersonand Grew, 1977). Subcritical fracture propagation typi-cally runs at velocities less than 10−3 m/s and can betreated as quasi-static, kinetic energy effects being neg-ligible (Segall and Pollard, 1983). A minimum thresholdvalue of the stress intensity factor is required for the
1538 Fractures in Tight Gas Sandstones
propagation (termed K�Ic), which is estimated to be on
the order ofK�Ic ffi KIc=10 (Segall and Pollard, 1983; Se-
gall, 1984; Atkinson and Meredith, 1987).Joint and vein networks are widely proposed to re-
present the result of subcritical fracture growth (Atkin-son, 1984; Segall, 1984; Atkinson and Meredith, 1987;Olson, 1993). Given the idea that crack propagation oc-curs when a threshold value of the stress intensity factorhas been reached or exceeded, we can set the stress in-tensity factor in equation 1 to KI ¼ K�
Ic as a conditionfor subcritical growth, and rearrange the terms to showthe driving stress required for propagation of an isolatedfracture as (Olson, 2003)
DsI ¼ K�Icffiffiffiffiffipa
p ð3Þ
Segall (1984) proposed that the positive driving stressneeded to generate regional opening-mode (joint) pat-terns can be a result of regional extension imposed onthe rock body, widely distributed elevated fluid pressure,or both. Olson (2003) discussed the variation in drivingstress under regional extension loading or fluid-pressure-driven natural hydraulic fracturing, arguing that square-root scaling of aperture to lengthmeasured in some jointsand dikes indicates propagation at constant stress inten-sity factor.
Figure 2. Plane strain fracture idealiza-tion for analysis in the x-z plane, showingfracture orientation relative to the coor-dinate system. Mode I driving stress, DsI,for fracture opening and growth is afunction of the internal fluid pressure inthe fracture, Pf, and the normal stressacting perpendicular to the fracture plane,Sn. For vertical fractures, typically Sn =Shmin (Shmin is the minimum horizontalcompressive stress).

FAILURE CONDITIONS IN APOROELASTIC MEDIUM
Pore-Pressure Conditions forOpening-Mode Growth
The initiation of opening-mode growth for vertical jointsor veins in the subsurface requires Pp > Shmin, and therehas been some question as to the likelihood of such con-ditions (Lorenz et al., 1991). We examine one aspect ofthis question from the perspective of natural hydraulicfracturing (Engelder and Lacazette, 1990) to illustratehow a porous media can move from stress conditionsthat inhibit opening-mode fracture growth (PP < Shmin)to conditions that favor it (PP > Shmin). Evidence fromsubsurface oil and gas operations demonstrates that hor-izontal in-situ stress varies proportional to pore-pressurechange (Lorenz et al., 1991; Engelder and Fisher, 1994).However, field data from the Vicksburg Formation ofsouth Texas (Salz, 1977) illustrate that horizontal stresschange is only a fraction of the pore-pressure changeðDShmin ffi 0:6DPPÞ. Similar results are found in otheroil and gas fields around the world (Engelder and Fisher,1994; Segall and Fitzgerald, 1998; Zoback and Zinke,2002). The proportionality between stress and pore-pressure change has been explained by analyzing the res-ervoir as a poroelastic solid (Engelder and Fisher, 1994;Segall and Fitzgerald, 1998). As such, the relationshipbetween Shmin and PP should take the form of
Shmin ¼ S0hmin þ1� 2n1� n
apPP ð4Þ
where n is Poisson’s ratio, ap is Biot’s poroelastic constant,and S0hmin is the part of the horizontal stress that is notpore pressure dependent. The S0hmin can be quantifiedbased on plane strain elastic equations as (Prats, 1981;Blanton and Olson, 1999)
S0hmin ¼ n1� n
Svert þ E1� n2
etect þ E1� n
aTDT ð5Þ
where E is Young’s modulus, etect is the horizontal tec-tonic strain (used as a calibration term and assumed to beuniform with depth), aT is the linear elastic thermal ex-pansion coefficient of the rock, and DT is the increase intemperature the rock experienced during burial. Otherauthors have includedmore complicated earth rheologiessuch as viscoelasticity to represent the time-dependentdeformation expected in rocks over long periods (Narrand Currie, 1982; Warpinski, 1989). We employ this
simpler approach here because we are only interestedin pore-pressure effects and because practical applicationsuggests that equations 4 and 5 can be used to adequatelyrepresent layer to layer variations in present-day stressfor sedimentary sequences (Blanton and Olson, 1999).
Taking the derivative of Shmin with respect to porepressure gives
dShmin
dPP¼ 1� 2n
1� nap ð6Þ
and using reasonable values for the elastic constants (0 <n < 0.5 and 0 < ap < 1), we can show that the variation intotal horizontal stress with pore pressure(dShmin/dPP)should always be less than or equal to 1 (Engelder andFisher, 1994). The ratio of 0.6 observed in the field bySalz (1977) can be obtained with typical sandstone con-stants of n = 0.2 and ap = 0.8, among other combinations.Also note that, for pore-pressure change in a laterally ex-tensive permeable zone, the magnitude of the overburdenstress (Svert) is unaffected (Segall and Fitzgerald, 1998).
The pore pressure required to generate opening-mode fractures canbe related to the vertical stress by com-bining the horizontal stress relations and fracture me-chanics equations. Following the conceptual model ofEngelder and Lacazette (1990), we combine equations 2and3, setting Sn = Shmin and Pf = Pp, to find the pore pres-sure required for the propagation of vertical fractures
Pp ¼ Shmin þK�
Icffiffiffiffiffipa
p ð7Þ
Substituting equation 4 for Shmin into equation 7 andsolving for pore pressure gives an LEFM-poroelastic-based expression for the conditions of opening-modefracture growth
Pp ¼ ð1� nÞð1� n� ð1� 2nÞapÞ Sohmin þ
K�Icffiffiffiffiffipa
p� �
ð8Þ
Expanding the S0hmin term and normalizing both sides ofequation 8 by the vertical stress, Svert, gives the ratio ofpore pressure to vertical stress for fracture propagation
Pp=Svert ¼ nð1� n� ð1� 2nÞapÞ
þ 1Svert
� ð1� nÞð1� n� ð1� 2nÞapÞ
� �
� Eetectð1� n2Þ þ EaTDT
ð1� nÞ þ K�Icffiffiffiffiffipa
p� �
ð9Þ
Olson et al. 1539

For the sake of discussion, wemake a first-order approx-imation that the tectonic strain and thermoelastic andthreshold subcritical stress-intensity terms in equation 9are small relative to the vertical stress and are thus ofonly secondary interest. This leaves us with a simplerexpression that is useful for estimating the order of mag-nitude of pore pressure relative to vertical stress requiredfor opening-mode fracturing as
Pp=Svert ffi nð1� n� ð1� 2nÞapÞ ð10Þ
Interestingly, when ap = 1, equation 10 becomes in-dependent of Poisson’s ratio and is always equal to 1(Figure 3). However, when ap < 1, the pore-pressureratio required for fracturing can drop to below hydro-static (Pp/Svert ffi 0.4) depending on the value of Pois-son’s ratio. The better the cement and the lower the po-rosity in a sandstone, the lower its poroelastic constantis expected to be. Consequently, for such rocks, thefirst-order approximation of equation 10 suggests thatopening-mode fracturing can occur at pore pressuressignificantly less than the overburden stress, and giventypical elastic values for tight gas sandstones (n < 0.3and 0.5 < ap < 0.7), even subhydrostatic pore pressurecould be conducive to opening-mode failure (Figure 3).
1540 Fractures in Tight Gas Sandstones
Shear Failure Versus Tensile Failure
One last factor to consider when looking at the likeli-hood of natural hydraulic fracturing is whether thelayer will fail in shear before the tensile failure criterionis met. Because shear failure also becomes more likelywhen the pore pressure reaches a significant fractionof the vertical stress and fault slip can relieve drivingstresses that may also cause opening-mode failure, itseems probable that if the shear failure occurs first ona typical loading path, it will suppress or possibly pre-vent later opening-mode failure. We test this conceptusing a simple Mohr-Coulomb shear failure criterion(Jaeger and Cook, 1979). Zoback and Healy (1984)showed that the Mohr-Coulomb frictional sliding onpreexisting faults is a reasonable model for constrainingin-situ stress magnitudes on a regional scale. For our pur-poses, we are interested in stresses at the well scale oroutcrop scale in a bedof intact rock (nopreexisting faults),and we want to see if that particular layer will fail first inshear or tension. Stability with respect toMohr-Coulombfailure can be described as (Zoback, 2007)
ðS1 � PPÞ <ffiffiffiffiffiffiffiffiffiffiffiffiffiffi1þ m2i
qþ mi
� �2
ðS3 � PPÞ þUCS ð11Þ
Figure 3. Ratio of pore pres-sure to vertical stress (lp = Pp/Svert) required for opening-modefracture growth as a functionof Biot’s poroelastic parameter,ap, and Poisson’s ratio, n.

where S1 and S3 are the most and least compressiveprincipal stresses, respectively, mi is the coefficient ofinternal friction, and UCS is the unconfined compressivestrength. If the inequality of equation 11 is true, Mohr-Coulomb shear failure should not occur. To determine ifopening-mode failure will occur at a pore pressure lowerthan that required for shear failure (i.e., opening-modefailure will occur first), we can substitute the pore-pressurevalue Pp = S3 into equation 11, which is our nominal con-dition for opening-mode growth. The term (S3 − PP) thenbecomes zero, and equation 11 can be rewritten as
S3=S1 > 1�UCS=S1 ð12Þ
or noting that Pp and S3 are interchangeable
PP=S1 > 1�UCS=S1 ð13Þ
If this condition is true, then opening-mode failure islikely to precede shear failure. This is a useful resultin that it only depends on one rock property, uncon-fined compressive strength (UCS). If we assume a nor-mal faulting stress regime (S1 = Svert), we can rewriteequation 13 in terms of the vertical stress (to be analo-gous to equations 9 and 10) as
PP=Svert > 1�UCS=Svert ð14Þ
SONORA FIELD, CANYON GROUP EXAMPLE
In summary, we have defined a possible set of con-straints on pore pressure for the generation of vertical,opening-mode fractures. A quantitative example, basedon measured subsurface data from the Philips C-11Ward well in the Canyon Group of the Sonora field,Texas (Miller et al., 1994), illustrates how this ap-
proach can be applied to fracture prediction. At thetime of the stress measurements, the Sonora Canyonreservoir was underpressured (dPP/dz = 7.6 MPa/km)and Pp < Shmin. Table 1 summarizes the in-situ datacollected for this well in each of seven zones, includingthe magnitude of the least compressive horizontalstress as measured by microfractures (labeled S�hmin).The last column in Table 1 (labeled Shmin) is the bestestimate of the least compressive horizontal stress ap-plying equations 4 and 5 with a tectonic strain value ofetect ¼ �4:017� 10�4.
The pore-pressure ratio, lp = Pp/Svert, to satisfy thenominal opening-mode fracturing condition of Pp =Shmin, was computed using equation 9 (Table 2). Weagain assumed that ðK�
Ic=ffiffiffiffiffipa
p ÞSvert << 1 and could beneglected, but we did include the tectonic and ther-mal strain terms as constrained by the stress analysis ofTable 1. The pore-pressure ratios required to initiateopening-mode fracturing for the seven zones in the So-nora field Canyon Group represent significant over-pressures, ranging from lp = 0.86 to lp = 0.94, but thepore pressures are all below the overburden stress. Thecalculations also predict that natural hydraulic fracturing
Table 1. Mechanical Property and In-Situ Stress Data for Canyon Group, Sonora Gas Field, Texas
Depth (m)
Lith** Svert (MPa) E (GPa) n ap Pp (MPa) aT DT (°F) Shmin* (MPa)Olson et al.
Shmin (MPa)
1844
ss 45.5 46.9 0.23 0.59 13.8 5.6 � 10−6 90.8 31.2 29.6 941 ss 47.9 53.8 0.15 0.63 14.5 5.6 � 10−6 95.5 26.8 27.4 1954 sh 48.2 32.4 0.30 0.62 14.6 5.0 � 10−6 96.2 33.5 33.2 1987 ss 49.0 55.2 0.13 0.64 14.8 5.6 � 10−6 97.8 27.5 27.3 2002 sh 49.4 32.4 0.29 0.63 14.9 5.0 � 10−6 98.5 33.2 34.0 2017 ss 49.7 51.7 0.15 0.64 15.1 5.6 � 10−6 99.3 28.1 29.1 2045 sh 50.4 27.6 0.30 0.67 15.3 5.0 � 10−6 100.6 35.6 35.1**Lith = lithology; ss = sandstone; sh = shale.
Table 2. Predicted Failure Data for Sonora Gas Field
Depth(m)
Lith* lpUCS(MPa)
1 − UCS/Svert
1 − (UCS/10)/Svert
1844
ss 0.90 149 −2.28 0.67 1941 ss 0.86 180 −2.76 0.62 1954 sh 0.91 86 −0.78 0.82 1987 ss 0.86 187 −2.81 0.62 2002 sh 0.92 86 −0.74 0.83 2017 ss 0.90 170 −2.42 0.66 2045 sh 0.94 77 −0.52 0.85*Lith = lithology; ss = sandstone; sh = shale.
1541

would occur at lower pore-pressure ratios in the strongersandstones than in the weaker shales, although the dif-ference is slight.
Using equation 14, we testedwhether opening-modefailure was likely to precede shear failure. The UCS val-ues were estimated using a Young’s modulus correlationfrom Zoback (2007, his tables 4.1 and 4.2). Given thevery high estimated UCS values (70 MPa or higher),the quantity (1 −UCS/Svert) was negative for all depths(Table 2), clearly satisfying the inequality in equation 14and indicating that opening-mode fracturing would oc-cur before faulting. We also tried 1/10 of the UCS val-ues from the correlations for each zone to see if reducingrock strength would significantly change the result. Allzones still passed the test that opening-mode fracture in-itiation would precede faulting, but the margin of differ-ence was much smaller (Table 2). Core observations fromother wells in the Sonora Canyon reveal porous, quartz-bridged opening-mode fractures (Laubach et al., 2009,this issue), which is consistent with themodel prediction.
FRACTURE PROPAGATION MODELING
Given the premise that opening-mode fracture growthcan be driven by reasonable combinations of tectonicstrain and pore pressure, we employ the joints modeldescribed by Olson (2004, 2007) to investigate frac-ture porosity and permeability generation under smallstrain loading. The numerical model simulates lateralpropagation of vertical fractures in a semi-infinite elas-tic media where the fractures are confined to a horizon-tal, finite thickness layer (see Olson, 2003, 2004, for adetailed discussion of the three-dimensional aspects ofthe modeling). Accounting for the stress shadow ef-fects of finite height fractures in bedded sedimentarysequences is essential in explaining the common corre-lation between fracture spacing and layer thickness(Narr and Suppe, 1991; Bai and Pollard, 2000).
Propagation is assumed to be subcritical, wherebypropagation velocity can be described as a direct func-tion of stress intensity factor (Atkinson, 1987) as
V ¼ A KI=KIcð Þn ð15Þ
where A is the velocity constant and the exponent n iscalled the subcritical index, both empirically deter-mined. For tests done in air, the lowest values of the sub-critical index are found for silica glass (n ffi 15) andweakly cemented sandstone (nffi 25), whereas the high-
1542 Fractures in Tight Gas Sandstones
est values are obtained for carbonates and shales (n >100) (Atkinson, 1987; Holder et al., 2001). Typical va-lues for well-cemented sandstones fall in the range of 40≤ n ≤ 80 in air and water (Rijken et al., 2002; Rijken,2005). We chose an average value of n = 50 for the sim-ulations presented below.
Three simulations were performed to examinethe influence of strain anisotropy on fracture growthdriven from flaws under constant pore pressure withinitial conditions such that PP = Shmin = Syy. The me-chanical properties and geometry of the fracturing layerare summarized in Table 3. Figure 4a–c are trace mapsillustrating the diversity of fracture pattern geometrythat results for even a minor loading path variation.Figure 4d–f are depictions of the aperture distributionsfor the three different simulations. In all three cases,the fractures propagated from 100 initial flaws of0.1 m (0.3 ft) total length in response to a biaxial strainof exx ¼ eyy ¼ 2� 10�4 imposed in 20 equal incre-ments over 10 m.y., resulting in an effective strain rateof @e=@t ¼ 6:3� 10�19=s. All fracture elements had alength of 0.05 mm (0.001 in.), and fracture growthwas achieved by adding elements at the crack tips pro-portional to the propagation velocity calculated usingequation 15 (see Olson, 2007, for details on the propa-gation algorithm). The fracture geometry results rangedfrom a random polygonal pattern (Figure 4a, d) to across-fractured pattern (Figure 4b, e) to a single set ofnominally parallel fractures (Figure 4c, f). The differ-ence between the three simulations was achieved byvarying the anisotropy of the initial horizontal strainsapplied to the layer. The initial strain in the y directionwas zero for all three cases (eyy = 0), but the initial strainin the x direction was varied from exx = 0 (Figure 4a, d)to exx ¼ �1� 10�4 (Figure 4b, e) to exx ¼ �2� 10�4
(Figure 4c, f ), representing an increasing anisotropy
Table 3. Modeling Parameters for Fracture Pattern Generation
Finite body, areal extent
7.2 � 7.2 m Fracture propagation area 6 � 6 m Layer thickness 1 m Fracture toughness, KIc 1.5 MPa-√m Young’s modulus 20 GPa Poisson’s ratio 0.2 Friction coefficient 0.6 Subcritical index 50 Initial flaw length 0.1 m Number of flaws 100
with Sxx being more compressive than Syy. This increas-ing stress anisotropy progressively inhibited fracturecurving and reorientation away from the x direction(also the SHmax direction), a phenomenon reflecting thecompetition between in-situ stress and mechanical crackinteraction in controlling fracture propagation paths
(Olson and Pollard, 1989). The results suggest that verysmall variations in the strain state (on the order of 10−4
strain) can significantly alter the fracture pattern geometry.These numerically generated fracture patterns also
illustrate that extensive opening-mode fracture patternscan be generated with very small incremental strains, on
Figure 4. Networks of verticalfractures generated from 100starter flaws in a semi-infiniteelastic body with areal (x, y) di-mensions of 7.2 by 7.2 m (23.6by 23.6 ft) (areal boundariesindicated by solid-lined squaresoutlining fracture patterns inpanels a–c). Fractures are limitedto grow within a 6 by 6 m (20by 20 ft) window to minimizeedge effects (see Olson, 1993).Fractures have a fixed heightof 1 m (3 ft) as if constrained toa finite thickness layer, but thebody has infinite thickness in thez direction. (a–c) Trace maps and(d–f) aperture distributions areplotted for three different casesof initial strain anisotropy: (a, d)isotropic initial strain, (b, e)initial x-parallel contraction strainof exx ¼ �1� 10�4, and (c, f)initial strain exx ¼ �2� 10�4.Aperture distributions (d–f) areplotted using circles centeredon each fracture element witha diameter equal to aperture(diameter of quarter circle inthe lower left of each diagramfor scale, representing an openingof 1 � 10−3 m [3 � 10−3 m],exaggeration about 150 times).See Table 3 for additionalparameters.
Olson et al. 1543

the order of 10−4, strains that would probably be unde-tectable if not for the fracture patterns they left behind.The model prediction of substantial fracture growth atsmall strain is consistent with field-measured fracturestrains on the order of 10−4 for closely spaced, miner-alized joints in granite (Segall and Pollard, 1983) andwith small fracture strain values measured from tightgas sandstones (Hooker et al., 2009).
EFFECTIVE PERMEABILITY AND DIAGENESIS
Another challenge for fractured reservoir characteriza-tion is quantifying the effective permeability of fracturenetworks like those in Figure 4 (Table 4). A benefit ofthe mechanics-based analysis exemplified above is thatfracture aperture is an intrinsic part of the solution; aresult of boundary conditions imposed, propagationcriteria, and the mechanical interaction between neigh-boring fractures. To demonstrate the influence of frac-ture pattern variability on flow properties, we can quan-tify the effective permeabilities in the x and y directions,kx and ky, using a finite difference solution that accountsfor contributions from both the matrix and fractures(Philip et al., 2005; Olson et al., 2007). The 2-D, steady-state flow equations for an anisotropic, nonhomogeneousmedia can be written as (Bear, 1979)
@
@xkx
@P@x
� �þ @
@yky
@P@y
� �¼ 0 ð16Þ
This equation was solved using the central finitedifference method (Bear, 1979) on a 120 by 120 basegrid with grid-block (cell) dimensions of Dx = Dy =0.05 m (0.01 ft). The flow boundaries were moved in5% from the edge of the 120 by 120 grid in an attempt
1544 Fractures in Tight Gas Sandstones
to avoid the influence of nonsystematic fracture ge-ometry on the edge of the fracture patterns. Becausethe dimension of the grid blocks was comparable tothe fracture element size (0.05 m [0.01 ft]), the flowgrid could be readily overlayed on the fracture pattern.Grid blocks that included a fracture element were givena permeability, kfracd, proportional to the fracture aper-ture size of the included element, whereas grid blockswithout fractures were assigned a matrix permeabilityvalue. The permeability of fractured grid blocks wascomputed as (Philip et al., 2005)
kfracd ¼ kf � d þ km � ðDc � dÞDc
ð17Þ
where km is the matrix permeability (km = 0.1 md) andkf is the intrinsic fracture permeability
kf ¼d2
12ð18Þ
The Dc is the grid-block dimension (equivalent to Dxand Dy), and d is the fracture aperture. For fracturesnot aligned with the x or y direction, we followed theprocedure of Rijken (2005) and introduced off-diagonalgrid blocks with fractured block attributes to maintainfracture flow continuity. The permeability of the frac-tured, fine-scale grid-blocks was assumed to be isotropic(kx = ky = kfracd). This method was shown to be accuratewith respect to analytical steady-state solutions whengrid refinement was such that at least four nonfracturedgrid blocks between parallel fractures were maintained(Philip et al., 2005).
The polygonal fracture pattern (Figure 4d), whichwas generated under isotropic strain conditions, has anominally isotropic effective permeability of kx =8514 md and ky = 8734 md. The cross-fractured pat-tern (Figure 4e), where the apertures for throughgoingfractures parallel to x are clearly larger than the cross-fractures, has a kx = 5978 md and ky = 687 md, a per-meability anisotropy of almost 9:1. Finally, the single-set fracture pattern (Figure 4f) has permeabilities of kx =4149 md and ky = 0.15 md. These permeabilities arehigh for tight gas sandstones, but the calculations pre-sume that all of the mechanically generated aperturesfor the fracture patterns in Figure 4 are preserved forflow. However, in fractures formed in the subsurface,crack-seal textures and other evidence suggest that ce-ment may be deposited simultaneously with fractureopening and propagation (synkinematic cement), par-tially filling and propping the large aperture parts of the
Table 4. Simulation Results: Aperture, Fracture Porosity, and
Effective PermeabilityPattern
Polygonal Cross-Fracture ParallelPorosity (%)
0.079 0.063 0.052 kx (md) 8514 5978 4149 ky (md) 8734 687 0.15 davg (m) 3.71 � 10−4 3.46 � 10−4 3.35 � 10−4dmax (m)
9.26 � 10−4 8.85 � 10−4 7.84 � 10−4dmin (m)
1.20 � 10−6 1.35 � 10−6 1.01 � 10−6
fracture pattern but completely plugging and occludingnarrower sections such as fracture tips (Laubach, 1988,2003; Laubach et al., 2004b; Laubach and Ward, 2006;Gale et al., 2009; Hooker et al., 2009). Mapping of quartzcement in fracture bridges, combined with fluid inclu-sion analysis, suggests that an incremental crack-sealopening for a given fracture may persist for as long as50 m.y. (Becker et al., in press).
The highly heterogeneous quartz cement thick-nesses found in partially cemented fractures are a func-tion of the processes that control quartz crystal growthrates (Lander et al., 2008). Quartz crystals show substan-tial anisotropies in growth rate depending on the nuclea-tion substrate. The fastest rates of growth occur onnoneuhedral surfaces that are perpendicular to the crys-tallographic c axis. Rates are about 20 to 60 times slower,respectively, on euhedral pyramidal and euhedral prismaticfaces. Quartz growth rate is also a strong function of tem-perature, which can be expressed using an Arrhenius ex-pression (Walderhaug, 2000; Lander et al., 2008) as
q ¼ Ae�Eanc
RT ð19Þ
where q is the rate of quartz precipitation per unit area(mol/cm2s), A is a constant (mol/cm2s), Eanc is theactivation energy for quartz precipitation on non-euhedral c axis surfaces (J/mol), R is the real gas con-stant (8.314 J/mol°K), and T is the temperature (K).
The values in Figure 5 were generated using A = 9 �10−9 mol/cm2s and Eanc = 49 kJ/mol. The latter valuewas obtained by matching simulated quartz cementabundances to measured values for an unfractured sand-stone sample in the Travis Peak Formation using thePrism2D model described by Lander et al. (2008).
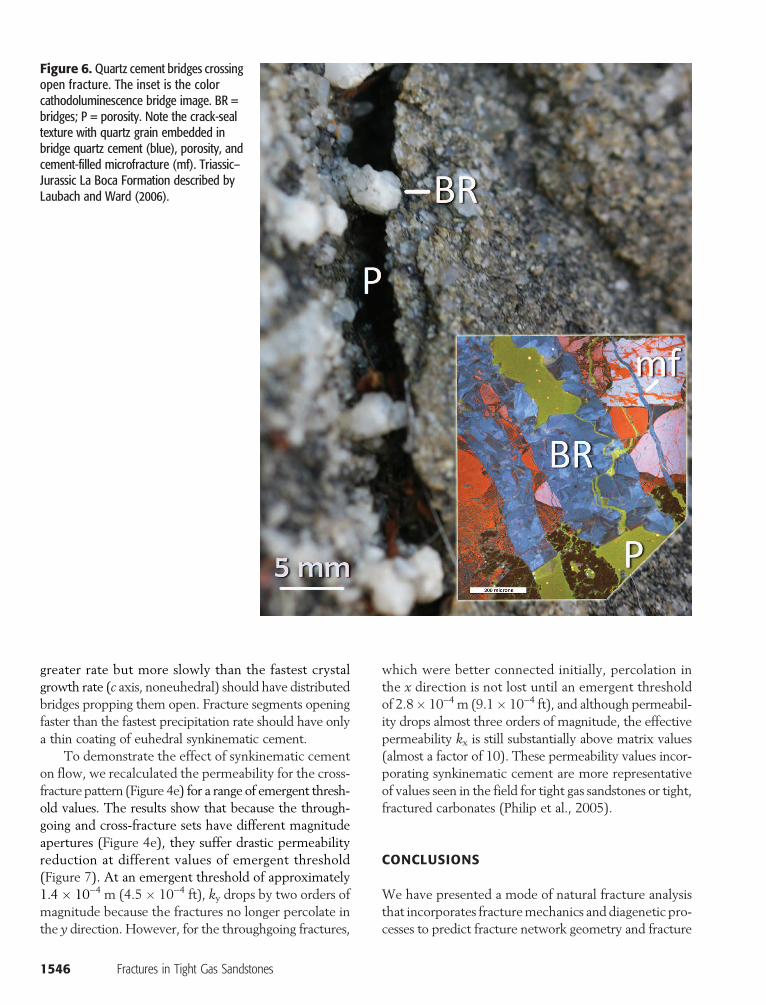
The competition between quartz precipitation rateand fracture opening rate determines whether a frac-ture is completely filled with cement (no porosity), par-tially filled with occasional aperture spanning bridgesthat prop it open, or mostly open with only a thin coat-ing of euhedral quartz crystals (Figure 6). All of theseeventualities can be observed in quartz-rich sandstonesamples from the subsurface (e.g., Laubach, 2003;Becker et al., in press) and outcrop (Laubach andWard,2006; Laubach and Diaz-Tushman, 2009). To estimatethe impact of quartz cement precipitation on fracturepermeability, we employ the concept of emergentthreshold (Laubach, 2003), an empirical observationthat, in many quartz-rich sandstones, a kinematic aper-ture exists below which fractures are completely filledwith cement and occluded and above which they areonly partially cemented and bridged or completely open.We can estimate the emergent threshold by picking theslowest precipitation rate (parallel to the a axis on aeuhedral surface) indicative of the sandstone’s tem-perature during fracturing (Figure 5). Any fracturesegment that opened more slowly than this rate shouldbe completely sealed. Fracture segments opening at a
Figure 5. Quartz precipitationrate in micrometers per millionyears for a range of temperaturefrom 25 to 250°C. The three curvesrepresent the range of expectedgrowth rate in a fracture, withthe greatest rate being parallelto the c crystallographic axis fornoneuhedral crystals, followedby c axis parallel growth oneuhedral crystals, with theslowest growth parallel to thea axis on euhedral crystals.
Olson et al. 1545
greater rate but more slowly than the fastest crystalgrowth rate (c axis, noneuhedral) should have distributedbridges propping them open. Fracture segments openingfaster than the fastest precipitation rate should have onlya thin coating of euhedral synkinematic cement.
To demonstrate the effect of synkinematic cementon flow, we recalculated the permeability for the cross-fracturepattern (Figure 4e) for a range of emergent thresh-old values. The results show that because the through-going and cross-fracture sets have different magnitudeapertures (Figure 4e), they suffer drastic permeabilityreduction at different values of emergent threshold(Figure 7). At an emergent threshold of approximately1.4 � 10−4 m (4.5 � 10−4 ft), ky drops by two orders ofmagnitude because the fractures no longer percolate inthe y direction. However, for the throughgoing fractures,
1546 Fractures in Tight Gas Sandstones
which were better connected initially, percolation inthe x direction is not lost until an emergent thresholdof 2.8� 10−4 m (9.1� 10−4 ft), and although permeabil-ity drops almost three orders of magnitude, the effectivepermeability kx is still substantially above matrix values(almost a factor of 10). These permeability values incor-porating synkinematic cement are more representativeof values seen in the field for tight gas sandstones or tight,fractured carbonates (Philip et al., 2005).
CONCLUSIONS
We have presented a mode of natural fracture analysisthat incorporates fracturemechanics and diagenetic pro-cesses to predict fracture network geometry and fracture
Figure 6. Quartz cement bridges crossingopen fracture. The inset is the colorcathodoluminescence bridge image. BR =bridges; P = porosity. Note the crack-sealtexture with quartz grain embedded inbridge quartz cement (blue), porosity, andcement-filled microfracture (mf). Triassic–Jurassic La Boca Formation described byLaubach and Ward (2006).

aperture distribution and preservation. Using stress datafrom a low-permeability gas field in Texas, poroelasticstress calculations combinedwith fracturemechanics cri-teria show that it is possible to sustain opening-mode frac-ture growth with sublithostatic pore pressure withoutassociated or preemptive shear failure. Representativenumerical simulations of fracture pattern developmentcaused by subcritical fracture growth demonstrate thatsubstantial opening-mode growth can occur at tiny ex-tensional strains (on the order of 10−4). The effective per-meabilities for these low-strain fracture patterns can beconsiderable if calculated using the ultimate mechanicalopening experienced during propagation, but permeabil-ities are significantly reduced when accounting for likelydiagenetic modifications to the fracture apertures. Sig-nificant changes in fracture pattern geometry and flowproperties caused by minor changes in deformational ordiagenetic boundary conditions highlight the challengesof accurate characterization of natural fractures causedby small strain events. The potential lack of dependenceof opening-mode fracture network characteristics onmore readily observable macroscopic structures suchas folds and faults emphasizes the importance of site-specific subsurface observations of fracture attributes,including diagenesis, that can only be acquired fromcore. In the absence of subsurface rock samples, wellboreobservations via logs and reservoir imaging using geophys-ical techniques need to be augmented with modeling
predictions constrained by reasonable geologic bound-ary conditions to assess fracture pattern details that arebelow observational thresholds.
REFERENCES CITED
Anderson, O. L., and P. C. Grew, 1977, Stress corrosion theory ofcrack propagation with applications to geophysics: Reviews ofGeophysics and Space Physics, v. 15, p. 77–104.
Asquith, G., and D. Krygowski, 2004, Basic well log analysis: AAPGMethods in Exploration Series 16, 240 p.
Atkinson, B. K., 1984, Subcritical crack growth in geological mate-rials: Journal of Geophysical Research, v. 89, p. 4077–4114,doi:10.1029/JB089iB06p04077.
Atkinson, B. K., 1987, Introduction to fracture mechanics and itsgeophysical applications, in B. K. Atkinson, ed., Fracture me-chanics of rock: London, Academic Press, p. 1–26.
Atkinson, B. K., and P. G. Meredith, 1987, The theory of subcriticalcrack growth with applications to minerals and rocks, in B. K.Atkinson, ed., Fracture mechanics of rock: London, AcademicPress, p. 111–166.
Bai, T., and D. D. Pollard, 2000, Fracture spacing in layered rocks: Anew explanation based on the stress transition: Journal of Struc-tural Geology, v. 22, p. 43–57, doi:10.1016/S0191-8141(99)00137-6.
Bai, T., L. Martin, M. R. Gross, and A. Aydin, 2002, Orthogonal crossjoints: Do they imply a regional stress rotation?: Journal of Struc-tural Geology, v. 24, p. 77–88, doi:10.1016/S0191-8141(01)00050-5.
Barton, C., D. Moos, and K. Tezuka, 2009, Geomechanical wellboreimaging: Implications for reservoir fracture permeability: AAPGBulletin, v. 93, no. 11, p. 1551–1569, doi:10.1306/06180909030.
Figure 7. Modification ofthe calculated steady-state effec-tive permeability (left axis) forthe fracture pattern of Figure 4e,showing reduction in effectivepermeabilities, kx and ky, causedby quartz cementation repre-sented by the increasing emer-gent threshold. Fracture porosityis plotted on the right axis.
Olson et al. 1547

Barton, C. A., M. D. Zoback, and D. Moos, 1995, Fluid-flow along po-tentially active faults in crystalline rock:Geology, v. 23, p. 683–686,doi:10.1130/0091-7613(1995)023<0683:FFAPAF>2.3.CO;2.
Bear, J., 1979, Hydraulics of groundwater: New York, McGraw-Hill,567 p.
Becker, S. P., P. Eichhubl, S. E. Laubach, R. M. Reed, R. H. Lander,and R. J. Bodnar, in press, A 48m.y. history of fracture opening,Cretaceous Travis Peak Formation, east Texas: Geological So-ciety of America Bulletin.
Blanton, T. L., and J. E. Olson, 1999, Stress magnitudes from logs:Effects of tectonic strains and temperature: Society of PetroleumEngineers Reservoir Evaluation and Engineering, v. 2, p. 62–68.
Camac, B. A., and S. P. Hunt, 2009, Predicting the regional distribu-tion of fracture networks using the distinct element numericalmethod: AAPG Bulletin, v. 93, no. 11, p. 1571–1583, doi:10.1306/07230909040.
Datta-Gupta, A., L. W. Lake, and G. A. Pope, 1995, Characterizingheterogeneous permeable media with spatial statistics and trac-er data using sequential simulated annealing: MathematicalGeology, v. 27, p. 763–787, doi:10.1007/BF02273537.
Engelder, T., and M. P. Fisher, 1994, Influence of poroelastic behav-ior on the magnitude of minimum horizontal stress, Sh, in over-pressured parts of sedimentary basins: Geology, v. 22, p. 949–952, doi:10.1130/0091-7613(1994)022<0949:IOPBOT>2.3.CO;2.
Engelder, T., and A. Lacazette, 1990, Natural hydraulic fracturing, inN. Barton and O. Stephansson, eds., Rock joints: Rotterdam,A. A. Balkema, p. 35–44.
Gale, J. F. W., R. H. Lander, R. M. Reed, and S. E. Laubach, 2009,Modeling fracture porosity evolution in dolostone: Journal ofStructural Geology, v. 31, doi:101016/j.jsg.2009.04.018.
Gross, M. R., 1993, The origin and spacing of cross joints: Examplesfrom the Monterey Formation, Santa Barbara coastline, Califor-nia: Journal of Structural Geology, v. 15, p. 737–751,doi:10.1016/0191-8141(93)90059-J.
Heffer, K. J., and J. Lean, 1993, Earth stress orientation-control on,and guide to, flooding directionality in a majority of reservoirs,in W. Linville, ed., Reservoir characterization III: Tulsa, Penn-Well Books, p. 799–822.
Hennings, P. H., J. E. Olson, and L. B. Thompson, 2000, Combiningoutcrop and three-dimensional structural modeling to charac-terize fractured reservoirs: An example from Wyoming: AAPGBulletin, v. 84, p. 830–849.
Holder, J., J. E. Olson, and Z. Philip, 2001, Experimental determina-tion of subcritical crack growth parameters in sedimentary rock:Geophysical Research Letters, v. 28, p. 599–602.
Hooker, J. H., J. F. W. Gale, L. A. Gomez, S. E. Laubach, R. Marrett,and R. M. Reed, 2009, Aperture-size scaling variations in a low-strain opening-mode fracture set, Cozzette Sandstone, Colorado:Journal of Structural Geology, v. 31, p. 707–718, doi:10.1016/j.jsg.2009.04.001.
Jaeger, J. C., and N. G. W. Cook, 1979, Fundamentals of rock me-chanics: London, Chapman and Hall, 593 p.
Lander, R. H., R. E. Larese, and L. M. Bonnell, 2008, Toward moreaccurate quartz cement models—The importance of euhedralvs. non-euhedral growth rates: AAPG Bulletin, v. 92, p. 1537–1564, doi:10.1306/07160808037.
Laubach, S. E., 1988, Subsurface fractures and their relationship tostress history in east Texas Basin sandstone: Tectonophysics,v. 156, p. 37–49, doi:10.1016/0040-1951(88)90281-8.
Laubach, S. E., 1997, A method to detect natural fracture strike insandstones: AAPG Bulletin, v. 81, p. 604–623.
Laubach, S. E., 2003, Practical approaches to identifying sealed andopen fractures: AAPG Bulletin, v. 87, p. 561–579, doi:10.1306/11060201106.
Laubach, S. E., and K. Diaz-Tushman, 2009, Laurentian paleostress
1548 Fractures in Tight Gas Sandstones
trajectories and ephemeral fracture permeability, CambrianEriboll Formation sandstones west of the Moine thrust zone,northwest Scotland: Journal of the Geological Society (London),v. 166, p. 349–362, doi:10.1144/0016-76492008-061.
Laubach, S. E., and J. F. W. Gale, 2006, Obtaining fracture informa-tion for low-permeability (tight) gas sandstones from sidewallcores: Journal of Petroleum Geology, v. 29, p. 147–158, doi:10.1111/j.1747-5457.2006.00147.x.
Laubach, S. E., and M. W. Ward, 2006, Diagenesis in porosity evo-lution of opening-mode fractures, Middle Triassic to Lower Ju-rassic La Boca Formation, NE Mexico: Tectonophysics, v. 419,p. 75–97, doi:10.1016/j.tecto.2006.03.020.
Laubach, S. E., J. E. Olson, and J. F. W. Gale, 2004a, Are open frac-tures necessarily aligned with maximum horizontal stress?:Earth and Planetary Science Letters, v. 222, p. 191–195.
Laubach, S. E., R. M. Reed, J. E. Olson, R. H. Lander, and L. M.Bonnell, 2004b, Coevolution of crack-seal texture and fractureporosity in sedimentary rocks: Cathodoluminescence observa-tions of regional fractures: Journal of Structural Geology, v. 26,p. 967–982, doi:10.1016/j.jsg.2003.08.019.
Laubach, S. E., J. E. Olson, and M. R. Gross, 2009, Mechanical andfracture stratigraphy: AAPG Bulletin, v. 93, no. 11, p. 1413–1426, doi:10.1306/07270909094.
Lawn, B. R., and T. R. Wilshaw, 1975, Fracture of brittle solids:Cambridge, Cambridge University Press, 204 p.
Lorenz, J. C., L. W. Teufel, and N. R. Warpinski, 1991, Regionalfractures: I. A mechanism for the formation of regional fractureat depth in flat-lying reservoirs: AAPG Bulletin, v. 75, p. 1714–1737.
McLennan, J. A., P. F. Allwardt, P. H. Hennings, and H. E. Farrell,2009, Multivariate fracture intensity prediction: Applicationto Oil Mountain anticline, Wyoming: AAPG Bulletin, v. 93,no. 11, p. 1585–1595, doi:10.1306/07220909081.
Miller II, W. K., R. E. Peterson, C. W. Harrison, J. E. Stevens, andC. B. Lackey, 1994, In-situ stress profiling and prediction of hy-draulic fracture azimuth for the west Texas Canyon Sands for-mation: Society of Petroleum Engineers Production and Facil-ities, v. 9, no. 3, p. 204–210.
Narr,W., and J. B. Currie, 1982,Origin of fracture porosity—ExamplefromAltamont field, Utah: AAPGBulletin, v. 66, p. 1231–1247.
Narr, W., and J. Suppe, 1991, Joint spacing in sedimentary rocks:Journal of Structural Geology, v. 13, p. 1037–1048, doi:10.1016/0191-8141(91)90055-N.
Nelson, R. A., 1985, Geologic analysis of naturally fractued reser-voirs: Houston, Texas, Gulf Publishing Co., 320 p.
Olson, J., and D. D. Pollard, 1989, Inferring paleostresses from naturalfracture patterns: A new method: Geology, v. 17, p. 345–348,doi:10.1130/0091-7613(1989)017<0345:IPFNFP>2.3.CO;2.
Olson, J. E., 1993, Joint pattern development: Effects of subcriti-cal crack-growth and mechanical crack interaction: Journal ofGeophysical Research, v. 98, p. 12,251–12,265, doi:10.1029/93JB00779.
Olson, J. E., 2003, Sublinear scaling of fracture aperture versuslength: An exception or the rule?: Journal of Geophysical Re-search, v. 108, no. B9, p. ETG3-1, Cite ID 2413, doi:10.1029/2001JB000419.
Olson, J. E., 2004, Predicting fracture swarms—The influence ofsubcritical crack growth and the crack-tip process zone on jointspacing in rock, in T. Engelder and J. W. Cosgrove, eds., Theinitiation, propagation, and arrest of joints and other fractures:Geological Society (London) Special Publication 231, p. 73–87.
Olson, J. E., 2007, Fracture aperture, length and pattern geometrydevelopment under biaxial loading: A numerical study with ap-plications to natural, cross-jointed systems, in G. Couples andH. Lewis, eds., Fracture-like damage and localization: Geologi-cal Society (London) Special Publication 289, p. 123–142.

Olson, J. E., S. E. Laubach, and R. H. Lander, 2007, Combining dia-genesis and mechanics to quantify fracture aperture distribu-tions and fracture pattern permeability, in L. Lonergan, R. J. H.Jolly, D. J. Sanderson, and K. Rawnsley, eds., Fractured reservoirs:Geological Society (London) Special Publication 270, p. 97–112.
Ortega, O. J., R. Marrett, and S. E. Laubach, 2006, A scale-independentapproach to fracture intensity and average fracture spacing:AAPG Bulletin, v. 90, p. 193–208, doi:10.1306/08250505059.
Philip, Z. G., J. W. Jennings, J. E. Olson, S. E. Laubach, and J.Holder, 2005, Modeling coupled fracture-matrix fluid flow ingeomechanically simulated fracture networks: Society of Petro-leum Engineers Reservoir Evaluation and Engineering, v. 8,p. 300–309.
Pollard, D. D., and A. Aydin, 1988, Progress in understanding joint-ing over the past century: Geological Society of America Bulle-tin, v. 100, p. 1181–1204.
Pollard, D. D., P. Segall, and P. T. Delaney, 1982, Formation andinterpretation of dilatant echelon cracks: Geological Societyof America Bulletin, v. 93, p. 1291–1303.
Prats, M., 1981, Effect of burial history on the subsurface horizon-tal stresses of formations having different material properties:Society of Petroleum Engineers Journal, v. 21, no. 6, p. 658–662.
Rawnsley, K. D., T. Rives, and J. P. Petit, 1992, Joint developmentin perturbed stress fields near faults: Journal of Structural Geol-ogy, v. 14, p. 939–951, doi:10.1016/0191-8141(92)90025-R.
Rijken, P., 2005, Modeling naturally fractured reservoirs: From ex-perimental rock mechanics to flow simulation: Ph.D. disserta-tion, University of Texas at Austin, Department of Petroleumand Geosystems Engineering, Austin, Texas, 239 p.
Rijken, P., J. Holder, J. E. Olson, and S. E. Laubach, 2002, Predictingfracture attributes in the Travis Peak Formation using quantita-tive mechanical modeling and structural diagenesis: Transac-tions: 52nd Annual Convention of the Gulf Coast Associationof Geological Societies, v. 52, p. 837–847.
Salz, L. B., 1977, Relationship between fracture propagation pres-sure and pore pressure: Society of Petroleum Engineers AnnualFall Technical Conference and Exhibition, October 9–12,
1977, Denver, Colorado, SPE Paper 6870, 7 p., doi:10.2118/6870-MS.
Sayers, C., 2007, Introduction to this special section: Fractures: TheLeading Edge, v. 26, p. 1102–1105, doi:10.1190/1.2780777.
Segall, P., 1984, Formation and growth of extensional fracture sets:Geological Society of America Bulletin, v. 95, p. 454–462.
Segall, P., andS.D. Fitzgerald, 1998,Anote on induced stress changes inhydrocarbon and geothermal reservoirs: Tectonophysics, v. 289,p. 117–128, doi:10.1016/S0040-1951(97)00311-9.
Segall, P., and D. D. Pollard, 1983, Joint formation in granitic rock ofthe Sierra Nevada: Geological Society of America Bulletin, v. 94,p. 563–575.
Smart, K. J., D. A. Ferrill, and A. P. Morris, 2009, Impact of inter-layer slip on fracture prediction from geomechanical models offault-related folds: AAPG Bulletin, v. 93, no. 11, p. 1447–1458,doi:10.1306/05110909034.
Walderhaug, O., 2000, Modeling quartz cementation and porosityloss in Middle Jurassic Brent Group sandstones of the Kvitebjørnfield, northern North Sea: AAPG Bulletin, v. 84, p. 1325–1339.
Warpinski, N. R., 1989, Elastic and viscoelastic calculations of stressesin sedimentary basins: Society of PetroleumEngineers FormationEvaluation, v. 4, p. 522–530.
Wu, H., and D. D. Pollard, 2002, Imaging 3-D fracture networksaround boreholes: AAPG Bulletin, v. 86, p. 593–604.
Zahm, C. K., and P. H. Hennings, 2009, Complex fracture develop-ment related to stratigraphic architecture: Challenges for struc-tural deformation prediction, Tensleep Sandstone at the Alcovaanticline, Wyoming: AAPG Bulletin, v. 93, no. 11, p. 1427–1446, doi:10.1306/08040909110.
Zemanek, J., E. E. Glenn, L. J. Norton, and R. L. Caldwell, 1970,Formation evaluation by inspection with borehole televiewer:Geophysics, v. 35, p. 254–269, doi:10.1190/1.1440089.
Zoback, M. D., 2007, Reservoir geomechanics: Cambridge, Cam-bridge University Press, 449 p.
Zoback, M. D., and J. H. Healy, 1984, Friction, faulting, and in situstress: Annales Geophysicae, v. 2, p. 689–698.
Zoback, M. D., and J. C. Zinke, 2002, Production-induced normalfaulting in the Valhall and Ekofisk oil fields: Pure and AppliedGeophysics, v. 159, p. 403–420.
Olson et al. 1549


