Embed Size (px)
Citation preview

Neural Correlates of True and False Memory in MildCognitive ImpairmentCatherineM. Sweeney-Reed1,3*, Patricia M. Riddell2, Judi A. Ellis2, Jayne E. Freeman2, Slawomir J. Nasuto3
1Memory and Consciousness Research Group, University Clinic for Neurology and Stereotactic Neurosurgery, Medical Faculty, Otto von Guericke University, Magdeburg,
Germany, 2 School of Psychology and Clinical Language Sciences, University of Reading, Earley Gate, Reading, United Kingdom, 3Cybernetics Research Group, School of
Systems Engineering, University of Reading, Whiteknights, Reading, Berkshire, United Kingdom
Abstract
The goal of this research was to investigate the changes in neural processing in mild cognitive impairment. We measuredphase synchrony, amplitudes, and event-related potentials in veridical and false memory to determine whether thesediffered in participants with mild cognitive impairment compared with typical, age-matched controls. Empirical modedecomposition phase locking analysis was used to assess synchrony, which is the first time this analysis technique has beenapplied in a complex cognitive task such as memory processing. The technique allowed assessment of changes in frontaland parietal cortex connectivity over time during a memory task, without a priori selection of frequency ranges, which hasbeen shown previously to influence synchrony detection. Phase synchrony differed significantly in its timing and degreebetween participant groups in the theta and alpha frequency ranges. Timing differences suggested greater dependence ongist memory in the presence of mild cognitive impairment. The group with mild cognitive impairment had significantlymore frontal theta phase locking than the controls in the absence of a significant behavioural difference in the task,providing new evidence for compensatory processing in the former group. Both groups showed greater frontal phaselocking during false than true memory, suggesting increased searching when no actual memory trace was found. Significantinter-group differences in frontal alpha phase locking provided support for a role for lower and upper alpha oscillations inmemory processing. Finally, fronto-parietal interaction was significantly reduced in the group with mild cognitiveimpairment, supporting the notion that mild cognitive impairment could represent an early stage in Alzheimer’s disease,which has been described as a ‘disconnection syndrome’.
Citation: Sweeney-Reed CM, Riddell PM, Ellis JA, Freeman JE, Nasuto SJ (2012) Neural Correlates of True and False Memory in Mild Cognitive Impairment. PLoSONE 7(10): e48357. doi:10.1371/journal.pone.0048357
Editor: Jorge J. Riera, Tohoku University, Institute for Development, Aging and Cancer, Japan
Received May 21, 2012; Accepted September 24, 2012; Published October 31, 2012
Copyright: � 2012 Sweeney-Reed et al. This is an open-access article distributed under the terms of the Creative Commons Attribution License, which permitsunrestricted use, distribution, and reproduction in any medium, provided the original author and source are credited.
Funding: Economic and Social Research Council(E.R.S.C.) http://www.esrc.ac.uk/. Dr. P.M. Riddell, RES-474-25-0014): funding for the EEG recording equipment.The funders had no role in study design, data collection and analysis, decision to publish, or preparation of the manuscript.
Competing Interests: The authors have declared that no competing interests exist.
* E-mail: [email protected]
Introduction
Alzheimer’s disease (AD) is a neurodegenerative process re-
sponsible for fifty to sixty percent of cases of dementia over the age
of 65 [1]. Early recognition of prodromal signs is increasingly
important as advances are made in treatment, so that preventative
or symptom-delaying medications may be started by arrest of the
pathological processes before irreversible damage occurs [2,3,4,5].
Furthermore, better prediction of progression to AD is essential for
planning patient care. The well-recognised neuropathological
changes found in AD are also frequently found in mild cognitive
impairment (MCI), and therefore it is possible that MCI represents
an early stage of the same process [6,7]. MCI can be defined as
subjective memory impairment and reduced memory for age, but
typical general cognitive function and activities of daily living and
no dementia, and using this definition, 12% of patients with MCI
develop AD per year [8]. Detection of underlying neural
mechanisms that differ between those with normal memory and
those with MCI should lead to refinement of future diagnostic
tests, allowing more accurate prediction of which people with MCI
will go on to develop AD, and of this group, who will benefit from
specific treatment approaches. Furthermore, a greater under-
standing of the electrophysiological correlates of memory proces-
sing may in future allow development of new treatment
approaches, including both pharmacological and electrical. Our
aim was to explore differences in the neural correlates of true and
false memory to characterise how memory processing differs
between typical older people and those with MCI.
The electroencephalogram (EEG) provides a potential low-cost,
non-invasive method to improve early diagnosis as well as a means
to enhance our understanding of the cortical processes affected.
Here, we primarily investigated the use of phase synchrony in
EEG recorded from participants with MCI and age-matched
controls during true and false memory, calculated using a recently
introduced analysis technique, empirical mode decomposition
phase locking (EMDPL) [9]. The method has been introduced and
compared with other approaches to phase synchrony analysis
elsewhere [9,10], but as we introduce the method here for the first
time to the study of memory, we also provide a comparison with
traditional bandpass filtering and wavelet based approaches, both
to illustrate the advantages offered by EMDPL, as well as to
validate our findings. Amplitude information was also determined
following empirical mode decomposition and wavelet time-
frequency decomposition to investigate whether amplitude differ-
ences could provide complementary information to highlight inter-
group differences. Finally, event-related potentials (ERPs) were
PLOS ONE | www.plosone.org 1 October 2012 | Volume 7 | Issue 10 | e48357

measured, to provide a benchmark comparison with previous ERP
studies investigating true and false memory processing in such
groups. Here, we will introduce the reasoning behind our choice of
approach, before providing a brief review of what is already
known about the behavioural and neurophysiological correlates of
true and false memory.
Phase synchrony was chosen for this study as it is thought to be
of fundamental importance in cognitive processing [11,12] and to
be affected in AD [2,13], making it a potentially useful
measurement to detect differences in neural processing between
participants with MCI and age-matched controls. It has been
postulated that synchronisation is the mechanism by which
information processed by functionally separate brain regions is
integrated for cognitive functions, including memory processing
[11,12]. The transient, dynamic neural assemblies resulting from
activation of different brain regions over time, which are mediated
by synchrony in particular frequency ranges, can be studied in
electrophysiological data such as the EEG [11,14,15].
Short and long range synchrony, that is synchronous EEG
activity between adjacent and distant brain areas respectively,
have already been identified during memory tasks in typical
participants and those with memory impairment
[15,16,17,18,19,20,21,22]. The findings indicate that synchrony
can be useful in separating these participant groups both using
resting EEG [13,16,23,24,25,26,27,28] and EEG recorded during
a relevant task [29,30,31,32]. However, differences between
typical and MCI groups are not always detected at rest. For
example, in a study of EEG power differences between normal
and MCI groups, differences were detected during working
memory tasks but not at rest [33]. For this reason, we chose to
record EEG during a memory task.
Performance has been shown to differ between typical
participants and those with MCI in tasks known to increase the
likelihood of false memory, and therefore we chose to measure
EEG correlates of the Deese-Roediger-MacDermott (DRM)
paradigm. In addition to group differences in this task, true and
false memories have been demonstrated to show different neural
signatures, at least in typical young participants [34]. EEG
measured during this task therefore has the potential to shed light
on how true versus false memory processing changes in patients
with MCI, as well as to differentiate between participant groups.
As far as we are aware, this is the first study in which phase
synchrony has been used to explore false memory in patients with
MCI.
1. ParadigmFalse memory was introduced by [35] and demonstrated in
simple list learning tasks by [36], where participants who had
viewed a list of related words would falsely recall the presence of
a word associated with the list, often termed the lure word. This
task was extended to include a recognition memory task [37], and
used by [38] with extended word lists to show that typical
participants falsely recalled, and confidently recognised, the lure in
40% of trials. The paradigm used in the current study was
a version of the task used by [38], known as the DRM paradigm.
2. Phase SynchronyAn ideal measure of the activity of distributed neural networks
would allow measurement of changes in the synchronous firing
patterns within the network over time. Typically, synchrony has
been calculated using coherence, a measure reflecting both
amplitude and timing information. Furthermore, the dynamic
changes in synchrony over time are often not considered. It has
been suggested that phase or timing information alone, in-
dependent of amplitude information, provides a mechanism by
which functionally separate regions of the brain interact [11]. In
this study, we therefore calculated instantaneous phase using
EMDPL, allowing us to investigate changes in connectivity over
time.
Phase locking (PL) must be calculated in a narrow frequency
band for the phase to be interpretable, which usually necessitates
a priori selection of frequency range cut-offs. Previous EEG studies
have indicated that particular frequency ranges are associated with
different aspects of cognition, but there is little consistency in the
precise choice of the frequencies included in a given range. The
precise corner frequencies chosen to define the particular
frequency bands have an important influence on phase synchrony
detection. Firstly, the frequency range relevant to a particular task
varies between participants [10,39,40,41,42] and secondly, the
cut-offs can influence whether phase synchrony is even detected
[9,10,43]. We introduced EMDPL to the study of phase synchrony
in EEG signals in order to address this problem [9,10,44,45]. The
method is an extension of EMD, an approach to time-frequency
analysis of broadband signals initially developed by [46] for the
analysis of geophysical data, which has since been utilised in
a broad range of applications, from engineering and biomedical to
financial time series analysis [46,47,48,49,50,51,52].
EMD is an iterative sifting process by which a broadband signal
is decomposed into frequency modulated components whose
definition allows calculation of instantaneous amplitude, phase,
and frequency using the Hilbert transform (HT) [46]. We first
explored the use of EMD to isolate neural assemblies mediated by
brief episodes of phase synchrony [44,45], and subsequently
extended the method to introduce EMDPL analysis, which
incorporates a statistical framework for the assessment of the
significance of episodes of PL and also the EMDPL spectrum [9].
The latter is a phase synchrony adaptation of the Hilbert spectrum
(HS), in which episodes of significant synchrony between a pair of
signals are plotted against instantaneous frequency and time. Both
application to artificial signals, and to real EEG data in the context
of a simple motor task, demonstrated that EMDPL permits
successful time-frequency localisation of PL between broadband
signals [10,53]. In the current study, the assessment of statistical
significance was extended to permit comparison between different
study conditions.
3. FrequenciesIn previous studies, theta oscillations have been shown to be
involved in episodic memory, and upper alpha oscillations have
been associated with long-term memory in particular [15,54].
Lower alpha oscillations have been postulated to play a role in
attention [55], which may also be relevant, as attentional deficits
are thought to contribute in AD [56,57]. On the basis of this
literature we chose oscillations in the theta and alpha ranges as the
focus of the study. We postulated that synchronisation changes
related to memory and to attention would be detected in patients
with MCI before the development of AD, demonstrated by
differences between people with MCI compared to typical older
adults.
While review of the literature indicates that theta and alpha
frequency ranges are likely to be relevant to the task, the cut-offs
for these ranges differ greatly between studies. For example, the
theta range has been defined as 3–5 Hz [58], 3.9–6.8 Hz [21], 4–
6 Hz [59], 4–7 Hz [19], 4–7.5 Hz [31], 4–8 Hz [16], and 4.5–
7.5 Hz [13]. Similar variation in alpha frequency ranges have also
been reported [10,39,54]. Since EMDPL is data-driven on
a subject-by-subject, trial-by-trial basis and does not require
Mild Cognitive Impairment Memory Neural Correlates
PLOS ONE | www.plosone.org 2 October 2012 | Volume 7 | Issue 10 | e48357

a priori selection of frequency ranges for analysis, relevant
information is not lost by a priori parameter selection [10].
4. Brain RegionsFrontal and parietal areas have been shown to be important in
memory processing using a variety of neuroimaging techniques
[19,21,34,60,61,62,63,64,65,66,67]. More specifically, the right
frontal and left parietal regions were selected for study here, both
on the basis of evidence for their involvement in recognition
memory [65,68,69,70,71,72,73], and also following neuropsycho-
logical and lesion studies, which have identified neural correlates
of true versus false memory in these areas (reviewed by [74]).
Indeed, true and false recognition have elicited prefrontal and
parietal cortex as well as hippocampal activity [75,76], all areas
commonly involved in episodic memory retrieval [74].
False memory has been demonstrated to change with age and in
disease, occurring more readily with increasing age [77], in MCI
and AD [78,79,80], and in frontal lobe damage [81,82,83]. The
increase in false recognition found in patients with frontal damage
has led to the suggestion that frontal areas have a role in reducing
or avoiding false episodic memory [74]. This provides a potential
mechanism for the reduction in suppression of false memories in
patients with AD [84] since frontal regions have been found to be
affected by AD [84,85,86,87,88]. One hypothesis is that impaired
frontal lobe function could result in increases in false memory via
a combination of semantic memory network breakdown alongside
reduced attentional control and inhibition. It has been suggested,
for instance, that participants with frontal lobe damage might rely
excessively on similarities between the items presented [74] as
a result of monitoring deficits [74,83,89,90]. Furthermore, in-
vestigation of recognition memory has revealed dissociations that
have given rise to a number of dual-process models, in which
recognition is taken to involve either recollection of past events or
assessment of familiarity [91]. At least partially separate neural
networks are thought to underlie these two processes, with
recollection involving the hippocampus, anterior thalamus, and
pre-frontal cortex, and familiarity requiring the parahippocampal
gyrus, the dorsomedial thalamus, and the frontal lobes [92]. In
particular, the two processes are believed to be separate at
retrieval, and indeed, ERPs differ between the two. Thus,
differences in ability to recognise past events between groups
might be expected to result from differences in activation of the
familiarity network, which includes the frontal lobe. Patients with
MCI are hypothesised to have a greater tendency to rely on
familiarity, since this has been shown to be spared relative to
recollection [93]. On the basis of these findings, we postulated that
reliance on different types of memory processing would result in
differences in frontal neural processing underlying false memory
between participant groups and therefore that this would provide
one way to differentiate between the groups in the absence of
a difference in performance.
Evidence also suggests a contribution of parietal lobe activation
during memory tasks [66]. For instance, left parietal theta power
has been shown to increase during retrieval [71]. It has been
suggested that parietal evoked activity (power increase) and PL
may indicate simultaneous activation of storage networks [94].
Furthermore, central executive processes, reflecting attention and
the interface between working and long-term memory [19,95,96],
have been postulated to result from functional connectivity
between frontal and parietal areas forming a fronto-parietal
network [16,21]. [19] demonstrated consistently increased long-
range theta coherence suggesting enhanced connectivity between
left posterior areas and the right prefrontal cortex, during episodic
memory retention. The increased connectivity demonstrated by
[21] was not associated with any change in theta power (amplitude
of response), indicating that phase-coupling was a suitable measure
of changes in this network. We aimed to extend this finding by
examining correlation between time varying levels of spatially
averaged PL within each region (frontal and parietal) over time.
Patients with AD are known to have reduced central executive
function [97], and this reduction has been associated with
decreased fronto-parietal EEG coherence in theta and alpha
frequency ranges [16,20,21,58]. Fronto-parietal interaction has
already been examined using EEG in true and false memory
processing in typical young participants [34]. Fronto-parietal
gamma coherence was greater for old (true), than for false or new
items. On the basis of the evidence, we postulated that fronto-
parietal correlation in theta and alpha PL levels would differ both
between false memory compared with true memory, and in adults
with MCI compared with age-matched controls.
We chose the right frontal and left parietal regions for
investigation for two reasons. Firstly, the literature, as reviewed
above, indicates that these are likely to be sites where relevant
processing is carried out. The hemispheric encoding/retrieval
asymmetry (HERA) model describes the frontal lateralisation of
encoding versus retrieval processes, with right frontal involvement
in episodic memory retrieval [65,98]. Indeed, frontal lateralisation
for retrieval of episodic memory has been demonstrated using
PET studies [63,65,72], PET with ERPs [70], repetitive
transcranial stimulation (TMS) [99], and neuroimaging studies
[76,90,100]. The left parietal area was chosen, as verbal
information is thought to be maintained in a phonological loop
localised within the left parietal area [19,64,101,102], and sub-
vocal rehearsal of visually presented words is thought to activate
this loop [19,95].
The second reason for focus on right frontal and left parietal
areas, i.e. regions in opposite brain hemispheres, was that one aim
in this study was identification of a potential early diagnostic
indicator of AD. Imaging and behavioural studies have shown that
episodic memories involve interhemispheric interactions, with
semantic memory processed mainly on the left [103]. As
interhemispheric activity and corpus callosal size have been shown
to be reduced in AD [30,104], this could also contribute to the
increase in false memories in AD. By assessing correlation between
activity levels in opposite hemispheres, we postulated that the
probability of identifying an intergroup difference would increase.
In summary, a review of the literature suggests that neural
correlates of true and false memory offer a promising way of
differentiating between typical older participants and those with
MCI at risk of developing AD. There is considerable evidence that
not only performance will differ, but that the differences in neural
processing during such a task will be detectable by examining the
phase synchrony of right frontal and left parietal activity in the
theta and alpha frequency ranges. In this paper, we provide a test
of this hypothesis using EMDPL to identify phase synchronies
between these brain regions in participants with MCI compared to
typical age-matched controls.
Amplitude differences between groups and conditions in the
theta and alpha frequencies were also calculated, to explore
potentially complementary characteristics of the EEG data that
could highlight inter-group differences. While the Hilbert and
wavelet transforms have been shown to provide equivalent phase
information [105,106], the differing approaches to time-frequency
decomposition offered the possibility of complementary findings
by using both approaches. Finally, we performed an ERP analysis
to verify that the dataset contained the EEG correlates that would
be expected from previous studies [68,69,107,108,109,110,111].
Mild Cognitive Impairment Memory Neural Correlates
PLOS ONE | www.plosone.org 3 October 2012 | Volume 7 | Issue 10 | e48357

Methods
1. Ethics StatementEthical approval was obtained from the University Ethics and
Research Committee of the School of Psychology at the University
of Reading (Ref. 2006/120/JE for the pilot study and 2006/146/
JE for the EEG study) and all participants gave their informed
written consent prior to their inclusion in the study.
EEG data were recorded from participants with MCI and age-
matched controls using the DRM paradigm, and phase synchrony
levels, amplitudes, and ERPs were compared both between groups
and between true and false memory processing within groups.
2. Experimental ProtocolThe paradigm, summarised in Fig. 1, was based on the DRM
word recognition task used by [34]. 24 lists of 10 words were
shown serially on a screen, each followed by free recall, and
recognition memory was tested using lists of 12 words pertaining to
each lure, consisting of 6 words randomly taken from each list, the
lures, two of the highest associates of each lure, and three of the
lowest associates as foils. In total, 180 words, in their associated
groups, were shown for encoding, and 288 were presented in
a mixed order for recognition (see Table S1, for word lists). To
increase the number of false recalls, no non-associated words were
used [34]. To ensure that participants would not see a pattern and
realise that the lure was never included in the studied lists, the high
and low associates and the lure were presented for 6 of the lists,
and the moderate associates were used as the foils in the
recognition phase. These lists are referred to as reversed lists.
For all lists, high associates were presented first to increase the
chance of false memory [34].
Words were taken primarily from the lists provided by [38] and
[112]. The selection of lists most likely to produce false memory
was informed by [112], in which lists were ranked according to
likelihood of producing false memory in the recognition phase.
The lists were presented in a mixed order, so that those most likely
to lead to false memory were not all together. For those lures used
by [38], the associates for the new words in the recognition phase
were taken from the lists given. The Florida Word Association
Norms [113] were used to select the two highest and three lowest
associates from these lists. For those lures not found in the lists by
[38], the associates were drawn entirely from the Florida Word
Association Norms. Words judged to be more commonly used in
American English were excluded, after checking their rankings in
the Edinburgh Word Association Norms [114], and the chosen
words had an equal forward and backward association with the
lure as far as was possible.
Full instructions were given at the beginning and repeated as
a reminder at each stage. Participants controlled reading time. As
per [34], the trials were completed in three blocks. In each block,
participants studied items from 6 regular and 2 reversed lists. Each
word was shown for 1000 ms followed by a blank screen for
1000 ms. After list presentation, participants counted backwards
aloud for ten seconds as a distraction task and then freely recalled
as many words as possible. At the end of each block, the 96 word
recognition test was performed, with the 48 studied words and 48
new words, all associated with the lure. Word recognition was
chosen to minimise movement artefacts in the EEG recordings,
and responses were recorded using a simple button-press. Words
were presented for 1000 ms, then participants pressed a ‘yes’ or
a ‘no’ button to indicate whether they recognised the word, then
pressed a button a second time to indicate whether they were
Figure 1. Behavioural paradigm. Experimental protocol followed for the recording of EEG data during performance of the Deese-Roediger-MacDermott paradigm.doi:10.1371/journal.pone.0048357.g001
Mild Cognitive Impairment Memory Neural Correlates
PLOS ONE | www.plosone.org 4 October 2012 | Volume 7 | Issue 10 | e48357

certain or not, in response to ‘Are you certain?’ on the screen.
Analysis included only trials with high-confidence responses to
ensure that guess rates would not intrude, as per [34]. PL,
amplitudes, and ERPs in EEG recorded during trials classified as
‘hits’ (correct recognition of old words) were compared with ‘false
alarms (FA)’ (incorrect recognition of new or lure words), as the
focus was on true/false effects.
3. ParticipantsA pilot study was performed with two young (mean age 34
years) and two older participants (mean age 71 years), contacted
via the Aging Panel recruited from the community by the School
of Psychology at the University of Reading. Several adjustments
followed the pilot study. In the recognition phase, participants
were given control over response time length, since if the next
word appeared before a response was made, participants fell
behind. The 1 s of EEG recorded during word presentation was
used for EEG analysis. The number of response keys was reduced
from 4 for recognition and certainty to two, for ‘yes’ and ‘no’ to
each question. Instructions were made clearer. Finally, the word
list presentation was fixed.
Episodic memory impairment is generally greater in MCI than
expected for normal aging [115] and is commonly studied through
word recall and recognition tasks [72]. The Consortium to
Establish a Registry for AD (CERAD) word learning test provides
sub-tests for each measure, and both sub-tests have an established
sensitivity to MCI and AD [116,117]. Delayed recall has been
found to be the best discriminator overall when comparing
participants with mild AD versus controls [4,118,119,120]. Given
the relative success of these tasks in identifying those at risk of AD,
immediate and delayed word recall and delayed recognition were
measured to contribute to identifying groups of typical older
participants and those with MCI for this study.
As for the pilot study, participants for the main study were also
identified from the Aging Panel. Typical participants were
required to score 28–30 on Mini-Mental State Examination
(MMSE) while participants with MCI were chosen from those
scoring between 23–28 on this test, in accordance with ICD-10
criteria [121]. Account was also taken of scores primarily in the
CERAD delayed recall test and secondarily in the CERAD
immediate recall and recognition tests. All participants were right-
handed. Potential participants were contacted by telephone
initially and with their agreement, were sent an information sheet
and consent form. 22 participants were recruited, with 11 per
group. One participant in the MCI group felt unwell on the testing
day and did not complete any blocks, so was excluded from the
analysis, and a second participant developed discomfort in one
hand in the final block, so completed only two of the three testing
blocks. These data were included.
4. EEG RecordingParticipants sat in a comfortable chair, 57 cm from the screen
and with the keyboard within easy reach. EEG was recorded from
a 129 sensor net (128 channels), with an Electrical Geodesics, Inc.
amplifier and Net Station software. The experimental paradigm
was presented using ePrime stimulus presentation software.
Following recording, the data from the recognition phase were
bandpass filtered between 0.5 and 100 Hz using a finite response
filter with a 2 Hz roll-off. The data were segmented into epochs in
ePrime during word presentation for recognition, then exported
into Matlab.
5. Electrode SelectionIn EEG/MEG analysis, particular brain areas are frequently
chosen on the basis of well-recognised findings in the literature in
order to reduce the vast number of possible comparisons to be
made [16,19,21,58,122,123,124]. Given the extensive evidence for
right frontal and left parietal involvement in memory retrieval,
these regions were selected for region-of-interest analysis. Due to
variation between studies in the sensor nets used for EEG
recording, it was not possible to select electrodes identical to those
used in the relevant studies but rather was necessary to select
corresponding electrode locations. We chose electrodes whose
locations corresponded most closely with the locations identified in
other studies to be involved in similar memory processing tasks.
With the sensor net we used, 4 electrodes from each area
adequately covered the relevant regions.
In order to confirm that the areas chosen were indeed relevant
in our data set, we calculated post-stimulus ERP differences
between hits and FA in the typical group in all 128 electrodes. We
also calculated post-stimulus theta and alpha phase alignment in
all 128 electrodes, in order to include a phase-based approach. (As
discussed in the introduction, we chose to explore phase synchrony
in detail in this work, given the evidence for its role in cognition in
general and in memory processing in particular.) Details of the
methods applied are in Appendix S1. All 8 electrodes chosen from
the literature showed a difference in activity during hits versus FA,
supporting their use in the study (Fig. 2).
6. Data Pre-Processing6.1 Artefact removal. As adding the additional instruction of
avoiding blinking during trials could impair task performance in
participants with MCI, all participants were simply asked to avoid
excessive movement. Common in EEG studies is to inspect data
visually and reject trials with clear artefacts [14,125,126]. This was
not possible here, as the vast majority of the trials contained ocular
artefacts.
Blinks and eye movements have a different temporal structure
when compared with electrocortical activity, therefore temporal
decorrelation separation (TDSEP) provided a straightforward
method of removing this activity [127]. TDSEP is a type of
independent component analysis (ICA), in which signals compris-
ing contributions from a mixture of sources are separated by
maximising the temporal independence of the components
[128,129].
TDSEP was applied to each trial, and the independent
components (ICs) containing the ocular data were removed by
visual inspection. The corresponding column of the mixing matrix
was set to zero when the ICs were back-projected to the scalp
electrodes for reconstruction of the data without artefacts. Fig. 3
provides an illustration of a blink artefact (Fig. 3A) and its
subsequent removal from the signal recorded at one electrode
(Fig. 3B). Following removal of ocular artefacts, visual inspection
was used to exclude any trials clearly contaminated by artefacts
from other non-cortical sources.
6.2 Volume conduction. The signals recorded at the scalp
surface comprise contributions from multiple cortical sources,
which are linearly combined during conduction through the brain
parenchyma, cerebrospinal fluid, skull, and scalp. As a result,
spurious synchrony can be detected between adjacent electrodes.
Laplacian transformation of the raw EEG data not only addresses
the problem of choosing a montage [10,130,131], which can affect
phase synchrony measurement [132,133], but it also goes some
way to removing the effects of volume conduction [10,131].
A frontal group and a parietal group of electrodes were selected
for analysis. In order to reduce volume conduction further, while
Mild Cognitive Impairment Memory Neural Correlates
PLOS ONE | www.plosone.org 5 October 2012 | Volume 7 | Issue 10 | e48357

preserving phase synchrony, a second TDSEP was applied to each
group [10,134]. In summary, the raw data, cleaned of blink
artefacts by identifying components of the signals containing blink
data using TDSEP, were spline Laplacian transformed, and then
TDSEP was applied to the clean, Laplacian-transformed signals.
The subsequent analyses, including EMDPL, bandpass filter and
wavelet based phase synchrony, phase alignment, amplitude
analyses, and ERP calculation were then applied to the resulting
components.
7. EMDPLThe first stage of EMDPL is performance of EMD. The Matlab
code used to implement EMD was adapted from that used by
[135,136]. The initial step is to identify the extrema of each of the
pair of signals between which synchrony is to be sought, then to
find the upper and lower envelopes by connecting the maxima and
minima respectively using cubic spline interpolation. The mean of
the envelope of the signal is then subtracted, and the component
found is assessed to determine whether it fulfils the two criteria by
which an intrinsic mode function (IMF) is defined. The first is that
the mean of the envelope must be zero. The threshold used here
for acceptable proximity to zero was 0.001. The second criterion is
that the number of extrema must differ at most by one. Once an
IMF is found, it is subtracted from the signal, and the process is
repeated until a stopping condition is reached. This condition
requires that each IMF must differ from the previous one
according to a mean squared error stopping criterion, which is
empirically set at 10e25. Furthermore, each IMF must contribute
at least 5% of the variance of the signal [9].
The definition of IMFs allows calculation of instantaneous
features of a signal Xt using the Hilbert transform (HT) (Eq. 1),
Yt ~1
pP
ð?{?
Xt’
t{ t’dt’ ð1Þ
where Yt is the HT of Xt, P indicates the Cauchy principal value of
the integral, and t is time [46]. Using Yt as the imaginary
component, an analytic signal Zt is formed, (Eq. 2),
Zt ~Xt z iYt ~ ateiht ð2Þ
where at is the series of instantaneous amplitudes when the
Figure 2. Spatial localisation of ERP and phase alignment differences between hits and FA in typical participants. The right frontal andleft parietal electrodes chosen for study are highlighted in the Electrical Geodesics Inc. Sensor Net used for recording EEG. A. ERP differences in thefirst 250 ms post-stimulus. B. ERP differences 400–650 ms post-stimulus. C. Mean theta phase alignment differences in the first 250 ms post-stimulus.D. Mean alpha phase alignment differences 150–400 ms post-stimulus. The colourbar represents p-values determined using a two-sample T-test.doi:10.1371/journal.pone.0048357.g002
Mild Cognitive Impairment Memory Neural Correlates
PLOS ONE | www.plosone.org 6 October 2012 | Volume 7 | Issue 10 | e48357

analytic signal is represented in polar coordinates, and ht are the
instantaneous phases. Instantaneous frequency ft may be derived,
as the rate of change of the instantaneous phase (Eq. 3).
ft ~dhtdt
ð3Þ
PL is sought pairwise between all possible combinations of the
IMFs from the signal pair in question. It is defined in a statistical
sense as a constant value of the difference between the series of
instantaneous phases over time, as follows [137],
DWn:m(t)Dv const where Wn:m(t)~ nh1(t){mh2(t), ð4Þ
where Wmn is the relative phase, h1 and h2 are the phase series fromeach signal, t is time, and n and m are integers. The single-trial
phase locking value (SPLV) is calculated using Eq. 5.
SPLV (f , t)~ D1
d
ðtzd2
t{d2
ei(hy(f ,t){hy(f ,t)) dtD ð5Þ
where the phases of signals x and y are hx and hy, at each
frequency f and time t, and d is the time window over which the
SPLVs are calculated [138]. In this study, 350 ms temporal
windows were used for SPLV calculation [9]. In order to ensure
that the results would not be influenced by PL outside the 1 s
during which participants looked at the presented word, the
EMDPL spectra were plotted from 200 to 800 ms. Note that as
SPLVs are calculated over time for each trial, the number of trials
for a given condition does not affect the phase locking values.
Statistically significant episodes of PL were identified using
phase-scattered surrogate data derived from the IMFs in question,
and significant phase synchrony was localised in time and
frequency on the EMDPL spectrum [9]. A 95% significance cut-
off was applied to phase scattered surrogate data for each IMF pair
in order to determine when PL occurred more strongly than that
which would be found by chance between similarly constructed
signals with independent phases [9]. Any PL with a value greater
than 95% of background PL was plotted in bins on the EMDPL
spectrum for the given electrode pair. It should be highlighted that
the use of phase-scattered surrogate data is actually a step in the
EMDPL method itself. IMFs are frequency-modulated, with
frequency and also bandwidth varying over time, and each trial
is decomposed uniquely, adapting to individual data content. We
have shown previously that background phase locking levels are
dependent on bandwidth, which means that when a comparison is
made between synchrony levels in two different signals, account
must be taken of the bandwidth of a given component at the time
of interest [9]. As a result, it does not make sense, when EMD is
used, to calculate a PLV over trials directly as per [12]. We
addressed this problem by generating phase scattered surrogate
data for each IMF individually, calculating single-trial PLVs across
time [138], and defining synchrony in a binary fashion, as an
SPLV for a given time window being at a level greater than that in
95% of pairs of phase-scattered surrogates from the given IMF. A
synchrony index is then determined at a particular time and
frequency for a given condition by finding a mean across trials,
a step analogous to the calculation of PLV across trials. In the next
section, we describe the statistical analysis involved in comparing
groups and conditions.
Following calculation of the EMDPL spectra, the grand
EMDPL spectrum was then created by summing the EMDPL
spectra for the 6 possible combinations of 4 electrodes in the right
frontal network, across all trials for each participant, and similarly
for the left parietal network. These were then in turn summed over
participants to yield two EMDPL spectra, which included all trials
for all participants, one for the frontal networks, and one for the
parietal networks, for hits and FA in typical participants, and the
same for those with MCI. In total, 8 such EMDPL spectra were
obtained, one for each combination of a region, participating
group, and experimental response.
8. Statistical Analysis8.1 Two sample two-dimensional Kolmogorov-Smirnov
test. The EMDPL spectra for normal participants and those
with MCI were compared during hits and FA using two sample
two-dimensional Kolmogorov-Smirnov (2D K–S) tests, to de-
termine significant differences between the distributions of PL
values in the different participant groups and response types. This
statistical test was chosen as account is taken both of frequency and
time simultaneously. This extension to the classical one-dimen-
sional Kolmogorov-Smirnov test was implemented here in Matlab
[139,140]. Details of the algorithm were taken from [141].
In order to establish whether two data sets were drawn from the
same 2D distribution, both sets are first plotted together. The 2D
K–S test then involves using each data point from one sample as
the origin of the plot, which is then divided into four natural
quadrants. In each quadrant, the difference between the number
of points from sample one and the number from sample two is
calculated and normalised. This procedure is then repeated using
each data point from sample two as the origin. The mean is taken
of the largest difference found using data points from sample one
as the origins and those using points from sample two. This
quantity is termed the D-statistic. The significance levels for the D-
statistic can be approximated as follows [141]:
Figure 3. Artefact removal. Illustration of the removal of two blinkartefacts using temporal decorrelation separation independent com-ponent analysis. A: the component which contained the blink artefactsfor one trial. B: the data before and after removal of the lattercomponent.doi:10.1371/journal.pone.0048357.g003
Mild Cognitive Impairment Memory Neural Correlates
PLOS ONE | www.plosone.org 7 October 2012 | Volume 7 | Issue 10 | e48357

Probability(Dw observed)
~Q
ffiffiffiffiffiN
pd
1zffiffiffiffiffiffiffiffiffiffiffiffiffi1{ r2
p(0:25{ 0:75=N)
!ð6Þ
where:
N~N1N2
N1 zN2
and Q(l)~ 2X?j~1
({1)j{1e{2j2l2 ð7Þ
N is the number of samples. r2 is a sum of r12 and r2
2, where r1 is
the Pearson’s correlation coefficient between the x- and y-
coordinates of sample one, and r2 is the equivalent for sample
two. Eq. 6 gives the probability that the null hypothesis is true, and
both samples are drawn from the same distribution.
Monto Carlo simulations have been used to demonstrate that
this approach provides a distribution-free test [139]. Furthermore,
it takes account of the sample sizes and also the degree of
correlation of the data points [139].
8.2 Two sample T-test. The particular times and frequen-
cies at which the time-frequency PL pattern differed significantly
between study conditions or participant groups were then
evaluated using the two sample T-test, implemented in Matlab.
PL levels were averaged over 2 Hz frequency windows with 1 Hz
overlap and 9 ms time windows for each participant, for group
and condition contrasts, and Bonferroni correction was applied for
multiple group/condition/frequency comparisons. The figures
show differences significant at p,0.05 after Bonferroni correction.
8.3 Pearson’s correlation coefficient. The degree of
correlation between frontal and parietal time varying PL levels
was calculated in the same frequency windows over trials and
subjects, applying 100 ms time windows with 25 ms overlap, using
Pearson’s correlation coefficient [141]:
r~
Pi (xi { �xx)(yi { �yy)ffiffiffiffiffiffiffiffiffiffiffiffiffiffiffiffiffiffiffiffiffiffiffiffiffiffiP
i (xi { �xx)2q ffiffiffiffiffiffiffiffiffiffiffiffiffiffiffiffiffiffiffiffiffiffiffiffiffiP
i (yi { �yy)2q ð8Þ
r varies between 21 with complete negative correlation and 1,
with complete positive correlation. 0 implies no correlation.
The significance of r was determined using the t-distribution,
calculated using Eq. 9 [142],
t~rffiffiffiffiffiffiffiffiffiffiffiffiffiffiffiffiffiffiffiffiffiffiffiffiffiffiffiffiffiffiffiffiffiffiffiffi
(1{ r2) = (N{ 2)p ð9Þ
where N is the number of pairs of samples, and N-2 gives the
number of degrees of freedom. The figures show results significant
at p,0.05 and below after Bonferroni correction for groups/
conditions/frequencies compared.
9. Traditional Phase Synchrony Analyses9.1 Bandpass filter based phase synchrony. Phase syn-
chrony was also calculated following application of bandpass
filters, both in order to validate the EMDPL analysis and to
demonstrate the advantages provided by EMDPL. First, a 4–8 Hz
4th order Butterworth filter was applied, using commonly defined
limits for the theta frequency range, to investigate whether the
phase synchrony detected using EMDPL could indeed be
identified using a standard method. Secondly, a 4th order
Butterworth filter was applied using a range of frequency cut-
offs identified in the literature, as listed in the introduction, as
denoting the theta frequency range. The latter was focused on an
episode of theta phase synchrony identified using EMDPL. The
same statistical analyses applied following EMDPL were also used
here.
9.2 Wavelet based phase synchrony. We also carried out
phase synchronisation analysis following a wavelet time-frequency
decomposition, as is commonly applied in neuroscience. The
signal was convoluted with the wavelet basis function, which was
dilated to evaluate frequency content and translated over time
[143]. Wavelet calculation was carried out using a modified
version of the Matlab toolbox by [144]. The complex Morlet
wavelet, a complex sine wave modulated by a Gaussian, was used
as the mother wavelet:
y0(g)~p{14eif0ge
g2
2 ð10Þ
where f0 was the nondimensional frequency (the number of cycles
in the wavelet), and g was the nondimensional time parameter of
the shift divided by the dilatation. Six cycles were used per wavelet
[9,145,146]. Following the wavelet transform, amplitudes and
phases were extracted. Further details of this well-known approach
may be found in [9,12,143,146]. The significance assessment was
analogous to that following EMDPL, including application of
a Bonferroni correction.
10. AmplitudesSignificant differences in amplitude following time-frequency
decomposition were also sought. Time-frequency decomposition
was carried out using EMD, and an alternative time-frequency
decomposition was also performed using the wavelet transform in
order to provide a comprehensive characterisation of the groups/
conditions.
Significance was calculated for amplitudes using the same
sliding time window as for EMDPL, but no Bonferroni correction
was used.
11. ERPsThe data were first filtered using a 1–30 Hz 4th order
Butterworth bandpass filter then averaged over trials for each
participant. A mean ERP for each group/condition was then
calculated across participants for each condition, and a 100 ms
baseline was subtracted. Statistical analysis was carried out using
T-tests to compare mean ERP amplitudes between groups and
conditions over sliding windows of 50 ms. The data were filtered
between 1–12 Hz for the purpose of displaying the ERP
waveforms, but the 1–30 Hz filtered data were used for the
statistical analysis. (A 12 Hz filter is often applied to provide clear
visualisation (e.g. [147,148]). However, it is not deemed acceptable
to use such a filter for ERP quantification [149]. For statistical
analysis, ERPs are commonly filtered using a 30 Hz filter (e.g.
[147,150,151]). 20 ms time windows were used to calculate
amplitudes to assess latency of the P300 component, which is
thought to be related to reactivation of memory traces. The time of
the P300 peak was taken as the central time in the highest
amplitude 20 ms time window between 200 and 400 ms in
comparing latencies for hits versus FA in the normal group.
Similarly, to compare latencies for hits in the typical group versus
the group with MCI, the highest amplitude in a time window
between 300 and 500 ms was determined, to account for longer
latencies in the MCI group. The ERPs were calculated for all 8
electrodes, but as the ERPs were only being considered as an
Mild Cognitive Impairment Memory Neural Correlates
PLOS ONE | www.plosone.org 8 October 2012 | Volume 7 | Issue 10 | e48357

illustration that the data contain expected relationships well-
recognised in the literature, we focused on the parietal ERP in
which inter-condition and inter-group differences were significant.
Results
1. Behavioural FindingsThe participant selection criteria and behavioural test scores
before inclusion in the study are shown in Table 1. The typical and
MCI groups were matched for age, years of formal education, and
gender (T-test p-value .0.05). The groups differed significantly,
however, in performance in the MMSE (p,0.00005) and the
CERAD delayed recall test (p,0.00005), which were the primary
measures used to determine typical and MCI group allocation. In
the immediate recall and recognition tests, participants in the
typical group achieved higher scores, but the difference did not
reach statistical significance.
Tables 2 and 3 show the behavioural results for the DRM
paradigm, carried out during EEG recording. The typical group
had a significantly higher correct free recall rate (p,0.01) than the
MCI group, while adults with MCI produced the critical lure
significantly more frequently (p,0.05) than the typical group. In
the recognition phase, while the participants from the typical
group achieved more hits and fewer FA than the MCI group, the
difference between groups was not statistically significant, in-
dicating that the impairment in the MCI group was indeed mild. It
can be seen that there was no statistically significant difference
between the groups’ performance in either the CERAD or the
DRM word recognition tests. The significant between-group
difference in the DRM free recall, when none was found on the
CERAD immediate free recall, might be accounted for by
increased delay due to the distractor task in the DRM test.
1.1 Reaction times. Reaction times (RTs) from the DRM
recognition test were compared between conditions and groups
using a two sample T-test. In both typical participants and those
with MCI, the mean RTs were significantly longer for hits than for
FA (typical: 2631 ms vs. 2036 ms, p,0.04, MCI: 2372 ms vs.
1989 ms, p,0.004). RTs both for hits and for FA were
significantly longer for the typical group than for the MCI group
(hits: 2036 ms vs. 1989 ms, p,0.00021, FA: 2631 ms vs. 2372 ms,
p,0.0422).
The analysis was performed again after removing all RTs
.5000 ms, as some RTs were over 10 s, and it was deemed
possible that the participants had paused for some extraneous
reason during those trials. In typical participants, 2.9% of hit
responses and 5.1% of FA responses occurred over 5 s after the
stimulus, as opposed to 2% of hits and 0.83% of FA in the MCI
group. Again, RTs for hits were significantly longer than for FA
both in typical participants (p,0.04) and in MCI (p,0.04). RTs
remained slower for the typical group compared with those with
MCI for hits (p,0.0014) and for FA (p,0.04). The analysis was
also performed using median RTs, both including and excluding
RTs over 5 s. The same pattern with respect to conditions and
groups remained statistically significant.
1.2 Certainty. Significantly more of the hits were rated as
certain in the typical group, compared with the MCI group
(91.7% vs. 83.1%, p,0.00001).
2. EMDPLThe time-frequency distributions of SPLVs which reached
significance (5% threshold compared with the surrogate data) are
termed the EMDPL spectra. The mean EMDPL spectra over
trials and participants for the right frontal and left parietal regions
were first compared for both groups for hits and FA using the 2D
K–S test. The test was applied to the entire post-stimulus time
period of interest (200–800 ms) and over the whole frequency
range of interest, which included theta and alpha activity from 4–
12 Hz. The p-values were corrected for multiple comparisons
(groups/conditions) and are shown in Tables 4 and 5.
Table 1. Parameters for typical and MCI participant groups.
Test Typical MCI p-value from
Mean (SD) Mean (SD) T-test
Age 68.2 (7.1) 71.6 (3.9) 0.1915
Years formal education 13.5 (2.6) 14.9 (5.5) 0.4711
Gender (F:M) 1.5 (0.5) 1.6 (0.5) 0.8127
MMSE 28.8 (0.8) 26.9 (0.9) ,0.00005
Immediate recalla 0.720 (0.097) 0.713 (0.089) 0.8655
Delayed recalla 0.845 (0.113) 0.450 (0.190) ,0.00005
Recognitiona 0.995 (0.015) 0.950 (0.091) 0.1193
aNote: CERAD recall and recognition scores are normalised.doi:10.1371/journal.pone.0048357.t001
Table 2. Free recall using the DRM paradigm.
Free Recall (%) Typicala MCIb p-value from
Mean (SD) Mean (SD) T-test
Correct recall 54.30 (13.52) 39.00 (7.64) ,0.01
Critical lure 19.53 (9.50) 32.14 (15.65) ,0.05
aTotal of 1980 words presented to typical participants for encoding.bTotal of 1740 words presented to participants with MCI for encoding.doi:10.1371/journal.pone.0048357.t002
Table 3. Word recognition using the DRM paradigm.
Recognition (%) Typicala MCIb p-value from
Mean (SD) Mean (SD) T-test
Hits 49.9 (4.9) 48.9 (9.0) 0.5216
False alarms 15.9 (10.0) 18.6 (9.5) 0.6712
aTotal of 3168 words presented to typical participants for recognition.bTotal of 2784 words presented to participants with MCI for recognition.doi:10.1371/journal.pone.0048357.t003
Table 4. Two sample two-dimensional Kolmogorov-Smirnovtest comparing time-frequency distributions of phase lockingvalues in frontal and parietal networks.
Hits vs. False Alarms Typicala MCIa
Frontal ,0.01 ,0.01
Parietal ,0.05 ,0.05
ap-values given after correction for multiple comparisons.doi:10.1371/journal.pone.0048357.t004
Mild Cognitive Impairment Memory Neural Correlates
PLOS ONE | www.plosone.org 9 October 2012 | Volume 7 | Issue 10 | e48357

Significant differences with a p-value ,0.01 were identified in 3
of the comparisons of SPLVs within frontal regions: hits versus FA
in typical participants (p-value ,0.01), hits versus FA in
participants with MCI (p-value ,0.01), and for hits in typical
versus participants with MCI (p-value ,0.005).
The EMDPL spectra were then compared using a two sample
T-test, with sliding time and frequency windows, in order to
identify the time and frequency of occurrence of any significant
difference in PL levels between groups or conditions. Significant
differences are shown in Fig. 4, in which p-values are plotted.
Black indicates the PL in the first condition was significantly
greater than in the second, and white indicates that the PL in the
second condition was significantly greater than in the first.
In typical participants, there was significantly greater (corrected
p,0.01) lower theta (4–5 Hz) frontal PL at 475 ms in hits than in
FA (Fig. 4A). The finding was absent in the MCI group (Fig. 4B).
In participants with MCI, significantly more theta PL was found in
FA vs. hits both earlier, at 230 ms (corrected p,0.03), and later, at
700 ms (corrected p,0.01).
In upper alpha (10–12 Hz), there was significantly greater
frontal PL in FA than hits in the typical group (corrected p,0.01)
at 475 ms, the time at which theta PL was significantly greater in
hits (Fig. 4A). There was significantly greater frontal upper theta
PL (6–8 Hz) at 600 ms in the typical group than in the MCI
group, more markedly for hits (corrected p,0.01) (Fig. 4C) but
also for FA (corrected p,0.05) (Fig. 4D). At 750 ms, there was
significantly more alpha PL for FA than for hits in both the typical
group (corrected p,0.03) and more so in the MCI group
(corrected p,0.01). In the typical group, this PL took place
around 40 ms earlier than in the MCI group.
Significantly greater theta (4–8 Hz) PL (corrected p,0.01) was
found in the parietal network at 350 ms in the typical group
during hits compared with the MCI group (Fig. 4G). In the typical
group, significantly greater theta (6–8 Hz) PL (corrected p,0.01)
took place at 280 ms for FA than for hits (Fig. 4E). There were no
significant differences in PL in the theta or alpha frequency ranges
in the MCI group for hits versus FA nor for FA in the typical
versus MCI groups (Fig. 4F and H).
3. Fronto-parietal CorrelationCorrelation between spatially averaged frontal and parietal PL
fluctuations was significant at 450–550 ms (corrected p,0.01)
during hits in the typical group in lower theta (4–5 Hz) (Fig. 5A).
This correlation was neither seen during hits in the MCI group
(Fig. 5C) nor during FA in either group (Fig. 5B and D). During
hits in both groups, significant fronto-parietal PL correlation was
seen at 200 ms (corrected p,0.05) and again at 300 ms in lower
alpha (8–10 Hz) (Fig. 5A and C), though more markedly in the
typical group (corrected p,0.01), and also at 200 ms in upper
alpha (10–12 Hz) in both groups, persisting for longer in the
typical group (p,0.01) than in the MCI group (p,0.03).
4. Traditional Phase Synchrony Analyses4.1 Bandpass filtered based phase synchrony
analysis. Phase synchrony was detected at the same times and
frequencies as identified using EMDPL, but the findings were
dependent on the precise filter cut-offs applied, as illustrated in
Figs. 6 and 7, in which hits and FA are compared in the typical
group. The greater theta synchrony in hits than in FA identified
just before 500 ms using EMDPL was detected and found to be
significant when a 4–8 Hz bandpass filter was applied (Fig. 6),
supporting the EMDPL findings. However, application of different
theta filter cut-offs taken from the literature demonstrated that the
choice determines not only the timing of synchrony detected but
also whether it is detected, confirming findings in [10], where
EMDPL was contrasted with standard approaches to phase
synchrony calculation using both data synthetically constructed for
the purpose and EEG data recorded during a simple motor task
(Fig. 7).
4.2 Wavelet based phase synchrony analysis. Again,
following wavelet based phase synchrony analysis, the inter-group
and condition phase synchrony differences found using EMDPL
were detected, suggesting that the findings reflect the content of
the data rather than being an artefact of EMDPL. However, when
wavelets are used for time-frequency decomposition, there is
a trade-off between localisation in time and in frequency, such that
time localisation is sacrificed at lower frequencies. The findings are
illustrated in Fig. 8. The greater synchrony in hits than FA in the
MCI group was again detected in theta between 200 and 300 ms
and between 600 and 700 ms, as well as in alpha between 700 and
800 ms (Fig. 8). p-values are shown following correction for the
same multiple comparisons as accounted for using EMDPL. The
presence of these episodes was thus confirmed following a time-
frequency decomposition unrelated to EMD, strengthening the
findings. However, as expected, in these low frequency ranges, the
time-frequency trade-off is evident, with reduced localisation in
time.
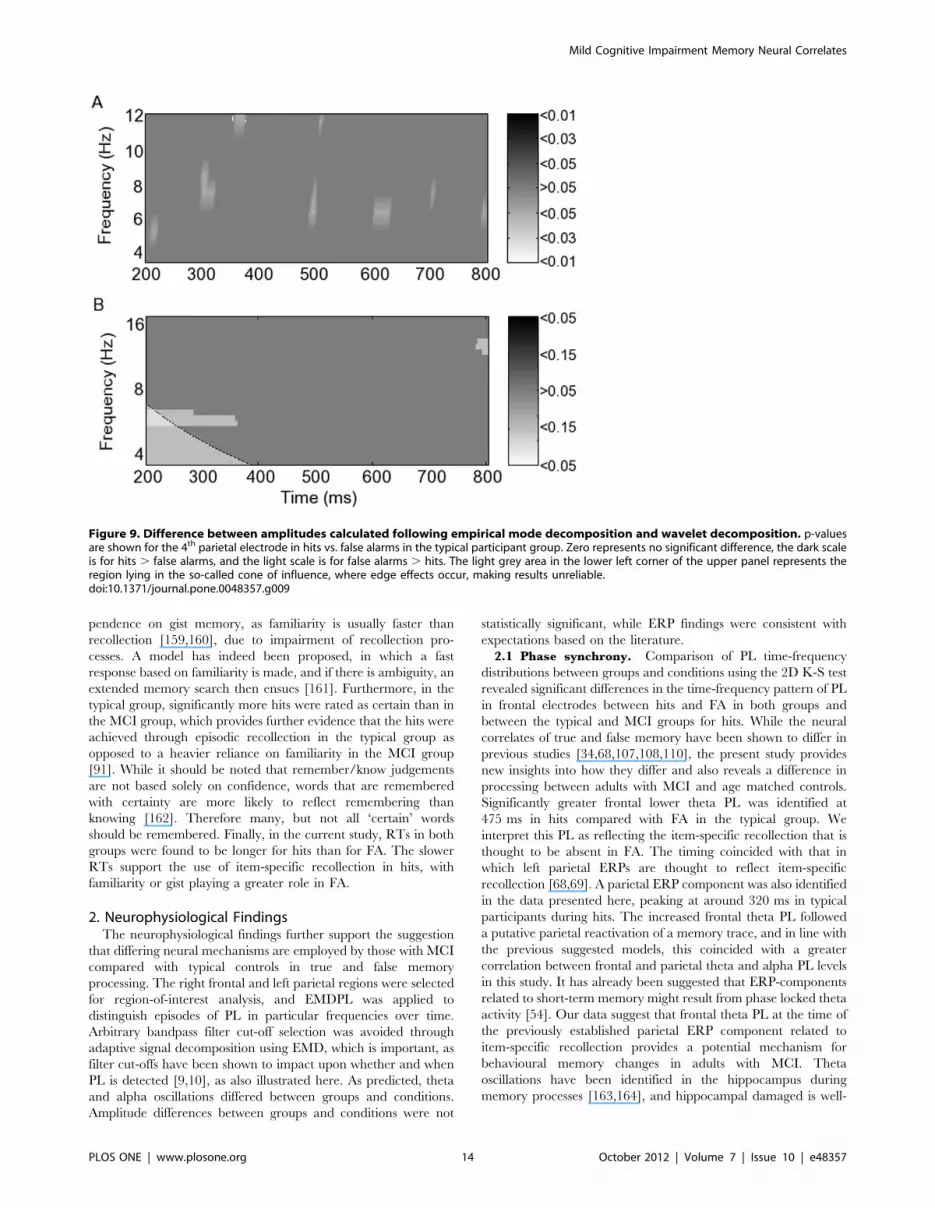
5. AmplitudesAmplitude differences were calculated following EMD. Note
that although the scale in the figure matches that used in the
figures showing PL, the latter are corrected p-values. A significant
amplitude difference was found only in the 4th parietal electrode
between hits and FA in typical participants in theta (Fig. 9A). The
difference, however, was only significant at p,0.05 in the absence
of Bonferroni correction. Given the absence of significant inter-
group/condition differences, amplitude differences were also
sought following wavelet decomposition (Fig. 9B) Theta amplitude
at 300 ms was also found to be greater in FA than in hits following
wavelet decomposition, but only at p,0.15. Indeed no amplitude
differences were significant following wavelet decomposition, even
without correction. Moreover, the time-frequency trade-off when
wavelets were used meant that time localisation in this low
frequency range was reduced, with the episode beginning before
200 ms and continuing to 360 ms. When EMD was applied, the
episode was localised to around 290–310 ms. The beginning of the
episode, as detected by wavelets, was affected by the cone of
influence, the border region in which wavelet calculation is
unreliable, but appears to start at least as early as 220 ms. Note
that the frequency scales correspond with the frequencies at which
amplitudes are most appropriately calculated for each method, in
particular to reduce redundancy with the wavelets.
6. ERPsERPs during hits and during FA in the typical group are shown
in Fig. 10A, and during hits in the typical group and in the MCI
Table 5. Two sample two-dimensional Kolmogorov-Smirnovtest comparing time-frequency distributions of phase lockingvalues in frontal and parietal networks.
Typical vs. MCI Hitsa False alarmsa
Frontal ,0.005 0.1059
Parietal ,0.05 ,0.05
ap-values given after correction for multiple comparisons.doi:10.1371/journal.pone.0048357.t005
Mild Cognitive Impairment Memory Neural Correlates
PLOS ONE | www.plosone.org 10 October 2012 | Volume 7 | Issue 10 | e48357

group in Fig. 10B. The amplitude of the ERP during hits was
significantly greater at 340–400 ms (p,0.05) and again from 480–
550 ms (p,0.04) than during FA in the typical group (Fig. 10A).
The ERP from 290–360 ms during hits in the typical group was
significantly more positive than for the group with MCI (p,0.05)
(Fig. 10B). The latency of the P300 peak in the typical group
during FA was shorter than that for the MCI group, though this
difference did not reach statistical significance (p,0.09). The P300
latency for hits in the MCI group was significantly longer
(p,0.009) than for hits in the typical group.
Discussion
The DRM paradigm was used to explore the neural correlates
of veridical and false memory in participants with MCI and age-
matched controls, and analysis of functional connectivity was
carried out using EMDPL. Additional inter-group/condition
differences were sought by calculating amplitudes, and ERPs were
determined, to verify the presence of neural correlates of true and
false memory expected based on the ERP memory literature. The
results suggest that the neural mechanisms employed both in the
true and in the false memory processing differed between typical
participants and those with MCI, with phase synchrony calculated
using EMDPL providing the most information about how neural
processing differs between groups and conditions. Both beha-
vioural and neurophysiological findings are consistent with the
hypothesis that the MCI group relied more on familiarity than the
typical participants, for whom evidence pointed to the use of
episodic retrieval mechanisms. Furthermore, the findings are
consistent with the theory that those with MCI employed
compensatory processing to achieve hits. The PL detected during
FA suggests that additional search mechanisms were implemented
in the absence of identification of a memory trace, and that this
took place more readily in the MCI group.
Figure 4. Phase locking differences between groups and condition, calculated using empirical mode decomposition phase lockinganalysis. p-values corrected for multiple comparisons are shown using the greyscale. Zero represents no significant difference, the dark scale is forwhen the first named group and condition is significantly greater than the second, and the light scale is for when the second group/condition issignificantly greater.doi:10.1371/journal.pone.0048357.g004
Mild Cognitive Impairment Memory Neural Correlates
PLOS ONE | www.plosone.org 11 October 2012 | Volume 7 | Issue 10 | e48357

1. Behavioural FindingsOn DRM free recall, typical participants correctly recalled
significantly more presented words than those with MCI, while the
latter gave the critical lure significantly more often than the typical
group, as found previously [78,79,115]. While the same pattern
was seen here in the recognition phase, it was not statistically
significant. Consistent with our findings, similar recognition levels
have been found elsewhere in a DRM task in MCI and controls,
and it was postulated that an inter-group difference might have
been identified if a free recall component had been included, since
recognition requires less cognitive processing than free recall
[152]. It is likely here that while episodic memory was required for
free recall, after the delay involved in completing 8 word lists,
episodic memory was reduced, with gist contributing to recogni-
tion. In the free recall stage, greater requirement for episodic
memory would have disadvantaged those with MCI compared
with typical participants, but the difference in performance on the
recognition test may have been reduced, due to relatively less
familiarity than episodic memory impairment in MCI [153,154].
Indeed, while familiarity memory impairment is also recognised in
AD, dependence on this type of memory seems to be greater
[80,81,153,154]. The results therefore point to the employment of
differing types of memory processing in the two groups during the
recognition task. There is existing evidence that familiarity
(involving gist memory) and recollection (important in free recall)
actually have separate neural mechanisms [91,155], and our
results support the notion that these are differentially affected in
MCI.
Figure 5. Fronto-parietal correlation between levels of phase locking calculated using empirical mode decomposition phaselocking analysis. p-values corrected for multiple comparisons are shown in greyscale for typical and mildly cognitively impaired groups during hitsand false alarms.doi:10.1371/journal.pone.0048357.g005
Figure 6. Phase synchrony calculated following 4–8 Hz bandpass filtering during hits and FA in typical participants. A. Single trialphase locking values (SPLVs) averaged over trials and subjects in hits and in false alarms (FA). B. The difference between SPLVs averaged across trialsin hits versus FA. Asterisks indicate the time period in which the difference was found to be statistically significant.doi:10.1371/journal.pone.0048357.g006
Mild Cognitive Impairment Memory Neural Correlates
PLOS ONE | www.plosone.org 12 October 2012 | Volume 7 | Issue 10 | e48357

A number of theories have been proposed to account for an
increased dependence on gist in MCI. It has been postulated that
this results from proportionally greater item-specific memory
deterioration [154]. This suggestion is consistent with fuzzy-trace
theory, which proposes that episodic memory comprises detail and
verbatim information and goes on to predict that gist memory is
more persistent than verbatim recollection [153,154]. According
to this theory, a gist representation is constructed during encoding
[152]. False recognition would then result from use of the gist
information. There is indeed evidence that gist information can be
applied to circumvent reduced verbatim, episodic memory [152].
Firstly, the likelihood of false recognition is increased with
repeated study lists in those with AD [93]. With repetition of the
study list, participants with AD are thought increasingly to build
up a semantic gist unchecked by episodic memory of the actual
words on the list, while controls are thought to increase their
specific, episodic recollections. The expected reduction in semantic
memory in AD was accounted for by needing several trials for
those with AD to build this gist, which was then used instead of
reliable episodic memory [93]. Secondly, false recognition
increases when true recognition performance is matched between
those with AD and controls [78]. Another theory is that increased
false recognition in AD after deep encoding may be due to an
inability to use actual recollection to overcome familiarity [80].
Other mechanisms employed in MCI to circumvent reduced
episodic memory, that could lead to increases in false recognition
include reliance on the plausibility of information [156], and the
encoding of generic information [157]. Further evidence for the
use of gist was found in false recollection of a picture of an object
after presentation of a number of pictures of different versions of
the same object [158]. It has been suggested that familiarity results
from gist, and that in a typical participant, frontal lobe
verification-inhibition mechanisms are used, which are impaired
in AD due to frontal lobe dysfunction, leading to greater false
recognition [84]. The present study provides both behavioural and
neurophysiological evidence in support of an increase in gist
memory use in MCI.
Reaction times (RTs) for both hits and FA, were significantly
slower in the typical group than the MCI group. A quicker
response in the MCI group might suggest an increased de-
Figure 7. Varying bandpass filter corner frequencies in thetheta frequency range. Differing frequency cut-offs were identifiedin the literature. Both the detection and the time localisation ofsignificant differences in phase synchrony between conditions wereaffected by the a priori choice of bandpass filter corner frequencies.Note that the scale for the phase synchrony index is the same for eachpanel to facilitate direct comparison. As a result, the peak differencesfound in the second and fourth panels from the top are only to be seenby reference to the asterisks indicating the timing of a significantdifference.doi:10.1371/journal.pone.0048357.g007
Figure 8. Phase locking differences between hits and FA in participants with MCI calculated following wavelet decomposition. p-values corrected for multiple comparisons are shown using the grayscale. Zero represents no significant difference, the light scale is for hits. FA, andthe dark scale is for FA . hits. The light grey area in the lower left corner of the upper panel represents the region lying in the so-called cone ofinfluence, where edge effects occur, making results unreliable.doi:10.1371/journal.pone.0048357.g008
Mild Cognitive Impairment Memory Neural Correlates
PLOS ONE | www.plosone.org 13 October 2012 | Volume 7 | Issue 10 | e48357
pendence on gist memory, as familiarity is usually faster than
recollection [159,160], due to impairment of recollection pro-
cesses. A model has indeed been proposed, in which a fast
response based on familiarity is made, and if there is ambiguity, an
extended memory search then ensues [161]. Furthermore, in the
typical group, significantly more hits were rated as certain than in
the MCI group, which provides further evidence that the hits were
achieved through episodic recollection in the typical group as
opposed to a heavier reliance on familiarity in the MCI group
[91]. While it should be noted that remember/know judgements
are not based solely on confidence, words that are remembered
with certainty are more likely to reflect remembering than
knowing [162]. Therefore many, but not all ‘certain’ words
should be remembered. Finally, in the current study, RTs in both
groups were found to be longer for hits than for FA. The slower
RTs support the use of item-specific recollection in hits, with
familiarity or gist playing a greater role in FA.
2. Neurophysiological FindingsThe neurophysiological findings further support the suggestion
that differing neural mechanisms are employed by those with MCI
compared with typical controls in true and false memory
processing. The right frontal and left parietal regions were selected
for region-of-interest analysis, and EMDPL was applied to
distinguish episodes of PL in particular frequencies over time.
Arbitrary bandpass filter cut-off selection was avoided through
adaptive signal decomposition using EMD, which is important, as
filter cut-offs have been shown to impact upon whether and when
PL is detected [9,10], as also illustrated here. As predicted, theta
and alpha oscillations differed between groups and conditions.
Amplitude differences between groups and conditions were not
statistically significant, while ERP findings were consistent with
expectations based on the literature.
2.1 Phase synchrony. Comparison of PL time-frequency
distributions between groups and conditions using the 2D K-S test
revealed significant differences in the time-frequency pattern of PL
in frontal electrodes between hits and FA in both groups and
between the typical and MCI groups for hits. While the neural
correlates of true and false memory have been shown to differ in
previous studies [34,68,107,108,110], the present study provides
new insights into how they differ and also reveals a difference in
processing between adults with MCI and age matched controls.
Significantly greater frontal lower theta PL was identified at
475 ms in hits compared with FA in the typical group. We
interpret this PL as reflecting the item-specific recollection that is
thought to be absent in FA. The timing coincided with that in
which left parietal ERPs are thought to reflect item-specific
recollection [68,69]. A parietal ERP component was also identified
in the data presented here, peaking at around 320 ms in typical
participants during hits. The increased frontal theta PL followed
a putative parietal reactivation of a memory trace, and in line with
the previous suggested models, this coincided with a greater
correlation between frontal and parietal theta and alpha PL levels
in this study. It has already been suggested that ERP-components
related to short-term memory might result from phase locked theta
activity [54]. Our data suggest that frontal theta PL at the time of
the previously established parietal ERP component related to
item-specific recollection provides a potential mechanism for
behavioural memory changes in adults with MCI. Theta
oscillations have been identified in the hippocampus during
memory processes [163,164], and hippocampal damaged is well-
Figure 9. Difference between amplitudes calculated following empirical mode decomposition and wavelet decomposition. p-valuesare shown for the 4th parietal electrode in hits vs. false alarms in the typical participant group. Zero represents no significant difference, the dark scaleis for hits . false alarms, and the light scale is for false alarms . hits. The light grey area in the lower left corner of the upper panel represents theregion lying in the so-called cone of influence, where edge effects occur, making results unreliable.doi:10.1371/journal.pone.0048357.g009
Mild Cognitive Impairment Memory Neural Correlates
PLOS ONE | www.plosone.org 14 October 2012 | Volume 7 | Issue 10 | e48357

recognised in AD, thus the changes in theta oscillations
demonstrated in our findings are compatible with previous studies.
Three findings here therefore suggest the use of gist memory in
MCI may at least in part account for differing neural correlates of
memory processing in this group. Firstly, there was more false
memory in the MCI group, and the use of gist memory is indeed
thought to increase the probability of false memory [160].
Secondly, RTs in the MCI group were on average shorter than
in the typical group. Gist is based on familiarity, which is processed
earlier than recollection [161]. Thirdly, a greater theta PL in FA
than in hits in MCI takes place earlier, at 230 ms, than the theta
PL proposed to relate to episodic memory use in hits in the typical
group.
The neural processing associated with attention might provide
an additional explanation for the behavioural findings. Attention
deficits in MCI might lead to reduced ability to inhibit other
pathways in the presence of intact semantic networks [78].
Absence of inhibition of a novel (unpresented), yet semantically-
related item might lead to its false recall. Deficits in inhibition in
MCI and in AD have been identified using the Stroop test
[165,166]. We suggest therefore that frontal theta PL might be
a neural correlate of the verification-inhibition mechanism which
is impaired in AD, and that this impairment might begin early in
the disease process when the person has MCI.
Both semantic memory network breakdown and reduced
attentional control and inhibition are consistent with the findings
of reduced frontal lobe function in AD, and with the suggestion
that impairment in these processes might already be present in
participants with MCI, some of whom go on to develop AD.
Increased false recognition has indeed been found with frontal
lobe damage [81], and increased tendency to exhibit false memory
in older compared with younger adults has been suggested to
result from frontal lobe dysfunction [77].
Although typical participants produced more hits than adults
with MCI in the DRM recognition task, the difference was not
statistically significant. We suggest that this might be evidence for
the use of compensatory processing in adults with MCI. Increased
functional connectivity found in MCI has previously been
suggested to be the result of compensatory activity [29,31]. In
addition, significantly higher EEG synchronisation has been
shown in the alpha and beta frequency ranges in participants
with MCI, which were attributed to compensational mechanisms
in adults with MCI, which are no longer effective once AD
develops [32]. There were two episodes of increases in theta PL
during FA compared to hits in the MCI group, at 230 ms and at
700 ms. This greater PL could be interpreted as reflecting
increased searching when a true memory was not activated, and,
since this was only present in the group with MCI, it suggests more
ready use of compensatory activity when episodic memory is
impaired.
At 475 ms, we found both significantly more theta PL during
hits than FA, and significantly greater upper alpha PL in FA than
Figure 10. Left parietal event-related potentials differing between conditions and groups. Asterisks mark the time during which therewas a statistically significant difference between the event-related potentials shown, with the relevant p-values (uncorrected).doi:10.1371/journal.pone.0048357.g010
Mild Cognitive Impairment Memory Neural Correlates
PLOS ONE | www.plosone.org 15 October 2012 | Volume 7 | Issue 10 | e48357

in hits in the typical group. Upper alpha oscillations are thought to
reflect semantic information processing and long-term memory
[55]. They may also play a role in working memory, reflecting
transient reactivation of long-term memory [123]. We suggest that
when a recent episodic memory is not identified, long-term
memory stores including gist information may be accessed,
facilitating the occurrence of a false memory. This notion is
supported by the significant upper alpha fronto-parietal correla-
tion of PL levels found in hits but not in FA in both groups, which
could reflect frontal accessing of a parietally stored long-term
memory. The episode of correlation was brief in those with MCI,
and we suggest this could be due to accessing of gist rather than
a true memory trace, or impairment of this process in the MCI
group.
Significantly more parietal PL was found in typical participants
than in those with MCI at 350 ms. As already stated, parietal PL
might indicate activation of memory storage networks [94]. A
greater left parietal activation has also been found elsewhere in
true compared with false recognition [68,110,167]. Its absence in
MCI provides further support for the hypothesis that the neural
processing underlying successful hits differs between typical adults
and those with MCI.
Anatomical studies have demonstrated that frontal and poste-
rior association cortices are highly interconnected [168]. It has
been suggested that prefrontal regions play a role in integrating
inputs from various modalities during encoding and at retrieval
[169], while the parietal region is thought to be the location where
a memory is stored. Fronto-parietal interaction is thought to
mediate central executive processes [95,96], involving attention
and long-term memory [21,59]. One interpretation of our
findings, therefore would be that coupling between these areas
reflects interaction between storage and central executive pro-
cesses [20]. When a hit takes place, a successful verification,
represented by connectivity, would confirm that the information is
old, while in a false memory, this verification does not occur. The
increased frontal PL found here in FA compared with hits at
around 750 ms in both groups may reflect on-going search for
a memory trace when the memory is not available. Failure to find
a memory trace would therefore negate the need for connectivity
between the parietal and frontal regions, thus providing an
explanation for the failure to find significant fronto-parietal
correlation in PL during FAs in this study.
In support of this explanation, correlation between frontal and
parietal PL levels was significant in the theta frequency range only
in the typical group during hits, in which item-specific recollection
was achieved. The timing of the correlated activity coincided with
a significantly greater frontal theta PL in the typical group during
hits compared with FA and followed the greater parietal theta PL
in the typical group compared with the MCI group during hits.
This might also suggest that the use of gist memory does not
necessarily require access to a specific parietally stored memory
trace.
Significant correlation of frontal and parietal PL levels also took
place in the lower alpha frequency range in hits in both groups.
Lower alpha activity has been linked to attention [170], which will
be required for hits in this task. It is plausible that reduced
attention contributes to FA in both groups. Attention is known to
be impaired in AD, and we suggest that the hits in the MCI group
either take place despite reduced attention, as attention impair-
ment is only partial, or that attention is less essential when a hit
takes place due to the use of gist memory.
Calculation of phase synchrony following two alternative time-
frequency decompositions gave rise to two key findings. Firstly, the
synchrony found using EMDPL was indeed also found when
traditional bandpass filters or wavelets were used, validating the
findings using EMDPL. Secondly, EMDPL offered advantages
over the other approaches. The precise frequency cut-offs of the
filters used did affect whether and when the synchrony was
actually detected, and while the timing of phase synchrony
detected following wavelet decomposition was similar, time
localisation was reduced, as expected using a method in which
there is a trade-off between time and frequency localisation.
Indeed, a further recent example of better time localisation
following EMD than wavelet decomposition is localisation of
transcranial magnetic stimulation-evoked EEG oscillations [171].
We concluded that band pass filter- and wavelet-based calculation
of PL did not provide any additional information to separate the
neural processing between groups and conditions.
2.2 Amplitude changes. We calculated amplitudes using
EMD and wavelet time-frequency decomposition. No significant
amplitude differences were detected using either method, suggest-
ing that PL provides a more useful approach to assessing the
differences in neural processing underlying true and false memory
in the two groups. This is consistent with the findings of [21] who
demonstrated that increased fronto-parietal theta synchrony found
during retrieval in a working memory task did not coincide with
a power change. They concluded that the coherence measurement
reflected temporal information only.
2.3 ERPs. ERP amplitude was calculated in order to identify
the expected P300 component and verify that the data conformed
to the literature. Left parietal ERP differences are thought to
reflect item-specific recollection [68,69], and it has been suggested
that the greater amplitude in true memory reflects stronger
imagery for true memories [107,108,110]. Thus, the significantly
greater positivity during hits than FA found in the typical group
could be interpreted as indicative of retrieval of a true memory.
The same component was also found to have significantly
greater amplitude in hits in the typical group than in the MCI
group, and the P300 latency in hits in the MCI group was
significantly longer than in the typical group. These effects
replicate the findings of [109,111]. These results would also
support impairment of reactivation of a true memory in the MCI
group.
3. ConclusionsThe neural correlates of true and false memory processing in
participants with mild cognitive impairment were compared with
those of age-matched controls. The approach involved EMDPL,
which allowed study of the oscillations relating to memory
processing without the need for arbitrary bandpass filter cut-off
selection. By studying phase information separately from ampli-
tude information, it was possible to study functional connectivity
independently from any power changes. Indeed, while no
significant inter-group/condition amplitude differences were
found, differences in the neural correlates of true and false
memory were identified on measurement of PL, and PL
differences were also found between typical memory processing
and processing by those with MCI.
There was more frontal PL in FA than hits in both groups, and
in the MCI group than in the typical group in FA. We have
suggested that the former indicates increased searching processes
in the absence of retrieval of a true memory and that the latter
resulted from differing neural mechanisms underlying retrieval in
the MCI group, with an increase in compensatory processing and
a greater tendency to rely on gist memory when episodic memory
is impaired. Lower correlation between frontal and parietal phase
locking levels in the MCI group fits with the notion of AD as
a ‘disconnection syndrome’ [2,25,28,58]. That synchrony levels
Mild Cognitive Impairment Memory Neural Correlates
PLOS ONE | www.plosone.org 16 October 2012 | Volume 7 | Issue 10 | e48357

differed within the frontal cortex is in agreement with previous
findings of impairment in this region in AD.
Currently there are few tools to determine which patients with
MCI will progress to AD. Better prediction of progression to AD is
essential for planning patient care, and as advances are made in
treatment, for starting preventative measures or symptom-delaying
medications before irreversible damage occurs [2]. We suggest that
the differing PL levels between groups might be detectable before
any other indication of MCI or early AD is present, as the
comparable behavioural results between the groups in the DRM
recognition task suggest that employment of differing neural
processing between the groups compensates for episodic memory
decline. We propose that future study could investigate the use of
this approach as a screening tool, which could be applied to those
deemed, for instance, through a family history of AD, to be at
increased risk of developing AD in the future. Long-term follow-up
would be required to ascertain whether this method can be used to
differentiate between adults with MCI who develop AD and those
that do not. Furthermore, the approach could be used to identify
those who would benefit from specific treatment approaches.
Finally, a greater understanding of the electrophysiological
correlates of memory processing should in future allow de-
velopment of new treatment approaches, including both pharma-
cological and electrical interventions.
Supporting Information
Table S1 Word lists used for the Deese-Roediger-McDermott paradigm.
(DOC)
Appendix S1 Topography of ERPs and phase alignment.
(DOC)
Acknowledgments
The authors would like to thank the participants for their kind
involvement.
Author Contributions
Conceived and designed the experiments: CMSR PMR JAE JEF SJN.
Performed the experiments: CMSR. Analyzed the data: CMSR SJN.
Contributed reagents/materials/analysis tools: CMSR SJN PMR. Wrote
the paper: CMSR.
References
1. Francis PT, Palmer AM, Snape M, Wilcock GK (1999) The cholinergic
hypothesis of Alzheimer’s disease: a review of progress. J Neurol Neurosurg
Psychiatry 66: 137–147.
2. Dauwels J, Vialatte F, and Cichocki A (2010) Diagnosis of Alzheimer’s disease
from EEG signals: Where are we Standing? Current Alzheimer Research 7:
487–505.
3. Mandzia J, Black S, Grady C, McAndrews MP, Graham S (2001) Encoding
and retrieval in aging and memory loss. An fMRI study. Brain and Cognition
49: 225–228.
4. Zakanis KK, Boulos MI. A meta-analysis of ApoE genotype and neuropsy-
chologic and neuroanatomic changes in preclinical Alzheimer’s Disease; 2002.
5. Sherwin BB (2000) Mild cognitive impairment: potential pharmacological
treatment options. Journal of the American Geriatrics Society 48: 431–441.
6. Morris JC, Storandt M, Miller JP, McKeel DW, Price JL, et al. (2001) Mild
cognitive impairment represents early-stage Alzheimer disease. Arch Neurol
58: 397–405.
7. Price J, Morris JC (1999) Tangles and plaques in nondemented aging and
p̀reclinical’ Alzheimer’s disease. Ann Neurol 45: 358–368.
8. Petersen RC, Smith GE, Waring SC, Ivnik RJ, Tangalos EG, et al. (1999) Mild
cognitive impairment: clinical characterization and outcome. Arch Neurol 56:
303–308.
9. Sweeney-Reed CM, Nasuto SJ (2007) A novel approach to the detection of
synchronisation in EEG based on empirical mode decomposition. J Comp
Neurosci 23: 79–111.
10. Sweeney-Reed CM, Nasuto SJ (2009) Detection of neural correlates of self-
paced motor activity using empirical mode decomposition phase locking
analysis. J Neurosci Methods 184: 54–70.
11. Varela F, Lachaux J-P, Rodriguez E, Martinerie J (2001) The brainweb: phase
synchronisation and large-scale integration. Nature Reviews: Neuroscience 2:
228–239.
12. Lachaux J-P, Rodriguez E, Martinerie J, Varela FJ (1999) Measuring phase
synchrony in brain signals. Human Brain Mapping 8: 194–208.
13. Koenig T, Prichep L, Dierks T, Hubl D, Wahlend LO, et al. (2005) Decreased
EEG synchronization in Alzheimer’s disease and mild cognitive impairment.
Neurobiol Aging 26: 165–171.
14. Fell J, Klaver P, Lehnertz K, Grunwald T, Schaller C, et al. (2001) Human
memory formation is accompanied by rhinal-hippocampal coupling and
decoupling. Nature Neuroscience 4: 1259–1264.
15. Klimesch W, Schack B, Sauseng P (2005) The functional significance of theta
and upper alpha oscillations. Experimental Psychology 52: 99–108.
16. Babiloni C, Ferri R, Moretti D, Strambi A, Binetti G, et al. (2004) Abnormal
fronto-parietal coupling of brain rhythms in mild Alzheimer’s Disease:
a multicentric EEG study. Eur J Neurosci 19: 2583–2590.
17. Buzsaki G (1996) The hippocampo-neocortical dialogue. Cereb Cortex 6: 81–
92.
18. Duezel E, Richardson-Klavehn A, Neufang M, Schott BH, Scholz M, et al.
(2005) Early, partly anticipatory, neural oscillations during identification set the
stage for priming. Neuroimage 25: 690–700.
19. Sarnthein J, Petsche H, Rappelsberger P, Shaw GL, von Stein A (1998)
Synchronization between prefrontal and posterior association cortex during
human working memory. Proc Natl Acad Sci, USA 95: 7092–7096.
20. Sauseng P, Klimesch W, Doppelmayr M, Hanslmayr S, Schabus M, et al.
(2004) Theta coupling in the human electroencephalogram during a working
memory task. Neurosci Lett 354: 123–126.
21. Sauseng P, Klimesch W, Schabus M, Doppelmayr M (2005) Fronto-parietal
EEG coherence in theta and upper alpha reflect central executive functions of
working memory. Int J Psychophysiol 57: 97–103.
22. Stam CJ, van der Made Y, Pijnenburg YAL, Scheltens PH (2003) EEG
synchronization in mild cognitive impairment and Alzheimer’s Disease. Acta
Neurol Scand 108: 90–96.
23. Knyazeva M, Jalili M, Brioschi A, Bourquin I, Fornari E, et al (2010)
Topography of EEG multivariate phase synchronization in early Alzheimer’s
disease. Neurobiol Aging 7: 1132–1144.
24. Kramer MA, Chang F-L, Cohen M, Hudson D, Szeri AJ (2007)
Synchronization measures of the scalp electroencephalogram can discriminate
healthy from Alzheimer’s subjects. Int J Neural Syst 17: 1–9.
25. Locatelli T, Cursi M, Liberati D, Franceschi M, Comi G (1998) EEG
coherence in Alzheimer’s disease. Electroencephalogr Clin Neurophysiol 106:
229–237.
26. Stam CJ, Breakspear M, van Cappellen van Walsum AM, van Dijk BW (2003)
Nonlinear synchronization in EEG and whole-head MEG recordings of
healthy subjects. Human Brain Mapping 19: 63–78.
27. Stam CJ, Montez T, Jones BF, Rombouts SARB, van der Made Y, et al. (2005)
Disturbed fluctuations of resting state EEG synchronization in Alzheimer’s
disease. Clinical Neurophysiology 116: 708–715.
28. Dauwels J, Vialatte F, Musha T, Cichocki A (2010) A comparative study of
synchrony measures for the early diagnosis of Alzheimer’s disease based on
EEG. Neuroimage 49: 668–693.
29. Jiang Z-Y (2005) Study on EEG power and coherence in patients with mild
cognitive impairment during working memory task. Journal of Zhejiang
University Science B 6: 1213–1219.
30. Jiang Z-Y (2005) Abnormal cortical functional connections in Alzheimer’s
disease: analysis of inter- and intra-hemispheric EEG coherence. Journal of
Zhejiang University Science B 6B: 259–264.
31. Jiang Z-Y, Zheng L-L (2006) Inter- and intra-hemispheric EEG coherence in
patients with mild cognitive impairment at rest and during working memory
task. Journal of Zhejiang University Science B 75: 357–364.
32. Pijnenburg YAL, v d Made Y, van Cappellen van Walsum AM, Knol DL,
Scheltens P, et al. (2004) EEG synchronization likelihood in mild cognitive
impairment and Alzheimer’s disease during a working memory task. Clinical
Neurophysiology 115: 1332–1339.
33. van der Hiele K, Vein AA, Kramer CGS, Reijntjes RHAM, van Buchem MA,
et al. (2007) Memory activation enhances EEG abnormality in mild cognitive
impairment. Neurobiol Aging 28: 85–90.
34. Summerfield C, Mangels J (2005) Functional coupling between frontal and
parietal lobes during recognition memory. NeuroReport 16: 117–122.
35. Bartlett FC (1932) Remembering: a study in experimental and social
psychology. Cambridge: Cambridge University Press.
36. Deese J (1959) On the prediction of occurrence of particular verbal intrusions
in immediate recall. J Exp Psychol 58: 17–22.
37. Underwood BJ (1965) False recognition produced by implicit verbal responses.
J Exp Psychol 70: 122–129.
Mild Cognitive Impairment Memory Neural Correlates
PLOS ONE | www.plosone.org 17 October 2012 | Volume 7 | Issue 10 | e48357

38. Roediger HLI, McDermott KB (1995) Creating false memories: remembering
words not presented in lists. J Exp Psychol Learn Mem Cogn 21: 803–814.
39. Ginter Jr J, Blinowska KJ, Kaminski M, Durka PJ (2001) Phase and amplitude
analysis in time-frequency space - application to voluntary finger movement.
J Neurosci Methods 110: 113–124.
40. Gross J, Pollok B, Dirks M, Timmermann L, Butz M, et al. (2005) Task-
dependent oscillations during unimanual and bimanual movements in the
human primary motor cortex and SMA studied with magnetoencephalogra-
phy. Neuroimage 26.
41. Klimesch W, Schimke H, Schwaiger J (1994) Episodic and semantic memory:
an analysis in the EEG theta and alpha band. Electroencephalogr Clin
Neurophysiol 91: 428–441.
42. Myers LJ, MacKinnon CD (2004)The time course of functional coupling
between human cortical motor areas during internally driven vs. externally
cued movements; San Francisco, USA. 4669–4672.
43. Tcheslavski GV, Beex AA (2005) Properties and parameter selection for phase
synchrony processing of EEG signals. 2nd IASTED International Multi-
Conference Signal and Image Processing (ACIT-SIP): 164–169.
44. Sweeney-Reed CM, Andrade AO, Nasuto SJ (2004) Empirical mode
decomposition of EEG signals for synchronisation analysis. IEEE Engineering
in Medicine and Biology Student Society (EMBSS) UKRI Postgraduate
Conference on Biomedical Engineering and Medical Physics: 15–16.
45. Sweeney-Reed CM, Howroyd JD, Andrade ADO, Nasuto SJ (2005) Empirical
mode decomposition for isolation of neural assemblies underlying cognitive
acts. IEEE Engineering in Medicine and Biology Student Society (EMBSS)
UKRI Postgraduate Conference on Biomedical Engineering and Medical
Physics: 21–22.
46. Huang NE, Shen Z, Long SR, Wu MC, Shih HH, et al. (1998) The empirical
mode decomposition and the Hilbert spectrum for nonlinear and non-
stationary time series analysis. Proc R Soc Lond 454: 903–995.
47. Liang HL, Lin Z, McCallum RW (2000) Artifact reduction in electrogastro-
gram based on the empirical mode decomposition method. Med Biol Eng
Comput 38: 35–41.
48. McKeown MJ, Saab R, Abu-Gharbieh R (2005) A combined independent
component analysis (ICA)/empirical mode decomposition (EMD) method to
infer cortico-muscular coupling; Arlington, Virginia. Proceedings of the 2nd
Annual International Conference of the IEEE Engineering in Medicine and
Biology Society (EMBS). 679–682.
49. Yang A, Fuh JL, Huang NE, Shia BC, Peng C-K, et al. (2011) Temporal
associations between weather and headache: analysis by empirical mode
decomposition. PloS ONE 6: e14612.
50. Huang NE, Long SR (2003) Analyzing time series using EMD and Hilbert
spectra. Goddard Space Flight Centre.
51. Balocchi R, Menicucci D, Santarcangelo E, Sebastiani L, Gemignani A, et al.
(2004) Deriving the respiratory sinus arrhythmia from the heartbeat time series
using empirical mode decomposition. Chaos, Solitons, and Fractals 20: 171–
177.
52. Leo M, Looney D, D’Orazio T, Mandic DP (2010) Defective areas
identification in aircraft components by bivariate EMD analysis of ultrasound
aignals. Artificial Neural Networks in Pattern Recognition, Lecture Notes in
Computer Science. 219–230.
53. Zhou Z-X, Wan B-K, Ming D, Qi H-Z (2010) A novel technique for phase
synchrony measurement from the complex motor imaginary potential of
combined body and limb action. J Neural Eng 046008: 1–11.
54. Klimesch W (1995) Memory processing described as brain oscillations in the
EEG-alpha and theta bands. Psycoloquy 95: memory.brain.1.klimesch.
55. Klimesch W (1999) EEG alpha and theta oscillations reflect cognitive and
memory performance: a review and analysis. Brain Res Rev 29: 169–195.
56. Buckner RL, Snyder AZ, Shannon BJ, LaRossa G, Sachs R, et al. (2005)
Molecular, structural, and functional characterization of Alzheimer’s disease:
evidence for a relationship between default activity, amyloid, and memory.
J Neurosci 25: 7709–7717.
57. Perry RJ, Hodges JR (1999) Attention and execution deficits in Alzheimer’s
disease: a critical review. Brain 122: 383–404.
58. Hogan MJ, Swanwick GRJ, Kaiser J, Rowan M, Lawlor B (2003) Memory-
related EEG power and coherence reductions in mild Alzheimer’s disease.
Int J Psychophysiol 49: 147–163.
59. Babiloni C, Babiloni F, Carducci F, Cappa S, Cincotti F, et al. (2004) Human
cortical EEG rhythms during long-term episodic memory task. A high-
resolution EEG study of the HERA model. Neuroimage 21: 1576–1584.
60. Cabeza R, Nyberg L (2000) Imaging cognition II: An empirical review of 275
PET and fMRI studies. Journal of Cognitive Neuroscience 12: 1–47.
61. Goldman-Rakic P (1997) Space and time in the mental universe. Nature 386:
559–560.
62. Naghavi HR, Nyberg L (2005) Common fronto-parietal activity in attention,
memory, and consciousness: shared demands on integration? Consciousness
and Cognition 14: 390–425.
63. Shallice T, Fletcher P, Frith CD, Grasby P, Frackowiak RS, et al. (1994) Brain
regions associated with acquisition and retrieval of verbal episodic memory.
Nature 368: 633–635.
64. Smith EE, Jonides J, Koeppe RA (1996) Dissociating verbal and spatial
working memory using PET. Cereb Cortex 6: 11–20.
65. Tulving E, Kapur S, Craik FIM, Moscovitch M, Houle S (1994) Hemisphericencoding/retrieval asymmetry in episodic memory: positron emission tomog-
raphy findings. Proc Natl Acad Sci, USA 91: 2016–2020.
66. Wagner AD, Shannon BJ, Kahn I, Buckner RL (2005) Parietal lobe
contributions to episodic memory retrieval. Trends in Cognitive Sciences 9:
445–453.
67. Wimber M, Heinze HJ, Richardson-Klavehn A (2010) Distinct fronto-parietal
networks set the stage for later perceptual identification priming and episodicrecognition memory. J Neurosci 30: 13272–13280.
68. Curran T, Schacter DL, Johnson MK, Spinks R (2001) Brain potentials reflectbehavioural differences in true and false recognition. Journal of Cognitive
Neuroscience 13: 201–216.
69. Duezel E, Yonelinas AP, Mangun GR, Heinze H-J, Tulving E (1997) Event-related brain potential correlates of two states of conscious awareness in
memory. Proc Natl Acad Sci, USA 94: 5973–5978.
70. Duezel E, Cabeza R, Picton TW, Yonelinas AP, Scheich H, et al. (1999) Task-
related and item-related brain processes of memory retrieval. Proc Natl Acad
Sci, USA 96: 1794–1799.
71. Jacobs J, Hwang G, Curran T, Kahana MJ (2006) EEG oscillations and
recognition memory: theta correlates of memory retrieval and decision making.Neuroimage 32: 978–987.
72. Nyberg L, McIntosh AR, Cabeza R, Habib R, Houle S, et al. (1996) Generaland specific brain regions involved in encoding and retrieval of events: What,
where, and when. Proc Natl Acad Scie, USA 93: 11280–11285.
73. Richardson-Klavehn A (2010) Priming, automatic recollection, and control ofretrieval: toward an integrative retrieval architecture. In: Mace J, editor. The
act of remembering. New York: Wiley-Blackwell.
74. Schacter DL, Slotnick SD (2004) The cognitive neuroscience of memory
distortion. Neuron 44: 149–160.
75. Buckner RL, Wheeler ME (2001) The cognitive neuroscience of remembering.
Nature Reviews: Neuroscience 2: 624–634.
76. Cabeza R, Rao SM, Wagner AD, Mayer AR, Schacter DL (2001) Can medialtemporal lobe regions distinguish true from false? An event-related functional
MRI study of veridical and illusory recognition memory. Proc Natl Acad Sci,USA 98: 4805–4810.
77. Norman KA, Schacter DL (1997) False recognition in younger and olderadults: exploring the characteristics of illusory memories. Memory and
Cognition 25: 838–848.
78. Balota DA, Cortese MJ, Duchek JM, Adams D, Roediger III HL, et al. (1999)Veridical and false memories in healthy older adults and in dementia of the
Alzheimer’s type. Cognitive Neuropsychology 16: 361–384.
79. Greenaway MC, Lacritz LH, Binegar D, Weiner MF, Lipton A, et al. (2006)
Patterns of verbal memory performance in mild cognitive impairment,Alzheimer disease, and normal aging. Cognitive and Behavioral Neurology
19: 79–84.
80. Pierce BH, Sullivan AL, Schacter DL, Budson AE (2005) Comparing source-based and gist-based false recognition in aging and Alzheimer’s disease.
Neuropsychology 19: 411–419.
81. Schacter D, Dodson CS (2001) Misattribution, false recognition and the sins of
memory. Philos Trans R Soc Lond B Biol Sci 356: 1385–1393.
82. Parkin AJ, Bindschaedler C, Harsent L, Metzler C (1996) Pathological false
alarm rates following damage to the left frontal cortex. Brain Cogn 32: 14–27.
83. Schacter DL, Curran T, Galluccio L, Milberg WP, Bates JF (1996) Falserecognition and the right frontal lobe: a case study. Neuropsychologia 34: 793–
808.
84. Budson AE, Sullivan AL, Mayer E, Daffner KR, Black PM, et al. (2002)
Suppression of false recognition in Alzheimer’s disease and in patients with
frontal lobe lesions. Brain 125: 2750–2765.
85. Haxby JV, Grady CL, Koss E, Horwitz B, Schapiro M, et al. (1988)
Heterogeneous anterior-posterior metabolic patterns in dementia of theAlzheimer type. Neurology 38: 1853–1863.
86. Lidstroem AM, Bogdanovic N, Hese C, Volkman I, Davidson P, et al. (1998)Clusterin (apolipoprotein J) protein levels are increased in hippocampus and in
frontal cortex in Alzheimer’s disease. Exp Neurol 154: 511–521.
87. Magrin-Chagnolleau I, Baraniuk R (1999) Empirical mode decompositionbased time-frequency attributes. Seg Technical Program Expanded Abstracts.
Houston, Texas, USA. 18(1): 1949–1952.
88. Mountjoy CQ, Roth M, Evans NJ, Evans HM (1983) Cortical neuronal counts
in normal elderly controls and demented patients. Neurobiol Aging 4: 1–11.
89. Johnson MK, Nolde SF, Mather M, Kounios J, Schacter DL, et al. (1997) The
similarity of brain activity asociated with true and false recognition memory
depends on test format. Psychological Science 8: 250–257.
90. Schacter DL, Buckner RL, Koutstaal W, Dale AM, Rosen BR (1997) Late
onset of anterior prefrontal activity during true and false recognition: an event-related fMRI study. Neuroimage 6: 259–269.
91. Yonelinas AP (2002) The nature of recollection and familiarity: a review of 30years of research. J Mem Lang 46: 441–517.
92. Aggleton J, Brown MW (1999) Episodic memory, amnesia, and the
hippocampal-anterior thalamic axis. Behav Brain Sci 22: 425–444.
93. Budson AE, Daffner KR, Desikan R, Schacter DL (2000) When false
recognition is unopposed by true recognition: gist-based memory distortion inAlzheimer’s disease. Neuropsychology 14: 277–287.
94. Klimesch W, Schack B (2003) Activation of a long-term memory by alphaoscillations in a working-memory task? Behav Brain Sci 26: 743.
Mild Cognitive Impairment Memory Neural Correlates
PLOS ONE | www.plosone.org 18 October 2012 | Volume 7 | Issue 10 | e48357

95. Baddeley A (1992) Working memory. Science 255: 556–559.
96. Baddeley A (1998) The central executive: a concept and some misconceptions.
Journal of the International Neuropsychological Society 4: 523–526.
97. Baddeley AD, Logie R, Bressi S, Della Salla S, Spinnler H (1991) The decline
of working memory in Alzheimer’s disease. Brain 114: 2521–2542.
98. Wilding EL, Herron JE (2006) Electrophysiological measures of episodic
memory control and memory retrieval. Clinical EEG and Neuroscience 37:
315–321.
99. Sandrini M, Cappa SF, Rossi S, Rossini PM, Miniussi C (2003) The role of
prefrontal cortex in verbal episodic memory: rTMS evidence. Journal of
Cognitive Neuroscience 15: 855–861.
100. Schacter DL, Reiman E, Curran T, Yun LS, Bandy D, et al. (1996)
Neuroanatomical correlates of veridical and illusory recognition memory:
evidence from positron emission tomography. Neuron 17: 267–274.
101. Clark CR, Moores KA, Lewis A, Weber DL, Fitzgibbon S, et al. (2001)
Cortical network dynamics during verbal working memory function.
Int J Psychophysiol 42: 161–176.
102. Gevins A (1995) Prefrontal and parietal networks of working memory function
imaged with 124-channel EEG and MRI. Electroencephalogr Clin Neurophy-
siol 97: 850.
103. Christman SD, Propper RE, Dion A (2004) Increased interhemispheric
interaction is associated with decreased false memories in a verbal converging
semantic associates paradigm. Brain Cogn 56: 313–319.
104. Pogarell O, Teipel SJ, Juckel G, Gootjes L, Moeller T, et al. (2005) EEG
coherence reflects regional corpus callosum areas in Alzheimer’s disease.
J Neurol Neurosurg Psychiatry 76: 109–111.
105. Bruns A (2004) Fourier-, Hilbert-, and wavelet-based signal analysis: are they
really different approaches? J Neurosci Methods 137: 321–332.
106. Le Van Quyen M, Foucher J, Lachaux J-P, Rodriguez E, Lutz A, et al. (2001)
Comparison of Hilbert transform and wavelet methods for the analysis of
neuronal synchrony. J Neurosci Methods 111: 83–98.
107. Geng H, Qi Y, Li Y, Fan S, Wu Y, et al (2007) Neurophysiological correlates of
memory illusion in both encoding and retrieval phases. Br Res 1136: 154–168.
108. Gonsalves B, Paller, K A (2000) Neural events that underlie remembering
something that never happened. Nature Neuroscience 3: 1316–1321.
109. Frodl T, Hampel H, Juckel G, Buerger K, Padberg F, et al (2002) Value of
event-related P300 subcomponents in the clinical diagnosis of mild cognitive
impairment and Alzheimer’s disease. Psychophysiology 9: 175–181.
110. Nessler D, Mecklinger A, Penney TB (2001) Event related brain potentials and
illusory memories: the effects of differential encoding. Cognitive BrainResearch 10: 283–301.
111. van Deursen J, Vuurman EFPM, Smits LL, Verhey FRJ, Riedel WJ (2009)
Response speed, contingent negative variation and P300 in Alzheimer’s disease
and MCI. Br and Cogn 69: 592–599.
112. Stadler MA, Roediger III HL, McDermott KB (1999) Norms for word lists that
create false memories. Memory and Cognition 27: 494–500.
113. Nelson DL, McEvoy CL, Schreiber TA (1998) The University of South Florida
word association, rhyme, and word fragment norms. Available: http://
wwwusfedu/FreeAssociation/.
114. Wilson MD (1988) Edinburgh Associative Thesaurus. The MRC Psycholin-
guistic Database: Machine Readable Dictionary, Version 2. Behavioural
Research Methods, Instruments and Computers 20: 6–11. Available: http://
www.eat.rl.ac.uk/.
115. Bennett I, Golob EJ, Parker ES, Starr A (2006) Memory evaluation in mild
cognitive impairment using recall and recognition tests. J Clin Exp Neuropsych
28: 1408–1422.
116. Karrasch M, Sinerva E, Groenholm P, Rinne J, Laine M (2005) CERAD test
performances in amnestic mild cognitive impairment and Alzheimer’s disease.
Acta Neurol Scand 111: 172–179.
117. Satzger W, Ingrassia G, Nolde T, Buerger K, Hampel H, et al. The CERAD
Neuropsychological Battery as a Screening Instrument in Differentiating
Dementia and Depression; 1999; Nuremberg. Pharmacopsychiatry. 205–206.
118. Albert MS (1997) Preclinical predictors of Alzheimer’s disease. Brain and
Cognition 35: 284–285.
119. Welsh K, Butters N, Hughes J, Mohs R, Heyman A (1991) Detection of
abnormal memory decline in mild cases of Alzheimer’s disease using CERAD
neuropsychological measures. Arch Neurol 48: 278–281.
120. Welsh KA, Butters N, Hughes JP, Mohs RC, Heyman A (1992) Detection and
staging of dementia in Alzheimer’s disease. Use of the neuropsychological
measures developed for the Consortium to Establish a Registry for Alzheimer’s
Disease. Arch Neurol 49: 448–452.
121. Zaudig M (1992) A new systematic method of measurement and diagnosis of
m̀ild cognitive impairment’ and dementia according to ICD-10 and DSM-III-
R criteria. Int Psychogeriatr 4: 203–219.
122. Phillips S, Takeda Y (2009) Greater frontal-parietal synchrony at low gamma-
band frequencies for inefficient than efficient visual search in human EEG.
Int J Psychophysiol 73: 350–354.
123. Schack B, Klimesch W, Sauseng P (2005) Phase synchronization between theta
and upper alpha oscillations in a working memory task. Int J Psychophysiol 57:
105–114.
124. Walla P, Puerregger E, Lehrner J, Mayer D, Deecke L, et al. (2005) Depth of
word processing in Alzheimer patients and normal controls: a magnetoence-
phalographic study. Journal of Neurotransmission 2005: 713–730.
125. Klimesch W, Doppelmayr M, Stadler W, Poellhuber D, Sauseng P, et al. (2001)Episodic retrieval is reflected by a process specific increase in human
electroencephalographic theta activity. Neurosci Lett 302: 49–52.
126. Pfurtscheller G, Brunner C, Schoegl A, Lopes da Silva FH (2006) Mu rhythm
(de)synchronization and EEG single-trial classification of different motorimagery tasks. Neuroimage 31: 153–159.
127. Nicolaou N, Nasuto SJ (2007) Automatic artefact removal from event-relatedpotentials via clustering. Invited paper. Journal of VLSI Signal Processing
Special Issue on Machine Learning for Signal Processing (MLSP, 2005).
128. Molgedey L, Schuster HG (1994) Separation of a mixture of independent
signals using time delayed correlations. Physical Review Letters 72: 3634–3637.
129. Ziehe A, Mueller K-R (1998) TDSEP - an efficient algorithm for blind
separation using time structure. In: Niklasson L, Boden M, Ziemke T, editors.Berlin. Springer-Verlag. 675–680.
130. Babiloni C, Brancucci A, Vecchio F, Arendt-Nielsen L, Chen ACN, et al.(2006) Anticipation of somatosensory and motor events increases centro-
parietal functional coupling: an EEG coherence study. Clinical Neurophysi-ology 117: 1000–1008.
131. Nunez P, Srinivasan R (2006) Electric fields of the brain: the neurophysics ofEEG: Oxford University Press.
132. Guevara R, Velazquez JLP, Nenadovic V, Wennberg R, Senjanovic G, et al.(2005) Phase synchronisation measurements using electroencephalographic
recordings. Neuroinformatics 3: 301–313.
133. Schiff SJ (2005) Dangerous phase. Neuroinformatics 3: 315–317.
134. Meineke FC, Ziehe A, Kurths J, Mueller K-R (2005) Measuring phasesynchronization of superimposed signals. Physical Review Letters 94: 084102.
135. Andrade A, Kyberd PJ, Taffler SD (2003) A novel spectral representation ofelectromyographic signals. In: Leder RS, editor. Cancun, Mexico. 2598–2601.
136. Andrade A, Kyberd PJ, Nasuto SJ (2008) The application of the Hilbertspectrum to the analysis of electromyographic signals. Information Sciences
178: 2176–2193.
137. Tass P, Rosenblum MG, Weule J, Kurths J, Pikovsky A, et al. (1998) Detection
of n:m phase locking from noisy data: application of magnetoencephalography.Physical Review Letters 81: 3291–3294.
138. Lachaux J-P, Rodriguez E, Le Van Quyen M, Martinerie J, Varela FJ (2000)Studying single trials of phase synchronous activity in brain. International
Journal of Bifurcation and Chaos 10: 2429–2439.
139. Fasano G, Franceschini A (1987) A multidimensional version of the
Kolmogorov-Smirnov test. Monthly Notices of the Royal Astronomical Society225: 155–170.
140. Peacock J (1983) Two-Dimensional Goodness-of-Fit Testing in Astronomy.Monthly Notices of the Royal Astronomical Society 202: 615–627.
141. Press WH, Teukolsky SA, Vetterling WT, Flannery BP (1992) Numericalrecipes in C. The art of scientific computing: Cambridge University Press.
142. Lowry R (1998) VassarStats: Web Site for Statistical Computation. Available:http://facultyvassaredu/lowry/VassarStatshtml.
143. Torrence C, Compo GP (1998) A practical guide to wavelet analysis. Bull AmMeteorol Soc 79: 61–78.
144. Grinsted A, Moore JC, Jevrejeva S (2004) Cross wavelet and wavelet coherenceMatlab toolbox. Available: http://wwwpolacuk/home/research/
waveletcoherence/.
145. Farge M (1992) Wavelet transforms and their applications to turbulence.
Annual Review of Fluid Mechanics 24: 395–457.
146. Grinsted A, Moore JC, Jevrejeva S (2004) Application of the cross wavelet
transform and wavelet coherence to geophysical time series. NonlinearProcesses in Geophysics 11: 561–566.
147. Ganushchak LY, Schiller NO (2009) Speaking one’s second language undertime pressure: An ERP study on verbal self-monitoring in German-Dutch
bilinguals. Psychophysiology 46: 410–419.
148. Ghassemi F, Moradi MH, Tehrani-Doost M, Abootalebi V (2010) Effects of
correct and wrong answers on ERPs recorded under conditions of theContinuous Performance Test in ADHD/normal participants. Neurophysiol-
ogy 42.
149. Duncan CC, Barry RJ, Connolly JF, Fischer C, Michie PT, et al. (2009) Event-
related potentials in clinical research: Guidelines for eliciting, recording, andquantifying mismatch negativity, P300, and N400. Clinical Neurophysiology
120: 1883–1908.
150. Chan SCC, Chan CCH, Kwan ASK, Ting K-H, Chui T-Y (2012) Orienting
attention modulates pain perception: an ERP study. PLoS ONE 7: e40215.
151. Wang X, Ma Q, Wang C (2012.) N400 as an index of uncontrolled
categorization processing in brand extension. Neuroscience Letters: Article inpress.
152. Hudon C, Belleville S, Souchay C, Gely-Nargeot M-C, Chertkow H (2006)Memory for gist and detail information in Alzheimer’s disease and mild
cognitive impairment. Neuropsychology 20: 566–577.
153. Brainerd CJ, Reyna VF (1998) Fuzzy trace theory and children’s false
memories. J Exp Child Psychol 71: 81–129.
154. Gallo D, Shahid K, Olson M, Solomon T, Schacter D, et al. (2006)
Overdependence on degraded gist memory in Alzheimer’s disease. Neuropsy-chology 20: 625–632.
155. Rugg MD, Yonelinas AP (2003) Human recognition memory: a cognitiveneuroscience perspective. Trends in Cognitive Sciences 7: 313–319.
156. Reder LM, Wible C, Martin J (1986) Different memory changes with age: exactretrieval versus plausible inference. J Exp Psychol Learn Mem Cogn 12: 72–81.
Mild Cognitive Impairment Memory Neural Correlates
PLOS ONE | www.plosone.org 19 October 2012 | Volume 7 | Issue 10 | e48357

157. Rabinowitz JC, Craik FIM, Ackerman BP (1982) A processing resource
account of age differences in recall. Canadian Journal of Psychology 36: 325–
344.
158. Koutstaal W, Schacter DL (1997) Gist-based false recognition of pictures in
older and younger adults. J Mem Lang 37: 555–583.
159. Mandler G (1980) Recognizing: the judgement of previous occurrence. Psychol
Rev 87: 252–271.
160. Yonelinas AP, Jacoby LL (1994) Dissociations of processes in recognition
memory: effects of interference and of response speed. Canadian J Exp Psychol
48: 516–534.
161. Atkinson R, Juola JF (1974) Search and decision processes in recognition
memory. In: Krantz D, Atkinson RC, Luce RD, Suppes P, editor.
Contemporary developments in mathematical psychology: learning, memory,
and thinking. San Francisco: Freeman.
162. Holmes B, Waters HS, Rajaram S (1998) The phenomenology of false
memories: episodic content and confidence. J Exp Psychol Learn Mem Cogn
24: 1026–1040.
163. Fernandez G, Effern A, Grunwald T, Pezer N, Lehnertz K, et al. (1999) Real-
time tracking of memory formation in the human rhinal cortex and
hippocampus. Science 285: 1582–1585.
164. Fell J, Klaver P, Elfadil H, Schaller C, Elger C, et al (2003) Rhinal-
hippocampal theta coherence during declarative memory formation: in-teraction with gamma synchronization? Eur J Neurosci 17: 1082–1088.
165. Spieler DH, Balota DA, Faust ME (1996) Stroop performance in younger
adults, healthy older adults and individuals with senile dementia of theAlzheimer’s type. J Exp Psychol: Hum Percept Perform 22: 461–479.
166. Belanger S, Belleville S, Gauthier S (2010) Inhibition impairments inAlzheimer’s disease, mild cognitive impairment and healthy aging: effect of
congruency proportion in a Stroop task. Neuropsychologia 48: 581–589.
167. Fabiani M, Stadler MA, Wessels PM (2000) True but not false memoriesproduce a sensory signature in human lateralized brain potentials. Journal of
Cognitive Neuroscience 12: 941–949.168. Goldman-Rakic P (1988) Topography of cognition: parallel distributed
networks in primate association cortex. Annu Rev Neurosci 11: 137–156.169. Quintana J, Fuster JM (1999) From perception to action: temporal integrative
functions of prefrontal and parietal neurons. Cereb Cortex 9: 213–221.
170. Stam CJ (2000) Brain dynamics in theta and alpha frequency bands andworking memory performance in humans. Neurosci Lett 286: 115–118.
171. Pigorini A, Casali AG, Casarottoa S, Ferrarelli F, Baselli G, et al. (2011) Time–frequency spectral analysis of TMS-evoked EEG oscillations by means of
Hilbert–Huang transform. J Neurosci Methods 198: 236–245.
Mild Cognitive Impairment Memory Neural Correlates
PLOS ONE | www.plosone.org 20 October 2012 | Volume 7 | Issue 10 | e48357


