Embed Size (px)
Citation preview
Methods 37 (2005) 261–273
www.elsevier.com/locate/ymeth
True and false discovery in DNA microarray experiments: Transcriptome changes in the hippocampus of presenilin 1 mutant mice
Travis Unger a, Zeljka Korade c, Orly Lazarov d, David Terrano d, Sangram S. Sisodia d, Károly Mirnics a,b,¤
a Department of Psychiatry, University of Pittsburgh School of Medicine, Pittsburgh, PA 15261, USAb Department of Neurobiology, University of Pittsburgh School of Medicine, Pittsburgh, PA 15261, USA
c Department of Pediatrics, University of Pittsburgh School of Medicine, Pittsburgh, PA 15261, USAd Center for Molecular Neurobiology, University of Chicago, Chicago, IL, USA
Accepted 15 March 2005
Abstract
In transcriptome proWling experiments using DNA microarrays, it is critical to maximize putatively true data discovery while keepingthe false discovery rate at acceptable levels. Using previously published and veriWed transcriptome datasets of mice with geneticallyaltered PS1 physiology, we present a simple, robust, and system-speciWc assessment of type I and type II errors in two independent micro-array experimental series. We provide evidence to suggest that for maximizing true discovery and minimizing false discovery, statisticalcriteria alone are inferior to statistical signiWcance plus magnitude of change criteria. Furthermore, we found that, regardless of the exactcriteria used for determining diVerential expression, diVerent data extraction protocols give rise to diVerent discovery and false discoveryrates. In addition, a large proportion of expression diVerences were both dataset and analytical approach dependent. The data assessmentmethods presented and discussed in this manuscript can be easily carried out on any microarray dataset using basic spreadsheet functionsas the only tool needed. Finally, we provide an in-depth analysis of the hippocampal transcriptome of �E9 hPS1 transgenic mice and micewith a conditional ablation of the PS1 gene. 2005 Elsevier Inc. All rights reserved.
Keywords: Presenilin 1; Mutation; Transgenic; Knockout; Alzheimer’s disease; DNA microarray; Hippocampus; DCHIP; MAS5; RMA; Latin square;False discovery rate; Statistical signiWcance; Data mining; Normalization; AVymetrix; Brain
1. Introduction
Over the last several years, DNA microarrays have revo-lutionized RNA proWling studies [1–4]. The microarray-conducted transcriptomic studies performed to date arediverse in platforms used, labeling approaches, image seg-mentation, and statistical–analytical procedures imple-mented [5–15]. While the inXuences of platform diversityand labeling approaches have been extensively discussed inthe literature [16–19], the eVects of various data analysisapproaches on the Wnal experimental outcome are less
* Corresponding author. Fax: +1 412 648 1441.E-mail address: [email protected] (K. Mirnics).
1046-2023/$ - see front matter 2005 Elsevier Inc. All rights reserved.doi:10.1016/j.ymeth.2005.09.005
widely studied to date, especially on samples originatingfrom brain tissue [2,20,21].
AVymetrix microarrays represent one of the most com-monly used platforms in transcriptome proWling experiments.These oligonucleotide microarrays interrogate the testedsamples with multiple, non-redundant probesets [4,22,23],and the analytical method of combining probe-level informa-tion into one single expression value per gene becomes criticalfor the experimental outcome. We hypothesized that the out-come of transcriptome proWling experiments on brain tissue,where expression diVerences are relatively modest comparedto cancer biology [1,2,20,21], may be increasingly sensitive tothe probeset extraction strategy employed. To test this, weWrst decided to explore the eVect of three widely used probe-level extraction algorithms on the experimental outcome of

262 T. Unger et al. / Methods 37 (2005) 261–273
two independently derived microarray datasets generated inour previous studies [24]. DCHIP [25], RMA [26], and MAS5[22] are routinely used for extraction and normalizing probe-level data of AVymetrix GeneChips. All three approachesemploy diVerent philosophies in this regard, yet all have beensuccessfully utilized in uncovering true expression changes invarious GeneChip datasets. Second, to assess the eVect ofthese three probeset extractions and their normalizations ondiVerential expression calls, we performed a systematicassessment of total discovery (number of genes diVerentiallyexpressed across two conditions), false discovery (number ofgenes reporting expression diVerence by chance), and “true”discovery (total discovery¡ false discovery), using variouscombined statistical signiWcance/fold change criteria.
In our previous experiments, we performed extensivetranscriptome proWling of brain tissue originating from sev-eral mice with altered PS-1 gene function [24]. The Wrstexperimental series (TG comparison) focused on compar-ing the hippocampal transcriptome of humanized trans-genic mice carrying the �E9 hPS1 mutation (�E9 hPS1)[27–30] to that of transgenic mice carrying the normalhuman transgene (wt hPS1). In both of these mice, endoge-nous mPS1 transcript production is suppressed to undetect-able levels and hPS1 transgene expression levels arecomparable to those seen in normal wild-type control mice.Due to low endogenous APP production, neither of thesemice develops behavioral deWcits or amyloid depositions.
The second experimental dataset (cKO comparison) origi-nated from mice with a conditional deletion of endogenousmPS1 and matched controls. Conditional PS1 ablation inthe forebrain is achieved via cre-lox recombination underCam2 kinase control [31]. Unlike PS1/PS2-deWcient mice[32], these mice are viable and do not show alterations inpost-enrichment contextual memory.
This study had the goals of (1) establishing the diVerencesbetween the outcome of various probeset extraction/normali-zation methods on two brain microarray datasets, (2) assess-ing true and false discovery rates (FDR) of diVerentialexpression associated with the diVerent probeset extraction/normalization methods used, (3) identifying the most reliableexpression changes that characterize hippocampal deletion ofPS1, and (4) uncovering the most prominent expressionchanges that characterize the �E9 hPS1 mutation in the hip-pocampus. Furthermore, we wanted to establish an easy-to-use, robust, and intuitive approach that can comprehensivelyassess the quality of the diVerential expression calls associatedwith various statistical criteria in a dataset-speciWc manner.
2. Material and methods
2.1. Experimental samples
All experimental animals have been described previ-ously. For the transgenic comparison in the Wrst experi-
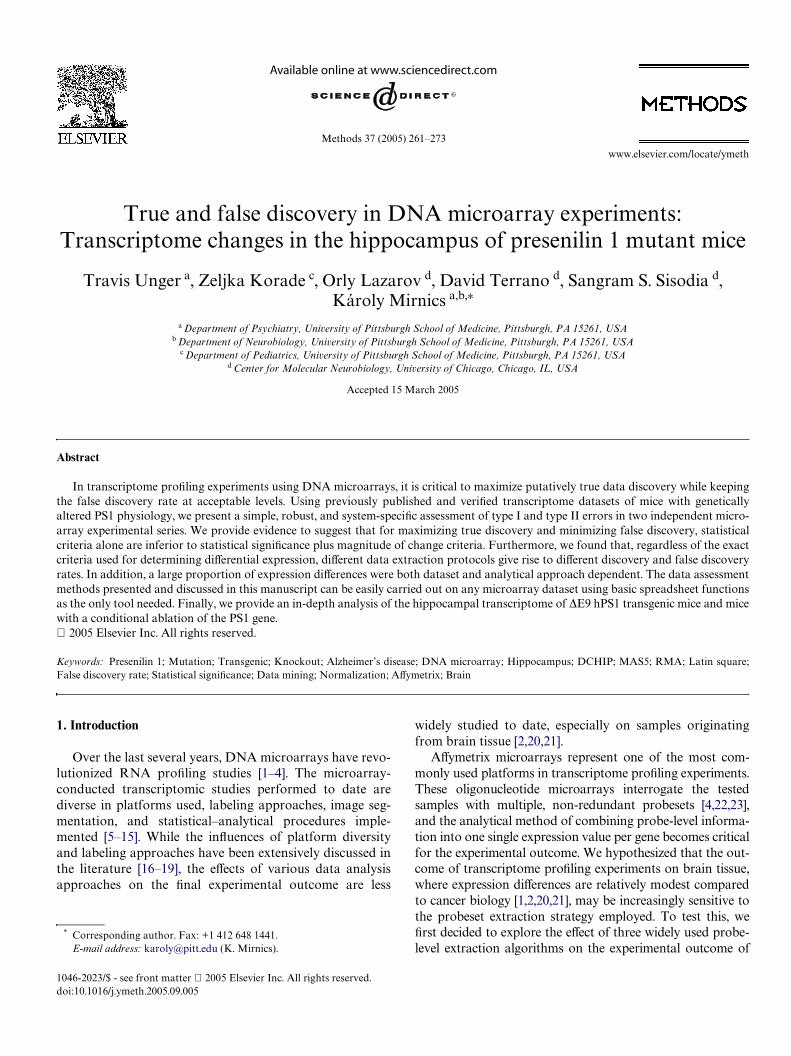
Fig. 1. Experimental design. Five �E9 hPS1 and Wve hPS1 transgenic mouse hippocampal RNA samples were analyzed on AVymetrix MOE430A arrayswith >22,000 probesets. The data from the arrays were then extracted/normalized using three diVerent analytical approaches (MAS5, DCHIP, and RMA).The obtained data underwent a systematic diVerential expression/FDR assessment using t test and LSQ analysis. After establishing a set of statistical cri-teria that minimized type I error and maximized true discovery (|ALR| > 0.263 and p value <0.05), we compared the analysis outcome across the four dataanalysis approaches. We used the same experimental design for the PS1-ablated experimental series (not shown).
wt hPS1dE9 hPS1
hPS1-transgenic mice comparison: hippocampal data
PROBE-LEVEL DATA EXTRACTION NORMALIZATION, SCALING
SEGMENTATION
ISOLATION, HYBRIDIZATION, SCANNING
e1 e2 e3 e4 e5 c1 c2 c3 c4 c5
Dchip MAS5RMA
ESTABLISH DIFF EXPRESSION FILTERING ALR>0.263, pval <0.05
LSQ
59 471182 174
FDR FDRFDR FDR SYSTEMATIC FDR ASSESSMENT
COMPARE ANALYSIS OUTCOME

T. Unger et al. / Methods 37 (2005) 261–273 263
ment, RNA from the hippocampi of Wve �E9 hPS1transgenic mice [27–30] and Wve humanized hPS1 trans-genic mice were analyzed on AVymetrix MOE430A micro-arrays (www.aVymetrix.com). In the second experiment,four hippocampi of mice with a conditional ablation of PS1and four matched wild-type mPS1 controls were analyzed[31]. These data are part of a previously published experi-mental series [24] (Fig. 1).
2.2. Microarrays
AVymetrix MOE430A oligonucleotide microarrays wereused for transcriptome proWling. These microarrays contain
>22,000 gene probesets investigating >14,000 unique mousegenes, with each gene interrogated by 11 independentlyderived oligonucleotide probes. Samples were prepared andhybridizations were performed according to manufac-turer’s instructions. Input RNA quality was assessed usingBioanalyzer (Agilent Technologies, Palo Alto, CA). Eachsample was hybridized to a single microarray. All sampleshad a GAPDH/actin 5�:3� ratio > 1:1.2.
2.3. Probeset extraction and normalization
Scanning and segmentation of the arrays were performedusing Microarray Analysis Suite 5.0 (AVymetrix, Sunnyvale,
Fig. 2. Similarities and diVerences in experimental outcome. Experimental outcome of the four employed extraction/normalization methods (MAS5,DCHIP, LSQ, and RMA) was compared across the two independently generated datasets (cKO and TG). This was done using two sets of statistical crite-ria that were chosen by the FDR analysis outcome (|ALR| > 0.263 + p value <0.05 and |ALR| > 0.378 + p value <0.01). The overlaps and non-overlapsbetween genes are represented using Venn diagrams; the numbers in the diagrams refer to the number of AVymetrix probesets showing diVerential expres-sion. MAS5-LSQ and RMA-DCHIP data overlap are denoted in parenthesis. Note that a large proportion of genes showed diVerential expression by onlyone of the enlisted methods, which cannot be explained by the established FDR. The data from all four Venn diagrams are derived from Table 2.
hPS1 TRANSGENIC COMPARISON cKO mPS1 COMPARISON
MAS5 MAS5
RMA(7)*
RMA(3)*
LSQ(25)**
LSQ(23)**
DCHIP DCHIP
P <0.05 and |ALR|> 0.263
MAS5 MAS5
RMA(0)*
RMA(0)*
LSQ(3)**
LSQ(4)**
DCHIP DCHIP
P <0.01 and |ALR|> 0.378
23
1
35
0
1
7
15
32
63
354 13
61
16
0 5
32 5
15
3
521
4047
454 15
4
0 3
2
0
0
1 0
4
7
4
9
625
51
5 24
172
3
4
0
0
14
0
7
* RMA-DCHIP overlap; **LSQ-MAS5 overlap
hPS1 TRANSGENIC COMPARISON cKO mPS1 COMPARISON

264 T. Unger et al. / Methods 37 (2005) 261–273
Table 1Summary of FDR assessment across four analysis approaches and two experimental series
I. hPS1 Transgenic comparisonA. RMA FDR summary
ALR 0.000 0.000 0.263 0.263 0.263 0.378 0.378p value 0.050 0.010 0.050 0.010 0.005 0.010 0.005
EXP 669 116 182 50 23 32 17FDR (%) 57.3 50.4 39.3 29.0 28.3 12.5 17.6FDR (#) 384 59 72 15 7 4 3EXP-FDR 286 58 111 36 17 28 14
B. DCHIP FDR summaryALR 0.000 0.000 0.263 0.263 0.263 0.378 0.378p value 0.050 0.010 0.050 0.010 0.005 0.010 0.005
EXP 340 61 59 20 13 10 7FDR (%) 74.0 59.0 50.8 22.5 19.2 15.0 7.1FDR (#) 252 36 30 5 3 2 1EXP-FDR 89 25 29 16 11 9 7
C. MAS5 FDR summaryALR 0.000 0.000 0.263 0.263 0.263 0.378 0.378p value 0.050 0.010 0.050 0.010 0.005 0.010 0.005
EXP 662 116 471 97 52 72 41FDR (%) 66.4 69.0 57.6 55.7 48.1 43.1 37.8FDR (#) 440 80 272 54 25 31 16EXP-FDR 223 36 200 43 27 41 26
D. LSQ FDR summaryALR 0.000 0.000 0.263 0.263 0.263 0.378 0.378NEDC >12/25 >16/25 >12/25 >16/25 >19/25 >16/25 >19/25
EXP 186 53 174 53 23 50 23FDR (%) 7.0 0.0 6.6 0.0 0.0 0.0 0.0FDR (#) 13 0 12 0 0 0 0EXP-FDR 173 53 163 53 23 50 23
II. mPS1 cKO comparisonA. RMA FDR summary
ALR 0.000 0.000 0.263 0.263 0.263 0.378 0.378p value 0.050 0.010 0.050 0.010 0.005 0.010 0.005
EXP 756 142 139 42 27 21 16FDR (%) 75.7 71.8 21.9 17.9 18.5 4.8 0.0FDR (#) 573 102 31 8 5 1 0EXP-FDR 184 40 109 35 22 20 16
B. DCHIP FDR summaryALR 0.000 0.000 0.263 0.263 0.263 0.378 0.378p value 0.050 0.010 0.050 0.010 0.005 0.010 0.005
EXP 609 105 52 18 10 6 5FDR (%) 48.8 51.4 36.5 27.8 20.0 16.7 0.0FDR (#) 297 54 19 5 2 1 0EXP-FDR 312 51 33 13 8 5 5
C. MAS5 FDR summaryALR 0.000 0.000 0.263 0.263 0.263 0.378 0.378p value 0.050 0.010 0.050 0.010 0.005 0.010 0.005
EXP 853 182 554 136 82 87 54FDR (%) 71.6 61.8 63.2 51.8 45.7 42.5 37.0FDR (#) 611 113 350 71 38 37 20EXP-FDR 243 70 204 66 45 50 34
D. LSQ FDR summaryALR 0.000 0.000 0.263 0.263 0.263 0.378 0.378NEDC >8/16 >11/16 >8/16 >11/16 >13/16 >11/16 >13/16
EXP 144 46 141 46 12 41 12FDR (%) 4.2 0.0 3.9 0.0 0.0 0.0 0.0FDR (#) 6 0 6 0 0 0 0EXP-FDR 138 46 136 46 12 41 12

CA). The probe-level data were independently normalizedby RMA [26], MAS5 [22] or Dchip3.1 [25]. RMA normaliza-tion was performed using RMA-express (http://stat-www.Berkeley.edu/users/bolstad/RMAexpress/RMAexpress.html),MAS5 normalization was achieved by scaling to a meanarray intensity of 150 using all array probesets, whileDCHIP normalization was performed to the array with themedian intensity using the “perfect match only” method.For all experiments, expression in the sample was estab-lished using MAS5 presence-absence calls. For further anal-ysis, MAS5 and DCHIP normalized data were Log2transformed. In each experimental series the gene was con-sidered expressed if it showed a presence in >30% of thesamples.
2.4. Calculation of diVerential expression
In addition to data extraction with MAS, DCHIP, andRMA, a Latin square (LSQ) analysis was also performed[22]. For the MAS, DCHIP, and RMA data, we calculateddiVerential expression in a series of increasing stringencybased on absolute average log ratio (ALR) and two-tailedStudent’s t test value: (1) |ALR| > 0.00 and p < 0.05; (2)|ALR| > 0.00 and p < 0.01; (3) |ALR| > 0.263 and p < 0.05; (4)|ALR| > 0.263 and p < 0.01; (5) |ALR| > 0.263 and p < 0.005;(6) |ALR| > 0.378 and p < 0.01; and (7) |ALR| > 0.378 andp < 0.005.
For the transgenic and knockout comparisons, a LSQanalysis of either 5 £ 5 or 4 £ 4 was established using aMAS5 pairwise comparison signiWcance using defaultcriteria. In this design, each experimental animal wascompared to each control animal. The control animalarray data were used as a baseline in all pairwise compar-isons. For establishing signiWcance, we counted the num-ber of comparisons in which the experimental sampleshowed a signiWcant up-regulation or down-regulation(maximum 25 for the TG comparison and maximum 16in the cKO comparison). In the case where one compari-son showed a decrease, and another an increase, thesecounts cancelled out. Based on this, the LSQ-obtaineddiVerential expression was assessed with a net expressiondiVerence count (NEDC) rather than a numerical p value.For the LSQ data, mean ALR was calculated across allcomparisons performed and used in determining signiW-
cance. For the TG comparisons, the following parame-ters were used: (1) |ALR| > 0.00 and |NEDC| > 12; (2)|ALR| > 0.00 and |NEDC| > 16; (3) |ALR| > 0.263 and|NEDC| > 12; (4) |ALR| > 0.263 and |NEDC| > 16; (5)|ALR| > 0.263 and |NEDC| > 19; (6) |ALR| > 0.378 and|NEDC| > 16; and (7) |ALR| > 0.378 and |NDEC| > 19. As
fewer arrays participated in the LSQ analysis for thecKO, the following parameters were used: (1)|ALR| > 0.00 and |NEDC| > 8; (2) |ALR| > 0.00 and|NEDC| > 11; (3) |ALR| > 0.263 and |NEDC| > 8; (4)|ALR| > 0.263 and |NEDC| > 11; (5) |ALR| > 0.263 and|NEDC| > 13; (6) |ALR| > 0.378 and |NEDC| > 11; and (7)|ALR| > 0.378 and |NEDC| > 13 (Fig. 2).
2.5. False discovery assessment
False discovery rates were determined by running multi-ple bootstraps with the same seven criteria used in the origi-nal experimental design. The experimental and controlsamples were assigned into two groups, with experimentaland control samples distributed across the groups as evenlyas possible. For RMA, DCHIP, and Mas5, the valuesobtained from the 18 iterations are shown in Table 1, Sup-plemental Figs. 1 and 2 and Supplemental Tables 1 and 2.Individual FDR counts across the iterations were averagedand compared to the numbers obtained from the experimen-tal dataset to determine the overall false discovery rate in theexperimental series. The same procedure was independentlyperformed for both the TG and cKO datasets.
For the Latin square data, FDR assessment was per-formed by a pairwise comparison of experimental arrays(Supplemental Figs. 1 and 2), as well as a comparison ofcontrol arrays within their own group. On the obtaineddata the same seven statistical approaches were utilized asin the initial experimental design. Four iterations wereperformed, with varying baseline arrays in the compari-sons. For LSQ FDR, the p value cutoVs were establishedas 50, 70, and 80% of the performed bootstrapped com-parisons showing a statistically signiWcant p value in thesame direction. For the TG comparison with 20 compari-sons in each bootstrap, this corresponded to a NEDC of>10, >14, and >16, respectively, while in the cKO FDRassessment (12 bootstrap comparisons) we used NEDCvalues >6, >8, and >9, respectively. Overall FDR wasestablished by averaging the FDR obtained in each itera-tion. The same procedure was independently performedfor both the TG and cKO datasets.
True discovery was deWned as total number of diVeren-tially expressed probesets—FDR (Table 1) for each ofseven sets of criteria, each of the four analytical methodsand each of the two datasets.
2.6. Hierarchical clustering
Data that indicated a signiWcant expression diVerencein a minimum of three of the four normalizations were
T. Unger et al. / Methods 37 (2005) 261–273 265
False discovery rate (FDR) was determined using a custom-designed permutation method seen in Supplemental Figs. 1 and 2 at various levels of statisticalstringency (p value) and magnitude of change (|ALR|) for all 4 tested methods (RMA, DCHIP, MAS5, and LSQ) and for the two independent datasets (TGand cKO). In each of the eight small tables the header represents |ALR| and p value criteria. The Wrst row represents the number of diVerentially expressedprobesets by each of the four methods. Second row corresponds to median FDR%, while the third row represents the number of probesets that is likelyobtained as an error. The last row depicts “true discovery,” which is calculated as discovery (Wrst row) ¡ FDR # (third row) for each of the four methods.
Table 1 (continued)

266 T. Unger et al. / Methods 37 (2005) 261–273
Fig. 3. Hierarchical clustering of diVerentially expressed genes. Two-way hierarchical clustering (genes-horizontal, samples-vertical) was performed on thelog2 RMA normalized data using Genes at Work. Each colored pixel represents a single expression value in a single animal. The intensity of red and greenpixels are proportional to the magnitude of the expression decrease or increase, respectively. On the upper dendrogram, the red lines represent the experi-mental mice and the black lines represent the control animals in both the transgenic and knockout clusters. Each gene is identiWed by an NCBI accessionnumber and oYcial gene symbol. For detailed statistical data, see Tables 3 and 4. Note that the animal genotypes cluster together perfectly in both of thedatasets. (For interpretation of the references to color in this Wgure legend, the reader is referred to the web version of this paper.)

T. Unger et al. / Methods 37 (2005) 261–273 267
clustered independently for the TG and cKO comparisonsusing Genes at Work [33]. For the clustering, we used a cri-teria of (1) |ALR| > 0.263 and p value <0.05 using the log2intensity RMA values. The two-way clusterings (genesand samples) were performed using Euclidian distance(Fig. 3).
3. Results
First, we analyzed the dataset obtained in expression pro-Wling of the hippocampi of �E9 PS1 hPS1 transgenic miceand matched control mice carrying the wild-type hPS1 trans-gene (Fig. 1). A similar analysis was also performed on a sec-ond, independently obtained dataset where the hippocampaltranscriptome of PS1-ablated mice was compared to that ofmatched controls. The segmented data were normalizedusing Microarray Analysis Suite 5.0 (MAS5), DCHIP 3.2(DCP) and Robust Analysis of Microarrays (RMA).
3.1. FDR estimates for the two experimental datasets
As the vast majority of false-positive observations (typeI error) have a tendency to report statistical signiWcance atexpression changes that are very small in magnitude (for areview, see [2]), we decided to test the FDR as a function ofstatistical signiWcance and magnitude of gene expressionchanges. As a result, for each analytical method diVerentialexpression was established using various levels of signiW-
cance in a Student’s t test (p < 0.05 to 0.005) and AverageLog2 Ratios ranging from 0 to 30% (|ALR| > 0–0.378 or
1- to 1.3-fold change). Furthermore, MAS5-generated datawas also subjected to a Latin square cross-comparison(LSQ) of arrays (5 £ 5 D 25 in the transgenic or 4 £ 4 cross-comparisons in the cKO dataset). In the LSQ analysis,genes were Wltered by the same ALR criteria, while the Stu-dent’s t test signiWcance assessment was replaced by thenumber of comparisons in which MAS5 pairwise compari-son reported a signiWcant expression diVerence (e.g., >50%or >70% of all possible comparisons).
The FDR analyses are depicted in Supplemental Figs. 1 and2. In this design, microarrays were permutated andsystematically divided into two groups containing equal ornear-equal numbers of control and experimental arrays (18permutations in total for each of the two datasets). For boththe PS1-transgenic and PS1-ablated experimental series, thetwo groups were subjected to the same analytical procedures asthe actual experiment was performed. The FDR analysis wasperformed with 7 diVerent settings (Table 1 and SupplementalTables 1 and 2). For further comparison of the datasets, basedon the FDR obtained, we selected two sets of criteria: a com-bined p value/ALR cutoV of 0.05/0.263 and 0.01/0.378. Thesecriteria ensured that the majority of our data represented truediscovery across the majority of analytical approaches. For thep value/ALR cutoV of 0.05/0.263 the analytical methodsshowed a wide range of FDR from 63.2% (MAS5 in KO com-parison) to 1.8% (LSQ in the cKO comparison). Interestingly,FDR only marginally improved at more stringent p value/
ALR criteria of 0.01/0.378, but at the price of eliminating alarge number of putatively true expression diVerences.
In general, obtained FDR could be rankedMAS > DCHIP > RMA > LSQ in both of the experimentaldatasets. In contrast, the number of identiWed genes thatrepresent true discovery of diVerential expression could beranked as MAS5 > LSQ > RMA > DCHIP.
3.2. Comparison of humanized transgenic mice carrying the �E9 PS1 mutation to those carrying the wild-type human PS1 transgene.
Based on two sets of FDR-selected criteria (|ALR|> 0.263p value < 0.05 and |ALR| > 0.378 p value< 0.01), we compared
Table 2Data overlap between MAS5, DCHIP, RMA, and LSQ analyses acrossthe TG and cKO datasets
Data overlap was determined at two stringencies: |ALR| > 0.263 + pvalue < 0.05 (top panel) and |ALR| > 0.378 + p value < 0.01 (bottom panel)for the two investigated datasets. Numbers correspond to probe setsreporting diVerential expression with one or more methods.
|ALR| > 0.263, p < 0.05 hPS1 TG mPS1 cKO
Probesets expressed 13,998 13,127Total number of probesets 22,691 22,691
RMA 182 139DCHIP 59 52MAS5 471 554LSQ 174 141
RMA-DCHIP 37 24RMA-LSQ 80 68RMA-MAS5 90 69DCHIP-MAS5 25 24DCHIP-LSQ 38 31MAS5-LSQ 84 76
RMA-DCHIP-MAS5 23 16RMA-DCHIP-LSQ 30 21RMA-MAS5-LSQ 58 48DCHIP-MAS5-LSQ 24 21
RMA-DCHIP-MAS5-LSQ 23 16
|ALR| > 0.378, p < 0.01
Probesets expressed 13,998 13,127Total number of probesets 22,691 22,691
RMA 32 21DCHIP 10 6MAS5 72 87LSQ 50 41
RMA-DCHIP 6 5RMA-LSQ 21 13RMA-MAS5 17 11DCHIP-MAS5 5 4DCHIP-LSQ 7 5MAS5-LSQ 17 12
RMA-DCHIP-MAS5 4 4RMA-DCHIP-LSQ 6 5RMA-MAS5-LSQ 13 8DCHIP-MAS5-LSQ 5 4
RMA-DCHIP-MAS5-LSQ 4 4

268 T. Unger et al. / Methods 37 (2005) 261–273
(continued on next page)
Table 3Expression changes in the �E9 hPS1 and wt hPS1 transgenic comparison
Probeset ID Gene title Symbol IdentiWer RMA DCHIP MAS5 LSQ
ALR p value ALR p value ALR p value ALR NEDC
1454696_at — — BG071068 1.50 0.00366 1.40 0.00397 1.37 0.00820 1.50 241452705_at Expressed sequence AA415817 EST AK004611 1.40 0.01739 0.15 0.11025 2.00 0.01675 1.94 211417765_a_at Amylase 1, salivary Amy1 NM_007446 1.33 0.00093 0.22 0.16214 1.31 0.00025 1.25 251436713_s_at GTL2, imprinted maternally expressed untranslated Gtl2 BM119226 1.14 0.04215 2.12 0.00417 1.50 0.02299 1.34 151448162_at Vascular cell adhesion molecule 1* Vcam1 NM_011693 0.95 0.00770 0.47 0.01296 0.76 0.01915 1.01 221431032_at Amylo-1,6-glucosidase, 4-�-glucanotransferase Agl AA681807 0.94 0.01784 0.04 0.34659 0.72 0.01178 0.78 201424095_at RNA terminal phosphate cyclase domain 1 Rtcd1 BC016519 0.94 0.00075 0.83 0.00051 1.31 0.00069 0.98 251417644_at Sarcospan Sspn NM_010656 0.88 0.00781 0.00 n/a 0.93 0.00149 0.97 221449118_at Dihydrolipoamide branched chain transacylase E2 Dbt NM_010022 0.88 0.00824 0.17 0.16789 0.73 0.00678 0.75 211416953_at Connective tissue growth factor Ctgf NM_010217 0.87 0.02404 0.03 0.34659 0.81 0.03474 0.80 191423195_at Hippocampus abundant gene transcript 1* Hiat1 BM122917 0.86 0.01894 0.71 0.02151 0.80 0.01605 0.80 211431033_x_at Amylo-1,6-glucosidase, 4-�-glucanotransferase Agl AA681807 0.83 0.03017 0.01 0.34659 0.60 0.00205 0.79 211418350_at Diphtheria toxin receptor Dtr L07264 0.82 0.01482 0.41 0.05069 0.96 0.01533 0.97 191423100_at FBJ osteosarcoma oncogene Fos AV026617 0.77 0.03085 0.51 0.05163 0.83 0.03206 0.76 181448830_at Dual speciWcity phosphatase 1 Dusp1 NM_013642 0.76 0.00971 0.67 0.01195 0.79 0.01537 0.76 211438377_x_at Solute carrier family 13, member 3 Slc13a3 BB497312 0.75 0.03580 0.00 n/a 0.52 0.01832 0.60 161424589_s_at RIKEN cDNA 2810441O16 gene EST BC016603 0.74 0.01463 0.00 n/a 0.75 0.01116 0.75 201452839_at RIKEN cDNA 2410012M04 gene EST AK010475 0.74 0.00415 0.01 0.34659 0.63 0.00119 0.68 221415989_at Vascular cell adhesion molecule 1* Vcam1 BB250384 0.72 0.00112 0.04 0.23276 0.80 0.00035 0.65 181422538_at Exotoses (multiple)-like 2* Extl2 NM_021388 0.67 0.00584 0.49 0.02023 0.81 0.00614 0.74 211423571_at — — BB133079 0.64 0.00050 0.52 0.00174 0.36 0.03391 0.67 251419685_at Regulator of non-sense transcripts 1 Rent1 NM_030680 0.61 0.00995 0.02 0.34659 0.80 0.01657 0.70 191455965_at A disintegrin-like and metalloprotease type 1 Adamts4 BG064671 0.59 0.01500 0.01 0.34659 1.76 0.01054 1.86 191450898_at Hippocampus abundant gene transcript 1* Hiat1 BM208582 0.57 0.00103 0.46 0.00140 0.97 0.00077 0.64 221422539_at Exotoses (multiple)-like 2* Extl2 BM203810 0.55 0.00324 0.59 0.00727 0.85 0.00105 0.75 241427247_at DNA segment, Chr3 EST BB238462 0.52 0.00017 0.49 0.00026 0.54 0.01819 0.48 221418687_at Activity regulated cytoskeletal-associated protein Arc NM_018790 0.50 0.04157 0.44 0.04051 0.61 0.09154 0.58 161448306_at NF-� light chain gene enhancer, � Nfkbia NM_010907 0.50 0.00836 0.32 0.01480 0.47 0.04500 0.44 161415694_at Tryptophenyl-tRNA synthetase Wars AK004541 0.49 0.03415 0.29 0.07415 0.73 0.02076 0.59 151449773_s_at Growth arrest and DNA-damage-inducible 45� Gadd45b AI323528 0.48 0.02584 0.06 0.34659 0.42 0.02222 0.42 161417251_at Palmdelphin Palmd NM_023245 0.47 0.00262 0.15 0.01679 0.55 0.00095 0.58 191435137_s_at RIKEN cDNA 1200015M12 gene EST BG066678 0.44 0.00231 ¡0.06 0.76505 0.76 0.00510 0.60 161421087_at Period homolog 3 (Drosophila) Per3 BB757992 0.41 0.00139 0.21 0.00342 0.47 0.01941 0.49 181434328_at — — BM213176 0.41 0.01226 0.38 0.01785 0.64 0.00859 0.48 191423119_at Radial spokehead-like 2 Rshl2 AK016473 0.40 0.02362 0.35 0.02049 0.38 0.01976 0.34 171416505_at Nuclear receptor subfamily 4, group A, member 1 Nr4a1 NM_010444 0.40 0.01755 0.38 0.01955 0.42 0.07953 0.46 151426301_at Activated leukocyte cell adhesion molecule Alcam BF583242 0.37 0.02039 0.31 0.02158 0.40 0.01142 0.37 171418937_at Deiodinase, iodothyronine, type II Dio2 NM_010050 0.32 0.01940 0.29 0.00073 0.32 0.00956 0.39 141426124_a_at CDC-like kinase 1 Clk1 U21209 0.32 0.06178 0.36 0.04365 0.33 0.04014 0.27 131449491_at Caspase recruitment domain family, member 10 Card10 NM_130859 0.30 0.02049 0.01 0.92797 0.46 0.03152 0.40 141438370_x_at Downstream of Stk11 Dos BB357126 0.27 0.01496 0.26 0.01412 0.30 0.02572 0.27 14
1435252_at � 1,3-galactosyltransferase, polypeptide 6 B3galt6 AV328064 ¡0.29 0.00971 0.00 n/a ¡1.70 0.01223 ¡1.35 ¡131422156_a_at — — NM_008503 ¡0.29 0.02477 ¡0.27 0.00707 ¡0.26 0.14537 ¡0.31 ¡151449511_a_at Single stranded DNA binding protein 4 Ssbp4 NM_133772 ¡0.30 0.02895 ¡0.20 0.11549 ¡0.29 0.01111 ¡0.35 ¡161460167_at Aldehyde dehydrogenase family 7, member A1 Aldh7a1 BC012407 ¡0.30 0.02946 ¡0.37 0.00885 ¡0.45 0.01396 ¡0.40 ¡191450154_at Folate hydrolase Folh1 NM_016770 ¡0.30 0.01000 0.00 n/a ¡0.43 0.03532 ¡0.48 ¡141417236_at EH-domain containing 3 Ehd3 BM234719 ¡0.31 0.04347 –0.18 0.04153 ¡0.32 0.03167 ¡0.31 ¡151419453_at Ubiquitin carboxyl-terminal esterase L5 Uchl5 AV313813 ¡0.32 0.03784 0.00 n/a ¡0.88 0.02966 ¡0.74 ¡141431191_a_at Synaptotagmin 1 Syt1 AK018163 ¡0.35 0.03764 ¡0.32 0.03645 ¡0.45 0.06839 ¡0.39 ¡171438679_at — — AI843272 ¡0.35 0.02031 0.00 n/a ¡0.77 0.03107 ¡0.69 ¡161415710_at cDNA sequence BC038311 EST BM 123013 ¡0.36 0.02789 ¡0.16 0.08137 ¡0.34 0.00652 ¡0.41 ¡161451045_at Synaptotagmin 13 Syt13 BE648447 ¡0.37 0.01326 ¡0.31 0.02916 ¡0.63 0.00787 ¡0.49 ¡201449401_at Complement component 1q, � polypeptide C1qg NM_007574 ¡0.37 0.03656 ¡0.29 0.07949 ¡0.48 0.02743 ¡0.46 ¡161448825_at Pyruvate dehydrogenase kinase, isoenzyme 2 Pdk2 NM_133667 ¡0.39 0.04195 ¡0.31 0.04003 ¡0.40 0.10465 ¡0.46 ¡141426951_at Cysteine-rich motor neuron 1 Crim1 AV227314 ¡0.40 0.00649 ¡0.20 0.01922 ¡0.60 0.01415 ¡0.51 ¡191425263_a_at Myelin basic protein Mbp L07508 ¡0.40 0.03782 ¡0.29 0.04754 ¡0.61 0.07701 ¡0.42 ¡131425863_a_at Protein tyrosine phosphatase, receptor type, O Ptpro AF295638 ¡0.46 0.03303 0.00 n/a ¡0.52 0.04578 ¡0.54 ¡171439479_at Lactase-glycosylceramidase — C78577 ¡0.47 0.04987 ¡0.11 0.50550 ¡0.52 0.03070 ¡0.47 ¡171418455_at Coatomer protein complex, subunit � 2 Copz2 NM_019877 ¡0.50 0.00466 ¡0.11 0.06050 ¡0.75 0.01701 ¡0.82 ¡161416130_at Prion protein Prnp BE630020 ¡0.51 0.00667 ¡0.52 0.01196 ¡0.64 0.05273 ¡0.46 ¡161451457_at Sterol-C5-desaturase Sc5d AB016248 ¡0.54 0.01167 ¡0.33 0.0222 ¡0.64 0.02220 ¡0.62 ¡19

T. Unger et al. / Methods 37 (2005) 261–273 269
the diVerentially expressed transcripts uncovered by MAS5,DCHIP, RMA, and LSQ. The experimental outcome is sum-marized in Table 2 and Fig. 2. Of the 13,998 probesets,MAS5-generated t test reported the greatest number ofdiVerentially expressed genes (nD471 and nD72), but withan unexpectedly high FDR of 57.6 and 43.1%. DCHIPreported a smaller, but still signiWcant FDR at both ALR/pvalue cutoVs of 50.8 and 15.0% with very few diVerentiallyexpressed genes (nD59 and nD10). In contrast, althoughRMA reported a larger number of diVerentially expressedgenes (nD182 and nD32), it had a smaller FDR of 39.3 and12.5%, respectively. Finally, LSQ data had both a high truediscovery rate and a small FDR at both statistical cutoVs(|ALR| > 0.263, NEDC> 50%, nD174, FDR D6.6% and|ALR| > 0.378, NEDC> 70%, nD50, FDRD0.0%).
Interestingly, at |ALR| > 0.263, p < 0.05 the actual genesreporting diVerential expression varied considerably acrossthe datasets generated by the diVerent probeset extractionmethods. In general, the highest proportion of data overlapwas reported by RMA and LSQ analysis, while Dhip andLSQ could agree on very few of the diVerentially expressedgenes. Only 23 probesets reported diVerential expressionacross all four methods, with an additional 43 probesetsshowing diVerential expression across three out of fouranalysis approaches. The common genes included manypreviously veriWed transcript changes [24] and are pre-sented in Table 3. In addition, a two-way hierarchical clus-tering of the 66 probesets showing diVerential expressionacross 3 or more methods nicely separated the animalsaccording to their genotype into two distinct clusters(Fig. 3A).
3.3. Comparison of mice with conditional PS1-ablation and matched controls
In our second dataset we compared the hippocampi offour wild-type mice to those of four experimental mice witha PS1 conditional ablation. The same analysis strategy wasemployed as in a TG comparison (see above). The experi-mental outcome is summarized in Table 2 and Fig. 2. Gen-erally, the statistical outcome of the experiment was similarto that obtained for the TG dataset, but with reduced FDRacross the board. This is potentially due to a more symmet-rical bootstrapping design in the cKO comparison (e.g.,
equal number of control and experimental arrays in the twotested groups) or biological diVerences across the two stud-ied systems.
Again, of the 13,127 probesets MAS5-generated t testidentiWed the largest number of diVerentially expressedgenes (n D 554 and n D 87), but still with a high FDR of 63.2and 42.5% at a combined p value/ALR cutoV of 0.05/0.263and 0.01/0.378. Similarly to the Wrst dataset, DCHIP oncemore reported a low discovery frequency (n D 52 and n D 6genes) at a moderate FDR of 36.5 and 16.7%. As in the TGcomparison, the RMA outcome reported high total discov-ery at n D 139 and n D 21 at smaller FDR of 21.9 and 4.8%,respectively. Finally, LSQ data had both a high total dis-covery rate and a small FDR at both statistical cutoVs(|ALR| > 0.263, NEDC > 50%, n D 141, FDR D 3.9% and|ALR| > 0.378, NEDC > 70%, n D 41, FDR D;0.0%).
In the cKO dataset, 16 probesets reported diVerentialexpression across all four methods, with an additional 42probesets uncovering diVerential expression across threeout of four analysis techniques (Table 4). Two-way hierar-chical clustering of these 58 probesets correctly clusteredthe animals according to their genotype (Fig. 3B).
4. Discussion
Based on the analysis performed, we can make multiplecritical observations regarding microarray data analysis:(1) using combined magnitude of change + statistical sig-niWcance criteria is more eVective in reducing FDR thanstatistical criteria alone. (2) The probeset extraction/nor-malization algorithm utilized determines diVerentialexpression calls to a large extent. (3) FDR assessment atdiVerent levels is critical for separating type I errors fromtrue expression diVerences and thus maximizing true dis-covery. (4) The FDR data suggest that each of the methodsmay be associated with a high type II error rate, and under-scores the importance of analyzing the datasets with multi-ple approaches. (5) FDR rates are both dataset dependentand data extraction dependent. (6) As there is a signiWcantFDR associated with most of the data extraction methodsdespite statistical signiWcance, data veriWcation by othermethods will continue to play a pivotal role in all braintranscriptome proWling experiments. (7) Analyzing thedataset with diVerent data extraction methods may be
Table 3 (continued)
In the transgenic comparison, 66 genes were found diVerentially expressed by 73 analysis methods. Gray values indicate that the diVerential expressiondid not reach the desired statistical stringency (|ALR| > 0.263, p < 0.05). Abbreviations: ALR, average log2 ratio; p value, Student’s t test p value, NEDC,net diVerential expression count; IdentiWer, NCBI accession number.
* A gene that had more than one probeset which obtained signiWcance.
Probeset ID Gene title Symbol IdentiWer RMA DCHIP MAS5 LSQ
ALR p value ALR p value ALR p value ALR NEDC
1415799_at WW domain binding protein 11 Wbp11 NM_021714 ¡0.55 0.00609 ¡0.43 0.01221 ¡0.61 0.00578 ¡0.54 ¡191424077_at RIKEN cDNA 2610020H15 gene EST AK016023 ¡0.57 0.00226 ¡0.11 0.33462 ¡0.65 0.00194 ¡0.72 ¡191424952_at OCIA domain containing 1 Ociad1 BC006937 ¡0.59 0.00180 0.00 n/a ¡0.84 0.01369 ¡0.88 ¡231415904_at Lipoprotein lipase Lpl NM_008509 ¡0.62 0.01019 ¡0.56 0.00923 ¡0.83 0.00295 ¡0.70 ¡211419327_at Expressed sequence AA415817 EST NM_053181 ¡1.61 0.01417 ¡0.67 0.01248 ¡2.53 0.02944 ¡2.34 ¡22

270 T. Unger et al. / Methods 37 (2005) 261–273
Table 4Expression changes in the PS1-ablated and wild-type mPS1 comparison
Statistical parameters for 58 diVerentially expressed genes are presented. Table layout and abbreviations are similar to those presented in Table 3.* A gene that had more than one probeset which obtained signiWcance.
Probeset ID Gene title Symbol IdentiWer RMA DCHIP MAS5 LSQ
ALR p Value ALR p Value ALR p Value ALR NEDC
1419130_at Deaminase domain containing 1 Deadc1 NM_025748 1.07 0.00034 0.10 0.06776 0.91 0.00305 1.03 161427820_at Erythroid diVerentiation regulator 1 Erdr1 BC021831 0.64 0.00371 0.54 0.00193 0.71 0.00180 0.68 161437142_a_at Phosphatidylinositol glycan, class O Pigo BB546713 0.62 0.00001 0.25 0.00030 0.92 0.00001 0.73 161437685_x_at Fibromodulin Fmod BB235530 0.53 0.01015 0.00 n/a 0.90 0.01951 0.97 141435386_at Von Willebrand factor homolog Vwf BB667216 0.53 0.00057 0.00 n/a 1.83 0.03449 1.44 131423322_at Lin 7 homolog c (C. elegans) Lin7c AV026879 0.50 0.07640 0.49 0.01143 0.69 0.00685 0.61 121419672_at Sparc/osteonectin Spock1 NM_009262 0.48 0.02871 0.40 0.03245 0.67 0.01368 0.48 121451784_x_at Histocompatibility 2, D region locus 1* H2-D1 L36068 0.46 0.02313 0.24 0.13797 0.59 0.03274 0.65 131430375_a_at Chemokine (C–C motif) ligand 27* Ccl27 BE198116 0.45 0.00101 0.30 0.00300 0.60 0.01596 0.52 151423547_at — — AW208566 0.41 0.03301 0.03 0.35592 0.64 0.01433 0.62 101419188_s_at Chemokine (C–C motif) ligand 27* Ccl27 NM_011336 0.40 0.00936 0.30 0.00422 0.46 0.11611 0.50 131451045_at Synaptotagmin 13 Syt13 BE648447 0.39 0.05511 0.35 0.00840 0.57 0.00988 0.49 121421553_at Progressive myoclonic epilepsy, type 2 gene � Epm2a NM_010146 0.38 0.02270 0.02 0.35592 0.53 0.02566 0.58 111424607_a_at Xanthine dehydrogenase Xdh BC020078 0.36 0.00789 0.05 0.22871 0.53 0.01887 0.41 131454686_at RIKEN cDNA 6430706D22 gene EST BM248225 0.34 0.01871 0.02 0.35592 0.49 0.01640 0.58 111452439_s_at Splicing factor, arginine/serine-rich 2 (SC-35) Sfrs2 AF250135 0.32 0.01812 0.31 0.00692 0.32 0.07767 0.36 121431602_a_at RIKEN cDNA 1810064L21 gene EST AK007746 0.32 0.01369 0.00 n/a 0.47 0.04084 0.43 121418090_at Plasmalemma vesicle associated protein Plvap NM_032398 0.32 0.03141 –0.02 0.88607 0.60 0.03973 0.47 121451931_x_at Histocompatibility 2, D region locus 1* H2-D1 M69068 0.31 0.03125 0.18 0.11722 0.62 0.02833 0.63 91420429_at Protocadherin � 3 Pcdhb3 NM_053128 0.30 0.02622 0.04 0.17319 0.47 0.00287 0.44 111417063_at Complement component 1q � polypeptide C1qb NM_009777 0.29 0.02742 0.15 0.29282 0.32 0.04935 0.31 101423216_a_at RIKEN cDNA 2510049I19 gene EST BM249463 0.28 0.01889 0.20 0.07930 0.47 0.01668 0.36 111425665_a_at Signal recognition particle 54 Srp54 BC005543 0.27 0.00478 0.26 0.02827 0.43 0.00895 0.38 12
1433691_at Protein phosphatase 1, regulatory subunit 3C Ppp1r3c BQ176864 ¡0.30 0.03247 ¡0.25 0.00180 ¡0.57 0.01120 ¡0.52 ¡101449977_at Early growth response 4 Egr4 NM_020596 ¡0.30 0.00808 ¡0.17 0.00108 ¡0.60 0.01145 ¡0.41 ¡131419291_x_at Growth arrest speciWc 5 Gas5 NM_013525 ¡0.30 0.06651 ¡0.29 0.01906 ¡0.63 0.03409 ¡0.27 ¡121449158_at Potassium channel, subfamily K, member 2 Kcnk2 NM_010607 ¡0.33 0.01031 ¡0.05 0.29749 ¡0.51 0.00216 ¡0.39 ¡111452540_a_at Histone 1, H2b Hist1h2bc M25487 ¡0.34 0.00764 ¡0.33 0.01696 ¡0.35 0.04404 ¡0.41 ¡101448830_at Dual speciWcity phosphatase 1 Dusp1 NM_013642 ¡0.35 0.01250 ¡0.17 0.10844 ¡0.28 0.04192 ¡0.31 ¡91425349_a_at Myelin basic protein expression factor 2, repressor Myef2 AF483504 ¡0.36 0.00275 0.00 n/a ¡0.73 0.02968 ¡0.46 ¡111415748_a_at Dynactin 5 Dctn5 NM_021608 ¡0.37 0.00272 ¡0.24 0.01446 ¡0.36 0.01546 ¡0.33 ¡91449410_a_at Growth arrest speciWc 5 Gas5 NM_013525 ¡0.37 0.05225 ¡0.41 0.00708 ¡0.42 0.03999 ¡0.39 ¡111449533_at RIKEN cDNA 1810057C19 gene EST NM_026433 ¡0.37 0.00237 0.00 n/a ¡0.59 0.04704 ¡0.66 ¡111423150_at Secretory granule neuroendocrine protein 1, 7B2 Sgne1 AK019337 ¡0.38 0.01214 ¡0.50 0.01764 ¡0.27 0.00430 ¡0.48 ¡111418260_at Hormonally upregulated Neu-associated kinase Hunk NM_015755 ¡0.38 0.00577 ¡0.36 0.02064 ¡0.25 0.24686 ¡0.44 ¡91449083_at RIKEN cDNA 1810060J02 gene EST NM_025911 ¡0.38 0.00107 ¡0.04 0.19842 ¡0.56 0.04297 ¡0.35 ¡111448715_x_at RIKEN cDNA 3110007P09 gene EST NM_010490 ¡0.38 0.02134 ¡0.36 0.02441 ¡0.43 0.00700 ¡0.39 ¡121453851_a_at Growth arrest and DNA-damage-inducible 45 � Gadd45g AK007410 ¡0.39 0.00645 0.00 n/a ¡0.54 0.00236 ¡0.46 ¡111427344_s_at RASD family, member 2 Rasd2 BC026377 ¡0.41 0.00130 ¡0.28 0.00439 ¡0.41 0.20664 ¡0.30 ¡111419971_s_at — — C86506 ¡0.43 0.02110 0.00 n/a ¡0.47 0.01603 ¡0.42 ¡91416101_a_at Histone 1, H1c Hist1h1c NM_015786 ¡0.45 0.00297 ¡0.06 0.35592 ¡0.37 0.01589 ¡0.29 ¡91451425_a_at Makorin, ring Wnger protein, 1 Mkrn1 BC003329 ¡0.45 0.00583 ¡0.20 0.08228 ¡0.53 0.00769 ¡0.46 ¡91450779_at Fatty acid binding protein 7, brain Fabp7 NM_021272 ¡0.46 0.00732 ¡0.43 0.01124 ¡0.53 0.01731 ¡0.51 ¡111455316_x_at CCR4 carbon catabolite repression 4-like Ccrn4l AI987693 ¡0.48 0.05039 ¡0.48 0.04795 ¡0.56 0.02846 ¡0.53 ¡121437708_x_at Vesicle-associated membrane protein 3 Vamp3 BB552111 ¡0.53 0.04690 ¡0.47 0.04332 ¡1.53 0.05128 ¡1.03 ¡121417065_at — — NM_007913 ¡0.54 0.00051 ¡0.60 0.00001 ¡0.64 0.01435 ¡0.56 ¡161434196_at DnaJ (Hsp40) homolog, subfamily A, member 4 Dnaja4 BQ176119 ¡0.54 0.01153 ¡0.19 0.03342 ¡0.72 0.00085 ¡0.72 ¡111418072_at — — NM_023422 ¡0.56 0.00227 ¡0.52 0.00196 ¡0.48 0.00486 ¡0.50 ¡131422751_at Transducin-like enhancer of split 1 Tle1 NM_011599 ¡0.57 0.00716 ¡0.18 0.05181 ¡0.68 0.00332 ¡0.51 ¡111452406_x_at Erythroid diVerentiation regulator 1 Erdr1 AJ007909 ¡0.67 0.01227 ¡0.60 0.02020 ¡0.44 0.01694 ¡0.69 ¡131455892_x_at — — BB794742 ¡0.70 0.02402 ¡0.43 0.02137 ¡1.01 0.04899 ¡0.93 ¡161418687_at Activity regulated cytoskeletal-associated protein Arc NM 018790 ¡0.78 0.00046 ¡0.70 0.00011 ¡1.24 0.00183 ¡0.98 ¡161423100_at FBJ osteosarcoma oncogene Fos AV026617 ¡0.85 0.00024 ¡0.45 0.00039 ¡0.96 0.00019 ¡0.78 ¡161438390 s at Pituitary tumor-transforming 1* Pttg1 AV105428 ¡1.17 0.03267 ¡1.05 0.03423 ¡1.79 0.04304 ¡1.84 ¡111424105_a_at Pituitary tumor-transforming 1* Pttg1 AF069051 ¡1.34 0.03058 0.25 0.25651 ¡2.13 0.03116 ¡1.83 ¡121417462_at CAP, adenylate cyclase-associated protein 1* Cap1 NM_007598 ¡1.53 0.00397 ¡0.58 0.03470 ¡2.21 0.00289 ¡1.82 ¡151417461_at CAP, adenylate cyclase-associated protein 1* Cap1 BC005446 ¡1.61 0.00442 ¡1.07 0.01085 ¡1.61 0.02051 ¡1.58 ¡151431213_a_at — — BG297038 ¡1.90 0.00460 ¡0.24 0.27885 ¡2.21 0.00709 ¡1.94 ¡16

T. Unger et al. / Methods 37 (2005) 261–273 271
important for further reduction of FDR and maximizingtrue discovery. Related to biology, using converging dataanalysis strategies we established precise transcriptome sig-natures in the hippocampus of two experimental series withdisturbed PS1 physiology.
4.1. Using combined magnitude of change + statistical signiWcance criteria greatly reduces FDR
We found that statistical signiWcance approach alone isless eVective in controlling FDR than a combined magni-tude of change + signiWcance of change criteria. For exam-ple, increasing t test statistical stringency from p < 0.05 top < 0.01 only marginally improves FDR for DCHIP,MAS5, and RMA (Fig. 4). In contrast, implementing amodest magnitude of change cutoV (|ALR| D 0.263, whichcorresponds to a 20% expression change) results in a dra-
matic reduction of FDR for the RMA normalized datasetin the knockout mice. However, it should be also pointedout that the DCHIP, RMA, and MAS5 generated datasetsall report relatively high FDRs. Importantly, while FDRsomewhat improve by increasing ALR/p value stringency,implementing more stringent criteria eliminated putativelytrue discovery at an alarming rate.
Interestingly, LSQ showed a high discovery with very lowFDR across all seven sets of Wltering criteria. We explain thisby the nature of the LSQ comparisons performed. Thisassessment is based on MAS5 pairwise comparisons, wherethe two arrays are compared directly to one another at thelevel of individual probe features. This results in a p value foreach of the comparisons performed. As a result, our LSQWltering was based on multiple p values (25 for the TG and16 for the cKO comparisons), and not just a single groupwisep value as in the other 3 analysis methods.
Fig. 4. Summary: discovery vs. false discovery. In all Wgurines X axis denotes the seven tested p value/|ALR| criteria. Y axes in A,B denote average FDRpercentage in the two datasets. Y axes in C,D denote “true discovery” deWned as total number of diVerentially expressed genes-FDR for each parameterclass. The four analytical methods are represented by solid lines. Note in A,B that FDR at p < 0.05 is high for RMA, MAS5, and DCHIP, and furtherincreasing statistical stringency starts to eliminate putatively true expression changes at an alarming rate (C,D). In contrast, LSQ data, regardless of cut-oVs, showed a very high discovery rate and low FDR.
FDR: hPS1 TRANSGENIC COMPARISON ATVARIOUS p< and |ALR|
0
10
20
30
40
50
60
70
80
0.05
/0.0
0
0.01
/0.0
0
0.05
/0.2
63
0.01
/0.2
63
0.00
5/0.
263
0.01
/0.3
78
0.00
5/0.
378
STATISTICAL CRITERIA (pval/|ALR|)
Ave
rag
e F
DR
(%
)
RMA
DCHIP
MAS5
LSQ
A FDR: mPS1 ABLATED COMPARISON ATVARIOUS p< and |ALR|
0
20
40
60
80
100
120
0.05/
0.00
0.01/
0.00
0.05/
0.263
0.01/
0.263
0.005
/0.26
3
0.01/
0.378
0.005
/0.37
8
STATISTICAL CRITERIA (pval/|ALR|)
Ave
rag
e F
DR
(%
)
RMA
DCHIP
MAS5
LSQ
B
DISCOVERY: hPS1 TRANSGENIC COMPARISON ATVARIOUS p< and |ALR|
0
50
100
150
200
250
300
350
400
0.05/
0.00
0.01/
0.00
0.05/
0.263
0.01/
0.263
0.005
/0.26
3
0.01/
0.378
0.005
/0.37
8
STATISTICAL CRITERIA (pval/|ALR|)
EX
P-F
DR
(#
of
gen
es)
RMA
DCHIP
MAS5
LSQ
C DISCOVERY: mPS1 ABLATED COMPARISON ATVARIOUS p< and |ALR|
0
50
100
150
200
250
300
350
0.05/
0.00
0.01/
0.00
0.05/
0.263
0.01/
0.263
0.005
/0.26
3
0.01/
0.378
0.005
/0.37
8
STATISTICAL CRITERIA (pval/|ALR|)
EX
P-F
DR
(#
of
gen
es)
RMA
DCHIP
MAS5
LSQ
D

272 T. Unger et al. / Methods 37 (2005) 261–273
4.2. FDR rates are dataset dependent
The two datasets we analyzed had very similar overallcharacteristics, including platforms used, array intensities,analytical approaches employed, and number of genescalled present. Both of the datasets are typical datasets, gen-erated in an academic setting; however, it is also importantto point out that the cKO dataset contained 4 biologicalreplicates/group, while the TG comparison was performedwith 5 biological replicates/group. One would expect asmaller FDR in an experiment with a higher number ofarrays (TG experiment), yet, the cKO experiment that con-tained fewer number of biological replicates had a muchsmaller FDR in all four analytical methods used. Logicalexplanations to this counterintuitive Wnding are technicaland biological. As a technical explanation, one might specu-late that this is due to 5 replicates/group, which results in anasymmetrical number of experimental and control arrays ineach of the TG iterations used for FDR (2 experimental + 3controls vs. 3 experimental + 2 controls). However, ran-domly eliminating one microarray/group (4 £ 4 design)actually resulted in an increase of FDR (data not shown).This favors a second, biological explanation, arguing thatdiVerent biological manipulations have intrinsically diVerentFDRs. This underscores the importance of determining theFDR in every studied dataset (rather than relying on FDRassessments of published data).
4.3. DiVerent probeset extraction/normalization methods have a large eVect on determining diVerential expression
The gene expression changes uncovered by the four pro-beset extraction/normalization approaches were quitediVerent. In both experimental datasets at |ALR| > 0.263,p < 0.05 we found that »30–85% of all expression calls wereonly made by one of the four analyses. For example, RMA-extracted data reported 139 gene probesets showing diVer-ential expression (|ALR| > 0.263, p < 0.05; FDR D 21.9%) inthe cKO comparison, but about a third of these genes(n D 47, 33.8%) were identiWed as diVerentially expressedonly by RMA, and not by the other three methods. Inter-estingly, DCHIP data, which identiWed the least number ofdiVerentially expressed genes (n D 59 TG, n D 52 cKO), werenot fully contained within the other three analytical meth-ods (e.g., made >30% of unique calls).
From the overall data, we can conclude that the extentof the diVerential calls by the four extraction/normalizationmethods cannot be explained by false discovery. This sug-gests that, in addition to type I errors, all of these methodsare potentially associated with a signiWcant type II errorrate. This is also in concordance with recently publishedWndings across other systems [16,19].
4.4. PS1-dependent expression changes in the hippocampus
Analysis of these two datasets also have biologicalimplications. First, we precisely deWned the transcriptome
proWle due to expression of the mutant �E9 hPS1, whichin humans leads to familial Alzheimer’s disease (FAD).Second, we obtained a comprehensive hippocampal tran-scriptome proWle of mice with a conditional PS1 ablation.These expression proWles are essential for understandingPS1 physiology, and are important for deciphering thePS1-dependent transcriptome processes that may under-lie the molecular pathology associated with Alzheimer’sdisease. Interestingly, both of the TG and cKO compari-sons identiWed three immediate early genes (IEGs:DUPS1, ARC, and FOS) that were oppositely regulatedacross the two animal models. Furthermore, SYT13expression was downregulated in both experimentalseries, suggesting that the �E9 hPS1 mutation and PS1-ablation may both lead to some of the similar expressionchanges. Finally, in our previous study, many of the geneswere veriWed by qPCR and in situ hybridization, thusproviding a biological validation of the experimentaloutcome [24].
5. Summary
In summary, we outlined a simple, yet very eVectiveFDR assessment method that is easily applied to virtuallyany microarray experiment. This method is platform inde-pendent and dataset speciWc, and could be used on all data-sets with a limited number of microarrays. It is importantto notice that FDR is dataset dependent, and that the beststatistical + fold change criteria for determining diVerentialexpression will vary across diVerent biological systems. Oursystematic testing of the critical parameters allows choosingthe statistical criteria for determining diVerential expressionat the desired FDR (type I error), yet retaining the largestnumber of putatively true expression diVerences (thus mini-mizing type II error). This approach works very well undercontrolled experimental conditions when one can assumerelative uniformity of the samples within the tested classes(e.g., genetically homogenous animals). However, the utilityof the presented analysis strategy involving tissue fromhuman subjects is unclear at the present time, as geneticvariability and numerous epigenetic factors cannot be con-trolled.
Acknowledgments
We thank Drs. David A. Lewis, Etienne Sibille, andEleanor Feingold for valuable comments on the manu-script. The presented work was supported by NIMH K02MH070786 (KM), NIMH 1 R01 MH067234-01A1 (KM),and NIMH 2 P50 MH45156-14 Project 2 (KM).
Appendix A. Supplementary data
Supplementary data associated with this article can befound, in the online version, at doi:10.1016/j.ymeth.2005.09.005.

T. Unger et al. / Methods 37 (2005) 261–273 273
References
[1] Z. Luo, D.H. Geschwind, Neurobiol. Dis. 8 (2001) 183–193.[2] K. Mirnics, J. Pevsner, Nat. Neurosci. 7 (2004) 434–439.[3] M. Schena, D. Shalon, R.W. Davis, P.O. Brown, Science 270 (1995)
467–470.[4] R.J. Lipshutz, S.P. Fodor, T.R. Gingeras, D.J. Lockhart, Nat. Genet.
21 (1999) 20–24.[5] S. Huang, A.A. Yeo, L. Gelbert, X. Lin, L. Nisenbaum, K.G. Bemis,
Am. J. Pharmacogenomics 4 (2004) 129–139.[6] I.V. Yang, E. Chen, J.P. Hasseman, L. Wei, S. Wang, V. Sharov, A.I.
Saeed, J. White, J. Li, N.H. Lee, T.J. Yeatman, J. Quackenbush,Genome Biol. 3 (2002) 00621–6212.
[7] L.X. Qin, K.F. Kóerr, Nucleic Acids Res. 32 (2004) 5471–5479.[8] D.E. Martin, P. Demougin, M.N. Hall, M. Bellis, BMC Bioinformatics
5 (2004) 148.[9] G.A. Churchill, Biotechniques 37 (2004) 173–175, 77.
[10] Z. Taib, C. R. Biol. 327 (2004) 175–180.[11] T.H. Meuwissen, M.E. Goddard, Genet. Sel. Evol. 36 (2004) 191–205.[12] J.S. Brown, D. Kuhn, R. Wisser, E. Power, R. Schnell, Biotechniques
36 (2004) 324–332.[13] B. Rosati, F. Grau, A. Kuehler, S. Rodriguez, D. McKinnon, Biotech-
niques 36 (2004) 316–322.[14] T. Park, S.G. Yi, S.H. Kang, S. Lee, Y.S. Lee, R. Simon, BMC Bioin-
formatics 4 (2003) 33.[15] S.C. Geller, J.P. Gregg, P. Hagerman, D.M. Rocke, Bioinformatics 19
(2003) 1817–1823.[16] D. Hollingshead, D.A. Lewis, K. Mirnics, Neurobiol. Dis. 18 (2005)
649–655.[17] L.G. Puskas, A. Zvara, L. Hackler Jr., P. VanHummelen, Biotechni-
ques 32 (2002) 1330–1334, 36, 38, 40.[18] K. Dobbin, J.H. Shih, R. Simon, Bioinformatics 19 (2003) 803–810.[19] P.K. Tan, T.J. Downey, E.L. Spitznagel, P. Xu, D. Fu, D.S. Dimitrov, R.A.
Lempicki, B.M. Raaka, M.C. Cam, Nucleic Acids Res. 31 (2003) 5676–5684.[20] K. Mirnics, Current Genomics 3 (2002) 13–19.
[21] K. Mirnics, F.A. Middleton, D.A. Lewis, P. Levitt, Trends Neurosci.24 (2001) 479–486.
[22] W.M. Liu, R. Mei, X. Di, T.B. Ryder, E. Hubbell, S. Dee, T.A. Web-ster, C.A. Harrington, M.H. Ho, J. Baid, S.P. Smeekens, Bioinformat-ics 18 (2002) 1593–1599.
[23] D.J. Lockhart, H. Dong, M.C. Byrne, M.T. Follettie, M.V. Gallo, M.S.Chee, M. Mittmann, C. Wang, M. Kobayashi, H. Horton, E.L. Brown,Nat. Biotechnol. 14 (1996) 1675–1680.
[24] K. Mirnics, Z. Korade, D. Arion, O. Lazarov, T. Unger, M. Macioce,M. Sabatini, D. Terrano, K.C. Douglass, N.F. Schor, S.S. Sisodia, J.Neurosci. 25 (2005) 1571–1578.
[25] C. Li, W.H. Wong, Proc. Natl. Acad. Sci. USA 98 (2001) 31–36.[26] R.A. Irizarry, B.M. Bolstad, F. Collin, L.M. Cope, B. Hobbs, T.P.
Speed, Nucleic Acids Res. 31 (2003) e15.[27] M.K. Lee, D.R. Borchelt, G. Kim, G. Thinakaran, H.H. Slunt,
T. Ratovitski, L.J. Martin, A. Kittur, S. Gandy, A.I. Levey, N. Jen-kins, N. Copeland, D.L. Price, S.S. Sisodia, Nat. Med. 3 (1997)756–760.
[28] O. Lazarov, M. Lee, D.A. Peterson, S.S. Sisodia, J. Neurosci. 22 (2002)9785–9793.
[29] D.R. Borchelt, T. Ratovitski, J. van Lare, M.K. Lee, V. Gonzales, N.A.Jenkins, N.G. Copeland, D.L. Price, S.S. Sisodia, Neuron 19 (1997)939–945.
[30] G. Thinakaran, D.R. Borchelt, M.K. Lee, H.H. Slunt, L. Spitzer, G.Kim, T. Ratovitsky, F. Davenport, C. Nordstedt, M. Seeger, J. Hardy,A.I. Levey, S.E. Gandy, N.A. Jenkins, N.G. Copeland, D.L. Price, S.S.Sisodia, Neuron 17 (1996) 181–190.
[31] R. Feng, C. Rampon, Y.P. Tang, D. Shrom, J. Jin, M. Kyin, B. Sopher,M.W. Miller, C.B. Ware, G.M. Martin, S.H. Kim, R.B. Langdon, S.S.Sisodia, J.Z. Tsien, Neuron 32 (2001) 911–926.
[32] C.A. Saura, S.Y. Choi, V. Beglopoulos, S. Malkani, D. Zhang, B.S.Shankaranarayana Rao, S. Chattarji, R.J. Kelleher 3rd, E.R. Kandel,K. DuV, A. Kirkwood, J. Shen, Neuron 42 (2004) 23–36.
[33] J. Lepre, J.J. Rice, Y. Tu, G. Stolovitzky, Bioinformatics 20 (2004)1033–1044.


