Embed Size (px)
Citation preview

ARTICLE IN PRESS
Available at www.sciencedirect.com
journal homepage: www.elsevier.com/locate/he
I N T E R N A T I O N A L J O U R N A L O F H Y D R O G E N E N E R G Y 3 3 ( 2 0 0 8 ) 3 3 7 3 – 3 3 8 4
0360-3199/$ - see frodoi:10.1016/j.ijhyde
$Certain trade nathe experimental pNational Institute o�Corresponding auE-mail address:
Neutron imaging investigation of liquid water distributionin and the performance of a PEM fuel cell$
J. Parka, Xianguo Lia,�, D. Tranb, T. Abdel-Basetb, D.S. Husseyc, D.L. Jacobsonc, M. Arifc
aDepartment of Mechanical Engineering, University of Waterloo, 200 University Ave W., Waterloo, Ontario, Canada N2L 3G1bDaimlerChrysler Corporation, Auburn Hills, MI 48326, USAcNational Institute of Standards and Technology, Gaithersburg, MD 20899-8461, USA
a r t i c l e i n f o
Article history:
Received 28 October 2006
Received in revised form
15 March 2008
Accepted 16 March 2008
Available online 16 June 2008
Keywords:
Neutron radiography
Neutron imaging
PEM fuel cell
Liquid water distribution
Liquid water measurement
Performance hysteresis
nt matter & 2008 Internane.2008.03.019
mes and company produrocedure and equipmentf Standards and [email protected] (X. Li).
a b s t r a c t
In this study neutron radiography is applied to investigate the performance of a polymer
electrolyte membrane (PEM) fuel cell based on the effect of liquid water accumulation in
the cell. Dynamic performance tests have been carried out on a PEM fuel cell with a
specially designed serpentine flow channel under various operating conditions and
simultaneous measurements of accumulated liquid water with neutron imaging. Liquid
water tends to accumulate in the gas diffusion layer (GDL) adjacent to the flow channel area
while the liquid water formed in the GDL next to the channel land area seems to be
effectively removed by the cross leakage flow through the porous GDL between the
adjacent flow channels. The amount of liquid water accumulation in the cell is dependant
on the cell operating temperature, the pressure drop in the flow channel and the current
density under the present test conditions of fixed stoichiometry. It is shown that the cell
performance is strongly affected by the presence and accumulation of liquid water,
especially at high current densities. This phenomenon results in performance hysteresis
for load variations. The rate of liquid water production is also mathematically modeled to
analyze the effect of the cell operating temperature and pressure drop on the liquid water
formation in a cell. The model result shows good agreement with experimental
measurements. The history of liquid water accumulation is also analyzed.
& 2008 International Association for Hydrogen Energy. Published by Elsevier Ltd. All rights
reserved.
1. Introduction
Water management is one of the critical issues for the design
and operation of polymer electrolyte membrane (PEM) fuel
cells since the accumulation and transport of liquid water in
the PEM fuel cell can significantly deteriorate the PEM fuel cell
performance [1,2]. Water is usually provided to the PEM fuel
cell through the fully humidified anode and cathode gas
tional Association for Hy
cts are mentioned in theused. In no case does su
ogy, nor does it imply tha
stream in order to provide adequate hydration for the
polymer membrane electrolyte. On the other hand, water is
produced at the cathode of the cell as a part of electro-
chemical reaction. Water is also transported inside the cell
through a number of mechanisms [1]: the electroosmotic drag
effect transports water from the anode to the cathode side,
back diffusion occurs due to the concentration difference
between the cathode and the anode side and water convec-
drogen Energy. Published by Elsevier Ltd. All rights reserved.
text or identified in an illustration in order to adequately specifych identification imply recommendation or endorsement by thet the products are necessarily the best available for the purpose.

ARTICLE IN PRESS
Nomenclature
Acell active cell area, m2
Cf wall friction coefficient
Cl laminar wall friction coefficient
Ccr,l correction number for pressure correlation (lami-
nar flow)
Ccr,t correction number for pressure correlation (tur-
bulent flow)
dh flow channel hydraulic diameter, mm
F faraday constant, 96 485 C mole�1
H rate of heat transfer, kW
I intensity of transmitted neutron beam
I0 intensity of incident neutron beam
J cell current density, A m�2
L flow channel length, m_m mass flow rate, kg s�1
N atom density
Ncell number of cell_N molar flow rate, mol s�1
_NR rate of reactant consumption in the catalyst layer,
mol s�1
P pressure, Pa
Psat saturation pressure of liquid water, Pa
Q volume flow rate, m3/s
R universal gas constant, 8.314 kJ kmol�1 K�1
Re Reynolds number
RH relative humidity
t equivalent thickness of liquid water layer
T temperature, K
V average velocity, m s�1
Y mole fraction
Greek letters
D difference
z stoichiometry
m viscosity, N s m�2
r density, kg m�3
s neutron cross section
Subscripts
0 initial/inlet value
A anode
A_In anode inlet
C cathode
C_In cathode inlet
ch flow channel
c, cell fuel cell
f friction
H2 hydrogen
H2O water
O2 oxygen
In in/inlet value
k species number
l laminar flow
out out/Outlet value
R reacting
t turbulent flow
I N T E R N AT I O N A L J O U R N A L O F H Y D R O G E N E N E R G Y 3 3 ( 2 0 0 8 ) 3 3 7 3 – 3 3 8 43374
tion may be present as a result of the pressure gradient.
Further, liquid water can also form due to the relative
increase of the water vapor concentration in the gas stream
arising from the depletion of the reactant gas species,
especially at the anode if pure hydrogen is provided as the
fuel. The presence of liquid water in the cell structure can
have an adverse impact on the cell performance. The
performance loss resulting from liquid water accumulation
in the cell components is often referred to as water flooding.
Measuring the amount and accumulation of the liquid water
in an operating PEM fuel cell is crucial to understand the
nature of flooding and or membrane drying although it is
highly difficult to do so. As a result, significant thrust has
been built in investigating liquid water formation and
distribution in PEM fuel cells.
One of the simplest methods to measure the amount of
liquid water formation in the cell is to weigh the cell before
and after the cell operation [3], in addition to other ex situ
measurements. Empirical techniques have also been used to
analyze and diagnose the water distribution in PEM fuel cells
[4,5], e.g., Mench et al. [4] used gas chromatography to provide
in situ measurement of the water vapor distribution in the gas
flow channels. On the other hand, liquid water formation and
movement in the flow channel have been recently visualized
with the use of optically accessible flow channels and digital
photography [2,6–9]. These conventional optical imaging
methods through the transparent window, however, suffer a
number of disadvantages, including the change of the
channel surface conditions (optically accessible window sur-
face is not the same as the typical flow channel surface built
on the bipolar plates), and more importantly, the fogging of
the windows due to the higher temperature and almost fully
saturated gas stream in the flow channels (as compared to the
ambient temperature). These issues not only complicate and
obscure measurements and observations, but also question
the relevance of the measurements to the real fuel cell
operation. As a result, more advanced imaging techniques
have recently been used to provide in situ measurement of
liquid water formation and distribution in PEM fuel cells,
including scanning electron microscopy [10,11], nuclear
magnetic resonance microscopy [12,13], and neutron radio-
graphy [14–21].
Neutron radiography is a relatively new and attractive
technique to quantify the amount and distribution of liquid
water in PEM fuel cells, due to the neutron’s sensitivity to
hydrogen atoms in water. Since most of the PEM fuel cell
components are transparent to the neutron beam, this
technique enables quantification of liquid water accumulated
in the entire PEM fuel cell structures including gas diffusion
layers (GDLs) and gas flow channels. This technique provides
an in situ, non-destructive diagnosis of liquid water forma-
tion and distribution for a live PEM fuel cell in normal

ARTICLE IN PRESS
I N T E R N A T I O N A L J O U R N A L O F H Y D R O G E N E N E R G Y 3 3 ( 2 0 0 8 ) 3 3 7 3 – 3 3 8 4 3375
operation without restrictions. The technique has been
successfully applied to PEM fuel cells and improved over the
years by a few research groups to quantify the liquid water
content in a PEM fuel [14–21]. Pekula et al. [19] conducted
visualization study of two-phase flow in an operating PEM
fuel cell by neutron imaging technique, and they found
that liquid water tended to accumulate along or under
the channel walls (or lands), especially at high current
densities. Chuang et al. [22] found that small amount of
liquid water can cause significant voltage loss at high current
densities. In their work, masking techniques were utilized to
distinguish the liquid water present in the flow channels and
land area. Neutron imaging was extended to a tomography
technique by taking pictures from different angles and a
digital 3-dimensional reconstruction was made for a dry cell
[16]. Hickner et al. [23] showed that the water content in a PEM
fuel cell is not simply proportional to current density, but can
decrease with increasing current density. In Zhang et al. [21]
the influence of material on liquid water formation was
visualized and the results were related to the relevant
operating conditions. However, in all these previous studies,
the flow channels used are simple serpentine type of short
length with only a few turns of the channels. As a result, the
observed characteristics of liquid water formation, distribu-
tion and dynamics may not be representatives of what
happens in practical PEM fuel cells. This is because liquid
water in the cell structure is known to be predominantly
influenced by the flow channel designs, and the flow channels
in practical PEM fuel cells are typically much longer, resulting
in significant cross leakage flow through the porous GDL
between the adjacent flow channels or the successive turns of
the flow channel [24,25]. This cross leakage flow helps to
remove the liquid water in the GDL adjacent to the flow
channel.
In the present study, the accumulation of liquid water was
quantified using neutron radiography for a live PEM fuel cell
with a thin and long serpentine flow channel typically found
Fig. 1 – Schematic of a PEM fuel cell
in practical PEM fuel cells. The flow channel is specially
designed to effectively remove water formed in the cell by the
reactant gas stream [26]. The characteristics of liquid water
distribution under two different types of dynamic loading
have been investigated based on the neutron images acquired
and quantitative data of liquid accumulation obtained from
post-processing. The amount of liquid water formed is also
mathematically modeled to account for the effect of tem-
perature on the accumulation of liquid water in a wide range
of current densities. The model results are compared to the
experimental measurements to provide an analysis on the
steady-state amount of liquid water within the cell structure
under various load conditions.
2. Experimental
Fig. 1 shows a schematic diagram of a PEM fuel cell for the
present neutron imaging experiment. A PEM fuel cell consists
of a membrane electrolyte assembly (MEA) sandwiched
between two bipolar plates. The GDL (electrode backings),
catalyst layer and PEM are referred to as an MEA where
current is produced. Fuel and oxidant are supplied to either
side of the MEA through flow channels on the bipolar plates
producing electrons and protons in the anode catalyst layer
and water in the cathode catalyst layer. Single cell test
fixtures with active areas of 100.1 cm2 were assembled using
Nafions 112 membrane. All parameters of cell elements are
given in Table 1.
The neutron radiography system at the National Institute of
Standard and Technology (NIST, Gaithersburg, USA) was used
for the present study. Fig. 1 illustrates neutron radiography to
image the liquid water produced in a PEM fuel cell. The
neutron beam attenuates hydrogenous material, such as
liquid water, while it passes through an operating PEM fuel
cell. A flat panel amorphous silicon detector with 127 mm pixel
pitch was used to capture the neutron image of liquid water
and neutron radiography setup.

ARTICLE IN PRESS
Table 1 – Parameters for the test cell
Parameter Value
Bipolar plate
Number of channel (Nch) 1
Number of U-turn (Nturn) 50
Channel width (w) 1.0 mm
Land width (s) 1.0 mm
Channel depth (d) 1.1 mm
Channel length (l) 5.05 m
Channel hydraulic diameter (dh) 1.0476 mm
Cell active area (Ac) 100.1 cm2
Membrane (Nafions 112)
Catalyst loading 0.5 mg PT cm�2
Thickness (dn) 50mm
Gas diffusion layer (SL Carbon Sigracet 10BB .0165’’)
Permeability (K) 10�11 m2
Porosity (e) 0.5
Thickness (de) 200mm
Pressure drop [25]
Cathode (at 0.5 A/cm2, 100% RH) 72 kPa
Anode (at 0.5 A/cm2, 100% RH) 8 kPa
Table 2 – Experimental conditions for the dynamic tests
Parameter Value
Constants
Stoichiometry 1.2 (anode), 2.0 (cathode)
Inlet relative humidity (%) 100 (anode, cathode)
Outlet pressure (atm) 1
Variables
Temperature (1C) 60, 80
Current density (A/cm2):
Case I 0-0.05-0.25-0.5-0.75-
0.5-0.25-0.05-0
Case II 0-0.05-0.25-0.5-0.75-
1.0-0.75-0.5-0.25-0.05-0
Time duration 3, 5 min for each load
I N T E R N AT I O N A L J O U R N A L O F H Y D R O G E N E N E R G Y 3 3 ( 2 0 0 8 ) 3 3 7 3 – 3 3 8 43376
in the fuel cell. The resultant is the shadow image of neutron
beam attenuation with the intensity given by
I ¼ I0 e�Nst, (1)
where I is the transmitted intensity, I0 is the incident intensity
(with no attenuation), N is the atom density, s is the neutron
cross-section and t is the equivalent thickness of a liquid
water layer [16]. The real density of the material, Nt, is
determined from I, I0 and s which are measured in this
experiment. The raw image was analyzed using the
IDL programming language (RSI, Inc., Boulder, CO) with
specialized analysis routines developed at NIST. The images
were taken continuously at the rate of 1 Hz during normal
fuel cell operation. The fuel cell was operated according
to two different unsteady load conditions; the current
density was changed between 0 and 0.75 A/cm2 in Case I
and between 0 and 1.0 A/cm2 in Case II. Details of test
conditions are given in Table 2. A reference image (dry image)
was taken after the MEA had been dried in the cell for
at least 15 min with dry flowing nitrogen gas. The cell
features that do not change with water content (such as cell
hardware, background features) are subtracted by the dry
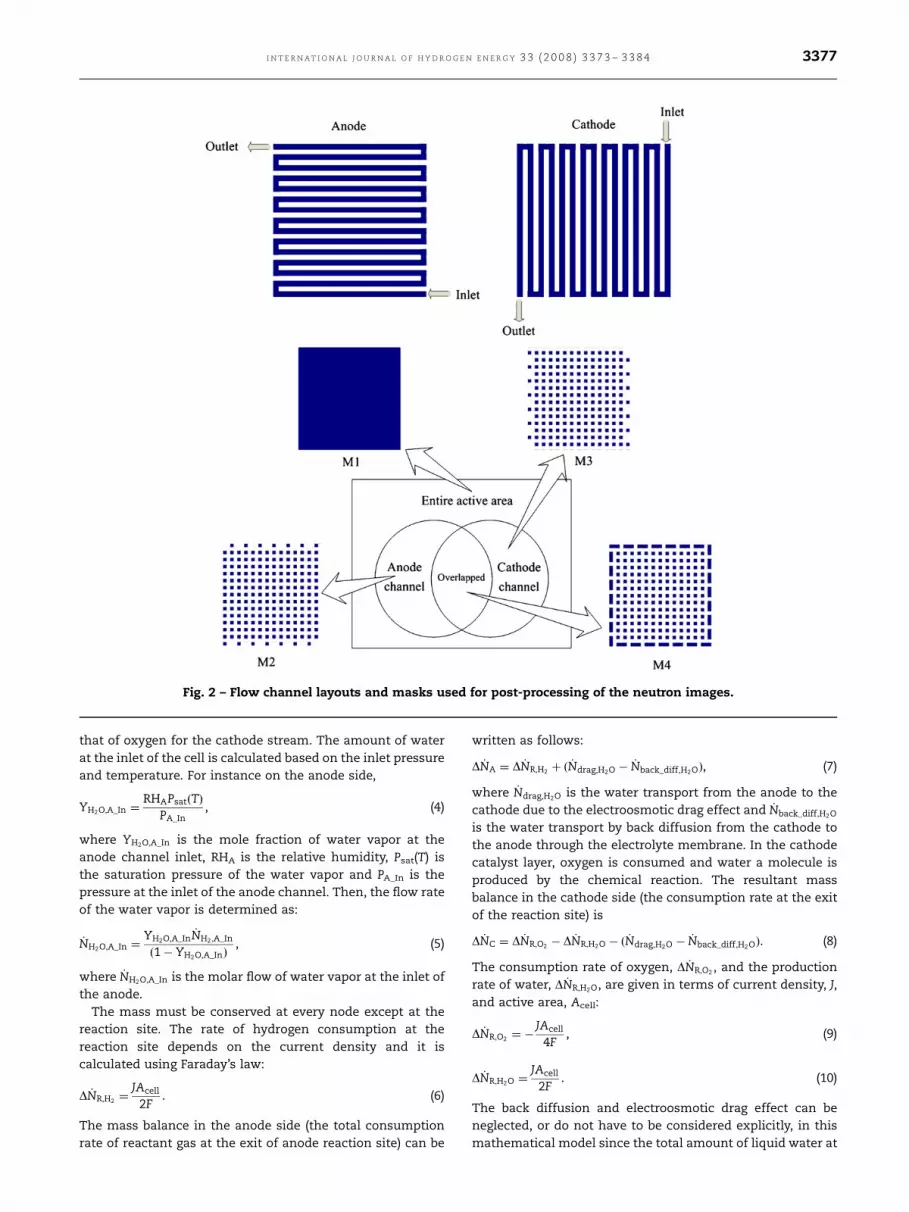
image and not visible in the resulting image. The flow
channel layouts are schematically given in Fig. 2 to explain
how the anode and cathode flow channels overlap in the
neutron images which are the resultant integration of
attenuation along the beam path. A few masks are applied
to distinguish the water location in the neutron images as
indicated in the area diagram of Fig. 2. The average water
thickness is then obtained from the natural log of the ratio of
the wet to dry intensities [23]. A more detailed description of
the present neutron imaging technique can be found else-
where [15,16,23].
2.1. Mathematical modeling of liquid water production
There are a number of previous multi-dimensional numerical
simulations on PEM fuel cells including liquid water transport
in serpentine channels [32] and two-phase flow and chemical
reactions [33,34]. However numerical simulation of dynamic
liquid water distribution in PEM fuel cells is still a challenging
task demanding large computing power, especially with
strong cross flow through the GDL between the adjacent flow
channels. In this section, a mathematical model is formulated
to predict the amount of liquid water formation in an
operating PEM fuel cell. The rate of liquid water production
is dependant on the inlet humidity, cell temperature, pressure
drop and current density (the rate of reaction) for a fixed
stoichiometry operation. The rate of liquid water production
may not be calculated directly from the inlet conditions since
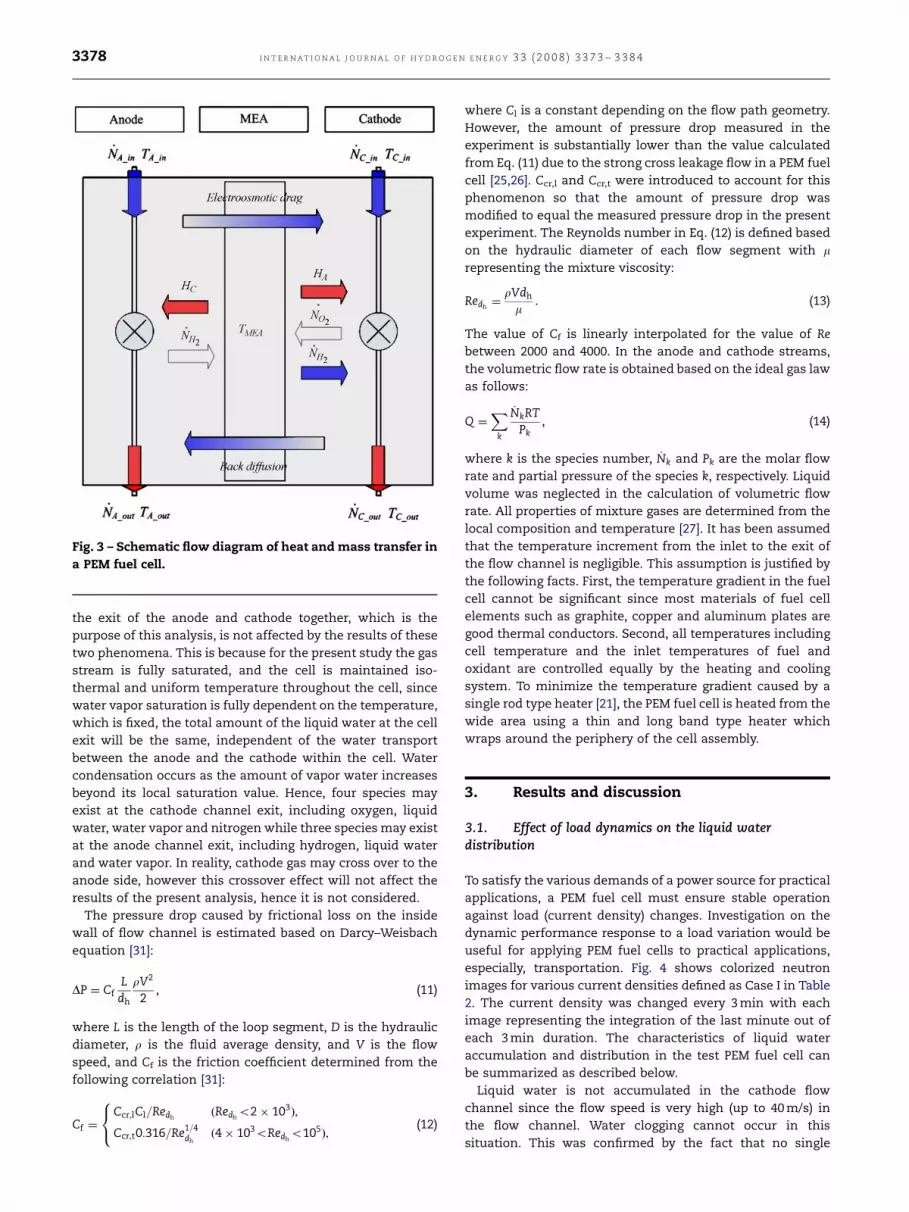
all these parameters are strongly coupled. Fig. 3 shows a
schematic flow diagram of heat and mass transfer for present
modeling. The serpentine flow channel on the bipolar plate is
modeled as up and downstream segments with one reaction
site where the electro-chemical reaction and heat transfer
occur. Pressure drop is calculated based on the assumption
that there is no reaction for the upstream part while the
reaction is completed for the downstream part. The pressure,
temperature and compositions are assumed to be uniform in
each of loop segment. The inlet hydrogen and oxygen molar
flow rates to the anode and cathode are determined according
to the stoichiometry:
_NH2 ¼zANcellJAcell
2F, (2)
_NO2 ¼zCNcellJAcell
4F, (3)
where zA and zC are the anode and cathode stoichiometries,
Ncell is the number of cells in the stack, which is taken as one
in the present study, J is the current density, Acell is the active
area of the cell, and F is the Faraday constant. The inlets of
the anode and cathode flow channels are saturated with
water vapor. The total flow rates are obtained by adding the
amount of water vapor to that of hydrogen for the anode
stream and by adding the amount of water and nitrogen to
ARTICLE IN PRESS
Fig. 2 – Flow channel layouts and masks used for post-processing of the neutron images.
I N T E R N A T I O N A L J O U R N A L O F H Y D R O G E N E N E R G Y 3 3 ( 2 0 0 8 ) 3 3 7 3 – 3 3 8 4 3377
that of oxygen for the cathode stream. The amount of water
at the inlet of the cell is calculated based on the inlet pressure
and temperature. For instance on the anode side,
YH2O;A_In ¼RHAPsatðTÞ
PA_In, (4)
where YH2O;A_In is the mole fraction of water vapor at the
anode channel inlet, RHA is the relative humidity, Psat(T) is
the saturation pressure of the water vapor and PA_In is the
pressure at the inlet of the anode channel. Then, the flow rate
of the water vapor is determined as:
_NH2O;A_In ¼YH2O;A_In
_NH2 ;A_In
ð1� YH2O;A_InÞ, (5)
where _NH2O;A_In is the molar flow of water vapor at the inlet of
the anode.
The mass must be conserved at every node except at the
reaction site. The rate of hydrogen consumption at the
reaction site depends on the current density and it is
calculated using Faraday’s law:
D _NR;H2 ¼JAcell
2F. (6)
The mass balance in the anode side (the total consumption
rate of reactant gas at the exit of anode reaction site) can be
written as follows:
D _NA ¼ D _NR;H2 þ ð_Ndrag;H2O �
_Nback_diff;H2OÞ, (7)
where _Ndrag;H2O is the water transport from the anode to the
cathode due to the electroosmotic drag effect and _Nback_diff;H2O
is the water transport by back diffusion from the cathode to
the anode through the electrolyte membrane. In the cathode
catalyst layer, oxygen is consumed and water a molecule is
produced by the chemical reaction. The resultant mass
balance in the cathode side (the consumption rate at the exit
of the reaction site) is
D _NC ¼ D _NR;O2 � D _NR;H2O � ð _Ndrag;H2O �_Nback_diff;H2OÞ. (8)
The consumption rate of oxygen, D _NR;O2 , and the production
rate of water, D _NR;H2O, are given in terms of current density, J,
and active area, Acell:
D _NR;O2 ¼ �JAcell
4F, (9)
D _NR;H2O ¼JAcell
2F. (10)
The back diffusion and electroosmotic drag effect can be
neglected, or do not have to be considered explicitly, in this
mathematical model since the total amount of liquid water at
ARTICLE IN PRESS
Fig. 3 – Schematic flow diagram of heat and mass transfer in
a PEM fuel cell.
I N T E R N AT I O N A L J O U R N A L O F H Y D R O G E N E N E R G Y 3 3 ( 2 0 0 8 ) 3 3 7 3 – 3 3 8 43378
the exit of the anode and cathode together, which is the
purpose of this analysis, is not affected by the results of these
two phenomena. This is because for the present study the gas
stream is fully saturated, and the cell is maintained iso-
thermal and uniform temperature throughout the cell, since
water vapor saturation is fully dependent on the temperature,
which is fixed, the total amount of the liquid water at the cell
exit will be the same, independent of the water transport
between the anode and the cathode within the cell. Water
condensation occurs as the amount of vapor water increases
beyond its local saturation value. Hence, four species may
exist at the cathode channel exit, including oxygen, liquid
water, water vapor and nitrogen while three species may exist
at the anode channel exit, including hydrogen, liquid water
and water vapor. In reality, cathode gas may cross over to the
anode side, however this crossover effect will not affect the
results of the present analysis, hence it is not considered.
The pressure drop caused by frictional loss on the inside
wall of flow channel is estimated based on Darcy–Weisbach
equation [31]:
DP ¼ CfLdh
rV2
2, (11)
where L is the length of the loop segment, D is the hydraulic
diameter, r is the fluid average density, and V is the flow
speed, and Cf is the friction coefficient determined from the
following correlation [31]:
Cf ¼Ccr;lCl=Redh
ðRedho2� 103
Þ;
Ccr;t0:316=Re1=4dhð4� 103oRedh
o105Þ;
8<: (12)
where Cl is a constant depending on the flow path geometry.
However, the amount of pressure drop measured in the
experiment is substantially lower than the value calculated
from Eq. (11) due to the strong cross leakage flow in a PEM fuel
cell [25,26]. Ccr,l and Ccr,t were introduced to account for this
phenomenon so that the amount of pressure drop was
modified to equal the measured pressure drop in the present
experiment. The Reynolds number in Eq. (12) is defined based
on the hydraulic diameter of each flow segment with mrepresenting the mixture viscosity:
Redh¼
rVdh
m. (13)
The value of Cf is linearly interpolated for the value of Re
between 2000 and 4000. In the anode and cathode streams,
the volumetric flow rate is obtained based on the ideal gas law
as follows:
Q ¼X
k
_NkRTPk
, (14)
where k is the species number, _Nk and Pk are the molar flow
rate and partial pressure of the species k, respectively. Liquid
volume was neglected in the calculation of volumetric flow
rate. All properties of mixture gases are determined from the
local composition and temperature [27]. It has been assumed
that the temperature increment from the inlet to the exit of
the flow channel is negligible. This assumption is justified by
the following facts. First, the temperature gradient in the fuel
cell cannot be significant since most materials of fuel cell
elements such as graphite, copper and aluminum plates are
good thermal conductors. Second, all temperatures including
cell temperature and the inlet temperatures of fuel and
oxidant are controlled equally by the heating and cooling
system. To minimize the temperature gradient caused by a
single rod type heater [21], the PEM fuel cell is heated from the
wide area using a thin and long band type heater which
wraps around the periphery of the cell assembly.
3. Results and discussion
3.1. Effect of load dynamics on the liquid waterdistribution
To satisfy the various demands of a power source for practical
applications, a PEM fuel cell must ensure stable operation
against load (current density) changes. Investigation on the
dynamic performance response to a load variation would be
useful for applying PEM fuel cells to practical applications,
especially, transportation. Fig. 4 shows colorized neutron
images for various current densities defined as Case I in Table
2. The current density was changed every 3 min with each
image representing the integration of the last minute out of
each 3 min duration. The characteristics of liquid water
accumulation and distribution in the test PEM fuel cell can
be summarized as described below.
Liquid water is not accumulated in the cathode flow
channel since the flow speed is very high (up to 40 m/s) in
the flow channel. Water clogging cannot occur in this
situation. This was confirmed by the fact that no single

ARTICLE IN PRESS
Fig. 4 – Colorized neutron images at different current densities for Case I, cell operating temperature of Tc ¼ 60 1C, and 3 min
duration for each load. Anode and cathode flow channel layouts are shown in Fig. 1. (a,g) 0.05 A/cm2, (b,f) 0.25 A/cm2, (c,e)
0.5 A/cm2 and (d) 0.75 A/cm2.
Fig. 5 – Colorized neutron images at the different current densities for Case II, cell operating temperature of Tc ¼ 60 1C, and
3 min duration for each load. Anode and cathode flow channel layouts are shown in Fig. 1. (a,i) 0.05 A/cm2, (b,h) 0.25 A/cm2,
(c,g) 0.5 A/cm2, (d,f) 0.75 A/cm2 and (e) 1.0 A/cm2.
I N T E R N A T I O N A L J O U R N A L O F H Y D R O G E N E N E R G Y 3 3 ( 2 0 0 8 ) 3 3 7 3 – 3 3 8 4 3379
neutron image shows any noticeable water droplet in the flow
channel area. As shown in a magnified view in Fig. 4, liquid
water tends to accumulate in the GDL above the flow channel
area, in contrast to most of the previous observations, e.g.,
[21,22], which reported that liquid water was accumulated
in the GDL segment adjacent to the channel land area.

ARTICLE IN PRESS
I N T E R N AT I O N A L J O U R N A L O F H Y D R O G E N E N E R G Y 3 3 ( 2 0 0 8 ) 3 3 7 3 – 3 3 8 43380
This phenomenon can be attributed to the effect of the strong
cross leakage flow in the test PEM fuel cell with a thin and
long serpentine flow channel [24,25], i.e., the liquid water
accumulated in the GDL above the channel land area is
removed effectively by the cross leakage flow. However, the
liquid water is not removed in the GDL above the flow channel
since the cross leakage flow is very weak there.
Figs. 4(a)–(c) indicate that the amount of liquid water in the
cell structure increases with increasing current density. The
liquid water seems uniformly distributed in the cell, both
anode and cathode side. At the peak current density of
0.75 A/cm2 liquid water is not observed near the anode inlet,
and increasing water content is observed towards the anode
channel exit. The liquid water on the cathode seems to be
more uniformly distributed. However, when the cell current
density is decreased from 0.75 to 0.05 A/cm2, a completely
different distribution of liquid water is observed, by compar-
ing Figs. 4(e)–(g) with Figs. 4(a)–(c), even under the nominally
identical conditions of the same current density and flow
conditions. About half the anode side near the channel inlet
is free of liquid water; liquid water is also observed around the
channel turn regions near the middle of the anode side, and
then increases significantly towards the anode channel exit.
In contrast, the cathode side actually has less liquid water
Fig. 6 – Equivalent average liquid water thickness in the entire t
Fig. 5 (b); the uncertainty of each average water thickness (the s
71.42–2.16 lm with 95% probability.
and seems to be more uniformly distributed, without a clear
accumulation of liquid water in the channel turn regions.
This seems to contradict intuition since water is produced in
the cathode side and electroosmotic drag also transports
water to the cathode side. This seems to suggest that the
cathode gas stream is very effective in removing water in the
cathode. The apparently different distribution of liquid water
with the seemingly identical operating conditions shown in
Figs. 4(a)–(c) and (e)–(g) is responsible for the unreliable and
unrepeatable PEM fuel cell performance observed in early
studies [28].
Fig. 5 shows the neutron images for the same dynamic load
variations as for Fig. 4, except that the maximum current
density is increased from 0.75 A/cm2 for Fig. 4 to 1.0 A/cm2 for
Fig. 5. The liquid water distribution shown in Figs. 5(a)–(d) is
fairly similar to that in Figs. 4(a)–(d) for the same current
density with uniform distribution and increasing thickness as
the current density is increased from 0.05 to 0.75 A/cm2.
However, for the peak current density of 1.0 A/cm2 liquid
water is only observed to exist in the last few anode channels
near the anode channel exit without liquid water accumula-
tion in the channel turn areas. Little liquid water is observed
for the cathode and the significant portion of the anode away
from the anode channel exit. The entire cell seems to be free
est cell corresponding to the test conditions of Fig. 4 (a) and
tandard deviation of mean average water thickness) ranges

ARTICLE IN PRESS
Fig. 7 – Dynamic cell performance corresponding to the test
conditions of Fig. 4 (a) and Fig. 5 (b).
I N T E R N A T I O N A L J O U R N A L O F H Y D R O G E N E N E R G Y 3 3 ( 2 0 0 8 ) 3 3 7 3 – 3 3 8 4 3381
of liquid water presence when the cell current density is
reduced from the peak value of 1.0 to the minimum value of
0.05 A/cm2. Clearly, the amount and distribution of the liquid
water in the cell differs significantly in proportion to the
current density. The hysteresis phenomenon in the quantity
and distribution of liquid water in the cell clearly leads to the
hysteresis in the cell performance.
The results shown in Figs. 4 and 5 are measured at the cell
operating temperature of 60 1C. At the higher cell operating
temperature of 80 1C, very little liquid water is detected by the
neutron imaging technique, suggesting that liquid water
flooding may not be a problem at that temperature, although
the possibility of cell dehydration occurs then.
3.2. Performance hysteresis: the effect of liquid wateraccumulation and distribution
Figs. 6(a) and (b) show the dynamic response of the current
density and liquid water in the cell for the conditions
identical to those of Figs. 4 and 5, respectively. The current
density shown is the measured response of the test cell when
the current density is set for 3 min for each load condition. It
is seen for both cases shown in Fig. 6 that when the load is
increased, the current density responds to the load change
very quickly for the low values of the current densities (0.0
and 0.05 A/cm2), then the response is slowed for the higher
current densities of 0.25, 0.50, 0.75 and 1.0 A/cm2. However,
the response is again very fast when the load is reduced.
These different dynamic responses are due to the formation
and accumulation of liquid water in the cell as shown in
Figs. 4 and 5. The response slows as current density increases,
due to more liquid water formation and presence in the cell
structure as shown in Figs. 4(a)–(d) and 5(a)–(e). The amount
of liquid water decreases with decreasing load as shown in
Figs. 4(e)–(g), with virtually no liquid present in Figs. 5(f)–(i). As
a result, the performance response is fast. These observations
are consistent with the numerical simulation of the dynamic
responses for PEM fuel cells [29].
Fig. 6 also shows the equivalent average thickness of liquid
water in the test cell (obtained from the neutron images and
presented below the current density response for the two
cases investigated). The amount of liquid water increases
with increasing current density and reaches the maximum
when the current density is increased to 0.5 A/cm2 for both
cases. Then the liquid water content is reduced even when
the current density is further increased to the peak value and
then decreased. As also indicated in the previous section, the
amount of liquid water is much less for Case II (Fig. 5) than
that for Case I (Fig. 4) after reaching the peak value of the
liquid water accumulation. Different amounts of liquid water
in the cell explains the difference in the performance
hysteresis with load changes, as shown in Fig. 7. Case I
highlights (corresponding to the test conditions for Fig. 4) that
the cell performance is slightly better for the decreasing
sweep of current density than the sweep of increasing current
density. This result agrees with the observations made by
Zhang et al. [21], who attributed it to a reduced surface
coverage of the cathode with OH adsorbates [15] and a
reduced ohmic resistance. In contrast to Case I, a lower
performance is observed for Case II, corresponding to the
conditions for Fig. 5, for the sweep of decreasing current
density. The voltage recovers to that of the increasing current
density sweep when the current density is decreased to
0.25 A/cm2. Finally, it should be pointed out that the
characteristics of liquid water formation and accumulation
as well as the associated performance hysteresis are almost
identical to the results shown in Figs. 4–7 when the current
density was changed every 5 min; hence, they are not shown
here.
3.3. Mathematical modeling of liquid water productionand the effect of temperature
Experimental investigation concerning the effect of cell
temperature on the formation of liquid water in a PEM fuel
cell can be found in Liu et al. [9] and Hickner et al. [23].
Hickner at al. [23] showed that the rate of liquid water
production in a PEM fuel cell can become negative at high

ARTICLE IN PRESS
Fig. 9 – Model predictions for the mass flow rate of liquid
water at the exit of the test cell for various cell operating
temperatures.
Fig. 8 – Model predictions for the mole fraction of liquid
water at the exit of the test cell for various cell operating
temperatures.
I N T E R N AT I O N A L J O U R N A L O F H Y D R O G E N E N E R G Y 3 3 ( 2 0 0 8 ) 3 3 7 3 – 3 3 8 43382
temperatures (above 80 1C) due to evaporation and lower
partial pressure of water. Liu et al. [9] visualized the inside of
the flow channels and showed that the amount of liquid
water formation is substantially reduced at higher tempera-
tures (480 1C) due to evaporation. Since the liquid water
accumulation is critical on the cell performance at high
current densities, predicting the amount of liquid water
formation in a PEM fuel cell would be highly beneficial for
the practical design and operation of the system. This effect
becomes increasingly important in transportation applica-
tions where dynamic loading is common.
Fig. 8 shows the total mole fraction of the liquid water at the
exit of the anode and cathode flow channels, determined
from the present model analysis. Here the mole fraction
of liquid water is defined as the molar flow rate of liquid
water from both the anode and cathode channel exits divided
by the total molar flow rate of all the species at the channel
exits. It is seen that the molar fraction of the liquid water
decreases consistently as the current density increases
for all temperatures analyzed. This phenomenon is mainly
caused by two reasons: first, the saturation pressure of
water depends on the temperature only, and is independent
of the reactant flow rate, hence it is independent of the
current density since the stoichiometry for both the
anode and cathode stream is fixed in the present study, as
shown in Table 2. Second, as the current density increases,
the reactant flow rate increases proportionally for the fixed
stoichiometries, resulting in a larger pressure drop in the cell,
because the frictional and minor pressure loss mechanisms
are predominant, relative to the effect of reactant gas
consumption in the cell, for the present channel design of
small but long serpentine channels [26]. A larger pressure
drop in the cell for the reactant gas streams results in (i) a
relatively smaller amount of water vapor at the inlet of the
flow channels because of a higher total pressure at the
channel inlet (since in the present study the cell pressure is
set at the channel exit) and (ii) more water removal in vapor
form [1]. As a result, the amount of liquid water remaining at
the channel exit is reduced as the reactant gas flow rate or
current density increases. Fig. 8 also shows that the amount
of liquid water at the channel exits decreases as the cell
operating temperature increases due to the higher vapor
capacity of the gas stream in vaporizing liquid water [1]. For
the operating temperature of 70 1C, the mole fraction of liquid
water becomes zero at the current density of about 0.4 A/cm2.
When the operating temperature exceeds 90 1C the mole
fraction of liquid water drops to zero for the entire current
density range of interest.
Fig. 9 shows the total mass flow rate of liquid water at
the channel exits calculated from the mole fraction given in
Fig. 8. Similar to the mole fraction, the liquid mass flow rate
decreases as the cell temperature is increased due to a higher
water removal capacity of the gas stream in the form of water
vapor. Unlike the mole fraction shown in Fig. 8, the amount of
liquid water flow increases consistently as the current density
is increased for the cell temperature below �60 1C. When the
cell operating temperature is at or above 60 1C, the liquid
water mass flow rate increases with current density until
reaching a maximum value, beyond which it starts to
decrease for further increase in the current density. This
occurs since at low current densities, the reactant flow rate is
low and thus water production as a result of cell reaction
dominates. As the current density increases, reactant gas
flow increases, and the pressure drop becomes substantial.
Thus, more water is removed from the cell in the form of
vapor resulting in a lower liquid water mass flow rate at the
channel exits. Although the present model calculates the rate
of net liquid water production in a steady-state condition the
result could be useful to predict the trend of liquid water
accumulation especially when the cell has a quick response
against the load change. It is noticed that the value of current
density at the maximum liquid water mass flow rate in Fig. 9
(Tc ¼ 60 1C), about 0.5 A/cm2, coincides with the peak water
accumulation in Fig. 6.

ARTICLE IN PRESS
Fig. 10 – Equivalent average liquid water thickness in the
test cell as measured from the neutron imaging technique
for different cell operating temperatures under the dynamic
loading condition of Case I. The current density variation
with time is given in Fig. 6.
I N T E R N A T I O N A L J O U R N A L O F H Y D R O G E N E N E R G Y 3 3 ( 2 0 0 8 ) 3 3 7 3 – 3 3 8 4 3383
Fig. 10 shows the total amount of liquid water in the test
cell (determined by the neutron images), for two different
operating temperatures (60 and 80 1C) under the same load
variations (Case I). The amount of liquid water in the cell is
much less when the temperature is higher (80 1C). Note that
the peak water accumulation occurs at the current density of
0.25 A/cm2, which agrees again with the modeling results
shown in Fig. 9 for the temperature of 80 1C. At this operating
temperature, the cell could not sustain its voltage at 1 A/cm2
at the operating temperature of 80 1C; however, such temporal
and short-duration dehydration did not seem to result in any
permanent damage on the membrane, because the same
performance was measured in repeated tests under other
operating conditions. On the other hand, significantly more
liquid water is present in the cell at the cell temperature of
60 1C, as also implied by the model results shown in Fig. 9, and
the peak value of the liquid water accumulation in the cell,
about 0.5 A/cm2 in Fig. 10, also agrees with the model results
shown in Fig. 9.
4. Conclusions
In this study, the amount and distribution of liquid water in
an operating PEM fuel cell with a single serpentine flow
channel for the anode and cathode side has been investigated
under dynamic loading using neutron imaging technique. It is
observed that liquid water accumulation in the cell generally
reduces or slows down the dynamic response of the fuel cell
to changing load conditions. In addition, performance
hysteresis is also observed due to the different amount of
liquid water content in the cell at the nominally identical
operating conditions. The amount of liquid water accumula-
tion in the cell is dependent on the cell operating tempera-
ture, the pressure drop in the flow channel and the current
density. It is shown that the cell performance is strongly
affected by the presence and accumulation of liquid water,
especially at high current densities. The rate of liquid water
production is also mathematically modeled to analyze the
effect of the cell operating temperature and pressure drop on
the liquid water formation in a cell. The model predicts
successfully the trend of liquid water accumulation in an
operating PEM fuel cell. Finally, the history of liquid water
accumulation is also analyzed.
Acknowledgments
This work was financially supported by AUTO21, the Network
of Centers of Excellence, Canada, the DaimlerChrysler
Corporation, and the U.S. Department of Commerce, the NIST
Ionizing Radiation Division, the Director’s office of NIST, the
NIST Center for Neutron Research, and the Department
of Energy through interagency agreement no. DE-AI01-
01EE50660.
R E F E R E N C E S
[1] Li X. Principles of fuel cells. New York: Taylor & Francis; 2006.[2] Tuber K, Pcza D, Hebling C. Visualization of water buildup in
the cathode of a transparent PEM fuel cell. J Power Sources2003;124:403–14.
[3] Nguyen TV. A gas distributor design for proton-exchange-membrane fuel cells. J Electrochem Soc 2002;143(5):L103–5.
[4] Mench MM, Dong Q, Wang CY. In situ water distributionmeasurements in a polymer electrolyte fuel cell. J PowerSources 2003;124:90–8.
[5] Stumper J, Lhr M, Hamada S. Diagnostic tools for liquid waterin PEM fuel cells. J Power Sources 2005;143:150–7.
[6] Hakenjos A, Muenter H, Wittstadt U, Hebling C. A PEM fuelcell for combined measurement of current and temperaturedistribution, and flow field flooding. J Power Sources2004;131:213–6.
[7] Yang X, Zhang F, Lubawy L, Wang CY. Visualization of liquidwater transport in a PEFC. Electrochem Solid-State Lett2004;7(11):A408–11.
[8] Sugiura K, Nakata M, Yodo T, Nishiguchi Y, Yamauchi M, ItohY. Evaluation of a cathode gas channel with a waterabsorption layer/waste channel in a PEFC by using visuali-zation technique. J Power Sources 2005;145:526–33.
[9] Liu X, Guo H, Ma C. Water flooding and two-phase flow incathode channels of proton exchange membrane fuel cells. JPower Sources 2006;156:267–80.
[10] Nam J, Kaviany M. Effective diffusivity and water-saturationdistribution in single- and two-layer PEMFC diffusion med-ium. Int J Heat and Mass Transfer 2003;46:4595–611.
[11] Lim C, Wang CY. Effects of hydrophobic polymer content inGDL on power performance of a PEM fuel cell. ElectrochimActa 2004;49:4149–56.
[12] Feindel K, LaRocque L-A, Starke D, Bergens S, WasylishenR. In situ observations of water production and distributionin an operating H2/O2 PEM fuel cell assembly using 1 H NMRmicroscopy. J Am Chem Soc 2004;126:11436–7.
[13] Tsushima S, Teranishi K, Nishida K, Hirai S. Water contentdistribution in a polymer electrolyte membrane for advancedfuel cell system with liquid water supply. Magn ResonImaging 2005;23:255–8.
[14] Mosdale R, Gebel G, Pineri M. Water profile determination ina running proton exchange membrane fuel cell using small-angle neutron scattering. J Membr Sci 1996;118:269–77.

ARTICLE IN PRESS
I N T E R N AT I O N A L J O U R N A L O F H Y D R O G E N E N E R G Y 3 3 ( 2 0 0 8 ) 3 3 7 3 – 3 3 8 43384
[15] Bellows RJ, Lin MY, Arif M, Thompson AK, Jacobson D.Neutron imaging for in situ measurement of water trans-port gradients within Nafion in polymer electrolyte fuel cells.J Electrochem Soc 1999;146:1099–103.
[16] Satija R, Jacobson DL, Arif M, Werner SA. In situ neutronimaging technique for evaluation of water managementsystems in operating PEM fuel cells. J Power Sources2004;129:238–45.
[17] Kramer D, Zhang J, Shimoi R, Lehmann E, Wokaun A,Shinohara K, et al. In situ diagnostic of two-phase flowphenomena in polymer electrolyte fuel cells by neutronimaging part A. Experimental, data treatment, and quantifi-cation. Electrochim Acta 2005;50:2603–14.
[18] Kramer D, Lehmann E, Frei G, Vontobel P, Wokaun A, SchererG. An on-line study of fuel cell behavior by thermal neutrons.Nucl Instrum Methods Phys Res A 2005;542:52–60.
[19] Pekula N, Heller K, Chuang P, Turhan A, Mench MM, BrenizerJ, et al. Study of water distribution and transport in a polymerelectrolyte fuel cell using neutron imaging. Nucl InstrumMethods Phys Res A 2005;542:134–41.
[20] Turhan A, Heller K, Brenizer JS, Mench MM. Quantification ofliquid water accumulation and distribution in a polymerelectrolyte fuel cell using neutron imaging. J Power Sources,in press.
[21] Zhang J, Kramer D, Shimoi R, Ono Y, Lehmann E, Wokaun A,et al. In situ diagnostic of two-phase flow phenomena inpolymer electrolyte fuel cells by neutron imaging part B.Material variations. Electrochim Acta 2006;51:2715–27.
[22] Chuang PA, Turhan A, Heller AK, Brenizer JS, Trabold TA,Mench MM. Real-time imaging of liquid water in an operat-ing proton exchange membrane fuel cell. In: Proceedings ofFUELCELL2005 third international conference on fuel cellscience, engineering and technology, May 23–25, 2005,Ypsilanti, Michigan, USA.
[23] Hickner MA, Siegel NP, Chen KS, Mcbrayer DN, Hussey DS,Jacobson DL, et al. Real-time imaging of liquid water in anoperating proton exchange membrane fuel cell. J Electro-chem Soc 2003;153(5):A902–8.
[24] Kanezaki K, Li X, Baschuk JJ. Cross-leakage flow betweenadjacent flow channels in PEM fuel cells. J Power Sources2006;162:415–25.
[25] Park J, Li X. An experimental and numerical investigation onthe cross flow through gas diffusion layer in a PEM fuel cellwith a serpentine flow channel. J Power Sources2007;163:853–63.
[26] Li X, Sabir I, Park J. A flow channel design procedure for PEMfuel cells with effective water removal. J Power Sources2007;163:933–42.
[27] Baschuk JJ, Li X. Mathematical model of a PEM fuel cellincorporating CO poisoning and O2 (air) bleeding. Int J GlobalEnergy Issues 2003;20(3):245–76.
[28] Mughal A, Li X. Experimental diagnostics of PEM fuel cells.Int J Environ Stud 2006;63:377–89.
[29] Wu H, Li X, Berg P. Numerical analysis of dynamic processesin fully humidified PEM fuel cells. Intl J Hydrogen Energy2007;32:2022–31.
[31] White FM. Fluid mechanics. 3rd ed. New York: McGraw-Hill;1994.
[32] Jiao K, Zhou B, Quan P. Liquid water transport in parallelserpentine channels with manifolds on cathode sideof a PEM fuel cell stack. J Power Sources 2006;154:124–37.
[33] Shimpalee S, Greenway S, Spuckler D, Van Zee JW. Predictingwater and current distributions in a commercial-size PEMFC.J Power Sources 2004;135:79–87.
[34] Wang ZH, Wang CY, Chen KS. Two-phase flow and transportin the air cathode of proton exchange membrane fuel cells. JPower Sources 2001;94:40–50.