Embed Size (px)
Citation preview

Form 20-F 2005
No
kia Form
20-F 2005
Copy
righ
t©
2006
. Nok
ia C
orpo
rati
on. A
ll ri
ghts
res
erve
d.N
okia
and
Nok
ia C
onne
ctin
g Pe
ople
are
reg
iste
red
trad
emar
ks o
f Nok
ia C
orpo
rati
on.
20-F_2005_cover.pmd 26.2.2006, 20:571

The device on the cover is a Nokia 6131.
As filed with the Securities and Exchange Commission on March 2, 2006.
SECURITIES AND EXCHANGE COMMISSIONWashington, D.C. 20549
FORM 20-FANNUAL REPORT PURSUANT TO SECTION 13 OR 15(D) OF THE
SECURITIES EXCHANGE ACT OF 1934
For the fiscal year ended December 31, 2005
Commission file number 1-13202
Nokia Corporation(Exact name of Registrant as specified in its charter)
Republic of Finland(Jurisdiction of incorporation)
Keilalahdentie 4, P.O. Box 226, FIN-00045 NOKIA GROUP, Espoo, Finland(Address of principal executive offices)
Securities registered pursuant to Section 12(b) of the Act:
Name of each exchangeTitle of each class on which registered
American Depositary Shares New York Stock ExchangeShares, par value EUR 0.06 New York Stock Exchange(1)
(1) Not for trading, but only in connection with the registration of American Depositary Shares representing these shares,pursuant to the requirements of the Securities and Exchange Commission.
Securities registered pursuant to Section 12(g) of the Act: None
Securities for which there is a reporting obligation pursuant to Section 15(d) of the Act: None
Indicate the number of outstanding shares of each of the registrant’s classes of capital or common stockas of the close of the period covered by the annual report.
Shares, par value EUR 0.06: 4,433,886,540
Indicate by check mark if the registrant is a well-known seasoned issuer, as defined in Rule 405 of theSecurities Act.
Yes � No �
If this report is an annual or transition report, indicate by check mark if the registrant is not requiredto file reports pursuant to Section 13 or 15(d) of the Securities Exchange Act of 1934.
Yes � No �
Indicate by check mark whether the registrant: (1) has filed all reports required to be filed bySection 13 or 15(d) of the Securities Exchange Act of 1934 during the preceding 12 months (or for suchshorter period that the registrant was required to file such reports), and (2) has been subject to suchfiling requirements for the past 90 days.
Yes � No �
Indicate by check mark which financial statement item the registrant has elected to follow.Item 17 � Item 18 �
If this is an annual report, indicate by check mark whether the registrant is a shell company (asdefined in Rule 12b-2 of the Exchange Act).
Yes � No �
TABLE OF CONTENTS
Page
INTRODUCTION AND USE OF CERTAIN TERMS . . . . . . . . . . . . . . . . . . . . . . . . . . . . . . . . . . . . . . . . 4FORWARD-LOOKING STATEMENTS . . . . . . . . . . . . . . . . . . . . . . . . . . . . . . . . . . . . . . . . . . . . . . . . 4
PART IITEM 1. IDENTITY OF DIRECTORS, SENIOR MANAGEMENT AND ADVISERS . . . . . . . . . . . . 7ITEM 2. OFFER STATISTICS AND EXPECTED TIMETABLE . . . . . . . . . . . . . . . . . . . . . . . . . 7ITEM 3. KEY INFORMATION . . . . . . . . . . . . . . . . . . . . . . . . . . . . . . . . . . . . . . . . . . . . . . . 7
3.A Selected Financial Data . . . . . . . . . . . . . . . . . . . . . . . . . . . . . . . . . . . . . . . . . . . 73.B Capitalization and Indebtedness . . . . . . . . . . . . . . . . . . . . . . . . . . . . . . . . . . . . 123.C Reasons for the Offer and Use of Proceeds . . . . . . . . . . . . . . . . . . . . . . . . . . . . 123.D Risk Factors . . . . . . . . . . . . . . . . . . . . . . . . . . . . . . . . . . . . . . . . . . . . . . . . . . . . 12
ITEM 4. INFORMATION ON THE COMPANY . . . . . . . . . . . . . . . . . . . . . . . . . . . . . . . . . . . . 234.A History and Development of the Company . . . . . . . . . . . . . . . . . . . . . . . . . . . . 234.B Business Overview . . . . . . . . . . . . . . . . . . . . . . . . . . . . . . . . . . . . . . . . . . . . . . . 244.C Organizational Structure . . . . . . . . . . . . . . . . . . . . . . . . . . . . . . . . . . . . . . . . . . 424.D Property, Plants and Equipment . . . . . . . . . . . . . . . . . . . . . . . . . . . . . . . . . . . . 43
ITEM 4A. UNRESOLVED STAFF COMMENTS . . . . . . . . . . . . . . . . . . . . . . . . . . . . . . . . . . . . . 43ITEM 5. OPERATING AND FINANCIAL REVIEW AND PROSPECTS . . . . . . . . . . . . . . . . . . . 44
5.A Operating Results . . . . . . . . . . . . . . . . . . . . . . . . . . . . . . . . . . . . . . . . . . . . . . . 445.B Liquidity and Capital Resources . . . . . . . . . . . . . . . . . . . . . . . . . . . . . . . . . . . . 725.C Research and Development, Patents and Licenses . . . . . . . . . . . . . . . . . . . . . . 755.D Trends . . . . . . . . . . . . . . . . . . . . . . . . . . . . . . . . . . . . . . . . . . . . . . . . . . . . . . . . 765.E Off-Balance Sheet Arrangements . . . . . . . . . . . . . . . . . . . . . . . . . . . . . . . . . . . . 765.F Tabular Disclosure of Contractual Obligations . . . . . . . . . . . . . . . . . . . . . . . . . 76
ITEM 6. DIRECTORS, SENIOR MANAGEMENT AND EMPLOYEES . . . . . . . . . . . . . . . . . . . . . 786.A Directors and Senior Management . . . . . . . . . . . . . . . . . . . . . . . . . . . . . . . . . . 786.B Compensation . . . . . . . . . . . . . . . . . . . . . . . . . . . . . . . . . . . . . . . . . . . . . . . . . . 886.C Board Practices . . . . . . . . . . . . . . . . . . . . . . . . . . . . . . . . . . . . . . . . . . . . . . . . . 996.D Employees . . . . . . . . . . . . . . . . . . . . . . . . . . . . . . . . . . . . . . . . . . . . . . . . . . . . . 1026.E Share Ownership . . . . . . . . . . . . . . . . . . . . . . . . . . . . . . . . . . . . . . . . . . . . . . . . 103
ITEM 7. MAJOR SHAREHOLDERS AND RELATED PARTY TRANSACTIONS . . . . . . . . . . . . . . 1137.A Major Shareholders . . . . . . . . . . . . . . . . . . . . . . . . . . . . . . . . . . . . . . . . . . . . . . 1137.B Related Party Transactions . . . . . . . . . . . . . . . . . . . . . . . . . . . . . . . . . . . . . . . . 1137.C Interests of Experts and Counsel . . . . . . . . . . . . . . . . . . . . . . . . . . . . . . . . . . . . 113
ITEM 8. FINANCIAL INFORMATION . . . . . . . . . . . . . . . . . . . . . . . . . . . . . . . . . . . . . . . . . 1138.A Consolidated Statements and Other Financial Information . . . . . . . . . . . . . . . 1138.B Significant Changes . . . . . . . . . . . . . . . . . . . . . . . . . . . . . . . . . . . . . . . . . . . . . . 116
ITEM 9. THE OFFER AND LISTING . . . . . . . . . . . . . . . . . . . . . . . . . . . . . . . . . . . . . . . . . . 1169.A Offer and Listing Details . . . . . . . . . . . . . . . . . . . . . . . . . . . . . . . . . . . . . . . . . . 1169.B Plan of Distribution . . . . . . . . . . . . . . . . . . . . . . . . . . . . . . . . . . . . . . . . . . . . . . 1179.C Markets . . . . . . . . . . . . . . . . . . . . . . . . . . . . . . . . . . . . . . . . . . . . . . . . . . . . . . . 1179.D Selling Shareholders . . . . . . . . . . . . . . . . . . . . . . . . . . . . . . . . . . . . . . . . . . . . . 1179.E Dilution . . . . . . . . . . . . . . . . . . . . . . . . . . . . . . . . . . . . . . . . . . . . . . . . . . . . . . . 1179.F Expenses of the Issue . . . . . . . . . . . . . . . . . . . . . . . . . . . . . . . . . . . . . . . . . . . . 117
ITEM 10. ADDITIONAL INFORMATION . . . . . . . . . . . . . . . . . . . . . . . . . . . . . . . . . . . . . . . . 11810.A Share Capital . . . . . . . . . . . . . . . . . . . . . . . . . . . . . . . . . . . . . . . . . . . . . . . . . . . 11810.B Memorandum and Articles of Association . . . . . . . . . . . . . . . . . . . . . . . . . . . . 11810.C Material Contracts . . . . . . . . . . . . . . . . . . . . . . . . . . . . . . . . . . . . . . . . . . . . . . . 120
2
Page
10.D Exchange Controls . . . . . . . . . . . . . . . . . . . . . . . . . . . . . . . . . . . . . . . . . . . . . . . 12010.E Taxation . . . . . . . . . . . . . . . . . . . . . . . . . . . . . . . . . . . . . . . . . . . . . . . . . . . . . . . 12010.F Dividends and Paying Agents . . . . . . . . . . . . . . . . . . . . . . . . . . . . . . . . . . . . . . 12410.G Statement by Experts . . . . . . . . . . . . . . . . . . . . . . . . . . . . . . . . . . . . . . . . . . . . 12410.H Documents on Display . . . . . . . . . . . . . . . . . . . . . . . . . . . . . . . . . . . . . . . . . . . . 12410.I Subsidiary Information . . . . . . . . . . . . . . . . . . . . . . . . . . . . . . . . . . . . . . . . . . . 124
ITEM 11. QUANTITATIVE AND QUALITATIVE DISCLOSURES ABOUT MARKET RISK . . . . . . 124ITEM 12. DESCRIPTION OF SECURITIES OTHER THAN EQUITY SECURITIES . . . . . . . . . . . . . 127
PART IIITEM 13. DEFAULTS, DIVIDEND ARREARAGES AND DELINQUENCIES . . . . . . . . . . . . . . . . . 128ITEM 14. MATERIAL MODIFICATIONS TO THE RIGHTS OF SECURITY HOLDERS AND USE
OF PROCEEDS . . . . . . . . . . . . . . . . . . . . . . . . . . . . . . . . . . . . . . . . . . . . . . . . . 128ITEM 15. CONTROLS AND PROCEDURES . . . . . . . . . . . . . . . . . . . . . . . . . . . . . . . . . . . . . . . 128ITEM 16A. AUDIT COMMITTEE FINANCIAL EXPERT . . . . . . . . . . . . . . . . . . . . . . . . . . . . . . . 128ITEM 16B. CODE OF ETHICS . . . . . . . . . . . . . . . . . . . . . . . . . . . . . . . . . . . . . . . . . . . . . . . . . 128ITEM 16C. PRINCIPAL ACCOUNTANT FEES AND SERVICES . . . . . . . . . . . . . . . . . . . . . . . . . . 128ITEM 16D. EXEMPTIONS FROM THE LISTING STANDARDS FOR AUDIT COMMITTEES . . . . . . 130ITEM 16E. PURCHASES OF EQUITY SECURITIES BY THE ISSUER AND AFFILIATED
PURCHASERS . . . . . . . . . . . . . . . . . . . . . . . . . . . . . . . . . . . . . . . . . . . . . . . . . . 131
PART IIIITEM 17. FINANCIAL STATEMENTS . . . . . . . . . . . . . . . . . . . . . . . . . . . . . . . . . . . . . . . . . . 132ITEM 18. FINANCIAL STATEMENTS . . . . . . . . . . . . . . . . . . . . . . . . . . . . . . . . . . . . . . . . . . 132ITEM 19. EXHIBITS . . . . . . . . . . . . . . . . . . . . . . . . . . . . . . . . . . . . . . . . . . . . . . . . . . . . . . 132
GLOSSARY OF TERMS . . . . . . . . . . . . . . . . . . . . . . . . . . . . . . . . . . . . . . . . . . . . . . . . . . . . . . . . . . . 133
3
INTRODUCTION AND USE OF CERTAIN TERMS
Nokia Corporation is a public limited liability company incorporated under the laws of theRepublic of Finland. In this document, any reference to ‘‘we,’’ ‘‘us,’’ ‘‘the Group’’ or ‘‘Nokia’’ meansNokia Corporation and its subsidiaries on a consolidated basis, except where we make clear thatthe term means Nokia Corporation or a particular subsidiary or business group only, and exceptthat references to ‘‘our shares,’’ matters relating to our shares or matters of corporate governanceshall refer to the shares and corporate governance of Nokia Corporation. Nokia Corporation haspublished its consolidated financial statements in euro for periods beginning on or after January 1,1999. In this Form 20-F, references to ‘‘EUR,’’ ‘‘euro’’ or ‘‘A’’ are to the common currency of theEuropean Economic and Monetary Union, or EMU, and references to ‘‘dollars,’’ ‘‘US dollars,’’ ‘‘USD’’or ‘‘$’’ are to the currency of the United States. Solely for the convenience of the reader, thisForm 20-F contains conversions of selected euro amounts into US dollars at specified rates, or, ifnot so specified, at the rate of 1.1842 US dollars per euro, which was the noon buying rate in NewYork City for cable transfers in euro as certified for customs purposes by the Federal Reserve Bankof New York on December 31, 2005. No representation is made that the amounts have been, couldhave been or could be converted into US dollars at the rates indicated or at any other rates.
In this Form 20-F, unless otherwise stated, references to ‘‘shares’’ are to Nokia Corporation shares,par value EUR 0.06.
Our principal executive office is currently located at Keilalahdentie 4, P.O. Box 226, FIN-00045 NokiaGroup, Espoo, Finland and our telephone number is +358 (0) 7 1800-8000.
Nokia Corporation furnishes Citibank, N.A., as Depositary, with consolidated financial statementsand a related audit opinion of our independent auditors annually. These financial statements areprepared on the basis of International Financial Reporting Standards, or IFRS. Nokia’s consolidatedfinancial statements contain a reconciliation of net income and shareholders’ equity to accountingprinciples generally accepted in the United States, or US GAAP. Upon receipt, the Depositarygenerally delivers these consolidated financial statements to record holders of American DepositaryReceipts, or ADRs, evidencing American Depositary Shares, or ADSs. One ADS represents one share.We also furnish the Depositary with quarterly reports containing unaudited financial informationprepared on the basis of IFRS, as well as all notices of shareholders’ meetings and other reportsand communications that are made available generally to our shareholders. The Depositary makesthese notices, reports and communications available for inspection by record holders of ADSs anddelivers to all record holders of ADSs notices of shareholders’ meetings received by the Depositary.In addition to the reports delivered to holders of ADSs by the Depositary, holders can access ourconsolidated financial statements, as well as other information previously included in our printedannual reports, at www.nokia.com. This Form 20-F is also available at www.nokia.com. With eachannual distribution of our consolidated financial statements, we offer our shareholders and recordholders of ADSs the option of receiving all of these documents electronically in the future.
FORWARD-LOOKING STATEMENTS
It should be noted that certain statements herein which are not historical facts, including, withoutlimitation, those regarding:
• the timing of product and solution deliveries;
• our ability to develop, implement and commercialize new products, solutions andtechnologies;
• expectations regarding market growth, developments and structural changes;
• expectations and targets for our results of operations;
4
• the outcome of pending and threatened litigation; and
• statements preceded by ‘‘believe,’’ ‘‘expect,’’ ‘‘anticipate,’’ ‘‘foresee,’’ ‘‘target’’ or similarexpressions
are forward-looking statements.
Because these statements involve risks and uncertainties, actual results may differ materially fromthe results that we currently expect. Factors that could cause these differences include, but are notlimited to:
• the extent of the growth of the mobile communications industry, as well as the growth andprofitability of the new market segments within that industry which we target;
• the availability of new products and services by network operators and other marketparticipants;
• our ability to identify key market trends and to respond timely and successfully to theneeds of our customers;
• the impact of changes in technology and our ability to develop or otherwise acquirecomplex technologies as required by the market, with full rights needed to use;
• competitiveness of our product portfolio;
• timely and successful commercialization of new advanced products and solutions;
• price erosion and cost management;
• the intensity of competition in the mobile communications industry and our ability tomaintain or improve our market position and respond to changes in the competitivelandscape;
• our ability to manage efficiently our manufacturing and logistics, as well as to ensure thequality, safety, security and timely delivery of our products and solutions;
• inventory management risks resulting from shifts in market demand;
• our ability to source quality components without interruption and at acceptable prices;
• our success in collaboration arrangements relating to development of technologies or newproducts and solutions;
• the success, financial condition and performance of our collaboration partners, suppliersand customers;
• any disruption to information technology systems and networks that our operations relyon;
• our ability to protect the complex technologies that we or others develop or that we licensefrom claims that we have infringed third parties’ intellectual property rights, as well as ourunrestricted use on commercially acceptable terms of certain technologies in our productsand solution offerings;
• general economic conditions globally and, in particular, economic or political turmoil inemerging market countries where we do business;
• developments under large, multi-year contracts or in relation to major customers;
5

• exchange rate fluctuations, including, in particular, fluctuations between the euro, which isour reporting currency, and the US dollar, the Chinese yuan, the UK pound sterling and theJapanese yen;
• the management of our customer financing exposure;
• our ability to recruit, retain and develop appropriately skilled employees; and
• the impact of changes in government policies, laws or regulations;
as well as the risk factors specified in this annual report on Form 20-F under ‘‘Item 3.D RiskFactors.’’
6
PART I
ITEM 1. IDENTITY OF DIRECTORS, SENIOR MANAGEMENT AND ADVISERS
Not applicable.
ITEM 2. OFFER STATISTICS AND EXPECTED TIMETABLE
Not applicable.
ITEM 3. KEY INFORMATION
3.A Selected Financial Data
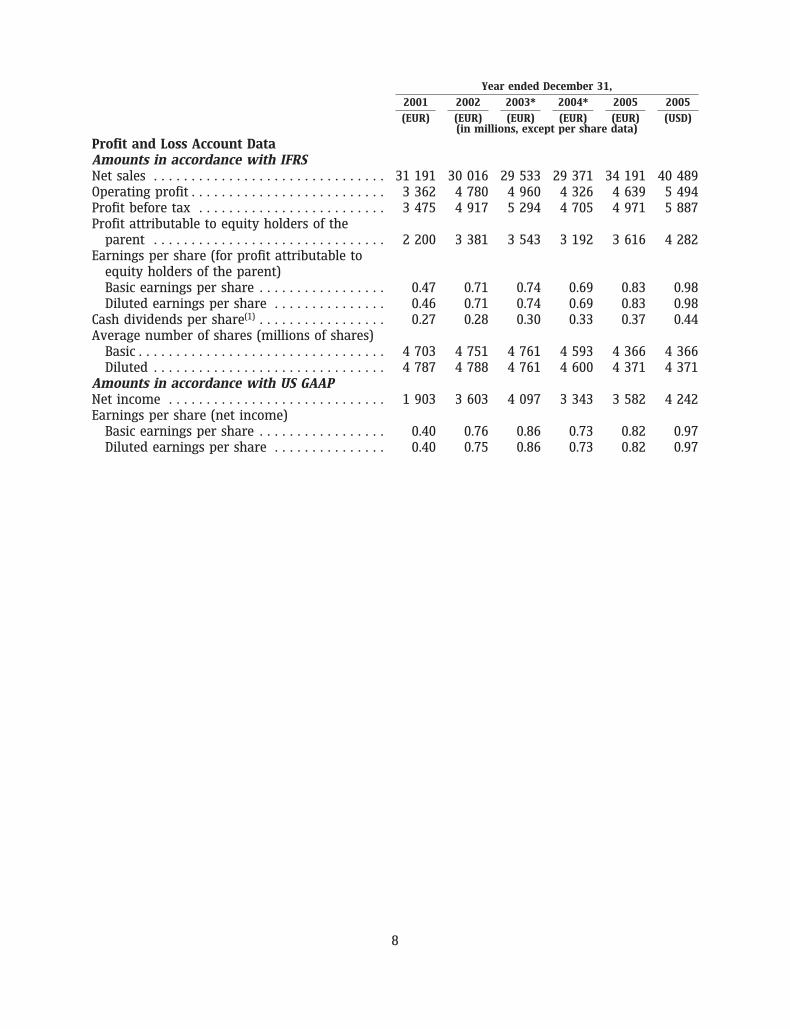
The financial data set forth below at December 31, 2004, as revised, and 2005 and for each of theyears in the three-year period ended December 31, 2005 have been derived from our auditedconsolidated financial statements included in Item 18 of this annual report on Form 20-F. Financialdata at December 31, 2001 and 2002, and December 31, 2003, as revised, and for each of the yearsin the two-year period ended December 31, 2002 have been derived from Nokia’s previouslypublished audited consolidated financial statements not included in this document.
The financial data at December 31, 2004, as revised, and 2005 and for each of the years in thethree-year period ended December 31, 2005 should be read in conjunction with, and are qualifiedin their entirety by reference to, our audited consolidated financial statements.
The audited consolidated financial statements from which the selected consolidated financial dataset forth below have been derived were prepared in accordance with IFRS, and net income andshareholders’ equity have been reconciled to US GAAP, which differ in some respects from IFRS.For a discussion of the principal differences between IFRS and US GAAP, see ‘‘Item 5.A OperatingResults—Results of Operations—Principal Differences Between IFRS and US GAAP’’ and Note 39 toour audited consolidated financial statements.
7
Year ended December 31,
2001 2002 2003* 2004* 2005 2005
(EUR) (EUR) (EUR) (EUR) (EUR) (USD)(in millions, except per share data)
Profit and Loss Account DataAmounts in accordance with IFRSNet sales . . . . . . . . . . . . . . . . . . . . . . . . . . . . . . . 31 191 30 016 29 533 29 371 34 191 40 489Operating profit . . . . . . . . . . . . . . . . . . . . . . . . . . 3 362 4 780 4 960 4 326 4 639 5 494Profit before tax . . . . . . . . . . . . . . . . . . . . . . . . . 3 475 4 917 5 294 4 705 4 971 5 887Profit attributable to equity holders of the
parent . . . . . . . . . . . . . . . . . . . . . . . . . . . . . . . 2 200 3 381 3 543 3 192 3 616 4 282Earnings per share (for profit attributable to
equity holders of the parent)Basic earnings per share . . . . . . . . . . . . . . . . . 0.47 0.71 0.74 0.69 0.83 0.98Diluted earnings per share . . . . . . . . . . . . . . . 0.46 0.71 0.74 0.69 0.83 0.98
Cash dividends per share(1) . . . . . . . . . . . . . . . . . 0.27 0.28 0.30 0.33 0.37 0.44Average number of shares (millions of shares)
Basic . . . . . . . . . . . . . . . . . . . . . . . . . . . . . . . . . 4 703 4 751 4 761 4 593 4 366 4 366Diluted . . . . . . . . . . . . . . . . . . . . . . . . . . . . . . . 4 787 4 788 4 761 4 600 4 371 4 371
Amounts in accordance with US GAAPNet income . . . . . . . . . . . . . . . . . . . . . . . . . . . . . 1 903 3 603 4 097 3 343 3 582 4 242Earnings per share (net income)
Basic earnings per share . . . . . . . . . . . . . . . . . 0.40 0.76 0.86 0.73 0.82 0.97Diluted earnings per share . . . . . . . . . . . . . . . 0.40 0.75 0.86 0.73 0.82 0.97
8
Year ended December 31,
2001 2002 2003* 2004* 2005 2005
(EUR) (EUR) (EUR) (EUR) (EUR) (USD)(in millions, except per share data)
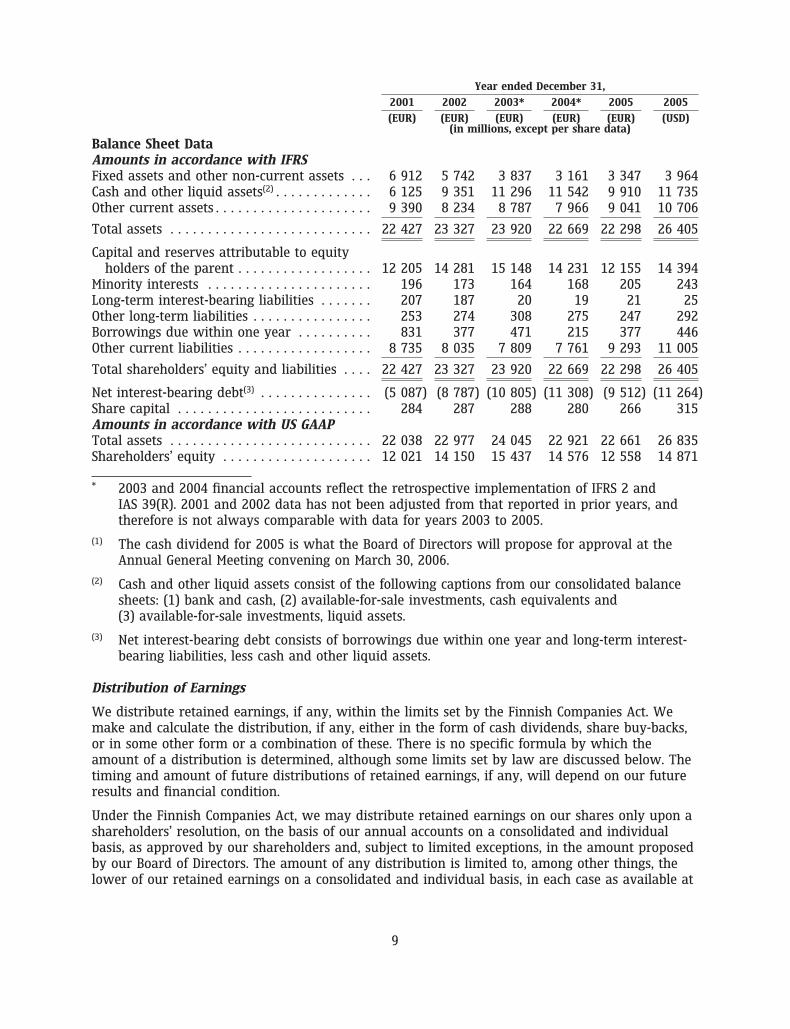
Balance Sheet DataAmounts in accordance with IFRSFixed assets and other non-current assets . . . 6 912 5 742 3 837 3 161 3 347 3 964Cash and other liquid assets(2) . . . . . . . . . . . . . 6 125 9 351 11 296 11 542 9 910 11 735Other current assets . . . . . . . . . . . . . . . . . . . . . 9 390 8 234 8 787 7 966 9 041 10 706
Total assets . . . . . . . . . . . . . . . . . . . . . . . . . . . 22 427 23 327 23 920 22 669 22 298 26 405
Capital and reserves attributable to equityholders of the parent . . . . . . . . . . . . . . . . . . 12 205 14 281 15 148 14 231 12 155 14 394
Minority interests . . . . . . . . . . . . . . . . . . . . . . 196 173 164 168 205 243Long-term interest-bearing liabilities . . . . . . . 207 187 20 19 21 25Other long-term liabilities . . . . . . . . . . . . . . . . 253 274 308 275 247 292Borrowings due within one year . . . . . . . . . . 831 377 471 215 377 446Other current liabilities . . . . . . . . . . . . . . . . . . 8 735 8 035 7 809 7 761 9 293 11 005
Total shareholders’ equity and liabilities . . . . 22 427 23 327 23 920 22 669 22 298 26 405
Net interest-bearing debt(3) . . . . . . . . . . . . . . . (5 087) (8 787) (10 805) (11 308) (9 512) (11 264)Share capital . . . . . . . . . . . . . . . . . . . . . . . . . . 284 287 288 280 266 315Amounts in accordance with US GAAPTotal assets . . . . . . . . . . . . . . . . . . . . . . . . . . . 22 038 22 977 24 045 22 921 22 661 26 835Shareholders’ equity . . . . . . . . . . . . . . . . . . . . 12 021 14 150 15 437 14 576 12 558 14 871
* 2003 and 2004 financial accounts reflect the retrospective implementation of IFRS 2 andIAS 39(R). 2001 and 2002 data has not been adjusted from that reported in prior years, andtherefore is not always comparable with data for years 2003 to 2005.
(1) The cash dividend for 2005 is what the Board of Directors will propose for approval at theAnnual General Meeting convening on March 30, 2006.
(2) Cash and other liquid assets consist of the following captions from our consolidated balancesheets: (1) bank and cash, (2) available-for-sale investments, cash equivalents and(3) available-for-sale investments, liquid assets.
(3) Net interest-bearing debt consists of borrowings due within one year and long-term interest-bearing liabilities, less cash and other liquid assets.
Distribution of Earnings
We distribute retained earnings, if any, within the limits set by the Finnish Companies Act. Wemake and calculate the distribution, if any, either in the form of cash dividends, share buy-backs,or in some other form or a combination of these. There is no specific formula by which theamount of a distribution is determined, although some limits set by law are discussed below. Thetiming and amount of future distributions of retained earnings, if any, will depend on our futureresults and financial condition.
Under the Finnish Companies Act, we may distribute retained earnings on our shares only upon ashareholders’ resolution, on the basis of our annual accounts on a consolidated and individualbasis, as approved by our shareholders and, subject to limited exceptions, in the amount proposedby our Board of Directors. The amount of any distribution is limited to, among other things, thelower of our retained earnings on a consolidated and individual basis, in each case as available at
9
the end of the preceding financial year pursuant to the annual accounts as approved by ourshareholders. Subject to exceptions relating to the right of minority shareholders to requestotherwise, the distribution may not exceed the amount proposed by the Board of Directors. TheFinnish Companies Act of 1978, which provides for distribution of earnings, is currently subject toa major reform expected to become effective in the latter part of 2006.
Share Buy-backs
Under the Finnish Companies Act, Nokia Corporation may repurchase its own shares pursuant toeither a shareholders’ resolution or an authorization to the Board of Directors approved by thecompany’s shareholders. Such authorizations to the Board of Directors are effective for a maximumof one year. The undertaking of share buy-backs is subject not only to the regulations in theFinnish Companies Act, but also to the rules of the stock exchanges on which the repurchases takeplace. The Board of Directors of Nokia has been regularly authorized by our shareholders in theAnnual General Meetings to repurchase Nokia’s own shares: 225 million shares in 2001,220 million shares in 2002, 225 million shares in 2003, 230 million shares in 2004 and443.2 million shares in 2005. The amount authorized each year has been at or slightly under themaximum limit provided by the Finnish Companies Act. The upper limit for share repurchaseswas increased from 5% to 10% in 2005.
On January 26, 2006, we announced that the Board of Directors will propose that the AnnualGeneral Meeting, convening on March 30, 2006, approve a new authorization to repurchase amaximum of 405 million shares corresponding to nearly 10% of Nokia’s share capital and totalvoting rights.
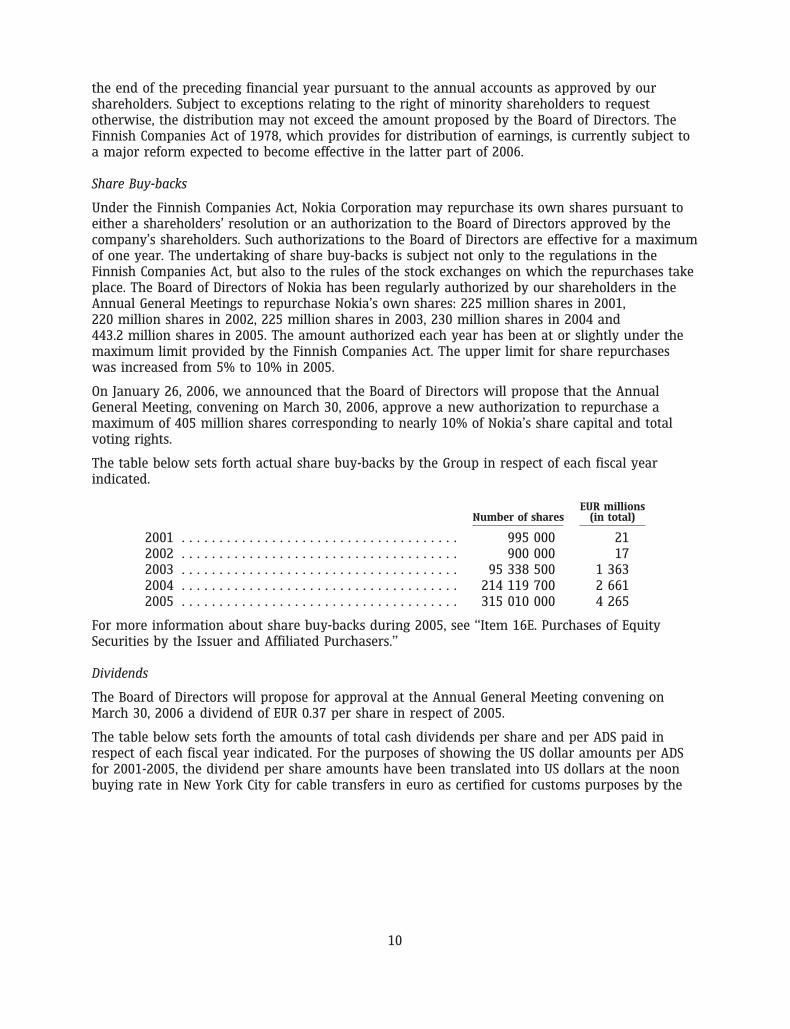
The table below sets forth actual share buy-backs by the Group in respect of each fiscal yearindicated.
EUR millionsNumber of shares (in total)
2001 . . . . . . . . . . . . . . . . . . . . . . . . . . . . . . . . . . . . . 995 000 212002 . . . . . . . . . . . . . . . . . . . . . . . . . . . . . . . . . . . . . 900 000 172003 . . . . . . . . . . . . . . . . . . . . . . . . . . . . . . . . . . . . . 95 338 500 1 3632004 . . . . . . . . . . . . . . . . . . . . . . . . . . . . . . . . . . . . . 214 119 700 2 6612005 . . . . . . . . . . . . . . . . . . . . . . . . . . . . . . . . . . . . . 315 010 000 4 265
For more information about share buy-backs during 2005, see ‘‘Item 16E. Purchases of EquitySecurities by the Issuer and Affiliated Purchasers.’’
Dividends
The Board of Directors will propose for approval at the Annual General Meeting convening onMarch 30, 2006 a dividend of EUR 0.37 per share in respect of 2005.
The table below sets forth the amounts of total cash dividends per share and per ADS paid inrespect of each fiscal year indicated. For the purposes of showing the US dollar amounts per ADSfor 2001-2005, the dividend per share amounts have been translated into US dollars at the noonbuying rate in New York City for cable transfers in euro as certified for customs purposes by the
10
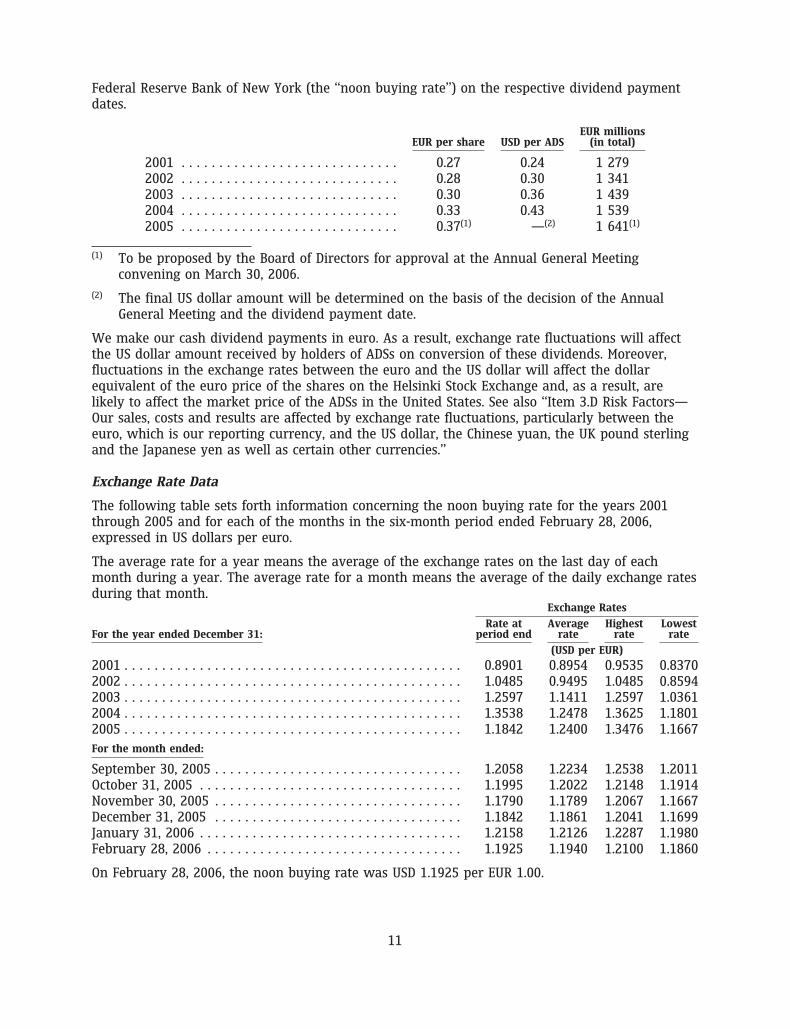
Federal Reserve Bank of New York (the ‘‘noon buying rate’’) on the respective dividend paymentdates.
EUR millionsEUR per share USD per ADS (in total)
2001 . . . . . . . . . . . . . . . . . . . . . . . . . . . . . 0.27 0.24 1 2792002 . . . . . . . . . . . . . . . . . . . . . . . . . . . . . 0.28 0.30 1 3412003 . . . . . . . . . . . . . . . . . . . . . . . . . . . . . 0.30 0.36 1 4392004 . . . . . . . . . . . . . . . . . . . . . . . . . . . . . 0.33 0.43 1 5392005 . . . . . . . . . . . . . . . . . . . . . . . . . . . . . 0.37(1) —(2) 1 641(1)
(1) To be proposed by the Board of Directors for approval at the Annual General Meetingconvening on March 30, 2006.
(2) The final US dollar amount will be determined on the basis of the decision of the AnnualGeneral Meeting and the dividend payment date.
We make our cash dividend payments in euro. As a result, exchange rate fluctuations will affectthe US dollar amount received by holders of ADSs on conversion of these dividends. Moreover,fluctuations in the exchange rates between the euro and the US dollar will affect the dollarequivalent of the euro price of the shares on the Helsinki Stock Exchange and, as a result, arelikely to affect the market price of the ADSs in the United States. See also ‘‘Item 3.D Risk Factors—Our sales, costs and results are affected by exchange rate fluctuations, particularly between theeuro, which is our reporting currency, and the US dollar, the Chinese yuan, the UK pound sterlingand the Japanese yen as well as certain other currencies.’’
Exchange Rate Data
The following table sets forth information concerning the noon buying rate for the years 2001through 2005 and for each of the months in the six-month period ended February 28, 2006,expressed in US dollars per euro.
The average rate for a year means the average of the exchange rates on the last day of eachmonth during a year. The average rate for a month means the average of the daily exchange ratesduring that month.
Exchange Rates
Rate at Average Highest LowestFor the year ended December 31: period end rate rate rate
(USD per EUR)
2001 . . . . . . . . . . . . . . . . . . . . . . . . . . . . . . . . . . . . . . . . . . . . . 0.8901 0.8954 0.9535 0.83702002 . . . . . . . . . . . . . . . . . . . . . . . . . . . . . . . . . . . . . . . . . . . . . 1.0485 0.9495 1.0485 0.85942003 . . . . . . . . . . . . . . . . . . . . . . . . . . . . . . . . . . . . . . . . . . . . . 1.2597 1.1411 1.2597 1.03612004 . . . . . . . . . . . . . . . . . . . . . . . . . . . . . . . . . . . . . . . . . . . . . 1.3538 1.2478 1.3625 1.18012005 . . . . . . . . . . . . . . . . . . . . . . . . . . . . . . . . . . . . . . . . . . . . . 1.1842 1.2400 1.3476 1.1667For the month ended:
September 30, 2005 . . . . . . . . . . . . . . . . . . . . . . . . . . . . . . . . . 1.2058 1.2234 1.2538 1.2011October 31, 2005 . . . . . . . . . . . . . . . . . . . . . . . . . . . . . . . . . . . 1.1995 1.2022 1.2148 1.1914November 30, 2005 . . . . . . . . . . . . . . . . . . . . . . . . . . . . . . . . . 1.1790 1.1789 1.2067 1.1667December 31, 2005 . . . . . . . . . . . . . . . . . . . . . . . . . . . . . . . . . 1.1842 1.1861 1.2041 1.1699January 31, 2006 . . . . . . . . . . . . . . . . . . . . . . . . . . . . . . . . . . . 1.2158 1.2126 1.2287 1.1980February 28, 2006 . . . . . . . . . . . . . . . . . . . . . . . . . . . . . . . . . . 1.1925 1.1940 1.2100 1.1860
On February 28, 2006, the noon buying rate was USD 1.1925 per EUR 1.00.
11
3.B Capitalization and Indebtedness
Not applicable.
3.C Reasons for the Offer and Use of Proceeds
Not applicable.
3.D Risk Factors
Set forth below is a description of factors that may affect our business, results of operations andshare price from time to time.
Our sales and profitability depend on the continued growth of the mobile communicationsindustry as well as the growth and profitability of the new market segments within thatindustry which we target. If the mobile communications industry does not grow as weexpect, or if the new market segments which we target grow less or are less profitable thanexpected, or if new faster growing market segments emerge in which we have not invested,our sales and profitability may be materially adversely affected.
Our business depends on continued growth in mobile communications in terms of the number ofexisting mobile subscribers who upgrade or simply replace their existing mobile devices, thenumber of new subscribers and increased usage. As well, our sales and profitability are affectedby the extent to which there is increasing demand for, and development of, value-added services,leading to opportunities for us to successfully market mobile devices that feature those services.These developments in our industry are to a certain extent outside of our control. For example, weare dependent on operators in highly penetrated markets to successfully introduce services thatdrive the upgrade and replacement of devices. Further, in order to support a continued increase inmobile subscribers in certain low penetration markets, we are dependent on operators to increasetheir sales volumes of lower cost mobile devices, to offer affordable tariffs and to offer tailoredmobile network solutions designed for a low total cost of ownership. If operators are notsuccessful in their attempts to increase subscriber numbers, stimulate increased usage or drivereplacement sales, our business and results of operations could be materially adversely affected.
Our industry continues to undergo significant changes. First, the mobile communications,information technology, media and consumer electronics industries are converging in some areasinto one broader industry leading to the creation of new mobile devices, services and ways to usemobile devices. Second, while participants in the mobile communications industry once providedcomplete products and solutions, industry players are increasingly providing specific hardwareand software layers for products and solutions. As a result of these changes, new market segmentswithin our industry have begun to emerge and we have made significant investments in newbusiness opportunities in certain of these market segments, such as smartphones, imaging, musicand games in our device businesses, and enterprise mobility infrastructure as well as managedservices, systems integration and consulting businesses in our infrastructure business. However, anumber of the new market segments in the mobile communications industry are still in the earlystages of development, and it may be difficult for us to accurately predict which new marketsegments are the most advantageous for us to focus on. As a result, if the segments which wetarget grow less than expected, we may not receive a return on our investment as soon as weexpect, or at all. We may also forego growth opportunities in new market segments of the mobilecommunications industry on which we do not focus. Moreover, the market segments that wetarget may be less profitable than we currently foresee. We may also incur short-term operatinglosses in certain of these new market segments if we are not able to generate sufficient revenueto cover the early stage investments required to pursue these new business opportunities. Our
12
past performance in our established market segments does not guarantee our success in thesenew market segments.
We need to understand the different markets in which we operate, and meet the needs ofour customers, which include mobile network operators, distributors, independent retailers,corporate customers and end-users. We need to have a competitive product portfolio and towork together with our operator customers to address their needs. Our failure to identifykey market trends and to respond timely and successfully to the needs of our customers mayhave a material adverse impact on our market share, business and results of operations.
We serve a diverse range of mobile device and infrastructure customers, ranging from mobilenetwork operators, distributors, independent retailers, corporate customers to end-users, across avariety of markets. In many of these markets, the mobile communications industry is at differentstages of development, and many of these markets have different characteristics and dynamics, forexample, in terms of mobile penetration rates and technology, feature and pricing preferences.Establishing and maintaining good relationships with our customers, including both our mobiledevice customers and our networks infrastructure customers, and understanding trends and needsin their markets require us to constantly obtain and evaluate a complex array of feedback andother data. We must do this efficiently in order to be able to identify key market trends and usersegments and address our customers’ needs proactively and in a timely manner, for examplethrough launching our products at optimal times to meet customer requirements and preferences,while taking into account the availability of competitors’ products. If we fail to analyze correctlyand respond timely and appropriately to customer feedback and other data, our business may bematerially adversely affected.
Certain mobile network operators require mobile devices to be customized to their specificationswith certain preferred features, functionalities or design and co-branding with the networkoperator’s brand. We believe that customization is an important element in increasing operatorcustomer satisfaction, and we are working together with operators on product planning, as wellas accelerating product hardware and software customization programs. These developments mayresult in new challenges, such as the need for us to produce mobile devices in smaller lot sizes,which can impede our economies of scale, or the potential for the erosion of the Nokia brand,which we consider to be one of our key competitive advantages.
In order to meet our customers’ needs, we need to maintain a competitive product portfolio. ForNokia, a competitive mobile device product portfolio means a broad and balanced offering ofcommercially appealing mobile devices with attractive features, functionality and design for allmajor consumer segments and price points supported by the Nokia brand, quality and competitivecost structure. The competitiveness of our product portfolio is also influenced by our ability tocommunicate about our products and services effectively through consistent and focusedmarketing messages to the target audience. If we do not achieve and maintain a competitiveportfolio, we believe that we will be at a competitive disadvantage, which may lead to lowerrevenue and lower profits.
The competitiveness of our portfolio is also influenced by the value of the Nokia brand. A numberof factors, including actual or even alleged defects in our products and solutions, may have anegative effect on our reputation and erode the value of the Nokia brand.
We must develop or otherwise acquire complex, evolving technologies to use in our business.If we fail to develop or otherwise acquire these complex technologies as required by themarket, with full rights needed to use in our business, or to successfully commercialize suchtechnologies as new advanced products and solutions that meet customer demand, or fail todo so on a timely basis, this may have a material adverse effect on our business, our abilityto meet our targets and our results of operations.
13
In order to succeed in our markets, we believe that we must develop or otherwise acquirecomplex, evolving technologies to use in our business. However, the development and use of newtechnologies, applications and technology platforms for our mobile devices involves time,substantial costs and risks both within and outside of our control. This is true whether wedevelop these technologies internally, acquire or invest in other companies with these technologiesor collaborate with third parties on the development of these technologies.
The technologies, functionalities and features on which we choose to focus may not achieve asbroad or timely customer acceptance as we expect. This may result from numerous factorsincluding the availability of more attractive alternatives or a lack of sufficient compatibility withother existing technologies, products and solutions. Additionally, even if we do select thetechnologies, functionalities and features that customers ultimately want, we or the companiesthat work with us may not be able to bring them to the market at the right time. We may alsoface difficulties accessing the technologies preferred by our potential customers, or at pricesacceptable to them.
Our products and solutions include increasingly complex technology involving numerous newNokia patented and other proprietary technologies, as well as some developed or licensed to us bythird parties. There can be no assurance that the technologies, with full rights needed to use inour business, will be available or available on commercially acceptable terms at such times as wemay seek to use them.
Furthermore, as a result of ongoing technological developments, our products and solutions areincreasingly used together with hardware or software components that have been developed bythird parties, whether or not Nokia has authorized their use with our products and solutions.However, such components, such as batteries or software applications, may not be compatiblewith our products and solutions and may not meet our and our customers’ quality, safety, securityor other standards. As well, certain components or layers that may be used with our productsmay enable our products and solutions to be used for objectionable purposes, such as to transfercontent that might be hateful or derogatory. The use of our products and solutions withincompatible or otherwise substandard hardware or software components, or for purposes thatare inappropriate, is largely outside of our control and could harm the Nokia brand.
In our networks business, we are developing a number of network infrastructure solutionsincorporating advanced technologies. Currently, our networks business designs and buildsnetworks based primarily on GSM, EDGE and 3G/WCDMA technologies. Although we believe thatthese are currently the leading mobile communications technology platforms, this may not alwaysbe the case, due to operators’ choices or regulators’ decisions. Our networks business’s sales andoperating results may be adversely affected if these technologies or subsequent new technologieson which we focus do not achieve as broad acceptance among customers as we expect, or if wefail to adapt to different technology platforms that emerge over time.
Our results of operations, particularly our profitability, may be materially adversely affectedif we do not successfully manage price erosion and are not able to manage costs related toour products and operations.
Price erosion is a characteristic of the mobile communications industry, and the products andsolutions offered by us are also subject to natural price erosion over time. If we are not able tolower our costs at the same rate or faster than this price erosion and introduce new cost-efficientproducts with higher prices in a timely manner, as well as generally manage costs related to ourproducts and operations, this will have a material adverse effect on our business and results ofoperations, particularly our profitability.
14
Competition in our industry is intense. Our failure to maintain or improve our marketposition and respond successfully to changes in the competitive landscape may have amaterial adverse impact on our business and results of operations.
The markets for our products and solutions are intensely competitive. Industry participantscompete with each other mainly on the basis of the breadth and depth of their product portfolios,price, operational and manufacturing efficiency, technical performance, product features, quality,customer support and brand recognition. We are facing increased competition from both ourtraditional competitors in the mobile communications industry as well as a number of newcompetitors, particularly from countries where production costs tend to be lower. Some of thesecompetitors have used, and we expect will continue to use, more aggressive pricing strategies,different design approaches and alternative technologies. In addition, some competitors havechosen to focus on building products based on commercially available components, which mayenable them to introduce these products faster and with lower levels of research and developmentspending than Nokia.
Nokia believes that it has a cost advantage in mobile devices compared to our competitors as aresult of its market position. If we fail to maintain or increase our market share and scalecompared to our competitors, our cost advantage may be eroded, which could materiallyadversely affect our competitive position and our results of operations, particularly ourprofitability.
Consolidation among the industry participants could potentially result in stronger competitors thatare better able to compete as end-to-end suppliers as well as competitors who are morespecialized in particular areas. This could have a material adverse effect on our business,operating results, and financial condition.
As a result of developments in our industry, we also expect to face new competition fromcompanies in related industries, such as consumer electronics manufacturers and business deviceand solution providers. Additionally, because mobile network operators are increasingly offeringmobile devices under their own brand, we face increasing competition from non-branded mobiledevice manufacturers. If we cannot respond successfully to these competitive developments, ourbusiness and results of operations may be materially adversely affected. See ‘‘Item 4.B BusinessOverview—Competition,’’ for a more detailed discussion of competition in our industry.
Our sales and results of operations could be materially adversely affected if we fail toefficiently manage our manufacturing and logistics without interruption, or fail to ensurethat our products and solutions meet our and our customers’ quality, safety, security andother requirements and are delivered on time.
Our manufacturing and logistics are complex, require advanced and costly equipment and includeoutsourcing to third parties. These operations are continuously modified in an effort to improvemanufacturing efficiency and flexibility. We may experience difficulties in adapting our supply tomeet the demand for our products, ramping up or down production at our facilities as needed,maintaining an optimal inventory level, adopting new manufacturing processes, finding the mosttimely way to develop the best technical solutions for new products, managing the increasinglycomplex manufacturing process for our high-end products, particularly the software for thesehigh-end products, or achieving manufacturing efficiency and flexibility, whether we manufactureour products and solutions ourselves or outsource to third parties. Such difficulties may have amaterial adverse effect on our sales and results of operations and may result from, among otherthings, delays in adjusting or upgrading production at our facilities, delays in expandingproduction capacity, failure in our manufacturing and logistics processes, failures in the activitieswe have outsourced, and interruptions in the data communication systems that run ouroperations. Also, a failure or an interruption could occur at any stage of our product creation,
15
manufacturing and delivery processes, resulting in our products and solutions not meeting ourand our customers’ quality, safety, security and other requirements, or being delivered latecompared to our own estimates or customer requirements, which could have a material adverseeffect on our sales, our results of operations and reputation, and the value of the Nokia brand.
We depend on a limited number of suppliers for the timely delivery of components and fortheir compliance with our supplier requirements, such as our and our customers’ productquality, safety, security and other standards. Their failure to do so could materially adverselyaffect our ability to deliver our products and solutions successfully and on time.
Our manufacturing operations depend to a certain extent on obtaining adequate supplies of fullyfunctional components on a timely basis. Our principal supply requirements are for electroniccomponents, mechanical components and software, which all have a wide range of applications inour products. Electronic components include integrated circuits, microprocessors, standardcomponents, memory devices, cameras, displays, batteries and chargers while mechanicalcomponents include covers, connectors, key mats and antennas. Software includes various third-party software that enables various new features and applications to be added, like third-partye-mail, into our products.
In addition, a particular component may be available only from a limited number of suppliers.Suppliers may from time to time extend lead times, limit supplies or increase prices due tocapacity constraints or other factors, which could adversely affect our ability to deliver ourproducts and solutions on a timely basis. Moreover, a component supplier may fail to meet oursupplier requirements, such as, most notably, our and our customers’ product quality, safety,security and other standards, and consequently some of our products may be unacceptable to usand our customers, or may fail to meet our own quality controls. In addition, a componentsupplier may experience delays or disruption to its manufacturing processes or financialdifficulties. Any of these events could delay our successful delivery of products and solutions thatmeet our and our customers’ quality, safety, security and other requirements, or otherwisematerially adversely affect our sales and our results of operations. Also, our reputation and brandvalue may be materially adversely affected due to real or merely alleged failures in our productsand solutions.
Possible consolidation among our suppliers could potentially result in larger suppliers withstronger bargaining power and limit the choice of alternative suppliers, which could lead to anincrease in the cost, or limit the availability, of components that may materially adversely affectour sales and profitability.
Many of the production sites of our suppliers are geographically concentrated. In the event thatany of these geographic areas is generally affected by adverse conditions that disrupt productionand/or deliveries from any of our suppliers, this could adversely affect our ability to deliver ourproducts and solutions on a timely basis, which may materially adversely affect our sales andprofitability.
We are developing a number of our new products and solutions together with othercompanies. If any of these companies were to fail to perform, we may not be able to bringour products and solutions to market successfully or in a timely way and this could have amaterial adverse impact on our sales and profitability.
We invite the providers of technology, components or software to work with us to developtechnologies or new products and solutions. These arrangements involve the commitment by eachcompany of various resources, including technology, research and development efforts, andpersonnel. Although the objective of these arrangements is a mutually beneficial outcome for eachparty, our ability to introduce new products and solutions that meet our and our customers’
16
quality, safety, security and other standards successfully and on schedule could be hampered if,for example, any of the following risks were to materialize: the arrangements with the companiesthat work with us do not develop as expected; the technologies provided by the companies thatwork with us are not sufficiently protected or infringe third parties’ intellectual property rights ina way that we cannot foresee or prevent; the technologies, products or solutions supplied by thecompanies that work with us do not meet the required quality, safety, security and otherstandards or customer needs; our own quality controls fail; or the financial condition of thecompanies that work with us deteriorates.
Our operations rely on complex and highly centralized information technology systems andnetworks. If any system or network disruption occurs, this reliance could have a materialadverse impact on our operations, sales and operating results.
Our operations rely to a significant degree on the efficient and uninterrupted operation of complexand highly centralized information technology systems and networks, which are integrated withthose of third parties. Any failure or disruption of our current or future systems or networks couldhave a material adverse effect on our operations, sales and operating results. Furthermore, anydata leakages resulting from information technology security breaches could also adverselyaffect us.
All information technology systems are potentially vulnerable to damage or interruption from avariety of sources. We pursue various measures in order to manage our risks related to systemand network disruptions, including the use of multiple suppliers and available informationtechnology security. However, despite precautions taken by us, an outage in a telecommunicationsnetwork utilized by any of our information technology systems, attack by a virus or other eventthat leads to an unanticipated interruption of our information technology systems or networkscould have a material adverse effect on our operations, sales and operating results.
Our products and solutions include increasingly complex technology involving numerous newNokia patented and other proprietary technologies, as well as some developed or licensed tous by certain third parties. As a consequence, evaluating the rights related to thetechnologies we use or intend to use is more and more challenging, and we expectincreasingly to face claims that we have infringed third parties’ intellectual property rights.The use of increasingly complex technology may also result in increased licensing costs forus, restrictions on our ability to use certain technologies in our products and solutionofferings, and/or costly and time-consuming litigation. Third parties may also commenceactions seeking to establish the invalidity of intellectual property rights on which we depend.
Our products and solutions include increasingly complex technology involving numerous newNokia patented and other proprietary technologies, as well as some developed or licensed to us bythird parties. As the amount of such proprietary technologies and the number of parties claimingrights continues to increase, even within individual products, and as the Nokia product rangebecomes more diversified, and as the complexity of the technology increases, the possibility ofalleged infringement and related intellectual property claims against us continues to rise. Theholders of patents and other intellectual property rights potentially relevant to our product andsolution offerings may be unknown to us, or may otherwise make it difficult for us to acquire alicense on commercially acceptable terms. There may also be technologies licensed to and reliedon by us that are subject to infringement or other corresponding allegations or claims by otherswhich could damage our ability to rely on such technologies. In addition, although we endeavor toensure that companies that work with us possess appropriate intellectual property rights orlicenses, we cannot fully avoid risks of intellectual property rights infringement created bysuppliers of components and various layers in our products and solutions or by companies withwhich we work in cooperative research and development activities. Similarly, we and our
17
customers may face claims of infringement in connection with our customers’ use of our productsand solutions.
In many aspects, the business models for mobile services have not yet been established. The lackof availability of licenses for copyrighted content, delayed negotiations, or restrictive copyrightlicensing terms may have an adverse effect on the cost or timing of content related services by us,operators or third party service providers, and may also indirectly affect the sales of our mobiledevices.
Since all technology standards, including those used and relied on by us, include some intellectualproperty rights, we cannot fully avoid risks of a claim for infringement of such rights due to ourreliance on such standards. We believe that the number of third parties declaring their intellectualproperty to be relevant to these standards, for example, those standards related to so-called 3Gmobile communication technologies, including 3GPP and 3GPP2, as well as other advanced mobilecommunications standards, is increasing, which may increase the likelihood that we will besubject to such claims in the future. While we believe that any such intellectual property rightsdeclared and found to be essential to a given standard carry with them an obligation to belicensed on fair, reasonable and non-discriminatory terms, not all intellectual property ownersagree on the meaning of that obligation and thus costly and time-consuming litigation over suchissues may result in the future.
From time to time, some existing patent licenses may expire, may become partially paid-up, orotherwise may become subject to renegotiation. The inability to renew or finalize sucharrangements with acceptable commercial terms may result in costly and time-consuminglitigation, and any adverse result in any such litigation may lead to restrictions on our ability tosell certain products or solutions, and could result in payments that potentially would have amaterial adverse impact on our operating results.
Any restrictions on our ability to sell our products and solutions due to expected or allegedinfringements of third party intellectual property rights and any intellectual property rightsclaims, regardless of merit, could result in material losses of profits, costly litigation, the paymentof damages and other compensation, the diversion of the attention of our personnel, productshipment delays or the need for us to develop non-infringing technology or to enter into royaltyor licensing agreements. If we were unable to develop non-infringing technology, or if royalty orlicensing agreements were not available on commercially acceptable terms, we could be precludedfrom making and selling the affected products and solutions. As new features are added to ourproducts and solutions, we may need to acquire further licenses, including from new andsometimes unidentified owners of intellectual property. The cumulative costs of obtaining anynecessary licenses are difficult to predict and may over time have a negative effect on ouroperating results.
In addition, despite the steps that we have taken to protect our intellectual property rights, wecannot be certain that any rights or pending applications will be granted or that the rightsgranted in connection with any future patents or other intellectual property rights will besufficiently broad to protect our technology. Any patents or other intellectual property rights thatare granted to us may be challenged, invalidated or circumvented, and any right granted underour patents may not provide competitive advantages for Nokia. Other companies may commenceactions seeking to establish the invalidity of our intellectual property, for example, patent rights.In the event that one or more of our patents are challenged, a court may invalidate the patent ordetermine that the patent is not enforceable, which could harm our competitive position. If any ofour key patents are invalidated, or if the scope of the claims in any of these patents is limited bya court decision, we could be prevented from using such patent as basis for product differentiationor from licensing the invalidated or limited portion of our intellectual property rights. Even if such
18
a patent challenge is not successful, it could be expensive and time-consuming, divertmanagement attention from our business and harm our reputation. Any diminution of theprotection that our own intellectual property rights enjoy could cause us to lose some of thebenefits of our investments in R&D, which may have a negative effect on our results of operations.See ‘‘Item 4.B Business Overview—Patents and Licenses’’ for a more detailed discussion of ourintellectual property activities.
The global networks business relies on a limited number of customers and large multi-yearcontracts. Unfavorable developments under such a contract or in relation to a majorcustomer may adversely and materially affect our sales, our results of operations and cashflow.
Large multi-year contracts, which are typical in the networks industry, include a risk that thetiming of sales and results of operations associated with these contracts will differ from what wasexpected when we first entered into such contracts. Moreover, such contracts usually require thededication of substantial amounts of working capital and other resources, which impacts our cashflow negatively. Any non-performance by us under these contracts may have significant adverseconsequences for us because network operators have demanded and may continue to demandstringent contract undertakings, such as penalties for contract violations.
Furthermore, the number of our customers may diminish due to operator consolidation. This willincrease our reliance on fewer larger customers, which may negatively impact our bargainingposition, sales and profitability.
Our sales derived from, and assets located in, emerging market countries may be materiallyadversely affected by economic, regulatory and political developments in those countries orby other countries imposing regulations against imports to such countries. As sales fromthese countries represent a significant portion of our total sales, economic or politicalturmoil in these countries could adversely affect our sales and results of operations. Ourinvestments in emerging market countries may also be subject to other risks anduncertainties.
We generate sales from and have invested in various emerging market countries. As sales fromthese countries represent a significant portion of our total sales and as these countries represent asignificant portion of the expected industry growth, economic or political turmoil in thesecountries could materially adversely affect our sales and results of operations. Our investments inemerging market countries may also be subject to risks and uncertainties, including unfavorabletaxation treatment, exchange controls, challenges in protecting our intellectual property rights,nationalization, inflation, currency fluctuations, or the absence of, or unexpected changes in,regulation as well as other unforeseeable operational risks.
Our sales, costs and results are affected by exchange rate fluctuations, particularly betweenthe euro, which is our reporting currency, and the US dollar, the Chinese yuan, the UK poundsterling and the Japanese yen, as well as certain other currencies.
We operate globally and are therefore exposed to foreign exchange risks in the form of bothtransaction risks and translation risks. Our policy is to monitor and hedge exchange rate exposure,and we manage our operations to mitigate, but not to eliminate, the impacts of exchange ratefluctuations. Our sales and results may be materially affected by exchange rate fluctuations.Similarly, exchange rate fluctuations may also materially affect the US dollar value of anydividends or other distributions that are paid in euro. For more information, see ‘‘Item 5.AOperating Results—Overview—Certain Other Factors—United States Dollar,’’ ‘‘Item 5.A OperatingResults—Results of Operations—Exchange Rates’’ and ‘‘Item 11. Quantitative and QualitativeDisclosures About Market Risk.’’
19
Customer financing to network operators can be a competitive requirement and couldadversely and materially affect our sales, results of operations, balance sheet and cash flow.
Network operators in some markets sometimes require their suppliers, including us, to arrange orprovide long-term financing as a condition to obtaining or bidding on infrastructure projects.Moreover, they may require extended payment terms. In some cases, the amounts and duration ofthese financings and trade credits, and the associated impact on our working capital, may besignificant. Defaults under these financings have occurred in the past and may also occur in thefuture.
Customer financing continues to be requested by some operators in some markets, but to aconsiderably lesser extent and with considerably lower importance than during the past years. Asa strategic market requirement, we plan to continue to arrange and facilitate financing to ourcustomers, and provide financing and extended payment terms to a small number of selectedcustomers. Extended payment terms may continue to result in a material aggregate amount oftrade credits, but the associated risk is mitigated by the fact that the portfolio relates to a varietyof customers. We cannot guarantee that we will be successful in providing needed financing tocustomers. Also, our ability to manage our total customer finance and trade credit exposuredepends on a number of factors, including our capital structure, market conditions affecting ourcustomers, the level of credit available to us and our ability to mitigate exposure on acceptableterms. We cannot guarantee that we will be successful in managing the challenges connected withthe total customer financing and trade credit exposure that we may from time to time have. See‘‘Item 4.B Business Overview—Networks,’’ ‘‘Item 5.B Liquidity and Capital Resources—StructuredFinance,’’ and Notes 9 and 38(b) to our consolidated financial statements included in Item 18 ofthis annual report on Form 20-F for a more detailed discussion of issues relating to customerfinancing, trade credits and related commercial credit risk.
Allegations of health risks from the electromagnetic fields generated by base stations andmobile devices, and the lawsuits and publicity relating to them, regardless of merit, couldnegatively affect our operations by leading consumers to reduce their use of mobile devicesor by causing us to allocate monetary and personnel resources to these issues.
There has been public speculation about possible health risks to individuals from exposure toelectromagnetic fields from base stations and from the use of mobile devices. While a substantialamount of scientific research conducted to date by various independent research bodies hasindicated that these radio signals, at levels within the limits prescribed by safety standards set byand recommendations of public health authorities, present no adverse effect to human health, wecannot be certain that future studies, irrespective of their scientific basis, will not suggest a linkbetween electromagnetic fields and adverse health effects that would adversely affect our salesand share price. Research into these issues is ongoing by government agencies, internationalhealth organizations and other scientific bodies in order to develop a better scientific and publicunderstanding of these issues.
Nokia is named as a defendant in several class action matters alleging that Nokia and othermanufacturers and cellular service providers should have included headsets with every handset toreduce the potential for adverse health effects. The original cases were consolidated before the USDistrict Court for the District of Maryland in Baltimore, Maryland. After full review, the DistrictCourt determined that federal jurisdiction existed and that the claims of the plaintiffs werepreempted by federal law. On March 16, 2005, the United States Court of Appeals for the FourthCircuit reversed those findings and held that the claims were not preempted by federal law andthat the matters could properly be brought in the state courts or courts of origin. Those cases havenow been returned to the courts of origin for further proceedings. In addition, we and othermobile device manufacturers and network operators have been named as defendants in five
20
lawsuits by individual plaintiffs who allege that radio emissions from mobile phones caused orcontributed to each plaintiff’s brain tumor. Those cases are before the District of Columbia courts.See ‘‘Item 8.A.7—Litigation’’ for a more detailed discussion of these lawsuits.
Although Nokia products and solutions are designed to meet all relevant safety standards andrecommendations globally, no more than a perceived risk of adverse health effects of mobilecommunications devices could adversely affect us through a reduction in sales of mobile devicesor increased difficulty in obtaining sites for base stations, and could have a negative effect on ourreputation and brand value as well as harm our share price.
An unfavorable outcome of litigation could materially impact our business, financialcondition or results of operations.
We are a party to lawsuits in the normal course of our business. Litigation can be expensive,lengthy and disruptive to normal business operations. Moreover, the results of complex legalproceedings are difficult to predict. An unfavorable resolution of a particular lawsuit could have amaterial adverse effect on our business, operating results, or financial condition.
If we are unable to recruit, retain and develop appropriately skilled employees, our ability toimplement our strategies may be hampered and, consequently, our results of operations maybe materially harmed.
We must continue to recruit, retain and through constant competence training developappropriately skilled employees with a comprehensive understanding of our businesses andtechnologies. As competition for skilled personnel remains keen, we seek to create a corporateculture that encourages creativity and continuous learning. We are also continuously developingour compensation and benefits policies and taking other measures to attract and motivate skilledpersonnel. Nevertheless, we have encountered in the past, and may encounter in the future,shortages of appropriately skilled personnel, which may hamper our ability to implement ourstrategies and materially harm our results of operations.
Changes in various types of regulation in countries around the world could have a materialadverse effect on our business.
Our business is subject to direct and indirect regulation in each of the countries in which we, thecompanies with which we work or our customers do business. As a result, changes in varioustypes of regulations applicable to current or new technologies, products or services could affectour business adversely. For example, it is in our interest that the Federal CommunicationsCommission maintains a regulatory environment that ensures the continued growth of thewireless sector in the United States. In addition, changes in regulation affecting the construction ofbase stations and other network infrastructure could adversely affect the timing and costs of newnetwork construction or expansion and the commercial launch and ultimate commercial success ofthese networks.
Moreover, the implementation of new technological or legal requirements, such as therequirement in the United States that all handsets must be able to indicate their physical location,could impact our products and solutions, manufacturing or distribution processes, and could affectthe timing of product and solution introductions, the cost of our production, products or solutionsas well as their commercial success. Finally, export control, tariffs or other fees or levies imposedon our products, environmental, product safety and security and other regulations that adverselyaffect the export, import, pricing or costs of our products and solutions, as well as new servicesrelated to our products, could adversely affect our net sales and results of operations.
The impact of these changes in regulation could affect our business adversely even though thespecific regulations do not always directly apply to us or our products and solutions.
21
See ‘‘Item 4.B Business Overview—Government Regulation’’ for a more detailed discussion aboutthe impact of various regulations.
Our share price may be volatile in response to conditions in the global securities marketsgenerally and in the communications and technology sectors in particular.
Our share price has at times been subject to some volatility, in part due to generally volatilesecurities markets, particularly for communications and technology companies’ shares, as well asdevelopments in our sales and results of operations. Factors other than Nokia’s results ofoperations that may affect our share price include, among other things, market expectations of ourperformance, projected developments in the mobile device and communications network marketsand the mobile communications industry, and any adverse changes in our brand value. Inaddition, our share price may be affected by factors such as the level of business activity orperceived growth in the market in general, the performance of other technology companies,announcements by or the results of operations of our competitors, customers and suppliers,potential litigation involving ourselves or our industry, and announcements concerning the successof new products and services, as well as general market volatility. See ‘‘Item 9.A Offer and ListingDetails’’ for information regarding the trading price history of our shares and ADSs.
22
ITEM 4. INFORMATION ON THE COMPANY
4.A History and Development of the Company
Nokia is the world’s largest manufacturer of mobile devices and a leader in mobile networkequipment, solutions and services. We also provide equipment, solutions and services forcorporate customers.
For 2005, Nokia’s net sales totaled EUR 34.2 billion (USD 40.5 billion) and net profit wasEUR 3.6 billion (USD 4.3 billion). At the end of 2005, we employed 58,874 people and hadproduction facilities in eight countries, sales in more than 130 countries, and a global network ofsales, customer service and other operational units.
During our 140-year history, Nokia has evolved from its origins in the paper industry to become aworld leader in mobile communications. In 1967, we took our current form as Nokia Corporation,a corporation under the laws of the Republic of Finland. This was the result of the merger of threeFinnish companies: Nokia AB, a wood-pulp mill founded in 1865, which took its name from thenearby Nokia River; Finnish Rubber Works Ltd, a manufacturer of rubber boots, tires and otherrubber products founded in 1898; and Finnish Cable Works Ltd, a manufacturer of telephone andpower cables founded in 1912.
Nokia entered the telecommunications equipment market in 1960, when an electronicsdepartment was established at Finnish Cable Works to concentrate on the production of radio-transmission equipment. During this time Nokia diversified into other industries as a hedgeagainst economic cycles.
In the 1980s, we strengthened our position in the telecommunications, consumer electronics andpersonal-computer markets. In 1982, we introduced the first fully-digital local telephone exchangein Europe, and in that same year we introduced the world’s first car phone for the Nordic MobileTelephone analogue standard. It weighed approximately 10 kilograms, or 22 pounds, and wasprimarily used as a business tool. Since then, Nokia has introduced mobile phones across all majorcellular standards. In 1987, we acquired the consumer electronics operations and part of thecomponents business of Standard Elektrik Lorenz of Germany, as well as the French consumerelectronics company, Oceanic. At the beginning of 1988, Nokia purchased Ericsson’s informationsystems division and became the largest technology company in the Nordic region.
Regulatory and technological reforms have played a role in our success. Deregulation of theEuropean telecommunications industries since the late 1980s has stimulated competition andboosted customer demand. The technological breakthrough of GSM, which made more efficient useof frequencies and had greater capacity in addition to high-quality sound, was followed by theEuropean resolution in 1987 to adopt GSM as the European digital standard by July 1, 1991. Later,GSM technology proved to be an efficient carrier of data. The first GSM call was made with a Nokiaphone over the Nokia-built network of a Finnish operator called Radiolinja, and in the same yearNokia won contracts to supply GSM networks in other European countries. During this period, GSMwas also established as a standard in several Asian countries, opening important new markets forus. Our expertise in GSM and earlier analogue technologies laid the foundation for our subsequentsuccess in the broader mobile communications industry, as Nokia has introduced mobile phonesand devices across all major cellular standards.
In the early 1990s, we made a strategic decision to make telecommunications our core business,with the goal of establishing market leadership in every major global market. Basic industry andnon-telecommunications operations—including paper, personal computer, rubber, footwear,chemicals, power plant, cable, aluminum and television businesses—were divested during theperiod from 1989 to 1996. Our organizational structure also evolved to consist of two mainbusiness groups, Nokia Mobile Phones and Nokia Networks. A venturing arm called Nokia Ventures
23
Organization was later created to foster new businesses. Over the course of the decade, therelative financial contribution of the two main business groups fluctuated. However, by the end ofthe 1990s, Nokia Mobile Phones represented the largest part of our business, and together withNokia Networks accounted for substantially all of our net sales.
Finland’s competitive business climate and emphasis on innovation have also contributed to oursuccess. From the beginning of the telecommunications era, there have been severaltelecommunications operators in Finland. These companies were not required to purchaseequipment from national suppliers, providing a spur to competition in the domestic market. Theneed to export products to other markets to achieve substantial volume growth encouraged us todevelop our business and products in an international environment and build a leadingcompetitive position.
Since the early 1990s, mobile telecommunications penetration has grown rapidly. Today, mobilecommunications continues to evolve, creating new opportunities in entertainment and enterpriseuse. Nokia’s mobile devices are now used by virtually every demographic segment of thepopulation, for communications, business, entertainment and even as fashion accessories.
In January 2004, Nokia reorganized to further align the company’s overall structure with itsstrategy, to better position each business group to meet the specific needs of diverse marketsegments, to increase Nokia’s operational efficiency and to maintain economies of scale. As aresult, we began 2004 with an organizational base from which to make progress in expandingmobile voice, driving consumer multimedia and bringing extended mobility to enterprises. Today,Nokia has four business groups: Mobile Phones, Multimedia, Enterprise Solutions and Networks.
Nokia is not a capital-intensive company in terms of fixed assets, but rather invests in researchand development, marketing, and building the Nokia brand. We expect the amount of capitalexpenditure during 2006 to be more than in 2005 and to be funded from our cash flow fromoperations. During 2005, Nokia’s capital expenditures totaled EUR 607 million compared withEUR 548 million in 2004. For further information regarding capital expenditures see ‘‘Item 5.AOperating Results’’ and for a description of capital expenditures by business segment see Note 3 toour consolidated financial statements included in Item 18 of this annual report on Form 20-F.
Nokia maintains listings on four major securities exchanges. The principal trading markets for theshares are the New York Stock Exchange, in the form of American Depositary Shares, and theHelsinki Stock Exchange, in the form of shares. In addition, the shares are listed on the Frankfurtand Stockholm stock exchanges.
Our principal executive office is located at Keilalahdentie 4, P.O. Box 226, FIN-00045 Nokia Group,Espoo, Finland and our telephone number is +358 (0) 7 1800-8000.
4.B Business Overview
Industry Development and Trends
Our industry is becoming more complex. Mobile communications is expanding into newgeographical markets with diverse characteristics and dynamics, operator demands in maturemarkets are becoming more sophisticated with the advent of new multimedia services, andbusinesses are becoming increasingly mobile.
We believe that the global mobile subscriber base reached approximately 2.2 billion at the end of2005, and we estimate that this figure will reach 3 billion during 2008. In high-growth markets,also referred to in the industry as new-growth, unsaturated or emerging markets, the number ofnew mobile users is growing faster than the overall global market. Growth is particularly strongin the high-growth markets of the Middle East, Africa, Latin America and South Asia. In these
24
markets, the ability to offer tailored mobile network solutions and devices that reduce the totalcost of ownership is an important competitive advantage.
Uptake of 3G/WCDMA continued to increase during 2005. This was largely the result of attractivepricing of services, the further maturity of 3G/WCDMA technology, and the greater availability of3G/WCDMA handsets. The pace of 3G/WCDMA network rollouts also continued steadily in 2005, andby the end of the year a cumulative total of 100 operators had launched commercial 3G/WCDMAservices.
During 2005, we also saw a continued trend towards industry consolidation among componentsuppliers, networks and device manufacturers, and operators. In light of this, we believecompanies with a strong brand, established market presence, volume advantage, well-developedlogistics, and a broad product range across geographies and segments are best positioned tosucceed. In addition, design and features are becoming central to consumer demands, whichmeans effective research and development, or R&D, and a strong intellectual property rights, orIPR, portfolio are also increasingly important for success.
There is evolving consumer interest in non-cellular wireless technologies such as wireless localarea networks, or WLAN (including WiFi), Worldwide Interoperability for Microwave Access, orWiMAX, and Voice over Internet Protocol, or VoIP. Depending on how customer interests develop,these technologies could migrate to mobile communications and complement traditional cellulartechnologies.
Mobile Device Market
The mobile device market continued its strong volume growth during 2005. According to Nokia’sestimates, in 2005 the global device market volume grew by 24% to 795 million units, comparedwith 643 million units in 2004. This growth was driven by demand for voice-centric mobiledevices, particularly in emerging markets, as well as by robust replacement sales from primarilycolor screen and camera devices in advanced markets.
Nokia expects the mobile device market volume to grow more than 10% in 2006, from ourpreliminary estimate of approximately 795 million units in 2005. We also expect the deviceindustry to experience value growth in 2006, but expect some decline in industry average sellingprices, or ASPs, primarily reflecting the increasing impact of the emerging markets. Nokia expectsthe majority of volume growth in 2006 to come from the emerging markets, which are expectedto account for approximately half of the mobile device industry volumes.
Nokia estimates that the replacement market will represent over 60% of industry volumes in2006, compared with approximately 60% in 2005. We believe that replacement sales will bedriven by camera phones, 3G/WCDMA devices, smartphones, continued penetration of colordisplays, music features, mobile multimedia services and general aesthetic trends. According to ourestimates the global 3G/WCDMA market totaled 44 million units in 2005 and we believe that it willat least double in 2006.
In the future, we expect to see a growing number of mobile devices in which telephony may notbe the primary feature, or may be only one of many important features, that motivates the userto buy the device. This trend comes as the mobile communications, information technology, mediaand consumer electronics industries are converging in some areas into one broader industry, andas advances in radio technologies enable a variety of products and services to becomeinterconnected. This convergence is leading to the creation of new mobile devices, services andways of using mobile devices. Some of the first examples of convergence are the camera phoneand the use of mobile devices for e-mail, listening to the radio, web browsing and playing games.
25
A smartphone, increasingly referred to as a converged device, is a generic category of mobiledevice that can run computer-like applications such as e-mail, web browsing and enterprisesoftware and can also have built-in music players, video recorders, mobile TV and othermultimedia features. According to our estimates, the global smartphone market is expected togrow from around 50 million units in 2005 to approximately 100 million units in 2006. Thesmartphone market overlaps with the 3G/WCDMA market.
In 2006, we expect applications such as downloading music to become more prevalent, whilemobile TV is expected to become available in select markets and to reach mass market by 2008. Inthe longer term, the use of mobile devices for close range communication with and sending ofcontent to home televisions, entertainment systems, printers and other household appliances isexpected to become more common.
Mobility is also increasingly important to the business market as companies assess the potentialproductivity gains, cost savings and competitive advantages of having a mobile workforce.However, the enterprise mobility market is still fragmented and mobile e-mail is still in an earlystage of development. We expect that as the technologies become more reliable, affordable andeasier to use, employees will increasingly use mobile devices for business communication andmobile e-mail will become the lead enterprise application.
For more information on the mobile device market, see ‘‘Item 5.A Operating Results—Overview—Principal Factors Affecting our Results of Operations—Mobile Devices.’’
Mobile Infrastructure Market
During 2005, the mobile infrastructure market showed year-on-year growth of approximately 10%in euro terms. In 2004, the market grew approximately 14% in euro terms. These two years ofgrowth came largely from operator investments in the current technologies of GSM, EDGE, andGPRS and their related services, especially in low penetration markets, and from operatorinvestments in next-generation technologies, such as 3G/WCDMA. In 2006, we expect moderategrowth in the mobile infrastructure market in euro terms.
Competition in the network infrastructure market remains intense. In 2G, competition is driven byprice, solutions that are able to offer low total cost of ownership, and the vendor’s ability to rollout mobile networks in high-growth markets. In 3G, vendors compete on the basis of price andtrack record of network implementations, as well as in terms of which new technologies theyplan to introduce and when.
We increasingly see operators outsourcing network management, in whole or in part, both tobecome more cost efficient and to better manage the increased range and complexity of mobileservices and technologies. This is the result of a number of factors, including slowing subscribergrowth and rising competition from both traditional and newer mobile virtual network operatorsin more mature markets, and the challenges of managing rapid subscriber growth in emergingmarkets. Increased outsourcing is an important opportunity for network infrastructure suppliersthat have the scale and competence to manage networks efficiently.
As the demand for multimedia services grows, there is a need to integrate increasingly complexnetwork elements. This represents an opportunity for network infrastructure suppliers, who canuse their extensive knowledge of operators’ networks and business needs to provide systemsintegration services.
We see those operators with both fixed and mobile assets exploring the option of offering accessto services and applications over Internet Protocol, or IP, in fixed and mobile networks during thecoming years. When operators begin to use IP technologies to provide access to the same services
26
in fixed and mobile networks, they will be able to optimize the use of their network assets whilemaking communications services more cost efficient for consumers and business users.
For more information on the mobile infrastructure market, see ‘‘Item 5.A Operating Results—Overview—Principal Factors Affecting our Results of Operations—Infrastructure.’’
Business Strategy
Nokia’s strategy to be the most customer-focused product company is defined by four mainimperatives:
• Expand mobile voice business
• Enhance experiences for consumers
• Bring more mobility to enterprises
• Expand networks business
Organizational Structure
Nokia has four business groups: Mobile Phones, Multimedia, Enterprise Solutions and Networks.
Mobile Phones connects people by providing expanding mobile voice and data capabilities across awide range of mobile devices. We seek to put consumers first in our product-creation process andprimarily target high-volume category sales. Mobile Phones currently offers mobile phones anddevices based on the following global cellular technologies: GSM/EDGE, 3G/WCDMA and CDMA.
Multimedia brings mobile multimedia experiences to consumers in the form of advanced mobiledevices and applications with connectivity over GSM, 3G/WCDMA, WLAN, Bluetooth and otherstandards. Our products give people the ability to create, access and consume multimedia, as wellas share their experiences with others.
Enterprise Solutions offers businesses and institutions a broad range of products and solutions,including enterprise-grade mobile devices, underlying security infrastructure, software andservices. We also collaborate with a range of companies to provide fixed IP network security,mobilize corporate e-mail and extend corporate telephone systems to Nokia’s mobile devices.
Networks provides network infrastructure, communications and networks service platforms, aswell as professional services to operators and service providers. Networks focuses on the GSMfamily of radio technologies and aims at leadership in three areas: GSM, EDGE and 3G/WCDMAnetworks; core networks with increasing IP and multi-access capabilities; and services.
Two horizontal groups, Customer and Market Operations and Technology Platforms, support andservice our mobile device business groups, with the goal of increasing our operational efficiencyand competitiveness by taking advantage of our economies of scale. Technology Platforms alsoserves external customers. These two horizontal groups are not separate reporting entities andtheir costs are carried mainly by the three mobile device business groups, with the balanceincluded in Common Group Expenses.
Customer and Market Operations is responsible for marketing, sales, sourcing, manufacturing andlogistics for mobile devices from Mobile Phones, Multimedia and Enterprise Solutions. TheNetworks business group has its own dedicated sales and marketing, logistics and sourcingfunctions, and Enterprise Solutions complements the Customer and Market Operations’ focus onoperators with its own sales and marketing organization focused on corporate customers.
Technology Platforms is responsible for the competitiveness of Nokia’s technology assets. Itsupports Nokia’s overall technology management and development by delivering leading
27
technologies and well-defined platforms to Nokia’s business groups as well as to externalcustomers.
For a breakdown of our net sales and other operating results by category of activity andgeographical location, see Note 3 to our financial statements included in Item 18 of this annualreport on Form 20-F.
Mobile Devices
The mobile communications market is dynamic, new vocabulary is emerging and definitions arechanging. This is in line with the introduction of entirely new products and product categories.
• Mobile device is a generic term for all device products made by our Mobile Phones,Multimedia and Enterprise Solutions business groups.
• The term smartphone, or converged device, refers to a generic category of mobile devicethat can run computer-like applications such as e-mail, web browsing and enterprisesoftware, and can also have built-in music players, video recorders, mobile TV and othermultimedia features.
• All Nokia Nseries devices produced by our Multimedia business group are called multimediacomputers to distinguish them from the generic category of smartphones.
Our mobile device businesses currently offer mobile phones and devices based primarily on thefollowing global cellular technologies: GSM/EDGE, 3G/WCDMA and CDMA. For 2005, the total mobiledevice volume achieved by the Mobile Phones, Multimedia and Enterprise Solutions businessgroups reached a record 265 million units, representing growth of 28% compared with 2004.Based on an estimated global market volume for mobile devices of 795 million units, our globalmarket share was 33% for 2005, compared with an estimated 32% for 2004. This makes Nokia theclear market leader in mobile devices.
In 2005, Nokia shipped a total of 28.5 million smartphones and more than 40 million mobiledevices with an integrated music player, making us the world’s largest music devicemanufacturer. In 2005, Nokia announced a total of 56 new mobile devices in a wide variety ofdesigns and technologies for all segments and at all price points. We also made strong progress incustomizing mobile devices for operators.
Nokia periodically updates its segmentation of the consumer market, as we did in 2005 followingan extensive global consumer segmentation survey in 16 countries. From the findings we haveidentified 11 unique consumer segments and have gained even more insight into what peoplewant and need from their mobile phones. We believe this knowledge will allow our businessgroups to deliver products and solutions focused on meeting the demands of consumers in theidentified segments.
Mobile Phones
Mobile Phones connects people by providing expanding mobile voice and data capabilities across awide range of mobile devices. We seek to put consumers first in our product-creation process andprimarily target high-volume category sales. Mobile Phones currently offers mobile phones anddevices based on the following global cellular technologies: GSM/EDGE, 3G/WCDMA and CDMA.
In voice-centric and mainstream mobile phones, we believe that design, brand, ease of use andprice are our customers’ most important considerations. Increasingly, our product portfolioincludes new features and functionality designed to appeal to the mass market, such as megapixelcameras, music players and advanced-quality color screens.
28
In 2005, Mobile Phones introduced its first 3G/WCDMA products: the Nokia 6280, the Nokia 6233,the Nokia 6234 (exclusively for operator Vodafone), and the Nokia 6282 (for the Americas).
The Mobile Phones business group has five units: Broad Appeal; Entry; Lifestyle Products; CDMA;and Vertu.
The Broad Appeal unit focuses on mid-range products where the balance between price,functionality and style is key. The vast majority of Nokia’s product portfolio falls into this category.Product highlights for 2005 include the Nokia 3250, a music-optimized device supporting 1GB ofmemory; the Nokia 6280, a 3G/WCDMA phone with a 2-megapixel camera; and the Nokia 6230i,Nokia’s highest revenue generating phone in 2005.
The Entry unit addresses markets where we believe there is potential for growth and wheremobile penetration levels are relatively low. Our aim is to provide affordable mobile phones whilecooperating with local mobile operators to reduce the total cost of ownership. Current productsinclude the Nokia 2600 monoblock and the Nokia 2652 clamshell, both with color-screens, and theNokia 1100, Nokia’s best-selling phone in volume terms in 2005. During the year we introducedthe Nokia 1110 and the Nokia 1600, both of which were designed specifically for new growthmarkets.
Towards the beginning of 2006, we changed the name of our Focused Appeal unit to LifestyleProducts. This unit concentrates on top-end products for consumers who will pay a premium forhigher-quality materials, design and features. Products launched by this unit tend to commandhigher prices. In 2005, the unit introduced the Nokia 8800 phone, featuring a sliding stainless steelcase; the ‘‘L’Amour’’ collection of fashion-inspired mobile phones, which come in three differentform factors and two distinct color schemes; and the Nokia 5140i outdoor mobile phone featuringthermometer, compass and flashlight.
The CDMA unit supports operators that use CDMA technology. In 2005, CDMA industry devicevolumes represented approximately 17% of total industry device volumes. CDMA operators aremainly in the United States, China, India, Indonesia, Australia, Brazil and some other LatinAmerican markets. In 2005, we continued to expand our CDMA portfolio. Products introducedinclude the Nokia 6265 slide design phone with a 2-megapixel camera and Bluetooth connectivity,and the Nokia 6155, a CDMA mid-range phone for the Americas. On February 14, 2006, Nokia andSANYO Electric Co., Ltd announced a preliminary agreement with intent to form a new globalcompany comprised of their respective CDMA mobile phone businesses—separate from the parentcompanies. The relevant assets from both companies will be contributed or made available for thenew entity. Final agreements are expected to be signed in the second quarter of 2006, with thenew business expected to commence operations in the third quarter of 2006, provided that thedue diligence has been completed and all necessary regulatory approvals obtained. For moreinformation on this preliminary agreement, see ‘‘Item 5.A Operating Results—Overview—Subsequent Events—Preliminary Agreement with SANYO.’’
Vertu, our unit for luxury communications products, continues to make progress towardsestablishing a luxury mobile phone category. Recent launches include the Signature DiamondCollection of tri-band GSM phones, including a model inlaid with 700 diamonds. Also launchedrecently were the Ascent White Special Edition and Motorsport Limited Edition phones, both ofwhich are handcrafted from leather and stainless steel with a custom-developed, scratch-resistantalloy, and include tri-band GSM and Bluetooth connectivity.
Multimedia
Multimedia brings mobile multimedia experiences to consumers in the form of advanced mobiledevices and applications with connectivity over GSM, 3G/WCDMA, WLAN, Bluetooth and other
29
standards. Our products give people the ability to create, access and consume multimedia, as wellas share their experiences with others. We are working with leading companies in otherindustries to bring to the market advanced specialized technology and applications such asInternet services, optics, music synchronization and streaming video.
Product highlights in 2005 included the Nokia 6630 and Nokia 6680 3G/WCDMA devices, and theNokia 6600 and the Nokia 7610 imaging devices.
In April 2005, Nokia announced a new sub-brand, the Nokia Nseries, for a category of advancedmultimedia computers that variously offer consumers the ability to shoot video and still pictures,print-quality images, watch TV, listen to music, and access the web and e-mail. In addition tosupporting 3G/WCDMA connectivity, certain Nokia Nseries multimedia computers also featurenon-cellular connectivity, including WLAN, FM radio, Digital Video Broadcasting—Handheld, orDVB-H, and Bluetooth. During the second half of 2005, we began building awareness of this newsub-brand through product specific and Nokia Nseries wide marketing campaigns in print, online,in movies, outdoors and at the point of sale.
Multimedia has two main entities responsible for the development of its products and relatedexperiences, the Multimedia Computers unit and the Multimedia Experiences unit.
The Multimedia Computers unit focuses on managing, delivering and expanding the Nokia Nseriesmultimedia computer portfolio, as well as developing and marketing accessory products and carcommunications solutions. Highlights include:
• During the third quarter of 2005 we started shipping the Nokia N90, featuring Carl Zeissoptics for video and still imaging, and the Nokia N70, a small device with a 2-megapixelcamera.
• Upcoming products in the Nokia Nseries range include the Nokia N71, featuring a largeQVGA display and extensive music capabilities, the Nokia N80, featuring a 3-megapixelcamera and WLAN connectivity, and the Nokia N91, featuring a 4GB hard disk and WLANconnectivity.
• In November 2005, we announced the Nokia N92, the world’s first mobile device with anintegrated DVB-H receiver that enables broadcast TV services on a mobile device. It isexpected to start shipping in the middle of 2006.
The Multimedia Experiences unit develops and markets multimedia applications and solutions inthe following areas:
• Mobile photography: We are developing imaging applications for Nokia Nseries products thatallow easy capturing, editing, printing, sharing and storing of photos and video.
• Mobile music: We are developing music applications and features that deliver high qualityaudio and enable easy music management. Nokia is working closely with mobile operatorsand leading industry partners to enable an enhanced music experience for users, includingthe purchase of music by Nokia device users.
• Mobile computing: We are developing applications for Nokia Nseries products in four areas:personal productivity, Internet services, software additions and digital home connectivity.
• Mobile TV: We are developing applications for the DVB-H standard.
• Mobile games: We are developing the N-Gage platform and N-Gage Arena gamingcommunity, as well as the Nokia SNAP mobile gaming platform, to support a broaderpopulation of Java-based mobile phones. In May 2005, we announced plans to expand theN-Gage multiplayer platform to all Nokia S60 based smartphones starting in 2006.
30
Multimedia has one business program, Convergence Products, which develops and drivestechnologies and products based on IP applications and multiradio connectivity. In May 2005, thisprogram announced the first product in the new Internet Tablet product category, the Nokia 770.Based on the open source Linux operating system, the Nokia 770 is a non-cellular device optimizedfor Internet communications. Key applications include Internet browsing and e-mail.
Enterprise Solutions
Enterprise Solutions offers businesses and institutions a broad range of products and solutions,including enterprise-grade mobile devices, underlying security infrastructure, software andservices. We also collaborate with a range of companies to provide fixed IP network security,mobilize corporate e-mail and extend corporate telephone systems to Nokia’s mobile devices.
Product highlights in 2005 include:
• The Nokia Business Center: software that combines and manages corporate mobile e-mail,personal organizer, voice and other business applications in a mobile device, and iscompatible with select mobile devices from Nokia and other vendors. The solution beganshipping in the fourth quarter of 2005.
• The Nokia Eseries: a new line of devices designed for business users and the ITorganizations that support them. The devices, which differ in terms of physical design andfeatures, all use a single platform that can be adapted to different corporate ITinfrastructures. The Nokia Eseries was announced in late 2005 and the devices are expectedto start shipping in 2006.
• The Nokia 9300 and Nokia 9300i enterprise smartphones, and the Nokia 9500Communicator, each of which features a range of corporate mobile e-mail solutions from anumber of vendor companies. The WLAN-enabled Nokia 9300i enterprise smartphone wasintroduced in November 2005 and began shipping in the first quarter of 2006.
• The Nokia 6708, a device focused on the requirements of the Chinese market, beganshipping in December 2005.
Enterprise Solutions business group comprises four main units: Mobile Devices; Mobility Solutions;Security and Mobile Connectivity; and Sales, Marketing and Services.
The Mobile Devices unit produces mobile devices specifically designed for business use. Our productportfolio contains devices with both cellular, such as GSM and 3G/WCDMA, and non-cellularconnectivity, such as WLAN. Current products include the Nokia E60, the Nokia E61 and the NokiaE70, as well as the Nokia 9300, Nokia 9300i and Nokia 9500 devices. These mobile devices aredesigned to address the security and manageability concerns of corporate IT departments, the costconcerns of management, and ease-of-use requirements of employees. The common characteristicsof all our mobile devices include full network connectivity, personal information management ande-mail access, connectivity to IT infrastructure, device management and security solutions.
The Mobility Solutions unit is developing a full suite of software solutions. The unit also workswith external vendors such as Research in Motion, Microsoft, IBM, Good, Visto, and Seven to makeNokia’s mobile devices compatible with their solutions. In addition, the unit works with leadingvendors like Avaya and Cisco on other applications, such as connecting our mobile devices tocorporate fixed line telephone networks, or PBXs, over WLAN technology.
The Security and Mobile Connectivity unit has a broad range of application and secure connectivityofferings designed to help enterprise customers grant employees access to corporate informationand connect their mobile devices to their corporate network in a secure way. These offerings
31
consist primarily of firewall gateways and software-based tools that operate with both Nokia andnon-Nokia devices, as well as with other existing IT infrastructures.
Nokia’s firewall gateways run software from Checkpoint Corporation. Nokia and Checkpoint havecommon distributors, integrators and Value Added Resellers, or VARs, that integrate Nokiagateways with Checkpoint software for customers. Nokia also provides end user and resellersupport for these security products.
The Sales, Marketing and Services unit is responsible for sales to corporate customers, themanagement of relationships with IT distributors, systems integrator and VARs, as well as forspecialized sales resources for selling Enterprise Solutions products to operator customers. The unitis also responsible for management of the services business, which includes support services forcorporate customers and resellers, as well as professional services to help corporate customerswith more complex mobility solutions.
In February 2006, Nokia acquired Intellisync Corporation (‘‘Intellisync’’). Intellisync is a leadingprovider of mobility software and becomes part of the Enterprise Solutions business group.Intellisync delivers wireless e-mail and other applications over an array of devices and applicationplatforms across carrier networks. For more information see ‘‘Item 5.A Operating Results—Overview—Subsequent Events—Acquisition of Intellisync’’.
Networks
Networks provides network infrastructure, communications and networks service platforms, aswell as professional services to operators and service providers. Networks focuses on the GSMfamily of radio technologies and aims at leadership in three areas: GSM, EDGE and 3G/WCDMAnetworks; core networks with increasing IP and multi-access capabilities; and services. At the endof 2005, Networks had more than 150 mobile network customers in more than 60 countries, withour systems serving in excess of 400 million subscribers.
In GSM/EDGE radio access, we signed 39 deals in 2005. By year end, Nokia had delivered GSM/EDGEtechnology to more than 130 customers in more than 60 countries, was a supplier to 45 of the 121operators that have launched EDGE commercially, and had signed more than 50 contracts in EDGE.Nokia demonstrated its commitment to further GSM/EDGE evolution by launching the DualTransfer Mode network solution in February 2005.
Networks signed 20 contracts in 3G/WCDMA in 2005, including agreements with 10 newcustomers. By year end, Nokia had supplied to a total of 44 of the 100 operators that had launchedcommercial 3G/WCDMA services to date. One of the year’s highlights was the launch of our highlyinnovative Flexi WCDMA Base Station, which is designed to deliver operators site cost savings ofup to 70%.
In the growing HSDPA market we announced seven deals, bringing Nokia’s total HSDPA referencesto more than 20 by the end of 2005. We demonstrated HSUPA in February 2005, and inMarch 2005 we launched the I-HSPA innovation.
Nokia cemented its leadership in the Third Generation Partnership Project, or 3GPP, Release 4mobile softswitch market, with 60 deals for the Nokia MSC Server System during 2005. In the IPMultimedia Subsystem market Nokia won 11 commercial deals for IMS platform and trialed thesolution with almost 20 operators. In GSM-based Push to Talk over Cellular, or PoC, we woncontracts with 24 new customers in 2005. In fixed-mobile convergence, we concluded agreementswith 10 customers and launched our Voice over IP server. We also launched new core andservices solutions, including our Open Mobile Alliance compliant PoC solution. In core networks wesigned a total of 192 deals in 2005.
32
Nokia’s Networks business group established its Services Business Unit at the start of 2005,building on close to 20 years in the services business and seeking to tap growing demand forservices as both operator competition and technological complexity increase. By year end, Servicesaccounted for over 30% of Networks’ revenues, and key managed services deals had beenconcluded with Bharti Tele-Ventures and 3GIS among others. By the end of 2005 we had signed35 managed services deals. The company announced plans to open a services-focused Nokia GlobalNetworks Solutions Center in Chennai, India during the first half of 2006.
Other developments in 2005 included the announcement of a joint venture with China Putian tofocus on R&D, as well as manufacturing and sales of 3G network solutions for TD-SCDMA andWCDMA technologies; the sale of our TETRA business; and Networks entrance into new growthmarkets like Bangladesh and Vietnam. Nokia’s offering for such markets was bolstered by itslaunch of the Nokia Prepaid Tracker, which lets subscribers keep track of their prepaid balanceand call expenses. In 2005, Networks also won deals in Kuwait and China for its Nokia ConnecteRefill prepaid recharging platform.
The Networks business group has five units: Radio Networks; Core Networks; Services; NetworksCustomer and Market Operations; and Delivery Operations.
Radio Networks develops GSM, EDGE and 3G/WCDMA radio access networks and cellulartransmission for operators and network providers, and in 2005 said it would also support wirelessbroadband technologies such as WiMAX. The main products offered by Radio Networks are basestations, base station controllers and cellular transmission equipment. As data speeds evolve, theseproducts are increasingly used for data traffic in addition to traditional wireless voice traffic.
Core Networks develops core network solutions for operators. The main products are switches anddifferent kinds of network servers. In circuit-switched networks, Nokia’s solutions are helpingoperators to reduce the cost of providing voice minutes to subscribers. In packet-switchednetworks, Nokia’s new core network solutions bring new functionality to the networks, enablingoperators to offer advanced multimedia services more efficiently. Many of Nokia’s core networkproducts can be used in both fixed and mobile networks.
Services offers operators a full range of services, from network planning and implementation tonetwork optimization, care, managed services and operations outsourcing. Our tools and servicesare designed to assist operators to achieve a higher quality of service with lower operating andcapital expenditures by improving and automating their processes.
Networks Customer and Market Operations deals with operator customers and is responsible forsales and marketing as well as for overall customer relationships. The Networks business group,which has organized its customer business teams on a regional basis, works in close cooperationwith other Nokia businesses in addressing operator customers.
Delivery Operations is responsible for the sourcing, manufacturing and distribution of networkproducts, in addition to network delivery and services.
Sales and Marketing
In 2005, Nokia’s sales and marketing expenditure was EUR 3.0 billion, representing 8.7% of netsales.
Sales
The Customer and Market Operations horizontal group is responsible for the sales of Nokia’smobile devices from the Mobile Phones, Multimedia and Enterprise Solutions business groups. Mostof our mobile device business derives from sales to operators, distributors, independent retailers
33
and corporate customers. However, the percentage of the total device volume from each channelvaries by region. In the Asia-Pacific area, distributors and retailers account for more than half ofthe total device volume. In China, handsets are sold almost solely through the retail channel. InEurope, the Middle East and Africa, sales are split approximately equally between operators andthe other channels. In Latin America and North America, operator sales represent the majorpercentage of our sales.
Each of our active operator and distributor customers is supported by a dedicated Nokia accountteam. In addition, we have customer executive teams with Nokia Group Executive Board membersas the customer executives for the largest global operators.
We have also established specialized sales channels for certain business groups in order to reachcustomers in segments where we are introducing mobility. Each of these channels is specific to,and managed by, an individual business group. For example, Enterprise Solutions manages sales ofour security and mobile connectivity products and Nokia Business Center to certain resellers orsystems integrators who contribute value, such as consulting services or additional software,before distribution.
Networks’ sales channels mainly comprise dedicated account management teams for operatorcustomers. The account management teams design solutions and suggest products based onoperator requirements. In addition to the marketing done within customer teams, Networks usescustomer events, exhibitions, brand marketing and an established interactive electronic channel.
As we are a global company and have sales in most countries of the world, in 2005 we also hadsales to customers in Iran, Libya and Syria. Furthermore, in 2004 we had very minor sales tocustomers in Sudan, but none in 2005.
In 2005, we sold mobile devices and accessories to customers in Iran, Libya, and Syria. In addition,we sold network equipment to a customer in Iran. In 2004, we also signed a network salescontract with a customer in Libya, but that contract has not resulted in any sales by the end of2005. In 2005, our aggregate sales to customers in Iran, Libya and Syria accounted forapproximately 1.2% of our total revenue or EUR 417 million. Iran and, to a lesser extent Syria, aresubject to U.S. economic sanctions that are primarily designed to implement U.S. foreign policy.
Marketing
According to a survey published in July 2005 by Interbrand, the Nokia brand was recognized asthe sixth most valued brand in the world. Since the early 1990s, Nokia’s products have largelydefined the Nokia brand in the minds of consumers, enabling the brand to build the equity it hastoday.
In 2005, we introduced a new strategy to build on our existing brand strength. This was inresponse to an increasingly complex industry environment and our push into new geographic andbusiness areas. The initial impact of this initiative is already evident in our product developmentand design, in the greater harmonization of our visual identity and in our marketing activities indifferent countries around the world.
We continue to invest in print, online and broadcast advertising, as well as sponsorship of avariety of sporting and leisure events. High profile examples in 2005 include the Nokia FISsnowboard world cup tour, the Live 8 concerts and the Nokia Sugar Bowl. We also promote ourproducts by securing product placements in movies so that Nokia phones feature prominentlyalongside the lead characters.
During 2005, we opened our first Nokia Flagship store, in Moscow, giving consumers anopportunity to test, experience and purchase products from our entire portfolio. More Nokia
34
Flagship stores are planned for other major cities around the world during 2006 and 2007. InNorth America, 25 Nokia Experience Centers, where consumers can test and experience Nokia’sproducts, have been opened in high profile mall locations.
Production
Nokia operated 14 manufacturing facilities in eight countries around the world as of December 31,2005, for the production of mobile devices and network infrastructure. The Customer and MarketOperations group is responsible for the production of Nokia mobile devices, while the Networksgroup is responsible for the production of network infrastructure.
Our principal supply requirements are for electronic components, mechanical components andsoftware. Electronic components include integrated circuits, microprocessors, memory devices,cameras, displays, batteries and chargers. Mechanical components include covers, connectors, keymats and antennas. Our products also incorporate software provided by third parties.
Mobile Devices
The Customer and Market Operations horizontal group is responsible for production and logisticsfor the device businesses of Mobile Phones, Multimedia and Enterprise Solutions, including controlof the mobile device factories. The Customer and Market Operations horizontal group is alsoresponsible for process development in the demand-supply network, including EnterpriseSolutions’ network security infrastructure business. We consider our mobile device manufacturingto be a core competence and competitive advantage.
Our Customer and Market Operations horizontal group currently operates nine mobile devicemanufacturing plants in eight countries. Our Mexican and Brazilian plants primarily supply theNorth and South American markets. Three European plants, located in Finland, Germany andHungary, principally supply Europe, the Middle East and Africa. Our two plants in China and onein South Korea primarily supply the Asian markets. In addition, we have a manufacturing plant inthe United Kingdom serving Vertu. In 2006, Nokia is scheduled to open a mobile devicemanufacturing plant in India to meet growing demand there and in surrounding areas.
We also use outsourcing to add flexibility to our manufacturing activities. During 2005,outsourcing covered on average approximately 26% of our manufacturing volume of mobiledevice engines.
In the past several years, we have made significant capital investments in order to provide thecapacity required to meet demand growth. Each of our plants employs state-of-the-art technologyand is highly automated. Although our plants generally manufacture for the cellular standards oflocal geographic markets, each plant is capable of providing mobile devices for most of the world’smajor standards. As a result, we believe we are able to respond rapidly to the needs of differentgeographic markets and to take advantage of the flexibility of a global manufacturing network.
In line with industry practice, we source a large proportion of components for our mobile devicesfrom a global network of suppliers. We and our contract manufacturers then assemble thesecomponents and activate the device with our own software. Final assembly typically takes placeonly for firm customer orders. Certain of these components may experience some price volatilityfrom time to time. Management believes that our business relationships with our suppliers arestable, and they typically involve a high degree of cooperation in research and development,product design and manufacturing. See ‘‘Item 3.D Risk Factors—We depend on a limited number ofsuppliers for the timely delivery of components and for their compliance with our supplierrequirements, such as our and our customers’ product quality, safety, security and other
35
standards. Their failure to do so could materially adversely affect our ability to deliver ourproducts and solutions successfully and on time.’’
Overall, we aim to manage our inventories to ensure that production meets demand for ourproducts, while minimizing inventory-carrying costs. The inventory level we maintain is afunction of a number of factors, including estimates of demand for each product category, productprice levels, the availability of raw materials, supply-chain integration with suppliers, and the rateof technological change. From time to time, our inventory levels may differ from actualrequirements. See ‘‘Item 3.D Risk Factors—Our sales and results of operations could be materiallyadversely affected if we fail to efficiently manage our manufacturing and logistics withoutinterruption, or fail to ensure that our products and solutions meet our and our customers’quality, safety, security and other requirements and are delivered on time.’’
Networks
At December 31, 2005, the Networks business group operated five production plants, three inFinland and two in China. During 2005, Nokia announced that it intends to establish a high-endbase station controller manufacturing unit in Chennai, India, with production expected tocommence in 2006. In line with our strategy to invest resources in key areas to improve efficiency,some product support activities and over 50% of Networks’ production are outsourced.
Nokia generally prefers to have multiple sources for its components, but Networks sources somecomponents for its telecommunications systems from a single or a small number of selectedsuppliers. As is the case with suppliers to our other business groups, management believes thatthese business relationships are stable and typically involve a high degree of cooperation inresearch and development, product design and manufacturing. This is necessary in order toensure optimal product interoperability. See ‘‘Item 3.D Risk Factors—We depend on a limitednumber of suppliers for the timely delivery of components and for their compliance with oursupplier requirements, such as our and our customers’ product quality, safety, security and otherstandards. Their failure to do so could materially adversely affect our ability to deliver ourproducts and solutions successfully and on time.’’
Some components and sub-assemblies for Networks products, including Nokia-specific integratedcircuits and radio frequency components; servers; sub-assemblies such as filters, combiners andpower units; cabinets; and Nokia-specific connectors, are sourced and manufactured by third-partysuppliers. Our strategy is to focus on core competencies in our own operations and to worktogether with world-class companies outside our core areas. This strategy is designed to increaseour competitiveness in the mobile infrastructure market by improving our flexibility and reactionspeed. We then assemble components and sub-assemblies into final products and solutions.Consistent with industry practice, we manufacture our telecommunications systems on acontract-by-contract basis.
Technology, Research and Development
At Nokia, research and development takes place within Technology Platforms, the four businessgroups and the Nokia Research Center.
Technology Platforms
Technology Platforms is responsible for the competitiveness of Nokia’s technology assets. Itsupports the company’s overall technology management and development by delivering leadingtechnologies and well-defined platforms to Nokia’s business groups and external customers.
36
Key focus areas include software platforms, chipset platforms, technology access, creation ofintellectual property rights and the user experience. Technology Platforms’ work encompassesmultiradio technologies such as GSM, EDGE, CDMA, WCDMA, WLAN, Bluetooth, Near FieldCommunications, or NFC, and mobile DVB-H. To ensure early access to state-of-the-art technologiesin areas such as displays, audio and memory, Technology Platforms also works with leadingexternal developers, suppliers and partners.
Technology Platforms is responsible for the development of S60, the market-leading smartphonesoftware platform that Nokia uses in its own devices and also licenses to other handsetmanufacturers. Nokia’s global mobile device software developer support operation, Forum Nokia, isalso part of Technology Platforms. Forum Nokia includes Preminet, a platform for operators,developers and content providers to use in launching and managing services and applications forSymbian OS and Java-based mobile devices.
Technology Platforms develops technology architecture for converging digital industries inco-operation with leading industry players and alliances. This includes the creation of intellectualproperty rights, standards-based interfaces, high performance mobile computing and usabilityinnovations. Technology Platforms also coordinates Nokia’s participation in more than 100specification-making and industry cooperation organizations across the globe, including the OpenMobile Alliance, or OMA; the 3GPP, or Third Generation Partnership Project; the Third GenerationPartnership Project 2, or 3GPP2; the Internet Engineering Task Force, or IETF; and the Institute ofElectrical and Electronics Engineers, or IEEE.
Nokia sees open source development as a way to extend its R&D and foster innovation. In 2005,Nokia Technology Platforms unveiled the first significant projects based on open sourcedevelopment, including a new browser for S60 software and the Carbide developer tools family. Inaddition, Nokia has introduced a new Internet portal that consolidates the company’s open sourceactivities and provides access to its projects.
Business Groups
Design and technology go hand-in-hand at Nokia. The company’s mobile device design team bringsthe user experience perspective to the product creation process, combining technology with form,size, functionality and product packaging. Each of Nokia’s mobile device business groups takes intoaccount its own customer needs in product-focused R&D. They integrate technologies from theirown research, from Technology Platforms and from external vendors into their products andsolutions.
The Networks business group’s R&D work focuses on GSM, EDGE and 3G/WCDMA radio technologies,wireless broadband technologies, circuit-switched and IP-based core networks, and networkmanagement. With these investments, Nokia aims to support the development of existing networkinfrastructure solutions as well as implement new solutions to support future end-user services.Further, we focus on creating open hardware and software architecture, which results in researchand development costs being spread among industry players.
Our business groups improve R&D efficiency and speed time to market by often basing theirproducts on the same technologies. For example, Mobile Phones, Multimedia and EnterpriseSolutions all develop devices based on the S60 software platform, on top of which they can installapplications specific to their business. Multimedia has developed mobile imaging and videoapplications for S60, while the Enterprise Solutions business group offers a variety of e-mailsolutions that run on the platform. In addition, all Nokia’s mobile device business groups use acommon chipset platform in their devices. This brings economies of scale and allows flexibilityboth in R&D and in the management of demand and supply networks.
37
Nokia Research Center
Looking beyond the development of current products, platforms and technologies, Nokia’scorporate research center develops leading-edge technologies and creates competencies intechnology areas that we believe will be vital to the company’s future success. The ResearchCenter works closely with Nokia’s four business groups and Technology Platforms to develop newconcepts, technologies and applications.
Our global network of relationships with universities and other industry R&D players expands thescope of our long-term technology development. For example, in October 2005, Nokia ResearchCenter and the Massachusetts Institute of Technology Computer Science and Artificial IntelligenceLaboratory announced the establishment of the Nokia Research Center Cambridge.
Competition
Mobile Devices
Mobile phone market participants compete mainly on the basis of the breadth and depth of theirproduct portfolios, price, operational and manufacturing efficiency, technical performance, productfeatures, quality, customer support, and brand recognition. Mobile network operators areincreasingly offering mobile phones under their own brand, which may result in increasingcompetition from non-branded mobile device manufacturers.
Historically, our principal competitors in mobile devices have been other mobile device companiessuch as LG, Motorola, Samsung, Siemens and Sony Ericsson. However, we face new competition,particularly in Multimedia and Enterprise Solutions, where we compete with consumer electronicsmanufacturers and business device and solution providers respectively. We also face newcompetitors from countries where production costs tend to be lower. Further, as the industry nowincludes increasing numbers of participants that provide specific hardware and software layerswithin products and solutions, we will compete at the level of these layers rather than solely atthe level of complete products and solutions. Examples of such layers include operating systemand user interface software, chipsets, and application software such as games software. As a resultof these developments, we face new competitors such as, but not limited to, Apple, Canon, Dell, HP,Microsoft, Palm, Research in Motion and Sony. We will also face competition from a large numberof smaller competitors and some of our traditional competitors in new areas, as well ascompetitors that have chosen to focus on building products based on commercially availablecomponents.
It is difficult to predict how the competitive landscape of the mobile communications industry willdevelop in the future. In the mobile communications industry, the parameters of competition areless firmly established than in mature, low-growth industries, where the competitive landscapedoes not change greatly from year to year. See ‘‘Item 3.D Risk Factors—Competition in our industryis intense. Our failure to maintain or improve our market position and respond successfully tochanges in the competitive landscape may have a material adverse impact on our business andresults of operations.’’
Infrastructure
In the network infrastructure business, our principal competitors include Alcatel, Ericsson, Huawei,Lucent, Motorola, NEC, Nortel and Siemens. Competition in both the 2G and the 3G networkinfrastructure market remains intense. In 2G, competition is driven by price, solutions that areable to offer low total cost of ownership, and the vendor’s ability to roll-out mobile networks inhigh-growth markets. In 3G, vendors compete on the basis of price and track record of networkimplementations, as well as in terms of which new technologies they plan to introduce and when.
38
There is a growing opportunity for Nokia to enter the systems integration and consulting businessthat serves mobile operators, given its extensive understanding of the mobile communicationsmarket and the rising importance of mobile data services and related IT systems for operators.This will bring us into direct competition with traditional systems integrators and consultingcompanies such as IBM, HP, and Accenture, as well as a large number of local and regionalsystems integrators.
On the security infrastructure side of the Enterprise Solutions business, our principal competitorsare Cisco and Juniper Networks.
Seasonality
For information on the seasonality of our business, please see ‘‘Item 5.A Operating Results—Overview—Certain Other Factors—Seasonality’’.
Patents and Licenses
A high level of R&D investment and rapid technological development has meant that the role ofIPR in our industry has always been important. Digital convergence, multiradio solutions,alternative radio technologies, differing business models combined with large volumes areincreasing the complexity and importance of IPR further.
The detailed designs of our products are based primarily on our own research and developmentwork and design efforts and comply with all relevant and applicable public standards. We seek tosafeguard our investments in technology through adequate intellectual property protection,including patents, design registrations and patents, trade secrets, trademark registrations andcopyrights that are used to protect proprietary features of our products. For example, in 2005 wefiled new patent applications for more than 1 200 new inventions on a global basis, and currentlyour IPR patent portfolio provides protection for over 10 500 inventions. We believe that Nokia hasa strong IPR position, including across all major cellular and mobile communications standards,data applications, user interface features and functions and many other areas. We also believethat Nokia is one of the leading companies in the development of GSM/GPRS/EDGE/WCDMAtechnologies, and that we hold a strong patent position in this field.
Nokia is a holder of numerous essential patents for various mobile communications standards. Anessential patent covers a feature or function that is incorporated into an open standard that allmanufacturers are required to meet in order to comply with the standard. In accordance with thedeclarations we have made and the legal obligations created under the applicable rules of variousstandardization bodies, such as the European Telecommunication Standardization Institute (ETSI),we are committed to promoting open standards, and to offering to license and to granting licensesfor our essential patents on a fair, reasonable and non-discriminatory basis. We have entered intoseveral license agreements with other companies relating to both essential and other patents.Many of these agreements are cross license agreements with major telecommunications companiesthat cover broad product areas and allow Nokia to choose its preferred product design.
With the introduction of new mobile data and other evolving technologies, such as those enablingmultimedia services, our products and solutions include increasingly complex technologicalsolutions that incorporate a variety of patented and proprietary technologies. A 3G/WCDMA mobiledevice, for example, may incorporate three times as many components, including substantiallymore complex software, as our 2G/GSM mobile devices. As the number of entrants in the marketgrows, as the Nokia product range becomes more diversified, and as the complexity of thetechnology increases, the possibility of alleged infringement and other intellectual property claimsagainst us increases. As new features are added to our products and solutions, we are alsoentering into licensing agreements with a number of new companies in the field of new mobile
39
data and evolving technologies. We believe companies like Nokia with a strong IPR position,cumulative know-how and IPR expertise can have a competitive advantage in the convergingindustry, and on the increasingly competitive marketplace.
In many aspects, the business models for mobile services have not yet been established. The lackof availability of licenses for copyrighted content, delayed negotiations, or restrictive copyrightlicensing terms may have an adverse effect on the cost or timing of content related services by us,operators or third party service providers, and may also indirectly affect the sales of our mobiledevices.
From time to time we are subject to patent infringement claims from third parties. We believethat, based on industry practice and applicable legal obligations, any necessary licenses or rightsunder patents that we may require can be obtained on terms that would not have a materialadverse effect on our business, results of operations or financial condition. Nevertheless, in somesituations, necessary licenses may not be available on acceptable commercial terms, if at all. Theinability to obtain necessary licenses or other rights, or the need to engage in litigation, couldhave a material adverse effect on our business, results of operations and financial condition. See‘‘Item 3.D Risk Factors—We must develop or otherwise acquire complex, evolving technologies touse in our business. If we fail to develop or otherwise acquire these complex technologies asrequired by the market, with full rights needed to use in our business, or to successfullycommercialize such technologies as new advanced products and solutions that meet customerdemand, or fail to do so on a timely basis, this may have a material adverse effect on ourbusiness, our ability to meet our targets and our results of operations.’’ See also ‘‘Item 3.D RiskFactors—Our products and solutions include increasingly complex technology involving numerousnew Nokia patented and other proprietary technologies, as well as some developed or licensed tous by certain third parties. As a consequence, evaluating the rights related to the technologies weuse or intend to use is more and more challenging, and we expect increasingly to face claims thatwe have infringed third parties’ intellectual property rights. The use of increasingly complextechnology may also result in increased licensing costs for us, restrictions on our ability to usecertain technologies in our products and solution offerings, and/or costly and time-consuminglitigation. Third parties may also commence actions seeking to establish the invalidity ofintellectual property rights on which we depend.’’
Government Regulation
In the United States, our products are subject to government regulations that have a direct andsubstantial impact on our business. It is in our interest for the Federal CommunicationsCommission, or FCC, to maintain a regulatory environment for mobile device and networkproducts that ensures the continued robust growth of the wireless sector. Most of our productsmust meet specified radio frequency emission and other standards. The FCC and other US agenciesalso regulate the spectrum available for wireless products and solutions, and it is important for usthat these agencies make sufficient and suitable spectrum available to meet the demands ofadvanced wireless products and services.
EU regulation has in many areas a direct effect on the business of Nokia and our customers withinthe single market of the European Union. For example, in the telecommunications sector theCouncil of Ministers has adopted a set of rules that harmonizes the EU Member States’ regulatoryframework for electronic communication networks and services, and aims to encouragecompetition in the internal electronic communications markets. Also, other regulatory measureshave been taken in recent years in order to address consumer protection and environmentalpolicy issues relating to the sector. We are in a continuous dialogue with the EU institutionsthrough our experts, industry associations and our office in Brussels.
40
Other countries also have direct and indirect regulations that affect our business. Changes in theregulations or their interpretation, whether relating to our device, network, or other products orbusiness processes, could affect our business. For example, the implementation of newtechnological or legal requirements could impact products, wireless services and solutions,manufacturing or distribution processes, and could affect the timing of product introductions, thecost of production, and the commercial success of products. Our net sales and results of operationscould be adversely affected by export controls, tariffs or other fees or levies imposed on ourproducts, as well as by environmental, product safety and security and other regulations thataffect the export, import, pricing or cost of our products and solutions, as well as new servicesrelated to our products. We are in a continuous dialogue with regulatory bodies through ourexperts, industry associations and lobbyists.
Corporate Responsibility
As market leader and a top global brand, our impact on society comes with responsibilities that gobeyond providing useful, safe, secure and quality products. During 2005, we made progress in anumber of key areas.
In anticipation of upcoming EU environmental legislation on the restriction of certain hazardoussubstances, or RoHS, Nokia introduced its first two fully-compliant products. This was well inadvance of the July 1, 2006 deadline, when the new directive restricting the use of lead, cadmium,mercury, chromium and two flame retardants in electronic products takes effect.
Nokia’s first global stakeholder engagement event, in October 2005, brought together 160participants representing civil society, the public sector, academia, and a range of businesses. Theaim of the event was to provide a platform for people to give frank and honest views onimportant issues, including the importance of multi-sector cooperation, youth care, mobilecommunications for development, and corporate responsibility reporting.
Following an update of our Code of Conduct, Nokia’s Group Executive Board launched acompanywide Code of Conduct awareness campaign focused on an e-learning training anddiscussion platform. The initial September to December 2005 phase reached a sub-target of close to30 000 Nokia employees, with a further 15 000 targeted by April 2006. Nokia’s Code of Conduct,which has been translated into 25 languages, explains how our employees must carry out theirwork and comply with ethical and legal standards.
Employee Development
Fundamental to our success is the ‘‘Nokia Way’’ for all our people. The Nokia Way is a philosophyof attracting and retaining the best people and maintaining continuous renewal. It centers aroundfour core values: customer satisfaction, respect, achievement and renewal. We believe these arecritical in order for a global organization such as Nokia to work effectively.
Nokia’s employee-value proposition framework remains strong. The four fundamentals of theproposition, together with the elements encompassed by each of them, are as follows:
• Nokia Way and Values: fact-based management/value-based leadership, code of conduct,equal opportunities, diversity, internal communications and feedback channels.
• Extensive performance-based rewarding: base pay, equity-based instruments, comprehensiveincentive system through Nokia ‘‘Connecting People’’ bonuses and individual, team andproject/program incentive payments.
• Professional and personal growth: career development, job rotation, training andperformance management.
41
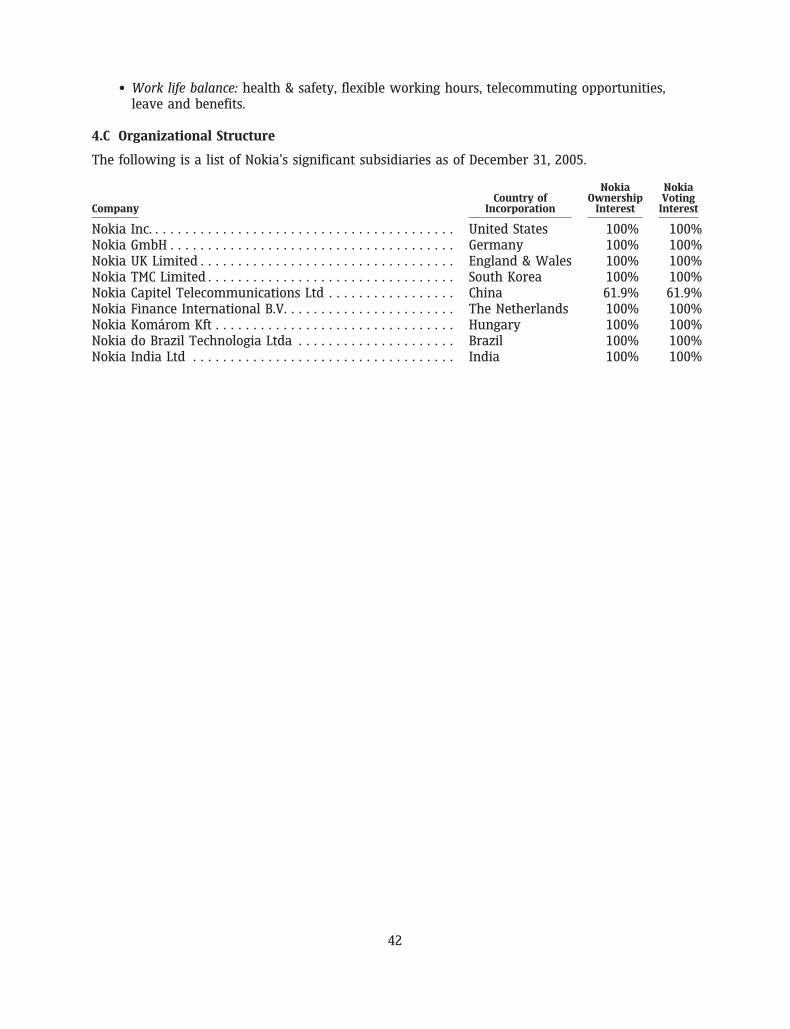
• Work life balance: health & safety, flexible working hours, telecommuting opportunities,leave and benefits.
4.C Organizational Structure
The following is a list of Nokia’s significant subsidiaries as of December 31, 2005.
Nokia NokiaCountry of Ownership Voting
Company Incorporation Interest Interest
Nokia Inc. . . . . . . . . . . . . . . . . . . . . . . . . . . . . . . . . . . . . . . . . United States 100% 100%Nokia GmbH . . . . . . . . . . . . . . . . . . . . . . . . . . . . . . . . . . . . . . Germany 100% 100%Nokia UK Limited . . . . . . . . . . . . . . . . . . . . . . . . . . . . . . . . . . England & Wales 100% 100%Nokia TMC Limited . . . . . . . . . . . . . . . . . . . . . . . . . . . . . . . . . South Korea 100% 100%Nokia Capitel Telecommunications Ltd . . . . . . . . . . . . . . . . . China 61.9% 61.9%Nokia Finance International B.V. . . . . . . . . . . . . . . . . . . . . . . The Netherlands 100% 100%Nokia Komarom Kft . . . . . . . . . . . . . . . . . . . . . . . . . . . . . . . . Hungary 100% 100%Nokia do Brazil Technologia Ltda . . . . . . . . . . . . . . . . . . . . . Brazil 100% 100%Nokia India Ltd . . . . . . . . . . . . . . . . . . . . . . . . . . . . . . . . . . . India 100% 100%
42
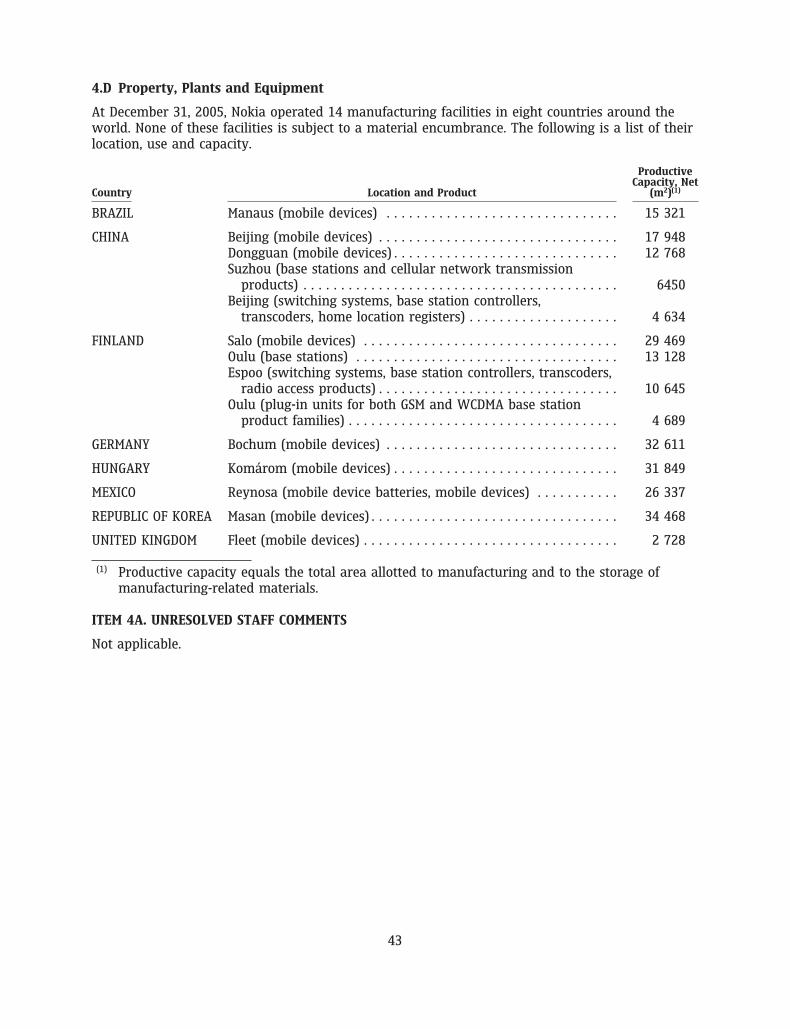
4.D Property, Plants and Equipment
At December 31, 2005, Nokia operated 14 manufacturing facilities in eight countries around theworld. None of these facilities is subject to a material encumbrance. The following is a list of theirlocation, use and capacity.
ProductiveCapacity, Net
Country Location and Product (m2)(1)
BRAZIL Manaus (mobile devices) . . . . . . . . . . . . . . . . . . . . . . . . . . . . . . . 15 321
CHINA Beijing (mobile devices) . . . . . . . . . . . . . . . . . . . . . . . . . . . . . . . . 17 948Dongguan (mobile devices) . . . . . . . . . . . . . . . . . . . . . . . . . . . . . . 12 768Suzhou (base stations and cellular network transmission
products) . . . . . . . . . . . . . . . . . . . . . . . . . . . . . . . . . . . . . . . . . . 6450Beijing (switching systems, base station controllers,
transcoders, home location registers) . . . . . . . . . . . . . . . . . . . . 4 634
FINLAND Salo (mobile devices) . . . . . . . . . . . . . . . . . . . . . . . . . . . . . . . . . . 29 469Oulu (base stations) . . . . . . . . . . . . . . . . . . . . . . . . . . . . . . . . . . . 13 128Espoo (switching systems, base station controllers, transcoders,
radio access products) . . . . . . . . . . . . . . . . . . . . . . . . . . . . . . . . 10 645Oulu (plug-in units for both GSM and WCDMA base station
product families) . . . . . . . . . . . . . . . . . . . . . . . . . . . . . . . . . . . . 4 689
GERMANY Bochum (mobile devices) . . . . . . . . . . . . . . . . . . . . . . . . . . . . . . . 32 611
HUNGARY Komarom (mobile devices) . . . . . . . . . . . . . . . . . . . . . . . . . . . . . . 31 849
MEXICO Reynosa (mobile device batteries, mobile devices) . . . . . . . . . . . 26 337
REPUBLIC OF KOREA Masan (mobile devices) . . . . . . . . . . . . . . . . . . . . . . . . . . . . . . . . . 34 468
UNITED KINGDOM Fleet (mobile devices) . . . . . . . . . . . . . . . . . . . . . . . . . . . . . . . . . . 2 728
(1) Productive capacity equals the total area allotted to manufacturing and to the storage ofmanufacturing-related materials.
ITEM 4A. UNRESOLVED STAFF COMMENTS
Not applicable.
43
ITEM 5. OPERATING AND FINANCIAL REVIEW AND PROSPECTS
5.A Operating Results
This section begins with an overview of our four business groups and the principal factors andtrends affecting our results of operations. The overview is followed by a discussion of our criticalaccounting policies and estimates that we believe are important to understanding the assumptionsand judgments reflected in our reported financial results. We then present a detailed analysis ofour results of operations for the last three fiscal years, as well as our liquidity and capitalresources.
The following should be read in conjunction with our consolidated financial statements includedin Item 18 of this annual report on Form 20-F and ‘‘Item 3.D Risk Factors.’’ Our financialstatements and the financial information discussed below have been prepared in accordance withIFRS. For a discussion of the principal differences between IFRS and US GAAP, see ‘‘—Results ofOperations—Principal Differences between IFRS and US GAAP’’ below and Note 39 to ourconsolidated financial statements.
Overview
Nokia is the world’s largest manufacturer of mobile devices and a leader in mobile networkequipment, solutions and services. We also provide equipment, solutions and services forcorporate customers.
Nokia is organized in four business groups: Mobile Phones, Multimedia, Enterprise Solutions andNetworks. There are also two horizontal groups that support the mobile device business groups:Customer and Market Operations and Technology Platforms. In addition, the structure includescommon group functions that consist of common research and general group functions.
Mobile Phones connects people by providing expanding mobile voice and data capabilities across awide range of mobile devices. Multimedia brings connected mobile multimedia experiences toconsumers in the form of advanced mobile devices and applications. Enterprise Solutions offersbusinesses and institutions a broad range of products and solutions, including enterprise-grademobile devices, underlying security infrastructure, software and services. Networks providesnetwork infrastructure, communications and networks service platforms, as well as professionalservices to operators and service providers.
For the purposes of the discussion under ‘‘—Principal Factors Affecting our Results of Operations—Mobile Devices’’ and ‘‘Item 5.C Research and Development, Patents and Licenses’’, our mobile devicenet sales and costs include the total net sales and costs of the Mobile Phones and Multimediabusiness groups as well as the Mobile Devices business unit of the Enterprise Solutions businessgroup. Mobile device net sales and costs exclude the Security & Mobile Connectivity business unitof the Enterprise Solutions business group. The results of that business unit historically have beenimmaterial.
Business segment data in the following discussion and analysis is prior to inter-segmenteliminations. See Note 3 to our consolidated financial statements included in Item 18 of thisannual report on Form 20-F.
Nokia’s current business group reporting structure was effective as of January 1, 2004. Theinformation for the fiscal year 2003 has been regrouped to reflect that business group structure asif it had been in existence during that year.
44
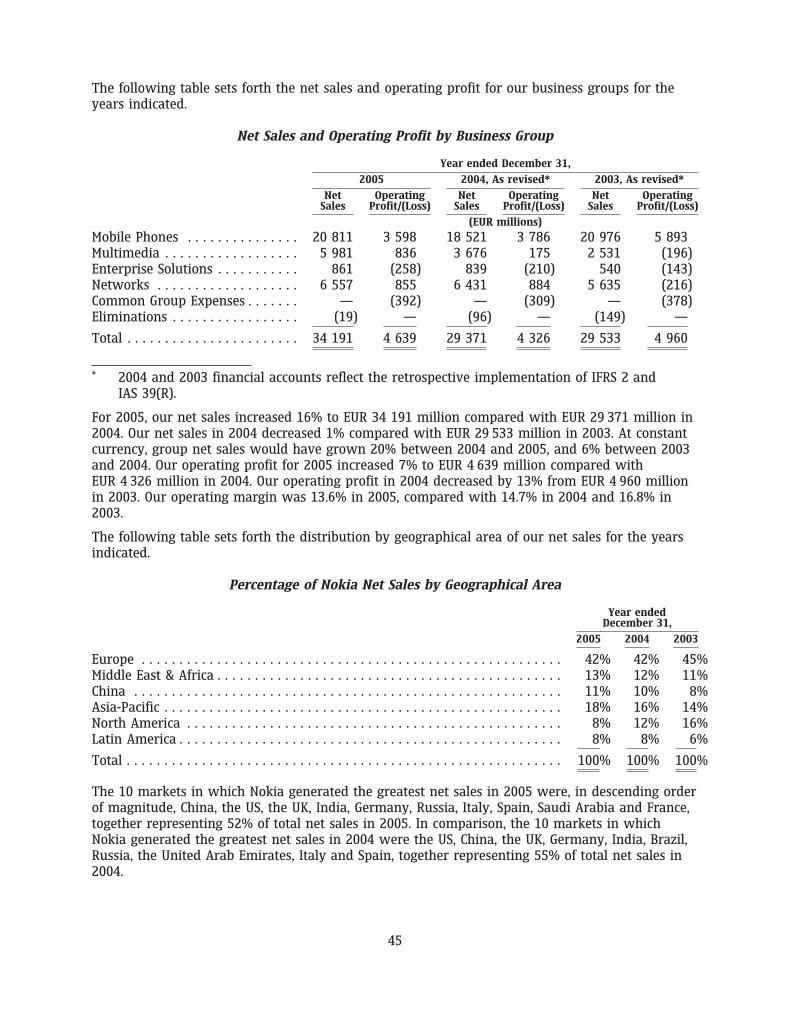
The following table sets forth the net sales and operating profit for our business groups for theyears indicated.
Net Sales and Operating Profit by Business Group
Year ended December 31,
2005 2004, As revised* 2003, As revised*
Net Operating Net Operating Net OperatingSales Profit/(Loss) Sales Profit/(Loss) Sales Profit/(Loss)
(EUR millions)
Mobile Phones . . . . . . . . . . . . . . . 20 811 3 598 18 521 3 786 20 976 5 893Multimedia . . . . . . . . . . . . . . . . . . 5 981 836 3 676 175 2 531 (196)Enterprise Solutions . . . . . . . . . . . 861 (258) 839 (210) 540 (143)Networks . . . . . . . . . . . . . . . . . . . 6 557 855 6 431 884 5 635 (216)Common Group Expenses . . . . . . . — (392) — (309) — (378)Eliminations . . . . . . . . . . . . . . . . . (19) — (96) — (149) —
Total . . . . . . . . . . . . . . . . . . . . . . . 34 191 4 639 29 371 4 326 29 533 4 960
* 2004 and 2003 financial accounts reflect the retrospective implementation of IFRS 2 andIAS 39(R).
For 2005, our net sales increased 16% to EUR 34 191 million compared with EUR 29 371 million in2004. Our net sales in 2004 decreased 1% compared with EUR 29 533 million in 2003. At constantcurrency, group net sales would have grown 20% between 2004 and 2005, and 6% between 2003and 2004. Our operating profit for 2005 increased 7% to EUR 4 639 million compared withEUR 4 326 million in 2004. Our operating profit in 2004 decreased by 13% from EUR 4 960 millionin 2003. Our operating margin was 13.6% in 2005, compared with 14.7% in 2004 and 16.8% in2003.
The following table sets forth the distribution by geographical area of our net sales for the yearsindicated.
Percentage of Nokia Net Sales by Geographical Area
Year endedDecember 31,
2005 2004 2003
Europe . . . . . . . . . . . . . . . . . . . . . . . . . . . . . . . . . . . . . . . . . . . . . . . . . . . . . . . . 42% 42% 45%Middle East & Africa . . . . . . . . . . . . . . . . . . . . . . . . . . . . . . . . . . . . . . . . . . . . . . 13% 12% 11%China . . . . . . . . . . . . . . . . . . . . . . . . . . . . . . . . . . . . . . . . . . . . . . . . . . . . . . . . . 11% 10% 8%Asia-Pacific . . . . . . . . . . . . . . . . . . . . . . . . . . . . . . . . . . . . . . . . . . . . . . . . . . . . . 18% 16% 14%North America . . . . . . . . . . . . . . . . . . . . . . . . . . . . . . . . . . . . . . . . . . . . . . . . . . 8% 12% 16%Latin America . . . . . . . . . . . . . . . . . . . . . . . . . . . . . . . . . . . . . . . . . . . . . . . . . . . 8% 8% 6%
Total . . . . . . . . . . . . . . . . . . . . . . . . . . . . . . . . . . . . . . . . . . . . . . . . . . . . . . . . . . 100% 100% 100%
The 10 markets in which Nokia generated the greatest net sales in 2005 were, in descending orderof magnitude, China, the US, the UK, India, Germany, Russia, Italy, Spain, Saudi Arabia and France,together representing 52% of total net sales in 2005. In comparison, the 10 markets in whichNokia generated the greatest net sales in 2004 were the US, China, the UK, Germany, India, Brazil,Russia, the United Arab Emirates, Italy and Spain, together representing 55% of total net sales in2004.
45
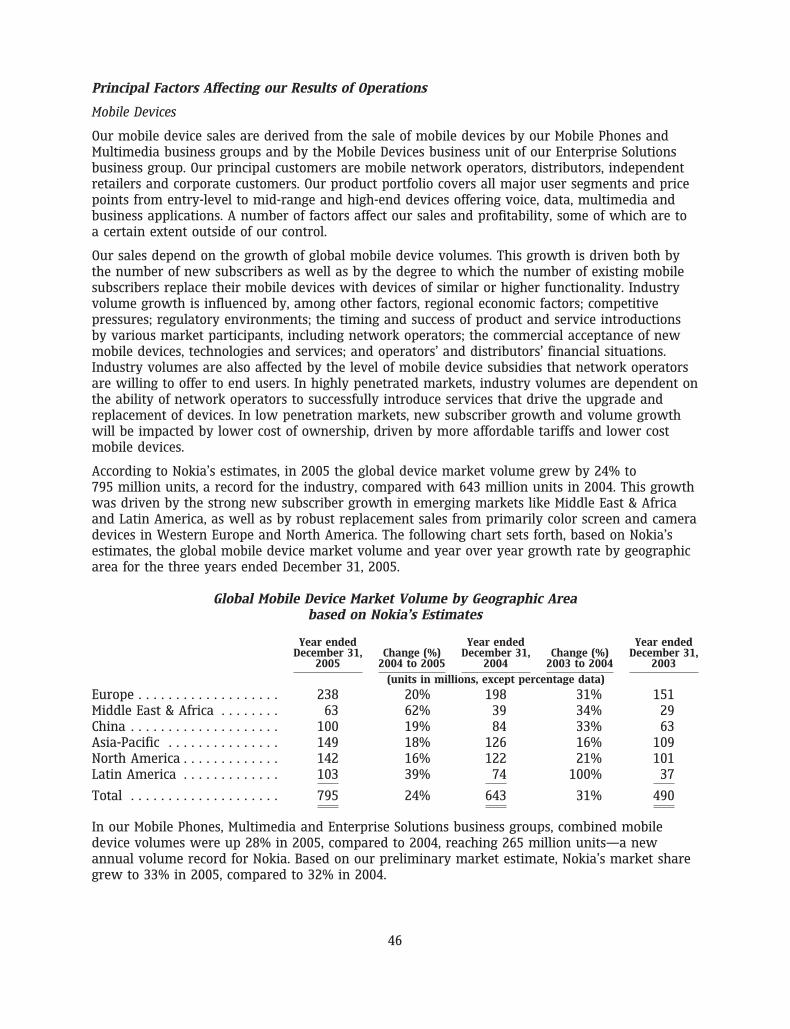
Principal Factors Affecting our Results of Operations
Mobile Devices
Our mobile device sales are derived from the sale of mobile devices by our Mobile Phones andMultimedia business groups and by the Mobile Devices business unit of our Enterprise Solutionsbusiness group. Our principal customers are mobile network operators, distributors, independentretailers and corporate customers. Our product portfolio covers all major user segments and pricepoints from entry-level to mid-range and high-end devices offering voice, data, multimedia andbusiness applications. A number of factors affect our sales and profitability, some of which are toa certain extent outside of our control.
Our sales depend on the growth of global mobile device volumes. This growth is driven both bythe number of new subscribers as well as by the degree to which the number of existing mobilesubscribers replace their mobile devices with devices of similar or higher functionality. Industryvolume growth is influenced by, among other factors, regional economic factors; competitivepressures; regulatory environments; the timing and success of product and service introductionsby various market participants, including network operators; the commercial acceptance of newmobile devices, technologies and services; and operators’ and distributors’ financial situations.Industry volumes are also affected by the level of mobile device subsidies that network operatorsare willing to offer to end users. In highly penetrated markets, industry volumes are dependent onthe ability of network operators to successfully introduce services that drive the upgrade andreplacement of devices. In low penetration markets, new subscriber growth and volume growthwill be impacted by lower cost of ownership, driven by more affordable tariffs and lower costmobile devices.
According to Nokia’s estimates, in 2005 the global device market volume grew by 24% to795 million units, a record for the industry, compared with 643 million units in 2004. This growthwas driven by the strong new subscriber growth in emerging markets like Middle East & Africaand Latin America, as well as by robust replacement sales from primarily color screen and cameradevices in Western Europe and North America. The following chart sets forth, based on Nokia’sestimates, the global mobile device market volume and year over year growth rate by geographicarea for the three years ended December 31, 2005.
Global Mobile Device Market Volume by Geographic Areabased on Nokia’s Estimates
Year ended Year ended Year endedDecember 31, Change (%) December 31, Change (%) December 31,
2005 2004 to 2005 2004 2003 to 2004 2003
(units in millions, except percentage data)
Europe . . . . . . . . . . . . . . . . . . . 238 20% 198 31% 151Middle East & Africa . . . . . . . . 63 62% 39 34% 29China . . . . . . . . . . . . . . . . . . . . 100 19% 84 33% 63Asia-Pacific . . . . . . . . . . . . . . . 149 18% 126 16% 109North America . . . . . . . . . . . . . 142 16% 122 21% 101Latin America . . . . . . . . . . . . . 103 39% 74 100% 37
Total . . . . . . . . . . . . . . . . . . . . 795 24% 643 31% 490
In our Mobile Phones, Multimedia and Enterprise Solutions business groups, combined mobiledevice volumes were up 28% in 2005, compared to 2004, reaching 265 million units—a newannual volume record for Nokia. Based on our preliminary market estimate, Nokia’s market sharegrew to 33% in 2005, compared to 32% in 2004.
46
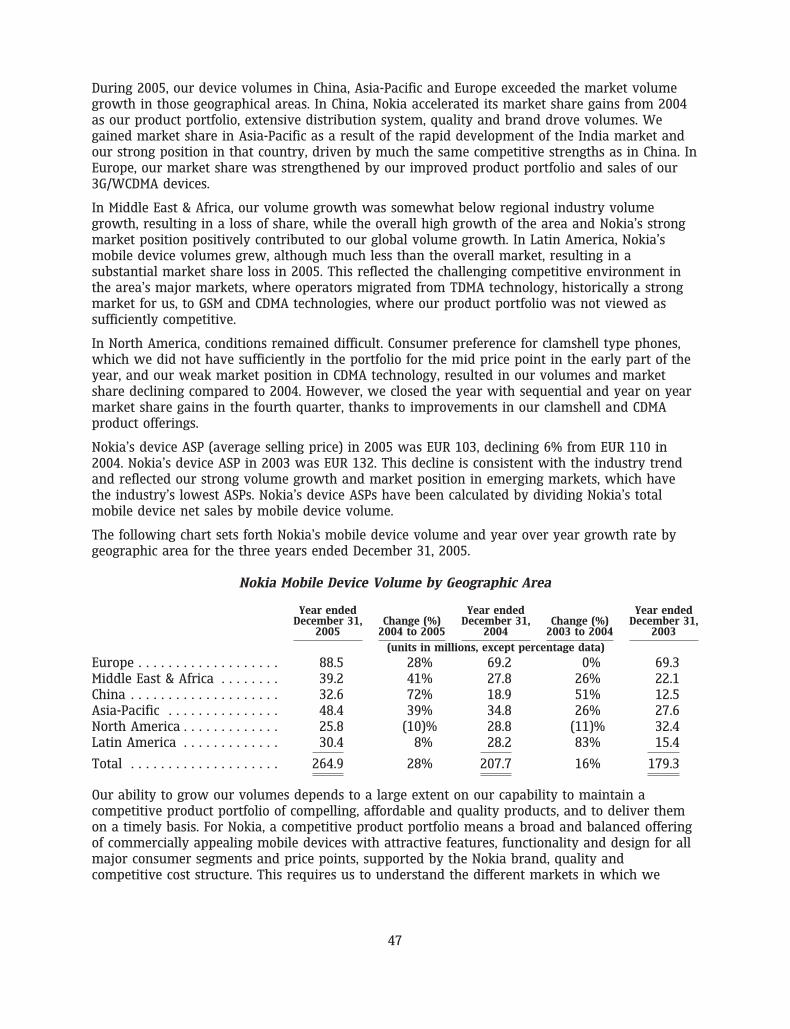
During 2005, our device volumes in China, Asia-Pacific and Europe exceeded the market volumegrowth in those geographical areas. In China, Nokia accelerated its market share gains from 2004as our product portfolio, extensive distribution system, quality and brand drove volumes. Wegained market share in Asia-Pacific as a result of the rapid development of the India market andour strong position in that country, driven by much the same competitive strengths as in China. InEurope, our market share was strengthened by our improved product portfolio and sales of our3G/WCDMA devices.
In Middle East & Africa, our volume growth was somewhat below regional industry volumegrowth, resulting in a loss of share, while the overall high growth of the area and Nokia’s strongmarket position positively contributed to our global volume growth. In Latin America, Nokia’smobile device volumes grew, although much less than the overall market, resulting in asubstantial market share loss in 2005. This reflected the challenging competitive environment inthe area’s major markets, where operators migrated from TDMA technology, historically a strongmarket for us, to GSM and CDMA technologies, where our product portfolio was not viewed assufficiently competitive.
In North America, conditions remained difficult. Consumer preference for clamshell type phones,which we did not have sufficiently in the portfolio for the mid price point in the early part of theyear, and our weak market position in CDMA technology, resulted in our volumes and marketshare declining compared to 2004. However, we closed the year with sequential and year on yearmarket share gains in the fourth quarter, thanks to improvements in our clamshell and CDMAproduct offerings.
Nokia’s device ASP (average selling price) in 2005 was EUR 103, declining 6% from EUR 110 in2004. Nokia’s device ASP in 2003 was EUR 132. This decline is consistent with the industry trendand reflected our strong volume growth and market position in emerging markets, which havethe industry’s lowest ASPs. Nokia’s device ASPs have been calculated by dividing Nokia’s totalmobile device net sales by mobile device volume.
The following chart sets forth Nokia’s mobile device volume and year over year growth rate bygeographic area for the three years ended December 31, 2005.
Nokia Mobile Device Volume by Geographic Area
Year ended Year ended Year endedDecember 31, Change (%) December 31, Change (%) December 31,
2005 2004 to 2005 2004 2003 to 2004 2003
(units in millions, except percentage data)
Europe . . . . . . . . . . . . . . . . . . . 88.5 28% 69.2 0% 69.3Middle East & Africa . . . . . . . . 39.2 41% 27.8 26% 22.1China . . . . . . . . . . . . . . . . . . . . 32.6 72% 18.9 51% 12.5Asia-Pacific . . . . . . . . . . . . . . . 48.4 39% 34.8 26% 27.6North America . . . . . . . . . . . . . 25.8 (10)% 28.8 (11)% 32.4Latin America . . . . . . . . . . . . . 30.4 8% 28.2 83% 15.4
Total . . . . . . . . . . . . . . . . . . . . 264.9 28% 207.7 16% 179.3
Our ability to grow our volumes depends to a large extent on our capability to maintain acompetitive product portfolio of compelling, affordable and quality products, and to deliver themon a timely basis. For Nokia, a competitive product portfolio means a broad and balanced offeringof commercially appealing mobile devices with attractive features, functionality and design for allmajor consumer segments and price points, supported by the Nokia brand, quality andcompetitive cost structure. This requires us to understand the different markets in which we
47
operate, and to identify key market trends and address our customers’ needs in a proactive andtimely manner. Our ability to continuously renew our product portfolio is also key to our success.
We see significant volume growth potential both in the emerging as well as in the developedmarkets, both in terms of new subscribers and replacements. Nokia also sees sales growthopportunities in capturing value from other markets by bringing enhanced mobile experiences toconsumers, such as, mobile photography and mobile music. Nokia also believes there is significantsales growth potential in bringing mobility to enterprises where the market is still at the earlystages of development.
The enterprise market is emerging as an opportunity for the mobile communications industry.Businesses are beginning to realize the potential productivity gains, cost savings and competitiveadvantages created by secure mobile voice, data and business applications. With our EnterpriseSolutions business group we intend to capture profitable segments of the enterprise market byoffering products and services designed to help enterprises improve their performance byextending their use of mobility with a diverse range of mobile devices, mobile applications andsecurity, as well as service and support.
Nokia believes that the device business is increasing in complexity. The industry winners willneed to master an array of challenges to succeed in the marketplace. In our view, winners need tohave great products with the right design, leading technology, a low cost base and excellentquality, all supported by a world recognized brand. In addition, the winners must possess scaleadvantages and excellent manufacturing and logistics. Scale, operational efficiency and cost controlhave been and will continue to be important factors affecting Nokia’s profitability andcompetitiveness. Our mobile device product costs are comprised of the cost of components,manufacturing labor and overhead, royalties and license fees, the depreciation of productmachinery, logistics costs as well as warranty and other quality costs. We believe our 2005 devicevolume of 265 million units, close to twice the volume of the nearest competitor, gives us sizeablescale benefits in component procurement. We also believe that effective and efficient research anddevelopment is vital to remaining competitive. For 2005 and 2004, the research and developmentexpenses represented approximately 9% and 10%, respectively, of mobile device net sales. In 2005,the sales and marketing costs related to mobile devices were EUR 2.4 billion compared withEUR 1.9 billion in 2004. We are focusing on return on investment of our marketing expenditure byfurther leveraging our scale benefits and by deriving further efficiencies in the investments wemake.
Nokia’s aim is to execute our strategy by expanding the market and also by growing our mobiledevice market share. Of all new subscribers estimated to be added over the next three years, aclear majority are expected to come from the emerging markets. In 2006, we expect to seecontinued demand for advanced products, such as camera phones, 3G/WCDMA devices,smartphones and other mobile multimedia devices and services. In the short term, we believe themost significant opportunities are in mobile photography, mobile music and continued penetrationof color displays. In 2005, Nokia was a clear leader in Europe, Middle East & Africa, Asia-Pacific,China, the smartphone market and in the advanced 3G/WCDMA and EDGE technologies. Nokia’sgoal is to increase its overall volume market share in its device business in 2006.
Nokia expects the mobile device market volume to grow more than 10% in 2006, from ourpreliminary estimate of approximately 795 million units in 2005. We also expect the deviceindustry to experience value growth in 2006, but expect some decline in industry ASPs, primarilyreflecting the increasing impact of the emerging markets. Nokia expects the majority of theindustry’s volume growth in 2006 to come from the emerging markets, which are expected toaccount for approximately half of the mobile device industry volumes in 2006.
48
Nokia estimates that the replacement market will represent over 60% of industry volumes in2006, compared with approximately 60% in 2005. We believe that replacement sales will bedriven by camera phones, 3G/WCDMA devices, smartphones, continued penetration of colordisplays, music features, mobile multimedia services and general aesthetic trends. According to ourestimates the global 3G/WCDMA market totaled 44 million units in 2005 and we believe that it willat least double in 2006. We believe that the global mobile subscriber base reached approximately2.2 billion at the end of 2005, and we estimate that this figure will reach 3 billion during 2008.
Our target is to continue to lower our mobile device R&D expenses/net sales ratio to 8% by theend of 2006, while simultaneously ensuring that the most compelling products are brought tomarket at the right time.
Infrastructure
Our Networks business group drives our infrastructure net sales by providing networkinfrastructure, communications and networks service platforms, as well as professional services tooperators and service providers. Nokia’s Enterprise Solutions business group also provides avariety of interoperable corporate infrastructure products, as discussed in the last paragraph ofthis section. A number of factors affect the sales and profitability of our infrastructure business,some of which are to a certain extent outside of our control.
Networks’ net sales depend on the mobile infrastructure market driven by network operatorinvestments. In low penetration markets, the principal factor influencing operator investments isthe growth in mobile usage and the growth in number of subscribers. This growth in turn leadsto increased demand for mobile network infrastructure as operators seek to build networks andlaunch commercial services to meet coverage and capacity requirements. In low penetrationmarkets, where most networks currently use 2G technology, competition among suppliers isdriven by price, the ability to provide networks and services designed for low total cost ofownership, and the ability to roll-out and support mobile networks. Investments by networkoperators in low penetration markets may also depend on regulatory developments, such as theavailability, number and cost of telecommunications licenses. 3G/WCDMA deployment plans mayalso have an impact on the size and speed of operators’ 2G investments.
In more developed markets, operator investments are driven primarily by the decision to expandthe capacity of existing networks or upgrade them in order to incorporate new technologies, suchas 3G/WCDMA, and next generation core. The demand for and commercial acceptance of such newtechnologies is largely dependent upon the attractiveness of related services, the pricing of 3Gmobile devices, and the further maturity of 3G technologies as well as local regulation. In 3G,vendors compete on the basis of price, track record of network implementations, and which futuretechnologies they plan to offer and when.
In 2005, according to our estimates, the value of the mobile infrastructure market increasedapproximately 10% from 2004, while in 2004 it increased by approximately 14% from 2003 ineuro terms. Subscriber growth combined with increased voice usage in some markets has beenthe main driver for the 2005 market growth. Investments in 3G also contributed positively tomarket growth in Western Europe, Asia-Pacific and the US.
The following chart sets forth the global mobile infrastructure market size by geographic area,based on Nokia’s estimates, for the three years ended December 31, 2005. Nokia’s estimate of thevalue of the mobile infrastructure market includes sales of mobile infrastructure equipment andrelated services for all cellular standards.
49
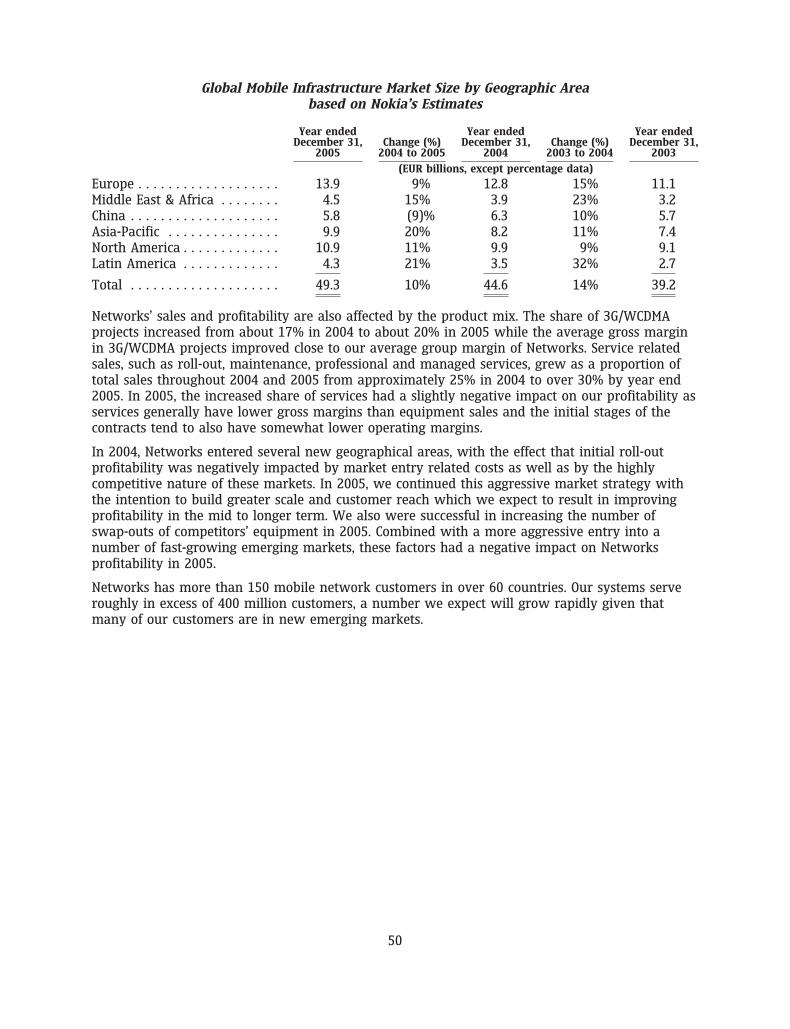
Global Mobile Infrastructure Market Size by Geographic Areabased on Nokia’s Estimates
Year ended Year ended Year endedDecember 31, Change (%) December 31, Change (%) December 31,
2005 2004 to 2005 2004 2003 to 2004 2003
(EUR billions, except percentage data)
Europe . . . . . . . . . . . . . . . . . . . 13.9 9% 12.8 15% 11.1Middle East & Africa . . . . . . . . 4.5 15% 3.9 23% 3.2China . . . . . . . . . . . . . . . . . . . . 5.8 (9)% 6.3 10% 5.7Asia-Pacific . . . . . . . . . . . . . . . 9.9 20% 8.2 11% 7.4North America . . . . . . . . . . . . . 10.9 11% 9.9 9% 9.1Latin America . . . . . . . . . . . . . 4.3 21% 3.5 32% 2.7
Total . . . . . . . . . . . . . . . . . . . . 49.3 10% 44.6 14% 39.2
Networks’ sales and profitability are also affected by the product mix. The share of 3G/WCDMAprojects increased from about 17% in 2004 to about 20% in 2005 while the average gross marginin 3G/WCDMA projects improved close to our average group margin of Networks. Service relatedsales, such as roll-out, maintenance, professional and managed services, grew as a proportion oftotal sales throughout 2004 and 2005 from approximately 25% in 2004 to over 30% by year end2005. In 2005, the increased share of services had a slightly negative impact on our profitability asservices generally have lower gross margins than equipment sales and the initial stages of thecontracts tend to also have somewhat lower operating margins.
In 2004, Networks entered several new geographical areas, with the effect that initial roll-outprofitability was negatively impacted by market entry related costs as well as by the highlycompetitive nature of these markets. In 2005, we continued this aggressive market strategy withthe intention to build greater scale and customer reach which we expect to result in improvingprofitability in the mid to longer term. We also were successful in increasing the number ofswap-outs of competitors’ equipment in 2005. Combined with a more aggressive entry into anumber of fast-growing emerging markets, these factors had a negative impact on Networksprofitability in 2005.
Networks has more than 150 mobile network customers in over 60 countries. Our systems serveroughly in excess of 400 million customers, a number we expect will grow rapidly given thatmany of our customers are in new emerging markets.
50
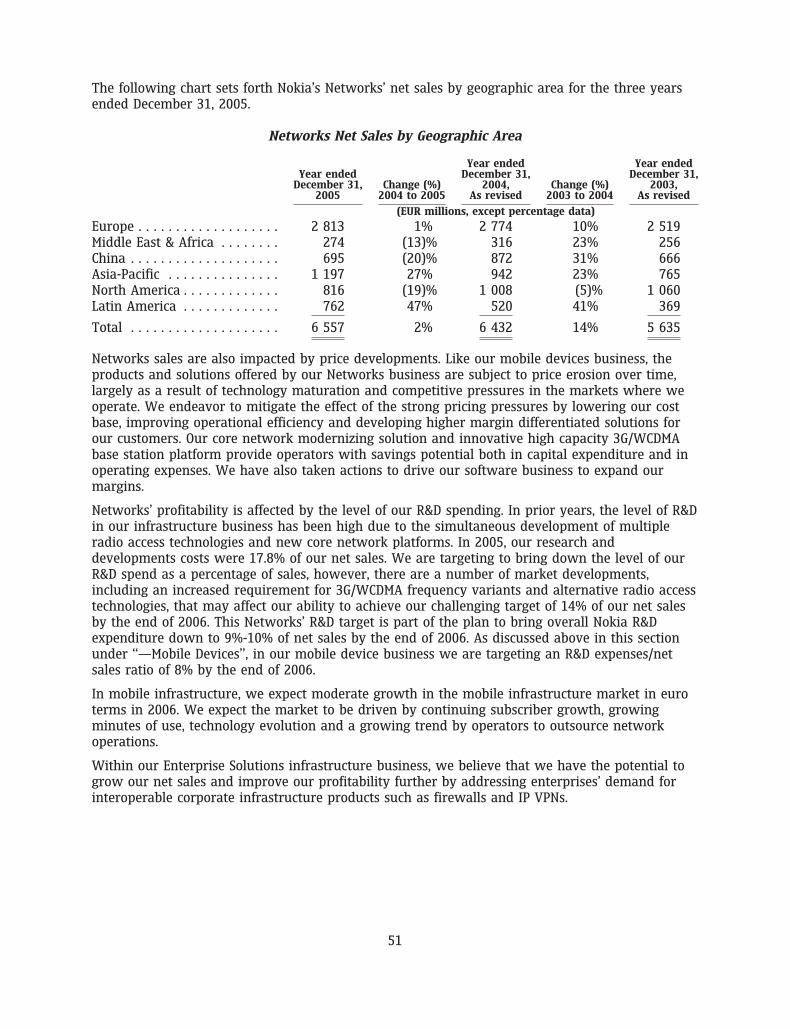
The following chart sets forth Nokia’s Networks’ net sales by geographic area for the three yearsended December 31, 2005.
Networks Net Sales by Geographic Area
Year ended Year endedYear ended December 31, December 31,
December 31, Change (%) 2004, Change (%) 2003,2005 2004 to 2005 As revised 2003 to 2004 As revised
(EUR millions, except percentage data)
Europe . . . . . . . . . . . . . . . . . . . 2 813 1% 2 774 10% 2 519Middle East & Africa . . . . . . . . 274 (13)% 316 23% 256China . . . . . . . . . . . . . . . . . . . . 695 (20)% 872 31% 666Asia-Pacific . . . . . . . . . . . . . . . 1 197 27% 942 23% 765North America . . . . . . . . . . . . . 816 (19)% 1 008 (5)% 1 060Latin America . . . . . . . . . . . . . 762 47% 520 41% 369
Total . . . . . . . . . . . . . . . . . . . . 6 557 2% 6 432 14% 5 635
Networks sales are also impacted by price developments. Like our mobile devices business, theproducts and solutions offered by our Networks business are subject to price erosion over time,largely as a result of technology maturation and competitive pressures in the markets where weoperate. We endeavor to mitigate the effect of the strong pricing pressures by lowering our costbase, improving operational efficiency and developing higher margin differentiated solutions forour customers. Our core network modernizing solution and innovative high capacity 3G/WCDMAbase station platform provide operators with savings potential both in capital expenditure and inoperating expenses. We have also taken actions to drive our software business to expand ourmargins.
Networks’ profitability is affected by the level of our R&D spending. In prior years, the level of R&Din our infrastructure business has been high due to the simultaneous development of multipleradio access technologies and new core network platforms. In 2005, our research anddevelopments costs were 17.8% of our net sales. We are targeting to bring down the level of ourR&D spend as a percentage of sales, however, there are a number of market developments,including an increased requirement for 3G/WCDMA frequency variants and alternative radio accesstechnologies, that may affect our ability to achieve our challenging target of 14% of our net salesby the end of 2006. This Networks’ R&D target is part of the plan to bring overall Nokia R&Dexpenditure down to 9%-10% of net sales by the end of 2006. As discussed above in this sectionunder ‘‘—Mobile Devices’’, in our mobile device business we are targeting an R&D expenses/netsales ratio of 8% by the end of 2006.
In mobile infrastructure, we expect moderate growth in the mobile infrastructure market in euroterms in 2006. We expect the market to be driven by continuing subscriber growth, growingminutes of use, technology evolution and a growing trend by operators to outsource networkoperations.
Within our Enterprise Solutions infrastructure business, we believe that we have the potential togrow our net sales and improve our profitability further by addressing enterprises’ demand forinteroperable corporate infrastructure products such as firewalls and IP VPNs.
51
Subsequent Events
Preliminary Agreement with SANYO
On February 14, 2006, Nokia and SANYO Electric Co., Ltd announced a preliminary agreement withintent to form a new global company comprised of their respective CDMA mobile phonebusinesses—separate from the parent companies. The relevant assets from both companies will becontributed or made available for the new entity. Final agreements are expected to be signed inthe second quarter of 2006, with the new business expected to commence operations in the thirdquarter of 2006, provided that the due diligence has been completed and all necessary regulatoryapprovals obtained.
Considering the preliminary structure, the new entity is expected to be treated as an associatedcompany for accounting purposes, and therefore upon formation Nokia’s share of the revenuesand expenses and assets and liabilities of the entity will be shown as single line item in theconsolidated profit and loss, balance sheet and financial statements of the Group. The historicalNokia CDMA business has represented less than 5% of our net sales, operating profit and totalassets. Additional information regarding the impact of this transaction on us will become availableonce agreements with SANYO Electric Co., Ltd are finalized.
Acquisition of Intellisync
In February 2006, Nokia acquired 100% of the outstanding common shares of IntellisyncCorporation for cash consideration of approximately EUR 368 million. Intellisync delivers wirelessemail and other applications over an array of devices and application platforms across carriernetworks. Intellisync will be integrated into the Enterprise Solutions business group, and its resultsof operations will be included in our consolidated financial statements as from the acquisitiondate.
Other than the cash consideration paid and corresponding intangible assets recognized, principallygoodwill, the acquisition is not expected to have a material effect on our results of operations,financial position, or cash flows in 2006.
Telsim settlement
As previously agreed with Telsim and the Turkish Savings and Deposit Insurance Fund (TMSF),which currently controls and manages Telsim’s assets, Nokia will receive a settlement paymentupon completion of the sale of Telsim’s assets for losses Nokia incurred in 2001. Our share of theannounced purchase price expected to be received during the first half of 2006 is 7.5% of thepurchase price, or USD 341 million (EUR 285 million) and is subject to negotiations.
Certain Other Factors
United States Dollar
In 2005 the US dollar was weaker on average than in 2004, even though the US dollar trendreversed and the US dollar appreciated against the euro by 12.6% (when measured year-end ratecompared to the year-end rate for the previous year). When measured by the average rate used torecord transactions in foreign currency for accounting purposes for the year compared with thecorresponding rate for the previous year, the US dollar depreciated against the euro by 1.7% in2005. The weaker US dollar on average had a slight negative impact on our net sales expressed ineuros because somewhat more than 50% of our net sales are generated in US dollars andcurrencies closely following the US dollar. However, the average depreciation of the US dollar alsocontributed to a lower average product cost as more than 50% of the components we use aresourced in US dollars. To mitigate the impact of changes in exchange rates on net sales as well as
52
average product cost, we hedge all material transaction exposures on a gross basis. All in all, theaverage depreciation of the US dollar had a slightly negative impact on our operating profit in2005. For more information, see ‘‘—Results of Operations—Exchange Rates’’ below.
Finnish Corporate Tax Rate
Effective January 1, 2005 the Finnish corporate tax rate was reduced by 3 percentage points from29% to 26%. This reduction had a significant favorable impact on Nokia’s net profit as more thanhalf of Nokia’s profit before tax has been generated in Finland. See also Note 13 to ourconsolidated financial statements for a further discussion of our income taxes.
Seasonality
Our device sales are somewhat affected by seasonality. Historically, the first quarter of the yearwas the lowest quarter of the year, while the fourth quarter was the strongest quarter. This wasmainly due to the effect of holiday sales. The second quarter of the year was another high season,as consumers in the Northern Hemisphere prepared for summer vacations. The third quarter wasusually slower than the second and fourth quarters, as consumers postponed purchases until theend of year holiday season.
However, over the past four years, we have seen a trend towards less seasonality. We stillcontinue to see the fourth quarter as our strongest quarter, while the differences between thethree other quarters have begun to moderate. This trend has resulted, first, from the fact that thepurchasing behavior of first-time mobile device buyers tends to be more seasonal than that ofpeople who are replacing their device for a new model. Because replacement sales comprise anincreasing percentage of sales, the seasonality of mobile device sales has decreased. The trendtowards less seasonality has also been aided by an increase of our geographical sales reach. Thetimes at which people give gifts vary across the world, and as our global sales coverage increases,this softens the seasonality of sales. However, as we still continue to see our strongest sales in thefourth quarter, we believe that they are still supported by the year-end and holiday seasonality.
Our infrastructure business has also experienced some seasonality during the last few years. Saleshave been higher in the last quarter of the year compared with the first quarter of the followingyear, due to operators’ planning, budgeting and spending cycle.
Accounting developments
As of January 1, 2005, we adopted new accounting standards, the most significant of which were:IFRS 2, Share-based payment and IAS 39(R), Financial instruments: Recognition and Measurement,which supersedes IAS 39 (revised 2000). These are discussed in more detail under ‘‘Basis ofpresentation’’ in Note 1 and in Note 2 to our consolidated financial statements included in Item 18of this annual report on Form 20-F.
The International Accounting Standards Board, or IASB, has and will continue to critically examinecurrent International Financial Reporting Standards, or IFRS, with a view toward increasinginternational harmonization of accounting rules. This process of amendment and convergence ofworldwide accounting rules continued in 2005 resulting in amendments to the existing ruleseffective from January 1, 2006 and additional amendments effective the following year. These arediscussed in more detail under ‘‘New IFRS standards and revised IAS standards’’ in Note 1 to ourconsolidated financial statements included in Item 18 of this annual report on Form 20-F.
53
Critical Accounting Policies
Our accounting policies affecting our financial condition and results of operations are more fullydescribed in Note 1 to our consolidated financial statements included in Item 18 of this annualreport on Form 20-F. Certain of Nokia’s accounting policies require the application of judgment bymanagement in selecting appropriate assumptions for calculating financial estimates, whichinherently contain some degree of uncertainty. Management bases its estimates on historicalexperience and various other assumptions that are believed to be reasonable under thecircumstances, the results of which form the basis for making judgments about the reportedcarrying values of assets and liabilities and the reported amounts of revenues and expenses thatmay not be readily apparent from other sources. Actual results may differ from these estimatesunder different assumptions or conditions.
Nokia believes the following are the critical accounting policies and related judgments andestimates used in the preparation of its consolidated financial statements. We have discussed theapplication of these critical accounting estimates with our Board of Directors and Audit Committee.
Revenue recognition
Revenue from the majority of the Group is recognized when persuasive evidence of anarrangement exists, delivery has occurred, the fee is fixed or determinable and collectibility isprobable. The remainder of revenue is recorded under the percentage of completion method.
Mobile Phones, Multimedia and Enterprise Solutions, and certain Networks’ revenue is recognizedwhen persuasive evidence of an arrangement exists, delivery has occurred, the fee is fixed ordeterminable and collectibility is probable. This requires us to assess at the point of deliverywhether these criteria have been met. When management determines that such criteria have beenmet, revenue is recognized. Nokia records estimated reductions to revenue for special pricingagreements, price protection and other volume based discounts at the time of sale, mainly in themobile device business. Sales adjustments for volume based discount programs are estimatedbased largely on historical activity under similar programs. Price protection adjustments are basedon estimates of future price reductions and certain agreed customer inventories at the date of theprice adjustment. An immaterial part of the revenue from products sold through distributionchannels is recognized when the reseller or distributor sells the product to the end user.
Networks’ revenue and cost of sales from contracts involving solutions achieved throughmodification of complex telecommunications equipment is recognized on the percentage ofcompletion basis when the outcome of the contract can be estimated reliably. This occurs whentotal contract revenue and the cost to complete the contract can be estimated reliably, it isprobable that economic benefits associated with the contract will flow to the Group, and the stageof contract completion can be measured. When we are not able to meet those conditions, thepolicy is to recognize revenues only equal to costs incurred to date, to the extent that such costsare expected to be recovered. Completion is measured by reference to costs incurred to date as apercentage of estimated total project costs, the cost-to-cost method.
The percentage of completion method relies on estimates of total expected contract revenue andcosts, as well as the dependable measurement of the progress made towards completing theparticular project. Recognized revenues and profit are subject to revisions during the project in theevent that the assumptions regarding the overall project outcome are revised. The cumulativeimpact of a revision in estimates is recorded in the period such revisions become likely andestimable. Losses on projects in progress are recognized in the period they become likely andestimable.
54
Networks’ customer contracts may include the provision of separately identifiable components of asingle transaction, for example the construction of a network solution and subsequent networkmaintenance services. Accordingly, for these arrangements, revenue recognition requires properidentification of the components of the transaction and evaluation of their commercial effect inorder to reflect the substance of the transaction. If the components are considered separable,revenue is allocated across the identifiable components based upon relative fair values.
Networks’ current sales and profit estimates for projects may change due to the early stage of along-term project, new technology, changes in the project scope, changes in costs, changes intiming, changes in customers’ plans, realization of penalties, and other corresponding factors.
Customer financing
We have provided a limited amount of customer financing and agreed extended payment termswith selected customers in our Networks business. In establishing credit arrangements,management must assess the creditworthiness of the customer and the timing of cash flowsexpected to be received under the arrangement. However, should the actual financial position ofour customers or general economic conditions differ from our assumptions, we may be requiredto re-assess the ultimate collectibility of such financings and trade credits, which could result in awrite-off of these balances in future periods and thus negatively impact our profits in futureperiods. Our assessment of the net recoverable value considers the collateral and securityarrangements of the receivable as well as the likelihood and timing of estimated collections. Seealso Note 38(b) to our consolidated financial statements for a further discussion of long-term loansto customers and other parties.
Allowances for doubtful accounts
We maintain allowances for doubtful accounts for estimated losses resulting from the subsequentinability of our customers to make required payments. If the financial conditions of our customerswere to deteriorate, resulting in an impairment of their ability to make payments, additionalallowances may be required in future periods. Management specifically analyzes accountsreceivables and analyzes historical bad debt, customer concentrations, customer creditworthiness,current economic trends and changes in our customer payment terms when evaluating theadequacy of the allowance for doubtful accounts.
Inventory-related allowances
We periodically review our inventory for excess, obsolescence and declines in market value belowcost and record an allowance against the inventory balance for any such declines. These reviewsrequire management to estimate future demand for our products. Possible changes in theseestimates could result in revisions to the valuation of inventory in future periods.
Warranty provisions
We provide for the estimated cost of product warranties at the time revenue is recognized. Nokia’sproducts are covered by product warranty plans of varying periods, depending on local practicesand regulations. While we engage in extensive product quality programs and processes, includingactively monitoring and evaluating the quality of our component suppliers, our warrantyobligations are affected by actual product failure rates (field failure rates) and by material usageand service delivery costs incurred in correcting a product failure. Our warranty provision isestablished based upon our best estimates of the amounts necessary to settle future and existingclaims on products sold as of the balance sheet date. As we continuously introduce new productswhich incorporate complex technology, and as local laws, regulations and practices may change, it
55
will be increasingly difficult to anticipate our failure rates, the length of warranty periods andrepair costs. While we believe that our warranty provisions are adequate and that the judgmentsapplied are appropriate, the ultimate cost of product warranty could differ materially from ourestimates. When the actual cost of quality of our products is lower than we originally anticipated,we release an appropriate proportion of the provision, and if the cost of quality is higher thananticipated, we increase the provision.
Provision for intellectual property rights, or IPR, infringements
We provide for the estimated future settlements related to asserted and unasserted IPRinfringements based on the probable outcome of each infringement.
Our products and solutions include increasingly complex technologies involving numerouspatented and other proprietary technologies. Although we proactively try to ensure that we areaware of any patents and other intellectual property rights related to our products and solutionsunder development and thereby avoid inadvertent infringement of proprietary technologies, thenature of our business is such that patent and other intellectual property right infringements mayand do occur. Through contact with parties claiming infringement of their patented or otherwiseexclusive technology, or through our own monitoring of developments in patent and otherintellectual property right cases involving our competitors, we identify potential IPR infringements.
We estimate the outcome of all potential IPR infringements made known to us through assertionby third parties, or through our own monitoring of patent- and other IPR-related cases in therelevant legal systems. To the extent that we determine that an identified potential infringementwill result in a probable outflow of resources, we record a liability based on our best estimate ofthe expenditure required to settle infringement proceedings.
Our experience with claims of IPR infringement is that there is typically a discussion period withthe accusing party, which can last from several months to years. In cases where a settlement isnot reached, the discovery and ensuing legal process typically lasts a minimum of one year. Forthis reason, IPR infringement claims can last for varying periods of time, resulting in irregularmovements in the IPR infringement provision. In addition, the ultimate outcome or actual cost ofsettling an individual infringement may materially vary from our estimates.
Legal contingencies
As discussed in Item 8.A.7 Litigation and Note 32 to the consolidated financial statements, legalproceedings covering a wide range of matters are pending or threatened in various jurisdictionsagainst the Group. We record provisions for pending litigation when we determine that anunfavorable outcome is probable and the amount of loss can be reasonably estimated. Due to theinherent uncertain nature of litigation, the ultimate outcome or actual cost of settlement maymaterially vary from estimates.
Capitalized development costs
We capitalize certain development costs when it is probable that a development project will be asuccess and certain criteria, including commercial and technical feasibility, have been met. Thesecosts are then amortized on a systematic basis over their expected useful lives, which due to theconstant development of new technologies is between two to five years. During the developmentstage, management must estimate the commercial and technical feasibility of these projects aswell as their expected useful lives. Should a product fail to substantiate its estimated feasibility orlife cycle, we may be required to write off excess development costs in future periods.
56
Whenever there is an indicator that development costs capitalized for a specific project may beimpaired, the recoverable amount of the asset is estimated. An asset is impaired when thecarrying amount of the asset exceeds its recoverable amount. The recoverable amount is definedas the higher of an asset’s net selling price and value in use. Value in use is the present value ofdiscounted estimated future cash flows expected to arise from the continuing use of an asset andfrom its disposal at the end of its useful life. For projects still in development, these estimatesinclude the future cash outflows that are expected to occur before the asset is ready for use. SeeNote 8 to our consolidated financial statements.
Impairment reviews are based upon our projections of anticipated future cash flows. The mostsignificant variables in determining cash flows are discount rates, terminal values, the number ofyears on which to base the cash flow projections, as well as the assumptions and estimates usedto determine the cash inflows and outflows. Management determines discount rates to be usedbased on the risk inherent in the related activity’s current business model and industrycomparisons. Terminal values are based on the expected life of products and forecasted life cycleand forecasted cash flows over that period. While we believe that our assumptions areappropriate, such amounts estimated could differ materially from what will actually occur in thefuture. For IFRS, discounted estimated cash flows are used to identify the existence of animpairment while for US GAAP undiscounted future cash flows are used. Consequently, animpairment could be required under IFRS but not under US GAAP.
Valuation of long-lived and intangible assets and goodwill
We assess the carrying value of identifiable intangible assets, long-lived assets and goodwillannually, or more frequently if events or changes in circumstances indicate that such carryingvalue may not be recoverable. Factors we consider important, which could trigger an impairmentreview, include the following:
• significant underperformance relative to historical or projected future results;
• significant changes in the manner of our use of the acquired assets or the strategy for ouroverall business; and
• significantly negative industry or economic trends.
When we determine that the carrying value of intangible assets, long-lived assets or goodwill maynot be recoverable based upon the existence of one or more of the above indicators ofimpairment, we measure any impairment based on discounted projected cash flows.
This review is based upon our projections of anticipated future cash flows. The most significantvariables in determining cash flows are discount rates, terminal values, the number of years onwhich to base the cash flow projections, as well as the assumptions and estimates used todetermine the cash inflows and outflows. Management determines discount rates to be used basedon the risk inherent in the related activity’s current business model and industry comparisons.Terminal values are based on the expected life of products and forecasted life cycle and forecastedcash flows over that period. While we believe that our assumptions are appropriate, such amountsestimated could differ materially from what will actually occur in the future. In assessinggoodwill, for IFRS these discounted cash flows are prepared at a cash generating unit level, andfor US GAAP these cash flows are prepared at a reporting unit level. Consequently, an impairmentcould be required under IFRS and not US GAAP or vice versa. Amounts estimated could differmaterially from what will actually occur in the future.
57
Fair value of derivatives and other financial instruments
The fair value of financial instruments that are not traded in an active market (for example,unlisted equities, currency options and embedded derivatives) are determined using valuationtechniques. We use judgment to select an appropriate valuation methodology and underlyingassumptions based principally on existing market conditions. Changes in these assumptions maycause the Group to recognize impairments or losses in the future periods.
Deferred taxes
Management judgment is required in determining our provision for income taxes, deferred taxassets and liabilities and the extent to which deferred tax assets can be recognized. We recognizedeferred tax assets if it is probable that sufficient taxable income will be available in the futureagainst which the temporary differences and unused tax losses can be utilized. We haveconsidered future taxable income and tax planning strategies in assessing whether deferred taxassets should be recognized. If the final outcome of these matters differs from the amountsinitially recorded, differences will impact the income tax and deferred tax provisions in the periodin which such determination is made.
Pensions
The determination of our pension benefit obligation and expense for defined benefit pension plansis dependent on our selection of certain assumptions used by actuaries in calculating suchamounts. Those assumptions are described in Note 6 to our consolidated financial statements andinclude, among others, the discount rate, expected long-term rate of return on plan assets andannual rate of increase in future compensation levels. A portion of our plan assets is invested inequity securities. The equity markets have experienced volatility, which has affected the value ofour pension plan assets. This volatility may make it difficult to estimate the long-term rate ofreturn on plan assets. Actual results that differ from our assumptions are accumulated andamortized over future periods and therefore generally affect our recognized expense and recordedobligation in such future periods. Our assumptions are based on actual historical experience andexternal data regarding compensation and discount rate trends. While we believe that ourassumptions are appropriate, significant differences in our actual experience or significant changesin our assumptions may materially affect our pension obligation and our future expense.
Share-based compensation
We have various types of equity settled share based compensation schemes for employees.Employee services received, and the corresponding increase in equity, are measured by referenceto the fair value of the equity instruments as at the date of grant, excluding the impact of anynon-market vesting conditions. Fair value of stock options is estimated by using the Black Scholesmodel on the date of grant based on certain assumptions. Those assumptions are described inNote 24 to the consolidated financial statements and include, among others, the dividend yield,expected volatility and expected life of the options. The expected life of options is estimated byobserving general option holder behavior and actual historical terms of Nokia stock optionprograms, whereas the assumption of the expected volatility has been set by reference to theimplied volatility of options available on Nokia shares in the open market and in light of historicalpatterns of volatility. These variables make estimation of fair value of stock options difficult.
58
Non-market vesting conditions attached to the performance shares are included in assumptionsabout the number of shares that the employee will ultimately receive relating to projections ofsales and earnings per share. On a regular basis we review the assumptions made and revise theestimates of the number of performance shares that are expected to be settled, where necessary.At the date of grant the number of performance shares granted to employees that are expected tobe settled is assumed to be the target amount. Any subsequent revisions to the estimates of thenumber of performance shares expected to be settled may increase or decrease total compensationexpense. Such increase or decrease adjusts the prior period compensation expense in the period ofthe review on a cumulative basis for unvested performance shares for which compensationexpense has already been recognized in the profit and loss account, and in subsequent periods forunvested performance shares for which the expense has not yet been recognized in the profit andloss account. Significant differences in employee option activity, equity market performance andour projected and actual sales and earnings per share performance, may materially affect futureexpense. In addition, the value, if any, an employee ultimately receives from share-based paymentawards may not correspond to the expense amounts recorded by the Group.
Results of Operations
2005 compared with 2004
Nokia Group
The following table sets forth selective line items and the percentage of net sales that theyrepresent for Nokia for the fiscal years 2005 and 2004.
Year endedYear ended December 31, Percentage
December 31, Percentage of 2004 Percentage of Increase/2005 Net Sales As revised Net Sales (decrease)
(EUR millions, except percentage data)
Net sales . . . . . . . . . . . . . . . . . . 34 191 100.0% 29 371 100.0% 16%Cost of sales . . . . . . . . . . . . . . . . (22 209) (65.0)% (18 179) (61.9)% 22%
Gross profit . . . . . . . . . . . . . . . . 11 982 35.0% 11 192 38.1% 7%Research and development
expenses . . . . . . . . . . . . . . . . . (3 825) (11.2)% (3 776) (12.9)% 1%Selling and marketing expenses (2 961) (8.7)% (2 564) (8.7)% 15%Administrative and general
expenses . . . . . . . . . . . . . . . . . (609) (1.8)% (611) (2.1)% —Other operating income and
expenses . . . . . . . . . . . . . . . . . 52 0.2% 181 0.6% (71)%Amortization of goodwill . . . . . — — (96) (0.3)% (100)%
Operating profit . . . . . . . . . . . . . 4 639 13.6% 4 326 14.7% 7%
For 2005, Nokia’s net sales increased 16% to EUR 34.2 billion compared with EUR 29.4 billion in2004. At constant currency, group net sales would have grown 20% in 2005. Our gross margin in2005 was 35.0% compared with 38.1% in 2004. This reflected the higher proportion of entry leveldevices in our product mix in 2005 due to strong volume growth in emerging markets, whichhave the industry’s lowest ASPs. Our gross margin in 2005 was also affected by intense pricecompetition in both the device and infrastructure markets, as well as by the lower marginservices business and emerging markets representing an increased share of Networks sales.
Research and development, or R&D, expenses were EUR 3.8 billion in both 2005 and 2004.Research and development expenses represented 11.2% of net sales in 2005, down from 12.9% in
59
2004. Research and development expenses increased in Mobile Phones and Enterprise Solutionsand decreased in Multimedia and Networks. In 2005, Multimedia incurred a restructuring chargeof EUR 15 million related to R&D activities. Networks R&D expenses included impairments ofEUR 115 million in 2004. If these items were excluded, R&D expenses would have increased 4% in2005 and would have represented 11.1% of Nokia net sales in 2005 compared with 12.5% of Nokianet sales in 2004.
Selling and marketing expenses increased in Mobile Phones, Multimedia and Enterprise Solutionsdue to increased marketing spend in the device business groups and decreased spending inNetworks. In 2005, selling and marketing expenses were EUR 3.0 billion, up 15% fromEUR 2.6 billion in 2004. Selling and marketing expenses were equal to 8.7% of Nokia net sales inboth 2005 and 2004.
Administrative and general expenses were EUR 0.6 billion in both 2005 and 2004. Administrativeand general expenses were equal to 1.8% of net sales in 2005 and 2.1% in 2004.
In 2005, other operating income and expenses included a gain of EUR 61 million relating to thedivesture of the Group’s Tetra business, a gain of EUR 18 million related to the partial sale of aminority investment, and a gain of EUR 45 million related to qualifying sales and leasebacktransactions for real estate. In 2005, Enterprise Solutions recorded a charge of EUR 29 million forpersonnel expenses and other costs in connection with the restructuring taken in light of generaldownturn in market conditions. In 2004, other operating income and expenses included a returnof an insurance premium of EUR 160 million and a EUR 12 million loss from the divestiture ofNextrom.
Nokia Group’s operating profit for 2005 increased 7% to EUR 4 639 million compared withEUR 4 326 million in 2004. A substantial increase in Multimedia’s operating profit in 2005 morethan offset operating profit declines in the other business groups. Our operating margin was 13.6%in 2005 compared with 14.7% in 2004.
Results by Segments
Mobile Phones
The following table sets forth selective line items and the percentage of net sales that theyrepresent for the Mobile Phones business group for the fiscal years 2005 and 2004.
Year endedYear ended December 31, Percentage
December 31, Percentage of 2004 Percentage of Increase/2005 Net Sales As revised Net Sales (decrease)
(EUR millions, except percentage data)
Net sales . . . . . . . . . . . . . . . . . . 20 811 100% 18 521 100.0% 12%Cost of sales . . . . . . . . . . . . . . . . (14 331) (68.9)% (12 045) (65.0)% 19%
Gross profit . . . . . . . . . . . . . . . . 6 480 31.1% 6 476 35.0% —Research and development
expenses . . . . . . . . . . . . . . . . . (1 245) (6.0)% (1 196) (6.5)% 4%Selling and marketing expenses (1 541) (7.4)% (1 300) (7.0)% 19%Administrative and general
expenses . . . . . . . . . . . . . . . . . (68) (0.3)% (96) (0.5)% (29)%Other operating income and
expenses . . . . . . . . . . . . . . . . . (28) (0.1)% (21) (0.1)% 33%Amortization of goodwill . . . . . — — (77) (0.4)% (100)%
Operating profit . . . . . . . . . . . . . 3 598 17.3% 3 786 20.4% (5)%
60
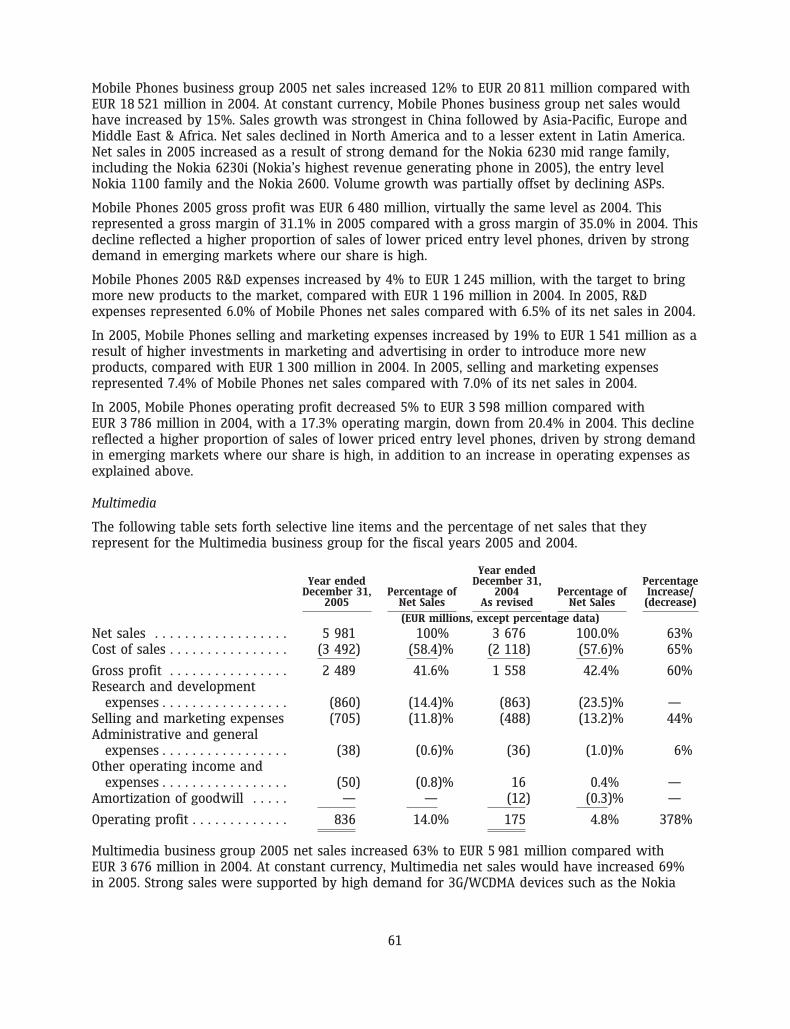
Mobile Phones business group 2005 net sales increased 12% to EUR 20 811 million compared withEUR 18 521 million in 2004. At constant currency, Mobile Phones business group net sales wouldhave increased by 15%. Sales growth was strongest in China followed by Asia-Pacific, Europe andMiddle East & Africa. Net sales declined in North America and to a lesser extent in Latin America.Net sales in 2005 increased as a result of strong demand for the Nokia 6230 mid range family,including the Nokia 6230i (Nokia’s highest revenue generating phone in 2005), the entry levelNokia 1100 family and the Nokia 2600. Volume growth was partially offset by declining ASPs.
Mobile Phones 2005 gross profit was EUR 6 480 million, virtually the same level as 2004. Thisrepresented a gross margin of 31.1% in 2005 compared with a gross margin of 35.0% in 2004. Thisdecline reflected a higher proportion of sales of lower priced entry level phones, driven by strongdemand in emerging markets where our share is high.
Mobile Phones 2005 R&D expenses increased by 4% to EUR 1 245 million, with the target to bringmore new products to the market, compared with EUR 1 196 million in 2004. In 2005, R&Dexpenses represented 6.0% of Mobile Phones net sales compared with 6.5% of its net sales in 2004.
In 2005, Mobile Phones selling and marketing expenses increased by 19% to EUR 1 541 million as aresult of higher investments in marketing and advertising in order to introduce more newproducts, compared with EUR 1 300 million in 2004. In 2005, selling and marketing expensesrepresented 7.4% of Mobile Phones net sales compared with 7.0% of its net sales in 2004.
In 2005, Mobile Phones operating profit decreased 5% to EUR 3 598 million compared withEUR 3 786 million in 2004, with a 17.3% operating margin, down from 20.4% in 2004. This declinereflected a higher proportion of sales of lower priced entry level phones, driven by strong demandin emerging markets where our share is high, in addition to an increase in operating expenses asexplained above.
Multimedia
The following table sets forth selective line items and the percentage of net sales that theyrepresent for the Multimedia business group for the fiscal years 2005 and 2004.
Year endedYear ended December 31, Percentage
December 31, Percentage of 2004 Percentage of Increase/2005 Net Sales As revised Net Sales (decrease)
(EUR millions, except percentage data)
Net sales . . . . . . . . . . . . . . . . . . 5 981 100% 3 676 100.0% 63%Cost of sales . . . . . . . . . . . . . . . . (3 492) (58.4)% (2 118) (57.6)% 65%
Gross profit . . . . . . . . . . . . . . . . 2 489 41.6% 1 558 42.4% 60%Research and development
expenses . . . . . . . . . . . . . . . . . (860) (14.4)% (863) (23.5)% —Selling and marketing expenses (705) (11.8)% (488) (13.2)% 44%Administrative and general
expenses . . . . . . . . . . . . . . . . . (38) (0.6)% (36) (1.0)% 6%Other operating income and
expenses . . . . . . . . . . . . . . . . . (50) (0.8)% 16 0.4% —Amortization of goodwill . . . . . — — (12) (0.3)% —
Operating profit . . . . . . . . . . . . . 836 14.0% 175 4.8% 378%
Multimedia business group 2005 net sales increased 63% to EUR 5 981 million compared withEUR 3 676 million in 2004. At constant currency, Multimedia net sales would have increased 69%in 2005. Strong sales were supported by high demand for 3G/WCDMA devices such as the Nokia
61
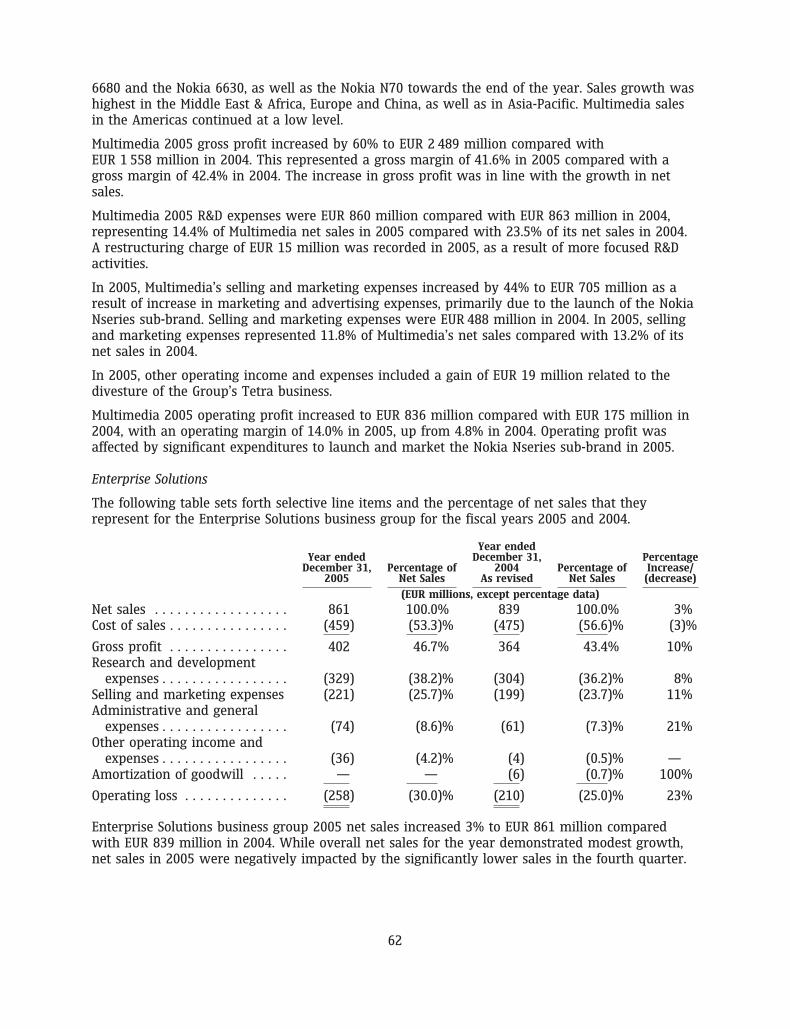
6680 and the Nokia 6630, as well as the Nokia N70 towards the end of the year. Sales growth washighest in the Middle East & Africa, Europe and China, as well as in Asia-Pacific. Multimedia salesin the Americas continued at a low level.
Multimedia 2005 gross profit increased by 60% to EUR 2 489 million compared withEUR 1 558 million in 2004. This represented a gross margin of 41.6% in 2005 compared with agross margin of 42.4% in 2004. The increase in gross profit was in line with the growth in netsales.
Multimedia 2005 R&D expenses were EUR 860 million compared with EUR 863 million in 2004,representing 14.4% of Multimedia net sales in 2005 compared with 23.5% of its net sales in 2004.A restructuring charge of EUR 15 million was recorded in 2005, as a result of more focused R&Dactivities.
In 2005, Multimedia’s selling and marketing expenses increased by 44% to EUR 705 million as aresult of increase in marketing and advertising expenses, primarily due to the launch of the NokiaNseries sub-brand. Selling and marketing expenses were EUR 488 million in 2004. In 2005, sellingand marketing expenses represented 11.8% of Multimedia’s net sales compared with 13.2% of itsnet sales in 2004.
In 2005, other operating income and expenses included a gain of EUR 19 million related to thedivesture of the Group’s Tetra business.
Multimedia 2005 operating profit increased to EUR 836 million compared with EUR 175 million in2004, with an operating margin of 14.0% in 2005, up from 4.8% in 2004. Operating profit wasaffected by significant expenditures to launch and market the Nokia Nseries sub-brand in 2005.
Enterprise Solutions
The following table sets forth selective line items and the percentage of net sales that theyrepresent for the Enterprise Solutions business group for the fiscal years 2005 and 2004.
Year endedYear ended December 31, Percentage
December 31, Percentage of 2004 Percentage of Increase/2005 Net Sales As revised Net Sales (decrease)
(EUR millions, except percentage data)
Net sales . . . . . . . . . . . . . . . . . . 861 100.0% 839 100.0% 3%Cost of sales . . . . . . . . . . . . . . . . (459) (53.3)% (475) (56.6)% (3)%
Gross profit . . . . . . . . . . . . . . . . 402 46.7% 364 43.4% 10%Research and development
expenses . . . . . . . . . . . . . . . . . (329) (38.2)% (304) (36.2)% 8%Selling and marketing expenses (221) (25.7)% (199) (23.7)% 11%Administrative and general
expenses . . . . . . . . . . . . . . . . . (74) (8.6)% (61) (7.3)% 21%Other operating income and
expenses . . . . . . . . . . . . . . . . . (36) (4.2)% (4) (0.5)% —Amortization of goodwill . . . . . — — (6) (0.7)% 100%
Operating loss . . . . . . . . . . . . . . (258) (30.0)% (210) (25.0)% 23%
Enterprise Solutions business group 2005 net sales increased 3% to EUR 861 million comparedwith EUR 839 million in 2004. While overall net sales for the year demonstrated modest growth,net sales in 2005 were negatively impacted by the significantly lower sales in the fourth quarter.
62
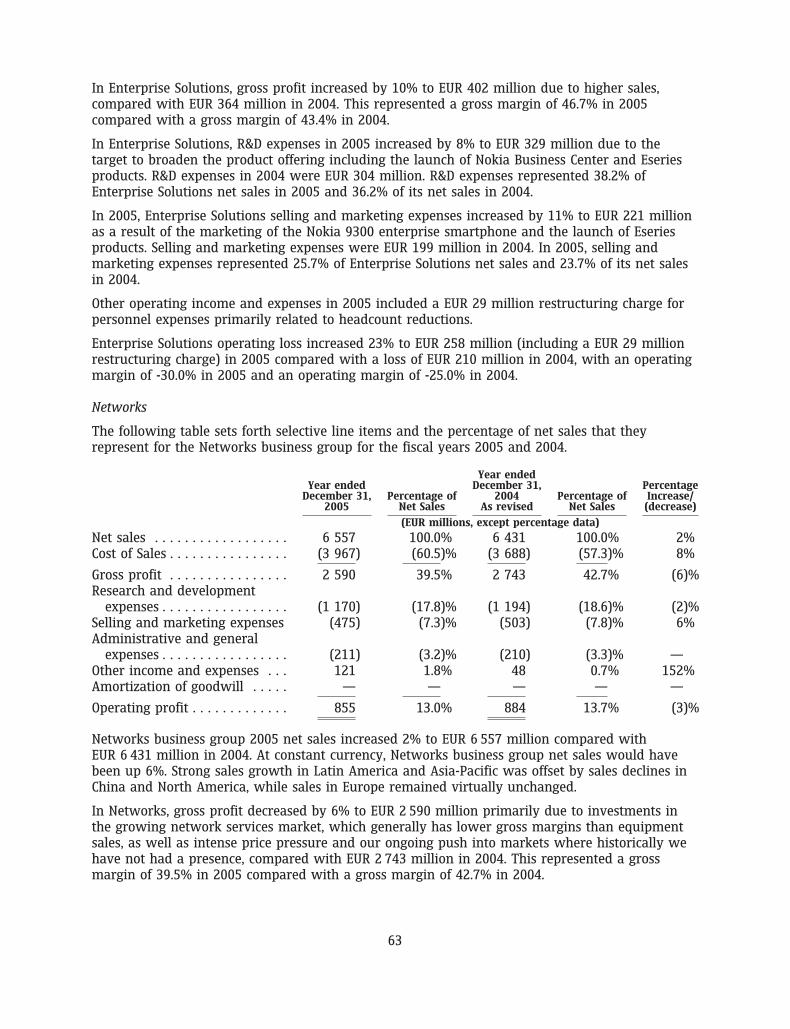
In Enterprise Solutions, gross profit increased by 10% to EUR 402 million due to higher sales,compared with EUR 364 million in 2004. This represented a gross margin of 46.7% in 2005compared with a gross margin of 43.4% in 2004.
In Enterprise Solutions, R&D expenses in 2005 increased by 8% to EUR 329 million due to thetarget to broaden the product offering including the launch of Nokia Business Center and Eseriesproducts. R&D expenses in 2004 were EUR 304 million. R&D expenses represented 38.2% ofEnterprise Solutions net sales in 2005 and 36.2% of its net sales in 2004.
In 2005, Enterprise Solutions selling and marketing expenses increased by 11% to EUR 221 millionas a result of the marketing of the Nokia 9300 enterprise smartphone and the launch of Eseriesproducts. Selling and marketing expenses were EUR 199 million in 2004. In 2005, selling andmarketing expenses represented 25.7% of Enterprise Solutions net sales and 23.7% of its net salesin 2004.
Other operating income and expenses in 2005 included a EUR 29 million restructuring charge forpersonnel expenses primarily related to headcount reductions.
Enterprise Solutions operating loss increased 23% to EUR 258 million (including a EUR 29 millionrestructuring charge) in 2005 compared with a loss of EUR 210 million in 2004, with an operatingmargin of -30.0% in 2005 and an operating margin of -25.0% in 2004.
Networks
The following table sets forth selective line items and the percentage of net sales that theyrepresent for the Networks business group for the fiscal years 2005 and 2004.
Year endedYear ended December 31, Percentage
December 31, Percentage of 2004 Percentage of Increase/2005 Net Sales As revised Net Sales (decrease)
(EUR millions, except percentage data)
Net sales . . . . . . . . . . . . . . . . . . 6 557 100.0% 6 431 100.0% 2%Cost of Sales . . . . . . . . . . . . . . . . (3 967) (60.5)% (3 688) (57.3)% 8%
Gross profit . . . . . . . . . . . . . . . . 2 590 39.5% 2 743 42.7% (6)%Research and development
expenses . . . . . . . . . . . . . . . . . (1 170) (17.8)% (1 194) (18.6)% (2)%Selling and marketing expenses (475) (7.3)% (503) (7.8)% 6%Administrative and general
expenses . . . . . . . . . . . . . . . . . (211) (3.2)% (210) (3.3)% —Other income and expenses . . . 121 1.8% 48 0.7% 152%Amortization of goodwill . . . . . — — — — —
Operating profit . . . . . . . . . . . . . 855 13.0% 884 13.7% (3)%
Networks business group 2005 net sales increased 2% to EUR 6 557 million compared withEUR 6 431 million in 2004. At constant currency, Networks business group net sales would havebeen up 6%. Strong sales growth in Latin America and Asia-Pacific was offset by sales declines inChina and North America, while sales in Europe remained virtually unchanged.
In Networks, gross profit decreased by 6% to EUR 2 590 million primarily due to investments inthe growing network services market, which generally has lower gross margins than equipmentsales, as well as intense price pressure and our ongoing push into markets where historically wehave not had a presence, compared with EUR 2 743 million in 2004. This represented a grossmargin of 39.5% in 2005 compared with a gross margin of 42.7% in 2004.
63
In Networks, R&D expenses decreased 2% to EUR 1 170 million compared with EUR 1 194 millionin 2004. In 2005, R&D expenses represented 17.8% of Networks net sales compared with 18.6% in2004. R&D expenses in 2004 included impairments of capitalized R&D of EUR 115 million due to thediscontinuation of certain products and base station horizontalization projects and an impairmentrelated to the 3G/WCDMA radio access network project. If these impairments were excluded, R&Dexpenses would have increased 8% in 2005. This would have represented 17.8% of Networks netsales in 2005 compared with 16.8% of its net sales in 2004.
In 2005, Networks selling and marketing expenses decreased by 6% to EUR 475 million comparedwith EUR 503 million in 2004. In 2005, selling and marketing expenses represented 7.3% ofNetworks net sales compared with 7.8% of its net sales in 2004.
Other operating income and expenses included a gain of EUR 42 million related to the divesture ofthe Group’s Tetra business and EUR 18 million gain related to the partial sale of a minorityinvestment.
Networks 2005 operating profit decreased to EUR 855 million from EUR 884 million in 2004. Thebusiness group’s operating margin for 2005 was 13.0% compared with 13.7% in 2004. The declinein Networks profitability was primarily due to investments in the growing network servicesmarket, which generally has lower gross margins than equipment sales, as well as intense pricepressure and our ongoing push into markets where historically we have not had a presence.
Common Group Expenses
Common Group expenses totaled EUR 392 million in 2005 compared with EUR 309 million in 2004.In 2005, this included a EUR 45 million gain for real estate sales and in 2004 a positive item ofEUR 160 million representing the premium return under our multi-line, multi-year insuranceprogram, which expired during 2004. The return was due to our low claims experience during thepolicy period. In 2004, it also included a EUR 12 million negative impact from the divestiture ofour holding in Nextrom Holding S.A.
Net Financial Income
Net financial income totaled EUR 322 million in 2005 compared with EUR 405 million in 2004. Netfinancial income included a EUR 57 million gain from the sale of the remaining France Telecombond in 2005 and a gain of EUR 106 million from the sale of a portion of the France Telecom bondin 2004. Interest income decreased due to a lower level of cash and other liquid assets towardsthe end of the year due to higher share buybacks. Above mentioned lower gains and lowerinterest income were the main reasons for lower net financial income in 2005 than in 2004.
The net debt to equity ratio was negative -77% at December 31, 2005 compared with a net debt toequity ratio of -79% at December 31, 2004. See ‘‘Item 5.B Liquidity and Capital Resources’’ below.
Profit Before Taxes
Profit before tax and minority interests increased 6% to EUR 4 971 million in 2005 compared withEUR 4 705 million in 2004. Taxes amounted to EUR 1 281 million and EUR 1 446 million in 2005and 2004, respectively. Taxes include a tax refund from previous years of EUR 48 million in 2005.Effective tax rate decreased to 25.8% in 2005 compared with 30.7% in 2004, impacted by thedecrease in the Finnish Corporate tax from 29% to 26%.
Minority Interests
Minority shareholders’ interest in our subsidiaries’ profits totaled EUR 74 million in 2005 comparedwith EUR 67 million in 2004.
64
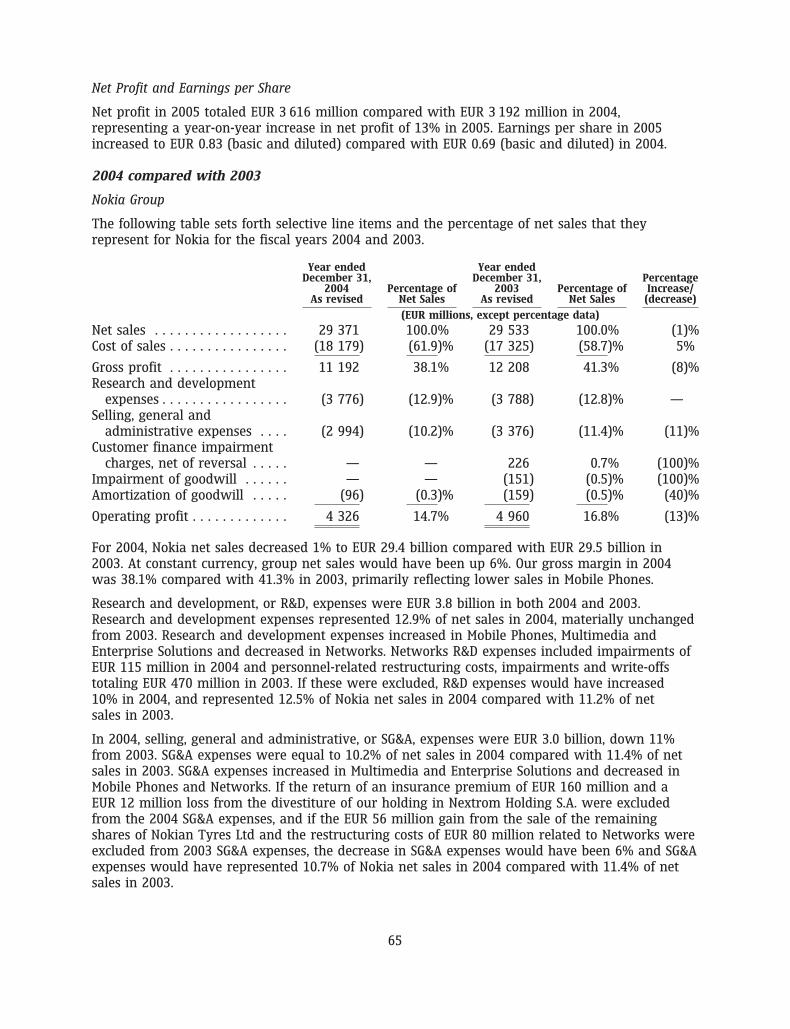
Net Profit and Earnings per Share
Net profit in 2005 totaled EUR 3 616 million compared with EUR 3 192 million in 2004,representing a year-on-year increase in net profit of 13% in 2005. Earnings per share in 2005increased to EUR 0.83 (basic and diluted) compared with EUR 0.69 (basic and diluted) in 2004.
2004 compared with 2003
Nokia Group
The following table sets forth selective line items and the percentage of net sales that theyrepresent for Nokia for the fiscal years 2004 and 2003.
Year ended Year endedDecember 31, December 31, Percentage
2004 Percentage of 2003 Percentage of Increase/As revised Net Sales As revised Net Sales (decrease)
(EUR millions, except percentage data)
Net sales . . . . . . . . . . . . . . . . . . 29 371 100.0% 29 533 100.0% (1)%Cost of sales . . . . . . . . . . . . . . . . (18 179) (61.9)% (17 325) (58.7)% 5%
Gross profit . . . . . . . . . . . . . . . . 11 192 38.1% 12 208 41.3% (8)%Research and development
expenses . . . . . . . . . . . . . . . . . (3 776) (12.9)% (3 788) (12.8)% —Selling, general and
administrative expenses . . . . (2 994) (10.2)% (3 376) (11.4)% (11)%Customer finance impairment
charges, net of reversal . . . . . — — 226 0.7% (100)%Impairment of goodwill . . . . . . — — (151) (0.5)% (100)%Amortization of goodwill . . . . . (96) (0.3)% (159) (0.5)% (40)%
Operating profit . . . . . . . . . . . . . 4 326 14.7% 4 960 16.8% (13)%
For 2004, Nokia net sales decreased 1% to EUR 29.4 billion compared with EUR 29.5 billion in2003. At constant currency, group net sales would have been up 6%. Our gross margin in 2004was 38.1% compared with 41.3% in 2003, primarily reflecting lower sales in Mobile Phones.
Research and development, or R&D, expenses were EUR 3.8 billion in both 2004 and 2003.Research and development expenses represented 12.9% of net sales in 2004, materially unchangedfrom 2003. Research and development expenses increased in Mobile Phones, Multimedia andEnterprise Solutions and decreased in Networks. Networks R&D expenses included impairments ofEUR 115 million in 2004 and personnel-related restructuring costs, impairments and write-offstotaling EUR 470 million in 2003. If these were excluded, R&D expenses would have increased10% in 2004, and represented 12.5% of Nokia net sales in 2004 compared with 11.2% of netsales in 2003.
In 2004, selling, general and administrative, or SG&A, expenses were EUR 3.0 billion, down 11%from 2003. SG&A expenses were equal to 10.2% of net sales in 2004 compared with 11.4% of netsales in 2003. SG&A expenses increased in Multimedia and Enterprise Solutions and decreased inMobile Phones and Networks. If the return of an insurance premium of EUR 160 million and aEUR 12 million loss from the divestiture of our holding in Nextrom Holding S.A. were excludedfrom the 2004 SG&A expenses, and if the EUR 56 million gain from the sale of the remainingshares of Nokian Tyres Ltd and the restructuring costs of EUR 80 million related to Networks wereexcluded from 2003 SG&A expenses, the decrease in SG&A expenses would have been 6% and SG&Aexpenses would have represented 10.7% of Nokia net sales in 2004 compared with 11.4% of netsales in 2003.
65
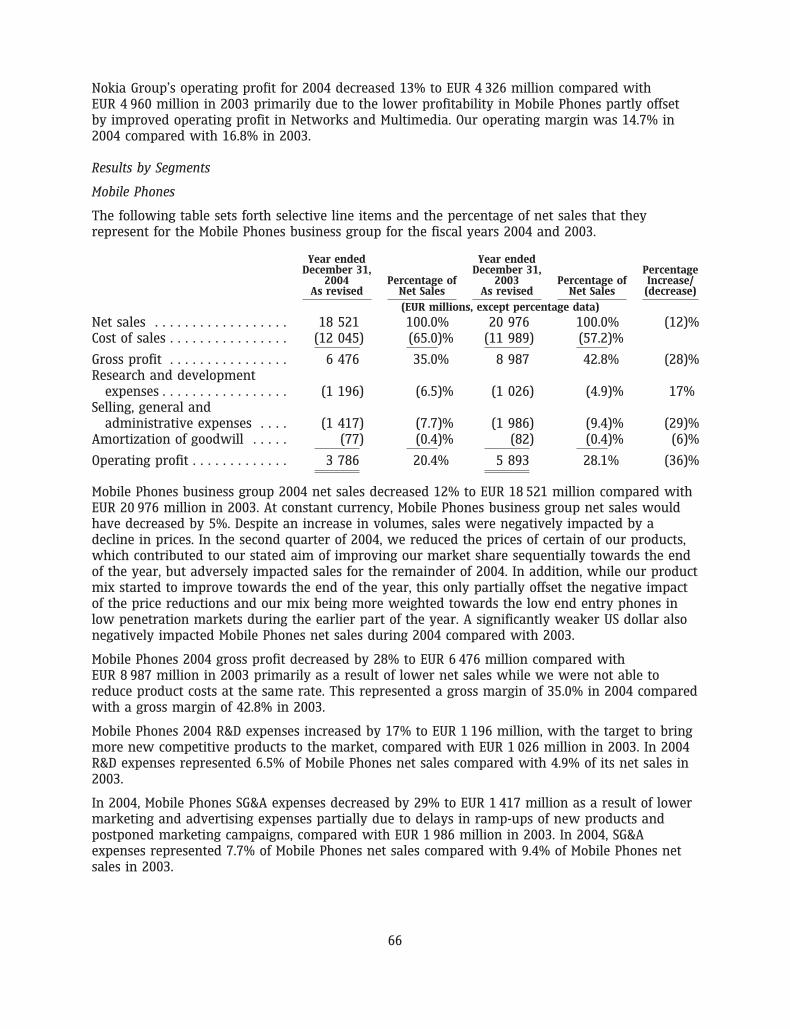
Nokia Group’s operating profit for 2004 decreased 13% to EUR 4 326 million compared withEUR 4 960 million in 2003 primarily due to the lower profitability in Mobile Phones partly offsetby improved operating profit in Networks and Multimedia. Our operating margin was 14.7% in2004 compared with 16.8% in 2003.
Results by Segments
Mobile Phones
The following table sets forth selective line items and the percentage of net sales that theyrepresent for the Mobile Phones business group for the fiscal years 2004 and 2003.
Year ended Year endedDecember 31, December 31, Percentage
2004 Percentage of 2003 Percentage of Increase/As revised Net Sales As revised Net Sales (decrease)
(EUR millions, except percentage data)
Net sales . . . . . . . . . . . . . . . . . . 18 521 100.0% 20 976 100.0% (12)%Cost of sales . . . . . . . . . . . . . . . . (12 045) (65.0)% (11 989) (57.2)%
Gross profit . . . . . . . . . . . . . . . . 6 476 35.0% 8 987 42.8% (28)%Research and development
expenses . . . . . . . . . . . . . . . . . (1 196) (6.5)% (1 026) (4.9)% 17%Selling, general and
administrative expenses . . . . (1 417) (7.7)% (1 986) (9.4)% (29)%Amortization of goodwill . . . . . (77) (0.4)% (82) (0.4)% (6)%
Operating profit . . . . . . . . . . . . . 3 786 20.4% 5 893 28.1% (36)%
Mobile Phones business group 2004 net sales decreased 12% to EUR 18 521 million compared withEUR 20 976 million in 2003. At constant currency, Mobile Phones business group net sales wouldhave decreased by 5%. Despite an increase in volumes, sales were negatively impacted by adecline in prices. In the second quarter of 2004, we reduced the prices of certain of our products,which contributed to our stated aim of improving our market share sequentially towards the endof the year, but adversely impacted sales for the remainder of 2004. In addition, while our productmix started to improve towards the end of the year, this only partially offset the negative impactof the price reductions and our mix being more weighted towards the low end entry phones inlow penetration markets during the earlier part of the year. A significantly weaker US dollar alsonegatively impacted Mobile Phones net sales during 2004 compared with 2003.
Mobile Phones 2004 gross profit decreased by 28% to EUR 6 476 million compared withEUR 8 987 million in 2003 primarily as a result of lower net sales while we were not able toreduce product costs at the same rate. This represented a gross margin of 35.0% in 2004 comparedwith a gross margin of 42.8% in 2003.
Mobile Phones 2004 R&D expenses increased by 17% to EUR 1 196 million, with the target to bringmore new competitive products to the market, compared with EUR 1 026 million in 2003. In 2004R&D expenses represented 6.5% of Mobile Phones net sales compared with 4.9% of its net sales in2003.
In 2004, Mobile Phones SG&A expenses decreased by 29% to EUR 1 417 million as a result of lowermarketing and advertising expenses partially due to delays in ramp-ups of new products andpostponed marketing campaigns, compared with EUR 1 986 million in 2003. In 2004, SG&Aexpenses represented 7.7% of Mobile Phones net sales compared with 9.4% of Mobile Phones netsales in 2003.
66
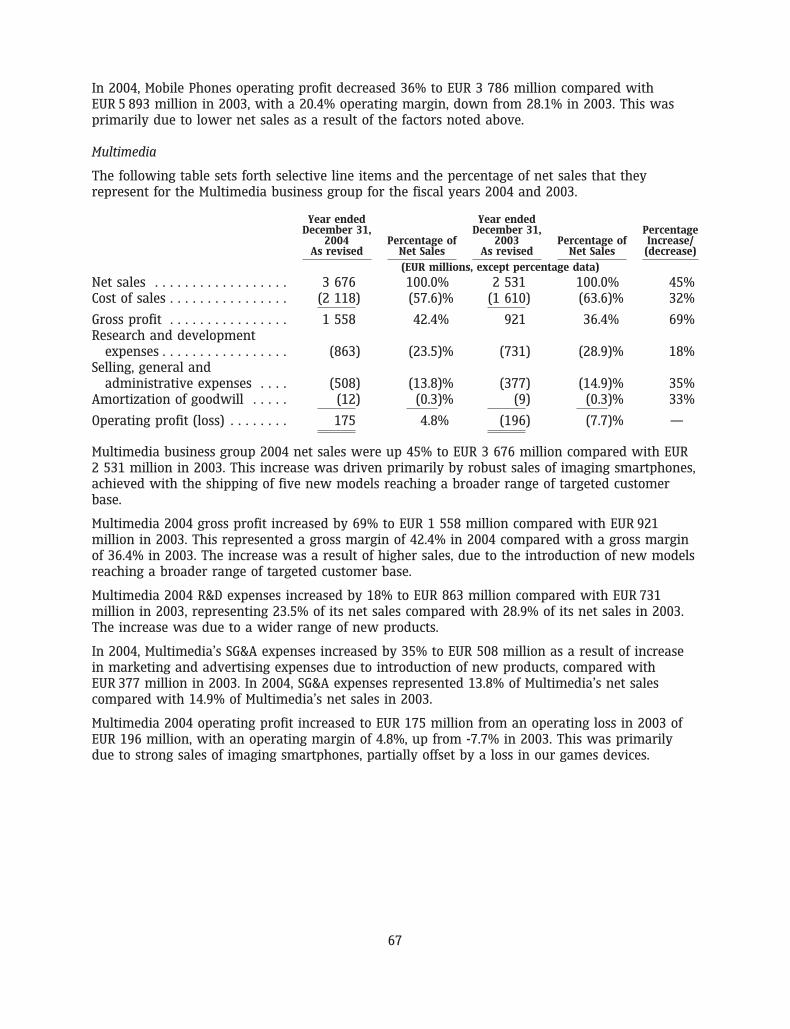
In 2004, Mobile Phones operating profit decreased 36% to EUR 3 786 million compared withEUR 5 893 million in 2003, with a 20.4% operating margin, down from 28.1% in 2003. This wasprimarily due to lower net sales as a result of the factors noted above.
Multimedia
The following table sets forth selective line items and the percentage of net sales that theyrepresent for the Multimedia business group for the fiscal years 2004 and 2003.
Year ended Year endedDecember 31, December 31, Percentage
2004 Percentage of 2003 Percentage of Increase/As revised Net Sales As revised Net Sales (decrease)
(EUR millions, except percentage data)
Net sales . . . . . . . . . . . . . . . . . . 3 676 100.0% 2 531 100.0% 45%Cost of sales . . . . . . . . . . . . . . . . (2 118) (57.6)% (1 610) (63.6)% 32%
Gross profit . . . . . . . . . . . . . . . . 1 558 42.4% 921 36.4% 69%Research and development
expenses . . . . . . . . . . . . . . . . . (863) (23.5)% (731) (28.9)% 18%Selling, general and
administrative expenses . . . . (508) (13.8)% (377) (14.9)% 35%Amortization of goodwill . . . . . (12) (0.3)% (9) (0.3)% 33%
Operating profit (loss) . . . . . . . . 175 4.8% (196) (7.7)% —
Multimedia business group 2004 net sales were up 45% to EUR 3 676 million compared with EUR2 531 million in 2003. This increase was driven primarily by robust sales of imaging smartphones,achieved with the shipping of five new models reaching a broader range of targeted customerbase.
Multimedia 2004 gross profit increased by 69% to EUR 1 558 million compared with EUR 921million in 2003. This represented a gross margin of 42.4% in 2004 compared with a gross marginof 36.4% in 2003. The increase was a result of higher sales, due to the introduction of new modelsreaching a broader range of targeted customer base.
Multimedia 2004 R&D expenses increased by 18% to EUR 863 million compared with EUR 731million in 2003, representing 23.5% of its net sales compared with 28.9% of its net sales in 2003.The increase was due to a wider range of new products.
In 2004, Multimedia’s SG&A expenses increased by 35% to EUR 508 million as a result of increasein marketing and advertising expenses due to introduction of new products, compared withEUR 377 million in 2003. In 2004, SG&A expenses represented 13.8% of Multimedia’s net salescompared with 14.9% of Multimedia’s net sales in 2003.
Multimedia 2004 operating profit increased to EUR 175 million from an operating loss in 2003 ofEUR 196 million, with an operating margin of 4.8%, up from -7.7% in 2003. This was primarilydue to strong sales of imaging smartphones, partially offset by a loss in our games devices.
67
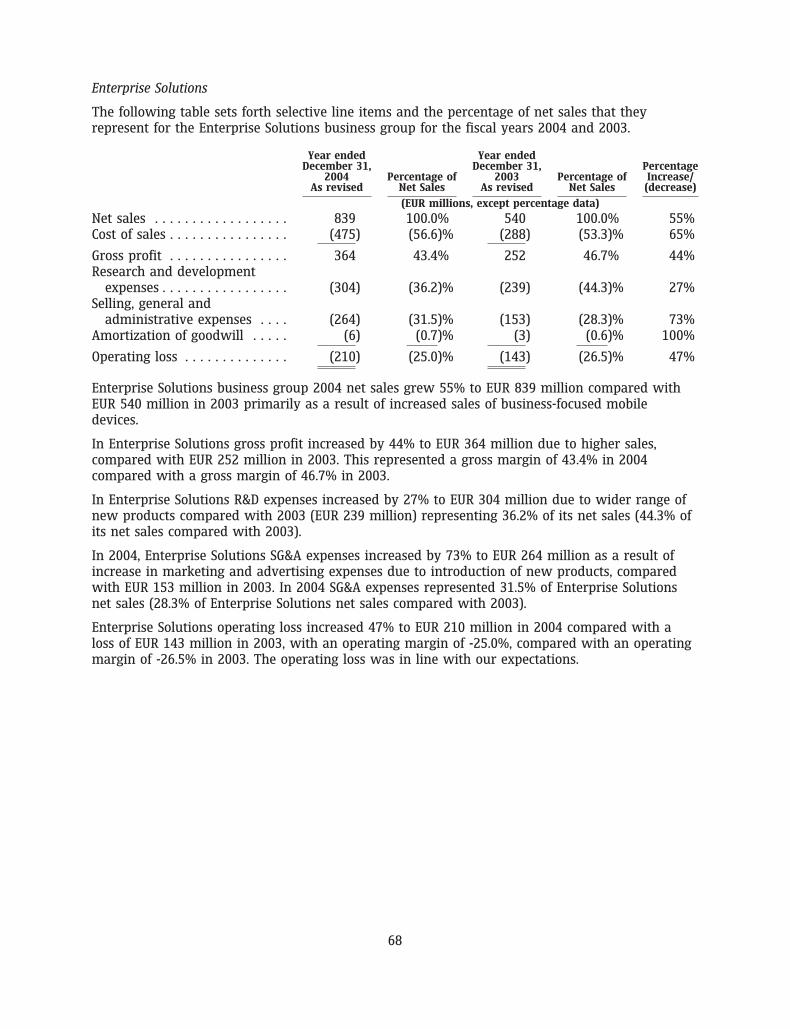
Enterprise Solutions
The following table sets forth selective line items and the percentage of net sales that theyrepresent for the Enterprise Solutions business group for the fiscal years 2004 and 2003.
Year ended Year endedDecember 31, December 31, Percentage
2004 Percentage of 2003 Percentage of Increase/As revised Net Sales As revised Net Sales (decrease)
(EUR millions, except percentage data)
Net sales . . . . . . . . . . . . . . . . . . 839 100.0% 540 100.0% 55%Cost of sales . . . . . . . . . . . . . . . . (475) (56.6)% (288) (53.3)% 65%
Gross profit . . . . . . . . . . . . . . . . 364 43.4% 252 46.7% 44%Research and development
expenses . . . . . . . . . . . . . . . . . (304) (36.2)% (239) (44.3)% 27%Selling, general and
administrative expenses . . . . (264) (31.5)% (153) (28.3)% 73%Amortization of goodwill . . . . . (6) (0.7)% (3) (0.6)% 100%
Operating loss . . . . . . . . . . . . . . (210) (25.0)% (143) (26.5)% 47%
Enterprise Solutions business group 2004 net sales grew 55% to EUR 839 million compared withEUR 540 million in 2003 primarily as a result of increased sales of business-focused mobiledevices.
In Enterprise Solutions gross profit increased by 44% to EUR 364 million due to higher sales,compared with EUR 252 million in 2003. This represented a gross margin of 43.4% in 2004compared with a gross margin of 46.7% in 2003.
In Enterprise Solutions R&D expenses increased by 27% to EUR 304 million due to wider range ofnew products compared with 2003 (EUR 239 million) representing 36.2% of its net sales (44.3% ofits net sales compared with 2003).
In 2004, Enterprise Solutions SG&A expenses increased by 73% to EUR 264 million as a result ofincrease in marketing and advertising expenses due to introduction of new products, comparedwith EUR 153 million in 2003. In 2004 SG&A expenses represented 31.5% of Enterprise Solutionsnet sales (28.3% of Enterprise Solutions net sales compared with 2003).
Enterprise Solutions operating loss increased 47% to EUR 210 million in 2004 compared with aloss of EUR 143 million in 2003, with an operating margin of -25.0%, compared with an operatingmargin of -26.5% in 2003. The operating loss was in line with our expectations.
68
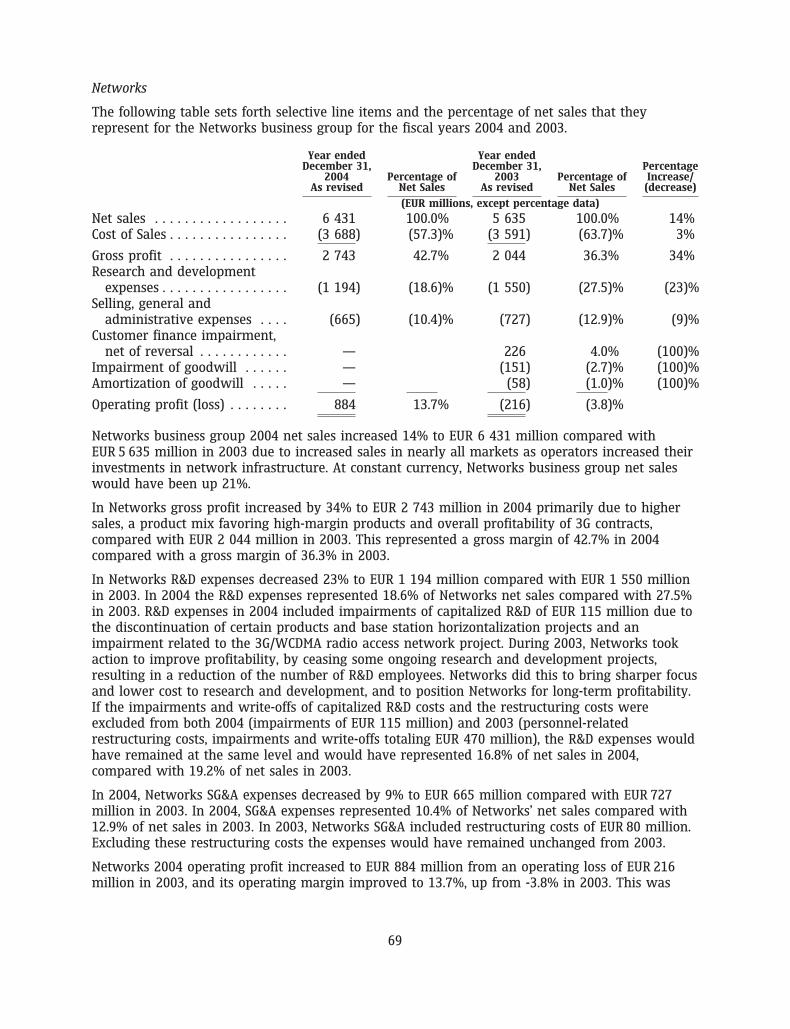
Networks
The following table sets forth selective line items and the percentage of net sales that theyrepresent for the Networks business group for the fiscal years 2004 and 2003.
Year ended Year endedDecember 31, December 31, Percentage
2004 Percentage of 2003 Percentage of Increase/As revised Net Sales As revised Net Sales (decrease)
(EUR millions, except percentage data)
Net sales . . . . . . . . . . . . . . . . . . 6 431 100.0% 5 635 100.0% 14%Cost of Sales . . . . . . . . . . . . . . . . (3 688) (57.3)% (3 591) (63.7)% 3%
Gross profit . . . . . . . . . . . . . . . . 2 743 42.7% 2 044 36.3% 34%Research and development
expenses . . . . . . . . . . . . . . . . . (1 194) (18.6)% (1 550) (27.5)% (23)%Selling, general and
administrative expenses . . . . (665) (10.4)% (727) (12.9)% (9)%Customer finance impairment,
net of reversal . . . . . . . . . . . . — 226 4.0% (100)%Impairment of goodwill . . . . . . — (151) (2.7)% (100)%Amortization of goodwill . . . . . — (58) (1.0)% (100)%
Operating profit (loss) . . . . . . . . 884 13.7% (216) (3.8)%
Networks business group 2004 net sales increased 14% to EUR 6 431 million compared withEUR 5 635 million in 2003 due to increased sales in nearly all markets as operators increased theirinvestments in network infrastructure. At constant currency, Networks business group net saleswould have been up 21%.
In Networks gross profit increased by 34% to EUR 2 743 million in 2004 primarily due to highersales, a product mix favoring high-margin products and overall profitability of 3G contracts,compared with EUR 2 044 million in 2003. This represented a gross margin of 42.7% in 2004compared with a gross margin of 36.3% in 2003.
In Networks R&D expenses decreased 23% to EUR 1 194 million compared with EUR 1 550 millionin 2003. In 2004 the R&D expenses represented 18.6% of Networks net sales compared with 27.5%in 2003. R&D expenses in 2004 included impairments of capitalized R&D of EUR 115 million due tothe discontinuation of certain products and base station horizontalization projects and animpairment related to the 3G/WCDMA radio access network project. During 2003, Networks tookaction to improve profitability, by ceasing some ongoing research and development projects,resulting in a reduction of the number of R&D employees. Networks did this to bring sharper focusand lower cost to research and development, and to position Networks for long-term profitability.If the impairments and write-offs of capitalized R&D costs and the restructuring costs wereexcluded from both 2004 (impairments of EUR 115 million) and 2003 (personnel-relatedrestructuring costs, impairments and write-offs totaling EUR 470 million), the R&D expenses wouldhave remained at the same level and would have represented 16.8% of net sales in 2004,compared with 19.2% of net sales in 2003.
In 2004, Networks SG&A expenses decreased by 9% to EUR 665 million compared with EUR 727million in 2003. In 2004, SG&A expenses represented 10.4% of Networks’ net sales compared with12.9% of net sales in 2003. In 2003, Networks SG&A included restructuring costs of EUR 80 million.Excluding these restructuring costs the expenses would have remained unchanged from 2003.
Networks 2004 operating profit increased to EUR 884 million from an operating loss of EUR 216million in 2003, and its operating margin improved to 13.7%, up from -3.8% in 2003. This was
69
primarily due to higher net sales, a product mix favoring high-margin products, overallprofitability of 3G contracts, and a streamlined cost structure as a result of restructuring actionstaken in 2003.
Networks 2004 operating profit included impairments of capitalized R&D costs of EUR 115 million.In 2003 Networks operating profit included a positive adjustment of EUR 226 million as a result ofthe customer finance impairment recorded in 2002 related to Mobilcom, and R&D related coststotaling EUR 470 million, other restructuring costs of EUR 80 million, as well as a goodwillimpairment of EUR 151 million related to Nokia Networks’ core networks business, with a totalnet impact of EUR 475 million.
Common Group Expenses
Common Group expenses totaled EUR 309 million in 2004 compared with EUR 378 million in 2003.In 2004, this included a positive item of EUR 160 million representing the premium return underour multi-line, multi-year insurance program, which expired during 2004. The return was due toour low claims experience during the policy period. It also included a EUR 12 million negativeimpact from the divestiture of Nextrom Holding S.A. In 2003, Common Group expenses includedthe gain of EUR 56 million on the sale of the remaining shares of Nokian Tyres Ltd.
Net Financial Income
Net financial income totaled EUR 405 million in 2004 compared with EUR 352 million in 2003. Netfinancial income in 2004 resulted from a continued strong cash position reflected in the negativenet debt to equity ratio of -79% at December 31, 2004 compared with a net debt to equity ratio of-71% at December 31, 2003. See ‘‘—Exchange Rates’’ below. During 2004, Nokia sold approximately69% of the original holdings in its subordinated convertible perpetual bonds issued by FranceTelecom. As a result, the company booked a total net gain of EUR 106 million. The bonds had beenclassified as available-for-sale investments and fair valued through shareholders’ equity.
Profit Before Taxes
Profit before tax and minority interests decreased 11% to EUR 4 705 million in 2004 comparedwith EUR 5 294 million in 2003. Taxes amounted to EUR 1 446 million and EUR 1 697 million in2004 and 2003, respectively. Effective tax rate changed slightly to 30.7% in 2004 compared with32.1% in 2003. Excluding the impact of non-deductible goodwill impairments the tax rate in 2003would have been 31.2%.
Minority Interests
Minority shareholders’ interest in our subsidiaries’ profits totaled EUR 67 million in 2004 comparedwith EUR 54 million in 2003.
Net Profit and Earnings per Share
Net profit in 2004 totaled to EUR 3 192 million compared with EUR 3 543 million in 2003,representing a year-on-year decrease in net profit of 10% in 2004. Earnings per share in 2004decreased to EUR 0.69 (basic and diluted), compared with EUR 0.74 (basic and diluted) in 2003.
Related Party Transactions
There have been no material transactions during the last three fiscal years to which any director,executive officer or 5% shareholder, or any relative or spouse of any of them, was party. There is
70
no significant outstanding indebtedness owed to Nokia by any director, executive officer or 5%shareholder.
There are no material transactions with enterprises controlling, controlled by or under commoncontrol with Nokia or associates of Nokia.
See Note 34 to our consolidated financial statements included in Item 18 of this annual report onForm 20-F.
Exchange Rates
Nokia’s business and results of operations are from time to time affected by changes in exchangerates, particularly between the euro and other currencies such as the US dollar, the Japanese yenand the UK pound sterling. See ‘‘Item 3.A Selected Financial Data—Exchange Rate Data.’’ Foreigncurrency denominated assets and liabilities, together with highly probable purchase and salecommitments, give rise to foreign exchange exposure. In general, depreciation of another currencyrelative to the euro has an adverse effect on Nokia’s sales and operating profit, while appreciationof another currency has a positive effect, with the exception of Japanese yen, being the onlysignificant foreign currency in which Nokia has more purchases than sales.
During 2005, 2004 and 2003, both the US dollar as well as the Japanese yen depreciated (averagerate used to record transactions in foreign currency for accounting purposes for the yearcompared with corresponding rate for the previous year) against the euro. The US dollardepreciated approximately 1.7%, 10.7% and 19.1%, respectively, and the Japanese yenapproximately 1.6%, 3.0% and 11.2%, respectively. The change in value of the US dollar had aslight negative impact in 2005 and a material negative impact in both 2004 and 2003 on Nokia’snet sales expressed in euros. The impact was slightly negative on Nokia’s operating profit in allyears due to the offsetting impact of production and local component sourcing. The change invalue of the Japanese yen had a slightly positive impact on Nokia’s operating profit in each year.During 2005 and 2003, the UK pound sterling depreciated by approximately 0.5% and 9.9% againstthe euro, respectively. In 2004, the UK pound sterling appreciated approximately 1.2% against theeuro. The change in value of the UK pound sterling had a slightly negative impact on Nokia’s netsales expressed in euros as well as operating profit in 2005 and 2003, and slightly positive effectin 2004. To mitigate the impact of changes in exchange rates on net sales, average product cost aswell as operating profit, Nokia hedges all material transaction exposures on a gross basis.
Nokia’s balance sheet is also affected by the translation into euro for financial reporting purposesof the shareholders’ equity of our foreign subsidiaries that are denominated in currencies otherthan the euro. In general, this translation increases our shareholders’ equity when the eurodepreciates, and affects shareholders’ equity adversely when the euro appreciates against therelevant other currencies (year-end rate to previous year-end rate).
For a discussion on the instruments used by Nokia in connection with the hedging activities, seeNote 38 to our consolidated financial statements included in Item 18 of this annual report onForm 20-F. See also ‘‘Item 11. Quantitative and Qualitative Disclosures About Market Risk’’ and‘‘Item 3.D Risk Factors—Our sales, costs and results are affected by exchange rate fluctuations,particularly between the euro, which is our reporting currency, and the US dollar, the Chineseyuan, the UK pound sterling and the Japanese yen, as well as certain other currencies.’’
Principal Differences Between IFRS and US GAAP
Nokia’s consolidated financial statements are prepared in accordance with IFRS.
Our net profit in 2005 under IFRS was EUR 3 616 million compared with EUR 3 192 million in 2004and EUR 3 543 million in 2003. Under US GAAP, Nokia would have reported net income of
71
EUR 3 582 million in 2005 compared with EUR 3 343 million in 2004 and EUR 4 097 million in2003.
The principal differences between IFRS and US GAAP that affect our net profit or loss, as well asour shareholders’ equity, relate to the treatment of capitalization and impairment of developmentcosts, pension costs, provision for social security costs on share-based payments, share-basedcompensation expense, identifiable intangible assets acquired, amortization and impairment ofgoodwill, translation of goodwill, cash flow hedges and marketable securities and unlistedinvestments. See Note 39 to our consolidated financial statements included in Item 18 of thisannual report on Form 20-F for a description of the principal differences between IFRS andUS GAAP and for a description of the anticipated impact on the consolidated financial statementsof the adoption of recently issued US GAAP accounting standards.
5.B Liquidity and Capital Resources
At December 31, 2005, Nokia’s cash and other liquid assets (bank and cash; available-for-saleinvestments, cash equivalents; and available-for-sale investments, liquid assets) decreased toEUR 9 910 million, compared with EUR 11 542 million at December 31, 2004, mainly due to anincrease in the purchases of treasury shares partly offset with the cash from investing activities.
Cash and cash equivalents increased to EUR 3 058 million compared with EUR 2 457 million atDecember 31, 2004. We hold our cash and cash equivalents predominantly in euros. Cash and cashequivalents totaled EUR 2 784 million at December 31, 2003.
Net cash from operating activities was EUR 4 144 million in 2005 compared with EUR 4 343 millionin 2004, and EUR 5 252 million in 2003. In 2005, net cash generated from operating activitiesdecreased primarily due to an increase in working capital. In 2004, net cash generated fromoperating activities decreased primarily due to lower profit partly offset by a reduction in workingcapital.
Net cash from investing activities in 2005 was EUR 1 844 million compared with net cash used ininvesting activities of EUR 329 million in 2004, and EUR 3 215 million in 2003. Cash flow frominvesting activities in 2005 included purchases of current available-for-sale investments, liquidassets, of EUR 7 277 million, compared with EUR 10 318 million in 2004, and EUR 11 695 millionin 2003. Additions to capitalized R&D expenses totaled EUR 153 million, representing an increasecompared with EUR 101 million in 2004. In 2003, additions to capitalized R&D were EUR 218million. Long-term loans made to customers increased to EUR 56 million in 2005, compared withEUR 0 million in 2004 and EUR 97 million in 2003. Capital expenditures for 2005 were EUR 607million compared with EUR 548 million in 2004 and EUR 432 million in 2003. Major items ofcapital expenditure included production lines, test equipment and computer hardware usedprimarily in research and development as well as office and manufacturing facilities. Proceedsfrom maturities and sale of current available-for-sale investments, liquid assets, decreased toEUR 9 402 million, compared with EUR 9 737 million in 2004, and EUR 8 793 million in 2003.During 2005 we sold the remaining holdings in the subordinated convertible perpetual bondsissued by France Telecom. As a result, we booked proceeds from sale of current available-for-saleinvestments of EUR 247 million (EUR 587 million in 2004).
Net cash used in financing activities increased to EUR 5 570 million in 2005 compared withEUR 4 318 million in 2004, primarily as a result of an increase in the purchases of treasury shareswith EUR 1 610 million during 2005. Net cash used in financing activities increased to EUR 4 318million in 2004 compared with EUR 2 780 million in 2003, primarily as a result of an increase inthe purchases of treasury shares with EUR 1 293 million and an increase in the repayment ofshort-term borrowings of EUR 233 million during 2004. Dividends paid increased to EUR 1 531million in 2005 compared with EUR 1 413 million in 2004 and EUR 1 378 million in 2003.
72
At December 31, 2005, Nokia had EUR 21 million in long-term interest-bearing liabilities andEUR 377 million in short-term borrowings, offset by EUR 9 910 million in cash and other liquidassets, resulting in a liquid assets balance of EUR 9 512 million, compared with EUR 11 308 millionat the end of 2004. In addition, we held EUR 255 million in 2004 of subordinated convertibleperpetual bonds of France Telecom classified as available-for-sale investments and not included incash and other liquid assets. We were not unconditionally permitted to sell these bonds until theend of June 2004. For further information regarding our long-term liabilities, including interestrate structure and currency mix, see Note 26 to our consolidated financial statements included inItem 18 of this annual report on Form 20-F. Our ratio of net interest- bearing debt, defined asshort-term and long-term debt less cash and other liquid assets, to equity, defined as shareholders’equity and minority interests, was -77%, -79% and -71% at December 31, 2005, 2004 and 2003,respectively. The change in 2005 resulted from an increased number of share buybacks. Thechange in 2004 resulted from both our continued good profitability and the improvements in ourcash and other liquid assets position reflecting the increased amount of share buy-backs.
The total dividends per share were EUR 0.37 for the year ended December 31, 2005, subject toshareholders’ approval, compared with EUR 0.33 and EUR 0.30 for the years ended December 31,2004 and 2003, respectively. See ‘‘Item 3.A Selected Financial Data—Distribution of Earnings.’’
Nokia has no potentially significant refinancing requirements in 2006. Nokia expects to incuradditional indebtedness from time to time as required to finance working capital needs. AtDecember 31, 2005, Nokia had a USD 500 million US Commercial Paper, or USCP, program and aUSD 500 million Euro Commercial Paper, or ECP, program. In addition, at the same date, Nokia hada Finnish local commercial paper program totaling EUR 750 million. At December 31, 2005, we alsohad a committed credit facility of USD 2 000 million and a number of short-term uncommittedfacilities. For further information regarding our short-term borrowings, including the averageinterest rate, see Note 28 to our consolidated financial statements included in Item 18 of thisannual report on Form 20-F.
Nokia has historically maintained a high level of liquid assets. Management estimates that the cashand other liquid assets level of EUR 9 910 million at the end of 2005, together with Nokia’savailable credit facilities, cash flow from operations, funds available from long-term andshort-term debt financings, as well as the proceeds of future equity or convertible bond offerings,will be sufficient to satisfy our future working capital needs, capital expenditure, research anddevelopment and debt service requirements at least through 2006. The ratings of our short andlong-term debt from credit rating agencies have not changed during the year. The ratings atDecember 31, 2005, were:
Short-term Standard & Poor’s A-1Moody’s P-1
Long-term Standard & Poor’s AMoody’s A1
We believe that Nokia will continue to be able to access the capital markets on terms and inamounts that will be satisfactory to us, and that we will be able to obtain bid and performancebonds, to arrange or provide customer financing as necessary to support our business and toengage in hedging transactions on commercially acceptable terms.
Nokia is not a capital intensive company in terms of fixed assets, but rather invests in researchand development, marketing and building the Nokia brand. In 2005, capital expenditures totaledEUR 607 million compared with EUR 548 million in 2004 and EUR 432 million 2003. The increasein 2005 resulted from increased amount of capital expenditures in machinery and equipment tosupport the company’s growing volumes. Principal capital expenditures during the three years
73
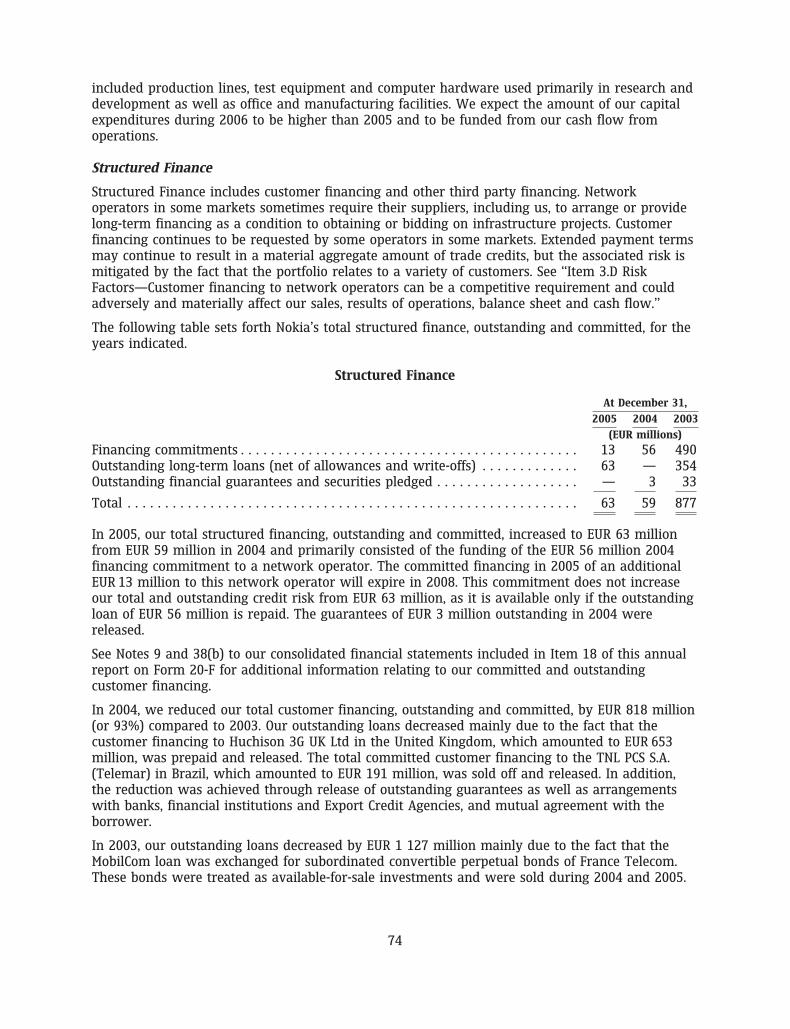
included production lines, test equipment and computer hardware used primarily in research anddevelopment as well as office and manufacturing facilities. We expect the amount of our capitalexpenditures during 2006 to be higher than 2005 and to be funded from our cash flow fromoperations.
Structured Finance
Structured Finance includes customer financing and other third party financing. Networkoperators in some markets sometimes require their suppliers, including us, to arrange or providelong-term financing as a condition to obtaining or bidding on infrastructure projects. Customerfinancing continues to be requested by some operators in some markets. Extended payment termsmay continue to result in a material aggregate amount of trade credits, but the associated risk ismitigated by the fact that the portfolio relates to a variety of customers. See ‘‘Item 3.D RiskFactors—Customer financing to network operators can be a competitive requirement and couldadversely and materially affect our sales, results of operations, balance sheet and cash flow.’’
The following table sets forth Nokia’s total structured finance, outstanding and committed, for theyears indicated.
Structured Finance
At December 31,
2005 2004 2003
(EUR millions)
Financing commitments . . . . . . . . . . . . . . . . . . . . . . . . . . . . . . . . . . . . . . . . . . . . . 13 56 490Outstanding long-term loans (net of allowances and write-offs) . . . . . . . . . . . . . 63 — 354Outstanding financial guarantees and securities pledged . . . . . . . . . . . . . . . . . . . — 3 33
Total . . . . . . . . . . . . . . . . . . . . . . . . . . . . . . . . . . . . . . . . . . . . . . . . . . . . . . . . . . . . 63 59 877
In 2005, our total structured financing, outstanding and committed, increased to EUR 63 millionfrom EUR 59 million in 2004 and primarily consisted of the funding of the EUR 56 million 2004financing commitment to a network operator. The committed financing in 2005 of an additionalEUR 13 million to this network operator will expire in 2008. This commitment does not increaseour total and outstanding credit risk from EUR 63 million, as it is available only if the outstandingloan of EUR 56 million is repaid. The guarantees of EUR 3 million outstanding in 2004 werereleased.
See Notes 9 and 38(b) to our consolidated financial statements included in Item 18 of this annualreport on Form 20-F for additional information relating to our committed and outstandingcustomer financing.
In 2004, we reduced our total customer financing, outstanding and committed, by EUR 818 million(or 93%) compared to 2003. Our outstanding loans decreased mainly due to the fact that thecustomer financing to Huchison 3G UK Ltd in the United Kingdom, which amounted to EUR 653million, was prepaid and released. The total committed customer financing to the TNL PCS S.A.(Telemar) in Brazil, which amounted to EUR 191 million, was sold off and released. In addition,the reduction was achieved through release of outstanding guarantees as well as arrangementswith banks, financial institutions and Export Credit Agencies, and mutual agreement with theborrower.
In 2003, our outstanding loans decreased by EUR 1 127 million mainly due to the fact that theMobilCom loan was exchanged for subordinated convertible perpetual bonds of France Telecom.These bonds were treated as available-for-sale investments and were sold during 2004 and 2005.
74
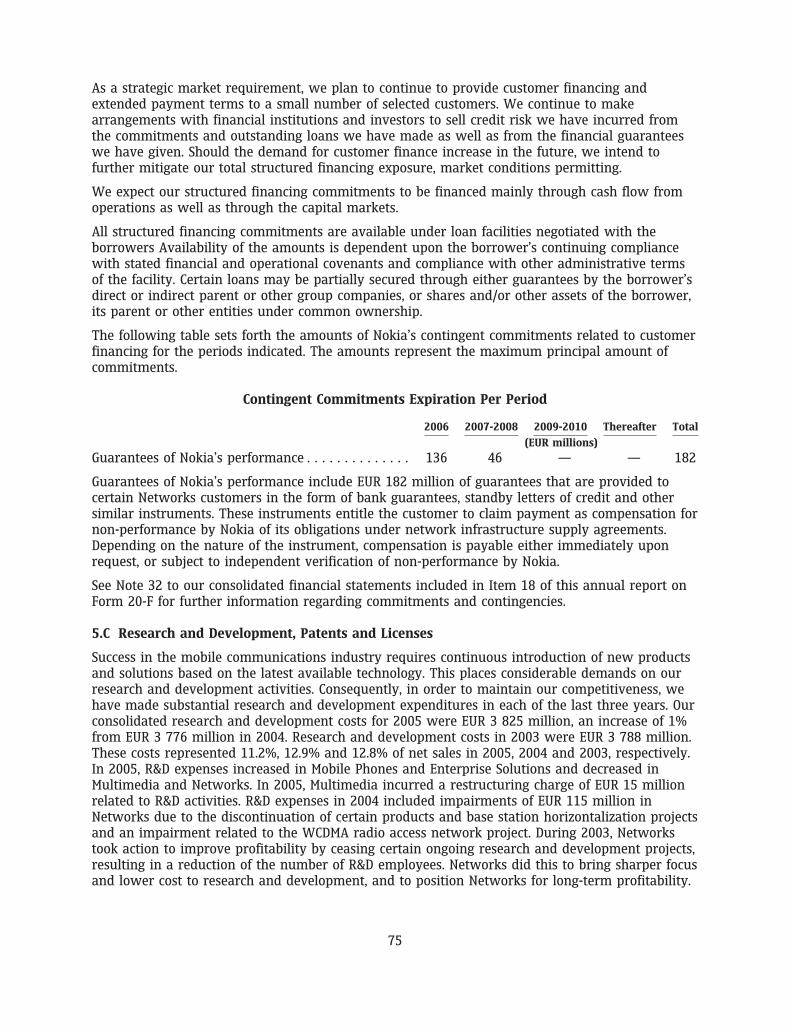
As a strategic market requirement, we plan to continue to provide customer financing andextended payment terms to a small number of selected customers. We continue to makearrangements with financial institutions and investors to sell credit risk we have incurred fromthe commitments and outstanding loans we have made as well as from the financial guaranteeswe have given. Should the demand for customer finance increase in the future, we intend tofurther mitigate our total structured financing exposure, market conditions permitting.
We expect our structured financing commitments to be financed mainly through cash flow fromoperations as well as through the capital markets.
All structured financing commitments are available under loan facilities negotiated with theborrowers Availability of the amounts is dependent upon the borrower’s continuing compliancewith stated financial and operational covenants and compliance with other administrative termsof the facility. Certain loans may be partially secured through either guarantees by the borrower’sdirect or indirect parent or other group companies, or shares and/or other assets of the borrower,its parent or other entities under common ownership.
The following table sets forth the amounts of Nokia’s contingent commitments related to customerfinancing for the periods indicated. The amounts represent the maximum principal amount ofcommitments.
Contingent Commitments Expiration Per Period
2006 2007-2008 2009-2010 Thereafter Total
(EUR millions)
Guarantees of Nokia’s performance . . . . . . . . . . . . . . 136 46 — — 182
Guarantees of Nokia’s performance include EUR 182 million of guarantees that are provided tocertain Networks customers in the form of bank guarantees, standby letters of credit and othersimilar instruments. These instruments entitle the customer to claim payment as compensation fornon-performance by Nokia of its obligations under network infrastructure supply agreements.Depending on the nature of the instrument, compensation is payable either immediately uponrequest, or subject to independent verification of non-performance by Nokia.
See Note 32 to our consolidated financial statements included in Item 18 of this annual report onForm 20-F for further information regarding commitments and contingencies.
5.C Research and Development, Patents and Licenses
Success in the mobile communications industry requires continuous introduction of new productsand solutions based on the latest available technology. This places considerable demands on ourresearch and development activities. Consequently, in order to maintain our competitiveness, wehave made substantial research and development expenditures in each of the last three years. Ourconsolidated research and development costs for 2005 were EUR 3 825 million, an increase of 1%from EUR 3 776 million in 2004. Research and development costs in 2003 were EUR 3 788 million.These costs represented 11.2%, 12.9% and 12.8% of net sales in 2005, 2004 and 2003, respectively.In 2005, R&D expenses increased in Mobile Phones and Enterprise Solutions and decreased inMultimedia and Networks. In 2005, Multimedia incurred a restructuring charge of EUR 15 millionrelated to R&D activities. R&D expenses in 2004 included impairments of EUR 115 million inNetworks due to the discontinuation of certain products and base station horizontalization projectsand an impairment related to the WCDMA radio access network project. During 2003, Networkstook action to improve profitability by ceasing certain ongoing research and development projects,resulting in a reduction of the number of R&D employees. Networks did this to bring sharper focusand lower cost to research and development, and to position Networks for long-term profitability.
75
If the restructuring costs in Multimedia in 2005 (EUR 15 million) and the impairments andwrite-offs of capitalized R&D costs and the restructuring costs in Networks were excluded fromboth the 2004 (impairments of EUR 115 million) and 2003 (personnel-related restructuring costs,impairments and write-offs of EUR 470 million), R&D expenses would have increased 4% in 2005and 10% in 2004. This would have represented 11.1% of Nokia net sales in 2005 compared with12.5% of Nokia net sales in 2004 and 11.3% of net sales in 2003.
To enable our future growth, we continued to improve the efficiency of our worldwide researchand development network and increased our collaboration with third parties. At December 31,2005, we employed 20 882 people in research and development, representing approximately 36%of Nokia’s total workforce. Research and development expenses of Mobile Phones as a percentageof its net sales were 6.0% in 2005 compared with 6.5% in 2004 and 4.9% in 2003. In Multimedia,research and development expenses as a percentage of its net sales were 14.4% in 2005 comparedwith 23.5% in 2004 and 28.9% in 2003. Research and development expenses of EnterpriseSolutions as a percentage of its net sales were 38.2%, compared with 36.2% in 2004 and 44.3% in2003. In the case of Networks, research and development costs represented 17.8%, 18.6% and27.5% of its net sales in 2005, 2004 and 2003, respectively. If the impairments and write-offs ofcapitalized R&D costs and restructuring costs described in the previous paragraph were excluded,the R&D costs of Networks would have represented 17.8%, 16.8% and 19.2% of Networks’ net salesin 2005, 2004 and 2003, respectively. See ‘‘Item 4.B Business Overview—Technology, Research andDevelopment’’ and ‘‘—Patents and Licenses.’’
We are reviewing our R&D activities in order to get the most compelling products to market at theright time, and we are aiming to lower our R&D expenses/net sales ratio while remaining effectiveand focused in our efforts. This will require focused R&D spending and a re-engineered productcreation process intended to reduce product development cycle times. Our target is to bring overallNokia R&D expenditure down to 9%-10% of net sales by the end of 2006. In accordance with thisplan, we have set as a target that by the end of 2006 the R&D expenses/net sales ratio of ourmobile devices business would be 8% and 14% for our infrastructure business. However, there area number of market developments, including an increased requirement for 3G/WCDMA frequencyvariants and alternative radio access technologies, that may affect our ability to achieve our 14%target for our infrastructure business by the end of 2006.
5.D Trends
See ‘‘Item 5.A Operating Results—Overview’’ for information on material trends affecting ourbusiness and results of operations.
5.E Off-Balance Sheet Arrangements
There are no material off-balance sheet arrangements that have or are reasonably likely to have acurrent or future effect on our financial condition, changes in financial condition, revenues orexpenses, results of operations, liquidity, capital expenditures or capital resources that is materialto investors.
5.F Tabular Disclosure of Contractual Obligations
The following table sets forth our contractual obligations for the periods indicated.
76
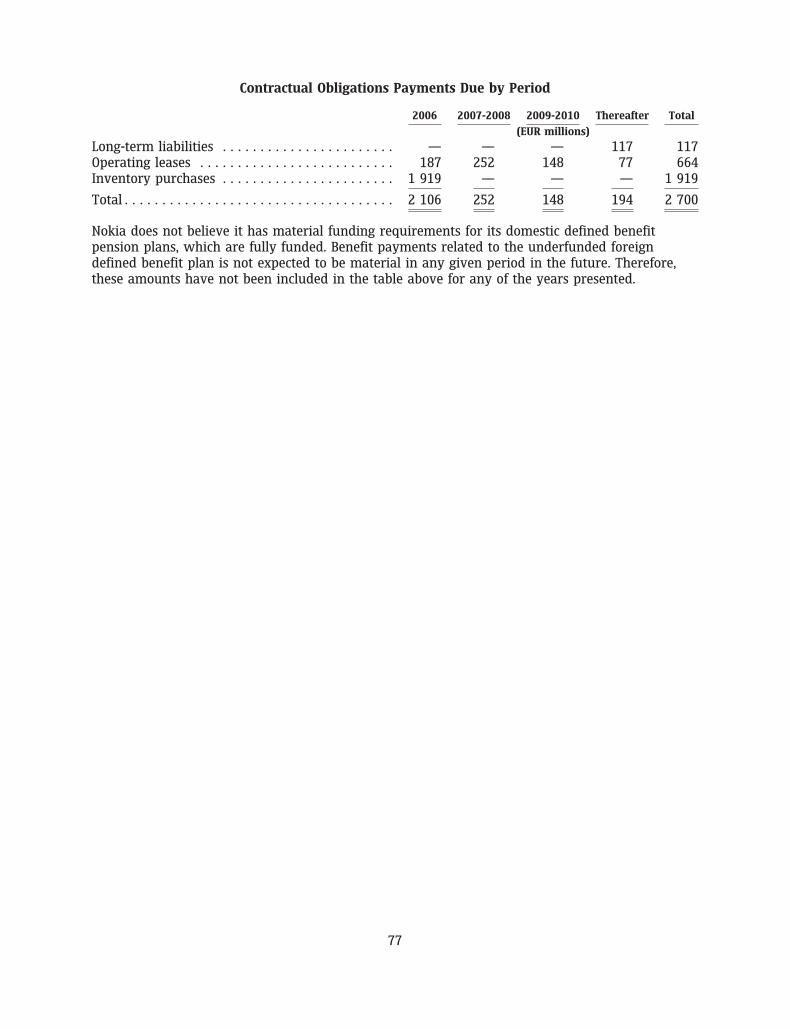
Contractual Obligations Payments Due by Period
2006 2007-2008 2009-2010 Thereafter Total
(EUR millions)
Long-term liabilities . . . . . . . . . . . . . . . . . . . . . . . — — — 117 117Operating leases . . . . . . . . . . . . . . . . . . . . . . . . . . 187 252 148 77 664Inventory purchases . . . . . . . . . . . . . . . . . . . . . . . 1 919 — — — 1 919
Total . . . . . . . . . . . . . . . . . . . . . . . . . . . . . . . . . . . . 2 106 252 148 194 2 700
Nokia does not believe it has material funding requirements for its domestic defined benefitpension plans, which are fully funded. Benefit payments related to the underfunded foreigndefined benefit plan is not expected to be material in any given period in the future. Therefore,these amounts have not been included in the table above for any of the years presented.
77
ITEM 6. DIRECTORS, SENIOR MANAGEMENT AND EMPLOYEES
6.A Directors and Senior Management
Pursuant to the provisions of the Finnish Companies Act and our articles of association, the controland management of Nokia is divided among the shareholders at a general meeting, the Board ofDirectors and the Group Executive Board.
Board of Directors
The current members of the Board of Directors were elected at the Annual General Meeting onApril 7, 2005, in accordance with the proposal of the Corporate Governance and NominationCommittee of the Board of Directors. On the same date, the Chairman and Vice Chairman wereelected by the members of the Board of Directors.
On August 1, 2005, we announced that the Board of Directors has released Jorma Ollila, Chairmanand CEO, upon his request, from his duties as CEO effective June 1, 2006. The Corporate Governanceand Nomination Committee of the Board of Directors will propose to the Annual General Meetingconvening on March 30, 2006 that Jorma Ollila continues after June 1, 2006 as Non-ExecutiveChairman. The Committee has received Mr. Ollila’s confirmation that he is available for thisposition.
Certain information with respect to the members of the Board of Directors is set forth below.
Chairman Jorma Ollila, b. 1950 Chairman and CEOand Chairman of the Group Executive Board of NokiaCorporation.Board member since 1995. Chairman since 1999.
Master of Political Science (University of Helsinki), Masterof Science (Econ.) (London School of Economics), Master ofScience (Eng.) (Helsinki University of Technology).
President and CEO, Chairman of the Group ExecutiveBoard of Nokia Corporation 1992-1999, President of NokiaMobile Phones 1990-1992, Senior Vice President, Financeof Nokia 1986-1989. Holder of various managerialpositions at Citibank within corporate banking 1978-1985.
Member of the Board of Directors of Ford Motor Company,Vice Chairman of the Board of Directors of UPM-KymmeneCorporation, Vice Chairman of the Board of Directors ofOtava Books and Magazines Group Ltd. Chairman of theBoard of Directors of Royal Dutch Shell Plc from June 1,2006. Chairman of the Boards of Directors and theSupervisory Boards of Finnish Business and Policy ForumEVA and The Research Institute of the Finnish EconomyETLA. Chairman of The European Round Table ofIndustrialists.
78
Vice Chairman Paul J. Collins, b. 1936 Board member since 1998. Vice Chairman since 2000.
BBA (University of Wisconsin), MBA (Harvard BusinessSchool).
Vice Chairman of Citigroup Inc. 1998-2000, Vice Chairmanand member of the Board of Directors of Citicorp andCitibank N.A. 1988-2000. Holder of various executivepositions at Citibank within investment management,investment banking, corporate planning as well asfinance and administration 1961-1988.
Member of the Boards of Directors of BG Group and TheEnstar Group, Inc. Member of the Supervisory Board ofActis Capital LLP.
Georg Ehrnrooth, b. 1940 Board member since 2000.
Master of Science (Eng.) (Helsinki University ofTechnology).
President and CEO of Metra Corporation 1991-2000,President and CEO of Lohja Corporation 1979-1991. Holderof various executive positions at Wartsila Corporationwithin production and management 1965-1979.
Chairman of the Board of Directors of Assa Abloy AB(publ) and Vice Chairman of the Board of Directors ofRautaruukki Corporation, member of the Boards ofDirectors of Oy Karl Fazer Ab, Sandvik AB (publ) andSampo plc. Vice Chairman of the Boards of Directors ofThe Research Institute of the Finnish Economy ETLA andFinnish Business and Policy Forum EVA.
Daniel R. Hesse, b. 1953 CEO of Sprint Communication, Local TelecommunicationsDivision.Board member since 2005.
A.B. (University of Notre Dame), M.B.A. (CornellUniversity), M.S. (Massachusetts Institute of Technology).
Chairman, President and CEO of Terabeam 2000-2004,President and CEO of AT&T Wireless Services 1997-2000,Executive Vice President of AT&T 1997-2000, GeneralManager for the AT&T Online Services Group 1996,President and CEO of AT&T Network SystemsInternational 1991-1995. Various managerial positions inAT&T, including network operations, strategic planningand sales 1977-1991.
Member of the Board of Directors of VF Corporation.Member of the National Board of Governors of the Boys &Girls Clubs of America.
79
Dr. Bengt Holmstrom, b. 1949 Paul A. Samuelson Professor of Economics at MIT, jointappointment at the MIT Sloan School of Management.Board member since 1999.
Bachelor of Science (Helsinki University), Master ofScience (Stanford University), Doctor of Philosophy(Stanford University).
Edwin J. Beinecke Professor of Management Studies atYale University 1985-1994.
Member of the Board of Directors of Kuusakoski Oy.Member of the American Academy of Arts and Sciencesand Foreign Member of The Royal Swedish Academy ofSciences.
Per Karlsson, b. 1955 Independent Corporate Advisor.Board member since 2002.
Degree in Economics and Business Administration(Stockholm School of Economics).
Executive Director, with mergers and acquisitionsadvisory responsibilities, at Enskilda M&A, EnskildaSecurities (London) 1986-1992. Corporate strategyconsultant at the Boston Consulting Group (London)1979-1986.
Board member of IKANO Holdings S.A.
Edouard Michelin, b. 1963 Managing Partner and CEO of Michelin Group.Board member since 2005.
Engineering graduate (Ecole Centrale de Paris)
Head of Michelin Manufacturing Facilities and MichelinTruck Business in North America 1990-1993, variousmanagerial positions at Michelin, including research,manufacturing, marketing and sales 1988-1990.
Member of the World Business Council for SustainableDevelopment (WBCSD).
Dame Marjorie Scardino, b. 1947 Chief Executive and member of the Board of Directors ofPearson plc.Board member since 2001.
BA (Baylor), JD (University of San Francisco).
Chief Executive of The Economist Group 1993-1997,President of the North American Operations of TheEconomist Group 1985-1993, lawyer 1976-1985 andpublisher of The Georgia Gazette newspaper 1978-1985.
80
Vesa Vainio, b. 1942 Board member since 1993.
LL.M. (University of Helsinki).
Chairman 1998-1999 and 2000-2002 and Vice Chairman1999-2000 of the Board of Directors of Nordea AB (publ).Chairman of the Executive Board and CEO of Merita BankLtd and CEO of Merita Ltd 1992-1997. President ofKymmene Corporation 1991-1992. Holder of various otherexecutive positions in Finnish industry 1972-1991.
Chairman of the Board of Directors of UPM-KymmeneCorporation.
Arne Wessberg, b. 1943 President of the European Broadcasting Union (EBU).Board member since 2001.
Studies in economics in the University of Tampere1963-1966.
Chairman of the Board of Directors and Chief ExecutiveOfficer of Yleisradio Oy (Finnish Broadcasting Company)1994-2005, Director of TV 1 and TV 2 1980-1994, reporterand editor 1971-1976 of Yleisradio Oy.
Chairman of the Board of Eurosport Consortium1998-2000, member 1989-1997. President of theInternational Institute of Communications, member of theBoard of Directors of the International Academy ofTelevision Arts & Sciences and member of the TrilateralCommission (Europe). Member of the Board of ArcadaPolytechnic.
Proposal of the Corporate Governance and Nomination Committee of the Board
On January 26, 2006, the Corporate Governance and Nomination Committee announced itsproposal to the Annual General Meeting convening on March 30, 2006 regarding the election of themembers of the Board of Directors. The Corporate Governance and Nomination Committee willpropose to the Annual General Meeting that the number of Board members remains at ten, andthat the following current Board members: Paul J. Collins, Georg Ehrnrooth, Daniel R. Hesse, BengtHolmstrom, Per Karlsson, Edouard Michelin, Jorma Ollila, Marjorie Scardino and Vesa Vainio, bere-elected for a term of one year. Arne Wessberg, member of the Nokia Board since 2001, will notstand for re-election to the Board of Directors. In addition, the Committee proposes that Keijo Suilabe elected as a new member of the Board of Directors for the next one-year term. Keijo Suila, 60,acted as President and CEO of Finnair Oyj, the major Finnish aviation company, from 1999 untilhis retirement in 2005. Prior to this, Mr. Suila held various senior executive positions, includingVice Chairman and Executive Vice President, at Huhtamaki Oy, Leaf Group and Leaf Europe during1985-1998.
81
Group Executive Board
According to our articles of association, we have a Group Executive Board, which is responsible forthe operative management of the Group. The Chairman and members of the Group ExecutiveBoard are appointed by the Board of Directors. Only the Chairman of the Group Executive Boardcan be a member of both the Board of Directors and the Group Executive Board.
On August 1, 2005, we announced that the Board of Directors has released Jorma Ollila, Chairmanand CEO, upon his request from his duties as the CEO and Chairman of the Group Executive Boardeffective June 1, 2006. The Board of Directors has appointed Olli-Pekka Kallasvuo President and COOwith effect from October 1, 2005 until May 31, 2006. From June 1, 2006, Mr. Kallasvuo will becomePresident and CEO and Chairman of the Group Executive Board.
During 2005, we announced the following changes in the members of the Group Executive Board:
• Tero Ojanpera was appointed Chief Strategy Officer and member of the Group ExecutiveBoard effective January 1, 2005.
• Sari Baldauf, formerly Executive Vice President and General Manager of Networks, resignedeffective January 31, 2005.
• J.T. Bergqvist, formerly Senior Vice President and General Manager of Business Units ofNetworks, resigned effective January 31, 2005.
• Simon Beresford-Wylie was appointed Executive Vice President and General Manager ofNetworks and member of the Group Executive Board effective February 1, 2005.
• Pekka Ala-Pietila, formerly President of Nokia and Head of Customer and Market Operationsresigned from the Group Executive Board effective October 1, 2005. Thereafter, Mr. Ala-Pietilaserved as an Executive Advisor for Nokia until January 31, 2006.
• Yrjo Neuvo, formerly Senior Vice President and Technology Advisor, resigned from theGroup Executive Board effective October 1, 2005.
• Robert Andersson was appointed Executive Vice President of Customer and MarketOperations and member of the Group Executive Board effective October 1, 2005.
• Kai Oistamo was appointed Executive Vice President and General Manager of Mobile Phonesand member of the Group Executive Board effective October 1, 2005.
The current members of our Group Executive Board are set forth below.
Chairman Jorma Ollila, b. 1950 Chairman and CEO of Nokia Corporation.Group Executive Board member since 1986. Group ExecutiveBoard Chairman since 1992.Joined Nokia 1985.
Master of Political Science (University of Helsinki), Masterof Science (Econ.) (London School of Economics), Master ofScience (Eng.) (Helsinki University of Technology).
President and CEO, and Chairman of the Group ExecutiveBoard of Nokia Corporation 1992-1999, President of NokiaMobile Phones 1990-1992, Senior Vice President, Financeof Nokia 1986-1989. Holder of various managerialpositions at Citibank within corporate banking 1978-1985.
82
Member of the Board of Directors of Ford Motor Company,Vice Chairman of the Board of Directors of UPM-KymmeneCorporation and Vice Chairman of the Board of Directorsof Otava Books and Magazines Group Ltd. Chairman of theBoard of Directors of Royal Dutch Shell Plc from June 1,2006. Chairman of the Boards of Directors and theSupervisory Boards of Finnish Business and Policy ForumEVA and The Research Institute of the Finnish EconomyETLA. Chairman of The European Round Table ofIndustrialists.
Robert Andersson, b. 1960 Executive Vice President of Customer and MarketOperations.Group Executive Board member since October 1, 2005.Joined Nokia in 1985.
Master of Business Administration (George WashingtonUniversity), Master of Science (Econ.) (Swedish School ofEconomics and Business Administration in Helsinki).
Senior Vice President for Customer and MarketOperations, Europe, Middle East and Africa 2004-2005,Senior Vice President of Nokia Mobile Phones in Asia-Pacific 2001-2004, Vice President of Sales for Nokia MobilePhones in Europe and Africa 1998-2001.
Simon Beresford-Wylie, b. 1958 Executive Vice President and General Manager of Networks.Group Executive Board member since February 1, 2005.Joined Nokia 1998.
Bachelor of Arts (Economic Geography and History)(Australian National University).
Senior Vice President of Nokia Networks, Asia Pacific2003-2004, Senior Vice President, Customer Operations ofNokia Networks, 2002-2003, Vice President, CustomerOperations of Nokia Networks 2000-2002, ManagingDirector of Nokia Networks in India and Area GeneralManager, South Asia 1999-2000, Regional Director ofBusiness Development, Project and Trade Finance ofNokia Networks, Asia Pacific 1998-1999, Chief ExecutiveOfficer of Modi Testra, India 1995-1998, General Manager,Banking and Finance, Corporate and Governmentbusiness unit of Telstra Corporation 1993-1995, holder ofexecutive positions in the Corporate and Governmentbusiness units of Telstra Corporation 1989-1993, holder ofexecutive, managerial and clerical positions in theAustralian Commonwealth Public Service 1982-1989.
Member of the Board of Directors of The Vitec Group.
83
Olli-Pekka Kallasvuo, b. 1953 President and COO. President and CEO as from June 1, 2006.Group Executive Board member since 1990.With Nokia 1980-81, rejoined 1982.
LL.M. (University of Helsinki).
Executive Vice President and General Manager of MobilePhones 2004-2005, Executive Vice President, CFO of Nokia1999-2003, Executive Vice President of Nokia Americasand President of Nokia Inc. 1997-1998, Executive VicePresident, CFO of Nokia 1992-1996, Senior Vice President,Finance of Nokia 1990-1991.
Chairman of the Board of Directors of Sampo plc andmember of the Board of Directors of EMC Corporation.
Pertti Korhonen, b. 1961 Executive Vice President, Chief Technology Officer.Group Executive Board member since 2002.Joined Nokia 1986.
Master of Science (Electronics Eng.) (University of Oulu).
Executive Vice President of Nokia Mobile Software2001-2003, Senior Vice President, Global Operations,Logistics and Sourcing of Nokia Mobile Phones 1999-2001,Senior Vice President, Global Operations and Logistics ofNokia Mobile Phones 1998-1999, Vice President, Logisticsof Nokia Mobile Phones 1996-1998, Vice President,Manufacturing Europe of Nokia Mobile Phones 1993-1996,Project Executive of Nokia Mobile Phones UK Ltd1991-1993, Vice President, R&D of Nokia Mobile Phones,Oulu 1990-1991.
Mary T. McDowell, b. 1964 Executive Vice President and General Manager of EnterpriseSolutions.Group Executive Board member since 2004.Joined Nokia 2004.
Bachelor of Science (Computer Science) (College ofEngineering at the University of Illinois).
Senior Vice President, Strategy and CorporateDevelopment of Hewlett-Packard Company 2003, SeniorVice President & General Manager, Industry-StandardServers of Hewlett-Packard Company 2002-2003, SeniorVice President & General Manager, Industry-StandardServers of Compaq Computer Corporation 1998-2002, VicePresident, Marketing, Server Products Division of CompaqComputer Corporation 1996-1998. Holder of executive,managerial and other positions at Compaq ComputerCorporation 1986-1996.
Member of the Board of Visitors for the College ofEngineering at the University of Illinois.
84
Hallstein Moerk, b. 1953 Executive Vice President, Human Resources.Group Executive Board member since 2004.Joined Nokia 1999.
Diplomøkonom (Econ.) (Norwegian School ofManagement). Holder of various positions at Hewlett-Packard Corporation 1977-1999.
Member of the Board of Advisors for Center for HRStrategy, Rutgers University.
Dr. Tero Ojanpera, b. 1966 Executive Vice President, Chief Strategy Officer.Group Executive Board member since January 1, 2005.Joined Nokia 1990.
Master of Science (University of Oulu), Ph.D. (DelftUniversity of Technology, The Netherlands).
Senior Vice President, Head of Nokia Research Center2002-2004. Vice President, Research, Standardization andTechnology of IP Mobility Networks, Nokia Networks1999-2001. Vice President, Radio Access Systems Researchand General Manager of Nokia Networks in Korea, 1999.Head of Radio Access Systems Research, Nokia Networks1998-1999, Principal Engineer, Nokia Research Center,1997-1998.
Chairman of Nokia Foundation. Vice Chairman of theCenter for Wireless Communications, Oulu University.Member of the Board of Technomedicum ResearchInstitute. Member of IST Advisory Group (ISTAG) for theEuropean Commission. Member of the Board of theFoundation of Finnish Institute in Japan. Member of theIndustrial Advisory Council of Center forTeleInFrastruktur (CTIF), Aalborg University. Member ofthe Institute of Electrical and Electronics Engineers, Inc.(IEEE).
Richard A. Simonson, b. 1958 Executive Vice President, Chief Financial Officer.Group Executive Board member since 2004.Joined Nokia 2001.
Bachelor of Science (Mining Eng.) (Colorado School ofMines), Master of Business Administration (Finance)(Wharton School of Business at University ofPennsylvania).
Vice President & Head of Customer Finance of NokiaCorporation 2001-2003, Managing Director of Telecom &Media Group of Barclays 2001, Head of Global ProjectFinance and other various positions at Bank of AmericaSecurities 1985-2001.
Member of the Board of Trustees of International House—New York.
85
Veli Sundback, b. 1946 Executive Vice President, Corporate Relations andResponsibility of Nokia Corporation.Group Executive Board member since 1996.Joined Nokia 1996.
LL.M. (University of Helsinki).
Executive Vice President, Corporate Relations and TradePolicy of Nokia Corporation 1996-. Secretary of State atthe Ministry for Foreign Affairs 1993-1995, Under-Secretary of State for External Economic Relations at theMinistry for Foreign Affairs 1990-1993.
Member of the Board of Directors of Finnair Oyj. Memberof the Board and its executive committee, Confederationof Finnish Industries (EK), Vice Chairman of the Board,Technology Industries of Finland, Vice Chairman of theBoard of the International Chamber of Commerce, FinnishSection, Chairman of the Board of the Finland-ChinaTrade Association.
Anssi Vanjoki, b. 1956 Executive Vice President and General Manager ofMultimedia.Group Executive Board member since 1998.Joined Nokia 1991.
Master of Science (Econ.) (Helsinki School of Economicsand Business Administration).
Executive Vice President of Nokia Mobile Phones1998-2003, Senior Vice President, Europe and Africa ofNokia Mobile Phones 1994-1998, Vice President, Sales ofNokia Mobile Phones 1991-1994, 3M Corporation1980-1991.
Member of the Board of Directors of Amer Group Plc.
Dr. Kai Oistamo, b. 1964 Executive Vice President and General Manager of MobilePhones.Group Executive Board member since October 1, 2005.Joined Nokia in 1991.
Doctor of Technology (Signal Processing), Master ofScience (Engineering) (Tampere University ofTechnology).
Senior Vice President, Business Line Management ofMobile Phones 2004-2005, Senior Vice President, MobilePhones Business Unit of Nokia Mobile Phones 2002-2003,Vice President, TDMA/GSM 1900 Product Line of NokiaMobile Phones 1999-2002, Vice President, TDMA ProductLine 1997-1999, various technical and managerialpositions in Nokia Consumer Electronics and Nokia MobilePhones 1991-1997.
86

Changes in the Nokia Group Executive Board
On February 15, 2006, we announced that Pertti Korhonen, Chief Technology Officer and ExecutiveVice President, Technology Platforms, and a member of the Group Executive Board will resignfrom the Group Executive Board as of April 1, 2006. He will also resign from Nokia. NiklasSavander has been appointed as Executive Vice President, Technology Platforms and a member ofthe Group Executive Board as of April 1, 2006.
87
6.B Compensation
Remuneration Report
The following section reports the remuneration to the Board of Directors, describes ourremuneration policies for the Group Executive Board and other executive officers and our use ofequity incentives.
Board of Directors
For the year ended December 31, 2005, the aggregate compensation of the nine non-executivemembers of the Board of Directors was approximately EUR 1 097 500. Non-executive members ofthe Board of Directors do not receive stock options or other variable compensation. Theremuneration for members of our Board of Directors for each term expiring at the close of thenext Annual General Meeting is resolved annually by our Annual General Meeting, after beingproposed by the Corporate Governance and Nomination Committee of our Board.
The following table depicts the total annual remuneration paid to the members of our Board ofDirectors, as resolved by the Annual General Meetings in the respective years. Since the fiscal year1999, approximately 60% of each Board member’s annual fee has been paid in cash, with thebalance in Nokia Corporation shares acquired from the market.
Compensation of the Board of Directors 2003-2005
Chairman Vice Chairman Other Members
Gross Gross Grossannual Shares annual Shares annual Shares
Year fee received(1) fee received(1) fee received(1) Additional annual fees
EUR EUR EUR
2003 . . . . 150 000 4 032 125 000(2) 3 360 100 000 2 688 Chairman of the AuditCommittee and PersonnelCommittee, eachEUR 25 000
2004 . . . . 150 000 4 834 125 000(2) 4 028 100 000(3) 3 223 Chairman of the AuditCommittee and PersonnelCommittee, eachEUR 25 000
2005 . . . . 165 000 5 011 137 500(4) 4 175 110 000(5)(6) 3 340 Chairman of the AuditCommittee and PersonnelCommittee, eachEUR 25 000;Each other member of theAudit Committee,EUR 10 000
(1) As part of the gross annual fee for that year.
(2) The 2003 and 2004 fees of Paul Collins amounted to totals of EUR 150 000 per year, consistingof a fee of EUR 125 000 for services as Vice Chairman of the Board and EUR 25 000 forservices as Chairman of the Personnel Committee. As part of the total remuneration,Mr. Collins has received a total of 4 032 Nokia shares in 2003, and 4 834 Nokia shares in 2004.
88
(3) The 2004 fee of Per Karlsson amounted to a total of EUR 125 000, consisting of a fee ofEUR 100 000 for services as member of the Board and EUR 25 000 for services as Chairman ofthe Audit Committee. As part of the total remuneration, Mr. Karlsson has received a total of4 029 Nokia shares.
(4) The 2005 fee of Paul Collins amounts to a total of EUR 162 500, consisting of a fee ofEUR 137 500 for services as Vice Chairman of the Board and EUR 25 000 for services asChairman of the Personnel Committee. As part of the total remuneration, Mr. Collins hasreceived a total of 4 935 Nokia shares.
(5) The 2005 fee of Per Karlsson amounts to a total of EUR 135 000, consisting of a fee ofEUR 110 000 for services as member of the Board and EUR 25 000 for services as Chairman ofthe Audit Committee. As part of the total remuneration, Mr. Karlsson has received a total of4 100 Nokia shares.
(6) The 2005 fee of each of Georg Ehrnrooth, Vesa Vainio and Arne Wessberg amounts to a totalof EUR 120 000 consisting of a fee of EUR 110 000 for services as a member of the Board andEUR 10 000 for services as a member of the Audit Committee. As part of the totalremuneration, each of them has received a total of 3 644 Nokia shares.
Proposal of the Corporate Governance and Nomination Committee of the Board
On February 13, 2006, the Nokia Board Corporate Governance and Nomination Committeeannounced its proposal to the Annual General Meeting on March 30, 2006 that the annual feepayable to members of the Board of Directors to be elected at the Annual General Meeting for theterm expiring at the close of the Annual General Meeting in 2007 be as follows: EUR 375 000 forChairman, EUR 137 500 for Vice Chairman, and EUR 110 000 for each member. In addition, theCommittee will propose that Chairman of the Audit Committee and Chairman of the PersonnelCommittee will each receive an additional annual fee of EUR 25 000, and each member of theAudit Committee an additional annual fee of EUR 10 000. Further, the Corporate Governance andNomination Committee proposes that approximately 40% of the remuneration be paid in NokiaCorporation shares purchased from the market, in accordance with the practice since 1999.
As background to the proposal, the Nokia Board Corporate Governance and Nomination Committeenotes that the proposed remuneration is on the same level than the remuneration approved bythe Annual General Meeting in 2005, except for the remuneration payable to the Chairman of theBoard. The Committee proposes that Jorma Ollila continues after June 1, 2006 as a Non-ExecutiveChairman of the Nokia Board of Directors, and the Committee has received Mr. Ollila’s confirmationthat he is available for this position. As from June 1, 2006, Mr. Ollila will no longer be a Nokiaemployee and his service contract will terminate as of that date without any severance or otherpayments by Nokia. Thereafter, he will no longer be eligible for incentives, bonuses, stock optionsor other equity grants from Nokia. He will be entitled to retain all vested and unvested stockoptions and other equity compensation granted to him prior to June 1, 2006. Further, following hiscurrent contract, he will not be eligible to receive any additional retirement benefits from Nokiaafter June 1, 2006. In addition to the proposed annual remuneration as the Chairman of the Boardof Directors he will be entitled to secretarial and office services as well as reimbursement ofreasonable expenses directly related to his duties as the Non-Executive Chairman of Nokia Board ofDirectors.
Executive Remuneration
Please refer to the role of the Personnel Committee under ‘‘Item 6.C Board Practices.’’
89
Executive Compensation Philosophy
Nokia operates in the extremely competitive, complex and rapidly evolving high technologyindustry. We are a leading company in the industry and conduct a global business. The keyobjectives of the executive compensation programs are to attract, retain, and motivate talentedexecutive officers that drive Nokia’s success and industry leadership.
The Personnel Committee benchmarks Nokia’s compensation practices against those of otherrelevant companies in the same or similar industries. The relevant companies include both hightechnology and telecommunications firms that are headquartered in Europe and the United States.The compensation levels of the executive officers in these relevant companies are consideredwhen the Committee makes decisions regarding the compensation of our executive officers. TheCommittee also has access to, and uses outside independent consultants.
The executive compensation programs are designed to:
• provide a total compensation package that is competitive with the relevant market,
• provide competitive base pay rates,
• deliver significant variable cash compensation for the achievement of stretch goals and
• align the interests of the executives with those of the shareholders through long-termincentives in the form of equity-based awards.
Components of executive compensation
The compensation program for executive officers includes the following components:
Annual cash compensation
• Base salaries targeted at globally competitive market levels.
• Short-term cash incentives tied directly to performance and representing a significant portionof executive officers’ total annual cash compensation. The short-term cash incentiveopportunity is expressed as a percentage of the executive officer’s annual base salary. Theseaward opportunities, measurement criteria and performance periods are presented in thetable below. These incentive payments are primarily determined based on a formula thatcompares the company’s actual performance to pre-established targets for net sales,operating profit and net working capital measures. Certain executives may also haveobjectives related to market share, quality, technology innovation, new product revenue, orother objectives of key strategic importance which require a discretionary assessment ofperformance by the Personnel Committee.
In certain exceptional situations the actual short-term cash incentive awarded to theexecutive could be zero. The maximum payout is only possible with maximum performanceon all measures. A portion of the short-term cash incentives is paid twice each year based onthe performance for each of Nokia’s short-term plans that end on June 30 and December 31of each year. Another portion is paid annually at the end of the year, based on thePersonnel Committee’s assessment of the company’s total shareholder return compared tokey comparators in the high technology and telecommunications industries over a one,
90
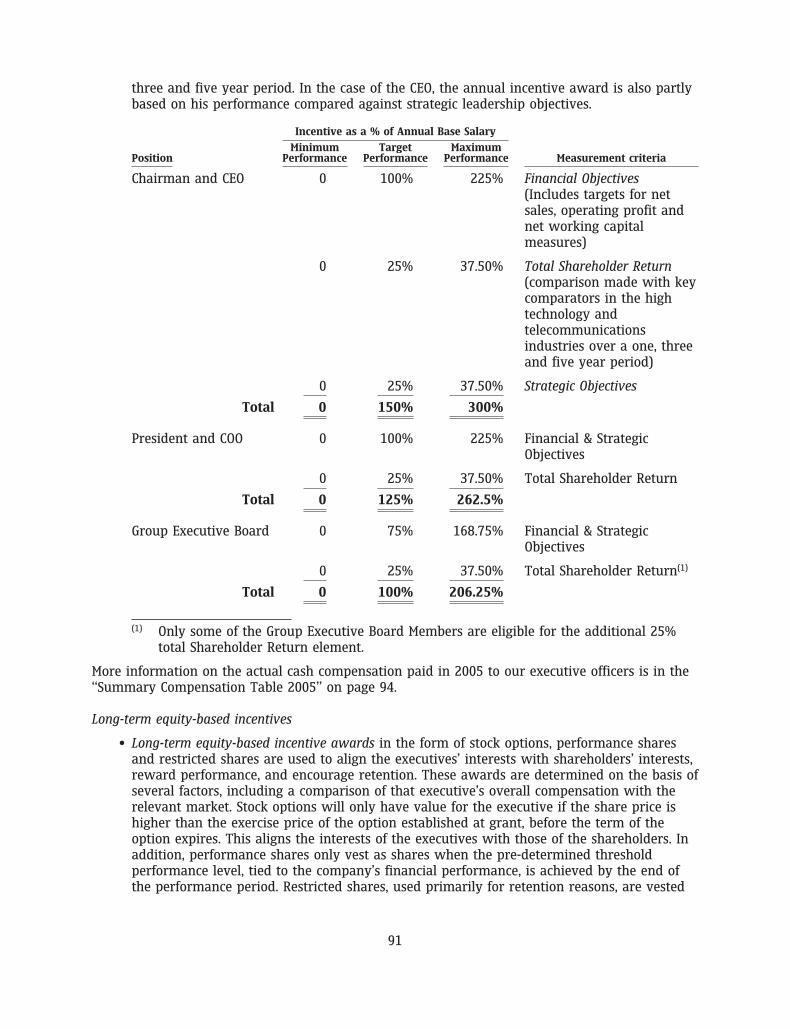
three and five year period. In the case of the CEO, the annual incentive award is also partlybased on his performance compared against strategic leadership objectives.
Incentive as a % of Annual Base Salary
Minimum Target MaximumPosition Performance Performance Performance Measurement criteria
Chairman and CEO 0 100% 225% Financial Objectives(Includes targets for netsales, operating profit andnet working capitalmeasures)
0 25% 37.50% Total Shareholder Return(comparison made with keycomparators in the hightechnology andtelecommunicationsindustries over a one, threeand five year period)
0 25% 37.50% Strategic Objectives
Total 0 150% 300%
President and COO 0 100% 225% Financial & StrategicObjectives
0 25% 37.50% Total Shareholder Return
Total 0 125% 262.5%
Group Executive Board 0 75% 168.75% Financial & StrategicObjectives
0 25% 37.50% Total Shareholder Return(1)
Total 0 100% 206.25%
(1) Only some of the Group Executive Board Members are eligible for the additional 25%total Shareholder Return element.
More information on the actual cash compensation paid in 2005 to our executive officers is in the‘‘Summary Compensation Table 2005’’ on page 94.
Long-term equity-based incentives
• Long-term equity-based incentive awards in the form of stock options, performance sharesand restricted shares are used to align the executives’ interests with shareholders’ interests,reward performance, and encourage retention. These awards are determined on the basis ofseveral factors, including a comparison of that executive’s overall compensation with therelevant market. Stock options will only have value for the executive if the share price ishigher than the exercise price of the option established at grant, before the term of theoption expires. This aligns the interests of the executives with those of the shareholders. Inaddition, performance shares only vest as shares when the pre-determined thresholdperformance level, tied to the company’s financial performance, is achieved by the end ofthe performance period. Restricted shares, used primarily for retention reasons, are vested
91
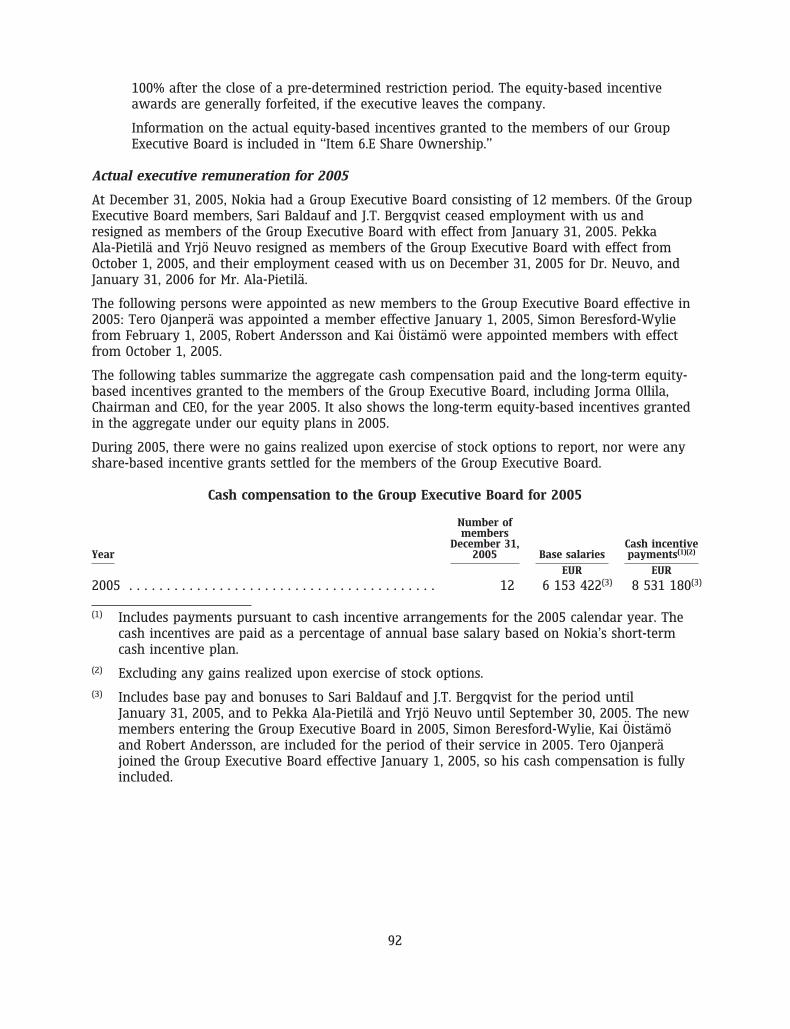
100% after the close of a pre-determined restriction period. The equity-based incentiveawards are generally forfeited, if the executive leaves the company.
Information on the actual equity-based incentives granted to the members of our GroupExecutive Board is included in ‘‘Item 6.E Share Ownership.’’
Actual executive remuneration for 2005
At December 31, 2005, Nokia had a Group Executive Board consisting of 12 members. Of the GroupExecutive Board members, Sari Baldauf and J.T. Bergqvist ceased employment with us andresigned as members of the Group Executive Board with effect from January 31, 2005. PekkaAla-Pietila and Yrjo Neuvo resigned as members of the Group Executive Board with effect fromOctober 1, 2005, and their employment ceased with us on December 31, 2005 for Dr. Neuvo, andJanuary 31, 2006 for Mr. Ala-Pietila.
The following persons were appointed as new members to the Group Executive Board effective in2005: Tero Ojanpera was appointed a member effective January 1, 2005, Simon Beresford-Wyliefrom February 1, 2005, Robert Andersson and Kai Oistamo were appointed members with effectfrom October 1, 2005.
The following tables summarize the aggregate cash compensation paid and the long-term equity-based incentives granted to the members of the Group Executive Board, including Jorma Ollila,Chairman and CEO, for the year 2005. It also shows the long-term equity-based incentives grantedin the aggregate under our equity plans in 2005.
During 2005, there were no gains realized upon exercise of stock options to report, nor were anyshare-based incentive grants settled for the members of the Group Executive Board.
Cash compensation to the Group Executive Board for 2005
Number ofmembers
December 31, Cash incentiveYear 2005 Base salaries payments(1)(2)
EUR EUR
2005 . . . . . . . . . . . . . . . . . . . . . . . . . . . . . . . . . . . . . . . . . 12 6 153 422(3) 8 531 180(3)
(1) Includes payments pursuant to cash incentive arrangements for the 2005 calendar year. Thecash incentives are paid as a percentage of annual base salary based on Nokia’s short-termcash incentive plan.
(2) Excluding any gains realized upon exercise of stock options.
(3) Includes base pay and bonuses to Sari Baldauf and J.T. Bergqvist for the period untilJanuary 31, 2005, and to Pekka Ala-Pietila and Yrjo Neuvo until September 30, 2005. The newmembers entering the Group Executive Board in 2005, Simon Beresford-Wylie, Kai Oistamoand Robert Andersson, are included for the period of their service in 2005. Tero Ojanperajoined the Group Executive Board effective January 1, 2005, so his cash compensation is fullyincluded.
92
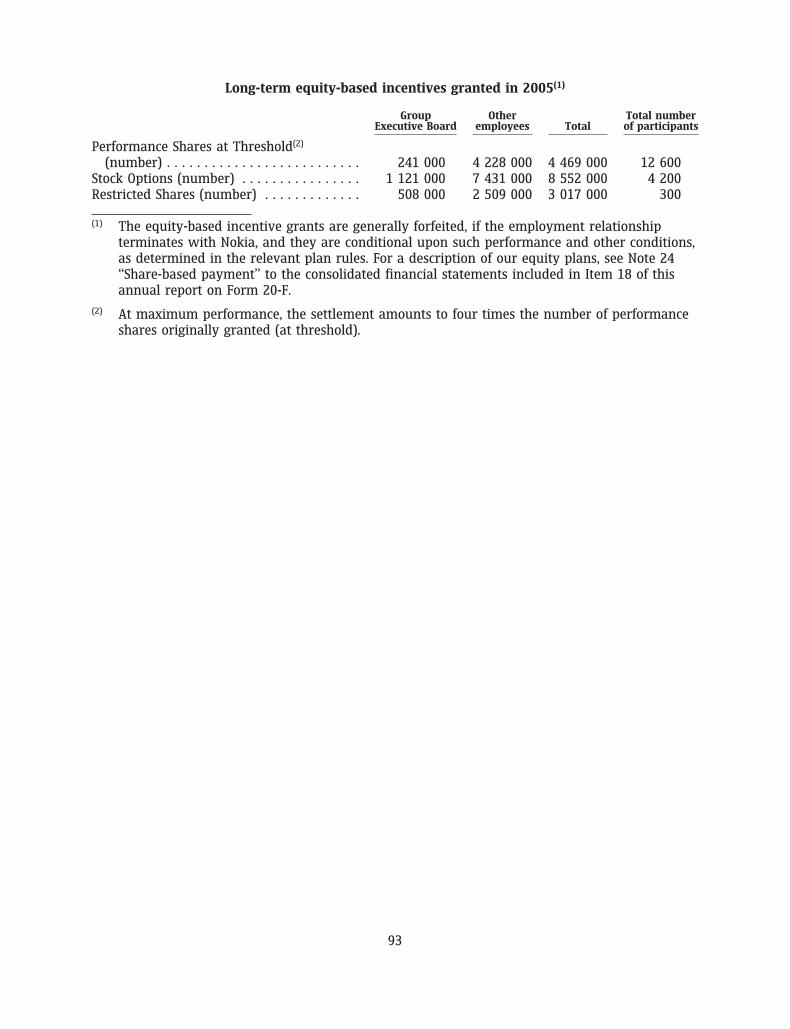
Long-term equity-based incentives granted in 2005(1)
Group Other Total numberExecutive Board employees Total of participants
Performance Shares at Threshold(2)
(number) . . . . . . . . . . . . . . . . . . . . . . . . . . 241 000 4 228 000 4 469 000 12 600Stock Options (number) . . . . . . . . . . . . . . . . 1 121 000 7 431 000 8 552 000 4 200Restricted Shares (number) . . . . . . . . . . . . . 508 000 2 509 000 3 017 000 300
(1) The equity-based incentive grants are generally forfeited, if the employment relationshipterminates with Nokia, and they are conditional upon such performance and other conditions,as determined in the relevant plan rules. For a description of our equity plans, see Note 24‘‘Share-based payment’’ to the consolidated financial statements included in Item 18 of thisannual report on Form 20-F.
(2) At maximum performance, the settlement amounts to four times the number of performanceshares originally granted (at threshold).
93
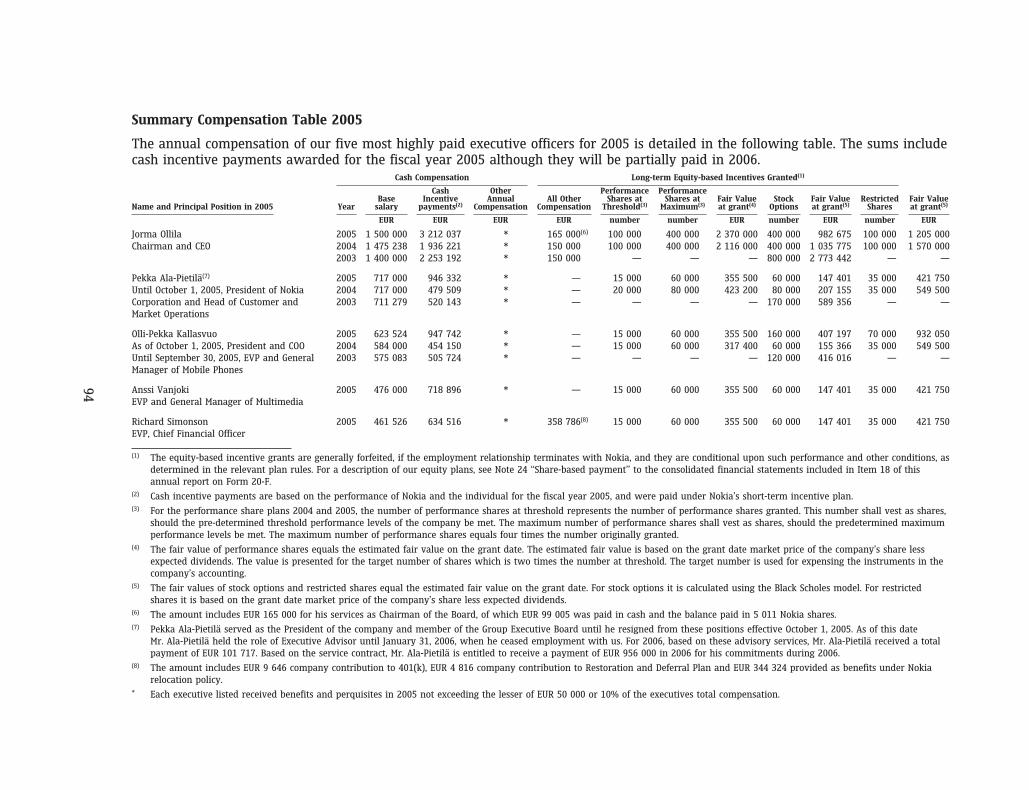
94
Summary Compensation Table 2005
The annual compensation of our five most highly paid executive officers for 2005 is detailed in the following table. The sums includecash incentive payments awarded for the fiscal year 2005 although they will be partially paid in 2006.
Cash Compensation Long-term Equity-based Incentives Granted(1)
Cash Other Performance PerformanceBase Incentive Annual All Other Shares at Shares at Fair Value Stock Fair Value Restricted Fair Value
Name and Principal Position in 2005 Year salary payments(2) Compensation Compensation Threshold(3) Maximum(3) at grant(4) Options at grant(5) Shares at grant(5)
EUR EUR EUR EUR number number EUR number EUR number EUR
Jorma Ollila 2005 1 500 000 3 212 037 * 165 000(6) 100 000 400 000 2 370 000 400 000 982 675 100 000 1 205 000Chairman and CEO 2004 1 475 238 1 936 221 * 150 000 100 000 400 000 2 116 000 400 000 1 035 775 100 000 1 570 000
2003 1 400 000 2 253 192 * 150 000 — — — 800 000 2 773 442 — —
Pekka Ala-Pietila(7) 2005 717 000 946 332 * — 15 000 60 000 355 500 60 000 147 401 35 000 421 750Until October 1, 2005, President of Nokia 2004 717 000 479 509 * — 20 000 80 000 423 200 80 000 207 155 35 000 549 500Corporation and Head of Customer and 2003 711 279 520 143 * — — — — 170 000 589 356 — —Market Operations
Olli-Pekka Kallasvuo 2005 623 524 947 742 * — 15 000 60 000 355 500 160 000 407 197 70 000 932 050As of October 1, 2005, President and COO 2004 584 000 454 150 * — 15 000 60 000 317 400 60 000 155 366 35 000 549 500Until September 30, 2005, EVP and General 2003 575 083 505 724 * — — — — 120 000 416 016 — —Manager of Mobile Phones
Anssi Vanjoki 2005 476 000 718 896 * — 15 000 60 000 355 500 60 000 147 401 35 000 421 750EVP and General Manager of Multimedia
Richard Simonson 2005 461 526 634 516 * 358 786(8) 15 000 60 000 355 500 60 000 147 401 35 000 421 750EVP, Chief Financial Officer
(1) The equity-based incentive grants are generally forfeited, if the employment relationship terminates with Nokia, and they are conditional upon such performance and other conditions, asdetermined in the relevant plan rules. For a description of our equity plans, see Note 24 ‘‘Share-based payment’’ to the consolidated financial statements included in Item 18 of thisannual report on Form 20-F.
(2) Cash incentive payments are based on the performance of Nokia and the individual for the fiscal year 2005, and were paid under Nokia’s short-term incentive plan.(3) For the performance share plans 2004 and 2005, the number of performance shares at threshold represents the number of performance shares granted. This number shall vest as shares,
should the pre-determined threshold performance levels of the company be met. The maximum number of performance shares shall vest as shares, should the predetermined maximumperformance levels be met. The maximum number of performance shares equals four times the number originally granted.
(4) The fair value of performance shares equals the estimated fair value on the grant date. The estimated fair value is based on the grant date market price of the company’s share lessexpected dividends. The value is presented for the target number of shares which is two times the number at threshold. The target number is used for expensing the instruments in thecompany’s accounting.
(5) The fair values of stock options and restricted shares equal the estimated fair value on the grant date. For stock options it is calculated using the Black Scholes model. For restrictedshares it is based on the grant date market price of the company’s share less expected dividends.
(6) The amount includes EUR 165 000 for his services as Chairman of the Board, of which EUR 99 005 was paid in cash and the balance paid in 5 011 Nokia shares.(7) Pekka Ala-Pietila served as the President of the company and member of the Group Executive Board until he resigned from these positions effective October 1, 2005. As of this date
Mr. Ala-Pietila held the role of Executive Advisor until January 31, 2006, when he ceased employment with us. For 2006, based on these advisory services, Mr. Ala-Pietila received a totalpayment of EUR 101 717. Based on the service contract, Mr. Ala-Pietila is entitled to receive a payment of EUR 956 000 in 2006 for his commitments during 2006.
(8) The amount includes EUR 9 646 company contribution to 401(k), EUR 4 816 company contribution to Restoration and Deferral Plan and EUR 344 324 provided as benefits under Nokiarelocation policy.
* Each executive listed received benefits and perquisites in 2005 not exceeding the lesser of EUR 50 000 or 10% of the executives total compensation.
Pension arrangements for the members of the Group Executive Board
The members the Group Executive Board in 2005 participate in the local retirement programsapplicable to employees in the country where they reside. Executives in Finland participate in theFinnish TEL pension system, which provides for a retirement benefit based on years of service andearnings according to the prescribed statutory system. Under the Finnish TEL pension system, basepay, incentives and other taxable fringe benefits are included in the definition of earnings,although gains realized from equity are not. The Finnish TEL pension scheme provides for earlyretirement benefits at age 62. Standard retirement benefits are available from ages 63 through 68,according to an increasing scale.
Executives in the United States participate in Nokia’s Retirement Savings and Investment Plan.Under this 401(k) plan, participants elect to make voluntary pre-tax contributions that are 100%matched by the company up to 6% of eligible earnings. The company makes an additional annualdiscretionary contribution of up to 2% of eligible earnings. In addition for participants earning inexcess of the eligible earning limit, the company offers an additional Restoration and Deferral Plan.This plan allows employees to defer up to 50% of their salary and 100% of their bonus into anon-qualified plan. The company also makes an annual discretionary contribution to thisnon-qualified plan of up to 2% of the earnings above 401(k) eligibility limits.
Simon Beresford-Wylie participates in the Nokia International Employee Benefit Plan (NIEBP). TheNIEBP is a defined contribution retirement arrangement provided to some Nokia employees oninternational assignments. The contributions to NIEBP are funded two-thirds by Nokia andone-third by the employee. Because Mr. Beresford-Wylie also participates in the Finnish TELsystem, the company contribution to NIEBP is 1.3% of annual earnings.
Jorma Ollila and Olli-Pekka Kallasvuo can as part of their service contract retire at the age of 60with full retirement benefit, should they be employed by Nokia at the time. The full retirementbenefit is calculated as if the executive had continued his service with Nokia through the statutoryretirement age of 65. Mr. Ollila’s service contract will terminate as of June 1, 2006. Following thecurrent contract, he will not be eligible to receive any additional retirement benefits from Nokiaafter that date. Pekka Ala-Pietila had an equal retirement arrangement during his employment atNokia and he will not receive any additional retirement benefits from Nokia after termination ofemployment.
Hallstein Moerk, following his arrangement with a previous employer, has a retirement benefit of65% of his pensionable salary beginning at the age of 62. Early retirement is possible at the age of55 with reductions in benefits.
Service Contract of the Chairman and CEO, of the President and COO, and of the formerPresident
We have a service contract with each of Jorma Ollila and Olli-Pekka Kallasvuo.
Jorma Ollila’s contract covers his current position as Chairman and CEO, and Chairman of theGroup Executive Board. Mr. Ollila’s employment will come to an end on June 1, 2006 based on hisrequest as a result of which the Board of Directors has released him from his duties as CEO andChairman of the Group Executive Board from that date. As of June 1, 2006, his service contract willterminate without any severance or other payments by Nokia. Thereafter, he will no longer beeligible for incentives, bonuses, stock options or other equity grants from Nokia. He will be entitledto retain all vested and unvested stock options and other equity compensation granted to himprior to June 1, 2006. Further, following his current contract, he will not be eligible to receive anyadditional retirement benefits from Nokia after June 1, 2006.
95
Olli-Pekka Kallasvuo’s contract covers his current position as President and COO, and his futureposition as President and CEO, and Chairman of the Group Executive Board, as from June 1, 2006.Mr. Kallasvuo’s annual total gross base salary, which is subject to an annual review by the Boardof Directors, is EUR 750 000 starting from October 1, 2005, and will be EUR 1 000 000 from June 1,2006. His incentive targets under the Nokia short-term incentive plan are 125% starting fromOctober 1, 2005 and will be 150% from June 1, 2006. In case of termination by Nokia for reasonsother than cause, including a change of control, Mr. Kallasvuo is entitled to a severance paymentof up to 18 months of compensation (both annual total gross base salary and target incentive). Incase of termination by Mr. Kallasvuo, the notice period is 6 months and he is entitled to apayment for such notice period (both annual total gross base salary and target incentive for6 months). Mr. Kallasvuo is subject to a 12-month non-competition obligation after termination ofthe contract. Unless the contract is terminated for cause, Mr. Kallasvuo may be entitled tocompensation during the non-competition period or a part of it. Such compensation amounts tothe annual total gross base salary and target incentive for the respective period during which noseverance payment is paid. Mr. Kallasvuo is entitled to a full statutory pension from the date heturns 60 years of age, instead of the statutory age of 65.
During 2005, we also had a service contract with Pekka Ala-Pietila, who acted as President untilOctober 1, 2005. Thereafter he acted as Executive Advisor until termination of employment onJanuary 31, 2006. Mr. Ala-Pietila’s contract had provisions for severance payments for up to18 months of compensation (both base compensation and bonus) in the event of termination ofemployment for reasons other than cause. For compensation paid to Mr. Ala-Pietila pursuant to hisservice contract, which has been terminated, see ‘‘—Summary Compensation Table 2005’’ onpage 94.
Equity-based compensation programs
General
Nokia has today three global stock option plans outstanding, two performance share plans andthree restricted share plans. After using broad-based employee stock option plans since 1997, weintroduced in 2004 performance shares as the main element to our broad-based equitycompensation program, to further emphasize the performance element in employees’ long-termincentives. As part of this change, the number of stock options granted has been significantlyreduced since then. From 2003 we have also granted restricted shares to very few selectedemployees each year.
The broad-based equity compensation program in 2005, approved by the Board of Directors,followed the same structure adopted in 2004. The target group for the 2005 equity-based incentiveprogram continued to be broad with a wide number of employees in many levels of theorganization eligible to participate. The rationale for using a combination of both performanceshares and stock options for employees in higher job grades is to build an optimal and balancedcombination of equity-based incentives. The program aligns the potential value received byparticipants directly with the performance of the company.
The equity-based incentive grants are conditional upon continued employment with Nokia, as wellas the fulfillment of the performance related and other conditions, as determined in the relevantplan rules.
The aggregate number of participants in all of our equity-based programs in 2005 wasapproximately 34 000, which is similar to the number in 2004.
96
For a more detailed description of all of our equity-based incentive plans, see Note 24 ‘‘Share-based payment’’ to the consolidated financial statements included in Item 18 of this annual reporton Form 20-F.
Performance Shares
We have granted performance shares under the 2004 and 2005 plans, which have been approvedby the Board of Directors. The performance shares represent a commitment by the company todeliver Nokia shares to employees at a future point in time, subject to the company’s fulfillment ofpre-defined performance criteria. No performance shares will vest unless the companyperformance reaches at least one of the threshold levels measured by two independent,pre-defined performance criteria: the company’s average annual net sales growth and earningsper share (‘‘EPS’’) growth (basic) for the four year performance period of the plan. For the 2004plan the performance period consists of the fiscal years 2004 through 2007, with an interimpayout possible after 2005, and for the 2005 plan the years 2005 through 2008, with an interimpayout possible after 2006.
For both the 2004 and 2005 plans, if the required performance level is achieved, the first payoutwill take place after a two-year interim measurement period. The second and final payout, if any,will be after the close of the four-year performance period.
Stock Options
Nokia’s outstanding global stock option plans have been approved by the Annual General Meetingsin the year when the plan was launched, i.e. in 2001, 2003 and 2005.
Each stock option entitles the holder to subscribe for one new Nokia share with a par value ofEUR 0.06. Under the 2001 stock option plan the stock options are transferable by the participants.Under the 2003 and 2005 plans the stock options are non-transferable. All of the stock optionshave a quarterly staggered vesting schedule, which has been Nokia’s policy since 2001. Thesubcategories of stock options under the plans have a life of approximately five years.
The exercise prices are determined at the time of the grant, on a quarterly basis equaling thetrade volume weighted average price of the Nokia share on the Helsinki Stock Exchange duringthe trading days of the first whole week of the second month (i.e. February, May, August orNovember) of the respective calendar quarter.
Restricted Shares
Since 2003 we have granted restricted shares to recruit, retain, reward and motivate selected highpotential employees, who are critical to the future success of Nokia. It is the Personnel Committee’sphilosophy that restricted shares will be used only for key management positions and othercritical resources. The 2003, 2004 and 2005 restricted share plans have been approved by theBoard of Directors.
All of our restricted share plans have a restriction period of three years after grant. As the sharesvest, they will be transferred and delivered to the recipients. Until the shares are transferred anddelivered, the recipients will not have any shareholder rights, such as voting or dividend rightsassociated with these restricted shares.
Other Equity Plans for Employees
In addition to our global stock option plans described above, we have minor stock option plans forNokia employees in the U.S. and Canada which do not result in an increase of the share capital ofNokia Corporation under which option holders receive Nokia ADSs. Also we have an Employee
97
Share Purchase Plan in the United States, which permits all full-time Nokia employees located inthe United States to acquire Nokia ADSs at a 15% discount. The ADSs to be purchased are fundedthrough monthly payroll deductions from the salary of the participants, and the ADSs arepurchased on a monthly basis. As of December 31, 2005, a total of 1 866 518 ADSs had beenpurchased under the plan since its inception, and there were a total of approximately 1 000participants. For more information of these plans, see Note 24 ‘‘Share-based payment’’ to theconsolidated financial statements included in Item 18 of this annual report on Form 20-F.
Equity-based compensation program 2006
Nokia’s Equity Program 2006
The Board of Directors announced its proposed scope and design for the 2006 Equity Program onJanuary 26, 2006. The main equity instrument in 2006 will be performance shares. In addition,stock options will be granted to a more limited population, and restricted shares will be used fora small number of high potential and critical employees.
The Performance Share Plan in 2006 will cover a performance period of three years (2006-2008)with no interim measurement period as compared with the 2004 and 2005 plans with four-yearperformance periods and two-year interim measurement periods. No performance shares will vestunless the company performance reaches at least one of the threshold levels measured by twoindependent, pre-defined performance criteria: the company’s average annual net sales growthand earnings per share (‘‘EPS’’) (basic) growth for 2006 to 2008.
The performance criteria of the Performance Share Plan 2006 are:
(1) Average Annual Net Sales Growth: 5% (threshold) and 20% (maximum), and
(2) Annual EPS Growth: EUR 0.96 (threshold) and EUR 1.41 in 2008 (maximum).
EPS growth is calculated based on the compounded annual growth rate over the performanceperiod (2006-2008) compared to 2005 EPS of 0.83. Average Annual Net Sales Growth is calculatedas an average of the net sales growth rates for the years 2005 through 2008. Both the EPS andAverage Annual Net Sales Growth criteria are equally weighted and performance under each ofthe two performance criteria are calculated independent of each other.
Achievement of the maximum performance for both criteria will result in the vesting of themaximum of 32.6 million Nokia shares. Performance exceeding the maximum criteria does notincrease the number of performance shares that will vest. Achievement of the thresholdperformance for both criteria will result in the vesting of 8.15 million shares. If only one of thethreshold levels of performance are achieved, only 4.08 million of the performance shares willvest. If none of the threshold levels are achieved, then none of the performance shares will vest.For performance between the threshold and maximum performance levels the settlement followsa linear scale. If the required performance levels are achieved, the settlement will take place in2009. Until the shares are transferred and delivered, the recipients will not have any shareholderrights, such as voting or dividend rights associated with these performance shares.
The stock options to be granted in 2006 will be primarily out of the Stock Option Plan 2005,approved by the Annual General Meeting, on April 7, 2005. Each stock option would entitle theoption holder to subscribe for one newly issued Nokia share. The share subscription priceapplicable upon exercise of the stock options will be determined on a quarterly or, subject to theBoard’s decision, a monthly basis. The intention is to determine the exercise prices at fair marketvalue. The share subscription price for each subcategory of stock options to be issued will equalthe trade volume weighted average price of Nokia shares on the Helsinki Stock Exchange for thefirst whole week of the second month of the calendar quarter (i.e. February, May, August or
98
November) or, for the monthly priced stock options, the first whole week of such calendar monthwhen the subcategory of the stock option has been denominated. The stock options will have aquarterly staggered vesting schedule. The subcategories of stock options to be issued under theplan will have a life of approximately five years, with the last of the subcategories expiring as ofDecember 31, 2011.
The restricted shares to be granted under the Restricted Share Plan 2006 will have a three-yearrestriction period. The restricted shares will be delivered in 2009, subject to fulfilling therestriction criteria. Shares are not eligible for any shareholder rights or voting rights during therestriction period, until transferred to plan participants.
The maximum number of planned grants under the 2006 Equity Program (i.e. performance shares,stock options and restricted shares) are depicted in the table below. The planned amounts for2006 are in line with the total amounts approved and disclosed in 2005.
Number of planned grants in 2006(number, millions)
RecruitmentAnnual grants and special
Plan type 2006 retention needs Total
Stock Options . . . . . . . . . . . . . . . . . . . . . . . . . . . . . . . . . . . . . 8.90 7.90 16.80Restricted Shares . . . . . . . . . . . . . . . . . . . . . . . . . . . . . . . . . . 2.30 7.20 9.50Performance Shares at Threshold(1) . . . . . . . . . . . . . . . . . . . . 4.50 3.65 8.15
(1) The maximum number of shares to be delivered at maximum performance is four times thenumber originally granted (at threshold).
As of December 31, 2005, the total dilution effect of Nokia’s stock options, performance shares andrestricted shares currently outstanding, assuming full dilution, is approximately 4.2% in theaggregate. The potential maximum effect of the proposed new program, including the impact ofthe equity grants in connection with the acquisition of Intellisync Inc., would be approximatelyanother 1.4%.
Cash Incentive Plans
In addition to equity-based compensation programs we also provide our executives and employeeswith cash incentive payments through our comprehensive cash incentive plans. Theseperformance-based cash incentives include individual, team and project/program incentivepayments as well as the Nokia Connecting People bonus.
6.C Board Practices
The Board of Directors
The operations of the company are managed under the direction of the Board of Directors, withinthe framework set by the Finnish Companies Act and our articles of association and thecomplementary Corporate Governance Guidelines and related charters as adopted by the Board.
The Board represents and is accountable to the shareholders of the company. The Board’sresponsibilities are active and not passive and include the responsibility to regularly evaluate thestrategic direction of the company, management policies and the effectiveness with whichmanagement implements its policies. The Board’s responsibilities further include overseeing thestructure and composition of the company’s top management and monitoring legal complianceand the management of risks related to the company’s operations. In doing so the Board may set
99
out annual ranges and/or individual limits for capital expenditures, investments and divestituresand financial commitments not to be exceeded without Board approval.
The Board has the responsibility for appointing and discharging the Chief Executive Officer and thePresident and the other members of the Group Executive Board. Subject to the requirements ofFinnish law, the independent directors of the Board will confirm the compensation and theemployment conditions of the Chief Executive Officer and the President upon the recommendationof the Personnel Committee. The compensation and employment conditions of the other membersof the Group Executive Board are approved by the Personnel Committee.
The basic responsibility of the members of the Board is to act in good faith and with due care soas to exercise their business judgment on an informed basis in what they reasonably and honestlybelieve to be the best interests of the company and its shareholders. In discharging that obligation,the directors must inform themselves of all relevant information reasonably available to them.
Pursuant to the articles of association, Nokia Corporation has a Board of Directors composed of aminimum of seven and a maximum of ten members. The members of the Board are elected for aterm of one year at each Annual General Meeting, which convenes each March, April or May. Sincethe Annual General Meeting held on April 7, 2005, the Board has consisted of ten members. Nokia’sCEO, Jorma Ollila, also serves as the Chairman of the Board. The other members of the Board areall non-executive and independent as defined under Finnish rules and regulations. InJanuary 2006, the Board determined that eight members of the Board are independent, as definedin the New York Stock Exchange’s corporate governance listing standards, as amended inNovember 2004. In addition to the Chairman, Bengt Holmstrom was determined to benon-independent due to a family relationship with an executive officer of a Nokia supplier ofwhose consolidated gross revenues Nokia accounts for an amount that exceeds the limit providedin the NYSE listing standards, but that is less than 10%. The Board convened thirteen times during2005, five of the meetings were held by using technical equipment and the average ratio ofattendance at the meetings was 98%. The non-executive directors meet without executivedirectors twice a year, or more often as they deem appropriate. Such sessions are presided over bythe Vice Chairman of the Board or, in his absence, the most senior non-executive member of theBoard. In addition, the independent directors meet separately at least once annually. The Boardand each committee also has the power to hire independent legal, financial or other advisors as itdeems necessary.
The Board elects a Chairman and a Vice Chairman from among its members for one term at atime. On April 7, 2005 the Board resolved that Jorma Ollila should continue to act as Chairman andthat Paul J. Collins should continue to act as Vice Chairman. The Board also appoints the membersand the chairmen for its committees from among its non-executive, independent members for oneterm at a time.
Under Finnish law, if the roles of the Chairman and the Chief Executive Officer are combined, thecompany must have a President. The responsibilities of the President are defined in the FinnishCompanies Act and other relevant legislation along with any additional guidance and instructionsgiven from time to time by the Board and the Chief Executive Officer. The responsibilities of theChief Executive Officer are determined by the Board.
The Board conducts annual performance self-evaluations, which also include evaluations of thecommittees’ work, the results of which are discussed by the Board. The Corporate GovernanceGuidelines concerning the directors’ responsibilities, the composition and selection of the Board,Board committees and certain other matters relating to corporate governance are available on ourwebsite, www.nokia.com.
100
We also have a company Code of Conduct which is equally applicable to all of our employees,directors and management and is accessible at our website, www.nokia.com. As well, we have aCode of Ethics for the Principal Executive Officers and the Senior Financial Officers. For moreinformation about our Code of Ethics, see ‘‘Item 16.B. Code of Ethics.’’
With the exception of the service contract we have with Mr. Jorma Ollila, Chairman and CEO, noother Board member has a service contract with us. For a discussion of service contracts withcertain Nokia executives, see ‘‘Item 6.B Compensation—Service Contract of the Chairman and CEO,of the President and COO, and of the former President’’
Committees of the Board of Directors
The Audit Committee consists of a minimum of three members of the Board, who meet allapplicable independence, financial literacy and other requirements of Finnish law and the rules ofthe stock exchanges where Nokia shares are listed, including the Helsinki Stock Exchange and theNew York Stock Exchange. Since April 7, 2005, the Committee has consisted of the following fourmembers of the Board: Per Karlsson (Chairman), Georg Ehrnrooth, Vesa Vainio and Arne Wessberg.
The Audit Committee is established by the Board primarily for the purpose of overseeing theaccounting and financial reporting processes of the company and audits of the financialstatements of the company. The Committee is responsible for assisting the Board’s oversight of(1) the quality and integrity of the company’s financial statements and related disclosure, (2) theexternal auditor’s qualifications and independence, (3) the performance of the external auditorsubject to the requirements of Finnish law, (4) the performance of the company’s internal controlsand risk management and assurance function, and (5) the company’s compliance with legal andregulatory requirements. The Committee also maintains procedures for the receipt, retention andtreatment of complaints received by the company regarding accounting, internal controls, orauditing matters and for the confidential, anonymous submission by employees of the company ofconcerns regarding accounting or auditing matters. Under Finnish law, our external auditor iselected by our shareholders at the Annual General Meeting. The Committee makes arecommendation to the shareholders in respect of the appointment of the external auditor basedupon its evaluation of the qualifications and independence of the auditor to be proposed forelection or re-election. The Committee meets at least four times per year based upon a scheduleestablished at the first meeting following the appointment of the Committee. The Committee meetsseparately with the representatives of Nokia’s management and the external auditor at least twicea year. The Audit Committee convened five times in 2005.
The Personnel Committee consists of a minimum of three members of the Board, who meet allapplicable independence requirements of Finnish law and the rules of the stock exchanges whereNokia shares are listed, including the Helsinki Stock Exchange and the New York Stock Exchange.Since April 7, 2005, the Personnel Committee has consisted of the following four members of theBoard: Paul J. Collins (Chairman), Daniel R. Hesse, Marjorie Scardino and Vesa Vainio.
The primary purpose of the Personnel Committee is to oversee the personnel policies and practicesof the company. It assists the Board in discharging its responsibilities relating to all compensation,including equity compensation, of the company’s executives and the terms of employment of thesame. The Committee has overall responsibility for evaluating, resolving and makingrecommendations to the Board regarding (1) compensation of the company’s top executives andtheir employment conditions, (2) all equity-based plans, (3) incentive compensation plans, policiesand programs of the company affecting executives, and (4) other significant incentive plans. TheCommittee is responsible for ensuring the above compensation programs are performance-based,properly motivate management, support overall corporate strategies and are aligned with
101
shareholders’ interests. The Committee is responsible for the review of senior managementdevelopment and succession plans. The Personnel Committee convened three times in 2005.
The Corporate Governance and Nomination Committee consists of three to five members of theBoard, who meet all applicable independence requirements of Finnish law and the rules of thestock exchanges where Nokia shares are listed, including the Helsinki Stock Exchange and the NewYork Stock Exchange. Since April 7, 2005, the Corporate Governance and Nomination Committeehas consisted of the following three members of the Board: Marjorie Scardino (Chairman), Paul J.Collins and Vesa Vainio.
The Corporate Governance and Nomination Committee’s purpose is (1) to prepare the proposals forthe general meetings in respect of the composition of the Board along with the directorremuneration to be approved by the shareholders, and (2) to monitor issues and practices relatedto corporate governance and to propose necessary actions in respect thereof.
The Committee fulfills its responsibilities by (i) actively identifying individuals qualified to becomemembers of the Board, (ii) recommending to the shareholders the director nominees for election atthe Annual General Meetings, (iii) monitoring significant developments in the law and practice ofcorporate governance and of the duties and responsibilities of directors of public companies,(iv) assisting the Board and each committee of the Board in its annual performanceself-evaluations, including establishing criteria to be used in connection with such evaluations, and(v) developing and recommending to the Board and administering the Corporate GovernanceGuidelines of the company. The Corporate Governance and Nomination Committee convened threetimes in 2005.
The charters of each of the committees are available on our website, www.nokia.com.
Home Country Practices
Under the New York Stock Exchange’s corporate governance listing standards, listed foreign privateissuers, like Nokia, must disclose any significant ways in which their corporate governancepractices differ from those followed by U.S. domestic companies under the NYSE listing standards.There are no significant differences in the corporate governance practices followed by Nokia ascompared to those followed by U.S. domestic companies under the NYSE listing standards, exceptthat (i) Nokia follows the requirements of Finnish law with respect to the approval of equitycompensation plans, and (ii) Finnish laws and regulations do not mandatorily require companiesto have an internal audit function which in Nokia is covered by comprehensive risk managementand internal control processes. Under Finnish law, stock option plans require shareholder approvalat the time of their launch. All other plans that include the delivery of company stock in the formof newly issued shares or treasury shares require shareholder approval at the time of the deliveryof the shares or, if shareholder approval is granted through an authorization to the Board ofDirectors, not earlier than one year in advance of the delivery of the shares. The NYSE listingstandards require that equity compensation plans be approved by a company’s shareholders.
Nokia’s corporate governance practices also comply with the Corporate GovernanceRecommendation for Listed Companies approved by the Helsinki Stock Exchange in December 2003effective as of July 1, 2004.
6.D Employees
At December 31, 2005, Nokia employed 58 874 people, compared with 55 505 at December 31,2004 and 51 359 at December 31, 2003. The average number of personnel for 2005, 2004 and 2003
102
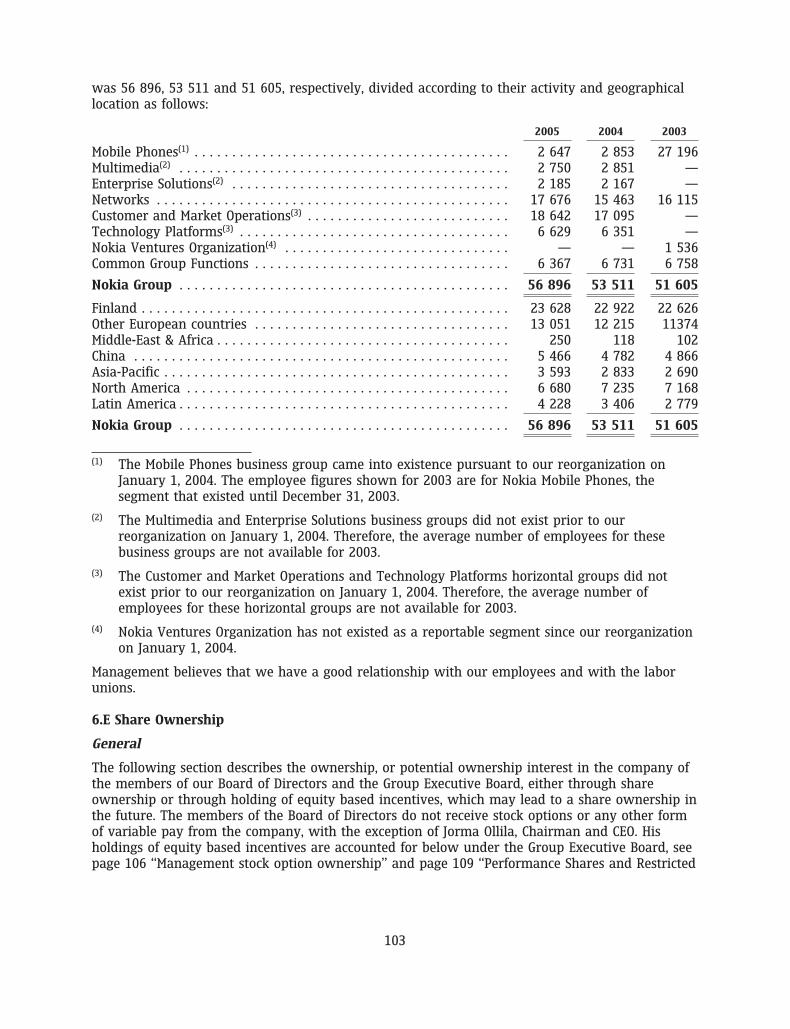
was 56 896, 53 511 and 51 605, respectively, divided according to their activity and geographicallocation as follows:
2005 2004 2003
Mobile Phones(1) . . . . . . . . . . . . . . . . . . . . . . . . . . . . . . . . . . . . . . . . . . 2 647 2 853 27 196Multimedia(2) . . . . . . . . . . . . . . . . . . . . . . . . . . . . . . . . . . . . . . . . . . . . 2 750 2 851 —Enterprise Solutions(2) . . . . . . . . . . . . . . . . . . . . . . . . . . . . . . . . . . . . . 2 185 2 167 —Networks . . . . . . . . . . . . . . . . . . . . . . . . . . . . . . . . . . . . . . . . . . . . . . . 17 676 15 463 16 115Customer and Market Operations(3) . . . . . . . . . . . . . . . . . . . . . . . . . . . 18 642 17 095 —Technology Platforms(3) . . . . . . . . . . . . . . . . . . . . . . . . . . . . . . . . . . . . 6 629 6 351 —Nokia Ventures Organization(4) . . . . . . . . . . . . . . . . . . . . . . . . . . . . . . — — 1 536Common Group Functions . . . . . . . . . . . . . . . . . . . . . . . . . . . . . . . . . . 6 367 6 731 6 758
Nokia Group . . . . . . . . . . . . . . . . . . . . . . . . . . . . . . . . . . . . . . . . . . . . 56 896 53 511 51 605
Finland . . . . . . . . . . . . . . . . . . . . . . . . . . . . . . . . . . . . . . . . . . . . . . . . . 23 628 22 922 22 626Other European countries . . . . . . . . . . . . . . . . . . . . . . . . . . . . . . . . . . 13 051 12 215 11374Middle-East & Africa . . . . . . . . . . . . . . . . . . . . . . . . . . . . . . . . . . . . . . . 250 118 102China . . . . . . . . . . . . . . . . . . . . . . . . . . . . . . . . . . . . . . . . . . . . . . . . . . 5 466 4 782 4 866Asia-Pacific . . . . . . . . . . . . . . . . . . . . . . . . . . . . . . . . . . . . . . . . . . . . . . 3 593 2 833 2 690North America . . . . . . . . . . . . . . . . . . . . . . . . . . . . . . . . . . . . . . . . . . . 6 680 7 235 7 168Latin America . . . . . . . . . . . . . . . . . . . . . . . . . . . . . . . . . . . . . . . . . . . . 4 228 3 406 2 779
Nokia Group . . . . . . . . . . . . . . . . . . . . . . . . . . . . . . . . . . . . . . . . . . . . 56 896 53 511 51 605
(1) The Mobile Phones business group came into existence pursuant to our reorganization onJanuary 1, 2004. The employee figures shown for 2003 are for Nokia Mobile Phones, thesegment that existed until December 31, 2003.
(2) The Multimedia and Enterprise Solutions business groups did not exist prior to ourreorganization on January 1, 2004. Therefore, the average number of employees for thesebusiness groups are not available for 2003.
(3) The Customer and Market Operations and Technology Platforms horizontal groups did notexist prior to our reorganization on January 1, 2004. Therefore, the average number ofemployees for these horizontal groups are not available for 2003.
(4) Nokia Ventures Organization has not existed as a reportable segment since our reorganizationon January 1, 2004.
Management believes that we have a good relationship with our employees and with the laborunions.
6.E Share Ownership
General
The following section describes the ownership, or potential ownership interest in the company ofthe members of our Board of Directors and the Group Executive Board, either through shareownership or through holding of equity based incentives, which may lead to a share ownership inthe future. The members of the Board of Directors do not receive stock options or any other formof variable pay from the company, with the exception of Jorma Ollila, Chairman and CEO. Hisholdings of equity based incentives are accounted for below under the Group Executive Board, seepage 106 ‘‘Management stock option ownership’’ and page 109 ‘‘Performance Shares and Restricted
103
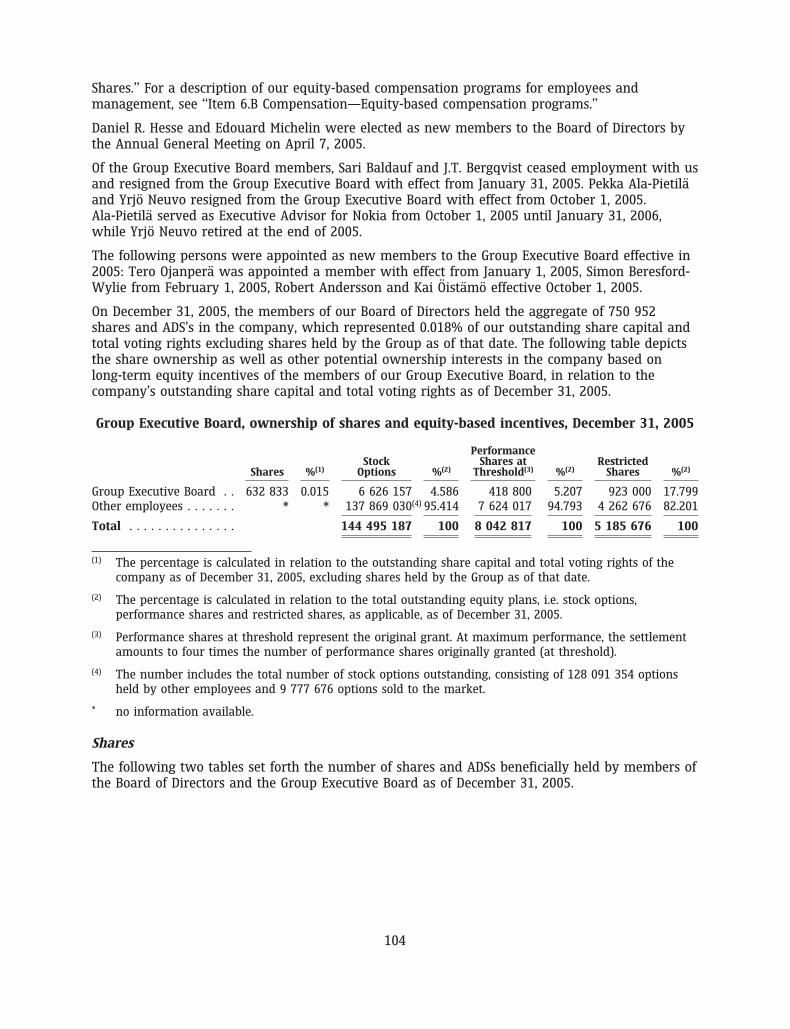
Shares.’’ For a description of our equity-based compensation programs for employees andmanagement, see ‘‘Item 6.B Compensation—Equity-based compensation programs.’’
Daniel R. Hesse and Edouard Michelin were elected as new members to the Board of Directors bythe Annual General Meeting on April 7, 2005.
Of the Group Executive Board members, Sari Baldauf and J.T. Bergqvist ceased employment with usand resigned from the Group Executive Board with effect from January 31, 2005. Pekka Ala-Pietilaand Yrjo Neuvo resigned from the Group Executive Board with effect from October 1, 2005.Ala-Pietila served as Executive Advisor for Nokia from October 1, 2005 until January 31, 2006,while Yrjo Neuvo retired at the end of 2005.
The following persons were appointed as new members to the Group Executive Board effective in2005: Tero Ojanpera was appointed a member with effect from January 1, 2005, Simon Beresford-Wylie from February 1, 2005, Robert Andersson and Kai Oistamo effective October 1, 2005.
On December 31, 2005, the members of our Board of Directors held the aggregate of 750 952shares and ADS’s in the company, which represented 0.018% of our outstanding share capital andtotal voting rights excluding shares held by the Group as of that date. The following table depictsthe share ownership as well as other potential ownership interests in the company based onlong-term equity incentives of the members of our Group Executive Board, in relation to thecompany’s outstanding share capital and total voting rights as of December 31, 2005.
Group Executive Board, ownership of shares and equity-based incentives, December 31, 2005
PerformanceStock Shares at Restricted
Shares %(1) Options %(2) Threshold(3) %(2) Shares %(2)
Group Executive Board . . 632 833 0.015 6 626 157 4.586 418 800 5.207 923 000 17.799Other employees . . . . . . . * * 137 869 030(4) 95.414 7 624 017 94.793 4 262 676 82.201
Total . . . . . . . . . . . . . . . 144 495 187 100 8 042 817 100 5 185 676 100
(1) The percentage is calculated in relation to the outstanding share capital and total voting rights of thecompany as of December 31, 2005, excluding shares held by the Group as of that date.
(2) The percentage is calculated in relation to the total outstanding equity plans, i.e. stock options,performance shares and restricted shares, as applicable, as of December 31, 2005.
(3) Performance shares at threshold represent the original grant. At maximum performance, the settlementamounts to four times the number of performance shares originally granted (at threshold).
(4) The number includes the total number of stock options outstanding, consisting of 128 091 354 optionsheld by other employees and 9 777 676 options sold to the market.
* no information available.
Shares
The following two tables set forth the number of shares and ADSs beneficially held by members ofthe Board of Directors and the Group Executive Board as of December 31, 2005.
104
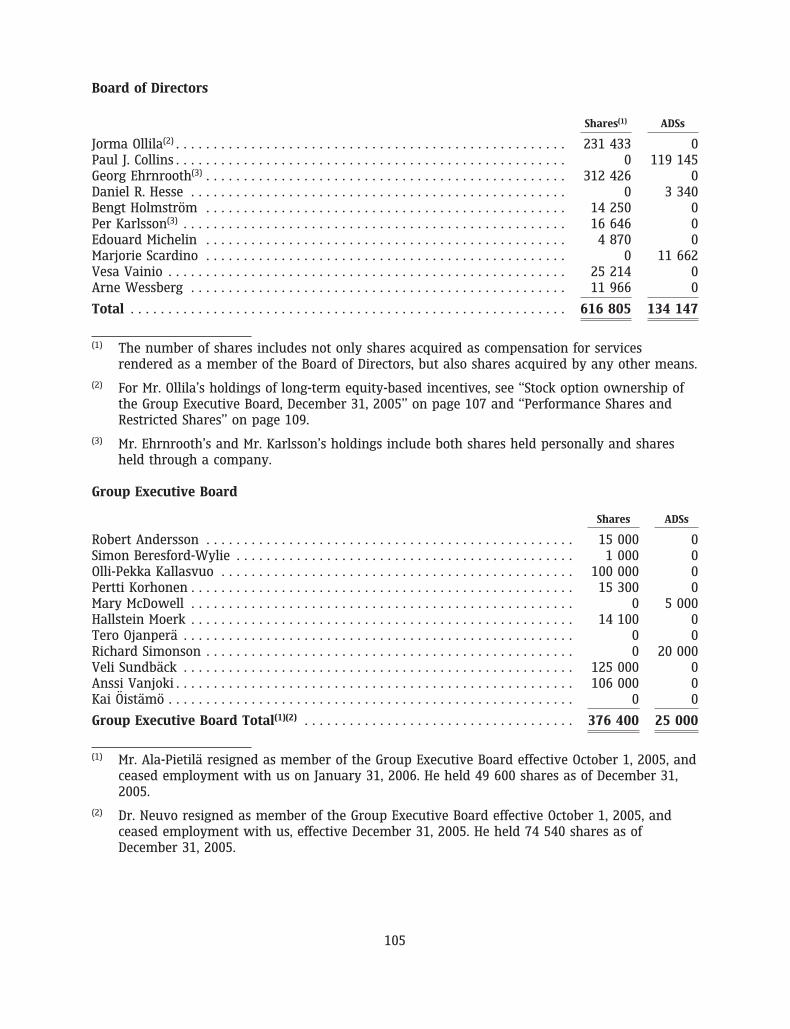
Board of Directors
Shares(1) ADSs
Jorma Ollila(2) . . . . . . . . . . . . . . . . . . . . . . . . . . . . . . . . . . . . . . . . . . . . . . . . . . . . 231 433 0Paul J. Collins . . . . . . . . . . . . . . . . . . . . . . . . . . . . . . . . . . . . . . . . . . . . . . . . . . . . 0 119 145Georg Ehrnrooth(3) . . . . . . . . . . . . . . . . . . . . . . . . . . . . . . . . . . . . . . . . . . . . . . . . 312 426 0Daniel R. Hesse . . . . . . . . . . . . . . . . . . . . . . . . . . . . . . . . . . . . . . . . . . . . . . . . . . 0 3 340Bengt Holmstrom . . . . . . . . . . . . . . . . . . . . . . . . . . . . . . . . . . . . . . . . . . . . . . . . 14 250 0Per Karlsson(3) . . . . . . . . . . . . . . . . . . . . . . . . . . . . . . . . . . . . . . . . . . . . . . . . . . . 16 646 0Edouard Michelin . . . . . . . . . . . . . . . . . . . . . . . . . . . . . . . . . . . . . . . . . . . . . . . . 4 870 0Marjorie Scardino . . . . . . . . . . . . . . . . . . . . . . . . . . . . . . . . . . . . . . . . . . . . . . . . 0 11 662Vesa Vainio . . . . . . . . . . . . . . . . . . . . . . . . . . . . . . . . . . . . . . . . . . . . . . . . . . . . . 25 214 0Arne Wessberg . . . . . . . . . . . . . . . . . . . . . . . . . . . . . . . . . . . . . . . . . . . . . . . . . . 11 966 0
Total . . . . . . . . . . . . . . . . . . . . . . . . . . . . . . . . . . . . . . . . . . . . . . . . . . . . . . . . . . 616 805 134 147
(1) The number of shares includes not only shares acquired as compensation for servicesrendered as a member of the Board of Directors, but also shares acquired by any other means.
(2) For Mr. Ollila’s holdings of long-term equity-based incentives, see ‘‘Stock option ownership ofthe Group Executive Board, December 31, 2005’’ on page 107 and ‘‘Performance Shares andRestricted Shares’’ on page 109.
(3) Mr. Ehrnrooth’s and Mr. Karlsson’s holdings include both shares held personally and sharesheld through a company.
Group Executive Board
Shares ADSs
Robert Andersson . . . . . . . . . . . . . . . . . . . . . . . . . . . . . . . . . . . . . . . . . . . . . . . . . 15 000 0Simon Beresford-Wylie . . . . . . . . . . . . . . . . . . . . . . . . . . . . . . . . . . . . . . . . . . . . . 1 000 0Olli-Pekka Kallasvuo . . . . . . . . . . . . . . . . . . . . . . . . . . . . . . . . . . . . . . . . . . . . . . . 100 000 0Pertti Korhonen . . . . . . . . . . . . . . . . . . . . . . . . . . . . . . . . . . . . . . . . . . . . . . . . . . . 15 300 0Mary McDowell . . . . . . . . . . . . . . . . . . . . . . . . . . . . . . . . . . . . . . . . . . . . . . . . . . . 0 5 000Hallstein Moerk . . . . . . . . . . . . . . . . . . . . . . . . . . . . . . . . . . . . . . . . . . . . . . . . . . . 14 100 0Tero Ojanpera . . . . . . . . . . . . . . . . . . . . . . . . . . . . . . . . . . . . . . . . . . . . . . . . . . . . 0 0Richard Simonson . . . . . . . . . . . . . . . . . . . . . . . . . . . . . . . . . . . . . . . . . . . . . . . . . 0 20 000Veli Sundback . . . . . . . . . . . . . . . . . . . . . . . . . . . . . . . . . . . . . . . . . . . . . . . . . . . . 125 000 0Anssi Vanjoki . . . . . . . . . . . . . . . . . . . . . . . . . . . . . . . . . . . . . . . . . . . . . . . . . . . . . 106 000 0Kai Oistamo . . . . . . . . . . . . . . . . . . . . . . . . . . . . . . . . . . . . . . . . . . . . . . . . . . . . . . 0 0
Group Executive Board Total(1)(2) . . . . . . . . . . . . . . . . . . . . . . . . . . . . . . . . . . . . 376 400 25 000
(1) Mr. Ala-Pietila resigned as member of the Group Executive Board effective October 1, 2005, andceased employment with us on January 31, 2006. He held 49 600 shares as of December 31,2005.
(2) Dr. Neuvo resigned as member of the Group Executive Board effective October 1, 2005, andceased employment with us, effective December 31, 2005. He held 74 540 shares as ofDecember 31, 2005.
105

Management stock option ownership
The following tables provide certain information relating to stock options held by members of theGroup Executive Board as of December 31, 2005. These stock options were issued pursuant to ourNokia Stock Option Plans 2001, 2003 and 2005. For a description of our stock option plans,including information regarding the expiration date of the options under these plans, please seethe table ‘‘Outstanding stock option plans of the Group, December 31, 2005’’ in Note 24 to theconsolidated financial statements in Item 18 of this annual report on Form 20-F.
106
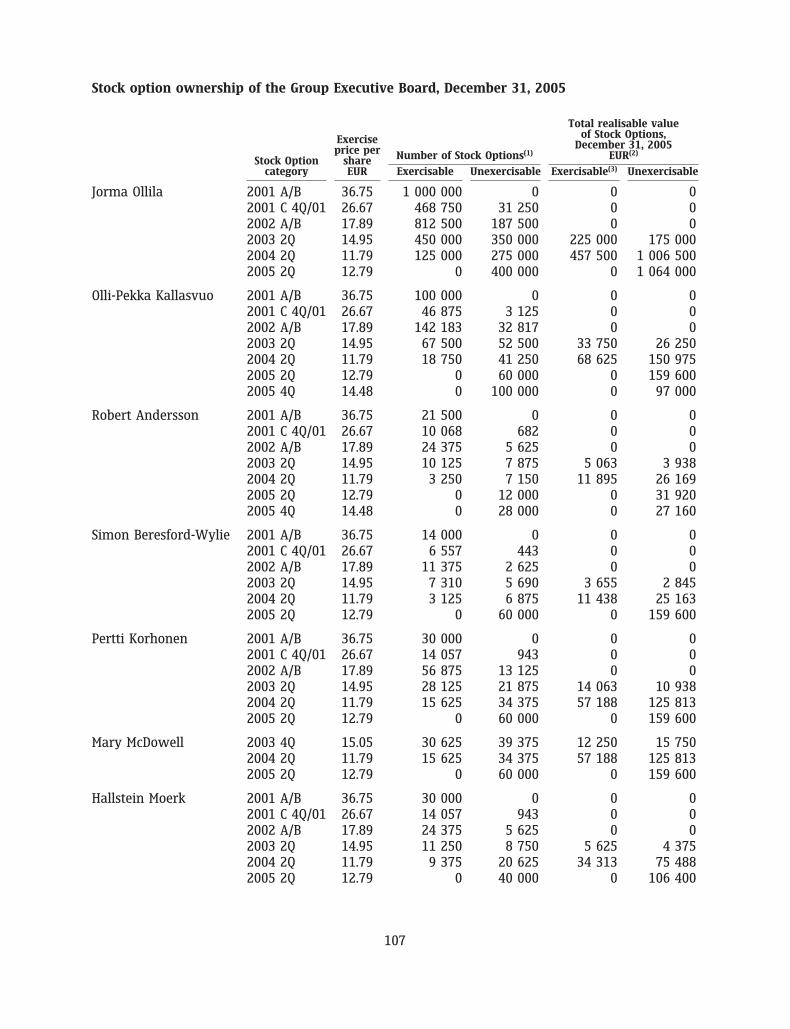
Stock option ownership of the Group Executive Board, December 31, 2005
Total realisable valueof Stock Options,Exercise December 31, 2005price per Number of Stock Options(1) EUR(2)
Stock Option sharecategory EUR Exercisable Unexercisable Exercisable(3) Unexercisable
Jorma Ollila 2001 A/B 36.75 1 000 000 0 0 02001 C 4Q/01 26.67 468 750 31 250 0 02002 A/B 17.89 812 500 187 500 0 02003 2Q 14.95 450 000 350 000 225 000 175 0002004 2Q 11.79 125 000 275 000 457 500 1 006 5002005 2Q 12.79 0 400 000 0 1 064 000
Olli-Pekka Kallasvuo 2001 A/B 36.75 100 000 0 0 02001 C 4Q/01 26.67 46 875 3 125 0 02002 A/B 17.89 142 183 32 817 0 02003 2Q 14.95 67 500 52 500 33 750 26 2502004 2Q 11.79 18 750 41 250 68 625 150 9752005 2Q 12.79 0 60 000 0 159 6002005 4Q 14.48 0 100 000 0 97 000
Robert Andersson 2001 A/B 36.75 21 500 0 0 02001 C 4Q/01 26.67 10 068 682 0 02002 A/B 17.89 24 375 5 625 0 02003 2Q 14.95 10 125 7 875 5 063 3 9382004 2Q 11.79 3 250 7 150 11 895 26 1692005 2Q 12.79 0 12 000 0 31 9202005 4Q 14.48 0 28 000 0 27 160
Simon Beresford-Wylie 2001 A/B 36.75 14 000 0 0 02001 C 4Q/01 26.67 6 557 443 0 02002 A/B 17.89 11 375 2 625 0 02003 2Q 14.95 7 310 5 690 3 655 2 8452004 2Q 11.79 3 125 6 875 11 438 25 1632005 2Q 12.79 0 60 000 0 159 600
Pertti Korhonen 2001 A/B 36.75 30 000 0 0 02001 C 4Q/01 26.67 14 057 943 0 02002 A/B 17.89 56 875 13 125 0 02003 2Q 14.95 28 125 21 875 14 063 10 9382004 2Q 11.79 15 625 34 375 57 188 125 8132005 2Q 12.79 0 60 000 0 159 600
Mary McDowell 2003 4Q 15.05 30 625 39 375 12 250 15 7502004 2Q 11.79 15 625 34 375 57 188 125 8132005 2Q 12.79 0 60 000 0 159 600
Hallstein Moerk 2001 A/B 36.75 30 000 0 0 02001 C 4Q/01 26.67 14 057 943 0 02002 A/B 17.89 24 375 5 625 0 02003 2Q 14.95 11 250 8 750 5 625 4 3752004 2Q 11.79 9 375 20 625 34 313 75 4882005 2Q 12.79 0 40 000 0 106 400
107
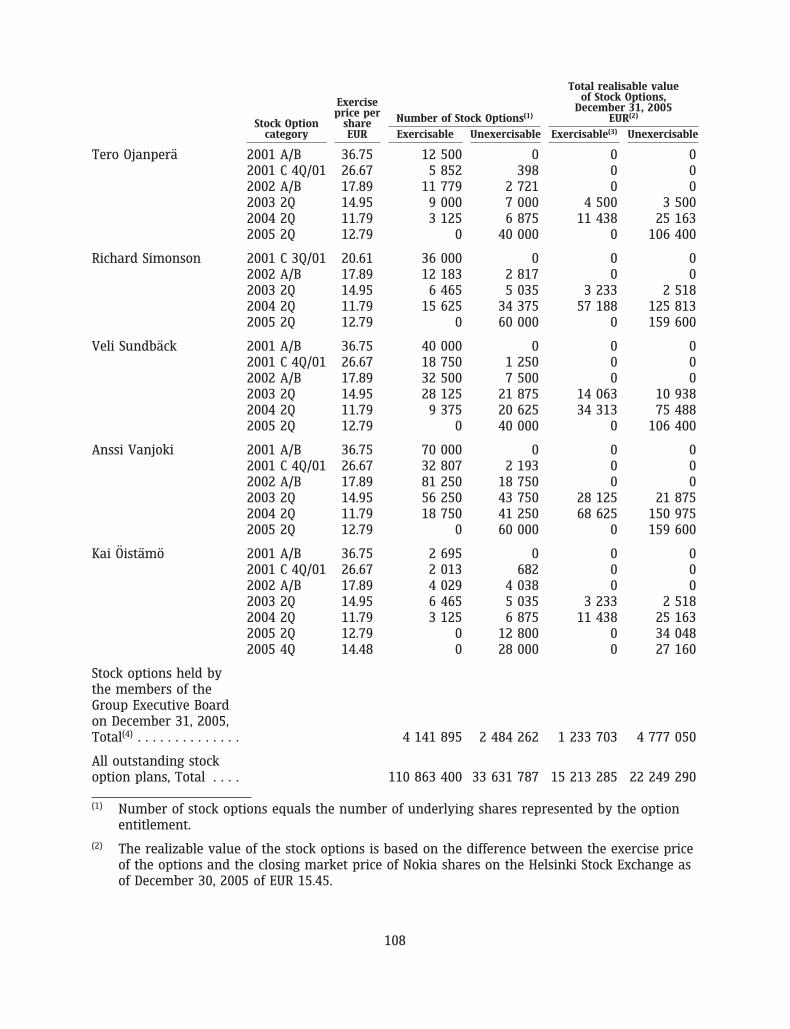
Total realisable valueof Stock Options,Exercise December 31, 2005price per Number of Stock Options(1) EUR(2)
Stock Option sharecategory EUR Exercisable Unexercisable Exercisable(3) Unexercisable
Tero Ojanpera 2001 A/B 36.75 12 500 0 0 02001 C 4Q/01 26.67 5 852 398 0 02002 A/B 17.89 11 779 2 721 0 02003 2Q 14.95 9 000 7 000 4 500 3 5002004 2Q 11.79 3 125 6 875 11 438 25 1632005 2Q 12.79 0 40 000 0 106 400
Richard Simonson 2001 C 3Q/01 20.61 36 000 0 0 02002 A/B 17.89 12 183 2 817 0 02003 2Q 14.95 6 465 5 035 3 233 2 5182004 2Q 11.79 15 625 34 375 57 188 125 8132005 2Q 12.79 0 60 000 0 159 600
Veli Sundback 2001 A/B 36.75 40 000 0 0 02001 C 4Q/01 26.67 18 750 1 250 0 02002 A/B 17.89 32 500 7 500 0 02003 2Q 14.95 28 125 21 875 14 063 10 9382004 2Q 11.79 9 375 20 625 34 313 75 4882005 2Q 12.79 0 40 000 0 106 400
Anssi Vanjoki 2001 A/B 36.75 70 000 0 0 02001 C 4Q/01 26.67 32 807 2 193 0 02002 A/B 17.89 81 250 18 750 0 02003 2Q 14.95 56 250 43 750 28 125 21 8752004 2Q 11.79 18 750 41 250 68 625 150 9752005 2Q 12.79 0 60 000 0 159 600
Kai Oistamo 2001 A/B 36.75 2 695 0 0 02001 C 4Q/01 26.67 2 013 682 0 02002 A/B 17.89 4 029 4 038 0 02003 2Q 14.95 6 465 5 035 3 233 2 5182004 2Q 11.79 3 125 6 875 11 438 25 1632005 2Q 12.79 0 12 800 0 34 0482005 4Q 14.48 0 28 000 0 27 160
Stock options held bythe members of theGroup Executive Boardon December 31, 2005,Total(4) . . . . . . . . . . . . . . 4 141 895 2 484 262 1 233 703 4 777 050
All outstanding stockoption plans, Total . . . . 110 863 400 33 631 787 15 213 285 22 249 290
(1) Number of stock options equals the number of underlying shares represented by the optionentitlement.
(2) The realizable value of the stock options is based on the difference between the exercise priceof the options and the closing market price of Nokia shares on the Helsinki Stock Exchange asof December 30, 2005 of EUR 15.45.
108
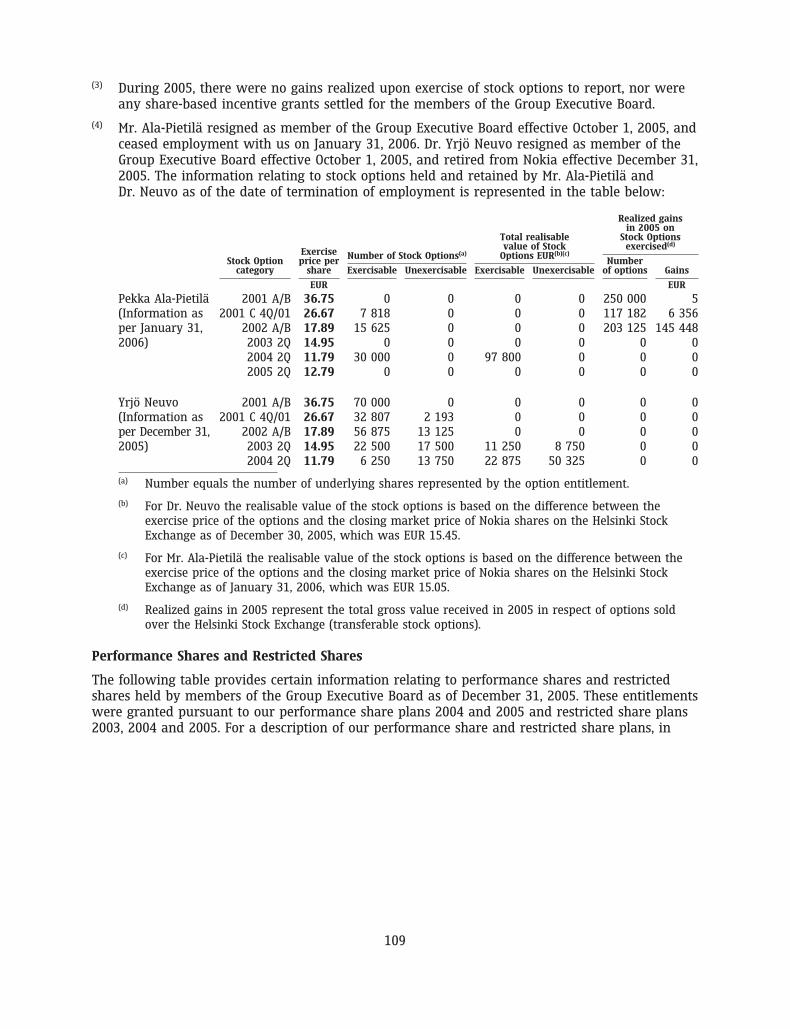
(3) During 2005, there were no gains realized upon exercise of stock options to report, nor wereany share-based incentive grants settled for the members of the Group Executive Board.
(4) Mr. Ala-Pietila resigned as member of the Group Executive Board effective October 1, 2005, andceased employment with us on January 31, 2006. Dr. Yrjo Neuvo resigned as member of theGroup Executive Board effective October 1, 2005, and retired from Nokia effective December 31,2005. The information relating to stock options held and retained by Mr. Ala-Pietila andDr. Neuvo as of the date of termination of employment is represented in the table below:
Realized gainsin 2005 on
Total realisable Stock Optionsvalue of Stock exercised(d)
Exercise Number of Stock Options(a) Options EUR(b)(c)
Stock Option price per Numbercategory share Exercisable Unexercisable Exercisable Unexercisable of options Gains
EUR EUR
Pekka Ala-Pietila 2001 A/B 36.75 0 0 0 0 250 000 5(Information as 2001 C 4Q/01 26.67 7 818 0 0 0 117 182 6 356per January 31, 2002 A/B 17.89 15 625 0 0 0 203 125 145 4482006) 2003 2Q 14.95 0 0 0 0 0 0
2004 2Q 11.79 30 000 0 97 800 0 0 02005 2Q 12.79 0 0 0 0 0 0
Yrjo Neuvo 2001 A/B 36.75 70 000 0 0 0 0 0(Information as 2001 C 4Q/01 26.67 32 807 2 193 0 0 0 0per December 31, 2002 A/B 17.89 56 875 13 125 0 0 0 02005) 2003 2Q 14.95 22 500 17 500 11 250 8 750 0 0
2004 2Q 11.79 6 250 13 750 22 875 50 325 0 0
(a) Number equals the number of underlying shares represented by the option entitlement.
(b) For Dr. Neuvo the realisable value of the stock options is based on the difference between theexercise price of the options and the closing market price of Nokia shares on the Helsinki StockExchange as of December 30, 2005, which was EUR 15.45.
(c) For Mr. Ala-Pietila the realisable value of the stock options is based on the difference between theexercise price of the options and the closing market price of Nokia shares on the Helsinki StockExchange as of January 31, 2006, which was EUR 15.05.
(d) Realized gains in 2005 represent the total gross value received in 2005 in respect of options soldover the Helsinki Stock Exchange (transferable stock options).
Performance Shares and Restricted Shares
The following table provides certain information relating to performance shares and restrictedshares held by members of the Group Executive Board as of December 31, 2005. These entitlementswere granted pursuant to our performance share plans 2004 and 2005 and restricted share plans2003, 2004 and 2005. For a description of our performance share and restricted share plans, in
109
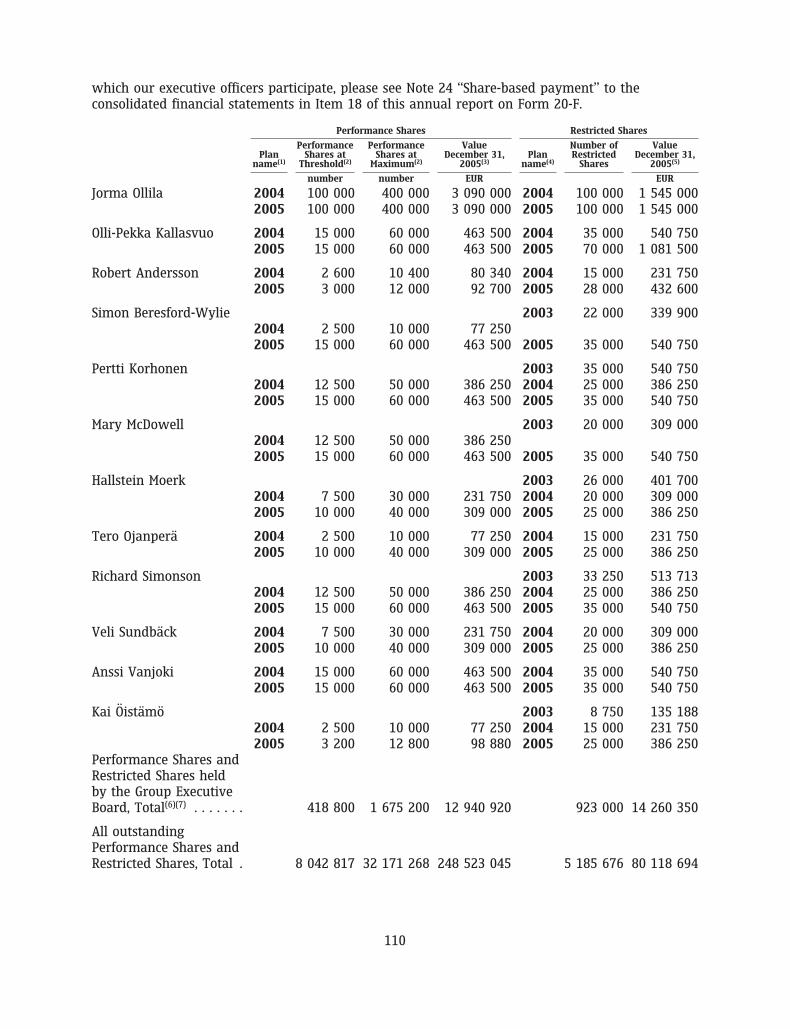
which our executive officers participate, please see Note 24 ‘‘Share-based payment’’ to theconsolidated financial statements in Item 18 of this annual report on Form 20-F.
Performance Shares Restricted Shares
Performance Performance Value Number of ValuePlan Shares at Shares at December 31, Plan Restricted December 31,
name(1) Threshold(2) Maximum(2) 2005(3) name(4) Shares 2005(5)
number number EUR EUR
Jorma Ollila 2004 100 000 400 000 3 090 000 2004 100 000 1 545 0002005 100 000 400 000 3 090 000 2005 100 000 1 545 000
Olli-Pekka Kallasvuo 2004 15 000 60 000 463 500 2004 35 000 540 7502005 15 000 60 000 463 500 2005 70 000 1 081 500
Robert Andersson 2004 2 600 10 400 80 340 2004 15 000 231 7502005 3 000 12 000 92 700 2005 28 000 432 600
Simon Beresford-Wylie 2003 22 000 339 9002004 2 500 10 000 77 2502005 15 000 60 000 463 500 2005 35 000 540 750
Pertti Korhonen 2003 35 000 540 7502004 12 500 50 000 386 250 2004 25 000 386 2502005 15 000 60 000 463 500 2005 35 000 540 750
Mary McDowell 2003 20 000 309 0002004 12 500 50 000 386 2502005 15 000 60 000 463 500 2005 35 000 540 750
Hallstein Moerk 2003 26 000 401 7002004 7 500 30 000 231 750 2004 20 000 309 0002005 10 000 40 000 309 000 2005 25 000 386 250
Tero Ojanpera 2004 2 500 10 000 77 250 2004 15 000 231 7502005 10 000 40 000 309 000 2005 25 000 386 250
Richard Simonson 2003 33 250 513 7132004 12 500 50 000 386 250 2004 25 000 386 2502005 15 000 60 000 463 500 2005 35 000 540 750
Veli Sundback 2004 7 500 30 000 231 750 2004 20 000 309 0002005 10 000 40 000 309 000 2005 25 000 386 250
Anssi Vanjoki 2004 15 000 60 000 463 500 2004 35 000 540 7502005 15 000 60 000 463 500 2005 35 000 540 750
Kai Oistamo 2003 8 750 135 1882004 2 500 10 000 77 250 2004 15 000 231 7502005 3 200 12 800 98 880 2005 25 000 386 250
Performance Shares andRestricted Shares heldby the Group ExecutiveBoard, Total(6)(7) . . . . . . . 418 800 1 675 200 12 940 920 923 000 14 260 350
All outstandingPerformance Shares andRestricted Shares, Total . 8 042 817 32 171 268 248 523 045 5 185 676 80 118 694
110
(1) The performance period for the 2004 plan is 2004-2007, with one interim measurementperiod for fiscal years 2004-2005.
Similarily, the performance period for the 2005 Plan is 2005-2008, with one interimmeasurement period for fiscal years 2005-2006.
(2) For the performance share plans 2004 and 2005, the number of performance shares atthreshold represents the number of performance shares granted. This number shall vest asshares, should the pre-determined threshold performance levels of the company be met. Themaximum number of performance shares shall vest as shares, should the predeterminedmaximum performance levels be met. The maximum number of performance shares equalsfour times the number originally granted.
(3) Value is based on the closing market price of the Nokia share on the Helsinki Stock Exchangeas of December 30, 2005 of EUR 15.45. The value is presented for the target number of shares,which is two times the number at threshold. The target number is used for expensing theinstruments in the company’s accounting.
(4) Restriction period ends for the restricted share plan 2003 on October 1, 2006 (Vesting Date).Vesting Date for the 2004 plan is October 1, 2007, and for the 2005 plan October 1, 2008.
(5) Value is based on the closing market price of the Nokia share on the Helsinki Stock Exchangeas of December 30, 2005 of EUR 15.45.
(6) Pekka Ala-Pietila resigned as member of the Group Executive Board as of October 1, 2005, andceased employment with us on January 31, 2006.
As of December 31, 2005 he held 35 000 restricted shares from each of the 2004 and 2005Restricted Share Plans, 20 000 performance shares at threshold from the 2004 PerformanceShare Plan and 15 000 performance shares at threshold from the 2005 Performance SharePlan. He forfeited all his performance shares and restricted shares in accordance with therelevant plan rules.
(7) Yrjo Neuvo resigned as member of the Group Executive Board effective October 1, 2005, andretired from Nokia as of December 31, 2005.
As of December 31, 2005 he held 5 000 performance shares at threshold from 2004Performance Share Plan. He was entitled to keep all his performance shares and restrictedshares in accordance with the relevant plan rules.
Stock Ownership Guidelines for Executive Management
One of the goals of our long-term equity-based incentive program is to focus executives onbuilding value for shareholders. In addition to granting them stock options, performance sharesand restricted shares, we also encourage stock ownership by our top executives. In January 2001,we introduced a stock ownership commitment guidelines with minimum recommendations tied toannual base salaries. For the members of the Group Executive Board, the recommended minimuminvestment in our shares corresponds to two times the member’s annual base salary. ForMr. Kallasvuo, who has already met this requirement as of the end of 2005, the Board of Directorshas set a new recommended minimum ownership guideline of three times his annual base salary.To meet this requirement, all members are expected to retain after-tax equity gains in shares untilthe same minimum investment level is met.
111
Insiders’ Trading in Securities
The Board of Directors has established a policy in respect of insiders’ trading in Nokia securities.Under the policy, the holdings of Nokia securities by the primary insiders (as defined in the policy)are public information, which is available in the Finnish Central Securities Depositary and on thecompany’s website. Both primary insiders and secondary insiders (as defined in the policy) aresubject to a number of trading restrictions and rules, including among other things, prohibitionson trading in Nokia securities during the three-week ‘‘closed-window’’ period immediatelypreceding the disclosure of our quarterly results and the four-week ‘‘closed-window’’ periodimmediately preceding the disclosure of our annual results. In addition, Nokia may set tradingrestrictions based on participation in projects. We update our insider trading policy from time totime and monitor our insiders’ compliance with the policy on a regular basis. Nokia’s InsiderPolicy is in line with the Helsinki Stock Exchange Guidelines for Insiders and also setsrequirements beyond these guidelines.
112
ITEM 7. MAJOR SHAREHOLDERS AND RELATED PARTY TRANSACTIONS
7.A Major Shareholders
No persons are known by Nokia to hold currently, or to have held during the past three years,more than 5% of the voting securities of Nokia Corporation. As far as we know, Nokia is notdirectly or indirectly owned or controlled by another corporation or by any government, andthere are no arrangements that may result in a change of control of Nokia.
As at December 31, 2005, 1 265 913 827 ADSs (equivalent to the same number of shares orapproximately 28.55% of the total outstanding shares) were outstanding and held of record by19 884 registered holders in the United States. We are aware that many ADSs are held of record bybrokers and other nominees, and accordingly the above numbers are not necessarilyrepresentative of the actual number of persons who are beneficial holders of ADSs or the numberof ADSs beneficially held by such persons. Based on information available from Automatic DataProcessing, Inc., or ADP, the number of beneficial owners of ADSs as at December 31, 2005 wasapproximately 1.1 million.
As at December 31, 2005, there were approximately 126 352 holders of record of our shares. Ofthese holders, around 570 had registered addresses in the United States and held a total of some2 759 027 of our shares, approximately 0.062% of the total outstanding shares. In addition, certainaccounts of record with registered addresses other than in the United States hold our shares, inwhole or in part, beneficially for United States persons.
7.B Related Party Transactions
There have been no material transactions during the last three fiscal years to which any director,executive officer or 5% shareholder, or any relative or spouse of any of them, was a party. Thereis no significant outstanding indebtedness owed to Nokia by any director, executive officer or 5%shareholder.
There are no material transactions with enterprises controlling, controlled by or under commoncontrol with Nokia or associates of Nokia.
See Note 34 to our consolidated financial statements included in Item 18 of this annual report onForm 20-F.
7.C Interests of Experts and Counsel
Not applicable.
ITEM 8. FINANCIAL INFORMATION
8.A Consolidated Statements and Other Financial Information
8.A.1 See Item 18 for our audited consolidated financial statements.
8.A.2 See Item 18 for our audited consolidated financial statements, which cover the last threefinancial years.
8.A.3 See page F-1 for the audit report of our accountants, entitled ‘‘Report of IndependentRegistered Public Accounting Firm.’’
8.A.4 Not applicable.
8.A.5 Not applicable.
8.A.6 See Note 3 to our audited consolidated financial statements included in Item 18 of thisannual report on Form 20-F for the amount of our export sales.
113
8.A.7 Litigation Nokia and several other mobile device manufacturers, distributors and networkoperators were named as defendants in a series of class action suits filed in various USjurisdictions. The cases were consolidated before a US federal district court in Baltimore, Maryland,United States. The actions were brought on behalf of a purported class of persons in the UnitedStates as a whole consisting of all individuals that purchased mobile phones without a headset. Ingeneral, the complaints allege that the defendants should have included a headset with everyhand-held mobile telephone as a means of reducing any potential health risk associated with thetelephone’s use, and assert causes of action based on negligence, fraud and misrepresentation. Therelief sought by the complaint included unspecified amounts of compensation for phone andheadset costs, and attorneys’ fees. All of the cases were dismissed by the Federal Court on March 5,2003, on the theory that the issues raised are primarily within the jurisdiction of the FederalCommunications Commission, not the courts. The US Fourth Circuit Court of Appeals reversed thedismissal and remanded the cases back to the courts of origin. The individual courts are nowestablishing scheduling orders that will determine how each case proceeds. Nokia does not believethe cases have merit and will vigorously defend them.
Nokia has also been named as a defendant along with other mobile device manufacturers andnetwork operators in five lawsuits by individual plaintiffs who allege that the radio emissionsfrom mobile phones caused or contributed to each plaintiff’s brain tumor. The cases are nowbefore the courts in the District of Columbia. The cases are in the initial stages and motions todismiss are being filed. Nokia does not believe that any of these cases has merit and willvigorously defend them.
We believe that the allegations described above are without merit, and intend to defend theseactions vigorously. Other courts that have reviewed similar matters to date have found that thereis no reliable scientific basis for the plaintiffs’ claims.
One of our customers in Turkey, Telsim Mobil Telekomuniksyon Hiz. A.S., has defaulted on itsobligations under a financing arrangement secured by us. In February 2004, the Arbitral Tribunalin Zurich rendered an award fully approving the claim against Telsim, which was owned andcontrolled by the Uzan family and their affiliates. In June 2004, the Swiss Federal Supreme Courtdismissed Telsim’s appeal which rendered the award final and enforceable. In addition, inconjunction with co-plaintiff Motorola Credit Corporation, we have been successful in a US lawsuitagainst individual members of the Uzan family and certain Uzan-controlled corporations. Thelawsuit alleges that the defendants fraudulently induced us and Motorola, through a pattern ofmisleading and illegal conduct, to provide financing to Telsim. In July 2003, the trial judge heldthat Nokia was entitled to a USD 1.7 billion judgment. That judgment has now been affirmed byan appeals court. In August 2005, we reached a settlement with Telsim and Turkish Savings andDeposit Insurance Fund (TMSF), which currently controls and manages Telsim’s assets. InDecember 2005, the Turkish government completed an auction of Telsim’s assets to Vodafone.Nokia’s settlement payment will be 7.5% of the purchase price, which is expected to be receivedduring the first quarter of 2006 in connection with the closing of the sale. On the basis of the USjudgment, we, however, vigorously continue the pursuit to recover all amounts due to us from theUzan family. We wrote off our total financing exposure to Telsim by the end of 2002.
Nokia is also involved in a number of lawsuits with Basari Elektronik Sanayi ve Ticaret A.S.(‘‘Basari Elektronik’’) and Basari Teknik regarding claims associated with the expiration of aproduct distribution agreement and the termination of a product service agreement. Those suitsare currently before various courts in Turkey. Basari Elektronik claims that it is entitled tocompensation for goodwill it generated on behalf of Nokia during the term of the distributionagreement. Basari Teknik has filed several suits related to alleged unpaid invoices and a suit thatclaims that the product service agreement between the parties was improperly terminated. Nokiais vigorously defending all these claims.
114
In 1999, Nokia entered into a license agreement with InterDigital Technology Corporation (‘‘IDT’’)for certain technology. The license provided for a fixed royalty payment through 2001 and mostfavored licensee treatment from 2002 through 2006. The patents being licensed were subject tolitigation by other manufacturers. In March 2003, IDT settled patent litigation with Ericsson andSony-Ericsson and announced that it intended to apply the settlement royalty rates to Nokia underthe most favored licensee provision. After failed attempts at negotiating a settlement, Nokia filedan arbitration demand seeking access to withheld information necessary to an evaluation of thematter. IDT responded with a counterclaim seeking to apply the Ericsson and Sony-Ericssonlicenses to Nokia. An arbitration hearing was completed in January 2005 and an award (‘‘Award’’)was issued by two of the three arbitrators in July 2005. The Award was accompanied by a lengthydissent from the third arbitrator. In the Award, which Nokia believes was internally inconsistent,the majority generally set royalty rates that IDT has publicly contended imposes $232 to$252 million in royalty obligations on Nokia for the period of 2002 through 2006. Nokia disputesthis calculation. Immediately after the Award was issued, IDT filed a demand with a federaldistrict court in New York to confirm the Award. Nokia asked the same federal court to vacate theAward in its entirety under applicable law. On December 28, 2005, the federal district court issuedan order confirming the Award and denying Nokia’s motion to vacate. Two days prior to theissuance of the federal district court’s order, IDT announced its intention to invoke the disputeresolution mechanisms under the parties’ 1999 agreement with regard to Nokia’s royalty reportingand payment obligations under the Award. In late January, Nokia filed a notice of appeal of thefederal district court’s order, and a schedule for briefing those matters to the Second Circuit Courtof Appeals is in place. In addition, the parties have engaged in continued settlement discussions inan effort to resolve issues that are in dispute. Nokia continues to believe that the Award should bevacated under applicable law and is currently evaluating its options with regard to both theappeal process and IDT’s request for further dispute resolution proceedings under the parties’agreement.
In November 2005, Qualcomm Incorporated (‘‘Qualcomm’’) and its wholly owned subsidiary SnapTrack, Inc. filed a patent infringement suit against Nokia Corporation and Nokia Inc. in the FederalDistrict Court for the Southern District of California. The lawsuit involves twelve patents thatQualcomm apparently contends apply to the manufacture and sale of unidentified GSM products.On December 20, 2005, Nokia moved to stay the lawsuit pending resolution of a confidentialarbitration pending between Nokia and Qualcomm. Nokia also simultaneously moved to dismissthe lawsuit for failure to state a claim for patent infringement or, in the alternative, for a moredefinite statement by Qualcomm of its purported claims. Nokia’s motions are currently pendingbefore the federal court with a hearing scheduled for mid-March 2006 and rulings expected shortlythereafter. Nokia will vigorously defend itself against these claims.
On April 6, 2004, Irving Greenfeld filed suit against Nokia, Jorma Ollila, Pekka Ala-Pietila, MattiAlahuhta and Richard Simonson in the United States District Court for the Southern District of NewYork on behalf of all purchasers of Nokia’s stock between January 8, 2004 and April 6, 2004.Subsequently, six individuals, Marc Abrams, Emery Chu, Zoe Myerson, Thomas Pflugbeil, MichaelDevine and Donald L. Siefert, filed related actions, each alleging that Nokia’s January 8, 2004earnings guidance was materially misleading, as allegedly revealed in Nokia’s April 6, 2004 pressrelease. In addition, the complaints allege that Nokia’s senior executives possessed materialadverse information about the success of Nokia’s reorganization and fraudulently failed to disclosethis information. In September 2004, the court appointed Generic Trading, Martin Bergljung andGerald Hoberman as lead plaintiffs and Milberg Weiss and Entwistle & Capucci as lead counsel. OnJanuary 7, 2005, lead plaintiffs filed a consolidated class action complaint (the ‘‘ConsolidatedComplaint’’), on behalf of all purchasers ‘‘worldwide’’ of Nokia securities during the class period.The Consolidated Complaint expanded the original class period (January 8, 2004 through April 6,2004) to October 16, 2003 through April 15, 2004. The Consolidated Complaint also added two new
115
defendants, Olli-Pekka Kallasvuo and Anssi Vanjoki, in addition to the four individual defendantsnamed in the initial complaint. The Consolidated Complaint alleges principally that Nokia’s positivestatements about its product portfolio and the projections based thereon were false andmisleading because Nokia knew that there were substantial weaknesses in the product portfolio.The Consolidated Complaint also alleges that Nokia employed accounting and inventory techniquesthat were allegedly used to improperly manipulate sales figures. Nokia does not believe that thelead plaintiff’s claims have merit and intends to vigorously defend itself.
Based upon the information currently available, management does not expect the resolution ofany of the matters discussed above to have a material adverse effect on our financial condition orresults of operations.
We are also party to routine litigation incidental to the normal conduct of our business. Basedupon the information currently available, our management does not believe that liabilities relatedto these proceedings, in the aggregate, are likely to be material to our financial condition orresults of operations.
8.A.8 See ‘‘Item 3.A Selected Financial Data—Distribution of Earnings’’ for a discussion of ourdividend policy.
8.B Significant Changes
No significant changes have occurred since the date of our consolidated financial statementsincluded in this annual report on Form 20-F. See ‘‘Item 5.A Operating Results—Overview’’ forinformation on material trends affecting our business and results of operations.
ITEM 9. THE OFFER AND LISTING
9.A Offer and Listing Details
Our capital consists of shares traded on the Helsinki Stock Exchange under the symbol ‘‘NOK1V.’’American Depositary Shares, or ADSs, each representing one of our shares are traded on the NewYork Stock Exchange under the symbol ‘‘NOK.’’ The ADSs are evidenced by American DepositaryReceipts, or ADRs, issued by Citibank, N.A., as Depositary under the Amended and Restated DepositAgreement dated as of March 28, 2000 (as amended), among Nokia, Citibank, N.A. and registeredholders from time to time of ADRs. ADSs were first issued in July 1994.
116
The table below sets forth, for the periods indicated, the reported high and low quoted prices forour shares on the Helsinki Stock Exchange and the high and low quoted prices for the shares, inthe form of ADSs, on the New York Stock Exchange.
Helsinki New YorkStock Exchange Stock Exchange
Price per share Price per ADS
High Low High Low
(EUR) (USD)
2001 . . . . . . . . . . . . . . . . . . . . . . . . . . . . . . . . . . . . . . . . . . . . . . . . . . . 46.50 14.35 44.69 12.952002 . . . . . . . . . . . . . . . . . . . . . . . . . . . . . . . . . . . . . . . . . . . . . . . . . . . 29.45 11.10 26.90 10.762003 . . . . . . . . . . . . . . . . . . . . . . . . . . . . . . . . . . . . . . . . . . . . . . . . . . . 16.16 11.44 18.45 12.67
2004First Quarter . . . . . . . . . . . . . . . . . . . . . . . . . . . . . . . . . . . . . . . . . . . . . 18.79 13.78 23.22 17.17Second Quarter . . . . . . . . . . . . . . . . . . . . . . . . . . . . . . . . . . . . . . . . . . . 17.40 10.83 21.15 13.08Third Quarter . . . . . . . . . . . . . . . . . . . . . . . . . . . . . . . . . . . . . . . . . . . . 12.05 8.97 14.67 11.03Fourth Quarter . . . . . . . . . . . . . . . . . . . . . . . . . . . . . . . . . . . . . . . . . . . 12.89 11.11 16.85 13.80Full Year . . . . . . . . . . . . . . . . . . . . . . . . . . . . . . . . . . . . . . . . . . . . . . . . 18.79 8.97 23.22 11.03
2005First Quarter . . . . . . . . . . . . . . . . . . . . . . . . . . . . . . . . . . . . . . . . . . . . . 12.36 10.75 16.41 13.92Second Quarter . . . . . . . . . . . . . . . . . . . . . . . . . . . . . . . . . . . . . . . . . . . 14.39 11.29 17.60 14.68Third Quarter . . . . . . . . . . . . . . . . . . . . . . . . . . . . . . . . . . . . . . . . . . . . 15.03 12.53 18.03 15.18Fourth Quarter . . . . . . . . . . . . . . . . . . . . . . . . . . . . . . . . . . . . . . . . . . . 15.75 13.28 18.62 15.90Full Year . . . . . . . . . . . . . . . . . . . . . . . . . . . . . . . . . . . . . . . . . . . . . . . . 15.75 10.75 18.62 13.92
Most recent six monthsSeptember 2005 . . . . . . . . . . . . . . . . . . . . . . . . . . . . . . . . . . . . . . . . . . 13.94 12.70 16.91 15.86October 2005 . . . . . . . . . . . . . . . . . . . . . . . . . . . . . . . . . . . . . . . . . . . . . 14.32 13.28 17.05 15.90November 2005 . . . . . . . . . . . . . . . . . . . . . . . . . . . . . . . . . . . . . . . . . . 14.85 14.14 17.50 16.92December 2005 . . . . . . . . . . . . . . . . . . . . . . . . . . . . . . . . . . . . . . . . . . . 15.75 14.70 18.62 17.36January 2006 . . . . . . . . . . . . . . . . . . . . . . . . . . . . . . . . . . . . . . . . . . . . 16.18 14.88 19.74 18.05February 2006 . . . . . . . . . . . . . . . . . . . . . . . . . . . . . . . . . . . . . . . . . . . 15.91 14.81 18.93 17.72
9.B Plan of Distribution
Not applicable.
9.C Markets
The principal trading markets for the shares are the New York Stock Exchange, in the form ofADSs, and the Helsinki Stock Exchange, in the form of shares. In addition, the shares are listed onthe Frankfurt and Stockholm stock exchanges.
9.D Selling Shareholders
Not applicable.
9.E Dilution
Not applicable.
9.F Expenses of the Issue
Not applicable.
117
ITEM 10. ADDITIONAL INFORMATION
10.A Share Capital
Not applicable.
10.B Memorandum and Articles of Association
Registration
Nokia is organized under the laws of the Republic of Finland and registered under the businessidentity code 0112 038 - 9. Nokia’s corporate purpose under Article 1 of its articles of association isto engage in the telecommunications industry and other sectors of the electronics industry,including the manufacture and marketing of telecommunications systems and equipment, mobilephones, consumer electronics and industrial electronic products. We also may engage in otherindustrial and commercial operations, as well as securities trading and other investment activities.
Director’s Voting Powers
Under Finnish law, a director shall refrain from taking any part in the consideration of a contractor other issue that may provide any material benefit to him. Under Finnish law, there is no agelimit requirement for directors, and there are no requirements under Finnish law that a directormust own a minimum number of shares in order to qualify to act as a director. Under Finnishlaw, a company may lend funds to a director only out of the distributable profits and againstsufficient collateral. However, lending for the purpose of acquiring the company’s shares is notpermitted.
Share Rights, Preferences and Restrictions
For a description of dividend rights attaching to our shares, see ‘‘Item 3.A Selected Financial Data—Distribution of Earnings.’’ Dividend entitlement lapses after ten years, if a dividend remainsunclaimed for that period, in which case the unclaimed dividend will be retained by Nokia.
Each share confers the right to one vote. Votes may be used at general meetings called by theBoard of Directors. According to Finnish law, a company generally must hold an Annual GeneralMeeting once a year. In addition, the Board is obliged to call an extraordinary general meeting atthe request of shareholders representing a minimum of one tenth of all outstanding shares. Themembers of the board are elected for a term of one year at each Annual General Meeting.
Under Finnish law, shareholders may attend and vote at a general meeting in person or by proxy.It is not customary in Finland for a company to issue forms of proxy to its shareholders.Accordingly, Nokia does not do so. However, registered holders and beneficial owners of ADSs areissued forms of proxy by the Depositary.
To attend and vote at a general meeting, a shareholder must be registered in the register ofshareholders in the Finnish book-entry system. A registered holder or a beneficial owner of theADSs, like other beneficial owners whose shares are registered in the company’s register ofshareholders in the name of a nominee, may vote his shares provided that he arranges to havehis name entered in the temporary register of shareholders as of the record date of the meeting.
The record date is the tenth calendar day preceding the meeting. To be entered into thetemporary register of shareholders as of the record date of the meeting, a holder of ADSs mustprovide the Depositary, or have his broker or other custodian provide the Depositary, on or beforethe voting deadline as well as the blocking deadline if any, as defined in the proxy material issuedby the Depositary, a proxy with the following information: the name, address, and social securitynumber or another corresponding personal identification number of the holder of the ADSs, the
118
number of shares to be voted by the holder of the ADSs, and the voting instructions. The registerof shareholders as of the record date of each general meeting is public until the end of therespective meeting.
As a further prerequisite for attending and voting at a general meeting, shareholders must givenotice to Nokia of their intention to attend no later than the date and time specified by the Boardof Directors in the notice of the meeting. By completing and returning the form of proxy providedby the Depositary, a holder of ADSs authorizes the Depositary to give this notice.
Each of our shares confers equal rights to share in our profits, and in any surplus in the event ofour liquidation.
Under Finnish law, the rights of shareholders related to shares are as stated by law and in ourarticles of association. Amendment of the articles of association requires a decision of the generalmeeting, supported by two-thirds of the votes cast and two-thirds of the shares represented at themeeting.
Disclosure of Shareholder Ownership
According to the Finnish Securities Market Act of 1989, as amended, a shareholder shall disclosehis ownership to the company and the Financial Supervision Authority when it reaches, exceedsor goes below 1⁄20, 1⁄10, 3⁄20, 1⁄5, 1⁄4, 1⁄3, 1⁄2 or 2⁄3 of all the shares outstanding. The term ‘‘ownership’’includes ownership by the shareholder, as well as selected related parties.
Purchase Obligation
Our articles of association require a shareholder that holds one-third or one-half of all of ourshares to purchase the shares of all other shareholders that request that he do so, at a pricegenerally based on the historical weighted average trading price of the shares. A shareholder ofthis magnitude also is obligated to purchase any subscription rights, stock options, warrants orconvertible bonds issued by the company if so requested by the holder.
Under the Finnish Securities Market Act of 1989, as amended, a shareholder whose holding exceedstwo-thirds of the total voting rights in a company shall, within one month, offer to purchase theremaining shares of the company, as well as any subscription rights, warrants, convertible bondsor stock options issued by the company. The purchase price shall be the market price of thesecurities in question. The market price is determined, among other things, on the basis of theaverage of the prices paid for the security in public trading during the preceding twelve months,and any higher price paid by the shareholder, as well as any other special circumstances.
Under the Finnish Companies Act of 1978, as amended, a shareholder whose holding exceedsnine-tenths of the total number of shares or voting rights in Nokia has both the right and theobligation to purchase all the shares of the minority shareholders for the current price. Thecurrent price is determined, among other things, on the basis of the recent market price of theshares. The purchase procedure under the Companies Act differs, and the purchase price maydiffer, from the purchase procedure and price under the Securities Market Act, as discussed above.
The Finnish Companies Act of 1978 is currently subject to a major reform. Similarly, the FinnishSecurities Market Act of 1989 is currently in the process of being significantly amended. Changes toboth of these laws are expected to become effective in the latter part of 2006.
Pre-Emptive Rights
In connection with any offering of shares, the existing shareholders have a pre-emptive right tosubscribe for shares offered in proportion to the amount of shares in their possession. However, ageneral meeting of shareholders may vote, by a majority of two-thirds of the votes cast and
119
two-thirds of the shares represented at the meeting, to waive this pre-emptive right provided that,from the company’s perspective, important financial grounds exist.
Under the Act on the Control of Foreigners’ Acquisition of Finnish Companies of 1992, clearance bythe Ministry of Trade and Industry is required for a non-resident of Finland, directly or indirectly,to acquire one-third or more of the voting power of a company. The Ministry of Trade andIndustry may refuse clearance where the acquisition would jeopardize important nationalinterests, in which case the matter is referred to the Council of State. These clearancerequirements are not applicable if, for instance, the voting power is acquired in an issuance ofshares that is proportional to the holder’s ownership of the shares. Moreover, the clearancerequirements do not apply to residents of countries in the European Economic Area or countriesthat have ratified the Convention on the Organization for Economic Cooperation and Development.
10.C Material Contracts
Nokia is not party to any material contract other than those entered into in the ordinary course ofbusiness.
10.D Exchange Controls
There are currently no Finnish laws which may affect the import or export of capital, or theremittance of dividends, interest or other payments.
10.E Taxation
General
The taxation discussion set forth below is intended only as a descriptive summary and does notpurport to be a complete analysis or listing of all potential tax effects relevant to ownership of ourshares represented by ADSs.
The statements of United States and Finnish tax laws set out below are based on the laws in forceas of the date of this annual report on Form 20-F and may be subject to any changes in US orFinnish law, and in any double taxation convention or treaty between the United States andFinland, occurring after that date, possibly with retroactive effect.
For purposes of this summary, beneficial owners of ADSs that hold the ADSs as capital assets andthat are considered residents of the United States for purposes of the current income taxconvention between the United States and Finland, signed September 21, 1989, referred to as theTreaty, and that are entitled to the benefits of the Treaty under the ‘‘Limitation on Benefits’’provisions contained in the Treaty, are referred to as ‘‘US Holders.’’ Beneficial owners that arecitizens or residents of the United States, corporations created in or organized under US law, andestates or trusts (to the extent their income is subject to US tax either directly or in the hands ofbeneficiaries) generally will be considered to be residents of the United States under the Treaty.Special rules apply to US Holders that are also residents of Finland and to citizens or residents ofthe United States that do not maintain a substantial presence, permanent home, or habitual abodein the United States. For purposes of this discussion, it is assumed that the Depositary and itscustodian will perform all actions as required by the deposit agreement with the Depositary andother related agreements between the Depositary and Nokia.
If a partnership holds ADSs (including for this purpose any entity treated as a partnership for USfederal income tax purposes), the tax treatment of a partner will depend upon the status of thepartner and activities of the partnership. If a US holder is a partner in a partnership that holdsADSs, the holder is urged to consult its own tax advisor regarding the specific tax consequences ofowning and disposing of its ADSs.
120
Because this summary is not exhaustive of all possible tax considerations—such as situationsinvolving financial institutions, banks, tax-exempt entities, US expatriates, real estate investmenttrusts, persons that are dealers in securities, persons who own (directly, indirectly or byattribution) 10% or more of the share capital or voting stock of Nokia, persons who acquired theirADSs pursuant to the exercise of employee stock options or otherwise as compensation, or whosefunctional currency is not the US dollar, who may be subject to special rules that are not discussedherein—holders of shares or ADSs that are US Holders are advised to satisfy themselves as to theoverall United States federal, state and local tax consequences, as well as to the overall Finnishand other applicable non-US tax consequences, of their ownership of ADSs and the underlyingshares by consulting their own tax advisors. This summary does not discuss the treatment of ADSsthat are held in connection with a permanent establishment or fixed base in Finland.
For the purposes of both the Treaty and the United States Internal Revenue Code of 1986, asamended, referred to as the Code, US Holders of ADSs will be treated as the owners of theunderlying shares that are represented by those ADSs. Accordingly, the following discussion, exceptwhere otherwise expressly noted, applies equally to US Holders of ADSs on the one hand and ofshares on the other.
The holders of ADSs will, for Finnish tax purposes, be treated as the owners of the shares that arerepresented by the ADSs. The Finnish tax consequences to the holders of shares, as discussedbelow, also apply to the holders of ADSs.
US and Finnish Taxation of Cash Dividends
For US federal income tax purposes, the gross amount of dividends paid to US Holders of shares orADSs, including any related Finnish withholding tax, generally will be included in gross income asforeign source dividend income. Dividends will not be eligible for the dividends received deductionallowed to corporations under Section 243 of the Code. The amount includible in income(including any Finnish withholding tax) will equal the US dollar value of the payment, determinedat the time such payment is received by the Depositary (in the case of ADSs) or by the US Holder(in the case of shares), regardless of whether the payment is in fact converted into US dollars.Generally, any gain or loss resulting from currency exchange rate fluctuations during the periodbetween the time such payment is received and the date the dividend payment is converted intoUS dollars will be treated as ordinary income or loss to a US Holder.
Special rules govern the manner in which accrual method taxpayers are required (or may elect) todetermine the US dollar amount includible in income in the case of a dividend paid (and taxeswithheld) in foreign currency. Certain of these rules have changed effective January 1, 2005.Accrual basis taxpayers therefore are urged to consult their own tax advisors regarding therequirements and elections applicable in this connection.
Under the Finnish Act on Taxation of Non-residents’ Income and Wealth, non-residents of Finlandare generally subject to a withholding tax at a rate of 28% payable on dividends paid by acompany. However, pursuant to the Treaty, dividends paid to US Holders generally will be subjectto Finnish withholding tax at a reduced rate of 15% of the gross amount of the dividend. See‘‘—Finnish Withholding Taxes on Nominee Registered Shares’’ below.
Subject to conditions and limitations, Finnish withholding taxes will be treated as foreign taxeseligible for credit against a US Holder’s US federal income tax liability. Dividends received generallywill constitute foreign source passive income for foreign tax credit purposes. In lieu of a credit, aUS Holder may elect to deduct all of its foreign taxes provided the deduction is claimed for all ofthe foreign taxes paid by the US Holder in a particular year. A deduction does not reduce US taxon a dollar-for-dollar basis like a tax credit. The deduction, however, is not subject to thelimitations applicable to foreign tax credits.
121
Certain US Holders (including individuals and some trusts and estates) are eligible for reducedrates of U.S. federal income tax at a maximum rate of 15% in respect of ‘‘qualified dividendincome’’ received in taxable years beginning before January 1, 2009, provided that certain holdingperiod requirements are met. Dividends that Nokia pays with respect to its shares and ADSsgenerally will be qualified dividend income if Nokia was not, in the year prior to the year inwhich the dividend was paid, and is not, in the year in which the dividend is paid, a passiveforeign investment company. Nokia currently believes that dividends paid with respect to itsshares and ADSs will constitute qualified dividend income for US federal income tax purposes,however, this is a factual matter and is subject to change. Nokia intends to report its dividends asqualified dividends on Forms 1099-DIV delivered to US Holders. US Holders of shares or ADSs areurged to consult their own tax advisors regarding the availability to them of the reduced dividendtax rate in light of their own particular situation and the computations of their foreign tax creditlimitation with respect to any qualified dividends paid to them, as applicable.
The US Treasury has expressed concern that parties to whom ADSs are released may be takingactions inconsistent with the claiming of foreign tax credits or reduced rates in respect of qualifieddividends by US Holders of ADSs. Accordingly, the analysis of the creditability of Finnishwithholding taxes or the availability of qualified dividend treatment could be affected by futureactions that may be taken by the US Treasury with respect to ADSs.
Finnish Withholding Taxes on Nominee Registered Shares
For US Holders, the reduced 15% withholding tax rate of the Treaty (instead of 28%) is applicableto dividends paid to nominee registered shares only when the conditions of the new provisionsapplied to dividends that are paid on January 1, 2006 or after are met (Section 10b of the FinnishAct on Taxation of Non-residents’ Income and Wealth).
According to the new provisions, the Finnish account operator and a foreign custodian arerequired to have a custody agreement, according to which the custodian undertakes to a) declarethe country of residence of the beneficial owner of the dividend, b) confirm the applicability of theTreaty to the dividend, c) inform the account operator of any changes to the country of residenceor the applicability of the Treaty, and d) provide the legal identification and address of thebeneficial owner of the dividend and a certificate of residence issued by the local tax authoritiesupon request. It is further required that the foreign custodian is domiciled in a country withwhich Finland has entered into a treaty for the avoidance of double taxation and that thecustodian is entered into the register of foreign custodians maintained by the Finnish taxauthorities.
In general, if based on an applicable treaty for the avoidance of double taxation the withholdingtax rate for dividends is 15% or higher, the treaty rate may be applied when the above-describedconditions of the new provisions are met (Section 10b of the Finnish Act on Taxation ofNon-residents’ Income and Wealth). A lower rate than 15% may be applied based on theapplicable treaty for the avoidance of double taxation only when the following information on thebeneficial owner of the dividend is provided to the payer prior to the dividend payment: name,date of birth or business ID (if applicable) and address in the country of residence.
US and Finnish Tax on Sale or Other Disposition
A US Holder generally will recognize taxable capital gain or loss on the sale or other disposition ofADSs in an amount equal to the difference between the US dollar value of the amount realizedand the adjusted tax basis (determined in US dollars) in the ADSs. If the ADSs are held as a capitalasset, this gain or loss generally will be long-term capital gain or loss if, at the time of the sale,the ADSs have been held for more than one year. Any capital gain or loss, for foreign tax credit
122
purposes, generally will constitute US source gain or loss. In the case of a US Holder that is anindividual, any capital gain generally will be subject to US federal income tax at preferential ratesin effect until December 31, 2008 if specified minimum holding periods are met. The deductibilityof capital losses is subject to significant limitations.
The deposit or withdrawal by a US Holder of shares in exchange for ADSs or of ADSs for sharesunder the deposit agreement generally will not be subject to US federal income tax or Finnishincome tax.
The sale by a US Holder of the ADSs or the underlying shares, other than an individual that, byreason of his residence in Finland for a period exceeding six months, is or becomes liable forFinnish income tax according to the relevant provisions of Finnish tax law, generally will not besubject to income tax in Finland, in accordance with Finnish tax law and the Treaty.
Finnish Capital Taxes
The Finnish capital tax regime was abolished in the beginning of 2006.
Finnish Transfer Tax
Transfers of shares will be, and transfers of ADSs may be, subject to the Finnish transfer tax onlywhen one of the parties to the transfer is subject to Finnish taxation under the Finnish IncomeTax Act by virtue of being a resident of Finland or a Finnish branch of a non-Finnish creditinstitution. In case the Finnish Transfer Tax Act is applicable, transfer tax, however, would not bepayable on stock exchange transfers. Otherwise, the transfer tax would be payable at the rate of1.6% of the transfer value of the security traded.
Finnish Inheritance and Gift Taxes
A transfer of an underlying share by gift or by reason of the death of a US Holder and the transferof an ADS are not subject to Finnish gift or inheritance tax provided that none of the deceasedperson, the donor, the beneficiary of the deceased person or the recipient of the gift is resident inFinland.
Non-Residents of the United States
Beneficial owners of ADSs that are not US Holders will not be subject to US federal income tax ondividends received with respect to ADSs unless this dividend income is effectively connected withthe conduct of a trade or business within the United States. Similarly, non-US Holders generallywill not be subject to US federal income tax on the gain realized on the sale or other disposition ofADSs, unless (a) the gain is effectively connected with the conduct of a trade or business in theUnited States or (b) in the case of an individual, that individual is present in the United States for183 days or more in the taxable year of the disposition and other conditions are met.
US Information Reporting and Backup Withholding
Dividend payments with respect to shares or ADSs and proceeds from the sale or other dispositionof shares or ADSs may be subject to information reporting to the Internal Revenue Service andpossible US backup withholding at the current rate of 28%. Backup withholding will not apply to aHolder, however, if the Holder furnishes a correct taxpayer identification number or certificate offoreign status and makes any other required certification or if it is a recipient otherwise exemptfrom backup withholding (such as a corporation). Any US person required to establish its exemptstatus generally must furnish a duly completed Internal Revenue Service Form W-9 (Request forTaxpayer Identification Number and Certification). Non-US Holders generally are not subject to US
123
information reporting or backup withholding. However, such Holders may be required to providecertification of non-US status (generally on IRS Form W-8BEN) in connection with paymentsreceived in the United States or through certain US-related financial intermediaries. Backupwithholding is not an additional tax. Amounts withheld as backup withholding may be creditedagainst a Holder’s US federal income tax liability, and the Holder may obtain a refund of anyexcess amounts withheld under the backup withholding rules by filing the appropriate claim forrefund with the Internal Revenue Service and furnishing any required information.
10.F Dividends and Paying Agents
Not applicable.
10.G Statement by Experts
Not applicable.
10.H Documents on Display
The documents referred to in this report can be read at the Securities and Exchange Commission’spublic reference facilities at 100 F Street, N.E., Room 1580, Washington, D.C. 20549.
10.I Subsidiary Information
Not applicable.
ITEM 11. QUANTITATIVE AND QUALITATIVE DISCLOSURES ABOUT MARKET RISK
General risk management principles
Nokia’s overall risk management concept is based on visibility of the key risks preventing Nokiafrom reaching its business objectives. This covers all risk areas: strategic, operational, financial andhazard risks. Risk management at Nokia is a systematic and pro-active way to analyze, reviewand manage all opportunities, threats and risks related to Nokia´s objectives rather than to solelyeliminate risks.
The principles documented in Nokia´s Risk Policy and accepted by the Audit Committee of theBoard of Directors require risk management and its elements to be integrated into businessprocesses. One of the main principles is that the business or function owner is also the risk owner,however, it is everyone’s responsibility at Nokia to identify risks preventing us from reaching ourobjectives.
Key risks are reported to the business and Group level management to create assurance onbusiness risks and to enable prioritization of risk management implementation at Nokia. Inaddition to general principles there are specific risk management policies covering, for example,treasury and customer finance risks.
Financial risks
The key financial targets for Nokia are growth, profitability, operational efficiency and a strongbalance sheet. The objective for the Treasury function is twofold: to guarantee cost-efficientfunding for the Group at all times, and to identify, evaluate and hedge financial risks in closeco-operation with the business groups. There is a strong focus in Nokia on creating shareholdervalue. The Treasury function supports this aim by minimizing the adverse effects caused byfluctuations in the financial markets on the profitability of the underlying businesses and bymanaging the balance sheet structure of the Group.
124
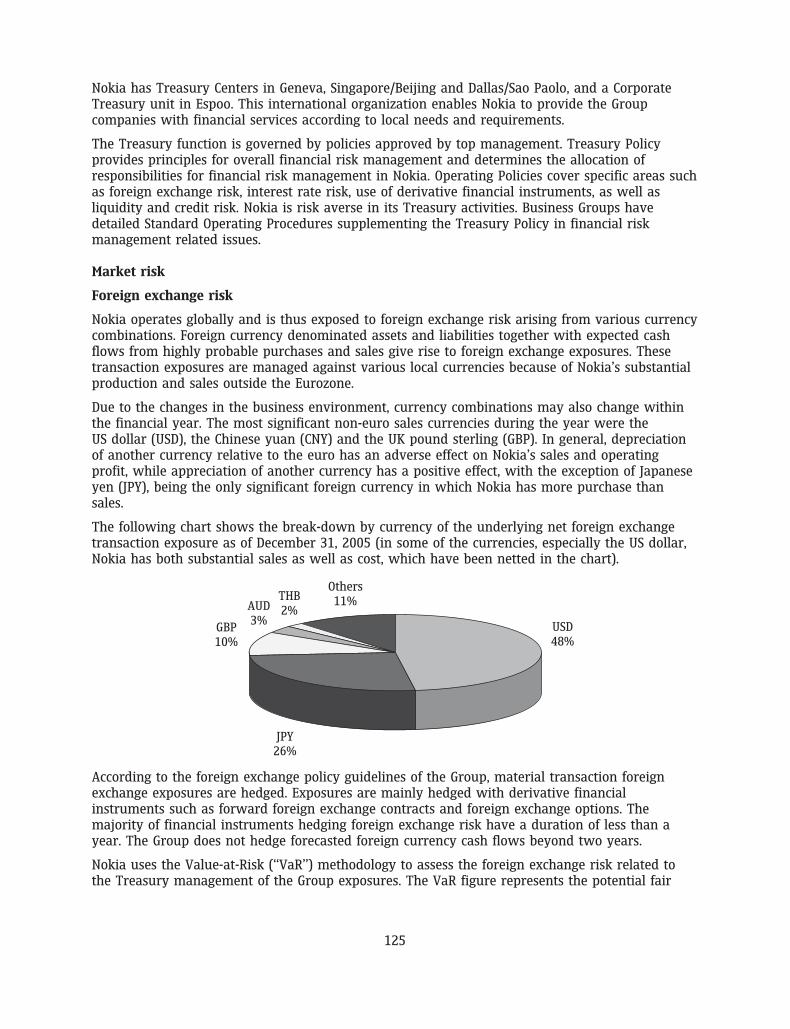
20FEB200617415963
Nokia has Treasury Centers in Geneva, Singapore/Beijing and Dallas/Sao Paolo, and a CorporateTreasury unit in Espoo. This international organization enables Nokia to provide the Groupcompanies with financial services according to local needs and requirements.
The Treasury function is governed by policies approved by top management. Treasury Policyprovides principles for overall financial risk management and determines the allocation ofresponsibilities for financial risk management in Nokia. Operating Policies cover specific areas suchas foreign exchange risk, interest rate risk, use of derivative financial instruments, as well asliquidity and credit risk. Nokia is risk averse in its Treasury activities. Business Groups havedetailed Standard Operating Procedures supplementing the Treasury Policy in financial riskmanagement related issues.
Market risk
Foreign exchange risk
Nokia operates globally and is thus exposed to foreign exchange risk arising from various currencycombinations. Foreign currency denominated assets and liabilities together with expected cashflows from highly probable purchases and sales give rise to foreign exchange exposures. Thesetransaction exposures are managed against various local currencies because of Nokia’s substantialproduction and sales outside the Eurozone.
Due to the changes in the business environment, currency combinations may also change withinthe financial year. The most significant non-euro sales currencies during the year were theUS dollar (USD), the Chinese yuan (CNY) and the UK pound sterling (GBP). In general, depreciationof another currency relative to the euro has an adverse effect on Nokia’s sales and operatingprofit, while appreciation of another currency has a positive effect, with the exception of Japaneseyen (JPY), being the only significant foreign currency in which Nokia has more purchase thansales.
The following chart shows the break-down by currency of the underlying net foreign exchangetransaction exposure as of December 31, 2005 (in some of the currencies, especially the US dollar,Nokia has both substantial sales as well as cost, which have been netted in the chart).
THB2%AUD
3%GBP10%
USD48%
JPY26%
Others11%
According to the foreign exchange policy guidelines of the Group, material transaction foreignexchange exposures are hedged. Exposures are mainly hedged with derivative financialinstruments such as forward foreign exchange contracts and foreign exchange options. Themajority of financial instruments hedging foreign exchange risk have a duration of less than ayear. The Group does not hedge forecasted foreign currency cash flows beyond two years.
Nokia uses the Value-at-Risk (‘‘VaR’’) methodology to assess the foreign exchange risk related tothe Treasury management of the Group exposures. The VaR figure represents the potential fair
125
value losses for a portfolio resulting from adverse changes in market factors using a specified timeperiod and confidence level based on historical data. To correctly take into account the non-linearprice function of certain derivative instruments, Nokia uses Monte Carlo simulation. Volatilities andcorrelations are calculated from a one-year set of daily data. The VaR figures assume that theforecasted cash flows materialize as expected. The VaR figures for the Group transaction foreignexchange exposure, including hedging transactions and Treasury exposures for netting and riskmanagement purposes, with a one-week horizon and 95% confidence level, are shown in Table 1,below.
Table 1 Transaction foreign exchange position Value-at-Risk
VaR 2005 2004
(EUR million)
At December 31 . . . . . . . . . . . . . . . . . . . . . . . . . . . . . . . . . . . . . . . . . . . . . . . . . . . 12.4 12.7Average for the year . . . . . . . . . . . . . . . . . . . . . . . . . . . . . . . . . . . . . . . . . . . . . . . 10.2 14Range for the year . . . . . . . . . . . . . . . . . . . . . . . . . . . . . . . . . . . . . . . . . . . . . . . . . 3.3-29.3 1.6-26.9
Since Nokia has subsidiaries outside the Eurozone, the euro-denominated value of theshareholders’ equity of Nokia is also exposed to fluctuations in exchange rates. Equity changescaused by movements in foreign exchange rates are shown as a translation difference in theGroup consolidation. Nokia uses, from time to time, foreign exchange contracts and foreigncurrency denominated loans to hedge its equity exposure arising from foreign net investments.
Interest rate risk
The Group is exposed to interest rate risk either through market value fluctuations of balancesheet items (i.e. price risk) and through changes in interest income or expenses (i.e. re-investmentrisk). Interest rate risk mainly arises through interest-bearing liabilities and assets. Estimatedfuture changes in cash flows and balance sheet structure also expose the Group to interest raterisk.
Treasury is responsible for monitoring and managing the interest rate exposure of the Group. Dueto the current balance sheet structure of Nokia, emphasis is placed on managing the interest raterisk of investments.
Nokia uses the VaR methodology to assess and measure the interest rate risk in the investmentportfolio, which is benchmarked against a combination of three-month and one-to-three-yearinvestment horizon. The VaR figure represents the potential fair value losses for a portfolioresulting from adverse changes in market factors using a specified time period and confidencelevel based on historical data. For interest rate risk VaR, Nokia uses variance-covariancemethodology. Volatilities and correlations are calculated from a one-year set of daily data. TheVaR-based interest rate risk figures for an investment portfolio with a one-week horizon and 95%confidence level are shown in Table 2, below.
Table 2 Treasury investment portfolio Value-at-Risk
VaR 2005 2004
(EUR million)
At December 31 . . . . . . . . . . . . . . . . . . . . . . . . . . . . . . . . . . . . . . . . . . . . . . . . . . . 6.9 10.4Average for the year . . . . . . . . . . . . . . . . . . . . . . . . . . . . . . . . . . . . . . . . . . . . . . . 10.0 6.3Range for the year . . . . . . . . . . . . . . . . . . . . . . . . . . . . . . . . . . . . . . . . . . . . . . . . . 6.9-15.3 3.6-10.8
126
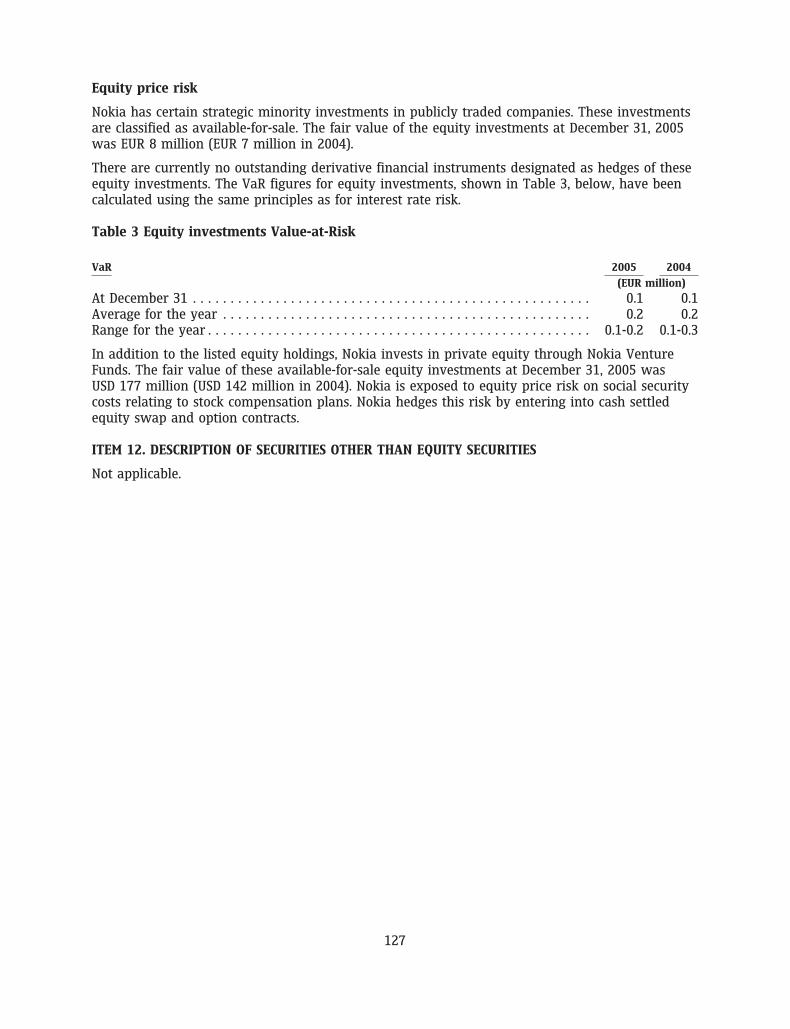
Equity price risk
Nokia has certain strategic minority investments in publicly traded companies. These investmentsare classified as available-for-sale. The fair value of the equity investments at December 31, 2005was EUR 8 million (EUR 7 million in 2004).
There are currently no outstanding derivative financial instruments designated as hedges of theseequity investments. The VaR figures for equity investments, shown in Table 3, below, have beencalculated using the same principles as for interest rate risk.
Table 3 Equity investments Value-at-Risk
VaR 2005 2004
(EUR million)
At December 31 . . . . . . . . . . . . . . . . . . . . . . . . . . . . . . . . . . . . . . . . . . . . . . . . . . . . . 0.1 0.1Average for the year . . . . . . . . . . . . . . . . . . . . . . . . . . . . . . . . . . . . . . . . . . . . . . . . . 0.2 0.2Range for the year . . . . . . . . . . . . . . . . . . . . . . . . . . . . . . . . . . . . . . . . . . . . . . . . . . . 0.1-0.2 0.1-0.3
In addition to the listed equity holdings, Nokia invests in private equity through Nokia VentureFunds. The fair value of these available-for-sale equity investments at December 31, 2005 wasUSD 177 million (USD 142 million in 2004). Nokia is exposed to equity price risk on social securitycosts relating to stock compensation plans. Nokia hedges this risk by entering into cash settledequity swap and option contracts.
ITEM 12. DESCRIPTION OF SECURITIES OTHER THAN EQUITY SECURITIES
Not applicable.
127
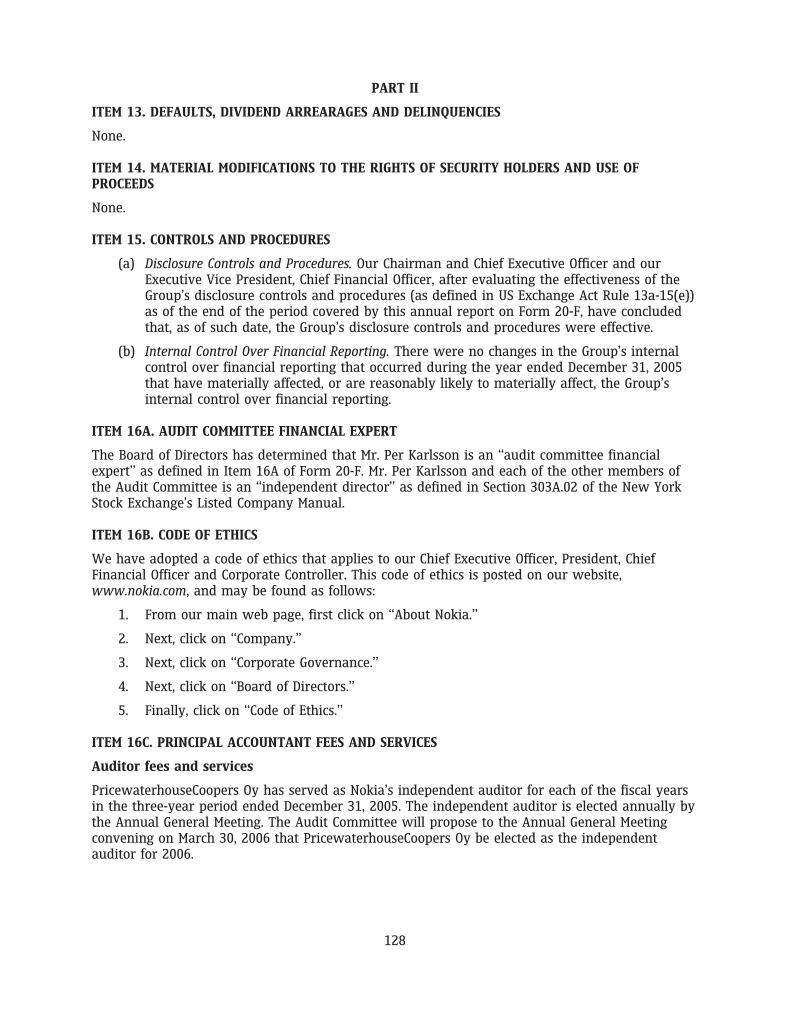
PART II
ITEM 13. DEFAULTS, DIVIDEND ARREARAGES AND DELINQUENCIES
None.
ITEM 14. MATERIAL MODIFICATIONS TO THE RIGHTS OF SECURITY HOLDERS AND USE OFPROCEEDS
None.
ITEM 15. CONTROLS AND PROCEDURES
(a) Disclosure Controls and Procedures. Our Chairman and Chief Executive Officer and ourExecutive Vice President, Chief Financial Officer, after evaluating the effectiveness of theGroup’s disclosure controls and procedures (as defined in US Exchange Act Rule 13a-15(e))as of the end of the period covered by this annual report on Form 20-F, have concludedthat, as of such date, the Group’s disclosure controls and procedures were effective.
(b) Internal Control Over Financial Reporting. There were no changes in the Group’s internalcontrol over financial reporting that occurred during the year ended December 31, 2005that have materially affected, or are reasonably likely to materially affect, the Group’sinternal control over financial reporting.
ITEM 16A. AUDIT COMMITTEE FINANCIAL EXPERT
The Board of Directors has determined that Mr. Per Karlsson is an ‘‘audit committee financialexpert’’ as defined in Item 16A of Form 20-F. Mr. Per Karlsson and each of the other members ofthe Audit Committee is an ‘‘independent director’’ as defined in Section 303A.02 of the New YorkStock Exchange’s Listed Company Manual.
ITEM 16B. CODE OF ETHICS
We have adopted a code of ethics that applies to our Chief Executive Officer, President, ChiefFinancial Officer and Corporate Controller. This code of ethics is posted on our website,www.nokia.com, and may be found as follows:
1. From our main web page, first click on ‘‘About Nokia.’’
2. Next, click on ‘‘Company.’’
3. Next, click on ‘‘Corporate Governance.’’
4. Next, click on ‘‘Board of Directors.’’
5. Finally, click on ‘‘Code of Ethics.’’
ITEM 16C. PRINCIPAL ACCOUNTANT FEES AND SERVICES
Auditor fees and services
PricewaterhouseCoopers Oy has served as Nokia’s independent auditor for each of the fiscal yearsin the three-year period ended December 31, 2005. The independent auditor is elected annually bythe Annual General Meeting. The Audit Committee will propose to the Annual General Meetingconvening on March 30, 2006 that PricewaterhouseCoopers Oy be elected as the independentauditor for 2006.
128
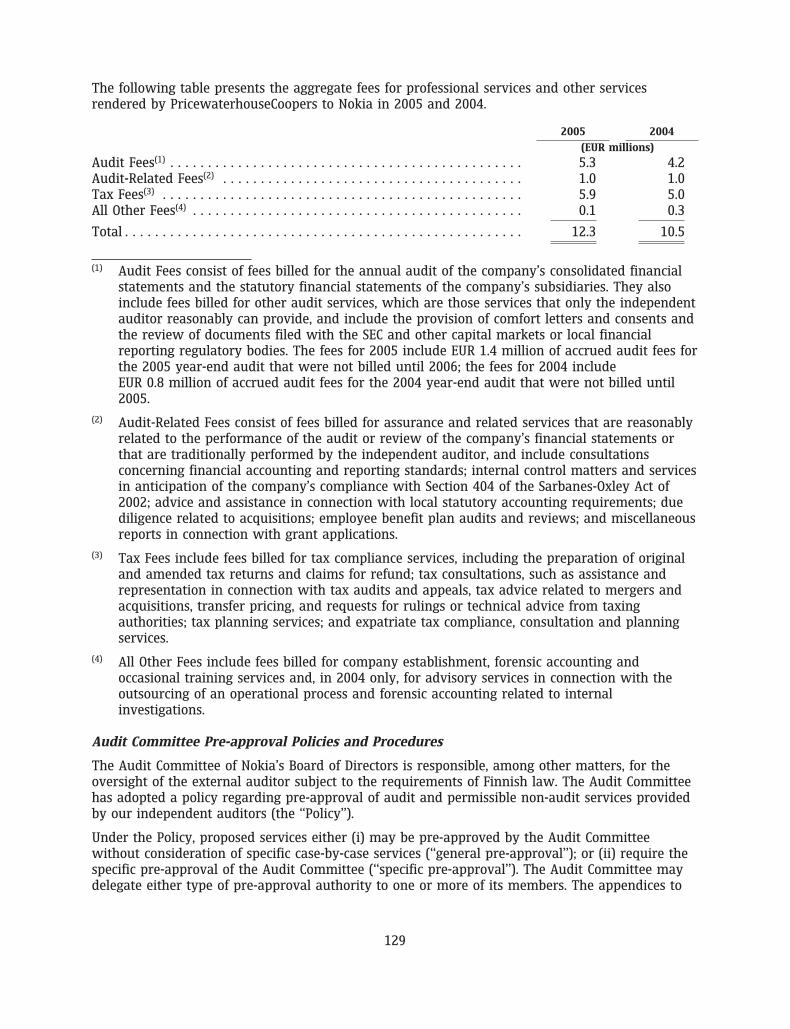
The following table presents the aggregate fees for professional services and other servicesrendered by PricewaterhouseCoopers to Nokia in 2005 and 2004.
2005 2004
(EUR millions)
Audit Fees(1) . . . . . . . . . . . . . . . . . . . . . . . . . . . . . . . . . . . . . . . . . . . . . . . 5.3 4.2Audit-Related Fees(2) . . . . . . . . . . . . . . . . . . . . . . . . . . . . . . . . . . . . . . . . 1.0 1.0Tax Fees(3) . . . . . . . . . . . . . . . . . . . . . . . . . . . . . . . . . . . . . . . . . . . . . . . . 5.9 5.0All Other Fees(4) . . . . . . . . . . . . . . . . . . . . . . . . . . . . . . . . . . . . . . . . . . . . 0.1 0.3
Total . . . . . . . . . . . . . . . . . . . . . . . . . . . . . . . . . . . . . . . . . . . . . . . . . . . . . 12.3 10.5
(1) Audit Fees consist of fees billed for the annual audit of the company’s consolidated financialstatements and the statutory financial statements of the company’s subsidiaries. They alsoinclude fees billed for other audit services, which are those services that only the independentauditor reasonably can provide, and include the provision of comfort letters and consents andthe review of documents filed with the SEC and other capital markets or local financialreporting regulatory bodies. The fees for 2005 include EUR 1.4 million of accrued audit fees forthe 2005 year-end audit that were not billed until 2006; the fees for 2004 includeEUR 0.8 million of accrued audit fees for the 2004 year-end audit that were not billed until2005.
(2) Audit-Related Fees consist of fees billed for assurance and related services that are reasonablyrelated to the performance of the audit or review of the company’s financial statements orthat are traditionally performed by the independent auditor, and include consultationsconcerning financial accounting and reporting standards; internal control matters and servicesin anticipation of the company’s compliance with Section 404 of the Sarbanes-Oxley Act of2002; advice and assistance in connection with local statutory accounting requirements; duediligence related to acquisitions; employee benefit plan audits and reviews; and miscellaneousreports in connection with grant applications.
(3) Tax Fees include fees billed for tax compliance services, including the preparation of originaland amended tax returns and claims for refund; tax consultations, such as assistance andrepresentation in connection with tax audits and appeals, tax advice related to mergers andacquisitions, transfer pricing, and requests for rulings or technical advice from taxingauthorities; tax planning services; and expatriate tax compliance, consultation and planningservices.
(4) All Other Fees include fees billed for company establishment, forensic accounting andoccasional training services and, in 2004 only, for advisory services in connection with theoutsourcing of an operational process and forensic accounting related to internalinvestigations.
Audit Committee Pre-approval Policies and Procedures
The Audit Committee of Nokia’s Board of Directors is responsible, among other matters, for theoversight of the external auditor subject to the requirements of Finnish law. The Audit Committeehas adopted a policy regarding pre-approval of audit and permissible non-audit services providedby our independent auditors (the ‘‘Policy’’).
Under the Policy, proposed services either (i) may be pre-approved by the Audit Committeewithout consideration of specific case-by-case services (‘‘general pre-approval’’); or (ii) require thespecific pre-approval of the Audit Committee (‘‘specific pre-approval’’). The Audit Committee maydelegate either type of pre-approval authority to one or more of its members. The appendices to
129
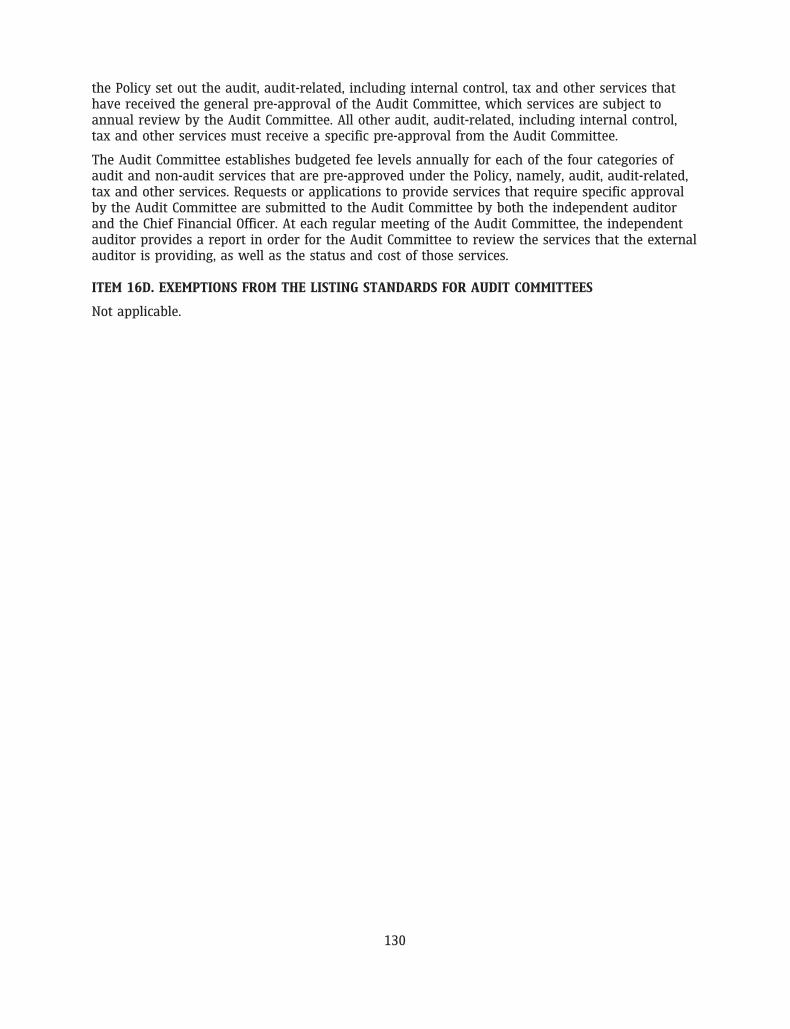
the Policy set out the audit, audit-related, including internal control, tax and other services thathave received the general pre-approval of the Audit Committee, which services are subject toannual review by the Audit Committee. All other audit, audit-related, including internal control,tax and other services must receive a specific pre-approval from the Audit Committee.
The Audit Committee establishes budgeted fee levels annually for each of the four categories ofaudit and non-audit services that are pre-approved under the Policy, namely, audit, audit-related,tax and other services. Requests or applications to provide services that require specific approvalby the Audit Committee are submitted to the Audit Committee by both the independent auditorand the Chief Financial Officer. At each regular meeting of the Audit Committee, the independentauditor provides a report in order for the Audit Committee to review the services that the externalauditor is providing, as well as the status and cost of those services.
ITEM 16D. EXEMPTIONS FROM THE LISTING STANDARDS FOR AUDIT COMMITTEES
Not applicable.
130
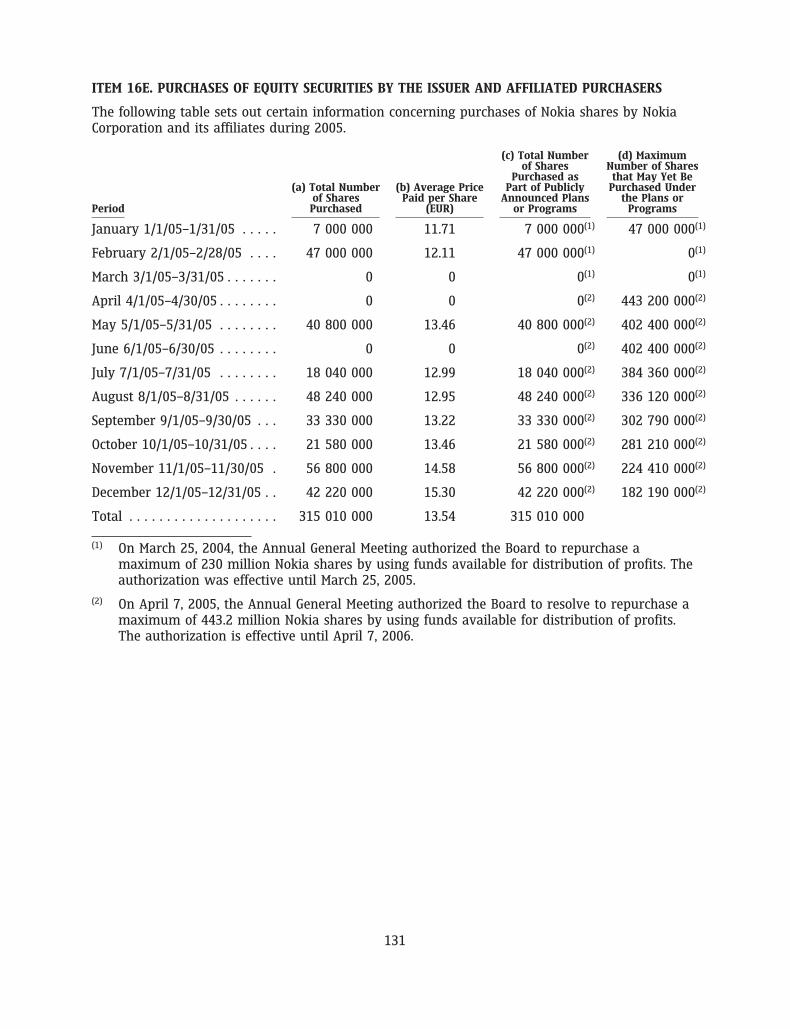
ITEM 16E. PURCHASES OF EQUITY SECURITIES BY THE ISSUER AND AFFILIATED PURCHASERS
The following table sets out certain information concerning purchases of Nokia shares by NokiaCorporation and its affiliates during 2005.
(c) Total Number (d) Maximumof Shares Number of Shares
Purchased as that May Yet Be(a) Total Number (b) Average Price Part of Publicly Purchased Under
of Shares Paid per Share Announced Plans the Plans orPeriod Purchased (EUR) or Programs Programs
January 1/1/05–1/31/05 . . . . . 7 000 000 11.71 7 000 000(1) 47 000 000(1)
February 2/1/05–2/28/05 . . . . 47 000 000 12.11 47 000 000(1) 0(1)
March 3/1/05–3/31/05 . . . . . . . 0 0 0(1) 0(1)
April 4/1/05–4/30/05 . . . . . . . . 0 0 0(2) 443 200 000(2)
May 5/1/05–5/31/05 . . . . . . . . 40 800 000 13.46 40 800 000(2) 402 400 000(2)
June 6/1/05–6/30/05 . . . . . . . . 0 0 0(2) 402 400 000(2)
July 7/1/05–7/31/05 . . . . . . . . 18 040 000 12.99 18 040 000(2) 384 360 000(2)
August 8/1/05–8/31/05 . . . . . . 48 240 000 12.95 48 240 000(2) 336 120 000(2)
September 9/1/05–9/30/05 . . . 33 330 000 13.22 33 330 000(2) 302 790 000(2)
October 10/1/05–10/31/05 . . . . 21 580 000 13.46 21 580 000(2) 281 210 000(2)
November 11/1/05–11/30/05 . 56 800 000 14.58 56 800 000(2) 224 410 000(2)
December 12/1/05–12/31/05 . . 42 220 000 15.30 42 220 000(2) 182 190 000(2)
Total . . . . . . . . . . . . . . . . . . . . 315 010 000 13.54 315 010 000
(1) On March 25, 2004, the Annual General Meeting authorized the Board to repurchase amaximum of 230 million Nokia shares by using funds available for distribution of profits. Theauthorization was effective until March 25, 2005.
(2) On April 7, 2005, the Annual General Meeting authorized the Board to resolve to repurchase amaximum of 443.2 million Nokia shares by using funds available for distribution of profits.The authorization is effective until April 7, 2006.
131
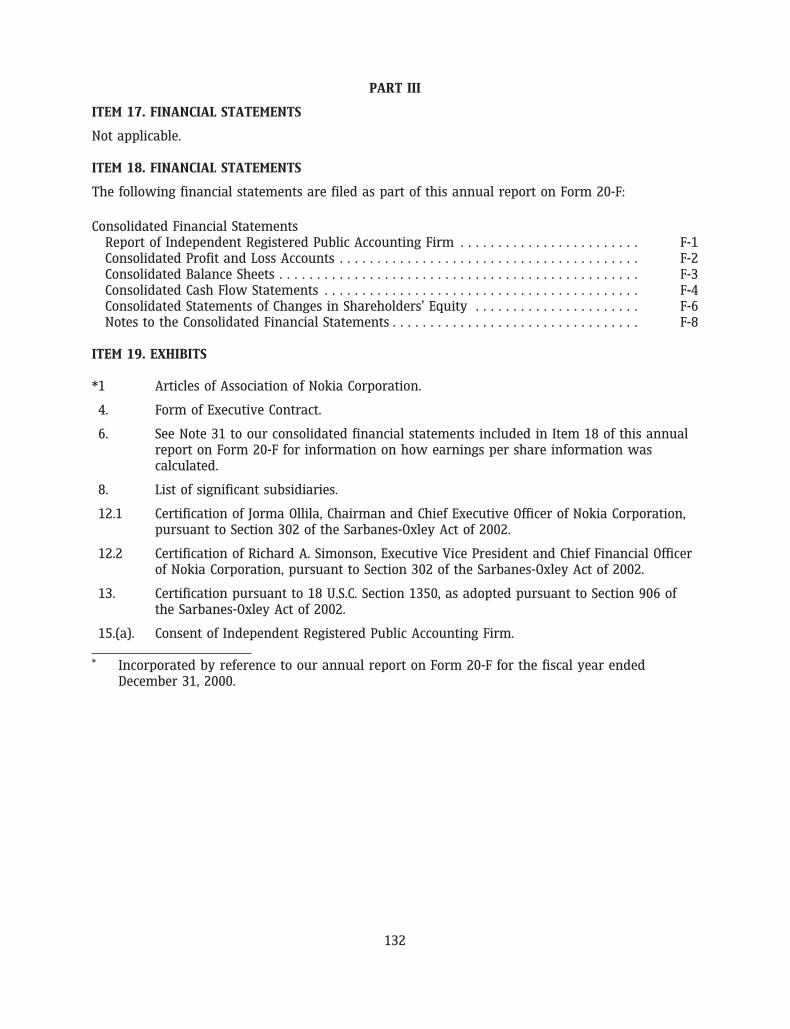
PART III
ITEM 17. FINANCIAL STATEMENTS
Not applicable.
ITEM 18. FINANCIAL STATEMENTS
The following financial statements are filed as part of this annual report on Form 20-F:
Consolidated Financial StatementsReport of Independent Registered Public Accounting Firm . . . . . . . . . . . . . . . . . . . . . . . . F-1Consolidated Profit and Loss Accounts . . . . . . . . . . . . . . . . . . . . . . . . . . . . . . . . . . . . . . . . F-2Consolidated Balance Sheets . . . . . . . . . . . . . . . . . . . . . . . . . . . . . . . . . . . . . . . . . . . . . . . . F-3Consolidated Cash Flow Statements . . . . . . . . . . . . . . . . . . . . . . . . . . . . . . . . . . . . . . . . . . F-4Consolidated Statements of Changes in Shareholders’ Equity . . . . . . . . . . . . . . . . . . . . . . F-6Notes to the Consolidated Financial Statements . . . . . . . . . . . . . . . . . . . . . . . . . . . . . . . . . F-8
ITEM 19. EXHIBITS
*1 Articles of Association of Nokia Corporation.
4. Form of Executive Contract.
6. See Note 31 to our consolidated financial statements included in Item 18 of this annualreport on Form 20-F for information on how earnings per share information wascalculated.
8. List of significant subsidiaries.
12.1 Certification of Jorma Ollila, Chairman and Chief Executive Officer of Nokia Corporation,pursuant to Section 302 of the Sarbanes-Oxley Act of 2002.
12.2 Certification of Richard A. Simonson, Executive Vice President and Chief Financial Officerof Nokia Corporation, pursuant to Section 302 of the Sarbanes-Oxley Act of 2002.
13. Certification pursuant to 18 U.S.C. Section 1350, as adopted pursuant to Section 906 ofthe Sarbanes-Oxley Act of 2002.
15.(a). Consent of Independent Registered Public Accounting Firm.
* Incorporated by reference to our annual report on Form 20-F for the fiscal year endedDecember 31, 2000.
132
GLOSSARY OF TERMS
2G (second generation mobile communications): A digital cellular system such as GSM 900,1800 and 1900.
3G (third generation mobile communications): A digital system for mobile communicationsthat provides increased bandwidth and lets a mobile device user access a wide variety of services,such as multimedia.
3GPP (Third Generation Partnership Project) and 3GPP2 (Third Generation PartnershipProject 2): Projects in which standards organizations and other related bodies have agreed toco-operate on the production of globally applicable technical specifications for a third generationmobile system.
3GPP Release 4: A particular version of 3GPP standards in which the control and traffic layers inthe circuit-switched core are separated.
Access network: A telecommunications network between a local exchange and the subscriberstation.
Analogue: A signaling technique in which signals are conveyed by continuously varying thefrequency, amplitude or phase of the transmission.
Base station: A network element in a mobile network responsible for radio transmission andreception to or from the mobile station.
Base station controller: A network element in a mobile network for controlling one or morebase transceiver stations in the call set-up functions, in signaling, in the use of radio channels, andin various maintenance tasks.
Bluetooth: A technology that provides short-range radio links to allow mobile computers, mobilephones, digital cameras, and other portable devices to communicate with each other withoutcables.
Broadband network: A network that delivers higher bandwidth by using transmission channelscapable of supporting data rates greater than the primary rate of 9.6 Kbit/s.
CDMA (Code Division Multiple Access): A technique in which radio transmissions using the samefrequency band are coded in a way that a signal from a certain transmitter can be received onlyby certain receivers.
Cellular network: A mobile telephone network consisting of switching centers, radio basestations and transmission equipment.
Circuit switching: Electronic communications via a dedicated channel, or circuit, for the durationof the communication.
Core network: A combination of exchanges and the basic transmission equipment that togetherform the basis for network services.
Digital: A signaling technique in which a signal is encoded into digits for transmission.
Dual Transfer Mode (DTM): A transfer mode in which a mobile station is simultaneously indedicated mode and packet transfer mode.
DVB-H (Digital Video Broadcast—Handheld): A digital TV broadcasting technology based ontraditional terrestrial antenna broadcast technology that enables service reception in handhelddevices.
133
EDGE (Enhanced Data Rates for Global Evolution): A technology to boost cellular networkcapacity and increase data rates of existing GSM networks to as high as 473 Kbit/s.
ETSI (European Telecommunications Standards Institute): Standards produced by the ETSIcontain technical specifications laying down the characteristics required for a telecommunicationsproduct.
Firewall Gateways: Network points that act as an entrance to another network.
GPRS (General Packet Radio Services): A service that provides packet switched data, primarilyfor second generation GSM networks.
GSM (Global System for Mobile Communications): A digital system for mobile communicationsthat is based on a widely accepted standard and typically operates in the 900 MHz, 1800 MHz, and1900 MHz frequency bands.
HSDPA (High Speed Downlink Packet Access): A wideband code division multiple access featurethat provides high data rate transmission in a WCDMA downlink to support multimedia services.HSDPA brings high speed data delivery to 3G terminals, ensuring that users requiring effectivemultimedia capabilities benefit from data rates previously unavailable because of limitations inthe radio access network.
HSUPA (High Speed Uplink Packet Access): A wideband code division multiple access featurethat provides high data rate transmission in a WCDMA uplink to support multimedia services.
I-HSPA (Internet-HSPA): A 3GPP standards-based simplified network architecture innovationfrom Nokia implemented as a data overlay radio access layer that can be built with alreadydeployed WCDMA base stations.
IEEE (Institute of Electrical and Electronics Engineers): A non-profit, technical professionalassociation that is an authority in technical areas ranging from computer engineering, biomedicaltechnology and telecommunications, to electric power, aerospace and consumer electronics, amongothers.
IETF (The Internet Engineering Task Force): An international organization consisting of over80 working groups responsible for developing Internet standards.
IMS (IP Multimedia Subsystem): A subsystem providing IP multimedia services that complementthe services provided by the circuit switched core network domain.
IP (Internet Protocol): A network layer protocol that offers a connectionless Internetworkservice and forms part of the TCP/IP protocol.
IP Network (Internet Protocol Network): A data communications network based on theInternet protocol.
IPSec (Internet Protocol Security): A protocol that provides Internet security architecture fordata confidentiality, data integrity, and data authentication to support secure exchange of packetsat the IP layer.
IPSec VPN (Internet Protocol Security Virtual Private Network): A technology for establishing aVirtual Private Network connection by using the IPSec protocol.
Java: An object-oriented programming language that is intended to be hardware and softwareindependent.
MMS (Multimedia Messaging Services): An open standard defined by the Open Mobile Alliancethat enables mobile phone users to send and receive messages with rich content, such as images,polyphonic ring tones, audio clips and even short videos.
134
Multiradio: Able to support several different radio access technologies.
NFC (Near Field Communication): A technology that enables users to exchange informationbetween devices located near to each other.
OMA (Open Mobile Alliance): An organization that acts as a mobile industry standards forumaiming at interoperable mobile services across geographic areas, network operators, and mobileterminals, as well as at an open standards-based framework that permits services in a multi-vendor environment.
OS: Operating System
Packet: Part of a message transmitted over a packet switched network.
Packet switching: A technique that enables digitized data to be split into a number of packets,sometimes called datagrams, and sent out over various network routes to their location.
PBX (Private Branch Exchange): A local exchange serving extensions in a business complex andproviding access to the public network.
PDA (Personal Digital Assistant): A portable device that combines a wide range of functions,such as diary, address book, word processor, and calculator.
Pixel: The basic unit of the composition of an image on an electronic display screen.
Platform: A basic system on which different applications can be developed. A platform consistsof physical hardware entities and basic software elements such as the operating system.
Push to talk over Cellular (PoC): A service that provides direct one-to-one and one-to-manyvoice communication in the cellular network.
QVGA: A screen resolution of 320x240 pixels.
S60: A feature rich software platform for smartphones with advanced data capabilities that isoptimized for the Symbian OS.
Softswitch: A switch that has distributed, layered software architecture and is meant for thepublic network infrastructure for data, video, and voice communications.
SSL (Secure Socket Layer): A transport-level protocol that adds authentication and dataencryption to TCP connections and as such is the standard protocol for securing web browsing.
SSL VPN: A technology for establishing a VPN connection by using the SSL protocol.
Streaming: The simultaneous transfer of digital media, such as video, voice and data, which isreceived as a continuous stream.
Symbian OS: An operating system, application framework and application suite optimized for theneeds of wireless information devices such as smartphones and communicators, and for handheld,battery-powered, computers.
Synchronization: A process that causes something to occur or recur at the same time or inunison. Synchronization can be used to make the contents of specific files identical on differentdevices.
TCP/IP (Transmission Control Protocol/Internet Protocol): A basic communication protocolused to transmit data over networks, on the Internet and on private networks.
TD-SCDMA (time division synchronous code division multiple access): An alternative 3Gstandard.
135
TETRA (Terrestrial Trunked Radio): An open digital trunked radio standard defined by ETSI.
Transfer mode: Transmission, multiplexing and switching in a telecommunications network.
Transmission: The action of conveying signals from one point to one or more other points.
VAR (Value Added Reseller): A reseller that adds something to a product, thus creating acomplete customer solution which it then sells under its own name.
VoIP (Voice over Internet Protocol): Use of the Internet protocol to carry and route two-wayvoice communications.
VPN (Virtual Private Network): A private network built using a public network as a base.
WCDMA (Wideband Code Division Multiple Access): A third-generation mobile wirelesstechnology that offers high data speeds to mobile and portable wireless devices.
WiFi: A technology of wireless local area networks that operates according to the 802.11standard of the Institute of Electrical and Electronics Engineers (IEEE).
WiMAX (Worldwide Interoperability for Microwave Access): A technology of wireless networksthat operates according to the 802.16 standard of the Institute of Electrical and ElectronicsEngineers (IEEE).
WLAN (wireless local area network): A local area network using wireless connections, such asradio, microwave or infrared links, in place of physical cables.
136
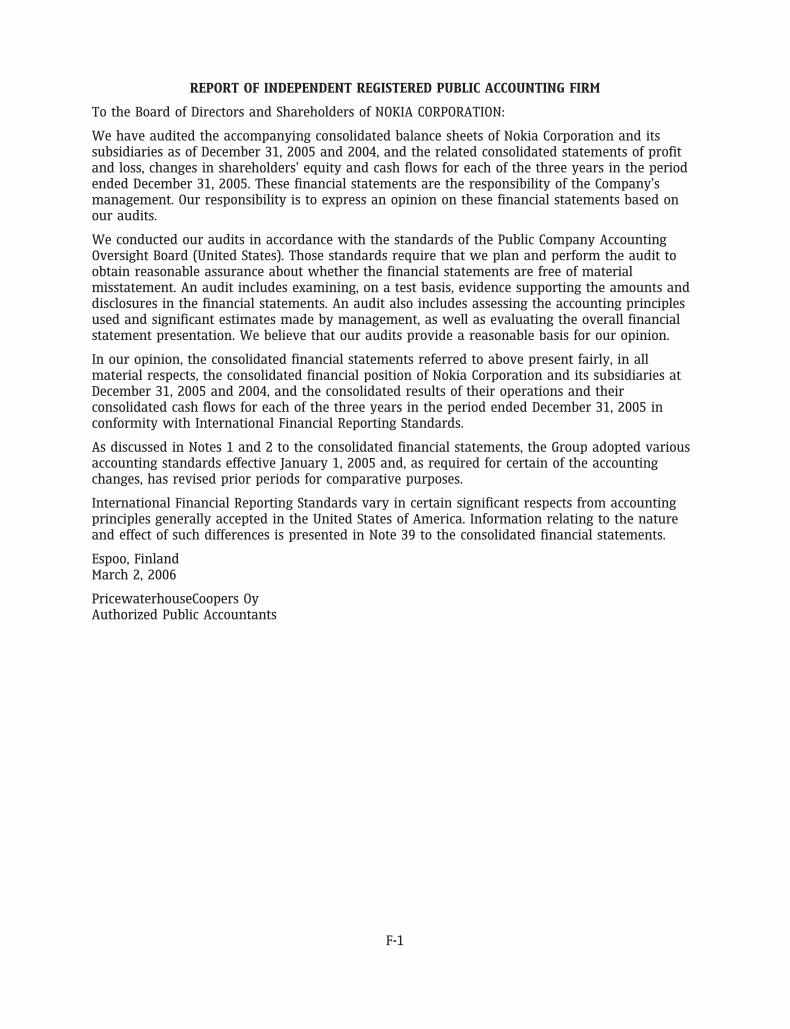
REPORT OF INDEPENDENT REGISTERED PUBLIC ACCOUNTING FIRM
To the Board of Directors and Shareholders of NOKIA CORPORATION:
We have audited the accompanying consolidated balance sheets of Nokia Corporation and itssubsidiaries as of December 31, 2005 and 2004, and the related consolidated statements of profitand loss, changes in shareholders’ equity and cash flows for each of the three years in the periodended December 31, 2005. These financial statements are the responsibility of the Company’smanagement. Our responsibility is to express an opinion on these financial statements based onour audits.
We conducted our audits in accordance with the standards of the Public Company AccountingOversight Board (United States). Those standards require that we plan and perform the audit toobtain reasonable assurance about whether the financial statements are free of materialmisstatement. An audit includes examining, on a test basis, evidence supporting the amounts anddisclosures in the financial statements. An audit also includes assessing the accounting principlesused and significant estimates made by management, as well as evaluating the overall financialstatement presentation. We believe that our audits provide a reasonable basis for our opinion.
In our opinion, the consolidated financial statements referred to above present fairly, in allmaterial respects, the consolidated financial position of Nokia Corporation and its subsidiaries atDecember 31, 2005 and 2004, and the consolidated results of their operations and theirconsolidated cash flows for each of the three years in the period ended December 31, 2005 inconformity with International Financial Reporting Standards.
As discussed in Notes 1 and 2 to the consolidated financial statements, the Group adopted variousaccounting standards effective January 1, 2005 and, as required for certain of the accountingchanges, has revised prior periods for comparative purposes.
International Financial Reporting Standards vary in certain significant respects from accountingprinciples generally accepted in the United States of America. Information relating to the natureand effect of such differences is presented in Note 39 to the consolidated financial statements.
Espoo, FinlandMarch 2, 2006
PricewaterhouseCoopers OyAuthorized Public Accountants
F-1
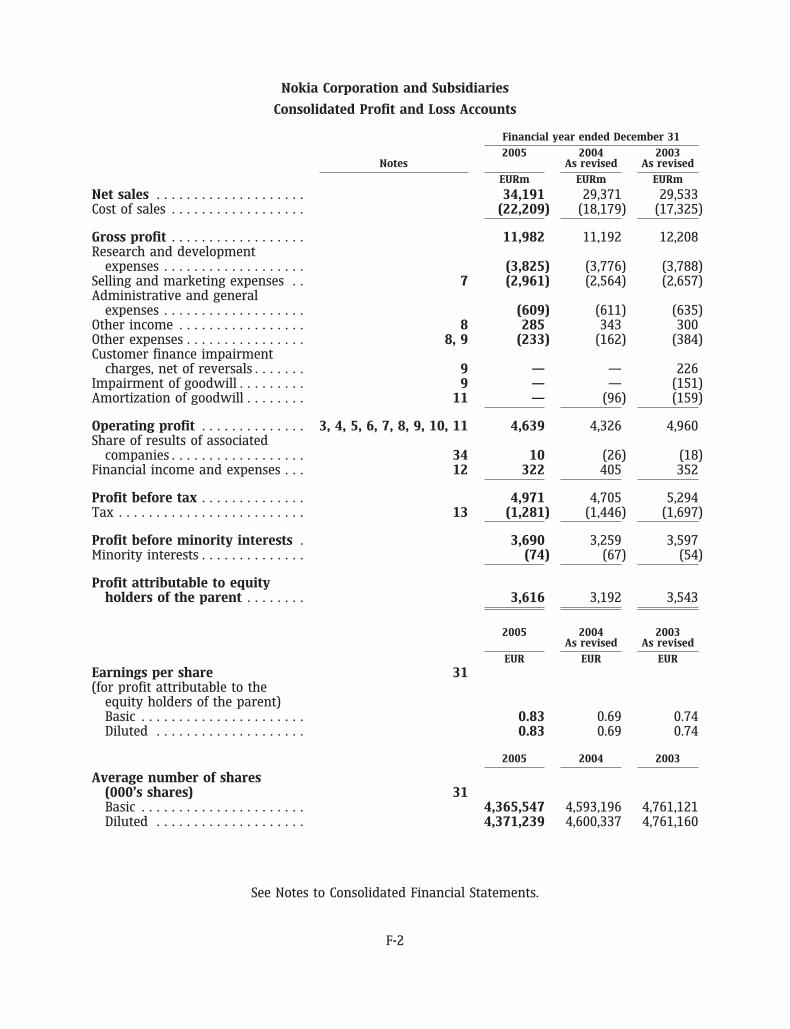
Nokia Corporation and Subsidiaries
Consolidated Profit and Loss Accounts
Financial year ended December 31
2005 2004 2003Notes As revised As revised
EURm EURm EURm
Net sales . . . . . . . . . . . . . . . . . . . . 34,191 29,371 29,533Cost of sales . . . . . . . . . . . . . . . . . . (22,209) (18,179) (17,325)
Gross profit . . . . . . . . . . . . . . . . . . 11,982 11,192 12,208Research and development
expenses . . . . . . . . . . . . . . . . . . . (3,825) (3,776) (3,788)Selling and marketing expenses . . 7 (2,961) (2,564) (2,657)Administrative and general
expenses . . . . . . . . . . . . . . . . . . . (609) (611) (635)Other income . . . . . . . . . . . . . . . . . 8 285 343 300Other expenses . . . . . . . . . . . . . . . . 8, 9 (233) (162) (384)Customer finance impairment
charges, net of reversals . . . . . . . 9 — — 226Impairment of goodwill . . . . . . . . . 9 — — (151)Amortization of goodwill . . . . . . . . 11 — (96) (159)
Operating profit . . . . . . . . . . . . . . 3, 4, 5, 6, 7, 8, 9, 10, 11 4,639 4,326 4,960Share of results of associated
companies . . . . . . . . . . . . . . . . . . 34 10 (26) (18)Financial income and expenses . . . 12 322 405 352
Profit before tax . . . . . . . . . . . . . . 4,971 4,705 5,294Tax . . . . . . . . . . . . . . . . . . . . . . . . . 13 (1,281) (1,446) (1,697)
Profit before minority interests . 3,690 3,259 3,597Minority interests . . . . . . . . . . . . . . (74) (67) (54)
Profit attributable to equityholders of the parent . . . . . . . . 3,616 3,192 3,543
2005 2004 2003As revised As revised
EUR EUR EUREarnings per share 31(for profit attributable to the
equity holders of the parent)Basic . . . . . . . . . . . . . . . . . . . . . . 0.83 0.69 0.74Diluted . . . . . . . . . . . . . . . . . . . . 0.83 0.69 0.74
2005 2004 2003
Average number of shares(000’s shares) 31Basic . . . . . . . . . . . . . . . . . . . . . . 4,365,547 4,593,196 4,761,121Diluted . . . . . . . . . . . . . . . . . . . . 4,371,239 4,600,337 4,761,160
See Notes to Consolidated Financial Statements.
F-2
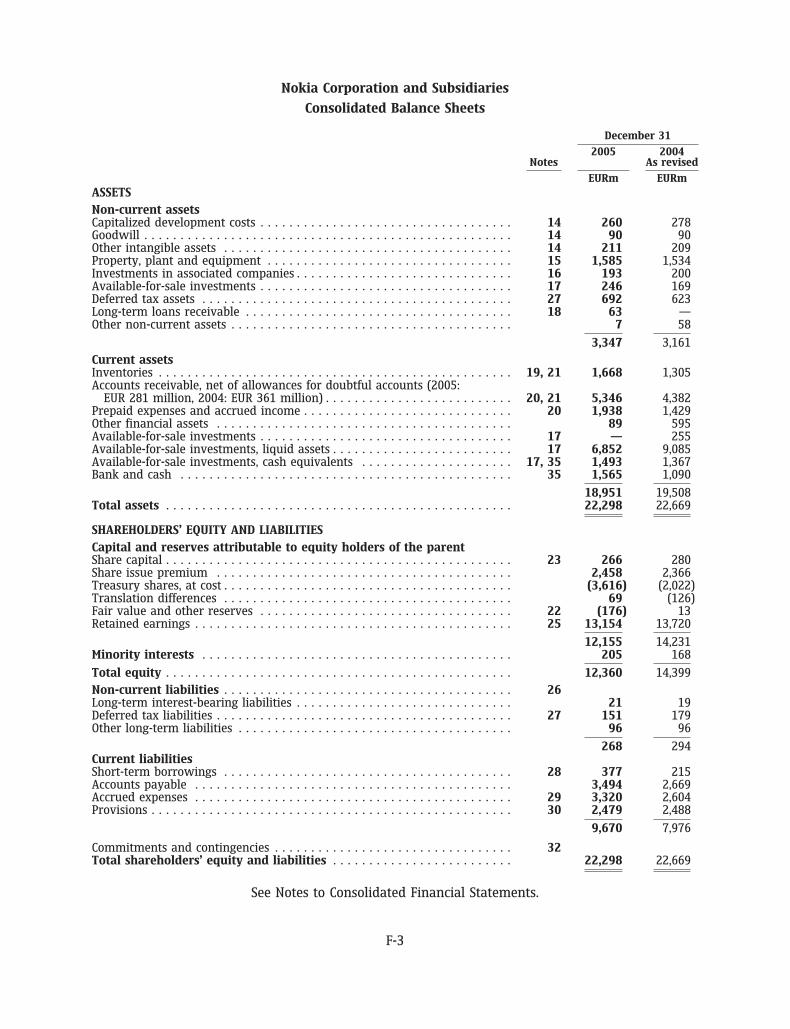
Nokia Corporation and Subsidiaries
Consolidated Balance Sheets
December 31
2005 2004Notes As revised
EURm EURmASSETS
Non-current assetsCapitalized development costs . . . . . . . . . . . . . . . . . . . . . . . . . . . . . . . . . . . 14 260 278Goodwill . . . . . . . . . . . . . . . . . . . . . . . . . . . . . . . . . . . . . . . . . . . . . . . . . . . 14 90 90Other intangible assets . . . . . . . . . . . . . . . . . . . . . . . . . . . . . . . . . . . . . . . . 14 211 209Property, plant and equipment . . . . . . . . . . . . . . . . . . . . . . . . . . . . . . . . . . 15 1,585 1,534Investments in associated companies . . . . . . . . . . . . . . . . . . . . . . . . . . . . . . 16 193 200Available-for-sale investments . . . . . . . . . . . . . . . . . . . . . . . . . . . . . . . . . . . 17 246 169Deferred tax assets . . . . . . . . . . . . . . . . . . . . . . . . . . . . . . . . . . . . . . . . . . . 27 692 623Long-term loans receivable . . . . . . . . . . . . . . . . . . . . . . . . . . . . . . . . . . . . . 18 63 —Other non-current assets . . . . . . . . . . . . . . . . . . . . . . . . . . . . . . . . . . . . . . . 7 58
3,347 3,161
Current assetsInventories . . . . . . . . . . . . . . . . . . . . . . . . . . . . . . . . . . . . . . . . . . . . . . . . . 19, 21 1,668 1,305Accounts receivable, net of allowances for doubtful accounts (2005:
EUR 281 million, 2004: EUR 361 million) . . . . . . . . . . . . . . . . . . . . . . . . . . 20, 21 5,346 4,382Prepaid expenses and accrued income . . . . . . . . . . . . . . . . . . . . . . . . . . . . . 20 1,938 1,429Other financial assets . . . . . . . . . . . . . . . . . . . . . . . . . . . . . . . . . . . . . . . . . 89 595Available-for-sale investments . . . . . . . . . . . . . . . . . . . . . . . . . . . . . . . . . . . 17 — 255Available-for-sale investments, liquid assets . . . . . . . . . . . . . . . . . . . . . . . . . 17 6,852 9,085Available-for-sale investments, cash equivalents . . . . . . . . . . . . . . . . . . . . . 17, 35 1,493 1,367Bank and cash . . . . . . . . . . . . . . . . . . . . . . . . . . . . . . . . . . . . . . . . . . . . . . 35 1,565 1,090
18,951 19,508Total assets . . . . . . . . . . . . . . . . . . . . . . . . . . . . . . . . . . . . . . . . . . . . . . . . 22,298 22,669
SHAREHOLDERS’ EQUITY AND LIABILITIES
Capital and reserves attributable to equity holders of the parentShare capital . . . . . . . . . . . . . . . . . . . . . . . . . . . . . . . . . . . . . . . . . . . . . . . . 23 266 280Share issue premium . . . . . . . . . . . . . . . . . . . . . . . . . . . . . . . . . . . . . . . . . 2,458 2,366Treasury shares, at cost . . . . . . . . . . . . . . . . . . . . . . . . . . . . . . . . . . . . . . . . (3,616) (2,022)Translation differences . . . . . . . . . . . . . . . . . . . . . . . . . . . . . . . . . . . . . . . . 69 (126)Fair value and other reserves . . . . . . . . . . . . . . . . . . . . . . . . . . . . . . . . . . . 22 (176) 13Retained earnings . . . . . . . . . . . . . . . . . . . . . . . . . . . . . . . . . . . . . . . . . . . . 25 13,154 13,720
12,155 14,231Minority interests . . . . . . . . . . . . . . . . . . . . . . . . . . . . . . . . . . . . . . . . . . . 205 168
Total equity . . . . . . . . . . . . . . . . . . . . . . . . . . . . . . . . . . . . . . . . . . . . . . . . 12,360 14,399
Non-current liabilities . . . . . . . . . . . . . . . . . . . . . . . . . . . . . . . . . . . . . . . . 26Long-term interest-bearing liabilities . . . . . . . . . . . . . . . . . . . . . . . . . . . . . . 21 19Deferred tax liabilities . . . . . . . . . . . . . . . . . . . . . . . . . . . . . . . . . . . . . . . . . 27 151 179Other long-term liabilities . . . . . . . . . . . . . . . . . . . . . . . . . . . . . . . . . . . . . . 96 96
268 294Current liabilitiesShort-term borrowings . . . . . . . . . . . . . . . . . . . . . . . . . . . . . . . . . . . . . . . . 28 377 215Accounts payable . . . . . . . . . . . . . . . . . . . . . . . . . . . . . . . . . . . . . . . . . . . . 3,494 2,669Accrued expenses . . . . . . . . . . . . . . . . . . . . . . . . . . . . . . . . . . . . . . . . . . . . 29 3,320 2,604Provisions . . . . . . . . . . . . . . . . . . . . . . . . . . . . . . . . . . . . . . . . . . . . . . . . . . 30 2,479 2,488
9,670 7,976
Commitments and contingencies . . . . . . . . . . . . . . . . . . . . . . . . . . . . . . . . . 32Total shareholders’ equity and liabilities . . . . . . . . . . . . . . . . . . . . . . . . . 22,298 22,669
See Notes to Consolidated Financial Statements.
F-3
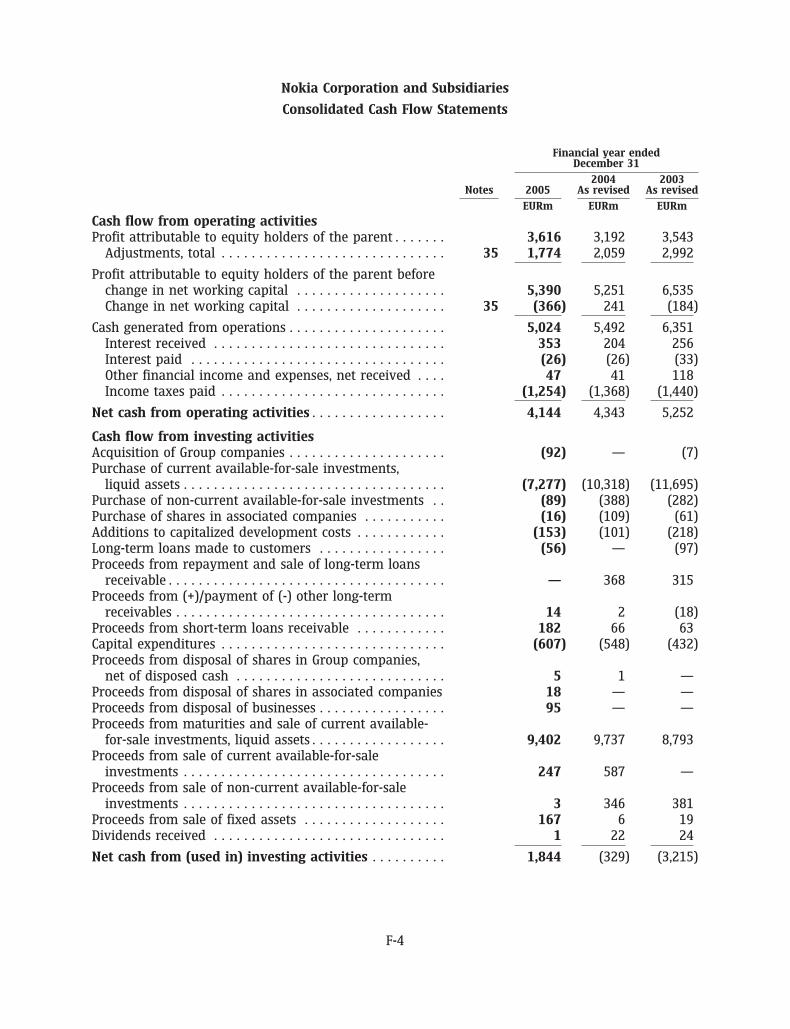
Nokia Corporation and Subsidiaries
Consolidated Cash Flow Statements
Financial year endedDecember 31
2004 2003Notes 2005 As revised As revised
EURm EURm EURm
Cash flow from operating activitiesProfit attributable to equity holders of the parent . . . . . . . 3,616 3,192 3,543
Adjustments, total . . . . . . . . . . . . . . . . . . . . . . . . . . . . . . 35 1,774 2,059 2,992
Profit attributable to equity holders of the parent beforechange in net working capital . . . . . . . . . . . . . . . . . . . . 5,390 5,251 6,535Change in net working capital . . . . . . . . . . . . . . . . . . . . 35 (366) 241 (184)
Cash generated from operations . . . . . . . . . . . . . . . . . . . . . 5,024 5,492 6,351Interest received . . . . . . . . . . . . . . . . . . . . . . . . . . . . . . . 353 204 256Interest paid . . . . . . . . . . . . . . . . . . . . . . . . . . . . . . . . . . (26) (26) (33)Other financial income and expenses, net received . . . . 47 41 118Income taxes paid . . . . . . . . . . . . . . . . . . . . . . . . . . . . . . (1,254) (1,368) (1,440)
Net cash from operating activities . . . . . . . . . . . . . . . . . . 4,144 4,343 5,252
Cash flow from investing activitiesAcquisition of Group companies . . . . . . . . . . . . . . . . . . . . . (92) — (7)Purchase of current available-for-sale investments,
liquid assets . . . . . . . . . . . . . . . . . . . . . . . . . . . . . . . . . . . (7,277) (10,318) (11,695)Purchase of non-current available-for-sale investments . . (89) (388) (282)Purchase of shares in associated companies . . . . . . . . . . . (16) (109) (61)Additions to capitalized development costs . . . . . . . . . . . . (153) (101) (218)Long-term loans made to customers . . . . . . . . . . . . . . . . . (56) — (97)Proceeds from repayment and sale of long-term loans
receivable . . . . . . . . . . . . . . . . . . . . . . . . . . . . . . . . . . . . . — 368 315Proceeds from (+)/payment of (-) other long-term
receivables . . . . . . . . . . . . . . . . . . . . . . . . . . . . . . . . . . . . 14 2 (18)Proceeds from short-term loans receivable . . . . . . . . . . . . 182 66 63Capital expenditures . . . . . . . . . . . . . . . . . . . . . . . . . . . . . . (607) (548) (432)Proceeds from disposal of shares in Group companies,
net of disposed cash . . . . . . . . . . . . . . . . . . . . . . . . . . . . 5 1 —Proceeds from disposal of shares in associated companies 18 — —Proceeds from disposal of businesses . . . . . . . . . . . . . . . . . 95 — —Proceeds from maturities and sale of current available-
for-sale investments, liquid assets . . . . . . . . . . . . . . . . . . 9,402 9,737 8,793Proceeds from sale of current available-for-sale
investments . . . . . . . . . . . . . . . . . . . . . . . . . . . . . . . . . . . 247 587 —Proceeds from sale of non-current available-for-sale
investments . . . . . . . . . . . . . . . . . . . . . . . . . . . . . . . . . . . 3 346 381Proceeds from sale of fixed assets . . . . . . . . . . . . . . . . . . . 167 6 19Dividends received . . . . . . . . . . . . . . . . . . . . . . . . . . . . . . . 1 22 24
Net cash from (used in) investing activities . . . . . . . . . . 1,844 (329) (3,215)
F-4
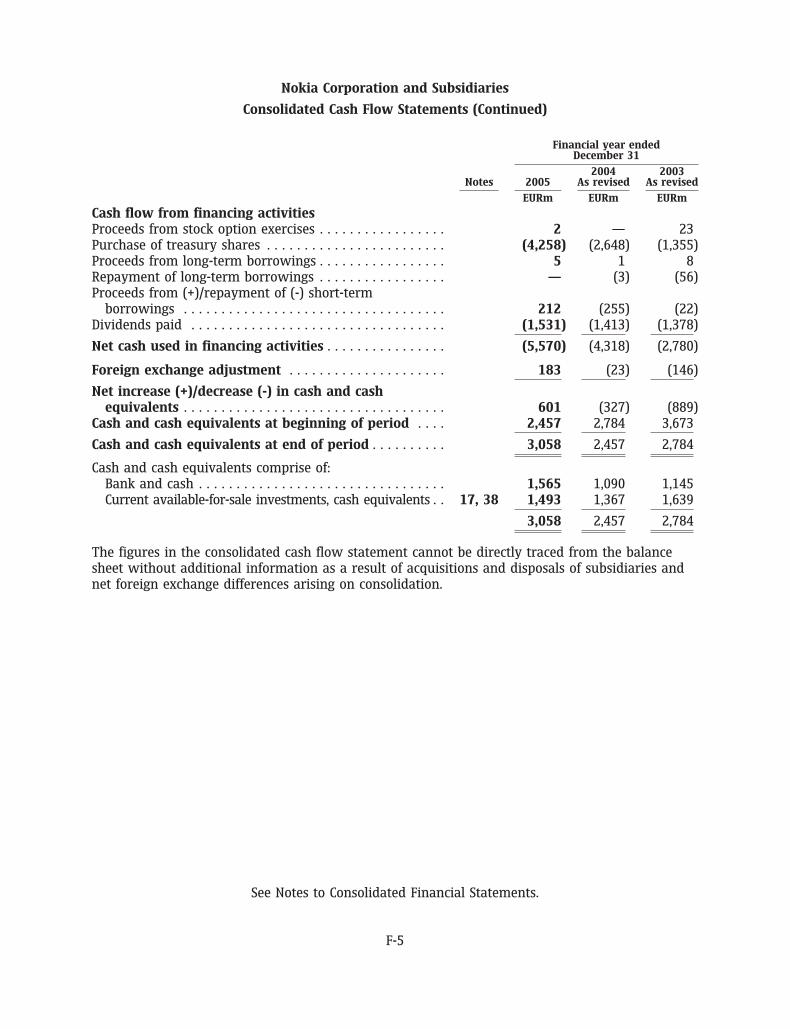
Nokia Corporation and Subsidiaries
Consolidated Cash Flow Statements (Continued)
Financial year endedDecember 31
2004 2003Notes 2005 As revised As revised
EURm EURm EURm
Cash flow from financing activitiesProceeds from stock option exercises . . . . . . . . . . . . . . . . . 2 — 23Purchase of treasury shares . . . . . . . . . . . . . . . . . . . . . . . . (4,258) (2,648) (1,355)Proceeds from long-term borrowings . . . . . . . . . . . . . . . . . 5 1 8Repayment of long-term borrowings . . . . . . . . . . . . . . . . . — (3) (56)Proceeds from (+)/repayment of (-) short-term
borrowings . . . . . . . . . . . . . . . . . . . . . . . . . . . . . . . . . . . 212 (255) (22)Dividends paid . . . . . . . . . . . . . . . . . . . . . . . . . . . . . . . . . . (1,531) (1,413) (1,378)
Net cash used in financing activities . . . . . . . . . . . . . . . . (5,570) (4,318) (2,780)
Foreign exchange adjustment . . . . . . . . . . . . . . . . . . . . . 183 (23) (146)
Net increase (+)/decrease (-) in cash and cashequivalents . . . . . . . . . . . . . . . . . . . . . . . . . . . . . . . . . . . 601 (327) (889)
Cash and cash equivalents at beginning of period . . . . 2,457 2,784 3,673
Cash and cash equivalents at end of period . . . . . . . . . . 3,058 2,457 2,784
Cash and cash equivalents comprise of:Bank and cash . . . . . . . . . . . . . . . . . . . . . . . . . . . . . . . . . 1,565 1,090 1,145Current available-for-sale investments, cash equivalents . . 17, 38 1,493 1,367 1,639
3,058 2,457 2,784
The figures in the consolidated cash flow statement cannot be directly traced from the balancesheet without additional information as a result of acquisitions and disposals of subsidiaries andnet foreign exchange differences arising on consolidation.
See Notes to Consolidated Financial Statements.
F-5
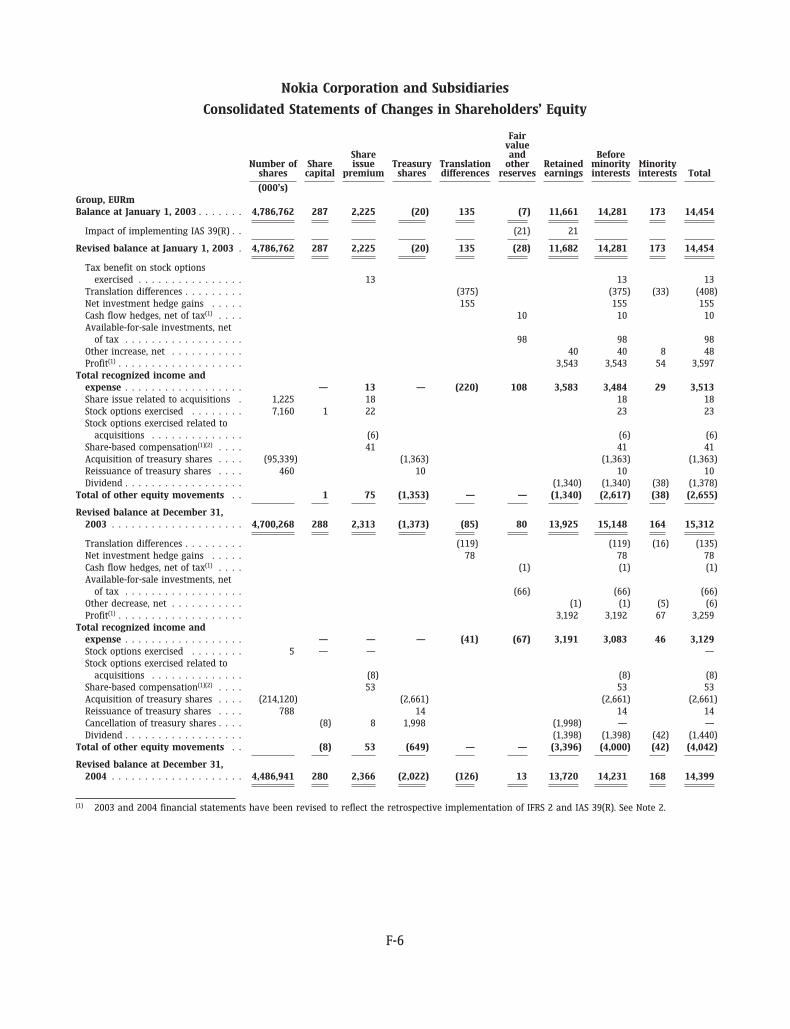
Nokia Corporation and Subsidiaries
Consolidated Statements of Changes in Shareholders’ Equity
Fairvalue
Share and BeforeNumber of Share issue Treasury Translation other Retained minority Minority
shares capital premium shares differences reserves earnings interests interests Total
(000’s)Group, EURmBalance at January 1, 2003 . . . . . . . 4,786,762 287 2,225 (20) 135 (7) 11,661 14,281 173 14,454
Impact of implementing IAS 39(R) . . (21) 21
Revised balance at January 1, 2003 . 4,786,762 287 2,225 (20) 135 (28) 11,682 14,281 173 14,454
Tax benefit on stock optionsexercised . . . . . . . . . . . . . . . . 13 13 13
Translation differences . . . . . . . . . (375) (375) (33) (408)Net investment hedge gains . . . . . 155 155 155Cash flow hedges, net of tax(1) . . . . 10 10 10Available-for-sale investments, net
of tax . . . . . . . . . . . . . . . . . . 98 98 98Other increase, net . . . . . . . . . . . 40 40 8 48Profit(1) . . . . . . . . . . . . . . . . . . . 3,543 3,543 54 3,597
Total recognized income andexpense . . . . . . . . . . . . . . . . . . — 13 — (220) 108 3,583 3,484 29 3,513Share issue related to acquisitions . 1,225 18 18 18Stock options exercised . . . . . . . . 7,160 1 22 23 23Stock options exercised related to
acquisitions . . . . . . . . . . . . . . (6) (6) (6)Share-based compensation(1)(2) . . . . 41 41 41Acquisition of treasury shares . . . . (95,339) (1,363) (1,363) (1,363)Reissuance of treasury shares . . . . 460 10 10 10Dividend . . . . . . . . . . . . . . . . . . (1,340) (1,340) (38) (1,378)
Total of other equity movements . . 1 75 (1,353) — — (1,340) (2,617) (38) (2,655)
Revised balance at December 31,2003 . . . . . . . . . . . . . . . . . . . . 4,700,268 288 2,313 (1,373) (85) 80 13,925 15,148 164 15,312
Translation differences . . . . . . . . . (119) (119) (16) (135)Net investment hedge gains . . . . . 78 78 78Cash flow hedges, net of tax(1) . . . . (1) (1) (1)Available-for-sale investments, net
of tax . . . . . . . . . . . . . . . . . . (66) (66) (66)Other decrease, net . . . . . . . . . . . (1) (1) (5) (6)Profit(1) . . . . . . . . . . . . . . . . . . . 3,192 3,192 67 3,259
Total recognized income andexpense . . . . . . . . . . . . . . . . . . — — — (41) (67) 3,191 3,083 46 3,129Stock options exercised . . . . . . . . 5 — — —Stock options exercised related to
acquisitions . . . . . . . . . . . . . . (8) (8) (8)Share-based compensation(1)(2) . . . . 53 53 53Acquisition of treasury shares . . . . (214,120) (2,661) (2,661) (2,661)Reissuance of treasury shares . . . . 788 14 14 14Cancellation of treasury shares . . . . (8) 8 1,998 (1,998) — —Dividend . . . . . . . . . . . . . . . . . . (1,398) (1,398) (42) (1,440)
Total of other equity movements . . (8) 53 (649) — — (3,396) (4,000) (42) (4,042)
Revised balance at December 31,2004 . . . . . . . . . . . . . . . . . . . . 4,486,941 280 2,366 (2,022) (126) 13 13,720 14,231 168 14,399
(1) 2003 and 2004 financial statements have been revised to reflect the retrospective implementation of IFRS 2 and IAS 39(R). See Note 2.
F-6
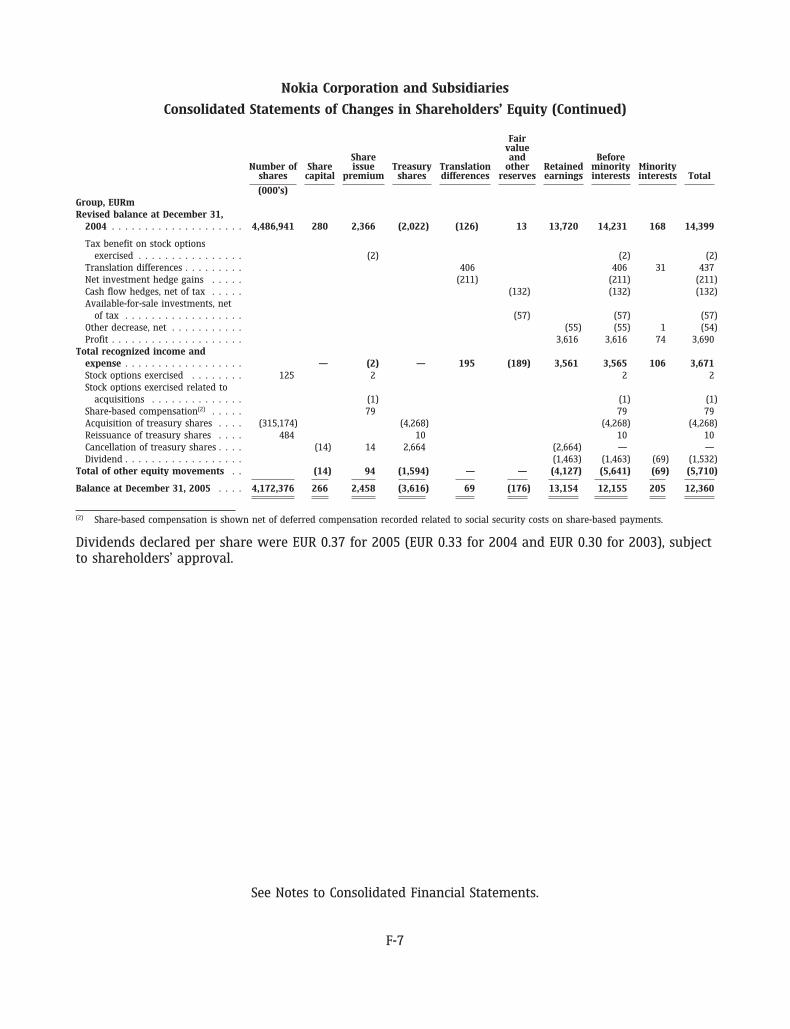
Nokia Corporation and Subsidiaries
Consolidated Statements of Changes in Shareholders’ Equity (Continued)
Fairvalue
Share and BeforeNumber of Share issue Treasury Translation other Retained minority Minority
shares capital premium shares differences reserves earnings interests interests Total
(000’s)Group, EURmRevised balance at December 31,
2004 . . . . . . . . . . . . . . . . . . . . 4,486,941 280 2,366 (2,022) (126) 13 13,720 14,231 168 14,399
Tax benefit on stock optionsexercised . . . . . . . . . . . . . . . . (2) (2) (2)
Translation differences . . . . . . . . . 406 406 31 437Net investment hedge gains . . . . . (211) (211) (211)Cash flow hedges, net of tax . . . . . (132) (132) (132)Available-for-sale investments, net
of tax . . . . . . . . . . . . . . . . . . (57) (57) (57)Other decrease, net . . . . . . . . . . . (55) (55) 1 (54)Profit . . . . . . . . . . . . . . . . . . . . 3,616 3,616 74 3,690
Total recognized income andexpense . . . . . . . . . . . . . . . . . . — (2) — 195 (189) 3,561 3,565 106 3,671Stock options exercised . . . . . . . . 125 2 2 2Stock options exercised related to
acquisitions . . . . . . . . . . . . . . (1) (1) (1)Share-based compensation(2) . . . . . 79 79 79Acquisition of treasury shares . . . . (315,174) (4,268) (4,268) (4,268)Reissuance of treasury shares . . . . 484 10 10 10Cancellation of treasury shares . . . . (14) 14 2,664 (2,664) — —Dividend . . . . . . . . . . . . . . . . . . (1,463) (1,463) (69) (1,532)
Total of other equity movements . . (14) 94 (1,594) — — (4,127) (5,641) (69) (5,710)
Balance at December 31, 2005 . . . . 4,172,376 266 2,458 (3,616) 69 (176) 13,154 12,155 205 12,360
(2) Share-based compensation is shown net of deferred compensation recorded related to social security costs on share-based payments.
Dividends declared per share were EUR 0.37 for 2005 (EUR 0.33 for 2004 and EUR 0.30 for 2003), subjectto shareholders’ approval.
See Notes to Consolidated Financial Statements.
F-7
Notes to the Consolidated Financial Statements
1. Accounting principles
Basis of presentation
The consolidated financial statements of Nokia Corporation (‘‘Nokia’’ or ‘‘the Group’’), a Finnishlimited liability company with domicile in Helsinki, are prepared in accordance with InternationalFinancial Reporting Standards (‘‘IFRS’’). The consolidated financial statements are presented inmillions of euros (‘‘EURm’’), except as noted, and are prepared under the historical cost convention,except as disclosed in the accounting policies below. The notes to the consolidated financialstatements also conform with Finnish Accounting legislation. On January 26, 2006, the Group’sBoard of Directors authorized the financial statements for issue.
As of January 1, 2005 the Group adopted IFRS 2, Share-based Payment. The standard requires therecognition of share-based payment transactions in financial statements, including transactionswith employees or other parties to be settled in cash, other assets, or equity instruments of theCompany. Prior to the adoption of IFRS 2, the Group did not recognize the financial effect of share-based payments until such payments were settled. In accordance with the transitional provisionsof IFRS 2, the Standard has been applied retrospectively to all grants of shares, share options orother equity instruments that were granted after November 7, 2002 and that were not yet vestedat the effective date of the standard.
As of January 1, 2005 the Group adopted IAS 39(R), Financial Instruments: Recognition andMeasurement, which supersedes IAS 39 (revised 2000). Under IAS 39(R), hedge accounting is nolonger allowed under Treasury Center foreign exchange netting. This change is retrospective forthe Group as an existing IFRS user.
The comparative figures for 2004 and 2003 have been revised to reflect the adoption of IFRS 2 andIAS 39(R) and the effects are summarized in the consolidated statement of changes inshareholders’ equity, and further information is disclosed in the accounting policies and in Notesto the consolidated financial statements.
The Group adopted IFRS 3, Business Combinations together with IAS 36(R), Impairment of Assets,and IAS 38(R), Intangible Assets, as of January 1, 2005, resulting in a change in the accountingpolicy for goodwill. Until December 31, 2004, goodwill was amortized on a straight line basis overits expected useful life over a period ranging from two to five years and assessed for an indicationof impairment, periodically. In accordance with the provisions of IFRS 3, the Group ceasedamortization of goodwill from January 1, 2005 for all acquisitions made prior to March 31, 2004.Accumulated amortization as of December 31, 2004 has been eliminated with a correspondingdecrease in the cost of goodwill. From January 1, 2005, goodwill is assessed for impairmentannually, and whenever there are indications of impairment. Under the transitional provisions ofIFRS 3, this change in accounting policy was effective immediately for acquisitions made afterMarch 31, 2004.
Consequent upon the adoption of IAS 21(R), The Effects of Changes in Foreign Exchange Rates, theGroup has changed its accounting policy for the translation differences of goodwill arising onacquisitions of foreign companies made after January 1, 2005. Goodwill on acquisitions of foreigncompanies made prior to that is translated to euros at historical rates. In accordance withIAS 21(R), goodwill on acquisitions of foreign companies made after January 1, 2005, is translatedinto euros at closing rates.
The impacts of IFRS 3 and IAS 21(R) are prospective from January 1, 2005. The adoption of IFRS 3,IAS 21(R), IAS 36(R) and IAS 38(R) did not have any impact to the Group’s financial position, resultsof operations or cash flows.
F-8
Notes to the Consolidated Financial Statements (Continued)
1. Accounting principles (Continued)
Principles of consolidation
The consolidated financial statements include the accounts of Nokia’s parent company (‘‘ParentCompany’’), and each of those companies in which it either owns, directly or indirectly throughsubsidiaries, over 50% of the voting rights, or over which it has control of their operating andfinancial policies. The Group’s share of profits and losses of associated companies (generally 20%to 50% voting rights or over which the Group has significant influence) is included in theconsolidated profit and loss account in accordance with the equity method of accounting.
All inter-company transactions are eliminated as part of the consolidation process. Minorityinterests are presented separately in arriving at the net profit and they are shown as a componentof shareholders’ equity in the consolidated balance sheet.
Profits realized in connection with the sale of fixed assets between the Group and associatedcompanies are eliminated in proportion to share ownership. Such profits are deducted from theGroup’s equity and fixed assets and released in the Group accounts over the same period asdepreciation is charged.
The companies acquired during the financial periods presented have been consolidated from thedate on which control of the net assets and operations was transferred to the Group. Similarly theresult of a Group company divested during an accounting period is included in the Group accountsonly to the date of disposal.
Goodwill
Acquisitions of companies are accounted for using the purchase method of accounting. Goodwillrepresents the excess of the purchase cost over the fair value of assets less liabilities of acquiredcompanies.
The Group assesses the carrying value of goodwill annually or, more frequently, if events orchanges in circumstances indicate that such carrying value may not be recoverable. If suchindication exists the recoverable amount is determined for the cash-generating unit, to whichgoodwill belongs. This amount is then compared to the carrying amount of the cash-generatingunit and an impairment loss is recognized if the recoverable amount is less than the carryingamount. Impairment losses are recognized immediately in the profit and loss account.
Transactions in foreign currencies
Transactions in foreign currencies are recorded at the rates of exchange prevailing at the dates ofthe individual transactions. For practical reasons, a rate that approximates the actual rate at thedate of the transaction is often used. At the end of the accounting period, the unsettled balanceson foreign currency receivables and liabilities are valued at the rates of exchange prevailing at theyear-end. Foreign exchange gains and losses arising from balance sheet items, as well as fair valuechanges in the related hedging instruments, are reported in Financial Income and Expenses.
Foreign Group companies
In the consolidated accounts all items in the profit and loss accounts of foreign subsidiaries aretranslated into euro at the average foreign exchange rates for the accounting period. The balancesheets of foreign Group companies are translated into euro at the year-end foreign exchange rateswith the exception of goodwill arising on the acquisition of a foreign company prior to theadoption of IAS 21 (revised 2004) as of January 1, 2005, which is translated to euro at historical
F-9
Notes to the Consolidated Financial Statements (Continued)
1. Accounting principles (Continued)
rates. Differences resulting from the translation of profit and loss account items at the average rateand the balance sheet items at the closing rate are treated as an adjustment affecting consolidatedshareholders’ equity. On the disposal of all or part of a foreign Group company by sale, liquidation,repayment of share capital or abandonment, the cumulative amount or proportionate share of thetranslation difference is recognized as income or as expense in the same period in which the gainor loss on disposal is recognized.
Fair valuing principles
Financial assets and liabilities
Under IAS 39(R), the Group classifies its investments in marketable debt and equity securities andinvestments in unlisted equity securities into the following categories: held-to-maturity, trading, oravailable-for-sale depending on the purpose for acquiring the investments as well as ongoingintentions. All investments of the Group are currently classified as available-for-sale. Available-for-sale investments are fair valued by using quoted market rates, discounted cash flow analyses andother appropriate valuation models at the balance sheet date. Certain unlisted equities for whichfair values cannot be measured reliably are reported at cost less impairment. All purchases andsales of investments are recorded on the trade date, which is the date that the Group commits topurchase or sell the asset.
The fair value changes of available-for-sale investments are recognized in shareholders’ equity.When the investment is disposed of, the related accumulated fair value changes are released fromshareholders’ equity and recognized in the profit and loss account. The weighted average methodis used when determining the cost-basis of publicly listed equities being disposed of. FIFO (First-inFirst-out) method is used to determine the cost basis of fixed income securities being disposed of.An impairment is recorded when the carrying amount of an available-for-sale investment isgreater than the estimated fair value and there is objective evidence that the asset is impaired.The cumulative net loss relating to that investment is removed from equity and recognized in theprofit and loss account for the period. If, in a subsequent period, the fair value of the investmentincreases and the increase can be objectively related to an event occurring after the loss wasrecognized, the loss is reversed, with the amount of the reversal included in the profit and lossaccount.
The fair values of other financial assets and financial liabilities are assumed to approximate theircarrying values, either because of their short maturities, or their fair values cannot be measuredreliably.
Derivatives
Fair values of forward rate agreements, interest rate options, futures contracts and exchangetraded options are calculated based on quoted market rates at the balance sheet date. Interest rateand currency swaps are valued by using discounted cash flow analyses. The changes in the fairvalues of these contracts are reported in the profit and loss account.
Fair values of cash settled equity derivatives are calculated by revaluing the contract at year-endquoted market rates. Changes in fair value are reported in the profit and loss account.
Forward foreign exchange contracts are valued at the market forward exchange rates. Changes infair value are measured by comparing these rates with the original contract forward rate.Currency options are valued at the balance sheet date by using the Garman & Kohlhagen option
F-10
Notes to the Consolidated Financial Statements (Continued)
1. Accounting principles (Continued)
valuation model. Changes in the fair value on these instruments are reported in the profit and lossaccount except to the extent they qualify for hedge accounting.
Embedded derivatives are identified and monitored in the Group and fair valued at the balancesheet date. In assessing the fair value of embedded derivatives the Group uses a variety ofmethods, such as option pricing models and discounted cash flow analysis, and makesassumptions that are based on market conditions existing at each balance sheet date. The fairvalue changes are reported in the profit and loss account.
Hedge accounting
Hedging of anticipated foreign currency denominated sales and purchases
The Group applies hedge accounting for ‘‘Qualifying hedges’’. Qualifying hedges are those properlydocumented cash flow hedges of the foreign exchange rate risk of future anticipated foreigncurrency denominated sales and purchases that meet the requirements set out in IAS 39(R). Thecash flow being hedged must be ‘‘highly probable’’ and must ultimately impact the profit and lossaccount. The hedge must be highly effective both prospectively and retrospectively.
The Group claims hedge accounting in respect of certain forward foreign exchange contracts andoptions, or option strategies, which have zero net premium or a net premium paid, and where thecritical terms of the bought and sold options within a collar or zero premium structure are thesame and where the nominal amount of the sold option component is no greater than that of thebought option.
For qualifying foreign exchange forwards the change in fair value that reflects the change in spotexchange rates is deferred in shareholders’ equity to the extent that the hedge is effective. Forqualifying foreign exchange options, or option strategies, the change in intrinsic value is deferredin shareholders’ equity to the extent that the hedge is effective. In all cases the ineffective portionis recognized immediately in the profit and loss account. Hedging costs, either expressed as thechange in fair value that reflects the change in forward exchange rates less the change in spotexchange rates for forward foreign exchange contracts, or changes in the time value for options,or options strategies, are recognized within other operating income or expenses.
Accumulated fair value changes from qualifying hedges are released from shareholders’ equityinto the profit and loss account as adjustments to sales and cost of sales, in the period when thehedged cash flow affects the profit and loss account. If the hedged cash flow is no longer expectedto take place, all deferred gains or losses are released into the profit and loss account asadjustments to sales and cost of sales, immediately. If the hedged cash flow ceases to be highlyprobable, but is still expected to take place, accumulated gains and losses remain in equity untilthe hedged cash flow affects the profit and loss account.
Changes in the fair value of any derivative instruments that do not qualify for hedge accountingunder IAS 39(R) are recognized immediately in the profit and loss account. The fair value changesof derivative instruments that directly relate to normal business operations are recognized withinother operating income and expenses. The fair value changes from all other derivativeinstruments are recognized in financial income and expenses.
F-11
Notes to the Consolidated Financial Statements (Continued)
1. Accounting principles (Continued)
Foreign currency hedging of net investments
The Group also applies hedge accounting for its foreign currency hedging on net investments.Qualifying hedges are those properly documented hedges of the foreign exchange rate risk offoreign currency-denominated net investments that meet the requirements set out in IAS 39(R).The hedge must be effective both prospectively and retrospectively.
The Group claims hedge accounting in respect of forward foreign exchange contracts, foreigncurrency-denominated loans, and options, or option strategies, which have zero net premium or anet premium paid, and where the terms of the bought and sold options within a collar or zeropremium structure are the same.
For qualifying foreign exchange forwards the change in fair value that reflects the change in spotexchange rates is deferred in shareholders’ equity. The change in fair value that reflects thechange in forward exchange rates less the change in spot exchange rates is recognized in theprofit and loss account within financial income and expenses. For qualifying foreign exchangeoptions the change in intrinsic value is deferred in shareholders’ equity. Changes in the time valueare at all times taken directly to the profit and loss account within financial income and expenses.If a foreign currency-denominated loan is used as a hedge, all foreign exchange gains and lossesarising from the transaction are recognized in shareholders’ equity.
Accumulated fair value changes from qualifying hedges are released from shareholders’ equityinto the profit and loss account only if the legal entity in the given country is sold, liquidated,repays its share capital or is abandoned.
Revenue recognition
Sales from the majority of the Group are recognized when persuasive evidence of an arrangementexists, delivery has occurred, the fee is fixed or determinable and collectibility is probable. Animmaterial part of the revenue from products sold through distribution channels is recognizedwhen the reseller or distributor sells the products to the end users. The Group records reductionsto revenue for special pricing agreements, price protection and other volume based discounts.
In addition, sales and cost of sales from contracts involving solutions achieved throughmodification of complex telecommunications equipment are recognized on the percentage ofcompletion method when the outcome of the contract can be estimated reliably. This occurs whentotal contract revenue and the costs to complete the contract can be estimated reliably, it isprobable that the economic benefits associated with the contract will flow to the Group and thestage of contract completion can be measured. When the Group is not able to meet thoseconditions, the policy is to recognize revenues only equal to costs incurred to date, to the extentthat such costs are expected to be recovered.
Completion is measured by reference to cost incurred to date as a percentage of estimated totalproject costs, the cost-to-cost method.
The percentage of completion method relies on estimates of total expected contract revenue andcosts, as well as dependable measurement of the progress made towards completing a particularproject. Recognized revenues and profits are subject to revisions during the project in the eventthat the assumptions regarding the overall project outcome are revised. The cumulative impact ofa revision in estimates is recorded in the period such revisions become likely and estimable.Losses on projects in progress are recognized in the period they become likely and estimable.
F-12
Notes to the Consolidated Financial Statements (Continued)
1. Accounting principles (Continued)
The Group’s customer contracts may include the provision of separately identifiable components ofa single transaction, for example the construction of a network solution and subsequent networkmaintenance services. Accordingly, for these arrangements, revenue recognition requires properidentification of the components of the transaction and evaluation of their commercial effect inorder to reflect the substance of the transaction. If the components are considered separable,revenue is allocated across the identifiable components based upon relative fair values.
All the Group’s material revenue streams are recorded according to the above policies.
Shipping and handling costs
The costs of shipping and distributing products are included in cost of sales.
Research and development
Research and development costs are expensed as they are incurred, except for certaindevelopment costs, which are capitalized when it is probable that a development project willgenerate future economic benefits, and certain criteria, including commercial and technicalfeasibility, have been met. Capitalized development costs, comprising direct labor and relatedoverhead, are amortized on a systematic basis over their expected useful lives between two andfive years.
Capitalized development costs are subject to regular assessments of recoverability based onanticipated future revenues, including the impact of changes in technology. Unamortizedcapitalized development costs determined to be in excess of their recoverable amounts areexpensed immediately.
Other intangible assets
Expenditures on acquired patents, trademarks and licenses are capitalized and amortized using thestraight-line method over their useful lives, but not exceeding 20 years. Where an indication ofimpairment exists, the carrying amount of any intangible asset is assessed and written down toits recoverable amount. Costs of software licenses associated with internal-use software arecapitalized. These costs are included within other intangible assets and are amortized over aperiod not to exceed three years.
Pensions
The Group companies have various pension schemes in accordance with the local conditions andpractices in the countries in which they operate. The schemes are generally funded throughpayments to insurance companies or to trustee-administered funds as determined by periodicactuarial calculations.
The Group’s contributions to defined contribution plans and to multi-employer and insured plansare charged to the profit and loss account in the period to which the contributions relate.
For defined benefit plans, principally the reserved portion of the Finnish TEL system, pension costsare assessed using the projected unit credit method: the cost of providing pensions is charged tothe profit and loss account so as to spread the service cost over the service lives of employees. Thepension obligation is measured as the present value of the estimated future cash outflows usinginterest rates on government securities that have terms to maturity approximating the terms of
F-13
Notes to the Consolidated Financial Statements (Continued)
1. Accounting principles (Continued)
the related liabilities. Actuarial gains and losses outside the corridor are recognized over theaverage remaining service lives of employees.
Property, plant and equipment
Property, plant and equipment are stated at cost less accumulated depreciation. Depreciation isrecorded on a straight-line basis over the expected useful lives of the assets as follows:
Buildings and constructions . . . . . . . . . . . . . . . . . . . . . . . . . . . . . . . . 20–33 yearsProduction machinery, measuring and test equipment . . . . . . . . . . . 1–3 yearsOther machinery and equipment . . . . . . . . . . . . . . . . . . . . . . . . . . . . 3–10 years
Land and water areas are not depreciated.
Maintenance, repairs and renewals are generally charged to expense during the financial period inwhich they are incurred. However, major renovations are capitalized and included in the carryingamount of the asset when it is probable that future economic benefits in excess of the originallyassessed standard of performance of the existing asset will flow to the Group. Major renovationsare depreciated over the remaining useful life of the related asset. Leasehold improvements aredepreciated over the lease term or useful life, whatever is shorter.
Gains and losses on the disposal of fixed assets are included in operating profit/loss.
Leases
The Group has entered into various operating leases, the payments under which are treated asrentals and charged to the profit and loss account on a straight-line basis over the lease terms.
Inventories
Inventories are stated at the lower of cost or net realizable value. Cost is determined usingstandard cost, which approximates actual cost, on a first in first out (FIFO) basis. Net realizablevalue is the amount that can be realized from the sale of the inventory in the normal course ofbusiness after allowing for the costs of realization.
In addition to the cost of materials and direct labor, an appropriate proportion of productionoverheads are included in the inventory values.
An allowance is recorded for excess inventory and obsolescence.
Accounts receivable
Accounts receivable are carried at the original invoice amount to customers less an estimate madefor doubtful receivables based on a periodic review of all outstanding amounts, which includes ananalysis of historical bad debt, customer concentrations, customer creditworthiness, currenteconomic trends and changes in our customer payment terms. Bad debts are written off whenidentified.
Cash and cash equivalents
Bank and cash consist of cash at bank and in hand. Cash equivalents consist of highly liquidavailable-for-sale investments purchased with remaining maturities at the date of acquisition ofthree months or less.
F-14
Notes to the Consolidated Financial Statements (Continued)
1. Accounting principles (Continued)
Short-term Investments
The Group considers all highly liquid marketable securities purchased with maturity at acquisitionof more than three months as short-term investments. They are included in current available-for-sale investments, liquid assets, in the balance sheet.
Borrowings
Borrowings are classified as loans and are recognized initially at an amount equal to the proceedsreceived, net of transaction costs incurred. In subsequent periods, they are stated at amortized costusing the effective yield method; any difference between proceeds (net of transaction costs) andthe redemption value is recognized in the profit and loss account over the period of theborrowings.
Loans to customers
Loans to customers are recorded at amortized cost. Loans are subject to regular and thoroughreview as to their collectibility and as to available collateral; in the event that any loan is deemednot fully recoverable, provision is made to reflect the shortfall between the carrying amount andthe present value of the expected cash flows. Interest income on loans to customers is accruedmonthly on the principal outstanding at the market rate on the date of financing and is includedin other operating income.
Income taxes
Current taxes are based on the results of the Group companies and are calculated according tolocal tax rules.
Deferred tax assets and liabilities are determined, using the liability method, for all temporarydifferences arising between the tax basis of assets and liabilities and their carrying values forfinancial reporting purposes. Currently enacted tax rates are used in the determination of deferredincome tax.
Under this method the Group is required, in relation to an acquisition, to make provision fordeferred taxes on the difference between the fair values of the net assets acquired and theirtax bases.
The principal temporary differences arise from intercompany profit in inventory, warranty andother provisions, untaxed reserves and tax losses carried forward. Deferred tax assets relating tothe carry forward of unused tax losses are recognized to the extent that it is probable that futuretaxable profit will be available against which the unused tax losses can be utilized.
Provisions
Provisions are recognized when the Group has a present legal or constructive obligation as a resultof past events, it is probable that an outflow of resources will be required to settle the obligationand a reliable estimate of the amount can be made. Where the Group expects a provision to bereimbursed, the reimbursement would be recognized as an asset but only when thereimbursement is virtually certain.
F-15
Notes to the Consolidated Financial Statements (Continued)
1. Accounting principles (Continued)
The Group recognizes the estimated liability to repair or replace products still under warranty atthe balance sheet date. The provision is calculated based on historical experience of the level ofrepairs and replacements.
The Group recognizes the estimated liability for non-cancellable purchase commitments forinventory in excess of forecasted requirements at each balance sheet date.
The Group recognizes a provision for the estimated future settlements related to asserted andunasserted Intellectual Property Rights (IPR) infringements, based on the probable outcome of eachcase as of each balance sheet date.
The Group recognizes a provision for pension and other social costs on unvested equityinstruments based upon local statutory law, net of deferred compensation, which is recorded as acomponent of shareholders equity. The provision is considered as a cash-settled share-basedpayment and is measured by reference to the fair value of the equity benefits provided, and theamount of the provision is adjusted to reflect the changes in the Nokia share price. The Grouprecognizes a provision for prior year tax contingencies based upon the estimated future settlementamount at each balance sheet date.
Share-based compensation
The Group has three types of equity settled share based compensation schemes for employees:stock options, performance shares and restricted shares. Employee services received, and thecorresponding increase in equity, are measured by reference to the fair value of the equityinstruments as at the date of grant, excluding the impact of any non-market vesting conditions.Non-market vesting conditions attached to the performance shares are included in assumptionsabout the number of shares that the employee will ultimately receive. On a regular basis theGroup reviews the assumptions made and revises its estimates of the number of performanceshares that are expected to be settled, where necessary. Share-based compensation is recognizedas an expense in the profit and loss account over the service period. When stock options areexercised, the proceeds received net of any transaction costs are credited to share capital (nominalvalue) and share premium.
Dividends
Dividends proposed by the Board of Directors are not recorded in the financial statements untilthey have been approved by the shareholders at the Annual General Meeting.
Earnings per share
The Group calculates both basic and diluted earnings per share in accordance with IAS 33,Earnings per share, (IAS 33). Under IAS 33, basic earnings per share is computed using theweighted average number of shares outstanding during the period. Diluted earnings per share iscomputed using the weighted average number of shares outstanding during the period plus thedilutive effect of stock options, restricted shares and performance shares outstanding during theperiod.
Use of estimates
The preparation of financial statements in conformity with IFRS requires the application ofjudgment by management in selecting appropriate assumptions for calculating financial estimates,
F-16
Notes to the Consolidated Financial Statements (Continued)
1. Accounting principles (Continued)
which inherently contain some degree of uncertainty. Management bases its estimates onhistorical experience and various other assumptions that are believed to be reasonable under thecircumstances, the results of which form the basis for making judgments about the reportedcarrying values of assets and liabilities and the reported amounts of revenues and expenses thatmay not be readily apparent from other sources. Actual results may differ from these estimatesunder different assumptions or conditions.
Set forth below are areas requiring significant judgment and estimation that may have an impacton reported results and the financial position.
Revenue recognition
Sales from the majority of the Group are recognized when persuasive evidence of an arrangementexists, delivery has occurred, the fee is fixed or determinable and collectibility is probable. Currentsales may materially change if management’s assessment of such criteria was determined to beinaccurate.
Revenue from contracts involving solutions achieved through modification of complextelecommunications equipment is recognized on the percentage of completion basis when theoutcome of the contract can be estimated reliably. Recognized revenues and profits are subject torevisions during the project in the event that the assumptions regarding the overall projectoutcome are revised. Current sales and profit estimates for projects may materially change due tothe early stage of a long-term project, new technology, changes in the project scope, changes incosts, changes in timing, changes in customers’ plans, realization of penalties, and othercorresponding factors.
Customer financing
The Group has provided a limited amount of customer financing and agreed extended paymentterms with selected customers. Should the actual financial position of the customers or generaleconomic conditions differ from assumptions, the ultimate collectibility of such financings andtrade credits may be required to be re-assessed, which could result in a write-off of these balancesand thus negatively impact profits in future periods.
Allowances for doubtful accounts
The Group maintains allowances for doubtful accounts for estimated losses resulting from thesubsequent inability of customers to make required payments. If the financial conditions ofcustomers were to deteriorate, resulting in an impairment of their ability to make payments,additional allowances may be required in future periods.
Inventory-related allowances
The Group periodically reviews inventory for excess amounts, obsolescence and declines in marketvalue below cost and records an allowance against the inventory balance for any such declines.These reviews require management to estimate future demand for products. Possible changes inthese estimates could result in revisions to the valuation of inventory in future periods.
F-17
Notes to the Consolidated Financial Statements (Continued)
1. Accounting principles (Continued)
Warranty provisions
The Group provides for the estimated cost of product warranties at the time revenue is recognized.The Group’s warranty provision is established based upon best estimates of the amounts necessaryto settle future and existing claims on products sold as of the balance sheet date. As new productsincorporating complex technologies are continuously introduced, and as local laws, regulationsand practices may change, changes in these estimates could result in additional allowances orchanges to recorded allowances being required in future periods.
Provision for intellectual property rights, or IPR, infringements
The Group provides for the estimated future settlements related to asserted and unasserted IPRinfringements based on the probable outcome of each infringement. IPR infringement claims canlast for varying periods of time, resulting in irregular movements in the IPR infringementprovision. The ultimate outcome or actual cost of settling an individual infringement maymaterially vary from estimates.
Legal contingencies
Legal proceedings covering a wide range of matters are pending or threatened in variousjurisdictions against the Group. Provisions are recorded for pending litigation when it isdetermined that an unfavorable outcome is probable and the amount of loss can be reasonablyestimated. Due to the inherent uncertain nature of litigation, the ultimate outcome or actual costof settlement may materially vary from estimates.
Capitalized development costs
The Group capitalizes certain development costs when it is probable that a development projectwill generate future economic benefits and certain criteria, including commercial and technicalfeasibility, have been met. Should a product fail to substantiate its estimated feasibility or lifecycle, material development costs may be required to be written off in future periods.
Valuation of long-lived and intangible assets and goodwill
The Group assesses the carrying value of identifiable intangible assets, long-lived assets andgoodwill annually, or more frequently if events or changes in circumstances indicate that suchcarrying value may not be recoverable. Factors that trigger an impairment review includeunderperformance relative to historical or projected future results, significant changes in themanner of the use of the acquired assets or the strategy for the overall business and significantnegative industry or economic trends. The most significant variables in determining cash flows arediscount rates, terminal values, the number of years on which to base the cash flow projections,as well as the assumptions and estimates used to determine the cash inflows and outflows.Amounts estimated could differ materially from what will actually occur in the future.
Fair value of derivatives and other financial instruments
The fair value of financial instruments that are not traded in an active market (for example,unlisted equities, currency options and embedded derivatives) are determined using valuationtechniques. The Group uses judgment to select an appropriate valuation methodology as well asunderlying assumptions based on existing market practice and conditions. Changes in theseassumptions may cause the Group to recognize impairments or losses in future periods.
F-18
Notes to the Consolidated Financial Statements (Continued)
1. Accounting principles (Continued)
Deferred taxes
Management judgment is required in determining provisions for income taxes, deferred tax assetsand liabilities and the extent to which deferred tax assets can be recognized. If the final outcomeof these matters differs from the amounts initially recorded, differences will impact the incometax and deferred tax provisions in the period in which such determination is made.
Pensions
The determination of pension benefit obligation and expense for defined benefit pension plans isdependent on the selection of certain assumptions used by actuaries in calculating such amounts.Those assumptions include, among others, the discount rate, expected long-term rate of return onplan assets and annual rate of increase in future compensation levels. A portion of plan assets isinvested in equity securities which are subject to equity market volatility. Changes in assumptionsmay materially affect the pension obligation and future expense.
Share-based compensation
The Group has various types of equity settled share-based compensation schemes for employees.Fair value of stock options is based on certain assumptions, including, among others, expectedvolatility and expected life of the options. Non-market vesting conditions attached to performanceshares are included in assumptions about the number of shares that the employee will ultimatelyreceive relating to projections of sales and earnings per share. Significant differences in equitymarket performance, employee option activity and the Group’s projected and actual sales andearnings per share performance, may materially affect future expense.
New IFRS standards and revised IAS standards
In August 2005, the IASB issued IFRS 7, Financial Instruments: Disclosures, which will supersede alldisclosure requirements addressed earlier in IAS 32, Financial Instruments: Recognition andMeasurement, and includes a comprehensive set of qualitative and quantitative disclosures on riskexposures from all financial instruments. IFRS 7 is effective for fiscal years beginning on or afterJanuary 1, 2007. The Group does not expect the adoption of this standard to have a materialimpact on the disclosures as it has also in the past disclosed qualitative and quantitativeinformation on risk exposures.
In December 2004, the IASB issued Amendment to IAS 19 Employee Benefits—Actuarial Gains andLosses, Group Plans and Disclosures, which introduces the option of an alternative recognitionapproach for actuarial gains and losses. It also adds new disclosure requirements. As the Groupdoes not intend to change the accounting policy adopted for recognition of actuarial gains andlosses, adoption of this amendment will only impact the format and extent of disclosurespresented in the accounts. The Group will apply this amendment from annual periods beginningJanuary 1, 2006.
F-19
Notes to the Consolidated Financial Statements (Continued)
2. Adoption of IFRS 2 and IAS 39(R)
The comparative figures for 2004 and 2003 have been revised to reflect the adoption of IFRS 2 andIAS 39(R) and the effects are summarized as follows:
2004 2003
IFRS 2 IAS 39(R) Total IFRS 2 IAS 39(R) Total
EURm EURm EURm EURm EURm EURm
Increase in net sales . . . . . . . . . . . . . . . . . . . . . . — 104 104 — 78 78Increase in cost of sales . . . . . . . . . . . . . . . . . . . . — (46) (46) — (88) (88)Increase in research and development expenses (43) — (43) (28) — (28)Increase in selling and marketing expenses . . . . (12) — (12) (8) — (8)Increase in administrative and general expenses (7) — (7) (5) — (5)Increase (-)/decrease (+) in tax expense . . . . . . . 2 (13) (11) — 2 2Increase (+)/decrease (-) in profit attributable to
equity holders of the parent . . . . . . . . . . . . . . (60) 45 (15) (41) (8) (49)
Decrease in accrued expenses . . . . . . . . . . . . . . . (2) — (2) — — —Increase in provisions . . . . . . . . . . . . . . . . . . . . . 9 — 9 — — —Increase in share issue premium . . . . . . . . . . . . 94 — 94 41 — 41Decrease in fair value and other reserves . . . . . . — (56) (56) — (12) (12)
2004 2003
IFRS 2 IAS 39(R) Total IFRS 2 IAS 39(R) Total
EUR EUR EUR EUR EUR EUR
Decrease in basic earnings per share . . . . . . . . . . (0.01) 0.00 (0.01) (0.01) 0.00 (0.01)Decrease in diluted earnings per share . . . . . . . . (0.01) 0.00 (0.01) (0.01) 0.00 (0.01)
3. Segment information
Nokia is organized on a worldwide basis into four primary business segments: Mobile Phones;Multimedia; Enterprise Solutions; and Networks. Nokia’s reportable segments represent thestrategic business units that offer different products and services for which monthly financialinformation is provided to the Board.
Mobile Phones connects people by providing expanding mobile voice and data capabilities across awide range of mobile devices.
Multimedia brings connected mobile multimedia experiences to consumers in the form ofadvanced mobile devices and applications.
Enterprise Solutions offers businesses and institutions a broad range of products and solutions,including enterprise-grade mobile devices, underlying security infrastructure, software andservices.
Networks provides network infrastructure, communications and networks service platforms aswell as professional services to operators and service providers.
In addition to the four business groups, the Group’s organization has two horizontal units tosupport the mobile device business groups, increase operational efficiency and competitiveness,and to take advantage of economies of scale: Customer and Market Operations and TechnologyPlatforms. The horizontal groups are not separate reporting entities, but their costs are carried
F-20
Notes to the Consolidated Financial Statements (Continued)
3. Segment information (Continued)
mainly by the mobile device business groups, which comprises of Mobile Phones, Multimedia andEnterprise Solutions, with the balance included in Common Group Functions. The costs andrevenues as well as assets and liabilities of the horizontal groups are allocated to the mobiledevice business groups on a symmetrical basis; with any amounts not so allocated included inCommon Group Functions. Common Group Functions consists of common research and generalGroup functions.
The accounting policies of the segments are the same as those described in Note 1. Nokia accountsfor intersegment revenues and transfers as if the revenues or transfers were to third parties, thatis, at current market prices. Nokia evaluates the performance of its segments and allocatesresources to them based on operating profit.
No single customer represents 10% or more of Group revenues.
Total CommonMobile Enterprise reportable GroupPhones Multimedia Solutions Networks segments Functions Eliminations Group
EURm EURm EURm EURm EURm EURm EURm EURm2005
Profit and LossInformationNet sales to external
customers . . . . . . . . . 20,811 5,979 839 6,556 34,185 6 34,191Net sales to other
segments . . . . . . . . . . — 2 22 1 25 (6) (19) —Depreciation and
amortization . . . . . . . 247 83 22 241 593 119 712Impairment and
customer financecharges . . . . . . . . . . . — 36 — — 36 30 66
Operating profit/(loss) . . 3,598 836 (258) 855 5,031 (392) 4,639Share of results of
associated companies — — — — — 10 10
Balance SheetInformationCapital expenditures(1) . . 273 77 24 102 476 131 607Segment assets(2) . . . . . . 4,355 1,374 202 3,437 9,368 1,135 (53) 10,450of which:
Investments inassociatedcompanies . . . . . . . — — — — — 193 193
Unallocated assets(3) . . . 11,848
Total assets . . . . . . . . . . 22,298
Segment liabilities(4) . . . 4,772 1,505 315 1,607 8,199 241 (156) 8,284Unallocated liabilities(5) . 1,654
Total liabilities . . . . . . . 9,938
F-21
Notes to the Consolidated Financial Statements (Continued)
3. Segment information (Continued)
Total CommonMobile Enterprise reportable GroupPhones Multimedia Solutions Networks segments Functions Eliminations Group
EURm EURm EURm EURm EURm EURm EURm EURm2004, As revised
Profit and LossInformationNet sales to external
customers . . . . . . . . . 18,443 3,653 815 6,431 29,342 29 29,371Net sales to other
segments . . . . . . . . . . 78 23 24 — 125 (29) (96) —Depreciation and
amortization . . . . . . . 306 77 23 314 720 148 868Impairment and
customer financecharges . . . . . . . . . . . — — — 115 115 11 126
Operating profit/(loss) . . 3,786 175 (210) 884 4,635 (309) 4,326Share of results of
associated companies . — — — — — (26) (26)
Balance SheetInformationCapital expenditures(1) . . 279 67 18 91 455 93 548Segment assets(2) . . . . . . 3,758 787 210 3,055 7,810 1,142 (12) 8,940of which:
Investments inassociatedcompanies . . . . . . . — — — — — 200 200
Unallocated assets(3) . . . . 13,729
Total assets . . . . . . . . . . 22,669
Segment liabilities(4) . . . . 4,114 934 271 1,574 6,893 170 (12) 7,051Unallocated liabilities(5) . 1,219
Total liabilities . . . . . . . 8,270
F-22
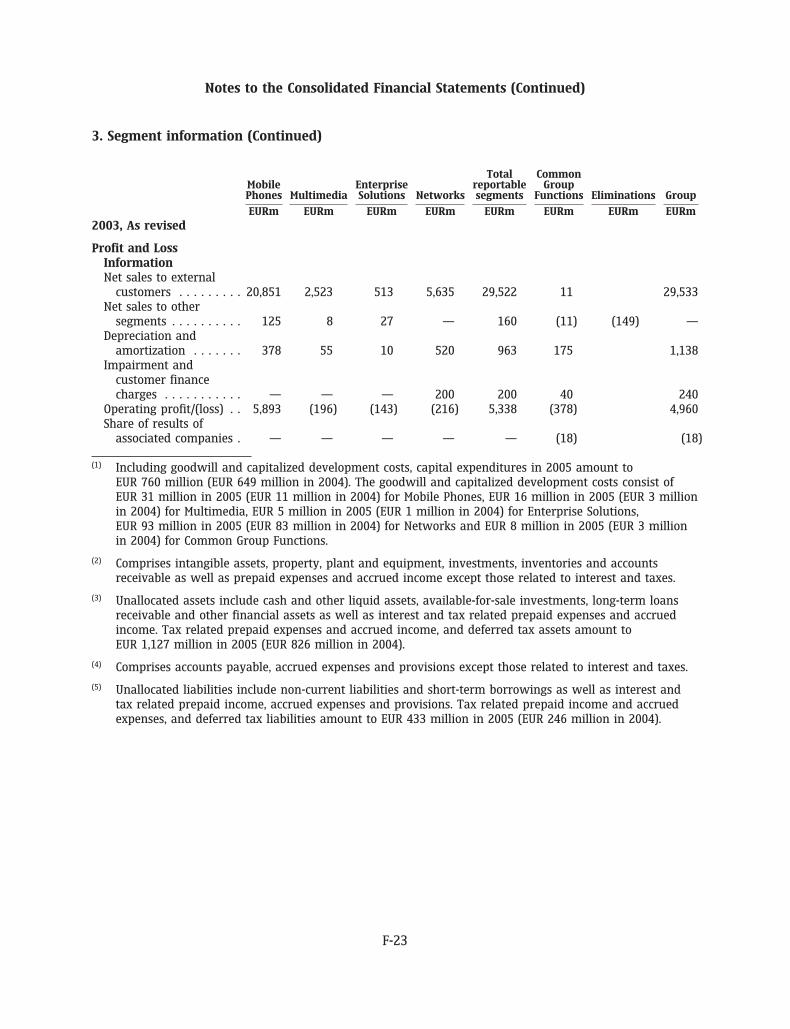
Notes to the Consolidated Financial Statements (Continued)
3. Segment information (Continued)
Total CommonMobile Enterprise reportable GroupPhones Multimedia Solutions Networks segments Functions Eliminations Group
EURm EURm EURm EURm EURm EURm EURm EURm2003, As revised
Profit and LossInformationNet sales to external
customers . . . . . . . . . 20,851 2,523 513 5,635 29,522 11 29,533Net sales to other
segments . . . . . . . . . . 125 8 27 — 160 (11) (149) —Depreciation and
amortization . . . . . . . 378 55 10 520 963 175 1,138Impairment and
customer financecharges . . . . . . . . . . . — — — 200 200 40 240
Operating profit/(loss) . . 5,893 (196) (143) (216) 5,338 (378) 4,960Share of results of
associated companies . — — — — — (18) (18)
(1) Including goodwill and capitalized development costs, capital expenditures in 2005 amount toEUR 760 million (EUR 649 million in 2004). The goodwill and capitalized development costs consist ofEUR 31 million in 2005 (EUR 11 million in 2004) for Mobile Phones, EUR 16 million in 2005 (EUR 3 millionin 2004) for Multimedia, EUR 5 million in 2005 (EUR 1 million in 2004) for Enterprise Solutions,EUR 93 million in 2005 (EUR 83 million in 2004) for Networks and EUR 8 million in 2005 (EUR 3 millionin 2004) for Common Group Functions.
(2) Comprises intangible assets, property, plant and equipment, investments, inventories and accountsreceivable as well as prepaid expenses and accrued income except those related to interest and taxes.
(3) Unallocated assets include cash and other liquid assets, available-for-sale investments, long-term loansreceivable and other financial assets as well as interest and tax related prepaid expenses and accruedincome. Tax related prepaid expenses and accrued income, and deferred tax assets amount toEUR 1,127 million in 2005 (EUR 826 million in 2004).
(4) Comprises accounts payable, accrued expenses and provisions except those related to interest and taxes.
(5) Unallocated liabilities include non-current liabilities and short-term borrowings as well as interest andtax related prepaid income, accrued expenses and provisions. Tax related prepaid income and accruedexpenses, and deferred tax liabilities amount to EUR 433 million in 2005 (EUR 246 million in 2004).
F-23
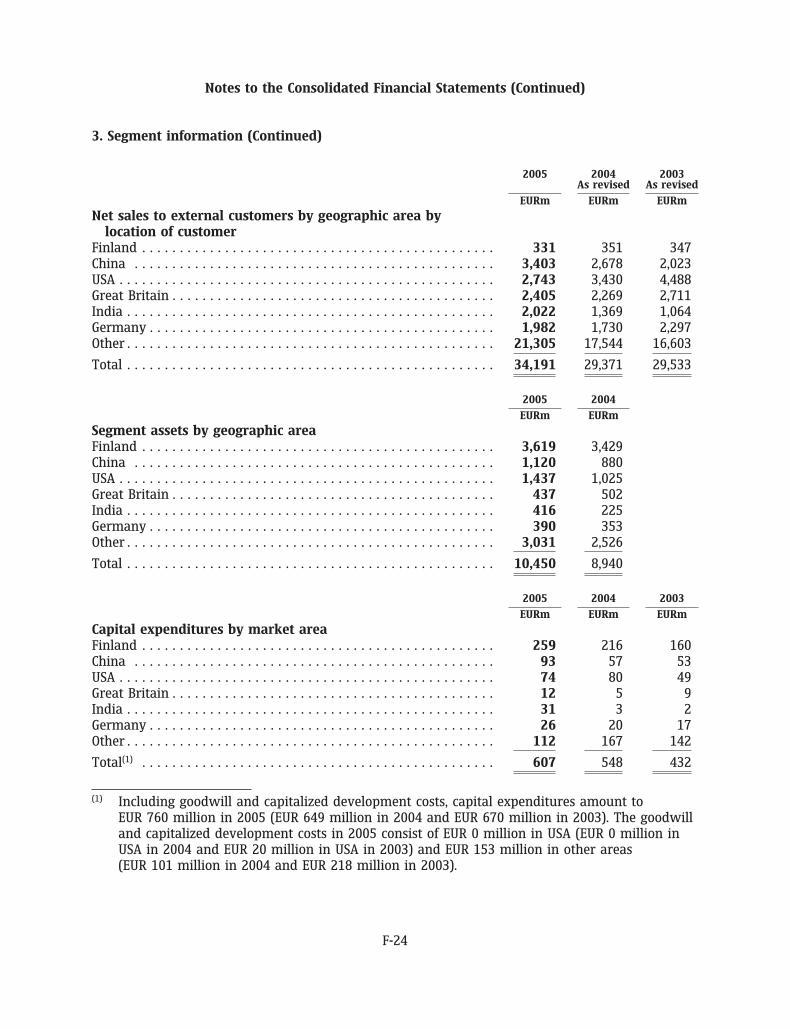
Notes to the Consolidated Financial Statements (Continued)
3. Segment information (Continued)
2005 2004 2003As revised As revised
EURm EURm EURm
Net sales to external customers by geographic area bylocation of customer
Finland . . . . . . . . . . . . . . . . . . . . . . . . . . . . . . . . . . . . . . . . . . . . . . . 331 351 347China . . . . . . . . . . . . . . . . . . . . . . . . . . . . . . . . . . . . . . . . . . . . . . . . 3,403 2,678 2,023USA . . . . . . . . . . . . . . . . . . . . . . . . . . . . . . . . . . . . . . . . . . . . . . . . . . 2,743 3,430 4,488Great Britain . . . . . . . . . . . . . . . . . . . . . . . . . . . . . . . . . . . . . . . . . . . 2,405 2,269 2,711India . . . . . . . . . . . . . . . . . . . . . . . . . . . . . . . . . . . . . . . . . . . . . . . . . 2,022 1,369 1,064Germany . . . . . . . . . . . . . . . . . . . . . . . . . . . . . . . . . . . . . . . . . . . . . . 1,982 1,730 2,297Other . . . . . . . . . . . . . . . . . . . . . . . . . . . . . . . . . . . . . . . . . . . . . . . . . 21,305 17,544 16,603
Total . . . . . . . . . . . . . . . . . . . . . . . . . . . . . . . . . . . . . . . . . . . . . . . . . 34,191 29,371 29,533
2005 2004
EURm EURm
Segment assets by geographic areaFinland . . . . . . . . . . . . . . . . . . . . . . . . . . . . . . . . . . . . . . . . . . . . . . . 3,619 3,429China . . . . . . . . . . . . . . . . . . . . . . . . . . . . . . . . . . . . . . . . . . . . . . . . 1,120 880USA . . . . . . . . . . . . . . . . . . . . . . . . . . . . . . . . . . . . . . . . . . . . . . . . . . 1,437 1,025Great Britain . . . . . . . . . . . . . . . . . . . . . . . . . . . . . . . . . . . . . . . . . . . 437 502India . . . . . . . . . . . . . . . . . . . . . . . . . . . . . . . . . . . . . . . . . . . . . . . . . 416 225Germany . . . . . . . . . . . . . . . . . . . . . . . . . . . . . . . . . . . . . . . . . . . . . . 390 353Other . . . . . . . . . . . . . . . . . . . . . . . . . . . . . . . . . . . . . . . . . . . . . . . . . 3,031 2,526
Total . . . . . . . . . . . . . . . . . . . . . . . . . . . . . . . . . . . . . . . . . . . . . . . . . 10,450 8,940
2005 2004 2003
EURm EURm EURm
Capital expenditures by market areaFinland . . . . . . . . . . . . . . . . . . . . . . . . . . . . . . . . . . . . . . . . . . . . . . . 259 216 160China . . . . . . . . . . . . . . . . . . . . . . . . . . . . . . . . . . . . . . . . . . . . . . . . 93 57 53USA . . . . . . . . . . . . . . . . . . . . . . . . . . . . . . . . . . . . . . . . . . . . . . . . . . 74 80 49Great Britain . . . . . . . . . . . . . . . . . . . . . . . . . . . . . . . . . . . . . . . . . . . 12 5 9India . . . . . . . . . . . . . . . . . . . . . . . . . . . . . . . . . . . . . . . . . . . . . . . . . 31 3 2Germany . . . . . . . . . . . . . . . . . . . . . . . . . . . . . . . . . . . . . . . . . . . . . . 26 20 17Other . . . . . . . . . . . . . . . . . . . . . . . . . . . . . . . . . . . . . . . . . . . . . . . . . 112 167 142
Total(1) . . . . . . . . . . . . . . . . . . . . . . . . . . . . . . . . . . . . . . . . . . . . . . . 607 548 432
(1) Including goodwill and capitalized development costs, capital expenditures amount toEUR 760 million in 2005 (EUR 649 million in 2004 and EUR 670 million in 2003). The goodwilland capitalized development costs in 2005 consist of EUR 0 million in USA (EUR 0 million inUSA in 2004 and EUR 20 million in USA in 2003) and EUR 153 million in other areas(EUR 101 million in 2004 and EUR 218 million in 2003).
F-24
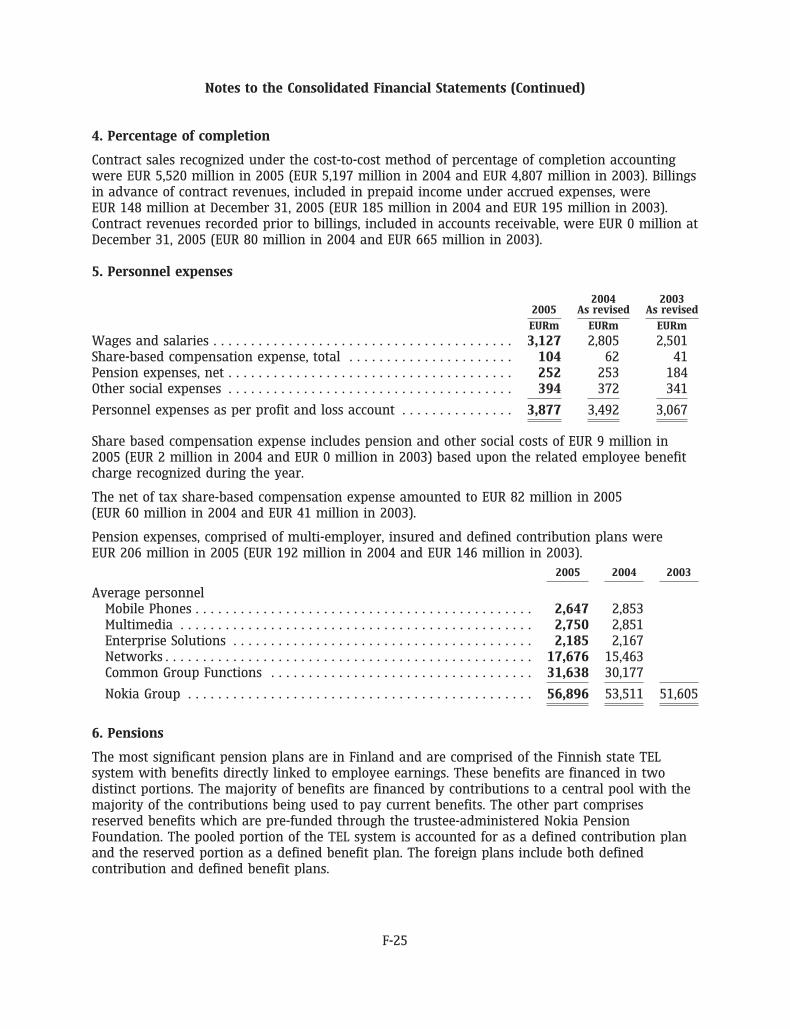
Notes to the Consolidated Financial Statements (Continued)
4. Percentage of completion
Contract sales recognized under the cost-to-cost method of percentage of completion accountingwere EUR 5,520 million in 2005 (EUR 5,197 million in 2004 and EUR 4,807 million in 2003). Billingsin advance of contract revenues, included in prepaid income under accrued expenses, wereEUR 148 million at December 31, 2005 (EUR 185 million in 2004 and EUR 195 million in 2003).Contract revenues recorded prior to billings, included in accounts receivable, were EUR 0 million atDecember 31, 2005 (EUR 80 million in 2004 and EUR 665 million in 2003).
5. Personnel expenses
2004 20032005 As revised As revised
EURm EURm EURm
Wages and salaries . . . . . . . . . . . . . . . . . . . . . . . . . . . . . . . . . . . . . . . . 3,127 2,805 2,501Share-based compensation expense, total . . . . . . . . . . . . . . . . . . . . . . 104 62 41Pension expenses, net . . . . . . . . . . . . . . . . . . . . . . . . . . . . . . . . . . . . . . 252 253 184Other social expenses . . . . . . . . . . . . . . . . . . . . . . . . . . . . . . . . . . . . . . 394 372 341
Personnel expenses as per profit and loss account . . . . . . . . . . . . . . . 3,877 3,492 3,067
Share based compensation expense includes pension and other social costs of EUR 9 million in2005 (EUR 2 million in 2004 and EUR 0 million in 2003) based upon the related employee benefitcharge recognized during the year.
The net of tax share-based compensation expense amounted to EUR 82 million in 2005(EUR 60 million in 2004 and EUR 41 million in 2003).
Pension expenses, comprised of multi-employer, insured and defined contribution plans wereEUR 206 million in 2005 (EUR 192 million in 2004 and EUR 146 million in 2003).
2005 2004 2003
Average personnelMobile Phones . . . . . . . . . . . . . . . . . . . . . . . . . . . . . . . . . . . . . . . . . . . . . 2,647 2,853Multimedia . . . . . . . . . . . . . . . . . . . . . . . . . . . . . . . . . . . . . . . . . . . . . . . 2,750 2,851Enterprise Solutions . . . . . . . . . . . . . . . . . . . . . . . . . . . . . . . . . . . . . . . . 2,185 2,167Networks . . . . . . . . . . . . . . . . . . . . . . . . . . . . . . . . . . . . . . . . . . . . . . . . . 17,676 15,463Common Group Functions . . . . . . . . . . . . . . . . . . . . . . . . . . . . . . . . . . . 31,638 30,177
Nokia Group . . . . . . . . . . . . . . . . . . . . . . . . . . . . . . . . . . . . . . . . . . . . . . 56,896 53,511 51,605
6. Pensions
The most significant pension plans are in Finland and are comprised of the Finnish state TELsystem with benefits directly linked to employee earnings. These benefits are financed in twodistinct portions. The majority of benefits are financed by contributions to a central pool with themajority of the contributions being used to pay current benefits. The other part comprisesreserved benefits which are pre-funded through the trustee-administered Nokia PensionFoundation. The pooled portion of the TEL system is accounted for as a defined contribution planand the reserved portion as a defined benefit plan. The foreign plans include both definedcontribution and defined benefit plans.
F-25
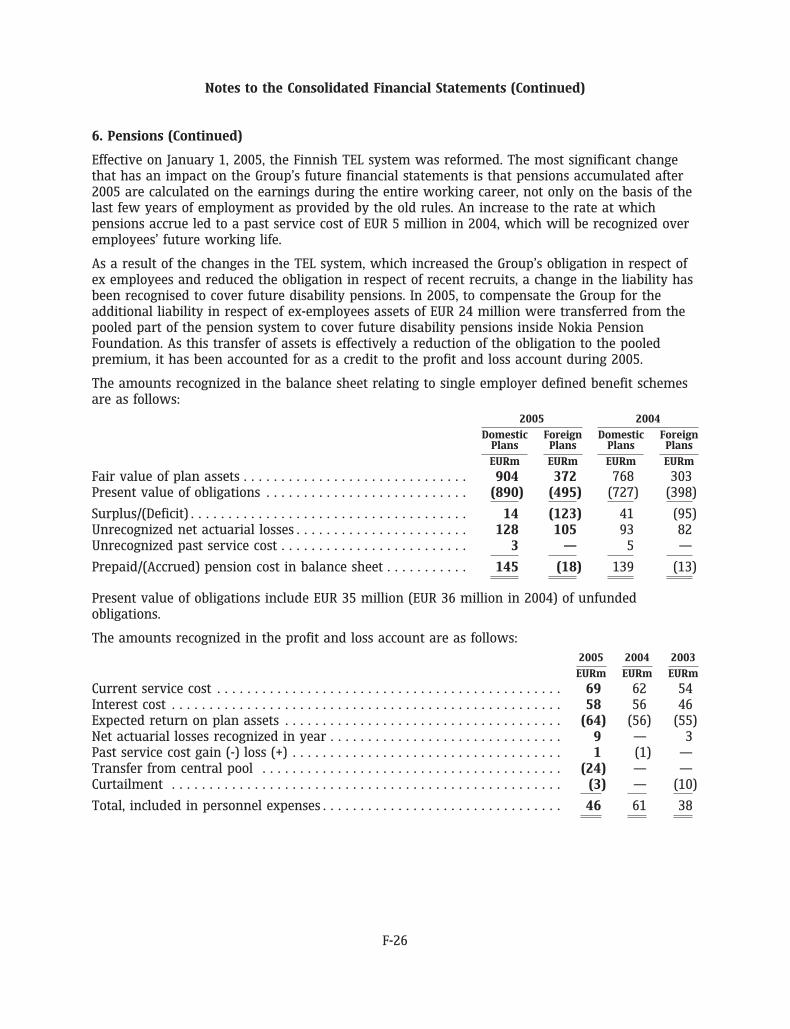
Notes to the Consolidated Financial Statements (Continued)
6. Pensions (Continued)
Effective on January 1, 2005, the Finnish TEL system was reformed. The most significant changethat has an impact on the Group’s future financial statements is that pensions accumulated after2005 are calculated on the earnings during the entire working career, not only on the basis of thelast few years of employment as provided by the old rules. An increase to the rate at whichpensions accrue led to a past service cost of EUR 5 million in 2004, which will be recognized overemployees’ future working life.
As a result of the changes in the TEL system, which increased the Group’s obligation in respect ofex employees and reduced the obligation in respect of recent recruits, a change in the liability hasbeen recognised to cover future disability pensions. In 2005, to compensate the Group for theadditional liability in respect of ex-employees assets of EUR 24 million were transferred from thepooled part of the pension system to cover future disability pensions inside Nokia PensionFoundation. As this transfer of assets is effectively a reduction of the obligation to the pooledpremium, it has been accounted for as a credit to the profit and loss account during 2005.
The amounts recognized in the balance sheet relating to single employer defined benefit schemesare as follows:
2005 2004
Domestic Foreign Domestic ForeignPlans Plans Plans Plans
EURm EURm EURm EURm
Fair value of plan assets . . . . . . . . . . . . . . . . . . . . . . . . . . . . . . 904 372 768 303Present value of obligations . . . . . . . . . . . . . . . . . . . . . . . . . . . (890) (495) (727) (398)
Surplus/(Deficit) . . . . . . . . . . . . . . . . . . . . . . . . . . . . . . . . . . . . . 14 (123) 41 (95)Unrecognized net actuarial losses . . . . . . . . . . . . . . . . . . . . . . . 128 105 93 82Unrecognized past service cost . . . . . . . . . . . . . . . . . . . . . . . . . 3 — 5 —
Prepaid/(Accrued) pension cost in balance sheet . . . . . . . . . . . 145 (18) 139 (13)
Present value of obligations include EUR 35 million (EUR 36 million in 2004) of unfundedobligations.
The amounts recognized in the profit and loss account are as follows:2005 2004 2003
EURm EURm EURm
Current service cost . . . . . . . . . . . . . . . . . . . . . . . . . . . . . . . . . . . . . . . . . . . . . . 69 62 54Interest cost . . . . . . . . . . . . . . . . . . . . . . . . . . . . . . . . . . . . . . . . . . . . . . . . . . . . 58 56 46Expected return on plan assets . . . . . . . . . . . . . . . . . . . . . . . . . . . . . . . . . . . . . (64) (56) (55)Net actuarial losses recognized in year . . . . . . . . . . . . . . . . . . . . . . . . . . . . . . . 9 — 3Past service cost gain (-) loss (+) . . . . . . . . . . . . . . . . . . . . . . . . . . . . . . . . . . . . 1 (1) —Transfer from central pool . . . . . . . . . . . . . . . . . . . . . . . . . . . . . . . . . . . . . . . . (24) — —Curtailment . . . . . . . . . . . . . . . . . . . . . . . . . . . . . . . . . . . . . . . . . . . . . . . . . . . . (3) — (10)
Total, included in personnel expenses . . . . . . . . . . . . . . . . . . . . . . . . . . . . . . . . 46 61 38
F-26
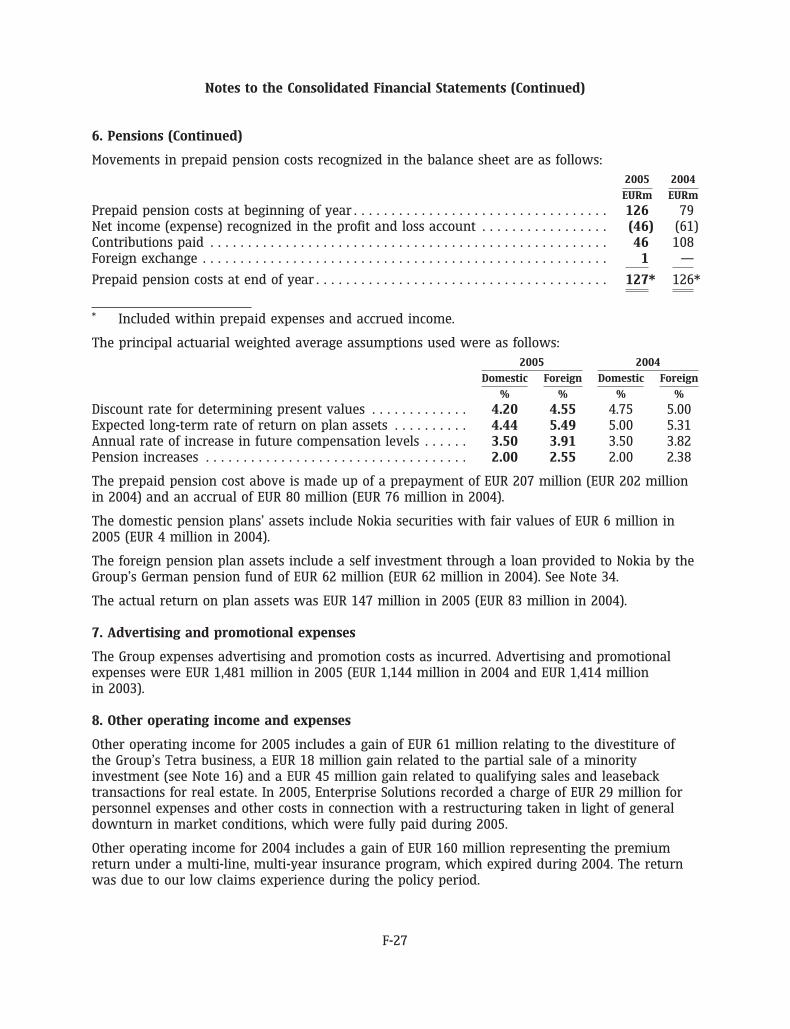
Notes to the Consolidated Financial Statements (Continued)
6. Pensions (Continued)
Movements in prepaid pension costs recognized in the balance sheet are as follows:2005 2004
EURm EURm
Prepaid pension costs at beginning of year . . . . . . . . . . . . . . . . . . . . . . . . . . . . . . . . . . 126 79Net income (expense) recognized in the profit and loss account . . . . . . . . . . . . . . . . . (46) (61)Contributions paid . . . . . . . . . . . . . . . . . . . . . . . . . . . . . . . . . . . . . . . . . . . . . . . . . . . . . 46 108Foreign exchange . . . . . . . . . . . . . . . . . . . . . . . . . . . . . . . . . . . . . . . . . . . . . . . . . . . . . . 1 —
Prepaid pension costs at end of year . . . . . . . . . . . . . . . . . . . . . . . . . . . . . . . . . . . . . . . 127* 126*
* Included within prepaid expenses and accrued income.
The principal actuarial weighted average assumptions used were as follows:2005 2004
Domestic Foreign Domestic Foreign
% % % %
Discount rate for determining present values . . . . . . . . . . . . . 4.20 4.55 4.75 5.00Expected long-term rate of return on plan assets . . . . . . . . . . 4.44 5.49 5.00 5.31Annual rate of increase in future compensation levels . . . . . . 3.50 3.91 3.50 3.82Pension increases . . . . . . . . . . . . . . . . . . . . . . . . . . . . . . . . . . . 2.00 2.55 2.00 2.38
The prepaid pension cost above is made up of a prepayment of EUR 207 million (EUR 202 millionin 2004) and an accrual of EUR 80 million (EUR 76 million in 2004).
The domestic pension plans’ assets include Nokia securities with fair values of EUR 6 million in2005 (EUR 4 million in 2004).
The foreign pension plan assets include a self investment through a loan provided to Nokia by theGroup’s German pension fund of EUR 62 million (EUR 62 million in 2004). See Note 34.
The actual return on plan assets was EUR 147 million in 2005 (EUR 83 million in 2004).
7. Advertising and promotional expenses
The Group expenses advertising and promotion costs as incurred. Advertising and promotionalexpenses were EUR 1,481 million in 2005 (EUR 1,144 million in 2004 and EUR 1,414 millionin 2003).
8. Other operating income and expenses
Other operating income for 2005 includes a gain of EUR 61 million relating to the divestiture ofthe Group’s Tetra business, a EUR 18 million gain related to the partial sale of a minorityinvestment (see Note 16) and a EUR 45 million gain related to qualifying sales and leasebacktransactions for real estate. In 2005, Enterprise Solutions recorded a charge of EUR 29 million forpersonnel expenses and other costs in connection with a restructuring taken in light of generaldownturn in market conditions, which were fully paid during 2005.
Other operating income for 2004 includes a gain of EUR 160 million representing the premiumreturn under a multi-line, multi-year insurance program, which expired during 2004. The returnwas due to our low claims experience during the policy period.
F-27
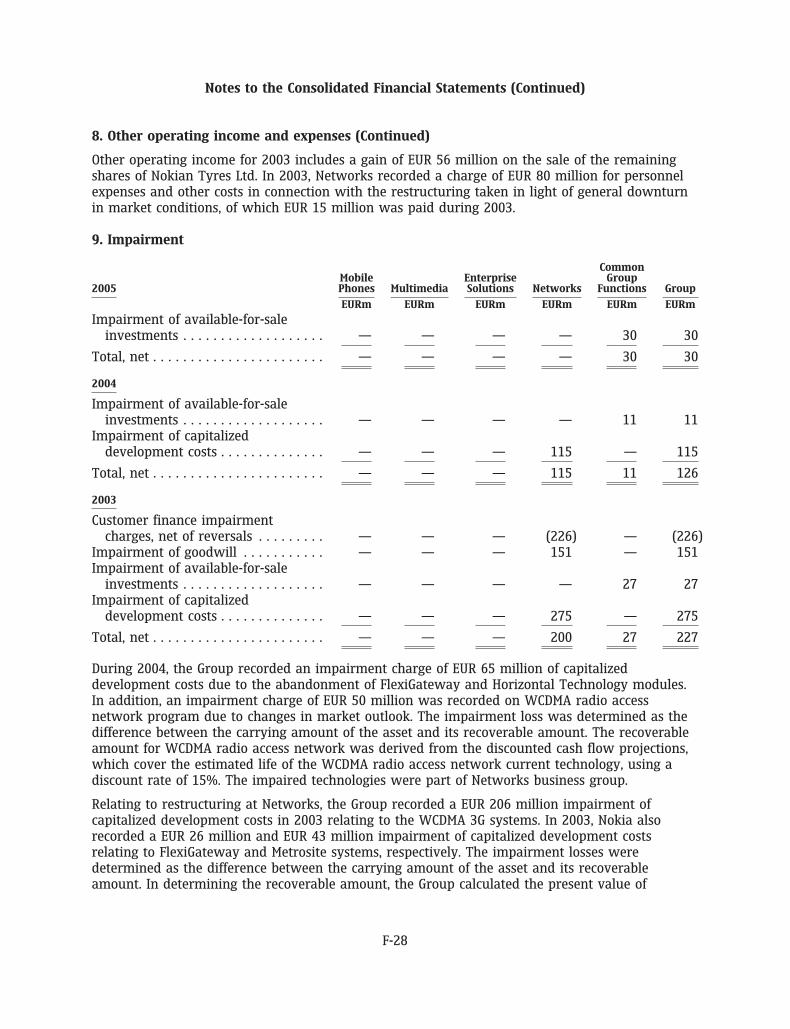
Notes to the Consolidated Financial Statements (Continued)
8. Other operating income and expenses (Continued)
Other operating income for 2003 includes a gain of EUR 56 million on the sale of the remainingshares of Nokian Tyres Ltd. In 2003, Networks recorded a charge of EUR 80 million for personnelexpenses and other costs in connection with the restructuring taken in light of general downturnin market conditions, of which EUR 15 million was paid during 2003.
9. Impairment
CommonMobile Enterprise Group
2005 Phones Multimedia Solutions Networks Functions Group
EURm EURm EURm EURm EURm EURm
Impairment of available-for-saleinvestments . . . . . . . . . . . . . . . . . . . — — — — 30 30
Total, net . . . . . . . . . . . . . . . . . . . . . . . — — — — 30 30
2004
Impairment of available-for-saleinvestments . . . . . . . . . . . . . . . . . . . — — — — 11 11
Impairment of capitalizeddevelopment costs . . . . . . . . . . . . . . — — — 115 — 115
Total, net . . . . . . . . . . . . . . . . . . . . . . . — — — 115 11 126
2003
Customer finance impairmentcharges, net of reversals . . . . . . . . . — — — (226) — (226)
Impairment of goodwill . . . . . . . . . . . — — — 151 — 151Impairment of available-for-sale
investments . . . . . . . . . . . . . . . . . . . — — — — 27 27Impairment of capitalized
development costs . . . . . . . . . . . . . . — — — 275 — 275
Total, net . . . . . . . . . . . . . . . . . . . . . . . — — — 200 27 227
During 2004, the Group recorded an impairment charge of EUR 65 million of capitalizeddevelopment costs due to the abandonment of FlexiGateway and Horizontal Technology modules.In addition, an impairment charge of EUR 50 million was recorded on WCDMA radio accessnetwork program due to changes in market outlook. The impairment loss was determined as thedifference between the carrying amount of the asset and its recoverable amount. The recoverableamount for WCDMA radio access network was derived from the discounted cash flow projections,which cover the estimated life of the WCDMA radio access network current technology, using adiscount rate of 15%. The impaired technologies were part of Networks business group.
Relating to restructuring at Networks, the Group recorded a EUR 206 million impairment ofcapitalized development costs in 2003 relating to the WCDMA 3G systems. In 2003, Nokia alsorecorded a EUR 26 million and EUR 43 million impairment of capitalized development costsrelating to FlexiGateway and Metrosite systems, respectively. The impairment losses weredetermined as the difference between the carrying amount of the asset and its recoverableamount. In determining the recoverable amount, the Group calculated the present value of
F-28
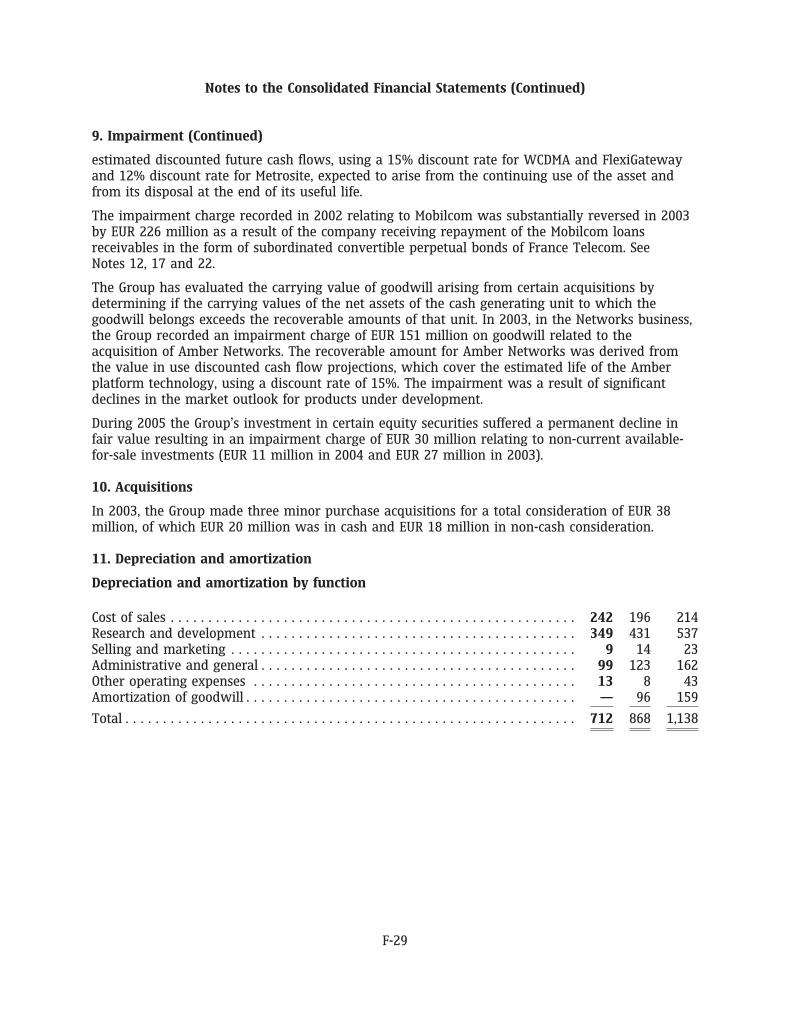
Notes to the Consolidated Financial Statements (Continued)
9. Impairment (Continued)
estimated discounted future cash flows, using a 15% discount rate for WCDMA and FlexiGatewayand 12% discount rate for Metrosite, expected to arise from the continuing use of the asset andfrom its disposal at the end of its useful life.
The impairment charge recorded in 2002 relating to Mobilcom was substantially reversed in 2003by EUR 226 million as a result of the company receiving repayment of the Mobilcom loansreceivables in the form of subordinated convertible perpetual bonds of France Telecom. SeeNotes 12, 17 and 22.
The Group has evaluated the carrying value of goodwill arising from certain acquisitions bydetermining if the carrying values of the net assets of the cash generating unit to which thegoodwill belongs exceeds the recoverable amounts of that unit. In 2003, in the Networks business,the Group recorded an impairment charge of EUR 151 million on goodwill related to theacquisition of Amber Networks. The recoverable amount for Amber Networks was derived fromthe value in use discounted cash flow projections, which cover the estimated life of the Amberplatform technology, using a discount rate of 15%. The impairment was a result of significantdeclines in the market outlook for products under development.
During 2005 the Group’s investment in certain equity securities suffered a permanent decline infair value resulting in an impairment charge of EUR 30 million relating to non-current available-for-sale investments (EUR 11 million in 2004 and EUR 27 million in 2003).
10. Acquisitions
In 2003, the Group made three minor purchase acquisitions for a total consideration of EUR 38million, of which EUR 20 million was in cash and EUR 18 million in non-cash consideration.
11. Depreciation and amortization
Depreciation and amortization by function
Cost of sales . . . . . . . . . . . . . . . . . . . . . . . . . . . . . . . . . . . . . . . . . . . . . . . . . . . . . . 242 196 214Research and development . . . . . . . . . . . . . . . . . . . . . . . . . . . . . . . . . . . . . . . . . . 349 431 537Selling and marketing . . . . . . . . . . . . . . . . . . . . . . . . . . . . . . . . . . . . . . . . . . . . . . 9 14 23Administrative and general . . . . . . . . . . . . . . . . . . . . . . . . . . . . . . . . . . . . . . . . . . 99 123 162Other operating expenses . . . . . . . . . . . . . . . . . . . . . . . . . . . . . . . . . . . . . . . . . . . 13 8 43Amortization of goodwill . . . . . . . . . . . . . . . . . . . . . . . . . . . . . . . . . . . . . . . . . . . . — 96 159
Total . . . . . . . . . . . . . . . . . . . . . . . . . . . . . . . . . . . . . . . . . . . . . . . . . . . . . . . . . . . . 712 868 1,138
F-29
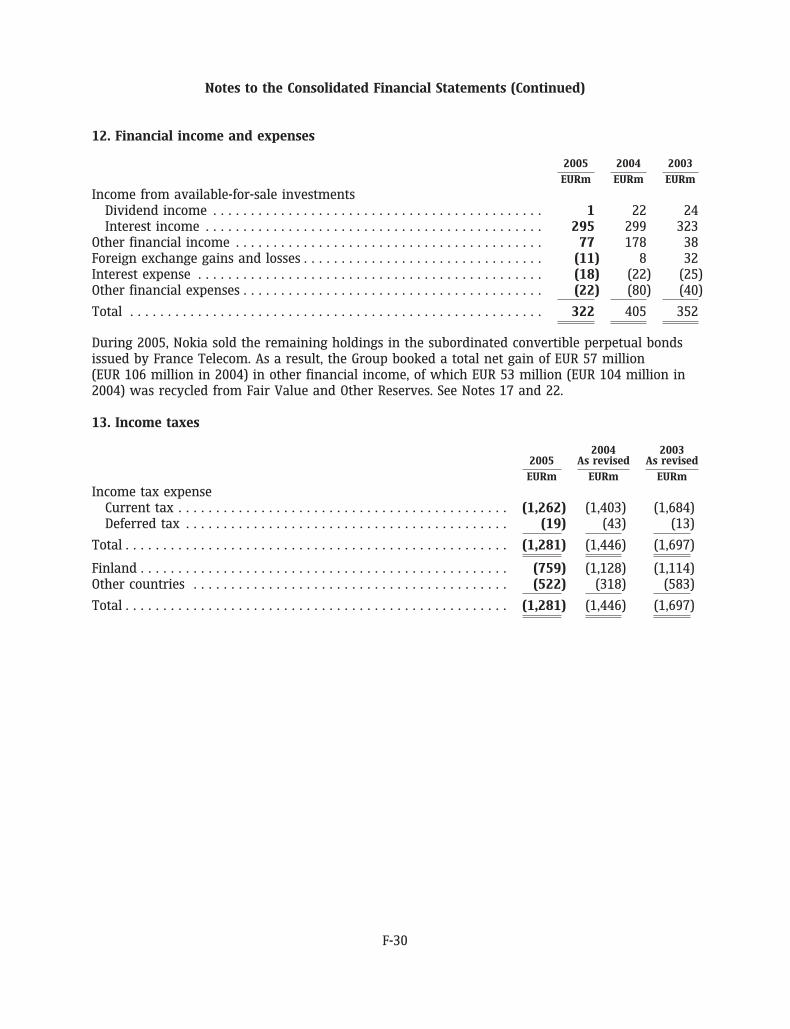
Notes to the Consolidated Financial Statements (Continued)
12. Financial income and expenses
2005 2004 2003
EURm EURm EURm
Income from available-for-sale investmentsDividend income . . . . . . . . . . . . . . . . . . . . . . . . . . . . . . . . . . . . . . . . . . . . 1 22 24Interest income . . . . . . . . . . . . . . . . . . . . . . . . . . . . . . . . . . . . . . . . . . . . . 295 299 323
Other financial income . . . . . . . . . . . . . . . . . . . . . . . . . . . . . . . . . . . . . . . . . 77 178 38Foreign exchange gains and losses . . . . . . . . . . . . . . . . . . . . . . . . . . . . . . . . (11) 8 32Interest expense . . . . . . . . . . . . . . . . . . . . . . . . . . . . . . . . . . . . . . . . . . . . . . (18) (22) (25)Other financial expenses . . . . . . . . . . . . . . . . . . . . . . . . . . . . . . . . . . . . . . . . (22) (80) (40)
Total . . . . . . . . . . . . . . . . . . . . . . . . . . . . . . . . . . . . . . . . . . . . . . . . . . . . . . . 322 405 352
During 2005, Nokia sold the remaining holdings in the subordinated convertible perpetual bondsissued by France Telecom. As a result, the Group booked a total net gain of EUR 57 million(EUR 106 million in 2004) in other financial income, of which EUR 53 million (EUR 104 million in2004) was recycled from Fair Value and Other Reserves. See Notes 17 and 22.
13. Income taxes
2004 20032005 As revised As revised
EURm EURm EURm
Income tax expenseCurrent tax . . . . . . . . . . . . . . . . . . . . . . . . . . . . . . . . . . . . . . . . . . . . (1,262) (1,403) (1,684)Deferred tax . . . . . . . . . . . . . . . . . . . . . . . . . . . . . . . . . . . . . . . . . . . (19) (43) (13)
Total . . . . . . . . . . . . . . . . . . . . . . . . . . . . . . . . . . . . . . . . . . . . . . . . . . . (1,281) (1,446) (1,697)
Finland . . . . . . . . . . . . . . . . . . . . . . . . . . . . . . . . . . . . . . . . . . . . . . . . . (759) (1,128) (1,114)Other countries . . . . . . . . . . . . . . . . . . . . . . . . . . . . . . . . . . . . . . . . . . (522) (318) (583)
Total . . . . . . . . . . . . . . . . . . . . . . . . . . . . . . . . . . . . . . . . . . . . . . . . . . . (1,281) (1,446) (1,697)
F-30
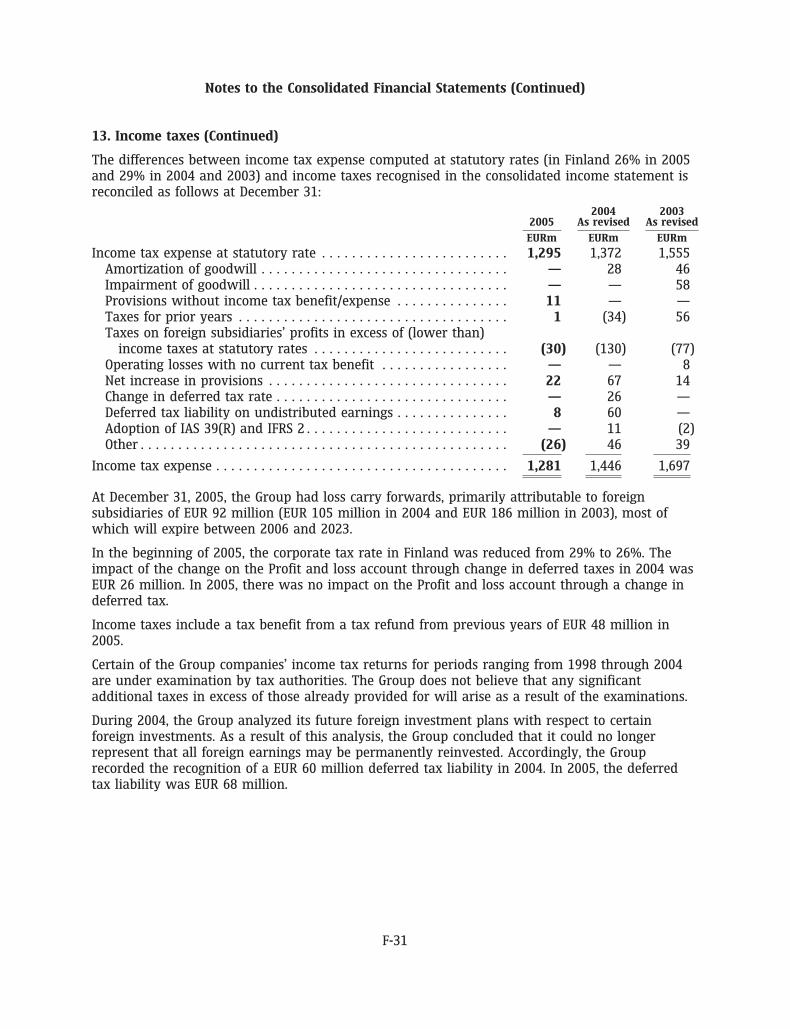
Notes to the Consolidated Financial Statements (Continued)
13. Income taxes (Continued)
The differences between income tax expense computed at statutory rates (in Finland 26% in 2005and 29% in 2004 and 2003) and income taxes recognised in the consolidated income statement isreconciled as follows at December 31:
2004 20032005 As revised As revised
EURm EURm EURm
Income tax expense at statutory rate . . . . . . . . . . . . . . . . . . . . . . . . . 1,295 1,372 1,555Amortization of goodwill . . . . . . . . . . . . . . . . . . . . . . . . . . . . . . . . . — 28 46Impairment of goodwill . . . . . . . . . . . . . . . . . . . . . . . . . . . . . . . . . . — — 58Provisions without income tax benefit/expense . . . . . . . . . . . . . . . 11 — —Taxes for prior years . . . . . . . . . . . . . . . . . . . . . . . . . . . . . . . . . . . . 1 (34) 56Taxes on foreign subsidiaries’ profits in excess of (lower than)
income taxes at statutory rates . . . . . . . . . . . . . . . . . . . . . . . . . . (30) (130) (77)Operating losses with no current tax benefit . . . . . . . . . . . . . . . . . — — 8Net increase in provisions . . . . . . . . . . . . . . . . . . . . . . . . . . . . . . . . 22 67 14Change in deferred tax rate . . . . . . . . . . . . . . . . . . . . . . . . . . . . . . . — 26 —Deferred tax liability on undistributed earnings . . . . . . . . . . . . . . . 8 60 —Adoption of IAS 39(R) and IFRS 2 . . . . . . . . . . . . . . . . . . . . . . . . . . . — 11 (2)Other . . . . . . . . . . . . . . . . . . . . . . . . . . . . . . . . . . . . . . . . . . . . . . . . . (26) 46 39
Income tax expense . . . . . . . . . . . . . . . . . . . . . . . . . . . . . . . . . . . . . . . 1,281 1,446 1,697
At December 31, 2005, the Group had loss carry forwards, primarily attributable to foreignsubsidiaries of EUR 92 million (EUR 105 million in 2004 and EUR 186 million in 2003), most ofwhich will expire between 2006 and 2023.
In the beginning of 2005, the corporate tax rate in Finland was reduced from 29% to 26%. Theimpact of the change on the Profit and loss account through change in deferred taxes in 2004 wasEUR 26 million. In 2005, there was no impact on the Profit and loss account through a change indeferred tax.
Income taxes include a tax benefit from a tax refund from previous years of EUR 48 million in2005.
Certain of the Group companies’ income tax returns for periods ranging from 1998 through 2004are under examination by tax authorities. The Group does not believe that any significantadditional taxes in excess of those already provided for will arise as a result of the examinations.
During 2004, the Group analyzed its future foreign investment plans with respect to certainforeign investments. As a result of this analysis, the Group concluded that it could no longerrepresent that all foreign earnings may be permanently reinvested. Accordingly, the Grouprecorded the recognition of a EUR 60 million deferred tax liability in 2004. In 2005, the deferredtax liability was EUR 68 million.
F-31
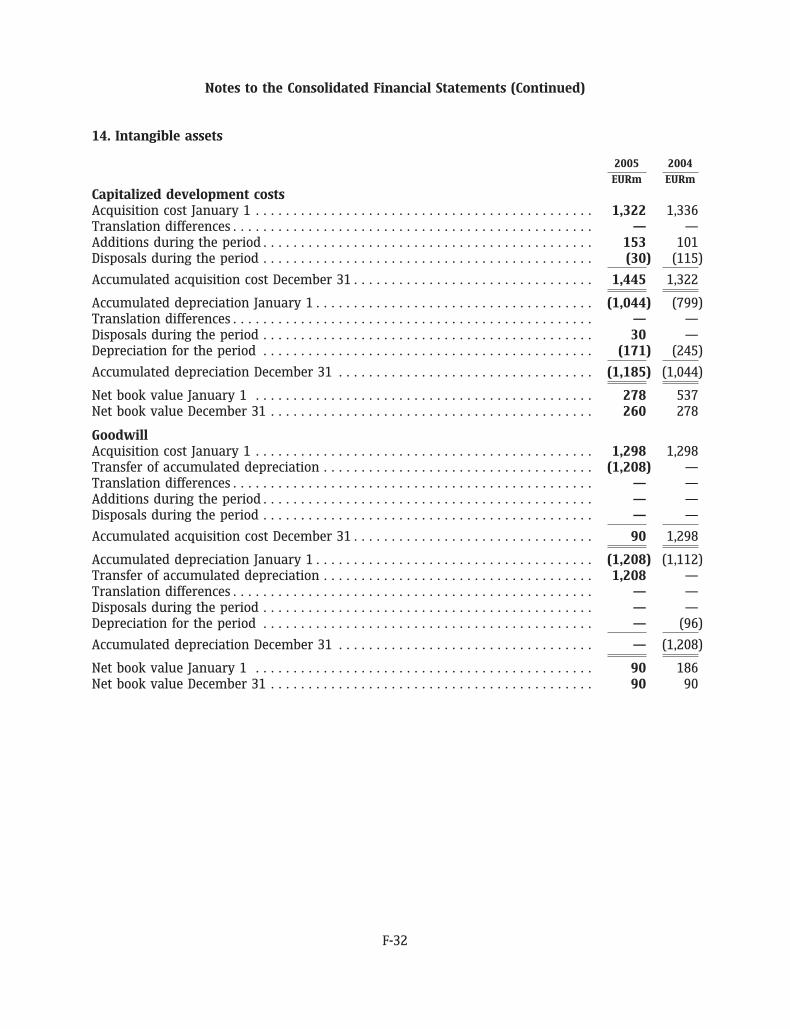
Notes to the Consolidated Financial Statements (Continued)
14. Intangible assets
2005 2004
EURm EURm
Capitalized development costsAcquisition cost January 1 . . . . . . . . . . . . . . . . . . . . . . . . . . . . . . . . . . . . . . . . . . . . . 1,322 1,336Translation differences . . . . . . . . . . . . . . . . . . . . . . . . . . . . . . . . . . . . . . . . . . . . . . . . — —Additions during the period . . . . . . . . . . . . . . . . . . . . . . . . . . . . . . . . . . . . . . . . . . . . 153 101Disposals during the period . . . . . . . . . . . . . . . . . . . . . . . . . . . . . . . . . . . . . . . . . . . . (30) (115)
Accumulated acquisition cost December 31 . . . . . . . . . . . . . . . . . . . . . . . . . . . . . . . . 1,445 1,322
Accumulated depreciation January 1 . . . . . . . . . . . . . . . . . . . . . . . . . . . . . . . . . . . . . (1,044) (799)Translation differences . . . . . . . . . . . . . . . . . . . . . . . . . . . . . . . . . . . . . . . . . . . . . . . . — —Disposals during the period . . . . . . . . . . . . . . . . . . . . . . . . . . . . . . . . . . . . . . . . . . . . 30 —Depreciation for the period . . . . . . . . . . . . . . . . . . . . . . . . . . . . . . . . . . . . . . . . . . . . (171) (245)
Accumulated depreciation December 31 . . . . . . . . . . . . . . . . . . . . . . . . . . . . . . . . . . (1,185) (1,044)
Net book value January 1 . . . . . . . . . . . . . . . . . . . . . . . . . . . . . . . . . . . . . . . . . . . . . 278 537Net book value December 31 . . . . . . . . . . . . . . . . . . . . . . . . . . . . . . . . . . . . . . . . . . . 260 278
GoodwillAcquisition cost January 1 . . . . . . . . . . . . . . . . . . . . . . . . . . . . . . . . . . . . . . . . . . . . . 1,298 1,298Transfer of accumulated depreciation . . . . . . . . . . . . . . . . . . . . . . . . . . . . . . . . . . . . (1,208) —Translation differences . . . . . . . . . . . . . . . . . . . . . . . . . . . . . . . . . . . . . . . . . . . . . . . . — —Additions during the period . . . . . . . . . . . . . . . . . . . . . . . . . . . . . . . . . . . . . . . . . . . . — —Disposals during the period . . . . . . . . . . . . . . . . . . . . . . . . . . . . . . . . . . . . . . . . . . . . — —
Accumulated acquisition cost December 31 . . . . . . . . . . . . . . . . . . . . . . . . . . . . . . . . 90 1,298
Accumulated depreciation January 1 . . . . . . . . . . . . . . . . . . . . . . . . . . . . . . . . . . . . . (1,208) (1,112)Transfer of accumulated depreciation . . . . . . . . . . . . . . . . . . . . . . . . . . . . . . . . . . . . 1,208 —Translation differences . . . . . . . . . . . . . . . . . . . . . . . . . . . . . . . . . . . . . . . . . . . . . . . . — —Disposals during the period . . . . . . . . . . . . . . . . . . . . . . . . . . . . . . . . . . . . . . . . . . . . — —Depreciation for the period . . . . . . . . . . . . . . . . . . . . . . . . . . . . . . . . . . . . . . . . . . . . — (96)
Accumulated depreciation December 31 . . . . . . . . . . . . . . . . . . . . . . . . . . . . . . . . . . — (1,208)
Net book value January 1 . . . . . . . . . . . . . . . . . . . . . . . . . . . . . . . . . . . . . . . . . . . . . 90 186Net book value December 31 . . . . . . . . . . . . . . . . . . . . . . . . . . . . . . . . . . . . . . . . . . . 90 90
F-32
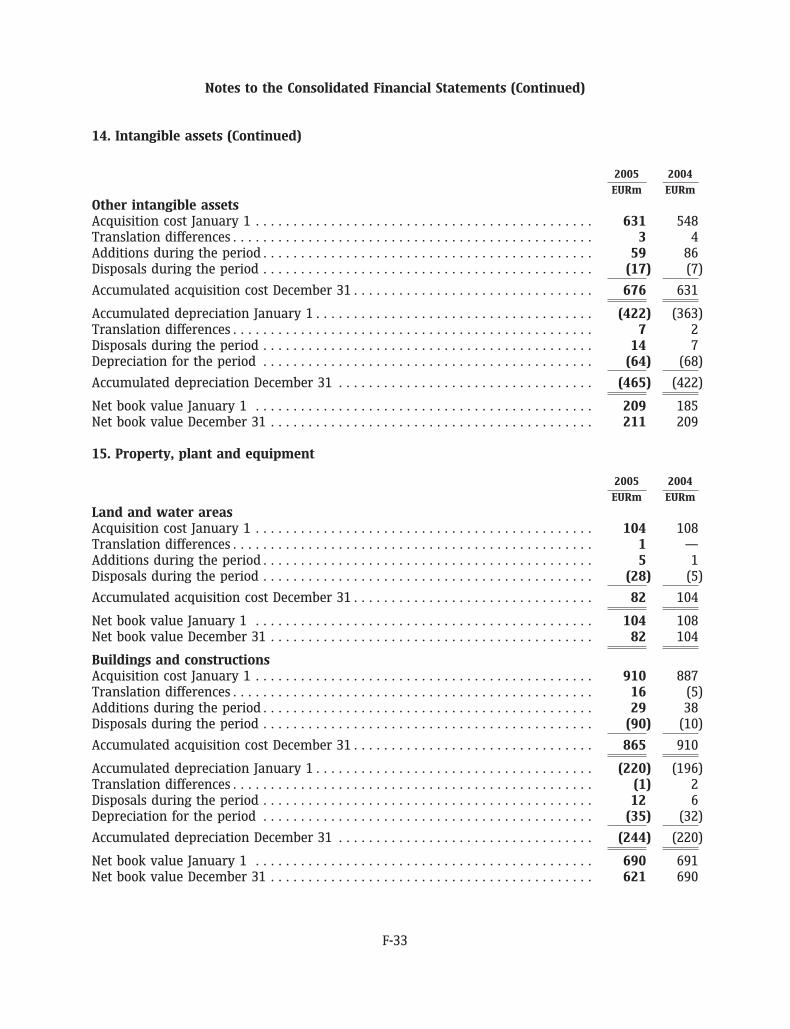
Notes to the Consolidated Financial Statements (Continued)
14. Intangible assets (Continued)
2005 2004
EURm EURm
Other intangible assetsAcquisition cost January 1 . . . . . . . . . . . . . . . . . . . . . . . . . . . . . . . . . . . . . . . . . . . . . 631 548Translation differences . . . . . . . . . . . . . . . . . . . . . . . . . . . . . . . . . . . . . . . . . . . . . . . . 3 4Additions during the period . . . . . . . . . . . . . . . . . . . . . . . . . . . . . . . . . . . . . . . . . . . . 59 86Disposals during the period . . . . . . . . . . . . . . . . . . . . . . . . . . . . . . . . . . . . . . . . . . . . (17) (7)
Accumulated acquisition cost December 31 . . . . . . . . . . . . . . . . . . . . . . . . . . . . . . . . 676 631
Accumulated depreciation January 1 . . . . . . . . . . . . . . . . . . . . . . . . . . . . . . . . . . . . . (422) (363)Translation differences . . . . . . . . . . . . . . . . . . . . . . . . . . . . . . . . . . . . . . . . . . . . . . . . 7 2Disposals during the period . . . . . . . . . . . . . . . . . . . . . . . . . . . . . . . . . . . . . . . . . . . . 14 7Depreciation for the period . . . . . . . . . . . . . . . . . . . . . . . . . . . . . . . . . . . . . . . . . . . . (64) (68)
Accumulated depreciation December 31 . . . . . . . . . . . . . . . . . . . . . . . . . . . . . . . . . . (465) (422)
Net book value January 1 . . . . . . . . . . . . . . . . . . . . . . . . . . . . . . . . . . . . . . . . . . . . . 209 185Net book value December 31 . . . . . . . . . . . . . . . . . . . . . . . . . . . . . . . . . . . . . . . . . . . 211 209
15. Property, plant and equipment
2005 2004
EURm EURm
Land and water areasAcquisition cost January 1 . . . . . . . . . . . . . . . . . . . . . . . . . . . . . . . . . . . . . . . . . . . . . 104 108Translation differences . . . . . . . . . . . . . . . . . . . . . . . . . . . . . . . . . . . . . . . . . . . . . . . . 1 —Additions during the period . . . . . . . . . . . . . . . . . . . . . . . . . . . . . . . . . . . . . . . . . . . . 5 1Disposals during the period . . . . . . . . . . . . . . . . . . . . . . . . . . . . . . . . . . . . . . . . . . . . (28) (5)
Accumulated acquisition cost December 31 . . . . . . . . . . . . . . . . . . . . . . . . . . . . . . . . 82 104
Net book value January 1 . . . . . . . . . . . . . . . . . . . . . . . . . . . . . . . . . . . . . . . . . . . . . 104 108Net book value December 31 . . . . . . . . . . . . . . . . . . . . . . . . . . . . . . . . . . . . . . . . . . . 82 104
Buildings and constructionsAcquisition cost January 1 . . . . . . . . . . . . . . . . . . . . . . . . . . . . . . . . . . . . . . . . . . . . . 910 887Translation differences . . . . . . . . . . . . . . . . . . . . . . . . . . . . . . . . . . . . . . . . . . . . . . . . 16 (5)Additions during the period . . . . . . . . . . . . . . . . . . . . . . . . . . . . . . . . . . . . . . . . . . . . 29 38Disposals during the period . . . . . . . . . . . . . . . . . . . . . . . . . . . . . . . . . . . . . . . . . . . . (90) (10)
Accumulated acquisition cost December 31 . . . . . . . . . . . . . . . . . . . . . . . . . . . . . . . . 865 910
Accumulated depreciation January 1 . . . . . . . . . . . . . . . . . . . . . . . . . . . . . . . . . . . . . (220) (196)Translation differences . . . . . . . . . . . . . . . . . . . . . . . . . . . . . . . . . . . . . . . . . . . . . . . . (1) 2Disposals during the period . . . . . . . . . . . . . . . . . . . . . . . . . . . . . . . . . . . . . . . . . . . . 12 6Depreciation for the period . . . . . . . . . . . . . . . . . . . . . . . . . . . . . . . . . . . . . . . . . . . . (35) (32)
Accumulated depreciation December 31 . . . . . . . . . . . . . . . . . . . . . . . . . . . . . . . . . . (244) (220)
Net book value January 1 . . . . . . . . . . . . . . . . . . . . . . . . . . . . . . . . . . . . . . . . . . . . . 690 691Net book value December 31 . . . . . . . . . . . . . . . . . . . . . . . . . . . . . . . . . . . . . . . . . . . 621 690
F-33
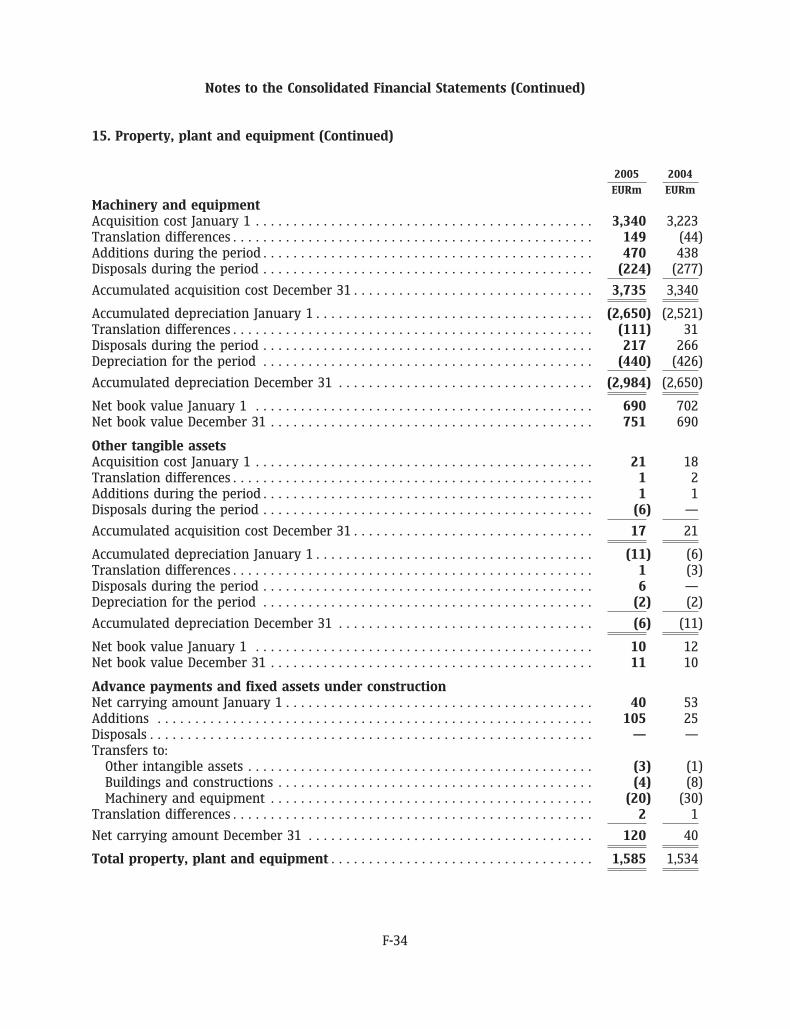
Notes to the Consolidated Financial Statements (Continued)
15. Property, plant and equipment (Continued)
2005 2004
EURm EURm
Machinery and equipmentAcquisition cost January 1 . . . . . . . . . . . . . . . . . . . . . . . . . . . . . . . . . . . . . . . . . . . . . 3,340 3,223Translation differences . . . . . . . . . . . . . . . . . . . . . . . . . . . . . . . . . . . . . . . . . . . . . . . . 149 (44)Additions during the period . . . . . . . . . . . . . . . . . . . . . . . . . . . . . . . . . . . . . . . . . . . . 470 438Disposals during the period . . . . . . . . . . . . . . . . . . . . . . . . . . . . . . . . . . . . . . . . . . . . (224) (277)
Accumulated acquisition cost December 31 . . . . . . . . . . . . . . . . . . . . . . . . . . . . . . . . 3,735 3,340
Accumulated depreciation January 1 . . . . . . . . . . . . . . . . . . . . . . . . . . . . . . . . . . . . . (2,650) (2,521)Translation differences . . . . . . . . . . . . . . . . . . . . . . . . . . . . . . . . . . . . . . . . . . . . . . . . (111) 31Disposals during the period . . . . . . . . . . . . . . . . . . . . . . . . . . . . . . . . . . . . . . . . . . . . 217 266Depreciation for the period . . . . . . . . . . . . . . . . . . . . . . . . . . . . . . . . . . . . . . . . . . . . (440) (426)
Accumulated depreciation December 31 . . . . . . . . . . . . . . . . . . . . . . . . . . . . . . . . . . (2,984) (2,650)
Net book value January 1 . . . . . . . . . . . . . . . . . . . . . . . . . . . . . . . . . . . . . . . . . . . . . 690 702Net book value December 31 . . . . . . . . . . . . . . . . . . . . . . . . . . . . . . . . . . . . . . . . . . . 751 690
Other tangible assetsAcquisition cost January 1 . . . . . . . . . . . . . . . . . . . . . . . . . . . . . . . . . . . . . . . . . . . . . 21 18Translation differences . . . . . . . . . . . . . . . . . . . . . . . . . . . . . . . . . . . . . . . . . . . . . . . . 1 2Additions during the period . . . . . . . . . . . . . . . . . . . . . . . . . . . . . . . . . . . . . . . . . . . . 1 1Disposals during the period . . . . . . . . . . . . . . . . . . . . . . . . . . . . . . . . . . . . . . . . . . . . (6) —
Accumulated acquisition cost December 31 . . . . . . . . . . . . . . . . . . . . . . . . . . . . . . . . 17 21
Accumulated depreciation January 1 . . . . . . . . . . . . . . . . . . . . . . . . . . . . . . . . . . . . . (11) (6)Translation differences . . . . . . . . . . . . . . . . . . . . . . . . . . . . . . . . . . . . . . . . . . . . . . . . 1 (3)Disposals during the period . . . . . . . . . . . . . . . . . . . . . . . . . . . . . . . . . . . . . . . . . . . . 6 —Depreciation for the period . . . . . . . . . . . . . . . . . . . . . . . . . . . . . . . . . . . . . . . . . . . . (2) (2)
Accumulated depreciation December 31 . . . . . . . . . . . . . . . . . . . . . . . . . . . . . . . . . . (6) (11)
Net book value January 1 . . . . . . . . . . . . . . . . . . . . . . . . . . . . . . . . . . . . . . . . . . . . . 10 12Net book value December 31 . . . . . . . . . . . . . . . . . . . . . . . . . . . . . . . . . . . . . . . . . . . 11 10
Advance payments and fixed assets under constructionNet carrying amount January 1 . . . . . . . . . . . . . . . . . . . . . . . . . . . . . . . . . . . . . . . . . 40 53Additions . . . . . . . . . . . . . . . . . . . . . . . . . . . . . . . . . . . . . . . . . . . . . . . . . . . . . . . . . . 105 25Disposals . . . . . . . . . . . . . . . . . . . . . . . . . . . . . . . . . . . . . . . . . . . . . . . . . . . . . . . . . . . — —Transfers to:
Other intangible assets . . . . . . . . . . . . . . . . . . . . . . . . . . . . . . . . . . . . . . . . . . . . . . (3) (1)Buildings and constructions . . . . . . . . . . . . . . . . . . . . . . . . . . . . . . . . . . . . . . . . . . (4) (8)Machinery and equipment . . . . . . . . . . . . . . . . . . . . . . . . . . . . . . . . . . . . . . . . . . . (20) (30)
Translation differences . . . . . . . . . . . . . . . . . . . . . . . . . . . . . . . . . . . . . . . . . . . . . . . . 2 1
Net carrying amount December 31 . . . . . . . . . . . . . . . . . . . . . . . . . . . . . . . . . . . . . . 120 40
Total property, plant and equipment . . . . . . . . . . . . . . . . . . . . . . . . . . . . . . . . . . . 1,585 1,534
F-34
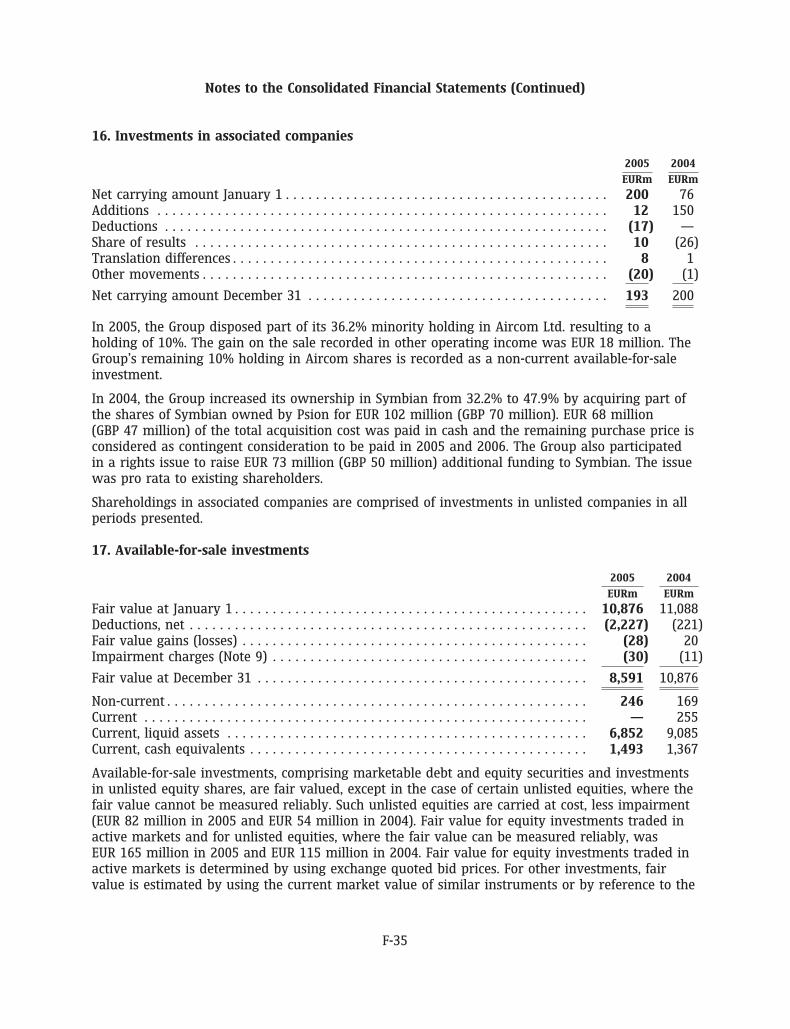
Notes to the Consolidated Financial Statements (Continued)
16. Investments in associated companies
2005 2004
EURm EURm
Net carrying amount January 1 . . . . . . . . . . . . . . . . . . . . . . . . . . . . . . . . . . . . . . . . . . . 200 76Additions . . . . . . . . . . . . . . . . . . . . . . . . . . . . . . . . . . . . . . . . . . . . . . . . . . . . . . . . . . . . 12 150Deductions . . . . . . . . . . . . . . . . . . . . . . . . . . . . . . . . . . . . . . . . . . . . . . . . . . . . . . . . . . . (17) —Share of results . . . . . . . . . . . . . . . . . . . . . . . . . . . . . . . . . . . . . . . . . . . . . . . . . . . . . . . 10 (26)Translation differences . . . . . . . . . . . . . . . . . . . . . . . . . . . . . . . . . . . . . . . . . . . . . . . . . . 8 1Other movements . . . . . . . . . . . . . . . . . . . . . . . . . . . . . . . . . . . . . . . . . . . . . . . . . . . . . . (20) (1)
Net carrying amount December 31 . . . . . . . . . . . . . . . . . . . . . . . . . . . . . . . . . . . . . . . . 193 200
In 2005, the Group disposed part of its 36.2% minority holding in Aircom Ltd. resulting to aholding of 10%. The gain on the sale recorded in other operating income was EUR 18 million. TheGroup’s remaining 10% holding in Aircom shares is recorded as a non-current available-for-saleinvestment.
In 2004, the Group increased its ownership in Symbian from 32.2% to 47.9% by acquiring part ofthe shares of Symbian owned by Psion for EUR 102 million (GBP 70 million). EUR 68 million(GBP 47 million) of the total acquisition cost was paid in cash and the remaining purchase price isconsidered as contingent consideration to be paid in 2005 and 2006. The Group also participatedin a rights issue to raise EUR 73 million (GBP 50 million) additional funding to Symbian. The issuewas pro rata to existing shareholders.
Shareholdings in associated companies are comprised of investments in unlisted companies in allperiods presented.
17. Available-for-sale investments
2005 2004
EURm EURm
Fair value at January 1 . . . . . . . . . . . . . . . . . . . . . . . . . . . . . . . . . . . . . . . . . . . . . . . 10,876 11,088Deductions, net . . . . . . . . . . . . . . . . . . . . . . . . . . . . . . . . . . . . . . . . . . . . . . . . . . . . . (2,227) (221)Fair value gains (losses) . . . . . . . . . . . . . . . . . . . . . . . . . . . . . . . . . . . . . . . . . . . . . . (28) 20Impairment charges (Note 9) . . . . . . . . . . . . . . . . . . . . . . . . . . . . . . . . . . . . . . . . . . (30) (11)
Fair value at December 31 . . . . . . . . . . . . . . . . . . . . . . . . . . . . . . . . . . . . . . . . . . . . 8,591 10,876
Non-current . . . . . . . . . . . . . . . . . . . . . . . . . . . . . . . . . . . . . . . . . . . . . . . . . . . . . . . . 246 169Current . . . . . . . . . . . . . . . . . . . . . . . . . . . . . . . . . . . . . . . . . . . . . . . . . . . . . . . . . . . — 255Current, liquid assets . . . . . . . . . . . . . . . . . . . . . . . . . . . . . . . . . . . . . . . . . . . . . . . . 6,852 9,085Current, cash equivalents . . . . . . . . . . . . . . . . . . . . . . . . . . . . . . . . . . . . . . . . . . . . . 1,493 1,367
Available-for-sale investments, comprising marketable debt and equity securities and investmentsin unlisted equity shares, are fair valued, except in the case of certain unlisted equities, where thefair value cannot be measured reliably. Such unlisted equities are carried at cost, less impairment(EUR 82 million in 2005 and EUR 54 million in 2004). Fair value for equity investments traded inactive markets and for unlisted equities, where the fair value can be measured reliably, wasEUR 165 million in 2005 and EUR 115 million in 2004. Fair value for equity investments traded inactive markets is determined by using exchange quoted bid prices. For other investments, fairvalue is estimated by using the current market value of similar instruments or by reference to the
F-35
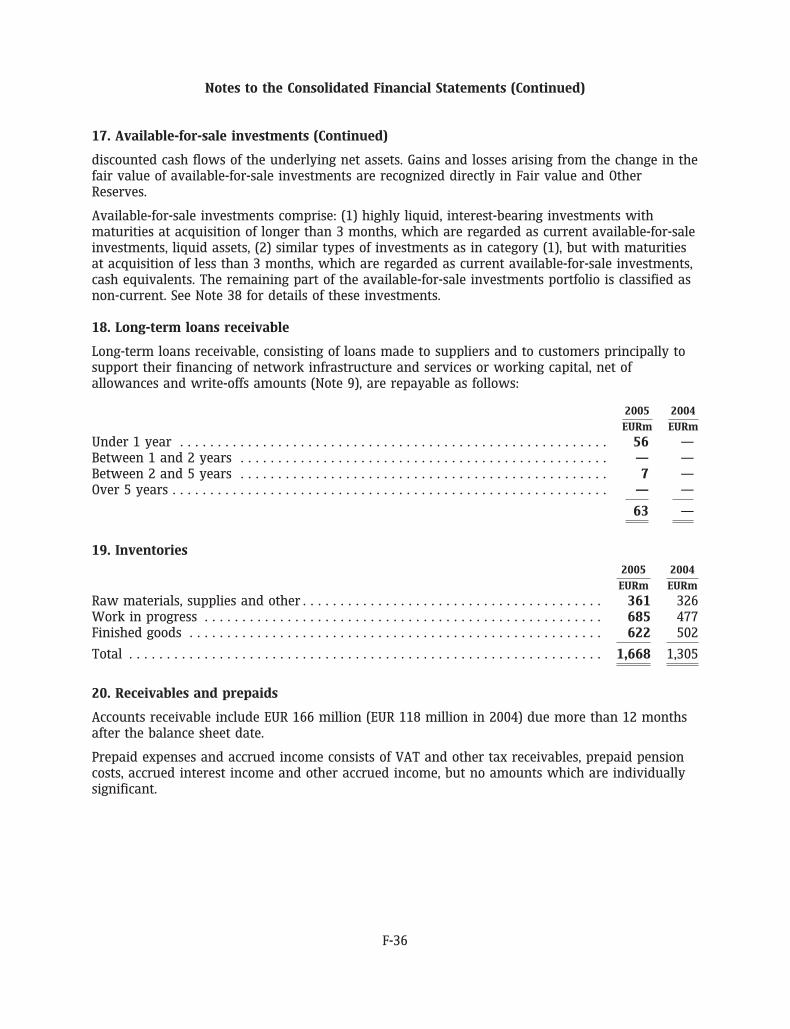
Notes to the Consolidated Financial Statements (Continued)
17. Available-for-sale investments (Continued)
discounted cash flows of the underlying net assets. Gains and losses arising from the change in thefair value of available-for-sale investments are recognized directly in Fair value and OtherReserves.
Available-for-sale investments comprise: (1) highly liquid, interest-bearing investments withmaturities at acquisition of longer than 3 months, which are regarded as current available-for-saleinvestments, liquid assets, (2) similar types of investments as in category (1), but with maturitiesat acquisition of less than 3 months, which are regarded as current available-for-sale investments,cash equivalents. The remaining part of the available-for-sale investments portfolio is classified asnon-current. See Note 38 for details of these investments.
18. Long-term loans receivable
Long-term loans receivable, consisting of loans made to suppliers and to customers principally tosupport their financing of network infrastructure and services or working capital, net ofallowances and write-offs amounts (Note 9), are repayable as follows:
2005 2004
EURm EURm
Under 1 year . . . . . . . . . . . . . . . . . . . . . . . . . . . . . . . . . . . . . . . . . . . . . . . . . . . . . . . . . 56 —Between 1 and 2 years . . . . . . . . . . . . . . . . . . . . . . . . . . . . . . . . . . . . . . . . . . . . . . . . . — —Between 2 and 5 years . . . . . . . . . . . . . . . . . . . . . . . . . . . . . . . . . . . . . . . . . . . . . . . . . 7 —Over 5 years . . . . . . . . . . . . . . . . . . . . . . . . . . . . . . . . . . . . . . . . . . . . . . . . . . . . . . . . . . — —
63 —
19. Inventories2005 2004
EURm EURm
Raw materials, supplies and other . . . . . . . . . . . . . . . . . . . . . . . . . . . . . . . . . . . . . . . . 361 326Work in progress . . . . . . . . . . . . . . . . . . . . . . . . . . . . . . . . . . . . . . . . . . . . . . . . . . . . . 685 477Finished goods . . . . . . . . . . . . . . . . . . . . . . . . . . . . . . . . . . . . . . . . . . . . . . . . . . . . . . . 622 502
Total . . . . . . . . . . . . . . . . . . . . . . . . . . . . . . . . . . . . . . . . . . . . . . . . . . . . . . . . . . . . . . . 1,668 1,305
20. Receivables and prepaids
Accounts receivable include EUR 166 million (EUR 118 million in 2004) due more than 12 monthsafter the balance sheet date.
Prepaid expenses and accrued income consists of VAT and other tax receivables, prepaid pensioncosts, accrued interest income and other accrued income, but no amounts which are individuallysignificant.
F-36
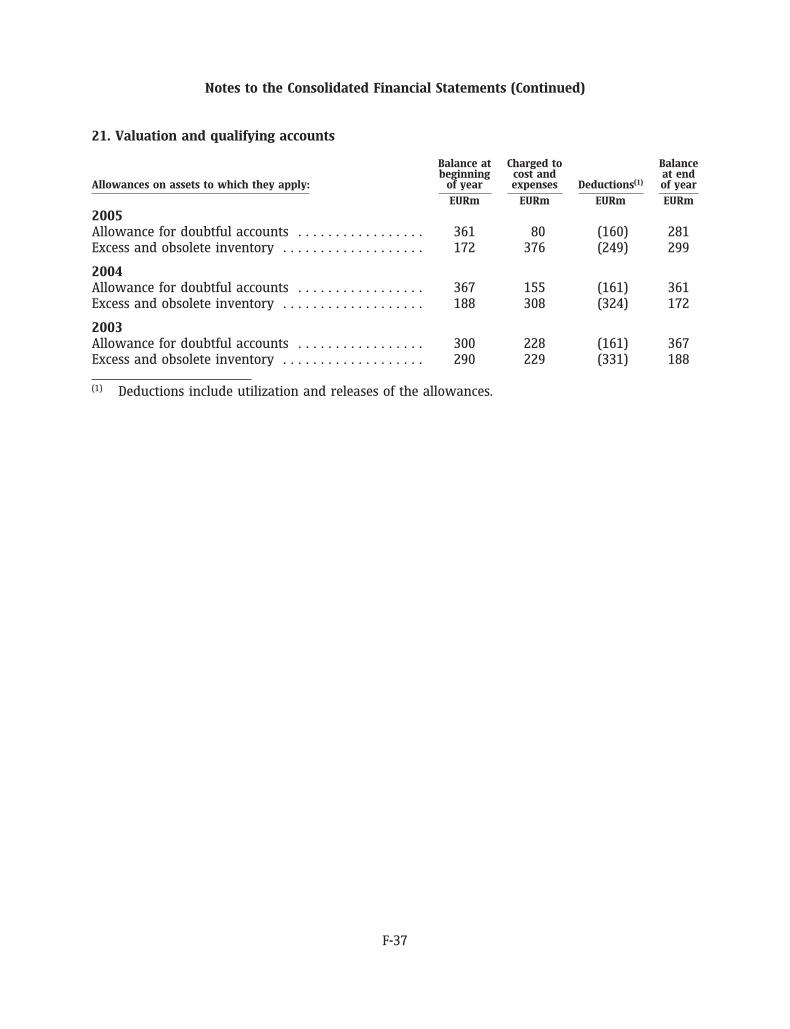
Notes to the Consolidated Financial Statements (Continued)
21. Valuation and qualifying accounts
Balance at Charged to Balancebeginning cost and at end
Allowances on assets to which they apply: of year expenses Deductions(1) of year
EURm EURm EURm EURm
2005Allowance for doubtful accounts . . . . . . . . . . . . . . . . . 361 80 (160) 281Excess and obsolete inventory . . . . . . . . . . . . . . . . . . . 172 376 (249) 299
2004Allowance for doubtful accounts . . . . . . . . . . . . . . . . . 367 155 (161) 361Excess and obsolete inventory . . . . . . . . . . . . . . . . . . . 188 308 (324) 172
2003Allowance for doubtful accounts . . . . . . . . . . . . . . . . . 300 228 (161) 367Excess and obsolete inventory . . . . . . . . . . . . . . . . . . . 290 229 (331) 188
(1) Deductions include utilization and releases of the allowances.
F-37
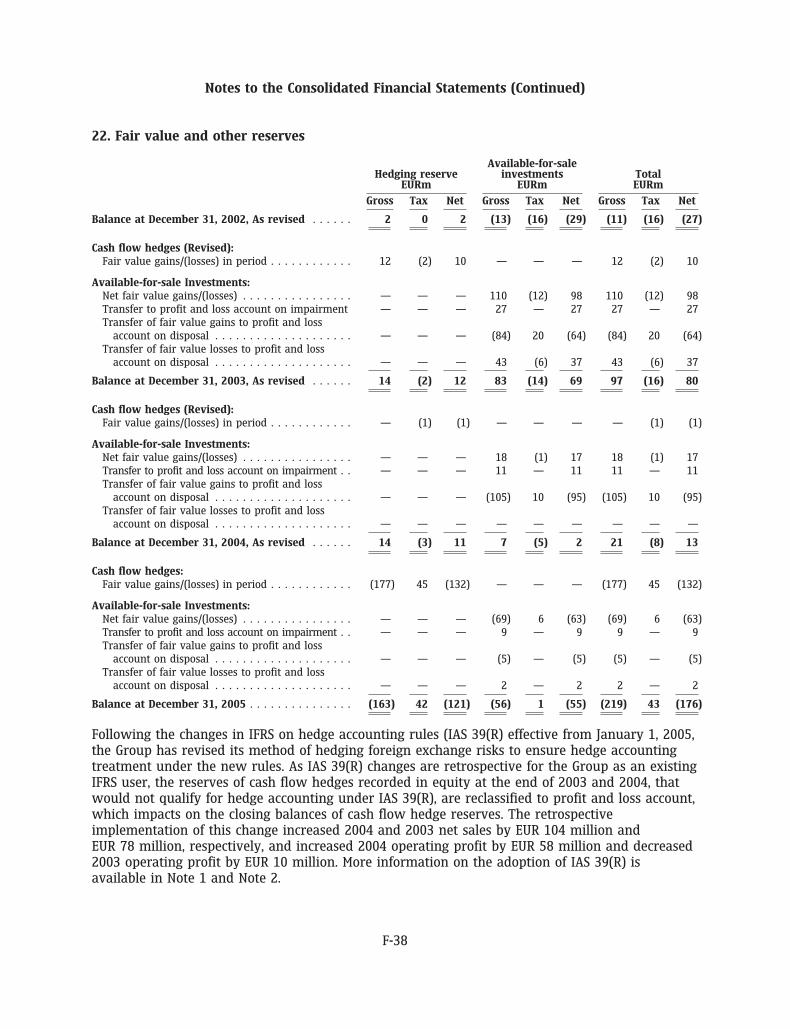
Notes to the Consolidated Financial Statements (Continued)
22. Fair value and other reserves
Available-for-saleHedging reserve investments Total
EURm EURm EURm
Gross Tax Net Gross Tax Net Gross Tax Net
Balance at December 31, 2002, As revised . . . . . . 2 0 2 (13) (16) (29) (11) (16) (27)
Cash flow hedges (Revised):Fair value gains/(losses) in period . . . . . . . . . . . . 12 (2) 10 — — — 12 (2) 10
Available-for-sale Investments:Net fair value gains/(losses) . . . . . . . . . . . . . . . . — — — 110 (12) 98 110 (12) 98Transfer to profit and loss account on impairment — — — 27 — 27 27 — 27Transfer of fair value gains to profit and loss
account on disposal . . . . . . . . . . . . . . . . . . . . — — — (84) 20 (64) (84) 20 (64)Transfer of fair value losses to profit and loss
account on disposal . . . . . . . . . . . . . . . . . . . . — — — 43 (6) 37 43 (6) 37
Balance at December 31, 2003, As revised . . . . . . 14 (2) 12 83 (14) 69 97 (16) 80
Cash flow hedges (Revised):Fair value gains/(losses) in period . . . . . . . . . . . . — (1) (1) — — — — (1) (1)
Available-for-sale Investments:Net fair value gains/(losses) . . . . . . . . . . . . . . . . — — — 18 (1) 17 18 (1) 17Transfer to profit and loss account on impairment . . — — — 11 — 11 11 — 11Transfer of fair value gains to profit and loss
account on disposal . . . . . . . . . . . . . . . . . . . . — — — (105) 10 (95) (105) 10 (95)Transfer of fair value losses to profit and loss
account on disposal . . . . . . . . . . . . . . . . . . . . — — — — — — — — —
Balance at December 31, 2004, As revised . . . . . . 14 (3) 11 7 (5) 2 21 (8) 13
Cash flow hedges:Fair value gains/(losses) in period . . . . . . . . . . . . (177) 45 (132) — — — (177) 45 (132)
Available-for-sale Investments:Net fair value gains/(losses) . . . . . . . . . . . . . . . . — — — (69) 6 (63) (69) 6 (63)Transfer to profit and loss account on impairment . . — — — 9 — 9 9 — 9Transfer of fair value gains to profit and loss
account on disposal . . . . . . . . . . . . . . . . . . . . — — — (5) — (5) (5) — (5)Transfer of fair value losses to profit and loss
account on disposal . . . . . . . . . . . . . . . . . . . . — — — 2 — 2 2 — 2
Balance at December 31, 2005 . . . . . . . . . . . . . . . (163) 42 (121) (56) 1 (55) (219) 43 (176)
Following the changes in IFRS on hedge accounting rules (IAS 39(R) effective from January 1, 2005,the Group has revised its method of hedging foreign exchange risks to ensure hedge accountingtreatment under the new rules. As IAS 39(R) changes are retrospective for the Group as an existingIFRS user, the reserves of cash flow hedges recorded in equity at the end of 2003 and 2004, thatwould not qualify for hedge accounting under IAS 39(R), are reclassified to profit and loss account,which impacts on the closing balances of cash flow hedge reserves. The retrospectiveimplementation of this change increased 2004 and 2003 net sales by EUR 104 million andEUR 78 million, respectively, and increased 2004 operating profit by EUR 58 million and decreased2003 operating profit by EUR 10 million. More information on the adoption of IAS 39(R) isavailable in Note 1 and Note 2.
F-38
Notes to the Consolidated Financial Statements (Continued)
22. Fair value and other reserves (Continued)
In order to ensure that amounts deferred in the cash flow hedging reserve represent only theeffective portion of gains and losses on properly designated hedges of future transactions thatremain highly probable at the balance sheet date, Nokia has adopted a process under which allderivative gains and losses are initially recognized in the profit and loss account. The appropriatereserve balance is calculated at the end of each period and posted to the Hedging Reserve.
The Group continuously reviews the underlying cash flows and the hedges allocated thereto, toensure that the amounts transferred to the Hedging Reserve during the year ended December 31,2005 and 2004 do not include gains/losses on forward exchange contracts that have beendesignated to hedge forecasted sales or purchases that are no longer expected to occur. Because ofthe number of transactions undertaken during each period and the process used to calculate thereserve balance, separate disclosure of the transfers of gains and losses to and from the reservewould be impractical.
All of the net fair value gains or losses recorded in the Fair value and other reserve atDecember 31, 2005 on open forward foreign exchange contracts which hedge anticipated futureforeign currency sales or purchases are transferred from the Hedging Reserve to the profit andloss account when the forecasted foreign currency cash flows occur, at various dates up to 1 yearfrom the balance sheet date.
23. The shares of the Parent Company
Nokia shares and shareholders
Shares and share capital
Nokia has one class of shares. Each Nokia share entitles the holder to one (1) vote at GeneralMeetings of Nokia. The par value of the share is EUR 0.06.
The minimum share capital stipulated in the Articles of Association is EUR 170 million and themaximum share capital EUR 680 million. The share capital may be increased or reduced withinthese limits without amending the Articles of Association.
On December 31, 2005, the share capital of Nokia Corporation was EUR 266,033,192.40 and thetotal number of shares was 4,433,886,540.
On December 31, 2005, the total number of shares included 261,511,283 shares owned by theGroup companies with an aggregate par value of EUR 15,690,676.98 representing approximately5.9% of the share capital and the total voting rights.
Authorizations
Authorization to increase the share capital
The Board of Directors had been authorized by Nokia shareholders at the Annual General Meetingheld on March 25, 2004 to decide on an increase of the share capital by a maximum ofEUR 55,500,000 offering a maximum of 925,000,000 new shares. In 2005, the Board of Directors didnot increase the share capital on the basis of this authorization. The authorization expired onMarch 25, 2005.
At the Annual General Meeting held on April 7, 2005 Nokia shareholders authorized the Board ofDirectors to decide on an increase of the share capital by a maximum of EUR 53,160,000 within
F-39
Notes to the Consolidated Financial Statements (Continued)
23. The shares of the Parent Company (Continued)
one year from the resolution of the Annual General Meeting. The increase of the share capital mayconsist of one or more issues offering a maximum of 886,000,000 new shares with a par value ofEUR 0.06 each. The share capital may be increased in deviation from the shareholders’ pre-emptiverights for share subscription provided that from the company’s perspective important financialgrounds exist such as financing or carrying out of an acquisition or another arrangement orgranting incentives to selected members of the personnel. In 2005, the Board of Directors did notincrease the share capital on the basis of this authorization. The authorization is effective untilApril 7, 2006.
At the end of 2005, the Board of Directors had no other authorizations to issue shares, convertiblebonds, warrants or stock options.
The Board of Directors will propose to the Annual General Meeting convening on March 30, 2006that the Board of Directors be authorized to resolve to increase the share capital of the companyby issuing new shares, stock options or convertible bonds in one or more issues. The increase ofthe share capital through issuance of new shares, subscription of shares pursuant to stock optionsand conversion of convertible bonds into shares, may amount to a maximum of EUR 48,540,000 intotal. As a result of share issuance, subscription of shares pursuant to stock options and conversionof convertible bonds into shares an aggregate maximum of 809,000,000 new shares with a parvalue of EUR 0.06 may be issued. The authorization is proposed to be effective until March 30,2007, or in the event that the new Companies Act has been approved by the time of the AnnualGeneral Meeting, and enters into force latest on March 30, 2007, this authorization is proposed tobe effective until June 30, 2007.
Other authorizations
At the Annual General Meeting held on March 25, 2004, Nokia shareholders authorized the Board ofDirectors to repurchase a maximum of 230 million Nokia shares. In 2005 Nokia repurchased54 million Nokia shares on the basis of this authorization.
At the Annual General Meeting held on April 7, 2005, Nokia shareholders authorized the Board ofDirectors to repurchase a maximum of 443,200,000 Nokia shares, representing less than 10% of theshare capital and the total voting rights, and to resolve on the disposal of a maximum of443,200,000 Nokia shares. In 2005, a total of 261,010,000 Nokia shares were repurchased underthis buy-back authorization, as a result of which the unused authorization amounted to182,190,000 shares on December 31, 2005. No shares were disposed of in 2005 under therespective authorization. The shares may be repurchased under the buy-back authorization inorder to carry out the company’s stock repurchase plan. In addition, the shares may berepurchased in order to develop the capital structure of the company, to finance or carry outacquisitions or other arrangements, to settle the company’s equity-based incentive plans, to betransferred for other purposes, or to be cancelled. The authorization to dispose of the shares maybe carried out pursuant to terms determined by the Board in connection with acquisitions or inother arrangements or for incentive purposes to selected members of the personnel. The Boardmay resolve to dispose the shares in another proportion than that of the shareholders’pre-emptive rights to the company’s shares, provided that from the company’s perspectiveimportant financial grounds exist for such disposal. These authorizations are effective untilApril 7, 2006.
F-40
Notes to the Consolidated Financial Statements (Continued)
23. The shares of the Parent Company (Continued)
The Board of Directors will propose to the Annual General Meeting convening on March 30, 2006that the Board of Directors be authorized to repurchase a maximum of 405 million Nokia sharesby using unrestricted shareholders’ equity. Further, the Board of Directors will propose that theAnnual General Meeting authorize the Board of Directors to resolve to dispose a maximum of405 million Nokia shares. These authorizations are proposed to be effective until March 30, 2007,or in the event that the new Companies Act has been approved by the time of the Annual GeneralMeeting, and enters into force latest on March 30, 2007, these authorizations are proposed to beeffective until June 30, 2007.
24. Share-based payment
The Group has several equity based incentive programs for employees, in which management alsoparticipates. The programs include performance share plans, stock option plans and restrictedshare plans.
The equity-based incentive grants are generally forfeited, if the employment relationship with theGroup terminates, and they are conditional upon the fulfillment of the performance and suchother conditions, as determined in the relevant plan rules.
Stock options
The Group’s outstanding stock option plans currently include the so called ‘‘Global plans’’ launchedin 2001, 2003 and 2005. These plans have been approved by the Annual General Meeting in theyear of the launch of the plan.
Under these plans, each stock option entitles the holder to subscribe for one new Nokia share witha par value of EUR 0.06 each. In the 2001 stock option plan the stock options are transferable andthe stock options under the 2003 and 2005 plans are non-transferable by the participants. All ofthe stock options have a quarterly staggered vesting schedule, as specified in the table below. Theexercise prices are determined at the time of the grant, on a quarterly basis equalling the tradevolume weighted average price of the Nokia share on the Helsinki Stock Exchange during thetrading days of the first whole week of the second month (i.e. February, May, August orNovember) of the respective calendar quarter, when the sub-category of the stock option isdenominated.
The exercises based on the stock options issued under the 2001, 2003 and 2005 stock option plansare settled with newly issued shares which will entitle the holder to a dividend for the financialyear in which the subscription occurs. Other shareholder rights commence on the date on whichthe shares subscribed for are registered with the Finnish Trade Register.
Pursuant to the stock options issued, an aggregate maximum number of 144,495,187 new shareswere authorized for subscription representing EUR 8,669,711 of the share capital andapproximately 3% of the total number of votes on December 31, 2005. During 2005 the exercise of125,240 options resulted in the issuance of 125,240 new shares and an increase of the sharecapital of the Group by EUR 7,514.40.
There were no other stock options or convertible bonds outstanding as of December 31, 2005,which upon exercise would result in an increase of the share capital of the parent company.
F-41
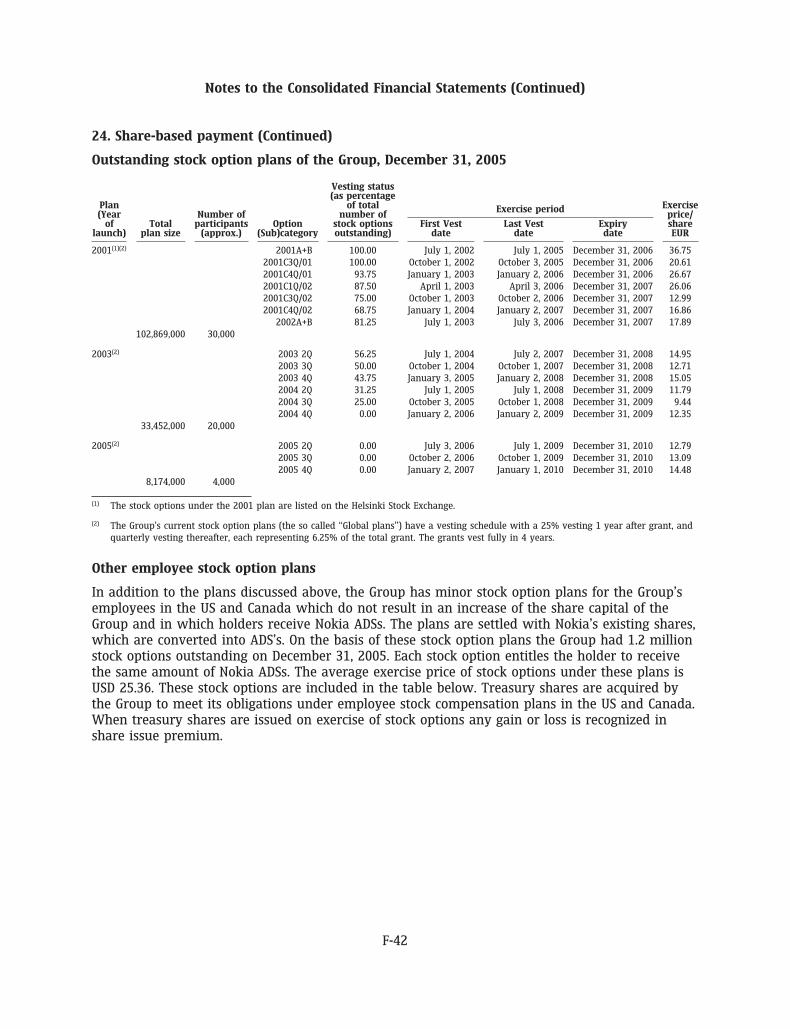
Notes to the Consolidated Financial Statements (Continued)
24. Share-based payment (Continued)
Outstanding stock option plans of the Group, December 31, 2005
Vesting status(as percentage
Plan of total ExerciseExercise period(Year Number of number of price/
of Total participants Option stock options First Vest Last Vest Expiry sharelaunch) plan size (approx.) (Sub)category outstanding) date date date EUR
2001(1)(2) 2001A+B 100.00 July 1, 2002 July 1, 2005 December 31, 2006 36.752001C3Q/01 100.00 October 1, 2002 October 3, 2005 December 31, 2006 20.612001C4Q/01 93.75 January 1, 2003 January 2, 2006 December 31, 2006 26.672001C1Q/02 87.50 April 1, 2003 April 3, 2006 December 31, 2007 26.062001C3Q/02 75.00 October 1, 2003 October 2, 2006 December 31, 2007 12.992001C4Q/02 68.75 January 1, 2004 January 2, 2007 December 31, 2007 16.86
2002A+B 81.25 July 1, 2003 July 3, 2006 December 31, 2007 17.89102,869,000 30,000
2003(2) 2003 2Q 56.25 July 1, 2004 July 2, 2007 December 31, 2008 14.952003 3Q 50.00 October 1, 2004 October 1, 2007 December 31, 2008 12.712003 4Q 43.75 January 3, 2005 January 2, 2008 December 31, 2008 15.052004 2Q 31.25 July 1, 2005 July 1, 2008 December 31, 2009 11.792004 3Q 25.00 October 3, 2005 October 1, 2008 December 31, 2009 9.442004 4Q 0.00 January 2, 2006 January 2, 2009 December 31, 2009 12.35
33,452,000 20,000
2005(2) 2005 2Q 0.00 July 3, 2006 July 1, 2009 December 31, 2010 12.792005 3Q 0.00 October 2, 2006 October 1, 2009 December 31, 2010 13.092005 4Q 0.00 January 2, 2007 January 1, 2010 December 31, 2010 14.48
8,174,000 4,000
(1) The stock options under the 2001 plan are listed on the Helsinki Stock Exchange.
(2) The Group’s current stock option plans (the so called ‘‘Global plans’’) have a vesting schedule with a 25% vesting 1 year after grant, andquarterly vesting thereafter, each representing 6.25% of the total grant. The grants vest fully in 4 years.
Other employee stock option plans
In addition to the plans discussed above, the Group has minor stock option plans for the Group’semployees in the US and Canada which do not result in an increase of the share capital of theGroup and in which holders receive Nokia ADSs. The plans are settled with Nokia’s existing shares,which are converted into ADS’s. On the basis of these stock option plans the Group had 1.2 millionstock options outstanding on December 31, 2005. Each stock option entitles the holder to receivethe same amount of Nokia ADSs. The average exercise price of stock options under these plans isUSD 25.36. These stock options are included in the table below. Treasury shares are acquired bythe Group to meet its obligations under employee stock compensation plans in the US and Canada.When treasury shares are issued on exercise of stock options any gain or loss is recognized inshare issue premium.
F-42
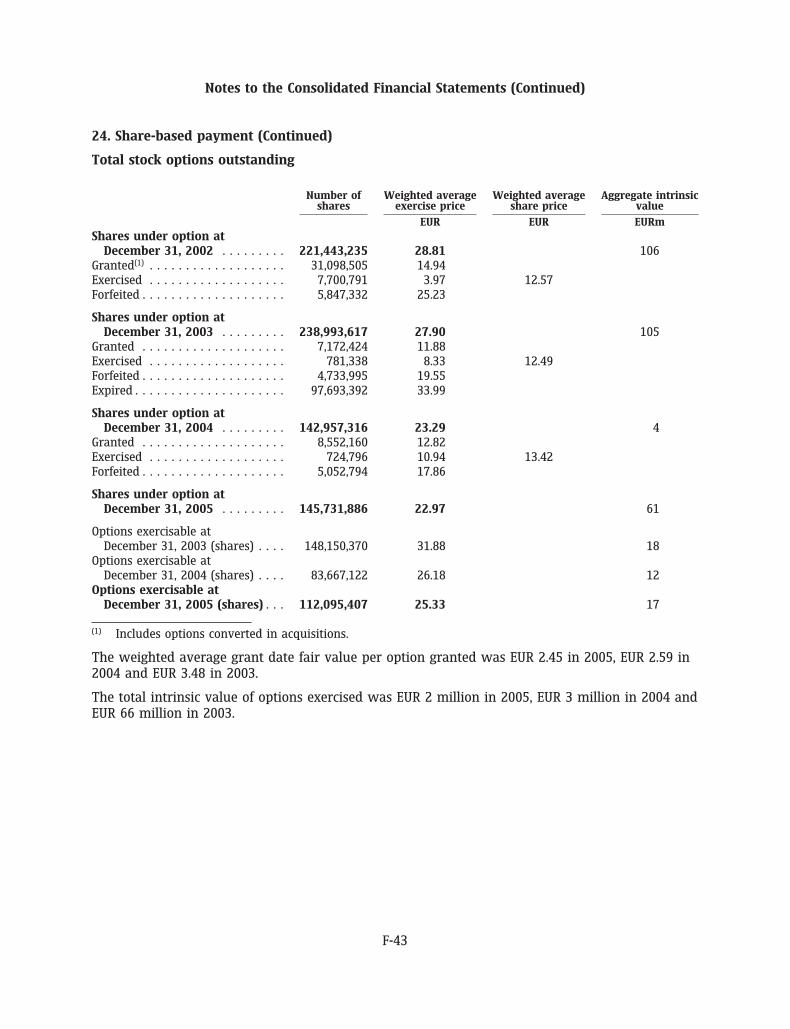
Notes to the Consolidated Financial Statements (Continued)
24. Share-based payment (Continued)
Total stock options outstanding
Number of Weighted average Weighted average Aggregate intrinsicshares exercise price share price value
EUR EUR EURmShares under option at
December 31, 2002 . . . . . . . . . 221,443,235 28.81 106Granted(1) . . . . . . . . . . . . . . . . . . . 31,098,505 14.94Exercised . . . . . . . . . . . . . . . . . . . 7,700,791 3.97 12.57Forfeited . . . . . . . . . . . . . . . . . . . . 5,847,332 25.23
Shares under option atDecember 31, 2003 . . . . . . . . . 238,993,617 27.90 105
Granted . . . . . . . . . . . . . . . . . . . . 7,172,424 11.88Exercised . . . . . . . . . . . . . . . . . . . 781,338 8.33 12.49Forfeited . . . . . . . . . . . . . . . . . . . . 4,733,995 19.55Expired . . . . . . . . . . . . . . . . . . . . . 97,693,392 33.99
Shares under option atDecember 31, 2004 . . . . . . . . . 142,957,316 23.29 4
Granted . . . . . . . . . . . . . . . . . . . . 8,552,160 12.82Exercised . . . . . . . . . . . . . . . . . . . 724,796 10.94 13.42Forfeited . . . . . . . . . . . . . . . . . . . . 5,052,794 17.86
Shares under option atDecember 31, 2005 . . . . . . . . . 145,731,886 22.97 61
Options exercisable atDecember 31, 2003 (shares) . . . . 148,150,370 31.88 18
Options exercisable atDecember 31, 2004 (shares) . . . . 83,667,122 26.18 12
Options exercisable atDecember 31, 2005 (shares) . . . 112,095,407 25.33 17
(1) Includes options converted in acquisitions.
The weighted average grant date fair value per option granted was EUR 2.45 in 2005, EUR 2.59 in2004 and EUR 3.48 in 2003.
The total intrinsic value of options exercised was EUR 2 million in 2005, EUR 3 million in 2004 andEUR 66 million in 2003.
F-43
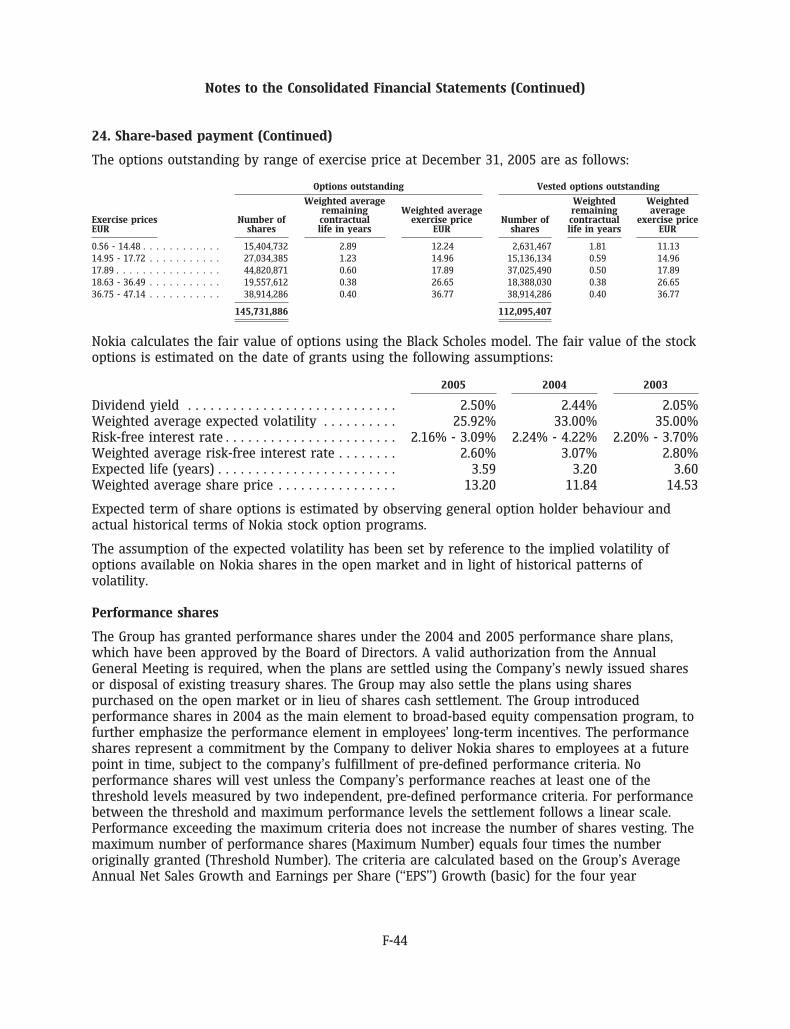
Notes to the Consolidated Financial Statements (Continued)
24. Share-based payment (Continued)
The options outstanding by range of exercise price at December 31, 2005 are as follows:
Options outstanding Vested options outstanding
Weighted average Weighted Weightedremaining Weighted average remaining average
Exercise prices Number of contractual exercise price Number of contractual exercise priceEUR shares life in years EUR shares life in years EUR
0.56 - 14.48 . . . . . . . . . . . . 15,404,732 2.89 12.24 2,631,467 1.81 11.1314.95 - 17.72 . . . . . . . . . . . 27,034,385 1.23 14.96 15,136,134 0.59 14.9617.89 . . . . . . . . . . . . . . . . 44,820,871 0.60 17.89 37,025,490 0.50 17.8918.63 - 36.49 . . . . . . . . . . . 19,557,612 0.38 26.65 18,388,030 0.38 26.6536.75 - 47.14 . . . . . . . . . . . 38,914,286 0.40 36.77 38,914,286 0.40 36.77
145,731,886 112,095,407
Nokia calculates the fair value of options using the Black Scholes model. The fair value of the stockoptions is estimated on the date of grants using the following assumptions:
2005 2004 2003
Dividend yield . . . . . . . . . . . . . . . . . . . . . . . . . . . . 2.50% 2.44% 2.05%Weighted average expected volatility . . . . . . . . . . 25.92% 33.00% 35.00%Risk-free interest rate . . . . . . . . . . . . . . . . . . . . . . . 2.16% - 3.09% 2.24% - 4.22% 2.20% - 3.70%Weighted average risk-free interest rate . . . . . . . . 2.60% 3.07% 2.80%Expected life (years) . . . . . . . . . . . . . . . . . . . . . . . . 3.59 3.20 3.60Weighted average share price . . . . . . . . . . . . . . . . 13.20 11.84 14.53
Expected term of share options is estimated by observing general option holder behaviour andactual historical terms of Nokia stock option programs.
The assumption of the expected volatility has been set by reference to the implied volatility ofoptions available on Nokia shares in the open market and in light of historical patterns ofvolatility.
Performance shares
The Group has granted performance shares under the 2004 and 2005 performance share plans,which have been approved by the Board of Directors. A valid authorization from the AnnualGeneral Meeting is required, when the plans are settled using the Company’s newly issued sharesor disposal of existing treasury shares. The Group may also settle the plans using sharespurchased on the open market or in lieu of shares cash settlement. The Group introducedperformance shares in 2004 as the main element to broad-based equity compensation program, tofurther emphasize the performance element in employees’ long-term incentives. The performanceshares represent a commitment by the Company to deliver Nokia shares to employees at a futurepoint in time, subject to the company’s fulfillment of pre-defined performance criteria. Noperformance shares will vest unless the Company’s performance reaches at least one of thethreshold levels measured by two independent, pre-defined performance criteria. For performancebetween the threshold and maximum performance levels the settlement follows a linear scale.Performance exceeding the maximum criteria does not increase the number of shares vesting. Themaximum number of performance shares (Maximum Number) equals four times the numberoriginally granted (Threshold Number). The criteria are calculated based on the Group’s AverageAnnual Net Sales Growth and Earnings per Share (‘‘EPS’’) Growth (basic) for the four year
F-44
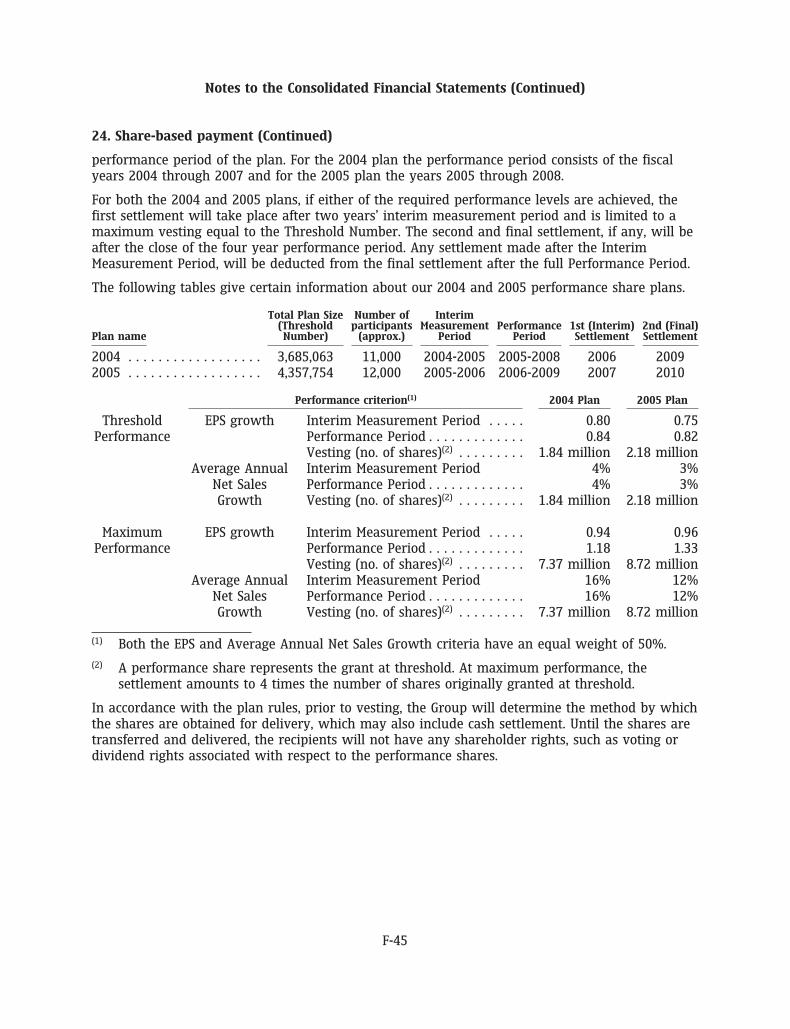
Notes to the Consolidated Financial Statements (Continued)
24. Share-based payment (Continued)
performance period of the plan. For the 2004 plan the performance period consists of the fiscalyears 2004 through 2007 and for the 2005 plan the years 2005 through 2008.
For both the 2004 and 2005 plans, if either of the required performance levels are achieved, thefirst settlement will take place after two years’ interim measurement period and is limited to amaximum vesting equal to the Threshold Number. The second and final settlement, if any, will beafter the close of the four year performance period. Any settlement made after the InterimMeasurement Period, will be deducted from the final settlement after the full Performance Period.
The following tables give certain information about our 2004 and 2005 performance share plans.
Total Plan Size Number of Interim(Threshold participants Measurement Performance 1st (Interim) 2nd (Final)
Plan name Number) (approx.) Period Period Settlement Settlement
2004 . . . . . . . . . . . . . . . . . . 3,685,063 11,000 2004-2005 2005-2008 2006 20092005 . . . . . . . . . . . . . . . . . . 4,357,754 12,000 2005-2006 2006-2009 2007 2010
Performance criterion(1) 2004 Plan 2005 Plan
Threshold EPS growth Interim Measurement Period . . . . . 0.80 0.75Performance Performance Period . . . . . . . . . . . . . 0.84 0.82
Vesting (no. of shares)(2) . . . . . . . . . 1.84 million 2.18 millionAverage Annual Interim Measurement Period 4% 3%
Net Sales Performance Period . . . . . . . . . . . . . 4% 3%Growth Vesting (no. of shares)(2) . . . . . . . . . 1.84 million 2.18 million
Maximum EPS growth Interim Measurement Period . . . . . 0.94 0.96Performance Performance Period . . . . . . . . . . . . . 1.18 1.33
Vesting (no. of shares)(2) . . . . . . . . . 7.37 million 8.72 millionAverage Annual Interim Measurement Period 16% 12%
Net Sales Performance Period . . . . . . . . . . . . . 16% 12%Growth Vesting (no. of shares)(2) . . . . . . . . . 7.37 million 8.72 million
(1) Both the EPS and Average Annual Net Sales Growth criteria have an equal weight of 50%.
(2) A performance share represents the grant at threshold. At maximum performance, thesettlement amounts to 4 times the number of shares originally granted at threshold.
In accordance with the plan rules, prior to vesting, the Group will determine the method by whichthe shares are obtained for delivery, which may also include cash settlement. Until the shares aretransferred and delivered, the recipients will not have any shareholder rights, such as voting ordividend rights associated with respect to the performance shares.
F-45
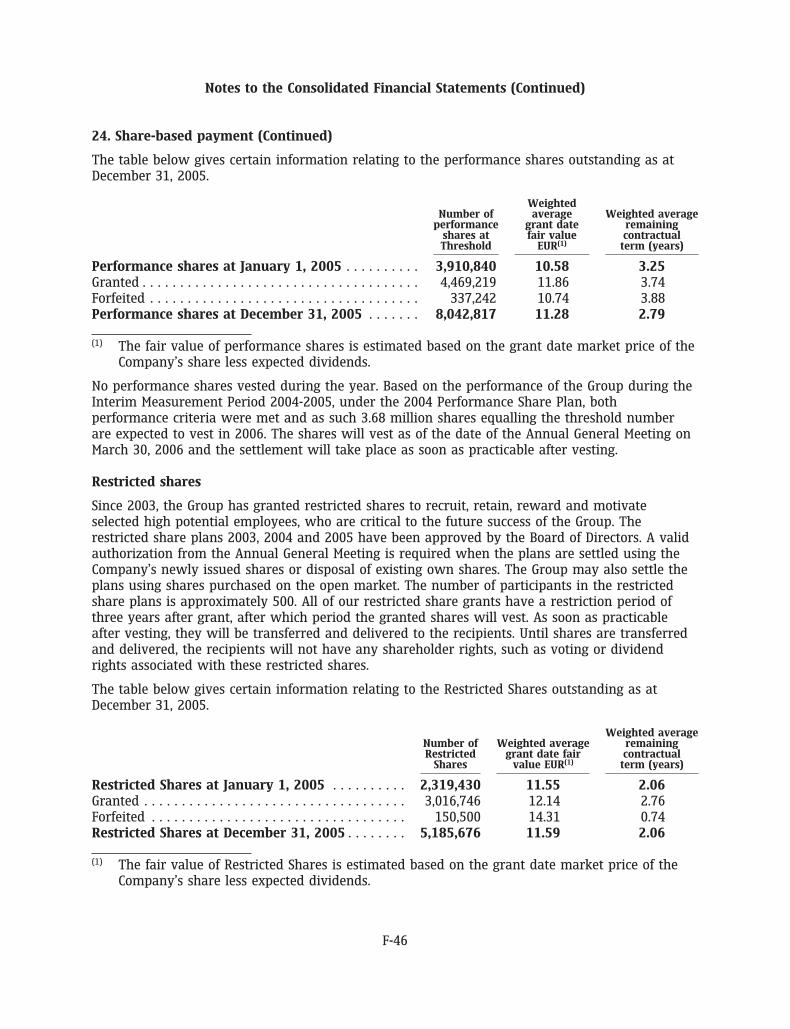
Notes to the Consolidated Financial Statements (Continued)
24. Share-based payment (Continued)
The table below gives certain information relating to the performance shares outstanding as atDecember 31, 2005.
WeightedNumber of average Weighted average
performance grant date remainingshares at fair value contractualThreshold EUR(1) term (years)
Performance shares at January 1, 2005 . . . . . . . . . . 3,910,840 10.58 3.25Granted . . . . . . . . . . . . . . . . . . . . . . . . . . . . . . . . . . . . . 4,469,219 11.86 3.74Forfeited . . . . . . . . . . . . . . . . . . . . . . . . . . . . . . . . . . . . 337,242 10.74 3.88Performance shares at December 31, 2005 . . . . . . . 8,042,817 11.28 2.79
(1) The fair value of performance shares is estimated based on the grant date market price of theCompany’s share less expected dividends.
No performance shares vested during the year. Based on the performance of the Group during theInterim Measurement Period 2004-2005, under the 2004 Performance Share Plan, bothperformance criteria were met and as such 3.68 million shares equalling the threshold numberare expected to vest in 2006. The shares will vest as of the date of the Annual General Meeting onMarch 30, 2006 and the settlement will take place as soon as practicable after vesting.
Restricted shares
Since 2003, the Group has granted restricted shares to recruit, retain, reward and motivateselected high potential employees, who are critical to the future success of the Group. Therestricted share plans 2003, 2004 and 2005 have been approved by the Board of Directors. A validauthorization from the Annual General Meeting is required when the plans are settled using theCompany’s newly issued shares or disposal of existing own shares. The Group may also settle theplans using shares purchased on the open market. The number of participants in the restrictedshare plans is approximately 500. All of our restricted share grants have a restriction period ofthree years after grant, after which period the granted shares will vest. As soon as practicableafter vesting, they will be transferred and delivered to the recipients. Until shares are transferredand delivered, the recipients will not have any shareholder rights, such as voting or dividendrights associated with these restricted shares.
The table below gives certain information relating to the Restricted Shares outstanding as atDecember 31, 2005.
Weighted averageNumber of Weighted average remainingRestricted grant date fair contractual
Shares value EUR(1) term (years)
Restricted Shares at January 1, 2005 . . . . . . . . . . 2,319,430 11.55 2.06Granted . . . . . . . . . . . . . . . . . . . . . . . . . . . . . . . . . . . 3,016,746 12.14 2.76Forfeited . . . . . . . . . . . . . . . . . . . . . . . . . . . . . . . . . . 150,500 14.31 0.74Restricted Shares at December 31, 2005 . . . . . . . . 5,185,676 11.59 2.06
(1) The fair value of Restricted Shares is estimated based on the grant date market price of theCompany’s share less expected dividends.
F-46
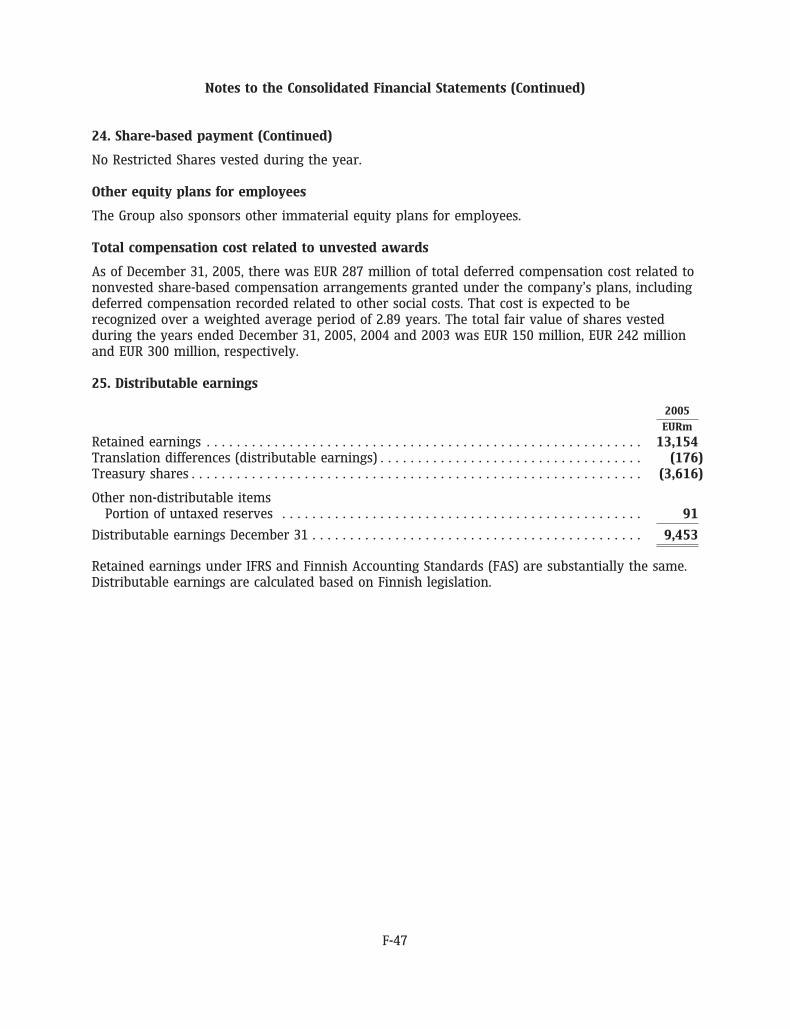
Notes to the Consolidated Financial Statements (Continued)
24. Share-based payment (Continued)
No Restricted Shares vested during the year.
Other equity plans for employees
The Group also sponsors other immaterial equity plans for employees.
Total compensation cost related to unvested awards
As of December 31, 2005, there was EUR 287 million of total deferred compensation cost related tononvested share-based compensation arrangements granted under the company’s plans, includingdeferred compensation recorded related to other social costs. That cost is expected to berecognized over a weighted average period of 2.89 years. The total fair value of shares vestedduring the years ended December 31, 2005, 2004 and 2003 was EUR 150 million, EUR 242 millionand EUR 300 million, respectively.
25. Distributable earnings
2005
EURm
Retained earnings . . . . . . . . . . . . . . . . . . . . . . . . . . . . . . . . . . . . . . . . . . . . . . . . . . . . . . . . . . 13,154Translation differences (distributable earnings) . . . . . . . . . . . . . . . . . . . . . . . . . . . . . . . . . . . (176)Treasury shares . . . . . . . . . . . . . . . . . . . . . . . . . . . . . . . . . . . . . . . . . . . . . . . . . . . . . . . . . . . . (3,616)
Other non-distributable itemsPortion of untaxed reserves . . . . . . . . . . . . . . . . . . . . . . . . . . . . . . . . . . . . . . . . . . . . . . . . 91
Distributable earnings December 31 . . . . . . . . . . . . . . . . . . . . . . . . . . . . . . . . . . . . . . . . . . . . 9,453
Retained earnings under IFRS and Finnish Accounting Standards (FAS) are substantially the same.Distributable earnings are calculated based on Finnish legislation.
F-47
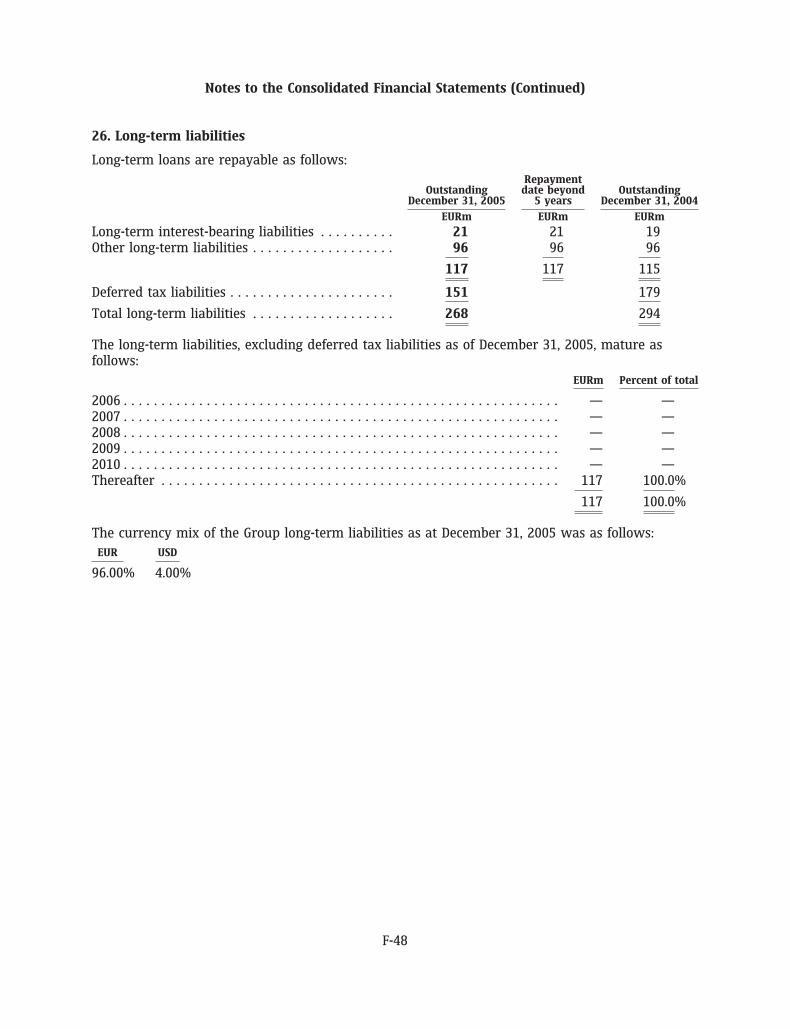
Notes to the Consolidated Financial Statements (Continued)
26. Long-term liabilities
Long-term loans are repayable as follows:Repayment
Outstanding date beyond OutstandingDecember 31, 2005 5 years December 31, 2004
EURm EURm EURm
Long-term interest-bearing liabilities . . . . . . . . . . 21 21 19Other long-term liabilities . . . . . . . . . . . . . . . . . . . 96 96 96
117 117 115
Deferred tax liabilities . . . . . . . . . . . . . . . . . . . . . . 151 179
Total long-term liabilities . . . . . . . . . . . . . . . . . . . 268 294
The long-term liabilities, excluding deferred tax liabilities as of December 31, 2005, mature asfollows:
EURm Percent of total
2006 . . . . . . . . . . . . . . . . . . . . . . . . . . . . . . . . . . . . . . . . . . . . . . . . . . . . . . . . . . — —2007 . . . . . . . . . . . . . . . . . . . . . . . . . . . . . . . . . . . . . . . . . . . . . . . . . . . . . . . . . . — —2008 . . . . . . . . . . . . . . . . . . . . . . . . . . . . . . . . . . . . . . . . . . . . . . . . . . . . . . . . . . — —2009 . . . . . . . . . . . . . . . . . . . . . . . . . . . . . . . . . . . . . . . . . . . . . . . . . . . . . . . . . . — —2010 . . . . . . . . . . . . . . . . . . . . . . . . . . . . . . . . . . . . . . . . . . . . . . . . . . . . . . . . . . — —Thereafter . . . . . . . . . . . . . . . . . . . . . . . . . . . . . . . . . . . . . . . . . . . . . . . . . . . . . 117 100.0%
117 100.0%
The currency mix of the Group long-term liabilities as at December 31, 2005 was as follows:EUR USD
96.00% 4.00%
F-48
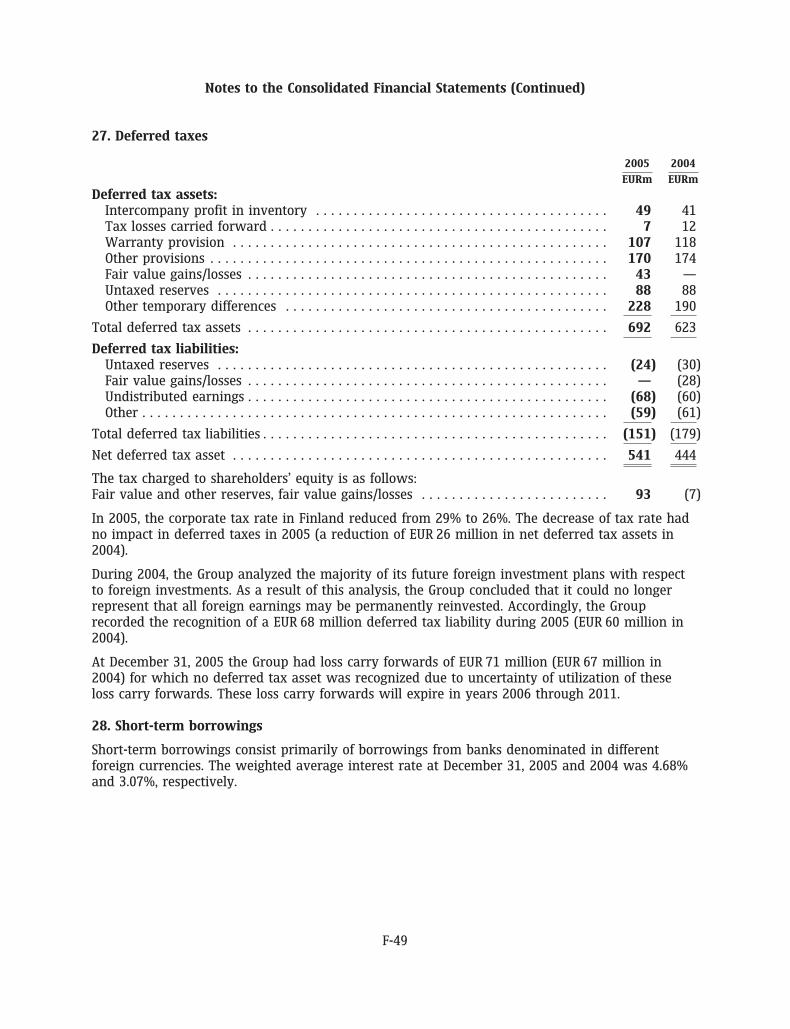
Notes to the Consolidated Financial Statements (Continued)
27. Deferred taxes
2005 2004
EURm EURm
Deferred tax assets:Intercompany profit in inventory . . . . . . . . . . . . . . . . . . . . . . . . . . . . . . . . . . . . . . . 49 41Tax losses carried forward . . . . . . . . . . . . . . . . . . . . . . . . . . . . . . . . . . . . . . . . . . . . . 7 12Warranty provision . . . . . . . . . . . . . . . . . . . . . . . . . . . . . . . . . . . . . . . . . . . . . . . . . . 107 118Other provisions . . . . . . . . . . . . . . . . . . . . . . . . . . . . . . . . . . . . . . . . . . . . . . . . . . . . . 170 174Fair value gains/losses . . . . . . . . . . . . . . . . . . . . . . . . . . . . . . . . . . . . . . . . . . . . . . . . 43 —Untaxed reserves . . . . . . . . . . . . . . . . . . . . . . . . . . . . . . . . . . . . . . . . . . . . . . . . . . . . 88 88Other temporary differences . . . . . . . . . . . . . . . . . . . . . . . . . . . . . . . . . . . . . . . . . . . 228 190
Total deferred tax assets . . . . . . . . . . . . . . . . . . . . . . . . . . . . . . . . . . . . . . . . . . . . . . . . 692 623
Deferred tax liabilities:Untaxed reserves . . . . . . . . . . . . . . . . . . . . . . . . . . . . . . . . . . . . . . . . . . . . . . . . . . . . (24) (30)Fair value gains/losses . . . . . . . . . . . . . . . . . . . . . . . . . . . . . . . . . . . . . . . . . . . . . . . . — (28)Undistributed earnings . . . . . . . . . . . . . . . . . . . . . . . . . . . . . . . . . . . . . . . . . . . . . . . . (68) (60)Other . . . . . . . . . . . . . . . . . . . . . . . . . . . . . . . . . . . . . . . . . . . . . . . . . . . . . . . . . . . . . . (59) (61)
Total deferred tax liabilities . . . . . . . . . . . . . . . . . . . . . . . . . . . . . . . . . . . . . . . . . . . . . . (151) (179)
Net deferred tax asset . . . . . . . . . . . . . . . . . . . . . . . . . . . . . . . . . . . . . . . . . . . . . . . . . . 541 444
The tax charged to shareholders’ equity is as follows:Fair value and other reserves, fair value gains/losses . . . . . . . . . . . . . . . . . . . . . . . . . 93 (7)
In 2005, the corporate tax rate in Finland reduced from 29% to 26%. The decrease of tax rate hadno impact in deferred taxes in 2005 (a reduction of EUR 26 million in net deferred tax assets in2004).
During 2004, the Group analyzed the majority of its future foreign investment plans with respectto foreign investments. As a result of this analysis, the Group concluded that it could no longerrepresent that all foreign earnings may be permanently reinvested. Accordingly, the Grouprecorded the recognition of a EUR 68 million deferred tax liability during 2005 (EUR 60 million in2004).
At December 31, 2005 the Group had loss carry forwards of EUR 71 million (EUR 67 million in2004) for which no deferred tax asset was recognized due to uncertainty of utilization of theseloss carry forwards. These loss carry forwards will expire in years 2006 through 2011.
28. Short-term borrowings
Short-term borrowings consist primarily of borrowings from banks denominated in differentforeign currencies. The weighted average interest rate at December 31, 2005 and 2004 was 4.68%and 3.07%, respectively.
F-49
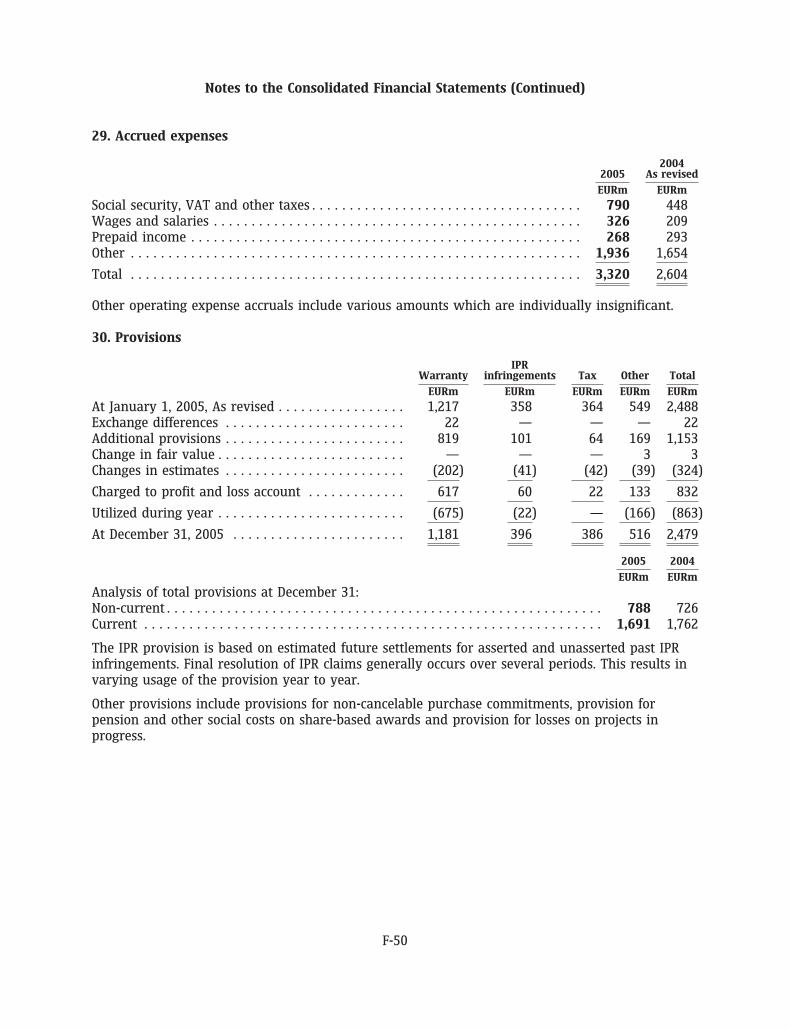
Notes to the Consolidated Financial Statements (Continued)
29. Accrued expenses
20042005 As revised
EURm EURm
Social security, VAT and other taxes . . . . . . . . . . . . . . . . . . . . . . . . . . . . . . . . . . . . 790 448Wages and salaries . . . . . . . . . . . . . . . . . . . . . . . . . . . . . . . . . . . . . . . . . . . . . . . . . 326 209Prepaid income . . . . . . . . . . . . . . . . . . . . . . . . . . . . . . . . . . . . . . . . . . . . . . . . . . . . 268 293Other . . . . . . . . . . . . . . . . . . . . . . . . . . . . . . . . . . . . . . . . . . . . . . . . . . . . . . . . . . . . 1,936 1,654
Total . . . . . . . . . . . . . . . . . . . . . . . . . . . . . . . . . . . . . . . . . . . . . . . . . . . . . . . . . . . . 3,320 2,604
Other operating expense accruals include various amounts which are individually insignificant.
30. Provisions
IPRWarranty infringements Tax Other Total
EURm EURm EURm EURm EURm
At January 1, 2005, As revised . . . . . . . . . . . . . . . . . 1,217 358 364 549 2,488Exchange differences . . . . . . . . . . . . . . . . . . . . . . . . 22 — — — 22Additional provisions . . . . . . . . . . . . . . . . . . . . . . . . 819 101 64 169 1,153Change in fair value . . . . . . . . . . . . . . . . . . . . . . . . . — — — 3 3Changes in estimates . . . . . . . . . . . . . . . . . . . . . . . . (202) (41) (42) (39) (324)
Charged to profit and loss account . . . . . . . . . . . . . 617 60 22 133 832
Utilized during year . . . . . . . . . . . . . . . . . . . . . . . . . (675) (22) — (166) (863)
At December 31, 2005 . . . . . . . . . . . . . . . . . . . . . . . 1,181 396 386 516 2,479
2005 2004
EURm EURm
Analysis of total provisions at December 31:Non-current . . . . . . . . . . . . . . . . . . . . . . . . . . . . . . . . . . . . . . . . . . . . . . . . . . . . . . . . . . 788 726Current . . . . . . . . . . . . . . . . . . . . . . . . . . . . . . . . . . . . . . . . . . . . . . . . . . . . . . . . . . . . . 1,691 1,762
The IPR provision is based on estimated future settlements for asserted and unasserted past IPRinfringements. Final resolution of IPR claims generally occurs over several periods. This results invarying usage of the provision year to year.
Other provisions include provisions for non-cancelable purchase commitments, provision forpension and other social costs on share-based awards and provision for losses on projects inprogress.
F-50
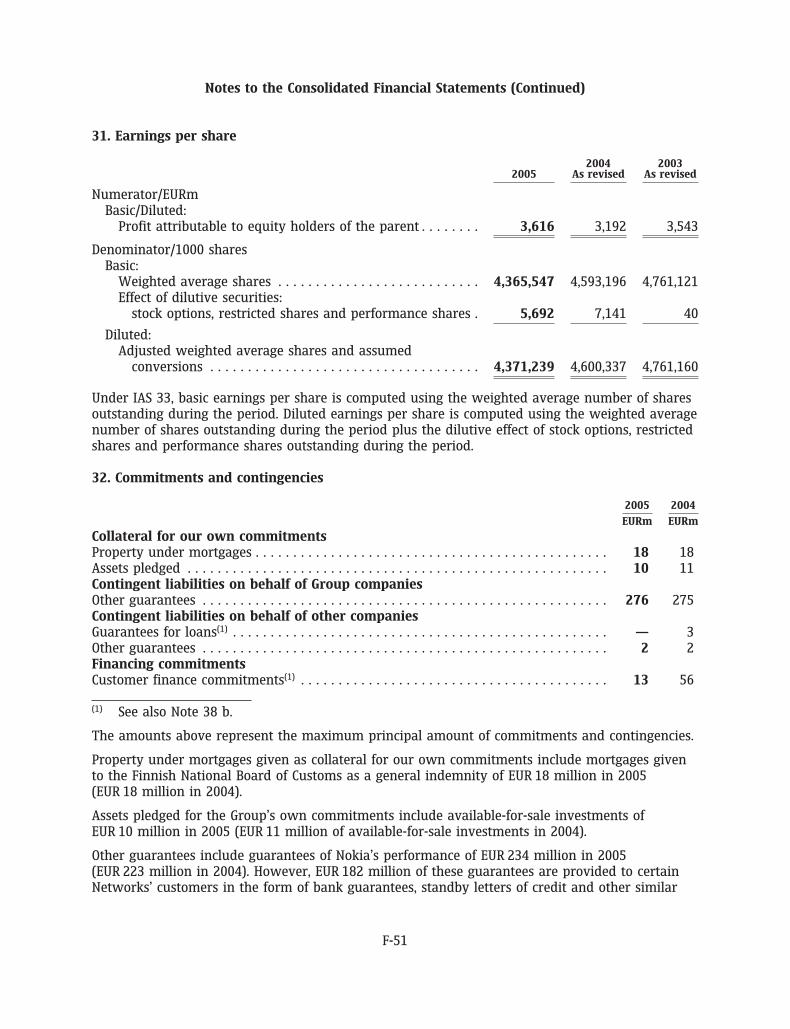
Notes to the Consolidated Financial Statements (Continued)
31. Earnings per share
2004 20032005 As revised As revised
Numerator/EURmBasic/Diluted:
Profit attributable to equity holders of the parent . . . . . . . . 3,616 3,192 3,543
Denominator/1000 sharesBasic:
Weighted average shares . . . . . . . . . . . . . . . . . . . . . . . . . . . 4,365,547 4,593,196 4,761,121Effect of dilutive securities:
stock options, restricted shares and performance shares . 5,692 7,141 40
Diluted:Adjusted weighted average shares and assumed
conversions . . . . . . . . . . . . . . . . . . . . . . . . . . . . . . . . . . . . 4,371,239 4,600,337 4,761,160
Under IAS 33, basic earnings per share is computed using the weighted average number of sharesoutstanding during the period. Diluted earnings per share is computed using the weighted averagenumber of shares outstanding during the period plus the dilutive effect of stock options, restrictedshares and performance shares outstanding during the period.
32. Commitments and contingencies
2005 2004
EURm EURm
Collateral for our own commitmentsProperty under mortgages . . . . . . . . . . . . . . . . . . . . . . . . . . . . . . . . . . . . . . . . . . . . . . . 18 18Assets pledged . . . . . . . . . . . . . . . . . . . . . . . . . . . . . . . . . . . . . . . . . . . . . . . . . . . . . . . . 10 11Contingent liabilities on behalf of Group companiesOther guarantees . . . . . . . . . . . . . . . . . . . . . . . . . . . . . . . . . . . . . . . . . . . . . . . . . . . . . . 276 275Contingent liabilities on behalf of other companiesGuarantees for loans(1) . . . . . . . . . . . . . . . . . . . . . . . . . . . . . . . . . . . . . . . . . . . . . . . . . . — 3Other guarantees . . . . . . . . . . . . . . . . . . . . . . . . . . . . . . . . . . . . . . . . . . . . . . . . . . . . . . 2 2Financing commitmentsCustomer finance commitments(1) . . . . . . . . . . . . . . . . . . . . . . . . . . . . . . . . . . . . . . . . . 13 56
(1) See also Note 38 b.
The amounts above represent the maximum principal amount of commitments and contingencies.
Property under mortgages given as collateral for our own commitments include mortgages givento the Finnish National Board of Customs as a general indemnity of EUR 18 million in 2005(EUR 18 million in 2004).
Assets pledged for the Group’s own commitments include available-for-sale investments ofEUR 10 million in 2005 (EUR 11 million of available-for-sale investments in 2004).
Other guarantees include guarantees of Nokia’s performance of EUR 234 million in 2005(EUR 223 million in 2004). However, EUR 182 million of these guarantees are provided to certainNetworks’ customers in the form of bank guarantees, standby letters of credit and other similar
F-51
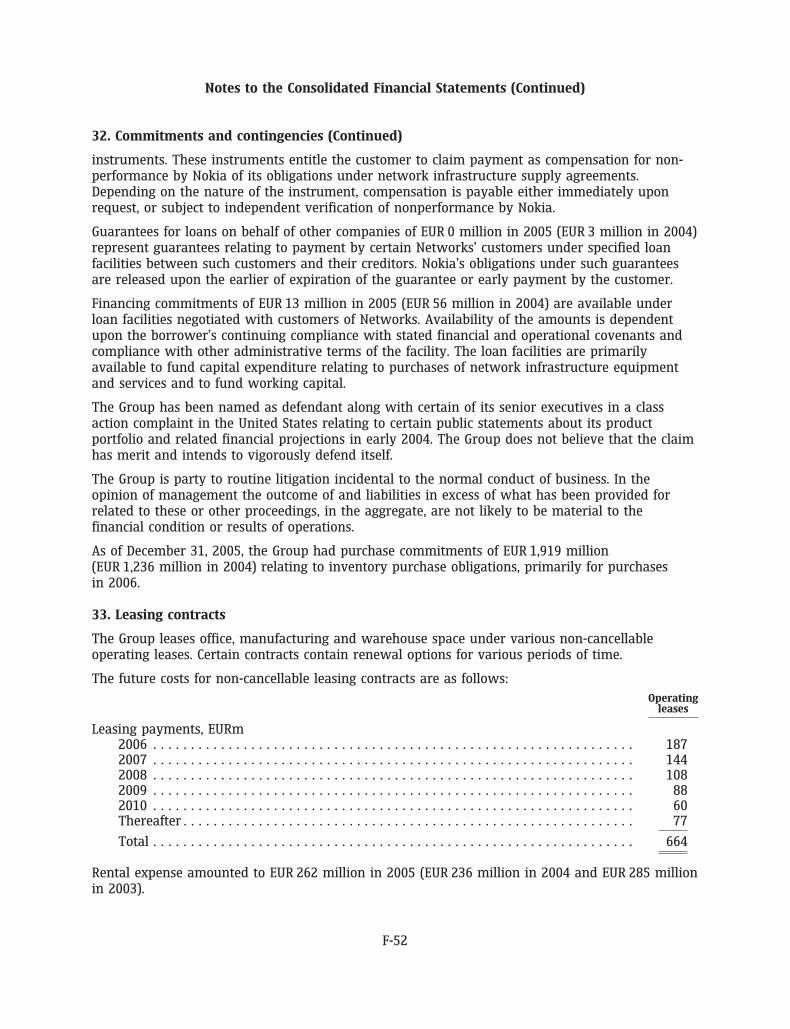
Notes to the Consolidated Financial Statements (Continued)
32. Commitments and contingencies (Continued)
instruments. These instruments entitle the customer to claim payment as compensation for non-performance by Nokia of its obligations under network infrastructure supply agreements.Depending on the nature of the instrument, compensation is payable either immediately uponrequest, or subject to independent verification of nonperformance by Nokia.
Guarantees for loans on behalf of other companies of EUR 0 million in 2005 (EUR 3 million in 2004)represent guarantees relating to payment by certain Networks’ customers under specified loanfacilities between such customers and their creditors. Nokia’s obligations under such guaranteesare released upon the earlier of expiration of the guarantee or early payment by the customer.
Financing commitments of EUR 13 million in 2005 (EUR 56 million in 2004) are available underloan facilities negotiated with customers of Networks. Availability of the amounts is dependentupon the borrower’s continuing compliance with stated financial and operational covenants andcompliance with other administrative terms of the facility. The loan facilities are primarilyavailable to fund capital expenditure relating to purchases of network infrastructure equipmentand services and to fund working capital.
The Group has been named as defendant along with certain of its senior executives in a classaction complaint in the United States relating to certain public statements about its productportfolio and related financial projections in early 2004. The Group does not believe that the claimhas merit and intends to vigorously defend itself.
The Group is party to routine litigation incidental to the normal conduct of business. In theopinion of management the outcome of and liabilities in excess of what has been provided forrelated to these or other proceedings, in the aggregate, are not likely to be material to thefinancial condition or results of operations.
As of December 31, 2005, the Group had purchase commitments of EUR 1,919 million(EUR 1,236 million in 2004) relating to inventory purchase obligations, primarily for purchasesin 2006.
33. Leasing contracts
The Group leases office, manufacturing and warehouse space under various non-cancellableoperating leases. Certain contracts contain renewal options for various periods of time.
The future costs for non-cancellable leasing contracts are as follows:Operating
leases
Leasing payments, EURm2006 . . . . . . . . . . . . . . . . . . . . . . . . . . . . . . . . . . . . . . . . . . . . . . . . . . . . . . . . . . . . . . . . 1872007 . . . . . . . . . . . . . . . . . . . . . . . . . . . . . . . . . . . . . . . . . . . . . . . . . . . . . . . . . . . . . . . . 1442008 . . . . . . . . . . . . . . . . . . . . . . . . . . . . . . . . . . . . . . . . . . . . . . . . . . . . . . . . . . . . . . . . 1082009 . . . . . . . . . . . . . . . . . . . . . . . . . . . . . . . . . . . . . . . . . . . . . . . . . . . . . . . . . . . . . . . . 882010 . . . . . . . . . . . . . . . . . . . . . . . . . . . . . . . . . . . . . . . . . . . . . . . . . . . . . . . . . . . . . . . . 60Thereafter . . . . . . . . . . . . . . . . . . . . . . . . . . . . . . . . . . . . . . . . . . . . . . . . . . . . . . . . . . . . 77
Total . . . . . . . . . . . . . . . . . . . . . . . . . . . . . . . . . . . . . . . . . . . . . . . . . . . . . . . . . . . . . . . . 664
Rental expense amounted to EUR 262 million in 2005 (EUR 236 million in 2004 and EUR 285 millionin 2003).
F-52
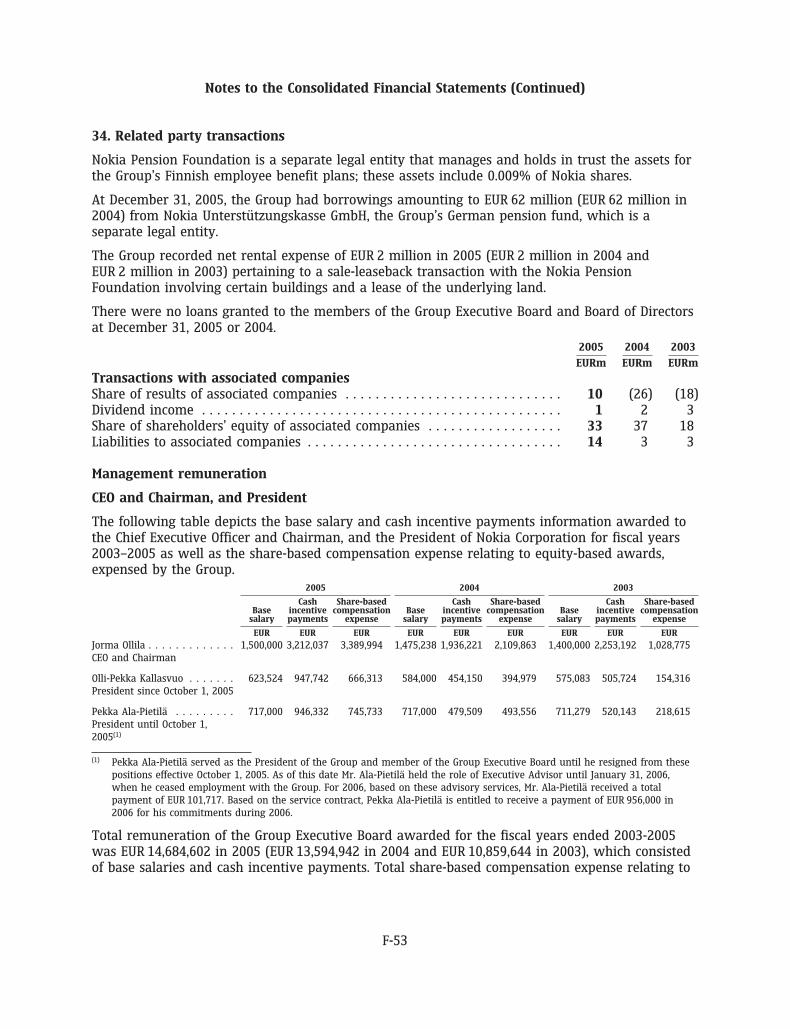
Notes to the Consolidated Financial Statements (Continued)
34. Related party transactions
Nokia Pension Foundation is a separate legal entity that manages and holds in trust the assets forthe Group’s Finnish employee benefit plans; these assets include 0.009% of Nokia shares.
At December 31, 2005, the Group had borrowings amounting to EUR 62 million (EUR 62 million in2004) from Nokia Unterstutzungskasse GmbH, the Group’s German pension fund, which is aseparate legal entity.
The Group recorded net rental expense of EUR 2 million in 2005 (EUR 2 million in 2004 andEUR 2 million in 2003) pertaining to a sale-leaseback transaction with the Nokia PensionFoundation involving certain buildings and a lease of the underlying land.
There were no loans granted to the members of the Group Executive Board and Board of Directorsat December 31, 2005 or 2004.
2005 2004 2003
EURm EURm EURm
Transactions with associated companiesShare of results of associated companies . . . . . . . . . . . . . . . . . . . . . . . . . . . . . 10 (26) (18)Dividend income . . . . . . . . . . . . . . . . . . . . . . . . . . . . . . . . . . . . . . . . . . . . . . . . 1 2 3Share of shareholders’ equity of associated companies . . . . . . . . . . . . . . . . . . 33 37 18Liabilities to associated companies . . . . . . . . . . . . . . . . . . . . . . . . . . . . . . . . . . 14 3 3
Management remuneration
CEO and Chairman, and President
The following table depicts the base salary and cash incentive payments information awarded tothe Chief Executive Officer and Chairman, and the President of Nokia Corporation for fiscal years2003–2005 as well as the share-based compensation expense relating to equity-based awards,expensed by the Group.
2005 2004 2003
Cash Share-based Cash Share-based Cash Share-basedBase incentive compensation Base incentive compensation Base incentive compensation
salary payments expense salary payments expense salary payments expense
EUR EUR EUR EUR EUR EUR EUR EUR EUR
Jorma Ollila . . . . . . . . . . . . . 1,500,000 3,212,037 3,389,994 1,475,238 1,936,221 2,109,863 1,400,000 2,253,192 1,028,775CEO and Chairman
Olli-Pekka Kallasvuo . . . . . . . 623,524 947,742 666,313 584,000 454,150 394,979 575,083 505,724 154,316President since October 1, 2005
Pekka Ala-Pietila . . . . . . . . . 717,000 946,332 745,733 717,000 479,509 493,556 711,279 520,143 218,615President until October 1,2005(1)
(1) Pekka Ala-Pietila served as the President of the Group and member of the Group Executive Board until he resigned from thesepositions effective October 1, 2005. As of this date Mr. Ala-Pietila held the role of Executive Advisor until January 31, 2006,when he ceased employment with the Group. For 2006, based on these advisory services, Mr. Ala-Pietila received a totalpayment of EUR 101,717. Based on the service contract, Pekka Ala-Pietila is entitled to receive a payment of EUR 956,000 in2006 for his commitments during 2006.
Total remuneration of the Group Executive Board awarded for the fiscal years ended 2003-2005was EUR 14,684,602 in 2005 (EUR 13,594,942 in 2004 and EUR 10,859,644 in 2003), which consistedof base salaries and cash incentive payments. Total share-based compensation expense relating to
F-53
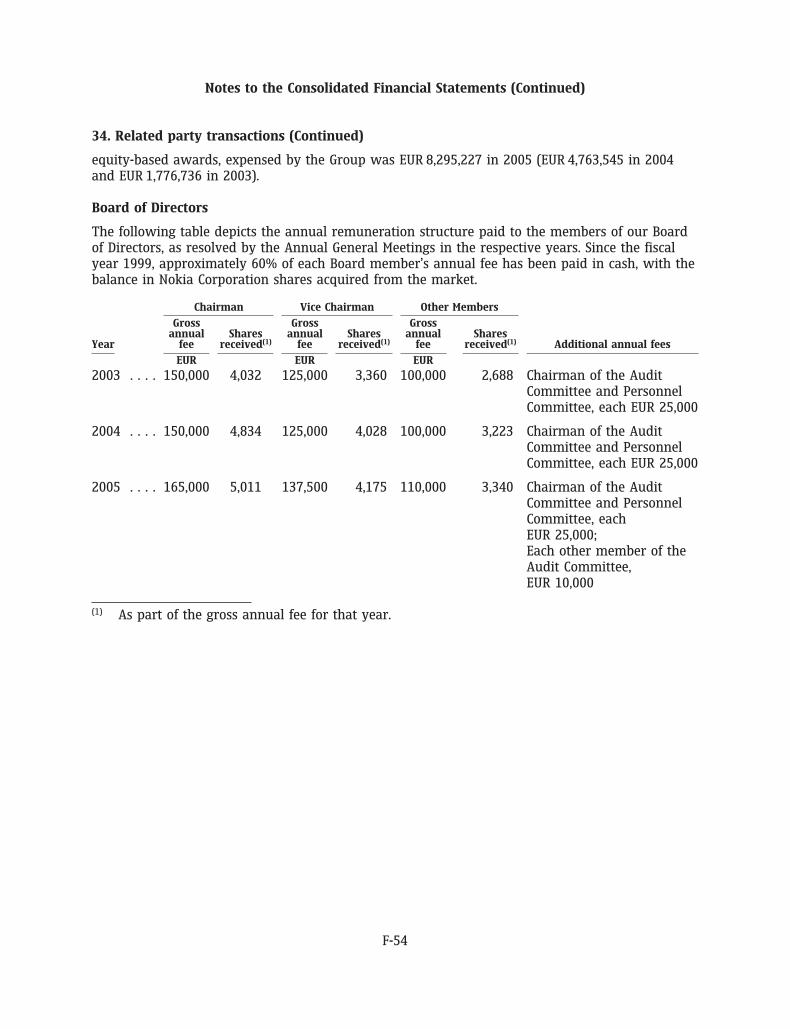
Notes to the Consolidated Financial Statements (Continued)
34. Related party transactions (Continued)
equity-based awards, expensed by the Group was EUR 8,295,227 in 2005 (EUR 4,763,545 in 2004and EUR 1,776,736 in 2003).
Board of Directors
The following table depicts the annual remuneration structure paid to the members of our Boardof Directors, as resolved by the Annual General Meetings in the respective years. Since the fiscalyear 1999, approximately 60% of each Board member’s annual fee has been paid in cash, with thebalance in Nokia Corporation shares acquired from the market.
Chairman Vice Chairman Other Members
Gross Gross Grossannual Shares annual Shares annual Shares
Year fee received(1) fee received(1) fee received(1) Additional annual fees
EUR EUR EUR
2003 . . . . 150,000 4,032 125,000 3,360 100,000 2,688 Chairman of the AuditCommittee and PersonnelCommittee, each EUR 25,000
2004 . . . . 150,000 4,834 125,000 4,028 100,000 3,223 Chairman of the AuditCommittee and PersonnelCommittee, each EUR 25,000
2005 . . . . 165,000 5,011 137,500 4,175 110,000 3,340 Chairman of the AuditCommittee and PersonnelCommittee, eachEUR 25,000;Each other member of theAudit Committee,EUR 10,000
(1) As part of the gross annual fee for that year.
F-54
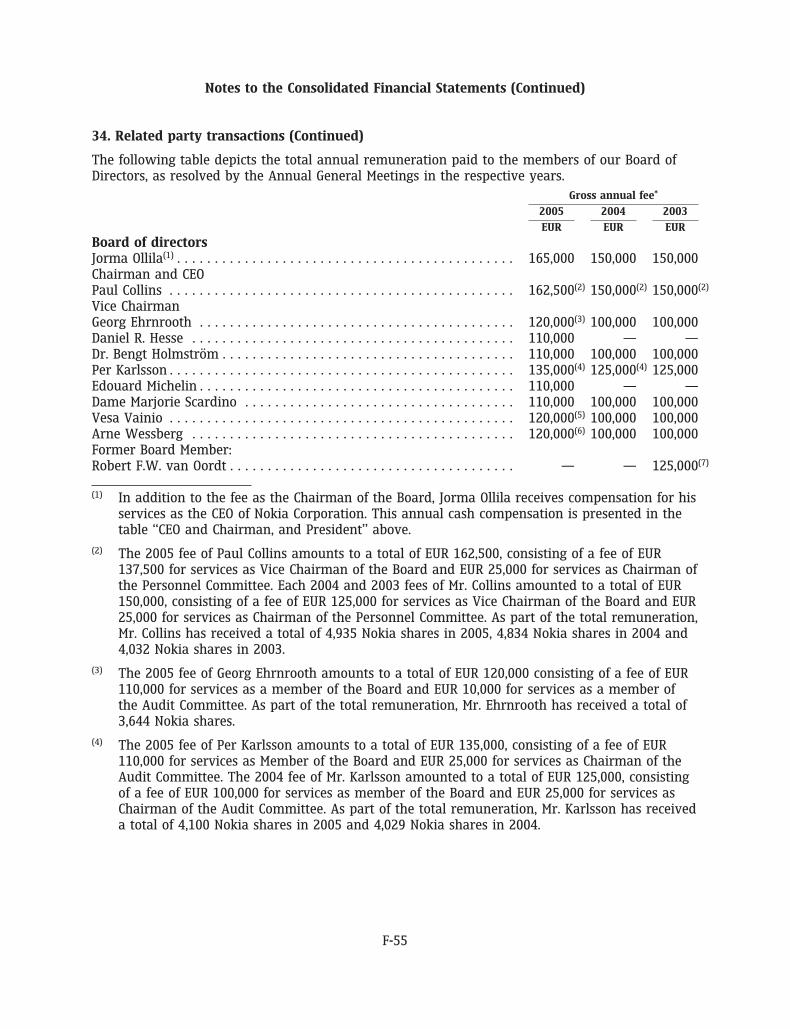
Notes to the Consolidated Financial Statements (Continued)
34. Related party transactions (Continued)
The following table depicts the total annual remuneration paid to the members of our Board ofDirectors, as resolved by the Annual General Meetings in the respective years.
Gross annual fee*
2005 2004 2003
EUR EUR EUR
Board of directorsJorma Ollila(1) . . . . . . . . . . . . . . . . . . . . . . . . . . . . . . . . . . . . . . . . . . . . . 165,000 150,000 150,000Chairman and CEOPaul Collins . . . . . . . . . . . . . . . . . . . . . . . . . . . . . . . . . . . . . . . . . . . . . . 162,500(2) 150,000(2) 150,000(2)
Vice ChairmanGeorg Ehrnrooth . . . . . . . . . . . . . . . . . . . . . . . . . . . . . . . . . . . . . . . . . . 120,000(3) 100,000 100,000Daniel R. Hesse . . . . . . . . . . . . . . . . . . . . . . . . . . . . . . . . . . . . . . . . . . . 110,000 — —Dr. Bengt Holmstrom . . . . . . . . . . . . . . . . . . . . . . . . . . . . . . . . . . . . . . . 110,000 100,000 100,000Per Karlsson . . . . . . . . . . . . . . . . . . . . . . . . . . . . . . . . . . . . . . . . . . . . . . 135,000(4) 125,000(4) 125,000Edouard Michelin . . . . . . . . . . . . . . . . . . . . . . . . . . . . . . . . . . . . . . . . . . 110,000 — —Dame Marjorie Scardino . . . . . . . . . . . . . . . . . . . . . . . . . . . . . . . . . . . . 110,000 100,000 100,000Vesa Vainio . . . . . . . . . . . . . . . . . . . . . . . . . . . . . . . . . . . . . . . . . . . . . . 120,000(5) 100,000 100,000Arne Wessberg . . . . . . . . . . . . . . . . . . . . . . . . . . . . . . . . . . . . . . . . . . . 120,000(6) 100,000 100,000Former Board Member:Robert F.W. van Oordt . . . . . . . . . . . . . . . . . . . . . . . . . . . . . . . . . . . . . . — — 125,000(7)
(1) In addition to the fee as the Chairman of the Board, Jorma Ollila receives compensation for hisservices as the CEO of Nokia Corporation. This annual cash compensation is presented in thetable ‘‘CEO and Chairman, and President’’ above.
(2) The 2005 fee of Paul Collins amounts to a total of EUR 162,500, consisting of a fee of EUR137,500 for services as Vice Chairman of the Board and EUR 25,000 for services as Chairman ofthe Personnel Committee. Each 2004 and 2003 fees of Mr. Collins amounted to a total of EUR150,000, consisting of a fee of EUR 125,000 for services as Vice Chairman of the Board and EUR25,000 for services as Chairman of the Personnel Committee. As part of the total remuneration,Mr. Collins has received a total of 4,935 Nokia shares in 2005, 4,834 Nokia shares in 2004 and4,032 Nokia shares in 2003.
(3) The 2005 fee of Georg Ehrnrooth amounts to a total of EUR 120,000 consisting of a fee of EUR110,000 for services as a member of the Board and EUR 10,000 for services as a member ofthe Audit Committee. As part of the total remuneration, Mr. Ehrnrooth has received a total of3,644 Nokia shares.
(4) The 2005 fee of Per Karlsson amounts to a total of EUR 135,000, consisting of a fee of EUR110,000 for services as Member of the Board and EUR 25,000 for services as Chairman of theAudit Committee. The 2004 fee of Mr. Karlsson amounted to a total of EUR 125,000, consistingof a fee of EUR 100,000 for services as member of the Board and EUR 25,000 for services asChairman of the Audit Committee. As part of the total remuneration, Mr. Karlsson has receiveda total of 4,100 Nokia shares in 2005 and 4,029 Nokia shares in 2004.
F-55
Notes to the Consolidated Financial Statements (Continued)
34. Related party transactions (Continued)
(5) The 2005 fee of Vesa Vainio amounts to a total of EUR 120,000 consisting of a fee of EUR110,000 for services as a member of the Board and EUR 10,000 for services as a member ofthe Audit Committee. As part of the total remuneration, Mr. Vainio has received a total of3,644 Nokia shares.
(6) The 2005 fee of Arne Wessberg amounts to a total of EUR 120,000 consisting of a fee of EUR110,000 for services as a member of the Board and EUR 10,000 for services as a member ofthe Audit Committee. As part of the total remuneration, Mr. Wessberg has received a total of3,644 Nokia shares.
(7) The 2003 fee of Robert F.W. van Oordt amounted to a total of EUR 125,000, consisting of a feeof EUR 100,000 for services as Member of the Board and EUR 25,000 for services as Chairmanof the Audit Committee. As part of the total remuneration, Mr. van Oordt received a total of3,360 Nokia shares.
* In case a Board member’s gross annual fee does not include any additional annual fees, thenumber of shares received as part of gross annual fee for that year is presented in the ‘‘Sharesreceived’’ column on the table on page F-54.
Retirement benefits of certain Group Executive Board Members
Jorma Ollila and Olli-Pekka Kallasvuo can as part of their service contract retire at the age of 60with full retirement benefit, should they be employed by Nokia at the time. The full retirementbenefit is calculated as if the executive had continued his service with Nokia through the statutoryretirement age of 65. Mr. Ollila’s service contract will terminate as of June 1, 2006. Following thecurrent contract, he will not be eligible to receive any additional retirement benefits from Nokiaafter that date. Pekka Ala-Pietila had an equal retirement arrangement during his employment atNokia and he will not receive any additional retirement benefits from Nokia after termination ofemployment.
Hallstein Moerk, following his arrangement with a previous employer, has a retirement benefit of65% of his pensionable salary beginning at the age of 62. Early retirement is possible at the age of55 with reductions in benefits.
Simon Beresford-Wylie participates in the Nokia International Employee Benefit Plan (NIEBP). TheNIEBP is a defined contribution retirement arrangement provided to some Nokia employees oninternational assignments. The contributions to NIEBP are funded two-thirds by Nokia andone-third by the employee. Because Mr. Beresford-Wylie also participates in the Finnish TELsystem, the company contribution to NIEBP is 1.3% of annual earnings.
F-56
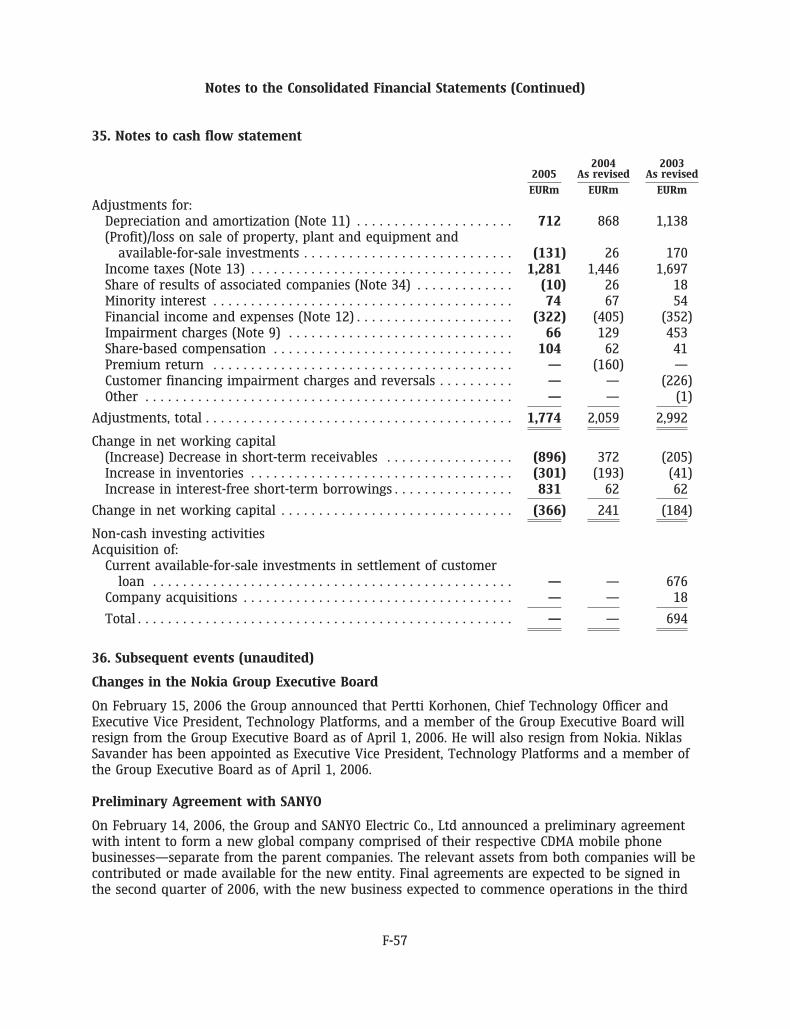
Notes to the Consolidated Financial Statements (Continued)
35. Notes to cash flow statement
2004 20032005 As revised As revised
EURm EURm EURm
Adjustments for:Depreciation and amortization (Note 11) . . . . . . . . . . . . . . . . . . . . . 712 868 1,138(Profit)/loss on sale of property, plant and equipment and
available-for-sale investments . . . . . . . . . . . . . . . . . . . . . . . . . . . . (131) 26 170Income taxes (Note 13) . . . . . . . . . . . . . . . . . . . . . . . . . . . . . . . . . . . 1,281 1,446 1,697Share of results of associated companies (Note 34) . . . . . . . . . . . . . (10) 26 18Minority interest . . . . . . . . . . . . . . . . . . . . . . . . . . . . . . . . . . . . . . . . 74 67 54Financial income and expenses (Note 12) . . . . . . . . . . . . . . . . . . . . . (322) (405) (352)Impairment charges (Note 9) . . . . . . . . . . . . . . . . . . . . . . . . . . . . . . 66 129 453Share-based compensation . . . . . . . . . . . . . . . . . . . . . . . . . . . . . . . . 104 62 41Premium return . . . . . . . . . . . . . . . . . . . . . . . . . . . . . . . . . . . . . . . . — (160) —Customer financing impairment charges and reversals . . . . . . . . . . — — (226)Other . . . . . . . . . . . . . . . . . . . . . . . . . . . . . . . . . . . . . . . . . . . . . . . . . — — (1)
Adjustments, total . . . . . . . . . . . . . . . . . . . . . . . . . . . . . . . . . . . . . . . . . 1,774 2,059 2,992
Change in net working capital(Increase) Decrease in short-term receivables . . . . . . . . . . . . . . . . . (896) 372 (205)Increase in inventories . . . . . . . . . . . . . . . . . . . . . . . . . . . . . . . . . . . (301) (193) (41)Increase in interest-free short-term borrowings . . . . . . . . . . . . . . . . 831 62 62
Change in net working capital . . . . . . . . . . . . . . . . . . . . . . . . . . . . . . . (366) 241 (184)
Non-cash investing activitiesAcquisition of:
Current available-for-sale investments in settlement of customerloan . . . . . . . . . . . . . . . . . . . . . . . . . . . . . . . . . . . . . . . . . . . . . . . . — — 676
Company acquisitions . . . . . . . . . . . . . . . . . . . . . . . . . . . . . . . . . . . . — — 18
Total . . . . . . . . . . . . . . . . . . . . . . . . . . . . . . . . . . . . . . . . . . . . . . . . . . — — 694
36. Subsequent events (unaudited)
Changes in the Nokia Group Executive Board
On February 15, 2006 the Group announced that Pertti Korhonen, Chief Technology Officer andExecutive Vice President, Technology Platforms, and a member of the Group Executive Board willresign from the Group Executive Board as of April 1, 2006. He will also resign from Nokia. NiklasSavander has been appointed as Executive Vice President, Technology Platforms and a member ofthe Group Executive Board as of April 1, 2006.
Preliminary Agreement with SANYO
On February 14, 2006, the Group and SANYO Electric Co., Ltd announced a preliminary agreementwith intent to form a new global company comprised of their respective CDMA mobile phonebusinesses—separate from the parent companies. The relevant assets from both companies will becontributed or made available for the new entity. Final agreements are expected to be signed inthe second quarter of 2006, with the new business expected to commence operations in the third
F-57
Notes to the Consolidated Financial Statements (Continued)
36. Subsequent events (unaudited) (Continued)
quarter 2006, provided that the due diligence has been completed and all necessary regulatoryapprovals obtained.
Acquisition of Intellisync
In February 2006, the Group acquired 100% of the outstanding common shares of IntellisyncCorporation for cash consideration of approximately EUR 368 million. Intellisync delivers wirelessemail and other applications over an array of devices and application platforms across carriernetworks. Intellisync will be integrated into the Enterprise Solutions business group, and its resultsof operations will be included in the Group’s consolidated financial statements as from theacquisition date. The purchase price allocation is being performed with the assistance of a thirdparty.
Assets acquired are expected to be EUR 51 million and liabilities EUR 17 million with a majority ofthe excess recognised as goodwill. The principal items that are expected to generate goodwill arethe value of the synergies between Intellisync and the Group and the acquired workforce, neitherof which qualifies as a separate amortizable intangible asset. None of the goodwill is expected tobe deductible for tax purposes. The Group does not expect to write off any in-process R&D ordispose of any of the acquired operations.
For its recently completed fiscal year ended July 31, 2005 and quarter ended October 31, 2005,Intellisync reported revenues of USD 39 million (EUR 31 million) and USD 10 million(EUR 8 million), respectively, and net loss of USD 13 million (EUR 10 million) and USD 8 million(EUR 7 million), respectively. At July 31, 2005 and October 31, 2005, Intellisync’s total assets wereUSD 161 million (EUR 133 million) and USD 156 million (EUR 130 million), respectively, andshareholders’ equity was USD 82 million (EUR 68 million) and USD 79 million (EUR 66 million),respectively.
Telsim settlement
As previously agreed with Telsim and the Turkish Savings and Deposit Insurance Fund (TMSF),which currently controls and manages Telsim’s assets, the Group will receive a settlementpayment upon completion of the sale of Telsim’s assets for losses the Group incurred in 2001. TheGroup’s share of the announced purchase price expected to be received during the first half of2006 is 7.5% of the purchase price, or USD 341 million (EUR 285 million) and is subject tonegotiations.
F-58
Notes to the Consolidated Financial Statements (Continued)
37. Principal Nokia Group companies at December 31, 2005Parent Group
holding majority% %
US Nokia Inc. . . . . . . . . . . . . . . . . . . . . . . . . . . . . . . . . . . . . . . . . . . . . . . . . . . . . . — 100.00DE Nokia GmbH . . . . . . . . . . . . . . . . . . . . . . . . . . . . . . . . . . . . . . . . . . . . . . . . . . . 100.00 100.00GB Nokia UK Limited . . . . . . . . . . . . . . . . . . . . . . . . . . . . . . . . . . . . . . . . . . . . . . — 100.00KR Nokia TMC Limited . . . . . . . . . . . . . . . . . . . . . . . . . . . . . . . . . . . . . . . . . . . . . 100.00 100.00CN Nokia Capitel Telecommunications Ltd . . . . . . . . . . . . . . . . . . . . . . . . . . . . . . 4.50 61.90NL Nokia Finance International B.V. . . . . . . . . . . . . . . . . . . . . . . . . . . . . . . . . . . . 100.00 100.00HU Nokia Komarom Kft . . . . . . . . . . . . . . . . . . . . . . . . . . . . . . . . . . . . . . . . . . . . . 100.00 100.00BR Nokia do Brazil Technologia Ltda . . . . . . . . . . . . . . . . . . . . . . . . . . . . . . . . . . 99.99 100.00IN Nokia India Ltd . . . . . . . . . . . . . . . . . . . . . . . . . . . . . . . . . . . . . . . . . . . . . . . . 100.00 100.00
Associated companiesSymbian Limited . . . . . . . . . . . . . . . . . . . . . . . . . . . . . . . . . . . . . . . . . . . . . . . . . . 47.90 47.90
A complete list of subsidiaries and associated companies is included in Nokia’s Statutory Accounts.
38. Risk management
General risk management principles
Nokia’s overall risk management concept is based on visibility of the key risks preventing Nokiafrom reaching its business objectives. This covers all risk areas; strategic, operational, financial andhazard risks. Risk management at Nokia is a systematic and pro-active way to analyze, reviewand manage all opportunities, threats and risks related to Nokia´s objectives rather than to solelyeliminate risks.
The principles documented in Nokia´s Risk Policy and accepted by the Audit Committee of theBoard of Directors require risk management and its elements to be integrated into businessprocesses. One of the main principles is that the business or function owner is also the risk owner,however, it is everyone’s responsibility at Nokia to identify risks preventing us from reaching ourobjectives.
Key risks are reported to the business and Group level management to create assurance onbusiness risks and to enable prioritization of risk management implementation at Nokia. Inaddition to general principles there are specific risk management policies covering, for example,treasury and customer finance risks.
Financial risks
The key financial targets for Nokia are growth, profitability, operational efficiency and a strongbalance sheet. The objective for the Treasury function is twofold: to guarantee cost-efficientfunding for the Group at all times, and to identify, evaluate and hedge financial risks in closeco-operation with the business groups. There is a strong focus in Nokia on creating shareholdervalue. The Treasury function supports this aim by minimizing the adverse effects caused byfluctuations in the financial markets on the profitability of the underlying businesses and bymanaging the balance sheet structure of the Group.
F-59
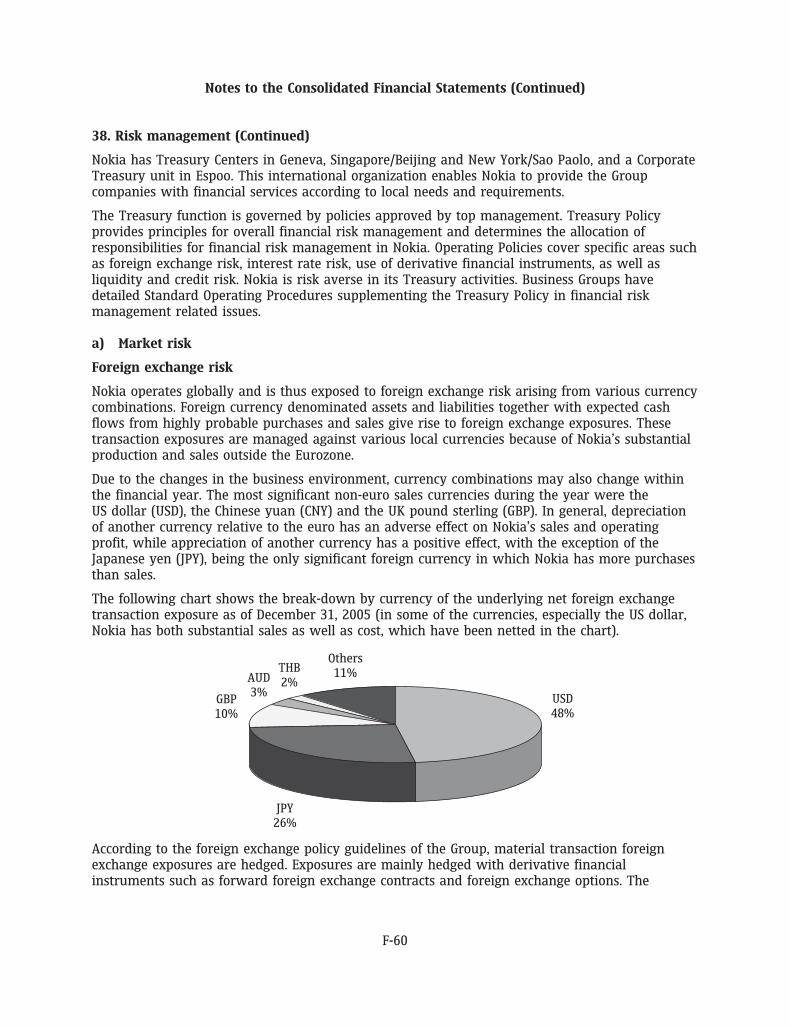
20FEB200617415963
Notes to the Consolidated Financial Statements (Continued)
38. Risk management (Continued)
Nokia has Treasury Centers in Geneva, Singapore/Beijing and New York/Sao Paolo, and a CorporateTreasury unit in Espoo. This international organization enables Nokia to provide the Groupcompanies with financial services according to local needs and requirements.
The Treasury function is governed by policies approved by top management. Treasury Policyprovides principles for overall financial risk management and determines the allocation ofresponsibilities for financial risk management in Nokia. Operating Policies cover specific areas suchas foreign exchange risk, interest rate risk, use of derivative financial instruments, as well asliquidity and credit risk. Nokia is risk averse in its Treasury activities. Business Groups havedetailed Standard Operating Procedures supplementing the Treasury Policy in financial riskmanagement related issues.
a) Market risk
Foreign exchange risk
Nokia operates globally and is thus exposed to foreign exchange risk arising from various currencycombinations. Foreign currency denominated assets and liabilities together with expected cashflows from highly probable purchases and sales give rise to foreign exchange exposures. Thesetransaction exposures are managed against various local currencies because of Nokia’s substantialproduction and sales outside the Eurozone.
Due to the changes in the business environment, currency combinations may also change withinthe financial year. The most significant non-euro sales currencies during the year were theUS dollar (USD), the Chinese yuan (CNY) and the UK pound sterling (GBP). In general, depreciationof another currency relative to the euro has an adverse effect on Nokia’s sales and operatingprofit, while appreciation of another currency has a positive effect, with the exception of theJapanese yen (JPY), being the only significant foreign currency in which Nokia has more purchasesthan sales.
The following chart shows the break-down by currency of the underlying net foreign exchangetransaction exposure as of December 31, 2005 (in some of the currencies, especially the US dollar,Nokia has both substantial sales as well as cost, which have been netted in the chart).
THB2%AUD
3%GBP10%
USD48%
JPY26%
Others11%
According to the foreign exchange policy guidelines of the Group, material transaction foreignexchange exposures are hedged. Exposures are mainly hedged with derivative financialinstruments such as forward foreign exchange contracts and foreign exchange options. The
F-60
Notes to the Consolidated Financial Statements (Continued)
38. Risk management (Continued)
majority of financial instruments hedging foreign exchange risk have a duration of less than ayear. The Group does not hedge forecasted foreign currency cash flows beyond two years.
Nokia uses the Value-at-Risk (‘‘VaR’’) methodology to assess the foreign exchange risk related tothe Treasury management of the Group exposures. The VaR figure represents the potential fairvalue losses for a portfolio resulting from adverse changes in market factors using a specified timeperiod and confidence level based on historical data. To correctly take into account the non-linearprice function of certain derivative instruments, Nokia uses Monte Carlo simulation. Volatilities andcorrelations are calculated from a one-year set of daily data.
Since Nokia has subsidiaries outside the Euro zone, the euro-denominated value of theshareholders’ equity of Nokia is also exposed to fluctuations in exchange rates. Equity changescaused by movements in foreign exchange rates are shown as a translation difference in theGroup consolidation. Nokia uses, from time to time, foreign exchange contracts and foreigncurrency denominated loans to hedge its equity exposure arising from foreign net investments.
Interest rate risk
The Group is exposed to interest rate risk either through market value fluctuations of balancesheet items (i.e. price risk) or through changes in interest income or expenses (i.e. re-investmentrisk). Interest rate risk mainly arises through interest-bearing liabilities and assets. Estimatedfuture changes in cash flows and balance sheet structure also expose the Group to interestrate risk.
Treasury is responsible for monitoring and managing the interest rate exposure of the Group. Dueto the current balance sheet structure of Nokia, emphasis is placed on managing the interest raterisk of investments.
Nokia uses the VaR methodology to assess and measure the interest rate risk in the investmentportfolio, which is benchmarked against a combination of three-month and one-to-three-yearinvestment horizon. The VaR figure represents the potential fair value losses for a portfolioresulting from adverse changes in market factors using a specified time period and confidencelevel based on historical data. For interest rate risk VaR, Nokia uses variance-covariancemethodology. Volatilities and correlations are calculated from a one-year set of daily data.
Equity price risk
Nokia has certain strategic minority investments in publicly traded companies. These investmentsare classified as available-for-sale. The fair value of the equity investments at December 31, 2005was EUR 8 million (EUR 7 million in 2004).
There are currently no outstanding derivative financial instruments designated as hedges of theseequity investments.
In addition to the listed equity holdings, Nokia invests in private equity through Nokia VentureFunds. The fair value of these available-for-sale equity investments at December 31, 2005 wasUSD 177 million (USD 142 million in 2004). Nokia is exposed to equity price risk on social securitycosts relating to stock compensation plans. Nokia hedges this risk by entering into cash settledequity swap and option contracts.
F-61
Notes to the Consolidated Financial Statements (Continued)
38. Risk management (Continued)
b) Credit risk
Structured Finance Credit Risk
Network operators in some markets sometimes require their suppliers to arrange or provide termfinancing in relation to infrastructure projects. Nokia has maintained a financing policy aimed atclose cooperation with banks, financial institutions and Export Credit Agencies to support selectedcustomers in their financing of infrastructure investments. Nokia actively mitigates, marketconditions permitting, this exposure by arrangements with these institutions and investors.
Credit risks related to customer financing are systematically analyzed, monitored and managed byNokia’s Customer Finance organization, reporting to the Chief Financial Officer. Credit risks areapproved and monitored by Nokia’s Credit Committee along principles defined in the Company’scredit policy and according to the credit approval process. The Credit Committee consists of theCFO, Group Controller, Head of Group Treasury and Head of Nokia Customer Finance.
At the end of December 31, 2005, our long-term loans to customers and other third parties totaledEUR 63 million (no outstanding loans in 2004), while there was nil financial guarantees given onbehalf of third parties (EUR 3 million in 2004). In addition, we had financing commitments totalingEUR 13 million, which does not, however, increase total outstanding and committed credit riskfrom EUR 63 million, as it is available only provided that outstanding loan EUR 56 million isrepaid. Total structured financing (outstanding and committed) stood at EUR 63 million(EUR 59 million in 2004).
The term structured financing portfolio at December 31, 2005 was:Financing
Outstanding commitments Total
EURm EURm EURm
Total Portfolio . . . . . . . . . . . . . . . . . . . . . . . . . . . . . . . . . . . . . . . . 63 13 63
The term structured financing portfolio at December 31, 2005 mainly consists of outstanding andcommitted customer financing to a network operator.
Financial credit risk
Financial instruments contain an element of risk of the counterparties being unable to meet theirobligations. This risk is measured and monitored by the Treasury function. The Group minimizesfinancial credit risk by limiting its counterparties to a sufficient number of major banks andfinancial institutions, as well as through entering into netting arrangements, which gives theCompany the right to offset in the case that the counterparty would not be able to fulfill theobligations.
Direct credit risk represents the risk of loss resulting from counterparty default in relation toon-balance sheet products. The fixed income and money market investment decisions are based onstrict creditworthiness criteria. The outstanding investments are also constantly monitored by theTreasury. Nokia does not expect the counterparties to default given their high credit quality.
F-62
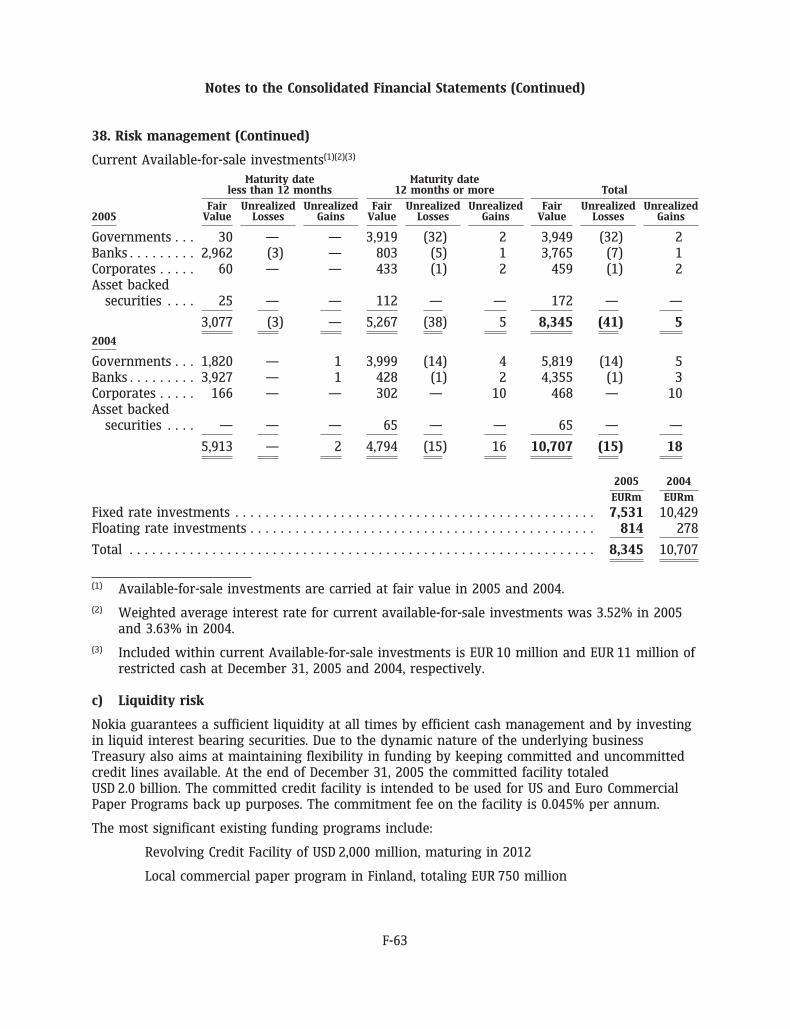
Notes to the Consolidated Financial Statements (Continued)
38. Risk management (Continued)
Current Available-for-sale investments(1)(2)(3)
Maturity date Maturity dateless than 12 months 12 months or more Total
Fair Unrealized Unrealized Fair Unrealized Unrealized Fair Unrealized Unrealized2005 Value Losses Gains Value Losses Gains Value Losses Gains
Governments . . . 30 — — 3,919 (32) 2 3,949 (32) 2Banks . . . . . . . . . 2,962 (3) — 803 (5) 1 3,765 (7) 1Corporates . . . . . 60 — — 433 (1) 2 459 (1) 2Asset backed
securities . . . . 25 — — 112 — — 172 — —
3,077 (3) — 5,267 (38) 5 8,345 (41) 52004
Governments . . . 1,820 — 1 3,999 (14) 4 5,819 (14) 5Banks . . . . . . . . . 3,927 — 1 428 (1) 2 4,355 (1) 3Corporates . . . . . 166 — — 302 — 10 468 — 10Asset backed
securities . . . . — — — 65 — — 65 — —
5,913 — 2 4,794 (15) 16 10,707 (15) 18
2005 2004
EURm EURm
Fixed rate investments . . . . . . . . . . . . . . . . . . . . . . . . . . . . . . . . . . . . . . . . . . . . . . . . 7,531 10,429Floating rate investments . . . . . . . . . . . . . . . . . . . . . . . . . . . . . . . . . . . . . . . . . . . . . . 814 278
Total . . . . . . . . . . . . . . . . . . . . . . . . . . . . . . . . . . . . . . . . . . . . . . . . . . . . . . . . . . . . . . 8,345 10,707
(1) Available-for-sale investments are carried at fair value in 2005 and 2004.
(2) Weighted average interest rate for current available-for-sale investments was 3.52% in 2005and 3.63% in 2004.
(3) Included within current Available-for-sale investments is EUR 10 million and EUR 11 million ofrestricted cash at December 31, 2005 and 2004, respectively.
c) Liquidity risk
Nokia guarantees a sufficient liquidity at all times by efficient cash management and by investingin liquid interest bearing securities. Due to the dynamic nature of the underlying businessTreasury also aims at maintaining flexibility in funding by keeping committed and uncommittedcredit lines available. At the end of December 31, 2005 the committed facility totaledUSD 2.0 billion. The committed credit facility is intended to be used for US and Euro CommercialPaper Programs back up purposes. The commitment fee on the facility is 0.045% per annum.
The most significant existing funding programs include:
Revolving Credit Facility of USD 2,000 million, maturing in 2012
Local commercial paper program in Finland, totaling EUR 750 million
F-63
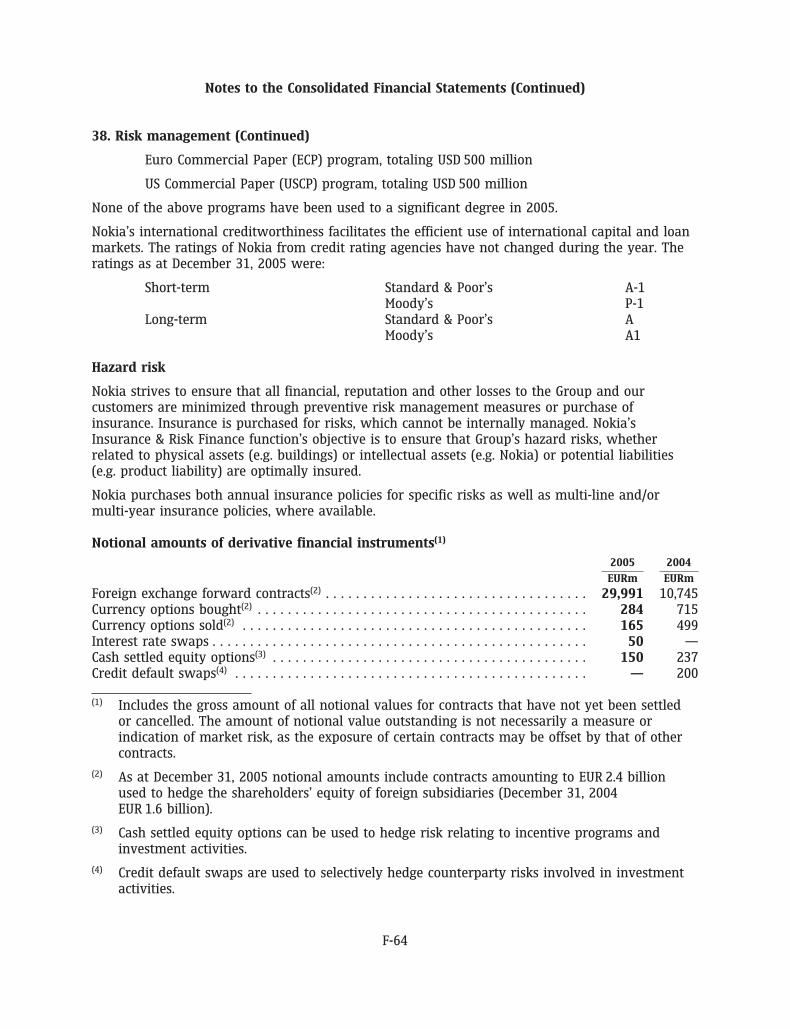
Notes to the Consolidated Financial Statements (Continued)
38. Risk management (Continued)
Euro Commercial Paper (ECP) program, totaling USD 500 million
US Commercial Paper (USCP) program, totaling USD 500 million
None of the above programs have been used to a significant degree in 2005.
Nokia’s international creditworthiness facilitates the efficient use of international capital and loanmarkets. The ratings of Nokia from credit rating agencies have not changed during the year. Theratings as at December 31, 2005 were:
Short-term Standard & Poor’s A-1Moody’s P-1
Long-term Standard & Poor’s AMoody’s A1
Hazard risk
Nokia strives to ensure that all financial, reputation and other losses to the Group and ourcustomers are minimized through preventive risk management measures or purchase ofinsurance. Insurance is purchased for risks, which cannot be internally managed. Nokia’sInsurance & Risk Finance function’s objective is to ensure that Group’s hazard risks, whetherrelated to physical assets (e.g. buildings) or intellectual assets (e.g. Nokia) or potential liabilities(e.g. product liability) are optimally insured.
Nokia purchases both annual insurance policies for specific risks as well as multi-line and/ormulti-year insurance policies, where available.
Notional amounts of derivative financial instruments(1)
2005 2004
EURm EURm
Foreign exchange forward contracts(2) . . . . . . . . . . . . . . . . . . . . . . . . . . . . . . . . . . . 29,991 10,745Currency options bought(2) . . . . . . . . . . . . . . . . . . . . . . . . . . . . . . . . . . . . . . . . . . . . 284 715Currency options sold(2) . . . . . . . . . . . . . . . . . . . . . . . . . . . . . . . . . . . . . . . . . . . . . . 165 499Interest rate swaps . . . . . . . . . . . . . . . . . . . . . . . . . . . . . . . . . . . . . . . . . . . . . . . . . . 50 —Cash settled equity options(3) . . . . . . . . . . . . . . . . . . . . . . . . . . . . . . . . . . . . . . . . . . 150 237Credit default swaps(4) . . . . . . . . . . . . . . . . . . . . . . . . . . . . . . . . . . . . . . . . . . . . . . . — 200
(1) Includes the gross amount of all notional values for contracts that have not yet been settledor cancelled. The amount of notional value outstanding is not necessarily a measure orindication of market risk, as the exposure of certain contracts may be offset by that of othercontracts.
(2) As at December 31, 2005 notional amounts include contracts amounting to EUR 2.4 billionused to hedge the shareholders’ equity of foreign subsidiaries (December 31, 2004EUR 1.6 billion).
(3) Cash settled equity options can be used to hedge risk relating to incentive programs andinvestment activities.
(4) Credit default swaps are used to selectively hedge counterparty risks involved in investmentactivities.
F-64
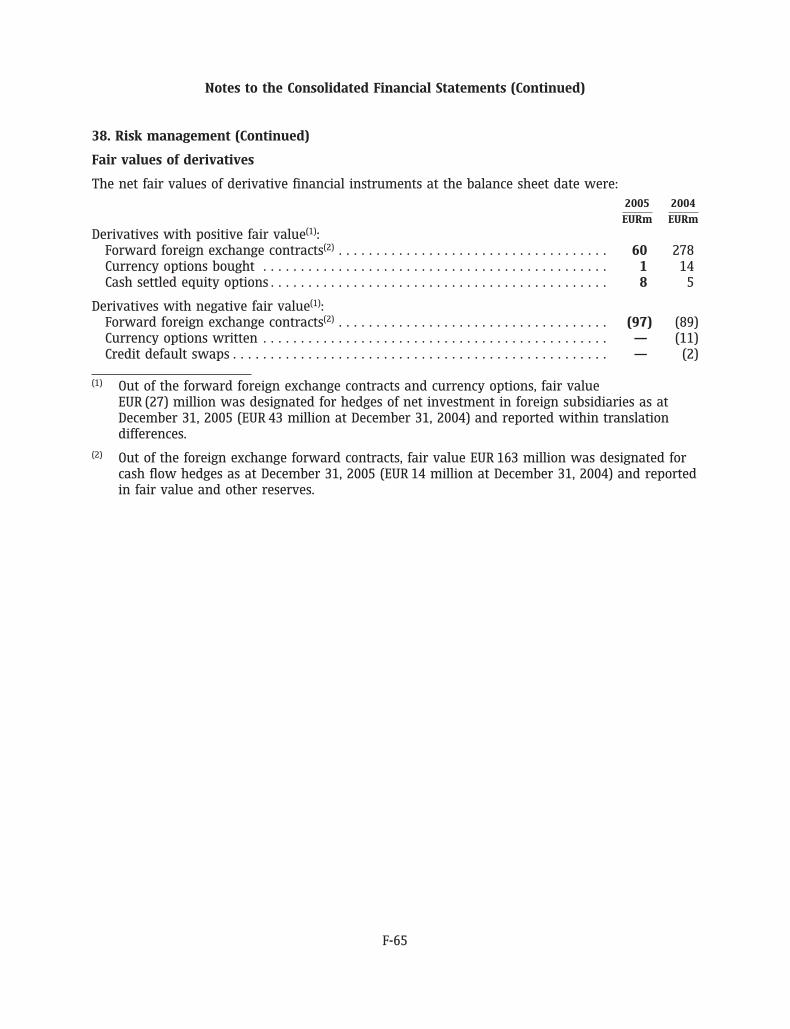
Notes to the Consolidated Financial Statements (Continued)
38. Risk management (Continued)
Fair values of derivatives
The net fair values of derivative financial instruments at the balance sheet date were:2005 2004
EURm EURm
Derivatives with positive fair value(1):Forward foreign exchange contracts(2) . . . . . . . . . . . . . . . . . . . . . . . . . . . . . . . . . . . . 60 278Currency options bought . . . . . . . . . . . . . . . . . . . . . . . . . . . . . . . . . . . . . . . . . . . . . . 1 14Cash settled equity options . . . . . . . . . . . . . . . . . . . . . . . . . . . . . . . . . . . . . . . . . . . . . 8 5
Derivatives with negative fair value(1):Forward foreign exchange contracts(2) . . . . . . . . . . . . . . . . . . . . . . . . . . . . . . . . . . . . (97) (89)Currency options written . . . . . . . . . . . . . . . . . . . . . . . . . . . . . . . . . . . . . . . . . . . . . . — (11)Credit default swaps . . . . . . . . . . . . . . . . . . . . . . . . . . . . . . . . . . . . . . . . . . . . . . . . . . — (2)
(1) Out of the forward foreign exchange contracts and currency options, fair valueEUR (27) million was designated for hedges of net investment in foreign subsidiaries as atDecember 31, 2005 (EUR 43 million at December 31, 2004) and reported within translationdifferences.
(2) Out of the foreign exchange forward contracts, fair value EUR 163 million was designated forcash flow hedges as at December 31, 2005 (EUR 14 million at December 31, 2004) and reportedin fair value and other reserves.
F-65
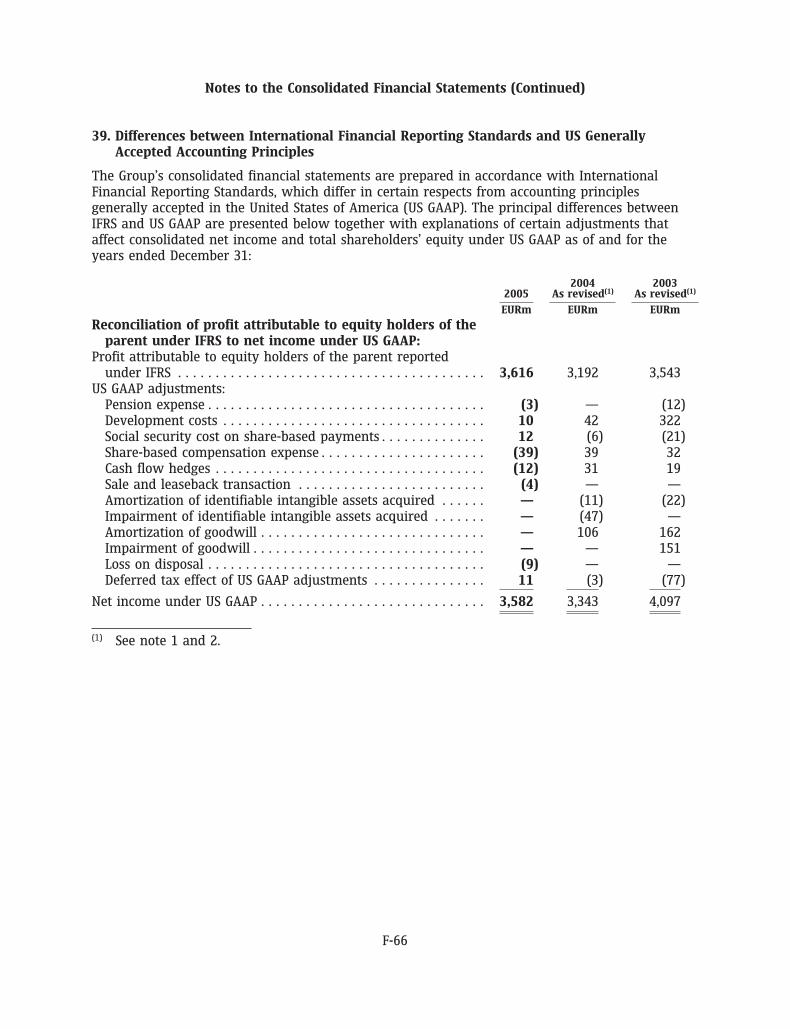
Notes to the Consolidated Financial Statements (Continued)
39. Differences between International Financial Reporting Standards and US GenerallyAccepted Accounting Principles
The Group’s consolidated financial statements are prepared in accordance with InternationalFinancial Reporting Standards, which differ in certain respects from accounting principlesgenerally accepted in the United States of America (US GAAP). The principal differences betweenIFRS and US GAAP are presented below together with explanations of certain adjustments thataffect consolidated net income and total shareholders’ equity under US GAAP as of and for theyears ended December 31:
2004 20032005 As revised(1) As revised(1)
EURm EURm EURm
Reconciliation of profit attributable to equity holders of theparent under IFRS to net income under US GAAP:
Profit attributable to equity holders of the parent reportedunder IFRS . . . . . . . . . . . . . . . . . . . . . . . . . . . . . . . . . . . . . . . . . 3,616 3,192 3,543
US GAAP adjustments:Pension expense . . . . . . . . . . . . . . . . . . . . . . . . . . . . . . . . . . . . . (3) — (12)Development costs . . . . . . . . . . . . . . . . . . . . . . . . . . . . . . . . . . . 10 42 322Social security cost on share-based payments . . . . . . . . . . . . . . 12 (6) (21)Share-based compensation expense . . . . . . . . . . . . . . . . . . . . . . (39) 39 32Cash flow hedges . . . . . . . . . . . . . . . . . . . . . . . . . . . . . . . . . . . . (12) 31 19Sale and leaseback transaction . . . . . . . . . . . . . . . . . . . . . . . . . (4) — —Amortization of identifiable intangible assets acquired . . . . . . — (11) (22)Impairment of identifiable intangible assets acquired . . . . . . . — (47) —Amortization of goodwill . . . . . . . . . . . . . . . . . . . . . . . . . . . . . . — 106 162Impairment of goodwill . . . . . . . . . . . . . . . . . . . . . . . . . . . . . . . — — 151Loss on disposal . . . . . . . . . . . . . . . . . . . . . . . . . . . . . . . . . . . . . (9) — —Deferred tax effect of US GAAP adjustments . . . . . . . . . . . . . . . 11 (3) (77)
Net income under US GAAP . . . . . . . . . . . . . . . . . . . . . . . . . . . . . . 3,582 3,343 4,097
(1) See note 1 and 2.
F-66
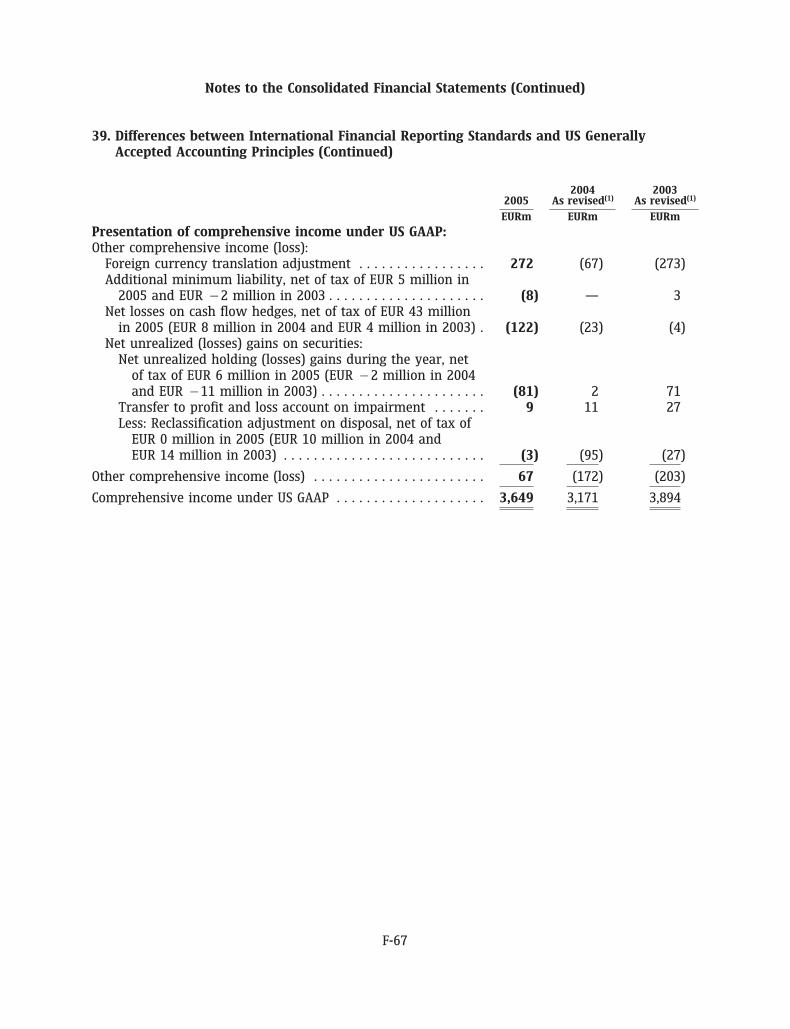
Notes to the Consolidated Financial Statements (Continued)
39. Differences between International Financial Reporting Standards and US GenerallyAccepted Accounting Principles (Continued)
2004 20032005 As revised(1) As revised(1)
EURm EURm EURm
Presentation of comprehensive income under US GAAP:Other comprehensive income (loss):
Foreign currency translation adjustment . . . . . . . . . . . . . . . . . 272 (67) (273)Additional minimum liability, net of tax of EUR 5 million in
2005 and EUR �2 million in 2003 . . . . . . . . . . . . . . . . . . . . . (8) — 3Net losses on cash flow hedges, net of tax of EUR 43 million
in 2005 (EUR 8 million in 2004 and EUR 4 million in 2003) . (122) (23) (4)Net unrealized (losses) gains on securities:
Net unrealized holding (losses) gains during the year, netof tax of EUR 6 million in 2005 (EUR �2 million in 2004and EUR �11 million in 2003) . . . . . . . . . . . . . . . . . . . . . . (81) 2 71
Transfer to profit and loss account on impairment . . . . . . . 9 11 27Less: Reclassification adjustment on disposal, net of tax of
EUR 0 million in 2005 (EUR 10 million in 2004 andEUR 14 million in 2003) . . . . . . . . . . . . . . . . . . . . . . . . . . . (3) (95) (27)
Other comprehensive income (loss) . . . . . . . . . . . . . . . . . . . . . . . 67 (172) (203)
Comprehensive income under US GAAP . . . . . . . . . . . . . . . . . . . . 3,649 3,171 3,894
F-67
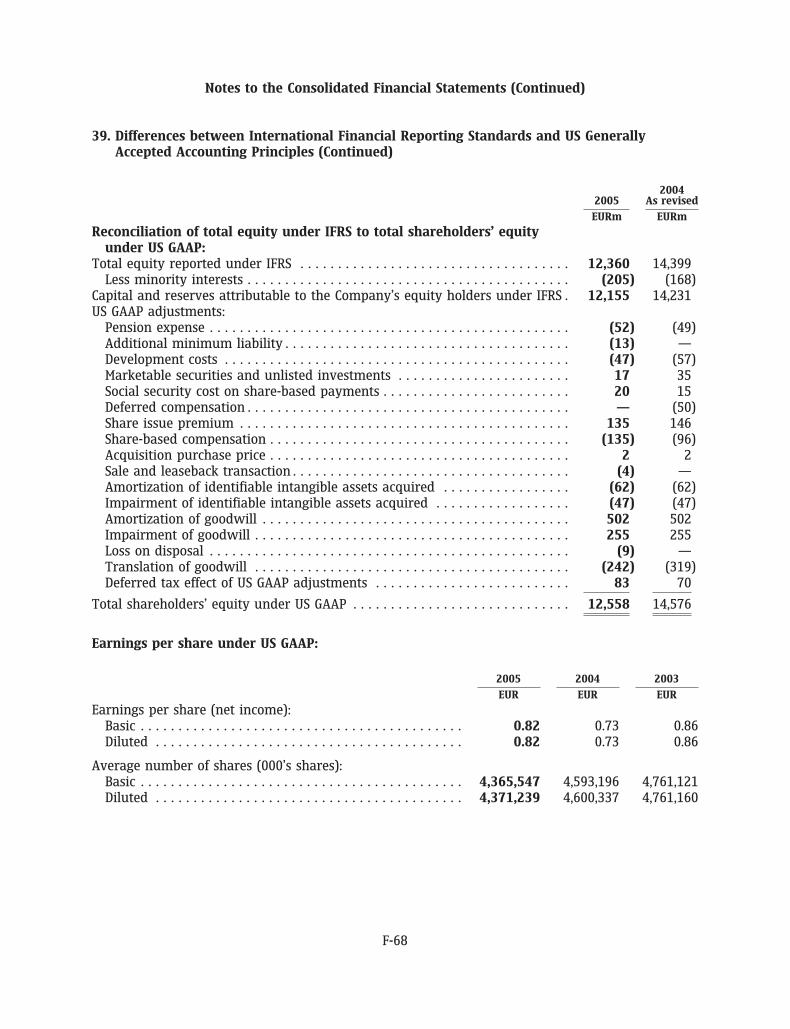
Notes to the Consolidated Financial Statements (Continued)
39. Differences between International Financial Reporting Standards and US GenerallyAccepted Accounting Principles (Continued)
20042005 As revised
EURm EURm
Reconciliation of total equity under IFRS to total shareholders’ equityunder US GAAP:
Total equity reported under IFRS . . . . . . . . . . . . . . . . . . . . . . . . . . . . . . . . . . . . 12,360 14,399Less minority interests . . . . . . . . . . . . . . . . . . . . . . . . . . . . . . . . . . . . . . . . . . . (205) (168)
Capital and reserves attributable to the Company’s equity holders under IFRS . 12,155 14,231US GAAP adjustments:
Pension expense . . . . . . . . . . . . . . . . . . . . . . . . . . . . . . . . . . . . . . . . . . . . . . . . (52) (49)Additional minimum liability . . . . . . . . . . . . . . . . . . . . . . . . . . . . . . . . . . . . . . (13) —Development costs . . . . . . . . . . . . . . . . . . . . . . . . . . . . . . . . . . . . . . . . . . . . . . (47) (57)Marketable securities and unlisted investments . . . . . . . . . . . . . . . . . . . . . . . 17 35Social security cost on share-based payments . . . . . . . . . . . . . . . . . . . . . . . . . 20 15Deferred compensation . . . . . . . . . . . . . . . . . . . . . . . . . . . . . . . . . . . . . . . . . . . — (50)Share issue premium . . . . . . . . . . . . . . . . . . . . . . . . . . . . . . . . . . . . . . . . . . . . 135 146Share-based compensation . . . . . . . . . . . . . . . . . . . . . . . . . . . . . . . . . . . . . . . . (135) (96)Acquisition purchase price . . . . . . . . . . . . . . . . . . . . . . . . . . . . . . . . . . . . . . . . 2 2Sale and leaseback transaction . . . . . . . . . . . . . . . . . . . . . . . . . . . . . . . . . . . . . (4) —Amortization of identifiable intangible assets acquired . . . . . . . . . . . . . . . . . (62) (62)Impairment of identifiable intangible assets acquired . . . . . . . . . . . . . . . . . . (47) (47)Amortization of goodwill . . . . . . . . . . . . . . . . . . . . . . . . . . . . . . . . . . . . . . . . . 502 502Impairment of goodwill . . . . . . . . . . . . . . . . . . . . . . . . . . . . . . . . . . . . . . . . . . 255 255Loss on disposal . . . . . . . . . . . . . . . . . . . . . . . . . . . . . . . . . . . . . . . . . . . . . . . . (9) —Translation of goodwill . . . . . . . . . . . . . . . . . . . . . . . . . . . . . . . . . . . . . . . . . . (242) (319)Deferred tax effect of US GAAP adjustments . . . . . . . . . . . . . . . . . . . . . . . . . . 83 70
Total shareholders’ equity under US GAAP . . . . . . . . . . . . . . . . . . . . . . . . . . . . . 12,558 14,576
Earnings per share under US GAAP:
2005 2004 2003
EUR EUR EUR
Earnings per share (net income):Basic . . . . . . . . . . . . . . . . . . . . . . . . . . . . . . . . . . . . . . . . . . . 0.82 0.73 0.86Diluted . . . . . . . . . . . . . . . . . . . . . . . . . . . . . . . . . . . . . . . . . 0.82 0.73 0.86
Average number of shares (000’s shares):Basic . . . . . . . . . . . . . . . . . . . . . . . . . . . . . . . . . . . . . . . . . . . 4,365,547 4,593,196 4,761,121Diluted . . . . . . . . . . . . . . . . . . . . . . . . . . . . . . . . . . . . . . . . . 4,371,239 4,600,337 4,761,160
F-68
Notes to the Consolidated Financial Statements (Continued)
39. Differences between International Financial Reporting Standards and US GenerallyAccepted Accounting Principles (Continued)
Pension expense and additional minimum liability
Under IFRS, pension assets, defined benefit pension liabilities and pension expense are actuariallydetermined in a similar manner to US GAAP. However, under IFRS the prior service cost, transitionadjustments and pension expense resulting from plan amendments are generally recognizedimmediately. Under US GAAP, these expenses are generally recognized over a longer period. Also,under US GAAP the employer should recognize an additional minimum pension liability charged toother comprehensive income when the accumulated benefit obligation (ABO) exceeds the fair valueof the plan assets and this amount is not covered by the liability recognized in the balance sheet.The calculation of the ABO is based on approach two as described in EITF 88-1, Determination ofVested Benefit Obligation for a Defined Benefit Pension Plan, under which the actuarial presentvalue is based on the date of separation from service.
The US GAAP pension expense adjustments reflect the difference between the prepaid pensionasset and related pension expense as determined by applying IAS 19, Employee Benefits, and thepension asset and related pension expense determined by applying FAS 87, Employers’ Accountingfor Pensions.
Development costs
Development costs are capitalized under IFRS after the product involved has reached a certaindegree of technical feasibility. Capitalization ceases and depreciation begins when the productbecomes available to customers. The depreciation period of these capitalized assets is between twoand five years.
Under US GAAP, software development costs are similarly capitalized after the product has reacheda certain degree of technological feasibility. However, certain non-software related developmentcosts capitalized under IFRS are not capitalizable under US GAAP and therefore are expensed.
Under IFRS, whenever there is an indication that capitalized development costs may be impairedthe recoverable amount of the asset is estimated. An asset is impaired when the carrying amountof the asset exceeds its recoverable amount. Recoverable amount is defined as the higher of anasset’s net selling price and value in use. Value in use is the present value of estimated discountedfuture cash flows expected to arise from the continuing use of an asset and from its disposal atthe end of its useful life.
Under US GAAP, the unamortized capitalized costs of a software product are compared at eachbalance sheet date to the net realizable value of that product with any excess written off. Netrealizable value is defined as the estimated future gross revenues from that product reduced bythe estimated future costs of completing and disposing of that product, including the costs ofperforming maintenance and customer support required to satisfy the enterprise’s responsibilityset forth at the time of sale.
The amount of unamortized capitalized software development costs under US GAAP isEUR 213 million in 2005 (EUR 210 million in 2004).
The US GAAP development cost adjustment reflects the reversal of capitalized non-software relateddevelopment costs under US GAAP net of the reversal of associated amortization expense andimpairments under IFRS. The adjustment also reflects differences in impairment methodologies
F-69
Notes to the Consolidated Financial Statements (Continued)
39. Differences between International Financial Reporting Standards and US GenerallyAccepted Accounting Principles (Continued)
under IFRS and US GAAP for the determination of the recoverable amount and net realizable valueof software related development costs.
Marketable securities and unlisted investments
Under IFRS, all available-for-sale investments, which includes all publicly listed and non-listedmarketable securities, are measured at fair value and gains and losses are recognized withinshareholders’ equity until realized in the profit and loss account upon sale or disposal.
Under US GAAP, the Group’s listed marketable securities are classified as available-for-sale andcarried at aggregate fair value with gross unrealized holding gains and losses reported as acomponent of other comprehensive income (loss). Investments in equity securities that are nottraded on a public market are carried at historical cost, giving rise to an adjustment between IFRSand US GAAP.
Social security cost on share-based payments
Under IFRS, the Group recognizes a provision for social security costs on unvested equityinstruments based upon local statutory law, net of deferred compensation, which is recorded as acomponent of total equity. The provision is considered as a cash-settled share-based payment andis measured by reference to the fair value of the equity benefits provided and the amount of theprovision is adjusted to reflect the changes in Nokia’s share price.
Under US GAAP, a liability for social security costs on unvested equity instruments is recognized onthe date of the event triggering the measurement and payment of the tax to the taxing authority.Accordingly, no expense is recorded until stock options are exercised or nonvested shares are fullyvested.
The US GAAP social security costs adjustment reflects the reversal of social security costs recordedunder IFRS for outstanding options and unvested performance and restricted shares.
Share-based compensation
The Group maintains several share-based employee compensation plans, which are describedmore fully in Note 24. As of January 1, 2005 the Group adopted IFRS 2. Prior to the adoption ofIFRS 2, the Group did not recognize the financial effect of share-based payments until suchpayments were settled. In accordance with the transitional provisions of IFRS 2, the Standard hasbeen applied retrospectively to all grants of shares, share options or other equity instruments thatwere granted after November 7, 2002 and that were not yet vested at the effective date of thestandard.
Through December 31, 2004, the Group accounted for its employee share-based compensationprograms under US GAAP using the intrinsic value method in accordance with AccountingPrinciples Board Opinion No. 25, Accounting for Stock Issued to Employees (APB 25) and relatedinterpretations to measure employee stock compensation. Under APB 25, compensation expensewas recognized under the Group’s option programs when options were awarded at an exerciseprice below the market price of the Group’s shares on the grant date and under the Group’sperformance and restricted share programs as they were accounted for as variable award plans.Under APB 25, compensation arising from stock option programs, restricted shares and
F-70
Notes to the Consolidated Financial Statements (Continued)
39. Differences between International Financial Reporting Standards and US GenerallyAccepted Accounting Principles (Continued)
performance shares was recorded as deferred compensation within shareholders’ equity andrecognized in the profit and loss account over the vesting period of the underlying equityinstruments.
Effective January 1, 2005, the Group adopted the Statement of Financial Accounting StandardsNo. 123 (R), Share Based Payment (FAS 123R), using the modified prospective method. Under themodified prospective method, all new equity-based compensation awards granted to employeesand existing awards modified on or after January 1, 2005, are measured based on the fair value ofthe award and are recognized in the statement of income over the required service period. Priorperiods have not been revised.
The retrospective transition provision of IFRS 2 and the modified prospective transition provisionof FAS 123(R) give rise to differences in the historical income statement for share-basedcompensation. Further, associated differences surrounding the effective date of application of thestandards to unvested shares give rise to both current and historical income statement differencesin share-based compensation. Share issue premium reflects the cumulative difference between theamount of share based compensation recorded under US GAAP and IFRS and the amount ofdeferred compensation previously recorded in accordance with APB 25.
Total share-based compensation expense under US GAAP was EUR 134 million in 2005. Totalshare-based compensation expense in 2005 would have been EUR 110 million under APB 25. Theincrease in share-based compensation expense resulting from the adoption of FAS 123R reducedbasic and diluted earnings per share under US GAAP by 0.01 EUR in 2005.
Cash flow hedges
Under IFRS, the Group adopted IAS 39(R) as of January 1, 2005, which supersedes IAS 39 (revised2000). The changes, which are retrospective, under IAS 39(R) are that hedge accounting is nolonger allowed under Treasury Center foreign exchange netting.
Under US GAAP, the Group applies FAS 133, Accounting for Derivative Instruments and HedgingActivities.
The US GAAP difference arises when a subsidiary’s reporting currency is different from TreasuryCenter’s reporting currency and external and internal hedge maturities are different more than31 days. For those hedges not qualifying under US GAAP, the unrealized spot foreign exchangegains and losses from those hedges are released to the income statement. The US GAAP adjustmentfor prior years has been adjusted for the adoption for IAS 39(R).
Sale and leaseback transaction
In 2005, the Group entered into a sale and leaseback transaction. Under the agreement, the Grouphas a potential liability related to a pending zoning change scheduled to be final in 2006. UnderIFRS, the transaction qualified as a sale and leaseback as the potential liability related to thezoning change is considered to be remote. Accordingly, the Group recorded a gain on the sale ofthe property and rental expense associated with the subsequent leaseback.
Under US GAAP, the transaction did not qualify for sale and leaseback accounting as the clause isdeemed to create continuing involvement by the Group. Accordingly, the transaction is accounted
F-71
Notes to the Consolidated Financial Statements (Continued)
39. Differences between International Financial Reporting Standards and US GenerallyAccepted Accounting Principles (Continued)
for as a capital lease until the potential obligation lapses with the zoning change expected in 2006.Once the potential obligation lapses and continuing involvement ceases, the transaction can beaccounted for as a sale and the corresponding gain can be realized. Until that time, the amount ofthe asset will remain on the US GAAP balance sheet and rental payments are recorded as areduction of the principal amount of the obligation and as interest expense.
The US GAAP sale and leaseback adjustment reflects the reversal of the gain on sale of theproperty and rental expense recorded under IFRS net of interest expense recorded under US GAAP.
Acquisition purchase price
Under IFRS, when the consideration paid in a business combination includes shares of theacquirer, the purchase price of the acquired business is determined on the date at which theshares are exchanged.
Under US GAAP, the measurement date for shares of the acquirer is the date the acquisition isannounced or, if the number of shares is uncertain on such date, the first day on which both thenumber of acquirer shares and the amount of other consideration becomes fixed. The averageshare price for a reasonable period before and after the measurement date is then used to valuethe shares.
The US GAAP acquisition purchase price adjustment reflects the different measurement dates usedunder IFRS and US GAAP in the valuation of shares issued in connection with a businesscombination.
Amortization and impairment of identifiable intangible assets acquired
Under IFRS, prior to April 1, 2004, unpatented technology acquired was not separately recognizedupon acquisition as an identifiable intangible asset but was included within goodwill.
Under US GAAP, any unpatented technology acquired in a business combination is recorded as anidentifiable intangible asset with an associated deferred tax liability. The intangible asset isamortized over its estimated useful life.
The adjustment to US GAAP net income and shareholders’ equity relates to the amortization andaccumulated amortization, respectively, recorded under IFRS related to Amber Networks’intangible asset.
During 2004 the carrying value of Amber Network unpatented technology was impaired sinceNokia no longer developed nor used the technology acquired and its carrying amount was deemednot recoverable through estimated future cash flows. The total impact on net income in 2004amounted to EUR 58 million of which the impairment recognized under US GAAP wasEUR 47 million.
The net carrying amount of other intangible assets under US GAAP is EUR 425 million in 2005(EUR 419 million in 2004) and consists of capitalized development costs of EUR 213 million(EUR 210 million) and acquired patents, trademarks and licenses of EUR 212 million(EUR 209 million). The Group does not have any indefinite lived intangible assets. Amortization
F-72
Notes to the Consolidated Financial Statements (Continued)
39. Differences between International Financial Reporting Standards and US GenerallyAccepted Accounting Principles (Continued)
expense under US GAAP of other intangible assets as of December 31, 2005, is expected to be asfollows:
EURm
2006 . . . . . . . . . . . . . . . . . . . . . . . . . . . . . . . . . . . . . . . . . . . . . . . . . . . . . . . . . . . . . . . . . . . . . . 1642007 . . . . . . . . . . . . . . . . . . . . . . . . . . . . . . . . . . . . . . . . . . . . . . . . . . . . . . . . . . . . . . . . . . . . . . 792008 . . . . . . . . . . . . . . . . . . . . . . . . . . . . . . . . . . . . . . . . . . . . . . . . . . . . . . . . . . . . . . . . . . . . . . 272009 . . . . . . . . . . . . . . . . . . . . . . . . . . . . . . . . . . . . . . . . . . . . . . . . . . . . . . . . . . . . . . . . . . . . . . 132010 . . . . . . . . . . . . . . . . . . . . . . . . . . . . . . . . . . . . . . . . . . . . . . . . . . . . . . . . . . . . . . . . . . . . . . 6Thereafter . . . . . . . . . . . . . . . . . . . . . . . . . . . . . . . . . . . . . . . . . . . . . . . . . . . . . . . . . . . . . . . . . . 136
425
Amortization of goodwill
Under IFRS, the Group adopted the provisions of IFRS 3 on January 1, 2005. As a result, goodwillrecognized relating to purchase acquisitions and acquisitions of associated companies is no longersubject to amortization. Under the transitional provisions of IFRS 3, this change in accountingpolicy was effective immediately for acquisitions made after March 31, 2004.
Under US GAAP, the Group records goodwill in accordance with FAS 142, Goodwill and OtherIntangible Assets, (FAS 142). The Group adopted the provisions of FAS 142 on January 1, 2002 andas a result, goodwill relating to purchase acquisitions and acquisitions of associated companies isno longer subject to amortization subsequent to the date of adoption.
The US GAAP adjustment reverses amortization expense and the associated movement inaccumulated amortization recorded under IFRS prior to the adoption of IFRS 3.
Impairment of goodwill
Under IFRS, goodwill is allocated to ‘‘cash generating units’’, which are the smallest group ofidentifiable assets that include the goodwill under review for impairment and generate cashinflows from continuing use that are largely independent of the cash inflows from other assets.Under IFRS, the Group recorded an impairment of goodwill of EUR 151 million related to AmberNetworks in 2003 as the carrying amount of the cash generating unit exceeded the recoverableamount of the unit.
Under US GAAP, goodwill is allocated to ‘‘reporting units’’, which are operating segments or onelevel below an operating segment (as defined in FAS 131, Disclosures about Segments of anEnterprise and Related Information). The goodwill impairment test under FAS 142 compares thecarrying value for each reporting unit to its fair value based on discounted cash flows.
The US GAAP impairment of goodwill adjustment reflects the cumulative reversal of impairmentsrecorded under IFRS that do not qualify as impairments under US GAAP.
Upon completion of the 2003 annual impairment test, the Group determined that the impairmentrecorded for Amber Networks should be reversed under US GAAP as the fair value of the reportingunit in which Amber Networks resides exceeded the book value of the reporting unit. The annualimpairment tests performed subsequent to 2003 continue to support the reversal of thisimpairment.
F-73
Notes to the Consolidated Financial Statements (Continued)
39. Differences between International Financial Reporting Standards and US GenerallyAccepted Accounting Principles (Continued)
The Group recorded no goodwill impairments during 2005 and 2004.
Below is a roll forward of US GAAP goodwill during 2005 and 2004:
CommonMobile Enterprise GroupPhones Multimedia Solutions Networks Functions Group
EURm EURm EURm EURm EURm EURm
Balance as of January 1, 2004 . . . . . . . 129 22 40 271 9 471
Translation adjustment . . . . . . . . . . . . (1) — (3) (22) — (26)
Balance as of December 31, 2004 . . . . . 128 22 37 249 9 445
Goodwill disposed . . . . . . . . . . . . . . . . — — — — (9) (9)Translation adjustment . . . . . . . . . . . . 45 — 4 28 — 77
Balance as of December 31, 2005 . . . . . 173 22 41 277 — 513
Loss on disposal
In 2005, the Group divested the remaining holdings in a Group company resulting in a loss ondisposal. Under IFRS, the goodwill related to the original acquisition had been fully amortized.
Under US GAAP, the goodwill related to the acquisition of the Group company was written offupon disposal resulting in an additional loss.
The US GAAP loss on disposal adjustment reflects the write-off of goodwill under US GAAP thatwas fully amortized under IFRS.
Translation of goodwill
Under IFRS, the Group has historically translated goodwill arising on the acquisition of foreignsubsidiaries at historical foreign exchange rates. Subsequent to the adoption of IAS 21 (revised2004) as of January 1, 2005, the Group translates goodwill arising on prospective acquisitions offoreign companies at balance sheet date closing rates.
Under US GAAP, goodwill is translated at the closing rate on the balance sheet date with gains andlosses recorded as a component of other comprehensive income.
The US GAAP translation of goodwill adjustment reflects cumulative translation differencesbetween historical and current exchange rates on goodwill arising from acquisitions of foreignsubsidiaries.
Disclosures required by US GAAP
Dependence on limited sources of supply
Nokia’s manufacturing operations depend to a certain extent on obtaining adequate supplies offully functional components on a timely basis. The Group’s principal supply requirements are forelectronic components, mechanical components and software, which all have a wide range ofapplications in our products. Electronic components include integrated circuits, microprocessors,standard components, memory devices, cameras, displays, batteries and chargers while
F-74
Notes to the Consolidated Financial Statements (Continued)
39. Differences between International Financial Reporting Standards and US GenerallyAccepted Accounting Principles (Continued)
mechanical components include covers, connectors, key mats and antennas. Software includesvarious third-party software that enables various new features and applications to be added, likethird-party e-mail, into our products. In addition, a particular component may be available onlyfrom a limited number of suppliers. Suppliers may from time to time extend lead times, limitsupplies or increase prices due to capacity constraints or other factors, which could adverselyaffect our ability to deliver our products and solutions on a timely basis. Moreover, a componentsupplier may fail to meet our supplier requirements, such as, most notably, our and ourcustomers’ product quality, safety, security and other standards, and consequently some of ourproducts may be unacceptable to us and our customers, or may fail to meet our own qualitycontrols. In addition, a component supplier may experience delays or disruption to itsmanufacturing processes or financial difficulties. Any of these events could delay our successfuldelivery of products and solutions that meet our and our customers’ quality, safety, security andother requirements, or otherwise adversely affect our sales and our results of operations.
Segment information
The accounting policies of the segments are the same as those described in Note 1, Accountingprinciples. Nokia accounts for intersegment revenues and transfers as if the revenues or transferswere to third parties, and therefore at current market prices. Nokia evaluates the performance ofits segments and allocates resources to them based on operating profit.
Under IFRS, segment assets and liabilities of the horizontal groups are allocated to business groupson a symmetrical basis. Under US GAAP, segment assets and liabilities are reported on the basis ofthe internal reporting structure reflecting management reporting.
Assets on an IFRS basis, as reported under FAS 131 as at December 31, 2005 for Mobile Phones,Multimedia, Enterprise Solutions and Networks were EUR 2,525 million (EUR 2,192 million in2004), EUR 920 million (EUR 533 million in 2004), EUR 133 million (EUR 163 million in 2004) andEUR 3,437 million (EUR 3,055 million in 2004), respectively. Liabilities on an IFRS basis as reportedunder FAS 131 as at December 31, 2005 for Mobile Phones, Multimedia, Enterprise Solutions andNetworks were EUR 1,775 million (EUR 2,668 million in 2004), EUR 1,314 million (EUR 701 millionin 2004), EUR 276 million (EUR 230 million in 2004) and EUR 1,775 million (EUR 1,574 million in2004), respectively. Assets and liabilities included in Common Group Functions as at December 31,
F-75
Notes to the Consolidated Financial Statements (Continued)
39. Differences between International Financial Reporting Standards and US GenerallyAccepted Accounting Principles (Continued)
2005 were EUR 3,488 million (EUR 3,009 million in 2004) and EUR 3,736 million (EUR 1,890 millionin 2004), respectively.
2005 2004
EURm EURm
Long lived assets by location of assets (1):Finland . . . . . . . . . . . . . . . . . . . . . . . . . . . . . . . . . . . . . . . . . . . . . . . . . . . . . . . . . . . . . 745 763USA . . . . . . . . . . . . . . . . . . . . . . . . . . . . . . . . . . . . . . . . . . . . . . . . . . . . . . . . . . . . . . . . 126 133China . . . . . . . . . . . . . . . . . . . . . . . . . . . . . . . . . . . . . . . . . . . . . . . . . . . . . . . . . . . . . . . 174 104Great Britain . . . . . . . . . . . . . . . . . . . . . . . . . . . . . . . . . . . . . . . . . . . . . . . . . . . . . . . . . 107 143India . . . . . . . . . . . . . . . . . . . . . . . . . . . . . . . . . . . . . . . . . . . . . . . . . . . . . . . . . . . . . . . 31 3Germany . . . . . . . . . . . . . . . . . . . . . . . . . . . . . . . . . . . . . . . . . . . . . . . . . . . . . . . . . . . . 110 108Other . . . . . . . . . . . . . . . . . . . . . . . . . . . . . . . . . . . . . . . . . . . . . . . . . . . . . . . . . . . . . . . 292 280
Group . . . . . . . . . . . . . . . . . . . . . . . . . . . . . . . . . . . . . . . . . . . . . . . . . . . . . . . . . . . . . . 1,585 1,534
2005 2004
EURm EURm
Capital additions to long lived assets(1):Mobile Phones . . . . . . . . . . . . . . . . . . . . . . . . . . . . . . . . . . . . . . . . . . . . . . . . . . . . . . . . 23 20Multimedia . . . . . . . . . . . . . . . . . . . . . . . . . . . . . . . . . . . . . . . . . . . . . . . . . . . . . . . . . . . 10 20Enterprise Solutions . . . . . . . . . . . . . . . . . . . . . . . . . . . . . . . . . . . . . . . . . . . . . . . . . . . . 7 8Networks . . . . . . . . . . . . . . . . . . . . . . . . . . . . . . . . . . . . . . . . . . . . . . . . . . . . . . . . . . . . 94 89Common Group Functions . . . . . . . . . . . . . . . . . . . . . . . . . . . . . . . . . . . . . . . . . . . . . . . 414 326
Group . . . . . . . . . . . . . . . . . . . . . . . . . . . . . . . . . . . . . . . . . . . . . . . . . . . . . . . . . . . . . . . 548 463
(1) Long-lived assets include property, plant and equipment.
Compensation expense
The following table illustrates the effect on net income and earnings per share under US GAAP ifthe Group had applied the fair value recognition provisions of Statement 123 to options grantedunder the company’s stock option plans for 2004 and 2003. For purposes of this pro forma
F-76
Notes to the Consolidated Financial Statements (Continued)
39. Differences between International Financial Reporting Standards and US GenerallyAccepted Accounting Principles (Continued)
disclosure, the value of the options is estimated using a Black-Scholes option-pricing formula andamortized to expense over the options’ vesting periods:
2004 2003
Net income under US GAAP (EURm)As reported . . . . . . . . . . . . . . . . . . . . . . . . . . . . . . . . . . . . . . . . . . . . . . . . . . . . . . . . 3,343 4,097
Add: Share-based employee compensation expense included in reported net incomeunder US GAAP, net of tax . . . . . . . . . . . . . . . . . . . . . . . . . . . . . . . . . . . . . . . . . . . . . 1 3
Deduct: Total share-based employee compensation expensedetermined under fair value method for all awards, net of tax . . . . . . . . . . . . . . . . . (116) (325)
Net income under US GAAP (EURm)Pro forma . . . . . . . . . . . . . . . . . . . . . . . . . . . . . . . . . . . . . . . . . . . . . . . . . . . . . . . . . . 3,228 3,775
Basic and diluted earnings per share (EUR)As reported . . . . . . . . . . . . . . . . . . . . . . . . . . . . . . . . . . . . . . . . . . . . . . . . . . . . . . . . 0.73 0.86Pro forma . . . . . . . . . . . . . . . . . . . . . . . . . . . . . . . . . . . . . . . . . . . . . . . . . . . . . . . . . . 0.70 0.79
Deferred taxes
Under IFRS, the presentation of deferred taxes differs from the methodology set forth in US GAAP.For purposes of US GAAP, deferred tax assets and liabilities must either be classified as current ornon-current based on the classification of the related non-tax asset or liability for financial
F-77
Notes to the Consolidated Financial Statements (Continued)
39. Differences between International Financial Reporting Standards and US GenerallyAccepted Accounting Principles (Continued)
reporting. This table presents the IFRS deferred tax assets and liabilities according to thepresentation prescribed by FAS 109, Accounting for Income Taxes under US GAAP.
2005 2004
EURm EURm
Current assets:Intercompany profit in inventory . . . . . . . . . . . . . . . . . . . . . . . . . . . . . . . . . . . . . . . 49 41Warranty provision . . . . . . . . . . . . . . . . . . . . . . . . . . . . . . . . . . . . . . . . . . . . . . . . . . 74 50Other provisions . . . . . . . . . . . . . . . . . . . . . . . . . . . . . . . . . . . . . . . . . . . . . . . . . . . . . 28 29Tax losses carried forward . . . . . . . . . . . . . . . . . . . . . . . . . . . . . . . . . . . . . . . . . . . . . 6 28Other . . . . . . . . . . . . . . . . . . . . . . . . . . . . . . . . . . . . . . . . . . . . . . . . . . . . . . . . . . . . . . 191 124
348 272
Non-current assets:Tax losses carried forward . . . . . . . . . . . . . . . . . . . . . . . . . . . . . . . . . . . . . . . . . . . . . 26 3Warranty provision . . . . . . . . . . . . . . . . . . . . . . . . . . . . . . . . . . . . . . . . . . . . . . . . . . 33 68Other provisions . . . . . . . . . . . . . . . . . . . . . . . . . . . . . . . . . . . . . . . . . . . . . . . . . . . . . 142 145Untaxed reserves . . . . . . . . . . . . . . . . . . . . . . . . . . . . . . . . . . . . . . . . . . . . . . . . . . . . 85 86Fair value gains/losses . . . . . . . . . . . . . . . . . . . . . . . . . . . . . . . . . . . . . . . . . . . . . . . . 43 —Other temporary differences . . . . . . . . . . . . . . . . . . . . . . . . . . . . . . . . . . . . . . . . . . . 40 69
369 371
Deferred tax assets . . . . . . . . . . . . . . . . . . . . . . . . . . . . . . . . . . . . . . . . . . . . . . . . . . . . . 717 643Less: valuation allowance . . . . . . . . . . . . . . . . . . . . . . . . . . . . . . . . . . . . . . . . . . . . . . . (25) (20)
Total deferred tax assets . . . . . . . . . . . . . . . . . . . . . . . . . . . . . . . . . . . . . . . . . . . . . . . . 692 623
Current deferred tax liabilities . . . . . . . . . . . . . . . . . . . . . . . . . . . . . . . . . . . . . . . . . . (26) (17)
Non-current deferred tax liabilities:Untaxed reserves . . . . . . . . . . . . . . . . . . . . . . . . . . . . . . . . . . . . . . . . . . . . . . . . . . . . (13) (30)Fair value gains/losses . . . . . . . . . . . . . . . . . . . . . . . . . . . . . . . . . . . . . . . . . . . . . . . . — (28)Undistributed earnings . . . . . . . . . . . . . . . . . . . . . . . . . . . . . . . . . . . . . . . . . . . . . . . . (68) (60)Other . . . . . . . . . . . . . . . . . . . . . . . . . . . . . . . . . . . . . . . . . . . . . . . . . . . . . . . . . . . . . . (44) (44)
(125) (162)
Total deferred tax liabilities . . . . . . . . . . . . . . . . . . . . . . . . . . . . . . . . . . . . . . . . . . . . . . (151) (179)
Net deferred tax asset . . . . . . . . . . . . . . . . . . . . . . . . . . . . . . . . . . . . . . . . . . . . . . . . . . 541 444
F-78
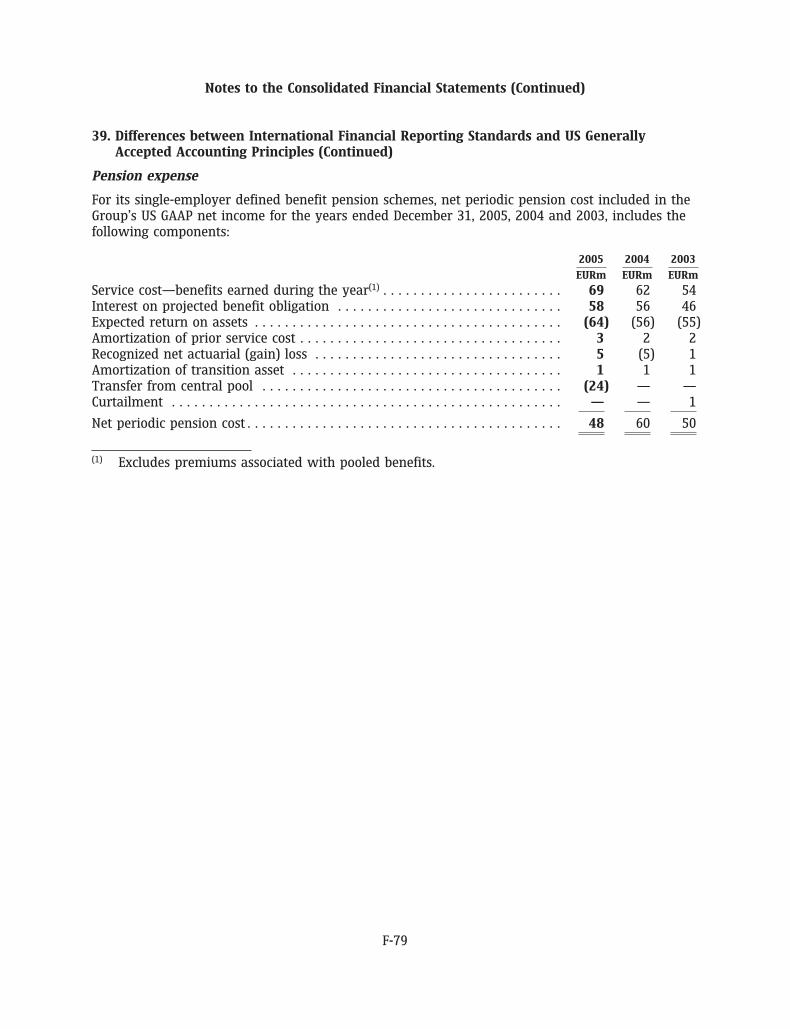
Notes to the Consolidated Financial Statements (Continued)
39. Differences between International Financial Reporting Standards and US GenerallyAccepted Accounting Principles (Continued)
Pension expense
For its single-employer defined benefit pension schemes, net periodic pension cost included in theGroup’s US GAAP net income for the years ended December 31, 2005, 2004 and 2003, includes thefollowing components:
2005 2004 2003
EURm EURm EURm
Service cost—benefits earned during the year(1) . . . . . . . . . . . . . . . . . . . . . . . . 69 62 54Interest on projected benefit obligation . . . . . . . . . . . . . . . . . . . . . . . . . . . . . . 58 56 46Expected return on assets . . . . . . . . . . . . . . . . . . . . . . . . . . . . . . . . . . . . . . . . . (64) (56) (55)Amortization of prior service cost . . . . . . . . . . . . . . . . . . . . . . . . . . . . . . . . . . . 3 2 2Recognized net actuarial (gain) loss . . . . . . . . . . . . . . . . . . . . . . . . . . . . . . . . . 5 (5) 1Amortization of transition asset . . . . . . . . . . . . . . . . . . . . . . . . . . . . . . . . . . . . 1 1 1Transfer from central pool . . . . . . . . . . . . . . . . . . . . . . . . . . . . . . . . . . . . . . . . (24) — —Curtailment . . . . . . . . . . . . . . . . . . . . . . . . . . . . . . . . . . . . . . . . . . . . . . . . . . . . — — 1
Net periodic pension cost . . . . . . . . . . . . . . . . . . . . . . . . . . . . . . . . . . . . . . . . . . 48 60 50
(1) Excludes premiums associated with pooled benefits.
F-79
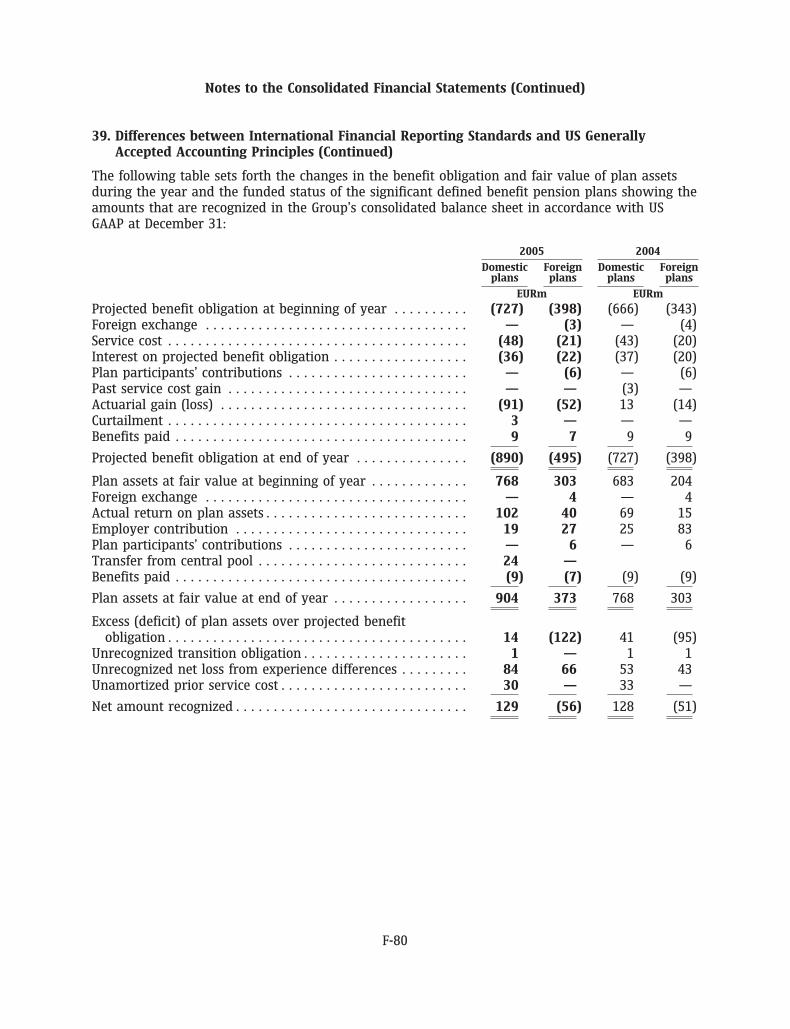
Notes to the Consolidated Financial Statements (Continued)
39. Differences between International Financial Reporting Standards and US GenerallyAccepted Accounting Principles (Continued)
The following table sets forth the changes in the benefit obligation and fair value of plan assetsduring the year and the funded status of the significant defined benefit pension plans showing theamounts that are recognized in the Group’s consolidated balance sheet in accordance with USGAAP at December 31:
2005 2004
Domestic Foreign Domestic Foreignplans plans plans plans
EURm EURm
Projected benefit obligation at beginning of year . . . . . . . . . . (727) (398) (666) (343)Foreign exchange . . . . . . . . . . . . . . . . . . . . . . . . . . . . . . . . . . . — (3) — (4)Service cost . . . . . . . . . . . . . . . . . . . . . . . . . . . . . . . . . . . . . . . . (48) (21) (43) (20)Interest on projected benefit obligation . . . . . . . . . . . . . . . . . . (36) (22) (37) (20)Plan participants’ contributions . . . . . . . . . . . . . . . . . . . . . . . . — (6) — (6)Past service cost gain . . . . . . . . . . . . . . . . . . . . . . . . . . . . . . . . — — (3) —Actuarial gain (loss) . . . . . . . . . . . . . . . . . . . . . . . . . . . . . . . . . (91) (52) 13 (14)Curtailment . . . . . . . . . . . . . . . . . . . . . . . . . . . . . . . . . . . . . . . . 3 — — —Benefits paid . . . . . . . . . . . . . . . . . . . . . . . . . . . . . . . . . . . . . . . 9 7 9 9
Projected benefit obligation at end of year . . . . . . . . . . . . . . . (890) (495) (727) (398)
Plan assets at fair value at beginning of year . . . . . . . . . . . . . 768 303 683 204Foreign exchange . . . . . . . . . . . . . . . . . . . . . . . . . . . . . . . . . . . — 4 — 4Actual return on plan assets . . . . . . . . . . . . . . . . . . . . . . . . . . . 102 40 69 15Employer contribution . . . . . . . . . . . . . . . . . . . . . . . . . . . . . . . 19 27 25 83Plan participants’ contributions . . . . . . . . . . . . . . . . . . . . . . . . — 6 — 6Transfer from central pool . . . . . . . . . . . . . . . . . . . . . . . . . . . . 24 —Benefits paid . . . . . . . . . . . . . . . . . . . . . . . . . . . . . . . . . . . . . . . (9) (7) (9) (9)
Plan assets at fair value at end of year . . . . . . . . . . . . . . . . . . 904 373 768 303
Excess (deficit) of plan assets over projected benefitobligation . . . . . . . . . . . . . . . . . . . . . . . . . . . . . . . . . . . . . . . . 14 (122) 41 (95)
Unrecognized transition obligation . . . . . . . . . . . . . . . . . . . . . . 1 — 1 1Unrecognized net loss from experience differences . . . . . . . . . 84 66 53 43Unamortized prior service cost . . . . . . . . . . . . . . . . . . . . . . . . . 30 — 33 —
Net amount recognized . . . . . . . . . . . . . . . . . . . . . . . . . . . . . . . 129 (56) 128 (51)
F-80
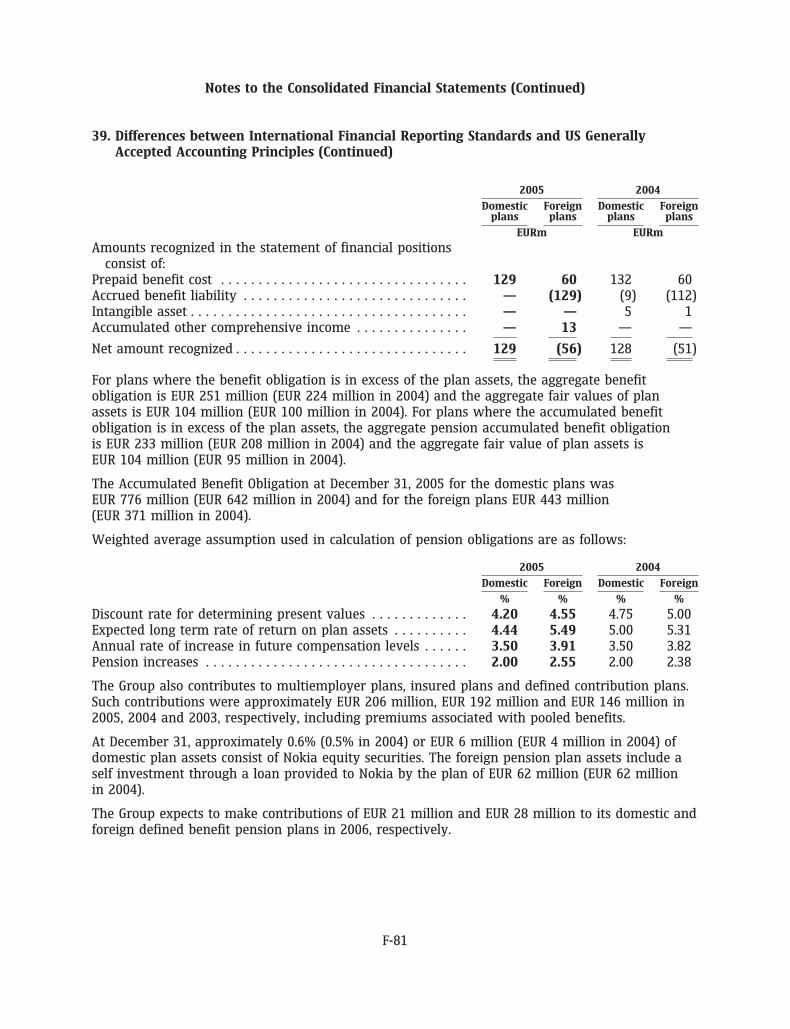
Notes to the Consolidated Financial Statements (Continued)
39. Differences between International Financial Reporting Standards and US GenerallyAccepted Accounting Principles (Continued)
2005 2004
Domestic Foreign Domestic Foreignplans plans plans plans
EURm EURm
Amounts recognized in the statement of financial positionsconsist of:
Prepaid benefit cost . . . . . . . . . . . . . . . . . . . . . . . . . . . . . . . . . 129 60 132 60Accrued benefit liability . . . . . . . . . . . . . . . . . . . . . . . . . . . . . . — (129) (9) (112)Intangible asset . . . . . . . . . . . . . . . . . . . . . . . . . . . . . . . . . . . . . — — 5 1Accumulated other comprehensive income . . . . . . . . . . . . . . . — 13 — —
Net amount recognized . . . . . . . . . . . . . . . . . . . . . . . . . . . . . . . 129 (56) 128 (51)
For plans where the benefit obligation is in excess of the plan assets, the aggregate benefitobligation is EUR 251 million (EUR 224 million in 2004) and the aggregate fair values of planassets is EUR 104 million (EUR 100 million in 2004). For plans where the accumulated benefitobligation is in excess of the plan assets, the aggregate pension accumulated benefit obligationis EUR 233 million (EUR 208 million in 2004) and the aggregate fair value of plan assets isEUR 104 million (EUR 95 million in 2004).
The Accumulated Benefit Obligation at December 31, 2005 for the domestic plans wasEUR 776 million (EUR 642 million in 2004) and for the foreign plans EUR 443 million(EUR 371 million in 2004).
Weighted average assumption used in calculation of pension obligations are as follows:
2005 2004
Domestic Foreign Domestic Foreign
% % % %
Discount rate for determining present values . . . . . . . . . . . . . 4.20 4.55 4.75 5.00Expected long term rate of return on plan assets . . . . . . . . . . 4.44 5.49 5.00 5.31Annual rate of increase in future compensation levels . . . . . . 3.50 3.91 3.50 3.82Pension increases . . . . . . . . . . . . . . . . . . . . . . . . . . . . . . . . . . . 2.00 2.55 2.00 2.38
The Group also contributes to multiemployer plans, insured plans and defined contribution plans.Such contributions were approximately EUR 206 million, EUR 192 million and EUR 146 million in2005, 2004 and 2003, respectively, including premiums associated with pooled benefits.
At December 31, approximately 0.6% (0.5% in 2004) or EUR 6 million (EUR 4 million in 2004) ofdomestic plan assets consist of Nokia equity securities. The foreign pension plan assets include aself investment through a loan provided to Nokia by the plan of EUR 62 million (EUR 62 millionin 2004).
The Group expects to make contributions of EUR 21 million and EUR 28 million to its domestic andforeign defined benefit pension plans in 2006, respectively.
F-81
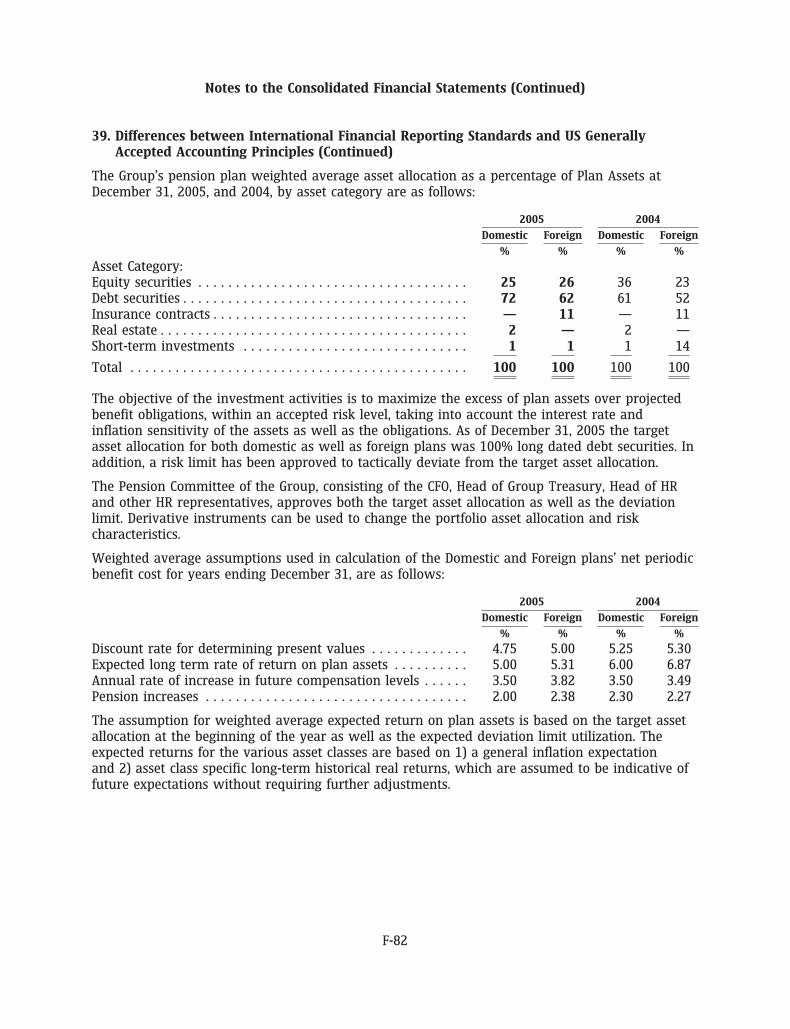
Notes to the Consolidated Financial Statements (Continued)
39. Differences between International Financial Reporting Standards and US GenerallyAccepted Accounting Principles (Continued)
The Group’s pension plan weighted average asset allocation as a percentage of Plan Assets atDecember 31, 2005, and 2004, by asset category are as follows:
2005 2004
Domestic Foreign Domestic Foreign
% % % %
Asset Category:Equity securities . . . . . . . . . . . . . . . . . . . . . . . . . . . . . . . . . . . . 25 26 36 23Debt securities . . . . . . . . . . . . . . . . . . . . . . . . . . . . . . . . . . . . . . 72 62 61 52Insurance contracts . . . . . . . . . . . . . . . . . . . . . . . . . . . . . . . . . . — 11 — 11Real estate . . . . . . . . . . . . . . . . . . . . . . . . . . . . . . . . . . . . . . . . . 2 — 2 —Short-term investments . . . . . . . . . . . . . . . . . . . . . . . . . . . . . . 1 1 1 14
Total . . . . . . . . . . . . . . . . . . . . . . . . . . . . . . . . . . . . . . . . . . . . . 100 100 100 100
The objective of the investment activities is to maximize the excess of plan assets over projectedbenefit obligations, within an accepted risk level, taking into account the interest rate andinflation sensitivity of the assets as well as the obligations. As of December 31, 2005 the targetasset allocation for both domestic as well as foreign plans was 100% long dated debt securities. Inaddition, a risk limit has been approved to tactically deviate from the target asset allocation.
The Pension Committee of the Group, consisting of the CFO, Head of Group Treasury, Head of HRand other HR representatives, approves both the target asset allocation as well as the deviationlimit. Derivative instruments can be used to change the portfolio asset allocation and riskcharacteristics.
Weighted average assumptions used in calculation of the Domestic and Foreign plans’ net periodicbenefit cost for years ending December 31, are as follows:
2005 2004
Domestic Foreign Domestic Foreign
% % % %
Discount rate for determining present values . . . . . . . . . . . . . 4.75 5.00 5.25 5.30Expected long term rate of return on plan assets . . . . . . . . . . 5.00 5.31 6.00 6.87Annual rate of increase in future compensation levels . . . . . . 3.50 3.82 3.50 3.49Pension increases . . . . . . . . . . . . . . . . . . . . . . . . . . . . . . . . . . . 2.00 2.38 2.30 2.27
The assumption for weighted average expected return on plan assets is based on the target assetallocation at the beginning of the year as well as the expected deviation limit utilization. Theexpected returns for the various asset classes are based on 1) a general inflation expectationand 2) asset class specific long-term historical real returns, which are assumed to be indicative offuture expectations without requiring further adjustments.
F-82
Notes to the Consolidated Financial Statements (Continued)
39. Differences between International Financial Reporting Standards and US GenerallyAccepted Accounting Principles (Continued)
Estimated future benefits payments, which reflect expected future service, as appropriate, areexpected to be paid as follows:
Domestic ForeignPension PensionBenefits Benefits
EURm EURm
2006 . . . . . . . . . . . . . . . . . . . . . . . . . . . . . . . . . . . . . . . . . . . . . . . . . . . . . . . . . . . . . 9 92007 . . . . . . . . . . . . . . . . . . . . . . . . . . . . . . . . . . . . . . . . . . . . . . . . . . . . . . . . . . . . . 13 92008 . . . . . . . . . . . . . . . . . . . . . . . . . . . . . . . . . . . . . . . . . . . . . . . . . . . . . . . . . . . . . 15 102009 . . . . . . . . . . . . . . . . . . . . . . . . . . . . . . . . . . . . . . . . . . . . . . . . . . . . . . . . . . . . . 16 102010 . . . . . . . . . . . . . . . . . . . . . . . . . . . . . . . . . . . . . . . . . . . . . . . . . . . . . . . . . . . . . 18 102011–2015 . . . . . . . . . . . . . . . . . . . . . . . . . . . . . . . . . . . . . . . . . . . . . . . . . . . . . . . . 105 62
Reclassification of foreign currency translation
Net foreign exchange gains/(losses) of EUR (161) million, EUR (54) million and EUR 182 million areincluded in the determination of net income under US GAAP of which EUR 418 million, EUR (345)million and EUR (717) million are included in cost of sales for the year ended December 31, 2005,2004, and 2003, respectively. EUR (568) million, EUR 283 million and EUR 867 million of the netforeign exchange gains/(losses) are included in the determination of net sales in 2005, 2004 and2003, respectively.
Reclassification to financial income and expense
Under IFRS, certain net gains of EUR 0 million, EUR 137 million, EUR 65 million in 2005, 2004 and2003, respectively, have been classified as other operating income in 2005 and 2004, and as areduction of cost of sales in 2003. These gains resulted from instruments held for operatingpurposes that were considered to be non-hedging derivatives under US GAAP and are classified asfinancial income and expense.
Included within the EUR 137 million net gain recognized in 2004 is EUR 160 million, representingthe premium return under a multi-line, multi-year insurance program, see Note 8. Under US GAAP,this gain represents the settlement of a call option on the counter party’s interest in anunconsolidated reinsurance subsidiary.
Reclassification of bank and cash
Under US GAAP, bank overdrafts of EUR 46 million and EUR 21 million in 2005 and 2004,respectively, for which there is a legal right of offset are excluded from short-term borrowings andincluded within bank and cash, which has been reflected in total US GAAP assets ofEUR 22,661 million and EUR 22,921 million, respectively.
Reclassification of treasury stock retirement
Under IFRS, the accounting treatment for treasury stock retirement involves an increase in theshare premium account corresponding to the reduction in share capital for the nominal value oftreasury stock retired. Treasury stock is reduced by the acquisition cost of retired treasury stockwith a corresponding reduction in retained earnings.
F-83
Notes to the Consolidated Financial Statements (Continued)
39. Differences between International Financial Reporting Standards and US GenerallyAccepted Accounting Principles (Continued)
Under US GAAP, the accounting treatment for treasury stock retirement does not affect the sharepremium account. Instead, the reduction in retained earnings is offset in part by the reduction inshare capital for the nominal value of treasury stock retired. The impact of this difference is areduction in the share premium account amounting to EUR 14 million and EUR 8 million in 2005and 2004, respectively.
Reclassification of minority interests
IFRS requires the presentation of minority interests within equity on the face of the balance sheet.Under US GAAP, minority interests is presented as a separate item on the face of the balance sheetoutside of equity.
Adoption of pronouncements under US GAAP
In May 2005, the FASB issued FAS 154, Accounting Changes and Error Corrections, a replacement ofAPB Opinion No. 20 and FASB Statement No. 3. FAS 154 provides guidance on the accounting forand reporting of accounting changes and error corrections. FAS 154 is effective for accountingchanges and corrections of errors made in fiscal years beginning after December 15, 2005. TheGroup elected to early adopt FAS 154 and as such has characterized the retrospective adoption ofIFRS 2 and IAS 39(R) as a revision. The adoption of FAS 154 did not have a material impact on theGroup’s financial condition or results of operations.
In June 2005, the FASB issued FSP 143-1, Accounting for Electronic Equipment Waste Obligations.FSP 143-1 and related FASB Interpretation No. 47 provide guidance on how commercial users andproducers of electronic equipment should recognize and measure asset retirement obligations thatarise from European Union (EU) Directive 2002/96/EC on Waste Electrical and Electronic Equipment(Directive). FSP 143-1 is effective the later of the first reporting period that ends after June 8, 2005or the date that the EU-member country adopts a law to implement the Directive. The Group hasadopted FSP 143-1 and the statement did not have a material impact on the Group’s financialstatements.
New accounting pronouncements under US GAAP
In November 2005, The FASB issued Staff Position No. (FSP) 115-1 The Meaning ofOther-Than-Temporary Impairment and its Application to Certain Investments. FSP 115-1 providesaccounting guidance for identifying and recognizing other-than-temporary impairments of debtand equity securities, as well as cost method investments in addition to disclosure requirements.FSP 115-1 is effective for reporting periods beginning after December 15, 2005. The adoption ofFSP 115-1 is not expected to have a material impact on the Group’s financial condition or resultsor operations.
F-84

(This page has been left blank intentionally.)

(This page has been left blank intentionally.)

(This page has been left blank intentionally.)
SIGNATURES
The registrant hereby certifies that it meets all of the requirements for filing on Form 20-F andthat it has duly caused and authorized the undersigned to sign this annual report on its behalf.
NOKIA CORPORATION
By: /s/ MAIJA TORKKO
Name: Maija TorkkoTitle: Senior Vice President, Corporate Controller
By: /s/ KAARINA STAHLBERG
Name: Kaarina StahlbergTitle: Vice President, Assistant General Counsel
March 2, 2006

Form 20-F 2005
No
kia Form
20-F 2005
Copy
righ
t©
2006
. Nok
ia C
orpo
rati
on. A
ll ri
ghts
res
erve
d.N
okia
and
Nok
ia C
onne
ctin
g Pe
ople
are
reg
iste
red
trad
emar
ks o
f Nok
ia C
orpo
rati
on.
20-F_2005_cover.pmd 26.2.2006, 20:571