Embed Size (px)
Citation preview

Non-exponential T2* decay in White Matter
Peter van Gelderen1, Jacco A. de Zwart1, Jongho Lee1,3, Pascal Sati2, Daniel S. Reich2, andJeff H. Duyn1
1 Advanced MRI Section, Laboratory of Functional and Molecular Imaging, National Institute ofNeurologic Disorders and Stroke, National Institutes of Health2 Translational Neuroradiology Unit, Neuroimmunology Branch, National Institute of NeurologicDisorders and Stroke, National Institutes of Health3 Department of Radiology, University of Pennsylvania
AbstractVisualizing myelin in human brain may help the study of diseases such as multiple sclerosis.Previous studies based on T1 and T2 relaxation contrast have suggested the presence of a distinctwater pool that may report directly on local myelin content. Recent work indicates that T2
*
contrast may offer particular advantages over T1 and T2 contrast, especially at high field.However, the complex mechanism underlying T2
* relaxation may render interpretation difficult.
To address this issue, T2* relaxation behavior in human brain was studied at 3 and 7 tesla.
Multiple gradient echoes covering most of the decay curve were analyzed for deviations frommono-exponential behavior. The data confirm the previous finding of a distinct rapidly relaxingsignal component (T2
* ~ 6 ms), tentatively attributed to myelin water. However, in extension toprevious findings, this rapidly relaxing component displayed a substantial resonance frequencyshift, reaching 36 Hz in the corpus callosum at 7 T. The component’s fractional amplitude andfrequency shift appeared to depend on both field strength and fiber orientation, consistent with amechanism originating from magnetic susceptibility effects. The findings suggest that T2
* contrastat high field may be uniquely sensitive to tissue myelin content, and that proper interpretation willrequire modeling of susceptibility-induced resonance frequency shifts.
KeywordsT2* relaxation; high field imaging; myelin water fraction; white matter imaging
IntroductionLoss of axonal myelin in human brain white matter (WM) may lead to impaired brainfunction. Such loss may result from normal aging as well as a number of neurologicaldiseases, most notably multiple sclerosis (MS). For this reason, the measurement of localmyelin content has been a longstanding goal of MRI technique development. Most of thecurrent techniques aim at measuring the relative concentration of myelin water based on itscharacteristic relaxation properties. The term “myelin water” is used here as a looselydefined entity which includes all water that is in close vicinity to myelin. It is often assumedthat the myelin water may be physically restricted to the spaces between myelin sheetssurrounding axons, and may experience accelerated relaxation due to reduced mobility.
Correspondence to: Peter van Gelderen, Bld 10, Rm B1D-725, 10 Center Drive, Bethesda MD 20892, USA, [email protected].
NIH Public AccessAuthor ManuscriptMagn Reson Med. Author manuscript; available in PMC 2013 January 1.
Published in final edited form as:Magn Reson Med. 2012 January ; 67(1): 110–117. doi:10.1002/mrm.22990.
NIH
-PA Author Manuscript
NIH
-PA Author Manuscript
NIH
-PA Author Manuscript

Several methods have been proposed to distinguish myelin water from other water signals,based on various contrast mechanisms. Magnetization transfer (MT) effects (1) can beexploited to selectively saturate water in contact with macromolecules or myelin (e.g. (2)).Subtraction of MT-saturated images from unsaturated images may thus provide an estimateof myelin water content. T2 relaxation measurements can be used to identify fast and slowT2 components (3,4), with the fast component interpreted as myelin water. Simultaneous T1and T2 information maybe obtained with the DESPOT1 and DESPOT2 techniques (5)(driven equilibrium single pulse observation of T1 and T2). Inclusion of T1 information mayimprove the reliability of the estimated fast T2 fraction and, under some conditions, allowestimation of exchange rates between the differentially relaxing putative compartments or“pools”. More quantitative methods, based on MT measurements at a range of saturationfrequencies and T1 measurements, and analyzed with a two-pool model of magnetization(6), have been proposed as well. These methods allow estimation of the size of the rapidlydecaying proton fraction and its exchange rate (7–9), resulting in a measure of a boundproton pool, generally assumed to be representative of larger molecules, such as thoseforming myelin. However, a comparison between quantitative MT and T2 data in MSpatients showed little correlation between the myelin water fractions derived with thesemethods (10), indicating that the underlying contrast mechanisms are still poorlyunderstood.
Although promising, current myelin water measurement methods generally suffer from longmeasurement time, poor signal to noise ratio (SNR), and limited specificity to myelin water.Some of the methods furthermore lack the ability to provide reproducible quantitativenumbers. The hope is therefore that further improvements in MRI measurement of myelinwater will arise from novel methods.
One very recent and particularly promising technique to measure myelin associated water isthe use of T2
* contrast (11,12). Similar to the T1 or T2 based methods, the premise is that themyelin associated water has a distinctly reduced T2
*, and that the exchange between the freeand myelin water pools is slow enough to observe multi-exponential T2
* decay as functionof echo time (TE) for myelin containing tissue.
Potential advantages of using T2* contrast over alternative methods are its rather strong
(relative to other contrasts) amplification at high field strength and the fact that the relativelysimple gradient echo (GRE) pulse sequence can be used. Moreover, GRE pulse sequenceshave low RF power deposition. This is important, because RF power deposition increasesquadratically with field strength, and thus may limit the field strength at which T1 and T2measurements are practical. The goal of this study therefore was to investigate whether T2
*
decay at 7 T can be used to detect and further characterize myelin water. For this purpose,multi-echo GRE data were acquired in a number of normal volunteers at 7 T. Forcomparison, similar data were acquired at 3 T as well in a smaller group of subjects. Itshould be pointed out that it is not proven here that the short component is indeed a myelinwater fraction; although this seems plausible, there maybe other sources of susceptibilityassociated with myelin that could produce similar results.
MethodsSeven healthy volunteers (3 female, 4 male, ages 33–54, average age 41) were studied at 7T, one of whom was scanned twice. Four volunteers (1 female, ages 24–45, average 36years) were scanned at 3 T, three of which also participated in the 7 T study. Both scannerswere General Electric (GE, Milwaukee, Wisconsin) systems, equipped with standard clinicalgradients (maximum amplitude 40 mT/m, slew rate 150 T/m/s). For the 7 T study, a NovaMedical (Wilmington, Massachusetts) birdcage transmit coil was used in combination with a
van Gelderen et al. Page 2
Magn Reson Med. Author manuscript; available in PMC 2013 January 1.
NIH
-PA Author Manuscript
NIH
-PA Author Manuscript
NIH
-PA Author Manuscript

32 channel receive coil, for the 3 T study the GE body coil was used for transmission and a16 channel Nova Medical coil for reception. All studies were performed under an InternalReview Board approved human protocol.
The pulse sequence was an in-house developed multi GRE acquisition for mapping the T2*
decay. A train of echoes was produced by alternating the acquisition gradient, similar to anecho planar imaging (EPI) acquisition, but omitting the phase encoding blips between echoacquisitions. Only the positive gradient lobes were used to avoid misalignment betweenpositive and negative echoes due to local off resonance effects, and the negative gradientlobes were maximized for minimum inter echo spacing (13). The acquisition time of the firstecho was minimized by using a short (1.6 ms) RF excitation pulse and combining the slicerephrasing, phase encoding and acquisition dephasing gradients. A single 2 mm slice wasmeasured per scan, with an in plane resolution of 256×96 voxels and a field of view of240×180 mm. The repetition time was 70 ms, and the flip angle (as estimated at the center ofthe slice) was 30 degrees. The single slice acquisition was repeated 50 times for a total scantime was 336 s. The repetitions were selectively averaged (see below) for improved SNRand stability. The shortest echo time (TE) was 2.7 ms, the longest one 45.0 ms, for a total of19 echoes spaced at 2.35 ms. The tenth echo was programmed to be used a navigator; forthis purpose, the phase encoding was rewound before the echo and re-applied immediatelyafter. This navigator was intended to help improve the stability, but not used in the finalanalysis. Two slices were scanned in separate experiments, in a close to axial orientationparallel to the AC/PC line (anterior and posterior commissure). One slice was positioned afew millimeters above AC/PC to capture a section of the corpus callosum, and a second slicewas acquired at a position approximately 25 mm higher to capture white matter outside themajor fiber bundles.
The images from individual receiver channels were combined using a sensitivity encoding(SENSE)(14) type calculation without external reference (15) based on the first echo of thefirst repetition. For each repetition and each voxel, the signal across echo times was fitted toa single-exponential decay using a Levenberg-Marquardt non-linear least squares algorithm.The results were averaged over repetitions after excluding outliers. The outliers weredetermined by analyzing the fluctuation over the repetitions of the fitted amplitudes. Theseamplitudes were averaged over the repetitions. Susequently, the difference of the amplitudeswith this average was calculated and normalized by its standard deviation (SD), and thensummed over all voxels. The repetitions for which the summed deviation from average wasmore than twice the SD were excluded from further analysis.
Subsequent analysis was geared towards investigating the potential presence of multi-exponential relaxation, as previously found at 3 T (11,12), by looking at the deviation fromsingle exponential relaxation. To determine this deviation, the averaged fit results werecompared with the averaged echo signals, resulting in average difference maps for each TEmeasured. These maps were then further analyzed in selected regions of interest (ROIs).Using the average R2
* map as a guide, ROIs were selected in posterior part (the splenium)of the corpus callosum (SCC), in the posterior internal capsule (PIC) and in the white mattersurrounding the posterior part of the CC, not associated with any major fiber bundle. In thefollowing the last of these is referred to as general white matter (GWM).
After region selection, ROI averaged signals were used to derive quantitative estimates of apotential fast relaxing component. For this purpose, a single exponential, slow relaxationcomponent was estimated by performing a single exponential fit to ROI-averaged data afterexclusion of data from the first two TEs for the 7 T data and exclusion of the first fourechoes for the 3 T data. This exclusion was designed to select the slow component in the
van Gelderen et al. Page 3
Magn Reson Med. Author manuscript; available in PMC 2013 January 1.
NIH
-PA Author Manuscript
NIH
-PA Author Manuscript
NIH
-PA Author Manuscript

data. The difference with this fit was used to study the deviation from single exponentialdecay resulting from a putative fast component.
The choice of the ROIs was informed by comparison of the R2* maps with diffusion derived
fiber orientation and anisotropy maps acquired in a previous, unrelated study. Two of thesubjects in the current study had also participated in that diffusion study and a closelycorresponding slice position and orientation could be selected in one of these two volunteersto allow identification of several structures in the R2
* data using the diffusion maps as aguide. The fiber orientation in the three selected ROIs (SCC, PIC and GWM) waspredominantly perpendicular to the main magnetic field, parallel to it and mixed,respectively. Susceptibility effects in structured tissue, like parallel fiber bundles, aredependent on the angle of the structure with respect to the main magnetic field (16,17). As aresult, the T2
* decay may show a deviation from single exponential behavior that isorientation dependent.
Further analysis revealed that a three-component model, as suggested in (18) may produce abetter fit to the data, provided that a variable offset frequency is allowed for the components.This analysis is analogous to the model proposed previously for the separation of greymatter, cerebrospinal fluid (CSF) and intravascular signals (19), and that for the separationof tissue water and CSF (20). In white matter, compartment-specific resonance frequencyshifts may occur due to the magnetic susceptibility effects of the distribution of myelin-associated lipids and iron (21). If one assumes that there is one dominant component andtwo components of relatively small amplitude, then only the frequency difference betweenthe two smaller components and the dominant term is relevant when considering magnitudedata. The phase of the total signal will be set by the dominant component, and this phase isremoved by taking the magnitude of the signal. The resulting model is:
[1]
where S is the magnitude signal as function of time, ||•|| indicates the magnitude operator,and Ai is the amplitude, fi the off-resonance frequency (in Hz) and the relaxation rate ofcomponent i. The model has eight free parameters (f2 is zero and therefore not included inthe model, as this component is assumed to be on resonance). All components start in-phaseat t=0. The first (fast) component is tentatively assigned to myelin water, the secondcomponent represents the dominant, larger signal of the on-resonance tissue water, the thirdand longer component represents mobile water in CSF and extracellular spaces.
As the fitting of such a model to data acquired in a relatively short range of echo times isinherently an ill-conditioned problem, a simple (and slow) fitting procedure was followed inwhich in successive iterations every component in the model was optimized by minimizingthe quadratic sum of the residue of the fit for a given range of its parameters. The search waslimited to positive values for the amplitude and relaxation rates. After each iteration, therange was reduced by a factor of two to refine the search if an optimum was found withinthe given range; otherwise the range was increased by a factor two. The initial search rangewas 70–130% of the initial guess for each parameter. The optimization was halted whenfurther reduction of the residue was no longer significant. This fitting procedure was onlyapplied to the 7 T ROI averaged signal in the SCC and GWM areas, as the PIC data did notgive reproducible results.
On the 3 T data the fitting of the three components did not result in reproducible results, sothose data were fitted with a comparable two-component model:
van Gelderen et al. Page 4
Magn Reson Med. Author manuscript; available in PMC 2013 January 1.
NIH
-PA Author Manuscript
NIH
-PA Author Manuscript
NIH
-PA Author Manuscript

[2]
leaving out the third, slow component, reducing the number of parameters to five.
ResultsThe SNR in the coil-combined images for the first echo (TE 2.7 ms) was 30–90 at 3 T and70–180 at 7 T(before averaging). The large range at each field is attributed to the highlyinhomogeneous B1 profile of the receive coil arrays. The temporal stability, expressed asmean divided by the SD of the fitted amplitude over time, was 20–60 for both field strengthsbefore the rejection of deviating repetitions (see Methods). After this rejection, the stabilitywas 50–90 for the 3 T scans and 60–150 for the 7 T scans. In the majority of studies, thefraction of rejected repetitions was below 20%.
Figure 1 shows an example of the average difference maps (the difference between data andthe mono-exponential fit) at selected echo times, calculated from 46 repetitions. Substantialdifference signal is observed at the shortest echo time (TE=2.7 ms), which is mostpronounced in the myelin-rich SCC. Interestingly, substantial difference signal remainsvisible at longer echo times, both in grey and white matter regions. Even at TE=45 ms,significant deviation from the single-exponential fit is observed. This observed contrastevolution with echo time appears inconsistent with the difference of a previously suggestedmulti-exponential decay (12) and a mono-exponential fit (see Appendix 1).
Results of the ROI-based T2* decay analysis are shown in Figs. 2 and 3. Fig. 2 shows an
example of ROI selection; ROI-and subject-averaged differences between the data and themono-exponential fit for the 7 T data are shown in Fig. 3. The error bars in the plot, derivedfrom the SD over the subjects, show that the shape of the decay curves is very reproducible.Across ROIs, substantial differences in amplitude and shape are observed. An illustration ofthe field dependence of the non-exponential T2
* decay is shown in Fig. 4, showing thesubject averaged differences with a mono-exponential fit for the SCC ROI data at 3 T. Theerror bars reflect the standard error or the averages. The shape is notably different than theresidue for the 7 T data, plotted in the same figure for comparison (it is the same curve as inFig 3b). The 3 T curve is expanded in time compared to the 7 T curve and lower inamplitude.
The deviation from single exponential decay appears not to be consistent with a multi-compartment model without frequency offsets, as discussed Appendix 1. A model includinga frequency offset for the two smaller components (Eq.1) however fits the data very well, asshown in Fig. 5. The adjusted coefficient of determination (R2) improved from 1–1.8·10−4
for the model without frequency offsets to 1–1.6·10−6 for the model with the offsets. Theaverage of the fit parameters for the 7 T and 3 T data is presented in Table 1. Asdemonstrated by the SD of the fit parameters, the 7 T results are reproducible over subjects.However the results of the fit of the three-compartment model to the 3 T data were notreproducible between subjects and therefore only the results of fit with the two-compartmentmodel (Eq. 2) are shown.
The triple-exponential model could not be fitted reliably to the data on a voxel by voxelbasis. In order to create a map of the fast component, the model was modified by fixing therelaxation and frequency parameters to the values determined in the fit to the SCC ROIaveraged data. This reduced the fitting problem to a three parameter linear least squaresoptimization to find the amplitudes of the three components. The resulting map of theamplitude of the fast component is shown in Fig. 6, together with the difference between the
van Gelderen et al. Page 5
Magn Reson Med. Author manuscript; available in PMC 2013 January 1.
NIH
-PA Author Manuscript
NIH
-PA Author Manuscript
NIH
-PA Author Manuscript
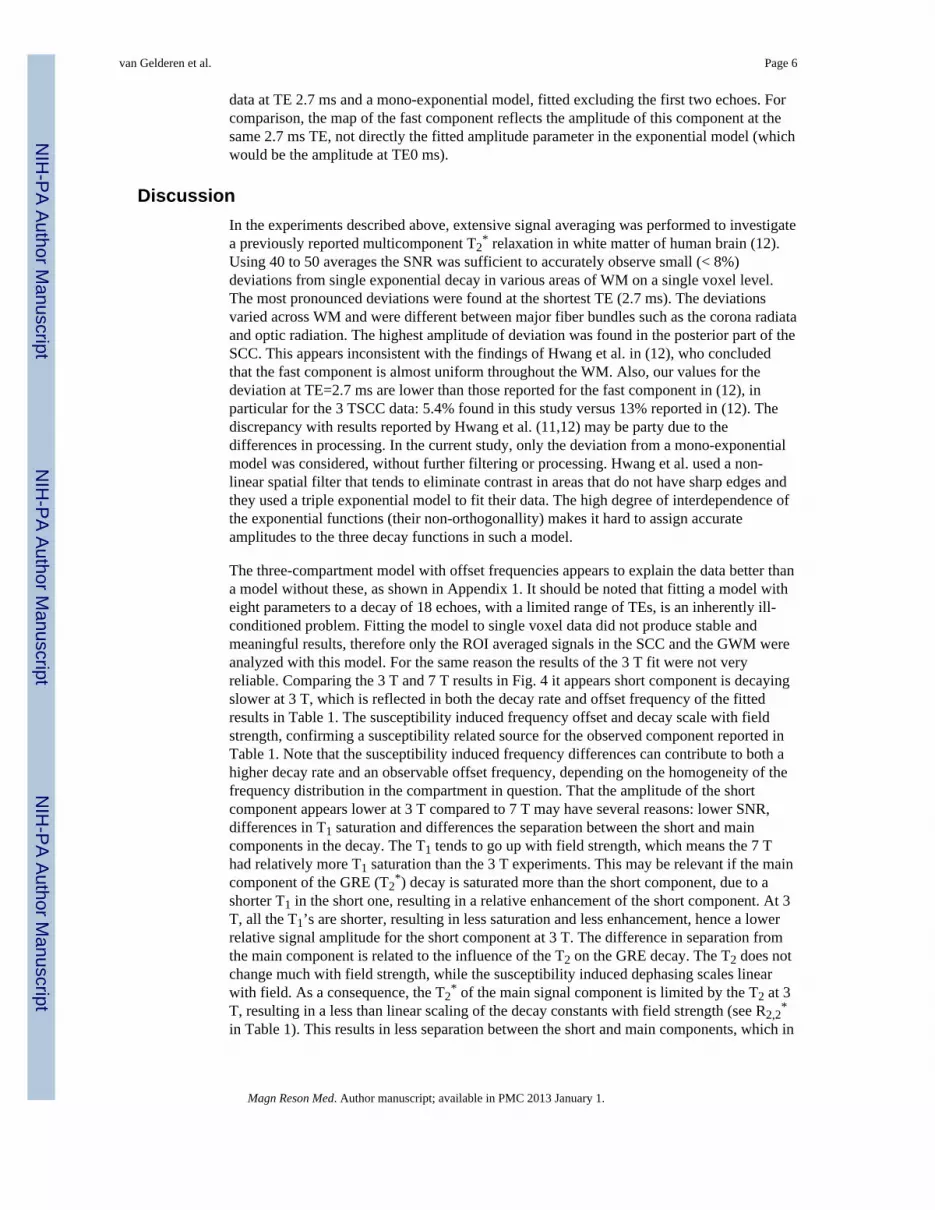
data at TE 2.7 ms and a mono-exponential model, fitted excluding the first two echoes. Forcomparison, the map of the fast component reflects the amplitude of this component at thesame 2.7 ms TE, not directly the fitted amplitude parameter in the exponential model (whichwould be the amplitude at TE0 ms).
DiscussionIn the experiments described above, extensive signal averaging was performed to investigatea previously reported multicomponent T2
* relaxation in white matter of human brain (12).Using 40 to 50 averages the SNR was sufficient to accurately observe small (< 8%)deviations from single exponential decay in various areas of WM on a single voxel level.The most pronounced deviations were found at the shortest TE (2.7 ms). The deviationsvaried across WM and were different between major fiber bundles such as the corona radiataand optic radiation. The highest amplitude of deviation was found in the posterior part of theSCC. This appears inconsistent with the findings of Hwang et al. in (12), who concludedthat the fast component is almost uniform throughout the WM. Also, our values for thedeviation at TE=2.7 ms are lower than those reported for the fast component in (12), inparticular for the 3 TSCC data: 5.4% found in this study versus 13% reported in (12). Thediscrepancy with results reported by Hwang et al. (11,12) may be party due to thedifferences in processing. In the current study, only the deviation from a mono-exponentialmodel was considered, without further filtering or processing. Hwang et al. used a non-linear spatial filter that tends to eliminate contrast in areas that do not have sharp edges andthey used a triple exponential model to fit their data. The high degree of interdependence ofthe exponential functions (their non-orthogonallity) makes it hard to assign accurateamplitudes to the three decay functions in such a model.
The three-compartment model with offset frequencies appears to explain the data better thana model without these, as shown in Appendix 1. It should be noted that fitting a model witheight parameters to a decay of 18 echoes, with a limited range of TEs, is an inherently ill-conditioned problem. Fitting the model to single voxel data did not produce stable andmeaningful results, therefore only the ROI averaged signals in the SCC and the GWM wereanalyzed with this model. For the same reason the results of the 3 T fit were not veryreliable. Comparing the 3 T and 7 T results in Fig. 4 it appears short component is decayingslower at 3 T, which is reflected in both the decay rate and offset frequency of the fittedresults in Table 1. The susceptibility induced frequency offset and decay scale with fieldstrength, confirming a susceptibility related source for the observed component reported inTable 1. Note that the susceptibility induced frequency differences can contribute to both ahigher decay rate and an observable offset frequency, depending on the homogeneity of thefrequency distribution in the compartment in question. That the amplitude of the shortcomponent appears lower at 3 T compared to 7 T may have several reasons: lower SNR,differences in T1 saturation and differences the separation between the short and maincomponents in the decay. The T1 tends to go up with field strength, which means the 7 Thad relatively more T1 saturation than the 3 T experiments. This may be relevant if the maincomponent of the GRE (T2
*) decay is saturated more than the short component, due to ashorter T1 in the short one, resulting in a relative enhancement of the short component. At 3T, all the T1’s are shorter, resulting in less saturation and less enhancement, hence a lowerrelative signal amplitude for the short component at 3 T. The difference in separation fromthe main component is related to the influence of the T2 on the GRE decay. The T2 does notchange much with field strength, while the susceptibility induced dephasing scales linearwith field. As a consequence, the T2
* of the main signal component is limited by the T2 at 3T, resulting in a less than linear scaling of the decay constants with field strength (see R2,2
*
in Table 1). This results in less separation between the short and main components, which in
van Gelderen et al. Page 6
Magn Reson Med. Author manuscript; available in PMC 2013 January 1.
NIH
-PA Author Manuscript
NIH
-PA Author Manuscript
NIH
-PA Author Manuscript

turn, together with the lower SNR, makes the fitting of multiple components less reliableand could cause an underestimation of the relative amplitude of the short component at 3 T.
To investigate the possibility that microscopic magnetic susceptibility variations indeedcould underlie the observed relaxation behavior, we simulated the signal decay of spinssurrounding a cylindrical susceptibility perturber. The results suggest that the signal decaycan be distinctly different from mono-exponential behavior, as illustrated in Appendix 2.Not enough detail is known about the exact distribution of susceptibility sources in braintissue to create an accurate and realistic model, but this simulation shows it is at leastplausible that the T2
* decay is partly shaped by the susceptibility variations on a microscopicscale..
The dependence of amplitude of the short component on fiber orientation with respect to theB0 field and the resulting strong contrast within the WM also support a susceptibility-relatedsource, the effects being the strongest in highly oriented fibers perpendicular to the mainfield (SCC), small in oriented fibers parallel with the field (PIC) and in between for a moremixed source (GWM). The GWM ROI contains a mix of fibers types and orientations,which may explain the results shown in Table 1. The fibers oriented parallel with themagnetic field and those with a more random structure would not contribute to the fastcomponent, while bundles with an orientation predominantly perpendicular to the field mayshow a frequency effect similar to the SCC, or perhaps a somewhat smaller effect if the localfibers have a different structure. Averaging these various orientations together could resultin the observed lower amplitude and frequency for the short component in the GWM ROI.The susceptibility induced field changes in and around elongated structures in general have asin2θ dependence for their orientation with respect to the main magnetic field (17), whichcan easily be derived from the two-fold rotation symmetry, meaning the largest difference inorientation effects will be found between parallel and perpendicular fibers. While it cannotbe proven to be the sole source of the observed signal decay behavior, it appears likely thatthe microscopic susceptibility distribution is responsible for most, if not all, of the observeddeviations from mono-exponential decay. It may be possible to exploit these effects and useT2
* based measurements to study the microscopic structure of brain tissue. T2* data are
easier to acquire and could provide a higher spatial resolution than alternative MR contrasts.
One obvious feature in the residue images (see Fig. 1) is a region in the anterior part of thebrain that shows a smaller effect and generally a negative deviation from exponential decayfor the shorter echo time. This negative deviation is likely related to macroscopicsusceptibility effects, which are strongest in orbito-frontal areas. Comparison with Bo fieldmaps (not shown) indeed confirmed that the areas of poor Bo homogeneity correspond to thedarker areas for the short and long echo times in Fig. 1, and the brighter ones for theintermediate echo times. A calculation based on the 2 D phase map did show that shimmingcould explain a large part of the observed effects. The amplitude map of the fast componentof the triple-exponential fit (Fig. 6) appears less sensitive to this problem, which may beexplained by the fact that the poor (macroscopic) shimming primarily changes the slowercomponent in the signal and not the amplitude of the fast one. Fitting a mono-exponentialfunction as done for Fig. 1 will result in a lower T2
* in areas of poor shimming, bringing thefit closer to the fast component and reducing the difference signal. Macroscopicsusceptibility effects can also give rise to a more quadratic exponential decay (17), whichwould influence mostly the later echoes. The triple-exponential model can account for thateffect in the third component, while the mono-exponential fit would be adversely affected,contributing to the differences between Fig. 1 and 6. A double exponential model with alinear and quadratic term in the second (and dominant) exponent resulted in a similar residueafter fitting as the presented triple exponential model. Based on these data, it can not be
van Gelderen et al. Page 7
Magn Reson Med. Author manuscript; available in PMC 2013 January 1.
NIH
-PA Author Manuscript
NIH
-PA Author Manuscript
NIH
-PA Author Manuscript

determined which of these models is the best to explain the deviation from exponentialdecay in the later echo times.
Fiber structure differences in the anterior and posterior parts of the CC may explain some ofthe differences in deviation from exponential decay. Interestingly, the contrast in thedeviation map (as in Fig. 1) bears resemblance to the contrast observed in a bSSFPasymmetry study (22), including the difference between posterior and anterior CC andorientation dependence. The frequency shifts observed in that study (20–25 Hz in theperpendicular CC fibers) appear somewhat higher than expected based the frequency of thefast component in the 3 compartment fit of the 7 T data (36 Hz), assuming that thefrequency shifts scale with field strength. The deviation maps from Fig. 1 also resemble themaps of the fast relaxation water fraction in a cross-relaxation (MT) study ((9), Fig 2),suggesting again that both methods are sensitive to the local fiber density.
A 3D multi echo experiment on a fixed section of brain tissue containing the CC, WM andsome grey matter showed an only very small deviation from mono-exponential T2
* decay inall tissue types (less than 0.6%, data not presented here). In contrast, a previous T2 study(23) found a preservation of a fast T2 component after fixation. The short componentreported there at 20 ms may be too close to the main component in the T2
* decay to beobservable as a separate fraction in T2
* data.
A limitation of the implementation presented here is the use of a single slice acquisitionmode with a long total scan time due to the number of repetitions. This method was chosento maximize the achievable resolution, SNR and stability of the scans. Single imageacquisitions were occasionally degraded by small motion artifacts. Using a large number ofrepetitions and rejecting the outliers from the average resulted in high quality data where thesmall deviations from exponential decay could reliably be detected and analyzed. Someform of 3D acquisition with motion correction (navigators etc.) is likely of more practicalvalue. This would also improve the available phase information to possibly allow for acorrection of the macroscopic susceptibility effects (shimming).
ConclusionMulti-gradient echo data obtained at 7 T suggest non-exponential T2
* decay in white matterfiber bundles. Multi-component fitting of the decay characteristics confirm earlierindications of the presence of a short component whose amplitude and resonance frequencyappeared to depend on fiber orientation relative to B0. This phenomenon may be exploited toinvestigate the local myelin structure and will need to be taken into account when estimatingtissue myelin content from T2
* data.
AcknowledgmentsWe would like to thank Dr. M. Fukunaga and Dr. T.Q. Li for making their diffusion images available for this study.This work was supported by the Intramural Research Program of the National Institute of Neurological Disordersand Stroke.
References1. Wolff SD, Balaban RS. Magnetization transfer contrast (MTC) and tissue water proton relaxation in
vivo. Magn Reson Med. 1989; 10:135–144. [PubMed: 2547135]2. Helms G, Dathe H, Kallenberg K, Dechent P. High-resolution maps of magnetization transfer with
inherent correction for RF inhomogeneity and T1 relaxation obtained from 3D FLASH MRI. MagnReson Med. 2008; 60:1396–1407. [PubMed: 19025906]
van Gelderen et al. Page 8
Magn Reson Med. Author manuscript; available in PMC 2013 January 1.
NIH
-PA Author Manuscript
NIH
-PA Author Manuscript
NIH
-PA Author Manuscript

3. MacKay A, Whittall K, Adler J, Li D, Paty D, Graeb D. In vivo visualization of myelin water inbrain by magnetic resonance. Magn Reson Med. 1994; 31:673–677. [PubMed: 8057820]
4. Oh J, Han ET, Pelletier D, Nelson SJ. Measurement of in vivo multi-component T2 relaxation timesfor brain tissue using multi-slice T2 prep at 1.5 and 3 T. Magn Reson Imaging. 2006; 24:33–43.[PubMed: 16410176]
5. Deoni SC, Rutt BK, Arun T, Pierpaoli C, Jones DK. Gleaning multicomponent T1 and T2information from steady-state imaging data. Magn Reson Med. 2008; 60:1372–1387. [PubMed:19025904]
6. Henkelman RM, Huang X, Xiang QS, Stanisz GJ, Swanson SD, Bronskill MJ. Quantitativeinterpretation of magnetization transfer. Magn Reson Med. 1993; 29:759–766. [PubMed: 8350718]
7. Mougin OE, Coxon RC, Pitiot A, Gowland PA. Magnetization transfer phenomenon in the humanbrain at 7 T. Neuroimage. 49:272–281. [PubMed: 19683581]
8. Sled JG, Pike GB. Quantitative imaging of magnetization transfer exchange and relaxationproperties in vivo using MRI. Magn Reson Med. 2001; 46:923–931. [PubMed: 11675644]
9. Yarnykh VL, Yuan C. Cross-relaxation imaging reveals detailed anatomy of white matter fibertracts in the human brain. Neuroimage. 2004; 23:409–424. [PubMed: 15325389]
10. Levesque IR, Giacomini PS, Narayanan S, Ribeiro LT, Sled JG, Arnold DL, Pike GB. Quantitativemagnetization transfer and myelin water imaging of the evolution of acute multiple sclerosislesions. Magn Reson Med. 63:633–640. [PubMed: 20146232]
11. Hwang D, Du YP. Improved myelin water quantification using spatially regularized non-negativeleast squares algorithm. J Magn Reson Imaging. 2009; 30:203–208. [PubMed: 19557738]
12. Hwang D, Kim DH, Du YP. In vivo multi-slice mapping of myelin water content using T2* decay.Neuroimage. 2010; 52:198–204. [PubMed: 20398770]
13. Duerk JL, Simonetti OP. Theoretical aspects of motion sensitivity and compensation in echo-planar imaging. J Magn Reson Imaging. 1991; 1:643–650. [PubMed: 1823169]
14. Pruessmann KP, Weiger M, Scheidegger MB, Boesiger P. SENSE: sensitivity encoding for fastMRI. Magn Reson Med. 1999; 42:952–962. [PubMed: 10542355]
15. de Zwart JA, van Gelderen P, Kellman P, Duyn JH. Application of sensitivity-encoded echo-planarimaging for blood oxygen level-dependent functional brain imaging. Magn Reson Med. 2002;48:1011–1020. [PubMed: 12465111]
16. Schenck JF. The role of magnetic susceptibility in magnetic resonance imaging: MRI magneticcompatibility of the first and second kinds. Med Phys. 1996; 23:815–850. [PubMed: 8798169]
17. Yablonskiy DA, Haacke EM. Theory of NMR signal behavior in magnetically inhomogeneoustissues: the static dephasing regime. Magn Reson Med. 1994; 32:749–763. [PubMed: 7869897]
18. Lancaster JL, Andrews T, Hardies LJ, Dodd S, Fox PT. Three-pool model of white matter. J MagnReson Imaging. 2003; 17:1–10. [PubMed: 12500269]
19. He X, Yablonskiy DA. Quantitative BOLD: mapping of human cerebral deoxygenated bloodvolume and oxygen extraction fraction: default state. Magn Reson Med. 2007; 57:115–126.[PubMed: 17191227]
20. Bender B, Klose U. Cerebrospinal fluid and interstitial fluid volume measurements in the humanbrain at 3T with EPI. Magn Reson Med. 2009; 61:834–841. [PubMed: 19191287]
21. Duyn JH, van Gelderen P, Li TQ, de Zwart JA, Koretsky AP, Fukunaga M. High-field MRI ofbrain cortical substructure based on signal phase. Proc Natl Acad Sci U S A. 2007; 104:11796–11801. [PubMed: 17586684]
22. Miller KL, Smith SM, Jezzard P. Asymmetries of the balanced SSFP profile. Part II: white matter.Magn Reson Med. 63:396–406. [PubMed: 20099329]
23. Laule C, Kozlowski P, Leung E, Li DK, Mackay AL, Moore GR. Myelin water imaging ofmultiple sclerosis at 7 T: correlations with histopathology. Neuroimage. 2008; 40:1575–1580.[PubMed: 18321730]
24. Salomir R, de Senneville BD, Moonen CTW. A fast calculation method for magnetic fieldinhomogeneity due to an arbitrary disctribution of bulk susceptibility. Concepts in MagneticResonance Part B. 2003; 19B:26–34.
van Gelderen et al. Page 9
Magn Reson Med. Author manuscript; available in PMC 2013 January 1.
NIH
-PA Author Manuscript
NIH
-PA Author Manuscript
NIH
-PA Author Manuscript

Appendix 1. Multi-exponential model without frequency offsetsFig. A1 shows the residual after fitting a triple-exponential model without frequency offsetsto the 7 T CC ROI averaged and normalized data. The residuals are averaged over the 8subjects and the standard error of the average is indicated with the error bars. Although thedifferences are small (+/−1%), they are highly significant, showing the model does notproperly fit the data. The model fit including the offset frequencies reduces the residue tonoise, as shown in Fig. 4b. The improvement in the fitting is reflected in the adjusted R2
value: 1–1.8·10−4 versus 1–1.6·10−6. The R2 values are close to 1, because the signal isdominated by the intermediate (main) component, which is fitted well by both models.
Appendix 2. Simulated decay functions in the presence of susceptibilityinduced inhomogeneities
To illustrate that the presence of susceptibility-induced inhomogeneities can result in a non-exponential T2
* decay, the field around a cylinder of higher susceptibility was calculatedand the resulting signal evolution as a function of echo time was simulated. Note this is notintended to be an accurate model of human brain tissue, merely an illustration of amechanism that could contribute to a non-exponential decay. Therefore the simulation is ofunrealistic simplicity and lacks for example T2 and diffusion effects.
A uniform spin density was assumed outside of the cylinder, and zero inside. The phase wascalculated as product of the field strength and echo time, after which the decay curve wascalculated as the complex sum over all points outside of the cylinder. The FOV (‘voxelsize’) of the simulation was 9 times the diameter of the cylinder. The field was calculatedusing a k-space filtering technique (24), assuming the cylinder axis to be perpendicular tothe main magnetic field. A plot of the resulting decay is shown in Fig. A2a. Anon-exponential, sinc-like behavior can be readily appreciated. In a similar fashion, the decay inthe presence of a closely packed set of hollow cylinders, filling the entire FOV, wascalculated. The size of each cylinder was again 1/9th of the FOV. The result is shown in Fig.A2b. Again a non-exponential decay is observed, albeit with a rather different temporalevolution than the signal in Fig. A2a.
van Gelderen et al. Page 10
Magn Reson Med. Author manuscript; available in PMC 2013 January 1.
NIH
-PA Author Manuscript
NIH
-PA Author Manuscript
NIH
-PA Author Manuscript

Figure 1.The difference between a mono-exponential model and the T2
*-weighted data at fourselected echo times, as fraction of the fitted amplitude for echo time zero. The echo timesare indicated below each image. The images show that the deviation from exponentialbehavior is not limited to the contribution of a fast component, and notably different incontrast for different anatomical structures.
van Gelderen et al. Page 11
Magn Reson Med. Author manuscript; available in PMC 2013 January 1.
NIH
-PA Author Manuscript
NIH
-PA Author Manuscript
NIH
-PA Author Manuscript

Figure 2.ROIs selection based on R2
* maps using diffusion data to identify the structures of interest.The diffusion data were processed to show fractional anisotropy (FA) and a color-codedpredominant fiber orientation with green for left-right, red for anterior-posterior and blue forthe superior-inferior direction. The three ROIs represent the posterior corpus callosum (CC,red) with predominantly left-right fibers, the posterior internal capsule (PIC, brown) withmostly up-down fibers and a mixed WM area (GWM) in green containing fibers of variousorientations and therefore has a lower FA. The scale for the R2
* images is in Hz.
van Gelderen et al. Page 12
Magn Reson Med. Author manuscript; available in PMC 2013 January 1.
NIH
-PA Author Manuscript
NIH
-PA Author Manuscript
NIH
-PA Author Manuscript

Figure 3.a) An example of the decay curve, averaged over a ROI in the splenium of the corpuscallosum (SCC), and the corresponding mono-exponential fit for one subject.b) Plots of the subject-averaged differences between the ROI averaged T2
* weighted dataand a mono-exponential fits. The curves show the mean over 8 studies at 7 T with error barsindicating the standard error of the mean for the three ROIs (see Figure 2 for locations).
van Gelderen et al. Page 13
Magn Reson Med. Author manuscript; available in PMC 2013 January 1.
NIH
-PA Author Manuscript
NIH
-PA Author Manuscript
NIH
-PA Author Manuscript

Figure 4.Plot of the subject averaged difference between the splenium of the corpus callosum (SCC)ROI data and a mono-exponential fit for 3 T. The error bars reflect the standard error of themean. The 7 T data is repeated from Fig 3b for comparison.
van Gelderen et al. Page 14
Magn Reson Med. Author manuscript; available in PMC 2013 January 1.
NIH
-PA Author Manuscript
NIH
-PA Author Manuscript
NIH
-PA Author Manuscript

Figure 5.Results of a 3-compartment model fit (Eq. 1) for the same data as in Fig. 3 (SCC ROI), a)data with the fitted model, b) the residue, scaled up 1000 times.
van Gelderen et al. Page 15
Magn Reson Med. Author manuscript; available in PMC 2013 January 1.
NIH
-PA Author Manuscript
NIH
-PA Author Manuscript
NIH
-PA Author Manuscript

Figure 6.Image showing the relative amplitude of the fast component of a triple-exponential fit on theright and the difference between the data and a mono-exponential fit at TE 2.7 ms on theleft. The triple-exponential model was fitted with the relaxation and frequency parametersfixed to the values found for the CC ROI averaged signal, the image is scaled to reflect theamplitude of the fast component at TE 2.7 ms.
van Gelderen et al. Page 16
Magn Reson Med. Author manuscript; available in PMC 2013 January 1.
NIH
-PA Author Manuscript
NIH
-PA Author Manuscript
NIH
-PA Author Manuscript

Figure A1.The residue of a ROI averaged decay curve (from the splenium of the corpus callosum)fitted with a triple-exponential model without frequency offsets.
van Gelderen et al. Page 17
Magn Reson Med. Author manuscript; available in PMC 2013 January 1.
NIH
-PA Author Manuscript
NIH
-PA Author Manuscript
NIH
-PA Author Manuscript

Figure A2.Simulations of the dephasing effects of the susceptibility-induced field inhomogeneityaround a) one solid cylinder and b) in and around a bundle of hollow cylinders, allperpendicular to the main field.
van Gelderen et al. Page 18
Magn Reson Med. Author manuscript; available in PMC 2013 January 1.
NIH
-PA Author Manuscript
NIH
-PA Author Manuscript
NIH
-PA Author Manuscript

NIH
-PA Author Manuscript
NIH
-PA Author Manuscript
NIH
-PA Author Manuscript
van Gelderen et al. Page 19
Tabl
e 1
The
aver
age
and
SD (o
ver s
ubje
cts)
of m
ulti
com
partm
ent m
odel
par
amet
ers (
Eq. 1
for 7
T a
nd E
q. 2
for 3
T) f
itted
to th
e SC
C R
OI a
vera
ged
sign
alde
cays
for t
wo
field
stre
ngth
s; th
e co
rres
pond
ing
GW
M d
ata
for 7
T a
re a
lso
show
n.
B0 [
T]
RO
IA 1
f 1 [H
z]A 2
A 3f 3
[Hz]
7SC
Cav
0.13
015
935
.80.
776
36.5
0.09
422
.87.
0
sd0.
020
122.
90.
018
1.0
0.01
16.
40.
7
7G
WM
av0.
077
169
31.8
0.80
936
.00.
114
10.8
5.9
sd0.
009
113.
30.
008
1.4
0.01
12.
010.
7
3SC
Cav
0.05
492
19.4
0.94
621
.2
sd0.
019
102.
60.
019
0.7
Magn Reson Med. Author manuscript; available in PMC 2013 January 1.


