Embed Size (px)
Citation preview

T2-Weighted Balanced SSFP Imaging (T2-TIDE) UsingVariable Flip Angles
Dominik Paul,1* Michael Markl,1 Hans-Peter Fautz,1 and Jurgen Hennig1
A new technique for acquiring T2-weighted, balanced steady-state free precession (b-SSFP) images is presented. Based onthe recently proposed transition into driven equilibrium (TIDE)method, T2-TIDE uses a special flip angle scheme to achieveT2-weighted signal decay during the transient phase. In combi-nation with half-Fourier image acquisition, T2-weighted imagescan be obtained using T2-TIDE. Numerical simulations wereperformed to analyze the signal behavior of T2-TIDE in compar-ison with TSE and b-SSFP. The results indicate identical signalevolution of T2-TIDE and TSE during the transient phase. T2-TIDE was used in phantom experiments, and quantitative ROIanalysis shows a linear relationship between TSE and T2-TIDESNR values. T2-TIDE was also applied to abdominal and headimaging on healthy volunteers. The resulting images were an-alyzed quantitatively and compared with standard T2-weightedand standard b-SSFP methods. T2-TIDE images clearly revealedT2 contrast and less blurring compared to T2-HASTE images. Incombination with a magnetization preparation technique, STIR-weighted images were obtained. T2-TIDE is a robust techniquefor acquiring T2-weighted images while exploiting the advan-tages of b-SSFP imaging, such as high signal-to-noise ratio(SNR) and short TRs. Magn Reson Med 56:82–93, 2006. © 2006Wiley-Liss, Inc.
Key words: steady-state free precession (SSFP); TrueFISP;TIDE; T2-weighting; variable flip angles
Fully refocused or balanced steady-state free precession(b-SSFP or SSFP) sequences (1), such as true fast imagingwith steady precession (TrueFISP) (2), balanced fast fieldencoding (b-FFE), and fast imaging employing steady-stateexcitation (FIESTA), have found widespread applicationin clinical MRI in the last few years. The availability of fastgradient amplifier technology in state-of-the-art MR sys-tems permits the realization of short repetition times (TRs)on the order of a few milliseconds, which are crucial forartifact-free b-SSFP imaging (3).
Data acquisition with b-SSFP methods offers severaladvantages, such as imaging speed, high signal samplingefficiency, high signal-to-noise ratio (SNR), and good tis-sue contrast (blood vs. tissue) at high resolution. As aresult, many applications that utilize these benefits of b-SSFP imaging have been reported, including cardiac im-aging (4), abdominal imaging (5), interventional radiology(6), and whole-body screening (7). In combination with
magnetization preparation (8–10) or fat suppression (5),the routine clinical use of TrueFISP may even increase inthe future.
A potential drawback of TrueFISP is related to the con-trast, which is determined by T2/T1, if data acquisition isperformed in the steady state (11). However, in manyclinical applications a pure T2-weighted contrast is moredesirable.
To achieve T2-weighted image contrast, 180° RF pulsescan be applied during the transient phase to generate pureT2 signal decay (12). However, due to specific absorptionrate (SAR) limitations, the application of such high flipangles in combination with the short b-SSFP TRs is prob-lematic.
To overcome these limitations, we propose a novelmethod called T2-TIDE. Our technique is based on thepreviously reported transition into driven equilibrium(TIDE) sequence (13). The standard TIDE sequence, incontrast to a TrueFISP imaging sequence with �/2-prepa-ration (14) and constant flip angle, uses variable flip an-gles. Following an �/2-preparation, the acquisition startswith a high flip angle of 180°. The flip angle is then rampeddown to a lower flip angle that is typically used for stan-dard SSFP imaging in the steady-state approach. Otherimaging parameters, such as TE, TR, and bandwidth, re-main unchanged. The advantages of the TIDE sequenceinclude better transition into the steady state with reducedor absent signal fluctuation even for off-resonant spins.
The aim of this work was to develop a specially adaptedflip angle scheme and k-space trajectory to optimally uti-lize the T2 decay in the transient phase of a b-SSFP exper-iment (12). Simulations and measurements demonstratethat a T2-weighted image contrast can be achieved. T2-TIDE was applied to abdominal and brain imaging andcompared with standard T2-weighted imaging sequencessuch as T2-weighted turbo spin echo (T2-TSE) and T2-weighted half-Fourier single-shot TSE (T2-HASTE).
THEORY
The signal behavior for on-resonant spins in the initialphase of a b-SSFP experiment, starting from thermal equi-librium magnetization M0, can be described by (12)
M�n��(sin(�/2)M0�Mss)�n�Mss. [1]
In this context M(n) represents the signal intensity after thenth pulse, Mss is the steady-state signal intensity, � is theapplied flip angle, and � is the signal decay rate. The decayrate can be calculated as
� � E2 sin2(�/2)�E1cos2(�/2), [2]
Department of Diagnostic Radiology, Medical Physics, University HospitalFreiburg, Freiburg, Germany.Presented in part at the 13th Annual Meeting of ISMRM, Miami Beach, FL,USA, 2005.*Correspondence to: Dominik Paul, Department of Diagnostic Radiology,Medical Physics, University Hospital Freiburg, Hugstetterstr. 55, 79106Freiburg, Germany. E-mail: [email protected] 10 August 2005; revised 2 March 2006; accepted 13 March 2006.DOI 10.1002/mrm.20922Published online 5 June 2006 in Wiley InterScience (www.interscience.wiley.com).
Magnetic Resonance in Medicine 56:82–93 (2006)
© 2006 Wiley-Liss, Inc. 82

where E1;2 � exp(–TR/T1;2).Therefore, � is determined by a mixture between T1 and
T2 decay, weighted by the flip angle �. For � � 180° Eqs.[1] and [2] represent an SE experiment, the cosine-termdisappears, and Eq. [2] reduces to
� � E2. [3]
As a result, � depends on T2 only and the signal undergoespure T2 decay (12). Because of the SE character of 180° flipangles, Eq. [3] is also valid for off-resonant spins.
MATERIALS AND METHODS
Flip Angle Scheme and k-Space Trajectory
The basic principle of the T2-TIDE flip angle scheme, andthe corresponding k-space trajectory are shown in Fig. 1.Different sections of the flip angle scheme are labeled withnumbers 1–5, and the acquisition of the central k-spaceline is indicated by the letter C.
After �/2-TR/2 preparation (1), T2-TIDE is executed us-ing an initial series of RF-excitations with high flip angles(� � 180°) (2–4), in which the signal evolves according toEq. [3] and undergoes pure T2 decay (12). This period isdivided into #M preparation (2 and 3) and #N plateau (3and 4) pulses. To avoid SAR problems the flip angle isramped down (4 and 5) after the plateau phase in #nTIDEsteps to a smaller flip angle �min. The flip angle rampconsists of a linear function, as described in Ref. 13. Forthe remaining RF pulses (5 and 6) the standard b-SSFP flipangle �min is used.
All RF pulses are equidistant and use a phase incrementof 180° (alternating RF pulses). The parameters for the flip
angle plot in Fig. 1 are �max � 180°, �min � 60°, #M � 5,#N � 30, #nTIDE � 20.
The adapted half-Fourier encoding scheme is shown inFig. 1 below the flip angle graph. Data acquisition starts atlabel 3 directly following the preparation phase, n phase-encoding lines separated from the k-space center, suchthat the trajectory traverses through the central k-spaceline (C) during T2 decay of the b-SSFP signal.
The half-Fourier factor (HFF) is defined as the relationbetween sampled phase-encoding lines (n � ky) and totalnumber of k-space lines (2ky):
HFF �n � ky
2ky. [4]
To avoid phase errors in the half-Fourier reconstruction(17), at least seven additional k-space lines were acquiredin the unsampled half of k-space.
Similarly to TSE sequences, the effective echo time(TEeff) is defined as the time from the first RF pulse (1) tothe acquisition of the central k-space line (C). For T2-weighted imaging TEeff is typically within [80,120] ms.Flexibility with respect to TEeff was achieved by changingthe matrix size, the number of phase-encoding steps (PE),the number of preparation pulses (#M), and the HFF.
Simulations
For further analysis of the b-SSFP signal evolution, numer-ical simulations based on the Bloch equations were per-formed on a standard PC using Matlab (The Mathworks,Natick, MA, USA). Simulations were performed by itera-tively applying a matrix representation of the Bloch equa-tions similarly to Ref. 15. The signal behavior of the T2-TIDE sequence, a standard TrueFISP, and a TSE sequencewas analyzed and compared with pure T2 decay. Addi-tional simulations with frequency offsets were performedin order to analyze the off-resonance behavior of T2-TIDE.
For simplicity, RF pulses and signal acquisition wereassumed to be infinitesimally short and based on an idealslice profile. The proton density M0 was set to one for allsimulations. The parameters for the T2-TIDE and TrueFISPsimulations were TR/TE � 4 ms/2 ms. A constant flipangle of 60° with �/2 preparation was used for TrueFISP.For the T2-TIDE simulations the parameters were as fol-lows: �max � 180°, �min � 60°, #M � 6, #N � 20, and#nTIDE � 20. T1 was set to 900, 600, and 300 ms, respec-tively, and T2 was set to 85 and 60 ms.
To analyze edge sharpness we performed additionalsimulations to obtain the point spread function (PSF) ofdifferent tissues using T2-TIDE and HASTE. The effectiveTE was set to 80 ms. Echo spacing was 5 ms in bothHASTE and T2-TIDE. The flip angle scheme parameters forT2-TIDE were: �max � 180°, �min � 60°, #M � 6, #N � 20,and #nTIDE � 20. Simulations were performed with re-spect to phase-encoding in the experiments and the effec-tive TE.
The following tissues with corresponding relaxationtimes (T1/T2) were examined: CSF (2400 ms/500 ms), kid-ney (650 ms/75 ms), fat (250 ms/60 ms), and muscle(900 ms/50 ms). Fat tissue was simulated with 220 Hz
FIG. 1. The figure shows the T2-TIDE flip angle scheme and thecorresponding half-Fourier phase-encoding trajectory below. Thesequence starts with a �/2-TR/2 preparation (1), followed by aperiod of 180° pulses (2–4), divided into #M preparation (2 and 3)and #N plateau (3 and 4) pulses. The flip angle is then ramped down(4 and 5) in #nTIDE steps to �min � 60°, which is used until allk-space data are collected (5 and 6). Half-Fourier phase-encodingstarts near k-space center (offset by n k-space lines, C) after #Mpreparation pulses. The TEeff is defined as the time from the firstpulse (1) to the acquisition of the central k-space line (C).
T2-Weighted TIDE Imaging 83

off-resonance according to the off-resonance frequency at1.5T.
Experiments
All measurements were performed on a 1.5 T system (Mag-netom Sonata, Siemens, Germany). The gradient systemhas a maximum amplitude of 40 mT/m and a slew rate of200 T/m/s.
Phantom measurements were performed using eightgadolinium- (Gd-DTPA, Magnevist, Schering, Germany)and agarose-doped water bottles with a diameter of 30 mm.Additionally, a NiSO4-doped water phantom with 120 mmdiameter was used.
For reference, the longitudinal relaxation times (T1) ofthe phantoms were measured with a single-point inversionrecovery (IR)-SE sequence. After adiabatic inversion,spoiling of residual transverse magnetization and subse-quent delay (inversion time (TI)), a single line of k-spacewas acquired with TE � 11 ms, followed by a delay of 10 sbefore the next inversion. Images were acquired at 18different TIs ranging from 22 ms to 3500 ms.
Transverse relaxation (T2) was assessed using an SEsequence at 15 different TEs ranging from 11 ms to1000 ms, with TR � 10 s.
For all phantoms, T1 and T2 values were calculated fromthe corresponding magnitude image series by three- andtwo-parameter fitting routines, respectively (16).
For phantom measurements, images were acquired witha standard quadrature head coil and four different se-quences: standard TrueFISP, T2-TIDE, T2-TSE, and T2-HASTE. The imaging bandwidth (BW) was chosen tomatch default values of the standard sequences: BWTrue-
Fisp � BWT2-TIDE � 810 Hz/Px, BWTSE � 100 Hz/Px, andBWHASTE � 196 Hz/Px. The half-Fourier factors were asfollows: HFFT2-TIDE � 5/8, HFFTrueFISP � 1, HFFTSE � 1,and HFFHASTE � 4/8. All remaining imaging parametersare listed in Table 1.
Resulting images were analyzed quantitatively with re-spect to the relative SNR. Image artifacts and edge sharp-ness were rated by visual inspection.
For SNR analysis the mean signal intensities were mea-sured in regions of interest (ROIs) placed within the phan-tom bottles. One additional ROI was placed outside the
phantoms to estimate the noise level. The SNR values ofthe different probes were calculated for all experiments.
According to Ref. 17, measured SNR values depend onvoxel size V and total sampling time Ts:
SNR � V�Ts. [5]
To permit direct comparison of relative SNRs of differentimaging techniques, all images were acquired with thesame spatial resolution and slice thickness to obtain iden-tical voxel sizes V.
To compare different methods, the measured SNR val-ues were corrected for sampling time using the followingequation:
SNRcorrected � �BWHFF
SNR. [6]
Ts was calculated from the number of phase-encodingsteps NPE and ADC sampling time. In our experimentsdifferent Ts values result from different BWs and HFFs.
The human studies included T2-weighted TIDE imagingin healthy volunteers using a standard body coil for ab-dominal imaging and a head coil for brain imaging. Allhuman studies were approved by the local ethics commit-tee, and informed consent was obtained from all volun-teers.
Abdominal images were acquired using T2-TIDE, a stan-dard TrueFISP sequence, and a T2-HASTE sequence. Eight2D slices were acquired during breath-hold. Relevant im-age parameters for all acquisition techniques are listed inTable 2. SAR values were taken from the SAR informationprovided by the scanner software. The relative SAR com-pared to HASTE is given for all sequences in Table 2.
To quantify image contrast, ROIs were placed insidedifferent organs and contrast-to noise-ratios (CNR) werecalculated. The CNR values were corrected similarly to Eq.[6] using
CNRcorrected � �BWHFF
CNR. [7]
Table 1Imaging Parameters for Phantom Experiments in Fig. 5
T2-TSE T2-HASTE T2-TIDE TrueFISP
TR (ms) 10000 10000 4.27 4.27TE (ms) 95 97 2.14 2.14TEeff (ms) 95 97 100 —Bandwidth (Hz/px) 100 195 810 810Slice thickness (mm) 10 10 10 10Field of view (mm � mm) 220 � 165 220 � 165 220 � 165 220 � 165Matrix 256 � 192 256 � 192 256 � 192 256 � 192Turbo factor 11 Single shot Single shot Single shotEcho spacing 15.8 7.46 4.27 4.27Half Fourier factor 1 4/8 5/8 1Flip angle 90°/180° 90°/180° 180°/60° 60°#nTIDE/#M/#N — — 20/5/20 —TA (s) 192 1.4 0.5 0.8
84 Paul et al.
Additionally, images were compared concerning differen-tiation of organs and artifacts.
In addition, T2-TIDE was combined with magnetizationpreparation. In this context, STIR-weighted imaging (18)was performed using IR HASTE (STIR-HASTE) and IR-T2-TIDE (STIR-TIDE) with a TI of 160 ms and a TE of 80 ms.The imaging parameters and relative SAR compared toSTIR imaging are also listed in Table 2.
For head imaging, 15 slices were acquired with an in-planeresolution of 1 mm and 7-mm slice thickness using a stan-dard TrueFISP sequence and T2-TIDE. The imaging parame-ters are given in Table 3. The CNR between gray and whitematter was measured and corrected using Eq. [7].
RESULTS
Signal Simulations
Figure 2 shows the simulated signal intensities as a func-tion of the applied RF pulse number for different com-
binations of the relaxation times for T2-TIDE (a), TrueFISP(b), and pure T2-weighted signal decay as it is expected forTSE and HASTE (d). Additionally, a direct comparisonbetween pure T2 decay and the T2-TIDE signal evolution isplotted in Fig. 2c.
From the T2-TIDE simulation (Fig. 2a) it is evident thatthe signal intensity for different T1 but equal T2 is identicalduring the plateau phase and for part of the ramp (30 RFpulses). In contrast, signals with different T2 differ inintensity. In comparison to the pure T2-weighted signaldecay of TSE or HASTE (Fig. 2c and 2d), T2-TIDE simula-tions exhibit an identical signal evolution during the tran-sient phase such that the signal evolution during the initialphase of the simulation depends on T2 only.
However, the T2-TIDE signal does not fully decay to zeroas does pure T2 decay. Due to the variable flip anglescheme, signal intensities reach a plateau that correspondsto the normal SSFP steady-state signal intensity dependingon T2/T1.
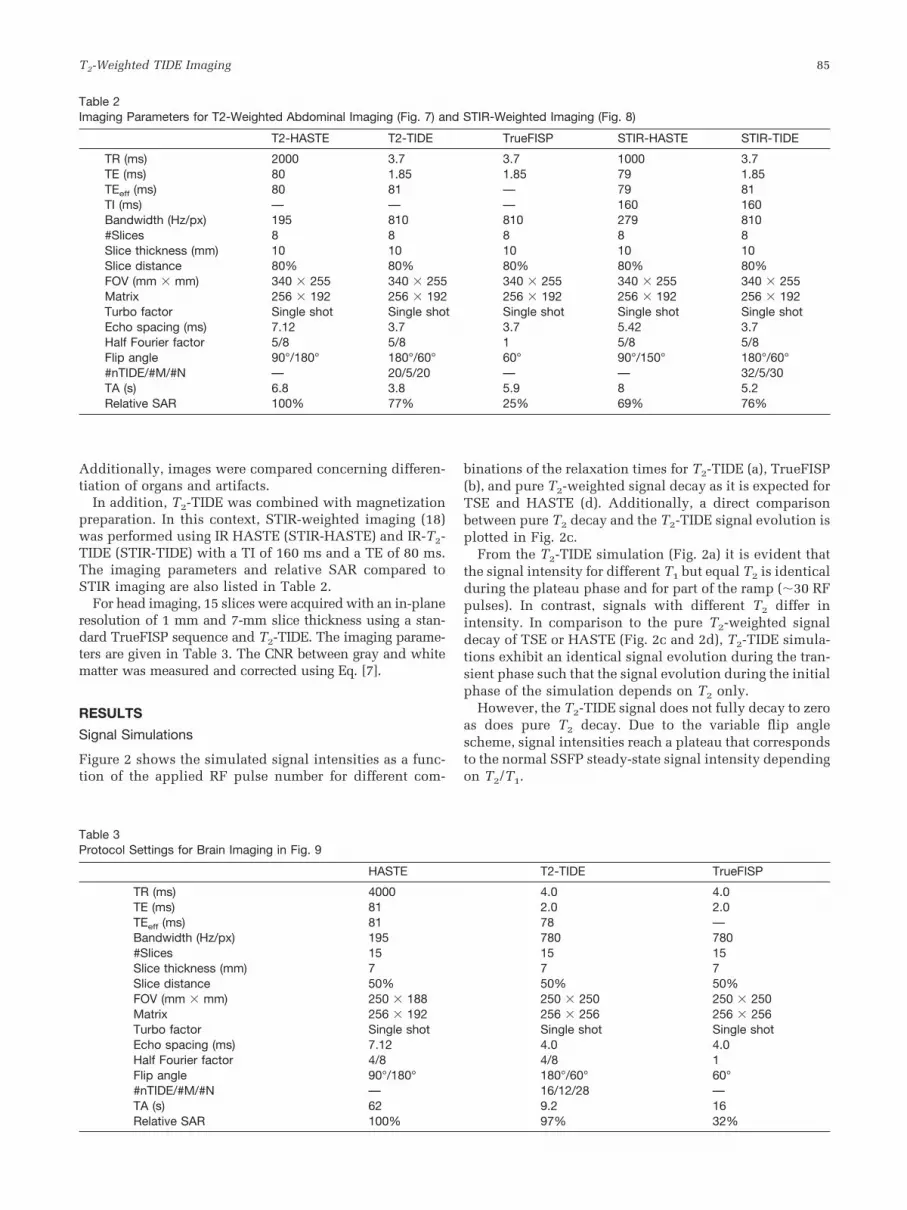
Table 2Imaging Parameters for T2-Weighted Abdominal Imaging (Fig. 7) and STIR-Weighted Imaging (Fig. 8)
T2-HASTE T2-TIDE TrueFISP STIR-HASTE STIR-TIDE
TR (ms) 2000 3.7 3.7 1000 3.7TE (ms) 80 1.85 1.85 79 1.85TEeff (ms) 80 81 — 79 81TI (ms) — — — 160 160Bandwidth (Hz/px) 195 810 810 279 810#Slices 8 8 8 8 8Slice thickness (mm) 10 10 10 10 10Slice distance 80% 80% 80% 80% 80%FOV (mm � mm) 340 � 255 340 � 255 340 � 255 340 � 255 340 � 255Matrix 256 � 192 256 � 192 256 � 192 256 � 192 256 � 192Turbo factor Single shot Single shot Single shot Single shot Single shotEcho spacing (ms) 7.12 3.7 3.7 5.42 3.7Half Fourier factor 5/8 5/8 1 5/8 5/8Flip angle 90°/180° 180°/60° 60° 90°/150° 180°/60°#nTIDE/#M/#N — 20/5/20 — — 32/5/30TA (s) 6.8 3.8 5.9 8 5.2Relative SAR 100% 77% 25% 69% 76%
Table 3Protocol Settings for Brain Imaging in Fig. 9
HASTE T2-TIDE TrueFISP
TR (ms) 4000 4.0 4.0TE (ms) 81 2.0 2.0TEeff (ms) 81 78 —Bandwidth (Hz/px) 195 780 780#Slices 15 15 15Slice thickness (mm) 7 7 7Slice distance 50% 50% 50%FOV (mm � mm) 250 � 188 250 � 250 250 � 250Matrix 256 � 192 256 � 256 256 � 256Turbo factor Single shot Single shot Single shotEcho spacing (ms) 7.12 4.0 4.0Half Fourier factor 4/8 4/8 1Flip angle 90°/180° 180°/60° 60°#nTIDE/#M/#N — 16/12/28 —TA (s) 62 9.2 16Relative SAR 100% 97% 32%
T2-Weighted TIDE Imaging 85

In comparison, the simulation results for standard True-FISP imaging (Fig. 2b) highlight the T2 and T1 dependenceduring the transient phase and the steady state. Each curveundergoes a different T1- and T2-dependent signal evolu-tion until it reaches its steady-state signal intensity.
As a result, completely different signal evolution can beachieved if TrueFISP and T2-TIDE simulations are com-pared, and T2-dependent signal behavior can be utilizedfor imaging by choosing the effective TE in the range of80–120 ms.
Figure 3a shows simulated signal intensities as a func-tion of applied RF pulse number for four different off-resonant frequencies. The corresponding signal intensitiesand off-resonance locations in the SSFP steady-state fre-
quency response profile (FRP) are indicated in Fig. 3b. Thesimulation parameters are given in the figure caption.
All signals undergo identical evolution during the pla-teau phase and part of the flip angle ramp (30 RF pulses).However, further signal evolution exhibits a clear off-res-onance dependence. Signal originations from spins withinthe main SSFP band behave similarly to on-resonant spinsand undergo a smooth transition to steady-state signalintensity. In contrast, spins with higher off-resonance fullydecay to zero but recover again if they are not directlylocated at the SSFP band (dotted line, 125 Hz).
The resulting PSF obtained from the assessed tissues areplotted in Fig. 4. The graphs are arranged with decreasingT2 and contain the peak and full width at half maximum
FIG. 2. Simulated signal evolution for 125 consecutive RF pulses using T2-TIDE (a), TrueFISP (b), and pure T2 decay (d). Line size representsT2 (T2 � 85 ms and 60 ms) and line style indicates T1 (T1 � 900, 600, and 300 ms). c: Direct comparison of signal evolution of T2-TIDE andpure T2-decay. Simulation parameters for T2-TIDE are �max � 180°, �min � 60°, #M � 6, #N � 20, #nTIDE � 20, and TR/TE � 4 ms/2 ms.The corresponding flip angle scheme is depicted above the simulation curve. TrueFISP uses a constant flip angle of 60° and �/2-TR/2preparation. For T2-TIDE simulations (a), identical T2 clearly demonstrates equal signal evolution during the transient phase (high flip anglesand part of the flip angle ramp), which corresponds well with pure T2 decay (c). After the flip angle ramp-down, the T2-TIDE signal curvesgo to their steady-state value. b: For TrueFISP, signal evolution depends on both T1 and T2, and all lines diverge from the start of RFexcitation. d: TSE and HASTE simulations show an identical signal evolution for lines with identical T2 but different T1 during the entire trainof RF pulses.
86 Paul et al.

(FWHM) values. Simulations with long T2, such as forCSF, result in a similar PSF for HASTE and T2-TIDE. Inboth cases the peak values are high with low FWHM,indicating good edge sharpness. However, with decreasingT2 times FWHM in HASTE simulations increases, whereasit is nearly constant for T2-TIDE. This behavior will result
in blurring for HASTE, while edge sharpness is main-tained for T2-TIDE.
In contrast to the Gaussian-shaped PSF profile inHASTE simulations, T2-TIDE exhibits different behavior.Due to variable flip angles the signal increases again afterthe T2 decay (see signal simulations in Fig. 2). This results
FIG. 3. a: Simulated signal evolu-tion for different off-resonancefrequencies �f using T2-TIDE. b:The location of frequency offsetsis indicated in the FRP of stan-dard b-SSFP in steady state. Theparameters for T2-TIDE wereidentical to those used for thesimulations in Fig. 2: �max � 180°,�min � 60°, #M � 6, #N � 20,#nTIDE � 20, and TR/TE � 4 ms/2 ms. Spin parameters were T1 �600 ms, T2 � 85 ms, �f � 0Hz,70 Hz, 125 Hz, and 220 Hz.Note the identical signal evolutionfor all off-resonant frequenciesduring the plateau phase and partof the ramp-down (30 pulses).
FIG. 4. Comparison of PSFs sim-ulated for T2-TIDE (solid line) andHASTE (dashed line). Peak andFWHM values are given in the fig-ures.
T2-Weighted TIDE Imaging 87
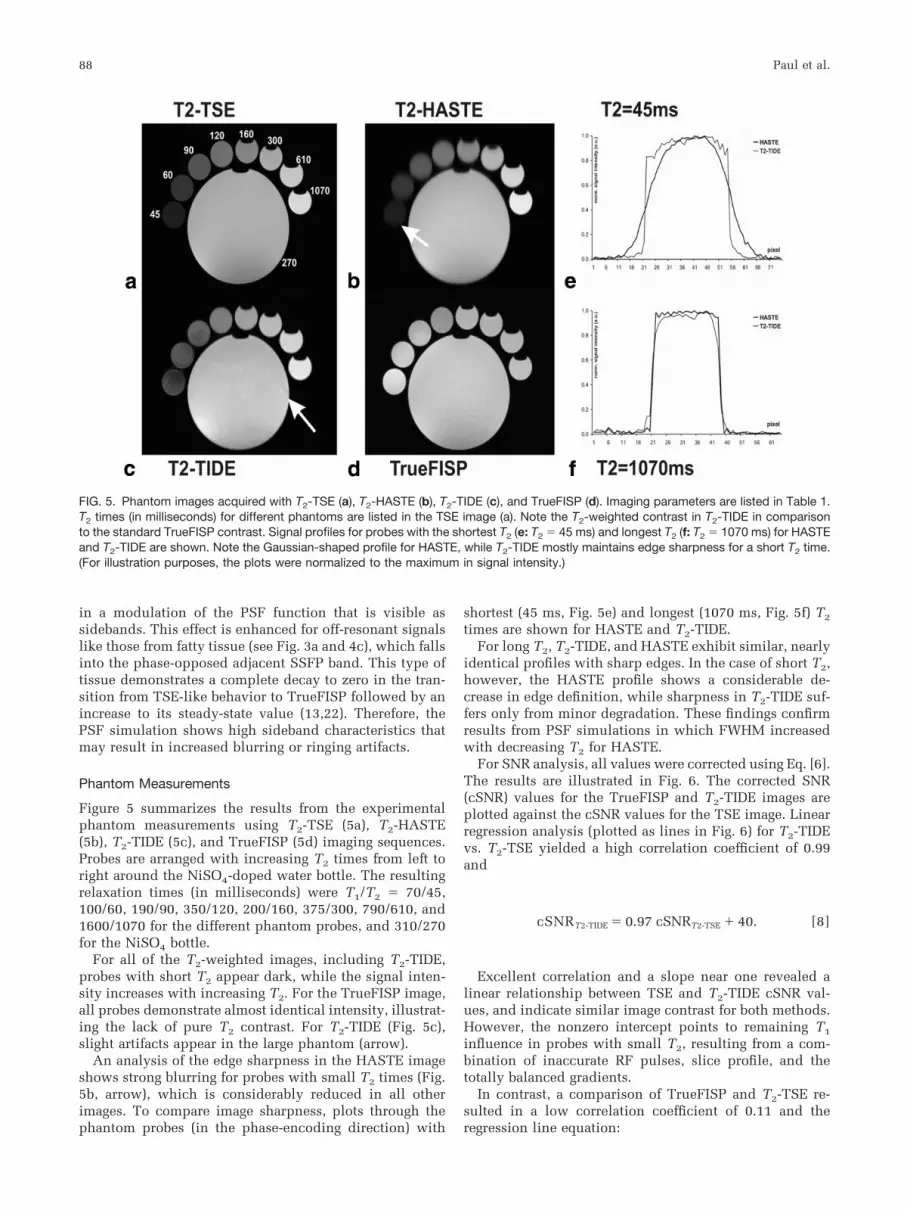
in a modulation of the PSF function that is visible assidebands. This effect is enhanced for off-resonant signalslike those from fatty tissue (see Fig. 3a and 4c), which fallsinto the phase-opposed adjacent SSFP band. This type oftissue demonstrates a complete decay to zero in the tran-sition from TSE-like behavior to TrueFISP followed by anincrease to its steady-state value (13,22). Therefore, thePSF simulation shows high sideband characteristics thatmay result in increased blurring or ringing artifacts.
Phantom Measurements
Figure 5 summarizes the results from the experimentalphantom measurements using T2-TSE (5a), T2-HASTE(5b), T2-TIDE (5c), and TrueFISP (5d) imaging sequences.Probes are arranged with increasing T2 times from left toright around the NiSO4-doped water bottle. The resultingrelaxation times (in milliseconds) were T1/T2 � 70/45,100/60, 190/90, 350/120, 200/160, 375/300, 790/610, and1600/1070 for the different phantom probes, and 310/270for the NiSO4 bottle.
For all of the T2-weighted images, including T2-TIDE,probes with short T2 appear dark, while the signal inten-sity increases with increasing T2. For the TrueFISP image,all probes demonstrate almost identical intensity, illustrat-ing the lack of pure T2 contrast. For T2-TIDE (Fig. 5c),slight artifacts appear in the large phantom (arrow).
An analysis of the edge sharpness in the HASTE imageshows strong blurring for probes with small T2 times (Fig.5b, arrow), which is considerably reduced in all otherimages. To compare image sharpness, plots through thephantom probes (in the phase-encoding direction) with
shortest (45 ms, Fig. 5e) and longest (1070 ms, Fig. 5f) T2
times are shown for HASTE and T2-TIDE.For long T2, T2-TIDE, and HASTE exhibit similar, nearly
identical profiles with sharp edges. In the case of short T2,however, the HASTE profile shows a considerable de-crease in edge definition, while sharpness in T2-TIDE suf-fers only from minor degradation. These findings confirmresults from PSF simulations in which FWHM increasedwith decreasing T2 for HASTE.
For SNR analysis, all values were corrected using Eq. [6].The results are illustrated in Fig. 6. The corrected SNR(cSNR) values for the TrueFISP and T2-TIDE images areplotted against the cSNR values for the TSE image. Linearregression analysis (plotted as lines in Fig. 6) for T2-TIDEvs. T2-TSE yielded a high correlation coefficient of 0.99and
cSNRT2-TIDE � 0.97 cSNRT2-TSE � 40. [8]
Excellent correlation and a slope near one revealed alinear relationship between TSE and T2-TIDE cSNR val-ues, and indicate similar image contrast for both methods.However, the nonzero intercept points to remaining T1
influence in probes with small T2, resulting from a com-bination of inaccurate RF pulses, slice profile, and thetotally balanced gradients.
In contrast, a comparison of TrueFISP and T2-TSE re-sulted in a low correlation coefficient of 0.11 and theregression line equation:
FIG. 5. Phantom images acquired with T2-TSE (a), T2-HASTE (b), T2-TIDE (c), and TrueFISP (d). Imaging parameters are listed in Table 1.T2 times (in milliseconds) for different phantoms are listed in the TSE image (a). Note the T2-weighted contrast in T2-TIDE in comparisonto the standard TrueFISP contrast. Signal profiles for probes with the shortest T2 (e: T2 � 45 ms) and longest T2 (f: T2 � 1070 ms) for HASTEand T2-TIDE are shown. Note the Gaussian-shaped profile for HASTE, while T2-TIDE mostly maintains edge sharpness for a short T2 time.(For illustration purposes, the plots were normalized to the maximum in signal intensity.)
88 Paul et al.

cSNRTrueFISP � -0.07 cSNRT2-TSE � 190. [9]
Therefore, the two methods deliver different image con-trast.
Volunteer Measurements
Figures 7–9 show the application of T2-TIDE to head andabdominal imaging in comparison with standard imagingmethods. At no time during the measurements were theSAR limits exceeded.
Figure 7 shows three sets of identical axial slices ob-tained from the abdomen of a healthy volunteer usingT2-HASTE (7a), T2-TIDE (7b), and standard TrueFISP (7c)imaging during breath-holding.
Compared to standard TrueFISP (7c), different contrastis clearly visible in the T2-TIDE images (7b). For example,the corrected CNR (cCNR) using Eq. [7] between liver andkidney was increased from cCNRTrueFISP � 43.6 to cC-NRT2-TIDE � 80.8, and the cCNR between kidney andmuscle was increased from cCNRTrueFISP � 11.6 tocCNRT2-TIDE � 58.8. Therefore, T2-TIDE not only shows anincrease in cCNR, it also exhibits different contrast behav-ior compared to TrueFISP.
In addition, data acquisition using HASTE results inimage contrast comparable to that of T2-TIDE (cC-NRHASTE � 75.7 between liver and kidney, and 63.1 be-tween kidney and muscle, which corresponds well to thevalues obtained for T2-TIDE).
As for the phantom measurements, T2-TIDE suffers fromminor blurring but shows improved image sharpness com-pared to HASTE. Improved sharpness between organs and
FIG. 6. Quantitative ROI analysis of the phantom measurements inFig. 5. The relative SNR was corrected for differences in acquisitiontime in all ROIs for TrueFISP, T2-TIDE, and TSE. The cSNR values ofTrueFISP and T2-TIDE (y-axis) were then plotted against the TSEvalues (x-axis). Error bars for all SNR values are given in the diagram.Results of linear regression analysis are plotted as solid black lines.
FIG. 7. Comparison of abdominal images for T2-HASTE (a), T2-TIDE (b), and standard TrueFISP (c) during breath-hold. TEeff � 80 ms forT2-HASTE and T2-TIDE. Total acquisition times were TAHASTE � 6.8 s, TAT2-TIDE � 4.45 s, and TATrueFISP � 5.9 s. Imaging parameters arelisted in Table 2. Note the reduced OPE in T2-TIDE in comparison to TrueFISP, and the bright-blood signal in comparison to HASTE.
T2-Weighted TIDE Imaging 89

small structures, e.g., the structures inside the liver, isclearly visible.
Another difference between T2-TIDE and HASTE is re-lated to the appearance of flowing blood. Because of dif-ferences with respect to inflow and outflow effects, bloodappears dark in all of the HASTE slices. However, bothT2-TIDE and TrueFISP exhibit a bright blood signal.
Furthermore, the opposed phase effect (OPE), whichappears in standard TrueFISP imaging in pixels with acomposition of fat and water, is reduced for T2-TIDE. Dueto the different precession frequency of fat and water (�f �220 Hz at 1.5T), the signal of these two compartments canhave a phase difference of pi at the TE and can thereforecancel each other out. The effect is visible as a black borderaround organs and can be seen in the TrueFISP images(Fig. 7c, arrow). In contrast, no OPE is visible in T2-TIDEand HASTE images.
As expected, the SAR for abdominal T2-TIDE imagingcould be reduced to 77% in comparison to HASTE.
The results from the combination of T2-TIDE with IR areshown in Fig. 8 as a comparison between STIR-weightedimaging using a STIR-HASTE (8a) and a STIR-TIDE (8b)sequence. The TI was set to 160 ms, and TEeff was 80 ms.The STIR-HASTE and STIR-TIDE sequences exhibit com-parable image contrast. As before, blood flow appearsbright in the TIDE-based images.
As shown in Table 2, T2-TIDE with IR requires 7% moreRF power compared to STIR. The higher SAR in T2-TIDE isexplained by the fact that STIR uses a reduced flip angle of150°.
Figure 9 shows human brain images for standard HASTE(a), TrueFISP (c), and T2-TIDE imaging (b). The total ac-
quisition time (TA) for 15 slices was 9.2 s for T2-TIDEusing half-Fourier acquisition and 16 s for TrueFISP withfull acquisition.
It is obvious that the contrast between gray and whitematter was substantially increased using T2-TIDE. If bothvalues are corrected for the difference in BW and HFF, amore than six-fold contrast enhancement can be achieved(CNRTrueFISP � 10.4 and CNRT2-TIDE � 65.6 between grayand white matter).
In addition, the OPE and susceptibility artifacts (see Fig.9c, white arrow) are reduced for T2-TIDE, especially inareas around the optical nerves and the inner nose. No sus-ceptibility artifacts were visible in HASTE images (Fig. 9a).Because of the long T2 times for brain tissue, HASTE brainimages do not suffer from blurring compared to abdominalHASTE imaging.
DISCUSSION
This work demonstrates the feasibility of b-SSFP imagingwith T2 contrast. The proposed T2-TIDE flip angle and dataacquisition scheme provides a robust technique for com-bining SSFP imaging and T2 contrast while maintainingthe advantages of b-SSFP imaging, such as high SNRs andshort TRs.
To generate a T2 image contrast, T2-TIDE utilizes theT2-weighted signal decay during the transient phase,while 180° flip angles and sampling of the central part ofthe k-space are applied during T2 decay. The method wastested on phantoms and healthy volunteers, and was alsosuccessfully combined with magnetization preparation.
FIG. 8. Abdominal STIR-weightedimaging using standard STIR-HASTE (a) and STIR-TIDE (b). TI �160 ms, TEeff � 80 ms. Other im-aging parameters are listed in Ta-ble 2.
90 Paul et al.

Numerical simulations performed on the basis of thenewly developed T2-TIDE flip angle scheme demonstratedT2-weighted signal decay during the application of 180°flip angles. Because of this SE behavior of T2-TIDE duringthe transient phase, the images show a T2-weighted imagecontrast. This was shown in phantom experiments as wellas in abdominal and brain imaging.
In this context, there is one drawback related to theinfluence of T1, which was evident in phantom experi-ments for short T2. This T1 influence is due to a combina-tion of slice profile and totally balanced gradients. Thiseffect was not seen in our simulations. Further simulationsshould therefore include slice profile effects to predict thesignal evolution more precisely.
Additional simulations were performed to analyze theoff-resonance behavior of T2-TIDE. Our results showed anidentical signal evolution during the plateau phase (appli-cation of 180° pulses) and part of the ramp-down. How-ever, the signal paths diverged for higher off-resonancefrequencies and led to different image properties for dif-ferent frequency offsets.
Off-resonance spins in the adjacent SSFP band showedcomplete signal decay followed by a signal increase intothe steady state. This behavior led to the sideband charac-teristics observed in the simulated PSFs.
Off-resonant spins in the SSFP null demonstrate a fulldecay to zero signal in the steady state and should there-fore be characterized by higher blurring. However, due tofield fluctuations and the relatively small size of the SSFPnull, this effect will probably not be visible in experi-ments.
In a comparison between HASTE and T2-TIDE, less blur-ring was seen on probes with short T2 times in T2-TIDEimages. Blurring in HASTE is related to the vanishingsignal in outer k-space due to the T2 signal decay. Incontrast, due to the variable flip angle scheme in T2-TIDE,the signal does not vanish at the outer part of k-space.Instead, the signal evolves to its steady-state value, result-ing in nonzero signal intensities at outer k-space and re-duced blurring (compare simulations in Fig. 2).
The experiments confirmed simulation findings con-cerning edge sharpness. The FWHM of the simulated PSFs
FIG. 9. Comparison of images of the head of a healthy volunteer: (a) standard HASTE, (b) T2-TIDE, and (c) TrueFISP. Note the increasedcontrast between gray and white matter in T2-TIDE (similar to HASTE) compared to TrueFISP. The white arrow indicates susceptibilityartifacts in TrueFISP.
T2-Weighted TIDE Imaging 91

broadened with decreasing T2 in HASTE, while it re-mained nearly constant for T2-TIDE. Increased blurring orringing artifacts in off-resonant tissues was expected fromthe PSF simulations for T2-TIDE. However, the effect wasrather small and was not investigated in the experiments.For a more thorough analysis in the future, a phantom witha well defined border between fat and water might be used.
As a result of improved PSF, longer echo trains arepossible for T2-TIDE compared to HASTE or TSE se-quences. Longer echo trains could be utilized for biggermatrix sizes and higher resolution, or for 3D imaging.
The variable flip angle scheme also affects the SAR.Compared to HASTE, T2-TIDE requires less RF power forimaging. With our protocol settings, the SAR reductionwas about 33% for abdominal imaging, which may beespecially beneficial at higher field strengths.
Another advantage of the proposed technique is relatedto the reduction of the OPE in T2-TIDE. OPEs are typicalfor standard SSFP imaging and may lead to unwantedblack borders around organs. No OPE was evident in theT2-TIDE images. As a result, for potential applications,such as rapid scout imaging, T2-TIDE provides a fast andreliable method with defined T2-image contrast and poten-tially higher image quality.
Susceptibility artifacts were also reduced using TIDEcompared TrueFISP imaging. No susceptibility artifactswere seen in HASTE. However, a decrease in HFF inprinciple led to increased susceptibility sensitivity, as itdoes in HASTE imaging. To overcome these limitations inour implementation, at least seven additional k-space lineswere acquired on the second half of k-space, even forHFF � 1⁄2, in order to minimize such artifacts.
Because abdominal imaging is one of the main applica-tions for HASTE and TrueFISP imaging, we used thenewly developed T2-TIDE sequence for that purpose aswell. The increased CNR values show the different andimproved contrast of T2-TIDE. In comparison, T2-TIDEand T2-HASTE demonstrated a similar T2-weighted con-trast. In combination with IR, STIR-TIDE was also usedsuccessfully to generate abdominal images with high qual-ity, reduced blurring, and STIR contrast.
Differences in image contrast may result from the bright-blood appearance in T2-TIDE vs. the black-blood appear-ance in HASTE images. The same difference in the repre-sentation of blood occurred in STIR-weighted imaging.This is because TSE and HASTE sequences use transversemagnetization, which is created by the first excitationpulse only. Therefore, blood appears dark due to an out-flow effect, and inflowing blood does not contribute to thesignal. For T2-TIDE, new magnetization is also createdwith every RF pulse from inflowing blood due to a com-bination of inaccurate RF pulses, slice profile, and totallybalanced gradients (19).
While the bright-blood signal can be of great benefit (e.g.,for differentiating between flowing blood and calcifica-tion), it may also lead to false interpretation of STIR im-ages. Since STIR is mainly used to detect metastases,which appear bright, signal from inflowing blood may leadto difficulties in image interpretation.
Nevertheless, T2-TIDE could be combined with a black-blood preparation scheme to overcome this limitation inSTIR-weighted imaging.
As for standard b-SSFP imaging, T2-TIDE offers highsampling efficiency, resulting in short overall acquisitiontimes. In combination with partial Fourier, the total scantime (TA) is typically on the order of 0.5 s per slice. Incomparison with TSE abdominal imaging, reduced breath-hold times and better patient comfort can therefore beachieved using T2-TIDE.
In combination with black- or dark-blood preparationand ECG triggering, T2-TIDE has the potential to improvecontrast in morphological imaging.
A drawback of T2-TIDE is related to some minor arti-facts, as seen, for example, in the large phantom bottle(Fig. 5c). The artifact originates from the T2-TIDE signalevolution during the transition from flip angle ramping toconstant flip angles. As is evident from Fig. 2, such flipangle changes result in a rather abrupt bending of theT2-TIDE signal intensities, which may cause artifacts iflinear phase-encoding is used. A potential solution may beoffered by alternative k-space reordering schemes, such ascombined half-Fourier imaging and centric reordering.
However, such k-space trajectories may lead to in-creased, non-constant eddy currents, and lead to addi-tional artifacts (20). To avoid such artifacts in centric re-ordering, other phase-encoding schemes may be used,such as double cycle (20) or double averaging (21), whichwould allow artifact-free imaging while permitting thesampling of central k-space during the transient phase.
Future work will also focus on the multicontrast possi-bilities of TIDE. If central k-space is sampled twice (onceduring the initial T2 decay and later in the steady state), T2
as well as T2/T1-weighted images could be achievedwithin a single measurement while sharing other parts ofthe k-space. A combination with proton density-weightedimaging may also be feasible if the effective TE is set tozero.
CONCLUSIONS
Our results show that it is possible to obtain T2-weightedimages with b-SSFP imaging if variable flip angles in TIDEstyle are used. A flip angle scheme with prolonged appli-cation of 180° pulses and a half-Fourier acquisition areused.
T2-TIDE sequences undergo T2-weighted signal decayduring the transient phase, which can be utilized for T2
contrast in SSFP imaging. T2-TIDE was applied to abdom-inal and head imaging and compared with standardHASTE and TrueFISP methods. In terms of blurring, imagequality was improved. Compared to TrueFISP imaging,CNR was increased, especially between gray and whitematter. Possible applications of the proposed techniqueinclude abdominal and cardiac imaging.
ACKNOWLEDGMENT
The authors thank Matthias Weigel, from our department,for providing the complete sequence protocol and the Mat-lab toolbox for calculating the relaxation time in the phan-tom probes.
REFERENCES1. Carr HY. Steady-state free precession in nuclear magnetic resonance.
Phys Rev 1958;112:1693–1701.
92 Paul et al.

2. Oppelt A, Graumann R, Barfuss H, Fischer H, Hartl W, Shajor W.FISP—a new fast MRI sequence. Electromedica 1986;54:15–18.
3. Scheffler K, Lehnhardt S. Principles and applications of balanced SSFPtechniques. Eur Radiol 2003;13:2409–2418.
4. Plein S, Bloomer TN, Ridgway JP, Jones TR, Bainbridge GJ, Sivanan-than MU. Steady-state free precession magnetic resonance imaging ofthe heart: comparison with segmented k-space gradient-echo imaging. JMagn Reson Imaging 2001;14:230–236.
5. Scheffler K, Heid O, Hennig J. Magnetization preparation during thesteady state: fat-saturated 3D TrueFISP. Magn Reson Med 2001;45:1075–1080.
6. Duerk JL, Lewin JS, Wendt M, Petersilge C. Remember true FISP? Ahigh SNR, near 1-second imaging method for T2-like contrast in inter-ventional MRI at .2 T. J Magn Reson Imaging 1998;8:203–208.
7. Barkhausen J, Quick HH, Lauenstein T, Goyen M, Ruehm SG, Laub G,Debatin JF, Ladd ME. Whole-body MR imaging in 30 seconds withreal-time true FISP and a continuously rolling table platform: feasibilitystudy. Radiology 2001;220:252–256.
8. Scheffler K, Hennig J. T1 quantification with inversion recovery True-FISP. Magn Reson Med 2001;45:720–723.
9. Deshpande VS, Shea SM, Laub G, Simonetti OP, Finn JP, Li D. 3Dmagnetization-prepared true-FISP: a new technique for imaging coro-nary arteries. Magn Reson Med 2001;46:494–502.
10. Schmitt P, Griswold M, Jakob P, Kotas M, Gulani V, Flentje M, Haase A.Inversion recovery TrueFISP: quantification of T1, T2, and spin den-sity. Magn Reson Med 2004;51:661–667.
11. Huang T-Y, Huang I-J, Chen C-Y, Scheffler K, Chung H-W, Cheng H-C. AreTrueFISP images T2/T1-weighted? Magn Reson Med 2002:48:684–688.
12. Scheffler K. On the transient phase of balanced SSFP sequences. MagnReson Med 2003;49:781–783.
13. Hennig J, Speck O, Scheffler K. Optimization of signal behaviour in thetransition to driven equilibrium in steady-state free precession se-quences. Magn Reson Med 2002;48:801–809.
14. Deimling M, Heid O. Magnetization prepared true FISP imaging. In:Proceedings of the 2nd Annual Meeting of ISMRM, San Francisco, CA,USA, 1994. p 495.
15. Hargreaves BA, Vasanawala SS, Pauly JM, Nishimura DG. Character-ization and reduction of the transient response in steady-state MRimaging. Magn Reson Med 2001;46:149–158.
16. Press WH, Teukolsky SA, Vetterling WT, Flannery BP. Numericalrecipes in C. Cambridge: Cambridge University Press; 1994.
17. Haacke EM, Brown RW, Thompson MR, Venkatesan R. Magnetic reso-nance imaging—physical principles and sequence design. New York:John Wiley and Sons Inc.; 1999.
18. Ohno Y, Hatabu H, Takenaka D, Higashino T, Watanabe H, OhbayashiC, Yoshimura M, Satouchi M, Nishimura Y, Sugimura K. Metastases inmediastinal and hilar lymph nodes in patients with non-small cell lungcancer: quantitative and qualitative assessment with STIR turbo spin-echo MR imaging. Radiology 2004;231:872–879.
19. Markl M, Alley MT, Elkins CJ, Pelc NJ. Flow effects in balanced steadystate free precession imaging. Magn Reson Med 2003;50:892–903.
20. Bieri O, Markl M, Scheffler K. Analysis and compensation of eddycurrents in balanced SSFP. Magn Reson Med 2005;54:129–137.
21. Leupold J, Paul D, Markl M, Hennig J. Improving image quality ofBSSFP with centric k-space trajectory. In: Proceedings of the 13thAnnual Meeting of ISMRM, Miami Beach, FL, USA, 2005. p 2379.
22. Paul D, Hennig J. Reduced opposed phase effects in balanced SSFP-imaging using TIDE. In: Proceedings of the 13th Annual Meeting ofISMRM, Miami Beach, FL, USA, 2005. p 2380.
T2-Weighted TIDE Imaging 93


