Embed Size (px)
Citation preview

1
Numerical investigation of the scale effects of rock bridges
Fengchang Bu1,2,3, Lei Xue1,2,3*, Mengyang Zhai1,2,3, Chao Xu1,2,3, Yuan Cui1,2,3
*Corresponding author.
E-mail address of all co-authors:
[email protected] (Fengchang Bu)
[email protected] (Lei Xue)
[email protected] (Mengyang Zhai)
[email protected] (Chao Xu)
[email protected] (Yuan Cui)
1. Key Laboratory of Shale Gas and Geoengineering, Institute of Geology and Geophysics, Chinese
Academy of Sciences, Beijing 100029, China
2. Innovation Academy for Earth Science, Chinese Academy of Sciences, Beijing 100029, China
3. College of Earth and Planetary Sciences, University of Chinese Academy of Sciences, Beijing
100049, China
2
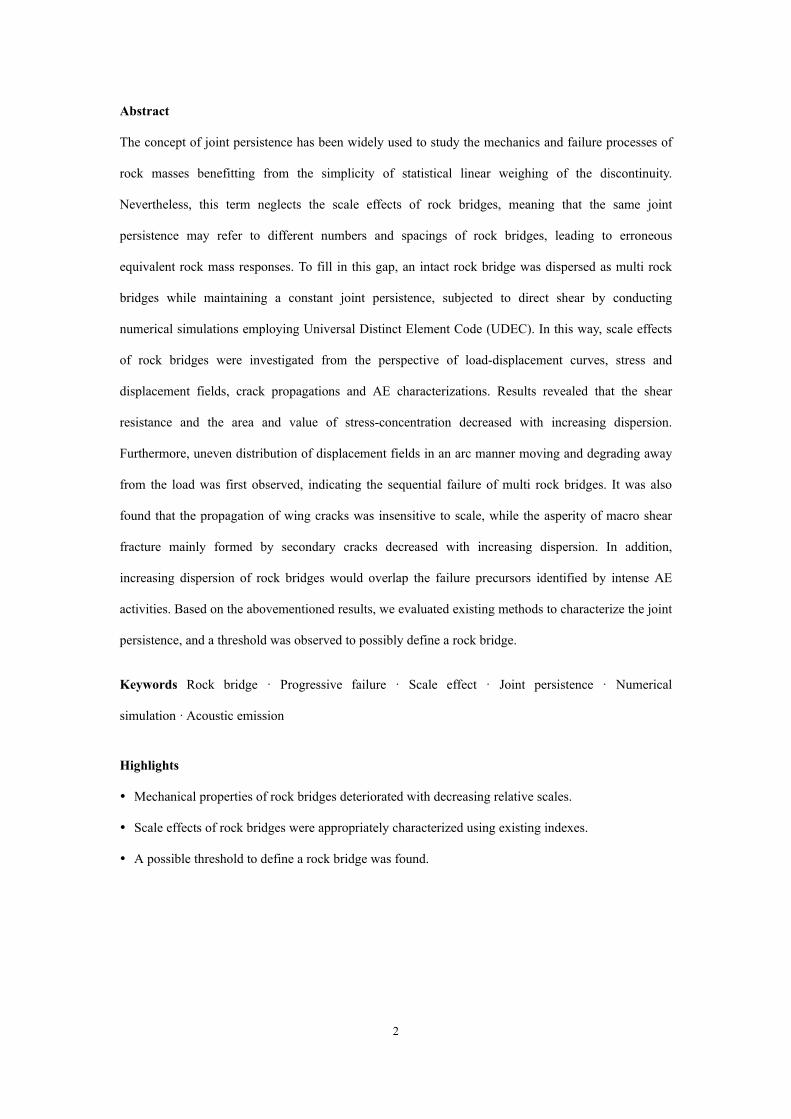
Abstract
The concept of joint persistence has been widely used to study the mechanics and failure processes of
rock masses benefitting from the simplicity of statistical linear weighing of the discontinuity.
Nevertheless, this term neglects the scale effects of rock bridges, meaning that the same joint
persistence may refer to different numbers and spacings of rock bridges, leading to erroneous
equivalent rock mass responses. To fill in this gap, an intact rock bridge was dispersed as multi rock
bridges while maintaining a constant joint persistence, subjected to direct shear by conducting
numerical simulations employing Universal Distinct Element Code (UDEC). In this way, scale effects
of rock bridges were investigated from the perspective of load-displacement curves, stress and
displacement fields, crack propagations and AE characterizations. Results revealed that the shear
resistance and the area and value of stress-concentration decreased with increasing dispersion.
Furthermore, uneven distribution of displacement fields in an arc manner moving and degrading away
from the load was first observed, indicating the sequential failure of multi rock bridges. It was also
found that the propagation of wing cracks was insensitive to scale, while the asperity of macro shear
fracture mainly formed by secondary cracks decreased with increasing dispersion. In addition,
increasing dispersion of rock bridges would overlap the failure precursors identified by intense AE
activities. Based on the abovementioned results, we evaluated existing methods to characterize the joint
persistence, and a threshold was observed to possibly define a rock bridge.
Keywords Rock bridge · Progressive failure · Scale effect · Joint persistence · Numerical
simulation · Acoustic emission
Highlights
Mechanical properties of rock bridges deteriorated with decreasing relative scales.
Scale effects of rock bridges were appropriately characterized using existing indexes.
A possible threshold to define a rock bridge was found.
3
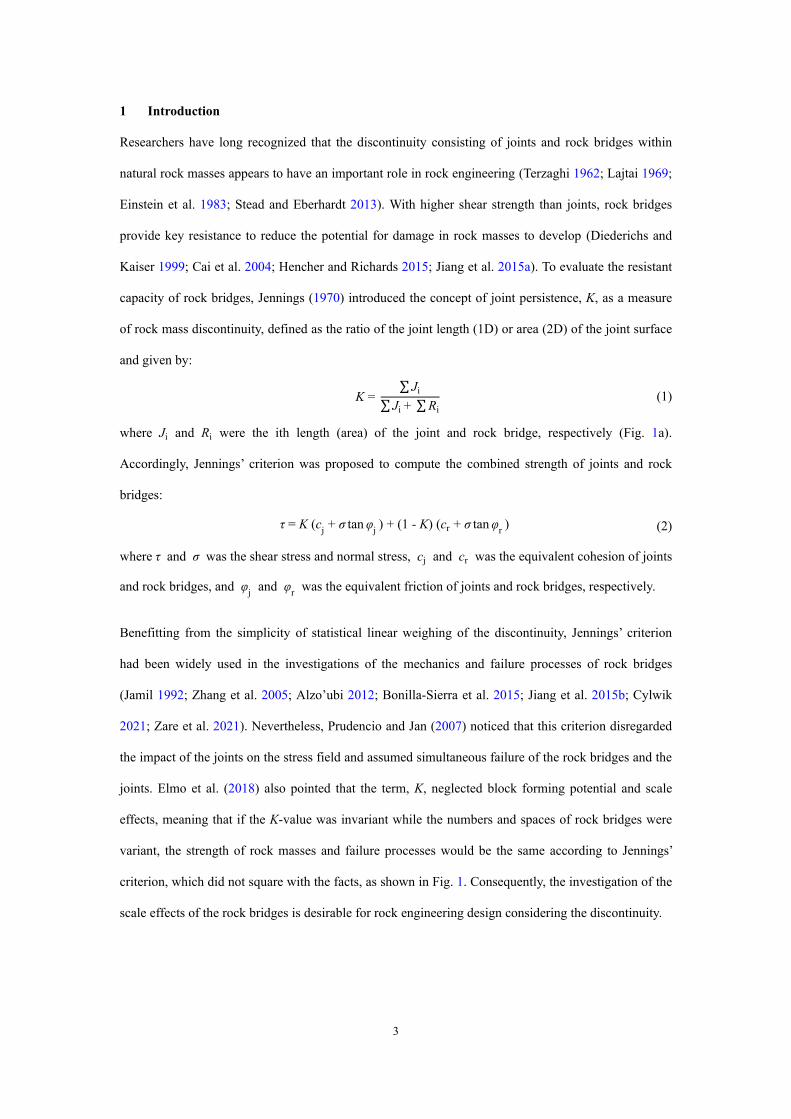
1 Introduction
Researchers have long recognized that the discontinuity consisting of joints and rock bridges within
natural rock masses appears to have an important role in rock engineering (Terzaghi 1962; Lajtai 1969;
Einstein et al. 1983; Stead and Eberhardt 2013). With higher shear strength than joints, rock bridges
provide key resistance to reduce the potential for damage in rock masses to develop (Diederichs and
Kaiser 1999; Cai et al. 2004; Hencher and Richards 2015; Jiang et al. 2015a). To evaluate the resistant
capacity of rock bridges, Jennings (1970) introduced the concept of joint persistence, K, as a measure
of rock mass discontinuity, defined as the ratio of the joint length (1D) or area (2D) of the joint surface
and given by:
K = ∑ Ji∑ Ji + ∑Ri
(1)
where Ji and Ri were the ith length (area) of the joint and rock bridge, respectively (Fig. 1a).
Accordingly, Jennings’ criterion was proposed to compute the combined strength of joints and rock
bridges:
τ = K (cj + σ tanφj ) + (1 - K) (cr + σ tanφr ) (2)
where τ and σ was the shear stress and normal stress, cj and cr was the equivalent cohesion of joints
and rock bridges, and φj and φr was the equivalent friction of joints and rock bridges, respectively.
Benefitting from the simplicity of statistical linear weighing of the discontinuity, Jennings’ criterion
had been widely used in the investigations of the mechanics and failure processes of rock bridges
(Jamil 1992; Zhang et al. 2005; Alzo’ubi 2012; Bonilla-Sierra et al. 2015; Jiang et al. 2015b; Cylwik
2021; Zare et al. 2021). Nevertheless, Prudencio and Jan (2007) noticed that this criterion disregarded
the impact of the joints on the stress field and assumed simultaneous failure of the rock bridges and the
joints. Elmo et al. (2018) also pointed that the term, K, neglected block forming potential and scale
effects, meaning that if the K-value was invariant while the numbers and spaces of rock bridges were
variant, the strength of rock masses and failure processes would be the same according to Jennings’
criterion, which did not square with the facts, as shown in Fig. 1. Consequently, the investigation of the
scale effects of the rock bridges is desirable for rock engineering design considering the discontinuity.
4
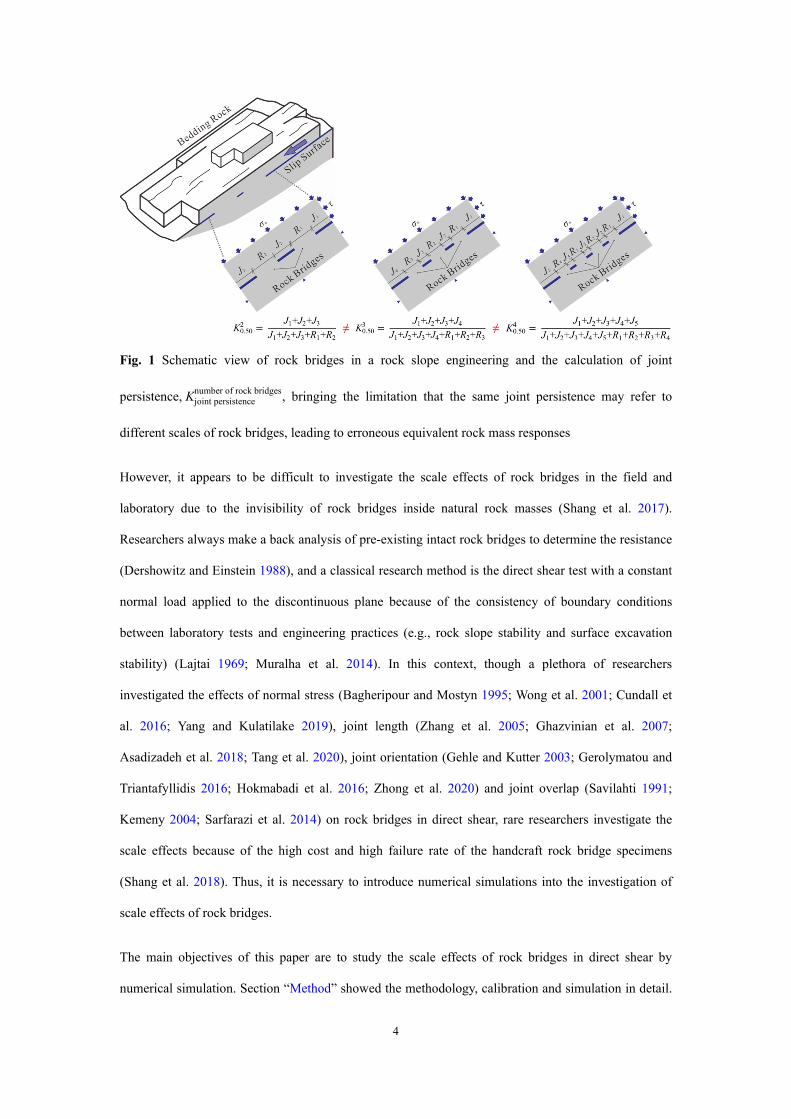
Fig. 1 Schematic view of rock bridges in a rock slope engineering and the calculation of joint
persistence, Kjoint persistencenumber of rock bridges, bringing the limitation that the same joint persistence may refer to
different scales of rock bridges, leading to erroneous equivalent rock mass responses
However, it appears to be difficult to investigate the scale effects of rock bridges in the field and
laboratory due to the invisibility of rock bridges inside natural rock masses (Shang et al. 2017).
Researchers always make a back analysis of pre-existing intact rock bridges to determine the resistance
(Dershowitz and Einstein 1988), and a classical research method is the direct shear test with a constant
normal load applied to the discontinuous plane because of the consistency of boundary conditions
between laboratory tests and engineering practices (e.g., rock slope stability and surface excavation
stability) (Lajtai 1969; Muralha et al. 2014). In this context, though a plethora of researchers
investigated the effects of normal stress (Bagheripour and Mostyn 1995; Wong et al. 2001; Cundall et
al. 2016; Yang and Kulatilake 2019), joint length (Zhang et al. 2005; Ghazvinian et al. 2007;
Asadizadeh et al. 2018; Tang et al. 2020), joint orientation (Gehle and Kutter 2003; Gerolymatou and
Triantafyllidis 2016; Hokmabadi et al. 2016; Zhong et al. 2020) and joint overlap (Savilahti 1991;
Kemeny 2004; Sarfarazi et al. 2014) on rock bridges in direct shear, rare researchers investigate the
scale effects because of the high cost and high failure rate of the handcraft rock bridge specimens
(Shang et al. 2018). Thus, it is necessary to introduce numerical simulations into the investigation of
scale effects of rock bridges.
The main objectives of this paper are to study the scale effects of rock bridges in direct shear by
numerical simulation. Section “Method” showed the methodology, calibration and simulation in detail.
5
Section “Results” displayed the scale effects of rock bridges from the perspective of load-displacement
curves, stress and displacement fields, crack propagations and AE characterizations. Previous
approaches to describe the joint persistence were evaluated and discussed in the “Discussion”.
“Conclusions” were given finally.
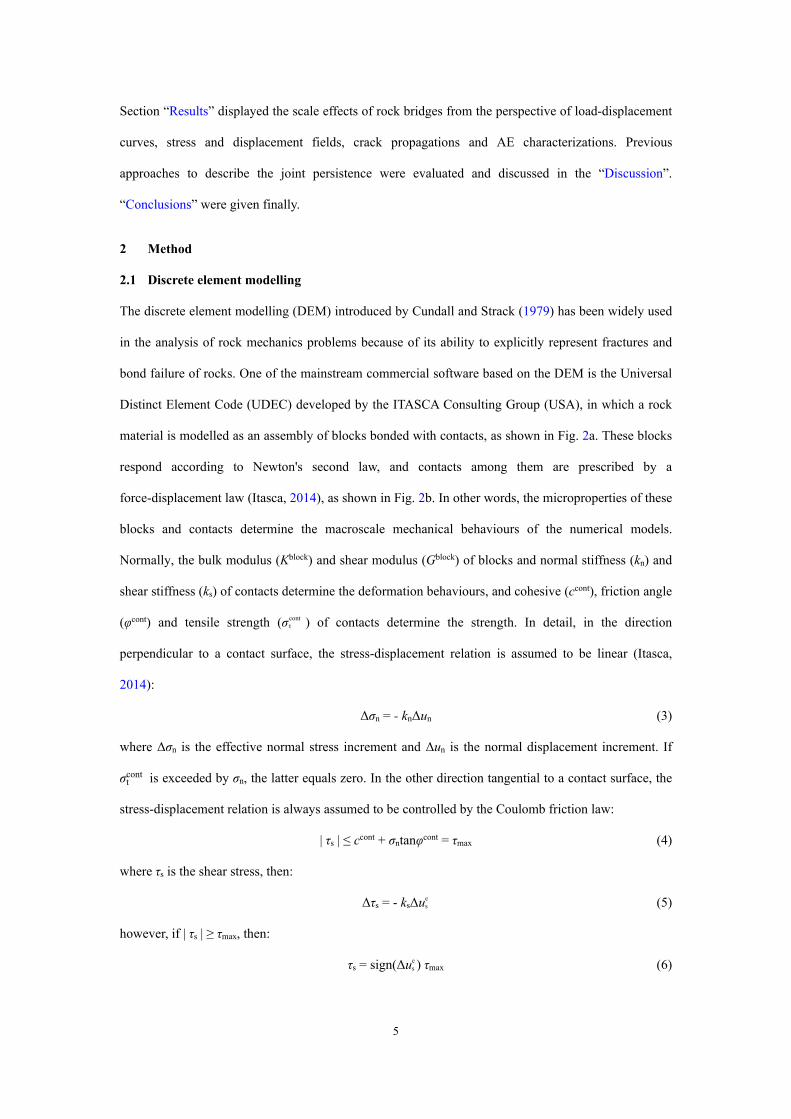
2 Method
2.1 Discrete element modelling
The discrete element modelling (DEM) introduced by Cundall and Strack (1979) has been widely used
in the analysis of rock mechanics problems because of its ability to explicitly represent fractures and
bond failure of rocks. One of the mainstream commercial software based on the DEM is the Universal
Distinct Element Code (UDEC) developed by the ITASCA Consulting Group (USA), in which a rock
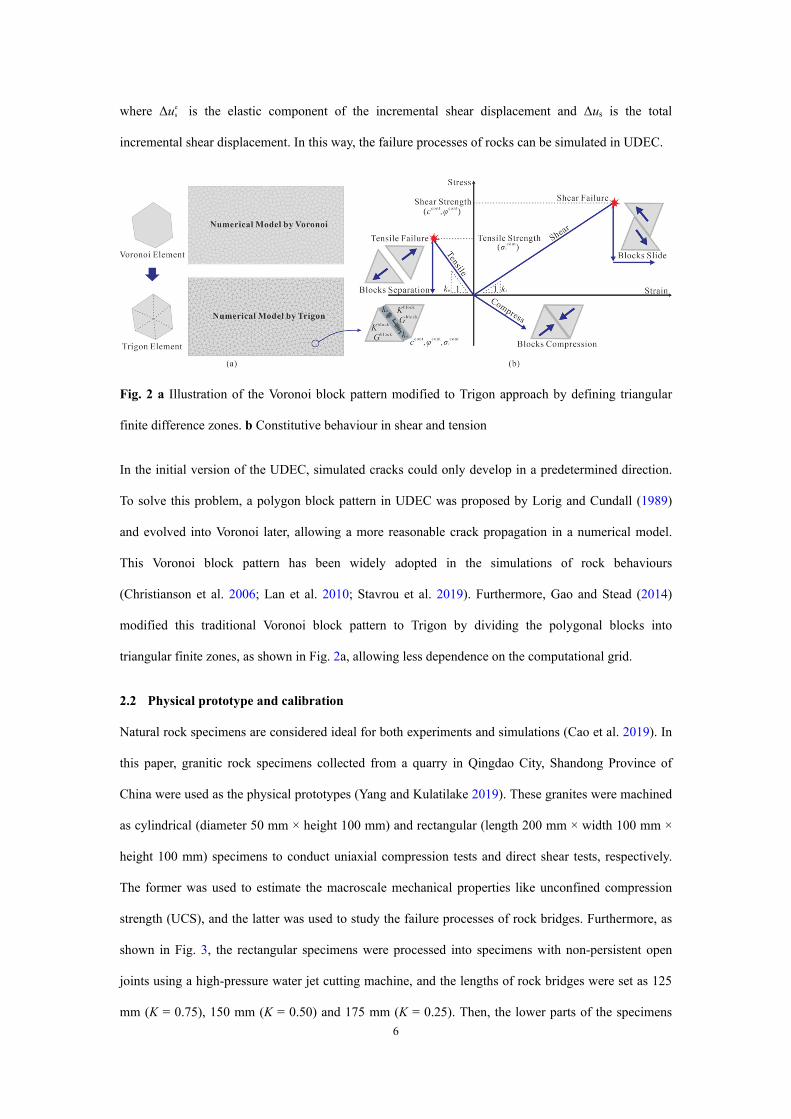
material is modelled as an assembly of blocks bonded with contacts, as shown in Fig. 2a. These blocks
respond according to Newton's second law, and contacts among them are prescribed by a
force-displacement law (Itasca, 2014), as shown in Fig. 2b. In other words, the microproperties of these
blocks and contacts determine the macroscale mechanical behaviours of the numerical models.
Normally, the bulk modulus (Kblock) and shear modulus (Gblock) of blocks and normal stiffness (kn) and
shear stiffness (ks) of contacts determine the deformation behaviours, and cohesive (ccont), friction angle
(φcont) and tensile strength (σcont t ) of contacts determine the strength. In detail, in the direction
perpendicular to a contact surface, the stress-displacement relation is assumed to be linear (Itasca,
2014):
Δσn = - knΔun (3)
where Δσn is the effective normal stress increment and Δun is the normal displacement increment. If
σtcont is exceeded by σn, the latter equals zero. In the other direction tangential to a contact surface, the
stress-displacement relation is always assumed to be controlled by the Coulomb friction law:
| τs | ≤ ccont + σntanφcont = τmax (4)
where τs is the shear stress, then:
Δτs = - ksΔue s (5)
however, if | τs | ≥ τmax, then:
τs = sign(Δue s ) τmax (6)
6
where Δue s is the elastic component of the incremental shear displacement and Δus is the total
incremental shear displacement. In this way, the failure processes of rocks can be simulated in UDEC.
Fig. 2 a Illustration of the Voronoi block pattern modified to Trigon approach by defining triangular
finite difference zones. b Constitutive behaviour in shear and tension
In the initial version of the UDEC, simulated cracks could only develop in a predetermined direction.
To solve this problem, a polygon block pattern in UDEC was proposed by Lorig and Cundall (1989)
and evolved into Voronoi later, allowing a more reasonable crack propagation in a numerical model.
This Voronoi block pattern has been widely adopted in the simulations of rock behaviours
(Christianson et al. 2006; Lan et al. 2010; Stavrou et al. 2019). Furthermore, Gao and Stead (2014)
modified this traditional Voronoi block pattern to Trigon by dividing the polygonal blocks into
triangular finite zones, as shown in Fig. 2a, allowing less dependence on the computational grid.
2.2 Physical prototype and calibration
Natural rock specimens are considered ideal for both experiments and simulations (Cao et al. 2019). In
this paper, granitic rock specimens collected from a quarry in Qingdao City, Shandong Province of
China were used as the physical prototypes (Yang and Kulatilake 2019). These granites were machined
as cylindrical (diameter 50 mm × height 100 mm) and rectangular (length 200 mm × width 100 mm ×
height 100 mm) specimens to conduct uniaxial compression tests and direct shear tests, respectively.
The former was used to estimate the macroscale mechanical properties like unconfined compression
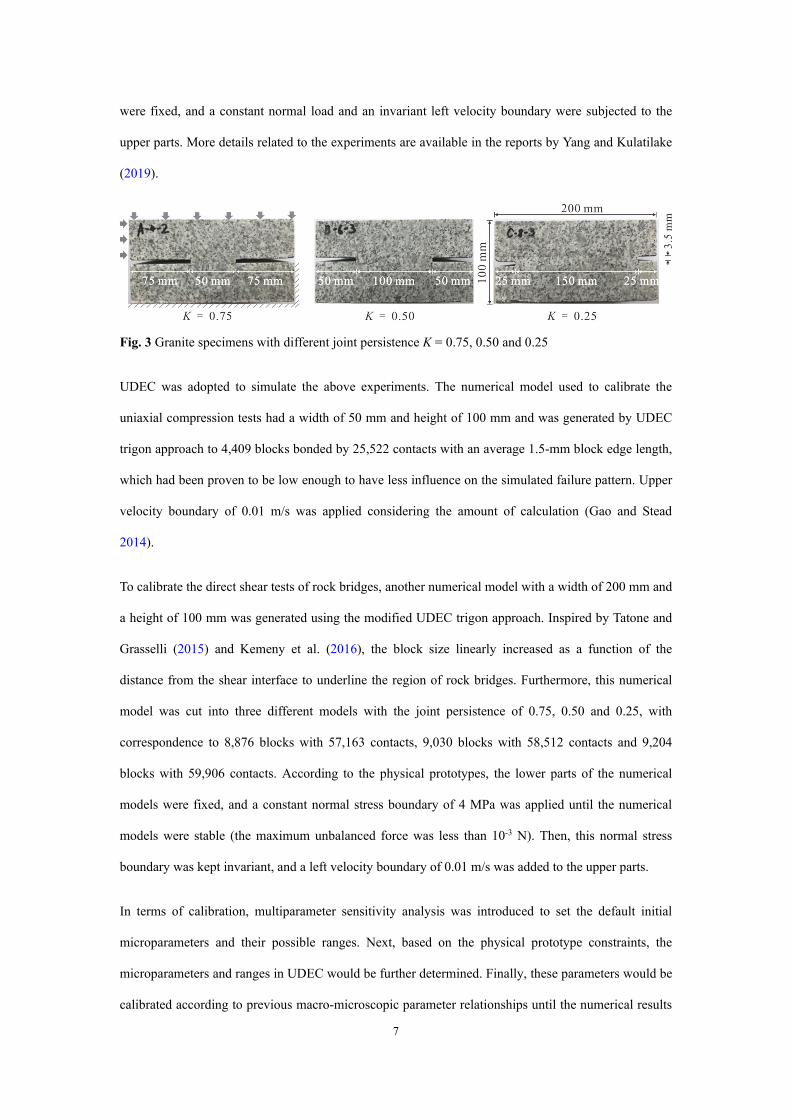
strength (UCS), and the latter was used to study the failure processes of rock bridges. Furthermore, as
shown in Fig. 3, the rectangular specimens were processed into specimens with non-persistent open
joints using a high-pressure water jet cutting machine, and the lengths of rock bridges were set as 125
mm (K = 0.75), 150 mm (K = 0.50) and 175 mm (K = 0.25). Then, the lower parts of the specimens
7
were fixed, and a constant normal load and an invariant left velocity boundary were subjected to the
upper parts. More details related to the experiments are available in the reports by Yang and Kulatilake
(2019).
Fig. 3 Granite specimens with different joint persistence K = 0.75, 0.50 and 0.25
UDEC was adopted to simulate the above experiments. The numerical model used to calibrate the
uniaxial compression tests had a width of 50 mm and height of 100 mm and was generated by UDEC
trigon approach to 4,409 blocks bonded by 25,522 contacts with an average 1.5-mm block edge length,
which had been proven to be low enough to have less influence on the simulated failure pattern. Upper
velocity boundary of 0.01 m/s was applied considering the amount of calculation (Gao and Stead
2014).
To calibrate the direct shear tests of rock bridges, another numerical model with a width of 200 mm and
a height of 100 mm was generated using the modified UDEC trigon approach. Inspired by Tatone and
Grasselli (2015) and Kemeny et al. (2016), the block size linearly increased as a function of the
distance from the shear interface to underline the region of rock bridges. Furthermore, this numerical
model was cut into three different models with the joint persistence of 0.75, 0.50 and 0.25, with
correspondence to 8,876 blocks with 57,163 contacts, 9,030 blocks with 58,512 contacts and 9,204
blocks with 59,906 contacts. According to the physical prototypes, the lower parts of the numerical
models were fixed, and a constant normal stress boundary of 4 MPa was applied until the numerical
models were stable (the maximum unbalanced force was less than 10-3 N). Then, this normal stress
boundary was kept invariant, and a left velocity boundary of 0.01 m/s was added to the upper parts.
In terms of calibration, multiparameter sensitivity analysis was introduced to set the default initial
microparameters and their possible ranges. Next, based on the physical prototype constraints, the
microparameters and ranges in UDEC would be further determined. Finally, these parameters would be
calibrated according to previous macro-microscopic parameter relationships until the numerical results
8
were generally in line with the physical prototype results. In this study, the microparameters shown in
Table 1 had been calibrated for a range of macroparameters of both uniaxial compression tests and
direct shear tests presented in Table 2, indicating that the simulation in UDEC agreed well with the
prototype results.
Properties Values
Young's modulus of blocks, Eblock (GPa) 27.20
Poisson's ratio of blocks, μblock 0.12
Normal stiffness of contacts, kn (GPa/m) 140,600
Shear stiffness of contacts, ks (GPa/m) 56,240
Contact cohesion, ccont (MPa) 24.80
Contact friction angle, φcont (°) 23.00
Contact tensile strength, σcont t (MPa) 4.00
Table 1 Calibrated micro-properties used in UDEC to present the granite specimens
Properties Experiment Modelling
Young's modulus, E (GPa) 21.48 21.53
Poisson's ratio, μ 0.16 0.16
UCS (MPa) 87.80 87.75
Cohesion strength, c (MPa) 23.40 21.39
Internal friction angle, φ (°) 33.50 32.08
Shear strength K0.75 (MPa) 10.74 10.63
Shear strength K0.50 (MPa) 14.16 13.82
Shear strength K0.25 (MPa) 15.53 16.16
Table 2 Calibrated results of macro-properties
2.3 Numerical models and monitorings
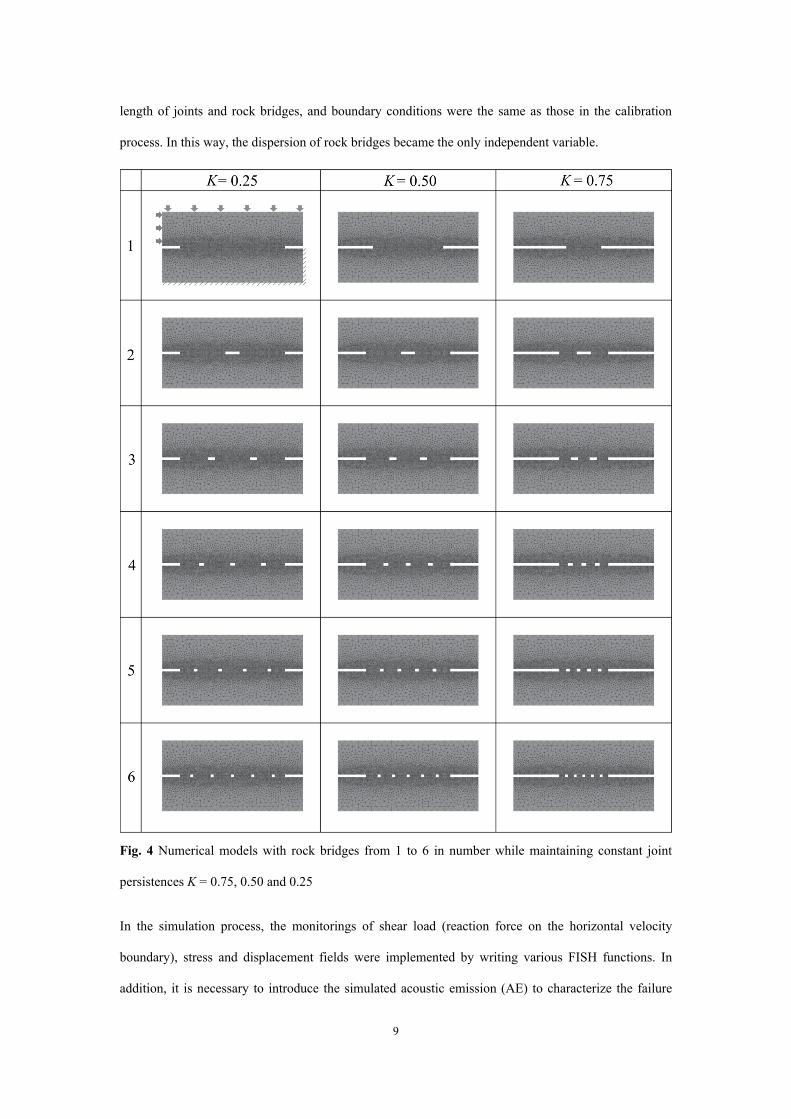
As shown in Fig. 4, the three above numerical models used for calibration were extended to 18 models
with different numbers of rock bridges, n, while maintaining a constant joint persistence of 0.75, 0.50
and 0.25. The n-value was set as integers from 1 to 6, meaning that the intact rock bridge was dispersed
into equivalent lengths. To maintain the comparability, the dispersed part should keep the same total
9
length of joints and rock bridges, and boundary conditions were the same as those in the calibration
process. In this way, the dispersion of rock bridges became the only independent variable.
Fig. 4 Numerical models with rock bridges from 1 to 6 in number while maintaining constant joint
persistences K = 0.75, 0.50 and 0.25
In the simulation process, the monitorings of shear load (reaction force on the horizontal velocity
boundary), stress and displacement fields were implemented by writing various FISH functions. In
addition, it is necessary to introduce the simulated acoustic emission (AE) to characterize the failure
10
processes of rock bridges. Typically, Bu et al. (2021) proposed a feasible and simple model to simulate
AE by monitoring and analyzing element velocity in DEM, which was applied in this research to
acquire AE events and AE energy.
3 Results
3.1 Peak shear resistance
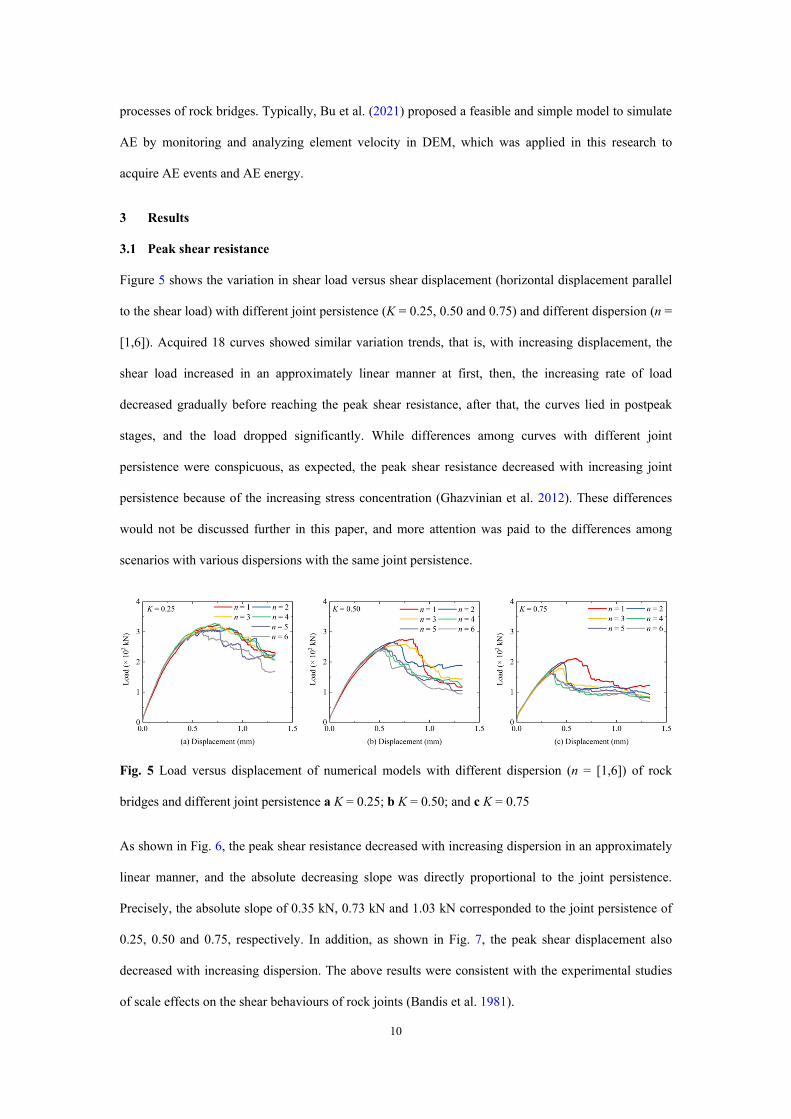
Figure 5 shows the variation in shear load versus shear displacement (horizontal displacement parallel
to the shear load) with different joint persistence (K = 0.25, 0.50 and 0.75) and different dispersion (n =
[1,6]). Acquired 18 curves showed similar variation trends, that is, with increasing displacement, the
shear load increased in an approximately linear manner at first, then, the increasing rate of load
decreased gradually before reaching the peak shear resistance, after that, the curves lied in postpeak
stages, and the load dropped significantly. While differences among curves with different joint
persistence were conspicuous, as expected, the peak shear resistance decreased with increasing joint
persistence because of the increasing stress concentration (Ghazvinian et al. 2012). These differences
would not be discussed further in this paper, and more attention was paid to the differences among
scenarios with various dispersions with the same joint persistence.
Fig. 5 Load versus displacement of numerical models with different dispersion (n = [1,6]) of rock
bridges and different joint persistence a K = 0.25; b K = 0.50; and c K = 0.75
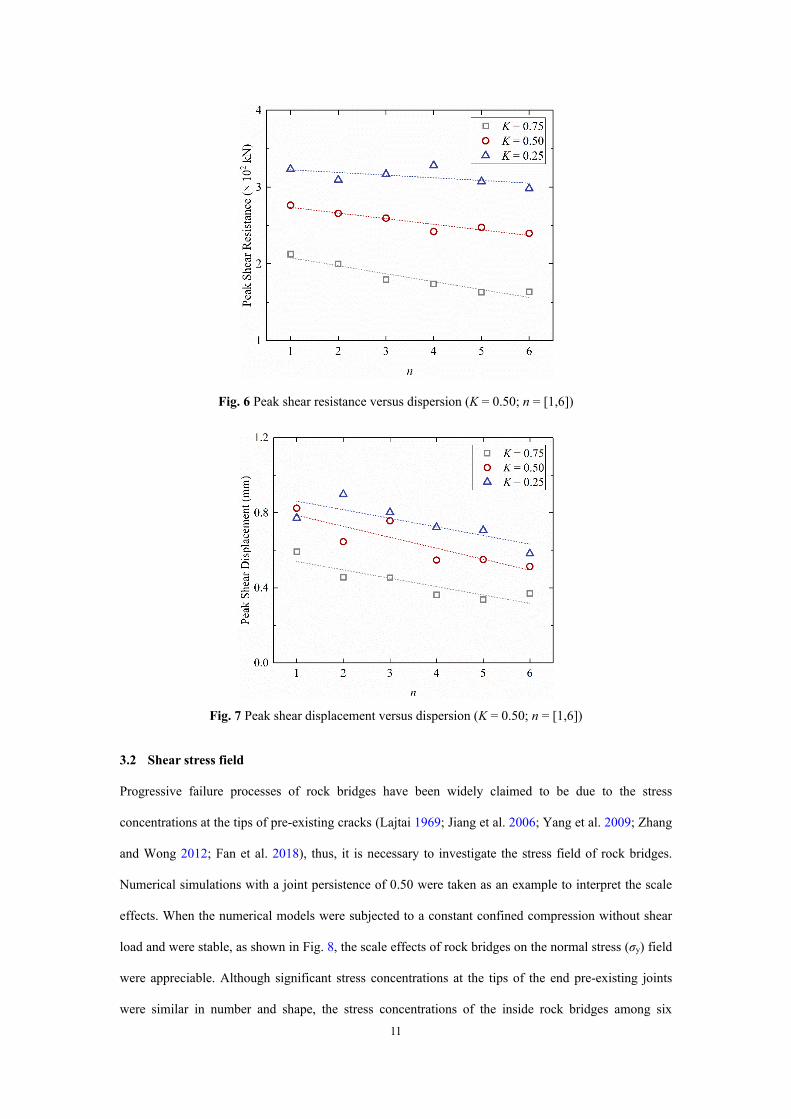
As shown in Fig. 6, the peak shear resistance decreased with increasing dispersion in an approximately
linear manner, and the absolute decreasing slope was directly proportional to the joint persistence.
Precisely, the absolute slope of 0.35 kN, 0.73 kN and 1.03 kN corresponded to the joint persistence of
0.25, 0.50 and 0.75, respectively. In addition, as shown in Fig. 7, the peak shear displacement also
decreased with increasing dispersion. The above results were consistent with the experimental studies
of scale effects on the shear behaviours of rock joints (Bandis et al. 1981).
11
Fig. 6 Peak shear resistance versus dispersion (K = 0.50; n = [1,6])
Fig. 7 Peak shear displacement versus dispersion (K = 0.50; n = [1,6])
3.2 Shear stress field
Progressive failure processes of rock bridges have been widely claimed to be due to the stress
concentrations at the tips of pre-existing cracks (Lajtai 1969; Jiang et al. 2006; Yang et al. 2009; Zhang
and Wong 2012; Fan et al. 2018), thus, it is necessary to investigate the stress field of rock bridges.
Numerical simulations with a joint persistence of 0.50 were taken as an example to interpret the scale
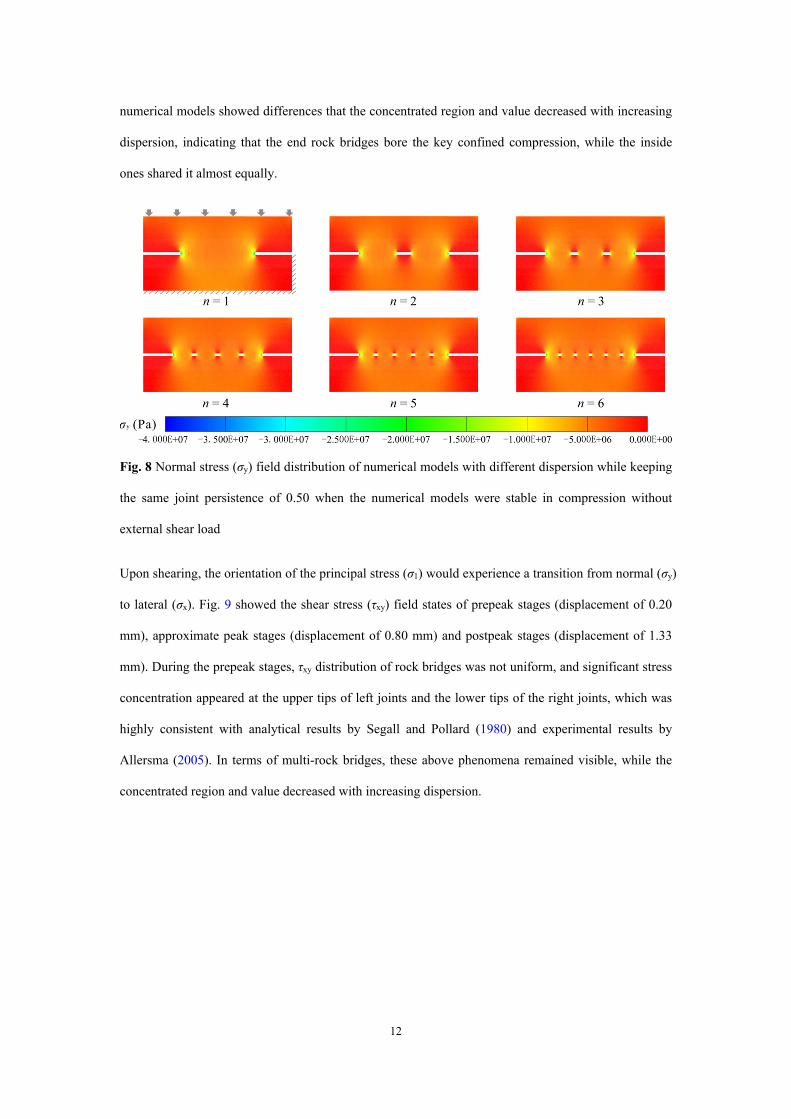
effects. When the numerical models were subjected to a constant confined compression without shear
load and were stable, as shown in Fig. 8, the scale effects of rock bridges on the normal stress (σy) field
were appreciable. Although significant stress concentrations at the tips of the end pre-existing joints
were similar in number and shape, the stress concentrations of the inside rock bridges among six
12
numerical models showed differences that the concentrated region and value decreased with increasing
dispersion, indicating that the end rock bridges bore the key confined compression, while the inside
ones shared it almost equally.
Fig. 8 Normal stress (σy) field distribution of numerical models with different dispersion while keeping
the same joint persistence of 0.50 when the numerical models were stable in compression without
external shear load
Upon shearing, the orientation of the principal stress (σ1) would experience a transition from normal (σy)
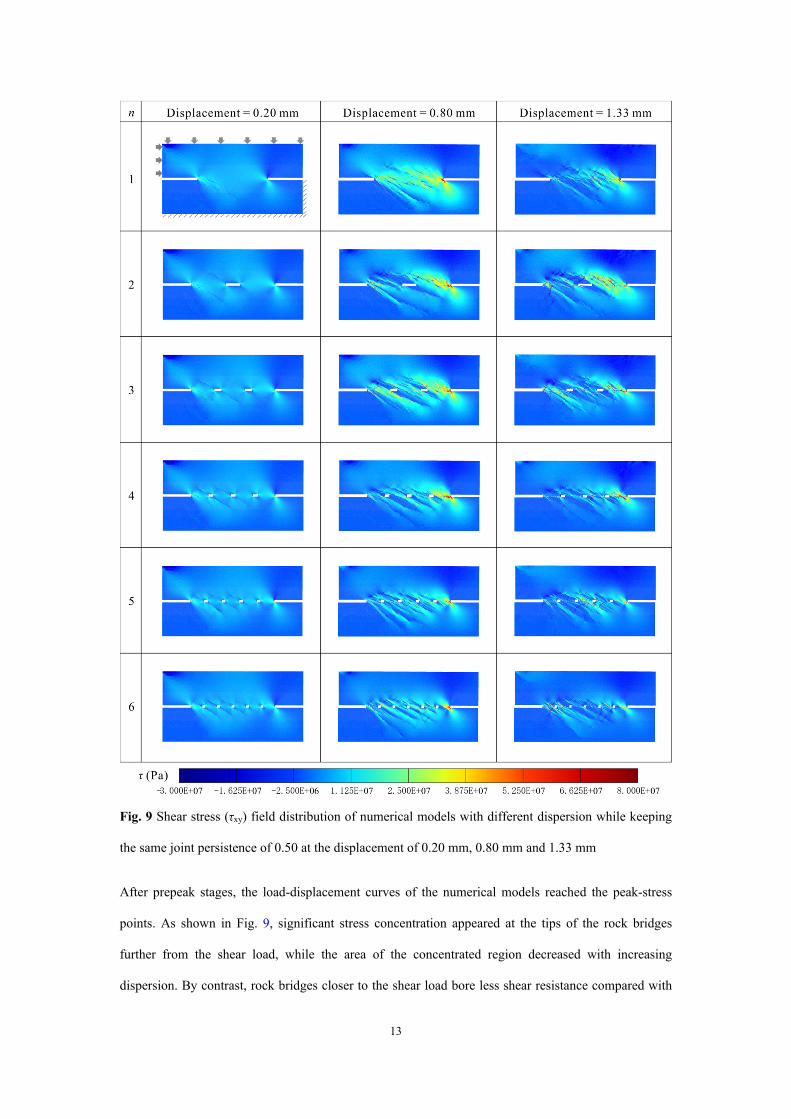
to lateral (σx). Fig. 9 showed the shear stress (τxy) field states of prepeak stages (displacement of 0.20
mm), approximate peak stages (displacement of 0.80 mm) and postpeak stages (displacement of 1.33
mm). During the prepeak stages, τxy distribution of rock bridges was not uniform, and significant stress
concentration appeared at the upper tips of left joints and the lower tips of the right joints, which was
highly consistent with analytical results by Segall and Pollard (1980) and experimental results by
Allersma (2005). In terms of multi-rock bridges, these above phenomena remained visible, while the
concentrated region and value decreased with increasing dispersion.
13
Fig. 9 Shear stress (τxy) field distribution of numerical models with different dispersion while keeping
the same joint persistence of 0.50 at the displacement of 0.20 mm, 0.80 mm and 1.33 mm
After prepeak stages, the load-displacement curves of the numerical models reached the peak-stress
points. As shown in Fig. 9, significant stress concentration appeared at the tips of the rock bridges
further from the shear load, while the area of the concentrated region decreased with increasing
dispersion. By contrast, rock bridges closer to the shear load bore less shear resistance compared with
14
that at prepeak stages because most of these rock bridges had been broken, concluded from the section
“Displacement field”.
When the numerical models lied in postpeak stages, the bearing capacity dropped significantly,
manifested by smaller stress concentration values and areas. The concentrated positions were also at
the tips of the rock bridges further from the shear load, and the concentrated values and areas decreased
with increasing dispersion as well.
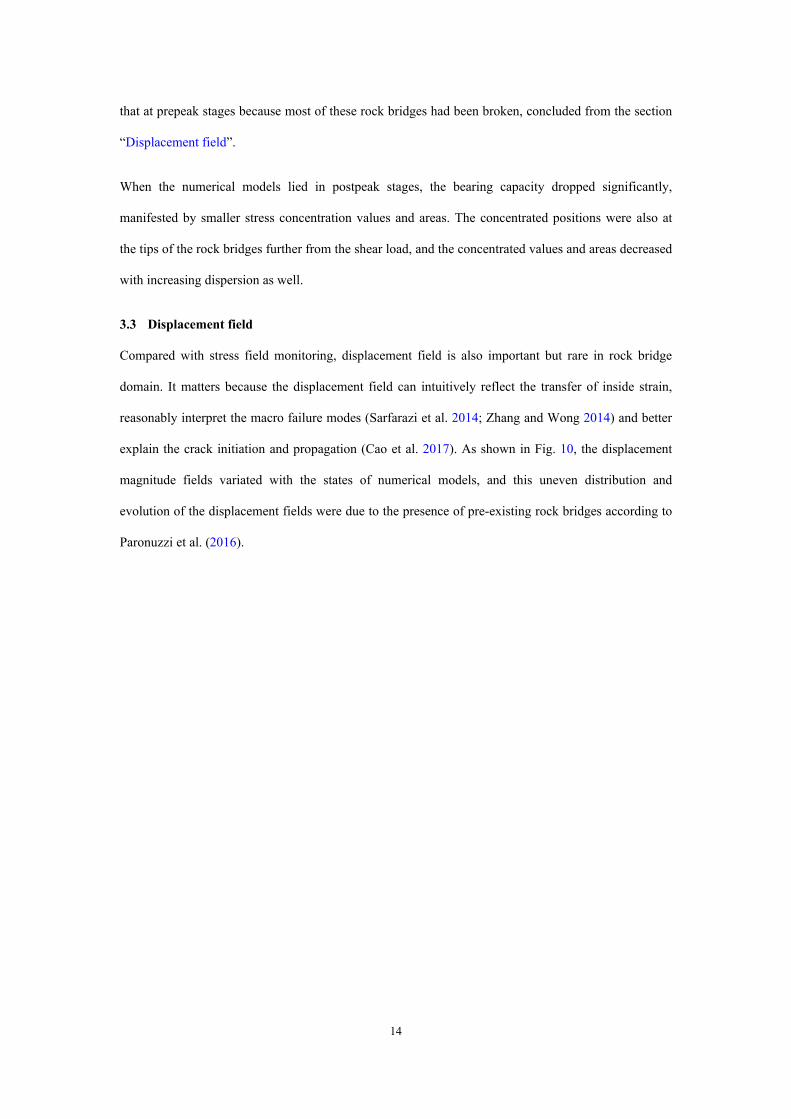
3.3 Displacement field
Compared with stress field monitoring, displacement field is also important but rare in rock bridge
domain. It matters because the displacement field can intuitively reflect the transfer of inside strain,
reasonably interpret the macro failure modes (Sarfarazi et al. 2014; Zhang and Wong 2014) and better
explain the crack initiation and propagation (Cao et al. 2017). As shown in Fig. 10, the displacement
magnitude fields variated with the states of numerical models, and this uneven distribution and
evolution of the displacement fields were due to the presence of pre-existing rock bridges according to
Paronuzzi et al. (2016).
15
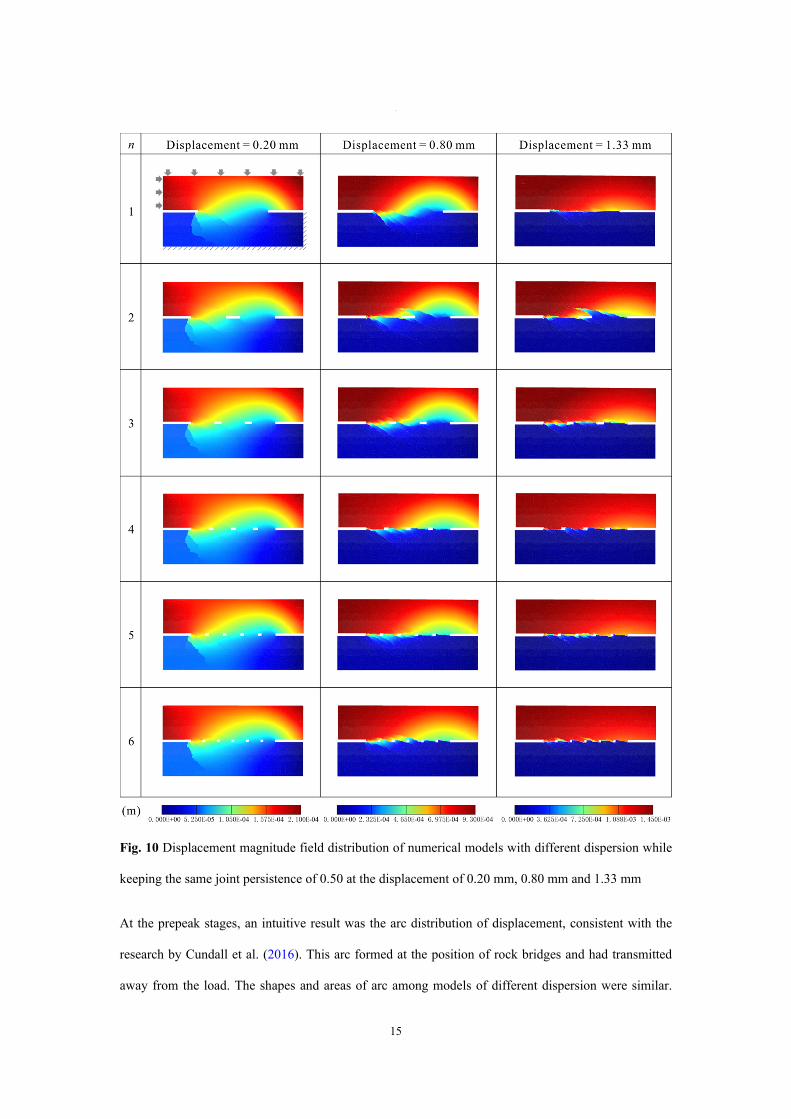
Fig. 10 Displacement magnitude field distribution of numerical models with different dispersion while
keeping the same joint persistence of 0.50 at the displacement of 0.20 mm, 0.80 mm and 1.33 mm
At the prepeak stages, an intuitive result was the arc distribution of displacement, consistent with the
research by Cundall et al. (2016). This arc formed at the position of rock bridges and had transmitted
away from the load. The shapes and areas of arc among models of different dispersion were similar.
16
Other characteristics of this arc were the asymmetry and approximate continuity, of which the former
was due to the progressive failure, and the latter was greatly affected by the pre-existing joints and
formed microcracks. These formed microcracks could be clearly observed because the displacement
field would vary abruptly in magnitude within a short distance in the vicinity of a crack (Zhang and
Wong 2014). As shown in Fig. 10, clear tensile microcracks that initiated from the tips of the left joints
were observed, and the propagation was constrained by Griffith theory, that is, tensile wing cracks
propagated in the direction normal to the axis of pre-existing joints firstly, followed by the extension
along a curvilinear path that aligned with the direction of the principal stress, which had been proven to
be a typical crack pattern in rock bridges by Sarfarazi and Haeri (2016). This propagation pattern of
tensile wing cracks was hardly affected by scales of rock bridges. In addition to the wing cracks,
another typical mode was secondary cracks described as shear zones formed by the accumulation of
microscopic tensile cracks that initiated in a direction coplanar or quasi-coplanar to the pre-existing
joints (Ghazvinian et al. 2012). While the propagation of secondary cracks at this stage had some
differences that the length decreased with increasing dispersion.
When the load-displacement curves of the numerical models approximately reached the peak-stress
points, the position, shape and area of the arc and crack propagation changed appreciably. In terms of
the arc, it moved away from the load further, and the displacement field on the left side of the arc
varied significantly, indicating the failure of left rock bridges that were closer to the load. Precisely,
half of the rock bridge was broken significantly, which was common in all of the six models. Another
change was that the area of the arc became smaller, while the reduction increased with increasing
dispersion. In terms of the crack propagation, tensile wing cracks at the tips of left rock bridges were
not clear because the range of displacement contours increased several times, in other words,
displacement in the shear zone was greatly larger than the displacement at tensile wing cracks. Thus,
secondary cracks were visually main pattern at this stage. Furthermore, left formed fracture had
different morphology that the asperity basically decreased with increasing dispersion, since the smaller
intact rock bridges would be easier to be broken in shear.
Displacement fields at postpeak stages were also shown in Fig. 10. The arc at the previous two stages
was invisible, and the displacement fields strongly separated along the rock bridges, indicating that the
17
cracks had a large-scale coalesce. Formed rough macro fracture provided residual shear strength, and
the roughness basically decreased with increasing dispersion as well.
3.4 AE characterization
AE characterization is becoming a popular interest in rock bridge study (Chen et al. 2015; Guo et al.
2020; Jiang et al. 2020; Qin et al. 2020; Wu et al. 2020; Zhang et al. 2020). Normally, AE signals
accompanied with fracturing events were always operated in the form of waveform analysis to acquire
AE parameters to quantify the failure process of rocks, of which the AE events and AE energy were
classical AE parameters. To better interpret the progressive failure processes of rock bridges, the
average τxy of each rock bridge was also recorded. As shown in Fig. 11a, there was a sharp increase of
both AE events and AE energy before and near the peak strength point, and these two points could be
respectively determined as the volume-expansion point and the peak-stress point according to
Moradian et al. (2016), which had been proven to play a crucial role in the evolution of damage in
heterogeneous rocks and to predict the macroscopic rupture (Xue et al. 2014a; Xue et al. 2014b; Chen
et al. 2021). At the volume-expansion point, both curves of the shear load and τxy of rock bridges
emerged with slight drops, meaning that the model was perceptibly fractured. Moving to the
peak-stress point, both curves dropped significantly just before the second intensive AE activities,
which was claimed to be the lag of macro fracture behind the peak-stress point (Zhu et al. 2019).
18
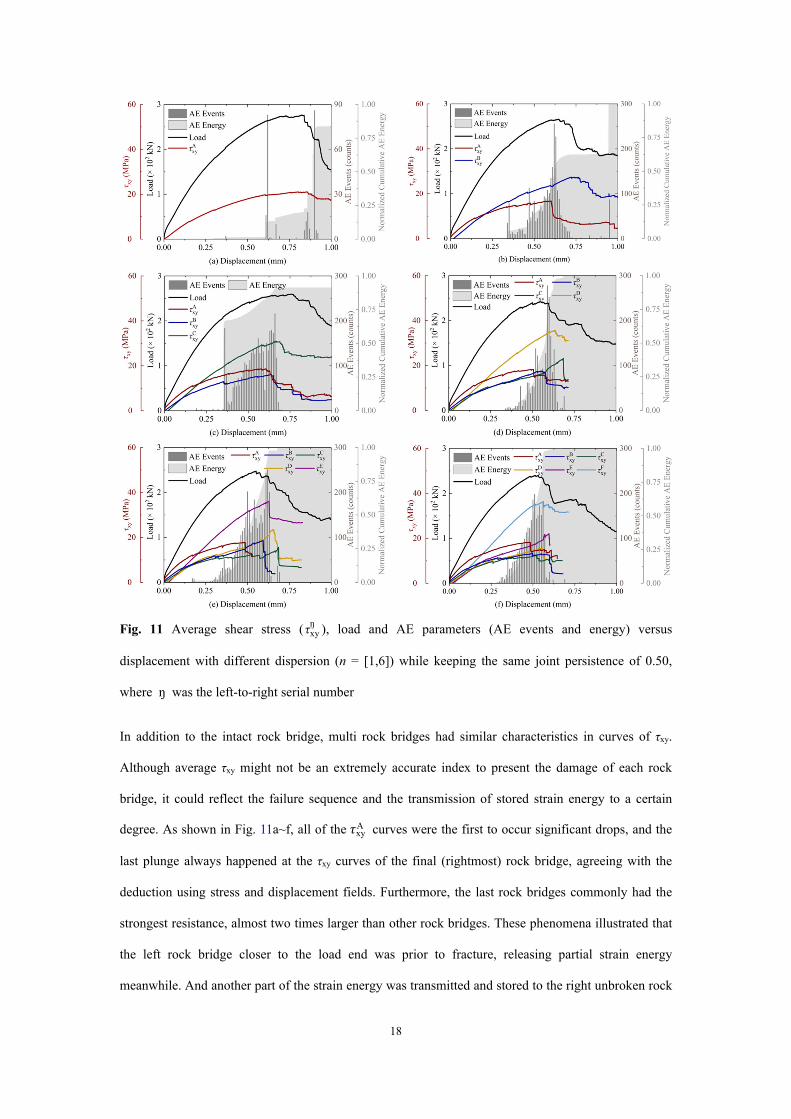
Fig. 11 Average shear stress ( τxyŋ ), load and AE parameters (AE events and energy) versus
displacement with different dispersion (n = [1,6]) while keeping the same joint persistence of 0.50,
where ŋ was the left-to-right serial number
In addition to the intact rock bridge, multi rock bridges had similar characteristics in curves of τxy.
Although average τxy might not be an extremely accurate index to present the damage of each rock
bridge, it could reflect the failure sequence and the transmission of stored strain energy to a certain
degree. As shown in Fig. 11a~f, all of the 𝜏xyA curves were the first to occur significant drops, and the
last plunge always happened at the τxy curves of the final (rightmost) rock bridge, agreeing with the
deduction using stress and displacement fields. Furthermore, the last rock bridges commonly had the
strongest resistance, almost two times larger than other rock bridges. These phenomena illustrated that
the left rock bridge closer to the load end was prior to fracture, releasing partial strain energy
meanwhile. And another part of the strain energy was transmitted and stored to the right unbroken rock
19
bridges further from the load end. With more stored energy, the last rock bridges provided key
resistance, meaning that the breakage of the last rock bridges would result in the macro failure of the
whole model.
The intensive AE activities always indicated fracturing events on a relatively large scale. Several
sudden increases in AE events and AE energy could be observed in Fig. 11, of which the last increase
was the highest, corresponding to the peak-stress point and significant drops of τxy curves of the final
(rightmost) rock bridges. It was also valuable to analyse the intensive AE activities at prepeak stages as
the precursors to macroscopic rupture. As shown in Fig. 11, the precursor of intact rock bridge was
easier to be identified compared with the precursors of multi rock bridges. With increasing dispersion,
the shear resistant zone was more crushed, leading to a superposition of the precursors.
4 Discussion
4.1 Concept of the rock bridge: Insights from scale effects
Elmo et al. (2018) proposed several important but unanswered questions related to rock bridges, and
the first is “What is a rock bridge and what parameters govern whether a given intact rock portion of
the rock mass can or should be defined as a rock bridge?” To answer this question, considering that the
shear resistance of rock bridge would be reduced with higher fragmentation until the original intact
rock bridge was deprived of the resistance and could not be defined as a rock bridge, we designed an
intact rock bridge in shear and dispersed it into different scales but kept the joint persistence invariant.
In this way, there should be a scale threshold between rock bridge and non-rock bridge. According to
section “Peak shear resistance”, there was a linear relationship between the peak shear resistance and
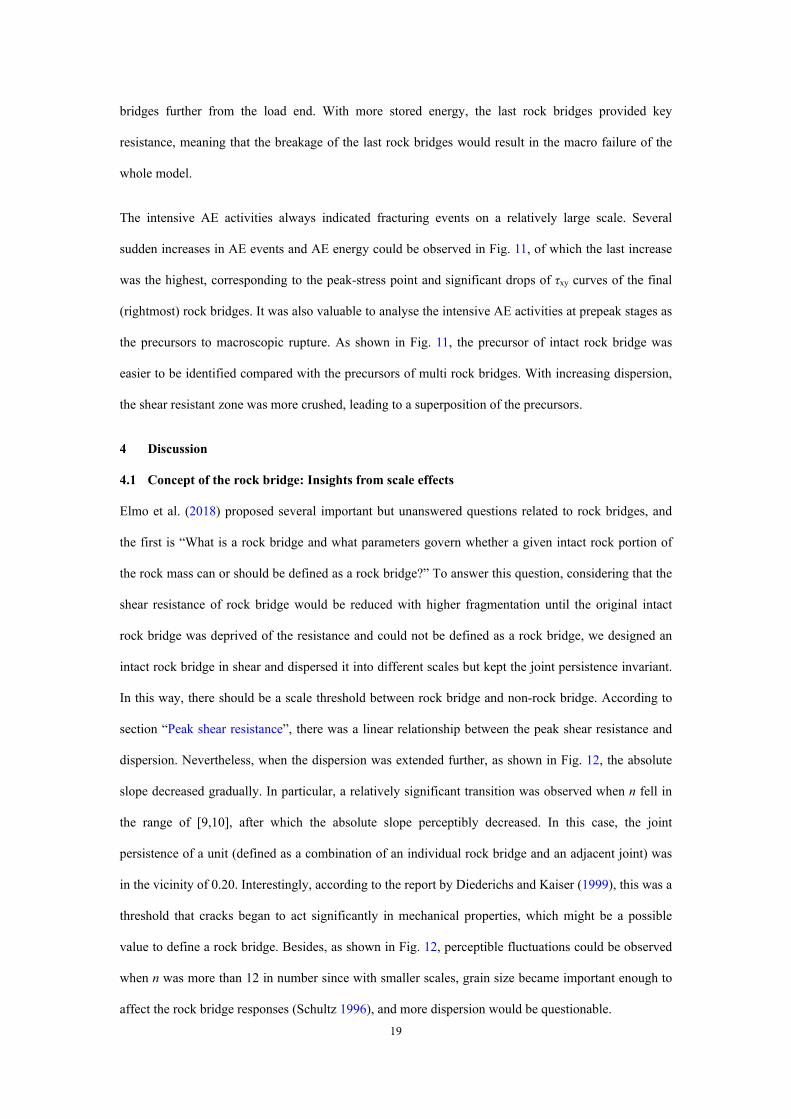
dispersion. Nevertheless, when the dispersion was extended further, as shown in Fig. 12, the absolute
slope decreased gradually. In particular, a relatively significant transition was observed when n fell in
the range of [9,10], after which the absolute slope perceptibly decreased. In this case, the joint
persistence of a unit (defined as a combination of an individual rock bridge and an adjacent joint) was
in the vicinity of 0.20. Interestingly, according to the report by Diederichs and Kaiser (1999), this was a
threshold that cracks began to act significantly in mechanical properties, which might be a possible
value to define a rock bridge. Besides, as shown in Fig. 12, perceptible fluctuations could be observed
when n was more than 12 in number since with smaller scales, grain size became important enough to
affect the rock bridge responses (Schultz 1996), and more dispersion would be questionable.
20
Fig. 12 Peak shear resistance versus dispersion (K = 0.50; n = [1,20])
4.2 Concept of the joint persistence: Insights from scale effects
As noted by this research and previous understandings (Shang et al. 2018; Tang et al. 2021), scale
effects of rock bridges presented a challenge to the concept of the joint persistence. Based on a
traditional back analysis method, we assumed that an intact rock bridge was dispersed as multi rock
bridges while maintaining a constant joint persistence, which was in an ideal state. Thus, it seemed to
be unreasonable to propose a new criterion according to this assumption to replace the concept of the
joint persistence. With regard to the rock engineering design, joint persistence had been widely
concerned in the rock mass classification systems. Excellent rock mass classification systems were
RMR (Bieniawski 1973), Q (Barton et al. 1974) and GSI (Hoek and Kaiser 1995). These classical and
inductive approaches were always based on the experience and subjectivity of engineers, leading to
potential inevitable errors in rock mass characterization (Elmo et al. 2021a). According to the report by
Kim et al. (2007), joint persistence was involved in RMR system, but its weighted values were
underestimated; Q system gave insufficient consideration to the joint persistence in practice; and GSI
descriptively referred joint persistence as block interlocking. In this context, several researchers made
positive contributions to refer joint persistence in rock mass classification systems. Laubscher (1990)
proposed a measurement using the average fracture frequency rating (FFR) in MRMR classification
system. The rock bridge percentage Prb was determined as follows:
Prb = FFR × a
40 (7)
21
where a was the constant and could be determined using experiences (Dempers et al. 2011). While this
measurement was pointed to neglect the fundamental role of fracture persistence (Elmo et al. 2018).
Furthermore, Elmo et al. (2021a) proposed a network connectivity index (NCI) based on a combination
of fracture intensity, fracture density and fracture intersection density parameters, expressed by the
formula:
NCI = P21
P20I20 (8)
where P21, P20 and I20 were the areal fracture intensity, the areal fracture density and areal fracture
intersection density, respectively. Then, Elmo et al. (2021b) introduced the concept of NCId by
considering the impact of stress-driven fractures, defined by:
NCId = NCI + NCIrb (9)
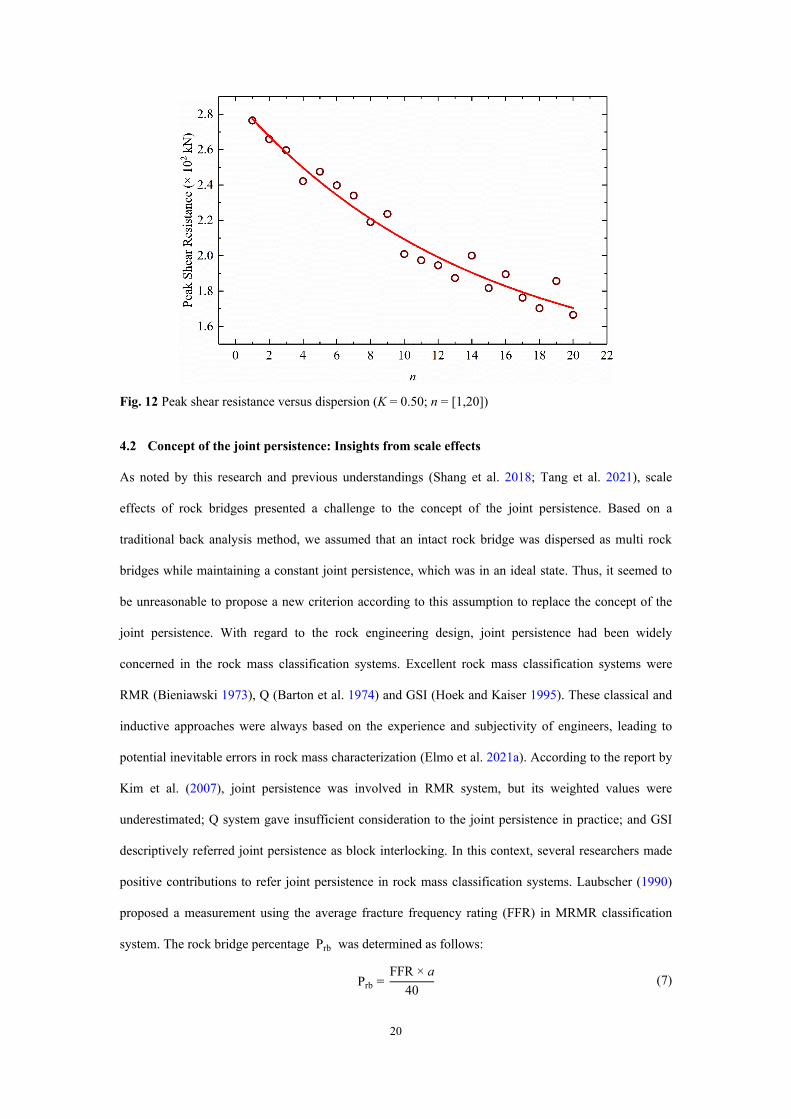
where NCIrb was the NCI calculated considering just the induced fractures. The ratio between NCIrb
and NCId was defined as the rock bridge potential (RBP), as shown in Fig. 13 and Eq. 10:
RBP = NCIrb
NCId=
NCIrb
NCI + NCIrb (10)
In this way, the higher RBP meant the higher contribution of rock bridge to the overall rock mass
behaiviours. In this study, we adopted RBP index to represent the scale effects of rock bridges, as
shown in Fig. 14.
Fig. 13 Definition of the RBP as a function of the initial NCI and the induced NCIrb
In addition, some other calculations of joint persistence were proposed as well. For example, Park
(2005) proposed a probabilistic analysis by treating joint persistence as a random variable,
22
implemented by comparing the individual joint length with the maximum sliding dimension in each
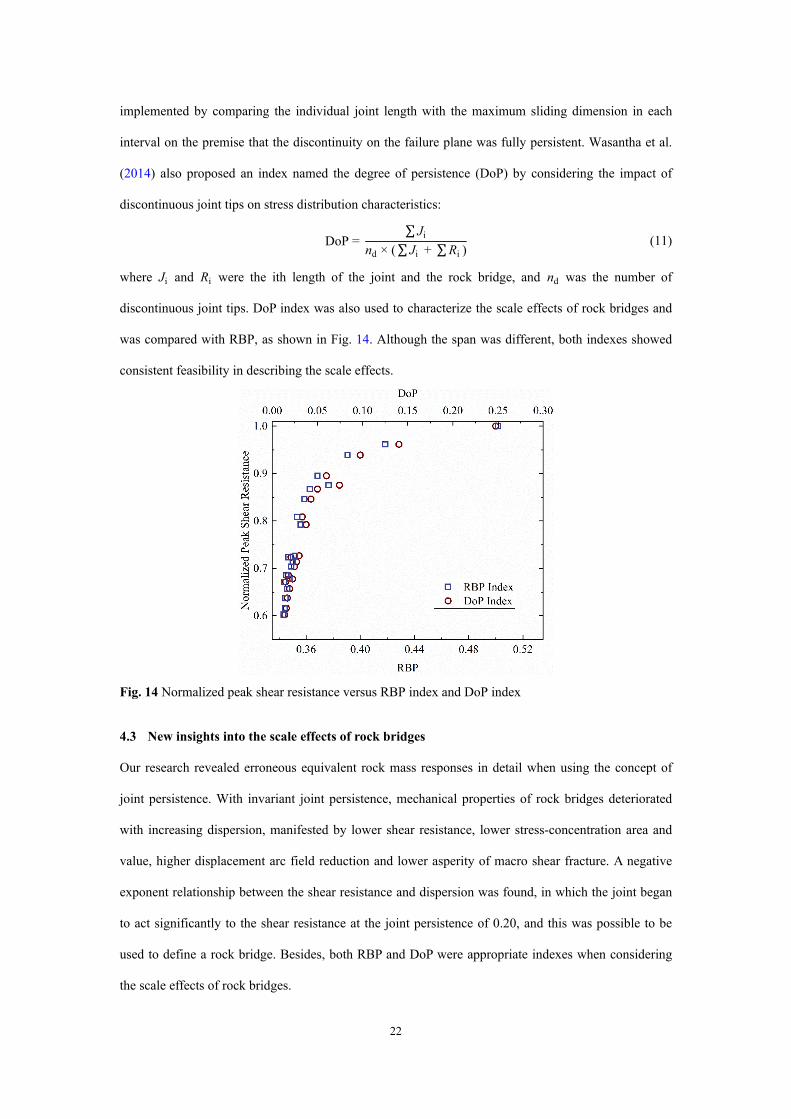
interval on the premise that the discontinuity on the failure plane was fully persistent. Wasantha et al.
(2014) also proposed an index named the degree of persistence (DoP) by considering the impact of
discontinuous joint tips on stress distribution characteristics:
DoP = ∑ Ji
nd × (∑ Ji + ∑Ri ) (11)
where Ji and Ri were the ith length of the joint and the rock bridge, and nd was the number of
discontinuous joint tips. DoP index was also used to characterize the scale effects of rock bridges and
was compared with RBP, as shown in Fig. 14. Although the span was different, both indexes showed
consistent feasibility in describing the scale effects.
Fig. 14 Normalized peak shear resistance versus RBP index and DoP index
4.3 New insights into the scale effects of rock bridges
Our research revealed erroneous equivalent rock mass responses in detail when using the concept of
joint persistence. With invariant joint persistence, mechanical properties of rock bridges deteriorated
with increasing dispersion, manifested by lower shear resistance, lower stress-concentration area and
value, higher displacement arc field reduction and lower asperity of macro shear fracture. A negative
exponent relationship between the shear resistance and dispersion was found, in which the joint began
to act significantly to the shear resistance at the joint persistence of 0.20, and this was possible to be
used to define a rock bridge. Besides, both RBP and DoP were appropriate indexes when considering
the scale effects of rock bridges.
23
4.4 Limitations of the present study
In the present study, numerical simulations were implemented at the 2D level, bringing the limitations
of high consistency with the 3D physical prototypes though the results at the 2D level might
theoretically appear compatible at the 3D level and could save plenty of time to calculate and analyse.
Furthermore, this research focused on filling in the gap of scale effects of rock bridges, and other
factors, such as minerals, joint length and orientation, normal stress and loading rate, were not included.
In addition, our understandings of the scale effects of rock bridges were still at the laboratory scale and
based on a traditional back analysis method due to the invisibility of rock bridges, which might be
improved by introducing some techniques to identify rock bridges in the field.
5 Conclusions
To fill in the gap of the investigation of the scale effects of rock bridges, numerical simulations were
performed on direct shear tests with different dispersion of rock bridges using UDEC while
maintaining a constant joint persistence. From the perspective of load-displacement curves, stress and
displacement fields, crack propagations and AE characterizations, the following key conclusions could
be drawn.
1. Both shear resistance and peak shear displacement decreased with increasing dispersion, and the
former reduction increased with increasing joint persistence. While the shear modulus was
insensitive to the scale of rock bridges.
2. Rock bridges at the end bore the key resistance, and stress-concentration area and value decreased
with increasing dispersion.
3. The uneven distribution of displacement field of rock bridges was in an arc manner moving and
degrading away from the load, illustrating the sequent failure of multi rock bridges. The relative
degradation of this arc increased with increasing dispersion.
4. Propagation of wing cracks was not sensitive to the scale, while the asperity of macro shear
fracture mainly formed by secondary cracks basically decreased with increasing dispersion.
5. Dispersion of rock bridges might lead to the overlap of the precursors identified by intense AE
events and abrupt AE energy.
6. A unit with joint persistence of 0.20 might be a threshold to define a rock bridge, and both RBP
and DoP were appropriate indexes when considering the scale effects of rock bridges.
24
References
1 Allersma HGB (2005) Optical analysis of stress and strain in shear zones. In: International Conference on Powders and Grains, Stuttgart, Germany, pp 187-191
2 Alzo’ubi AK (2012) Modeling of rocks under direct shear loading by using discrete element method. Alhosn University Journal of Engineering & Applied Sciences 4:5-20
3 Asadizadeh M, Moosavi M, Hossaini MF, Masoumi H (2018) Shear strength and cracking process of non-persistent jointed rocks: An extensive experimental investigation. Rock Mechanics and Rock Engineering 51(2):415-428. https://doi.org/10.1007/s00603-017-1328-6
4 Bagheripour MH, Mostyn GR (1995) Strength of a discontinuously jointed rock mass in shear. In: 8th ISRM Congress, Tokyo, Japan, pp 1209-1212
5 Bandis S, Lumsden AC, Barton NR (1981) Experimental studies of scale effects on the shear behaviour of rock joints. International Journal of Rock Mechanics and Mining Sciences & Geomechanics Abstracts 18(1):1-21. https://doi.org/10.1016/0148-9062(81)90262-X
6 Barton NR, Lien R, Lunde J (1974) Engineering classification of rock masses for the design of tunnel support. Rock Mechanics 6(4):189-236. https://doi.org/10.1007/BF01239496
7 Bieniawski ZT (1973) Engineering classification of jointed rock masses. Civil Engineer in South Africa 15:335-343
8 Bonilla-Sierra V, Scholtès L, Donzé FV, Elmouttie M (2015) DEM analysis of rock bridges and the contribution to rock slope stability in the case of translational sliding failures. International Journal of Rock Mechanics and Mining Sciences 80:67-78. https://doi.org/10.1016/j.ijrmms.2015.09.008
9 Bu FC, Xue L, Zhai MY, Huang XL, Dong JY, Liang N, Xu C (2021) Evaluation of the characterization of acoustic emission of brittle rocks from the experiment to numerical simulation. Scientific Reports. https://doi.org/10.1038/s41598-021-03910-8
10 Cai M, Kaiser PK, Uno H, Tasaka Y, Minami M (2004) Estimation of rock mass deformation modulus and strength of jointed hard rock masses using the GSI system. International Journal of Rock Mechanics and Mining Sciences 41(1):3-19. https://doi.org/10.1016/S1365-1609(03)00025-X
11 Cao RH, Cao P, Lin H, Ma GW, Chen Y (2017) Failure characteristics of intermittent fissures under a compressive-shear test: Experimental and numerical analyses. Theoretical and Applied Fracture Mechanics 96:740-757. https://doi.org/10.1016/j.tafmec.2017.11.002
12 Cao RH, Cao P, Lin H, Fan X, Zhang CY, Liu TY, Stochino F (2019) Crack initiation, propagation, and failure characteristics of jointed rock or rock-like specimens: A review. Advances in Civil Engineering 6975751. https://doi.org/10.1155/2019/6975751
13 Chen GQ, Zhang Y, Huang RQ, Guo F, Zhang GF (2015) Failure mechanism of rock bridge based on acoustic emission technique. Journal of Sensors 964730. https://doi.org/10.1155/2015/964730
14 Chen HR, Qin SQ, Xue L, Yang BC, Zhang K (2021) Universal precursor seismicity pattern before locked-segment rupture and evolutionary rule for landmark earthquakes. Geoscience Frontiers 101314. https://doi.org/10.1016/j.gsf.2021.101314
15 Christianson M, Board M, Rigby D (2006) UDEC simulation of triaxial testing of lithophysal tuff. In: Proceedings of the 41st U.S. Rock Mechanics Symposium, Golden, USA, paper ARMA-06-968
16 Cundall PA, Strack ODL (1979) A discrete numerical model for granular assemblies. Géotechnique 29(1):47-65. https://doi.org/10.1680/geot.1979.29.1.47
25
17 Cundall PA, Damjanac B, Varun (2016) Considerations on slope stability in a jointed rock mass. In: 50th U.S. Rock Mechanics/Geomechanics Symposium, Houston, USA, paper ARMA-2016-339
18 Cylwik SD (2021) Three-dimensional anisotropic shear strength of jointed rock masses. In: 55th U.S. Rock Mechanics/Geomechanics Symposium, Houston, USA, paper ARMA-2021-1799
19 Dempers GD, Seymour CRW, Jenkins PA (2011) A new approach to assess open pit slope stability. In: Proceedings, Slope Stability 2011: International Symposium on Rock Slope Stability in Open Pit Mining and Civil Engineering, Vancouver, Canada
20 Dershowitz WS, Einstein HH (1988) Characterizing rock joint geometry with joint system models. Rock Mechanics and Rock Engineering 21(1):21-51. https://doi.org/10.1007/BF01019674
21 Diederichs MS, Kaiser PK (1999) Tensile strength and abutment relaxation as failure control mechanisms in underground excavations. International Journal of Rock Mechanics and Mining Sciences 36(1):69-96. https://doi.org/10.1016/S0148-9062(98)00179-X
22 Einstein HH, Veneziano D, Baecher GB, O'Reilly KJ (1983) The effect of discontinuity persistence on rock slope stability. International Journal of Rock Mechanics and Mining Sciences & Geomechanics Abstracts 20(5):227-236. https://doi.org/10.1016/0148-9062(83)90003-7
23 Elmo D, Donati D, Stead D (2018) Challenges in the characterisation of intact rock bridges in rock slopes. Engineering Geology 245:81-96. https://doi.org/10.1016/j.enggeo.2018.06.014
24 Elmo D, Yang B, Stead D, Rogers S (2021a) A discrete fracture network approach to rock mass classification. In: Barla M, Di Donna A, Sterpi D (eds) Challenges and Innovations in Geomechanics, Proceedings of the 16th International Conference of IACMAG - Volume 1, Lecture Notes in Civil Engineering, Springer, Cham, Switzerland, pp 854-861. https://doi.org/10.1007/978-3-030-64514-4_92
25 Elmo D, Stead D, Yang B, Marcato G, Borgatti L (2021b) A new approach to characterise the impact of rock bridges in stability analysis. Rock Mechanics and Rock Engineering 1:1-19. https://doi.org/10.1007/s00603-021-02488-x
26 Fan X, Li KH, Lai HP, Zhao QH, Sun ZH (2018) Experimental and numerical study of the failure behavior of intermittent rock joints subjected to direct shear load. Advances in Civil Engineering 4294501. https://doi.org/10.1155/2018/4294501
27 Gao FQ, Stead D (2014) The application of a modified Voronoi logic to brittle fracture modelling at the laboratory and field scale. International Journal of Rock Mechanics and Mining Sciences 68:1-14. https://doi.org/10.1016/j.ijrmms.2014.02.003
28 Gehle C, Kutter HK (2003) Breakage and shear behaviour of intermittent rock joints. International Journal of Rock Mechanics and Mining Sciences 40(5):687-700. https://doi.org/10.1016/S1365-1609(03)00060-1
29 Gerolymatou E, Triantafyllidis T (2016) Shearing of materials with intermittent joints. Rock Mechanics and Rock Engineering 49(7):2689-2700. https://doi.org/10.1007/s00603-016-0956-6
30 Ghazvinian A, Nikudel MR, Sarfarazi V (2007) Effect of rock bridge continuity and area on shear behavior of joints. In: 11th ISRM Congress, Lisbon, Portugal, paper ISRM-11CONGRESS-2007-054
31 Ghazvinian A, Sarfarazi V, Schubert W, Blumel M (2012) A study of the failure mechanism of planar non-persistent open joints using PFC2D. Rock Mechanics and Rock Engineering 45(5):677-693. https://doi.org/10.1007/s00603-012-0233-2
26
32 Guo QF, Pan JL, Cai MF, Zhang Y (2020) Investigating the effect of rock bridge on the stability of locked section slopes by the direct shear test and acoustic emission technique. Sensors 20(3):638. https://doi.org/10.3390/s20030638
33 Hencher SR, Richards LR (2015) Assessing the shear strength of rock discontinuities at laboratory and field scales. Rock Mechanics and Rock Engineering 48(3):883-905. https://doi.org/10.1007/s00603-014-0633-6
34 Hoek E, Kaiser PK (1995) Support of underground excavation in hard rock. Balkema, Rotterdam, Netherlands, pp 215
35 Hokmabadi NN, Sarfarazi V, Moshrefifar M (2016) Investigation of separation non-persistent faults in fracture mechanism of rock bridge. Civil Engineering Journal 2(7):348-357. https://doi.org/10.28991/cej-2016-00000039
36 Itasca (2014) Universal distinct element code (UDEC), version 6.0. Itasca Consulting Group, Inc., Minneapolis, USA
37 Jamil (1992) Strength of non-persistent rock joints. PhD Thesis, University of Illinois at Urbana-Champaign.
38 Jennings JE (1970) A mathematical theory for the calculation of the stability of open cast mines. In: Proceedings of the Symposium on the Theoretical Background to the Plannings of Open Pit Mines with Special Reference to Slope Stability, Johannesburg, South Africa, pp 87-102
39 Jiang MJ, Sun C, Rodriguez-Dono A, Zhang N, Shao JF (2015a) Influence of time-dependence on failure of echelon rock joints through a novel DEM model. European Journal of Environmental and Civil Engineering 19 (sup1):s108-s118. https://doi.org/10.1080/19648189.2015.1064624
40 Jiang MJ, Jiang T, Crosta GB, Shi ZM, Chen H, Zhang N (2015b) Modeling failure of jointed rock slope with two main joint sets using a novel DEM bond contact model. Engineering Geology 193:79-96. https://doi.org/10.1016/j.enggeo.2015.04.013
41 Jiang YJ, Li B, Tanabashi Y (2006) Estimating the relation between surface roughness and mechanical properties of rock joints. International Journal of Rock Mechanics and Mining Sciences 43(6):837-846. https://doi.org/10.1016/j.ijrmms.2005.11.013
42 Jiang YJ, Chen YQ, Cheng XZ, Luan HJ, Zhang SH, Zhao QZ, Han W (2020) Experimental study on shear behavior and acoustic emission characteristics of nonpersistent joints. Geofluids 8815467. https://doi.org/10.1155/2020/8815467
43 Kemeny J (2004) Time-dependent drift degradation due to the progressive failure of rock bridges along discontinuities. International Journal of Rock Mechanics and Mining Sciences 42(1):35-46. https://doi.org/10.1016/j.ijrmms.2004.07.001
44 Kemeny J, Roth K, Wu H (2016) Modeling of time-dependent rock failure in Abaqus and PFC3D. In: 50th U.S. Rock Mechanics/Geomechanics Symposium, Houston, USA, paper ARMA-2016-581
45 Kim BH, Cai M, Kaiser PK, Yang HS (2007) Estimation of block sizes for rock masses with non-persistent joints. Rock Mechanics and Rock Engineering 40(2):169-192. https://doi.org/10.1007/s00603-006-0093-8
46 Lajtai EZ (1969) Strength of discontinuous rocks in direct shear. Géotechnique 19(2):218-233. https://doi.org/10.1680/geot.1969.19.2.218
47 Lan HX, Martin CD, Hu B (2010) Effect of heterogeneity of brittle rock on micromechanical extensile behavior during compression loading. Journal of Geophysical Research: Solid Earth 115: B01202. https://doi.org/10.1029/2009JB006496
27
48 Laubscher DH (1990) A geomechanics classification system for the rating of rock mass in mine design. Journal of the Southern African Institute of Mining and Metallurgy 90(10):257-273
49 Lorig LJ, Cundall PA (1989) Modeling of reinforced concrete using the distinct element method. In: Shah SP, Swartz SE (eds) Fracture of Concrete and Rock, Springer, New York, USA, pp 276-287. https://doi.org/10.1007/978-1-4612-3578-1_28
50 Moradian Z, Einstein HH, Ballivy G (2016) Detection of cracking levels in brittle rocks by parametric analysis of the acoustic emission signals. Rock Mechanics and Rock Engineering 49(3):785-800. https://doi.org/10.1007/s00603-015-0775-1
51 Muralha J, Grasselli G, Tatone B, Blümel M, Chryssanthakis P, Jiang YJ (2014) ISRM suggested method for laboratory determination of the shear strength of rock joints: Revised version. Rock Mechanics and Rock Engineering 47(1):291-302. https://doi.org/10.1007/s00603-013-0519-z
52 Park H-J (2005) A new approach for persistence in probabilistic rock slope stability analysis. Geosciences Journal 9(3):287. https://doi.org/10.1007/BF02910589
53 Paronuzzi P, Bolla A, Rigo E (2016) 3D stress-strain analysis of a failed limestone wedge influenced by an intact rock bridge. Rock Mechanics and Rock Engineering 49(8):3223-3242. https://doi.org/10.1007/s00603-016-0963-7
54 Prudencio M, Jan MVS (2007) Strength and failure modes of rock mass models with non-persistent joints. International Journal of Rock Mechanics and Mining Sciences 44(6):890-902. https://doi.org/10.1016/j.ijrmms.2007.01.005
55 Qin CA, Chen GQ, Zhu J, Tang P (2020) A precursor of bedding rockslide: Rock spalling in the key block triggered by tensile cracks. Bulletin of Engineering Geology and the Environment 79(5):2513-2528. https://doi.org/10.1007/s10064-019-01703-y
56 Sarfarazi V, Ghazvinian A, Schubert W, Blumel M, Nejati HR (2014) Numerical simulation of the process of fracture of echelon rock joints. Rock Mechanics and Rock Engineering 47(4):1355-1371. https://doi.org/10.1007/s00603-013-0450-3
57 Sarfarazi V, Haeri H (2016) A review of experimental and numerical investigations about crack propagation. Computers and Concrete 18(2):235-266. https://doi.org/10.12989/CAC.2016.18.2.235
58 Savilahti T, Nordlund E, Stephansson O (1991) Shear box testing and modelling of joint bridges. International Journal of Rock Mechanics and Mining Sciences & Geomechanics Abstracts 28(2-3):A71. https://doi.org/10.1016/0148-9062(91)92236-R
59 Schultz RA (1996) Relative scale and the strength and deformability of rock masses. Journal of Structural Geology 18(9):1139-1149. https://doi.org/10.1016/0191-8141(96)00045-4
60 Segall P, Pollard DD (1980) Mechanics of discontinuous faults. Journal of Geophysical Research: Solid Earth 85(B8):4337-4350. https://doi.org/10.1029/JB085iB08p04337
61 Shang JL, Hencher SR, West LJ, Handley K (2017) Forensic excavation of rock masses: A technique to investigate discontinuity persistence. Rock Mechanics and Rock Engineering 50(11):2911-2928. https://doi.org/10.1007/s00603-017-1290-3
62 Shang JL, Zhao Z, Hu J, Handley K (2018) 3D particle-based DEM investigation into the shear behaviour of incipient rock joints with various geometries of rock bridges. Rock Mechanics and Rock Engineering 51(11):3563-3584. https://doi.org/10.1007/s00603-018-1531-0
63 Stavrou A, Vazaios I, Murphy W, Vlachopoulos N (2019) Refined approaches for estimating the strength of rock blocks. Geotechnical and Geological Engineering 37(6):5409-5439. https://doi.org/10.1007/s10706-019-00989-9
28
64 Stead D, Eberhardt E (2013) Understanding the mechanics of large landslides. Italian Journal of Engineering Geology and Environment - Book Series (6):85-112. https://doi.org/10.4408/IJEGE.2013-06.B-07
65 Tang P, Chen GQ, Huang RQ, Zhu J (2020) Brittle failure of rockslides linked to the rock bridge length effect. Landslides 17(4):793-803. https://doi.org/10.1007/s10346-019-01323-3
66 Tang P, Chen GQ, Huang RQ, Wang D (2021) Effect of the number of coplanar rock bridges on the shear strength and stability of slopes with the same discontinuity persistence. Bulletin of Engineering Geology and the Environment 80(1):3675-3691. https://doi.org/10.1007/s10064-021-02180-y
67 Tatone B, Grasselli G (2015) A combined experimental (micro-CT) and numerical (FDEM) methodology to study rock joint asperities subjected to direct shear. In: 49th U.S. Rock Mechanics/Geomechanics Symposium, San Francisco, USA, paper ARMA-2015-304
68 Terzaghi K (1962) Stability of steep slopes on hard unweathered rock. Géotechnique 12(4):251-270. https://doi.org/10.1680/geot.1962.12.4.251
69 Wasantha PLP, Ranjith PG, Xu T, Zhao J, Yan YL (2014) A new parameter to describe the persistency of non-persistent joints. Engineering Geology 181:71-77. https://doi.org/10.1016/j.enggeo.2014.08.003
70 Wong RHC, Leung WL, Wang SW (2001) Shear strength studies on rock-like models containing arrayed open joints. In: 38th U.S. Symposium on Rock Mechanics, Washington, USA, paper ARMA-01-0843
71 Wu XL, Wang G, Li GX, Han W, Sun SQ, Zhang SB, Bi WL (2020) Research on shear behavior and crack evolution of symmetrical discontinuous rock joints based on FEM-CZM. Symmetry 12(8):1314. https://doi.org/10.1016/10.3390/sym12081314
72 Xue L, Qin SQ, Li P, Li GL, Oyediran IA, Pan XH (2014a) New quantitative displacement criteria for slope deformation process: From the onset of the accelerating creep to brittle rupture and final failure. Engineering Geology 182:79-87. http://dx.doi.org/10.1016/j.enggeo.2014.08.007
73 Xue L, Qin SQ, Sun Q, Wang YY, Lee LM, Li WC (2014b) A study on crack damage stress thresholds of different rock types based on uniaxial compression tests. Rock Mechanics and Rock Engineering 47(4):1183-1195. http://dx.doi.org/10.1007/s00603-013-0479-3
74 Yang SQ, Dai YH, Han LJ, Jin ZQ (2009) Experimental study on mechanical behavior of brittle marble samples containing different flaws under uniaxial compression. Engineering Fracture Mechanics 76(12):1833-1845. https://doi.org/10.1016/j.engfracmech.2009.04.005
75 Yang XX, Kulatilake PHSW (2019) Laboratory investigation of mechanical behavior of granite samples containing discontinuous joints through direct shear tests. Arabian Journal of Geosciences 12(3):79. https://doi.org/10.1007/s12517-019-4278-3
76 Zare S, Karimi-Nasab S, Jalalifar H (2021) Analysis and determination of the behavioral mechanism of rock bridges using experimental and numerical modeling of non-persistent rock joints. International Journal of Rock Mechanics and Mining Sciences 141:104714. https://doi.org/10.1016/j.ijrmms.2021.104714
77 Zhang HQ, Zhao ZY, Tang CA, Song L (2005) Numerical study of shear behavior of intermittent rock joints with different geometrical parameters. International Journal of Rock Mechanics and Mining Sciences 43(5):802-816. https://doi.org/10.1016/j.ijrmms.2005.12.006
78 Zhang XP, Wong LNY (2012) Cracking processes in rock-like material containing a single flaw under uniaxial compression: A numerical study based on parallel bonded-particle model approach.
29
Rock Mechanics and Rock Engineering 45(5):711-737. https://doi.org/10.1007/s00603-011-0176-z
79 Zhang XP, Wong LNY (2014) Displacement field analysis for cracking processes in bonded-particle model. Bulletin of Engineering Geology and the Environment 73(1):13-21. https://doi.org/10.1007/s10064-013-0496-1
80 Zhang YC, Jiang YJ, Asahina D, Wang CS (2020) Experimental and numerical investigation on shear failure behavior of rock-like samples containing multiple non-persistent joints. Rock Mechanics and Rock Engineering 53(10):4717-4744. https://doi.org/10.1007/s00603-020-02186-0
81 Zhong Z, Huang D, Zhang YF, Ma GW (2020) Experimental study on the effects of unloading normal stress on shear mechanical behaviour of sandstone containing a parallel fissure pair. Rock Mechanics and Rock Engineering 53(4):1647-1663. https://doi.org/10.1007/s00603-019-01997-0
82 Zhu L, Zhang Y, Dong L, Wu JW, Duan LQ, Zhang L (2019) Experimental study on acoustic emission characteristics of intermittent jointed rock mass under uniaxial compression. IOP Conference Series: Earth and Environmental Science 283(1):012015. https://doi.org/10.1088/1755-1315/283/1/012015