Embed Size (px)
Citation preview
Observations of the southern East Madagascar Current and
undercurrent and countercurrent system
J. J. Nauw,1,3 H. M. van Aken,1 A. Webb,2 J. R. E. Lutjeharms,2 and W. P. M. de Ruijter3
Received 16 November 2007; revised 1 April 2008; accepted 14 April 2008; published 5 August 2008.
[1] In April 2001 four hydrographic sections perpendicular to the southern EastMadagascar Current were surveyed as part of the Agulhas Current Sources Experiment.Observations with a vessel mounted and a lowered ADCP produced information on thecurrent field while temperature, salinity, oxygen and nutrient data obtained with a CTD-Rosette system, gave information on the water mass structure of the currents southeast ofMadagascar. The peak velocity in the pole-ward East Madagascar Current throughthese four sections had a typical magnitude of �110 cm/s, while the width of this currentwas of the order of 120 km. The mean pole-ward volume transport rate of this currentduring the survey above the 5�C isotherm was estimated to be 37 ± 10 Sv. On all foursections an undercurrent was observed at intermediate depths below the East MadagascarCurrent. Its equator-ward transport rate amounted to 2.8 ± 1.4 Sv. Offshore of the EastMadagascar Current the shallow South Indian Ocean Countercurrent was observed. Thiseastward frontal jet coincided with the barotropic and thermohaline front that separates thesaline Subtropical Surface Water from the fresher Tropical Surface Water in the EastMadagascar Current. The near-surface geostrophic flow of the East Madagascar Current,derived from satellite altimetry data from 1992 to 2005, suggests a strong variabilityof this transport due to eddy variability and interannual changes. The long-term pole-wardmean transport of the East Madagascar Current, roughly estimated from those altimetrydata amounts to 32 Sv. The upper-ocean water mass of the East Madagascar Currentwas very saline in 2001, compared to WOCE surveys from 1995. Comparison of ourundercurrent data with those of the WOCE surveys in 1995 confirms that the undercurrentis a recurrent feature. Its water mass properties are relatively saline, due to the presenceof water originating from the Red Sea outflow at intermediate levels. The saline waterwas advected from the Mozambique Channel to the eastern slope of Madagascar.
Citation: Nauw, J. J., H. M. van Aken, A. Webb, J. R. E. Lutjeharms, and W. P. M. de Ruijter (2008), Observations of the southern
East Madagascar Current and undercurrent and countercurrent system, J. Geophys. Res., 113, C08006, doi:10.1029/2007JC004639.
1. Introduction
[2] The westward South Equatorial Current (SEC) in theIndian Ocean feeds the ocean currents along the easternshores of Madagascar. Water approaching the island isdeflected either northward or southwards, depending onlatitude, with the bifurcation point assumed to be on averageat approximately 18� to 20�S [Chapman et al., 2003;Siedler et al., 2006]. New et al. [2007] have observed thatthe Mascarene Plateau near 60�E splits the SEC into twocores, each transporting about 25 Sv (1 Sv = 106 m3/s).They speculate that the southernmost of these SEC coresfeeds the southward flowing western boundary current
along the eastern ocean margin of Madagascar, the EastMadagascar Current (EMC). The southward flowing EMCis observed between �20�S and the southern point ofMadagascar at �25�300S (Cap Sainte Marie), with a totallength of only about 650 km, is the western boundarycurrent of the South Indian subtropical gyre [Duncan,1970; Lutjeharms, 1988b]. Geostrophic estimates of thepole-ward volume transport by the EMC relative to a varietyof reference levels vary from 56 to 41 Sv, 21 Sv, 25 Sv, and20 Sv by, respectively, Harris [1972], Lutjeharms et al.[1981], Swallow et al. [1988], and Stramma and Lutjeharms[1997]. The main causes of uncertainty in these estimatesare probably the different assumptions about the existenceand properties of a level of no motion, obscuring any realtemporal variability. Using hydrographic observations fromthe World Ocean Circulation Experiment, Donohue andToole [2003] derived a southward transport of 20 Sv forthe pole-ward flow east of Madagascar from an inversemodel. Schott et al. [1988] estimated a mean southwardtransport in the EMC at 23�S of 20 Sv from 11 months ofmeasurements with moored current meters. Simulations
JOURNAL OF GEOPHYSICAL RESEARCH, VOL. 113, C08006, doi:10.1029/2007JC004639, 2008
1Department of Physical Oceanography, Royal Netherlands Institute forSea Research, Den Burg/Texel, Netherlands.
2Department of Oceanography, University of Cape Town, Rondebosch,South Africa.
3Department of Physics and Astronomy, Institute for Marine andAtmospheric Research Utrecht, Utrecht University, Utrecht, Netherlands.
Copyright 2008 by the American Geophysical Union.0148-0227/08/2007JC004639
C08006 1 of 15
with ocean general circulation models suggest a meantransport rate by the EMC between 14.8 Sv [Quartly etal., 2006] and 30 Sv [Matano et al., 2002]. The variations inthe transport estimates may also depend on different defi-nitions of the width and depth of the EMC and on theinclusion or exclusion of parts of mid ocean eddies at theend of sections as well as the seasonal and interannualvariability of the EMC transport.[3] Palastanga et al. [2007] and Siedler et al. [2006] have
described the existence of an eastward South Indian OceanCountercurrent (SICC), just south of the westward exten-sion of the EMC south of Madagascar. The SICC isprobably identical to the Subtropical Countercurrent de-scribed earlier by Sharma [1976]. This shallow frontal jetreaches east to at least 100�E. The source of the SICC is notyet known, but data from satellite altimetry suggest that theeastward SICC is already present in the Mozambique Basin,southwest of Madagascar [Siedler et al., 2006].[4] Considerable eddy variability of the EMC has been
derived from surface drifters and subsurface floats [Chapmanet al., 2003; Shenoi et al., 1999]. The characteristic magni-tude of the eddy velocity anomalies (twice the standarddeviation) is about 0.5 to 1 times the long term meanvelocity [Schott et al., 1988]. Eddies arrive in the EMCfrom the east, according to satellite altimetry and infraredobservations as well as model simulations [Quartly et al.,2005; de Ruijter et al., 2005]. Some of those individualhighs and lows are elongated meridionally, suggestive ofRossby wavefronts, while others are approximately circularas might be expected for vortical eddies. They may partlyoriginate from the recently discovered SICC and the SEC.Palastanga et al. [2007] have shown ‘‘that regions of largevertical shear along the SICC-SEC system are baroclinicallyunstable’’. Estimates of the frequencies of these unstablemodes in the order of 3.5 to 6 times/a are close toobservations of the mesoscale variability, derived fromaltimetry data. However, Weijer [2008] suggests that freeoscillatory barotropic Rossby basin modes in the Mascarenebasin east of Madagascar are responsible for the 60 dquasiperiodicity in current observations. After leaving theEMC, the eddies have a tendency to drift southwestwardsouth of Madagascar and to join the northern AgulhasCurrent [Biastoch and Krauss, 1999; Quartly and Srokosz,2002; Chapman et al., 2003; de Ruijter et al., 2004].[5] The annual variation of the wind-forcing over the
southern Indian Ocean may cause an annual variation ofthe EMC volume transport rate in response. However, thepresent knowledge on the annual variability is quite con-fusing. While You [1997] derived a southward flow in theaustral winter (May to October) from water mass analysis,he found a reversal to a northward flow during the australsummer (November to April). Matano et al. [1999] deriveda marked decrease of the EMC strength in the austral fall(April) and relative maxima during late summer and latewinter from simulations with a general circulation model ofthe Indian Ocean. However, Matano et al. [2002] found aseasonal range of only ±2 Sv relative to a mean transport ofthe EMC of 30 Sv, with a maximal southward transportduring the austral fall (April and May) in simulations with aParallel Ocean Circulation Model.[6] Although most eddies from the EMC are observed to
move southwestward to the Agulhas Current, the path taken
by the EMC water after it has passed the southern tip ofMadagascar is not obvious; three different flow patternshave been suggested [Tomczak and Godfrey, 1994; Quartlyand Srokosz, 2004]. One path continues along the southcoast of Madagascar and carries the waters of the EMC intothe southern part of the Mozambique Channel [Tchernia,1980; Grundlingh, 1993], where it makes an anticyclonicloop toward the African coast. The EMC also has beenshown to flow directly west into the Agulhas Current[Grundlingh, 1985, 1987, 1993; Lutjeharms, 1988a]. Finally,the EMC can retroflect or break up south of Madagascar, assuggested by satellite data of Sea Surface Temperature (SST)and chlorophyll concentrations and shed rings and filamentsof the EMC into the Mozambique Basin [Lutjeharms, 1988b;DiMarco et al., 2000; Quartly and Srokosz, 2002; de Ruijteret al., 2002, 2004]. However, these data could also beinterpreted as being caused by the regular presence oftransient anticyclonic eddies in this area. These advecthigh-chlorophyll surface waters from the continental slopecounter-clockwise into the interior of the subtropical gyre[Quartly et al., 2006].[7] Not much is known about the vertical structure of the
EMC, since measurements in the EMC are very scarce. Forthe nearby Agulhas Current, the existence of a deep under-current at depths between 700 and 2000 m along the Africancontinental slope has been reported [Beal and Bryden, 1997;Donohue et al., 2000]. The southern Mozambique Channel,west of Madagascar, also displays an equator-ward under-current along the African continental slope, probably anextension of the Agulhas Undercurrent [DiMarco et al.,2002; de Ruijter et al., 2002]. van Aken et al. [2004] showedfrom current measurements east of Madagascar (between1900 and 3100 m depth) and water mass analysis at 20� and23�S that aged North Indian Deep Water (NIDW) flowssouthward along the east Madagascar slope, in the samedirection as the upper-layer flow of the EMC. A velocityminimum in the southward velocity was suggested by ex-trapolation of the current measurements, and even a smallnorthward flow at depths of �1100 to 1700 m was possible,in between the southward flowing surface and thermoclinewaters of the EMC andNIDWbelow 1900m [van Aken et al.,2004]. Below the deep water (>3500 m) Antarctic BottomWater flowed northward along the East Madagascar Slopeaccording to geostrophic computations relative to a referencelevel between 3100 and 3500 m [Swallow and Pollard,1988]. This agrees with the results of an inverse model,presented by Donohue and Toole [2003] who found anorthward flow of AABW with a magnitude of 3 Sv.[8] In this paper we will analyze the hydrographic prop-
erties of the EMC in its termination region southeast ofMadagascar, e.g., its transport rate and the temperature andsalinity structure in the upper 2400 m of the water column.This analysis is based on observations, carried out in 2001with RV Pelagia during the Dutch-South African AgulhasCurrent Sources Experiment (ACSEX [de Ruijter et al.,2006]), with additional data from WOCE surveys andsatellite altimetry.
2. Data
[9] In the ACSEX programme three hydrographic sur-veys around Madagascar were carried out by RV Pelagia.
C08006 NAUW ET AL.: EAST MADAGASCAR CURRENT SYSTEM
2 of 15
C08006
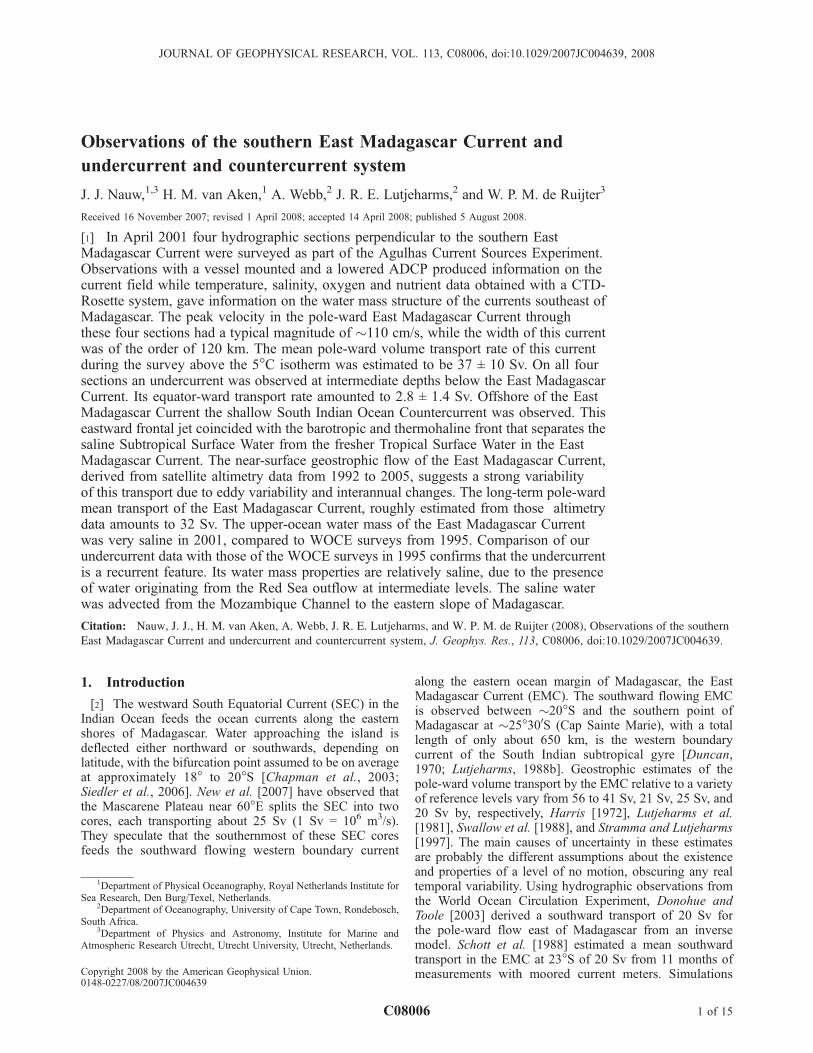
During the ACSEX1 cruise (Figure 1) hydrographicsections M1 to M4 were surveyed from 26 March to 8 April2000 [de Ruijter et al., 2002]; the ACSEX2 and ACSEX3cruises took place between 5 March and 16 April 2001 andcovered sections T1 to T9 together with E1 and re-occupiedsection M3 as E2 [Ridderinkhof and de Ruijter, 2003; vanAken et al., 2004; Nauw et al., 2005]. The mean intervalbetween successive hydrographic stations in the sectionswas about 24 nautical miles (44 km), smaller over thecontinental slope of Madagascar where a station distanceof less than 10 to about 35 km was used. In general,hydrographic casts were performed with a 24-bottlerosette/CTD system to yield full depth conductivity/salinityand temperature profiles. However, due to a damaged cablethe CTD casts were terminated at a depth of about 2400 mat most stations of sections T2 to T8 (Figure 1). Additionaldamage to the cable forced us to end the final casts of theACSEX2 cruise on sections T8 and T9 at about 800 mdepth. The latter shallow CTD casts are not used in thispaper. During the up-casts water samples were taken atstandard depths and analyzed for salinity (for use in theconductivity calibration), nutrient (phosphate, nitrate, andsilicate) and oxygen concentrations.[10] During the survey 1-min velocity profile ensembleswere
recorded in 8 m depth bins with a 75 kHz narrow band VesselMounted Acoustic Doppler Current Profiler (VMADCP,RD Instruments). From these data 30-min averaged velocityprofiles were determined for the upper 500 m, with anestimated accuracy of 5 cm/s or better. With a characteristicship speed of 10 knots, these ensembles have a horizontalresolution of 5 nautical miles or 9.2 km. No indications
were found of a significant influence of the Ekman layer onthe upper ocean velocity structure. Therefore the meanvelocity vector in the upper 100 m of the ocean from theVMADCP measurements is used as an approximation of thegeostrophic velocity. Bulk sea surface temperature (SST)and salinity (SSS) were measured continuously with sensorsin a water inlet 3 m below the sea surface. These underwaydata were recorded every minute. The data were calibratedby comparison with the salinity from water samples (2 to3 per day) and temperature and salinity at 3 m depth fromcalibrated CTD down-casts. The SST and SSS data werethen low-pass filtered and subsampled every 30 min toremove occasional spikes and noise. Their accuracy isestimated to be better than 0.1�C and 0.01, respectively.[11] At each hydrographic station deep profiles of the
horizontal current velocities were attained with two syn-chronized self-contained 300-kHz ADCPs mounted in theCTD frame. The raw data were postprocessed with aninverse solution method, in which the near bottom velocitieswere constrained using bottom tracking, if near-bottom datawere available for that particular station [Visbeck, 2002].Because of the available limited length of the CTD cablebottom tracking was only possible for the few stations overcontinental shelf and slope of Madagascar, to a maximumwater depth of 2400 m. Velocity profiles were also deter-mined with the more traditional shear-based method forcomparison [Fischer and Visbeck, 1993]. Moreover, indi-vidual profiles for the down- and up-cast only were deter-mined with the inverse method. For the profiles the solutionwas constrained by initially assuming a zero depth averaged
Figure 1. Map of hydrographic stations, occupied during the ACSEX cruises in 2000 and 2001. Thesection M1 to M4 (triangles) were surveyed during ACSEX1 in 2000, the Section T1 to T9 and E1 andE2 during ACSEX2 (bullets) and ACSEX3 (crosses) in 2001.
C08006 NAUW ET AL.: EAST MADAGASCAR CURRENT SYSTEM
3 of 15
C08006
velocity after which the mean barotropic velocity wasadded.[12] For the shear-based method, the error in the depth-
averaged or barotropic current component was estimated tobe 1 cm/s due to navigational errors [Hacker et al., 1996;Beal and Bryden, 1999]. The error in the velocity at anygiven depth could be estimated to be 2 to 4 cm/s and wasrelated to errors in the shear profiles from each ping of theADCP [Beal and Bryden, 1999; Donohue et al., 2000;Donohue and Toole, 2003]. Estimates of accuracies of 2and 5 cm/s for the depth-averaged and depth-dependent partof the velocity profile, respectively, were given in literaturefor profiles determined with the inverse method [Schott etal., 2004; Stramma et al., 2005]. These are of similar size asthose for the shear-based method, but were determined formeasurement with a single LADCP. A thorough discussionof LADCP error estimates are discussed by King et al.[2001]. They conclude that a precise quantification of theerrors in LADCP profiles is an ongoing project and is in theorder of a few cm/s (at that time).[13] The volume transports in the EMC were determined
with the standard velocity profiles derived from the LADCPdata with the inverse method. The velocity between twosuccessive stations was determined with a linear interpola-tion. For extrapolation of the velocity toward the continentalslope two assumptions can be made. In the first case, thevelocity was assumed to decrease linearly to zero at thecontinental slope (no-slip condition). In the second case,the velocity at the continental slope was taken equal to thenearest measurement at the same depth, which will be called‘‘slip’’-condition [Beal and Bryden, 1997]. The transportwas calculated by integrating the velocity over the areacontaining the pole-ward EMC, where the zero-velocity-contour was taken as a boundary and the possible additionaltransport on the continental shelf was neglected.[14] Errors in the transport calculation can be caused by
the instrumental inaccuracy of the velocity measurementsbecause of variations in the number of scatterers, theavailability of bottom tracking data, the influence of navi-gational errors on the barotropic component of the flow,discussed above, as well as the different LADCP dataprocessing methods to calculate the velocity profiles. Toassess the accuracy of the transport estimates because ofdifferent possible processing and calculation methods, cal-culations were performed with the velocity profiles derivedwith the shear-based method, with and without a correctionfor the barotropic tide. Furthermore, transports were alsodetermined for velocity profiles derived from either thedown- or the up-cast using the inverse method. The differ-ences in transport determined with the standard method andthese other methods were used to derive a error estimate forthe transport. This comparison revealed that velocity errorscaused by instrumental and navigation errors introducedmuch smaller transport errors than the differences betweenthe velocity profiles obtained with each method. Theresulting typical accuracy of the estimates of the pole-wardtransport by the EMC amounted to 5 Sv, the accuracy of thetransport estimates for the undercurrent (see below) to1.5 Sv. The difference between the transport estimates withthe no-slip and the slip conditions amounted to 3 and 0.6 Sv(for the EMC and the undercurrent, respectively), definitelysmaller than the estimated accuracies due to different
LADCP data processing methods. Obviously, the slip trans-port rates were larger than no-slip transports rates. The realvelocity maximum in the core of a current will often bemissed in part of the section because of the limited hori-zontal resolution of the LADCP observations, comparedwith the continuous VMADCP measurements. This willlead to an under-estimate of the transport. Therefore thetransports reported here will be determined with a ‘‘slip’’condition, assuming that these systematic errors will (partly)cancel each other.[15] Internal and barotropic tides add an ageostrophic
high-frequency contribution to the flow in which we arenot primarily interested. Internal wave activity introducesdifferences between the up- and down cast and result in anRMS error of 2 to 5 cm/s [Send, 1994; DiMarco et al.,2002]. Barotropic tidal currents for eight primary (M2, S2,K1, O1, N2, P1, K2, Q1) and two long period (Mf, Mm) tideswere estimated with the TPXO.6 tidal model [Egbert andErofeeva, 2002]. The amplitude of the barotropic tidesouthwest of Madagascar was 2 cm/s in general and couldreach values up to 6 cm/s at stations over the continentalslope. A rough estimate suggests a resulting uncertainty of2 Sv for the estimate of the EMC transport. Hence the high-frequency variability may add an amount of uncertainty tothe velocity profiles smaller than the uncertainty due to thenavigational and instrumental errors.[16] Sea level anomaly (SLA) data were derived from the
1/3 � 1/3� Mercator gridded sea level anomaly maps. Thesealtimeter products were produced by SSALTO/DUACSand distributed by AVISO, Toulouse, with support fromCNES. They were used to extend our information on thepresence of mesoscale eddies near the EMC. These mapsof the SLA relative to the 1993-1999 mean sea level arebased on a merged data set from different American andEuropean satellites (TOPEX/Poseidon, Jason-1, ERS-1, 2,and Envisat).
3. Results
3.1. Near-Surface Horizontal Structure of the EMC
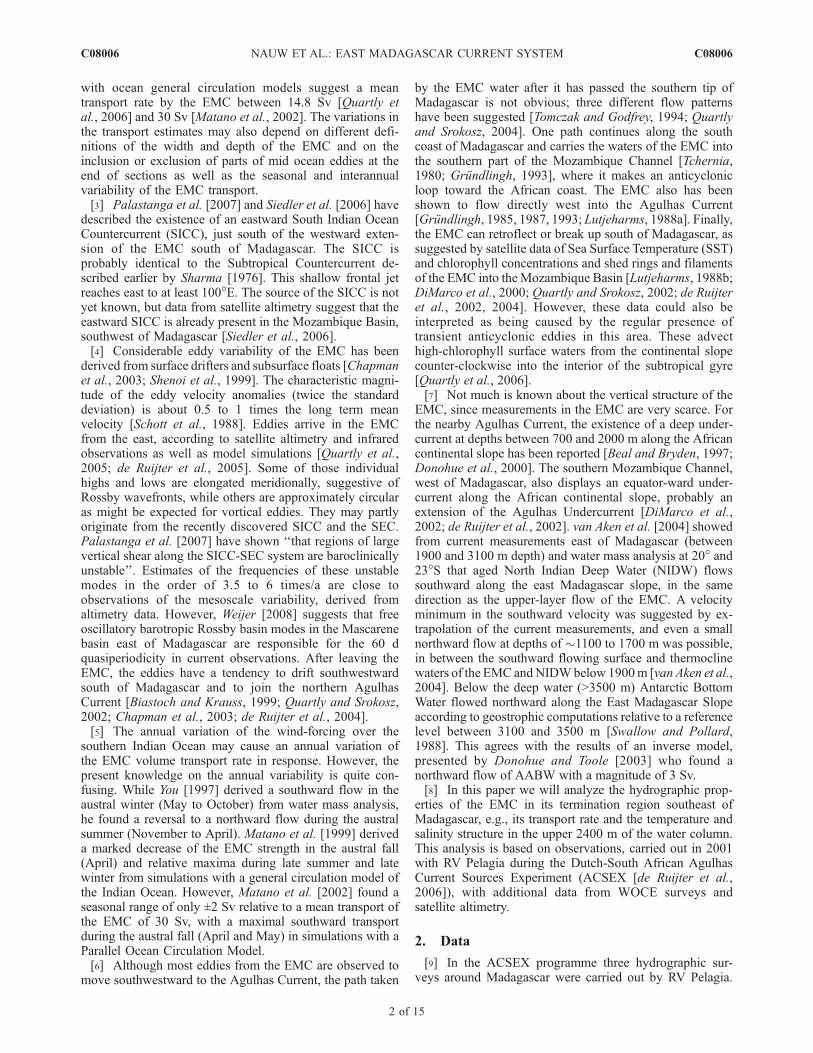
[17] The ACSEX-2 sections T5 to T8, perpendicular tothe coast of southeastern Madagascar, indeed crossed theEMC. The mean current velocity from the upper 100 m,derived from the VMADCP measurements, showed a max-imum speed in the order of 1.1 m/s (112 ± 19 cm/s close tothe 1200 m isobath at 83 ± 24 km from the coast ofMadagascar, arrows in Figure 2). The width of the EMCnear the surface was of the order of 120 km. Its core wascharacterized by an SST maximum of over 28�C (whiteisotherms in Figure 2), with the highest temperaturesobserved along section T6. Inshore of the EMC lowerSST values were found, occasionally coinciding with acountercurrent, probably related to upwelling at the inshoreside of the EMC [Machu et al., 2002] and the presence of anewly formed cyclonic eddy [de Ruijter et al., 2004].[18] The SLA pattern, synchronous with the ACSEX
survey near southeast Madagascar (grey scales in Figure 2),shows the presence of an irregularly formed high pressureridge of mesoscale eddies bounding the EMC on its seawardside. Southeast of this ridge, at sections T5, T6, and T7, ameandering countercurrent is found, transporting coolersurface water overall to the northeast. The maximum mean
C08006 NAUW ET AL.: EAST MADAGASCAR CURRENT SYSTEM
4 of 15
C08006
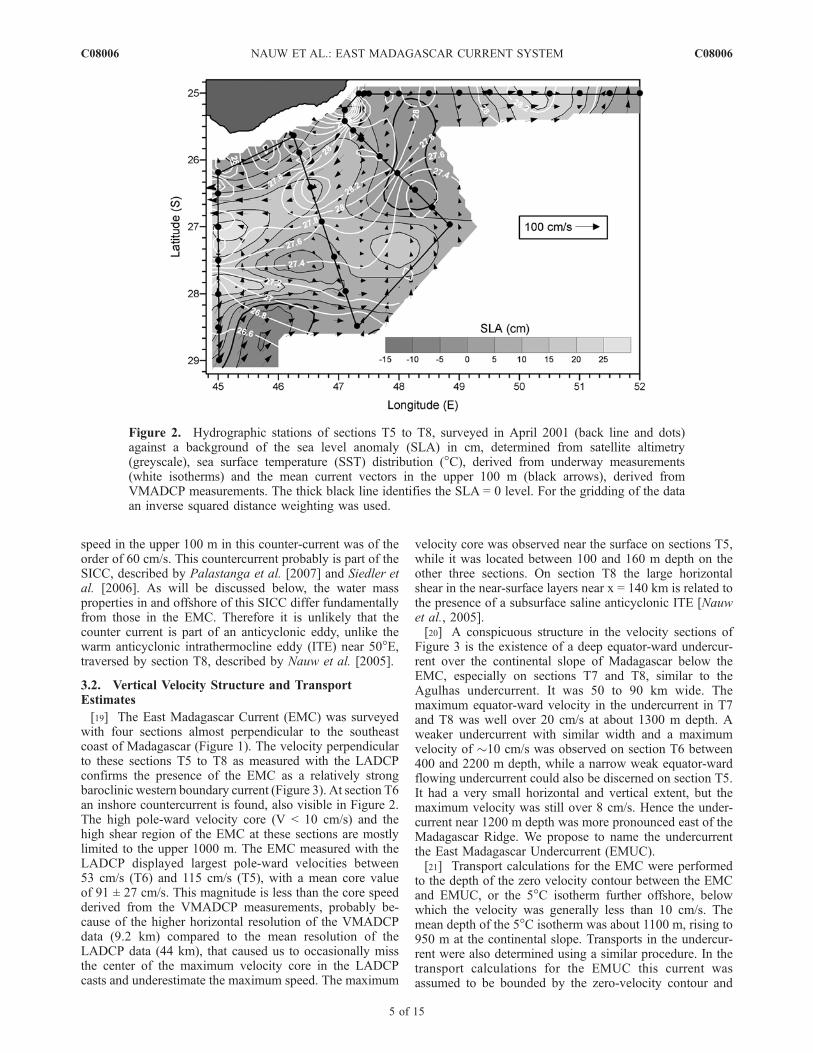
speed in the upper 100 m in this counter-current was of theorder of 60 cm/s. This countercurrent probably is part of theSICC, described by Palastanga et al. [2007] and Siedler etal. [2006]. As will be discussed below, the water massproperties in and offshore of this SICC differ fundamentallyfrom those in the EMC. Therefore it is unlikely that thecounter current is part of an anticyclonic eddy, unlike thewarm anticyclonic intrathermocline eddy (ITE) near 50�E,traversed by section T8, described by Nauw et al. [2005].
3.2. Vertical Velocity Structure and TransportEstimates
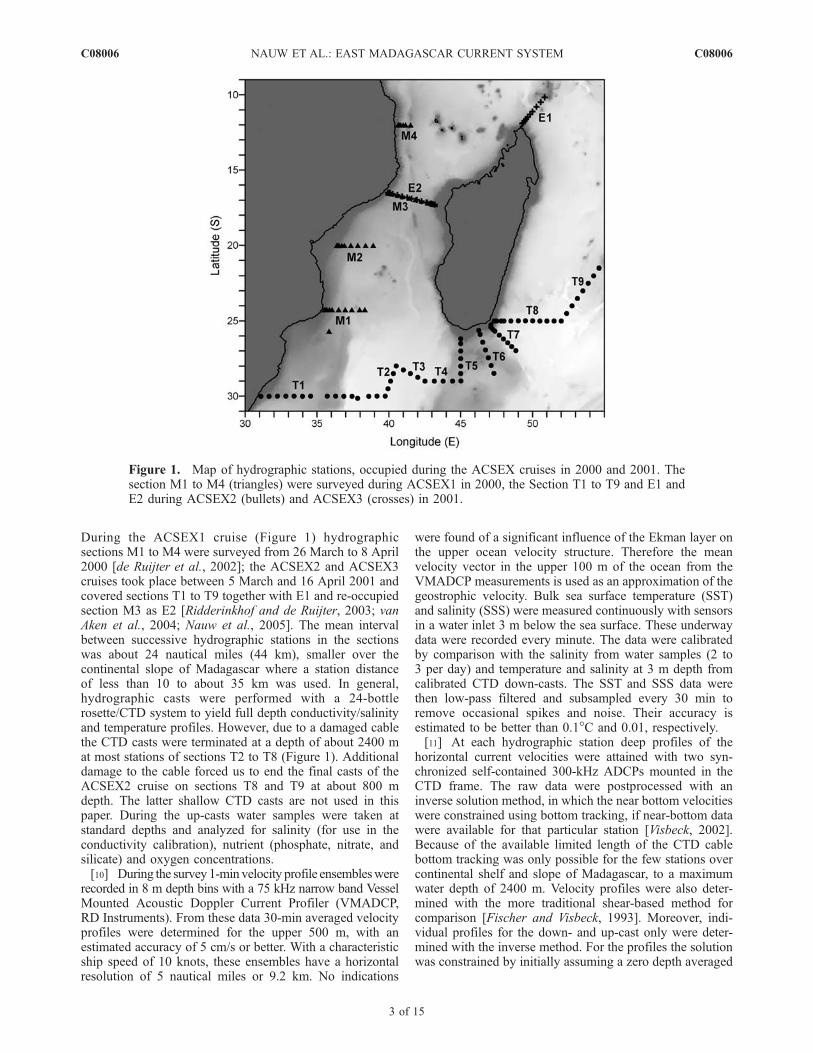
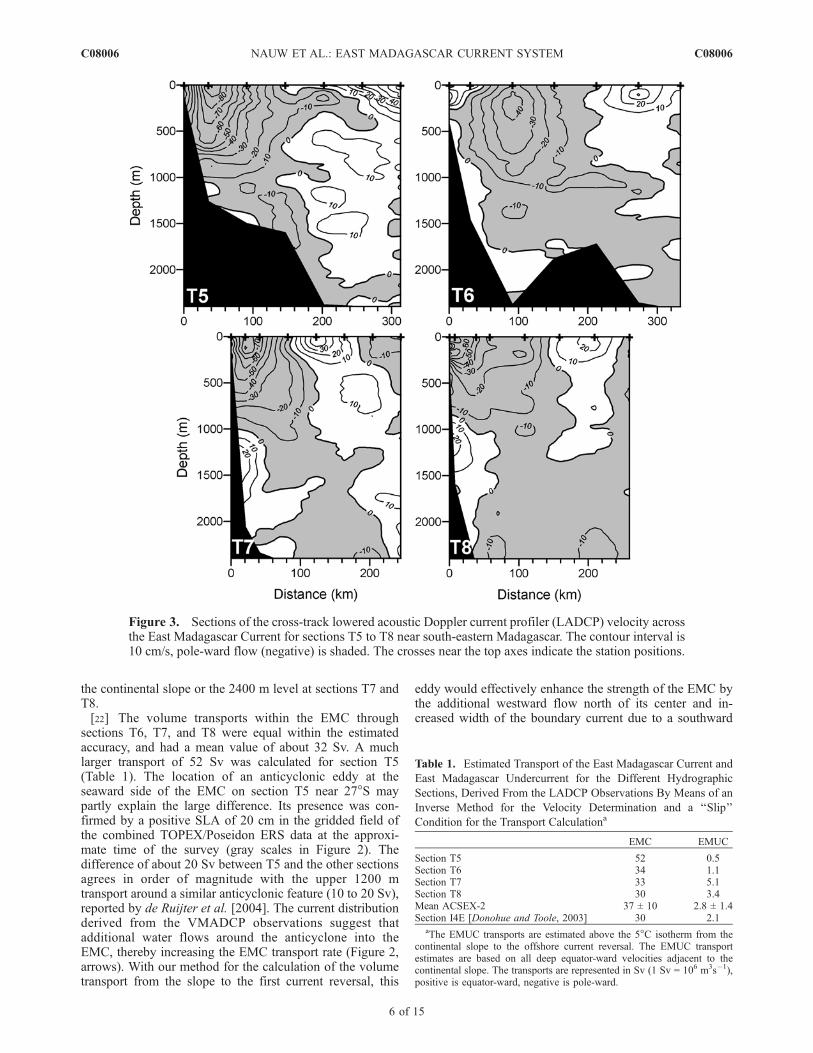
[19] The East Madagascar Current (EMC) was surveyedwith four sections almost perpendicular to the southeastcoast of Madagascar (Figure 1). The velocity perpendicularto these sections T5 to T8 as measured with the LADCPconfirms the presence of the EMC as a relatively strongbaroclinic western boundary current (Figure 3). At section T6an inshore countercurrent is found, also visible in Figure 2.The high pole-ward velocity core (V < 10 cm/s) and thehigh shear region of the EMC at these sections are mostlylimited to the upper 1000 m. The EMC measured with theLADCP displayed largest pole-ward velocities between53 cm/s (T6) and 115 cm/s (T5), with a mean core valueof 91 ± 27 cm/s. This magnitude is less than the core speedderived from the VMADCP measurements, probably be-cause of the higher horizontal resolution of the VMADCPdata (9.2 km) compared to the mean resolution of theLADCP data (44 km), that caused us to occasionally missthe center of the maximum velocity core in the LADCPcasts and underestimate the maximum speed. The maximum
velocity core was observed near the surface on sections T5,while it was located between 100 and 160 m depth on theother three sections. On section T8 the large horizontalshear in the near-surface layers near x = 140 km is related tothe presence of a subsurface saline anticyclonic ITE [Nauwet al., 2005].[20] A conspicuous structure in the velocity sections of
Figure 3 is the existence of a deep equator-ward undercur-rent over the continental slope of Madagascar below theEMC, especially on sections T7 and T8, similar to theAgulhas undercurrent. It was 50 to 90 km wide. Themaximum equator-ward velocity in the undercurrent in T7and T8 was well over 20 cm/s at about 1300 m depth. Aweaker undercurrent with similar width and a maximumvelocity of �10 cm/s was observed on section T6 between400 and 2200 m depth, while a narrow weak equator-wardflowing undercurrent could also be discerned on section T5.It had a very small horizontal and vertical extent, but themaximum velocity was still over 8 cm/s. Hence the under-current near 1200 m depth was more pronounced east of theMadagascar Ridge. We propose to name the undercurrentthe East Madagascar Undercurrent (EMUC).[21] Transport calculations for the EMC were performed
to the depth of the zero velocity contour between the EMCand EMUC, or the 5�C isotherm further offshore, belowwhich the velocity was generally less than 10 cm/s. Themean depth of the 5�C isotherm was about 1100 m, rising to950 m at the continental slope. Transports in the undercur-rent were also determined using a similar procedure. In thetransport calculations for the EMUC this current wasassumed to be bounded by the zero-velocity contour and
Figure 2. Hydrographic stations of sections T5 to T8, surveyed in April 2001 (back line and dots)against a background of the sea level anomaly (SLA) in cm, determined from satellite altimetry(greyscale), sea surface temperature (SST) distribution (�C), derived from underway measurements(white isotherms) and the mean current vectors in the upper 100 m (black arrows), derived fromVMADCP measurements. The thick black line identifies the SLA = 0 level. For the gridding of the dataan inverse squared distance weighting was used.
C08006 NAUW ET AL.: EAST MADAGASCAR CURRENT SYSTEM
5 of 15
C08006
the continental slope or the 2400 m level at sections T7 andT8.[22] The volume transports within the EMC through
sections T6, T7, and T8 were equal within the estimatedaccuracy, and had a mean value of about 32 Sv. A muchlarger transport of 52 Sv was calculated for section T5(Table 1). The location of an anticyclonic eddy at theseaward side of the EMC on section T5 near 27�S maypartly explain the large difference. Its presence was con-firmed by a positive SLA of 20 cm in the gridded field ofthe combined TOPEX/Poseidon ERS data at the approxi-mate time of the survey (gray scales in Figure 2). Thedifference of about 20 Sv between T5 and the other sectionsagrees in order of magnitude with the upper 1200 mtransport around a similar anticyclonic feature (10 to 20 Sv),reported by de Ruijter et al. [2004]. The current distributionderived from the VMADCP observations suggest thatadditional water flows around the anticyclone into theEMC, thereby increasing the EMC transport rate (Figure 2,arrows). With our method for the calculation of the volumetransport from the slope to the first current reversal, this
eddy would effectively enhance the strength of the EMC bythe additional westward flow north of its center and in-creased width of the boundary current due to a southward
Figure 3. Sections of the cross-track lowered acoustic Doppler current profiler (LADCP) velocity acrossthe East Madagascar Current for sections T5 to T8 near south-eastern Madagascar. The contour interval is10 cm/s, pole-ward flow (negative) is shaded. The crosses near the top axes indicate the station positions.
Table 1. Estimated Transport of the East Madagascar Current and
East Madagascar Undercurrent for the Different Hydrographic
Sections, Derived From the LADCP Observations By Means of an
Inverse Method for the Velocity Determination and a ‘‘Slip’’
Condition for the Transport Calculationa
EMC EMUC
Section T5 52 0.5Section T6 34 1.1Section T7 33 5.1Section T8 30 3.4Mean ACSEX-2 37 ± 10 2.8 ± 1.4Section I4E [Donohue and Toole, 2003] 30 2.1
aThe EMUC transports are estimated above the 5�C isotherm from thecontinental slope to the offshore current reversal. The EMUC transportestimates are based on all deep equator-ward velocities adjacent to thecontinental slope. The transports are represented in Sv (1 Sv = 106 m3s�1),positive is equator-ward, negative is pole-ward.
C08006 NAUW ET AL.: EAST MADAGASCAR CURRENT SYSTEM
6 of 15
C08006
displacement of the zero-velocity-contour. The regular gen-eration and advection of eddies near southeast Madagascarmay probably be responsible for a large part of the vari-ability of the transport rate of the EMC. Therefore it may bejust by chance that the EMC transports through section T6to T8 show such small differences.[23] The transport rate of the EMUC was 3.4 and 5.1 Sv
across, respectively, sections T7 and T8 (Table 1). Thetransport across section T6 was about 1 Sv, while it wasonly about 0.5 Sv across section T5. The latter relativelylow value might also be related to the presence of theanticyclonic eddy on T5, which could have enhanced thewestward flow at intermediate depths and thereby weakenedthe eastward flowing EMUC. The average transport of theEMUC for all four sections amounts to 2.8 Sv (±2.1 Svstandard deviation). The standard deviation of the fourEMUC transport estimates is only less than twice theestimated error of these individual estimates. So the ob-served variability may in part be caused by the limitedaccuracy of the transport calculations.[24] Similar to the VMADCP derived velocities, the
velocity field derived from the LADCP observations allshow a current reversal offshore of the EMC, probablyconnected with the SICC. The observed velocity compo-nents perpendicular to the sections in the SICC have valuesup to 82 cm/s at section T5, with an average maximumvalue of 58 cm/s, about 65% of the mean velocity maximumin the EMC. Contrary to the EMC, which reached to depthsof about 1000 m, the high velocity core in the countercur-rent appears to be limited to the upper 250 m. The NE-wardsflowing cores at sections T6 and T7 suggest a width of theSICC of the order of 100 km. With a width of the SICC ofthe same order of magnitude as the EMC, this implies thatthe transport rate of the countercurrent is 10 to 20% of thetransport rate of the EMC. That implies an SICC transportrate of about 3 to 6 Sv. A more detailed transport estimatefor the SICC is not possible, since the hydrographic sectionsdid not reach completely across the SICC at all sections.East of the EMC at 25�S a northward counter-flow acrosssection T8 was observed. However, it cannot be identifiedwith the SICC, since here the ITE, reported by Nauw et al.[2005] is responsible for this flow reversal.
3.3. Temporal Variability of the EMC
[25] We can compare our estimate of the transport rate ofthe EMC with estimates based on data from other hydro-graphic surveys. In June 1995 WOCE hydrographic sectionI4E at 25�S, coinciding with our T8 section, as well as theI3W section further north at 20�S, were surveyed in 1995 byRV Knorr [Donohue and Toole, 2003]. During that surveyLADCP observations were carried out at the hydrographicstations. Those LADCP data show a vertical structure forthe EMC similar to our Figure 3, including a deep coun-tercurrent below the EMC, the EMUC, at depths between1000 and 2700 m at both latitudes. We have processed thoseADCP data from 25�S similarly to the LADCP data fromthe ACSEX surveys. That resulted in estimates of a south-ward transport rate of the EMC of 30 Sv, and a northwardtransport of the EMUC of 2.1 Sv. These compare to ourmean transports of respectively 37 ± 10 Sv and 2.5 ± 2.1 Sv,shown in Table 1.
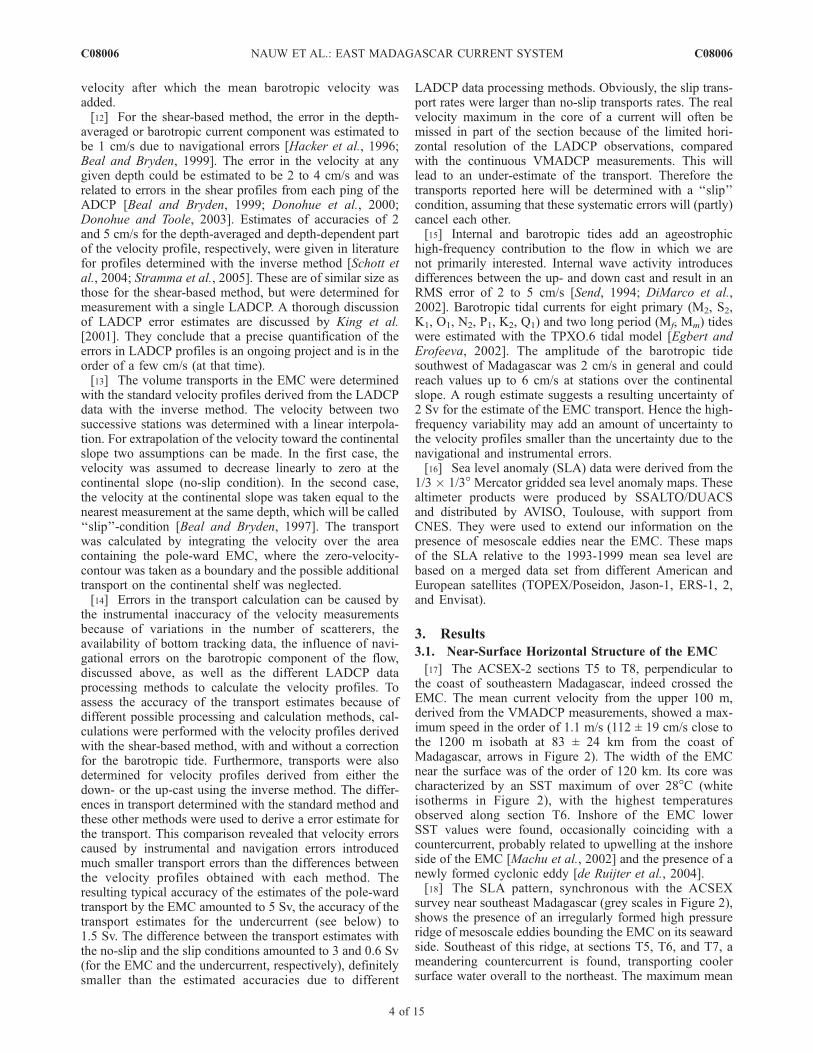
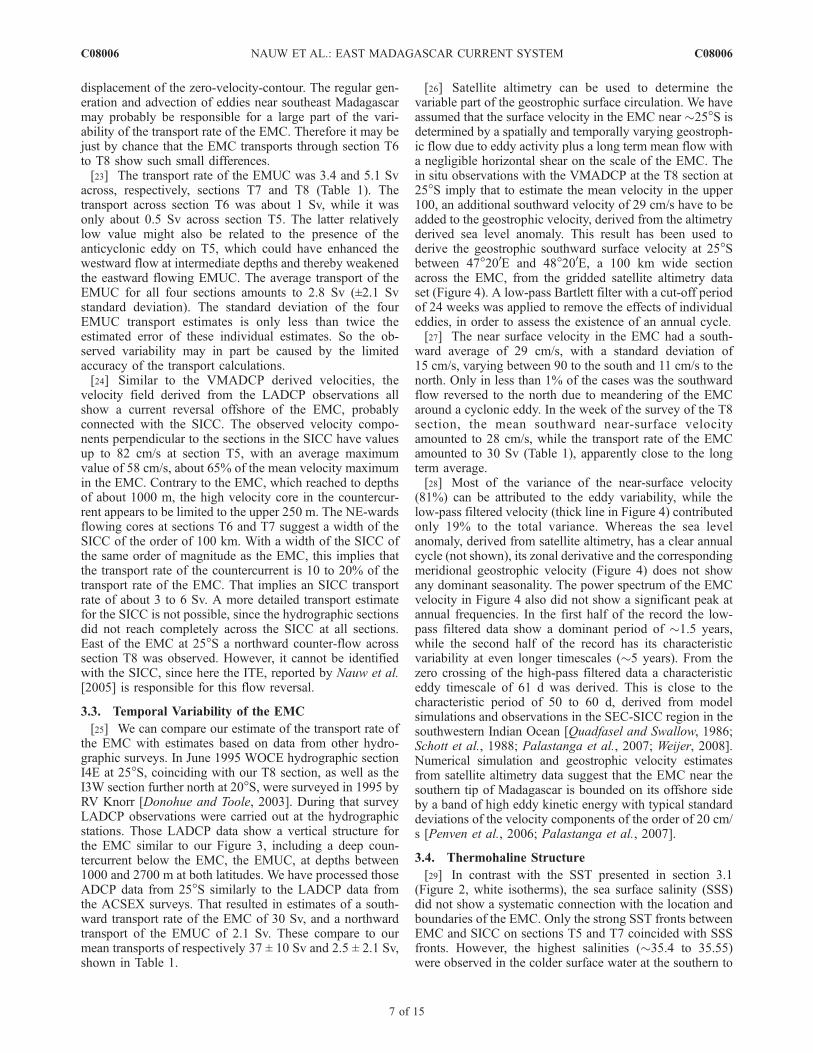
[26] Satellite altimetry can be used to determine thevariable part of the geostrophic surface circulation. We haveassumed that the surface velocity in the EMC near �25�S isdetermined by a spatially and temporally varying geostroph-ic flow due to eddy activity plus a long term mean flow witha negligible horizontal shear on the scale of the EMC. Thein situ observations with the VMADCP at the T8 section at25�S imply that to estimate the mean velocity in the upper100, an additional southward velocity of 29 cm/s have to beadded to the geostrophic velocity, derived from the altimetryderived sea level anomaly. This result has been used toderive the geostrophic southward surface velocity at 25�Sbetween 47�200E and 48�200E, a 100 km wide sectionacross the EMC, from the gridded satellite altimetry dataset (Figure 4). A low-pass Bartlett filter with a cut-off periodof 24 weeks was applied to remove the effects of individualeddies, in order to assess the existence of an annual cycle.[27] The near surface velocity in the EMC had a south-
ward average of 29 cm/s, with a standard deviation of15 cm/s, varying between 90 to the south and 11 cm/s to thenorth. Only in less than 1% of the cases was the southwardflow reversed to the north due to meandering of the EMCaround a cyclonic eddy. In the week of the survey of the T8section, the mean southward near-surface velocityamounted to 28 cm/s, while the transport rate of the EMCamounted to 30 Sv (Table 1), apparently close to the longterm average.[28] Most of the variance of the near-surface velocity
(81%) can be attributed to the eddy variability, while thelow-pass filtered velocity (thick line in Figure 4) contributedonly 19% to the total variance. Whereas the sea levelanomaly, derived from satellite altimetry, has a clear annualcycle (not shown), its zonal derivative and the correspondingmeridional geostrophic velocity (Figure 4) does not showany dominant seasonality. The power spectrum of the EMCvelocity in Figure 4 also did not show a significant peak atannual frequencies. In the first half of the record the low-pass filtered data show a dominant period of �1.5 years,while the second half of the record has its characteristicvariability at even longer timescales (�5 years). From thezero crossing of the high-pass filtered data a characteristiceddy timescale of 61 d was derived. This is close to thecharacteristic period of 50 to 60 d, derived from modelsimulations and observations in the SEC-SICC region in thesouthwestern Indian Ocean [Quadfasel and Swallow, 1986;Schott et al., 1988; Palastanga et al., 2007; Weijer, 2008].Numerical simulation and geostrophic velocity estimatesfrom satellite altimetry data suggest that the EMC near thesouthern tip of Madagascar is bounded on its offshore sideby a band of high eddy kinetic energy with typical standarddeviations of the velocity components of the order of 20 cm/s [Penven et al., 2006; Palastanga et al., 2007].
3.4. Thermohaline Structure
[29] In contrast with the SST presented in section 3.1(Figure 2, white isotherms), the sea surface salinity (SSS)did not show a systematic connection with the location andboundaries of the EMC. Only the strong SST fronts betweenEMC and SICC on sections T5 and T7 coincided with SSSfronts. However, the highest salinities (�35.4 to 35.55)were observed in the colder surface water at the southern to
C08006 NAUW ET AL.: EAST MADAGASCAR CURRENT SYSTEM
7 of 15
C08006
southeastern ends of sections T5, T6, and T7, in andsoutheast of the SICC. Near the core of the EMC mainlySSS values of �35.2 to 35.3 were found, while in the coldsurface water inshore of the EMC on section T7 the SSSalso had values similar to the core of the EMC. The generalpicture of warm and fresh surface waters in the EMC, thatwe derive from the ACSEX data, was also observed in Juneof 1995 at two zonal WOCE sections at 25�S and at 20�S
and was attributed to the southward advection of TropicalSurface Water (TSW) in the EMC [Donohue and Toole,2003]. In June of 1995, the SST in the EMC was several �Clower and the SSS at least 0.1 fresher compared with ourobservations. The SST difference is most likely related toseasonal changes. Below it will be argued that salinitychanges are connected with a temporal variability extendingto several 100 m deep.
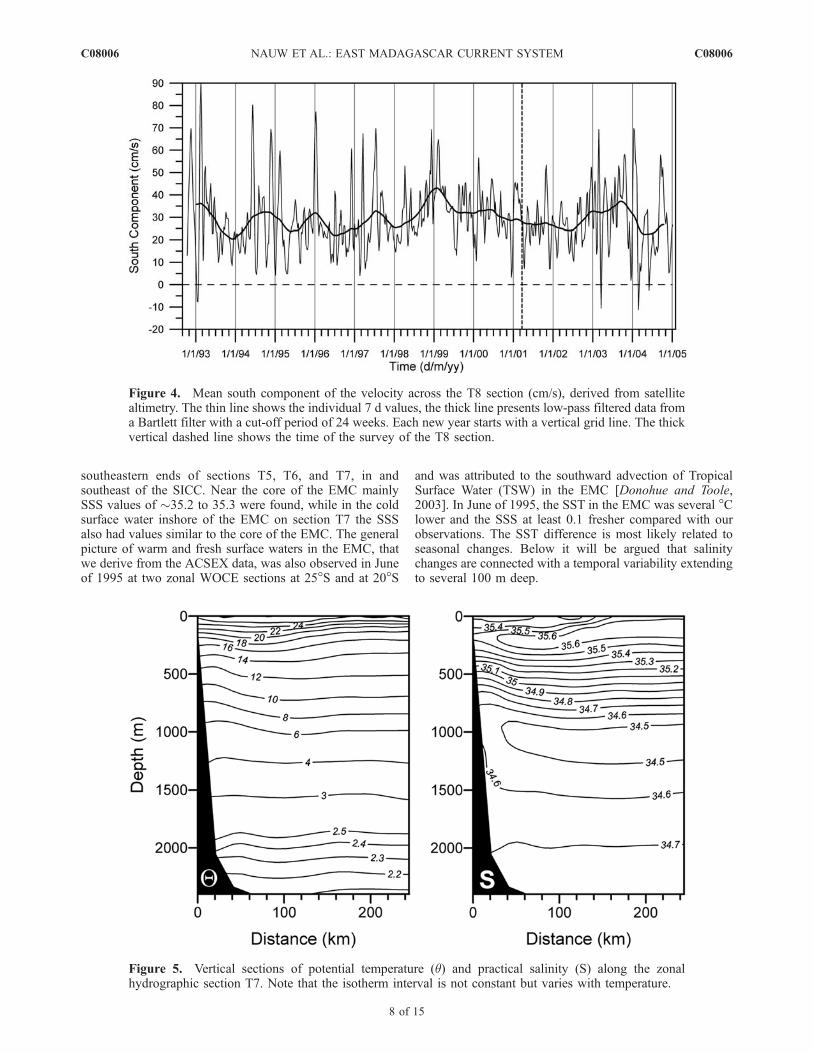
Figure 5. Vertical sections of potential temperature (q) and practical salinity (S) along the zonalhydrographic section T7. Note that the isotherm interval is not constant but varies with temperature.
Figure 4. Mean south component of the velocity across the T8 section (cm/s), derived from satellitealtimetry. The thin line shows the individual 7 d values, the thick line presents low-pass filtered data froma Bartlett filter with a cut-off period of 24 weeks. Each new year starts with a vertical grid line. The thickvertical dashed line shows the time of the survey of the T8 section.
C08006 NAUW ET AL.: EAST MADAGASCAR CURRENT SYSTEM
8 of 15
C08006
[30] Section T7 is characteristic for the vertical stratifica-tion of potential temperature (q) and salinity (S), along allfour sections extending offshore from the continental slopeoff southeastern Madagascar (Figure 5). In the EMC,between x = 0 and 90 km, the isotherms on average ascendtoward the continental slope above �1200 m depth, anddescend to the continental slope below that level. Thepotential density (not shown) has a similar pattern, inagreement with the horizontal density gradient required tomaintain a meridional geostrophic current similar to theLADCP derived EMC and EMUC across the T7 section(Figure 3). Further offshore the isotherms in the upper 800 mrise again until they level off at x � 160 km. Thegeostrophic current shear, connected with this distributionof q, S and density agrees with the observed velocitystructure for section T7, with a flow and shear reversalfrom the EMC to the SICC, the latter being a relativelyshallow baroclinic frontal jet. The salinity section in Figure 5shows that the shallow density front of the SICC (x �130 km) is also a thermohaline front [Fedorov, 1986]. Thefresher surface layer (S < 35.6), observed in the upper 150 m
of the EMC, shallows toward the SICC and is almostcompletely absent offshore of the SICC jet. At the levelsof the core of the EMUC (1100 to 1800 m) the salinity nearthe continental slope is systematically higher than furtheroffshore where a salinity minimum S < 34.5 is encoun-tered, related to the presence of the low-salinity AntarcticIntermediate Water (AAIW). Below this salinity minimum ver-tical gradients in q and S are observed due to the gradual changeof the hydrographic properties to those of the Lower CircumpolarDeep Water that is found below 2500 m [van Aken et al., 2004].[31] The averaged q-S curves from the EMC at sections
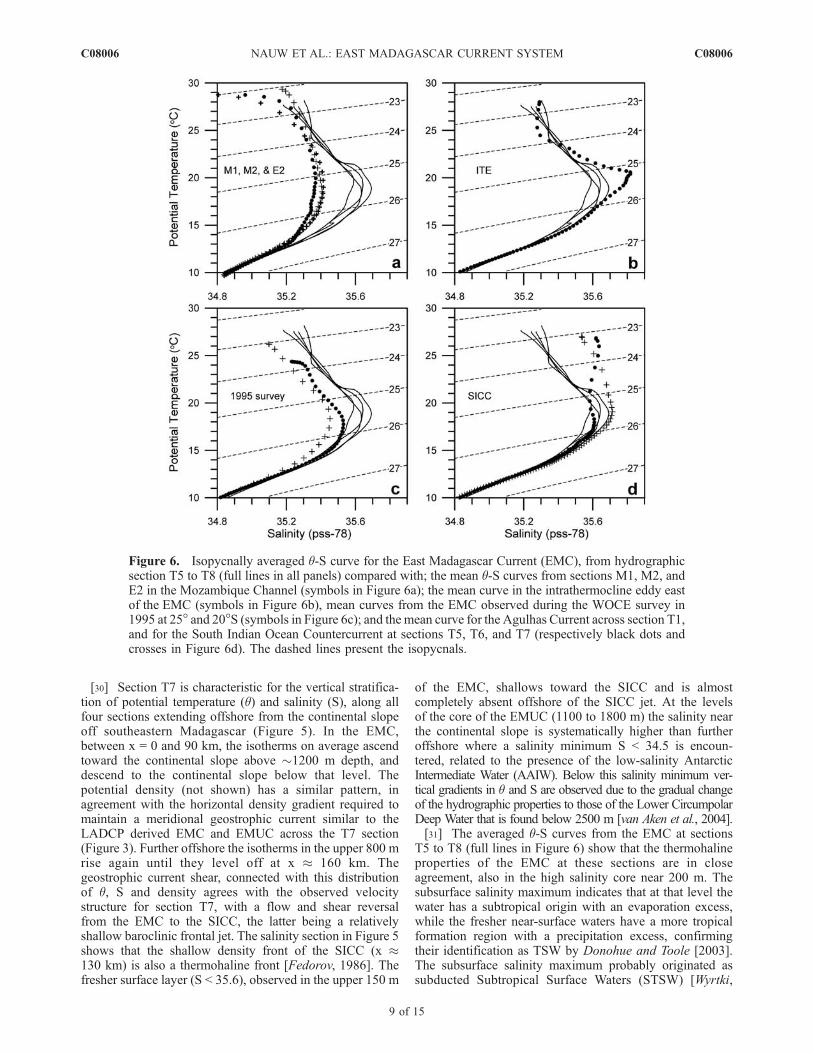
T5 to T8 (full lines in Figure 6) show that the thermohalineproperties of the EMC at these sections are in closeagreement, also in the high salinity core near 200 m. Thesubsurface salinity maximum indicates that at that level thewater has a subtropical origin with an evaporation excess,while the fresher near-surface waters have a more tropicalformation region with a precipitation excess, confirmingtheir identification as TSW by Donohue and Toole [2003].The subsurface salinity maximum probably originated assubducted Subtropical Surface Waters (STSW) [Wyrtki,
Figure 6. Isopycnally averaged q-S curve for the East Madagascar Current (EMC), from hydrographicsection T5 to T8 (full lines in all panels) compared with; the mean q-S curves from sections M1, M2, andE2 in the Mozambique Channel (symbols in Figure 6a); the mean curve in the intrathermocline eddy eastof the EMC (symbols in Figure 6b), mean curves from the EMC observed during the WOCE survey in1995 at 25� and 20�S (symbols in Figure 6c); and the mean curve for the Agulhas Current across section T1,and for the South Indian Ocean Countercurrent at sections T5, T6, and T7 (respectively black dots andcrosses in Figure 6d). The dashed lines present the isopycnals.
C08006 NAUW ET AL.: EAST MADAGASCAR CURRENT SYSTEM
9 of 15
C08006
1973] and is called Subtropical Underwater (STUW)[Hanawa and Talley, 2001]. Comparisons with the q-Scurves from sections in M1, M2, and E2 in the MozambiqueChannel (dots, small crosses and big crosses in Figure 6a)reveal that the upper-ocean water mass in the MozambiqueChannel is less saline and has a more tropical origin than theEMC at all levels. However, the very low surface salinityvalues along the E2 section (a section average of 34.7 withlowest values at individual stations down to 32.2 near theMozambique coast) is probably caused by the local dis-charge of freshwater by rivers from theAfrican continent. Theq-S curves for water from the ITE at section T8 (Figure 6b)shows that southeast of Madagascar the major water massdifferences in the near-surface layers at section T8 reflectthe differences between the EMC water advected in fromthe north and the ITE water further offshore.[32] Some impression of the possible temporal change of
the hydrographic properties of the EMC can be obtainedfrom comparison with data, collected during the WOCEsurveys of the Indian Ocean in 1995 along sections acrossthe EMC at 25� and 20�S (respectively black dots andcrosses in Figure 6c). These show that also in 1995 thealong-current salinity differences were small, of the order of0.1 or less. However, they also reveal that interannualchanges of the EMC salinity of about 0.2 may occur. Suchlong-term salinity changes have a magnitude similar to theinterannual salinity decrease observed west of Madagascarbetween 2000 and 2005 (M.W. Schouten, personal commu-nication, 2006). This change can be attributed to interannualchanges of the wind-driven surface circulation in the IndianOcean. Such wind changes are also expected to influencethe hydrographic properties of the South Equatorial currentthat brings water from the wind driven subtropical gyre toits western boundary current, the EMC.[33] If we compare the q-S curves from the EMC at
sections T5 to T8 with the curve from the Agulhas Currentat section T1 at 30�S it is revealed that some form of watermass salinification has taken place between the EMC andthe Agulhas Current (black dots in Figure 6d), or betweenthe Mozambique Channel (symbols in Figure 6a) and theAgulhas Current. In the Agulhas Current no sign of asystematically lower surface salinity relative to a depth of�150 m is found in the ACSEX data, the upper-ocean watermass structure has a subtropical character. In earlier surveysof the Agulhas Current a clear salinity maximum near�150 m was reported, underlying fresher tropical surfacewater [Toole and Warren, 1993; Beal et al., 2006]. This maybe due to seasonal effects. One of the processes that canhave caused the salinification is an evaporation excessbetween Madagascar and the African slope in the precedingsummer. The salinity difference presents a fresh waterdeficit in the upper 150 m between the EMC and theAgulhas current of about 85 cm. This is close to the annualmean value of the evaporation excess of slightly over 75 cmfrom the HOAPS data set for the region [Jost et al., 2002].If the dominant source region for the water mass of theAgulhas Current at 30�S is partly in the fresher Mozambi-que Channel, a large salinity increase takes place, and astronger evaporation excess is needed. However, the highsalinity, observed in the Agulhas Current, may also reflectstrong temporal hydrographic variability near southernMadagascar, in the period before the reported survey, so
that the observed high salinity at section T1 was advectedfrom a more saline EMC to T1 some time before the survey.In the month before the survey of our sections the meantransport through the Mozambique Channel was reversed tothe north compared to the normal southward transport[Ridderinkhof and de Ruijter, 2003], a situation favorableto bring subtropical water to the Mozambique Channel.[34] As discussed above, comparison of Figures 3 and 5
shows that the SICC core at T7 is located at a thermohalinefront. Therefore the water mass structure of the SICC jet istransitional between the tropical water mass from the EMCand the subtropical water mass further south. Offshore ofthe thermohaline front and the SICC frontal jet at section T7the upper-ocean q-S properties (crosses in Figure 6d) have aclose resemblance with those of the saline Agulhas Currentat 25�S, which makes a subtropical origin of the waterobserved in the Agulhas current more likely.[35] At the intermediate levels where the EMUC was
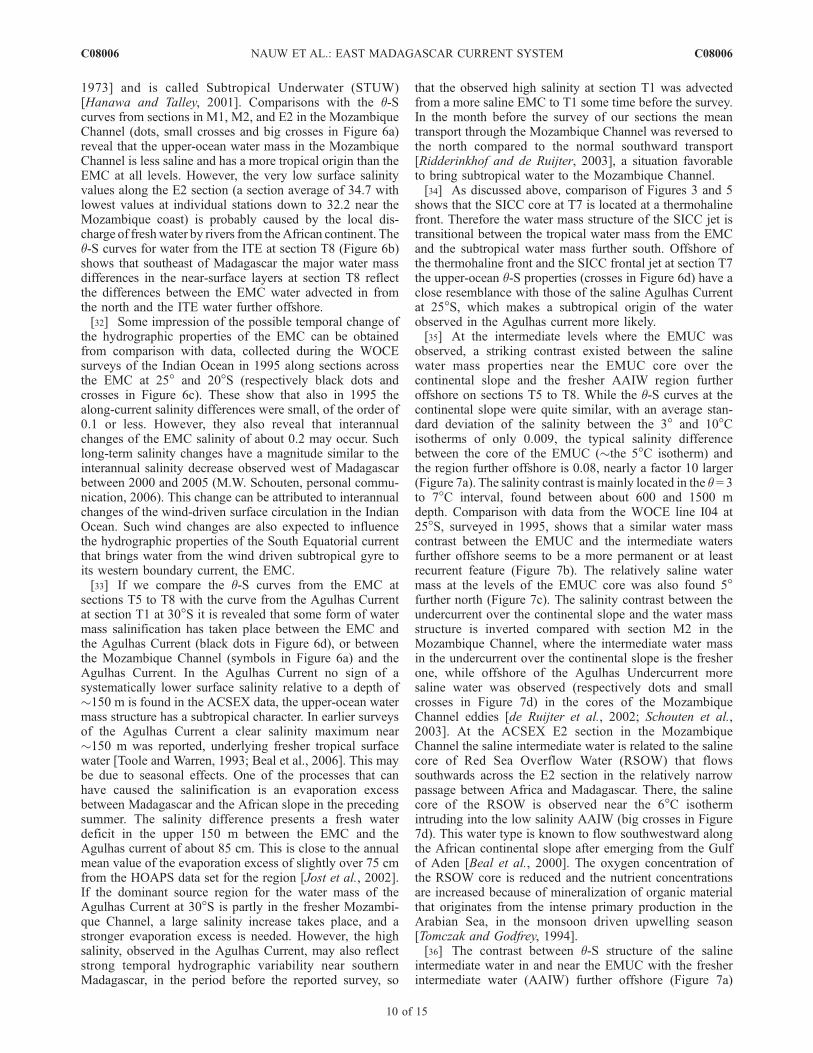
observed, a striking contrast existed between the salinewater mass properties near the EMUC core over thecontinental slope and the fresher AAIW region furtheroffshore on sections T5 to T8. While the q-S curves at thecontinental slope were quite similar, with an average stan-dard deviation of the salinity between the 3� and 10�Cisotherms of only 0.009, the typical salinity differencebetween the core of the EMUC (�the 5�C isotherm) andthe region further offshore is 0.08, nearly a factor 10 larger(Figure 7a). The salinity contrast is mainly located in the q = 3to 7�C interval, found between about 600 and 1500 mdepth. Comparison with data from the WOCE line I04 at25�S, surveyed in 1995, shows that a similar water masscontrast between the EMUC and the intermediate watersfurther offshore seems to be a more permanent or at leastrecurrent feature (Figure 7b). The relatively saline watermass at the levels of the EMUC core was also found 5�further north (Figure 7c). The salinity contrast between theundercurrent over the continental slope and the water massstructure is inverted compared with section M2 in theMozambique Channel, where the intermediate water massin the undercurrent over the continental slope is the fresherone, while offshore of the Agulhas Undercurrent moresaline water was observed (respectively dots and smallcrosses in Figure 7d) in the cores of the MozambiqueChannel eddies [de Ruijter et al., 2002; Schouten et al.,2003]. At the ACSEX E2 section in the MozambiqueChannel the saline intermediate water is related to the salinecore of Red Sea Overflow Water (RSOW) that flowssouthwards across the E2 section in the relatively narrowpassage between Africa and Madagascar. There, the salinecore of the RSOW is observed near the 6�C isothermintruding into the low salinity AAIW (big crosses in Figure7d). This water type is known to flow southwestward alongthe African continental slope after emerging from the Gulfof Aden [Beal et al., 2000]. The oxygen concentration ofthe RSOW core is reduced and the nutrient concentrationsare increased because of mineralization of organic materialthat originates from the intense primary production in theArabian Sea, in the monsoon driven upwelling season[Tomczak and Godfrey, 1994].[36] The contrast between q-S structure of the saline
intermediate water in and near the EMUC with the fresherintermediate water (AAIW) further offshore (Figure 7a)
C08006 NAUW ET AL.: EAST MADAGASCAR CURRENT SYSTEM
10 of 15
C08006
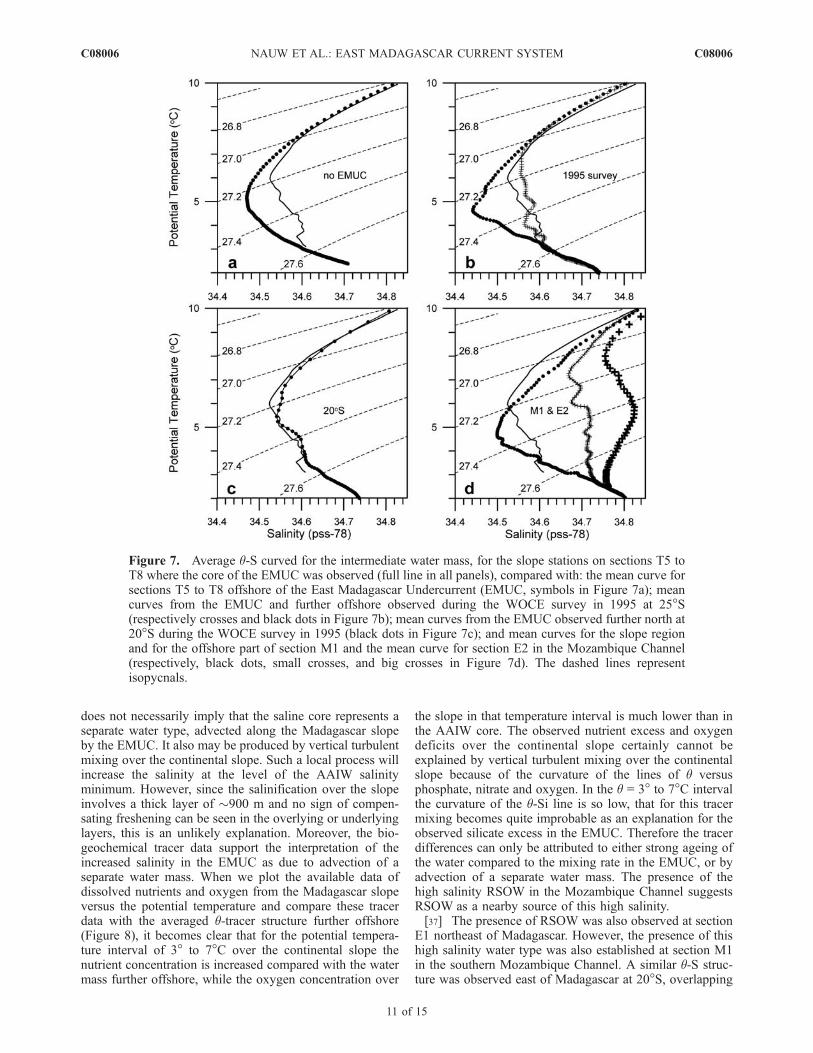
does not necessarily imply that the saline core represents aseparate water type, advected along the Madagascar slopeby the EMUC. It also may be produced by vertical turbulentmixing over the continental slope. Such a local process willincrease the salinity at the level of the AAIW salinityminimum. However, since the salinification over the slopeinvolves a thick layer of �900 m and no sign of compen-sating freshening can be seen in the overlying or underlyinglayers, this is an unlikely explanation. Moreover, the bio-geochemical tracer data support the interpretation of theincreased salinity in the EMUC as due to advection of aseparate water mass. When we plot the available data ofdissolved nutrients and oxygen from the Madagascar slopeversus the potential temperature and compare these tracerdata with the averaged q-tracer structure further offshore(Figure 8), it becomes clear that for the potential tempera-ture interval of 3� to 7�C over the continental slope thenutrient concentration is increased compared with the watermass further offshore, while the oxygen concentration over
the slope in that temperature interval is much lower than inthe AAIW core. The observed nutrient excess and oxygendeficits over the continental slope certainly cannot beexplained by vertical turbulent mixing over the continentalslope because of the curvature of the lines of q versusphosphate, nitrate and oxygen. In the q = 3� to 7�C intervalthe curvature of the q-Si line is so low, that for this tracermixing becomes quite improbable as an explanation for theobserved silicate excess in the EMUC. Therefore the tracerdifferences can only be attributed to either strong ageing ofthe water compared to the mixing rate in the EMUC, or byadvection of a separate water mass. The presence of thehigh salinity RSOW in the Mozambique Channel suggestsRSOW as a nearby source of this high salinity.[37] The presence of RSOW was also observed at section
E1 northeast of Madagascar. However, the presence of thishigh salinity water type was also established at section M1in the southern Mozambique Channel. A similar q-S struc-ture was observed east of Madagascar at 20�S, overlapping
Figure 7. Average q-S curved for the intermediate water mass, for the slope stations on sections T5 toT8 where the core of the EMUC was observed (full line in all panels), compared with: the mean curve forsections T5 to T8 offshore of the East Madagascar Undercurrent (EMUC, symbols in Figure 7a); meancurves from the EMUC and further offshore observed during the WOCE survey in 1995 at 25�S(respectively crosses and black dots in Figure 7b); mean curves from the EMUC observed further north at20�S during the WOCE survey in 1995 (black dots in Figure 7c); and mean curves for the slope regionand for the offshore part of section M1 and the mean curve for section E2 in the Mozambique Channel(respectively, black dots, small crosses, and big crosses in Figure 7d). The dashed lines representisopycnals.
C08006 NAUW ET AL.: EAST MADAGASCAR CURRENT SYSTEM
11 of 15
C08006
in part with the EMUC that appears to flow anticlockwisearound Madagascar. This suggests that RSOW mixed intothe AAIW low salinity core of the Mozambique Channel isthe main source of the relatively saline water mass over thecontinental slope of Madagascar. Apparently some of thissaline intermediate water is caught in the southern Mozam-bique Channel into the intermediate current which feeds theEMUC south and east off Madagascar.
4. Discussion
[38] The results of the ACSEX-2 survey of the regionsoutheast of Madagascar have established some character-istic features: the strong pole-ward flow of TSW in theEMC, the recurrent, and possibly permanent, equator-wardflow in the EMUC below the EMC, coinciding with a salineintermediate water mass over the Madagascar continentalslope, and the SICC further offshore south of Madagascar asa near-surface frontal jet. The EMC is a western boundarycurrent of the subtropical gyre, channeling water from theSouth Equatorial Current southwards. The EMUC is asubsurface western boundary current at intermediate depths,which probably feeds the internal circulation of intermediatewater over the Mascarene Abyssal Plain east of Madagascar.Its relatively high salinity, probably derived from RSOW inthe Mozambique Channel is expected to slightly increasethe salinity at the levels of the AAIW core. The presented
data showed a strong interannual variability of the q-Sproperties of the EMC as well as the variability of thecurrent transports southeast of Madagascar. As stated above,the thermohaline changes in the upper 200 to 300 m can beattributed to changes in the wind-forcing (M.W. Schouten,personal communication, 2006). Nauw et al. [2005] ascribethe strong thermohaline variability in the thermocline tohydrographic variability in the source regions of the STSWor STUW. Phillips et al. [2005] have described salinitychanges in the upper 180 m in the Indonesian-AustralianBasin in the period 1980 to 2004 with a similar amplitude.These variations are connected to interannual rainfallanomalies over this basin and the Indonesian Seas, partlycorrelated with the El Nino cycle [Perigaud and McCreary,2003]. Since the Indonesian-Australian Basin is the sourceregion of the SEC, the observed salinity variations nearMadagascar may have been advected westward in the SEC.At present we do not have a sufficient temporal data densityin the tropical and southwestern Indian Ocean to allow us toresolve the thermohaline variability in sufficient detail.Probably the ARGO float program will make such ananalysis possible in a few (10?) years. However, theavailability of accurate satellite altimetry data for over adecade allowed us to study more details of the transportvariability of the EMC.[39] First: it was noted above that during the survey of the
sections T5 to T8 the EMC was bounded on its seaward side
Figure 8. Potential temperature-tracer diagrams for water samples taken at sections T5 to T8 over thecontinental slope (crosses) and the mean distribution curves further offshore (full line with black dots):(a) dissolved phosphate, (b) dissolved silicate, (c) dissolved nitrate, and (d) dissolved oxygen.
C08006 NAUW ET AL.: EAST MADAGASCAR CURRENT SYSTEM
12 of 15
C08006
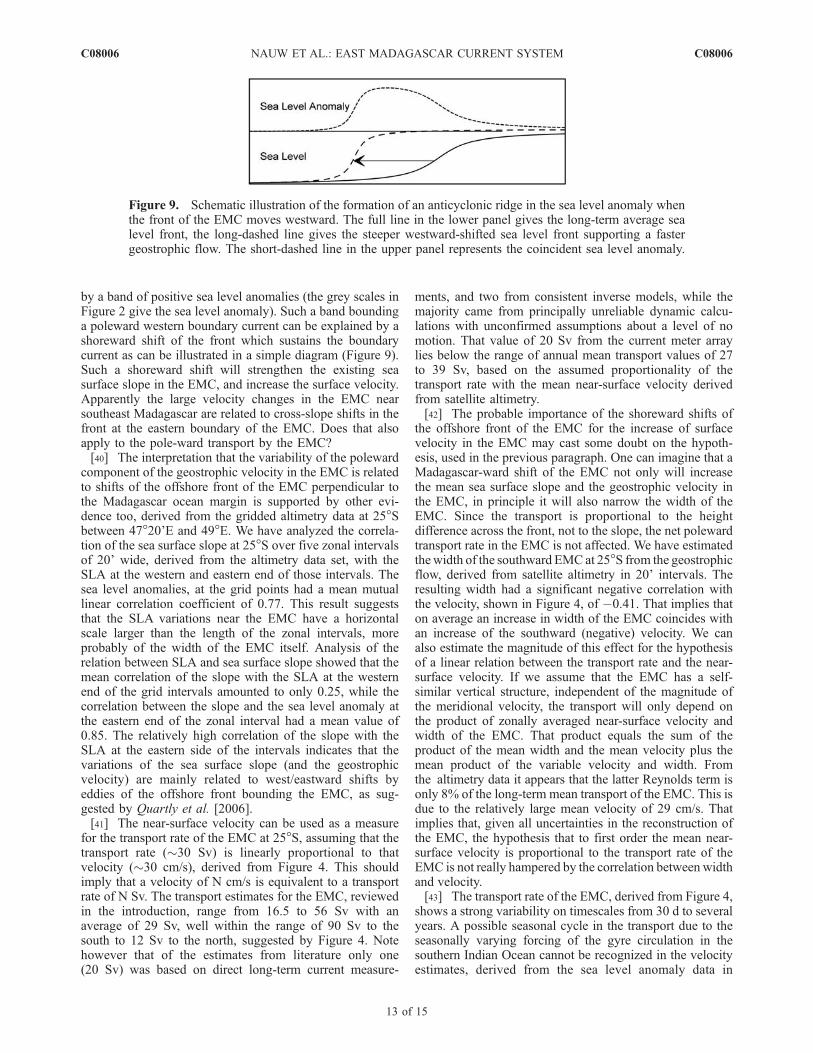
by a band of positive sea level anomalies (the grey scales inFigure 2 give the sea level anomaly). Such a band boundinga poleward western boundary current can be explained by ashoreward shift of the front which sustains the boundarycurrent as can be illustrated in a simple diagram (Figure 9).Such a shoreward shift will strengthen the existing seasurface slope in the EMC, and increase the surface velocity.Apparently the large velocity changes in the EMC nearsoutheast Madagascar are related to cross-slope shifts in thefront at the eastern boundary of the EMC. Does that alsoapply to the pole-ward transport by the EMC?[40] The interpretation that the variability of the poleward
component of the geostrophic velocity in the EMC is relatedto shifts of the offshore front of the EMC perpendicular tothe Madagascar ocean margin is supported by other evi-dence too, derived from the gridded altimetry data at 25�Sbetween 47�20’E and 49�E. We have analyzed the correla-tion of the sea surface slope at 25�S over five zonal intervalsof 20’ wide, derived from the altimetry data set, with theSLA at the western and eastern end of those intervals. Thesea level anomalies, at the grid points had a mean mutuallinear correlation coefficient of 0.77. This result suggeststhat the SLA variations near the EMC have a horizontalscale larger than the length of the zonal intervals, moreprobably of the width of the EMC itself. Analysis of therelation between SLA and sea surface slope showed that themean correlation of the slope with the SLA at the westernend of the grid intervals amounted to only 0.25, while thecorrelation between the slope and the sea level anomaly atthe eastern end of the zonal interval had a mean value of0.85. The relatively high correlation of the slope with theSLA at the eastern side of the intervals indicates that thevariations of the sea surface slope (and the geostrophicvelocity) are mainly related to west/eastward shifts byeddies of the offshore front bounding the EMC, as sug-gested by Quartly et al. [2006].[41] The near-surface velocity can be used as a measure
for the transport rate of the EMC at 25�S, assuming that thetransport rate (�30 Sv) is linearly proportional to thatvelocity (�30 cm/s), derived from Figure 4. This shouldimply that a velocity of N cm/s is equivalent to a transportrate of N Sv. The transport estimates for the EMC, reviewedin the introduction, range from 16.5 to 56 Sv with anaverage of 29 Sv, well within the range of 90 Sv to thesouth to 12 Sv to the north, suggested by Figure 4. Notehowever that of the estimates from literature only one(20 Sv) was based on direct long-term current measure-
ments, and two from consistent inverse models, while themajority came from principally unreliable dynamic calcu-lations with unconfirmed assumptions about a level of nomotion. That value of 20 Sv from the current meter arraylies below the range of annual mean transport values of 27to 39 Sv, based on the assumed proportionality of thetransport rate with the mean near-surface velocity derivedfrom satellite altimetry.[42] The probable importance of the shoreward shifts of
the offshore front of the EMC for the increase of surfacevelocity in the EMC may cast some doubt on the hypoth-esis, used in the previous paragraph. One can imagine that aMadagascar-ward shift of the EMC not only will increasethe mean sea surface slope and the geostrophic velocity inthe EMC, in principle it will also narrow the width of theEMC. Since the transport is proportional to the heightdifference across the front, not to the slope, the net polewardtransport rate in the EMC is not affected. We have estimatedthewidth of the southward EMC at 25�S from the geostrophicflow, derived from satellite altimetry in 20’ intervals. Theresulting width had a significant negative correlation withthe velocity, shown in Figure 4, of �0.41. That implies thaton average an increase in width of the EMC coincides withan increase of the southward (negative) velocity. We canalso estimate the magnitude of this effect for the hypothesisof a linear relation between the transport rate and the near-surface velocity. If we assume that the EMC has a self-similar vertical structure, independent of the magnitude ofthe meridional velocity, the transport will only depend onthe product of zonally averaged near-surface velocity andwidth of the EMC. That product equals the sum of theproduct of the mean width and the mean velocity plus themean product of the variable velocity and width. Fromthe altimetry data it appears that the latter Reynolds term isonly 8% of the long-term mean transport of the EMC. This isdue to the relatively large mean velocity of 29 cm/s. Thatimplies that, given all uncertainties in the reconstruction ofthe EMC, the hypothesis that to first order the mean near-surface velocity is proportional to the transport rate of theEMC is not really hampered by the correlation between widthand velocity.[43] The transport rate of the EMC, derived from Figure 4,
shows a strong variability on timescales from 30 d to severalyears. A possible seasonal cycle in the transport due to theseasonally varying forcing of the gyre circulation in thesouthern Indian Ocean cannot be recognized in the velocityestimates, derived from the sea level anomaly data in
Figure 9. Schematic illustration of the formation of an anticyclonic ridge in the sea level anomaly whenthe front of the EMC moves westward. The full line in the lower panel gives the long-term average sealevel front, the long-dashed line gives the steeper westward-shifted sea level front supporting a fastergeostrophic flow. The short-dashed line in the upper panel represents the coincident sea level anomaly.
C08006 NAUW ET AL.: EAST MADAGASCAR CURRENT SYSTEM
13 of 15
C08006
Figure 4. This result allows the conclusions, to be drawnfrom Figure 4 that the mean pole-ward transport rate of theEMC amounts to about 32 Sv, with a standard deviation of16 Sv. No preferential timescales could be seen in thevariability. The data do not support the existence of aseasonal variation in the transport rate connected with aseasonal variability of the winds over the Indian Ocean.
[44] Acknowledgments. This investigation was funded by: Nether-lands Organization for Scientific Research (NWO) via its CLIVARNETprogram, and by the Royal Netherlands Institute of Sea Research, theInstitute for Marine and Atmospheric Research Utrecht, and the Universityof Cape Town. We thank the crew and technicians of RV Pelagia and allwho participated in the ACSEX cruises for their tireless efforts to keep theobservational system operational despite serious drawbacks. E. Firing andK. A. Donohue are gratefully acknowledged for making LADCP data fromthe 1995 WOCE sections in the southwestern part of the Indian Oceanavailable to us. The altimeter products were produced by SSALTO/DUACSand distributed by AVISO, with support from CNES.
ReferencesBeal, L. M., and H. L. Bryden (1997), Observations of an Agulhas Under-current, Deep Sea Res., Part I, 44, 1715–1724.
Beal, L. M., and H. L. Bryden (1999), The velocity and vorticity structureof the Agulhas Current at 32�, J. Geophys. Res., 104, 5151–5176.
Beal, L. M., A. Ffield, and A. L. Gordon (2000), Spreading of Red Seaoverflow waters in the Indian Ocean, J. Geophys. Res., 105, 8549–8564.
Biastoch, A., and W. Krauss (1999), The role of mesoscale eddies in thesource regions of the Agulhas Current, J. Phys. Oceanogr., 29, 2303–2317.
Chapman, P., S. F. Di Marco, R. E. Davis, and A. C. Coward (2003), Flowat intermediate depths around Madagascar based on ALACE float trajec-tories, Deep Sea Res., Part II, 1957–1986.
de Ruijter, W. P. M., H. Ridderinkhof, J. R. E. Lutjeharms, M. W. Schouten,and C. Veth (2002), Observations of the flow in the Mozambique Chan-nel, Geophys. Res. Lett., 29(10), 1502, doi:10.1029/2001GL013714.
de Ruijter, W. P. M., H. M. van Aken, E. J. Beier, J. R. E. Lutjeharms, P. M.Matano, and M. W. Schouten (2004), Eddies and dipoles around SouthMadagascar: Formation, pathways and large-scale impact, Deep Sea Res.,Part I, 51, 383–400.
de Ruijter, W. P. M., H. Ridderinkhof, and M. W. Schouten (2005), Varia-bility of the southwest Indian Ocean, Philos. Trans. R. Soc. Ser. A, 363,63–76.
de Ruijter,W. P.M., G.-J. A. Brummer, S. S. Drijfhout, J. R. E. Lutjeharms, F.Peeters, H. Ridderinkhof, and H. van Aken (2006), Observations of theinter-ocean exchange around South Africa, Eos Trans. AGU, 87(9), 97,doi:10.1029/2006EO090002.
DiMarco, S. F., P. Chapman, and W. D. Nowlin Jr. (2000), Satellite ob-servations of upwelling on the continental shelf south of Madagascar,Geophys. Res. Lett., 27, 3965–3968.
DiMarco, S. F., P. Chapman, W. D. Nowlin Jr., P. Hacker, K. Donohue,M. Luther, G. C. Johnson, and J. Toole (2002), Volume transport andproperty distributions of the Mozambique Channel, Deep Sea Res., PartII, 49, 1481–1511.
Donohue, K. A., and J. M. Toole (2003), A near-synoptic survey of theSouthwest Indian Ocean, Deep Sea Res., Part II, 50, 1893–1931.
Donohue, K. A., E. Firing, and L. M. Beal (2000), Comparison of threevelocity section of the Agulhas Current and the Agulhas Undercurrent,J. Geophys. Res., 105, 28,585–28,593.
Duncan, C. P. (1970), The Agulhas Current, Ph.D. thesis, 76 pp., Univ. ofHawaii, Manoa.
Egbert, G. D., and S. Y. Erofeeva (2002), Efficient inverse modeling ofbarotropic ocean tides, J. Atmos. Oceanic Technol., 19, 183–204.
Fedorov, K. N. (1986), The physical nature and structure of oceanic fronts,in Lecture Notes on Coastal and Estuarine Studies, 333 pp., Springer,Berlin.
Fischer, J., and M. Visbeck (1993), Deep velocity profiling with self-con-tained ADCPs, J. Atmos. Oceanic Technol., 10, 764–773.
Grundlingh, M. L. (1985), Occurrence of Red Sea water in the southwes-tern Indian Ocean, 1981, J. Phys. Oceanogr., 15, 207–212.
Grundlingh, M. L. (1987), Cyclogenesis in the Mozambique Ridge Current,Deep Sea Res., Part I, 34, 89–103.
Grundlingh, M. L. (1993), On the winter flow in the southern MozambiqueChannel, Deep Sea Res., Part I, 40, 409–418.
Hacker, P., E. Firing, W. D. Wilson, and R. Molinari (1996), Direct ob-servations of the current structure east of the Bahamas, Geophys. Res.Lett., 23, 1127–1130.
Hanawa, K., and L. D. Talley (2001), Mode waters, in Ocean Circulationand Climate, Observing and Modelling the Global Ocean, edited byG. Siedler, J. Church, and J. Gould, Int. Geophys. Ser., 77, 373–387,Elsevier, San Diego, Calif.
Harris, T. F. W. (1972), Sources of the Agulhas Current in the spring of1964, Deep Sea Res., Part I, 19, 633–650.
Jost, V., S. Bakan, and K. Fennig (2002), HOAPS - A new satellite-derivedfreshwater flux climatology, Meteorol. Z., 11, 61–70.
King, B. A., E. Firing, and T. M. Joyce (2001), Shipboard observationsduring WOCE, in Ocean Circulation and Climate, Observing and Mod-elling the Global Ocean, edited by G. Siedler, J. Church, and J. Gould,Int. Geophys. Ser., 77, 99–122, Elsevier, San Diego, Calif.
Lutjeharms, J. R. E. (1988a), On the role of the East Madagascar Current asa source of the Agulhas Current, S. Afr. J. Sci., 84, 236–238.
Lutjeharms, J. R. E. (1988b), Remote sensing corroboration of retroflectionof the East Madagascar Current, Deep Sea Res., Part I, 35, 2045–2050.
Lutjeharms, J. R. E., N. D. Bang, and C. P. Duncan (1981), Characteristicsof the currents east and south of Madagascar, Deep Sea Res., Part I, 28A,879–899.
Machu, E., J. R. E. Lutjeharms, A. M. Webb, and H. M. van Aken (2002),First hydrographic evidence of the southeast Madagascar upwelling cell,Geophys. Res. Lett., 29(21), 2009, doi:10.1029/2002GL015381.
Matano, R. P., C. G. Simionato, and P. T. Strub (1999), Modeling the wind-driven variability of the South Indian Ocean, J. Phys. Oceanogr., 29,217–230.
Matano, R. P., E. J. Beier, and P. T. Strub (2002), Large-scale forcing of theAgulhas variability: The seasonal cycle, J. Phys. Oceanogr., 32, 1220–1241.
Nauw, J. J., H. M. van Aken, J. R. E. Lutjeharms, and W. P. M. de Ruijter(2005), Intrathermocline eddies in the southern Indian Ocean, J. Geo-phys. Res., 111, C03006, doi:10.1029/2005JC002917.
New, A. L., S. G. Alderson, D. A. Smeed, and K. L. Stansfield (2007), Onthe circulation of water masses across the Mascarene Plateau in the SouthIndian Ocean, Deep Sea Res., Part I, 54, 42–74.
Palastanga, V., P. J. van Leeuwen, M. W. Schouten, and W. P. M. de Ruijter(2007), Flow structure and variability in the subtropical Indian Ocean:Instability of the South Indian Ocean Countercurrent, J. Geophys. Res.,112, C01001, doi:10.1029/2005JC003395.
Penven, P., J. R. E. Lutjeharms, and P. Florenchie (2006), Madagascar:A pacemaker for the Agulhas Current system?, Geophys. Res. Lett., 33,L17609, doi:10.1029/2006GL026854.
Perigaud, C., and J. P. McCreary Jr. (2003), Influence of interannual rainfallanomalies on sea level variations in the tropical Indian Ocean, J. Geo-phys. Res., 108(C10), 3335, doi:10.1029/2003JC001857.
Phillips, H. E., S. E. Wijffels, and M. Fing (2005), Interannual variability inthe freshwater content of the Indonesian-Australian Basin, Geophys. Res.Lett., 32, L03603, doi:10.1029/2004GL021755.
Quadfasel, D. R., and J. C. Swallow (1986), Evidence for 50-dayperiodplanetary waves in the South Equatorial current of the Indian Ocean,Deep Sea Res., Part I, 33, 1307–1312.
Quartly, G. D., and M. A. Srokosz (2002), SST observations of the Agulhasand East Madagascar retroflections by the TRMM microwave imager,J. Phys. Oceanogr., 32, 1585–1592.
Quartly, G. D., and M. A. Srokosz (2004), Eddies in the southern Mozam-bique Channel, Deep Sea Res., Part II, 51, 69–83.
Quartly, G. D., J. J. H. Buck, and .M. A. Srokosz (2005), Eddy variabilityeast of Madagascar, Philos. Trans. R. Soc. Ser. A, 363, 77–79.
Quartly, G. D., J. J. H. Buck, M. A. Srokosz, and A. C. Coward (2006),Eddies around Madagascar - The retroflection re-considered, J. Mar.Syst., 63, 115–129.
Ridderinkhof, H., and W. P. M. de Ruijter (2003), Moored current observa-tions in the Mozambique Channel, Deep Sea Res., Part II, 50, 1933-195.
Schott, F., M. Fieux, J. Kindle, J. Swallow, and R. Zantopp (1988), Theboundary currents East and North of Madagascar: 2. Direct measure-ments and model comparisons, J. Geophys. Res., 93, 4963–4974.
Schott, F. A., R. Zantopp, L. Stramma, M. Dengler, J. Fischer, andW. Wibaux (2004), Circulation and Deep-Water export at the western exitof the subpolar North Atlantic, J. Phys. Oceanogr., 34, 817–843.
Schouten, W., W. P. M. de Ruijter, P. J. van Leeuwen, and H. Ridderinkhof(2003), Eddies and variability in the Mozambique Channel, Deep SeaRes., Part II, 50, 1987–2003.
Send, U. (1994), Accuracy of current profile measurements - Effect oftropical and midlatitude internal waves, J. Geophys. Res., 99(C8),16,229–16,236.
Sharma, G. S. (1976), Water characteristics and current structure at 65�Eduring the southwest monsoon, J. Oceanogr. Soc. Jpn., 32, 284–296.
Shenoi, S. S. C., P. K. Saji, and A. M. Almeida (1999), Near-surfacecirculation and kinetic energy in the tropical Indian Ocean derived fromLagrangian drifters, J. Mar. Res., 57, 885–907.
C08006 NAUW ET AL.: EAST MADAGASCAR CURRENT SYSTEM
14 of 15
C08006
Siedler, G., M. Rouault, and J. R. E. Lutjeharms (2006), Structure andorigin of the subtropical South Indian Ocean Countercurrent, Geophys.Res. Lett., 33, L24609, doi:10.1029/2006GL027399.
Stramma, L., and J. R. E. Lutjeharms (1997), The flow field of the sub-tropical gyre of the South Indian Ocean, J. Geophys. Res., 102, 5513–5530.
Stramma, L., M. Rhein, P. Brandt, M. Dengler, C. Boning, and M. Walter(2005), Upper ocean circulation in the western tropical Atlantic in borealfall 2000, Deep Sea Res., Part I, 52, 221–240.
Swallow, J., and R. T. Pollard (1988), Flow of bottom water through theMadagascar Basin, Deep Sea Res., Part I, 35, 1437–1440.
Swallow, J., M. Fieux, and F. Schott (1988), The boundary currents Eastand North of Madagascar: 1. Geostrophic currents and transports,J. Geophys. Res., 93, 4951–4962.
Tchernia, P. (1980), Descriptive Regional Oceanography, 253 pp., Elsevier,New York.
Tomczak, M., and J. S. Godfrey, (1994), Regional Oceanography: An In-troduction, 422 pp., Elsevier, New York.
van Aken, H. M., H. Ridderinkhof, and W. P. M. de Ruijter (2004), NorthAtlantic deep water in the south-western Indian Ocean, Deep Sea Res.,Part I, 51, 755–776.
Visbeck, M. (2002), Deep velocity profiling using Lowered AcousticDoppler Current Profiler: Bottom track and inverse solutions, J. Atmos.Oceanic Technol., 19, 794–807.
Weijer, W. (2008), Normal modes of the Mascarene Basin, Deep Sea Res.,Part I, 55, 128–136.
Wyrtki, K. (1973), Physical oceanography of the Indian Ocean. In:B. Zeitzschel (Ed.), The Biology of the Indian Ocean, pp. 18–36, Spring-er, New York.
You, Y. (1997), Seasonal variations of thermocline circulation and ventila-tion in the Indian Ocean, J. Geophys. Res., 102, 10,391–10,422.
�����������������������W. P. M. de Ruijter, Department of Physics and Astronomy, Institute for
Marine and Atmospheric Research Utrecht, Utrecht University, Princeton-plein 5, 3584 CC, Utrecht, Netherlands.J. R. E. Lutjeharms and A. Webb, Department of Oceanography,
University of Cape Town, Private Bag, Rondebosch 7701, South Africa.J. J. Nauw and H. M. van Aken, Department of Physical Oceanography,
Royal Netherlands Institute for Sea Research, Landsdiep 4, 1797 SZ DenHoorn (Texel), Netherlands. ([email protected])
C08006 NAUW ET AL.: EAST MADAGASCAR CURRENT SYSTEM
15 of 15
C08006


