Embed Size (px)
Citation preview

Available online at www.sciencedirect.com
Environmental Pollution 151 (2008) 121e129www.elsevier.com/locate/envpol
Occurrence of coal and coal-derived particle-bound polycyclicaromatic hydrocarbons (PAHs) in a river floodplain soil
Yi Yang a, Bertrand Ligouis b, Carmen Pies c, Peter Grathwohl b, Thilo Hofmann a,*
a Environmental Geosciences, Vienna University, Althanstrasse 14, 109 Vienna, Austriab Center for Applied Geoscience, Tubingen University, Tubingen, Germany
c Applied Geology, Mainz University, Mainz, Germany
Received 1 October 2006; received in revised form 21 February 2007; accepted 25 February 2007
Coal and coal-derived particles have been identified as dominant geosorbents for PAHs in a river floodplain soil.
Abstract
A PAH contaminated river floodplain soil was separated according to grain size and density. Coal and coal-derived particles from coal min-ing, coal industry and coal transportation activities were identified by organic petrographic analysis in our samples. Distinct concentrations ofPAHs were found in different grain size and density fractions, however, similar distribution patterns of PAHs indicated similar sources. In ad-dition, although light fractions had the mass fraction by weight of less than 5%, they contributed almost 75% of the total PAHs in the soil. PAHconcentrations of all sub fractions showed positive correlation with their TOC contents. Altogether, coal and coal-derived particles that wereabundant in light fractions could be the dominant geosorbents for PAHs in our samples.� 2007 Elsevier Ltd. All rights reserved.
Keywords: Coal; Coal derived particles; Black carbon; PAH; Geosorbents; Sediments; Floodplain
1. Introduction
In the aquatic environment, due to their hydrophobic na-ture, persistent organic pollutants (POPs), such as PAHs,PCBs, can strongly sorb to non-aquatic phases and accumulatein sediment/soil as the result of rain, flood and river discharge.Therefore sediment/soil plays an important role as the reser-voir for these pollutants. Sorption and desorption of contami-nants in sediment/soil affect the bioavailability, and thereforeact as the trigger for the management and remediation forthese contaminations.
However, sediment/soil is not a uniform matrix, but con-sists of heterogeneous geosorbents which have different ori-gin, formation, and physicochemical properties. Theseheterogeneous geosorbents exhibit widely different amounts
* Corresponding author. Tel.:þ43 1 4277 53320; fax: þ43 1 4277 53399.
E-mail address: [email protected] (T. Hofmann).
0269-7491/$ - see front matter � 2007 Elsevier Ltd. All rights reserved.
doi:10.1016/j.envpol.2007.02.020
of POPs. Studies carried out on harbor sediments in variousfractions found that coal/wood-derived particles constitutedlittle of the sediment by weight but contained most of the totalPAHs (Ghosh et al., 2001; Ahrens and Depree, 2004), whileanother study showed that 50e80% of PAHs were associatedwith the light detrital plant debris (Rockne et al., 2002). Or-ganic matter (OM) is thought to be the dominant geosorbentfor PAHs when present in concentrations above 0.1% of natu-ral sediment/soil (Johnson et al., 2001). The three main OMsare considered to be humic substances, geopolymers (kerogensand coals) and combustion/pyrolysis forms (black carbon)with different sorption/desorption characteristics (Allen-Kinget al., 2002). Otherwise, ‘‘soft carbon’’, consisting of fulvicacids and humic acids in their rubbery state, and ‘‘hard car-bon’’, including kerogen, black carbon and humin in theirglassy state, were defined by Weber et al. (1992) in relationto their different physical chemical characteristics. There areseveral approaches to elucidate such geosorbents, one ofwhich is to determine the distribution of hydrophobic organic

122 Y. Yang et al. / Environmental Pollution 151 (2008) 121e129
Fig. 1. Petrographic identification of organic carbon particles in the soil.
123Y. Yang et al. / Environmental Pollution 151 (2008) 121e129
contaminants, such as PAHs in different grain size fractions.Because of their different compositions and origins, PAHs as-sociated with particles may show different distribution charac-teristics. However, a finding of uniform PAH profiles amongdifferent size fractions can be taken as evidence for a commonsource or, alternatively, for the presence of dynamic exchangeand equilibration processes within the sediment/soil matrix(Ahrens and Depree, 2004). In addition, different sized parti-cles in sediment/soil may show different bioavailability(Talley et al., 2002). It is especially important for the sedi-ment/soil dwelling animals, such as earthworms, which selec-tively feed on small particles (Shipitalo and Protz, 1989;Zhang and Schrader, 1993).
Previous studies at the Mosel River identified largeamounts of black particles in soils at different sites. Linkedto this, particles had elevated PAH concentrations (Pieset al., 2006). The aim of this study was to identify, in detail,the dominant geosorbents in the floodplain soils of the MoselRiver. Therefore we chose one typical site identified from theprevious studies (close to the town of Leiwen) for a detailedinvestigation. Soils were separated into several fractions ac-cording to the grain size and density. The purposes of thisstudy were: (1) to identify these black particles; (2) to charac-terize the distribution of PAHs in the soil and (3) to elucidatethe dominant geosorbents for the PAHs.
2. Materials and methods
2.1. Study site and sample collection
Soil samples used in this study were collected from the Mosel River flood-
plain. The Mosel River is a tributary of the Rhine River in Germany, and has
a length of 520 km. It rises at the Col de Bussang Vosges (France) and joins
the Rhine River at Koblenz (Germany). Large-scale coal mining activities
0
50
100
150
200
250
0 10 20 30Total PAH concentration (mg/kg)
Dep
th
(cm
)
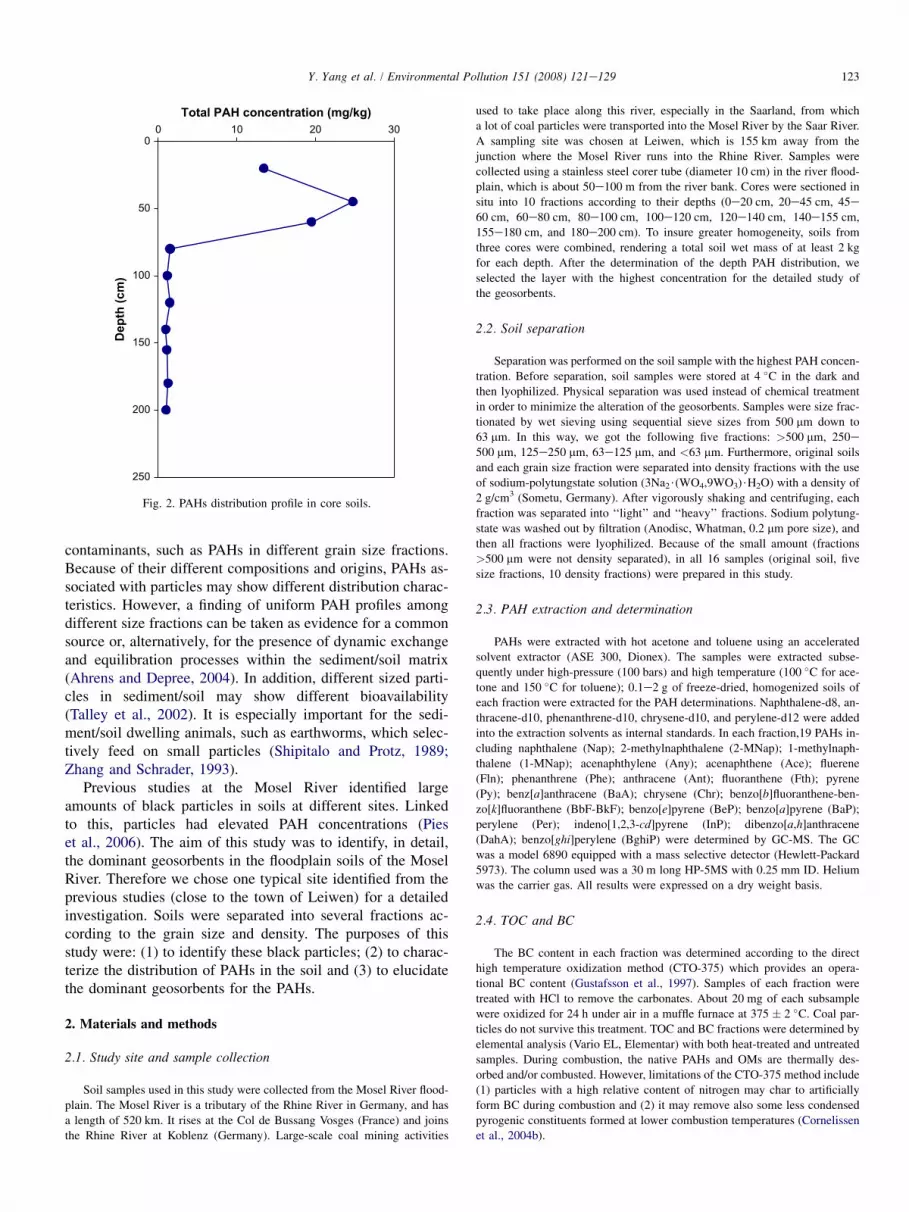
Fig. 2. PAHs distribution profile in core soils.
used to take place along this river, especially in the Saarland, from which
a lot of coal particles were transported into the Mosel River by the Saar River.
A sampling site was chosen at Leiwen, which is 155 km away from the
junction where the Mosel River runs into the Rhine River. Samples were
collected using a stainless steel corer tube (diameter 10 cm) in the river flood-
plain, which is about 50e100 m from the river bank. Cores were sectioned in
situ into 10 fractions according to their depths (0e20 cm, 20e45 cm, 45e
60 cm, 60e80 cm, 80e100 cm, 100e120 cm, 120e140 cm, 140e155 cm,
155e180 cm, and 180e200 cm). To insure greater homogeneity, soils from
three cores were combined, rendering a total soil wet mass of at least 2 kg
for each depth. After the determination of the depth PAH distribution, we
selected the layer with the highest concentration for the detailed study of
the geosorbents.
2.2. Soil separation
Separation was performed on the soil sample with the highest PAH concen-
tration. Before separation, soil samples were stored at 4 �C in the dark and
then lyophilized. Physical separation was used instead of chemical treatment
in order to minimize the alteration of the geosorbents. Samples were size frac-
tionated by wet sieving using sequential sieve sizes from 500 mm down to
63 mm. In this way, we got the following five fractions: >500 mm, 250e
500 mm, 125e250 mm, 63e125 mm, and <63 mm. Furthermore, original soils
and each grain size fraction were separated into density fractions with the use
of sodium-polytungstate solution (3Na2$(WO4,9WO3)$H2O) with a density of
2 g/cm3 (Sometu, Germany). After vigorously shaking and centrifuging, each
fraction was separated into ‘‘light’’ and ‘‘heavy’’ fractions. Sodium polytung-
state was washed out by filtration (Anodisc, Whatman, 0.2 mm pore size), and
then all fractions were lyophilized. Because of the small amount (fractions
>500 mm were not density separated), in all 16 samples (original soil, five
size fractions, 10 density fractions) were prepared in this study.
2.3. PAH extraction and determination
PAHs were extracted with hot acetone and toluene using an accelerated
solvent extractor (ASE 300, Dionex). The samples were extracted subse-
quently under high-pressure (100 bars) and high temperature (100 �C for ace-
tone and 150 �C for toluene); 0.1e2 g of freeze-dried, homogenized soils of
each fraction were extracted for the PAH determinations. Naphthalene-d8, an-
thracene-d10, phenanthrene-d10, chrysene-d10, and perylene-d12 were added
into the extraction solvents as internal standards. In each fraction,19 PAHs in-
cluding naphthalene (Nap); 2-methylnaphthalene (2-MNap); 1-methylnaph-
thalene (1-MNap); acenaphthylene (Any); acenaphthene (Ace); fluerene
(Fln); phenanthrene (Phe); anthracene (Ant); fluoranthene (Fth); pyrene
(Py); benz[a]anthracene (BaA); chrysene (Chr); benzo[b]fluoranthene-ben-
zo[k]fluoranthene (BbF-BkF); benzo[e]pyrene (BeP); benzo[a]pyrene (BaP);
perylene (Per); indeno[1,2,3-cd]pyrene (InP); dibenzo[a,h]anthracene
(DahA); benzo[ghi]perylene (BghiP) were determined by GC-MS. The GC
was a model 6890 equipped with a mass selective detector (Hewlett-Packard
5973). The column used was a 30 m long HP-5MS with 0.25 mm ID. Helium
was the carrier gas. All results were expressed on a dry weight basis.
2.4. TOC and BC
The BC content in each fraction was determined according to the direct
high temperature oxidization method (CTO-375) which provides an opera-
tional BC content (Gustafsson et al., 1997). Samples of each fraction were
treated with HCl to remove the carbonates. About 20 mg of each subsample
were oxidized for 24 h under air in a muffle furnace at 375 � 2 �C. Coal par-
ticles do not survive this treatment. TOC and BC fractions were determined by
elemental analysis (Vario EL, Elementar) with both heat-treated and untreated
samples. During combustion, the native PAHs and OMs are thermally des-
orbed and/or combusted. However, limitations of the CTO-375 method include
(1) particles with a high relative content of nitrogen may char to artificially
form BC during combustion and (2) it may remove also some less condensed
pyrogenic constituents formed at lower combustion temperatures (Cornelissen
et al., 2004b).

Table 1
Compositio
2.3 X X 0.2 0.6 0.7 4.6 32.2 0.4
0.70.8
AL
ON
No
n-g
eli
fie
d w
oo
dy
p
hy
to
cla
st (
tis
su
es
& s
tru
ctu
re
les
s h
um
ic
de
trit
us
)
Ho
mo
ge
ne
ou
s h
um
ic g
els
rbonized
esidue
RECEN
Te
nu
isp
he
re
Cra
ss
ine
tw
ork
Te
nu
ine
tw
ork
Py
ro
lytic
ca
rb
on
Se
co
nd
ary
se
mic
ok
e
CO
AL
- A
ND
PE
TR
OL
EU
M- D
ER
IVE
D F
LU
OR
ES
CE
NT
M
AT
ER
IAL
S
(ta
r,
oil
s,
lub
ric
an
ts
...)
CHAR
(solid residues of coal
liquefaction, coal combustion)
Min
ero
id
(>
50
% A
sh
)
>75%
unfused
material,
<5%
porosity
So
lid
Fu
sin
oid
Ine
rto
id (
5-4
0%
po
ro
sit
y)
Mix
ed
(2
5-7
5%
fu
se
d &
un
fu
se
d m
ate
ria
l)
Cra
ss
isp
he
re
<25% unfused
material, 40-
90% porosity
Ge
lifie
d w
oo
dy
ph
yto
cla
st (
tis
su
es
& s
tru
ctu
re
les
s h
um
ic d
etrit
us
)
Ge
lifie
d m
atrix
wit
h h
um
ic d
etrit
us
37.2
INORGANIC
MATTER
Qu
artz
Fly
as
h (
sp
ine
l, g
las
s..
.)
Ca
rb
on
-ric
h c
lay
ey
ma
trix
(c
on
ta
ins
ve
ry
sm
all
co
al
an
d c
ok
e
pa
rtic
les
)
X present b ifusinite and fusinite from hard coal
12
4Y
.Y
anget
al./
Environm
entalP
ollution151
(2008)121e
129
n of the organic matter as revealed by organic petrographic analysis (based on 525 counts, macerals and minerals, in volume %)
HARD COAL
0.2 0.2 0.2 0.4 0.4 0.2 15.4 X X 0.2 28.9 1.3 3.2 2.6 0.2 1.5 0.6 0.6 0.4 0.6 1.5 0.2 0.2
0.63.3
RESIDUES OF CO
HYDROGENATI
Fu
ng
al
ph
yto
cla
st
Ma
trix
wit
h f
us
ed
& u
nfu
se
d i
nc
lus
ion
s
Ca
r
Ce
no
sp
he
re
(is
otro
pic
or a
nis
otro
pic
)
CH
AR
CO
AL
(re
ce
nt &
fo
ss
il)**
T ORGANIC MATTER
(soil & peat)
Su
b-b
itu
min
ou
s c
oa
l
Prim
ary
se
mic
ok
e
Gra
nu
lar r
es
idu
e
Hig
h r
efle
ctin
g (
wh
ite
)
Lo
w r
efle
ctin
g (
gre
y)
Se
ed
c
oa
tin
gs
Re
sin
ou
s s
ub
sta
nc
es
Su
be
rin
ize
d t
iss
ue
s (
ba
rk
, ro
ot)
Cu
tic
les
(e
pid
erm
al
tis
su
es
)
Po
lle
n
an
d
sp
ore
s
Lip
to
de
trin
ite
(fin
e l
iptin
ite
fra
gm
en
ts
)
COKE CARBON FORMS
(coal carbonization)
RAW
BROWN
COAL
Xy
lite
(li
gn
ifie
d w
oo
d: c
orte
x t
iss
ue
s,
se
co
nd
ary
xy
lem
)
Ma
trix
c
oa
l
Iso
tro
pic
Cir
cu
lar a
nis
otro
pic
Rib
bo
n a
nis
otro
pic
Lo
w v
ola
til
e b
itu
min
ou
s c
oa
l
An
th
ra
cit
e
Reacted
coal
macerals
Matrix particles
Vit
ro
pla
st
Hig
h v
ola
til
e b
itu
min
ou
s c
oa
l
Inc
ipie
nt a
nis
otro
pic
Le
ntic
ula
r a
nis
otro
pic
Pa
rtia
lly
re
ac
te
d c
oa
l m
ac
era
ls
Me
diu
m v
ola
til
e b
itu
min
ou
s c
oa
l
Ox
idiz
ed
ma
ce
ra
l &
co
al
wit
h o
xid
atio
n r
ims
(h
ea
te
d a
lte
re
d)
Un
alt
ere
d c
oa
l m
ac
era
ls
Ma
trix
pa
rtic
les
Co
ke
fu
sit
e
Vit
rit
e*
1.96.54.544.5
Sp
orin
ite
(p
oll
en
an
d s
po
re
s)
ORGANIC
MATTER
IN
ANCIENT
SEDIMENTS
Bit
um
en
Lip
to
de
trin
ite
(fin
e l
iptin
ite
fra
gm
en
ts
)
Bit
um
init
e (
am
orp
ho
us
org
an
ic m
atte
r,
AO
M)
Te
lalg
init
e a
nd
La
ma
lgin
ite
(m
arin
e a
nd
fre
sh
wa
te
r a
lga
e)
BROWN-
COAL COKE
Pa
rtia
lly
re
ac
te
d b
ro
wn
-c
oa
l m
ac
era
ls
Ce
no
sp
he
re
(is
otro
pic
or a
nis
otro
pic
)
ut not expressed as percentage due to scarcity; (44.5) volume * isolated vitrite (dark) from sub-bituminous coal; ** isolated sem

125Y. Yang et al. / Environmental Pollution 151 (2008) 121e129
0
1
2
3
4
Nap
2-M
Nap
1-M
Nap An
y
Ace
Fln
Phe
Ant
Fth Py
BaA
Chr
BbF-
BkF
BeP
BaP
Per
InP
Dah
A
Bghi
P
PA
H co
ncen
tratio
n (m
g/kg
)
Fig. 3. Concentration of 19 PAHs in the river floodplain soil.
2.5. Organic petrography
The light fraction of original soils was treated with HCl, and was embed-
ded in an epoxy resin and then polished. Microscopic investigations were car-
ried out on the polished mounts with a Leitz DMRX-MPVSP microscope
photometer. The organic matter of the sample was characterized in both inci-
dent white light and UV þ violet-light illumination (fluorescence mode) using
immersion objectives under oil (magnification 200e500�). The ICCP’s clas-
sification systems for macerals (Taylor et al., 1998) and the classification of
carbonaceous airborne contaminants published by Ligouis (2005) were used
in this study to describe and classify the different organic particles. The quan-
titative estimation of the proportions of the organic and inorganic constituents
was carried out by a point counting method used in coal petrography (Taylor
et al., 1998). A minimum of 500 points were counted on the whole surface of
the polished mount. The proportions of various constituents were expressed as
volume %.
3. Results and discussion
3.1. Organic petrography
For the detailed organic petrography study we chose thesample with the highest concentration of black particles visi-ble to the naked eye (and likewise PAH, Fig. 2) at 20e45cm. The various groups of organic materials identified by or-ganic petrographic analysis are summarized in Table 1. Threemajor groups can be distinguished (Ligouis et al., 2005). First,the recent organic matter group consists of woody phytoclasts,humic gels, suberinized tissues, pollen and spores, and recentcharcoal. Second, the fossil organic matter in ancient
sediments consists primarily of pollen, spores, algae, andamorphous organic matter. Coal particles in this group, notfound in our samples, would correspond to ancient erodedand re-sedimented coal particles. Third, the group of anthropo-genic organic matters is composed of particles of raw browncoal, hard coal, charcoal, brown-coal coke, hard-coal coke,char, and asphalt. The particles are classified according theirmorphology and their optical properties. Coal particles fromthe coal industry/mining are larger, showing weak or no alter-ation, and are not corroded with an angular outline. In oursamples, the optical properties of the coal and brown coal par-ticles found showed those properties associated with the coalindustry/mining and coal transportation activities (Fig. 1).The term ‘‘coal and coal-derived particles’’ in our paper repre-sents the particles summarized in the third group.
The coal particles contributed greatly to the total percent-age of carbonaceous particles with 44.5%. Most of themwere in the form of vitrite from sub-bituminous coal, andraw sub-bituminous coal as well. Their emission was probablyrelated to the Saar-coal production and the treatment of coal. Itis important to note that the sample was characterized by a rel-atively high amount of carbon-rich clayey matrices containingvery small (few micrometers in size) coal and coke particles(Fig. 1). These particles could be ‘‘residues’’ from the coal in-dustry treatment (e.g. washing, crushing). Fly ash is generallycomposed of very fine solid particles, often less than 10 mm indiameter (Taylor et al., 1998). These particles consisted ofthermal transformation products found in minerals contained
Table 2
Characteristics of the river floodplain soil
Grain size fraction Mass contribution (%) Corg% BC%P
PAH (mg/kg dw)P
PAH (mg/kg OC) Mass-weighted contribution
toP
PAH (%)
>500 mm 0.34 32.0 1.9 332.6 1039.3 5.1
250e500 mm 1.7 15.2 0.88 137.1 902.0 10.6
125e250 mm 16.0 3.9 0.40 27.8 712.8.8 19.9
63e125 mm 22.6 2.0 0.32 15.5 775.0 15.6
<63 mm 59.3 3.3 0.40 18.0 545.5 48.8
Composite 3.4 0.57 22.2 640.5
Bulk 3.5 0.37 24.7 705.7

126 Y. Yang et al. / Environmental Pollution 151 (2008) 121e129
in feed coal. In cases of incomplete combustion, fly ash parti-cles could also exhibit unburnt carbon in the form of char andunburnt coal particles. Not surprisingly, coal from differentranks, charring and coking residues, and charcoal were alsofound in the sample. Coke pollution may be due to cokingplants, steel smelters or gas manufactured plants, whereascharred particles are by-products of all combustion processesof fossil fuels from industries, power plants, and vehicles.However, both of them are airborne particles which probablycontributed to our sample by dust particles from former coalmining industries in the neighborhood of our study area. Char-coal particles occurred in the form of isolated semifusinitesand fusinites. They belonged to coal dust and had beenproduced by coal crushing from hard coal. In addition, coal-and petroleum-derived fluorescent materials were also encoun-tered in our sample. Recent organic matter occurred mostly inthe form of non-gelified woody phytoclasts with an amount of2.2%.
3.2. PAHs depth distribution
Fig. 2 shows the distribution profile of PAHs (sum of 19PAHs) in the core. The highest concentration of 24.7 mg/kgwas at 20e45 cm, and decreased with the increase of depth.Fig. 3 shows the distribution of the analyzed PAHs. Compared
0
2
4
6
8
10
12
14
16
% o
f P
AH
s
Orig.S>500um250-500um125-250um63-25um<63um
Nap
2-M
Nap
1-M
Nap An
yAc
eFl
nPh
eAn
tFt
h PyBa
AC
hrBb
F-Bk
FBe
PBa
PPe
rIn
PD
ahA
Bghi
P
Fig. 4. Distribution of PAHs in different grain size fractions from the river
floodplain soil.
to other PAHs, 4,5-ring PAHs were dominant. The high con-centration of Nap and MNap might result from the largeamount of raw coal particles in our samples. We determinedPAHs in these coal particles from our samples and found sim-ilar pattern of Nap and Mnap, but very low concentration ofhigh molecular weight PAHs (Pies et al., 2006). For all depths,PAHs showed a similar distribution pattern, which is an indi-cator of a similar origin.
3.3. PAH distribution in different soil fractions
3.3.1. Distribution in different grain size fractionsSoil samples were wet sieved into five fractions: >500 mm,
250e500 mm, 125e250 mm, 63e125 mm, and <63 mm. Thecharacteristics of the studied samples are summarized inTable 2. Our soil samples were composed primarily of silt-and clay- sized particles and the soil mass in each size fractiondecreased with increasing grain size. TOC values, as measuredby elemental analyzer, ranged between 2.0e32.0% andshowed a positive correlation with grain size. All of the datafrom bulk samples, except of BC contents, were in agreementwith the composite ones by summing mass-weighted contribu-tions for all grain size fractions. The larger error of BC mighthave resulted from the overestimation of the BC amount be-cause of the charring and transforming of OC to BC by theCTO-375 method (Gelinas et al., 2001).
The PAH distribution in each size fraction showed a similarpattern, which indicated a common PAH source, while the con-centrations varied more than 10-fold for individual compoundsand total PAH (Fig. 4). However, when normalized by TOC,PAH concentrations varied from 545.5 to 1039.3 mg/kg OC(Table 2). In addition, it is very interesting that the highestPAH concentration occurred in the coarsest grain size fraction,while the intermediate and finest fractions had lower PAH con-centrations. Large variations of PAH concentrations found indifferent size fractions were probably controlled by the organicmatter (coal and coal derived particles) enriched in different sizefractions, which will be discussed later in detail.
The PAH concentration in each size fraction was multipliedby the corresponding mass proportion, respectively (Table 2).Due to the high mass percentage, fractions <63 mm contrib-uted almost 50% of the total PAH mass in soils. In contrast,although having the highest PAH concentration, fractions>500 mm contributed only 5.1% of total PAH mass.
Table 3
Characteristics of the river floodplain soil, separated by grain size and density
Grain size
fraction (mm)
Mass contribution
to fraction dw
Mass weighted
contribution to total
soil dw
TOC (%) BC (%) PAH (mg/kg dw) Mass weighted
contribution to total PAH
Li Hv Li Hv Li Hv Li Hv Li Hv Li Hv
>500 mm e e e e e e e e e e e e250e500 mm 25.4 74.6 0.44 1.3 64.7 0.80 4.2 0.15 509.2 4.1 10.0 0.24
125e250 mm 8.3 91.7 1.3 14.7 45.4 0.79 6.4 0.14 333.1 2.3 19.8 1.5
63e125 mm 4.4 95.7 0.98 21.6 43.9 0.27 12.6 0.07 324.6 1.4 14.2 1.4
<63 mm 3.3 96.7 1.9 57.3 45.8 1.5 8.8 0.26 375.0 7.4 32.4 18.8
Bulk 4.3 95.7 e e 48.5 1.3 8.9 0.20 461.5 7.0 74.9 25.1

127Y. Yang et al. / Environmental Pollution 151 (2008) 121e129
0
100
200
300
400
500
600
Bulk 250-500µm
125-250µm
63-125µm
<63 µm Bulk 250-500µm
125-250µm
63-125µm
<63 µm
To
tal P
AH
co
nc. (m
g/kg
) Li. Hv.
0
200
400
600
800
1000
To
tal P
AH
co
nc. (m
g/kg
O
C)
Fig. 5. PAH distributions in size and density fractions.
3.3.2. Distribution in different density fractionsThe bulk sample and each of the grain size fractions were
further density separated into ‘‘light’’ (r < 2 g/cm3) and‘‘heavy’’ (r > 2 g/cm3) sub-fractions, and the PAH concentra-tion in each density fraction was determined by GC-MS. Table3 summarizes mass contributions of density fractions to theircorresponding grain size fractions, as well as their mass con-tributions to the whole soil mass. Mass contributions of lightfractions to their corresponding grain size fractions decreasedwith increasing grain size, in the range of 3.3e25.4%. In sum-mary, the mass-weighted contribution to total soil for all lightfractions (excluding >500 mm fractions) was 4.7% of the lightfraction contribution. Due to the very low mass contributionfrom the fractions >500 mm, this data was acceptable accord-ing to the results from the bulk soil, in which the light frac-tions contributed 4.3% of the total mass in soils.
PAH concentrations determined in each ‘‘light’’ and‘‘heavy’’ fractions revealed that large concentrations of PAHswere associated with the coal and coal-derived particles. PAHconcentrations in light fractions were in the range of 325e509mg/kg, which were 50e200 times more than those in the heavyfractions (Table 3 and Fig. 5). Fig. 5 also shows the TOCnormalized total PAH concentrations in different fractions.Compared to their corresponding heavy fractions, the lightfractions had higher TOC normalized values.
As shown in Fig. 6, the contribution of total PAHs associ-ated with light particles in river floodplain soils was almost
75%, although their mass contribution to the total soil masswas less than 5%. In detail, light materials contributed the ma-jority to the PAHs mass in their corresponding grain size frac-tions for all size fractions. However, we noticed that due to thehighest mass contribution, heavy materials in the finest size(<63 mm) contributed more PAHs mass, compared to thoseof other grain size fractions.
3.4. Dominant geosorbents
In all of the grain size and density fractions studied, totalPAH concentrations showed a strongly positive correlation rel-ative to their OC fraction in soils (Fig. 7) (r ¼ 0.99,P < 0.0001; here OC% ¼ TOC%eBC%). There was a weakerrelationship between BC values and PAH concentrations(r ¼ 0.78, P < 0.005) (Fig. 8), although BC particles werethought to be very strong sorbents for PAHs (Accardi-Deyand Gschwend, 2002; Kleineidam et al., 1998; Jonker andSmedes, 2002; Cornelissen and Gustafsson, 2004a; Cornelis-sen et al., 2004c). However, neglecting light fractions from re-gression analysis, a strong positive correlation was found(r ¼ 0.99, P < 0.0001). This can be justified considering thelarger error for BC might be caused by the combustion methodfor light fractions. As identified by our organic petrographicquantified analysis, there were large amounts of coal particlesand various BC particles in our samples. Former heavy indus-trialized and coal mining activities were associated with
0
20
40
60
80
% o
f to
tal P
AH
0
20
40
60
80
100
% o
f sed
im
en
t m
ass
Bulk 250-500µm
125-250µm
63-125µm
<63 µm Bulk 250-500µm
125-250µm
63-125µm
<63 µm
Li. Hv.
Fig. 6. Masses and PAH contributions in size and density fractions.

128 Y. Yang et al. / Environmental Pollution 151 (2008) 121e129
pyrolysis processes, with PAHs as by-products. Hence our pet-rographic results, together with the strong correlation betweenPAH concentrations and OC, as well as BC, showed on the onehand that coal and coal-derived particles are probably very im-portant sources for PAHs in the area; on the other hand, be-cause sorption strengths of coal are generally in the sameorder of magnitude as those of BC (Kleineidam et al., 2002;Cornelissen and Gustafsson, 2005), these coal and coal-de-rived particles could act also as sinks for PAH contaminants.The relationship shown by TOC and PAH concentrations re-vealed that light fractions associated with coal and coal-de-rived particles could be the dominant geosorbents for PAHsin our sample.
4. Conclusion
Sediment/soil plays an important role for PAHs as the sink/source in the aquatic environment. Understanding the differentbehaviors of PAHs in different fractions of these complex ma-trices has useful implications for environmental management.In our study, coal and coal-derived particles from coal trans-portation activities, coal mining and coal industry in the
0
10
20
30
40
50
60
70
0 100 200 300 400 500 600Total PAH concentration (mg/kg)
OC
(%
)
0
1
2
3
4
0 10 20 30
Fig. 7. Correlation of OC with total PAH concentrations in different fractions.
0
1
2
3
4
5
6
7
8
9
10
0
0.5
1
1.5
2
0 200 400
0 100 200 300 400 500 600Total PAH concentration (mg/kg)
BC
(%
)
Fig. 8. Correlation of BC with total PAH concentrations in different fractions.
neighboring region were identified and quantified by organicpetrographic analysis. In spite of distinct concentrations in dif-ferent fractions, similar PAH distribution patterns indicatedsimilar sources. Due to the high mass percentage the finestsoil fractions contributed almost half of the total PAH mass.The >500 mm soil fractions showed the highest PAHs concen-tration, but contributed only marginally to the total soil mass.The light fraction of the soil, although contributing less than5% to the total soil mass, represented 75% of total PAHsmass. Our study shows a positive correlation between PAHconcentrations and TOC/BC contents. Together with the re-sults of organic petrographic identification, we consider coaland coal-derived particles to be the dominant geosorbentsfor PAHs. Hence, instead of normal grain size separation, den-sity separation could give more detailed information becausePAH behavior is not controlled by the grain size distributionbut by the density fraction (i.e. the light fraction with coaland coal-derived particles, in our study). Coal and coal-de-rived particles have a very large sorption capacity (Kleineidamet al., 2002; Ran et al., 2003; Cornelissen and Gustafsson,2004a), and show a slow and very slow desorption (Jonkeret al., 2005). PAHs may be less available for biological uptakeand bio-treatment (Jonker and Koelmans, 2002; Jonker et al.,2005). Thus, determining only the total extracted PAHs fromsoils containing coal and coal-derived geosorbents may mis-lead environmental risk assessment (which also applies forsoils containing other strong geosorbents). For the establish-ment and development of soil quality criteria (SQC) it is im-portant to understand the environmental behavior of PAHs,especially if associated with heterogeneous geosorbents likecoal and coal-derived particles.
Acknowledgements
This study was funded by the State of Rhineland Palatinate,Germany, represented by the Office for Environment, WaterEconomy, and Trade Supervisory (Landesamt fur Umwelt,Wasserwirtschaft und Gewerbeaufsicht Rheinland-Pfalz).The authors thank Dr Thomas Wendel, Renate Riehle and Re-nate Seelig for their technical assistance and kind help in thelaboratory of Tubingen University.
References
Accardi-Dey, A., Gschwend, P.M., 2002. Assessing the combined roles of nat-
ural organic matter and black carbon as sorbents in sediments. Environ-
mental Science and Technology 36, 21e29.
Ahrens, M.J., Depree, C.V., 2004. Inhomogeneous distribution of polycyclic
aromatic hydrocarbons in different size and density fractions of contami-
nated sediment from Auckland Harbour, New Zealand: an opportunity.
Marine Pollution Bulletin 48, 341e350.
Allen-King, R.M., Grathwohl, P., Ball, W.P., 2002. New modeling paradigms
for the sorption of hydrophobic organic chemicals to heterogeneous carbo-
naceous matter in soils, sediments, and rocks. Advances in Water Re-
sources 25, 985e1016.
Cornelissen, G., Gustafsson, O, 2004a. Sorption of phenanthrene to envi-
ronmental black carbon in sediment with and without organic matter
and native sorbates. Environmental Science and Technology 38,
148e155.

129Y. Yang et al. / Environmental Pollution 151 (2008) 121e129
Cornelissen, G., Kukulska, Z., Kalaitzidis, S., Christanis, K., Gustafsson, O,
2004b. Relations between environmental black carbon sorption and geo-
chemical sorbent characteristics. Environmental Science and Technology
38, 3632e3640.
Cornelissen, G., Elmquist, M., Groth, I., Gustafsson, O, 2004c. Effect of sor-
bate planarity on environmental black carbon sorption. Environmental Sci-
ence and Technology 38, 3574e3580.
Cornelissen, G., Gustafsson, O, 2005. Prediction of large variation in biota to
sediment accumulation factors due to concentration-dependent black car-
bon adsorption of planar hydrophobic organic compounds. Environmental
Toxicology and Chemistry 24, 495e498.
Gelinas, Y., Prentice, K.M., Baldock, J.A., Hedges, J.I., 2001. An improved
thermal oxidation method for the quantification of soot/graphitic black car-
bon in sediments and soils. Environmental Science and Technology 35,
3519e3525.
Ghosh, U., Talley, J.W., Luthy, R.G., 2001. Particle-scale investigation of PAH
desorption kinetics and thermodynamics from sediment. Environmental
Science and Technology 35, 3468e3475.
Gustafsson, O, Haghseta, C., Chan, J., MacFarlane, J., Gschwend, P.M., 1997.
Quantification of the dilute sedimentary soot phase: Implications for PAH
speciation and bioavailability. Environmental Science and Technology 31,
203e209.
Johnson, M.D., Huang, W., Weber Jr., W.J., 2001. A distributed reactivity
model for sorption by soils and sediments. 13. simulated diagenesis of nat-
ural sediment organic matter and its impact on sorption/desorption equilib-
ria. Environmental Science and Technology 35, 1680e1687.
Jonker, M.T.O., Smedes, F., 2002. Preferential sorption of planar contaminants
in sediments from Lake Ketelmeer, The Netherlands. Environmental Sci-
ence and Technology 34, 1620e1626.
Jonker, M.T.O., Hawthorne, S.B., Koelmans, A.A., 2005. Extremely slowly
desorbing polycyclic aromatic hydrocarbons from soot and soot-like mate-
rials: evidence by supercritical fluid extraction. Environmental Science and
Technology 39, 7889e7895.
Jonker, M.T.O., Koelmans, A.A., 2002. Sorption of polycyclic aromatic hydro-
carbons and polychlorinated biphenyls to soot and soot-like materials in
the aqueous environment: mechanistic considerations. Environmental
Science and Technology 36, 3725e3734.
Kleineidam, S., Rugner, H., Ligouis, B., Grathwohl, P., 1998. Organic matter
facies and equilibrium sorption of phenanthrene. Environmental Science
and Technology 33, 1637e1644.
Kleineidam, S., Schuth, C., Grathwohl, P., 2002. Solubility-normalized com-
bined adsorption-partitioning sorption isotherms for organic pollutants.
Environmental Science and Technology 36, 4689e4697.
Ligouis, B., Kleineidam, S., Karapanagioti, H.K., Kiem, R., Grathwohl, P.,
Niemz, C., 2005. Organic petrology: a new tool to study contaminants
in soils and sediments. In: Lichtfouse, E., Dudd, S., Robert, D. (Eds.), En-
vironmental Chemistry. Green Chemistry and Pollutants in Ecosystems.
Springer, Berlin, Heidelberg, p. 89.
Pies, C., Yang, Y., Hoffmann, B., Petrowsky, J., Hummel, D., Ternes, T., Hof-
mann, T. 2006. PAH source identification of bank and alluvial soils. EGU
Conference, Vienna, Austria.
Ran, Y., Xiao, B., Fu, J., Sheng, G., 2003. Sorption and desorption hysteresis
of organic contaminants by kerogen in a sandy aquifer material. Chemo-
sphere 50, 1365e1376.
Rockne, K.J., Shor, L.M., Young, L.Y., Taghon, G.L., Kosson, D.S., 2002. Dis-
tribution sequestration and release of PAHs in weathered sediment: the role
of sediment structure and organic carbon properties. Environmental Sci-
ence and Technology 36, 2636e2644.
Shipitalo, M.J., Protz, R., 1989. Chemistry and micromorphology of aggrega-
tion in earthworm casts. Geoderma 45, 357e374.
Taylor, G.H., Teichmuller, M., Davis, A., Diessel, C.E.K., Littke, R.,
Robert, P., 1998. Organic Petrology. Gebruder Borntraeger, Berlin.
Talley, J.W., Ghosh, U., Tucker, S.G., Furey, J.S., Luthy, R.G., 2002. Particle-
scale understanding of the bioavailability of PAHs in sediments. Environ-
mental Science and Technology 36, 477e483.
Weber Jr., W.J., McGinley, P.M., Katz, L.E., 1992. A distributed reactivity model
for sorption by soils and sediments: 1. Conceptual basis and equilibrium
assessments. Environmental Science and Technology 26, 1955e1962.
Zhang, H., Schrader, S., 1993. Earthworm effects on selected physical and chem-
ical properties of soil aggregates. Biology and Fertility of Soils 15, 229e234.