Embed Size (px)
Citation preview
Staff Subcommittee on Electricity and Electric
Reliability
Staff Subcommittee on Electricity & Electric Reliability and Staff
Subcommittee on Clean Coal & Carbon Management
Chinese Clean Coal Technology
Chinese Clean Coal Technology
Moderator: Hon Jeremy Oden, Alabama
Presenter: Dr. Peter Chen, Forest Power & Energy Holdings
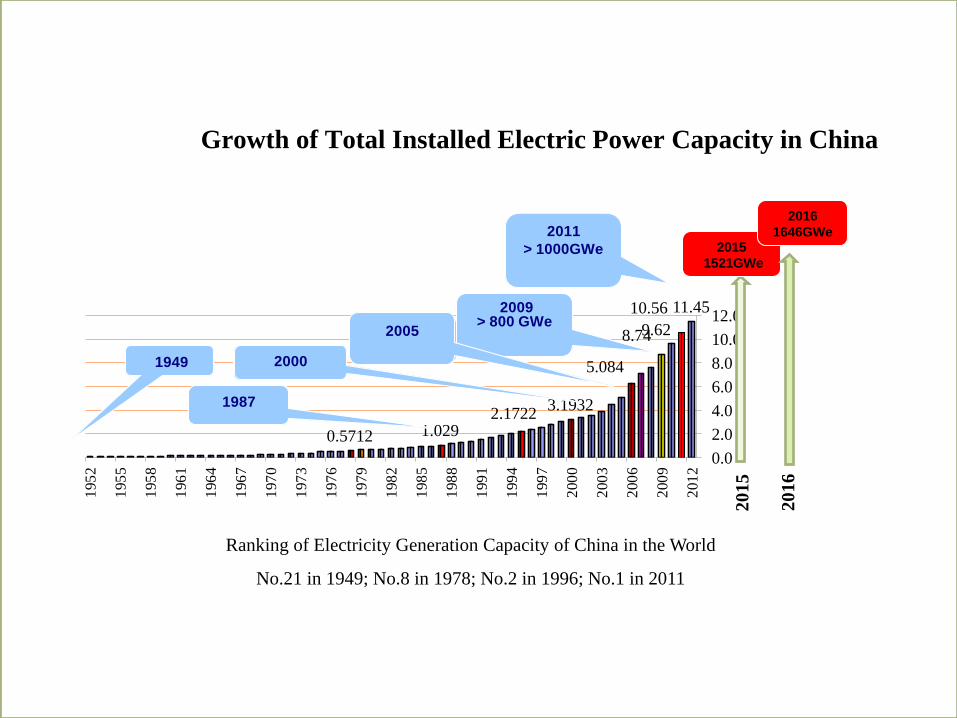
Growth of Total Installed Electric Power Capacity in China
0.5712 1.0292.1722
3.1932
5.084
8.749.62
10.56 11.45
0.0
2.0
4.0
6.0
8.0
10.0
12.0
195
2
195
5
195
8
196
1
196
4
196
7
197
0
197
3
197
6
197
9
198
2
198
5
198
8
199
1
199
4
199
7
200
0
200
3
200
6
200
9
201
2
Year
Year
Year
Year Year
Year 2009> 1000GW
2000
1987
1949
2009> 800 GWe
2005
2011
> 1000GWe
Ranking of Electricity Generation Capacity of China in the World
No.21 in 1949; No.8 in 1978; No.2 in 1996; No.1 in 2011
2015
1521GWe
2016
1646GWe
20
15
20
16
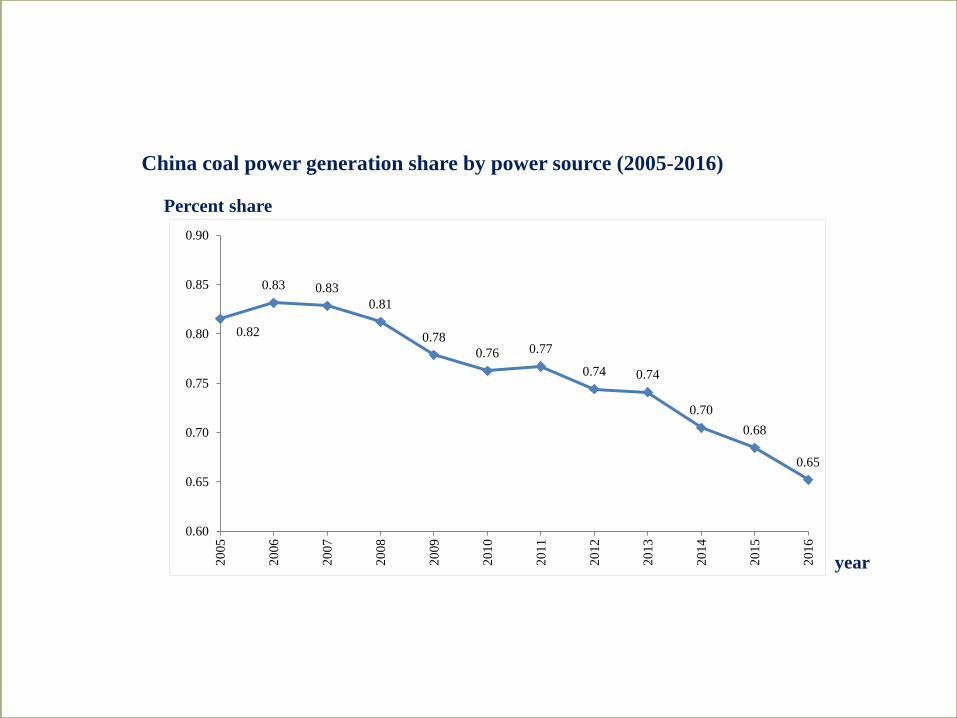
China coal power generation share by power source (2005-2016)
0.82
0.83 0.83
0.81
0.78
0.76 0.77
0.74 0.74
0.70
0.68
0.65
0.60
0.65
0.70
0.75
0.80
0.85
0.902
00
5
20
06
20
07
20
08
20
09
20
10
20
11
20
12
20
13
20
14
20
15
20
16
Percent share
year
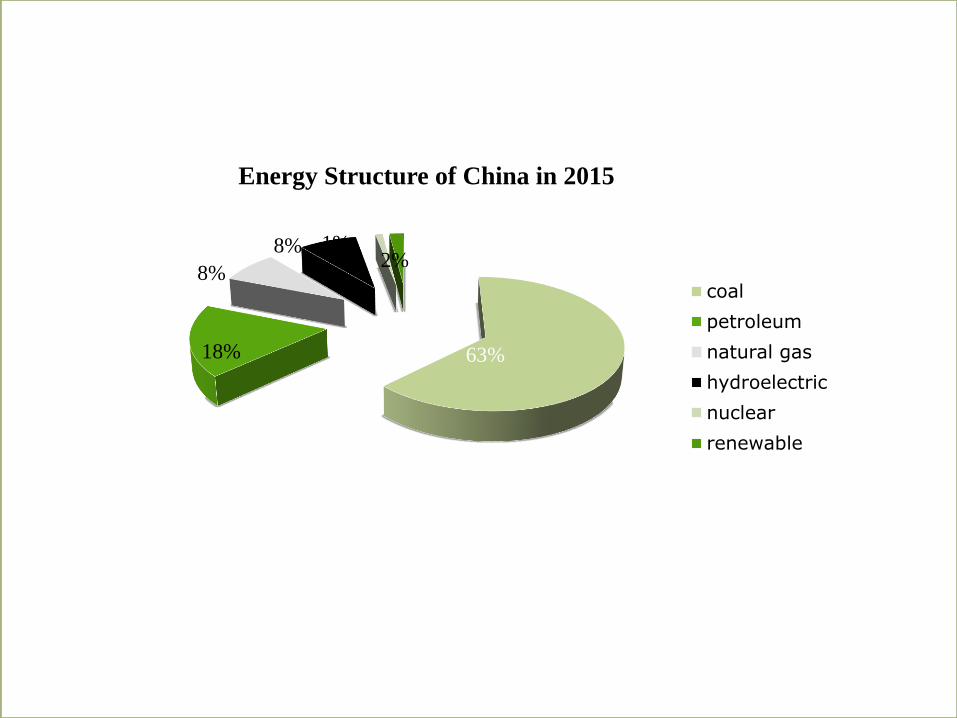
Energy Structure of China in 2015
coal
petroleum
natural gas
hydroelectric
nuclear
renewable
63%18%
8%
8%2%
1%
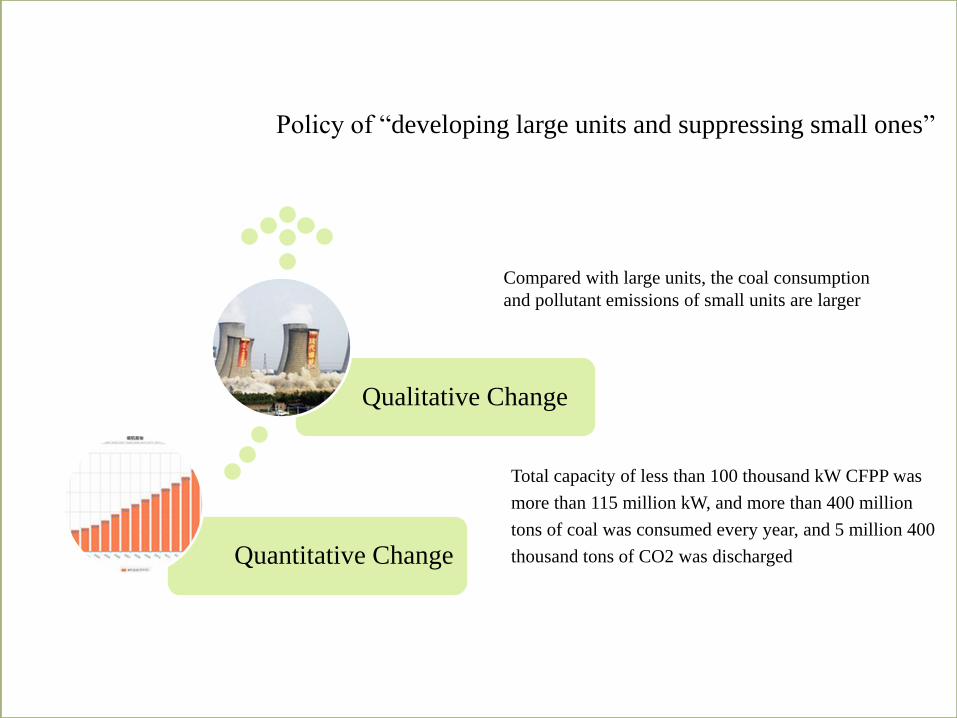
Policy of “developing large units and suppressing small ones”
Quantitative Change
Qualitative Change
Total capacity of less than 100 thousand kW CFPP was
more than 115 million kW, and more than 400 million
tons of coal was consumed every year, and 5 million 400
thousand tons of CO2 was discharged
Compared with large units, the coal consumption
and pollutant emissions of small units are larger
1955 1960 1965 1970 1975 1980 1985 1990 1995 2000
Ste
am
Paramete
rs
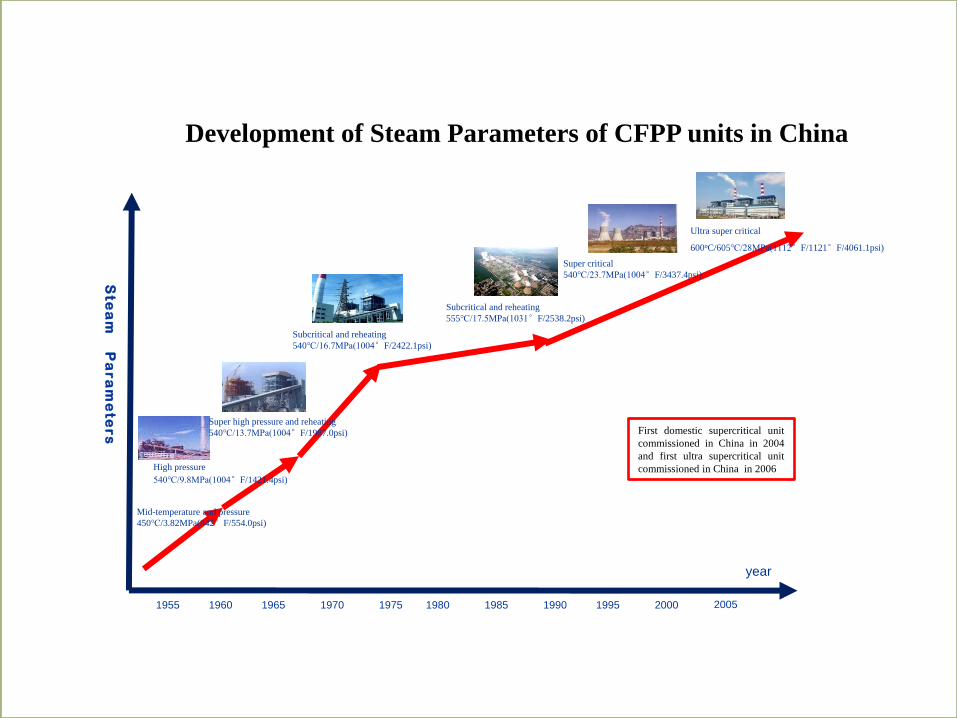
Subcritical and reheating
555℃/17.5MPa(1031°F/2538.2psi)
year
2005
Ultra super critical
600oC/605℃/28MPa(1112°F/1121°F/4061.1psi)
First domestic supercritical unit
commissioned in China in 2004
and first ultra supercritical unit
commissioned in China in 2006
Mid-temperature and pressure
450℃/3.82MPa(842°F/554.0psi)
Super high pressure and reheating
540℃/13.7MPa(1004°F/1987.0psi)
Subcritical and reheating
540℃/16.7MPa(1004°F/2422.1psi)
High pressure
540℃/9.8MPa(1004°F/1421.4psi)
Super critical
540℃/23.7MPa(1004°F/3437.4psi)
Development of Steam Parameters of CFPP units in China
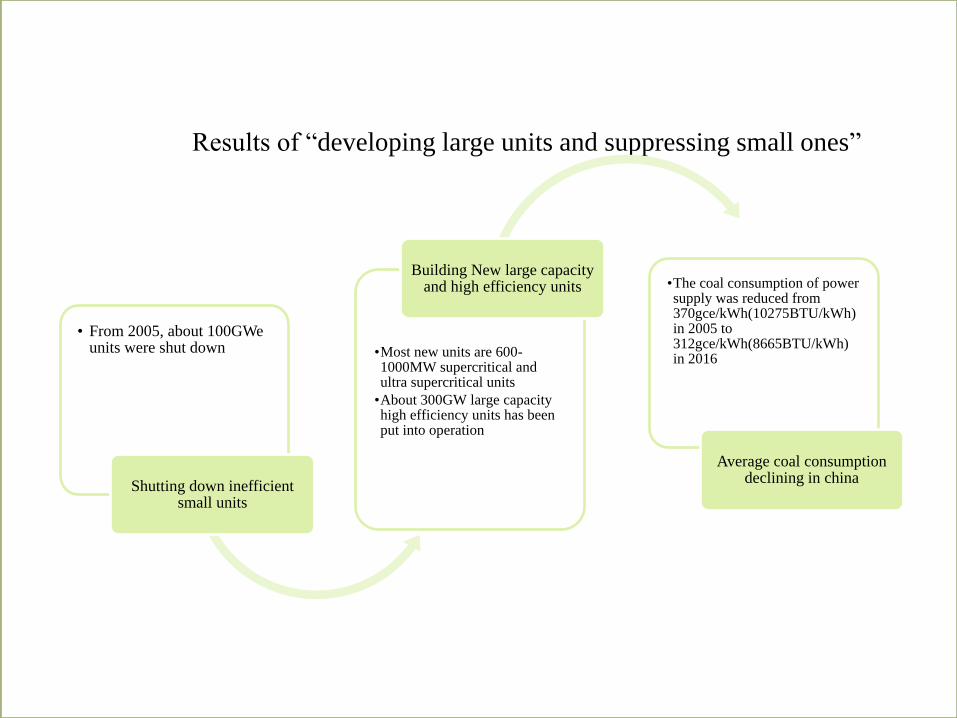
Results of “developing large units and suppressing small ones”
• From 2005, about 100GWe units were shut down
Shutting down inefficient small units
•Most new units are 600-1000MW supercritical and ultra supercritical units
•About 300GW large capacity high efficiency units has been put into operation
Building New large capacity and high efficiency units •The coal consumption of power
supply was reduced from 370gce/kWh(10275BTU/kWh) in 2005 to 312gce/kWh(8665BTU/kWh) in 2016
Average coal consumption declining in china
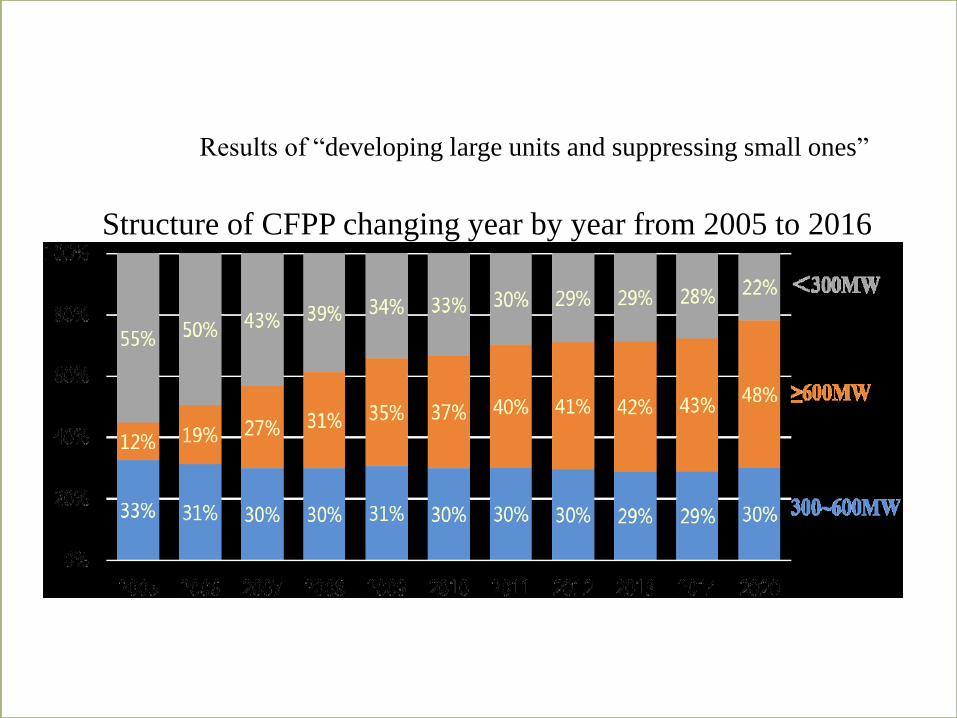
Results of “developing large units and suppressing small ones”
Structure of CFPP changing year by year from 2005 to 2016
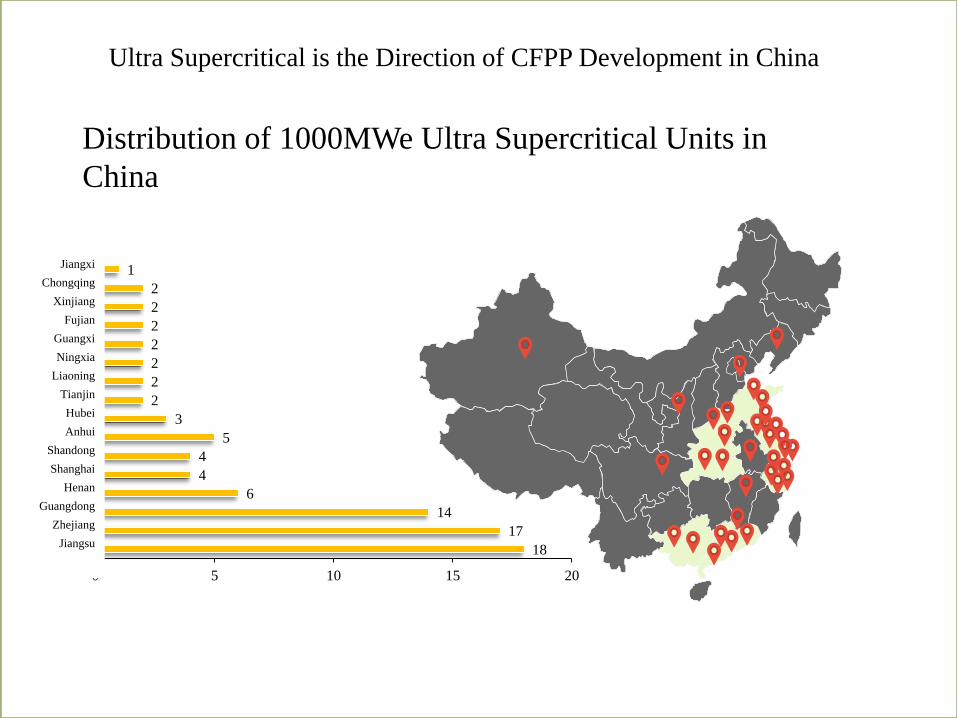
Ultra Supercritical is the Direction of CFPP Development in China
18
17
14
6
4
4
5
3
2
2
2
2
2
2
2
1
0 5 10 15 20
江苏
浙江广东
河南上海山东
安徽湖北天津辽宁
宁夏广西福建新疆重庆
江西
Distribution of 1000MWe Ultra Supercritical Units in
China
Jiangxi
Chongqing
Xinjiang
Fujian
Guangxi
Ningxia
Liaoning
Tianjin
Hubei
Anhui
Shandong
Shanghai
Henan
Guangdong
Zhejiang
Jiangsu
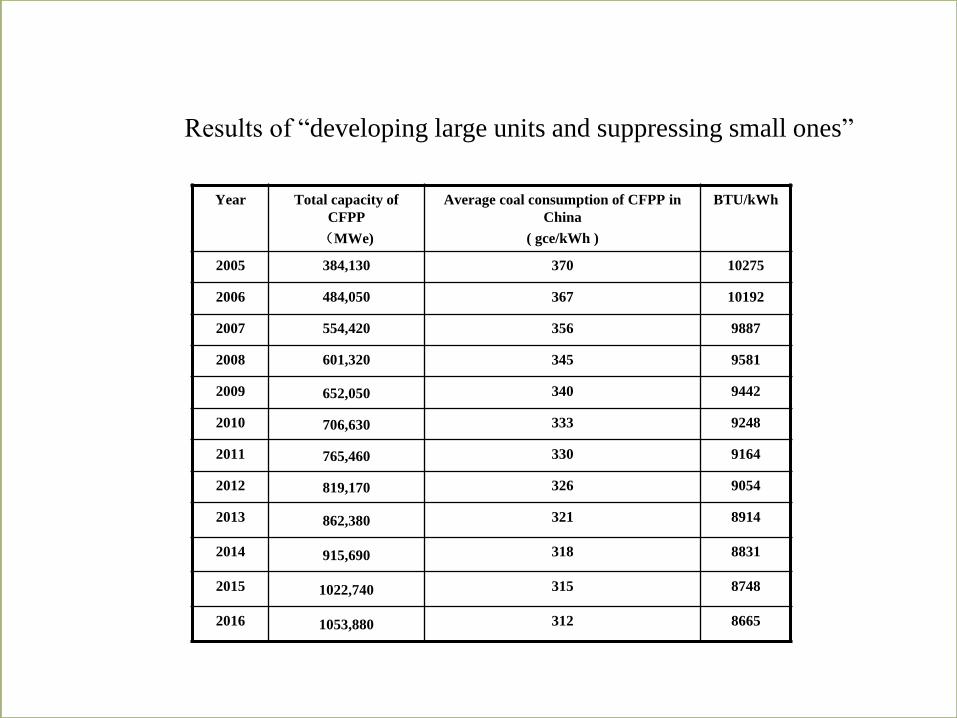
Year Total capacity of
CFPP
(MWe)
Average coal consumption of CFPP in
China
( gce/kWh )
BTU/kWh
2005 384,130 370 10275
2006 484,050 367 10192
2007 554,420 356 9887
2008 601,320 345 9581
2009 652,050 340 9442
2010 706,630 333 9248
2011 765,460 330 9164
2012 819,170 326 9054
2013 862,380 321 8914
2014 915,690 318 8831
2015 1022,740 315 8748
2016 1053,880 312 8665
Results of “developing large units and suppressing small ones”
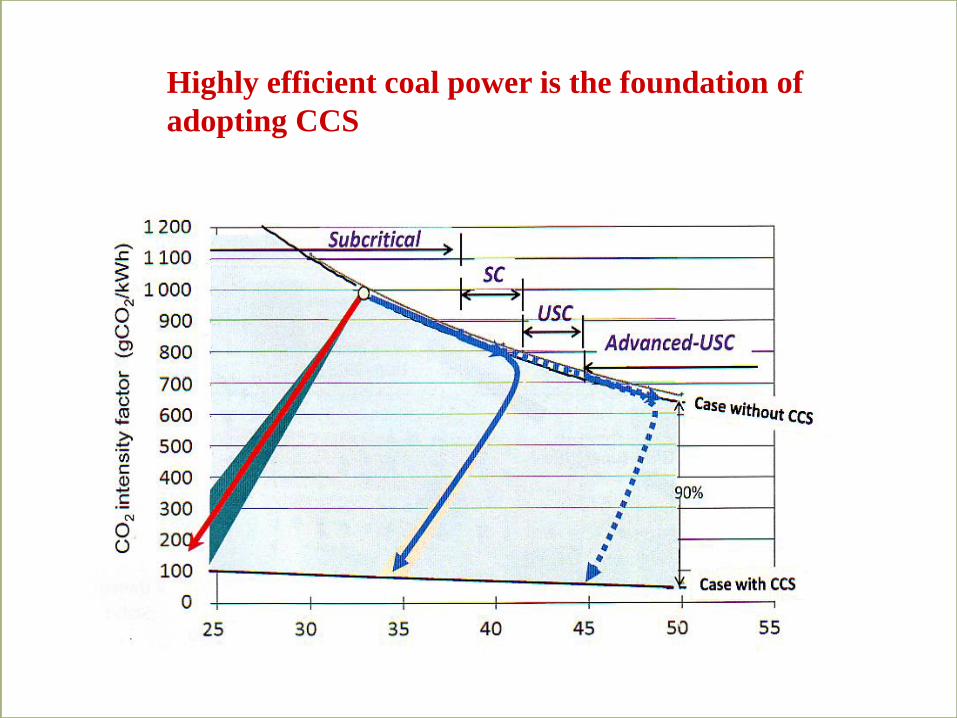
Highly efficient coal power is the foundation of
adopting CCS
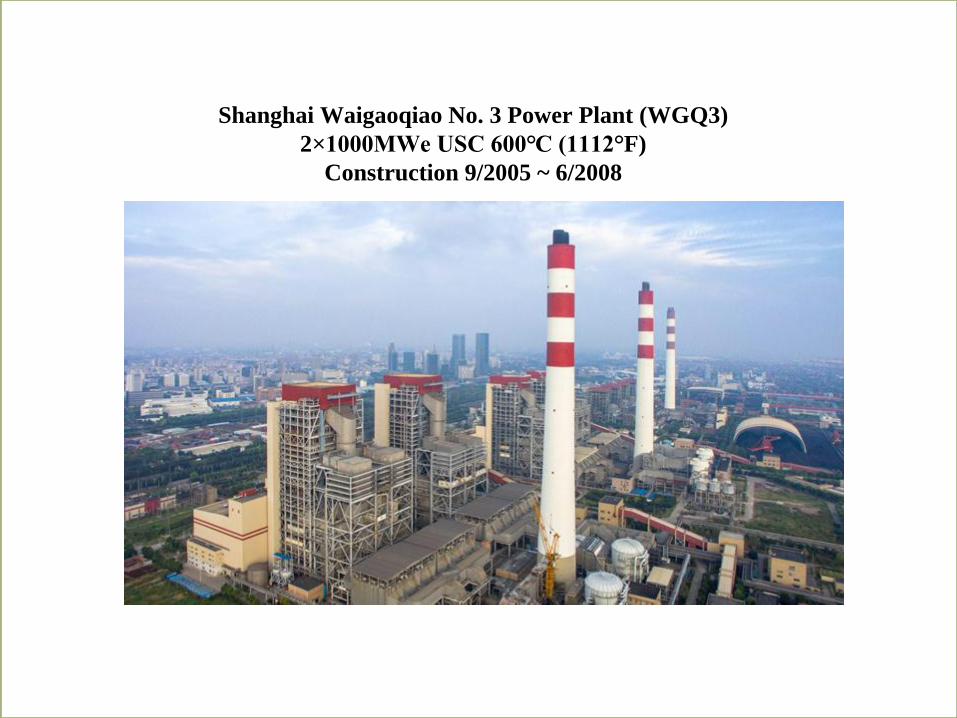
Shanghai Waigaoqiao No. 3 Power Plant (WGQ3)
2×1000MWe USC 600℃ (1112°F)
Construction 9/2005 ~ 6/2008
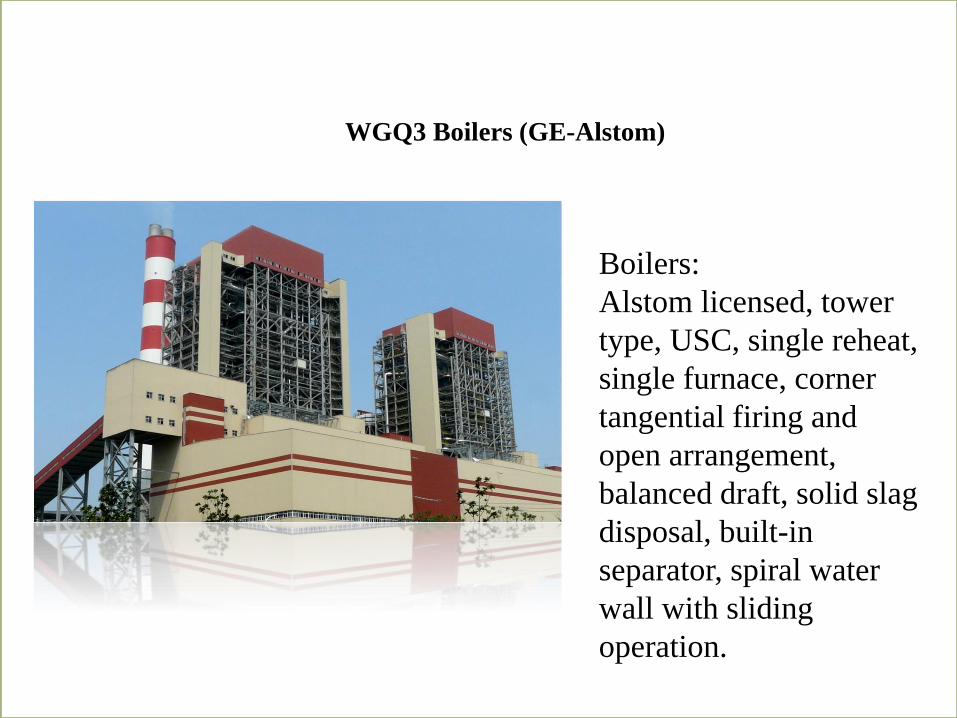
WGQ3 Boilers (GE-Alstom)
Boilers:
Alstom licensed, tower
type, USC, single reheat,
single furnace, corner
tangential firing and
open arrangement,
balanced draft, solid slag
disposal, built-in
separator, spiral water
wall with sliding
operation.
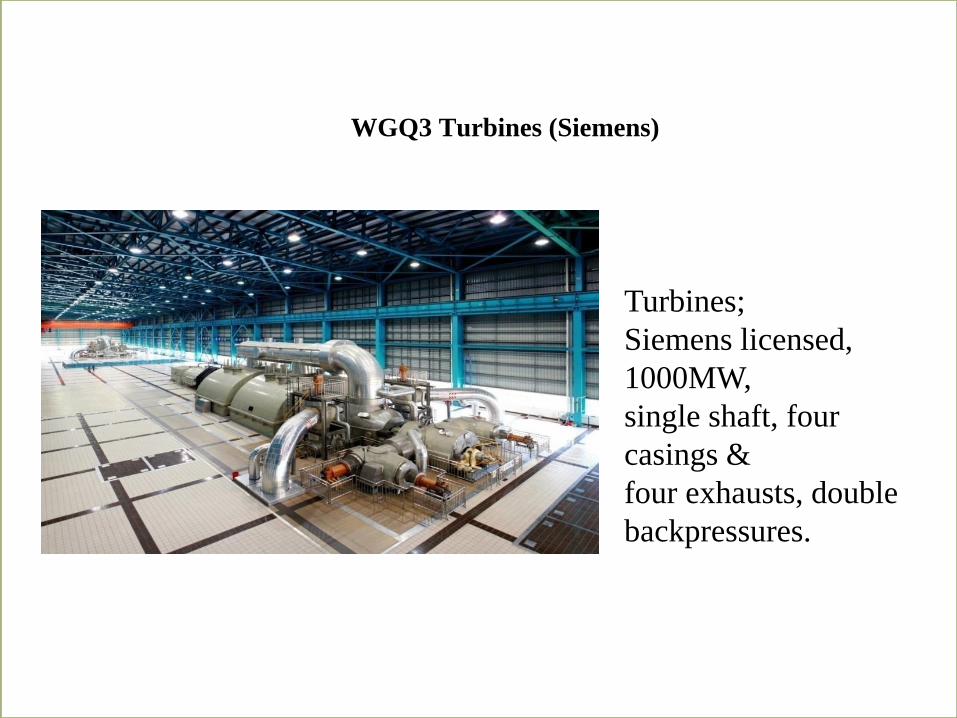
WGQ3 Turbines (Siemens)
Turbines;
Siemens licensed,
1000MW,
single shaft, four
casings &
four exhausts, double
backpressures.
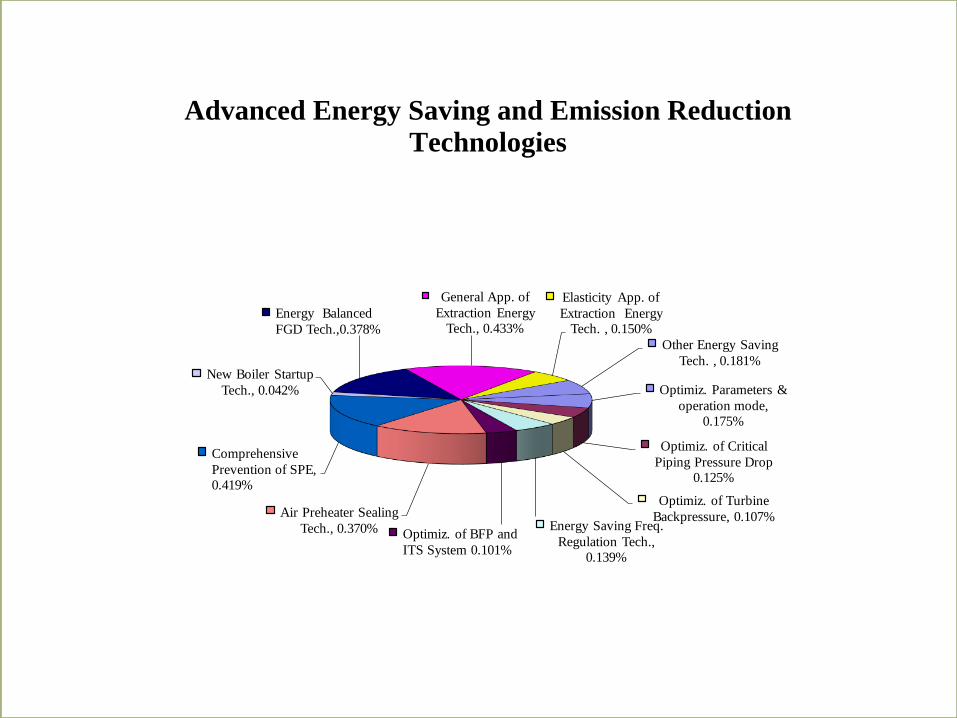
Optimiz. Parameters &
operation mode, 0.175%
Optimiz. of Critical
Piping Pressure Drop 0.125%
Optimiz. of Turbine
Backpressure, 0.107%Energy Saving Freq.
Regulation Tech., 0.139%
Optimiz. of BFP and
ITS System 0.101%
Air Preheater Sealing
Tech., 0.370%
Comprehensive
Prevention of SPE, 0.419%
New Boiler Startup
Tech., 0.042%
Energy Balanced
FGD Tech.,0.378%
General App. of
Extraction Energy Tech., 0.433%
Elasticity App. of
Extraction Energy Tech. , 0.150%
Other Energy Saving
Tech. , 0.181%
Advanced Energy Saving and Emission Reduction
Technologies
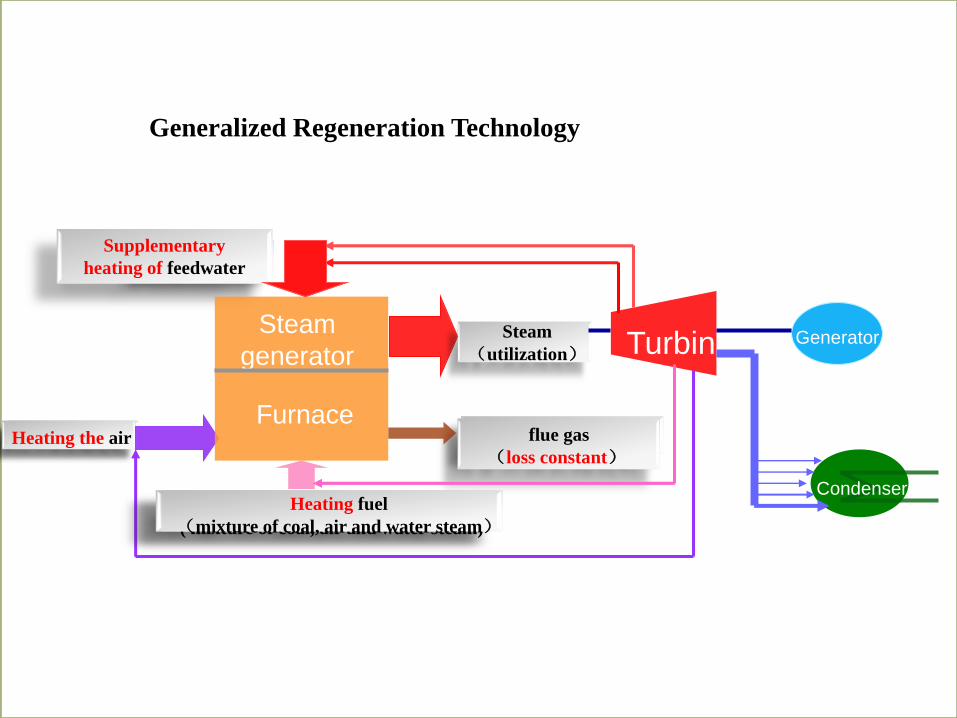
Feedwater Feedwater
heating
Supplementary
heating of feedwater
Flue gas(loss)
Fuel feeding
( mixture of coal, air and water steam)
Air intake flue gas
(loss constant)Heating the air
Steam
(utilization)GeneratorTurbin
e
Condenser
Steam
generator
Heating fuel
(mixture of coal, air and water steam)
Generalized Regeneration Technology
Furnace
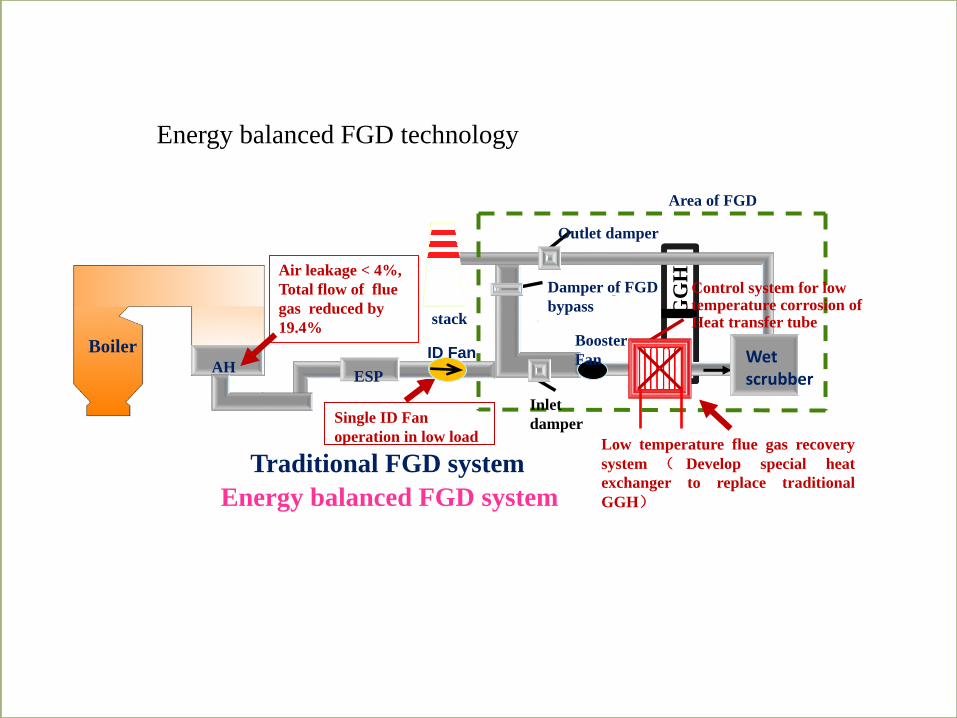
Single ID Fan
operation in low load
Energy balanced FGD system
Traditional FGD system
GG
H
Area of FGD
Energy balanced FGD technology
BoilerAH
ESP
ID FanBooster
Fan
Inlet
damper
Damper of FGD
bypass
Outlet damper
stack
Wet
scrubbr
Wet scrubber
Low temperature flue gas recovery
system ( Develop special heat
exchanger to replace traditional
GGH)
Control system for low temperature corrosion of Heat transfer tube
Air leakage < 4%,
Total flow of flue
gas reduced by
19.4%
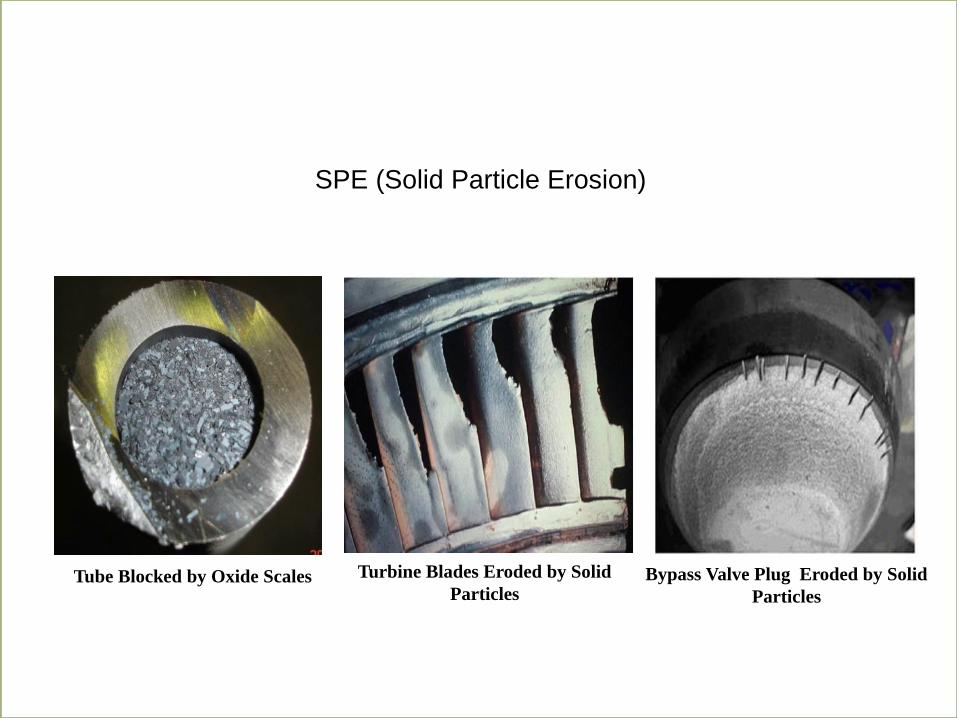
Tube Blocked by Oxide Scales Turbine Blades Eroded by Solid
ParticlesBypass Valve Plug Eroded by Solid
Particles
SPE (Solid Particle Erosion)
The oxide clogging in the last superheater of a 600MW subcritical
unit
The oxide deposits in the last superheater of a 1000MW USC boiler in
Zhejiang province
The inside of reheater tube inWaigaoqiao II 900MW after one
operation.
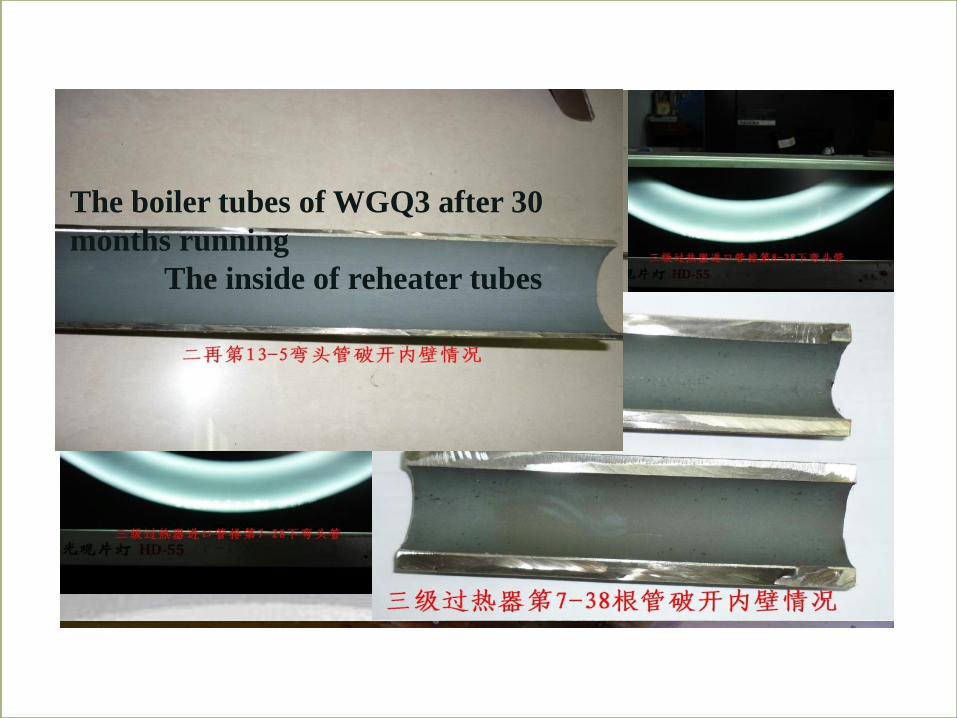
The boiler tube after 30 months operation in
WGQIII
The boiler tubes of WGQ3 after 30
months running
The inside of reheater tubes
The seriously eroded control stage of a 600MW
USC turbine
The eroded blading of a 600MW USC turbine
The eroded blading of a 600MW
USC turbine
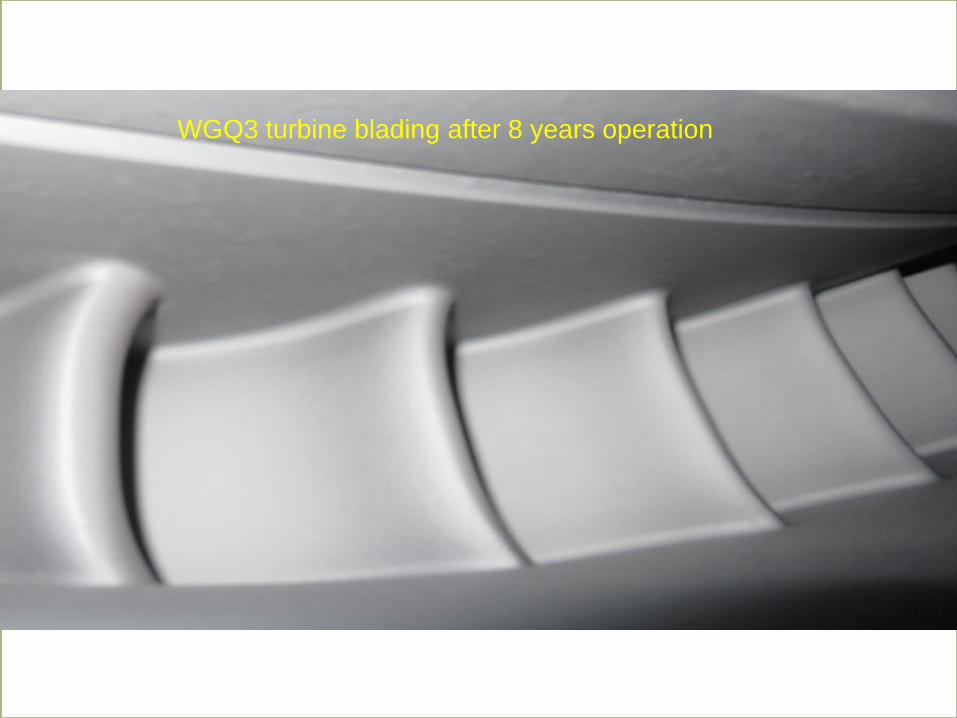
WGQ3 turbine blading after 8 years operation
DeNOx vs. Operating hours (NH3 slip: 3 ppm wet)100
90
80
70
60
50
40
30
20
10
0 0 4000 8000 12000 16000 20000 24000 28000 60000
design
operating hours
DeN
Ox
%
Actual
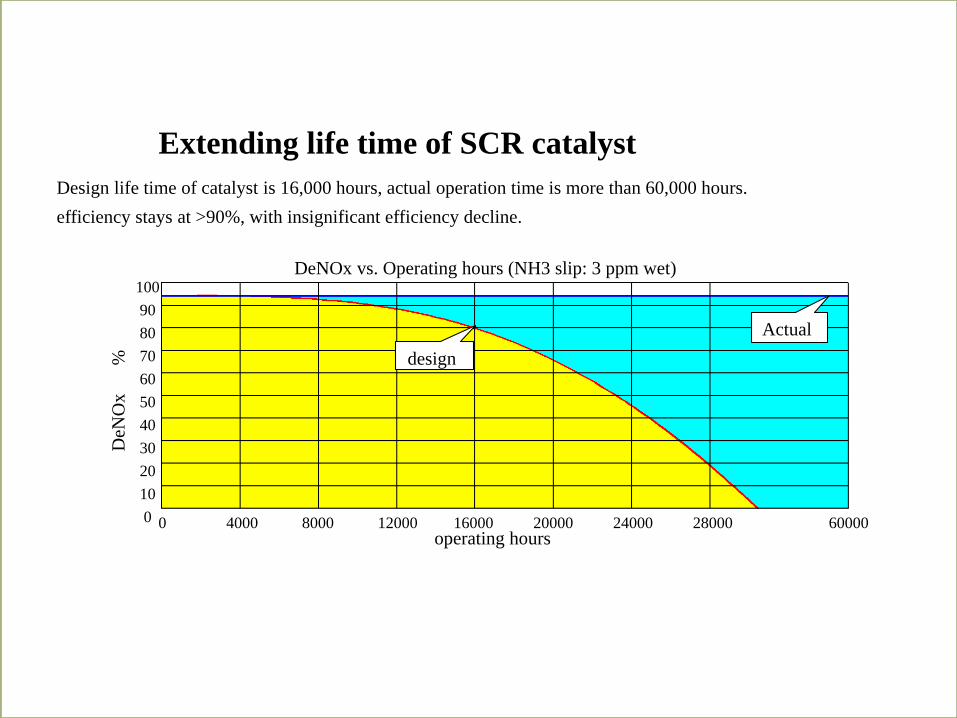
Design life time of catalyst is 16,000 hours, actual operation time is more than 60,000 hours.
efficiency stays at >90%, with insignificant efficiency decline.
Extending life time of SCR catalyst
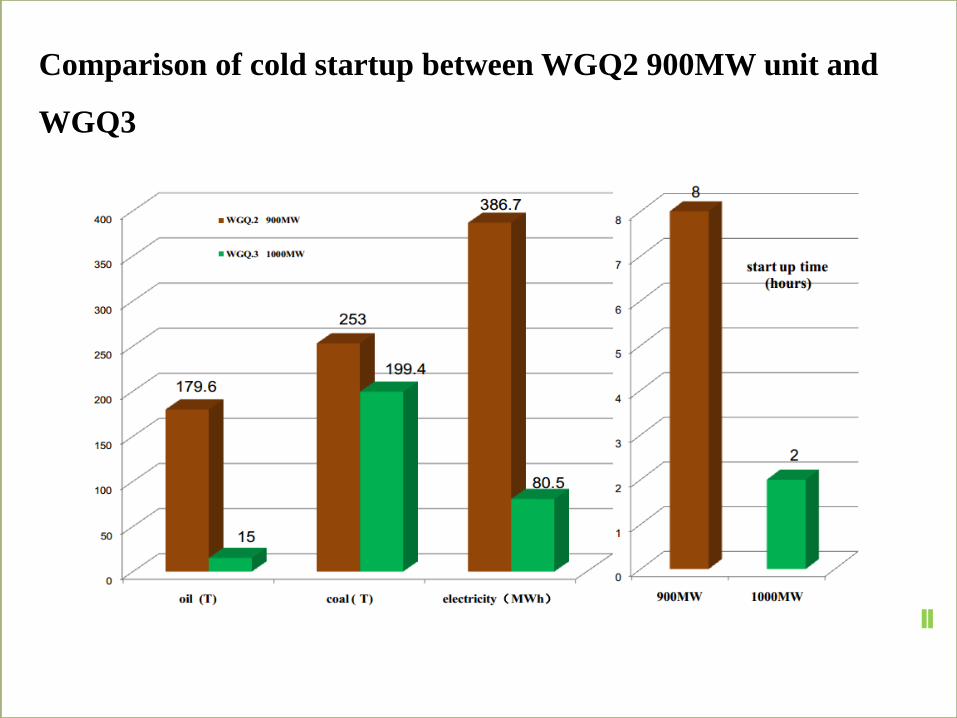
Comparison of cold startup between WGQ2 900MW unit and
WGQ3
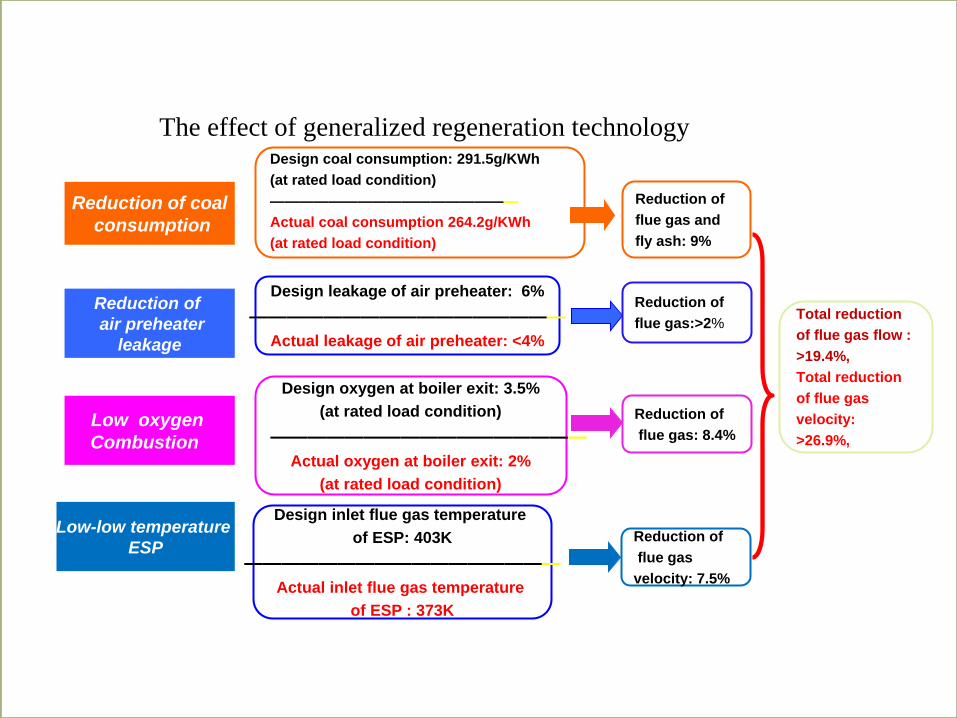
The effect of generalized regeneration technologyDesign coal consumption: 291.5g/KWh
(at rated load condition)
—————————————————
Actual coal consumption 264.2g/KWh
(at rated load condition)
Reduction of
flue gas and
fly ash: 9%
Design leakage of air preheater: 6%
—————————————————
Actual leakage of air preheater: <4%
Reduction of
flue gas:>2%
Design oxygen at boiler exit: 3.5%
(at rated load condition)
—————————————————
Actual oxygen at boiler exit: 2%
(at rated load condition)
Reduction of
flue gas: 8.4%
Total reduction
of flue gas flow :
>19.4%,
Total reduction
of flue gas
velocity:
>26.9%,
Reduction of coal
consumption
Reduction of
air preheater
leakage
Low oxygen
Combustion
Design inlet flue gas temperature
of ESP: 403K
—————————————————
Actual inlet flue gas temperature
of ESP : 373K
Low-low temperature
ESPReduction of
flue gas
velocity: 7.5%
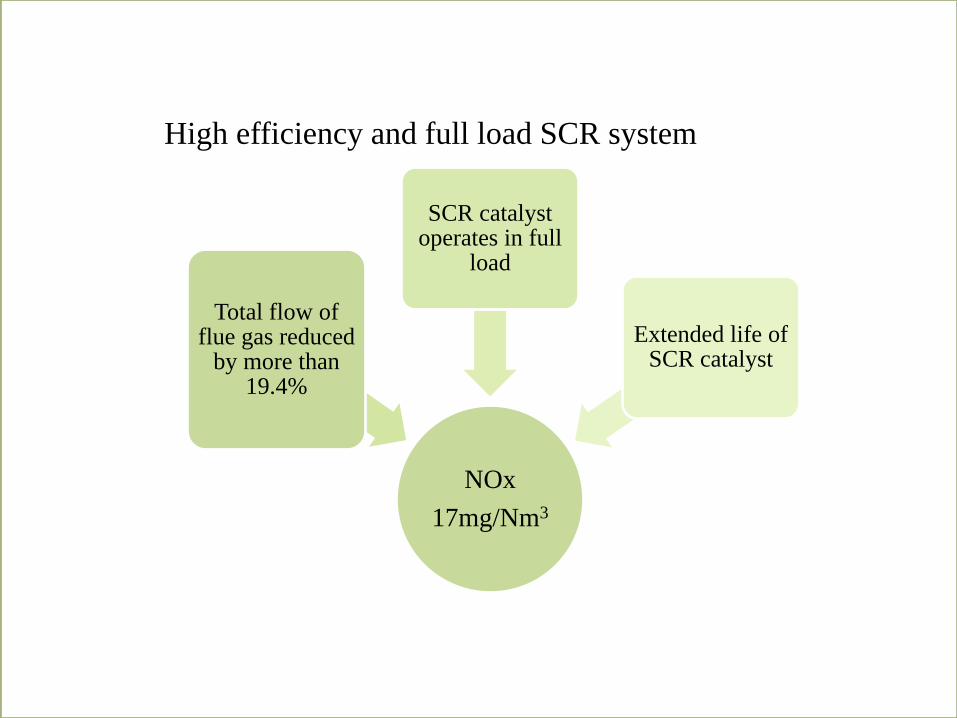
High efficiency and full load SCR system
NOx
17mg/Nm3
Total flow of flue gas reduced
by more than 19.4%
SCR catalyst operates in full
load
Extended life of SCR catalyst
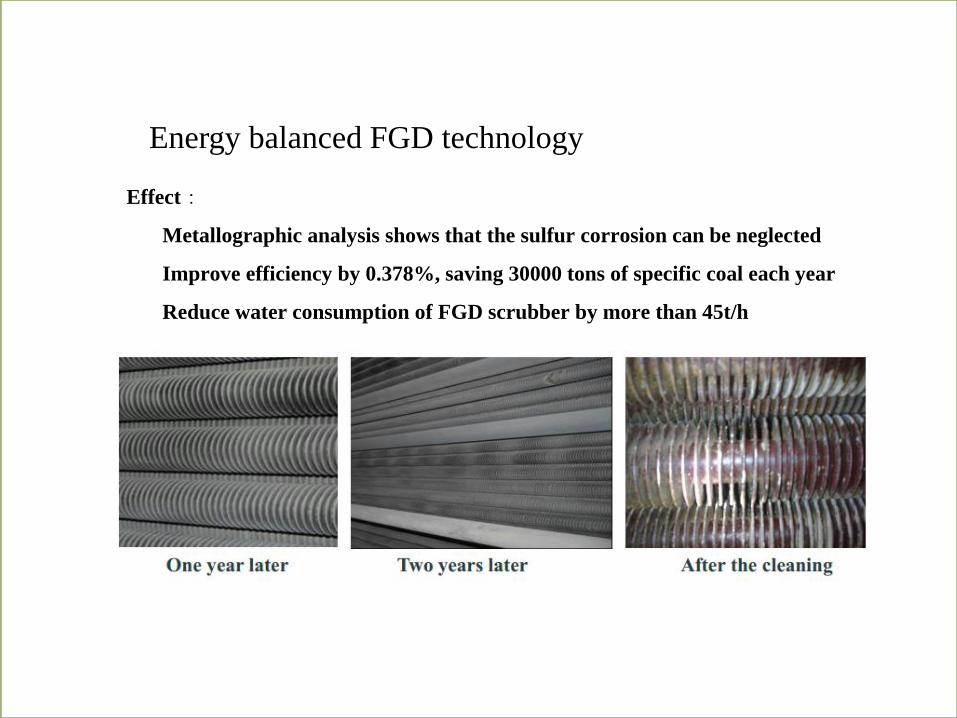
Effect:
Metallographic analysis shows that the sulfur corrosion can be neglected
Improve efficiency by 0.378%, saving 30000 tons of specific coal each year
Reduce water consumption of FGD scrubber by more than 45t/h
Energy balanced FGD technology
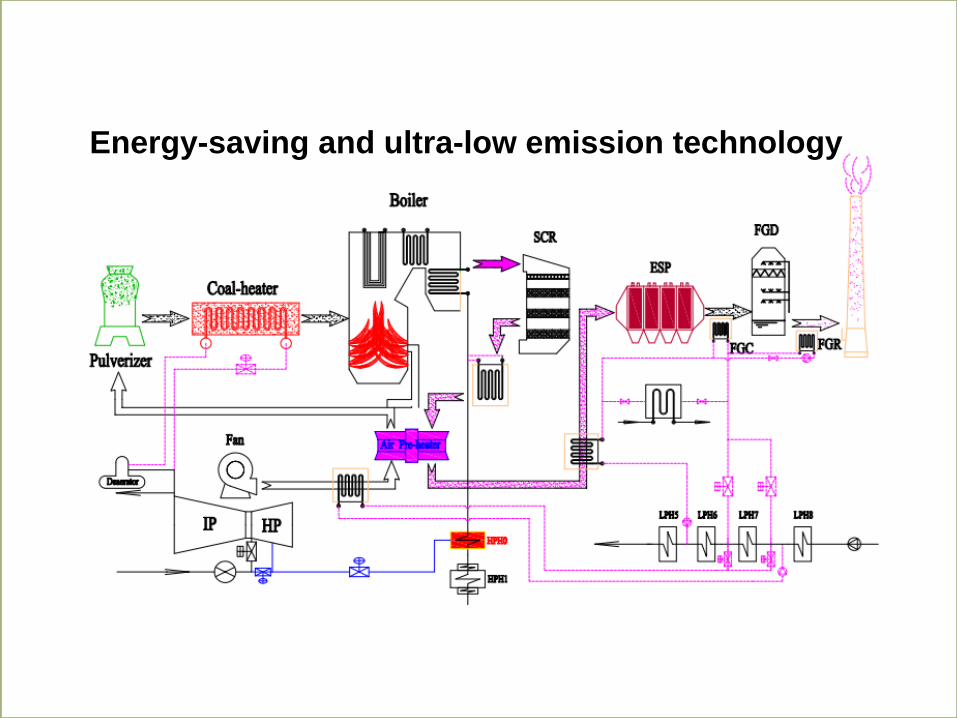
Energy-saving and ultra-low emission technology
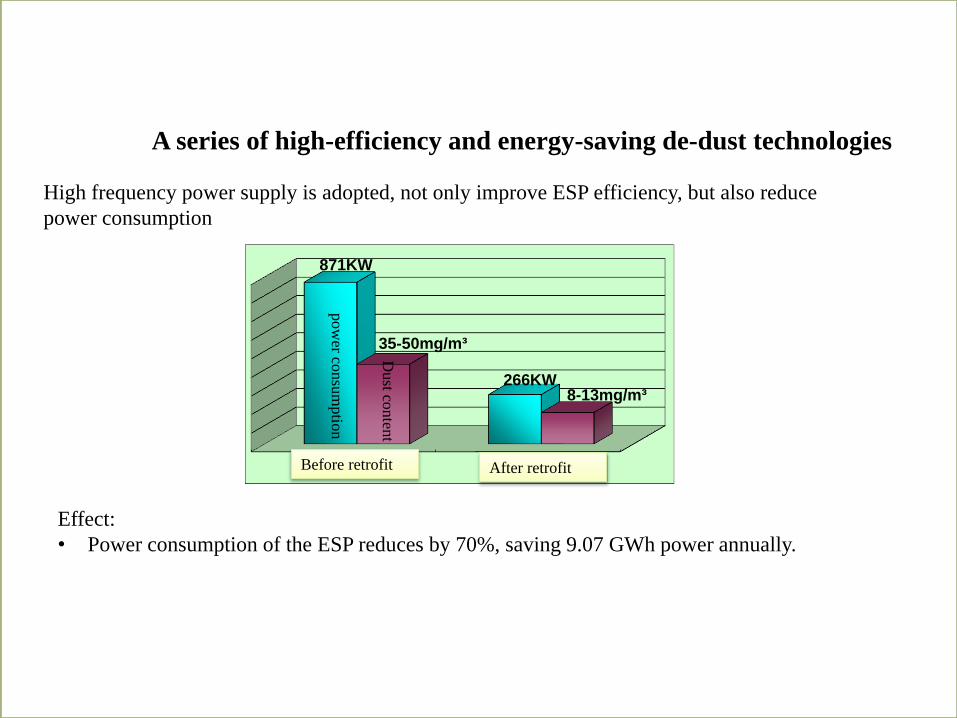
A series of high-efficiency and energy-saving de-dust technologies
High frequency power supply is adopted, not only improve ESP efficiency, but also reduce
power consumption
8-13mg/m³
871KW
266KW
pow
er consu
mptio
n
35-50mg/m³
Effect:
• Power consumption of the ESP reduces by 70%, saving 9.07 GWh power annually. D
ust co
nten
t
Before retrofit After retrofit
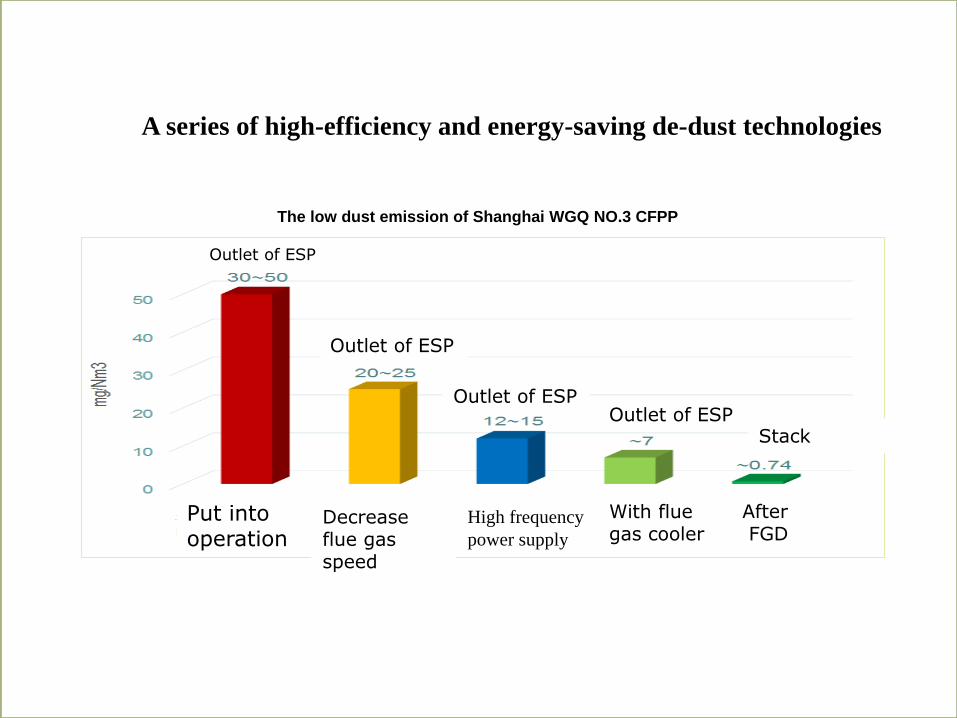
The low dust emission of Shanghai WGQ NO.3 CFPP
A series of high-efficiency and energy-saving de-dust technologies
Outlet of ESP
Outlet of ESP
Outlet of ESPOutlet of ESP
Stack
Put into operation
High frequency
power supply
With flue gas cooler
Decrease flue gas speed
AfterFGD
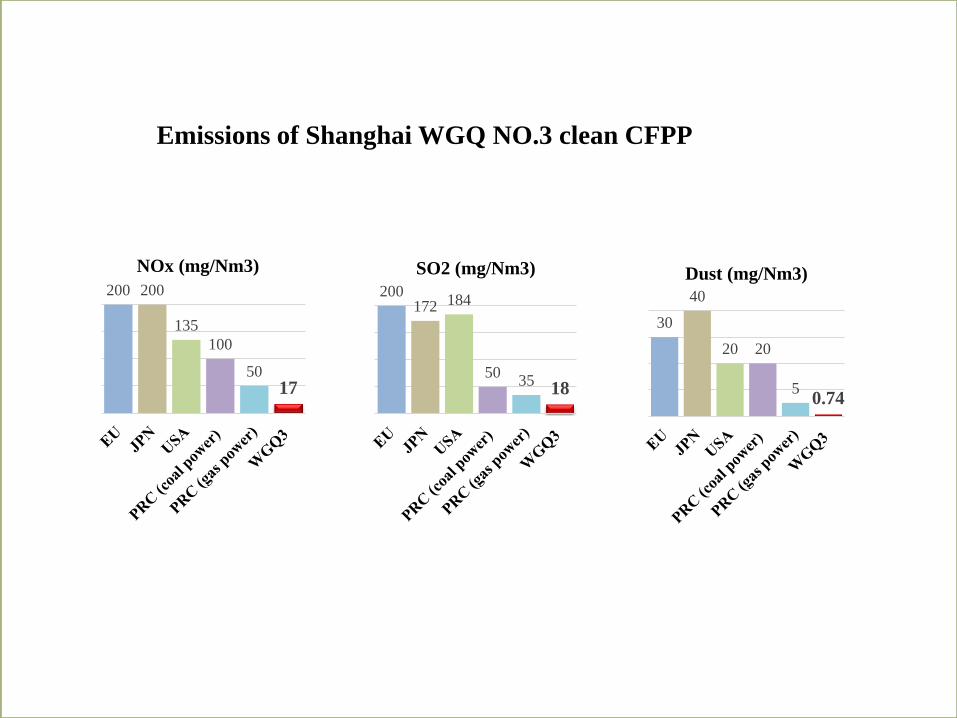
200 200
135
100
5017
NOx (mg/Nm3)
200172 184
5035
18
SO2 (mg/Nm3)
30
40
20 20
50.74
Dust (mg/Nm3)
Emissions of Shanghai WGQ NO.3 clean CFPP
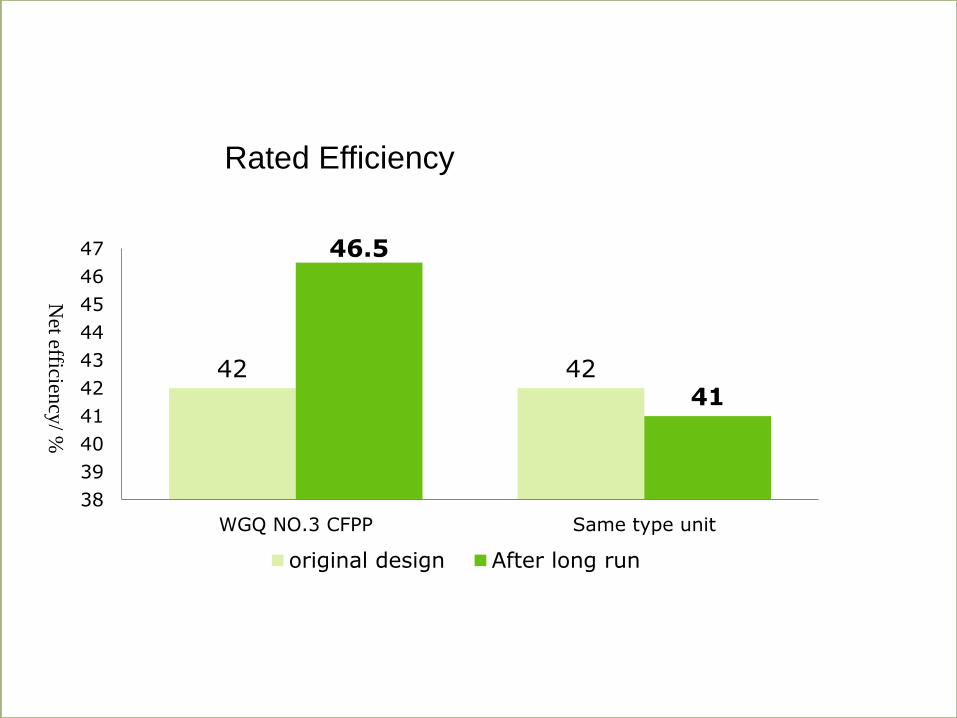
42 42
46.5
41
38
39
40
41
42
43
44
45
46
47
WGQ NO.3 CFPP Same type unit
original design After long run
Net efficien
cy/ %
Rated Efficiency
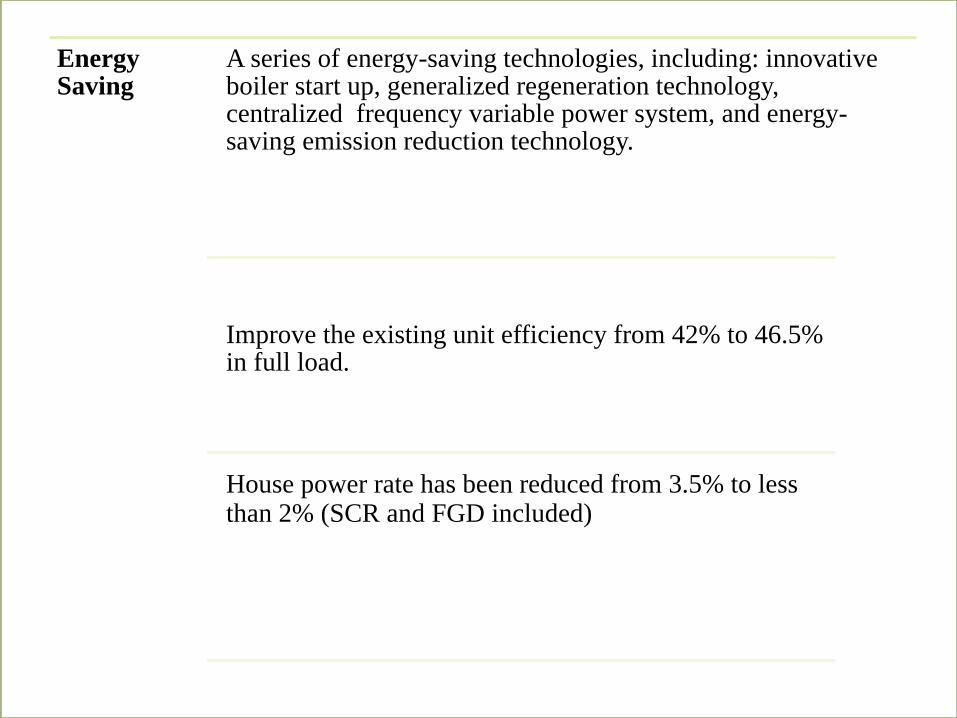
Energy Saving
A series of energy-saving technologies, including: innovative boiler start up, generalized regeneration technology, centralized frequency variable power system, and energy-saving emission reduction technology.
Improve the existing unit efficiency from 42% to 46.5% in full load.
House power rate has been reduced from 3.5% to less than 2% (SCR and FGD included)
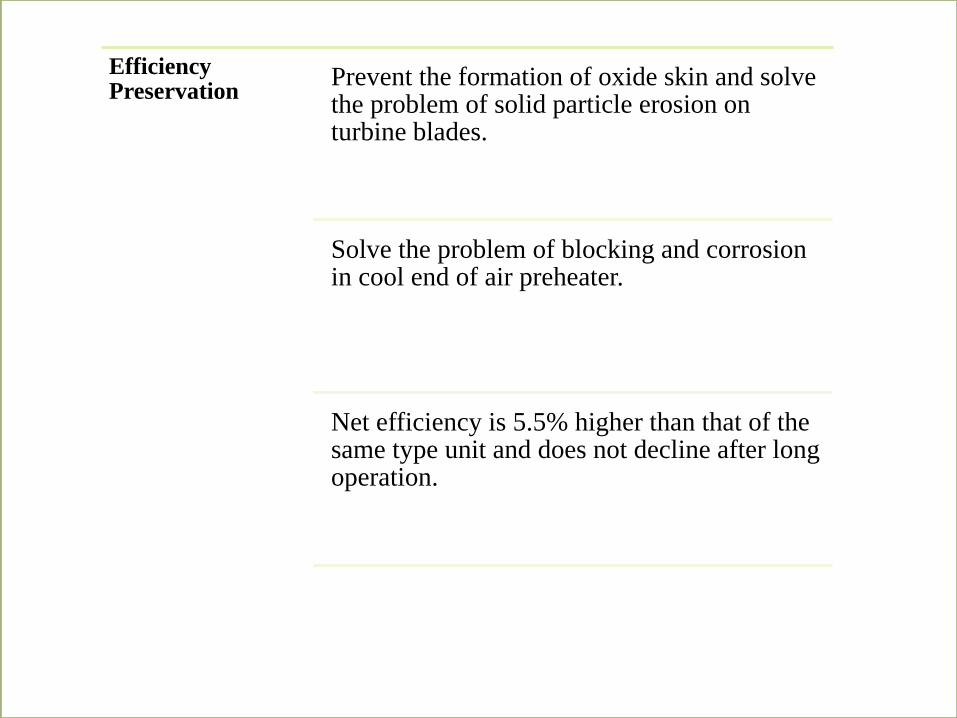
Efficiency Preservation
Prevent the formation of oxide skin and solve the problem of solid particle erosion on turbine blades.
Solve the problem of blocking and corrosion in cool end of air preheater.
Net efficiency is 5.5% higher than that of the same type unit and does not decline after long operation.
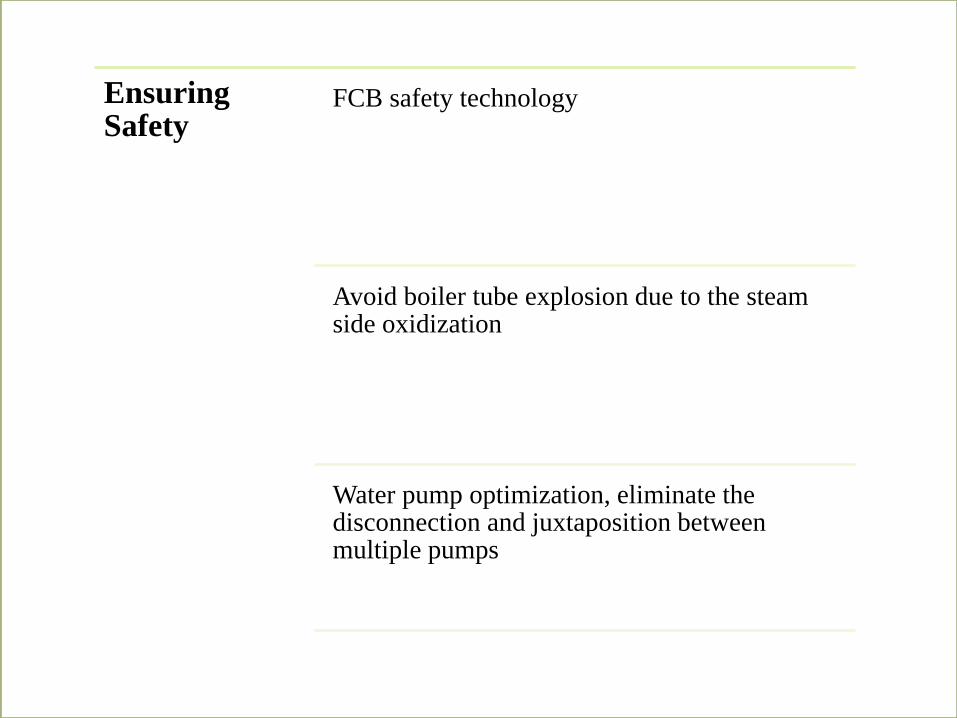
Ensuring Safety
FCB safety technology
Avoid boiler tube explosion due to the steam side oxidization
Water pump optimization, eliminate the disconnection and juxtaposition between multiple pumps
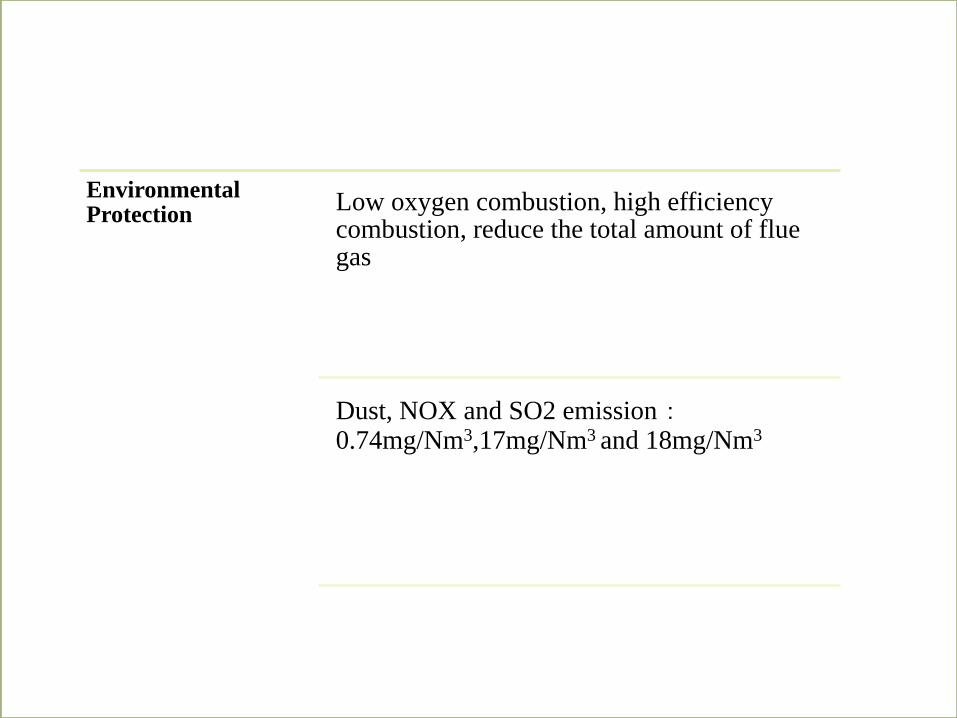
Environmental Protection
Low oxygen combustion, high efficiency combustion, reduce the total amount of flue gas
Dust, NOX and SO2 emission:0.74mg/Nm3,17mg/Nm3 and 18mg/Nm3
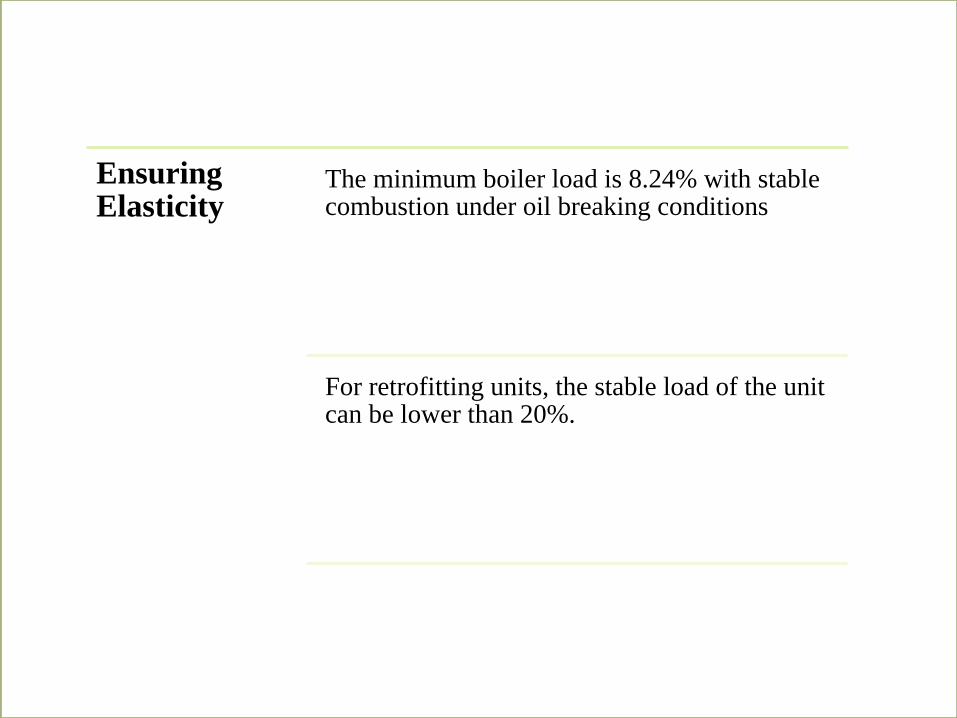
Ensuring Elasticity
The minimum boiler load is 8.24% with stable combustion under oil breaking conditions
For retrofitting units, the stable load of the unit can be lower than 20%.
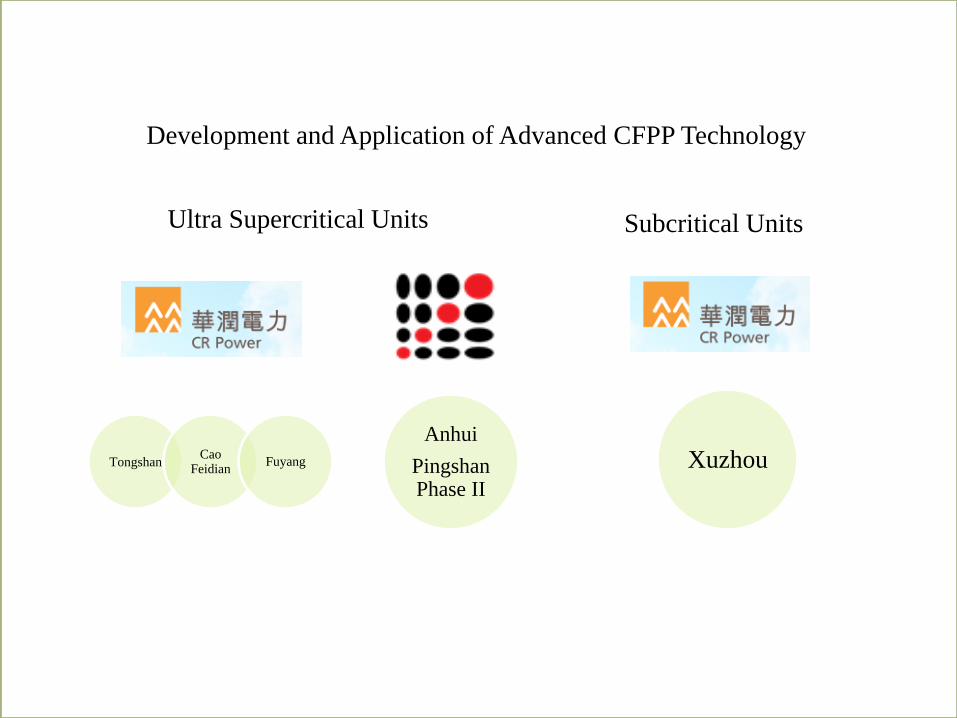
Subcritical UnitsUltra Supercritical Units
Development and Application of Advanced CFPP Technology
TongshanCao
FeidianFuyang
Anhui
PingshanPhase II
Xuzhou
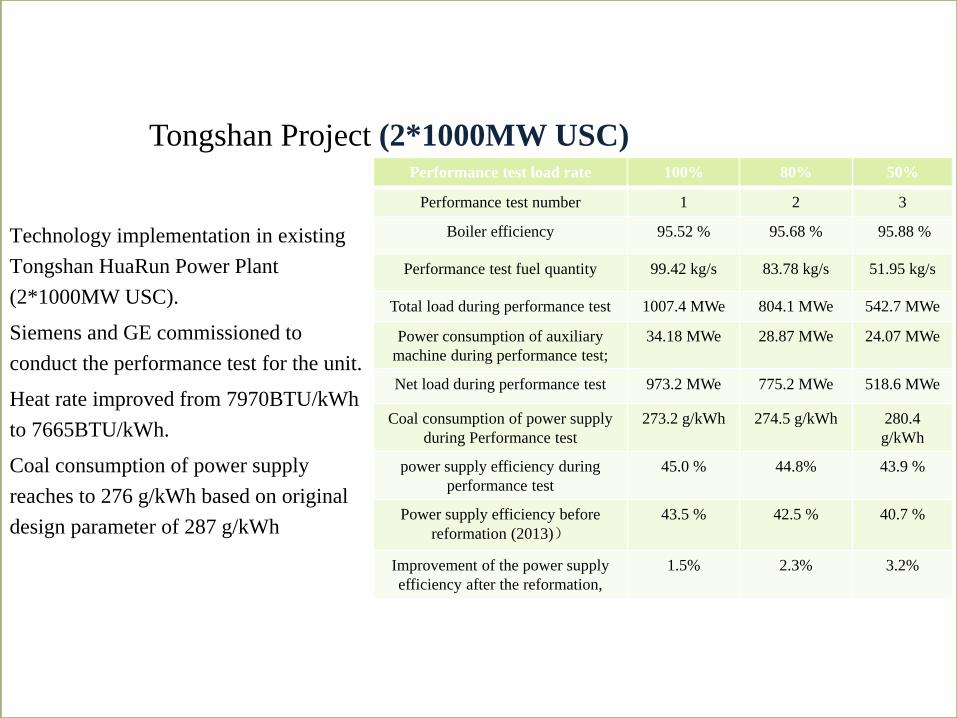
Technology implementation in existing
Tongshan HuaRun Power Plant
(2*1000MW USC).
Siemens and GE commissioned to
conduct the performance test for the unit.
Heat rate improved from 7970BTU/kWh
to 7665BTU/kWh.
Coal consumption of power supply
reaches to 276 g/kWh based on original
design parameter of 287 g/kWh
Performance test load rate 100% 80% 50%
Performance test number 1 2 3
Boiler efficiency 95.52 % 95.68 % 95.88 %
Performance test fuel quantity 99.42 kg/s 83.78 kg/s 51.95 kg/s
Total load during performance test 1007.4 MWe 804.1 MWe 542.7 MWe
Power consumption of auxiliary
machine during performance test;
34.18 MWe 28.87 MWe 24.07 MWe
Net load during performance test 973.2 MWe 775.2 MWe 518.6 MWe
Coal consumption of power supply
during Performance test
273.2 g/kWh 274.5 g/kWh 280.4
g/kWh
power supply efficiency during
performance test
45.0 % 44.8% 43.9 %
Power supply efficiency before
reformation (2013))43.5 % 42.5 % 40.7 %
Improvement of the power supply
efficiency after the reformation,
1.5% 2.3% 3.2%
Tongshan Project (2*1000MW USC)
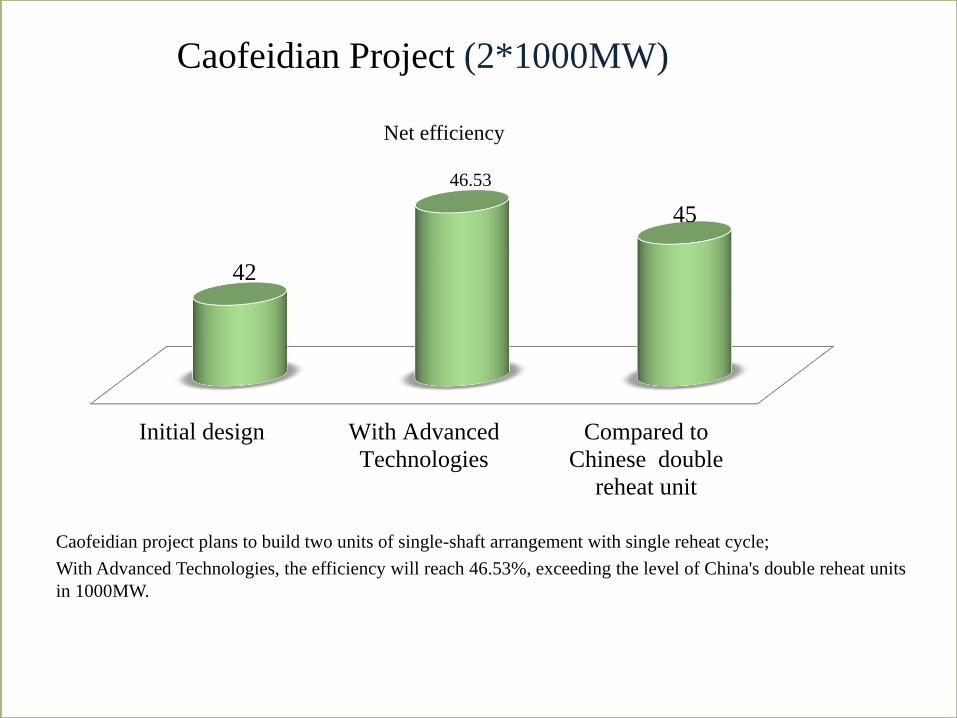
Caofeidian project plans to build two units of single-shaft arrangement with single reheat cycle;
With Advanced Technologies, the efficiency will reach 46.53%, exceeding the level of China's double reheat units
in 1000MW.
Caofeidian Project (2*1000MW)
Initial design With Advanced
Technologies
Compared to
Chinese double
reheat unit
42
46.53
45
Net efficiency
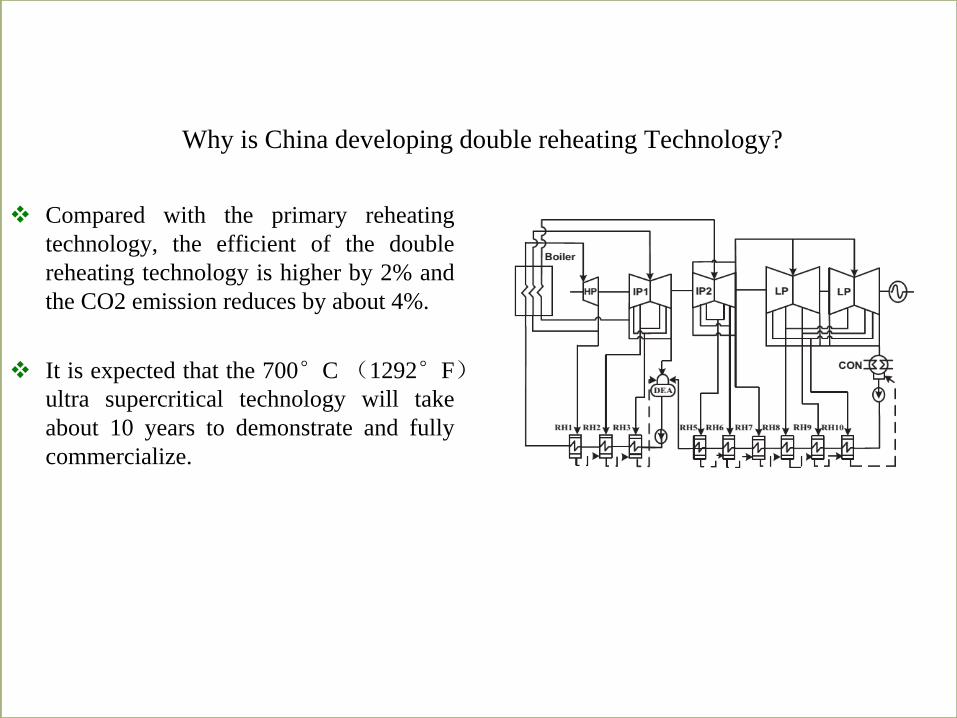
Why is China developing double reheating Technology?
Compared with the primary reheating
technology, the efficient of the double
reheating technology is higher by 2% and
the CO2 emission reduces by about 4%.
It is expected that the 700°C (1292°F)ultra supercritical technology will take
about 10 years to demonstrate and fully
commercialize.
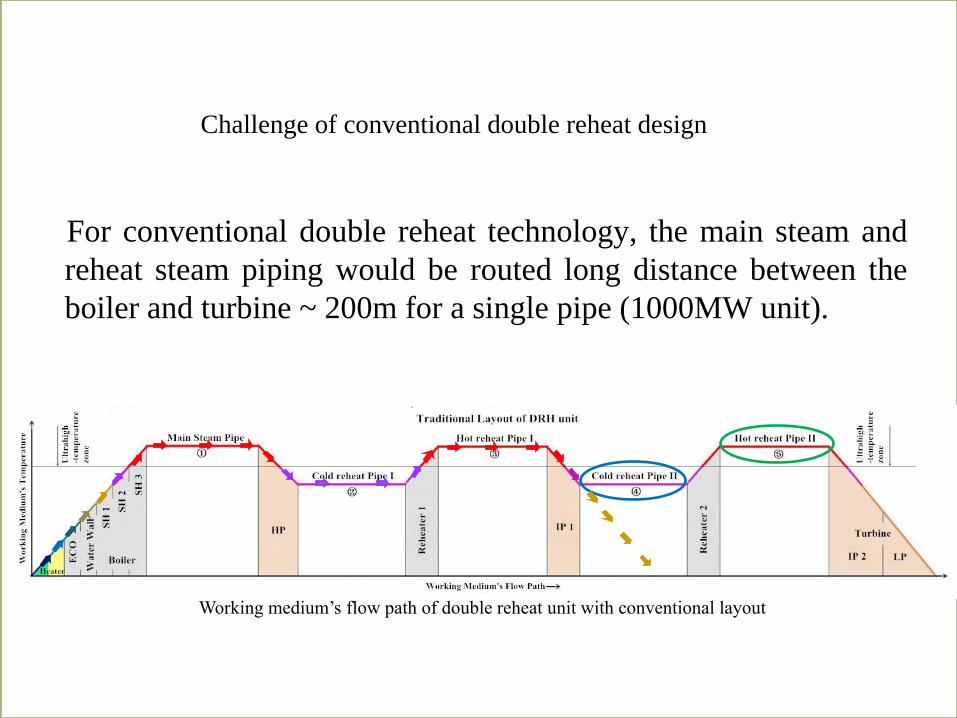
For conventional double reheat technology, the main steam and
reheat steam piping would be routed long distance between the
boiler and turbine ~ 200m for a single pipe (1000MW unit).
Working medium’s flow path of double reheat unit with conventional layout
Challenge of conventional double reheat design
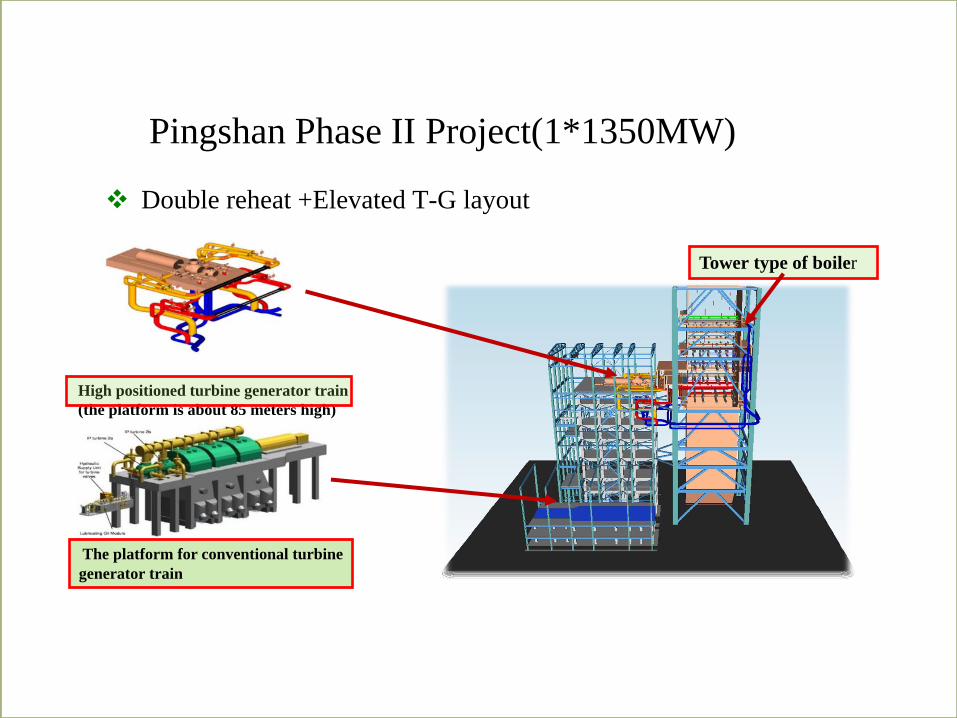
Double reheat +Elevated T-G layout
Pingshan Phase II Project(1*1350MW)
The platform for conventional turbine
generator train
High positioned turbine generator train
(the platform is about 85 meters high)
Tower type of boiler
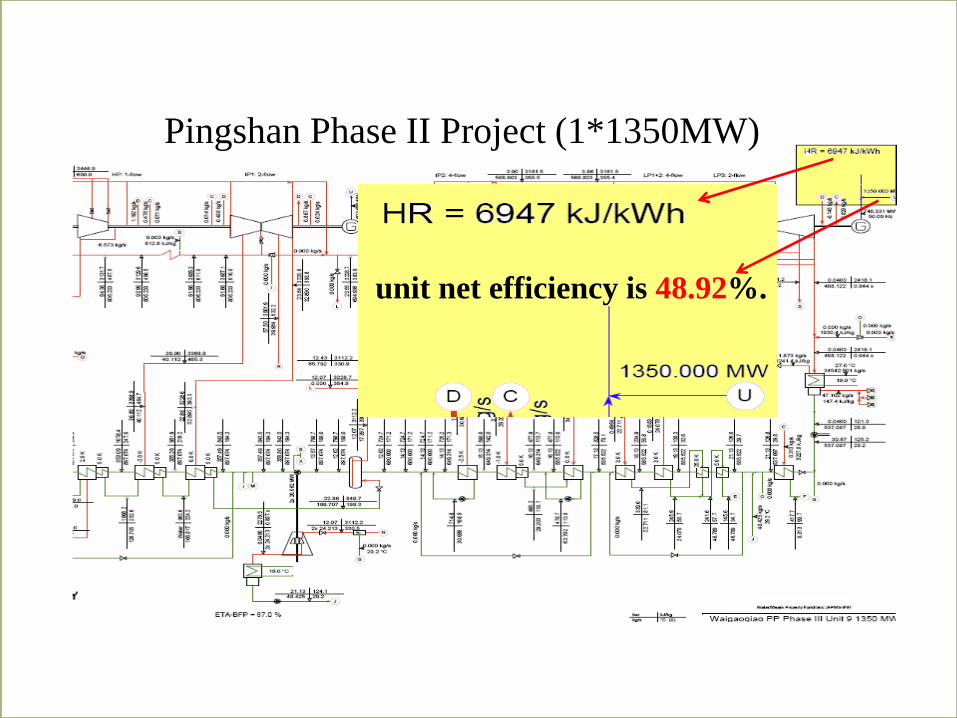
unit net efficiency is 48.92%.
Pingshan Phase II Project (1*1350MW)
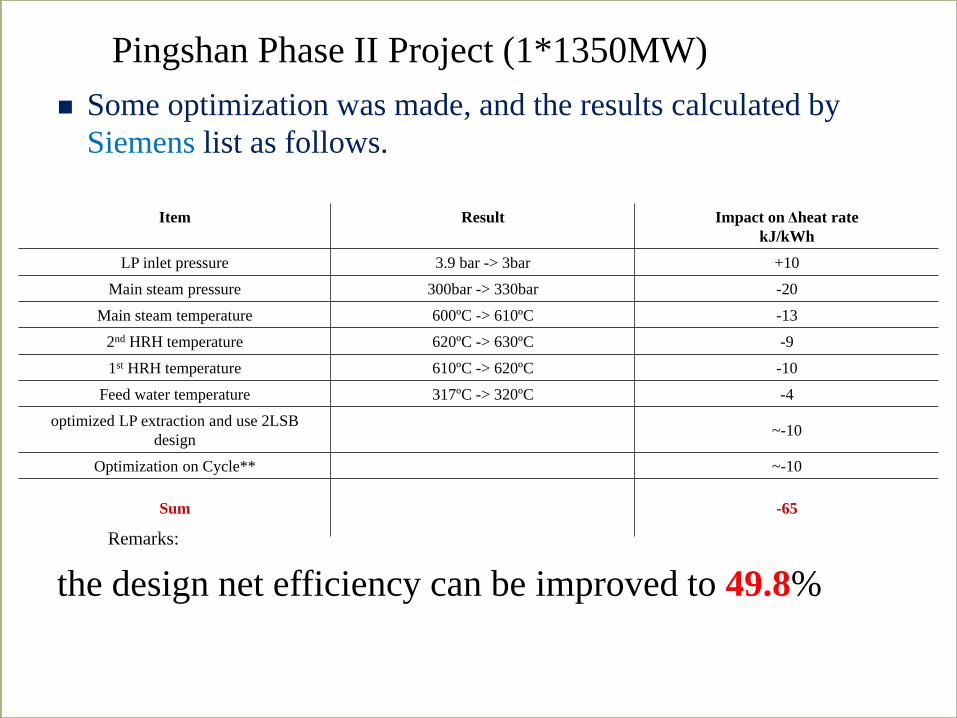
Remarks:
** Optimization on cycle means optimization of extraction point and blading stage load can be differed du
different boundary conditions.
Item Result Impact on Δheat rate
kJ/kWh
LP inlet pressure 3.9 bar -> 3bar +10
Main steam pressure 300bar -> 330bar -20
Main steam temperature 600ºC -> 610ºC -13
2nd HRH temperature 620ºC -> 630ºC -9
1st HRH temperature 610ºC -> 620ºC -10
Feed water temperature 317ºC -> 320ºC -4
optimized LP extraction and use 2LSB
design~-10
Optimization on Cycle** ~-10
Sum -65
Some optimization was made, and the results calculated by
Siemens list as follows.
the design net efficiency can be improved to 49.8%
Pingshan Phase II Project (1*1350MW)
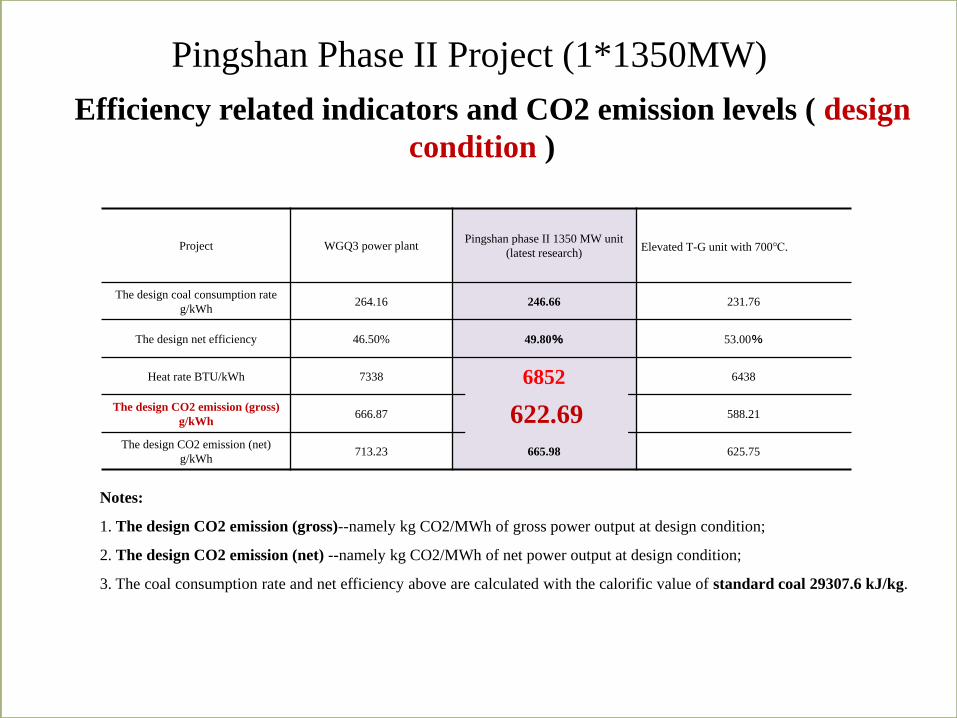
Project WGQ3 power plantPingshan phase II 1350 MW unit
(latest research)Elevated T-G unit with 700℃.
The design coal consumption rate
g/kWh264.16 246.66 231.76
The design net efficiency 46.50% 49.80% 53.00%
Heat rate BTU/kWh 7338 6852 6438
The design CO2 emission (gross)
g/kWh666.87 622.69 588.21
The design CO2 emission (net)
g/kWh713.23 665.98 625.75
Notes:
1. The design CO2 emission (gross)--namely kg CO2/MWh of gross power output at design condition;
2. The design CO2 emission (net) --namely kg CO2/MWh of net power output at design condition;
3. The coal consumption rate and net efficiency above are calculated with the calorific value of standard coal 29307.6 kJ/kg.
Efficiency related indicators and CO2 emission levels ( design
condition )
622.69
Pingshan Phase II Project (1*1350MW)
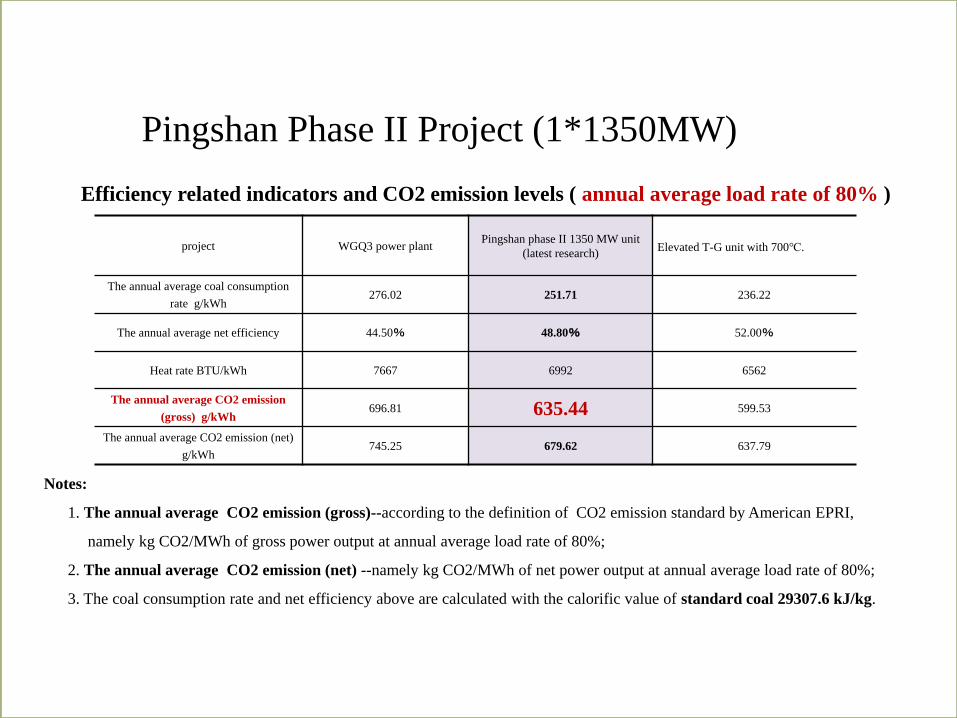
project WGQ3 power plantPingshan phase II 1350 MW unit
(latest research)Elevated T-G unit with 700℃.
The annual average coal consumption
rate g/kWh276.02 251.71 236.22
The annual average net efficiency 44.50% 48.80% 52.00%
Heat rate BTU/kWh 7667 6992 6562
The annual average CO2 emission
(gross) g/kWh696.81 635.44 599.53
The annual average CO2 emission (net)
g/kWh745.25 679.62 637.79
Notes:
1. The annual average CO2 emission (gross)--according to the definition of CO2 emission standard by American EPRI,
namely kg CO2/MWh of gross power output at annual average load rate of 80%;
2. The annual average CO2 emission (net) --namely kg CO2/MWh of net power output at annual average load rate of 80%;
3. The coal consumption rate and net efficiency above are calculated with the calorific value of standard coal 29307.6 kJ/kg.
Efficiency related indicators and CO2 emission levels ( annual average load rate of 80% )
Pingshan Phase II Project (1*1350MW)
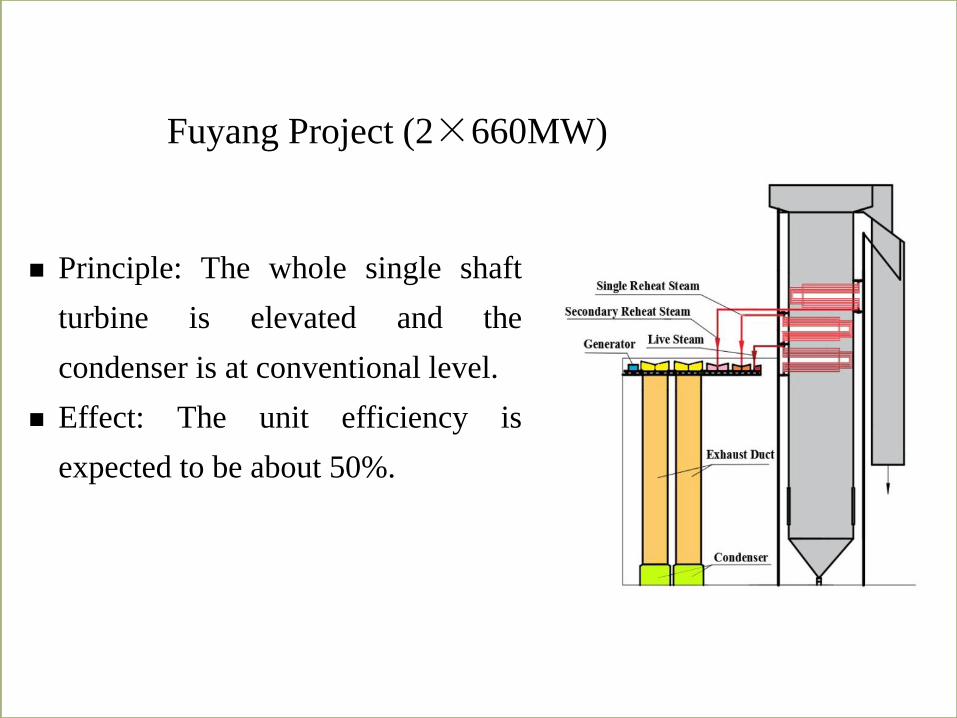
Fuyang Project (2×660MW)
Principle: The whole single shaft
turbine is elevated and the
condenser is at conventional level.
Effect: The unit efficiency is
expected to be about 50%.
The reformation technology of the high temperature sub critical unit is to keep the unit pressure
at the sub critical level (about 17MPa) but improving the temperature of the main steam and
reheat steam to about 600℃(1112°F)
Reform content
• Super heater and reheater, HP and IP pressure cylinders, and other main steam pipes and valves,
hot steam pipes and valves, high and medium pressure by-pass valves.
• Extent of reform is relatively small: the wall thickness of the pipe can be controlled and the
pressure is unchanged.
Xuzhou Power Plant——
Reformation of high temperature subcritical unit
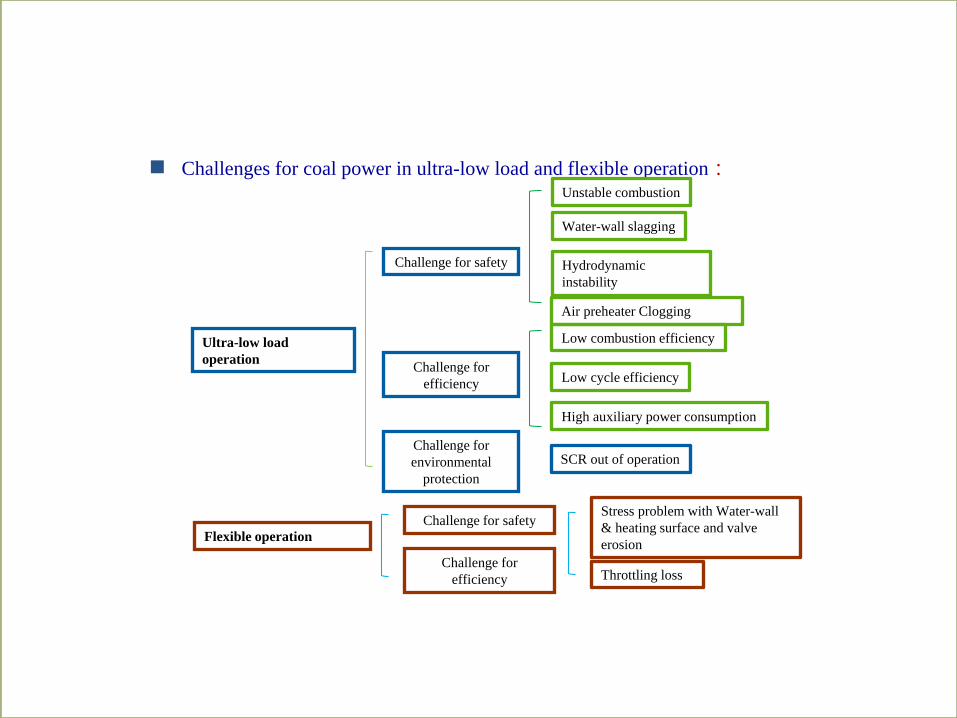
Challenge for
efficiency
Flexible operation
Challenge for safetyStress problem with Water-wall
& heating surface and valve
erosion
Throttling loss
Challenges for coal power in ultra-low load and flexible operation:
Ultra-low load
operation
Unstable combustion
Hydrodynamic
instability
Water-wall slagging
Low combustion efficiency
SCR out of operation
Challenge for safety
Challenge for
environmental
protection
Low cycle efficiency
High auxiliary power consumption
Challenge for
efficiency
Air preheater Clogging
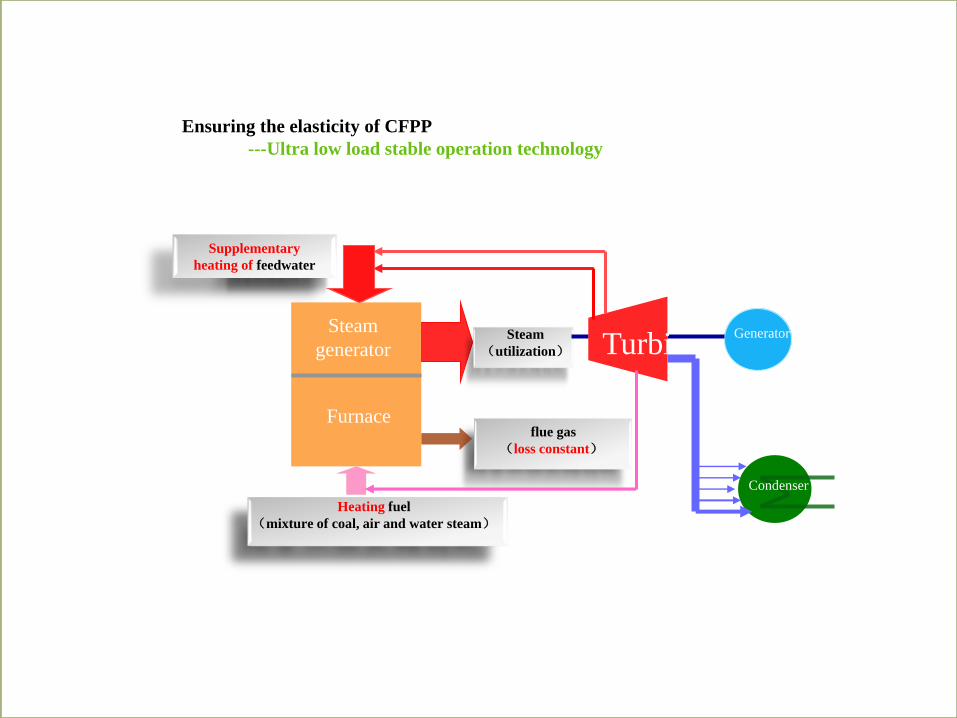
Ensuring the elasticity of CFPP
---Ultra low load stable operation technology
Feedwater Feedwater
heating
Supplementary
heating of feedwater
Flue gas(loss)
Fuel feeding
( mixture of coal, air and water steam)
flue gas
(loss constant)
Steam
(utilization)
Generator
Turbi
ne
Condenser
Steam
generator
Heating fuel
(mixture of coal, air and water steam)
Furnace
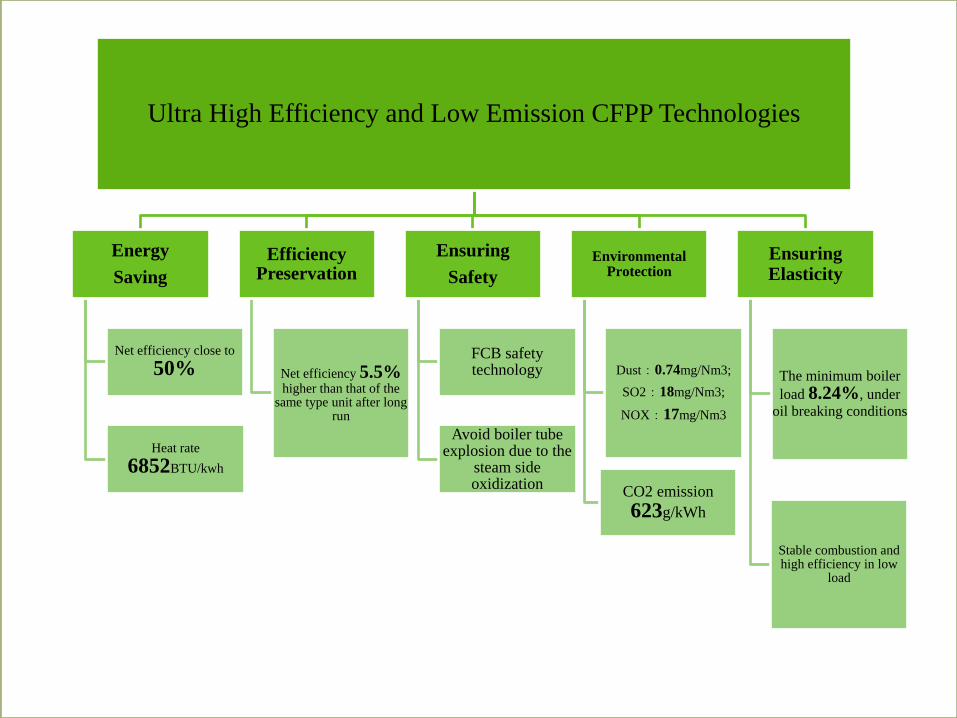
Ultra High Efficiency and Low Emission CFPP Technologies
Energy
Saving
Net efficiency close to
50%
Heat rate
6852BTU/kwh
Efficiency Preservation
Net efficiency 5.5% higher than that of the
same type unit after long run
Ensuring
Safety
FCB safety technology
Avoid boiler tube explosion due to the
steam side oxidization
Environmental Protection
Dust:0.74mg/Nm3;
SO2:18mg/Nm3;
NOX:17mg/Nm3
CO2 emission
623g/kWh
Ensuring Elasticity
The minimum boiler
load 8.24%, under
oil breaking conditions
Stable combustion and high efficiency in low
load

Staff Subcommittee on Electricity and Electric
Reliability