Embed Size (px)
Citation preview
OJVG Golouma Gold Project Updated Feasibility Study Technical Report Sénégal
Report Prepared for
Oromin Joint Venture Group
Report Prepared by
SRK Consulting (Canada) Inc.
2CO003.008
Effective Date: January 30, 2013
Date submitted to OJVG: March 15, 2013
2CO003.008 – Oromin Joint Venture Group Independent Technical Report for the OJVG Golouma Gold Project, Sénégal Page i
NMW_DM_TS /WB_MN OJVG Golouma Gold_2012_FS_Technical_Report_2CO003 008_NMW_DM_TS_GA_DGP_20130315_1 March 15, 2013
Revised OJVG Golouma Gold Project
Updated Technical Report
Technical Report
Project Location: 13o 09’ N, 12o 06’ W (approx.)
Kédougou Department, Tambacounda Region, Senegal, West Africa
Oromin Joint Venture Group 2000-1055 West Hastings St. Vancouver, B.C, V6E 2E9
SRK Consulting (Canada) Inc. Suite 2200 – 1066 West Hastings Street Vancouver, BC V6E 3X2 e-mail: [email protected] website: www.srk.com Tel: +1.604.681.4196 Fax: +1.604.687.5532
SRK Project Number 2CO003.006
Effective Date: January 30, 2013
Submitted To OJVG: March 15, 2013
Authors:
Dr. Gilles Arseneau, PGeo Dr. Wayne Barnett Pr Sci Nat Marek Nowak, PEng. Guy Dishaw, PGeo Fred Brown CPG Darrell Farrow, Pr Sci Nat Dino Pilotto, PEng Gary Poxleitner, PEng Luis Peloquin, PEng Maritz Rykaart, PEng Chris Elliott, FAusIMM Neil Winkelmann Kevin Scott, PEng Mark Liscowich, PGeo
Peer Reviewed by:
Dr. Wayne Barnett Pr Sci Nat Cover: Typical landscape of the OJVG Golouma Project
2CO003.008 – Oromin Joint Venture Group Independent Technical Report for the OJVG Golouma Gold Project, Sénégal Page ii
NMW_DM_TS /WB/MN OJVG Golouma Gold_2012_FS_Technical_Report_2CO003 008_NMW_DM_TS_GA_DGP_20130315_1 March 15, 2013
Important Notice This report was prepared as a National Instrument 43-101Technical Report for Oromin Joint
Venture Group (OJVG) by SRK Consulting (Canada) Inc. (SRK). The quality of information,
conclusions, and estimates contained herein is consistent with the level of effort involved in
SRK‟s services, based on: i) information available at the time of preparation, ii) data supplied by
outside sources, and iii) the assumptions, conditions, and qualifications set forth in this report.
This report is intended for use by OJVG subject to the terms and conditions of its contract with
SRK and relevant securities legislation. The contract permits OJVG to file this report as a
Technical Report with Canadian securities regulatory authorities pursuant to National Instrument
43-101, Standards of Disclosure for Mineral Projects. Except for the purposes legislated under
provincial securities law, any other uses of this report by any third party is at that party‟s sole
risk. The responsibility for this disclosure remains with OJVG. The user of this document should
ensure that this is the most recent Technical Report for the property as it is not valid if a new
Technical Report has been issued.
Copyright This report is protected by copyright vested in SRK Consulting (Canada) Inc. It may not be
reproduced or transmitted in any form or by any means whatsoever to any person without the
written permission of the copyright holder, other than in accordance with stock exchange and
other regulatory authority requirements.
2CO003.008 – Oromin Joint Venture Group Independent Technical Report for the OJVG Golouma Gold Project, Sénégal Page iii
NMW_DM_TS /WB/MN OJVG Golouma Gold_2012_FS_Technical_Report_2CO003 008_NMW_DM_TS_GA_DGP_20130315_1 March 15, 2013
Executive Summary
Introduction
The Oromin Joint Venture Group (OJVG) holds a 15 year renewable mining license in respect of
the Golouma Gold Concession (the Project), approximately 212.6 km2 of land in the
Tambacounda region of south-eastern Senegal. The registered name of the mining concession
is the Golouma Gold Concession and although it has previously been referred to as OJVG‟s
Sabodala Project, it is currently referred to as the OJVG Gold Project in almost all public
disclosure by the OJVG. For the purposes of this study, the OJVG Gold Project, OJVG
concession, OJVG property, OJVG Golouma Gold Project, Golouma Gold Project and Project
are synonymous. Gold exploration on the property has been conducted by Oromin Explorations
Ltd. (Oromin) since 2005. Oromin‟s exploration work has progressed from property-wide soil
geochemical sampling and geophysical surveys to more focussed trenching, reverse-circulation
(RC) drilling and diamond drilling (DDH). Oromin has been successful in identifying numerous
exploration targets and fourteen gold deposits thus far; Masato, Golouma (West, South, and
Northwest), Kerekounda, Niakafiri Southeast, Maki Medina, Kourouloulou, Niakafiri Southwest,
Kobokoto, Mamasato, Koulouqwinde, Sekoto, Kinemba, Koutouniokolla, and Kouroundi. The
Golouma deposits were treated as separate deposits for past resource updates but are being
treated as a single deposit in this update. All fourteen of these have been drilled to a level that
supports classification as mineral resources. This Technical Report provides an information
update to the mineral resource statement previously compiled by SRK Consulting (Canada) Inc.
(SRK) and Ausenco Ltd. and includes mineral resource updates for four of the deposits: Masato,
Golouma (West, South, and Northwest), Kerekounda and Kourouloulou. In addition to the
resource updates, ten new resources have been defined. The new mineral resource updates are
for: Niakafiri Southeast, Maki Medina, Niakafiri Southwest, Kobokoto, Mamasato, Koulouqwinde,
Sekoto, Kinemba, Koutouniokolla, and Kouroundi.
The OJVG Gold Project lies in a sparsely populated area of Senegal approximately 650
kilometres (km) east-southeast of Dakar, a 12-hour journey by road. The property is 185 km
east-southeast of Tambacounda and 65 km north of Kédougou. The border with Mali lies about
40 km to the east. There is a paved airstrip that supports twin engine charter flights from Dakar.
OJVG has access to the use of the airstrip. Road access to the property is via a paved road to
Tambacounda and Kédougou and a combination of paved and dirt roads thereafter. Roads on
the property have soil bases and can degrade substantially during heavy rains.
The property borders Teranga Gold Corporation‟s (“Teranga” – formerly Mineral Deposit Ltd.)
20.3 km2 mining concession, which hosts the OJVG Gold Deposit. OJVG‟s property is situated
on the divide between the Gambia and Falémé River catchments to the west and east
respectively. The terrain is comprised of open savannah vegetation on gently rolling hills and is
at an elevation of roughly 200 m above sea level (masl). The climate of the region belongs to the
Sudanic zone and is generally hot and humid. The rainy season, between June and September,
brings heavy downpours that are generally short and intense and can cause disruption to
transport. The estimated average annual rainfall on the property is 1,100 mm, the vast majority
falling in the rainy season.
In October 2004, OJVG was awarded an exploration permit for the Project, issued in accordance
with the Mining Convention. The permit was formalized with the government in February 2005.
2CO003.008 – Oromin Joint Venture Group Independent Technical Report for the OJVG Golouma Gold Project, Sénégal Page iv
NMW_DM_TS /WB/MN OJVG Golouma Gold_2012_FS_Technical_Report_2CO003 008_NMW_DM_TS_GA_DGP_20130315_1 March 15, 2013
The OJVG spent US$ 11 million on exploration during the first 22 month period to December 31,
2006, which has been extended twice to December 22, 2009.
The project is held by the OJVG, of which 43.5% is owned by Sabodala Holding Limited (SHL),
which is wholly owned by Oromin. Bendon International Ltd. also holds 43.5% of the project, with
Badr Investment and Finance Company holding 13%. On January 26, 2010, OJVG was granted
a mining licence for the Project.
The mining licence is for a term of 15 years, renewable, and will permit OJVG to begin mining
operations in accordance with recommendations of the 2010 feasibility study. OJVG has recently
completed the process of establishing an operating company, Somigol, to undertake the
development of the Project.
Somigol is 90% owned by OJVG and 10% by the Government of Senegal. The interest owned
by the Government of Senegal is fully carried and the Government of Senegal is also entitled to
a royalty equal to 3% of net smelter returns. Under the terms of the Mining Convention, OJVG is
obliged to offer to Senegalese nationals the right to purchase 25% of such operating company at
a price determined by an independent valuator.
The renewable mining licence allows for a minimum seven years tax free benefit, which can be
extended for up to 15 years through Government negotiation.
Geology and Exploration
The Project lies within the Kédougou-Kéniéba Inlier; part of the highly deformed circa 2.1 billion
years (Ga) Paleoproterozoic Birimian-Eburnean province of the West African Craton. The
Kédougou-Kéniéba Inlier is a triangular shaped area composed of felsic gneiss terranes
separated by greenstone belts that consist of supracrustal metavolcanic and metasedimentary
rocks; including the Mako Volcanic Group thick succession of mafic to ultramafic material,
Kakadian Batholith granitic complex, and the Eburnean Syn-tectonic Granites comprising
discrete granodioritic intrusives and possibly felsic dykes.
The concession straddles the Main Transcurrent Shear Zone, which is a regional-scale
north-northeast trending ductile fault that accommodated sinistral displacement during the
Paleoproterozoic Eburnean Orogeny. All the deposits lie within rocks affected by this zone of
north-northeast-south-southwest oriented shear.
The mineral deposits within the Property fall within the broad classification of orogenic gold. The
principal mineralized zones within the deposits are hosted by high strain areas within the
prevailing shear zones. Gold mineralization is associated with zones of metavolcanics affected
by intense Fe-carbonate-sericite ± quartz ± feldspar ± pyrite alteration, the intensity of which
broadly correlates to the intensity of the deformation fabric and the presence of thicker quartz-
carbonate veins. At Masato, fuchsite (Cr-mica) is also present, owing to the presence of
ultramafic rocks. Multiple parallel zones comprise each deposit, with individual zones of
anomalous gold values typically ranging 2 m to15 m in true thickness.
There are two pimary deposit types at the project; high grade Golouma style and lower grade
bulk tonnage Masato style. The Golouma style deposits consist of Kerekounda, Kourouloulou,
Golouma (West, South, and Northwest), Kouroundi, Koutouniokolla, Mamasato, and
Koulouqwinde. These are found in the central to eastern parts of the concession. Masato type
2CO003.008 – Oromin Joint Venture Group Independent Technical Report for the OJVG Golouma Gold Project, Sénégal Page v
NMW_DM_TS /WB/MN OJVG Golouma Gold_2012_FS_Technical_Report_2CO003 008_NMW_DM_TS_GA_DGP_20130315_1 March 15, 2013
deposits consist of Masato, Niakafiri Southwest, Niakafiri Southeast, Maki Medina, Kobokoto,
Kinemba, and Sekoto.
The Masato deposit has been defined over a 2,100 m strike length of a north-northeast trending,
moderately west-dipping shear zone. The zone consists of between two and six separate
mineralized zones over a distance of up to 90 m, which have been drilled to a depth of about
220 m below surface.
The geology of the Niakafiri Southeast deposit is dominated by a north-northeast trending, west
dipping ductile shear zone, several tens of metres wide. The mineral zone has been traced for
approximately 1.2 km and down to 180 m depth and remains open to expansion.
The Niakafiri Southwest deposit is interpreted to be a 200 m to 300 m wide structural zone
consisting of north-northeast trending steeply west dipping strongly sheared and altered mafic
and ultramafic metavolcanic rocks. The mineralization has been traced in drilling for 400 m along
strike and to a depth of 140 m and remains open to expansion.
The Maki Medina deposit is along the same steeply west dipping north-northeast trending
structural zone that hosts Masato and Niakafiri Southeast to the north and Kobokoto and
Kinemba West to the south. Drilling has defined a northern zone with a strike length of 700 m
and a smaller southern zone defined for 200 m. The current resource is drilled to a 120 m depth.
The main mineralized zone consists of a shallow west dipping, variably sheared zone. The
current resource is drilled to a depth of 100 m and over a strike length of 1 km.
The Kinemba deposit mineralization trends approximately north-northeast, dipping steeply
westward (-80°), and has been traced over a strike length of approximately 600 m to a depth of
200 m.
Gold mineralization tested at Sekoto is hosted within multiple sub-parallel zones of replacement-
style pink carbonate-silica-pyrite alteration that range in thickness from 3 m to 30 m. The zones
strike toward the north or northeast and dip moderate-steeply toward the west. A relatively
continuous body of low-grade gold mineralization has been defined and traced on strike for
approximately 350 m and down-dip for approximately 150 m. This zone remains open to the
northeast and down-dip.
The Golouma West deposit consists of two broadly east-west trending zones, which together
have a total strike length of approximately 800 m and are drilled-off to a depth of approximately
500 m, and one north-northeast trending zone with a strike of over 250 m. A total of six steeply
south-dipping shear zone-hosted sheet-like bodies of mineralization have been defined in the
east-west zones.
Golouma South occupies a north-northeast oriented, moderately to steeply west-dipping ductile
shear zone. Mineralization has currently been defined for a strike length of approximately 640 m
and down to about 280 m below surface. It has been modelled within four shear zone-hosted
sheet-like bodies of mineralization.
The Golouma Northwest deposit trends west-northwest, sub-parallel to the main Golouma West
zone. A fairly continuous zone of gold mineralization has been defined and traced for
approximately 400 m on strike and 120 m down-dip. Mineralization at Kerekounda occupies four
north-northwest trending shear zones, dipping 50-70° towards the west-southwest.
2CO003.008 – Oromin Joint Venture Group Independent Technical Report for the OJVG Golouma Gold Project, Sénégal Page vi
NMW_DM_TS /WB/MN OJVG Golouma Gold_2012_FS_Technical_Report_2CO003 008_NMW_DM_TS_GA_DGP_20130315_1 March 15, 2013
Mineralization has been defined over a strike length of about 350 m and down-dip for
approximately 430 m.
Kourouloulou has four east-southeast striking shear zone-hosted sheet-like bodies of
mineralization that dip at intermediate angles to the south. Although the strike length of this
deposit is currently defined to only approximately 200 m, the grades are higher than the other
deposits.
The main gold zone in Kouroundi has been traced for approximately 100 m along strike, and
approximately 150 m down-dip. It strikes to the northwest and dips shallowly to moderately
(approximately 40º) to the southwest.
Gold mineralization at Koutouniokolla is located in two structural / alteration zones and in
northwest-trending brittle veins. Two separate, parallel zones of mineralization have been
encountered along the north-northeast trend for approximately 230 m along strike and 150 m
down-dip. The trend is steeply dipping west-northwest
Gold mineralization at Mamasato consists of three narrow, sub-parallel zones (2 m to 10 m) that
strike to the west and dip moderately to the north. Gold values show good continuity along a 650
m strike length and approximately 250 m down-dip within the central and western portions of the
shear system.
Low-grade gold mineralization at Koulouqwinde is hosted primarily within several, sub-parallel,
northeast trending shear zones. The shears are generally 10-20 m in width and dip steeply to
the northwest. Narrow (~1m), high grade quartz-toumaline veining has been observed on
surface as well as in drill-core at Koulouqwinde. The veining is hosted within massive mafic
volcanic units that are intercalated with sub-parallel, northeast trending shear zones. Due to the
limited distance between the bounding shear zones, the strike length and plunge of the veins is
limited to approximately 50-75 m. The veins generally strike east-northeasterly and dip steeply
towards the southeast. Current gold resources may be further expanded to depth at the Masato,
Golouma West, Golouma South, Kerekounda, and Kourouloulou deposits.
Resources
The fourteen mineral resource models presented here represent an update to four deposits from
the 2011 resource evaluation described in the SRK Revised Feasibility Study (December, 2011),
as well as ten newly defined resources. This resource update incorporates drilling completed by
OJVG as recently as December 2011 for the majority of the deposits. In the opinion of SRK, the
block model resource estimates reported herein are a reasonable representation of the gold
mineral resources located on the Project at the current level of sampling.
The design of gold mineralization wireframes and the resource estimates were completed in
Gemcom GEMS 6.4 and Vulcan 8.2. Statistical analysis and resource validation were carried out
in GEMS, Sage2001, and in non-commercial software.
For nine of the deposits, Masato, Golouma West, Golouma South, Kerekounda, Niakafiri
Southwest, Maki Medina, Kobokoto, Kinemba, and Kouroundi, gold grades were estimated using
ordinary kriging. The other seven deposits: Golouma Northwest, Niakafiri Southeast,
Kourouloulou, Mamasato, Koulouqwinde, Sekoto, and Koutouniokolla, were estimated by the
inverse distance squared procedure. The two Golouma deposits were estimated individually to
honour their geological attributes but reported as a single deposit.
2CO003.008 – Oromin Joint Venture Group Independent Technical Report for the OJVG Golouma Gold Project, Sénégal Page vii
NMW_DM_TS /WB/MN OJVG Golouma Gold_2012_FS_Technical_Report_2CO003 008_NMW_DM_TS_GA_DGP_20130315_1 March 15, 2013
Mineral resources estimates for the Project are reported in accordance with the guidelines of the
Canadian Securities Administrators National Instrument 43-101 (“NI 43-101”), and have been
estimated in conformity with generally accepted CIM “Estimation and Mineral Resource and
Mineral Reserve Best Practices” guidelines. Mineral resources are not mineral reserves and do
not have demonstrated economic viability.
Four deposits updated in this report have been previously classified in 2011 by SRK. The
remaining ten deposits are newly defined resources. Classifications were adjusted to account for
newly defined zones and new drilling. All resources have been classified as indicated and
inferred according to the confidence in the geologic and grade continuity as defined by
variogram modelling and the number of samples used to estimate block grades.
SRK considers that the mineral resource estimates presented herein satisfy “reasonable
prospects for economic extraction”, implying that the quantity and grade estimates meet certain
economic thresholds and that the mineral resources are reported at an appropriate cut-off grade,
taking into account extraction scenarios and processing recoveries. SRK considers that large
portions of the OJVG deposits are amenable for open pit extraction. SRK designed Whittle shells
to report open pit resources for all deposits.
Some portions of the deposits below the Whittle shells are considered suited for underground
mining. The respective resource tonnages for each of these deposit styles are shown in Table i.
Note that all deposits from the Project will be serviced by the same plant.
2CO003.008 – Oromin Joint Venture Group Independent Technical Report for the OJVG Golouma Gold Project, Sénégal Page viii
NMW_DM_TS /WB_MN OJVG Golouma Gold_2012_FS_Technical_Report_2CO003
008_NMW_DM_TS_GA_DGP_20130315_1 March 15, 2013
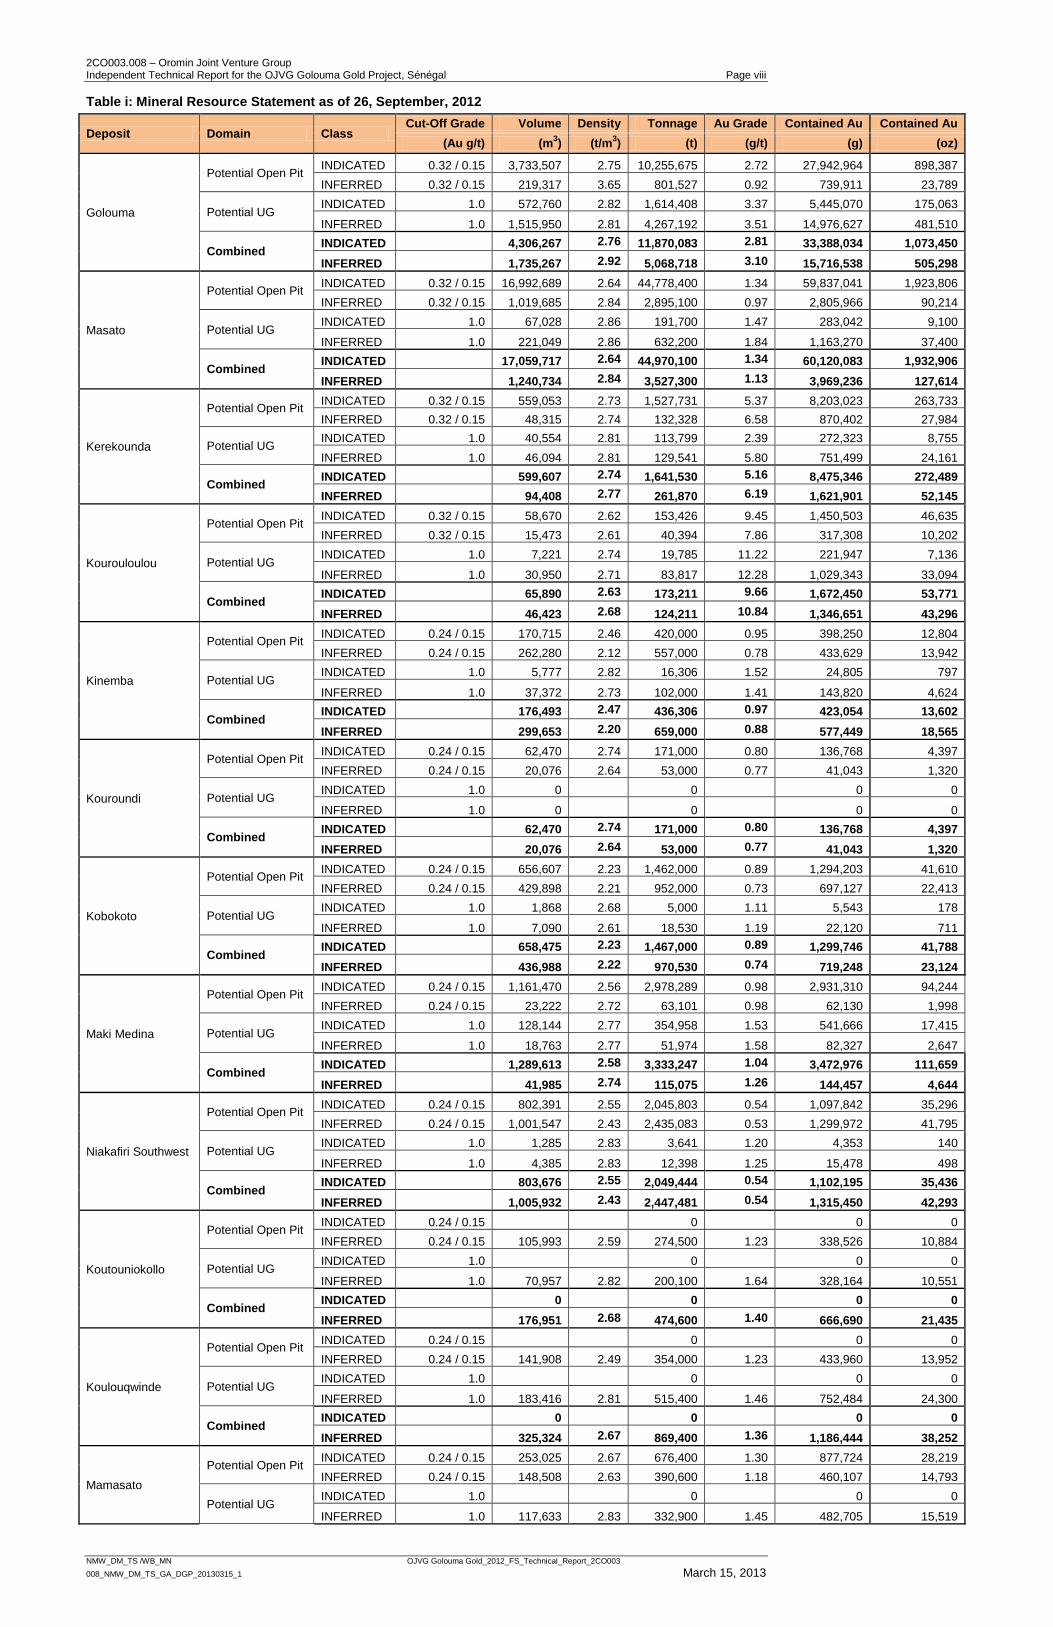
Table i: Mineral Resource Statement as of 26, September, 2012
Deposit Domain Class Cut-Off Grade Volume Density Tonnage Au Grade Contained Au Contained Au
(Au g/t) (m3) (t/m
3) (t) (g/t) (g) (oz)
Golouma
Potential Open Pit INDICATED 0.32 / 0.15 3,733,507 2.75 10,255,675 2.72 27,942,964 898,387
INFERRED 0.32 / 0.15 219,317 3.65 801,527 0.92 739,911 23,789
Potential UG INDICATED 1.0 572,760 2.82 1,614,408 3.37 5,445,070 175,063
INFERRED 1.0 1,515,950 2.81 4,267,192 3.51 14,976,627 481,510
Combined INDICATED 4,306,267 2.76 11,870,083 2.81 33,388,034 1,073,450
INFERRED 1,735,267 2.92 5,068,718 3.10 15,716,538 505,298
Masato
Potential Open Pit INDICATED 0.32 / 0.15 16,992,689 2.64 44,778,400 1.34 59,837,041 1,923,806
INFERRED 0.32 / 0.15 1,019,685 2.84 2,895,100 0.97 2,805,966 90,214
Potential UG INDICATED 1.0 67,028 2.86 191,700 1.47 283,042 9,100
INFERRED 1.0 221,049 2.86 632,200 1.84 1,163,270 37,400
Combined INDICATED 17,059,717 2.64 44,970,100 1.34 60,120,083 1,932,906
INFERRED 1,240,734 2.84 3,527,300 1.13 3,969,236 127,614
Kerekounda
Potential Open Pit INDICATED 0.32 / 0.15 559,053 2.73 1,527,731 5.37 8,203,023 263,733
INFERRED 0.32 / 0.15 48,315 2.74 132,328 6.58 870,402 27,984
Potential UG INDICATED 1.0 40,554 2.81 113,799 2.39 272,323 8,755
INFERRED 1.0 46,094 2.81 129,541 5.80 751,499 24,161
Combined INDICATED 599,607 2.74 1,641,530 5.16 8,475,346 272,489
INFERRED 94,408 2.77 261,870 6.19 1,621,901 52,145
Kourouloulou
Potential Open Pit INDICATED 0.32 / 0.15 58,670 2.62 153,426 9.45 1,450,503 46,635
INFERRED 0.32 / 0.15 15,473 2.61 40,394 7.86 317,308 10,202
Potential UG INDICATED 1.0 7,221 2.74 19,785 11.22 221,947 7,136
INFERRED 1.0 30,950 2.71 83,817 12.28 1,029,343 33,094
Combined INDICATED 65,890 2.63 173,211 9.66 1,672,450 53,771
INFERRED 46,423 2.68 124,211 10.84 1,346,651 43,296
Kinemba
Potential Open Pit INDICATED 0.24 / 0.15 170,715 2.46 420,000 0.95 398,250 12,804
INFERRED 0.24 / 0.15 262,280 2.12 557,000 0.78 433,629 13,942
Potential UG INDICATED 1.0 5,777 2.82 16,306 1.52 24,805 797
INFERRED 1.0 37,372 2.73 102,000 1.41 143,820 4,624
Combined INDICATED 176,493 2.47 436,306 0.97 423,054 13,602
INFERRED 299,653 2.20 659,000 0.88 577,449 18,565
Kouroundi
Potential Open Pit INDICATED 0.24 / 0.15 62,470 2.74 171,000 0.80 136,768 4,397
INFERRED 0.24 / 0.15 20,076 2.64 53,000 0.77 41,043 1,320
Potential UG INDICATED 1.0 0 0 0 0
INFERRED 1.0 0 0 0 0
Combined INDICATED 62,470 2.74 171,000 0.80 136,768 4,397
INFERRED 20,076 2.64 53,000 0.77 41,043 1,320
Kobokoto
Potential Open Pit INDICATED 0.24 / 0.15 656,607 2.23 1,462,000 0.89 1,294,203 41,610
INFERRED 0.24 / 0.15 429,898 2.21 952,000 0.73 697,127 22,413
Potential UG INDICATED 1.0 1,868 2.68 5,000 1.11 5,543 178
INFERRED 1.0 7,090 2.61 18,530 1.19 22,120 711
Combined INDICATED 658,475 2.23 1,467,000 0.89 1,299,746 41,788
INFERRED 436,988 2.22 970,530 0.74 719,248 23,124
Maki Medina
Potential Open Pit INDICATED 0.24 / 0.15 1,161,470 2.56 2,978,289 0.98 2,931,310 94,244
INFERRED 0.24 / 0.15 23,222 2.72 63,101 0.98 62,130 1,998
Potential UG INDICATED 1.0 128,144 2.77 354,958 1.53 541,666 17,415
INFERRED 1.0 18,763 2.77 51,974 1.58 82,327 2,647
Combined INDICATED 1,289,613 2.58 3,333,247 1.04 3,472,976 111,659
INFERRED 41,985 2.74 115,075 1.26 144,457 4,644
Niakafiri Southwest
Potential Open Pit INDICATED 0.24 / 0.15 802,391 2.55 2,045,803 0.54 1,097,842 35,296
INFERRED 0.24 / 0.15 1,001,547 2.43 2,435,083 0.53 1,299,972 41,795
Potential UG INDICATED 1.0 1,285 2.83 3,641 1.20 4,353 140
INFERRED 1.0 4,385 2.83 12,398 1.25 15,478 498
Combined INDICATED 803,676 2.55 2,049,444 0.54 1,102,195 35,436
INFERRED 1,005,932 2.43 2,447,481 0.54 1,315,450 42,293
Koutouniokollo
Potential Open Pit INDICATED 0.24 / 0.15 0 0 0
INFERRED 0.24 / 0.15 105,993 2.59 274,500 1.23 338,526 10,884
Potential UG INDICATED 1.0 0 0 0
INFERRED 1.0 70,957 2.82 200,100 1.64 328,164 10,551
Combined INDICATED 0 0 0 0
INFERRED 176,951 2.68 474,600 1.40 666,690 21,435
Koulouqwinde
Potential Open Pit INDICATED 0.24 / 0.15 0 0 0
INFERRED 0.24 / 0.15 141,908 2.49 354,000 1.23 433,960 13,952
Potential UG INDICATED 1.0 0 0 0
INFERRED 1.0 183,416 2.81 515,400 1.46 752,484 24,300
Combined INDICATED 0 0 0 0
INFERRED 325,324 2.67 869,400 1.36 1,186,444 38,252
Mamasato
Potential Open Pit INDICATED 0.24 / 0.15 253,025 2.67 676,400 1.30 877,724 28,219
INFERRED 0.24 / 0.15 148,508 2.63 390,600 1.18 460,107 14,793
Potential UG INDICATED 1.0 0 0 0
INFERRED 1.0 117,633 2.83 332,900 1.45 482,705 15,519
2CO003.008 – Oromin Joint Venture Group Independent Technical Report for the OJVG Golouma Gold Project, Sénégal Page ix
NMW_DM_TS /WB_MN OJVG Golouma Gold_2012_FS_Technical_Report_2CO003
008_NMW_DM_TS_GA_DGP_20130315_1 March 15, 2013
Deposit Domain Class Cut-Off Grade Volume Density Tonnage Au Grade Contained Au Contained Au
(Au g/t) (m3) (t/m
3) (t) (g/t) (g) (oz)
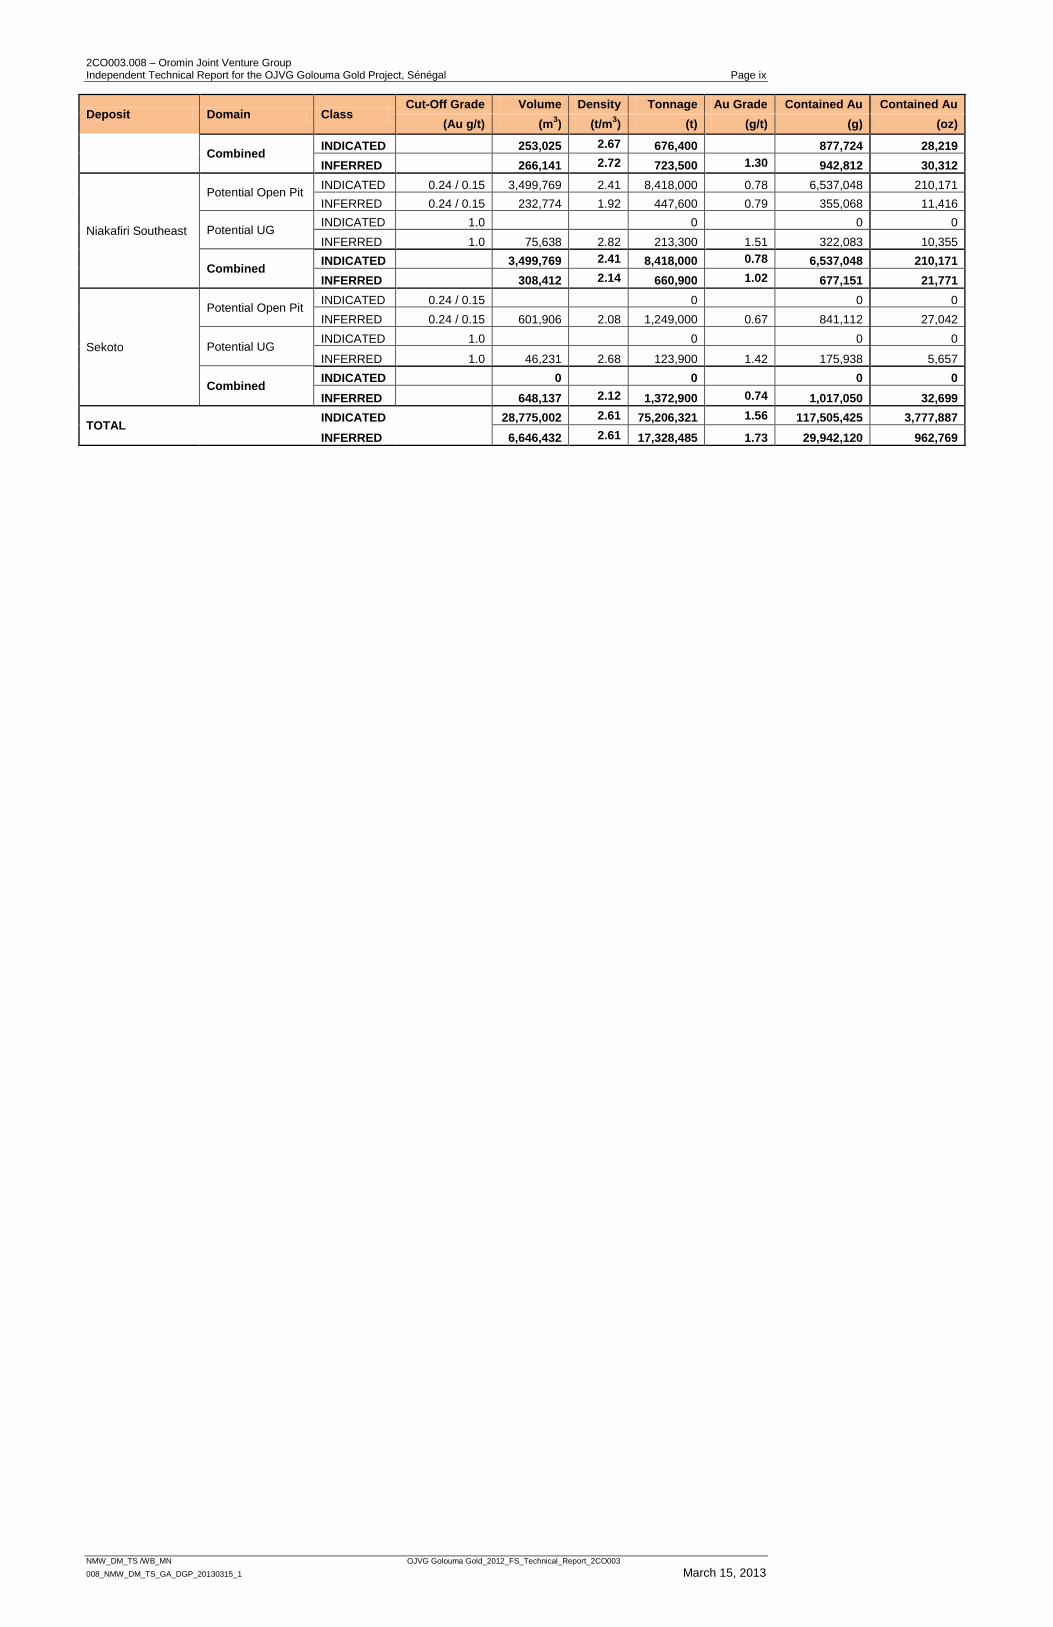
Combined INDICATED 253,025 2.67 676,400 877,724 28,219
INFERRED 266,141 2.72 723,500 1.30 942,812 30,312
Niakafiri Southeast
Potential Open Pit INDICATED 0.24 / 0.15 3,499,769 2.41 8,418,000 0.78 6,537,048 210,171
INFERRED 0.24 / 0.15 232,774 1.92 447,600 0.79 355,068 11,416
Potential UG INDICATED 1.0 0 0 0
INFERRED 1.0 75,638 2.82 213,300 1.51 322,083 10,355
Combined INDICATED 3,499,769 2.41 8,418,000 0.78 6,537,048 210,171
INFERRED 308,412 2.14 660,900 1.02 677,151 21,771
Sekoto
Potential Open Pit INDICATED 0.24 / 0.15 0 0 0
INFERRED 0.24 / 0.15 601,906 2.08 1,249,000 0.67 841,112 27,042
Potential UG INDICATED 1.0 0 0 0
INFERRED 1.0 46,231 2.68 123,900 1.42 175,938 5,657
Combined INDICATED 0 0 0 0
INFERRED 648,137 2.12 1,372,900 0.74 1,017,050 32,699
TOTAL INDICATED 28,775,002 2.61 75,206,321 1.56 117,505,425 3,777,887
INFERRED 6,646,432 2.61 17,328,485 1.73 29,942,120 962,769
2CO003.008 – Oromin Joint Venture Group Independent Technical Report for the OJVG Golouma Gold Project, Sénégal Page x
NMW_DM_TS /WB/MN OJVG Golouma Gold_2012_FS_Technical_Report_2CO003 008_NMW_DM_TS_GA_DGP_20130315_1 March 15, 2013
Mineral Reserve Estimate
The mineral reserve estimate for the OJVG Gold Project has been subdivided into an open pit
portion and an underground portion. Table ii presents the open pit reserve and Table iii
presents the underground reserve, while the total reserve summary is presented in Table iv.
Table ii: Open Pit Mineral Reserve Estimate
Deposit Reserve
Class Diluted Tonnes
('000s)
Cut-off* Diluted Grade
Contained Gold
(g/t) (g/t) Au
(koz)
Golouma Style Higher Grade Deposits
Golouma W,S,NW
Oxide Probable 602 0.52 2.11 41
Sulphide Probable 2,267 0.89 2.37 173
Kerekounda
Oxide Probable 26 0.52 5.6 5
Sulphide Probable 7 0.90 12.01 3
Subtotal Golouma Style Probable 2,902 variable 2.38 222
Masato Style Bulk Tonnage Deposits
Masato
Oxide Probable 6,202 0.51 1.47 293
Sulphide Probable 12,785 0.88 2.26 930
Subtotal Masato Style Probable 18,987 variable 2.00 1,223
Total Mineral Reserve Probable 21,889 variable 2.05 1,445
Notes:*Internal (mill) average cut-off based on Whittle optimization parameters
Table iii: Underground Mineral Reserve Estimate
Golouma Style Higher Grade Deposits
Reserve Class
Diluted Tonnes ('000s)
Cut-off
Diluted Grade
Contained Gold
(g/t) (g/t) Au (koz)
Golouma W,S Probable 4,600 2.18 4.19 620
Kerekounda Probable 1,333 2.18 5.15 221
Kourouloulou Probable 189 2.18 8.16 49
Subtotal Golouma Style Probable 6,122 2.18 4.52 890
Table iv: Total Mineral Reserve Estimate
Deposit Reserve
Class Diluted Tonnes
('000s)
Cut-off
Diluted Grade
Contained Gold
(g/t) (g/t) Au (koz)
Golouma Style Higher Grade Deposits
Golouma W,S,NW Probable 7,469 N/A 3.47 834
Kerekounda Probable 1,366 N/A 5.21 229
Kourouloulou Probable 189 N/A 8.06 49
Subtotal Golouma Style Probable 9,024 N/A 3.83 1,112
Masato Style Bulk Tonnage Deposits
Masato Probable 18,987 N/A 2.00 1,223
Subtotal Masato Style Probable 18,987 N/A 2.00 1,223
Total Mineral Reserve Probable 28,011 N/A 2.59 2,335
2CO003.008 – Oromin Joint Venture Group Independent Technical Report for the OJVG Golouma Gold Project, Sénégal Page xi
NMW_DM_TS /WB/MN OJVG Golouma Gold_2012_FS_Technical_Report_2CO003 008_NMW_DM_TS_GA_DGP_20130315_1 March 15, 2013
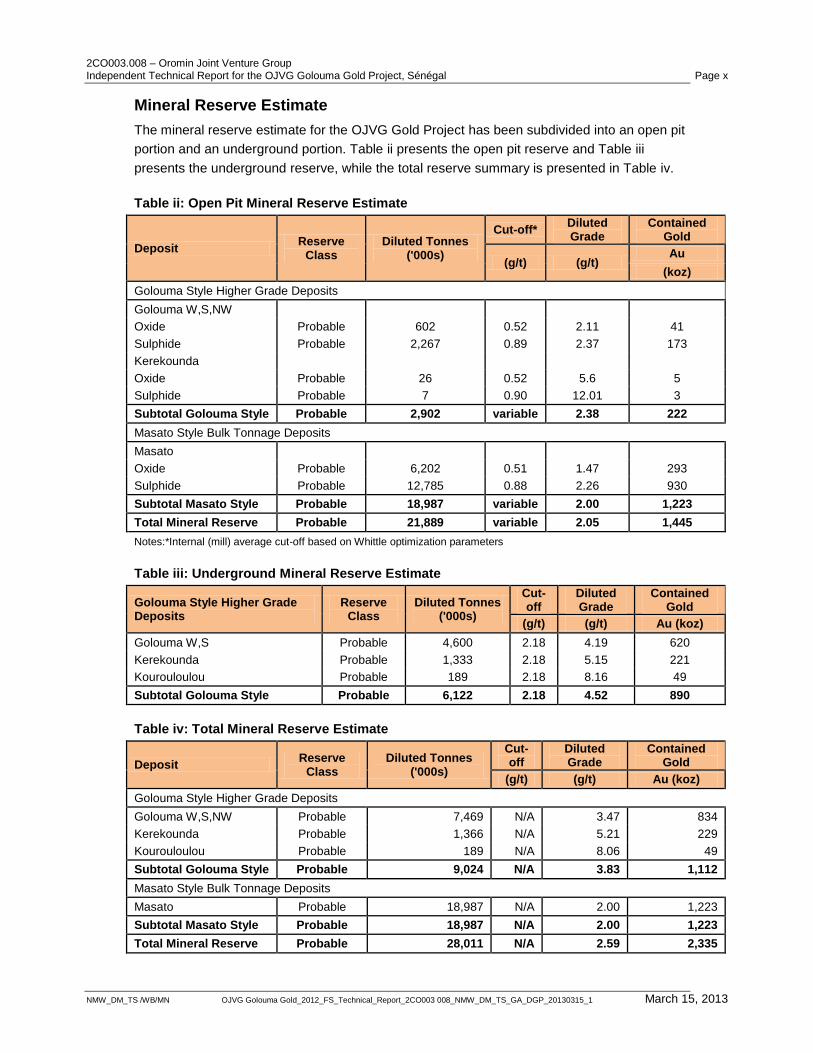
The mineral reserve estimate for the OJVG open pits was constrained with estimates of gold
price, mining dilution, process recovery, refining/transport costs and royalties. Mining,
processing and general administration costs were also estimated based on expected mill
throughputs and, along with geotechnical parameters, formed the basis for open pit
optimization. A distinction between material types was made (soft/hard) for both ore and
waste in order to capture the expected variation in mining and processing costs and rates.
The mineral inventory block models for each of the deposits were then used with the Gemcom
Whittle - Strategic Mine Planning™ (Whittle) software to determine optimal mining shells. Only
indicated mineral resources were included in the pit optimization process (no resource has
been classified in the measured category).
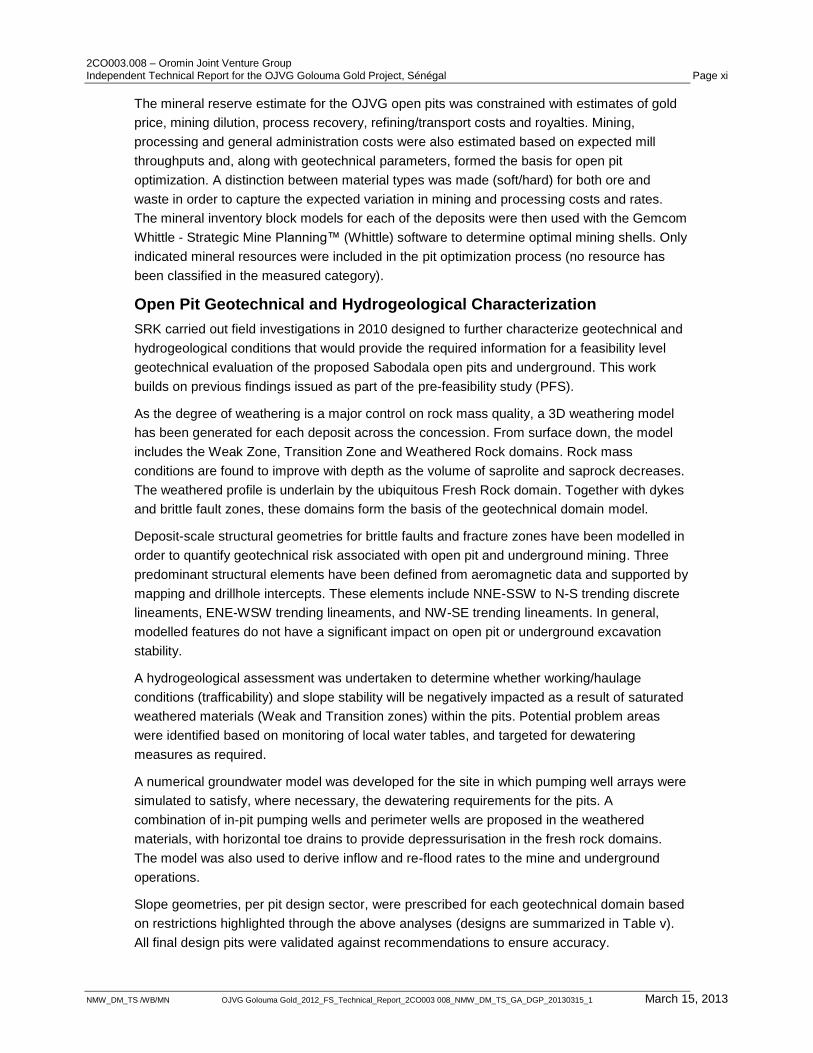
Open Pit Geotechnical and Hydrogeological Characterization
SRK carried out field investigations in 2010 designed to further characterize geotechnical and
hydrogeological conditions that would provide the required information for a feasibility level
geotechnical evaluation of the proposed Sabodala open pits and underground. This work
builds on previous findings issued as part of the pre-feasibility study (PFS).
As the degree of weathering is a major control on rock mass quality, a 3D weathering model
has been generated for each deposit across the concession. From surface down, the model
includes the Weak Zone, Transition Zone and Weathered Rock domains. Rock mass
conditions are found to improve with depth as the volume of saprolite and saprock decreases.
The weathered profile is underlain by the ubiquitous Fresh Rock domain. Together with dykes
and brittle fault zones, these domains form the basis of the geotechnical domain model.
Deposit-scale structural geometries for brittle faults and fracture zones have been modelled in
order to quantify geotechnical risk associated with open pit and underground mining. Three
predominant structural elements have been defined from aeromagnetic data and supported by
mapping and drillhole intercepts. These elements include NNE-SSW to N-S trending discrete
lineaments, ENE-WSW trending lineaments, and NW-SE trending lineaments. In general,
modelled features do not have a significant impact on open pit or underground excavation
stability.
A hydrogeological assessment was undertaken to determine whether working/haulage
conditions (trafficability) and slope stability will be negatively impacted as a result of saturated
weathered materials (Weak and Transition zones) within the pits. Potential problem areas
were identified based on monitoring of local water tables, and targeted for dewatering
measures as required.
A numerical groundwater model was developed for the site in which pumping well arrays were
simulated to satisfy, where necessary, the dewatering requirements for the pits. A
combination of in-pit pumping wells and perimeter wells are proposed in the weathered
materials, with horizontal toe drains to provide depressurisation in the fresh rock domains.
The model was also used to derive inflow and re-flood rates to the mine and underground
operations.
Slope geometries, per pit design sector, were prescribed for each geotechnical domain based
on restrictions highlighted through the above analyses (designs are summarized in Table v).
All final design pits were validated against recommendations to ensure accuracy.
2CO003.008 – Oromin Joint Venture Group Independent Technical Report for the OJVG Golouma Gold Project, Sénégal Page xii
NMW_DM_TS /WB/MN OJVG Golouma Gold_2012_FS_Technical_Report_2CO003 008_NMW_DM_TS_GA_DGP_20130315_1 March 15, 2013
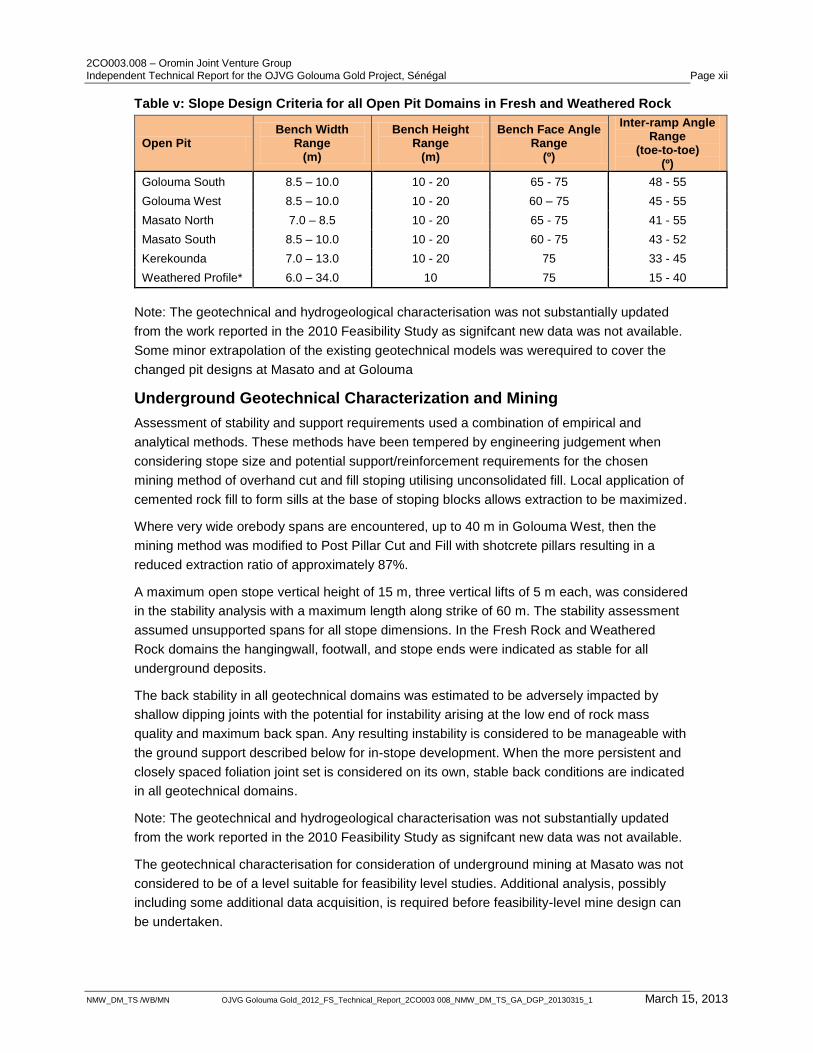
Table v: Slope Design Criteria for all Open Pit Domains in Fresh and Weathered Rock
Open Pit Bench Width
Range (m)
Bench Height Range
(m)
Bench Face Angle Range
(º)
Inter-ramp Angle Range
(toe-to-toe) (º)
Golouma South 8.5 – 10.0 10 - 20 65 - 75 48 - 55
Golouma West 8.5 – 10.0 10 - 20 60 – 75 45 - 55
Masato North 7.0 – 8.5 10 - 20 65 - 75 41 - 55
Masato South 8.5 – 10.0 10 - 20 60 - 75 43 - 52
Kerekounda 7.0 – 13.0 10 - 20 75 33 - 45
Weathered Profile* 6.0 – 34.0 10 75 15 - 40
Note: The geotechnical and hydrogeological characterisation was not substantially updated
from the work reported in the 2010 Feasibility Study as signifcant new data was not available.
Some minor extrapolation of the existing geotechnical models was werequired to cover the
changed pit designs at Masato and at Golouma
Underground Geotechnical Characterization and Mining
Assessment of stability and support requirements used a combination of empirical and
analytical methods. These methods have been tempered by engineering judgement when
considering stope size and potential support/reinforcement requirements for the chosen
mining method of overhand cut and fill stoping utilising unconsolidated fill. Local application of
cemented rock fill to form sills at the base of stoping blocks allows extraction to be maximized.
Where very wide orebody spans are encountered, up to 40 m in Golouma West, then the
mining method was modified to Post Pillar Cut and Fill with shotcrete pillars resulting in a
reduced extraction ratio of approximately 87%.
A maximum open stope vertical height of 15 m, three vertical lifts of 5 m each, was considered
in the stability analysis with a maximum length along strike of 60 m. The stability assessment
assumed unsupported spans for all stope dimensions. In the Fresh Rock and Weathered
Rock domains the hangingwall, footwall, and stope ends were indicated as stable for all
underground deposits.
The back stability in all geotechnical domains was estimated to be adversely impacted by
shallow dipping joints with the potential for instability arising at the low end of rock mass
quality and maximum back span. Any resulting instability is considered to be manageable with
the ground support described below for in-stope development. When the more persistent and
closely spaced foliation joint set is considered on its own, stable back conditions are indicated
in all geotechnical domains.
Note: The geotechnical and hydrogeological characterisation was not substantially updated
from the work reported in the 2010 Feasibility Study as signifcant new data was not available.
The geotechnical characterisation for consideration of underground mining at Masato was not
considered to be of a level suitable for feasibility level studies. Additional analysis, possibly
including some additional data acquisition, is required before feasibility-level mine design can
be undertaken.

2CO003.008 – Oromin Joint Venture Group Independent Technical Report for the OJVG Golouma Gold Project, Sénégal Page xiii
NMW_DM_TS /WB/MN OJVG Golouma Gold_2012_FS_Technical_Report_2CO003 008_NMW_DM_TS_GA_DGP_20130315_1 March 15, 2013
Open Pit Mine Plan and Phasing
Three of the OJVG Golouma Gold deposits (Golouma South, Golouma West, and
Kerekounda) have both open pit and underground mining, while one deposit (Masato)
involves only open pit mining. Kourouloulou involves only underground mining.
Based on the analysis of the Whittle pit shells, a base case shell was chosen for each deposit
and used as the template for the detailed ultimate pit designs. These detailed ultimate pit
designs incorporated geotechnical parameters (bench face angle, inter-ramp angles, and
berm widths) for the various rock types and pit sectors and included a 10% gradient access
ramp design and take into account minimum mining widths. Waste dumps were then designed
to account for the waste material produced in each mining phase.
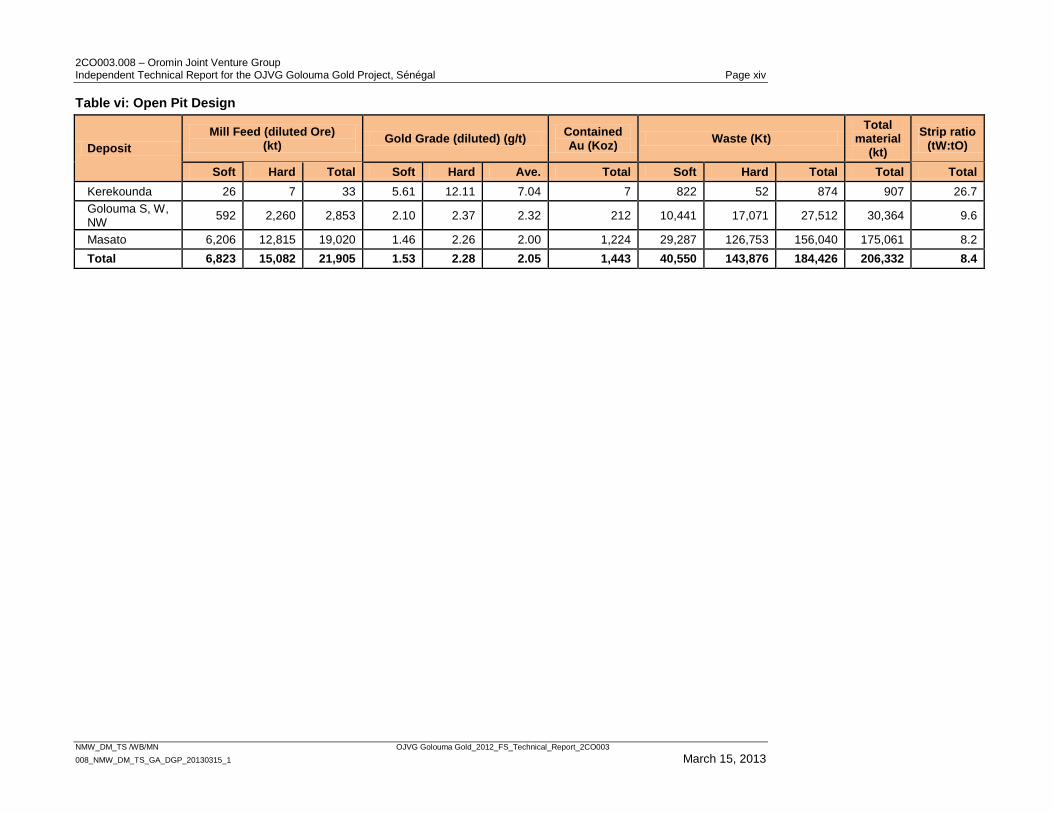
Table vi below summarizes the resulting detailed pit design ore tonnages and grades for each
of the four open pit deposits along with a summary of waste by rock type (soft material is
assumed to be a weaker zone of free-digging material that will not require drilling and
blasting).
2CO003.008 – Oromin Joint Venture Group Independent Technical Report for the OJVG Golouma Gold Project, Sénégal Page xiv
NMW_DM_TS /WB/MN OJVG Golouma Gold_2012_FS_Technical_Report_2CO003
008_NMW_DM_TS_GA_DGP_20130315_1 March 15, 2013
Table vi: Open Pit Design
Deposit
Mill Feed (diluted Ore) (kt)
Gold Grade (diluted) (g/t) Contained Au (Koz)
Waste (Kt) Total
material (kt)
Strip ratio (tW:tO)
Soft Hard Total Soft Hard Ave. Total Soft Hard Total Total Total
Kerekounda 26 7 33 5.61 12.11 7.04 7 822 52 874 907 26.7
Golouma S, W, NW
592 2,260 2,853 2.10 2.37 2.32 212 10,441 17,071 27,512 30,364 9.6
Masato 6,206 12,815 19,020 1.46 2.26 2.00 1,224 29,287 126,753 156,040 175,061 8.2
Total 6,823 15,082 21,905 1.53 2.28 2.05 1,443 40,550 143,876 184,426 206,332 8.4
2CO003.008 – Oromin Joint Venture Group Independent Technical Report for the OJVG Golouma Gold Project, Sénégal Page xv
NMW_DM_TS /WB/MN OJVG Golouma Gold_2012_FS_Technical_Report_2CO003 008_NMW_DM_TS_GA_DGP_20130315_1 March 15, 2013
The detailed pit designs for the various deposits for the project were divided into various
pushback phases for the mine plan development in order to provide flexibility in the schedule,
maximize grade in the early part of the schedule, and reduce pre-stripping requirements while
providing the required mill feed production per period. The mining schedule maximizes the
attainable mill throughputs based on the soft/hard ore ratios produced. The phases are
designed to allow for the mining of the weaker zones of soft material first in order to maximize
plant throughputs in the early years of the project.
OP and UG Mine Schedule
The open pit and underground mine production schedule for the OJVG deposits incorporates
the deposits at Golouma South, Golouma West, Masato, Kerekounda, and Kourouloulou. The
mill feed tonnage was designed to match the mining schedule except in years 1 and 2.
The plant throughput was planned at a net yearly production of 1.7 mtpa for hard ore and 2.7
mtpa for soft ore. Pre-production stripping was planned to occur in year 1, with the
commencement of full-scale processing, beginning in year 3.
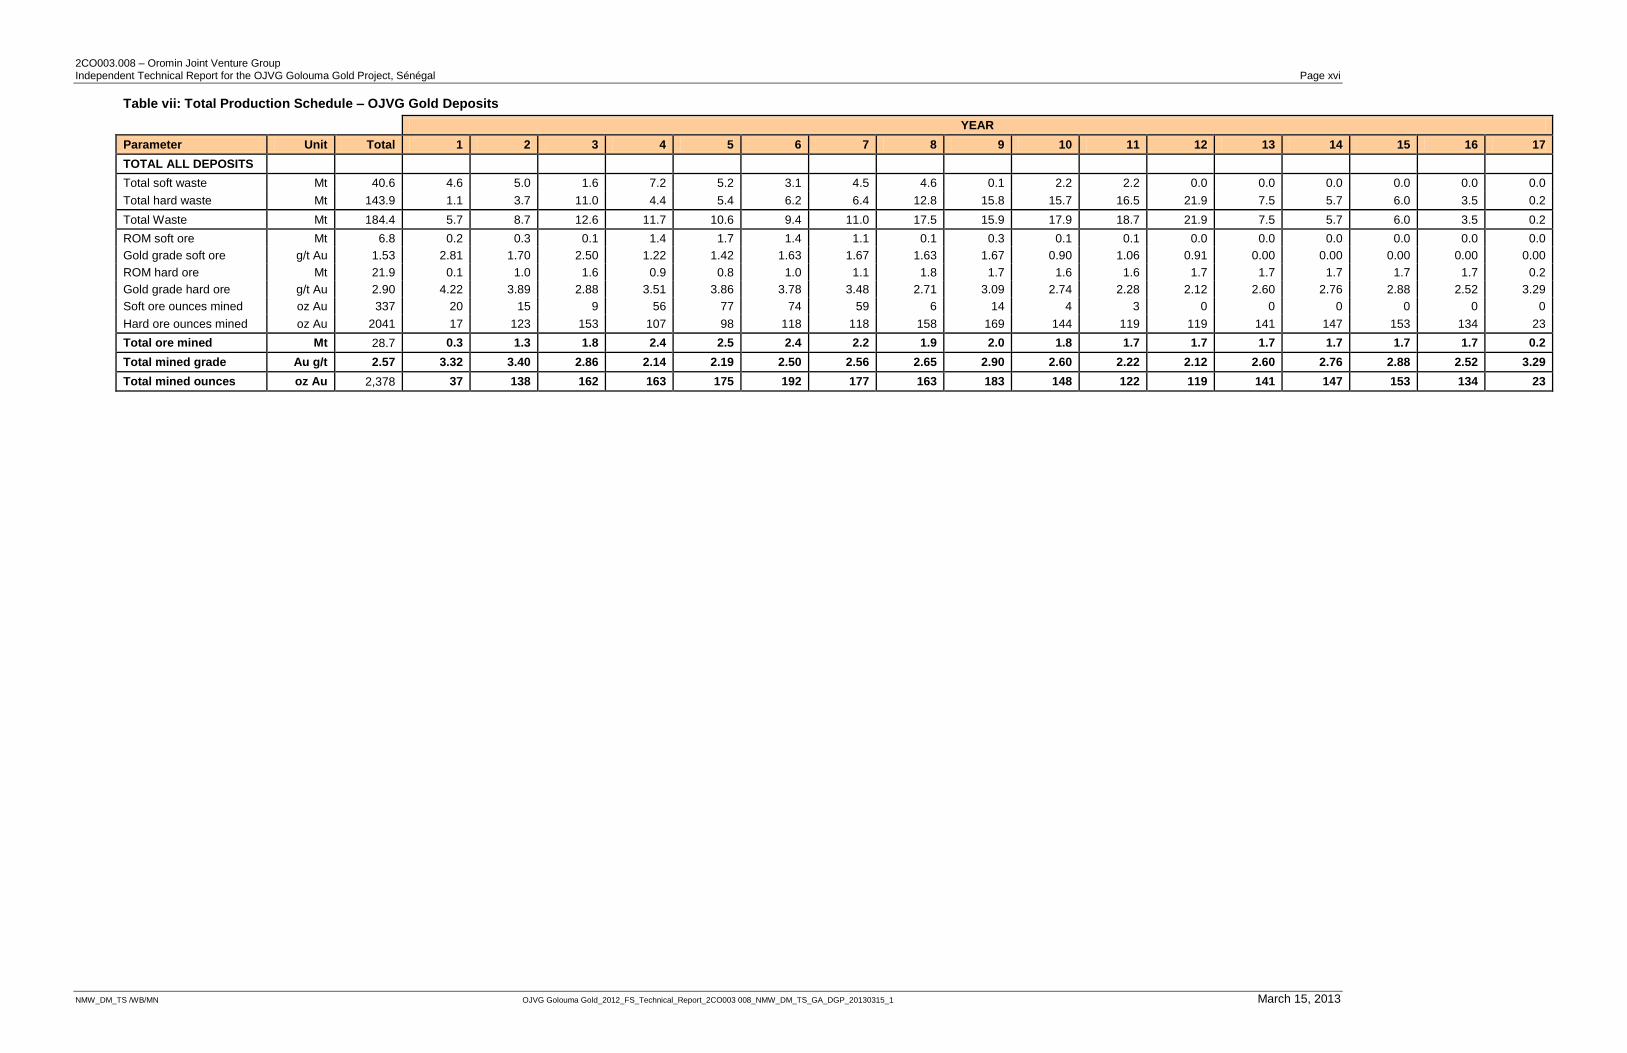
Table vii below is a summary of total material movement by year for the LOM mine production
schedule.
The project‟s open pit and underground mines will produce a total of 28 million tonnes (Mt) of
mill feed and 184 Mt of waste rock over a 17-year mine operating. The mine schedule focuses
on achieving the required plant feed production rate, mining of higher grade material early in the
schedule, while balancing grade and strip ratios. The mining schedule maximizes the attainable
mill throughputs based on the soft/hard ore ratios produced. The OJVG deposits are most
economical when the open pit phases as well as the underground workings are mined
concurrently.
2CO003.008 – Oromin Joint Venture Group Independent Technical Report for the OJVG Golouma Gold Project, Sénégal Page xvi
NMW_DM_TS /WB/MN OJVG Golouma Gold_2012_FS_Technical_Report_2CO003 008_NMW_DM_TS_GA_DGP_20130315_1 March 15, 2013
Table vii: Total Production Schedule – OJVG Gold Deposits
YEAR
Parameter Unit Total 1 2 3 4 5 6 7 8 9 10 11 12 13 14 15 16 17
TOTAL ALL DEPOSITS
Total soft waste Mt 40.6 4.6 5.0 1.6 7.2 5.2 3.1 4.5 4.6 0.1 2.2 2.2 0.0 0.0 0.0 0.0 0.0 0.0
Total hard waste Mt 143.9 1.1 3.7 11.0 4.4 5.4 6.2 6.4 12.8 15.8 15.7 16.5 21.9 7.5 5.7 6.0 3.5 0.2
Total Waste Mt 184.4 5.7 8.7 12.6 11.7 10.6 9.4 11.0 17.5 15.9 17.9 18.7 21.9 7.5 5.7 6.0 3.5 0.2
ROM soft ore Mt 6.8 0.2 0.3 0.1 1.4 1.7 1.4 1.1 0.1 0.3 0.1 0.1 0.0 0.0 0.0 0.0 0.0 0.0
Gold grade soft ore g/t Au 1.53 2.81 1.70 2.50 1.22 1.42 1.63 1.67 1.63 1.67 0.90 1.06 0.91 0.00 0.00 0.00 0.00 0.00
ROM hard ore Mt 21.9 0.1 1.0 1.6 0.9 0.8 1.0 1.1 1.8 1.7 1.6 1.6 1.7 1.7 1.7 1.7 1.7 0.2
Gold grade hard ore g/t Au 2.90 4.22 3.89 2.88 3.51 3.86 3.78 3.48 2.71 3.09 2.74 2.28 2.12 2.60 2.76 2.88 2.52 3.29
Soft ore ounces mined oz Au 337 20 15 9 56 77 74 59 6 14 4 3 0 0 0 0 0 0
Hard ore ounces mined oz Au 2041 17 123 153 107 98 118 118 158 169 144 119 119 141 147 153 134 23
Total ore mined Mt 28.7 0.3 1.3 1.8 2.4 2.5 2.4 2.2 1.9 2.0 1.8 1.7 1.7 1.7 1.7 1.7 1.7 0.2
Total mined grade Au g/t 2.57 3.32 3.40 2.86 2.14 2.19 2.50 2.56 2.65 2.90 2.60 2.22 2.12 2.60 2.76 2.88 2.52 3.29
Total mined ounces oz Au 2,378 37 138 162 163 175 192 177 163 183 148 122 119 141 147 153 134 23
2CO003.008 – Oromin Joint Venture Group Independent Technical Report for the OJVG Golouma Gold Project, Sénégal Page xvii
NMW_DM_TS /WB/MN OJVG Golouma Gold_2012_FS_Technical_Report_2CO003 008_NMW_DM_TS_GA_DGP_20130315_1 March 15, 2013
Waste Management
Waste rock from the various open pits at the OJVG Gold Project will be deposited in engineered
dumps adjacent to each of the deposits as well as into previously mined-out pits. Tailings from the
process plant are proposed to be delivered to a TMF due east of the proposed plant location and
contained within the same valley. In order to contain the 29 Mt of tailings, staged earthen dams will
be constructed. Dam construction material will be sourced from local borrow sources.
Mineral Processing
The process plant and associated service facilities was designed to process run of mine (“ROM”)
ore delivered to the primary crusher, to produce doré bars and tailings. The process encompasses
crushing and grinding of the ROM ore, carbon in leach (CIL) cyanidation and adsorption, carbon
stripping, electro-winning and smelting to produce gold bars that are then shipped to a refinery for
further processing. The CIL tailings will be thickened before placement in the tailings management
facility (TMF) to conserve water.
The key criteria selected for the plant design are:
Treatment of an average 4711 dry metric tonnes per day (t/d) for 365 days per year, after
allowance for availability whilst treating 100% primary hard (un-weathered) ore;
Treatment of an average 7669 t/d for 365 days per year, after allowance for availability whilst
treating weak weathered ore, or a blend of weak and hard ore containing no more that 43%
hard ore;
Design availability of 91.3%, being 7,998 operating hours per year, with standby equipment in
critical areas,
Sufficient plant design flexibility for treatment of all ore types as per test work completed at
design throughput.
The soft (weathered) ore treatment rate is higher than the primary hard ore treatment rate due to the
ore being significantly less competent and therefore requiring less power in the grinding circuit.
The 2010 Metallurgical test work on the Masato and Golouma West oxidized lithologies (SPVO and
OXAL) returned gold extractions ranging from 93.5 – 96.9%.
Environmental Considerations
The Sabodala area has no readily accessible water supply and, therefore, a water reservoir is
proposed to capture enough wet season runoff for the plant to operate year round. The reservoir is
proposed to be constructed 3 km north-east of the village of Mamakono (9 km from the processing
plant) with a designed capacity to contain 9.3 Mm3 of water.
Data collected to further characterize the physical and biological environments of the study area
suggest there are no environmental impacts significant enough to jeopardize OJVG‟s ability to
ultimately secure regulatory approvals to proceed with the development. This position is also
supported by the feedback received to date from the community consultations. All potential
environmental and social impacts foreseen with this project can be addressed to international
standards.
Analytical results received to date suggest any metal leaching and/or acid generation from the waste
rock dumps, pit walls and potential pit lakes will be minimal and easily mitigated throughout the
operating, closure and post closure phases of the project.
2CO003.008 – Oromin Joint Venture Group Independent Technical Report for the OJVG Golouma Gold Project, Sénégal Page xviii
NMW_DM_TS /WB/MN OJVG Golouma Gold_2012_FS_Technical_Report_2CO003 008_NMW_DM_TS_GA_DGP_20130315_1 March 15, 2013
Permitting Considerations
OJVG has received approval for its 2010 Feasibility Study project plan and ESIA through Attestation
of Conformance, as issued by the Government of Senegal on May 24th, 2012.
OJVG is proposing an updated mine plan and feasibility study in order to capture the larger
resource. The proposed changes have resulted in amendments to the mine plan that was approved
in the ESIA.
Senegal does not have a formal mechanism for amending the Certificate of Conformance, but a new
ESIA will most likely not be required for the proposed amendments to the mine plan. OJVG has a
comprehensive and approved ESIA for the site that was based on extensive baseline work,
assessment and development of thorough management and monitoring plans.
Economics
Economic analysis was undertaken using standard Discounted Cash Flow modelling using an
annual periods and a discount rate of 5%. Modelling was undertaken in Real Q1 2103 USD. The
summary results of the modelling are shown in Table viii
Table viii: Economic Summary
Gold Price ($/oz)
Parameter Unit $1,350 $1,550 $1,750
Off-site cost $/oz $7.00 $7.00 $7.00
Royalty @ 3% of NSR $/oz $40.34 $46.29 $52.29
Net gold price $/oz $1,304 $1,497 $1,691
Ore mined (LOM - UG and OP) Mt 28.0 28.0 28.0
Average ROM grade g/t Au 2.59 2.59 2.59
Average process recovery % 90.8% 90.8% 90.8%
Gold produced M. oz. 2,119 2,119 2,119
Unit operating cost per tonne milled $/t milled $49.44 $49.44 $49.44
Unit operating cost per oz $/oz Au $654 $654 $654
Pre-production capital cost $M 297.1 297.1 297.1
Total capital cost (Life of mine) $M 504.7 504.7 504.7
Pre-tax NPV0% $M 854 1261 1672
Pre-tax NPV5% $M 476 740 1007
Pre-tax IRR % 23.9% 31.3% 38.2%
Pre-tax payback period Months from start Prod. 29 23 18
Post-tax NPV0% $M 652 961 1274
Post-tax NPV5% $M 353 558 765
Post-tax IRR % 20.7% 27.7% 34.3%
Post-tax payback period Months from start Prod. 30 23 18
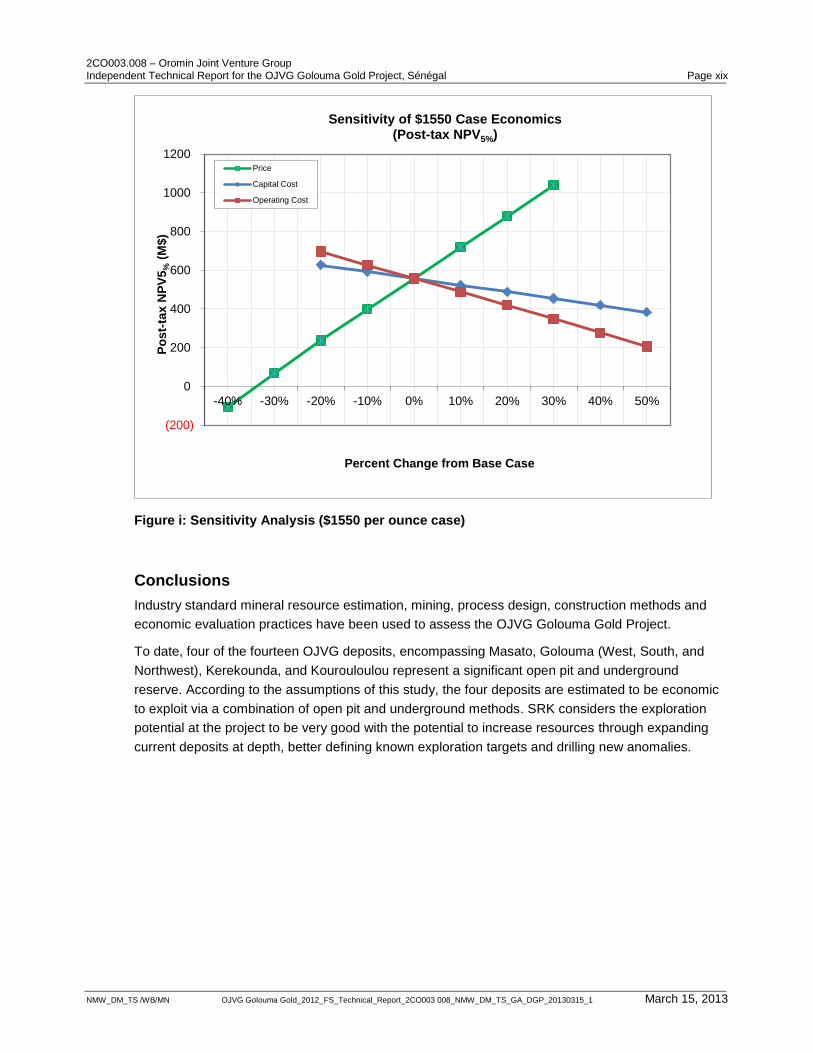
The project presents a robust economic value proposition at these evaluation prices. Sensitivity
analysis of NPV to price and costing assumptions (using the $1550/oz evaluation case) is
summarised in Figure xx
2CO003.008 – Oromin Joint Venture Group Independent Technical Report for the OJVG Golouma Gold Project, Sénégal Page xix
NMW_DM_TS /WB/MN OJVG Golouma Gold_2012_FS_Technical_Report_2CO003 008_NMW_DM_TS_GA_DGP_20130315_1 March 15, 2013
Figure i: Sensitivity Analysis ($1550 per ounce case)
Conclusions
Industry standard mineral resource estimation, mining, process design, construction methods and
economic evaluation practices have been used to assess the OJVG Golouma Gold Project.
To date, four of the fourteen OJVG deposits, encompassing Masato, Golouma (West, South, and
Northwest), Kerekounda, and Kourouloulou represent a significant open pit and underground
reserve. According to the assumptions of this study, the four deposits are estimated to be economic
to exploit via a combination of open pit and underground methods. SRK considers the exploration
potential at the project to be very good with the potential to increase resources through expanding
current deposits at depth, better defining known exploration targets and drilling new anomalies.
(200)
0
200
400
600
800
1000
1200
-40% -30% -20% -10% 0% 10% 20% 30% 40% 50%
Po
st-
tax
NP
V5
% (
M$
)
Percent Change from Base Case
Sensitivity of $1550 Case Economics (Post-tax NPV5%)
Price
Capital Cost
Operating Cost
2CO003.008 – Oromin Joint Venture Group Independent Technical Report for the OJVG Golouma Gold Project, Sénégal Page xx
NMW_DM_TS /WB/MN OJVG Golouma Gold_2012_FS_Technical_Report_2CO003 008_NMW_DM_TS_GA_DGP_20130315_1 March 15, 2013
Table of Contents
Important Notice ................................................................................................................ ii
Copyright ........................................................................................................................... ii
Executive Summary ......................................................................................................... iii
Table of Contents ............................................................................................................ xx
List of Tables ................................................................................................................ xxix
List of Figures ............................................................................................................. xxxiii
1 Introduction and Terms of Reference ........................................................................ 1 1.1 Scope of Work ................................................................................................................. 2 1.2 Work Program.................................................................................................................. 2 1.3 Basis of Technical Report ................................................................................................ 2 1.4 Qualifications of SRK ....................................................................................................... 3 1.5 Site Visit........................................................................................................................... 3 1.6 Acknowledgement ........................................................................................................... 3 1.7 Declaration ...................................................................................................................... 3
2 Reliance on Other Experts .......................................................................................... 4
3 Property Description and Location ............................................................................ 5
4 Accessibility, Climate, Local Resources, Infrastructure and Physiography ........ 10
5 History ........................................................................................................................ 13 5.1 Exploration ..................................................................................................................... 13 5.2 OJVG Ownership ........................................................................................................... 15 5.3 2010 Feasibility Study and Subsequent 2010 Milestone Activities ................................. 15 5.4 2011 Milestone Activities ............................................................................................... 16 5.5 Production History ......................................................................................................... 17
6 Geological Setting and Mineralization ..................................................................... 18 6.1 Regional Geology .......................................................................................................... 18
6.1.1 The Kédougou-Kéniéba Inlier (KKI) ................................................................................... 19 6.1.2 Regional Geological Structure ........................................................................................... 19
6.2 Geology of the OJVG Golouma Concession .................................................................. 23 6.2.1 Geological Mapping ........................................................................................................... 23 6.2.2 Distribution of Major Lithologies ......................................................................................... 23 6.2.3 Structural Geology ............................................................................................................. 24 6.2.4 Residual Soils .................................................................................................................... 25
6.3 Geology of the OJVG Golouma Concession Mineral Deposits ....................................... 27 6.3.1 Masato ............................................................................................................................... 28 6.3.2 Golouma West, Golouma South, Golouma Northwest, and Kourouloulou ........................ 28 6.3.3 Kerekounda ........................................................................................................................ 29 6.3.4 Niakafiri Southeast and Niakafiri Southwest ...................................................................... 29 6.3.5 Maki Medina ....................................................................................................................... 30 6.3.6 Kobokoto ............................................................................................................................ 30 6.3.7 Mamasato .......................................................................................................................... 30 6.3.8 Koulouqwinde .................................................................................................................... 30 6.3.9 Sekoto ................................................................................................................................ 31 6.3.10 Kinemba ............................................................................................................................. 31 6.3.11 Koutouniokolla ................................................................................................................... 31 6.3.12 Kouroundi ........................................................................................................................... 31
2CO003.008 – Oromin Joint Venture Group Independent Technical Report for the OJVG Golouma Gold Project, Sénégal Page xxi
NMW_DM_TS /WB/MN OJVG Golouma Gold_2012_FS_Technical_Report_2CO003 008_NMW_DM_TS_GA_DGP_20130315_1 March 15, 2013
6.4 Mineralization ................................................................................................................ 34 6.4.1 Masato Type Deposits ....................................................................................................... 34 6.4.2 Golouma Type Deposits .................................................................................................... 36
7 Deposit Types ............................................................................................................ 41
8 Exploration ................................................................................................................. 42 8.1 2005-2006 Exploration ................................................................................................... 42 8.2 2007-2008 Exploration ................................................................................................... 43 8.3 2009 Exploration ............................................................................................................ 44 8.4 2010 Exploration ............................................................................................................ 45 8.5 2011 Exploration ............................................................................................................ 45
8.5.1 Masato ............................................................................................................................... 45 8.5.2 Golouma West ................................................................................................................... 46 8.5.3 Golouma South .................................................................................................................. 46 8.5.4 Golouma Northwest ........................................................................................................... 46 8.5.5 Kerekounda ........................................................................................................................ 47 8.5.6 Niakafiri Southeast & Niakafiri Southwest ......................................................................... 47 8.5.7 Kourouloulou ...................................................................................................................... 47 8.5.8 Saboraya ............................................................................................................................ 48 8.5.9 Kobokoto ............................................................................................................................ 48 8.5.10 Mamasato .......................................................................................................................... 48 8.5.11 Sekoto ................................................................................................................................ 48 8.5.12 Kinemba ............................................................................................................................. 49 8.5.13 Koutouniokolla ................................................................................................................... 49 8.5.14 Kouroundi ........................................................................................................................... 50 8.5.15 Sabodala North .................................................................................................................. 50 8.5.16 Goumbati West .................................................................................................................. 50 8.5.17 Torosita .............................................................................................................................. 50
8.6 2012 Exploration ............................................................................................................ 50 8.7 Exploration Summary ..................................................................................................... 51
9 Drilling ........................................................................................................................ 56 9.1 Reverse Circulation Drilling ............................................................................................ 59
9.1.1 2006 RC Drill Program ....................................................................................................... 60 9.1.2 2007 RC Drill Program ....................................................................................................... 60 9.1.3 2008 RC Drill Program ....................................................................................................... 60 9.1.4 2009 RC Drill Program ....................................................................................................... 60 9.1.5 2010 RC Drill Program ....................................................................................................... 60 9.1.6 2011 RC Drill Program ....................................................................................................... 61 9.1.7 RC Drill Summary 2006-2011 ............................................................................................ 61
9.2 Diamond Core Drilling .................................................................................................... 62 9.2.1 2006 Core Drilling .............................................................................................................. 63 9.2.2 2007 Core Drilling .............................................................................................................. 63 9.2.3 2008 Core Drilling .............................................................................................................. 63 9.2.4 2009 Core Drilling .............................................................................................................. 63 9.2.5 2010 Core Drilling .............................................................................................................. 64 9.2.6 2011 Core Drilling .............................................................................................................. 64 9.2.7 Core Drill Summary ............................................................................................................ 64
10 Sample Preparation, Analyses, and Security .......................................................... 66 10.1 Sample Preparation ....................................................................................................... 66
10.1.1 Core Sampling ................................................................................................................... 66 10.2 Reverse Circulation Drill Sampling ................................................................................. 66 10.3 Onsite Preparation ......................................................................................................... 67 10.4 Shipment and Storage of Samples ................................................................................. 67 10.5 Chain of Custody ........................................................................................................... 67
2CO003.008 – Oromin Joint Venture Group Independent Technical Report for the OJVG Golouma Gold Project, Sénégal Page xxii
NMW_DM_TS /WB/MN OJVG Golouma Gold_2012_FS_Technical_Report_2CO003 008_NMW_DM_TS_GA_DGP_20130315_1 March 15, 2013
10.6 Gold Analysis ................................................................................................................. 68 10.7 Bulk Density Data .......................................................................................................... 68 10.8 OJVG Quality Assurance and Quality Control Programs ................................................ 68
10.8.1 Blanks ................................................................................................................................ 69 10.8.2 Duplicate Samples ............................................................................................................. 69 10.8.3 Standard Reference Material Samples (SRMs) ................................................................ 70
10.9 Record Keeping for Traceability ..................................................................................... 71 10.10 Data Storage and Security ............................................................................................. 71
10.10.1 Paper Data ......................................................................................................................... 71 10.10.2 Computer Data ................................................................................................................... 72
10.11 Conclusion ..................................................................................................................... 72
11 Data Verification ........................................................................................................ 73 11.1 Verification of OJVG Database from Assay Certificates ................................................. 73 11.2 Independent Check Assays ........................................................................................... 73 11.3 Verification of Drill Hole Positions .................................................................................. 75 11.4 Performance of Quality Assurance and Quality Control Samples ................................... 77
11.4.1 Data.................................................................................................................................... 77 11.4.2 Performance of Field Blanks .............................................................................................. 77 11.4.3 Performance of Duplicate Samples ................................................................................... 78 11.4.4 Performance of Standard Reference Material (SRM) ........................................................ 81
12 Mineral Processing and Metallurgical Testing ........................................................ 82 12.1 Mineral Processing ........................................................................................................ 82
12.1.1 Introduction ........................................................................................................................ 82 12.1.2 Process Plant Design Basis ............................................................................................... 82 12.1.3 Throughput and Availability ............................................................................................... 82 12.1.4 Processing Strategy ........................................................................................................... 83
12.2 Flowsheet Development and Equipment Sizing ............................................................. 85 12.2.1 Unit Process Selection ....................................................................................................... 87 12.2.2 Comminution Circuit Sizing ................................................................................................ 87 12.2.3 Comminution Design Criteria ............................................................................................. 87 12.2.4 Gold Leaching and Adsorption Circuit Sizing .................................................................... 91 12.2.5 Carbon Desorption and Electro-winning ............................................................................ 92 12.2.6 Tailings Disposal Circuit Sizing .......................................................................................... 92
12.3 Process Description ....................................................................................................... 92 12.3.1 Primary Crushing ............................................................................................................... 93 12.3.2 Reclaim and Grinding ........................................................................................................ 93 12.3.3 Carbon-in-Leach (CIL) ....................................................................................................... 94 12.3.4 Acid Washing ..................................................................................................................... 94 12.3.5 Elution ................................................................................................................................ 95 12.3.6 Carbon Regeneration......................................................................................................... 95 12.3.7 Electro-winning and Refining ............................................................................................. 96 12.3.8 Tailings Thickening ............................................................................................................ 96 12.3.9 Plant Water Services ......................................................................................................... 96 12.3.10 Reagents and Consumables ............................................................................................. 96 12.3.11 Air Services ........................................................................................................................ 98 12.3.12 Water Services ................................................................................................................... 98
12.4 Recoverability ................................................................................................................ 99 12.4.1 Leaching and Adsorption Circuit Model ............................................................................. 99
12.5 Review of the 2008 Metallurgical Test Work ................................................................ 102 12.6 Review of the 2009 Metallurgical Test Work ................................................................ 102
12.6.1 Sample Selection ............................................................................................................. 103 12.6.2 Gravity and Cyanidation Test Work ................................................................................. 103 Gravity Concentration Testing ......................................................................................................... 104 Cyanidation of the Gravity Tailings ................................................................................................. 104
2CO003.008 – Oromin Joint Venture Group Independent Technical Report for the OJVG Golouma Gold Project, Sénégal Page xxiii
NMW_DM_TS /WB/MN OJVG Golouma Gold_2012_FS_Technical_Report_2CO003 008_NMW_DM_TS_GA_DGP_20130315_1 March 15, 2013
12.6.3 Dawson Metallurgical Laboratories – Column Leach Tests ............................................ 110 12.6.4 Dawson Metallurgical Laboratories – Grinding Tests ...................................................... 111 12.6.5 Pocock Industrial, Inc. – Filtration and Settling Tests ...................................................... 115
12.7 Summary of the 2010 Metallurgical Test Work ............................................................. 116 12.7.1 Sample Selection ............................................................................................................. 116 12.7.2 Comminution Test Work .................................................................................................. 118 12.7.3 Gravity and Cyanidation Test Work ................................................................................. 119
12.8 Metallurgical Test Work Analysis and Conclusions ...................................................... 125 12.8.1 Comminution Test Work Conclusions .............................................................................. 125 12.8.2 Cyanide Leach and Gravity Test Work Conclusions ....................................................... 125 12.8.3 Settling and Rheology Test Work Conclusions ............................................................... 129 12.8.4 Column Cyanide Leach Tests .......................................................................................... 129 12.8.5 Summary .......................................................................................................................... 129
13 Mineral Resource Estimates ................................................................................... 130 13.1 Introduction .................................................................................................................. 130 13.2 Resource Database ..................................................................................................... 130
13.2.1 Assay Data ....................................................................................................................... 131 13.2.2 Bulk Density Data ............................................................................................................ 133
13.3 Geological Models and Domains ................................................................................. 133 13.3.1 Masato ............................................................................................................................. 133 13.3.2 Golouma Deposits ........................................................................................................... 134 13.3.3 Kerekounda ...................................................................................................................... 138 13.3.4 Niakafiri Southeast ........................................................................................................... 140 13.3.5 Kourouloulou .................................................................................................................... 141 13.3.6 Niakafiri Southwest .......................................................................................................... 142 13.3.7 Maki Medina ..................................................................................................................... 143 13.3.8 Kobokoto .......................................................................................................................... 144 13.3.9 Mamasato ........................................................................................................................ 145 13.3.10 Koulouqwinde .................................................................................................................. 146 13.3.11 Sekoto .............................................................................................................................. 147 13.3.12 Kinemba ........................................................................................................................... 148 13.3.13 Koutouniokolla ................................................................................................................. 149 13.3.14 Kouroundi ......................................................................................................................... 150
13.4 Evaluation of Extreme Assay Values ........................................................................... 151 13.5 Statistical Analysis ....................................................................................................... 153
13.5.1 Masato ............................................................................................................................. 153 13.5.2 Golouma West ................................................................................................................. 153
13.6 Variography ................................................................................................................. 155 13.6.1 Masato ............................................................................................................................. 155 13.6.2 Golouma West ................................................................................................................. 155 13.6.3 Golouma South ................................................................................................................ 156 13.6.4 Golouma Northwest ......................................................................................................... 156 13.6.5 Kerekounda ...................................................................................................................... 156 13.6.6 Niakafiri Southeast ........................................................................................................... 157 13.6.7 Niakafiri Southwest .......................................................................................................... 157 13.6.8 Maki Medina ..................................................................................................................... 157 13.6.9 Kourouloulou .................................................................................................................... 157 13.6.10 Kobokoto .......................................................................................................................... 157 13.6.11 Mamasato ........................................................................................................................ 157 13.6.12 Koulouqwinde .................................................................................................................. 157 13.6.13 Sekoto .............................................................................................................................. 157 13.6.14 Kinemba ........................................................................................................................... 158 13.6.15 Koutouniokolla ................................................................................................................. 158 13.6.16 Kouroundi ......................................................................................................................... 158
13.7 Block Model Setup ....................................................................................................... 158
2CO003.008 – Oromin Joint Venture Group Independent Technical Report for the OJVG Golouma Gold Project, Sénégal Page xxiv
NMW_DM_TS /WB/MN OJVG Golouma Gold_2012_FS_Technical_Report_2CO003 008_NMW_DM_TS_GA_DGP_20130315_1 March 15, 2013
13.8 Bulk Density Models .................................................................................................... 160 13.9 Block Model Resource Estimation................................................................................ 162
13.9.1 Masato ............................................................................................................................. 162 13.9.2 Golouma West ................................................................................................................. 162 13.9.3 Golouma South ................................................................................................................ 163 13.9.4 Golouma Northwest ......................................................................................................... 163 13.9.5 Kerekounda ...................................................................................................................... 163 13.9.6 Niakafiri Southeast ........................................................................................................... 163 13.9.7 Niakafiri Southwest .......................................................................................................... 163 13.9.8 Maki Medina ..................................................................................................................... 164 13.9.9 Kourouloulou .................................................................................................................... 164 13.9.10 Kobokoto .......................................................................................................................... 164 13.9.11 Mamasato ........................................................................................................................ 164 13.9.12 Koulouqwinde .................................................................................................................. 165 13.9.13 Sekoto .............................................................................................................................. 165 13.9.14 Kinemba ........................................................................................................................... 165 13.9.15 Koutouniokolla ................................................................................................................. 165 13.9.16 Kouroundi ......................................................................................................................... 165
13.10 Block Model Grade Validation ...................................................................................... 165 13.10.1 Golouma .......................................................................................................................... 166 13.10.2 Masato ............................................................................................................................. 167 13.10.3 Validation Summary ......................................................................................................... 168
13.11 Mineral Resource Classification ................................................................................... 168 13.12 Sensitivity of the Block Model to Selection of Cut-off Grade ......................................... 169 13.13 Mineral Resource Statement ........................................................................................ 171
14 Mineral Reserve Estimates ..................................................................................... 175 14.1 Mineral Reserves Summary ......................................................................................... 175 14.2 Geotechnical and Hydrogeological Characterization .................................................... 176
14.2.1 Structural Geology for Geotechnical Risk ........................................................................ 176 14.2.2 Hydrogeological Assessment for Geotechnical Stability and Inflow ................................ 177 14.2.3 Geotechnical Assessment for Slope Design ................................................................... 180 14.2.4 Underground Rock Mass Evaluation ............................................................................... 188 14.2.5 Excavation Design Parameters ....................................................................................... 189
15 Mining Methods ....................................................................................................... 193 15.1 Open Pit Mining ........................................................................................................... 193
15.1.1 Open Pit Mine Plan Parameters ...................................................................................... 193 15.1.2 Open Pit Mine Plan and Schedule ................................................................................... 194 15.1.3 Open Pit Mine Sequence/Phasing ................................................................................... 203
15.2 Underground Mine Schedule ....................................................................................... 205 15.2.1 Underground Mining Context ........................................................................................... 206 15.2.2 Underground Mining Method Selection and Description ................................................. 208 15.2.3 Mine Design ..................................................................................................................... 211 15.2.4 Stoping ............................................................................................................................. 215 15.2.5 Dilution ............................................................................................................................. 215 15.2.6 Mining Recovery .............................................................................................................. 215 15.2.7 Unit Mining Operations .................................................................................................... 215 15.2.8 UG Mine Schedule ........................................................................................................... 218 15.2.9 Sequence ......................................................................................................................... 218 15.2.10 UG Mine Infrastructure and Ancillary Services ................................................................ 229 15.2.11 UG Mine Development..................................................................................................... 243 15.2.12 UG Mine Mobile Equipment ............................................................................................. 243 15.2.13 UG Mine Infrastructure..................................................................................................... 244
15.3 Combined Mine Schedule ............................................................................................ 245
16 Recovery Methods ................................................................................................... 251
2CO003.008 – Oromin Joint Venture Group Independent Technical Report for the OJVG Golouma Gold Project, Sénégal Page xxv
NMW_DM_TS /WB/MN OJVG Golouma Gold_2012_FS_Technical_Report_2CO003 008_NMW_DM_TS_GA_DGP_20130315_1 March 15, 2013
17 Project Infrastructure .............................................................................................. 252 17.1 Power Supply .............................................................................................................. 252 17.2 Fuel and Lube Storage ................................................................................................ 252 17.3 Fire Protection ............................................................................................................. 252 17.4 Water Supply and Treatment ....................................................................................... 253 17.5 Sewage Treatment ...................................................................................................... 253 17.6 Site Drainage ............................................................................................................... 253 17.7 In-Plant Roads ............................................................................................................. 254 17.8 Communication ............................................................................................................ 254 17.9 Security........................................................................................................................ 254 17.10 Airfield 254 17.11 Site Buildings ............................................................................................................... 254 17.12 Site Roads ................................................................................................................... 256 17.13 Water Reservoir ........................................................................................................... 257 17.14 Tailings Management Facility ....................................................................................... 258
18 Market Studies and Contracts ................................................................................ 261 18.1 Market Studies ............................................................................................................. 261 18.2 Pricing 261 18.3 Contracts ..................................................................................................................... 261
19 Environmental Studies, Permitting, and Social or Community Impact .............. 262 19.1 Introduction .................................................................................................................. 262 19.2 Current Permitting Status ............................................................................................. 262 19.3 ESIA Baseline and Modelling Summary ....................................................................... 262
19.3.1 Physical Context .............................................................................................................. 262 19.3.2 Biological Context ............................................................................................................ 264 19.3.3 Social Context .................................................................................................................. 265
19.4 Approved ESIA Management Plan............................................................................... 266 19.5 Current Monitoring and Management Activities ............................................................ 268 19.6 Proposed Design Changes .......................................................................................... 268
19.6.1 Pit, Waste Pile and Tailings Management Facility Extensions ........................................ 268 19.6.2 ESIA Amendment Process .............................................................................................. 268 19.6.3 Additional Permitting and Approval Requirements .......................................................... 270
19.7 Summary Conclusions ................................................................................................. 270
20 Capital and Operating Costs .................................................................................. 272 20.1 Open Pit Mine Capital Expenses (CAPEX) .................................................................. 272
20.1.1 Open Pit Mobile Equipment ............................................................................................. 272 20.1.2 Water Control ................................................................................................................... 274 20.1.3 Open Pit Development ..................................................................................................... 274
20.2 Open Pit Mine Operating Expenses (OPEX) ................................................................ 275 20.2.1 Open Pit Mine .................................................................................................................. 275
20.3 Underground Mine CAPEX .......................................................................................... 276 20.3.1 UG Mine Development..................................................................................................... 278 20.3.2 UG Mine Mobile Equipment ............................................................................................. 278 20.3.3 UG Mine Infrastructure..................................................................................................... 279
20.4 Underground Mine OPEX ............................................................................................ 279 20.4.1 Secondary Development ................................................................................................. 280 20.4.2 Cut and Fill Stoping .......................................................................................................... 280 20.4.3 Haulage ............................................................................................................................ 280 20.4.4 Ancillary Equipment ......................................................................................................... 281 20.4.5 Electricity .......................................................................................................................... 281 20.4.6 Labour .............................................................................................................................. 281 20.4.7 Mine Dewatering .............................................................................................................. 281
2CO003.008 – Oromin Joint Venture Group Independent Technical Report for the OJVG Golouma Gold Project, Sénégal Page xxvi
NMW_DM_TS /WB/MN OJVG Golouma Gold_2012_FS_Technical_Report_2CO003 008_NMW_DM_TS_GA_DGP_20130315_1 March 15, 2013
20.4.8 Mine Miscellaneous Costs ............................................................................................... 281 20.5 Plant and Infrastructure Capital Cost Estimate (CAPEX) ............................................. 281
Estimate Contributors ...................................................................................................................... 282 Estimate Organisation ..................................................................................................................... 283 Scope of Estimate ........................................................................................................................... 283 Estimating Design Allowances ........................................................................................................ 284 Direct Cost Development ................................................................................................................ 286 General Cost Development ............................................................................................................. 290 Indirect Cost Development .............................................................................................................. 292 20.5.1 Escalation ........................................................................................................................ 293 20.5.2 Owner‟s Costs .................................................................................................................. 293 20.5.3 Taxes and Duties ............................................................................................................. 293 20.5.4 Contingency ..................................................................................................................... 293
20.6 Process Plant Operating Cost Estimate (OPEX) .......................................................... 293 20.6.1 Basis of Process and G&A Operating Cost Estimate ...................................................... 294 20.6.2 Plant Operating Cost Estimate Inclusions ....................................................................... 296
21 Economic Analysis .................................................................................................. 306 21.1 Summary ..................................................................................................................... 306 21.2 Modelling Practice ....................................................................................................... 306 21.3 Construction Schedule ................................................................................................. 307 21.4 Production Schedule .................................................................................................... 307 21.5 Commodity Pricing ....................................................................................................... 310 21.6 Capital Costs ............................................................................................................... 310 21.7 Operating Costs ........................................................................................................... 311 21.8 Taxes and Royalties .................................................................................................... 312
21.8.1 Government Royalty ........................................................................................................ 312 21.8.2 Corporate Income Tax ..................................................................................................... 312 21.8.3 Customs Duties ................................................................................................................ 312 21.8.4 Value Added Tax ............................................................................................................. 313 21.8.5 Withholding Tax ............................................................................................................... 313
21.9 Working Capital ........................................................................................................... 313 21.10 Life-of-Mine summary Cashflows ................................................................................. 313 21.11 Sensitivities .................................................................................................................. 322 21.12 Payback Period ............................................................................................................ 325
22 Adjacent Properties ................................................................................................. 326 22.2 Randgold Resources Ltd. ............................................................................................ 330
23 Other Relevant Data and Information .................................................................... 331
24 Interpretation and Conclusions.............................................................................. 332 24.1 Conclusions ................................................................................................................. 332 24.2 Upside Risks ................................................................................................................ 332 24.3 Downside Risks ........................................................................................................... 332
25 Recommendations .................................................................................................. 334 25.1 Project Mining and Processing Strategy....................................................................... 334 25.2 Exploration ................................................................................................................... 334 25.3 Hydrogeology .............................................................................................................. 334 25.4 Metallurgical and Mineral Processing Recommendations ............................................ 335
25.4.1 Further Comminution Test Work ...................................................................................... 335 25.4.2 General Plant Design Test Work ..................................................................................... 335 25.4.3 Mill Power ........................................................................................................................ 335
25.5 General ........................................................................................................................ 335
26 Acronyms and Abbreviations ................................................................................. 336

2CO003.008 – Oromin Joint Venture Group Independent Technical Report for the OJVG Golouma Gold Project, Sénégal Page xxvii
NMW_DM_TS /WB/MN OJVG Golouma Gold_2012_FS_Technical_Report_2CO003 008_NMW_DM_TS_GA_DGP_20130315_1 March 15, 2013
27 References ............................................................................................................... 337
28 Date and Signature Page ........................................................................................ 339
2CO003.008 – Oromin Joint Venture Group Independent Technical Report for the OJVG Golouma Gold Project, Sénégal Page xxviii
NMW_DM_TS /WB/MN OJVG Golouma Gold_2012_FS_Technical_Report_2CO003 008_NMW_DM_TS_GA_DGP_20130315_1 March 15, 2013
Appendix A – Mineral Deposit Geology
Appendix B – Drilling by Deposit
Appendix C - Performance of Standard Reference Material (SRM)
Appendix D – Process Design Criteria
Appendix E – Resource Solid Block Codes
Appendix F - Extreme Assays and Capping
Appendix G - Statistical Analysis
Appendix H – Variography
Appendix I – Block Model Resource Estimation Parameters
Appendix J – Block Model Grade Validation
Appendix K – Sensitivity of Block Model to Cut-off Grade
Appendix L – Open Pit Configuration Status (End of Period)
Appendix M – Mill Area General Arrangement Drawings
2CO003.008 – Oromin Joint Venture Group Independent Technical Report for the OJVG Golouma Gold Project, Sénégal Page xxix
NMW_DM_TS /WB/MN OJVG Golouma Gold_2012_FS_Technical_Report_2CO003 008_NMW_DM_TS_GA_DGP_20130315_1 March 15, 2013
List of Tables
Table 1.1: Qualified Persons and Areas of Responsibility ................................................................................. 1
Table 3.1: Property Coordinates, OJVG Exploration Concession corners ......................................................... 5
Table 9.1: RC Drill Summary 2006 – 2011 ....................................................................................................... 61
Table 9.2: Total Diamond Drilling 2006 – 2011 ................................................................................................ 65
Table 10.1: CDN Laboratory Standard Reference Material used at the OJVG Gold Project ........................... 71
Table 11.1: Results of SRK Check Assay Sampling and Analysis Program .................................................... 74
Table 11.2: Verification of Selected Drill Hole Positions ............................................................................ 76
Table 11.3: QA/QC Sample Summary ............................................................................................................. 77
Table 12.1: Key Process Design Criteria Summary ......................................................................................... 84
Table 12.2: Ore Deposit Resource Tonnage Ratio .......................................................................................... 88
Table 12.3: Primary Ore Comminution Parameters ......................................................................................... 88
Table 12.4: Oxide/Weak Ore Comminution Parameters .................................................................................. 88
Table 12.5: Grinding Mill Design Criteria .......................................................................................................... 89
Table 12.6: Leaching and Adsorption Design Criteria ...................................................................................... 91
Table 12.7: Summary of Major Ore Lithology Gold Extractions ....................................................................... 99
Table 12.8: Metallurgical Test work Reports Reviewed ................................................................................. 101
Table 12.9: Chemical Composition of the Composite Samples ..................................................................... 103
Table 12.10: Summary of G&T Metallurgical Data ......................................................................................... 103
Table 12.11: Gravity Concentration Test Results ........................................................................................... 104
Table 12.12: Summary of Gravity Concentration plus Cyanide Leaching .............................................. 105
Table 12.13: Large Scale Test Results ....................................................................................................... 106
Table 12.14: Variability Test Results .......................................................................................................... 107
Table 12.15: Chemical Composition of the Samples ..................................................................................... 110
Table 12.16: Samples Used for SAG Mill Design Testing .............................................................................. 111
Table 12.17: Summary of Data from the DML Grindability Tests ................................................................... 112
Table 12.18: Summary of SAG Mill Grinding Circuit Evaluation by Starkey and Associates ......................... 114
Table 12.19: Summary of Pocock Thickening Recommendations .......................................................... 115
Table 12.20: Thickener Underflow Rheology Summary ........................................................................... 116
Table 12.21: Summary of UCS Test Work Results ........................................................................................ 118
Table 12.22: Summary of SMC Test Work Results ........................................................................................ 118
Table 12.23: Summary of Bond Index Determinations ................................................................................... 119
Table 12.24: Head Assay Summary ............................................................................................................... 119
Table 12.25: Summary of Grind Optimisation Tests ...................................................................................... 120
Table 12.26: Diagnostic Leach Test Summary .......................................................................................... 122
Table 12.27: Summary of Gravity Tests ......................................................................................................... 123
Table 12.28: Coarse Bottle Roll Test Summary ............................................................................................. 124
2CO003.008 – Oromin Joint Venture Group Independent Technical Report for the OJVG Golouma Gold Project, Sénégal Page xxx
NMW_DM_TS /WB/MN OJVG Golouma Gold_2012_FS_Technical_Report_2CO003 008_NMW_DM_TS_GA_DGP_20130315_1 March 15, 2013
Table 12.29: Inputs for the Optimum Grind Size Determination Study .......................................................... 126
Table 12.30: Summary of Metallurgical Data ................................................................................................. 128
Table 12.31: Summary of Major Gold Mineralized Lithology Gold Extractions .............................................. 128
Table 13.1: Drilling Statistics for the OJVG Project Area. .............................................................................. 132
Table 13.2: Number of Density Data in Each Deposit .................................................................................... 133
Table 13.3: Summary of impact of capping by rock type at Masato............................................................... 152
Table 13.4: Summary of impact of capping by rock type in at Golouma West ............................................... 152
Table 13.5: Variogram Models at Masato....................................................................................................... 155
Table 13.6: Correlogram Models in the Golouma West Mineralized Domains .............................................. 156
Table 13.7: Percent Block Model Extents for all Deposits ....................................................................... 159
Table 13.8: Average Bulk Density Values in Lower and Higher Density Domains within the Pit......... 160
Table 13.9: Bulk Density Estimation Parameters ...................................................................................... 161
Table 13.10: Classified Tonnes and Grade at Various Gold Cut-off Grades at Golouma (Golouma South, Golouma West, and Golouma Northwest Combined) ......................................................... 170
Table 13.11 Classified Tonnes and Grade at Various Gold Cut-off Grades at Masato ................................. 170
Table 13.12: Mineral Resource Statement, OJVG Gold Project, September 2012 ................................. 173
Table 14.1: Open Pit Mineral Reserve Estimate ............................................................................................ 175
Table 14.2: Underground Mineral Reserve Estimate ..................................................................................... 175
Table 14.3: Summary of Total Mineral Reserve Estimates ............................................................................ 176
Table 14.4: Hydraulic Parameters used in Groundwater Numerical Model ................................................... 178
Table 14.5: Estimates Inflows to Golouma Gold Project Pits and Underground Operations ......................... 179
Table 15.1: Open Pit Whittle Parameters and Cut-off Grade Calculation ...................................................... 194
Table 15.2: Open Pit Design .......................................................................................................................... 196
Table 15.3: Mining Equipment ........................................................................................................................ 202
Table 15.4: Pit Phase Tonnages and Grades ................................................................................................ 204
Table 15.5: Kerekounda UG Deposit Context ................................................................................................. 206
Table 15.6: Kourouloulou UG Deposit Context ............................................................................................... 207
Table 15.7: Golouma South UG Deposit Context ........................................................................................... 207
Table 15.8: Golouma West UG Deposit Context ............................................................................................ 208
Table 15.9: Golouma Gold Project Underground Development Dimensions ................................................. 212
Table 15.10: Summary of Backfill Types ........................................................................................................ 217
Table 15.11: Production Capacity of Golouma Gold Project Underground Mines by Deposit ....................... 218
Table 15.12: Golouma Gold Project Underground Production Schedule ....................................................... 221
Table 15.13: Golouma Gold Project Underground Development Schedule ................................................... 223
Table 15.14: Annual UG Manpower Estimate ................................................................................................ 225
Table 15.15: Mobile Equipment Requirements .............................................................................................. 227
Table 15.16: LHD Average Productivity Estimates ......................................................................................... 228
Table 15.17: Estimation of LHD Productivities ............................................................................................... 228
2CO003.008 – Oromin Joint Venture Group Independent Technical Report for the OJVG Golouma Gold Project, Sénégal Page xxxi
NMW_DM_TS /WB/MN OJVG Golouma Gold_2012_FS_Technical_Report_2CO003 008_NMW_DM_TS_GA_DGP_20130315_1 March 15, 2013
Table 15.18: Truck Requirements .................................................................................................................. 229
Table 15.19: Surface Substations for Underground Service .......................................................................... 230
Table 15.20: Underground Compressed Air Demand per Area ..................................................................... 231
Table 15.21: Main Ventilation Fan Summary ................................................................................................. 233
Table 15.22: Kerekounda Head Loss Calculations ........................................................................................ 234
Table 15.23: Kourouloulou Head Loss Calculations ...................................................................................... 235
Table 15.24: Goluma South 1 Head Loss Calculations .................................................................................. 236
Table 15.25: Goluma West 1 Head Loss Calculations ................................................................................... 237
Table 15.26: Goluma West 2 Head Loss Calculations ................................................................................... 238
Table 15.27: Goluma West 3 Head Loss Calculations ................................................................................... 239
Table 15.28: Open Pit Equipment Capital Cost Summary ............................................................................. 241
Table 15.29: UG Mine Capital Cost Estimate ................................................................................................. 242
Table 15.30: UG Capital Development End Types ........................................................................................ 243
Table 15.31: Capital Mobile Equipment.......................................................................................................... 243
Table 15.32: Open Pit Production Schedule – OJVG Deposits ..................................................................... 246
Table 15.33: Underground Production Schedule – OJVG Deposits .............................................................. 247
Table 15.34: Total Production Schedule – OJVG Deposits ........................................................................... 247
Table 17.1: Golouma Gold Project Road Design Criteria ............................................................................... 257
Table 19.1: Physical environment context for the proposed mine. ................................................................ 263
Table 19.2: Biological context for the proposed mine. ................................................................................... 264
Table 19.3: Social context for the proposed mine. ......................................................................................... 265
Table 19.4: Summary of impacts and significance from the ESIA for which management plans were developed. ...................................................................................................................................... 267
Table 20.1: Open Pit Equipment Capital Cost Summary ............................................................................... 273
Table 20.2: Open Pit Surface Water Control Capital Costs ........................................................................... 274
Table 20.3: Open Pit Dewatering Capital Costs ............................................................................................. 274
Table 20.4: Open Pit Operating Cost Estimate – by Function ........................................................................ 275
Table 20.5: UG Mine Capital Cost Estimate ................................................................................................... 277
Table 20.6: UG Capital Development End Types .......................................................................................... 278
Table 20.7: Capital Mobile Equipment ............................................................................................................ 278
Table 20.8: Underground Operating Cost Estimate Breakdown .................................................................... 279
Table 20.9: Secondary Development ............................................................................................................. 280
Table 20.10: Total Plant and Infrastructure Capital Cost Summary by Area ................................................. 282
Table 20.11: Total Cost Breakdown ............................................................................................................... 285
Table 20.12: Table Cost Report by Pricing Type ........................................................................................... 286
Table 20.13: Summary of Mobile Equipment ................................................................................................. 291
Table 20.14: Estimated Average Operating Costs ($/t) .................................................................................. 294
Table 20.15: Derivation of Plant Operating Costs ..................................................................................... 295
2CO003.008 – Oromin Joint Venture Group Independent Technical Report for the OJVG Golouma Gold Project, Sénégal Page xxxii
NMW_DM_TS /WB/MN OJVG Golouma Gold_2012_FS_Technical_Report_2CO003 008_NMW_DM_TS_GA_DGP_20130315_1 March 15, 2013
Table 20.16: Summary of Process Plant Labour ............................................................................................ 296
Table 20.17: Process Plant Labour rates ................................................................................................... 297
Table 20.18: Process Plant Labour Cost Summary .................................................................................. 298
Table 20.19: Power generation cost inputs .................................................................................................... 298
Table 20.20: Plant and Site Power Cost Summary ........................................................................................ 299
Table 20.21: Process Plant Vehicle Maintenance Cost Summary ................................................................. 300
Table 20.22: Reagent Consumption Rates .................................................................................................... 301
Table 20.23: Reagent Costs ........................................................................................................................... 301
Table 20.24: Crusher and Mill Liner Consumption ......................................................................................... 302
Table 20.25: Grinding Media Details Usage and Pricing .......................................................................... 302
Table 20.26: Grinding Media Costs ................................................................................................................ 302
Table 20.27: G&A Costs ................................................................................................................................. 303
Table 20.28: Primary and Weathered Ore OPEX Variances ..................................................................... 304
Table 20.29: Example of Process Cost Modelling ..................................................................................... 305
Table 21.1: Summary Economics. .................................................................................................................. 306
Table 21.2: Modelled base production schedule. ........................................................................................... 308
Table 21.3: Underground Production Schedule ............................................................................................. 309
Table 21.4: Total Production Schedule .......................................................................................................... 309
Table 21.5: High Level Capital Cost Summary .............................................................................................. 310
Table 21.6: Unit Operating Costs Summary ................................................................................................... 311
Table 21.7: Unit Operating Costs per Tonne of Ore (Underground) .............................................................. 311
Table 21.8: Unit Operating Costs per Tonne (Open Pit) ................................................................................ 311
Table 21.9: Unit Operating Costs per Tonne of Ore (Processing) ................................................................. 312
Table 21.10: Unit Operating Costs per Tonne of Ore (G&A) .......................................................................... 312
Table 21.11: Summary Unit Costs per Ounce of Gold ................................................................................... 312
Table 21.12: LOM Summary Cashflow at $1250 per Ounce.......................................................................... 314
Table 21.13: LOM Summary Cashflow at $1350 per Ounce.......................................................................... 316
Table 21.14: LOM Summary Cashflow at $1550 per Ounce.......................................................................... 318
Table 21.15: LOM Summary Cashflow at $1750 per Ounce.......................................................................... 320
Table 21.16: Effect of Variation of Gold Price and Operating Costs on NPV5 ($1,550 base price). ............. 322
Table 21.17: Effect of Variation of Capital and Operating Costs on NPV5 ($1,550 base price) ..................... 322
Table 21.18: Effect of variation in Price and All Costs on NPV5 ($1,550 base price). ................................... 323
Table 21.19:Payback Period from Commencement of Production ................................................................ 325
Table 22.1: Teranga Exploration Concessions .............................................................................................. 328
2CO003.008 – Oromin Joint Venture Group Independent Technical Report for the OJVG Golouma Gold Project, Sénégal Page xxxiii
NMW_DM_TS /WB/MN OJVG Golouma Gold_2012_FS_Technical_Report_2CO003 008_NMW_DM_TS_GA_DGP_20130315_1 March 15, 2013
List of Figures
Figure 3.1: Regional Map ................................................................................................................................... 6
Figure 4.1: Typical Landscape in the Golouma Gold Project Area. ................................................................. 12
Figure 5.1: Concession Deposits and Targets ............................................................................................ 14
Figure 6.1: Map Showing the Extent and Subdivisions of the Birimian-Eburnean Province of West Africa (Modified From Hirdes & Davis, 2002) ................................................................................... 18
Figure 6.2: Geological Map of the Kédougou-Kéniéba Inlier (Modified From Ledru et al. 1991). Also shown are the Main Transcurrent Shear Zone (MTSZ) and the Senegalese-Malian Shear Zone (SMSZ) .................................................................................................................................... 20
Figure 6.3: Lithological Sketch Map of the Southern Part of the KKI Containing OJVG’s Concession (Modified from Hirdes and Davis, 2002) .................................................................. 21
Figure 6.4: Simplified Cross-Section across the KKI (Modified From Hirdes and Davis, 2002) ...................... 22
Figure 6.5: Fugro Airmag Interp ....................................................................................................................... 26
Figure 6.6: Map showing location of deposits in the Project. ........................................................................... 27
Figure 6.7: Simplified Geological map of Masato ............................................................................................. 32
Figure 8.1: Concession Soil Geochemistry OJVG Property ............................................................................. 53
Figure 8.2: Golouma and Kerekounda Soil Geochemistry ............................................................................... 54
Figure 8.3: Masato Soil Geochemistry ............................................................................................................. 55
Figure 9.1: Golouma (West, South, and Northwest) drill hole locations ........................................................... 57
Figure 9.2: Masato drill hole locations. ............................................................................................................. 58
Figure 9.3: Forage Technic-Eau‟s Reverse Circulation drill at Niakafiri Southwest. ........................................ 59
Figure 9.4: A Falcon 2000 drill at Kouroundi. ................................................................................................... 62
Figure 11.1: Parity Plot Comparison of SRK Check Assay Samples from 2008, 2009, and 2011 with Original Assay Determinations ......................................................................................................... 75
Figure 11.2: Performance of RC and Diamond Drill Hole Blank Samples from January 2011 to December 2011 ................................................................................................................................ 77
Figure 11.3: Scatter Plot of Laboratory Check Duplicate Samples to Acme Lab ............................................. 78
Figure 11.4: Smaller Scale Scatter Plot Check Assay Samples to Acme Labs ............................................... 79
Figure 11.5: Scatter Plot of Diamond Drill Hole and RC Duplicates; 2011 Data .............................................. 80
Figure 11.6: Ranked Half Absolute Relative Deviation Plot for Diamond Drill Hole and RC Duplicates; 2011 data .......................................................................................................................................... 81
Figure 12.1: Overall Process Plant Flowsheet ................................................................................................. 86
Figure 12.2: Plant Throughput Prediction Model .............................................................................................. 90
Figure 12.3: Oxide and Primary Ore Extraction Curves ................................................................................. 100
Figure 12.4: Plant Gold Recovery Prediction Models ..................................................................................... 100
Figure 12.5: Photomicrograph 1 Showing Gold Occurrences in the Leached Residue from Masato ............ 109
Figure 12.6: Leach Curves for Samples Tested At 106 Micron...................................................................... 121
Figure 12.7: Leach Curves for Samples Tested At 75 Micron ........................................................................ 122
Figure 12.8: Column Heap Leach Extraction Curves ..................................................................................... 124
Figure 12.9: Graph of Grind Size versus Gold Extraction .............................................................................. 126
2CO003.008 – Oromin Joint Venture Group Independent Technical Report for the OJVG Golouma Gold Project, Sénégal Page xxxiv
NMW_DM_TS /WB/MN OJVG Golouma Gold_2012_FS_Technical_Report_2CO003 008_NMW_DM_TS_GA_DGP_20130315_1 March 15, 2013
Figure 12.10: Optimum Grind Size Curves for Masato and Golouma West .................................................. 127
Figure 13.1: 3D view of the Masato Mineralized Zones (showing the 0.2 g/t Au cut-off Grade Shells (looking east-southeast). ................................................................................................................ 134
Figure 13.2: Plan View of the Golouma West gold zones represented by 0.2 g/t Au Grade Shells with Mafic Dyke (Fully projected). Grid spacing is 200 x 200 m. ........................................................... 135
Figure 13.3: 3D View of the Golouma West gold zones represented by 0.2 g/t Au Grade Shells with Mafic Dykes (looking north-northwest). .......................................................................................... 136
Figure 13.4: Plan View of the Golouma South gold zones represented by 0.2 g/t Au Grade Shells without Felsic Dykes (Fully projected). Grid spacing is 200 x 200 m. ............................................ 137
Figure 13.5: Plan View of the Golouma South gold zones represented by 0.2 g/t Au Grade Shells with Felsic Dykes (Fully projected). Grid spacing is 200 x 200 m. ......................................................... 137
Figure 13.6: Plan View of the Golouma Northwest gold zones represented by 0.2 g/t Au Grade Shells with Mafic Dyke (Fully projected). Grid spacing is 100 x 100 m. .................................................... 138
Figure 13.7: Plan View of the Kerekounda deposit gold zones represented by 1.0 g/t Au Grade Shells with Late Mafic Dykes (Fully projected). Zone 3400 is not shown in this view. Grid spacing is 200 x 200 m. ................................................................................................................................... 139
Figure 13.8: 3D View of the Kerekounda deposit gold zones represented by 1.0 g/t Au Grade Shells without Late Mafic Dykes (looking west-northwest). ...................................................................... 140
Figure 13.9: Plan View of the Niakafiri Southeast deposit gold zones represented by 0.2 g/t Au Grade Shells (Fully Projected). Grid spacing is 200 x 200 m. ................................................................... 141
Figure 13.10: 3D View of the Kourouloulou deposit gold zones represented by 1.0 g/t Au Grade Shells (looking west-southwest). ............................................................................................................... 142
Figure 13.11: Plan View of the Niakafiri Southwest deposit gold zones represented by 0.2 g/t Au Grade Shells (Fully Projected). Grid spacing is 200 x 200 m. ........................................................ 143
Figure 13.12: 3D View of the Maki Medina deposit gold zones represented by 0.2 g/t Au Grade Shells with Felsic Dykes (Fully Projected). ................................................................................................ 144
Figure 13.13: 3D View of the Kobokoto deposit gold zones represented by 0.2 g/t Au Grade Shells (looking northeast). ......................................................................................................................... 145
Figure 13.14: 3D View of the Mamasato deposit gold zones represented by 0.2 g/t Au Grade Shells (looking southeast). ........................................................................................................................ 146
Figure 13.15: Plan View of the Koulouqwinde deposit gold zones represented by 0.2 g/t Au Grade Shells (Fully Projected). Grid spacing is 200 x 200 m. ................................................................... 147
Figure 13.16: Plan View of the Sekoto deposit gold zones represented by 0.2 g/t Au Grade Shells (Fully Projected). Grid spacing is 200 x 200 m. .............................................................................. 148
Figure 13.17: 3D View of the Kinemba deposit gold zones represented by 0.2 g/t Au Grade Shells (looking northeast). ......................................................................................................................... 149
Figure 13.18: 3D View of the Koutouniokolla deposit gold zones represented by 0.2 g/t Au Grade Shells (looking northeast). .............................................................................................................. 150
Figure 13.19: Plan View of the Kouroundi deposit gold zones represented by 0.2 g/t Au Grade Shells (Fully Projected). Grid spacing is 200 x 200 m. .............................................................................. 151
Figure 13.20: Statistics of Declustered and Capped Gold Assays in Masato ................................................ 153
Figure 13.21: Statistics of Declustered and Capped Gold Assays in Golouma West: Part 1. High grade zones are labelled with a “HG” suffix.................................................................................... 153
Figure 13.22: Statistics of Declustered and Capped Gold Assays in Golouma West: Part 2. High grade zones are labelled with a “HG” suffix.................................................................................... 154
2CO003.008 – Oromin Joint Venture Group Independent Technical Report for the OJVG Golouma Gold Project, Sénégal Page xxxv
NMW_DM_TS /WB/MN OJVG Golouma Gold_2012_FS_Technical_Report_2CO003 008_NMW_DM_TS_GA_DGP_20130315_1 March 15, 2013
Figure 13.23: Statistics of Declustered and Capped Gold Assays in Golouma West: Part 3. High grade zones are labelled with a “HG” suffix.................................................................................... 154
Figure 13.24: Comparison of Block Estimates with Borehole Assay Data Contained within the Blocks in the Mineralized Domains in (a) Golouma South and (b) Golouma West areas ......................... 166
Figure 13.25: Declustered Assays Compared to Block Estimates in 2100HG Domain at Golouma South Area ...................................................................................................................................... 167
Figure 13.26: Assays Compared to Block Estimates in 18000HG Zone at Golouma West Area .................. 167
Figure 13.27: Comparison of Block Estimates with Borehole Assay Data Contained within the Blocks in the Mineralized Domains in the Masato Deposit in (a) 5101 and (b) 5102 domains .................. 168
Figure 13.28: Declustered Assays Compared to Block Estimates in 5101 Domain in the Masato Deposit ............................................................................................................................................ 168
Figure 13.29: Grade-tonnage curves for different categories in Golouma (West, South, and Northwest combined): (a) Indicated, (b) Inferred ............................................................................................. 170
Figure 13.30: Grade-tonnage curves for different categories in Masato: (a) Indicated, (b) Inferred .............. 171
Figure 15.1: Pit Design – Golouma South, Golouma West, Golouma Northwest and Kerekounda .............. 197
Figure 15.2: Cross Section A-A‟ of Golouma West ........................................................................................ 198
Figure 15.3: Cross Section B-B‟ of Golouma South ....................................................................................... 198
Figure 15.4: Cross-Section C-C‟ of Kerekounda ............................................................................................ 199
Figure 15.5: Pit Design - Masato .................................................................................................................... 200
Figure 15.6: Cross Section A-A‟ of Masato South .......................................................................................... 201
Figure 15.7: Cross Section B-B‟ of Masato North .......................................................................................... 201
Figure 15.8: Section View of Cut and Fill Mining Sequence .......................................................................... 210
Figure 15.9: General Plan View of Underground Development ..................................................................... 213
Figure 15.10: Isometric View Showing Stoping and Development................................................................. 214
Figure 15.11: Golouma Gold Project Underground Development and Production Gantt Schedules ............. 219
Figure 15.12: Typical UG Power Distribution Arrangement ........................................................................... 230
Figure 15.13: Period Tonnages and Gold Grade ........................................................................................... 248
Figure 15.14: Contained Gold and Grades..................................................................................................... 249
Figure 18.1: Historical gold prices. ................................................................................................................. 261
Figure 19.1: Proposed changes to the existing mine plan and areas of land use concern. ........................... 269
Figure 20.1: Plant throughput vs. Processing Costs ...................................................................................... 305
Figure 21.1: Sensitivity Graph at $1350 Price Base ....................................................................................... 323
Figure 21.2: Sensitivity Graph at $1550 Price Base ....................................................................................... 324
Figure 21.3: Sensitivity Graph at $1750 Price Base ....................................................................................... 324
Figure 22.1: Adjacent Properties .................................................................................................................... 327
2CO003.008 – Oromin Joint Venture Group Independent Technical Report for the OJVG Golouma Gold Project, Sénégal Page 1
NMW_DM_TS /WB/MN OJVG Golouma Gold_2012_FS_Technical_Report_2CO003 008_NMW_DM_TS_GA_DGP_20130315_1 March 15, 2013
1 Introduction and Terms of Reference This technical report was prepared for OJVG Joint Venture Group (OVJG) by SRK Consulting
(Canada) Inc. to summarize the 2011 updated mineral resource estimates prepared for the Masato,
Golouma West and Golouma South, Kourouloulou and Kerekounda gold deposits located in OJVG‟s
Golouma exploration concession.
For clarity, it must be noted that Teranga Gold Corporation (“Teranga” formerly Mineral Deposits
Limited “MDL”) currently refers to its eastern Senegal gold property as “Sabodala” and is host to the
Sabodala Gold Deposit. The registered name of OJVG‟s mining concession is the Golouma Gold
Concession; however, it has previously been referred to in public disclosure and technical reports as
OJVG‟s Sabodala Project.
Currently, the OJVG concession is referred to as the “OJVG Gold Project” in all public disclosure by
OJVG. For the purposes of this study, the OJVG Gold Project, OJVG concession, OJVG property,
OJVG Golouma Gold Project, Golouma Gold Project and Project are synonymous. The Teranga
mine and mining concession will be referred as “Teranga Sabodala”. Collectively the OJVG,
Teranga and other adjacent properties are referred to as the “Sabodala area” or “Sabodala Gold
District”.
This technical report was written by the independent Qualified Persons (QPs) shown in Table 1.1. A
personal visit to the OJVG Golouma Project site was conducted by Dr. Wayne Barnett, Pr Sci Nat.
on September 11 and 12 of 2012.
Table 1.1: Qualified Persons and Areas of Responsibility
Name of Qualified Person Area of Responsibility
Dr. Wayne Barnett, Pr Sci Nat. Project Management, Geology, Mineral Resource Estimation
Marek Nowak, PEng Geostatistical Analysis, Mineral Resource Validation
Kevin Scott, PEng. Metallurgy
Dino Pilotto, PEng. Open Pit Mine Engineering
Gary Poxleitner, PEng. Underground Mine Engineering
Luis Peloquin, PEng. Underground Mine Engineering
Chris Elliott, PEng. Feasibility Study Report Summary, Operational and Capital Expenses
Any previous technical reports or literature used in the compilation of this report are referenced
throughout the text. In particular, the majority of the information preceding the Mineral Resource
Estimates is taken from the 2010 Feasibility Study Revised Technical Report with updates made to
those sections where appropriate.
All units in this report are based on the International System of Units (SI), except industry standard
units, such as troy ounces for the mass of precious metals. All currency values are United States
Dollars (US$ or $) unless otherwise stated.
This report uses abbreviations and acronyms common within the minerals industry. Explanations
are located in Section 26.
2CO003.008 – Oromin Joint Venture Group Independent Technical Report for the OJVG Golouma Gold Project, Sénégal Page 2
NMW_DM_TS /WB/MN OJVG Golouma Gold_2012_FS_Technical_Report_2CO003 008_NMW_DM_TS_GA_DGP_20130315_1 March 15, 2013
1.1 Scope of Work
The scope of work, as defined in a letter of engagement executed on May 16, 2012 between OJVG
Joint Venture Group (OVJG) and SRK includes the construction of a mineral resource model for the
orogenic gold mineralization delineated by drilling on the OJVG Gold Project and the preparation of
an independent technical report in compliance with National Instrument 43-101 and Form 43-101F1
guidelines. This work typically involves the assessment of the following aspects of this project:
Topography, landscape, access;
Regional and local geology;
Exploration history;
Exploration work carried out on the project;
Geological modelling;
Mineral resource estimation and validation;
Preparation of a mineral resource statement; and
Recommendations for additional work.
1.2 Work Program
The mineral resource statement reported herein is a collaborative effort between OJVG and SRK
personnel. The exploration database was compiled and maintained by Nowak and Associates, and
was audited by SRK. The geological model and outlines for the orogenic gold mineralization were
constructed by OJVG from a two-dimensional geological interpretation. In the opinion of SRK, the
geological model is a reasonable representation of the distribution of the targeted mineralization at
the current level of sampling. The geostatistical analysis, variography and grade models were
completed by SRK during the months August to September 2012. The mineral resource statement
reported herein was presented to OJVG and disclosed publicly in a news release dated October 1,
2013.
The mineral resource statement reported herein was prepared in conformity with generally accepted
CIM “Exploration Best Practices” and “Estimation of Mineral Resource and Mineral Reserves Best
Practices” guidelines. This technical report was prepared following the guidelines of the Canadian
Securities Administrators National Instrument 43-101 and Form 43-101F1.
The technical report was assembled in Vancouver BC during the months of November 2012 to
March 2013.
1.3 Basis of Technical Report
This report is based on information collected by SRK during a site visit performed between
September 11 and 12 of 2012 and on additional information provided by OJVG throughout the
course of SRK‟s investigations. Other information was obtained from the public domain. SRK has no
reason to doubt the reliability of the information provided by OJVG. This technical report is based on
the following sources of information:
Discussions with OJVG personnel;
Inspection of the OJVG Gold Project area, including outcrop and drill core;
Review of exploration data collected by OJVG; and
2CO003.008 – Oromin Joint Venture Group Independent Technical Report for the OJVG Golouma Gold Project, Sénégal Page 3
NMW_DM_TS /WB/MN OJVG Golouma Gold_2012_FS_Technical_Report_2CO003 008_NMW_DM_TS_GA_DGP_20130315_1 March 15, 2013
Additional information from public domain sources.
1.4 Qualifications of SRK
The SRK Group comprises over 1,600 professionals, offering expertise in a wide range of resource
engineering disciplines. The SRK Group‟s independence is ensured by the fact that it holds no
equity in any project and that its ownership rests solely with its staff. This fact permits SRK to
provide its clients with conflict-free and objective recommendations on crucial judgment issues. SRK
has a demonstrated track record in undertaking independent assessments of Mineral Resources
and Mineral Reserves, project evaluations and audits, technical reports and independent feasibility
evaluations to bankable standards on behalf of exploration and mining companies and financial
institutions worldwide. The SRK Group has also worked with a large number of major international
mining companies and their projects, providing mining industry consultancy service inputs.
1.5 Site Visit
In accordance with National Instrument 43-101 guidelines, Dr. Wayne Barnett, Pr Sci Nat visited the
OJVG Gold Project on September 11 and 12 of 2012.
The purpose of the site visit was to review the digitalization of the exploration database and
validation procedures, review exploration procedures, define geological modelling procedures,
examine drill core, interview project personnel, and to collect all relevant information for the
preparation of a revised mineral resource model and the compilation of a technical report. During
the visit, a particular attention was given to the new drilling data collected over the past year.
SRK was given full access to relevant data and conducted interviews of OJVG personnel to obtain
information on the past exploration work, to understand procedures used to collect, record, store
and analyze historical and current exploration data.
1.6 Acknowledgement
SRK would like to acknowledge the support and collaboration provided by OJVG personnel for this
assignment. Their collaboration was greatly appreciated and instrumental to the success of this
project.
1.7 Declaration
SRK‟s opinion contained herein and effective January 30, 2013, is based on information collected
by SRK throughout the course of SRK‟s investigations, which in turn reflect various technical and
economic conditions at the time of writing. Given the nature of the mining business, these conditions
can change significantly over relatively short periods of time. Consequently, actual results may be
significantly more or less favourable.
This report may include technical information that requires subsequent calculations to derive sub-
totals, totals and weighted averages. Such calculations inherently involve a degree of rounding and
consequently introduce a margin of error. Where these occur, SRK does not consider them to be
material.
SRK is not an insider, associate or an affiliate of OJVG, and neither SRK nor any affiliate has acted
as advisor to OJVG, its subsidiaries or its affiliates in connection with this project. The results of the
technical review by SRK are not dependent on any prior agreements concerning the conclusions to
be reached, nor are there any undisclosed understandings concerning any future business dealings.
2CO003.008 – Oromin Joint Venture Group Independent Technical Report for the OJVG Golouma Gold Project, Sénégal Page 4
NMW_DM_TS /WB/MN OJVG Golouma Gold_2012_FS_Technical_Report_2CO003 008_NMW_DM_TS_GA_DGP_20130315_1 March 15, 2013
2 Reliance on Other Experts Preparation of this report is based upon public and private information provided by Oromin Joint
Venture Group (OJVG) and information provided in various previous Technical Reports listed in
Section 20 of this report. This report also relies upon the work and opinions of some non-QP
experts. The following list outlines the information provided by other experts, who are independent
to the authors:
Metallurgical testing was conducted by AMMTEC Ltd and G&T Metallurgical Services Ltd;
Each QP in this report takes sole responsibility for their work as outlined in their QP Certificates.
The authors believe that the information provided and relied upon for preparation of this report is
accurate at the time of the report and that the interpretations and opinions expressed in them are
reasonable and based on current understanding of mining and processing techniques and costs,
economics, mineralization processes and the host geologic setting. The authors have made
reasonable efforts to verify the accuracy of the data relied on in this report.
The results and opinions expressed in this report are conditional upon the aforementioned
information being current, accurate, and complete as of the date of this report, and the
understanding that no information has been withheld that would affect the conclusions made herein
the authors reserve the right, but will not be obliged, to revise this report and conclusions if
additional information becomes known to the authors subsequent to the date of this report.
Neither SRK nor the authors of this technical report are qualified to provide extensive comment on
legal issues associated with the OJVG property. As such, portions of Section 3 dealing with the
types and numbers of mineral tenures and licenses, the nature and extent of OJVG‟s title and
interest in the OJVG property, the terms of any royalties, back-in rights, payments or other
agreements and encumbrances to which the property is subject are descriptive in nature and are
provided exclusive of a legal opinion.
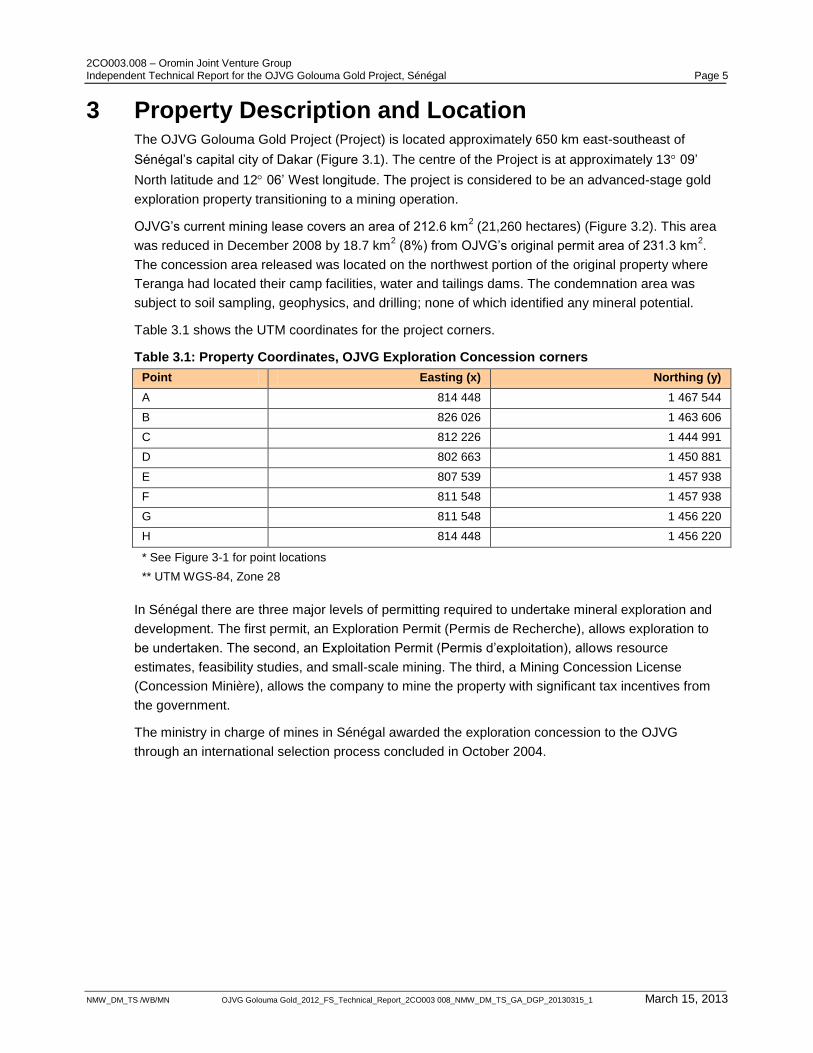
2CO003.008 – Oromin Joint Venture Group Independent Technical Report for the OJVG Golouma Gold Project, Sénégal Page 5
NMW_DM_TS /WB/MN OJVG Golouma Gold_2012_FS_Technical_Report_2CO003 008_NMW_DM_TS_GA_DGP_20130315_1 March 15, 2013
3 Property Description and Location The OJVG Golouma Gold Project (Project) is located approximately 650 km east-southeast of
Sénégal‟s capital city of Dakar (Figure 3.1). The centre of the Project is at approximately 13 09‟
North latitude and 12 06‟ West longitude. The project is considered to be an advanced-stage gold
exploration property transitioning to a mining operation.
OJVG‟s current mining lease covers an area of 212.6 km2 (21,260 hectares) (Figure 3.2). This area
was reduced in December 2008 by 18.7 km2 (8%) from OJVG‟s original permit area of 231.3 km
2.
The concession area released was located on the northwest portion of the original property where
Teranga had located their camp facilities, water and tailings dams. The condemnation area was
subject to soil sampling, geophysics, and drilling; none of which identified any mineral potential.
Table 3.1 shows the UTM coordinates for the project corners.
Table 3.1: Property Coordinates, OJVG Exploration Concession corners
Point Easting (x) Northing (y)
A 814 448 1 467 544
B 826 026 1 463 606
C 812 226 1 444 991
D 802 663 1 450 881
E 807 539 1 457 938
F 811 548 1 457 938
G 811 548 1 456 220
H 814 448 1 456 220
* See Figure 3-1 for point locations
** UTM WGS-84, Zone 28
In Sénégal there are three major levels of permitting required to undertake mineral exploration and
development. The first permit, an Exploration Permit (Permis de Recherche), allows exploration to
be undertaken. The second, an Exploitation Permit (Permis d‟exploitation), allows resource
estimates, feasibility studies, and small-scale mining. The third, a Mining Concession License
(Concession Minière), allows the company to mine the property with significant tax incentives from
the government.
The ministry in charge of mines in Sénégal awarded the exploration concession to the OJVG
through an international selection process concluded in October 2004.
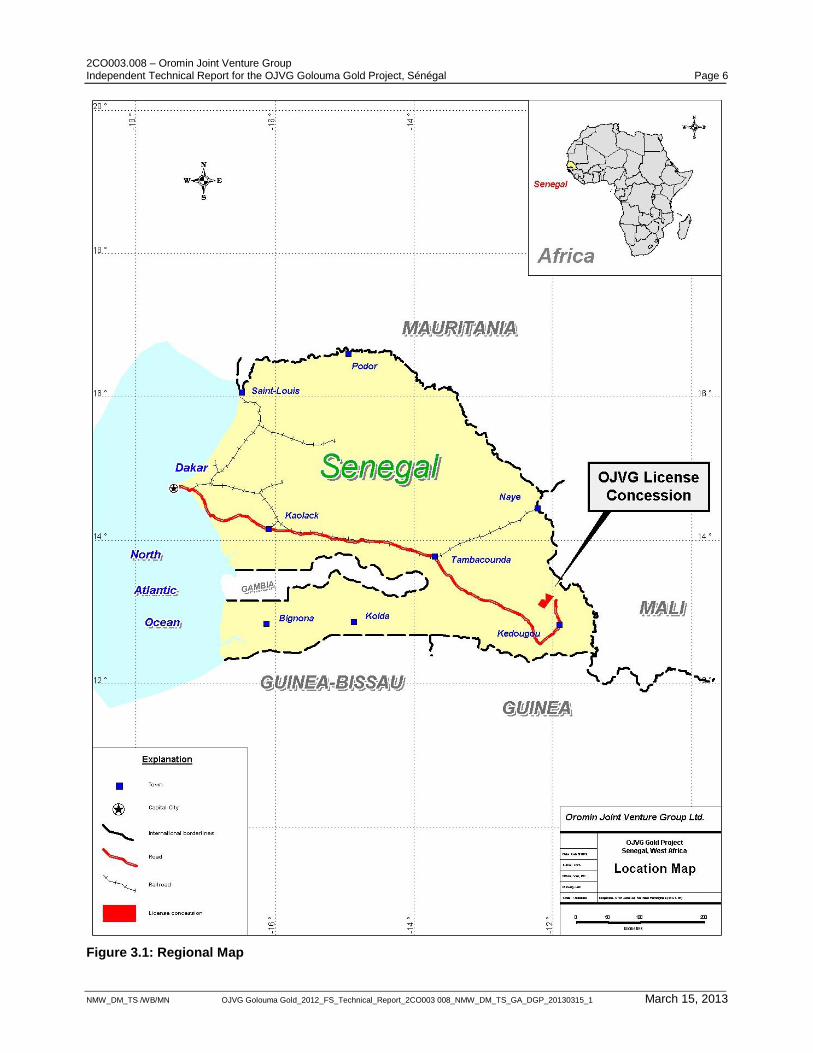
2CO003.008 – Oromin Joint Venture Group Independent Technical Report for the OJVG Golouma Gold Project, Sénégal Page 6
NMW_DM_TS /WB/MN OJVG Golouma Gold_2012_FS_Technical_Report_2CO003 008_NMW_DM_TS_GA_DGP_20130315_1 March 15, 2013
Figure 3.1: Regional Map
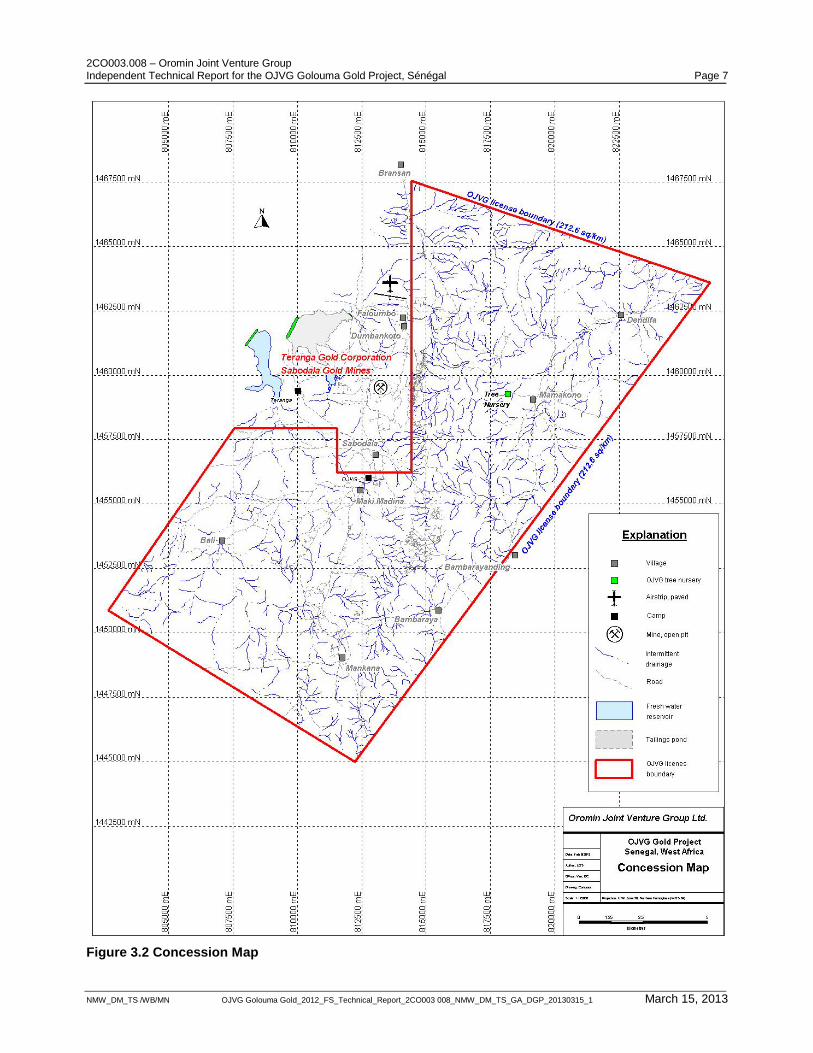
2CO003.008 – Oromin Joint Venture Group Independent Technical Report for the OJVG Golouma Gold Project, Sénégal Page 7
NMW_DM_TS /WB/MN OJVG Golouma Gold_2012_FS_Technical_Report_2CO003 008_NMW_DM_TS_GA_DGP_20130315_1 March 15, 2013
Figure 3.2 Concession Map
2CO003.008 – Oromin Joint Venture Group Independent Technical Report for the OJVG Golouma Gold Project, Sénégal Page 8
NMW_DM_TS /WB/MN OJVG Golouma Gold_2012_FS_Technical_Report_2CO003 008_NMW_DM_TS_GA_DGP_20130315_1 March 15, 2013
Oromin Explorations Ltd. (Oromin) entered into agreements with two Saudi Arabian companies;
Bendon International Ltd. (Bendon) and Badr Investment and Finance (Badr) (43.5% and 13%
interest respectively), thus forming the OJVG of which Oromin owns 43.5% and is the operator.
Oromin‟s stake in the OJVG is held through Sabodala Holding Limited, a company wholly owned by
Oromin. Oromin and Bendon are each responsible for 50% of the project funding, as Badr has no
obligation to contribute capital.
OJVG acquired a 15-year renewable Mining License in January 2010. Under terms of the Mining
Convention, OJVG must form a Sénégalese company to mine the property which has now been
completed. The name of this recently formed company is Somigol. OJVG owns 90% of Somigol
while the Sénégalese government will be granted a 10% carried interest in Somigol and up to 25%
of the share capital of Somigol shall be reserved for purchase by the government and Sénégalese
private sector. The property is also subject to a 3% royalty on net smelter return (NSR) payable to
the Sénégal government.
The authors have made no attempt to verify the legal status and ownership of the property, nor are
they qualified to do so. Oromin supplied information regarding property title and ownership and the
authors saw no evidence to suggest that it is not correct.
The stable democratic political climate and newly enacted Mining Code in Sénégal are considered
favourable for both the exploration and exploitation of mineral resources. Land use permits were
obtained from the Direction of Mines and Geology (DMG), as required, prior to carrying out the
exploration programs outlined in this report. Surface disturbance resulting from the exploration
programs consists of excavator trenching and reverse circulation and core diamond drilling in
various areas. The disturbed areas are reclaimed upon completion of the respective work.
Many areas of gold mineralization have been identified within the concession. Historic information
about the mineralization can be found in previous reports: Awmack (2005), McArthur (2006, 2012),
Apex (2008, 2009), and SRK (2010, 2011). Detailed information is also provided in Section 6,
entitled Geological Setting and Mineralization.
Evidence of local artisanal mining is found in many of the mineralized areas. Several of the local
communities now derive a portion of their communal wealth from artisan mining. This mining may
have been carried out intermittently for at least the last fifty years since the Bureau de Recherches
Géologiques et Minières (BRGM) discovery of the Sabodala deposit.
Currently, minimal remedial effort will be required to return the operation areas to the pre-exploration
state. The main components that would require rehabilitation include:
removal of camp buildings (if the local community has no use for them)
closure of the camp waste site and the remaining exploration trenches
final cleanup of minor hydrocarbon spills around the workshops
re-vegetation and contouring of drill sites
OJVG has had an active program of community engagement and support and has built good
working relations with the local communities, artisanal miners, and all levels of government. There is
currently no known compensation outstanding.
An Environmental and Social Impact Assessment (ESIA) process with public consultation was
initiated at site by SRK for the proposed CIL operation. It was undertaken in compliance with

2CO003.008 – Oromin Joint Venture Group Independent Technical Report for the OJVG Golouma Gold Project, Sénégal Page 9
NMW_DM_TS /WB/MN OJVG Golouma Gold_2012_FS_Technical_Report_2CO003 008_NMW_DM_TS_GA_DGP_20130315_1 March 15, 2013
Sénégalese, Canadian, IFC, and Equator Principle guidelines. The ESIA was presented to the
Sénégalese government in March 2011 for its initial review. The government identified some issues
that needed to be addressed or clarified and the updated ESIA was resubmitted by Consult 5 Inc.
and Synergie in September 2011. A technical review committee involving several governmental
bodies, including Mines and Environment, validated the ESIA document on November 2011. A
subsequent and final public hearing approved the ESIA on a plenary session held in Sabodala
village in March 2012. An attestation of conformance of the ESIA was issued by the Government of
Sénégal to OJVG on May 24, 2012. This will form the basis for an operational mine permit
application.

2CO003.008 – Oromin Joint Venture Group Independent Technical Report for the OJVG Golouma Gold Project, Sénégal Page 10
NMW_DM_TS /WB/MN OJVG Golouma Gold_2012_FS_Technical_Report_2CO003 008_NMW_DM_TS_GA_DGP_20130315_1 March 15, 2013
4 Accessibility, Climate, Local Resources, Infrastructure and Physiography Sénégal is the western-most country on the African continent and is bordered by Mauritania to the
north, Mali to the east and Guinea and Guinea-Bissau to the south. The country of Gambia, which
flanks the Gambia River estuary for up to 300 km inland, is surrounded by Sénégal (Figure 3.1).
Sénégal has a population of more than 11 million people; more than half live in or near the capital
city of Dakar. Ninety-four percent of the population is Muslim and five percent is Christian. Sénégal
is a multilingual country with French as its official language. Wolof is the lingua franca and is
understood by 80% of the population.
Sénégal does not have a well-established mining industry, particularly in the sparsely populated
eastern region in which the Project is located. Many of the services and support needed for the
development of mining operations are not available. Equipment and consumable suppliers are
limited and their facilities, in most cases, are inadequate. Sénégal does not have an experienced
mining workforce from which to draw labour and the development and operation of mining projects
will rely upon external expertise and training of Sénégalese nationals.
Transportation to the project is via road or air. Road access is via the regional centre of Kédougou
(2-3 hrs), the town of Tambacounda (5-6 hrs) or the capital city of Dakar (10-12 hrs), each of which
supplies basic services. The road from the port of Dakar to the regional centre of Kédougou is
paved and in excellent condition. A 1,250 m paved airstrip, located approximately 8 km north of the
OJVG camp at the north end of the Teranga‟s Sabodala Mining Concession, is used by twin-engine
charter aircraft based in Dakar.
Road conditions are not envisioned to be a constraint to the development of the Project. Teranga
was able to build their plant using the road prior to recent improvements by the government. The
maximum load capacity of the roads from the Project to Dakar is 30 tonnes. On the Project and
nearby vicinity, a network of dirt roads and tracks allow easy access in the dry season but many
roads require four-wheel drive vehicles during much of the rainy season as some roads become
impassible for short periods during and immediately after heavy rains.
The regional power grid runs parallel to the paved highway from Tambacounda to Mako and lies
30 km south of the Project. There are no plans to extend the power line to the Project. The Project
and the OJVG exploration camp generate their own power using two diesel generators. On the
adjacent Teranga‟s Sabodala Mining Concession, Teranga uses low-speed heavy fuel oil
generators (HFO) to supply power to the mine and ancillary operations. The Teranga HFO plant has
a total capacity of 36 MW. There is insufficient capacity at the Teranga site to power the proposed
OJVG processing plant.
Just beyond the eastern boundary of the concession is the village of Khossanto, a regional centre,
which has telephone service, a government office, schools and a medical centre.
There are seven small villages within the project area, each housing 100-300 people. Subsistence
gardens and a scattering of small fields including sorghum and cotton surround the villages. At the
larger villages of Sabodala (located on the Teranga‟s Sabodala Mining Concession) and
Mamakono, there are schools and small shops. The small villages of Bransan, Faloumbo, Dendifa,
Mankana, Bambaraya and Maki Medina have no services or facilities, although they do have water
wells.

2CO003.008 – Oromin Joint Venture Group Independent Technical Report for the OJVG Golouma Gold Project, Sénégal Page 11
NMW_DM_TS /WB/MN OJVG Golouma Gold_2012_FS_Technical_Report_2CO003 008_NMW_DM_TS_GA_DGP_20130315_1 March 15, 2013
Topography on the property is gentle to hilly. The main topographic feature is a long ridge extending
north-south across the property. The ridge separates two major river systems. Waters on the east of
the divide flow into the Falémé River, part of the Sénégal River system which forms the northern
border with Mali and Mauritania, while waters to the west flow into the Gambia River. Figure 4.1
shows the typical landscape of the project area. Approximately eighty percent of the Project area is
covered by flat-lying laterite plateaus. Outcrops cover less than one percent of the property and are
generally limited to road cuts, ridge crests and creeks. Elevations range from 150 to 420 masl.
Vegetation is of the tall-grass savannah type with common thickets of bamboo and a scattering of
trees. Fauna includes warthogs, baboons, various species of monkeys and birds, and local herds of
domesticated goats, sheep and cattle.
The subtropical climate belongs to the Sudanic zone and is characterized by a long dry season from
September to May, followed by a short rainy season from June to August. Daily temperatures range
from highs of 30C to 45C from September to May with cooler temperatures of 17C to 26C in
December and January. The mean annual rainfall is 1,130 mm. The annual harmattan is a dry wind
that blows from the Sahara desert in the north resulting in dusty hazy skies during December to
February.
The OJVG Project has had a weather station in operation for about 2.5 years.
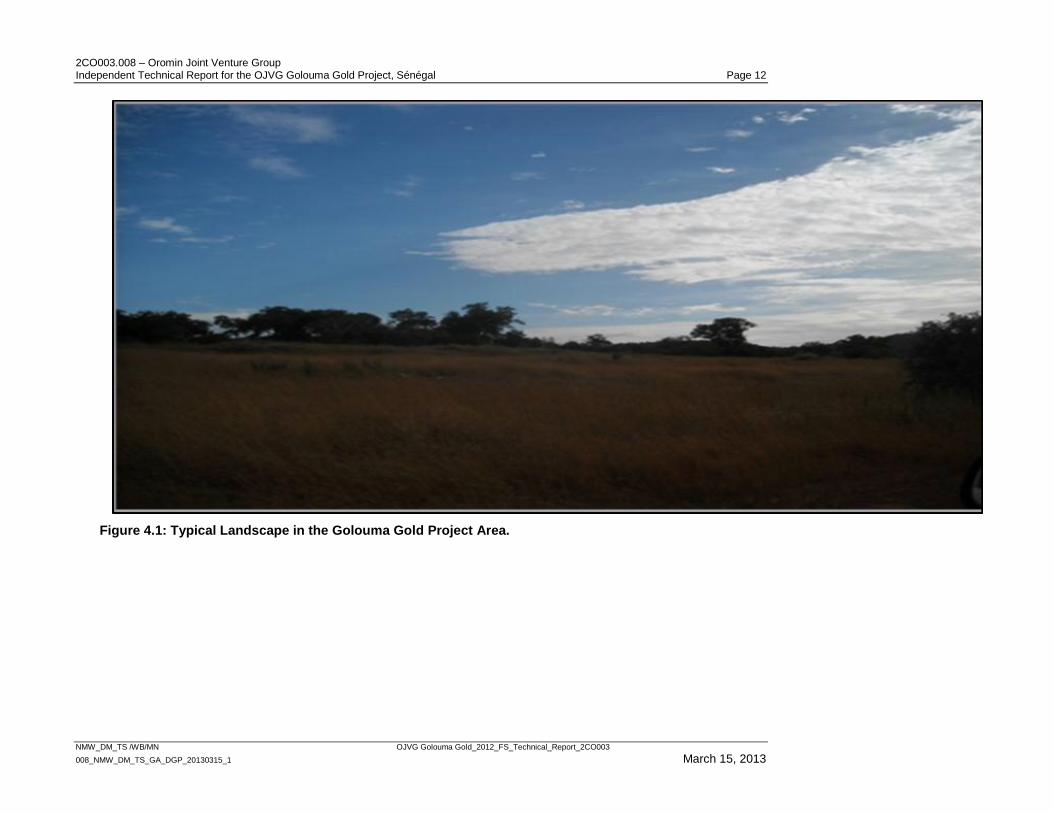
2CO003.008 – Oromin Joint Venture Group Independent Technical Report for the OJVG Golouma Gold Project, Sénégal Page 12
NMW_DM_TS /WB/MN OJVG Golouma Gold_2012_FS_Technical_Report_2CO003
008_NMW_DM_TS_GA_DGP_20130315_1 March 15, 2013
Figure 4.1: Typical Landscape in the Golouma Gold Project Area.
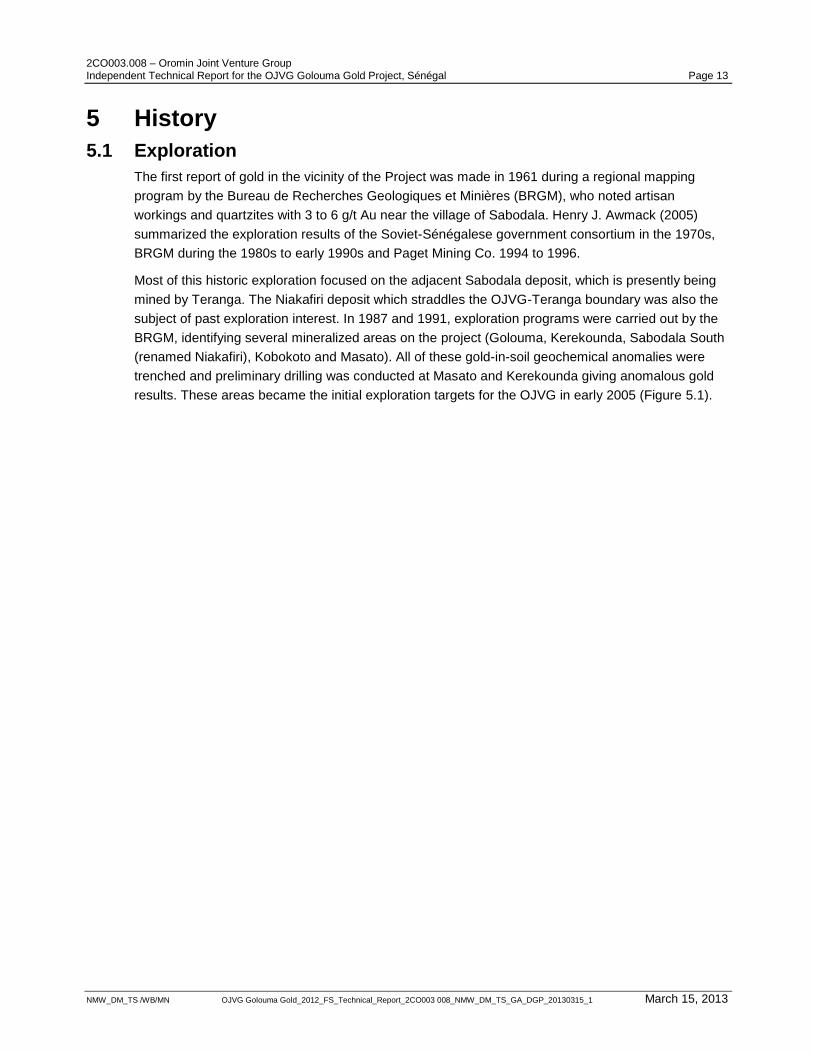
2CO003.008 – Oromin Joint Venture Group Independent Technical Report for the OJVG Golouma Gold Project, Sénégal Page 13
NMW_DM_TS /WB/MN OJVG Golouma Gold_2012_FS_Technical_Report_2CO003 008_NMW_DM_TS_GA_DGP_20130315_1 March 15, 2013
5 History
5.1 Exploration
The first report of gold in the vicinity of the Project was made in 1961 during a regional mapping
program by the Bureau de Recherches Geologiques et Minières (BRGM), who noted artisan
workings and quartzites with 3 to 6 g/t Au near the village of Sabodala. Henry J. Awmack (2005)
summarized the exploration results of the Soviet-Sénégalese government consortium in the 1970s,
BRGM during the 1980s to early 1990s and Paget Mining Co. 1994 to 1996.
Most of this historic exploration focused on the adjacent Sabodala deposit, which is presently being
mined by Teranga. The Niakafiri deposit which straddles the OJVG-Teranga boundary was also the
subject of past exploration interest. In 1987 and 1991, exploration programs were carried out by the
BRGM, identifying several mineralized areas on the project (Golouma, Kerekounda, Sabodala South
(renamed Niakafiri), Kobokoto and Masato). All of these gold-in-soil geochemical anomalies were
trenched and preliminary drilling was conducted at Masato and Kerekounda giving anomalous gold
results. These areas became the initial exploration targets for the OJVG in early 2005 (Figure 5.1).
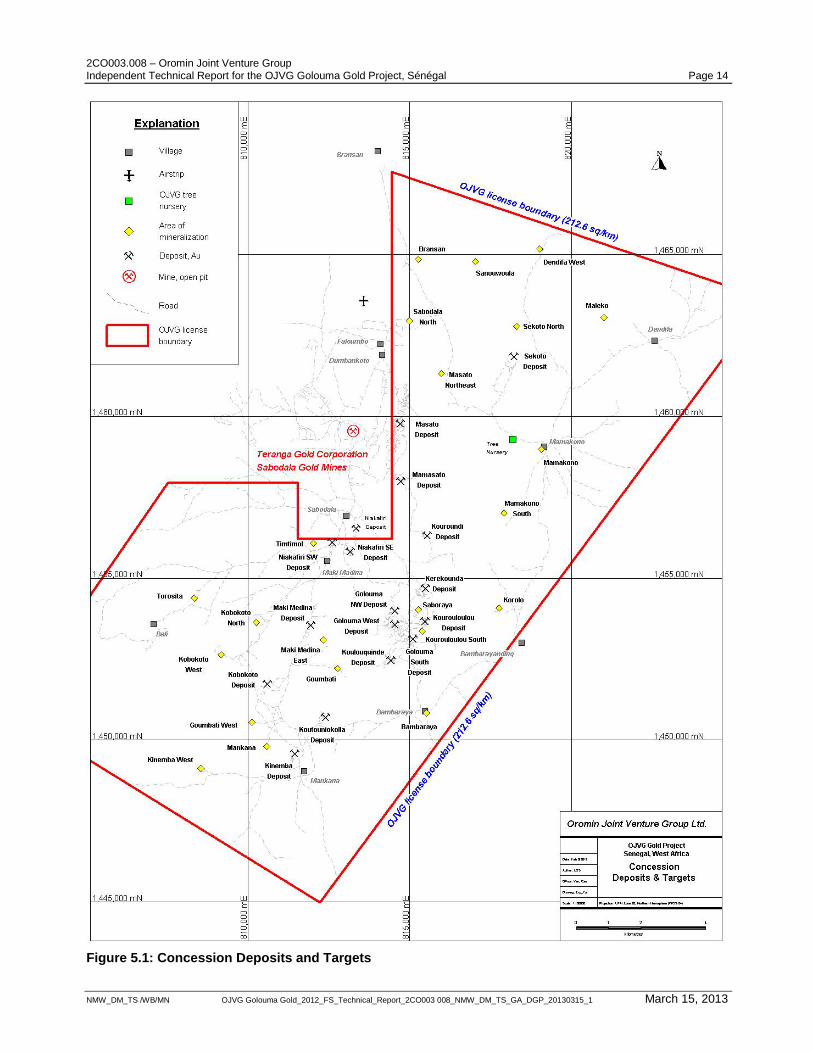
2CO003.008 – Oromin Joint Venture Group Independent Technical Report for the OJVG Golouma Gold Project, Sénégal Page 14
NMW_DM_TS /WB/MN OJVG Golouma Gold_2012_FS_Technical_Report_2CO003 008_NMW_DM_TS_GA_DGP_20130315_1 March 15, 2013
Figure 5.1: Concession Deposits and Targets
2CO003.008 – Oromin Joint Venture Group Independent Technical Report for the OJVG Golouma Gold Project, Sénégal Page 15
NMW_DM_TS /WB/MN OJVG Golouma Gold_2012_FS_Technical_Report_2CO003 008_NMW_DM_TS_GA_DGP_20130315_1 March 15, 2013
5.2 OJVG Ownership
Oromin, with its OJVG partners, secured rights to the OJVG exploration concession through an open
tender process completed in 2004. Initial exploration work programs focused on testing prospects
defined by historic exploration and defining new targets. Work began in early 2005, and by year-end
2006, US$11 million was spent to methodically explore the property on a district scale and outline
several high priority gold targets.
Upon completion of the original Exploration License in February 2007, the OJVG petitioned the
Sénégalese government for an extension as allowed within the Mining Act. A twenty-month extension
was granted until December 22, 2008, during which time the OJVG was required to spend US$12
million. These expenditures led to the undertaking of a Pre Feasibility Study (PFS) guided by SRK, to
provide information to help determine the best path forward for the Project. Concurrent with the
extension in December 2008, OJVG was required to relinquish a portion of the concession, reducing
the original concession from 231.3 km2 to its current size of 212.6 km
2.
In September 2009, the OJVG submitted a PFS to the Sénégalese government. Although the study
concluded negative Project economics, the ongoing resource expansion and exploration drilling
programs continued to expand the Project resource base beyond the PFS drill data cut-off date of
May 2009. The OJVG elected to complete the drill program and produce an updated PFS in 2010.
In December 2009, the OJVG submitted a Strategic Environmental Evaluation (SEE) report to the
Sénégalese government as support for OJVG‟s application for a project mining license.
In January 2010, OJVG announced that it would upgrade the scope of the updated study to a full
Feasibility Study, scheduled for completion at the end of June 2010. Additionally in January 2010,
OJVG received government approval for the SEE report submitted in 2009. In February 2010, the
Sénégalese government granted the OJVG a mining license for a term of 15 years, at which time the
license can be renewed.
5.3 2010 Feasibility Study and Subsequent 2010 Milestone Activities
In June 2010, OJVG completed a full Feasibility Study (SRK & Ausenco). The 2010 Feasibility Study
(FS) was based on resource estimates available in early 2010 for Masato, Golouma South, Golouma
West, Kerekounda and Kourouloulou deposits (Table 5.1 to 5.3). The 2010 FS proposed
development included combined open pit and underground mining and Carbon-In Leach (CIL) gold
recovery. The 2010 FS is now out of date.
Table 5.1: Historical (June 2010) Open Pit Mineral Reserve Estimate
Deposit Class Diluted Tonnes Cut-off g/t Grade Gold (kg) (koz)
Golouma W Probable 1,732 0.9 3.53 6,114 197
Golouma S Probable 959 0.89 4.79 4,599 148
Kerekounda Probable 42 0.66 6.54 278 9
Masato Probable 10,154 0.7 1.41 14,306 460
Total Probable 12,888 0.74 1.96 25,296 813
2CO003.008 – Oromin Joint Venture Group Independent Technical Report for the OJVG Golouma Gold Project, Sénégal Page 16
NMW_DM_TS /WB/MN OJVG Golouma Gold_2012_FS_Technical_Report_2CO003 008_NMW_DM_TS_GA_DGP_20130315_1 March 15, 2013
Table 5.2: Historical (June 2010) Underground Mineral Reserve Estimate
Deposit Class Diluted Tonnes
Cut-off g/t Grade Gold (kg) (koz)
Golouma W Probable 2,656 2 3.61 9,601 309
Golouma S Probable 710 2 4.07 2,892 93
Kerekounda Probable 1,154 2 4.77 5,500 177
Kourouloulou Probable 110 2 8.01 880 28
Total Probable 4,630 2 4.08 18,873 607
Table 5.3: Historical (June 2010) Total Mineral Reserve Estimate
Deposit Class Diluted Tonnes
Cut-off g/t Grade Gold (kg) (koz)
Golouma W Probable 4,388 1.57 3.58 15,715 505
Golouma S Probable 1,669 1.36 4.49 7,491 241
Kerekounda Probable 1,196 1.95 4.83 5,778 186
Kourouloulou Probable 110 2 8.01 880 28
Masato Probable 10,154 0.7 1.41 14,306 460
Total Probable 17,517 1.07 2.52 44,170 1,420
In September 2010, OJVG announced a resource update by DRA Americas (DRA) for four of the
Project deposits (Maki Medina, Kobokoto, Niakafiri Southeast and Niakafiri Southwest) and that deep
drilling would be undertaken to test the down dip extensions to the mineralization at Masato,
Golouma (West and South), Kerekounda, and Kourouloulou below the 2010 FS boundaries and their
respective underground potential.
In November 2010, OJVG announced positive results from their engineering optimization studies
(Ausenco) and the initiation of a Preliminary Economic Assessment (PEA) of the heap leach potential
at the Project (Ausenco & SRK).
By the end of 2010, OJVG announced the discovery of several new mineral occurrences including
Kourouloulou South, Saboraya, Koutouniokolla, Kinemba and newly discovered Mamasato,
Kouroundi and Torosita.
5.4 2011 Milestone Activities
The Environmental and Social Impact Assessment (ESIA) was presented to the Sénégalese
government in March 2011. The government identified some issues that needed clarification and the
ESIA was re-submitted in September 2011. A technical review committee validated the ESIA
document on November 2011 and a subsequent and final public hearing approved the ESIA in March
2012.
In May 2011, OJVG completed an update to the Project mineral resources. SRK updated resources
for Masato, Golouma (West and South), Kerekounda and Kourouloulou. DRA updated resources at
Maki Medina, Kobokoto, Niakafiri Southeast and Niakafiri Southwest. The updated resources include
drill data to early 2011.
In June 2011, Ausenco and SRK completed a PEA of the heap leach potential of the Project. Mineral
deposits assessed for the PEA included Masato, Maki Medina, Kobokoto, Niakafiri Southeast and
Niakafiri Southwest. The heap leach operation is viewed as a supplementary production source to

2CO003.008 – Oromin Joint Venture Group Independent Technical Report for the OJVG Golouma Gold Project, Sénégal Page 17
NMW_DM_TS /WB/MN OJVG Golouma Gold_2012_FS_Technical_Report_2CO003 008_NMW_DM_TS_GA_DGP_20130315_1 March 15, 2013
the 2010 FS proposed CIL operation. The preliminary results of the PEA were positive and no fatal
flaws are apparent but additional testing and studies are required to optimize the process.
5.5 Production History
The only known production from the Project has been from local small-scale artisanal mining and a
small mechanically excavated open cut at Kerekounda. Accurate records of the tonnage and grade
from Kerekounda are not available.
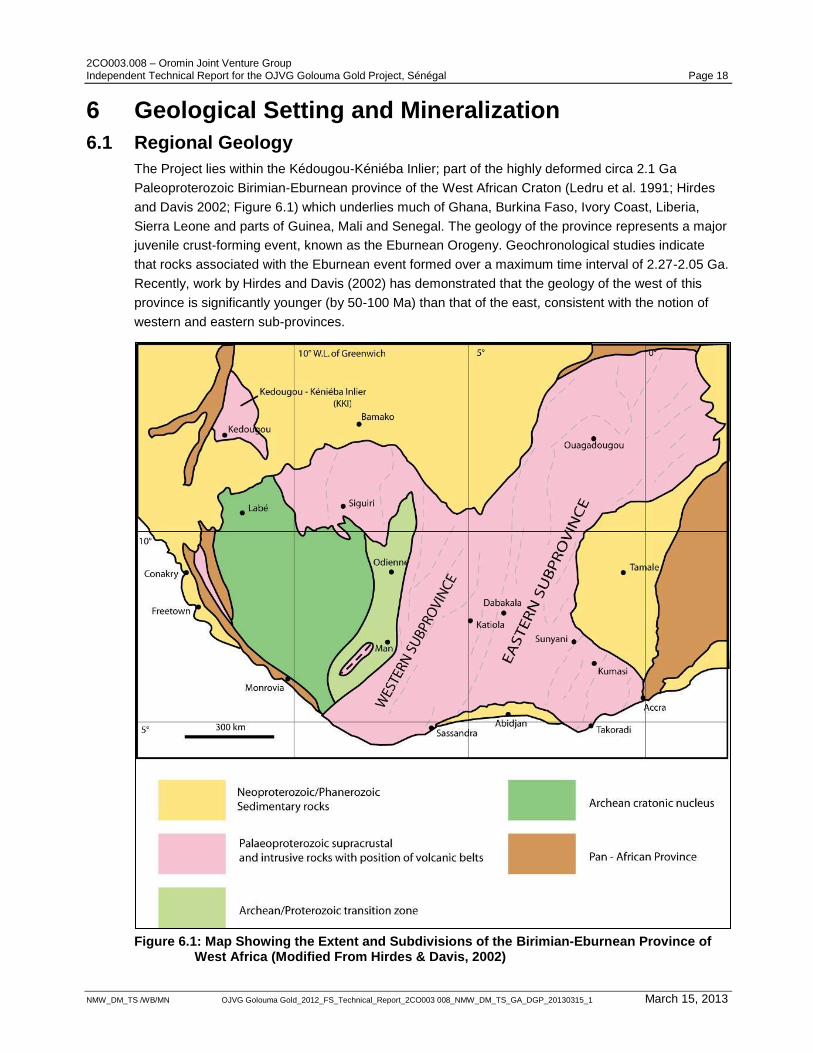
2CO003.008 – Oromin Joint Venture Group Independent Technical Report for the OJVG Golouma Gold Project, Sénégal Page 18
NMW_DM_TS /WB/MN OJVG Golouma Gold_2012_FS_Technical_Report_2CO003 008_NMW_DM_TS_GA_DGP_20130315_1 March 15, 2013
6 Geological Setting and Mineralization
6.1 Regional Geology
The Project lies within the Kédougou-Kéniéba Inlier; part of the highly deformed circa 2.1 Ga
Paleoproterozoic Birimian-Eburnean province of the West African Craton (Ledru et al. 1991; Hirdes
and Davis 2002; Figure 6.1) which underlies much of Ghana, Burkina Faso, Ivory Coast, Liberia,
Sierra Leone and parts of Guinea, Mali and Senegal. The geology of the province represents a major
juvenile crust-forming event, known as the Eburnean Orogeny. Geochronological studies indicate
that rocks associated with the Eburnean event formed over a maximum time interval of 2.27-2.05 Ga.
Recently, work by Hirdes and Davis (2002) has demonstrated that the geology of the west of this
province is significantly younger (by 50-100 Ma) than that of the east, consistent with the notion of
western and eastern sub-provinces.
Figure 6.1: Map Showing the Extent and Subdivisions of the Birimian-Eburnean Province of West Africa (Modified From Hirdes & Davis, 2002)
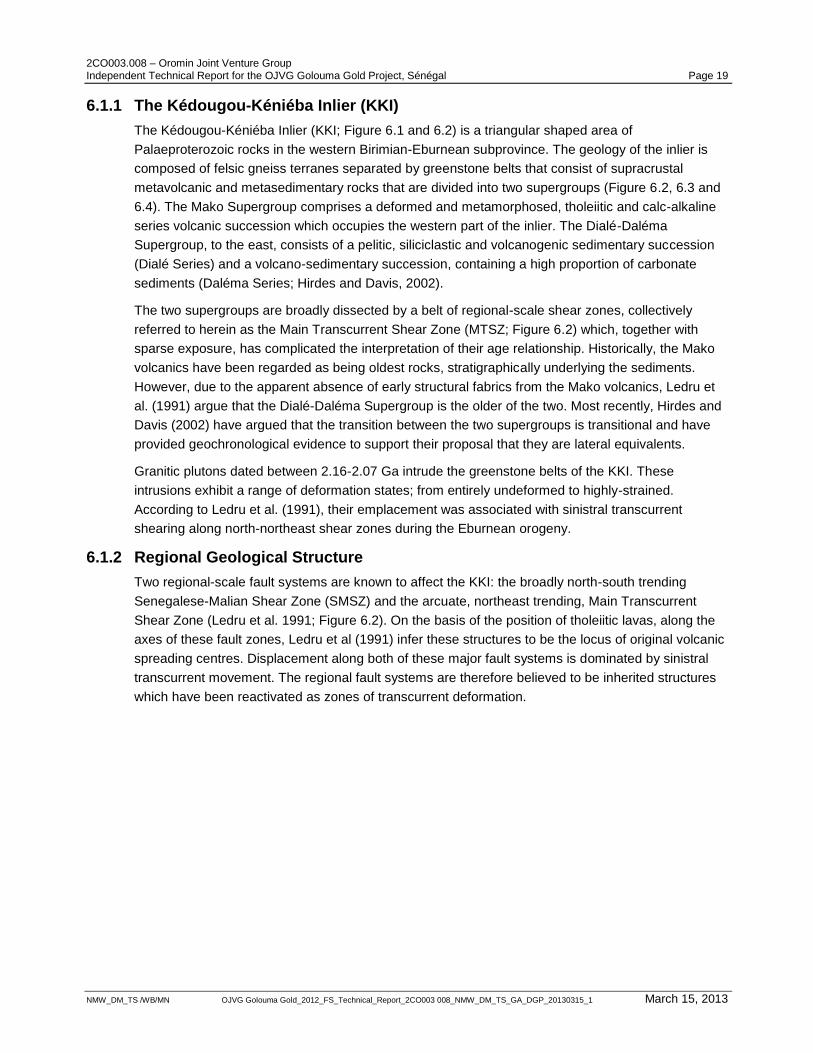
2CO003.008 – Oromin Joint Venture Group Independent Technical Report for the OJVG Golouma Gold Project, Sénégal Page 19
NMW_DM_TS /WB/MN OJVG Golouma Gold_2012_FS_Technical_Report_2CO003 008_NMW_DM_TS_GA_DGP_20130315_1 March 15, 2013
6.1.1 The Kédougou-Kéniéba Inlier (KKI)
The Kédougou-Kéniéba Inlier (KKI; Figure 6.1 and 6.2) is a triangular shaped area of
Palaeproterozoic rocks in the western Birimian-Eburnean subprovince. The geology of the inlier is
composed of felsic gneiss terranes separated by greenstone belts that consist of supracrustal
metavolcanic and metasedimentary rocks that are divided into two supergroups (Figure 6.2, 6.3 and
6.4). The Mako Supergroup comprises a deformed and metamorphosed, tholeiitic and calc-alkaline
series volcanic succession which occupies the western part of the inlier. The Dialé-Daléma
Supergroup, to the east, consists of a pelitic, siliciclastic and volcanogenic sedimentary succession
(Dialé Series) and a volcano-sedimentary succession, containing a high proportion of carbonate
sediments (Daléma Series; Hirdes and Davis, 2002).
The two supergroups are broadly dissected by a belt of regional-scale shear zones, collectively
referred to herein as the Main Transcurrent Shear Zone (MTSZ; Figure 6.2) which, together with
sparse exposure, has complicated the interpretation of their age relationship. Historically, the Mako
volcanics have been regarded as being oldest rocks, stratigraphically underlying the sediments.
However, due to the apparent absence of early structural fabrics from the Mako volcanics, Ledru et
al. (1991) argue that the Dialé-Daléma Supergroup is the older of the two. Most recently, Hirdes and
Davis (2002) have argued that the transition between the two supergroups is transitional and have
provided geochronological evidence to support their proposal that they are lateral equivalents.
Granitic plutons dated between 2.16-2.07 Ga intrude the greenstone belts of the KKI. These
intrusions exhibit a range of deformation states; from entirely undeformed to highly-strained.
According to Ledru et al. (1991), their emplacement was associated with sinistral transcurrent
shearing along north-northeast shear zones during the Eburnean orogeny.
6.1.2 Regional Geological Structure
Two regional-scale fault systems are known to affect the KKI: the broadly north-south trending
Senegalese-Malian Shear Zone (SMSZ) and the arcuate, northeast trending, Main Transcurrent
Shear Zone (Ledru et al. 1991; Figure 6.2). On the basis of the position of tholeiitic lavas, along the
axes of these fault zones, Ledru et al (1991) infer these structures to be the locus of original volcanic
spreading centres. Displacement along both of these major fault systems is dominated by sinistral
transcurrent movement. The regional fault systems are therefore believed to be inherited structures
which have been reactivated as zones of transcurrent deformation.
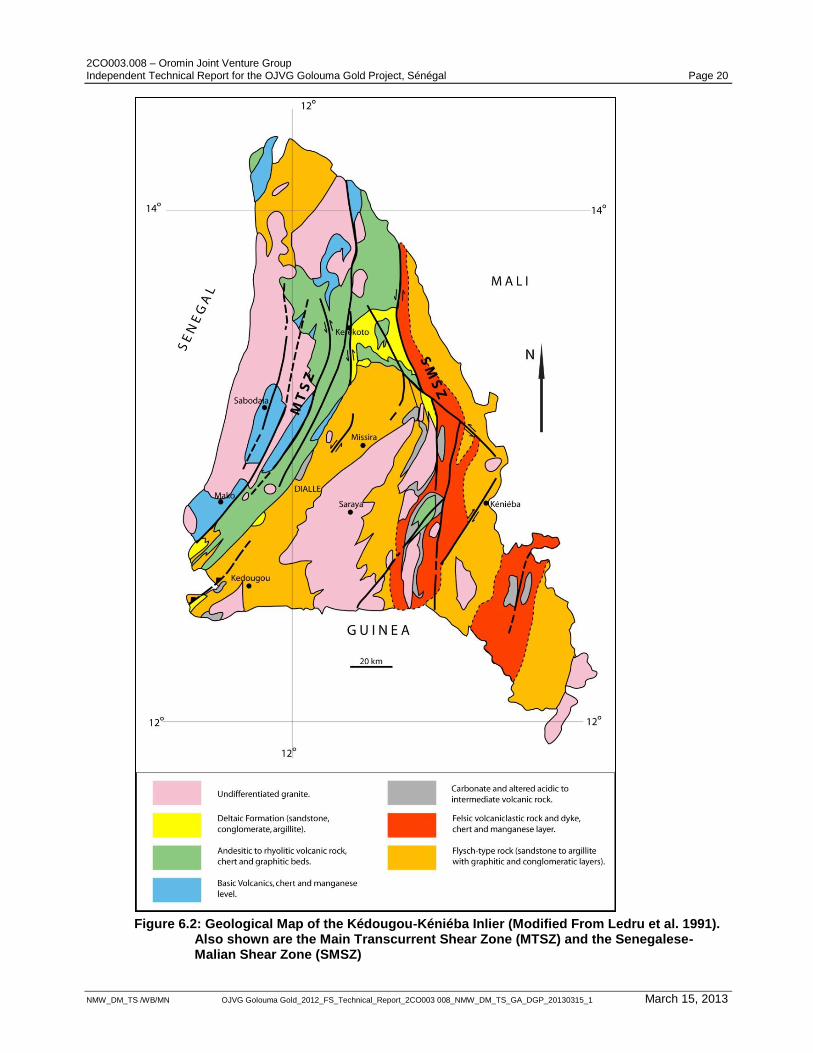
2CO003.008 – Oromin Joint Venture Group Independent Technical Report for the OJVG Golouma Gold Project, Sénégal Page 20
NMW_DM_TS /WB/MN OJVG Golouma Gold_2012_FS_Technical_Report_2CO003 008_NMW_DM_TS_GA_DGP_20130315_1 March 15, 2013
Figure 6.2: Geological Map of the Kédougou-Kéniéba Inlier (Modified From Ledru et al. 1991). Also shown are the Main Transcurrent Shear Zone (MTSZ) and the Senegalese-Malian Shear Zone (SMSZ)
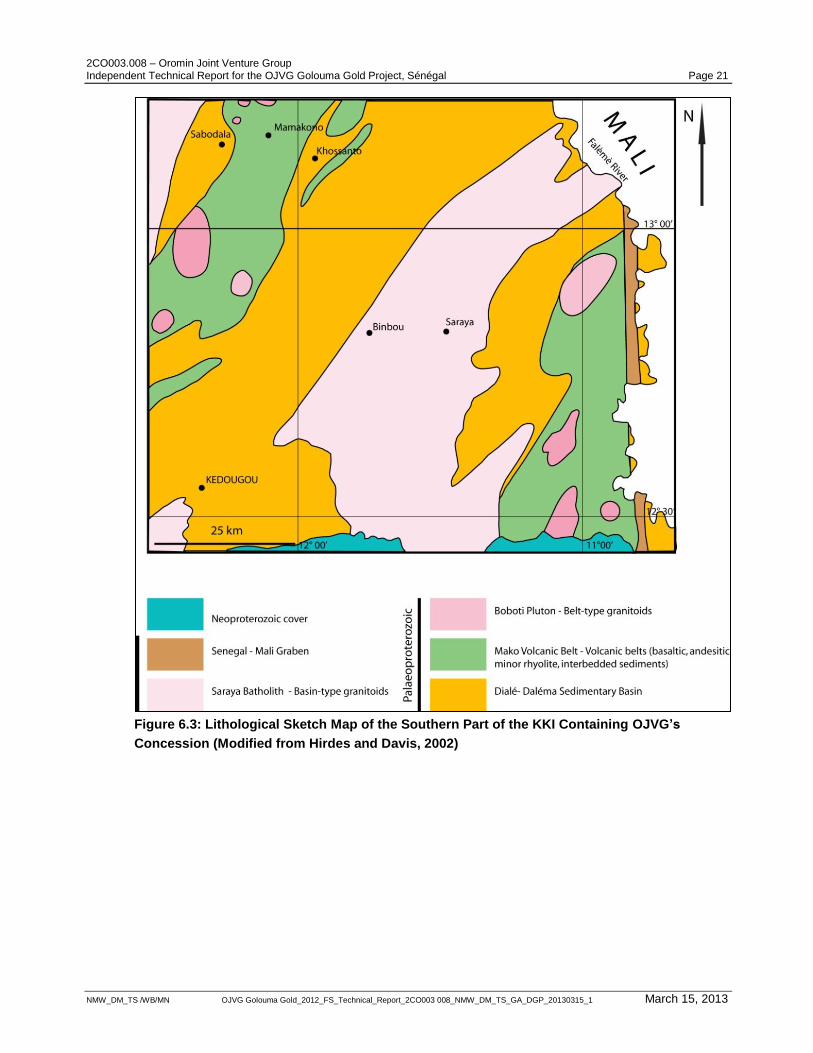
2CO003.008 – Oromin Joint Venture Group Independent Technical Report for the OJVG Golouma Gold Project, Sénégal Page 21
NMW_DM_TS /WB/MN OJVG Golouma Gold_2012_FS_Technical_Report_2CO003 008_NMW_DM_TS_GA_DGP_20130315_1 March 15, 2013
Figure 6.3: Lithological Sketch Map of the Southern Part of the KKI Containing OJVG’s
Concession (Modified from Hirdes and Davis, 2002)
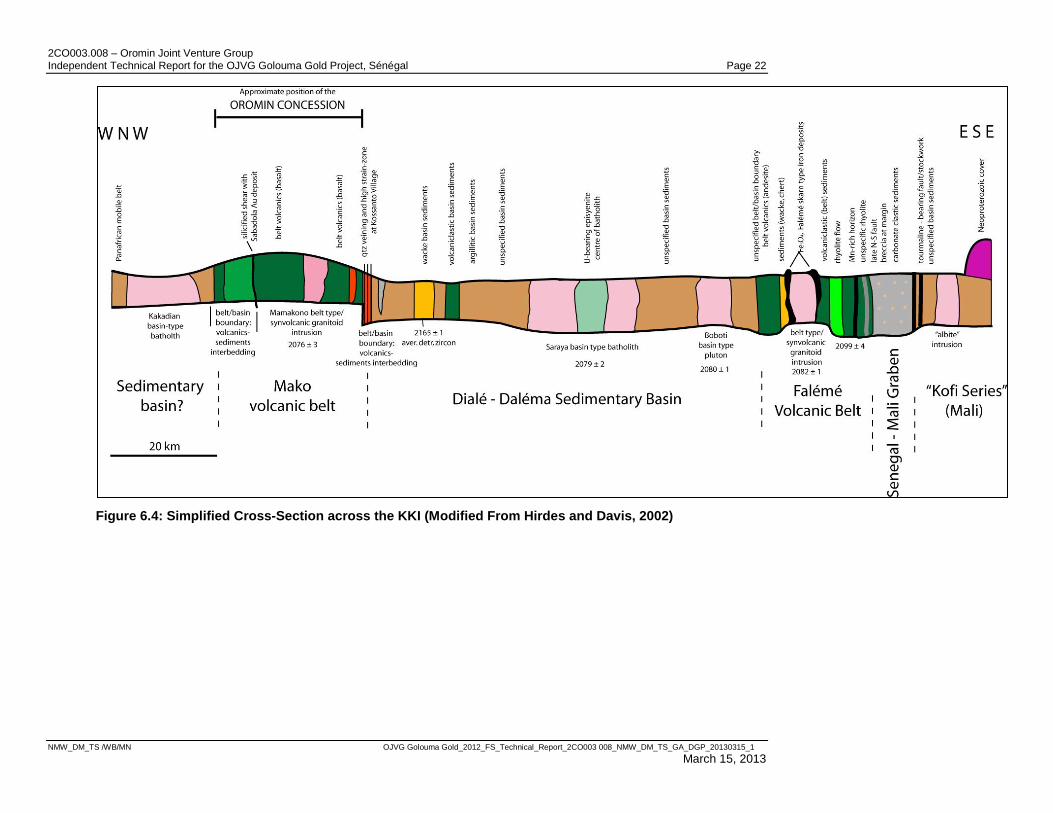
2CO003.008 – Oromin Joint Venture Group Independent Technical Report for the OJVG Golouma Gold Project, Sénégal Page 22
NMW_DM_TS /WB/MN OJVG Golouma Gold_2012_FS_Technical_Report_2CO003 008_NMW_DM_TS_GA_DGP_20130315_1
March 15, 2013
Figure 6.4: Simplified Cross-Section across the KKI (Modified From Hirdes and Davis, 2002)
2CO003.008 – Oromin Joint Venture Group Independent Technical Report for the OJVG Golouma Gold Project, Sénégal Page 23
NMW_DM_TS /WB/MN OJVG Golouma Gold_2012_FS_Technical_Report_2CO003 008_NMW_DM_TS_GA_DGP_20130315_1 March 15, 2013
A regionally developed ductile foliation trending 030° appears to be related to folding on all scales
throughout the KKI. This fabric is thought to have formed during the Eburnean Orogeny (Ledru et
al. 1991) and is associated with the development of the MTSZ. Deformation fabrics contained
within granitic plutonic rocks throughout the inlier, are interpreted to suggest that the regional
folding event was synchronous to the emplacement of granites (Ledru et al. 1991; Gueye et al.
2008).
The regional shear zones and their subsidiary structures appear key in the emplacement of several
significant mineral deposits in the KKI. In western Mali and easternmost Senegal, several gold
mines (producing or under construction) are associated with the Senegal-Malian Shear Zone,
including IAMGOLD and Anglogold Ashanti‟s Yatela and Sadiola mines, Randgold‟s Loulo mine,
Endeavour Mining Corporation‟s and Avion Gold Corporation‟s Tabakoto mine and also hosts
IAMGOLD‟s Boto gold exploration project. Similarly in eastern Senegal, rocks affected by the Main
Transcurrent Shear Zone host several of OJVG‟s gold deposits and prospects as well as Teranga‟s
Sabodala Mine and Randgold‟s Massawa gold exploration project.
6.2 Geology of the OJVG Golouma Concession
6.2.1 Geological Mapping
In the 1960s, the Bureau de Recherches Géologiques et Minières (France; BRGM) conducted a
nationwide 1:200,000-scale mapping program and geological study (Bassot, 1966) that included
mapping the area of the OJVG concession. Their maps define the area of intrusive rocks in the
northwest of the property as part of the Kakadian Batholith, the central area of volcanic rocks as
belonging to the Mako Supergroup and a succession of sedimentary/volcanic rocks towards the
east as part of the Dialé Series. More detailed mapping has been carried out in the central of the
concession area, surrounding Teranga‟s Sabodala deposit by Husson et al. (1987). However, due
to the presence of vegetation, overburden and thick, lateritic and saprolitic weathering profiles,
detailed maps of the solid geology of Sabodala area are highly conjectural.
As part of its mapping campaign, in 2005 OJVG commissioned Encom to produce a
concession-scale geological and structural interpretation of an airborne magnetic survey acquired
by Fugro. OJVG also conducted detailed geological mapping of excavation trenches around their
prospects and retained SRK Consulting to assist with specialist structural geological mapping and
evaluation of its most-advanced prospects.
6.2.2 Distribution of Major Lithologies
The distribution of the major lithological units within the OJVG concession has been mapped
through a combination of OJVG‟s outcrop and trench mapping, and Encom‟s interpretation of the
magnetic attributes of the Fugro survey data. Encom defined broad areas of similar lithology based
on their distinctive magnetic signature summarised as follows below.
Mako Volcanics
Along the centre of the concession is a deformed north-northeast trending belt of strongly magnetic
units, approximately 2 km wide, which forms the spine of the project area and corresponds to a
range of low hills in the otherwise flat landscape. Highly magnetic mafic and ultramafic units, some
layered, within the central-north part of the concession are interpreted to be sub-volcanic intrusives
(Hirdes and Davis, 2002).
2CO003.008 – Oromin Joint Venture Group Independent Technical Report for the OJVG Golouma Gold Project, Sénégal Page 24
NMW_DM_TS /WB/MN OJVG Golouma Gold_2012_FS_Technical_Report_2CO003 008_NMW_DM_TS_GA_DGP_20130315_1 March 15, 2013
These are tectonically interleaved with slivers of mafic to intermediate composition
metasedimentary material, including tuffaceous units which have a less-pronounced magnetic
signature. A significant part of the central concession area comprises basaltic and andesitic
metavolcanics including lithologies identifiable as flows and pillows. Metavolcanics are commonly
weakly altered to a buff-brown or light green colour by carbonate alteration; some are weakly
brecciated. All of the rocks are characterised by varying degrees of ductile (quasi-plastic)
deformation and, to a lesser extent, affected by brittle faulting and jointing. Most rocks contain one
or more ductile deformation fabrics, usually exhibiting a weak to moderate slatey or spaced
cleavage. More massive basaltic units and some mafic dykes are less deformed, appearing blocky
at outcrop.
Kakadian Batholith
The area to the northwest of the Sabodala deposit and Kobokoto is characterised by a high-
amplitude response in the magnetic survey data. This corresponds to a large granitic body,
interpreted to be part of the regional-scale Kakadian Batholith, which stretches 120 km to the north
(Figure 6.2). The batholith is a composite body, consisting of granites, granodiorites,
monzongranites and gabbros, some arranged in layered complexes, containing a variety of mafic
enclaves and dykes (Gueye et al. 2008).
Eburnean Syn-tectonic Granites
In the northeast part of the concession, a number of discrete intrusives are interpreted, such as
those at Mamakono and Sekoto. The Mamakono intrusive has been studied by Gueye et al.
(2008), who describe it as a small, relatively equant pluton of homogeneous biotite-amphibole
granodiorite, intruded into volcanic and volcanosedimentary rocks. Partial alteration by chlorite and
carbonate has been noted. Gueye et al. (2008) consider this pluton, and other weakly deformed or
undeformed granites like it, to be late kinematic intrusives associated with the Eburnean Orogenic
event.
Steeply dipping felsic dykes, up to 5 m wide, occur throughout the OJVG concession area in close
proximity to areas of gold mineralization in Golouma South, Masato and Kerekounda. Their weak
deformation characteristics suggest that they were emplaced as late-kinematic intrusives, with
respect to transcurrent displacements along the MTSZ, and therefore may be of a similar age to
the late kinematic intrusives of Gueye et al (2008).
6.2.3 Structural Geology
The Fugro aeromagnetic dataset, processed by Encom (Figure 6.5), provides good concession-
scale information on the structural geology of the Sabodala area. The magnetic anomalies on the
survey define two predominant structural elements, described below.
East-Northeast Shear Zones
Relatively discontinuous magnetic lineaments with straight to sinuous traces are relatively
ubiquitous throughout the Project area. Linear anomalies of this set have a mutually cross-cutting
relationship with north-northeast-south-southwest to north-south trending discrete lineaments,
described below. However, on the balance of their relationships, the former appear to pre-date the
latter. The east-northeast-west-southwest set of magnetic structures are parallel or sub-parallel to
several discrete through-going linear anomalies of regional extent. These are not obviously
2CO003.008 – Oromin Joint Venture Group Independent Technical Report for the OJVG Golouma Gold Project, Sénégal Page 25
NMW_DM_TS /WB/MN OJVG Golouma Gold_2012_FS_Technical_Report_2CO003 008_NMW_DM_TS_GA_DGP_20130315_1 March 15, 2013
affected by the north-northeast trending structures and therefore may represent deep-seated
structures.
Outcrop and trench exposures within areas with east-west linear anomalies contain greenschist
facies, fine-grained metavolcanic rocks which are weakly to moderately deformed, containing an
east-west or west-northwest oriented slaty cleavage or schistosity. Typically, the fabric dips steeply
to subvertically towards the south.
North-Northeast to North-South Shear Zones
The most striking structures on the magnetic survey data of OJVG‟s concession are an array of
north-northeast-south-southwest to north-south oriented discrete lineaments. A concentration of
these lineaments runs along the entire spine of the concession and another concentration occurs
along the south-western margin of the magnetic survey area. These lineaments commonly cause
small offsets or deflections of east-northeast-west-southwest trending anomalies, with apparent
left-lateral (sinistral) displacements and clearly represent shear zones. Collectively they are
assigned to the Main Transcurrent Shear Zone of Ledru et al. (1991). Several of the shear zones
have strong continuous magnetic signatures owing to the presence of gabbroic dykes along their
axes. Although the most obvious structures consist of concentrations of shear zones, away from
these clusters, weaker, less continuous shear zones are distributed throughout the lower strain
areas of the concession.
At outcrop, the north-northeast trending structures are manifest as zones of north-northeast
trending ductile-deformed rocks, a few metres to several hundreds of metres wide. Outside of the
main shear zones, the east-west fabric is crenulated by millimetre to centimetre-scale north-
northeast trending shear zones, indicating that they post-date the formation of the east-west fabric.
In higher strain zones, the crenulations grade into zones of crenulation cleavage. Where this has
been mapped, the crenulation planes and north-northeast-cleavage orientation generally dip
steeply to subvertically to the east-southeast.
In addition to these prominent lineations, Encom has interpreted a third northwest-southeast
trending set which is not easily recognised at outcrop. It is possible that the Kerekounda deposit is
hosted by one such structure.
6.2.4 Residual Soils
A thin layer (<0.3 m) of loose overburden containing organic matter is underlain by massive,
nodular, red-brown lateritic residual soils over the majority of the concession. Where observed in
excavation trenches in Golouma, the laterites grade into brown-grey coloured friable saprolites at
depths of approximately 1 m to 2 m below the ground surface. In some areas, particularly Masato,
the weathering is more intense and laterite thickness can be greater than 2 m. Where known from
drilling, saprolite thickness varies from several metres to several tens of metres, grading in to a
zone of discoloured oxidised bedrock at depth.
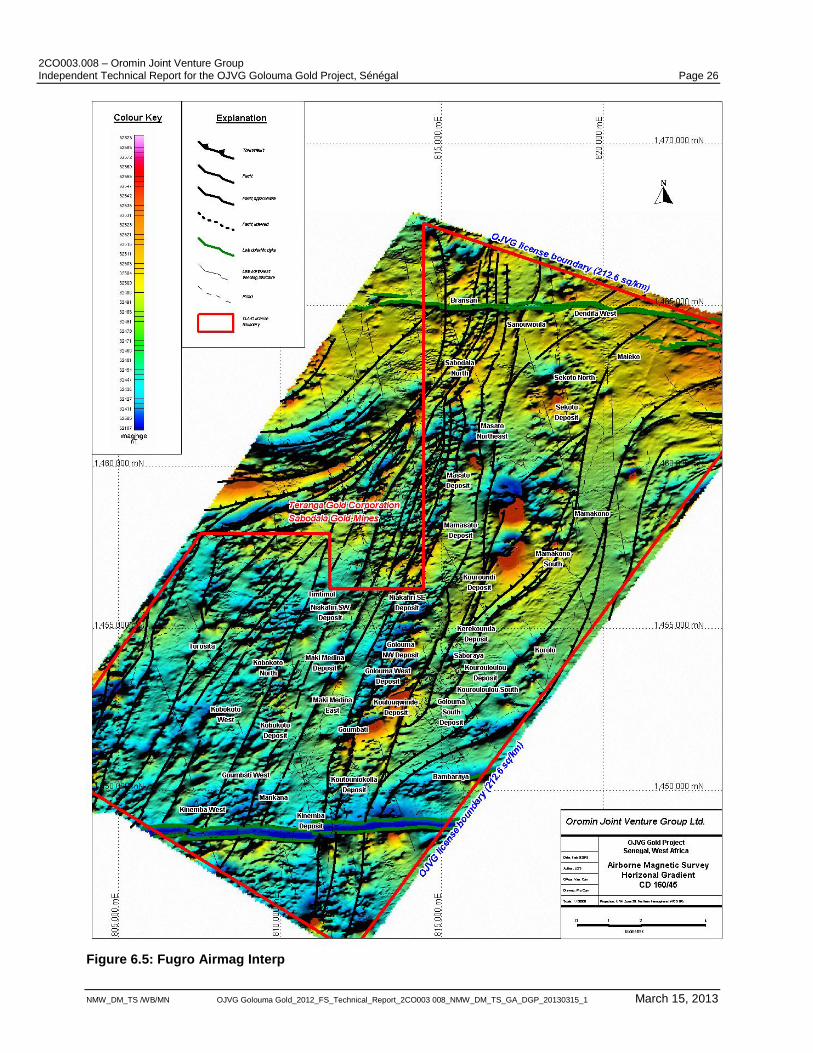
2CO003.008 – Oromin Joint Venture Group Independent Technical Report for the OJVG Golouma Gold Project, Sénégal Page 26
NMW_DM_TS /WB/MN OJVG Golouma Gold_2012_FS_Technical_Report_2CO003 008_NMW_DM_TS_GA_DGP_20130315_1 March 15, 2013
Figure 6.5: Fugro Airmag Interp
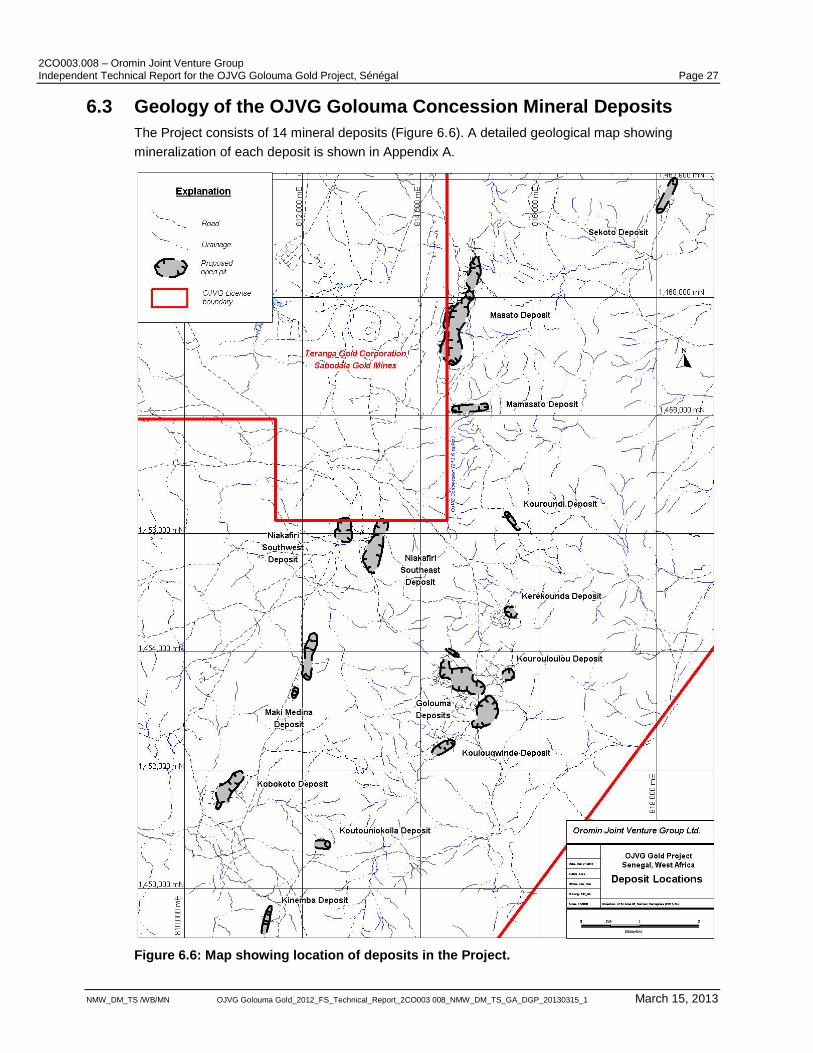
2CO003.008 – Oromin Joint Venture Group Independent Technical Report for the OJVG Golouma Gold Project, Sénégal Page 27
NMW_DM_TS /WB/MN OJVG Golouma Gold_2012_FS_Technical_Report_2CO003 008_NMW_DM_TS_GA_DGP_20130315_1 March 15, 2013
6.3 Geology of the OJVG Golouma Concession Mineral Deposits
The Project consists of 14 mineral deposits (Figure 6.6). A detailed geological map showing
mineralization of each deposit is shown in Appendix A.
Figure 6.6: Map showing location of deposits in the Project.
2CO003.008 – Oromin Joint Venture Group Independent Technical Report for the OJVG Golouma Gold Project, Sénégal Page 28
NMW_DM_TS /WB/MN OJVG Golouma Gold_2012_FS_Technical_Report_2CO003 008_NMW_DM_TS_GA_DGP_20130315_1 March 15, 2013
6.3.1 Masato
The Masato deposit occurs in the north central portion of the concession, several kilometres to the
north of Golouma West, within a zone of highly magnetic mafic and ultramafic volcanics (Figure
6.7). The geology of Masato is dominated by a north-northeast-south-southwest (~020º) trending
ductile shear zone several tens of metres in width. The mineralization is hosted within multiple
shear fabric-parallel zones with the broader shear zone. This shear zone can be traced to the north
and particularly to the south, where it appears to host further mineralization at Niakafiri Southeast.
The shear zone fabric dips about 70º west and locally areas of intense metre-scale folding can be
recognised in trench outcrops, although the mineralization does not appear to be affected (folded)
on a large scale. Some ultramafic rocks, recognised in drill core, are affected by the shearing and
commonly appear “greasy”, possibly resulting from alteration by talc and serpentine.
Carbonate-dominated alteration is relatively widespread. However; at Masato, fuchsite is present in
addition to the carbonate-quartz-sericite assemblage, particularly within ultramafic units. As at
Golouma South, pink felsic dykes occur in close proximity to the mineralized shear zone at Masato.
In total, ten brittle fault zones and one discrete high strain shear zone have been modelled at the
Masato deposit. The interpreted faults fall into two orientation trends. Eight faults are oriented east-
northeast-west-southwest and follow prominent linear magnetic breaks. With the exception of one
subvertical fault, these faults dip moderately or steeply towards the northwest. Two other faults
have been modelled broadly paralleling the axis of the deposit, striking north-south to north-
northeast-south-southwest and dipping steeply towards the west. None of the faults can be
correlated with resolvable displacements of the modelled resource or other modelled geological
elements. However, several corrugations in the wireframes do occur and may represent
displacements below the scale resolvable by the current drilling.
6.3.2 Golouma West, Golouma South, Golouma Northwest, and Kourouloulou
Golouma West Golouma South, and Golouma Northwest deposits, collectively the Golouma area,
occur in mafic volcanic rocks in the central part of the Project (Figure 6.8). The geology of the area
is dominated by moderately deformed massive flows and pillowed basaltic rocks. The rocks are
moderately chloritised, which in some instances is accompanied by the development of epidote
replacement. Hydrothermal carbonate-dominated alteration overprints the rocks where deformed
by ductile shear. In areas of low strain, the alteration yields a wispy appearance, but in more highly
deformed zones, it imparts a buff or salmon-pink colouration and is associated with anomalous
gold concentrations. Several felsic dykes, up to 5 m in width, occur throughout the Golouma area
and appear to be intimately associated with the gold mineralization, particularly in Golouma South.
A small number of mafic dykes have been recognised in drill core, including one thick gabbroic
dyke.
The Golouma area is bound by two north-northeast trending zones of ductile shear which dip
steeply to sub-vertically towards the west-northwest. The western shear zone is continuous to the
north and south for several kilometres and hosts part of the Golouma West mineralization (referred
to as Golouma Northwest), as well as a thick gabbroic dyke. The eastern shear zone appears to
converge with the western shear zone towards the south and hosts the Golouma South deposit
within northeast trending anastomosing shear zones.The two northeast trending shear zones are
linked by an east-west trending belt of intensely sheared and altered mafic volcanic rocks,
approximately 1 km in length.This zone dips steeply towards the south and hosts the main
2CO003.008 – Oromin Joint Venture Group Independent Technical Report for the OJVG Golouma Gold Project, Sénégal Page 29
NMW_DM_TS /WB/MN OJVG Golouma Gold_2012_FS_Technical_Report_2CO003 008_NMW_DM_TS_GA_DGP_20130315_1 March 15, 2013
mineralized bodies of the Golouma West deposit. Outcrops and trench exposures indicate that the
east-west trending shear fabric is locally overprinted by northeast oriented shear fabrics, giving rise
to crenulations, crenulation cleavage and differentiated foliations. Fabric asymmetries indicate the
northeast oriented shear zones accommodated a sinistral-oblique-normal movement sense.
The Golouma West deposit is affected by a significant fault, referred to as the Golouma West Fault
The fault strikes 061-241° and has a subvertical dip, which displaces the east-west trending
mineralization by approximately 140 m in an apparent dextral sense. Other structures of this
orientation are visible on magnetic survey maps of the Golouma area, three of which have been
modelled using drill hole data. A shallow north-northwest dipping thrust fault has also been located
in the south of the deposit.
The Kourouloulou deposit is situated directly west of the northern continuation of the Golouma
South shear zone. The deposit consists of four broadly east-southeast striking mineralized veins
arranged parallel to each other within a zone that dips steeply towards the south. Three cross-
cutting, subvertical northwest dipping brittle faults have been modelled for the deposit using drill
hole data.
6.3.3 Kerekounda
The Kerekounda deposit is located approximately 1.5 km to the north of the Golouma South
deposit, within the same east-northeast-west-southwest structural trend that hosts the
mineralization of the Golouma area. The deposit is hosted by weakly to moderately deformed mafic
volcanics, similar to the host rocks at Golouma. The main ductile foliation orientation is 060-240°,
consistent with the east-northeast trending regional structure.
However, mineralization at Kerekounda is localised within three relatively discrete north-northwest
trending shear zones which have only a very subtle expression on the Encom magnetic survey
maps. The mineralized bodies are planar and dip moderately to steeply (50°-70°) towards the west-
southwest. As in the Golouma deposits, the ductile deformation at Kerekounda, correlates with an
intensification of carbonate-quartz-sericite alteration and carbonate-quartz veining, both of which
contain anomalous gold. Approximately 100 m to the west of the main mineralization, a unit of
tuffaceous sediments occurs structurally below the mafic volcanics, and dips sub-parallel to the
main mineralized zones.
The deposit is cut by a relatively thick north-northeast trending mafic dyke which is not mineralized
and several smaller mafic dykes which do not cross-cut the mineralization. Additionally, felsic
dykes occur in the hangingwall and along the contact between the mafic volcanics and tuffaceous
sediments, within the footwall to the mineralization.
Four brittle fault structures have been identified from drill core logs and modelled. Two features
strike between east-west and west-southwest, with an intermediate north-northwest dip. One
additional structure dips at 67o towards the west-northwest and is described in core with a
significant amount of breccia. The final structure strikes northwest with a shallow northeast dip.
6.3.4 Niakafiri Southeast and Niakafiri Southwest
The Niakafiri Southeast and Niakafiri Southwest deposits occur within a zone of highly magnetic
mafic and ultramafic metavolcanics. The geology is dominated by a north-northeast trending, west
dipping ductile shear zone, several tens of metres wide. The structural zone appears to continue
from Masato southwards through Niakafiri, Maki Medina and Kobokoto to Kinemba. At Niakafiri
2CO003.008 – Oromin Joint Venture Group Independent Technical Report for the OJVG Golouma Gold Project, Sénégal Page 30
NMW_DM_TS /WB/MN OJVG Golouma Gold_2012_FS_Technical_Report_2CO003 008_NMW_DM_TS_GA_DGP_20130315_1 March 15, 2013
Southeast, the carbonate dominated hydrothermal alteration is relatively widespread and as at
Masato fuchsite (Cr-mica) is present in addition to the carbonate-silica-sericite alteration
assemblage, particularly within ultramafic units. As with many of the deposits, fine-grained pink
felsic dykes occur in close proximity to the mineralized shears. As at Masato, deep oxidation has
affected the mineral zones and preliminary testing has shown the lower grade oxide material to be
amenable to heap leach recovery.
Niakafiri Southwest is is parallel to and west of Niakafiri Southeast. Niakafiri Southwest is
interpreted to be a 200 m to 300 m wide structural zone consisting of north-northeast trending,
steeply west dipping, strongly sheared and altered mafic and ultramafic metavolcanic rocks.
Alteration is similar to that at Niakafiri Southeast and dominated by carbonate-silica-sericite and
locally fuchsite. As at Niakafiri Southeast, fine-grained pink felsic dykes occur in close proximity to
the mineralized shears.
6.3.5 Maki Medina
The Maki Medina deposit is situated along the same steeply west dipping, north-northeast trending
structural zone that hosts Masato and Niakafiri Southeast to the north, and Kobokoto and Kinemba
to the south. At Maki Medina, the host mafic metavolcanics and tuffaceous volcanoclastic
sediments are strongly sheared and carbonate dominated alteration is widespread. The main
mineralized zone consists of several west dipping, variably sheared zones of quartz-carbonate
alteration and quartz-carbonate-tourmaline veining. Several shear parallel, fine-grained, pink felsic
dykes occur in close proximity to the mineralized shears. Deep oxidation has affected the mineral
zones at Maki Medina and portions are amenable to heap leach recovery.
6.3.6 Kobokoto
The Kobokoto deposit is located along the same steeply west dipping north-northeast trending
structural zone that hosts Masato. At Kobokoto, the host mafic metavolcanics and tuffaceous
volcanoclastic sediments are strongly sheared and carbonate dominated alteration is widespread.
Deep oxidation has affected the mineral zone and lower-grade oxide mineralization may be
amenable to heap leach recovery.
6.3.7 Mamasato
The Mamasato deposit geology consists of mafic metavolcanics that have been strongly deformed
and sheared by an east-west striking, moderately north dipping, 30 m to 50 m wide shear zone.
Several prominent, narrow, fine-grained, pink, felsic dykes occur proximal to the gold
mineralization, and minor intermediate dykes occur in both the hanging wall and footwall of the
main shear. Oxidation at Mamasato extends to depths of 30 m to 50 m and portions of the
mineralization may be amenable to heap leaching.
6.3.8 Koulouqwinde
The Koulouqwinde deposit is situated within the southwest extension of the main structure that
hosts the Golouma South deposit. The principal rock type is massive to sheared mafic
metavolcanic, with minor felsic and mafic dykes. The felsic dykes are massive, fine grained,
pink/carbonate altered, approximately 5-10m in width, and are hosted within northeasterly trending
shear zones. The southeastern most felsic dyke has been interpreted to be an extension of the
main felsic dyke (northeast trending) that is located in the hanging wall of the Golouma South
2CO003.008 – Oromin Joint Venture Group Independent Technical Report for the OJVG Golouma Gold Project, Sénégal Page 31
NMW_DM_TS /WB/MN OJVG Golouma Gold_2012_FS_Technical_Report_2CO003 008_NMW_DM_TS_GA_DGP_20130315_1 March 15, 2013
deposit. A narrow mafic dyke- interpreted to be the south extension of the Kerekounda mafic dyke-
cross-cuts the northeast trending felsic dykes and shear zones near the eastern end of the deposit.
6.3.9 Sekoto
The Sekoto area geology consists of a central granodiorite stock, which has intruded adjacent,
deformed to highly-strained mafic metavolcanics and sediments. Late, massive, fine grained,
narrow, intermediate-mafic dykes intrude all of the units. Oxidation at Sekoto commonly extends 30
m to 40 m below surface (vertical). Locally, deeper oxidation is present along structures or where
laterite is present. Deeply oxidized mineralization may be amenable to heap leach recovery.
6.3.10 Kinemba
The geology of the Kinemba deposit consists of massive to locally strongly sheared mafic
metavolcanics intruded by a prominent magnetic mafic (gabbro) dyke, and minor intermediate to
felsic dykes. The shear zones and dykes commonly strike towards the northeast and dip
moderately to steeply westward, parallel to the regional trend. Oxidation at Kinemba can reach
depths of up to 70 m (vertical), making it an ideal target for heap leach operations.
6.3.11 Koutouniokolla
The geology at the Koutouniokolla deposit consists of strongly deformed mafic metavolcanics and
minor volcanoclastic sediments, which are locally intruded by fine-grained pink felsic dykes. The
mafic metavolcanics have been strongly deformed by two separate shear zones, with shearing
oriented either west-northwest or north-northeast.
6.3.12 Kouroundi
The geology of the Kouroundi deposit consists of mafic metavolcanics, which have been locally
strongly deformed by two major shear zones. The main gold bearing shear zone strikes to the
northwest and dips approximately 40° to the southwest, and is generally 10 m to 40 m wide. The
second major shear zone is located at the southern end of the prospect and is perpendicular to the
main gold bearing shear zone. The second shear zone strikes westerly, dips steeply to the north, is
approximately 25 m to 35 m in width and appears to interrupt/cut-off gold mineralization where it
intersects the main gold bearing shear. Prominent and minor intermediate dykes intrude both shear
zones, and are oriented generally sub-parallel to the strike of both shears. The most prominent
intermediate dyke is located in the footwall of the gold bearing shear and is approximately 10 m in
width and strikes towards the north.
Oxidation at Kouroundi is quite variable; with oxidation in the hanging wall commonly extending
down 30 m to 50 m. Oxidation within the footwall is more intermittent with oxidation locally
extending to depths of over 100 m, especially towards the north, where the mineralized zone
extends beneath a very thick laterite plateau.
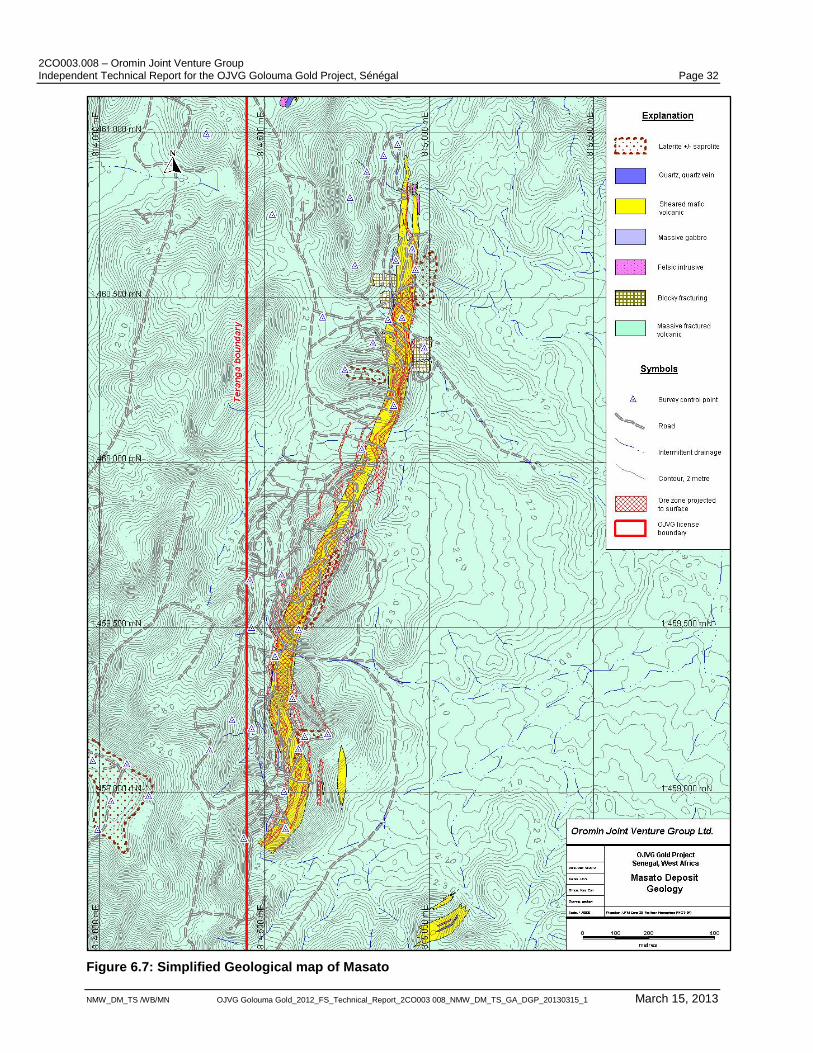
2CO003.008 – Oromin Joint Venture Group Independent Technical Report for the OJVG Golouma Gold Project, Sénégal Page 32
NMW_DM_TS /WB/MN OJVG Golouma Gold_2012_FS_Technical_Report_2CO003 008_NMW_DM_TS_GA_DGP_20130315_1 March 15, 2013
Figure 6.7: Simplified Geological map of Masato
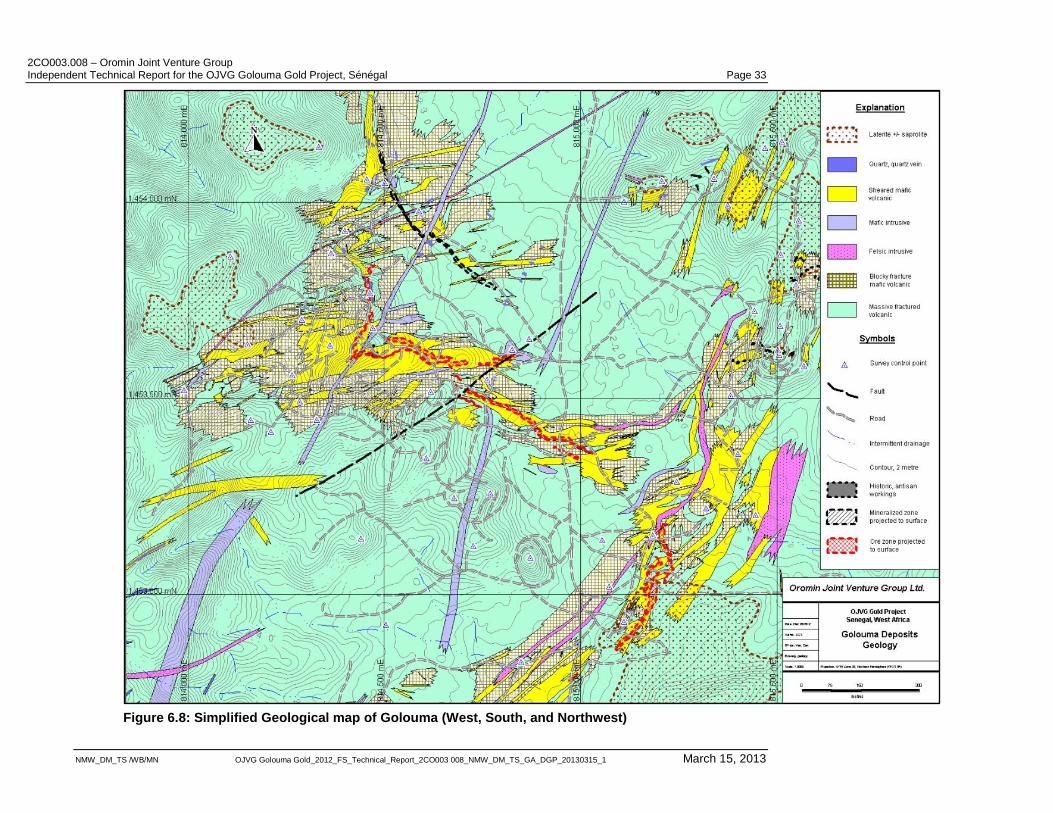
2CO003.008 – Oromin Joint Venture Group Independent Technical Report for the OJVG Golouma Gold Project, Sénégal Page 33
NMW_DM_TS /WB/MN OJVG Golouma Gold_2012_FS_Technical_Report_2CO003 008_NMW_DM_TS_GA_DGP_20130315_1 March 15, 2013
Figure 6.8: Simplified Geological map of Golouma (West, South, and Northwest)
2CO003.008 – Oromin Joint Venture Group Independent Technical Report for the OJVG Golouma Gold Project, Sénégal Page 34
NMW_DM_TS /WB/MN OJVG Golouma Gold_2012_FS_Technical_Report_2CO003 008_NMW_DM_TS_GA_DGP_20130315_1 March 15, 2013
6.4 Mineralization
Orogenic gold mineralization found on the OJVG Golouma Gold Concession is generally
subdivided into two types; higher grade “Golouma type” and lower grade bulk tonnage “Masato
type”. Golouma type deposits including the Kerekounda, Kourouloulou, Golouma (West, South and
Northwest), Kouroundi, Koutouniokolla, Mamasato, and Koulouqwinde deposits are found in the
central to eastern parts of the concession. Golouma type deposits are covered by relatively thin,
poorly developed laterite and saprolite where uplift has caused the commonly thick laterite and
saprolite to be locally eroded and occasionally exposing the underlying mafic metavolcanic
bedrock. Masato type deposits include Masato, Niakafiri Southwest, Niakafiri Southeast, Maki
Medina, Kobokoto, Kinemba, and Sekoto. Masato type deposits are generally located within an
extensive northeast trending structural zone lying to the west of the Golouma deposits. The Masato
type deposits are generally comprised of multiple closely-spaced, parallel, moderate to steep
dipping shear zones and largely covered by variable thickness of laterite. The deposits are
commonly deeply weathered often in excess of 50 m. The mineralization of each deposit is shown
along with the geology in Appendix A.
6.4.1 Masato Type Deposits
Masato
Shearing at Masato has a northeast trending strike and dips moderately (45°-65°,) to the west.
Currently, OJVG has defined the deposit over a strike length of 2.1 km. Mineralization has been
systematically drilled to a depth of approximately 250 m below surface. It remains open at depth
along most of its strike length.
Gold is hosted by a complex, north-northeast oriented shear zone, which trends along the axis of
the Main Transcurrent Shear Zone. The host rocks consist of strongly ductile-deformed greenschist
facies (chlorite-epidote-carbonate) metabasalts and meta-ultramafic (talc-serpentine) units. They
have been hydrothermally altered by an Iron-carbonate-silica-sericite-fuchsite and pyrite mineral
assemblage. The presence of fuchsite is seen in the mafic to ultramafic units at Masato, where it
imparts a bright green colouration. The most intensely altered zones are usually carbonate-silica-
sericite-pyrite dominated and appear pale pink (salmon) to cream in colour and fuchsite is less
significant. The most intense alteration is often associated with the presence of an intense
crenulation cleavage.
Gold values are associated with intensely altered zones dominated by the presence of carbonate,
silica and pyrite. Some textural evidence suggests that mineralization is associated with a relatively
late stage of the overall deformation framework. Gold distribution within the shear zones at Masato
show systematic northwest trending higher-grade shoot control. The Masato deposit hosts multiple
generations of mineral veins. Early white-grey coloured quartz- feldspar veins are commonly highly
deformed and do not contain anomalous gold values. Quartz-carbonate veins up to 0.5 m thick are
relatively common in the highly altered areas of the Masato deposit. The veins dip to the west and
strike broadly parallel to the main trace of the deposit. Numerous felsic dykes occur in close
proximity with mineralization at Masato.
Niakafiri Southeast
The geology is dominated by a north-northeast trending, west dipping ductile shear zone, several
tens of metres wide. Mineralization is hosted within multiple shear zones within the broader
structural zone. The structural zone appears to continue from Masato southwards through Niakafiri,
2CO003.008 – Oromin Joint Venture Group Independent Technical Report for the OJVG Golouma Gold Project, Sénégal Page 35
NMW_DM_TS /WB/MN OJVG Golouma Gold_2012_FS_Technical_Report_2CO003 008_NMW_DM_TS_GA_DGP_20130315_1 March 15, 2013
Maki Medina and Kobokoto to Kinemba. Carbonate dominated hydrothermal alteration is relatively
widespread and as at Masato fuchsite (Cr-mica) is present in addition to the carbonate-silica-
sericite alteration assemblage, particularly within ultramafic units. The mineral zone has been
traced for approximately 1.2 km and down to 180 m depth and remains open to expansion. Locally,
the north-northeast trending mineral zone appears to be offset by several late, brittle, east-west
cross faults.
Niakafiri Southwest
Niakafiri Southwest is located 1 km west of, and parallel to, Niakafiri Southeast. The area is
interpreted to be a 200 m to 300 m wide structural zone consisting of north-northeast trending
steeply west dipping strongly sheared and altered mafic and ultramafic metavolcanic rocks.
Alteration is similar to that at Niakafiri Southeast and dominated by carbonate-silica-sericite and
locally fuchsite. As at Niakafiri Southeast, fine-grained pink felsic dykes occur in close proximity to
the mineralized shears. The mineralization has been traced in drilling for 400 m along strike and to
a depth of 140 m and remains open to expansion. Locally, as at Niakafiri Southeast, the north-
northeast trending mineral zone appears to be offset by several, late-stage, brittle, east-west cross
faults.
Maki Medina
The Maki Medina deposit is situated along the same steeply west dipping north-northeast trending
structural zone that hosts Masato and Niakafiri Southeast to the north and Kobokoto and Kinemba
to the south. At Maki Medina, the host mafic metavolcanics and tuffaceous volcanoclastic
sediments are strongly sheared and carbonate dominated alteration is widespread. The main
mineralized zone consists of several west dipping, variably sheared zones of quartz-carbonate
alteration and quartz-carbonate-tourmaline veining. Several shear parallel, fine-grained, pink felsic
dykes occur in close proximity to the mineralized shears. Drilling has defined a northern zone with
a strike length of 700 m and a smaller southern zone defined for 200 m. The current resource is
drilled to a 120 m depth.
Kobokoto
At Kobokoto, the host mafic metavolcanics and tuffaceous volcanoclastic sediments are strongly
sheared and carbonate dominated alteration is widespread. The main mineralized zone consists of
a shallow west dipping, variably sheared zone of quartz-carbonate alteration and quartz-carbonate-
tourmaline veining. The current resource is drilled to a depth of 100 m and over a strike length of
1 km.
Sekoto
Gold mineralization tested at Sekoto is hosted within and along the margins of a variably altered,
massive to weakly deformed, medium grained, granodioritic intrusive. It is found within multiple
sub-parallel zones of replacement-style pink carbonate-silica-pyrite alteration that range in
thickness from 3 m to 30 m. The zones strike towards the north or northeast and dip moderate-
steeply towards the west. Gold values within the altered host rocks are commonly low with grades
typically ranging from 0.3 to 1.0 g/t Au. Locally, higher grades are present (>5 g/t Au) in narrow
quartz-tourmaline veins.
A relatively continuous body of low-grade gold mineralization has been defined and traced on strike
for approximately 350 m and down-dip for approximately 150 m. This zone remains open to the
northeast and down-dip.
2CO003.008 – Oromin Joint Venture Group Independent Technical Report for the OJVG Golouma Gold Project, Sénégal Page 36
NMW_DM_TS /WB/MN OJVG Golouma Gold_2012_FS_Technical_Report_2CO003 008_NMW_DM_TS_GA_DGP_20130315_1 March 15, 2013
Kinemba
Gold mineralization at Kinemba is found in multiple zones of weak to moderate carbonate-albite-
silica-sericite-pyrite alteration, varying in width from 5 m to 30 m, which are hosted by strongly
sheared mafic metavolcanic rocks. The mineralization trends approximately north-northeast,
dipping steeply westward (-80°), and has been traced over a strike length of approximately 600 m
to a depth of 200 m. A prominent north-northeast trending, 20 m to 40 m thick, massive mafic dyke
intrudes and subdivides the zones of shearing and alteration into East and West parts. Zones of
shearing and alteration on the west side of the dyke (hanging wall) exhibit stronger gold values and
better continuity along strike and down-dip, versus the alteration and shearing observed on the
east side (footwall) of the dyke. Due to the limited drilling completed to date on the footwall side,
the continuity of gold mineralization between the East and West zones is unknown at this time.
6.4.2 Golouma Type Deposits
Golouma West
The geometry of the Golouma West deposit consists of two broadly east-west trending shear zone-
hosted sheet-like bodies which together have a total strike length of approximately 900 m and a
north-northeast trending appendage, referred to as the West limb. In plan, the east-west trending
bodies are offset by approximately 140 m in a dextral sense along the east-northeast striking
Golouma West Fault and were therefore originally emplaced along a single east-west structure.
The West limb is approximately 200 m in length and dips moderately to steeply towards the west-
northwest.
The principal zone of mineralization at Golouma West changes orientation from east-west to north-
northeast where it intersects a strong north-northeast oriented shear zone of the Main Transcurrent
Shear Zone trend. In section, the main mineralized zone dips 75°-80º south, broadly parallel to the
main east-west ductile cleavage. The West limb dips at -65º west transitioning to about -45º at
depths of 200 m.
Gold mineralization is hosted in a highly ductile-deformed shear zone. The shear zone occurs as a
broad zone (20 m to 50 m wide) of intensely cleaved metavolcanic rocks. In excavator trenches,
anomalous gold values can be traced along strike of the shear zone. The highest strain zones
coincide with carbonate-silica-sericite altered rock and sometimes they coincide with the presence
of 0.1 m to 1.5 m thick quartz-carbonate veins. Veins tend to be steep and vary widely in their
strike orientation, and have an east to east-northeast trending strike orientation. The thickest veins
are generally sub-parallel to the deformation fabric. Mineralogically, the alteration is dominated by
very fine-grained carbonates (calcite and various Fe-Mg-Mn carbonates) usually with lessor
amounts of silica intergrowths and fine-grained sericitic mica. Feldspar, including both sodium and
potassium feldspar, also accompanies the alteration assemblage, generally at lower abundances.
Pyrite is commonly present as fine-grained clusters and disseminated brass coloured grains.
Anomalous gold values associated with the alteration assemblage define a deposit typically 5 m to
10 m in true width but the thickness may reach a maximum of about 40 m in exceptional cases.
Within the principal envelope of the east-west shear zone, gold grades are not uniform. Gold
distribution exhibits a strong shoot control, with four major shoots evident plunging 60-80º to the
west and west-southwest. Their orientation supports the inference that the ore shoots occupy the
linear zone of intersection between the east-west shear zone fabric and north-northeast trending
shear zones.
2CO003.008 – Oromin Joint Venture Group Independent Technical Report for the OJVG Golouma Gold Project, Sénégal Page 37
NMW_DM_TS /WB/MN OJVG Golouma Gold_2012_FS_Technical_Report_2CO003 008_NMW_DM_TS_GA_DGP_20130315_1 March 15, 2013
Golouma West has been drilled off to a depth of 350 m below surface, with widely distributed deep
step-out drilling intercepting mineralization down to a depth of about 900 m. The west limb is
currently open to the north and exploration is continuing to extend mineralization toward the
Golouma Northwest zone. A series of thick northeast oriented quartz-carbonate veins define the
trace of the sheet like body, which has similar mineralogical and alteration characteristics to
Golouma West. Mineralization is open both to the east and west of the main east-west body
although it appears to weaken to the east. High-grade shoot controlled mineralization remains
open at depth in several areas of the deposit.
Golouma South
Golouma South occupies a north-northeast oriented ductile shear zone with mineralization in a
sheet like body, dipping 50°-65º west. Mineralization has been defined by drilling for a strike length
of approximately 640 m and down to 560 m below surface (about 330 m below sea level).
Currently, the potential for further mineralization along strike is considered to be limited but the
down-dip extent of some high-grade shoots remains open to depth down plunge.
The deposit consists of one, two or three sub-parallel zones coinciding with higher strain zones
within the northeast oriented shear zone. Similar to Golouma West, excavator trenches indicate
that the gold is associated with the highest strain parts of the shear zone, corresponding to areas
of intense alteration and the presence of quartz veins. The veins are predominantly oriented
parallel to the shear fabric and tend to be localized on the margins between high and low strain
domains.
Along the margins of the mineralized bodies, the intensity of the northeast oriented foliation
decreases. The foliation transition into zones of east-west oriented sub-vertically dipping slatey or
schistose foliation, often crenulated along a northeast axis. Alteration consists of the same
carbonate-silica-sericite-feldspar-pyrite mineral assemblage as at Golouma West and similarly
correlates well with strain intensity in the shear zone. High gold values correspond to intensely
altered areas particularly where quartz-carbonate veining is present. The true thickness of
mineralized zones varies from 2 m to 20 m, but is typically 5 m to 12 m. Gold distribution is
generally more uniform than at Golouma West, but higher-grade shoots have been noted. These
shoots plunge steeply toward the west-southwest and are thought to occur at the intersection
between the northeast oriented shear zone and zones of intense east-west shear.
Golouma Northwest
The Golouma Northwest main zone is trending west-northwest, sub-parallel to the main Golouma
West zone. A fairly continuous zone of gold mineralization has been defined and traced for
approximately 400 m on strike and 120 m down-dip.
A barren mafic dyke is located at the eastern edge of the mineralized zone and has been
interpreted to be the northeastern extension of the mafic dyke that separates the main Golouma
West and Golouma West-West zones. The dyke is approximately 10 m to 20 m in width, strikes to
the north-northeast, dips steeply westward and crosscuts the main gold zone in its vicinity. The
mafic dyke appears to occupy a brittle fault zone, which mimics the strike and dip of the dyke. This
fault has been identified by an apparent dextral offset of the main gold zone of approximately 10 m
to 20 m.
A felsic dyke intrudes the central portion of the mineralized zone, and is interpreted to be the same
felsic dyke that is present in the Kerekounda deposit. This dyke is approximately 5 m to10 m in
2CO003.008 – Oromin Joint Venture Group Independent Technical Report for the OJVG Golouma Gold Project, Sénégal Page 38
NMW_DM_TS /WB/MN OJVG Golouma Gold_2012_FS_Technical_Report_2CO003 008_NMW_DM_TS_GA_DGP_20130315_1 March 15, 2013
width, strikes to the northeast, dips moderately northwest, and crosscuts the main gold zone. The
dyke appears to occupy a brittle fault, which appears to mimic the strike and dip of the dyke. This
fault has been identified by an apparent dextral offset of the main gold zone by approximately 15 m
to 20 m.
Gold mineralization at Golouma Northwest is hosted by a relatively narrow (2 m to 10 m), east-
southeast striking shear zone that dips steeply to the south. Alteration, characterized by moderate
to strong carbonate-sericite-silica-pyrite mineral assemblage, is accompanied locally by quartz-
tourmaline veining. Gold values are generally moderate to high grade and generally range from 1.5
to 10 g/t Au, with local 1 m intervals of up to 40 g/t Au.
Kerekounda
Mineralization at Kerekounda occupies three shear zones that dip 50º - 70º west-southwest and
are striking north-northwest. The shear zones are relatively discrete zones of high strain where the
chloritized mafic metavolcanic rocks are partially to pervasively altered by a carbonate-silica-
sericite-feldspar-pyrite mineral assemblage. Texturally, the mineralized rocks are similar to those at
Golouma South and West but visible gold occurrences are more abundant.
Three distinct shear zones host the mineralization at Kerekounda. Each zone typically ranges from
1 m to 10 m width and high-grade shoots plunge steeply toward the west-northwest. The plunging
shoots appear to be controlled by the intersection of the regional north-northeast trending GS-K
shear zone fabric, which controls the location of mineralization in the Golouma-Kerekounda area,
with the discrete north-northwest trending shear zones that host the mineralization. Of the three
mineralized shears, it is the easternomost which is most prevalent. It comprises a quartz-carbonate
vein and multiple veins and/or vein breccias, within a broader zone of carbonate dominated
alteration. The highest gold grades occur with the quartz veins especially those containing
tourmaline while lower grades are generally found in the adjacent altered rock.
Kourouloulou
At the Kourouloulou deposit, gold mineralization is associated with areas of highly ductile deformed
mafic metavolcanics. Four parallel, east-southeast striking mineralized quartz-carbonate veins
occur within a zone that dips steeply towards the south. Its proximity, structural setting, similar
mineral characteristics and abundant high-grade native gold indicate it is part of the Golouma type
deposits.
Mamasato
Gold mineralization at Mamasato consists of three narrow, sub-parallel zones (2 m to 10 m) that
strike to the west and dip moderately to the north. These zones are characterized by weak to
moderate intensity, carbonate-dolomite-sericite-silica-pyrite alteration, with localized quartz veining,
hosted within strongly sheared mafic metavolcanics. Barren felsic dykes commonly intrude one of
the three main gold zones, bisecting it into footwall and hanging wall components. Gold assay
values at Mamasato are low to medium grade (0.5–3.0 g/t), with locally elevated values between
5.0-14.0 g/t. Gold values show good continuity along a 650 m strike length and approximately 250
m down-dip within the central and western portions of the shear system.
Koutouniokolla
Gold mineralization at Koutouniokolla is located in two structural / alteration zones and in
northwest-trending brittle veins. The first structural trend strikes to the north-northeast and dips
2CO003.008 – Oromin Joint Venture Group Independent Technical Report for the OJVG Golouma Gold Project, Sénégal Page 39
NMW_DM_TS /WB/MN OJVG Golouma Gold_2012_FS_Technical_Report_2CO003 008_NMW_DM_TS_GA_DGP_20130315_1 March 15, 2013
steeply west-northwest. Two separate, parallel zones of mineralization have been encountered
along this trend for approximately 230 m along strike and 150 m down-dip. Mineralization is
characterized by strong to intense carbonate-silica-albite-sericite alteration, with local silicification
and carbonate-quartz-tourmaline veining hosted in strongly sheared to locally brecciated mafic
metavolcanics over widths of 10 m to 30 m. The second zone of mineralization is hosted by a west-
northwest striking moderately to steeply southwest dipping shear zone. Gold mineralization along
this structure is more sporadic, except in the vicinity of the intersection with the north-northeast
structure. Alteration is characterized by locally strong to intense carbonate-silica-albite-sericite
alteration with local silicification and quartz veining. It is hosted in strongly sheared to brecciated
mafic metavolcanics over widths of 5 m to 10 m.
Gold values at Koutouniokolla can be highly variable and somewhat unpredictable. In the north-
northeast structure, gold values are generally continuous down-dip and along strike to the
southwest of the intersecting west-northwest structure. Gold assay values can span from moderate
(2.0 g/t) to high (20 g/t) over significant widths. To the north of the intersection, alteration and
shearing continues in strength, but gold values drop off dramatically, with only anomalous values
(150-500 ppb Au) being reported.
Gold values in the west-northwest trending structure are generally insignificant except within 50 m
to 75 m of the structural intersection with the north-northeast trending structure. In this area high-
grade gold mineralization (5.0 g/t to 100 g/t) over widths of 3 m to 5 m has been encountered in
several holes.
The differences in grade between the two zones can be explained by the quantity of quartz-
tourmaline veining, with higher grades following higher percent veining. In zones where gold is
hosted by altered shear zones, higher grades typically follow pervasive silicification, with more
albite- rich zones being barren to anomalous. The exact controls of favourable alteration and
veining are poorly understood, but are likely related to structural intersections, dilations (high-grade
veins) and potential favourable host rocks (shear zones) as both structural trends crosscut
stratigraphy.
Kouroundi
At Kouroundi, the main gold zone has been traced by trenching and drilling for approximately 100
m along strike, and approximately 150 m down-dip. It strikes to the northwest and dips shallowly to
moderately (approximately 40º) to the southwest.
The main gold bearing shear zone strikes to the northwest and dips approximately 40° to the
southwest, and is generally 10 m to 40 m wide. The second major shear zone is located at the
southern end of the prospect and is perpendicular to the main gold bearing shear zone. The
second shear zone strikes westerly, dips steeply to the north, and is approximately 25 m to 35 m in
width. This zone appears to cut-off gold mineralization where it intersects the main gold bearing
shear.
Gold mineralization at Kouroundi is characterized by strong to intense carbonate-sericite-silica-
albite-pyrite alteration with local quartz-tourmaline veining hosted in strongly sheared mafic
metavolcanics. The main gold zone varies in thickness from 5 m to 10 m and has been traced for
100 m along strike to the northwest. Gold values within the zone are generally weak (200-700 ppb
Au) at its southern margin, where the zone intersects the prominent east-west shear zone. Gold
2CO003.008 – Oromin Joint Venture Group Independent Technical Report for the OJVG Golouma Gold Project, Sénégal Page 40
NMW_DM_TS /WB/MN OJVG Golouma Gold_2012_FS_Technical_Report_2CO003 008_NMW_DM_TS_GA_DGP_20130315_1 March 15, 2013
values gradually increase in grade towards the northwest (500-2,000 ppb Au) with a few high-
grade intervals (1 m @ 5-12 g/t Au) present in the northern most drilling.
Koulouqwinde
Low-grade gold mineralization at Koulouqwinde is hosted primarily within several, sub-parallel,
northeast trending shear zones. The shears are generally 10-20 m in width and dip steeply to the
northwest. Alteration within the shears is comprised of moderate to locally intense, patchy to
pervasive silica-albite-carbornate-sericite-Fe carbonate with traces of pyrite, and minor quartz-
tourmaline veining.
Narrow (~1 m), high grade quartz-toumaline veining has been observed on surface as well as in
drill-core at Koulouqwinde. The veining is hosted within massive mafic volcanic units that are
intercalated with sub-parallel, northeast trending shear zones. Due to the limited distance between
the bounding shear zones, the strike length and plunge of the veins is limited to approximately 50-
75 m. The veins generally strike east-northeasterly and dip steeply towards the southeast.
2CO003.008 – Oromin Joint Venture Group Independent Technical Report for the OJVG Golouma Gold Project, Sénégal Page 41
NMW_DM_TS /WB/MN OJVG Golouma Gold_2012_FS_Technical_Report_2CO003 008_NMW_DM_TS_GA_DGP_20130315_1 March 15, 2013
7 Deposit Types The many mineral deposits within the Golouma Gold Project are typical of other gold deposits
hosted by Birimian greenstones of the Kédougou-Kéniéba Inlier. These deposits include Teranga‟s
Sabodala deposit, Randgold‟s Massawa deposit, and Iamgold‟s Boto deposit, all within eastern
Sénégal as well as Anglogold Ashanti‟s and Iamgold‟s Sadiola and Yatela deposits, Endeavour
Mining Corporation‟s and Avion Gold Corporation‟s Tabakoto deposit, and Randgold‟s Loulo
deposit all located just across the border within western Mali. Although these deposits differ in
geological detail, such as their host rocks, mineralogy, size and grade, their principal
characteristics indicate they fall within the broad classification of orogenic gold deposits (Grove and
Foster, 1991; Groves et al., 1998).
This classification includes a variety of styles of mineralization that have similar temporal and
spatial associations with orogenesis and tend to have several of the following characteristics. The
host rocks are commonly mafic to ultramafic composition flows, pillows and pyroclastics rocks that
are metamorphosed to greenschist and occasionally amphibolite grade. The wall rock alteration
haloes are laterally zoned, formed by the metasomatic addition of silica, potassium, carbonate and
water. Mineralization is deposited synkinematically along ductile or brittle-ductile structures
subsidiary to the regional, often transcurrent, shear zones. They commonly have structurally
controlled higher-grade shoots. Gold mineralization is deposited by fluid-rock interaction or phase
separation of the fluid at approximately 300-350ºC normally during retrograde metamorphism.
Orogenic gold deposits account for a significant portion of current global gold production and
include a number of large gold fields. These large gold provinces are typically hosted by granite-
greenstone terranes, which comprise significant parts of Archaean and Early Proterozoic cratons,
similar to the Kédougou-Kéniéba Inlier. Based on their morphology, mineralogy, and alteration
characteristics, the deposits within the project appear very similar to orogenic gold deposits of the
Archaean age Eastern Goldfields of Western Australia in particular, whose characteristics are
summarised by Hagemann and Cassidy (2000).
The OJVG has further classified the mineral deposits on the concession into two types according to
their relative grade, style of gold mineralization and spatial relationship within a north northeast
trending 8 km wide structural corridor (MTSZ) that runs the entire length of the concession. The
western side of this structural corridor hosts lower grade, bulk mining style deposits referred to as
“Masato type”, which can be deeply weathered, while the eastern side hosts higher grade
“Golouma type” deposits.
2CO003.008 – Oromin Joint Venture Group Independent Technical Report for the OJVG Golouma Gold Project, Sénégal Page 42
NMW_DM_TS /WB/MN OJVG Golouma Gold_2012_FS_Technical_Report_2CO003 008_NMW_DM_TS_GA_DGP_20130315_1 March 15, 2013
8 Exploration The following sections describe the main exploration activities conducted on the OJVG Golouma
Gold Project since the start of the exploration program in 2005. Much of the description that follows
is reformatted from previous NI 43-101 Technical Reports (McArthur 2006, Apex 2008-2009, SRK
2008-2010, McArthur 2012).
8.1 2005-2006 Exploration
During the initial twenty-two month period, February 2005 to December 2006, the OJVG was
required to spend at least US$ 8 million on exploration. Up to December 31, 2006, the OJVG had
met and exceeded that commitment by spending at least US$ 11 million.
In 2005, exploration started in March, after Oromin signed the Mining Convention on behalf of the
OJVG. The OJVG undertook a multifaceted exploration program with several objectives, to outline
and define the dimensions of the gold mineralization discovered at Golouma, Masato and the
Niakafiri / Sabodala trends and to evaluate the property as a whole through soil geochemistry,
Induced Polarization (IP) geophysics and trenching.
Initially Pacific Geomatics Ltd. of Surrey, British Columbia, Canada obtained Quick-bird high-
resolution satellite imagery of the concession area in October and November 2004. In April and
May of 2005, they completed a topographic base covering the entire concession.
In early May 2005, Fugro Airborne Surveys (PTY) Ltd. (Fugro) of Perth / Sydney, Australia
completed a 6,242 km ultra-high resolution Midas II helicopter-borne magnetic and radiometric
survey. The entire exploration concession area was surveyed at 50 m line separations and several
of the more interesting areas were surveyed at 25 m line spacing. An Australian firm, Encom
Technology (PTY) Ltd. (Encom) analyzed the Fugro airborne magnetic data to produce a
geological and structural interpretation for the OJVG concession (Figure 6.5).
CCIA a Sénégalese company based in Kédougou and Dakar was contracted to provide equipment
including dozers and trackhoes for mechanical trenching, construction of access roads and drill
sites and to move the drills.
The field program started in May 2005. It comprised 3,895 soil samples, 139 rock assays and
707.5 m of hand trenching in 31 trenches. Excavator trenching completed linear meters of 2,956 m
in 32 trenches distributed amongst the Golouma West (6 trenches; 571 m), Golouma South (6
trenches; 459m), Golouma Northeast (Kourouloulou) (7 trenches; 528 m), Kerekounda (4 trenches;
263 m), Niakafiri Southeast (4 trenches; 642 m) and Niakafiri Southwest (5 trenches; 493 m) areas.
Sigma Geophysics of St. Bruno, Quebec, Canada was contracted to provide geophysical services
completing 119 km of IP and 66 km of ground magnetic surveying.
Exploration continued in 2006 from a newly constructed camp centrally located near the village of
Maki Medina. Given its success in locating gold mineralization, geochemical soil sampling was
expanded to cover the entire concession while close-spaced follow-up sampling was used to
further define anomalous areas. A total of 22,696 soils and 508 rocks were collected. Thirty-four
hand trenches, totaling 770 m, were completed at a number of new areas prior to excavator
trenching or drilling. One hundred-twenty excavator trenches totaling 15,657 m were completed,
testing seven areas at Golouma and seven additional targets. Geophysical surveys included 116
km of additional IP surveying at Masato, Golouma, Niakafiri and on the Mineral Deposits Ltd.
(Teranga) condemnation area required for their mine operation. Core drilling began in 2006 with 70
2CO003.008 – Oromin Joint Venture Group Independent Technical Report for the OJVG Golouma Gold Project, Sénégal Page 43
NMW_DM_TS /WB/MN OJVG Golouma Gold_2012_FS_Technical_Report_2CO003 008_NMW_DM_TS_GA_DGP_20130315_1 March 15, 2013
core holes totaling 11,732 m completed. Drilling focused mainly on three target areas, Masato (8
holes; 1,302 m), Golouma West (31 holes; 5,467 m) and Golouma South (22 holes; 3,514 m). The
initial ten reverse circulation holes totaling 1,146 m were all completed at Golouma South.
Results from the 2005-2006 exploration program include initial positive drill assays from Masato,
Golouma West and Golouma South. Trenching and drilling traced the mineral zone at Golouma
West for 750 m along an east-west strike and 150 m down-dip while at Golouma South gold
mineralization was traced for 300 m along strike and 150 m down-dip. A 1,500 m long, gold-in-soil
geochemical anomaly was outlined at Maki Medina and confirmed by excavator trenching (Trx 99-
131). Golouma Northwest mineral zone was discovered in excavator trenches (Trx 111-113) and
drill holes (Sab06-62, 65 and 66). Golouma Northeast (Kourouloulou) was discovered in drill holes
Sab06-67, 68, and 70. New mineralization was discovered in trenches at Sabodala North and
Masato North. IP geophysics outlined new areas of interest at Sekoto, Maki Medina, Golouma
West and Niakafiri.
8.2 2007-2008 Exploration
Upon completion of the original Mining Convention in December 2006, the OJVG petitioned the
Sénégalese government for an extension. A twenty-two month extension was granted until
December 22, 2008, during which time the OJVG was required to spend at least US$12 million.
During 2007, thirty-seven km of IP geophysics were completed at Sekoto and on the MDL
(Teranga) condemnation area. Soil sampling was conducted on the condemnation area as well as
follow-up sampling at Dendifa, Bransan, Kinemba, Korolo, Niakafiri and Maki Medina. A total of
11,700 soils and 53 rock samples were collected. Excavator trenching continued in 2007 with 111
new trenches (Trx 153-263) completed totaling 19,028m. Exploration drilling initially focused on
close-spaced (40 m x 40 m) holes to delineate mineralization at Golouma West, Golouma South
and Masato before testing several other areas including Maki Medina. A total of 30,019 m of
reverse circulation drilling were completed in 175 holes (RC Sab-07 11-185) while 23,311 m of
core drilling were completed in 115 holes (Sab07-71-185) plus twelve RC extensions (1,287.39 m).
Results from the 2007 exploration program include positive trench, core and RC drilling at
Golouma West outlining mineralization along a 1,500 m strike length to a depth of 300 m and
indicating that Golouma West and Golouma Northwest merge. RC and core drilling at Golouma
South outlined mineralization along a 1 km strike length to a depth of 220 m and identified multiple
zones of mineralization. New discoveries were made at Golouma Northwest and Golouma
Northeast (Kourouloulou). Positive trench and drill results were received from Masato with 1.8 km
of strike length and down-dip to 150 m successfully drill tested. Positive trench results were
received from outside targets at Sekoto, Dendifa, Maleko, Korolo and Kinemba.
Exploration during 2008 focused initially on close-spaced drilling for an up coming initial Project
resource estimate by SRK. Soil geochemistry comprised 5,581 samples designed to cover regional
targets and to further define existing anomalies. Fifteen excavator trenches totaling 1,677 m were
completed (Trx 264-278) on six areas. Reverse circulation drilling was conducted on nine areas
with 330 holes (RC Sab-08 184 to 511) drilled totaling 61,132 m. Core drilling tested 11 areas and
comprised 227 holes (Sab-08 186 to 412) totaling 45,530 m plus 13 RC extensions totaling 2,267
m.
The majority of the drilling was done to provide a sufficient drill density for resource estimation on
Masato (261 holes; 52,105 m), Kerekounda (32 holes; 5,023 m), Golouma West (75 holes;
2CO003.008 – Oromin Joint Venture Group Independent Technical Report for the OJVG Golouma Gold Project, Sénégal Page 44
NMW_DM_TS /WB/MN OJVG Golouma Gold_2012_FS_Technical_Report_2CO003 008_NMW_DM_TS_GA_DGP_20130315_1 March 15, 2013
14,330 m) and Golouma South (67 holes; 11,254 m). The OJVG drill tested several other targets
including Niakafiri Southeast (50 holes; 10,242 m), Maki Medina (26 holes; 4,667 m),
Koulouqwinde (5 holes; 1296 m), Goumbati (5 holes; 393 m), Korolo (6 holes; 862 m), Sekoto (7
holes; 1555 m) and Sabodala North (9 holes; 2,404 m).
8.3 2009 Exploration
Upon completion of the required commitments of the Mining Convention extension to December
2008, the OJVG applied for another extension, which was granted until December 2009.
Positive results from the 2008 exploration led to the undertaking of a Pre Feasibility Study (PFS) to
provide information to help determine the best path forward for the Project. Concurrent with the
Mining Convention extension, OJVG was required to relinquish a small portion of the concession
(MDL / Teranga condemnation area) reducing the original concession area from 231.3 km2 to
212.6 km2.
Exploration in 2009 focused almost entirely on drilling. Drilling was guided by previous soil and
trench results, as well as opportunities identified from resources modeled and estimated in 2008. A
total of 11,019 infill soil and 517 rock samples were collected from nine target areas including
Kerekounda, Dendifa, Koulouqwinde, Masato, Kinemba, Kobokoto and Sekoto. Sixty-seven
trenches were completed totaling 15,521 m as follows: Kerekounda (11 trenches; 2,295 m),
Kourouloulou (Golouma Northeast) (8 trenches; 1,992 m), Golouma Northwest (10 trenches; 1,739
m), Koulouqwinde (1 trench; 280 m), Koutouniokolla (8 trenches; 1,695 m) and Kobokoto (29
trenches; 7,520 m). A total of 41,164 m of core drilling in 206 holes, 26,532 m of reverse circulation
drilling in 151 holes and 2,205 m of core geotechnical drilling in 14 holes were completed on ten
different targets.
The majority of reverse circulation and core drilling was focused on the lateral and vertical
expansion of mineralization at Golouma West (25 holes; 8,105 m) Golouma South (14 holes; 3631
m), Kerekounda (136 holes; 30,510 m) and Masato (40 holes; 5,072 m) as well as infill drilling for
resource estimation updates. New mineralization was intersected at Golouma Northeast, which
was initially called Epsilon but was later renamed Kourouloulou (84 holes; 10,905 m). Systematic
step-out drilling at Kerekounda continued to intercept good widths of high-grade mineralization,
further indicating the potential for a resource having combined open-pit and underground mining
possibilities, with a down-dip extent of at least 300 m. Drilling at Maki Medina (4 holes; 545 m)
returned results indicative of extensive low-moderate grade gold mineralization with a significant
oxide portion, similar to the Masato deposit. At Koulouqwinde (20 holes; 3,528 m) the geochemical
anomaly was refined with additional infill sampling. Excavator trenching and drilling have both
indicated the presence of alteration and mineralization. Drilling at Niakafiri Southwest (5 holes;
1,131 m) intercepted alteration and mineralization similar to that encountered at Masato.
In September 2009, the OJVG submitted a PFS to the Sénégalese government. Although the study
concluded negative project economics, the ongoing resource expansion and exploration drilling
programs continued to expand the Project resource base beyond the PFS drill data cut-off date of
May 2009. The OJVG elected to complete the drill program towards producing an updated PFS in
2010.
In December 2009, the OJVG submitted a Strategic Environmental Evaluation (SEE) report to the
Sénégalese government in support of OJVG‟s application for a project mining license.
2CO003.008 – Oromin Joint Venture Group Independent Technical Report for the OJVG Golouma Gold Project, Sénégal Page 45
NMW_DM_TS /WB/MN OJVG Golouma Gold_2012_FS_Technical_Report_2CO003 008_NMW_DM_TS_GA_DGP_20130315_1 March 15, 2013
8.4 2010 Exploration
In January 2010, OJVG announced that it would upgrade the scope of the study to a full Feasibility
Study (FS), scheduled for completion at the end of June 2010. Additionally, in January 2010, OJVG
received government approval for the SEE report submitted in 2009.
In February 2010, the Sénégalese government granted the OJVG a mining license for a term of
fifteen years, at which time the license can be renewed.
Exploration in 2010 consisted largely of infill and step-out core and reverse circulation drilling.
Drilling totaled 81,133 m of core drilling in 330 holes, two RC extensions of 342 m, 22,213 m of
reverse circulation drilling in 184 holes, as well as 3,921 m of RC and 5,470 m of core geotechnical
drilling completed on twelve different areas. The geochemical anomaly at Kobokoto was refined by
917 soil samples.
Initially drilling focused on the lateral and vertical expansion and infill holes for resource estimation
purposes at Golouma West (42 holes; 14,663 m), Golouma South (15 holes; 5,770 m),
Kerekounda (9 holes; 3,654 m), Kourouloulou (32 holes; 8,745 m) and Masato (75 holes; 15,231
m). Later drilling tested Niakafiri Southeast (51 holes; 9,411 m), Niakafiri Southwest (29 holes;
4,408 m), Maki Medina (86 holes; 12,056 m), Kobokoto (79 holes; 11,481 m) and Koulouqwinde
(74 holes; 13,916 m).
Initial drilling at Kinemba West (4 holes; 884 m) and Koutouniokolla (18 holes; 3,014 m) identified
alteration and gold mineralization with both areas having locally deep oxidation profiles. Six
trenches totaling 1,772 m were completed at Kobokoto West and three at Koutouniokolla totaling
257 m.
In addition, 22,435 m of reverse air blast (RAB) drilling was completed in 630 shallow drill holes as
profiles across laterite covered areas at Mamakono, Maki Medina, Maleko, Kinemba, Kobokoto,
Koulouqwinde, Golouma West, Bambaraya, and Niakafiri Southwest.
Deep drilling to test below the 2010 Feasibility Study resource boundaries and for underground
resources was started at Masato, Kerekounda, Golouma South and Golouma West. Initial results
of the deep drilling were positive; all zones are open to expansion.
8.5 2011 Exploration
The 2011 exploration program commenced with 3,028 m of geotechnical core drilling required for
the resource update. Deep drilling continued at Masato, Kerekounda, Golouma South and
Golouma West as, infill drilling to update the resources and, to extend the mineralization below the
2010 FS resource boundaries. Several areas with deep oxidization and heap leach potential were
drilled (Sekoto, Kinemba, Kobokoto and Niakafiri). Thirteen areas were drilled with 146 core holes
and one RC extension, totaling 38,202 m. Fourteen areas were tested by reverse circulation drilling
with 108 holes completed, totaling 16,131 m. Three exploration targets (Golouma Northwest,
Kourouloulou East and Goumbati West) and three new discoveries (Mamasato, Kouroundi and
Torosita) were trenched. Fifty-two trenches were completed, totaling 8,630 m; 1,627 infill soil
samples and 306 rock samples were collected from Goumbati West and Torosita.
8.5.1 Masato
Exploration deep drilling at Masato continued during 2011, with 3,168 m in ten core holes and 547
m in four RC holes completed. There were two goals for the drill program at Masato. The first was
2CO003.008 – Oromin Joint Venture Group Independent Technical Report for the OJVG Golouma Gold Project, Sénégal Page 46
NMW_DM_TS /WB/MN OJVG Golouma Gold_2012_FS_Technical_Report_2CO003 008_NMW_DM_TS_GA_DGP_20130315_1 March 15, 2013
to continue and complete the infill drilling program started in the fall of 2010, which was initiated to
delineate higher grade, underground resources below the 2010 resource pit. The second goal of
the drill program was to extend zones of mineralization down plunge and down-dip by drilling step-
out holes starting at 100 m spacing below the 2010 resource shells.
Results of the infill drill program were positive and the tightened drill spacing assisted with the
delineation and continuity of higher-grade potential underground resources. Results of the deep
drilling program were generally positive as well, with the main Masato Zone intersected in these
broad step-out drill holes. Gold values and widths were typical of Masato style mineralization (1.5-3
g/t Au over 5-10 m) and extended the Masato zone 600 m down-dip from surface.
8.5.2 Golouma West
Deep drilling exploration at Golouma West continued during 2011 (10,248 m of core drilling in
thirteen core holes). The primary goal of the work program was to test the down plunge portions of
the 1300, and 1200 Zones (Golouma West), as well as the down plunge extension of the 1200
Zone in Golouma West to depths of 1,000 m from surface. Diamond core holes were targeted to
intersect the down plunge portions of each zone, starting at 150 m to 200 m down plunge from the
bottom of the existing 2010 resource shells. Subsequent holes were targeted to intersect the main
gold zones 150 m to 200 m down plunge.
Overall the drill program was very successful, as most drill-holes intersected zones of gold
mineralization that appear to correlate well with either the 1200 or 1300 Zones. Only one hole
failed to reach the main gold zone due to technical problems with the drill rig, and was abandoned
at approximately 1100 m. Gold values within the latest drilling were very good, with values well in
excess of the minimum mining grade (4g/t Au) and mining width (2 m) used to define potential
underground resources. Golouma West has been tested to a depth of 900 m and is open to
expansion. New sub-parallel zones of mineralization were discovered adjacent to Golouma West
during deep drilling and include the 950 Zone and Golouma West extension.
8.5.3 Golouma South
Deep drilling exploration at Golouma South continued during 2011 with 4,415 m of core drilling
completed in seven holes. The primary goal of the work program was to test the down plunge
portions of the main Golouma South zones at depth. Initial diamond core holes were designed to
intersect the main ore shoots starting from 150 m to 200 m down plunge from the current resource
shells. Subsequent holes were designed to hit the main gold zones 150 m to 200 m down plunge
from previous holes.
Results of the deep drilling program were very positive, with all drill-holes intersecting Golouma-
style mineralization. All of the new intercepts from the deep drilling program correlate well with
previously defined mineralization, and have extended the gold zones down to a depth of 560 m.
Results from the deep drilling were generally moderate to high-grade (5-20 g/t Au) to locally very
high-grade (>100 g/t Au), well in excess of the minimum underground mining grade of 4 g/t Au and
minimum mining width of two metres.
8.5.4 Golouma Northwest
At Golouma Northwest zone, located 200 m north of Golouma West, initial drilling targeted a zone
that was interpreted to be trending northeasterly and dipping steeply westerly. Results from the
initial holes were sporadic and indicated a zone of discontinuous mineralization. Reinterpretation of
2CO003.008 – Oromin Joint Venture Group Independent Technical Report for the OJVG Golouma Gold Project, Sénégal Page 47
NMW_DM_TS /WB/MN OJVG Golouma Gold_2012_FS_Technical_Report_2CO003 008_NMW_DM_TS_GA_DGP_20130315_1 March 15, 2013
the data in 2011 indicated that the mineral zone could be trending west-northwest, sub-parallel to
the main Golouma West zone. Drilling in 2011 included, 655 m in eight core holes and 319 m in
four RC holes. Drilling has confirmed the interpretation and defined a fairly continuous zone of gold
mineralization that has been traced for approximately 400 m along strike and 120 m down-dip.
8.5.5 Kerekounda
Deep drilling exploration continued in 2011 at Kerekounda with eight core holes completed in
3,695m of drilling. The main goal of the program was to test the continuity of Kerekounda style
mineralization to depths in excess of 500 m, down-dip, from surface.
Mineralization at Kerekounda has been drill-defined over a strike length of 370 m and down-dip for
approximately 490 m; it remains open to expansion.
Results of the drill program were largely disappointing, with only one drill hole (DH-956, 2m @ 10
g/t Au)) and one Geotech hole (KKGT-01, 14 m @ 8 g/t Au) intersecting Kerekounda-type grades,
which has extended the main zone approximately 125 m below the current defined resource shell.
The remaining drill holes failed to intersect Kerekounda-type grades and gold values are generally
only anomalous (<500 ppb Au).
8.5.6 Niakafiri Southeast & Niakafiri Southwest
Exploration drilling continued in 2011 at Niakafiri Southeast with seven core (1,235 m) and five
reverse circulation (562 m) drill holes completed. There were two goals for the drill program. The
first goal was to confirm the existence of an inferred east-west, gold bearing structure that could
host significant gold resources in the footwall of the main Niakafiri zone. The second goal was to
test for the on strike extension of the main deposit, adjacent to a strong gold-in-soil geochemical
anomaly, located 500m to the south of the current resource.
Results for the first goal were generally disappointing, with diamond drilling failing to confirm the
existence of an east-west trending, gold bearing structure in the footwall of the main Niakafiri gold
zone as only spotty, anomalous results were reported. An adjacent drill hole DH-1061 did intersect
the main zone returning 24 m @ 1.4 g/t Au and 10 m @ 1.27 g/t Au.
Drill results from the southern extension of Niakafiri Southeast were generally positive as indicated
by RC-956 which intersected 1.7 g/t Au over 28 m and extended the area of mineralization.
Niakafiri Southwest, located one kilometre west of and parallel to Niakafiri Southeast, is interpreted
to be a north-northeast trending, steeply west dipping, 200 to 300 m wide zone of strongly sheared
and altered mafic and ultramafic metavolcanic rocks. The mineralization has been traced in drilling
for 400 m along strike and to a depth of 140 m and remains open to expansion. Locally, as at
Niakafiri Southeast, the north-northeast trending mineral zone appears to be offset by several late,
brittle, east-west cross-faults.
The southern extent was drill tested by five RC holes totaling 921 m.
8.5.7 Kourouloulou
Several new geochemical anomalies and the main mineral zone were tested at Kourouloulou in
2011. The drill program targeted three areas. The first tested for the extension of the main ore
zones at depth and along strike. The second tested a new geochemical anomaly, Kourouloulou
East, located approximately 150 m to the northeast of the main Kourouloulou deposit. The third
2CO003.008 – Oromin Joint Venture Group Independent Technical Report for the OJVG Golouma Gold Project, Sénégal Page 48
NMW_DM_TS /WB/MN OJVG Golouma Gold_2012_FS_Technical_Report_2CO003 008_NMW_DM_TS_GA_DGP_20130315_1 March 15, 2013
tested a geochemical anomaly located 100 to 150 m south of the main zone near some historic
artisanal workings.
Results for the drill holes targeting the main Kourouloulou zone were mixed, with one drill hole
successfully intersecting the main zone at depth, while the second drill hole failed to extend the
zone to the east.
The Kourouloulou East geochemical anomaly, located 150 m northeast, was tested by two drill
holes and four trenches. Drill hole and trench results were disappointing intersecting only weakly
anomalous gold values. The Kourouloulou South geochemical anomaly located 100 to 150 m south
of the main zone was tested by five reverse circulation drill holes totaling 754 m. Drilling discovered
a new sub-parallel zone of shear hosted vein mineralization.
8.5.8 Saboraya
The Saboraya exploration target, located mid-way between the Kerekounda and Kourouloulou
deposits is related to dilational shear hosted quartz veining. Drilling has tested the mineralization
for 150 m along strike and to 100 m below surface. It was tested by three core (485 m) and nine
RC (1,308 m) holes.
8.5.9 Kobokoto
Kobokoto is located 2 km southwest of Maki Medina along the same steeply west dipping north-
northeast trending structural zone that hosts Niakafiri Southwest. The main mineralized zone
consists of a shallow west dipping, variably sheared zone of quartz-carbonate alteration and
quartz-carbonate-tourmaline veining. The current resource is drilled to a depth of 100 m and over a
strike length of 1 km. Deep oxidation has affected the mineral zone and near-surface, lower-grade
mineralization may be amenable to heap leach recovery.
During 2011, three reverse circulation holes totaling 366 m were drilled to test the Kobokoto South
geochemical anomaly.
8.5.10 Mamasato
The Mamasato deposit, a recent discovery located 2 km southeast of the Masato deposit was
identified by soil geochemistry and prospecting. The anomaly was tested by eight trenches
(1,538 m), eight reverse circulation drill holes (1,446 m) and forty-two core holes (7,586 m) along
an 800m east-west strike length and down dip to 250 m. The gold-in-soil geochemical anomaly is
coincident with a series of east-west to north-northeast oriented quartz vein systems hosted by
sheared and altered mafic metavolcanics and minor felsic intrusives. Near surface mineralization is
locally deeply oxidized to sixty metres and may have soft ore or heap leach potential.
8.5.11 Sekoto
The Sekoto deposit is located approximately 9 km to the northeast of the Golouma deposit and 4
km east of the Masato deposit. To date, ten trenches (3,280 m), fourteen reverse circulation (1,761
m) and nine core holes (661.6 m) have been completed at Sekoto.
The geology consists of a central granodiorite intrusive, which has intruded deformed to highly
strained mafic metavolcanics and sediments. Oxidation at Sekoto commonly extends 30 m to 40 m
below surface, however, oxidation is found to be deeper along structures or where laterite is
present. Deeply oxidized mineralization at Sekoto may be amenable to heap leach recovery.
2CO003.008 – Oromin Joint Venture Group Independent Technical Report for the OJVG Golouma Gold Project, Sénégal Page 49
NMW_DM_TS /WB/MN OJVG Golouma Gold_2012_FS_Technical_Report_2CO003 008_NMW_DM_TS_GA_DGP_20130315_1 March 15, 2013
Drilling in 2011, nine core (661 m) and ten RC holes (844 m), focused on mineralization intersected
in RC-363 (16m @ 1.15 g/t Au) that has been traced on surface by trenching. Drilling has outlined
a relatively continuous body of low-grade gold mineralization that has been traced along strike for
350 m and down-dip 150 m. This zone remains open to the northeast and down-dip. Additional
untested zones are present mainly to the west and in the hanging wall to the main zone.
8.5.12 Kinemba
There are three geochemical targets in the Kinemba, Mankana, and Kinemba West area. The
Kinemba deposit was tested by 20 RC holes (3,456 m) and three core holes (640 m); Mankana by
four RC holes (623 m); and Kinemba West by five RC holes (685 m). The best results were from
the Kinemba deposit area. The Kinemba deposit, located 3 km south-southwest of the Maki
Medina deposit, is defined by a 1.4 km by 0.6 km north-northeast trending gold-in-soil geochemical
anomaly.
The Kinemba area consists of massive to locally strongly sheared mafic metavolcanics intruded by
a prominent magnetic mafic dyke and minor intermediate to felsic dykes. The shear zones and
dykes commonly strike northeast and dip moderate to steeply westward, parallel to the regional
trend. Oxidation atKinemba can reach depths of up to 70 m making it a potential target for heap
leach processing.
Gold mineralization is hosted by multiple zones of strongly sheared, weakly to moderately
carbonate-albite-silica-sericite-pyrite altered, mafic metavolcanics that are 5 m to 30 m wide. The
north-northeast trending steep west dipping mineralization has been traced over a strike length of
600 m and to a depth of 200 m. A prominent north-northeast trending, 20 m to 40 m thick, massive
mafic dyke intrudes and subdivides the zones of shearing and alteration into east and west parts.
Zones of shearing and alteration on the west side of the dyke (hanging wall) exhibit stronger gold
values and better continuity along strike and down-dip. Gold assays at Kinemba are generally low,
with individual values ranging from 0.3 g/t Au to 10 g/t Au and composite grades ranging from 0.5
to 2.0 g/t Au over widths of 2 m to 10 m. The zone remains open in all directions.
8.5.13 Koutouniokolla
The Koutouniokolla deposit is located approximately 3.5 km southwest of the Golouma deposit. To
date, eleven trenches (1,952 m), twenty-eight core holes (4,423 m) and nine reverse circulations
drill-holes (1,255 m) have been completed at Koutouniokolla.
Mafic metavolcanics at Koutouniokolla have been strongly deformed by two separate shear zones
and intruded locally by fine-grained pink felsic dykes. One structure strikes north-northeast and
dips steeply west-northwest. Two separate, parallel zones of mineralization have been
encountered along this trend for approximately 230 m of strike length and down-dip for 150 m.
The second zone of mineralization is hosted by a west-northwest striking moderate to steeply
dipping shear zone. Gold mineralization along this structure is more sporadic, except in the vicinity
of the intersection with the north-northeast structure.
The differences in grade between the two zones can be explained by the quantity of quartz-
tourmaline veining, with higher grades following higher percent veining. In zones where gold is
hosted by altered shear zones, higher grades typically follow pervasive silicification.
Nine reverse circulation holes (1,255 m) and ten core holes (1,409 m) were drilled during 2011.
2CO003.008 – Oromin Joint Venture Group Independent Technical Report for the OJVG Golouma Gold Project, Sénégal Page 50
NMW_DM_TS /WB/MN OJVG Golouma Gold_2012_FS_Technical_Report_2CO003 008_NMW_DM_TS_GA_DGP_20130315_1 March 15, 2013
8.5.14 Kouroundi
Another recent soil geochemical discovery was made at the Kouroundi deposit located one
kilometre north of and across the valley from Kerekounda. Initial excavator trench results were
positive intercepting 3.5 g/t gold over nine metres within a broad zone grading 2 g/t Au over 20 m.
Mineralization at Kouroundi occurs in a broad zone of north-northwest trending shear hosted quartz
veining. The mineralization abuts a thick laterite plateau that covers any extension to the north. It
was tested by two trenches (352 m) and fourteen core holes (2,005 m) over a 100 m strike length
and 100 m down-dip.
8.5.15 Sabodala North
The Sabodala North prospect is located approximately 1.7 km to the north of Masato. Exploration
consists of six trenches spaced 100 m to 200 m apart and 16 core and RC holes drilled on three
sections spaced 300 m apart, with three to five holes per section.
Gold mineralization is hosted within moderately to steeply west dipping, northeasterly trending,
carbonate-dolomite-silica-albite-fuchsite altered shear zones, and in local quartz-tourmaline veins.
Gold values are generally low with sporadic one-metre intervals of higher grade. Due to the wide
drill spacing and sporadic nature of gold values, it is difficult to know how continuous gold
mineralization is along strike and down-dip. Significant infill and step-out drilling is needed in order
to upgrade this zone. Three RC holes totaling 366 m tested for a southern extension with poor
results.
8.5.16 Goumbati West
Goumbati West is a low-grade heap leach prospect located approximately 1.2 km to the southwest
of the Kobokoto deposit and 1.5 km west of the Kinemba deposit. The Goumbati West prospect is
defined by a 1 km by 0.4 km, >50 ppb gold-in-soil geochemical anomaly, that trends towards the
northeast. Two trenches (164 m) were completed in late 2011 to test an extension to the
geochemical anomaly exposing sheared mafic metavolcanics intruded by a narrow, pink, felsic
dyke.
8.5.17 Torosita
Torosita is the newest geochemical discovery. It is located 6 km west of Golouma and 1 km to 2 km
west of the Maki Medina and Kobokoto deposits. Torosita comprises a series of localized gold-in-
soil geochemical anomalies (TZ 1 to TZ 5) found within an extensive flat area covered by a variable
thickness of laterite. These geochemical anomalies are coincident with a series of northeast
trending altered shear zones and have over a kilometre of strike extent. In addition to the regional
structural target, there are a series of northwest and east-west oriented, higher-grade, dilational
shear-hosted quartz veins identified by prospecting and trenching.
The Torosita gold-in-soil geochemical anomalies were tested by thirty-one trenches (5245 m),
seven reverse circulation drill holes (842 m) and eight core holes (798 m). Drill results were
encouraging but locally spotty.
8.6 2012 Exploration
The exploration program in 2012 consisted of prospecting, mapping, and hand trenching in
underexplored areas of the mine license.
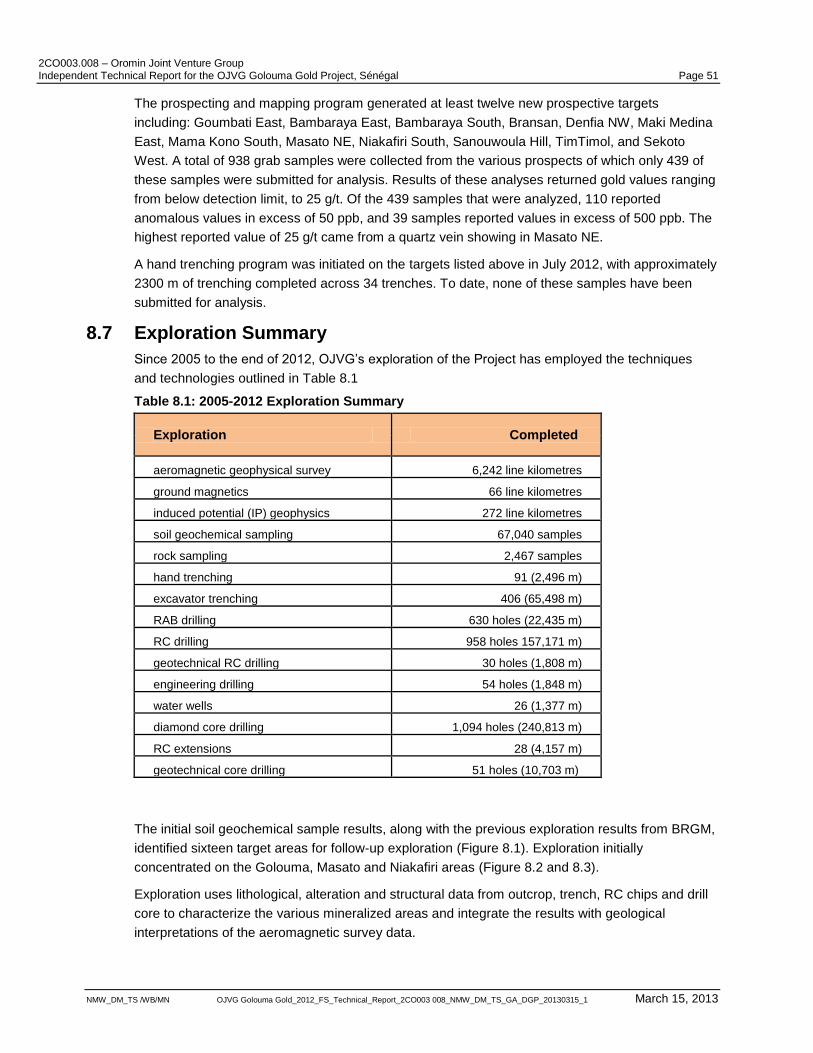
2CO003.008 – Oromin Joint Venture Group Independent Technical Report for the OJVG Golouma Gold Project, Sénégal Page 51
NMW_DM_TS /WB/MN OJVG Golouma Gold_2012_FS_Technical_Report_2CO003 008_NMW_DM_TS_GA_DGP_20130315_1 March 15, 2013
The prospecting and mapping program generated at least twelve new prospective targets
including: Goumbati East, Bambaraya East, Bambaraya South, Bransan, Denfia NW, Maki Medina
East, Mama Kono South, Masato NE, Niakafiri South, Sanouwoula Hill, TimTimol, and Sekoto
West. A total of 938 grab samples were collected from the various prospects of which only 439 of
these samples were submitted for analysis. Results of these analyses returned gold values ranging
from below detection limit, to 25 g/t. Of the 439 samples that were analyzed, 110 reported
anomalous values in excess of 50 ppb, and 39 samples reported values in excess of 500 ppb. The
highest reported value of 25 g/t came from a quartz vein showing in Masato NE.
A hand trenching program was initiated on the targets listed above in July 2012, with approximately
2300 m of trenching completed across 34 trenches. To date, none of these samples have been
submitted for analysis.
8.7 Exploration Summary
Since 2005 to the end of 2012, OJVG‟s exploration of the Project has employed the techniques
and technologies outlined in Table 8.1
Table 8.1: 2005-2012 Exploration Summary
Exploration Completed
aeromagnetic geophysical survey 6,242 line kilometres
ground magnetics 66 line kilometres
induced potential (IP) geophysics 272 line kilometres
soil geochemical sampling 67,040 samples
rock sampling 2,467 samples
hand trenching 91 (2,496 m)
excavator trenching 406 (65,498 m)
RAB drilling 630 holes (22,435 m)
RC drilling 958 holes 157,171 m)
geotechnical RC drilling 30 holes (1,808 m)
engineering drilling 54 holes (1,848 m)
water wells 26 (1,377 m)
diamond core drilling 1,094 holes (240,813 m)
RC extensions 28 (4,157 m)
geotechnical core drilling 51 holes (10,703 m)
The initial soil geochemical sample results, along with the previous exploration results from BRGM,
identified sixteen target areas for follow-up exploration (Figure 8.1). Exploration initially
concentrated on the Golouma, Masato and Niakafiri areas (Figure 8.2 and 8.3).
Exploration uses lithological, alteration and structural data from outcrop, trench, RC chips and drill
core to characterize the various mineralized areas and integrate the results with geological
interpretations of the aeromagnetic survey data.

2CO003.008 – Oromin Joint Venture Group Independent Technical Report for the OJVG Golouma Gold Project, Sénégal Page 52
NMW_DM_TS /WB/MN OJVG Golouma Gold_2012_FS_Technical_Report_2CO003 008_NMW_DM_TS_GA_DGP_20130315_1 March 15, 2013
As of January 31, 2013, OJVG had successfully advanced a total of fourteen deposits to the stage
of resource estimation. In addition to these successes, OJVG has received encouraging results
from gold-in-soil geochemistry, trenching and scout drilling from nine additional exploration targets,
prospects and deposits (Maleko, Dendifa, Mamakono, Sabodala North, Korolo, Saboraya,
Mankana, Goumbati, and Torosita).
The Golouma Concession still has a significant number of gold-in-soil geochemical anomalies
located during the project-wide geochemical survey that remain to be evaluated.
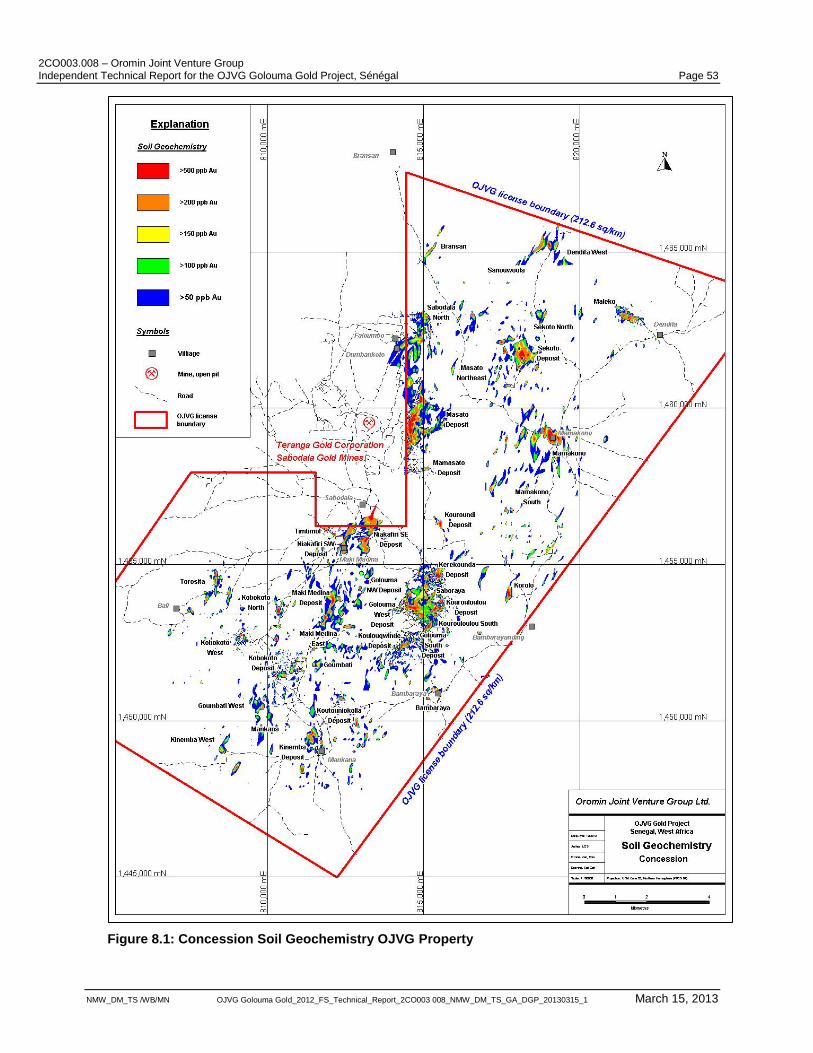
2CO003.008 – Oromin Joint Venture Group Independent Technical Report for the OJVG Golouma Gold Project, Sénégal Page 53
NMW_DM_TS /WB/MN OJVG Golouma Gold_2012_FS_Technical_Report_2CO003 008_NMW_DM_TS_GA_DGP_20130315_1 March 15, 2013
Figure 8.1: Concession Soil Geochemistry OJVG Property
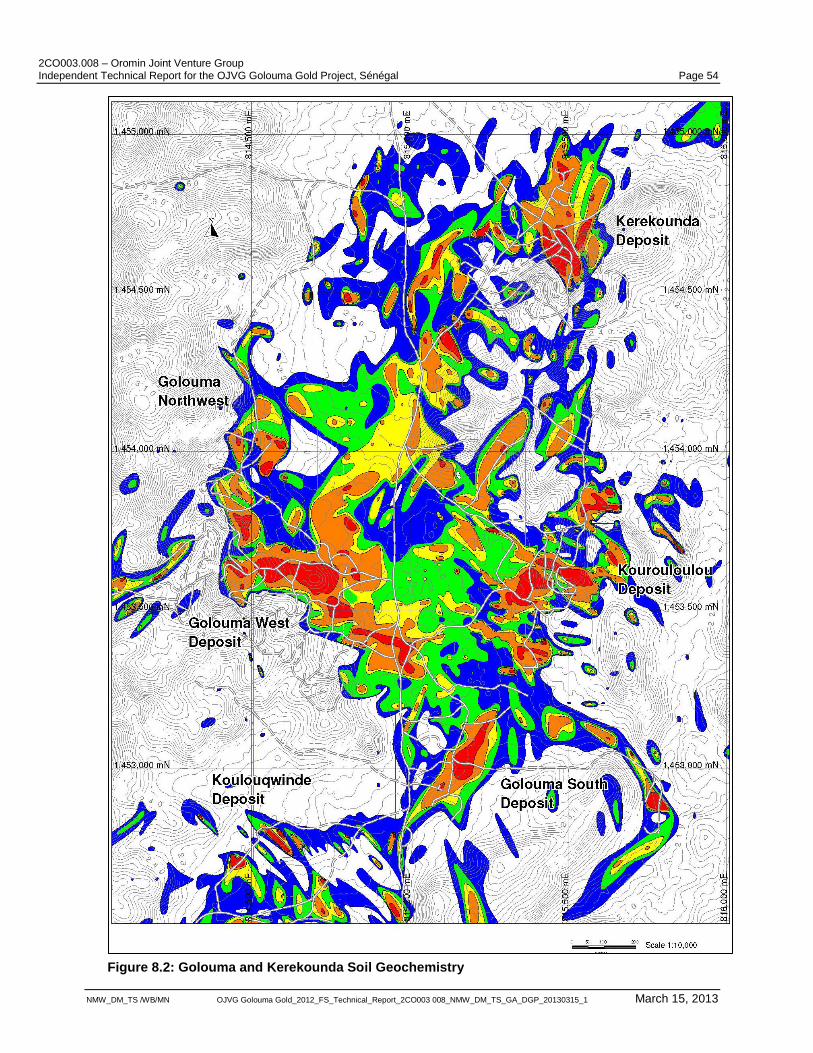
2CO003.008 – Oromin Joint Venture Group Independent Technical Report for the OJVG Golouma Gold Project, Sénégal Page 54
NMW_DM_TS /WB/MN OJVG Golouma Gold_2012_FS_Technical_Report_2CO003 008_NMW_DM_TS_GA_DGP_20130315_1 March 15, 2013
Figure 8.2: Golouma and Kerekounda Soil Geochemistry
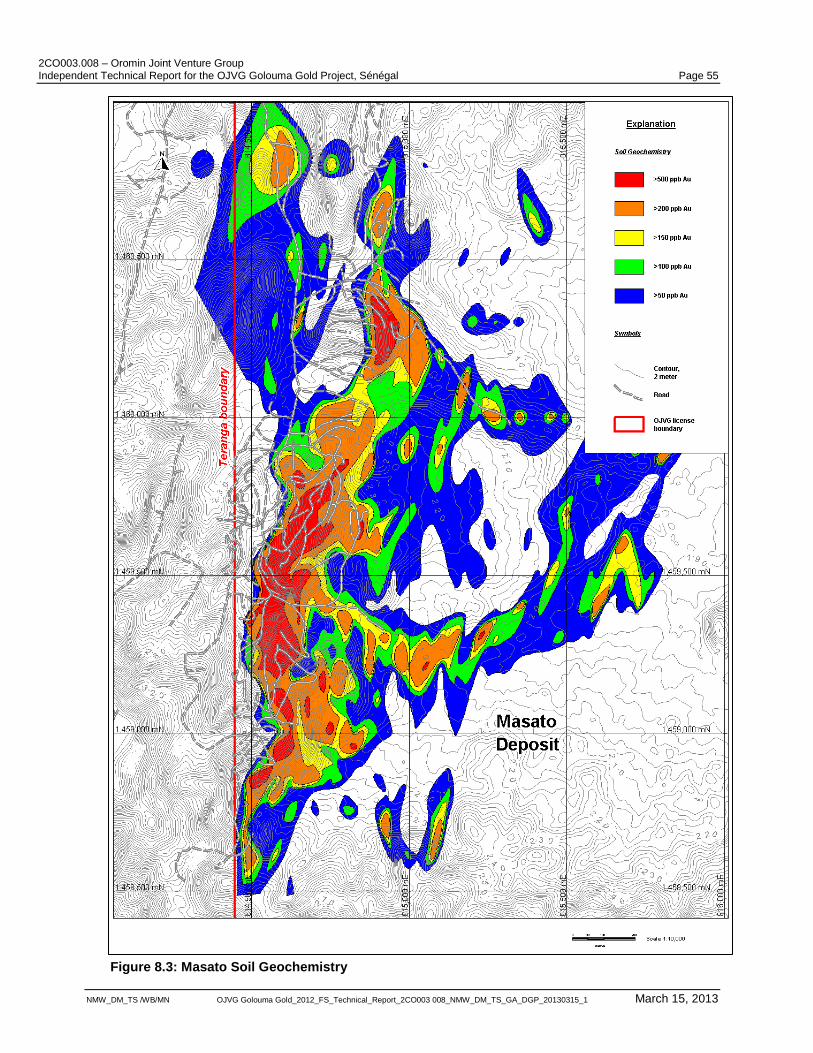
2CO003.008 – Oromin Joint Venture Group Independent Technical Report for the OJVG Golouma Gold Project, Sénégal Page 55
NMW_DM_TS /WB/MN OJVG Golouma Gold_2012_FS_Technical_Report_2CO003 008_NMW_DM_TS_GA_DGP_20130315_1 March 15, 2013
Figure 8.3: Masato Soil Geochemistry
2CO003.008 – Oromin Joint Venture Group Independent Technical Report for the OJVG Golouma Gold Project, Sénégal Page 56
NMW_DM_TS /WB/MN OJVG Golouma Gold_2012_FS_Technical_Report_2CO003 008_NMW_DM_TS_GA_DGP_20130315_1 March 15, 2013
9 Drilling The OJVG Golouma Gold Project has undergone significant core and reverse circulation drilling
campaigns since 2006. Drill holes of the Golouma and Masato deposits are shown in Figure 9.1
and Figure 9.2. All other figures of drill holes by deposit can be found in Appendix B.
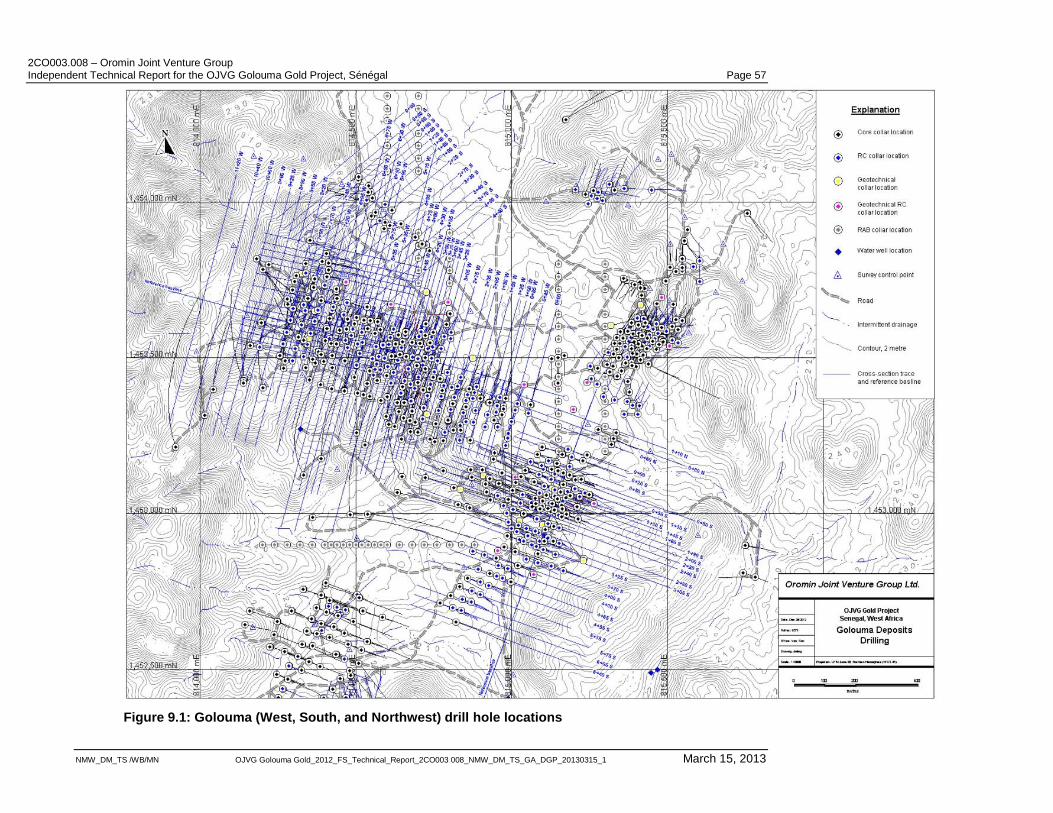
2CO003.008 – Oromin Joint Venture Group Independent Technical Report for the OJVG Golouma Gold Project, Sénégal Page 57
NMW_DM_TS /WB/MN OJVG Golouma Gold_2012_FS_Technical_Report_2CO003 008_NMW_DM_TS_GA_DGP_20130315_1 March 15, 2013
Figure 9.1: Golouma (West, South, and Northwest) drill hole locations
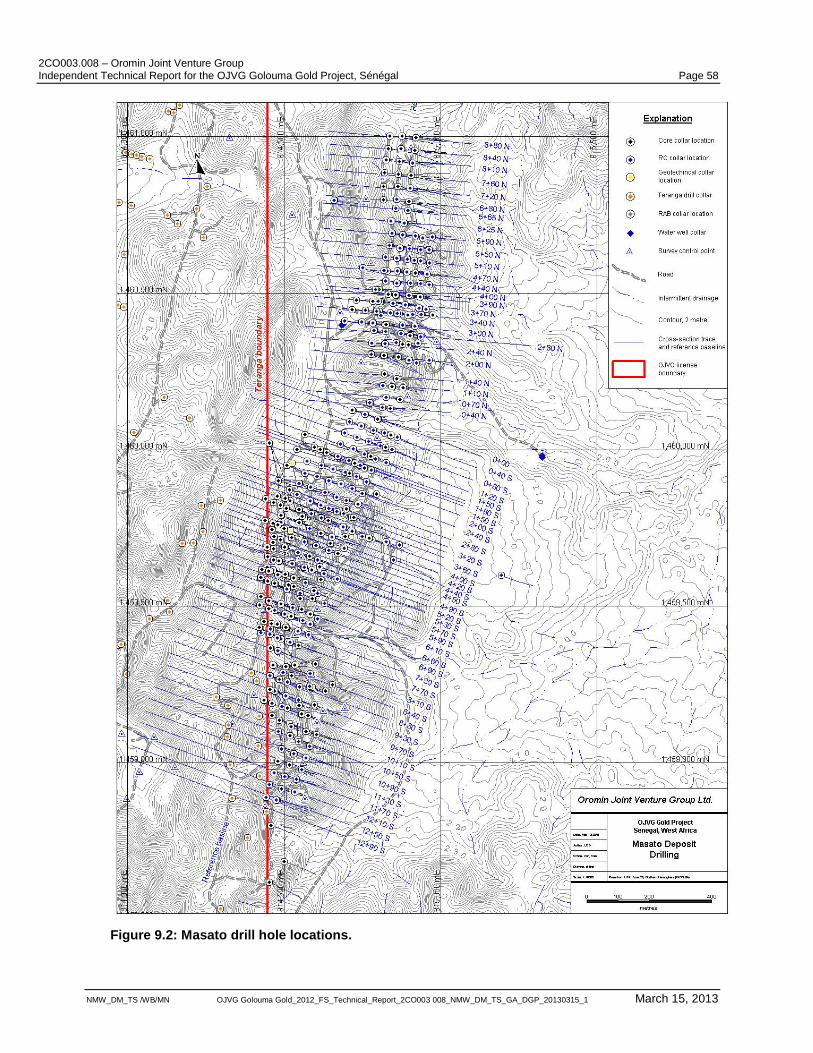
2CO003.008 – Oromin Joint Venture Group Independent Technical Report for the OJVG Golouma Gold Project, Sénégal Page 58
NMW_DM_TS /WB/MN OJVG Golouma Gold_2012_FS_Technical_Report_2CO003 008_NMW_DM_TS_GA_DGP_20130315_1 March 15, 2013
Figure 9.2: Masato drill hole locations.
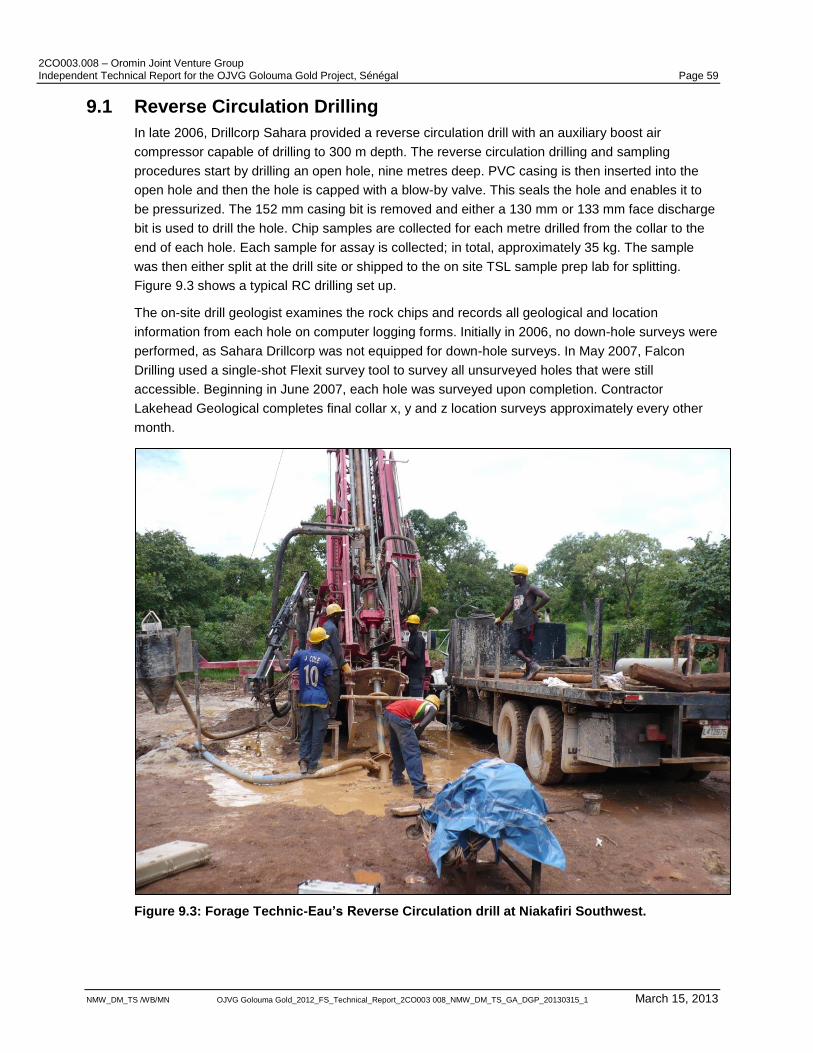
2CO003.008 – Oromin Joint Venture Group Independent Technical Report for the OJVG Golouma Gold Project, Sénégal Page 59
NMW_DM_TS /WB/MN OJVG Golouma Gold_2012_FS_Technical_Report_2CO003 008_NMW_DM_TS_GA_DGP_20130315_1 March 15, 2013
9.1 Reverse Circulation Drilling
In late 2006, Drillcorp Sahara provided a reverse circulation drill with an auxiliary boost air
compressor capable of drilling to 300 m depth. The reverse circulation drilling and sampling
procedures start by drilling an open hole, nine metres deep. PVC casing is then inserted into the
open hole and then the hole is capped with a blow-by valve. This seals the hole and enables it to
be pressurized. The 152 mm casing bit is removed and either a 130 mm or 133 mm face discharge
bit is used to drill the hole. Chip samples are collected for each metre drilled from the collar to the
end of each hole. Each sample for assay is collected; in total, approximately 35 kg. The sample
was then either split at the drill site or shipped to the on site TSL sample prep lab for splitting.
Figure 9.3 shows a typical RC drilling set up.
The on-site drill geologist examines the rock chips and records all geological and location
information from each hole on computer logging forms. Initially in 2006, no down-hole surveys were
performed, as Sahara Drillcorp was not equipped for down-hole surveys. In May 2007, Falcon
Drilling used a single-shot Flexit survey tool to survey all unsurveyed holes that were still
accessible. Beginning in June 2007, each hole was surveyed upon completion. Contractor
Lakehead Geological completes final collar x, y and z location surveys approximately every other
month.
Figure 9.3: Forage Technic-Eau’s Reverse Circulation drill at Niakafiri Southwest.
2CO003.008 – Oromin Joint Venture Group Independent Technical Report for the OJVG Golouma Gold Project, Sénégal Page 60
NMW_DM_TS /WB/MN OJVG Golouma Gold_2012_FS_Technical_Report_2CO003 008_NMW_DM_TS_GA_DGP_20130315_1 March 15, 2013
9.1.1 2006 RC Drill Program
Ten reverse circulation drill holes (RC-Sab-06-01 to 10) totaling 1,146 m were completed in
December by Sahara Drillcorp. Two northwest trending fences of three drill holes plus scattered
infill holes were drilled to test the Golouma South gold-in-soil geochemical anomaly. The holes all
intersected greenschist (chlorite-epidote-carbonate-silica) altered and deformed mafic
metavolcanic rocks crosscut by younger mafic dykes, pink felsic dykes and gold bearing quartz-
carbonate± sericite-albite-fuchite-tourmaline-pyrite alteration, veins, and vein stockworks.
9.1.2 2007 RC Drill Program
The 2007, RC drilling largely comprised close-spaced (40 m x 40 m) drilling to aid resource
estimation at Masato, Golouma West and Golouma South. One hundred thirty-six RC holes were
completed at Golouma West and Golouma South to the end of June at which time the Sahara
Drillcorp drill contract was not renewed. In October, following the rainy season during which RC
drilling is curtailed, Forage Technic-Eau were contracted to provide a RC drill to the project and
completed thirty-one holes at Golouma West and Masato. In November, a second RC drill was
contracted through Boart-Longyear, who completed eight holes at Golouma West. One hundred
and seventy-five holes (RC-Sab-07-11 to 186) were drilled in 2007, totaling 30,019 m and included
35 holes at Golouma South (5,483 m), 107 holes at Golouma West (20,055 m), 24 holes at Masato
(3,427 m) and 8 holes at Kourouloulou (1,054 m)
9.1.3 2008 RC Drill Program
Reverse circulation drilling during 2008 totaled 61,130 m in 330 drill holes (RC-Sab-08-185 to 511)
and 1,092 m in 18 engineering holes. The majority of the drilling was directed at seven deposits to
aid resource estimation. The deposits drilled include Golouma West (29 holes; 4,983 m), Golouma
South (24 holes; 3,345 m), Masato (185 holes; 35,639 m), Kerekounda (16 holes; 3,140 m),
Kourouloulou (9 holes; 1,569 m), Maki Medina (18 holes; 3,073 m) and Niakafiri Southeast (29
holes; 5,346 m). The remainder of the drilling tested Sekoto (4 holes; 917 m), Korolo (6 holes;
886 m) and Sabodala North (6 holes; 1,598 m).
9.1.4 2009 RC Drill Program
Reverse circulation drilling conducted during 2009 totaled 26,532 m in 151 holes (RC-Sab-09-512
to 662). The majority of the drilling was directed at six deposits for resource estimation. They
include Golouma West (2 holes; 606 m), Golouma South (5 holes; 1029 m), Kerekounda (87 holes;
15,472 m), Masato (11 holes; 1895 m), Kourouloulou (15 holes; 2,155 m) and Maki Medina (4
holes; 545 m) with the remainder testing Koulouqwinde (20 holes; 3,528 m), Saboraya (4 holes;
804 m) and Niakafiri Southwest (3 holes; 498 m).
9.1.5 2010 RC Drill Program
Reverse circulation drilling conducted during 2010 totaled 22,213 m in 184 holes (RC-Sab-10-663
to 846), 1,808 m in 30 geotechnical holes, and 2,113 m in 61 engineering and water holes. The
majority of the drilling was directed at six deposits to aid resource estimation. They include Masato
(29 holes; 2,099 m), Kourouloulou (10 holes; 1,660 m), Kobokoto (52 holes; 7,335 m), Maki Medina
(51 holes; 6,047 m), Niakafiri Southwest (23 holes; 2,781 m) and Niakafiri Southeast (10 holes;
1,053 m) with the remainder testing Koulouqwinde (6 holes; 766 m).
In addition to the RC drilling, Forage Technic Eau completed 22,435 m of Reverse Air Blast (RAB)
drilling in 630 shallow holes as profiles across a number of laterite covered target areas including
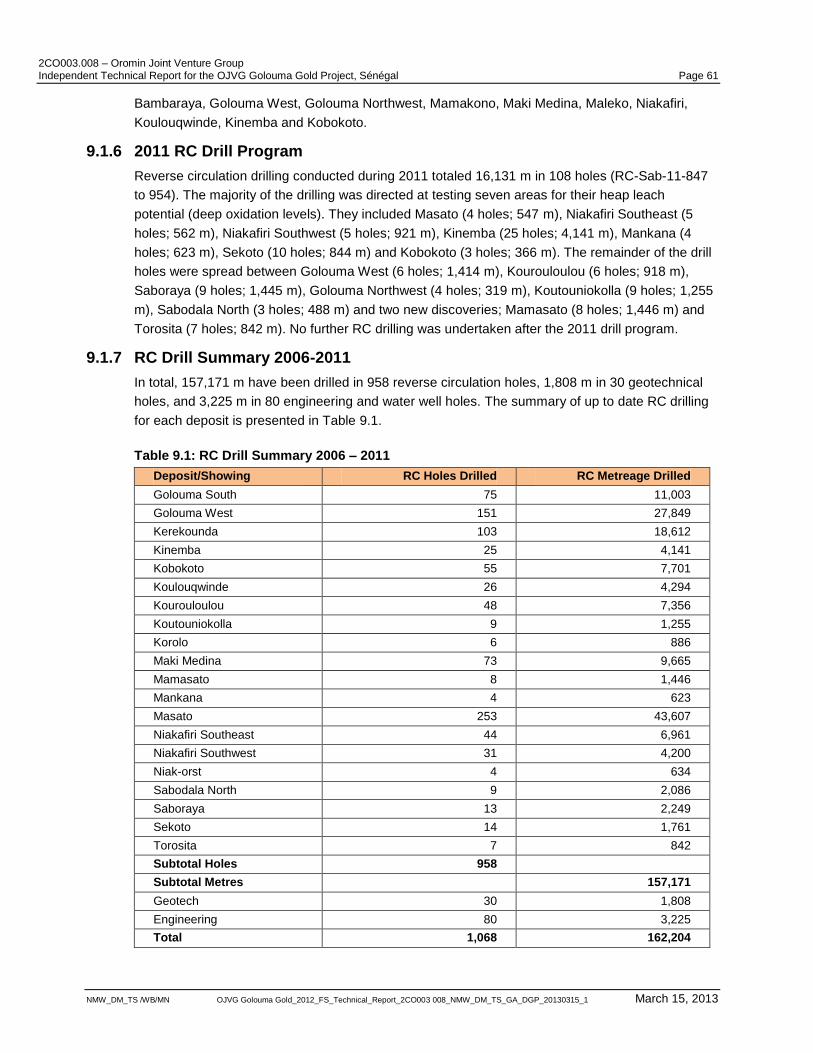
2CO003.008 – Oromin Joint Venture Group Independent Technical Report for the OJVG Golouma Gold Project, Sénégal Page 61
NMW_DM_TS /WB/MN OJVG Golouma Gold_2012_FS_Technical_Report_2CO003 008_NMW_DM_TS_GA_DGP_20130315_1 March 15, 2013
Bambaraya, Golouma West, Golouma Northwest, Mamakono, Maki Medina, Maleko, Niakafiri,
Koulouqwinde, Kinemba and Kobokoto.
9.1.6 2011 RC Drill Program
Reverse circulation drilling conducted during 2011 totaled 16,131 m in 108 holes (RC-Sab-11-847
to 954). The majority of the drilling was directed at testing seven areas for their heap leach
potential (deep oxidation levels). They included Masato (4 holes; 547 m), Niakafiri Southeast (5
holes; 562 m), Niakafiri Southwest (5 holes; 921 m), Kinemba (25 holes; 4,141 m), Mankana (4
holes; 623 m), Sekoto (10 holes; 844 m) and Kobokoto (3 holes; 366 m). The remainder of the drill
holes were spread between Golouma West (6 holes; 1,414 m), Kourouloulou (6 holes; 918 m),
Saboraya (9 holes; 1,445 m), Golouma Northwest (4 holes; 319 m), Koutouniokolla (9 holes; 1,255
m), Sabodala North (3 holes; 488 m) and two new discoveries; Mamasato (8 holes; 1,446 m) and
Torosita (7 holes; 842 m). No further RC drilling was undertaken after the 2011 drill program.
9.1.7 RC Drill Summary 2006-2011
In total, 157,171 m have been drilled in 958 reverse circulation holes, 1,808 m in 30 geotechnical
holes, and 3,225 m in 80 engineering and water well holes. The summary of up to date RC drilling
for each deposit is presented in Table 9.1.
Table 9.1: RC Drill Summary 2006 – 2011
Deposit/Showing RC Holes Drilled RC Metreage Drilled
Golouma South 75 11,003
Golouma West 151 27,849
Kerekounda 103 18,612
Kinemba 25 4,141
Kobokoto 55 7,701
Koulouqwinde 26 4,294
Kourouloulou 48 7,356
Koutouniokolla 9 1,255
Korolo 6 886
Maki Medina 73 9,665
Mamasato 8 1,446
Mankana 4 623
Masato 253 43,607
Niakafiri Southeast 44 6,961
Niakafiri Southwest 31 4,200
Niak-orst 4 634
Sabodala North 9 2,086
Saboraya 13 2,249
Sekoto 14 1,761
Torosita 7 842
Subtotal Holes 958
Subtotal Metres 157,171
Geotech 30 1,808
Engineering 80 3,225
Total 1,068 162,204
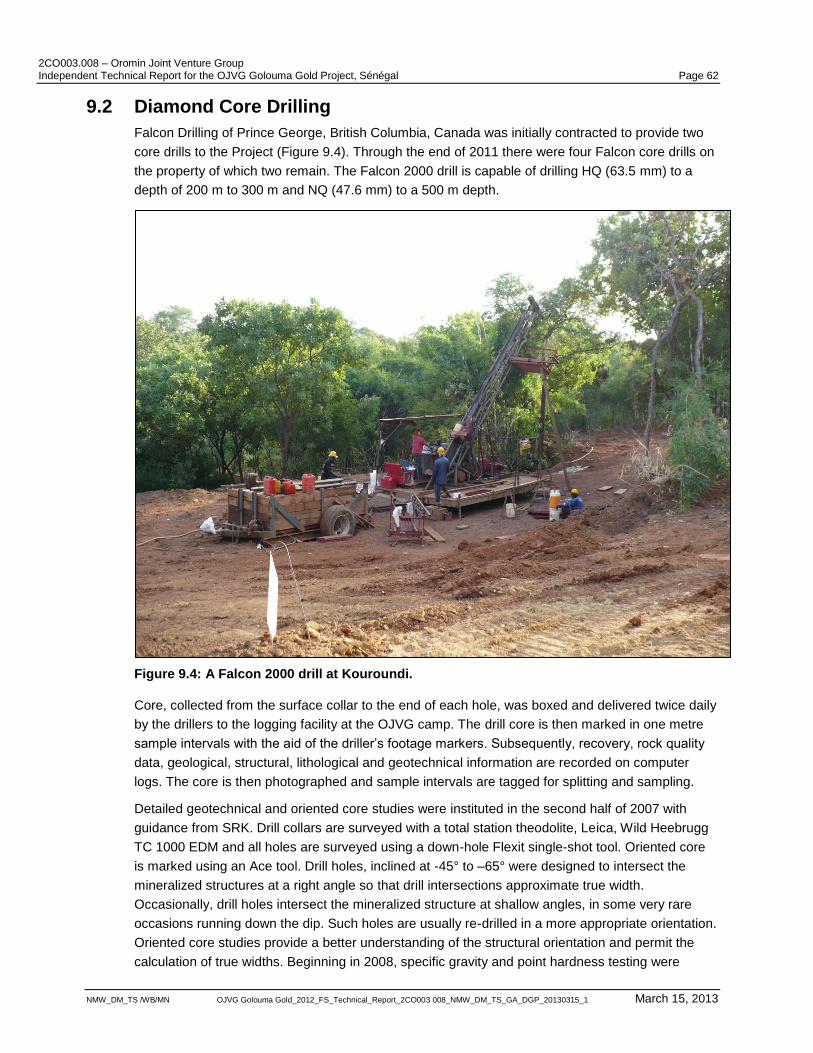
2CO003.008 – Oromin Joint Venture Group Independent Technical Report for the OJVG Golouma Gold Project, Sénégal Page 62
NMW_DM_TS /WB/MN OJVG Golouma Gold_2012_FS_Technical_Report_2CO003 008_NMW_DM_TS_GA_DGP_20130315_1 March 15, 2013
9.2 Diamond Core Drilling
Falcon Drilling of Prince George, British Columbia, Canada was initially contracted to provide two
core drills to the Project (Figure 9.4). Through the end of 2011 there were four Falcon core drills on
the property of which two remain. The Falcon 2000 drill is capable of drilling HQ (63.5 mm) to a
depth of 200 m to 300 m and NQ (47.6 mm) to a 500 m depth.
Figure 9.4: A Falcon 2000 drill at Kouroundi.
Core, collected from the surface collar to the end of each hole, was boxed and delivered twice daily
by the drillers to the logging facility at the OJVG camp. The drill core is then marked in one metre
sample intervals with the aid of the driller‟s footage markers. Subsequently, recovery, rock quality
data, geological, structural, lithological and geotechnical information are recorded on computer
logs. The core is then photographed and sample intervals are tagged for splitting and sampling.
Detailed geotechnical and oriented core studies were instituted in the second half of 2007 with
guidance from SRK. Drill collars are surveyed with a total station theodolite, Leica, Wild Heebrugg
TC 1000 EDM and all holes are surveyed using a down-hole Flexit single-shot tool. Oriented core
is marked using an Ace tool. Drill holes, inclined at -45° to –65° were designed to intersect the
mineralized structures at a right angle so that drill intersections approximate true width.
Occasionally, drill holes intersect the mineralized structure at shallow angles, in some very rare
occasions running down the dip. Such holes are usually re-drilled in a more appropriate orientation.
Oriented core studies provide a better understanding of the structural orientation and permit the
calculation of true widths. Beginning in 2008, specific gravity and point hardness testing were
2CO003.008 – Oromin Joint Venture Group Independent Technical Report for the OJVG Golouma Gold Project, Sénégal Page 63
NMW_DM_TS /WB/MN OJVG Golouma Gold_2012_FS_Technical_Report_2CO003 008_NMW_DM_TS_GA_DGP_20130315_1 March 15, 2013
undertaken by on-site laboratory personnel. Stored half core, from previous drilling, was also
tested. Coarse rejects and half core from previous drill holes are stored on site in a secure fenced
area.
9.2.1 2006 Core Drilling
Drilling operations commenced at the OJVG Concession in late January 2006 and ran continuously
to year-end. Drilling was restricted to one drill and one shift due to water shortages during the dry
season. Seventy drill holes were completed (Sab-06-01 to 70) totaling 11,732 m.
Drilling during 2006 focused on defining the limits of gold mineralization discovered by prospecting,
soil geochemistry, IP geophysics and trenching. Eight areas were tested including four at Golouma
South (22 holes; 3514.3 m), Golouma West (28 holes; 4,923.08 m), Golouma Northwest (3 holes;
543.98 m) and Golouma East (3 holes; 446.67 m) plus Masato (8 holes; 1,301.71 m), Niakafiri
Southeast (2 holes; 312.9 m) and Maki Medina (1 holes; 158.7 m). Very positive results were
obtained, especially from Masato, Golouma South and Golouma West where gold mineralization
was confirmed and expanded.
9.2.2 2007 Core Drilling
Core drilling continued in 2007 with 115 holes completed (Sab-07-71 to 185) totaling 23,311.17 m
including core extensions to 12 reverse circulation holes (1,287.39 m). During 2007, two diamond
drills operated during the day shift and, for a portion of the year, a night shift operated; thus
increasing drill production. Water shortages continued to cause occasional drilling delays during
the dry season. Core drilling in 2007 focused on close-spaced grid drilling at Masato (28 holes;
6,020.56 m), Kourouloulou (13 holes; 2,465.46 m), Golouma South (15 holes; 2,432.5m) and
Golouma West (47 holes; 10,131.07 m) and testing several new areas: Maki Medina (7 holes;
1,381.45 m), Kobokoto (3 holes; 421.91 m), and Goumbati (2 holes; 458.22 m). Drill results were
very positive and continued to expand and define the mineralization, especially at both Golouma
and Masato.
9.2.3 2008 Core Drilling
Core drilling continued in 2008 with 227 holes completed (Sab-08-186 to 412) totaling 45,529.93 m
plus core extensions to 13 RC holes (2,267.03 m). Initially, drilling focused on close-spaced drilling
to enable resource estimation at several deposits: Golouma South (43 holes; 7,895.89 m),
Golouma West (38 holes; 8,238.1 m), Masato (76 holes; 16,465.21 m), Kerekounda (16 holes;
1,882.84 m), Niakafiri Southeast (21 holes; 4,896.73 m) and Maki Medina (8 holes; 1,594.08 m).
Later, drilling tested several new areas including: Koulouqwinde (5 holes; 1,296.6 m), Sabodala
North (3 holes; 807.38 m), Sekoto (3 holes; 641.4 m) and Goumbati West (5 holes; 393.58 m). Drill
results were once again very positive and continued to define and expand mineralization at
Golouma South, Golouma West, Masato, Kerekounda and Kourlouloulou (previously named
Epsilon / Golouma Northeast).
9.2.4 2009 Core Drilling
Diamond drilling continued in 2009, 206 holes were completed (Sab-09-413 to 618) totaling
41,163.87 m. The drilling again focused on close-spaced drilling for resource estimation at
Golouma South (9 holes; 2,602.52 m), Golouma West (23 holes; 7,498.73 m), Golouma Northwest
(7 holes; 1,028.72 m), Masato (29 holes; 3,177.06 m), Kerekounda (49 holes; 15,038.67 m) and
Kourouloulou (69 holes; 8,750.64 m). Drilling also tested several other areas Kobokoto (14 holes;
2CO003.008 – Oromin Joint Venture Group Independent Technical Report for the OJVG Golouma Gold Project, Sénégal Page 64
NMW_DM_TS /WB/MN OJVG Golouma Gold_2012_FS_Technical_Report_2CO003 008_NMW_DM_TS_GA_DGP_20130315_1 March 15, 2013
1,505.49 m), Niakafiri Southwest (2 holes; 633.07 m), Sabodala North (3 holes; 731.76 m) and
Koulouqwinde (1 hole; 197.21 m). Fourteen geotechnical core holes totaling 2,205.46 m were also
completed at the five principle deposit areas.
9.2.5 2010 Core Drilling
Diamond drilling continued in 2010, 330 holes and two core extensions to RC holes (342.3 m) were
completed (Sab-10-619 to 948) totaling 81,133 m. The drilling focused on resource delineation and
expansion at Golouma South (15 holes; 5,769.82 m), Golouma West (39 holes; 14,198.59 m),
Masato (46 holes; 13,234.98 m), Kerekounda (9 holes; 3,653.78 m) and Kourouloulou (22 holes;
7,085.78 m) for the feasibility study and resource update completed by SRK. Drilling was
completed at several of the deposits to enable a resource calculation at Kobokoto (27 holes;
4,145.9 m), Maki Medina (35 holes; 6,009.35 m), Niakafiri Southeast (41 holes; 8,358.65 m) and
Niakafiri Southwest (6 holes; 1,627.7 m) by DRA. Later in 2010 deep drilling was undertaken to
evaluate potential economic mineralization below the 2010 FS resource boundaries at Golouma
West, Golouma South, Masato and Kerekounda. Several new areas were drill tested including
Koulouqwinde (68 holes; 13,150.29 m), Kinemba (4 holes; 884.2 m) and Koutounikolla (18 holes;
3,013.96 m). Thirty-one geotechnical core holes totaling 5,469.75 m were also completed.
9.2.6 2011 Core Drilling
Diamond drilling continued in 2011 with 146 new holes (Sab-11-949 to 1094) and a core extension
to one RC hole completed totaling 38,202.51 m. Once again drilling focused on resource
expansion at Golouma South (7 holes; 4,415.04 m), Golouma West (13 holes; 10,247.11 m),
Golouma Northwest (8 holes; 655.2 m), Masato (10 holes; 3,168.32 m), Kerekounda (8 holes;
3,695.66 m) and Kourouloulou (4 holes; 909.22 m) to enable a resource update. Deep drilling,
which started in late 2010, was continued at Golouma West, Golouma South, Masato, Kerekounda
and Kourouloulou. Positive results from this deep drilling indicate mineralization continues at depth
and is open to expansion. Several areas were drilled to evaluate their heap leach potential
including Niakafiri Southeast (7 holes; 1,235.5 m), Kinemba (3 holes; 639.74 m) and Sekoto (9
holes; 661.61 m). In addition, several new discoveries were drill tested including Mamasato (42
holes; 7,586.67 m), Saboraya (3 holes; 484.7 m), Kouroundi (14 holes; 2,005.45 m), Koutounikolla
(10 holes; 1,409.29 m) and Torosita (8 holes; 798.2 m). Six geotechnical core holes were also
completed totaling 3,028.32 m. No additional diamond drilling was undertaken after the 2011
program.
9.2.7 Core Drill Summary
In total 240,812.99 m of core have been drilled in 1,094 holes, 28 core extensions to RC drill holes
(4,156 m), and 51 geotechnical holes (10,703 m). A summary of up to date core drilling for each
deposit is presented in Table 9.2.
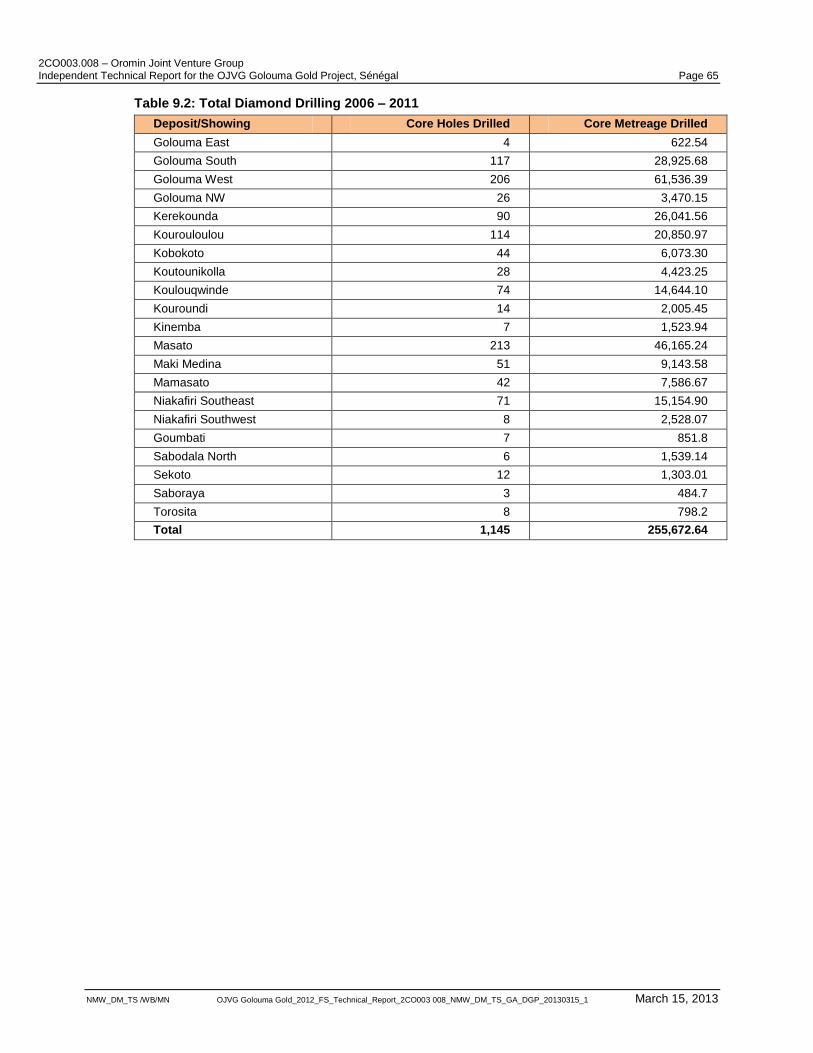
2CO003.008 – Oromin Joint Venture Group Independent Technical Report for the OJVG Golouma Gold Project, Sénégal Page 65
NMW_DM_TS /WB/MN OJVG Golouma Gold_2012_FS_Technical_Report_2CO003 008_NMW_DM_TS_GA_DGP_20130315_1 March 15, 2013
Table 9.2: Total Diamond Drilling 2006 – 2011
Deposit/Showing Core Holes Drilled Core Metreage Drilled
Golouma East 4 622.54
Golouma South 117 28,925.68
Golouma West 206 61,536.39
Golouma NW 26 3,470.15
Kerekounda 90 26,041.56
Kourouloulou 114 20,850.97
Kobokoto 44 6,073.30
Koutounikolla 28 4,423.25
Koulouqwinde 74 14,644.10
Kouroundi 14 2,005.45
Kinemba 7 1,523.94
Masato 213 46,165.24
Maki Medina 51 9,143.58
Mamasato 42 7,586.67
Niakafiri Southeast 71 15,154.90
Niakafiri Southwest 8 2,528.07
Goumbati 7 851.8
Sabodala North 6 1,539.14
Sekoto 12 1,303.01
Saboraya 3 484.7
Torosita 8 798.2
Total 1,145 255,672.64
2CO003.008 – Oromin Joint Venture Group Independent Technical Report for the OJVG Golouma Gold Project, Sénégal Page 66
NMW_DM_TS /WB/MN OJVG Golouma Gold_2012_FS_Technical_Report_2CO003 008_NMW_DM_TS_GA_DGP_20130315_1 March 15, 2013
10 Sample Preparation, Analyses, and Security Several of the following sections are abstracted from Apex Geoscience‟s NI-43-101 Technical
Report (January 2009), SRK‟s Technical Report (August 2008), SRK‟s Preliminary Feasibility Study
(August 2009), SRK‟s Feasibility Study (October 2010), and SRK‟s Updated Mineral Resources
(May 2011). All practices documented are current through the end of 2012.
10.1 Sample Preparation
10.1.1 Core Sampling
Following core mark-up, logging and photography, one-metre sample interval tags are inserted into
each box prior to being taken to the designated core cutting area. Core is cut in half using a circular
rock saw. Water used to lubricate the saw is not re-circulated. Each core piece is halved; one half
goes back into the core box for storage accompanied by its unique sample tag and the other half is
placed in a stainless steel tray with a duplicate of the same unique sample tag. As much as
possible, the sampled core is taken from the same half-split (consistent side).
All samples are one metre in length and until 2008, every metre drilled was sampled. After this
date, selective sampling of intervals in the more advanced prospects has been conducted, with
intervals based on the geologist‟s visual identification of potentially gold-bearing alteration.
However, for new and less well-defined prospects, OJVG continues to sample every metre for the
entire hole.
Drill core sampling conducted by OJVG is in line with industry standard practices. The samples are
representative of the intervals drilled and no factors that may have resulted in sample biases were
observed.
10.2 Reverse Circulation Drill Sampling
During the 2011 site visits, one RC drill rig was drilling and operated by Forage Technic-Eau.
Initially, Sahara Drill Corp. supplied a RC drill to the Project from December 2006 until the end of
June 2007, when their contract was not renewed. During October 2007, Forage Technic-Eau
supplied the RC drill and in November a second RC drill was supplied by Boart-Longyear. Both RC
rigs drilled during 2008. During 2009, 2010 and 2011, only one RC rig drilled; it was operated by
Forage Technic-Eau.
RC drill cuttings are collected individually; each one-metre interval in a separate numbered bag. In
2011, all RC cuttings were transported to a designated area, near the on-site sample preparation
laboratory, for riffle splitting. This also allowed the use of compressed air to clean the riffle splitter
between each sample. Near surface dry samples were collected in plastic bags. Wet samples were
collected below the cyclone in porous fabric bags placed inside a five-gallon bucket. Excess water
and suspended fine material from each sample interval were allowed to overflow until the sample
was collected. The entire cuttings from each drill hole were sampled and prepared for assaying. All
wet samples are dried before riffle splitting and re-homogenized so no clots of material are forced
through the splitter. Individual assay samples are generated by the entire 20 to 30 kg RC sample
passing through a riffle splitter twice. The retained split represents 12.5% of the total sample
interval recovered from the ground. This procedure was a modification of the original 2006 practice,
which used a 10 to 15 kg half sample split to generate the assay sample.
2CO003.008 – Oromin Joint Venture Group Independent Technical Report for the OJVG Golouma Gold Project, Sénégal Page 67
NMW_DM_TS /WB/MN OJVG Golouma Gold_2012_FS_Technical_Report_2CO003 008_NMW_DM_TS_GA_DGP_20130315_1 March 15, 2013
The RC sampling practices used on-site by OJVG are generally in line with industry standard
practices and the samples are representative of the intervals drilled. However, SRK noted during
their 2009 visit, the use of the riffle splitter in the field occasionally departed from the ideal protocol.
This is unlikely to have resulted in a systematic bias to the samples or a material difference to the
resource estimates and SRK recommended that OJVG monitor the riffle splitting closely to ensure
constant adherence to industry best practice.
10.3 Onsite Preparation
Staff from TSL Laboratory (TSL) oversees all stages of onsite sample preparation and their
shipment from camp.
All split half diamond drill core and RC sample splits are placed in clean stainless steel trays for
drying in the on-site laboratory. RC samples are sun dried and any excess moisture is removed
during oven drying for 5-6 hours at 65-70º C.
All rock, trench, RC chips and drill core samples are crushed using a primary jaw crusher to a
minimum of 70% passing through a –10 mesh (2.0mm) screen. A 250-gram sample split is
packaged for shipment to TSL in Saskatoon, Saskatchewan, Canada.
At their Saskatoon facility, TSL further processes the rock, trench, RC and core samples by
pulverizing to 95% passing a –150 mesh (106 µm) screen.
10.4 Shipment and Storage of Samples
Analytical samples are shipped from the OJVG camp to Dakar in trucks owned by OJVG. Once in
Dakar, OJVG personnel arrange customs documentation to transport the samples by commercial
airfreight to TSL in Saskatoon, Canada for preparation and analysis.
All split drill core is stored in purpose built core racks located in a secure, fenced-off core storage
area adjacent to the on-site TSL prep lab. RC chip trays are stored in racks within a purpose built
lockable building. Coarse rejects of both RC and core samples are kept for future reference or
reanalysis in locked storage containers adjacent to the TSL prep lab in the OJVG camp. All unused
materials are also stored at the TSL facility in Saskatoon for possible future use.
10.5 Chain of Custody
In 2005, all samples were shipped via truck to Dakar and then by airfreight to TSL in Saskatoon, for
sample preparation and analysis. During the initial phase of the exploration program, several
shipments of rock and soil samples were temporarily misplaced and/or delayed in shipment. This
was a consequence of the remote location of the concession and the lack of a permanent
exploration camp. During 2005, the sample shipment process gradually improved and few
problems were encountered later in the year. Since January 2006, TSL was contracted to operate
an on-site sample preparation facility. Samples are dropped off daily at their facility in the OJVG
camp where lab personnel sort, organize and dry the samples. After the initial sample preparation
is complete on site, the samples are packaged for shipment to Saskatoon. The remaining sample
material is stored on site in secure containers for potential future re-analysis. Samples are shipped
via OJVG truck to Dakar, where OJVG personnel arrange customs documentation. Then, the
samples are shipped via commercial airfreight to TSL in Saskatoon for analysis.
Prior to 2008, OJVG were able to track samples using a sample shipment list, created on-site and
sent to the OJVG office in Vancouver and TSL in Saskatoon who confirmed receipt of all samples.
2CO003.008 – Oromin Joint Venture Group Independent Technical Report for the OJVG Golouma Gold Project, Sénégal Page 68
NMW_DM_TS /WB/MN OJVG Golouma Gold_2012_FS_Technical_Report_2CO003 008_NMW_DM_TS_GA_DGP_20130315_1 March 15, 2013
Sample shipment arrival times could be tracked via the commercial freight company. No samples
have been lost in transport.
In March 2008, OJVG introduced the use of a sample-tracking (chain-of-custody) sheet, which
requires the dispatchers and drivers of the samples to sign-off at each stage of the sample
transportation. Tamper-proof security tags, each individually numbered, are now used to tie rice
sacks containing the samples; ensuring the detection of any unsolicited opening of the sacks. TSL
inspects these tags on arrival in Saskatoon and no tampering has been reported to date.
10.6 Gold Analysis
OJVG Project sample gold analysis is initially a fire assay with atomic absorption finish (FA/AA)
with a 5 ppb detection limit. Assay results that exceed a specified limit are reanalyzed using fire
assay with a gravimetric finish (FA/GRAV).
Prior to 2008, assay samples were weighed out into 30 gm analytical samples and the switch to
FA/GRAV method was set to FA/AA results exceeding 1 g/t Au. In early 2008, OJVG instructed
TSL to weigh out 50 gm analytical samples and use FA/GRAV for samples exceeding 3.0 g/t Au
(FA/AA).
OJVG fire assay oven samples are loaded into assay trays holding twenty-four samples. Twenty
OJVG samples are accompanied by four TSL internal QA/QC samples (two pulp duplicates, one
gold Standard Reference Material (SRM) and one blank).
TSL Laboratories completed the ISO/IEC 17025 Accreditation in 2004 and is Accredited Laboratory
No.538.
10.7 Bulk Density Data
A comprehensive bulk density data collection program was initiated in January 2008 and continues
to be conducted by TSL staff at their on-site preparation lab. There are 14,890 bulk density
determinations of core samples using a weight-in-air versus weight-in-water methodology. In
general, samples were taken approximately every ten metres to include all rock and alteration
types. Data is indexed to lithological records by drill hole ID and sample depth. Samples deemed to
be porous or absorbent were coated in wax after an initial weight-in-air determination. Together
with the waxed sample weights in air and water, the bulk density was calculated.
TSL laboratory utilizes QC samples (samples for which the density value is accurately determined)
with every batch of samples. One QC density determination is done before starting the
determinations from a new drill hole and another at the end of the sequence of samples.
10.8 OJVG Quality Assurance and Quality Control Programs
In 2008 and 2009, OJVG utilized Susan Lomas (P.Geo) of Lions Gate Geological Consulting
(LGGC) to undertake periodic reviews of the OJVG Project‟s quality assurance and quality control
(QA/QC) program. This included a periodic review of all data and site visits to the Project. On the
basis of these reviews, LGGC provided commentary and recommendations to the OJVG to ensure
optimum best practices. . Including this report, four review reports have been issued since March
2008 and are in addition to the review conducted by SRK for their NI 43-101 Technical Report of
August 31, 2008.
2CO003.008 – Oromin Joint Venture Group Independent Technical Report for the OJVG Golouma Gold Project, Sénégal Page 69
NMW_DM_TS /WB/MN OJVG Golouma Gold_2012_FS_Technical_Report_2CO003 008_NMW_DM_TS_GA_DGP_20130315_1 March 15, 2013
In 2009, for the Preliminary Feasibility Study Technical Report, SRK reviewed all the OJVG QA/QC
data and updated the LGGC analysis with all drill hole assay data used in the resource estimation.
SRK for the 2010 Feasibility Study Technical Report conducted additional quality assurance on the
2009 and early 2010 data, such that there was an overlap with the 2009 data previously reviewed.
SRK, for the May 2011 Mineral Resource Estimation update, has once again completed quality
assurance on QA/QC and drill hole assay data for all of 2010 to provide overlap with the previous
Feasibility Study.
For this Mineral Resource Estimation Report, SRK has completed quality assurance on 2011 drill
hole assay data. SRK felt that no overlap with the previous QAQC was necessary as SRK had
completed the previous two reviews with good results.
As a general practice, for each batch of 20 samples, OJVG include one blank, one duplicate and
one standard reference material.
10.8.1 Blanks
Throughout the 2006 drill program, no blanks were included in the sample shipments. In 2007,
OJVG inserted commercially available blank sand material with drill core but not RC samples.
However, the fine sand material, due to the small size, was unable to check any contamination that
could result from the crushing process. In 2008, OJVG started using gravel derived from a local
diorite intrusive as blank material. OJVG uses selective pieces void of fracturing after noticing that
fractured or veined material returned an occasional high assay value. Eliminating the fine fracture
material reduced any anomalous result in the blank material and no contamination between
samples is apparent in the blank sample results.
10.8.2 Duplicate Samples
OJVG Field Duplicates
OJVG began submitting 250 g field duplicates for analysis in January 2008. From April 2008
through 2009, sample sizes varied from 500 g to 250 grams. For 2010 and onwards, the duplicate
sample size was maintained at 500 g. In 2011 there were 2,419 field duplicates from the diamond
drill holes and RC drill holes submitted for analysis to TSL.
For the diamond drill hole duplicates, the sample preparation facility at the project site in Senegal
prepared the 500 g sample from crushed coarse reject. The RC field duplicates were taken as a
second split from the original sample at the drill rig. The duplicate samples were sent within the
sample stream to TSL in Saskatoon.
OJVG TSL Blind Pulp Re-assay Program
The first 8,326 core samples sent to the TSL lab for analysis in 2006 and 2007 were analyzed
without the benefit of any Standard Reference Material (SRM). Only 4,662 of these samples
returned assay results above the detection limit. In March of 2008 LGGC recommended that the
OJVG re-submit the pulp for about 10% of these samples to TSL for re-analysis with check SRM
samples inserted.
OJVG submitted 402 pulp samples to TSL and inserted 46 SRM to the Sample submission. LGGC
recommended that OJVG use these samples as a blind check on TSL laboratory performance on
the original assaying by changing the sample numbers of the pulps and inserting SRMs randomly,
but generally using a rule of one SRM per ten submitted samples. Two different SRMs were
2CO003.008 – Oromin Joint Venture Group Independent Technical Report for the OJVG Golouma Gold Project, Sénégal Page 70
NMW_DM_TS /WB/MN OJVG Golouma Gold_2012_FS_Technical_Report_2CO003 008_NMW_DM_TS_GA_DGP_20130315_1 March 15, 2013
included with the sample submission, both from CDN Resource Laboratory, Langley, B.C.,
Canada.
The duplicate results showed good reproducibility of the original results and the submitted SRMs
also show good performance by the laboratory. The re-assay program confirms the lack of any
analytical bias of the original assay results.
10.8.3 Standard Reference Material Samples (SRMs)
Standard reference material samples (SRMs) are used to ensure that the analytical results
reported to the public are reasonably accurate and reliable for resource estimation purposes.
SRMs are pulped rock material purchased commercially or custom created from rock material that
has been subjected to multi-laboratory round robin analysis and have a certified expected value
and a standard deviation, to allow for variance of the SRM material and minor analytical differences
between assay laboratories.
When submitted with assay samples, the SRM results are checked against the accepted ranges
provided on the SRM certificate, usually two or three standard deviations from the average grade
assigned to the SRM. Typically for gold, if a single SRM result is found to exceed three standard
deviations, then the results from the batch of samples is considered unreliable and should be re-
assayed. If an isolated SRM assay result is found to exceed two standard deviations, this can be
considered acceptable. However, if two consecutive SRM‟s exceed two standard deviation results
then those batches should be re-analyzed. Sample results associated with a failed SRM should not
be relied upon and held in quarantine until the samples are re-analyzed.
The SRMs used for the Project are purchased from CDN Laboratory in Vancouver and are listed in
Table 10.1. Initially, SRMs were inserted by TSL at their laboratory in Canada. However, since May
2008, OJVG geologists insert SRM samples into the sample stream as part of their regular logging
and sampling onsite procedure. OJVG‟s protocol is that the geologist selects an SRM with an
equivalent grade to that anticipated for the interval on either side of the SRM. The SRM size was
doubled in mid-2009 from 40 gm to 80 gm in response to LGGC‟s recommendations. FA/GRAV
samples higher than 3.0 g/t Au and any samples of expected higher grade require at least 120 gm
of the appropriate SRM.
OJVG on occasion has had a repeatability issue with a particular SRM. When this happens, the
standard is discontinued. Several new standards were introduced during the 2011 exploration
program.
2CO003.008 – Oromin Joint Venture Group Independent Technical Report for the OJVG Golouma Gold Project, Sénégal Page 71
NMW_DM_TS /WB/MN OJVG Golouma Gold_2012_FS_Technical_Report_2CO003 008_NMW_DM_TS_GA_DGP_20130315_1 March 15, 2013
Table 10.1: CDN Laboratory Standard Reference Material used at the OJVG Gold Project
SRM Name Expected Range Std Dev. (Au g/t) +2STD -2STD +3STD -3STD
(Au g/t) (Au g/t) (Au g/t) (Au g/t)
GS-1P5A 1.37 0.06 1.49 1.25 1.55 1.19
GS-1P5B 1.46 0.06 1.58 1.34 1.64 1.28
GS-19 0.74 0.035 0.81 0.67 0.85 0.64
CM1 1.85 0.08 2.01 1.69 2.09 1.61
CM2 1.42 0.065 1.55 1.29 1.615 1.225
CM4 1.18 0.06 1.3 1.06 1.36 1
CM5 0.294 0.023 0.34 0.248 0.363 0.225
GS-4A 4.42 0.23 4.88 3.96 5.11 3.73
GS-P5B 0.436 0.022 0.48 0.392 0.502 0.37
GS-3D 3.52 0.155 3.83 3.21 3.985 3.055
CDN-GS-2F 2.16 0.12 2.4 1.92 2.52 1.8
CDN-GS-5F 5.27 0.17 5.61 4.93 5.78 4.76
CDN-GS-1P5D 1.47 0.075 1.62 1.32 1.695 1.245
CDN-GS-3H 3.04 0.115 3.27 2.81 3.385 2.695
CDN-GS-P2 0.214 0.01 0.234 0.194 0.244 0.184
CDN-GS-P3A 0.338 0.011 0.36 0.316 0.371 0.305
CDN-GS-P4A 0.438 0.016 0.47 0.406 0.486 0.39
10.9 Record Keeping for Traceability
During trenching, drilling, logging, sampling and shipping multiple data keeping systems are
employed. Most data in the field are recorded in written form: in field books, maps, log books,
sample sheets, logging forms, or shipping forms. The field data is later recorded in the onsite
company computers. All hard copy forms are stored onsite and / or at the OJVG‟s Dakar office.
Geological logging is conducted with the aid of ruggedized laptop computers. All files containing
geological and summary logs are stored on the OJVG camp computer server and sent by e-mail on
a daily basis to OJVG management and OJVG‟s data management consultant, Nowak and
Associates (Dave Nowak P Geo.), Vancouver. Data verification is carried out on the data received
and any errors in labeling or sample sequence identified during this process can usually be traced
back to source and corrective action taken.
10.10 Data Storage and Security
10.10.1 Paper Data
Hard copies of all field data are stored and filed on-site. Field maps, sections, trench plans, and
field sketches are scanned and e-mailed to OJVG management and Nowak in Vancouver where
paper copies are made and stored. Paper copies of the drill logs and corresponding original TSL
assays are generated and stored at the Oromin office in Vancouver.
2CO003.008 – Oromin Joint Venture Group Independent Technical Report for the OJVG Golouma Gold Project, Sénégal Page 72
NMW_DM_TS /WB/MN OJVG Golouma Gold_2012_FS_Technical_Report_2CO003 008_NMW_DM_TS_GA_DGP_20130315_1 March 15, 2013
10.10.2 Computer Data
All computer data including the photographic records of drill core and RC chips is stored on-site in
the company server and the data is periodically transferred to Vancouver by Lakehead Geological
Services Inc.; the GIS and survey contractor.
Data from third parties such as laboratories or survey contractors are generally supplied in digital
and printed form. Nowak and Associates store digital files from surveyors and assay labs in their
original format, in addition to integrating them into the master database.
All OJVG Project electronic data received and generated by Nowak and Associates is backed up
on a scheduled basis to an external hard drive. In addition, the latest digital database is distributed
to off-site contractors, Lakehead Geological Services Inc. and SRK Consulting Inc. for plotting and
analysis.
10.11 Conclusion
Based on a review of the practices observed on-site and discussions with OJVG geological staff
and consultants, the author believes that OJVG‟s current sample preparation, analysis and security
practices generally meet or exceed industry standards. SRK reviewed the QA/QC data for their
resource estimate in May 2011. Dave Nowak and the author reviewed and updated the 2011
QA/QC data analysis. The results indicate that the program is acceptable for the resource
estimates conducted and provided previously by SRK and DRA. Some possible areas of
improvement have been identified by SRK and OJVG‟s consultants and have been communicated
to the company to ensure optimal practices.
2CO003.008 – Oromin Joint Venture Group Independent Technical Report for the OJVG Golouma Gold Project, Sénégal Page 73
NMW_DM_TS /WB/MN OJVG Golouma Gold_2012_FS_Technical_Report_2CO003 008_NMW_DM_TS_GA_DGP_20130315_1 March 15, 2013
11 Data Verification The following sub-sections describe the verification of exploration data undertaken by SRK. The
verification includes checks of assay certificates against the master database and the results from
the QA/QC program.
11.1 Verification of OJVG Database from Assay Certificates
In July 2012, Tessa Scott, SRK Consultant, verified the 2011 assay results for the Project recorded
in OJVG‟s drill hole database with copies of assay certificates from TSL Laboratories. In total,
33,995 drill hole assay results were verified. Of the total assay results, 12,076 are reverse
circulation (RC) drill hole and 21,919 are diamond drill hole (DDH) assay results. The assay
samples were selected from the January 2011 to December 2011 and represent over 80% of RC
and diamond drill hole samples assayed during this period. SRK did not find any inaccuracies in
OJVG‟s assay database. Data prior to January 2011 was previously verified by SRK for the May
11, 2011 SRK Technical Report: Revised OJVG Golouma Project Updated Mineral Resource.
11.2 Independent Check Assays
During the February 2011 site visit, SRK collected 20 samples of drill core along with three SRM
samples and one blank sample. Samples collected in 2011 were taken from drilling completed
primarily in 2010 and late 2009. Including the 45 samples collected by SRK in 2008 and 2009, all of
the deposits under consideration for this mineral resource study have had some check assays
conducted. Samples of drill core consisted of half-core samples corresponding to the same sample
intervals as defined by OJVG. In the case of very broken saprolitic and oxidised samples, the
sample consisted of all of the broken material remaining in the core tray over a particular sampling
interval.
Samples collected during the 2011 site visit were sent to ALS Laboratory in Vancouver for Au
analysis by fire assay with atomic absorption finish using 50 g sample weight. For any samples
greater than 10 g/t Au, fire assay and gravimetric finish was used. Visible gold was observed by
SRK in the core for several samples.
Results of the samples collected by SRK in 2008, 2009, and 2011 are shown in Table 11.1 and
Figure 11.1.
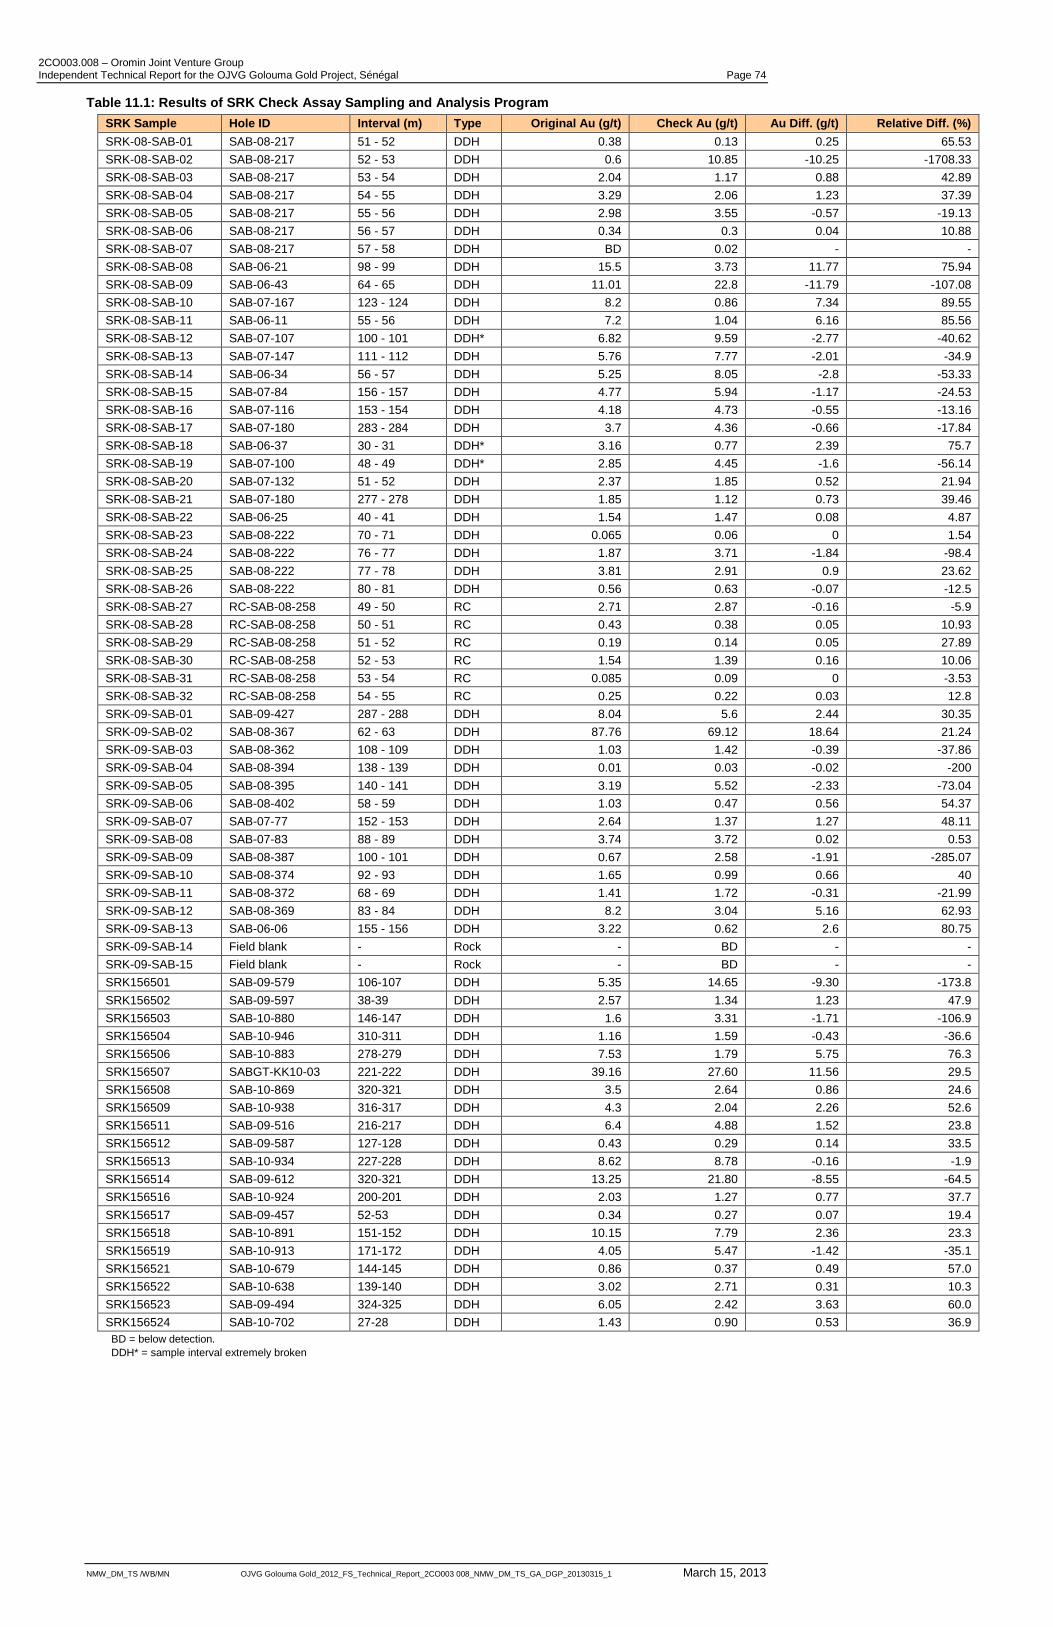
2CO003.008 – Oromin Joint Venture Group Independent Technical Report for the OJVG Golouma Gold Project, Sénégal Page 74
NMW_DM_TS /WB/MN OJVG Golouma Gold_2012_FS_Technical_Report_2CO003 008_NMW_DM_TS_GA_DGP_20130315_1 March 15, 2013
Table 11.1: Results of SRK Check Assay Sampling and Analysis Program
SRK Sample Hole ID Interval (m) Type Original Au (g/t) Check Au (g/t) Au Diff. (g/t) Relative Diff. (%)
SRK-08-SAB-01 SAB-08-217 51 - 52 DDH 0.38 0.13 0.25 65.53
SRK-08-SAB-02 SAB-08-217 52 - 53 DDH 0.6 10.85 -10.25 -1708.33
SRK-08-SAB-03 SAB-08-217 53 - 54 DDH 2.04 1.17 0.88 42.89
SRK-08-SAB-04 SAB-08-217 54 - 55 DDH 3.29 2.06 1.23 37.39
SRK-08-SAB-05 SAB-08-217 55 - 56 DDH 2.98 3.55 -0.57 -19.13
SRK-08-SAB-06 SAB-08-217 56 - 57 DDH 0.34 0.3 0.04 10.88
SRK-08-SAB-07 SAB-08-217 57 - 58 DDH BD 0.02 - -
SRK-08-SAB-08 SAB-06-21 98 - 99 DDH 15.5 3.73 11.77 75.94
SRK-08-SAB-09 SAB-06-43 64 - 65 DDH 11.01 22.8 -11.79 -107.08
SRK-08-SAB-10 SAB-07-167 123 - 124 DDH 8.2 0.86 7.34 89.55
SRK-08-SAB-11 SAB-06-11 55 - 56 DDH 7.2 1.04 6.16 85.56
SRK-08-SAB-12 SAB-07-107 100 - 101 DDH* 6.82 9.59 -2.77 -40.62
SRK-08-SAB-13 SAB-07-147 111 - 112 DDH 5.76 7.77 -2.01 -34.9
SRK-08-SAB-14 SAB-06-34 56 - 57 DDH 5.25 8.05 -2.8 -53.33
SRK-08-SAB-15 SAB-07-84 156 - 157 DDH 4.77 5.94 -1.17 -24.53
SRK-08-SAB-16 SAB-07-116 153 - 154 DDH 4.18 4.73 -0.55 -13.16
SRK-08-SAB-17 SAB-07-180 283 - 284 DDH 3.7 4.36 -0.66 -17.84
SRK-08-SAB-18 SAB-06-37 30 - 31 DDH* 3.16 0.77 2.39 75.7
SRK-08-SAB-19 SAB-07-100 48 - 49 DDH* 2.85 4.45 -1.6 -56.14
SRK-08-SAB-20 SAB-07-132 51 - 52 DDH 2.37 1.85 0.52 21.94
SRK-08-SAB-21 SAB-07-180 277 - 278 DDH 1.85 1.12 0.73 39.46
SRK-08-SAB-22 SAB-06-25 40 - 41 DDH 1.54 1.47 0.08 4.87
SRK-08-SAB-23 SAB-08-222 70 - 71 DDH 0.065 0.06 0 1.54
SRK-08-SAB-24 SAB-08-222 76 - 77 DDH 1.87 3.71 -1.84 -98.4
SRK-08-SAB-25 SAB-08-222 77 - 78 DDH 3.81 2.91 0.9 23.62
SRK-08-SAB-26 SAB-08-222 80 - 81 DDH 0.56 0.63 -0.07 -12.5
SRK-08-SAB-27 RC-SAB-08-258 49 - 50 RC 2.71 2.87 -0.16 -5.9
SRK-08-SAB-28 RC-SAB-08-258 50 - 51 RC 0.43 0.38 0.05 10.93
SRK-08-SAB-29 RC-SAB-08-258 51 - 52 RC 0.19 0.14 0.05 27.89
SRK-08-SAB-30 RC-SAB-08-258 52 - 53 RC 1.54 1.39 0.16 10.06
SRK-08-SAB-31 RC-SAB-08-258 53 - 54 RC 0.085 0.09 0 -3.53
SRK-08-SAB-32 RC-SAB-08-258 54 - 55 RC 0.25 0.22 0.03 12.8
SRK-09-SAB-01 SAB-09-427 287 - 288 DDH 8.04 5.6 2.44 30.35
SRK-09-SAB-02 SAB-08-367 62 - 63 DDH 87.76 69.12 18.64 21.24
SRK-09-SAB-03 SAB-08-362 108 - 109 DDH 1.03 1.42 -0.39 -37.86
SRK-09-SAB-04 SAB-08-394 138 - 139 DDH 0.01 0.03 -0.02 -200
SRK-09-SAB-05 SAB-08-395 140 - 141 DDH 3.19 5.52 -2.33 -73.04
SRK-09-SAB-06 SAB-08-402 58 - 59 DDH 1.03 0.47 0.56 54.37
SRK-09-SAB-07 SAB-07-77 152 - 153 DDH 2.64 1.37 1.27 48.11
SRK-09-SAB-08 SAB-07-83 88 - 89 DDH 3.74 3.72 0.02 0.53
SRK-09-SAB-09 SAB-08-387 100 - 101 DDH 0.67 2.58 -1.91 -285.07
SRK-09-SAB-10 SAB-08-374 92 - 93 DDH 1.65 0.99 0.66 40
SRK-09-SAB-11 SAB-08-372 68 - 69 DDH 1.41 1.72 -0.31 -21.99
SRK-09-SAB-12 SAB-08-369 83 - 84 DDH 8.2 3.04 5.16 62.93
SRK-09-SAB-13 SAB-06-06 155 - 156 DDH 3.22 0.62 2.6 80.75
SRK-09-SAB-14 Field blank - Rock - BD - -
SRK-09-SAB-15 Field blank - Rock - BD - -
SRK156501 SAB-09-579 106-107 DDH 5.35 14.65 -9.30 -173.8
SRK156502 SAB-09-597 38-39 DDH 2.57 1.34 1.23 47.9
SRK156503 SAB-10-880 146-147 DDH 1.6 3.31 -1.71 -106.9
SRK156504 SAB-10-946 310-311 DDH 1.16 1.59 -0.43 -36.6
SRK156506 SAB-10-883 278-279 DDH 7.53 1.79 5.75 76.3
SRK156507 SABGT-KK10-03 221-222 DDH 39.16 27.60 11.56 29.5
SRK156508 SAB-10-869 320-321 DDH 3.5 2.64 0.86 24.6
SRK156509 SAB-10-938 316-317 DDH 4.3 2.04 2.26 52.6
SRK156511 SAB-09-516 216-217 DDH 6.4 4.88 1.52 23.8
SRK156512 SAB-09-587 127-128 DDH 0.43 0.29 0.14 33.5
SRK156513 SAB-10-934 227-228 DDH 8.62 8.78 -0.16 -1.9
SRK156514 SAB-09-612 320-321 DDH 13.25 21.80 -8.55 -64.5
SRK156516 SAB-10-924 200-201 DDH 2.03 1.27 0.77 37.7
SRK156517 SAB-09-457 52-53 DDH 0.34 0.27 0.07 19.4
SRK156518 SAB-10-891 151-152 DDH 10.15 7.79 2.36 23.3
SRK156519 SAB-10-913 171-172 DDH 4.05 5.47 -1.42 -35.1
SRK156521 SAB-10-679 144-145 DDH 0.86 0.37 0.49 57.0
SRK156522 SAB-10-638 139-140 DDH 3.02 2.71 0.31 10.3
SRK156523 SAB-09-494 324-325 DDH 6.05 2.42 3.63 60.0
SRK156524 SAB-10-702 27-28 DDH 1.43 0.90 0.53 36.9
BD = below detection.
DDH* = sample interval extremely broken
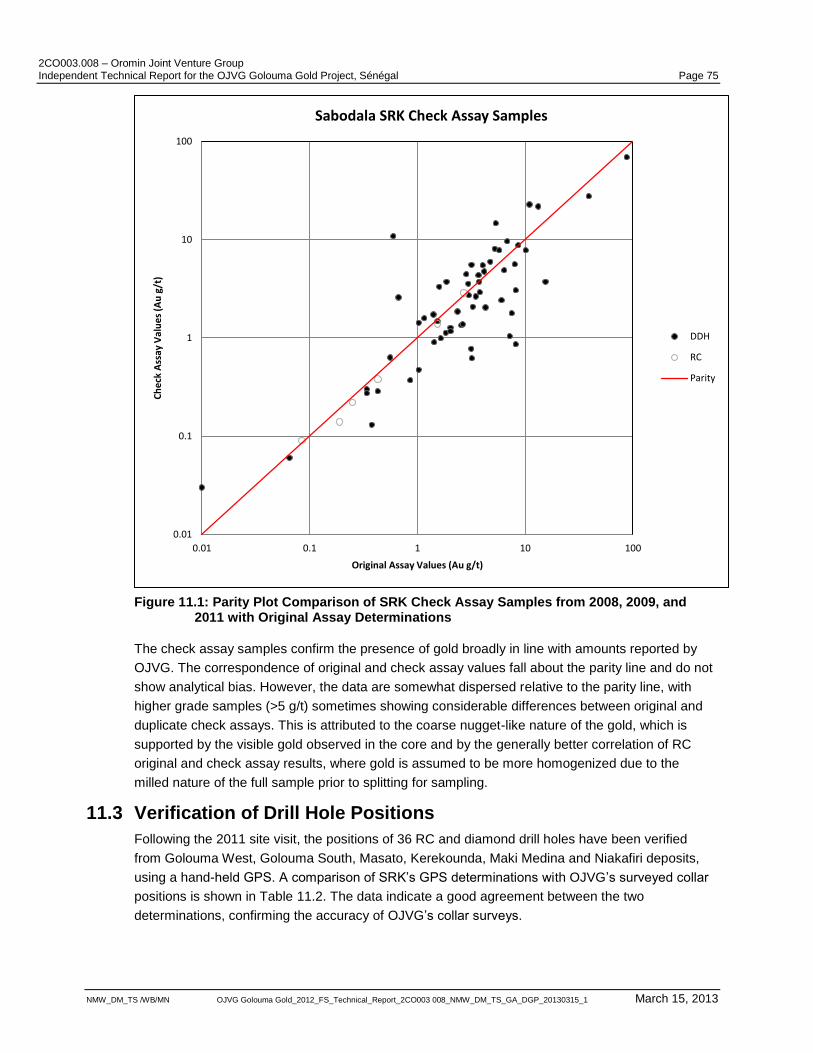
2CO003.008 – Oromin Joint Venture Group Independent Technical Report for the OJVG Golouma Gold Project, Sénégal Page 75
NMW_DM_TS /WB/MN OJVG Golouma Gold_2012_FS_Technical_Report_2CO003 008_NMW_DM_TS_GA_DGP_20130315_1 March 15, 2013
Figure 11.1: Parity Plot Comparison of SRK Check Assay Samples from 2008, 2009, and 2011 with Original Assay Determinations
The check assay samples confirm the presence of gold broadly in line with amounts reported by
OJVG. The correspondence of original and check assay values fall about the parity line and do not
show analytical bias. However, the data are somewhat dispersed relative to the parity line, with
higher grade samples (>5 g/t) sometimes showing considerable differences between original and
duplicate check assays. This is attributed to the coarse nugget-like nature of the gold, which is
supported by the visible gold observed in the core and by the generally better correlation of RC
original and check assay results, where gold is assumed to be more homogenized due to the
milled nature of the full sample prior to splitting for sampling.
11.3 Verification of Drill Hole Positions
Following the 2011 site visit, the positions of 36 RC and diamond drill holes have been verified
from Golouma West, Golouma South, Masato, Kerekounda, Maki Medina and Niakafiri deposits,
using a hand-held GPS. A comparison of SRK‟s GPS determinations with OJVG‟s surveyed collar
positions is shown in Table 11.2. The data indicate a good agreement between the two
determinations, confirming the accuracy of OJVG‟s collar surveys.
0.01
0.1
1
10
100
0.01 0.1 1 10 100
Ch
eck
Ass
ay V
alu
es
(Au
g/t
)
Original Assay Values (Au g/t)
Sabodala SRK Check Assay Samples
DDH
RC
Parity
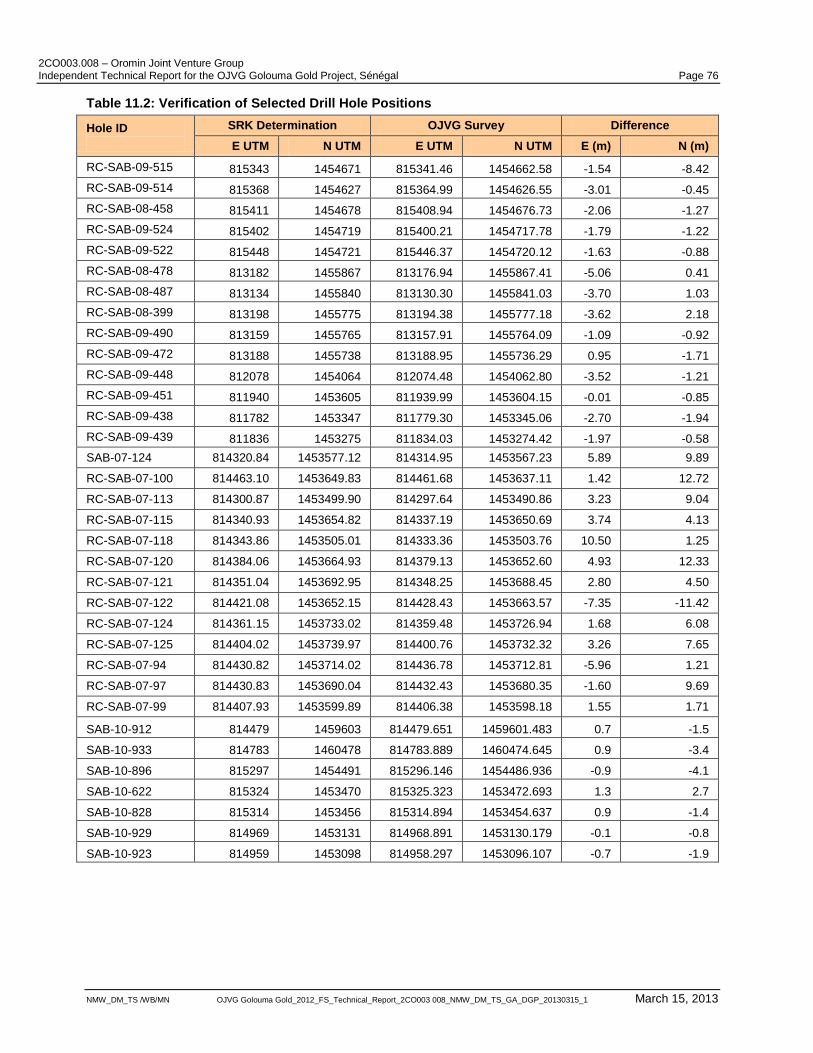
2CO003.008 – Oromin Joint Venture Group Independent Technical Report for the OJVG Golouma Gold Project, Sénégal Page 76
NMW_DM_TS /WB/MN OJVG Golouma Gold_2012_FS_Technical_Report_2CO003 008_NMW_DM_TS_GA_DGP_20130315_1 March 15, 2013
Table 11.2: Verification of Selected Drill Hole Positions
Hole ID
SRK Determination OJVG Survey Difference
E UTM N UTM E UTM N UTM E (m) N (m)
RC-SAB-09-515 815343 1454671 815341.46 1454662.58 -1.54 -8.42
RC-SAB-09-514 815368 1454627 815364.99 1454626.55 -3.01 -0.45
RC-SAB-08-458 815411 1454678 815408.94 1454676.73 -2.06 -1.27
RC-SAB-09-524 815402 1454719 815400.21 1454717.78 -1.79 -1.22
RC-SAB-09-522 815448 1454721 815446.37 1454720.12 -1.63 -0.88
RC-SAB-08-478 813182 1455867 813176.94 1455867.41 -5.06 0.41
RC-SAB-08-487 813134 1455840 813130.30 1455841.03 -3.70 1.03
RC-SAB-08-399 813198 1455775 813194.38 1455777.18 -3.62 2.18
RC-SAB-09-490 813159 1455765 813157.91 1455764.09 -1.09 -0.92
RC-SAB-09-472 813188 1455738 813188.95 1455736.29 0.95 -1.71
RC-SAB-09-448 812078 1454064 812074.48 1454062.80 -3.52 -1.21
RC-SAB-09-451 811940 1453605 811939.99 1453604.15 -0.01 -0.85
RC-SAB-09-438 811782 1453347 811779.30 1453345.06 -2.70 -1.94
RC-SAB-09-439 811836 1453275 811834.03 1453274.42 -1.97 -0.58
SAB-07-124 814320.84 1453577.12 814314.95 1453567.23 5.89 9.89
RC-SAB-07-100 814463.10 1453649.83 814461.68 1453637.11 1.42 12.72
RC-SAB-07-113 814300.87 1453499.90 814297.64 1453490.86 3.23 9.04
RC-SAB-07-115 814340.93 1453654.82 814337.19 1453650.69 3.74 4.13
RC-SAB-07-118 814343.86 1453505.01 814333.36 1453503.76 10.50 1.25
RC-SAB-07-120 814384.06 1453664.93 814379.13 1453652.60 4.93 12.33
RC-SAB-07-121 814351.04 1453692.95 814348.25 1453688.45 2.80 4.50
RC-SAB-07-122 814421.08 1453652.15 814428.43 1453663.57 -7.35 -11.42
RC-SAB-07-124 814361.15 1453733.02 814359.48 1453726.94 1.68 6.08
RC-SAB-07-125 814404.02 1453739.97 814400.76 1453732.32 3.26 7.65
RC-SAB-07-94 814430.82 1453714.02 814436.78 1453712.81 -5.96 1.21
RC-SAB-07-97 814430.83 1453690.04 814432.43 1453680.35 -1.60 9.69
RC-SAB-07-99 814407.93 1453599.89 814406.38 1453598.18 1.55 1.71
SAB-10-912 814479 1459603 814479.651 1459601.483 0.7 -1.5
SAB-10-933 814783 1460478 814783.889 1460474.645 0.9 -3.4
SAB-10-896 815297 1454491 815296.146 1454486.936 -0.9 -4.1
SAB-10-622 815324 1453470 815325.323 1453472.693 1.3 2.7
SAB-10-828 815314 1453456 815314.894 1453454.637 0.9 -1.4
SAB-10-929 814969 1453131 814968.891 1453130.179 -0.1 -0.8
SAB-10-923 814959 1453098 814958.297 1453096.107 -0.7 -1.9
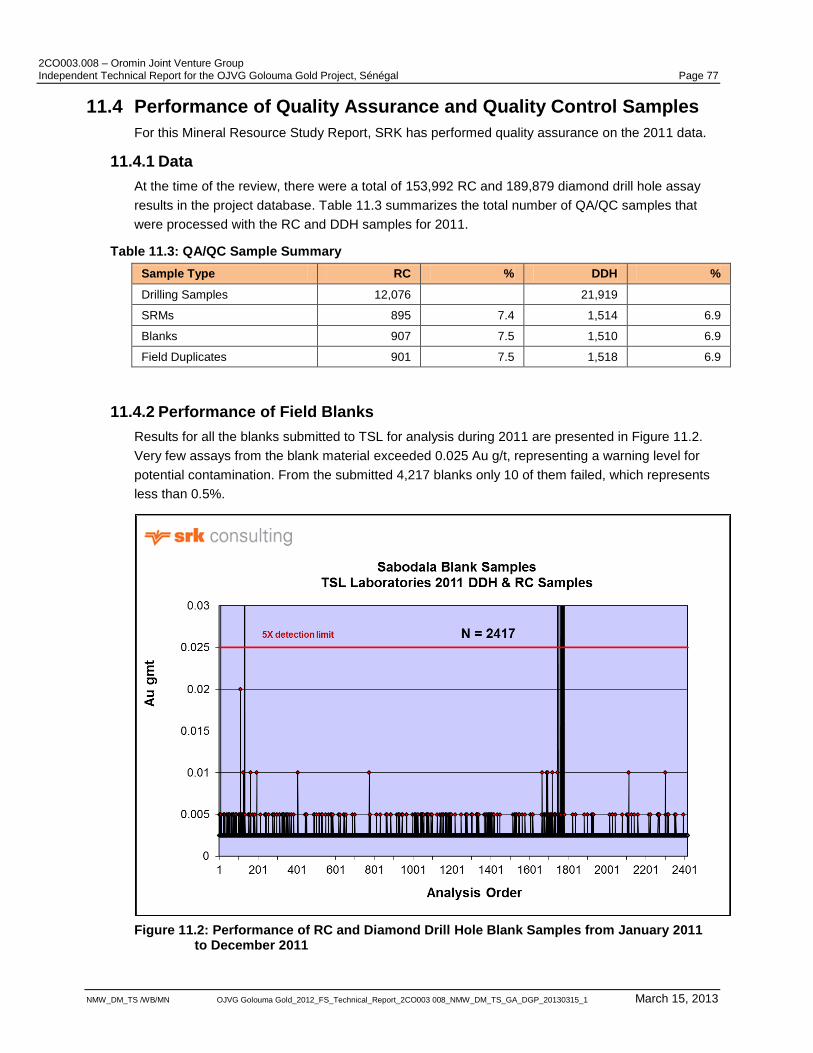
2CO003.008 – Oromin Joint Venture Group Independent Technical Report for the OJVG Golouma Gold Project, Sénégal Page 77
NMW_DM_TS /WB/MN OJVG Golouma Gold_2012_FS_Technical_Report_2CO003 008_NMW_DM_TS_GA_DGP_20130315_1 March 15, 2013
11.4 Performance of Quality Assurance and Quality Control Samples
For this Mineral Resource Study Report, SRK has performed quality assurance on the 2011 data.
11.4.1 Data
At the time of the review, there were a total of 153,992 RC and 189,879 diamond drill hole assay
results in the project database. Table 11.3 summarizes the total number of QA/QC samples that
were processed with the RC and DDH samples for 2011.
Table 11.3: QA/QC Sample Summary
Sample Type RC % DDH %
Drilling Samples 12,076 21,919
SRMs 895 7.4 1,514 6.9
Blanks 907 7.5 1,510 6.9
Field Duplicates 901 7.5 1,518 6.9
11.4.2 Performance of Field Blanks
Results for all the blanks submitted to TSL for analysis during 2011 are presented in Figure 11.2.
Very few assays from the blank material exceeded 0.025 Au g/t, representing a warning level for
potential contamination. From the submitted 4,217 blanks only 10 of them failed, which represents
less than 0.5%.
Figure 11.2: Performance of RC and Diamond Drill Hole Blank Samples from January 2011
to December 2011
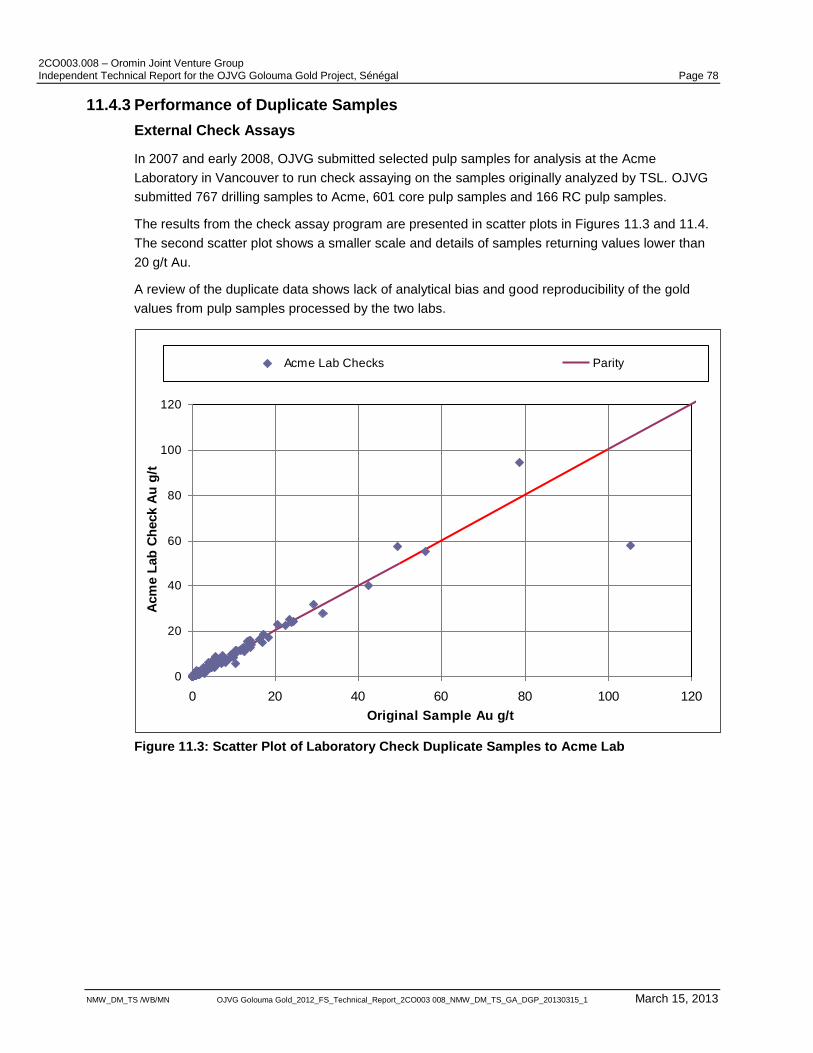
2CO003.008 – Oromin Joint Venture Group Independent Technical Report for the OJVG Golouma Gold Project, Sénégal Page 78
NMW_DM_TS /WB/MN OJVG Golouma Gold_2012_FS_Technical_Report_2CO003 008_NMW_DM_TS_GA_DGP_20130315_1 March 15, 2013
11.4.3 Performance of Duplicate Samples
External Check Assays
In 2007 and early 2008, OJVG submitted selected pulp samples for analysis at the Acme
Laboratory in Vancouver to run check assaying on the samples originally analyzed by TSL. OJVG
submitted 767 drilling samples to Acme, 601 core pulp samples and 166 RC pulp samples.
The results from the check assay program are presented in scatter plots in Figures 11.3 and 11.4.
The second scatter plot shows a smaller scale and details of samples returning values lower than
20 g/t Au.
A review of the duplicate data shows lack of analytical bias and good reproducibility of the gold
values from pulp samples processed by the two labs.
Figure 11.3: Scatter Plot of Laboratory Check Duplicate Samples to Acme Lab
0
20
40
60
80
100
120
0 20 40 60 80 100 120
Original Sample Au g/t
Acm
e L
ab
Ch
eck A
u g
/t
Acme Lab Checks Parity
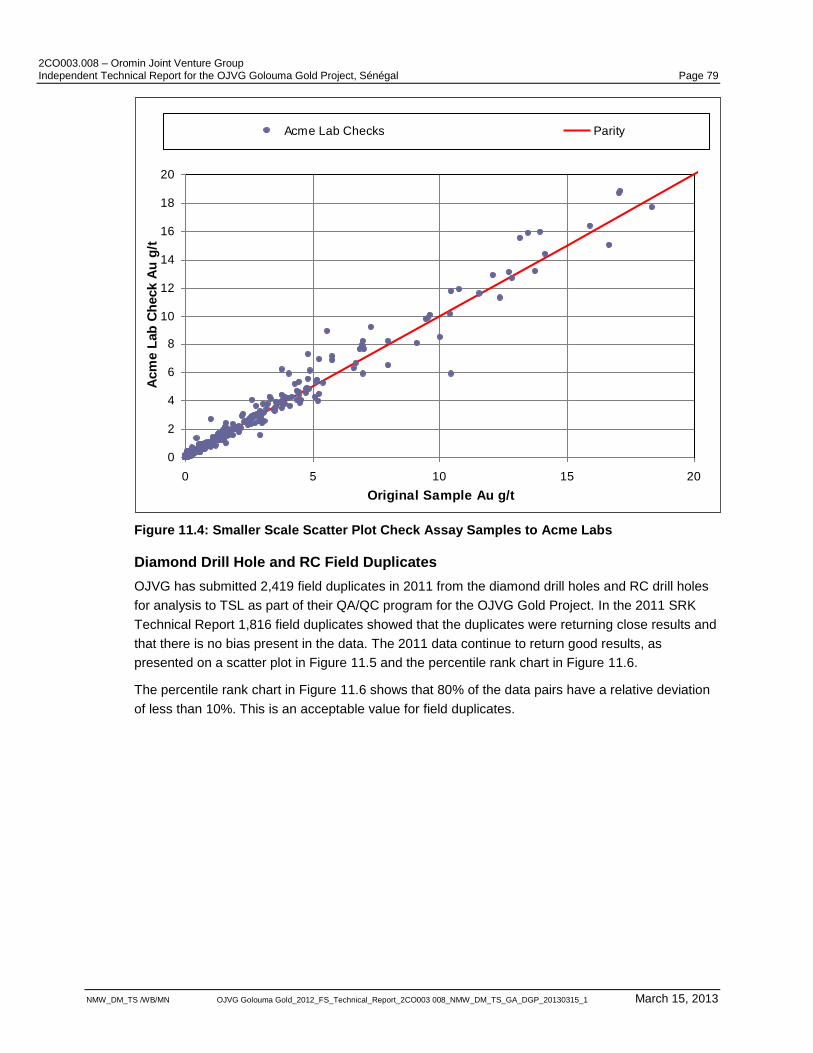
2CO003.008 – Oromin Joint Venture Group Independent Technical Report for the OJVG Golouma Gold Project, Sénégal Page 79
NMW_DM_TS /WB/MN OJVG Golouma Gold_2012_FS_Technical_Report_2CO003 008_NMW_DM_TS_GA_DGP_20130315_1 March 15, 2013
Figure 11.4: Smaller Scale Scatter Plot Check Assay Samples to Acme Labs
Diamond Drill Hole and RC Field Duplicates
OJVG has submitted 2,419 field duplicates in 2011 from the diamond drill holes and RC drill holes
for analysis to TSL as part of their QA/QC program for the OJVG Gold Project. In the 2011 SRK
Technical Report 1,816 field duplicates showed that the duplicates were returning close results and
that there is no bias present in the data. The 2011 data continue to return good results, as
presented on a scatter plot in Figure 11.5 and the percentile rank chart in Figure 11.6.
The percentile rank chart in Figure 11.6 shows that 80% of the data pairs have a relative deviation
of less than 10%. This is an acceptable value for field duplicates.
0
2
4
6
8
10
12
14
16
18
20
0 5 10 15 20
Original Sample Au g/t
Acm
e L
ab
Ch
eck A
u g
/t
Acme Lab Checks Parity
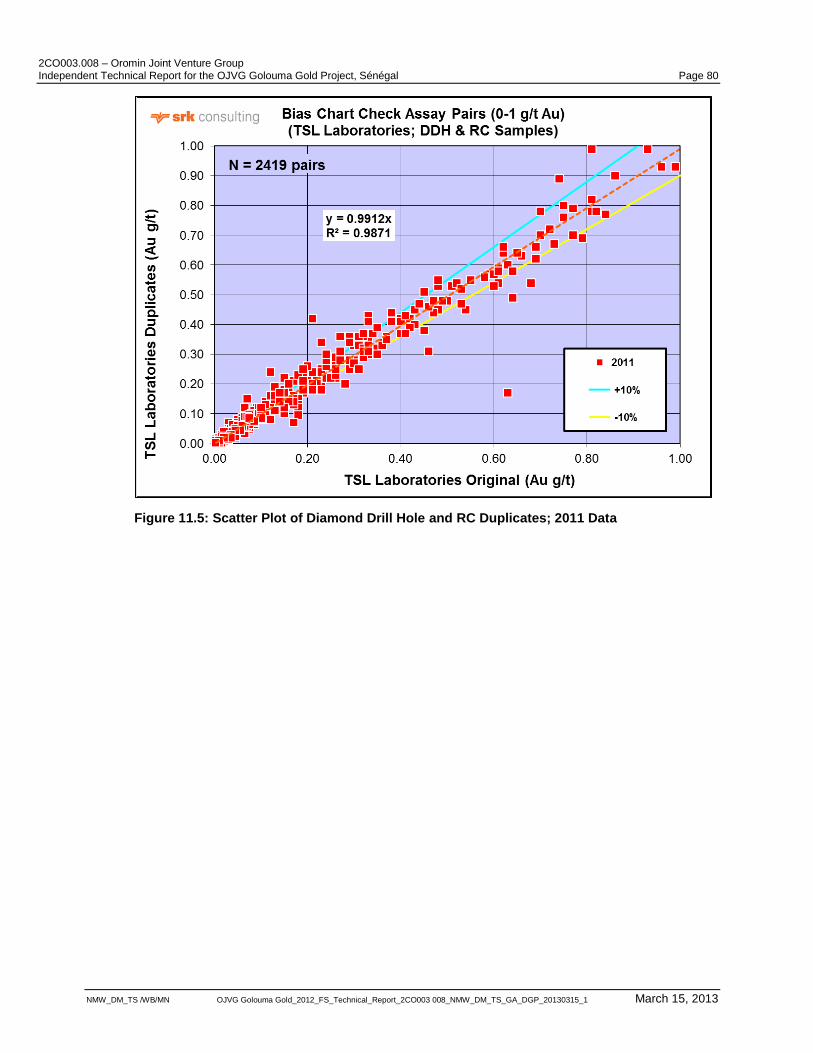
2CO003.008 – Oromin Joint Venture Group Independent Technical Report for the OJVG Golouma Gold Project, Sénégal Page 80
NMW_DM_TS /WB/MN OJVG Golouma Gold_2012_FS_Technical_Report_2CO003 008_NMW_DM_TS_GA_DGP_20130315_1 March 15, 2013
Figure 11.5: Scatter Plot of Diamond Drill Hole and RC Duplicates; 2011 Data
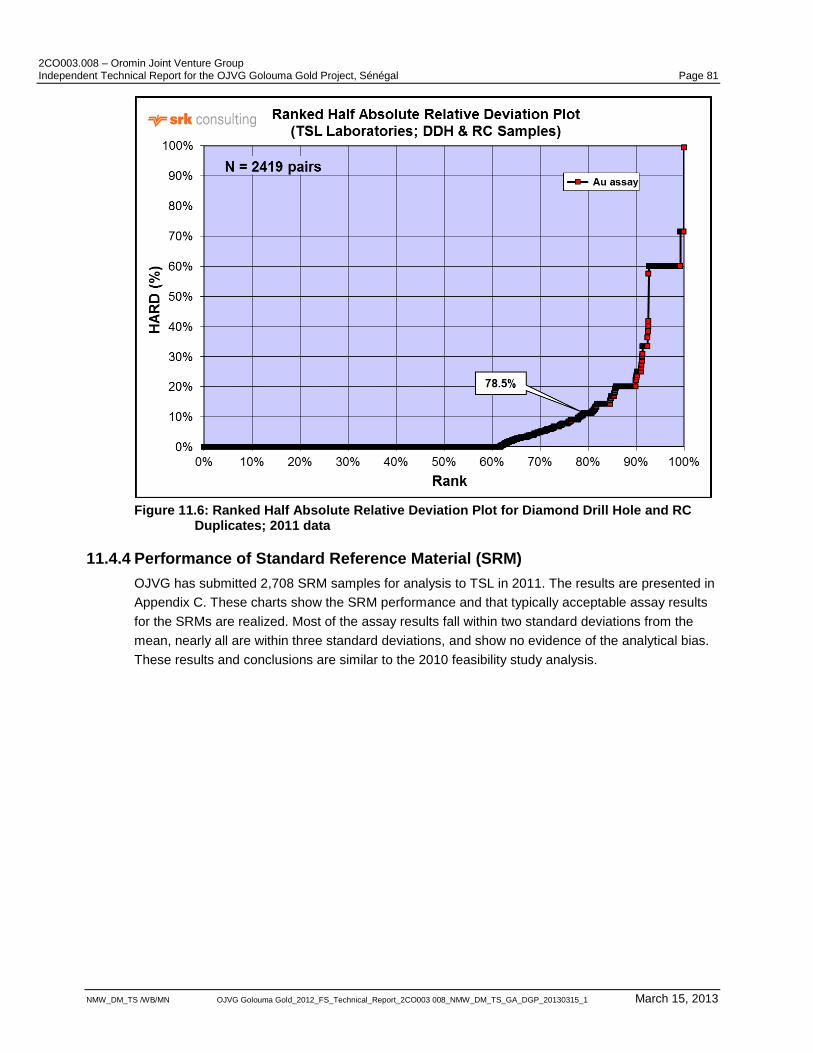
2CO003.008 – Oromin Joint Venture Group Independent Technical Report for the OJVG Golouma Gold Project, Sénégal Page 81
NMW_DM_TS /WB/MN OJVG Golouma Gold_2012_FS_Technical_Report_2CO003 008_NMW_DM_TS_GA_DGP_20130315_1 March 15, 2013
Figure 11.6: Ranked Half Absolute Relative Deviation Plot for Diamond Drill Hole and RC Duplicates; 2011 data
11.4.4 Performance of Standard Reference Material (SRM)
OJVG has submitted 2,708 SRM samples for analysis to TSL in 2011. The results are presented in
Appendix C. These charts show the SRM performance and that typically acceptable assay results
for the SRMs are realized. Most of the assay results fall within two standard deviations from the
mean, nearly all are within three standard deviations, and show no evidence of the analytical bias.
These results and conclusions are similar to the 2010 feasibility study analysis.
2CO003.008 – Oromin Joint Venture Group Independent Technical Report for the OJVG Golouma Gold Project, Sénégal Page 82
NMW_DM_TS /WB/MN OJVG Golouma Gold_2012_FS_Technical_Report_2CO003 008_NMW_DM_TS_GA_DGP_20130315_1 March 15, 2013
12 Mineral Processing and Metallurgical Testing
12.1 Mineral Processing
12.1.1 Introduction
The process plant and associated service facilities will process run of mine (ROM) ore delivered to
the primary crusher, to produce doré bars and tailings. The process encompasses crushing and
grinding of the ROM ore, carbon in leach (CIL) cyanidation and adsorption, carbon stripping,
electrowinning and smelting to produce gold bars that are then shipped to a refinery for further
processing. The CIL tailings will be thickened before placement in the tailings management facility
(TMF) to conserve water.
12.1.2 Process Plant Design Basis
The FS design criteria were based on test work completed as well as data from similar operations.
The timeline of the study meant that not all the test work typically recommended for a Feasibility
Study (FS) was completed and therefore benchmarking similar operations was required to confirm
the design criteria selected. Ausenco considers this approach to be adequate in terms of managing
project risk at the FS level of accuracy.
The key criteria selected for the plant design are:
Treatment of an average 4711 dry metric tonnes per day (t/d) for 365 days per year, after
allowance for availability whilst treating 100% primary hard (un-weathered) ore;
Treatment of an average 7669 t/d for 365 days per year, after allowance for availability whilst
treating weak weathered ore, or a blend of weak and hard ore containing no more that 43%
hard ore;
Design availability of 91.3%, being 7,998 operating hours per year, with standby equipment in
critical areas,
Sufficient plant design flexibility for treatment of all ore types as per test work completed at
design throughput.
The selection of these parameters is discussed in detail below.
12.1.3 Throughput and Availability
Ausenco performed an engineering study to achieve plant availability increase from 88% to 91.3%
by incorporating a stockpile and reclaim system into the OJVG flowsheet. The increased plant
availability calculates into the additional 101,000 tonnes per annum of blend material and 62,000
tonnes per annum of hard material. All design criteria and other process parameters are adjusted
in this report based on 91.3% plant availability. Benchmarking indicates that similar well operated
plants with abrasive ores similar to those tested have consistently achieved 91% overall plant
availability.
The throughput selected is mainly a function of the mining production schedule. From the review of
test work data, a plant throughput of 215 dry metric tonnes per hour (t/h) is sustainable based on
100% of the SAG feed material being primary (un-weathered) ore. With a 91.3% availability, an
average of 4711 tonnes per day (t/d) can be processed. This equates to an annual mill capacity of
1.72 million tonnes of primary un-weathered ore.
2CO003.008 – Oromin Joint Venture Group Independent Technical Report for the OJVG Golouma Gold Project, Sénégal Page 83
NMW_DM_TS /WB/MN OJVG Golouma Gold_2012_FS_Technical_Report_2CO003 008_NMW_DM_TS_GA_DGP_20130315_1 March 15, 2013
Plant throughput can be increased as the ratio of weak (weathered free digging ore) to hard ore is
increased in the feed blend. The plant throughput is maximized at 350 t/h when the hard ore
content of the feed blend is a maximum of 43%. With 91.3% availability, an average of 7669 t/d can
be processed. The plant throughput capacity is capped at 350 t/h, even for blends consisting of
100% weak ore, due to the volumetric constraints of downstream equipment. This equates to an
annual mill capacity of 2.80 million tonnes of combined ore.
12.1.4 Processing Strategy
The process design is based on treating the different ore types tested individually at the nominated
design throughput rates. Inputs for the Ausenco power based comminution model were based on
test work completed on samples from Masato, Golouma South, Golouma West and Kerekounda.
Ore hardness parameters were selected based on the 75th percentile, i.e.: 75% of the ore to be
processed is expected to be similar or softer in hardness than the ore hardness parameters used
for design.
Head Grade
The plant is designed to treat various tonnages of ore with a maximum feed rate of 350 t/h and 2.5
g/t Au (or gold in the feed of 875 g/h)
Process Plant Design Criteria Summary
The overall approach was to provide a robust process plant flow sheet that could handle the
variability in the metallurgical performance of the new ore bodies that have been evident from the
test work. A key design strategy was to reduce the unit process stages required to reduce the
capital and operating cost of the plant whilst maintaining good metallurgical performance.
The detailed process design criteria derived from the results of the metallurgical test work program
are included in Appendix D. A summary of the key criteria is shown in Table 12.1.
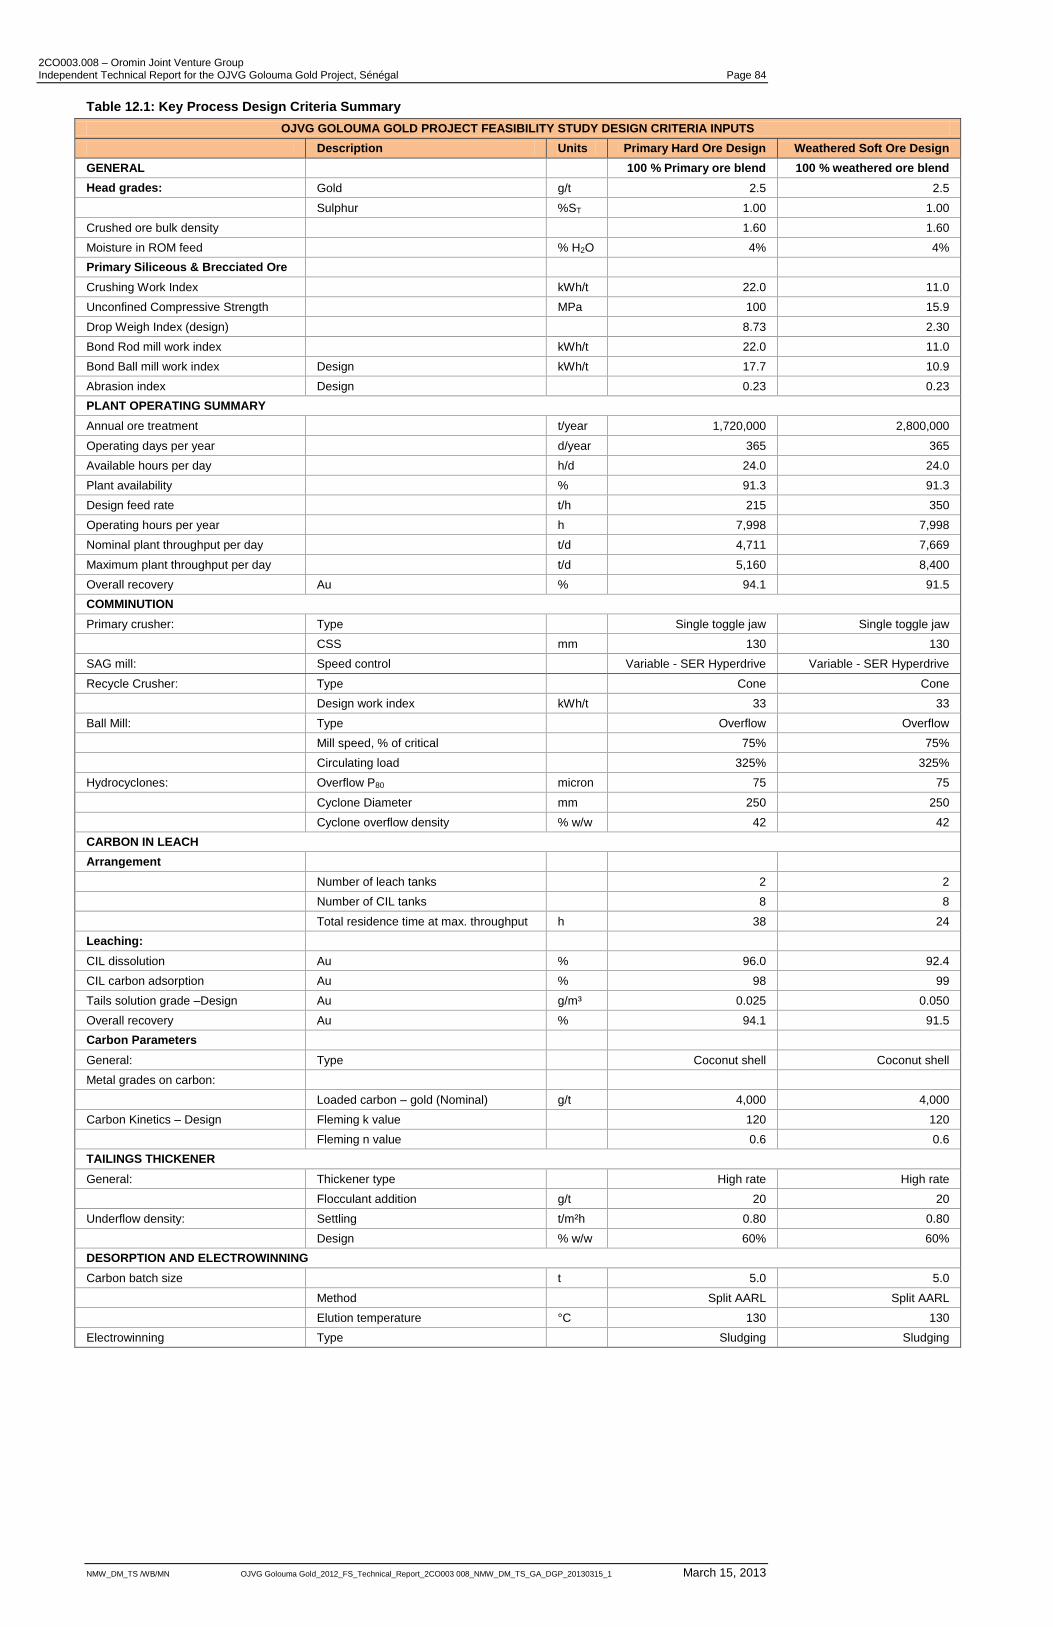
2CO003.008 – Oromin Joint Venture Group Independent Technical Report for the OJVG Golouma Gold Project, Sénégal Page 84
NMW_DM_TS /WB/MN OJVG Golouma Gold_2012_FS_Technical_Report_2CO003 008_NMW_DM_TS_GA_DGP_20130315_1 March 15, 2013
Table 12.1: Key Process Design Criteria Summary
OJVG GOLOUMA GOLD PROJECT FEASIBILITY STUDY DESIGN CRITERIA INPUTS
Description Units Primary Hard Ore Design Weathered Soft Ore Design
GENERAL 100 % Primary ore blend 100 % weathered ore blend
Head grades: Gold g/t 2.5 2.5
Sulphur %ST 1.00 1.00
Crushed ore bulk density 1.60 1.60
Moisture in ROM feed % H2O 4% 4%
Primary Siliceous & Brecciated Ore
Crushing Work Index kWh/t 22.0 11.0
Unconfined Compressive Strength MPa 100 15.9
Drop Weigh Index (design) 8.73 2.30
Bond Rod mill work index kWh/t 22.0 11.0
Bond Ball mill work index Design kWh/t 17.7 10.9
Abrasion index Design 0.23 0.23
PLANT OPERATING SUMMARY
Annual ore treatment t/year 1,720,000 2,800,000
Operating days per year d/year 365 365
Available hours per day h/d 24.0 24.0
Plant availability % 91.3 91.3
Design feed rate t/h 215 350
Operating hours per year h 7,998 7,998
Nominal plant throughput per day t/d 4,711 7,669
Maximum plant throughput per day t/d 5,160 8,400
Overall recovery Au % 94.1 91.5
COMMINUTION
Primary crusher: Type Single toggle jaw Single toggle jaw
CSS mm 130 130
SAG mill: Speed control Variable - SER Hyperdrive Variable - SER Hyperdrive
Recycle Crusher: Type Cone Cone
Design work index kWh/t 33 33
Ball Mill: Type Overflow Overflow
Mill speed, % of critical 75% 75%
Circulating load 325% 325%
Hydrocyclones: Overflow P80 micron 75 75
Cyclone Diameter mm 250 250
Cyclone overflow density % w/w 42 42
CARBON IN LEACH
Arrangement
Number of leach tanks 2 2
Number of CIL tanks 8 8
Total residence time at max. throughput h 38 24
Leaching:
CIL dissolution Au % 96.0 92.4
CIL carbon adsorption Au % 98 99
Tails solution grade –Design Au g/m³ 0.025 0.050
Overall recovery Au % 94.1 91.5
Carbon Parameters
General: Type Coconut shell Coconut shell
Metal grades on carbon:
Loaded carbon – gold (Nominal) g/t 4,000 4,000
Carbon Kinetics – Design Fleming k value 120 120
Fleming n value 0.6 0.6
TAILINGS THICKENER
General: Thickener type High rate High rate
Flocculant addition g/t 20 20
Underflow density: Settling t/m²h 0.80 0.80
Design % w/w 60% 60%
DESORPTION AND ELECTROWINNING
Carbon batch size t 5.0 5.0
Method Split AARL Split AARL
Elution temperature °C 130 130
Electrowinning Type Sludging Sludging
2CO003.008 – Oromin Joint Venture Group Independent Technical Report for the OJVG Golouma Gold Project, Sénégal Page 85
NMW_DM_TS /WB/MN OJVG Golouma Gold_2012_FS_Technical_Report_2CO003 008_NMW_DM_TS_GA_DGP_20130315_1 March 15, 2013
12.2 Flowsheet Development and Equipment Sizing
The FS plant flow sheet was designed based on the test work results and benchmarked data from
plants operating within the region on similar ore types. The overall plant flow sheet is shown in
Figure 12.1.
The flow sheet has been updated to reflect incorporation of the coarse ore stockpile and reclaim
system, an addition of the one CIL tank, and the increase in size of leaching and CIL tanks to
increase leach residence time for the soft ore from 17 to 24 hours
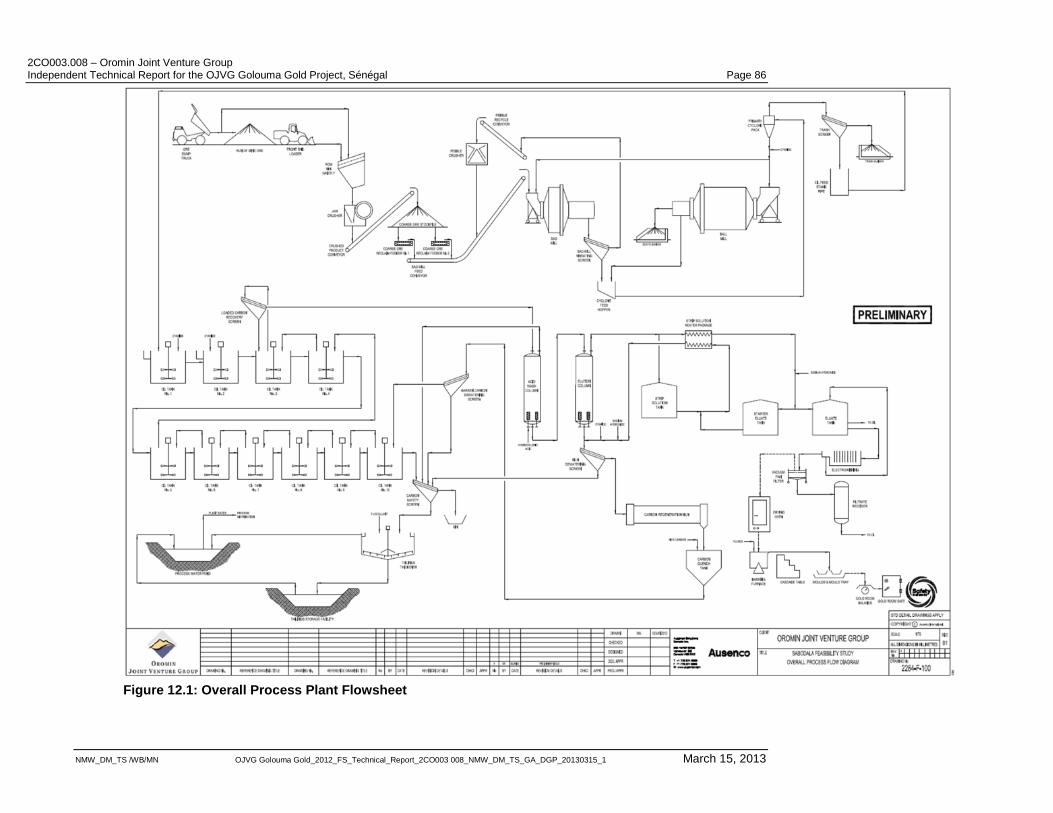
2CO003.008 – Oromin Joint Venture Group Independent Technical Report for the OJVG Golouma Gold Project, Sénégal Page 86
NMW_DM_TS /WB/MN OJVG Golouma Gold_2012_FS_Technical_Report_2CO003 008_NMW_DM_TS_GA_DGP_20130315_1 March 15, 2013
Figure 12.1: Overall Process Plant Flowsheet
2CO003.008 – Oromin Joint Venture Group Independent Technical Report for the OJVG Golouma Gold Project, Sénégal Page 87
NMW_DM_TS /WB/MN OJVG Golouma Gold_2012_FS_Technical_Report_2CO003 008_NMW_DM_TS_GA_DGP_20130315_1 March 15, 2013
12.2.1 Unit Process Selection
The process plant design is based on a flow sheet incorporating the following unit process
operations:
Ore from the open pit and underground mines is crushed using a primary jaw crusher to a
product size of nominally 80% passing (P80) 120 mm and fed to a SAG feed hopper;
A 4 MW SAG mill in closed circuit with pebble crushing;
A 4 MW ball mill in closed circuit with hydrocyclones;
2 x 1,298 m³ live capacity cyanidation leach tanks in series;
8 x 1,298 m³ live capacity CIL tanks in series;
5 tonne carbon acid wash and 5 tonne carbon elution column;
A 300 kg/h carbon regeneration kiln;
Electrowinning via a single sludging cell with stainless steel wool cathodes;
Electrowinning sludge drying oven and diesel fired crucible smelting furnace;
Tailings thickening in a high rate thickener to an underflow density of 60% solids;
Centrifugal pumping of tailings to a conventional single point discharge TMF;
Raw process plant water supply from the site raw water dam throughout the plant as required.
Process water is supplied from water reclaimed from the TMF, mine decant and process
operations;
Potable water generated by treatment of raw water in a filtration/UV disinfection/chlorination
treatment plant. Potable water is distributed to the plant and to various other locations around
the site; and
Plant and instrument air services and associated infrastructure.
12.2.2 Comminution Circuit Sizing
Test work data indicates that the majority of the orebodies are competent, hard and require a
relatively fine primary grind for mineral liberation. A SABC milling circuit has been selected as the
most practical flow sheet for this ore.
12.2.3 Comminution Design Criteria
The major comminution design parameters used for this study were based on the 2010
Metallurgical test work program. Results from two methods were evaluated when selecting the
design parameters:
Weighted average based on the resource tonnages of each deposit, and
75th percentile ore hardness parameters.
The ore resources tonnage percentages used for the weighted average were as reported in the
PFS and shown in Table 12.2.
2CO003.008 – Oromin Joint Venture Group Independent Technical Report for the OJVG Golouma Gold Project, Sénégal Page 88
NMW_DM_TS /WB/MN OJVG Golouma Gold_2012_FS_Technical_Report_2CO003 008_NMW_DM_TS_GA_DGP_20130315_1 March 15, 2013
Table 12.2: Ore Deposit Resource Tonnage Ratio
Deposit Percentage
Golouma West 15
Golouma South 5
Kerekounda 2
Masato 78
The Masato ore body contains around 80% of the expected plant feed tonnage and therefore this
has been considered in the comminution parameter selection.
The results for the primary hard ores are shown in Table12.3.
Table 12.3: Primary Ore Comminution Parameters
DWi BWi RWi UCS Ai
Masato Primary Ore Average 8.3 17.3 21.6 0.16
Masato Waste Average 7.6 15.9 20.3 0.04
Weighted Average 8.3 17.4 21.7 0.16
75th
Percentile (excluding waste and Kerekounda) 8.7 17.7 22.0 89 0.18
Parameters Selected For Design 8.7 17.7 22.0 100 0.23
The 75th percentile analysis did not include the waste or Kerekounda ore parameters as these
skewed the results towards unreasonably hard ore parameters. The parameters selected for
design were primarily based on the 75th percentile ore hardness parameters. These ore
parameters are harder than both the Masato ore and Masato waste parameters tested.
The oxide ore parameters were selected as shown in Table 12.4.
Table 12.4: Oxide/Weak Ore Comminution Parameters
DWi BWi RWi UCS Ai
Masato Oxide 2.2 10.9 11.0 16 0.1
Similar Benchmarked Ores 2.3 9.3 10.2 6 0.2
Starkey Test Work 9.9
Design Parameter Selections 2.3 10.9 11.0 16 0.2
Primary Crushing
Based on the design throughput and ore characteristics, a jaw crusher is considered the most
suitable primary crusher for the duty. A crusher size of 1400 x 1070 mm has been selected for the
duty.
Crushed Ore Surge Capacity
Crushed ore is conveyed to the coarse ore stockpile which has a capacity of 8400 tonnes. Two
reclaim feeders provide ore transfer from the stockpile directly to the SAG mill feed conveyor.
2CO003.008 – Oromin Joint Venture Group Independent Technical Report for the OJVG Golouma Gold Project, Sénégal Page 89
NMW_DM_TS /WB/MN OJVG Golouma Gold_2012_FS_Technical_Report_2CO003 008_NMW_DM_TS_GA_DGP_20130315_1 March 15, 2013
Comminution Circuit Model
There are several techniques used by various consultants to determine comminution power
requirements. These methods are typically power-based (empirical modification of Bond power) or
model-based (e.g. JKSimMet modelling).
Ausenco uses a power-based modelling approach, based on empirically derived models developed
from a database of actual plant operating data and associated bench-scale test work. Critical input
parameters to the model are ore competency (measured by either JK drop weight Axb or SMC DWI
values) and Bond work indices (CWI, RWI and BWI). Ausenco‟s power-based model predicts the
milling efficiency of the various circuits based on the JK drop weight/SMC data, which is a measure
of ore competency.
The specific energy and mill sizing determined using Ausenco‟s in-house method for the hard
primary and weak oxide ores are shown in Table12.5.
Table 12.5: Grinding Mill Design Criteria
Criteria Units Primary Ore Soft Ore
Throughput t/h 215 350
Mill Type SAG Grate D/C SAG Grate D/C
Pinion Power required kW 2,493 1,414
Mill Speed % Nc 65 - 80 65 - 80
Ball Charge Volume Nominal, operating % vol 15.5 8
Maximum for design % vol 18 18
Total Charge Volume Nominal, operating % vol 26 26
Maximum for design % vol 30 30
Mill Diameter Inside shell m 7.32 7.32
Mill Length EGL m 4.27 4.27
Installed Motor power kW 4,000 4,000
Mill Type Ball Ball
Grind Size P80 µm 75 76
Pinion Power required kW 3,540 2,748
Mill Speed % Nc 75 75
Ball Charge Volume Nominal, operating % vol 28.6 23
Maximum for design % vol 33 33
Mill Diameter Inside shell m 5.5 5.5
Mill Length EGL m 7.85 7.85
Installed Motor power kW 4,000 4,000
Installed ball mill power of 4,000 kW incorporates the allowances for drive train losses to determine
the motor power from the pinion power as well as a 10% design contingency to account for the
accuracy of the models, calculations and test work used to determine the expected average pinion
power.
The installed motor power for the SAG mill incorporates similar allowances, as well as an additional
contingency to allow adjustment in the mill operating conditions to handle ore variability. A 4,000
kW SAG mill was selected, based on these allowances and to provide common maintenance
spares for each mill.
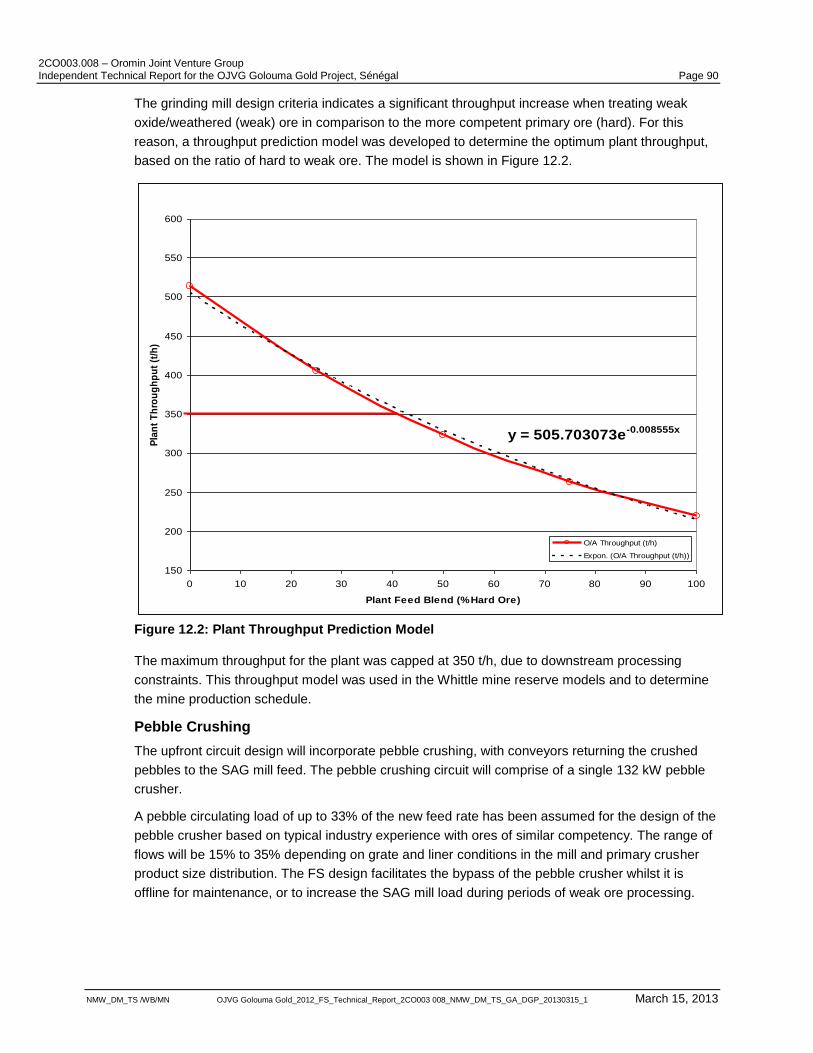
2CO003.008 – Oromin Joint Venture Group Independent Technical Report for the OJVG Golouma Gold Project, Sénégal Page 90
NMW_DM_TS /WB/MN OJVG Golouma Gold_2012_FS_Technical_Report_2CO003 008_NMW_DM_TS_GA_DGP_20130315_1 March 15, 2013
The grinding mill design criteria indicates a significant throughput increase when treating weak
oxide/weathered (weak) ore in comparison to the more competent primary ore (hard). For this
reason, a throughput prediction model was developed to determine the optimum plant throughput,
based on the ratio of hard to weak ore. The model is shown in Figure 12.2.
Figure 12.2: Plant Throughput Prediction Model
The maximum throughput for the plant was capped at 350 t/h, due to downstream processing
constraints. This throughput model was used in the Whittle mine reserve models and to determine
the mine production schedule.
Pebble Crushing
The upfront circuit design will incorporate pebble crushing, with conveyors returning the crushed
pebbles to the SAG mill feed. The pebble crushing circuit will comprise of a single 132 kW pebble
crusher.
A pebble circulating load of up to 33% of the new feed rate has been assumed for the design of the
pebble crusher based on typical industry experience with ores of similar competency. The range of
flows will be 15% to 35% depending on grate and liner conditions in the mill and primary crusher
product size distribution. The FS design facilitates the bypass of the pebble crusher whilst it is
offline for maintenance, or to increase the SAG mill load during periods of weak ore processing.
y = 505.703073e-0.008555x
150
200
250
300
350
400
450
500
550
600
0 10 20 30 40 50 60 70 80 90 100
Plant Feed Blend (% Hard Ore)
Pla
nt
Th
rou
gh
pu
t (t
/h)
O/A Throughput (t/h)
Expon. (O/A Throughput (t/h))
2CO003.008 – Oromin Joint Venture Group Independent Technical Report for the OJVG Golouma Gold Project, Sénégal Page 91
NMW_DM_TS /WB/MN OJVG Golouma Gold_2012_FS_Technical_Report_2CO003 008_NMW_DM_TS_GA_DGP_20130315_1 March 15, 2013
Mill Circuit Classification
The classification circuit has been designed for a maximum circulating load of 350%. This is a
typical design value widely used within the industry for an SABC circuit. The SAG mill discharge
slurry passes through a vibrating screen with 10 mm apertures to remove pebbles; the screen
undersize combines with the ball mill discharge and flows into the hydrocyclone feed hopper.
Slurry is pumped to a cluster of 16 x 400 mm diameter hydrocyclones, with 9 – 14 hydrocyclones
online at any time, based on the plant throughput. Fine hydrocyclone overflow (P80 75 micron) will
report to the CIL circuit whilst the coarse underflow will report to the ball mill for further grinding.
There is provision in the design to bypass a portion of the cyclone underflow stream back to the
SAG mill to allow for the SAG and ball mill power draws to be balanced and therefore optimise
plant throughput.
12.2.4 Gold Leaching and Adsorption Circuit Sizing
Gold is leached into a solution, using cyanide in a hybrid CIL circuit. This circuit incorporates two
dedicated cyanidation leach tanks, followed by eight CIL tanks.
Leaching and Adsorption Design Criteria
The major cyanidation leaching design parameters used for this study were based on the 2010
Metallurgical test work program. No carbon adsorption or equilibrium test work had been
completed for the Feasibility Study. Therefore, carbon adsorption parameters were based on either
industry standards or benchmarked plants operating on similar ores.
The engineering study was performed to determine the economic benefit of increasing leach
residence time for the soft ore from 17 to 24 hours. The study showed that this change in the
residence time resulted in gold recovery increase for soft and hard ores by about 1.5%. All design
criteria and other related parameters in this report were adjusted based on increased residence
time. One additional CIL tank was added to the flow sheet. In addition, the existing two leach CIL
tanks and seven CIL tanks have been increased to provide required residence time.
These design criteria are summarised in Table 12.6.
Table 12.6: Leaching and Adsorption Design Criteria
Criteria Units Primary Ore Soft Ore
Leaching Circuit Type Leach - CIL Leach - CIL
Throughput t/h 215 350
Leach Feed Density % Solids 42 42
Leach Feed Volumetric Throughput m³/h 374 608
Total Leaching and CIL Residence Time hrs 38 24
Gold Dissolution % 96.0 92.4
Carbon Concentration in CIL: Nominal g/l 15 15
Carbon Concentration in CIL: Maximum g/l 25 25
Carbon Kinetics – Design: Fleming k value 120 120
Carbon Kinetics – Design: Fleming n value 0.6 0.6
Loaded Carbon (Gold) g/t 4,000 4,000
Tails solution Grade Gold Au g/m³ 0.025 0.05
Carbon Stripped Per Day kg 5,000 5,000
2CO003.008 – Oromin Joint Venture Group Independent Technical Report for the OJVG Golouma Gold Project, Sénégal Page 92
NMW_DM_TS /WB/MN OJVG Golouma Gold_2012_FS_Technical_Report_2CO003 008_NMW_DM_TS_GA_DGP_20130315_1 March 15, 2013
Leaching
The FS design is based on 2 x 1,298 m³ leach tanks in series, followed by 8 x 1,298 m³ CIL tanks,
to provide the required leach residence time and adsorption stages for treatment of the soft ore at
350 t/h. All tanks are equipped with a 75 kW dual bladed hydrofoil agitator to provide sufficient
agitation whilst minimizing carbon attrition in the CIL tanks. Air will be sparged into each tank to
maintain the dissolved oxygen required in solution for the gold dissolution kinetics.
Carbon Adsorption and Processing
The CIL tanks contain a wedge wire carbon inter-tank pump screen and recessed impeller
centrifugal carbon transfer pumps to progress carbon in counter current flow to the leach slurry. An
average of 180 kg/h of carbon is moved through the CIL circuit and stripped per day to maintain the
maximum total gold loading of 4,000 g/t. The design carbon inventory in the CIL tanks is 123
tonnes which results in a carbon dwell time of 686 hours.
12.2.5 Carbon Desorption and Electro-winning
Loaded carbon is recovered in 5,000 kg batches and transferred to the rubber lined acid wash
column. Carbon is washed in a solution of 3% hydrochloric acid (HCl) to remove foulants. Carbon
is then transferred to the stainless steel elution column whereby precious metals are stripped from
the carbon under pressure via a solution containing 3% sodium cyanide and 2.5% sodium
hydroxide. The solution is heated to 130°C via a 1,700 kW diesel fired heater. The Anglo American
Research Laboratory (AARL) stripping method produces five bed volumes or 53 m³ of pregnant
solution.
Pregnant solution is pumped in a continuous cycle through a single stainless steel electrowinning
cell. A 4,500 amp rectifier supplies current to the cathodes and anodes to allow the gold to be
plated out of solution onto the cathodes.
12.2.6 Tailings Disposal Circuit Sizing
The FS design includes a tailings thickener with disposal of thickened tailings in a nearby Tailings
Management Facility (TMF) and recovery of water from the TMF surface.
The tailings thickener design has been based on a settling rate of 0.8 t/m2/h, which is the minimum
settling rate recommended for design by Pocock in the 2009 settling test work campaign. This has
resulted in the requirement for a 23 m diameter high rate tailings thickener. Thickener underflow
will be pumped to the TMF using two stage centrifugal pumps. Thickener overflow will gravity flow
to the process water storage pond for re-use in the process.
12.3 Process Description
The unit operations used to model the plant throughput and metallurgical performance are well
proven in the gold processing industry. The flow sheet incorporates the following major process
operations:
Primary crushing with the product directly feeding the milling circuit via a coarse ore stockpile;
Semi-autogenous grinding and secondary pebble crushing;
Ball mill grinding;
A hybrid CIL gold extraction circuit;
Split Anglo American Research Laboratory (AARL) carbon stripping;
2CO003.008 – Oromin Joint Venture Group Independent Technical Report for the OJVG Golouma Gold Project, Sénégal Page 93
NMW_DM_TS /WB/MN OJVG Golouma Gold_2012_FS_Technical_Report_2CO003 008_NMW_DM_TS_GA_DGP_20130315_1 March 15, 2013
Electro-winning and refining;
Tailings thickening;
Fresh and reclaim water supply; and
Reagent preparation and distribution.
12.3.1 Primary Crushing
The primary crushing areas are depicted on flow sheet 2284-F101.
Run-of-Mine rock will be dumped directly from haul trucks or a front end loader (FEL) through an
80 mm square-grid grizzly into a 150 tonne dump hopper. The hopper has been sized to
accommodate the 100 tonne capacity mine trucks. A 1,500 x 7,070 mm apron feeder is used to
transfer ore from the dump hopper into the 1,400 x 1,070 mm single toggle jaw crusher. The jaw
crusher is designed to operate with a closed side setting of 130 mm and produce a product with
80% passing (P80) 134 mm. The crusher operates in open circuit with the product being conveyed
directly to the SAG mill feed hopper.
12.3.2 Reclaim and Grinding
The reclaim, grinding and classification areas are depicted on flow sheets 2284-F-001/002.
Crushed ore is conveyed to the coarse ore stockpile-which has a capacity of 8400 tonnes. Two
reclaim feeders provide ore transfer from the stockpile to the SAG mill feed conveyor. Quicklime is
fed directly onto the SAG mill feed conveyor from the lime storage silo to provide pH control in the
downstream leaching circuit.
The SAG mill feed weightometer will be installed on the SAG mill feed conveyor. The reclaimed
crushed ore will be fed at a controlled rate to a SAG mill. The SAG mill will be equipped with a
single 4 MW wound rotor induction motor variable speed drive system, allowing the mill to operate
at 60 – 80% of critical speed.
Discharge from the SAG mill will gravitate through a trommel onto the mill discharge vibrating
screen. Undersize from the screen flows by gravity (gravitates) into a common mill hydrocyclone
feed hopper.
Oversized pebbles from the screen (scats) will be recycled back onto the mill feed conveyor and
reintroduced into the mill after having metal (from ground down mill balls) magnetically separated
and the pebbles crushed to below nominally 12 mm in a pebble crushing circuit.
The ball mill will be supplied with hybrid rubber/steel liners (polymet), a single 4 MW wound rotor
induction motor, trommel screen and retractable feed spout/chute. Discharge from the ball mill will
gravitate through a trommel and into the common mill hydrocyclone feed hopper. The combined
mills discharge slurry will be pumped to the mill hydrocyclone cluster operating in closed circuit
configuration with the ball mill by the hydrocyclone feed pump. Water is added to the hydrocyclone
feed hopper to achieve the required hydrocyclone feed pulp density.
Mill hydrocyclone underflow will gravitate to the ball mill feed and hydrocyclone overflow will
gravitate to the CIL feed vibrating trash screen.
The milling circuit will require a single cluster of 400 mm hydrocyclones to be installed, of which up
to twelve will be in operation at any one time, with four in stand-by mode. A pneumatically actuated
2CO003.008 – Oromin Joint Venture Group Independent Technical Report for the OJVG Golouma Gold Project, Sénégal Page 94
NMW_DM_TS /WB/MN OJVG Golouma Gold_2012_FS_Technical_Report_2CO003 008_NMW_DM_TS_GA_DGP_20130315_1 March 15, 2013
valve will be provided with each hydrocyclone for isolation requirement. Rubber lined steel pipes,
hoppers and chutes will be installed throughout the grinding circuit for handling coarse slurry.
Two vertical spindle sump pumps will be provided in the grinding area to facilitate clean-up.
12.3.3 Carbon-in-Leach (CIL)
Mill hydrocyclone cluster overflow will gravitate to a vibrating trash screen to prevent oversize
material (nominally +0.8 mm) arising from a possible hydrocyclone blockage entering the leaching
tanks. Trash from the screen will be removed and directed to a skip at ground level. Trash screen
underflow will gravitate to the CIL feed pumps and is pumped to the leaching/adsorption circuit.
Leaching of precious metals by cyanide occurs in a “hybrid” CIL circuit. This circuit consists of two
leach tanks followed by seven CIL tanks, whereby leaching of the precious metals continues to
occur whilst being adsorbed onto activated carbon articles. Leached slurry overflows from the
leach tanks through the eight CIL tanks.
Sodium cyanide solution is dosed to the leaching circuit via a pressurised ringmain. Air is injected
into each tank via a sparging system to assist with maintaining sufficient dissolved oxygen in the
slurry for leaching.
Each CIL tank is equipped with a dual stage agitator to ensure uniform mixing and a mechanically
driven intertank pump screen to retain the carbon. All tanks are fitted with bypass launder facilities
to allow any tank to be removed from service for agitator and tank maintenance. A CIL gantry
crane facilitates the removal of intertank screens for maintenance and routine cleaning.
Regenerated carbon from the carbon regeneration circuit is dewatered using the 1.2 x 1.2 mm
aperture barren carbon dewatering screen. The recovered water gravitates to the carbon safety
screen for disposal to tailings. The dewatered activated carbon is fed to CIL tank No. 10.
Carbon flows in counter-current direction to slurry flow from CIL tank No.8 to No.1 via recessed
impeller vertical spindle transfer pumps. Carbon loaded with precious metals (loaded carbon) is
transferred from CIL tank No. 1 to the 0.8 x 0.8 mm aperture loaded carbon recovery screen
mounted above the acid wash column in the desorption circuit. The screen underflow gravitates
back to the CIL tank No.1, with the loaded carbon reporting to the screen oversize and
subsequently the acid wash column.
Leach tailings discharge from CIL Tank No. 8, and gravitate to the tailings thickener via the 1 mm
slotted aperture carbon safety screen. Any leaked carbon from a holed intertank screen is captured
at the screen oversize and collected in a carbon bulk bag and manually returned to the CIL circuit.
The undersize from the carbon safety screen gravitates to the tailings thickener.
Two vertical spindle sump pumps will be provided in the leaching/adsorption area to facilitate clean
up.
12.3.4 Acid Washing
The acid wash area is depicted on flow sheet 2284-F-105.
Loaded carbon from CIL tanks is recovered on the loaded carbon recovery screen and directed to
the rubber lined acid wash column, with 5 tonne carbon capacity. The carbon is rinsed with filtered
raw water to remove any further entrained solids prior to being washed with dilute HCl.
Concentrated acid (HCl at 33% w/w) is added to the raw water entering the base of the column and
2CO003.008 – Oromin Joint Venture Group Independent Technical Report for the OJVG Golouma Gold Project, Sénégal Page 95
NMW_DM_TS /WB/MN OJVG Golouma Gold_2012_FS_Technical_Report_2CO003 008_NMW_DM_TS_GA_DGP_20130315_1 March 15, 2013
diluted to provide the required acid wash solution concentration of 3% w/v HCl. The acid wash
solution is passed through the acid wash column at two bed volumes (BVs) per hour. One bed
volume equates to 10.6 m3. Acid soluble foulants (mainly CaCO
3), which have loaded onto the
carbon are dissolved by the acid during this wash period. The spent acid wash solution is
discharged to the tailings thickener.
Following acid solution contact, the carbon is rinsed with raw water to remove residual acid and to
neutralise the pH of the carbon slurry respectively. Washed carbon is then hydraulically transferred
to the elution column, using water supplied from the raw water ringmain.
A vertical spindle sump pump is provided in the acid wash area to facilitate clean up, with the
waste directed to the tailings thickener.
12.3.5 Elution
The elution area is depicted on flow sheet 2284-F-105.
The stripping of precious metals loaded onto the carbon is achieved by utilizing the split Anglo
American Research Laboratories (AARL) elution method.
The stripping of precious metals occurs in a stainless steel insulated strip column. A stripping
solution containing 3% sodium cyanide (NaCN) and 2.5% sodium hydroxide (“NaOH”) is pumped
under a pressure of 550 kPa through the column at two bed volumes (“BV‟s”) per hour (22 m³/h).
The solution is heated to 130°C prior to entering the column by a diesel fired oil heater. The
pregnant strip solution exiting the top of the column is cooled via a recovery heat exchanger to
50°C before entering the pregnant solution tank.
The AARL elution process utilizes a total of five BV‟s for the stripping cycle resulting in 53 m³ of
pregnant eluate for electrowinning. Once the process is completed the carbon is cooled with raw
water and then transferred to the regeneration kiln dewatering screen.
A vertical spindle sump pump is provided in the elution area to facilitate clean-up, with the waste
directed to the CIL circuit.
12.3.6 Carbon Regeneration
The carbon regeneration area is depicted on flow sheet 2284-F-105.
Barren carbon from the elution column No.1 is hydraulically transferred to the kiln dewatering
screen. The screened carbon (screen oversize), is fed to the kiln feed hopper. The screen
undersize, mostly water, gravitates to the tailings thickener. The carbon is fed into the vendor
supplied carbon regeneration kiln.
The carbon is re-activated in the kiln operates at temperatures of 650 - 750°C. Regenerated
carbon exits the kiln and is quenched with water in the carbon quench tank. The carbon is then
pumped to the barren carbon dewatering screen for reuse in the CIL circuit. The barren carbon
screen oversize will report directly to CIL tank No. 7 while the undersize (mainly water) is directed
to the tailings thickener.
2CO003.008 – Oromin Joint Venture Group Independent Technical Report for the OJVG Golouma Gold Project, Sénégal Page 96
NMW_DM_TS /WB/MN OJVG Golouma Gold_2012_FS_Technical_Report_2CO003 008_NMW_DM_TS_GA_DGP_20130315_1 March 15, 2013
12.3.7 Electro-winning and Refining
The electrowinning and refining areas are depicted on flow sheet 2284-F-109.
Pregnant eluate is pumped through an electro-winning cell, depositing the precious metals onto
stainless steel mesh cathodes. The solution is recycled back to the pregnant eluate tank with the
complete electro-winning cycle taking around 11 hours to complete.
Once the cycle is completed the barren solution is pumped to the barren solution tank prior to
being returned at a steady rate to the CIL circuit.
Precious metals are harvested from the stainless steel cathodes on a periodic basis by manual
high pressure washing the cathodes to produce a gold sludge. The recovered gold bearing sludge
is filtered using a vacuum pan filter.
The filtrate is manually loaded into a vendor supplied drying oven. It is then combined with fluxes
(silica, nitre, borax) and smelted in a diesel fired crucible tilt furnace before being poured into doré
bars. The gold/silver doré solidifies and is quenched in water, cleaned to remove slag, stamped for
identification, sampled for analysis, weighed and stored in a vault.
The gold room sump trap collects all gold room spillage and is cleaned out to remove solid trash.
An overflow weir allows liquid spillage to over flow to the gold room sump pump for pumping back
to the leach circuit.
12.3.8 Tailings Thickening
The tailings thickening area is depicted on flow sheet 2284-F-106.
A high-rate thickener is used to dewater the CIL tailings to 60% solids prior to discharge. Slurry
discharging the CIL circuit passes through the carbon safety screen and gravitates to the tailings
thickener.
Flocculant is added to the tailings thickener to accelerate the solids settling. The thickened
underflow slurry then gravitates to the final tailings hopper prior to being pumped to the TMF using
the two stage series pumping systems. The thickener water overflow gravitates to the process
water standpipe for re-use in the plant.
A tailings area sump pump collects any spillage in this area and pumps it back to the tailings
thickener.
12.3.9 Plant Water Services
Water sourced from the fresh water dam is pumped to the process facility via the plant raw water
tank. This tank will also provide make-up water to the process and support the needs for reagent
mixing, pump seal water and elution raw water.
The fresh water tank also services the fire water system requirements with a four hour fire water
designated reserve.
Plant process water is also provided from the tailings thickener overflow and reclaimed water from
the TMF.
12.3.10 Reagents and Consumables
A number of reagents are used in the processing of the mineralized rock to produce gold doré. The
reagent preparation and distribution systems are depicted on flow sheet 2284-F-108 (Appendix D).
2CO003.008 – Oromin Joint Venture Group Independent Technical Report for the OJVG Golouma Gold Project, Sénégal Page 97
NMW_DM_TS /WB/MN OJVG Golouma Gold_2012_FS_Technical_Report_2CO003 008_NMW_DM_TS_GA_DGP_20130315_1 March 15, 2013
Lime
Lime is used to control the pH in the CIL circuit. Quicklime will be will be delivered in bulk bags (1
tonne) as granules and loaded into a storage silo. A rotary feeder is then used to dose quicklime
directly onto the SAG mill feed conveyor.
Flocculant
Flocculant is used in the CIL tailings thickener to enhance the solids settling. One flocculant mixing,
storage and dosing system will be provided. Flocculant powder will be delivered in 25 kg bags and
loaded into a storage hopper. Dry powder flocculant will be mixed with raw water to make a 0.25%
w/v solution in a package flocculant mixing system. The mixed flocculant solution will be pumped to
a storage tank. Flocculant solution will be dosed to the tailings thickener by dedicated variable
speed helical rotor pumps. Process water will be mixed into the flocculant lines to dilute solution to
0.025% w/v before addition to the thickener feed slurry.
Sodium Hydroxide
Sodium hydroxide (NaOH) is used as part of the elution process to strip precious metals off the
loaded carbon. Sodium Hydroxide will be delivered in 25 kg bags and mixed on site with raw water
to a solution strength of 25% w/w. The solution will be dosed to the elution circuit by a dedicated
variable speed helical rotor pump.
Sodium Cyanide
Sodium cyanide (NaCN) is primarily used in the leaching process for the dissolution of gold. It is
also used in the elution process for the stripping of precious metals off the loaded carbon.
Sodium cyanide will be delivered as dry pellets in bulk bags (1 tonne). The cyanide pellets are
loaded into a mixing tank and mixed with raw water into a solution containing 20% w/w cyanide.
The solution is then transferred to either one of two storage tanks. Cyanide is then dosed from the
storage tanks to the CIL circuit using a pressurised ringmain. Solution is also dosed directly to the
elution circuit by a dedicated variable speed helical rotor pump.
Hydrochloric Acid
Hydrochloric acid (HCl) is used in the acid wash stage of the carbon stripping circuit to clean the
carbon of scale and foulants. It is delivered to site as a concentrate solution containing 33% HCl in
200 litre (L) drums. The solution is pumped from the drums to a storage tank. The HCl is then
dosed directly to the acid wash circuit by a dedicated variable speed helical rotor pump.
Activated Carbon
Activated carbon is used in the CIL. Precious metals that are leached into solution adsorb onto the
activated and recovered to the carbon stripping circuit.
Carbon will be delivered in 500 kg bulk sacks and will be added to the CIL circuit via the carbon
quench tank.
Grinding Media
Grinding media is used in the SAG and ball mills as part of the ore comminution process. High
carbon steel forged grinding media will be delivered in 200 L drums and loaded directly into the
mills via a kibble and hoist system.
2CO003.008 – Oromin Joint Venture Group Independent Technical Report for the OJVG Golouma Gold Project, Sénégal Page 98
NMW_DM_TS /WB/MN OJVG Golouma Gold_2012_FS_Technical_Report_2CO003 008_NMW_DM_TS_GA_DGP_20130315_1 March 15, 2013
Smelting Fluxes
The main fluxes required for the smelting of the gold doré include silica, sodium nitrate and borax.
All of these reagents will be delivered in 25 kg bags and added directly to the smelting process as
required.
12.3.11 Air Services
The reagent preparation and distribution systems are depicted on flow sheet 2284-F-110.
High pressure air for plant and instrument air requirements will be provided by three rotary screw
air compressors. There will be two duty compressors and one standby compressor operating in
lead-lag mode. Plant air will be stored in the plant air receiver prior to being reticulated throughout
the plant. The high pressure airline will direct air to a dedicated air filter per compressor, followed
by the refrigeration type instrument air dryer (duty/standby) to produce instrument quality air for all
pneumatic controls.
A take-off from the high pressure airline (prior to the dryers) will direct air to a dedicated air supply
for the CIL circuit. This air is sparged into the leach tanks 1 – 4 to provide sufficient dissolved
oxygen in the leach solution to facilitate the gold dissolution.
12.3.12 Water Services
The water services and distribution systems are depicted on flow sheets 2284-F-107.
There are a number of water services required for the plant:
Process Water
Process water is primarily used in the grinding and CIL areas. The source of process water is CIL
thickener overflow, TMF decant water and raw water make-up.
Raw Water
Raw water is primarily used for reagent preparation and in the elution circuit. Raw water is sourced
from the raw water dam and stored in the plant raw water tank prior to being distributed through the
plant.
Gland Seal Water
Gland seal water is sourced from the plant raw water tank. It is pumped via both high and low
pressure staged centrifugal pumps to the slurry pumps around the plant that require gland seal
water.
Fire Water
Fire water is sourced from the plant raw water tank. The lower section of the raw water tank
contains a dedicated four hour or 575 m³ fire water reservoir. The fire water reticulation system
consists of an electric jockey pump to maintain line pressure, a single electric centrifugal fire water
pump, as well as a standby diesel powered pump.
Potable Water
Potable water is used through the plant offices and buildings as well as for the safety eye wash and
shower facilities. The plant potable water is sourced from the camp potable water circuit.
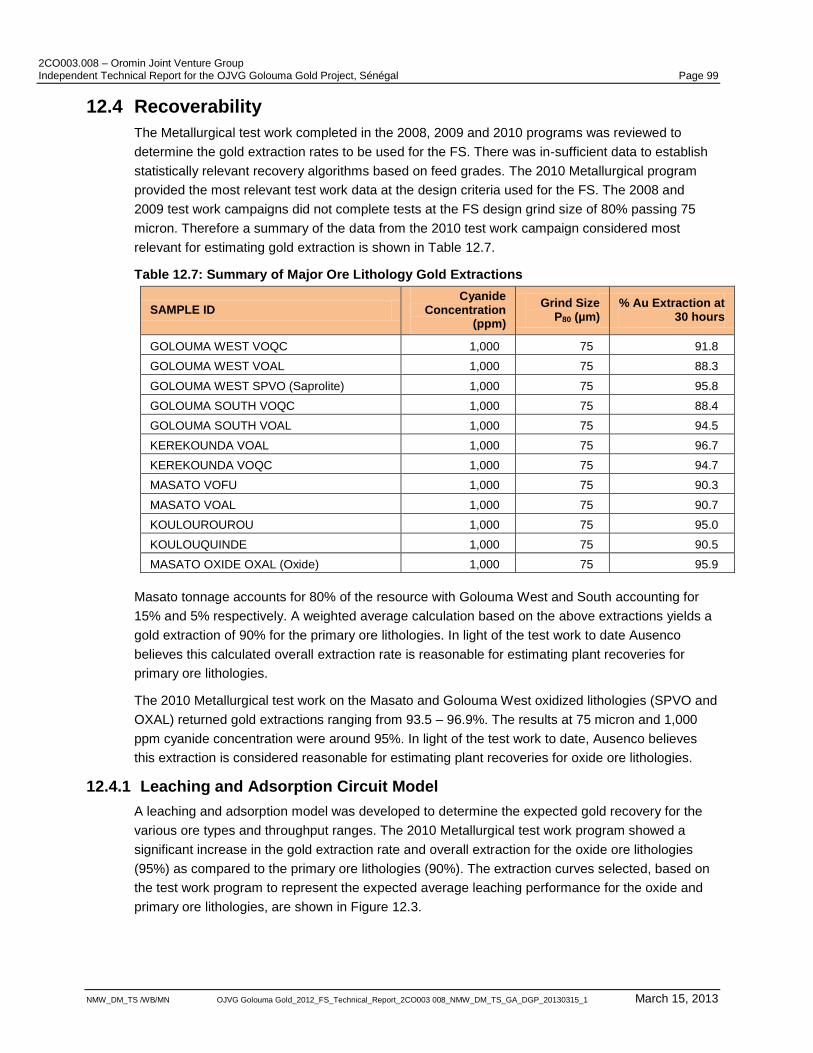
2CO003.008 – Oromin Joint Venture Group Independent Technical Report for the OJVG Golouma Gold Project, Sénégal Page 99
NMW_DM_TS /WB/MN OJVG Golouma Gold_2012_FS_Technical_Report_2CO003 008_NMW_DM_TS_GA_DGP_20130315_1 March 15, 2013
12.4 Recoverability
The Metallurgical test work completed in the 2008, 2009 and 2010 programs was reviewed to
determine the gold extraction rates to be used for the FS. There was in-sufficient data to establish
statistically relevant recovery algorithms based on feed grades. The 2010 Metallurgical program
provided the most relevant test work data at the design criteria used for the FS. The 2008 and
2009 test work campaigns did not complete tests at the FS design grind size of 80% passing 75
micron. Therefore a summary of the data from the 2010 test work campaign considered most
relevant for estimating gold extraction is shown in Table 12.7.
Table 12.7: Summary of Major Ore Lithology Gold Extractions
SAMPLE ID Cyanide
Concentration (ppm)
Grind Size P80 (µm)
% Au Extraction at 30 hours
GOLOUMA WEST VOQC 1,000 75 91.8
GOLOUMA WEST VOAL 1,000 75 88.3
GOLOUMA WEST SPVO (Saprolite) 1,000 75 95.8
GOLOUMA SOUTH VOQC 1,000 75 88.4
GOLOUMA SOUTH VOAL 1,000 75 94.5
KEREKOUNDA VOAL 1,000 75 96.7
KEREKOUNDA VOQC 1,000 75 94.7
MASATO VOFU 1,000 75 90.3
MASATO VOAL 1,000 75 90.7
KOULOUROUROU 1,000 75 95.0
KOULOUQUINDE 1,000 75 90.5
MASATO OXIDE OXAL (Oxide) 1,000 75 95.9
Masato tonnage accounts for 80% of the resource with Golouma West and South accounting for
15% and 5% respectively. A weighted average calculation based on the above extractions yields a
gold extraction of 90% for the primary ore lithologies. In light of the test work to date Ausenco
believes this calculated overall extraction rate is reasonable for estimating plant recoveries for
primary ore lithologies.
The 2010 Metallurgical test work on the Masato and Golouma West oxidized lithologies (SPVO and
OXAL) returned gold extractions ranging from 93.5 – 96.9%. The results at 75 micron and 1,000
ppm cyanide concentration were around 95%. In light of the test work to date, Ausenco believes
this extraction is considered reasonable for estimating plant recoveries for oxide ore lithologies.
12.4.1 Leaching and Adsorption Circuit Model
A leaching and adsorption model was developed to determine the expected gold recovery for the
various ore types and throughput ranges. The 2010 Metallurgical test work program showed a
significant increase in the gold extraction rate and overall extraction for the oxide ore lithologies
(95%) as compared to the primary ore lithologies (90%). The extraction curves selected, based on
the test work program to represent the expected average leaching performance for the oxide and
primary ore lithologies, are shown in Figure 12.3.
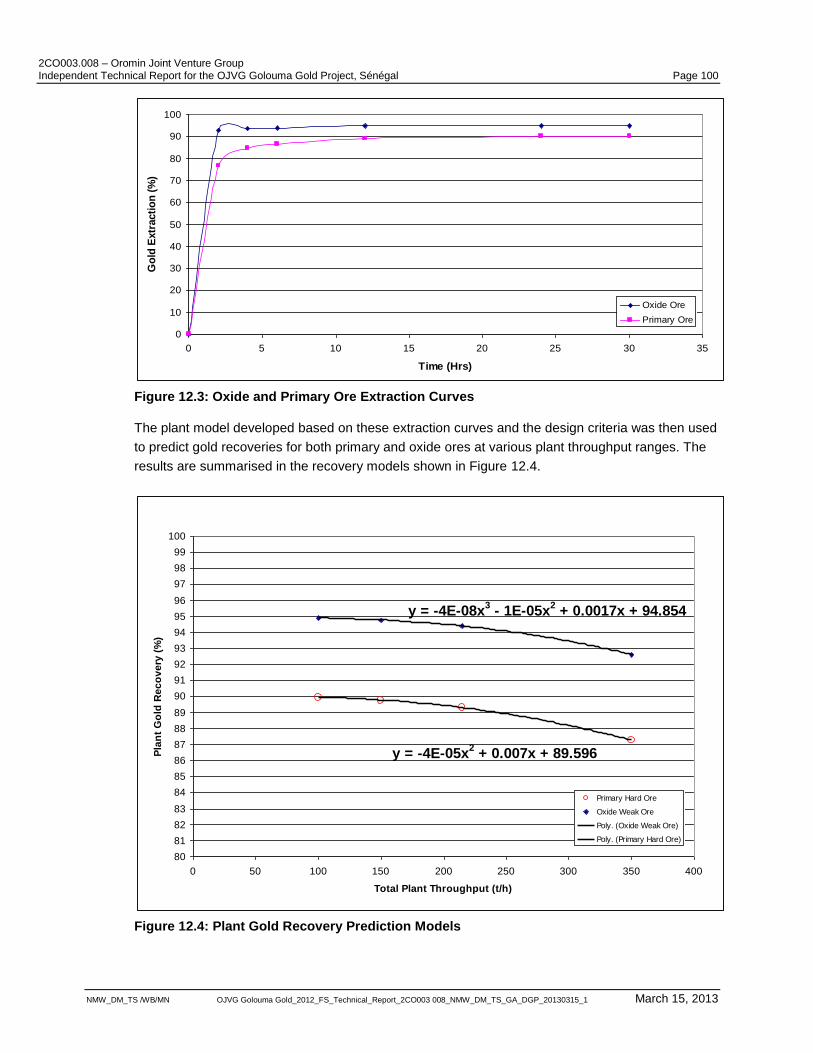
2CO003.008 – Oromin Joint Venture Group Independent Technical Report for the OJVG Golouma Gold Project, Sénégal Page 100
NMW_DM_TS /WB/MN OJVG Golouma Gold_2012_FS_Technical_Report_2CO003 008_NMW_DM_TS_GA_DGP_20130315_1 March 15, 2013
Figure 12.3: Oxide and Primary Ore Extraction Curves
The plant model developed based on these extraction curves and the design criteria was then used
to predict gold recoveries for both primary and oxide ores at various plant throughput ranges. The
results are summarised in the recovery models shown in Figure 12.4.
Figure 12.4: Plant Gold Recovery Prediction Models
0
10
20
30
40
50
60
70
80
90
100
0 5 10 15 20 25 30 35
Time (Hrs)
Go
ld E
xtr
acti
on
(%
)
Oxide Ore
Primary Ore
y = -4E-08x3 - 1E-05x
2 + 0.0017x + 94.854
y = -4E-05x2 + 0.007x + 89.596
80
81
82
83
84
85
86
87
88
89
90
91
92
93
94
95
96
97
98
99
100
0 50 100 150 200 250 300 350 400
Total Plant Throughput (t/h)
Pla
nt
Go
ld R
ec
ov
ery
(%
)
Primary Hard Ore
Oxide Weak Ore
Poly. (Oxide Weak Ore)
Poly. (Primary Hard Ore)
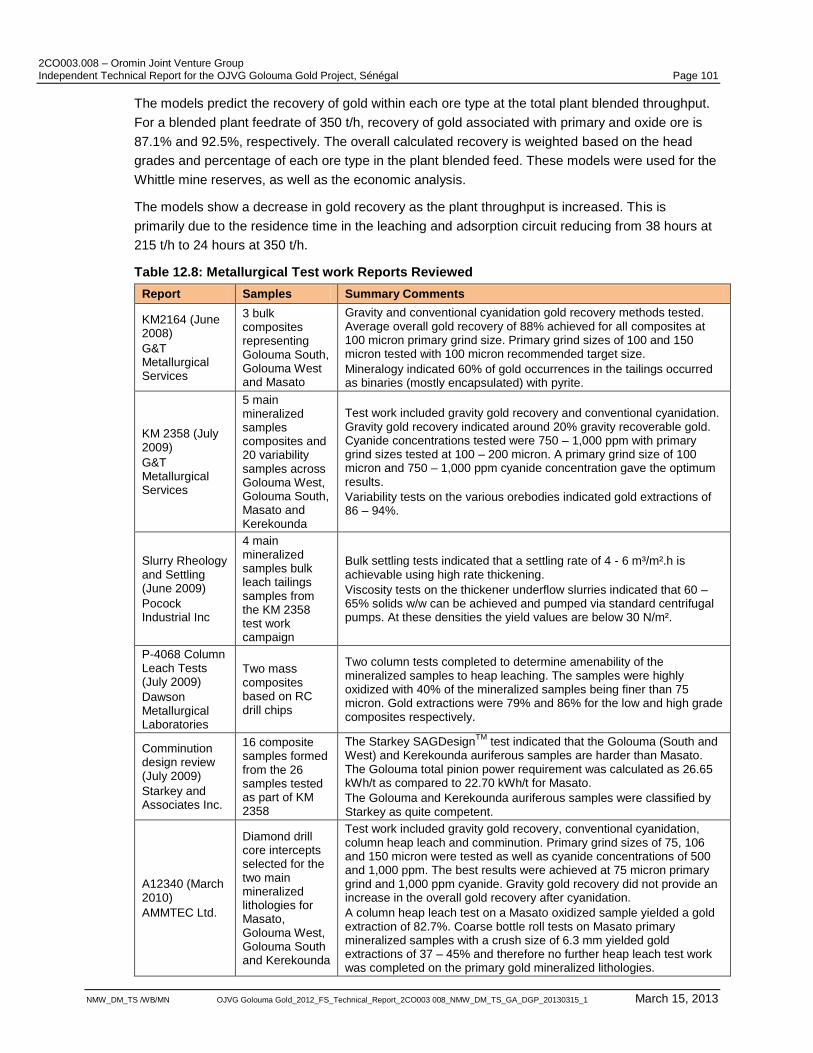
2CO003.008 – Oromin Joint Venture Group Independent Technical Report for the OJVG Golouma Gold Project, Sénégal Page 101
NMW_DM_TS /WB/MN OJVG Golouma Gold_2012_FS_Technical_Report_2CO003 008_NMW_DM_TS_GA_DGP_20130315_1 March 15, 2013
The models predict the recovery of gold within each ore type at the total plant blended throughput.
For a blended plant feedrate of 350 t/h, recovery of gold associated with primary and oxide ore is
87.1% and 92.5%, respectively. The overall calculated recovery is weighted based on the head
grades and percentage of each ore type in the plant blended feed. These models were used for the
Whittle mine reserves, as well as the economic analysis.
The models show a decrease in gold recovery as the plant throughput is increased. This is
primarily due to the residence time in the leaching and adsorption circuit reducing from 38 hours at
215 t/h to 24 hours at 350 t/h.
Table 12.8: Metallurgical Test work Reports Reviewed
Report Samples Summary Comments
KM2164 (June 2008)
G&T Metallurgical Services
3 bulk composites representing Golouma South, Golouma West and Masato
Gravity and conventional cyanidation gold recovery methods tested. Average overall gold recovery of 88% achieved for all composites at 100 micron primary grind size. Primary grind sizes of 100 and 150 micron tested with 100 micron recommended target size.
Mineralogy indicated 60% of gold occurrences in the tailings occurred as binaries (mostly encapsulated) with pyrite.
KM 2358 (July 2009)
G&T Metallurgical Services
5 main mineralized samples composites and 20 variability samples across Golouma West, Golouma South, Masato and Kerekounda
Test work included gravity gold recovery and conventional cyanidation. Gravity gold recovery indicated around 20% gravity recoverable gold. Cyanide concentrations tested were 750 – 1,000 ppm with primary grind sizes tested at 100 – 200 micron. A primary grind size of 100 micron and 750 – 1,000 ppm cyanide concentration gave the optimum results.
Variability tests on the various orebodies indicated gold extractions of 86 – 94%.
Slurry Rheology and Settling (June 2009)
Pocock Industrial Inc
4 main mineralized samples bulk leach tailings samples from the KM 2358 test work campaign
Bulk settling tests indicated that a settling rate of 4 - 6 m³/m².h is achievable using high rate thickening.
Viscosity tests on the thickener underflow slurries indicated that 60 – 65% solids w/w can be achieved and pumped via standard centrifugal pumps. At these densities the yield values are below 30 N/m².
P-4068 Column Leach Tests (July 2009)
Dawson Metallurgical Laboratories
Two mass composites based on RC drill chips
Two column tests completed to determine amenability of the mineralized samples to heap leaching. The samples were highly oxidized with 40% of the mineralized samples being finer than 75 micron. Gold extractions were 79% and 86% for the low and high grade composites respectively.
Comminution design review (July 2009)
Starkey and Associates Inc.
16 composite samples formed from the 26 samples tested as part of KM 2358
The Starkey SAGDesignTM
test indicated that the Golouma (South and West) and Kerekounda auriferous samples are harder than Masato. The Golouma total pinion power requirement was calculated as 26.65 kWh/t as compared to 22.70 kWh/t for Masato.
The Golouma and Kerekounda auriferous samples were classified by Starkey as quite competent.
A12340 (March 2010)
AMMTEC Ltd.
Diamond drill core intercepts selected for the two main mineralized lithologies for Masato, Golouma West, Golouma South and Kerekounda
Test work included gravity gold recovery, conventional cyanidation, column heap leach and comminution. Primary grind sizes of 75, 106 and 150 micron were tested as well as cyanide concentrations of 500 and 1,000 ppm. The best results were achieved at 75 micron primary grind and 1,000 ppm cyanide. Gravity gold recovery did not provide an increase in the overall gold recovery after cyanidation.
A column heap leach test on a Masato oxidized sample yielded a gold extraction of 82.7%. Coarse bottle roll tests on Masato primary mineralized samples with a crush size of 6.3 mm yielded gold extractions of 37 – 45% and therefore no further heap leach test work was completed on the primary gold mineralized lithologies.
2CO003.008 – Oromin Joint Venture Group Independent Technical Report for the OJVG Golouma Gold Project, Sénégal Page 102
NMW_DM_TS /WB/MN OJVG Golouma Gold_2012_FS_Technical_Report_2CO003 008_NMW_DM_TS_GA_DGP_20130315_1 March 15, 2013
12.5 Review of the 2008 Metallurgical Test Work
A test work campaign was completed by G&T Metallurgical Services Ltd. (G&T) in 2008 on gold
mineralization sampled from Masato, Golouma South and Golouma West to determine the
amenability of gold recovery by conventional cyanidation and gravity methods. The results were
reported in test work report KM2164 titled “Preliminary Metallurgical Testing – Sabodala Gold
Project, Senegal, West Africa”.
The test work campaign was based on bulk composites aimed at representing the complete
orebodies. The test work generally consisted of:
Determination of the chemical composition of the composites;
Gravity gold recovery using a centrifugal concentrator followed by upgrading the concentrate
via panning;
Conventional cyanidation by grinding the gold mineralization and subjecting it to bottle roll
leaching; and
Mineralogical scans on the leach test residues.
The following is a key summary of the 2008 test work campaign:
Gravity gold recovery ranged from 20% to 24% and averaged 22% across the three
composites. Tests were completed using grind-gravity-cyanidation and grind-cyanidation to
compare the overall effect of gravity concentration on recovery. The results indicated that the
overall gold recovery was not increased by the inclusion of a gravity recovery stage.
Gold extractions ranged from 84% for the Golouma West composite to 93% for the Masato
composite, based on cyanidation bottle roll tests. The average gold extraction without gravity
pre-concentration was 89%. The Masato and Golouma South composite samples showed
sensitivity to grind size in the range of 80%, passing (“P80”) 100 to 150 micron. It was
recommended that 100 micron be the primary grind size for future test work campaigns and
1,000 ppm cyanide concentration.
The sodium cyanide (NaCN) consumption rates ranged from 0.2 – 0.6 kg/t, with Masato being
the highest. The lime (CaO) consumption rates were steady at 1 kg/t.
Tailings residues from the cyanidation bottle roll tests were subjected to optical mineralogical
analysis, to investigate the mode of occurrence for gold particles in the tailings. Half of the gold
occurrences were as liberated gold with the balance of the occurrences observed as gold fully
encapsulated in pyrite binaries.
12.6 Review of the 2009 Metallurgical Test Work
A further test work program was completed in 2009 as part of the Pre-Feasibility Study. This
program was based on five bulk composite samples representing the following zones:
Golouma South;
Golouma West;
Golouma High Grade;
Masato; and
Kerekounda.
2CO003.008 – Oromin Joint Venture Group Independent Technical Report for the OJVG Golouma Gold Project, Sénégal Page 103
NMW_DM_TS /WB/MN OJVG Golouma Gold_2012_FS_Technical_Report_2CO003 008_NMW_DM_TS_GA_DGP_20130315_1 March 15, 2013
In addition to these composites, 20 variability samples taken across the same zones were tested
individually.
The 2009 test program for the PFS was performed by a number of laboratories as outlined below:
G & T Metallurgical Services Ltd. was contracted to conduct gravity and conventional
cyanidation testing;
Dawson Metallurgical Labs was contracted to conduct column leach tests on the Masato oxide
resource to help determine the amenability to cyanide heap leaching;
Additionally, Dawson Labs conducted SAGDesignTM and Bond tests on 16 composites from
the four mineralized resource areas. John Starkey and Associates interpreted this data to
provide projections for semi-autogenous grinding (SAG) and ball mill requirements for the
project; and
Pocock Industrial (Pocock) conducted thickening, filtration and slurry rheology testing to
provide data for thickener and filter sizing.
12.6.1 Sample Selection
G&T received 218 individual samples weighing between 1 kg and 2 kg. These samples were
combined to create four main zone composite samples plus a Golouma high grade (HG) composite
from the gold mineralization resources. Additionally, adequate material remained to create 20
variability samples, five for each main zone. There was insufficient material to include Golouma
HG. All tests were conducted on these samples using a combined gravity plus cyanidation flow
sheet.
A summary of the chemical compositions for the five composite samples is provided in Table 12.9.
Table 12.9: Chemical Composition of the Composite Samples
Composite Number of Individual
Samples
Au
(g/t)
Ag
(g/t)
Cu
(%)
Fe
(%)
Total S (%)
Masato 50 1.07 1 0.015 5.80 0.82
Golouma West 49 2.37 1 0.010 7.20 0.78
Golouma South 50 2.86 1 0.011 8.55 0.71
Golouma High Grade (HG) 12 8.18 1 0.012 7.85 1.68
Kerekounda 52 5.83 1 0.008 6.20 0.70
12.6.2 Gravity and Cyanidation Test Work
The testing program at G&T included a combination of gravity concentration and cyanide leaching
tests. The results of these tests are summarized in Table 12.10.
Table 12.10: Summary of G&T Metallurgical Data
Deposit Au Head Grade
(g/t)
Gravity Au Recovery
(%)
Gravity plus Cyanide Leach Au Recovery (%)
Centrifugal Concentrate
Pan Concentrate
Small Scale Tests
Large Scale Tests
Average of Variability
Tests
Masato 1.07 55 25 90 95 86
Golouma West 2.37 46 18 88 90 94
Golouma South 2.86 42 16 86 89 92
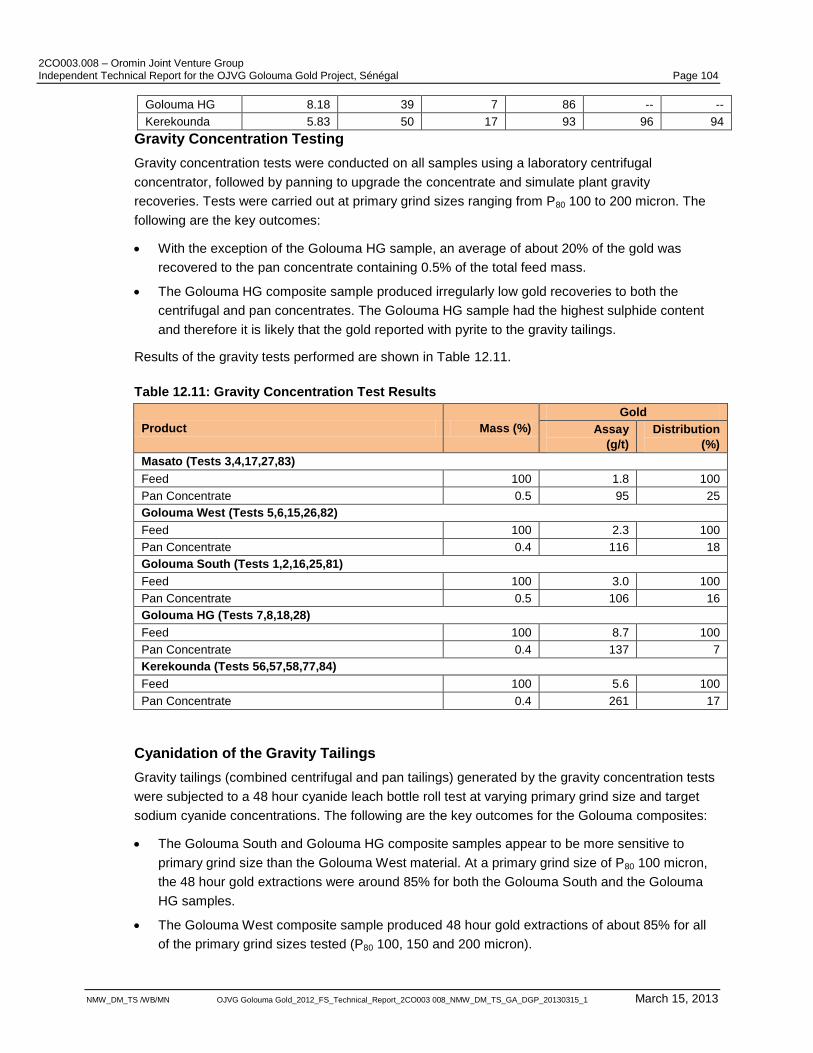
2CO003.008 – Oromin Joint Venture Group Independent Technical Report for the OJVG Golouma Gold Project, Sénégal Page 104
NMW_DM_TS /WB/MN OJVG Golouma Gold_2012_FS_Technical_Report_2CO003 008_NMW_DM_TS_GA_DGP_20130315_1 March 15, 2013
Golouma HG 8.18 39 7 86 -- --
Kerekounda 5.83 50 17 93 96 94
Gravity Concentration Testing
Gravity concentration tests were conducted on all samples using a laboratory centrifugal
concentrator, followed by panning to upgrade the concentrate and simulate plant gravity
recoveries. Tests were carried out at primary grind sizes ranging from P80 100 to 200 micron. The
following are the key outcomes:
With the exception of the Golouma HG sample, an average of about 20% of the gold was
recovered to the pan concentrate containing 0.5% of the total feed mass.
The Golouma HG composite sample produced irregularly low gold recoveries to both the
centrifugal and pan concentrates. The Golouma HG sample had the highest sulphide content
and therefore it is likely that the gold reported with pyrite to the gravity tailings.
Results of the gravity tests performed are shown in Table 12.11.
Table 12.11: Gravity Concentration Test Results
Product Mass (%)
Gold
Assay
(g/t)
Distribution
(%)
Masato (Tests 3,4,17,27,83)
Feed 100 1.8 100
Pan Concentrate 0.5 95 25
Golouma West (Tests 5,6,15,26,82)
Feed 100 2.3 100
Pan Concentrate 0.4 116 18
Golouma South (Tests 1,2,16,25,81)
Feed 100 3.0 100
Pan Concentrate 0.5 106 16
Golouma HG (Tests 7,8,18,28)
Feed 100 8.7 100
Pan Concentrate 0.4 137 7
Kerekounda (Tests 56,57,58,77,84)
Feed 100 5.6 100
Pan Concentrate 0.4 261 17
Cyanidation of the Gravity Tailings
Gravity tailings (combined centrifugal and pan tailings) generated by the gravity concentration tests
were subjected to a 48 hour cyanide leach bottle roll test at varying primary grind size and target
sodium cyanide concentrations. The following are the key outcomes for the Golouma composites:
The Golouma South and Golouma HG composite samples appear to be more sensitive to
primary grind size than the Golouma West material. At a primary grind size of P80 100 micron,
the 48 hour gold extractions were around 85% for both the Golouma South and the Golouma
HG samples.
The Golouma West composite sample produced 48 hour gold extractions of about 85% for all
of the primary grind sizes tested (P80 100, 150 and 200 micron).
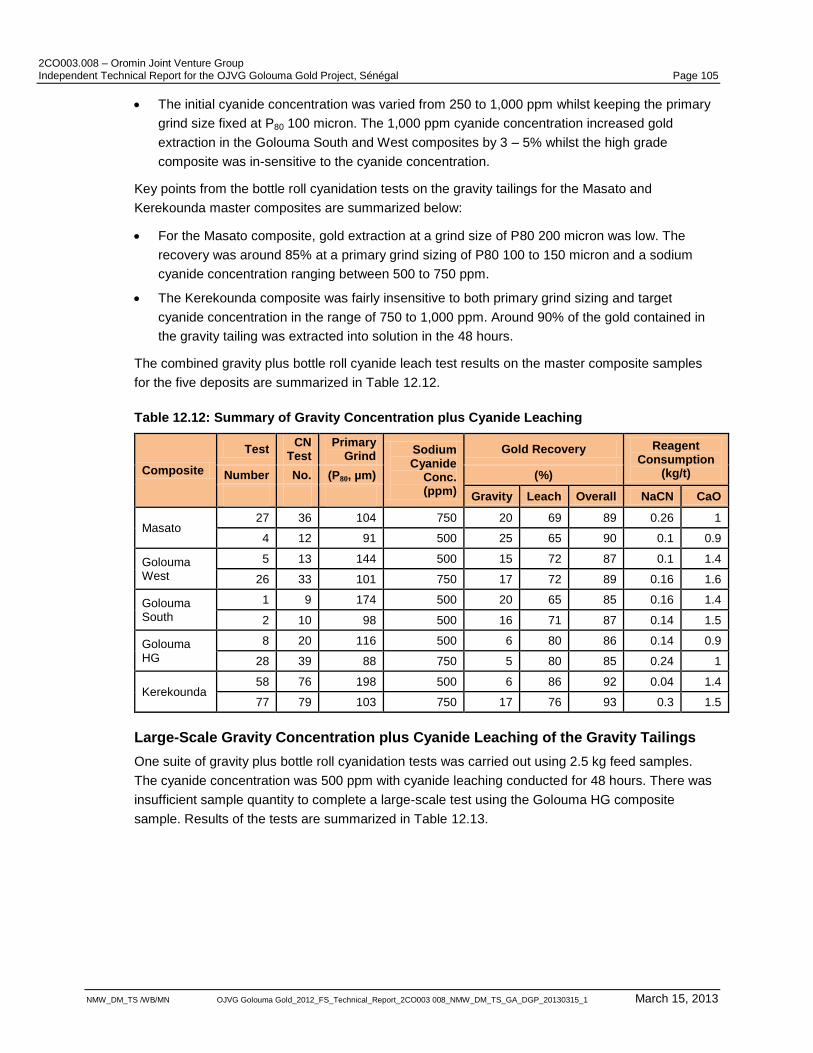
2CO003.008 – Oromin Joint Venture Group Independent Technical Report for the OJVG Golouma Gold Project, Sénégal Page 105
NMW_DM_TS /WB/MN OJVG Golouma Gold_2012_FS_Technical_Report_2CO003 008_NMW_DM_TS_GA_DGP_20130315_1 March 15, 2013
The initial cyanide concentration was varied from 250 to 1,000 ppm whilst keeping the primary
grind size fixed at P80 100 micron. The 1,000 ppm cyanide concentration increased gold
extraction in the Golouma South and West composites by 3 – 5% whilst the high grade
composite was in-sensitive to the cyanide concentration.
Key points from the bottle roll cyanidation tests on the gravity tailings for the Masato and
Kerekounda master composites are summarized below:
For the Masato composite, gold extraction at a grind size of P80 200 micron was low. The
recovery was around 85% at a primary grind sizing of P80 100 to 150 micron and a sodium
cyanide concentration ranging between 500 to 750 ppm.
The Kerekounda composite was fairly insensitive to both primary grind sizing and target
cyanide concentration in the range of 750 to 1,000 ppm. Around 90% of the gold contained in
the gravity tailing was extracted into solution in the 48 hours.
The combined gravity plus bottle roll cyanide leach test results on the master composite samples
for the five deposits are summarized in Table 12.12.
Table 12.12: Summary of Gravity Concentration plus Cyanide Leaching
Composite
Test CN
Test Primary
Grind Sodium Cyanide
Conc. (ppm)
Gold Recovery Reagent Consumption
(kg/t) Number No. (P80, µm) (%)
Gravity Leach Overall NaCN CaO
Masato 27 36 104 750 20 69 89 0.26 1
4 12 91 500 25 65 90 0.1 0.9
Golouma West
5 13 144 500 15 72 87 0.1 1.4
26 33 101 750 17 72 89 0.16 1.6
Golouma South
1 9 174 500 20 65 85 0.16 1.4
2 10 98 500 16 71 87 0.14 1.5
Golouma HG
8 20 116 500 6 80 86 0.14 0.9
28 39 88 750 5 80 85 0.24 1
Kerekounda 58 76 198 500 6 86 92 0.04 1.4
77 79 103 750 17 76 93 0.3 1.5
Large-Scale Gravity Concentration plus Cyanide Leaching of the Gravity Tailings
One suite of gravity plus bottle roll cyanidation tests was carried out using 2.5 kg feed samples.
The cyanide concentration was 500 ppm with cyanide leaching conducted for 48 hours. There was
insufficient sample quantity to complete a large-scale test using the Golouma HG composite
sample. Results of the tests are summarized in Table 12.13.
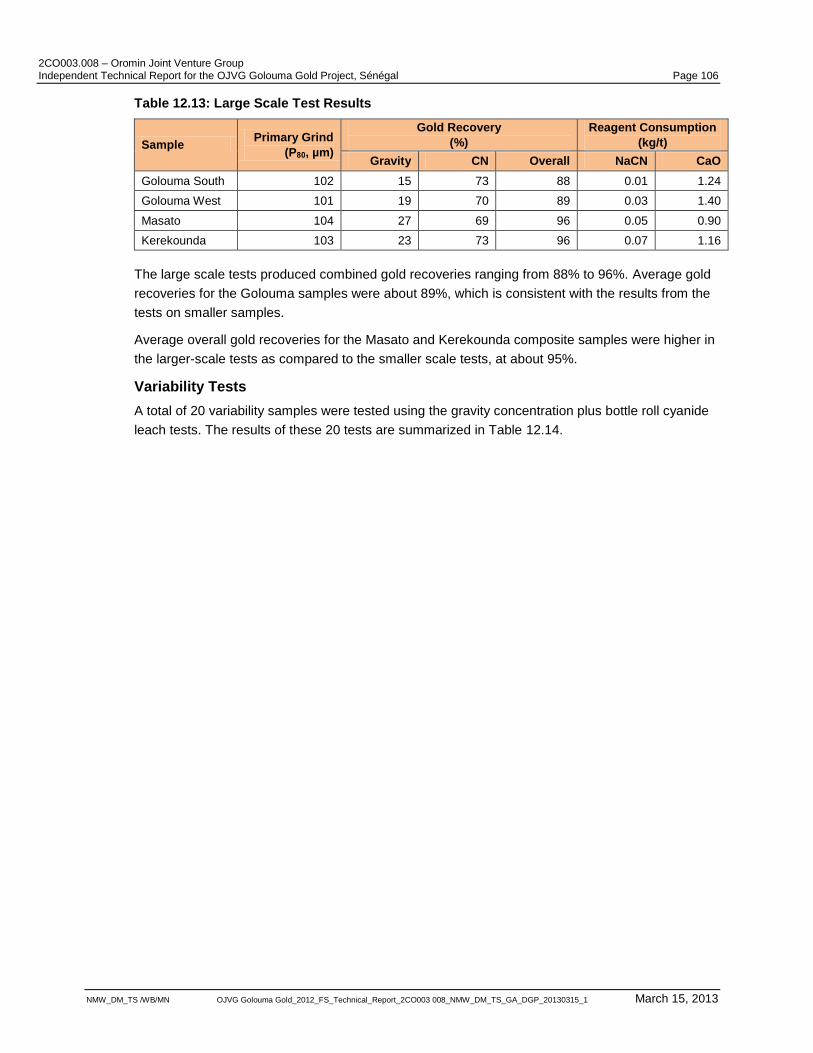
2CO003.008 – Oromin Joint Venture Group Independent Technical Report for the OJVG Golouma Gold Project, Sénégal Page 106
NMW_DM_TS /WB/MN OJVG Golouma Gold_2012_FS_Technical_Report_2CO003 008_NMW_DM_TS_GA_DGP_20130315_1 March 15, 2013
Table 12.13: Large Scale Test Results
Sample Primary Grind
(P80, µm)
Gold Recovery
(%)
Reagent Consumption
(kg/t)
Gravity CN Overall NaCN CaO
Golouma South 102 15 73 88 0.01 1.24
Golouma West 101 19 70 89 0.03 1.40
Masato 104 27 69 96 0.05 0.90
Kerekounda 103 23 73 96 0.07 1.16
The large scale tests produced combined gold recoveries ranging from 88% to 96%. Average gold
recoveries for the Golouma samples were about 89%, which is consistent with the results from the
tests on smaller samples.
Average overall gold recoveries for the Masato and Kerekounda composite samples were higher in
the larger-scale tests as compared to the smaller scale tests, at about 95%.
Variability Tests
A total of 20 variability samples were tested using the gravity concentration plus bottle roll cyanide
leach tests. The results of these 20 tests are summarized in Table 12.14.
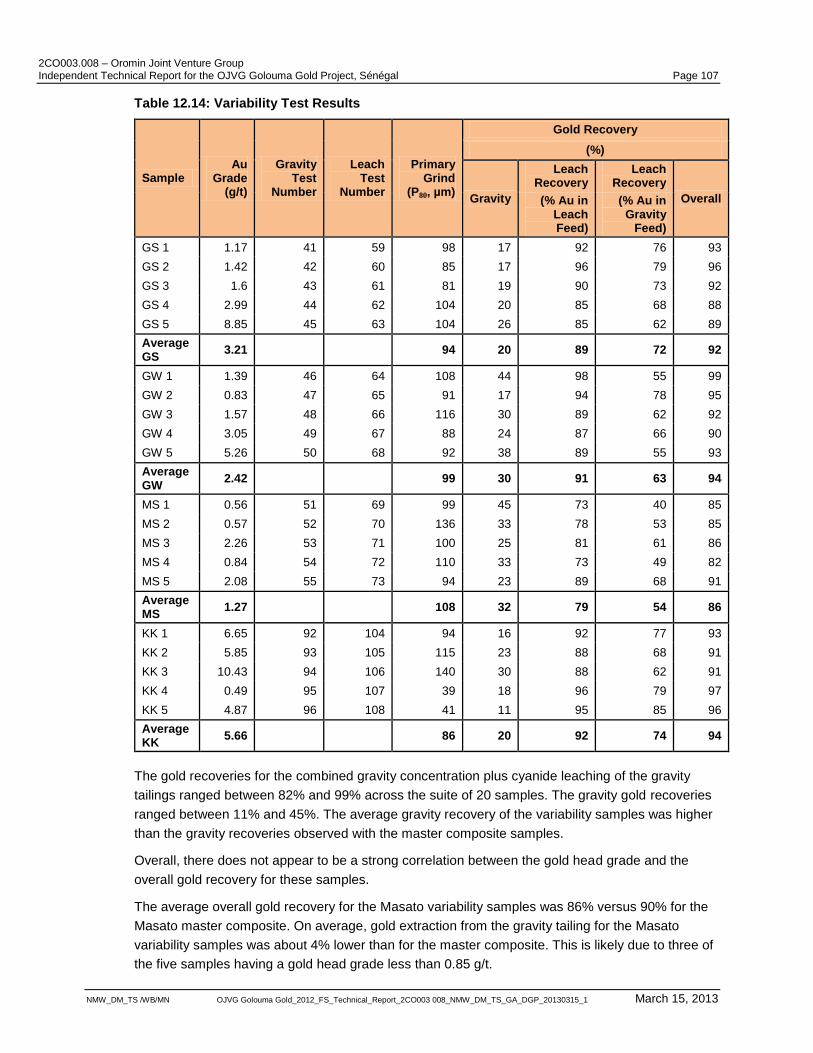
2CO003.008 – Oromin Joint Venture Group Independent Technical Report for the OJVG Golouma Gold Project, Sénégal Page 107
NMW_DM_TS /WB/MN OJVG Golouma Gold_2012_FS_Technical_Report_2CO003 008_NMW_DM_TS_GA_DGP_20130315_1 March 15, 2013
Table 12.14: Variability Test Results
Sample Au
Grade (g/t)
Gravity Test
Number
Leach Test
Number
Primary Grind
(P80, µm)
Gold Recovery
(%)
Gravity
Leach Recovery
Leach Recovery
Overall (% Au in Leach Feed)
(% Au in Gravity
Feed)
GS 1 1.17 41 59 98 17 92 76 93
GS 2 1.42 42 60 85 17 96 79 96
GS 3 1.6 43 61 81 19 90 73 92
GS 4 2.99 44 62 104 20 85 68 88
GS 5 8.85 45 63 104 26 85 62 89
Average GS
3.21 94 20 89 72 92
GW 1 1.39 46 64 108 44 98 55 99
GW 2 0.83 47 65 91 17 94 78 95
GW 3 1.57 48 66 116 30 89 62 92
GW 4 3.05 49 67 88 24 87 66 90
GW 5 5.26 50 68 92 38 89 55 93
Average GW
2.42 99 30 91 63 94
MS 1 0.56 51 69 99 45 73 40 85
MS 2 0.57 52 70 136 33 78 53 85
MS 3 2.26 53 71 100 25 81 61 86
MS 4 0.84 54 72 110 33 73 49 82
MS 5 2.08 55 73 94 23 89 68 91
Average MS
1.27 108 32 79 54 86
KK 1 6.65 92 104 94 16 92 77 93
KK 2 5.85 93 105 115 23 88 68 91
KK 3 10.43 94 106 140 30 88 62 91
KK 4 0.49 95 107 39 18 96 79 97
KK 5 4.87 96 108 41 11 95 85 96
Average KK
5.66 86 20 92 74 94
The gold recoveries for the combined gravity concentration plus cyanide leaching of the gravity
tailings ranged between 82% and 99% across the suite of 20 samples. The gravity gold recoveries
ranged between 11% and 45%. The average gravity recovery of the variability samples was higher
than the gravity recoveries observed with the master composite samples.
Overall, there does not appear to be a strong correlation between the gold head grade and the
overall gold recovery for these samples.
The average overall gold recovery for the Masato variability samples was 86% versus 90% for the
Masato master composite. On average, gold extraction from the gravity tailing for the Masato
variability samples was about 4% lower than for the master composite. This is likely due to three of
the five samples having a gold head grade less than 0.85 g/t.
2CO003.008 – Oromin Joint Venture Group Independent Technical Report for the OJVG Golouma Gold Project, Sénégal Page 108
NMW_DM_TS /WB/MN OJVG Golouma Gold_2012_FS_Technical_Report_2CO003 008_NMW_DM_TS_GA_DGP_20130315_1 March 15, 2013
Optical Mineralogy
An optical mineralogy analysis was completed at the end of the metallurgical testing program on
the cyanidation test residues. The residues were subjected to gravity concentration to increase the
likelihood of gold observations and to allow investigation into the mode of gold occurrence. The
results of the analysis are summarized below:
The gold assays of the gravity concentrate leach residues ranged from 25 to 150 g/t.
A significant number of gold occurrences were observed for each sample. In all samples, the
majority of the gold occurrences observed had a mean average particle diameter less than
10 micron. The only exception was the Kerekounda sample, which had an average gold
particle diameter of 14 micron.
Almost all gold particles that were detected occurred as very fine inclusions (majority fully
encapsulated) in pyrite, with a smaller amount in binaries with goethite or multiphase particles.
The following sample of photomicrographs show gold occurrences located in the Masato
cyanidation leach residues.
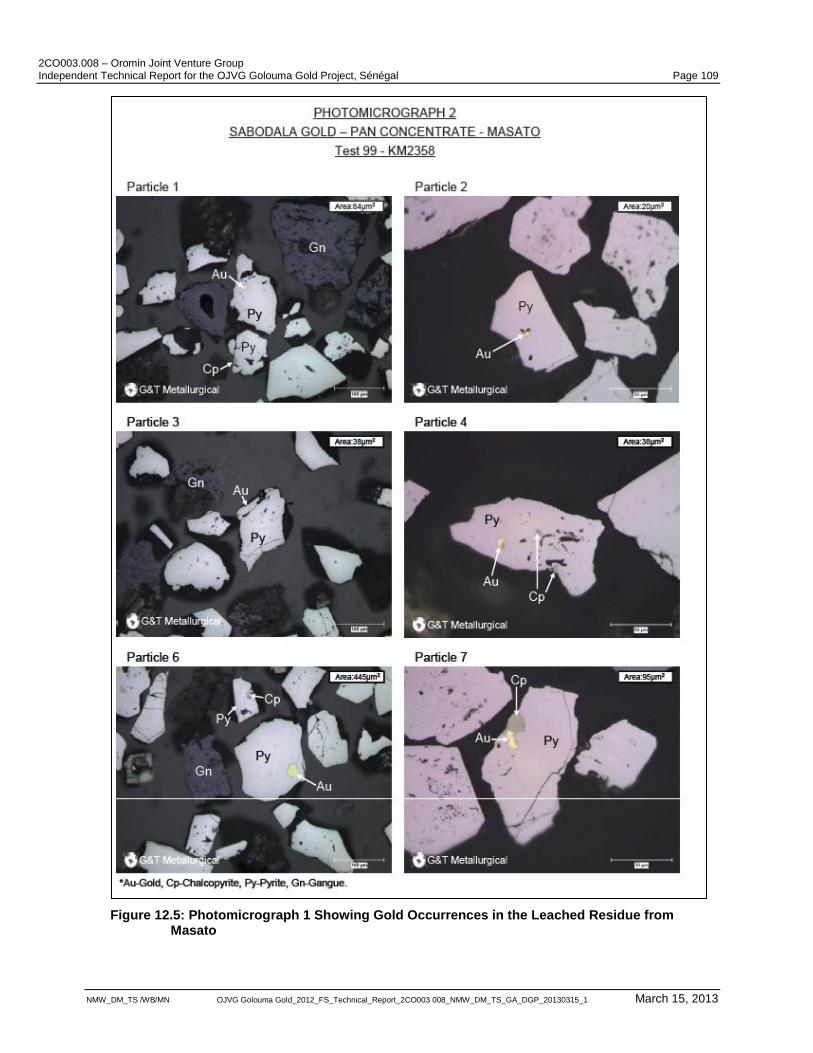
2CO003.008 – Oromin Joint Venture Group Independent Technical Report for the OJVG Golouma Gold Project, Sénégal Page 109
NMW_DM_TS /WB/MN OJVG Golouma Gold_2012_FS_Technical_Report_2CO003 008_NMW_DM_TS_GA_DGP_20130315_1 March 15, 2013
Figure 12.5: Photomicrograph 1 Showing Gold Occurrences in the Leached Residue from Masato
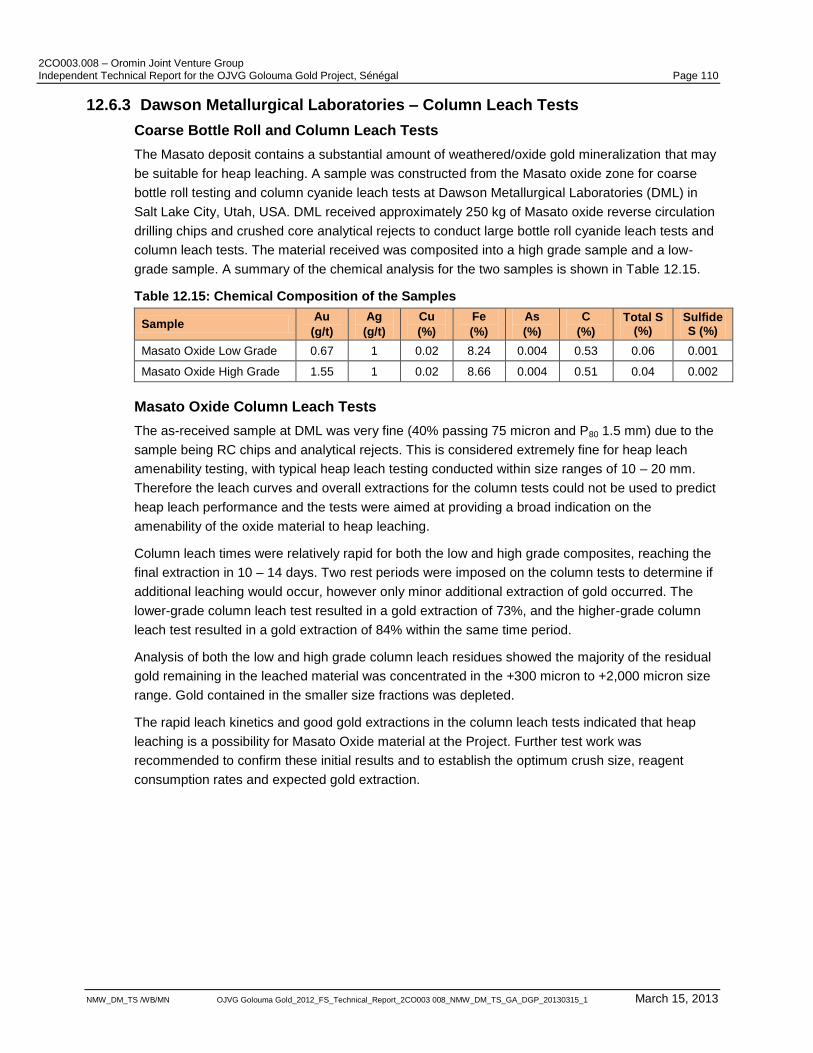
2CO003.008 – Oromin Joint Venture Group Independent Technical Report for the OJVG Golouma Gold Project, Sénégal Page 110
NMW_DM_TS /WB/MN OJVG Golouma Gold_2012_FS_Technical_Report_2CO003 008_NMW_DM_TS_GA_DGP_20130315_1 March 15, 2013
12.6.3 Dawson Metallurgical Laboratories – Column Leach Tests
Coarse Bottle Roll and Column Leach Tests
The Masato deposit contains a substantial amount of weathered/oxide gold mineralization that may
be suitable for heap leaching. A sample was constructed from the Masato oxide zone for coarse
bottle roll testing and column cyanide leach tests at Dawson Metallurgical Laboratories (DML) in
Salt Lake City, Utah, USA. DML received approximately 250 kg of Masato oxide reverse circulation
drilling chips and crushed core analytical rejects to conduct large bottle roll cyanide leach tests and
column leach tests. The material received was composited into a high grade sample and a low-
grade sample. A summary of the chemical analysis for the two samples is shown in Table 12.15.
Table 12.15: Chemical Composition of the Samples
Sample Au
(g/t)
Ag
(g/t)
Cu
(%)
Fe
(%)
As
(%)
C
(%)
Total S (%)
Sulfide S (%)
Masato Oxide Low Grade 0.67 1 0.02 8.24 0.004 0.53 0.06 0.001
Masato Oxide High Grade 1.55 1 0.02 8.66 0.004 0.51 0.04 0.002
Masato Oxide Column Leach Tests
The as-received sample at DML was very fine (40% passing 75 micron and P80 1.5 mm) due to the
sample being RC chips and analytical rejects. This is considered extremely fine for heap leach
amenability testing, with typical heap leach testing conducted within size ranges of 10 – 20 mm.
Therefore the leach curves and overall extractions for the column tests could not be used to predict
heap leach performance and the tests were aimed at providing a broad indication on the
amenability of the oxide material to heap leaching.
Column leach times were relatively rapid for both the low and high grade composites, reaching the
final extraction in 10 – 14 days. Two rest periods were imposed on the column tests to determine if
additional leaching would occur, however only minor additional extraction of gold occurred. The
lower-grade column leach test resulted in a gold extraction of 73%, and the higher-grade column
leach test resulted in a gold extraction of 84% within the same time period.
Analysis of both the low and high grade column leach residues showed the majority of the residual
gold remaining in the leached material was concentrated in the +300 micron to +2,000 micron size
range. Gold contained in the smaller size fractions was depleted.
The rapid leach kinetics and good gold extractions in the column leach tests indicated that heap
leaching is a possibility for Masato Oxide material at the Project. Further test work was
recommended to confirm these initial results and to establish the optimum crush size, reagent
consumption rates and expected gold extraction.
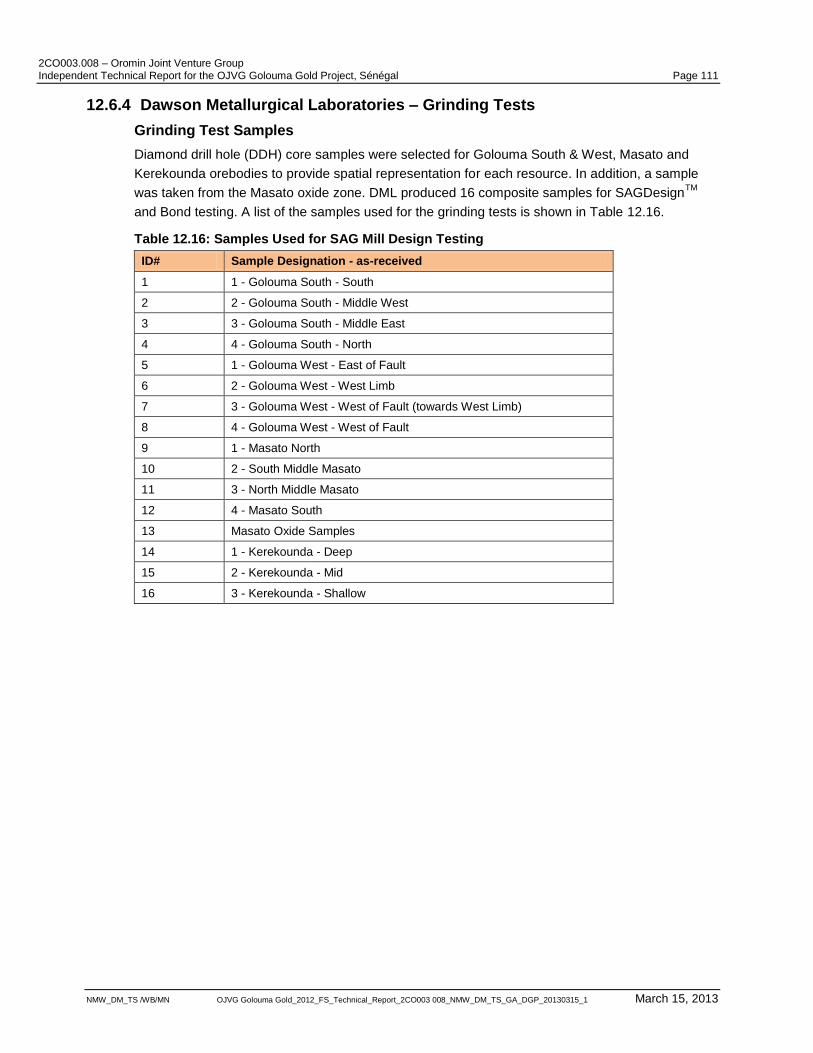
2CO003.008 – Oromin Joint Venture Group Independent Technical Report for the OJVG Golouma Gold Project, Sénégal Page 111
NMW_DM_TS /WB/MN OJVG Golouma Gold_2012_FS_Technical_Report_2CO003 008_NMW_DM_TS_GA_DGP_20130315_1 March 15, 2013
12.6.4 Dawson Metallurgical Laboratories – Grinding Tests
Grinding Test Samples
Diamond drill hole (DDH) core samples were selected for Golouma South & West, Masato and
Kerekounda orebodies to provide spatial representation for each resource. In addition, a sample
was taken from the Masato oxide zone. DML produced 16 composite samples for SAGDesignTM
and Bond testing. A list of the samples used for the grinding tests is shown in Table 12.16.
Table 12.16: Samples Used for SAG Mill Design Testing
ID# Sample Designation - as-received
1 1 - Golouma South - South
2 2 - Golouma South - Middle West
3 3 - Golouma South - Middle East
4 4 - Golouma South - North
5 1 - Golouma West - East of Fault
6 2 - Golouma West - West Limb
7 3 - Golouma West - West of Fault (towards West Limb)
8 4 - Golouma West - West of Fault
9 1 - Masato North
10 2 - South Middle Masato
11 3 - North Middle Masato
12 4 - Masato South
13 Masato Oxide Samples
14 1 - Kerekounda - Deep
15 2 - Kerekounda - Mid
16 3 - Kerekounda - Shallow
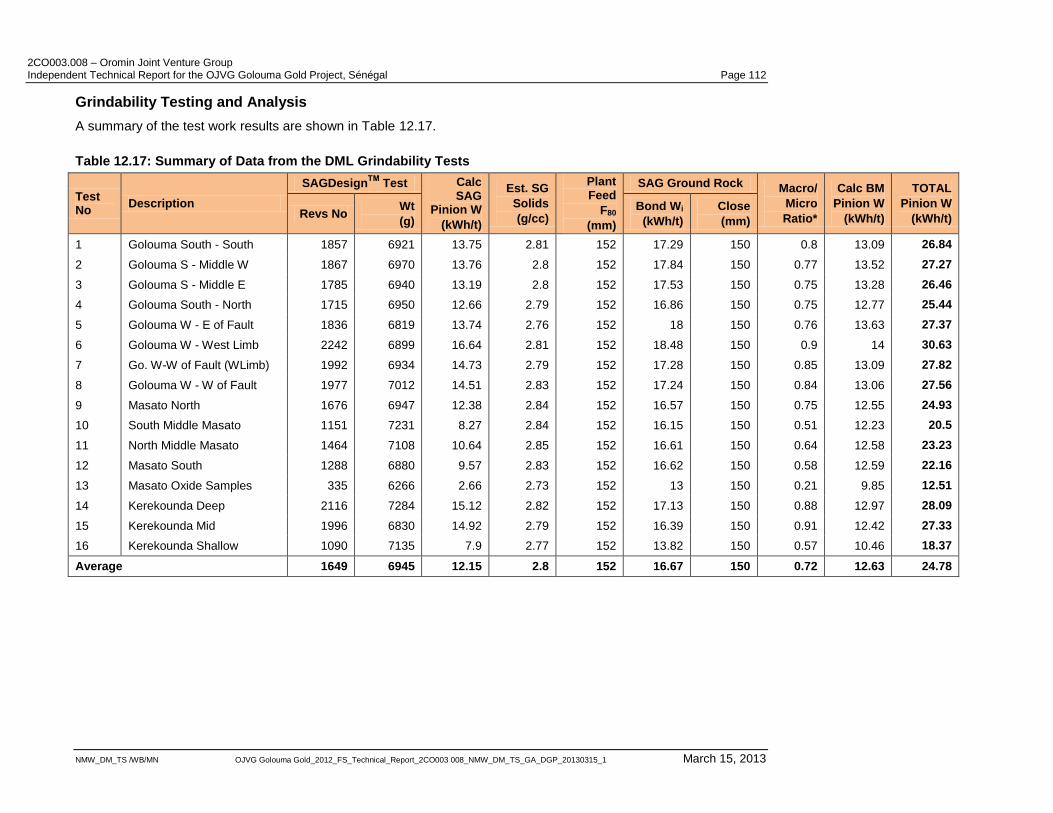
2CO003.008 – Oromin Joint Venture Group Independent Technical Report for the OJVG Golouma Gold Project, Sénégal Page 112
NMW_DM_TS /WB/MN OJVG Golouma Gold_2012_FS_Technical_Report_2CO003 008_NMW_DM_TS_GA_DGP_20130315_1 March 15, 2013
Grindability Testing and Analysis
A summary of the test work results are shown in Table 12.17.
Table 12.17: Summary of Data from the DML Grindability Tests
Test No
Description
SAGDesignTM
Test Calc SAG
Pinion W
(kWh/t)
Est. SG
Solids
(g/cc)
Plant Feed
F80
(mm)
SAG Ground Rock Macro/
Micro
Ratio*
Calc BM
Pinion W
(kWh/t)
TOTAL
Pinion W
(kWh/t) Revs No Wt
(g)
Bond Wi
(kWh/t)
Close
(mm)
1 Golouma South - South 1857 6921 13.75 2.81 152 17.29 150 0.8 13.09 26.84
2 Golouma S - Middle W 1867 6970 13.76 2.8 152 17.84 150 0.77 13.52 27.27
3 Golouma S - Middle E 1785 6940 13.19 2.8 152 17.53 150 0.75 13.28 26.46
4 Golouma South - North 1715 6950 12.66 2.79 152 16.86 150 0.75 12.77 25.44
5 Golouma W - E of Fault 1836 6819 13.74 2.76 152 18 150 0.76 13.63 27.37
6 Golouma W - West Limb 2242 6899 16.64 2.81 152 18.48 150 0.9 14 30.63
7 Go. W-W of Fault (WLimb) 1992 6934 14.73 2.79 152 17.28 150 0.85 13.09 27.82
8 Golouma W - W of Fault 1977 7012 14.51 2.83 152 17.24 150 0.84 13.06 27.56
9 Masato North 1676 6947 12.38 2.84 152 16.57 150 0.75 12.55 24.93
10 South Middle Masato 1151 7231 8.27 2.84 152 16.15 150 0.51 12.23 20.5
11 North Middle Masato 1464 7108 10.64 2.85 152 16.61 150 0.64 12.58 23.23
12 Masato South 1288 6880 9.57 2.83 152 16.62 150 0.58 12.59 22.16
13 Masato Oxide Samples 335 6266 2.66 2.73 152 13 150 0.21 9.85 12.51
14 Kerekounda Deep 2116 7284 15.12 2.82 152 17.13 150 0.88 12.97 28.09
15 Kerekounda Mid 1996 6830 14.92 2.79 152 16.39 150 0.91 12.42 27.33
16 Kerekounda Shallow 1090 7135 7.9 2.77 152 13.82 150 0.57 10.46 18.37
Average 1649 6945 12.15 2.8 152 16.67 150 0.72 12.63 24.78
2CO003.008 – Oromin Joint Venture Group Independent Technical Report for the OJVG Golouma Gold Project, Sénégal Page 113
NMW_DM_TS /WB/MN OJVG Golouma Gold_2012_FS_Technical_Report_2CO003 008_NMW_DM_TS_GA_DGP_20130315_1 March 15, 2013
The SAGDesignTM
test work procedure was specifically designed for the Starkey & Associates
comminution model. The results indicate:
Masato oxididized gold mineralization samples are significantly softer than the primary gold
mineralization samples;
The primary gold mineralization samples are considered as quite competent by Starkey and
Associates and require substantial power for grinding;
The calculated SAG pinion power and Bond work indices for the Masato primary gold
mineralization samples indicate that this orebody is slightly softer than the Golouma‟s and
Kerekounda. This is significant as Masato contains roughly 80% of the resource tonnage.
Starkey and Associates used this data to recommend various comminution options as outlined in
the July 2009 report titled “OJVG Sabodala Project Final Report”. The results are presented in
Table 12.18.
Starkey used a feed size specification of 80% passing 150 mm (6 inches) for all cases other than
Case 3 whereby the SAG F80 was decreased to 125 mm. The Starkey equations are calibrated at
150 mm feed size.
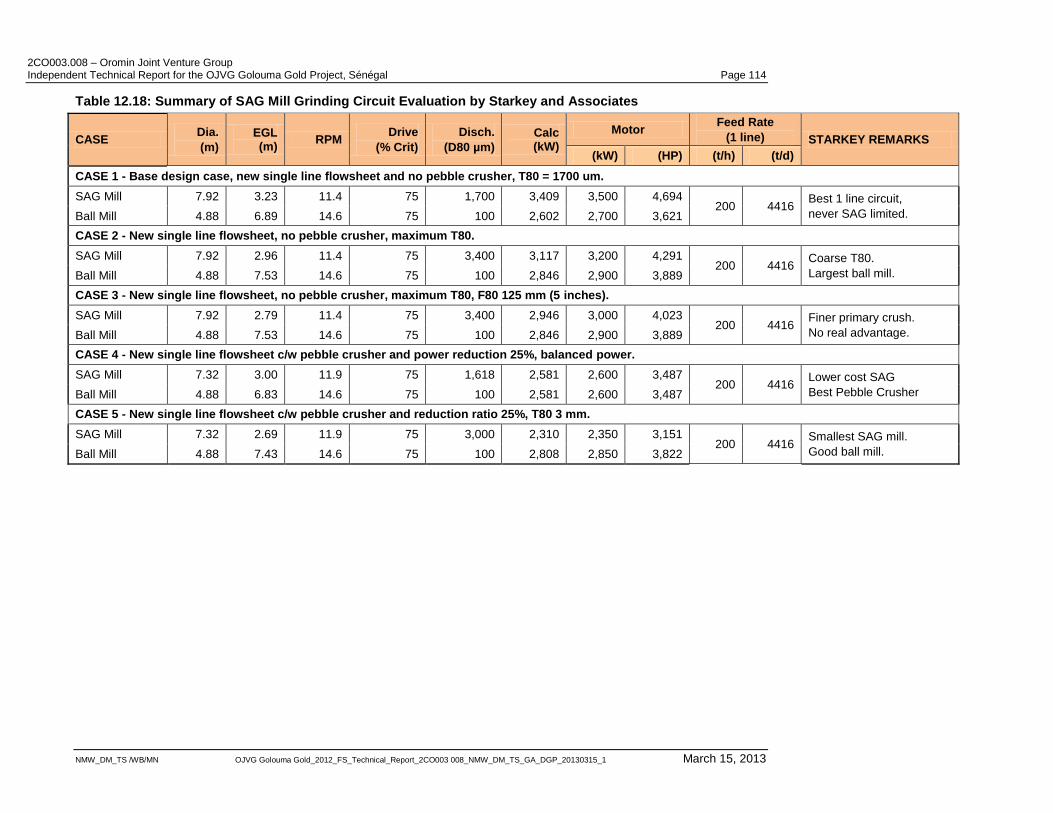
2CO003.008 – Oromin Joint Venture Group Independent Technical Report for the OJVG Golouma Gold Project, Sénégal Page 114
NMW_DM_TS /WB/MN OJVG Golouma Gold_2012_FS_Technical_Report_2CO003 008_NMW_DM_TS_GA_DGP_20130315_1 March 15, 2013
Table 12.18: Summary of SAG Mill Grinding Circuit Evaluation by Starkey and Associates
CASE Dia.
(m)
EGL (m)
RPM Drive
(% Crit)
Disch.
(D80 µm)
Calc (kW)
Motor Feed Rate
(1 line) STARKEY REMARKS
(kW) (HP) (t/h) (t/d)
CASE 1 - Base design case, new single line flowsheet and no pebble crusher, T80 = 1700 um.
SAG Mill 7.92 3.23 11.4 75 1,700 3,409 3,500 4,694 200 4416
Best 1 line circuit,
never SAG limited. Ball Mill 4.88 6.89 14.6 75 100 2,602 2,700 3,621
CASE 2 - New single line flowsheet, no pebble crusher, maximum T80.
SAG Mill 7.92 2.96 11.4 75 3,400 3,117 3,200 4,291 200 4416
Coarse T80.
Largest ball mill. Ball Mill 4.88 7.53 14.6 75 100 2,846 2,900 3,889
CASE 3 - New single line flowsheet, no pebble crusher, maximum T80, F80 125 mm (5 inches).
SAG Mill 7.92 2.79 11.4 75 3,400 2,946 3,000 4,023 200 4416
Finer primary crush.
No real advantage. Ball Mill 4.88 7.53 14.6 75 100 2,846 2,900 3,889
CASE 4 - New single line flowsheet c/w pebble crusher and power reduction 25%, balanced power.
SAG Mill 7.32 3.00 11.9 75 1,618 2,581 2,600 3,487 200 4416
Lower cost SAG
Best Pebble Crusher Ball Mill 4.88 6.83 14.6 75 100 2,581 2,600 3,487
CASE 5 - New single line flowsheet c/w pebble crusher and reduction ratio 25%, T80 3 mm.
SAG Mill 7.32 2.69 11.9 75 3,000 2,310 2,350 3,151 200 4416
Smallest SAG mill.
Good ball mill. Ball Mill 4.88 7.43 14.6 75 100 2,808 2,850 3,822
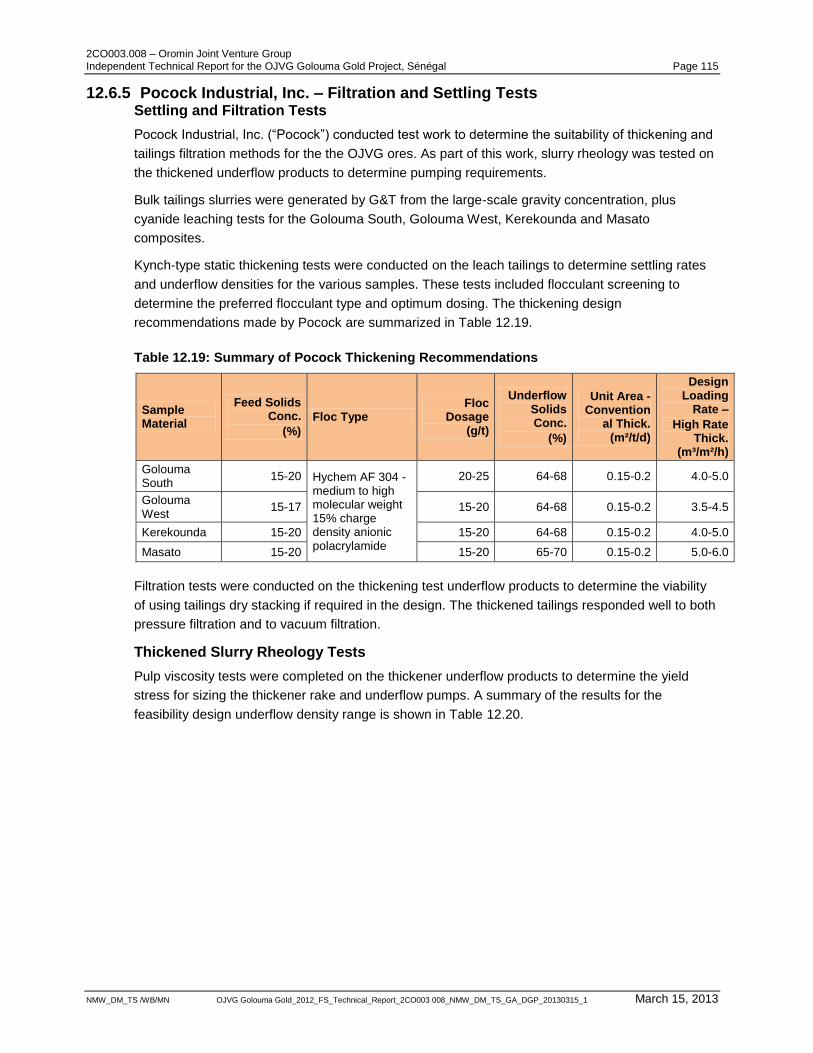
2CO003.008 – Oromin Joint Venture Group Independent Technical Report for the OJVG Golouma Gold Project, Sénégal Page 115
NMW_DM_TS /WB/MN OJVG Golouma Gold_2012_FS_Technical_Report_2CO003 008_NMW_DM_TS_GA_DGP_20130315_1 March 15, 2013
12.6.5 Pocock Industrial, Inc. – Filtration and Settling Tests Settling and Filtration Tests
Pocock Industrial, Inc. (“Pocock”) conducted test work to determine the suitability of thickening and
tailings filtration methods for the the OJVG ores. As part of this work, slurry rheology was tested on
the thickened underflow products to determine pumping requirements.
Bulk tailings slurries were generated by G&T from the large-scale gravity concentration, plus
cyanide leaching tests for the Golouma South, Golouma West, Kerekounda and Masato
composites.
Kynch-type static thickening tests were conducted on the leach tailings to determine settling rates
and underflow densities for the various samples. These tests included flocculant screening to
determine the preferred flocculant type and optimum dosing. The thickening design
recommendations made by Pocock are summarized in Table 12.19.
Table 12.19: Summary of Pocock Thickening Recommendations
Sample Material
Feed Solids Conc.
(%)
Floc Type Floc
Dosage (g/t)
Underflow Solids Conc.
(%)
Unit Area - Convention
al Thick. (m²/t/d)
Design Loading
Rate –
High Rate Thick.
(m³/m²/h)
Golouma South
15-20 Hychem AF 304 - medium to high molecular weight 15% charge density anionic polacrylamide
20-25 64-68 0.15-0.2 4.0-5.0
Golouma West
15-17 15-20 64-68 0.15-0.2 3.5-4.5
Kerekounda 15-20 15-20 64-68 0.15-0.2 4.0-5.0
Masato 15-20 15-20 65-70 0.15-0.2 5.0-6.0
Filtration tests were conducted on the thickening test underflow products to determine the viability
of using tailings dry stacking if required in the design. The thickened tailings responded well to both
pressure filtration and to vacuum filtration.
Thickened Slurry Rheology Tests
Pulp viscosity tests were completed on the thickener underflow products to determine the yield
stress for sizing the thickener rake and underflow pumps. A summary of the results for the
feasibility design underflow density range is shown in Table 12.20.
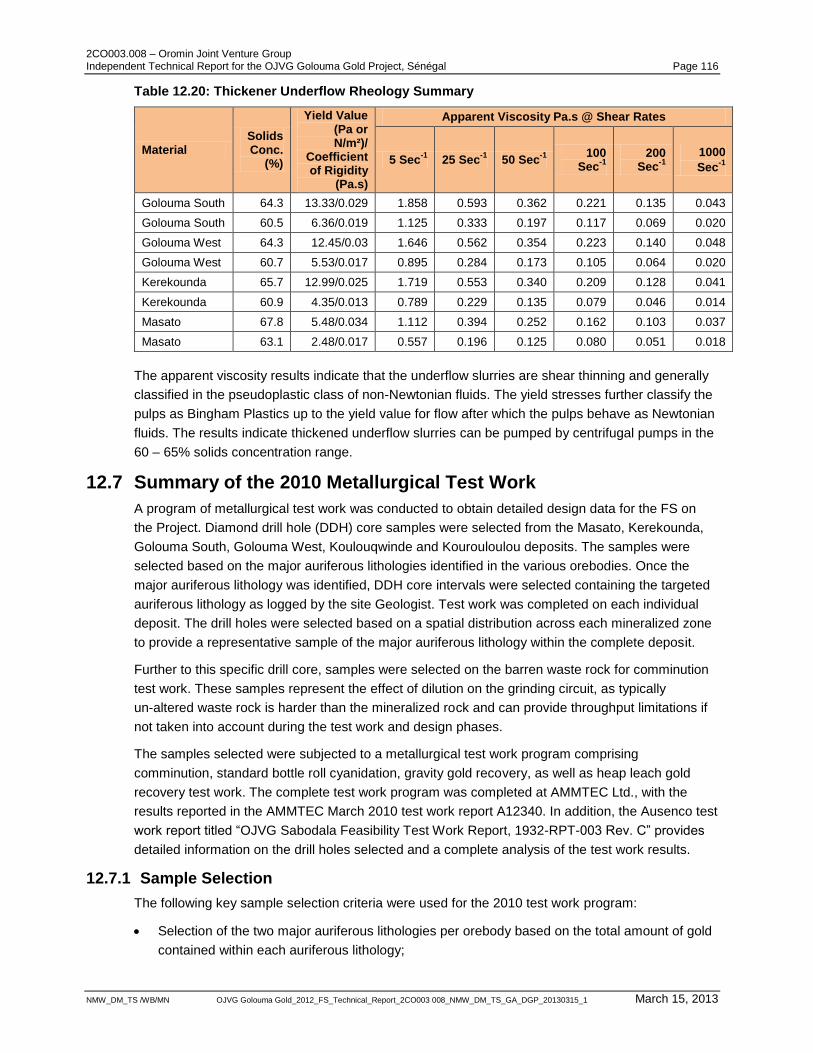
2CO003.008 – Oromin Joint Venture Group Independent Technical Report for the OJVG Golouma Gold Project, Sénégal Page 116
NMW_DM_TS /WB/MN OJVG Golouma Gold_2012_FS_Technical_Report_2CO003 008_NMW_DM_TS_GA_DGP_20130315_1 March 15, 2013
Table 12.20: Thickener Underflow Rheology Summary
Material Solids Conc.
(%)
Yield Value (Pa or N/m²)/
Coefficient of Rigidity
(Pa.s)
Apparent Viscosity Pa.s @ Shear Rates
5 Sec-1
25 Sec-1
50 Sec-1
100
Sec-1
200
Sec-1
1000
Sec-1
Golouma South 64.3 13.33/0.029 1.858 0.593 0.362 0.221 0.135 0.043
Golouma South 60.5 6.36/0.019 1.125 0.333 0.197 0.117 0.069 0.020
Golouma West 64.3 12.45/0.03 1.646 0.562 0.354 0.223 0.140 0.048
Golouma West 60.7 5.53/0.017 0.895 0.284 0.173 0.105 0.064 0.020
Kerekounda 65.7 12.99/0.025 1.719 0.553 0.340 0.209 0.128 0.041
Kerekounda 60.9 4.35/0.013 0.789 0.229 0.135 0.079 0.046 0.014
Masato 67.8 5.48/0.034 1.112 0.394 0.252 0.162 0.103 0.037
Masato 63.1 2.48/0.017 0.557 0.196 0.125 0.080 0.051 0.018
The apparent viscosity results indicate that the underflow slurries are shear thinning and generally
classified in the pseudoplastic class of non-Newtonian fluids. The yield stresses further classify the
pulps as Bingham Plastics up to the yield value for flow after which the pulps behave as Newtonian
fluids. The results indicate thickened underflow slurries can be pumped by centrifugal pumps in the
60 – 65% solids concentration range.
12.7 Summary of the 2010 Metallurgical Test Work
A program of metallurgical test work was conducted to obtain detailed design data for the FS on
the Project. Diamond drill hole (DDH) core samples were selected from the Masato, Kerekounda,
Golouma South, Golouma West, Koulouqwinde and Kourouloulou deposits. The samples were
selected based on the major auriferous lithologies identified in the various orebodies. Once the
major auriferous lithology was identified, DDH core intervals were selected containing the targeted
auriferous lithology as logged by the site Geologist. Test work was completed on each individual
deposit. The drill holes were selected based on a spatial distribution across each mineralized zone
to provide a representative sample of the major auriferous lithology within the complete deposit.
Further to this specific drill core, samples were selected on the barren waste rock for comminution
test work. These samples represent the effect of dilution on the grinding circuit, as typically
un-altered waste rock is harder than the mineralized rock and can provide throughput limitations if
not taken into account during the test work and design phases.
The samples selected were subjected to a metallurgical test work program comprising
comminution, standard bottle roll cyanidation, gravity gold recovery, as well as heap leach gold
recovery test work. The complete test work program was completed at AMMTEC Ltd., with the
results reported in the AMMTEC March 2010 test work report A12340. In addition, the Ausenco test
work report titled “OJVG Sabodala Feasibility Test Work Report, 1932-RPT-003 Rev. C” provides
detailed information on the drill holes selected and a complete analysis of the test work results.
12.7.1 Sample Selection
The following key sample selection criteria were used for the 2010 test work program:
Selection of the two major auriferous lithologies per orebody based on the total amount of gold
contained within each auriferous lithology;
2CO003.008 – Oromin Joint Venture Group Independent Technical Report for the OJVG Golouma Gold Project, Sénégal Page 117
NMW_DM_TS /WB/MN OJVG Golouma Gold_2012_FS_Technical_Report_2CO003 008_NMW_DM_TS_GA_DGP_20130315_1 March 15, 2013
Filtering DDH gold assays to remove holes with a gold grade lower than a nominal cut-off
grade of 1 g/t;
Selection of drill holes that provide a good spatial representation of the orebody;
Selection of dilution material to be included in each DDH core interval selected, typically 1 m of
“base grade” or waste, either side of the gold mineralized intercept. This method simulates
mining dilution, which is important as this can effect both the physical and chemical processes
within the plant;
Selection of waste rock material from Golouma West, Kerekounda and Masato specifically for
extensive comminution test work; and
Selection of major oxide mineralized sample type for Masato specifically for heap leach test
work.
Golouma West and South
The major gold mineralized sample lithology types for Golouma West and South were identified as:
VOAL - Volcanic altered with patchy to pervasive carbonate-dolomite+/-Fe Carbonate +/-pink
carbonate +/-silica +/-pyrite alteration +/- <10% quartz-carbonate-albeit veining. Bleached light
grey to grey-brown +/-pink; and
VOQC – Volcanic altered with >10% quartz-carbonate veining. Mineralization is similar to
VOAL with >10% quartz carbonate veining.
In addition, the major waste type was identified as:
MVMX - Massive mafic volcanic. Massive, fine to very fine grained basalt volcanic; green to
green-grey in colour.
Masato
The major gold mineralized sample lithologies for Masato were identifies as:
VOAL – similar to Golouma;
VOFU - Volcanic altered with fuchsite. Patchy to pervasive carbonate-dolomite- fuchsite+/-pink
carbonate +/-silica +/-pyrite +/-<10% quartz-albite+/-carbonate veining. Bleached light grey-
pistachio green+/-pink.
Masato has a significant amount of weathered or oxide material with the major lithology identified
as:
OXAL – Oxidised volcanic altered. Oxidised (moderate-intense Limonite and / or Hematite).
Altered (Carbonate-Dolomite+/-fuchsite+/-pink carbonate+/-silica+/- <10% quartz +/-albite
veining). Mafic-Ultramafic (Komatiitic) Volcanic. Light-dark orange-brown to pink-mauve-red-
brown.
The major waste rock lithology at Masato is:
MVBG – Mafic volcanic black and greasy. Massive or sheared mafic to ultra-mafic volcanic,
weak greasy talc-like feel. Dark grey to black in colour.
Kerekounda
The major gold mineralized and waste lithologies at Kerekounda are the same as Golouma.
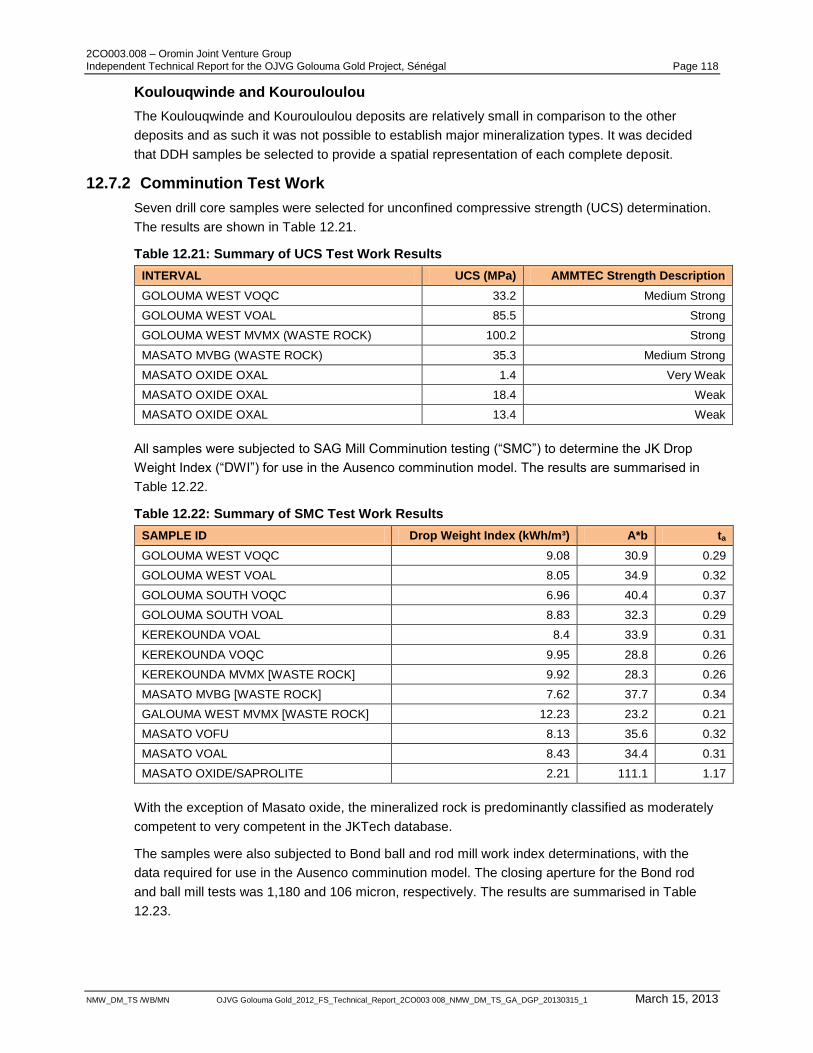
2CO003.008 – Oromin Joint Venture Group Independent Technical Report for the OJVG Golouma Gold Project, Sénégal Page 118
NMW_DM_TS /WB/MN OJVG Golouma Gold_2012_FS_Technical_Report_2CO003 008_NMW_DM_TS_GA_DGP_20130315_1 March 15, 2013
Koulouqwinde and Kourouloulou
The Koulouqwinde and Kourouloulou deposits are relatively small in comparison to the other
deposits and as such it was not possible to establish major mineralization types. It was decided
that DDH samples be selected to provide a spatial representation of each complete deposit.
12.7.2 Comminution Test Work
Seven drill core samples were selected for unconfined compressive strength (UCS) determination.
The results are shown in Table 12.21.
Table 12.21: Summary of UCS Test Work Results
INTERVAL UCS (MPa) AMMTEC Strength Description
GOLOUMA WEST VOQC 33.2 Medium Strong
GOLOUMA WEST VOAL 85.5 Strong
GOLOUMA WEST MVMX (WASTE ROCK) 100.2 Strong
MASATO MVBG (WASTE ROCK) 35.3 Medium Strong
MASATO OXIDE OXAL 1.4 Very Weak
MASATO OXIDE OXAL 18.4 Weak
MASATO OXIDE OXAL 13.4 Weak
All samples were subjected to SAG Mill Comminution testing (“SMC”) to determine the JK Drop
Weight Index (“DWI”) for use in the Ausenco comminution model. The results are summarised in
Table 12.22.
Table 12.22: Summary of SMC Test Work Results
SAMPLE ID Drop Weight Index (kWh/m³) A*b ta
GOLOUMA WEST VOQC 9.08 30.9 0.29
GOLOUMA WEST VOAL 8.05 34.9 0.32
GOLOUMA SOUTH VOQC 6.96 40.4 0.37
GOLOUMA SOUTH VOAL 8.83 32.3 0.29
KEREKOUNDA VOAL 8.4 33.9 0.31
KEREKOUNDA VOQC 9.95 28.8 0.26
KEREKOUNDA MVMX [WASTE ROCK] 9.92 28.3 0.26
MASATO MVBG [WASTE ROCK] 7.62 37.7 0.34
GALOUMA WEST MVMX [WASTE ROCK] 12.23 23.2 0.21
MASATO VOFU 8.13 35.6 0.32
MASATO VOAL 8.43 34.4 0.31
MASATO OXIDE/SAPROLITE 2.21 111.1 1.17
With the exception of Masato oxide, the mineralized rock is predominantly classified as moderately
competent to very competent in the JKTech database.
The samples were also subjected to Bond ball and rod mill work index determinations, with the
data required for use in the Ausenco comminution model. The closing aperture for the Bond rod
and ball mill tests was 1,180 and 106 micron, respectively. The results are summarised in Table
12.23.
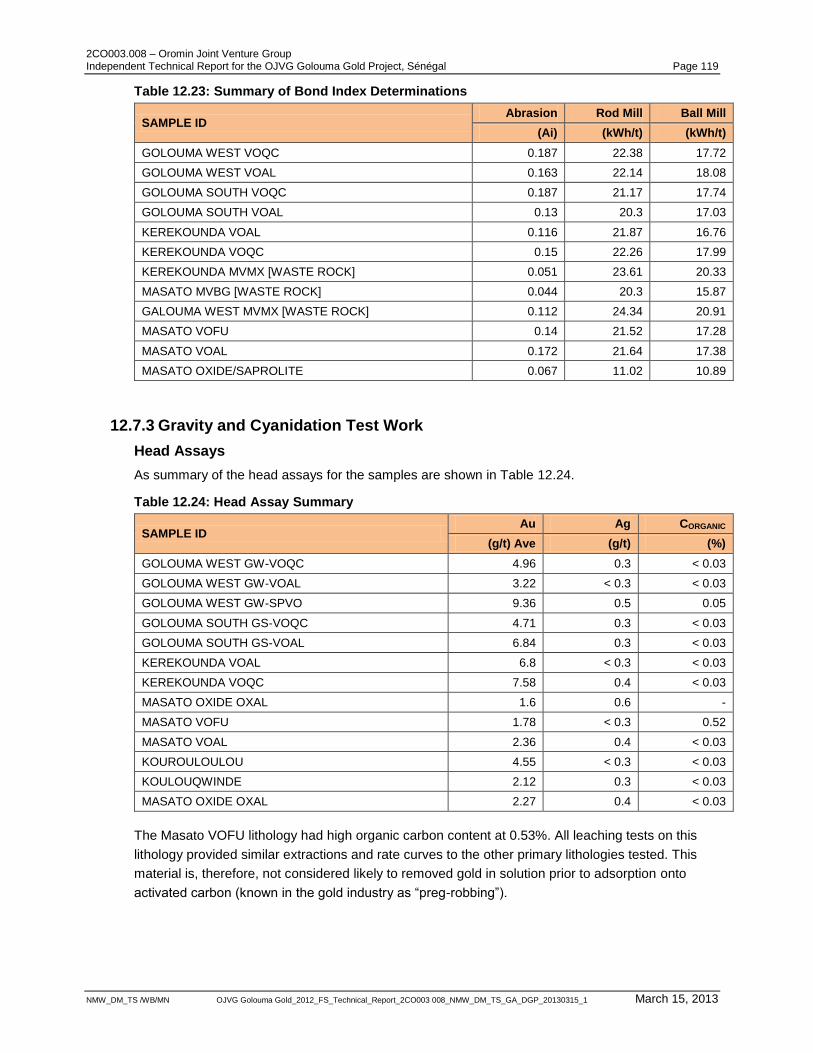
2CO003.008 – Oromin Joint Venture Group Independent Technical Report for the OJVG Golouma Gold Project, Sénégal Page 119
NMW_DM_TS /WB/MN OJVG Golouma Gold_2012_FS_Technical_Report_2CO003 008_NMW_DM_TS_GA_DGP_20130315_1 March 15, 2013
Table 12.23: Summary of Bond Index Determinations
SAMPLE ID Abrasion Rod Mill Ball Mill
(Ai) (kWh/t) (kWh/t)
GOLOUMA WEST VOQC 0.187 22.38 17.72
GOLOUMA WEST VOAL 0.163 22.14 18.08
GOLOUMA SOUTH VOQC 0.187 21.17 17.74
GOLOUMA SOUTH VOAL 0.13 20.3 17.03
KEREKOUNDA VOAL 0.116 21.87 16.76
KEREKOUNDA VOQC 0.15 22.26 17.99
KEREKOUNDA MVMX [WASTE ROCK] 0.051 23.61 20.33
MASATO MVBG [WASTE ROCK] 0.044 20.3 15.87
GALOUMA WEST MVMX [WASTE ROCK] 0.112 24.34 20.91
MASATO VOFU 0.14 21.52 17.28
MASATO VOAL 0.172 21.64 17.38
MASATO OXIDE/SAPROLITE 0.067 11.02 10.89
12.7.3 Gravity and Cyanidation Test Work
Head Assays
As summary of the head assays for the samples are shown in Table 12.24.
Table 12.24: Head Assay Summary
SAMPLE ID Au Ag CORGANIC
(g/t) Ave (g/t) (%)
GOLOUMA WEST GW-VOQC 4.96 0.3 < 0.03
GOLOUMA WEST GW-VOAL 3.22 < 0.3 < 0.03
GOLOUMA WEST GW-SPVO 9.36 0.5 0.05
GOLOUMA SOUTH GS-VOQC 4.71 0.3 < 0.03
GOLOUMA SOUTH GS-VOAL 6.84 0.3 < 0.03
KEREKOUNDA VOAL 6.8 < 0.3 < 0.03
KEREKOUNDA VOQC 7.58 0.4 < 0.03
MASATO OXIDE OXAL 1.6 0.6 -
MASATO VOFU 1.78 < 0.3 0.52
MASATO VOAL 2.36 0.4 < 0.03
KOUROULOULOU 4.55 < 0.3 < 0.03
KOULOUQWINDE 2.12 0.3 < 0.03
MASATO OXIDE OXAL 2.27 0.4 < 0.03
The Masato VOFU lithology had high organic carbon content at 0.53%. All leaching tests on this
lithology provided similar extractions and rate curves to the other primary lithologies tested. This
material is, therefore, not considered likely to removed gold in solution prior to adsorption onto
activated carbon (known in the gold industry as “preg-robbing”).
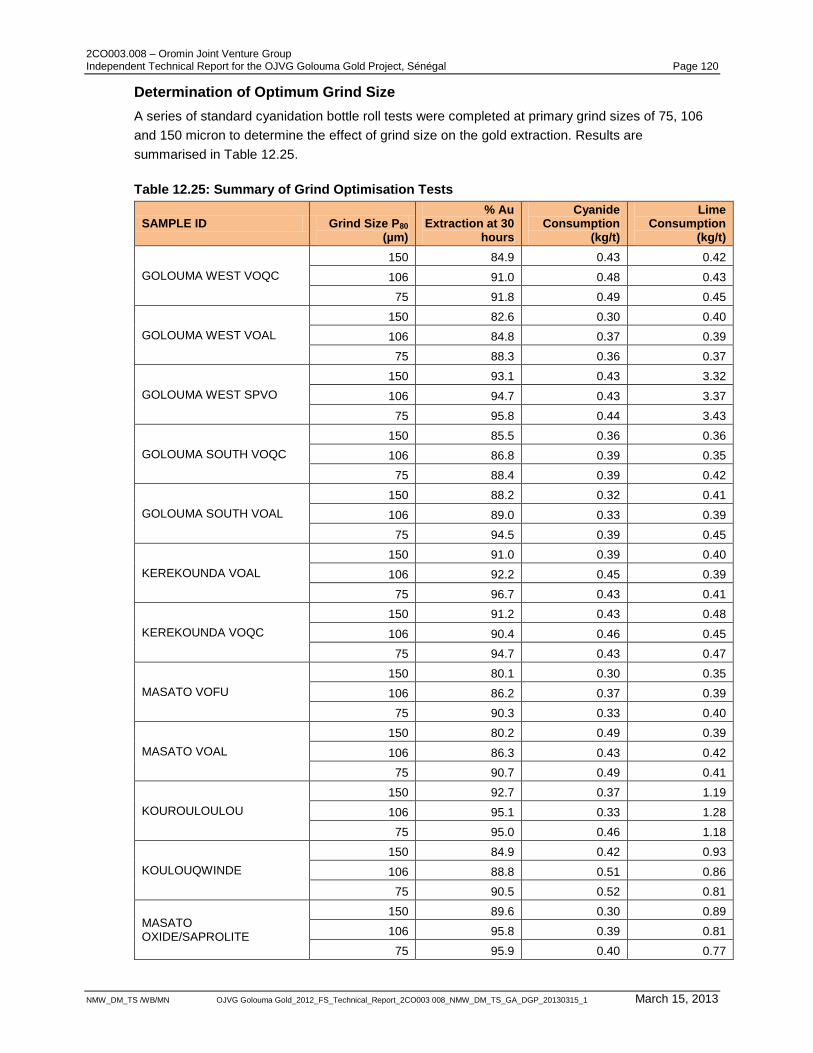
2CO003.008 – Oromin Joint Venture Group Independent Technical Report for the OJVG Golouma Gold Project, Sénégal Page 120
NMW_DM_TS /WB/MN OJVG Golouma Gold_2012_FS_Technical_Report_2CO003 008_NMW_DM_TS_GA_DGP_20130315_1 March 15, 2013
Determination of Optimum Grind Size
A series of standard cyanidation bottle roll tests were completed at primary grind sizes of 75, 106
and 150 micron to determine the effect of grind size on the gold extraction. Results are
summarised in Table 12.25.
Table 12.25: Summary of Grind Optimisation Tests
SAMPLE ID Grind Size P80 (µm)
% Au Extraction at 30
hours
Cyanide Consumption
(kg/t)
Lime Consumption
(kg/t)
GOLOUMA WEST VOQC
150 84.9 0.43 0.42
106 91.0 0.48 0.43
75 91.8 0.49 0.45
GOLOUMA WEST VOAL
150 82.6 0.30 0.40
106 84.8 0.37 0.39
75 88.3 0.36 0.37
GOLOUMA WEST SPVO
150 93.1 0.43 3.32
106 94.7 0.43 3.37
75 95.8 0.44 3.43
GOLOUMA SOUTH VOQC
150 85.5 0.36 0.36
106 86.8 0.39 0.35
75 88.4 0.39 0.42
GOLOUMA SOUTH VOAL
150 88.2 0.32 0.41
106 89.0 0.33 0.39
75 94.5 0.39 0.45
KEREKOUNDA VOAL
150 91.0 0.39 0.40
106 92.2 0.45 0.39
75 96.7 0.43 0.41
KEREKOUNDA VOQC
150 91.2 0.43 0.48
106 90.4 0.46 0.45
75 94.7 0.43 0.47
MASATO VOFU
150 80.1 0.30 0.35
106 86.2 0.37 0.39
75 90.3 0.33 0.40
MASATO VOAL
150 80.2 0.49 0.39
106 86.3 0.43 0.42
75 90.7 0.49 0.41
KOUROULOULOU
150 92.7 0.37 1.19
106 95.1 0.33 1.28
75 95.0 0.46 1.18
KOULOUQWINDE
150 84.9 0.42 0.93
106 88.8 0.51 0.86
75 90.5 0.52 0.81
MASATO OXIDE/SAPROLITE
150 89.6 0.30 0.89
106 95.8 0.39 0.81
75 95.9 0.40 0.77
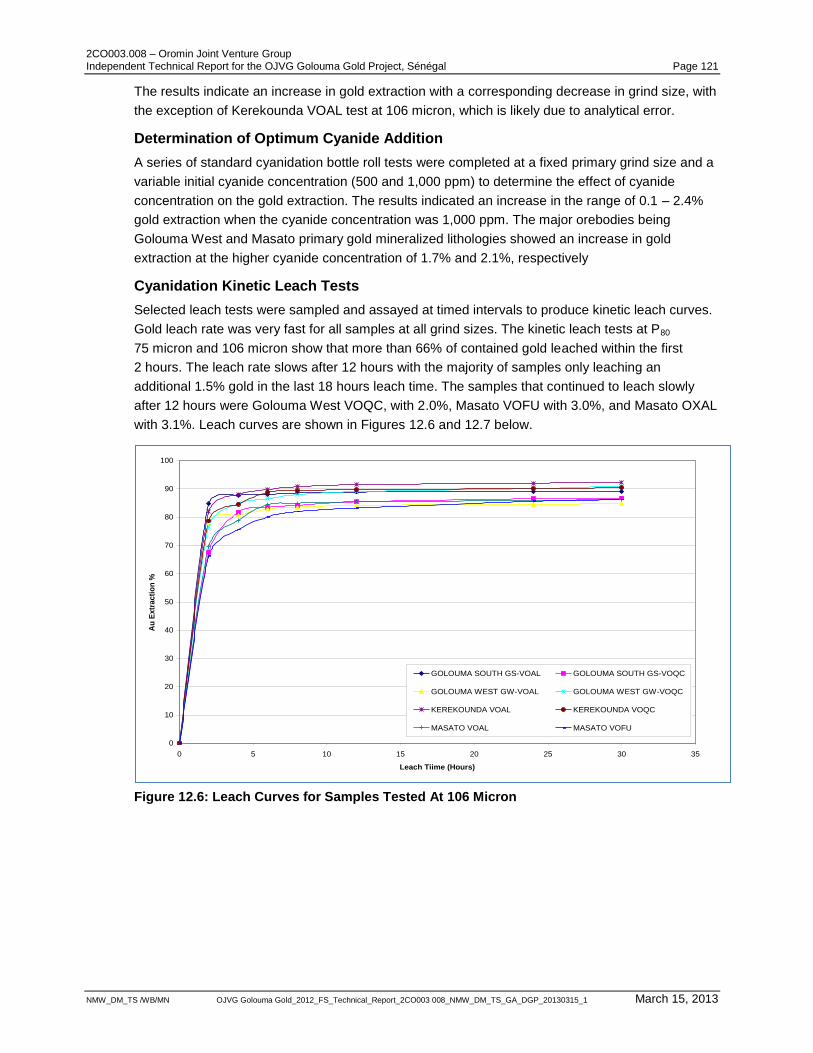
2CO003.008 – Oromin Joint Venture Group Independent Technical Report for the OJVG Golouma Gold Project, Sénégal Page 121
NMW_DM_TS /WB/MN OJVG Golouma Gold_2012_FS_Technical_Report_2CO003 008_NMW_DM_TS_GA_DGP_20130315_1 March 15, 2013
The results indicate an increase in gold extraction with a corresponding decrease in grind size, with
the exception of Kerekounda VOAL test at 106 micron, which is likely due to analytical error.
Determination of Optimum Cyanide Addition
A series of standard cyanidation bottle roll tests were completed at a fixed primary grind size and a
variable initial cyanide concentration (500 and 1,000 ppm) to determine the effect of cyanide
concentration on the gold extraction. The results indicated an increase in the range of 0.1 – 2.4%
gold extraction when the cyanide concentration was 1,000 ppm. The major orebodies being
Golouma West and Masato primary gold mineralized lithologies showed an increase in gold
extraction at the higher cyanide concentration of 1.7% and 2.1%, respectively
Cyanidation Kinetic Leach Tests
Selected leach tests were sampled and assayed at timed intervals to produce kinetic leach curves.
Gold leach rate was very fast for all samples at all grind sizes. The kinetic leach tests at P80
75 micron and 106 micron show that more than 66% of contained gold leached within the first
2 hours. The leach rate slows after 12 hours with the majority of samples only leaching an
additional 1.5% gold in the last 18 hours leach time. The samples that continued to leach slowly
after 12 hours were Golouma West VOQC, with 2.0%, Masato VOFU with 3.0%, and Masato OXAL
with 3.1%. Leach curves are shown in Figures 12.6 and 12.7 below.
Figure 12.6: Leach Curves for Samples Tested At 106 Micron
0
10
20
30
40
50
60
70
80
90
100
0 5 10 15 20 25 30 35
Leach Tiime (Hours)
Au
Extr
acti
on
%
GOLOUMA SOUTH GS-VOAL GOLOUMA SOUTH GS-VOQC
GOLOUMA WEST GW-VOAL GOLOUMA WEST GW-VOQC
KEREKOUNDA VOAL KEREKOUNDA VOQC
MASATO VOAL MASATO VOFU
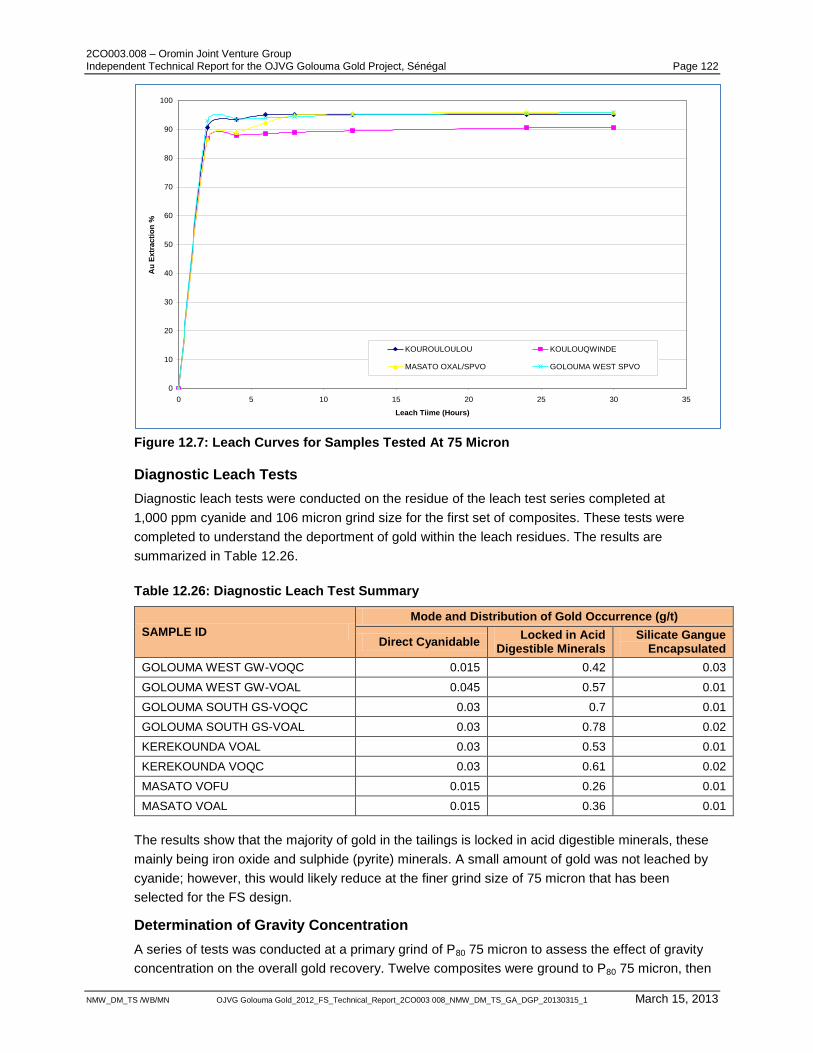
2CO003.008 – Oromin Joint Venture Group Independent Technical Report for the OJVG Golouma Gold Project, Sénégal Page 122
NMW_DM_TS /WB/MN OJVG Golouma Gold_2012_FS_Technical_Report_2CO003 008_NMW_DM_TS_GA_DGP_20130315_1 March 15, 2013
Figure 12.7: Leach Curves for Samples Tested At 75 Micron
Diagnostic Leach Tests
Diagnostic leach tests were conducted on the residue of the leach test series completed at
1,000 ppm cyanide and 106 micron grind size for the first set of composites. These tests were
completed to understand the deportment of gold within the leach residues. The results are
summarized in Table 12.26.
Table 12.26: Diagnostic Leach Test Summary
SAMPLE ID
Mode and Distribution of Gold Occurrence (g/t)
Direct Cyanidable Locked in Acid
Digestible Minerals Silicate Gangue
Encapsulated
GOLOUMA WEST GW-VOQC 0.015 0.42 0.03
GOLOUMA WEST GW-VOAL 0.045 0.57 0.01
GOLOUMA SOUTH GS-VOQC 0.03 0.7 0.01
GOLOUMA SOUTH GS-VOAL 0.03 0.78 0.02
KEREKOUNDA VOAL 0.03 0.53 0.01
KEREKOUNDA VOQC 0.03 0.61 0.02
MASATO VOFU 0.015 0.26 0.01
MASATO VOAL 0.015 0.36 0.01
The results show that the majority of gold in the tailings is locked in acid digestible minerals, these
mainly being iron oxide and sulphide (pyrite) minerals. A small amount of gold was not leached by
cyanide; however, this would likely reduce at the finer grind size of 75 micron that has been
selected for the FS design.
Determination of Gravity Concentration
A series of tests was conducted at a primary grind of P80 75 micron to assess the effect of gravity
concentration on the overall gold recovery. Twelve composites were ground to P80 75 micron, then
0
10
20
30
40
50
60
70
80
90
100
0 5 10 15 20 25 30 35
Leach Tiime (Hours)
Au
Extr
acti
on
%
KOUROULOULOU KOULOUQWINDE
MASATO OXAL/SPVO GOLOUMA WEST SPVO
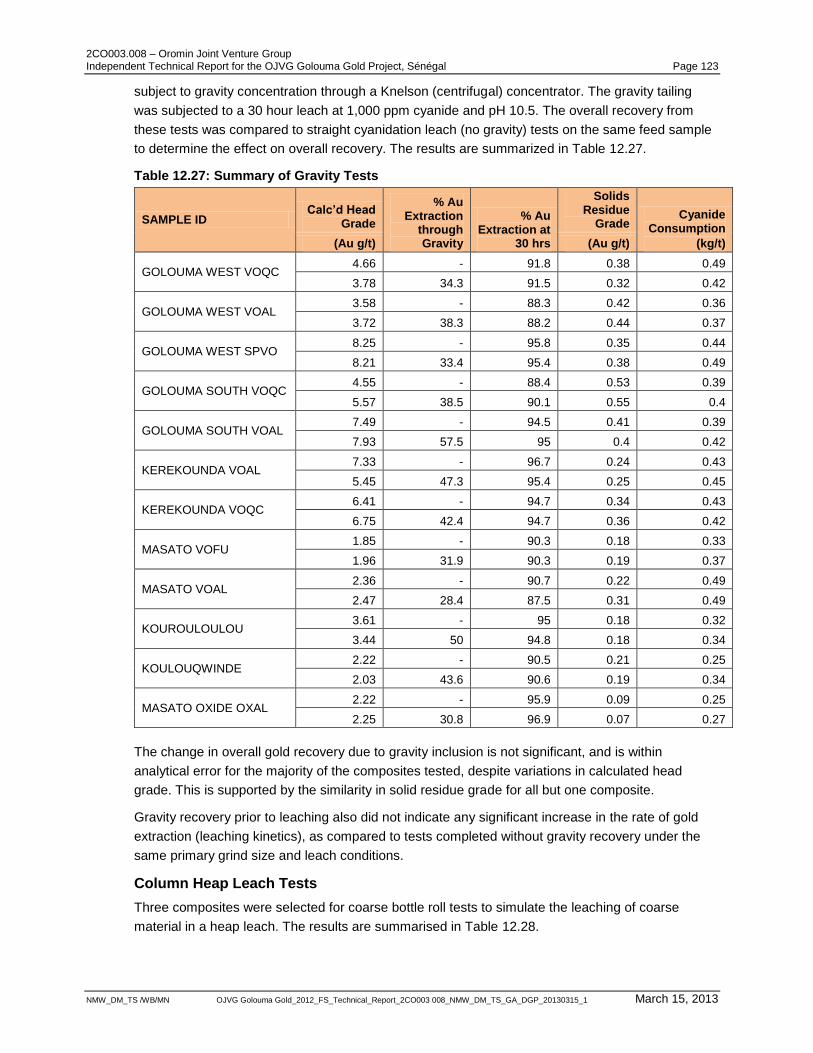
2CO003.008 – Oromin Joint Venture Group Independent Technical Report for the OJVG Golouma Gold Project, Sénégal Page 123
NMW_DM_TS /WB/MN OJVG Golouma Gold_2012_FS_Technical_Report_2CO003 008_NMW_DM_TS_GA_DGP_20130315_1 March 15, 2013
subject to gravity concentration through a Knelson (centrifugal) concentrator. The gravity tailing
was subjected to a 30 hour leach at 1,000 ppm cyanide and pH 10.5. The overall recovery from
these tests was compared to straight cyanidation leach (no gravity) tests on the same feed sample
to determine the effect on overall recovery. The results are summarized in Table 12.27.
Table 12.27: Summary of Gravity Tests
SAMPLE ID Calc’d Head
Grade
% Au Extraction
through Gravity
% Au Extraction at
30 hrs
Solids Residue
Grade Cyanide
Consumption
(kg/t) (Au g/t) (Au g/t)
GOLOUMA WEST VOQC 4.66 - 91.8 0.38 0.49
3.78 34.3 91.5 0.32 0.42
GOLOUMA WEST VOAL 3.58 - 88.3 0.42 0.36
3.72 38.3 88.2 0.44 0.37
GOLOUMA WEST SPVO 8.25 - 95.8 0.35 0.44
8.21 33.4 95.4 0.38 0.49
GOLOUMA SOUTH VOQC 4.55 - 88.4 0.53 0.39
5.57 38.5 90.1 0.55 0.4
GOLOUMA SOUTH VOAL 7.49 - 94.5 0.41 0.39
7.93 57.5 95 0.4 0.42
KEREKOUNDA VOAL 7.33 - 96.7 0.24 0.43
5.45 47.3 95.4 0.25 0.45
KEREKOUNDA VOQC 6.41 - 94.7 0.34 0.43
6.75 42.4 94.7 0.36 0.42
MASATO VOFU 1.85 - 90.3 0.18 0.33
1.96 31.9 90.3 0.19 0.37
MASATO VOAL 2.36 - 90.7 0.22 0.49
2.47 28.4 87.5 0.31 0.49
KOUROULOULOU 3.61 - 95 0.18 0.32
3.44 50 94.8 0.18 0.34
KOULOUQWINDE 2.22 - 90.5 0.21 0.25
2.03 43.6 90.6 0.19 0.34
MASATO OXIDE OXAL 2.22 - 95.9 0.09 0.25
2.25 30.8 96.9 0.07 0.27
The change in overall gold recovery due to gravity inclusion is not significant, and is within
analytical error for the majority of the composites tested, despite variations in calculated head
grade. This is supported by the similarity in solid residue grade for all but one composite.
Gravity recovery prior to leaching also did not indicate any significant increase in the rate of gold
extraction (leaching kinetics), as compared to tests completed without gravity recovery under the
same primary grind size and leach conditions.
Column Heap Leach Tests
Three composites were selected for coarse bottle roll tests to simulate the leaching of coarse
material in a heap leach. The results are summarised in Table 12.28.
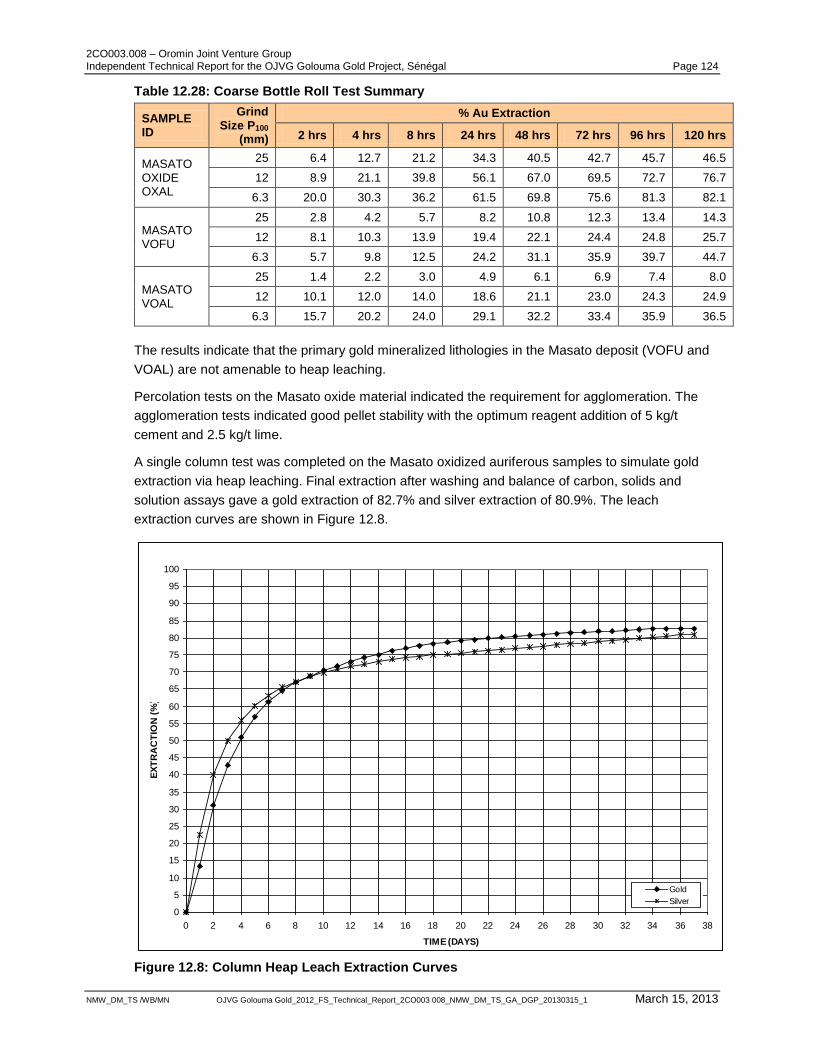
2CO003.008 – Oromin Joint Venture Group Independent Technical Report for the OJVG Golouma Gold Project, Sénégal Page 124
NMW_DM_TS /WB/MN OJVG Golouma Gold_2012_FS_Technical_Report_2CO003 008_NMW_DM_TS_GA_DGP_20130315_1 March 15, 2013
Table 12.28: Coarse Bottle Roll Test Summary
SAMPLE ID
Grind Size P100
(mm)
% Au Extraction
2 hrs 4 hrs 8 hrs 24 hrs 48 hrs 72 hrs 96 hrs 120 hrs
MASATO OXIDE OXAL
25 6.4 12.7 21.2 34.3 40.5 42.7 45.7 46.5
12 8.9 21.1 39.8 56.1 67.0 69.5 72.7 76.7
6.3 20.0 30.3 36.2 61.5 69.8 75.6 81.3 82.1
MASATO VOFU
25 2.8 4.2 5.7 8.2 10.8 12.3 13.4 14.3
12 8.1 10.3 13.9 19.4 22.1 24.4 24.8 25.7
6.3 5.7 9.8 12.5 24.2 31.1 35.9 39.7 44.7
MASATO VOAL
25 1.4 2.2 3.0 4.9 6.1 6.9 7.4 8.0
12 10.1 12.0 14.0 18.6 21.1 23.0 24.3 24.9
6.3 15.7 20.2 24.0 29.1 32.2 33.4 35.9 36.5
The results indicate that the primary gold mineralized lithologies in the Masato deposit (VOFU and
VOAL) are not amenable to heap leaching.
Percolation tests on the Masato oxide material indicated the requirement for agglomeration. The
agglomeration tests indicated good pellet stability with the optimum reagent addition of 5 kg/t
cement and 2.5 kg/t lime.
A single column test was completed on the Masato oxidized auriferous samples to simulate gold
extraction via heap leaching. Final extraction after washing and balance of carbon, solids and
solution assays gave a gold extraction of 82.7% and silver extraction of 80.9%. The leach
extraction curves are shown in Figure 12.8.
Figure 12.8: Column Heap Leach Extraction Curves
0
5
10
15
20
25
30
35
40
45
50
55
60
65
70
75
80
85
90
95
100
0 2 4 6 8 10 12 14 16 18 20 22 24 26 28 30 32 34 36 38
TIME (DAYS)
EX
TR
AC
TIO
N (
%)
Gold
Silver
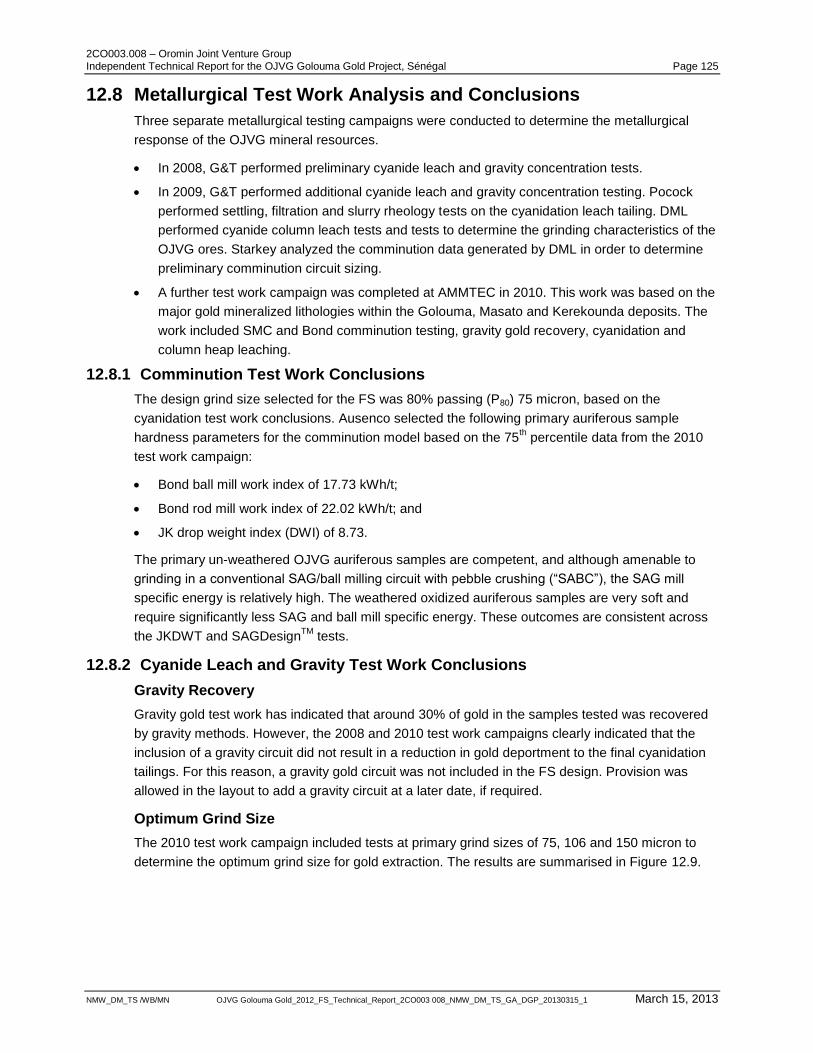
2CO003.008 – Oromin Joint Venture Group Independent Technical Report for the OJVG Golouma Gold Project, Sénégal Page 125
NMW_DM_TS /WB/MN OJVG Golouma Gold_2012_FS_Technical_Report_2CO003 008_NMW_DM_TS_GA_DGP_20130315_1 March 15, 2013
12.8 Metallurgical Test Work Analysis and Conclusions
Three separate metallurgical testing campaigns were conducted to determine the metallurgical
response of the OJVG mineral resources.
In 2008, G&T performed preliminary cyanide leach and gravity concentration tests.
In 2009, G&T performed additional cyanide leach and gravity concentration testing. Pocock
performed settling, filtration and slurry rheology tests on the cyanidation leach tailing. DML
performed cyanide column leach tests and tests to determine the grinding characteristics of the
OJVG ores. Starkey analyzed the comminution data generated by DML in order to determine
preliminary comminution circuit sizing.
A further test work campaign was completed at AMMTEC in 2010. This work was based on the
major gold mineralized lithologies within the Golouma, Masato and Kerekounda deposits. The
work included SMC and Bond comminution testing, gravity gold recovery, cyanidation and
column heap leaching.
12.8.1 Comminution Test Work Conclusions
The design grind size selected for the FS was 80% passing (P80) 75 micron, based on the
cyanidation test work conclusions. Ausenco selected the following primary auriferous sample
hardness parameters for the comminution model based on the 75th percentile data from the 2010
test work campaign:
Bond ball mill work index of 17.73 kWh/t;
Bond rod mill work index of 22.02 kWh/t; and
JK drop weight index (DWI) of 8.73.
The primary un-weathered OJVG auriferous samples are competent, and although amenable to
grinding in a conventional SAG/ball milling circuit with pebble crushing (“SABC”), the SAG mill
specific energy is relatively high. The weathered oxidized auriferous samples are very soft and
require significantly less SAG and ball mill specific energy. These outcomes are consistent across
the JKDWT and SAGDesignTM
tests.
12.8.2 Cyanide Leach and Gravity Test Work Conclusions
Gravity Recovery
Gravity gold test work has indicated that around 30% of gold in the samples tested was recovered
by gravity methods. However, the 2008 and 2010 test work campaigns clearly indicated that the
inclusion of a gravity circuit did not result in a reduction in gold deportment to the final cyanidation
tailings. For this reason, a gravity gold circuit was not included in the FS design. Provision was
allowed in the layout to add a gravity circuit at a later date, if required.
Optimum Grind Size
The 2010 test work campaign included tests at primary grind sizes of 75, 106 and 150 micron to
determine the optimum grind size for gold extraction. The results are summarised in Figure 12.9.
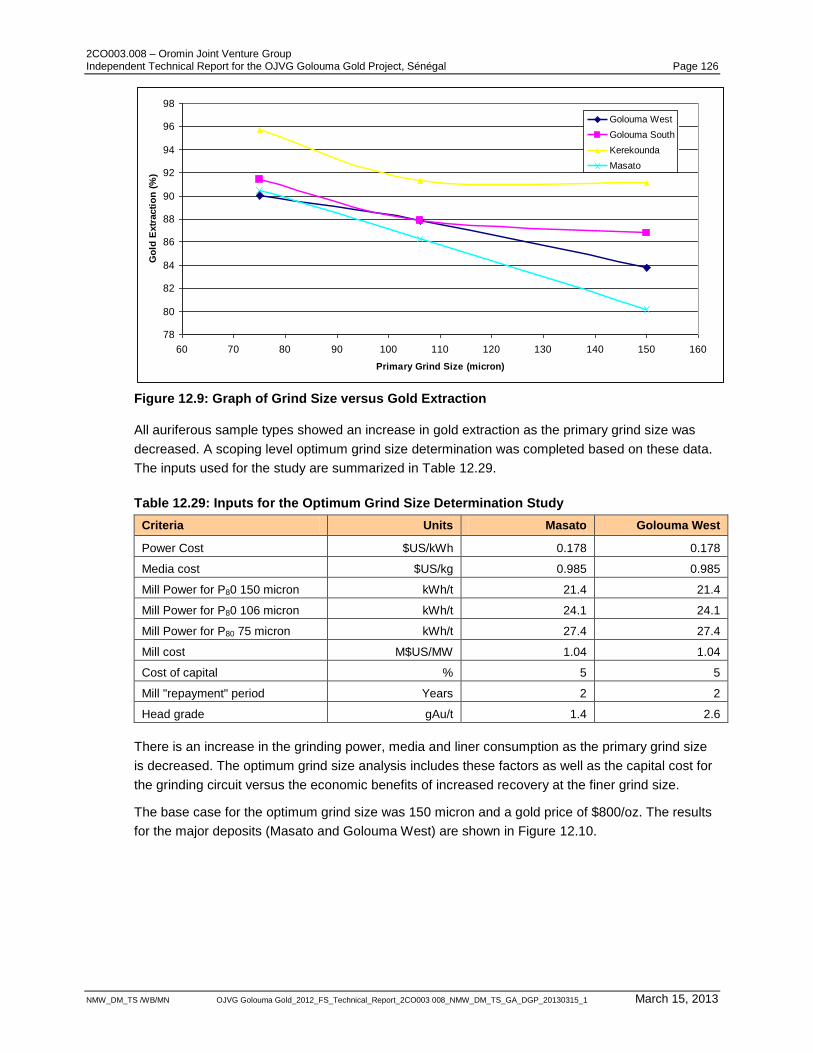
2CO003.008 – Oromin Joint Venture Group Independent Technical Report for the OJVG Golouma Gold Project, Sénégal Page 126
NMW_DM_TS /WB/MN OJVG Golouma Gold_2012_FS_Technical_Report_2CO003 008_NMW_DM_TS_GA_DGP_20130315_1 March 15, 2013
Figure 12.9: Graph of Grind Size versus Gold Extraction
All auriferous sample types showed an increase in gold extraction as the primary grind size was
decreased. A scoping level optimum grind size determination was completed based on these data.
The inputs used for the study are summarized in Table 12.29.
Table 12.29: Inputs for the Optimum Grind Size Determination Study
Criteria Units Masato Golouma West
Power Cost $US/kWh 0.178 0.178
Media cost $US/kg 0.985 0.985
Mill Power for P80 150 micron kWh/t 21.4 21.4
Mill Power for P80 106 micron kWh/t 24.1 24.1
Mill Power for P80 75 micron kWh/t 27.4 27.4
Mill cost M$US/MW 1.04 1.04
Cost of capital % 5 5
Mill "repayment" period Years 2 2
Head grade gAu/t 1.4 2.6
There is an increase in the grinding power, media and liner consumption as the primary grind size
is decreased. The optimum grind size analysis includes these factors as well as the capital cost for
the grinding circuit versus the economic benefits of increased recovery at the finer grind size.
The base case for the optimum grind size was 150 micron and a gold price of $800/oz. The results
for the major deposits (Masato and Golouma West) are shown in Figure 12.10.
78
80
82
84
86
88
90
92
94
96
98
60 70 80 90 100 110 120 130 140 150 160
Primary Grind Size (micron)
Go
ld E
xtr
acti
on
(%
)
Golouma West
Golouma South
Kerekounda
Masato
2CO003.008 – Oromin Joint Venture Group Independent Technical Report for the OJVG Golouma Gold Project, Sénégal Page 127
NMW_DM_TS /WB/MN OJVG Golouma Gold_2012_FS_Technical_Report_2CO003 008_NMW_DM_TS_GA_DGP_20130315_1 March 15, 2013
Figure 12.10: Optimum Grind Size Curves for Masato and Golouma West
The optimum grind size curves compare the incremental income realised as compared with that of
the base case. It is a high level study and does not take into account downstream process
operating costs but provides a clear indication of the optimum grind size for the project. A primary
grind size of P80 75 micron was selected for the FS, based on this analysis. The curves indicate
that a grind size less than 75 micron size is not expected to provide an economic benefit. As the
gold price is increased the incremental increase in income with the corresponding decrease in
grind size is more pronounced.
Optimum Cyanide Concentration
The 2009 and 2010 test work campaigns evaluated the effect of cyanide concentrations of
250-1,000 ppm. The results indicated that a cyanide concentration in the range of 750 – 1,000 ppm
provided the highest gold extractions. The FS design is based on a cyanide concentration of
1,000 ppm.
Cyanidation
Three composite samples were tested by G&T in 2008. An additional five composite samples, plus
a total of 20 variability samples and one large sample from each resource, were tested in 2009. A
summary of the results from these metallurgical tests is provided in Table 12.30.
0.0
1.0
2.0
3.0
4.0
5.0
6.0
7.0
8.0
9.0
50 70 90 110 130 150 170
Primary Grind Size (Micron)
Inc
rem
en
tal In
co
me
, $
US
/t
Masato $800/oz
Masato $880/oz
Golouma West $800/oz
Golouma West $880/oz
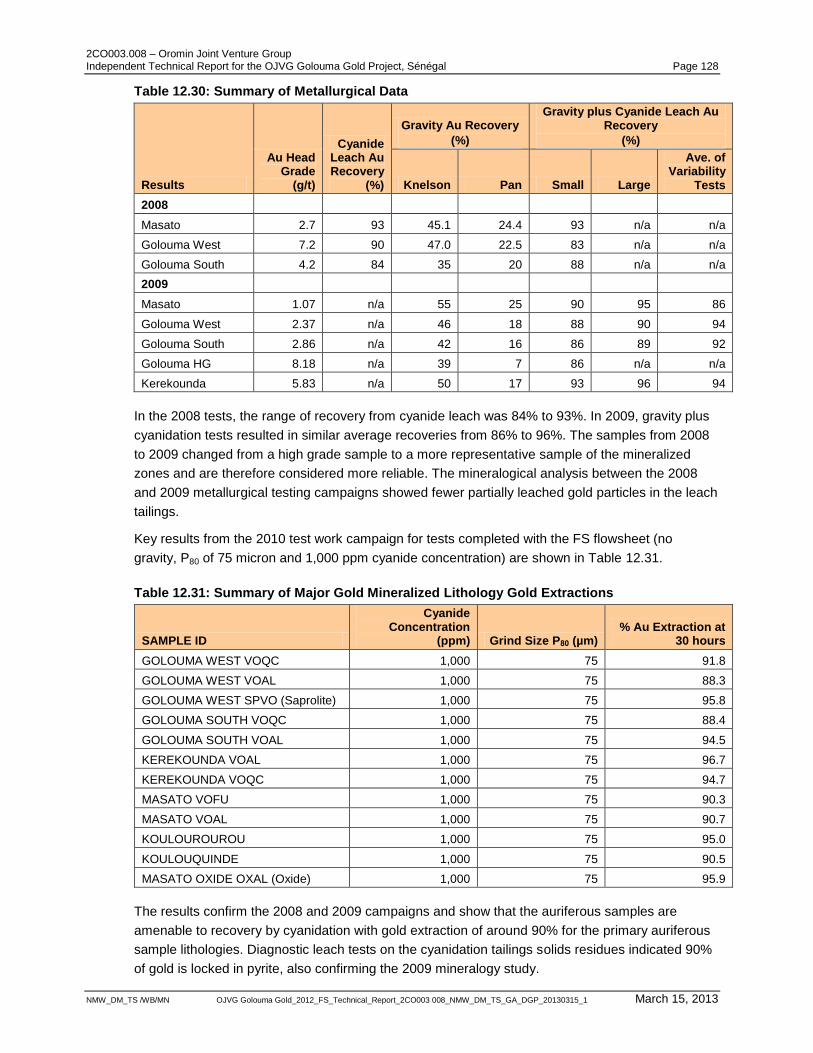
2CO003.008 – Oromin Joint Venture Group Independent Technical Report for the OJVG Golouma Gold Project, Sénégal Page 128
NMW_DM_TS /WB/MN OJVG Golouma Gold_2012_FS_Technical_Report_2CO003 008_NMW_DM_TS_GA_DGP_20130315_1 March 15, 2013
Table 12.30: Summary of Metallurgical Data
Results
Au Head Grade
(g/t)
Cyanide Leach Au Recovery
(%)
Gravity Au Recovery
(%)
Gravity plus Cyanide Leach Au Recovery
(%)
Knelson Pan Small Large
Ave. of Variability
Tests
2008
Masato 2.7 93 45.1 24.4 93 n/a n/a
Golouma West 7.2 90 47.0 22.5 83 n/a n/a
Golouma South 4.2 84 35 20 88 n/a n/a
2009
Masato 1.07 n/a 55 25 90 95 86
Golouma West 2.37 n/a 46 18 88 90 94
Golouma South 2.86 n/a 42 16 86 89 92
Golouma HG 8.18 n/a 39 7 86 n/a n/a
Kerekounda 5.83 n/a 50 17 93 96 94
In the 2008 tests, the range of recovery from cyanide leach was 84% to 93%. In 2009, gravity plus
cyanidation tests resulted in similar average recoveries from 86% to 96%. The samples from 2008
to 2009 changed from a high grade sample to a more representative sample of the mineralized
zones and are therefore considered more reliable. The mineralogical analysis between the 2008
and 2009 metallurgical testing campaigns showed fewer partially leached gold particles in the leach
tailings.
Key results from the 2010 test work campaign for tests completed with the FS flowsheet (no
gravity, P80 of 75 micron and 1,000 ppm cyanide concentration) are shown in Table 12.31.
Table 12.31: Summary of Major Gold Mineralized Lithology Gold Extractions
SAMPLE ID
Cyanide Concentration
(ppm) Grind Size P80 (µm) % Au Extraction at
30 hours
GOLOUMA WEST VOQC 1,000 75 91.8
GOLOUMA WEST VOAL 1,000 75 88.3
GOLOUMA WEST SPVO (Saprolite) 1,000 75 95.8
GOLOUMA SOUTH VOQC 1,000 75 88.4
GOLOUMA SOUTH VOAL 1,000 75 94.5
KEREKOUNDA VOAL 1,000 75 96.7
KEREKOUNDA VOQC 1,000 75 94.7
MASATO VOFU 1,000 75 90.3
MASATO VOAL 1,000 75 90.7
KOULOUROUROU 1,000 75 95.0
KOULOUQUINDE 1,000 75 90.5
MASATO OXIDE OXAL (Oxide) 1,000 75 95.9
The results confirm the 2008 and 2009 campaigns and show that the auriferous samples are
amenable to recovery by cyanidation with gold extraction of around 90% for the primary auriferous
sample lithologies. Diagnostic leach tests on the cyanidation tailings solids residues indicated 90%
of gold is locked in pyrite, also confirming the 2009 mineralogy study.
2CO003.008 – Oromin Joint Venture Group Independent Technical Report for the OJVG Golouma Gold Project, Sénégal Page 129
NMW_DM_TS /WB/MN OJVG Golouma Gold_2012_FS_Technical_Report_2CO003 008_NMW_DM_TS_GA_DGP_20130315_1 March 15, 2013
The leach kinetics for all samples tested were rapid with leaching effectively completed after
15 hours.
12.8.3 Settling and Rheology Test Work Conclusions
Settling and filtration tests were carried out by Pocock Industrial to investigate the optimal
conditions for settling. The results indicate that a tailings thickener underflow density of 64 - 68%
solids could be achieved with a flocculant dosage of 20 g/t. A thickened underflow density of 60%
was selected for the FS based on benchmarked plants operating on similar ores. Pocock
recommended a flux settling rate of 0.9 t/m²h. However, Ausenco selected a slightly more
conservative settling rate of 0.8 t/m²h for the FS based on benchmarked plants.
Slurry rheology tests on the thickened underflow slurries indicated that standard centrifugal pumps
were suitable for pumping slurry at the design density ranges (64 – 68% solids).
12.8.4 Column Cyanide Leach Tests
Both the 2009 and 2010 heap leaching test work indicated that the Masato oxidized auriferous
samples are amenable to heap leaching. The 2010 test work program was completed on a more
representative sample in terms of the particle size for the column tests. The gold extraction was
82% after 30 days.
There is the potential to incorporate heap leaching into future designs. Preliminary economic
studies as part of the FS indicated that the increased recovery by conventional leaching of 95%
and higher throughput of the softer, oxidized auriferous rock made milling and cyanidation in tanks
the preferred option for the FS.
12.8.5 Summary
The FS process flow sheet follows the results of the testing campaigns showing that gold from
Masato, Golouma, and Kerekounda deposits can be recovered by leaching in cyanide. The
deposits have demonstrated the following major characteristics.
Primary auriferous samples tested indicate competent material properties with moderate to
high hardness (Bond mill work indices ranging from 13 kWh/t to 18.5 kWh/t);
All auriferous samples tested have relatively rapid leach kinetics;
Oxidized auriferous samples are amenable to heap leaching but provide higher gold extraction
through cyanidation;
All auriferous samples tested are amenable to thickening and filtration; and
All auriferous samples tested are free of deleterious elements that could adversely affect the
process.
Mineralogy completed on the leach tails showed gold occurrences primarily present as very fine
inclusions in pyrite. The average diameter of these occurrences ranged from 6 to 14 micron. There
is the potential to increase gold recovery further primarily through the use of flotation to recover
gold encapsulated in pyrite. Additional testing is recommended during a value engineering phase
prior to detailed design to determine these benefits.
2CO003.008 – Oromin Joint Venture Group Independent Technical Report for the OJVG Golouma Gold Project, Sénégal Page 130
NMW_DM_TS /WB/MN OJVG Golouma Gold_2012_FS_Technical_Report_2CO003 008_NMW_DM_TS_GA_DGP_20130315_1 March 15, 2013
13 Mineral Resource Estimates
13.1 Introduction
To the best of SRK‟s knowledge and as described above, there are currently no title, legal,
taxation, marketing, permitting, socio-economic or other relevant issues that may materially affect
the mineral resources described in this Technical Report. Future changes to legislation (mining,
taxation, environmental, human resources and related issues) and/or government or local attitudes
to foreign investment cannot be, and have not been evaluated within the scope of this Technical
Report.
SRK‟s findings are based on reviews of readily available data sources at the time of preparing this
report. The mineral resources presented herein represent an update to the 2011 resource
evaluation described in the SRK report “Revised OJVG Golouma Project Updated Mineral
Resource Technical Report, Senegal” (SRK, 2011), dated December 9, 2011. This updated
resource estimate incorporates all drilling completed by OJVG by December 6, 2011. In the opinion
of SRK, the block model resource estimates reported herein are a reasonable representation of the
gold mineral resources located on the OJVG Golouma property at the current level of sampling.
Mineral Resources within the Project are reported in accordance with the guidelines of the
Canadian Securities Administrators National Instrument 43-101, and have been estimated in
conformity with generally accepted CIM “Estimation and Mineral Resource and Mineral Reserve
Best Practices” guidelines. Mineral resources are not mineral reserves and have not yet
demonstrated economic viability.
The mineral resource update is based on original interpretations prepared on cross-sections and
plans by OJVG geological staff. The newly developed geologic wireframes are based on these
models which were provided to SRK from June to August 2012. Data was provided to SRK for all
14 deposits as presented in Table 13.1 and each of these has been separately modelled and
evaluated. Data were received from OJVG in an Access database format, with separate core and
RC databases. Revision of geologic wireframes was supervised by Wayne Barnett, Pr.Sci.Nat. and
undertaken by Gilles Arseneau, P.Geo., Fred Brown CPG, Darrell Farrow, Pr.Sci.Nat., Guy
Dishaw, P.Geo., and Lakehead Geological Services. The Mineral Resource estimations have been
carried out by Fred Brown, Gilles Arseneau, Darrell Farrow, Guy Dishaw and validated by Marek
Nowak, P.Eng. The design of the geologic wireframes and the resource estimates were completed
in Gemcom GEMS 6.3, and in Vulcan. Statistical analysis and resource validation was carried out
in Gemcom GEMS, Sage, and in non-commercial software.
13.2 Resource Database
The individual deposit by deposit databases provided to SRK were imported into a Gemcom
GEMS, project database and consisted of a total of 2,137 drill holes, for a drilling total of 338,190
meters. An update of the database was provided to SRK immediately prior to the initiation of the
modelling for each deposit.
SRK‟s findings are based on reviews of readily available data sources at the time of preparing this
report, and the geologic models are dependent on the absolute final position of the existing drill
holes. The coordinates for one drill hole, SAB-10-877, in the Masato deposit area was obtained
solely by GPS. The drill hole will need to be updated by total station survey method. The change in
position for this hole is not considered to have a material impact on the resource estimate.
2CO003.008 – Oromin Joint Venture Group Independent Technical Report for the OJVG Golouma Gold Project, Sénégal Page 131
NMW_DM_TS /WB/MN OJVG Golouma Gold_2012_FS_Technical_Report_2CO003 008_NMW_DM_TS_GA_DGP_20130315_1 March 15, 2013
13.2.1 Assay Data
Sample Assays from both Reverse Circulation (RC) and Diamond drill (DDH) holes are contained
within the GEMS database. All drill holes used for the resource estimation for the 14 deposits are
summarised in Table 13.1. Drill holes not used in the resource estimation were predominantly
geotechnical, hydrogeological, condemnation or exploration holes drilled on other prospects within
the project area.
Almost all drill samples contained in the database are 1 m long (98.9%). The gold assay results
that reported below the detection limit were assigned half of the detection limit (0.0025 g/t). Non-
sampled intervals were assigned zero grades for the purpose of statistical analysis and grade
estimation. This is based on the assumption that there were no visible signs of mineralization and
therefore no reason to collect assay samples.
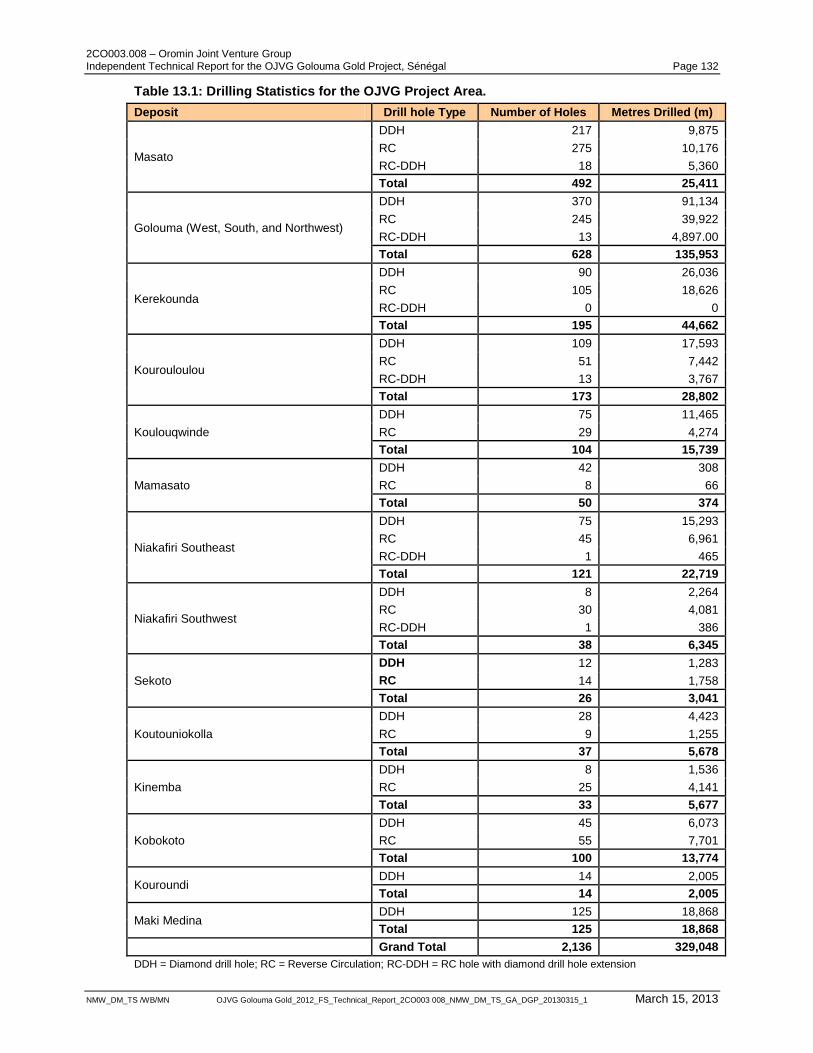
2CO003.008 – Oromin Joint Venture Group Independent Technical Report for the OJVG Golouma Gold Project, Sénégal Page 132
NMW_DM_TS /WB/MN OJVG Golouma Gold_2012_FS_Technical_Report_2CO003 008_NMW_DM_TS_GA_DGP_20130315_1 March 15, 2013
Table 13.1: Drilling Statistics for the OJVG Project Area.
Deposit Drill hole Type Number of Holes Metres Drilled (m)
Masato
DDH 217 9,875
RC 275 10,176
RC-DDH 18 5,360
Total 492 25,411
Golouma (West, South, and Northwest)
DDH 370 91,134
RC 245 39,922
RC-DDH 13 4,897.00
Total 628 135,953
Kerekounda
DDH 90 26,036
RC 105 18,626
RC-DDH 0 0
Total 195 44,662
Kourouloulou
DDH 109 17,593
RC 51 7,442
RC-DDH 13 3,767
Total 173 28,802
Koulouqwinde
DDH 75 11,465
RC 29 4,274
Total 104 15,739
Mamasato
DDH 42 308
RC 8 66
Total 50 374
Niakafiri Southeast
DDH 75 15,293
RC 45 6,961
RC-DDH 1 465
Total 121 22,719
Niakafiri Southwest
DDH 8 2,264
RC 30 4,081
RC-DDH 1 386
Total 38 6,345
Sekoto
DDH 12 1,283
RC 14 1,758
Total 26 3,041
Koutouniokolla
DDH 28 4,423
RC 9 1,255
Total 37 5,678
Kinemba
DDH 8 1,536
RC 25 4,141
Total 33 5,677
Kobokoto
DDH 45 6,073
RC 55 7,701
Total 100 13,774
Kouroundi DDH 14 2,005
Total 14 2,005
Maki Medina DDH 125 18,868
Total 125 18,868
Grand Total 2,136 329,048
DDH = Diamond drill hole; RC = Reverse Circulation; RC-DDH = RC hole with diamond drill hole extension
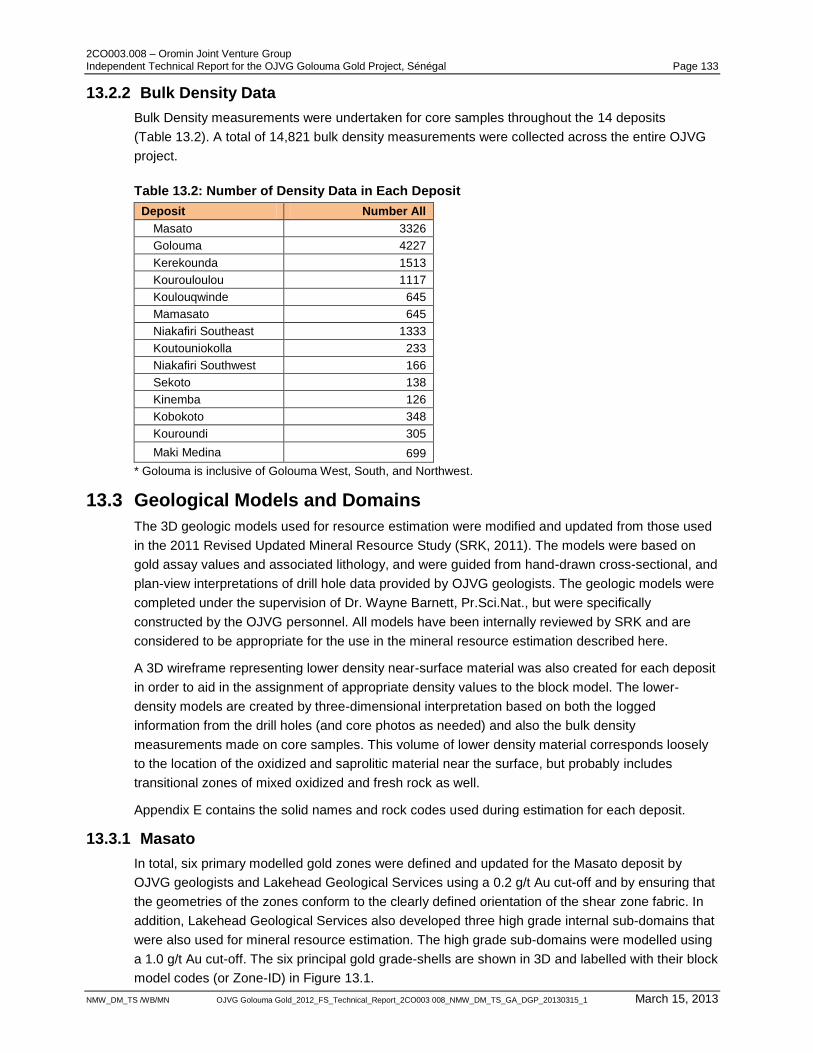
2CO003.008 – Oromin Joint Venture Group Independent Technical Report for the OJVG Golouma Gold Project, Sénégal Page 133
NMW_DM_TS /WB/MN OJVG Golouma Gold_2012_FS_Technical_Report_2CO003 008_NMW_DM_TS_GA_DGP_20130315_1 March 15, 2013
13.2.2 Bulk Density Data
Bulk Density measurements were undertaken for core samples throughout the 14 deposits
(Table 13.2). A total of 14,821 bulk density measurements were collected across the entire OJVG
project.
Table 13.2: Number of Density Data in Each Deposit
Deposit Number All
Masato 3326
Golouma 4227
Kerekounda 1513
Kourouloulou 1117
Koulouqwinde 645
Mamasato 645
Niakafiri Southeast 1333
Koutouniokolla 233
Niakafiri Southwest 166
Sekoto 138
Kinemba 126
Kobokoto 348
Kouroundi 305
Maki Medina 699
* Golouma is inclusive of Golouma West, South, and Northwest.
13.3 Geological Models and Domains
The 3D geologic models used for resource estimation were modified and updated from those used
in the 2011 Revised Updated Mineral Resource Study (SRK, 2011). The models were based on
gold assay values and associated lithology, and were guided from hand-drawn cross-sectional, and
plan-view interpretations of drill hole data provided by OJVG geologists. The geologic models were
completed under the supervision of Dr. Wayne Barnett, Pr.Sci.Nat., but were specifically
constructed by the OJVG personnel. All models have been internally reviewed by SRK and are
considered to be appropriate for the use in the mineral resource estimation described here.
A 3D wireframe representing lower density near-surface material was also created for each deposit
in order to aid in the assignment of appropriate density values to the block model. The lower-
density models are created by three-dimensional interpretation based on both the logged
information from the drill holes (and core photos as needed) and also the bulk density
measurements made on core samples. This volume of lower density material corresponds loosely
to the location of the oxidized and saprolitic material near the surface, but probably includes
transitional zones of mixed oxidized and fresh rock as well.
Appendix E contains the solid names and rock codes used during estimation for each deposit.
13.3.1 Masato
In total, six primary modelled gold zones were defined and updated for the Masato deposit by
OJVG geologists and Lakehead Geological Services using a 0.2 g/t Au cut-off and by ensuring that
the geometries of the zones conform to the clearly defined orientation of the shear zone fabric. In
addition, Lakehead Geological Services also developed three high grade internal sub-domains that
were also used for mineral resource estimation. The high grade sub-domains were modelled using
a 1.0 g/t Au cut-off. The six principal gold grade-shells are shown in 3D and labelled with their block
model codes (or Zone-ID) in Figure 13.1.
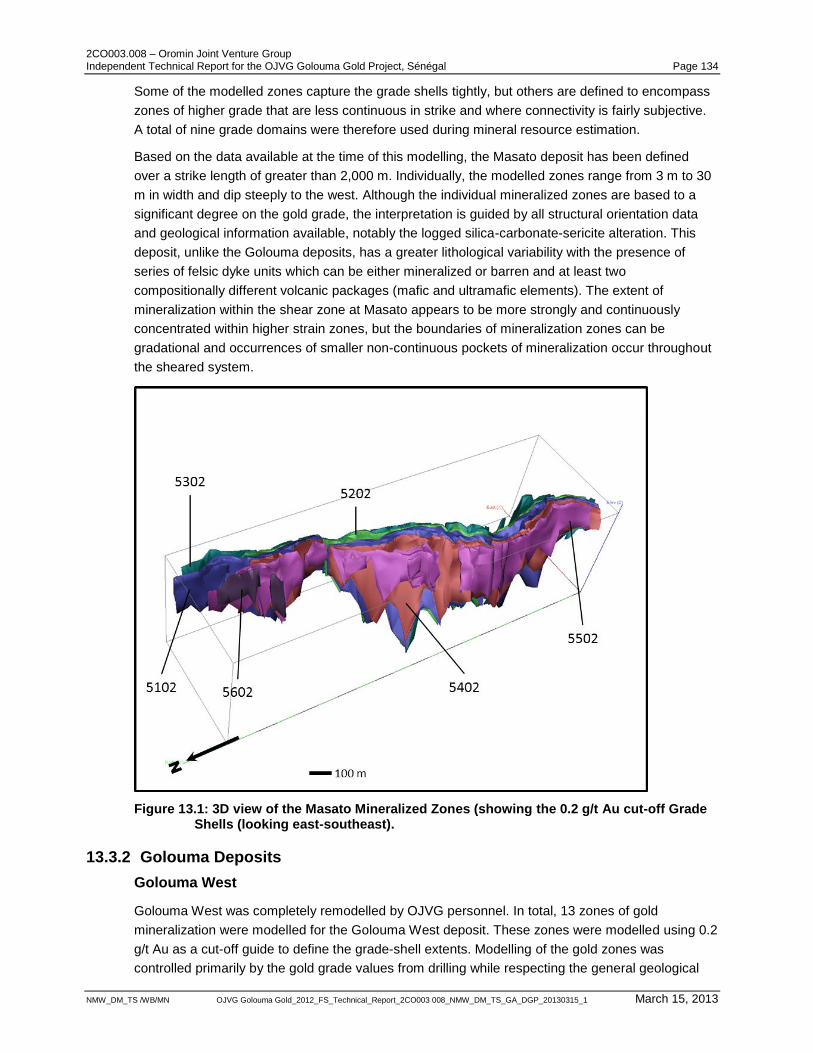
2CO003.008 – Oromin Joint Venture Group Independent Technical Report for the OJVG Golouma Gold Project, Sénégal Page 134
NMW_DM_TS /WB/MN OJVG Golouma Gold_2012_FS_Technical_Report_2CO003 008_NMW_DM_TS_GA_DGP_20130315_1 March 15, 2013
Some of the modelled zones capture the grade shells tightly, but others are defined to encompass
zones of higher grade that are less continuous in strike and where connectivity is fairly subjective.
A total of nine grade domains were therefore used during mineral resource estimation.
Based on the data available at the time of this modelling, the Masato deposit has been defined
over a strike length of greater than 2,000 m. Individually, the modelled zones range from 3 m to 30
m in width and dip steeply to the west. Although the individual mineralized zones are based to a
significant degree on the gold grade, the interpretation is guided by all structural orientation data
and geological information available, notably the logged silica-carbonate-sericite alteration. This
deposit, unlike the Golouma deposits, has a greater lithological variability with the presence of
series of felsic dyke units which can be either mineralized or barren and at least two
compositionally different volcanic packages (mafic and ultramafic elements). The extent of
mineralization within the shear zone at Masato appears to be more strongly and continuously
concentrated within higher strain zones, but the boundaries of mineralization zones can be
gradational and occurrences of smaller non-continuous pockets of mineralization occur throughout
the sheared system.
Figure 13.1: 3D view of the Masato Mineralized Zones (showing the 0.2 g/t Au cut-off Grade Shells (looking east-southeast).
13.3.2 Golouma Deposits
Golouma West
Golouma West was completely remodelled by OJVG personnel. In total, 13 zones of gold
mineralization were modelled for the Golouma West deposit. These zones were modelled using 0.2
g/t Au as a cut-off guide to define the grade-shell extents. Modelling of the gold zones was
controlled primarily by the gold grade values from drilling while respecting the general geological
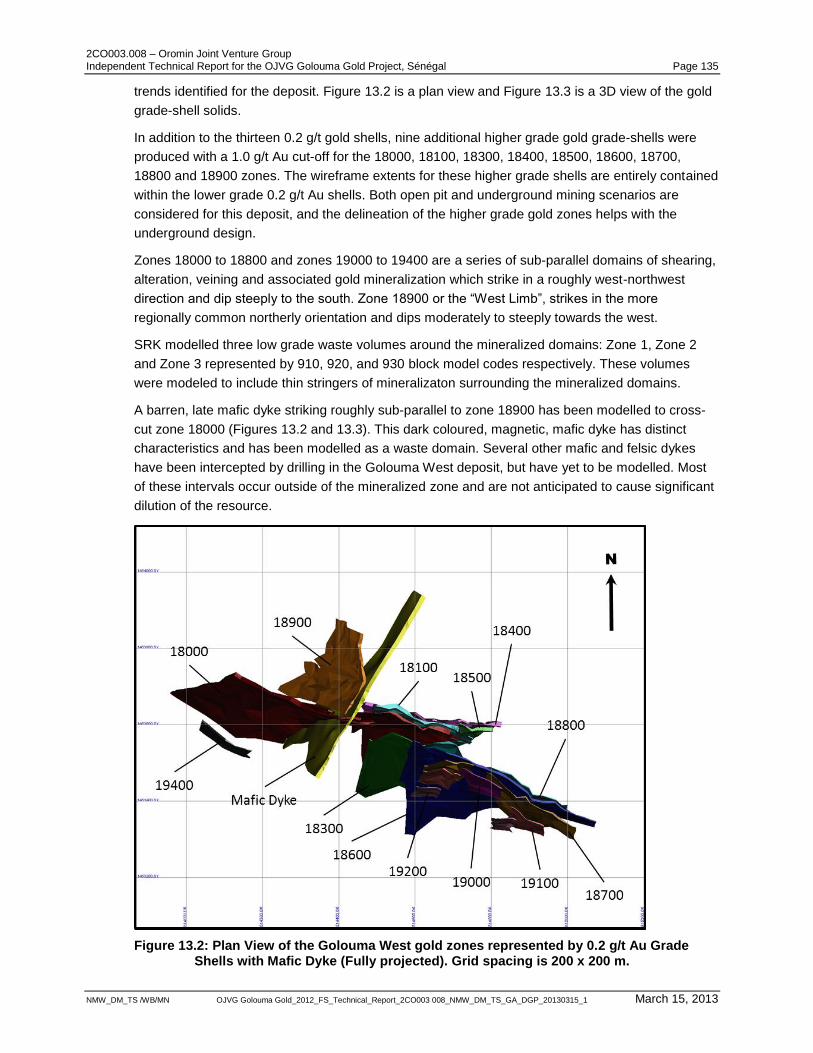
2CO003.008 – Oromin Joint Venture Group Independent Technical Report for the OJVG Golouma Gold Project, Sénégal Page 135
NMW_DM_TS /WB/MN OJVG Golouma Gold_2012_FS_Technical_Report_2CO003 008_NMW_DM_TS_GA_DGP_20130315_1 March 15, 2013
trends identified for the deposit. Figure 13.2 is a plan view and Figure 13.3 is a 3D view of the gold
grade-shell solids.
In addition to the thirteen 0.2 g/t gold shells, nine additional higher grade gold grade-shells were
produced with a 1.0 g/t Au cut-off for the 18000, 18100, 18300, 18400, 18500, 18600, 18700,
18800 and 18900 zones. The wireframe extents for these higher grade shells are entirely contained
within the lower grade 0.2 g/t Au shells. Both open pit and underground mining scenarios are
considered for this deposit, and the delineation of the higher grade gold zones helps with the
underground design.
Zones 18000 to 18800 and zones 19000 to 19400 are a series of sub-parallel domains of shearing,
alteration, veining and associated gold mineralization which strike in a roughly west-northwest
direction and dip steeply to the south. Zone 18900 or the “West Limb”, strikes in the more
regionally common northerly orientation and dips moderately to steeply towards the west.
SRK modelled three low grade waste volumes around the mineralized domains: Zone 1, Zone 2
and Zone 3 represented by 910, 920, and 930 block model codes respectively. These volumes
were modeled to include thin stringers of mineralizaton surrounding the mineralized domains.
A barren, late mafic dyke striking roughly sub-parallel to zone 18900 has been modelled to cross-
cut zone 18000 (Figures 13.2 and 13.3). This dark coloured, magnetic, mafic dyke has distinct
characteristics and has been modelled as a waste domain. Several other mafic and felsic dykes
have been intercepted by drilling in the Golouma West deposit, but have yet to be modelled. Most
of these intervals occur outside of the mineralized zone and are not anticipated to cause significant
dilution of the resource.
Figure 13.2: Plan View of the Golouma West gold zones represented by 0.2 g/t Au Grade Shells with Mafic Dyke (Fully projected). Grid spacing is 200 x 200 m.
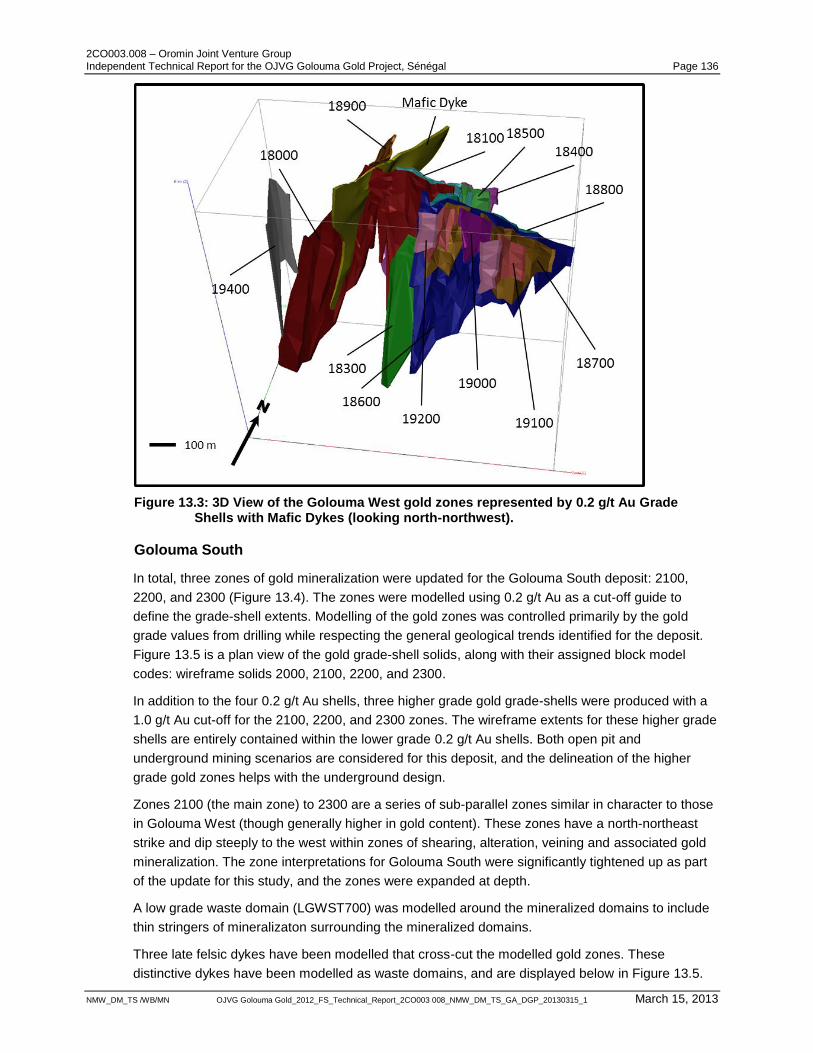
2CO003.008 – Oromin Joint Venture Group Independent Technical Report for the OJVG Golouma Gold Project, Sénégal Page 136
NMW_DM_TS /WB/MN OJVG Golouma Gold_2012_FS_Technical_Report_2CO003 008_NMW_DM_TS_GA_DGP_20130315_1 March 15, 2013
Figure 13.3: 3D View of the Golouma West gold zones represented by 0.2 g/t Au Grade Shells with Mafic Dykes (looking north-northwest).
Golouma South
In total, three zones of gold mineralization were updated for the Golouma South deposit: 2100,
2200, and 2300 (Figure 13.4). The zones were modelled using 0.2 g/t Au as a cut-off guide to
define the grade-shell extents. Modelling of the gold zones was controlled primarily by the gold
grade values from drilling while respecting the general geological trends identified for the deposit.
Figure 13.5 is a plan view of the gold grade-shell solids, along with their assigned block model
codes: wireframe solids 2000, 2100, 2200, and 2300.
In addition to the four 0.2 g/t Au shells, three higher grade gold grade-shells were produced with a
1.0 g/t Au cut-off for the 2100, 2200, and 2300 zones. The wireframe extents for these higher grade
shells are entirely contained within the lower grade 0.2 g/t Au shells. Both open pit and
underground mining scenarios are considered for this deposit, and the delineation of the higher
grade gold zones helps with the underground design.
Zones 2100 (the main zone) to 2300 are a series of sub-parallel zones similar in character to those
in Golouma West (though generally higher in gold content). These zones have a north-northeast
strike and dip steeply to the west within zones of shearing, alteration, veining and associated gold
mineralization. The zone interpretations for Golouma South were significantly tightened up as part
of the update for this study, and the zones were expanded at depth.
A low grade waste domain (LGWST700) was modelled around the mineralized domains to include
thin stringers of mineralizaton surrounding the mineralized domains.
Three late felsic dykes have been modelled that cross-cut the modelled gold zones. These
distinctive dykes have been modelled as waste domains, and are displayed below in Figure 13.5.
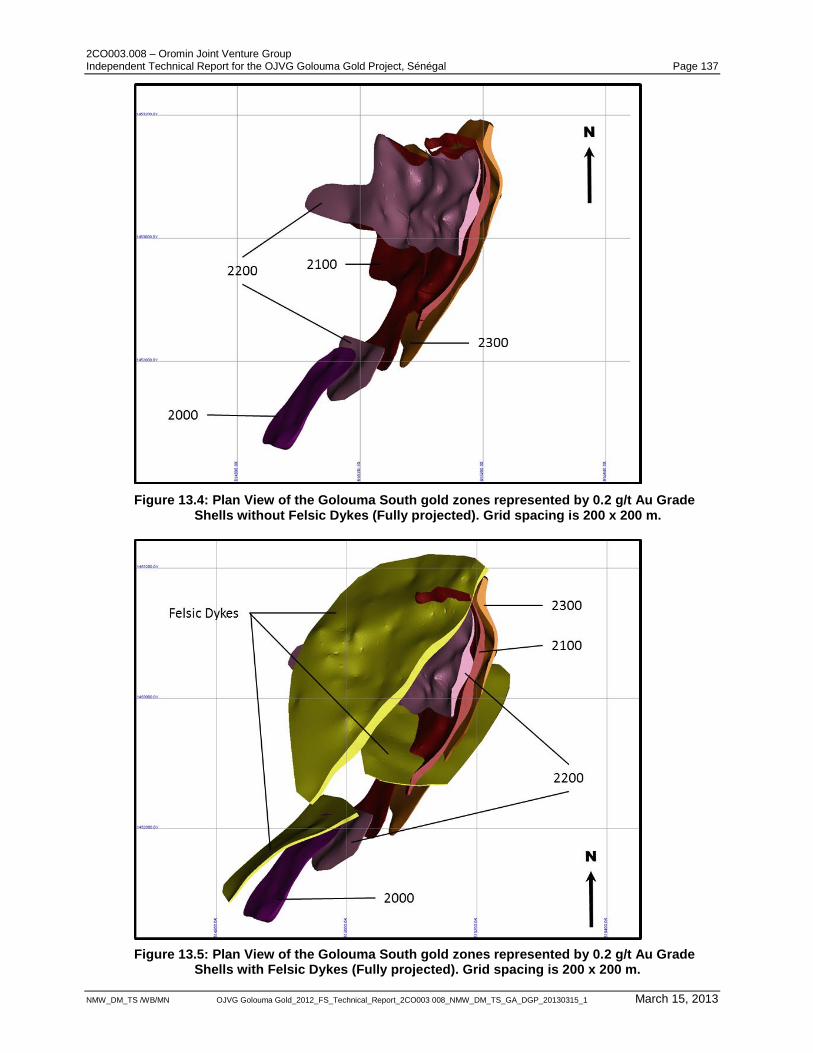
2CO003.008 – Oromin Joint Venture Group Independent Technical Report for the OJVG Golouma Gold Project, Sénégal Page 137
NMW_DM_TS /WB/MN OJVG Golouma Gold_2012_FS_Technical_Report_2CO003 008_NMW_DM_TS_GA_DGP_20130315_1 March 15, 2013
Figure 13.4: Plan View of the Golouma South gold zones represented by 0.2 g/t Au Grade Shells without Felsic Dykes (Fully projected). Grid spacing is 200 x 200 m.
Figure 13.5: Plan View of the Golouma South gold zones represented by 0.2 g/t Au Grade Shells with Felsic Dykes (Fully projected). Grid spacing is 200 x 200 m.
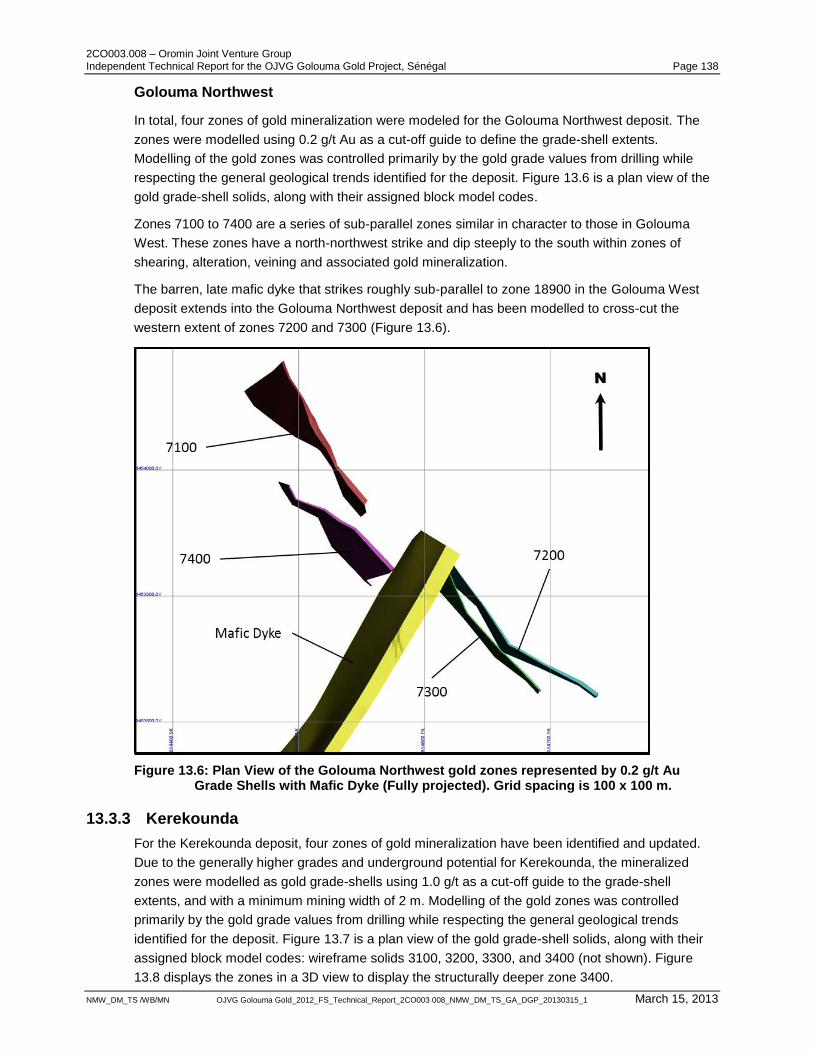
2CO003.008 – Oromin Joint Venture Group Independent Technical Report for the OJVG Golouma Gold Project, Sénégal Page 138
NMW_DM_TS /WB/MN OJVG Golouma Gold_2012_FS_Technical_Report_2CO003 008_NMW_DM_TS_GA_DGP_20130315_1 March 15, 2013
Golouma Northwest
In total, four zones of gold mineralization were modeled for the Golouma Northwest deposit. The
zones were modelled using 0.2 g/t Au as a cut-off guide to define the grade-shell extents.
Modelling of the gold zones was controlled primarily by the gold grade values from drilling while
respecting the general geological trends identified for the deposit. Figure 13.6 is a plan view of the
gold grade-shell solids, along with their assigned block model codes.
Zones 7100 to 7400 are a series of sub-parallel zones similar in character to those in Golouma
West. These zones have a north-northwest strike and dip steeply to the south within zones of
shearing, alteration, veining and associated gold mineralization.
The barren, late mafic dyke that strikes roughly sub-parallel to zone 18900 in the Golouma West
deposit extends into the Golouma Northwest deposit and has been modelled to cross-cut the
western extent of zones 7200 and 7300 (Figure 13.6).
Figure 13.6: Plan View of the Golouma Northwest gold zones represented by 0.2 g/t Au Grade Shells with Mafic Dyke (Fully projected). Grid spacing is 100 x 100 m.
13.3.3 Kerekounda
For the Kerekounda deposit, four zones of gold mineralization have been identified and updated.
Due to the generally higher grades and underground potential for Kerekounda, the mineralized
zones were modelled as gold grade-shells using 1.0 g/t as a cut-off guide to the grade-shell
extents, and with a minimum mining width of 2 m. Modelling of the gold zones was controlled
primarily by the gold grade values from drilling while respecting the general geological trends
identified for the deposit. Figure 13.7 is a plan view of the gold grade-shell solids, along with their
assigned block model codes: wireframe solids 3100, 3200, 3300, and 3400 (not shown). Figure
13.8 displays the zones in a 3D view to display the structurally deeper zone 3400.
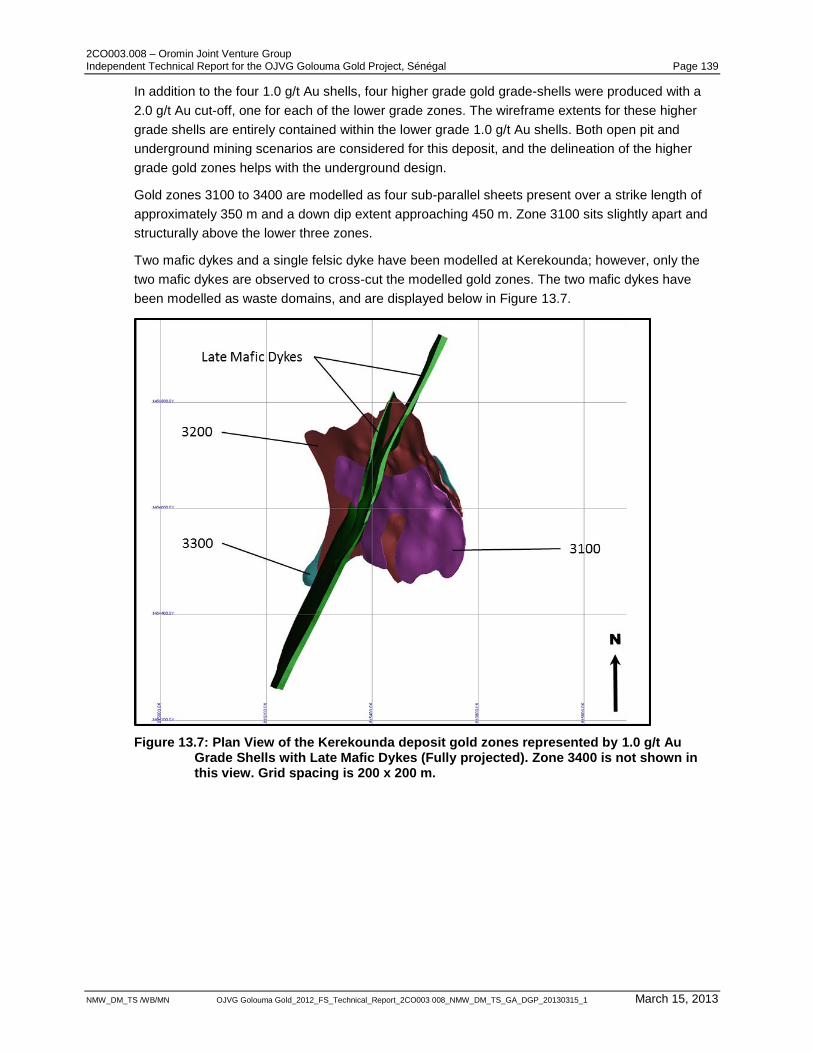
2CO003.008 – Oromin Joint Venture Group Independent Technical Report for the OJVG Golouma Gold Project, Sénégal Page 139
NMW_DM_TS /WB/MN OJVG Golouma Gold_2012_FS_Technical_Report_2CO003 008_NMW_DM_TS_GA_DGP_20130315_1 March 15, 2013
In addition to the four 1.0 g/t Au shells, four higher grade gold grade-shells were produced with a
2.0 g/t Au cut-off, one for each of the lower grade zones. The wireframe extents for these higher
grade shells are entirely contained within the lower grade 1.0 g/t Au shells. Both open pit and
underground mining scenarios are considered for this deposit, and the delineation of the higher
grade gold zones helps with the underground design.
Gold zones 3100 to 3400 are modelled as four sub-parallel sheets present over a strike length of
approximately 350 m and a down dip extent approaching 450 m. Zone 3100 sits slightly apart and
structurally above the lower three zones.
Two mafic dykes and a single felsic dyke have been modelled at Kerekounda; however, only the
two mafic dykes are observed to cross-cut the modelled gold zones. The two mafic dykes have
been modelled as waste domains, and are displayed below in Figure 13.7.
Figure 13.7: Plan View of the Kerekounda deposit gold zones represented by 1.0 g/t Au Grade Shells with Late Mafic Dykes (Fully projected). Zone 3400 is not shown in this view. Grid spacing is 200 x 200 m.
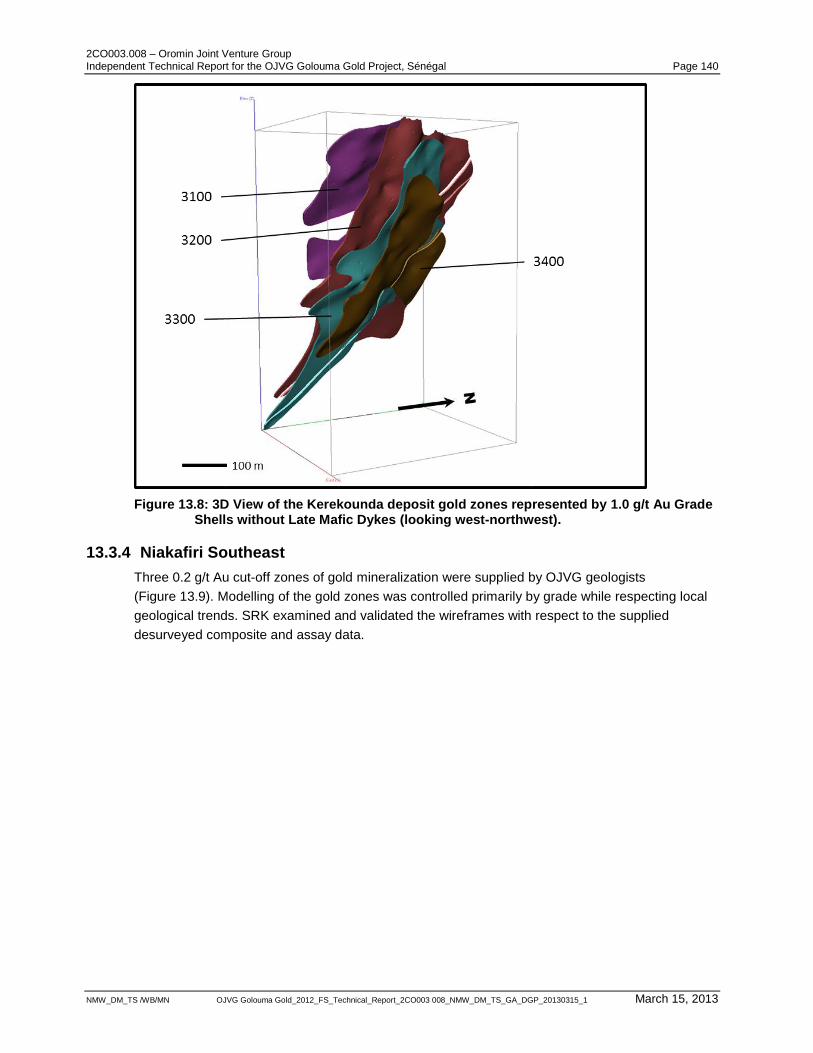
2CO003.008 – Oromin Joint Venture Group Independent Technical Report for the OJVG Golouma Gold Project, Sénégal Page 140
NMW_DM_TS /WB/MN OJVG Golouma Gold_2012_FS_Technical_Report_2CO003 008_NMW_DM_TS_GA_DGP_20130315_1 March 15, 2013
Figure 13.8: 3D View of the Kerekounda deposit gold zones represented by 1.0 g/t Au Grade Shells without Late Mafic Dykes (looking west-northwest).
13.3.4 Niakafiri Southeast
Three 0.2 g/t Au cut-off zones of gold mineralization were supplied by OJVG geologists
(Figure 13.9). Modelling of the gold zones was controlled primarily by grade while respecting local
geological trends. SRK examined and validated the wireframes with respect to the supplied
desurveyed composite and assay data.
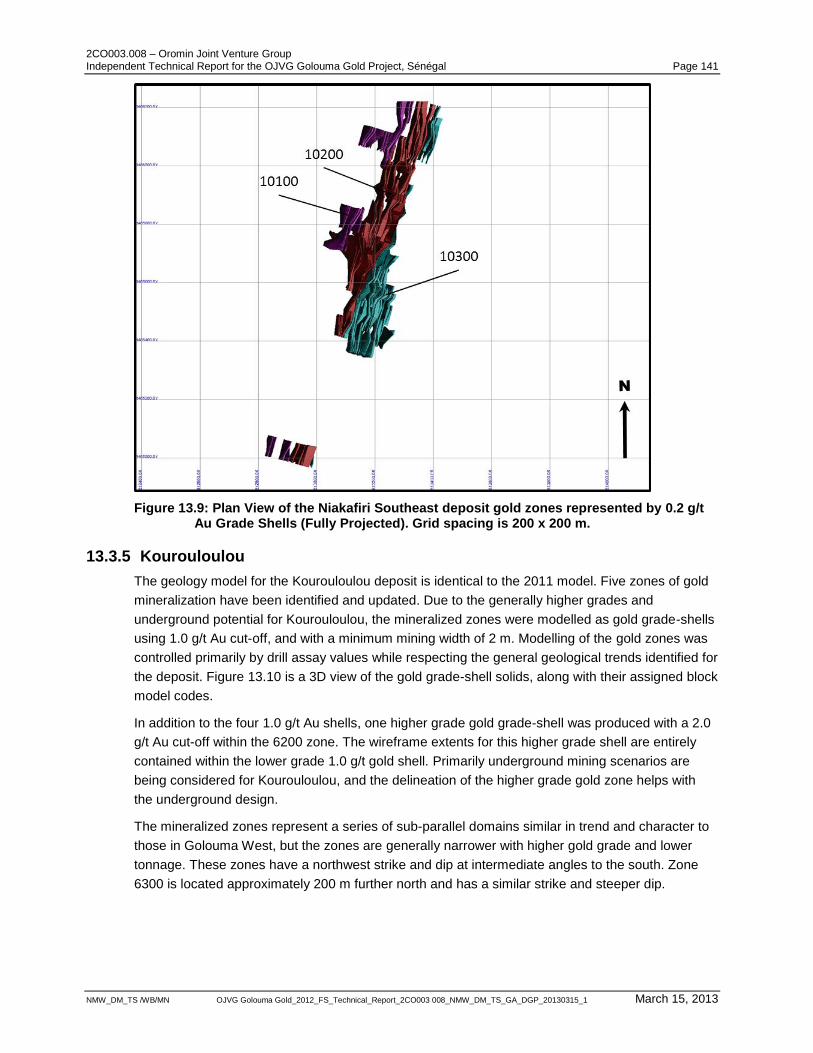
2CO003.008 – Oromin Joint Venture Group Independent Technical Report for the OJVG Golouma Gold Project, Sénégal Page 141
NMW_DM_TS /WB/MN OJVG Golouma Gold_2012_FS_Technical_Report_2CO003 008_NMW_DM_TS_GA_DGP_20130315_1 March 15, 2013
Figure 13.9: Plan View of the Niakafiri Southeast deposit gold zones represented by 0.2 g/t Au Grade Shells (Fully Projected). Grid spacing is 200 x 200 m.
13.3.5 Kourouloulou
The geology model for the Kourouloulou deposit is identical to the 2011 model. Five zones of gold
mineralization have been identified and updated. Due to the generally higher grades and
underground potential for Kourouloulou, the mineralized zones were modelled as gold grade-shells
using 1.0 g/t Au cut-off, and with a minimum mining width of 2 m. Modelling of the gold zones was
controlled primarily by drill assay values while respecting the general geological trends identified for
the deposit. Figure 13.10 is a 3D view of the gold grade-shell solids, along with their assigned block
model codes.
In addition to the four 1.0 g/t Au shells, one higher grade gold grade-shell was produced with a 2.0
g/t Au cut-off within the 6200 zone. The wireframe extents for this higher grade shell are entirely
contained within the lower grade 1.0 g/t gold shell. Primarily underground mining scenarios are
being considered for Kourouloulou, and the delineation of the higher grade gold zone helps with
the underground design.
The mineralized zones represent a series of sub-parallel domains similar in trend and character to
those in Golouma West, but the zones are generally narrower with higher gold grade and lower
tonnage. These zones have a northwest strike and dip at intermediate angles to the south. Zone
6300 is located approximately 200 m further north and has a similar strike and steeper dip.
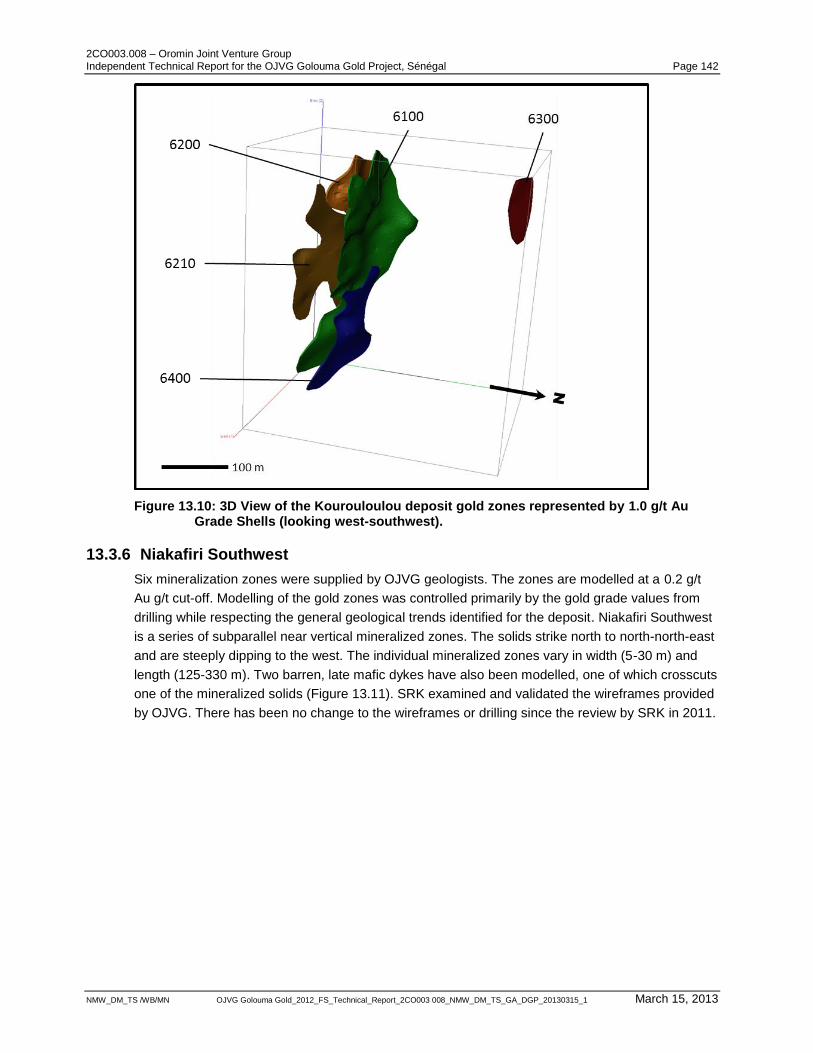
2CO003.008 – Oromin Joint Venture Group Independent Technical Report for the OJVG Golouma Gold Project, Sénégal Page 142
NMW_DM_TS /WB/MN OJVG Golouma Gold_2012_FS_Technical_Report_2CO003 008_NMW_DM_TS_GA_DGP_20130315_1 March 15, 2013
Figure 13.10: 3D View of the Kourouloulou deposit gold zones represented by 1.0 g/t Au Grade Shells (looking west-southwest).
13.3.6 Niakafiri Southwest
Six mineralization zones were supplied by OJVG geologists. The zones are modelled at a 0.2 g/t
Au g/t cut-off. Modelling of the gold zones was controlled primarily by the gold grade values from
drilling while respecting the general geological trends identified for the deposit. Niakafiri Southwest
is a series of subparallel near vertical mineralized zones. The solids strike north to north-north-east
and are steeply dipping to the west. The individual mineralized zones vary in width (5-30 m) and
length (125-330 m). Two barren, late mafic dykes have also been modelled, one of which crosscuts
one of the mineralized solids (Figure 13.11). SRK examined and validated the wireframes provided
by OJVG. There has been no change to the wireframes or drilling since the review by SRK in 2011.
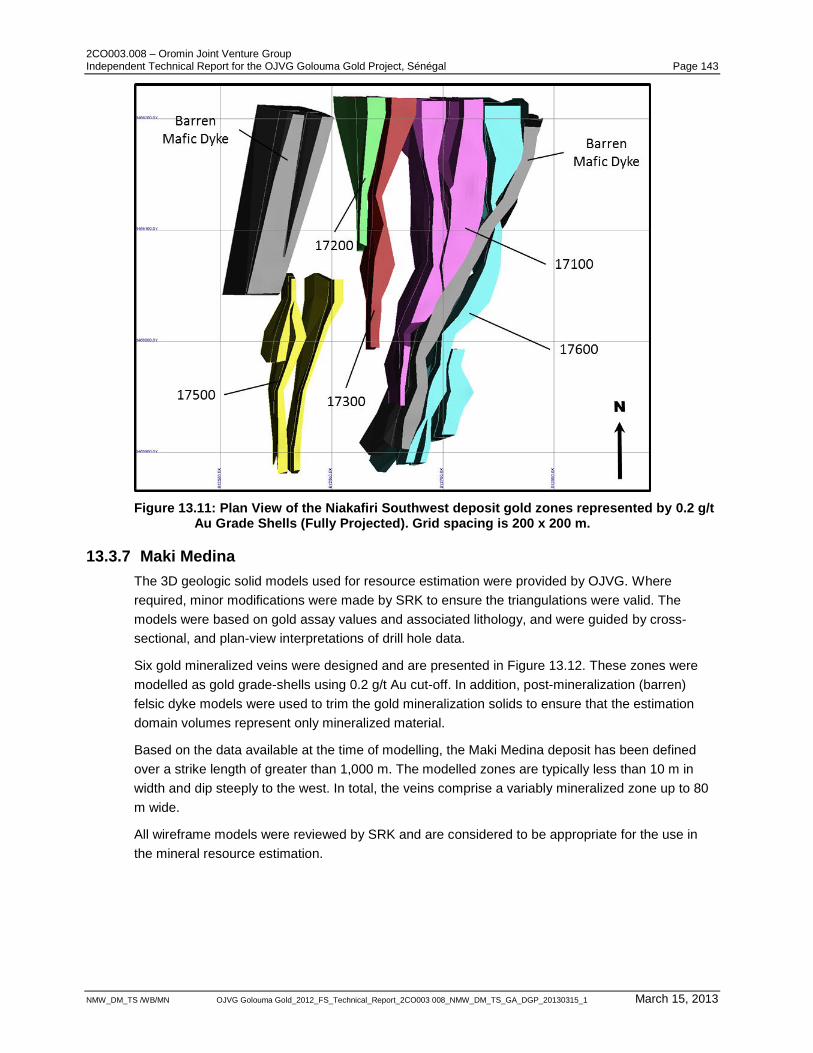
2CO003.008 – Oromin Joint Venture Group Independent Technical Report for the OJVG Golouma Gold Project, Sénégal Page 143
NMW_DM_TS /WB/MN OJVG Golouma Gold_2012_FS_Technical_Report_2CO003 008_NMW_DM_TS_GA_DGP_20130315_1 March 15, 2013
Figure 13.11: Plan View of the Niakafiri Southwest deposit gold zones represented by 0.2 g/t Au Grade Shells (Fully Projected). Grid spacing is 200 x 200 m.
13.3.7 Maki Medina
The 3D geologic solid models used for resource estimation were provided by OJVG. Where
required, minor modifications were made by SRK to ensure the triangulations were valid. The
models were based on gold assay values and associated lithology, and were guided by cross-
sectional, and plan-view interpretations of drill hole data.
Six gold mineralized veins were designed and are presented in Figure 13.12. These zones were
modelled as gold grade-shells using 0.2 g/t Au cut-off. In addition, post-mineralization (barren)
felsic dyke models were used to trim the gold mineralization solids to ensure that the estimation
domain volumes represent only mineralized material.
Based on the data available at the time of modelling, the Maki Medina deposit has been defined
over a strike length of greater than 1,000 m. The modelled zones are typically less than 10 m in
width and dip steeply to the west. In total, the veins comprise a variably mineralized zone up to 80
m wide.
All wireframe models were reviewed by SRK and are considered to be appropriate for the use in
the mineral resource estimation.
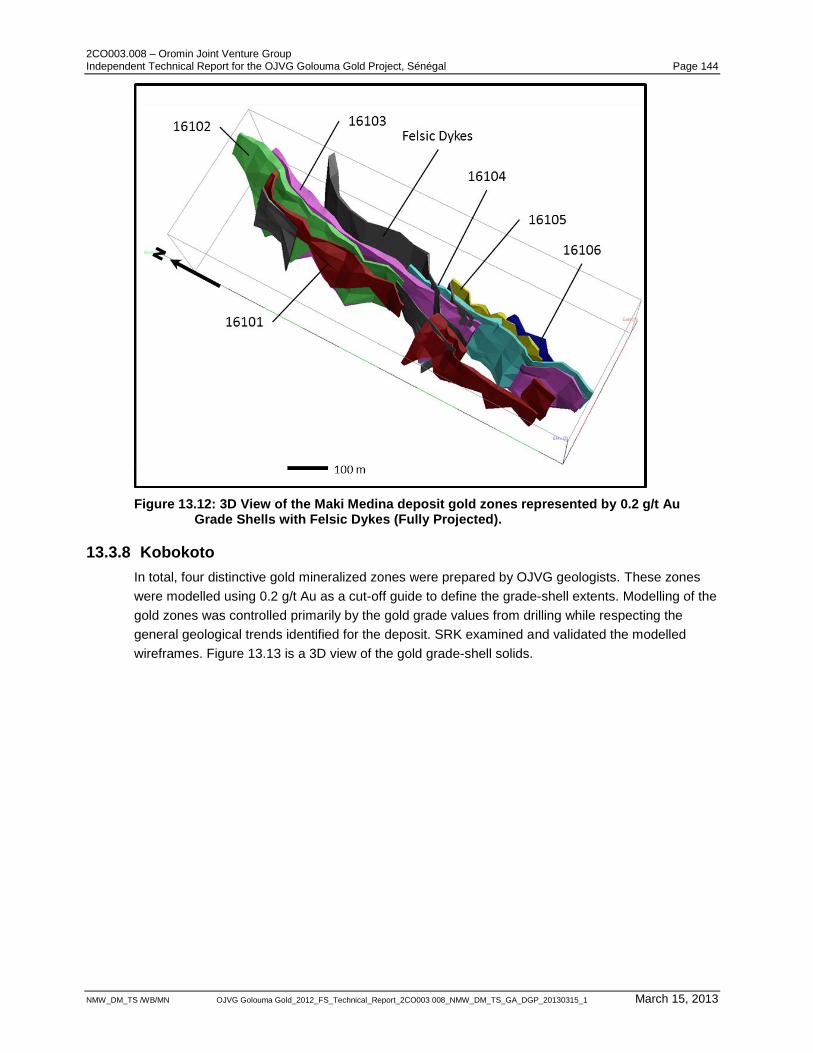
2CO003.008 – Oromin Joint Venture Group Independent Technical Report for the OJVG Golouma Gold Project, Sénégal Page 144
NMW_DM_TS /WB/MN OJVG Golouma Gold_2012_FS_Technical_Report_2CO003 008_NMW_DM_TS_GA_DGP_20130315_1 March 15, 2013
Figure 13.12: 3D View of the Maki Medina deposit gold zones represented by 0.2 g/t Au Grade Shells with Felsic Dykes (Fully Projected).
13.3.8 Kobokoto
In total, four distinctive gold mineralized zones were prepared by OJVG geologists. These zones
were modelled using 0.2 g/t Au as a cut-off guide to define the grade-shell extents. Modelling of the
gold zones was controlled primarily by the gold grade values from drilling while respecting the
general geological trends identified for the deposit. SRK examined and validated the modelled
wireframes. Figure 13.13 is a 3D view of the gold grade-shell solids.
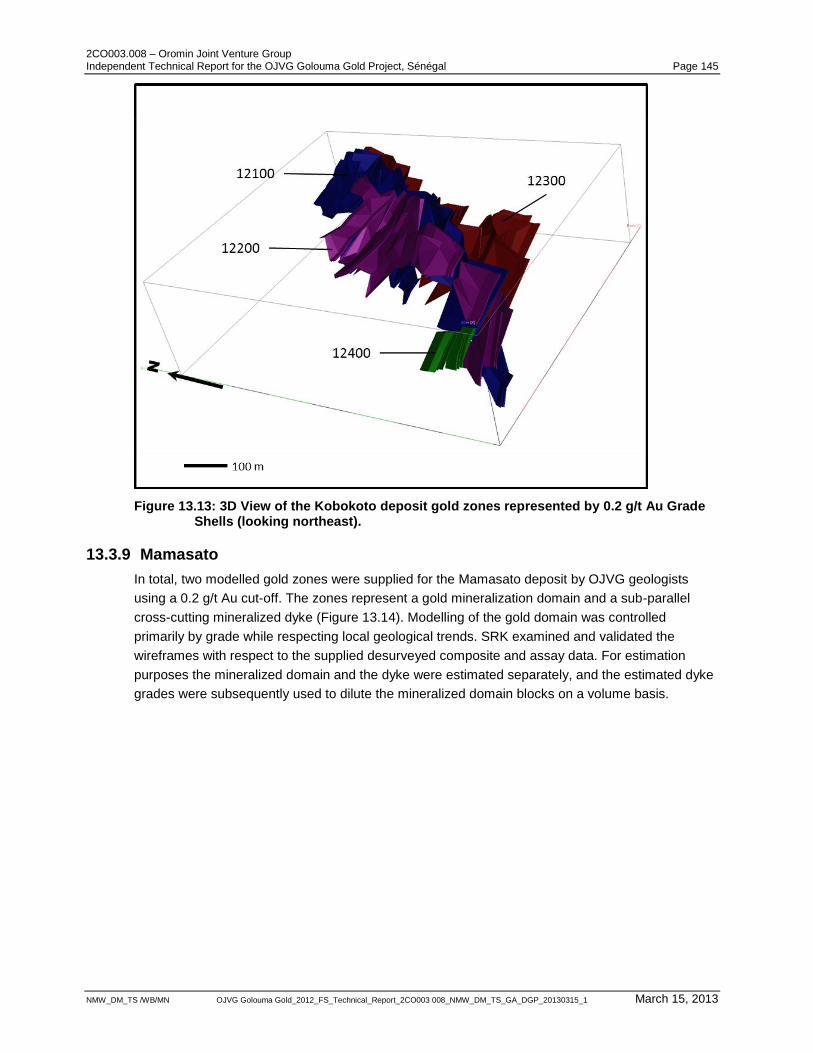
2CO003.008 – Oromin Joint Venture Group Independent Technical Report for the OJVG Golouma Gold Project, Sénégal Page 145
NMW_DM_TS /WB/MN OJVG Golouma Gold_2012_FS_Technical_Report_2CO003 008_NMW_DM_TS_GA_DGP_20130315_1 March 15, 2013
Figure 13.13: 3D View of the Kobokoto deposit gold zones represented by 0.2 g/t Au Grade Shells (looking northeast).
13.3.9 Mamasato
In total, two modelled gold zones were supplied for the Mamasato deposit by OJVG geologists
using a 0.2 g/t Au cut-off. The zones represent a gold mineralization domain and a sub-parallel
cross-cutting mineralized dyke (Figure 13.14). Modelling of the gold domain was controlled
primarily by grade while respecting local geological trends. SRK examined and validated the
wireframes with respect to the supplied desurveyed composite and assay data. For estimation
purposes the mineralized domain and the dyke were estimated separately, and the estimated dyke
grades were subsequently used to dilute the mineralized domain blocks on a volume basis.
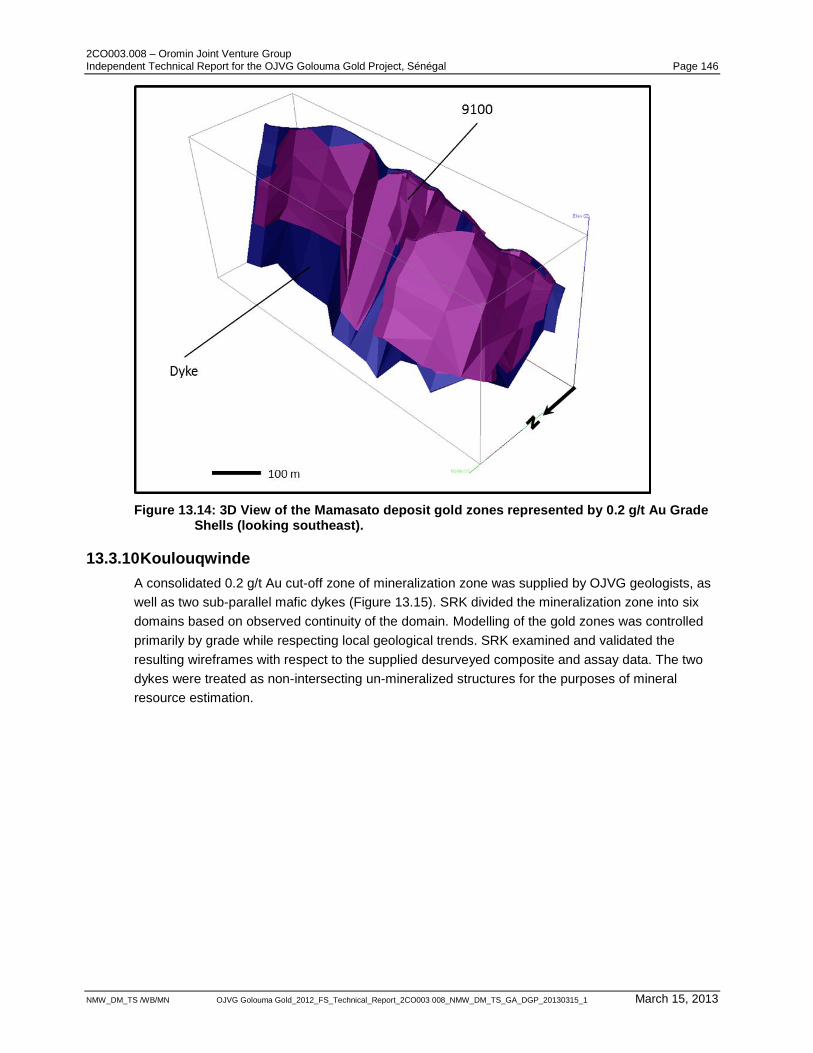
2CO003.008 – Oromin Joint Venture Group Independent Technical Report for the OJVG Golouma Gold Project, Sénégal Page 146
NMW_DM_TS /WB/MN OJVG Golouma Gold_2012_FS_Technical_Report_2CO003 008_NMW_DM_TS_GA_DGP_20130315_1 March 15, 2013
Figure 13.14: 3D View of the Mamasato deposit gold zones represented by 0.2 g/t Au Grade Shells (looking southeast).
13.3.10 Koulouqwinde
A consolidated 0.2 g/t Au cut-off zone of mineralization zone was supplied by OJVG geologists, as
well as two sub-parallel mafic dykes (Figure 13.15). SRK divided the mineralization zone into six
domains based on observed continuity of the domain. Modelling of the gold zones was controlled
primarily by grade while respecting local geological trends. SRK examined and validated the
resulting wireframes with respect to the supplied desurveyed composite and assay data. The two
dykes were treated as non-intersecting un-mineralized structures for the purposes of mineral
resource estimation.
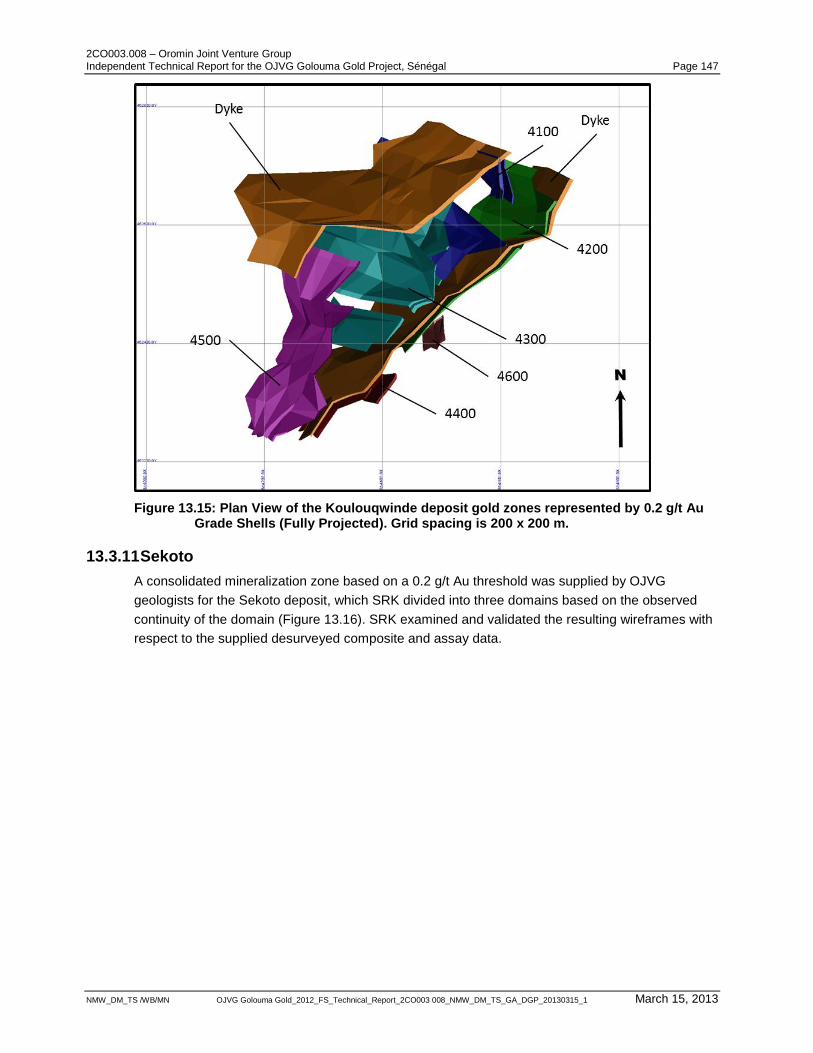
2CO003.008 – Oromin Joint Venture Group Independent Technical Report for the OJVG Golouma Gold Project, Sénégal Page 147
NMW_DM_TS /WB/MN OJVG Golouma Gold_2012_FS_Technical_Report_2CO003 008_NMW_DM_TS_GA_DGP_20130315_1 March 15, 2013
Figure 13.15: Plan View of the Koulouqwinde deposit gold zones represented by 0.2 g/t Au Grade Shells (Fully Projected). Grid spacing is 200 x 200 m.
13.3.11 Sekoto
A consolidated mineralization zone based on a 0.2 g/t Au threshold was supplied by OJVG
geologists for the Sekoto deposit, which SRK divided into three domains based on the observed
continuity of the domain (Figure 13.16). SRK examined and validated the resulting wireframes with
respect to the supplied desurveyed composite and assay data.
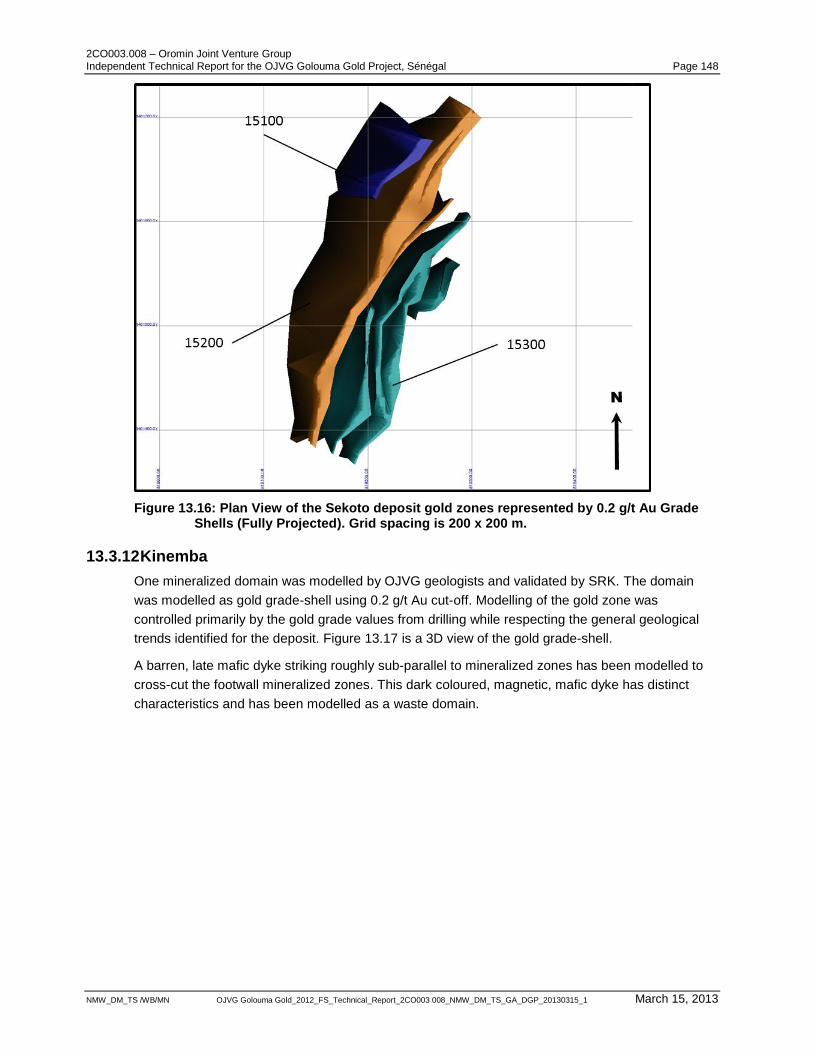
2CO003.008 – Oromin Joint Venture Group Independent Technical Report for the OJVG Golouma Gold Project, Sénégal Page 148
NMW_DM_TS /WB/MN OJVG Golouma Gold_2012_FS_Technical_Report_2CO003 008_NMW_DM_TS_GA_DGP_20130315_1 March 15, 2013
Figure 13.16: Plan View of the Sekoto deposit gold zones represented by 0.2 g/t Au Grade Shells (Fully Projected). Grid spacing is 200 x 200 m.
13.3.12 Kinemba
One mineralized domain was modelled by OJVG geologists and validated by SRK. The domain
was modelled as gold grade-shell using 0.2 g/t Au cut-off. Modelling of the gold zone was
controlled primarily by the gold grade values from drilling while respecting the general geological
trends identified for the deposit. Figure 13.17 is a 3D view of the gold grade-shell.
A barren, late mafic dyke striking roughly sub-parallel to mineralized zones has been modelled to
cross-cut the footwall mineralized zones. This dark coloured, magnetic, mafic dyke has distinct
characteristics and has been modelled as a waste domain.
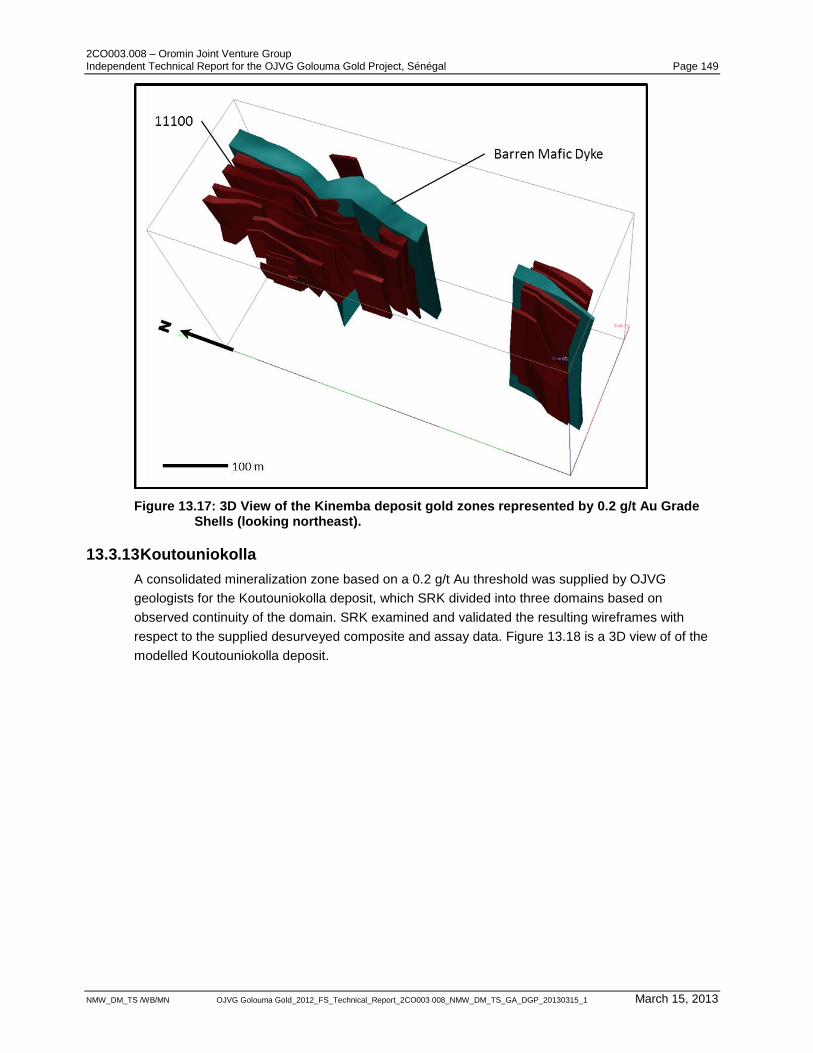
2CO003.008 – Oromin Joint Venture Group Independent Technical Report for the OJVG Golouma Gold Project, Sénégal Page 149
NMW_DM_TS /WB/MN OJVG Golouma Gold_2012_FS_Technical_Report_2CO003 008_NMW_DM_TS_GA_DGP_20130315_1 March 15, 2013
Figure 13.17: 3D View of the Kinemba deposit gold zones represented by 0.2 g/t Au Grade Shells (looking northeast).
13.3.13 Koutouniokolla
A consolidated mineralization zone based on a 0.2 g/t Au threshold was supplied by OJVG
geologists for the Koutouniokolla deposit, which SRK divided into three domains based on
observed continuity of the domain. SRK examined and validated the resulting wireframes with
respect to the supplied desurveyed composite and assay data. Figure 13.18 is a 3D view of of the
modelled Koutouniokolla deposit.
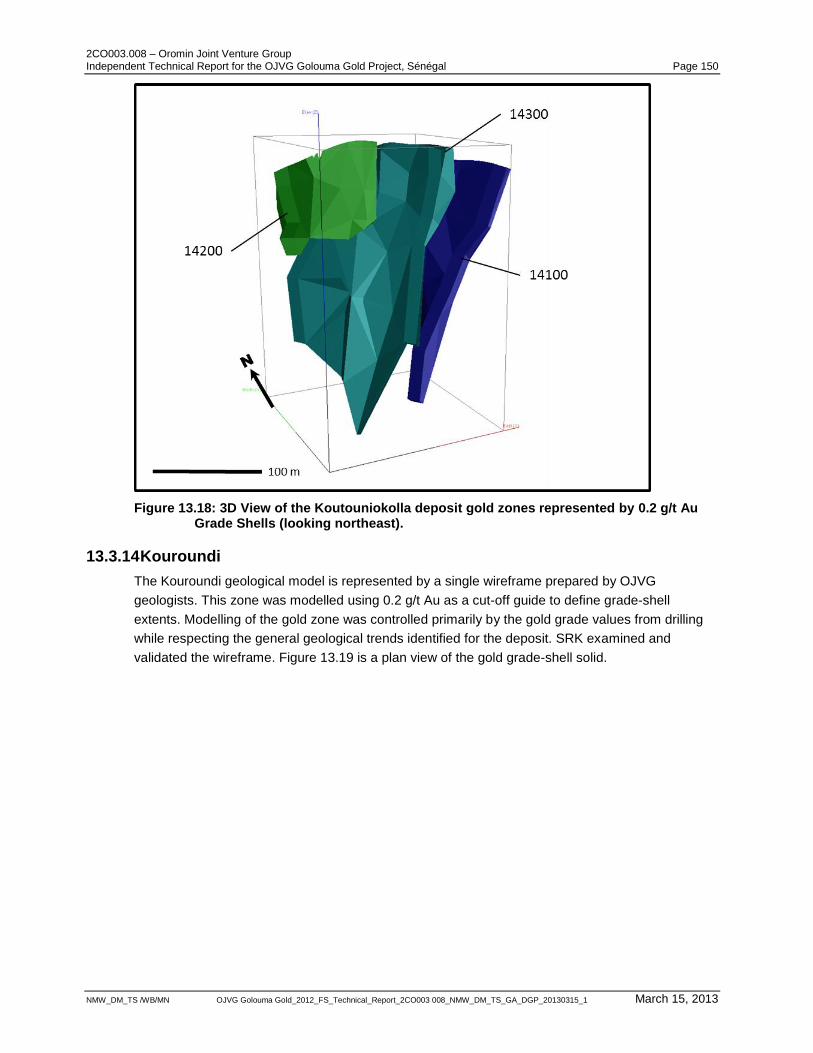
2CO003.008 – Oromin Joint Venture Group Independent Technical Report for the OJVG Golouma Gold Project, Sénégal Page 150
NMW_DM_TS /WB/MN OJVG Golouma Gold_2012_FS_Technical_Report_2CO003 008_NMW_DM_TS_GA_DGP_20130315_1 March 15, 2013
Figure 13.18: 3D View of the Koutouniokolla deposit gold zones represented by 0.2 g/t Au Grade Shells (looking northeast).
13.3.14 Kouroundi
The Kouroundi geological model is represented by a single wireframe prepared by OJVG
geologists. This zone was modelled using 0.2 g/t Au as a cut-off guide to define grade-shell
extents. Modelling of the gold zone was controlled primarily by the gold grade values from drilling
while respecting the general geological trends identified for the deposit. SRK examined and
validated the wireframe. Figure 13.19 is a plan view of the gold grade-shell solid.
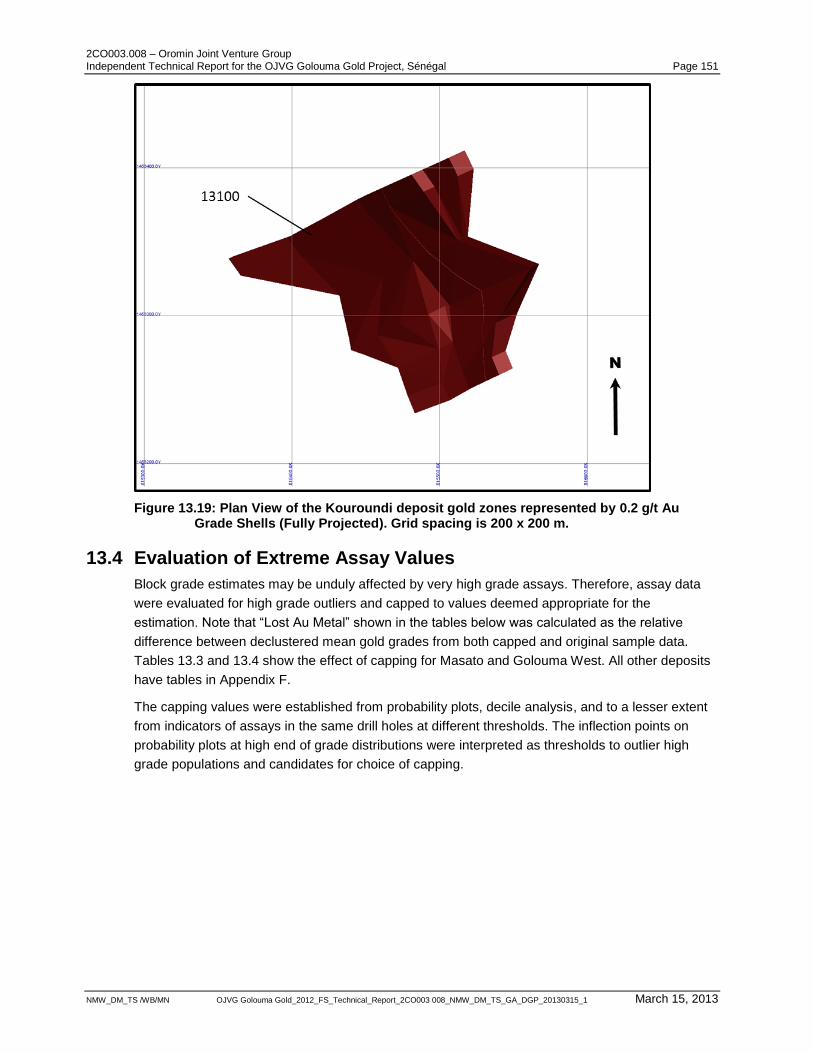
2CO003.008 – Oromin Joint Venture Group Independent Technical Report for the OJVG Golouma Gold Project, Sénégal Page 151
NMW_DM_TS /WB/MN OJVG Golouma Gold_2012_FS_Technical_Report_2CO003 008_NMW_DM_TS_GA_DGP_20130315_1 March 15, 2013
Figure 13.19: Plan View of the Kouroundi deposit gold zones represented by 0.2 g/t Au Grade Shells (Fully Projected). Grid spacing is 200 x 200 m.
13.4 Evaluation of Extreme Assay Values
Block grade estimates may be unduly affected by very high grade assays. Therefore, assay data
were evaluated for high grade outliers and capped to values deemed appropriate for the
estimation. Note that “Lost Au Metal” shown in the tables below was calculated as the relative
difference between declustered mean gold grades from both capped and original sample data.
Tables 13.3 and 13.4 show the effect of capping for Masato and Golouma West. All other deposits
have tables in Appendix F.
The capping values were established from probability plots, decile analysis, and to a lesser extent
from indicators of assays in the same drill holes at different thresholds. The inflection points on
probability plots at high end of grade distributions were interpreted as thresholds to outlier high
grade populations and candidates for choice of capping.
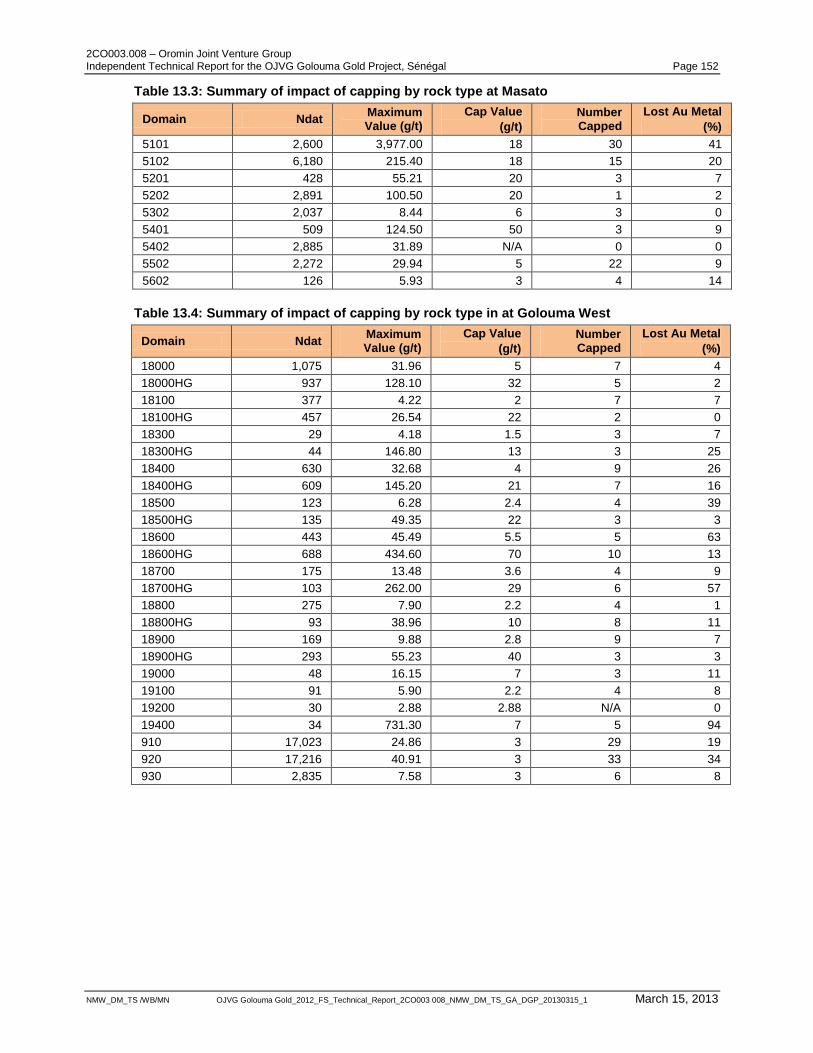
2CO003.008 – Oromin Joint Venture Group Independent Technical Report for the OJVG Golouma Gold Project, Sénégal Page 152
NMW_DM_TS /WB/MN OJVG Golouma Gold_2012_FS_Technical_Report_2CO003 008_NMW_DM_TS_GA_DGP_20130315_1 March 15, 2013
Table 13.3: Summary of impact of capping by rock type at Masato
Domain Ndat Maximum Value (g/t)
Cap Value
(g/t)
Number Capped
Lost Au Metal
(%)
5101 2,600 3,977.00 18 30 41
5102 6,180 215.40 18 15 20
5201 428 55.21 20 3 7
5202 2,891 100.50 20 1 2
5302 2,037 8.44 6 3 0
5401 509 124.50 50 3 9
5402 2,885 31.89 N/A 0 0
5502 2,272 29.94 5 22 9
5602 126 5.93 3 4 14
Table 13.4: Summary of impact of capping by rock type in at Golouma West
Domain Ndat Maximum Value (g/t)
Cap Value
(g/t)
Number Capped
Lost Au Metal
(%)
18000 1,075 31.96 5 7 4
18000HG 937 128.10 32 5 2
18100 377 4.22 2 7 7
18100HG 457 26.54 22 2 0
18300 29 4.18 1.5 3 7
18300HG 44 146.80 13 3 25
18400 630 32.68 4 9 26
18400HG 609 145.20 21 7 16
18500 123 6.28 2.4 4 39
18500HG 135 49.35 22 3 3
18600 443 45.49 5.5 5 63
18600HG 688 434.60 70 10 13
18700 175 13.48 3.6 4 9
18700HG 103 262.00 29 6 57
18800 275 7.90 2.2 4 1
18800HG 93 38.96 10 8 11
18900 169 9.88 2.8 9 7
18900HG 293 55.23 40 3 3
19000 48 16.15 7 3 11
19100 91 5.90 2.2 4 8
19200 30 2.88 2.88 N/A 0
19400 34 731.30 7 5 94
910 17,023 24.86 3 29 19
920 17,216 40.91 3 33 34
930 2,835 7.58 3 6 8
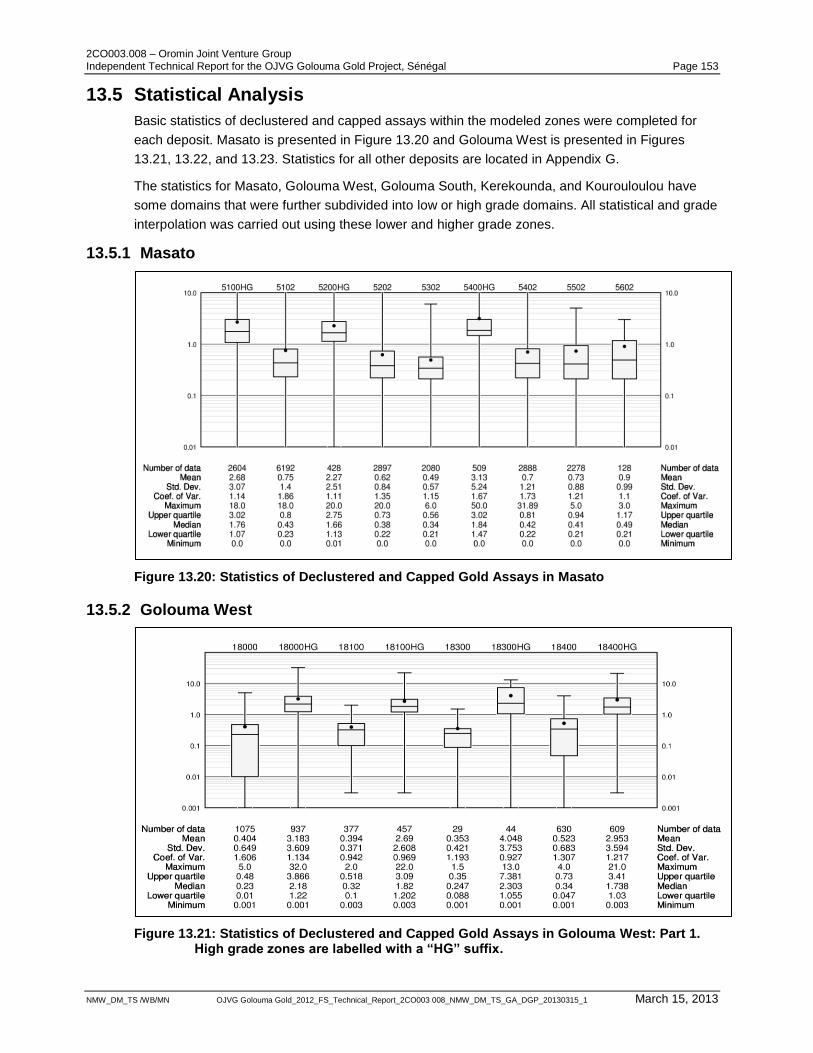
2CO003.008 – Oromin Joint Venture Group Independent Technical Report for the OJVG Golouma Gold Project, Sénégal Page 153
NMW_DM_TS /WB/MN OJVG Golouma Gold_2012_FS_Technical_Report_2CO003 008_NMW_DM_TS_GA_DGP_20130315_1 March 15, 2013
13.5 Statistical Analysis
Basic statistics of declustered and capped assays within the modeled zones were completed for
each deposit. Masato is presented in Figure 13.20 and Golouma West is presented in Figures
13.21, 13.22, and 13.23. Statistics for all other deposits are located in Appendix G.
The statistics for Masato, Golouma West, Golouma South, Kerekounda, and Kourouloulou have
some domains that were further subdivided into low or high grade domains. All statistical and grade
interpolation was carried out using these lower and higher grade zones.
13.5.1 Masato
Figure 13.20: Statistics of Declustered and Capped Gold Assays in Masato
13.5.2 Golouma West
Figure 13.21: Statistics of Declustered and Capped Gold Assays in Golouma West: Part 1. High grade zones are labelled with a “HG” suffix.
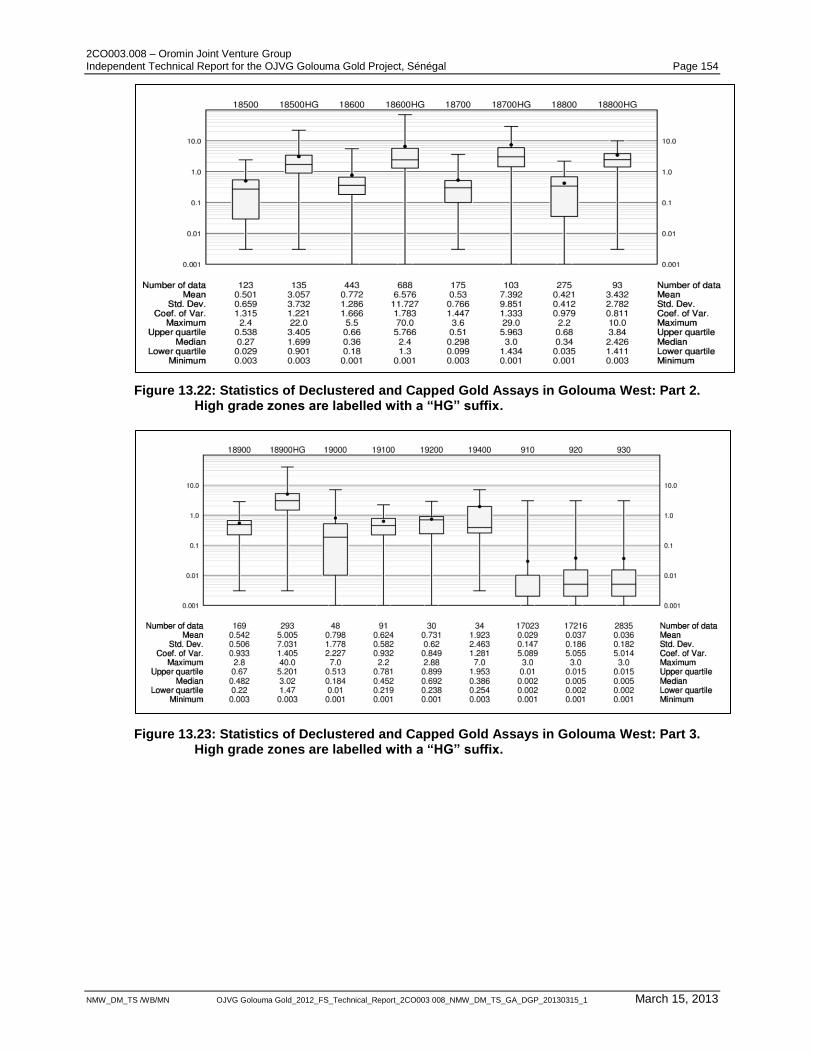
2CO003.008 – Oromin Joint Venture Group Independent Technical Report for the OJVG Golouma Gold Project, Sénégal Page 154
NMW_DM_TS /WB/MN OJVG Golouma Gold_2012_FS_Technical_Report_2CO003 008_NMW_DM_TS_GA_DGP_20130315_1 March 15, 2013
Figure 13.22: Statistics of Declustered and Capped Gold Assays in Golouma West: Part 2. High grade zones are labelled with a “HG” suffix.
Figure 13.23: Statistics of Declustered and Capped Gold Assays in Golouma West: Part 3. High grade zones are labelled with a “HG” suffix.
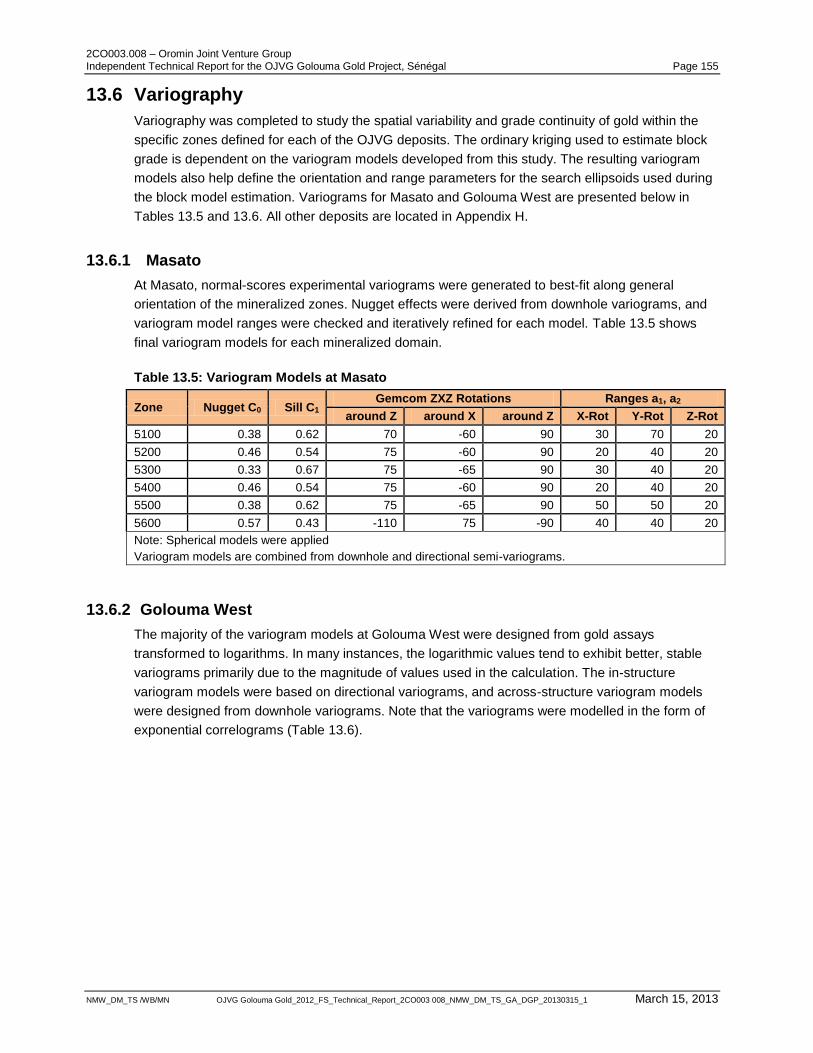
2CO003.008 – Oromin Joint Venture Group Independent Technical Report for the OJVG Golouma Gold Project, Sénégal Page 155
NMW_DM_TS /WB/MN OJVG Golouma Gold_2012_FS_Technical_Report_2CO003 008_NMW_DM_TS_GA_DGP_20130315_1 March 15, 2013
13.6 Variography
Variography was completed to study the spatial variability and grade continuity of gold within the
specific zones defined for each of the OJVG deposits. The ordinary kriging used to estimate block
grade is dependent on the variogram models developed from this study. The resulting variogram
models also help define the orientation and range parameters for the search ellipsoids used during
the block model estimation. Variograms for Masato and Golouma West are presented below in
Tables 13.5 and 13.6. All other deposits are located in Appendix H.
13.6.1 Masato
At Masato, normal-scores experimental variograms were generated to best-fit along general
orientation of the mineralized zones. Nugget effects were derived from downhole variograms, and
variogram model ranges were checked and iteratively refined for each model. Table 13.5 shows
final variogram models for each mineralized domain.
Table 13.5: Variogram Models at Masato
Zone Nugget C0 Sill C1 Gemcom ZXZ Rotations Ranges a1, a2
around Z around X around Z X-Rot Y-Rot Z-Rot
5100 0.38 0.62 70 -60 90 30 70 20
5200 0.46 0.54 75 -60 90 20 40 20
5300 0.33 0.67 75 -65 90 30 40 20
5400 0.46 0.54 75 -60 90 20 40 20
5500 0.38 0.62 75 -65 90 50 50 20
5600 0.57 0.43 -110 75 -90 40 40 20
Note: Spherical models were applied
Variogram models are combined from downhole and directional semi-variograms.
13.6.2 Golouma West
The majority of the variogram models at Golouma West were designed from gold assays
transformed to logarithms. In many instances, the logarithmic values tend to exhibit better, stable
variograms primarily due to the magnitude of values used in the calculation. The in-structure
variogram models were based on directional variograms, and across-structure variogram models
were designed from downhole variograms. Note that the variograms were modelled in the form of
exponential correlograms (Table 13.6).
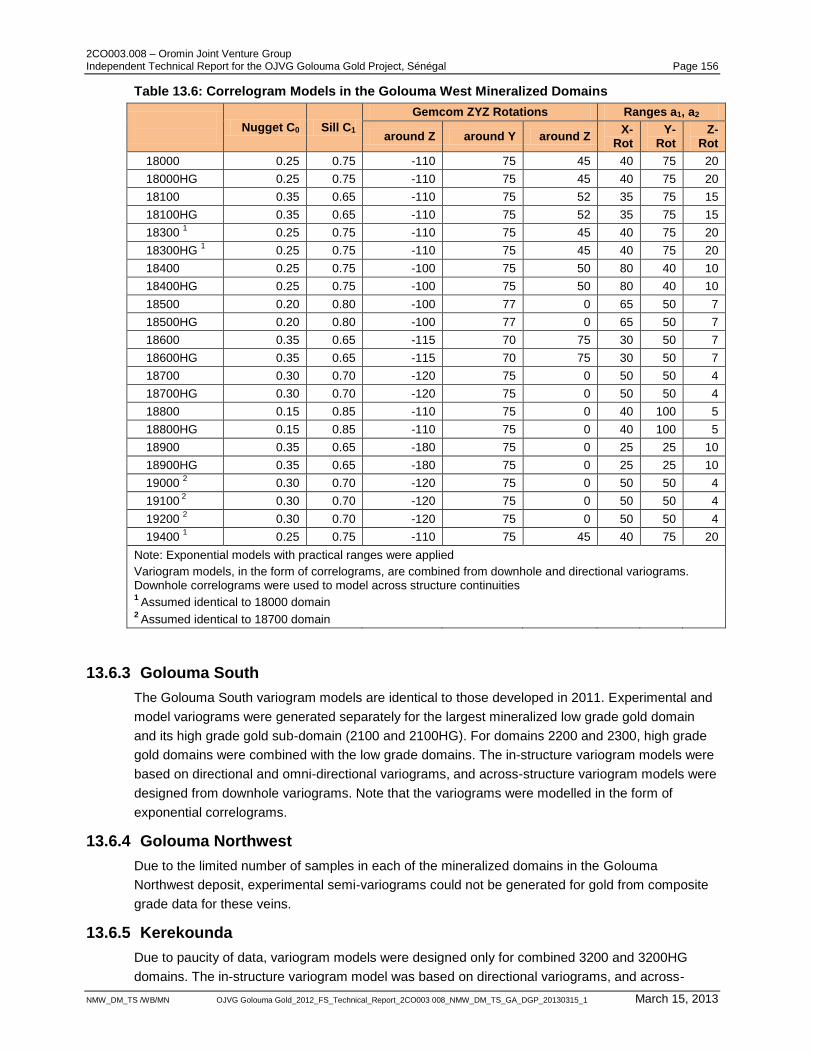
2CO003.008 – Oromin Joint Venture Group Independent Technical Report for the OJVG Golouma Gold Project, Sénégal Page 156
NMW_DM_TS /WB/MN OJVG Golouma Gold_2012_FS_Technical_Report_2CO003 008_NMW_DM_TS_GA_DGP_20130315_1 March 15, 2013
Table 13.6: Correlogram Models in the Golouma West Mineralized Domains
Nugget C0 Sill C1
Gemcom ZYZ Rotations Ranges a1, a2
around Z around Y around Z X-
Rot Y-
Rot Z-
Rot
18000 0.25 0.75 -110 75 45 40 75 20
18000HG 0.25 0.75 -110 75 45 40 75 20
18100 0.35 0.65 -110 75 52 35 75 15
18100HG 0.35 0.65 -110 75 52 35 75 15
18300 1 0.25 0.75 -110 75 45 40 75 20
18300HG 1 0.25 0.75 -110 75 45 40 75 20
18400 0.25 0.75 -100 75 50 80 40 10
18400HG 0.25 0.75 -100 75 50 80 40 10
18500 0.20 0.80 -100 77 0 65 50 7
18500HG 0.20 0.80 -100 77 0 65 50 7
18600 0.35 0.65 -115 70 75 30 50 7
18600HG 0.35 0.65 -115 70 75 30 50 7
18700 0.30 0.70 -120 75 0 50 50 4
18700HG 0.30 0.70 -120 75 0 50 50 4
18800 0.15 0.85 -110 75 0 40 100 5
18800HG 0.15 0.85 -110 75 0 40 100 5
18900 0.35 0.65 -180 75 0 25 25 10
18900HG 0.35 0.65 -180 75 0 25 25 10
19000 2 0.30 0.70 -120 75 0 50 50 4
19100 2 0.30 0.70 -120 75 0 50 50 4
19200 2 0.30 0.70 -120 75 0 50 50 4
19400 1 0.25 0.75 -110 75 45 40 75 20
Note: Exponential models with practical ranges were applied
Variogram models, in the form of correlograms, are combined from downhole and directional variograms. Downhole correlograms were used to model across structure continuities 1
Assumed identical to 18000 domain 2
Assumed identical to 18700 domain
13.6.3 Golouma South
The Golouma South variogram models are identical to those developed in 2011. Experimental and
model variograms were generated separately for the largest mineralized low grade gold domain
and its high grade gold sub-domain (2100 and 2100HG). For domains 2200 and 2300, high grade
gold domains were combined with the low grade domains. The in-structure variogram models were
based on directional and omni-directional variograms, and across-structure variogram models were
designed from downhole variograms. Note that the variograms were modelled in the form of
exponential correlograms.
13.6.4 Golouma Northwest
Due to the limited number of samples in each of the mineralized domains in the Golouma
Northwest deposit, experimental semi-variograms could not be generated for gold from composite
grade data for these veins.
13.6.5 Kerekounda
Due to paucity of data, variogram models were designed only for combined 3200 and 3200HG
domains. The in-structure variogram model was based on directional variograms, and across-
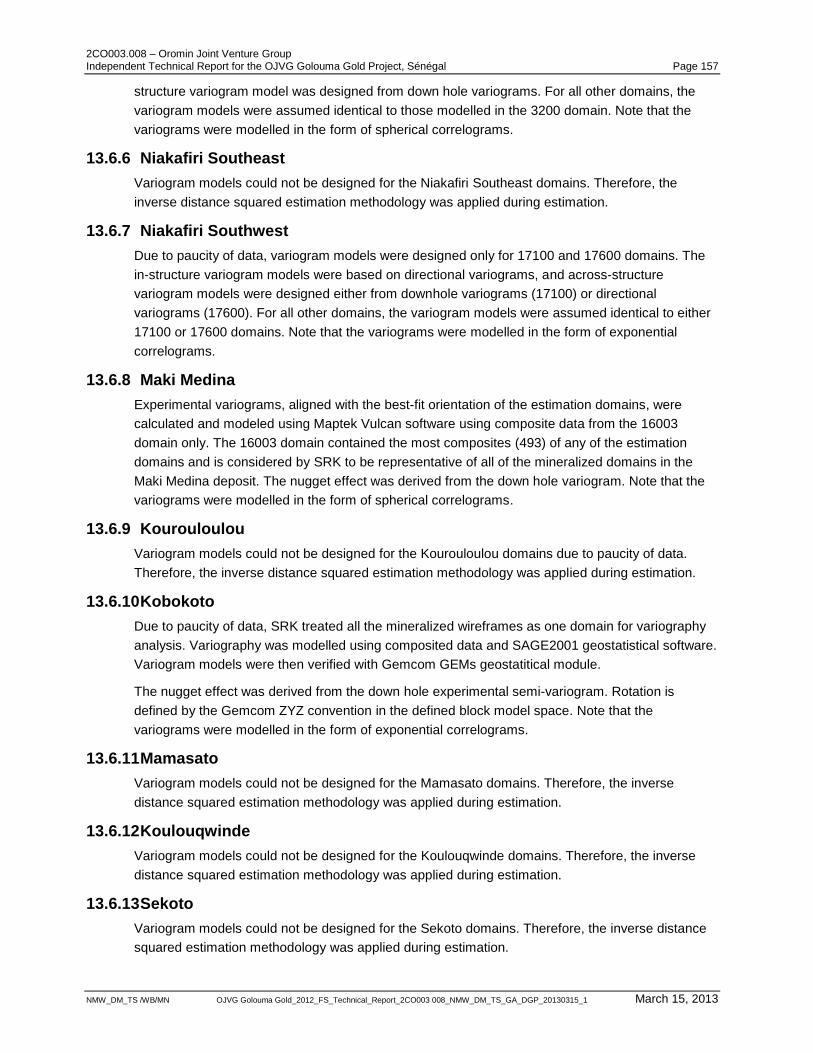
2CO003.008 – Oromin Joint Venture Group Independent Technical Report for the OJVG Golouma Gold Project, Sénégal Page 157
NMW_DM_TS /WB/MN OJVG Golouma Gold_2012_FS_Technical_Report_2CO003 008_NMW_DM_TS_GA_DGP_20130315_1 March 15, 2013
structure variogram model was designed from down hole variograms. For all other domains, the
variogram models were assumed identical to those modelled in the 3200 domain. Note that the
variograms were modelled in the form of spherical correlograms.
13.6.6 Niakafiri Southeast
Variogram models could not be designed for the Niakafiri Southeast domains. Therefore, the
inverse distance squared estimation methodology was applied during estimation.
13.6.7 Niakafiri Southwest
Due to paucity of data, variogram models were designed only for 17100 and 17600 domains. The
in-structure variogram models were based on directional variograms, and across-structure
variogram models were designed either from downhole variograms (17100) or directional
variograms (17600). For all other domains, the variogram models were assumed identical to either
17100 or 17600 domains. Note that the variograms were modelled in the form of exponential
correlograms.
13.6.8 Maki Medina
Experimental variograms, aligned with the best-fit orientation of the estimation domains, were
calculated and modeled using Maptek Vulcan software using composite data from the 16003
domain only. The 16003 domain contained the most composites (493) of any of the estimation
domains and is considered by SRK to be representative of all of the mineralized domains in the
Maki Medina deposit. The nugget effect was derived from the down hole variogram. Note that the
variograms were modelled in the form of spherical correlograms.
13.6.9 Kourouloulou
Variogram models could not be designed for the Kourouloulou domains due to paucity of data.
Therefore, the inverse distance squared estimation methodology was applied during estimation.
13.6.10 Kobokoto
Due to paucity of data, SRK treated all the mineralized wireframes as one domain for variography
analysis. Variography was modelled using composited data and SAGE2001 geostatistical software.
Variogram models were then verified with Gemcom GEMs geostatitical module.
The nugget effect was derived from the down hole experimental semi-variogram. Rotation is
defined by the Gemcom ZYZ convention in the defined block model space. Note that the
variograms were modelled in the form of exponential correlograms.
13.6.11 Mamasato
Variogram models could not be designed for the Mamasato domains. Therefore, the inverse
distance squared estimation methodology was applied during estimation.
13.6.12 Koulouqwinde
Variogram models could not be designed for the Koulouqwinde domains. Therefore, the inverse
distance squared estimation methodology was applied during estimation.
13.6.13 Sekoto
Variogram models could not be designed for the Sekoto domains. Therefore, the inverse distance
squared estimation methodology was applied during estimation.
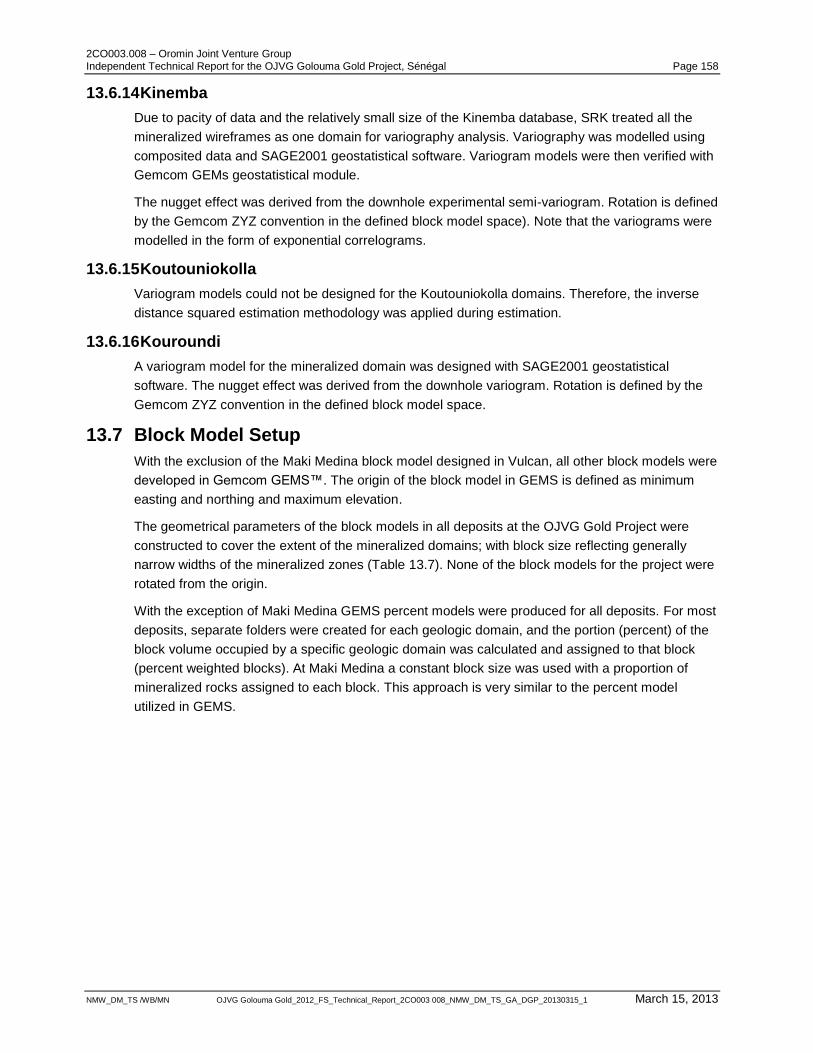
2CO003.008 – Oromin Joint Venture Group Independent Technical Report for the OJVG Golouma Gold Project, Sénégal Page 158
NMW_DM_TS /WB/MN OJVG Golouma Gold_2012_FS_Technical_Report_2CO003 008_NMW_DM_TS_GA_DGP_20130315_1 March 15, 2013
13.6.14 Kinemba
Due to pacity of data and the relatively small size of the Kinemba database, SRK treated all the
mineralized wireframes as one domain for variography analysis. Variography was modelled using
composited data and SAGE2001 geostatistical software. Variogram models were then verified with
Gemcom GEMs geostatistical module.
The nugget effect was derived from the downhole experimental semi-variogram. Rotation is defined
by the Gemcom ZYZ convention in the defined block model space). Note that the variograms were
modelled in the form of exponential correlograms.
13.6.15 Koutouniokolla
Variogram models could not be designed for the Koutouniokolla domains. Therefore, the inverse
distance squared estimation methodology was applied during estimation.
13.6.16 Kouroundi
A variogram model for the mineralized domain was designed with SAGE2001 geostatistical
software. The nugget effect was derived from the downhole variogram. Rotation is defined by the
Gemcom ZYZ convention in the defined block model space.
13.7 Block Model Setup
With the exclusion of the Maki Medina block model designed in Vulcan, all other block models were
developed in Gemcom GEMS™. The origin of the block model in GEMS is defined as minimum
easting and northing and maximum elevation.
The geometrical parameters of the block models in all deposits at the OJVG Gold Project were
constructed to cover the extent of the mineralized domains; with block size reflecting generally
narrow widths of the mineralized zones (Table 13.7). None of the block models for the project were
rotated from the origin.
With the exception of Maki Medina GEMS percent models were produced for all deposits. For most
deposits, separate folders were created for each geologic domain, and the portion (percent) of the
block volume occupied by a specific geologic domain was calculated and assigned to that block
(percent weighted blocks). At Maki Medina a constant block size was used with a proportion of
mineralized rocks assigned to each block. This approach is very similar to the percent model
utilized in GEMS.
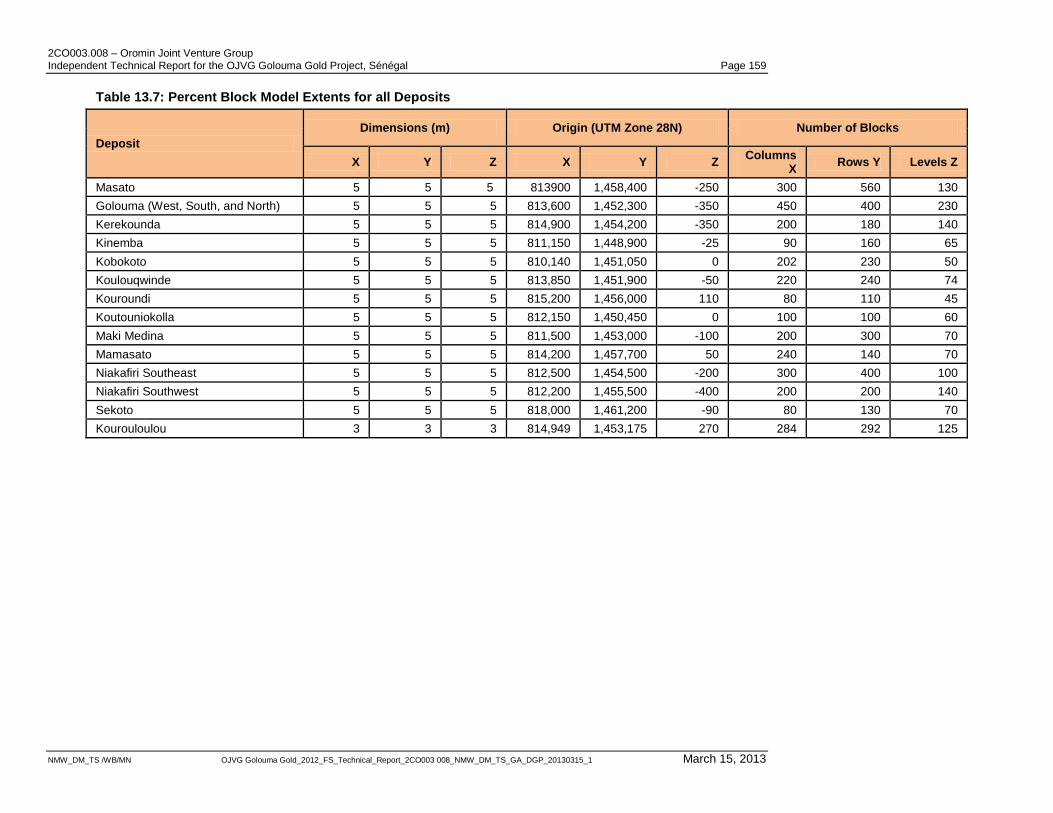
2CO003.008 – Oromin Joint Venture Group Independent Technical Report for the OJVG Golouma Gold Project, Sénégal Page 159
NMW_DM_TS /WB/MN OJVG Golouma Gold_2012_FS_Technical_Report_2CO003 008_NMW_DM_TS_GA_DGP_20130315_1 March 15, 2013
Table 13.7: Percent Block Model Extents for all Deposits
Deposit
Dimensions (m) Origin (UTM Zone 28N) Number of Blocks
X Y Z X Y Z Columns
X Rows Y Levels Z
Masato 5 5 5 813900 1,458,400 -250 300 560 130
Golouma (West, South, and North) 5 5 5 813,600 1,452,300 -350 450 400 230
Kerekounda 5 5 5 814,900 1,454,200 -350 200 180 140
Kinemba 5 5 5 811,150 1,448,900 -25 90 160 65
Kobokoto 5 5 5 810,140 1,451,050 0 202 230 50
Koulouqwinde 5 5 5 813,850 1,451,900 -50 220 240 74
Kouroundi 5 5 5 815,200 1,456,000 110 80 110 45
Koutouniokolla 5 5 5 812,150 1,450,450 0 100 100 60
Maki Medina 5 5 5 811,500 1,453,000 -100 200 300 70
Mamasato 5 5 5 814,200 1,457,700 50 240 140 70
Niakafiri Southeast 5 5 5 812,500 1,454,500 -200 300 400 100
Niakafiri Southwest 5 5 5 812,200 1,455,500 -400 200 200 140
Sekoto 5 5 5 818,000 1,461,200 -90 80 130 70
Kourouloulou 3 3 3 814,949 1,453,175 270 284 292 125
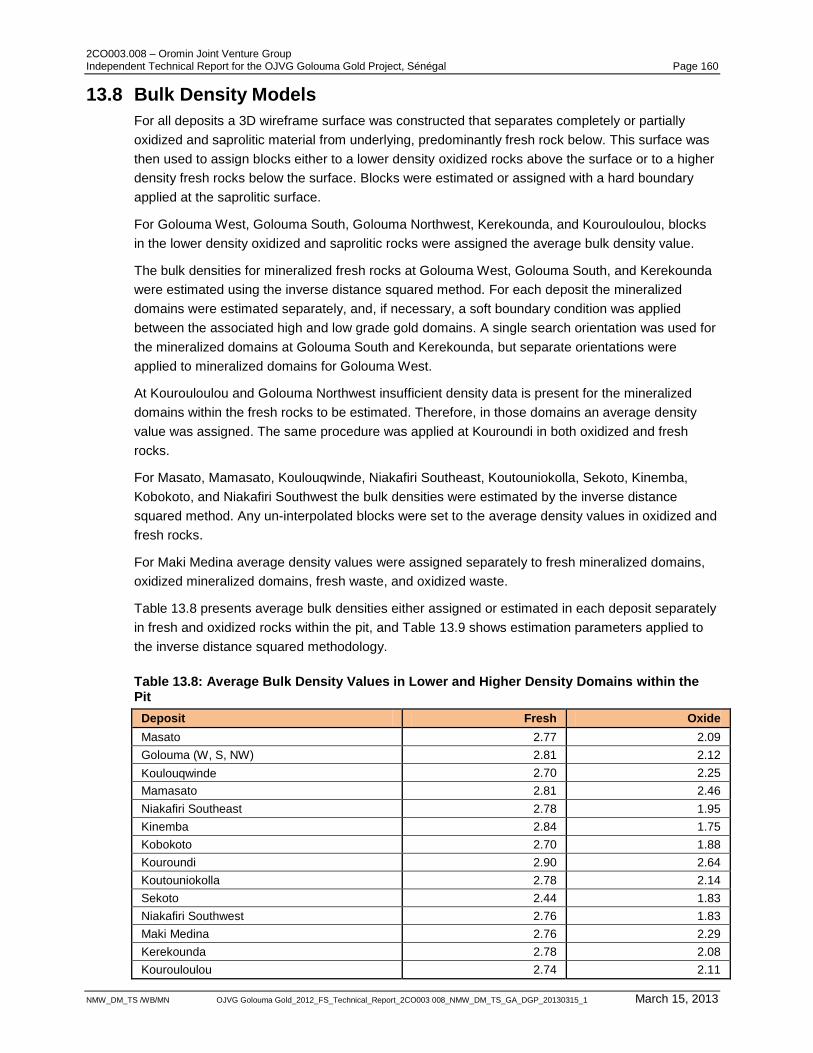
2CO003.008 – Oromin Joint Venture Group Independent Technical Report for the OJVG Golouma Gold Project, Sénégal Page 160
NMW_DM_TS /WB/MN OJVG Golouma Gold_2012_FS_Technical_Report_2CO003 008_NMW_DM_TS_GA_DGP_20130315_1 March 15, 2013
13.8 Bulk Density Models
For all deposits a 3D wireframe surface was constructed that separates completely or partially
oxidized and saprolitic material from underlying, predominantly fresh rock below. This surface was
then used to assign blocks either to a lower density oxidized rocks above the surface or to a higher
density fresh rocks below the surface. Blocks were estimated or assigned with a hard boundary
applied at the saprolitic surface.
For Golouma West, Golouma South, Golouma Northwest, Kerekounda, and Kourouloulou, blocks
in the lower density oxidized and saprolitic rocks were assigned the average bulk density value.
The bulk densities for mineralized fresh rocks at Golouma West, Golouma South, and Kerekounda
were estimated using the inverse distance squared method. For each deposit the mineralized
domains were estimated separately, and, if necessary, a soft boundary condition was applied
between the associated high and low grade gold domains. A single search orientation was used for
the mineralized domains at Golouma South and Kerekounda, but separate orientations were
applied to mineralized domains for Golouma West.
At Kourouloulou and Golouma Northwest insufficient density data is present for the mineralized
domains within the fresh rocks to be estimated. Therefore, in those domains an average density
value was assigned. The same procedure was applied at Kouroundi in both oxidized and fresh
rocks.
For Masato, Mamasato, Koulouqwinde, Niakafiri Southeast, Koutouniokolla, Sekoto, Kinemba,
Kobokoto, and Niakafiri Southwest the bulk densities were estimated by the inverse distance
squared method. Any un-interpolated blocks were set to the average density values in oxidized and
fresh rocks.
For Maki Medina average density values were assigned separately to fresh mineralized domains,
oxidized mineralized domains, fresh waste, and oxidized waste.
Table 13.8 presents average bulk densities either assigned or estimated in each deposit separately
in fresh and oxidized rocks within the pit, and Table 13.9 shows estimation parameters applied to
the inverse distance squared methodology.
Table 13.8: Average Bulk Density Values in Lower and Higher Density Domains within the Pit
Deposit Fresh Oxide
Masato 2.77 2.09
Golouma (W, S, NW) 2.81 2.12
Koulouqwinde 2.70 2.25
Mamasato 2.81 2.46
Niakafiri Southeast 2.78 1.95
Kinemba 2.84 1.75
Kobokoto 2.70 1.88
Kouroundi 2.90 2.64
Koutouniokolla 2.78 2.14
Sekoto 2.44 1.83
Niakafiri Southwest 2.76 1.83
Maki Medina 2.76 2.29
Kerekounda 2.78 2.08
Kourouloulou 2.74 2.11
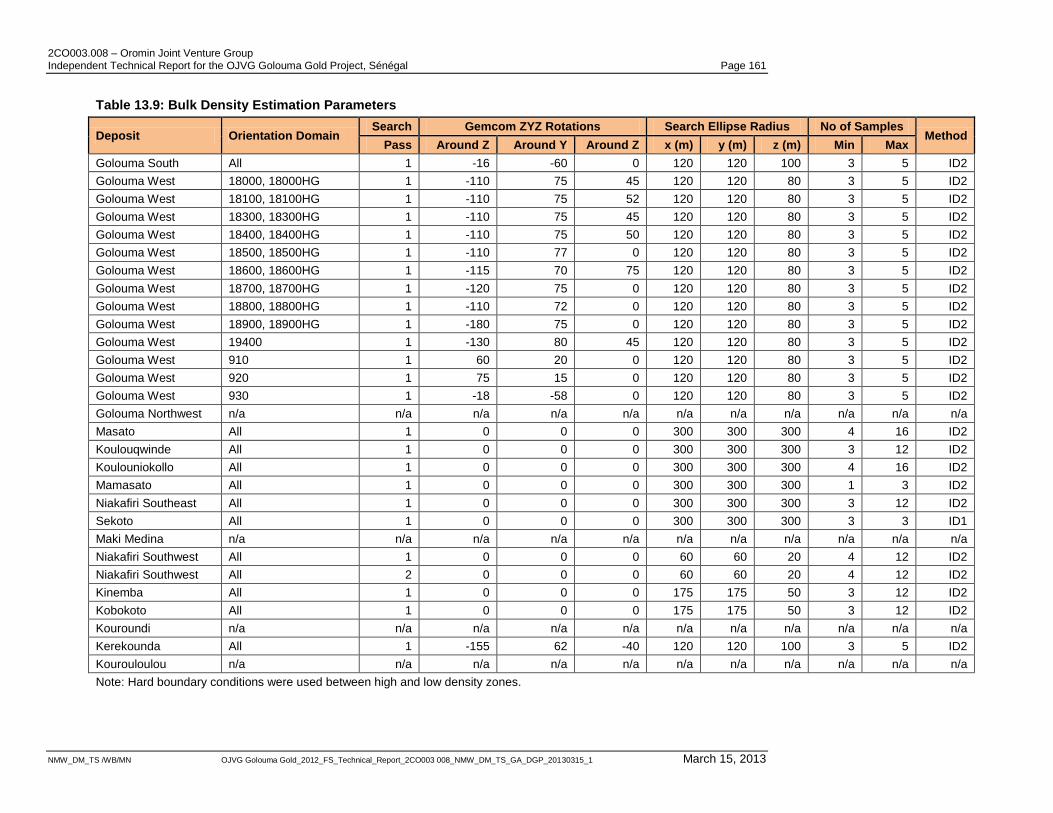
2CO003.008 – Oromin Joint Venture Group Independent Technical Report for the OJVG Golouma Gold Project, Sénégal Page 161
NMW_DM_TS /WB/MN OJVG Golouma Gold_2012_FS_Technical_Report_2CO003 008_NMW_DM_TS_GA_DGP_20130315_1 March 15, 2013
Table 13.9: Bulk Density Estimation Parameters
Deposit Orientation Domain Search Gemcom ZYZ Rotations Search Ellipse Radius No of Samples
Method Pass Around Z Around Y Around Z x (m) y (m) z (m) Min Max
Golouma South All 1 -16 -60 0 120 120 100 3 5 ID2
Golouma West 18000, 18000HG 1 -110 75 45 120 120 80 3 5 ID2
Golouma West 18100, 18100HG 1 -110 75 52 120 120 80 3 5 ID2
Golouma West 18300, 18300HG 1 -110 75 45 120 120 80 3 5 ID2
Golouma West 18400, 18400HG 1 -110 75 50 120 120 80 3 5 ID2
Golouma West 18500, 18500HG 1 -110 77 0 120 120 80 3 5 ID2
Golouma West 18600, 18600HG 1 -115 70 75 120 120 80 3 5 ID2
Golouma West 18700, 18700HG 1 -120 75 0 120 120 80 3 5 ID2
Golouma West 18800, 18800HG 1 -110 72 0 120 120 80 3 5 ID2
Golouma West 18900, 18900HG 1 -180 75 0 120 120 80 3 5 ID2
Golouma West 19400 1 -130 80 45 120 120 80 3 5 ID2
Golouma West 910 1 60 20 0 120 120 80 3 5 ID2
Golouma West 920 1 75 15 0 120 120 80 3 5 ID2
Golouma West 930 1 -18 -58 0 120 120 80 3 5 ID2
Golouma Northwest n/a n/a n/a n/a n/a n/a n/a n/a n/a n/a n/a
Masato All 1 0 0 0 300 300 300 4 16 ID2
Koulouqwinde All 1 0 0 0 300 300 300 3 12 ID2
Koulouniokollo All 1 0 0 0 300 300 300 4 16 ID2
Mamasato All 1 0 0 0 300 300 300 1 3 ID2
Niakafiri Southeast All 1 0 0 0 300 300 300 3 12 ID2
Sekoto All 1 0 0 0 300 300 300 3 3 ID1
Maki Medina n/a n/a n/a n/a n/a n/a n/a n/a n/a n/a n/a
Niakafiri Southwest All 1 0 0 0 60 60 20 4 12 ID2
Niakafiri Southwest All 2 0 0 0 60 60 20 4 12 ID2
Kinemba All 1 0 0 0 175 175 50 3 12 ID2
Kobokoto All 1 0 0 0 175 175 50 3 12 ID2
Kouroundi n/a n/a n/a n/a n/a n/a n/a n/a n/a n/a n/a
Kerekounda All 1 -155 62 -40 120 120 100 3 5 ID2
Kourouloulou n/a n/a n/a n/a n/a n/a n/a n/a n/a n/a n/a
Note: Hard boundary conditions were used between high and low density zones.
2CO003.008 – Oromin Joint Venture Group Independent Technical Report for the OJVG Golouma Gold Project, Sénégal Page 162
NMW_DM_TS /WB/MN OJVG Golouma Gold_2012_FS_Technical_Report_2CO003 008_NMW_DM_TS_GA_DGP_20130315_1 March 15, 2013
13.9 Block Model Resource Estimation
Except for Maki Medina, in all other deposits at the OJVG Gold Project the resources were
estimated in Gemcom GEMSTM
. Maki Medina resources were estimated in Vulcan. Resource
estimation was commonly carried out in two or three passes. In the first pass, blocks in the core of
the deposit were estimated with restrictive parameters and in subsequent passes more relaxed
parameters were applied (e.g., fewer number of holes required). Blocks estimated during each
sequential pass were flagged. The flags were used in assignment to resource categories.
The estimation approach applied hard boundaries for all geologic domains. Only samples located
within a particular domain were used to calculate grade for blocks within the associated domain.
The resource estimations for the Project were completed as follows:
Masato, Mamasato, Koulouqwinde, Niakafiri Southeast, Sekoto and Koutouniokolla were
estimated by Fred Brown, CPG;
Kinemba, Kobokoto, Kouroundi, and Niakafiri Southwest were estimated by Gilles Arseneau,
P.Geo.;
Golouma deposits were estimated by Darrell Farrow, Pr. Sci. Nat;
Kerekounda and Kourouloulou was estimated by Wayne Barnett, Pr. Sci. Nat, and
Maki Medina was estimated by Guy Dishaw, P.Geo.
All deposits were validated by Marek Nowak, P. Eng.
13.9.1 Masato
The Masato mineralized domains were estimated by ordinary kriging. The estimation ensured that
hard boundaries were applied between high grade and low grade sub-domains, and that the blocks
were estimated with three successive passes. Prior to estimation composites were capped to an
appropriate value as determined by analysis of probability plots and histograms. The first and
second passes were designed to ensure that the better drilled central core of the mineralized zones
would be interpolated from samples well arrayed around each estimated block. Blocks estimated
by the first pass were flagged, and the second and third passes only updated blocks not estimated
by the previous pass. In the second and third pass less restrictive estimation parameters were
applied (Appendix I).
13.9.2 Golouma West
The Golouma West mineralized domains and surrounding, poorly mineralized waste volumes were
estimated by ordinary kriging. The estimation ensured that hard boundaries were applied between
high grade and low grade sub-domains, and that the blocks were estimated with a minimum of two
successive passes. The first pass was designed to ensure that the better drilled core of the
mineralized zones would be interpolated from samples well arrayed around each estimated block.
The first pass considered a relatively small search ellipsoid with the search ellipsoid split into eight
octants (Appendix I).
For the poorly mineralized waste volumes, a high grade search restriction was applied. For
samples with grades greater than 1.0 g/t gold, those samples were only used to estimate grade if
they were located within 30 m of the block to be estimated. This reduced the impact of a few widely
spaced, high grade sample values on the greater block model.
2CO003.008 – Oromin Joint Venture Group Independent Technical Report for the OJVG Golouma Gold Project, Sénégal Page 163
NMW_DM_TS /WB/MN OJVG Golouma Gold_2012_FS_Technical_Report_2CO003 008_NMW_DM_TS_GA_DGP_20130315_1 March 15, 2013
13.9.3 Golouma South
The Golouma South mineralized domains and surrounding, poorly mineralized waste volumes were
estimated by ordinary kriging. The estimation employed hard boundaries that were applied
between high grade and low grade sub-domains, and the blocks were then estimated with two
successive passes. The first pass was designed to ensure that the better drilled core of the
mineralized zones would be interpolated from samples well arrayed around each estimated block.
The first pass considered a relatively small search ellipsoid with the search ellipsoid split into eight
octants (Appendix I). For the high grade zones 2100HG and 2300HG, a high grade search
restriction was applied. For samples with grades greater than 50 g/t and 22 g/t gold, respectively,
those samples were only used to estimate grade if they were located within 20 m of the block to be
estimated. This reduced the impact of a few spaced, high grade sample values on the greater block
model.
13.9.4 Golouma Northwest
The Golouma Northwest mineralized domains were estimated by the inverse distance squared
method. Search ellipses were set up to parallel the strike and dip of the veins. The estimation
employed hard boundaries that were applied between domains, and the blocks were then
estimated with two successive passes. The first pass was designed to ensure that the better drilled
core of the mineralized zones would be interpolated from samples well arrayed around each
estimated block. The first pass considered a relatively small search ellipsoid with the search
ellipsoid split into eight octants (Appendix I).
13.9.5 Kerekounda
The Kerekounda mineralized domains were estimated by ordinary kriging. The estimation
employed hard boundaries that were applied between high grade and low grade sub-domains, and
the blocks were then estimated with three successive passes. The first and second pass were
designed to ensure that the better drilled central core of the mineralized zones would be
interpolated from samples well arrayed around each estimated block. The first two passes
considered relatively small search ellipsoids with the search ellipsoid split into eight octants. Blocks
estimated by the first pass were flagged, and the second pass only updated blocks not estimated
by the first pass (Appendix I).
13.9.6 Niakafiri Southeast
The Niakafiri Southeast mineralized domains were estimated by the inverse distance squared
weighting of between four and twelve capped composite values from two or more drillholes. The
estimation employed hard boundaries that were applied between three domains as defined by
Lakehead Geological Services. Blocks were estimated with two successive passes. Blocks
estimated by the first pass were flagged, and the second pass only updated blocks not estimated
by the previous pass (Appendix I).
13.9.7 Niakafiri Southwest
The Niakafiri Southwest mineralized domains were estimated by ordinary kriging. The estimation
ensured that hard boundaries were applied between mineralized and waste domains. Blocks were
estimated with three successive passes. The first and second passes were designed to ensure that
the better drilled central core of the mineralized zones would be interpolated from samples well
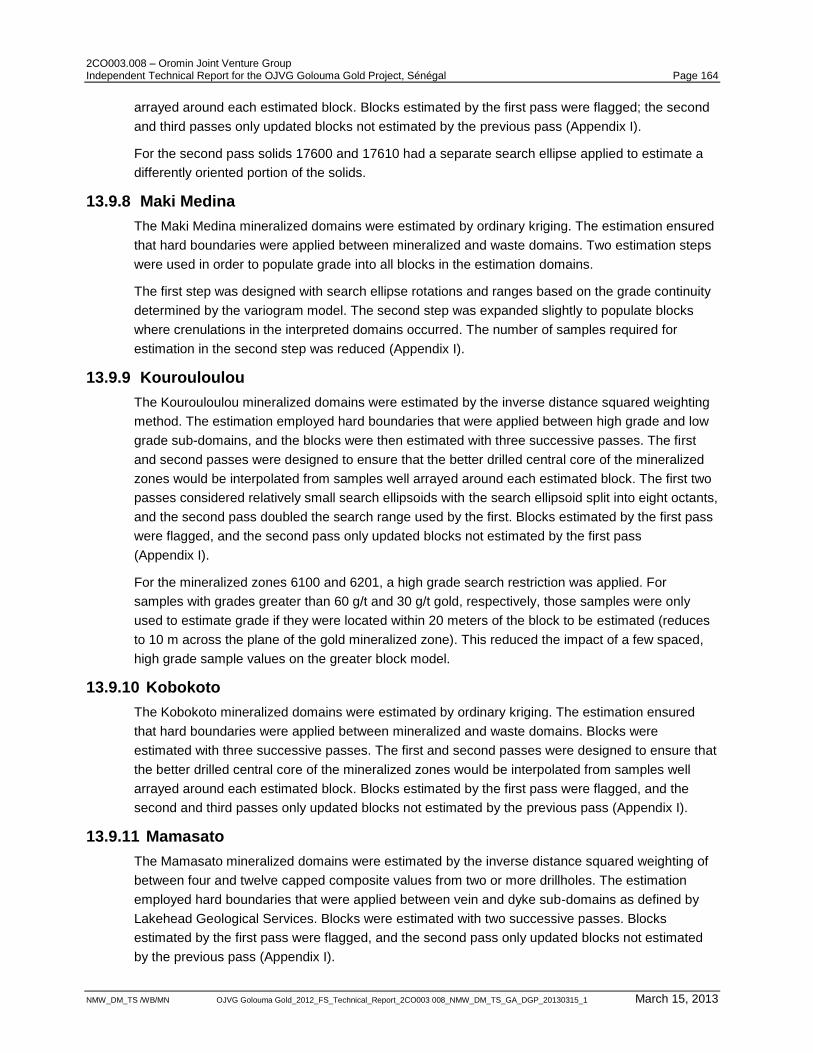
2CO003.008 – Oromin Joint Venture Group Independent Technical Report for the OJVG Golouma Gold Project, Sénégal Page 164
NMW_DM_TS /WB/MN OJVG Golouma Gold_2012_FS_Technical_Report_2CO003 008_NMW_DM_TS_GA_DGP_20130315_1 March 15, 2013
arrayed around each estimated block. Blocks estimated by the first pass were flagged; the second
and third passes only updated blocks not estimated by the previous pass (Appendix I).
For the second pass solids 17600 and 17610 had a separate search ellipse applied to estimate a
differently oriented portion of the solids.
13.9.8 Maki Medina
The Maki Medina mineralized domains were estimated by ordinary kriging. The estimation ensured
that hard boundaries were applied between mineralized and waste domains. Two estimation steps
were used in order to populate grade into all blocks in the estimation domains.
The first step was designed with search ellipse rotations and ranges based on the grade continuity
determined by the variogram model. The second step was expanded slightly to populate blocks
where crenulations in the interpreted domains occurred. The number of samples required for
estimation in the second step was reduced (Appendix I).
13.9.9 Kourouloulou
The Kourouloulou mineralized domains were estimated by the inverse distance squared weighting
method. The estimation employed hard boundaries that were applied between high grade and low
grade sub-domains, and the blocks were then estimated with three successive passes. The first
and second passes were designed to ensure that the better drilled central core of the mineralized
zones would be interpolated from samples well arrayed around each estimated block. The first two
passes considered relatively small search ellipsoids with the search ellipsoid split into eight octants,
and the second pass doubled the search range used by the first. Blocks estimated by the first pass
were flagged, and the second pass only updated blocks not estimated by the first pass
(Appendix I).
For the mineralized zones 6100 and 6201, a high grade search restriction was applied. For
samples with grades greater than 60 g/t and 30 g/t gold, respectively, those samples were only
used to estimate grade if they were located within 20 meters of the block to be estimated (reduces
to 10 m across the plane of the gold mineralized zone). This reduced the impact of a few spaced,
high grade sample values on the greater block model.
13.9.10 Kobokoto
The Kobokoto mineralized domains were estimated by ordinary kriging. The estimation ensured
that hard boundaries were applied between mineralized and waste domains. Blocks were
estimated with three successive passes. The first and second passes were designed to ensure that
the better drilled central core of the mineralized zones would be interpolated from samples well
arrayed around each estimated block. Blocks estimated by the first pass were flagged, and the
second and third passes only updated blocks not estimated by the previous pass (Appendix I).
13.9.11 Mamasato
The Mamasato mineralized domains were estimated by the inverse distance squared weighting of
between four and twelve capped composite values from two or more drillholes. The estimation
employed hard boundaries that were applied between vein and dyke sub-domains as defined by
Lakehead Geological Services. Blocks were estimated with two successive passes. Blocks
estimated by the first pass were flagged, and the second pass only updated blocks not estimated
by the previous pass (Appendix I).
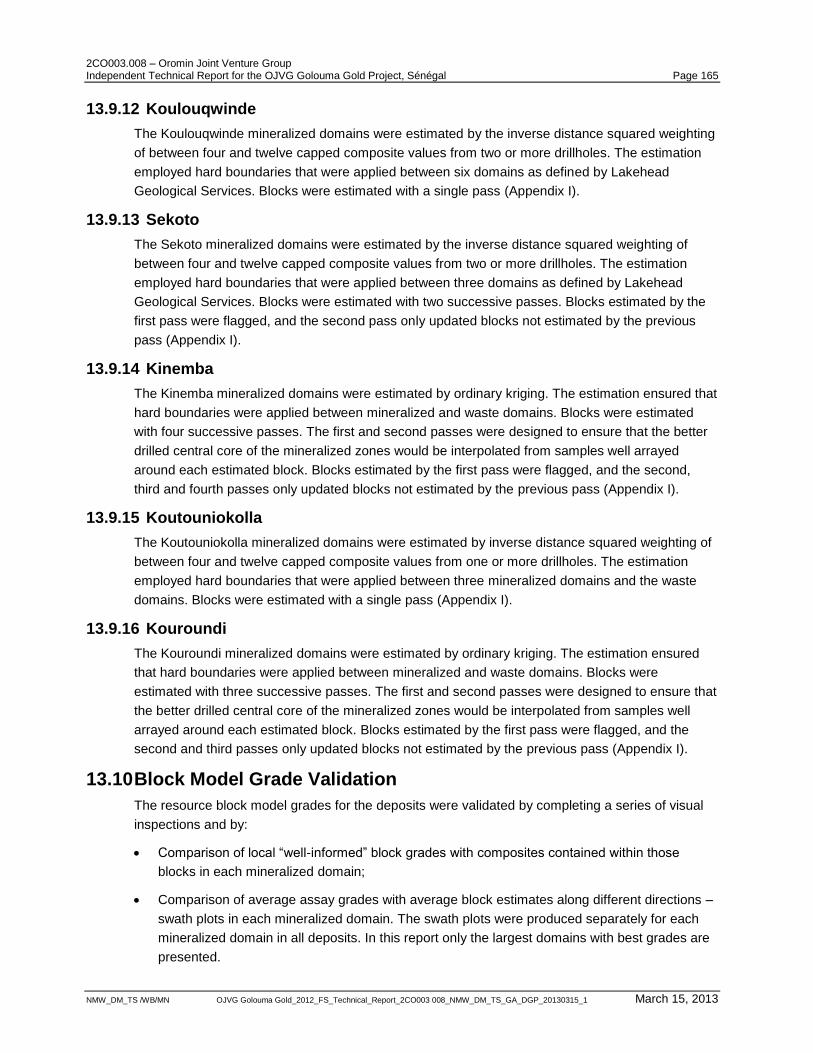
2CO003.008 – Oromin Joint Venture Group Independent Technical Report for the OJVG Golouma Gold Project, Sénégal Page 165
NMW_DM_TS /WB/MN OJVG Golouma Gold_2012_FS_Technical_Report_2CO003 008_NMW_DM_TS_GA_DGP_20130315_1 March 15, 2013
13.9.12 Koulouqwinde
The Koulouqwinde mineralized domains were estimated by the inverse distance squared weighting
of between four and twelve capped composite values from two or more drillholes. The estimation
employed hard boundaries that were applied between six domains as defined by Lakehead
Geological Services. Blocks were estimated with a single pass (Appendix I).
13.9.13 Sekoto
The Sekoto mineralized domains were estimated by the inverse distance squared weighting of
between four and twelve capped composite values from two or more drillholes. The estimation
employed hard boundaries that were applied between three domains as defined by Lakehead
Geological Services. Blocks were estimated with two successive passes. Blocks estimated by the
first pass were flagged, and the second pass only updated blocks not estimated by the previous
pass (Appendix I).
13.9.14 Kinemba
The Kinemba mineralized domains were estimated by ordinary kriging. The estimation ensured that
hard boundaries were applied between mineralized and waste domains. Blocks were estimated
with four successive passes. The first and second passes were designed to ensure that the better
drilled central core of the mineralized zones would be interpolated from samples well arrayed
around each estimated block. Blocks estimated by the first pass were flagged, and the second,
third and fourth passes only updated blocks not estimated by the previous pass (Appendix I).
13.9.15 Koutouniokolla
The Koutouniokolla mineralized domains were estimated by inverse distance squared weighting of
between four and twelve capped composite values from one or more drillholes. The estimation
employed hard boundaries that were applied between three mineralized domains and the waste
domains. Blocks were estimated with a single pass (Appendix I).
13.9.16 Kouroundi
The Kouroundi mineralized domains were estimated by ordinary kriging. The estimation ensured
that hard boundaries were applied between mineralized and waste domains. Blocks were
estimated with three successive passes. The first and second passes were designed to ensure that
the better drilled central core of the mineralized zones would be interpolated from samples well
arrayed around each estimated block. Blocks estimated by the first pass were flagged, and the
second and third passes only updated blocks not estimated by the previous pass (Appendix I).
13.10 Block Model Grade Validation
The resource block model grades for the deposits were validated by completing a series of visual
inspections and by:
Comparison of local “well-informed” block grades with composites contained within those
blocks in each mineralized domain;
Comparison of average assay grades with average block estimates along different directions –
swath plots in each mineralized domain. The swath plots were produced separately for each
mineralized domain in all deposits. In this report only the largest domains with best grades are
presented.
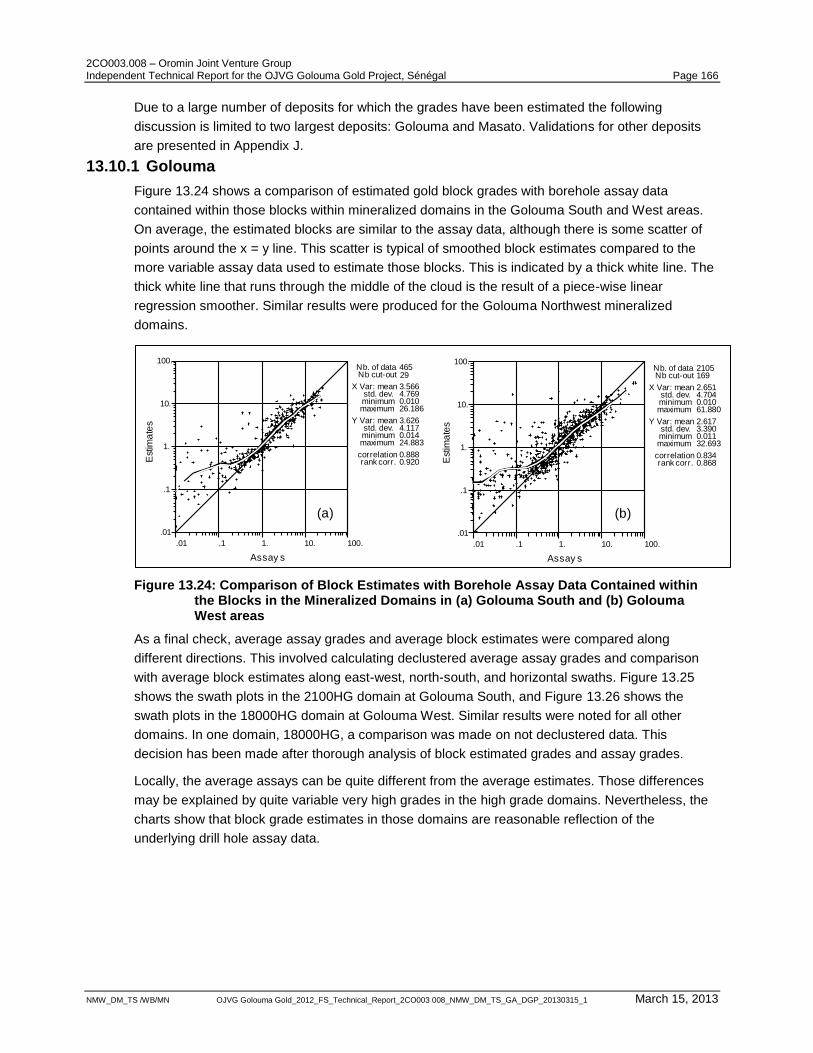
2CO003.008 – Oromin Joint Venture Group Independent Technical Report for the OJVG Golouma Gold Project, Sénégal Page 166
NMW_DM_TS /WB/MN OJVG Golouma Gold_2012_FS_Technical_Report_2CO003 008_NMW_DM_TS_GA_DGP_20130315_1 March 15, 2013
Due to a large number of deposits for which the grades have been estimated the following
discussion is limited to two largest deposits: Golouma and Masato. Validations for other deposits
are presented in Appendix J.
13.10.1 Golouma
Figure 13.24 shows a comparison of estimated gold block grades with borehole assay data
contained within those blocks within mineralized domains in the Golouma South and West areas.
On average, the estimated blocks are similar to the assay data, although there is some scatter of
points around the x = y line. This scatter is typical of smoothed block estimates compared to the
more variable assay data used to estimate those blocks. This is indicated by a thick white line. The
thick white line that runs through the middle of the cloud is the result of a piece-wise linear
regression smoother. Similar results were produced for the Golouma Northwest mineralized
domains.
Figure 13.24: Comparison of Block Estimates with Borehole Assay Data Contained within the Blocks in the Mineralized Domains in (a) Golouma South and (b) Golouma West areas
As a final check, average assay grades and average block estimates were compared along
different directions. This involved calculating declustered average assay grades and comparison
with average block estimates along east-west, north-south, and horizontal swaths. Figure 13.25
shows the swath plots in the 2100HG domain at Golouma South, and Figure 13.26 shows the
swath plots in the 18000HG domain at Golouma West. Similar results were noted for all other
domains. In one domain, 18000HG, a comparison was made on not declustered data. This
decision has been made after thorough analysis of block estimated grades and assay grades.
Locally, the average assays can be quite different from the average estimates. Those differences
may be explained by quite variable very high grades in the high grade domains. Nevertheless, the
charts show that block grade estimates in those domains are reasonable reflection of the
underlying drill hole assay data.
Est
ima
tes
Assay s
.01 .1 1. 10. 100.
.01
.1
1.
10.
100.Nb. of data 2105Nb cut-out 169
X Var: mean 2.651std. dev. 4.704minimum 0.010maximum 61.880
Y Var: mean 2.617std. dev. 3.390minimum 0.011maximum 32.693
correlation 0.834rank corr. 0.868E
stim
ate
s
Assay s
.01 .1 1. 10. 100.
.01
.1
1.
10.
100.Nb. of data 465Nb cut-out 29
X Var: mean 3.566std. dev. 4.769minimum 0.010maximum 26.186
Y Var: mean 3.626std. dev. 4.117minimum 0.014maximum 24.883
correlation 0.888rank corr. 0.920
(a) (b)
2CO003.008 – Oromin Joint Venture Group Independent Technical Report for the OJVG Golouma Gold Project, Sénégal Page 167
NMW_DM_TS /WB/MN OJVG Golouma Gold_2012_FS_Technical_Report_2CO003 008_NMW_DM_TS_GA_DGP_20130315_1 March 15, 2013
Figure 13.25: Declustered Assays Compared to Block Estimates in 2100HG Domain at Golouma South Area
Figure 13.26: Assays Compared to Block Estimates in 18000HG Zone at Golouma West Area
13.10.2 Masato
Figure 13.27 shows a comparison of estimated gold block grades with borehole assay data
contained within those blocks inside a major mineralized domain divided into high grade (5101) and
lower grade (5102) sub-domains. On average, the estimated blocks are similar to the assays with a
reasonable degree of correlation between the estimates and the assays.
As in Golouma, the estimates were further validated by comparing average assay grades with
average block estimates along different directions. This involved calculating declustered average
assay grades and comparison with average block estimates along east-west, north-south, and
horizontal swaths. Figure 13.28 shows the swath plots in the 5101 domain. Similar results were
noted for all other domains.
EstimatesComposites
2.0 5.0 8.0 11.0 14.0 17.0815000
815030
815060
815090
815120
815150
815180
815210
815240
815270
815300
Au (g/t)
Ea
sti
ng
(m)
2.0 5.0 8.0 11.0 14.0 17.01452800
1452840
1452880
1452920
1452960
1453000
1453040
1453080
1453120
1453160
1453200
No
rth
ing
(m)
2.0 5.0 8.0 11.0 14.0 17.0-100
-60
-20
20
60
100
140
180
220
260
300
Ele
va
tio
n(m
)
Au (g/t) Au (g/t)
0.0 0.6 1.2 1.8 2.4 3.0 3.6 4.2 4.8 5.4 6.01453400
1453440
1453480
1453520
1453560
1453600
1453640
1453680
1453720
1453760
1453800
No
rth
ing
(m)
EstimatesComposites
0.0 0.6 1.2 1.8 2.4 3.0 3.6 4.2 4.8 5.4 6.0813900
813990
814080
814170
814260
814350
814440
814530
814620
814710
814800
Au (g/t)
Ea
sti
ng
(m)
0.0 0.6 1.2 1.8 2.4 3.0 3.6 4.2 4.8 5.4 6.0-900
-770
-640
-510
-380
-250
-120
10
140
270
400
Ele
va
tio
n(m
)
Au (g/t) Au (g/t)
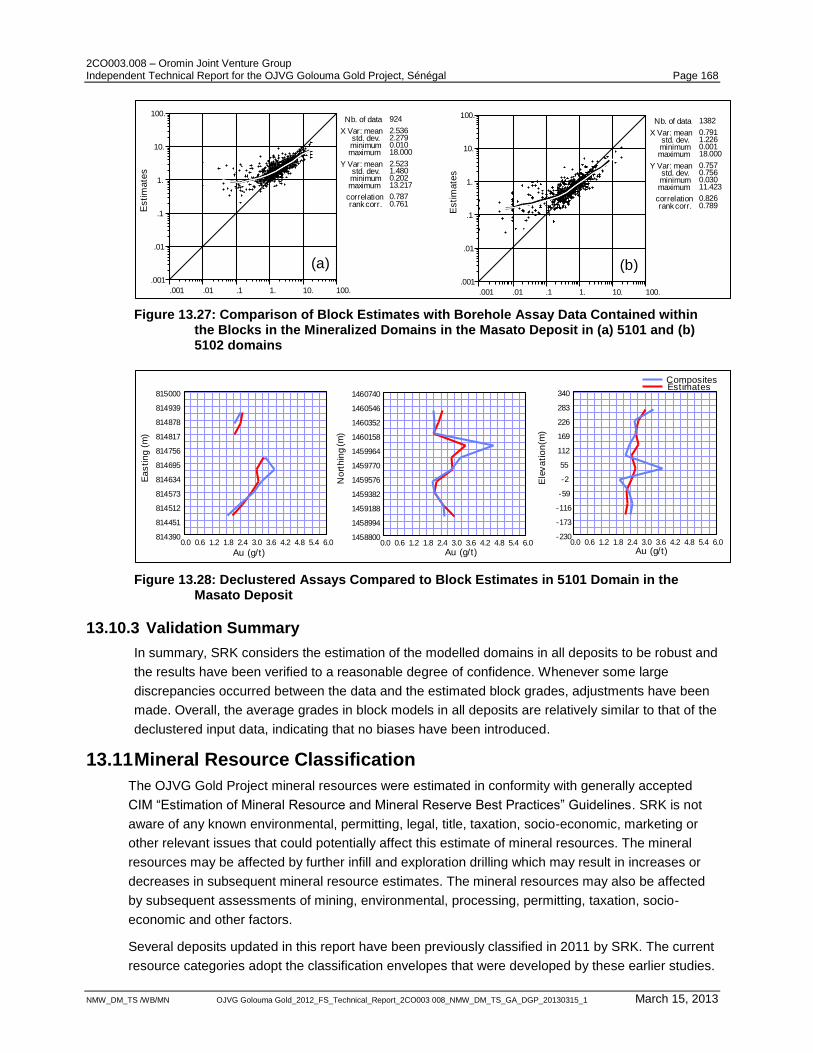
2CO003.008 – Oromin Joint Venture Group Independent Technical Report for the OJVG Golouma Gold Project, Sénégal Page 168
NMW_DM_TS /WB/MN OJVG Golouma Gold_2012_FS_Technical_Report_2CO003 008_NMW_DM_TS_GA_DGP_20130315_1 March 15, 2013
Figure 13.27: Comparison of Block Estimates with Borehole Assay Data Contained within the Blocks in the Mineralized Domains in the Masato Deposit in (a) 5101 and (b) 5102 domains
Figure 13.28: Declustered Assays Compared to Block Estimates in 5101 Domain in the Masato Deposit
13.10.3 Validation Summary
In summary, SRK considers the estimation of the modelled domains in all deposits to be robust and
the results have been verified to a reasonable degree of confidence. Whenever some large
discrepancies occurred between the data and the estimated block grades, adjustments have been
made. Overall, the average grades in block models in all deposits are relatively similar to that of the
declustered input data, indicating that no biases have been introduced.
13.11 Mineral Resource Classification
The OJVG Gold Project mineral resources were estimated in conformity with generally accepted
CIM “Estimation of Mineral Resource and Mineral Reserve Best Practices” Guidelines. SRK is not
aware of any known environmental, permitting, legal, title, taxation, socio-economic, marketing or
other relevant issues that could potentially affect this estimate of mineral resources. The mineral
resources may be affected by further infill and exploration drilling which may result in increases or
decreases in subsequent mineral resource estimates. The mineral resources may also be affected
by subsequent assessments of mining, environmental, processing, permitting, taxation, socio-
economic and other factors.
Several deposits updated in this report have been previously classified in 2011 by SRK. The current
resource categories adopt the classification envelopes that were developed by these earlier studies.
Estim
ate
s
Assay s
.001 .01 .1 1. 10. 100.
.001
.01
.1
1.
10.
100.Nb. of data 924
X Var: mean 2.536std. dev. 2.279minimum 0.010maximum 18.000
Y Var: mean 2.523std. dev. 1.480minimum 0.202maximum 13.217
correlation 0.787rank corr. 0.761
(a)
Estim
ate
s
Assay s
.001 .01 .1 1. 10. 100.
.001
.01
.1
1.
10.
100.Nb. of data 1382
X Var: mean 0.791std. dev. 1.226minimum 0.001maximum 18.000
Y Var: mean 0.757std. dev. 0.756minimum 0.030maximum 11.423
correlation 0.826rank corr. 0.789
(b)
EstimatesComposites
0.0 0.6 1.2 1.8 2.4 3.0 3.6 4.2 4.8 5.4 6.0814390
814451
814512
814573
814634
814695
814756
814817
814878
814939
815000
Au (g/t)
Ea
sti
ng
(m)
0.0 0.6 1.2 1.8 2.4 3.0 3.6 4.2 4.8 5.4 6.01458800
1458994
1459188
1459382
1459576
1459770
1459964
1460158
1460352
1460546
1460740
No
rth
ing
(m)
0.0 0.6 1.2 1.8 2.4 3.0 3.6 4.2 4.8 5.4 6.0-230
-173
-116
-59
-2
55
112
169
226
283
340
Ele
va
tio
n(m
)Au (g/t)Au (g/t)
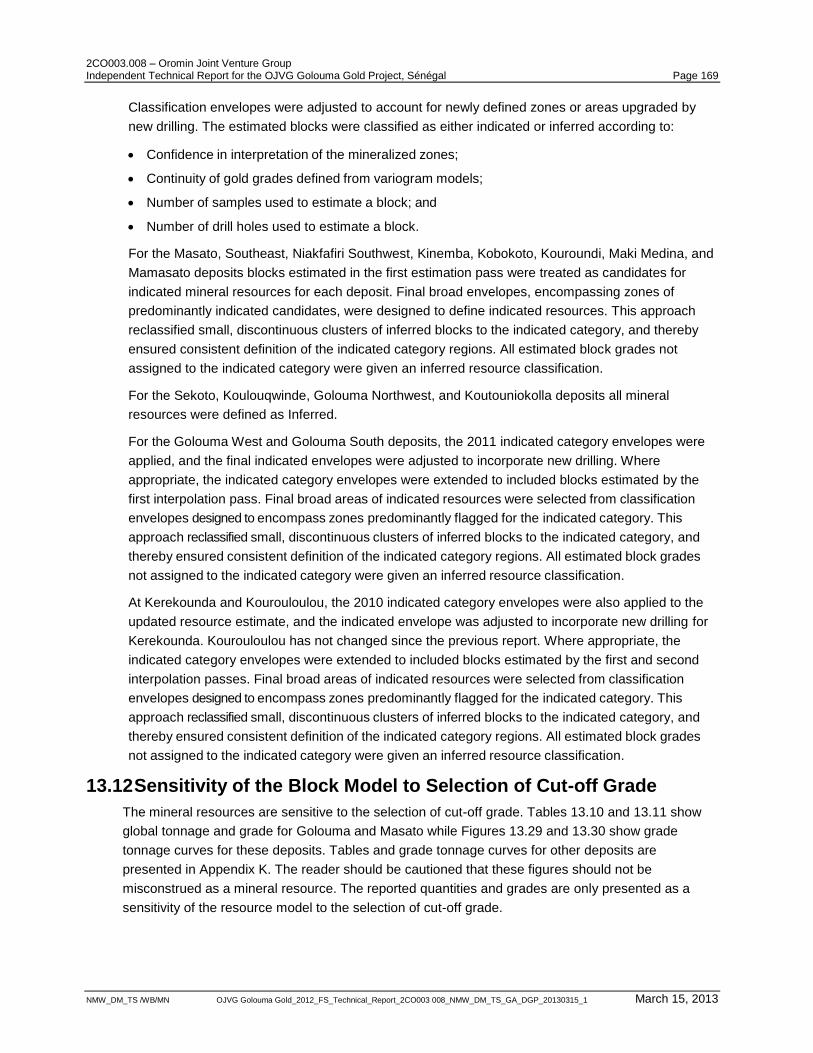
2CO003.008 – Oromin Joint Venture Group Independent Technical Report for the OJVG Golouma Gold Project, Sénégal Page 169
NMW_DM_TS /WB/MN OJVG Golouma Gold_2012_FS_Technical_Report_2CO003 008_NMW_DM_TS_GA_DGP_20130315_1 March 15, 2013
Classification envelopes were adjusted to account for newly defined zones or areas upgraded by
new drilling. The estimated blocks were classified as either indicated or inferred according to:
Confidence in interpretation of the mineralized zones;
Continuity of gold grades defined from variogram models;
Number of samples used to estimate a block; and
Number of drill holes used to estimate a block.
For the Masato, Southeast, Niakfafiri Southwest, Kinemba, Kobokoto, Kouroundi, Maki Medina, and
Mamasato deposits blocks estimated in the first estimation pass were treated as candidates for
indicated mineral resources for each deposit. Final broad envelopes, encompassing zones of
predominantly indicated candidates, were designed to define indicated resources. This approach
reclassified small, discontinuous clusters of inferred blocks to the indicated category, and thereby
ensured consistent definition of the indicated category regions. All estimated block grades not
assigned to the indicated category were given an inferred resource classification.
For the Sekoto, Koulouqwinde, Golouma Northwest, and Koutouniokolla deposits all mineral
resources were defined as Inferred.
For the Golouma West and Golouma South deposits, the 2011 indicated category envelopes were
applied, and the final indicated envelopes were adjusted to incorporate new drilling. Where
appropriate, the indicated category envelopes were extended to included blocks estimated by the
first interpolation pass. Final broad areas of indicated resources were selected from classification
envelopes designed to encompass zones predominantly flagged for the indicated category. This
approach reclassified small, discontinuous clusters of inferred blocks to the indicated category, and
thereby ensured consistent definition of the indicated category regions. All estimated block grades
not assigned to the indicated category were given an inferred resource classification.
At Kerekounda and Kourouloulou, the 2010 indicated category envelopes were also applied to the
updated resource estimate, and the indicated envelope was adjusted to incorporate new drilling for
Kerekounda. Kourouloulou has not changed since the previous report. Where appropriate, the
indicated category envelopes were extended to included blocks estimated by the first and second
interpolation passes. Final broad areas of indicated resources were selected from classification
envelopes designed to encompass zones predominantly flagged for the indicated category. This
approach reclassified small, discontinuous clusters of inferred blocks to the indicated category, and
thereby ensured consistent definition of the indicated category regions. All estimated block grades
not assigned to the indicated category were given an inferred resource classification.
13.12 Sensitivity of the Block Model to Selection of Cut-off Grade
The mineral resources are sensitive to the selection of cut-off grade. Tables 13.10 and 13.11 show
global tonnage and grade for Golouma and Masato while Figures 13.29 and 13.30 show grade
tonnage curves for these deposits. Tables and grade tonnage curves for other deposits are
presented in Appendix K. The reader should be cautioned that these figures should not be
misconstrued as a mineral resource. The reported quantities and grades are only presented as a
sensitivity of the resource model to the selection of cut-off grade.
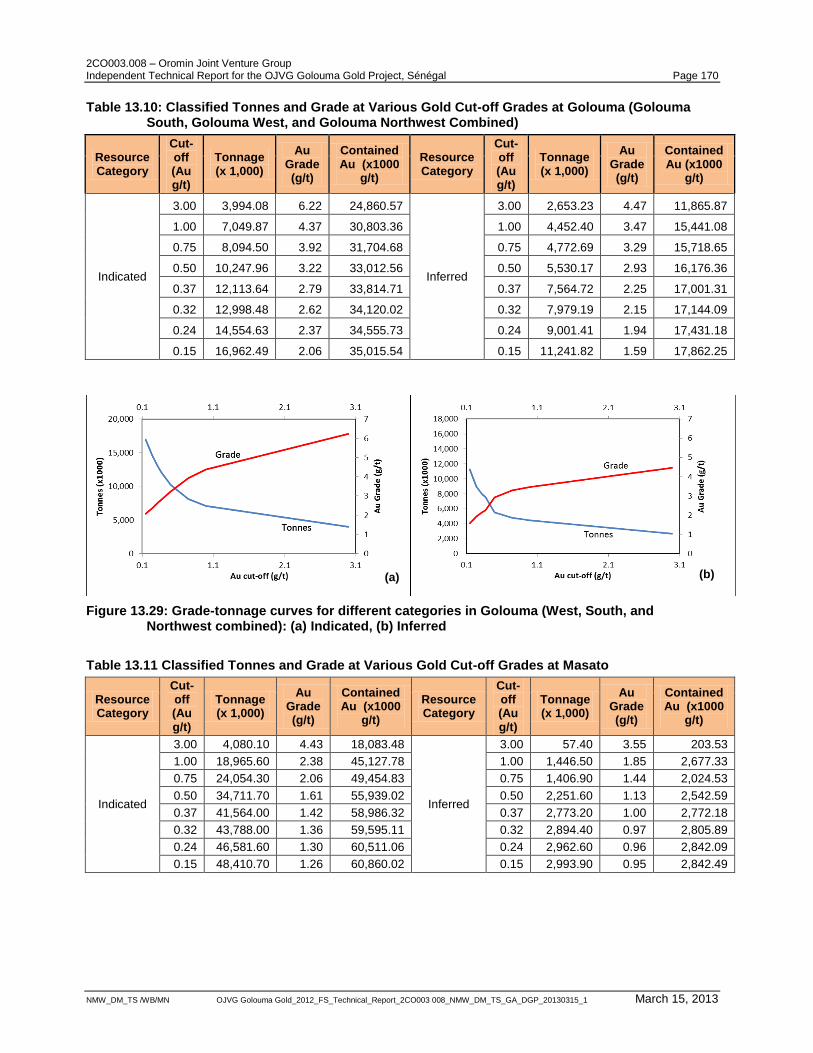
2CO003.008 – Oromin Joint Venture Group Independent Technical Report for the OJVG Golouma Gold Project, Sénégal Page 170
NMW_DM_TS /WB/MN OJVG Golouma Gold_2012_FS_Technical_Report_2CO003 008_NMW_DM_TS_GA_DGP_20130315_1 March 15, 2013
Table 13.10: Classified Tonnes and Grade at Various Gold Cut-off Grades at Golouma (Golouma South, Golouma West, and Golouma Northwest Combined)
Resource Category
Cut-off (Au g/t)
Tonnage (x 1,000)
Au Grade (g/t)
Contained Au (x1000
g/t)
Resource Category
Cut-off (Au g/t)
Tonnage (x 1,000)
Au Grade (g/t)
Contained Au (x1000
g/t)
Indicated
3.00 3,994.08 6.22 24,860.57
Inferred
3.00 2,653.23 4.47 11,865.87
1.00 7,049.87 4.37 30,803.36 1.00 4,452.40 3.47 15,441.08
0.75 8,094.50 3.92 31,704.68 0.75 4,772.69 3.29 15,718.65
0.50 10,247.96 3.22 33,012.56 0.50 5,530.17 2.93 16,176.36
0.37 12,113.64 2.79 33,814.71 0.37 7,564.72 2.25 17,001.31
0.32 12,998.48 2.62 34,120.02 0.32 7,979.19 2.15 17,144.09
0.24 14,554.63 2.37 34,555.73 0.24 9,001.41 1.94 17,431.18
0.15 16,962.49 2.06 35,015.54 0.15 11,241.82 1.59 17,862.25
Figure 13.29: Grade-tonnage curves for different categories in Golouma (West, South, and Northwest combined): (a) Indicated, (b) Inferred
Table 13.11 Classified Tonnes and Grade at Various Gold Cut-off Grades at Masato
Resource Category
Cut-off (Au g/t)
Tonnage (x 1,000)
Au Grade (g/t)
Contained Au (x1000
g/t)
Resource Category
Cut-off (Au g/t)
Tonnage (x 1,000)
Au Grade (g/t)
Contained Au (x1000
g/t)
Indicated
3.00 4,080.10 4.43 18,083.48
Inferred
3.00 57.40 3.55 203.53
1.00 18,965.60 2.38 45,127.78 1.00 1,446.50 1.85 2,677.33
0.75 24,054.30 2.06 49,454.83 0.75 1,406.90 1.44 2,024.53
0.50 34,711.70 1.61 55,939.02 0.50 2,251.60 1.13 2,542.59
0.37 41,564.00 1.42 58,986.32 0.37 2,773.20 1.00 2,772.18
0.32 43,788.00 1.36 59,595.11 0.32 2,894.40 0.97 2,805.89
0.24 46,581.60 1.30 60,511.06 0.24 2,962.60 0.96 2,842.09
0.15 48,410.70 1.26 60,860.02 0.15 2,993.90 0.95 2,842.49
(b) (a)
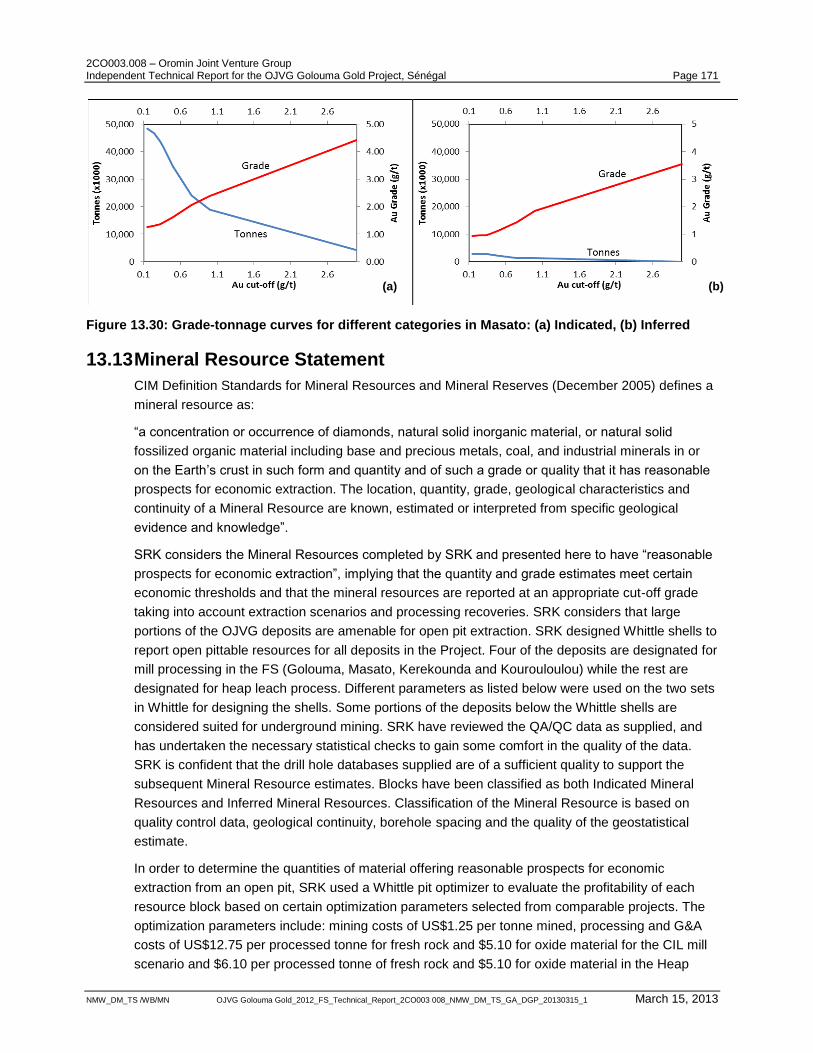
2CO003.008 – Oromin Joint Venture Group Independent Technical Report for the OJVG Golouma Gold Project, Sénégal Page 171
NMW_DM_TS /WB/MN OJVG Golouma Gold_2012_FS_Technical_Report_2CO003 008_NMW_DM_TS_GA_DGP_20130315_1 March 15, 2013
Figure 13.30: Grade-tonnage curves for different categories in Masato: (a) Indicated, (b) Inferred
13.13 Mineral Resource Statement
CIM Definition Standards for Mineral Resources and Mineral Reserves (December 2005) defines a
mineral resource as:
“a concentration or occurrence of diamonds, natural solid inorganic material, or natural solid
fossilized organic material including base and precious metals, coal, and industrial minerals in or
on the Earth‟s crust in such form and quantity and of such a grade or quality that it has reasonable
prospects for economic extraction. The location, quantity, grade, geological characteristics and
continuity of a Mineral Resource are known, estimated or interpreted from specific geological
evidence and knowledge”.
SRK considers the Mineral Resources completed by SRK and presented here to have “reasonable
prospects for economic extraction”, implying that the quantity and grade estimates meet certain
economic thresholds and that the mineral resources are reported at an appropriate cut-off grade
taking into account extraction scenarios and processing recoveries. SRK considers that large
portions of the OJVG deposits are amenable for open pit extraction. SRK designed Whittle shells to
report open pittable resources for all deposits in the Project. Four of the deposits are designated for
mill processing in the FS (Golouma, Masato, Kerekounda and Kourouloulou) while the rest are
designated for heap leach process. Different parameters as listed below were used on the two sets
in Whittle for designing the shells. Some portions of the deposits below the Whittle shells are
considered suited for underground mining. SRK have reviewed the QA/QC data as supplied, and
has undertaken the necessary statistical checks to gain some comfort in the quality of the data.
SRK is confident that the drill hole databases supplied are of a sufficient quality to support the
subsequent Mineral Resource estimates. Blocks have been classified as both Indicated Mineral
Resources and Inferred Mineral Resources. Classification of the Mineral Resource is based on
quality control data, geological continuity, borehole spacing and the quality of the geostatistical
estimate.
In order to determine the quantities of material offering reasonable prospects for economic
extraction from an open pit, SRK used a Whittle pit optimizer to evaluate the profitability of each
resource block based on certain optimization parameters selected from comparable projects. The
optimization parameters include: mining costs of US$1.25 per tonne mined, processing and G&A
costs of US$12.75 per processed tonne for fresh rock and $5.10 for oxide material for the CIL mill
scenario and $6.10 per processed tonne of fresh rock and $5.10 for oxide material in the Heap
(a) (b)
2CO003.008 – Oromin Joint Venture Group Independent Technical Report for the OJVG Golouma Gold Project, Sénégal Page 172
NMW_DM_TS /WB/MN OJVG Golouma Gold_2012_FS_Technical_Report_2CO003 008_NMW_DM_TS_GA_DGP_20130315_1 March 15, 2013
Leach scenario , overall pit slope angles of forty-five degrees, metallurgical recovery of 95% for
fresh rock and 80% for oxide in the CIL mill scenario and 60% for fresh rock and 80% for oxide in
the heap leach scenario, and appropriate dilution and offsite costs and royalties. A gold price of
US$1,500 per ounce was considered. The reader is cautioned that the results from the conceptual
pit optimization work are used solely for the purpose of reporting Mineral Resources that have
“reasonable prospects” for economic extraction by an open pit and do not represent an attempt to
estimate mineral reserves.
The resources from the Whittle shells are reported at 0.32 Au g/t cut-off, for fresh rock, 0.15 Au g/t
for oxide material in the CIL scenario; 0.24 Au g/t cut-off for fresh rock and 0.15 Au g/t cut-off for
oxide material in the Heap Leach scenario, and the underground portions of the deposits
representing material outside of the designed Whittle shells are reported at 1.0 Au g/t cut-off grade
(Table 13.12). Note that the close proximity and overlapping infrastructure design of the two similar
style deposits from the 2010 Feasibility Study suggests that Golouma West and Golouma South
should be considered as one deposit and are reported as such in this report and in future
disclosures.
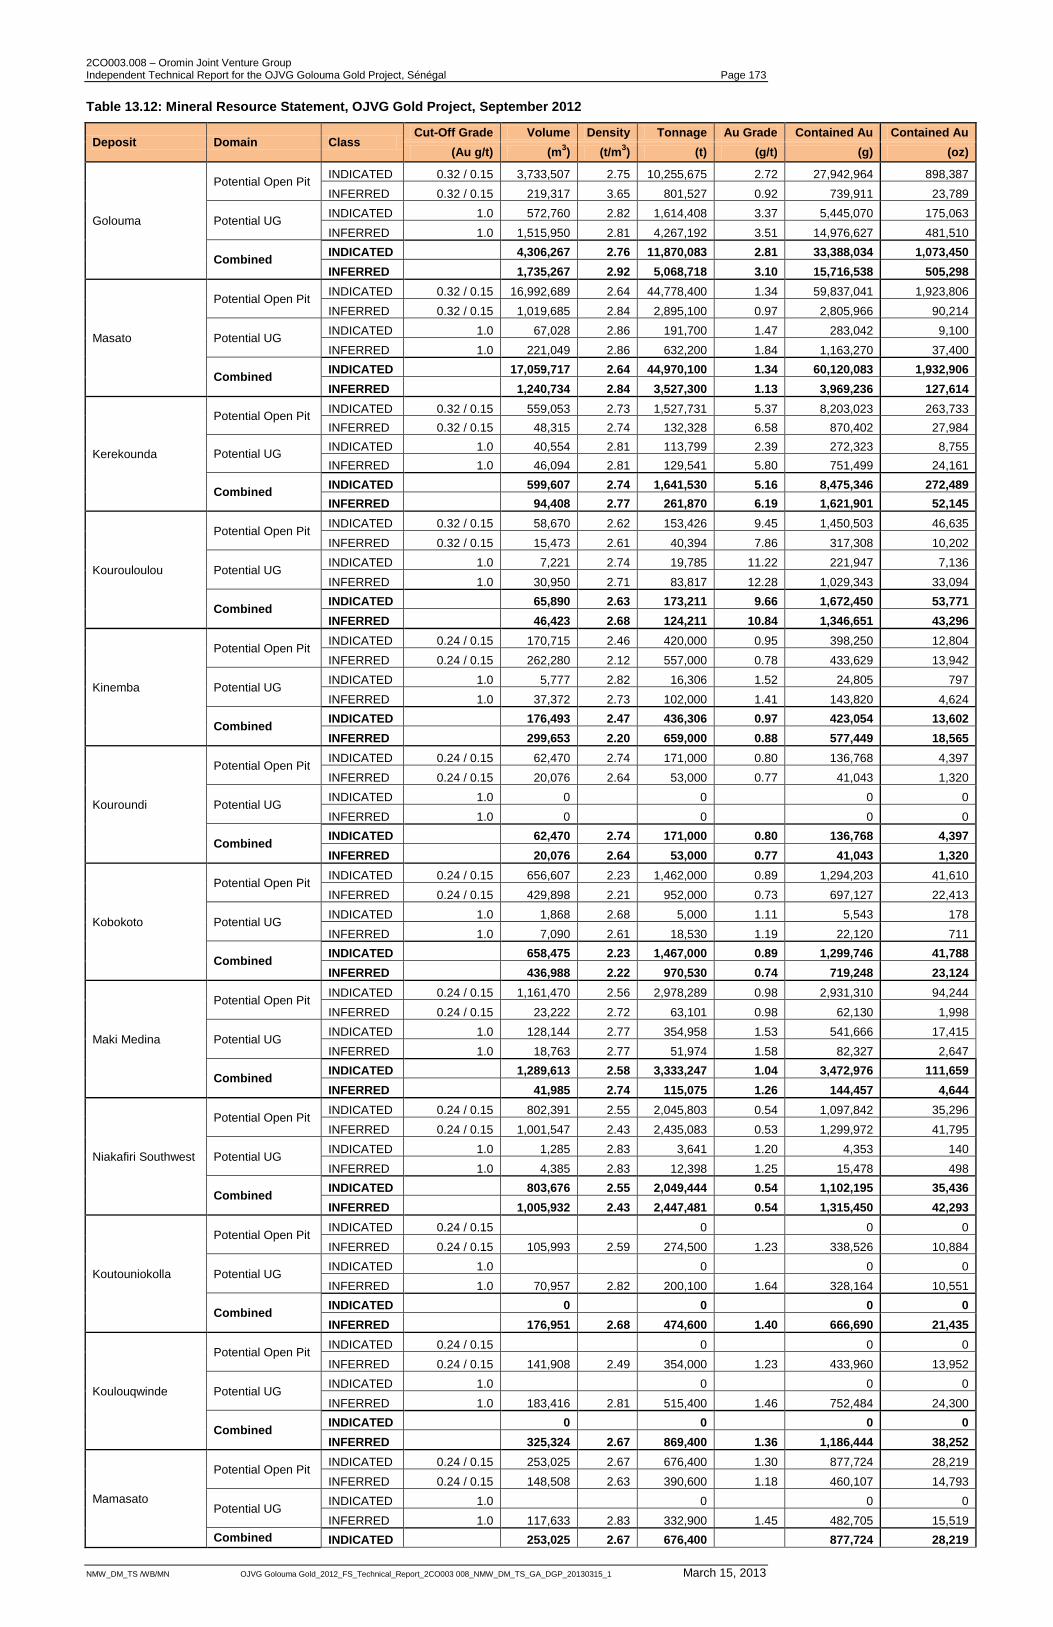
2CO003.008 – Oromin Joint Venture Group Independent Technical Report for the OJVG Golouma Gold Project, Sénégal Page 173
NMW_DM_TS /WB/MN OJVG Golouma Gold_2012_FS_Technical_Report_2CO003 008_NMW_DM_TS_GA_DGP_20130315_1 March 15, 2013
Table 13.12: Mineral Resource Statement, OJVG Gold Project, September 2012
Deposit Domain Class Cut-Off Grade Volume Density Tonnage Au Grade Contained Au Contained Au
(Au g/t) (m3) (t/m
3) (t) (g/t) (g) (oz)
Golouma
Potential Open Pit INDICATED 0.32 / 0.15 3,733,507 2.75 10,255,675 2.72 27,942,964 898,387
INFERRED 0.32 / 0.15 219,317 3.65 801,527 0.92 739,911 23,789
Potential UG INDICATED 1.0 572,760 2.82 1,614,408 3.37 5,445,070 175,063
INFERRED 1.0 1,515,950 2.81 4,267,192 3.51 14,976,627 481,510
Combined INDICATED 4,306,267 2.76 11,870,083 2.81 33,388,034 1,073,450
INFERRED 1,735,267 2.92 5,068,718 3.10 15,716,538 505,298
Masato
Potential Open Pit INDICATED 0.32 / 0.15 16,992,689 2.64 44,778,400 1.34 59,837,041 1,923,806
INFERRED 0.32 / 0.15 1,019,685 2.84 2,895,100 0.97 2,805,966 90,214
Potential UG INDICATED 1.0 67,028 2.86 191,700 1.47 283,042 9,100
INFERRED 1.0 221,049 2.86 632,200 1.84 1,163,270 37,400
Combined INDICATED 17,059,717 2.64 44,970,100 1.34 60,120,083 1,932,906
INFERRED 1,240,734 2.84 3,527,300 1.13 3,969,236 127,614
Kerekounda
Potential Open Pit INDICATED 0.32 / 0.15 559,053 2.73 1,527,731 5.37 8,203,023 263,733
INFERRED 0.32 / 0.15 48,315 2.74 132,328 6.58 870,402 27,984
Potential UG INDICATED 1.0 40,554 2.81 113,799 2.39 272,323 8,755
INFERRED 1.0 46,094 2.81 129,541 5.80 751,499 24,161
Combined INDICATED 599,607 2.74 1,641,530 5.16 8,475,346 272,489
INFERRED 94,408 2.77 261,870 6.19 1,621,901 52,145
Kourouloulou
Potential Open Pit INDICATED 0.32 / 0.15 58,670 2.62 153,426 9.45 1,450,503 46,635
INFERRED 0.32 / 0.15 15,473 2.61 40,394 7.86 317,308 10,202
Potential UG INDICATED 1.0 7,221 2.74 19,785 11.22 221,947 7,136
INFERRED 1.0 30,950 2.71 83,817 12.28 1,029,343 33,094
Combined INDICATED 65,890 2.63 173,211 9.66 1,672,450 53,771
INFERRED 46,423 2.68 124,211 10.84 1,346,651 43,296
Kinemba
Potential Open Pit INDICATED 0.24 / 0.15 170,715 2.46 420,000 0.95 398,250 12,804
INFERRED 0.24 / 0.15 262,280 2.12 557,000 0.78 433,629 13,942
Potential UG INDICATED 1.0 5,777 2.82 16,306 1.52 24,805 797
INFERRED 1.0 37,372 2.73 102,000 1.41 143,820 4,624
Combined INDICATED 176,493 2.47 436,306 0.97 423,054 13,602
INFERRED 299,653 2.20 659,000 0.88 577,449 18,565
Kouroundi
Potential Open Pit INDICATED 0.24 / 0.15 62,470 2.74 171,000 0.80 136,768 4,397
INFERRED 0.24 / 0.15 20,076 2.64 53,000 0.77 41,043 1,320
Potential UG INDICATED 1.0 0 0 0 0
INFERRED 1.0 0 0 0 0
Combined INDICATED 62,470 2.74 171,000 0.80 136,768 4,397
INFERRED 20,076 2.64 53,000 0.77 41,043 1,320
Kobokoto
Potential Open Pit INDICATED 0.24 / 0.15 656,607 2.23 1,462,000 0.89 1,294,203 41,610
INFERRED 0.24 / 0.15 429,898 2.21 952,000 0.73 697,127 22,413
Potential UG INDICATED 1.0 1,868 2.68 5,000 1.11 5,543 178
INFERRED 1.0 7,090 2.61 18,530 1.19 22,120 711
Combined INDICATED 658,475 2.23 1,467,000 0.89 1,299,746 41,788
INFERRED 436,988 2.22 970,530 0.74 719,248 23,124
Maki Medina
Potential Open Pit INDICATED 0.24 / 0.15 1,161,470 2.56 2,978,289 0.98 2,931,310 94,244
INFERRED 0.24 / 0.15 23,222 2.72 63,101 0.98 62,130 1,998
Potential UG INDICATED 1.0 128,144 2.77 354,958 1.53 541,666 17,415
INFERRED 1.0 18,763 2.77 51,974 1.58 82,327 2,647
Combined INDICATED 1,289,613 2.58 3,333,247 1.04 3,472,976 111,659
INFERRED 41,985 2.74 115,075 1.26 144,457 4,644
Niakafiri Southwest
Potential Open Pit INDICATED 0.24 / 0.15 802,391 2.55 2,045,803 0.54 1,097,842 35,296
INFERRED 0.24 / 0.15 1,001,547 2.43 2,435,083 0.53 1,299,972 41,795
Potential UG INDICATED 1.0 1,285 2.83 3,641 1.20 4,353 140
INFERRED 1.0 4,385 2.83 12,398 1.25 15,478 498
Combined INDICATED 803,676 2.55 2,049,444 0.54 1,102,195 35,436
INFERRED 1,005,932 2.43 2,447,481 0.54 1,315,450 42,293
Koutouniokolla
Potential Open Pit INDICATED 0.24 / 0.15 0 0 0
INFERRED 0.24 / 0.15 105,993 2.59 274,500 1.23 338,526 10,884
Potential UG INDICATED 1.0 0 0 0
INFERRED 1.0 70,957 2.82 200,100 1.64 328,164 10,551
Combined INDICATED 0 0 0 0
INFERRED 176,951 2.68 474,600 1.40 666,690 21,435
Koulouqwinde
Potential Open Pit INDICATED 0.24 / 0.15 0 0 0
INFERRED 0.24 / 0.15 141,908 2.49 354,000 1.23 433,960 13,952
Potential UG INDICATED 1.0 0 0 0
INFERRED 1.0 183,416 2.81 515,400 1.46 752,484 24,300
Combined INDICATED 0 0 0 0
INFERRED 325,324 2.67 869,400 1.36 1,186,444 38,252
Mamasato
Potential Open Pit INDICATED 0.24 / 0.15 253,025 2.67 676,400 1.30 877,724 28,219
INFERRED 0.24 / 0.15 148,508 2.63 390,600 1.18 460,107 14,793
Potential UG INDICATED 1.0 0 0 0
INFERRED 1.0 117,633 2.83 332,900 1.45 482,705 15,519
Combined INDICATED 253,025 2.67 676,400 877,724 28,219
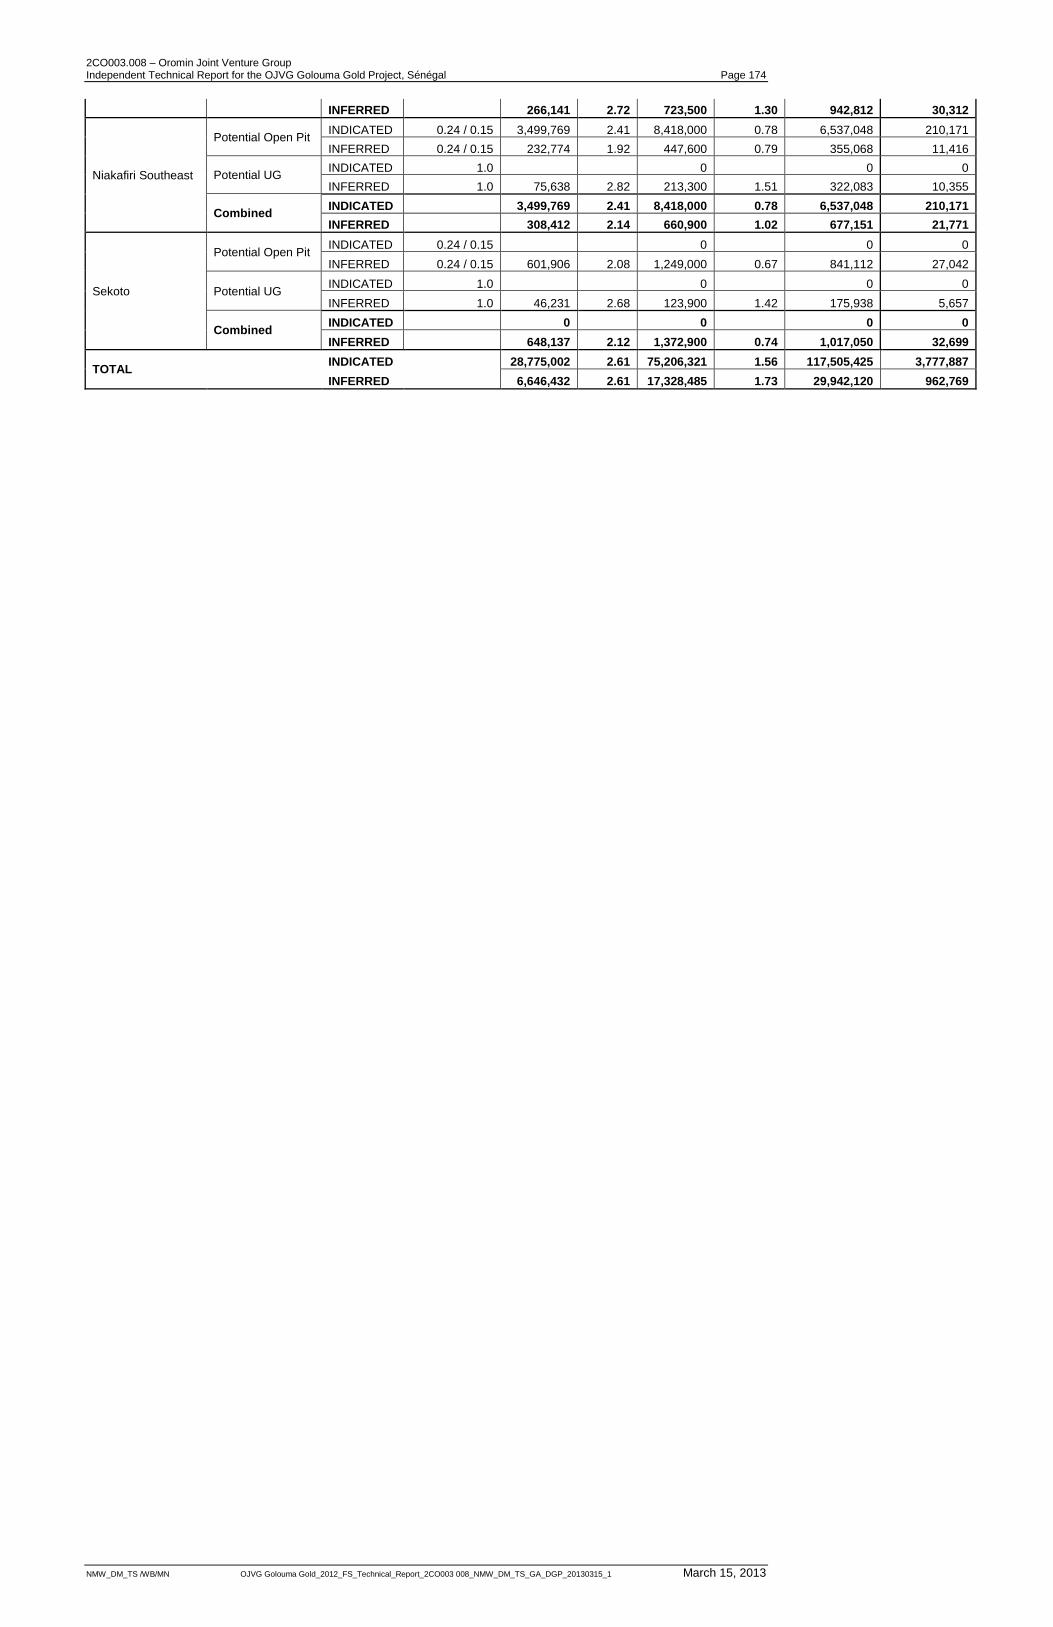
2CO003.008 – Oromin Joint Venture Group Independent Technical Report for the OJVG Golouma Gold Project, Sénégal Page 174
NMW_DM_TS /WB/MN OJVG Golouma Gold_2012_FS_Technical_Report_2CO003 008_NMW_DM_TS_GA_DGP_20130315_1 March 15, 2013
INFERRED 266,141 2.72 723,500 1.30 942,812 30,312
Niakafiri Southeast
Potential Open Pit INDICATED 0.24 / 0.15 3,499,769 2.41 8,418,000 0.78 6,537,048 210,171
INFERRED 0.24 / 0.15 232,774 1.92 447,600 0.79 355,068 11,416
Potential UG INDICATED 1.0 0 0 0
INFERRED 1.0 75,638 2.82 213,300 1.51 322,083 10,355
Combined INDICATED 3,499,769 2.41 8,418,000 0.78 6,537,048 210,171
INFERRED 308,412 2.14 660,900 1.02 677,151 21,771
Sekoto
Potential Open Pit INDICATED 0.24 / 0.15 0 0 0
INFERRED 0.24 / 0.15 601,906 2.08 1,249,000 0.67 841,112 27,042
Potential UG INDICATED 1.0 0 0 0
INFERRED 1.0 46,231 2.68 123,900 1.42 175,938 5,657
Combined INDICATED 0 0 0 0
INFERRED 648,137 2.12 1,372,900 0.74 1,017,050 32,699
TOTAL INDICATED 28,775,002 2.61 75,206,321 1.56 117,505,425 3,777,887
INFERRED 6,646,432 2.61 17,328,485 1.73 29,942,120 962,769
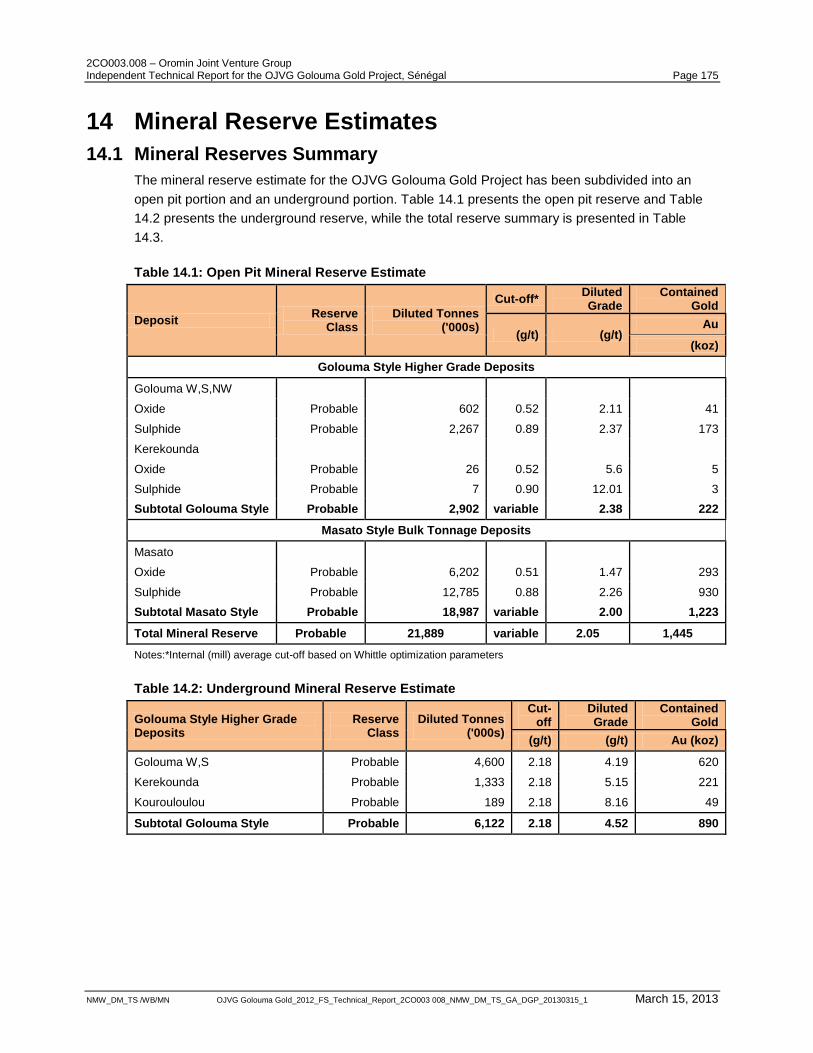
2CO003.008 – Oromin Joint Venture Group Independent Technical Report for the OJVG Golouma Gold Project, Sénégal Page 175
NMW_DM_TS /WB/MN OJVG Golouma Gold_2012_FS_Technical_Report_2CO003 008_NMW_DM_TS_GA_DGP_20130315_1 March 15, 2013
14 Mineral Reserve Estimates
14.1 Mineral Reserves Summary
The mineral reserve estimate for the OJVG Golouma Gold Project has been subdivided into an
open pit portion and an underground portion. Table 14.1 presents the open pit reserve and Table
14.2 presents the underground reserve, while the total reserve summary is presented in Table
14.3.
Table 14.1: Open Pit Mineral Reserve Estimate
Deposit Reserve
Class Diluted Tonnes
('000s)
Cut-off* Diluted Grade
Contained Gold
(g/t) (g/t) Au
(koz)
Golouma Style Higher Grade Deposits
Golouma W,S,NW
Oxide Probable 602 0.52 2.11 41
Sulphide Probable 2,267 0.89 2.37 173
Kerekounda
Oxide Probable 26 0.52 5.6 5
Sulphide Probable 7 0.90 12.01 3
Subtotal Golouma Style Probable 2,902 variable 2.38 222
Masato Style Bulk Tonnage Deposits
Masato
Oxide Probable 6,202 0.51 1.47 293
Sulphide Probable 12,785 0.88 2.26 930
Subtotal Masato Style Probable 18,987 variable 2.00 1,223
Total Mineral Reserve Probable 21,889 variable 2.05 1,445
Notes:*Internal (mill) average cut-off based on Whittle optimization parameters
Table 14.2: Underground Mineral Reserve Estimate
Golouma Style Higher Grade Deposits
Reserve Class
Diluted Tonnes ('000s)
Cut-off
Diluted Grade
Contained Gold
(g/t) (g/t) Au (koz)
Golouma W,S Probable 4,600 2.18 4.19 620
Kerekounda Probable 1,333 2.18 5.15 221
Kourouloulou Probable 189 2.18 8.16 49
Subtotal Golouma Style Probable 6,122 2.18 4.52 890
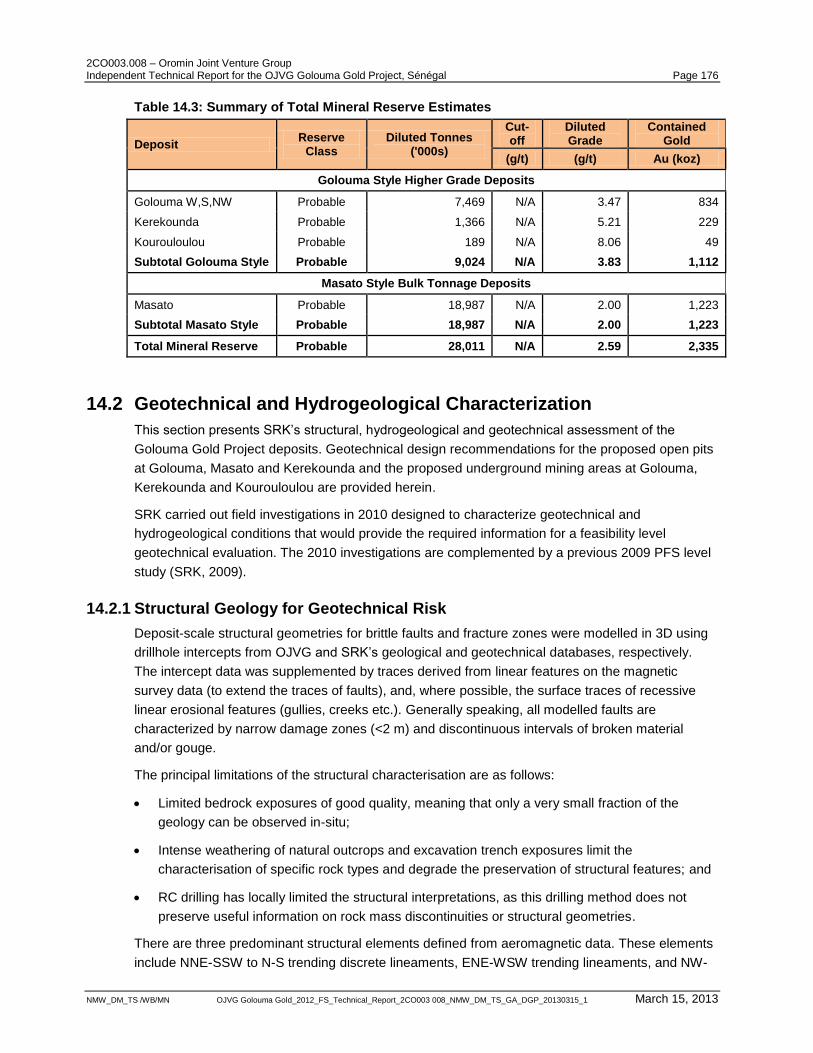
2CO003.008 – Oromin Joint Venture Group Independent Technical Report for the OJVG Golouma Gold Project, Sénégal Page 176
NMW_DM_TS /WB/MN OJVG Golouma Gold_2012_FS_Technical_Report_2CO003 008_NMW_DM_TS_GA_DGP_20130315_1 March 15, 2013
Table 14.3: Summary of Total Mineral Reserve Estimates
Deposit Reserve
Class Diluted Tonnes
('000s)
Cut-off
Diluted Grade
Contained Gold
(g/t) (g/t) Au (koz)
Golouma Style Higher Grade Deposits
Golouma W,S,NW Probable 7,469 N/A 3.47 834
Kerekounda Probable 1,366 N/A 5.21 229
Kourouloulou Probable 189 N/A 8.06 49
Subtotal Golouma Style Probable 9,024 N/A 3.83 1,112
Masato Style Bulk Tonnage Deposits
Masato Probable 18,987 N/A 2.00 1,223
Subtotal Masato Style Probable 18,987 N/A 2.00 1,223
Total Mineral Reserve Probable 28,011 N/A 2.59 2,335
14.2 Geotechnical and Hydrogeological Characterization
This section presents SRK‟s structural, hydrogeological and geotechnical assessment of the
Golouma Gold Project deposits. Geotechnical design recommendations for the proposed open pits
at Golouma, Masato and Kerekounda and the proposed underground mining areas at Golouma,
Kerekounda and Kourouloulou are provided herein.
SRK carried out field investigations in 2010 designed to characterize geotechnical and
hydrogeological conditions that would provide the required information for a feasibility level
geotechnical evaluation. The 2010 investigations are complemented by a previous 2009 PFS level
study (SRK, 2009).
14.2.1 Structural Geology for Geotechnical Risk
Deposit-scale structural geometries for brittle faults and fracture zones were modelled in 3D using
drillhole intercepts from OJVG and SRK‟s geological and geotechnical databases, respectively.
The intercept data was supplemented by traces derived from linear features on the magnetic
survey data (to extend the traces of faults), and, where possible, the surface traces of recessive
linear erosional features (gullies, creeks etc.). Generally speaking, all modelled faults are
characterized by narrow damage zones (<2 m) and discontinuous intervals of broken material
and/or gouge.
The principal limitations of the structural characterisation are as follows:
Limited bedrock exposures of good quality, meaning that only a very small fraction of the
geology can be observed in-situ;
Intense weathering of natural outcrops and excavation trench exposures limit the
characterisation of specific rock types and degrade the preservation of structural features; and
RC drilling has locally limited the structural interpretations, as this drilling method does not
preserve useful information on rock mass discontinuities or structural geometries.
There are three predominant structural elements defined from aeromagnetic data. These elements
include NNE-SSW to N-S trending discrete lineaments, ENE-WSW trending lineaments, and NW-
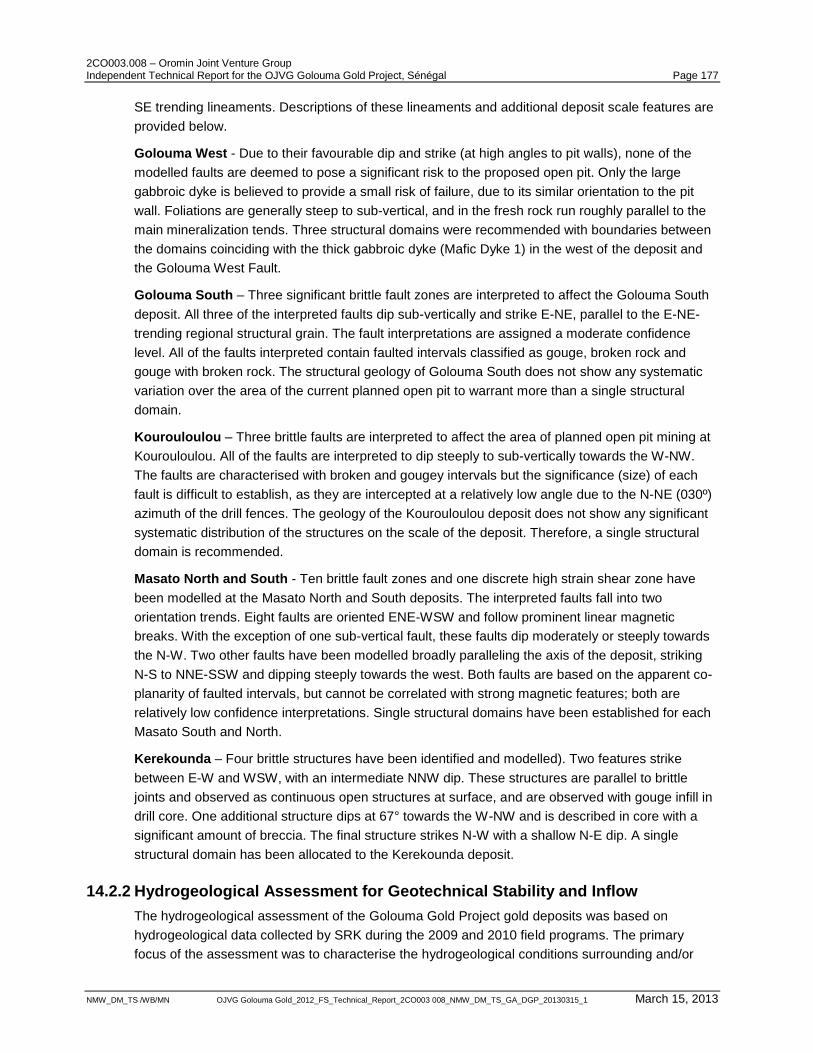
2CO003.008 – Oromin Joint Venture Group Independent Technical Report for the OJVG Golouma Gold Project, Sénégal Page 177
NMW_DM_TS /WB/MN OJVG Golouma Gold_2012_FS_Technical_Report_2CO003 008_NMW_DM_TS_GA_DGP_20130315_1 March 15, 2013
SE trending lineaments. Descriptions of these lineaments and additional deposit scale features are
provided below.
Golouma West - Due to their favourable dip and strike (at high angles to pit walls), none of the
modelled faults are deemed to pose a significant risk to the proposed open pit. Only the large
gabbroic dyke is believed to provide a small risk of failure, due to its similar orientation to the pit
wall. Foliations are generally steep to sub-vertical, and in the fresh rock run roughly parallel to the
main mineralization tends. Three structural domains were recommended with boundaries between
the domains coinciding with the thick gabbroic dyke (Mafic Dyke 1) in the west of the deposit and
the Golouma West Fault.
Golouma South – Three significant brittle fault zones are interpreted to affect the Golouma South
deposit. All three of the interpreted faults dip sub-vertically and strike E-NE, parallel to the E-NE-
trending regional structural grain. The fault interpretations are assigned a moderate confidence
level. All of the faults interpreted contain faulted intervals classified as gouge, broken rock and
gouge with broken rock. The structural geology of Golouma South does not show any systematic
variation over the area of the current planned open pit to warrant more than a single structural
domain.
Kourouloulou – Three brittle faults are interpreted to affect the area of planned open pit mining at
Kourouloulou. All of the faults are interpreted to dip steeply to sub-vertically towards the W-NW.
The faults are characterised with broken and gougey intervals but the significance (size) of each
fault is difficult to establish, as they are intercepted at a relatively low angle due to the N-NE (030º)
azimuth of the drill fences. The geology of the Kourouloulou deposit does not show any significant
systematic distribution of the structures on the scale of the deposit. Therefore, a single structural
domain is recommended.
Masato North and South - Ten brittle fault zones and one discrete high strain shear zone have
been modelled at the Masato North and South deposits. The interpreted faults fall into two
orientation trends. Eight faults are oriented ENE-WSW and follow prominent linear magnetic
breaks. With the exception of one sub-vertical fault, these faults dip moderately or steeply towards
the N-W. Two other faults have been modelled broadly paralleling the axis of the deposit, striking
N-S to NNE-SSW and dipping steeply towards the west. Both faults are based on the apparent co-
planarity of faulted intervals, but cannot be correlated with strong magnetic features; both are
relatively low confidence interpretations. Single structural domains have been established for each
Masato South and North.
Kerekounda – Four brittle structures have been identified and modelled). Two features strike
between E-W and WSW, with an intermediate NNW dip. These structures are parallel to brittle
joints and observed as continuous open structures at surface, and are observed with gouge infill in
drill core. One additional structure dips at 67° towards the W-NW and is described in core with a
significant amount of breccia. The final structure strikes N-W with a shallow N-E dip. A single
structural domain has been allocated to the Kerekounda deposit.
14.2.2 Hydrogeological Assessment for Geotechnical Stability and Inflow
The hydrogeological assessment of the Golouma Gold Project gold deposits was based on
hydrogeological data collected by SRK during the 2009 and 2010 field programs. The primary
focus of the assessment was to characterise the hydrogeological conditions surrounding and/or
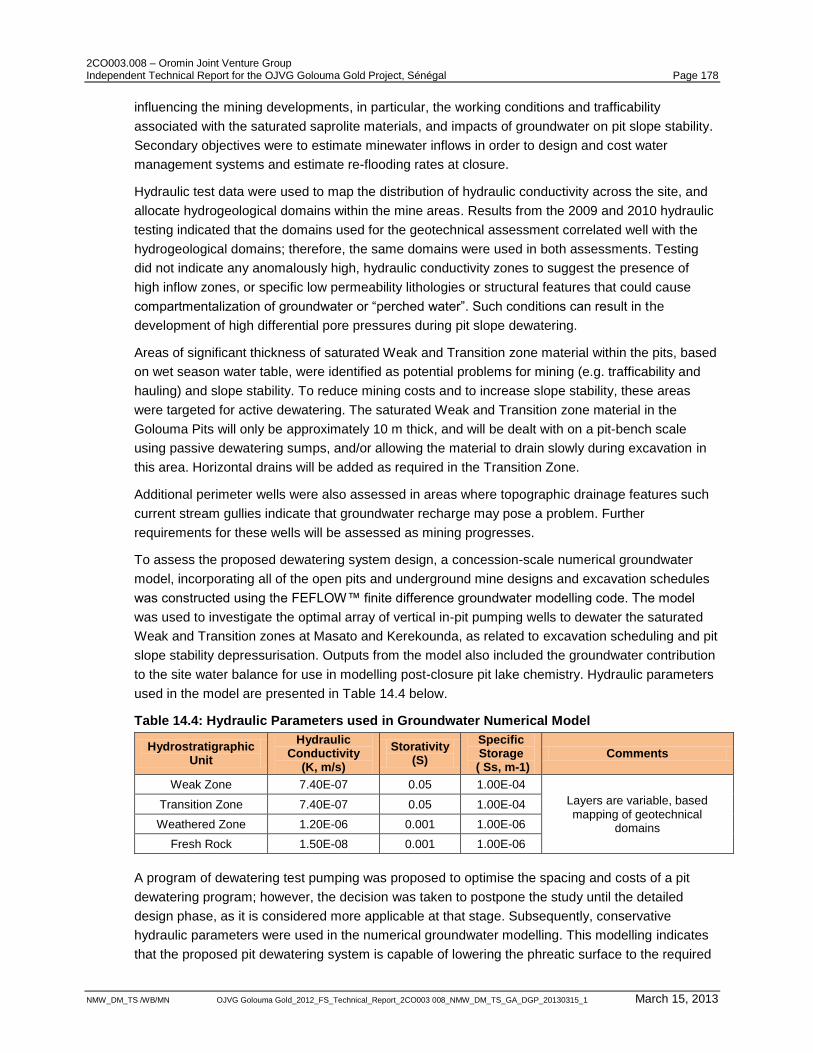
2CO003.008 – Oromin Joint Venture Group Independent Technical Report for the OJVG Golouma Gold Project, Sénégal Page 178
NMW_DM_TS /WB/MN OJVG Golouma Gold_2012_FS_Technical_Report_2CO003 008_NMW_DM_TS_GA_DGP_20130315_1 March 15, 2013
influencing the mining developments, in particular, the working conditions and trafficability
associated with the saturated saprolite materials, and impacts of groundwater on pit slope stability.
Secondary objectives were to estimate minewater inflows in order to design and cost water
management systems and estimate re-flooding rates at closure.
Hydraulic test data were used to map the distribution of hydraulic conductivity across the site, and
allocate hydrogeological domains within the mine areas. Results from the 2009 and 2010 hydraulic
testing indicated that the domains used for the geotechnical assessment correlated well with the
hydrogeological domains; therefore, the same domains were used in both assessments. Testing
did not indicate any anomalously high, hydraulic conductivity zones to suggest the presence of
high inflow zones, or specific low permeability lithologies or structural features that could cause
compartmentalization of groundwater or “perched water”. Such conditions can result in the
development of high differential pore pressures during pit slope dewatering.
Areas of significant thickness of saturated Weak and Transition zone material within the pits, based
on wet season water table, were identified as potential problems for mining (e.g. trafficability and
hauling) and slope stability. To reduce mining costs and to increase slope stability, these areas
were targeted for active dewatering. The saturated Weak and Transition zone material in the
Golouma Pits will only be approximately 10 m thick, and will be dealt with on a pit-bench scale
using passive dewatering sumps, and/or allowing the material to drain slowly during excavation in
this area. Horizontal drains will be added as required in the Transition Zone.
Additional perimeter wells were also assessed in areas where topographic drainage features such
current stream gullies indicate that groundwater recharge may pose a problem. Further
requirements for these wells will be assessed as mining progresses.
To assess the proposed dewatering system design, a concession-scale numerical groundwater
model, incorporating all of the open pits and underground mine designs and excavation schedules
was constructed using the FEFLOW™ finite difference groundwater modelling code. The model
was used to investigate the optimal array of vertical in-pit pumping wells to dewater the saturated
Weak and Transition zones at Masato and Kerekounda, as related to excavation scheduling and pit
slope stability depressurisation. Outputs from the model also included the groundwater contribution
to the site water balance for use in modelling post-closure pit lake chemistry. Hydraulic parameters
used in the model are presented in Table 14.4 below.
Table 14.4: Hydraulic Parameters used in Groundwater Numerical Model
Hydrostratigraphic Unit
Hydraulic Conductivity
(K, m/s)
Storativity (S)
Specific Storage
( Ss, m-1) Comments
Weak Zone 7.40E-07 0.05 1.00E-04
Layers are variable, based mapping of geotechnical
domains
Transition Zone 7.40E-07 0.05 1.00E-04
Weathered Zone 1.20E-06 0.001 1.00E-06
Fresh Rock 1.50E-08 0.001 1.00E-06
A program of dewatering test pumping was proposed to optimise the spacing and costs of a pit
dewatering program; however, the decision was taken to postpone the study until the detailed
design phase, as it is considered more applicable at that stage. Subsequently, conservative
hydraulic parameters were used in the numerical groundwater modelling. This modelling indicates
that the proposed pit dewatering system is capable of lowering the phreatic surface to the required
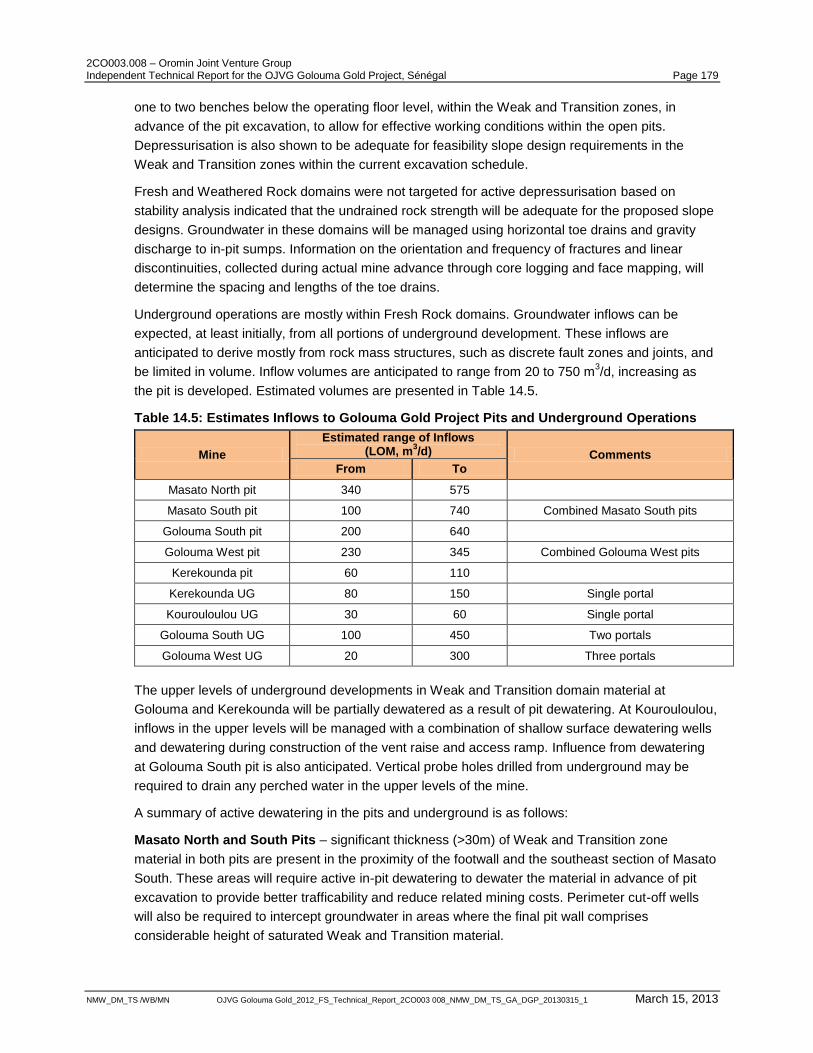
2CO003.008 – Oromin Joint Venture Group Independent Technical Report for the OJVG Golouma Gold Project, Sénégal Page 179
NMW_DM_TS /WB/MN OJVG Golouma Gold_2012_FS_Technical_Report_2CO003 008_NMW_DM_TS_GA_DGP_20130315_1 March 15, 2013
one to two benches below the operating floor level, within the Weak and Transition zones, in
advance of the pit excavation, to allow for effective working conditions within the open pits.
Depressurisation is also shown to be adequate for feasibility slope design requirements in the
Weak and Transition zones within the current excavation schedule.
Fresh and Weathered Rock domains were not targeted for active depressurisation based on
stability analysis indicated that the undrained rock strength will be adequate for the proposed slope
designs. Groundwater in these domains will be managed using horizontal toe drains and gravity
discharge to in-pit sumps. Information on the orientation and frequency of fractures and linear
discontinuities, collected during actual mine advance through core logging and face mapping, will
determine the spacing and lengths of the toe drains.
Underground operations are mostly within Fresh Rock domains. Groundwater inflows can be
expected, at least initially, from all portions of underground development. These inflows are
anticipated to derive mostly from rock mass structures, such as discrete fault zones and joints, and
be limited in volume. Inflow volumes are anticipated to range from 20 to 750 m3/d, increasing as
the pit is developed. Estimated volumes are presented in Table 14.5.
Table 14.5: Estimates Inflows to Golouma Gold Project Pits and Underground Operations
Mine
Estimated range of Inflows (LOM, m
3/d) Comments
From To
Masato North pit 340 575
Masato South pit 100 740 Combined Masato South pits
Golouma South pit 200 640
Golouma West pit 230 345 Combined Golouma West pits
Kerekounda pit 60 110
Kerekounda UG 80 150 Single portal
Kourouloulou UG 30 60 Single portal
Golouma South UG 100 450 Two portals
Golouma West UG 20 300 Three portals
The upper levels of underground developments in Weak and Transition domain material at
Golouma and Kerekounda will be partially dewatered as a result of pit dewatering. At Kourouloulou,
inflows in the upper levels will be managed with a combination of shallow surface dewatering wells
and dewatering during construction of the vent raise and access ramp. Influence from dewatering
at Golouma South pit is also anticipated. Vertical probe holes drilled from underground may be
required to drain any perched water in the upper levels of the mine.
A summary of active dewatering in the pits and underground is as follows:
Masato North and South Pits – significant thickness (>30m) of Weak and Transition zone
material in both pits are present in the proximity of the footwall and the southeast section of Masato
South. These areas will require active in-pit dewatering to dewater the material in advance of pit
excavation to provide better trafficability and reduce related mining costs. Perimeter cut-off wells
will also be required to intercept groundwater in areas where the final pit wall comprises
considerable height of saturated Weak and Transition material.
2CO003.008 – Oromin Joint Venture Group Independent Technical Report for the OJVG Golouma Gold Project, Sénégal Page 180
NMW_DM_TS /WB/MN OJVG Golouma Gold_2012_FS_Technical_Report_2CO003 008_NMW_DM_TS_GA_DGP_20130315_1 March 15, 2013
Golouma West and South Pits – limited saturated Weak and Transition zone thickness (in the
range of 10 metres or less) in both pits indicate that active in-pit dewatering will not be required.
Kerekounda Pit – significant thickness (>20m) of Weak and Transition one material in the central
section of the pit will require active in-pit dewatering to dewater the material in advance of pit
excavation to provide better trafficability and reduce related mining costs.
Golouma, Kerekounda, and Kourouloulou Underground – all underground mines are expected
to have medium to low inflows (in the range of 50-300m3/day) and require limited active
dewatering, with the exception of the upper stopes in Kourouloulou, which will likely require active
dewatering from upper stopes and pumping wells on surface to reduce inflow while mining.
Management of total open pit and underground inflows consisting of groundwater seepage, direct
precipitation, and undiverted surface run-off is included in this study. The site water management
system was designed to accommodate all groundwater inflows, as well as surface inflow from
1:1 year storm events. All pit water will be collected in sumps at the base of the pit, and then
pumped to surface holding ponds located in the vicinity of the mine area. Underground inflows will
also be pumped to the surface holding ponds using a system of pumping stages. Water from the
holding ponds will be either be discharged directly to the environment if water quality conditions
allow, or pumped to the mill and/or water treatment plant.
Capital and operational costs were calculated for water management for open pit and underground
operations during the life of mine. Although the dewatering design is considered conservative to
account for the lack of specific dewatering test data, normally used for optimization, an adequate
contingency will be applied to cover for contingency wells, if required. The costs include in-pit and
perimeter pumping wells, underground pumping, and piping for conveyance of inflows to the
surface holding ponds in the mine areas.
The baseline sampling of groundwater at monitoring wells was continued as part of the feasibility
design and environmental impact assessment. Dissolved metals data from wells in the Golouma,
Kerekounda, and Masato areas indicated elevated concentrations of arsenic, barium, boron,
chromium, lead, manganese, and molybdenum in relation to WHO drinking water standards, but
will be acceptable for direct surface discharge if required, once suspended solid loads have been
settled in the surface holding ponds
Inflow chemistry is discussed in more detail in Section 19 (Environment), as it relates to pit lake
modelling and closure options.
14.2.3 Geotechnical Assessment for Slope Design
The feasibility level geotechnical assessment for slope design utilized the following approach:
Generation of structural domains and selection of structural feature sets - prevailing large
scale structures have been used as a framework for the development of structural domains.
Representative large and small scale structural sets have been assigned to each domain.
Kinematic evaluation - a kinematic assessment has been undertaken utilizing the large and small
scale features derived from the structural and oriented core evaluations. Detailed kinematic
analyses for toppling, planar and wedge failure have been undertaken for major pit face
orientations for each of the proposed open pits. In each case, both the Weathered and Fresh Rock
domains have been considered for the kinematic analyses. A reduced friction angle of 30° was
used for the weathered rock.
2CO003.008 – Oromin Joint Venture Group Independent Technical Report for the OJVG Golouma Gold Project, Sénégal Page 181
NMW_DM_TS /WB/MN OJVG Golouma Gold_2012_FS_Technical_Report_2CO003 008_NMW_DM_TS_GA_DGP_20130315_1 March 15, 2013
Rock mass assessment and generation of geotechnical domains - a thorough analysis of
geotechnical data has been undertaken for the rock masses at the Golouma, Masato,
Kourouloulou and Kerekounda deposits including assessment of rock quality designation (“RQD”),
fracture frequency per meter (“ff/m”), joint condition, empirical field estimates of intact rock strength
(“IRS”), field (point load) and laboratory strength (uniaxial and triaxial compressive strength (“UCS”
and “TCS”)) and RMR89 (after Bieniawski, 1989). Modulus testing was also conducted on Golouma
West and Kerekounda underground deposits. Direct shear testing on joints has been conducted
over all deposits to confirm input criteria for the kinematic analyses. Mohr-Couloumb properties for
friction and cohesion have also been determined for the most weathered domains from field,
laboratory and benchmarking studies. These parameters can be found below in Table 14.3.
As initial geotechnical evaluations indicated that the degree of weathering and structure are the
main controls on rock mass quality in the concession, the SRK-generated weathering surfaces
model has been used as a framework for the rock mass assessment. Dykes and major structures
have also been independently assessed. Geotechnical domains have been developed along with
representative rock mass parameters.
Weak Zone Domain - The “Weak Zone” has been established by identifying the weakest portions
of the weathered rock mass at each of the deposits. The Weak Zone is defined by any interval with
>25% by volume of saprolite (which is characterized by completely weathered and leached soil
strength materials). The contact with the underlying Transitional Zone is typically gradational. Weak
Zone thickness ranges from 5 to >40 m. Rock strength typically ranges between S2-S6 (<1MPa)
with some competent sections (R2-R1) where saprock volumes are higher. RMR has been
estimated at less than 25 for this unit (POOR).
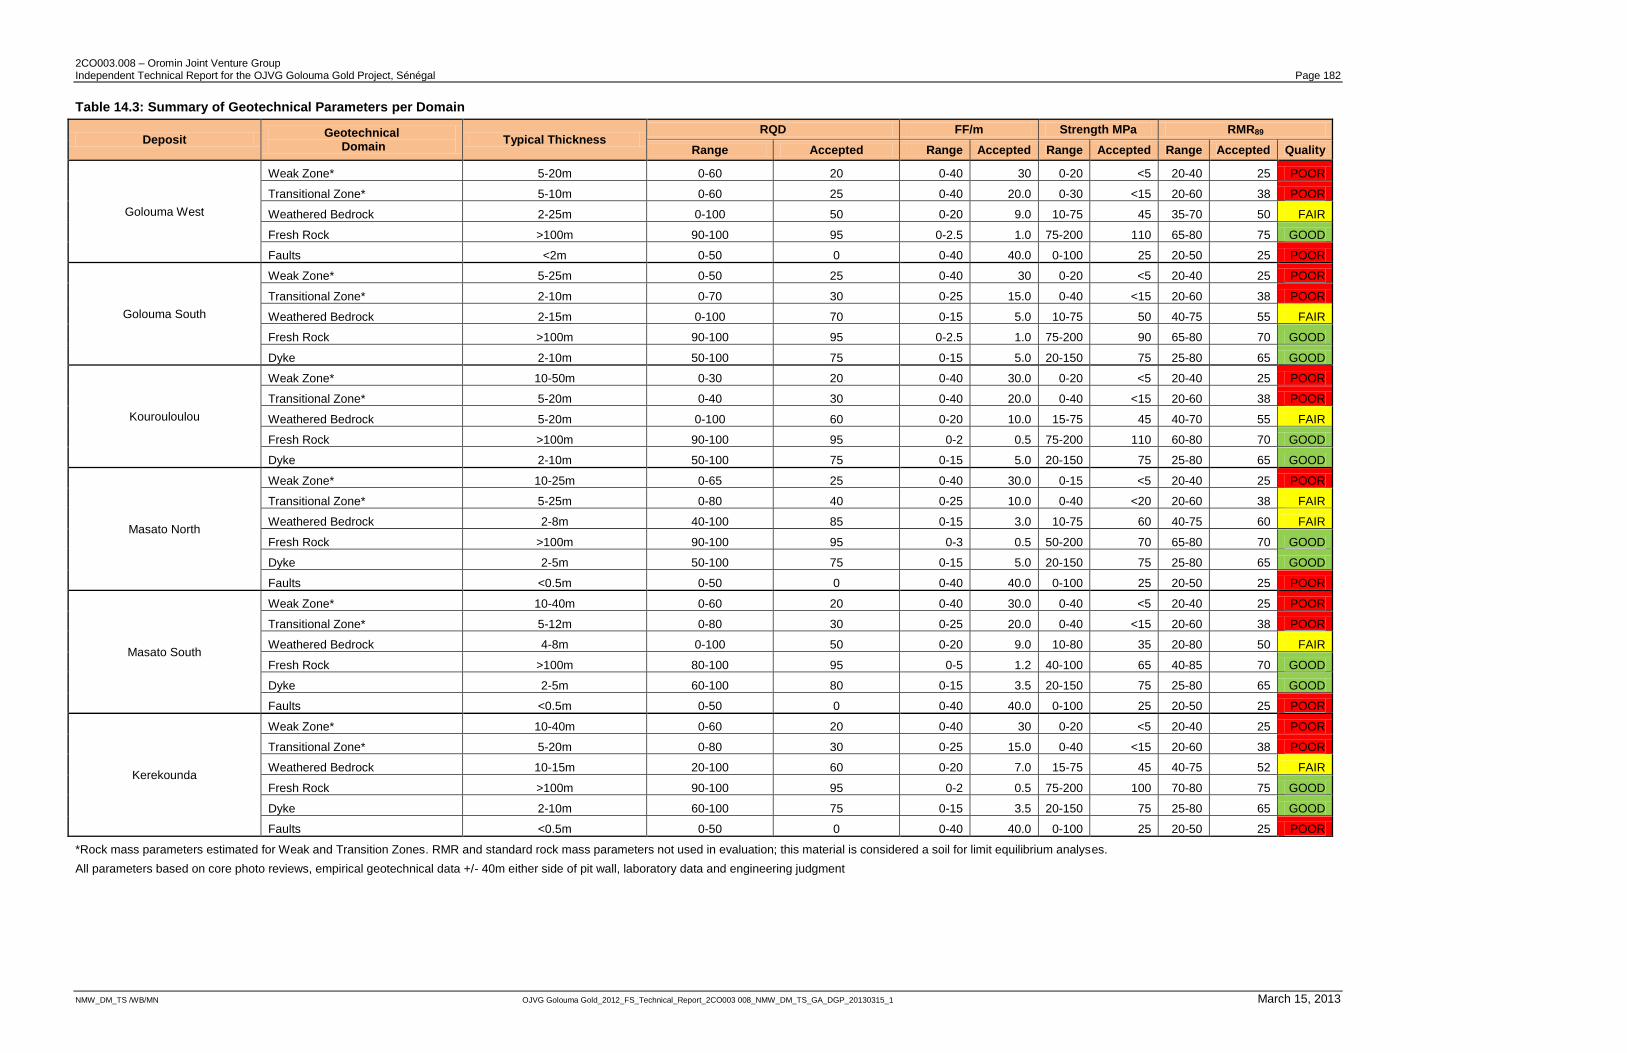
2CO003.008 – Oromin Joint Venture Group Independent Technical Report for the OJVG Golouma Gold Project, Sénégal Page 182
NMW_DM_TS /WB/MN OJVG Golouma Gold_2012_FS_Technical_Report_2CO003 008_NMW_DM_TS_GA_DGP_20130315_1 March 15, 2013
Table 14.3: Summary of Geotechnical Parameters per Domain
Deposit Geotechnical
Domain Typical Thickness
RQD FF/m Strength MPa RMR89
Range Accepted Range Accepted Range Accepted Range Accepted Quality
Golouma West
Weak Zone* 5-20m 0-60 20 0-40 30 0-20 <5 20-40 25 POOR
Transitional Zone* 5-10m 0-60 25 0-40 20.0 0-30 <15 20-60 38 POOR
Weathered Bedrock 2-25m 0-100 50 0-20 9.0 10-75 45 35-70 50 FAIR
Fresh Rock >100m 90-100 95 0-2.5 1.0 75-200 110 65-80 75 GOOD
Faults <2m 0-50 0 0-40 40.0 0-100 25 20-50 25 POOR
Golouma South
Weak Zone* 5-25m 0-50 25 0-40 30 0-20 <5 20-40 25 POOR
Transitional Zone* 2-10m 0-70 30 0-25 15.0 0-40 <15 20-60 38 POOR
Weathered Bedrock 2-15m 0-100 70 0-15 5.0 10-75 50 40-75 55 FAIR
Fresh Rock >100m 90-100 95 0-2.5 1.0 75-200 90 65-80 70 GOOD
Dyke 2-10m 50-100 75 0-15 5.0 20-150 75 25-80 65 GOOD
Kourouloulou
Weak Zone* 10-50m 0-30 20 0-40 30.0 0-20 <5 20-40 25 POOR
Transitional Zone* 5-20m 0-40 30 0-40 20.0 0-40 <15 20-60 38 POOR
Weathered Bedrock 5-20m 0-100 60 0-20 10.0 15-75 45 40-70 55 FAIR
Fresh Rock >100m 90-100 95 0-2 0.5 75-200 110 60-80 70 GOOD
Dyke 2-10m 50-100 75 0-15 5.0 20-150 75 25-80 65 GOOD
Masato North
Weak Zone* 10-25m 0-65 25 0-40 30.0 0-15 <5 20-40 25 POOR
Transitional Zone* 5-25m 0-80 40 0-25 10.0 0-40 <20 20-60 38 FAIR
Weathered Bedrock 2-8m 40-100 85 0-15 3.0 10-75 60 40-75 60 FAIR
Fresh Rock >100m 90-100 95 0-3 0.5 50-200 70 65-80 70 GOOD
Dyke 2-5m 50-100 75 0-15 5.0 20-150 75 25-80 65 GOOD
Faults <0.5m 0-50 0 0-40 40.0 0-100 25 20-50 25 POOR
Masato South
Weak Zone* 10-40m 0-60 20 0-40 30.0 0-40 <5 20-40 25 POOR
Transitional Zone* 5-12m 0-80 30 0-25 20.0 0-40 <15 20-60 38 POOR
Weathered Bedrock 4-8m 0-100 50 0-20 9.0 10-80 35 20-80 50 FAIR
Fresh Rock >100m 80-100 95 0-5 1.2 40-100 65 40-85 70 GOOD
Dyke 2-5m 60-100 80 0-15 3.5 20-150 75 25-80 65 GOOD
Faults <0.5m 0-50 0 0-40 40.0 0-100 25 20-50 25 POOR
Kerekounda
Weak Zone* 10-40m 0-60 20 0-40 30 0-20 <5 20-40 25 POOR
Transitional Zone* 5-20m 0-80 30 0-25 15.0 0-40 <15 20-60 38 POOR
Weathered Bedrock 10-15m 20-100 60 0-20 7.0 15-75 45 40-75 52 FAIR
Fresh Rock >100m 90-100 95 0-2 0.5 75-200 100 70-80 75 GOOD
Dyke 2-10m 60-100 75 0-15 3.5 20-150 75 25-80 65 GOOD
Faults <0.5m 0-50 0 0-40 40.0 0-100 25 20-50 25 POOR
*Rock mass parameters estimated for Weak and Transition Zones. RMR and standard rock mass parameters not used in evaluation; this material is considered a soil for limit equilibrium analyses.
All parameters based on core photo reviews, empirical geotechnical data +/- 40m either side of pit wall, laboratory data and engineering judgment
2CO003.008 – Oromin Joint Venture Group Independent Technical Report for the OJVG Golouma Gold Project, Sénégal Page 183
NMW_DM_TS /WB/MN OJVG Golouma Gold_2012_FS_Technical_Report_2CO003 008_NMW_DM_TS_GA_DGP_20130315_1 March 15, 2013
Transitional Zone Domain - The “Transition Zone” is defined by run-based intervals hosting <25%
saprolite and a high percentage of “saprock”. Saprock is defined as highly weathered material with
visible rock fabric and some degree of competency. The contact with the underlying Weathered
Rock horizon is typically abrupt (<1 m). The zone typically ranges from 2-25 m in thickness, and is
characterized by weathered, weak saprock (R3-R0) that retains elements of the original rock fabric.
RMR has been estimated at 38 for this unit (POOR).
Weathered Rock Domain - The “Weathered Rock” horizon is marked by non-pervasive staining and
local joint wall alteration. The contact with the underlying Fresh Rock domain is typically abrupt (<1
m). The thickness of the Weathered Rock is generally 2-25 m and is characterized by a competent
rock matrix with fracture controlled weathering. Typical RQD is 50-85, and rock strength is often
similarly competent to the underlying Fresh Rock domain (R3 to R4). RMR ranges over 50-60
(FAIR).
Fresh Rock and Dykes Domain – The Fresh Rock domain refers to all unweathered rock below the
weathered horizon and is comprised of competent, variably deformed metavolcanics, ultramafics
and minor metasediments. The domain is characterized by moderate to high rock strength (R4-R5)
and high RQD (>90%). Fresh Rock domains in all deposits host RMR ranges between 70 and 75
(GOOD). Mafic and felsic dykes, reported throughout the concession, typically follow a similar
weathering profile to that reported for the hosting sequence. The dykes also exhibit similar rock
mass conditions to those observed in the Fresh Rock.
Faults Domain - Faults identified across the Golouma Gold Project concession are typically sub-
vertical to steeply dipping. Fault zones are narrow (<2 m), hosting minor amounts of clay gouge
with short sequences of sheared and broken rock. Conservative rock mass parameters have been
allocated to the fault zones.
Limit equilibrium analysis - Limit equilibrium analyses have used the final feasibility open pit
designs for Golouma, Masato and Kerekounda as a reference for representative sections. The
assumed least favourable slope sections have been analysed using the 2D software tool SLIDE
5.0 (RocScience, 2008). In all deposits, the Weak Zone is characterized with c‟ = 25 kPa
(cohesion) and φ' = 16.5° (internal friction). The Transition Zone is characterized with c‟ = 40 kPa
and φ' = 32°. For modelling purposes, parameters for the Weathered Rock domain and the Fresh
Rock domain have been allocated Hoek-Brown failure criterion parameters as listed in Table 17.3.
Two end member scenarios have been modeled to investigate the degree of slope saturation and
effects of pore water pressures in the Weak and Transitional Zone domains: pore pressure as a
function of the overburden pressure using a value that may be expected to remain after slope
dewatering has occurred (Ru=0.2), and, fully saturated slope using a piezometric line drawn along
surface of slope/pit. A third hybrid situation has been evaluated where a static water level was and
R=0.2 were used in order to simulate more realistic conditions. To complement the thorough end
member assessments, a number of model runs were undertaken using the design pits with more
realistic hybrid models. Findings are summarized below in Table 14.4.
In general, the critical failure surfaces occur within the thick sequences of Weak and Transition
Zone material; specifically the areas where slopes are considered to be fully saturated. When
evaluated against actual designs, all factors of safety (FoS) are above 1.2, except for minor bench
scale instability on the local scale (FoS >1.0 <1.2). No significant failure surfaces/rock mass failure
occurs within the fresh rock domain, due to the limited slope height and rock mass strength.
2CO003.008 – Oromin Joint Venture Group Independent Technical Report for the OJVG Golouma Gold Project, Sénégal Page 184
NMW_DM_TS /WB/MN OJVG Golouma Gold_2012_FS_Technical_Report_2CO003 008_NMW_DM_TS_GA_DGP_20130315_1 March 15, 2013
Seismic hazard analysis - The impact of potential seismicity has been tested in all model
sections. A seismic coefficient 0.02g (derived from a Peak Ground Acceleration of 0.2 after Wright
et al., 1985) has been applied over a horizontal orientation in order to integrate the effect of
pseudo-static earthquake loading. The effect of the vertical seismic force has been set to zero due
to relative insignificance. The reduction in FoS relative to non-seismic runs varied from 0.02 to 0.11
when including the peak ground acceleration. These findings correlate well with more systematic
seismic analyses included as part of the PFS study (SRK, 2009). All results indicate that there is no
significant risk of pit slope instability as a result of earthquakes in the OJVG Golouma Gold Project
area.
Slope Design - Slope angles have been determined for each slope design sector within each
geotechnical domain. Slope design recommendations have been allocated based on the findings of
the kinematic evaluation, rock mass risks highlighted from the limit equilibrium analyses, and
hydrogeology. These recommendations are provided for all relevant pit wall face dip direction
ranges for Fresh Rock domains (Table 14.5). Design specifications for slopes in saturated and
unsaturated weathered material are presented separately in Table 14.6.
Due to the small footprint and relatively low height walls of the Kerekounda pit, a number of limit
equilibrium analyses have been conducted to determine the optimum slope design. Structure at
Kerekounda has also been cross-referenced against these designs to ensure risk of kinematic
failure is acceptable (Table 14.7). Following a thorough post design validation process, all slope
geometries are considered reasonable from a rock mass and structural stability standpoint.
To achieve the recommended bench face angles (BFA) and inter-ramp angles (IRA) within the
stronger rock mass units, it will be essential that an adequate number of pre-split drills and
sufficient time be included in the mining schedule to implement these programs. OPEX costs have
been included to cover the additional cost of a small diameter (3” to 4.5”) drill. An assumption for
25% utilization of this drill has been made for secondary drilling requirements. No additional cost
for small diameter explosives has been included in the OPEX. However, extra cost is not
anticipated to be in excess of the overall main production blasting costs.
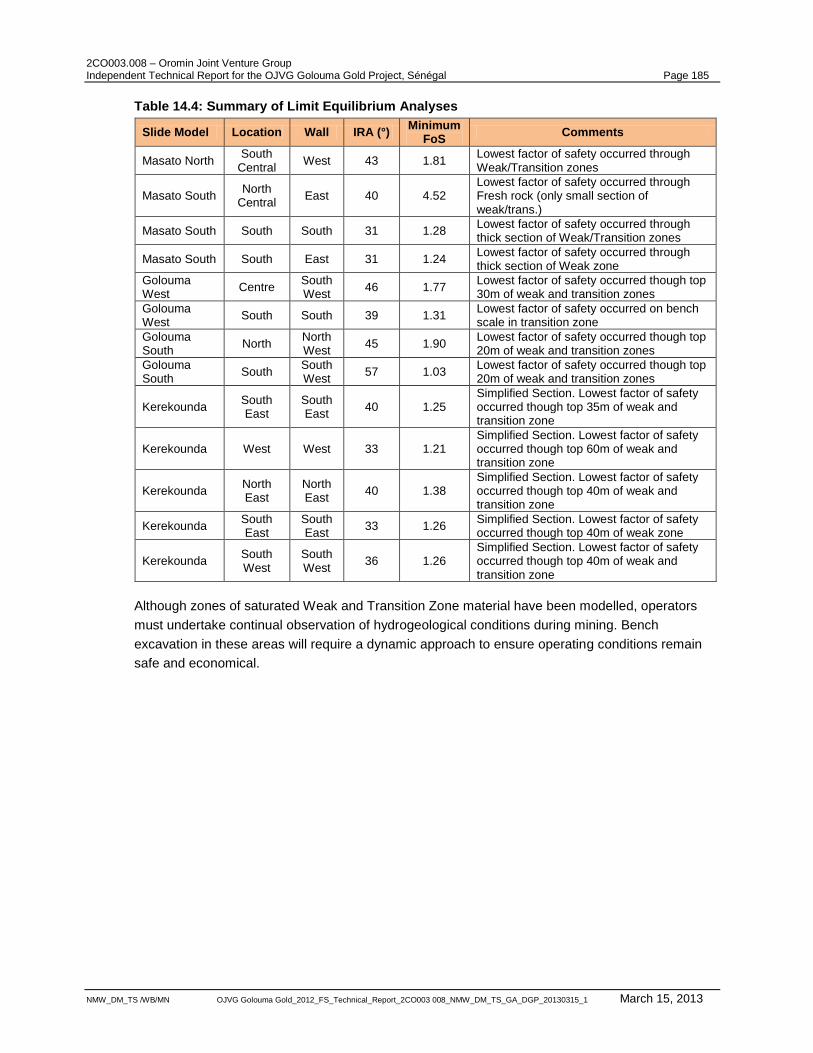
2CO003.008 – Oromin Joint Venture Group Independent Technical Report for the OJVG Golouma Gold Project, Sénégal Page 185
NMW_DM_TS /WB/MN OJVG Golouma Gold_2012_FS_Technical_Report_2CO003 008_NMW_DM_TS_GA_DGP_20130315_1 March 15, 2013
Table 14.4: Summary of Limit Equilibrium Analyses
Slide Model Location Wall IRA (°) Minimum
FoS Comments
Masato North South
Central West 43 1.81
Lowest factor of safety occurred through Weak/Transition zones
Masato South North
Central East 40 4.52
Lowest factor of safety occurred through Fresh rock (only small section of weak/trans.)
Masato South South South 31 1.28 Lowest factor of safety occurred through thick section of Weak/Transition zones
Masato South South East 31 1.24 Lowest factor of safety occurred through thick section of Weak zone
Golouma West
Centre South West
46 1.77 Lowest factor of safety occurred though top 30m of weak and transition zones
Golouma West
South South 39 1.31 Lowest factor of safety occurred on bench scale in transition zone
Golouma South
North North West
45 1.90 Lowest factor of safety occurred though top 20m of weak and transition zones
Golouma South
South South West
57 1.03 Lowest factor of safety occurred though top 20m of weak and transition zones
Kerekounda South East
South East
40 1.25 Simplified Section. Lowest factor of safety occurred though top 35m of weak and transition zone
Kerekounda West West 33 1.21 Simplified Section. Lowest factor of safety occurred though top 60m of weak and transition zone
Kerekounda North East
North East
40 1.38 Simplified Section. Lowest factor of safety occurred though top 40m of weak and transition zone
Kerekounda South East
South East
33 1.26 Simplified Section. Lowest factor of safety occurred though top 40m of weak zone
Kerekounda South West
South West
36 1.26 Simplified Section. Lowest factor of safety occurred though top 40m of weak and transition zone
Although zones of saturated Weak and Transition Zone material have been modelled, operators
must undertake continual observation of hydrogeological conditions during mining. Bench
excavation in these areas will require a dynamic approach to ensure operating conditions remain
safe and economical.
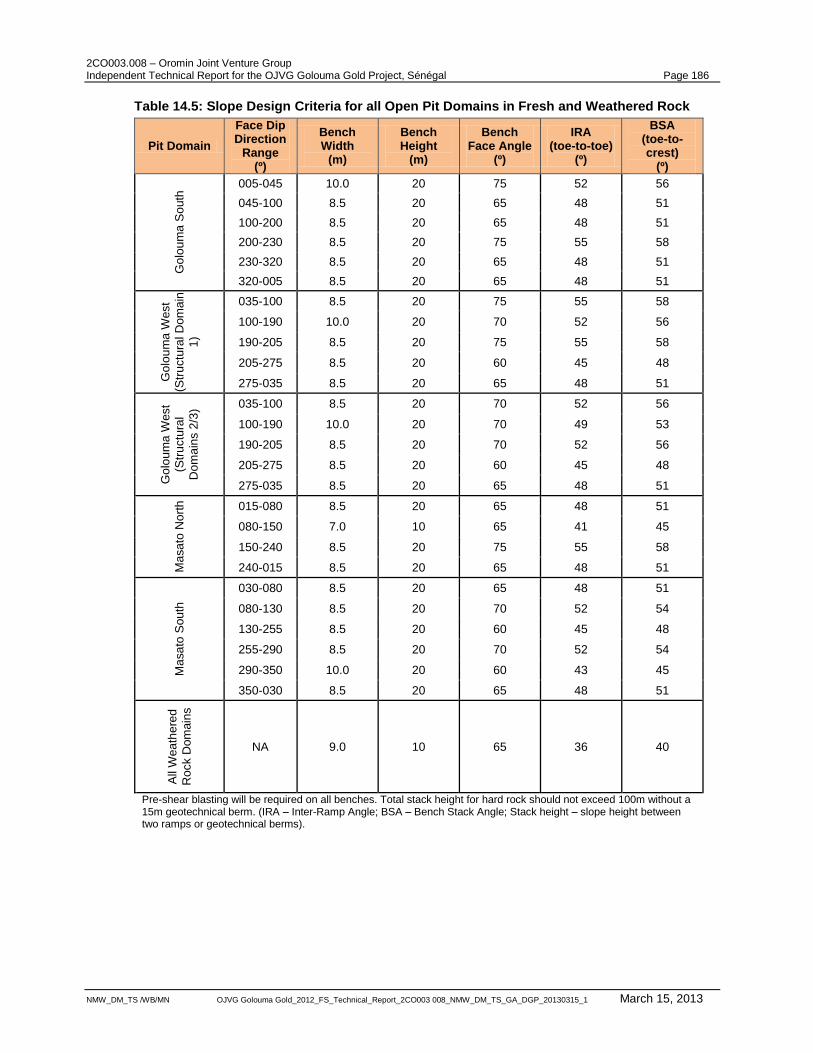
2CO003.008 – Oromin Joint Venture Group Independent Technical Report for the OJVG Golouma Gold Project, Sénégal Page 186
NMW_DM_TS /WB/MN OJVG Golouma Gold_2012_FS_Technical_Report_2CO003 008_NMW_DM_TS_GA_DGP_20130315_1 March 15, 2013
Table 14.5: Slope Design Criteria for all Open Pit Domains in Fresh and Weathered Rock
Pit Domain
Face Dip Direction
Range (º)
Bench Width
(m)
Bench Height
(m)
Bench Face Angle
(º)
IRA (toe-to-toe)
(º)
BSA (toe-to-crest)
(º) G
olo
um
a S
outh
005-045 10.0 20 75 52 56
045-100 8.5 20 65 48 51
100-200 8.5 20 65 48 51
200-230 8.5 20 75 55 58
230-320 8.5 20 65 48 51
320-005 8.5 20 65 48 51
Go
lou
ma
West
(Str
uctu
ral D
om
ain
1)
035-100 8.5 20 75 55 58
100-190 10.0 20 70 52 56
190-205 8.5 20 75 55 58
205-275 8.5 20 60 45 48
275-035 8.5 20 65 48 51
Go
lou
ma
West
(Str
uctu
ral
Dom
ain
s 2
/3) 035-100 8.5 20 70 52 56
100-190 10.0 20 70 49 53
190-205 8.5 20 70 52 56
205-275 8.5 20 60 45 48
275-035 8.5 20 65 48 51
Ma
sa
to N
ort
h
015-080 8.5 20 65 48 51
080-150 7.0 10 65 41 45
150-240 8.5 20 75 55 58
240-015 8.5 20 65 48 51
Ma
sa
to S
ou
th
030-080 8.5 20 65 48 51
080-130 8.5 20 70 52 54
130-255 8.5 20 60 45 48
255-290 8.5 20 70 52 54
290-350 10.0 20 60 43 45
350-030 8.5 20 65 48 51
All
Wea
the
red
Rock D
om
ain
s
NA 9.0 10 65 36 40
Pre-shear blasting will be required on all benches. Total stack height for hard rock should not exceed 100m without a 15m geotechnical berm. (IRA – Inter-Ramp Angle; BSA – Bench Stack Angle; Stack height – slope height between two ramps or geotechnical berms).
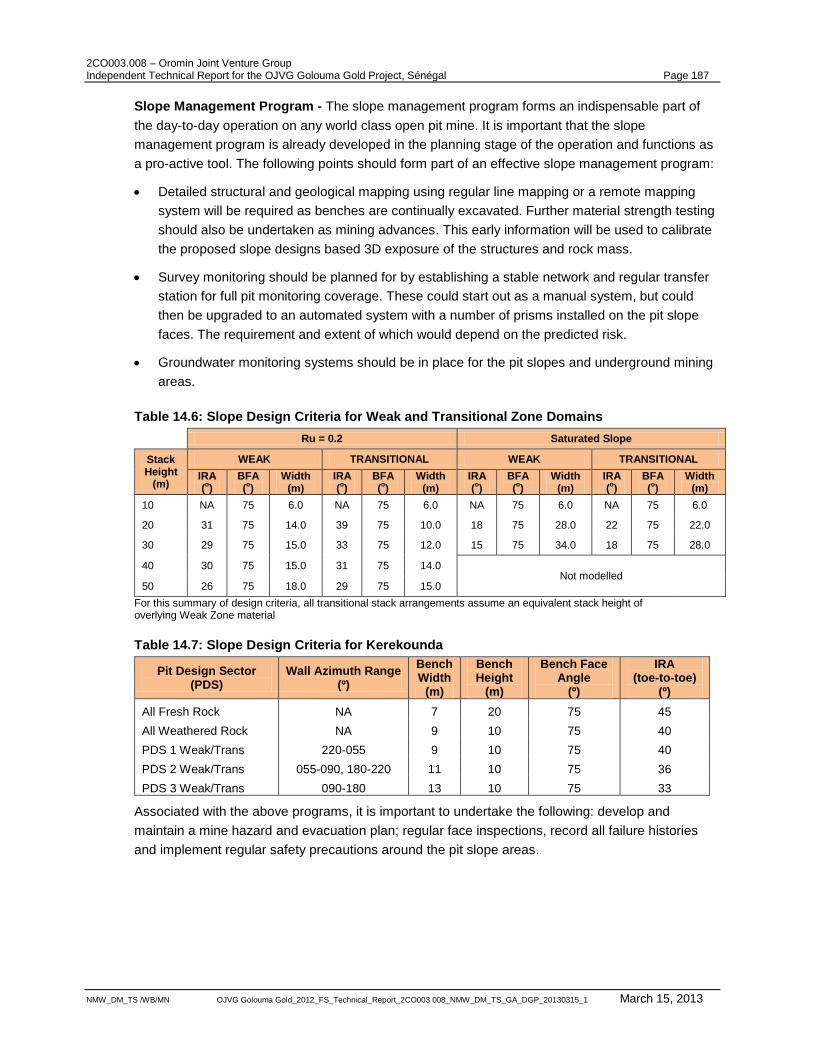
2CO003.008 – Oromin Joint Venture Group Independent Technical Report for the OJVG Golouma Gold Project, Sénégal Page 187
NMW_DM_TS /WB/MN OJVG Golouma Gold_2012_FS_Technical_Report_2CO003 008_NMW_DM_TS_GA_DGP_20130315_1 March 15, 2013
Slope Management Program - The slope management program forms an indispensable part of
the day-to-day operation on any world class open pit mine. It is important that the slope
management program is already developed in the planning stage of the operation and functions as
a pro-active tool. The following points should form part of an effective slope management program:
Detailed structural and geological mapping using regular line mapping or a remote mapping
system will be required as benches are continually excavated. Further material strength testing
should also be undertaken as mining advances. This early information will be used to calibrate
the proposed slope designs based 3D exposure of the structures and rock mass.
Survey monitoring should be planned for by establishing a stable network and regular transfer
station for full pit monitoring coverage. These could start out as a manual system, but could
then be upgraded to an automated system with a number of prisms installed on the pit slope
faces. The requirement and extent of which would depend on the predicted risk.
Groundwater monitoring systems should be in place for the pit slopes and underground mining
areas.
Table 14.6: Slope Design Criteria for Weak and Transitional Zone Domains
Ru = 0.2 Saturated Slope
Stack Height
(m)
WEAK TRANSITIONAL WEAK TRANSITIONAL
IRA (o)
BFA (o)
Width (m)
IRA (o)
BFA (o)
Width (m)
IRA (o)
BFA (o)
Width (m)
IRA (o)
BFA (o)
Width (m)
10 NA 75 6.0 NA 75 6.0 NA 75 6.0 NA 75 6.0
20 31 75 14.0 39 75 10.0 18 75 28.0 22 75 22.0
30 29 75 15.0 33 75 12.0 15 75 34.0 18 75 28.0
40 30 75 15.0 31 75 14.0 Not modelled
50 26 75 18.0 29 75 15.0
For this summary of design criteria, all transitional stack arrangements assume an equivalent stack height of overlying Weak Zone material
Table 14.7: Slope Design Criteria for Kerekounda
Pit Design Sector (PDS)
Wall Azimuth Range (º)
Bench Width
(m)
Bench Height
(m)
Bench Face Angle
(º)
IRA (toe-to-toe)
(º)
All Fresh Rock NA 7 20 75 45
All Weathered Rock NA 9 10 75 40
PDS 1 Weak/Trans 220-055 9 10 75 40
PDS 2 Weak/Trans 055-090, 180-220 11 10 75 36
PDS 3 Weak/Trans 090-180 13 10 75 33
Associated with the above programs, it is important to undertake the following: develop and
maintain a mine hazard and evacuation plan; regular face inspections, record all failure histories
and implement regular safety precautions around the pit slope areas.
2CO003.008 – Oromin Joint Venture Group Independent Technical Report for the OJVG Golouma Gold Project, Sénégal Page 188
NMW_DM_TS /WB/MN OJVG Golouma Gold_2012_FS_Technical_Report_2CO003 008_NMW_DM_TS_GA_DGP_20130315_1 March 15, 2013
14.2.4 Underground Rock Mass Evaluation
The hangingwall, orebody and footwall of each orebody have been independently evaluated for
rock mass parameters, geology and structure. Geotechnical properties have been generated for
each zone as variability in the rock mass has previously been identified (SRK, 2009). Infrastructure
zones have been independently reviewed for portal sites and other mine development. Domains
discussed below comply closely with the rock mass parameters.
Golouma West and South Underground
The Golouma West underground deposit is comprised of seven distinct orebodies referred to as
the 1100 through 1700 orebodies. These 3 m to 8 m wide, with local thickening of the orebody up
to 13 m, sub-parallel orebodies, generally dip at a steep angle (about 70-80°) to the S-W (orebody
1700 dips towards the N-W) and exhibit an undulating nature. The varying orebody geometry at the
south western extent of the Golouma West underground deposit results in a total mining width of
20 m to 40 m.
The Golouma South underground deposit is comprised of four distinct orebodies known as the
2100 to 2400 orebodies. These 5 m to 12 m wide, sub-parallel orebodies dip at a steep angle
(about 70-80°) to the S-W and exhibit an undulating nature.
The deposits at Golouma West and Golouma South are geotechnically similar and as such the
rock mechanics assessment and resulting excavation designs are common to both deposits. These
underground deposits are characterized by a competent hangingwall and footwall sequence
comprised of mafic volcanics and isolated dykes. Rock mass quality is markedly homogenous
through the various hangingwall, orebody and footwall sub-domains, although variable rock mass
conditions have been locally noted proximal to modeled faults. Foliation is prevalent sub-parallel to
most orebodies though the hangingwall and footwall sequences.
All stoping within the Golouma deposits is within the Fresh Rock geotechnical domain. The
hangingwall, footwall, and stope ends are indicated as stable. Local instability will be managed with
the ground support described below for in-stope development.
In total, the underground mining deposits have been divided up into seven underground mining
blocks. Golouma West 1, which lies on the N-S striking western margin of the Golouma West
deposit, has been isolated in this discussion as an alternate mining method is prescribed (relative
to all other mining blocks). All other mining blocks follow a similar geometry and are not
independently discussed in this section.
Kerekounda Underground
The Kerekounda underground deposit is comprised of three distinct orebodies known as the 3100,
3200 and 3300/3300-2 orebodies. These narrow vein, 3.5 m to 10 m wide, sub-parallel orebodies
dip at a steep angle (about 70-80°) to the S-W and exhibit an undulating nature.
There are two distinct geotechnical domains in the Kerekounda underground deposit. The
Upper Weak Domain is characterised by a reduction in rock mass quality, associated with
intense clay alteration and strength degradation of the rock matrix (the Upper Weak Domain
consists predominantly of Transition Zone and Weathered Rock material). The underlying
Lower Strong Domain is characterized by a generally competent hangingwall and footwall
sequence comprised of mafic volcanics and isolated faults and dykes.
2CO003.008 – Oromin Joint Venture Group Independent Technical Report for the OJVG Golouma Gold Project, Sénégal Page 189
NMW_DM_TS /WB/MN OJVG Golouma Gold_2012_FS_Technical_Report_2CO003 008_NMW_DM_TS_GA_DGP_20130315_1 March 15, 2013
Despite the observed homogeneity in the Lower Strong geotechnical domain, isolated zones of
reduced rock mass quality have been reported. Of particular note is the upper portion of the
3200 footwall (about 154-176 masl) at the south end of the deposit, which hosts an interval of
moderately to highly fractured rock visible across several drill holes which are related to Faults
NE1 and NNE1.
The majority of the stoping at the Kerekounda Deposit takes place within the Lower Strong
geotechnical domain, with only a small section (<5%) within the Upper Weak domain.
Kourouloulou Underground
The Kourouloulou underground deposit is comprised of three distinct orebodies known as the 6100
to 6300 orebodies. These narrow vein, 3.5 m to 7 m wide, sub-parallel orebodies dip at a steep
angle (about 70-80°) to the S-W and exhibit an undulating nature. Similar to Kerekounda, there are
two distinct geotechnical domains in the Kourouloulou underground deposit: an Upper Weak
domain (comprised mainly of Weathered Rock interval) and a Lower Strong domain hosting Fresh
Rock).
The Upper Weak Domain is characterised by a reduction in rock mass quality associated with
intense clay alteration and strength degradation of the rock matrix (above approx. 180 to
200 masl).
Below the Upper Weak Domain, the deposit is characterized by a generally competent rockmass.
The majority of the underground extraction of ore is within this Fresh Rock geotechnical unit with a
small proportion (<5%) is within the Weathered Rock unit.
14.2.5 Excavation Design Parameters
The design procedure involves two steps; the quality of the rock mass is rated using a pre-defined
classification system, and then the expected performance of the underground openings is
predicted using an empirically derived correlation with the rock quality. The stability of stope
geometries was assessed using the empirical Matthew‟s Method; the same input parameters were
used to estimate mineral dilution due to overbreak, and kinematic stability was assessed using the
Unwedge software package. Assessment of stope stability and support requirements considered
stope size and potential support/reinforcement requirements for overhand cut and fill stoping
utilising unconsolidated fill. Local application of cemented rock fill to form sills at the base of
stoping blocks, and in wider sections of the orebody to allow multiple pass mining allows extraction
to be maximized.
Numerical modelling was conducted using the Map3DTM
boundary element code to determine safe
stand off distances for mine infrastructure, to check the validity of the empirical excavation designs,
and to check the influence of mining on geological structures at the Kerekounda underground
deposit.
Stability Evaluation - A maximum open stope vertical height of 15 m, three vertical lifts of 5 m
each, was considered in the stability analysis with a maximum length along strike of 60 m. The
stability assessment assumes unsupported spans for all stope dimensions. In the Fresh Rock and
Weathered Rock domains the hangingwall, footwall, and stope ends are indicated as stable for all
underground deposits
2CO003.008 – Oromin Joint Venture Group Independent Technical Report for the OJVG Golouma Gold Project, Sénégal Page 190
NMW_DM_TS /WB/MN OJVG Golouma Gold_2012_FS_Technical_Report_2CO003 008_NMW_DM_TS_GA_DGP_20130315_1 March 15, 2013
Kinematic Assessment - Kinematic assessment of stopes and development was completed for
each underground deposit using joint sets identified during review of the oriented core and
downward-projected surface mapping.
In development excavations, potentially unstable wedges are confined to the back of the
excavation and are supported with the ground support recommended below. For in-stope cut and
fill drives, no unstable wedges were identified for spans of up to 5 m; for spans up to 10 m,
unstable wedges were identified in the drive back. These wedges are supported with the ground
support described below.
The back stability in all geotechnical domains is adversely impacted by shallow dipping joints with
the potential for instability arising at the low end of rock mass quality and maximum back span. Any
resulting instability is considered to be manageable with the ground support described below for in-
stope development. When the more persistent and closely spaced foliation joint set is considered
on its own, stable back conditions are indicated in all geotechnical domains.
Dilution - Sources of dilution of the mined ore are influenced by two key factors; geotechnical,
taking into consideration the quality of the rock mass and the excavation and ground support
design, and operational, where the influence of blasting, mining, geological and survey controls are
included. Where stopes are mined using the cut and fill method in narrow vein type deposits,
dilution of ore due to geotechnical factors is often small in relation to the dilution realised from
operational factors. In the Lower Strong domains, dilution is expected to be predominantly due to
operational rather than geotechnical factors. Unplanned dilution from geotechnical factors in the
Upper Weak domains (Kerekounda and Kourouloulou) can be expected with dilution ranging from
20% to greater than 70%.
Ground Support - The potential for instability of the rock around development and stopes has
been identified. These instabilities can, in general, be managed using levels of ground support
typical for a Fair rock mass. For liability reasons, most mines are moving towards the installation of
mesh and rockbolts throughout all parts of the mine in which personnel access is required.
For lateral development with a maximum span of 5.5 m in the upper weathered domains, 2.4 m
full column grouted rebar on a 1.2 m spacing, 2.0 m from the floor is recommended with mesh
down to 1.8 m above the floor in all areas. Local application of shotcrete is anticipated in 40-
50% of all areas.
For lateral development with a maximum span of 5.5 m in the stronger rock domains, 2.1 m full
column grouted rebar on a 1.5 m spacing, 2.0 m from the floor is recommended with spacing
dependant on excavation size. Mesh is anticipated to be required in 60% of all areas and this
should be carried down to 2.4 m above the floor.
For man-entry cut and fill stoping areas, larger excavations (>5 m and <8 m wide) in the upper
weathered domains, 2.4 m friction anchors on a 1.2 m spacing, 2.0 m from the floor is
recommended. Mesh is anticipated to be required in 60% of all areas and this should be
carried down to 2.0 m above the floor. In the smaller excavations (<5 m wide) the anchor
length is reduced to 1.8 m.
For man-entry cut and fill stoping areas, larger excavations (>5 m and <8 m wide) in the lower
stronger domains, 2.4 m friction anchors on a 1.5 m spacing, 2.0 m from the floor is
recommended. Mesh is anticipated to be required in 10% of all areas and this should be
2CO003.008 – Oromin Joint Venture Group Independent Technical Report for the OJVG Golouma Gold Project, Sénégal Page 191
NMW_DM_TS /WB/MN OJVG Golouma Gold_2012_FS_Technical_Report_2CO003 008_NMW_DM_TS_GA_DGP_20130315_1 March 15, 2013
carried down to 2.0 m above the floor. In the smaller excavations (<5 m wide) the anchor
length is reduced to 1.8 m.
Where the excavation span exceeds 8 m, additional local assessment of the ground support
requirements should be conducted. It is anticipated that for spans exceeding 10 m grouted cable
bolts with a length equivalent to the excavation span will be required on a 2.5 m square spacing or
shotcrete pillars on a 5m by 8m along strike spacing in addition to the support described above.
Where very wide orebody spans are encountered, up to 40m in Golouma West then the mining
method has to be modified to Post Pillar Cut and Fill. Pillars should be a minimum of 5m by 5m with
a maximum room span of 9m. Shotcrete pillars will be required at mid room span spaced 8 m along
the room in addition to the ground support described above. It is essential that where variances
from the standard mining geometry are encountered that comprehensive site specific geotechnical
assessment is conducted to maximise safe recovery of the ore.
In the stronger rock, vertical infrastructure, such as vent raises and ore passes, can be mined with
a raise borer or overhand raising. Raise bored vertical infrastructure is non-man entry and as such
ground support is not considered to be necessary. Overhand raised vertical infrastructure will
require ground support during excavation; 1.8 m long friction rock anchors in the good rock, and
2.4 m long friction rock anchors in the weak rock, at 1.5 m spacing are considered to be adequate
to provide temporary support during excavation.
Where vertical infrastructure is required through to surface, the location must be carefully chosen
to minimise the thickness of the near surface weak material. This material will have to be
excavated down to the better quality rock found in the lower Transition Zone to provide a
competent raise collar. Raise boring or overhand raising can then be used to hole through to
surface in the better quality rock found in the lower transition zone. It is considered essential to drill
a geotechnical raise pilot hole at the location of each of the proposed raises to confirm the rock
quality and unit thicknesses prior to excavation. The excavation method, geometry, and ground
support can then be tailored to the specific conditions encountered.
To ensure that the excavations remain serviceable for the life of the underground operations the
recommended ground support for the near surface sections of vertical infrastructure through the
weathered and transition geotechnical domains comprises 2.4 m long friction rock anchors on a 1.2
m spacing with steel mesh and 100 mm of shotcrete. The surface excavation through the weak and
upper transition zones will require 2.4 m long grouted rebar on a 1.5 m spacing, with steel mesh
and 50 mm of shotcrete to prevent sloughing of material into the raise collar.
Pillar Requirements - Crown pillar assessment was conducted using the Scaled Span method to
result in a Class D crown pillar; i.e. a semi temporary crown pillar with a minimum factor of safety of
1.5 and an anticipated 5 to 10 year lifespan that would allow extraction of the pillar towards the end
of mine life.
A minimum crown pillar thickness of 15 m is recommended for stope widths up to 10 m in the
Lower Strong domain.
A minimum crown pillar thickness of 20 m is recommended for stope widths up to 10 m wide in
the Upper Weak domain. The crown pillar at Kourouloulou and approximately 50% of the
crown pillar at Kerekounda is located within the Upper Weak Domain.
2CO003.008 – Oromin Joint Venture Group Independent Technical Report for the OJVG Golouma Gold Project, Sénégal Page 192
NMW_DM_TS /WB/MN OJVG Golouma Gold_2012_FS_Technical_Report_2CO003 008_NMW_DM_TS_GA_DGP_20130315_1 March 15, 2013
Recovery of the crown pillar is considered to be possible at the end of the mine life using a
continuation of the overhand cut and fill mining method with minimal dilution due to
geotechnical factors in the Lower Strong domain.
Increasing levels of ground support will be required as crown pillar mining progresses up
through the Upper Weak domain to maintain stope stability and to minimise dilution.
At Golouma, 10 m wide rib pillars are recommended at 60 m intervals along strike during crown
pillar recovery mining.
At Golouma West 1 post pillars required for thick sections of the orebody should be a minimum
of 5 m by 5 m on a maximum of 14 m centres. This results in a maximum room span of 9 m.
Access Portals – Access to the underground workings is achieved through ramps from surface
portals. The portals at both Golouma deposits and at Kerekounda are located within the open pits,
whilst the portal at Kourouloulou is located in an open box cut. The portals at the Golouma deposits
are located in the Lower Strong domains, whilst those at Kerekounda and Kourouloulou are located
in the upper weathered rock domains.
Additional ground support will be required at all portal locations to protect this critical infrastructure
from local instabilities which need to be further evaluated at the time of exposure with
comprehensive geological and geotechnical mapping and pilot drilling.
Catch benches and berms will be required above the portals to protect equipment and
personnel from local bench instability and loose rock.
Support of the pit bench face around the portal with 2.4 m long full column grouted rebar on a
1.5 m spacing with wire mesh. Support should extend to the top of the bench and 10 m either
side of the portal opening. Portals in the upper weathered domains will require the addition of
shotcrete over the wire mesh.
In the upper weathered rock domains at Kourouloulou and Kerekounda the first 20 m of
development will require 2.4 m long full column grouted rebar rockbolts on a 1.2 m spacing
down to 1.5 m from the floor with wire mesh to floor level. Shotcrete will be required over the
wire mesh.
Cable bolting may be required to stabilise deeper zones of instability identified during the
geotechnical evaluation prior to commencing portal mining.
Steel arches for the first 10 to 20 m of each portal. The total length being based on ground
conditions observed during development.
2CO003.008 – Oromin Joint Venture Group Independent Technical Report for the OJVG Golouma Gold Project, Sénégal Page 193
NMW_DM_TS /WB/MN OJVG Golouma Gold_2012_FS_Technical_Report_2CO003 008_NMW_DM_TS_GA_DGP_20130315_1 March 15, 2013
15 Mining Methods
15.1 Open Pit Mining
15.1.1 Open Pit Mine Plan Parameters
The mineral reserve estimate for the OJVG pits was initiated with estimates of gold price, mining
dilution, process recovery, refining/transport costs and royalties. Mining, processing and general
administration costs were also calculated based on calculated mill throughputs and, along with
geotechnical parameters, formed the basis for open pit optimization. A distinction between material
types was made (soft/hard) in order to capture the expected variation in mining and processing
costs and rates. The mineral inventory block models for each of the deposits were then used with
the Gemcom Whittle - Strategic Mine Planning™ (“Whittle”) software to determine optimal mining
shells.
Only indicated mineral resources were included in the optimization process (no measured
resources in models). A thorough analysis of the Whittle shells was then conducted (including
cross-over analyses where appropriate) in order to determine which shells were to be used as
guides to design detailed pits that included appropriate berms, minimum mining widths and access
ramps.
Table 15.4 below summarizes the parameters used, along with incremental (or mill) cut-off grade
calculations and mining dilution for both ore types. The external mining dilution is based on a
calculation of the number of waste blocks which touch an ore block in the mineral inventory block
model, along with an assumed dilution for each edge of a block. The internal (or mill) cut-off grade
incorporates all operating costs except mining. This internal cut-off is applied to material contained
within an economic pit shell where the decision to mine a given block was determined by the
Whittle optimization. This mill cut-off was applied to all of the mineral reserve estimates that follow.
The detailed pit designs, along with calculated cut-off grades, determine the mineral reserve
estimate for each deposit as summarized in Table 15.1.
2CO003.008 – Oromin Joint Venture Group Independent Technical Report for the OJVG Golouma Gold Project, Sénégal Page 194
NMW_DM_TS /WB/MN OJVG Golouma Gold_2012_FS_Technical_Report_2CO003 008_NMW_DM_TS_GA_DGP_20130315_1 March 15, 2013
Table 15.1: Open Pit Whittle Parameters and Cut-off Grade Calculation
Item Unit FS Fresh FS Soft
Revenue, smelting & refining
Gold Price (US$) US$/oz 1,250
Payable metal %Au 100%
Refining/transport US$/oz 7.00
Royalties @ 3% of NSR US$/oz 37.29
Net Return US$/oz 1205.71
US$/g 38.76
OPEX estimates
OP Mining Cost US$/t mined 1.99 1.45
Processing Cost US$/t milled 21.93 12.85
G&A US$/t milled 6.16 3.78
Sustaining Capital Cost US$/t milled 0.50 0.50
Total OPEX estimate (excluding mining) US$/t/milled 28.59 17.13
Process and Mining Losses
Process Recovery % 90.8% 94.0%
Dilution - OP
Masato % 8.00%
Golouma % 10.00%
Kerekounda % 11.00%
Kourouloulou % 10.00%
Incremental Cut-off Grade -OP
Masato g/t Au 0.88 0.52
Golouma g/t Au 0.89 0.52
Kerekounda g/t Au 0.89 0.52
Kourouloulou g/t Au 0.89 0.52
Geotechnical Parameters
Slope Angles (Overall) ° variable variable
Mill throughput tpd 4,540 7,392
15.1.2 Open Pit Mine Plan and Schedule
Mine planning for the Golouma Gold Project deposits was conducted using Gemcom GEMS™
software. The mineral inventory block models were produced by SRK using GEMS™. Three of the
deposits (Golouma South, Golouma West, Kerekounda) entail both open pit and underground
mining, while one deposit (Masato) involves only open pit mining. This section of the report
discusses the open pit aspects of the deposits. Underground mining is described in Section 15.2.
Based on the thorough analysis of the Whittle pit shells (discussed in Mineral Reserve Estimate
section 14), a base case shell was chosen for each deposit and used as the basis for the detailed
ultimate pit designs. These detailed ultimate pit designs incorporated geotechnical parameters
(bench face angle, inter-ramp angles, and berm widths) for the various rock types and pit sectors
2CO003.008 – Oromin Joint Venture Group Independent Technical Report for the OJVG Golouma Gold Project, Sénégal Page 195
NMW_DM_TS /WB/MN OJVG Golouma Gold_2012_FS_Technical_Report_2CO003 008_NMW_DM_TS_GA_DGP_20130315_1 March 15, 2013
and included 10% gradient access ramp design and take into account minimum mining widths
(based on open pit mining equipment selected). Waste dumps were then designed to account for
the waste material produced in each mining phase.
Table 15.2 below summarizes the resulting detailed pit design ore tonnages and grades for each of
the four open pit deposits (using the internal cut-off grade and dilution from the Mineral Reserve
Estimate section) along with summary of waste by rock type (soft material is assumed to be a
weaker zone of free-digging material that will not require drilling and blasting).
Figure 15.1 represents a plan view of the detailed pit designs for Golouma South, Golouma West
and Kerekounda with typical cross sections through the pits shown in Figures 15.2 through to 15.4.
Masato ultimate pit designs are illustrated in Figure 15.5 through to 15.7 (both plan and section
view).
The Golouma South pit dimension is about 580 m long and 290 m wide. The base of the pit is at an
elevation of 145 masl, resulting in a pit depth of approximately 75 m. For the Golouma South and
West Pits, a trade-off analysis was done to determine the cross-over point, The cross-over point is
the depth at which underground mining becomes more profitable than high strip ratio open pit
mining.
The Golouma West pit dimension is about 860 m long and 400 m wide. The base of the pit is at an
elevation of 115 masl, resulting in a pit depth of approximately 140 m.
The new Golouma Northwest pit dimension is about 220 m long and 160 m wide. The base of the
pit is at an elevation of 210 masl, resulting in a pit depth of approximately 55 m.
The Kerekounda pit dimension is about 220 m long and 160 m wide. The base of the pit is at an
elevation of 180 masl, resulting in a pit depth of approximately 60 m. The Kerekounda pit has a
high strip ratio (~26:1); however, this was required in order to push the pit deeper through the soft
ore down into the hard ore. It was felt that safe recovery of the soft ore would be difficult from
underground so this material was allocated to the pit.
The Masato pit dimension is about 1,900 m long and 580 m wide. The base of the pit is at an
elevation of -5 masl, resulting in a pit depth of approximately 240 m.
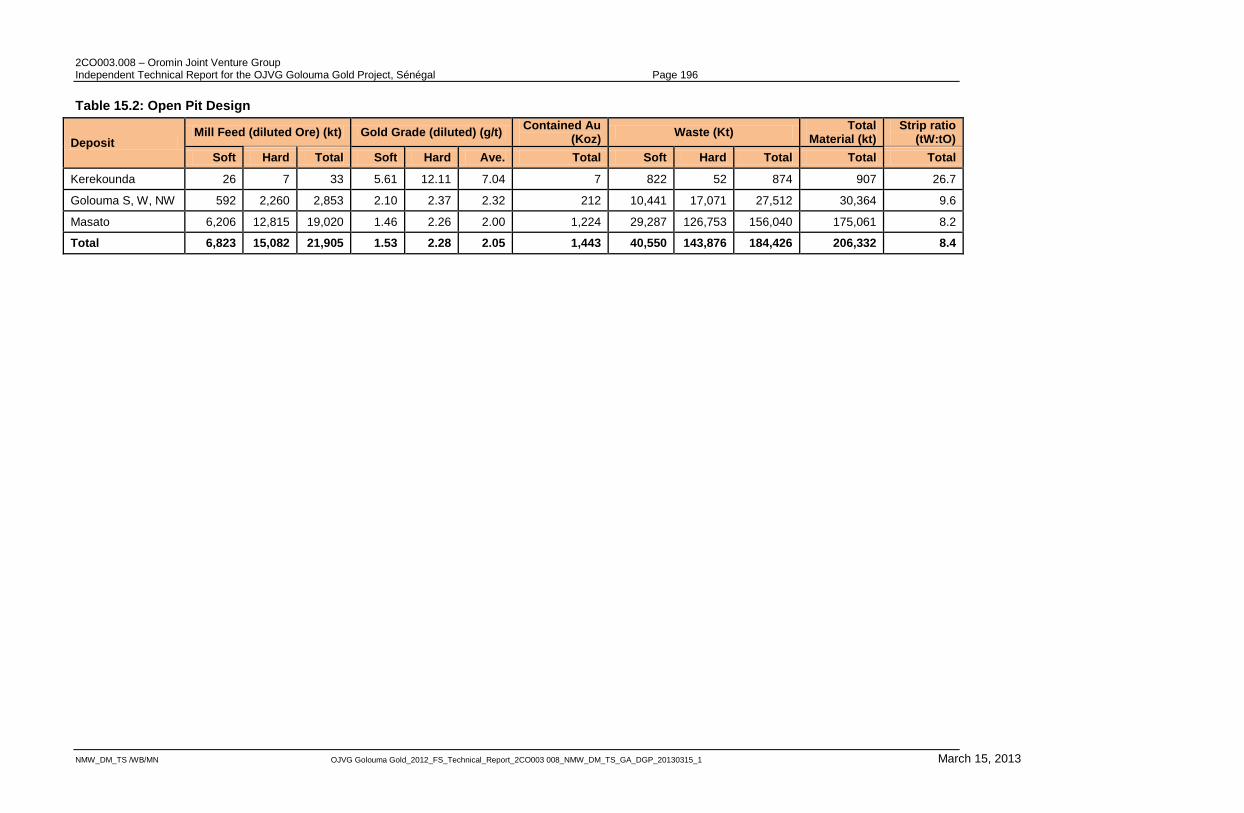
2CO003.008 – Oromin Joint Venture Group Independent Technical Report for the OJVG Golouma Gold Project, Sénégal Page 196
NMW_DM_TS /WB/MN OJVG Golouma Gold_2012_FS_Technical_Report_2CO003 008_NMW_DM_TS_GA_DGP_20130315_1 March 15, 2013
Table 15.2: Open Pit Design
Deposit Mill Feed (diluted Ore) (kt) Gold Grade (diluted) (g/t)
Contained Au (Koz)
Waste (Kt) Total
Material (kt) Strip ratio
(tW:tO)
Soft Hard Total Soft Hard Ave. Total Soft Hard Total Total Total
Kerekounda 26 7 33 5.61 12.11 7.04 7 822 52 874 907 26.7
Golouma S, W, NW 592 2,260 2,853 2.10 2.37 2.32 212 10,441 17,071 27,512 30,364 9.6
Masato 6,206 12,815 19,020 1.46 2.26 2.00 1,224 29,287 126,753 156,040 175,061 8.2
Total 6,823 15,082 21,905 1.53 2.28 2.05 1,443 40,550 143,876 184,426 206,332 8.4
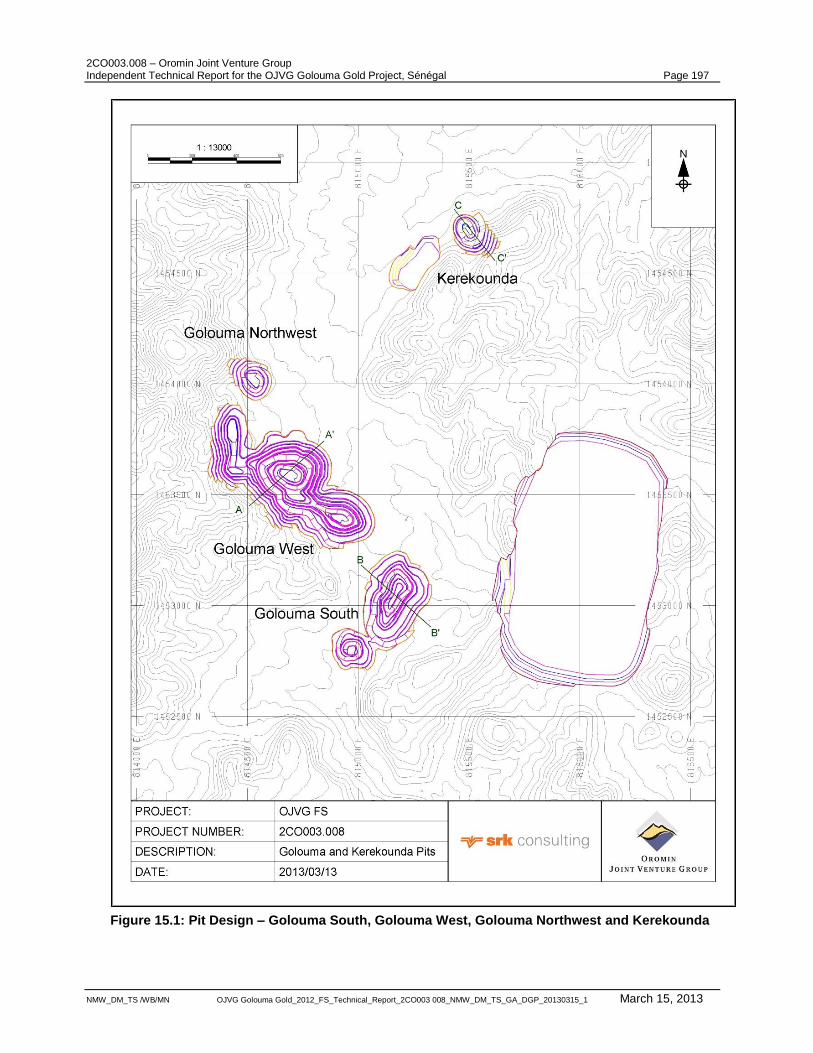
2CO003.008 – Oromin Joint Venture Group Independent Technical Report for the OJVG Golouma Gold Project, Sénégal Page 197
NMW_DM_TS /WB/MN OJVG Golouma Gold_2012_FS_Technical_Report_2CO003 008_NMW_DM_TS_GA_DGP_20130315_1 March 15, 2013
Figure 15.1: Pit Design – Golouma South, Golouma West, Golouma Northwest and Kerekounda
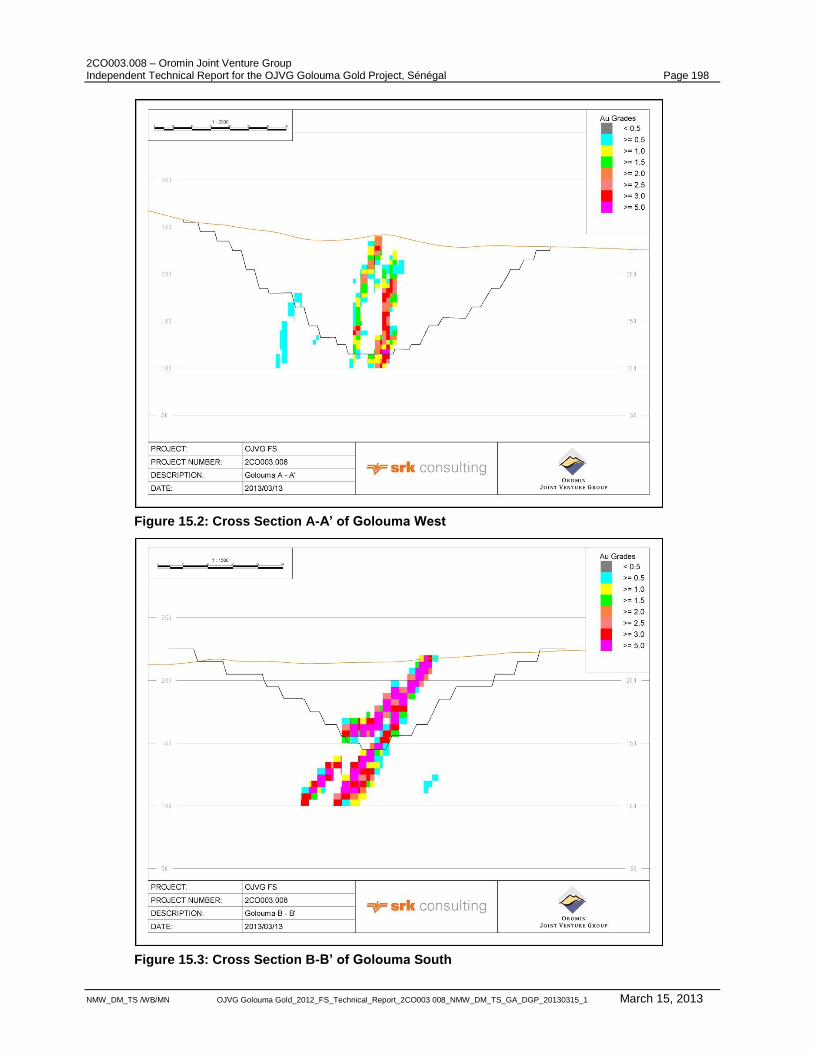
2CO003.008 – Oromin Joint Venture Group Independent Technical Report for the OJVG Golouma Gold Project, Sénégal Page 198
NMW_DM_TS /WB/MN OJVG Golouma Gold_2012_FS_Technical_Report_2CO003 008_NMW_DM_TS_GA_DGP_20130315_1 March 15, 2013
Figure 15.2: Cross Section A-A’ of Golouma West
Figure 15.3: Cross Section B-B’ of Golouma South
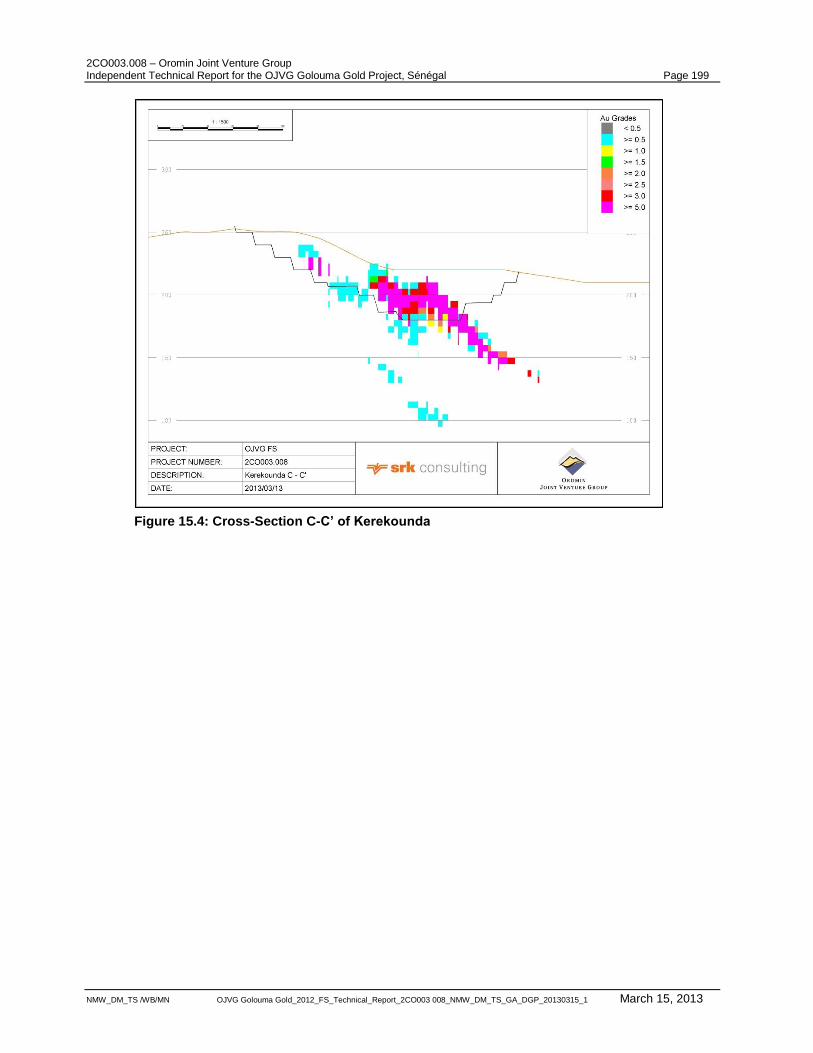
2CO003.008 – Oromin Joint Venture Group Independent Technical Report for the OJVG Golouma Gold Project, Sénégal Page 199
NMW_DM_TS /WB/MN OJVG Golouma Gold_2012_FS_Technical_Report_2CO003 008_NMW_DM_TS_GA_DGP_20130315_1 March 15, 2013
Figure 15.4: Cross-Section C-C’ of Kerekounda
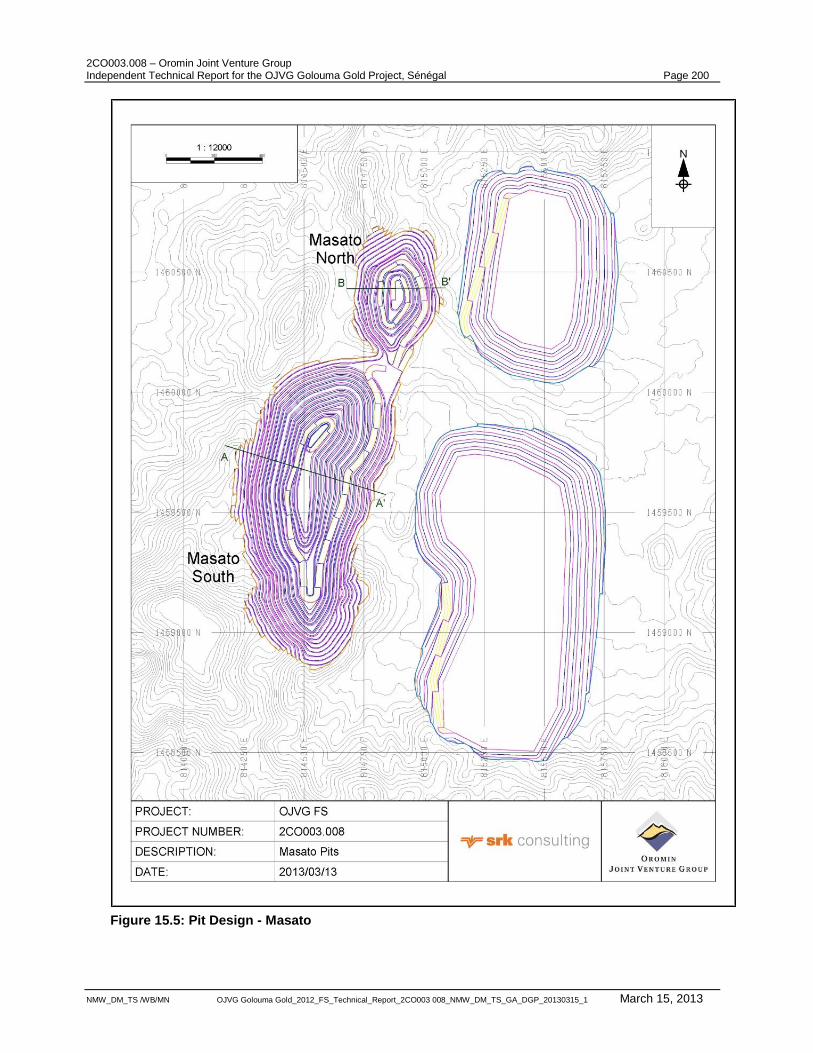
2CO003.008 – Oromin Joint Venture Group Independent Technical Report for the OJVG Golouma Gold Project, Sénégal Page 200
NMW_DM_TS /WB/MN OJVG Golouma Gold_2012_FS_Technical_Report_2CO003 008_NMW_DM_TS_GA_DGP_20130315_1 March 15, 2013
Figure 15.5: Pit Design - Masato
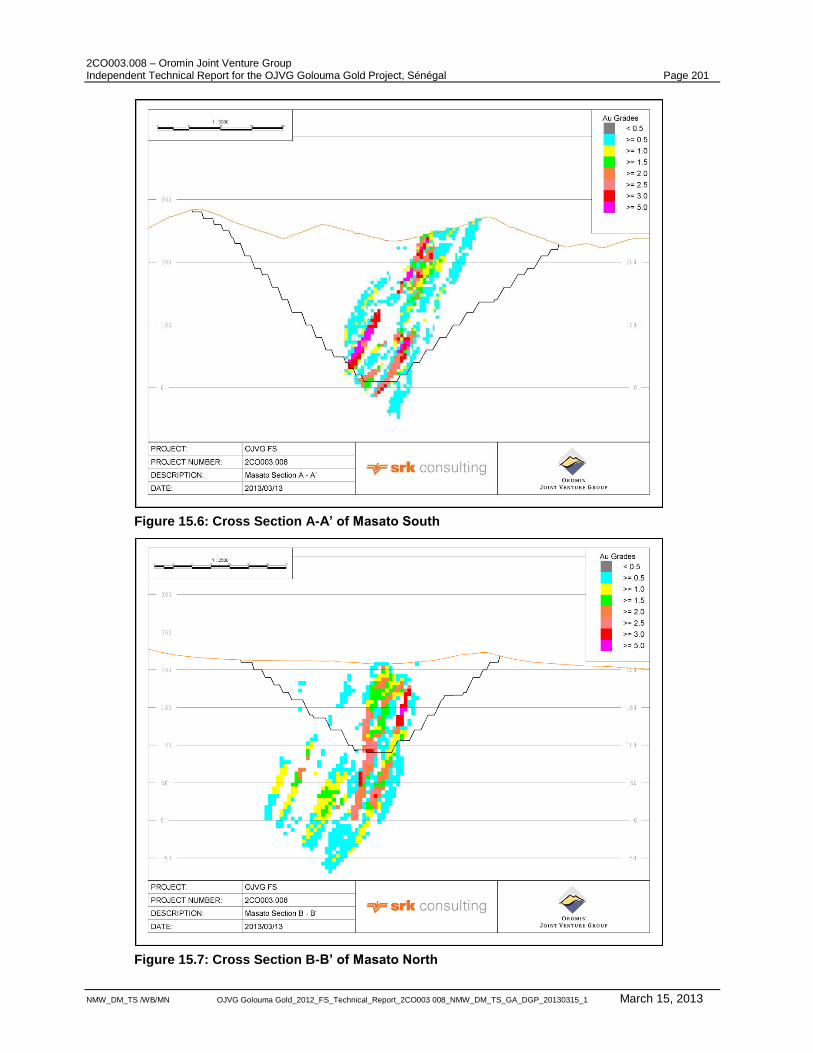
2CO003.008 – Oromin Joint Venture Group Independent Technical Report for the OJVG Golouma Gold Project, Sénégal Page 201
NMW_DM_TS /WB/MN OJVG Golouma Gold_2012_FS_Technical_Report_2CO003 008_NMW_DM_TS_GA_DGP_20130315_1 March 15, 2013
Figure 15.6: Cross Section A-A’ of Masato South
Figure 15.7: Cross Section B-B’ of Masato North
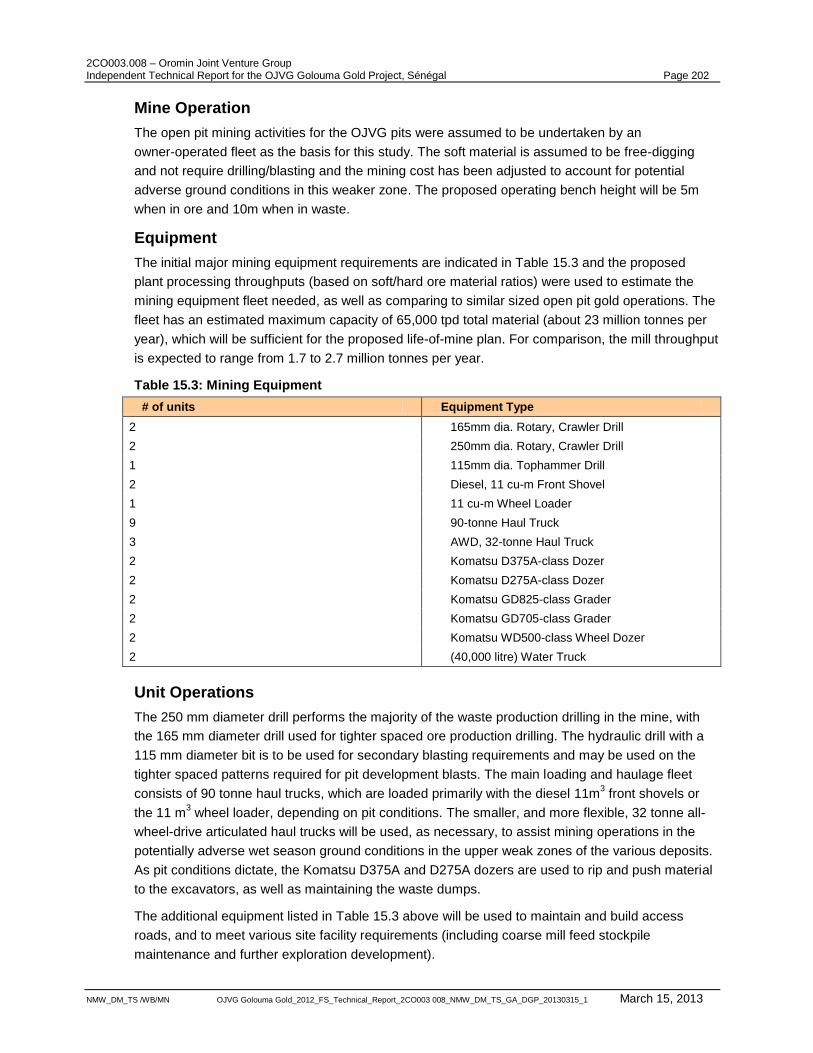
2CO003.008 – Oromin Joint Venture Group Independent Technical Report for the OJVG Golouma Gold Project, Sénégal Page 202
NMW_DM_TS /WB/MN OJVG Golouma Gold_2012_FS_Technical_Report_2CO003 008_NMW_DM_TS_GA_DGP_20130315_1 March 15, 2013
Mine Operation
The open pit mining activities for the OJVG pits were assumed to be undertaken by an
owner-operated fleet as the basis for this study. The soft material is assumed to be free-digging
and not require drilling/blasting and the mining cost has been adjusted to account for potential
adverse ground conditions in this weaker zone. The proposed operating bench height will be 5m
when in ore and 10m when in waste.
Equipment
The initial major mining equipment requirements are indicated in Table 15.3 and the proposed
plant processing throughputs (based on soft/hard ore material ratios) were used to estimate the
mining equipment fleet needed, as well as comparing to similar sized open pit gold operations. The
fleet has an estimated maximum capacity of 65,000 tpd total material (about 23 million tonnes per
year), which will be sufficient for the proposed life-of-mine plan. For comparison, the mill throughput
is expected to range from 1.7 to 2.7 million tonnes per year.
Table 15.3: Mining Equipment
# of units Equipment Type
2 165mm dia. Rotary, Crawler Drill
2 250mm dia. Rotary, Crawler Drill
1 115mm dia. Tophammer Drill
2 Diesel, 11 cu-m Front Shovel
1 11 cu-m Wheel Loader
9 90-tonne Haul Truck
3 AWD, 32-tonne Haul Truck
2 Komatsu D375A-class Dozer
2 Komatsu D275A-class Dozer
2 Komatsu GD825-class Grader
2 Komatsu GD705-class Grader
2 Komatsu WD500-class Wheel Dozer
2 (40,000 litre) Water Truck
Unit Operations
The 250 mm diameter drill performs the majority of the waste production drilling in the mine, with
the 165 mm diameter drill used for tighter spaced ore production drilling. The hydraulic drill with a
115 mm diameter bit is to be used for secondary blasting requirements and may be used on the
tighter spaced patterns required for pit development blasts. The main loading and haulage fleet
consists of 90 tonne haul trucks, which are loaded primarily with the diesel 11m3 front shovels or
the 11 m3 wheel loader, depending on pit conditions. The smaller, and more flexible, 32 tonne all-
wheel-drive articulated haul trucks will be used, as necessary, to assist mining operations in the
potentially adverse wet season ground conditions in the upper weak zones of the various deposits.
As pit conditions dictate, the Komatsu D375A and D275A dozers are used to rip and push material
to the excavators, as well as maintaining the waste dumps.
The additional equipment listed in Table 15.3 above will be used to maintain and build access
roads, and to meet various site facility requirements (including coarse mill feed stockpile
maintenance and further exploration development).

2CO003.008 – Oromin Joint Venture Group Independent Technical Report for the OJVG Golouma Gold Project, Sénégal Page 203
NMW_DM_TS /WB/MN OJVG Golouma Gold_2012_FS_Technical_Report_2CO003 008_NMW_DM_TS_GA_DGP_20130315_1 March 15, 2013
The work schedule is based on two 12 hour shifts, seven days a week, 365 days per year.
15.1.3 Open Pit Mine Sequence/Phasing
The detailed pit designs for the various deposits for the OJVG Golouma Gold Project were divided
into various pushback phases for the mine plan development in order to provide flexibility in the
schedule, maximize grade in the early part of the schedule, and to reduce pre-stripping
requirements while providing the required mill feed production per period. The mining schedule
maximizes the attainable mill throughputs based on the soft/hard ore ratios produced. The open pit
mining sequence, which mines higher grade material early on in schedule, begins with Kerekounda
(KK), followed by Golouma South, Golouma West, Golouma Northwest and ends with the Masato
deposit.
Masato has been split into two pits (North and South) with a total of four phases, which includes
one phase in the North Pit and three phases in the South. The phases are designed to allow for the
mining of the weaker zones of soft material first in order to maximize plant throughputs in the early
years of the project. The phase tonnages, associated grades and gold recoveries of the OJVG pits
are summarized in Table 15.4, along with a breakdown of waste material types.
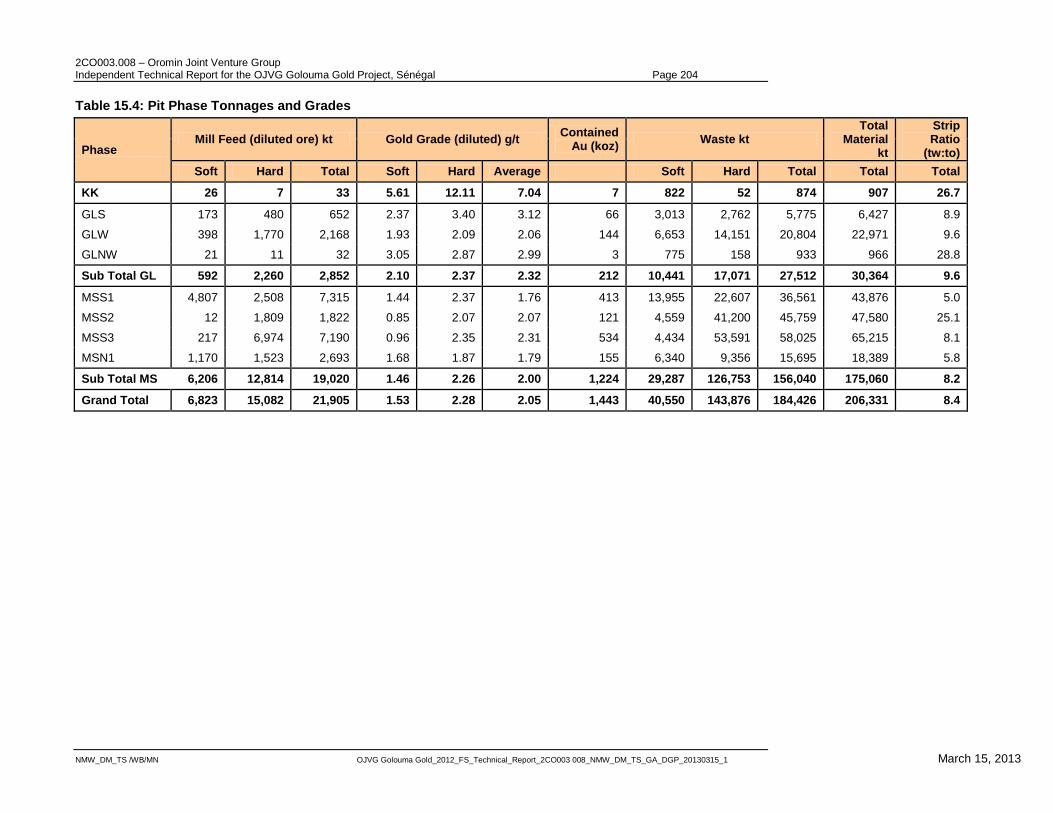
2CO003.008 – Oromin Joint Venture Group Independent Technical Report for the OJVG Golouma Gold Project, Sénégal Page 204
NMW_DM_TS /WB/MN OJVG Golouma Gold_2012_FS_Technical_Report_2CO003 008_NMW_DM_TS_GA_DGP_20130315_1 March 15, 2013
Table 15.4: Pit Phase Tonnages and Grades
Phase Mill Feed (diluted ore) kt Gold Grade (diluted) g/t
Contained Au (koz)
Waste kt Total
Material kt
Strip Ratio
(tw:to)
Soft Hard Total Soft Hard Average Soft Hard Total Total Total
KK 26 7 33 5.61 12.11 7.04 7 822 52 874 907 26.7
GLS 173 480 652 2.37 3.40 3.12 66 3,013 2,762 5,775 6,427 8.9
GLW 398 1,770 2,168 1.93 2.09 2.06 144 6,653 14,151 20,804 22,971 9.6
GLNW 21 11 32 3.05 2.87 2.99 3 775 158 933 966 28.8
Sub Total GL 592 2,260 2,852 2.10 2.37 2.32 212 10,441 17,071 27,512 30,364 9.6
MSS1 4,807 2,508 7,315 1.44 2.37 1.76 413 13,955 22,607 36,561 43,876 5.0
MSS2 12 1,809 1,822 0.85 2.07 2.07 121 4,559 41,200 45,759 47,580 25.1
MSS3 217 6,974 7,190 0.96 2.35 2.31 534 4,434 53,591 58,025 65,215 8.1
MSN1 1,170 1,523 2,693 1.68 1.87 1.79 155 6,340 9,356 15,695 18,389 5.8
Sub Total MS 6,206 12,814 19,020 1.46 2.26 2.00 1,224 29,287 126,753 156,040 175,060 8.2
Grand Total 6,823 15,082 21,905 1.53 2.28 2.05 1,443 40,550 143,876 184,426 206,331 8.4
2CO003.008 – Oromin Joint Venture Group Independent Technical Report for the OJVG Golouma Gold Project, Sénégal Page 205
NMW_DM_TS /WB_MN OJVG Golouma Gold_2012_FS_Technical_Report_2CO003 008_NMW_DM_TS_GA_DGP_20130315_1 March 15, 2013
The pit phases were based on the detailed pit designs created. The pit waste for each of the
individual deposits will be placed into waste dumps adjacent to the final pit limits or backfilled into
previously mine out pits. All process plant feed material will be hauled directly to the process plant
site.
15.2 Underground Mine Schedule
Underground (UG) mining on the Golouma Gold Project concession was investigated in the 2009
PFS for the Kerekounda deposit only and subsequently for the Kourouloulou, Goluma South and
Goluma West deposits in the 2010 Feasibility Study. This section describes the revised
underground mine plan and methodology for mining four underground deposits as an addendum
and extension to the work carried out in the 2010 Feasibility Study. Revisions due to added
resources included the development methodology and schedule, updated cut-off grade and
updated reserve tonnages.
The underground deposits were divided into six mining blocks each with its own ramp from surface
and ventilation raise(s). The featured mining blocks are:
Kerekounda (KK)
The northern-most deposit. It is located under the small Kerekounda open pit and access is via
an in-pit portal.
Kourouloulou (KL):
This deposit is located between KK and Golouma South. It has no open pit and is accessed
through a surface portal.
Golouma South 1 (GS1):
GS1 is the northern part of the Golouma South deposit. It is accessed via a portal in the
Golouma South pit and its development connects to the Golouma West deposits.
Golouma South 2 (GS2):
GS2 deposit was originally part of the design but was subsequently removed due to being
uneconomical.
Golouma West 1 (GW1):
Golouma West 1 is comprised of the carrot shaped deposit located under the west end of the
Golouma West pit. It is separated by a dyke from the other deposits but is connected via UG
development.
Golouma West 2 (GW2):
GW2 lies under the middle of the Golouma West pit
Golouma West 3 (GW3):
GW3 is the eastern-most part of the Golouma West deposit
Whittle Optimization software was used to assist with the estimation of the best open pit –
underground mining interface. Once the appropriate pit shapes were selected, the remaining
mineralized material at depth was considered for underground planning. It was decided that the KL
deposit was too narrow to be mineable by open pit methods so it was designed only as an
underground mine. KL is the only deposit where this was the case. The schedule was created
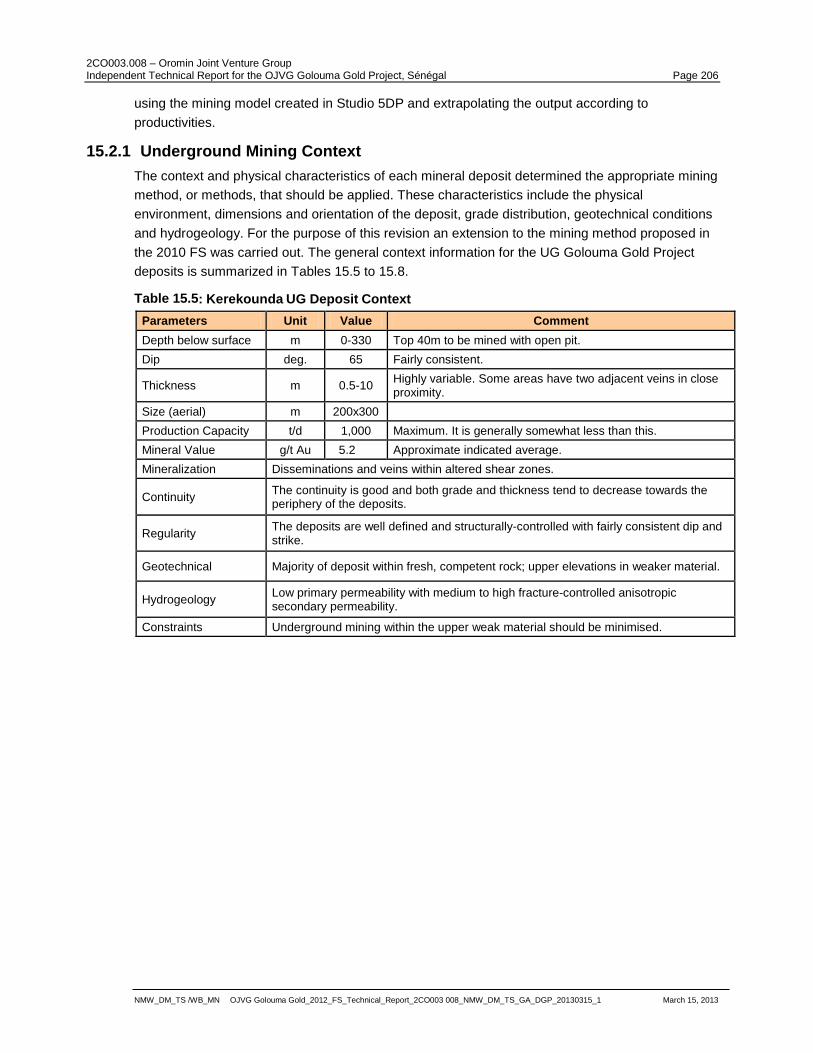
2CO003.008 – Oromin Joint Venture Group Independent Technical Report for the OJVG Golouma Gold Project, Sénégal Page 206
NMW_DM_TS /WB_MN OJVG Golouma Gold_2012_FS_Technical_Report_2CO003 008_NMW_DM_TS_GA_DGP_20130315_1 March 15, 2013
using the mining model created in Studio 5DP and extrapolating the output according to
productivities.
15.2.1 Underground Mining Context
The context and physical characteristics of each mineral deposit determined the appropriate mining
method, or methods, that should be applied. These characteristics include the physical
environment, dimensions and orientation of the deposit, grade distribution, geotechnical conditions
and hydrogeology. For the purpose of this revision an extension to the mining method proposed in
the 2010 FS was carried out. The general context information for the UG Golouma Gold Project
deposits is summarized in Tables 15.5 to 15.8.
Table 15.5: Kerekounda UG Deposit Context
Parameters Unit Value Comment
Depth below surface m 0-330 Top 40m to be mined with open pit.
Dip deg. 65 Fairly consistent.
Thickness m 0.5-10 Highly variable. Some areas have two adjacent veins in close proximity.
Size (aerial) m 200x300
Production Capacity t/d 1,000 Maximum. It is generally somewhat less than this.
Mineral Value g/t Au 5.2 Approximate indicated average.
Mineralization Disseminations and veins within altered shear zones.
Continuity The continuity is good and both grade and thickness tend to decrease towards the periphery of the deposits.
Regularity The deposits are well defined and structurally-controlled with fairly consistent dip and strike.
Geotechnical Majority of deposit within fresh, competent rock; upper elevations in weaker material.
Hydrogeology Low primary permeability with medium to high fracture-controlled anisotropic secondary permeability.
Constraints Underground mining within the upper weak material should be minimised.
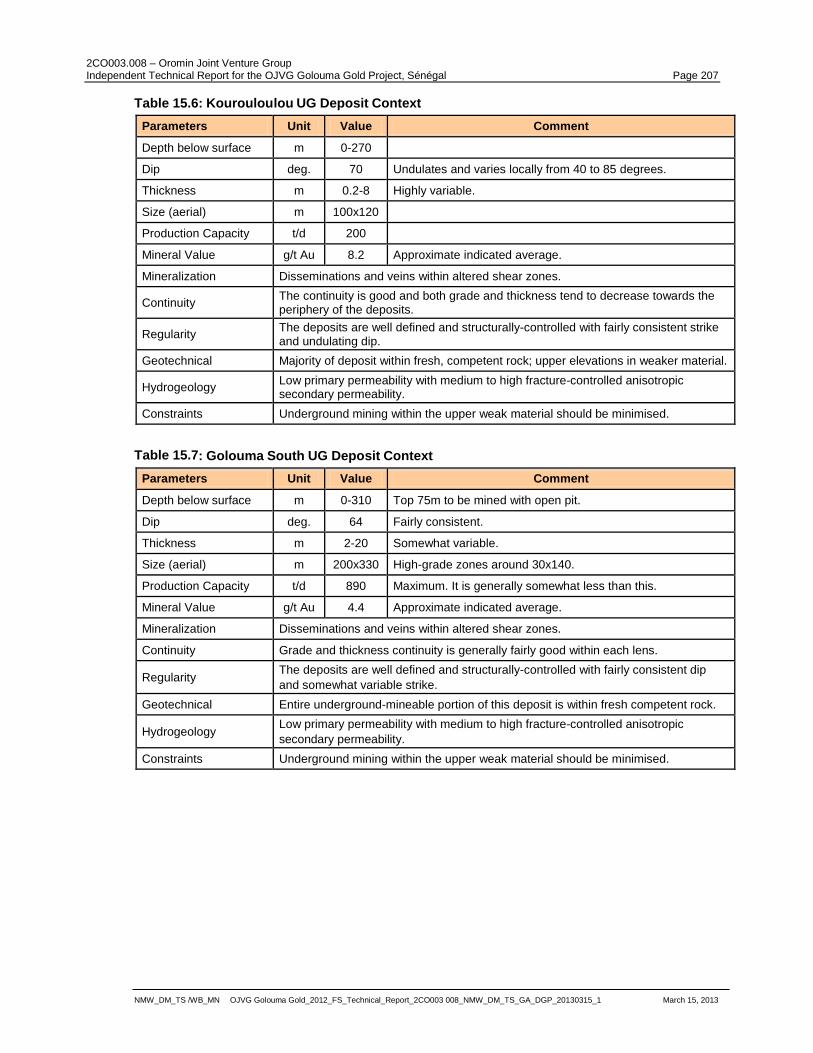
2CO003.008 – Oromin Joint Venture Group Independent Technical Report for the OJVG Golouma Gold Project, Sénégal Page 207
NMW_DM_TS /WB_MN OJVG Golouma Gold_2012_FS_Technical_Report_2CO003 008_NMW_DM_TS_GA_DGP_20130315_1 March 15, 2013
Table 15.6: Kourouloulou UG Deposit Context
Parameters Unit Value Comment
Depth below surface m 0-270
Dip deg. 70 Undulates and varies locally from 40 to 85 degrees.
Thickness m 0.2-8 Highly variable.
Size (aerial) m 100x120
Production Capacity t/d 200
Mineral Value g/t Au 8.2 Approximate indicated average.
Mineralization Disseminations and veins within altered shear zones.
Continuity The continuity is good and both grade and thickness tend to decrease towards the periphery of the deposits.
Regularity The deposits are well defined and structurally-controlled with fairly consistent strike and undulating dip.
Geotechnical Majority of deposit within fresh, competent rock; upper elevations in weaker material.
Hydrogeology Low primary permeability with medium to high fracture-controlled anisotropic secondary permeability.
Constraints Underground mining within the upper weak material should be minimised.
Table 15.7: Golouma South UG Deposit Context
Parameters Unit Value Comment
Depth below surface m 0-310 Top 75m to be mined with open pit.
Dip deg. 64 Fairly consistent.
Thickness m 2-20 Somewhat variable.
Size (aerial) m 200x330 High-grade zones around 30x140.
Production Capacity t/d 890 Maximum. It is generally somewhat less than this.
Mineral Value g/t Au 4.4 Approximate indicated average.
Mineralization Disseminations and veins within altered shear zones.
Continuity Grade and thickness continuity is generally fairly good within each lens.
Regularity The deposits are well defined and structurally-controlled with fairly consistent dip
and somewhat variable strike.
Geotechnical Entire underground-mineable portion of this deposit is within fresh competent rock.
Hydrogeology Low primary permeability with medium to high fracture-controlled anisotropic
secondary permeability.
Constraints Underground mining within the upper weak material should be minimised.
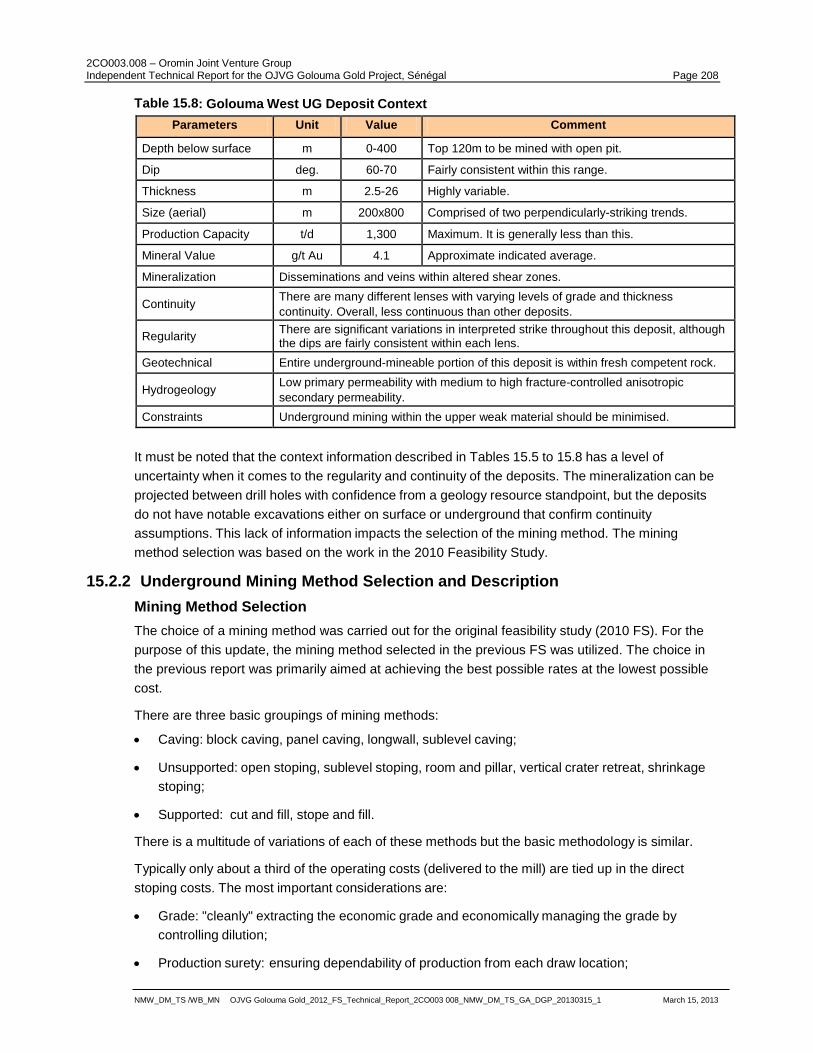
2CO003.008 – Oromin Joint Venture Group Independent Technical Report for the OJVG Golouma Gold Project, Sénégal Page 208
NMW_DM_TS /WB_MN OJVG Golouma Gold_2012_FS_Technical_Report_2CO003 008_NMW_DM_TS_GA_DGP_20130315_1 March 15, 2013
Table 15.8: Golouma West UG Deposit Context
Parameters Unit Value Comment
Depth below surface m 0-400 Top 120m to be mined with open pit.
Dip deg. 60-70 Fairly consistent within this range.
Thickness m 2.5-26 Highly variable.
Size (aerial) m 200x800 Comprised of two perpendicularly-striking trends.
Production Capacity t/d 1,300 Maximum. It is generally less than this.
Mineral Value g/t Au 4.1 Approximate indicated average.
Mineralization Disseminations and veins within altered shear zones.
Continuity There are many different lenses with varying levels of grade and thickness
continuity. Overall, less continuous than other deposits.
Regularity There are significant variations in interpreted strike throughout this deposit, although the dips are fairly consistent within each lens.
Geotechnical Entire underground-mineable portion of this deposit is within fresh competent rock.
Hydrogeology Low primary permeability with medium to high fracture-controlled anisotropic
secondary permeability.
Constraints Underground mining within the upper weak material should be minimised.
It must be noted that the context information described in Tables 15.5 to 15.8 has a level of
uncertainty when it comes to the regularity and continuity of the deposits. The mineralization can be
projected between drill holes with confidence from a geology resource standpoint, but the deposits
do not have notable excavations either on surface or underground that confirm continuity
assumptions. This lack of information impacts the selection of the mining method. The mining
method selection was based on the work in the 2010 Feasibility Study.
15.2.2 Underground Mining Method Selection and Description
Mining Method Selection
The choice of a mining method was carried out for the original feasibility study (2010 FS). For the
purpose of this update, the mining method selected in the previous FS was utilized. The choice in
the previous report was primarily aimed at achieving the best possible rates at the lowest possible
cost.
There are three basic groupings of mining methods:
Caving: block caving, panel caving, longwall, sublevel caving;
Unsupported: open stoping, sublevel stoping, room and pillar, vertical crater retreat, shrinkage
stoping;
Supported: cut and fill, stope and fill.
There is a multitude of variations of each of these methods but the basic methodology is similar.
Typically only about a third of the operating costs (delivered to the mill) are tied up in the direct
stoping costs. The most important considerations are:
Grade: "cleanly" extracting the economic grade and economically managing the grade by
controlling dilution;
Production surety: ensuring dependability of production from each draw location;
2CO003.008 – Oromin Joint Venture Group Independent Technical Report for the OJVG Golouma Gold Project, Sénégal Page 209
NMW_DM_TS /WB_MN OJVG Golouma Gold_2012_FS_Technical_Report_2CO003 008_NMW_DM_TS_GA_DGP_20130315_1 March 15, 2013
Production rate: estimating the rate at which an ore body can be extracted (average rate of fall)
will depend on the complexity of the method (complex methods are usually necessary to
overcome geometrical or ground control difficulties).
Since the cost to finished metal depends on grade times rate, costs spent on the "method" (more
development, higher cement, smaller stopes, more support, etc.) are nearly always cost effective.
The generally competent rock conditions and steeply dipping veins of narrow to medium width make
the Golouma Gold Project deposits conducive to many possible mining methods including
unsupported methods. The over-riding factors in the method selection, however, are the desire to
get as much ore out as possible (minimization of pillars) and the unconfirmed nature of the
continuity and regularity of the deposits. This latter condition can only be understood with
underground development and/or vein exposure on surface. The lack of certainty led to the
selection of cut and fill (C&F) as the mining method. C&F mining is simple, repetitive and is highly
flexible for deposits with uncertain continuity and regularity. The mine infrastructure in the FS mine
plan would also support other mining methods should they be deemed more appropriate once the
deposit has been exposed and its characteristics better understood. Other possible methods might
be AVOCA, LH stoping or shrinkage stoping.
Mining Method Description
Cut and fill mining involves mining the deposits in a series of horizontal slices 5 m high progressing
from the bottom up. In typical cut and fill mining practices, a slice of ore is removed from the back of
the stope and the new, exposed back is supported with rockbolts. Once a slice (lift) is taken for the
entire stope length, the remaining broken ore is removed and backfill is brought in to fill the mined-
out void. The backfill acts to provide ground support for the hangingwall and footwall and also acts
as the floor for the next lift.
At the Golouma Gold Project, the C&F method will employ a “double-lift” methodology in which two
lifts will be removed before backfill is put in place (Figure 15.8). The first drift will be mined and then
a bench will be mined underneath. Both lifts will then be filled with uncemented rock backfill. This
sequence reduces the ground support in the back to every second lift rather than every lift. A total of
four slices will be taken from each attack ramp. Once mining from an attack ramp is complete, the
ramp above will then be used to access the deposit.
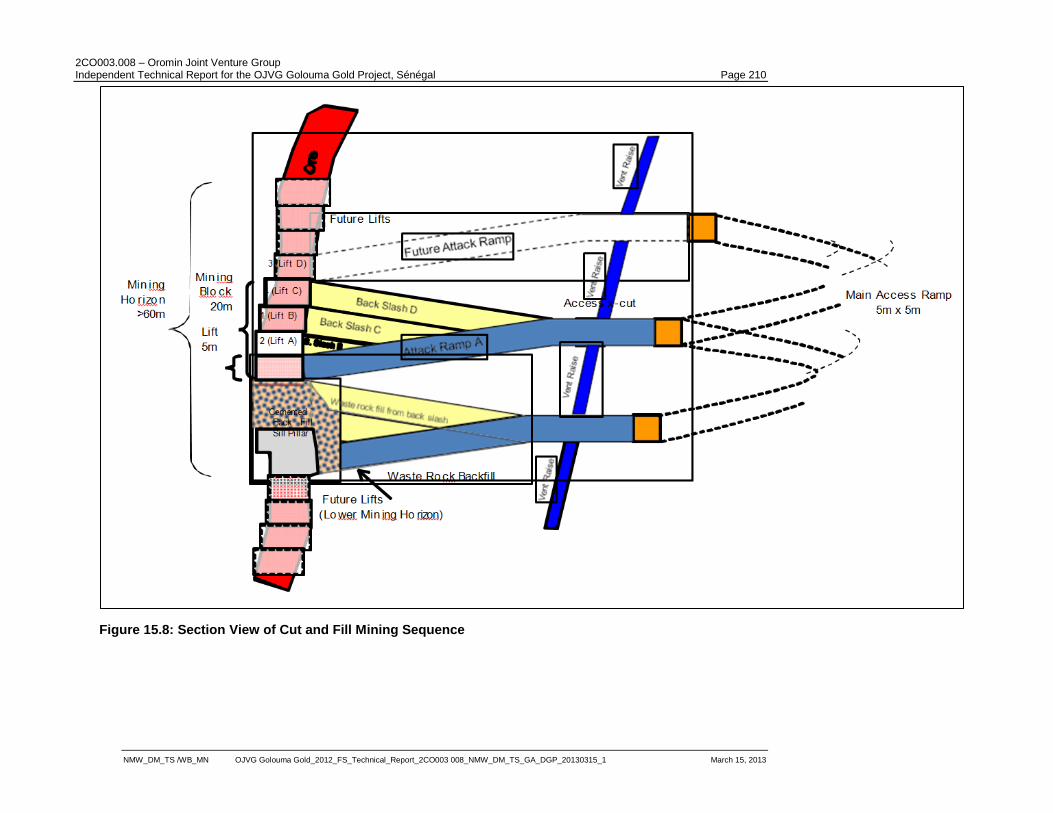
2CO003.008 – Oromin Joint Venture Group Independent Technical Report for the OJVG Golouma Gold Project, Sénégal Page 210
NMW_DM_TS /WB_MN OJVG Golouma Gold_2012_FS_Technical_Report_2CO003 008_NMW_DM_TS_GA_DGP_20130315_1 March 15, 2013
Figure 15.8: Section View of Cut and Fill Mining Sequence
2CO003.008 – Oromin Joint Venture Group Independent Technical Report for the OJVG Golouma Gold Project, Sénégal Page 211
NMW_DM_TS /WB_MN OJVG Golouma Gold_2012_FS_Technical_Report_2CO003 008_NMW_DM_TS_GA_DGP_20130315_1 March 15, 2013
Orebody access x-cuts and attack ramps will come off of the main ramps every 20 vertical metres.
Ore and waste remuck bays will be sized to accept the equivalent of two rounds of muck and will be
located off of the Access x-cut.
From the attack ramps, ore mining will advance in both directions along strike with a full vein-width
face up to 10 m wide. In general, the height of the ore drift will be 5 m. For wider areas like the
western deposit of Golouma West, pillars will be left in the middle of each lift as per a post-pillar cut
and fill method. In narrower zones height will decrease accordingly.
Upon reaching the end of the predetermined stope boundary, or running out of ore, mining of the
first cut will cease and a bench will then be taken staring back at the at the attack ramp. The
second, lower cut will be mined by slashing the floor (benching) of the first cut. The benching cycle
will create an opportunity for the jumbo to drill long (4 m+) holes and to be very productive as no cut
holes have to be drilled. A lower powder factor will also be possible with benching.
Once the second cut is completely blasted, all of the ore in the stope will be mucked out. Mining will
then stop and the stope will be filled close to the back with uncemented waste rock fill. The mining
cycle will begin again on the third cut followed by benching the fourth cut. At sill level, when mining
is planned to advance up from below, waste rock backfill will be cemented and allow the floor
underneath the fill to be extracted.
15.2.3 Mine Design
Development
Each of the six UG mining areas will be accessed by an independent decline through a portal from
surface. Five of the six portals will be collared in the wall of an open pit, with only the Kourouloulou
portal requiring a surface cut to be excavated down to competent rock.
All horizontal development in the mine is designed at a maximum 15% gradient. Level accesses are
driven from a main decline to access the ore body on 20 m centers. A primary attack ramp is driven
from the end of each level access to start mining the first lift of each stoping block. Subsequent lifts
in the same block are accessed by slashing the back or benching the floor of the primary attack
ramp. Primary attack ramps and subsequent slashed ramps are designed to a maximum gradient of
±15%. In-stope development is used to access adjacent stopes and to connect across low grade
sections of a stope. Remuck bays have been assumed every 150 m along each main decline to
facilitate the initial decline development and to allow vehicles a place to pull off the ramp to allow
others to pass during production. Two additional remuck bays, one for ore and the other for waste,
are assumed near each primary attack ramp to facilitate the mining and filling processes. The
remucks, electrical sub-stations, truck turn around bays, sumps and refuge stations have been
incorporated into the design by means of adding 15% percent to the total development footage.
Development sizes are outlined in Table 15.9.
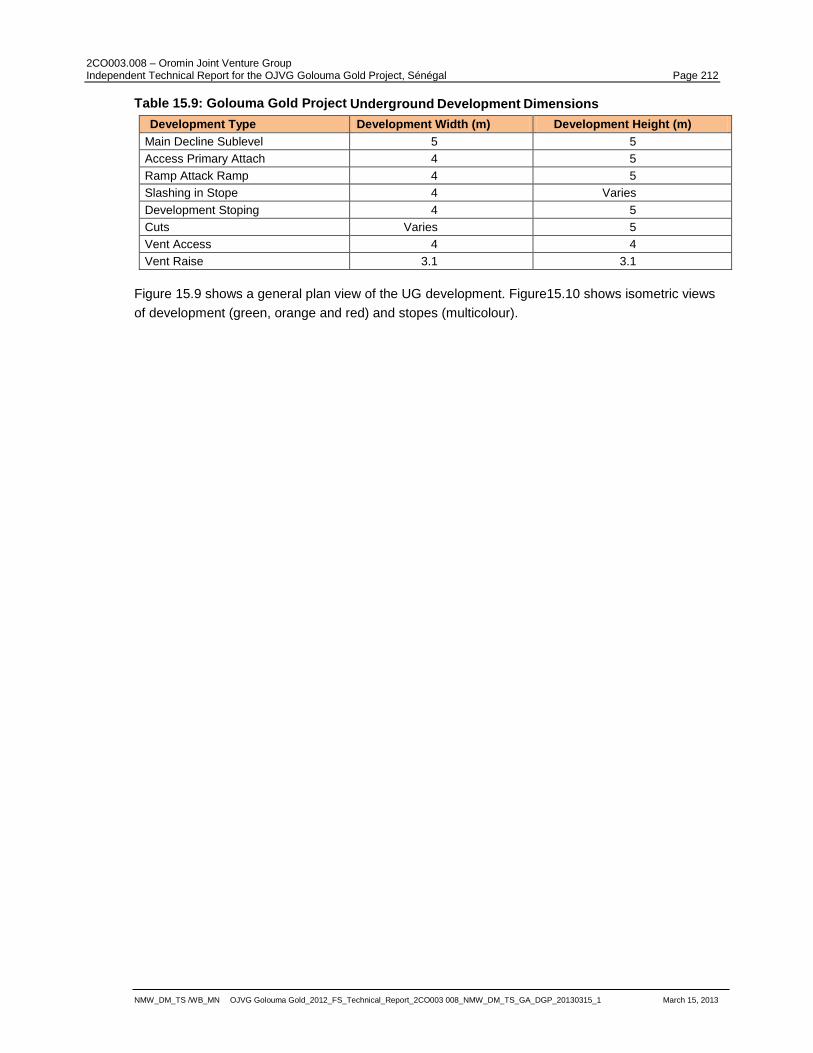
2CO003.008 – Oromin Joint Venture Group Independent Technical Report for the OJVG Golouma Gold Project, Sénégal Page 212
NMW_DM_TS /WB_MN OJVG Golouma Gold_2012_FS_Technical_Report_2CO003 008_NMW_DM_TS_GA_DGP_20130315_1 March 15, 2013
Table 15.9: Golouma Gold Project Underground Development Dimensions
Development Type Development Width (m) Development Height (m)
Main Decline Sublevel 5 5
Access Primary Attach 4 5
Ramp Attack Ramp 4 5
Slashing in Stope 4 Varies
Development Stoping 4 5
Cuts Varies 5
Vent Access 4 4
Vent Raise 3.1 3.1
Figure 15.9 shows a general plan view of the UG development. Figure15.10 shows isometric views
of development (green, orange and red) and stopes (multicolour).
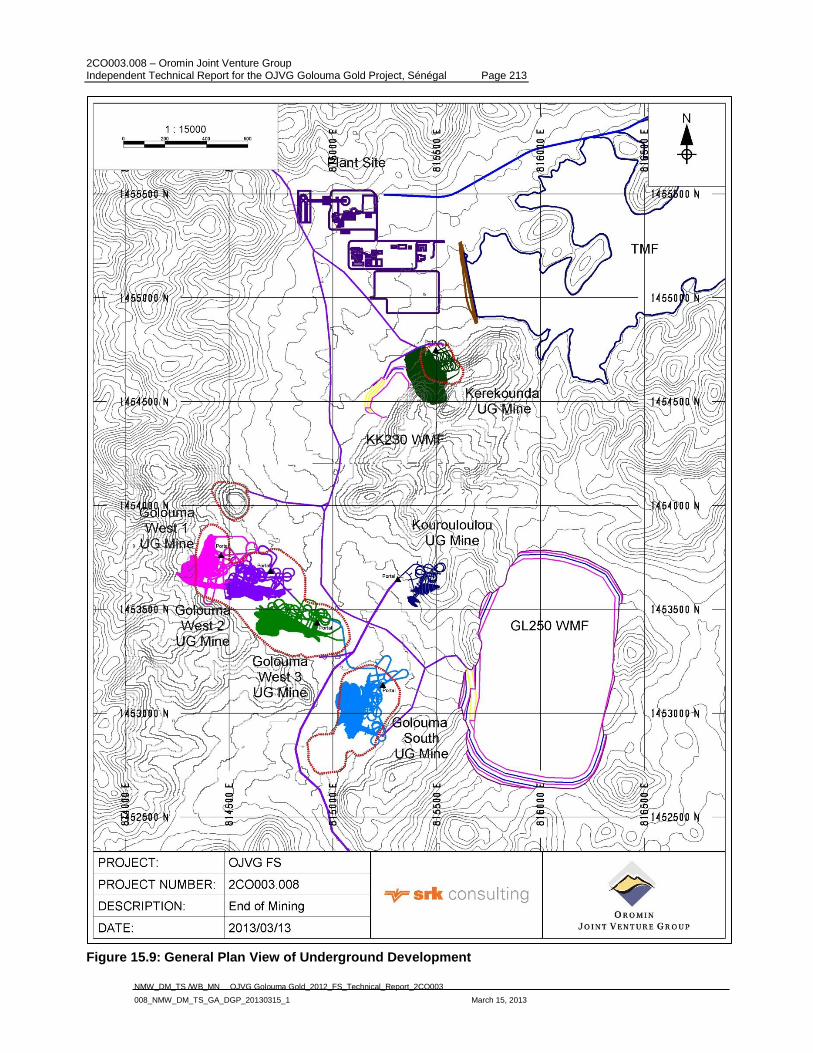
2CO003.008 – Oromin Joint Venture Group Independent Technical Report for the OJVG Golouma Gold Project, Sénégal Page 213
NMW_DM_TS /WB_MN OJVG Golouma Gold_2012_FS_Technical_Report_2CO003
008_NMW_DM_TS_GA_DGP_20130315_1 March 15, 2013
Figure 15.9: General Plan View of Underground Development
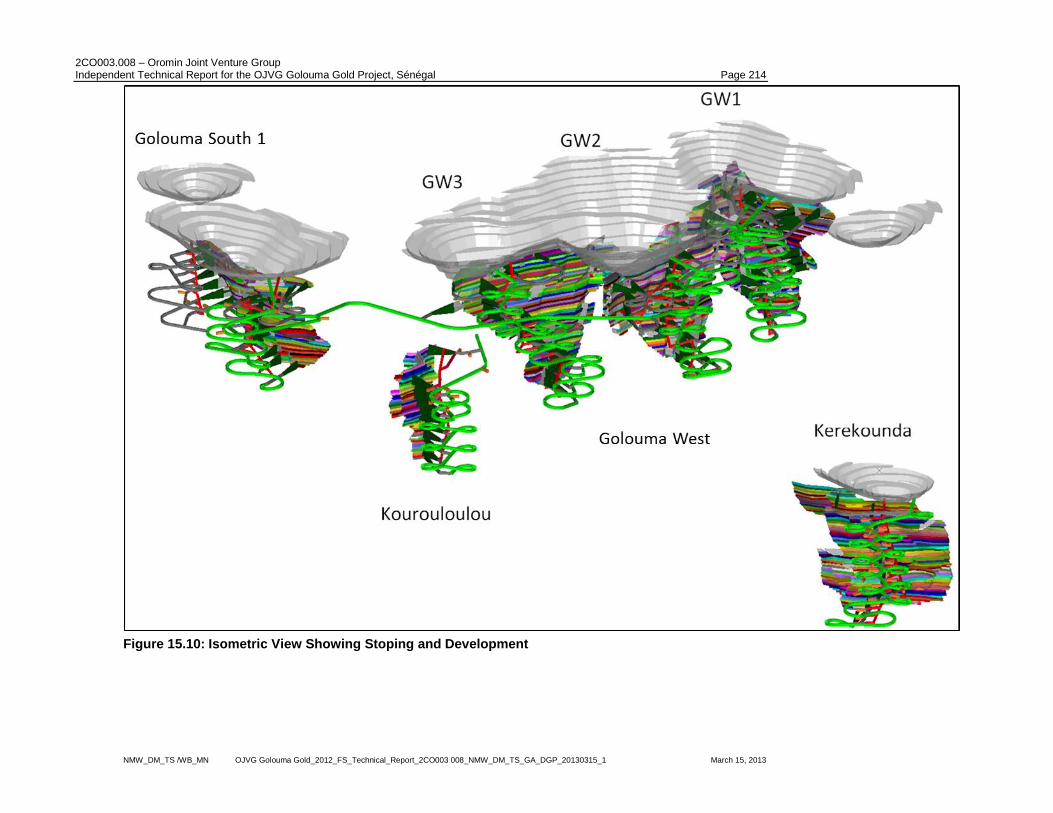
2CO003.008 – Oromin Joint Venture Group Independent Technical Report for the OJVG Golouma Gold Project, Sénégal Page 214
NMW_DM_TS /WB_MN OJVG Golouma Gold_2012_FS_Technical_Report_2CO003 008_NMW_DM_TS_GA_DGP_20130315_1 March 15, 2013
Figure 15.10: Isometric View Showing Stoping and Development
2CO003.008 – Oromin Joint Venture Group Independent Technical Report for the OJVG Golouma Gold Project, Sénégal Page 215
NMW_DM_TS /WB_MN OJVG Golouma Gold_2012_FS_Technical_Report_2CO003 008_NMW_DM_TS_GA_DGP_20130315_1 March 15, 2013
15.2.4 Stoping
Multiple horizons of stoping will be mined concurrently to provide additional active mining faces in
deposits where the vertical extent is large enough. The mining horizons have been kept to 80 m in
height where possible but variations exist depending upon scheduling requirements. With the
exception of the lowest horizon in each deposit, the bottom lifts of each horizon will be filled with
cemented fill to create a strong sill pillar under which a lower horizon can be safely mined.
Each horizon will be comprised of multiple mining blocks. Each mining block will contain four
mining lifts. Both mining methods, cut and fill and post-pillar cut and fill, will normally take 5m tall
lifts and will mine to a minimum width of 2.5 m. The sequences of mining individual lifts are different
for each method and are described in Section 15.2.2.
15.2.5 Dilution
The primary sources of dilution expected from both cut and fill and post pillar cut and fill mining
methods are the results of minimum stope shapes (34% dilution) ((waste/ore + waste) and mucking
from the top of waste fill (5% dilution). The planned dilution at 34% was is mainly a result of low
grade material being mixed in with high grade material in the stope, rather than a function of the
mining shapes. Also, waste dilution that must be taken to maintain minimum mining shapes were
included in the MSO analysis for the applicable ore bodies. Actual mining shapes may be able to
more closely follow the ore contacts, so it has been assumed that the design dilution is adequate.
Development required to connect stopes across areas where the ore grade is too low to meet cut-
off has been explicitly defined. Because of this, no additional dilution is expected in areas where
ore is not continuous.
15.2.6 Mining Recovery
The cut and fill and post-pillar cut and fill mining methods allow for accurate mining with the ability
to closely follow ore/waste contacts. This results it very high recovery as any ore identified in a
stope can be mined. The only restrictions to 100% recovery occur when geotechnical constraints
require the use of pillars in very wide stopes. Overall ore recovery, based on tonnes, in deposits
less than 10 m wide of 100% is assumed.
Some parts of Golouma West are too wide to be mined to their extents without additional support.
The post pillar cut and fill mining method proposed for these areas will mine 8 m wide rooms and
leave 5 m square pillars. This method should result in an overall ore recovery of 97%. Pillars were
calculated based on requirement and were not included in the extraction plan.
15.2.7 Unit Mining Operations
Drilling and Blasting
As calculated in the previous 2010FS study, production and development drilling was planned
using 45 mm diameters holes and two-boom jumbos. Development round lengths of 3.4 m were
assumed and breasting and benching rounds of 4m long were used.
Blasting will be conducted using pumped emulsion carried on dedicated vehicles. Charging
productivity from the emulsion loader was assumed to be 100 kg of emulsion per operating hour.
Secondary emulsion loaders mounted on trailers will also be used when required. Standard long-
period delays will be used for timing and detonation and will be initiated by detonating cord.
2CO003.008 – Oromin Joint Venture Group Independent Technical Report for the OJVG Golouma Gold Project, Sénégal Page 216
NMW_DM_TS /WB_MN OJVG Golouma Gold_2012_FS_Technical_Report_2CO003 008_NMW_DM_TS_GA_DGP_20130315_1 March 15, 2013
Powder factors for development ends were estimated to be averaged about 1.0 kg/t. Benching and
slashing explosive factors average a little over 0.5 kg/t.
Surface storage and security of explosives and caps will be the responsibility of the explosives
supplier in OJVG-supplied magazines.
Mucking
Stope mucking will take place using 10 t LHDs loading directly into truck when they are available
and when there is sufficient room to manoeuvre. When trucks aren‟t available ore and waste will be
mucked into re-muck bays for loading at a later time. A 4 t LHD was included in the plan to muck
narrow stopes (<3.5 m wide) that the 10 t LHD cannot access. There are only a small number of
narrow stopes planned.
Hauling
All ore and waste will be hauled using 30 t UG articulated trucks.
Ore will be hauled to surface direct to the primary crusher at the mill. UG trucks will be loaded with
ore by an LHD either directly in the stope or from the re-muck bays in the access x-cuts.
For waste haulage, trucks will loaded at the development face or adjacent remuck bay located
every 150 m in the main ramp. Waste will be hauled either to an empty stope for backfill, to a
temporary surface stockpile adjacent to the portal or to the main Golouma waste dump.
Backfill that is not hauled directly from waste development ends will be hauled from the temporary
waste stockpiles on surface to stopes requiring backfill. A 10 t surface front end loader (Cat 988 or
equivalent) will be used to load UG trucks with waste for the transport back underground to stopes
requiring backfill. Cemented rock fill will be mixed and loaded by the surface front end loader.
Ground Support
All development headings and stoping areas will be supported, at a minimum, in accordance with
the recommendations made in the geotechnical section of this report. All openings will be bolted
with 1.8 m to 2.4 m long rock bolts at spacings of 1.2 m to 1.5 m. Resin-rebar bolts will be used in
all permanent development and all in-stope and temporary openings will be supported with friction
anchors (Split Sets®, Swellex® or similar). Mesh and shotcrete will also be used in the upper
decline locations until fresh rock is reached and where local ground conditions warrant.
Ground support installations are planned to be conducted by dedicated crews equipped with
pneumatic stopers and jacklegs. Support will be conducted off of blasted rock piles or from scissor
lifts as appropriate.
Backfilling
Two types of backfill material will be used underground at the Golouma Gold Project:
Cemented Rock Fill;
Waste Rock Fill.
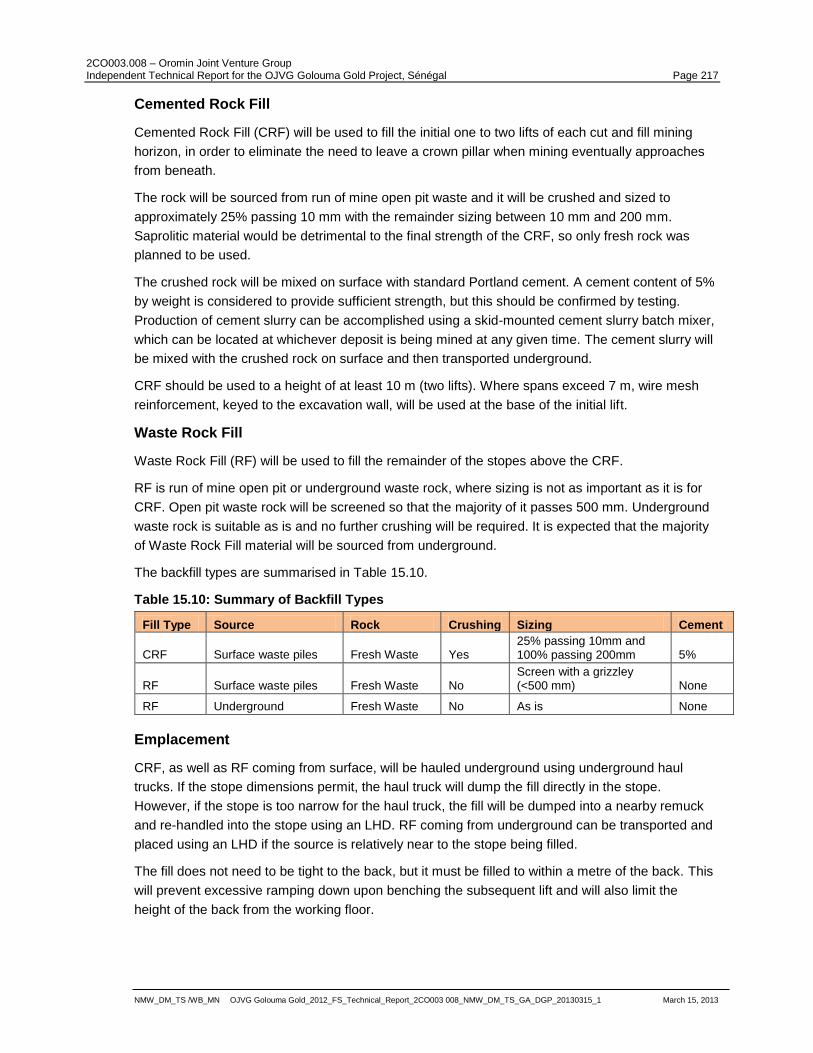
2CO003.008 – Oromin Joint Venture Group Independent Technical Report for the OJVG Golouma Gold Project, Sénégal Page 217
NMW_DM_TS /WB_MN OJVG Golouma Gold_2012_FS_Technical_Report_2CO003 008_NMW_DM_TS_GA_DGP_20130315_1 March 15, 2013
Cemented Rock Fill
Cemented Rock Fill (CRF) will be used to fill the initial one to two lifts of each cut and fill mining
horizon, in order to eliminate the need to leave a crown pillar when mining eventually approaches
from beneath.
The rock will be sourced from run of mine open pit waste and it will be crushed and sized to
approximately 25% passing 10 mm with the remainder sizing between 10 mm and 200 mm.
Saprolitic material would be detrimental to the final strength of the CRF, so only fresh rock was
planned to be used.
The crushed rock will be mixed on surface with standard Portland cement. A cement content of 5%
by weight is considered to provide sufficient strength, but this should be confirmed by testing.
Production of cement slurry can be accomplished using a skid-mounted cement slurry batch mixer,
which can be located at whichever deposit is being mined at any given time. The cement slurry will
be mixed with the crushed rock on surface and then transported underground.
CRF should be used to a height of at least 10 m (two lifts). Where spans exceed 7 m, wire mesh
reinforcement, keyed to the excavation wall, will be used at the base of the initial lift.
Waste Rock Fill
Waste Rock Fill (RF) will be used to fill the remainder of the stopes above the CRF.
RF is run of mine open pit or underground waste rock, where sizing is not as important as it is for
CRF. Open pit waste rock will be screened so that the majority of it passes 500 mm. Underground
waste rock is suitable as is and no further crushing will be required. It is expected that the majority
of Waste Rock Fill material will be sourced from underground.
The backfill types are summarised in Table 15.10.
Table 15.10: Summary of Backfill Types
Fill Type Source Rock Crushing Sizing Cement
CRF Surface waste piles Fresh Waste Yes 25% passing 10mm and 100% passing 200mm 5%
RF Surface waste piles Fresh Waste No Screen with a grizzley (<500 mm) None
RF Underground Fresh Waste No As is None
Emplacement
CRF, as well as RF coming from surface, will be hauled underground using underground haul
trucks. If the stope dimensions permit, the haul truck will dump the fill directly in the stope.
However, if the stope is too narrow for the haul truck, the fill will be dumped into a nearby remuck
and re-handled into the stope using an LHD. RF coming from underground can be transported and
placed using an LHD if the source is relatively near to the stope being filled.
The fill does not need to be tight to the back, but it must be filled to within a metre of the back. This
will prevent excessive ramping down upon benching the subsequent lift and will also limit the
height of the back from the working floor.
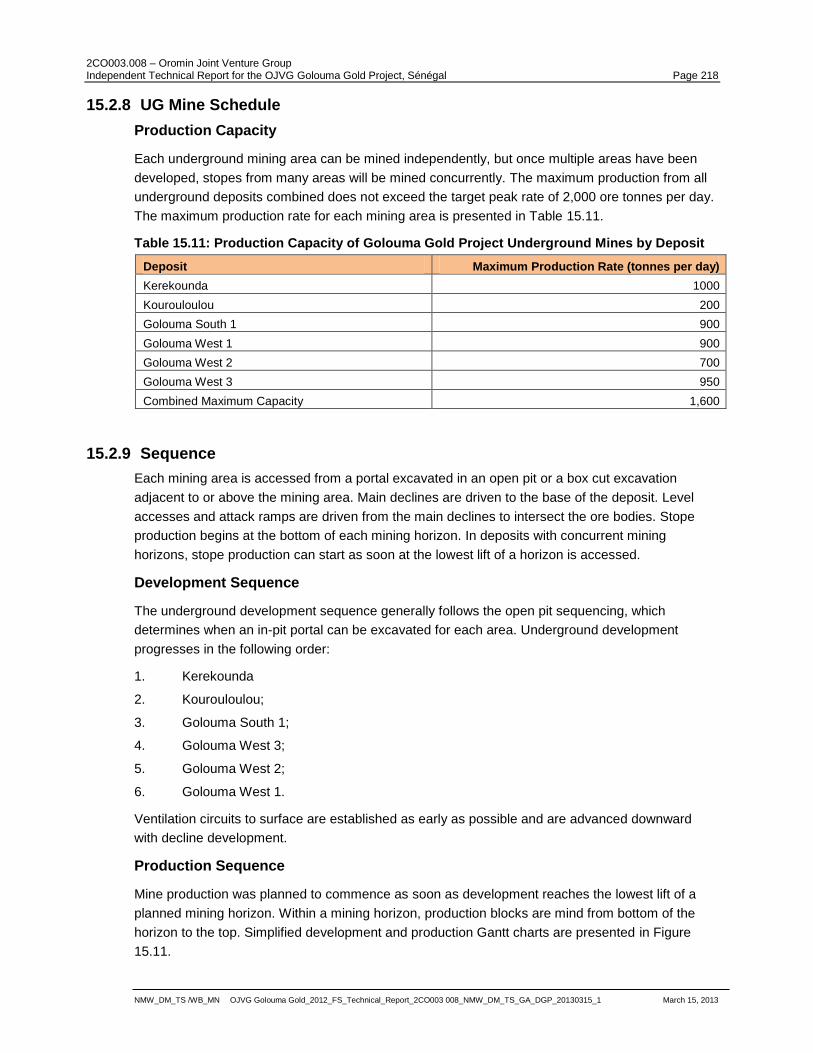
2CO003.008 – Oromin Joint Venture Group Independent Technical Report for the OJVG Golouma Gold Project, Sénégal Page 218
NMW_DM_TS /WB_MN OJVG Golouma Gold_2012_FS_Technical_Report_2CO003 008_NMW_DM_TS_GA_DGP_20130315_1 March 15, 2013
15.2.8 UG Mine Schedule
Production Capacity
Each underground mining area can be mined independently, but once multiple areas have been
developed, stopes from many areas will be mined concurrently. The maximum production from all
underground deposits combined does not exceed the target peak rate of 2,000 ore tonnes per day.
The maximum production rate for each mining area is presented in Table 15.11.
Table 15.11: Production Capacity of Golouma Gold Project Underground Mines by Deposit
Deposit Maximum Production Rate (tonnes per day)
Kerekounda 1000
Kourouloulou 200
Golouma South 1 900
Golouma West 1 900
Golouma West 2 700
Golouma West 3 950
Combined Maximum Capacity 1,600
15.2.9 Sequence
Each mining area is accessed from a portal excavated in an open pit or a box cut excavation
adjacent to or above the mining area. Main declines are driven to the base of the deposit. Level
accesses and attack ramps are driven from the main declines to intersect the ore bodies. Stope
production begins at the bottom of each mining horizon. In deposits with concurrent mining
horizons, stope production can start as soon at the lowest lift of a horizon is accessed.
Development Sequence
The underground development sequence generally follows the open pit sequencing, which
determines when an in-pit portal can be excavated for each area. Underground development
progresses in the following order:
1. Kerekounda
2. Kourouloulou;
3. Golouma South 1;
4. Golouma West 3;
5. Golouma West 2;
6. Golouma West 1.
Ventilation circuits to surface are established as early as possible and are advanced downward
with decline development.
Production Sequence
Mine production was planned to commence as soon as development reaches the lowest lift of a
planned mining horizon. Within a mining horizon, production blocks are mind from bottom of the
horizon to the top. Simplified development and production Gantt charts are presented in Figure
15.11.
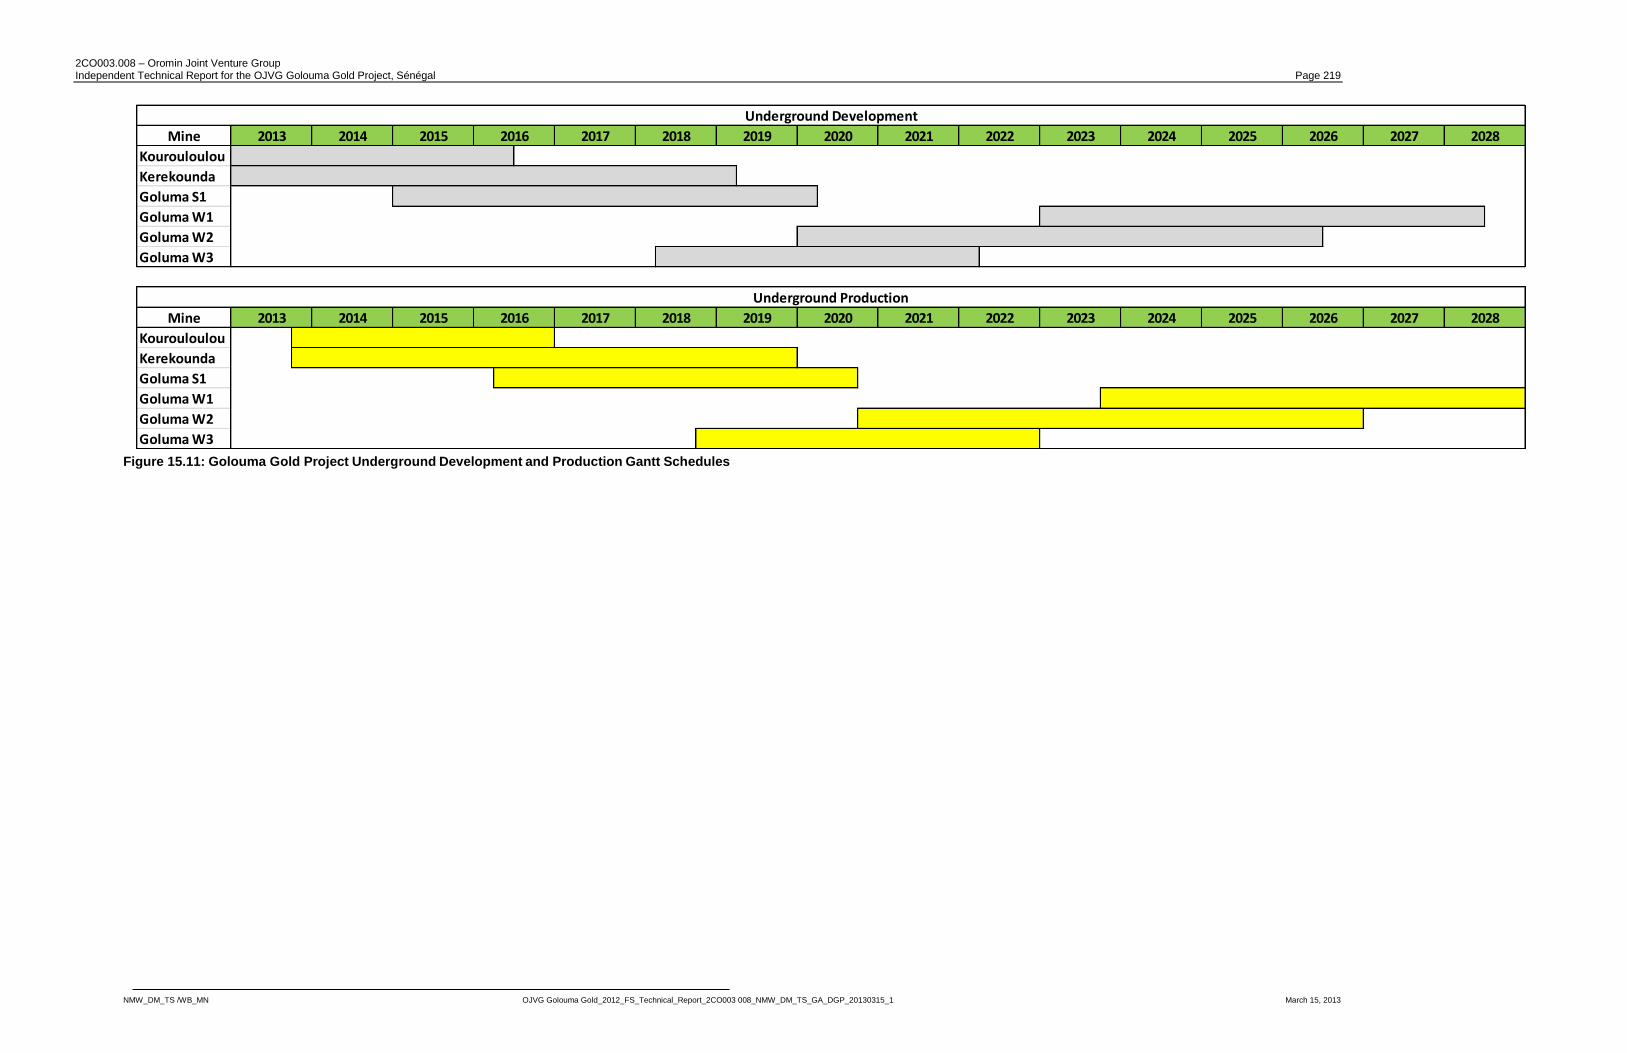
2CO003.008 – Oromin Joint Venture Group Independent Technical Report for the OJVG Golouma Gold Project, Sénégal Page 219
NMW_DM_TS /WB_MN OJVG Golouma Gold_2012_FS_Technical_Report_2CO003 008_NMW_DM_TS_GA_DGP_20130315_1 March 15, 2013
Figure 15.11: Golouma Gold Project Underground Development and Production Gantt Schedules
Mine
Kourouloulou
Kerekounda
Goluma S1
Goluma W1
Goluma W2
Goluma W3
Mine
Kourouloulou
Kerekounda
Goluma S1
Goluma W1
Goluma W2
Goluma W3
2013 2014 2015 2016 2017 2018
2025 2026 2027 2028
2025 2026 2027 20282019 2020 2021 2022 2023 2024
Underground Development
Underground Production
2019 2020 2021 2022 2023 20242013 2014 2015 2016 2017 2018

2CO003.008 – Oromin Joint Venture Group Independent Technical Report for the OJVG Golouma Gold Project, Sénégal Page 220
NMW_DM_TS /WB_MN OJVG Golouma Gold_2012_FS_Technical_Report_2CO003 008_NMW_DM_TS_GA_DGP_20130315_1 March 15, 2013
Production Schedule
The production and development schedules were based on a mine model created using Studio
5DP software. The schedule was constrained by the sequence in which development and stoping
must progress and the maximum rates at which they can progress. The schedule was also leveled
to make sure that production and development targets did not exceed the capabilities of the
selected mining equipment and infrastructure.
Maximum production rates were based on the assumption that an underground crew can advance
8m per day when multiple headings are available. Including both the cut and the fill cycles, it was
assumed that each available stope face can produce an overall average rate of 200 t per round.
The Kourouloulou deposit has a maximum production rate of 200 t/d as the stopes are too small to
support more than one active stoping face at a time. At peak capacity the Goluma South 1 deposit
will have three active mining horizons with a maximum of eight active faces allowing for a
maximum production rate of 900 t/d. The Kerekounda, Goluma West 1, and Goluma West 3 areas
will each have at least 3 active mining horizons for a maximum production capacity of 900 t/d.
Goluma West 2 has a maximum production rate of 700 t/d. Production schedules for each
Golouma Gold Project underground deposit are presented in Table 15.12.
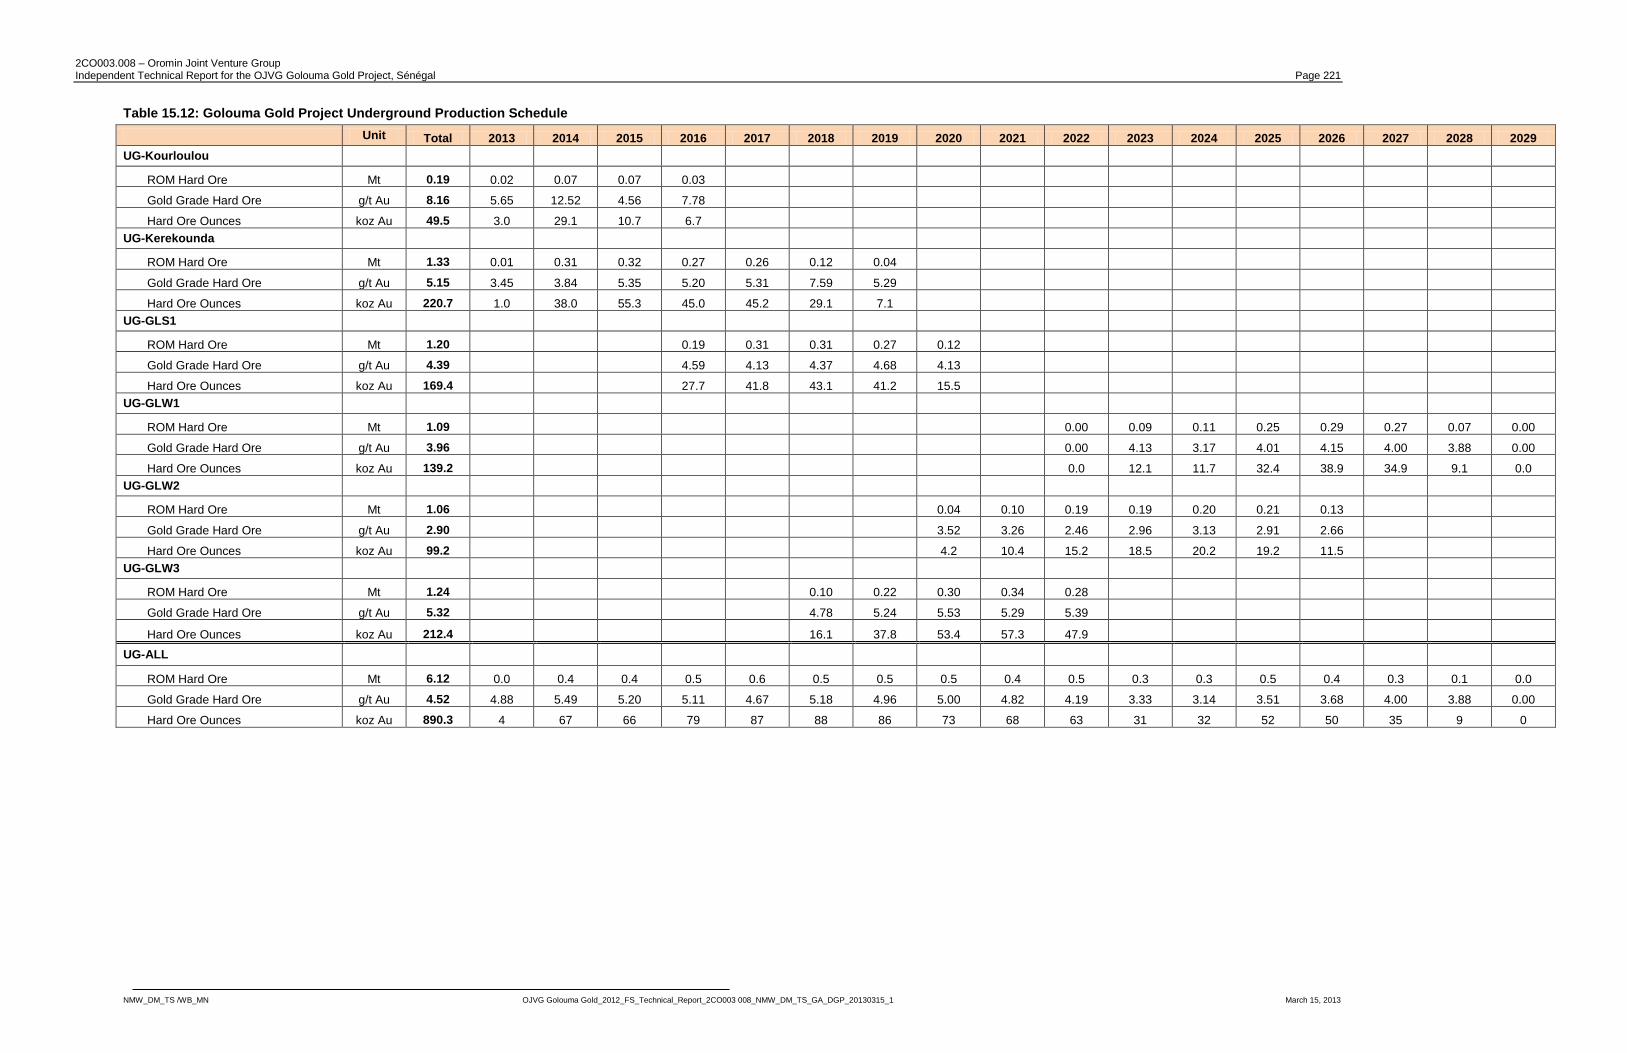
2CO003.008 – Oromin Joint Venture Group Independent Technical Report for the OJVG Golouma Gold Project, Sénégal Page 221
NMW_DM_TS /WB_MN OJVG Golouma Gold_2012_FS_Technical_Report_2CO003 008_NMW_DM_TS_GA_DGP_20130315_1 March 15, 2013
Table 15.12: Golouma Gold Project Underground Production Schedule
Unit Total 2013 2014 2015 2016 2017 2018 2019 2020 2021 2022 2023 2024 2025 2026 2027 2028 2029
UG-Kourloulou
ROM Hard Ore Mt 0.19 0.02 0.07 0.07 0.03
Gold Grade Hard Ore g/t Au 8.16 5.65 12.52 4.56 7.78
Hard Ore Ounces koz Au 49.5 3.0 29.1 10.7 6.7
UG-Kerekounda
ROM Hard Ore Mt 1.33 0.01 0.31 0.32 0.27 0.26 0.12 0.04
Gold Grade Hard Ore g/t Au 5.15 3.45 3.84 5.35 5.20 5.31 7.59 5.29
Hard Ore Ounces koz Au 220.7 1.0 38.0 55.3 45.0 45.2 29.1 7.1
UG-GLS1
ROM Hard Ore Mt 1.20 0.19 0.31 0.31 0.27 0.12
Gold Grade Hard Ore g/t Au 4.39 4.59 4.13 4.37 4.68 4.13
Hard Ore Ounces koz Au 169.4 27.7 41.8 43.1 41.2 15.5
UG-GLW1
ROM Hard Ore Mt 1.09 0.00 0.09 0.11 0.25 0.29 0.27 0.07 0.00
Gold Grade Hard Ore g/t Au 3.96 0.00 4.13 3.17 4.01 4.15 4.00 3.88 0.00
Hard Ore Ounces koz Au 139.2 0.0 12.1 11.7 32.4 38.9 34.9 9.1 0.0
UG-GLW2
ROM Hard Ore Mt 1.06 0.04 0.10 0.19 0.19 0.20 0.21 0.13
Gold Grade Hard Ore g/t Au 2.90 3.52 3.26 2.46 2.96 3.13 2.91 2.66
Hard Ore Ounces koz Au 99.2 4.2 10.4 15.2 18.5 20.2 19.2 11.5
UG-GLW3
ROM Hard Ore Mt 1.24 0.10 0.22 0.30 0.34 0.28
Gold Grade Hard Ore g/t Au 5.32 4.78 5.24 5.53 5.29 5.39
Hard Ore Ounces koz Au 212.4 16.1 37.8 53.4 57.3 47.9
UG-ALL
ROM Hard Ore Mt 6.12 0.0 0.4 0.4 0.5 0.6 0.5 0.5 0.5 0.4 0.5 0.3 0.3 0.5 0.4 0.3 0.1 0.0
Gold Grade Hard Ore g/t Au 4.52 4.88 5.49 5.20 5.11 4.67 5.18 4.96 5.00 4.82 4.19 3.33 3.14 3.51 3.68 4.00 3.88 0.00
Hard Ore Ounces koz Au 890.3 4 67 66 79 87 88 86 73 68 63 31 32 52 50 35 9 0

2CO003.008 – Oromin Joint Venture Group Independent Technical Report for the OJVG Golouma Gold Project, Sénégal Page 222
NMW_DM_TS /WB_MN OJVG Golouma Gold_2012_FS_Technical_Report_2CO003 008_NMW_DM_TS_GA_DGP_20130315_1 March 15, 2013
Development Schedule
For the development schedule the number of jumbos able to work in an area constrains both the
maximum development rate and the maximum production rate. Maximum development rates are
based on the assumption that a production jumbo can drill 8 m of development per day if multiple
drilling faces are available. It has been assumed that two and a half 3.2 m long rounds can be
developed day.
Raises will be advanced at a rate of 3.0 m per day. Development schedules for each Golouma
Gold Project Underground deposit are presented in Table 15.13.
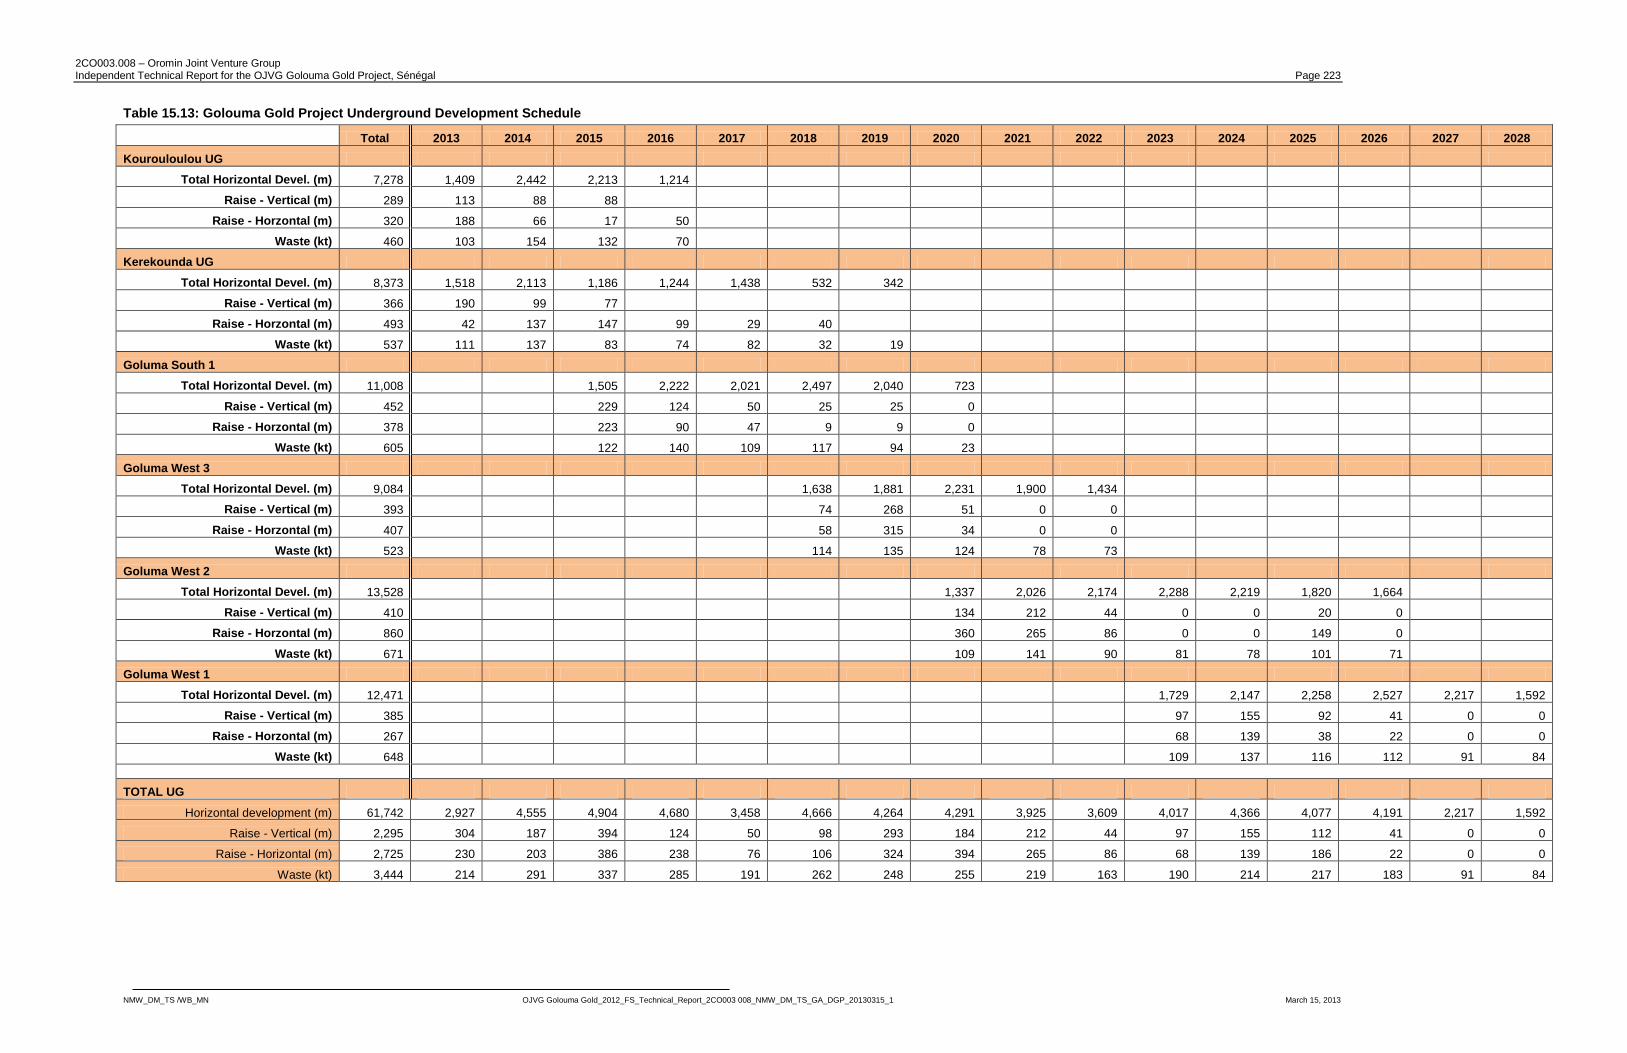
2CO003.008 – Oromin Joint Venture Group Independent Technical Report for the OJVG Golouma Gold Project, Sénégal Page 223
NMW_DM_TS /WB_MN OJVG Golouma Gold_2012_FS_Technical_Report_2CO003 008_NMW_DM_TS_GA_DGP_20130315_1 March 15, 2013
Table 15.13: Golouma Gold Project Underground Development Schedule
Total 2013 2014 2015 2016 2017 2018 2019 2020 2021 2022 2023 2024 2025 2026 2027 2028
Kourouloulou UG
Total Horizontal Devel. (m) 7,278 1,409 2,442 2,213 1,214
Raise - Vertical (m) 289 113 88 88
Raise - Horzontal (m) 320 188 66 17 50
Waste (kt) 460 103 154 132 70
Kerekounda UG
Total Horizontal Devel. (m) 8,373 1,518 2,113 1,186 1,244 1,438 532 342
Raise - Vertical (m) 366 190 99 77
Raise - Horzontal (m) 493 42 137 147 99 29 40
Waste (kt) 537 111 137 83 74 82 32 19
Goluma South 1
Total Horizontal Devel. (m) 11,008 1,505 2,222 2,021 2,497 2,040 723
Raise - Vertical (m) 452 229 124 50 25 25 0
Raise - Horzontal (m) 378 223 90 47 9 9 0
Waste (kt) 605 122 140 109 117 94 23
Goluma West 3
Total Horizontal Devel. (m) 9,084 1,638 1,881 2,231 1,900 1,434
Raise - Vertical (m) 393 74 268 51 0 0
Raise - Horzontal (m) 407 58 315 34 0 0
Waste (kt) 523 114 135 124 78 73
Goluma West 2
Total Horizontal Devel. (m) 13,528 1,337 2,026 2,174 2,288 2,219 1,820 1,664
Raise - Vertical (m) 410 134 212 44 0 0 20 0
Raise - Horzontal (m) 860 360 265 86 0 0 149 0
Waste (kt) 671 109 141 90 81 78 101 71
Goluma West 1
Total Horizontal Devel. (m) 12,471 1,729 2,147 2,258 2,527 2,217 1,592
Raise - Vertical (m) 385 97 155 92 41 0 0
Raise - Horzontal (m) 267 68 139 38 22 0 0
Waste (kt) 648 109 137 116 112 91 84
TOTAL UG
Horizontal development (m) 61,742 2,927 4,555 4,904 4,680 3,458 4,666 4,264 4,291 3,925 3,609 4,017 4,366 4,077 4,191 2,217 1,592
Raise - Vertical (m) 2,295 304 187 394 124 50 98 293 184 212 44 97 155 112 41 0 0
Raise - Horizontal (m) 2,725 230 203 386 238 76 106 324 394 265 86 68 139 186 22 0 0
Waste (kt) 3,444 214 291 337 285 191 262 248 255 219 163 190 214 217 183 91 84
2CO003.008 – Oromin Joint Venture Group Independent Technical Report for the OJVG Golouma Gold Project, Sénégal Page 224
NMW_DM_TS /WB_MN OJVG Golouma Gold_2012_FS_Technical_Report_2CO003 008_NMW_DM_TS_GA_DGP_20130315_1 March 15, 2013
Manpower
Manpower requirements for the mine were estimated in the 2010FS and kept consistent for this
update. They were calculated by compiling production crews for each type of stoping and
development and in accordance with the LOM (Life of Mine) schedule. Personnel numbers were
then reviewed,edited and finalized by ensuring that all equipment required to work full-time was
adequately manned. Mining supervision was then estimated based on the number of crews and
mining areas in production or development.
Maintenance personnel requirements were estimated based mainly on the amount of operating
mobile equipment but also on infrastructure maintenance requirements.
Technical staff requirements were estimated based on SRK experience.
Senegal‟s lack of UG mining expertise was recognised as a potential concern, and as a result, a
twenty-two expatriates were planned for the UG mine for 2014 and 2015. All expatriate staff will
have a local employee working with them for training purposes. As the Senegalese personnel are
trained, a steady reduction of expatriate personnel was planned. For years 2016 through 2019 the
expatriate numbers are down to two. They stay at this level for the remainder of the LOM.
A summary of the manpower requirement is shown in Table 15.14 with more details provided in
Section 20.4.6.
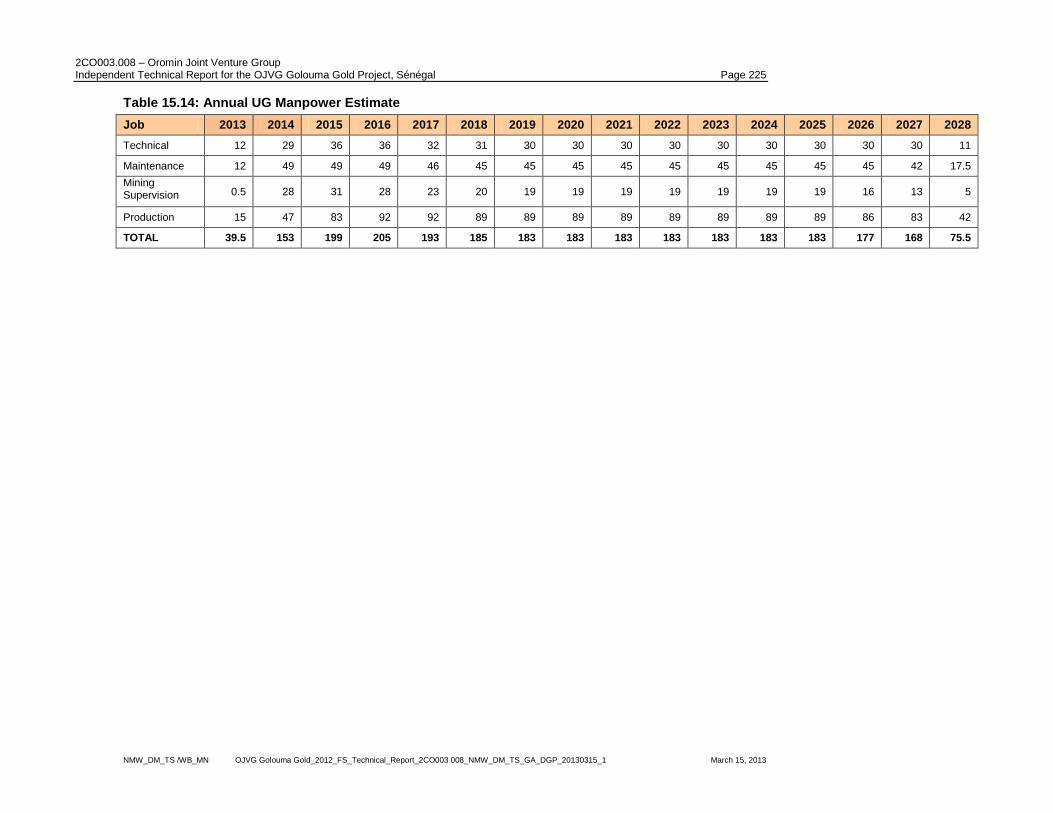
2CO003.008 – Oromin Joint Venture Group Independent Technical Report for the OJVG Golouma Gold Project, Sénégal Page 225
NMW_DM_TS /WB_MN OJVG Golouma Gold_2012_FS_Technical_Report_2CO003 008_NMW_DM_TS_GA_DGP_20130315_1 March 15, 2013
Table 15.14: Annual UG Manpower Estimate
Job 2013 2014 2015 2016 2017 2018 2019 2020 2021 2022 2023 2024 2025 2026 2027 2028
Technical 12 29 36 36 32 31 30 30 30 30 30 30 30 30 30 11
Maintenance 12 49 49 49 46 45 45 45 45 45 45 45 45 45 42 17.5
Mining Supervision 0.5 28 31 28 23 20 19 19 19 19 19 19 19 16 13 5
Production 15 47 83 92 92 89 89 89 89 89 89 89 89 86 83 42
TOTAL 39.5 153 199 205 193 185 183 183 183 183 183 183 183 177 168 75.5

2CO003.008 – Oromin Joint Venture Group Independent Technical Report for the OJVG Golouma Gold Project, Sénégal Page 226
NMW_DM_TS /WB_MN OJVG Golouma Gold_2012_FS_Technical_Report_2CO003 008_NMW_DM_TS_GA_DGP_20130315_1 March 15, 2013
UG Mobile Equipment
All production-related UG mobile equipment was assigned productivities based on their individual
tasks for each type of development and production mining. Drill jumbo, LHD and truck requirements
were based on the estimated required operating hours in each period and the number of units of
each piece of equipment needed to meet those hours. A summary sheet of the UG mobile
equipment requirements is shown in Table 15.15.
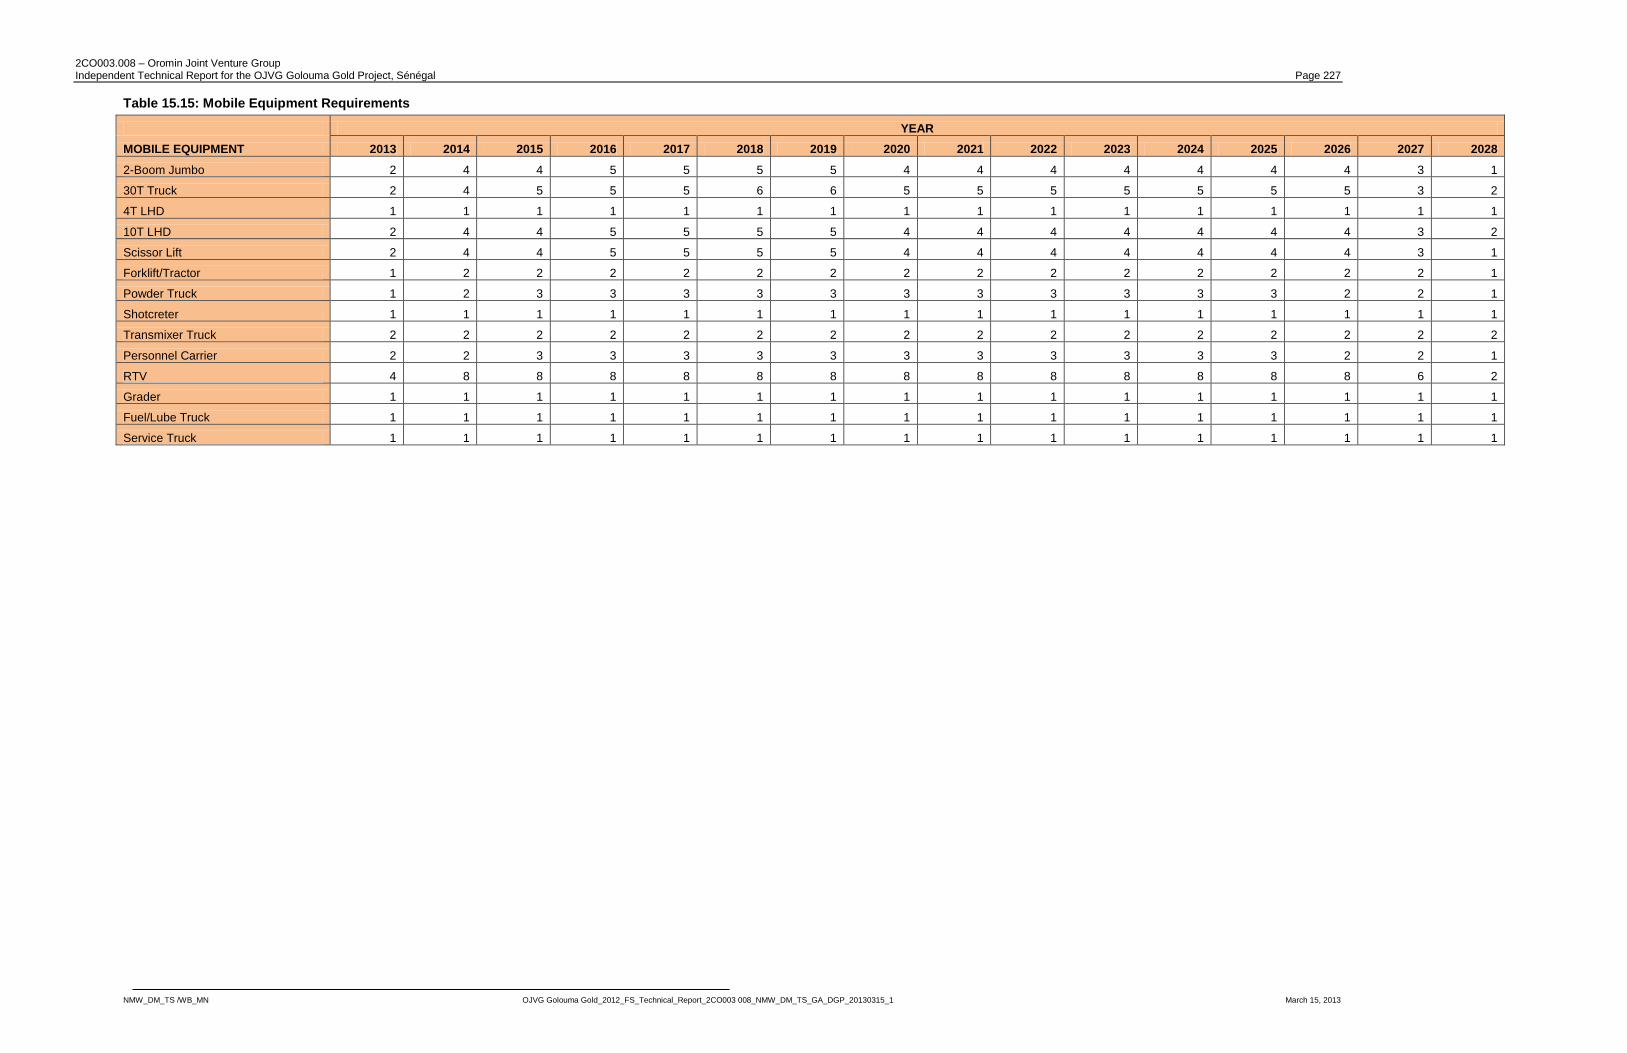
2CO003.008 – Oromin Joint Venture Group Independent Technical Report for the OJVG Golouma Gold Project, Sénégal Page 227
NMW_DM_TS /WB_MN OJVG Golouma Gold_2012_FS_Technical_Report_2CO003 008_NMW_DM_TS_GA_DGP_20130315_1 March 15, 2013
Table 15.15: Mobile Equipment Requirements
YEAR
MOBILE EQUIPMENT 2013 2014 2015 2016 2017 2018 2019 2020 2021 2022 2023 2024 2025 2026 2027 2028
2-Boom Jumbo 2 4 4 5 5 5 5 4 4 4 4 4 4 4 3 1
30T Truck 2 4 5 5 5 6 6 5 5 5 5 5 5 5 3 2
4T LHD 1 1 1 1 1 1 1 1 1 1 1 1 1 1 1 1
10T LHD 2 4 4 5 5 5 5 4 4 4 4 4 4 4 3 2
Scissor Lift 2 4 4 5 5 5 5 4 4 4 4 4 4 4 3 1
Forklift/Tractor 1 2 2 2 2 2 2 2 2 2 2 2 2 2 2 1
Powder Truck 1 2 3 3 3 3 3 3 3 3 3 3 3 2 2 1
Shotcreter 1 1 1 1 1 1 1 1 1 1 1 1 1 1 1 1
Transmixer Truck 2 2 2 2 2 2 2 2 2 2 2 2 2 2 2 2
Personnel Carrier 2 2 3 3 3 3 3 3 3 3 3 3 3 2 2 1
RTV 4 8 8 8 8 8 8 8 8 8 8 8 8 8 6 2
Grader 1 1 1 1 1 1 1 1 1 1 1 1 1 1 1 1
Fuel/Lube Truck 1 1 1 1 1 1 1 1 1 1 1 1 1 1 1 1
Service Truck 1 1 1 1 1 1 1 1 1 1 1 1 1 1 1 1
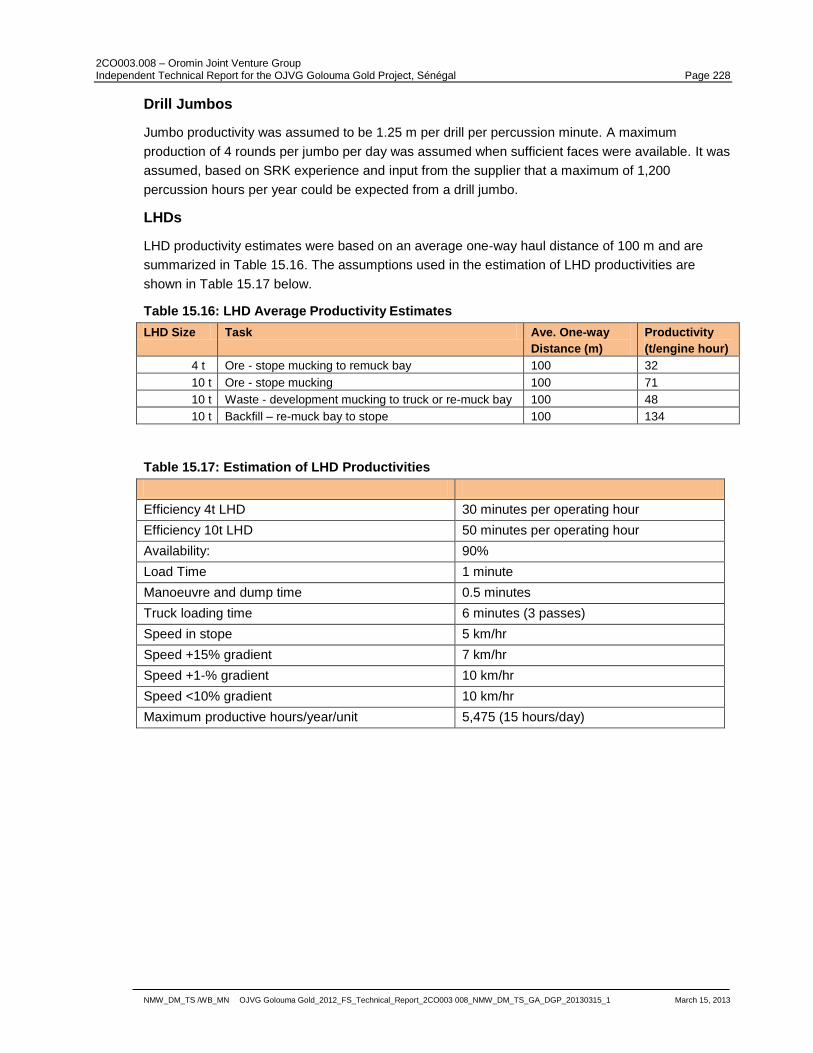
2CO003.008 – Oromin Joint Venture Group Independent Technical Report for the OJVG Golouma Gold Project, Sénégal Page 228
NMW_DM_TS /WB_MN OJVG Golouma Gold_2012_FS_Technical_Report_2CO003 008_NMW_DM_TS_GA_DGP_20130315_1 March 15, 2013
Drill Jumbos
Jumbo productivity was assumed to be 1.25 m per drill per percussion minute. A maximum
production of 4 rounds per jumbo per day was assumed when sufficient faces were available. It was
assumed, based on SRK experience and input from the supplier that a maximum of 1,200
percussion hours per year could be expected from a drill jumbo.
LHDs
LHD productivity estimates were based on an average one-way haul distance of 100 m and are
summarized in Table 15.16. The assumptions used in the estimation of LHD productivities are
shown in Table 15.17 below.
Table 15.16: LHD Average Productivity Estimates
LHD Size Task Ave. One-way
Distance (m)
Productivity
(t/engine hour)
4 t Ore - stope mucking to remuck bay 100 32
10 t Ore - stope mucking 100 71
10 t Waste - development mucking to truck or re-muck bay 100 48
10 t Backfill – re-muck bay to stope 100 134
Table 15.17: Estimation of LHD Productivities
Efficiency 4t LHD 30 minutes per operating hour
Efficiency 10t LHD 50 minutes per operating hour
Availability: 90%
Load Time 1 minute
Manoeuvre and dump time 0.5 minutes
Truck loading time 6 minutes (3 passes)
Speed in stope 5 km/hr
Speed +15% gradient 7 km/hr
Speed +1-% gradient 10 km/hr
Speed <10% gradient 10 km/hr
Maximum productive hours/year/unit 5,475 (15 hours/day)
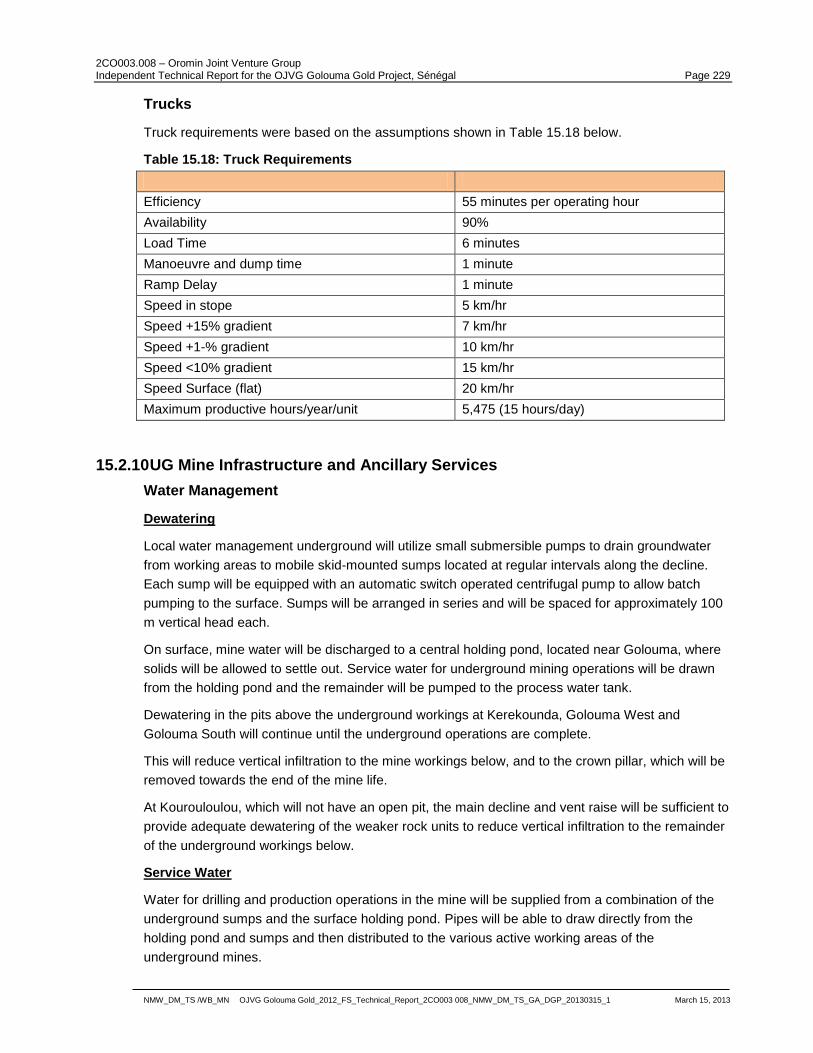
2CO003.008 – Oromin Joint Venture Group Independent Technical Report for the OJVG Golouma Gold Project, Sénégal Page 229
NMW_DM_TS /WB_MN OJVG Golouma Gold_2012_FS_Technical_Report_2CO003 008_NMW_DM_TS_GA_DGP_20130315_1 March 15, 2013
Trucks
Truck requirements were based on the assumptions shown in Table 15.18 below.
Table 15.18: Truck Requirements
Efficiency 55 minutes per operating hour
Availability 90%
Load Time 6 minutes
Manoeuvre and dump time 1 minute
Ramp Delay 1 minute
Speed in stope 5 km/hr
Speed +15% gradient 7 km/hr
Speed +1-% gradient 10 km/hr
Speed <10% gradient 15 km/hr
Speed Surface (flat) 20 km/hr
Maximum productive hours/year/unit 5,475 (15 hours/day)
15.2.10 UG Mine Infrastructure and Ancillary Services
Water Management
Dewatering
Local water management underground will utilize small submersible pumps to drain groundwater
from working areas to mobile skid-mounted sumps located at regular intervals along the decline.
Each sump will be equipped with an automatic switch operated centrifugal pump to allow batch
pumping to the surface. Sumps will be arranged in series and will be spaced for approximately 100
m vertical head each.
On surface, mine water will be discharged to a central holding pond, located near Golouma, where
solids will be allowed to settle out. Service water for underground mining operations will be drawn
from the holding pond and the remainder will be pumped to the process water tank.
Dewatering in the pits above the underground workings at Kerekounda, Golouma West and
Golouma South will continue until the underground operations are complete.
This will reduce vertical infiltration to the mine workings below, and to the crown pillar, which will be
removed towards the end of the mine life.
At Kourouloulou, which will not have an open pit, the main decline and vent raise will be sufficient to
provide adequate dewatering of the weaker rock units to reduce vertical infiltration to the remainder
of the underground workings below.
Service Water
Water for drilling and production operations in the mine will be supplied from a combination of the
underground sumps and the surface holding pond. Pipes will be able to draw directly from the
holding pond and sumps and then distributed to the various active working areas of the
underground mines.
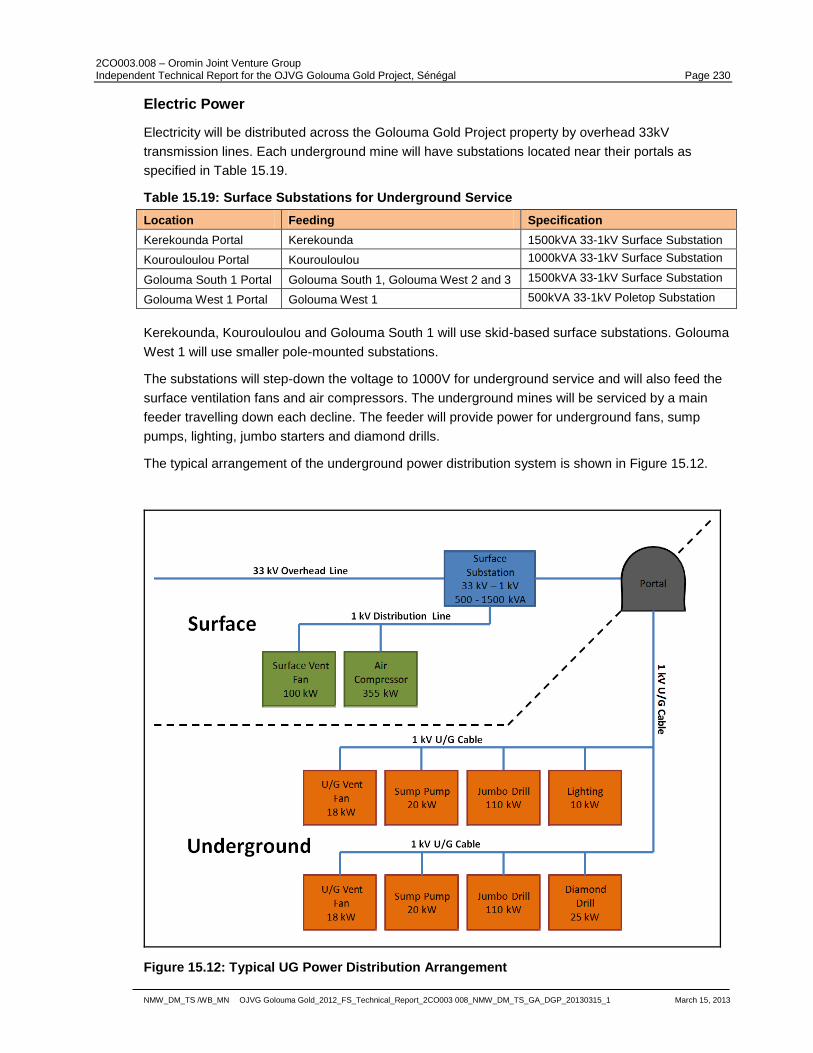
2CO003.008 – Oromin Joint Venture Group Independent Technical Report for the OJVG Golouma Gold Project, Sénégal Page 230
NMW_DM_TS /WB_MN OJVG Golouma Gold_2012_FS_Technical_Report_2CO003 008_NMW_DM_TS_GA_DGP_20130315_1 March 15, 2013
Electric Power
Electricity will be distributed across the Golouma Gold Project property by overhead 33kV
transmission lines. Each underground mine will have substations located near their portals as
specified in Table 15.19.
Table 15.19: Surface Substations for Underground Service
Location Feeding Specification
Kerekounda Portal Kerekounda 1500kVA 33-1kV Surface Substation
Kourouloulou Portal Kourouloulou 1000kVA 33-1kV Surface Substation
Golouma South 1 Portal Golouma South 1, Golouma West 2 and 3 1500kVA 33-1kV Surface Substation
Golouma West 1 Portal Golouma West 1 500kVA 33-1kV Poletop Substation
Kerekounda, Kourouloulou and Golouma South 1 will use skid-based surface substations. Golouma
West 1 will use smaller pole-mounted substations.
The substations will step-down the voltage to 1000V for underground service and will also feed the
surface ventilation fans and air compressors. The underground mines will be serviced by a main
feeder travelling down each decline. The feeder will provide power for underground fans, sump
pumps, lighting, jumbo starters and diamond drills.
The typical arrangement of the underground power distribution system is shown in Figure 15.12.
Figure 15.12: Typical UG Power Distribution Arrangement
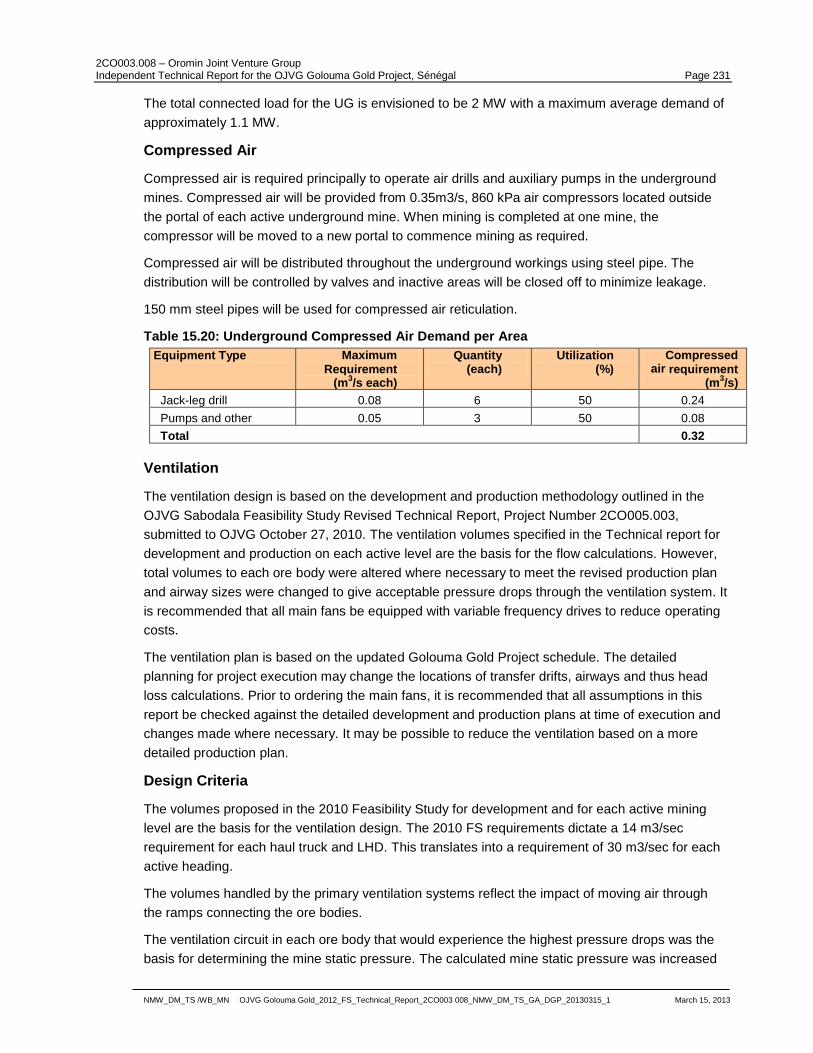
2CO003.008 – Oromin Joint Venture Group Independent Technical Report for the OJVG Golouma Gold Project, Sénégal Page 231
NMW_DM_TS /WB_MN OJVG Golouma Gold_2012_FS_Technical_Report_2CO003 008_NMW_DM_TS_GA_DGP_20130315_1 March 15, 2013
The total connected load for the UG is envisioned to be 2 MW with a maximum average demand of
approximately 1.1 MW.
Compressed Air
Compressed air is required principally to operate air drills and auxiliary pumps in the underground
mines. Compressed air will be provided from 0.35m3/s, 860 kPa air compressors located outside
the portal of each active underground mine. When mining is completed at one mine, the
compressor will be moved to a new portal to commence mining as required.
Compressed air will be distributed throughout the underground workings using steel pipe. The
distribution will be controlled by valves and inactive areas will be closed off to minimize leakage.
150 mm steel pipes will be used for compressed air reticulation.
Table 15.20: Underground Compressed Air Demand per Area
Equipment Type Maximum
Requirement (m
3/s each)
Quantity (each)
Utilization (%)
Compressed air requirement
(m3/s)
Jack-leg drill 0.08 6 50 0.24
Pumps and other 0.05 3 50 0.08
Total 0.32
Ventilation
The ventilation design is based on the development and production methodology outlined in the
OJVG Sabodala Feasibility Study Revised Technical Report, Project Number 2CO005.003,
submitted to OJVG October 27, 2010. The ventilation volumes specified in the Technical report for
development and production on each active level are the basis for the flow calculations. However,
total volumes to each ore body were altered where necessary to meet the revised production plan
and airway sizes were changed to give acceptable pressure drops through the ventilation system. It
is recommended that all main fans be equipped with variable frequency drives to reduce operating
costs.
The ventilation plan is based on the updated Golouma Gold Project schedule. The detailed
planning for project execution may change the locations of transfer drifts, airways and thus head
loss calculations. Prior to ordering the main fans, it is recommended that all assumptions in this
report be checked against the detailed development and production plans at time of execution and
changes made where necessary. It may be possible to reduce the ventilation based on a more
detailed production plan.
Design Criteria
The volumes proposed in the 2010 Feasibility Study for development and for each active mining
level are the basis for the ventilation design. The 2010 FS requirements dictate a 14 m3/sec
requirement for each haul truck and LHD. This translates into a requirement of 30 m3/sec for each
active heading.
The volumes handled by the primary ventilation systems reflect the impact of moving air through
the ramps connecting the ore bodies.
The ventilation circuit in each ore body that would experience the highest pressure drops was the
basis for determining the mine static pressure. The calculated mine static pressure was increased
2CO003.008 – Oromin Joint Venture Group Independent Technical Report for the OJVG Golouma Gold Project, Sénégal Page 232
NMW_DM_TS /WB_MN OJVG Golouma Gold_2012_FS_Technical_Report_2CO003 008_NMW_DM_TS_GA_DGP_20130315_1 March 15, 2013
by 20% to provide flexibility in the system and allow for a margin of error should the excavations be
such that the mine pressures are higher than anticipated. The fan TP (total pressure) was
determined by adding 0.37 kpa (to account for losses through the fan and plenum) to the calculated
mine SP (static pressure). This was done solely to determine an estimated operating power load.
The operating power will be lower than the connected power load.
The decision to use one or two fans was driven by the desire to have the volume and pressure in a
range that can be handled by the less expensive fans with internally mounted motors (Arrangement
3) versus the more expensive arrangement with externally mounted motors (Arrangement 4).
The transfer drifts and raise sizes are designed to give a „good practice‟ pressure drop. Each
section of raise between transfer drifts is sized to handle the worst case volume based on the
mining plan. This will raise development costs but will significantly lower fan capital and operating
costs.
Mine Development Ventilation
The exhaust raise was planned to be driven as a series of short raises in order to allow ventilation
loops to be established to advance the auxiliary ventilation fans. In general, this will result in a
ventilation transfer drift every 40m in elevation. While this is necessary to advance the
development, the offset raises and transfer drifts add a significant shock loss to the total mine head
losses.
It is estimated that the development plan will result in 350 to 400 m on a run of auxiliary duct in the
ramp before a ventilation loop can be established.
Mine Production Ventilation
It is assumed that one LHD and one haulage truck are required per active mining horizon and that
30 m3/sec will be supplied to each active mining horizon. It may be necessary to install the primary
fans with variable frequency drives to provide sufficient air volume for development before the ore
body is in production.
The ventilation plan was created based on the number of concurrent active headings requiring air to
be drawn through the highest resistance airway. Airway sizes are based on the volume of air
required to meet the mining plan and are based on the level of production plan detail available at
this time. A more detailed production plan may change the ventilation requirements.
In addition to production, for development and ventilation in the ramp connecting the ore bodies
was considered.
A summary of the main exhaust fan volume, pressure and operating power is shown in Table 15.21
below.
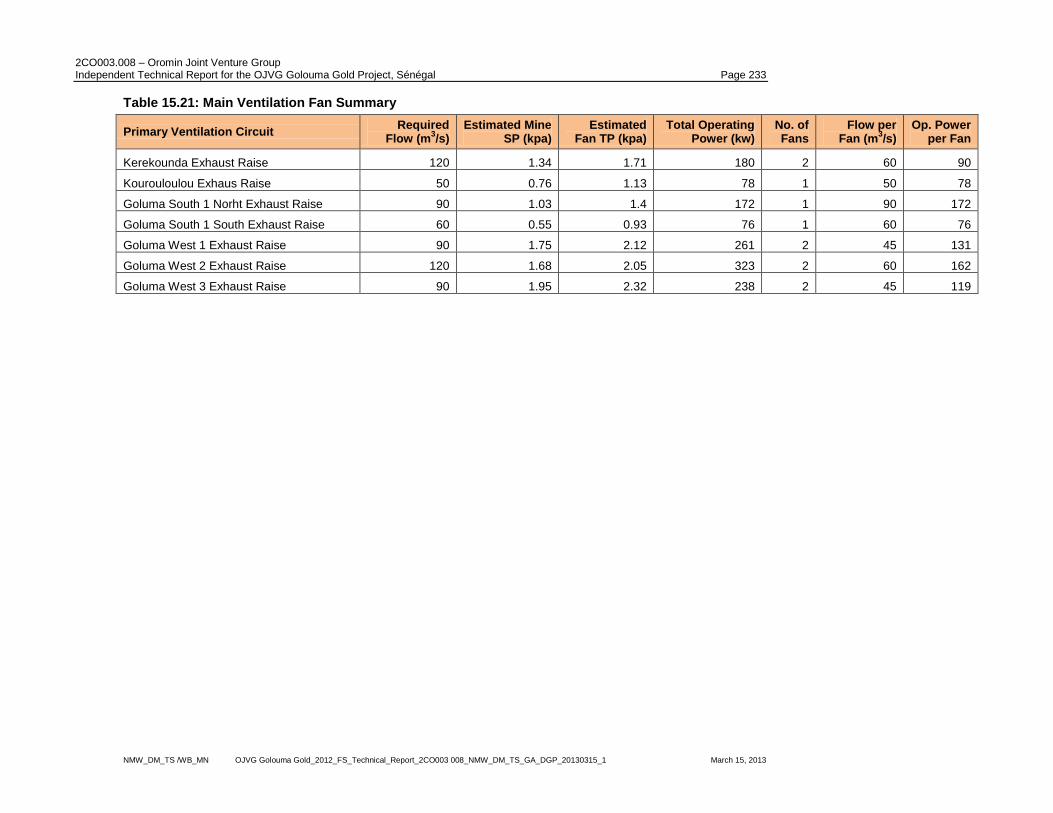
2CO003.008 – Oromin Joint Venture Group Independent Technical Report for the OJVG Golouma Gold Project, Sénégal Page 233
NMW_DM_TS /WB_MN OJVG Golouma Gold_2012_FS_Technical_Report_2CO003 008_NMW_DM_TS_GA_DGP_20130315_1 March 15, 2013
Table 15.21: Main Ventilation Fan Summary
Primary Ventilation Circuit Required
Flow (m3/s)
Estimated Mine SP (kpa)
Estimated Fan TP (kpa)
Total Operating Power (kw)
No. of Fans
Flow per Fan (m
3/s)
Op. Power per Fan
Kerekounda Exhaust Raise 120 1.34 1.71 180 2 60 90
Kourouloulou Exhaus Raise 50 0.76 1.13 78 1 50 78
Goluma South 1 Norht Exhaust Raise 90 1.03 1.4 172 1 90 172
Goluma South 1 South Exhaust Raise 60 0.55 0.93 76 1 60 76
Goluma West 1 Exhaust Raise 90 1.75 2.12 261 2 45 131
Goluma West 2 Exhaust Raise 120 1.68 2.05 323 2 60 162
Goluma West 3 Exhaust Raise 90 1.95 2.32 238 2 45 119
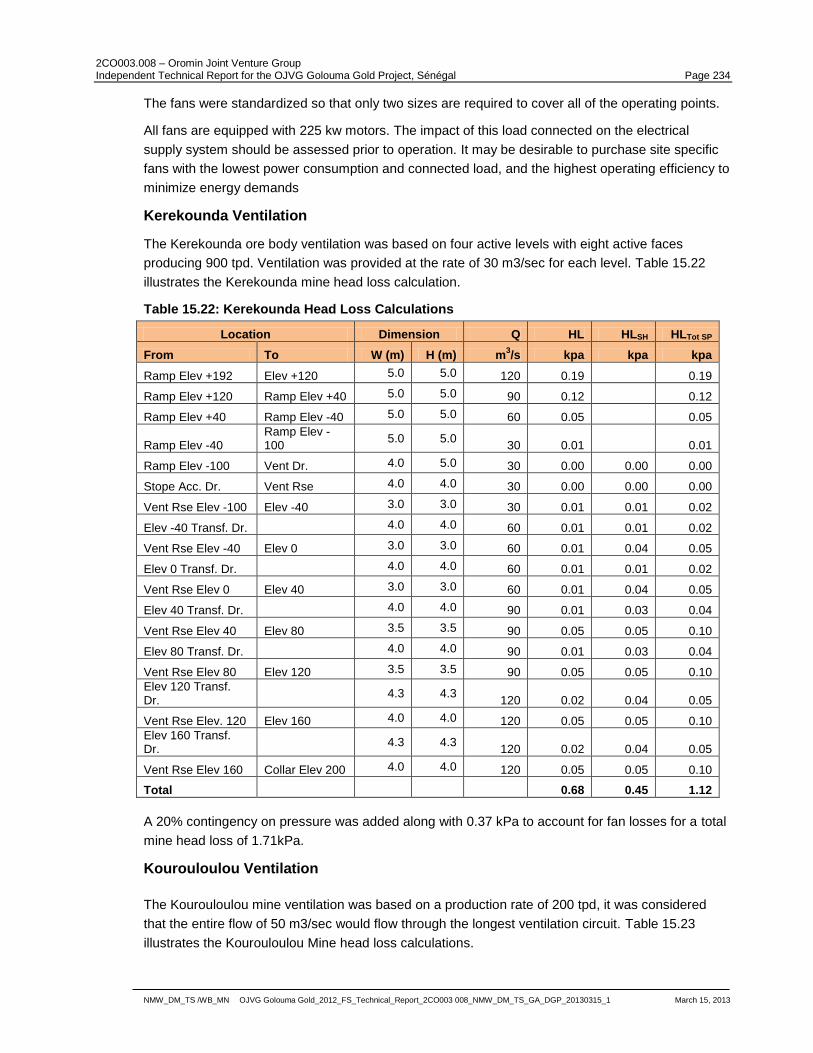
2CO003.008 – Oromin Joint Venture Group Independent Technical Report for the OJVG Golouma Gold Project, Sénégal Page 234
NMW_DM_TS /WB_MN OJVG Golouma Gold_2012_FS_Technical_Report_2CO003 008_NMW_DM_TS_GA_DGP_20130315_1 March 15, 2013
The fans were standardized so that only two sizes are required to cover all of the operating points.
All fans are equipped with 225 kw motors. The impact of this load connected on the electrical
supply system should be assessed prior to operation. It may be desirable to purchase site specific
fans with the lowest power consumption and connected load, and the highest operating efficiency to
minimize energy demands
Kerekounda Ventilation
The Kerekounda ore body ventilation was based on four active levels with eight active faces
producing 900 tpd. Ventilation was provided at the rate of 30 m3/sec for each level. Table 15.22
illustrates the Kerekounda mine head loss calculation.
Table 15.22: Kerekounda Head Loss Calculations
Location Dimension Q HL HLSH HLTot SP
From To W (m) H (m) m3/s kpa kpa kpa
Ramp Elev +192 Elev +120 5.0 5.0 120 0.19 0.19
Ramp Elev +120 Ramp Elev +40 5.0 5.0 90 0.12 0.12
Ramp Elev +40 Ramp Elev -40 5.0 5.0 60 0.05 0.05
Ramp Elev -40 Ramp Elev -100
5.0 5.0 30 0.01 0.01
Ramp Elev -100 Vent Dr. 4.0 5.0 30 0.00 0.00 0.00
Stope Acc. Dr. Vent Rse 4.0 4.0 30 0.00 0.00 0.00
Vent Rse Elev -100 Elev -40 3.0 3.0 30 0.01 0.01 0.02
Elev -40 Transf. Dr. 4.0 4.0 60 0.01 0.01 0.02
Vent Rse Elev -40 Elev 0 3.0 3.0 60 0.01 0.04 0.05
Elev 0 Transf. Dr. 4.0 4.0 60 0.01 0.01 0.02
Vent Rse Elev 0 Elev 40 3.0 3.0 60 0.01 0.04 0.05
Elev 40 Transf. Dr. 4.0 4.0 90 0.01 0.03 0.04
Vent Rse Elev 40 Elev 80 3.5 3.5 90 0.05 0.05 0.10
Elev 80 Transf. Dr. 4.0 4.0 90 0.01 0.03 0.04
Vent Rse Elev 80 Elev 120 3.5 3.5 90 0.05 0.05 0.10
Elev 120 Transf. Dr.
4.3 4.3 120 0.02 0.04 0.05
Vent Rse Elev. 120 Elev 160 4.0 4.0 120 0.05 0.05 0.10
Elev 160 Transf. Dr.
4.3 4.3 120 0.02 0.04 0.05
Vent Rse Elev 160 Collar Elev 200 4.0 4.0 120 0.05 0.05 0.10
Total 0.68 0.45 1.12
A 20% contingency on pressure was added along with 0.37 kPa to account for fan losses for a total
mine head loss of 1.71kPa.
Kourouloulou Ventilation
The Kourouloulou mine ventilation was based on a production rate of 200 tpd, it was considered
that the entire flow of 50 m3/sec would flow through the longest ventilation circuit. Table 15.23
illustrates the Kourouloulou Mine head loss calculations.
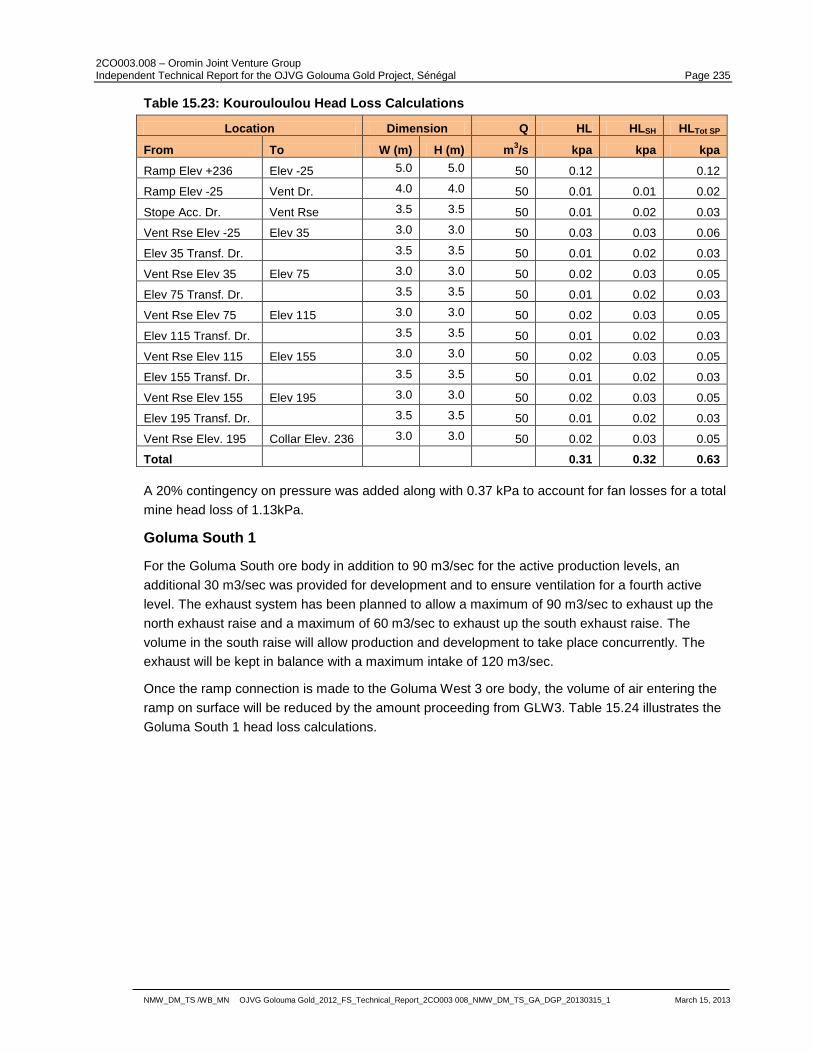
2CO003.008 – Oromin Joint Venture Group Independent Technical Report for the OJVG Golouma Gold Project, Sénégal Page 235
NMW_DM_TS /WB_MN OJVG Golouma Gold_2012_FS_Technical_Report_2CO003 008_NMW_DM_TS_GA_DGP_20130315_1 March 15, 2013
Table 15.23: Kourouloulou Head Loss Calculations
Location Dimension Q HL HLSH HLTot SP
From To W (m) H (m) m3/s kpa kpa kpa
Ramp Elev +236 Elev -25 5.0 5.0 50 0.12 0.12
Ramp Elev -25 Vent Dr. 4.0 4.0 50 0.01 0.01 0.02
Stope Acc. Dr. Vent Rse 3.5 3.5 50 0.01 0.02 0.03
Vent Rse Elev -25 Elev 35 3.0 3.0 50 0.03 0.03 0.06
Elev 35 Transf. Dr. 3.5 3.5 50 0.01 0.02 0.03
Vent Rse Elev 35 Elev 75 3.0 3.0 50 0.02 0.03 0.05
Elev 75 Transf. Dr. 3.5 3.5 50 0.01 0.02 0.03
Vent Rse Elev 75 Elev 115 3.0 3.0 50 0.02 0.03 0.05
Elev 115 Transf. Dr. 3.5 3.5 50 0.01 0.02 0.03
Vent Rse Elev 115 Elev 155 3.0 3.0 50 0.02 0.03 0.05
Elev 155 Transf. Dr. 3.5 3.5 50 0.01 0.02 0.03
Vent Rse Elev 155 Elev 195 3.0 3.0 50 0.02 0.03 0.05
Elev 195 Transf. Dr. 3.5 3.5 50 0.01 0.02 0.03
Vent Rse Elev. 195 Collar Elev. 236 3.0 3.0 50 0.02 0.03 0.05
Total 0.31 0.32 0.63
A 20% contingency on pressure was added along with 0.37 kPa to account for fan losses for a total
mine head loss of 1.13kPa.
Goluma South 1
For the Goluma South ore body in addition to 90 m3/sec for the active production levels, an
additional 30 m3/sec was provided for development and to ensure ventilation for a fourth active
level. The exhaust system has been planned to allow a maximum of 90 m3/sec to exhaust up the
north exhaust raise and a maximum of 60 m3/sec to exhaust up the south exhaust raise. The
volume in the south raise will allow production and development to take place concurrently. The
exhaust will be kept in balance with a maximum intake of 120 m3/sec.
Once the ramp connection is made to the Goluma West 3 ore body, the volume of air entering the
ramp on surface will be reduced by the amount proceeding from GLW3. Table 15.24 illustrates the
Goluma South 1 head loss calculations.
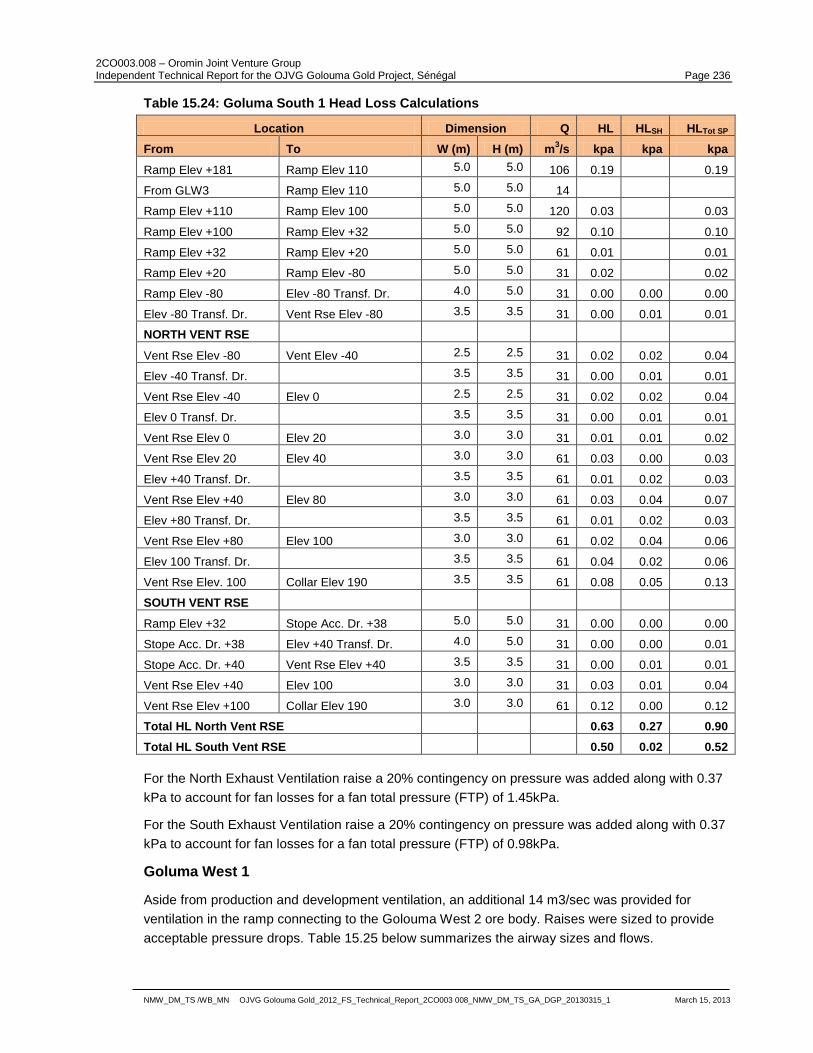
2CO003.008 – Oromin Joint Venture Group Independent Technical Report for the OJVG Golouma Gold Project, Sénégal Page 236
NMW_DM_TS /WB_MN OJVG Golouma Gold_2012_FS_Technical_Report_2CO003 008_NMW_DM_TS_GA_DGP_20130315_1 March 15, 2013
Table 15.24: Goluma South 1 Head Loss Calculations
Location Dimension Q HL HLSH HLTot SP
From To W (m) H (m) m3/s kpa kpa kpa
Ramp Elev +181 Ramp Elev 110 5.0 5.0 106 0.19 0.19
From GLW3 Ramp Elev 110 5.0 5.0 14
Ramp Elev +110 Ramp Elev 100 5.0 5.0 120 0.03 0.03
Ramp Elev +100 Ramp Elev +32 5.0 5.0 92 0.10 0.10
Ramp Elev +32 Ramp Elev +20 5.0 5.0 61 0.01 0.01
Ramp Elev +20 Ramp Elev -80 5.0 5.0 31 0.02 0.02
Ramp Elev -80 Elev -80 Transf. Dr. 4.0 5.0 31 0.00 0.00 0.00
Elev -80 Transf. Dr. Vent Rse Elev -80 3.5 3.5 31 0.00 0.01 0.01
NORTH VENT RSE
Vent Rse Elev -80 Vent Elev -40 2.5 2.5 31 0.02 0.02 0.04
Elev -40 Transf. Dr. 3.5 3.5 31 0.00 0.01 0.01
Vent Rse Elev -40 Elev 0 2.5 2.5 31 0.02 0.02 0.04
Elev 0 Transf. Dr. 3.5 3.5 31 0.00 0.01 0.01
Vent Rse Elev 0 Elev 20 3.0 3.0 31 0.01 0.01 0.02
Vent Rse Elev 20 Elev 40 3.0 3.0 61 0.03 0.00 0.03
Elev +40 Transf. Dr. 3.5 3.5 61 0.01 0.02 0.03
Vent Rse Elev +40 Elev 80 3.0 3.0 61 0.03 0.04 0.07
Elev +80 Transf. Dr. 3.5 3.5 61 0.01 0.02 0.03
Vent Rse Elev +80 Elev 100 3.0 3.0 61 0.02 0.04 0.06
Elev 100 Transf. Dr. 3.5 3.5 61 0.04 0.02 0.06
Vent Rse Elev. 100 Collar Elev 190 3.5 3.5 61 0.08 0.05 0.13
SOUTH VENT RSE
Ramp Elev +32 Stope Acc. Dr. +38 5.0 5.0 31 0.00 0.00 0.00
Stope Acc. Dr. +38 Elev +40 Transf. Dr. 4.0 5.0 31 0.00 0.00 0.01
Stope Acc. Dr. +40 Vent Rse Elev +40 3.5 3.5 31 0.00 0.01 0.01
Vent Rse Elev +40 Elev 100 3.0 3.0 31 0.03 0.01 0.04
Vent Rse Elev +100 Collar Elev 190 3.0 3.0 61 0.12 0.00 0.12
Total HL North Vent RSE 0.63 0.27 0.90
Total HL South Vent RSE 0.50 0.02 0.52
For the North Exhaust Ventilation raise a 20% contingency on pressure was added along with 0.37
kPa to account for fan losses for a fan total pressure (FTP) of 1.45kPa.
For the South Exhaust Ventilation raise a 20% contingency on pressure was added along with 0.37
kPa to account for fan losses for a fan total pressure (FTP) of 0.98kPa.
Goluma West 1
Aside from production and development ventilation, an additional 14 m3/sec was provided for
ventilation in the ramp connecting to the Golouma West 2 ore body. Raises were sized to provide
acceptable pressure drops. Table 15.25 below summarizes the airway sizes and flows.
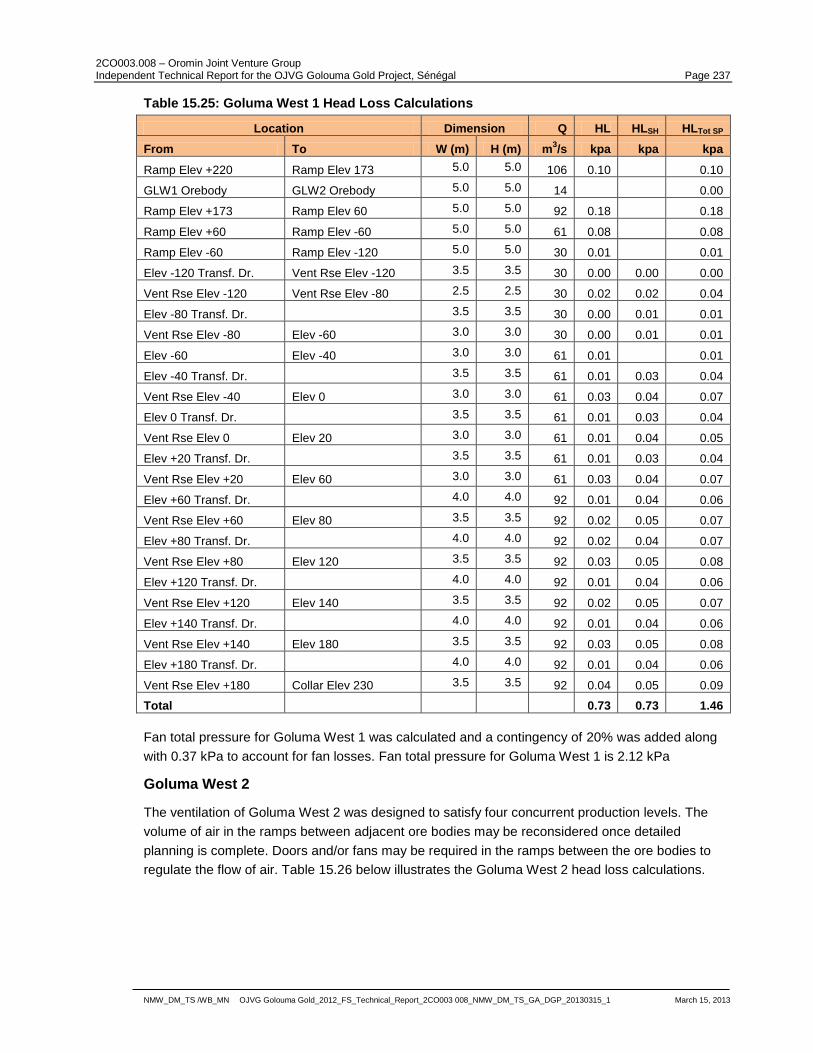
2CO003.008 – Oromin Joint Venture Group Independent Technical Report for the OJVG Golouma Gold Project, Sénégal Page 237
NMW_DM_TS /WB_MN OJVG Golouma Gold_2012_FS_Technical_Report_2CO003 008_NMW_DM_TS_GA_DGP_20130315_1 March 15, 2013
Table 15.25: Goluma West 1 Head Loss Calculations
Location Dimension Q HL HLSH HLTot SP
From To W (m) H (m) m3/s kpa kpa kpa
Ramp Elev +220 Ramp Elev 173 5.0 5.0 106 0.10 0.10
GLW1 Orebody GLW2 Orebody 5.0 5.0 14 0.00
Ramp Elev +173 Ramp Elev 60 5.0 5.0 92 0.18 0.18
Ramp Elev +60 Ramp Elev -60 5.0 5.0 61 0.08 0.08
Ramp Elev -60 Ramp Elev -120 5.0 5.0 30 0.01 0.01
Elev -120 Transf. Dr. Vent Rse Elev -120 3.5 3.5 30 0.00 0.00 0.00
Vent Rse Elev -120 Vent Rse Elev -80 2.5 2.5 30 0.02 0.02 0.04
Elev -80 Transf. Dr. 3.5 3.5 30 0.00 0.01 0.01
Vent Rse Elev -80 Elev -60 3.0 3.0 30 0.00 0.01 0.01
Elev -60 Elev -40 3.0 3.0 61 0.01 0.01
Elev -40 Transf. Dr. 3.5 3.5 61 0.01 0.03 0.04
Vent Rse Elev -40 Elev 0 3.0 3.0 61 0.03 0.04 0.07
Elev 0 Transf. Dr. 3.5 3.5 61 0.01 0.03 0.04
Vent Rse Elev 0 Elev 20 3.0 3.0 61 0.01 0.04 0.05
Elev +20 Transf. Dr. 3.5 3.5 61 0.01 0.03 0.04
Vent Rse Elev +20 Elev 60 3.0 3.0 61 0.03 0.04 0.07
Elev +60 Transf. Dr. 4.0 4.0 92 0.01 0.04 0.06
Vent Rse Elev +60 Elev 80 3.5 3.5 92 0.02 0.05 0.07
Elev +80 Transf. Dr. 4.0 4.0 92 0.02 0.04 0.07
Vent Rse Elev +80 Elev 120 3.5 3.5 92 0.03 0.05 0.08
Elev +120 Transf. Dr. 4.0 4.0 92 0.01 0.04 0.06
Vent Rse Elev +120 Elev 140 3.5 3.5 92 0.02 0.05 0.07
Elev +140 Transf. Dr. 4.0 4.0 92 0.01 0.04 0.06
Vent Rse Elev +140 Elev 180 3.5 3.5 92 0.03 0.05 0.08
Elev +180 Transf. Dr. 4.0 4.0 92 0.01 0.04 0.06
Vent Rse Elev +180 Collar Elev 230 3.5 3.5 92 0.04 0.05 0.09
Total 0.73 0.73 1.46
Fan total pressure for Goluma West 1 was calculated and a contingency of 20% was added along
with 0.37 kPa to account for fan losses. Fan total pressure for Goluma West 1 is 2.12 kPa
Goluma West 2
The ventilation of Goluma West 2 was designed to satisfy four concurrent production levels. The
volume of air in the ramps between adjacent ore bodies may be reconsidered once detailed
planning is complete. Doors and/or fans may be required in the ramps between the ore bodies to
regulate the flow of air. Table 15.26 below illustrates the Goluma West 2 head loss calculations.
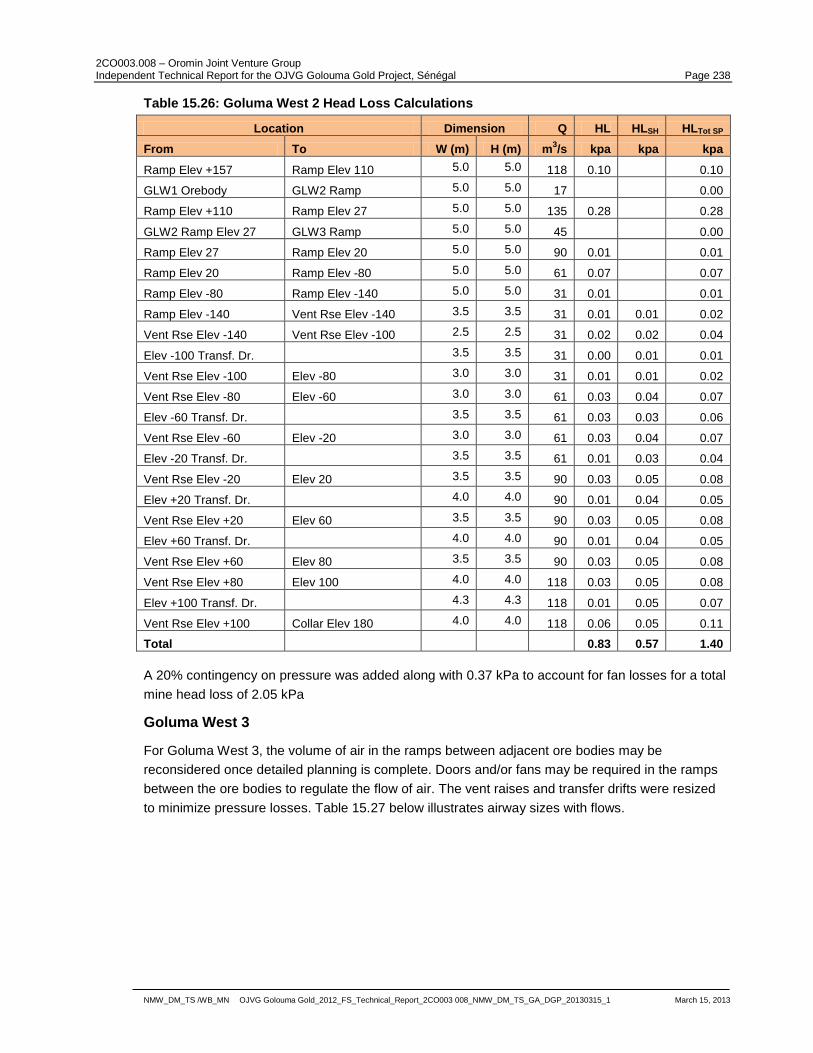
2CO003.008 – Oromin Joint Venture Group Independent Technical Report for the OJVG Golouma Gold Project, Sénégal Page 238
NMW_DM_TS /WB_MN OJVG Golouma Gold_2012_FS_Technical_Report_2CO003 008_NMW_DM_TS_GA_DGP_20130315_1 March 15, 2013
Table 15.26: Goluma West 2 Head Loss Calculations
Location Dimension Q HL HLSH HLTot SP
From To W (m) H (m) m3/s kpa kpa kpa
Ramp Elev +157 Ramp Elev 110 5.0 5.0 118 0.10 0.10
GLW1 Orebody GLW2 Ramp 5.0 5.0 17 0.00
Ramp Elev +110 Ramp Elev 27 5.0 5.0 135 0.28 0.28
GLW2 Ramp Elev 27 GLW3 Ramp 5.0 5.0 45 0.00
Ramp Elev 27 Ramp Elev 20 5.0 5.0 90 0.01 0.01
Ramp Elev 20 Ramp Elev -80 5.0 5.0 61 0.07 0.07
Ramp Elev -80 Ramp Elev -140 5.0 5.0 31 0.01 0.01
Ramp Elev -140 Vent Rse Elev -140 3.5 3.5 31 0.01 0.01 0.02
Vent Rse Elev -140 Vent Rse Elev -100 2.5 2.5 31 0.02 0.02 0.04
Elev -100 Transf. Dr. 3.5 3.5 31 0.00 0.01 0.01
Vent Rse Elev -100 Elev -80 3.0 3.0 31 0.01 0.01 0.02
Vent Rse Elev -80 Elev -60 3.0 3.0 61 0.03 0.04 0.07
Elev -60 Transf. Dr. 3.5 3.5 61 0.03 0.03 0.06
Vent Rse Elev -60 Elev -20 3.0 3.0 61 0.03 0.04 0.07
Elev -20 Transf. Dr. 3.5 3.5 61 0.01 0.03 0.04
Vent Rse Elev -20 Elev 20 3.5 3.5 90 0.03 0.05 0.08
Elev +20 Transf. Dr. 4.0 4.0 90 0.01 0.04 0.05
Vent Rse Elev +20 Elev 60 3.5 3.5 90 0.03 0.05 0.08
Elev +60 Transf. Dr. 4.0 4.0 90 0.01 0.04 0.05
Vent Rse Elev +60 Elev 80 3.5 3.5 90 0.03 0.05 0.08
Vent Rse Elev +80 Elev 100 4.0 4.0 118 0.03 0.05 0.08
Elev +100 Transf. Dr. 4.3 4.3 118 0.01 0.05 0.07
Vent Rse Elev +100 Collar Elev 180 4.0 4.0 118 0.06 0.05 0.11
Total 0.83 0.57 1.40
A 20% contingency on pressure was added along with 0.37 kPa to account for fan losses for a total
mine head loss of 2.05 kPa
Goluma West 3
For Goluma West 3, the volume of air in the ramps between adjacent ore bodies may be
reconsidered once detailed planning is complete. Doors and/or fans may be required in the ramps
between the ore bodies to regulate the flow of air. The vent raises and transfer drifts were resized
to minimize pressure losses. Table 15.27 below illustrates airway sizes with flows.
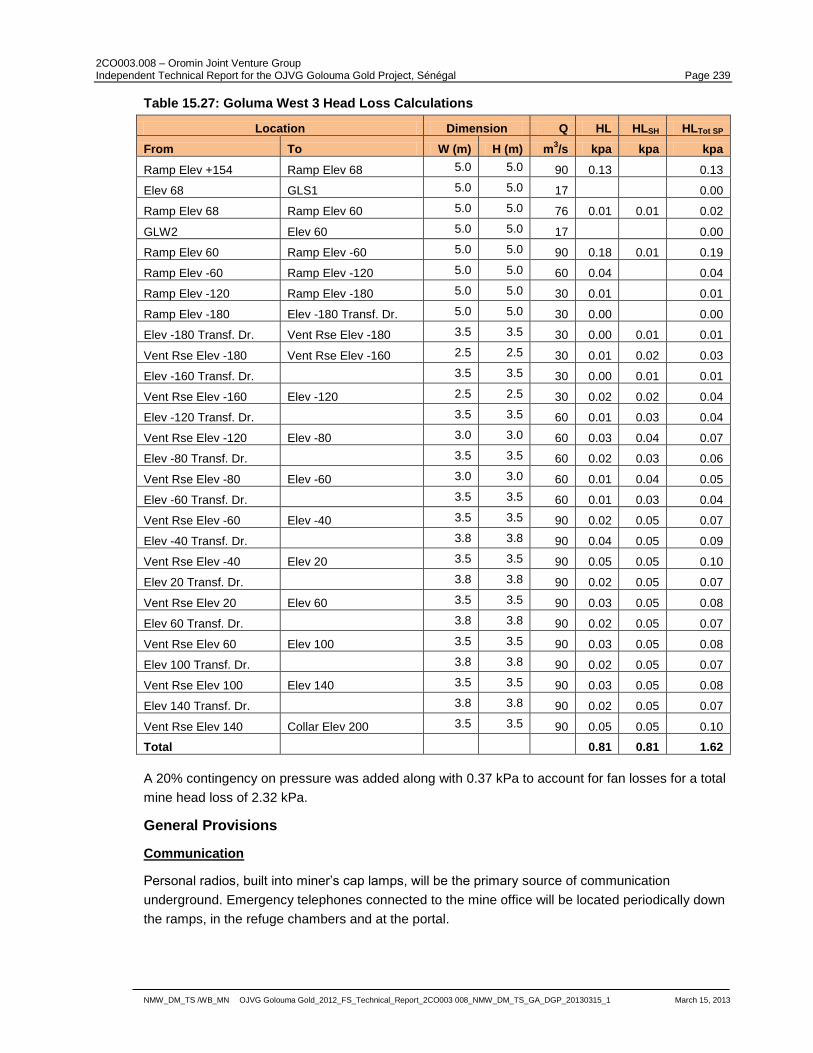
2CO003.008 – Oromin Joint Venture Group Independent Technical Report for the OJVG Golouma Gold Project, Sénégal Page 239
NMW_DM_TS /WB_MN OJVG Golouma Gold_2012_FS_Technical_Report_2CO003 008_NMW_DM_TS_GA_DGP_20130315_1 March 15, 2013
Table 15.27: Goluma West 3 Head Loss Calculations
Location Dimension Q HL HLSH HLTot SP
From To W (m) H (m) m3/s kpa kpa kpa
Ramp Elev +154 Ramp Elev 68 5.0 5.0 90 0.13 0.13
Elev 68 GLS1 5.0 5.0 17 0.00
Ramp Elev 68 Ramp Elev 60 5.0 5.0 76 0.01 0.01 0.02
GLW2 Elev 60 5.0 5.0 17 0.00
Ramp Elev 60 Ramp Elev -60 5.0 5.0 90 0.18 0.01 0.19
Ramp Elev -60 Ramp Elev -120 5.0 5.0 60 0.04 0.04
Ramp Elev -120 Ramp Elev -180 5.0 5.0 30 0.01 0.01
Ramp Elev -180 Elev -180 Transf. Dr. 5.0 5.0 30 0.00 0.00
Elev -180 Transf. Dr. Vent Rse Elev -180 3.5 3.5 30 0.00 0.01 0.01
Vent Rse Elev -180 Vent Rse Elev -160 2.5 2.5 30 0.01 0.02 0.03
Elev -160 Transf. Dr. 3.5 3.5 30 0.00 0.01 0.01
Vent Rse Elev -160 Elev -120 2.5 2.5 30 0.02 0.02 0.04
Elev -120 Transf. Dr. 3.5 3.5 60 0.01 0.03 0.04
Vent Rse Elev -120 Elev -80 3.0 3.0 60 0.03 0.04 0.07
Elev -80 Transf. Dr. 3.5 3.5 60 0.02 0.03 0.06
Vent Rse Elev -80 Elev -60 3.0 3.0 60 0.01 0.04 0.05
Elev -60 Transf. Dr. 3.5 3.5 60 0.01 0.03 0.04
Vent Rse Elev -60 Elev -40 3.5 3.5 90 0.02 0.05 0.07
Elev -40 Transf. Dr. 3.8 3.8 90 0.04 0.05 0.09
Vent Rse Elev -40 Elev 20 3.5 3.5 90 0.05 0.05 0.10
Elev 20 Transf. Dr. 3.8 3.8 90 0.02 0.05 0.07
Vent Rse Elev 20 Elev 60 3.5 3.5 90 0.03 0.05 0.08
Elev 60 Transf. Dr. 3.8 3.8 90 0.02 0.05 0.07
Vent Rse Elev 60 Elev 100 3.5 3.5 90 0.03 0.05 0.08
Elev 100 Transf. Dr. 3.8 3.8 90 0.02 0.05 0.07
Vent Rse Elev 100 Elev 140 3.5 3.5 90 0.03 0.05 0.08
Elev 140 Transf. Dr. 3.8 3.8 90 0.02 0.05 0.07
Vent Rse Elev 140 Collar Elev 200 3.5 3.5 90 0.05 0.05 0.10
Total 0.81 0.81 1.62
A 20% contingency on pressure was added along with 0.37 kPa to account for fan losses for a total
mine head loss of 2.32 kPa.
General Provisions
Communication
Personal radios, built into miner‟s cap lamps, will be the primary source of communication
underground. Emergency telephones connected to the mine office will be located periodically down
the ramps, in the refuge chambers and at the portal.
2CO003.008 – Oromin Joint Venture Group Independent Technical Report for the OJVG Golouma Gold Project, Sénégal Page 240
NMW_DM_TS /WB_MN OJVG Golouma Gold_2012_FS_Technical_Report_2CO003 008_NMW_DM_TS_GA_DGP_20130315_1 March 15, 2013
Refuge Stations
Refuge chambers will be used for long, blind development drives that temporarily have no
secondary egress. Once development is complete the chambers will be kept in a centralized
location in the event of an UG fire. Refuge chambers will have their own source of oxygen as well
as a connection to the compressed air system. A supply of fresh water, emergency food and first-
aid equipment will be kept in the chambers.
Maintenance Facility
No maintenance facilities have been proposed for the underground mine. Component change-outs
will be done in the mobile equipment shop on surface at the processing facility. Lube/fuel and
service trucks will be used to service the development jumbos. LHDs and trucks and other mobile
equipment will be serviced and fuelled on surface when possible.
Explosive and Blasting Accessory Magazine
The main open pit magazines will be used for the storage of underground explosives and
accessories. Small temporary underground magazines will be located in the mine to hold daily
quantities of explosive and accessories.
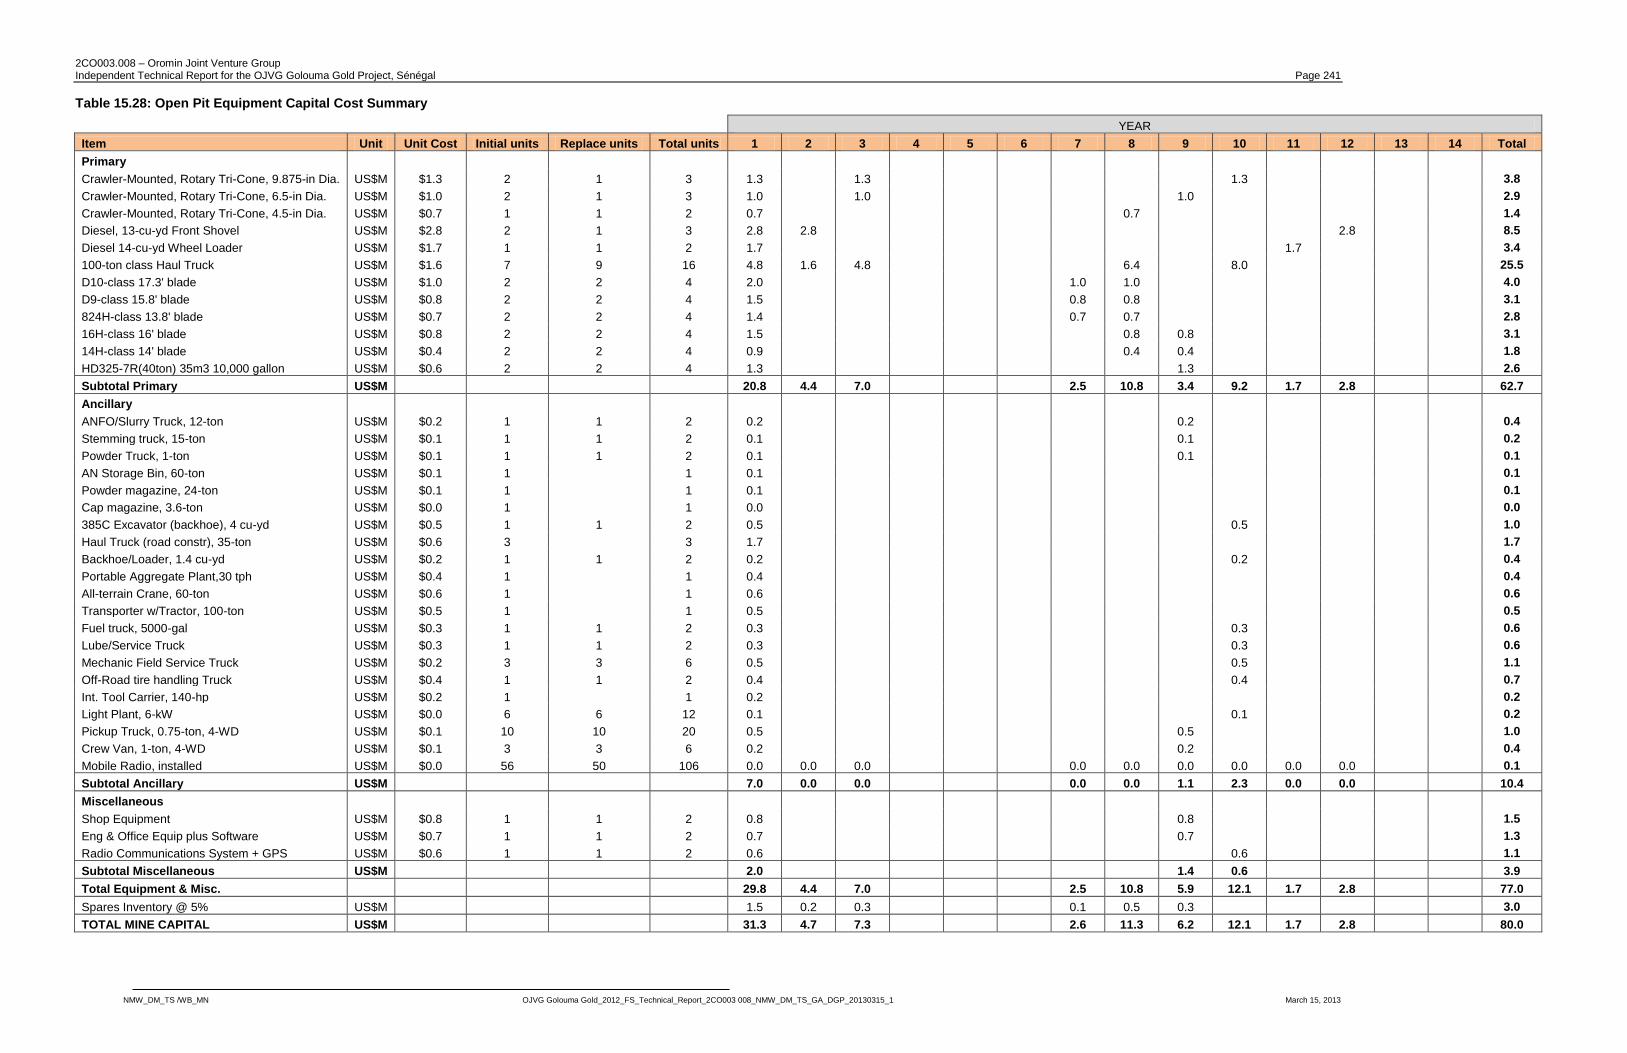
2CO003.008 – Oromin Joint Venture Group Independent Technical Report for the OJVG Golouma Gold Project, Sénégal Page 241
NMW_DM_TS /WB_MN OJVG Golouma Gold_2012_FS_Technical_Report_2CO003 008_NMW_DM_TS_GA_DGP_20130315_1 March 15, 2013
Table 15.28: Open Pit Equipment Capital Cost Summary
YEAR
Item Unit Unit Cost Initial units Replace units Total units 1 2 3 4 5 6 7 8 9 10 11 12 13 14 Total
Primary
Crawler-Mounted, Rotary Tri-Cone, 9.875-in Dia. US$M $1.3 2 1 3 1.3 1.3 1.3 3.8
Crawler-Mounted, Rotary Tri-Cone, 6.5-in Dia. US$M $1.0 2 1 3 1.0 1.0 1.0 2.9
Crawler-Mounted, Rotary Tri-Cone, 4.5-in Dia. US$M $0.7 1 1 2 0.7 0.7 1.4
Diesel, 13-cu-yd Front Shovel US$M $2.8 2 1 3 2.8 2.8 2.8 8.5
Diesel 14-cu-yd Wheel Loader US$M $1.7 1 1 2 1.7 1.7 3.4
100-ton class Haul Truck US$M $1.6 7 9 16 4.8 1.6 4.8 6.4 8.0 25.5
D10-class 17.3' blade US$M $1.0 2 2 4 2.0 1.0 1.0 4.0
D9-class 15.8' blade US$M $0.8 2 2 4 1.5 0.8 0.8 3.1
824H-class 13.8' blade US$M $0.7 2 2 4 1.4 0.7 0.7 2.8
16H-class 16' blade US$M $0.8 2 2 4 1.5 0.8 0.8 3.1
14H-class 14' blade US$M $0.4 2 2 4 0.9 0.4 0.4 1.8
HD325-7R(40ton) 35m3 10,000 gallon US$M $0.6 2 2 4 1.3 1.3 2.6
Subtotal Primary US$M 20.8 4.4 7.0 2.5 10.8 3.4 9.2 1.7 2.8 62.7
Ancillary
ANFO/Slurry Truck, 12-ton US$M $0.2 1 1 2 0.2 0.2 0.4
Stemming truck, 15-ton US$M $0.1 1 1 2 0.1 0.1 0.2
Powder Truck, 1-ton US$M $0.1 1 1 2 0.1 0.1 0.1
AN Storage Bin, 60-ton US$M $0.1 1 1 0.1 0.1
Powder magazine, 24-ton US$M $0.1 1 1 0.1 0.1
Cap magazine, 3.6-ton US$M $0.0 1 1 0.0 0.0
385C Excavator (backhoe), 4 cu-yd US$M $0.5 1 1 2 0.5 0.5 1.0
Haul Truck (road constr), 35-ton US$M $0.6 3 3 1.7 1.7
Backhoe/Loader, 1.4 cu-yd US$M $0.2 1 1 2 0.2 0.2 0.4
Portable Aggregate Plant,30 tph US$M $0.4 1 1 0.4 0.4
All-terrain Crane, 60-ton US$M $0.6 1 1 0.6 0.6
Transporter w/Tractor, 100-ton US$M $0.5 1 1 0.5 0.5
Fuel truck, 5000-gal US$M $0.3 1 1 2 0.3 0.3 0.6
Lube/Service Truck US$M $0.3 1 1 2 0.3 0.3 0.6
Mechanic Field Service Truck US$M $0.2 3 3 6 0.5 0.5 1.1
Off-Road tire handling Truck US$M $0.4 1 1 2 0.4 0.4 0.7
Int. Tool Carrier, 140-hp US$M $0.2 1 1 0.2 0.2
Light Plant, 6-kW US$M $0.0 6 6 12 0.1 0.1 0.2
Pickup Truck, 0.75-ton, 4-WD US$M $0.1 10 10 20 0.5 0.5 1.0
Crew Van, 1-ton, 4-WD US$M $0.1 3 3 6 0.2 0.2 0.4
Mobile Radio, installed US$M $0.0 56 50 106 0.0 0.0 0.0 0.0 0.0 0.0 0.0 0.0 0.0 0.1
Subtotal Ancillary US$M 7.0 0.0 0.0 0.0 0.0 1.1 2.3 0.0 0.0 10.4
Miscellaneous
Shop Equipment US$M $0.8 1 1 2 0.8 0.8 1.5
Eng & Office Equip plus Software US$M $0.7 1 1 2 0.7 0.7 1.3
Radio Communications System + GPS US$M $0.6 1 1 2 0.6 0.6 1.1
Subtotal Miscellaneous US$M 2.0 1.4 0.6 3.9
Total Equipment & Misc. 29.8 4.4 7.0 2.5 10.8 5.9 12.1 1.7 2.8 77.0
Spares Inventory @ 5% US$M 1.5 0.2 0.3 0.1 0.5 0.3 3.0
TOTAL MINE CAPITAL US$M 31.3 4.7 7.3 2.6 11.3 6.2 12.1 1.7 2.8 80.0
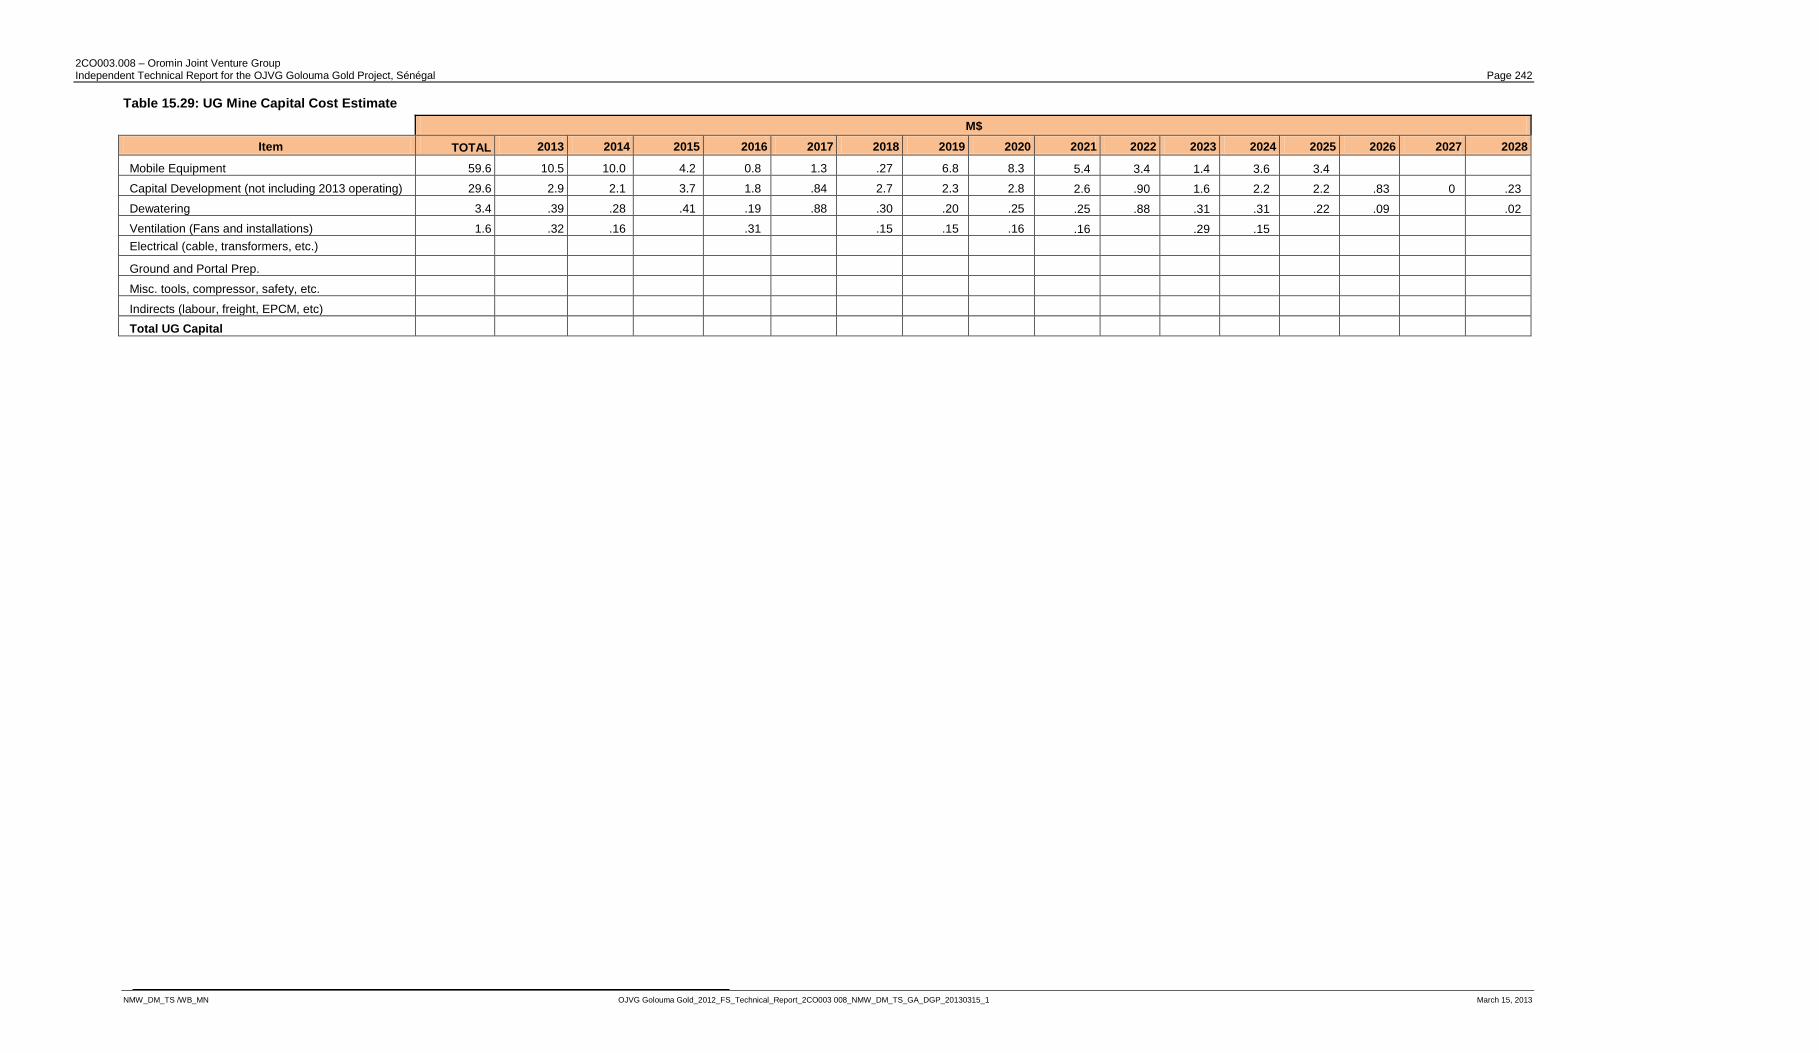
2CO003.008 – Oromin Joint Venture Group Independent Technical Report for the OJVG Golouma Gold Project, Sénégal Page 242
NMW_DM_TS /WB_MN OJVG Golouma Gold_2012_FS_Technical_Report_2CO003 008_NMW_DM_TS_GA_DGP_20130315_1 March 15, 2013
Table 15.29: UG Mine Capital Cost Estimate
M$
Item TOTAL 2013 2014 2015 2016 2017 2018 2019 2020 2021 2022 2023 2024 2025 2026 2027 2028
Mobile Equipment 59.6 10.5 10.0 4.2 0.8 1.3 .27 6.8 8.3 5.4 3.4 1.4 3.6 3.4
Capital Development (not including 2013 operating) 29.6 2.9 2.1 3.7 1.8 .84 2.7 2.3 2.8 2.6 .90 1.6 2.2 2.2 .83 0 .23
Dewatering 3.4 .39 .28 .41 .19 .88 .30 .20 .25 .25 .88 .31 .31 .22 .09 .02
Ventilation (Fans and installations) 1.6 .32 .16 .31 .15 .15 .16 .16 .29 .15
Electrical (cable, transformers, etc.)
Ground and Portal Prep.
Misc. tools, compressor, safety, etc.
Indirects (labour, freight, EPCM, etc)
Total UG Capital
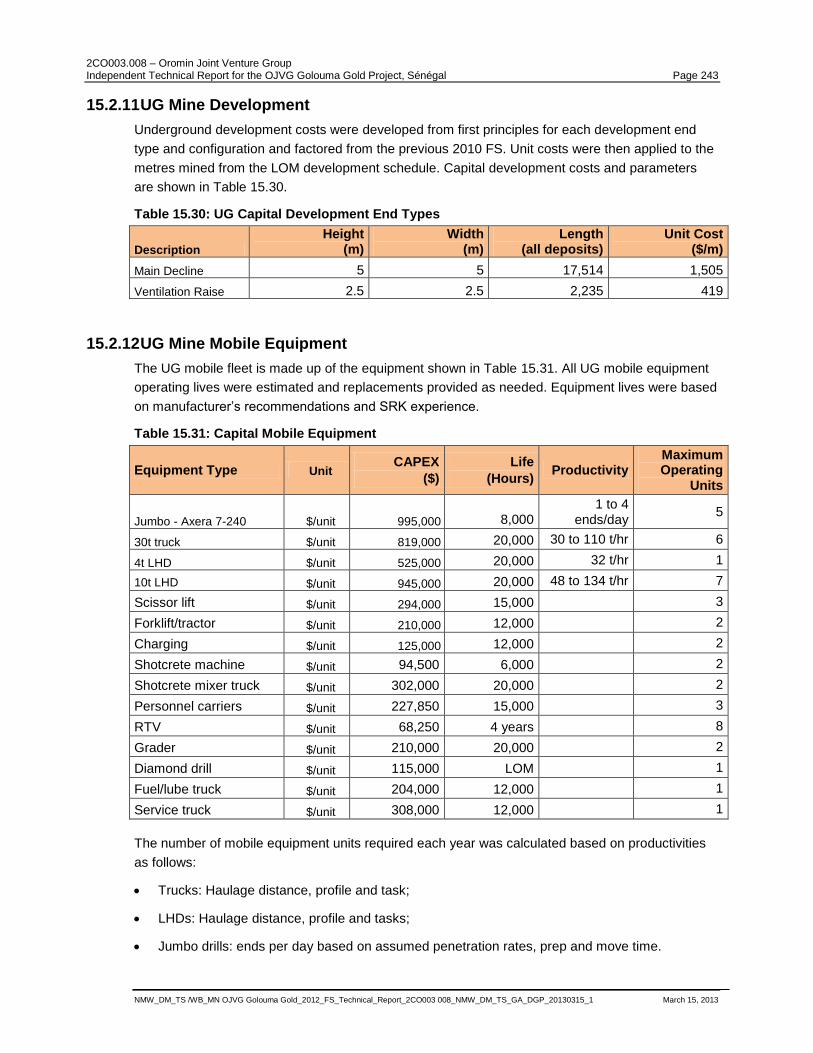
2CO003.008 – Oromin Joint Venture Group Independent Technical Report for the OJVG Golouma Gold Project, Sénégal Page 243
NMW_DM_TS /WB_MN OJVG Golouma Gold_2012_FS_Technical_Report_2CO003 008_NMW_DM_TS_GA_DGP_20130315_1 March 15, 2013
15.2.11 UG Mine Development
Underground development costs were developed from first principles for each development end
type and configuration and factored from the previous 2010 FS. Unit costs were then applied to the
metres mined from the LOM development schedule. Capital development costs and parameters
are shown in Table 15.30.
Table 15.30: UG Capital Development End Types
Description
Height (m)
Width (m)
Length (all deposits)
Unit Cost ($/m)
Main Decline 5 5 17,514 1,505
Ventilation Raise 2.5 2.5 2,235 419
15.2.12 UG Mine Mobile Equipment
The UG mobile fleet is made up of the equipment shown in Table 15.31. All UG mobile equipment
operating lives were estimated and replacements provided as needed. Equipment lives were based
on manufacturer‟s recommendations and SRK experience.
Table 15.31: Capital Mobile Equipment
Equipment Type Unit CAPEX
($)
Life
(Hours) Productivity
Maximum Operating
Units
Jumbo - Axera 7-240 $/unit 995,000 8,000 1 to 4
ends/day 5
30t truck $/unit 819,000 20,000 30 to 110 t/hr 6
4t LHD $/unit 525,000 20,000 32 t/hr 1
10t LHD $/unit 945,000 20,000 48 to 134 t/hr 7
Scissor lift $/unit 294,000 15,000 3
Forklift/tractor $/unit 210,000 12,000 2
Charging $/unit 125,000 12,000 2
Shotcrete machine $/unit 94,500 6,000 2
Shotcrete mixer truck $/unit 302,000 20,000 2
Personnel carriers $/unit 227,850 15,000 3
RTV $/unit 68,250 4 years 8
Grader $/unit 210,000 20,000 2
Diamond drill $/unit 115,000 LOM 1
Fuel/lube truck $/unit 204,000 12,000 1
Service truck $/unit 308,000 12,000 1
The number of mobile equipment units required each year was calculated based on productivities
as follows:
Trucks: Haulage distance, profile and task;
LHDs: Haulage distance, profile and tasks;
Jumbo drills: ends per day based on assumed penetration rates, prep and move time.
2CO003.008 – Oromin Joint Venture Group Independent Technical Report for the OJVG Golouma Gold Project, Sénégal Page 244
NMW_DM_TS /WB_MN OJVG Golouma Gold_2012_FS_Technical_Report_2CO003 008_NMW_DM_TS_GA_DGP_20130315_1 March 15, 2013
15.2.13 UG Mine Infrastructure
UG mine infrastructure for the four deposits was estimated to cost $4.4M over the life of the project
and is comprised of mine services equipment such as fans, pumps, electrical and compressed air
reticulation, ground preparation, tools and indirect costs. A significant portion of the mine
infrastructure cost estimate is for the owner‟s team of technical, supervisory, maintenance and
production personnel to provide EPCM and construction services for UG mine construction.
2CO003.008 – Oromin Joint Venture Group Independent Technical Report for the OJVG Golouma Gold Project, Sénégal Page 245
NMW_DM_TS /WB_MN OJVG Golouma Gold_2012_FS_Technical_Report_2CO003 008_NMW_DM_TS_GA_DGP_20130315_1 March 15, 2013
15.3 Combined Mine Schedule
The open pit and underground mine production schedule for the OJVG deposits incorporates the
deposits at Golouma, Masato, Kerekounda, and Kourouloulou. The mill feed tonnage will be
simultaneously provided by a series of open pits mines and underground mines. Due to the limited
production capacity of the underground mines, they alone will not produce the 4,500 tpd mill feed
requirement. Hence a combination of OP and UG mining is needed to supply feed to the plant.
The plant throughput was planned at a net yearly production of 1.7 mtpa for hard ore and 2.7 mtpa
for soft ore. Pre-production stripping was planned to occur within Year 1, with Year 3 representing
the commencement of full-scale processing. The maximum amount of planned total material to be
moved from the open pits is approximately 65,000 t/day. The life-of-mine (LOM) average total open
pit mining rate is 35,000 t/day. Only indicated resources were used in the LOM plan (no measured
resources have been modelled).
Tables 21.1 through to 21.3 below are a summary of total material movement by year for the LOM
mine production schedule, summarized by open pit, underground and total mine respectively
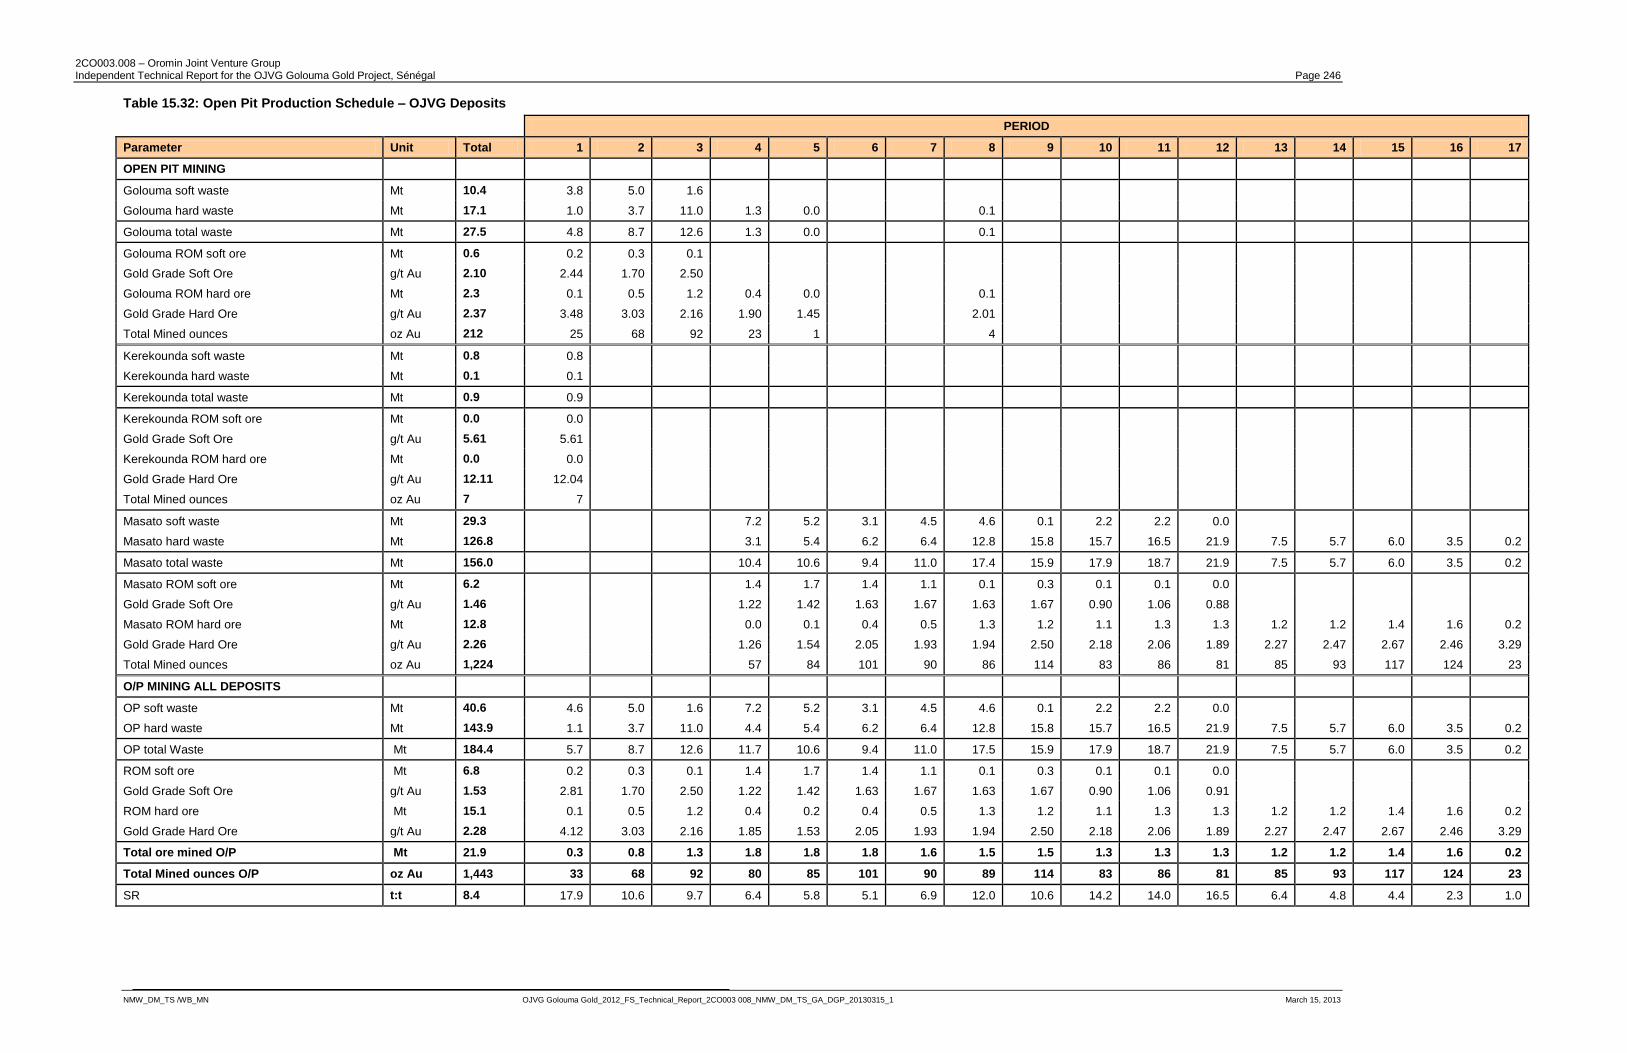
2CO003.008 – Oromin Joint Venture Group Independent Technical Report for the OJVG Golouma Gold Project, Sénégal Page 246
NMW_DM_TS /WB_MN OJVG Golouma Gold_2012_FS_Technical_Report_2CO003 008_NMW_DM_TS_GA_DGP_20130315_1 March 15, 2013
Table 15.32: Open Pit Production Schedule – OJVG Deposits
PERIOD
Parameter Unit Total 1 2 3 4 5 6 7 8 9 10 11 12 13 14 15 16 17
OPEN PIT MINING
Golouma soft waste Mt 10.4 3.8 5.0 1.6
Golouma hard waste Mt 17.1 1.0 3.7 11.0 1.3 0.0 0.1
Golouma total waste Mt 27.5 4.8 8.7 12.6 1.3 0.0 0.1
Golouma ROM soft ore Mt 0.6 0.2 0.3 0.1
Gold Grade Soft Ore g/t Au 2.10 2.44 1.70 2.50
Golouma ROM hard ore Mt 2.3 0.1 0.5 1.2 0.4 0.0 0.1
Gold Grade Hard Ore g/t Au 2.37 3.48 3.03 2.16 1.90 1.45 2.01
Total Mined ounces oz Au 212 25 68 92 23 1 4
Kerekounda soft waste Mt 0.8 0.8
Kerekounda hard waste Mt 0.1 0.1
Kerekounda total waste Mt 0.9 0.9
Kerekounda ROM soft ore Mt 0.0 0.0
Gold Grade Soft Ore g/t Au 5.61 5.61
Kerekounda ROM hard ore Mt 0.0 0.0
Gold Grade Hard Ore g/t Au 12.11 12.04
Total Mined ounces oz Au 7 7
Masato soft waste Mt 29.3 7.2 5.2 3.1 4.5 4.6 0.1 2.2 2.2 0.0
Masato hard waste Mt 126.8 3.1 5.4 6.2 6.4 12.8 15.8 15.7 16.5 21.9 7.5 5.7 6.0 3.5 0.2
Masato total waste Mt 156.0 10.4 10.6 9.4 11.0 17.4 15.9 17.9 18.7 21.9 7.5 5.7 6.0 3.5 0.2
Masato ROM soft ore Mt 6.2 1.4 1.7 1.4 1.1 0.1 0.3 0.1 0.1 0.0
Gold Grade Soft Ore g/t Au 1.46 1.22 1.42 1.63 1.67 1.63 1.67 0.90 1.06 0.88
Masato ROM hard ore Mt 12.8 0.0 0.1 0.4 0.5 1.3 1.2 1.1 1.3 1.3 1.2 1.2 1.4 1.6 0.2
Gold Grade Hard Ore g/t Au 2.26 1.26 1.54 2.05 1.93 1.94 2.50 2.18 2.06 1.89 2.27 2.47 2.67 2.46 3.29
Total Mined ounces oz Au 1,224 57 84 101 90 86 114 83 86 81 85 93 117 124 23
O/P MINING ALL DEPOSITS
OP soft waste Mt 40.6 4.6 5.0 1.6 7.2 5.2 3.1 4.5 4.6 0.1 2.2 2.2 0.0
OP hard waste Mt 143.9 1.1 3.7 11.0 4.4 5.4 6.2 6.4 12.8 15.8 15.7 16.5 21.9 7.5 5.7 6.0 3.5 0.2
OP total Waste Mt 184.4 5.7 8.7 12.6 11.7 10.6 9.4 11.0 17.5 15.9 17.9 18.7 21.9 7.5 5.7 6.0 3.5 0.2
ROM soft ore Mt 6.8 0.2 0.3 0.1 1.4 1.7 1.4 1.1 0.1 0.3 0.1 0.1 0.0
Gold Grade Soft Ore g/t Au 1.53 2.81 1.70 2.50 1.22 1.42 1.63 1.67 1.63 1.67 0.90 1.06 0.91
ROM hard ore Mt 15.1 0.1 0.5 1.2 0.4 0.2 0.4 0.5 1.3 1.2 1.1 1.3 1.3 1.2 1.2 1.4 1.6 0.2
Gold Grade Hard Ore g/t Au 2.28 4.12 3.03 2.16 1.85 1.53 2.05 1.93 1.94 2.50 2.18 2.06 1.89 2.27 2.47 2.67 2.46 3.29
Total ore mined O/P Mt 21.9 0.3 0.8 1.3 1.8 1.8 1.8 1.6 1.5 1.5 1.3 1.3 1.3 1.2 1.2 1.4 1.6 0.2
Total Mined ounces O/P oz Au 1,443 33 68 92 80 85 101 90 89 114 83 86 81 85 93 117 124 23
SR t:t 8.4 17.9 10.6 9.7 6.4 5.8 5.1 6.9 12.0 10.6 14.2 14.0 16.5 6.4 4.8 4.4 2.3 1.0
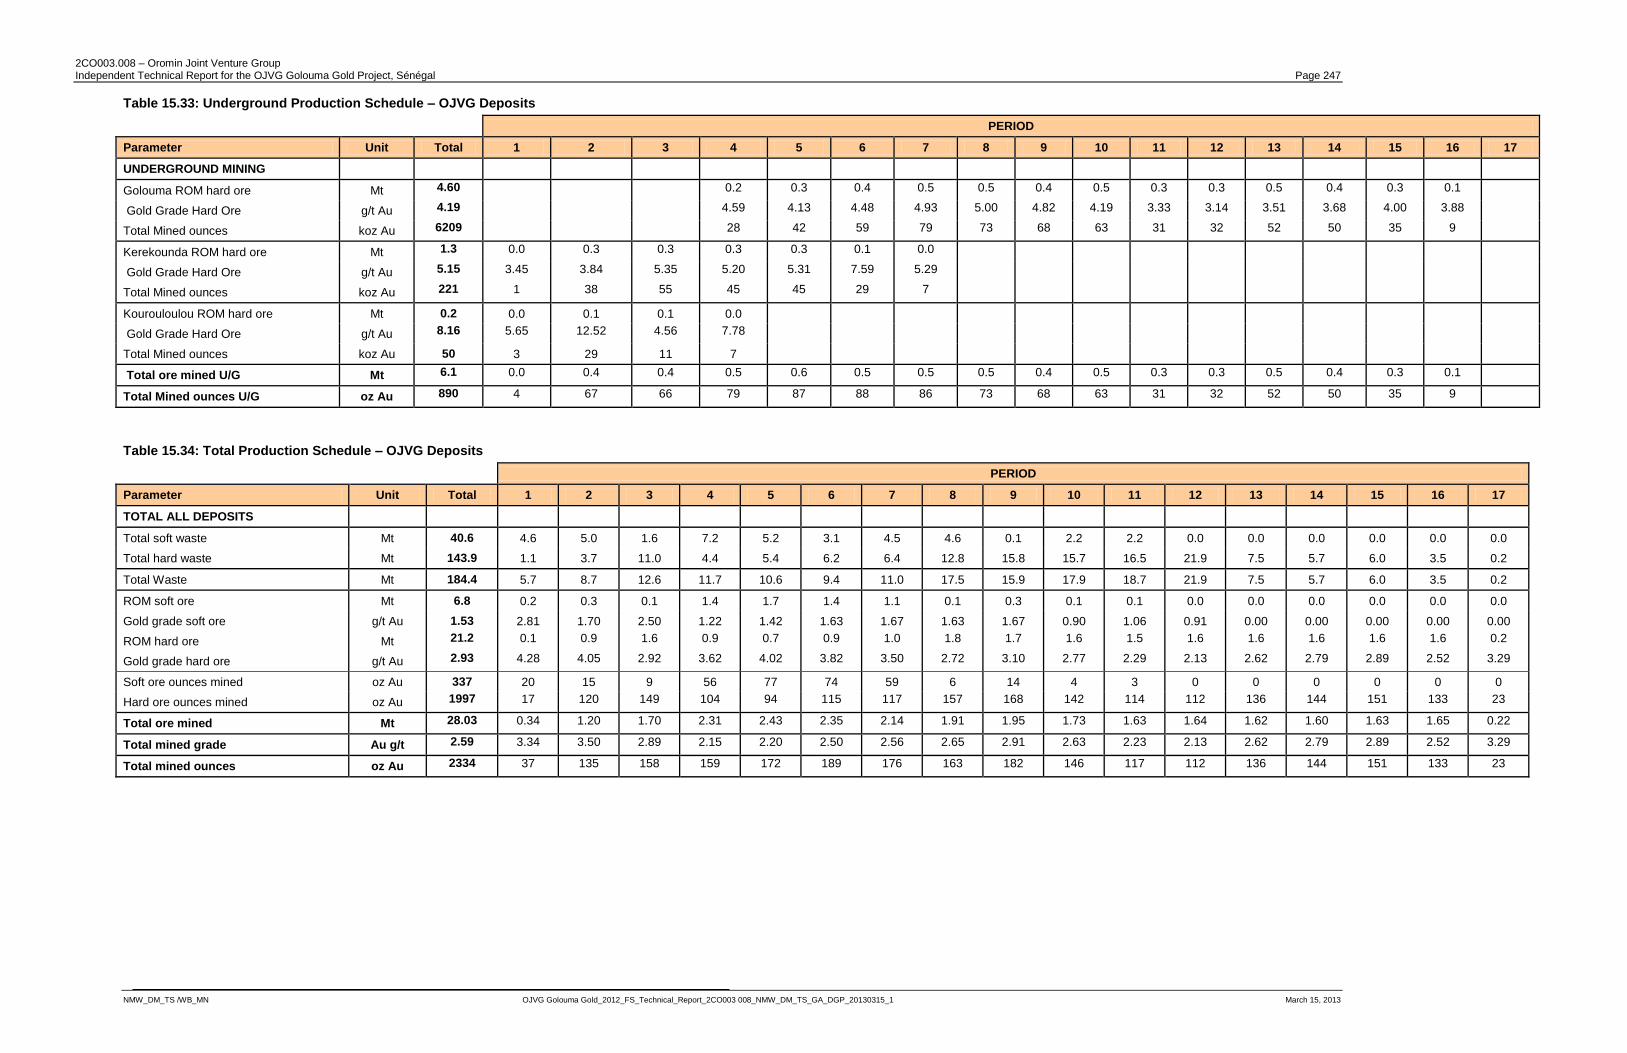
2CO003.008 – Oromin Joint Venture Group Independent Technical Report for the OJVG Golouma Gold Project, Sénégal Page 247
NMW_DM_TS /WB_MN OJVG Golouma Gold_2012_FS_Technical_Report_2CO003 008_NMW_DM_TS_GA_DGP_20130315_1 March 15, 2013
Table 15.33: Underground Production Schedule – OJVG Deposits
PERIOD
Parameter Unit Total 1 2 3 4 5 6 7 8 9 10 11 12 13 14 15 16 17
UNDERGROUND MINING
Golouma ROM hard ore Mt 4.60 0.2 0.3 0.4 0.5 0.5 0.4 0.5 0.3 0.3 0.5 0.4 0.3 0.1
Gold Grade Hard Ore g/t Au 4.19 4.59 4.13 4.48 4.93 5.00 4.82 4.19 3.33 3.14 3.51 3.68 4.00 3.88
Total Mined ounces koz Au 6209 28 42 59 79 73 68 63 31 32 52 50 35 9
Kerekounda ROM hard ore Mt 1.3 0.0 0.3 0.3 0.3 0.3 0.1 0.0
Gold Grade Hard Ore g/t Au 5.15 3.45 3.84 5.35 5.20 5.31 7.59 5.29
Total Mined ounces koz Au 221 1 38 55 45 45 29 7
Kourouloulou ROM hard ore Mt 0.2 0.0 0.1 0.1 0.0
Gold Grade Hard Ore g/t Au 8.16 5.65 12.52 4.56 7.78
Total Mined ounces koz Au 50 3 29 11 7
Total ore mined U/G Mt 6.1 0.0 0.4 0.4 0.5 0.6 0.5 0.5 0.5 0.4 0.5 0.3 0.3 0.5 0.4 0.3 0.1
Total Mined ounces U/G oz Au 890 4 67 66 79 87 88 86 73 68 63 31 32 52 50 35 9
Table 15.34: Total Production Schedule – OJVG Deposits
PERIOD
Parameter Unit Total 1 2 3 4 5 6 7 8 9 10 11 12 13 14 15 16 17
TOTAL ALL DEPOSITS
Total soft waste Mt 40.6 4.6 5.0 1.6 7.2 5.2 3.1 4.5 4.6 0.1 2.2 2.2 0.0 0.0 0.0 0.0 0.0 0.0
Total hard waste Mt 143.9 1.1 3.7 11.0 4.4 5.4 6.2 6.4 12.8 15.8 15.7 16.5 21.9 7.5 5.7 6.0 3.5 0.2
Total Waste Mt 184.4 5.7 8.7 12.6 11.7 10.6 9.4 11.0 17.5 15.9 17.9 18.7 21.9 7.5 5.7 6.0 3.5 0.2
ROM soft ore Mt 6.8 0.2 0.3 0.1 1.4 1.7 1.4 1.1 0.1 0.3 0.1 0.1 0.0 0.0 0.0 0.0 0.0 0.0
Gold grade soft ore g/t Au 1.53 2.81 1.70 2.50 1.22 1.42 1.63 1.67 1.63 1.67 0.90 1.06 0.91 0.00 0.00 0.00 0.00 0.00
ROM hard ore Mt 21.2 0.1 0.9 1.6 0.9 0.7 0.9 1.0 1.8 1.7 1.6 1.5 1.6 1.6 1.6 1.6 1.6 0.2
Gold grade hard ore g/t Au 2.93 4.28 4.05 2.92 3.62 4.02 3.82 3.50 2.72 3.10 2.77 2.29 2.13 2.62 2.79 2.89 2.52 3.29
Soft ore ounces mined oz Au 337 20 15 9 56 77 74 59 6 14 4 3 0 0 0 0 0 0
Hard ore ounces mined oz Au 1997 17 120 149 104 94 115 117 157 168 142 114 112 136 144 151 133 23
Total ore mined Mt 28.03 0.34 1.20 1.70 2.31 2.43 2.35 2.14 1.91 1.95 1.73 1.63 1.64 1.62 1.60 1.63 1.65 0.22
Total mined grade Au g/t 2.59 3.34 3.50 2.89 2.15 2.20 2.50 2.56 2.65 2.91 2.63 2.23 2.13 2.62 2.79 2.89 2.52 3.29
Total mined ounces oz Au 2334 37 135 158 159 172 189 176 163 182 146 117 112 136 144 151 133 23
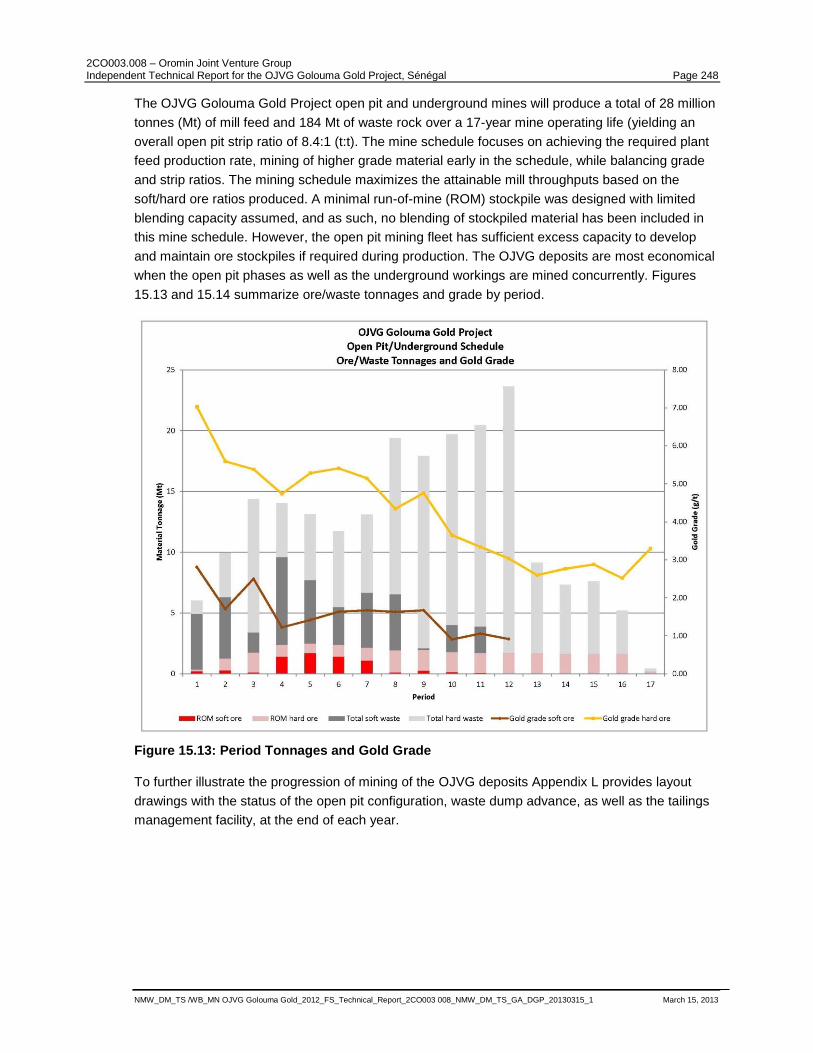
2CO003.008 – Oromin Joint Venture Group Independent Technical Report for the OJVG Golouma Gold Project, Sénégal Page 248
NMW_DM_TS /WB_MN OJVG Golouma Gold_2012_FS_Technical_Report_2CO003 008_NMW_DM_TS_GA_DGP_20130315_1 March 15, 2013
The OJVG Golouma Gold Project open pit and underground mines will produce a total of 28 million
tonnes (Mt) of mill feed and 184 Mt of waste rock over a 17-year mine operating life (yielding an
overall open pit strip ratio of 8.4:1 (t:t). The mine schedule focuses on achieving the required plant
feed production rate, mining of higher grade material early in the schedule, while balancing grade
and strip ratios. The mining schedule maximizes the attainable mill throughputs based on the
soft/hard ore ratios produced. A minimal run-of-mine (ROM) stockpile was designed with limited
blending capacity assumed, and as such, no blending of stockpiled material has been included in
this mine schedule. However, the open pit mining fleet has sufficient excess capacity to develop
and maintain ore stockpiles if required during production. The OJVG deposits are most economical
when the open pit phases as well as the underground workings are mined concurrently. Figures
15.13 and 15.14 summarize ore/waste tonnages and grade by period.
Figure 15.13: Period Tonnages and Gold Grade
To further illustrate the progression of mining of the OJVG deposits Appendix L provides layout
drawings with the status of the open pit configuration, waste dump advance, as well as the tailings
management facility, at the end of each year.
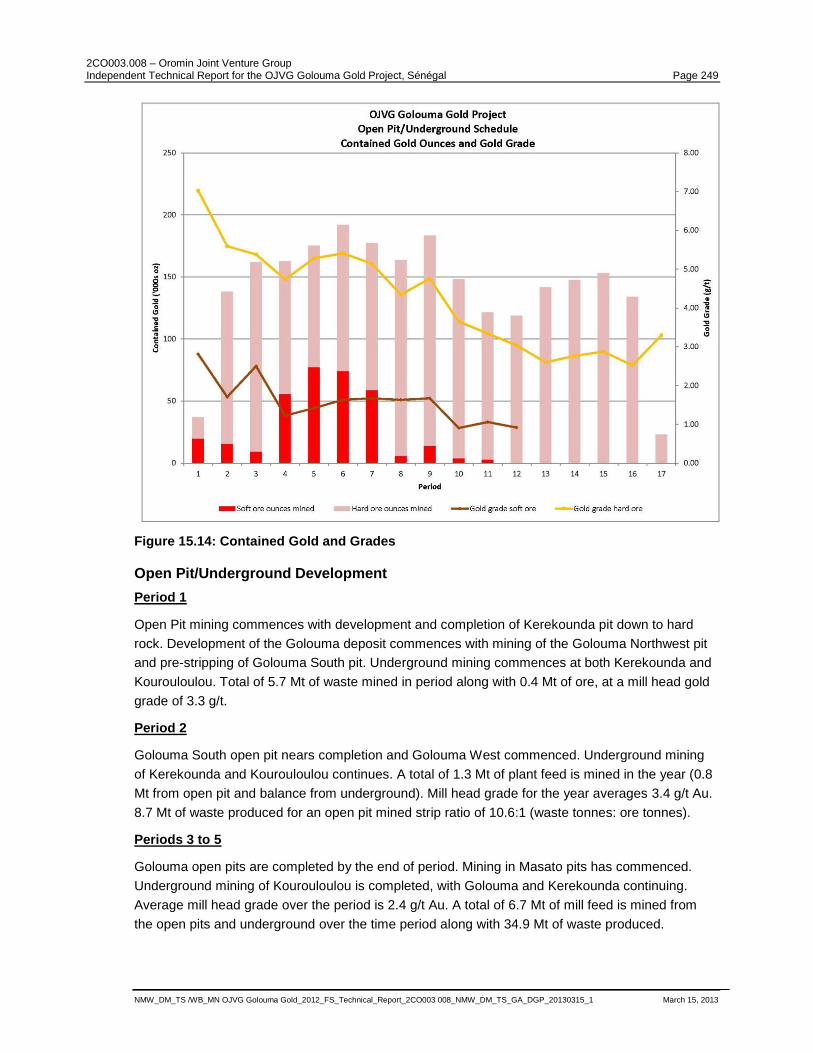
2CO003.008 – Oromin Joint Venture Group Independent Technical Report for the OJVG Golouma Gold Project, Sénégal Page 249
NMW_DM_TS /WB_MN OJVG Golouma Gold_2012_FS_Technical_Report_2CO003 008_NMW_DM_TS_GA_DGP_20130315_1 March 15, 2013
Figure 15.14: Contained Gold and Grades
Open Pit/Underground Development
Period 1
Open Pit mining commences with development and completion of Kerekounda pit down to hard
rock. Development of the Golouma deposit commences with mining of the Golouma Northwest pit
and pre-stripping of Golouma South pit. Underground mining commences at both Kerekounda and
Kourouloulou. Total of 5.7 Mt of waste mined in period along with 0.4 Mt of ore, at a mill head gold
grade of 3.3 g/t.
Period 2
Golouma South open pit nears completion and Golouma West commenced. Underground mining
of Kerekounda and Kourouloulou continues. A total of 1.3 Mt of plant feed is mined in the year (0.8
Mt from open pit and balance from underground). Mill head grade for the year averages 3.4 g/t Au.
8.7 Mt of waste produced for an open pit mined strip ratio of 10.6:1 (waste tonnes: ore tonnes).
Periods 3 to 5
Golouma open pits are completed by the end of period. Mining in Masato pits has commenced.
Underground mining of Kourouloulou is completed, with Golouma and Kerekounda continuing.
Average mill head grade over the period is 2.4 g/t Au. A total of 6.7 Mt of mill feed is mined from
the open pits and underground over the time period along with 34.9 Mt of waste produced.
2CO003.008 – Oromin Joint Venture Group Independent Technical Report for the OJVG Golouma Gold Project, Sénégal Page 250
NMW_DM_TS /WB_MN OJVG Golouma Gold_2012_FS_Technical_Report_2CO003 008_NMW_DM_TS_GA_DGP_20130315_1 March 15, 2013
Periods 6-10:
Open Pit mining in Masato continues (Masato South Phase 1 completed along with Masato
North).Kerekounda underground is completed in this time frame with Golouma continuing. Total of
10.2 Mt of plant feed mined over the five year period. Plant head grade averages 2.6 g/t Au. Total
waste tonnage is 72 Mt.
Periods 11-17
Open Pit mining in Masato is completed by Year 17, with underground mining of the Gouluma
depost completed in Year 16. Total of 10.3 Mt of plant feed mined over the seven year period.
Plant head grade averages 2.6 g/t Au. Open pit strip ratio averages 7.8:1.
2CO003.008 – Oromin Joint Venture Group Independent Technical Report for the OJVG Golouma Gold Project, Sénégal Page 251
NMW_DM_TS /WB_MN OJVG Golouma Gold_2012_FS_Technical_Report_2CO003 008_NMW_DM_TS_GA_DGP_20130315_1 March 15, 2013
16 Recovery Methods Details pertaining to the metallurgical testwork and characterisation, proposed flow-sheets,
predictions of metallurgical performance and other aspect of mineral processing and recovery
relevant to the project are contained in Section 12 of this report.
2CO003.008 – Oromin Joint Venture Group Independent Technical Report for the OJVG Golouma Gold Project, Sénégal Page 252
NMW_DM_TS /WB_MN OJVG Golouma Gold_2012_FS_Technical_Report_2CO003 008_NMW_DM_TS_GA_DGP_20130315_1 March 15, 2013
17 Project Infrastructure This Section outlines the infrastructure requirements for both the process plant and mine
operations for a 1.7 - 2.7 million tonne per year gold operation. The infrastructure covers the power
supply, fuel and lube storage, fire protection, sewage treatment, water supply and treatment, site
drainage, in-plant roads, communication, security, airfield, all site buildings and a permanent camp
facility. Refer to Appendix M for the associated mill area arrangement drawings.
The following sections outline the assumptions used in the design of the major site infrastructure
needed to service the operation.
17.1 Power Supply
Power for the plant, mine and associated infrastructure facilities such as the permanent camp and
water treatment plants will be supplied by a 21 MW installed power generation plant. The power
plant will consist of 2 x 7.45 MW heavy fuel oil (HFO) driven generators and 4 x 1.6 MW light fuel
oil (LFO or diesel) driven generators. The HFO generators will provide the primary source of power
with the LFO generators providing standby power and excess capacity as required for starting
major equipment such as the grinding mills. The HFO generator availability is around 90% with the
process plant operating availability being 88% for the FS design. Therefore, the approach of using
2 x duty HFO generators with LFO standby units provides a robust design offering flexibility whilst
minimising capital and operating costs.
Electricity is distributed across the complete site via 6.6 kV overhead power lines. The electricity
distribution includes the process plant, camp, waste and potable water treatment plants,
administration offices; heavy vehicle workshop, Golouma and Kerekounda open pit and
underground mines, and the tailings dam decant water pumps. Power is not distributed to the raw
water dam intake pumps or the Masato mine due to these being 9 km from the power plant. Mobile
generators will be used for powering these facilities.
17.2 Fuel and Lube Storage
The site includes a fuel storage area to contain heavy fuel oil (HFO) for the onsite power
generators, and diesel to service the mining fleet along with the medium and light duty equipment.
The HFO generator tank farm includes day tanks, settling tanks and storage tanks.
There will be 2 x 600 m³ diesel storage tanks as well as a 70 m³ day tank specifically for supplying
diesel to the mining fleet. All diesel tanks are installed in lined containment areas and are
constructed from carbon steel. The mobile equipment shop area will house a waste oil tank. Fuel
and lubricants are assumed to be transported to the site via truck containers from Dakar.
Additionally a purpose built fire truck will be available 24 hours per day to respond to emergencies.
17.3 Fire Protection
The site will include a fire protection and fire water distribution system. An underground fire main,
consisting of multiple loops, will provide fire water to the various building sprinkler systems, water
monitors and hydrants.
The process plant fire water will be supplied from a dedicated reservoir on the bottom portion of the
plant raw water tank. The plant fire water capacity is sized for 576 m³, and is supplied in a
2CO003.008 – Oromin Joint Venture Group Independent Technical Report for the OJVG Golouma Gold Project, Sénégal Page 253
NMW_DM_TS /WB_MN OJVG Golouma Gold_2012_FS_Technical_Report_2CO003 008_NMW_DM_TS_GA_DGP_20130315_1 March 15, 2013
pressurised system by an electric centrifugal pump with a diesel driven standby pump. There is
also a small jockey pump to maintain the line pressure.
The camp fire water system is similar to the plant design and is supplied from the camp raw water
tank. There is also a fire water reservoir and pumping system located at the mobile equipment
workshop.
Fire hydrants, water monitors, hose reel cabinets, wheeled fire extinguishers, hand held fire
extinguishers, and sprinkler systems will be strategically located throughout the site to provide the
required fire protection.
17.4 Water Supply and Treatment
All raw water required for the project will be harvested from a raw water catchment reservoir
located approximately 9 km North East of the plant site.
Potable Water Treatment
Vertical centrifugal pumps installed on a floating barge will deliver fresh water from the reservoir to
the 2 x 380 m³ camp raw water storage tanks. The water is treated in a vendor supplied potable
water treatment plant to meet North American standards for potable supply. The amount of water
treated is capable of supporting a 600 person camp (to cater for the construction period) as well as
the plant laboratory, safety showers, administration offices, a mobile equipment workshop, and
warehouse and mining offices. Potable water will be pumped from the camp to tanks located at the
process plant and mobile equipment workshop for further distribution.
In addition to the potable water supply, 160 m³/d of filtered raw water (not potable) will be supplied
to the camp for use in washing, cleaning and ablutions.
17.5 Sewage Treatment
A vendor supplied waste water treatment plant (WWTP) will be supplied to treat sewage generated
from the camp and various site ablutions and facilities at a rate of 200 m³/d. Sewage will be
pumped to the WWTP by transfer pumps located around the site within enclosed and lined transfer
pits. The WWTP will produce a sterilized solution suitable for re-use within the process plant water
system. The sludge produced will be disposed in the TMF.
17.6 Site Drainage
The plant is located in close proximity to the top of a drainage basin. No site specific drainage
study was performed for the Feasibility Study. As such, the anticipated surface runoff at the plant
site is considered limited and no detention or holding ponds are addressed in this study. All storm
run-off water from the plant site will flow toward the TMF.
All off-site storm water is routed around the buildings and facility pads with the use of drainage or
diversion ditches. All on-site storm water is directed away from proposed facilities and generally
flows towards the TMF. The diversion ditches connect to existing waterways as depicted on the
topographic information.
For the drainage control design, culvert pipe are used where existing waterways intercept roadway
alignments or fill areas, and V-shaped ditches are used for water diversion. The culverts are
assumed to be 600 mm diameter pipe and the ditches are 1 m deep with 2:1 side slopes. The
2CO003.008 – Oromin Joint Venture Group Independent Technical Report for the OJVG Golouma Gold Project, Sénégal Page 254
NMW_DM_TS /WB_MN OJVG Golouma Gold_2012_FS_Technical_Report_2CO003 008_NMW_DM_TS_GA_DGP_20130315_1 March 15, 2013
pipes are assumed to handle a 10-year storm event and the ditches are assumed to handle a 25-
year storm event.
17.7 In-Plant Roads
The plant roads identified herein are limited to the road surfaces within the boundary limits of the
plant operation. This includes roads from the security gate through the plant facilities, the service
road to the power generation plant, warehouse and administration area.
The roads proposed for in-plant access are designed for a maximum travel speed of 25 km/h, and
a width of 6 m with a minimum 10 m curve centerline. Road base is installed at 0.15 m thick on all
in-plant and main access roads within these limits.
17.8 Communication
A satellite based communications system including telephones and internet will be utilized. Two
way radios are used for communication within the plant operation.
17.9 Security
The entire processing plant will be double fenced. Two gates are available for vehicle traffic, one of
which is located at the main entrance at the South East end of the property. The second secured
gate area is located on the North East end of the property to allow maintenance access to the
crushed ore conveyor. The chain link fence, equipped with razor wire is intended to keep wild
animals and unauthorized personnel out of the plant area.
The gold room within the plant will be fully secured with a screening checkpoint for persons
entering/exiting the gold room. This location also includes a safe, metal detector, and camera
surveillance for additional security. The gold room will contain ablution and kitchen facilities to
reduce personnel traffic during gold processing.
The administration, medical treatment, power generation and warehouse facilities will be single
fenced with a single gate located adjacent to the low security gatehouse.
The perimeter will also have roving security patrols and guard stations to provide an added
measure of security and loss prevention.
17.10 Airfield
No new airstrip was considered for this project. It is assumed that the existing regional airstrip will
be shared with MDL‟s adjacent project. This airstrip is capable of handling light turbo-prop planes
with a capacity of 10 persons. Costs associated with ongoing operation of the strip are included in
the general and administrative (G&A) operating costs.
17.11 Site Buildings
Plant Administration Building
A plant administration building is included within the secured plant area. This will provide offices for
maintenance and operations personnel as well as meeting and training rooms, break rooms, and
ablutions.

2CO003.008 – Oromin Joint Venture Group Independent Technical Report for the OJVG Golouma Gold Project, Sénégal Page 255
NMW_DM_TS /WB_MN OJVG Golouma Gold_2012_FS_Technical_Report_2CO003 008_NMW_DM_TS_GA_DGP_20130315_1 March 15, 2013
Main Administration Building
An administration building will provide staff offices for meeting/training rooms, break rooms,
lavatories, and archive storage. This office building will house:
General and administrative staff;
Environmental staff; and
Mining management staff.
Security and Medical Treatment
There will be a high and low security gatehouse provided. The low security gatehouse will be
located at the main access road to administration office area. This will house the security guards
and provide the principal checkpoint for personnel and vehicles entering the administration and
warehouse area. The high security gatehouse building will be located adjacent to the vehicle
access point into the process plant area. This will be the main checkpoint area for both personnel
and vehicle traffic entering and exiting the process plant.
A medical treatment room will be provided adjacent to the administration building. This will house
nursing staff and emergency response treatment facilities for the project site. It will also provide
drug and alcohol testing facilities.
Laboratory and Geology Sample Preparation
The plant laboratory is located within the secured plant site. This laboratory will service both the
mining and process operations. The laboratory houses offices, sample storage, sample preparation
and drying area, weighing room, a metallurgical laboratory, wet laboratory, assay room,
mechanical services including fume and dust collection, lavatories and a break room.
In addition to the plant laboratory, a sample preparation facility will be provided for the mining and
geology samples. This design reduces the amount of material movement into the secured plant
location and therefore improves operability whilst reducing security risks.
Process Plant Workshop
A plant workshop will be provided to facilitate all plant maintenance requirements. The workshop is
located within the secured plant location. This building is equipped with a wash down oil sump for
cleaning up spillages.
Process Plant Changerooms and Mess Hall
A changeroom/ablution facility will be included in the secured plant location along with a mess hall.
This will allow workers to have meal breaks within the secured area of the plant to reduce traffic
in/out of the plant and therefore reduce security risks.
Warehouse
The warehouse facility provides covered storage for small and medium sized spares used by
process and mining operations. In addition to the covered warehouse there will be a large open air
storage area for bulky spares that don‟t require cover such as mill liners.
2CO003.008 – Oromin Joint Venture Group Independent Technical Report for the OJVG Golouma Gold Project, Sénégal Page 256
NMW_DM_TS /WB_MN OJVG Golouma Gold_2012_FS_Technical_Report_2CO003 008_NMW_DM_TS_GA_DGP_20130315_1 March 15, 2013
Process Plant Ancillary Buildings and Facilities
There are a number of other buildings within the process plant site. These include the gold room,
various motor control centers (MCCs), CIL titration room and plant control rooms.
Underground Mine Changeroom
An underground mine changeroom facility will be provided complete with ablutions and safety
equipment storage. This will be the principal area for controlling personnel movements into the
underground mine as well as issuing safety equipment such as self-rescue kits and lights. The
building will include offices for the shift supervisors as well as a training /meeting room. The
facilities are designed based on a shift crew of 50 underground mining persons.
Mine Mobile Equipment Workshop
The mobile equipment workshop building includes two 12.8 m wide high top bays for mining haul
vehicles and two 12.6 m wide light vehicle maintenance bays. These bays are covered using light
prefabricated frames and flexible canvass covers. The bays are each 24m long using 2 off 40‟
anchored sea containers at ground level which are modified for tools, spares and fittings storage.
In the high top bays the sea containers are stacked with pre-fabricated sea container offices with
fabricated access stairs. There is also an uncovered laydown area, parking and wash down
facilities adjacent to the workshop.
Permanent Camp
A permanent camp facility is situated 1.5 km NE from the process plant site. This site will also
serve as the construction camp, complete with housing, cafeteria, and recreation facilities. The
permanent camp is designed to house 350 personnel, with the normal occupancy expected to be
300. A temporary construction camp will be erected to house personnel required for the
construction and start-up period.
17.12 Site Roads
Golouma Gold Project site roads fall into two categories as summarized in Table 17.1. All site
roads are considered private roads and access will be controlled by OJVG.
Haul and operations roads are designed for duel lane traffic. Oversize equipment will however
travel on the operations roads at times, and under those conditions temporary management
protocols will be put in place allowing the road to be used as single lane traffic. Seasonal access
roads are generally considered temporary roads and will be constructed as and when required.
These roads will only accommodate single lane traffic and will only be accessible during the dry
season and occasionally during the wet season using all-wheel drive vehicles.
Haul roads and operations roads will have safety barriers along any stretch of road where the
shoulder height is greater than 3 m above the natural ground. The barrier will be half the height of
the largest vehicle tire that traverses that road. The roads do cross a number of ephemeral stream
channels. Large diameter metal culverts will be installed at these locations. No permanent bridges
are planned.
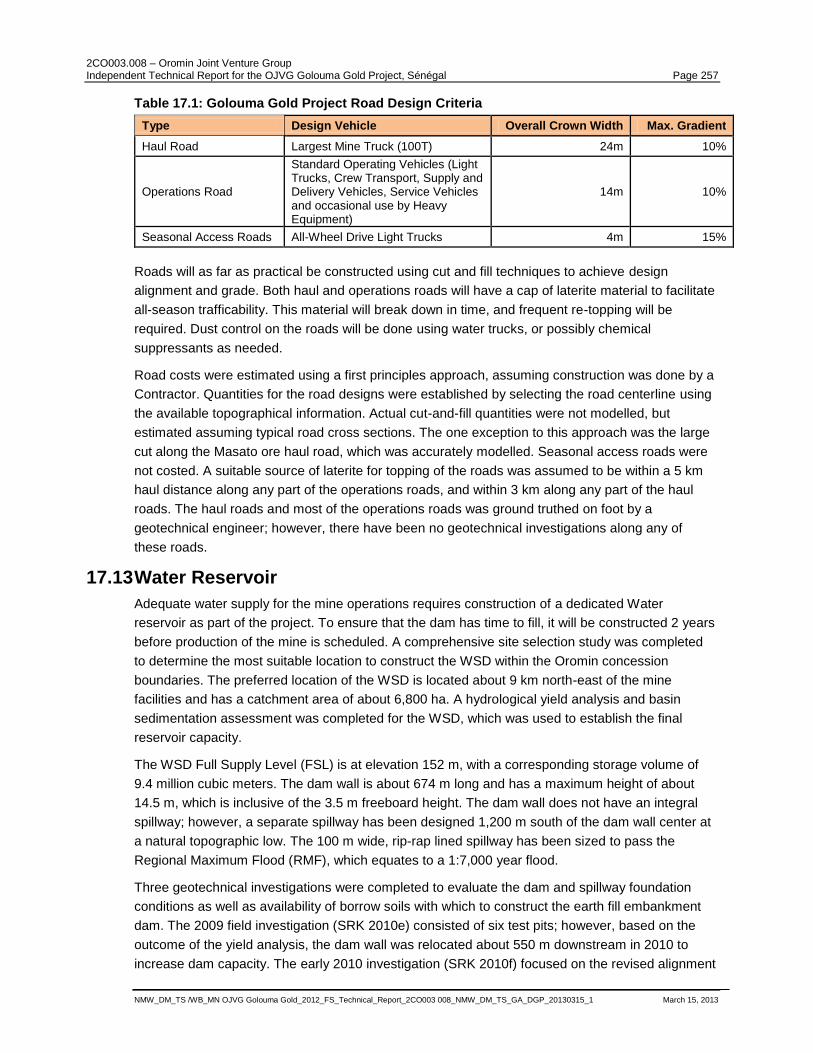
2CO003.008 – Oromin Joint Venture Group Independent Technical Report for the OJVG Golouma Gold Project, Sénégal Page 257
NMW_DM_TS /WB_MN OJVG Golouma Gold_2012_FS_Technical_Report_2CO003 008_NMW_DM_TS_GA_DGP_20130315_1 March 15, 2013
Table 17.1: Golouma Gold Project Road Design Criteria
Type Design Vehicle Overall Crown Width Max. Gradient
Haul Road Largest Mine Truck (100T) 24m 10%
Operations Road
Standard Operating Vehicles (Light Trucks, Crew Transport, Supply and Delivery Vehicles, Service Vehicles and occasional use by Heavy Equipment)
14m 10%
Seasonal Access Roads All-Wheel Drive Light Trucks 4m 15%
Roads will as far as practical be constructed using cut and fill techniques to achieve design
alignment and grade. Both haul and operations roads will have a cap of laterite material to facilitate
all-season trafficability. This material will break down in time, and frequent re-topping will be
required. Dust control on the roads will be done using water trucks, or possibly chemical
suppressants as needed.
Road costs were estimated using a first principles approach, assuming construction was done by a
Contractor. Quantities for the road designs were established by selecting the road centerline using
the available topographical information. Actual cut-and-fill quantities were not modelled, but
estimated assuming typical road cross sections. The one exception to this approach was the large
cut along the Masato ore haul road, which was accurately modelled. Seasonal access roads were
not costed. A suitable source of laterite for topping of the roads was assumed to be within a 5 km
haul distance along any part of the operations roads, and within 3 km along any part of the haul
roads. The haul roads and most of the operations roads was ground truthed on foot by a
geotechnical engineer; however, there have been no geotechnical investigations along any of
these roads.
17.13 Water Reservoir
Adequate water supply for the mine operations requires construction of a dedicated Water
reservoir as part of the project. To ensure that the dam has time to fill, it will be constructed 2 years
before production of the mine is scheduled. A comprehensive site selection study was completed
to determine the most suitable location to construct the WSD within the Oromin concession
boundaries. The preferred location of the WSD is located about 9 km north-east of the mine
facilities and has a catchment area of about 6,800 ha. A hydrological yield analysis and basin
sedimentation assessment was completed for the WSD, which was used to establish the final
reservoir capacity.
The WSD Full Supply Level (FSL) is at elevation 152 m, with a corresponding storage volume of
9.4 million cubic meters. The dam wall is about 674 m long and has a maximum height of about
14.5 m, which is inclusive of the 3.5 m freeboard height. The dam wall does not have an integral
spillway; however, a separate spillway has been designed 1,200 m south of the dam wall center at
a natural topographic low. The 100 m wide, rip-rap lined spillway has been sized to pass the
Regional Maximum Flood (RMF), which equates to a 1:7,000 year flood.
Three geotechnical investigations were completed to evaluate the dam and spillway foundation
conditions as well as availability of borrow soils with which to construct the earth fill embankment
dam. The 2009 field investigation (SRK 2010e) consisted of six test pits; however, based on the
outcome of the yield analysis, the dam wall was relocated about 550 m downstream in 2010 to
increase dam capacity. The early 2010 investigation (SRK 2010f) focused on the revised alignment
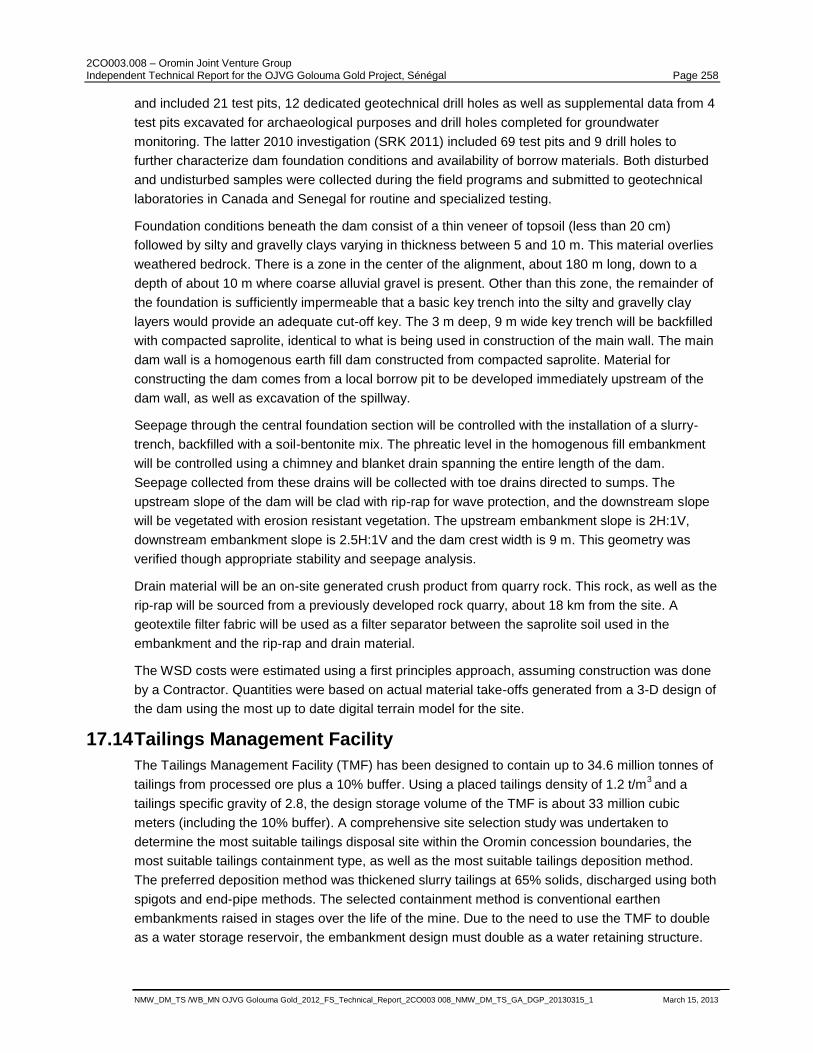
2CO003.008 – Oromin Joint Venture Group Independent Technical Report for the OJVG Golouma Gold Project, Sénégal Page 258
NMW_DM_TS /WB_MN OJVG Golouma Gold_2012_FS_Technical_Report_2CO003 008_NMW_DM_TS_GA_DGP_20130315_1 March 15, 2013
and included 21 test pits, 12 dedicated geotechnical drill holes as well as supplemental data from 4
test pits excavated for archaeological purposes and drill holes completed for groundwater
monitoring. The latter 2010 investigation (SRK 2011) included 69 test pits and 9 drill holes to
further characterize dam foundation conditions and availability of borrow materials. Both disturbed
and undisturbed samples were collected during the field programs and submitted to geotechnical
laboratories in Canada and Senegal for routine and specialized testing.
Foundation conditions beneath the dam consist of a thin veneer of topsoil (less than 20 cm)
followed by silty and gravelly clays varying in thickness between 5 and 10 m. This material overlies
weathered bedrock. There is a zone in the center of the alignment, about 180 m long, down to a
depth of about 10 m where coarse alluvial gravel is present. Other than this zone, the remainder of
the foundation is sufficiently impermeable that a basic key trench into the silty and gravelly clay
layers would provide an adequate cut-off key. The 3 m deep, 9 m wide key trench will be backfilled
with compacted saprolite, identical to what is being used in construction of the main wall. The main
dam wall is a homogenous earth fill dam constructed from compacted saprolite. Material for
constructing the dam comes from a local borrow pit to be developed immediately upstream of the
dam wall, as well as excavation of the spillway.
Seepage through the central foundation section will be controlled with the installation of a slurry-
trench, backfilled with a soil-bentonite mix. The phreatic level in the homogenous fill embankment
will be controlled using a chimney and blanket drain spanning the entire length of the dam.
Seepage collected from these drains will be collected with toe drains directed to sumps. The
upstream slope of the dam will be clad with rip-rap for wave protection, and the downstream slope
will be vegetated with erosion resistant vegetation. The upstream embankment slope is 2H:1V,
downstream embankment slope is 2.5H:1V and the dam crest width is 9 m. This geometry was
verified though appropriate stability and seepage analysis.
Drain material will be an on-site generated crush product from quarry rock. This rock, as well as the
rip-rap will be sourced from a previously developed rock quarry, about 18 km from the site. A
geotextile filter fabric will be used as a filter separator between the saprolite soil used in the
embankment and the rip-rap and drain material.
The WSD costs were estimated using a first principles approach, assuming construction was done
by a Contractor. Quantities were based on actual material take-offs generated from a 3-D design of
the dam using the most up to date digital terrain model for the site.
17.14 Tailings Management Facility
The Tailings Management Facility (TMF) has been designed to contain up to 34.6 million tonnes of
tailings from processed ore plus a 10% buffer. Using a placed tailings density of 1.2 t/m3 and a
tailings specific gravity of 2.8, the design storage volume of the TMF is about 33 million cubic
meters (including the 10% buffer). A comprehensive site selection study was undertaken to
determine the most suitable tailings disposal site within the Oromin concession boundaries, the
most suitable tailings containment type, as well as the most suitable tailings deposition method.
The preferred deposition method was thickened slurry tailings at 65% solids, discharged using both
spigots and end-pipe methods. The selected containment method is conventional earthen
embankments raised in stages over the life of the mine. Due to the need to use the TMF to double
as a water storage reservoir, the embankment design must double as a water retaining structure.
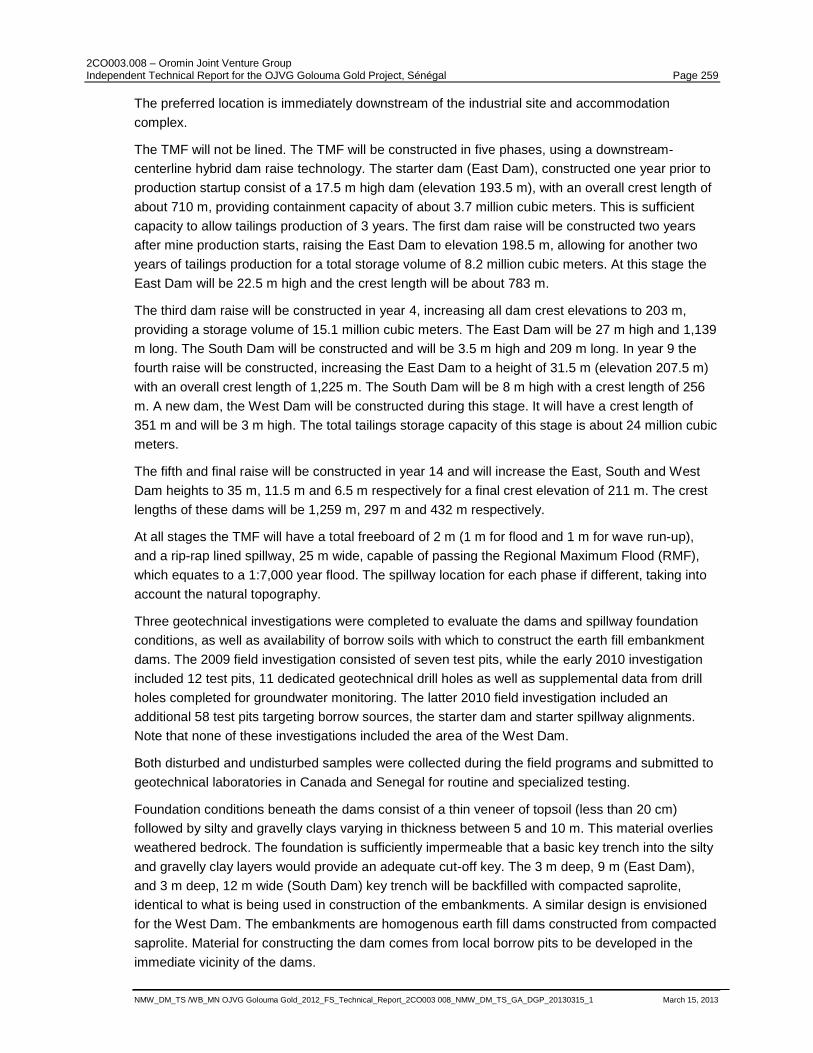
2CO003.008 – Oromin Joint Venture Group Independent Technical Report for the OJVG Golouma Gold Project, Sénégal Page 259
NMW_DM_TS /WB_MN OJVG Golouma Gold_2012_FS_Technical_Report_2CO003 008_NMW_DM_TS_GA_DGP_20130315_1 March 15, 2013
The preferred location is immediately downstream of the industrial site and accommodation
complex.
The TMF will not be lined. The TMF will be constructed in five phases, using a downstream-
centerline hybrid dam raise technology. The starter dam (East Dam), constructed one year prior to
production startup consist of a 17.5 m high dam (elevation 193.5 m), with an overall crest length of
about 710 m, providing containment capacity of about 3.7 million cubic meters. This is sufficient
capacity to allow tailings production of 3 years. The first dam raise will be constructed two years
after mine production starts, raising the East Dam to elevation 198.5 m, allowing for another two
years of tailings production for a total storage volume of 8.2 million cubic meters. At this stage the
East Dam will be 22.5 m high and the crest length will be about 783 m.
The third dam raise will be constructed in year 4, increasing all dam crest elevations to 203 m,
providing a storage volume of 15.1 million cubic meters. The East Dam will be 27 m high and 1,139
m long. The South Dam will be constructed and will be 3.5 m high and 209 m long. In year 9 the
fourth raise will be constructed, increasing the East Dam to a height of 31.5 m (elevation 207.5 m)
with an overall crest length of 1,225 m. The South Dam will be 8 m high with a crest length of 256
m. A new dam, the West Dam will be constructed during this stage. It will have a crest length of
351 m and will be 3 m high. The total tailings storage capacity of this stage is about 24 million cubic
meters.
The fifth and final raise will be constructed in year 14 and will increase the East, South and West
Dam heights to 35 m, 11.5 m and 6.5 m respectively for a final crest elevation of 211 m. The crest
lengths of these dams will be 1,259 m, 297 m and 432 m respectively.
At all stages the TMF will have a total freeboard of 2 m (1 m for flood and 1 m for wave run-up),
and a rip-rap lined spillway, 25 m wide, capable of passing the Regional Maximum Flood (RMF),
which equates to a 1:7,000 year flood. The spillway location for each phase if different, taking into
account the natural topography.
Three geotechnical investigations were completed to evaluate the dams and spillway foundation
conditions, as well as availability of borrow soils with which to construct the earth fill embankment
dams. The 2009 field investigation consisted of seven test pits, while the early 2010 investigation
included 12 test pits, 11 dedicated geotechnical drill holes as well as supplemental data from drill
holes completed for groundwater monitoring. The latter 2010 field investigation included an
additional 58 test pits targeting borrow sources, the starter dam and starter spillway alignments.
Note that none of these investigations included the area of the West Dam.
Both disturbed and undisturbed samples were collected during the field programs and submitted to
geotechnical laboratories in Canada and Senegal for routine and specialized testing.
Foundation conditions beneath the dams consist of a thin veneer of topsoil (less than 20 cm)
followed by silty and gravelly clays varying in thickness between 5 and 10 m. This material overlies
weathered bedrock. The foundation is sufficiently impermeable that a basic key trench into the silty
and gravelly clay layers would provide an adequate cut-off key. The 3 m deep, 9 m (East Dam),
and 3 m deep, 12 m wide (South Dam) key trench will be backfilled with compacted saprolite,
identical to what is being used in construction of the embankments. A similar design is envisioned
for the West Dam. The embankments are homogenous earth fill dams constructed from compacted
saprolite. Material for constructing the dam comes from local borrow pits to be developed in the
immediate vicinity of the dams.
2CO003.008 – Oromin Joint Venture Group Independent Technical Report for the OJVG Golouma Gold Project, Sénégal Page 260
NMW_DM_TS /WB_MN OJVG Golouma Gold_2012_FS_Technical_Report_2CO003 008_NMW_DM_TS_GA_DGP_20130315_1 March 15, 2013
The phreatic level in the homogenous fill embankments will be controlled using a chimney and
blanket drain spanning the entire length of each dam. Seepage collected from these drains will be
collected with toe drains directed to sumps. These drains will be increased as the dam raises are
constructed. Due to the geometry of the East Dam, the starter dam drain will be sacrificial. The
upstream slope of all dams will be clad with rip-rap for wave protection, and the downstream slopes
will be vegetated with erosion resistant vegetation. Upstream embankment slopes is 2H:1V,
downstream embankment slope is 2.5H:1V and the dam crest widths are all 9 m. This geometry
was verified though appropriate stability and seepage analysis.
Drain material will be an on-site generated crush product from quarry rock. This rock, as well as the
rip-rap will be sourced from a previously developed rock quarry, about 14 km from the site. A
geotextile filter fabric will be used as a filter separator between the saprolite soil used in the
embankment and the rip-rap and drain material.
The TMF costs were estimated using a first principles approach, assuming construction was done
by a Contractor. Quantities was based on actual material take-offs generated from a 3-D design of
the dam using the most up to date digital terrain model for the site.
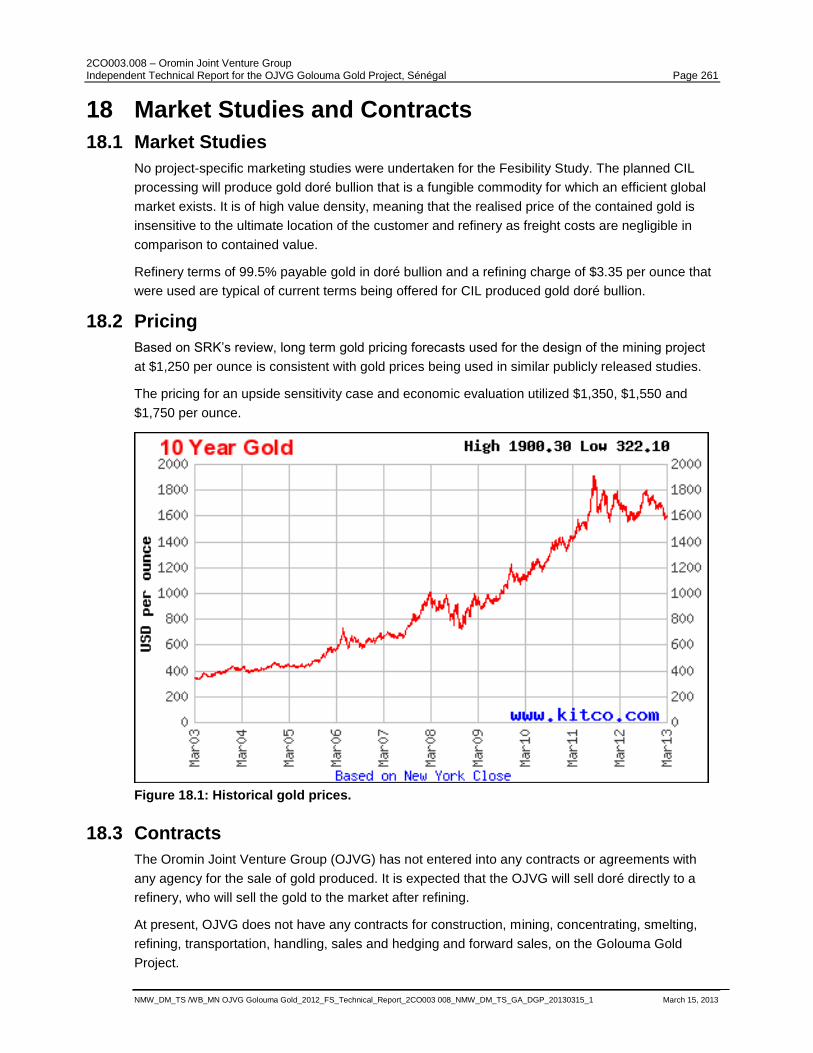
2CO003.008 – Oromin Joint Venture Group Independent Technical Report for the OJVG Golouma Gold Project, Sénégal Page 261
NMW_DM_TS /WB_MN OJVG Golouma Gold_2012_FS_Technical_Report_2CO003 008_NMW_DM_TS_GA_DGP_20130315_1 March 15, 2013
18 Market Studies and Contracts
18.1 Market Studies
No project-specific marketing studies were undertaken for the Fesibility Study. The planned CIL
processing will produce gold doré bullion that is a fungible commodity for which an efficient global
market exists. It is of high value density, meaning that the realised price of the contained gold is
insensitive to the ultimate location of the customer and refinery as freight costs are negligible in
comparison to contained value.
Refinery terms of 99.5% payable gold in doré bullion and a refining charge of $3.35 per ounce that
were used are typical of current terms being offered for CIL produced gold doré bullion.
18.2 Pricing
Based on SRK‟s review, long term gold pricing forecasts used for the design of the mining project
at $1,250 per ounce is consistent with gold prices being used in similar publicly released studies.
The pricing for an upside sensitivity case and economic evaluation utilized $1,350, $1,550 and
$1,750 per ounce.
Figure 18.1: Historical gold prices.
18.3 Contracts
The Oromin Joint Venture Group (OJVG) has not entered into any contracts or agreements with
any agency for the sale of gold produced. It is expected that the OJVG will sell doré directly to a
refinery, who will sell the gold to the market after refining.
At present, OJVG does not have any contracts for construction, mining, concentrating, smelting,
refining, transportation, handling, sales and hedging and forward sales, on the Golouma Gold
Project.
2CO003.008 – Oromin Joint Venture Group Independent Technical Report for the OJVG Golouma Gold Project, Sénégal Page 262
NMW_DM_TS /WB_MN OJVG Golouma Gold_2012_FS_Technical_Report_2CO003 008_NMW_DM_TS_GA_DGP_20130315_1 March 15, 2013
19 Environmental Studies, Permitting, and Social or Community Impact
19.1 Introduction
This section of the report includes information on the following:
The current environmental permitting and management plan status based on the project‟s
approved ESIA.
The proposed mine design changes, compliance requirements with the Senegalese
Environmental Law and additional permitting requirements.
A summary of the proposed changes and the requirements for permit updating.
19.2 Current Permitting Status
OJVG has received approval for its 2010 Feasibility Study project plan and ESIA through
Attestation of Conformance, as issued by the Government of Senegal on May 24th, 2012. The
ESIA was prepared to be Equator Principle compliant and to meet the requirements of the
International Finance Corporation (IFC). The project that was proposed and assessed was first
reviewed by the Senegalese Technical Review Committee in March 2011, and culminated with
blanket approval from all local stakeholders during the public audience held at the site in March
2012. OJVG submitted the final ESIA to the government in November 2011 and it passed all three
levels of review with only very minor amendments being required. The OJVG ESIA was accepted
with no requirement for the relocation of any local community housing and with only a minor
requirement for relocation of some farmers. The validity of the ESIA will diminish over time as local
development occurs and as local communities further develop their artisanal mining skills, adapt to
the presence of the existing mine operation and as they start the conversion to a more cash based
economy.
19.3 ESIA Baseline and Modelling Summary
The following information provides the Physical, Biological and Social Context from the ESIA.
19.3.1 Physical Context
The physical context for the proposed mine is described in Table 19.1 below.
2CO003.008 – Oromin Joint Venture Group Independent Technical Report for the OJVG Golouma Gold Project, Sénégal Page 263
NMW_DM_TS /WB_MN OJVG Golouma Gold_2012_FS_Technical_Report_2CO003 008_NMW_DM_TS_GA_DGP_20130315_1 March 15, 2013
Table 19.1: Physical environment context for the proposed mine.
Aspect Status Risk
Surface Water
The South East of Senegal is a water deficit region. The OJVG concession occurs partly in the Gambia and Senegal River catchments, with the Falémé River, a tributary of the Senegal River, as the nearest major river. Most of the OJVG deposits occur within the Falémé River catchment and all OJVG operations, as per the ESIA, are planned to be located within this catchment and will therefore have a low cumulative impact potential with existing mines.
Low
Water Reservoir
The proposed storage reservoir is fed by a 70 km2 watershed and designed to
store 9.3 Mm3 of water, sufficient to sustain operations in the event of a drought.
The full reservoir will not flood any homes or known sacred or archaeological sites
Low flood hazard risk rating in one village.
Surface Water Quality
Site river water quality monitoring during the short flow events shows a pH range of 7.02 to 7.90, and compliance with WHO drinking water guidelines for all parameters.
Low Risk
Pit Lakes
200 Year post closure pit lake water quality modelling shows reasonable water quality, mostly affected by evapo-concentration of compounds that have leached into the water from pit rock faces. The plan is to use the water as irrigation supply post closure.
Low risk provided pit water is used for irrigation after mine closure.
Ground Water
The regional hydrogeology is typical of tropical environments, with deep weathering profiles, varying from 10 m to 100 m depth across the site with multiple water tables. Local communities are entirely dependent on groundwater from village wells, generally sunk into the weathered saprolite layer and recharged by rainfall. Dewatering will cause drawdown of the groundwater in the local area around the mine operations, but modelling indicates it will not affect village wells.
Low Risk
Ground Water Quality
Baseline monitoring of existing village wells shows pH values from 6.38 to 11.60, although typically from pH 7 and 9. In some wells, on occasion, total metal concentrations exceed WHO drinking water guidelines for lead, manganese, and nickel; and naturally elevated concentrations of arsenic, barium, boron, chromium and molybdenum do occur. Nine out of ten village wells had at least one instance of unsatisfactory Total Coliform counts and two Sabodala village wells returned unsatisfactory counts for E. Coli.
Low risk. Requires monitoring and ongoing management.
Geochemistry
The deposits are generally characterised by heavily leached and oxidised material overlying a relatively unoxidised basement. The oxide layer is largely devoid of carbonate minerals and has minimal neutralising potential. The basement layer shows significant carbonate content capable of buffering acid produced during sulphide oxidation. Oxidation of sulphide minerals in the oxide layer indicates a low ARD potential based on ABA.
Only a small number of the waste rock samples have demonstrated to be Potentially Acid Forming (PAF). Testing suggests the possibility of long term leaching and sulphide oxidation resulting in localised release of ARD in some waste rock and potentially in tailings containing sulphide. Metal leaching could exist from waste rock in the Golouma South, Golouma West and the Masato deposits.
Low Risk.
Operational and post closure ARD issues are likely to be minimal from the tailings facility and the rock stockpiles, and negligible if they are appropriately capped.
Noise
The low development levels at the site result in very low noise levels. Modelling of noise for mine operations indicate that no communities will be affected by noise above compliance levels. Blasting noise will be heard in the broader area when it occurs.
Low Risk
Air Quality
Baseline air quality monitoring indicates dust in the form of PM10 and PM2.5 are well within compliance, and modelling suggests mining operations will only cause localised increases in dust and not affect local communities.
Air quality: NOX and SOX are all naturally low in the area as it is not well developed. Modelling of proposed OJVG mining operations shows mining is not expected to cause a non-compliance with Senegalese standards.
Low Risk
2CO003.008 – Oromin Joint Venture Group Independent Technical Report for the OJVG Golouma Gold Project, Sénégal Page 264
NMW_DM_TS /WB_MN OJVG Golouma Gold_2012_FS_Technical_Report_2CO003 008_NMW_DM_TS_GA_DGP_20130315_1 March 15, 2013
19.3.2 Biological Context
An overview of the biological context on the proposed mine site and surroundings is provided in
Table 19.2 below.
Table 19.2: Biological context for the proposed mine.
Group Status Risk
Amphibians None of the observed amphibians are threatened. Low risk
No significant conservation challenge. Year-round surface water availability is likely to benefit diversity.
Reptiles Four reptiles are protected under CITES. No significant conservation challenge.
Bats No species on the IUCN Red List. One species regarded as near threatened. Bats are very habitat dependent.
Low Risk: Mining will not lead to notable loss of habitat. Year-round surface water availability is likely to benefit diversity.
Mammals Fifty five terrestrial mammal species, but no rare or endangered animals identified on the concession, though chimpanzees, wild dogs and lions occur in the surrounds.
All larger mammals are rare in the concession area. Year-round surface water availability is likely to benefit species diversity and population numbers.
Insects None of the species identified on the site are on the IUCN red list.
Water and forest management at the mine are likely to benefit insect populations.
Birds 219 bird species belonging to 65 families occur on the site. Only the Bateleur eagle is classified as Near Threatened by the IUCN.
Operations on site are unlikely to affect the Bateleur due to their large home range. Permanent surface water is likely to increase diversity and population sizes.
Fish No rare or endangered fish encountered. Mercury is bio-accumulating in fish.
Permanent surface water is likely to increase species diversity and population sizes and may open the opportunity for aquaculture.
Vegetation No rare, threatened or endangered species were identified. Some trees are highly valued for wood and forest products and are heavily harvested. Forest is generally degraded and grasslands frequently burnt.
Forest management and the OJVG rehabilitation nursery are likely to benefit local communities and forest conservation.
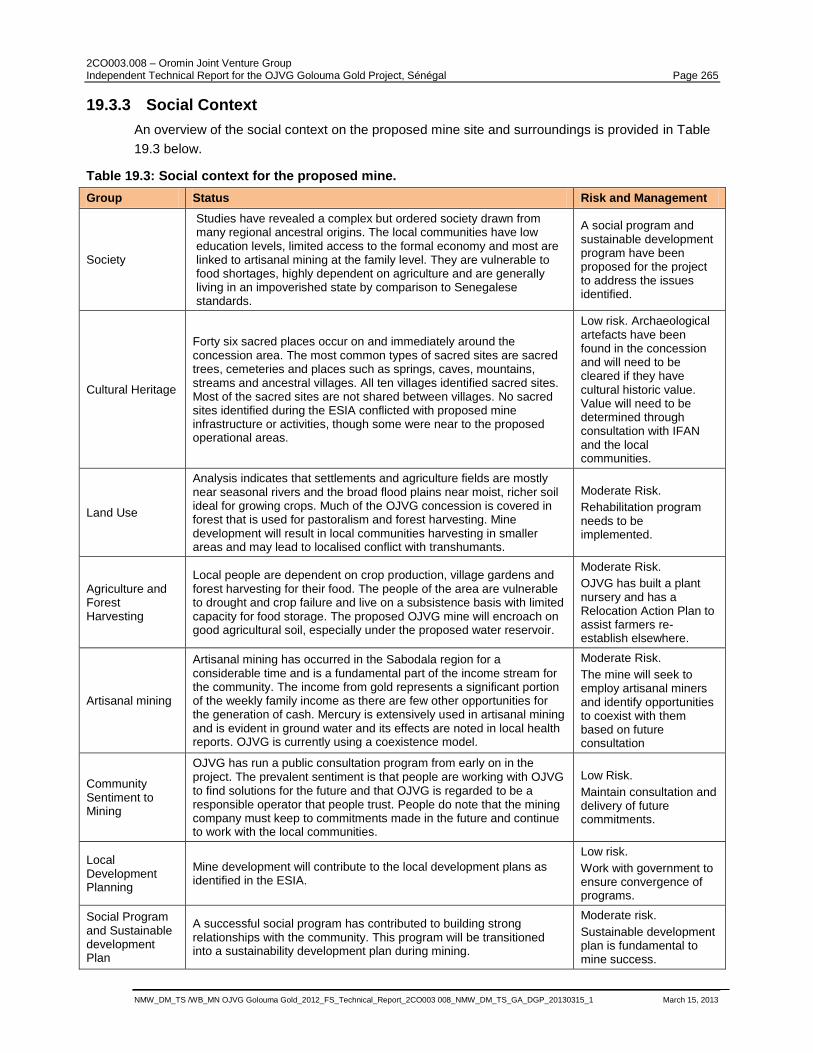
2CO003.008 – Oromin Joint Venture Group Independent Technical Report for the OJVG Golouma Gold Project, Sénégal Page 265
NMW_DM_TS /WB_MN OJVG Golouma Gold_2012_FS_Technical_Report_2CO003 008_NMW_DM_TS_GA_DGP_20130315_1 March 15, 2013
19.3.3 Social Context
An overview of the social context on the proposed mine site and surroundings is provided in Table
19.3 below.
Table 19.3: Social context for the proposed mine.
Group Status Risk and Management
Society
Studies have revealed a complex but ordered society drawn from many regional ancestral origins. The local communities have low education levels, limited access to the formal economy and most are linked to artisanal mining at the family level. They are vulnerable to food shortages, highly dependent on agriculture and are generally living in an impoverished state by comparison to Senegalese standards.
A social program and sustainable development program have been proposed for the project to address the issues identified.
Cultural Heritage
Forty six sacred places occur on and immediately around the concession area. The most common types of sacred sites are sacred trees, cemeteries and places such as springs, caves, mountains, streams and ancestral villages. All ten villages identified sacred sites. Most of the sacred sites are not shared between villages. No sacred sites identified during the ESIA conflicted with proposed mine infrastructure or activities, though some were near to the proposed operational areas.
Low risk. Archaeological artefacts have been found in the concession and will need to be cleared if they have cultural historic value. Value will need to be determined through consultation with IFAN and the local communities.
Land Use
Analysis indicates that settlements and agriculture fields are mostly near seasonal rivers and the broad flood plains near moist, richer soil ideal for growing crops. Much of the OJVG concession is covered in forest that is used for pastoralism and forest harvesting. Mine development will result in local communities harvesting in smaller areas and may lead to localised conflict with transhumants.
Moderate Risk.
Rehabilitation program needs to be implemented.
Agriculture and Forest Harvesting
Local people are dependent on crop production, village gardens and forest harvesting for their food. The people of the area are vulnerable to drought and crop failure and live on a subsistence basis with limited capacity for food storage. The proposed OJVG mine will encroach on good agricultural soil, especially under the proposed water reservoir.
Moderate Risk.
OJVG has built a plant nursery and has a Relocation Action Plan to assist farmers re-establish elsewhere.
Artisanal mining
Artisanal mining has occurred in the Sabodala region for a considerable time and is a fundamental part of the income stream for the community. The income from gold represents a significant portion of the weekly family income as there are few other opportunities for the generation of cash. Mercury is extensively used in artisanal mining and is evident in ground water and its effects are noted in local health reports. OJVG is currently using a coexistence model.
Moderate Risk.
The mine will seek to employ artisanal miners and identify opportunities to coexist with them based on future consultation
Community Sentiment to Mining
OJVG has run a public consultation program from early on in the project. The prevalent sentiment is that people are working with OJVG to find solutions for the future and that OJVG is regarded to be a responsible operator that people trust. People do note that the mining company must keep to commitments made in the future and continue to work with the local communities.
Low Risk.
Maintain consultation and delivery of future commitments.
Local Development Planning
Mine development will contribute to the local development plans as identified in the ESIA.
Low risk.
Work with government to ensure convergence of programs.
Social Program and Sustainable development Plan
A successful social program has contributed to building strong relationships with the community. This program will be transitioned into a sustainability development plan during mining.
Moderate risk.
Sustainable development plan is fundamental to mine success.
2CO003.008 – Oromin Joint Venture Group Independent Technical Report for the OJVG Golouma Gold Project, Sénégal Page 266
NMW_DM_TS /WB_MN OJVG Golouma Gold_2012_FS_Technical_Report_2CO003 008_NMW_DM_TS_GA_DGP_20130315_1 March 15, 2013
19.4 Approved ESIA Management Plan
Senegalese Law requires a costed management plan to be prepared as part of the ESIA. This plan
was approved and will roughly cost one million dollars per year and covers all physical,
environmental, and social aspects except for relocation cost, which will be determined by
consultation and negotiation. The cost also excludes the Social program which will be transitioned
into a Sustainable Development Program once the mine is operational and profitable. OJVG has
prepared a Relocation Action Plan to guide the relocation program and to use as a foundation for
relocation consultation and the Sustainable Development Plan. The main impacts that need
mitigation or management to improve the level of benefit obtained from the proposed mining
operation are shown in Table 19.4. Detailed plans in accordance with Senegalese requirements
were presented as part of the ESIA.
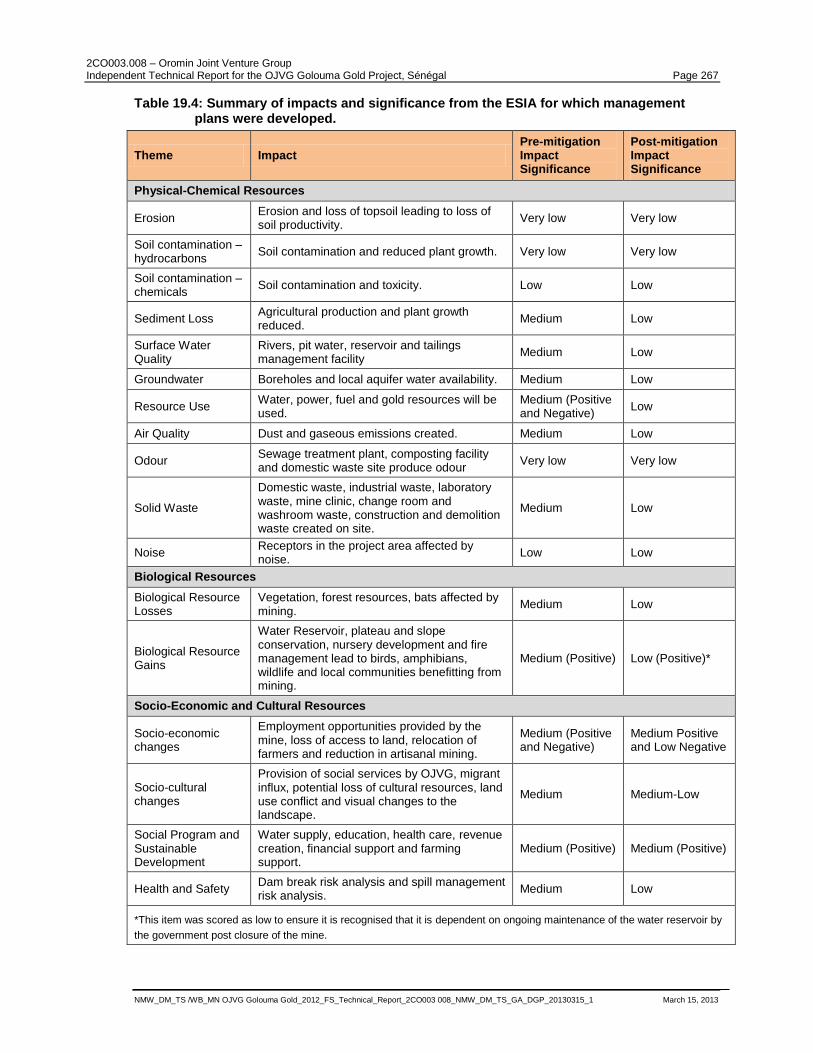
2CO003.008 – Oromin Joint Venture Group Independent Technical Report for the OJVG Golouma Gold Project, Sénégal Page 267
NMW_DM_TS /WB_MN OJVG Golouma Gold_2012_FS_Technical_Report_2CO003 008_NMW_DM_TS_GA_DGP_20130315_1 March 15, 2013
Table 19.4: Summary of impacts and significance from the ESIA for which management plans were developed.
Theme Impact Pre-mitigation Impact Significance
Post-mitigation Impact Significance
Physical-Chemical Resources
Erosion Erosion and loss of topsoil leading to loss of soil productivity.
Very low Very low
Soil contamination – hydrocarbons
Soil contamination and reduced plant growth. Very low Very low
Soil contamination – chemicals
Soil contamination and toxicity. Low Low
Sediment Loss Agricultural production and plant growth reduced.
Medium Low
Surface Water Quality
Rivers, pit water, reservoir and tailings management facility
Medium Low
Groundwater Boreholes and local aquifer water availability. Medium Low
Resource Use Water, power, fuel and gold resources will be used.
Medium (Positive and Negative)
Low
Air Quality Dust and gaseous emissions created. Medium Low
Odour Sewage treatment plant, composting facility and domestic waste site produce odour
Very low Very low
Solid Waste
Domestic waste, industrial waste, laboratory waste, mine clinic, change room and washroom waste, construction and demolition waste created on site.
Medium Low
Noise Receptors in the project area affected by noise.
Low Low
Biological Resources
Biological Resource Losses
Vegetation, forest resources, bats affected by mining.
Medium Low
Biological Resource Gains
Water Reservoir, plateau and slope conservation, nursery development and fire management lead to birds, amphibians, wildlife and local communities benefitting from mining.
Medium (Positive) Low (Positive)*
Socio-Economic and Cultural Resources
Socio-economic changes
Employment opportunities provided by the mine, loss of access to land, relocation of farmers and reduction in artisanal mining.
Medium (Positive and Negative)
Medium Positive and Low Negative
Socio-cultural changes
Provision of social services by OJVG, migrant influx, potential loss of cultural resources, land use conflict and visual changes to the landscape.
Medium Medium-Low
Social Program and Sustainable Development
Water supply, education, health care, revenue creation, financial support and farming support.
Medium (Positive) Medium (Positive)
Health and Safety Dam break risk analysis and spill management risk analysis.
Medium Low
*This item was scored as low to ensure it is recognised that it is dependent on ongoing maintenance of the water reservoir by
the government post closure of the mine.
2CO003.008 – Oromin Joint Venture Group Independent Technical Report for the OJVG Golouma Gold Project, Sénégal Page 268
NMW_DM_TS /WB_MN OJVG Golouma Gold_2012_FS_Technical_Report_2CO003 008_NMW_DM_TS_GA_DGP_20130315_1 March 15, 2013
19.5 Current Monitoring and Management Activities
OJVG is currently maintaining the site in a low level operational state. Activities that are being
undertaken during this time include the maintenance of:
The base camp and support infrastructure.
Low level communications with the communities, community leaders, local government and
central government.
Baseline water monitoring and operation of the meteorological station.
The moratorium area, which limits local development and ensures it can only be of a temporary
nature.
The plant nursery that was developed to support ongoing rehabilitation efforts and to
spearhead the sustainable development plans and agricultural relocation efforts.
19.6 Proposed Design Changes
19.6.1 Pit, Waste Pile and Tailings Management Facility Extensions
OJVG is proposing an updated mine plan and feasibility study in order to capture the larger
resource. The proposed changes have resulted in the following amendments to the mine plan that
was approved in the ESIA:
Golouma West and South minor pit extensions and a small pit to the west of the Golouma
West pit.
Kerekounda minor pit extension.
Masato pit extension.
Masato waste rock storage pile extension.
Tailings Management Facility minor extension and height increase.
Possible relocation of the proposed site for the camp accommodation buildings.
The changes to the proposed mine design are shown in Figure 20.1.
There are no changes being proposed to the processing plant site, the water reservoir, site roads,
and the number of deposits being developed.
19.6.2 ESIA Amendment Process
Under the current Senegalese Environmental legislation, there is no formal mechanism for
amending a Certificate of Conformance once issued for a particular ESIA for a mine design. There
is, however, a “Good Practice Guideline” that requires the proponent to submit in writing a
description of the proposed changes to DEEC, the Government group responsible for evaluating
ESIAs. DEEC then determines from the written submission the course of action they require. If the
changes are significant and fall outside of the baseline and assessment in the ESIA it will likely
require further investigation and assessment. Consultation with DEEC prior to the submission will
allow it to be focussed on their needs and support quicker approval of the changes.
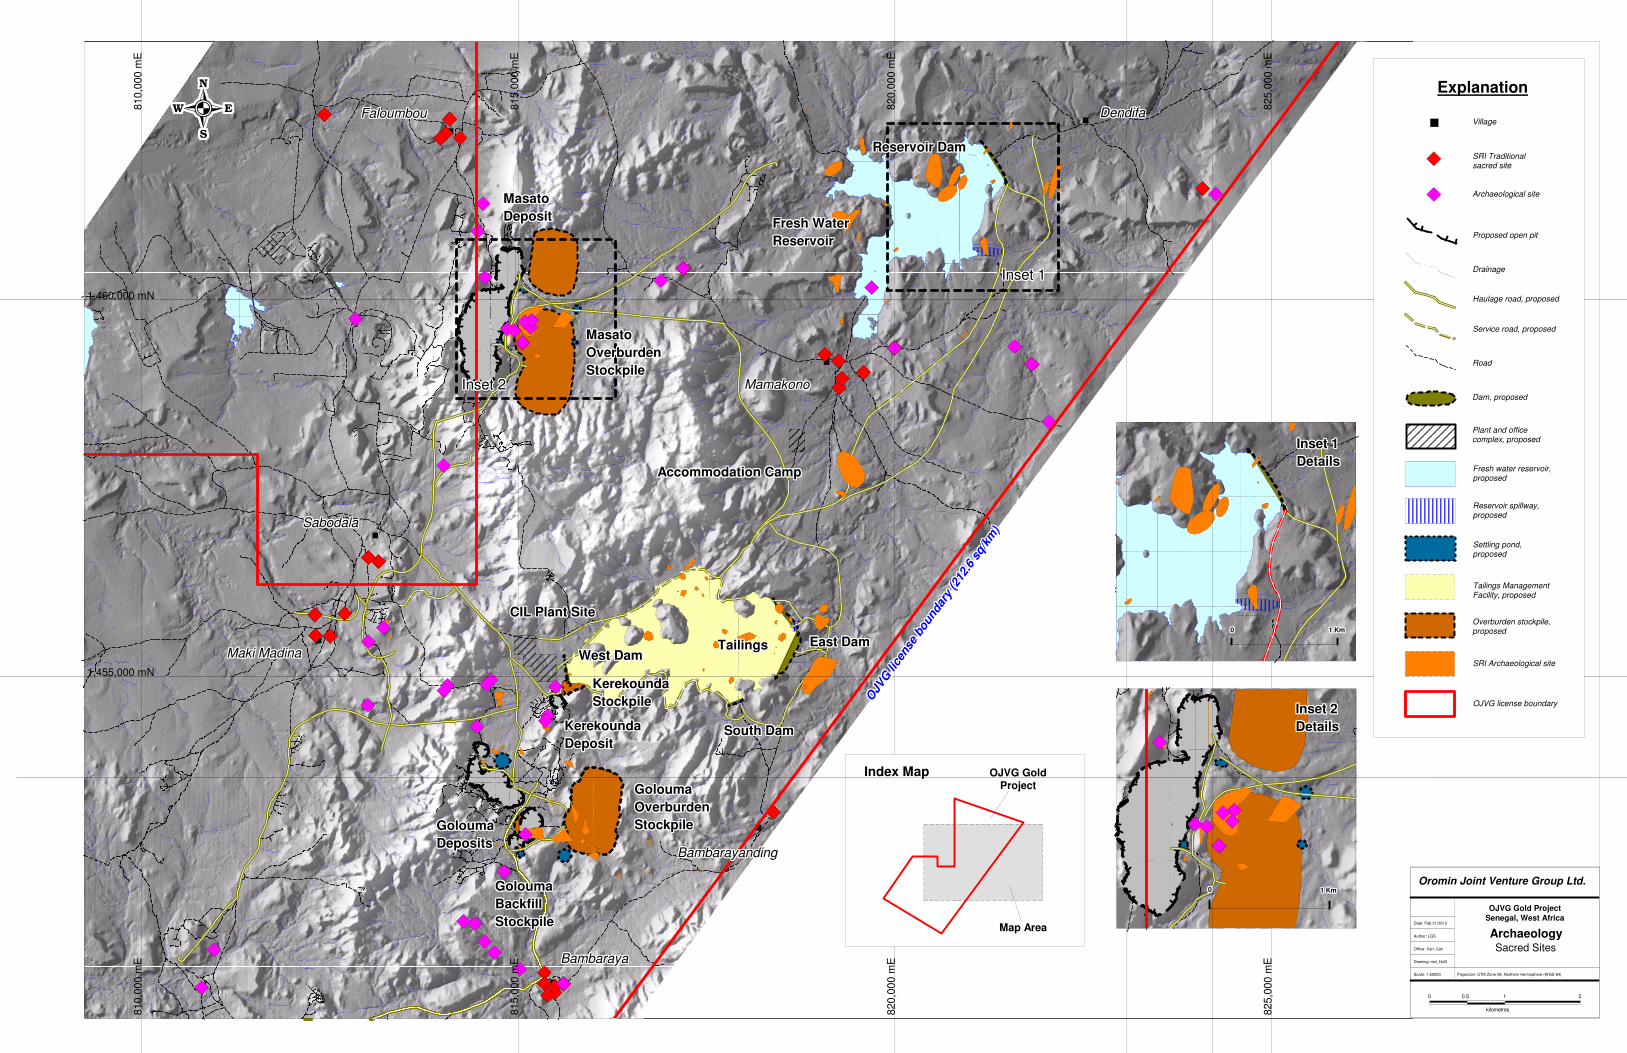
815,0
00 m
E
820,0
00 m
E820,0
00 m
E
825,0
00 m
E825,0
00 m
E
815,0
00 m
E
810,0
00 m
E810,0
00 m
E
1,455,000 mN
1,460,000 mN
OJV
G li
cense
boundar
y (2
12.6
sq/k
m)
OJV
G li
cense
boundar
y (2
12.6
sq/k
m)
OJV
G li
cense
boundar
y (2
12.6
sq/k
m)
OJV
G li
cense
boundar
y (2
12.6
sq/k
m)
OJV
G li
cense
boundar
y (2
12.6
sq/k
m)
OJV
G li
cense
boundar
y (2
12.6
sq/k
m)
OJV
G li
cense
boundar
y (2
12.6
sq/k
m)
OJV
G li
cense
boundar
y (2
12.6
sq/k
m)
OJV
G li
cense
boundar
y (2
12.6
sq/k
m)
DendifaDendifaDendifaDendifaDendifaDendifaDendifaDendifaDendifa
BambarayandingBambarayandingBambarayandingBambarayandingBambarayandingBambarayandingBambarayandingBambarayandingBambarayanding
MamakonoMamakonoMamakonoMamakonoMamakonoMamakonoMamakonoMamakonoMamakono
BambarayaBambarayaBambarayaBambarayaBambarayaBambarayaBambarayaBambarayaBambaraya
Maki MadinaMaki MadinaMaki MadinaMaki MadinaMaki MadinaMaki MadinaMaki MadinaMaki MadinaMaki Madina
FaloumbouFaloumbouFaloumbouFaloumbouFaloumbouFaloumbouFaloumbouFaloumbouFaloumbou
SabodalaSabodalaSabodalaSabodalaSabodalaSabodalaSabodalaSabodalaSabodala
Reservoir DamReservoir DamReservoir DamReservoir DamReservoir DamReservoir DamReservoir DamReservoir DamReservoir Dam
Fresh WaterFresh WaterFresh WaterFresh WaterFresh WaterFresh WaterFresh WaterFresh WaterFresh Water
ReservoirReservoirReservoirReservoirReservoirReservoirReservoirReservoirReservoir
TailingsTailingsTailingsTailingsTailingsTailingsTailingsTailingsTailings East DamEast DamEast DamEast DamEast DamEast DamEast DamEast DamEast Dam
South DamSouth DamSouth DamSouth DamSouth DamSouth DamSouth DamSouth DamSouth Dam
Accommodation CampAccommodation CampAccommodation CampAccommodation CampAccommodation CampAccommodation CampAccommodation CampAccommodation CampAccommodation Camp
CIL Plant SiteCIL Plant SiteCIL Plant SiteCIL Plant SiteCIL Plant SiteCIL Plant SiteCIL Plant SiteCIL Plant SiteCIL Plant Site
West DamWest DamWest DamWest DamWest DamWest DamWest DamWest DamWest Dam
KerekoundaKerekoundaKerekoundaKerekoundaKerekoundaKerekoundaKerekoundaKerekoundaKerekounda
StockpileStockpileStockpileStockpileStockpileStockpileStockpileStockpileStockpile
GoloumaGoloumaGoloumaGoloumaGoloumaGoloumaGoloumaGoloumaGolouma
OverburdenOverburdenOverburdenOverburdenOverburdenOverburdenOverburdenOverburdenOverburden
StockpileStockpileStockpileStockpileStockpileStockpileStockpileStockpileStockpile
MasatoMasatoMasatoMasatoMasatoMasatoMasatoMasatoMasato
OverburdenOverburdenOverburdenOverburdenOverburdenOverburdenOverburdenOverburdenOverburden
StockpileStockpileStockpileStockpileStockpileStockpileStockpileStockpileStockpile
GoloumaGoloumaGoloumaGoloumaGoloumaGoloumaGoloumaGoloumaGolouma
BackfillBackfillBackfillBackfillBackfillBackfillBackfillBackfillBackfill
StockpileStockpileStockpileStockpileStockpileStockpileStockpileStockpileStockpile
Inset 1Inset 1Inset 1Inset 1Inset 1Inset 1Inset 1Inset 1Inset 1
Inset 2Inset 2Inset 2Inset 2Inset 2Inset 2Inset 2Inset 2Inset 2
MasatoMasatoMasatoMasatoMasatoMasatoMasatoMasatoMasato
DepositDepositDepositDepositDepositDepositDepositDepositDeposit
GoloumaGoloumaGoloumaGoloumaGoloumaGoloumaGoloumaGoloumaGolouma
DepositsDepositsDepositsDepositsDepositsDepositsDepositsDepositsDeposits
KerekoundaKerekoundaKerekoundaKerekoundaKerekoundaKerekoundaKerekoundaKerekoundaKerekounda
DepositDepositDepositDepositDepositDepositDepositDepositDeposit
OJVG Gold Project
Senegal, West Africa
Archaeology
1
kilometres
2
Sacred Sites
Oromin Joint Venture Group Ltd.
0.5
Date: Feb 21/2013
Office: Van, Can
0
Scale: 1:50000 Projection: UTM Zone 28, Northern Hemisphere (WGS 84)
Author: LGS
Drawing: md_HuG
SRI Archaeological site
OJVG license boundary
Tailings ManagementFacility, proposed
Overburden stockpile,proposed
Archaeological site
SRI Traditionalsacred site
Drainage
Haulage road, proposed
Service road, proposed
Proposed open pit
Village
Explanation
Fresh water reservoir,proposed
Plant and officecomplex, proposed
Dam, proposed
Reservoir spillway,proposed
Settling pond,proposed
Road
Map Area
OJVG GoldProject
Index Map
1 Km1 Km1 Km1 Km1 Km1 Km1 Km1 Km1 Km000000000
1 Km1 Km1 Km1 Km1 Km1 Km1 Km1 Km1 Km000000000
Inset 1Inset 1Inset 1Inset 1Inset 1Inset 1Inset 1Inset 1Inset 1
DetailsDetailsDetailsDetailsDetailsDetailsDetailsDetailsDetails
Inset 2Inset 2Inset 2Inset 2Inset 2Inset 2Inset 2Inset 2Inset 2
DetailsDetailsDetailsDetailsDetailsDetailsDetailsDetailsDetails
2CO003.008 – Oromin Joint Venture Group Independent Technical Report for the OJVG Golouma Gold Project, Sénégal Page 270
NMW_DM_TS /WB_MN OJVG Golouma Gold_2012_FS_Technical_Report_2CO003 008_NMW_DM_TS_GA_DGP_20130315_1 March 15, 2013
19.6.3 Additional Permitting and Approval Requirements
OJVG is proposing to extend the foot print of various mine components while maintaining the
original mine development plan and process plant. Under this scenario, and considering the low
level of risk and impact identified in the original ESIA, a new ESIA will most likely not be required;
however, management and monitoring plans will need to be updated. To accommodate the design
changes the following work is anticipated to be needed for the written submission to DEEC:
Detailed description of proposed changes.
Update of seepage collection and surface and ground water management plans associated
with the proposed changes.
A possible update of the TMF water quality predictions during and post operations.
Reports on ongoing water quality monitoring.
Risk assessment of rock stockpiles, TMF failure, operational and post closure water quality
management and monitoring and final closure of structures.
Consultation with government, local community leaders, communities and IFAN regarding the
status of the proposed changes and ensuring plans acceptable to the local community are
submitted to DEEC.
Through consultation with IFAN and the community, determine the best course of action for the
recovery of the Masato archaeological site or the relocation of the rock storage pile to an area
decided on by the community. More detail is provided below.
Update the farming and land use of the area, and identify any additional farmers that need to
be relocated due to direct loss of land or due to the increased size of the safety area
downstream of the TMF.
Update the rehabilitation and closure plans.
In particular, at Masato, the waste rock stockpile proposed in the ESIA will be increased in size and
a second pile is proposed to be constructed that was not covered in the original ESIA (Figure 1).
The new and extended stockpiles will encroach on a culturally important site. These proposed
changes will require consultation with the communities, IFAN (the body responsible for cultural
heritage preservation), and the government.
The impacted cultural heritage site was identified in the original ESIA and is important to the
structure of the local communities. In the original mine design, efforts were made to avoid this
culturally important area. Under the proposed new mine plan, encroachment occurs and a
mechanism will need to be developed to capture the cultural heritage associated with that
particular site. There may also be an opportunity to modify the dump footprint based on
consultations, which could avoid the need for archaeological recovery of the site. OJVG has
established good relations with the communities, government and IFAN and it is anticipated that
the consultation will be effective in updating the solution already proposed and approved in the
original ESIA.
19.7 Summary Conclusions
Senegal does not have a formal mechanism for amending the Certificate of Conformance, but a
new ESIA will most likely not be required for the proposed amendments to the mine plan. OJVG
2CO003.008 – Oromin Joint Venture Group Independent Technical Report for the OJVG Golouma Gold Project, Sénégal Page 271
NMW_DM_TS /WB_MN OJVG Golouma Gold_2012_FS_Technical_Report_2CO003 008_NMW_DM_TS_GA_DGP_20130315_1 March 15, 2013
has a comprehensive and approved ESIA for the site that was based on extensive baseline work,
assessment and development of thorough management and monitoring plans. A written
submission to DEEC detailing the proposed changes along with an updated management and
monitoring plan, and risk assessment for the various amended mine components will be required.
Special attention and action will be required for the site with cultural heritage value that will be
encroached upon by the new and extended Masato waste rock stockpiles. The formal written
notification to DEEC can be prepared with ease, based on the thoroughness of the ESIA. The good
relations that exist with both the communities and government suggest a solution to the
encroachment on the site of cultural importance is likely to be found through consultation. The
proposed mine plan amendments will require approval, which should be easily achievable
considering the limited extension of and minor additions to the mine plan.
OJVG intends to continue exploration efforts on the property. Any new deposits ultimately brought
into production will be required to undergo similar amendments.
2CO003.008 – Oromin Joint Venture Group Independent Technical Report for the OJVG Golouma Gold Project, Sénégal Page 272
NMW_DM_TS /WB_MN OJVG Golouma Gold_2012_FS_Technical_Report_2CO003 008_NMW_DM_TS_GA_DGP_20130315_1 March 15, 2013
20 Capital and Operating Costs
20.1 Open Pit Mine Capital Expenses (CAPEX)
20.1.1 Open Pit Mobile Equipment
The capital cost estimate for the open pit operation is based on the scheduled plant processing
throughput rates (based on soft/hard ore material ratios) as well as comparing to similar sized open
pit gold operations (maximum processing throughputs of 1.7 mtpa of hard ore and 2.7 mtpa of soft
ore). The open pit mining activities for the OJVG pits were assumed to be undertaken by an owner-
operated fleet as the basis for this study with the fleet having an estimated maximum capacity of
50,000 tpd total material, which will be sufficient for the proposed LOM plan.
The open pit equipment capital costs required to achieve the target processing rate is summarized
in Table 20.1 below.
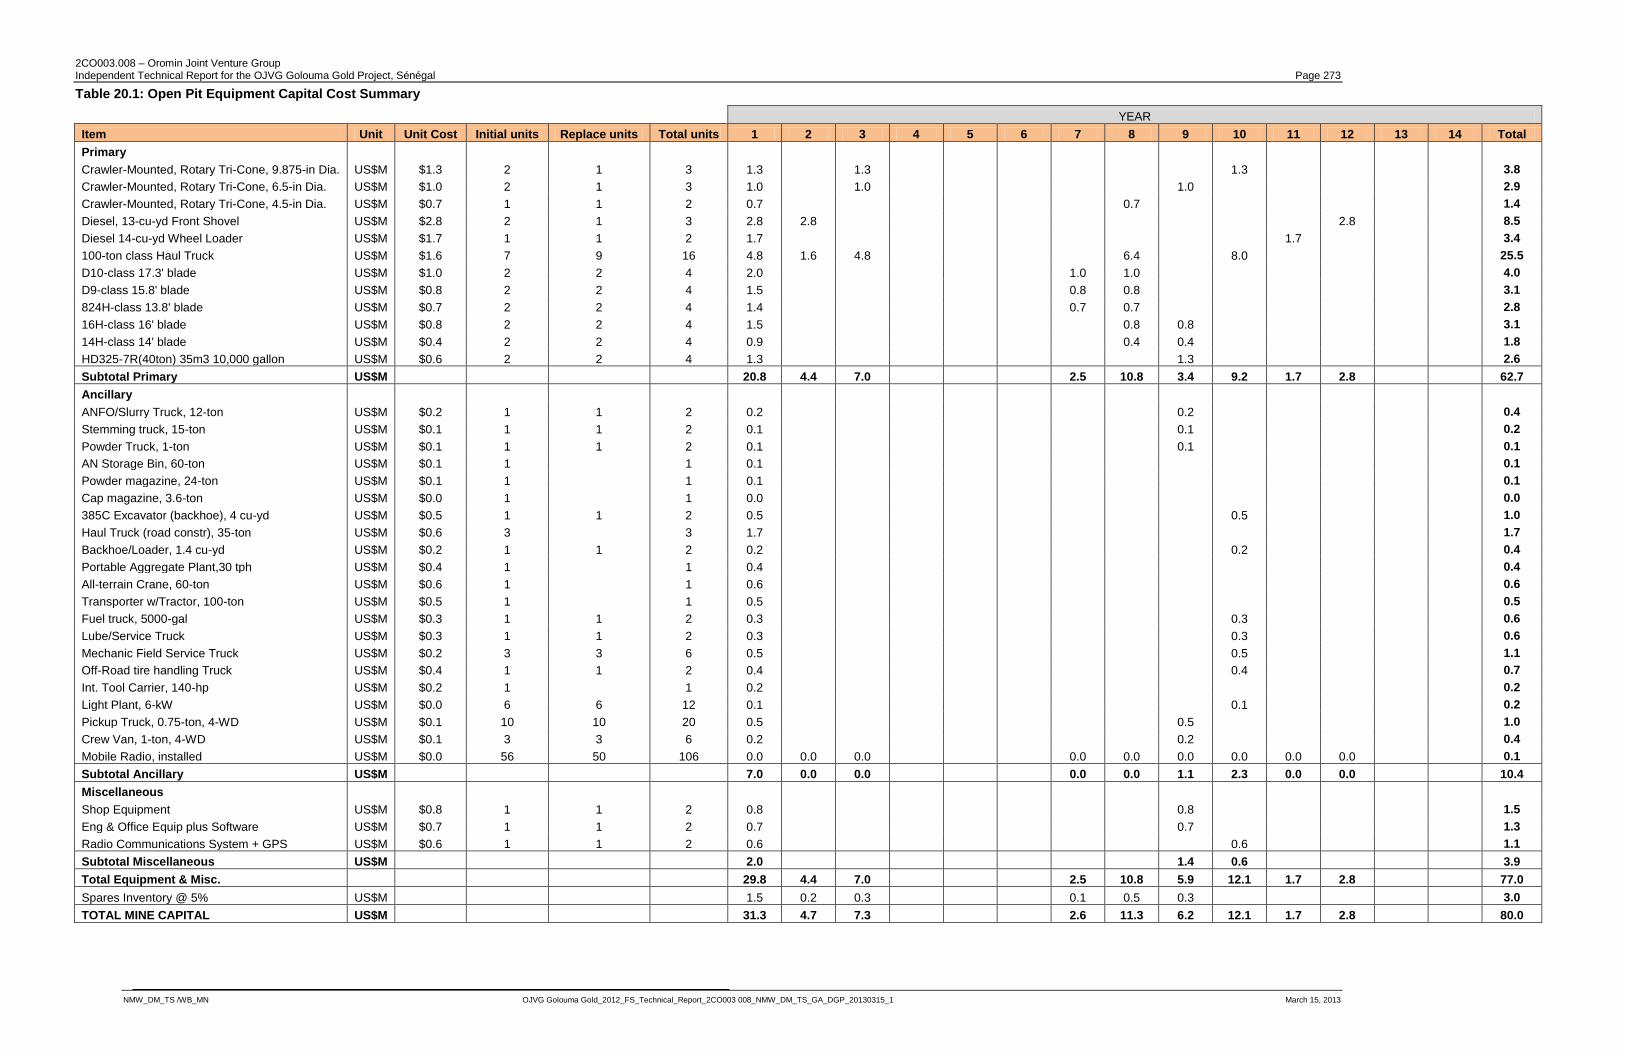
2CO003.008 – Oromin Joint Venture Group Independent Technical Report for the OJVG Golouma Gold Project, Sénégal Page 273
NMW_DM_TS /WB_MN OJVG Golouma Gold_2012_FS_Technical_Report_2CO003 008_NMW_DM_TS_GA_DGP_20130315_1 March 15, 2013
Table 20.1: Open Pit Equipment Capital Cost Summary
YEAR
Item Unit Unit Cost Initial units Replace units Total units 1 2 3 4 5 6 7 8 9 10 11 12 13 14 Total
Primary
Crawler-Mounted, Rotary Tri-Cone, 9.875-in Dia. US$M $1.3 2 1 3 1.3 1.3 1.3 3.8
Crawler-Mounted, Rotary Tri-Cone, 6.5-in Dia. US$M $1.0 2 1 3 1.0 1.0 1.0 2.9
Crawler-Mounted, Rotary Tri-Cone, 4.5-in Dia. US$M $0.7 1 1 2 0.7 0.7 1.4
Diesel, 13-cu-yd Front Shovel US$M $2.8 2 1 3 2.8 2.8 2.8 8.5
Diesel 14-cu-yd Wheel Loader US$M $1.7 1 1 2 1.7 1.7 3.4
100-ton class Haul Truck US$M $1.6 7 9 16 4.8 1.6 4.8 6.4 8.0 25.5
D10-class 17.3' blade US$M $1.0 2 2 4 2.0 1.0 1.0 4.0
D9-class 15.8' blade US$M $0.8 2 2 4 1.5 0.8 0.8 3.1
824H-class 13.8' blade US$M $0.7 2 2 4 1.4 0.7 0.7 2.8
16H-class 16' blade US$M $0.8 2 2 4 1.5 0.8 0.8 3.1
14H-class 14' blade US$M $0.4 2 2 4 0.9 0.4 0.4 1.8
HD325-7R(40ton) 35m3 10,000 gallon US$M $0.6 2 2 4 1.3 1.3 2.6
Subtotal Primary US$M 20.8 4.4 7.0 2.5 10.8 3.4 9.2 1.7 2.8 62.7
Ancillary
ANFO/Slurry Truck, 12-ton US$M $0.2 1 1 2 0.2 0.2 0.4
Stemming truck, 15-ton US$M $0.1 1 1 2 0.1 0.1 0.2
Powder Truck, 1-ton US$M $0.1 1 1 2 0.1 0.1 0.1
AN Storage Bin, 60-ton US$M $0.1 1 1 0.1 0.1
Powder magazine, 24-ton US$M $0.1 1 1 0.1 0.1
Cap magazine, 3.6-ton US$M $0.0 1 1 0.0 0.0
385C Excavator (backhoe), 4 cu-yd US$M $0.5 1 1 2 0.5 0.5 1.0
Haul Truck (road constr), 35-ton US$M $0.6 3 3 1.7 1.7
Backhoe/Loader, 1.4 cu-yd US$M $0.2 1 1 2 0.2 0.2 0.4
Portable Aggregate Plant,30 tph US$M $0.4 1 1 0.4 0.4
All-terrain Crane, 60-ton US$M $0.6 1 1 0.6 0.6
Transporter w/Tractor, 100-ton US$M $0.5 1 1 0.5 0.5
Fuel truck, 5000-gal US$M $0.3 1 1 2 0.3 0.3 0.6
Lube/Service Truck US$M $0.3 1 1 2 0.3 0.3 0.6
Mechanic Field Service Truck US$M $0.2 3 3 6 0.5 0.5 1.1
Off-Road tire handling Truck US$M $0.4 1 1 2 0.4 0.4 0.7
Int. Tool Carrier, 140-hp US$M $0.2 1 1 0.2 0.2
Light Plant, 6-kW US$M $0.0 6 6 12 0.1 0.1 0.2
Pickup Truck, 0.75-ton, 4-WD US$M $0.1 10 10 20 0.5 0.5 1.0
Crew Van, 1-ton, 4-WD US$M $0.1 3 3 6 0.2 0.2 0.4
Mobile Radio, installed US$M $0.0 56 50 106 0.0 0.0 0.0 0.0 0.0 0.0 0.0 0.0 0.0 0.1
Subtotal Ancillary US$M 7.0 0.0 0.0 0.0 0.0 1.1 2.3 0.0 0.0 10.4
Miscellaneous
Shop Equipment US$M $0.8 1 1 2 0.8 0.8 1.5
Eng & Office Equip plus Software US$M $0.7 1 1 2 0.7 0.7 1.3
Radio Communications System + GPS US$M $0.6 1 1 2 0.6 0.6 1.1
Subtotal Miscellaneous US$M 2.0 1.4 0.6 3.9
Total Equipment & Misc. 29.8 4.4 7.0 2.5 10.8 5.9 12.1 1.7 2.8 77.0
Spares Inventory @ 5% US$M 1.5 0.2 0.3 0.1 0.5 0.3 3.0
TOTAL MINE CAPITAL US$M 31.3 4.7 7.3 2.6 11.3 6.2 12.1 1.7 2.8 80.0
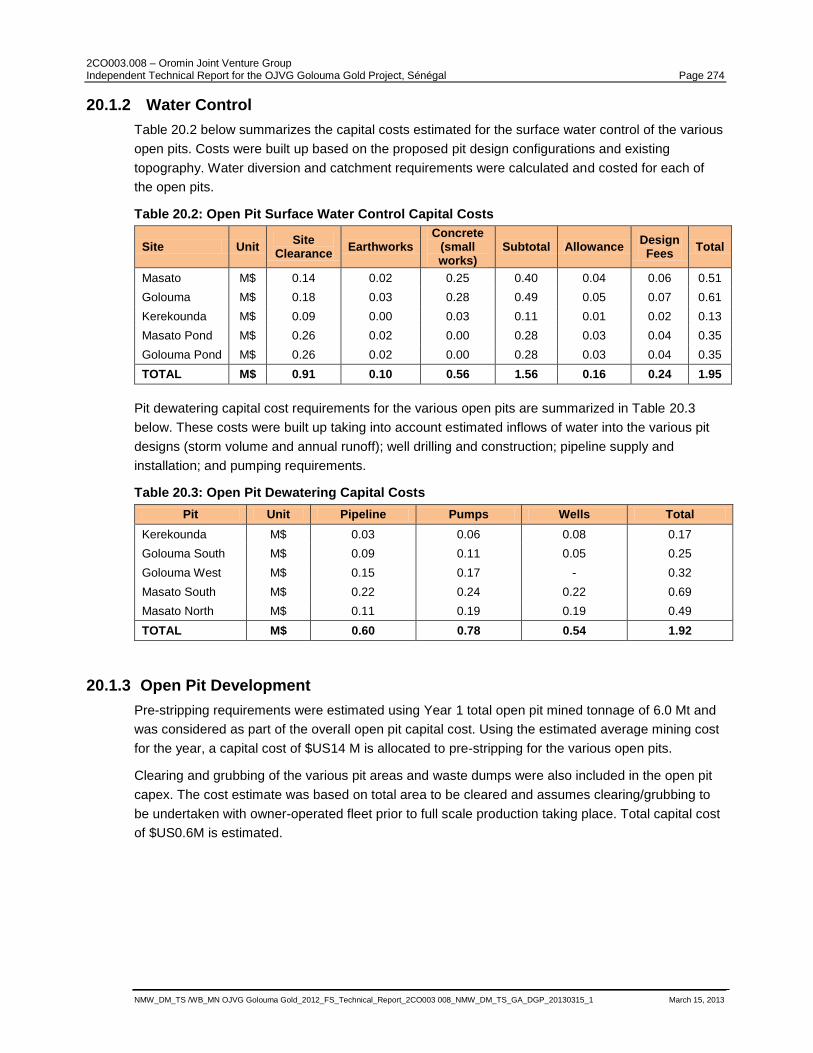
2CO003.008 – Oromin Joint Venture Group Independent Technical Report for the OJVG Golouma Gold Project, Sénégal Page 274
NMW_DM_TS /WB_MN OJVG Golouma Gold_2012_FS_Technical_Report_2CO003 008_NMW_DM_TS_GA_DGP_20130315_1 March 15, 2013
20.1.2 Water Control
Table 20.2 below summarizes the capital costs estimated for the surface water control of the various
open pits. Costs were built up based on the proposed pit design configurations and existing
topography. Water diversion and catchment requirements were calculated and costed for each of
the open pits.
Table 20.2: Open Pit Surface Water Control Capital Costs
Site Unit Site
Clearance Earthworks
Concrete (small works)
Subtotal Allowance Design Fees
Total
Masato M$ 0.14 0.02 0.25 0.40 0.04 0.06 0.51
Golouma M$ 0.18 0.03 0.28 0.49 0.05 0.07 0.61
Kerekounda M$ 0.09 0.00 0.03 0.11 0.01 0.02 0.13
Masato Pond M$ 0.26 0.02 0.00 0.28 0.03 0.04 0.35
Golouma Pond M$ 0.26 0.02 0.00 0.28 0.03 0.04 0.35
TOTAL M$ 0.91 0.10 0.56 1.56 0.16 0.24 1.95
Pit dewatering capital cost requirements for the various open pits are summarized in Table 20.3
below. These costs were built up taking into account estimated inflows of water into the various pit
designs (storm volume and annual runoff); well drilling and construction; pipeline supply and
installation; and pumping requirements.
Table 20.3: Open Pit Dewatering Capital Costs
Pit Unit Pipeline Pumps Wells Total
Kerekounda M$ 0.03 0.06 0.08 0.17
Golouma South M$ 0.09 0.11 0.05 0.25
Golouma West M$ 0.15 0.17 - 0.32
Masato South M$ 0.22 0.24 0.22 0.69
Masato North M$ 0.11 0.19 0.19 0.49
TOTAL M$ 0.60 0.78 0.54 1.92
20.1.3 Open Pit Development
Pre-stripping requirements were estimated using Year 1 total open pit mined tonnage of 6.0 Mt and
was considered as part of the overall open pit capital cost. Using the estimated average mining cost
for the year, a capital cost of $US14 M is allocated to pre-stripping for the various open pits.
Clearing and grubbing of the various pit areas and waste dumps were also included in the open pit
capex. The cost estimate was based on total area to be cleared and assumes clearing/grubbing to
be undertaken with owner-operated fleet prior to full scale production taking place. Total capital cost
of $US0.6M is estimated.
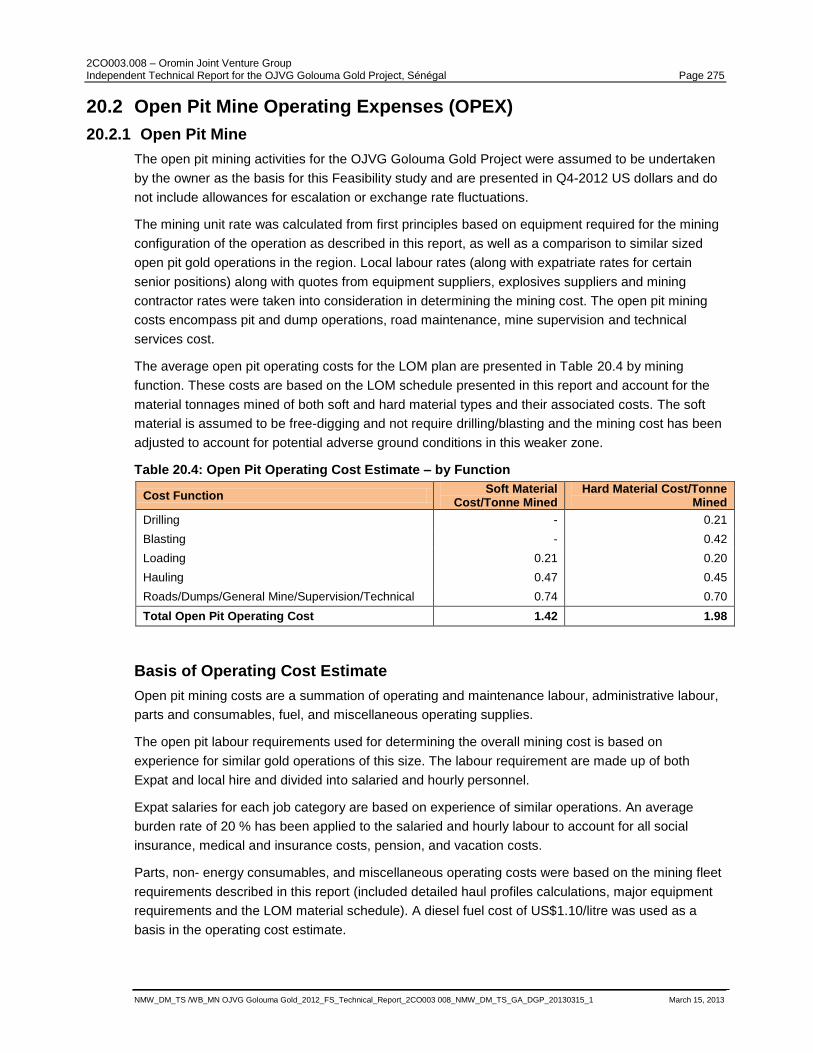
2CO003.008 – Oromin Joint Venture Group Independent Technical Report for the OJVG Golouma Gold Project, Sénégal Page 275
NMW_DM_TS /WB_MN OJVG Golouma Gold_2012_FS_Technical_Report_2CO003 008_NMW_DM_TS_GA_DGP_20130315_1 March 15, 2013
20.2 Open Pit Mine Operating Expenses (OPEX)
20.2.1 Open Pit Mine
The open pit mining activities for the OJVG Golouma Gold Project were assumed to be undertaken
by the owner as the basis for this Feasibility study and are presented in Q4-2012 US dollars and do
not include allowances for escalation or exchange rate fluctuations.
The mining unit rate was calculated from first principles based on equipment required for the mining
configuration of the operation as described in this report, as well as a comparison to similar sized
open pit gold operations in the region. Local labour rates (along with expatriate rates for certain
senior positions) along with quotes from equipment suppliers, explosives suppliers and mining
contractor rates were taken into consideration in determining the mining cost. The open pit mining
costs encompass pit and dump operations, road maintenance, mine supervision and technical
services cost.
The average open pit operating costs for the LOM plan are presented in Table 20.4 by mining
function. These costs are based on the LOM schedule presented in this report and account for the
material tonnages mined of both soft and hard material types and their associated costs. The soft
material is assumed to be free-digging and not require drilling/blasting and the mining cost has been
adjusted to account for potential adverse ground conditions in this weaker zone.
Table 20.4: Open Pit Operating Cost Estimate – by Function
Cost Function Soft Material
Cost/Tonne Mined Hard Material Cost/Tonne
Mined
Drilling - 0.21
Blasting - 0.42
Loading 0.21 0.20
Hauling 0.47 0.45
Roads/Dumps/General Mine/Supervision/Technical 0.74 0.70
Total Open Pit Operating Cost 1.42 1.98
Basis of Operating Cost Estimate
Open pit mining costs are a summation of operating and maintenance labour, administrative labour,
parts and consumables, fuel, and miscellaneous operating supplies.
The open pit labour requirements used for determining the overall mining cost is based on
experience for similar gold operations of this size. The labour requirement are made up of both
Expat and local hire and divided into salaried and hourly personnel.
Expat salaries for each job category are based on experience of similar operations. An average
burden rate of 20 % has been applied to the salaried and hourly labour to account for all social
insurance, medical and insurance costs, pension, and vacation costs.
Parts, non- energy consumables, and miscellaneous operating costs were based on the mining fleet
requirements described in this report (included detailed haul profiles calculations, major equipment
requirements and the LOM material schedule). A diesel fuel cost of US$1.10/litre was used as a
basis in the operating cost estimate.

2CO003.008 – Oromin Joint Venture Group Independent Technical Report for the OJVG Golouma Gold Project, Sénégal Page 276
NMW_DM_TS /WB_MN OJVG Golouma Gold_2012_FS_Technical_Report_2CO003 008_NMW_DM_TS_GA_DGP_20130315_1 March 15, 2013
20.3 Underground Mine CAPEX
Underground mining is planned for four deposits; Kerekounda, Golouma West, Golouma South, and
Kourouloulou. Two of these mines (Kerekounda and Kourouloulou) will be developed during the pre-
production period while the other two deposits will be developed in 2013 and 2028.
The underground mine capital costs were estimated from vendor quotes for all major equipment.
Minor costs were estimated based on vendor quotes, mining cost service information and/or factors
based on SRK‟s experience. No equipment was considered for lease as the terms were not
favourable when compared to purchase. Underground equipment was deemed to be at or near the
end of its lifecycle at the time of mine closure and therefore was not given a salvage value.
The UG Mine capital costs are shown in Table 20.5.
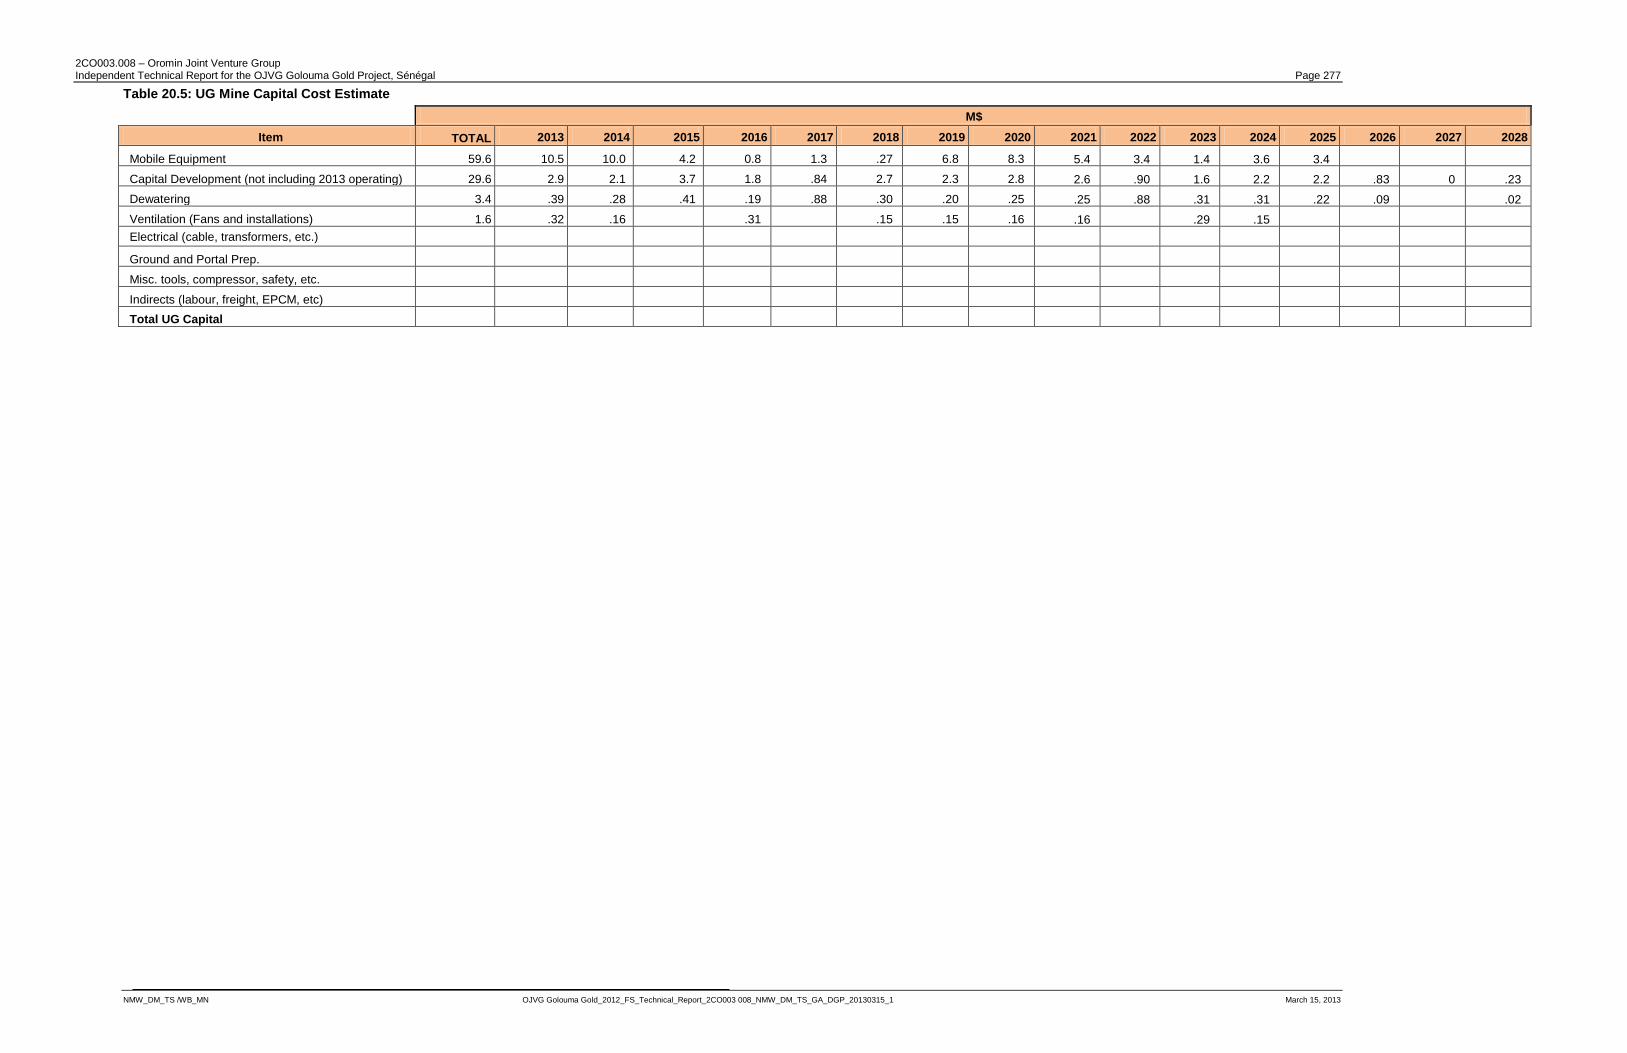
2CO003.008 – Oromin Joint Venture Group Independent Technical Report for the OJVG Golouma Gold Project, Sénégal Page 277
NMW_DM_TS /WB_MN OJVG Golouma Gold_2012_FS_Technical_Report_2CO003 008_NMW_DM_TS_GA_DGP_20130315_1 March 15, 2013
Table 20.5: UG Mine Capital Cost Estimate
M$
Item TOTAL 2013 2014 2015 2016 2017 2018 2019 2020 2021 2022 2023 2024 2025 2026 2027 2028
Mobile Equipment 59.6 10.5 10.0 4.2 0.8 1.3 .27 6.8 8.3 5.4 3.4 1.4 3.6 3.4
Capital Development (not including 2013 operating) 29.6 2.9 2.1 3.7 1.8 .84 2.7 2.3 2.8 2.6 .90 1.6 2.2 2.2 .83 0 .23
Dewatering 3.4 .39 .28 .41 .19 .88 .30 .20 .25 .25 .88 .31 .31 .22 .09 .02
Ventilation (Fans and installations) 1.6 .32 .16 .31 .15 .15 .16 .16 .29 .15
Electrical (cable, transformers, etc.)
Ground and Portal Prep.
Misc. tools, compressor, safety, etc.
Indirects (labour, freight, EPCM, etc)
Total UG Capital
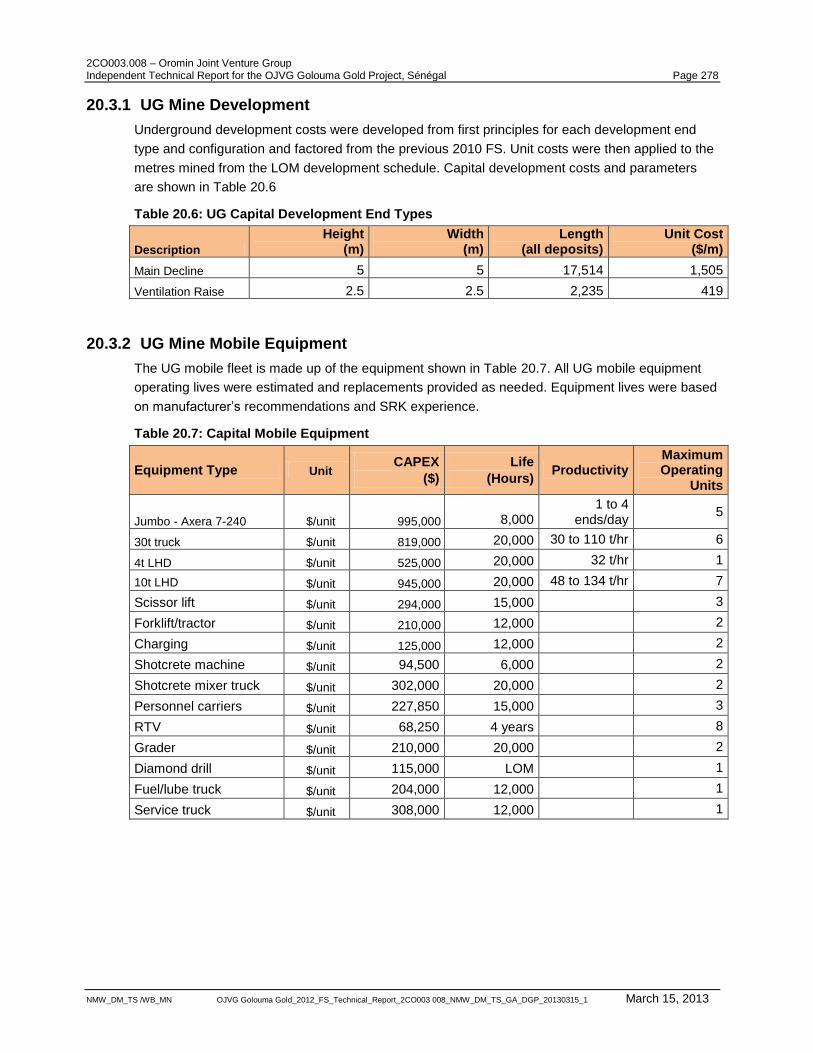
2CO003.008 – Oromin Joint Venture Group Independent Technical Report for the OJVG Golouma Gold Project, Sénégal Page 278
NMW_DM_TS /WB_MN OJVG Golouma Gold_2012_FS_Technical_Report_2CO003 008_NMW_DM_TS_GA_DGP_20130315_1 March 15, 2013
20.3.1 UG Mine Development
Underground development costs were developed from first principles for each development end
type and configuration and factored from the previous 2010 FS. Unit costs were then applied to the
metres mined from the LOM development schedule. Capital development costs and parameters
are shown in Table 20.6
Table 20.6: UG Capital Development End Types
Description
Height (m)
Width (m)
Length (all deposits)
Unit Cost ($/m)
Main Decline 5 5 17,514 1,505
Ventilation Raise 2.5 2.5 2,235 419
20.3.2 UG Mine Mobile Equipment
The UG mobile fleet is made up of the equipment shown in Table 20.7. All UG mobile equipment
operating lives were estimated and replacements provided as needed. Equipment lives were based
on manufacturer‟s recommendations and SRK experience.
Table 20.7: Capital Mobile Equipment
Equipment Type Unit CAPEX
($) Life
(Hours) Productivity
Maximum Operating
Units
Jumbo - Axera 7-240 $/unit 995,000 8,000 1 to 4
ends/day 5
30t truck $/unit 819,000 20,000 30 to 110 t/hr 6
4t LHD $/unit 525,000 20,000 32 t/hr 1
10t LHD $/unit 945,000 20,000 48 to 134 t/hr 7
Scissor lift $/unit 294,000 15,000 3
Forklift/tractor $/unit 210,000 12,000 2
Charging $/unit 125,000 12,000 2
Shotcrete machine $/unit 94,500 6,000 2
Shotcrete mixer truck $/unit 302,000 20,000 2
Personnel carriers $/unit 227,850 15,000 3
RTV $/unit 68,250 4 years 8
Grader $/unit 210,000 20,000 2
Diamond drill $/unit 115,000 LOM 1
Fuel/lube truck $/unit 204,000 12,000 1
Service truck $/unit 308,000 12,000 1
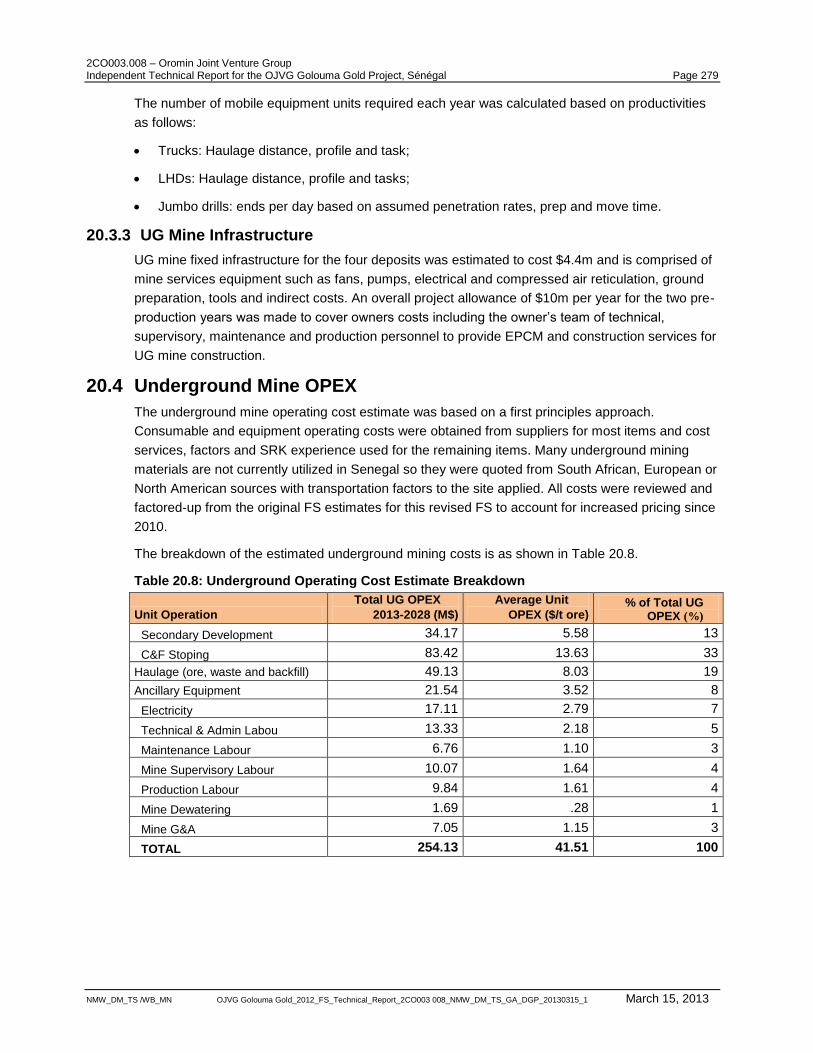
2CO003.008 – Oromin Joint Venture Group Independent Technical Report for the OJVG Golouma Gold Project, Sénégal Page 279
NMW_DM_TS /WB_MN OJVG Golouma Gold_2012_FS_Technical_Report_2CO003 008_NMW_DM_TS_GA_DGP_20130315_1 March 15, 2013
The number of mobile equipment units required each year was calculated based on productivities
as follows:
Trucks: Haulage distance, profile and task;
LHDs: Haulage distance, profile and tasks;
Jumbo drills: ends per day based on assumed penetration rates, prep and move time.
20.3.3 UG Mine Infrastructure
UG mine fixed infrastructure for the four deposits was estimated to cost $4.4m and is comprised of
mine services equipment such as fans, pumps, electrical and compressed air reticulation, ground
preparation, tools and indirect costs. An overall project allowance of $10m per year for the two pre-
production years was made to cover owners costs including the owner‟s team of technical,
supervisory, maintenance and production personnel to provide EPCM and construction services for
UG mine construction.
20.4 Underground Mine OPEX
The underground mine operating cost estimate was based on a first principles approach.
Consumable and equipment operating costs were obtained from suppliers for most items and cost
services, factors and SRK experience used for the remaining items. Many underground mining
materials are not currently utilized in Senegal so they were quoted from South African, European or
North American sources with transportation factors to the site applied. All costs were reviewed and
factored-up from the original FS estimates for this revised FS to account for increased pricing since
2010.
The breakdown of the estimated underground mining costs is as shown in Table 20.8.
Table 20.8: Underground Operating Cost Estimate Breakdown
Unit Operation Total UG OPEX
2013-2028 (M$) Average Unit
OPEX ($/t ore) % of Total UG
OPEX (%)
Secondary Development 34.17 5.58 13
C&F Stoping 83.42 13.63 33
Haulage (ore, waste and backfill) 49.13 8.03 19
Ancillary Equipment 21.54 3.52 8
Electricity 17.11 2.79 7
Technical & Admin Labou 13.33 2.18 5
Maintenance Labour 6.76 1.10 3
Mine Supervisory Labour 10.07 1.64 4
Production Labour 9.84 1.61 4
Mine Dewatering 1.69 .28 1
Mine G&A 7.05 1.15 3
TOTAL 254.13 41.51 100
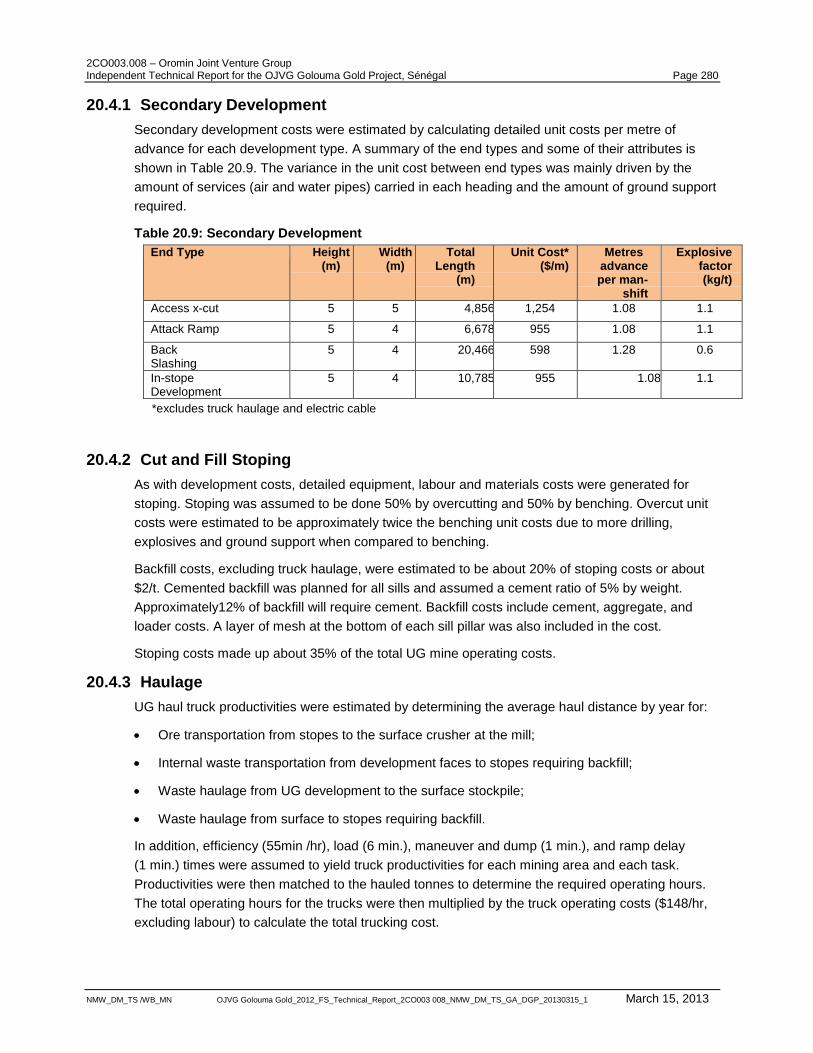
2CO003.008 – Oromin Joint Venture Group Independent Technical Report for the OJVG Golouma Gold Project, Sénégal Page 280
NMW_DM_TS /WB_MN OJVG Golouma Gold_2012_FS_Technical_Report_2CO003 008_NMW_DM_TS_GA_DGP_20130315_1 March 15, 2013
20.4.1 Secondary Development
Secondary development costs were estimated by calculating detailed unit costs per metre of
advance for each development type. A summary of the end types and some of their attributes is
shown in Table 20.9. The variance in the unit cost between end types was mainly driven by the
amount of services (air and water pipes) carried in each heading and the amount of ground support
required.
Table 20.9: Secondary Development
End Type Height (m)
Width (m)
Total Length
(m)
Unit Cost* ($/m)
Metres advance per man-
shift
Explosive factor (kg/t)
Access x-cut 5 5 4,856 1,254 1.08 1.1
Attack Ramp 5 4 6,678 955 1.08 1.1
Back Slashing
5 4 20,466 598 1.28 0.6
In-stope Development
5 4 10,785 955 1.08 1.1
*excludes truck haulage and electric cable
20.4.2 Cut and Fill Stoping
As with development costs, detailed equipment, labour and materials costs were generated for
stoping. Stoping was assumed to be done 50% by overcutting and 50% by benching. Overcut unit
costs were estimated to be approximately twice the benching unit costs due to more drilling,
explosives and ground support when compared to benching.
Backfill costs, excluding truck haulage, were estimated to be about 20% of stoping costs or about
$2/t. Cemented backfill was planned for all sills and assumed a cement ratio of 5% by weight.
Approximately12% of backfill will require cement. Backfill costs include cement, aggregate, and
loader costs. A layer of mesh at the bottom of each sill pillar was also included in the cost.
Stoping costs made up about 35% of the total UG mine operating costs.
20.4.3 Haulage
UG haul truck productivities were estimated by determining the average haul distance by year for:
Ore transportation from stopes to the surface crusher at the mill;
Internal waste transportation from development faces to stopes requiring backfill;
Waste haulage from UG development to the surface stockpile;
Waste haulage from surface to stopes requiring backfill.
In addition, efficiency (55min /hr), load (6 min.), maneuver and dump (1 min.), and ramp delay
(1 min.) times were assumed to yield truck productivities for each mining area and each task.
Productivities were then matched to the hauled tonnes to determine the required operating hours.
The total operating hours for the trucks were then multiplied by the truck operating costs ($148/hr,
excluding labour) to calculate the total trucking cost.
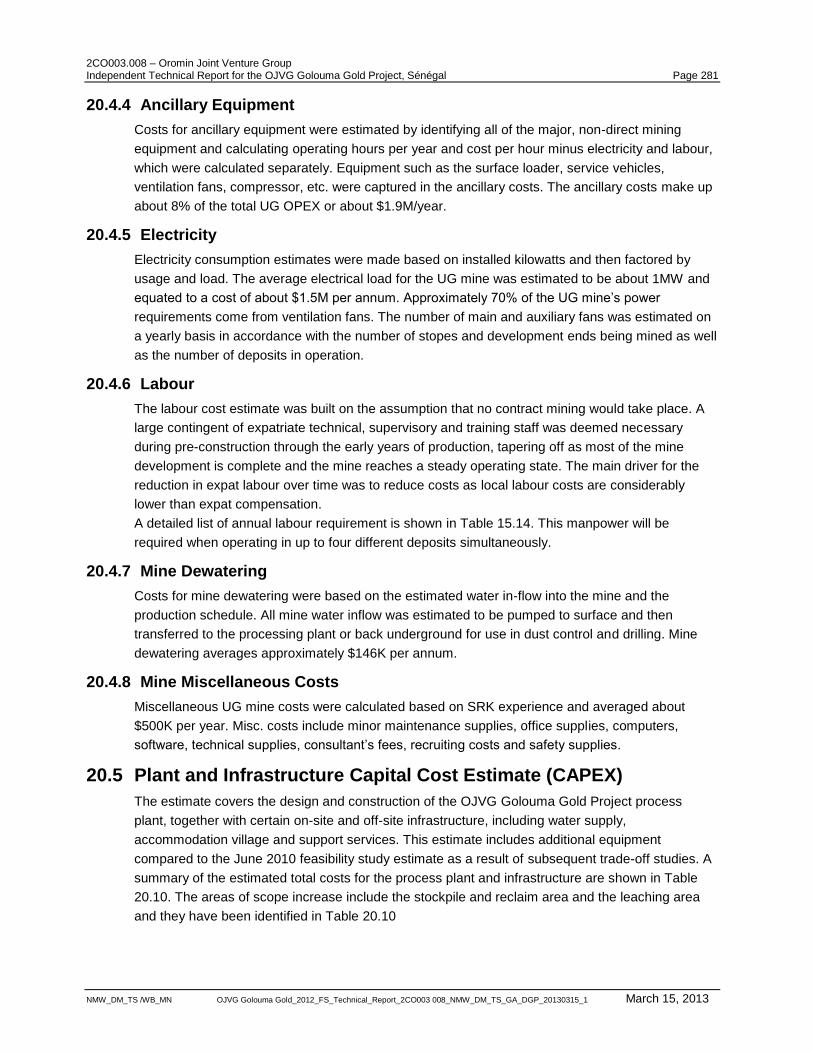
2CO003.008 – Oromin Joint Venture Group Independent Technical Report for the OJVG Golouma Gold Project, Sénégal Page 281
NMW_DM_TS /WB_MN OJVG Golouma Gold_2012_FS_Technical_Report_2CO003 008_NMW_DM_TS_GA_DGP_20130315_1 March 15, 2013
20.4.4 Ancillary Equipment
Costs for ancillary equipment were estimated by identifying all of the major, non-direct mining
equipment and calculating operating hours per year and cost per hour minus electricity and labour,
which were calculated separately. Equipment such as the surface loader, service vehicles,
ventilation fans, compressor, etc. were captured in the ancillary costs. The ancillary costs make up
about 8% of the total UG OPEX or about $1.9M/year.
20.4.5 Electricity
Electricity consumption estimates were made based on installed kilowatts and then factored by
usage and load. The average electrical load for the UG mine was estimated to be about 1MW and
equated to a cost of about $1.5M per annum. Approximately 70% of the UG mine‟s power
requirements come from ventilation fans. The number of main and auxiliary fans was estimated on
a yearly basis in accordance with the number of stopes and development ends being mined as well
as the number of deposits in operation.
20.4.6 Labour
The labour cost estimate was built on the assumption that no contract mining would take place. A
large contingent of expatriate technical, supervisory and training staff was deemed necessary
during pre-construction through the early years of production, tapering off as most of the mine
development is complete and the mine reaches a steady operating state. The main driver for the
reduction in expat labour over time was to reduce costs as local labour costs are considerably
lower than expat compensation.
A detailed list of annual labour requirement is shown in Table 15.14. This manpower will be
required when operating in up to four different deposits simultaneously.
20.4.7 Mine Dewatering
Costs for mine dewatering were based on the estimated water in-flow into the mine and the
production schedule. All mine water inflow was estimated to be pumped to surface and then
transferred to the processing plant or back underground for use in dust control and drilling. Mine
dewatering averages approximately $146K per annum.
20.4.8 Mine Miscellaneous Costs
Miscellaneous UG mine costs were calculated based on SRK experience and averaged about
$500K per year. Misc. costs include minor maintenance supplies, office supplies, computers,
software, technical supplies, consultant‟s fees, recruiting costs and safety supplies.
20.5 Plant and Infrastructure Capital Cost Estimate (CAPEX)
The estimate covers the design and construction of the OJVG Golouma Gold Project process
plant, together with certain on-site and off-site infrastructure, including water supply,
accommodation village and support services. This estimate includes additional equipment
compared to the June 2010 feasibility study estimate as a result of subsequent trade-off studies. A
summary of the estimated total costs for the process plant and infrastructure are shown in Table
20.10. The areas of scope increase include the stockpile and reclaim area and the leaching area
and they have been identified in Table 20.10
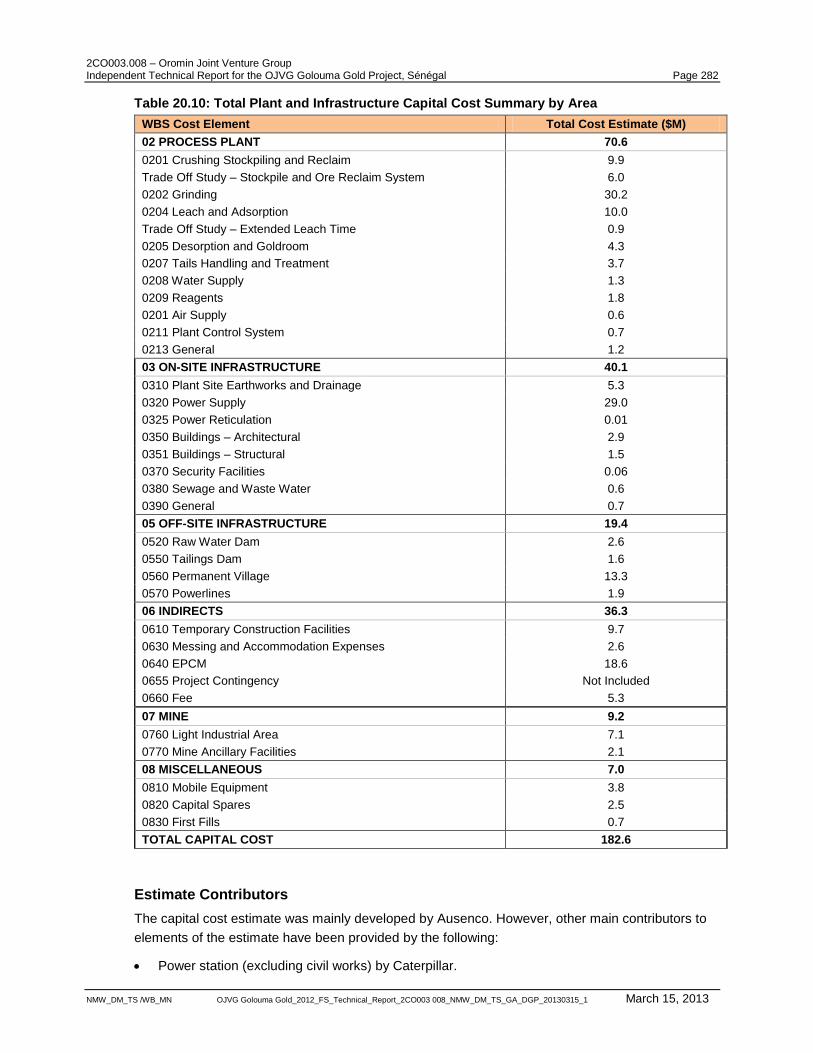
2CO003.008 – Oromin Joint Venture Group Independent Technical Report for the OJVG Golouma Gold Project, Sénégal Page 282
NMW_DM_TS /WB_MN OJVG Golouma Gold_2012_FS_Technical_Report_2CO003 008_NMW_DM_TS_GA_DGP_20130315_1 March 15, 2013
Table 20.10: Total Plant and Infrastructure Capital Cost Summary by Area
WBS Cost Element Total Cost Estimate ($M)
02 PROCESS PLANT 70.6
0201 Crushing Stockpiling and Reclaim 9.9
Trade Off Study – Stockpile and Ore Reclaim System 6.0
0202 Grinding 30.2
0204 Leach and Adsorption 10.0
Trade Off Study – Extended Leach Time 0.9
0205 Desorption and Goldroom 4.3
0207 Tails Handling and Treatment 3.7
0208 Water Supply 1.3
0209 Reagents 1.8
0201 Air Supply 0.6
0211 Plant Control System 0.7
0213 General 1.2
03 ON-SITE INFRASTRUCTURE 40.1
0310 Plant Site Earthworks and Drainage 5.3
0320 Power Supply 29.0
0325 Power Reticulation 0.01
0350 Buildings – Architectural 2.9
0351 Buildings – Structural 1.5
0370 Security Facilities 0.06
0380 Sewage and Waste Water 0.6
0390 General 0.7
05 OFF-SITE INFRASTRUCTURE 19.4
0520 Raw Water Dam 2.6
0550 Tailings Dam 1.6
0560 Permanent Village 13.3
0570 Powerlines 1.9
06 INDIRECTS 36.3
0610 Temporary Construction Facilities 9.7
0630 Messing and Accommodation Expenses 2.6
0640 EPCM 18.6
0655 Project Contingency Not Included
0660 Fee 5.3
07 MINE 9.2
0760 Light Industrial Area 7.1
0770 Mine Ancillary Facilities 2.1
08 MISCELLANEOUS 7.0
0810 Mobile Equipment 3.8
0820 Capital Spares 2.5
0830 First Fills 0.7
TOTAL CAPITAL COST 182.6
Estimate Contributors
The capital cost estimate was mainly developed by Ausenco. However, other main contributors to
elements of the estimate have been provided by the following:
Power station (excluding civil works) by Caterpillar.
2CO003.008 – Oromin Joint Venture Group Independent Technical Report for the OJVG Golouma Gold Project, Sénégal Page 283
NMW_DM_TS /WB_MN OJVG Golouma Gold_2012_FS_Technical_Report_2CO003 008_NMW_DM_TS_GA_DGP_20130315_1 March 15, 2013
Estimate Organisation
The estimate has been organized by the work breakdown structure (“WBS”) into facilities which are
further broken down by areas, and then further by discipline.
The estimate has been prepared in MS Excel and provides a number of reports as follows:
Total cost summary – provides a total cost summary by WBS by discipline and includes
estimating design allowance;
Total cost detail report – provides bare cost, total cost with the percentage of estimating design
allowance and total cost by WBS by discipline;
Bare cost summary - provides a bare cost summary by WBS by discipline and excludes
estimating design allowance;
Bare cost detail – provides the detailed bare cost breakdown of the estimate excluding
estimating design allowance and shows quantities, ex works pricing, freight, subcontract costs,
labour rates, labour costs, unit rate and resulting totals;
Discipline Summary; and
Estimate Comparison 2010 - 2013
Scope of Estimate
This estimate is based on the following inclusions:
Mechanical equipment costs for new process plant equipment;
Installation of mechanical equipment;
Commodity costs for supply delivery and installation of earthworks, concrete, structural steel,
platework, field run pipework, tankage, electrical and instrumentation;
Freight allowance;
EPCM, EPCM contractors fee & commissioning costs;
Allowance for vendor representatives;
Infrastructure buildings as noted in Section 17 and below;
Sewage and potable water systems;
Plant control system;
CCTV system;
Office fit outs;
Laboratory and fit out including laboratory equipment;
Diesel fuel facility;
Heavy vehicle workshop;
Allowance for capital spares, first fills and initial consumables;
Allowance for plant and G&A mobile equipment;
2CO003.008 – Oromin Joint Venture Group Independent Technical Report for the OJVG Golouma Gold Project, Sénégal Page 284
NMW_DM_TS /WB_MN OJVG Golouma Gold_2012_FS_Technical_Report_2CO003 008_NMW_DM_TS_GA_DGP_20130315_1 March 15, 2013
Tailings deposition pipeline with single point discharge and tailings decant water pipeline and
pumping system;
Raw water delivery pumping system;
Power supply and site distribution (excluding the Masato open pit power supply);
Permanent camp consisting of 100 senior staff and 240 junior staff accommodation;
Temporary 288 person temporary junior person construction camp; and
Temporary construction facilities.
The following assumptions underlie this estimate:
The design and estimate is based upon similar projects completed by Ausenco within the
region;
All construction waste materials are disposed of within 2 km of the project site;
All sand gravel and aggregate can be sourced within 2 km of the project site;
No major ground improvements need to be made such as piling and ground stabilization;
All drawings will be executed in AutoCAD;
Suitably qualified and experienced construction labour will be available at the time of execution
of the project; and
No extremes in weather will be experienced during the construction phase, and as such, no
allowances are included for flooding or construction labour stand down posts.
Estimating Design Allowances
Each element of the estimate was developed at bare cost. An estimating design allowance has
then been allocated to each element of the direct and indirect costs to reflect the level of definition.
Such estimating design allowances are an integral part of the capital cost estimate.
The purpose of the estimating design allowances is to make allowance for uncertain elements of
costs to cover such factors as:
Limited information on site conditions, especially concerning sub-surface conditions and the
engineering properties of excavated materials;
Accuracy of quantity take-offs and estimate assembly, and consolidation based on the level of
engineering and design undertaken at study level;
Accuracy of materials and labour rates (excludes extreme variation for which contingency
should be included to cover);
Accuracy of productivity expectations; and
Accuracy of equipment budget pricing.
The sum of the estimated bare cost and estimating design allowances is the estimated total cost
for the project. The overall estimating design allowances applied to the OJVG Golouma Gold
Project cost estimate represent 8.4% of the bare cost.
Table 20.11 summarises the total cost including estimating design allowances.
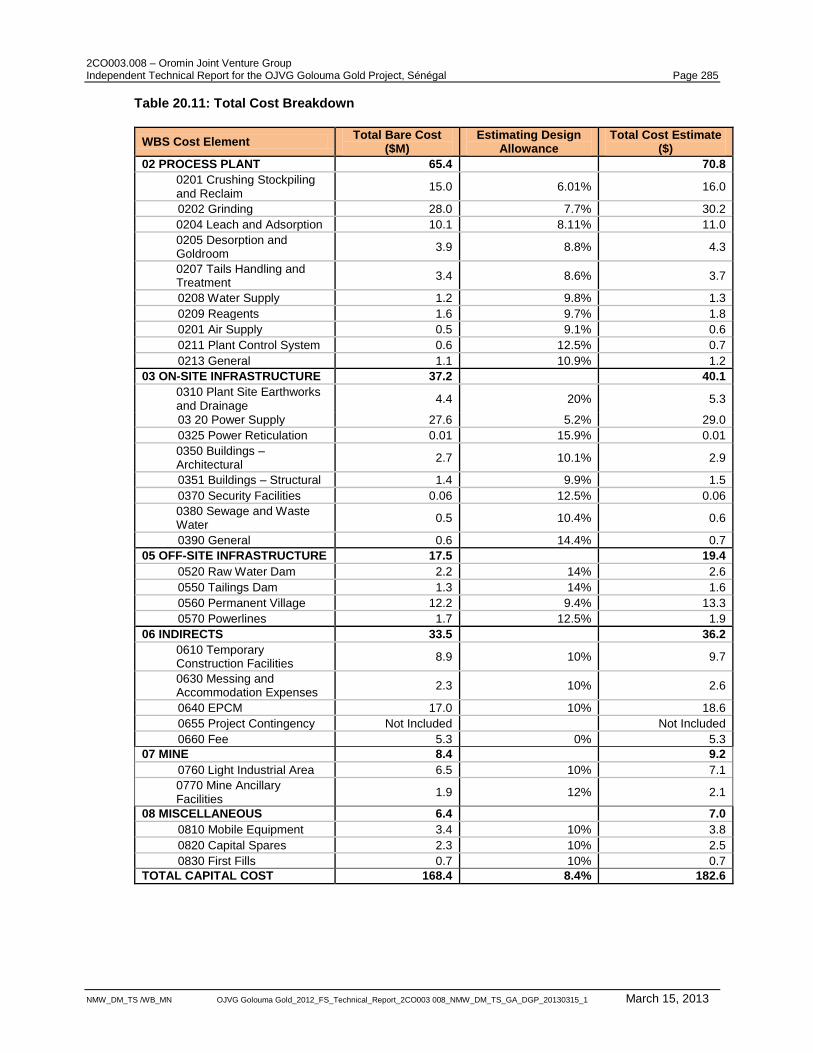
2CO003.008 – Oromin Joint Venture Group Independent Technical Report for the OJVG Golouma Gold Project, Sénégal Page 285
NMW_DM_TS /WB_MN OJVG Golouma Gold_2012_FS_Technical_Report_2CO003 008_NMW_DM_TS_GA_DGP_20130315_1 March 15, 2013
Table 20.11: Total Cost Breakdown
WBS Cost Element Total Bare Cost
($M) Estimating Design
Allowance Total Cost Estimate
($)
02 PROCESS PLANT 65.4 70.8
0201 Crushing Stockpiling and Reclaim
15.0 6.01% 16.0
0202 Grinding 28.0 7.7% 30.2
0204 Leach and Adsorption 10.1 8.11% 11.0
0205 Desorption and Goldroom
3.9 8.8% 4.3
0207 Tails Handling and Treatment
3.4 8.6% 3.7
0208 Water Supply 1.2 9.8% 1.3
0209 Reagents 1.6 9.7% 1.8
0201 Air Supply 0.5 9.1% 0.6
0211 Plant Control System 0.6 12.5% 0.7
0213 General 1.1 10.9% 1.2
03 ON-SITE INFRASTRUCTURE 37.2 40.1
0310 Plant Site Earthworks and Drainage
4.4 20% 5.3
03 20 Power Supply 27.6 5.2% 29.0
0325 Power Reticulation 0.01 15.9% 0.01
0350 Buildings – Architectural
2.7 10.1% 2.9
0351 Buildings – Structural 1.4 9.9% 1.5
0370 Security Facilities 0.06 12.5% 0.06
0380 Sewage and Waste Water
0.5 10.4% 0.6
0390 General 0.6 14.4% 0.7
05 OFF-SITE INFRASTRUCTURE 17.5 19.4
0520 Raw Water Dam 2.2 14% 2.6
0550 Tailings Dam 1.3 14% 1.6
0560 Permanent Village 12.2 9.4% 13.3
0570 Powerlines 1.7 12.5% 1.9
06 INDIRECTS 33.5 36.2
0610 Temporary Construction Facilities
8.9 10% 9.7
0630 Messing and Accommodation Expenses
2.3 10% 2.6
0640 EPCM 17.0 10% 18.6
0655 Project Contingency Not Included Not Included
0660 Fee 5.3 0% 5.3
07 MINE 8.4 9.2
0760 Light Industrial Area 6.5 10% 7.1
0770 Mine Ancillary Facilities
1.9 12% 2.1
08 MISCELLANEOUS 6.4 7.0
0810 Mobile Equipment 3.4 10% 3.8
0820 Capital Spares 2.3 10% 2.5
0830 First Fills 0.7 10% 0.7
TOTAL CAPITAL COST 168.4 8.4% 182.6
2CO003.008 – Oromin Joint Venture Group Independent Technical Report for the OJVG Golouma Gold Project, Sénégal Page 286
NMW_DM_TS /WB_MN OJVG Golouma Gold_2012_FS_Technical_Report_2CO003 008_NMW_DM_TS_GA_DGP_20130315_1 March 15, 2013
Table 20.12: Table Cost Report by Pricing Type
PRICING TYPE % OF DIRECT COST
Budget Quote 74.1 %
Database - escalated 17.5 %
Allowance 8.4 %
Total 100 %
Direct Cost Development
Direct costs include:
Supply of permanent materials and fixed equipment;
Labour to undertake and manage the construction activities. This includes wages and salaries,
with loadings for site labour, supervision and management, including associated expenses
such as home and/or satellite office management expenses;
Contractors and suppliers mark-up and profit; and
Transport expenses for permanent and temporary equipment and materials.
Earthworks
Bulk earthworks quantities were estimated by Ausenco for the process plant, and light industrial
areas, including drainage, internal roads were based on information available at the time of the
estimate. Limited detailed geotechnical information was available, and as such, the earthworks
quantities do not include any piling or soil stabilization. Structural fill quantity for the zone
immediately behind the crusher wall was included. The remainder of the crushing ROM pad is
excluded from the estimate, as it is assumed that it will be constructed from mine waste by the
mining contractor. Structural fill has also been included in the estimate under the SAG and ball mill
foundations.
All pricing was based on reissue of the original 2010 pricing schedules to the same contractors
previously used in the estimate to obtain budget rates.
Mobilisation and demobilisation costs were included separately in the temporary construction
facilities area of the estimate. The cost included in the estimate is the cost quoted by the major
contractor selected for the study.
Concrete
Concrete as-built quantities from a similar recently completed project were used for all areas of the
process plant and infrastructure, except for the crushing, stockpiling and reclaim area. The
crushing and reclaim area material take off quantities (MTOs) were developed by Ausenco, based
on preliminary design drawings and sketches of the FS design.
All pricing was based on reissue of the original 2010 pricing schedules to the same contractors
previously used in the estimate to obtain budget rates.
Mobilisation and demobilisation costs were included in the rates provided by the contractor, and as
such no additional mobilisation/demobilisation costs were included in the temporary construction
facilities costs.
2CO003.008 – Oromin Joint Venture Group Independent Technical Report for the OJVG Golouma Gold Project, Sénégal Page 287
NMW_DM_TS /WB_MN OJVG Golouma Gold_2012_FS_Technical_Report_2CO003 008_NMW_DM_TS_GA_DGP_20130315_1 March 15, 2013
Structural steelwork
Structural steel as-built quantities from a similar recently completed project were used for all areas
of the process plant except for the crushing, stockpiling and reclaim area. The crushing stockpile
and reclaim area MTO‟s for OJVG were developed by Ausenco based on preliminary design
drawings and sketches of the FS design.
All pricing was based on reissue of the original 2010 pricing schedules to the same contractors
previously used in the estimate to obtain budget rates.
The scope included supply, fabrication, shop detailing, surface treatment, supply of nuts, bolts,
washers, and shims, as well as a cost for delivery to site. Separate installation costs and manhours
were also requested.
Mobilisation and demobilisation costs were included separately in the temporary construction
facilities area of the estimate. The cost included was as quoted by the contractor.
Platework and Tankage
All pricing was based on reissue of the original 2010 pricing schedules to the same contractors
previously used in the Estimate to obtain budget rates.
The shop fabricated platework scope covered supply, shop detailing, fabrication, surface treatment,
liner plate, rubber lining, delivery and installation of shop fabricated platework and tanks.
The site erected platework and site erected tankage quantities were also issued to the same
contractors, and the scope covered the shop detailing, rolling of strakes, delivery, site erection of
platework and tanks.
Mobilisation and demobilisation costs were included separately in the temporary construction
facilities cost as estimated by the selected contractors.
Mechanical Equipment Supply
The mechanical equipment list was developed from the process flow sheets. These provided
equipment numbers, type, sizing and power.
Inquiries were issued to local and international suppliers for budget pricing of most of the
mechanical equipment based on original documents. The value of equipment priced from inquiries
represents 96% of the total equipment supply value. The remaining 4% consists of low-cost
equipment that was priced from budget quotations or purchase orders from recent other estimates
or projects.
Mechanical Equipment Installation
A mechanical installation enquiry document based on the original 2010 document for budget
pricing was issued to African based contractors. The equipment list issued was the detailed as-built
equipment list from a similar recently completed project. The contractor selected provided
individual costs for installing equipment along with the direct manhours. These costs and manhours
were subsequently used in the estimate, after benchmarking against installation costs for recently
completed projects in the region.
Mobilisation and demobilisation costs were included separately in the temporary construction
facilities area of the estimate. The cost included was the cost quoted by the contractor.
2CO003.008 – Oromin Joint Venture Group Independent Technical Report for the OJVG Golouma Gold Project, Sénégal Page 288
NMW_DM_TS /WB_MN OJVG Golouma Gold_2012_FS_Technical_Report_2CO003 008_NMW_DM_TS_GA_DGP_20130315_1 March 15, 2013
Additional allowances for heavy lift cranes are included in the temporary construction facilities.
Piping Supply and Installation
Field-run piping costs were calculated from material take-offs for pipe, based on the general
arrangement drawings. The material take-offs were used as a basis for applying rates received
from an African based contractor. Installation man-hours for off plant (non process plant) pipework
were estimated based on installation hours as quoted by the selected contractor.
A factor was added to the quoted pipe supply cost to include fittings and valves for field run piping.
Material prices were escalated based on current costs received from African contractors.
The total piping costs for process piping in each area were factored from the installed cost of the
mechanical equipment for the respective area. Factors were established from Ausenco‟s database
of similar installations. The process plant piping costs were arbitrarily split into material supply,
freight and labour costs, with the labour being expressed as man-hours and applied against the
gang rate to establish installation costs.
The labour gang rate used for installation was established from the revised mechanical installation
costs quoted by the contractor.
Mobilisation and demobilisation costs were included separately in the temporary construction
facilities area of the estimate. The cost included was an allowance based on previous similar
projects.
Electrical and Instrumentation
The electrical design was based on a medium voltage single line, specifically developed for the
study and a low voltage (LV) single line from a recently constructed almost identical plant.
Modifications were made in the electrical estimate to accommodate minor differences in the study
LV requirements as compared to that of the similar plant LV design.
The instrumentation estimate was developed from the instrument list from the same recently
completed project, with minor modifications to it to suit the OJVG plant requirements.
Electrical and instrumentation supply costs are based on costs within the Ausenco data base from
similar projects and budget inquiries.
Electrical installation hours were derived from the data received from contractors in Africa. The
revised labour rate was escalated based on the escalated costs received for structural and
mechanical labour rates.
An allowance for the mobilisation and demobilisation of an electrical contractor has been allowed
for separately in the temporary construction facilities area of the estimate.
Buildings
Steel-framed-and-cladded type building costs was included for the plant workshop, warehouse,
reagent store, sample preparation shed and MCC buildings. The design of these buildings is
identical to those installed at a similar recently completed project in the region and were re-priced
by the same supplier.
Building supply costs have been escalated based on costs received from local contractors for
similar works.
2CO003.008 – Oromin Joint Venture Group Independent Technical Report for the OJVG Golouma Gold Project, Sénégal Page 289
NMW_DM_TS /WB_MN OJVG Golouma Gold_2012_FS_Technical_Report_2CO003 008_NMW_DM_TS_GA_DGP_20130315_1 March 15, 2013
Civil material take-offs for steel framed buildings were also undertaken from as-built drawings and
the respective civil rates applied. Costs for electrical fit outs of the steel-framed buildings were
included in the electrical estimate. Warehouse racking and shelving has been included in the
estimate, based on similar installations.
Plant workshop tools and equipment, other than the compressed air system, wash down area
equipment and overhead crane, have been excluded from the plant workshop.
Split air conditioning systems have been allowed for both the crushing and grinding area
switchrooms.
The Heavy Vehicle workshop in the light industrial area has been included in the estimate and is
based on second hand containers, prefabricated offices complete with furniture, air system,
electrical system, concrete floors and footings with „Allshelter‟ type canopies. No further allowance
for any workshop tools and equipment, other than the air compressor system, has been included in
the estimate.
Costs for prefabricated buildings, including the administration building, plant office, plant
warehouse, plant office/ablutions, plant mess hall, laboratory, two security gatehouses and
medical/emergency response treatment (ERT) building were included in the estimate. The costs
were escalated based on costs received from local contractors for similar works.
Prefabricated building supply and erection costs are inclusive of fit out such as fixtures, electrics,
plumbing and air conditioning. A cost was included for basic furniture such as desks, chairs, tables,
filling cabinets, shelves, fridges, and microwaves. Items such as computers, phone systems,
photocopiers and printers are not included. Medical equipment in the ERT facility is also excluded.
Laboratory equipment for the laboratory and sample preparation shed was included, based on the
similar completed projects. Ground slabs and footings are included in the concrete costs and were
derived from the drawings and respective civil rates.
The crushing and main control rooms are prefabricated air conditioned buildings and were cost
based on the as-built cost for the control rooms from a recent project in the region. The main
control room consists of a 3.4 m x 3 m control room and a 3.4 m x 1.9 m titration room.
An underground change house has been included in the Mining Ancillaries area and is sized for
three times 60 man shifts and is inclusive of dirty side and wet side lockers, showers, toilets and
laundry facilities. Included in the building is a small mess area with kitchen, lamp and safety
equipment area, and some offices for underground supervisors.
Freight
Freight costs associated with items supplied as part of earthworks and concrete were included in
the quoted supply prices. Items in the estimate quoted as subcontract costs also include their
respective freight costs.
Freight costs for structural steel, platework, pipework and site erected tankage has also been
included as quoted by the selected contractor‟s revised budget rates.
Freight costs for mechanical equipment was factored from the ex works cost. The factors were
established from recent projects in the region. Freight costs for instrumentation are high, due to the
requirement of air freight. This is due to the rough road conditions experienced on similar projects
in the region. The freight, when assessed item by item may not be a fully accurate representation
2CO003.008 – Oromin Joint Venture Group Independent Technical Report for the OJVG Golouma Gold Project, Sénégal Page 290
NMW_DM_TS /WB_MN OJVG Golouma Gold_2012_FS_Technical_Report_2CO003 008_NMW_DM_TS_GA_DGP_20130315_1 March 15, 2013
of the actual freight cost for the item. The overall freight cost however is deemed reasonable,
based on similar projects completed in the region.
Freight costs do not include any import duties and/or taxes.
Labour
Labour gang rates were established from the various discipline rates inquiry packages, issued to
contractors. The gang rates included current industry and labour regulations and allowances, direct
labour, supervision, location allowances, any superannuation (or local equivalent that may exist),
contractor‟s overheads, profit, off-site costs, construction power, small tools, construction
equipment, safety equipment, consumables, light and medium cranes, recurring costs, loadings
and allowances.
Accommodation and messing were excluded from the gang rates and are included and identified
separately under accommodation and messing costs. These costs have been escalated based on
the average increase on costs.
Mobilisation and demobilisation costs were also excluded from the gang rates (and the direct
costs) and were included under temporary construction facilities costs.
General Cost Development
First-fill Reagents, Grinding Media, and Lubricants
First-fill reagents and grinding media were included in the estimate and developed from the
quantities required and reagent costs supplied for the FS.
In most cases, equipment suppliers will provide the required first-fill lubricants with the supplied
equipment. However, a provisional cost („PC‟) sum for first-fill lubricants was included in the
estimate to allow for any omission of the supply of first-fill lubricants. The PC sum also provides
additional funding should OJVG wish to self-source all lubricants from common suppliers.
Workshop Tools and Equipment
The cost of fitting out the workshop with small tools and equipment was excluded from the
estimate. An overhead crane has been included in the plant workshop and is identified separately
in the estimate from the building cost.
Warehouse Racking and Shelving
The cost of fitting out warehouses and storage sheds with shelving and racking was included in the
estimate and is based upon the cost from similar projects.
Mobile Plant and Equipment
Mobile plant and equipment costs have been escalated by 20% based on the average escalation
within the estimate for this period. This includes all G&A vehicles except for site road maintenance
equipment, which is assumed to be provided from the mining equipment fleet. All equipment is
new, except for the 30 tonne forklift and container truck, which are second-hand units. A summary
of the total plant and G&A vehicles included in the estimate is shown in Table 20.13.
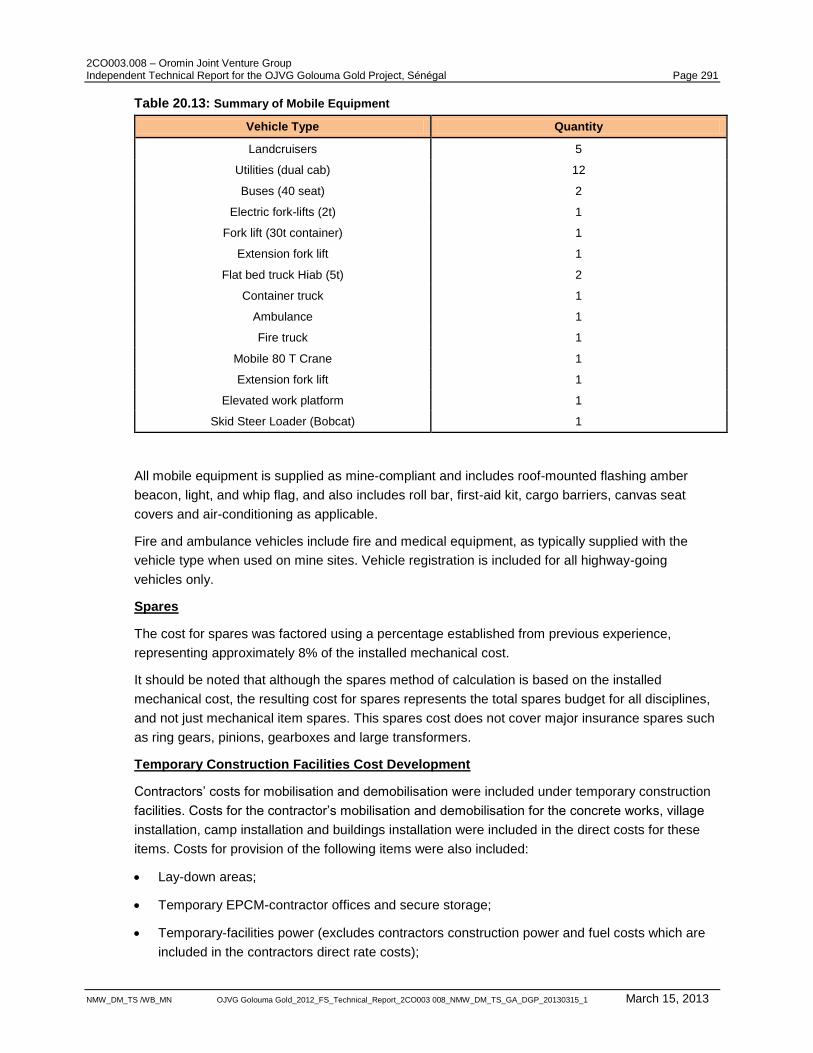
2CO003.008 – Oromin Joint Venture Group Independent Technical Report for the OJVG Golouma Gold Project, Sénégal Page 291
NMW_DM_TS /WB_MN OJVG Golouma Gold_2012_FS_Technical_Report_2CO003 008_NMW_DM_TS_GA_DGP_20130315_1 March 15, 2013
Table 20.13: Summary of Mobile Equipment
Vehicle Type Quantity
Landcruisers 5
Utilities (dual cab) 12
Buses (40 seat) 2
Electric fork-lifts (2t) 1
Fork lift (30t container) 1
Extension fork lift 1
Flat bed truck Hiab (5t) 2
Container truck 1
Ambulance 1
Fire truck 1
Mobile 80 T Crane 1
Extension fork lift 1
Elevated work platform 1
Skid Steer Loader (Bobcat) 1
All mobile equipment is supplied as mine-compliant and includes roof-mounted flashing amber
beacon, light, and whip flag, and also includes roll bar, first-aid kit, cargo barriers, canvas seat
covers and air-conditioning as applicable.
Fire and ambulance vehicles include fire and medical equipment, as typically supplied with the
vehicle type when used on mine sites. Vehicle registration is included for all highway-going
vehicles only.
Spares
The cost for spares was factored using a percentage established from previous experience,
representing approximately 8% of the installed mechanical cost.
It should be noted that although the spares method of calculation is based on the installed
mechanical cost, the resulting cost for spares represents the total spares budget for all disciplines,
and not just mechanical item spares. This spares cost does not cover major insurance spares such
as ring gears, pinions, gearboxes and large transformers.
Temporary Construction Facilities Cost Development
Contractors‟ costs for mobilisation and demobilisation were included under temporary construction
facilities. Costs for the contractor‟s mobilisation and demobilisation for the concrete works, village
installation, camp installation and buildings installation were included in the direct costs for these
items. Costs for provision of the following items were also included:
Lay-down areas;
Temporary EPCM-contractor offices and secure storage;
Temporary-facilities power (excludes contractors construction power and fuel costs which are
included in the contractors direct rate costs);
2CO003.008 – Oromin Joint Venture Group Independent Technical Report for the OJVG Golouma Gold Project, Sénégal Page 292
NMW_DM_TS /WB_MN OJVG Golouma Gold_2012_FS_Technical_Report_2CO003 008_NMW_DM_TS_GA_DGP_20130315_1 March 15, 2013
Temporary water supply;
Temporary site ablutions including temporary sewage treatment;
Temporary first aid medical facilities;
Construction site maintenance; and
Heavy cranes for installation of crusher, SAG and ball mill.
Indirect Cost Development
Engineering Procurement & Construction Management (EPCM) Labour
Home-office time-based hours such as project management, project controls, procurement and
contracting, and secretarial services were estimated based on the anticipated duration on the
project. Home-office content-related labour hours were estimated by development of lists of
deliverables and allocation of hours to each based on previous experience.
Site hour input was all time-based on estimated durations for the various phases of the project and
the personnel needed for each phase.
Costs for sub-consultants to the EPCM Contractor and vendors‟ representatives are identified and
included in the EPCM cost.
EPCM Expenses
These were developed by Ausenco to capture costs associated with EPCM activities. They include
expenses for business and site supervision, inspection and expediting services, and home office
expenses based on current Vancouver charge out fees 1stQ 2013 (including phone, postage,
copying, stationery and computer systems).
Costs for sub-consultant services are also included in the estimate in the EPCM costs.
Commissioning
This covers the estimated costs of construction contractors providing plant start-up assistance
during commissioning, together with associated miscellaneous materials and equipment.
The costs of the EPCM Contractor‟s commissioning group were included.
Costs associated with vendor commissioning assistance were included in the estimate. These
costs include allowances for interstate airfares, intercity accommodation and miscellaneous
expenses.
The labour costs of a modification squad (“mod squad”) and materials have not been included, as
the nature of any client requested modification cannot be determined at the time of estimate
preparation. These costs would be an extra cost.
Vendor Representatives
Vendor representation during the construction period was not deemed necessary. Suitably
experienced and qualified construction contractors will be used along with EPCM contractor
supervision.
The cost for vendor assistance during the pre-commissioning period was included in the EPCM
estimate on the basis of ten site visits from international vendors, and two from local vendors.
2CO003.008 – Oromin Joint Venture Group Independent Technical Report for the OJVG Golouma Gold Project, Sénégal Page 293
NMW_DM_TS /WB_MN OJVG Golouma Gold_2012_FS_Technical_Report_2CO003 008_NMW_DM_TS_GA_DGP_20130315_1 March 15, 2013
Project Fee
A project fee of 3% of the direct costs was included.
A fee is a notional allowance considered chargeable by any reputable engineering project
management supplier as profit and takes into account the type of project, project location, project
value and project risk.
This allowance also considers the engineer/project manager‟s liabilities for such items as process
guarantees, liquidated damages, indemnity insurance and other such liabilities.
In most cases, the fee is calculated as a percentage of the overall cost of the project or in some
cases may be negotiated as a fixed sum depending on the extent of risk and liability the project
owners are prepared to accept.
20.5.1 Escalation
No escalation costs were included in the estimate, as escalation for the entire project, including
other costs outside of the scope of this estimate, will be undertaken during the financial modelling
stage. All costs are based on 1Q 2013 quoted costs.
20.5.2 Owner’s Costs
Owners Cost is excluded from this estimate.
20.5.3 Taxes and Duties
No import duty or taxes have been included in the estimate as OJVG advised that the project is
exempt of these taxes for the first seven years.
20.5.4 Contingency
Contingency provides for the risk of changes in scope, or reasonable expectations embedded in
the estimate. Changes often arise from outside or unpredictable circumstances. These include:
Extreme escalation of engineering and field construction labour costs above the base line of
1Q 2013;
Extreme abnormalities in industrial relations;
Extreme change in market conditions and therefore equipment and material prices; and
Extreme weather or adverse political or regulatory developments.
Ausenco recommends that a contingency of 10% or $ 18.3M of the total plant and infrastructure
estimate be included in the overall project contingency.
The amount of project contingency is ultimately the client‟s decision. This decision is based on the
client‟s perceived risk for the project as well as their willingness to accept risk.
20.6 Process Plant Operating Cost Estimate (OPEX)
The total process and General & Administrative (G&A) operating costs were developed in United
States dollars (US$) on an annual throughput basis. The costs were divided into the key cost
centres and all figures are as of the first quarter 2013 (calendar year). The operating costs
presented do not include allowances for escalation or exchange rate fluctuations. The estimate is
considered Feasibility Study level with an accuracy of ±15%.
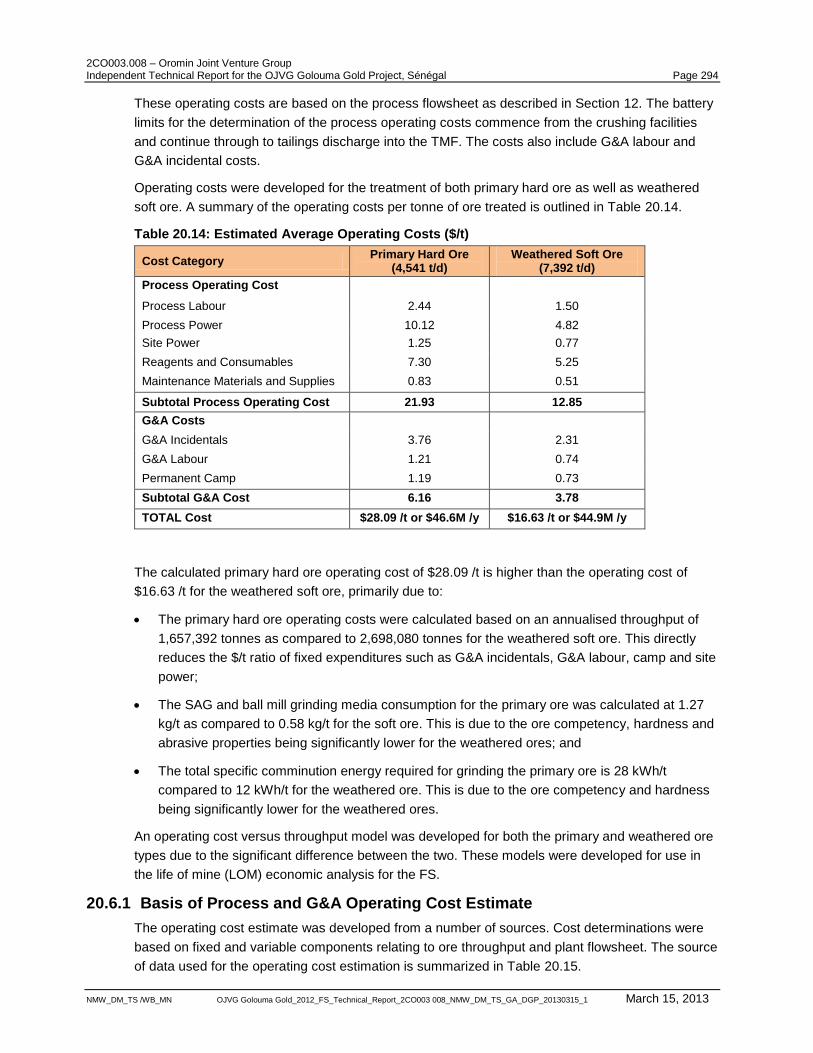
2CO003.008 – Oromin Joint Venture Group Independent Technical Report for the OJVG Golouma Gold Project, Sénégal Page 294
NMW_DM_TS /WB_MN OJVG Golouma Gold_2012_FS_Technical_Report_2CO003 008_NMW_DM_TS_GA_DGP_20130315_1 March 15, 2013
These operating costs are based on the process flowsheet as described in Section 12. The battery
limits for the determination of the process operating costs commence from the crushing facilities
and continue through to tailings discharge into the TMF. The costs also include G&A labour and
G&A incidental costs.
Operating costs were developed for the treatment of both primary hard ore as well as weathered
soft ore. A summary of the operating costs per tonne of ore treated is outlined in Table 20.14.
Table 20.14: Estimated Average Operating Costs ($/t)
Cost Category Primary Hard Ore
(4,541 t/d) Weathered Soft Ore
(7,392 t/d)
Process Operating Cost
Process Labour 2.44 1.50
Process Power 10.12 4.82
Site Power 1.25 0.77
Reagents and Consumables 7.30 5.25
Maintenance Materials and Supplies 0.83 0.51
Subtotal Process Operating Cost 21.93 12.85
G&A Costs
G&A Incidentals 3.76 2.31
G&A Labour 1.21 0.74
Permanent Camp 1.19 0.73
Subtotal G&A Cost 6.16 3.78
TOTAL Cost $28.09 /t or $46.6M /y $16.63 /t or $44.9M /y
The calculated primary hard ore operating cost of $28.09 /t is higher than the operating cost of
$16.63 /t for the weathered soft ore, primarily due to:
The primary hard ore operating costs were calculated based on an annualised throughput of
1,657,392 tonnes as compared to 2,698,080 tonnes for the weathered soft ore. This directly
reduces the $/t ratio of fixed expenditures such as G&A incidentals, G&A labour, camp and site
power;
The SAG and ball mill grinding media consumption for the primary ore was calculated at 1.27
kg/t as compared to 0.58 kg/t for the soft ore. This is due to the ore competency, hardness and
abrasive properties being significantly lower for the weathered ores; and
The total specific comminution energy required for grinding the primary ore is 28 kWh/t
compared to 12 kWh/t for the weathered ore. This is due to the ore competency and hardness
being significantly lower for the weathered ores.
An operating cost versus throughput model was developed for both the primary and weathered ore
types due to the significant difference between the two. These models were developed for use in
the life of mine (LOM) economic analysis for the FS.
20.6.1 Basis of Process and G&A Operating Cost Estimate
The operating cost estimate was developed from a number of sources. Cost determinations were
based on fixed and variable components relating to ore throughput and plant flowsheet. The source
of data used for the operating cost estimation is summarized in Table 20.15.
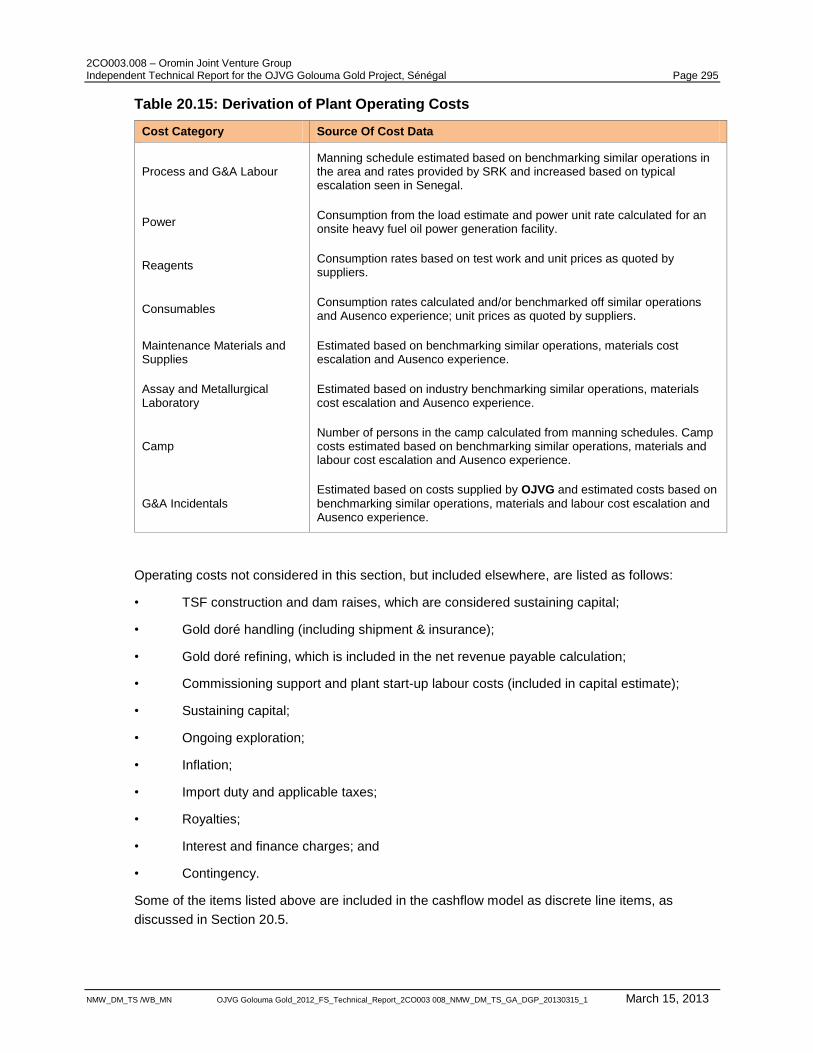
2CO003.008 – Oromin Joint Venture Group Independent Technical Report for the OJVG Golouma Gold Project, Sénégal Page 295
NMW_DM_TS /WB_MN OJVG Golouma Gold_2012_FS_Technical_Report_2CO003 008_NMW_DM_TS_GA_DGP_20130315_1 March 15, 2013
Table 20.15: Derivation of Plant Operating Costs
Cost Category Source Of Cost Data
Process and G&A Labour Manning schedule estimated based on benchmarking similar operations in the area and rates provided by SRK and increased based on typical escalation seen in Senegal.
Power Consumption from the load estimate and power unit rate calculated for an onsite heavy fuel oil power generation facility.
Reagents Consumption rates based on test work and unit prices as quoted by suppliers.
Consumables Consumption rates calculated and/or benchmarked off similar operations and Ausenco experience; unit prices as quoted by suppliers.
Maintenance Materials and Supplies
Estimated based on benchmarking similar operations, materials cost escalation and Ausenco experience.
Assay and Metallurgical Laboratory
Estimated based on industry benchmarking similar operations, materials cost escalation and Ausenco experience.
Camp Number of persons in the camp calculated from manning schedules. Camp costs estimated based on benchmarking similar operations, materials and labour cost escalation and Ausenco experience.
G&A Incidentals
Estimated based on costs supplied by OJVG and estimated costs based on
benchmarking similar operations, materials and labour cost escalation and Ausenco experience.
Operating costs not considered in this section, but included elsewhere, are listed as follows:
• TSF construction and dam raises, which are considered sustaining capital;
• Gold doré handling (including shipment & insurance);
• Gold doré refining, which is included in the net revenue payable calculation;
• Commissioning support and plant start-up labour costs (included in capital estimate);
• Sustaining capital;
• Ongoing exploration;
• Inflation;
• Import duty and applicable taxes;
• Royalties;
• Interest and finance charges; and
• Contingency.
Some of the items listed above are included in the cashflow model as discrete line items, as
discussed in Section 20.5.
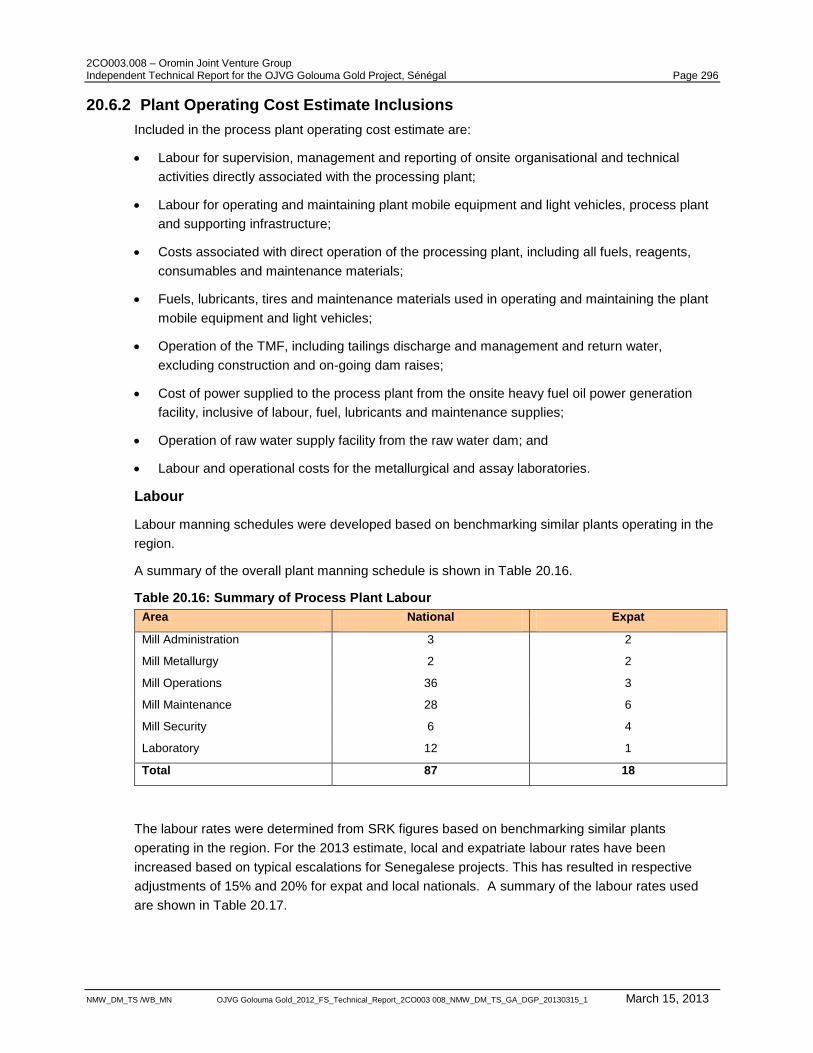
2CO003.008 – Oromin Joint Venture Group Independent Technical Report for the OJVG Golouma Gold Project, Sénégal Page 296
NMW_DM_TS /WB_MN OJVG Golouma Gold_2012_FS_Technical_Report_2CO003 008_NMW_DM_TS_GA_DGP_20130315_1 March 15, 2013
20.6.2 Plant Operating Cost Estimate Inclusions
Included in the process plant operating cost estimate are:
Labour for supervision, management and reporting of onsite organisational and technical
activities directly associated with the processing plant;
Labour for operating and maintaining plant mobile equipment and light vehicles, process plant
and supporting infrastructure;
Costs associated with direct operation of the processing plant, including all fuels, reagents,
consumables and maintenance materials;
Fuels, lubricants, tires and maintenance materials used in operating and maintaining the plant
mobile equipment and light vehicles;
Operation of the TMF, including tailings discharge and management and return water,
excluding construction and on-going dam raises;
Cost of power supplied to the process plant from the onsite heavy fuel oil power generation
facility, inclusive of labour, fuel, lubricants and maintenance supplies;
Operation of raw water supply facility from the raw water dam; and
Labour and operational costs for the metallurgical and assay laboratories.
Labour
Labour manning schedules were developed based on benchmarking similar plants operating in the
region.
A summary of the overall plant manning schedule is shown in Table 20.16.
Table 20.16: Summary of Process Plant Labour
Area National Expat
Mill Administration 3 2
Mill Metallurgy 2 2
Mill Operations 36 3
Mill Maintenance 28 6
Mill Security 6 4
Laboratory 12 1
Total 87 18
The labour rates were determined from SRK figures based on benchmarking similar plants
operating in the region. For the 2013 estimate, local and expatriate labour rates have been
increased based on typical escalations for Senegalese projects. This has resulted in respective
adjustments of 15% and 20% for expat and local nationals. A summary of the labour rates used
are shown in Table 20.17.
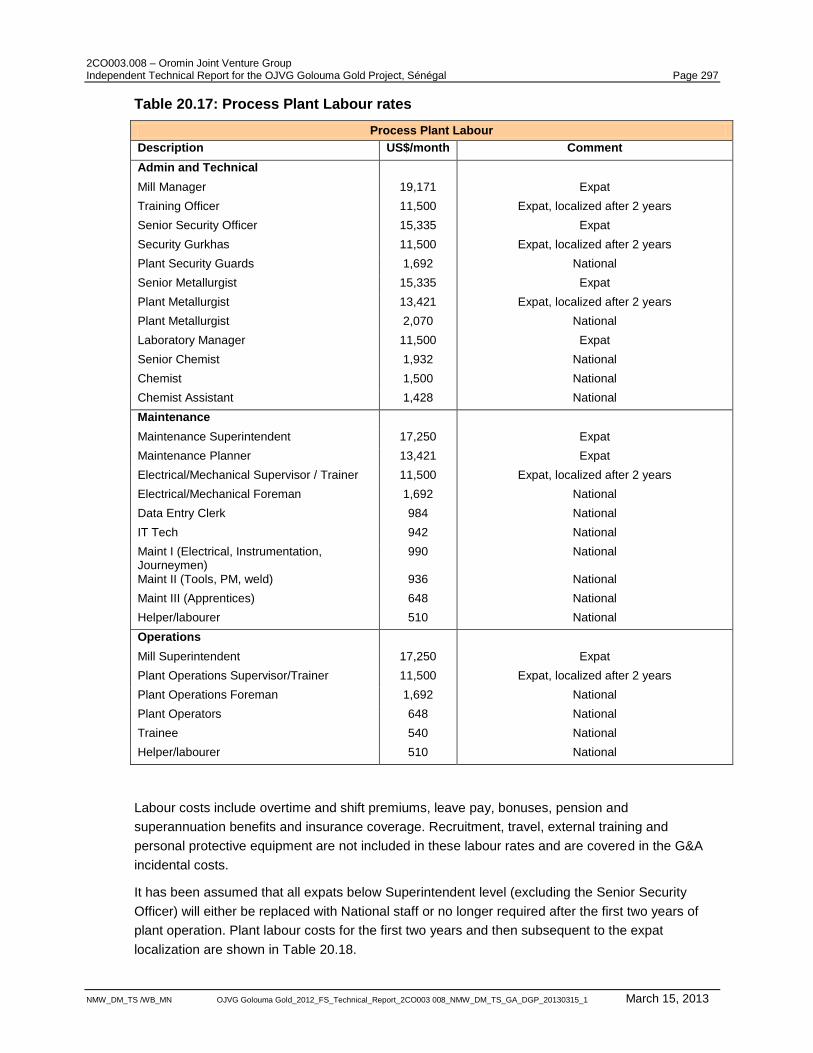
2CO003.008 – Oromin Joint Venture Group Independent Technical Report for the OJVG Golouma Gold Project, Sénégal Page 297
NMW_DM_TS /WB_MN OJVG Golouma Gold_2012_FS_Technical_Report_2CO003 008_NMW_DM_TS_GA_DGP_20130315_1 March 15, 2013
Table 20.17: Process Plant Labour rates
Process Plant Labour
Description US$/month Comment
Admin and Technical
Mill Manager 19,171 Expat
Training Officer 11,500 Expat, localized after 2 years
Senior Security Officer 15,335 Expat
Security Gurkhas 11,500 Expat, localized after 2 years
Plant Security Guards 1,692 National
Senior Metallurgist 15,335 Expat
Plant Metallurgist 13,421 Expat, localized after 2 years
Plant Metallurgist 2,070 National
Laboratory Manager 11,500 Expat
Senior Chemist 1,932 National
Chemist 1,500 National
Chemist Assistant 1,428 National
Maintenance
Maintenance Superintendent 17,250 Expat
Maintenance Planner 13,421 Expat
Electrical/Mechanical Supervisor / Trainer 11,500 Expat, localized after 2 years
Electrical/Mechanical Foreman 1,692 National
Data Entry Clerk 984 National
IT Tech 942 National
Maint I (Electrical, Instrumentation, Journeymen)
990 National
Maint II (Tools, PM, weld) 936 National
Maint III (Apprentices) 648 National
Helper/labourer 510 National
Operations
Mill Superintendent 17,250 Expat
Plant Operations Supervisor/Trainer 11,500 Expat, localized after 2 years
Plant Operations Foreman 1,692 National
Plant Operators 648 National
Trainee 540 National
Helper/labourer 510 National
Labour costs include overtime and shift premiums, leave pay, bonuses, pension and
superannuation benefits and insurance coverage. Recruitment, travel, external training and
personal protective equipment are not included in these labour rates and are covered in the G&A
incidental costs.
It has been assumed that all expats below Superintendent level (excluding the Senior Security
Officer) will either be replaced with National staff or no longer required after the first two years of
plant operation. Plant labour costs for the first two years and then subsequent to the expat
localization are shown in Table 20.18.
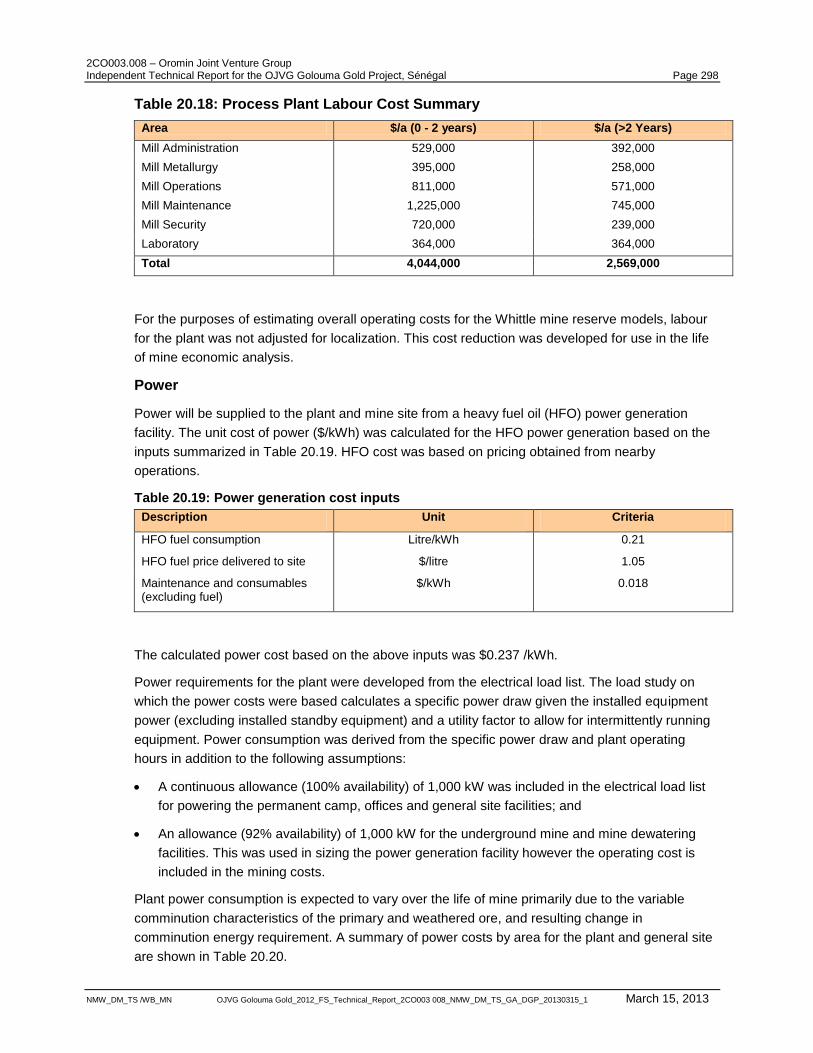
2CO003.008 – Oromin Joint Venture Group Independent Technical Report for the OJVG Golouma Gold Project, Sénégal Page 298
NMW_DM_TS /WB_MN OJVG Golouma Gold_2012_FS_Technical_Report_2CO003 008_NMW_DM_TS_GA_DGP_20130315_1 March 15, 2013
Table 20.18: Process Plant Labour Cost Summary
Area $/a (0 - 2 years) $/a (>2 Years)
Mill Administration 529,000 392,000
Mill Metallurgy 395,000 258,000
Mill Operations 811,000 571,000
Mill Maintenance 1,225,000 745,000
Mill Security 720,000 239,000
Laboratory 364,000 364,000
Total 4,044,000 2,569,000
For the purposes of estimating overall operating costs for the Whittle mine reserve models, labour
for the plant was not adjusted for localization. This cost reduction was developed for use in the life
of mine economic analysis.
Power
Power will be supplied to the plant and mine site from a heavy fuel oil (HFO) power generation
facility. The unit cost of power ($/kWh) was calculated for the HFO power generation based on the
inputs summarized in Table 20.19. HFO cost was based on pricing obtained from nearby
operations.
Table 20.19: Power generation cost inputs
Description Unit Criteria
HFO fuel consumption Litre/kWh 0.21
HFO fuel price delivered to site $/litre 1.05
Maintenance and consumables (excluding fuel)
$/kWh 0.018
The calculated power cost based on the above inputs was $0.237 /kWh.
Power requirements for the plant were developed from the electrical load list. The load study on
which the power costs were based calculates a specific power draw given the installed equipment
power (excluding installed standby equipment) and a utility factor to allow for intermittently running
equipment. Power consumption was derived from the specific power draw and plant operating
hours in addition to the following assumptions:
A continuous allowance (100% availability) of 1,000 kW was included in the electrical load list
for powering the permanent camp, offices and general site facilities; and
An allowance (92% availability) of 1,000 kW for the underground mine and mine dewatering
facilities. This was used in sizing the power generation facility however the operating cost is
included in the mining costs.
Plant power consumption is expected to vary over the life of mine primarily due to the variable
comminution characteristics of the primary and weathered ore, and resulting change in
comminution energy requirement. A summary of power costs by area for the plant and general site
are shown in Table 20.20.
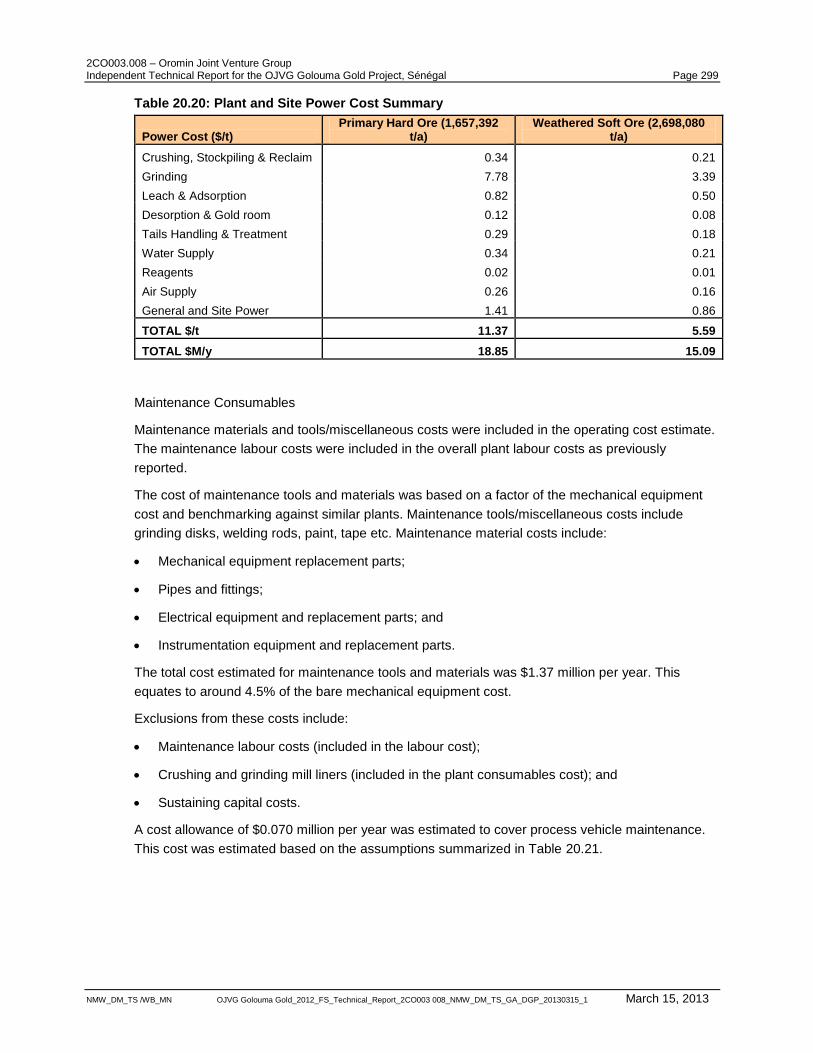
2CO003.008 – Oromin Joint Venture Group Independent Technical Report for the OJVG Golouma Gold Project, Sénégal Page 299
NMW_DM_TS /WB_MN OJVG Golouma Gold_2012_FS_Technical_Report_2CO003 008_NMW_DM_TS_GA_DGP_20130315_1 March 15, 2013
Table 20.20: Plant and Site Power Cost Summary
Power Cost ($/t) Primary Hard Ore (1,657,392
t/a) Weathered Soft Ore (2,698,080
t/a)
Crushing, Stockpiling & Reclaim 0.34 0.21
Grinding 7.78 3.39
Leach & Adsorption 0.82 0.50
Desorption & Gold room 0.12 0.08
Tails Handling & Treatment 0.29 0.18
Water Supply 0.34 0.21
Reagents 0.02 0.01
Air Supply 0.26 0.16
General and Site Power 1.41 0.86
TOTAL $/t 11.37 5.59
TOTAL $M/y 18.85 15.09
Maintenance Consumables
Maintenance materials and tools/miscellaneous costs were included in the operating cost estimate.
The maintenance labour costs were included in the overall plant labour costs as previously
reported.
The cost of maintenance tools and materials was based on a factor of the mechanical equipment
cost and benchmarking against similar plants. Maintenance tools/miscellaneous costs include
grinding disks, welding rods, paint, tape etc. Maintenance material costs include:
Mechanical equipment replacement parts;
Pipes and fittings;
Electrical equipment and replacement parts; and
Instrumentation equipment and replacement parts.
The total cost estimated for maintenance tools and materials was $1.37 million per year. This
equates to around 4.5% of the bare mechanical equipment cost.
Exclusions from these costs include:
Maintenance labour costs (included in the labour cost);
Crushing and grinding mill liners (included in the plant consumables cost); and
Sustaining capital costs.
A cost allowance of $0.070 million per year was estimated to cover process vehicle maintenance.
This cost was estimated based on the assumptions summarized in Table 20.21.
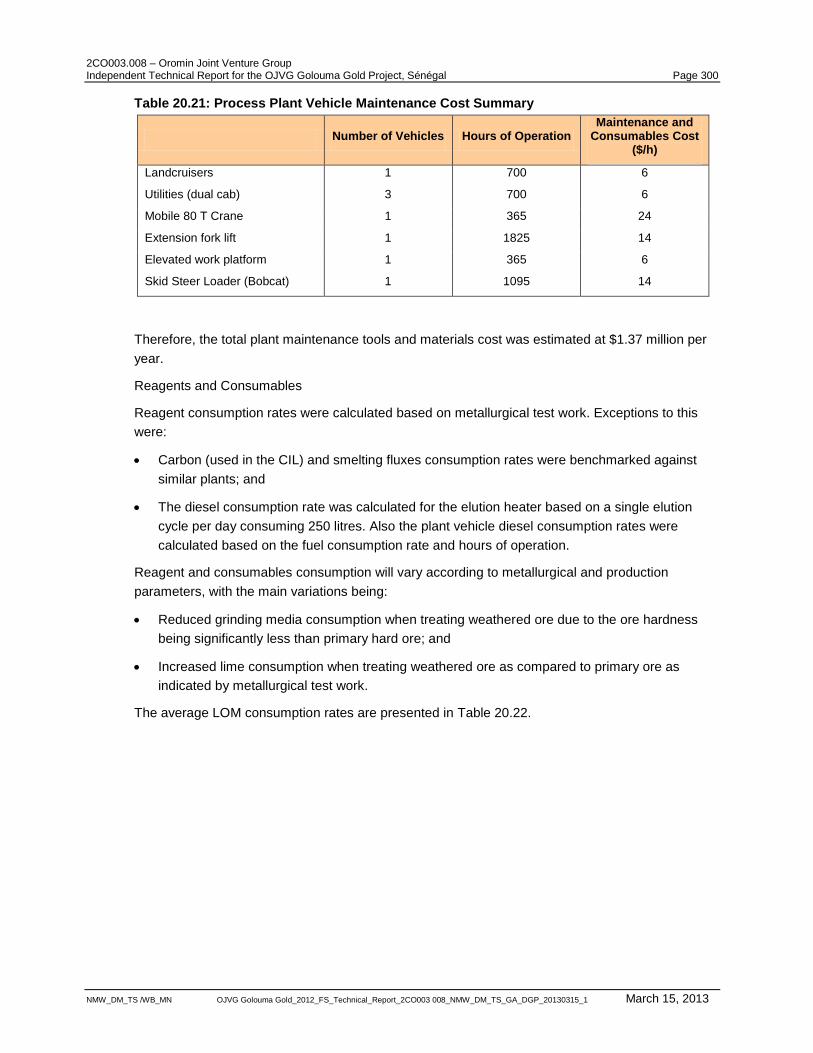
2CO003.008 – Oromin Joint Venture Group Independent Technical Report for the OJVG Golouma Gold Project, Sénégal Page 300
NMW_DM_TS /WB_MN OJVG Golouma Gold_2012_FS_Technical_Report_2CO003 008_NMW_DM_TS_GA_DGP_20130315_1 March 15, 2013
Table 20.21: Process Plant Vehicle Maintenance Cost Summary
Number of Vehicles Hours of Operation Maintenance and
Consumables Cost ($/h)
Landcruisers 1 700 6
Utilities (dual cab) 3 700 6
Mobile 80 T Crane 1 365 24
Extension fork lift 1 1825 14
Elevated work platform 1 365 6
Skid Steer Loader (Bobcat) 1 1095 14
Therefore, the total plant maintenance tools and materials cost was estimated at $1.37 million per
year.
Reagents and Consumables
Reagent consumption rates were calculated based on metallurgical test work. Exceptions to this
were:
Carbon (used in the CIL) and smelting fluxes consumption rates were benchmarked against
similar plants; and
The diesel consumption rate was calculated for the elution heater based on a single elution
cycle per day consuming 250 litres. Also the plant vehicle diesel consumption rates were
calculated based on the fuel consumption rate and hours of operation.
Reagent and consumables consumption will vary according to metallurgical and production
parameters, with the main variations being:
Reduced grinding media consumption when treating weathered ore due to the ore hardness
being significantly less than primary hard ore; and
Increased lime consumption when treating weathered ore as compared to primary ore as
indicated by metallurgical test work.
The average LOM consumption rates are presented in Table 20.22.
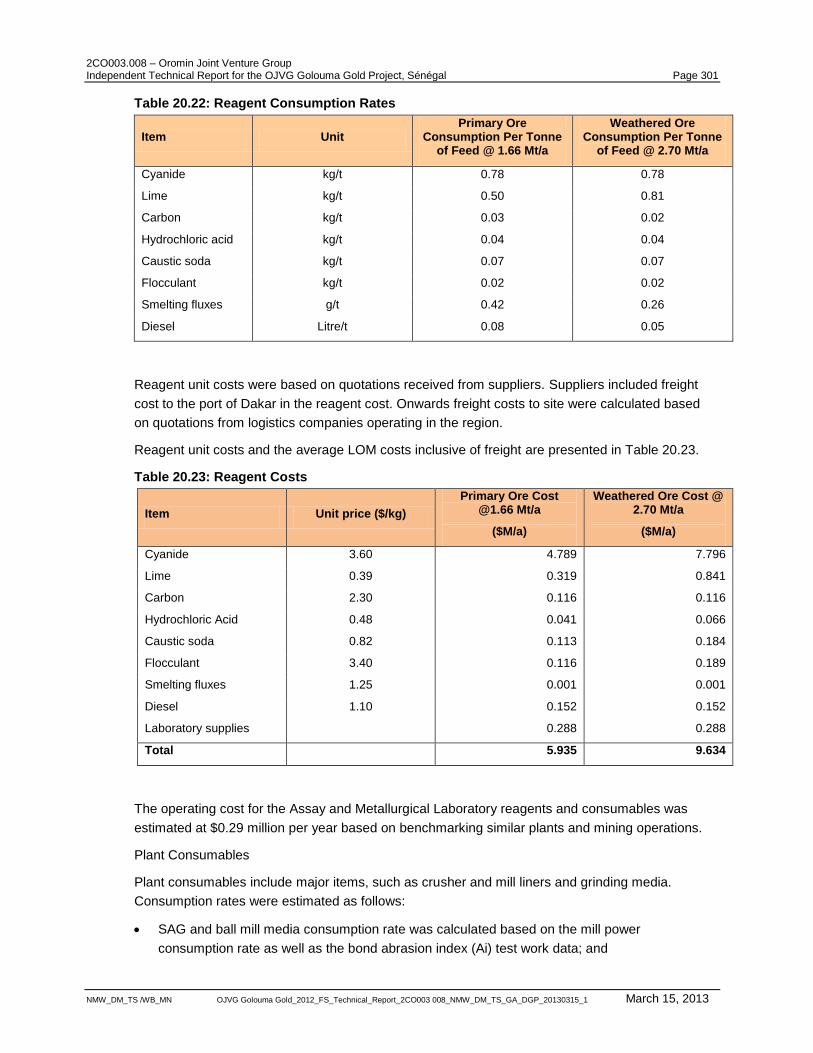
2CO003.008 – Oromin Joint Venture Group Independent Technical Report for the OJVG Golouma Gold Project, Sénégal Page 301
NMW_DM_TS /WB_MN OJVG Golouma Gold_2012_FS_Technical_Report_2CO003 008_NMW_DM_TS_GA_DGP_20130315_1 March 15, 2013
Table 20.22: Reagent Consumption Rates
Item Unit Primary Ore
Consumption Per Tonne of Feed @ 1.66 Mt/a
Weathered Ore Consumption Per Tonne
of Feed @ 2.70 Mt/a
Cyanide kg/t 0.78 0.78
Lime kg/t 0.50 0.81
Carbon kg/t 0.03 0.02
Hydrochloric acid kg/t 0.04 0.04
Caustic soda kg/t 0.07 0.07
Flocculant kg/t 0.02 0.02
Smelting fluxes g/t 0.42 0.26
Diesel Litre/t 0.08 0.05
Reagent unit costs were based on quotations received from suppliers. Suppliers included freight
cost to the port of Dakar in the reagent cost. Onwards freight costs to site were calculated based
on quotations from logistics companies operating in the region.
Reagent unit costs and the average LOM costs inclusive of freight are presented in Table 20.23.
Table 20.23: Reagent Costs
Item Unit price ($/kg)
Primary Ore Cost @1.66 Mt/a
($M/a)
Weathered Ore Cost @ 2.70 Mt/a
($M/a)
Cyanide 3.60 4.789 7.796
Lime 0.39 0.319 0.841
Carbon 2.30 0.116 0.116
Hydrochloric Acid 0.48 0.041 0.066
Caustic soda 0.82 0.113 0.184
Flocculant 3.40 0.116 0.189
Smelting fluxes 1.25 0.001 0.001
Diesel 1.10 0.152 0.152
Laboratory supplies 0.288 0.288
Total 5.935 9.634
The operating cost for the Assay and Metallurgical Laboratory reagents and consumables was
estimated at $0.29 million per year based on benchmarking similar plants and mining operations.
Plant Consumables
Plant consumables include major items, such as crusher and mill liners and grinding media.
Consumption rates were estimated as follows:
SAG and ball mill media consumption rate was calculated based on the mill power
consumption rate as well as the bond abrasion index (Ai) test work data; and
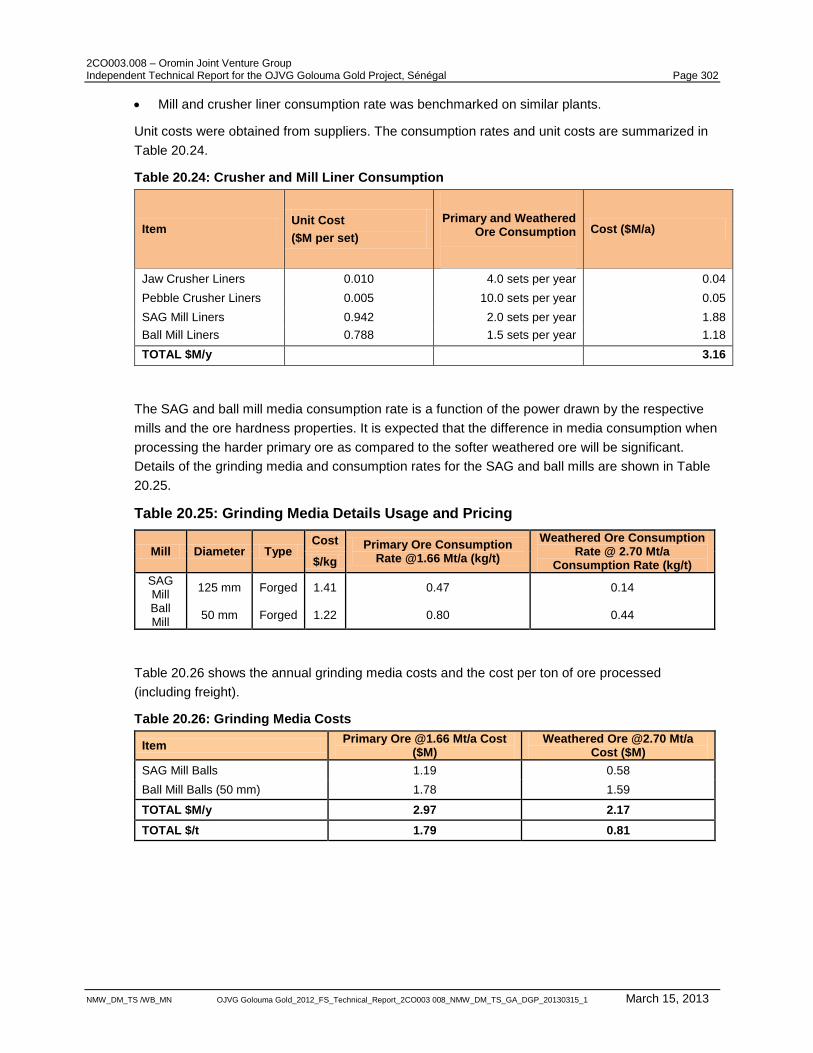
2CO003.008 – Oromin Joint Venture Group Independent Technical Report for the OJVG Golouma Gold Project, Sénégal Page 302
NMW_DM_TS /WB_MN OJVG Golouma Gold_2012_FS_Technical_Report_2CO003 008_NMW_DM_TS_GA_DGP_20130315_1 March 15, 2013
Mill and crusher liner consumption rate was benchmarked on similar plants.
Unit costs were obtained from suppliers. The consumption rates and unit costs are summarized in
Table 20.24.
Table 20.24: Crusher and Mill Liner Consumption
Item Unit Cost
($M per set)
Primary and Weathered Ore Consumption
Cost ($M/a)
Jaw Crusher Liners 0.010 4.0 sets per year 0.04
Pebble Crusher Liners 0.005 10.0 sets per year 0.05
SAG Mill Liners 0.942 2.0 sets per year 1.88
Ball Mill Liners 0.788 1.5 sets per year 1.18
TOTAL $M/y 3.16
The SAG and ball mill media consumption rate is a function of the power drawn by the respective
mills and the ore hardness properties. It is expected that the difference in media consumption when
processing the harder primary ore as compared to the softer weathered ore will be significant.
Details of the grinding media and consumption rates for the SAG and ball mills are shown in Table
20.25.
Table 20.25: Grinding Media Details Usage and Pricing
Mill Diameter Type Cost Primary Ore Consumption
Rate @1.66 Mt/a (kg/t)
Weathered Ore Consumption Rate @ 2.70 Mt/a
Consumption Rate (kg/t) $/kg
SAG Mill
125 mm Forged 1.41 0.47 0.14
Ball Mill
50 mm Forged 1.22 0.80 0.44
Table 20.26 shows the annual grinding media costs and the cost per ton of ore processed
(including freight).
Table 20.26: Grinding Media Costs
Item Primary Ore @1.66 Mt/a Cost
($M) Weathered Ore @2.70 Mt/a
Cost ($M)
SAG Mill Balls 1.19 0.58
Ball Mill Balls (50 mm) 1.78 1.59
TOTAL $M/y 2.97 2.17
TOTAL $/t 1.79 0.81
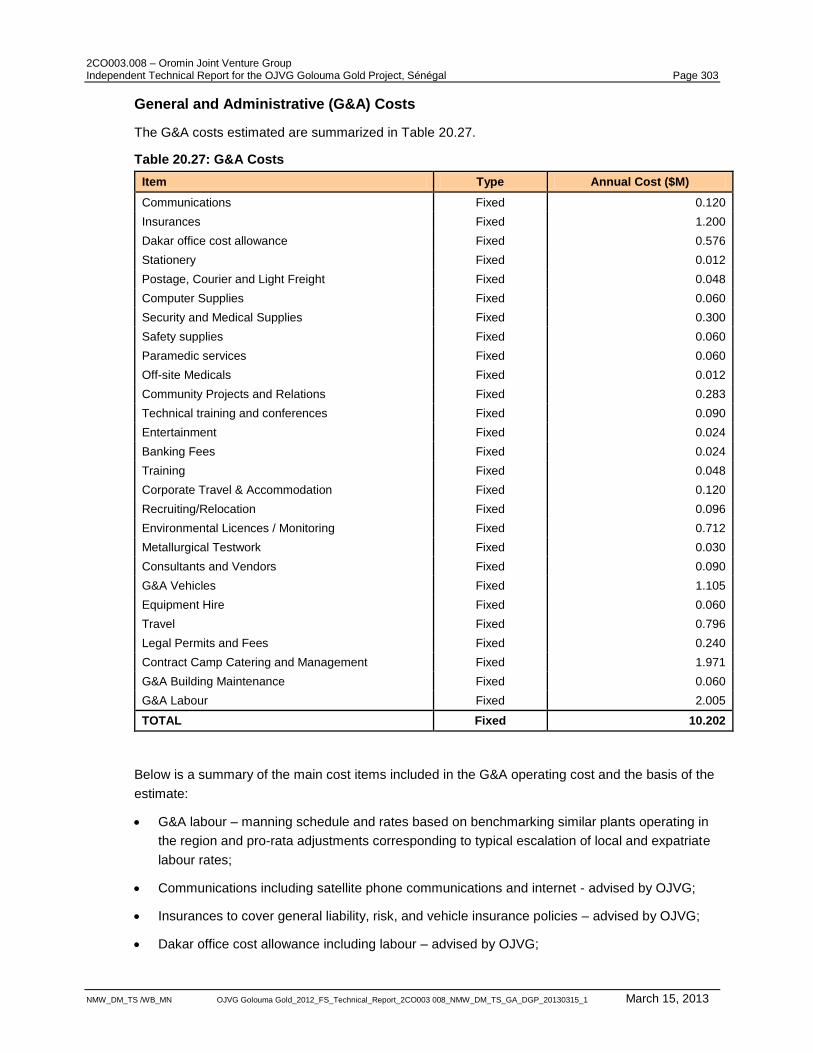
2CO003.008 – Oromin Joint Venture Group Independent Technical Report for the OJVG Golouma Gold Project, Sénégal Page 303
NMW_DM_TS /WB_MN OJVG Golouma Gold_2012_FS_Technical_Report_2CO003 008_NMW_DM_TS_GA_DGP_20130315_1 March 15, 2013
General and Administrative (G&A) Costs
The G&A costs estimated are summarized in Table 20.27.
Table 20.27: G&A Costs
Item Type Annual Cost ($M)
Communications Fixed 0.120
Insurances Fixed 1.200
Dakar office cost allowance Fixed 0.576
Stationery Fixed 0.012
Postage, Courier and Light Freight Fixed 0.048
Computer Supplies Fixed 0.060
Security and Medical Supplies Fixed 0.300
Safety supplies Fixed 0.060
Paramedic services Fixed 0.060
Off-site Medicals Fixed 0.012
Community Projects and Relations Fixed 0.283
Technical training and conferences Fixed 0.090
Entertainment Fixed 0.024
Banking Fees Fixed 0.024
Training Fixed 0.048
Corporate Travel & Accommodation Fixed 0.120
Recruiting/Relocation Fixed 0.096
Environmental Licences / Monitoring Fixed 0.712
Metallurgical Testwork Fixed 0.030
Consultants and Vendors Fixed 0.090
G&A Vehicles Fixed 1.105
Equipment Hire Fixed 0.060
Travel Fixed 0.796
Legal Permits and Fees Fixed 0.240
Contract Camp Catering and Management Fixed 1.971
G&A Building Maintenance Fixed 0.060
G&A Labour Fixed 2.005
TOTAL Fixed 10.202
Below is a summary of the main cost items included in the G&A operating cost and the basis of the
estimate:
G&A labour – manning schedule and rates based on benchmarking similar plants operating in
the region and pro-rata adjustments corresponding to typical escalation of local and expatriate
labour rates;
Communications including satellite phone communications and internet - advised by OJVG;
Insurances to cover general liability, risk, and vehicle insurance policies – advised by OJVG;
Dakar office cost allowance including labour – advised by OJVG;
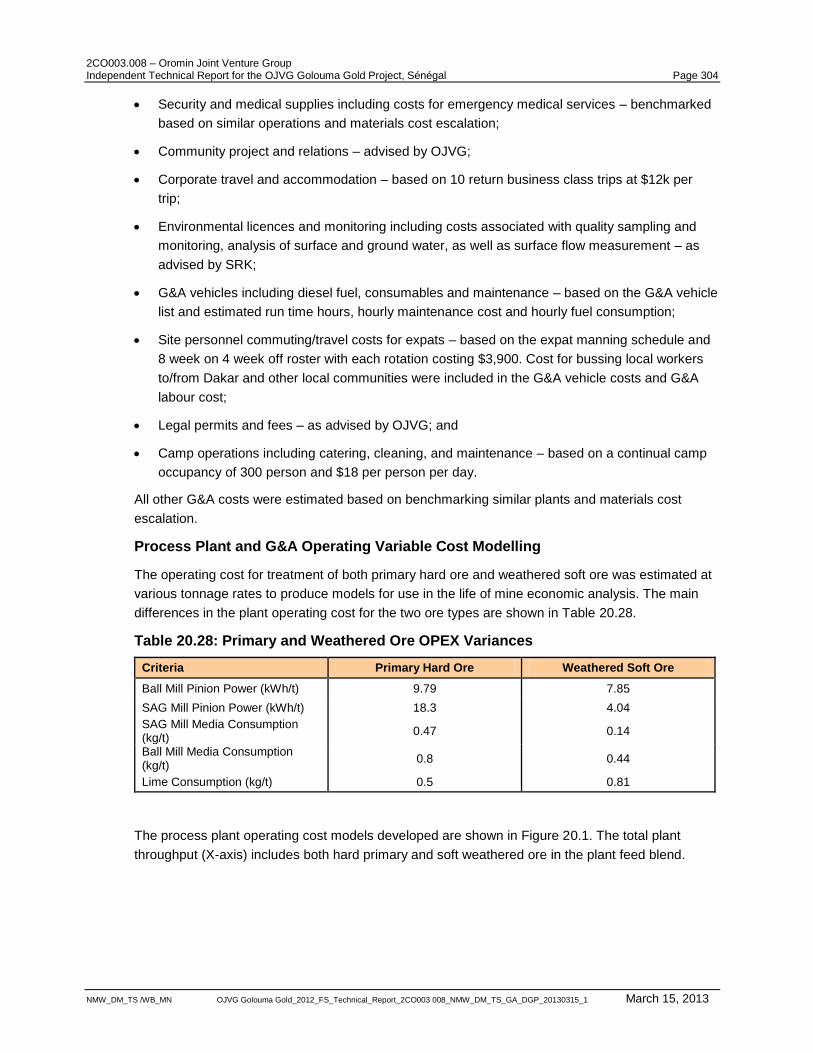
2CO003.008 – Oromin Joint Venture Group Independent Technical Report for the OJVG Golouma Gold Project, Sénégal Page 304
NMW_DM_TS /WB_MN OJVG Golouma Gold_2012_FS_Technical_Report_2CO003 008_NMW_DM_TS_GA_DGP_20130315_1 March 15, 2013
Security and medical supplies including costs for emergency medical services – benchmarked
based on similar operations and materials cost escalation;
Community project and relations – advised by OJVG;
Corporate travel and accommodation – based on 10 return business class trips at $12k per
trip;
Environmental licences and monitoring including costs associated with quality sampling and
monitoring, analysis of surface and ground water, as well as surface flow measurement – as
advised by SRK;
G&A vehicles including diesel fuel, consumables and maintenance – based on the G&A vehicle
list and estimated run time hours, hourly maintenance cost and hourly fuel consumption;
Site personnel commuting/travel costs for expats – based on the expat manning schedule and
8 week on 4 week off roster with each rotation costing $3,900. Cost for bussing local workers
to/from Dakar and other local communities were included in the G&A vehicle costs and G&A
labour cost;
Legal permits and fees – as advised by OJVG; and
Camp operations including catering, cleaning, and maintenance – based on a continual camp
occupancy of 300 person and $18 per person per day.
All other G&A costs were estimated based on benchmarking similar plants and materials cost
escalation.
Process Plant and G&A Operating Variable Cost Modelling
The operating cost for treatment of both primary hard ore and weathered soft ore was estimated at
various tonnage rates to produce models for use in the life of mine economic analysis. The main
differences in the plant operating cost for the two ore types are shown in Table 20.28.
Table 20.28: Primary and Weathered Ore OPEX Variances
Criteria Primary Hard Ore Weathered Soft Ore
Ball Mill Pinion Power (kWh/t) 9.79 7.85
SAG Mill Pinion Power (kWh/t) 18.3 4.04
SAG Mill Media Consumption (kg/t)
0.47 0.14
Ball Mill Media Consumption (kg/t)
0.8 0.44
Lime Consumption (kg/t) 0.5 0.81
The process plant operating cost models developed are shown in Figure 20.1. The total plant
throughput (X-axis) includes both hard primary and soft weathered ore in the plant feed blend.
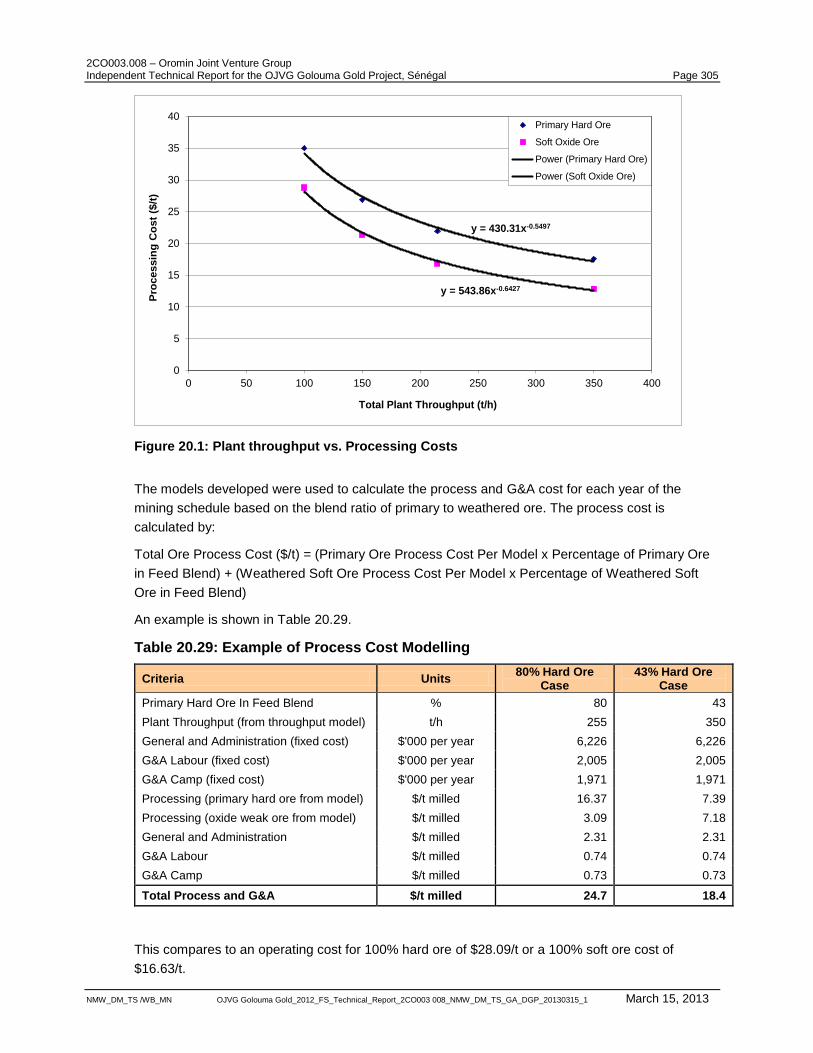
2CO003.008 – Oromin Joint Venture Group Independent Technical Report for the OJVG Golouma Gold Project, Sénégal Page 305
NMW_DM_TS /WB_MN OJVG Golouma Gold_2012_FS_Technical_Report_2CO003 008_NMW_DM_TS_GA_DGP_20130315_1 March 15, 2013
Figure 20.1: Plant throughput vs. Processing Costs
The models developed were used to calculate the process and G&A cost for each year of the
mining schedule based on the blend ratio of primary to weathered ore. The process cost is
calculated by:
Total Ore Process Cost ($/t) = (Primary Ore Process Cost Per Model x Percentage of Primary Ore
in Feed Blend) + (Weathered Soft Ore Process Cost Per Model x Percentage of Weathered Soft
Ore in Feed Blend)
An example is shown in Table 20.29.
Table 20.29: Example of Process Cost Modelling
Criteria Units 80% Hard Ore
Case 43% Hard Ore
Case
Primary Hard Ore In Feed Blend % 80 43
Plant Throughput (from throughput model) t/h 255 350
General and Administration (fixed cost) $'000 per year 6,226 6,226
G&A Labour (fixed cost) $'000 per year 2,005 2,005
G&A Camp (fixed cost) $'000 per year 1,971 1,971
Processing (primary hard ore from model) $/t milled 16.37 7.39
Processing (oxide weak ore from model) $/t milled 3.09 7.18
General and Administration $/t milled 2.31 2.31
G&A Labour $/t milled 0.74 0.74
G&A Camp $/t milled 0.73 0.73
Total Process and G&A $/t milled 24.7 18.4
This compares to an operating cost for 100% hard ore of $28.09/t or a 100% soft ore cost of
$16.63/t.
y = 430.31x-0.5497
y = 543.86x-0.6427
0
5
10
15
20
25
30
35
40
0 50 100 150 200 250 300 350 400
Pro
ces
sin
g C
os
t ($
/t)
Total Plant Throughput (t/h)
Primary Hard Ore
Soft Oxide Ore
Power (Primary Hard Ore)
Power (Soft Oxide Ore)
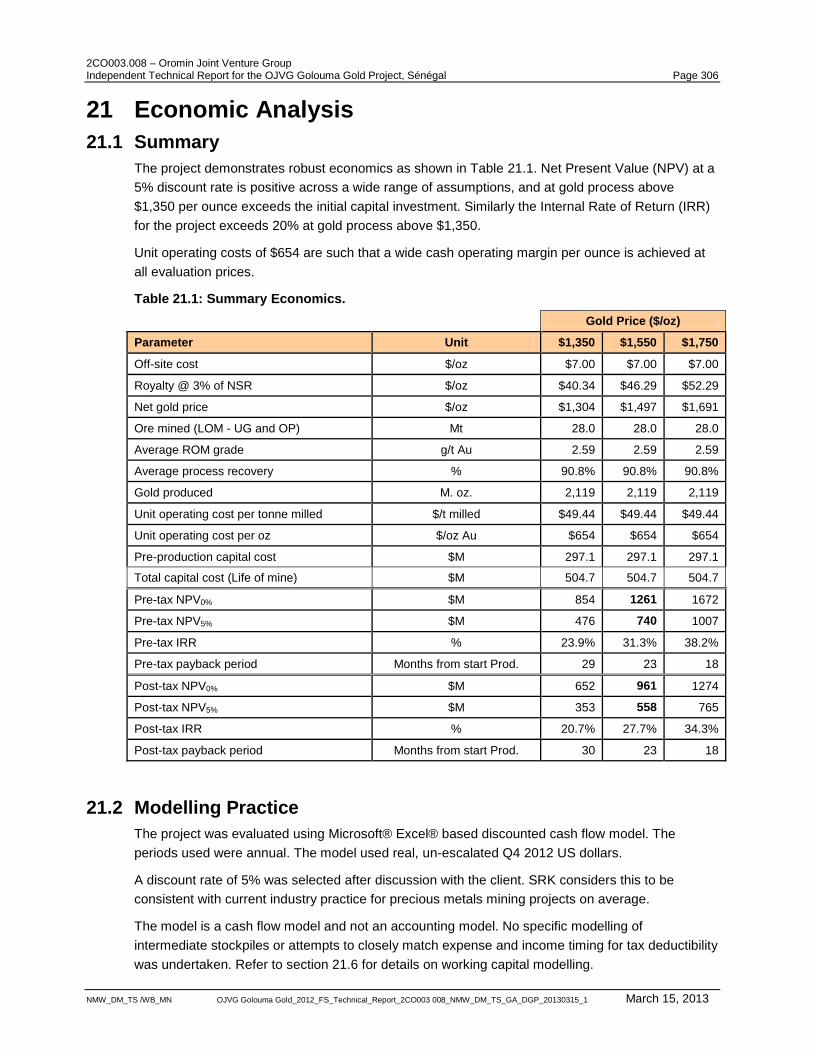
2CO003.008 – Oromin Joint Venture Group Independent Technical Report for the OJVG Golouma Gold Project, Sénégal Page 306
NMW_DM_TS /WB_MN OJVG Golouma Gold_2012_FS_Technical_Report_2CO003 008_NMW_DM_TS_GA_DGP_20130315_1 March 15, 2013
21 Economic Analysis
21.1 Summary
The project demonstrates robust economics as shown in Table 21.1. Net Present Value (NPV) at a
5% discount rate is positive across a wide range of assumptions, and at gold process above
$1,350 per ounce exceeds the initial capital investment. Similarly the Internal Rate of Return (IRR)
for the project exceeds 20% at gold process above $1,350.
Unit operating costs of $654 are such that a wide cash operating margin per ounce is achieved at
all evaluation prices.
Table 21.1: Summary Economics.
Gold Price ($/oz)
Parameter Unit $1,350 $1,550 $1,750
Off-site cost $/oz $7.00 $7.00 $7.00
Royalty @ 3% of NSR $/oz $40.34 $46.29 $52.29
Net gold price $/oz $1,304 $1,497 $1,691
Ore mined (LOM - UG and OP) Mt 28.0 28.0 28.0
Average ROM grade g/t Au 2.59 2.59 2.59
Average process recovery % 90.8% 90.8% 90.8%
Gold produced M. oz. 2,119 2,119 2,119
Unit operating cost per tonne milled $/t milled $49.44 $49.44 $49.44
Unit operating cost per oz $/oz Au $654 $654 $654
Pre-production capital cost $M 297.1 297.1 297.1
Total capital cost (Life of mine) $M 504.7 504.7 504.7
Pre-tax NPV0% $M 854 1261 1672
Pre-tax NPV5% $M 476 740 1007
Pre-tax IRR % 23.9% 31.3% 38.2%
Pre-tax payback period Months from start Prod. 29 23 18
Post-tax NPV0% $M 652 961 1274
Post-tax NPV5% $M 353 558 765
Post-tax IRR % 20.7% 27.7% 34.3%
Post-tax payback period Months from start Prod. 30 23 18
21.2 Modelling Practice
The project was evaluated using Microsoft® Excel® based discounted cash flow model. The
periods used were annual. The model used real, un-escalated Q4 2012 US dollars.
A discount rate of 5% was selected after discussion with the client. SRK considers this to be
consistent with current industry practice for precious metals mining projects on average.
The model is a cash flow model and not an accounting model. No specific modelling of
intermediate stockpiles or attempts to closely match expense and income timing for tax deductibility
was undertaken. Refer to section 21.6 for details on working capital modelling.
2CO003.008 – Oromin Joint Venture Group Independent Technical Report for the OJVG Golouma Gold Project, Sénégal Page 307
NMW_DM_TS /WB_MN OJVG Golouma Gold_2012_FS_Technical_Report_2CO003 008_NMW_DM_TS_GA_DGP_20130315_1 March 15, 2013
The asset-level model assumes a simple all-equity project ownership and financing. No
consideration of equipment leasing, project financing, bonding, metal strips, royalty sales (except
for existing government and private royalties) forward sales, hedging or any other financial
arrangements was undertaken. No consideration was given to the structure of the ownership
company.
21.3 Construction Schedule
For the purposes of economic evaluation it was assumed that construction would begin in 2014
and be completed in 2015. This is considered a reasonable period for construction activities, but
assumes that full permitting and financing will be available in early 2014.
Delays to commencement of construction do not materially alter the economic potential of the
underlying project, but it must be recognised that costs associated with permitting, studies and
management activities will accrue during the pre-construction phase. These costs have not been
modelled for delayed construction schedules.
21.4 Production Schedule
The mining production schedule evaluated was generated by SRK as described in Section 15.3
and is reproduced in Table 21.2.
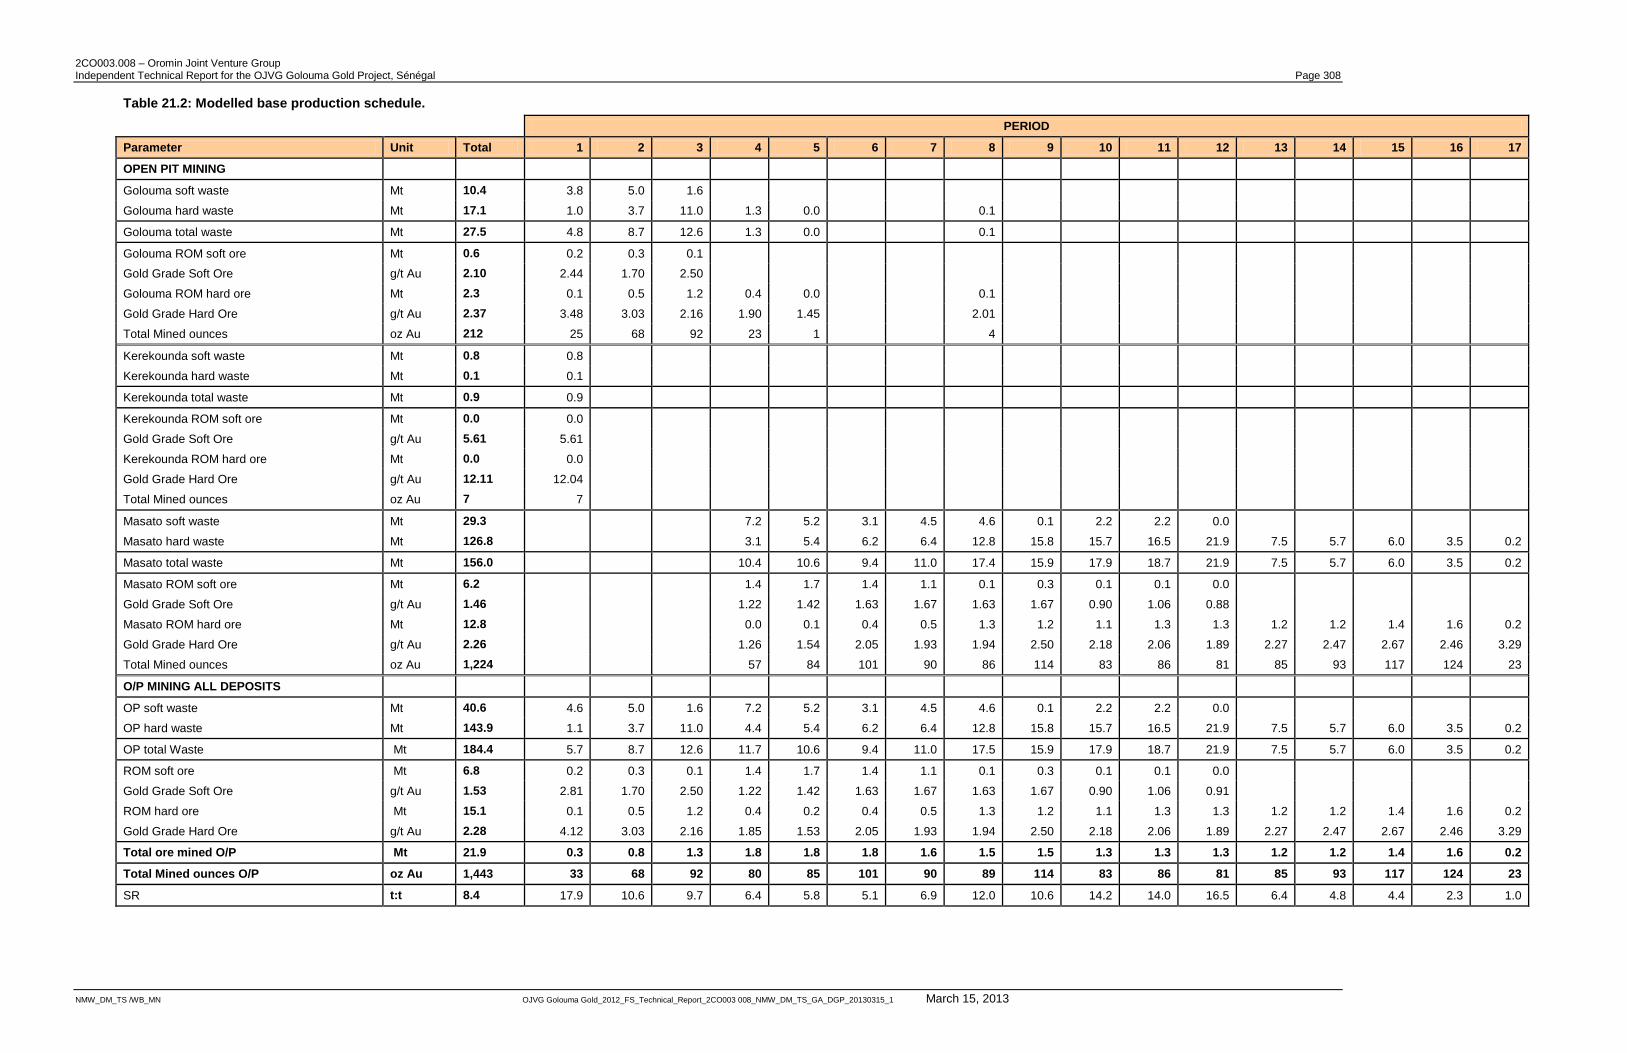
2CO003.008 – Oromin Joint Venture Group Independent Technical Report for the OJVG Golouma Gold Project, Sénégal Page 308
NMW_DM_TS /WB_MN OJVG Golouma Gold_2012_FS_Technical_Report_2CO003 008_NMW_DM_TS_GA_DGP_20130315_1 March 15, 2013
Table 21.2: Modelled base production schedule.
PERIOD
Parameter Unit Total 1 2 3 4 5 6 7 8 9 10 11 12 13 14 15 16 17
OPEN PIT MINING
Golouma soft waste Mt 10.4 3.8 5.0 1.6
Golouma hard waste Mt 17.1 1.0 3.7 11.0 1.3 0.0 0.1
Golouma total waste Mt 27.5 4.8 8.7 12.6 1.3 0.0 0.1
Golouma ROM soft ore Mt 0.6 0.2 0.3 0.1
Gold Grade Soft Ore g/t Au 2.10 2.44 1.70 2.50
Golouma ROM hard ore Mt 2.3 0.1 0.5 1.2 0.4 0.0 0.1
Gold Grade Hard Ore g/t Au 2.37 3.48 3.03 2.16 1.90 1.45 2.01
Total Mined ounces oz Au 212 25 68 92 23 1 4
Kerekounda soft waste Mt 0.8 0.8
Kerekounda hard waste Mt 0.1 0.1
Kerekounda total waste Mt 0.9 0.9
Kerekounda ROM soft ore Mt 0.0 0.0
Gold Grade Soft Ore g/t Au 5.61 5.61
Kerekounda ROM hard ore Mt 0.0 0.0
Gold Grade Hard Ore g/t Au 12.11 12.04
Total Mined ounces oz Au 7 7
Masato soft waste Mt 29.3 7.2 5.2 3.1 4.5 4.6 0.1 2.2 2.2 0.0
Masato hard waste Mt 126.8 3.1 5.4 6.2 6.4 12.8 15.8 15.7 16.5 21.9 7.5 5.7 6.0 3.5 0.2
Masato total waste Mt 156.0 10.4 10.6 9.4 11.0 17.4 15.9 17.9 18.7 21.9 7.5 5.7 6.0 3.5 0.2
Masato ROM soft ore Mt 6.2 1.4 1.7 1.4 1.1 0.1 0.3 0.1 0.1 0.0
Gold Grade Soft Ore g/t Au 1.46 1.22 1.42 1.63 1.67 1.63 1.67 0.90 1.06 0.88
Masato ROM hard ore Mt 12.8 0.0 0.1 0.4 0.5 1.3 1.2 1.1 1.3 1.3 1.2 1.2 1.4 1.6 0.2
Gold Grade Hard Ore g/t Au 2.26 1.26 1.54 2.05 1.93 1.94 2.50 2.18 2.06 1.89 2.27 2.47 2.67 2.46 3.29
Total Mined ounces oz Au 1,224 57 84 101 90 86 114 83 86 81 85 93 117 124 23
O/P MINING ALL DEPOSITS
OP soft waste Mt 40.6 4.6 5.0 1.6 7.2 5.2 3.1 4.5 4.6 0.1 2.2 2.2 0.0
OP hard waste Mt 143.9 1.1 3.7 11.0 4.4 5.4 6.2 6.4 12.8 15.8 15.7 16.5 21.9 7.5 5.7 6.0 3.5 0.2
OP total Waste Mt 184.4 5.7 8.7 12.6 11.7 10.6 9.4 11.0 17.5 15.9 17.9 18.7 21.9 7.5 5.7 6.0 3.5 0.2
ROM soft ore Mt 6.8 0.2 0.3 0.1 1.4 1.7 1.4 1.1 0.1 0.3 0.1 0.1 0.0
Gold Grade Soft Ore g/t Au 1.53 2.81 1.70 2.50 1.22 1.42 1.63 1.67 1.63 1.67 0.90 1.06 0.91
ROM hard ore Mt 15.1 0.1 0.5 1.2 0.4 0.2 0.4 0.5 1.3 1.2 1.1 1.3 1.3 1.2 1.2 1.4 1.6 0.2
Gold Grade Hard Ore g/t Au 2.28 4.12 3.03 2.16 1.85 1.53 2.05 1.93 1.94 2.50 2.18 2.06 1.89 2.27 2.47 2.67 2.46 3.29
Total ore mined O/P Mt 21.9 0.3 0.8 1.3 1.8 1.8 1.8 1.6 1.5 1.5 1.3 1.3 1.3 1.2 1.2 1.4 1.6 0.2
Total Mined ounces O/P oz Au 1,443 33 68 92 80 85 101 90 89 114 83 86 81 85 93 117 124 23
SR t:t 8.4 17.9 10.6 9.7 6.4 5.8 5.1 6.9 12.0 10.6 14.2 14.0 16.5 6.4 4.8 4.4 2.3 1.0
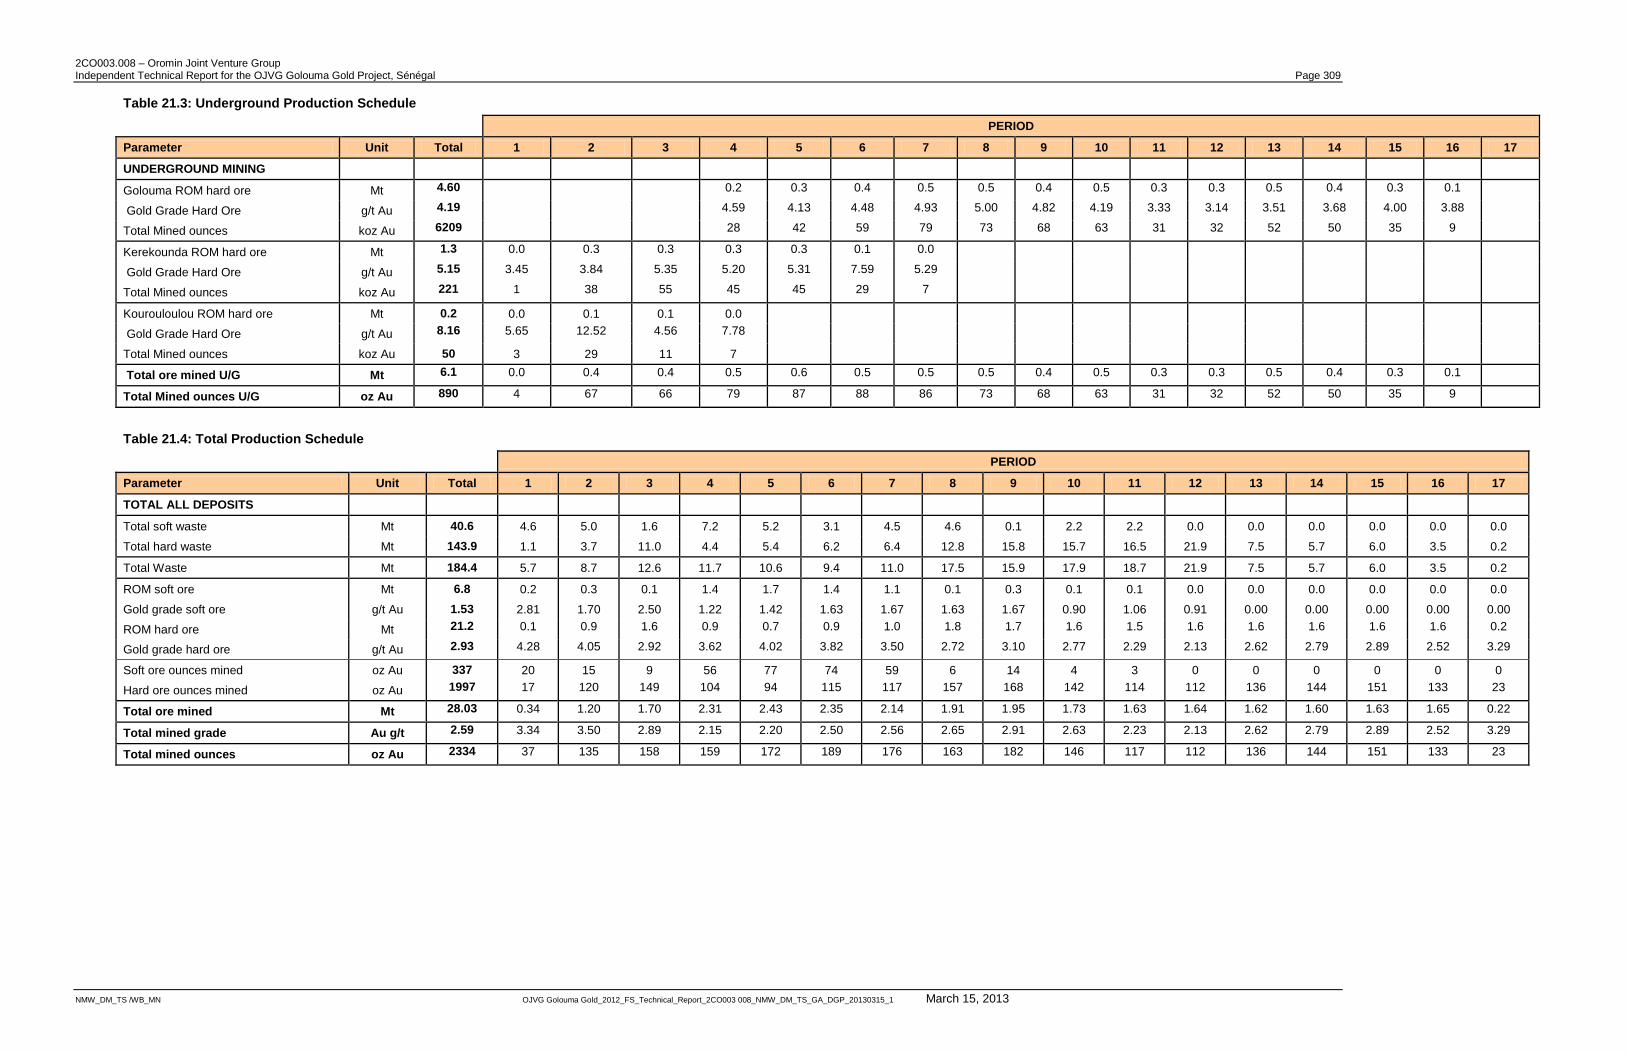
2CO003.008 – Oromin Joint Venture Group Independent Technical Report for the OJVG Golouma Gold Project, Sénégal Page 309
NMW_DM_TS /WB_MN OJVG Golouma Gold_2012_FS_Technical_Report_2CO003 008_NMW_DM_TS_GA_DGP_20130315_1 March 15, 2013
Table 21.3: Underground Production Schedule
PERIOD
Parameter Unit Total 1 2 3 4 5 6 7 8 9 10 11 12 13 14 15 16 17
UNDERGROUND MINING
Golouma ROM hard ore Mt 4.60 0.2 0.3 0.4 0.5 0.5 0.4 0.5 0.3 0.3 0.5 0.4 0.3 0.1
Gold Grade Hard Ore g/t Au 4.19 4.59 4.13 4.48 4.93 5.00 4.82 4.19 3.33 3.14 3.51 3.68 4.00 3.88
Total Mined ounces koz Au 6209 28 42 59 79 73 68 63 31 32 52 50 35 9
Kerekounda ROM hard ore Mt 1.3 0.0 0.3 0.3 0.3 0.3 0.1 0.0
Gold Grade Hard Ore g/t Au 5.15 3.45 3.84 5.35 5.20 5.31 7.59 5.29
Total Mined ounces koz Au 221 1 38 55 45 45 29 7
Kourouloulou ROM hard ore Mt 0.2 0.0 0.1 0.1 0.0
Gold Grade Hard Ore g/t Au 8.16 5.65 12.52 4.56 7.78
Total Mined ounces koz Au 50 3 29 11 7
Total ore mined U/G Mt 6.1 0.0 0.4 0.4 0.5 0.6 0.5 0.5 0.5 0.4 0.5 0.3 0.3 0.5 0.4 0.3 0.1
Total Mined ounces U/G oz Au 890 4 67 66 79 87 88 86 73 68 63 31 32 52 50 35 9
Table 21.4: Total Production Schedule
PERIOD
Parameter Unit Total 1 2 3 4 5 6 7 8 9 10 11 12 13 14 15 16 17
TOTAL ALL DEPOSITS
Total soft waste Mt 40.6 4.6 5.0 1.6 7.2 5.2 3.1 4.5 4.6 0.1 2.2 2.2 0.0 0.0 0.0 0.0 0.0 0.0
Total hard waste Mt 143.9 1.1 3.7 11.0 4.4 5.4 6.2 6.4 12.8 15.8 15.7 16.5 21.9 7.5 5.7 6.0 3.5 0.2
Total Waste Mt 184.4 5.7 8.7 12.6 11.7 10.6 9.4 11.0 17.5 15.9 17.9 18.7 21.9 7.5 5.7 6.0 3.5 0.2
ROM soft ore Mt 6.8 0.2 0.3 0.1 1.4 1.7 1.4 1.1 0.1 0.3 0.1 0.1 0.0 0.0 0.0 0.0 0.0 0.0
Gold grade soft ore g/t Au 1.53 2.81 1.70 2.50 1.22 1.42 1.63 1.67 1.63 1.67 0.90 1.06 0.91 0.00 0.00 0.00 0.00 0.00
ROM hard ore Mt 21.2 0.1 0.9 1.6 0.9 0.7 0.9 1.0 1.8 1.7 1.6 1.5 1.6 1.6 1.6 1.6 1.6 0.2
Gold grade hard ore g/t Au 2.93 4.28 4.05 2.92 3.62 4.02 3.82 3.50 2.72 3.10 2.77 2.29 2.13 2.62 2.79 2.89 2.52 3.29
Soft ore ounces mined oz Au 337 20 15 9 56 77 74 59 6 14 4 3 0 0 0 0 0 0
Hard ore ounces mined oz Au 1997 17 120 149 104 94 115 117 157 168 142 114 112 136 144 151 133 23
Total ore mined Mt 28.03 0.34 1.20 1.70 2.31 2.43 2.35 2.14 1.91 1.95 1.73 1.63 1.64 1.62 1.60 1.63 1.65 0.22
Total mined grade Au g/t 2.59 3.34 3.50 2.89 2.15 2.20 2.50 2.56 2.65 2.91 2.63 2.23 2.13 2.62 2.79 2.89 2.52 3.29
Total mined ounces oz Au 2334 37 135 158 159 172 189 176 163 182 146 117 112 136 144 151 133 23
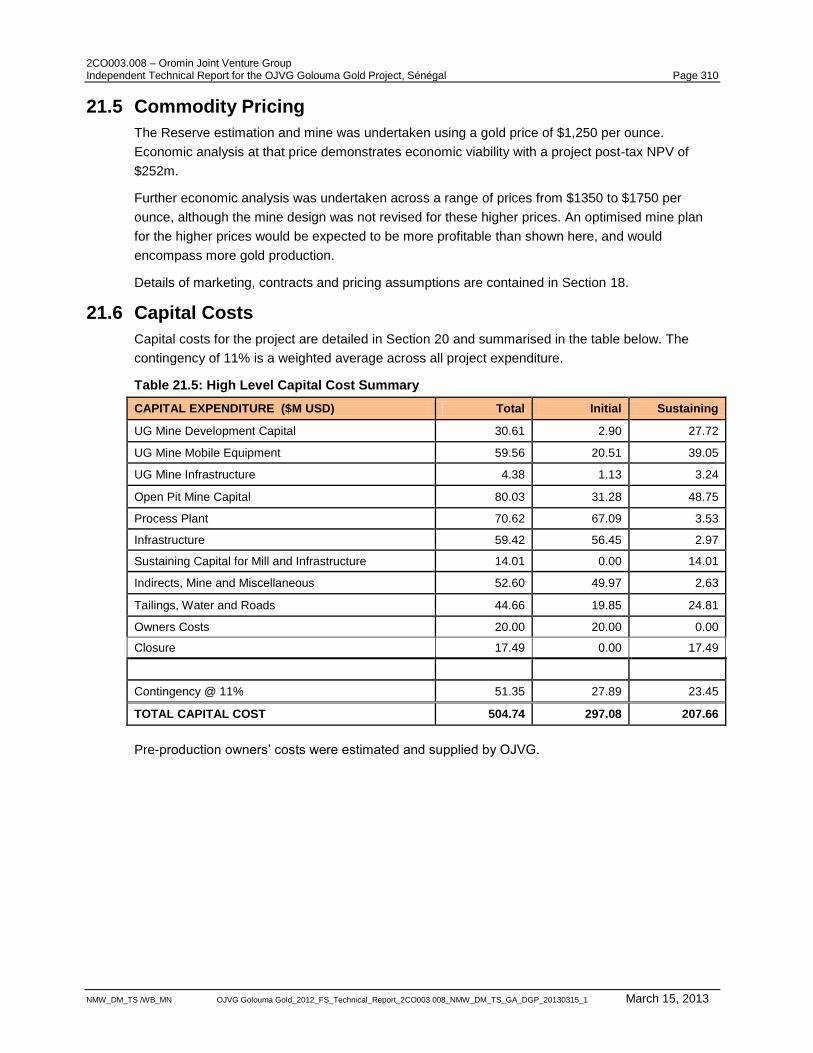
2CO003.008 – Oromin Joint Venture Group Independent Technical Report for the OJVG Golouma Gold Project, Sénégal Page 310
NMW_DM_TS /WB_MN OJVG Golouma Gold_2012_FS_Technical_Report_2CO003 008_NMW_DM_TS_GA_DGP_20130315_1 March 15, 2013
21.5 Commodity Pricing
The Reserve estimation and mine was undertaken using a gold price of $1,250 per ounce.
Economic analysis at that price demonstrates economic viability with a project post-tax NPV of
$252m.
Further economic analysis was undertaken across a range of prices from $1350 to $1750 per
ounce, although the mine design was not revised for these higher prices. An optimised mine plan
for the higher prices would be expected to be more profitable than shown here, and would
encompass more gold production.
Details of marketing, contracts and pricing assumptions are contained in Section 18.
21.6 Capital Costs
Capital costs for the project are detailed in Section 20 and summarised in the table below. The
contingency of 11% is a weighted average across all project expenditure.
Table 21.5: High Level Capital Cost Summary
CAPITAL EXPENDITURE ($M USD) Total Initial Sustaining
UG Mine Development Capital 30.61 2.90 27.72
UG Mine Mobile Equipment 59.56 20.51 39.05
UG Mine Infrastructure 4.38 1.13 3.24
Open Pit Mine Capital 80.03 31.28 48.75
Process Plant 70.62 67.09 3.53
Infrastructure 59.42 56.45 2.97
Sustaining Capital for Mill and Infrastructure 14.01 0.00 14.01
Indirects, Mine and Miscellaneous 52.60 49.97 2.63
Tailings, Water and Roads 44.66 19.85 24.81
Owners Costs 20.00 20.00 0.00
Closure 17.49 0.00 17.49
Contingency @ 11% 51.35 27.89 23.45
TOTAL CAPITAL COST 504.74 297.08 207.66
Pre-production owners‟ costs were estimated and supplied by OJVG.
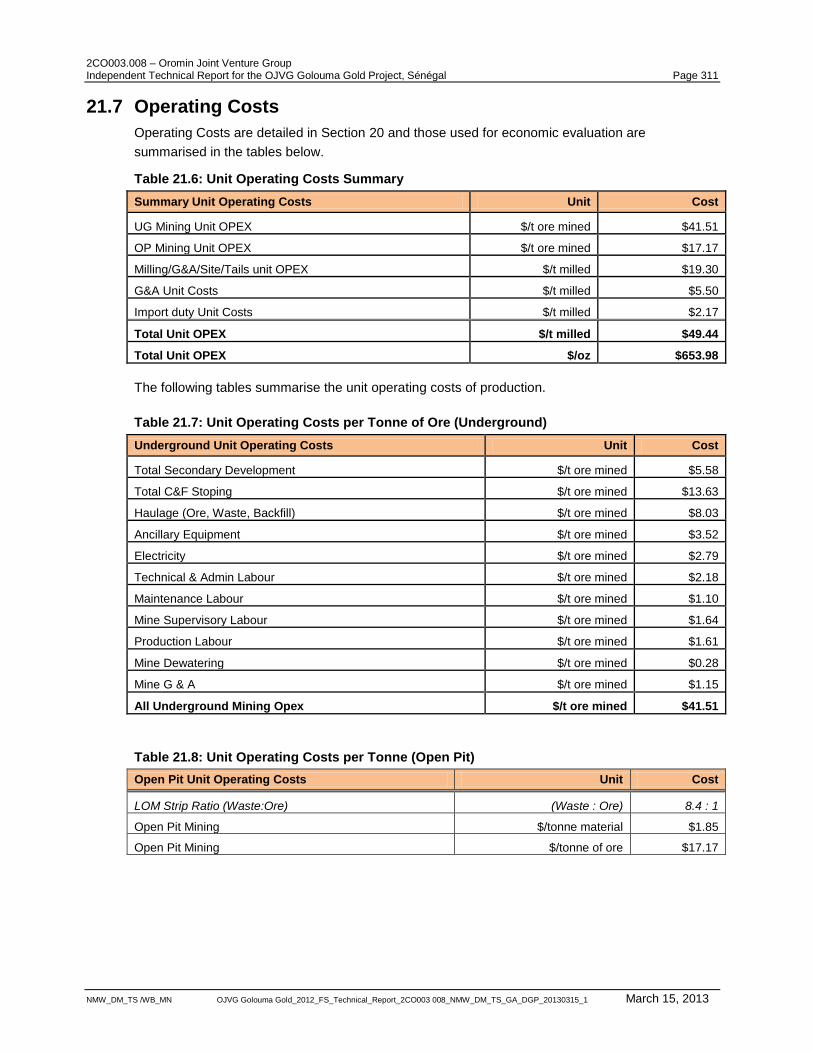
2CO003.008 – Oromin Joint Venture Group Independent Technical Report for the OJVG Golouma Gold Project, Sénégal Page 311
NMW_DM_TS /WB_MN OJVG Golouma Gold_2012_FS_Technical_Report_2CO003 008_NMW_DM_TS_GA_DGP_20130315_1 March 15, 2013
21.7 Operating Costs
Operating Costs are detailed in Section 20 and those used for economic evaluation are
summarised in the tables below.
Table 21.6: Unit Operating Costs Summary
Summary Unit Operating Costs Unit Cost
UG Mining Unit OPEX $/t ore mined $41.51
OP Mining Unit OPEX $/t ore mined $17.17
Milling/G&A/Site/Tails unit OPEX $/t milled $19.30
G&A Unit Costs $/t milled $5.50
Import duty Unit Costs $/t milled $2.17
Total Unit OPEX $/t milled $49.44
Total Unit OPEX $/oz $653.98
The following tables summarise the unit operating costs of production.
Table 21.7: Unit Operating Costs per Tonne of Ore (Underground)
Underground Unit Operating Costs Unit Cost
Total Secondary Development $/t ore mined $5.58
Total C&F Stoping $/t ore mined $13.63
Haulage (Ore, Waste, Backfill) $/t ore mined $8.03
Ancillary Equipment $/t ore mined $3.52
Electricity $/t ore mined $2.79
Technical & Admin Labour $/t ore mined $2.18
Maintenance Labour $/t ore mined $1.10
Mine Supervisory Labour $/t ore mined $1.64
Production Labour $/t ore mined $1.61
Mine Dewatering $/t ore mined $0.28
Mine G & A $/t ore mined $1.15
All Underground Mining Opex $/t ore mined $41.51
Table 21.8: Unit Operating Costs per Tonne (Open Pit)
Open Pit Unit Operating Costs Unit Cost
LOM Strip Ratio (Waste:Ore) (Waste : Ore) 8.4 : 1
Open Pit Mining $/tonne material $1.85
Open Pit Mining $/tonne of ore $17.17
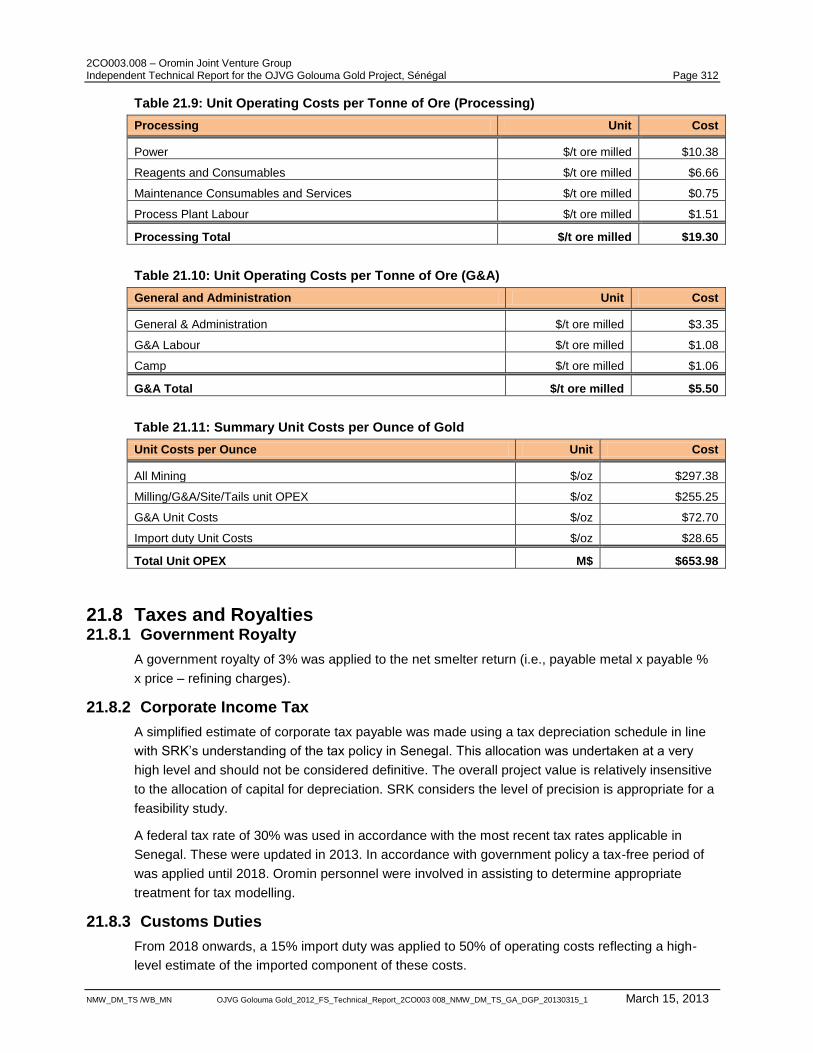
2CO003.008 – Oromin Joint Venture Group Independent Technical Report for the OJVG Golouma Gold Project, Sénégal Page 312
NMW_DM_TS /WB_MN OJVG Golouma Gold_2012_FS_Technical_Report_2CO003 008_NMW_DM_TS_GA_DGP_20130315_1 March 15, 2013
Table 21.9: Unit Operating Costs per Tonne of Ore (Processing)
Processing Unit Cost
Power $/t ore milled $10.38
Reagents and Consumables $/t ore milled $6.66
Maintenance Consumables and Services $/t ore milled $0.75
Process Plant Labour $/t ore milled $1.51
Processing Total $/t ore milled $19.30
Table 21.10: Unit Operating Costs per Tonne of Ore (G&A)
General and Administration Unit Cost
General & Administration $/t ore milled $3.35
G&A Labour $/t ore milled $1.08
Camp $/t ore milled $1.06
G&A Total $/t ore milled $5.50
Table 21.11: Summary Unit Costs per Ounce of Gold
Unit Costs per Ounce Unit Cost
All Mining $/oz $297.38
Milling/G&A/Site/Tails unit OPEX $/oz $255.25
G&A Unit Costs $/oz $72.70
Import duty Unit Costs $/oz $28.65
Total Unit OPEX M$ $653.98
21.8 Taxes and Royalties 21.8.1 Government Royalty
A government royalty of 3% was applied to the net smelter return (i.e., payable metal x payable %
x price – refining charges).
21.8.2 Corporate Income Tax
A simplified estimate of corporate tax payable was made using a tax depreciation schedule in line
with SRK‟s understanding of the tax policy in Senegal. This allocation was undertaken at a very
high level and should not be considered definitive. The overall project value is relatively insensitive
to the allocation of capital for depreciation. SRK considers the level of precision is appropriate for a
feasibility study.
A federal tax rate of 30% was used in accordance with the most recent tax rates applicable in
Senegal. These were updated in 2013. In accordance with government policy a tax-free period of
was applied until 2018. Oromin personnel were involved in assisting to determine appropriate
treatment for tax modelling.
21.8.3 Customs Duties
From 2018 onwards, a 15% import duty was applied to 50% of operating costs reflecting a high-
level estimate of the imported component of these costs.
2CO003.008 – Oromin Joint Venture Group Independent Technical Report for the OJVG Golouma Gold Project, Sénégal Page 313
NMW_DM_TS /WB_MN OJVG Golouma Gold_2012_FS_Technical_Report_2CO003 008_NMW_DM_TS_GA_DGP_20130315_1 March 15, 2013
21.8.4 Value Added Tax
The value added tax (VAT) was calculated at 18% and was applied to 80% of the capital and
operating costs, reflecting the expectation that some costs would be net of VAT. VAT refunds were
assumed to be delayed by 180 days and that only 90% of VAT would actually be refunded. The
Net present cost (NPC) (at 5% discount rate) of the modelled VAT tax stream is $14M.
21.8.5 Withholding Tax
No withholding tax was estimated. The project was evaluated “in country” and independently of
ownership and corporate structure. It must be noted that withholding taxes of various types are
applicable when repatriating funds out of country. Expert advice on Senegalese Tax should be
sought by any foreign investor.
21.9 Working Capital
A high level estimation of working capital (accounts payable, accounts receivable and stores stock)
has been incorporated into the cash flow. Accounts receivable delays also include the financial
effect of any intermediate stockpiles
21.10 Life-of-Mine summary Cashflows
Tables 21.12 to 12.15 summarise annual cash flows at various gold prices.
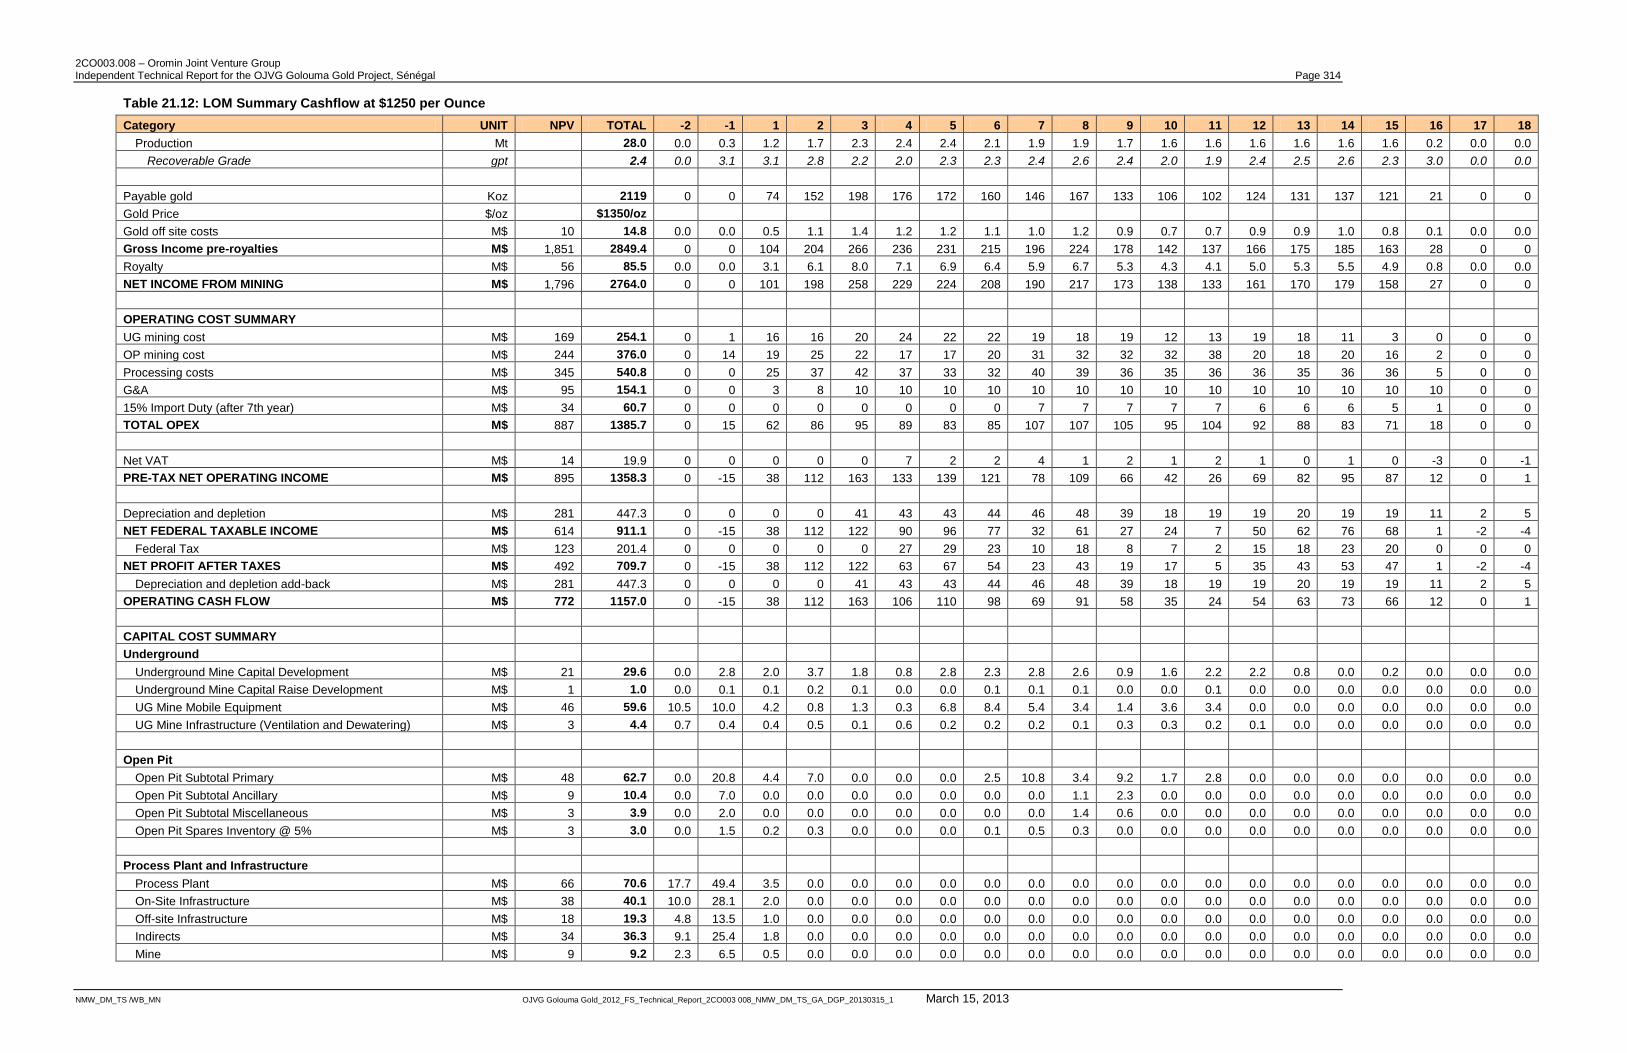
2CO003.008 – Oromin Joint Venture Group Independent Technical Report for the OJVG Golouma Gold Project, Sénégal Page 314
NMW_DM_TS /WB_MN OJVG Golouma Gold_2012_FS_Technical_Report_2CO003 008_NMW_DM_TS_GA_DGP_20130315_1 March 15, 2013
Table 21.12: LOM Summary Cashflow at $1250 per Ounce
Category UNIT NPV TOTAL -2 -1 1 2 3 4 5 6 7 8 9 10 11 12 13 14 15 16 17 18
Production Mt 28.0 0.0 0.3 1.2 1.7 2.3 2.4 2.4 2.1 1.9 1.9 1.7 1.6 1.6 1.6 1.6 1.6 1.6 0.2 0.0 0.0
Recoverable Grade gpt 2.4 0.0 3.1 3.1 2.8 2.2 2.0 2.3 2.3 2.4 2.6 2.4 2.0 1.9 2.4 2.5 2.6 2.3 3.0 0.0 0.0
Payable gold Koz 2119 0 0 74 152 198 176 172 160 146 167 133 106 102 124 131 137 121 21 0 0
Gold Price $/oz $1350/oz
Gold off site costs M$ 10 14.8 0.0 0.0 0.5 1.1 1.4 1.2 1.2 1.1 1.0 1.2 0.9 0.7 0.7 0.9 0.9 1.0 0.8 0.1 0.0 0.0
Gross Income pre-royalties M$ 1,851 2849.4 0 0 104 204 266 236 231 215 196 224 178 142 137 166 175 185 163 28 0 0
Royalty M$ 56 85.5 0.0 0.0 3.1 6.1 8.0 7.1 6.9 6.4 5.9 6.7 5.3 4.3 4.1 5.0 5.3 5.5 4.9 0.8 0.0 0.0
NET INCOME FROM MINING M$ 1,796 2764.0 0 0 101 198 258 229 224 208 190 217 173 138 133 161 170 179 158 27 0 0
OPERATING COST SUMMARY
UG mining cost M$ 169 254.1 0 1 16 16 20 24 22 22 19 18 19 12 13 19 18 11 3 0 0 0
OP mining cost M$ 244 376.0 0 14 19 25 22 17 17 20 31 32 32 32 38 20 18 20 16 2 0 0
Processing costs M$ 345 540.8 0 0 25 37 42 37 33 32 40 39 36 35 36 36 35 36 36 5 0 0
G&A M$ 95 154.1 0 0 3 8 10 10 10 10 10 10 10 10 10 10 10 10 10 10 0 0
15% Import Duty (after 7th year) M$ 34 60.7 0 0 0 0 0 0 0 0 7 7 7 7 7 6 6 6 5 1 0 0
TOTAL OPEX M$ 887 1385.7 0 15 62 86 95 89 83 85 107 107 105 95 104 92 88 83 71 18 0 0
Net VAT M$ 14 19.9 0 0 0 0 0 7 2 2 4 1 2 1 2 1 0 1 0 -3 0 -1
PRE-TAX NET OPERATING INCOME M$ 895 1358.3 0 -15 38 112 163 133 139 121 78 109 66 42 26 69 82 95 87 12 0 1
Depreciation and depletion M$ 281 447.3 0 0 0 0 41 43 43 44 46 48 39 18 19 19 20 19 19 11 2 5
NET FEDERAL TAXABLE INCOME M$ 614 911.1 0 -15 38 112 122 90 96 77 32 61 27 24 7 50 62 76 68 1 -2 -4
Federal Tax M$ 123 201.4 0 0 0 0 0 27 29 23 10 18 8 7 2 15 18 23 20 0 0 0
NET PROFIT AFTER TAXES M$ 492 709.7 0 -15 38 112 122 63 67 54 23 43 19 17 5 35 43 53 47 1 -2 -4
Depreciation and depletion add-back M$ 281 447.3 0 0 0 0 41 43 43 44 46 48 39 18 19 19 20 19 19 11 2 5
OPERATING CASH FLOW M$ 772 1157.0 0 -15 38 112 163 106 110 98 69 91 58 35 24 54 63 73 66 12 0 1
CAPITAL COST SUMMARY
Underground
Underground Mine Capital Development M$ 21 29.6 0.0 2.8 2.0 3.7 1.8 0.8 2.8 2.3 2.8 2.6 0.9 1.6 2.2 2.2 0.8 0.0 0.2 0.0 0.0 0.0
Underground Mine Capital Raise Development M$ 1 1.0 0.0 0.1 0.1 0.2 0.1 0.0 0.0 0.1 0.1 0.1 0.0 0.0 0.1 0.0 0.0 0.0 0.0 0.0 0.0 0.0
UG Mine Mobile Equipment M$ 46 59.6 10.5 10.0 4.2 0.8 1.3 0.3 6.8 8.4 5.4 3.4 1.4 3.6 3.4 0.0 0.0 0.0 0.0 0.0 0.0 0.0
UG Mine Infrastructure (Ventilation and Dewatering) M$ 3 4.4 0.7 0.4 0.4 0.5 0.1 0.6 0.2 0.2 0.2 0.1 0.3 0.3 0.2 0.1 0.0 0.0 0.0 0.0 0.0 0.0
Open Pit
Open Pit Subtotal Primary M$ 48 62.7 0.0 20.8 4.4 7.0 0.0 0.0 0.0 2.5 10.8 3.4 9.2 1.7 2.8 0.0 0.0 0.0 0.0 0.0 0.0 0.0
Open Pit Subtotal Ancillary M$ 9 10.4 0.0 7.0 0.0 0.0 0.0 0.0 0.0 0.0 0.0 1.1 2.3 0.0 0.0 0.0 0.0 0.0 0.0 0.0 0.0 0.0
Open Pit Subtotal Miscellaneous M$ 3 3.9 0.0 2.0 0.0 0.0 0.0 0.0 0.0 0.0 0.0 1.4 0.6 0.0 0.0 0.0 0.0 0.0 0.0 0.0 0.0 0.0
Open Pit Spares Inventory @ 5% M$ 3 3.0 0.0 1.5 0.2 0.3 0.0 0.0 0.0 0.1 0.5 0.3 0.0 0.0 0.0 0.0 0.0 0.0 0.0 0.0 0.0 0.0
Process Plant and Infrastructure
Process Plant M$ 66 70.6 17.7 49.4 3.5 0.0 0.0 0.0 0.0 0.0 0.0 0.0 0.0 0.0 0.0 0.0 0.0 0.0 0.0 0.0 0.0 0.0
On-Site Infrastructure M$ 38 40.1 10.0 28.1 2.0 0.0 0.0 0.0 0.0 0.0 0.0 0.0 0.0 0.0 0.0 0.0 0.0 0.0 0.0 0.0 0.0 0.0
Off-site Infrastructure M$ 18 19.3 4.8 13.5 1.0 0.0 0.0 0.0 0.0 0.0 0.0 0.0 0.0 0.0 0.0 0.0 0.0 0.0 0.0 0.0 0.0 0.0
Indirects M$ 34 36.3 9.1 25.4 1.8 0.0 0.0 0.0 0.0 0.0 0.0 0.0 0.0 0.0 0.0 0.0 0.0 0.0 0.0 0.0 0.0 0.0
Mine M$ 9 9.2 2.3 6.5 0.5 0.0 0.0 0.0 0.0 0.0 0.0 0.0 0.0 0.0 0.0 0.0 0.0 0.0 0.0 0.0 0.0 0.0
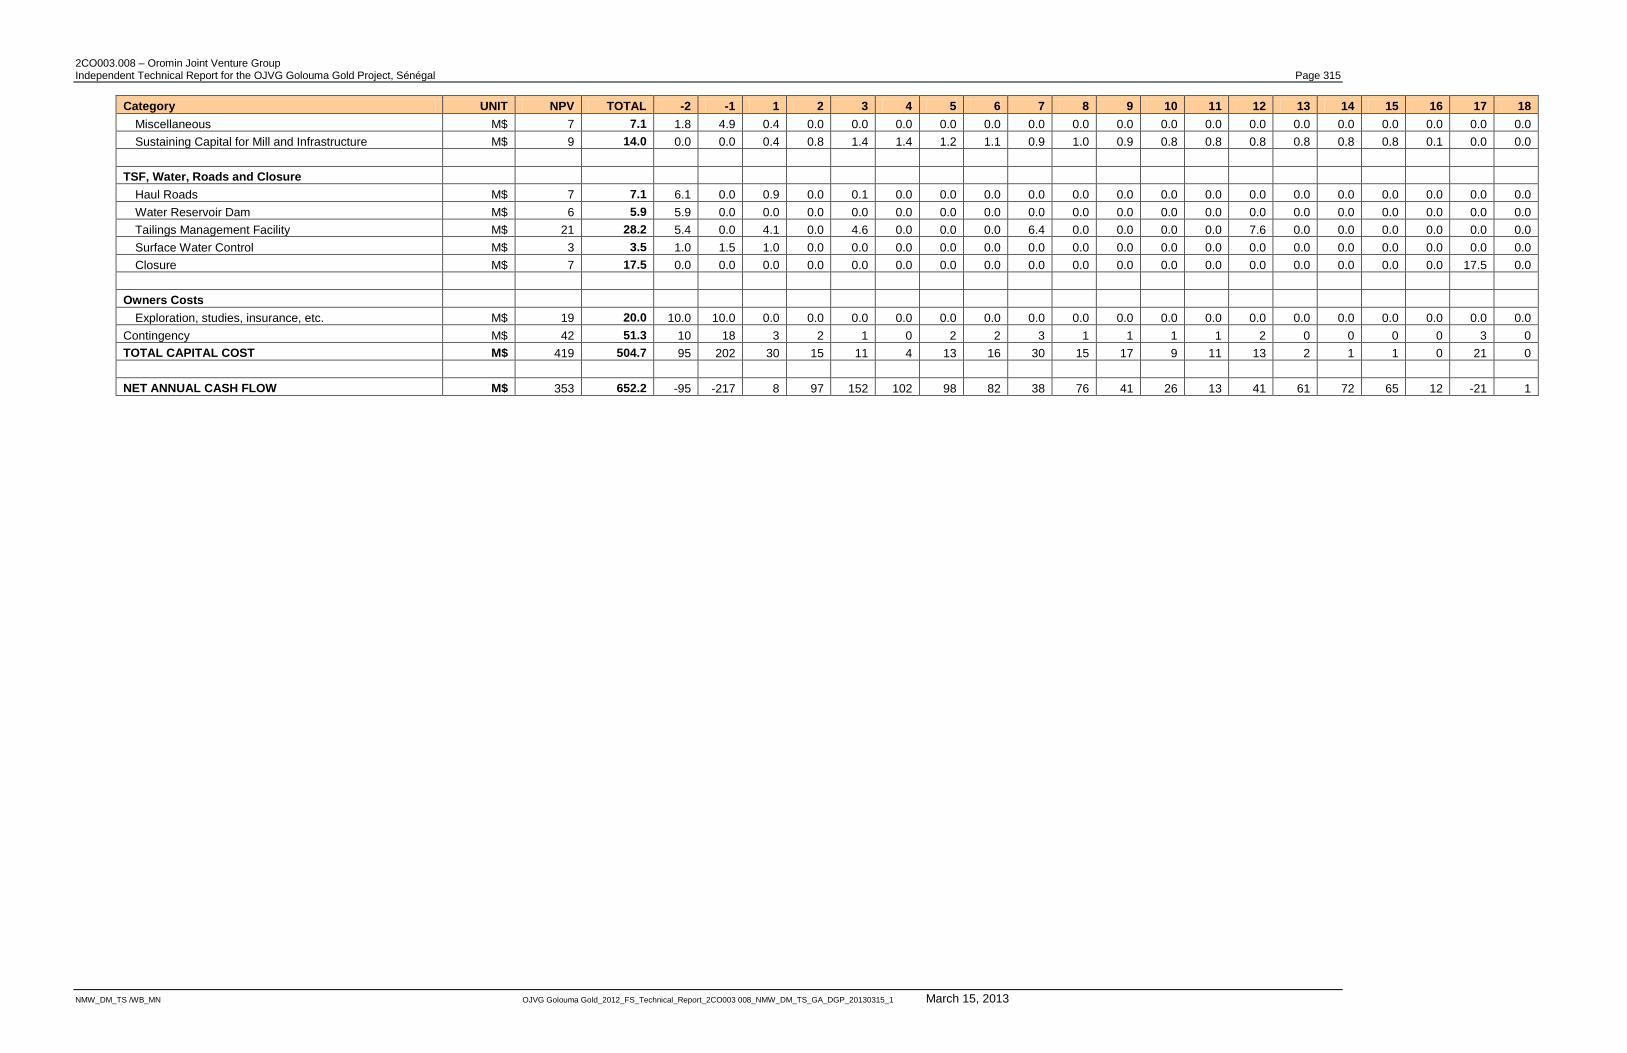
2CO003.008 – Oromin Joint Venture Group Independent Technical Report for the OJVG Golouma Gold Project, Sénégal Page 315
NMW_DM_TS /WB_MN OJVG Golouma Gold_2012_FS_Technical_Report_2CO003 008_NMW_DM_TS_GA_DGP_20130315_1 March 15, 2013
Category UNIT NPV TOTAL -2 -1 1 2 3 4 5 6 7 8 9 10 11 12 13 14 15 16 17 18
Miscellaneous M$ 7 7.1 1.8 4.9 0.4 0.0 0.0 0.0 0.0 0.0 0.0 0.0 0.0 0.0 0.0 0.0 0.0 0.0 0.0 0.0 0.0 0.0
Sustaining Capital for Mill and Infrastructure M$ 9 14.0 0.0 0.0 0.4 0.8 1.4 1.4 1.2 1.1 0.9 1.0 0.9 0.8 0.8 0.8 0.8 0.8 0.8 0.1 0.0 0.0
TSF, Water, Roads and Closure
Haul Roads M$ 7 7.1 6.1 0.0 0.9 0.0 0.1 0.0 0.0 0.0 0.0 0.0 0.0 0.0 0.0 0.0 0.0 0.0 0.0 0.0 0.0 0.0
Water Reservoir Dam M$ 6 5.9 5.9 0.0 0.0 0.0 0.0 0.0 0.0 0.0 0.0 0.0 0.0 0.0 0.0 0.0 0.0 0.0 0.0 0.0 0.0 0.0
Tailings Management Facility M$ 21 28.2 5.4 0.0 4.1 0.0 4.6 0.0 0.0 0.0 6.4 0.0 0.0 0.0 0.0 7.6 0.0 0.0 0.0 0.0 0.0 0.0
Surface Water Control M$ 3 3.5 1.0 1.5 1.0 0.0 0.0 0.0 0.0 0.0 0.0 0.0 0.0 0.0 0.0 0.0 0.0 0.0 0.0 0.0 0.0 0.0
Closure M$ 7 17.5 0.0 0.0 0.0 0.0 0.0 0.0 0.0 0.0 0.0 0.0 0.0 0.0 0.0 0.0 0.0 0.0 0.0 0.0 17.5 0.0
Owners Costs
Exploration, studies, insurance, etc. M$ 19 20.0 10.0 10.0 0.0 0.0 0.0 0.0 0.0 0.0 0.0 0.0 0.0 0.0 0.0 0.0 0.0 0.0 0.0 0.0 0.0 0.0
Contingency M$ 42 51.3 10 18 3 2 1 0 2 2 3 1 1 1 1 2 0 0 0 0 3 0
TOTAL CAPITAL COST M$ 419 504.7 95 202 30 15 11 4 13 16 30 15 17 9 11 13 2 1 1 0 21 0
NET ANNUAL CASH FLOW M$ 353 652.2 -95 -217 8 97 152 102 98 82 38 76 41 26 13 41 61 72 65 12 -21 1
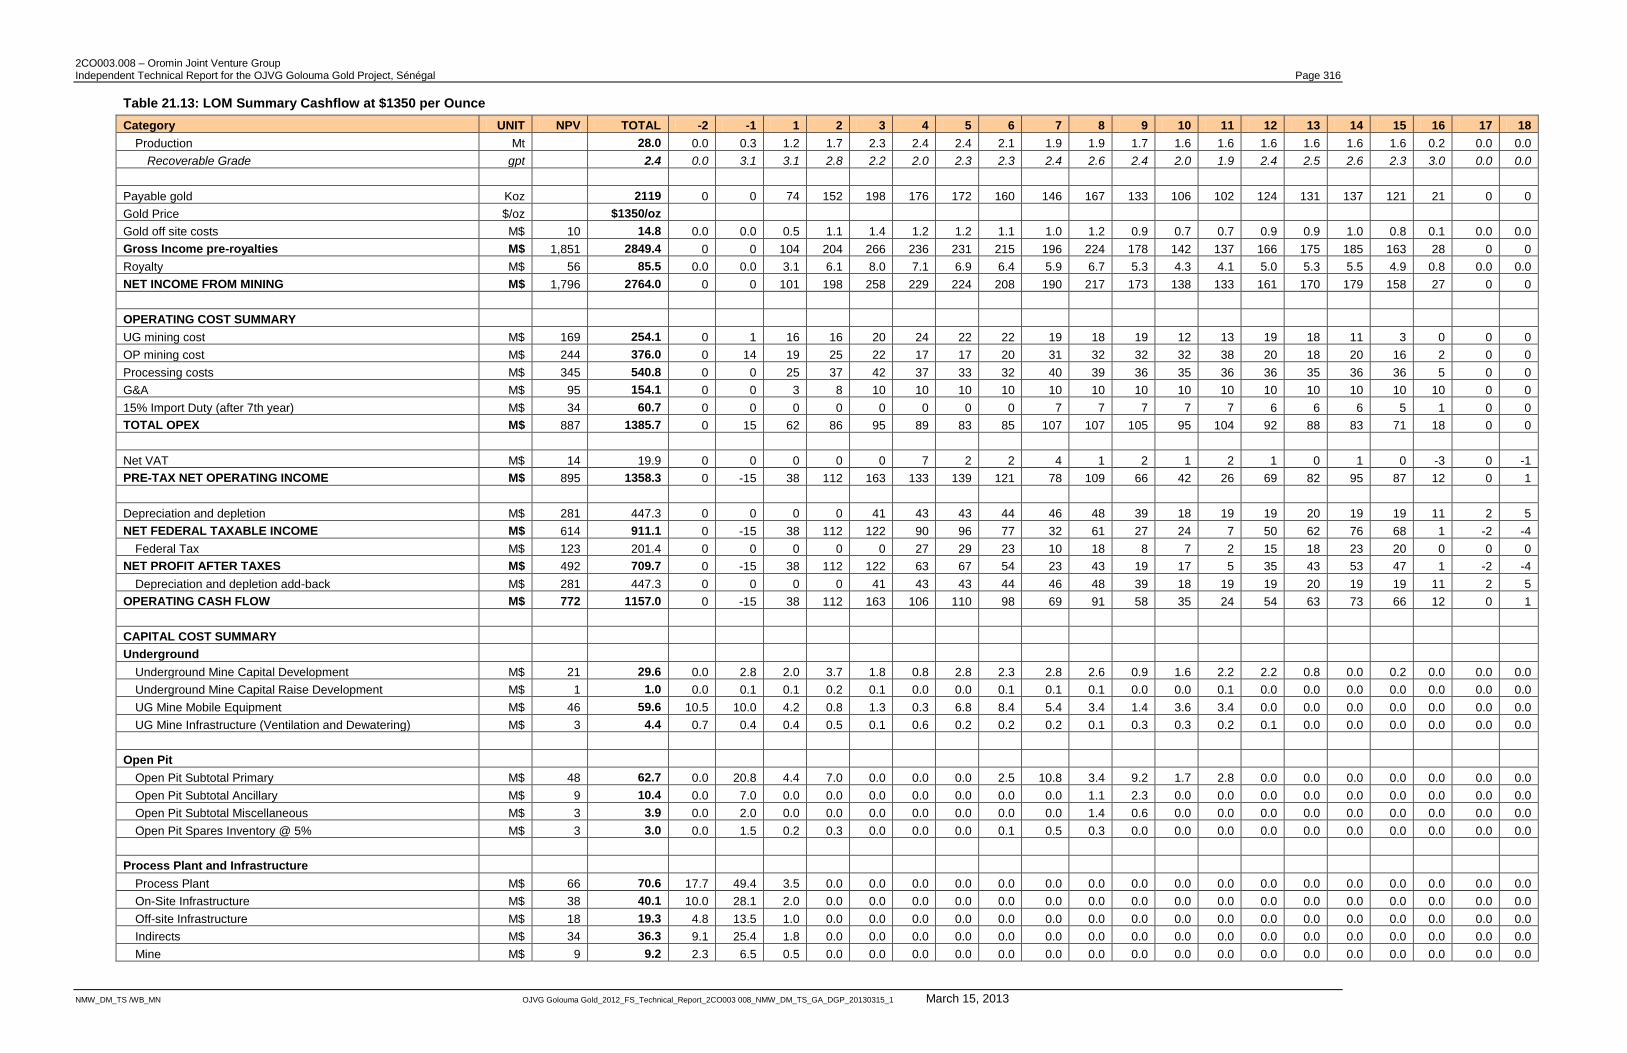
2CO003.008 – Oromin Joint Venture Group Independent Technical Report for the OJVG Golouma Gold Project, Sénégal Page 316
NMW_DM_TS /WB_MN OJVG Golouma Gold_2012_FS_Technical_Report_2CO003 008_NMW_DM_TS_GA_DGP_20130315_1 March 15, 2013
Table 21.13: LOM Summary Cashflow at $1350 per Ounce
Category UNIT NPV TOTAL -2 -1 1 2 3 4 5 6 7 8 9 10 11 12 13 14 15 16 17 18
Production Mt 28.0 0.0 0.3 1.2 1.7 2.3 2.4 2.4 2.1 1.9 1.9 1.7 1.6 1.6 1.6 1.6 1.6 1.6 0.2 0.0 0.0
Recoverable Grade gpt 2.4 0.0 3.1 3.1 2.8 2.2 2.0 2.3 2.3 2.4 2.6 2.4 2.0 1.9 2.4 2.5 2.6 2.3 3.0 0.0 0.0
Payable gold Koz 2119 0 0 74 152 198 176 172 160 146 167 133 106 102 124 131 137 121 21 0 0
Gold Price $/oz $1350/oz
Gold off site costs M$ 10 14.8 0.0 0.0 0.5 1.1 1.4 1.2 1.2 1.1 1.0 1.2 0.9 0.7 0.7 0.9 0.9 1.0 0.8 0.1 0.0 0.0
Gross Income pre-royalties M$ 1,851 2849.4 0 0 104 204 266 236 231 215 196 224 178 142 137 166 175 185 163 28 0 0
Royalty M$ 56 85.5 0.0 0.0 3.1 6.1 8.0 7.1 6.9 6.4 5.9 6.7 5.3 4.3 4.1 5.0 5.3 5.5 4.9 0.8 0.0 0.0
NET INCOME FROM MINING M$ 1,796 2764.0 0 0 101 198 258 229 224 208 190 217 173 138 133 161 170 179 158 27 0 0
OPERATING COST SUMMARY
UG mining cost M$ 169 254.1 0 1 16 16 20 24 22 22 19 18 19 12 13 19 18 11 3 0 0 0
OP mining cost M$ 244 376.0 0 14 19 25 22 17 17 20 31 32 32 32 38 20 18 20 16 2 0 0
Processing costs M$ 345 540.8 0 0 25 37 42 37 33 32 40 39 36 35 36 36 35 36 36 5 0 0
G&A M$ 95 154.1 0 0 3 8 10 10 10 10 10 10 10 10 10 10 10 10 10 10 0 0
15% Import Duty (after 7th year) M$ 34 60.7 0 0 0 0 0 0 0 0 7 7 7 7 7 6 6 6 5 1 0 0
TOTAL OPEX M$ 887 1385.7 0 15 62 86 95 89 83 85 107 107 105 95 104 92 88 83 71 18 0 0
Net VAT M$ 14 19.9 0 0 0 0 0 7 2 2 4 1 2 1 2 1 0 1 0 -3 0 -1
PRE-TAX NET OPERATING INCOME M$ 895 1358.3 0 -15 38 112 163 133 139 121 78 109 66 42 26 69 82 95 87 12 0 1
Depreciation and depletion M$ 281 447.3 0 0 0 0 41 43 43 44 46 48 39 18 19 19 20 19 19 11 2 5
NET FEDERAL TAXABLE INCOME M$ 614 911.1 0 -15 38 112 122 90 96 77 32 61 27 24 7 50 62 76 68 1 -2 -4
Federal Tax M$ 123 201.4 0 0 0 0 0 27 29 23 10 18 8 7 2 15 18 23 20 0 0 0
NET PROFIT AFTER TAXES M$ 492 709.7 0 -15 38 112 122 63 67 54 23 43 19 17 5 35 43 53 47 1 -2 -4
Depreciation and depletion add-back M$ 281 447.3 0 0 0 0 41 43 43 44 46 48 39 18 19 19 20 19 19 11 2 5
OPERATING CASH FLOW M$ 772 1157.0 0 -15 38 112 163 106 110 98 69 91 58 35 24 54 63 73 66 12 0 1
CAPITAL COST SUMMARY
Underground
Underground Mine Capital Development M$ 21 29.6 0.0 2.8 2.0 3.7 1.8 0.8 2.8 2.3 2.8 2.6 0.9 1.6 2.2 2.2 0.8 0.0 0.2 0.0 0.0 0.0
Underground Mine Capital Raise Development M$ 1 1.0 0.0 0.1 0.1 0.2 0.1 0.0 0.0 0.1 0.1 0.1 0.0 0.0 0.1 0.0 0.0 0.0 0.0 0.0 0.0 0.0
UG Mine Mobile Equipment M$ 46 59.6 10.5 10.0 4.2 0.8 1.3 0.3 6.8 8.4 5.4 3.4 1.4 3.6 3.4 0.0 0.0 0.0 0.0 0.0 0.0 0.0
UG Mine Infrastructure (Ventilation and Dewatering) M$ 3 4.4 0.7 0.4 0.4 0.5 0.1 0.6 0.2 0.2 0.2 0.1 0.3 0.3 0.2 0.1 0.0 0.0 0.0 0.0 0.0 0.0
Open Pit
Open Pit Subtotal Primary M$ 48 62.7 0.0 20.8 4.4 7.0 0.0 0.0 0.0 2.5 10.8 3.4 9.2 1.7 2.8 0.0 0.0 0.0 0.0 0.0 0.0 0.0
Open Pit Subtotal Ancillary M$ 9 10.4 0.0 7.0 0.0 0.0 0.0 0.0 0.0 0.0 0.0 1.1 2.3 0.0 0.0 0.0 0.0 0.0 0.0 0.0 0.0 0.0
Open Pit Subtotal Miscellaneous M$ 3 3.9 0.0 2.0 0.0 0.0 0.0 0.0 0.0 0.0 0.0 1.4 0.6 0.0 0.0 0.0 0.0 0.0 0.0 0.0 0.0 0.0
Open Pit Spares Inventory @ 5% M$ 3 3.0 0.0 1.5 0.2 0.3 0.0 0.0 0.0 0.1 0.5 0.3 0.0 0.0 0.0 0.0 0.0 0.0 0.0 0.0 0.0 0.0
Process Plant and Infrastructure
Process Plant M$ 66 70.6 17.7 49.4 3.5 0.0 0.0 0.0 0.0 0.0 0.0 0.0 0.0 0.0 0.0 0.0 0.0 0.0 0.0 0.0 0.0 0.0
On-Site Infrastructure M$ 38 40.1 10.0 28.1 2.0 0.0 0.0 0.0 0.0 0.0 0.0 0.0 0.0 0.0 0.0 0.0 0.0 0.0 0.0 0.0 0.0 0.0
Off-site Infrastructure M$ 18 19.3 4.8 13.5 1.0 0.0 0.0 0.0 0.0 0.0 0.0 0.0 0.0 0.0 0.0 0.0 0.0 0.0 0.0 0.0 0.0 0.0
Indirects M$ 34 36.3 9.1 25.4 1.8 0.0 0.0 0.0 0.0 0.0 0.0 0.0 0.0 0.0 0.0 0.0 0.0 0.0 0.0 0.0 0.0 0.0
Mine M$ 9 9.2 2.3 6.5 0.5 0.0 0.0 0.0 0.0 0.0 0.0 0.0 0.0 0.0 0.0 0.0 0.0 0.0 0.0 0.0 0.0 0.0
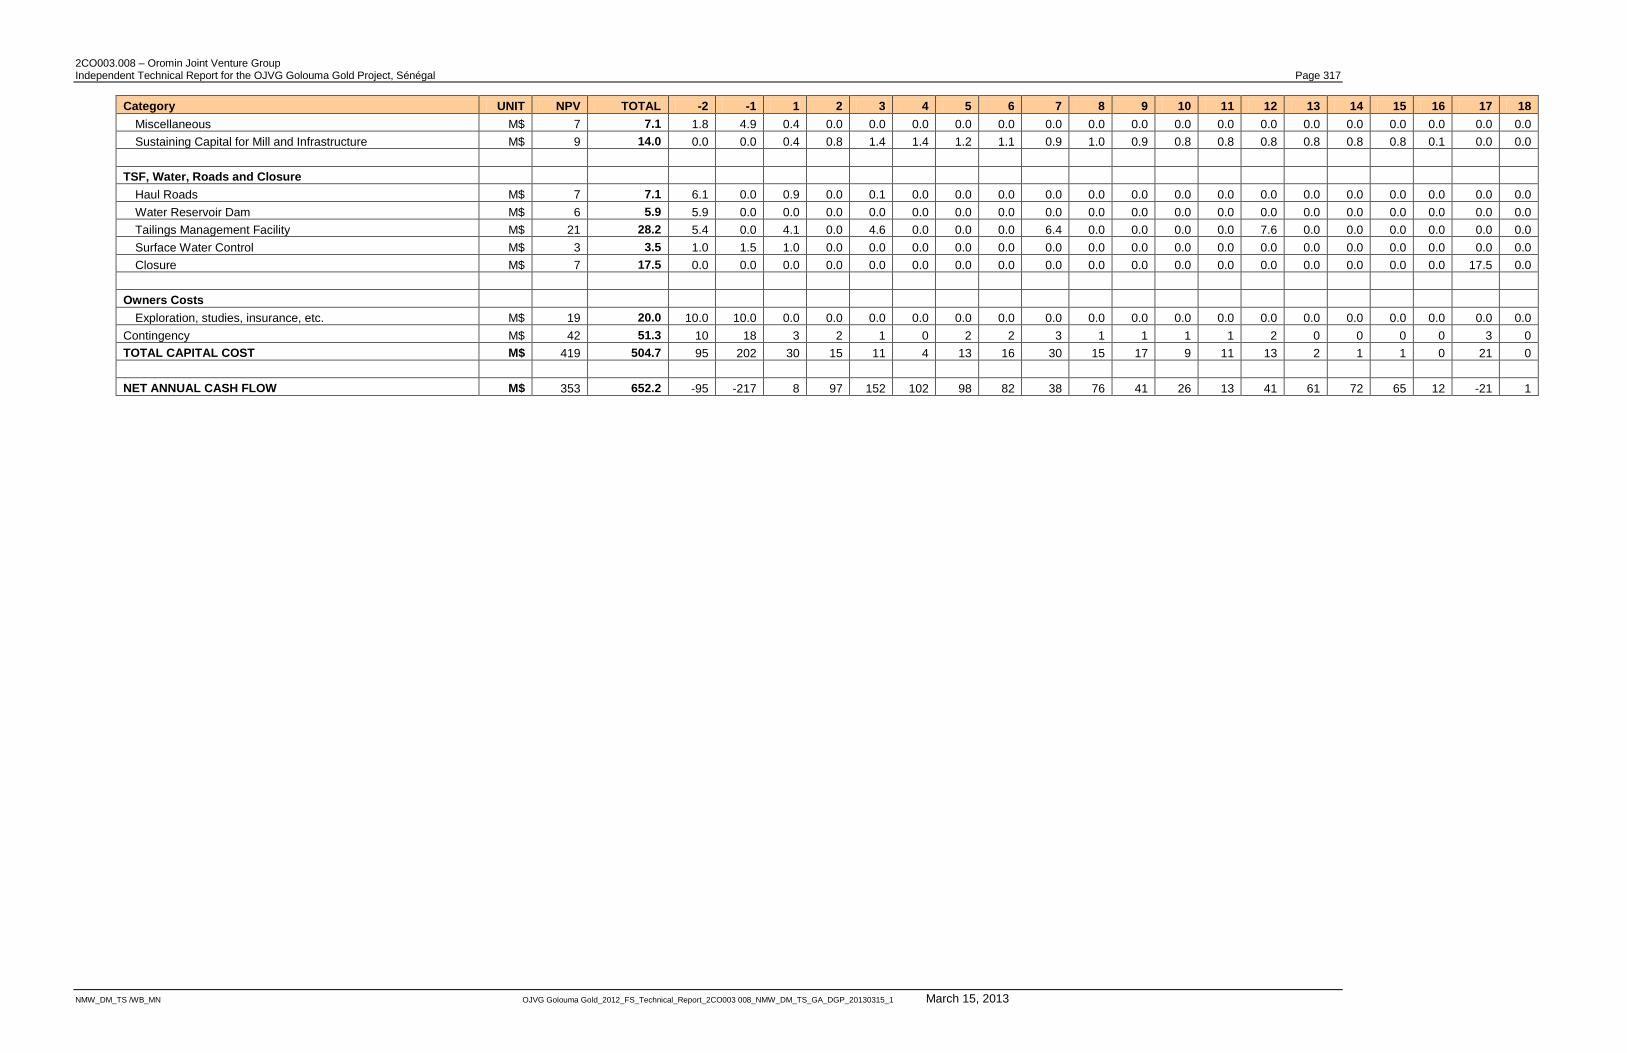
2CO003.008 – Oromin Joint Venture Group Independent Technical Report for the OJVG Golouma Gold Project, Sénégal Page 317
NMW_DM_TS /WB_MN OJVG Golouma Gold_2012_FS_Technical_Report_2CO003 008_NMW_DM_TS_GA_DGP_20130315_1 March 15, 2013
Category UNIT NPV TOTAL -2 -1 1 2 3 4 5 6 7 8 9 10 11 12 13 14 15 16 17 18
Miscellaneous M$ 7 7.1 1.8 4.9 0.4 0.0 0.0 0.0 0.0 0.0 0.0 0.0 0.0 0.0 0.0 0.0 0.0 0.0 0.0 0.0 0.0 0.0
Sustaining Capital for Mill and Infrastructure M$ 9 14.0 0.0 0.0 0.4 0.8 1.4 1.4 1.2 1.1 0.9 1.0 0.9 0.8 0.8 0.8 0.8 0.8 0.8 0.1 0.0 0.0
TSF, Water, Roads and Closure
Haul Roads M$ 7 7.1 6.1 0.0 0.9 0.0 0.1 0.0 0.0 0.0 0.0 0.0 0.0 0.0 0.0 0.0 0.0 0.0 0.0 0.0 0.0 0.0
Water Reservoir Dam M$ 6 5.9 5.9 0.0 0.0 0.0 0.0 0.0 0.0 0.0 0.0 0.0 0.0 0.0 0.0 0.0 0.0 0.0 0.0 0.0 0.0 0.0
Tailings Management Facility M$ 21 28.2 5.4 0.0 4.1 0.0 4.6 0.0 0.0 0.0 6.4 0.0 0.0 0.0 0.0 7.6 0.0 0.0 0.0 0.0 0.0 0.0
Surface Water Control M$ 3 3.5 1.0 1.5 1.0 0.0 0.0 0.0 0.0 0.0 0.0 0.0 0.0 0.0 0.0 0.0 0.0 0.0 0.0 0.0 0.0 0.0
Closure M$ 7 17.5 0.0 0.0 0.0 0.0 0.0 0.0 0.0 0.0 0.0 0.0 0.0 0.0 0.0 0.0 0.0 0.0 0.0 0.0 17.5 0.0
Owners Costs
Exploration, studies, insurance, etc. M$ 19 20.0 10.0 10.0 0.0 0.0 0.0 0.0 0.0 0.0 0.0 0.0 0.0 0.0 0.0 0.0 0.0 0.0 0.0 0.0 0.0 0.0
Contingency M$ 42 51.3 10 18 3 2 1 0 2 2 3 1 1 1 1 2 0 0 0 0 3 0
TOTAL CAPITAL COST M$ 419 504.7 95 202 30 15 11 4 13 16 30 15 17 9 11 13 2 1 1 0 21 0
NET ANNUAL CASH FLOW M$ 353 652.2 -95 -217 8 97 152 102 98 82 38 76 41 26 13 41 61 72 65 12 -21 1

2CO003.008 – Oromin Joint Venture Group Independent Technical Report for the OJVG Golouma Gold Project, Sénégal Page 318
NMW_DM_TS /WB_MN OJVG Golouma Gold_2012_FS_Technical_Report_2CO003 008_NMW_DM_TS_GA_DGP_20130315_1 March 15, 2013
Table 21.14: LOM Summary Cashflow at $1550 per Ounce
Category UNIT NPV TOTAL -2 -1 1 2 3 4 5 6 7 8 9 10 11 12 13 14 15 16 17 18
Production Mt 28.0 0.0 0.3 1.2 1.7 2.3 2.4 2.4 2.1 1.9 1.9 1.7 1.6 1.6 1.6 1.6 1.6 1.6 0.2 0.0 0.0
Recoverable Grade gpt 2.4 0.0 3.1 3.1 2.8 2.2 2.0 2.3 2.3 2.4 2.6 2.4 2.0 1.9 2.4 2.5 2.6 2.3 3.0 0.0 0.0
Payable gold Koz 2119 0 0 74 152 198 176 172 160 146 167 133 106 102 124 131 137 121 21 0 0
Gold Price $/oz $1350/oz
Gold off site costs M$ 10 14.8 0.0 0.0 0.5 1.1 1.4 1.2 1.2 1.1 1.0 1.2 0.9 0.7 0.7 0.9 0.9 1.0 0.8 0.1 0.0 0.0
Gross Income pre-royalties M$ 1,851 2849.4 0 0 104 204 266 236 231 215 196 224 178 142 137 166 175 185 163 28 0 0
Royalty M$ 56 85.5 0.0 0.0 3.1 6.1 8.0 7.1 6.9 6.4 5.9 6.7 5.3 4.3 4.1 5.0 5.3 5.5 4.9 0.8 0.0 0.0
NET INCOME FROM MINING M$ 1,796 2764.0 0 0 101 198 258 229 224 208 190 217 173 138 133 161 170 179 158 27 0 0
OPERATING COST SUMMARY
UG mining cost M$ 169 254.1 0 1 16 16 20 24 22 22 19 18 19 12 13 19 18 11 3 0 0 0
OP mining cost M$ 244 376.0 0 14 19 25 22 17 17 20 31 32 32 32 38 20 18 20 16 2 0 0
Processing costs M$ 345 540.8 0 0 25 37 42 37 33 32 40 39 36 35 36 36 35 36 36 5 0 0
G&A M$ 95 154.1 0 0 3 8 10 10 10 10 10 10 10 10 10 10 10 10 10 10 0 0
15% Import Duty (after 7th year) M$ 34 60.7 0 0 0 0 0 0 0 0 7 7 7 7 7 6 6 6 5 1 0 0
TOTAL OPEX M$ 887 1385.7 0 15 62 86 95 89 83 85 107 107 105 95 104 92 88 83 71 18 0 0
Net VAT M$ 14 19.9 0 0 0 0 0 7 2 2 4 1 2 1 2 1 0 1 0 -3 0 -1
PRE-TAX NET OPERATING INCOME M$ 895 1358.3 0 -15 38 112 163 133 139 121 78 109 66 42 26 69 82 95 87 12 0 1
Depreciation and depletion M$ 281 447.3 0 0 0 0 41 43 43 44 46 48 39 18 19 19 20 19 19 11 2 5
NET FEDERAL TAXABLE INCOME M$ 614 911.1 0 -15 38 112 122 90 96 77 32 61 27 24 7 50 62 76 68 1 -2 -4
Federal Tax M$ 123 201.4 0 0 0 0 0 27 29 23 10 18 8 7 2 15 18 23 20 0 0 0
NET PROFIT AFTER TAXES M$ 492 709.7 0 -15 38 112 122 63 67 54 23 43 19 17 5 35 43 53 47 1 -2 -4
Depreciation and depletion add-back M$ 281 447.3 0 0 0 0 41 43 43 44 46 48 39 18 19 19 20 19 19 11 2 5
OPERATING CASH FLOW M$ 772 1157.0 0 -15 38 112 163 106 110 98 69 91 58 35 24 54 63 73 66 12 0 1
CAPITAL COST SUMMARY
Underground
Underground Mine Capital Development M$ 21 29.6 0.0 2.8 2.0 3.7 1.8 0.8 2.8 2.3 2.8 2.6 0.9 1.6 2.2 2.2 0.8 0.0 0.2 0.0 0.0 0.0
Underground Mine Capital Raise Development M$ 1 1.0 0.0 0.1 0.1 0.2 0.1 0.0 0.0 0.1 0.1 0.1 0.0 0.0 0.1 0.0 0.0 0.0 0.0 0.0 0.0 0.0
UG Mine Mobile Equipment M$ 46 59.6 10.5 10.0 4.2 0.8 1.3 0.3 6.8 8.4 5.4 3.4 1.4 3.6 3.4 0.0 0.0 0.0 0.0 0.0 0.0 0.0
UG Mine Infrastructure (Ventilation and Dewatering) M$ 3 4.4 0.7 0.4 0.4 0.5 0.1 0.6 0.2 0.2 0.2 0.1 0.3 0.3 0.2 0.1 0.0 0.0 0.0 0.0 0.0 0.0
Open Pit
Open Pit Subtotal Primary M$ 48 62.7 0.0 20.8 4.4 7.0 0.0 0.0 0.0 2.5 10.8 3.4 9.2 1.7 2.8 0.0 0.0 0.0 0.0 0.0 0.0 0.0
Open Pit Subtotal Ancillary M$ 9 10.4 0.0 7.0 0.0 0.0 0.0 0.0 0.0 0.0 0.0 1.1 2.3 0.0 0.0 0.0 0.0 0.0 0.0 0.0 0.0 0.0
Open Pit Subtotal Miscellaneous M$ 3 3.9 0.0 2.0 0.0 0.0 0.0 0.0 0.0 0.0 0.0 1.4 0.6 0.0 0.0 0.0 0.0 0.0 0.0 0.0 0.0 0.0
Open Pit Spares Inventory @ 5% M$ 3 3.0 0.0 1.5 0.2 0.3 0.0 0.0 0.0 0.1 0.5 0.3 0.0 0.0 0.0 0.0 0.0 0.0 0.0 0.0 0.0 0.0
Process Plant and Infrastructure
Process Plant M$ 66 70.6 17.7 49.4 3.5 0.0 0.0 0.0 0.0 0.0 0.0 0.0 0.0 0.0 0.0 0.0 0.0 0.0 0.0 0.0 0.0 0.0
On-Site Infrastructure M$ 38 40.1 10.0 28.1 2.0 0.0 0.0 0.0 0.0 0.0 0.0 0.0 0.0 0.0 0.0 0.0 0.0 0.0 0.0 0.0 0.0 0.0
Off-site Infrastructure M$ 18 19.3 4.8 13.5 1.0 0.0 0.0 0.0 0.0 0.0 0.0 0.0 0.0 0.0 0.0 0.0 0.0 0.0 0.0 0.0 0.0 0.0
Indirects M$ 34 36.3 9.1 25.4 1.8 0.0 0.0 0.0 0.0 0.0 0.0 0.0 0.0 0.0 0.0 0.0 0.0 0.0 0.0 0.0 0.0 0.0
Mine M$ 9 9.2 2.3 6.5 0.5 0.0 0.0 0.0 0.0 0.0 0.0 0.0 0.0 0.0 0.0 0.0 0.0 0.0 0.0 0.0 0.0 0.0

2CO003.008 – Oromin Joint Venture Group Independent Technical Report for the OJVG Golouma Gold Project, Sénégal Page 319
NMW_DM_TS /WB_MN OJVG Golouma Gold_2012_FS_Technical_Report_2CO003 008_NMW_DM_TS_GA_DGP_20130315_1 March 15, 2013
Category UNIT NPV TOTAL -2 -1 1 2 3 4 5 6 7 8 9 10 11 12 13 14 15 16 17 18
Miscellaneous M$ 7 7.1 1.8 4.9 0.4 0.0 0.0 0.0 0.0 0.0 0.0 0.0 0.0 0.0 0.0 0.0 0.0 0.0 0.0 0.0 0.0 0.0
Sustaining Capital for Mill and Infrastructure M$ 9 14.0 0.0 0.0 0.4 0.8 1.4 1.4 1.2 1.1 0.9 1.0 0.9 0.8 0.8 0.8 0.8 0.8 0.8 0.1 0.0 0.0
TSF, Water, Roads and Closure
Haul Roads M$ 7 7.1 6.1 0.0 0.9 0.0 0.1 0.0 0.0 0.0 0.0 0.0 0.0 0.0 0.0 0.0 0.0 0.0 0.0 0.0 0.0 0.0
Water Reservoir Dam M$ 6 5.9 5.9 0.0 0.0 0.0 0.0 0.0 0.0 0.0 0.0 0.0 0.0 0.0 0.0 0.0 0.0 0.0 0.0 0.0 0.0 0.0
Tailings Management Facility M$ 21 28.2 5.4 0.0 4.1 0.0 4.6 0.0 0.0 0.0 6.4 0.0 0.0 0.0 0.0 7.6 0.0 0.0 0.0 0.0 0.0 0.0
Surface Water Control M$ 3 3.5 1.0 1.5 1.0 0.0 0.0 0.0 0.0 0.0 0.0 0.0 0.0 0.0 0.0 0.0 0.0 0.0 0.0 0.0 0.0 0.0
Closure M$ 7 17.5 0.0 0.0 0.0 0.0 0.0 0.0 0.0 0.0 0.0 0.0 0.0 0.0 0.0 0.0 0.0 0.0 0.0 0.0 17.5 0.0
Owners Costs
Exploration, studies, insurance, etc. M$ 19 20.0 10.0 10.0 0.0 0.0 0.0 0.0 0.0 0.0 0.0 0.0 0.0 0.0 0.0 0.0 0.0 0.0 0.0 0.0 0.0 0.0
Contingency M$ 42 51.3 10 18 3 2 1 0 2 2 3 1 1 1 1 2 0 0 0 0 3 0
TOTAL CAPITAL COST M$ 419 504.7 95 202 30 15 11 4 13 16 30 15 17 9 11 13 2 1 1 0 21 0
NET ANNUAL CASH FLOW M$ 353 652.2 -95 -217 8 97 152 102 98 82 38 76 41 26 13 41 61 72 65 12 -21 1
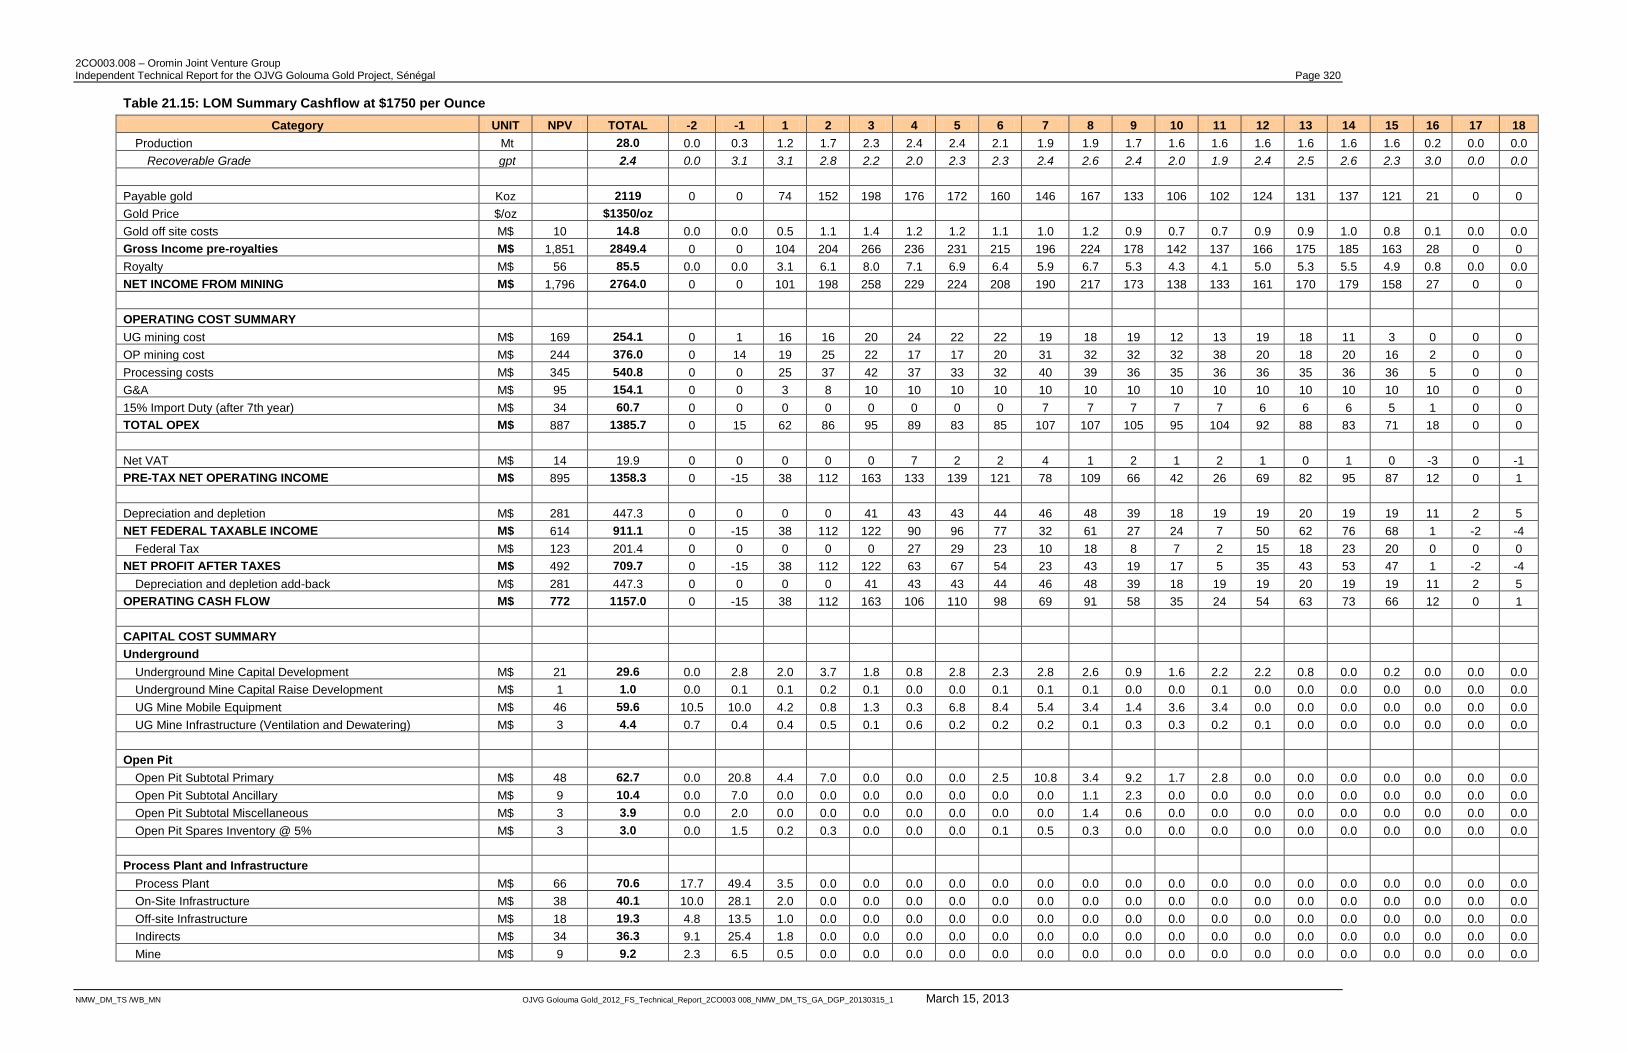
2CO003.008 – Oromin Joint Venture Group Independent Technical Report for the OJVG Golouma Gold Project, Sénégal Page 320
NMW_DM_TS /WB_MN OJVG Golouma Gold_2012_FS_Technical_Report_2CO003 008_NMW_DM_TS_GA_DGP_20130315_1 March 15, 2013
Table 21.15: LOM Summary Cashflow at $1750 per Ounce
Category UNIT NPV TOTAL -2 -1 1 2 3 4 5 6 7 8 9 10 11 12 13 14 15 16 17 18
Production Mt 28.0 0.0 0.3 1.2 1.7 2.3 2.4 2.4 2.1 1.9 1.9 1.7 1.6 1.6 1.6 1.6 1.6 1.6 0.2 0.0 0.0
Recoverable Grade gpt 2.4 0.0 3.1 3.1 2.8 2.2 2.0 2.3 2.3 2.4 2.6 2.4 2.0 1.9 2.4 2.5 2.6 2.3 3.0 0.0 0.0
Payable gold Koz 2119 0 0 74 152 198 176 172 160 146 167 133 106 102 124 131 137 121 21 0 0
Gold Price $/oz $1350/oz
Gold off site costs M$ 10 14.8 0.0 0.0 0.5 1.1 1.4 1.2 1.2 1.1 1.0 1.2 0.9 0.7 0.7 0.9 0.9 1.0 0.8 0.1 0.0 0.0
Gross Income pre-royalties M$ 1,851 2849.4 0 0 104 204 266 236 231 215 196 224 178 142 137 166 175 185 163 28 0 0
Royalty M$ 56 85.5 0.0 0.0 3.1 6.1 8.0 7.1 6.9 6.4 5.9 6.7 5.3 4.3 4.1 5.0 5.3 5.5 4.9 0.8 0.0 0.0
NET INCOME FROM MINING M$ 1,796 2764.0 0 0 101 198 258 229 224 208 190 217 173 138 133 161 170 179 158 27 0 0
OPERATING COST SUMMARY
UG mining cost M$ 169 254.1 0 1 16 16 20 24 22 22 19 18 19 12 13 19 18 11 3 0 0 0
OP mining cost M$ 244 376.0 0 14 19 25 22 17 17 20 31 32 32 32 38 20 18 20 16 2 0 0
Processing costs M$ 345 540.8 0 0 25 37 42 37 33 32 40 39 36 35 36 36 35 36 36 5 0 0
G&A M$ 95 154.1 0 0 3 8 10 10 10 10 10 10 10 10 10 10 10 10 10 10 0 0
15% Import Duty (after 7th year) M$ 34 60.7 0 0 0 0 0 0 0 0 7 7 7 7 7 6 6 6 5 1 0 0
TOTAL OPEX M$ 887 1385.7 0 15 62 86 95 89 83 85 107 107 105 95 104 92 88 83 71 18 0 0
Net VAT M$ 14 19.9 0 0 0 0 0 7 2 2 4 1 2 1 2 1 0 1 0 -3 0 -1
PRE-TAX NET OPERATING INCOME M$ 895 1358.3 0 -15 38 112 163 133 139 121 78 109 66 42 26 69 82 95 87 12 0 1
Depreciation and depletion M$ 281 447.3 0 0 0 0 41 43 43 44 46 48 39 18 19 19 20 19 19 11 2 5
NET FEDERAL TAXABLE INCOME M$ 614 911.1 0 -15 38 112 122 90 96 77 32 61 27 24 7 50 62 76 68 1 -2 -4
Federal Tax M$ 123 201.4 0 0 0 0 0 27 29 23 10 18 8 7 2 15 18 23 20 0 0 0
NET PROFIT AFTER TAXES M$ 492 709.7 0 -15 38 112 122 63 67 54 23 43 19 17 5 35 43 53 47 1 -2 -4
Depreciation and depletion add-back M$ 281 447.3 0 0 0 0 41 43 43 44 46 48 39 18 19 19 20 19 19 11 2 5
OPERATING CASH FLOW M$ 772 1157.0 0 -15 38 112 163 106 110 98 69 91 58 35 24 54 63 73 66 12 0 1
CAPITAL COST SUMMARY
Underground
Underground Mine Capital Development M$ 21 29.6 0.0 2.8 2.0 3.7 1.8 0.8 2.8 2.3 2.8 2.6 0.9 1.6 2.2 2.2 0.8 0.0 0.2 0.0 0.0 0.0
Underground Mine Capital Raise Development M$ 1 1.0 0.0 0.1 0.1 0.2 0.1 0.0 0.0 0.1 0.1 0.1 0.0 0.0 0.1 0.0 0.0 0.0 0.0 0.0 0.0 0.0
UG Mine Mobile Equipment M$ 46 59.6 10.5 10.0 4.2 0.8 1.3 0.3 6.8 8.4 5.4 3.4 1.4 3.6 3.4 0.0 0.0 0.0 0.0 0.0 0.0 0.0
UG Mine Infrastructure (Ventilation and Dewatering) M$ 3 4.4 0.7 0.4 0.4 0.5 0.1 0.6 0.2 0.2 0.2 0.1 0.3 0.3 0.2 0.1 0.0 0.0 0.0 0.0 0.0 0.0
Open Pit
Open Pit Subtotal Primary M$ 48 62.7 0.0 20.8 4.4 7.0 0.0 0.0 0.0 2.5 10.8 3.4 9.2 1.7 2.8 0.0 0.0 0.0 0.0 0.0 0.0 0.0
Open Pit Subtotal Ancillary M$ 9 10.4 0.0 7.0 0.0 0.0 0.0 0.0 0.0 0.0 0.0 1.1 2.3 0.0 0.0 0.0 0.0 0.0 0.0 0.0 0.0 0.0
Open Pit Subtotal Miscellaneous M$ 3 3.9 0.0 2.0 0.0 0.0 0.0 0.0 0.0 0.0 0.0 1.4 0.6 0.0 0.0 0.0 0.0 0.0 0.0 0.0 0.0 0.0
Open Pit Spares Inventory @ 5% M$ 3 3.0 0.0 1.5 0.2 0.3 0.0 0.0 0.0 0.1 0.5 0.3 0.0 0.0 0.0 0.0 0.0 0.0 0.0 0.0 0.0 0.0
Process Plant and Infrastructure
Process Plant M$ 66 70.6 17.7 49.4 3.5 0.0 0.0 0.0 0.0 0.0 0.0 0.0 0.0 0.0 0.0 0.0 0.0 0.0 0.0 0.0 0.0 0.0
On-Site Infrastructure M$ 38 40.1 10.0 28.1 2.0 0.0 0.0 0.0 0.0 0.0 0.0 0.0 0.0 0.0 0.0 0.0 0.0 0.0 0.0 0.0 0.0 0.0
Off-site Infrastructure M$ 18 19.3 4.8 13.5 1.0 0.0 0.0 0.0 0.0 0.0 0.0 0.0 0.0 0.0 0.0 0.0 0.0 0.0 0.0 0.0 0.0 0.0
Indirects M$ 34 36.3 9.1 25.4 1.8 0.0 0.0 0.0 0.0 0.0 0.0 0.0 0.0 0.0 0.0 0.0 0.0 0.0 0.0 0.0 0.0 0.0
Mine M$ 9 9.2 2.3 6.5 0.5 0.0 0.0 0.0 0.0 0.0 0.0 0.0 0.0 0.0 0.0 0.0 0.0 0.0 0.0 0.0 0.0 0.0

2CO003.008 – Oromin Joint Venture Group Independent Technical Report for the OJVG Golouma Gold Project, Sénégal Page 321
NMW_DM_TS /WB_MN OJVG Golouma Gold_2012_FS_Technical_Report_2CO003 008_NMW_DM_TS_GA_DGP_20130315_1 March 15, 2013
Category UNIT NPV TOTAL -2 -1 1 2 3 4 5 6 7 8 9 10 11 12 13 14 15 16 17 18
Miscellaneous M$ 7 7.1 1.8 4.9 0.4 0.0 0.0 0.0 0.0 0.0 0.0 0.0 0.0 0.0 0.0 0.0 0.0 0.0 0.0 0.0 0.0 0.0
Sustaining Capital for Mill and Infrastructure M$ 9 14.0 0.0 0.0 0.4 0.8 1.4 1.4 1.2 1.1 0.9 1.0 0.9 0.8 0.8 0.8 0.8 0.8 0.8 0.1 0.0 0.0
TSF, Water, Roads and Closure
Haul Roads M$ 7 7.1 6.1 0.0 0.9 0.0 0.1 0.0 0.0 0.0 0.0 0.0 0.0 0.0 0.0 0.0 0.0 0.0 0.0 0.0 0.0 0.0
Water Reservoir Dam M$ 6 5.9 5.9 0.0 0.0 0.0 0.0 0.0 0.0 0.0 0.0 0.0 0.0 0.0 0.0 0.0 0.0 0.0 0.0 0.0 0.0 0.0
Tailings Management Facility M$ 21 28.2 5.4 0.0 4.1 0.0 4.6 0.0 0.0 0.0 6.4 0.0 0.0 0.0 0.0 7.6 0.0 0.0 0.0 0.0 0.0 0.0
Surface Water Control M$ 3 3.5 1.0 1.5 1.0 0.0 0.0 0.0 0.0 0.0 0.0 0.0 0.0 0.0 0.0 0.0 0.0 0.0 0.0 0.0 0.0 0.0
Closure M$ 7 17.5 0.0 0.0 0.0 0.0 0.0 0.0 0.0 0.0 0.0 0.0 0.0 0.0 0.0 0.0 0.0 0.0 0.0 0.0 17.5 0.0
Owners Costs
Exploration, studies, insurance, etc. M$ 19 20.0 10.0 10.0 0.0 0.0 0.0 0.0 0.0 0.0 0.0 0.0 0.0 0.0 0.0 0.0 0.0 0.0 0.0 0.0 0.0 0.0
Contingency M$ 42 51.3 10 18 3 2 1 0 2 2 3 1 1 1 1 2 0 0 0 0 3 0
TOTAL CAPITAL COST M$ 419 504.7 95 202 30 15 11 4 13 16 30 15 17 9 11 13 2 1 1 0 21 0
NET ANNUAL CASH FLOW M$ 353 652.2 -95 -217 8 97 152 102 98 82 38 76 41 26 13 41 61 72 65 12 -21 1
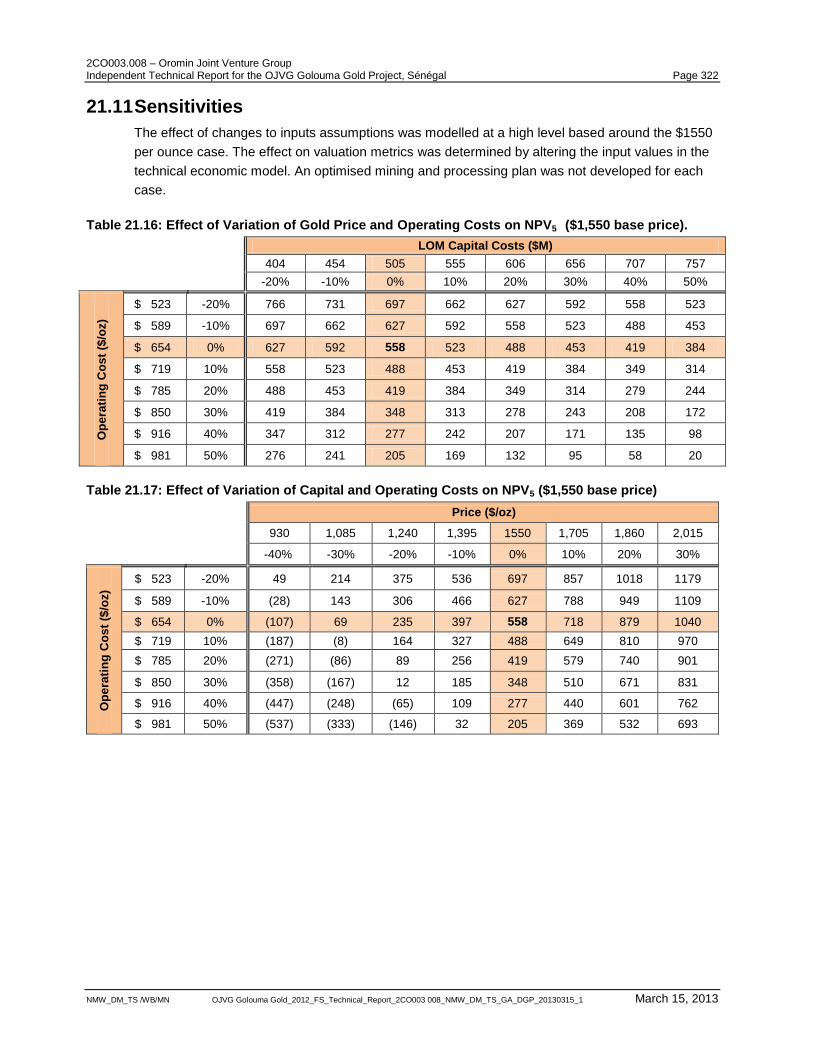
2CO003.008 – Oromin Joint Venture Group Independent Technical Report for the OJVG Golouma Gold Project, Sénégal Page 322
NMW_DM_TS /WB/MN OJVG Golouma Gold_2012_FS_Technical_Report_2CO003 008_NMW_DM_TS_GA_DGP_20130315_1 March 15, 2013
21.11 Sensitivities
The effect of changes to inputs assumptions was modelled at a high level based around the $1550
per ounce case. The effect on valuation metrics was determined by altering the input values in the
technical economic model. An optimised mining and processing plan was not developed for each
case.
Table 21.16: Effect of Variation of Gold Price and Operating Costs on NPV5 ($1,550 base price).
LOM Capital Costs ($M)
404 454 505 555 606 656 707 757
-20% -10% 0% 10% 20% 30% 40% 50%
Op
era
tin
g C
os
t ($
/oz)
$ 523 -20% 766 731 697 662 627 592 558 523
$ 589 -10% 697 662 627 592 558 523 488 453
$ 654 0% 627 592 558 523 488 453 419 384
$ 719 10% 558 523 488 453 419 384 349 314
$ 785 20% 488 453 419 384 349 314 279 244
$ 850 30% 419 384 348 313 278 243 208 172
$ 916 40% 347 312 277 242 207 171 135 98
$ 981 50% 276 241 205 169 132 95 58 20
Table 21.17: Effect of Variation of Capital and Operating Costs on NPV5 ($1,550 base price)
Price ($/oz)
930 1,085 1,240 1,395 1550 1,705 1,860 2,015
-40% -30% -20% -10% 0% 10% 20% 30%
Op
era
tin
g C
os
t ($
/oz)
$ 523 -20% 49 214 375 536 697 857 1018 1179
$ 589 -10% (28) 143 306 466 627 788 949 1109
$ 654 0% (107) 69 235 397 558 718 879 1040
$ 719 10% (187) (8) 164 327 488 649 810 970
$ 785 20% (271) (86) 89 256 419 579 740 901
$ 850 30% (358) (167) 12 185 348 510 671 831
$ 916 40% (447) (248) (65) 109 277 440 601 762
$ 981 50% (537) (333) (146) 32 205 369 532 693
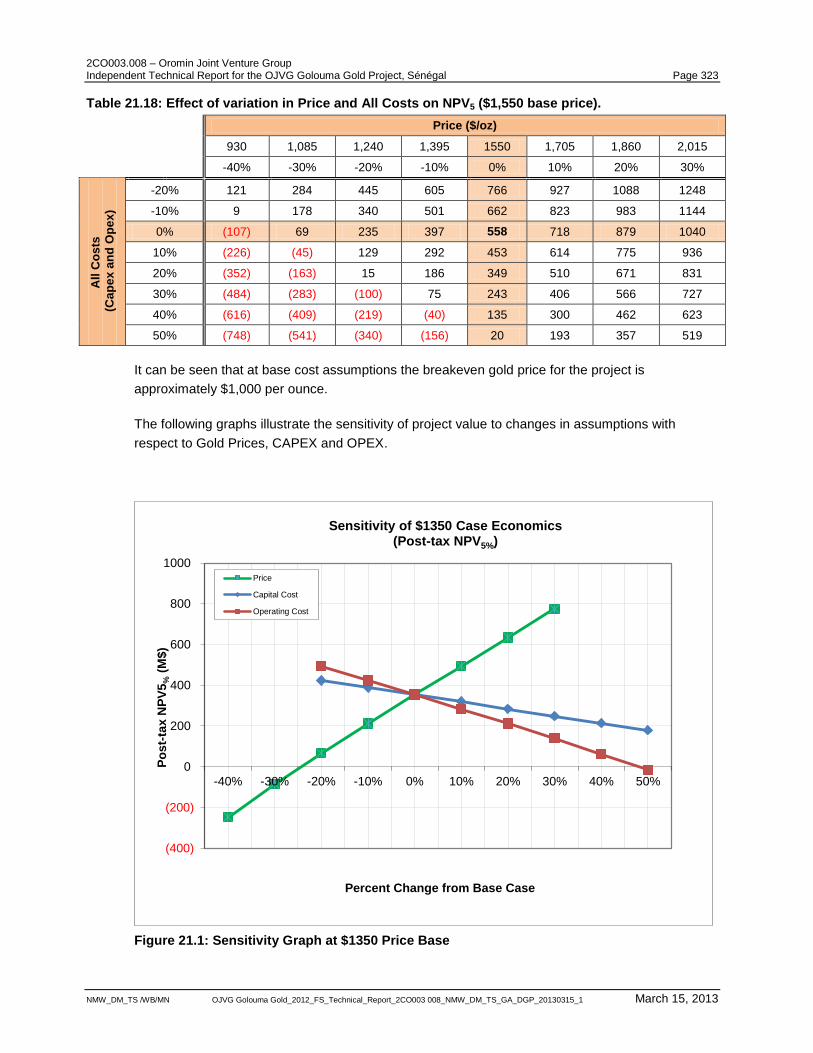
2CO003.008 – Oromin Joint Venture Group Independent Technical Report for the OJVG Golouma Gold Project, Sénégal Page 323
NMW_DM_TS /WB/MN OJVG Golouma Gold_2012_FS_Technical_Report_2CO003 008_NMW_DM_TS_GA_DGP_20130315_1 March 15, 2013
Table 21.18: Effect of variation in Price and All Costs on NPV5 ($1,550 base price).
Price ($/oz)
930 1,085 1,240 1,395 1550 1,705 1,860 2,015
-40% -30% -20% -10% 0% 10% 20% 30%
All
Co
sts
(C
ap
ex
an
d O
pe
x)
-20% 121 284 445 605 766 927 1088 1248
-10% 9 178 340 501 662 823 983 1144
0% (107) 69 235 397 558 718 879 1040
10% (226) (45) 129 292 453 614 775 936
20% (352) (163) 15 186 349 510 671 831
30% (484) (283) (100) 75 243 406 566 727
40% (616) (409) (219) (40) 135 300 462 623
50% (748) (541) (340) (156) 20 193 357 519
It can be seen that at base cost assumptions the breakeven gold price for the project is
approximately $1,000 per ounce.
The following graphs illustrate the sensitivity of project value to changes in assumptions with
respect to Gold Prices, CAPEX and OPEX.
Figure 21.1: Sensitivity Graph at $1350 Price Base
(400)
(200)
0
200
400
600
800
1000
-40% -30% -20% -10% 0% 10% 20% 30% 40% 50%
Po
st-
tax
NP
V5
% (
M$
)
Percent Change from Base Case
Sensitivity of $1350 Case Economics (Post-tax NPV5%)
Price
Capital Cost
Operating Cost
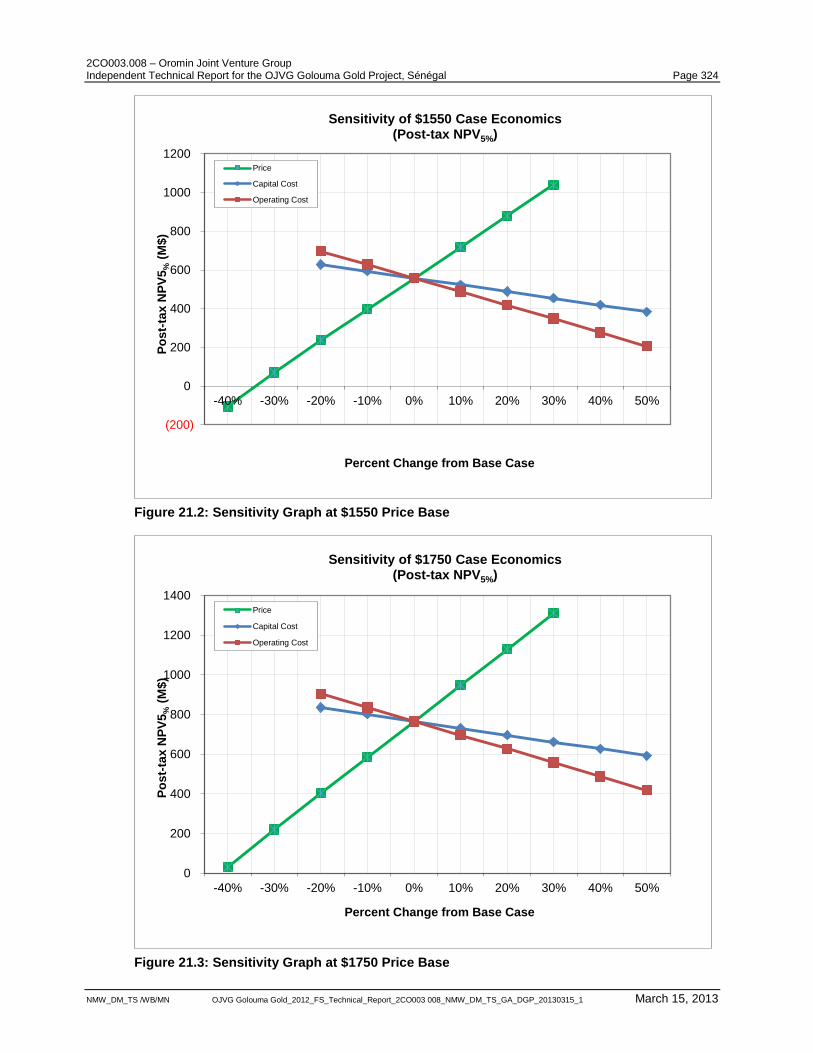
2CO003.008 – Oromin Joint Venture Group Independent Technical Report for the OJVG Golouma Gold Project, Sénégal Page 324
NMW_DM_TS /WB/MN OJVG Golouma Gold_2012_FS_Technical_Report_2CO003 008_NMW_DM_TS_GA_DGP_20130315_1 March 15, 2013
Figure 21.2: Sensitivity Graph at $1550 Price Base
Figure 21.3: Sensitivity Graph at $1750 Price Base
(200)
0
200
400
600
800
1000
1200
-40% -30% -20% -10% 0% 10% 20% 30% 40% 50%
Po
st-
tax
NP
V5
% (
M$
)
Percent Change from Base Case
Sensitivity of $1550 Case Economics (Post-tax NPV5%)
Price
Capital Cost
Operating Cost
0
200
400
600
800
1000
1200
1400
-40% -30% -20% -10% 0% 10% 20% 30% 40% 50%
Po
st-
tax
NP
V5
% (
M$
)
Percent Change from Base Case
Sensitivity of $1750 Case Economics (Post-tax NPV5%)
Price
Capital Cost
Operating Cost
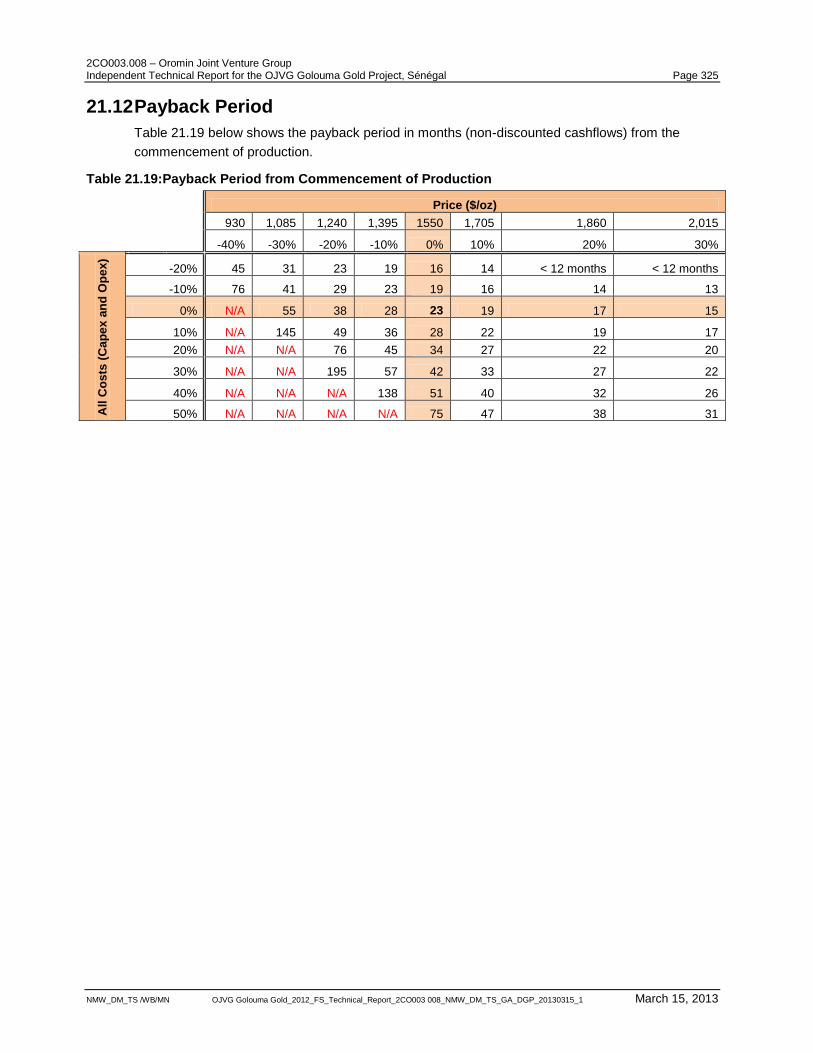
2CO003.008 – Oromin Joint Venture Group Independent Technical Report for the OJVG Golouma Gold Project, Sénégal Page 325
NMW_DM_TS /WB/MN OJVG Golouma Gold_2012_FS_Technical_Report_2CO003 008_NMW_DM_TS_GA_DGP_20130315_1 March 15, 2013
21.12 Payback Period
Table 21.19 below shows the payback period in months (non-discounted cashflows) from the
commencement of production.
Table 21.19:Payback Period from Commencement of Production
Price ($/oz)
930 1,085 1,240 1,395 1550 1,705 1,860 2,015
-40% -30% -20% -10% 0% 10% 20% 30%
All
Co
sts
(C
ap
ex
an
d O
pe
x)
-20% 45 31 23 19 16 14 < 12 months < 12 months
-10% 76 41 29 23 19 16 14 13
0% N/A 55 38 28 23 19 17 15
10% N/A 145 49 36 28 22 19 17
20% N/A N/A 76 45 34 27 22 20
30% N/A N/A 195 57 42 33 27 22
40% N/A N/A N/A 138 51 40 32 26
50% N/A N/A N/A N/A 75 47 38 31
2CO003.008 – Oromin Joint Venture Group Independent Technical Report for the OJVG Golouma Gold Project, Sénégal Page 326
NMW_DM_TS /WB/MN OJVG Golouma Gold_2012_FS_Technical_Report_2CO003 008_NMW_DM_TS_GA_DGP_20130315_1 March 15, 2013
22 Adjacent Properties The information contained in this section is not considered material to this technical report, or the
OJVG resource estimate. The information is shown only for general interest of the land holdings
and activities in the region. The information in this section was extracted from public domain
documents, most of which come from the websites of the concession holders and from the website
www.sedar.com.
The 212.6 km2 OJVG Golouma Gold Project concession is bordered on all sides by other mineral
concessions held by Randgold, AXMIN, Teranga and Sored Mines. A number of orogenic gold
deposits have been discovered in the area covered by these exploration and exploitation
concessions, and one mining operation has been commissioned (Teranga Sabodala). All regional
prospects appear to be associated with north-northeast to northeast trending shear zones.
Figure 22.1 shows the approximate locations of the adjacent properties.
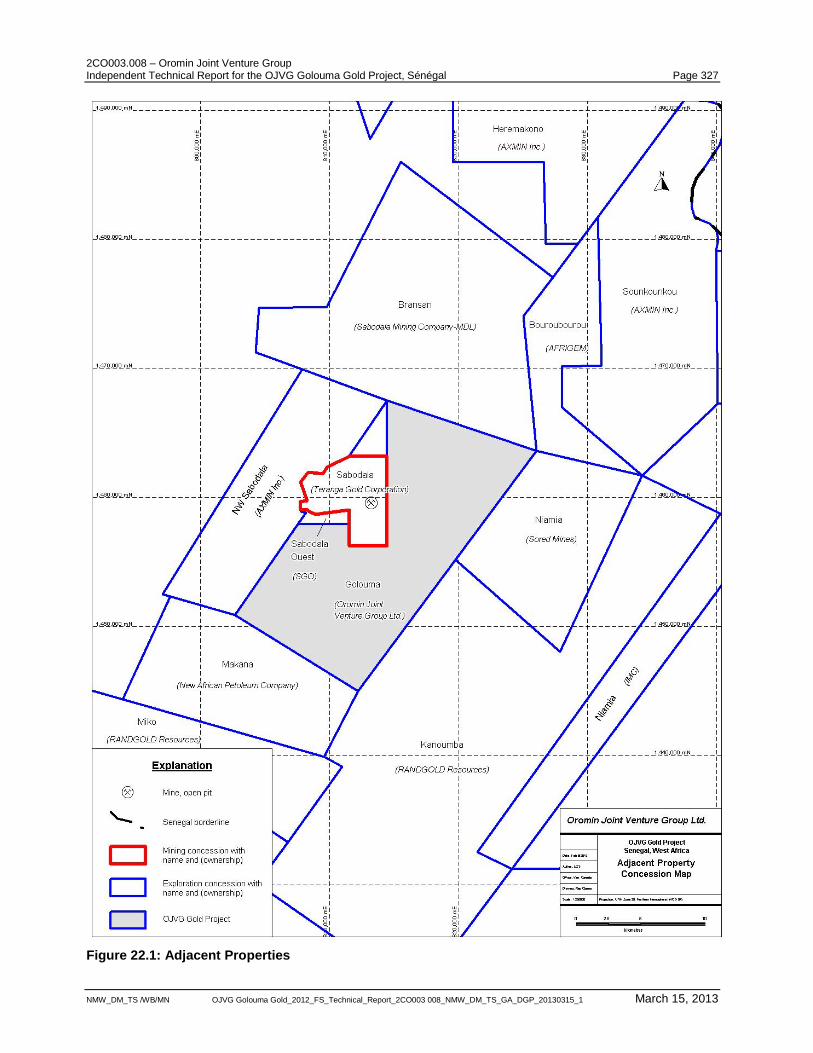
2CO003.008 – Oromin Joint Venture Group Independent Technical Report for the OJVG Golouma Gold Project, Sénégal Page 327
NMW_DM_TS /WB/MN OJVG Golouma Gold_2012_FS_Technical_Report_2CO003 008_NMW_DM_TS_GA_DGP_20130315_1 March 15, 2013
Figure 22.1: Adjacent Properties
2CO003.008 – Oromin Joint Venture Group Independent Technical Report for the OJVG Golouma Gold Project, Sénégal Page 328
NMW_DM_TS /WB/MN OJVG Golouma Gold_2012_FS_Technical_Report_2CO003 008_NMW_DM_TS_GA_DGP_20130315_1 March 15, 2013
22.1 Teranga Sabodala
The Sabodala Gold Mine is owned 90% by Teranga Gold Corporation (Teranga) through its wholly-
owned subsidiary Sabodala Gold Operations SA (SGO) and 10% by the Government of the
Republic of Sénégal and operates under Sabodala Gold Operations SA (SGO). The OJVG Project
lies adjacent to the Teranga property on the east and south and part of the west as well. The
Teranga concession is 33 km2 in size and has a mineral resource estimate of 2.87 million ounces
(Moz) of Measured and Indicated gold resources plus 1.67 Moz of inferred gold resources and has
a mineral reserve estimate of 1.59 Moz of gold.
The $330 million (estimate) Teranga Sabodala Gold project began commercial production in March
2009. Teranga produced 172 thousand ounces (“Koz”) of gold in 2011 and expects to produce 130
Koz of gold in 2012. The CIL cyanidation plant has a capacity of greater than 2 million tonnes per
annum (Mtpa) and underwent an expansion to 4 Mtpa in 2011.
Teranga‟s regional ground position comprises a Mining Concession and eleven Exploration
Permits in various joint ventures, totaling approximately 1,533 km2(Table 22.1). Over 75% of the
landholdings lie within a 35 km radius of Teranga‟s Sabodala mining operation.
Table 22.1: Teranga Exploration Concessions
Exploration Permit Teranga interest Area km² Anniversary Date
Dembala Berola 100% 244 Jan-12
Massakounda 100% 186 Jan-12
Bransan 70% 261 Oct-12
Makana 80% 125 Nov-12
Sabodala NW 80% 120 May-12
Heremakono 80% 215 Oct-12
Sounkounkou 80% 213 Sep-12
Bransen Sud 100% 7 Nov-13
Sabodala Ouest 100% 3 Nov-13
Saiansoutou 100% 81 Nov-13
Garaboureya North 75% 50 Aug-13
With its gold plant operating at Sabodala, Teranga is refocusing on its regional and mine lease
exploration programs and plans to spend $40 million to end of 2012 on major RAB, RC and
diamond drill campaigns on both the mine lease and regional portfolio. Teranga spent US$43M on
exploration in 2011.
Sabodala Mine Lease
Teranga, in 2012, plans to spend US$ 20 million for exploration on the Mine Lease, investigating
up to ten targets. This work includes additional drilling to further evaluate the Main Flat Extension
and the Lower Flat Zone; the two main faults controlling mineralization in the mine. They also plan
to drill test the structural corridor that hosts the Mine along trend to the north, the Sambaya Hill
target at the junction of the Niakafiri Shear Zone and the Main Flat fault, the extension of the
Masato deposit on Teranga ground, and the Niakafiri and Soukhoto extension areas.
2CO003.008 – Oromin Joint Venture Group Independent Technical Report for the OJVG Golouma Gold Project, Sénégal Page 329
NMW_DM_TS /WB/MN OJVG Golouma Gold_2012_FS_Technical_Report_2CO003 008_NMW_DM_TS_GA_DGP_20130315_1 March 15, 2013
Regional Exploration
Through 2010, only early stage exploration including soil geochemical sampling, termite mound
sampling, airborne magnetic and radiometric surveys, mapping, trenching, RAB drilling and some
RC and core were completed.
Teranga spent US$31 million in 2011 completing 86,000 m RC, 29,000 m core and 151,000 m of
RAB drilling. Twenty-eight drill targets were tested, fourteen by RC or core and fifteen by RAB and
trenching. They plan to spend US$20 million on regional exploration in 2012, testing 36 exploration
targets.
Bransan
The property covers an area of 261 km2 and is situated immediately adjacent to the OJVG
northeast boundary. Bransan is owned by a joint venture between SMC (70%) and private
Sénégalese interests (30%). They completed 23,000 m of RAB drilling in 2011, following up on the
results from the soil geochemical sampling program. Several anomalous areas were identified. The
Diadiako structure with alteration, brecciation and quartz veining was identified and a 1 km long
section was drill tested at 200 m to 400 m intervals. An inferred mineral resource of 0.12 Moz of
gold grading 1.27 g/t Au is estimated at Diadiako.
Dembala Berola
The property covers an area of 244 km2 and is situated to the east of the Bransan concession near
the Mali border and is 100% owned by SMC. Regional soil sampling and structural interpretation
defined eight prospective areas within a 2 km wide structural trend on the eastern boundary of the
Main Transcurrent Shear. The centrally located Dembala Hill mineralization is hosted in felsic
porphyry and dolerite with widths up to 74 m and grades to 6 g/t Au. The Tourokhoto area, located
west of Dembala Hills, is a 5 km by 1 km gold anomaly defined in termite sampling. It was tested by
1,006 RAB holes, totaling 23,416 m. Preliminary results were positive and additional RC drilling is
planned to further evaluate the area during 2012. No mineral resource estimate has been stated for
this concession.
Massakounda
The property covers an area of 186 km2 and is situated approximately 5 km to the north of the
boundary of the Bransan concession and is 100% owned by Teranga. During 2011, a RAB and RC
drilling program tested the Massakounda structural target and gold anomalies. No mineral resource
estimate has been stated for the Massakounda concession.
Makana
The Makana project is a joint venture between New African Petroleum Company, SARL (NAFPEC)
and SMC. The Makana concession is located immediately to the southwest of the OJVG property.
It is 125 km2 in size and covers a 5 km strike length of the structural trend that passes through the
OJVG concession and hosts the Sabodala gold deposit. The concession hosts the Majiva target;
one of several prospects defined by soil geochemistry and IP geophysics. A drill program to
evaluate several of the targets is proposed for 2012. An inferred mineral resource of 0.04 Moz of
gold grading 1.5 g/t Au is estimated at Majiva
2CO003.008 – Oromin Joint Venture Group Independent Technical Report for the OJVG Golouma Gold Project, Sénégal Page 330
NMW_DM_TS /WB/MN OJVG Golouma Gold_2012_FS_Technical_Report_2CO003 008_NMW_DM_TS_GA_DGP_20130315_1 March 15, 2013
Sounkounkou
AXMIN Inc. (AXMIN) holds 100% interest in the Sounkounkou, Sabodala NW and Heremakono
exploration concessions. AXMIN entered into a joint venture agreement with Teranga whereby
Teranga may earn 80% interest in the property. Teranga earned their 80% interest by spending
US$ 6 million on exploration by May 2011. AXMIN can retain its 20% interest by participating in
further expenditures on a pro rata basis or be reduced to a 1.5% production royalty.
The Gora deposit is located within the Sounkounkou concession, 22 km northeast of the mine. It
was first evaluated during early 2010, with a systematic RC drilling. This work delineated two sub-
parallel, shallow, southeast dipping, gold bearing quartz veins separated by 1 m to 20 m of country-
rock sediments. Vein one averages 8.8 g/t Au and a width of 2.5 m. Vein two averages 3g/t Au and
a width of 2.7 m. An extensive gradient array IP geophysical survey was completed in 2011 and it
has outlined several anomalies including a possible 700 m extension of the Gora vein system and
several sub-parallel anomalies.
Teranga completed 237 RC and Core holes, totaling 39,878 m. This 2011 follow-up drill program
commenced in early January and had three main goals. Goal one was the lateral resource
extension along strike to the north and south;now tested by 40 RC and core holes (6,278 m) and
open to expansion. Goal two was a resource definition by completing the initial systematic 40 m x
40 m drill grid in the central portions of the prospect. Goal three was to explore at depth and test for
wider zones of mineralization where the vein system is projected to intersect a number of intrusive
rocks in the southeast. The Gora zone has now been drill tested to a depth of 130 m. The Gora
deposit has Measured and Indicated gold resources of 0.22 million ounces (Moz) grading 5.22g/t
Au and a mineral reserve estimate of 0.16 Moz of gold grading 3.64g/t Au.
Termite sampling at the Diegoun area of the Sonkounkou concession, located west of Gora has
outlined a 7 km by 4 km gold anomaly. Three priority areas were identified in the anomaly for
further work. Drilling at Diegoun North identified a 4.5 km northeast trending mineralized structure.
Follow-up drilling is planned for 2012.
Sabodala Northwest
The Sabodala NW concession is located adjacent to the west of the OJVG property. Several north-
south trending anomalies were identified at Toumboumba by a 1,150-hole RAB drill program
totaling 49,000 m. Forty-nine RC holes tested fifteen of the eighteen trends. Additional drilling is
planned for 2012.
22.2 Randgold Resources Ltd.
Randgold Resources Ltd. (Randgold) holds the exploration rights for the Miko, Tomboronkoto and
Kanoumba concessions, located southwest and southeast respectively, of the OJVG property.
Several anomalous gold zones have been discovered by soil sampling, trenching, and drilling
programs including Sofia, Bambaraya, Delya and the Bakan corridor. These targets were
evaluated in 2011. Randgold delineated an indicated gold resource of 3.18 Moz gold grading 2.56
g/t Au at the Massawa deposit, located in the centre of the newly combined Kanoumba permit,
about 10 km due south from the OJVG concession boundary. The ore body at Massawa is known
to be refractory and may require sulphide concentration and pressure oxidation prior to CIL gold
recovery. The ore is abnormally hard and will require significant power to process, so alternate
power sources are being investigated.
2CO003.008 – Oromin Joint Venture Group Independent Technical Report for the OJVG Golouma Gold Project, Sénégal Page 331
NMW_DM_TS /WB/MN OJVG Golouma Gold_2012_FS_Technical_Report_2CO003 008_NMW_DM_TS_GA_DGP_20130315_1 March 15, 2013
23 Other Relevant Data and Information Ausenco Minerals and Metals Canada (Ausenco) and SRK Consulting (SRK) were contracted by
Oromin Joint Venture Group (OJVG) to assist in the production of a Preliminary Economic
Assessment (PEA) for the heap leaching of low grade ore at their OJVG Gold Project in Senegal.
The contract resulted in a technical report entitled “Oromin Joint Venture Group, Golouma Project
Heap Leach Preliminary Economic Assessment” dated June 18, 2011. The report was filed and is
available for review on SEDAR.
It is SRK‟s understanding that an updated PEA is being prepared by OJVG in relation to heap
leaching operations.
2CO003.008 – Oromin Joint Venture Group Independent Technical Report for the OJVG Golouma Gold Project, Sénégal Page 332
NMW_DM_TS /WB/MN OJVG Golouma Gold_2012_FS_Technical_Report_2CO003 008_NMW_DM_TS_GA_DGP_20130315_1 March 15, 2013
24 Interpretation and Conclusions
24.1 Conclusions
Industry standard mineral resource estimation and economic evaluation practices have been used
to assess the OJVG Golouma Gold Project.
SRK considers the exploration potential at the OJVG Golouma Gold Project to remain very good
with the potential to increase resources through expanding current deposits at depth, better
defining known exploration targets and drilling new anomalies.
To date, SRK is not aware of any fatal flaws for the project.
24.2 Upside Risks
The most significant upside risks that could potentially improve the project‟s financial results are
listed below:
Conversion of inferred resources to higher classifications an subsequent inclusion in mine
planning;
Discovery and evaluation new mineral resources and mineral reserves;
Gold grade may locally be higher than modelled once mining takes place, since the grades
from high grade drill intercepts are smoothed during the geostatistical interpolation process.
The continuity of high grade intersections is unknown but may offer flexibility and opportunities
during mining;
Expansion of existing deposits both laterally and vertically;
There is potential to recover gold through a pyrite flotation circuit prior to the CIL circuit and
regrind the concentrate prior to leaching. This may increase the overall gold recovery and
further test work is required to evaluate this option.
Recommended actions and opportunities for improving project value are outlined in Section 25.
24.3 Downside Risks
As with almost all mining ventures, there are risks and opportunities that can affect the outcome of
the OJVG Gold Project.
The major risk areas identified in this study are:
Lack of control over external drivers such as gold price and exchange rates;
Water supply in the region is scarce. The Golouma Gold Project relies upon water collected
during the rainy season and stored in the water reservoir. If the site water balance assumptions
are not achieved then there is a potential of the water shortage for the plant that could affect
the operations;
Ongoing attenuation studies may confirm that a liner would be required for the TMF. This
would result in a increase in capital cost in the order of $20M;
2CO003.008 – Oromin Joint Venture Group Independent Technical Report for the OJVG Golouma Gold Project, Sénégal Page 333
NMW_DM_TS /WB/MN OJVG Golouma Gold_2012_FS_Technical_Report_2CO003 008_NMW_DM_TS_GA_DGP_20130315_1 March 15, 2013
The FS design does not include a cyanide detoxification stage prior to discharging CIL tailings
into the TMF. This design is in accordance with a similar plant operating within the region.
Sufficient plant space has been incorporated into the FS design to facilitate the inclusion of an
Inco slurry detoxification circuit if a requirement is identified during the plant operation. The
total installed capital cost for this Inco slurry detoxification system is expected to be around $3
to $4 million based on a high level scoping study estimate. The increase in the operating cost
is in the order of $1.6 /t – $2.0 /t;
No government approvals or permits to proceed are granted following the submission and
evaluation of the ESIA and the public presentation of the project;
Ongoing geochemical studies indicate the natural attenuation of contaminants of concern in the
underlying substrate of the TMF does not reduce seepage from the facility to acceptable limits;
Water quality of potential pit lakes do not meet WHO drinking water quality guidelines;
Timely supply of expatriate and skilled local personnel has the potential to be a very significant
risk to the success of the project. The ability to adequately train local un-skilled labour to the
required level is also a key factor, particularly for the underground mine;
The local “between-hole” geological continuity of high-grade mineralization has not been
exposed by mining, leaving the possibility of segmented, en echelon geometries. Variation
between the predicted and actual deposit shapes can lead to unexpected dilution (lower head
grade); and
Project delay, due to finance delay, non-availability of key personnel, construction equipment,
contractors, long lead times on capital equipment delivery and environmental permitting can
affect the project.
2CO003.008 – Oromin Joint Venture Group Independent Technical Report for the OJVG Golouma Gold Project, Sénégal Page 334
NMW_DM_TS /WB/MN OJVG Golouma Gold_2012_FS_Technical_Report_2CO003 008_NMW_DM_TS_GA_DGP_20130315_1 March 15, 2013
25 Recommendations SRK has been involved in providing consulting services for the OJVG Gold Project over the past 6
years. The project still offers opportunity for growth and the following recommendations are made.
25.1 Project Mining and Processing Strategy
Underground mining at Masato beneath the current design open pit appears to be a potentially
value-adding consideration. Additional geotechnical characterisation is required before this can
be incorporated at a feasibility level;
The production schedules and cut-off grade strategies have not yet been fully optimised for the
project. Additional value may be able to be created by investigating variable cut-off policies
utilising intermediate grade stockpiles. OJVG and SRK are in dialogue regarding the execution
of this work.
The processing throughput rate has remained essentially unchanged from the previous study.
A strategic revision of the optimum processing rate and mill expansion strategy for maximum
project value is recommended, given that the Resources and Reserves have increased for the
project.
Incorporate heap leaching into the overall process flowsheet as part of the onging optimisation.
This study could take into consideration the other open pit deposits that are still in the resource
definition stage.
A significant costs savings in capital for both the WSD and TMF dams could potentially be
attained by changing the blanket drain to a finger drain. Further optimization study is required,
but early indication suggests that this may be attainable.
25.2 Exploration Continue exploration of existing deposits to increase both Inferred and Indicated Resources as
well as Reserves; and
Continue exploration of other zones for mineralization on the permit area.
OJVG‟s quality control procedure is considered robust enough to undertake resource estimation.
The following recommendations should be considered in the future in order to improve confidence
in the resource estimation:
OJVG should send samples to an umpire laboratory on a more regular basis.
OJVG should continue to be extremely careful in their choice of field blank material, ensuring
that no fine veining with anomalous gold values is present.
25.3 Hydrogeology
A test pumping program should be undertaken at Masato and Golouma to adequately stress
the Weak and Transition zones (saprolite aquifer). Screened observation wells should be
installed at varying depths and at distances from the pumping well to best understand and
characterize the aquifer, increase confidence in the hydraulic properties of the weaker material
and mafic dykes at depth, and calibrate the groundwater model for dewatering design. Once
2CO003.008 – Oromin Joint Venture Group Independent Technical Report for the OJVG Golouma Gold Project, Sénégal Page 335
NMW_DM_TS /WB/MN OJVG Golouma Gold_2012_FS_Technical_Report_2CO003 008_NMW_DM_TS_GA_DGP_20130315_1 March 15, 2013
the test results are known these should revaluate pit slopes and mineability. The approximate
cost for this program will be $450,000.
25.4 Metallurgical and Mineral Processing Recommendations
25.4.1 Further Comminution Test Work
The test work undertaken to date on the ore competency (impact breakage for SAG mill sizing) and
ore hardness (abrasion breakage for ball mill sizing) is mainly based on bulk composites. It is
recommended that further variability test work be completed based on individual diamond drill core
samples taken over a larger range of holes across the deposits to confirm the design criteria. The
test work should comprise of SMC and ball mill work index tests.
The purpose of further variability comminution test work is to mitigate risk associated with the
orebodies being either on average harder than the ore parameters used for the FS, or containing
localised zones of harder ore.
25.4.2 General Plant Design Test Work
Recommended additional test work identified during the FS includes:
• Sequential carbon contact and equilibrium loading test work;
• CIL leaching oxygen uptake test work;
• Slurry rheology test work to confirm agitator and pumping size requirements;
• Test work to confirm tailings thickening rates for high rate tailings thickener selection based
on a sample representing a production composite;
• Bulk materials handling test work to optimise design of the chutes, conveyors, crushed ore
stockpile and reclaim facility; and
• Confirmation of geotechnical foundation conditions for engineering design purposes in the
plant, particularly in the locations of heavy structures such as the grinding mills.
The overall cost for the recommended comminution, and general plant design test work is in the
order of $US 300,000.
25.4.3 Mill Power
Reduce the installed SAG and ball mill motors from 4,000 kW to 3,500 kW based on Ausenco
comminution modelling; however, there is a higher risk of not meeting the required 75 micron
grind size whilst treating 100% primary hard ore that could result in a decrease in gold
recovery.
25.5 General
SRK is unaware of any other significant factors and risks that may affect access, title, or the right or
ability to perform the exploration work recommended for the OJVG Golouma Gold Project.
2CO003.008 – Oromin Joint Venture Group Independent Technical Report for the OJVG Golouma Gold Project, Sénégal Page 336
NMW_DM_TS /WB/MN OJVG Golouma Gold_2012_FS_Technical_Report_2CO003 008_NMW_DM_TS_GA_DGP_20130315_1 March 15, 2013
26 Acronyms and Abbreviations Distance Other
µm micron (micrometre) oC degree Celsius
mm millimetre oF degree Fahrenheit
cm centimetre Btu British Thermal Unit
m metre cfm cubic feet per minute
km km elev elevation above sea level
” inch masl m above sea level
in inch hp horsepower
‟ foot hr hour
ft foot kW kilowatt
Area kWh kilowatt hour
m2 square metre M Million
km2 square km mph miles per hour
ac acre ppb parts per billion
Ha hectare ppm parts per million
Volume s second
l litre s.g. specific gravity
m3 cubic metre usgpm US gallon per minute
ft3 cubic foot V volt
usg US gallon W watt
lcm loose cubic metre Ω ohm
bcm bank cubic metre A ampere
Mbcm million bcm tph tonnes per hour
Mass tpd tonnes per day
kg kilogram mtpa million tonnes per annum
g gram Ø diam
t metric tonne Acronyms
Kt kilotonne SRK SRK Consulting (Canada) Inc.
lb pound CIM Canadian Institute of Mining
Mt megatonne NI 43-101 National Instrument 43-101
oz troy ounce ABA Acid- base accounting
wmt wet metric tonne AP Acid potential
dmt dry metric tonne
NP Neutralization potential
Pressure NPTIC Carbonate neutralization potential
psi pounds per square inch ML/ARD Metal leaching/ acid rock drainage
Pa pascal PAG Potentially acid generating
kPa kilopascal non-PAG Non-potentially acid generating
MPa megapascal RC reverse circulation
Elements and Compounds IP induced polarization
Au gold COG cut-off grade
Ag silver NSR net smelter return
Cu copper NPV net present value
Fe iron LOM life of mine
S sulphur Conversion Factors
CN cyanide 1 tonne 2,204.62 lb
NaCN sodium cyanide 1 oz 31.1035 g
2CO003.008 – Oromin Joint Venture Group Independent Technical Report for the OJVG Golouma Gold Project, Sénégal Page 337
NMW_DM_TS /WB/MN OJVG Golouma Gold_2012_FS_Technical_Report_2CO003 008_NMW_DM_TS_GA_DGP_20130315_1 March 15, 2013
27 References Oromin Explorations Ltd. Press Release, March 20, 2008, www.oromin.com.
Oromin Explorations Ltd. Press Release, May 5, 2008, www.oromin.com.
Oromin Explorations Ltd. Press Release, June 5, 2008, www.oromin.com.
Oromin Explorations Ltd. Press Release, August 6, 2008, www.oromin.com.
Oromin Explorations Ltd. Press Release, September 16, 2008, www.oromin.com.
Oromin Explorations Ltd. Press Release, December 11, 2008, www.oromin.com.
Oromin Explorations Ltd. Press Release, January 12, 2009, www.oromin.com.
Oromin Explorations Ltd. Press Release, May 14, 2009, www.oromin.com.
Apex, 2008. Technical Report, The Sabodala Property, Senegal, West Africa, dated June 15, 2008.
Apex Geosciences, p. 79, plus 5 appendices.
Apex, 2009.Technical Report, Sabodala Property, Senegal, West Africa, dated January 15, 2009.
Apex Geosciences, p.122.
Bassot, J.P. 1966. Etudes géologiques du Se´ne´gal Oriental et de ses confins guinéo-maliens.
Mémoires BRGM 40.
Campbell, R. 2007. Geotechnical Field Report from the October 9th-15
th Visit to the Sabodala
Property, Senegal. Technical Memorandum to Oromin Explorations Ltd. from SRK Consulting
(Canada) Inc.
Groves, D.I., Foster, R.P. 1991. Archean lode gold deposits. In, foster, R.P. (ed) Gold Metallogeny
and Exploration, Blackie, Glasgow, p. 63-103.
Groves, D.I., Goldfarb, R.J., Gebre-Mariam, M., Hagemann, S.G., Robert, F. 1998. Orogenic Gold.
Deposits in Ore Geology Reviews Vol. 13, p. 7-27.
Gueye, M., Ngom, P.M., Diène, M., Thiam, Y., Siegesmund, S., Wemmer, K., Pawlig, S. 2008.
Intrusive rocks and tectono-metamorphic evolution of the Mako Paleoproterozoic belt (Eastern
Senegal, West Africa). Journal of African Earth Sciences 50, 88–110.
Hagemann, S.G., Cassidy, K.F., 2000. Archean lode gold deposits. In, Hagemann, S.G., Brown,
P.E. (eds) Gold in 2000, Reviews in Economic Geology, 13, 19-68.
Harris, J.F. 2006. Petrographic examination of core samples from the Sabodala Project, Senegal.
Harris Exploration Services report for Oromin Explorations Ltd., p. 4 (plus figures and appendices).
Harris, J.F. 2007. Petrographic examination of drill core samples from the Sabodala Project,
Senegal. Harris Exploration Services report for Oromin Explorations Ltd., p. 2 (plus figures and
appendices).
Hirdes, W., Davis, D.W., 2002. U–Pb Geochronology of paleoproterozoic rocks in the southern part
of the Kédougou-Kénieba Inlier, Senegal, West Africa: evidence for diachronous accretionary
development of the eburnean province. Precambrian Research 118, 83–99.
Husson, Y., M‟Bemba, G. and Sy. L. 1987: Recherche de Reserves Complémentaires dans la
region de Sabodala; BRGM Report 87 SEN 146.
2CO003.008 – Oromin Joint Venture Group Independent Technical Report for the OJVG Golouma Gold Project, Sénégal Page 338
NMW_DM_TS /WB/MN OJVG Golouma Gold_2012_FS_Technical_Report_2CO003 008_NMW_DM_TS_GA_DGP_20130315_1 March 15, 2013
Ledru, P., Pons, J., Milési, J.P., Feybesse, J.L., Johan, V., 1991. Transcurrent tectonics and
polycyclic evolution in the Lower Proterozoic of Senegal-Mali. Precambrian Research 50, 337–354.
Lions Gate Geological Consulting, 2009. Review of QAQC Data for the Sabodala Project.
Memorandum to Oromin Explorations Ltd., p. 17.
McArthur, G.F. 2006. Summary report of exploration program: February 2005 to June 30, 2006,
Sabodala Exploration Concession, NI 43-101 Technical Report, Oromin Explorations Ltd.
SRK, 2008. Technical Report, Oromin Explorations Ltd. Sabodala Property, Senegal dated August
31, 2008.
SRK Consulting (Canada) Inc. 2010. OJVG Sabodala Project Feasibility Study, Revised Technical
Report. Report submitted to Oromin Joint Venture. October 2010.
SRK Consulting (Canada) Inc. 2010a. Sabodala Site Roads – Design Basis and Cost Estimate.
Memorandum to Oromin Joint Venture. July 2010.
SRK Consulting (Canada) Inc. 2010b. Sabodala Closure Plan – Cost Estimate. Memorandum to
Oromin Joint Venture. July 2010.
SRK Consulting (Canada) Inc. 2010c. Sabodala Water Supply Dam Feasibility Design. Report
submitted to Oromin Joint Venture. July 2010.
SRK Consulting (Canada) Inc. 2010d. Sabodala Tailing Management Facility Feasibility Design.
Report submitted to Oromin Joint Venture. July 2010.
SRK Consulting (Canada) Inc. 2010e. Sabodala 2009 Overburden Geotechnical Field
Investigation. Report submitted to Oromin Joint Venture. July 2010.
SRK Consulting (Canada) Inc. 2010f. Sabodala 2010 Overburden Geotechnical Field Investigation.
Report submitted to Oromin Joint Venture. July 2010.
SRK Consulting (Canada) Inc., 2011. Revised OJVG Golouma Project Updated Mineral Resource
Technical Report, Senegal. Report submitted to Oromin Joint Venture. December 2011.
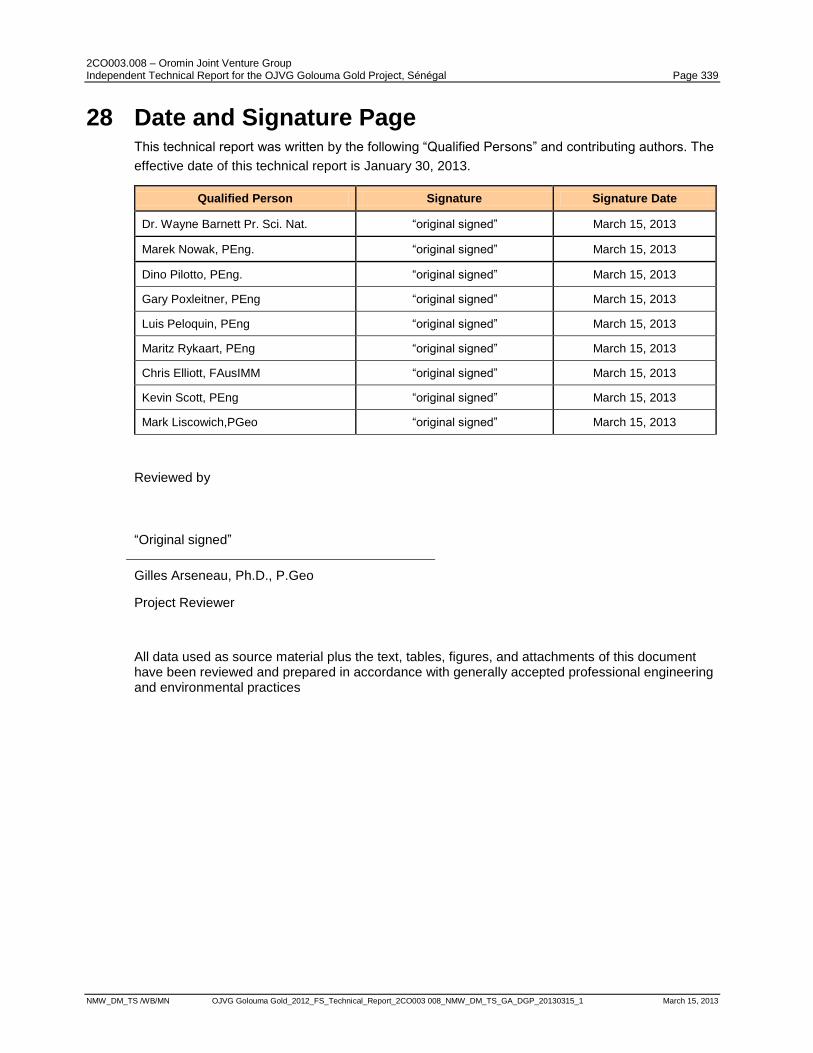
2CO003.008 – Oromin Joint Venture Group Independent Technical Report for the OJVG Golouma Gold Project, Sénégal Page 339
NMW_DM_TS /WB/MN OJVG Golouma Gold_2012_FS_Technical_Report_2CO003 008_NMW_DM_TS_GA_DGP_20130315_1 March 15, 2013
28 Date and Signature Page This technical report was written by the following “Qualified Persons” and contributing authors. The
effective date of this technical report is January 30, 2013.
Qualified Person Signature Signature Date
Dr. Wayne Barnett Pr. Sci. Nat. “original signed” March 15, 2013
Marek Nowak, PEng. “original signed” March 15, 2013
Dino Pilotto, PEng. “original signed” March 15, 2013
Gary Poxleitner, PEng “original signed” March 15, 2013
Luis Peloquin, PEng “original signed” March 15, 2013
Maritz Rykaart, PEng “original signed” March 15, 2013
Chris Elliott, FAusIMM “original signed” March 15, 2013
Kevin Scott, PEng “original signed” March 15, 2013
Mark Liscowich,PGeo “original signed” March 15, 2013
Reviewed by
“Original signed”
Gilles Arseneau, Ph.D., P.Geo
Project Reviewer
All data used as source material plus the text, tables, figures, and attachments of this document have been reviewed and prepared in accordance with generally accepted professional engineering and environmental practices
OROMIN Suite 2000, Guinness Tower, 1055 West Hastings Street, Vancouver, B.C. Canada V6E 2E9
EXPLORATIONS LTD. Tel: +1 (604) 331-8772 Toll-free (877) 529-8475
Fax: +1 (604) 331-8773 E-mail: [email protected]
ADDITIONAL INFORMATION TO THE TECHNICAL REPORT
OJVG GOLOUMA GOLD PROJECT
UPDATED FEASIBILITY STUDY TECHNICAL REPORT
Prepared by:
Dr. Gilles Arseneau, PGeo Dr. Wayne Barnett Pr Sci Nat
Marek Nowak, PEng. Guy Dishaw, PGeo Fred Brown CPG
Darrell Farrow, Pr Sci Nat Dino Pilotto, PEng
Gary Poxleitner, PEng Luis Peloquin, PEng Maritz Rykaart, PEng Chris Elliott, FAusIMM
Niel Winkelmann Kevin Scott, PEng
Mark Liscowich, PGeo
Effective Date: January, 30, 2013
To view all the Appendices associated with the above-noted report, please refer to the head office of:
Oromin Explorations Ltd.
Suite 2000 – 1055 West Hastings Street
Vancouver BC V6E 2E9 Canada
Phone: (604) 331-8772
Fax: (604) 331-8773
SRK Consulting (Canada) Inc. Suite 2200 - 1066 West Hastings Street Vancouver, BC V6E 3X2 T: +1.604.681.4196 F: +1.604.687.5532 [email protected] www.srk.com
U.S. Offices: Anchorage 907.677.3520 Denver 303.985.1333 Elko 775.753.4151 Fort Collins 970.407.8302 Reno 775.828.6800 Tucson 520.544.3688
Mexico Office: Guadalupe, Zacatecas 52.492.927.8982
Canadian Offices: Saskatoon 306.955.4778 Sudbury 705.682.3270 Toronto 416.601.1445 Vancouver 604.681.4196 Yellowknife 867.873.8670
Group Offices: Africa Asia Australia Europe North America South America
Certificate of QP_WBarnett
CERTIFICATE OF QUALIFIED PERSON
Wayne Barnett, Pr.Sci.Nat. I, Wayne Barnett, am a Professional Natural Scientist, employed as a Principal Geologist with SRK Consulting (Canada) Inc. This certificate applies to the technical report titled “OJVG Golouma Gold Project Updated Feasibility Study Technical Report, Senegal” dated March 15th, 2013 (Effective Date January 30, 2013) (“Technical Report”). I am a member of the South African Council for Natural Scientific Professions, South Africa. I graduated with a geology honours degree from the University of Cape Town in 1996, and a doctorate degree from the University of Kwa-Zulu Natal in 2006. I have been involved in mining and have practised my profession continuously since 1997. I have been involved in mining geology, exploration geology, geological modelling and estimation covering a wide range of mineral commodities in Africa, Australia, South America, North America and Asia. I have been involved in the Golouma Project since 2009, including field geological investigations, 3D modelling and resource estimations. As a result of my experience and qualifications, I am a Qualified Person as defined in National Instrument 43-101 Standards of Disclosure of Mineral Projects (NI 43-101). I have visited the OJVG project site on February 1-8, 2010 and September 11-12, 2012.
I am responsible for Sections 1 to 10, 13.1 to 13.3, 22 and 23, and portions of 24 and 25 of the Technical Report.
I am independent of Oromin Joint Venture Group as independence is described by Section 1.4 of NI 43-101. I have been involved with the Golouma Project since 2009 undertaking geological modelling and estimation. I have read National Instrument 43-101 and this report has been prepared in compliance with that Instrument. As of the date of this certificate, to the best of my knowledge, information and belief, the Technical Report contains all scientific and technical information that is required to be disclosed to make the technical report not misleading. “ORIGINAL SIGNED AND STAMPED” Wayne Barnett, Pr.Sci.Nat. Dated: March 15, 2013
SRK Consulting (Canada) Inc.
Suite 2200–1066 West Hastings Street
Vancouver, BC V6E 3X2
T: +1.604.681.4196
F: +1.604.687.5532
www.srk.com
U.S. Offices:
Anchorage 907.677.3520
Denver 303.985.1333
Elko 775.753.4151
Fort Collins 970.407.8302
Reno 775.828.6800
Tucson 520.544.3688
Mexico Office:
Zacatecas
52.492.927.8982
Queretaro
52.442.218.1030
Canadian Offices:
Saskatoon 306.955.4778
Sudbury 705.682.3270
Toronto 416.601.1445
Vancouver 604.681.4196
Yellowknife 867.873.8670
Group Offices:
Africa
Asia
Australia
Europe
North America
South America
CERTIFICATE Of Qualified person Chris Elliott
CERTIFICATE OF QUALIFIED PERSON
To accompany the report entitled: “OJVG Golouma Gold Project Updated Feasibility Study
Technical Report, Senegal” dated March 15, 2013 (Effective date January 30, 2013).
I, Christopher Elliott, declare that I am a Fellow of The Australasian Institute of Mining and Metallurgy (AusIMM), employed as a Principal Mining Consultant with SRK Consulting (Canada) Inc.
2) I am a graduate of the Ballarat CAE with a Bachelor of Engineering and of Macquarie University with a Graduate Diploma of Geoscience. I have practiced my profession continuously since 1986. I have worked as a Mining Engineer continuously for a total of 26 years since my graduation from University.
3) I am registered as a Fellow of The Australasian Institute of Mining and Metallurgy (AusIMM),
4) I have not visited the OJVG Golouma Gold Project site and relied on the site visit completed by other authors of this report.
5) I have read the definition of “qualified person” set out in National Instrument 43-101 and certify that by virtue of my education, affiliation to a professional association and past relevant work experience, I fulfill the requirements to be a “qualified person” for the purposes of National Instrument 43-101 and this technical report has been prepared in compliance with National Instrument 43-101 and Form 43-101F1;
6) I, as a qualified person, I am independent of the issuer as defined in Section 1.5 of National Instrument 43-101;
7) I am a co-author of this report and responsible for Section 18 and portions of sections 21, 24 and 25 of the report and accept professional responsibility for those sections of this technical report;
8) I have had no prior involvement with the subject property;
9) I have read National Instrument 43-101 and confirm that this technical report has been prepared in compliance therewith;
10) SRK Consulting (Canada) Inc. was retained by Oromin Joint Venture Group to prepare an Updated Feasibility Study and technical report of the OJVG Golouma Gold Project. In conducting our audit a gap analysis of project technical data was completed using CIM “Best practices” and Canadian Securities Administrators National Instrument 43-101 guidelines;
11) I have not received, nor do I expect to receive, any interest, directly or indirectly, in the OJVG Golouma Gold Project or securities of Oromin Joint Venture Group; and
12) That, at the effective date of the technical report, to the best of my knowledge, information and belief, this technical report contains all scientific and technical information that is required to be disclosed to make the technical report not misleading.

SRK Consulting Page 2
CERTIFICATE Of Qualified person Chris Elliott
Vancouver, BC March 15
th, 2013
“Original Signed and Stamped” _____________________________ Christopher Elliott. FAusIMM. Principal Consultant (Mining) SRK Consulting (Canada ), Inc.
SRK Consulting (Canada) Inc.
Suite 2200–1066 West Hastings Street
Vancouver, BC V6E 3X2
T: +1.604.681.4196
F: +1.604.687.5532
www.srk.com
U.S. Offices:
Anchorage 907.677.3520
Denver 303.985.1333
Elko 775.753.4151
Fort Collins 970.407.8302
Reno 775.828.6800
Tucson 520.544.3688
Mexico Office:
Zacatecas
52.492.927.8982
Queretaro
52.442.218.1030
Canadian Offices:
Saskatoon 306.955.4778
Sudbury 705.682.3270
Toronto 416.601.1445
Vancouver 604.681.4196
Yellowknife 867.873.8670
Group Offices:
Africa
Asia
Australia
Europe
North America
South America
CERTIFICATE Of Qualified person Kevin Scott_Mar15
CERTIFICATE OF QUALIFIED PERSON
To accompany the report entitled: “OJVG Golouma Gold Project Updated Feasibility Study
Technical Report, Senegal” dated March 15, 2013 (Effective date January 30, 2013).
I, Kevin Scott, do hereby certify that:
1) I am a Manager, Process and Studies for Ausenco Solutions Canada Inc., 855 Homer Street, Vancouver, BC V6B 2W2, Canada;
2) I am a graduate of the University of British Columbia, Vancouver, Canada with a Bachelor of Applied Science degree in Metals and Materials Engineering. I have practiced my profession continuously since 1989. I have worked as a Metallurgist continuously for a total of 23 years since my graduation from University. My relevant experience for the purpose of the Technical Report is:
Reviews and reports as a metallurgical consultant on a number of mining operations and projects for due diligence and financial monitoring requirements
Process engineer at three Canadian base metals mineral processing operations
Senior metallurgical engineer working for four multi-national engineering and construction companies on feasibility studies and in engineering design of mineral processing plants in Canada and South America
Senior process manager in charge of process design and engineering for a metallurgical processing plant in South America.;
3) I am a Professional Engineer registered with the Province of British Colombia (Licence # 25314) and the Province of Ontario (License # 90443342);
4) I have not personally visited the project area. I have relied on a previous site visit conducted by Clint Donkin, Senior Metallurgist with Ausenco, in 2010;
5) I have read the definition of “qualified person” set out in National Instrument 43-101 and certify that by virtue of my education, affiliation to a professional association and past relevant work experience, I fulfill the requirements to be a “qualified person” for the purposes of National Instrument 43-101 and this technical report has been prepared in compliance with National Instrument 43-101 and Form 43-101F1;
6) I, as a qualified person, I am independent of the issuer as defined in Section 1.5 of National Instrument 43-101;
7) I am the co-author of this report and responsible for Sections 12, 17.1-17.11 and 20.5 – 20.6 of the report and accept professional responsibility for those sections of this technical report;
8) I have had no prior involvement with the subject property;
9) I have read National Instrument 43-101 and confirm that this technical report has been prepared in compliance therewith;
10) SRK Consulting (Canada) Inc. was retained by Oromin Joint Venture Group to prepare an Updated Feasibility Study and technical report of the OJVG Gold Project. In conducting our audit a gap analysis of project technical data was completed using CIM “Best practices” and Canadian Securities Administrators National Instrument 43-101 guidelines;
SRK Consulting Page 2
CERTIFICATE Of Qualified person Kevin Scott_Mar15
11) I have not received, nor do I expect to receive, any interest, directly or indirectly, in the OJVG Gold Project or securities of Oromin Joint Venture Group; and
12) That, at the effective date of the technical report, to the best of my knowledge, information and belief, this technical report contains all scientific and technical information that is required to be disclosed to make the technical report not misleading.
Vancouver, BC March 15
th, 2013
__ signed and sealed____ __ Kevin Scott, P.Eng. Manager, Process and Studies Ausenco Solutions Canada
SRK Consulting (Canada) Inc. Suite 2200–1066 West Hastings Street Vancouver, BC V6E 3X2 T: +1.604.681.4196 F: +1.604.687.5532 [email protected] www.srk.com
U.S. Offices: Anchorage 907.677.3520 Denver 303.985.1333 Elko 775.753.4151 Fort Collins 970.407.8302 Reno 775.828.6800 Tucson 520.544.3688
Mexico Office: Zacatecas 52.492.927.8982 Queretaro 52.442.218.1030
Canadian Offices: Saskatoon 306.955.4778 Sudbury 705.682.3270 Toronto 416.601.1445 Vancouver 604.681.4196 Yellowknife 867.873.8670
Group Offices: Africa Asia Australia Europe North America South America
CERTIFICATE Of Qualified person Pilotto
CERTIFICATE OF QUALIFIED PERSON
To accompany the report entitled: “OJVG Golouma Gold Project Updated Feasibility Study Technical Report, Senegal” dated March 15, 2013 (Effective date January 30, 2013).
I, Dino Pilotto, residing at Gibsons BC do hereby certify that:
1) I am a Principal Consultant - Mining with the firm of SRK Consulting (Canada) Inc. (“SRK”) with an office at Suite 2200-1066 West Hastings Street, Vancouver, BC, Canada;
2) I am a graduate of the University of BC in Vancouver BC, I obtained a B.A.Sc. (Mining & Mineral Process Engineering). I have practiced my profession continuously since June 1987. I have been involved with mining operations, mine engineering and consulting covering a variety of commodities at locations in North America, South America, Africa, and Eastern Europe;
3) I am a Professional Engineer registered with the Association of Professional Engineers and Geoscientists of Saskatchewan and Alberta;
4) I have personally inspected the subject project March 4-7, 2009. 5) I have read the definition of “qualified person” set out in National Instrument 43-101 and certify that by
virtue of my education, affiliation to a professional association and past relevant work experience, I fulfill the requirements to be a “qualified person” for the purposes of National Instrument 43-101 and this technical report has been prepared in compliance with National Instrument 43-101 and Form 43-101F1;
6) I, as a qualified person, I am independent of the issuer as defined in Section 1.5 of National Instrument 43-101;
7) I am the co-author of this report and responsible for Section 15.1 as well as portions of 14, 15.3, and 20. and accept professional responsibility for those sections of this technical report;
8) I have been involved with the subject property since 2008 with various studies and technical reports; 9) I have read National Instrument 43-101 and confirm that this technical report has been prepared in
compliance therewith; 10) SRK Consulting (Canada) Inc. was retained by Oromin Joint Venture Group to prepare a technical audit
of the OJVG Golouma Gold Project. In conducting our audit, a gap analysis of project technical data was completed using CIM “Best practices” and Canadian Securities Administrators National Instrument 43-101 guidelines. The preceding report is based on a site visit, a review of project files and discussions with Oromin Joint Ventrue Group personnel;
11) I have not received, nor do I expect to receive, any interest, directly or indirectly, in the OJVG Golouma Gold Project or securities of Oromin Joint Venture Group and
12) That, at the effective date of the technical report, to the best of my knowledge, information and belief, this technical report contains all scientific and technical information that is required to be disclosed to make the technical report not misleading.

SRK Consulting Page 2
CERTIFICATE Of Qualified person Pilotto
Vancouver March 15, 2013
[“signed and sealed”] Dino Pilotto, P.Eng. Principal Consultant - Mining
SRK Consulting (Canada) Inc. Suite 2200–1066 West Hastings Street Vancouver, BC V6E 3X2 T: +1.604.681.4196 F: +1.604.687.5532 [email protected] www.srk.com
U.S. Offices: Anchorage 907.677.3520 Denver 303.985.1333 Elko 775.753.4151 Fort Collins 970.407.8302 Reno 775.828.6800 Tucson 520.544.3688
Mexico Office: Zacatecas 52.492.927.8982 Queretaro 52.442.218.1030
Canadian Offices: Saskatoon 306.955.4778 Sudbury 705.682.3270 Toronto 416.601.1445 Vancouver 604.681.4196 Yellowknife 867.873.8670
Group Offices: Africa Asia Australia Europe North America South America
CERTIFICATE Of Qualified person_EMR_20130315
CERTIFICATE OF QUALIFIED PERSON
To accompany the report entitled: “OJVG Golouma Gold Project Updated Feasibility Study Technical Report, Senegal” dated March 15, 2013 (Effective Date January 30, 2013).
I, Ewoud Maritz Rykaart, residing at 3009, 140 Street, Surrey, BC do hereby certify that:
1) I am a Practice Leader with the firm of SRK Consulting (Canada) Inc. (“SRK”) with an office at Suite 2200 – 1066 West Hastings Street, Vancouver, British Columbia, Canada;
2) I am a graduate of the Rand Afrikaans University in 1991 and 1993; I obtained BEng and MEng degrees in Civil Engineering. In 2001, I graduated with a PhD in geotechnical engineering from the university of Saskatchewan. I have practiced my profession continuously since January 1992. My working career has been exclusively as a Consultant for the mining industry, designing and constructing water and waste management structures;
3) I am a Professional Engineer registered with APEGBC, APEGS, NAPEG and APEY; 4) I have personally inspected the subject project on March 1-9, 2009 and again March 1-7, 2010; 5) I have read the definition of “qualified person” set out in National Instrument 43-101 and certify that by
virtue of my education, affiliation to a professional association and past relevant work experience, I fulfill the requirements to be a “qualified person” for the purposes of National Instrument 43-101 and this technical report has been prepared in compliance with National Instrument 43-101 and Form 43-101F1;
6) I, as a qualified person, I am independent of the issuer as defined in Section 1.5 of National Instrument 43-101;
7) I am a co-author of this report and responsible for Sections 17.12 through 17.14 of the report and accept professional responsibility for those sections of this technical report;
8) I have had no prior involvement with the subject property; 9) I have read National Instrument 43-101 and confirm that this technical report has been prepared in
compliance therewith; 10) SRK Consulting (Canada) Inc. and its supporting team of consultants were retained by Oromin Joint
Venture Group to prepare a revised Technical Report for the OJVG Golouma Gold Project. In conducting the assessment, CIM “Best practices” and Canadian Securities Administrators National Instrument 43-101 guidelines were used. The preceding report is based on a site visit, a review of project files and discussions with Oromin Joint Venture Group personnel;
11) I have not received, nor do I expect to receive, any interest, directly or indirectly, in the OJVG Golouma Gold Project or securities of Oromin Joint Venture Group; and
12) That, as of the date of this certificate, to the best of my knowledge, information and belief, this technical report contains all scientific and technical information that is required to be disclosed to make the technical report not misleading.

SRK Consulting Page 2
CERTIFICATE Of Qualified person_EMR_20130315
Vancouver, BC March 15, 2013
[“signed and sealed”] E. Maritz Rykaart, PEng, PhD Practice Leader
SRK Consulting (Canada) Inc. Suite 2200–1066 West Hastings Street Vancouver, BC V6E 3X2 T: +1.604.681.4196 F: +1.604.687.5532 [email protected] www.srk.com
U.S. Offices: Anchorage 907.677.3520 Denver 303.985.1333 Elko 775.753.4151 Fort Collins 970.407.8302 Reno 775.828.6800 Tucson 520.544.3688
Mexico Office: Zacatecas 52.492.927.8982 Queretaro 52.442.218.1030
Canadian Offices: Saskatoon 306.955.4778 Sudbury 705.682.3270 Toronto 416.601.1445 Vancouver 604.681.4196 Yellowknife 867.873.8670
Group Offices: Africa Asia Australia Europe North America South America
CERTIFICATE Of Qualified person_GMP
CERTIFICATE OF QUALIFIED PERSON
This certificate applies to the technical report titled “OJVG Golouma Gold Project Updated Feasibility Study Technical Report, Senegal” dated March 15th, 2013 (Effective Date January 30, 2013) (“Technical Report”).
I, Gary M Poxleitner residing at 418 Ester St, Sudbury, Ontario, Canada do hereby certify that:
1) I am a Professional Engineer with the firm of SRK Consulting (Canada) Inc. (“SRK”) with an office at Suite 101, 1984 Regent St South, Sudbury Ontario;
2) I am a graduate of the Laurentian University in 1991, I obtained a B.Eng. I have practiced my profession continuously since 1991. Since graduation I have been engaged in underground mine operations, mine engineering and design and project management;
3) I am a Professional Engineer registered with the Professional Engineers of Ontario; 4) I have not visited the OJVG Golouma Gold Project site and relied on the site visit completed by other
authors of this report; 5) I have read the definition of “qualified person” set out in National Instrument 43-101 and certify that by
virtue of my education, affiliation to a professional association and past relevant work experience, I fulfill the requirements to be a “qualified person” for the purposes of National Instrument 43-101 and this technical report has been prepared in compliance with National Instrument 43-101 and Form 43-101F1;
6) I, as a qualified person, I am independent of the issuer as defined in Section 1.5 of National Instrument 43-101;
7) I am the contributing author of this report and responsible for portions of Section 14, 15.2, 15.3, and 20 and accept professional responsibility for those sections of this technical report;
8) I have had no prior involvement with the subject property. 9) I have read National Instrument 43-101 and confirm that this technical report has been prepared in
compliance therewith; 10) SRK Consulting (Canada) Inc. was retained by Oromin Joint Venture Group to prepare a technical audit
of the OJVG Golouma Gold Project. In conducting our audit a gap analysis of project technical data was completed using CIM “Best practices” and Canadian Securities Administrators National Instrument 43-101 guidelines. The preceding report is based on a site visit, a review of project files and discussions with Oromin Joint Venture Group personnel;
11) I have not received, nor do I expect to receive, any interest, directly or indirectly, in the OJVG Golouma Gold Project or securities of Oromin Joint Venture Group and
12) That, at the effective date of the technical report, to the best of my knowledge, information and belief, this technical report contains all scientific and technical information that is required to be disclosed to make the technical report not misleading.

SRK Consulting Page 2
CERTIFICATE Of Qualified person_GMP
Sudbury, Ontario March 15, 2013
[“signed and sealed”] Gary M Poxleitner 100059860 PEng
SRK Consulting (Canada) Inc. Suite 2200–1066 West Hastings Street Vancouver, BC V6E 3X2 T: +1.604.681.4196 F: +1.604.687.5532 [email protected] www.srk.com
U.S. Offices: Anchorage 907.677.3520 Denver 303.985.1333 Elko 775.753.4151 Fort Collins 970.407.8302 Reno 775.828.6800 Tucson 520.544.3688
Mexico Office: Zacatecas 52.492.927.8982 Queretaro 52.442.218.1030
Canadian Offices: Saskatoon 306.955.4778 Sudbury 705.682.3270 Toronto 416.601.1445 Vancouver 604.681.4196 Yellowknife 867.873.8670
Group Offices: Africa Asia Australia Europe North America South America
CERTIFICATE Of Qualified person_LP
CERTIFICATE OF QUALIFIED PERSON
To accompany the report entitled: OJVG Golouma Project Updated Feasibility Study Technical Report, Senegal dated March 15, 2013 (Effective Date January 30, 2013).
I, Luis Peloquin, residing at 1012 Beverly Dr. Sudbury, Ontario do hereby certify that:
1) I am a Senior Consultant with the firm of SRK Consulting (Canada) Inc. (“SRK”) with an office at Suite 2200-1066 West Hastings Street, Vancouver, BC, Canada;
2) I am a graduate of Laurentian University in 2005, I obtained a Bachelor of Engineering and a Master of Applied Science (2007). I have practiced my profession continuously since 2005. I have been a mine planner and ventilation engineer/supervisor since graduation at various mine sites in Canada and abroad. I have worked in mine construction projects for nickel and gold mines;
3) I am a Professional Engineer registered with the Professional Engineers of Ontario, licence number 100144417;
4) I have not personally visited the project area but relied on a site visit conducted by Wayne Barnett, Pr. Sci. Nat., a co-author of this technical report;
5) I have read the definition of “qualified person” set out in National Instrument 43-101 and certify that by virtue of my education, affiliation to a professional association and past relevant work experience, I fulfill the requirements to be a “qualified person” for the purposes of National Instrument 43-101 and this technical report has been prepared in compliance with National Instrument 43-101 and Form 43-101F1;
6) I, as a qualified person, I am independent of the issuer as defined in Section 1.5 of National Instrument 43-101;
7) I am the co-author of this report and responsible for portions of Section 15.2 of 14, 15.2, 15.3, and 20, and accept professional responsibility for those sections of this technical report;
8) I have had no prior involvement with the subject property; 9) I have read National Instrument 43-101 and confirm that this technical report has been prepared in
compliance therewith; 10) SRK Consulting (Canada) Inc. was retained by Oromin Joint Venture Group to prepare a technical audit
of the OJVG Golouma Gold project. In conducting our audit a gap analysis of project technical data was completed using CIM “Best practices” and Canadian Securities Administrators National Instrument 43-101 guidelines. The preceding report is based on a site visit, a review of project files and discussions with Oromin Joint Venture Group personnel;
11) I have not received, nor do I expect to receive, any interest, directly or indirectly, in the OJVG Golouma Gold Project or securities of Oromin Joint Venture Group; and
12) That, at the effective date of the technical report, to the best of my knowledge, information and belief, this technical report contains all scientific and technical information that is required to be disclosed to make the technical report not misleading.

SRK Consulting Page 2
CERTIFICATE Of Qualified person_LP
Sudbury Ontario March 15, 2013
[“signed and sealed”] Luis J. Peloquin, PEng. Senior Consultant (Mining)
SRK Consulting (Canada) Inc. Suite 2200–1066 West Hastings Street Vancouver, BC V6E 3X2 T: +1.604.681.4196 F: +1.604.687.5532 [email protected] www.srk.com
U.S. Offices: Anchorage 907.677.3520 Denver 303.985.1333 Elko 775.753.4151 Fort Collins 970.407.8302 Reno 775.828.6800 Tucson 520.544.3688
Mexico Office: Zacatecas 52.492.927.8982 Queretaro 52.442.218.1030
Canadian Offices: Saskatoon 306.955.4778 Sudbury 705.682.3270 Toronto 416.601.1445 Vancouver 604.681.4196 Yellowknife 867.873.8670
Group Offices: Africa Asia Australia Europe North America South America
CERTIFICATE Of Qualified person_ML
CERTIFICATE OF QUALIFIED PERSON
To accompany the report entitled: “OJVG Golouma Gold Project Updated Feasibility Study Technical Report, Senegal” dated March 15, 2013 (Effective Date January 30, 2013).
Mark Liskowich, P.Geo
I, Mark Liskowich, residing at Saskatoon, Saskatchewan, do hereby certify that:
I am a Professional Geologist, employed as a Principal Consultant with SRK Consulting (Canada) Inc.
I am a member of the Association of Professional Engineers and Geoscientists of Saskatchewan. I graduated with a B.Sc. (Geology) degree from the University of Regina in May 1989.
I have practised my profession within the mineral exploration, mining industry since 1989. I have been directly involved, professionally in the environmental and social management of mineral exploration and mining projects covering a wide range of commodities since 1992 with both the public and private sector. My areas of expertise are environmental management, environmental auditing, and project permitting, licensing, public and regulatory consultation.
I have read the definition of “qualified person” set out in National Instrument 43-101 and certify that by virtue of my education, affiliation to a professional association and past relevant work experience, I fulfill the requirements to be a “qualified person” for the purposes of National Instrument 43-101 and this technical report has been prepared in compliance with National Instrument 43-101 and Form 43-101F1;
I, as a qualified person, I am independent of the issuer as defined in Section 1.5 of National Instrument 43-101
I have not visited the OJVG Golouma Gold Project site and relied on the site visit completed by other authors of this report;
I am a co-author of this report and responsible for the Environmental Considerations (Section 19) of the “OJVG Golouma Project Updated Feasibility Study Technical Report, Senegal” dated March 15, 2013
I have been involved with the OJVG Golouma Gold Project since March 2010 managing the environmental and social impacts assessment of the project as required for the Feasibility Study and Technical Report.
SRK Consulting Page 2
CERTIFICATE Of Qualified person_ML
I have read the National Instrument 43-101 and Section 19 of this report has been prepared in compliance with that Instrument. As of the date of this certificate, to the best of my knowledge, information and belief, the technical report contains all scientific and technical information that is required to be disclosed to make the technical report not misleading.
SRK Consulting (Canada) Inc. and its supporting team of consultants were retained by Oromin Joint Venture Group to prepare a revised Technical Report for the OJVG Golouma Gold Project. In conducting the assessment, CIM “Best practices” and Canadian Securities Administrators National Instrument 43-101 guidelines were used. The preceding report is based on a site visit, a review of project files and discussions with Oromin Joint Venture Group personnel;
I have not received, nor do I expect to receive, any interest, directly or indirectly, in the OJVG Golouma Gold Project or securities of Oromin Joint Venture Group; and
Saskatoon, Saskatchewan March 15, 2013
[“signed and sealed”] Mark Liskowich, P. Geo
SRK Consulting (Canada) Inc. Suite 2200–1066 West Hastings Street Vancouver, BC V6E 3X2 T: +1.604.681.4196 F: +1.604.687.5532 [email protected] www.srk.com
U.S. Offices: Anchorage 907.677.3520 Denver 303.985.1333 Elko 775.753.4151 Fort Collins 970.407.8302 Reno 775.828.6800 Tucson 520.544.3688
Mexico Office: Zacatecas 52.492.927.8982 Queretaro 52.442.218.1030
Canadian Offices: Saskatoon 306.955.4778 Sudbury 705.682.3270 Toronto 416.601.1445 Vancouver 604.681.4196 Yellowknife 867.873.8670
Group Offices: Africa Asia Australia Europe North America South America
CERTIFICATE Of Qualified person_MN
CERTIFICATE OF QUALIFIED PERSON
To accompany the report entitled: “OJVG Golouma Gold Project Updated Feasibility Study Technical Report, Senegal” dated March 15, 2013 (Effective date January 30th, 2013).
Marek Nowak, PEng
I, Marek Nowak, residing in Port Coquitlam, BC, do hereby certify that:
I, Marek Nowak, am a Professional Engineer, employed as a Principal Consultant - Geostatistics with SRK Consulting (Canada) Inc.
I am a member of the Association of Professional Engineers and Geoscientists of British Columbia. I have a Master of Science degree from the University of Mining and Metallurgy, Cracow, Poland, and a Master of Science degree from the University of British Columbia, Vancouver, Canada.
I have over 25 years of experience in the mining industry, as a mining engineer (in Poland), geologist and geostatistician (in Canada). I specialize in natural resource evaluation and risk assessment using a variety of geostatistical techniques. I have co-authored several independent technical reports on base and precious metals exploration and mining projects in Canada, and United States.
I have read the definition of “qualified person” set out in National Instrument 43-101 and certify that by virtue of my education, affiliation to a professional association and past relevant work experience, I fulfill the requirements to be a “qualified person” for the purposes of National Instrument 43-101 and this technical report has been prepared in compliance with National Instrument 43-101 and Form 43-101F1;
I am independent of Oromin Explorations Ltd. and the Oromin Joint Venture Group as independence is described by Section 1.4 of NI 43-101.
SRK Consulting (Canada) Inc. and its supporting team of consultants were retained by Oromin Joint Venture Group to prepare a revised Technical Report for the OJVG Golouma Gold Project. In conducting the assessment, CIM “Best practices” and Canadian Securities Administrators National Instrument 43-101 guidelines were used. The preceding report is based on a site visit, a review of project files and discussions with Oromin Joint Venture Group personnel;
I have not visited the OJVG Golouma Gold Project site and relied on the site visit completed by other authors of this report.
SRK Consulting Page 2
CERTIFICATE Of Qualified person_MN
I am a co-author of this report and responsible for Sections 11 and 13.4 through 13.13 of the “OJVG Golouma Project Updated Feasibility Study Technical Report, Senegal” dated March 15, 2013.
I have not received, nor do I expect to receive, any interest, directly or indirectly, in the OJVG Golouma Gold Project or securities of Oromin Joint Venture Group; and
As of the effective date of the report, January 30, 2013 to the best of my knowledge, information and belief, the technical report contains all scientific and technical information that is required to be disclosed to make the technical report not misleading.
I have read National Instrument 43-101 and this report has been prepared in compliance with that Instrument.
As of the date of this certificate, to the best of my knowledge, information and belief, the technical report contains all scientific and technical information that is required to be disclosed to make the technical report not misleading.
Port Coquitlam March 15, 2013
[“signed and sealed”] Marek Nowak, PEng Principal Consultant - Geostatistics


![[Updated Constantly] - ITExamAnswers.net](https://img.pdfslide.net/doc/110x75/6319c85a1e5d335f8d0b4da5/updated-constantly-itexamanswersnet.jpg)