Embed Size (px)
Citation preview
metals
Article
On the Behaviour of 316 and 304 Stainless Steel underMultiaxial Fatigue Loading: Application of theCritical Plane Approach
Alejandro S. Cruces 1 , Pablo Lopez-Crespo 1,* , Stefano Bressan 2, Takamoto Itoh 3 andBelen Moreno 1
1 Department of Civil and Materials Engineering, University of Malaga,C/Dr Ortiz Ramos s/n, 29071 Malaga, Spain
2 Graduate School of Science and Engineering, Ritsumeikan University, Kusatsu–shi, Shiga 525-8577, Japan3 Department of Mechanical Engineering, College of Science and Engineering, Ritsumeikan University,
Kusatsu–shi, Shiga 525-8577, Japan* Correspondence: [email protected]; Tel.: +34-951952308
Received: 23 July 2019; Accepted: 2 September 2019; Published: 3 September 2019�����������������
Abstract: In this work, the multiaxial fatigue behaviour of 316 and 304 stainless steel was studied.The study was based on the critical plane approach which is based on observations that cracks tend tonucleate and grow in specific planes. Three different critical plane models were employed to this end,namely Fatemi–Socie (FS), Smith–Watson–Topper (SWT) and the newly proposed Sandip–Kallmeyer–Smith (SKS) model. The study allowed equi-biaxial stress state, mean strain and non–proportionalhardening effects to be taken into consideration. Experimental tests including different combinationsof tension, torsion and inner pressure were performed and were useful to identify the predominantfailure mode for the two materials. The results also showed that the SKS damage parameter returnedmore conservative results than FS with lower scatter level in both materials, with prediction valuesbetween FS and SWT.
Keywords: critical plane model; multiaxial fatigue; non–proportional loading; 316 stainless steel; 304stainless steel
1. Introduction
Fatigue failure is a common problem for a wide range of industries. Since the first reportedstudy, new materials and advanced methods to predict the number of cycles until failure has appeared.Uniaxial or bending rotation cyclic tests are often conducted to characterise the fatigue behaviour ofdifferent metals [1]. However, most mechanical applications imply more complex scenarios, real serviceloads are usually variable and designs include complex profile shapes instead of just flat or cylindricalsurfaces. As a consequence, different stresses/strain distributions appear on the real structures subjectedto cyclic loads [2–4]. For characterising such complex scenarios there exists more sophisticated methodssuch as the critical plane approaches as an alternative to the classical models [5]. Critical planemodels have been successfully applied for different materials and service loads. For example Chuobserved improvements using these methods for AISI 1045 steel under complex loading conditions [6].Sharifimehr employed critical plane methods to predict the fatigue life of a brittle and a ductile materialunder variable amplitude loads [7]. Llavori also used the critical plane methods to study the fatigueperformance of a welded joint of S275JR, and was able to achieve better predictions as comparedto classical methods [8]. One of the main strengths of critical plane methods is that they take intoconsideration the physical mechanisms involved in the nucleation and growth of the fatigue crack [9,10].Nevertheless, there exists other alternative approaches that allow more accurate predictions to be
Metals 2019, 9, 978; doi:10.3390/met9090978 www.mdpi.com/journal/metals
Metals 2019, 9, 978 2 of 14
achieved. One such approach is the Strip Yield Model (implemented in Nasgro software [11]). Besidesthe total fatigue life, these cycle by cycle models can also describe with certain accuracy the propagationstage until final failure takes place [12]. Depending on the material and the loading conditions, certainmechanisms will show a dominant presence along the fatigue process. For example, brittle materialstend to show a dominant Mode I crack growth along the fatigue process while ductile materials tendto have a dominant Mode II crack growth [13]. Critical plane methods are based on defining the planewhere the highest damage takes place. This also means that they allow the crack growth angle to bepredicted. This has been shown by Reis et al. who assessed the crack path initiation and growth forseveral structural steels [14,15]. The procedure requires evaluating the damage along the cycle fromsome stress and strain components. In some cases, obtaining such stress and strain components canbe difficult and might introduce an additional source of error. Depending on the type of material,different critical plane models have been proposed. Models that include only stress variables are moreuseful in the high cycle regime but often fail at computing the fatigue damage in the low-cycle regimebased on S–N curves. Stress values used in such models are frequently unrealistic and different to theactual stress experienced by the specimen due to the material behaviour above yield stress. Modelsthat include strain variables are more robust in that sense.
To date, there is not a universal critical plane model that is valid for all the types of materials andall loading conditions. A very comprehensive review of different critical plane models can be found inthe literature [16].
Well established models such as the Fatemi–Socie [17] or Smith et al. [18] were thoroughly studied,showing good results for ductile and brittle behaviour materials, respectively. Usually these models arechosen as a benchmark to propose new damage parameters [19,20]. In some cases the new model willreturn better results for the studied material and load condition [21,22], considering it more appropriatefor those scenarios.
In this work a newly proposed critical plane damage parameter, called Sandip–Kallmeyer–Smith(SKS) was assessed based on its excellent performance on a low carbon steel [22]. First, the collapsecapacity of the newly proposed damage parameter was evaluated. This was done by fitting the modelto a set of experimental data with different loading paths both under proportional and non-proportionalloads. Then, the fitted curve was used to predict fatigue lives for different multiaxial cases. The studywas conducted on two stainless steels, namely 316 stainless steel and 304 stainless steel. The efficacy ofthe SKS damage parameter was compared with Fatemi–Socie model and Smith–Watson–Topper model.
2. Materials and Methods
The different models were tested on 316 and 304 stainless steels that are widely used in theindustry. Previous studies observed better results with Mode II/III dominant critical plane methods for316 stainless steel and with Mode I for 304 stainless steel [19,23].
All the tests were carried out on hollow cylindrical samples with 8.5 mm gauge length, 14 mm outerdiameter and 12 mm inner diameter. The specimens were carefully polished to a surface roughness ofapproximately 0.3 µm both in the external and the internal surface. An in-house built fatigue machineallowed axial loads as well as inner pressure to be applied, thus allowing a very wide range of loadingpaths to be applied (see Figures 1 and 2). All tests were conducted in air. More details about the biaxialloading rigs, as well as additional details about the experiments can be found elsewhere [24,25].
The experimental tests employed for fitting the models and to evaluate the collapse capacity ofthe models on the 316 and the 304 stainless steel are shown in Tables 1 and 2, respectively [26]. Bothexperimental sets include proportional and non-proportional (out-of-phase between axial and shearstrain) fatigue tests, as described in Figure 1. There are no mean stress tests among the experimentaltests used for the 316 stainless steel. This is because no significant effect of the means stress on thefatigue life was observed for this material [27]. A comparison of the equivalent tests between 316 and304 stainless steel (Tables 1 and 2) indicates that 304 stainless steel presents a higher hardening level.
Metals 2019, 9, 978 3 of 14
Metals 2019, 8, x; doi: FOR PEER REVIEW 3 of 15
The tests were used to fit the SKS model that was subsequently used to predict fatigue lives for both materials under a range of multiaxial loading conditions. The predictions given by the SKS model are valid for the range of fatigue lives covered in Tables 1 and 2 for 316 and 304 stainless steel, respectively.
Table 1. Summary of the experimental data used to fit the model parameters for 316 stainless steel.
Path ID εa γa σa τa Nf P 1 0.0025 - 225.5 - 25,100 2 0.0035 - 252.5 - 8750 3 0.005 - 278 - 4220 4 0.0075 - 326 - 2200
NP 1 0.0015 0.0026 219.5 138.5 32,400 2 0.0025 0.0043 344.5 219.5 4780 3 0.0035 0.0061 412.5 238.5 3660 4 0.0050 0.0087 474 299.5 1360 5 0.0075 0.0130 615 388 410
Table 2. Summary of the experimental data used to fit the model parameters for 304 stainless steel.
Path ID εa γa σa τa Nf P 1 0.0025 - 265 - 49,000 2 0.0033 - 290 - 23,400 3 0.004 - 315 - 7100 4 0.005 - 365 - 1500
NP 1 0.002 0.0035 300 168 50,000 2 0.002 0.0035 307 176 45,000 3 0.0035 0.0061 457 256 3730 4 0.0035 0.0061 477 267 3560
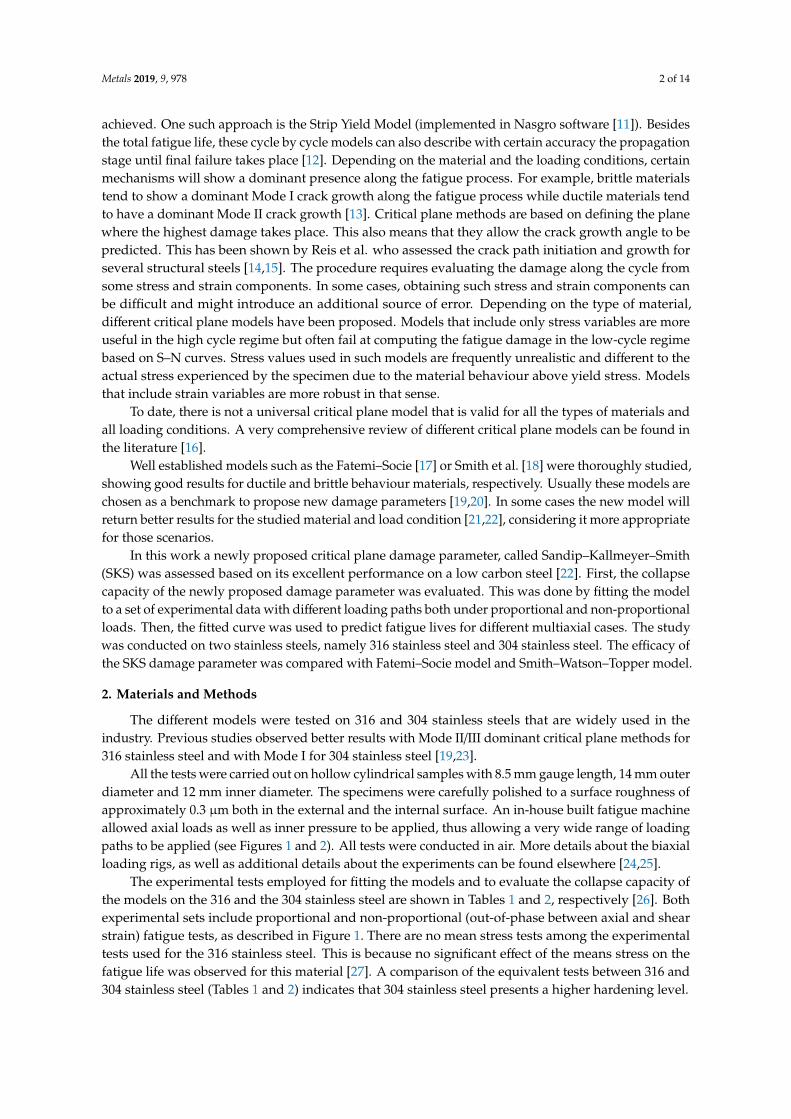
Figure 1. Proportional and non-proportional loading paths.
Figure 2. Proportional multiaxial loading paths applied on the 316 stainless steel specimens.
Fifteen different tests were conducted on 316 stainless steel to evaluate the different critical plane models, which are described in Table 3. The loading path used for the 316 stainless steel are shown
Figure 1. Proportional and non-proportional loading paths.
Metals 2019, 8, x; doi: FOR PEER REVIEW 3 of 15
The tests were used to fit the SKS model that was subsequently used to predict fatigue lives for both materials under a range of multiaxial loading conditions. The predictions given by the SKS model are valid for the range of fatigue lives covered in Tables 1 and 2 for 316 and 304 stainless steel, respectively.
Table 1. Summary of the experimental data used to fit the model parameters for 316 stainless steel.
Path ID εa γa σa τa Nf P 1 0.0025 - 225.5 - 25,100 2 0.0035 - 252.5 - 8750 3 0.005 - 278 - 4220 4 0.0075 - 326 - 2200
NP 1 0.0015 0.0026 219.5 138.5 32,400 2 0.0025 0.0043 344.5 219.5 4780 3 0.0035 0.0061 412.5 238.5 3660 4 0.0050 0.0087 474 299.5 1360 5 0.0075 0.0130 615 388 410
Table 2. Summary of the experimental data used to fit the model parameters for 304 stainless steel.
Path ID εa γa σa τa Nf P 1 0.0025 - 265 - 49,000 2 0.0033 - 290 - 23,400 3 0.004 - 315 - 7100 4 0.005 - 365 - 1500
NP 1 0.002 0.0035 300 168 50,000 2 0.002 0.0035 307 176 45,000 3 0.0035 0.0061 457 256 3730 4 0.0035 0.0061 477 267 3560
Figure 1. Proportional and non-proportional loading paths.
Figure 2. Proportional multiaxial loading paths applied on the 316 stainless steel specimens.
Fifteen different tests were conducted on 316 stainless steel to evaluate the different critical plane models, which are described in Table 3. The loading path used for the 316 stainless steel are shown
Figure 2. Proportional multiaxial loading paths applied on the 316 stainless steel specimens.
Table 1. Summary of the experimental data used to fit the model parameters for 316 stainless steel.
Path ID εa γa σa τa Nf
P 1 0.0025 - 225.5 - 25,1002 0.0035 - 252.5 - 87503 0.005 - 278 - 42204 0.0075 - 326 - 2200
NP 1 0.0015 0.0026 219.5 138.5 32,4002 0.0025 0.0043 344.5 219.5 47803 0.0035 0.0061 412.5 238.5 36604 0.0050 0.0087 474 299.5 13605 0.0075 0.0130 615 388 410
Table 2. Summary of the experimental data used to fit the model parameters for 304 stainless steel.
Path ID εa γa σa τa Nf
P 1 0.0025 - 265 - 49,0002 0.0033 - 290 - 23,4003 0.004 - 315 - 71004 0.005 - 365 - 1500
NP 1 0.002 0.0035 300 168 50,0002 0.002 0.0035 307 176 45,0003 0.0035 0.0061 457 256 37304 0.0035 0.0061 477 267 3560
The tests were used to fit the SKS model that was subsequently used to predict fatigue lives forboth materials under a range of multiaxial loading conditions. The predictions given by the SKSmodel are valid for the range of fatigue lives covered in Tables 1 and 2 for 316 and 304 stainlesssteel, respectively.
Fifteen different tests were conducted on 316 stainless steel to evaluate the different critical planemodels, which are described in Table 3. The loading path used for the 316 stainless steel are shown inFigure 2. The load control mode was used to conduct the tests. It was possible to produce a triaxialstress state at the inner surface of the specimen and a biaxial stress state at the outer surface. On the
Metals 2019, 9, 978 4 of 14
outer surface, cases 1, 2 and 3 produced a uniaxial stress state, cases 4 and 7 a biaxial stress state andcases 5 and 6 an alternating pulsating stress state in perpendicular directions. For all the cases, a highlevel of ratchetting was observed [27]. The total reverse stress was applied in the case 3 (Figure 1)which promoted a non-zero mean strain probably because of the real stress asymmetry caused by thehigh load levels. Accordingly, a biaxial stress condition was induced on the outer surface. Since theprincipal stress directions are constant in time, all loading paths can be considered as proportional,given that the main slip plane does not change along the load cycle. The load ratio for Path 3 in Figure 2is R = −1. The rest of tests had a zero load ratio, R = 0. These tests will be used in Section 4 to evaluatethe accuracy of the different models, as well as the response of the models under mean stress loads andbiaxial conditions.
Table 3. Summary of the 316 stainless steel experimental data used to evaluate the fitted models.
Path ∆σz ∆σθ ∆εz ∆εθ Nf
1 445.15 1.8277 0.0022 0.0007 159,6002 2.3931 450.32 0.0016 0.0055 29,3002 1.8885 420.25 0.0013 0.0037 24,8002 1.6815 366.46 0.0005 0.0033 53,0003 1,024.3 1.7169 0.0406 0.0059 2083 884.49 1.4092 0.0245 0.0042 3934 399.2 424.1 0.0006 0.0051 35604 373.95 413.12 0.0033 0.0036 84005 6.5677 346.09 0.0023 0.0058 14,4865 400.92 393.85 0.0057 0.0016 53005 376.34 383.25 0.0023 0.0045 14,4866 399.76 450.21 0.0016 0.0048 25,7706 442.64 511.01 0.0018 0.0049 13,5426 375.8 335.22 0.0022 0.0027 31,4007 389.49 465.73 0.0019 0.0019 24,700
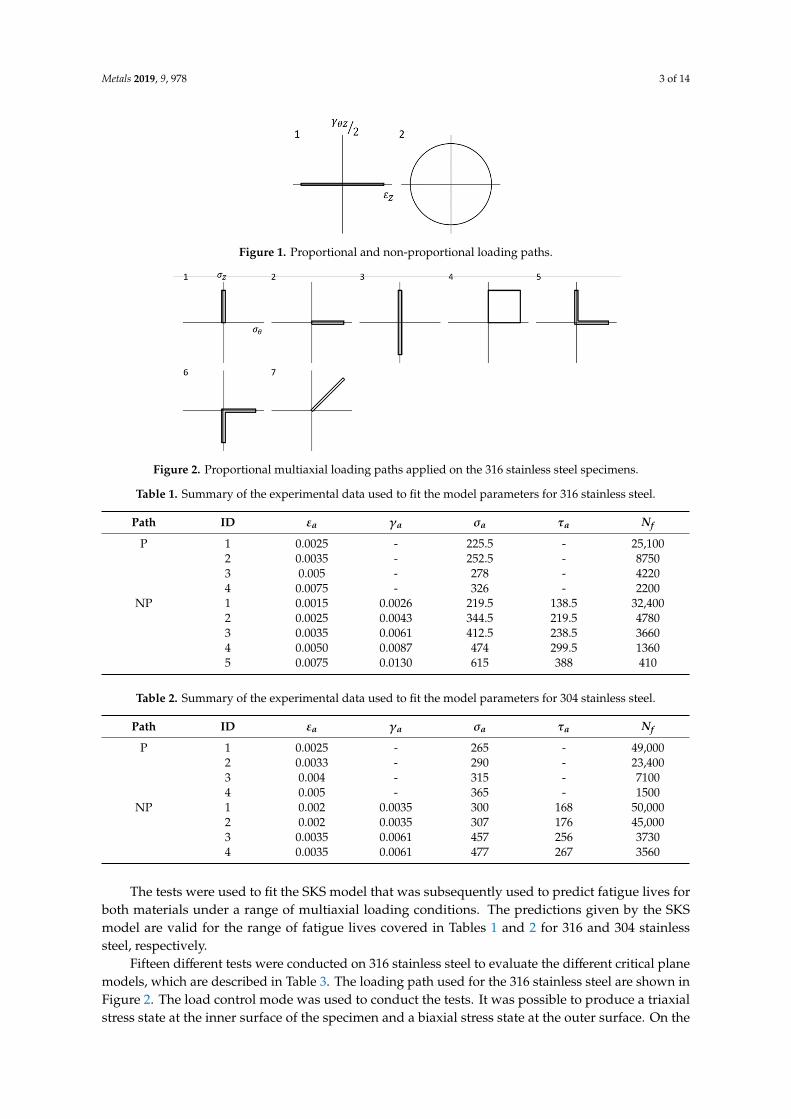
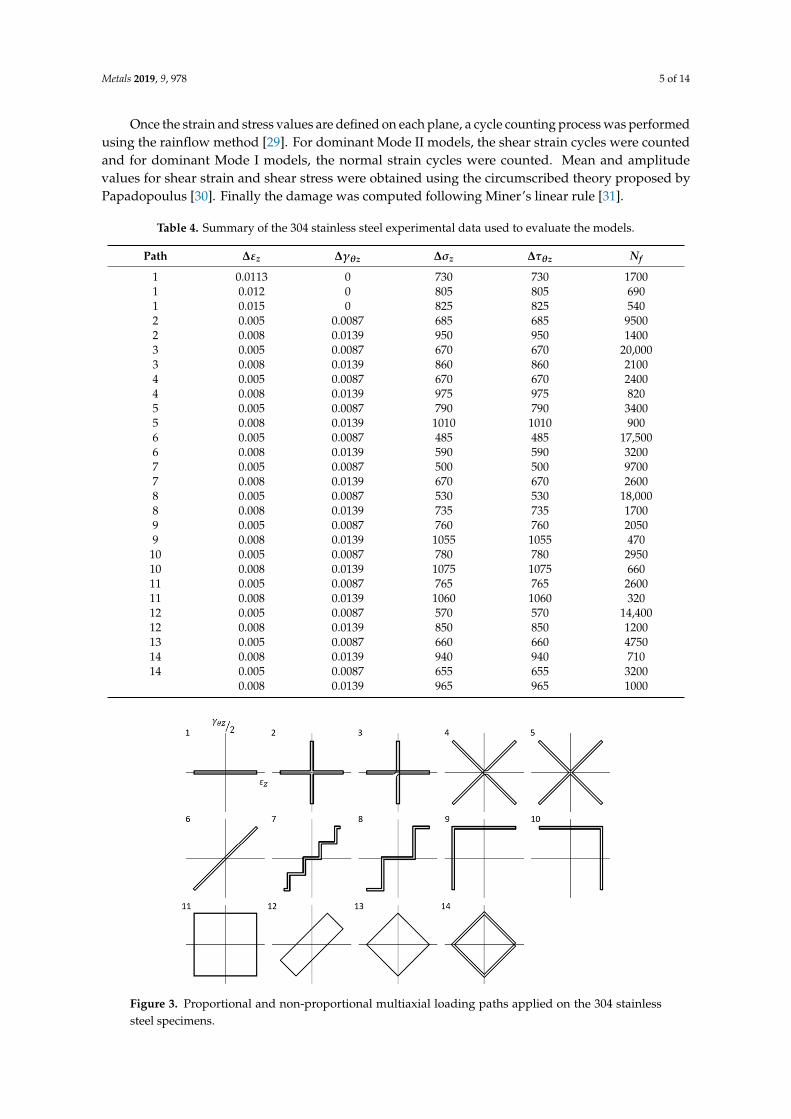
The experimental tests used to evaluate the different models on the 304 stainless steel are shownin Table 4. The loading path used for studying the 304 stainless steel are shown in Figure 3. That is 29experimental tests, three for path 0, and two for each of the other paths in Figure 3. These tests willallow the different models to be evaluated in terms of their capacity to take into account the fatiguedamage produced by the hardening caused by non-proportional loads. For the same range of appliedstrains, increasing the non-proportionality in the loads requires increasing stresses to conduct the test.Previous results showed a high-hardening level for the 304 stainless steel [26]. Cases 1 and 6 can beconsidered proportional as the principal stress direction are constant along the cycle. The maximumnon-proportionality factor appeared for cases 9, 10, 11, 13 and 14 [28]. Further experimental details areavailable elsewhere [25,26,28].
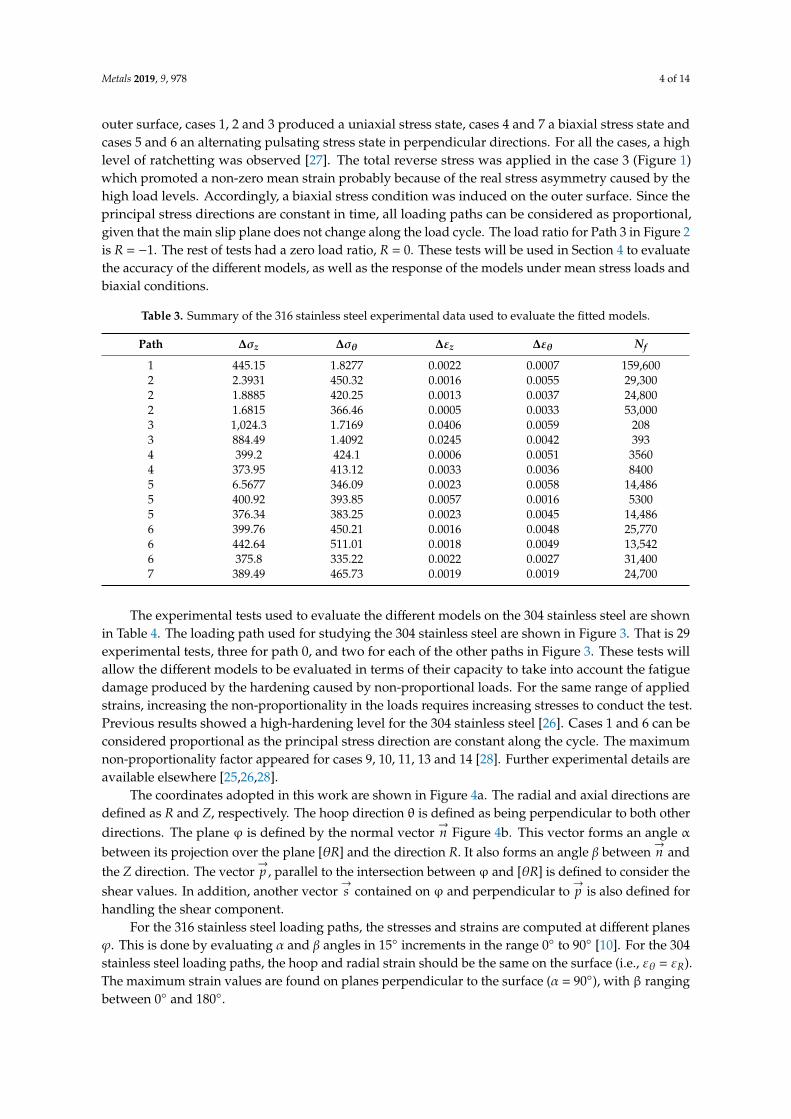
The coordinates adopted in this work are shown in Figure 4a. The radial and axial directions aredefined as R and Z, respectively. The hoop direction θ is defined as being perpendicular to both otherdirections. The plane ϕ is defined by the normal vector
→n Figure 4b. This vector forms an angle α
between its projection over the plane [θR] and the direction R. It also forms an angle β between→n and
the Z direction. The vector→p , parallel to the intersection between ϕ and [θR] is defined to consider the
shear values. In addition, another vector→s contained on ϕ and perpendicular to
→p is also defined for
handling the shear component.For the 316 stainless steel loading paths, the stresses and strains are computed at different planes
ϕ. This is done by evaluating α and β angles in 15◦ increments in the range 0◦ to 90◦ [10]. For the 304stainless steel loading paths, the hoop and radial strain should be the same on the surface (i.e., εθ = εR).The maximum strain values are found on planes perpendicular to the surface (α = 90◦), with β rangingbetween 0◦ and 180◦.
Metals 2019, 9, 978 5 of 14
Once the strain and stress values are defined on each plane, a cycle counting process was performedusing the rainflow method [29]. For dominant Mode II models, the shear strain cycles were countedand for dominant Mode I models, the normal strain cycles were counted. Mean and amplitudevalues for shear strain and shear stress were obtained using the circumscribed theory proposed byPapadopoulus [30]. Finally the damage was computed following Miner’s linear rule [31].
Table 4. Summary of the 304 stainless steel experimental data used to evaluate the models.
Path ∆εz ∆γθz ∆σz ∆τθz Nf
1 0.0113 0 730 730 17001 0.012 0 805 805 6901 0.015 0 825 825 5402 0.005 0.0087 685 685 95002 0.008 0.0139 950 950 14003 0.005 0.0087 670 670 20,0003 0.008 0.0139 860 860 21004 0.005 0.0087 670 670 24004 0.008 0.0139 975 975 8205 0.005 0.0087 790 790 34005 0.008 0.0139 1010 1010 9006 0.005 0.0087 485 485 17,5006 0.008 0.0139 590 590 32007 0.005 0.0087 500 500 97007 0.008 0.0139 670 670 26008 0.005 0.0087 530 530 18,0008 0.008 0.0139 735 735 17009 0.005 0.0087 760 760 20509 0.008 0.0139 1055 1055 470
10 0.005 0.0087 780 780 295010 0.008 0.0139 1075 1075 66011 0.005 0.0087 765 765 260011 0.008 0.0139 1060 1060 32012 0.005 0.0087 570 570 14,40012 0.008 0.0139 850 850 120013 0.005 0.0087 660 660 475014 0.008 0.0139 940 940 71014 0.005 0.0087 655 655 3200
0.008 0.0139 965 965 1000
Metals 2019, 8, x; doi: FOR PEER REVIEW 5 of 15
4 0.008 0.0139 975 975 820 5 0.005 0.0087 790 790 3400 5 0.008 0.0139 1,010 1,010 900 6 0.005 0.0087 485 485 17,500 6 0.008 0.0139 590 590 3200 7 0.005 0.0087 500 500 9700 7 0.008 0.0139 670 670 2600 8 0.005 0.0087 530 530 18,000 8 0.008 0.0139 735 735 1700 9 0.005 0.0087 760 760 2050 9 0.008 0.0139 1,055 1,055 470
10 0.005 0.0087 780 780 2950 10 0.008 0.0139 1,075 1,075 660 11 0.005 0.0087 765 765 2600 11 0.008 0.0139 1,060 1,060 320 12 0.005 0.0087 570 570 14,400 12 0.008 0.0139 850 850 1200 13 0.005 0.0087 660 660 4750 14 0.008 0.0139 940 940 710 14 0.005 0.0087 655 655 3200
0.008 0.0139 965 965 1000
Figure 3. Proportional and non-proportional multiaxial loading paths applied on the 304 stainless steel specimens.
The coordinates adopted in this work are shown in Figure 4a. The radial and axial directions are defined as R and Z, respectively. The hoop direction θ is defined as being perpendicular to both other directions. The plane φ is defined by the normal vector �� Figure 4b. This vector forms an angle α between its projection over the plane [θR] and the direction R. It also forms an angle β between �� and the Z direction. The vector ��, parallel to the intersection between φ and [θR] is defined to consider the shear values. In addition, another vector 𝑠 contained on φ and perpendicular to �� is also defined for handling the shear component.
For the 316 stainless steel loading paths, the stresses and strains are computed at different planes φ. This is done by evaluating α and β angles in 15° increments in the range 0° to 90° [10]. For the 304 stainless steel loading paths, the hoop and radial strain should be the same on the surface (i.e., εθ =
Figure 3. Proportional and non-proportional multiaxial loading paths applied on the 304 stainlesssteel specimens.
Metals 2019, 9, 978 6 of 14
Metals 2019, 8, x; doi: FOR PEER REVIEW 6 of 15
εR). The maximum strain values are found on planes perpendicular to the surface (α = 90°), with β ranging between 0° and 180°.
(a) (b)
Figure 4. (a) Coordinates adopted in this work and (b) definition of the plane ϕ that was used to evaluate the critical plane.
Once the strain and stress values are defined on each plane, a cycle counting process was performed using the rainflow method [29]. For dominant Mode II models, the shear strain cycles were counted and for dominant Mode I models, the normal strain cycles were counted. Mean and amplitude values for shear strain and shear stress were obtained using the circumscribed theory proposed by Papadopoulus [30]. Finally the damage was computed following Miner’s linear rule [31].
3. Critical Plane Models
Critical plane models are based on observations of the nucleation and growth of fatigue cracks [10]. They are based on a damage parameter (DP) which incorporates stress and/or strain information that is subsequently used to predict the fatigue life. The plane where the DP is maximised is called the critical plane. The DP is defined for each cycle extracted along the entire loading block. For the sake of computational speed, the damage below 25% of the maximum damage along the loading block was not taken into account in the algorithm. This is because the effect of such low damage values on the fatigue life is negligible. Subsequently, a damage accumulation rule was used to obtain the number of cycles until the failure. In this work, three different critical plane models were used to characterise the multiaxial fatigue behaviour of the 316 and 304 stainless steels. The Fatemi––Socie (FS) critical plane model is normally employed for materials prone to shear failure [17]. The Smith–Watson–Topper (SWT) critical plane model gives accurate predictions for materials with predominant tension failure [21]. In addition, a newly proposed critical plane model by Suman, Kallmeyer and Smith (SKS) was also used to investigate the two materials. By studying the two materials with the FS and SWT models, it will be possible to identify the predominant failure mechanism for each of the materials. In addition, the study will also be useful to assess the predictive capabilities of the newly proposed model via comparison with two widely used critical plane models.
3.1. Fatemi–Socie model (FS)
The Fatemi–Socie model defines a strain type DP (Equation (1)) [17]. The model is based on that proposed by Brown and Miller [1]. They suggested substituting the normal strain component by a normal stress component. The DP is defined on the plane φ* that maximises the shear strain range, Δγ.
Figure 4. (a) Coordinates adopted in this work and (b) definition of the plane φ that was used toevaluate the critical plane.
3. Critical Plane Models
Critical plane models are based on observations of the nucleation and growth of fatigue cracks [10].They are based on a damage parameter (DP) which incorporates stress and/or strain information thatis subsequently used to predict the fatigue life. The plane where the DP is maximised is called thecritical plane. The DP is defined for each cycle extracted along the entire loading block. For the sake ofcomputational speed, the damage below 25% of the maximum damage along the loading block wasnot taken into account in the algorithm. This is because the effect of such low damage values on thefatigue life is negligible. Subsequently, a damage accumulation rule was used to obtain the number ofcycles until the failure. In this work, three different critical plane models were used to characterise themultiaxial fatigue behaviour of the 316 and 304 stainless steels. The Fatemi—-Socie (FS) critical planemodel is normally employed for materials prone to shear failure [17]. The Smith–Watson–Topper (SWT)critical plane model gives accurate predictions for materials with predominant tension failure [21].In addition, a newly proposed critical plane model by Suman, Kallmeyer and Smith (SKS) was alsoused to investigate the two materials. By studying the two materials with the FS and SWT models, itwill be possible to identify the predominant failure mechanism for each of the materials. In addition,the study will also be useful to assess the predictive capabilities of the newly proposed model viacomparison with two widely used critical plane models.
3.1. Fatemi–Socie model (FS)
The Fatemi–Socie model defines a strain type DP (Equation (1)) [17]. The model is based on thatproposed by Brown and Miller [1]. They suggested substituting the normal strain component by anormal stress component. The DP is defined on the plane ϕ* that maximises the shear strain range, ∆γ.
DPFS =∆γmax
2
(1 + k
σn,max
σy
)(1)
where ∆γmax/2 is the maximum shear strain amplitude, σn,max is the maximum tensile stress at ϕ*, σy isthe yield stress and k is a material parameter. The values for the yield stress were set to 260 MPa and290 MPa for 316 and 304 stainless steel, respectively [26].
The strain hardening effect is considered with the ∆γmax to be 2 times the σn,max product. The meannormal stress effect is also considered via σn,max.
The parameter k represents the sensitivity of the material to normal stresses. This parameter canbe estimated from the fatigue life Nf [10], through Equation (2).
Metals 2019, 9, 978 7 of 14
k =
τ′fG
(2N f
)bγ+ γ′f
(2N f
)cγ
(1 + νe)σ′fE
(2N f
)b+
(1 + νp
)ε′f
(2N f
)c− 1
σ′y
σ′f
(2N f
)b(2)
where νe and νp are the Poisson’s ration in the elastic and plastic regimes, respectively, E the Youngmodulus, σ’f the fatigue strength coefficient, b the fatigue strength exponent, ε’f the fatigue ductilitycoefficient, c the fatigue ductility exponent, σ’y the cyclic yield stress, G the shear modulus, τ’f theshear fatigue strength coefficient, bγ the shear fatigue strength exponent, γ’f the shear fatigue ductilitycoefficient and cγ the shear fatigue ductility exponent.
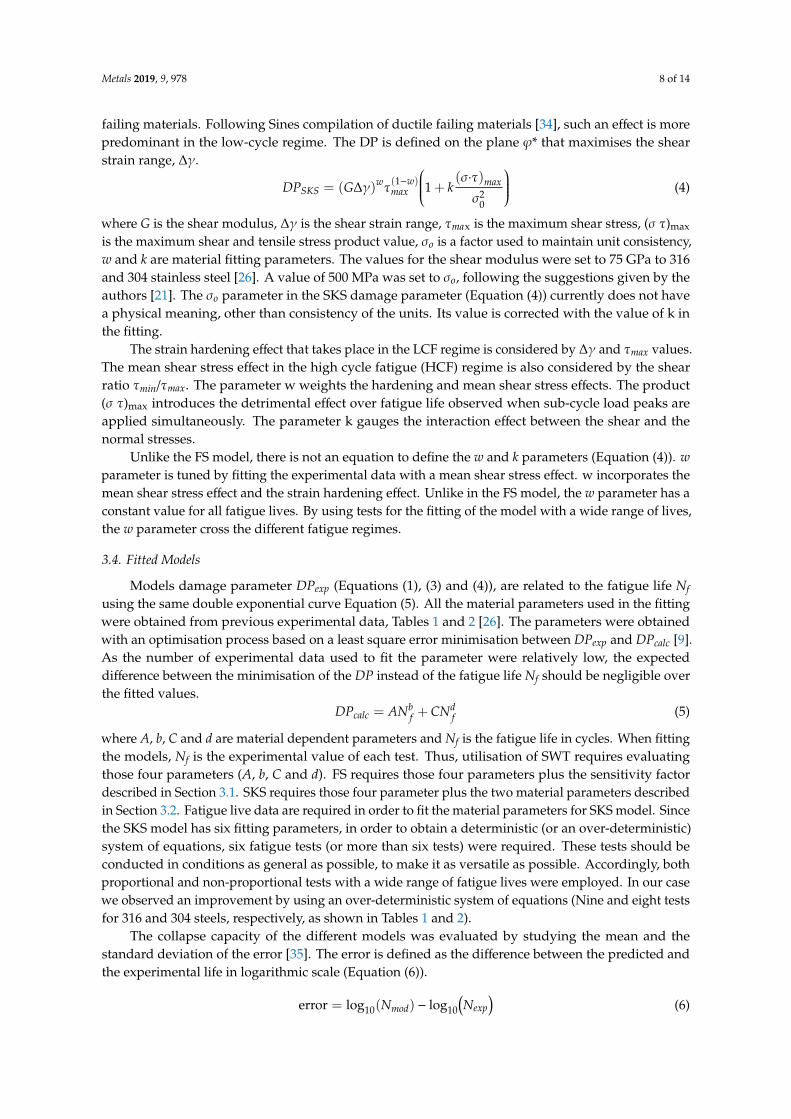
Figure 5 shows the k values for 316 and 304 stainless steel against fatigue life Nf. For the 316stainless steel, there is little variation of the k parameter with respect to the fatigue life. In addition thek parameter is very small (around 0.1) throughout the entire life. Figure 5 indicates that k parameter ismuch more sensitive to the fatigue life for the 304 stainless steel, with values ranging between ~0.5and ~1.25. It is noted that the sensitivity parameter increases with the fatigue life for both materials,although with a much greater gradient for the 304 steel. For the cases where little information isgathered at either low fatigue lives or high fatigue lives, it is possible to use a constant sensitivityfactor [10,19]. Nevertheless, in general this might reduce the accuracy of the fatigue predictions.
Metals 2019, 8, x; doi: FOR PEER REVIEW 7 of 15
DP = ∆γ2 1 + kσ ,σ (1)
where Δγmax/2 is the maximum shear strain amplitude, σn,max is the maximum tensile stress at φ*, σy is the yield stress and k is a material parameter. The values for the yield stress were set to 260 MPa and 290 MPa for 316 and 304 stainless steel, respectively [26].
The strain hardening effect is considered with the Δγmax to be 2 times the σn,max product. The mean normal stress effect is also considered via σn,max.
The parameter k represents the sensitivity of the material to normal stresses. This parameter can be estimated from the fatigue life Nf [10], through Equation (2).
k = τG (2N ) + γ (2N )(1 + ν ) σE (2N ) + 1 + ν ε (2N ) − 1 σσ (2N ) (2)
where νe and νp are the Poisson’s ration in the elastic and plastic regimes, respectively, E the Young modulus, σ’f the fatigue strength coefficient, b the fatigue strength exponent, ε’f the fatigue ductility coefficient, c the fatigue ductility exponent, σ’y the cyclic yield stress, G the shear modulus, τ’f the shear fatigue strength coefficient, bγ the shear fatigue strength exponent, γ’f the shear fatigue ductility coefficient and cγ the shear fatigue ductility exponent.
Figure 5 shows the k values for 316 and 304 stainless steel against fatigue life Nf. For the 316 stainless steel, there is little variation of the k parameter with respect to the fatigue life. In addition the k parameter is very small (around 0.1) throughout the entire life. Figure 5 indicates that k parameter is much more sensitive to the fatigue life for the 304 stainless steel, with values ranging between ~0.5 and ~1.25. It is noted that the sensitivity parameter increases with the fatigue life for both materials, although with a much greater gradient for the 304 steel. For the cases where little information is gathered at either low fatigue lives or high fatigue lives, it is possible to use a constant sensitivity factor [10,19]. Nevertheless, in general this might reduce the accuracy of the fatigue predictions.
Figure 5. Fatemi–Socie normal stress sensitive factor k for 304 and 316 stainless steel.
3.2. Smith–Watson–Topper Model (SWT)
The Smith, Watson and Topper model [18] defines a strain energy density type DP (Equation (3)). The DP considers the normal strain and stress acting on the critical plane φ*. The DP is defined on the plane φ* that maximises the normal strain range, Δε. DP = ∆ε2 σ , (3)
where Δε/2 is normal strain amplitude, σn,max is the maximum tensile stress at φ*.
Figure 5. Fatemi–Socie normal stress sensitive factor k for 304 and 316 stainless steel.
3.2. Smith–Watson–Topper Model (SWT)
The Smith, Watson and Topper model [18] defines a strain energy density type DP (Equation (3)).The DP considers the normal strain and stress acting on the critical plane ϕ*. The DP is defined on theplane ϕ* that maximises the normal strain range, ∆ε.
DPSWT =∆ε2σn,max (3)
where ∆ε/2 is normal strain amplitude, σn,max is the maximum tensile stress at ϕ*.The strain hardening effect is considered in the SWT model through the ∆ε/2 and σn,max product.
The mean normal stress effect is also taken into account via σn,max.
3.3. Sandip–Kallmeyer–Smith Model (SKS)
The multiaxial fatigue behaviour of the two steels is also evaluated with the Suman, Kallmeyer andSmith newly proposed critical plane model [21]. The SKS model defines a stress type DP (Equation (4)).Stress based models, such as Findley [32] and McDiarmid [33] normally give worse predictions forlow-cycle fatigue due to lack of real stress information under such conditions. This is overcome withSKS model because it includes a strain component, in a similar way to the FS [17] and SWT [18]models. By using shear strain and shear stress elements, the SKS damage is more suitable for ductile
Metals 2019, 9, 978 8 of 14
failing materials. Following Sines compilation of ductile failing materials [34], such an effect is morepredominant in the low-cycle regime. The DP is defined on the plane ϕ* that maximises the shearstrain range, ∆γ.
DPSKS = (G∆γ)wτ(1−w)max
1 + k(σ·τ)max
σ20
(4)
where G is the shear modulus, ∆γ is the shear strain range, τmax is the maximum shear stress, (σ τ)max
is the maximum shear and tensile stress product value, σo is a factor used to maintain unit consistency,w and k are material fitting parameters. The values for the shear modulus were set to 75 GPa to 316and 304 stainless steel [26]. A value of 500 MPa was set to σo, following the suggestions given by theauthors [21]. The σo parameter in the SKS damage parameter (Equation (4)) currently does not havea physical meaning, other than consistency of the units. Its value is corrected with the value of k inthe fitting.
The strain hardening effect that takes place in the LCF regime is considered by ∆γ and τmax values.The mean shear stress effect in the high cycle fatigue (HCF) regime is also considered by the shearratio τmin/τmax. The parameter w weights the hardening and mean shear stress effects. The product(σ τ)max introduces the detrimental effect over fatigue life observed when sub-cycle load peaks areapplied simultaneously. The parameter k gauges the interaction effect between the shear and thenormal stresses.
Unlike the FS model, there is not an equation to define the w and k parameters (Equation (4)). wparameter is tuned by fitting the experimental data with a mean shear stress effect. w incorporates themean shear stress effect and the strain hardening effect. Unlike in the FS model, the w parameter has aconstant value for all fatigue lives. By using tests for the fitting of the model with a wide range of lives,the w parameter cross the different fatigue regimes.
3.4. Fitted Models
Models damage parameter DPexp (Equations (1), (3) and (4)), are related to the fatigue life Nfusing the same double exponential curve Equation (5). All the material parameters used in the fittingwere obtained from previous experimental data, Tables 1 and 2 [26]. The parameters were obtainedwith an optimisation process based on a least square error minimisation between DPexp and DPcalc [9].As the number of experimental data used to fit the parameter were relatively low, the expecteddifference between the minimisation of the DP instead of the fatigue life Nf should be negligible overthe fitted values.
DPcalc = ANbf + CNd
f (5)
where A, b, C and d are material dependent parameters and Nf is the fatigue life in cycles. When fittingthe models, Nf is the experimental value of each test. Thus, utilisation of SWT requires evaluatingthose four parameters (A, b, C and d). FS requires those four parameters plus the sensitivity factordescribed in Section 3.1. SKS requires those four parameter plus the two material parameters describedin Section 3.2. Fatigue live data are required in order to fit the material parameters for SKS model. Sincethe SKS model has six fitting parameters, in order to obtain a deterministic (or an over-deterministic)system of equations, six fatigue tests (or more than six tests) were required. These tests should beconducted in conditions as general as possible, to make it as versatile as possible. Accordingly, bothproportional and non-proportional tests with a wide range of fatigue lives were employed. In our casewe observed an improvement by using an over-deterministic system of equations (Nine and eight testsfor 316 and 304 steels, respectively, as shown in Tables 1 and 2).
The collapse capacity of the different models was evaluated by studying the mean and thestandard deviation of the error [35]. The error is defined as the difference between the predicted andthe experimental life in logarithmic scale (Equation (6)).
error = log10(Nmod) − log10
(Nexp
)(6)
Metals 2019, 9, 978 9 of 14
where Nmod is the fatigue life predicted by the fitted model and Nexp is the experimental fatigue life.Table 5 includes the mean and standard deviation of the error values observed in the fitting.
Negative mean values are indicative of conservative results and vice versa. A better fitting is obtainedwith mean values as close as possible to zero. In a similar way, a better fitting is also obtained with thestandard deviation value as close as possible to zero. It is observed that the lowest mean values forboth materials were obtained with the SKS critical plane model, followed by FS. The mean values inTable 5 indicated that the SWT model appears to produce the least accurate predictions for the type ofexperiments under study. For both materials, SKS returns the best fit and SWT the worst fit, probablybecause of the different number of material parameters used in the different models. Materials thatnormally exhibit a ductile behaviour were more sensitive to damage mechanisms caused by shear stressrather than by normal stress. Materials that normally present a brittle behaviour were more sensitiveto damage mechanisms caused by normal stress [16]. Accordingly, the Fatemi–Socie model will bemore appropriate for ductile materials failing predominantly under shear mode (Mode II and III); andSmith–Watson–Topper for brittle materials failing predominantly under tension mode (Mode I).
Table 5. Statistical analysis for the comparison of the models collapse capacity.
Statistical Values FS SWT SKS
316 stainless steel - - -Mean value 0.0091 0.0308 0.0022
Standard deviation 0.0130 0.0370 0.0014304 stainless steel - - -
Mean value 0.0020 0.0069 0.0016Standard deviation 0.0026 0.0065 0.0019
4. Results and Discussion
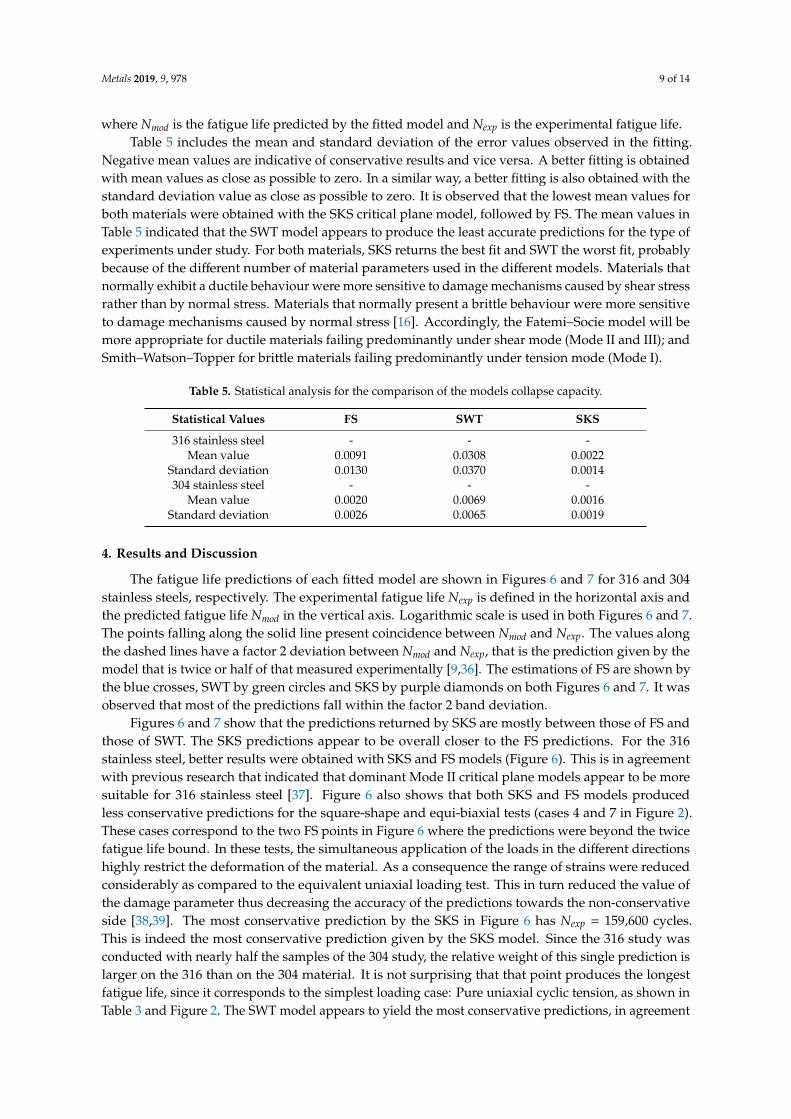
The fatigue life predictions of each fitted model are shown in Figures 6 and 7 for 316 and 304stainless steels, respectively. The experimental fatigue life Nexp is defined in the horizontal axis andthe predicted fatigue life Nmod in the vertical axis. Logarithmic scale is used in both Figures 6 and 7.The points falling along the solid line present coincidence between Nmod and Nexp. The values alongthe dashed lines have a factor 2 deviation between Nmod and Nexp, that is the prediction given by themodel that is twice or half of that measured experimentally [9,36]. The estimations of FS are shown bythe blue crosses, SWT by green circles and SKS by purple diamonds on both Figures 6 and 7. It wasobserved that most of the predictions fall within the factor 2 band deviation.
Figures 6 and 7 show that the predictions returned by SKS are mostly between those of FS andthose of SWT. The SKS predictions appear to be overall closer to the FS predictions. For the 316stainless steel, better results were obtained with SKS and FS models (Figure 6). This is in agreementwith previous research that indicated that dominant Mode II critical plane models appear to be moresuitable for 316 stainless steel [37]. Figure 6 also shows that both SKS and FS models producedless conservative predictions for the square-shape and equi-biaxial tests (cases 4 and 7 in Figure 2).These cases correspond to the two FS points in Figure 6 where the predictions were beyond the twicefatigue life bound. In these tests, the simultaneous application of the loads in the different directionshighly restrict the deformation of the material. As a consequence the range of strains were reducedconsiderably as compared to the equivalent uniaxial loading test. This in turn reduced the value ofthe damage parameter thus decreasing the accuracy of the predictions towards the non-conservativeside [38,39]. The most conservative prediction by the SKS in Figure 6 has Nexp = 159,600 cycles.This is indeed the most conservative prediction given by the SKS model. Since the 316 study wasconducted with nearly half the samples of the 304 study, the relative weight of this single prediction islarger on the 316 than on the 304 material. It is not surprising that that point produces the longestfatigue life, since it corresponds to the simplest loading case: Pure uniaxial cyclic tension, as shown inTable 3 and Figure 2. The SWT model appears to yield the most conservative predictions, in agreement
Metals 2019, 9, 978 10 of 14
with previous research [40] where a different steel with tendency to ductile failure was subjected toproportional loadings.
Metals 2019, 8, x; doi: FOR PEER REVIEW 10 of 15
considerably as compared to the equivalent uniaxial loading test. This in turn reduced the value of the damage parameter thus decreasing the accuracy of the predictions towards the non-conservative side [38,39]. The most conservative prediction by the SKS in Figure 6 has Nexp = 159,600 cycles. This is indeed the most conservative prediction given by the SKS model. Since the 316 study was conducted with nearly half the samples of the 304 study, the relative weight of this single prediction is larger on the 316 than on the 304 material. It is not surprising that that point produces the longest fatigue life, since it corresponds to the simplest loading case: Pure uniaxial cyclic tension, as shown in Table 3 and Figure 2. The SWT model appears to yield the most conservative predictions, in agreement with previous research [40] where a different steel with tendency to ductile failure was subjected to proportional loadings.
Nm
od
Figure 6. Fatigue life predicted by each model, Nmod versus experimental fatigue life, Nexp for 316 stainless steel.
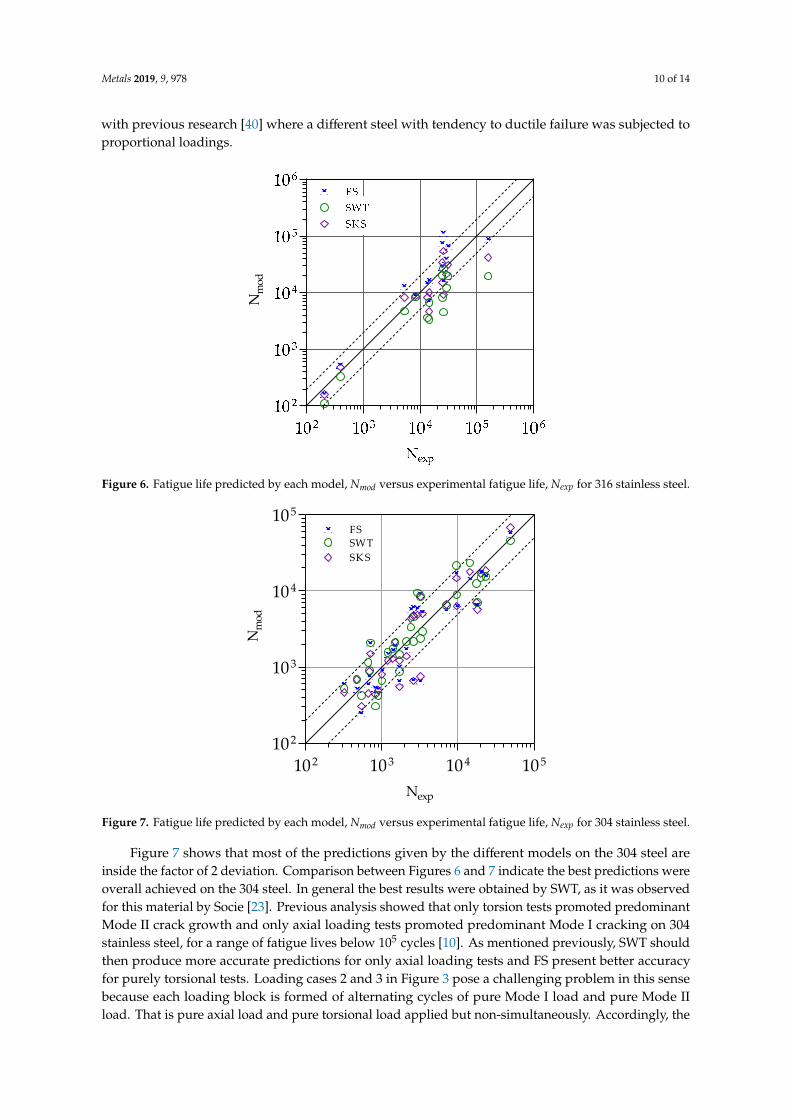
Figure 7 shows that most of the predictions given by the different models on the 304 steel are inside the factor of 2 deviation. Comparison between Figures 6 and 7 indicate the best predictions were overall achieved on the 304 steel. In general the best results were obtained by SWT, as it was observed for this material by Socie [23]. Previous analysis showed that only torsion tests promoted predominant Mode II crack growth and only axial loading tests promoted predominant Mode I cracking on 304 stainless steel, for a range of fatigue lives below 105 cycles [10]. As mentioned previously, SWT should then produce more accurate predictions for only axial loading tests and FS present better accuracy for purely torsional tests. Loading cases 2 and 3 in Figure 3 pose a challenging problem in this sense because each loading block is formed of alternating cycles of pure Mode I load and pure Mode II load. That is pure axial load and pure torsional load applied but non-simultaneously. Accordingly, the predictions given by FS and by SWT should be similar. This is indeed observed for the loading cases 2 and 3 in Figure 7.
As it can be seen in Figure 5, the sensitivity parameter k in FS model changes from ~0.5 to ~1.25 in the range from 102 to 105 cycles. If not enough experimental data in the entire range were available, it would be possible to take a constant value of 1 for the FS sensitivity parameter [10]. Nevertheless, the effect in the accuracy of the predictions would be detrimental, producing more conservative predictions in the lower range of the fatigue life (between 102 and 103 cycles in Figure 5) and non-conservative predictions in the higher range of the fatigue life (between 105 and 106 cycles in Figure 5).
Figure 6. Fatigue life predicted by each model, Nmod versus experimental fatigue life, Nexp for 316 stainless steel.
Metals 2019, 8, x; doi: FOR PEER REVIEW 11 of 15
FS and SWT models allow the additional hardening of the material caused by the non-proportionality of the loads to be taken into account because their damage parameter includes both stress and strain variables. SKS also includes the additional hardening cause by the non-proportionality because its damage parameter has both stress and strain information. This is clear for the loading cases with high non-proportionality (cases 9, 10, 11, 13 and 14 in Figure 3) where the three critical plane models yielded predictions within the factor 2 error bound. Tests with the loads applied proportionally (cases 6, 7 and 8 in Figure 3) were also handled satisfactorily by the three models.
102 103 104 105102
103
104
105
Nexp
Nm
od
SWTFS
SK S
Figure 7. Fatigue life predicted by each model, Nmod versus experimental fatigue life, Nexp for 304 stainless steel.
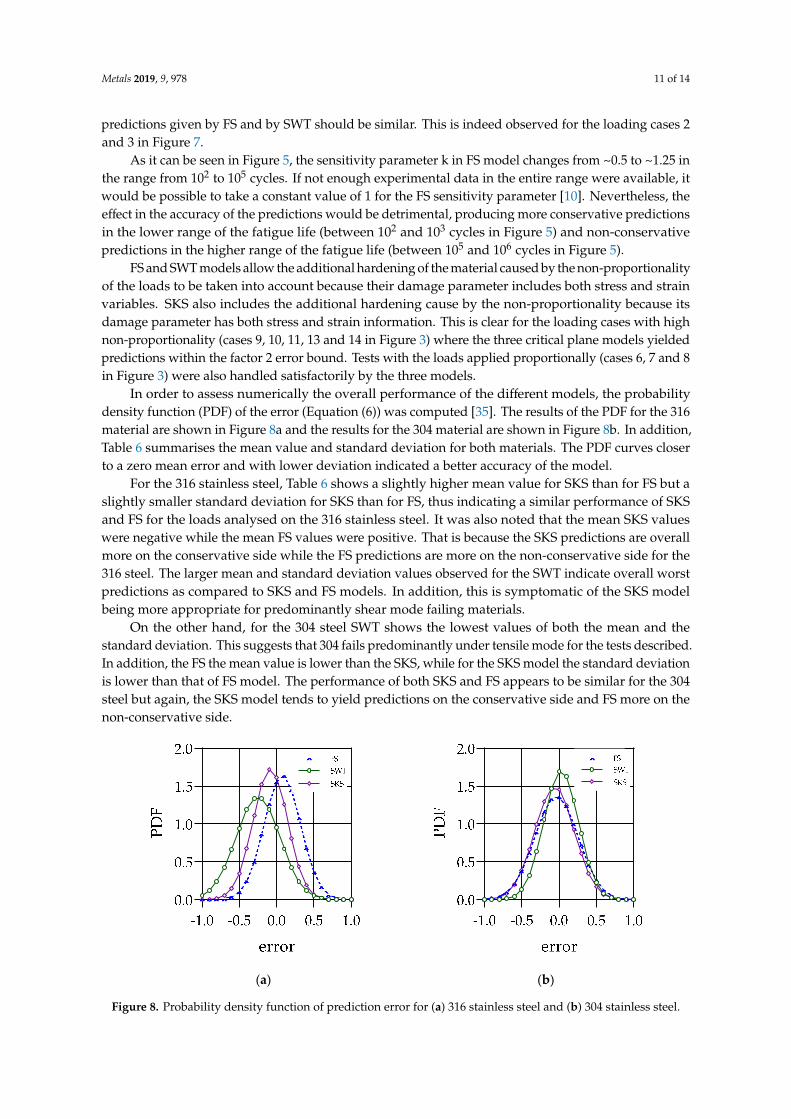
In order to assess numerically the overall performance of the different models, the probability density function (PDF) of the error (Equation (6)) was computed [35]. The results of the PDF for the 316 material are shown in Figure 8a and the results for the 304 material are shown in Figure 8b. In addition, Table 6 summarises the mean value and standard deviation for both materials. The PDF curves closer to a zero mean error and with lower deviation indicated a better accuracy of the model.
For the 316 stainless steel, Table 6 shows a slightly higher mean value for SKS than for FS but a slightly smaller standard deviation for SKS than for FS, thus indicating a similar performance of SKS and FS for the loads analysed on the 316 stainless steel. It was also noted that the mean SKS values were negative while the mean FS values were positive. That is because the SKS predictions are overall more on the conservative side while the FS predictions are more on the non-conservative side for the 316 steel. The larger mean and standard deviation values observed for the SWT indicate overall worst predictions as compared to SKS and FS models. In addition, this is symptomatic of the SKS model being more appropriate for predominantly shear mode failing materials.
On the other hand, for the 304 steel SWT shows the lowest values of both the mean and the standard deviation. This suggests that 304 fails predominantly under tensile mode for the tests described. In addition, the FS the mean value is lower than the SKS, while for the SKS model the standard deviation is lower than that of FS model. The performance of both SKS and FS appears to be similar for the 304 steel but again, the SKS model tends to yield predictions on the conservative side and FS more on the non-conservative side.
Table 6 also indicates that the three mean values are smaller for the 304 than for the 316 material, thus indicating that the predictions obtained for the 304 steel are slightly more accurate than for the 316 steel.
Figure 7. Fatigue life predicted by each model, Nmod versus experimental fatigue life, Nexp for 304 stainless steel.
Figure 7 shows that most of the predictions given by the different models on the 304 steel areinside the factor of 2 deviation. Comparison between Figures 6 and 7 indicate the best predictions wereoverall achieved on the 304 steel. In general the best results were obtained by SWT, as it was observedfor this material by Socie [23]. Previous analysis showed that only torsion tests promoted predominantMode II crack growth and only axial loading tests promoted predominant Mode I cracking on 304stainless steel, for a range of fatigue lives below 105 cycles [10]. As mentioned previously, SWT shouldthen produce more accurate predictions for only axial loading tests and FS present better accuracyfor purely torsional tests. Loading cases 2 and 3 in Figure 3 pose a challenging problem in this sensebecause each loading block is formed of alternating cycles of pure Mode I load and pure Mode IIload. That is pure axial load and pure torsional load applied but non-simultaneously. Accordingly, the
Metals 2019, 9, 978 11 of 14
predictions given by FS and by SWT should be similar. This is indeed observed for the loading cases 2and 3 in Figure 7.
As it can be seen in Figure 5, the sensitivity parameter k in FS model changes from ~0.5 to ~1.25 inthe range from 102 to 105 cycles. If not enough experimental data in the entire range were available, itwould be possible to take a constant value of 1 for the FS sensitivity parameter [10]. Nevertheless, theeffect in the accuracy of the predictions would be detrimental, producing more conservative predictionsin the lower range of the fatigue life (between 102 and 103 cycles in Figure 5) and non-conservativepredictions in the higher range of the fatigue life (between 105 and 106 cycles in Figure 5).
FS and SWT models allow the additional hardening of the material caused by the non-proportionalityof the loads to be taken into account because their damage parameter includes both stress and strainvariables. SKS also includes the additional hardening cause by the non-proportionality because itsdamage parameter has both stress and strain information. This is clear for the loading cases with highnon-proportionality (cases 9, 10, 11, 13 and 14 in Figure 3) where the three critical plane models yieldedpredictions within the factor 2 error bound. Tests with the loads applied proportionally (cases 6, 7 and 8in Figure 3) were also handled satisfactorily by the three models.
In order to assess numerically the overall performance of the different models, the probabilitydensity function (PDF) of the error (Equation (6)) was computed [35]. The results of the PDF for the 316material are shown in Figure 8a and the results for the 304 material are shown in Figure 8b. In addition,Table 6 summarises the mean value and standard deviation for both materials. The PDF curves closerto a zero mean error and with lower deviation indicated a better accuracy of the model.
For the 316 stainless steel, Table 6 shows a slightly higher mean value for SKS than for FS but aslightly smaller standard deviation for SKS than for FS, thus indicating a similar performance of SKSand FS for the loads analysed on the 316 stainless steel. It was also noted that the mean SKS valueswere negative while the mean FS values were positive. That is because the SKS predictions are overallmore on the conservative side while the FS predictions are more on the non-conservative side for the316 steel. The larger mean and standard deviation values observed for the SWT indicate overall worstpredictions as compared to SKS and FS models. In addition, this is symptomatic of the SKS modelbeing more appropriate for predominantly shear mode failing materials.
On the other hand, for the 304 steel SWT shows the lowest values of both the mean and thestandard deviation. This suggests that 304 fails predominantly under tensile mode for the tests described.In addition, the FS the mean value is lower than the SKS, while for the SKS model the standard deviationis lower than that of FS model. The performance of both SKS and FS appears to be similar for the 304steel but again, the SKS model tends to yield predictions on the conservative side and FS more on thenon-conservative side.
Metals 2019, 8, x; doi: FOR PEER REVIEW 12 of 15
(a) (b)
Figure 8. Probability density function of prediction error for (a) 316 stainless steel and (b) 304 stainless steel.
Table 6. Statistical analysis for the comparison of the model prediction errors.
Statistical Values FS SWT SKS 316 stainless steel - - -
Mean value 0.0763 -0.2490 -0.0836 Standard deviation 0.2432 0.2945 0.2315 304 stainless steel - - -
Mean value -0.0299 0.0291 -0.0595 Standard deviation 0.2919 0.2339 0.2681
The different performance of the different types of models were useful for identify the predominant failure mode of the two materials. The 316 steel appears to fail predominantly under shear mode because FS produces better estimations. Conversely, the 304 steel appears to fail predominantly under tension mode since SWT generated the best predictions. This appears to hold for the wide range of multiaxial loads analysed. Moreover, the alignment of SKS with FS in terms of predictions suggests that SKS model is most suitable for predominantly shear mode failing materials.
5. Conclusions and Future Works
The multiaxial fatigue behaviour of two widely used materials, 316 and 304 stainless steels, was studied by means of the critical plane approach. The analysis has been performed on a wide range of experimental tests including different combinations of tension, torsion and inner pressure. Three different critical plane models were used, namely FS, SWT and the newly proposed SKS model. First, the collapse capacity of the different models were evaluated. The larger number of material parameters of SKS model appeared to offer a higher flexibility in this sense, thus producing the best fitting. Nevertheless SKS did not offer any expression to define the k and w parameters included in the damage parameter. In addition, the σo parameter also included in the SKS damage parameter did not have any physical meaning. Producing analytical expressions relating the k and w parameters to different fatigue properties of the material remain as challenging prospective research activities. The SKS could also be improved by relating σo to another characteristic material property, to promote a more uniform use of the model. Unlike the FS model, the parameter k and w parameters take the same value across the whole range of fatigue lives. This can be a weakness for design situations where a very wide range of conditions and very different fatigue regimes are studied. In addition, the SKS model should also be applied to other different materials, to evaluate its performance for other types of alloys.
Figure 8. Probability density function of prediction error for (a) 316 stainless steel and (b) 304 stainless steel.
Metals 2019, 9, 978 12 of 14
Table 6. Statistical analysis for the comparison of the model prediction errors.
Statistical Values FS SWT SKS
316 stainless steel - - -Mean value 0.0763 −0.2490 −0.0836
Standard deviation 0.2432 0.2945 0.2315304 stainless steel - - -
Mean value −0.0299 0.0291 −0.0595Standard deviation 0.2919 0.2339 0.2681
Table 6 also indicates that the three mean values are smaller for the 304 than for the 316 material,thus indicating that the predictions obtained for the 304 steel are slightly more accurate than for the316 steel.
The different performance of the different types of models were useful for identify the predominantfailure mode of the two materials. The 316 steel appears to fail predominantly under shear modebecause FS produces better estimations. Conversely, the 304 steel appears to fail predominantly undertension mode since SWT generated the best predictions. This appears to hold for the wide range ofmultiaxial loads analysed. Moreover, the alignment of SKS with FS in terms of predictions suggeststhat SKS model is most suitable for predominantly shear mode failing materials.
5. Conclusions and Future Works
The multiaxial fatigue behaviour of two widely used materials, 316 and 304 stainless steels,was studied by means of the critical plane approach. The analysis has been performed on a widerange of experimental tests including different combinations of tension, torsion and inner pressure.Three different critical plane models were used, namely FS, SWT and the newly proposed SKS model.First, the collapse capacity of the different models were evaluated. The larger number of materialparameters of SKS model appeared to offer a higher flexibility in this sense, thus producing the bestfitting. Nevertheless SKS did not offer any expression to define the k and w parameters included inthe damage parameter. In addition, the σo parameter also included in the SKS damage parameter didnot have any physical meaning. Producing analytical expressions relating the k and w parametersto different fatigue properties of the material remain as challenging prospective research activities.The SKS could also be improved by relating σo to another characteristic material property, to promote amore uniform use of the model. Unlike the FS model, the parameter k and w parameters take the samevalue across the whole range of fatigue lives. This can be a weakness for design situations where a verywide range of conditions and very different fatigue regimes are studied. In addition, the SKS modelshould also be applied to other different materials, to evaluate its performance for other types of alloys.
The efficacy of the different models has also been analysed in terms of their accuracy for predictingthe fatigue life. To this end, the damage parameter was correlated with the fatigue life using a doubleexponential curve. The fitted curves for 316 and 304 stainless steel were used to predict fatigue lifeunder different loading path for the same materials. Most of the predictions given by the three modelsfall in the band defined by the factor of 2 deviation. For cases with a higher level of hardening, thecritical plane models have shown to also generate satisfactory predictions. SKS and FS produced thebest predictions for the 316 material while SWT generated the best predictions for the 304 material.Such a trend has been useful to identify the predominant failure mode of the two materials: 316 failspredominantly under the shear mode loading and 304 material fails predominantly under the tensionmode loading. The results also indicated that the SKS model appears to be most suitable for shearmode failing materials. For the experimental tests described, SKS has proven to generate predictionson the conservative side and FS on the non-conservative side. This suggests that SKS could be moresuitable from a design point of view.
Metals 2019, 9, 978 13 of 14
Author Contributions: Conceptualization, A.S.C. and P.L.-C.; methodology, A.S.C., P.L.-C., T.I., S.B. and B.M.;software, A.S.C. and B.M.; validation, P.L.-C., B.M. and T.I.; formal analysis, A.S.C., P.L.-C. and B.M.; investigation,A.S.C., P.L.-C., T.I., S.B. and B.M.; resources, A.S.C. and S.B.; data curation, A.S.C. and P.L.-C.; writing—originaldraft preparation, A.S.C.; writing—review and editing, P.L.-C.; visualization, A.S.C.; supervision, P.L.-C.; projectadministration, P.L.-C.; funding acquisition, P.L.-C.
Funding: This research was funded by Ministerio de Economia y Competitividad (Spain), grant numberMAT2016-76951-C2-2-P. The APC was funded by Ministerio de Economia y Competitividad (Spain).
Acknowledgments: The financial support of Ministerio de Economia y Competitividad (Spain) through grantreference MAT2016-76951-C2-2-P is acknowledged. Fernando V Antunes from University of Coimbra (Portugal) isalso greatly acknowledged for his help in conducting the experiments, analysis ideas and interesting discussions.Industrial support from Sandip Suman and UTC Aerospace Systems (CA, USA) is also greatly acknowledged.
Conflicts of Interest: The authors declare no conflict of interest.
References
1. Brown, M.W.; Miller, K.J. A theory for fatigue failure under multiaxial stress-strain conditions. Proc. Inst.Mech. Eng. 1973, 187, 745–755. [CrossRef]
2. Metcalfe, R.G.; Costanzi, R. Fatigue cracking of dragline boom support strands. Eng. Fail. Anal. 2019, 99,46–68. [CrossRef]
3. Gledic, I.; Parunov, J.; Prebeg, P.; Corak, M. Low-cycle fatigue of ship hull damaged in collision. Eng. Fail. Anal.2019, 96, 436–454.
4. Mamiya, E.N.; Castro, F.C.; Ferreira, G.V.; Nunes Filho, E.L.S.A.; Canut, F.A.; Neves, R.S.; Malcher, L. Fatigueof mooring chain links subjected to out-of-plane bending: Experiments and modeling. Eng. Fail. Anal. 2019,100, 206–213. [CrossRef]
5. Chen, X.; Xu, S.; Huang, D. Critical plane-strain energy density criterion for multiaxial low-cycle fatigue lifeunder non-proportional loading. Fatigue Fract. Eng. Mater. Struct. 1999, 22, 679–686. [CrossRef]
6. Chu, C. Multiaxial fatigue life prediction method in the ground vehicle industry. Int. J. Fatigue 1997, 19,325–330. [CrossRef]
7. Sharifimehr, S.; Fatemi, A. Fatigue analysis of ductile and brittle behaving steels under variable amplitudemultiaxial loading. Fatigue Fract. Eng. Mater. Struct. 2019, 42, 1722–1742. [CrossRef]
8. Llavori, I.; Etxeberria, U.; Lopez, A.; Ulacia, I.; Ugarte, D.; Esnaola, J.; Larrañaga, M. A numerical analysisof multiaxial fatigue in a butt weld specimen considering residual stresses. In Proceedings of the 12thInternational Fatigue Congress (FATIGUE 2018), Poitiers, Futuroscope, France, 27 May 2018; Volume 165,p. 21005.
9. Erickson, M.; Kallmeyer, A.R.; Van Stone, R.H.; Kurath, P. Development of a multiaxial fatigue damage modelfor high strength alloys using a critical plane methodology. J. Eng. Mater. Technol. 2008, 130, 0410081–0410089.[CrossRef]
10. Socie, D.F.; Marquis, G.B. Multiaxial Fatigue, 1st ed.; Society of Automotive Engineers Inc.: Warrendale, PA,USA, 2000.
11. Ten-Hoeve, H.; De-Koning, A. Reference Manual of the Strip-Yield Module in NASGRO or ESACRACK Softwarefor the Prediction of Retarded Crack Growth and Residual Strength in Metal Materials; Report No. TR 97012;National Aerospace Laboratory: Amsterdam, The Netherlands, 1977.
12. Moreno, B.; Martin, A.; Lopez-Crespo, P.; Zapatero, J.; Dominguez, J. Estimations of fatigue life and variabilityunder random loading in aluminum Al-2024T351 using strip yield models from NASGRO. Int. J. Fatigue2016, 91, 414–422. [CrossRef]
13. Li, B.; Reis, L.; de Freitas, M. Comparative study of multiaxial fatigue damage models for ductile structuralsteels and brittle materials. Int. J. Fatigue 2009, 31, 1895–1906. [CrossRef]
14. Reis, L.; Freitas, M.J. Crack initiation and growth path under multiaxial fatigue loading in structural steels.Int. J. Fatigue 2009, 31, 1660–1668. [CrossRef]
15. Anes, V.; Reis, L.; Li, B.; Freitas, M. Crack path evaluation on HC and BCC microstructures under multiaxialcyclic loading. Int. J. Fatigue 2014, 58, 102–113. [CrossRef]
16. Karolczuk, A.; Macha, E. A review of critical plane orientations in multiaxial fatigue failure criteria of metallicmaterials. Int. J. Fract. 2005, 134, 267–304. [CrossRef]
Metals 2019, 9, 978 14 of 14
17. Fatemi, A.; Socie, D.F. A Critical Plane Approach to Multiaxial Fatigue Damage Including out-of-PhaseLoading. Fatigue Fract. Eng. Mater. Struct. 1988, 11, 149–165. [CrossRef]
18. Smith, K.; Topper, T.H.; Watson, P. A stress-strain function for the fatigue of metals (Stress-strain function formetal fatigue including mean stress effect). J. Mater. 1970, 5, 767–778.
19. Jin, D.; Tian, D.J.; Li, J.H.; Sakane, M. Low-cycle fatigue of 316 L stainless steel under proportional andnonproportional loadings. Fatigue Fract. Eng. Mater. Struct. 2016, 39, 850–858. [CrossRef]
20. Anes, V.; Reis, L.; Li, B.; De Freitas, M. New cycle counting method for multiaxial fatigue. Int. J. Fatigue 2014,67, 78–94. [CrossRef]
21. Suman, S.; Kallmeyer, A.; Smith, J. Development of a multiaxial fatigue damage parameter and life predictionmethodology for non-proportional loading. Frattura ed Integrità Strutturale 2016, 10, 224–230. [CrossRef]
22. Cruces, A.S.; Lopez-Crespo, P.; Moreno, B.; Antunes, F.V. Multiaxial Fatigue Life Prediction on S355 Structuraland Offshore Steel Using the SKS Critical Plane Model. Metals 2018, 8, 1060. [CrossRef]
23. Socie, D. Multiaxial Fatigue Damage Models. J. Eng. Mater. Technol. 1987, 10, 293–298. [CrossRef]24. Ohnami, M.; Hamada, N. Crack Propagation Behavior of Biaxial Low-Cycle Fatigue at Elevated Temperatures
(Effects of the Cyclic Principal Stressing in Parallel with the Fatigue Crack and the Rotation of the PrincipalStress Axes). J. Soc. Mater. Sci. Japan 1981, 30, 822–828. [CrossRef]
25. Morishita, T.; Takada, Y.; Ogawa, F.; Hiyoshi, N.; Itoh, T. Multiaxial fatigue properties of stainless steel underseven loading paths consisting of cyclic inner pressure and push-pull loading. Theor. Appl. Fract. Mech. 2018,96, 387–397. [CrossRef]
26. Itoh, T.; Yang, T. Material dependence of multiaxial low cycle fatigue lives under non-proportional loading.Int. J. Fatigue 2011, 33, 1025–1031. [CrossRef]
27. Cruces, A.S.; Lopez-Crespo, P.; Bressan, S.; Itoh, T. Investigation of the multiaxial fatigue behaviour of 316stainless steel based on critical plane method. Fatigue Fract. Eng. Mater. Struct. 2019, 42, 1633–1645. [CrossRef]
28. Itoh, T.; Sakane, M.; Ohnami, M.; Socie, D.F. Nonproportional low-cycle fatigue criterion for type 304 stainlesssteel. J. Eng. Mater. Technol. ASME 1995, 117, 285–292. [CrossRef]
29. Matsuishi, M.; Endo, T. Fatigue of metals subjected to varying stress. Japan Soc. Mech. Eng. 1968, 68, 37–40.30. Papadopoulos, I. A comparative study of multiaxial high-cycle fatigue criteria for metals. Int. J. Fatigue 1997,
19, 219–235. [CrossRef]31. Miner, M. Cumulative damage in fatigue. J. Appl. Mech. 1945, 12, 159–164.32. Findley, W.N. A theory for the effect of mean stress on fatigue of metals under combined torsion and axial
load or bending. J. Eng. Ind. Trans. ASME 1959, 81, 301–306. [CrossRef]33. McDiarmid, D.L. A Shear Stress Based Critical-Plane Criterion of Multiaxial Fatigue Failure for Design and
Life Prediction. Fatigue Fract. Eng. Mater. Struct. 1994, 17, 1475–1485. [CrossRef]34. Sines, G. Failure of Materials Under Combined Repeated Stresses with Superimposed Static Stresses; TN3495; NACA:
Washington DC, USA, 1955.35. Ince, A.; Glinka, G. A modification of Morrow and Smith-Watson-Topper mean stress correction models.
Fatigue Fract. Eng. Mater. Struct. 2011, 34, 854–867. [CrossRef]36. Liu, Y.; Mahadevan, S. Multiaxial high-cycle fatigue criterion and life prediction for metals. Int. J. Fatigue
2005, 27, 790–800. [CrossRef]37. Liu, K.C.; Wang, J.A. An energy method for predicting fatigue life, crack orientation, and crack growth under
multiaxial loading conditions. Int. J. Fatigue 2001, 23, 129–134. [CrossRef]38. Ellison, E.G.; Andrews, J.M.H. Biaxial cyclic high-strain fatigue of aluminum alloy RR58. J. Strain Anal. Eng.
Des. 1973, 8, 209–219. [CrossRef]39. Ellyin, F.; Gołos, K.; Xia, Z. In phase and out–of–phase multiaxial fatigue. Trans. ASME 1991, 113, 112–118.
[CrossRef]40. Lopez-Crespo, P.; Moreno, B.; Lopez-Moreno, A.; Zapatero, J. Study of crack orientation and fatigue life
prediction in biaxial fatigue with critical plane models. Eng. Fract. Mech. 2015, 136, 115–130. [CrossRef]
© 2019 by the authors. Licensee MDPI, Basel, Switzerland. This article is an open accessarticle distributed under the terms and conditions of the Creative Commons Attribution(CC BY) license (http://creativecommons.org/licenses/by/4.0/).


