Embed Size (px)
Citation preview
HAL Id: tel-01186557https://tel.archives-ouvertes.fr/tel-01186557
Submitted on 25 Aug 2015
HAL is a multi-disciplinary open accessarchive for the deposit and dissemination of sci-entific research documents, whether they are pub-lished or not. The documents may come fromteaching and research institutions in France orabroad, or from public or private research centers.
L’archive ouverte pluridisciplinaire HAL, estdestinée au dépôt et à la diffusion de documentsscientifiques de niveau recherche, publiés ou non,émanant des établissements d’enseignement et derecherche français ou étrangers, des laboratoirespublics ou privés.
On the limits of cortical somatosensory plasticity andtheir functional consequences : a novel form of
cross-border plasticityDolly-Anne Muret
To cite this version:Dolly-Anne Muret. On the limits of cortical somatosensory plasticity and their functional conse-quences : a novel form of cross-border plasticity. Neurons and Cognition [q-bio.NC]. Université ClaudeBernard - Lyon I, 2015. English. �NNT : 2015LYO10063�. �tel-01186557�
N° d’ordre 63-2015 Année 2015
THESE DE L’UNIVERSITE DE LYON
Délivrée par L’UNIVERSITE CLAUDE BERNARD LYON 1
Ecole Doctorale Neurosciences et Cognition
DIPLOME DE DOCTORAT (arrêté du 7 août 2006)
soutenue publiquement le 27 Avril 2015
par
Dolly-Anne MURET
ON THE LIMITS OF CORTICAL SOMATOSENSORY PLASTICITY
AND THEIR FUNCTIONAL CONSEQUENCES:
A NOVEL FORM OF CROSS-BORDER PLASTICITY
Directeur de thèse: Dr. Alessandro Farnè, Ph.D. Co-encadrante: Dr. Karen Reilly, Ph.D.
JURY : Pr. Arno Villringer, M.D., Ph.D., D.R. Rapporteur Dr. Christian Xerri, Ph.D., D.R. Rapporteur Dr. Luis Garcia-Larrea, M.D., Ph.D., D.R. Examinateur Pr. Gilles Rode, M.D, Ph.D. Examinateur Dr. Hubert R. Dinse, Ph.D. Examinateur Dr. Alessandro Farnè, Ph.D., D.R. Examinateur Dr. Karen T. Reilly, Ph.D. Membre invité
Centre de Recherche en Neuroscience de Lyon, Equipe ImpAct (Integrative, Multisensory,
Perception and Action Team), INSERM U1028, CNRS UMR5292, Lyon, France

UNIVERSITE CLAUDE BERNARD - LYON 1
Président de l’Université
Vice-président du Conseil d’Administration
Vice-président du Conseil des Etudes et de la Vie Universitaire
Vice-président du Conseil Scientifique
Directeur Général des Services
M. François-Noël GILLY
M. le Professeur Hamda BEN HADID
M. le Professeur Philippe LALLE
M. le Professeur Germain GILLET
M. Alain HELLEU
COMPOSANTES SANTE
Faculté de Médecine Lyon Est – Claude Bernard Faculté de Médecine et de Maïeutique Lyon Sud – Charles Mérieux
Faculté d’Odontologie Institut des Sciences Pharmaceutiques et Biologiques Institut des Sciences et Techniques de la Réadaptation Département de formation et Centre de Recherche en Biologie Humaine
Directeur : M. le Professeur J. ETIENNE Directeur : Mme la Professeure C. BURILLON
Directeur : M. le Professeur D. BOURGEOIS Directeur : Mme la Professeure C. VINCIGUERRA Directeur : M. le Professeur Y. MATILLON Directeur : Mme. la Professeure A-M. SCHOTT
COMPOSANTES ET DEPARTEMENTS DE SCIENCES ET TECHNOLOGIE
Faculté des Sciences et Technologies Département Biologie Département Chimie Biochimie Département GEP Département Informatique Département Mathématiques Département Mécanique Département Physique
UFR Sciences et Techniques des Activités Physiques et Sportives
Observatoire des Sciences de l’Univers de Lyon
Polytech Lyon
Ecole Supérieure de Chimie Physique Electronique
Institut Universitaire de Technologie de Lyon 1
Ecole Supérieure du Professorat et de l’Education
Institut de Science Financière et d'Assurances
Directeur : M. F. DE MARCHI Directeur : M. le Professeur F. FLEURY Directeur : Mme Caroline FELIX Directeur : M. Hassan HAMMOURI Directeur : M. le Professeur S. AKKOUCHE Directeur : M. le Professeur Georges TOMANOV Directeur : M. le Professeur H. BEN HADID Directeur : M. Jean-Claude PLENET
Directeur : M. Y.VANPOULLE
Directeur : M. B. GUIDERDONI
Directeur : M. P. FOURNIER
Directeur : M. G. PIGNAULT
Directeur : M. le Professeur C. VITON
Directeur : M. le Professeur A. MOUGNIOTTE
Directeur : M. N. LEBOISNE


“The greatest sense in our body is our touch sense. It is probably the chief sense in the processes
of sleeping and waking; it gives us our knowledge of depth or thickness and form; we feel, we
love and hate, are touchy and are touched, through the touch corpuscules of our skin.”
J. Lionel Tayler, The Stages of Human Life,
1921, p. 157

REMERCIEMENTS - ACKNOWLEDGEMENTS
This dissertation provides only a small foretaste of what these 4 years and a half have been: a journey fraught with adventures. Even if some of these adventures were far from being pleasant, each of them contributed to a long and, I hope fruitful, learning. Yeap, “learning” is definitely the take home message of this journey (and of this work ;-))! I learned so many things. Of course I learned a lot at the professional level, thanks to the so numerous opportunities that were offered to me, but also, and I would say more importantly, at the personal level. This is the reason why this journey is and will stay one of the most precious experiences I have been through. Consequently, I would like to thank each of the persons who significantly contributed to this amazing journey.
And my first thoughts are for you, Ale. Que dire .... Tout d’abord, merci d’avoir toléré mes nombreux mails truffés (et souvent dès l’objet) d’onomatopées : « Argh ... », « He he he », « Heuuu ... », « Mmmmh ... », « hum hum ... », « Oups ... » et j’en passe. Plus sérieusement, merci infiniment pour ton écoute, ton respect, et ta disponibilité malgré ton emploi du temps chargé, merci pour les discussions passionnantes (toujours trop courtes) que nous avons eu. Mais tu le sais, j’ai d'ors et déjà toute une liste de sujets à aborder lors des discussions qui nous attendent encore ;-). Merci d'être aussi passionné par ce que tu fais … c'est un petit rien qui change tout et qui a rendu nos discussions si plaisantes! J'espère arriver à garder une passion aussi intacte. Je ne sais comment te remercier pour ton soutien à toute épreuve, pour les innombrables opportunités que tu m'as offertes et pour ta patience lors des quelques « crises » qui sont survenues tout au long de ces 4 ans et demi. Enfin (parce qu'il faut bien que j'arrête quelque part), un grand merci d’avoir permis que la franchise soit à la base de nos interactions ... même si j’en ai parfois peut-être trop usé, je t’en suis extrêmement reconnaissante car c’est une des valeurs que je chérie le plus.
Tout naturellement, mes pensées vont ensuite vers toi, Karen. Ca va faire maintenant plus de 5 ans que l'on travaille ensemble, et je n'ai pas vu le temps passer! Je ne pense pas te l'avoir jamais dis, mais je te suis extrêmement reconnaissante de m'avoir acceptée, en 200..9?, en tant que stagiaire de M2, de m'avoir initiée aux notions de plasticité corticale, et surtout, de m'avoir “ouvert” les portes de ce labo en me recommandant comme candidate auprès d'Alessandro. Je suis contente de t'avoir “suivie” jusqu'ici ;-). Mise à part ça, je tenais à te remercier pour ta constante réactivité et disponibilité durant ces années, pour les nombreuses fois où tu m'as proposé ton aide. Tu as toujours su te rendre disponible et je t'en remercie. Merci aussi d'avoir toujours été prête à corriger mon anglais … si j’ai progressé, c’est sans nul doute à ton contact! Et ce n'était pas gagné d'avance ;-).
Merci à toi Fadila pour ton aide et tes conseils sur la dernière ligne droite, et d'une manière générale, merci à tous les chercheurs, qui font que ce laboratoire est extrêmement humain et collégial. C'est une chose précieuse dans ce milieu où la compétition tend à prendre de grandes proportions.
Merci aux secrétaires et ingénieurs … avec une pensée spéciale pour Roméo que j'espère revoir très vite, mais aussi pour Christian, Olivier et Fred dont l'aide a été précieuse au début de
ce voyage pour développer mes setups/protocoles. Merci d'avoir été patients et toujours prêts à aider!
Mes pensées vont ensuite à mon autre “attache” à Lyon … le “coin” MEG! Un grand merci à Jérémie Mattout pour avoir pris le temps de m’initier avec pédagogie aux bases de Matlab quand j’étais encore en Master, puis en première année de thèse. Je te serais à jamais redevable ... sans cela, je n’aurais pas pu accomplir la moitié de ce travail. Un immense merci à toi Sébastien, pour ton aide plus que précieuse même aux heures les plus tardives!! Merci pour ta patience, et d'avoir pris la peine de répondre à mes questions incessantes. Ca aura été une belle expérience ;-). Merci aussi à tous les membres du club MEG … Françoise, Anne, Aline, Claude, … merci pour les échanges et vos conseils avisés. Merci d'une manière générale à tous les membres de Dycog, pour m'avoir accueillie, que ce soit en Master ou pendant les quelques mois qu'a duré ma manip MEG … petite pensée spéciale pour Gaëtan, Philippe, Margaux, Ludo, Yohana, et Manu!
The “formal” acknowledgements done, now I would like to thank my dear lab-mates with whom I shared so much these last four years. I do not know who to start with … I simply love each one of you! Delphine, ma chère Dédé, ah la la, quel dommage que tu ne sois pas là, j'aurais adoré faire la choré de notre chère chanson ;). Merci pour nos pauses café du matin, pour les nombreuses « séances de thérapie » … Selene, ou shorty pour les intimes (et ceux qui peuvent se permettre, he he he), que de péripéties tout au long de ces 4 ans! Je crois qu'on est rodées niveau montagnes russes ;). Olga, first of all, sorry for confusing your name with Inga’s for so long when you arrived, you know, I'm not good at remembering names … but I think I was slightly better at removing stitches ;). We had a lot of fun together, thanks a lot! I will never forget the canoe experience ;). To both of you, Selene and Olga, special thanks for taking care of me during the (most difficult) last months. I will call you mumy from now ;). Ouazna, ma chère Ouazna, ton arrivée dans le labo a changé bien des choses pour moi et tu le sais ;) … et notre amitié qui s'est développée au fil du temps m'est précieuse. Petit coucou spécial à Mayes ;). Merci aussi à tous les nouveaux arrivants: Inga, Eric, Elisa. It was nice meeting you, and your coming to the lab was refreshing . Petite pensée aussi aux "anciens" qui étaient présents dans les premières années de ma thèse, notamment Stéphane & Clément … que dire de vous deux à part que vous nous manquez depuis votre départ … petite pensée aussi pour Lucilla, Mumu, Laurence et bien d’autres, sans qui ce labo n'aurait pas été ce qu'il est.
Merci aussi à mes collègues « suisses » ... Marta, Polona et Alex : ah la la que de bon souvenir avec vous trois ... j’ai adoré nos petites sorties à Lausanne !! Merci à tous les autres du labo de l’EPFL pour leur accueil chaleureux : Elisa, Mariia, Roberto, Xavier, Jean-Paul, .... je suis heureuse de vous avoir rencontrés et d’avoir passé ce temps avec vous à Lausanne. Vous côtoyer m’a beaucoup appris et faite grandir. Enfin, Roberto ... cette étude IRMf aura été une sacrée aventure pour moi. Merci de m’en avoir donné l’opportunité.
Enfin, un grand merci à mes amis qui ont su être patients avec moi et tolérer mon côté associable des 6 derniers mois : Deborah, Sophie, Delphine, Christine & Jibé, et un peu plus loin en Belgique Yoyo et JC.
Et pour finir, je ne saurais comment remercier ma famille qui m’a entourée, encouragée et s’est
adaptée à mon rythme de vie des dernières années : Dadou, Sweta, Eliath et man.


RÉSUMÉ EN FRANÇAIS
En plus de sa forte valence sociale et émotionnelle, le toucher joue un rôle prépondérant dans
notre vie quotidienne, que ce soit pour pouvoir correctement saisir et manipuler des objets dans
le but de réaliser une action, la plus primitive étant de se nourrir, ou pour simplement se
mouvoir, la perception tactile émanant de nos pieds étant indispensable au maintien de notre
position ainsi qu'à la bonne réalisation des mouvements des jambes. Au niveau cortical, les aires
primaires dédiées à la perception tactile de l'ensemble de notre corps ont la particularité d'être
organisées selon une cartographie détaillée, appelée Homunculus. Alors que la majorité de notre
corps y est représenté avec la même continuité que celle de notre corps physique, cet
Homunculus présente la particularité d'avoir la main et le visage représentés côte à côte alors
que ces régions sont relativement distantes physiquement. Cette discontinuité que représente la
frontière main-visage a été le sujet de nombreuses études, l'une des raisons ayant trait à la
capacité fascinante qu'a notre cerveau à se réorganiser. En effet, de nombreuses études ont
démontrées que suite à une perte permanente ou transitoire d'afférence sensorielle, survenant par
exemple après une amputation ou une déafférentation, les cartes somatosensorielles primaires se
réorganisent fortement, allant jusqu'à traverser cette frontière entre la main et le visage. Ce genre
de plasticité liée à une perte d'afférence a été qualifiée de maladaptative du fait de son
association à des symptômes douloureux chez ces patients. A l'inverse, alors que l'existence de
réorganisations corticales induites par une augmentation d'afférence est connue depuis
longtemps et a souvent été associée à des effets bénéfiques sur les performances tactiles et
sensorimotrices, la qualifiant d'adaptative, la possibilité qu'une telle plasticité puisse avoir des
effets au-delà de la frontière entre la main et le visage reste inexplorée. Mes travaux de thèse ont
pour but d'apporter un début de réponse quant à cette question. Pour y parvenir, une première
étude comportementale a permit de mettre en évidence qu'une stimulation cutanée répétée d'un
doigt permettait non seulement d'améliorer la perception tactile localement, sur le doigt stimulé,
mais avait aussi des répercussions sur la perception tactile du visage, en améliorant également
l'acuité de la lèvre supérieure et de la joue. Cette première étude laissant penser qu'une
augmentation d'afférence par stimulation répétée pourrait en effet traverser la frontière main-
visage, deux études supplémentaires ont été réalisées en utilisant deux techniques d'imagerie
cérébrales complémentaires, à savoir l'imagerie par résonnance magnétique à haute résolution
(IRMf 7T), et la magnétoencéphalographie (MEG). La première d'entre elles (IRMf) révèle une
augmentation de l'activation (signal BOLD en surplus de celui au repos) du doigt stimulé dans
différentes sous-régions du cortex primaire somatosensoriel (l'aire de Brodmann 3b et 1),
associée à une augmentation de la désactivation (signal BOLD en défault par rapport à celui au
repos) évoquée en stimulant la lèvre. Ces deux sous-régions étant connues pour être impliquées
dans le traitement des caractéristiques spatiales simples d'un stimulus tactile, les changements
observés sont susceptibles d'être impliqués dans l'amélioration de l'acuité spatiale tactile
observée ici aussi au niveau du doigt stimulé et des lèvres. De plus, cette étude est la première à
rapporter que la désactivation observée suite à la stimulation de la lèvre est bilatérale (au sein
des deux hémisphères), avec la particularité que la désactivation controlatérale à la lèvre
stimulée a été trouvée plus dorsale que son homologue, la rendant par conséquent co-localisée
avec les activations controlatérales évoquées par la stimulation des doigts de la main droite. Ce
résultat suggère la présence d'un nouveau réseau “d'inhibition” entre les représentations de la
main et du visage et requiert une investigation plus poussée. Pour finir, d’importants clusters ont
été trouvés au niveau des sillons intrapariétaux et du cortex pariétal postérieur, ce qui suggère
une intégration des effets de la stimulation répétée dans des régions corticales de plus haut
niveau, impliquées notamment dans l'intégration multisensorielle, mais également dans des
tâches de discrimination spatiales ou dans la représentation du "body schema". Quant à la
seconde étude (MEG), les premiers résultats observés suggèrent une réorganisation de la
distribution des représentations de la main et du visage, avec un éloignement respectif des
représentations du doigt stimulé et de la lèvre, cohérent avec l'augmentation de l'activité
“inhibitrice” observée pour la lèvre dans l'étude précédente. Les analyses dipolaires ont
également mis en évidence une asymétrie entre les deux hémisphères quant à l'organisation
somatotopique de la main et du visage. Ensemble, ces études révèlent donc qu'une plasticité
adaptative induisant un bénéfice perceptif peut se propager sur de relativement grandes
distances corticales, et notamment au-delà de la frontière entre la main et le visage jusque là
impliquée essentiellement dans des processus maladaptatifs. De surcroit, nos résultats suggèrent
l'implication de mécanismes plus complexes que prévu entre les représentations de la main et du
visage, deux régions corporelles hautement sollicitées dans une palette d'activités que nous
réalisons quotidiennement, allant des tâches les plus simple et primitives comme le fait de se
nourrir, à des aspects beaucoup plus cognitifs et intégrés, comme notre communication non
verbale. Une étude plus approfondie de ces différents niveaux d'interaction et de leurs
répercussions au niveau perceptif se révèle indispensable. Pour finir, de part leurs aspects
doublement positifs (augmentation d'afférence et gain perceptif), ces travaux ouvrent également
une fenêtre sur un nouveau champ d'investigation pouvant avoir de réelles retombées sur les
techniques misent en œuvre afin de promouvoir une réhabilitation de la perception du toucher,
mais aussi des capacités motrices de patients cérébrolésés.
ABSTRACT
Touch plays a critical role in our daily life to grasp and manipulate objects, or simply walk. The primary somatosensory areas exhibit the striking feature of being somatotopically organized, giving rise to the so-called Homunculus. While most of our body surface is represented following an order similar to its physical continuity, the Homunculus displays a major discontinuity, the hand and the face being represented next to each other. The hand-face border has been widely used as a somatotopic hallmark to study one of the most fascinating features of our brain, its capacity for reorganization. Particularly, somatosensory plasticity was found to cross the hand-face border following deprivation of inputs. While it has long been known that increasing inputs also leads to cortical changes typically associated with perceptual benefits, whether such plasticity can cross the hand-face border remains unknown. My thesis work aimed to investigate this question. A first behavioural study revealed that increasing inputs to a finger improves not only the tactile acuity at this finger, but also at the face, suggesting a transfer of plastic changes across the hand-face border. To investigate this, two additional studies were performed using two complementary brain imaging techniques, namely high-field fMRI and MEG. In agreement with our hypotheses a reorganization of both hand and face representations was found. Altogether, this work reveals that adaptive plasticity leading to perceptual benefits can spread over large cortical distances, in particular across the hand-face border, and thus opens up a new window of investigation that may have a real impact in promoting rehabilitation.
RÉSUMÉ
Le toucher a un rôle critique dans notre vie quotidienne pour saisir, manipuler des objets, ou simplement marcher. Les aires primaires somatosensorielles présentent la particularité d’être organisées somatotopiquement, donnant lieu au dénommé Homunculus. Alors que la plupart de notre surface corporelle est représentée suivant un ordre similaire à sa continuité physique, l’Homunculus présente une discontinuité majeure, la main et le visage étant représentés côte à côte. La frontière main-visage a été souvent utilisée comme un repère pour étudier l’une des particularités les plus fascinantes de notre cerveau, sa capacité de réorganisation. En particulier, la plasticité somatosensorielle a été trouvée capable de traverser la frontière main-visage suite à une privation d’afférences. Alors qu’il est connu depuis longtemps que l’augmentation des afférences conduit également à des changements corticaux souvent associés à des bénéfices perceptifs, la possibilité qu’une telle plasticité puisse traverser la frontière main-visage reste inexplorée. Le travail de ma thèse a pour but d’examiner cette question. Une première étude comportementale a révélé que le fait d’augmenter les afférences d’un doigt améliore non seulement l’acuité tactile de ce doigt, mais aussi du visage, suggérant un transfert de changements plastiques au travers de la frontière main-visage. Afin d’examiner ceci, deux études supplémentaires ont été réalisées en utilisant deux techniques complémentaires d’imagerie cérébrales, à savoir l’IRMf et la MEG. En adéquation avec nos hypothèses, une réorganisation des représentations de la main et du visage a été trouvée. Dans l’ensemble, ce travail révèle qu’une plasticité adaptative menant à des bénéfices perceptifs peut se propager sur de larges distances corticales, en particulier au-delà de la frontière main-visage, et par conséquent ouvre une nouvelle fenêtre d’investigation pouvant avoir un réel impact dans la promotion de rééducation.

LIST OF ABBREVIATIONS
CNS Central nervous system VPL/M Ventroposterior lateral/medial nucleus SI/SII Primary/secondary somatosensory cortex MI Primary motor cortex BA3b, 3a, 1 and 2 Brodmann areas 3b, 3a, 1 and 2 PPC Posterior parietal cortex IPS/IPL Intraparietal sulcus/lobule SPL Superior parietal lobule SAI/II & FAI/II Slowly/rapidly adapting afferents of type I or II RF Receptive field EPSPs Excitatory postsynaptic potentials LTP/LTD Long-term potentiation/depression ICMS/ITMS Intracortical/intrathalamic microstimulation NMDA N-methyl-D-aspartate GABA gamma-aminobutyric acid STDP Spike-timing-dependent plasticity RSS Repetitive somatosensory stimulation 2PDT Two-point discrimination threshold GOT Grating orientation threshold D1-5 Digits 1 to 5 fMRI Functional magnetic resonance imaging CBF Cerebral blood flow RFX Random effects analysis CoG Centre of gravity PBR/NBR Positive/negative BOLD response MEG/EEG Magneto/electro-encephalography SEP/SEF Somatosensory evoked potential/field ECD Equivalent current dipole GoF Goodness of fit ED Euclidean distance

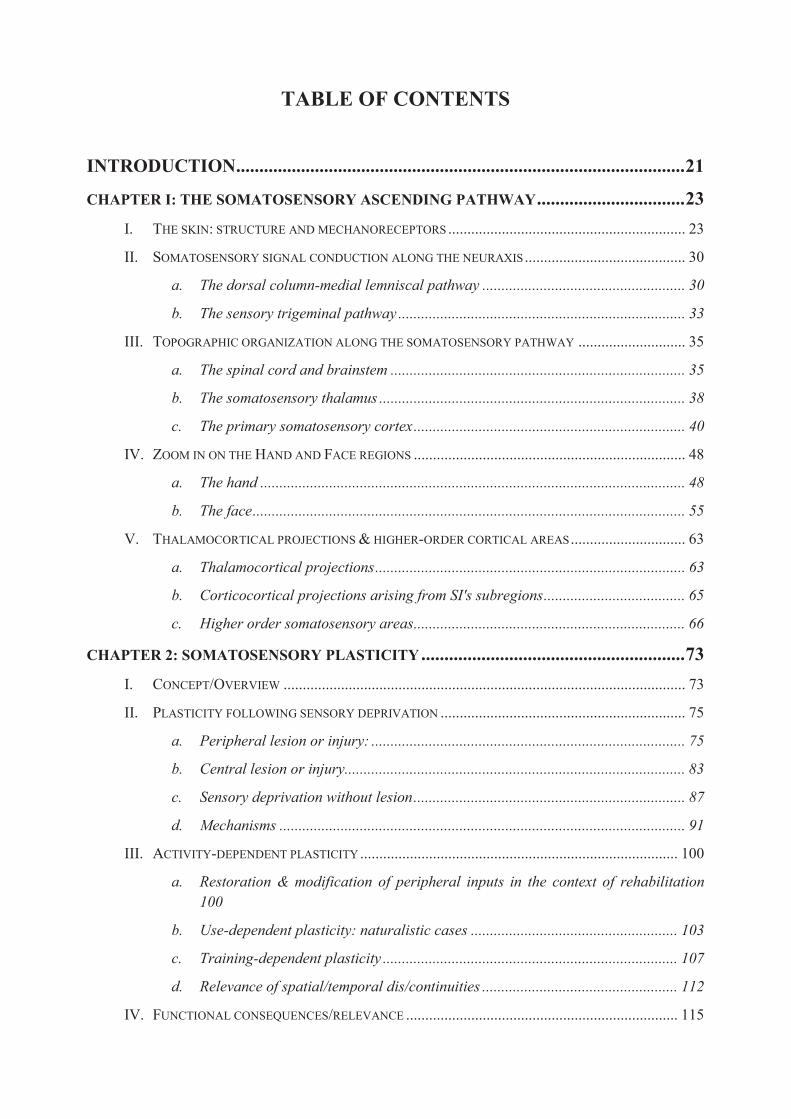
TABLE OF CONTENTS
INTRODUCTION ................................................................................................. 21
CHAPTER I: THE SOMATOSENSORY ASCENDING PATHWAY ................................ 23 I. THE SKIN: STRUCTURE AND MECHANORECEPTORS .............................................................. 23
II. SOMATOSENSORY SIGNAL CONDUCTION ALONG THE NEURAXIS .......................................... 30
a. The dorsal column-medial lemniscal pathway ..................................................... 30
b. The sensory trigeminal pathway ........................................................................... 33
III. TOPOGRAPHIC ORGANIZATION ALONG THE SOMATOSENSORY PATHWAY ............................ 35
a. The spinal cord and brainstem ............................................................................. 35
b. The somatosensory thalamus ................................................................................ 38
c. The primary somatosensory cortex ....................................................................... 40
IV. ZOOM IN ON THE HAND AND FACE REGIONS ....................................................................... 48
a. The hand ............................................................................................................... 48
b. The face ................................................................................................................. 55
V. THALAMOCORTICAL PROJECTIONS & HIGHER-ORDER CORTICAL AREAS .............................. 63
a. Thalamocortical projections ................................................................................. 63
b. Corticocortical projections arising from SI's subregions ..................................... 65
c. Higher order somatosensory areas ....................................................................... 66
CHAPTER 2: SOMATOSENSORY PLASTICITY ......................................................... 73 I. CONCEPT/OVERVIEW ......................................................................................................... 73
II. PLASTICITY FOLLOWING SENSORY DEPRIVATION ................................................................ 75
a. Peripheral lesion or injury: .................................................................................. 75
b. Central lesion or injury......................................................................................... 83
c. Sensory deprivation without lesion ....................................................................... 87
d. Mechanisms .......................................................................................................... 91
III. ACTIVITY-DEPENDENT PLASTICITY ................................................................................... 100
a. Restoration & modification of peripheral inputs in the context of rehabilitation 100
b. Use-dependent plasticity: naturalistic cases ...................................................... 103
c. Training-dependent plasticity ............................................................................. 107
d. Relevance of spatial/temporal dis/continuities ................................................... 112
IV. FUNCTIONAL CONSEQUENCES/RELEVANCE ....................................................................... 115
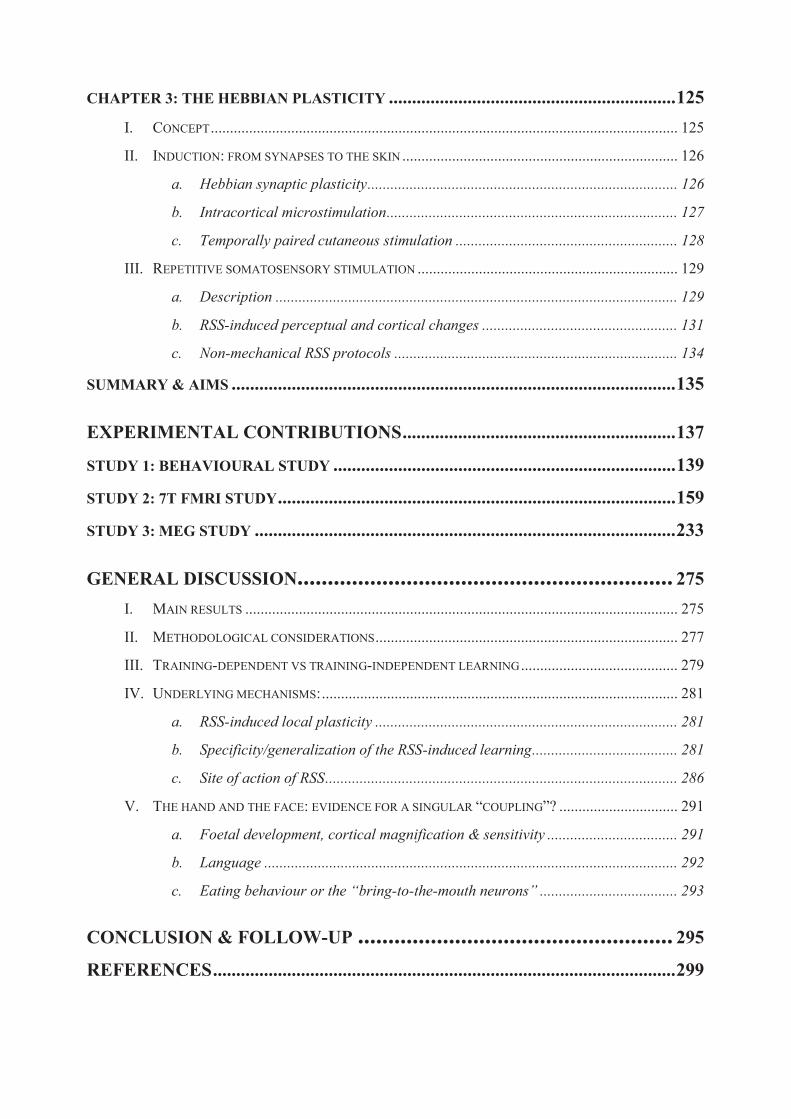
CHAPTER 3: THE HEBBIAN PLASTICITY .............................................................. 125 I. CONCEPT .......................................................................................................................... 125
II. INDUCTION: FROM SYNAPSES TO THE SKIN ........................................................................ 126
a. Hebbian synaptic plasticity ................................................................................. 126
b. Intracortical microstimulation ............................................................................ 127
c. Temporally paired cutaneous stimulation .......................................................... 128
III. REPETITIVE SOMATOSENSORY STIMULATION .................................................................... 129
a. Description ......................................................................................................... 129
b. RSS-induced perceptual and cortical changes ................................................... 131
c. Non-mechanical RSS protocols .......................................................................... 134
SUMMARY & AIMS ................................................................................................ 135
EXPERIMENTAL CONTRIBUTIONS ........................................................... 137
STUDY 1: BEHAVIOURAL STUDY .......................................................................... 139
STUDY 2: 7T FMRI STUDY ...................................................................................... 159
STUDY 3: MEG STUDY ........................................................................................... 233
GENERAL DISCUSSION.............................................................. 275 I. MAIN RESULTS ................................................................................................................. 275
II. METHODOLOGICAL CONSIDERATIONS ............................................................................... 277
III. TRAINING-DEPENDENT VS TRAINING-INDEPENDENT LEARNING ......................................... 279
IV. UNDERLYING MECHANISMS: ............................................................................................. 281
a. RSS-induced local plasticity ............................................................................... 281
b. Specificity/generalization of the RSS-induced learning ...................................... 281
c. Site of action of RSS ............................................................................................ 286
V. THE HAND AND THE FACE: EVIDENCE FOR A SINGULAR “COUPLING”? ............................... 291
a. Foetal development, cortical magnification & sensitivity .................................. 291
b. Language ............................................................................................................ 292
c. Eating behaviour or the “bring-to-the-mouth neurons” .................................... 293
CONCLUSION & FOLLOW-UP .................................................... 295
REFERENCES .................................................................................................... 299


21 | P a g e
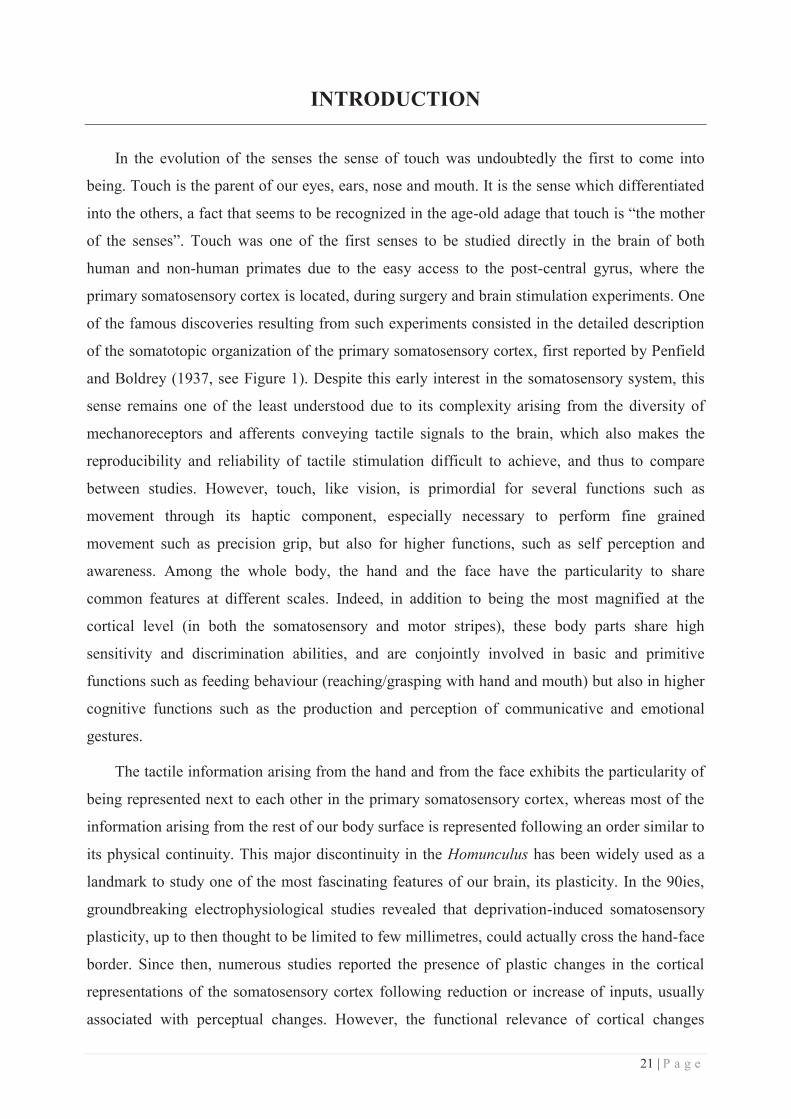
INTRODUCTION
In the evolution of the senses the sense of touch was undoubtedly the first to come into
being. Touch is the parent of our eyes, ears, nose and mouth. It is the sense which differentiated
into the others, a fact that seems to be recognized in the age-old adage that touch is “the mother
of the senses”. Touch was one of the first senses to be studied directly in the brain of both
human and non-human primates due to the easy access to the post-central gyrus, where the
primary somatosensory cortex is located, during surgery and brain stimulation experiments. One
of the famous discoveries resulting from such experiments consisted in the detailed description
of the somatotopic organization of the primary somatosensory cortex, first reported by Penfield
and Boldrey (1937, see Figure 1). Despite this early interest in the somatosensory system, this
sense remains one of the least understood due to its complexity arising from the diversity of
mechanoreceptors and afferents conveying tactile signals to the brain, which also makes the
reproducibility and reliability of tactile stimulation difficult to achieve, and thus to compare
between studies. However, touch, like vision, is primordial for several functions such as
movement through its haptic component, especially necessary to perform fine grained
movement such as precision grip, but also for higher functions, such as self perception and
awareness. Among the whole body, the hand and the face have the particularity to share
common features at different scales. Indeed, in addition to being the most magnified at the
cortical level (in both the somatosensory and motor stripes), these body parts share high
sensitivity and discrimination abilities, and are conjointly involved in basic and primitive
functions such as feeding behaviour (reaching/grasping with hand and mouth) but also in higher
cognitive functions such as the production and perception of communicative and emotional
gestures.
The tactile information arising from the hand and from the face exhibits the particularity of
being represented next to each other in the primary somatosensory cortex, whereas most of the
information arising from the rest of our body surface is represented following an order similar to
its physical continuity. This major discontinuity in the Homunculus has been widely used as a
landmark to study one of the most fascinating features of our brain, its plasticity. In the 90ies,
groundbreaking electrophysiological studies revealed that deprivation-induced somatosensory
plasticity, up to then thought to be limited to few millimetres, could actually cross the hand-face
border. Since then, numerous studies reported the presence of plastic changes in the cortical
representations of the somatosensory cortex following reduction or increase of inputs, usually
associated with perceptual changes. However, the functional relevance of cortical changes
22 | P a g e
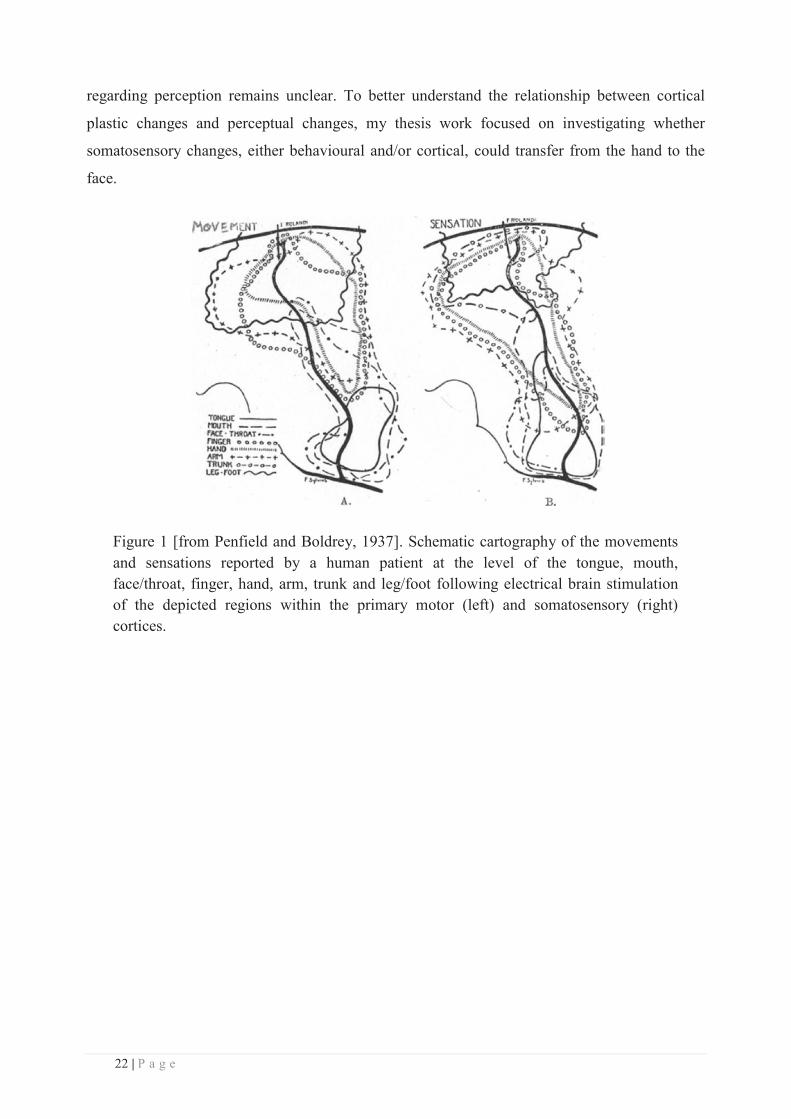
regarding perception remains unclear. To better understand the relationship between cortical
plastic changes and perceptual changes, my thesis work focused on investigating whether
somatosensory changes, either behavioural and/or cortical, could transfer from the hand to the
face.
Figure 1 [from Penfield and Boldrey, 1937]. Schematic cartography of the movements and sensations reported by a human patient at the level of the tongue, mouth, face/throat, finger, hand, arm, trunk and leg/foot following electrical brain stimulation of the depicted regions within the primary motor (left) and somatosensory (right) cortices.
23 | P a g e
CHAPTER I: THE SOMATOSENSORY ASCENDING
PATHWAY
Touch is the first sense that develops in utero, the foetus being capable of sensing the
pressure caused by one hair touching his cheek starting from week 8 of the gestational period
(Montagu, 1978), and the first response to electrical stimulation, the functional counterpart of
the N20 in adults, being detected even prior to full-term age (Taylor et al., 1996; Pihko and
Lauronen, 2004). This sense arises from the skin which is a highly complex organ, innervated
by a wide array of specialized sensory neurones sensitive not only to pressure, but also to heat,
cold, irritation, itch and pain (see Table 1 for a brief description of the different classes of
sensory afferent nerves innervating the human skin).
I. The skin: structure and mechanoreceptors
The skin is the most widely distributed sensory organ, spanning in adults over an average
area of 1.5-2.0m², which delimits our body and thus interfaces with the environment. Among the
multiple functions of the skin (i.e. protection, temperature and evaporation regulation etc), this
organ provides sensory information from our entire body. Mammalian skin is composed of three
main layers: (i) the epidermis, an outer stratified squamous epithelium which provides
waterproofing and serves as a barrier via keratinocytes, (ii) the dermis, which consists of a
thicker, supporting layer of connective tissue and provides tensile strength and elasticity to the
skin, which then sits on (iii) the hypodermis, which consists primarily of loose connective tissue
and adipocytes and acts as an energy reserve. The thickness of the dermis, which is a densely
innervated layer, varies from 0.5 mm over the eyelid to > 5.0 mm in glabrous skin. The two
outer layers are tightly connected through the basement membrane and compose the cutis from
which arise most of the somatic sensations through the numerous autonomic and sensory organs
it contains.
The specialized sensory receptors in the cutaneous and subcutaneous tissues are dauntingly
diverse. They include free nerve endings in the skin, nerve endings associated with
specializations that act as amplifiers or filters, and sensory terminals associated with specialized
transducing cells that influence the nerve ending by virtue of synapse-like contacts. Based on
their functional features, this variety of receptors can be divided into three classes:
mechanoreceptors, nociceptors, and thermoreceptors. Noci- and thermo-receptors are referred to
as free nerve endings, whereas most other cutaneous receptors show some degree of
24 | P a g e
encapsulation, which helps determining the nature of the stimuli to which they respond. Despite
their variety, all somatic sensory receptors work in fundamentally the same way: stimuli applied
to the skin deform or otherwise change the nerve endings, which in turn affects the ionic
permeability of the receptor cell membrane. Changes in permeability generate a depolarizing
current in the nerve ending, thus producing a receptor (or generator) potential that triggers action
potentials. This overall process, in which the energy of a stimulus is converted into an electrical
signal in the sensory neuron, is called sensory transduction and is the critical first step in all
sensory processing. Following this process, the action potentials are conveyed through the axons
of sensory neurons, which constitute sensory fibres. The glabrous skin of the hand is innervated
by 12 classes of afferent fibres (Table 1) comprising two broad classes of pain afferents
(Greenspan, 1997), two types of thermoreceptive afferents (one selectively responsive to cooling
and one to warming; Darian-Smith and Johnson, 1977), four types of proprioceptive afferents
(Matthews, 1988), and four types of mechanoreceptive afferents responsive to mechanical
deformation of the glabrous skin (described below).
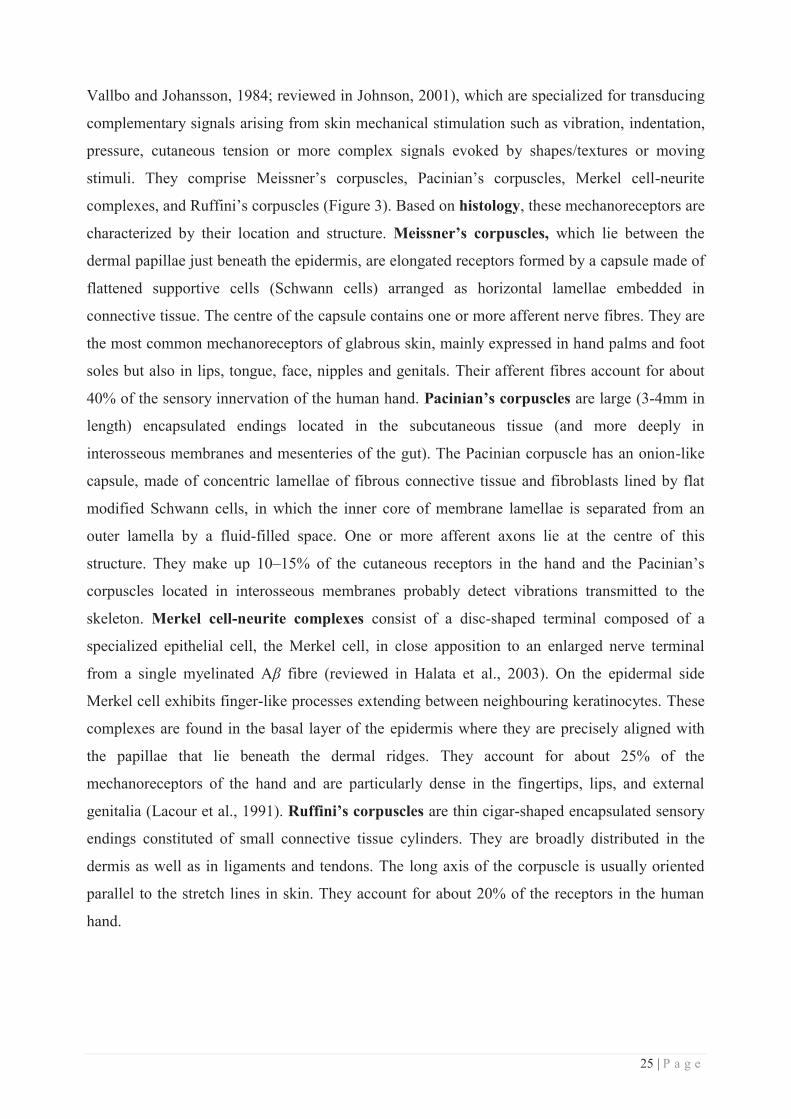
Table 1 [from McGlone and Reilly, 2010]. Summary of the main characteristics of primary sensory afferents innervating the human skin.
Among the different modalities of information the skin encodes, the mechanical sensory
signal (which is the one relevant to this work), is conveyed by large, myelinated fibres with
conduction velocities in the Aβ range (80m/sec), which innervate cutaneous mechanoreceptors.
Depending on the type of skin (hairy or glabrous), Aβ fibres are present at different densities
and innervate slightly different structures. In hairy skin, Aβ fibres also innervate vascular
structures and hair follicles that act as mechanical sensory receptors by detecting changes in hair
position. In contrast, the glabrous skin is more abundantly and homogenously innervated by Aβ
fibres because of the high number of mechanoreceptors embedded within this type of skin
(Figure 2, see Nolano et al., 2003; Provitera et al., 2007). Electrophysiological studies have
identified four major types of mechanoreceptors in the glabrous skin of the human hand (see
25 | P a g e
Vallbo and Johansson, 1984; reviewed in Johnson, 2001), which are specialized for transducing
complementary signals arising from skin mechanical stimulation such as vibration, indentation,
pressure, cutaneous tension or more complex signals evoked by shapes/textures or moving
stimuli. They comprise Meissner’s corpuscles, Pacinian’s corpuscles, Merkel cell-neurite
complexes, and Ruffini’s corpuscles (Figure 3). Based on histology, these mechanoreceptors are
characterized by their location and structure. Meissner’s corpuscles, which lie between the
dermal papillae just beneath the epidermis, are elongated receptors formed by a capsule made of
flattened supportive cells (Schwann cells) arranged as horizontal lamellae embedded in
connective tissue. The centre of the capsule contains one or more afferent nerve fibres. They are
the most common mechanoreceptors of glabrous skin, mainly expressed in hand palms and foot
soles but also in lips, tongue, face, nipples and genitals. Their afferent fibres account for about
40% of the sensory innervation of the human hand. Pacinian’s corpuscles are large (3-4mm in
length) encapsulated endings located in the subcutaneous tissue (and more deeply in
interosseous membranes and mesenteries of the gut). The Pacinian corpuscle has an onion-like
capsule, made of concentric lamellae of fibrous connective tissue and fibroblasts lined by flat
modified Schwann cells, in which the inner core of membrane lamellae is separated from an
outer lamella by a fluid-filled space. One or more afferent axons lie at the centre of this
structure. They make up 10–15% of the cutaneous receptors in the hand and the Pacinian’s
corpuscles located in interosseous membranes probably detect vibrations transmitted to the
skeleton. Merkel cell-neurite complexes consist of a disc-shaped terminal composed of a
specialized epithelial cell, the Merkel cell, in close apposition to an enlarged nerve terminal
from a single myelinated Aβ fibre (reviewed in Halata et al., 2003). On the epidermal side
Merkel cell exhibits finger-like processes extending between neighbouring keratinocytes. These
complexes are found in the basal layer of the epidermis where they are precisely aligned with
the papillae that lie beneath the dermal ridges. They account for about 25% of the
mechanoreceptors of the hand and are particularly dense in the fingertips, lips, and external
genitalia (Lacour et al., 1991). Ruffini’s corpuscles are thin cigar-shaped encapsulated sensory
endings constituted of small connective tissue cylinders. They are broadly distributed in the
dermis as well as in ligaments and tendons. The long axis of the corpuscle is usually oriented
parallel to the stretch lines in skin. They account for about 20% of the receptors in the human
hand.
26 | P a g e
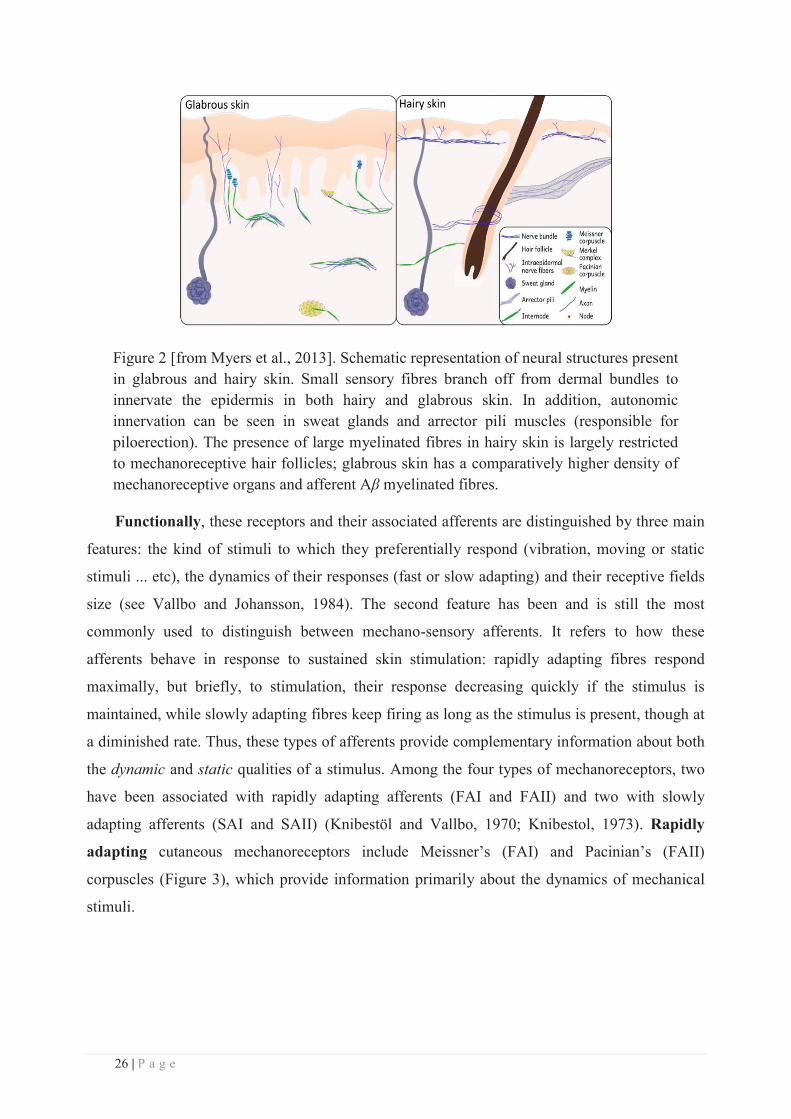
Figure 2 [from Myers et al., 2013]. Schematic representation of neural structures present in glabrous and hairy skin. Small sensory fibres branch off from dermal bundles to innervate the epidermis in both hairy and glabrous skin. In addition, autonomic innervation can be seen in sweat glands and arrector pili muscles (responsible for piloerection). The presence of large myelinated fibres in hairy skin is largely restricted to mechanoreceptive hair follicles; glabrous skin has a comparatively higher density of mechanoreceptive organs and afferent Aβ myelinated fibres.
Functionally, these receptors and their associated afferents are distinguished by three main
features: the kind of stimuli to which they preferentially respond (vibration, moving or static
stimuli ... etc), the dynamics of their responses (fast or slow adapting) and their receptive fields
size (see Vallbo and Johansson, 1984). The second feature has been and is still the most
commonly used to distinguish between mechano-sensory afferents. It refers to how these
afferents behave in response to sustained skin stimulation: rapidly adapting fibres respond
maximally, but briefly, to stimulation, their response decreasing quickly if the stimulus is
maintained, while slowly adapting fibres keep firing as long as the stimulus is present, though at
a diminished rate. Thus, these types of afferents provide complementary information about both
the dynamic and static qualities of a stimulus. Among the four types of mechanoreceptors, two
have been associated with rapidly adapting afferents (FAI and FAII) and two with slowly
adapting afferents (SAI and SAII) (Knibestöl and Vallbo, 1970; Knibestol, 1973). Rapidly
adapting cutaneous mechanoreceptors include Meissner’s (FAI) and Pacinian’s (FAII)
corpuscles (Figure 3), which provide information primarily about the dynamics of mechanical
stimuli.
27 | P a g e
1. The FAI system is particularly efficient at transducing information about the relatively
low-frequency vibrations (~5 to ~40 Hz) that occur when textured objects are moved across the
skin (low-frequency skin motion), and it provides the feedback signals required for grip control
(Srinivasan et al., 1990). The centre of Meissner’s corpuscles contains one or more afferent
nerve fibres that generate rapidly adapting action potentials following minimal skin depression,
which makes them especially sensitive to minute motion on the surface of the skin. They are
protected from the confounding effects of large, low-frequency skin displacements by the fluid-
filled corpuscle within which they reside.
2. The most important function served by the FAII system is the detection and transduction
of high-frequency tissue deformation at the nanometre level. One or more rapidly adapting
afferent axons lies at the centre of the multilayered, fluid-filled Pacinian’s corpuscle, which
again acts as a mechanical filter. In this case, its structure allows only transient disturbances at
high frequencies (~40 to ~400 Hz) to activate the nerve endings, thus protecting against the
confounding effects of high-amplitude, low-frequency stresses and strains that accompany
manual tasks. Pacinian’s corpuscles adapt more rapidly than Meissner’s corpuscles and have a
lower response threshold. These attributes suggest that Pacinian’s corpuscles are involved in the
discrimination of fine surface textures or other moving stimuli that produce high-frequency
vibration of the skin.
Slowly adapting cutaneous mechanoreceptors include Merkel cell-neurite complexes (SAI)
and Ruffini’s corpuscles (SAII, see Figure 3).
1. The SAI system is considered to play a major role in the static discrimination of shapes,
edges, and textures (see Johnson and Hsiao, 1992). Merkel cell-neurite complexes are
especially sensitive to the spatial features of a stimulus due to their selective sensitivity to a
particular component of tissue strain (strain energy density). This function is protected from the
confounding effects of variations in contact pressure by the fact that strain energy density is
relatively unaffected by changes in contact pressure. Whether the Merkel cell, the sensory
neuron or both are sites of mechanotransduction is still a matter of debate. However, a recent
study performed on mice showed that Merkel cells actively tune mechanosensory responses to
facilitate high spatio-temporal acuity (Maksimovic et al., 2014). Keratinocytes may also play an
important role in the normal functioning of the Merkel cell-neurite complex, the finger-like
processes moving with skin deformation and epidermis cell movement. Selective stimulation of
the SAI afferents in humans produces a sensation of light pressure.
28 | P a g e
2. The SAII system provides information used for the perception of limb conformation and
for the perception of forces acting on the hand. Ruffini’s corpuscles are supplied by one to
three myelinated nerve fibres. Their orientation, parallel to the stretch lines in the skin, makes
Ruffini’s corpuscles particularly sensitive to the deep tissue strain produced by skin stretching,
related to limb movements and/or position (i.e. proprioception). They are protected from the
confounding effects of stimuli within their receptive fields by relative insensitivity to local skin
deformation. They do not elicit any particular tactile sensation when stimulated electrically.
The second commonly used functional feature to distinguish between mechanoreceptors
consists of the receptive field (RF) size associated with each type of afferent fibre (Johansson,
1978). Receptive field is a term originally coined by (Sherrington, 1906) to describe an area of
the body surface where a stimulus could elicit a reflex. Hartline then extended the term to visual
neurons (1938), and has been since extended to other sensory neurons. The somatosensory RF
corresponds to the overall area of the skin that, when stimulated by indentation or hair
deflection, elicits a reliable neural discharge in a given sensory neuron or fibre. The precise
boundary of this area will depend to some extent on the intensity of the stimulus used, but with a
given stimulus type I units (SAI and FAI afferents arising from Merkel cell-neurite complexes
and Meissner’s corpuscles) will be activated by a much smaller area of skin than type II units
(SAII and FAII afferents arising from Ruffini’s and Pacinian’s corpuscles), meaning that they
have smaller RFs (Figure 3, left panel). Consequently, the SAI and FAI fibre systems transmit
neural images of events at the surface of the skin with relatively high spatial resolution, whereas
the SAII and FAII systems convey information of a more global nature to the central nervous
system. The resolution of the information transmitted from mechanoreceptors is also related to
the fact that they are differently distributed across the skin. Indeed, they exhibit regional
differences in innervation densities, the mechanoreceptors/afferents having small RFs (Merkel
cell-neurite complexes and Meissner’s corpuscles/SAI and FAI) showing a proximo-distal
increasing gradient of innervation (i.e. greatest density in the fingertips), and those having larger
RFs (Ruffini’s and Pacinian’s corpuscles/SAII and FAII) being more sparsely distributed with
only small differences in density across the hand surface (Johansson and Vallbo, 1979; see
Figure 3, right panel).
29 | P a g e
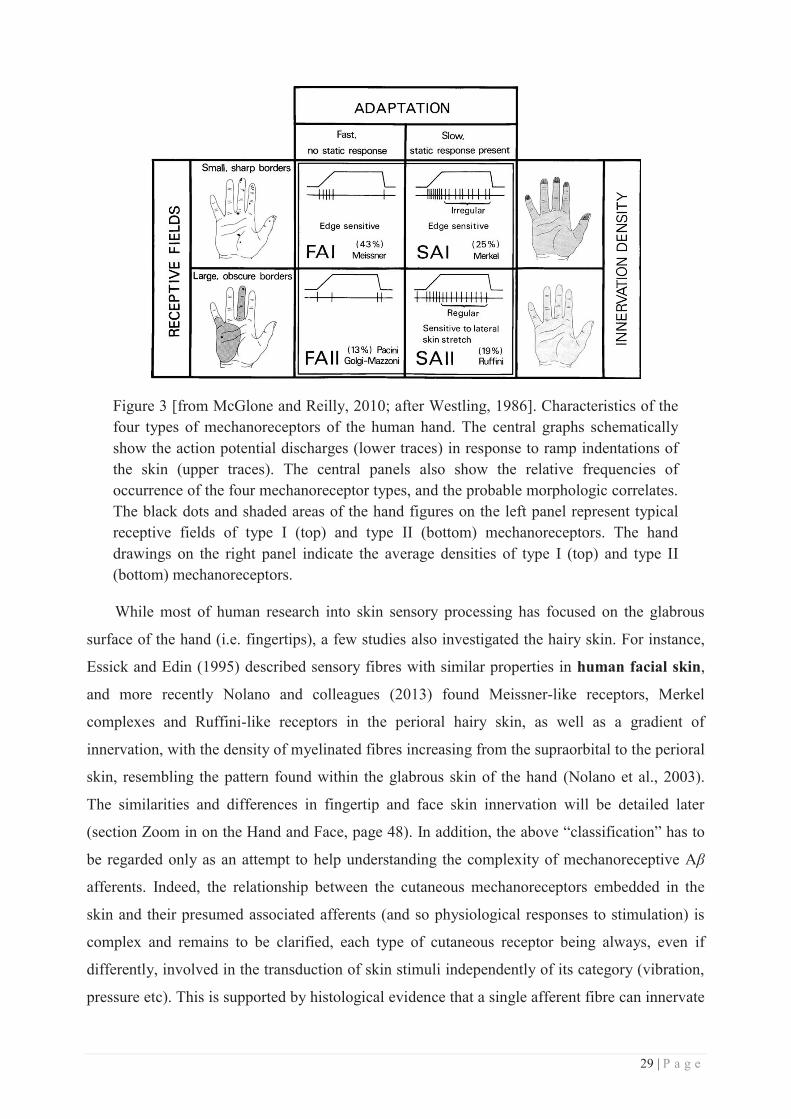
Figure 3 [from McGlone and Reilly, 2010; after Westling, 1986]. Characteristics of the four types of mechanoreceptors of the human hand. The central graphs schematically show the action potential discharges (lower traces) in response to ramp indentations of the skin (upper traces). The central panels also show the relative frequencies of occurrence of the four mechanoreceptor types, and the probable morphologic correlates. The black dots and shaded areas of the hand figures on the left panel represent typical receptive fields of type I (top) and type II (bottom) mechanoreceptors. The hand drawings on the right panel indicate the average densities of type I (top) and type II (bottom) mechanoreceptors.
While most of human research into skin sensory processing has focused on the glabrous
surface of the hand (i.e. fingertips), a few studies also investigated the hairy skin. For instance,
Essick and Edin (1995) described sensory fibres with similar properties in human facial skin,
and more recently Nolano and colleagues (2013) found Meissner-like receptors, Merkel
complexes and Ruffini-like receptors in the perioral hairy skin, as well as a gradient of
innervation, with the density of myelinated fibres increasing from the supraorbital to the perioral
skin, resembling the pattern found within the glabrous skin of the hand (Nolano et al., 2003).
The similarities and differences in fingertip and face skin innervation will be detailed later
(section Zoom in on the Hand and Face, page 48). In addition, the above “classification” has to
be regarded only as an attempt to help understanding the complexity of mechanoreceptive Aβ
afferents. Indeed, the relationship between the cutaneous mechanoreceptors embedded in the
skin and their presumed associated afferents (and so physiological responses to stimulation) is
complex and remains to be clarified, each type of cutaneous receptor being always, even if
differently, involved in the transduction of skin stimuli independently of its category (vibration,
pressure etc). This is supported by histological evidence that a single afferent fibre can innervate
30 | P a g e
multiple receptors and single receptors can receive multiple (Paré et al., 2002), but also different
class of afferent fibres (Reinisch and Tschachler, 2005).
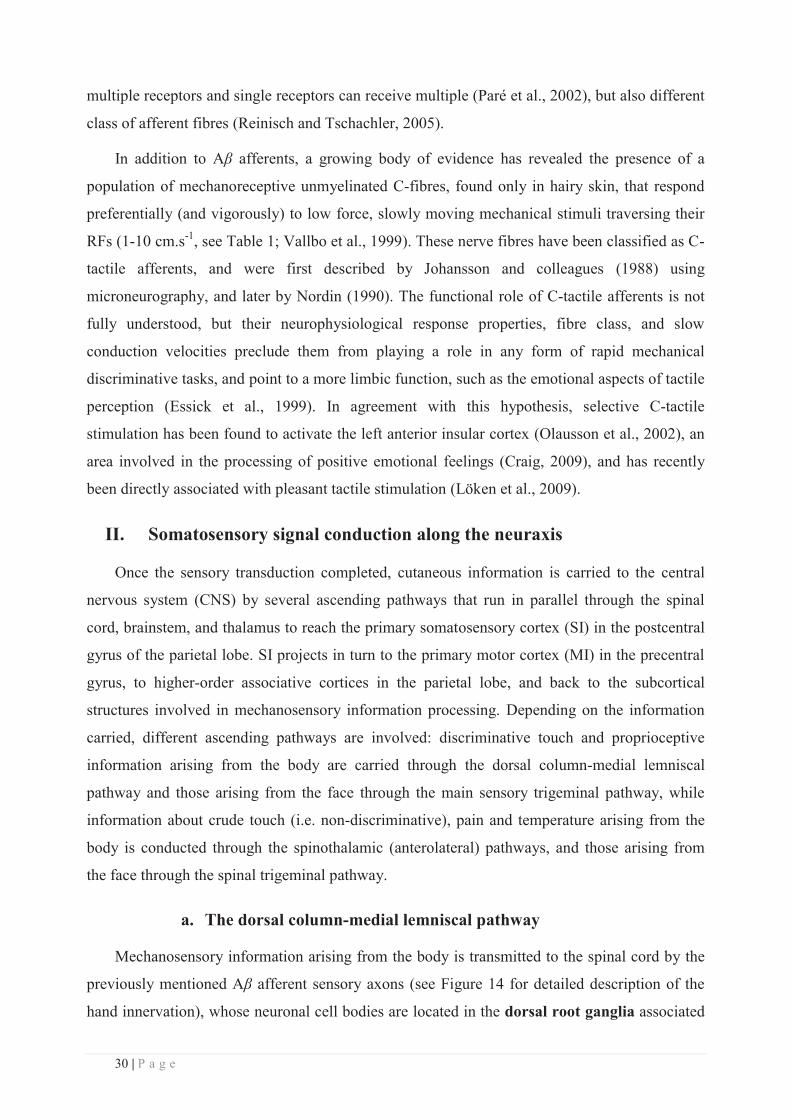
In addition to Aβ afferents, a growing body of evidence has revealed the presence of a
population of mechanoreceptive unmyelinated C-fibres, found only in hairy skin, that respond
preferentially (and vigorously) to low force, slowly moving mechanical stimuli traversing their
RFs (1-10 cm.s-1, see Table 1; Vallbo et al., 1999). These nerve fibres have been classified as C-
tactile afferents, and were first described by Johansson and colleagues (1988) using
microneurography, and later by Nordin (1990). The functional role of C-tactile afferents is not
fully understood, but their neurophysiological response properties, fibre class, and slow
conduction velocities preclude them from playing a role in any form of rapid mechanical
discriminative tasks, and point to a more limbic function, such as the emotional aspects of tactile
perception (Essick et al., 1999). In agreement with this hypothesis, selective C-tactile
stimulation has been found to activate the left anterior insular cortex (Olausson et al., 2002), an
area involved in the processing of positive emotional feelings (Craig, 2009), and has recently
been directly associated with pleasant tactile stimulation (Löken et al., 2009).
II. Somatosensory signal conduction along the neuraxis
Once the sensory transduction completed, cutaneous information is carried to the central
nervous system (CNS) by several ascending pathways that run in parallel through the spinal
cord, brainstem, and thalamus to reach the primary somatosensory cortex (SI) in the postcentral
gyrus of the parietal lobe. SI projects in turn to the primary motor cortex (MI) in the precentral
gyrus, to higher-order associative cortices in the parietal lobe, and back to the subcortical
structures involved in mechanosensory information processing. Depending on the information
carried, different ascending pathways are involved: discriminative touch and proprioceptive
information arising from the body are carried through the dorsal column-medial lemniscal
pathway and those arising from the face through the main sensory trigeminal pathway, while
information about crude touch (i.e. non-discriminative), pain and temperature arising from the
body is conducted through the spinothalamic (anterolateral) pathways, and those arising from
the face through the spinal trigeminal pathway.
a. The dorsal column-medial lemniscal pathway
Mechanosensory information arising from the body is transmitted to the spinal cord by the
previously mentioned Aβ afferent sensory axons (see Figure 14 for detailed description of the
hand innervation), whose neuronal cell bodies are located in the dorsal root ganglia associated
31 | P a g e
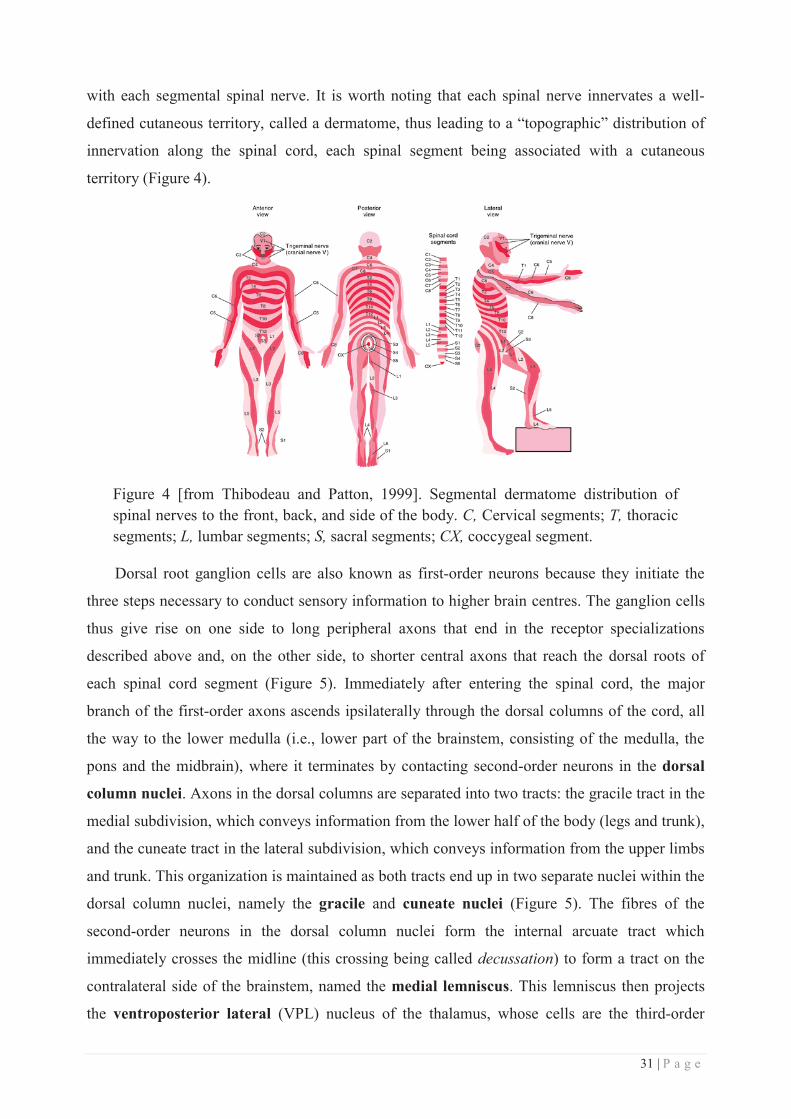
with each segmental spinal nerve. It is worth noting that each spinal nerve innervates a well-
defined cutaneous territory, called a dermatome, thus leading to a “topographic” distribution of
innervation along the spinal cord, each spinal segment being associated with a cutaneous
territory (Figure 4).
Figure 4 [from Thibodeau and Patton, 1999]. Segmental dermatome distribution of spinal nerves to the front, back, and side of the body. C, Cervical segments; T, thoracic segments; L, lumbar segments; S, sacral segments; CX, coccygeal segment.
Dorsal root ganglion cells are also known as first-order neurons because they initiate the
three steps necessary to conduct sensory information to higher brain centres. The ganglion cells
thus give rise on one side to long peripheral axons that end in the receptor specializations
described above and, on the other side, to shorter central axons that reach the dorsal roots of
each spinal cord segment (Figure 5). Immediately after entering the spinal cord, the major
branch of the first-order axons ascends ipsilaterally through the dorsal columns of the cord, all
the way to the lower medulla (i.e., lower part of the brainstem, consisting of the medulla, the
pons and the midbrain), where it terminates by contacting second-order neurons in the dorsal
column nuclei. Axons in the dorsal columns are separated into two tracts: the gracile tract in the
medial subdivision, which conveys information from the lower half of the body (legs and trunk),
and the cuneate tract in the lateral subdivision, which conveys information from the upper limbs
and trunk. This organization is maintained as both tracts end up in two separate nuclei within the
dorsal column nuclei, namely the gracile and cuneate nuclei (Figure 5). The fibres of the
second-order neurons in the dorsal column nuclei form the internal arcuate tract which
immediately crosses the midline (this crossing being called decussation) to form a tract on the
contralateral side of the brainstem, named the medial lemniscus. This lemniscus then projects
the ventroposterior lateral (VPL) nucleus of the thalamus, whose cells are the third-order
32 | P a g e
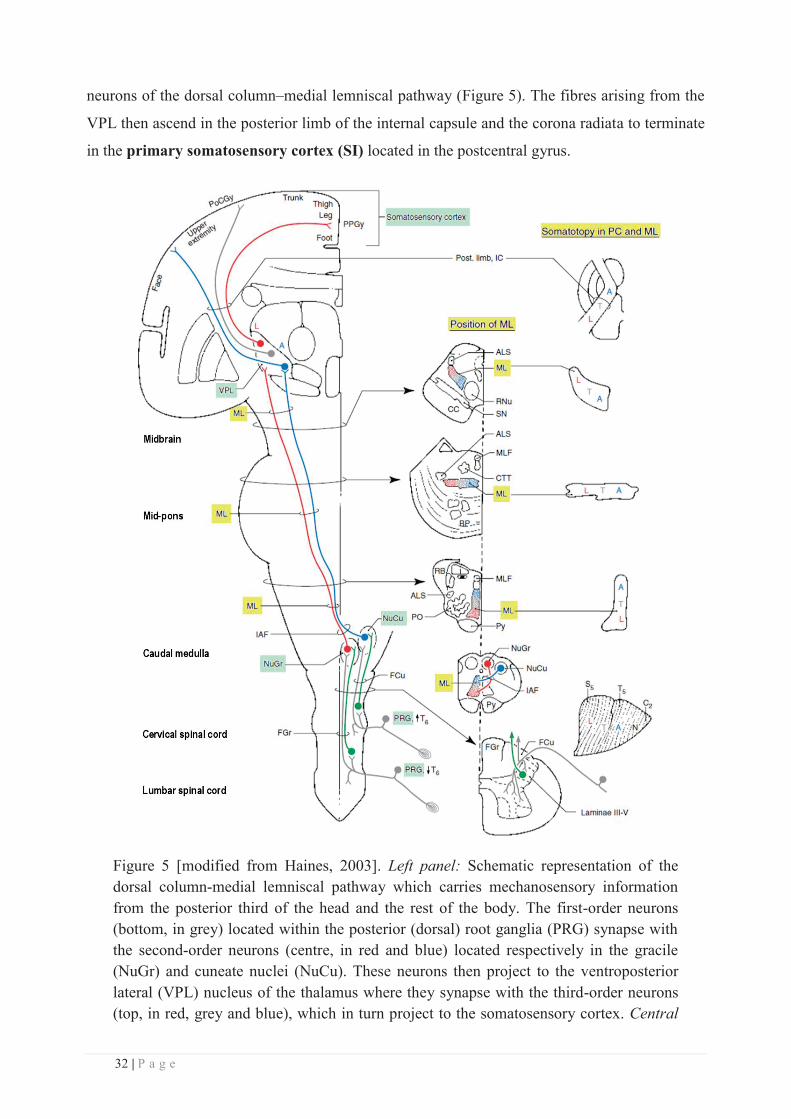
neurons of the dorsal column–medial lemniscal pathway (Figure 5). The fibres arising from the
VPL then ascend in the posterior limb of the internal capsule and the corona radiata to terminate
in the primary somatosensory cortex (SI) located in the postcentral gyrus.
Figure 5 [modified from Haines, 2003]. Left panel: Schematic representation of the dorsal column-medial lemniscal pathway which carries mechanosensory information from the posterior third of the head and the rest of the body. The first-order neurons (bottom, in grey) located within the posterior (dorsal) root ganglia (PRG) synapse with the second-order neurons (centre, in red and blue) located respectively in the gracile (NuGr) and cuneate nuclei (NuCu). These neurons then project to the ventroposterior lateral (VPL) nucleus of the thalamus where they synapse with the third-order neurons (top, in red, grey and blue), which in turn project to the somatosensory cortex. Central
33 | P a g e
panel: transverse sections along the neuraxis showing the position of the medial lemniscus (ML, highlighted in yellow), with its somatotopic organization schematically represented in the Right panel: the colour-coded letters represent fibres conveying input from different body parts: A: upper extremities, L: lower extremities, N: neck, T: trunk).
b. The sensory trigeminal pathway
As mentioned earlier, the dorsal column–medial lemniscal pathway carries somatic
information from the upper and lower body and from the posterior third of the head only.
Mechanosensory information arising from the face is transmitted to the central nervous system
via a different pathway, the trigeminal somatosensory pathway (Figure 6). The first-order
neurons innervating the face (see Figure 18 for a detailed description of facial innervation) have
their cell bodies located in the trigeminal ganglion. On one side these neurons give rise to the
three main subdivisions of the trigeminal nerve, while on the other side they form the sensory
roots of the trigeminal nerve. These Aβ fibres enter the brainstem at the level of the pons to
synapse with neurons in the principal nucleus (tripartite) of the trigeminal brainstem complex
(Figure 6). This nucleus can be divided into dorsomedial and ventrolateral regions, the
dorsomedial division receiving most of its primary afferent input from the oral cavity, and the
ventrolateral division receiving input from all three branches of the trigeminal nerve. Then, as
for the dorsal column-medial lemniscus, the projections of these second-order neurons located in
the ventrolateral part of the principal nucleus decussate and ascend along the medial lemniscus
via the anterior (or ventral) trigemino-thalamic tract (also called the trigeminal lemniscus) to
reach the contralateral thalamus where they synapse with the third-order neurons located in the
ventroposterior medial (VPM) nucleus (Figure 6). Neurons in the dorsomedial division of the
principal sensory nucleus project to the ipsilateral VPM via the posterior (or dorsal)
trigeminothalamic tract. Neurons located in the VPM nucleus (i.e., the third-order neurons)
then project via the posterior limb of the internal capsule to the lateral part of the primary
somatosensory cortex (SI) located in the postcentral gyrus.
Thus, mechanosensory pathways from the face and body join at the level of the mid-pons,
this first single sensory map of the entire body being then projected onto the ventroposterior
complex of the thalamus. However, it is worth noting that although the bulk of afferent input
adheres either to the dorsal column-medial lemniscus or to the trigeminal pathway outlined
above, a degree of mixing occurs, some axons responsible for cutaneous mechanoreception (the
C-tactile afferents mentioned above) presumably running in the spinothalamic pathway, with
the result that damage to the dorsal columns does not completely remove touch and pressure
sensation. The spinothalamic tract will not be described here (for a brief review, see McGlone
34 | P a g e
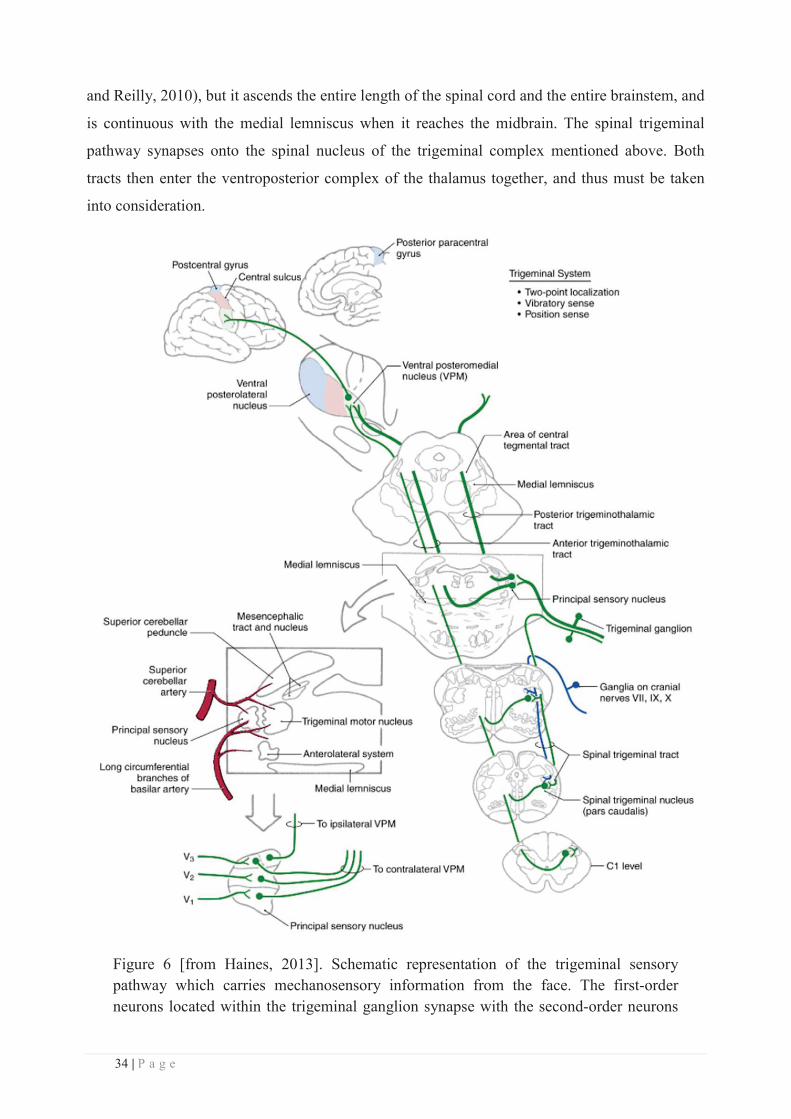
and Reilly, 2010), but it ascends the entire length of the spinal cord and the entire brainstem, and
is continuous with the medial lemniscus when it reaches the midbrain. The spinal trigeminal
pathway synapses onto the spinal nucleus of the trigeminal complex mentioned above. Both
tracts then enter the ventroposterior complex of the thalamus together, and thus must be taken
into consideration.
Figure 6 [from Haines, 2013]. Schematic representation of the trigeminal sensory pathway which carries mechanosensory information from the face. The first-order neurons located within the trigeminal ganglion synapse with the second-order neurons
35 | P a g e
located in the principal sensory nucleus at the pons level. These neurons then project to the ventroposterior medial (VPM) nucleus of the thalamus where they synapse with the third-order neurons, which in turn project to the somatosensory cortex. A zoom in on the pons is illustrated in the lower left part of the picture, with a second zoom showing the organization of the three trigeminal branches within the principal sensory nucleus. Note that some fibres arising from this nucleus do not cross the midline but instead project to the ipsilateral thalamus (VPM nucleus).
III. Topographic organization along the somatosensory pathway
a. The spinal cord and brainstem
One of the main features of the somatosensory system arise from its topographic
organization, each part of the skin being represented in a well-defined order following, most of
the time, the spatial continuity of the body. This organization, called somatotopy, is preserved
along the neuraxis throughout the somatosensory pathways. While the somatotopy of cortical
regions have been well described in humans (see paragraph c.), the organization of spinal and
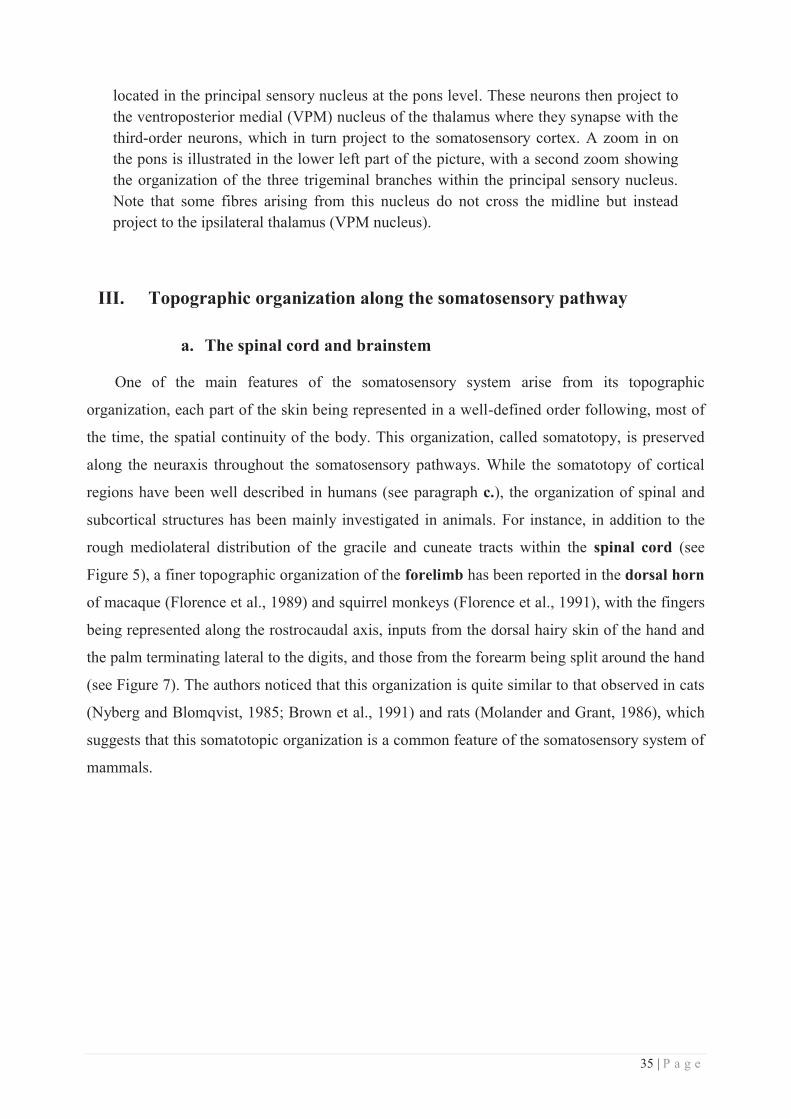
subcortical structures has been mainly investigated in animals. For instance, in addition to the
rough mediolateral distribution of the gracile and cuneate tracts within the spinal cord (see
Figure 5), a finer topographic organization of the forelimb has been reported in the dorsal horn
of macaque (Florence et al., 1989) and squirrel monkeys (Florence et al., 1991), with the fingers
being represented along the rostrocaudal axis, inputs from the dorsal hairy skin of the hand and
the palm terminating lateral to the digits, and those from the forearm being split around the hand
(see Figure 7). The authors noticed that this organization is quite similar to that observed in cats
(Nyberg and Blomqvist, 1985; Brown et al., 1991) and rats (Molander and Grant, 1986), which
suggests that this somatotopic organization is a common feature of the somatosensory system of
mammals.
36 | P a g e
Figure 7 [modified from Florence et al., 1989, 1991]. Schematic representation of the somatotopic organization of afferent terminations in the dorsal horn of the spinal cord from the forelimb of (A) squirrel (A, from Florence et al., 1991) and macaque monkeys (B, from Florence et al., 1989), cats (C, based on results from Nyberg and Blomqvist, 1985), and rats (D, based on results from Molander and Grant, 1986). C4-T2 and L2-L6: cervical, thoracic and lumbar levels of the spinal cord; D1-D5: digits; M/L/R: medial/lateral/rostral directions.
This spatial organization is preserved along the dorsal columns before reaching the dorsal
column nuclei in the lower medulla where an even more refined somatotopic organization has
been found. Indeed, inputs from distal and proximal parts of the glabrous fingers are already
well segregated at this level of the somatosensory pathway, with afferents from the proximal
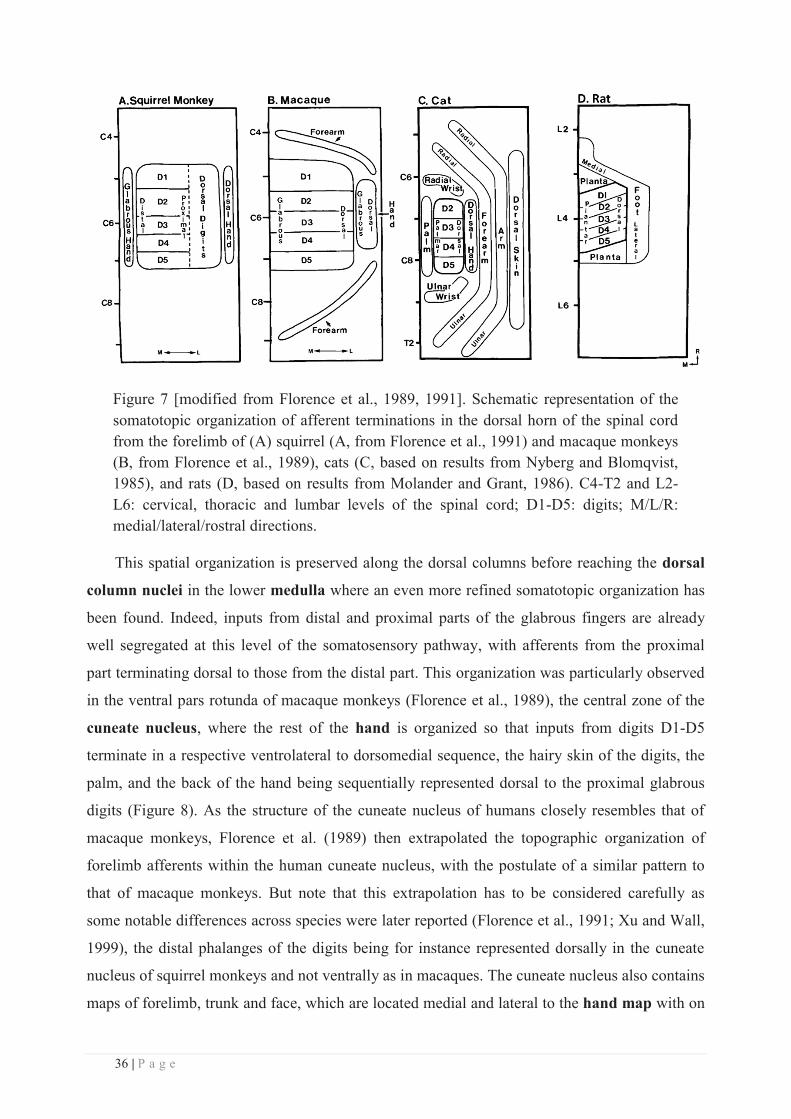
part terminating dorsal to those from the distal part. This organization was particularly observed
in the ventral pars rotunda of macaque monkeys (Florence et al., 1989), the central zone of the
cuneate nucleus, where the rest of the hand is organized so that inputs from digits D1-D5
terminate in a respective ventrolateral to dorsomedial sequence, the hairy skin of the digits, the
palm, and the back of the hand being sequentially represented dorsal to the proximal glabrous
digits (Figure 8). As the structure of the cuneate nucleus of humans closely resembles that of
macaque monkeys, Florence et al. (1989) then extrapolated the topographic organization of
forelimb afferents within the human cuneate nucleus, with the postulate of a similar pattern to
that of macaque monkeys. But note that this extrapolation has to be considered carefully as
some notable differences across species were later reported (Florence et al., 1991; Xu and Wall,
1999), the distal phalanges of the digits being for instance represented dorsally in the cuneate
nucleus of squirrel monkeys and not ventrally as in macaques. The cuneate nucleus also contains
maps of forelimb, trunk and face, which are located medial and lateral to the hand map with on
37 | P a g e
the lateral side the representations of the forelimb (usually radial surfaces), shoulder, chest, neck
and side of the face region, and on the medial side the representations of forelimb (usually ulnar
surfaces), shoulder, chest, trunk and proximal hindlimb (Xu and Wall, 1999). A similar
topographic organization has been more recently confirmed within the gracile nucleus
(containing afferents from the lower limbs and trunk) of several monkey species (Qi and Kaas,
2006), with the afferents from the tail, foot, distal leg and proximal leg being distributed along
the mediolateral axis, and the toes 1-5 following a ventro-to-dorsal sequence.
Figure 8 [from Florence et al., 1989]. Somatotopic organization of forelimb cutaneous regions into the pars rotunda of (A) macaque monkeys and (B) the proposed relation in humans based on histological observation of the substructures revealed by cytochrome oxidase (an enzyme related to metabolic activity) on human cuneate nuclei obtained post-mortem. Coronal views. Tri: triangularis nucleus. M/D: medial/dorsal directions.
Axons arising from both the cuneate and gracile nuclei then join to constitute the medial
lemniscus, within which the somatotopic organization is maintained. But, as axons arising from
the two nuclei cross each other in the process of the decussation, the orientation of the
somatotopy changes from mediolateral to dorsoventral, with the upper extremities, the trunk and
the lower extremities being sequentially more ventral (Figure 5). Then, the medial lemniscus
gradually rotates laterally as it ascends through the brainstem, resulting in a somatotopy rotated
by 90° at the level of the midbrain (see Figure 5), the upper extremities, trunk and lower
extremities being then in a ventromedial to dorsolateral sequence. This is the configuration in
which these fibres enter the VPL nucleus of the contralateral thalamus.
As for the trigeminal pathway, the three branches constituting the trigeminal nerve (see
Figure 18) are somatotopically represented within the principal sensory nucleus, following an
antero-posterior gradient with the ophthalmic branch (V1) being the most anterior, followed by
the maxillary branch (V2) and the mandibular branch (V3) being at the posterior part (see Figure
6). The afferent projections from the principal sensory nucleus also terminate somatotopically
38 | P a g e
within the VPM nucleus of the thalamus, so that the oral cavity is represented medially and the
external facial structures are represented more laterally.
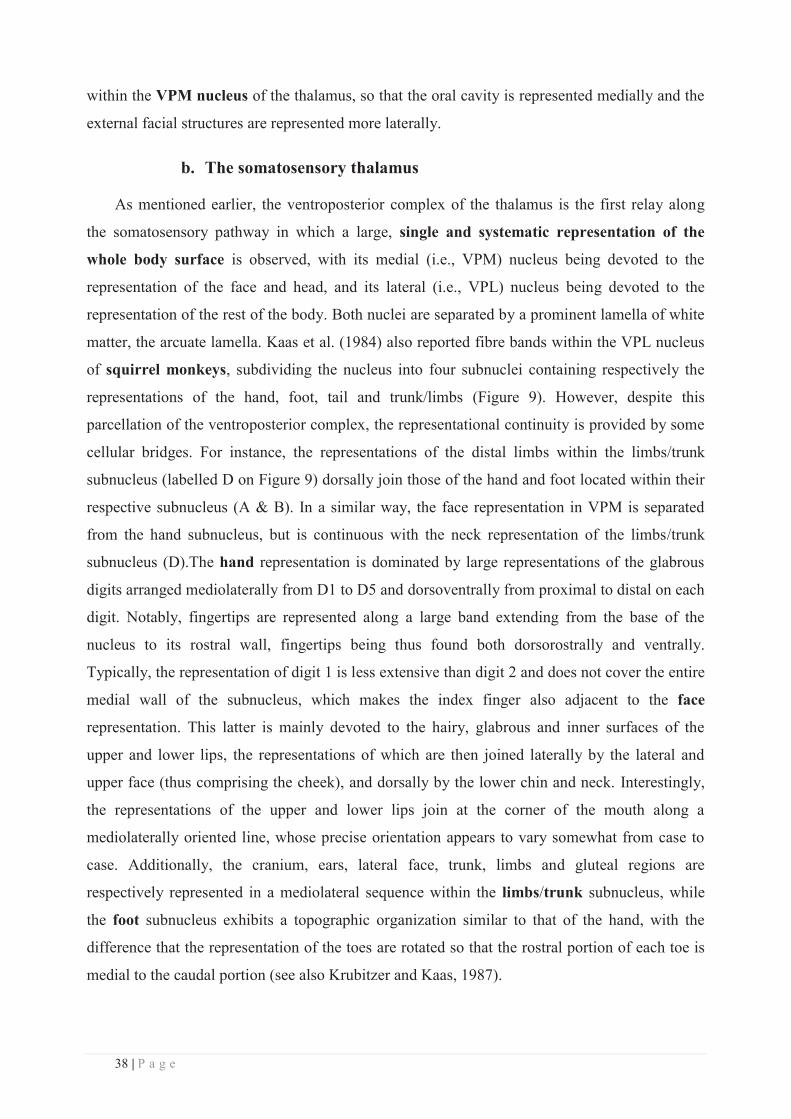
b. The somatosensory thalamus
As mentioned earlier, the ventroposterior complex of the thalamus is the first relay along
the somatosensory pathway in which a large, single and systematic representation of the
whole body surface is observed, with its medial (i.e., VPM) nucleus being devoted to the
representation of the face and head, and its lateral (i.e., VPL) nucleus being devoted to the
representation of the rest of the body. Both nuclei are separated by a prominent lamella of white
matter, the arcuate lamella. Kaas et al. (1984) also reported fibre bands within the VPL nucleus
of squirrel monkeys, subdividing the nucleus into four subnuclei containing respectively the
representations of the hand, foot, tail and trunk/limbs (Figure 9). However, despite this
parcellation of the ventroposterior complex, the representational continuity is provided by some
cellular bridges. For instance, the representations of the distal limbs within the limbs/trunk
subnucleus (labelled D on Figure 9) dorsally join those of the hand and foot located within their
respective subnucleus (A & B). In a similar way, the face representation in VPM is separated
from the hand subnucleus, but is continuous with the neck representation of the limbs/trunk
subnucleus (D).The hand representation is dominated by large representations of the glabrous
digits arranged mediolaterally from D1 to D5 and dorsoventrally from proximal to distal on each
digit. Notably, fingertips are represented along a large band extending from the base of the
nucleus to its rostral wall, fingertips being thus found both dorsorostrally and ventrally.
Typically, the representation of digit 1 is less extensive than digit 2 and does not cover the entire
medial wall of the subnucleus, which makes the index finger also adjacent to the face
representation. This latter is mainly devoted to the hairy, glabrous and inner surfaces of the
upper and lower lips, the representations of which are then joined laterally by the lateral and
upper face (thus comprising the cheek), and dorsally by the lower chin and neck. Interestingly,
the representations of the upper and lower lips join at the corner of the mouth along a
mediolaterally oriented line, whose precise orientation appears to vary somewhat from case to
case. Additionally, the cranium, ears, lateral face, trunk, limbs and gluteal regions are
respectively represented in a mediolateral sequence within the limbs/trunk subnucleus, while
the foot subnucleus exhibits a topographic organization similar to that of the hand, with the
difference that the representation of the toes are rotated so that the rostral portion of each toe is
medial to the caudal portion (see also Krubitzer and Kaas, 1987).
39 | P a g e
Figure 9 [from Kaas et al., 1984]. Summary of the somatotopic organization of the ventroposterior complex of the thalamus, divided into the VPM and VPL nuclei. VPL is further subdivided into four subnuclei respectively for the hand (A), the foot (B), the tail (C) and for the limbs/trunk (D). VPM represents the face. D/R/M: dorsal/rostral/medial directions.
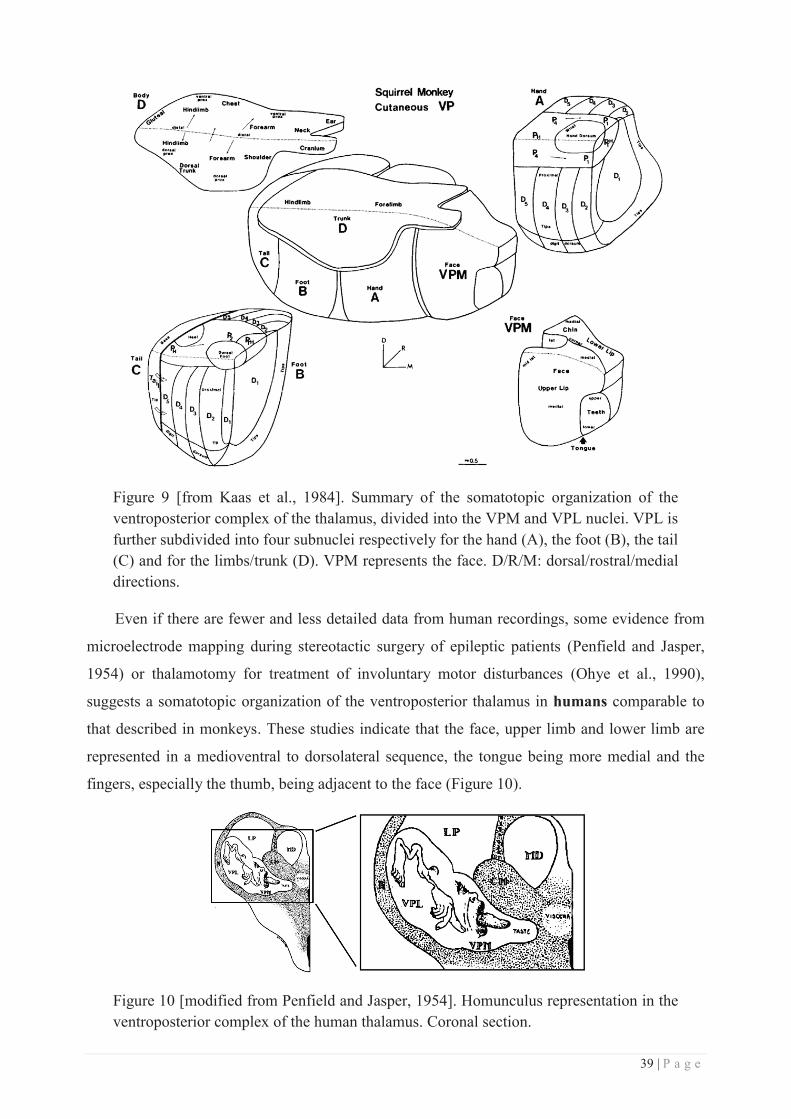
Even if there are fewer and less detailed data from human recordings, some evidence from
microelectrode mapping during stereotactic surgery of epileptic patients (Penfield and Jasper,
1954) or thalamotomy for treatment of involuntary motor disturbances (Ohye et al., 1990),
suggests a somatotopic organization of the ventroposterior thalamus in humans comparable to
that described in monkeys. These studies indicate that the face, upper limb and lower limb are
represented in a medioventral to dorsolateral sequence, the tongue being more medial and the
fingers, especially the thumb, being adjacent to the face (Figure 10).
Figure 10 [modified from Penfield and Jasper, 1954]. Homunculus representation in the ventroposterior complex of the human thalamus. Coronal section.
40 | P a g e
c. The primary somatosensory cortex
The thalamocortical projections then convey the signal, whether from VPL or VPM, to
somatosensory cortices by preserving the general somatotopic pattern (clusters of VP cells
projecting to restricted cortical regions (Jones et al., 1982), which is responsible for the maps of
the body that are an ubiquitous feature of early somatosensory cortical areas (Penfield and
Rasmussen, 1950). Early electrophysiological mapping studies of the cortex identified two
cortical areas responsive to peripheral tactile stimulation: the primary somatosensory cortex (SI)
and the second somatosensory cortex (SII) (Woolsey and Fairman, 1946). But since then,
electrophysiological and imaging studies have defined at least eight separate areas subserving
somatosensation, arising from the subdivision of SI into four subregions (Brodmann's areas 3a,
3b, 1 and 2, see next paragraph), and the addition of the insular cortex (Schneider et al., 1993)
and of two subdivisions of the posterior parietal cortex (Brodmann's areas 5 and 7b)(see ). Here
I will describe in details SI only, as our investigations, from behaviour to neuronal correlates,
focused on this early somatosensory area.
The human primary somatosensory cortex is located in the parietal lobe along the posterior
bank of the central sulcus (i.e., in the postcentral gyrus), and is divided into six distinct
cytoarchitectonic layers (for a review see Mountcastle, 1997). Most of the thalamocortical
projections arising from the ventroposterior complex of the thalamus terminate primarily in the
4th cortical layer and to a lesser extent, in layer 6 and lower layer 3 (Shanks and Powell, 1981)
of the contralateral post-central gyrus. In addition to this vertical laminar distribution, SI is also
subdivided into four subregions (namely, Brodmann's areas (BAs) 3a, 3b, 1 and 2, see Figure
23) that have been distinguished from each other based on their cytoarchitectonic structure
(Brodmann, 1909; Vogt and Vogt, 1919). BA3b corresponds to the anterior bank of the
postcentral gyrus, while BA3a lies in the fundus of the central sulcus. BA1 is located on the
crown of the postcentral gyrus and reaches down into the postcentral sulcus, and finally, BA2
covers the posterior crown of the postcentral gyrus (Brodmann, 1909; Geyer et al., 1999). BA3b
receives most of the projections arising from the ventroposterior thalamic complex, and is the
site where the initial cortical processing of tactile discrimination takes place (see Figure 24 and
next paragraph for further description of thalamocortical projections). This led to the suggestion
that, for homogeny with other sensory fields, only area 3b should be referred to as “primary
somatosensory cortex” (Merzenich et al., 1978). However, in this thesis the term primary
somatosensory cortex (or SI) follows the nowadays classical terminology and thus refers to the
entire postcentral gyrus (which includes BAs 3a, 3b, 1, and 2).
41 | P a g e
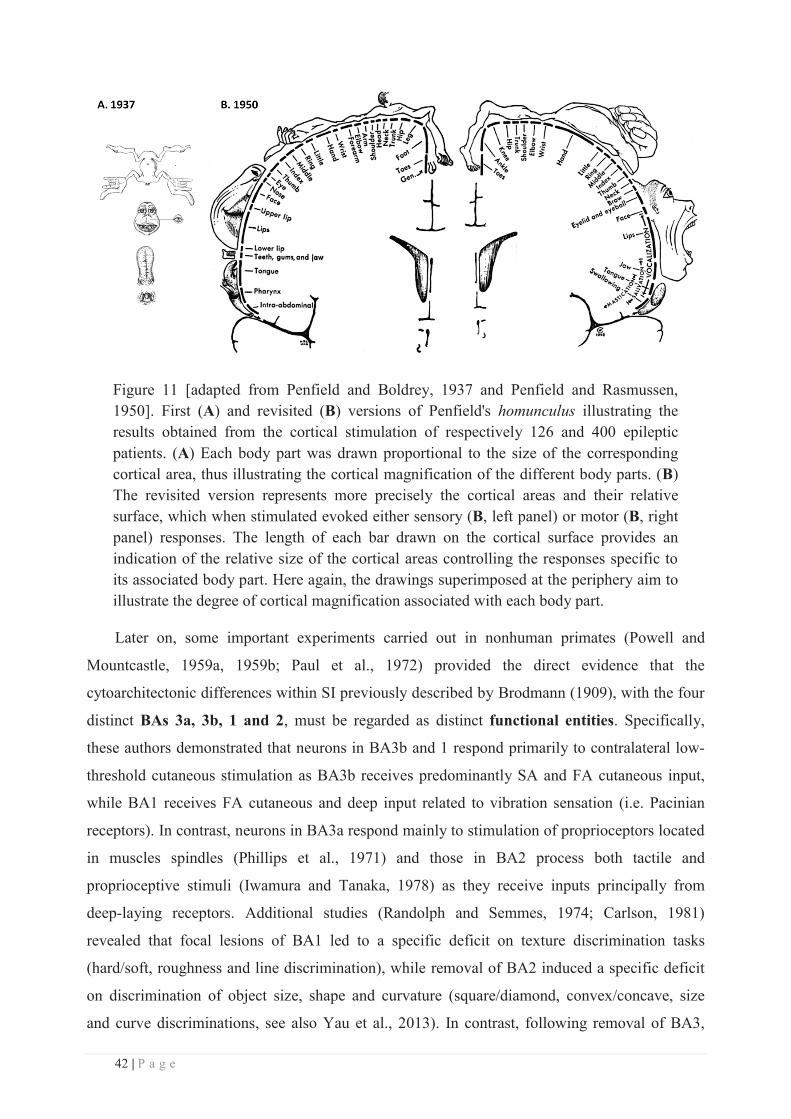
The first detailed cartography of the human primary somatosensory cortex was reported by
Penfield and Boldrey in 1937, by the use of cortical stimulation in patients undergoing surgical
procedures. Penfield started conducting these experiments in 1928, and in less than ten years he
managed to carry out cortical stimulation studies in 163 fully conscious patients undergoing
brain surgery for epilepsy. Data from 126 of these patients were good enough to be analyzed,
allowing Penfield and Boldrey to publish their groundbreaking work in Brain in 1937. The
authors rigorously reported any individual movement or sensation evoked by the stimulation of
different points on the brain, ending up with 170 summarizing charts then condensed into the 16
illustrative charts that appear in Penfield and Boldrey's paper. In order to render the topography
of their observations more legible, the authors then decided to add illustrations to their verbal
descriptions and schematic charts, and thus asked a medical illustrator, Hortense Pauline
Cantlie, to draw “a visual image and sequence of the cortical area”. This gave rise to the first
homunculus, which was associated with both sensory and motor responses (Figure 11A).
Thirteen years later, this first homunculus was revisited into a more precise representation of the
cortical regions and their related body parts (Figure 11B). Notably, the sensory and motor
responses were mapped separately onto a cross-section of the cerebral hemispheres with bars
underlying the spatial sequence and relative extent of cortical areas controlling body part-related
responses (either sensory or motor). On top of these sensory and motor topographic maps the
representation of the body surface was resized according to the cortical magnification dedicated
to each body part and superimposed for legibility. Sixty years later, this famous representation
still serves as a reference, even if some additional revisions have since been made. These
revisions concerned mainly the location of the genitals (Kell et al., 2005; Georgiadis et al.,
2006), which constitute one of the two notable discontinuities within the SI homunculus, the
other one (which we will discuss later on, see chapter Finger/face) involving the hand and face
representations.
42 | P a g e
Figure 11 [adapted from Penfield and Boldrey, 1937 and Penfield and Rasmussen, 1950]. First (A) and revisited (B) versions of Penfield's homunculus illustrating the results obtained from the cortical stimulation of respectively 126 and 400 epileptic patients. (A) Each body part was drawn proportional to the size of the corresponding cortical area, thus illustrating the cortical magnification of the different body parts. (B) The revisited version represents more precisely the cortical areas and their relative surface, which when stimulated evoked either sensory (B, left panel) or motor (B, right panel) responses. The length of each bar drawn on the cortical surface provides an indication of the relative size of the cortical areas controlling the responses specific to its associated body part. Here again, the drawings superimposed at the periphery aim to illustrate the degree of cortical magnification associated with each body part.
Later on, some important experiments carried out in nonhuman primates (Powell and
Mountcastle, 1959a, 1959b; Paul et al., 1972) provided the direct evidence that the
cytoarchitectonic differences within SI previously described by Brodmann (1909), with the four
distinct BAs 3a, 3b, 1 and 2, must be regarded as distinct functional entities. Specifically,
these authors demonstrated that neurons in BA3b and 1 respond primarily to contralateral low-
threshold cutaneous stimulation as BA3b receives predominantly SA and FA cutaneous input,
while BA1 receives FA cutaneous and deep input related to vibration sensation (i.e. Pacinian
receptors). In contrast, neurons in BA3a respond mainly to stimulation of proprioceptors located
in muscles spindles (Phillips et al., 1971) and those in BA2 process both tactile and
proprioceptive stimuli (Iwamura and Tanaka, 1978) as they receive inputs principally from
deep-laying receptors. Additional studies (Randolph and Semmes, 1974; Carlson, 1981)
revealed that focal lesions of BA1 led to a specific deficit on texture discrimination tasks
(hard/soft, roughness and line discrimination), while removal of BA2 induced a specific deficit
on discrimination of object size, shape and curvature (square/diamond, convex/concave, size
and curve discriminations, see also Yau et al., 2013). In contrast, following removal of BA3,
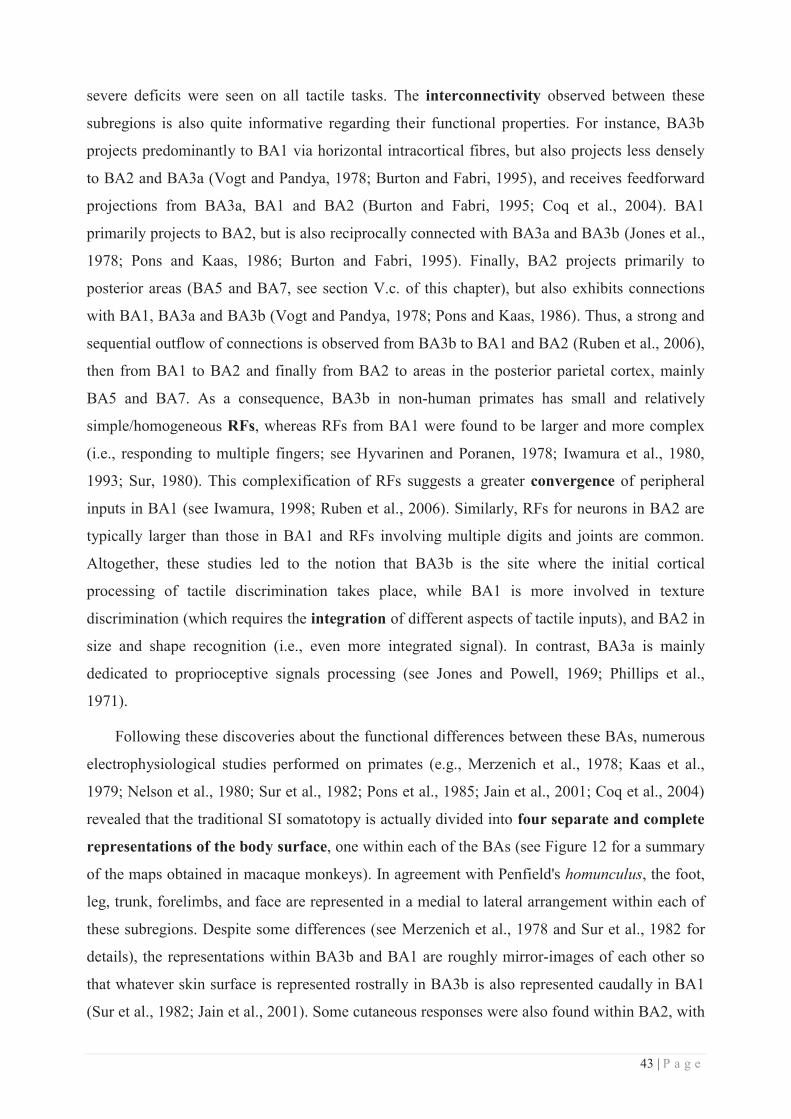
43 | P a g e
severe deficits were seen on all tactile tasks. The interconnectivity observed between these
subregions is also quite informative regarding their functional properties. For instance, BA3b
projects predominantly to BA1 via horizontal intracortical fibres, but also projects less densely
to BA2 and BA3a (Vogt and Pandya, 1978; Burton and Fabri, 1995), and receives feedforward
projections from BA3a, BA1 and BA2 (Burton and Fabri, 1995; Coq et al., 2004). BA1
primarily projects to BA2, but is also reciprocally connected with BA3a and BA3b (Jones et al.,
1978; Pons and Kaas, 1986; Burton and Fabri, 1995). Finally, BA2 projects primarily to
posterior areas (BA5 and BA7, see section V.c. of this chapter), but also exhibits connections
with BA1, BA3a and BA3b (Vogt and Pandya, 1978; Pons and Kaas, 1986). Thus, a strong and
sequential outflow of connections is observed from BA3b to BA1 and BA2 (Ruben et al., 2006),
then from BA1 to BA2 and finally from BA2 to areas in the posterior parietal cortex, mainly
BA5 and BA7. As a consequence, BA3b in non-human primates has small and relatively
simple/homogeneous RFs, whereas RFs from BA1 were found to be larger and more complex
(i.e., responding to multiple fingers; see Hyvarinen and Poranen, 1978; Iwamura et al., 1980,
1993; Sur, 1980). This complexification of RFs suggests a greater convergence of peripheral
inputs in BA1 (see Iwamura, 1998; Ruben et al., 2006). Similarly, RFs for neurons in BA2 are
typically larger than those in BA1 and RFs involving multiple digits and joints are common.
Altogether, these studies led to the notion that BA3b is the site where the initial cortical
processing of tactile discrimination takes place, while BA1 is more involved in texture
discrimination (which requires the integration of different aspects of tactile inputs), and BA2 in
size and shape recognition (i.e., even more integrated signal). In contrast, BA3a is mainly
dedicated to proprioceptive signals processing (see Jones and Powell, 1969; Phillips et al.,
1971).
Following these discoveries about the functional differences between these BAs, numerous
electrophysiological studies performed on primates (e.g., Merzenich et al., 1978; Kaas et al.,
1979; Nelson et al., 1980; Sur et al., 1982; Pons et al., 1985; Jain et al., 2001; Coq et al., 2004)
revealed that the traditional SI somatotopy is actually divided into four separate and complete
representations of the body surface, one within each of the BAs (see Figure 12 for a summary
of the maps obtained in macaque monkeys). In agreement with Penfield's homunculus, the foot,
leg, trunk, forelimbs, and face are represented in a medial to lateral arrangement within each of
these subregions. Despite some differences (see Merzenich et al., 1978 and Sur et al., 1982 for
details), the representations within BA3b and BA1 are roughly mirror-images of each other so
that whatever skin surface is represented rostrally in BA3b is also represented caudally in BA1
(Sur et al., 1982; Jain et al., 2001). Some cutaneous responses were also found within BA2, with
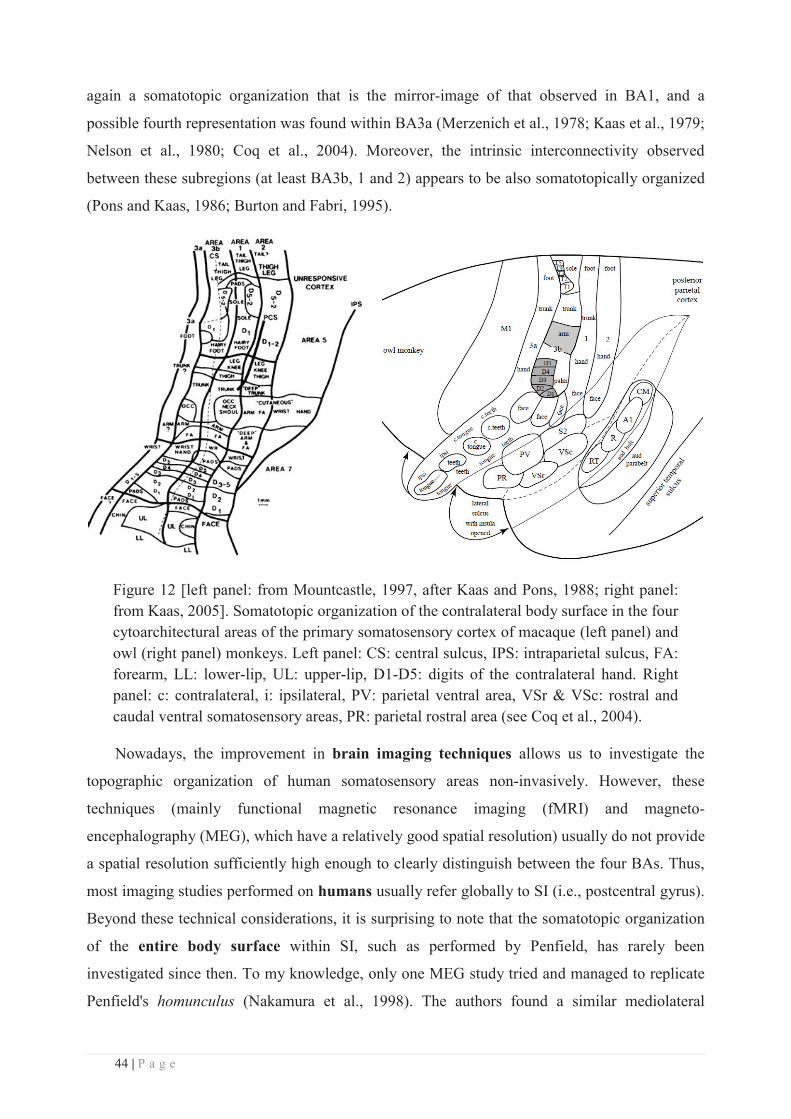
44 | P a g e
again a somatotopic organization that is the mirror-image of that observed in BA1, and a
possible fourth representation was found within BA3a (Merzenich et al., 1978; Kaas et al., 1979;
Nelson et al., 1980; Coq et al., 2004). Moreover, the intrinsic interconnectivity observed
between these subregions (at least BA3b, 1 and 2) appears to be also somatotopically organized
(Pons and Kaas, 1986; Burton and Fabri, 1995).
Figure 12 [left panel: from Mountcastle, 1997, after Kaas and Pons, 1988; right panel: from Kaas, 2005]. Somatotopic organization of the contralateral body surface in the four cytoarchitectural areas of the primary somatosensory cortex of macaque (left panel) and owl (right panel) monkeys. Left panel: CS: central sulcus, IPS: intraparietal sulcus, FA: forearm, LL: lower-lip, UL: upper-lip, D1-D5: digits of the contralateral hand. Right panel: c: contralateral, i: ipsilateral, PV: parietal ventral area, VSr & VSc: rostral and caudal ventral somatosensory areas, PR: parietal rostral area (see Coq et al., 2004).
Nowadays, the improvement in brain imaging techniques allows us to investigate the
topographic organization of human somatosensory areas non-invasively. However, these
techniques (mainly functional magnetic resonance imaging (fMRI) and magneto-
encephalography (MEG), which have a relatively good spatial resolution) usually do not provide
a spatial resolution sufficiently high enough to clearly distinguish between the four BAs. Thus,
most imaging studies performed on humans usually refer globally to SI (i.e., postcentral gyrus).
Beyond these technical considerations, it is surprising to note that the somatotopic organization
of the entire body surface within SI, such as performed by Penfield, has rarely been
investigated since then. To my knowledge, only one MEG study tried and managed to replicate
Penfield's homunculus (Nakamura et al., 1998). The authors found a similar mediolateral
45 | P a g e
topographic organization of the body surface within the contralateral post-central gyrus, with the
toes in the medial side of the hemisphere and the tongue in the most lateral region (Figure 13).
But such mapping of about 40 regions is demanding and time consuming. This may explain why
most of studies usually focus on specific (and few) body parts. Indeed, even if a few other MEG
studies reported, with a less systematic approach, the somatotopic organization of some regions
of distant body parts, such as the arm, leg and lip (Hoshiyama et al., 1997) or the dermatomes
(i.e., cervical, thoracic, lumbar and sacral afferents; Itomi et al., 2000; Castillo and
Papanicolaou, 2005), most studies usually focus solely on one body part at a time. For instance,
the hand has been extensively investigated using either fMRI (e.g., Maldjian et al., 1999;
Hlustík et al., 2001; McGlone et al., 2002; Sanchez-Panchuelo et al., 2010; Schweisfurth et al.,
2011, 2014; Besle et al., 2013a, 2013b) or MEG recordings (e.g., Baumgartner et al., 1991;
Forss et al., 1995; Tecchio et al., 1998; Mertens and Lütkenhöner, 2000; Druschky et al., 2002;
Inoue et al., 2012; Jamali and Ross, 2013), likely due to its large cortical representation and its
easy access to peripheral stimulation. Similarly, the face, also highly magnified at the cortical
level, has been quite intensively investigated the last two decades using again either fMRI
(Servos et al., 1999; Iannetti et al., 2003; Miyamoto et al., 2006; Blatow et al., 2007; Kopietz et
al., 2009; Moulton et al., 2009; Lin et al., 2010) or MEG recordings (Yang et al., 1993;
Mogilner et al., 1994; Hoshiyama et al., 1995, 1996; Nagamatsu et al., 2000; Disbrow et al.,
2003a; Nguyen et al., 2004; Suzuki et al., 2004; Nevalainen et al., 2006; Sakamoto et al., 2008;
Tamura et al., 2008). In contrast, the representations of the other body parts such as the arm
(Servos et al., 1998), the legs (Shimojo et al., 1996; Del Gratta et al., 2000; Bao et al., 2012), the
trunk and genitals (Kell et al., 2005; Rothemund et al., 2005) have been sparsely investigated.
But except for the genitals, whose representation was reported to be between those of the toe
and lower trunk (Kell et al., 2005), and for the face whose representation is still controversial
(see next section IV.b.), most of these studies support the somatotopic arrangement of Penfield's
homunculus.
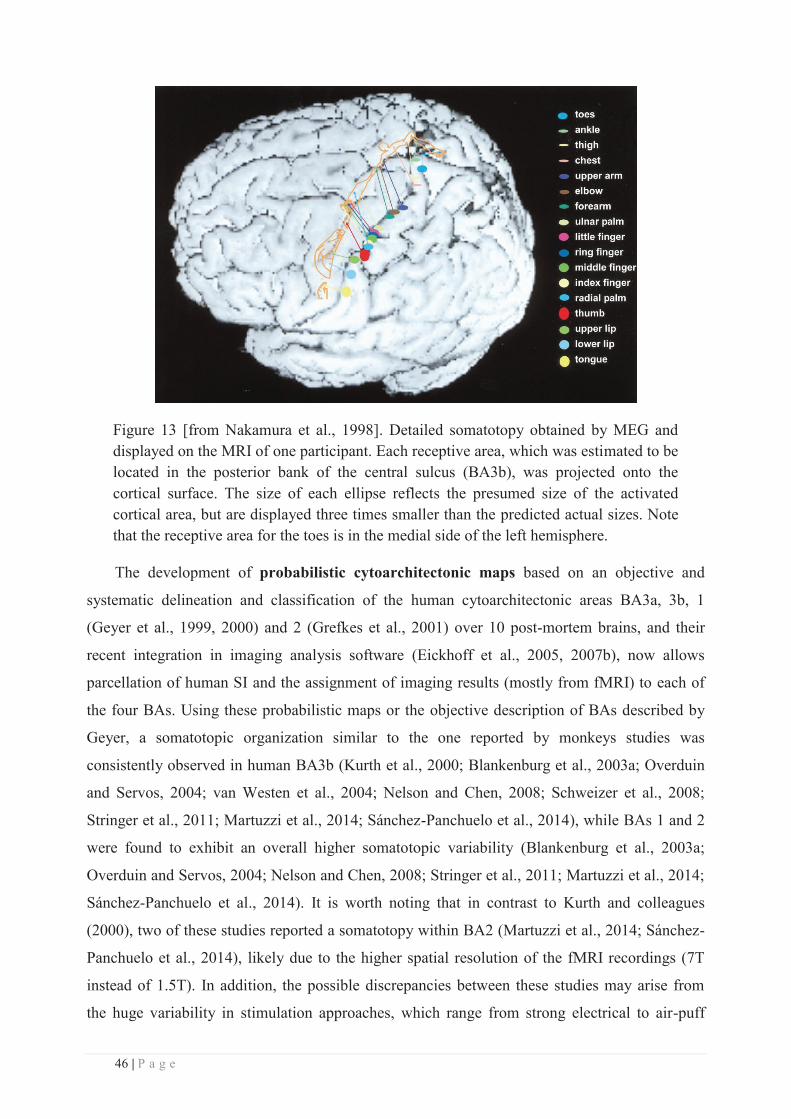
46 | P a g e
Figure 13 [from Nakamura et al., 1998]. Detailed somatotopy obtained by MEG and displayed on the MRI of one participant. Each receptive area, which was estimated to be located in the posterior bank of the central sulcus (BA3b), was projected onto the cortical surface. The size of each ellipse reflects the presumed size of the activated cortical area, but are displayed three times smaller than the predicted actual sizes. Note that the receptive area for the toes is in the medial side of the left hemisphere.
The development of probabilistic cytoarchitectonic maps based on an objective and
systematic delineation and classification of the human cytoarchitectonic areas BA3a, 3b, 1
(Geyer et al., 1999, 2000) and 2 (Grefkes et al., 2001) over 10 post-mortem brains, and their
recent integration in imaging analysis software (Eickhoff et al., 2005, 2007b), now allows
parcellation of human SI and the assignment of imaging results (mostly from fMRI) to each of
the four BAs. Using these probabilistic maps or the objective description of BAs described by
Geyer, a somatotopic organization similar to the one reported by monkeys studies was
consistently observed in human BA3b (Kurth et al., 2000; Blankenburg et al., 2003a; Overduin
and Servos, 2004; van Westen et al., 2004; Nelson and Chen, 2008; Schweizer et al., 2008;
Stringer et al., 2011; Martuzzi et al., 2014; Sánchez-Panchuelo et al., 2014), while BAs 1 and 2
were found to exhibit an overall higher somatotopic variability (Blankenburg et al., 2003a;
Overduin and Servos, 2004; Nelson and Chen, 2008; Stringer et al., 2011; Martuzzi et al., 2014;
Sánchez-Panchuelo et al., 2014). It is worth noting that in contrast to Kurth and colleagues
(2000), two of these studies reported a somatotopy within BA2 (Martuzzi et al., 2014; Sánchez-
Panchuelo et al., 2014), likely due to the higher spatial resolution of the fMRI recordings (7T
instead of 1.5T). In addition, the possible discrepancies between these studies may arise from
the huge variability in stimulation approaches, which range from strong electrical to air-puff
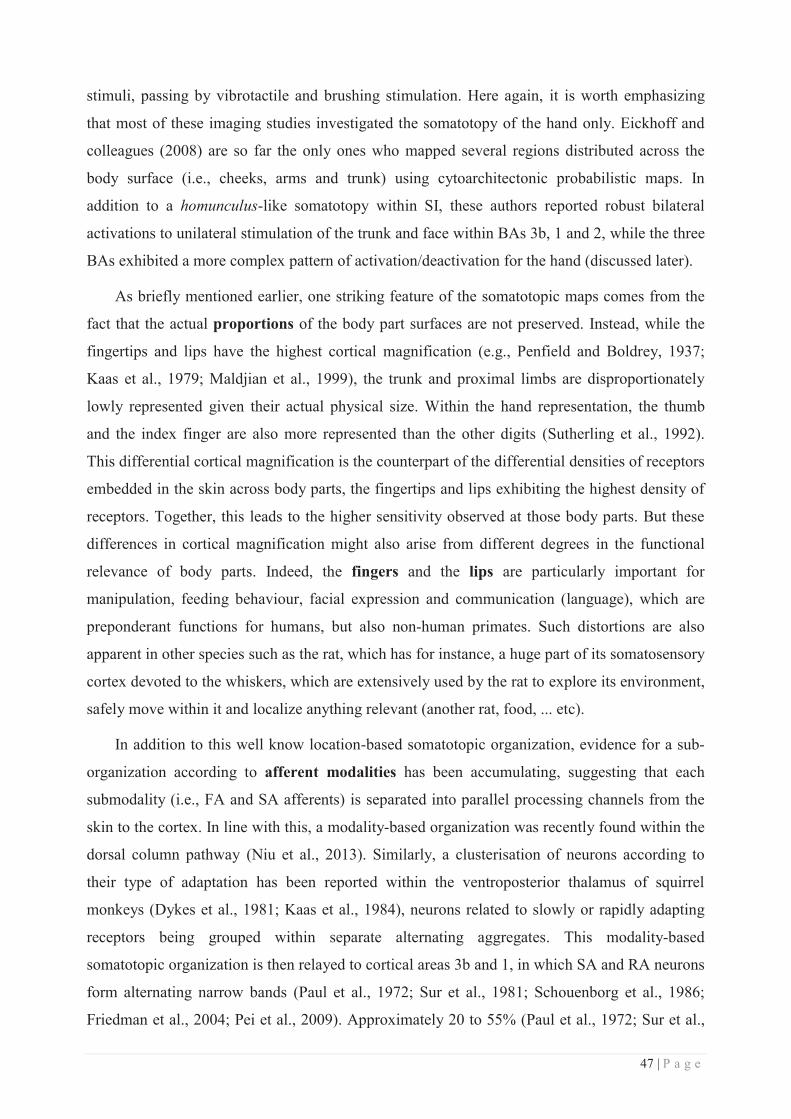
47 | P a g e
stimuli, passing by vibrotactile and brushing stimulation. Here again, it is worth emphasizing
that most of these imaging studies investigated the somatotopy of the hand only. Eickhoff and
colleagues (2008) are so far the only ones who mapped several regions distributed across the
body surface (i.e., cheeks, arms and trunk) using cytoarchitectonic probabilistic maps. In
addition to a homunculus-like somatotopy within SI, these authors reported robust bilateral
activations to unilateral stimulation of the trunk and face within BAs 3b, 1 and 2, while the three
BAs exhibited a more complex pattern of activation/deactivation for the hand (discussed later).
As briefly mentioned earlier, one striking feature of the somatotopic maps comes from the
fact that the actual proportions of the body part surfaces are not preserved. Instead, while the
fingertips and lips have the highest cortical magnification (e.g., Penfield and Boldrey, 1937;
Kaas et al., 1979; Maldjian et al., 1999), the trunk and proximal limbs are disproportionately
lowly represented given their actual physical size. Within the hand representation, the thumb
and the index finger are also more represented than the other digits (Sutherling et al., 1992).
This differential cortical magnification is the counterpart of the differential densities of receptors
embedded in the skin across body parts, the fingertips and lips exhibiting the highest density of
receptors. Together, this leads to the higher sensitivity observed at those body parts. But these
differences in cortical magnification might also arise from different degrees in the functional
relevance of body parts. Indeed, the fingers and the lips are particularly important for
manipulation, feeding behaviour, facial expression and communication (language), which are
preponderant functions for humans, but also non-human primates. Such distortions are also
apparent in other species such as the rat, which has for instance, a huge part of its somatosensory
cortex devoted to the whiskers, which are extensively used by the rat to explore its environment,
safely move within it and localize anything relevant (another rat, food, ... etc).
In addition to this well know location-based somatotopic organization, evidence for a sub-
organization according to afferent modalities has been accumulating, suggesting that each
submodality (i.e., FA and SA afferents) is separated into parallel processing channels from the
skin to the cortex. In line with this, a modality-based organization was recently found within the
dorsal column pathway (Niu et al., 2013). Similarly, a clusterisation of neurons according to
their type of adaptation has been reported within the ventroposterior thalamus of squirrel
monkeys (Dykes et al., 1981; Kaas et al., 1984), neurons related to slowly or rapidly adapting
receptors being grouped within separate alternating aggregates. This modality-based
somatotopic organization is then relayed to cortical areas 3b and 1, in which SA and RA neurons
form alternating narrow bands (Paul et al., 1972; Sur et al., 1981; Schouenborg et al., 1986;
Friedman et al., 2004; Pei et al., 2009). Approximately 20 to 55% (Paul et al., 1972; Sur et al.,
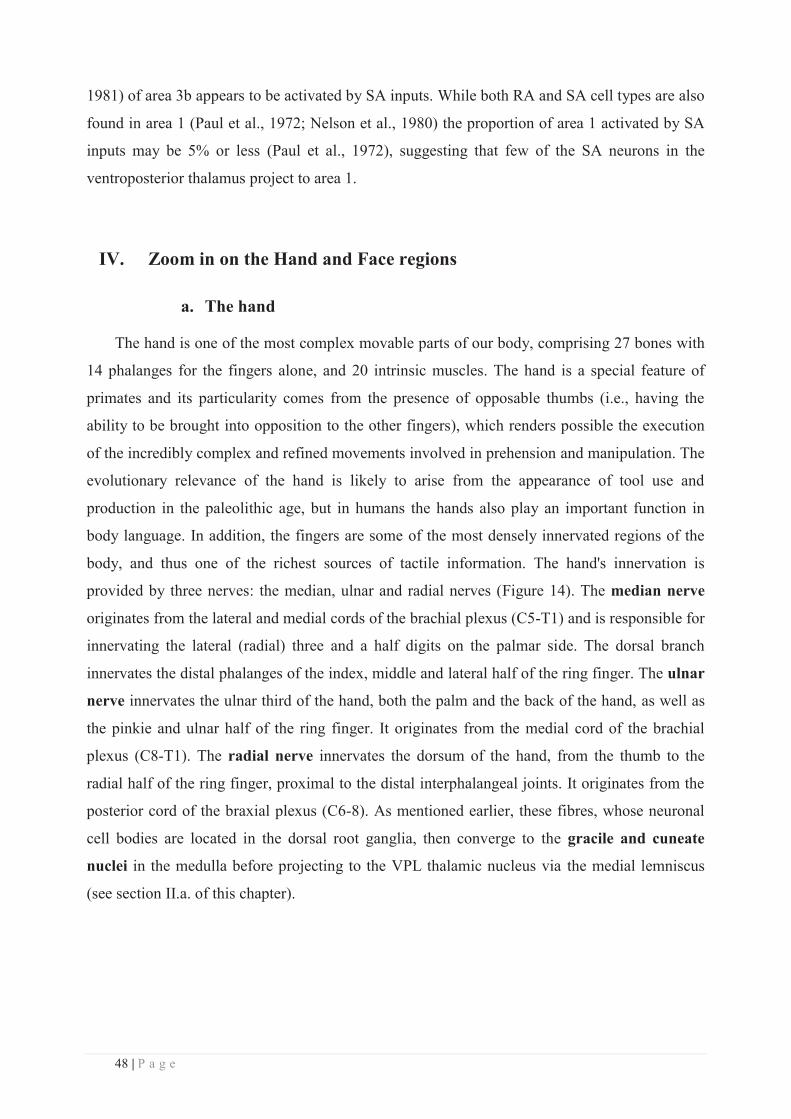
48 | P a g e
1981) of area 3b appears to be activated by SA inputs. While both RA and SA cell types are also
found in area 1 (Paul et al., 1972; Nelson et al., 1980) the proportion of area 1 activated by SA
inputs may be 5% or less (Paul et al., 1972), suggesting that few of the SA neurons in the
ventroposterior thalamus project to area 1.
IV. Zoom in on the Hand and Face regions
a. The hand
The hand is one of the most complex movable parts of our body, comprising 27 bones with
14 phalanges for the fingers alone, and 20 intrinsic muscles. The hand is a special feature of
primates and its particularity comes from the presence of opposable thumbs (i.e., having the
ability to be brought into opposition to the other fingers), which renders possible the execution
of the incredibly complex and refined movements involved in prehension and manipulation. The
evolutionary relevance of the hand is likely to arise from the appearance of tool use and
production in the paleolithic age, but in humans the hands also play an important function in
body language. In addition, the fingers are some of the most densely innervated regions of the
body, and thus one of the richest sources of tactile information. The hand's innervation is
provided by three nerves: the median, ulnar and radial nerves (Figure 14). The median nerve
originates from the lateral and medial cords of the brachial plexus (C5-T1) and is responsible for
innervating the lateral (radial) three and a half digits on the palmar side. The dorsal branch
innervates the distal phalanges of the index, middle and lateral half of the ring finger. The ulnar
nerve innervates the ulnar third of the hand, both the palm and the back of the hand, as well as
the pinkie and ulnar half of the ring finger. It originates from the medial cord of the brachial
plexus (C8-T1). The radial nerve innervates the dorsum of the hand, from the thumb to the
radial half of the ring finger, proximal to the distal interphalangeal joints. It originates from the
posterior cord of the braxial plexus (C6-8). As mentioned earlier, these fibres, whose neuronal
cell bodies are located in the dorsal root ganglia, then converge to the gracile and cuneate
nuclei in the medulla before projecting to the VPL thalamic nucleus via the medial lemniscus
(see section II.a. of this chapter).
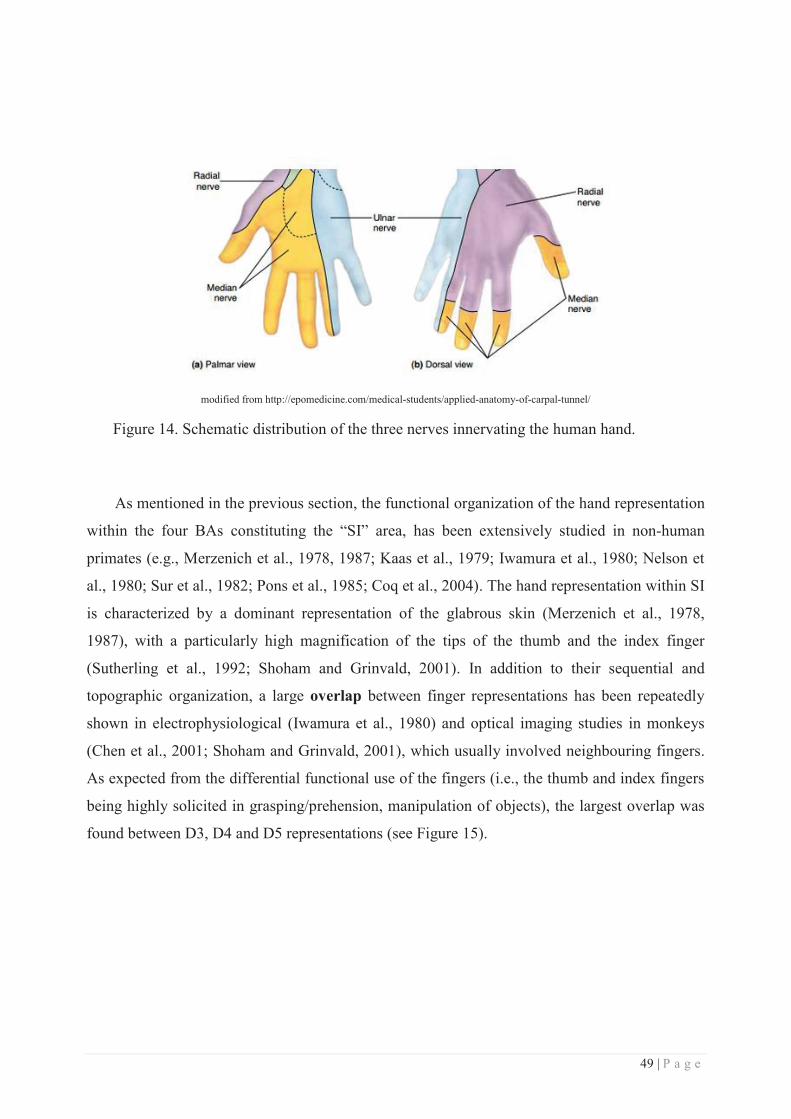
49 | P a g e
modified from http://epomedicine.com/medical-students/applied-anatomy-of-carpal-tunnel/
Figure 14. Schematic distribution of the three nerves innervating the human hand.
As mentioned in the previous section, the functional organization of the hand representation
within the four BAs constituting the “SI” area, has been extensively studied in non-human
primates (e.g., Merzenich et al., 1978, 1987; Kaas et al., 1979; Iwamura et al., 1980; Nelson et
al., 1980; Sur et al., 1982; Pons et al., 1985; Coq et al., 2004). The hand representation within SI
is characterized by a dominant representation of the glabrous skin (Merzenich et al., 1978,
1987), with a particularly high magnification of the tips of the thumb and the index finger
(Sutherling et al., 1992; Shoham and Grinvald, 2001). In addition to their sequential and
topographic organization, a large overlap between finger representations has been repeatedly
shown in electrophysiological (Iwamura et al., 1980) and optical imaging studies in monkeys
(Chen et al., 2001; Shoham and Grinvald, 2001), which usually involved neighbouring fingers.
As expected from the differential functional use of the fingers (i.e., the thumb and index fingers
being highly solicited in grasping/prehension, manipulation of objects), the largest overlap was
found between D3, D4 and D5 representations (see Figure 15).
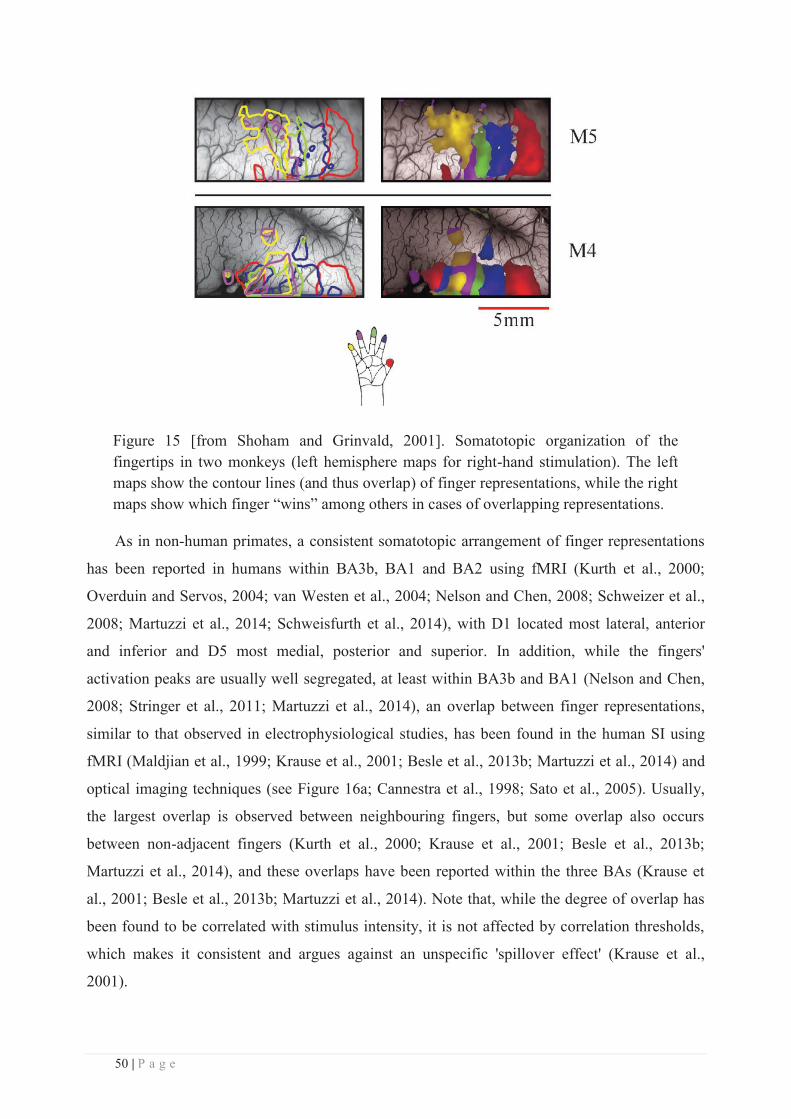
50 | P a g e
Figure 15 [from Shoham and Grinvald, 2001]. Somatotopic organization of the fingertips in two monkeys (left hemisphere maps for right-hand stimulation). The left maps show the contour lines (and thus overlap) of finger representations, while the right maps show which finger “wins” among others in cases of overlapping representations.
As in non-human primates, a consistent somatotopic arrangement of finger representations
has been reported in humans within BA3b, BA1 and BA2 using fMRI (Kurth et al., 2000;
Overduin and Servos, 2004; van Westen et al., 2004; Nelson and Chen, 2008; Schweizer et al.,
2008; Martuzzi et al., 2014; Schweisfurth et al., 2014), with D1 located most lateral, anterior
and inferior and D5 most medial, posterior and superior. In addition, while the fingers'
activation peaks are usually well segregated, at least within BA3b and BA1 (Nelson and Chen,
2008; Stringer et al., 2011; Martuzzi et al., 2014), an overlap between finger representations,
similar to that observed in electrophysiological studies, has been found in the human SI using
fMRI (Maldjian et al., 1999; Krause et al., 2001; Besle et al., 2013b; Martuzzi et al., 2014) and
optical imaging techniques (see Figure 16a; Cannestra et al., 1998; Sato et al., 2005). Usually,
the largest overlap is observed between neighbouring fingers, but some overlap also occurs
between non-adjacent fingers (Kurth et al., 2000; Krause et al., 2001; Besle et al., 2013b;
Martuzzi et al., 2014), and these overlaps have been reported within the three BAs (Krause et
al., 2001; Besle et al., 2013b; Martuzzi et al., 2014). Note that, while the degree of overlap has
been found to be correlated with stimulus intensity, it is not affected by correlation thresholds,
which makes it consistent and argues against an unspecific 'spillover effect' (Krause et al.,
2001).
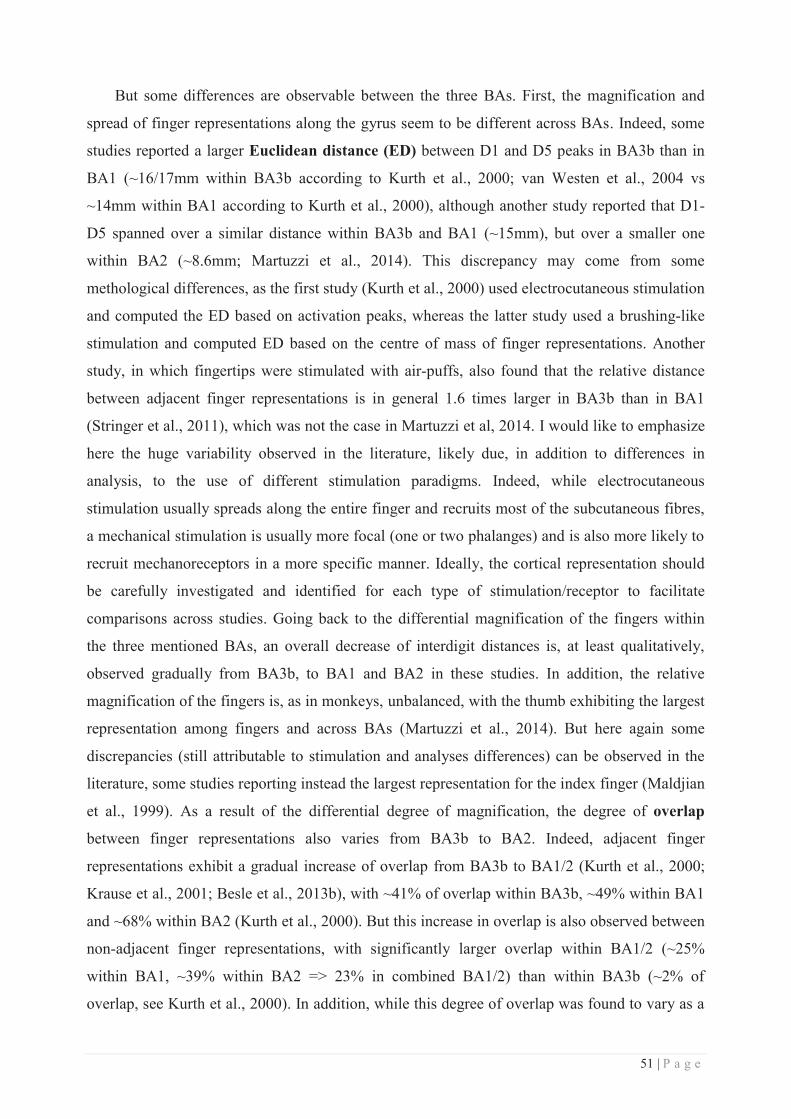
51 | P a g e
But some differences are observable between the three BAs. First, the magnification and
spread of finger representations along the gyrus seem to be different across BAs. Indeed, some
studies reported a larger Euclidean distance (ED) between D1 and D5 peaks in BA3b than in
BA1 (~16/17mm within BA3b according to Kurth et al., 2000; van Westen et al., 2004 vs
~14mm within BA1 according to Kurth et al., 2000), although another study reported that D1-
D5 spanned over a similar distance within BA3b and BA1 (~15mm), but over a smaller one
within BA2 (~8.6mm; Martuzzi et al., 2014). This discrepancy may come from some
methological differences, as the first study (Kurth et al., 2000) used electrocutaneous stimulation
and computed the ED based on activation peaks, whereas the latter study used a brushing-like
stimulation and computed ED based on the centre of mass of finger representations. Another
study, in which fingertips were stimulated with air-puffs, also found that the relative distance
between adjacent finger representations is in general 1.6 times larger in BA3b than in BA1
(Stringer et al., 2011), which was not the case in Martuzzi et al, 2014. I would like to emphasize
here the huge variability observed in the literature, likely due, in addition to differences in
analysis, to the use of different stimulation paradigms. Indeed, while electrocutaneous
stimulation usually spreads along the entire finger and recruits most of the subcutaneous fibres,
a mechanical stimulation is usually more focal (one or two phalanges) and is also more likely to
recruit mechanoreceptors in a more specific manner. Ideally, the cortical representation should
be carefully investigated and identified for each type of stimulation/receptor to facilitate
comparisons across studies. Going back to the differential magnification of the fingers within
the three mentioned BAs, an overall decrease of interdigit distances is, at least qualitatively,
observed gradually from BA3b, to BA1 and BA2 in these studies. In addition, the relative
magnification of the fingers is, as in monkeys, unbalanced, with the thumb exhibiting the largest
representation among fingers and across BAs (Martuzzi et al., 2014). But here again some
discrepancies (still attributable to stimulation and analyses differences) can be observed in the
literature, some studies reporting instead the largest representation for the index finger (Maldjian
et al., 1999). As a result of the differential degree of magnification, the degree of overlap
between finger representations also varies from BA3b to BA2. Indeed, adjacent finger
representations exhibit a gradual increase of overlap from BA3b to BA1/2 (Kurth et al., 2000;
Krause et al., 2001; Besle et al., 2013b), with ~41% of overlap within BA3b, ~49% within BA1
and ~68% within BA2 (Kurth et al., 2000). But this increase in overlap is also observed between
non-adjacent finger representations, with significantly larger overlap within BA1/2 (~25%
within BA1, ~39% within BA2 => 23% in combined BA1/2) than within BA3b (~2% of
overlap, see Kurth et al., 2000). In addition, while this degree of overlap was found to vary as a
52 | P a g e
function of stimulation intensity (Krause et al, 2001), its relative proportion is independent of
the threshold used to compute the maps (Krause et al., 2001), and is not driven by extra-vascular
contributions (Besle et al., 2013b), which goes against the idea that these overlaps are
artefactual. Along this line, another type of analysis revealed that while a high specificity was
observed within BA3b, the finger representations within BA1 and BA2 also strongly respond to
adjacent fingers, with their response decreasing gradually with distance between fingers
(Martuzzi et al., 2014). This gradual increase of overlap and thus decrease of specificity is
coherent with the increase in RF complexity from BA3b to BA1 and B2 reported in
electrophysiological studies in monkeys (see section III.c. of this chapter).
Figure 16 [from Sato et al., 2005]. Functional maps of fingers (a) and face (b) representations in the left somatosensory cortex (BA1) of four patients during surgical removal of tumors. The optical response areas evoked by transcutaneous electrical stimulation of each finger (D1, D2, D3, D4, D5) and trigeminal nerve branches (V1: supraorbital, V2: zygomaticofacial, V3: mental) are displayed on the vascular image of each patient’s brain.
Going into a more refined mapping of the fingers/hand, several studies took advantage of
the high spatial resolution of fMRI to investigate the cortical representation of the different
phalanges and bases of each finger (Blankenburg et al., 2003a; Overduin and Servos, 2004;
Schweisfurth et al., 2011, 2014; Sánchez-Panchuelo et al., 2012, 2014), as well as the palm
(Blankenburg et al., 2003a), and looked at their relative distribution. These studies yielded
somewhat different results. Some of them revealed a consistent somatotopic organization of the
different phalanges along the anteroposterior axis, orthogonally oriented compared to the
53 | P a g e
“between-digit” maps (Blankenburg et al., 2003a; Sánchez-Panchuelo et al., 2012, 2014). From
posterior to anterior, the representation of the finger is from base to tip within BA2 and BA3b,
and reverses at the border with the neighbouring BA1 and BA3a, where it is represented from
tip to base (see Figure 17). This result is in agreement with the electrophysiological literature
showing a similar sequential organization in mirror-image of finger representations across BAs
(e.g., Merzenich et al., 1978; Nelson et al., 1980). However, another group analyzed individual
maps elicited by tactile stimulation of the three phalanges and the base of each finger of the right
hand and found that among all the digits, only D5 exhibited a somatotopic organization of its
phalanges within BA3b, with the base of D5 being consistently located medial to its fingertip,
whereas no consistent pattern of organization was found for any of the other fingers
(Schweisfurth et al., 2011, 2014). Another study mapped the three phalanges of D1, D2 and D4,
but they performed only individual analyses without evaluating the existence of a consistent
somatotopy across-subjects due to difficulties in map interpretation caused by limitations in
cortical surface sampling (Overduin and Servos, 2004).
MEG also features a high spatial resolution, which allows the localization of dipole sources
on the scale of millimetres. However, its intrinsic properties make MEG able to detect only
fields oriented tangentially to the scalp (i.e., corresponding to a current oriented orthogonally to
the scalp). Thus within the SI area, MEG is likely to detect mainly the activity arising from
BA3b. As with fMRI, contradictory results have been reported regarding the distal-to-proximal
distribution of the phalange representations. For instance, while no significant ordering was
reported in two studies by Hashimoto et al. (1999a, 1999b), Hlushchuk et al. (2004) found, in
agreement with electrophysiology studies and both Blankenburg et al, 2003 and Sanchez-
Panchuelo et al, 2014, the proximal phalanx of D2 to be represented superior to its distal one.
Yet, another study localized the third phalanx of D3 lateral to that of the first phalanx (Tanosaki
and Hashimoto, 2004).
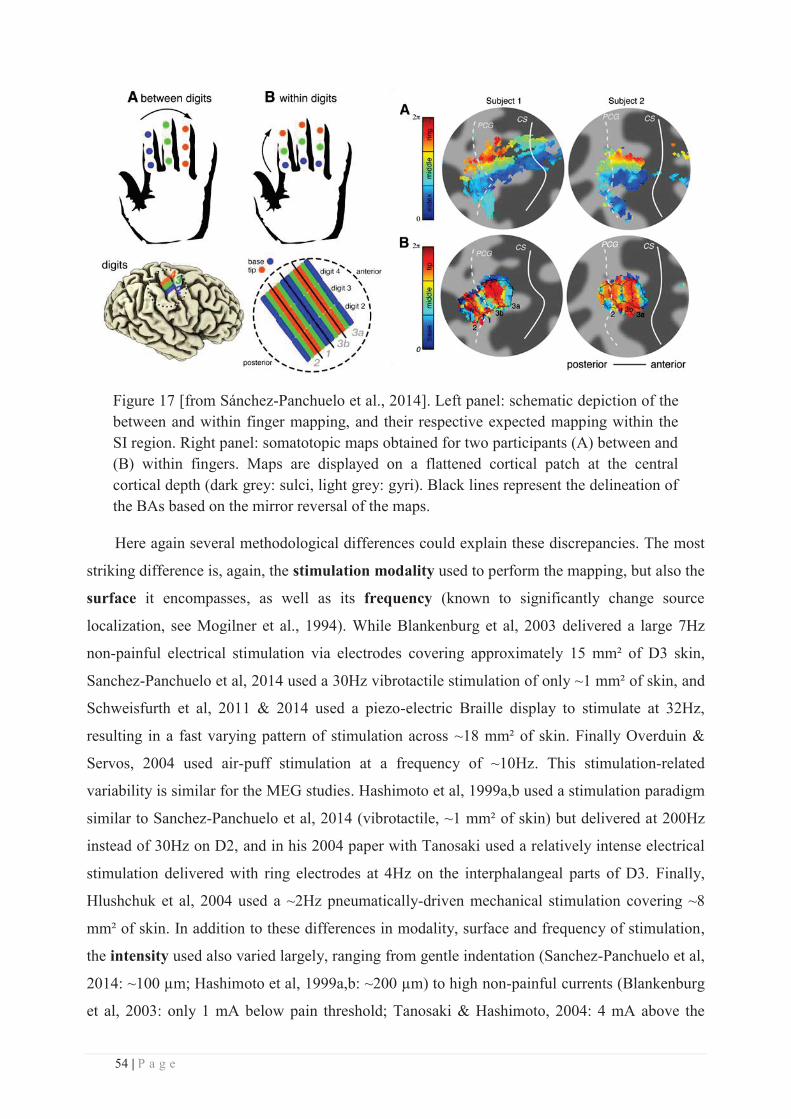
54 | P a g e
Figure 17 [from Sánchez-Panchuelo et al., 2014]. Left panel: schematic depiction of the between and within finger mapping, and their respective expected mapping within the SI region. Right panel: somatotopic maps obtained for two participants (A) between and (B) within fingers. Maps are displayed on a flattened cortical patch at the central cortical depth (dark grey: sulci, light grey: gyri). Black lines represent the delineation of the BAs based on the mirror reversal of the maps.
Here again several methodological differences could explain these discrepancies. The most
striking difference is, again, the stimulation modality used to perform the mapping, but also the
surface it encompasses, as well as its frequency (known to significantly change source
localization, see Mogilner et al., 1994). While Blankenburg et al, 2003 delivered a large 7Hz
non-painful electrical stimulation via electrodes covering approximately 15 mm² of D3 skin,
Sanchez-Panchuelo et al, 2014 used a 30Hz vibrotactile stimulation of only ~1 mm² of skin, and
Schweisfurth et al, 2011 & 2014 used a piezo-electric Braille display to stimulate at 32Hz,
resulting in a fast varying pattern of stimulation across ~18 mm² of skin. Finally Overduin &
Servos, 2004 used air-puff stimulation at a frequency of ~10Hz. This stimulation-related
variability is similar for the MEG studies. Hashimoto et al, 1999a,b used a stimulation paradigm
similar to Sanchez-Panchuelo et al, 2014 (vibrotactile, ~1 mm² of skin) but delivered at 200Hz
instead of 30Hz on D2, and in his 2004 paper with Tanosaki used a relatively intense electrical
stimulation delivered with ring electrodes at 4Hz on the interphalangeal parts of D3. Finally,
Hlushchuk et al, 2004 used a ~2Hz pneumatically-driven mechanical stimulation covering ~8
mm² of skin. In addition to these differences in modality, surface and frequency of stimulation,
the intensity used also varied largely, ranging from gentle indentation (Sanchez-Panchuelo et al,
2014: ~100 μm; Hashimoto et al, 1999a,b: ~200 μm) to high non-painful currents (Blankenburg
et al, 2003: only 1 mA below pain threshold; Tanosaki & Hashimoto, 2004: 4 mA above the
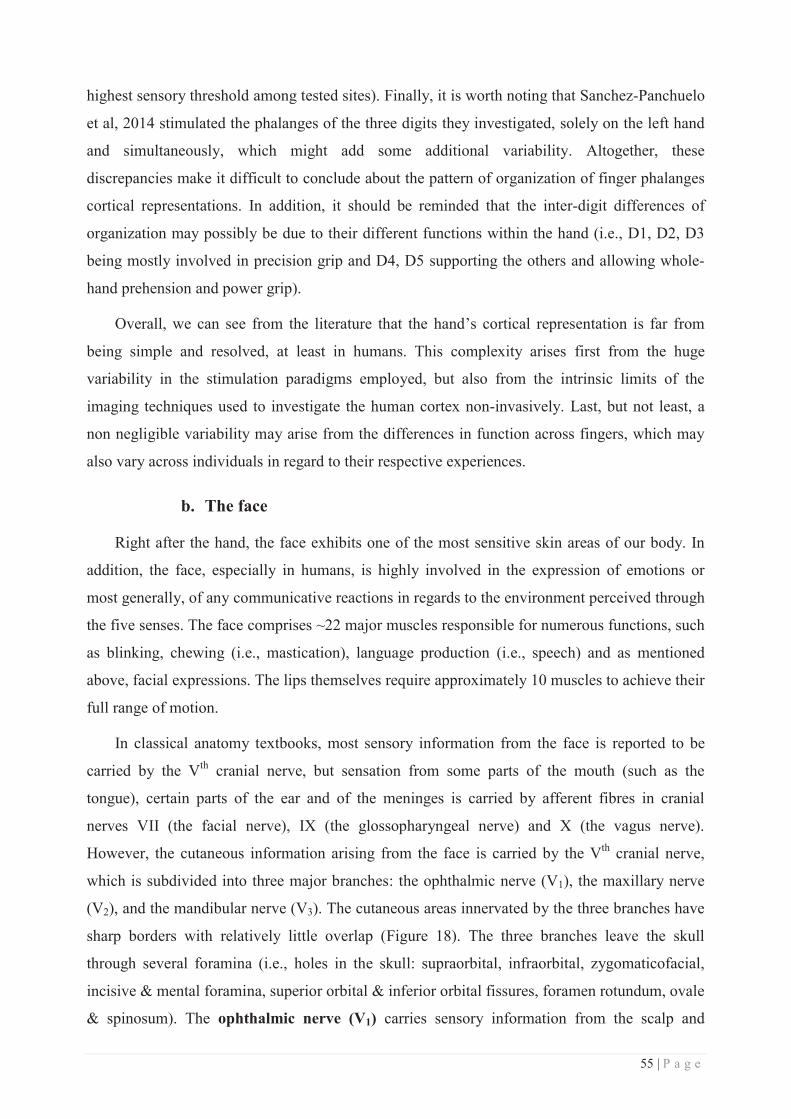
55 | P a g e
highest sensory threshold among tested sites). Finally, it is worth noting that Sanchez-Panchuelo
et al, 2014 stimulated the phalanges of the three digits they investigated, solely on the left hand
and simultaneously, which might add some additional variability. Altogether, these
discrepancies make it difficult to conclude about the pattern of organization of finger phalanges
cortical representations. In addition, it should be reminded that the inter-digit differences of
organization may possibly be due to their different functions within the hand (i.e., D1, D2, D3
being mostly involved in precision grip and D4, D5 supporting the others and allowing whole-
hand prehension and power grip).
Overall, we can see from the literature that the hand’s cortical representation is far from
being simple and resolved, at least in humans. This complexity arises first from the huge
variability in the stimulation paradigms employed, but also from the intrinsic limits of the
imaging techniques used to investigate the human cortex non-invasively. Last, but not least, a
non negligible variability may arise from the differences in function across fingers, which may
also vary across individuals in regard to their respective experiences.
b. The face
Right after the hand, the face exhibits one of the most sensitive skin areas of our body. In
addition, the face, especially in humans, is highly involved in the expression of emotions or
most generally, of any communicative reactions in regards to the environment perceived through
the five senses. The face comprises ~22 major muscles responsible for numerous functions, such
as blinking, chewing (i.e., mastication), language production (i.e., speech) and as mentioned
above, facial expressions. The lips themselves require approximately 10 muscles to achieve their
full range of motion.
In classical anatomy textbooks, most sensory information from the face is reported to be
carried by the Vth cranial nerve, but sensation from some parts of the mouth (such as the
tongue), certain parts of the ear and of the meninges is carried by afferent fibres in cranial
nerves VII (the facial nerve), IX (the glossopharyngeal nerve) and X (the vagus nerve).
However, the cutaneous information arising from the face is carried by the Vth cranial nerve,
which is subdivided into three major branches: the ophthalmic nerve (V1), the maxillary nerve
(V2), and the mandibular nerve (V3). The cutaneous areas innervated by the three branches have
sharp borders with relatively little overlap (Figure 18). The three branches leave the skull
through several foramina (i.e., holes in the skull: supraorbital, infraorbital, zygomaticofacial,
incisive & mental foramina, superior orbital & inferior orbital fissures, foramen rotundum, ovale
& spinosum). The ophthalmic nerve (V1) carries sensory information from the scalp and
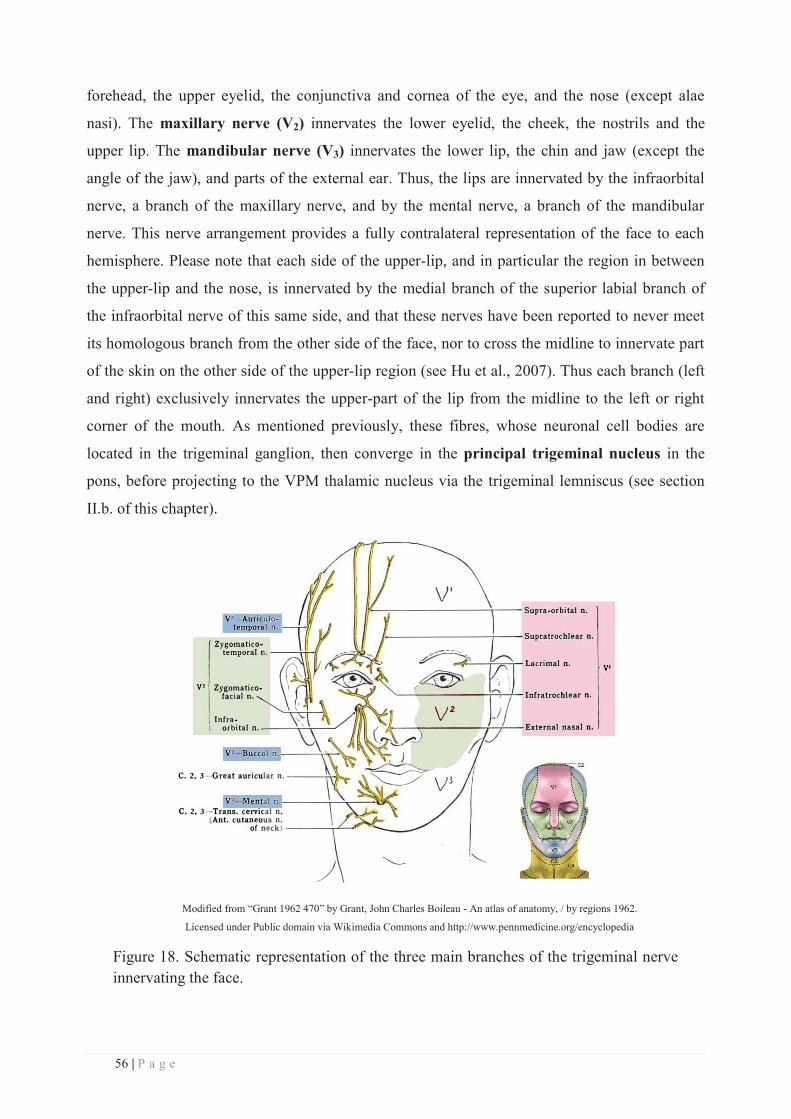
56 | P a g e
forehead, the upper eyelid, the conjunctiva and cornea of the eye, and the nose (except alae
nasi). The maxillary nerve (V2) innervates the lower eyelid, the cheek, the nostrils and the
upper lip. The mandibular nerve (V3) innervates the lower lip, the chin and jaw (except the
angle of the jaw), and parts of the external ear. Thus, the lips are innervated by the infraorbital
nerve, a branch of the maxillary nerve, and by the mental nerve, a branch of the mandibular
nerve. This nerve arrangement provides a fully contralateral representation of the face to each
hemisphere. Please note that each side of the upper-lip, and in particular the region in between
the upper-lip and the nose, is innervated by the medial branch of the superior labial branch of
the infraorbital nerve of this same side, and that these nerves have been reported to never meet
its homologous branch from the other side of the face, nor to cross the midline to innervate part
of the skin on the other side of the upper-lip region (see Hu et al., 2007). Thus each branch (left
and right) exclusively innervates the upper-part of the lip from the midline to the left or right
corner of the mouth. As mentioned previously, these fibres, whose neuronal cell bodies are
located in the trigeminal ganglion, then converge in the principal trigeminal nucleus in the
pons, before projecting to the VPM thalamic nucleus via the trigeminal lemniscus (see section
II.b. of this chapter).
Modified from “Grant 1962 470” by Grant, John Charles Boileau - An atlas of anatomy, / by regions 1962.
Licensed under Public domain via Wikimedia Commons and http://www.pennmedicine.org/encyclopedia
Figure 18. Schematic representation of the three main branches of the trigeminal nerve innervating the face.
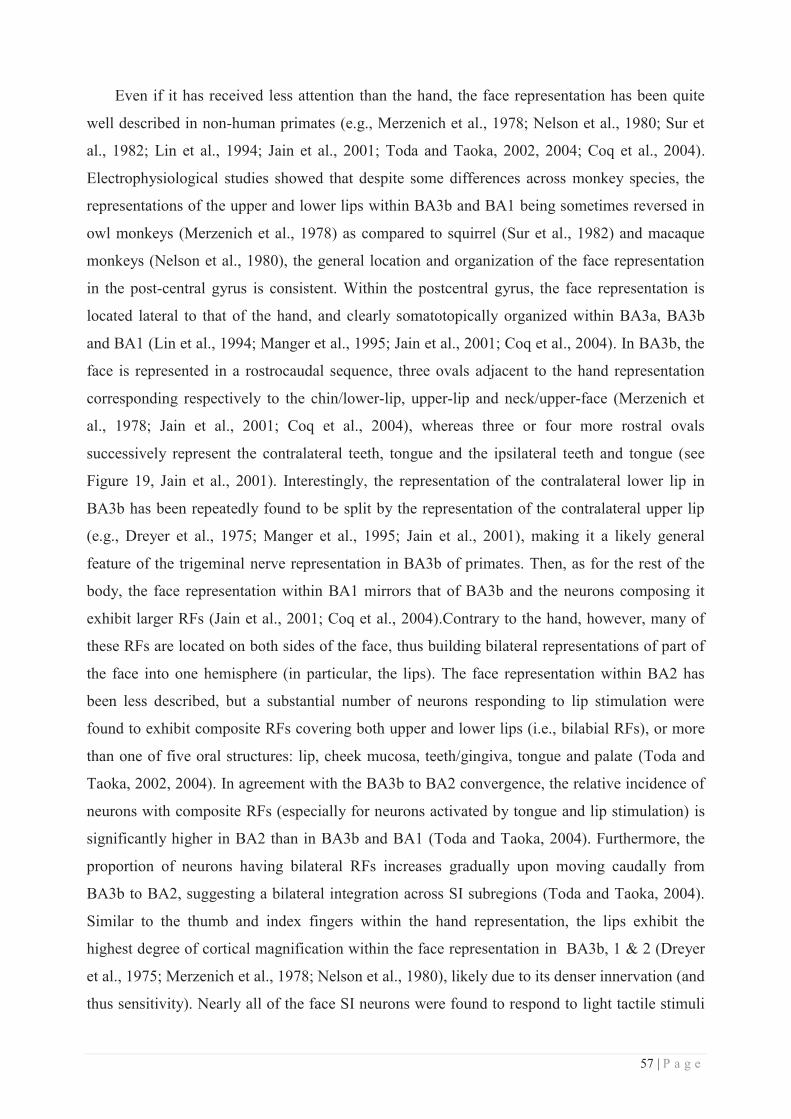
57 | P a g e
Even if it has received less attention than the hand, the face representation has been quite
well described in non-human primates (e.g., Merzenich et al., 1978; Nelson et al., 1980; Sur et
al., 1982; Lin et al., 1994; Jain et al., 2001; Toda and Taoka, 2002, 2004; Coq et al., 2004).
Electrophysiological studies showed that despite some differences across monkey species, the
representations of the upper and lower lips within BA3b and BA1 being sometimes reversed in
owl monkeys (Merzenich et al., 1978) as compared to squirrel (Sur et al., 1982) and macaque
monkeys (Nelson et al., 1980), the general location and organization of the face representation
in the post-central gyrus is consistent. Within the postcentral gyrus, the face representation is
located lateral to that of the hand, and clearly somatotopically organized within BA3a, BA3b
and BA1 (Lin et al., 1994; Manger et al., 1995; Jain et al., 2001; Coq et al., 2004). In BA3b, the
face is represented in a rostrocaudal sequence, three ovals adjacent to the hand representation
corresponding respectively to the chin/lower-lip, upper-lip and neck/upper-face (Merzenich et
al., 1978; Jain et al., 2001; Coq et al., 2004), whereas three or four more rostral ovals
successively represent the contralateral teeth, tongue and the ipsilateral teeth and tongue (see
Figure 19, Jain et al., 2001). Interestingly, the representation of the contralateral lower lip in
BA3b has been repeatedly found to be split by the representation of the contralateral upper lip
(e.g., Dreyer et al., 1975; Manger et al., 1995; Jain et al., 2001), making it a likely general
feature of the trigeminal nerve representation in BA3b of primates. Then, as for the rest of the
body, the face representation within BA1 mirrors that of BA3b and the neurons composing it
exhibit larger RFs (Jain et al., 2001; Coq et al., 2004).Contrary to the hand, however, many of
these RFs are located on both sides of the face, thus building bilateral representations of part of
the face into one hemisphere (in particular, the lips). The face representation within BA2 has
been less described, but a substantial number of neurons responding to lip stimulation were
found to exhibit composite RFs covering both upper and lower lips (i.e., bilabial RFs), or more
than one of five oral structures: lip, cheek mucosa, teeth/gingiva, tongue and palate (Toda and
Taoka, 2002, 2004). In agreement with the BA3b to BA2 convergence, the relative incidence of
neurons with composite RFs (especially for neurons activated by tongue and lip stimulation) is
significantly higher in BA2 than in BA3b and BA1 (Toda and Taoka, 2004). Furthermore, the
proportion of neurons having bilateral RFs increases gradually upon moving caudally from
BA3b to BA2, suggesting a bilateral integration across SI subregions (Toda and Taoka, 2004).
Similar to the thumb and index fingers within the hand representation, the lips exhibit the
highest degree of cortical magnification within the face representation in BA3b, 1 & 2 (Dreyer
et al., 1975; Merzenich et al., 1978; Nelson et al., 1980), likely due to its denser innervation (and
thus sensitivity). Nearly all of the face SI neurons were found to respond to light tactile stimuli
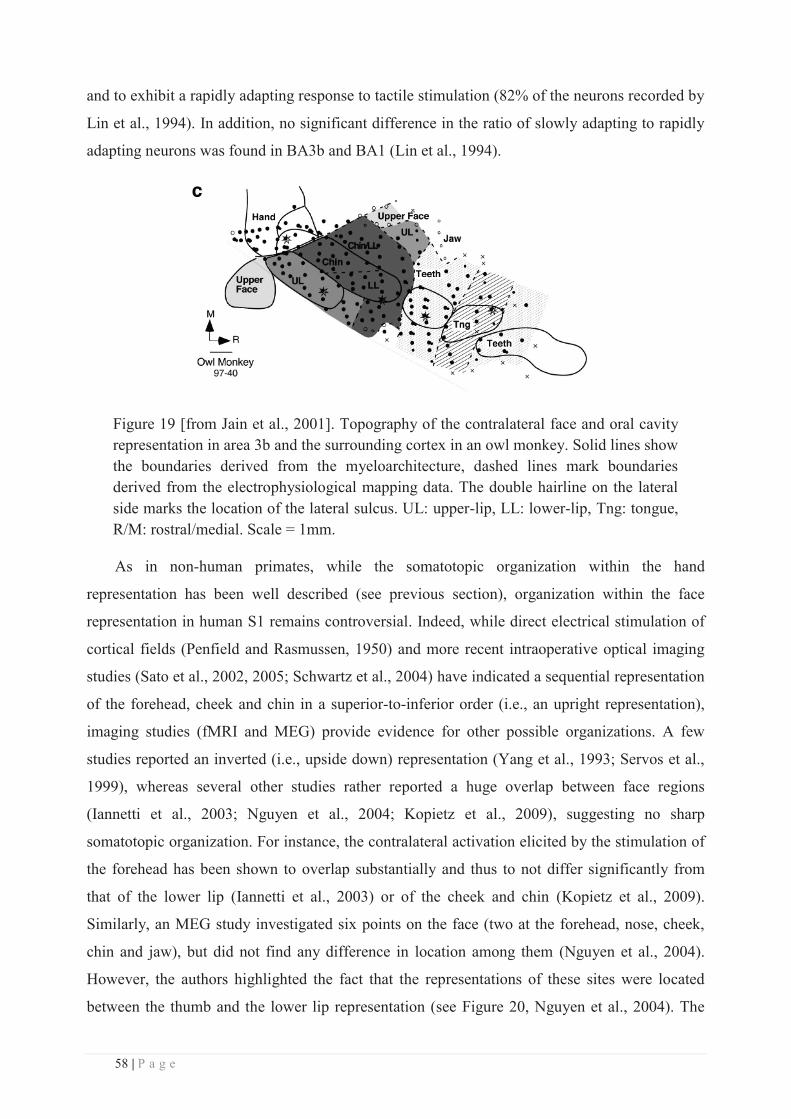
58 | P a g e
and to exhibit a rapidly adapting response to tactile stimulation (82% of the neurons recorded by
Lin et al., 1994). In addition, no significant difference in the ratio of slowly adapting to rapidly
adapting neurons was found in BA3b and BA1 (Lin et al., 1994).
Figure 19 [from Jain et al., 2001]. Topography of the contralateral face and oral cavity representation in area 3b and the surrounding cortex in an owl monkey. Solid lines show the boundaries derived from the myeloarchitecture, dashed lines mark boundaries derived from the electrophysiological mapping data. The double hairline on the lateral side marks the location of the lateral sulcus. UL: upper-lip, LL: lower-lip, Tng: tongue, R/M: rostral/medial. Scale = 1mm.
As in non-human primates, while the somatotopic organization within the hand
representation has been well described (see previous section), organization within the face
representation in human S1 remains controversial. Indeed, while direct electrical stimulation of
cortical fields (Penfield and Rasmussen, 1950) and more recent intraoperative optical imaging
studies (Sato et al., 2002, 2005; Schwartz et al., 2004) have indicated a sequential representation
of the forehead, cheek and chin in a superior-to-inferior order (i.e., an upright representation),
imaging studies (fMRI and MEG) provide evidence for other possible organizations. A few
studies reported an inverted (i.e., upside down) representation (Yang et al., 1993; Servos et al.,
1999), whereas several other studies rather reported a huge overlap between face regions
(Iannetti et al., 2003; Nguyen et al., 2004; Kopietz et al., 2009), suggesting no sharp
somatotopic organization. For instance, the contralateral activation elicited by the stimulation of
the forehead has been shown to overlap substantially and thus to not differ significantly from
that of the lower lip (Iannetti et al., 2003) or of the cheek and chin (Kopietz et al., 2009).
Similarly, an MEG study investigated six points on the face (two at the forehead, nose, cheek,
chin and jaw), but did not find any difference in location among them (Nguyen et al., 2004).
However, the authors highlighted the fact that the representations of these sites were located
between the thumb and the lower lip representation (see Figure 20, Nguyen et al., 2004). The
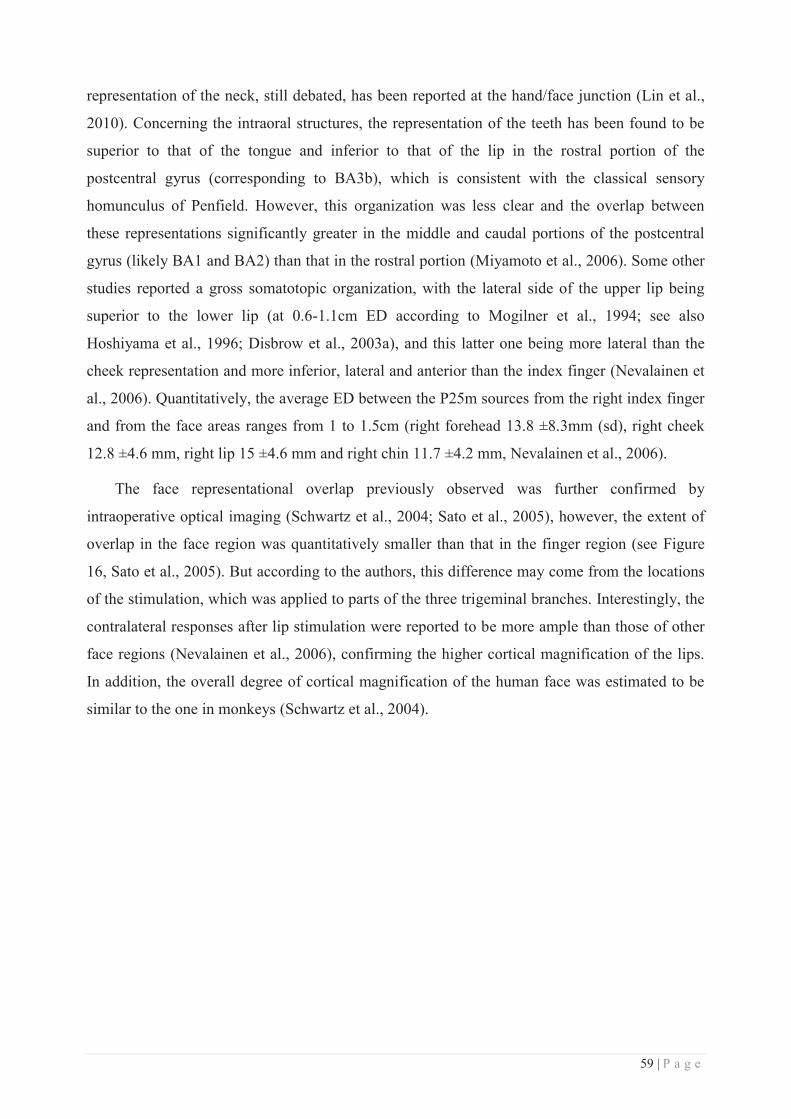
59 | P a g e
representation of the neck, still debated, has been reported at the hand/face junction (Lin et al.,
2010). Concerning the intraoral structures, the representation of the teeth has been found to be
superior to that of the tongue and inferior to that of the lip in the rostral portion of the
postcentral gyrus (corresponding to BA3b), which is consistent with the classical sensory
homunculus of Penfield. However, this organization was less clear and the overlap between
these representations significantly greater in the middle and caudal portions of the postcentral
gyrus (likely BA1 and BA2) than that in the rostral portion (Miyamoto et al., 2006). Some other
studies reported a gross somatotopic organization, with the lateral side of the upper lip being
superior to the lower lip (at 0.6-1.1cm ED according to Mogilner et al., 1994; see also
Hoshiyama et al., 1996; Disbrow et al., 2003a), and this latter one being more lateral than the
cheek representation and more inferior, lateral and anterior than the index finger (Nevalainen et
al., 2006). Quantitatively, the average ED between the P25m sources from the right index finger
and from the face areas ranges from 1 to 1.5cm (right forehead 13.8 ±8.3mm (sd), right cheek
12.8 ±4.6 mm, right lip 15 ±4.6 mm and right chin 11.7 ±4.2 mm, Nevalainen et al., 2006).
The face representational overlap previously observed was further confirmed by
intraoperative optical imaging (Schwartz et al., 2004; Sato et al., 2005), however, the extent of
overlap in the face region was quantitatively smaller than that in the finger region (see Figure
16, Sato et al., 2005). But according to the authors, this difference may come from the locations
of the stimulation, which was applied to parts of the three trigeminal branches. Interestingly, the
contralateral responses after lip stimulation were reported to be more ample than those of other
face regions (Nevalainen et al., 2006), confirming the higher cortical magnification of the lips.
In addition, the overall degree of cortical magnification of the human face was estimated to be
similar to the one in monkeys (Schwartz et al., 2004).
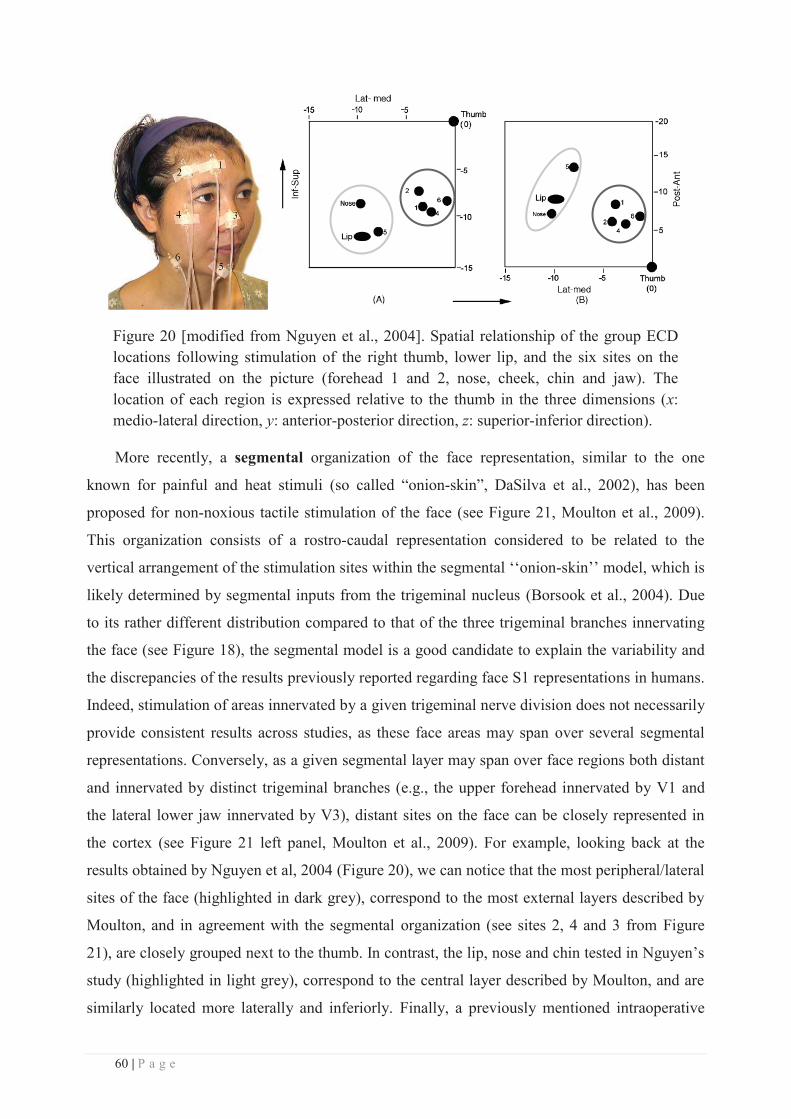
60 | P a g e
Figure 20 [modified from Nguyen et al., 2004]. Spatial relationship of the group ECD locations following stimulation of the right thumb, lower lip, and the six sites on the face illustrated on the picture (forehead 1 and 2, nose, cheek, chin and jaw). The location of each region is expressed relative to the thumb in the three dimensions (x: medio-lateral direction, y: anterior-posterior direction, z: superior-inferior direction).
More recently, a segmental organization of the face representation, similar to the one
known for painful and heat stimuli (so called “onion-skin”, DaSilva et al., 2002), has been
proposed for non-noxious tactile stimulation of the face (see Figure 21, Moulton et al., 2009).
This organization consists of a rostro-caudal representation considered to be related to the
vertical arrangement of the stimulation sites within the segmental ‘‘onion-skin’’ model, which is
likely determined by segmental inputs from the trigeminal nucleus (Borsook et al., 2004). Due
to its rather different distribution compared to that of the three trigeminal branches innervating
the face (see Figure 18), the segmental model is a good candidate to explain the variability and
the discrepancies of the results previously reported regarding face S1 representations in humans.
Indeed, stimulation of areas innervated by a given trigeminal nerve division does not necessarily
provide consistent results across studies, as these face areas may span over several segmental
representations. Conversely, as a given segmental layer may span over face regions both distant
and innervated by distinct trigeminal branches (e.g., the upper forehead innervated by V1 and
the lateral lower jaw innervated by V3), distant sites on the face can be closely represented in
the cortex (see Figure 21 left panel, Moulton et al., 2009). For example, looking back at the
results obtained by Nguyen et al, 2004 (Figure 20), we can notice that the most peripheral/lateral
sites of the face (highlighted in dark grey), correspond to the most external layers described by
Moulton, and in agreement with the segmental organization (see sites 2, 4 and 3 from Figure
21), are closely grouped next to the thumb. In contrast, the lip, nose and chin tested in Nguyen’s
study (highlighted in light grey), correspond to the central layer described by Moulton, and are
similarly located more laterally and inferiorly. Finally, a previously mentioned intraoperative
61 | P a g e
optical imaging study reported a high overlap between peri-orbital and peri-buccal regions of the
face (see Figure 21 right panel, Schwartz et al., 2004), which could correspond to the same layer
of the segmental distribution, thus possibly explaining their overlap.
Figure 21. Left panel [from Moulton et al., 2009]: Schematic segmental representation of the face observed in SI. The black/white dots represent positive activation peaks identified for each stimulation site for the group. Dashed lines in the concentric ovals indicate putative extrapolated segmental boundaries. Right panel [from Schwartz et al., 2004]: Cortical representations obtained by intraoperative optical imaging of the peri-orbital (green) and peri-buccal (red) sites, whose stimulation location is illustrated on the schema. Activations are displayed on blood vessel map. Bar = 5mm.
Even if a more systematic mapping of the face regions has to be done to confirm this
segmental organization, a few electrophysiological studies in monkeys have found a similar
pattern of organization within SI subregions (BA3a, 3b, 1 & 2), with the midline of the face
represented from top to bottom (i.e., from forehead to mental) along the mediolateral axis, and
the more lateral parts of the face represented following concentric-like patterns along the
anteroposterior axis (see Figure 22, Dreyer et al., 1975), more recently confirmed within BA3b
(Manger et al., 1996).
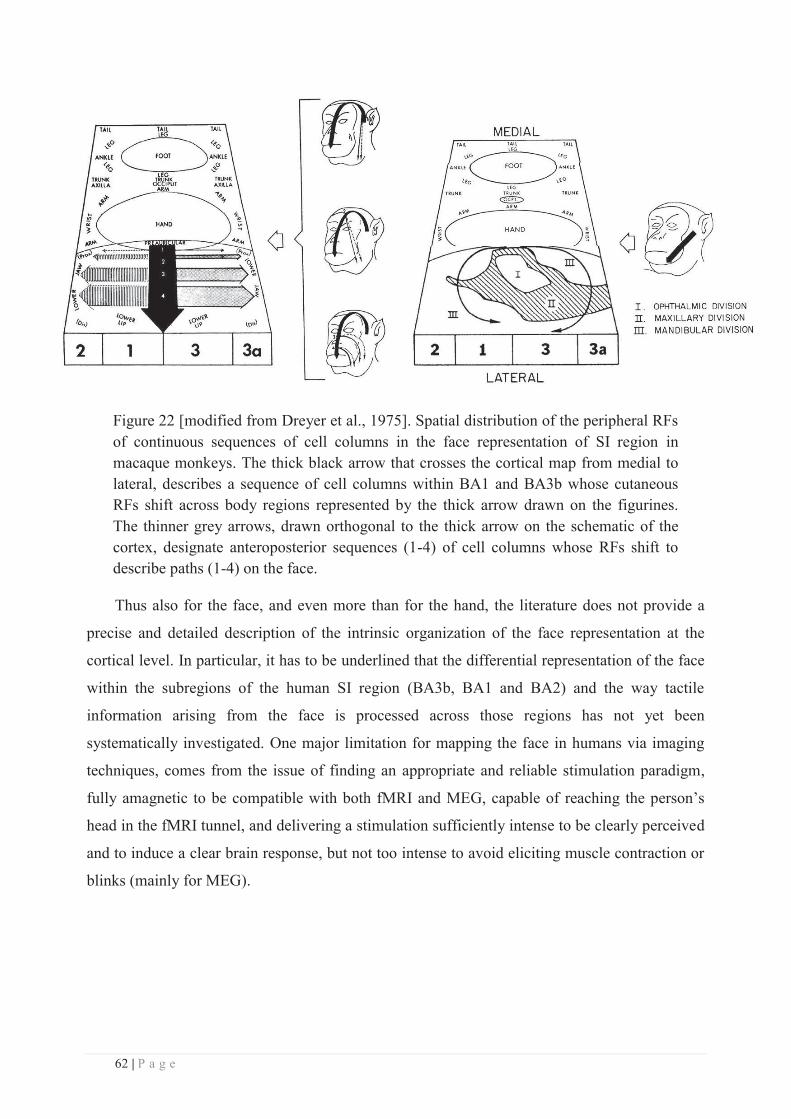
62 | P a g e
Figure 22 [modified from Dreyer et al., 1975]. Spatial distribution of the peripheral RFs of continuous sequences of cell columns in the face representation of SI region in macaque monkeys. The thick black arrow that crosses the cortical map from medial to lateral, describes a sequence of cell columns within BA1 and BA3b whose cutaneous RFs shift across body regions represented by the thick arrow drawn on the figurines. The thinner grey arrows, drawn orthogonal to the thick arrow on the schematic of the cortex, designate anteroposterior sequences (1-4) of cell columns whose RFs shift to describe paths (1-4) on the face.
Thus also for the face, and even more than for the hand, the literature does not provide a
precise and detailed description of the intrinsic organization of the face representation at the
cortical level. In particular, it has to be underlined that the differential representation of the face
within the subregions of the human SI region (BA3b, BA1 and BA2) and the way tactile
information arising from the face is processed across those regions has not yet been
systematically investigated. One major limitation for mapping the face in humans via imaging
techniques, comes from the issue of finding an appropriate and reliable stimulation paradigm,
fully amagnetic to be compatible with both fMRI and MEG, capable of reaching the person’s
head in the fMRI tunnel, and delivering a stimulation sufficiently intense to be clearly perceived
and to induce a clear brain response, but not too intense to avoid eliciting muscle contraction or
blinks (mainly for MEG).
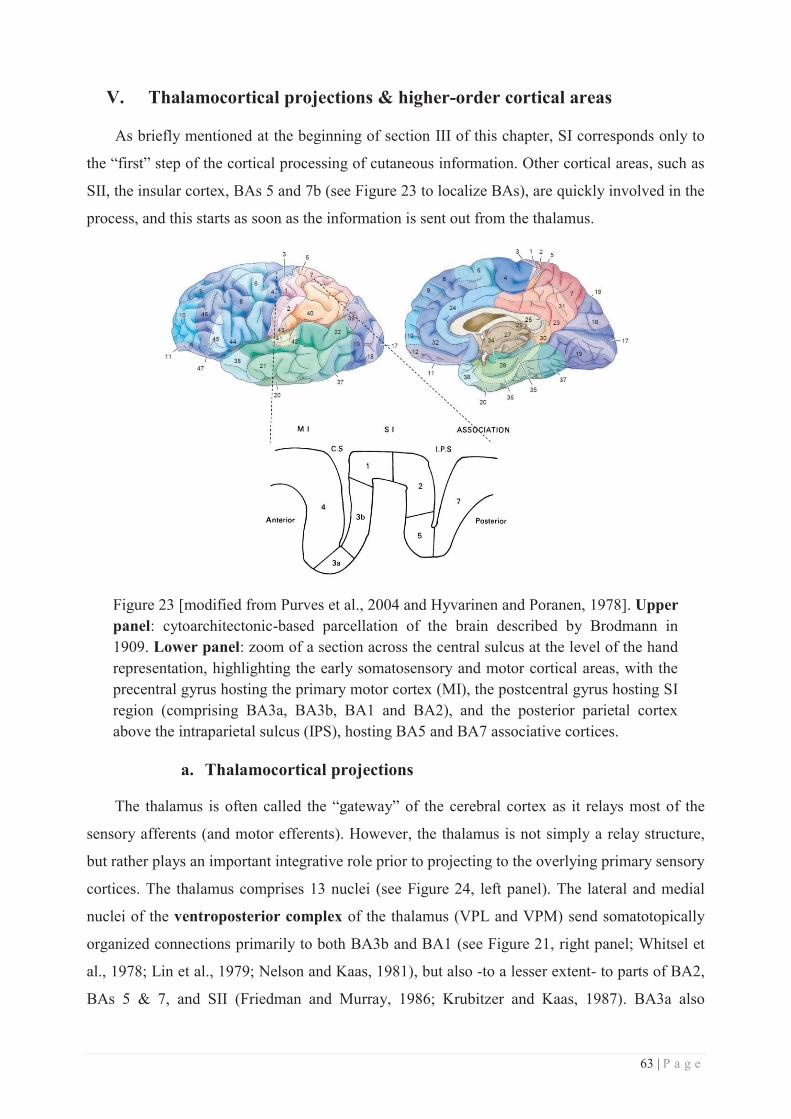
63 | P a g e
V. Thalamocortical projections & higher-order cortical areas
As briefly mentioned at the beginning of section III of this chapter, SI corresponds only to
the “first” step of the cortical processing of cutaneous information. Other cortical areas, such as
SII, the insular cortex, BAs 5 and 7b (see Figure 23 to localize BAs), are quickly involved in the
process, and this starts as soon as the information is sent out from the thalamus.
Figure 23 [modified from Purves et al., 2004 and Hyvarinen and Poranen, 1978]. Upper panel: cytoarchitectonic-based parcellation of the brain described by Brodmann in 1909. Lower panel: zoom of a section across the central sulcus at the level of the hand representation, highlighting the early somatosensory and motor cortical areas, with the precentral gyrus hosting the primary motor cortex (MI), the postcentral gyrus hosting SI region (comprising BA3a, BA3b, BA1 and BA2), and the posterior parietal cortex above the intraparietal sulcus (IPS), hosting BA5 and BA7 associative cortices.
a. Thalamocortical projections
The thalamus is often called the “gateway” of the cerebral cortex as it relays most of the
sensory afferents (and motor efferents). However, the thalamus is not simply a relay structure,
but rather plays an important integrative role prior to projecting to the overlying primary sensory
cortices. The thalamus comprises 13 nuclei (see Figure 24, left panel). The lateral and medial
nuclei of the ventroposterior complex of the thalamus (VPL and VPM) send somatotopically
organized connections primarily to both BA3b and BA1 (see Figure 21, right panel; Whitsel et
al., 1978; Lin et al., 1979; Nelson and Kaas, 1981), but also -to a lesser extent- to parts of BA2,
BAs 5 & 7, and SII (Friedman and Murray, 1986; Krubitzer and Kaas, 1987). BA3a also
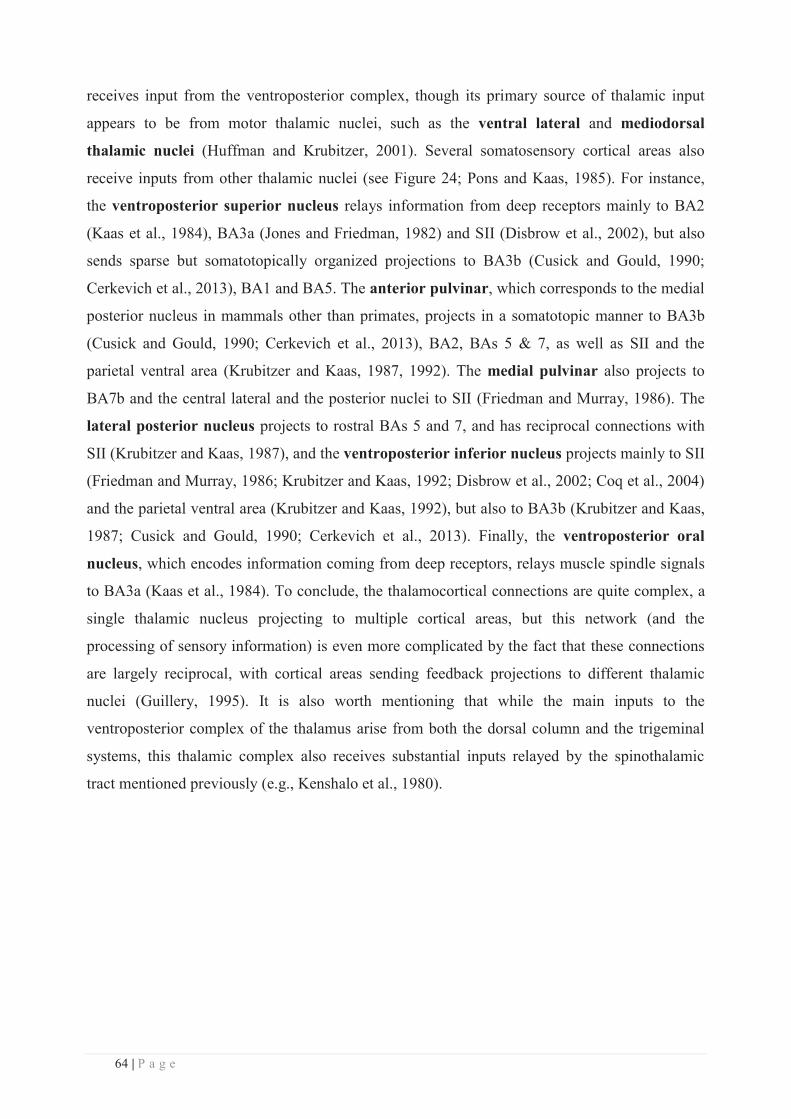
64 | P a g e
receives input from the ventroposterior complex, though its primary source of thalamic input
appears to be from motor thalamic nuclei, such as the ventral lateral and mediodorsal
thalamic nuclei (Huffman and Krubitzer, 2001). Several somatosensory cortical areas also
receive inputs from other thalamic nuclei (see Figure 24; Pons and Kaas, 1985). For instance,
the ventroposterior superior nucleus relays information from deep receptors mainly to BA2
(Kaas et al., 1984), BA3a (Jones and Friedman, 1982) and SII (Disbrow et al., 2002), but also
sends sparse but somatotopically organized projections to BA3b (Cusick and Gould, 1990;
Cerkevich et al., 2013), BA1 and BA5. The anterior pulvinar, which corresponds to the medial
posterior nucleus in mammals other than primates, projects in a somatotopic manner to BA3b
(Cusick and Gould, 1990; Cerkevich et al., 2013), BA2, BAs 5 & 7, as well as SII and the
parietal ventral area (Krubitzer and Kaas, 1987, 1992). The medial pulvinar also projects to
BA7b and the central lateral and the posterior nuclei to SII (Friedman and Murray, 1986). The
lateral posterior nucleus projects to rostral BAs 5 and 7, and has reciprocal connections with
SII (Krubitzer and Kaas, 1987), and the ventroposterior inferior nucleus projects mainly to SII
(Friedman and Murray, 1986; Krubitzer and Kaas, 1992; Disbrow et al., 2002; Coq et al., 2004)
and the parietal ventral area (Krubitzer and Kaas, 1992), but also to BA3b (Krubitzer and Kaas,
1987; Cusick and Gould, 1990; Cerkevich et al., 2013). Finally, the ventroposterior oral
nucleus, which encodes information coming from deep receptors, relays muscle spindle signals
to BA3a (Kaas et al., 1984). To conclude, the thalamocortical connections are quite complex, a
single thalamic nucleus projecting to multiple cortical areas, but this network (and the
processing of sensory information) is even more complicated by the fact that these connections
are largely reciprocal, with cortical areas sending feedback projections to different thalamic
nuclei (Guillery, 1995). It is also worth mentioning that while the main inputs to the
ventroposterior complex of the thalamus arise from both the dorsal column and the trigeminal
systems, this thalamic complex also receives substantial inputs relayed by the spinothalamic
tract mentioned previously (e.g., Kenshalo et al., 1980).
65 | P a g e
from: http://en.wikibooks.org/wiki/File:Constudthal.gif
Figure 24. Left panel: Schema of the different nuclei forming the thalamus. Right panel [from Pons and Kaas, 1985]: Some of the multiple thalamocortical connections. Solid lines indicate major projections and dashed lines represent minor connections or connections that may not project to all parts of a given field. Collaterals of neurons from a single nucleus are not represented.
b. Corticocortical projections arising from SI's subregions
Apart from the interconnectivity already mentioned within SI (see section III.c. of this
chapter), BA3b and BA1 are also reciprocally connected with SII (Jones et al., 1978; Vogt and
Pandya, 1978; Pons and Kaas, 1986; Burton et al., 1995), but BA3b projects less densely to SII
(Vogt and Pandya, 1978). While there is no evidence that BA3b is connected with the primary
motor cortex (M1) and BA5 (Jones et al., 1978; Vogt and Pandya, 1978), BA1 is also
reciprocally connected with M1, BAs 5 & 7 and the supplementary motor area (SMA) (Jones et
al., 1978; Vogt and Pandya, 1978; Pons and Kaas, 1986; Burton and Fabri, 1995). In addition,
BA3b and BA1 also project to the retroinsular area and the granular insula (Burton et al., 1995).
Finally, BA2 primarily projects to BA5, but also exhibits reciprocal connections with M1, SII,
the premotor cortex (BA6) and the SMA (Jones et al., 1978; Vogt and Pandya, 1978; Pons and
Kaas, 1986). So to summarise, SI and SII are reciprocally connected in a topographically
organized manner with each other and with M1 (Catani et al., 2012). Each of them sends further
fibres in an organized manner to the SMA and the insula, but only SI projects to BAs 5 & 7
(Jones and Powell, 1969), mainly through BA2 and BA1, which both receive inputs from BA3b.
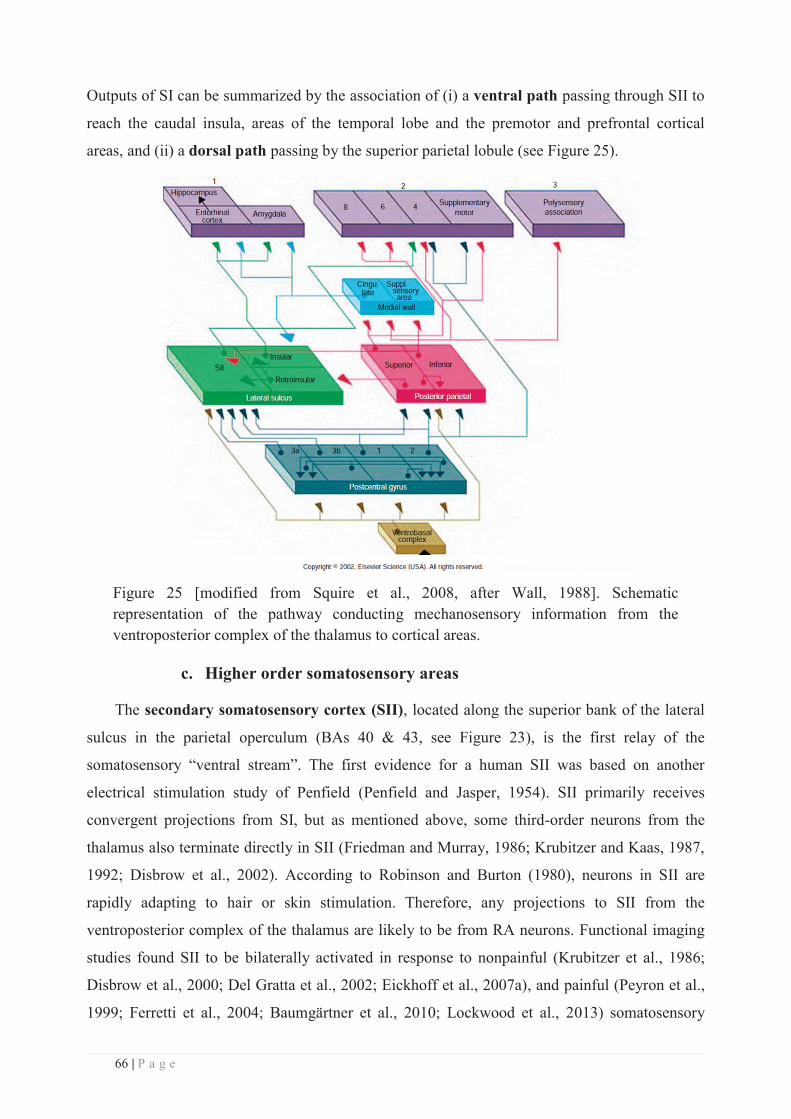
66 | P a g e
Outputs of SI can be summarized by the association of (i) a ventral path passing through SII to
reach the caudal insula, areas of the temporal lobe and the premotor and prefrontal cortical
areas, and (ii) a dorsal path passing by the superior parietal lobule (see Figure 25).
Figure 25 [modified from Squire et al., 2008, after Wall, 1988]. Schematic representation of the pathway conducting mechanosensory information from the ventroposterior complex of the thalamus to cortical areas.
c. Higher order somatosensory areas
The secondary somatosensory cortex (SII), located along the superior bank of the lateral
sulcus in the parietal operculum (BAs 40 & 43, see Figure 23), is the first relay of the
somatosensory “ventral stream”. The first evidence for a human SII was based on another
electrical stimulation study of Penfield (Penfield and Jasper, 1954). SII primarily receives
convergent projections from SI, but as mentioned above, some third-order neurons from the
thalamus also terminate directly in SII (Friedman and Murray, 1986; Krubitzer and Kaas, 1987,
1992; Disbrow et al., 2002). According to Robinson and Burton (1980), neurons in SII are
rapidly adapting to hair or skin stimulation. Therefore, any projections to SII from the
ventroposterior complex of the thalamus are likely to be from RA neurons. Functional imaging
studies found SII to be bilaterally activated in response to nonpainful (Krubitzer et al., 1986;
Disbrow et al., 2000; Del Gratta et al., 2002; Eickhoff et al., 2007a), and painful (Peyron et al.,
1999; Ferretti et al., 2004; Baumgärtner et al., 2010; Lockwood et al., 2013) somatosensory
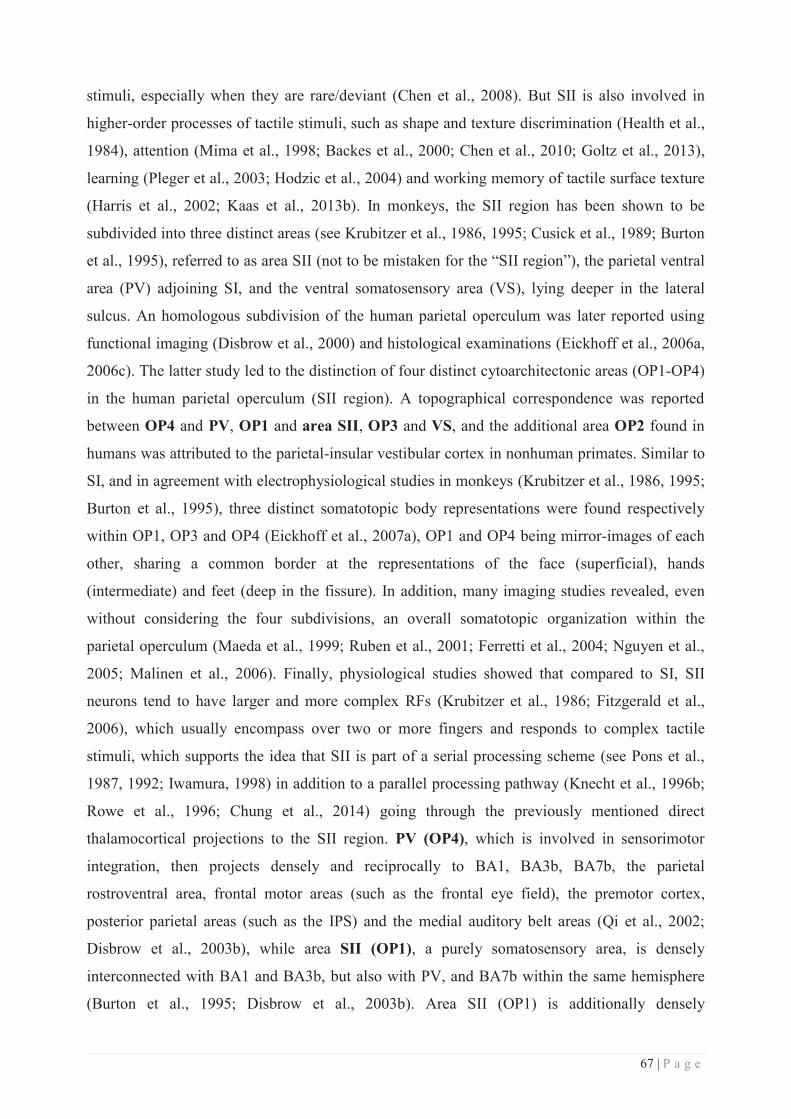
67 | P a g e
stimuli, especially when they are rare/deviant (Chen et al., 2008). But SII is also involved in
higher-order processes of tactile stimuli, such as shape and texture discrimination (Health et al.,
1984), attention (Mima et al., 1998; Backes et al., 2000; Chen et al., 2010; Goltz et al., 2013),
learning (Pleger et al., 2003; Hodzic et al., 2004) and working memory of tactile surface texture
(Harris et al., 2002; Kaas et al., 2013b). In monkeys, the SII region has been shown to be
subdivided into three distinct areas (see Krubitzer et al., 1986, 1995; Cusick et al., 1989; Burton
et al., 1995), referred to as area SII (not to be mistaken for the “SII region”), the parietal ventral
area (PV) adjoining SI, and the ventral somatosensory area (VS), lying deeper in the lateral
sulcus. An homologous subdivision of the human parietal operculum was later reported using
functional imaging (Disbrow et al., 2000) and histological examinations (Eickhoff et al., 2006a,
2006c). The latter study led to the distinction of four distinct cytoarchitectonic areas (OP1-OP4)
in the human parietal operculum (SII region). A topographical correspondence was reported
between OP4 and PV, OP1 and area SII, OP3 and VS, and the additional area OP2 found in
humans was attributed to the parietal-insular vestibular cortex in nonhuman primates. Similar to
SI, and in agreement with electrophysiological studies in monkeys (Krubitzer et al., 1986, 1995;
Burton et al., 1995), three distinct somatotopic body representations were found respectively
within OP1, OP3 and OP4 (Eickhoff et al., 2007a), OP1 and OP4 being mirror-images of each
other, sharing a common border at the representations of the face (superficial), hands
(intermediate) and feet (deep in the fissure). In addition, many imaging studies revealed, even
without considering the four subdivisions, an overall somatotopic organization within the
parietal operculum (Maeda et al., 1999; Ruben et al., 2001; Ferretti et al., 2004; Nguyen et al.,
2005; Malinen et al., 2006). Finally, physiological studies showed that compared to SI, SII
neurons tend to have larger and more complex RFs (Krubitzer et al., 1986; Fitzgerald et al.,
2006), which usually encompass over two or more fingers and responds to complex tactile
stimuli, which supports the idea that SII is part of a serial processing scheme (see Pons et al.,
1987, 1992; Iwamura, 1998) in addition to a parallel processing pathway (Knecht et al., 1996b;
Rowe et al., 1996; Chung et al., 2014) going through the previously mentioned direct
thalamocortical projections to the SII region. PV (OP4), which is involved in sensorimotor
integration, then projects densely and reciprocally to BA1, BA3b, BA7b, the parietal
rostroventral area, frontal motor areas (such as the frontal eye field), the premotor cortex,
posterior parietal areas (such as the IPS) and the medial auditory belt areas (Qi et al., 2002;
Disbrow et al., 2003b), while area SII (OP1), a purely somatosensory area, is densely
interconnected with BA1 and BA3b, but also with PV, and BA7b within the same hemisphere
(Burton et al., 1995; Disbrow et al., 2003b). Area SII (OP1) is additionally densely
68 | P a g e
interconnected, via massive transcallosal connections, to its homologue in the other hemisphere,
which then projects intrahemispherically to BA7b and BA3b (Disbrow et al., 2003b, see Figure
26 for a summary). In contrast, PV has callosal connections limited to its homologue in New
World monkeys (Disbrow et al., 2003b), plus to area SII in marmosets (Qi et al., 2002). In turn,
the SII region projects to limbic structures, such as the amygdala and hippocampus (see Figure
25). This “ventral” path is believed to play an important role in tactile learning and memory.
Figure 26 [from Disbrow et al., 2003b]. Summary of S2 and PV cortical connections (Disbrow et al., 2002, 2003b). FEF: frontal eye field, PM: premotor cortex, PP: posterior parietal cortex, MD & CL: non-sensory thalamic nuclei.
The other flow of information arising from SI goes through the “dorsal stream”, whose first
relays are BAs 5 & 7. BA5 and BA7 are part of the posterior parietal cortex (PPC), which is
located posterior to SI and superior to the occipital lobe. These regions are associative sensory
cortices that have been linked to a wide variety of high-level processing tasks, including
multisensory (Huang et al., 2012; Sereno and Huang, 2014) and sensorimotor integration, and
activation in association with language use. I will here provide a brief description of PPC to get
an overview of its function within the somatosensory pathway.
BA5 is located immediately posterior to SI in the middle of the rostral bank of the
intraparietal sulcus (IPS, see Figure 23). Like SII, BA5 receives direct projections from SI
(Jones and Powell, 1969), primarily from BA2 (Vogt and Pandya, 1978) and dense
thalamocortical projections from VPS, the anterior pulvinar and lateral posterior nuclei (Jones et
al., 1978; Padberg et al., 2009), which respectively process inputs from muscles and joints and
cutaneous inputs. Consequently, BA5 responds to stimulation of deep or cutaneous receptors on
the contralateral hemibody. Unlike anterior parietal fields (BA3b, 1 & 2), which are proposed to
be involved in more simple discrimination of object texture, shape and size (Randolph and
69 | P a g e
Semmes, 1974; Carlson, 1981; Murray and Mishkin, 1984), BA5 is involved in motor
preparation (Burbaud et al., 1991; Snyder et al., 1997), in preshaping the hand before grasping
an object (Debowy et al., 2001), and in generating body-centered coordinate systems for
reaching (see Padberg et al., 2007 for review). In humans, BA5 has been reported to be involved
in movement planning, and to be activated by forelimb movement execution and visualisation
(Astafiev et al., 2003; Hanakawa et al., 2003; Diedrichsen et al., 2004). Similar to the “primary”
areas (BA3b, 1 & 2), BA5 is somatotopically organized, but less precisely than BA2, with the
proximal forelimb and trunk being represented medial to the distal forelimb and hand (Padberg
et al., 2009; Huang et al., 2012). Strikingly, the forelimb and the hand are dominantly
represented within this area (Padberg et al., 2009). In addition, BA5's touch responsive neurons
exhibit RFs on average much larger and complex than those in BA1 and BA2 (Padberg et al.,
2009), that can be contralateral, ipsilateral or bilateral and modulated by attentional states or
experience (e.g., Iwamura et al., 1994; see Padberg et al., 2007 for review). The specialized
cutaneous portion of BA5 then connects with BA7 and SII (Pons and Kaas, 1986). Parts of BA5
are also interconnected with M1 and more posterior parts of BA5 are connected with parts of the
premotor cortex BA6 (Jones et al., 1978).
BA7 is located posterior to BA5 (see Figure 23) and superior to the occipital lobe, and is
subdivided into several regions, with medially the precuneus, laterally the superior parietal
lobule (SPL), at the base of which is the IPS, below which is the inferior parietal lobule (IPL),
which in turn divides into BA39 (angular gyrus) and BA40 (supramarginal gyrus). Its lateral
part, corresponding to BA7b (Vogt and Vogt, 1919), is more closely related to somatosensory
and active motor functions (Vogt and Vogt, 1919; Leinonen et al., 1979; Robinson and Burton,
1980a, 1980b; Hyvärinen, 1981) than its medial part, namely BA7a, which has been linked to
oculomotor functions (Vogt and Vogt, 1919; Mountcastle et al., 1975; Hyvärinen, 1981). BA5
and the SII area both send reciprocal and somatotopically organized connections to BA7b, but
not to BA7a (Stanton et al., 1977; Neal et al., 1986; Pons and Kaas, 1986). BA7b also receives
direct thalamocortical inputs from the anterior, medial and lateral pulvinar, the oral division of
the pulvinar, the lateral posterior nucleus, the centrolateral and centromedial nuclei and the
ventrolateral nucleus (Friedman and Murray, 1986; Padberg and Krubitzer, 2006), and inputs
from BA1 (Pons and Kaas, 1986). Moreover, while no corticocortical fibres have been found
between BA7a and BA7b (Neal et al., 1986), BA7a receives projections from extrastriate visual
areas such as BAs 18 and 19 (Pandya and Kuypers, 1969; Stanton et al., 1977). Multiunit
mapping of BA7 has revealed a somatotopic organization, with neurons responding to cutaneous
stimulation of the face being located near the anterior tip of the IPS (close to SI face area), and
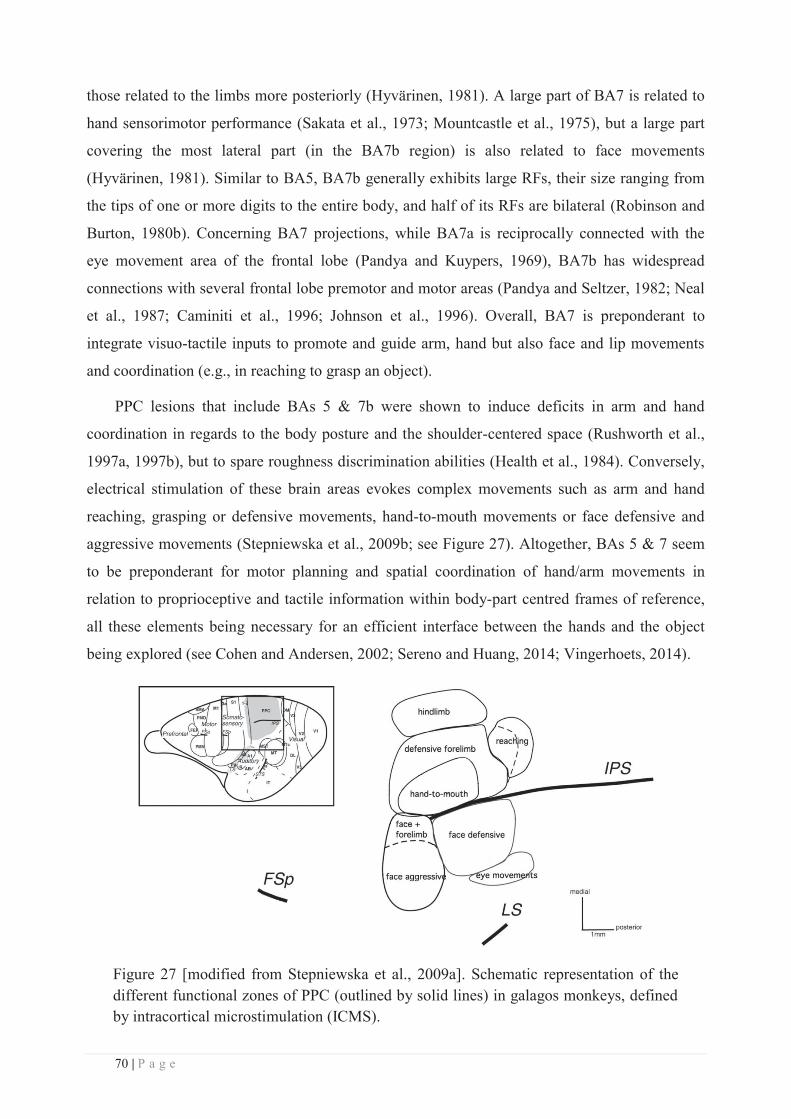
70 | P a g e
those related to the limbs more posteriorly (Hyvärinen, 1981). A large part of BA7 is related to
hand sensorimotor performance (Sakata et al., 1973; Mountcastle et al., 1975), but a large part
covering the most lateral part (in the BA7b region) is also related to face movements
(Hyvärinen, 1981). Similar to BA5, BA7b generally exhibits large RFs, their size ranging from
the tips of one or more digits to the entire body, and half of its RFs are bilateral (Robinson and
Burton, 1980b). Concerning BA7 projections, while BA7a is reciprocally connected with the
eye movement area of the frontal lobe (Pandya and Kuypers, 1969), BA7b has widespread
connections with several frontal lobe premotor and motor areas (Pandya and Seltzer, 1982; Neal
et al., 1987; Caminiti et al., 1996; Johnson et al., 1996). Overall, BA7 is preponderant to
integrate visuo-tactile inputs to promote and guide arm, hand but also face and lip movements
and coordination (e.g., in reaching to grasp an object).
PPC lesions that include BAs 5 & 7b were shown to induce deficits in arm and hand
coordination in regards to the body posture and the shoulder-centered space (Rushworth et al.,
1997a, 1997b), but to spare roughness discrimination abilities (Health et al., 1984). Conversely,
electrical stimulation of these brain areas evokes complex movements such as arm and hand
reaching, grasping or defensive movements, hand-to-mouth movements or face defensive and
aggressive movements (Stepniewska et al., 2009b; see Figure 27). Altogether, BAs 5 & 7 seem
to be preponderant for motor planning and spatial coordination of hand/arm movements in
relation to proprioceptive and tactile information within body-part centred frames of reference,
all these elements being necessary for an efficient interface between the hands and the object
being explored (see Cohen and Andersen, 2002; Sereno and Huang, 2014; Vingerhoets, 2014).
Figure 27 [modified from Stepniewska et al., 2009a]. Schematic representation of the different functional zones of PPC (outlined by solid lines) in galagos monkeys, defined by intracortical microstimulation (ICMS).
71 | P a g e
BAs 5 & 7 correspond to the “traditional” large divisions of PPC (Brodmann, 1909), but the
latter has been further subdivided into various areas, identified by connection patterns,
architecture and neuronal response properties in macaque monkeys. These areas include the
anterior intraparietal area (AIP), the ventral intraparietal area (VIP), the medial intraparietal area
(MIP), the lateral intraparietal area (LIP), and the posterior intraparietal area (PIP) (for review
see Grefkes and Fink, 2005). VIP is located in the depth of IPS and receives projections from
the visual area MT (Maunsell and van Essen, 1983), but also somatosensory inputs while
projecting to frontal motor cortex (for review see Gentilucci et al., 1988; Graziano and Cooke,
2006; Avillac et al., 2007). Stimulation of VIP in macaques results in a sequence of movements
that Cooke and colleagues (2003) described as defensive and avoidance movements (eye
closure, facial grimacing, and hand movement to the face). LIP is connected to FEF and is
involved in the control of eye movements (for review see Andersen and Buneo, 2002). AIP is
considered to be involved in the visual guidance of grasping (see, e.g., Sakata et al., 1995;
Fogassi et al., 2001), whereas a more posterior and medial region, the parietal reach region
(PRR), occupied largely by the previously defined MIP, is thought to be involved in the spatial
guidance of reaching (see, e.g., Batista et al., 1999).
In turn, PPC areas project to motor areas and multisensory associative cortex (see Figure
25). This “dorsal” path is believed to play an important role in prehension, grasping and
manipulation of objects. Altogether, through the lateral sulcus (SII + Insula) and the posterior
parietal areas (BAs 5 & 7), somatosensory information reaches (1) the limbic system (entorhinal
cortex, amygdala and hippocampus), (2) the motor system (M1, SMA, BA6), and (3) the
multisensory cortex in the superior temporal gyrus (see Figure 25).
An important feature of the nervous system is that at each synapse from the periphery to the
brain, information from adjacent ascending fibres can be combined locally as each neuron
receives projections from multiple neurons, thus leading to a convergence of the information
(Iwamura, 1998). However, each neuron also projects to multiple neurons, causing an extensive
divergence of ascending somatosensory projections. Thus, while gross somatotopy is preserved
between the periphery and CNS, there is ample opportunity for each synaptic relay point to act
as a station for the integration of information from spatially separate skin surfaces. This is
reflected in the differences and the overall increase in complexity observed at the map and RF
level along the somatosensory pathway. In addition to this periphery-to-central integration of the
sensory information, a further integration occurs vertically through the six layers of the cortex.
Indeed, experiments in rat and monkey somatosensory cortex indicate that the smallest RFs are
found in layer 4, while supragranular and infragranular layers exhibit larger RFs (Simons, 1978;
72 | P a g e
Sur et al., 1985; Chapin, 1986; Armstrong-James and Fox, 1987). Together these data support
the notion that at each level of cortical processing the neurons are sampling from a larger input
space, receiving convergent information from the previous level, diverging out to the next level,
and in the process, forming larger and more complexly integrated and combined RFs. In
addition to this vertical flow of information, the substantial horizontal interconnectivity allows
for integration of information from neighbouring regions and from specific, more distant cortical
zones (Lorente de No, 1938). Horizontal connectivity may be of particular relevance in cortical
map reorganization processes that will be detailed in the next chapter. Finally, while this
bottom-up integration of the signal is preponderant and well-known, somatosensory information
from cortical areas is also sent back to subcortical structures such as the thalamus, brainstem and
spinal cord via massive descending projections. These pathways originate in sensory cortical
fields and project to the thalamus, brainstem, and spinal cord. Although their physiological role
is not well understood, it is generally assumed that descending projections modulate the
ascending flow of sensory information at the level of the thalamus and brainstem.
To conclude, we can see from the literature (non-exhaustively) reviewed in this chapter that
the somatosensory system is extremely complex, from the mechanoreceptors embedded in the
skin to the higher order cortical areas and that its structure and function are still not fully
understood, despite the numerous studies investigating it.
73 | P a g e
CHAPTER 2: SOMATOSENSORY PLASTICITY
I. Concept/Overview
For almost forty years, the previously described somatotopic organization of the cortex (i.e.,
the homunculus) was thought to be stable once the brain achieved its maturation at the adult
stage. With regard to the RFs, they were -until recently- considered solely on the basis of their
spatial feature, the classical definition of the RF of a somatosensory neuron being the overall
area of the body surface eliciting significant variation in the neuron's firing rate when touched.
However, when we explore objects with the hands, the multiple contacts between the skin and
the object surface (which may be non-homogeneous) generate extraordinarily complex patterns
of tactile inputs that, in addition, continuously change in time. In agreement with this
observation, a temporal component has since been discovered to be a crucial feature of the RFs
properties, making them intrinsically dynamic (see Nicolelis and Chapin, 1994; Nicolelis et al.,
1997; Ghazanfar and Nicolelis, 1999; Brecht et al., 2003; Ramirez et al., 2014 for the
somatosensory system). These spatiotemporal features of somatosensory neuron RFs are
expressed by changes in their spatial selectivity as a function of time following stimulation (at
the ms scale). For example, in the rat somatosensory thalamus, VPM neurons exhibit RFs that
respond best to one whisker at the earliest post-stimulus time and then respond best to another
whisker at a later time (Nicolelis and Chapin, 1994). Consequently, this spatiotemporal coupling
is also reflected at the level of somatotopic maps, which also evolve with time. Thus, contrary to
the initial view, the somatosensory system and its intrinsic somatotopic organization are far
from being “static”, but rather process somatosensory information in a dynamic way. This
relates to the concept of plasticity, an intrinsic property of the brain, which unveils its ability to
adapt to our changing environment, but also determines and shapes our abilities to perceive and
act in this same environment. Indeed, cortical connections and representations in the adult’s
brain are not static but rather dynamic and constantly changing in response to both peripheral
manipulations and behaviourally important experience throughout life. Understanding the
relationships between cortical maps reorganization and functional changes is a valuable and
challenging step toward refining our knowledge of brain plasticity mechanisms which, in turn,
could be exploited to implement, complement, or boost plasticity-induced perceptual, cognitive,
or motor skill learning and rehabilitation.
As described in the previous chapter, most of the somatosensory relays and in particular the
SI region are organized topographically, each body-part being represented following a well-
74 | P a g e
defined orderly arrangement. This peculiar organization makes the somatosensory cortices a
particularly suitable model to study and quantify induced cortical plasticity by measuring
changes in maps distribution/topography. Brain plasticity at this macroscopic level can be
categorized either by what triggered the plastic changes (i.e., the event: reduction vs increase of
inputs), by its functional outcomes (i.e. maladaptive vs adaptive) or by the time-scale over
which the plastic changes occur (i.e. short vs long-term). The first categorization relies on the
fact that sensory representations can be remodelled following peripheral or central changes in
input sources or pattern. Numerous studies performed on animals or humans have indeed shown
that plasticity can occur at great(er) or small(er) degree, following peripheral or central lesions,
environmental manipulations, or an alteration in the incidence of sensory inputs. This
reorganization is usually expressed in terms of shifted boundaries, location or volume changes
of representational maps, as well as changes in the size and location of neuronal RFs. Moreover,
the grain of spatial representation within sensory maps can be modified, as RFs are sharpened or
expanded. The second way of categorizing brain plasticity focuses on the plasticity-induced
functional outcomes, which in a dichotomic approach, can be seen as adaptive or maladaptive.
To a first approximation, we can distinguish “positive” (or adaptive) cortical plasticity induced,
for example, by a perceptual or motor training that leads to some benefits (e.g., enhanced
performance), from “negative” (or maladaptive) plasticity, resulting in functional impairments
as a consequence, for example, of nerve injury, amputation or brain damage. In reality though,
things appear to be more complicated, making this classification attempt not fully viable due to
its subjectivity (i.e. what can be considered “positive” or “negative”?) and to the fact that it does
not capture the different aspects of the outcomes evoked at all possible levels (e.g. cross-modal
plasticity or side effects). Finally, the last proposed factor of classification of brain plasticity
relies on its temporal feature, which is one of the most important to keep in mind throughout the
reading of my work. Indeed, by definition brain plasticity refers to dynamic processes of
change/reorganization, which develop and evolve with time. However, most of the studies
investigating this phenomenon are limited in time and thus zoom in on the involved processes
during a limited time window. As a result, brain plasticity can refer to different processes (or at
least different degrees of evolution of these processes) depending on whether it is short-term or
long-term plasticity. On top of these attempts of classification, brain plasticity can be assessed
either at the structural or at the functional level.
Given its involvement in most neuronal processes (e.g. during developmental maturation
processes, memory, learning, recovery etc), gaining a better understanding of cortical plasticity
is still a huge challenge for neuroscientists, from a purely fundamental point of view, as well as
75 | P a g e
with the ultimate purpose of improving clinical rehabilitation strategies. Indeed, being capable
of promoting or strengthening CNS functions that are lost or weakened by guiding/enhancing
cerebral plasticity would be a huge achievement for brain plasticity research. In this work, the
functional aspects will be favoured, with a particular emphasis first on the different forms of
plastic changes with regard to the events triggering them, and second on the functional outcomes
and relevance of these plastic changes, while the temporal feature of plastic change will be
emphasized when needed. Moreover, despite the fact that plastic changes can occur at each relay
along the somatosensory pathway, I intentionally focused on plastic changes occurring at the
cortical level as this level is the one under investigation in this work.
II. Plasticity following sensory deprivation
a. Peripheral lesion or injury:
Interrupting signal transduction along sensory pathways was one of the first experimental
manipulations used to probe brain plasticity in animals. The early demonstrations of adult
somatosensory plasticity were reported after peripheral nerve damage or amputation in the
somatosensory cortex of several animal species, but mainly in monkeys.
Deafferentation resulting from amputation of one or a few digits (from upper or lower
limb) has been shown to induce plastic changes within SI. Immediately after amputation, many
neurons in the deprived cortical area of flying-foxes (Calford and Tweedale, 1988) and rats
(Byrne and Calford, 1991) were not silent, but rather became responsive to stimulation of
directly adjoining skin territories within a few minutes after denervation. Interestingly, these
enlarged RFs shrank back to their initial size and position in the week following amputation
(Calford and Tweedale, 1988). Because of their short time-scale, these plastic changes have
been interpreted as originating from removal of inhibition and the subsequent shrinkage as the
re-establishment of the inhibitory balance in the affected cortex and its inputs. However,
similarly restricted amputation in monkeys revealed more gradual reorganization within SI
(Rasmusson, 1982). The deprived digit’s cortical representation (digit 5) was initially totally
unresponsive, for as long as 2 weeks, before showing RFs extending over large regions of the
hand within 8 weeks (Figure 28, A), tending to shrink back to more restricted regions mostly on
the neighbouring finger (digit 4) and palm 16 weeks post-amputation (Figure 28, B). Despite
these possible species-dependent time course discrepancies, these studies in flying-foxes, rats or
monkeys revealed that restricted amputation leads to rather rapid changes in SI RF properties.
A similar emergence of new tactile RFs following digit amputation was also reported in the
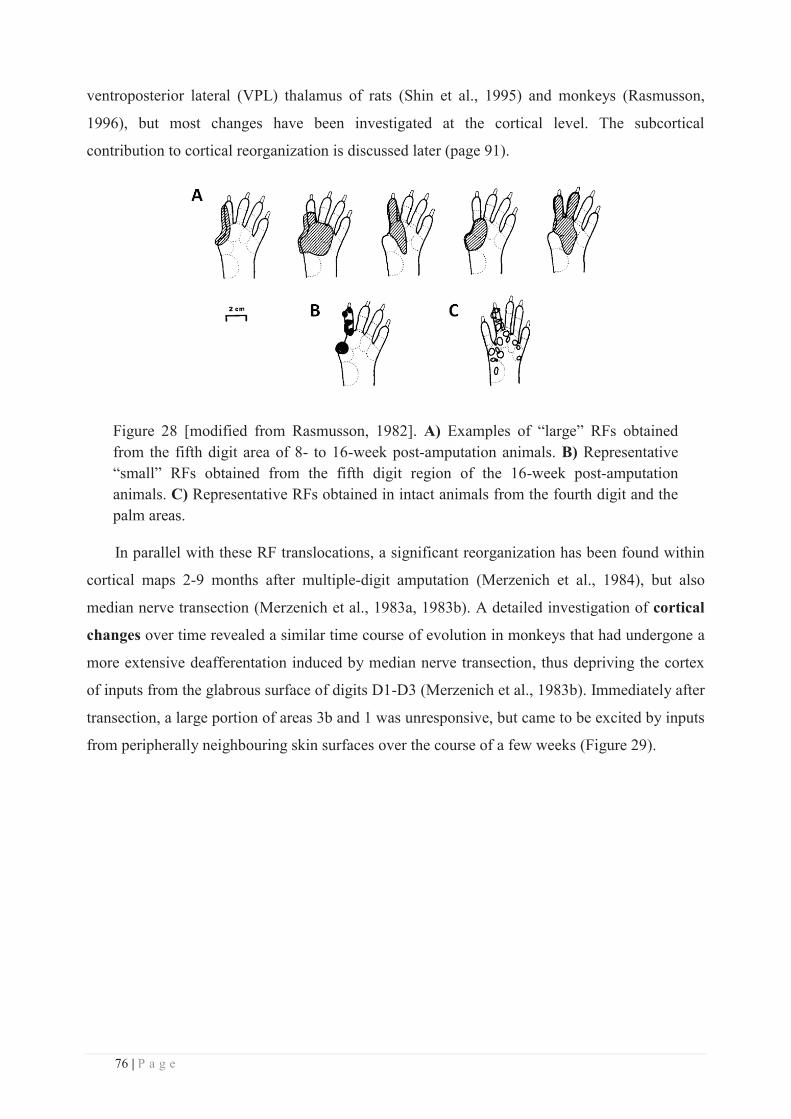
76 | P a g e
ventroposterior lateral (VPL) thalamus of rats (Shin et al., 1995) and monkeys (Rasmusson,
1996), but most changes have been investigated at the cortical level. The subcortical
contribution to cortical reorganization is discussed later (page 91).
Figure 28 [modified from Rasmusson, 1982]. A) Examples of “large” RFs obtained from the fifth digit area of 8- to 16-week post-amputation animals. B) Representative “small” RFs obtained from the fifth digit region of the 16-week post-amputation animals. C) Representative RFs obtained in intact animals from the fourth digit and the palm areas.
In parallel with these RF translocations, a significant reorganization has been found within
cortical maps 2-9 months after multiple-digit amputation (Merzenich et al., 1984), but also
median nerve transection (Merzenich et al., 1983a, 1983b). A detailed investigation of cortical
changes over time revealed a similar time course of evolution in monkeys that had undergone a
more extensive deafferentation induced by median nerve transection, thus depriving the cortex
of inputs from the glabrous surface of digits D1-D3 (Merzenich et al., 1983b). Immediately after
transection, a large portion of areas 3b and 1 was unresponsive, but came to be excited by inputs
from peripherally neighbouring skin surfaces over the course of a few weeks (Figure 29).
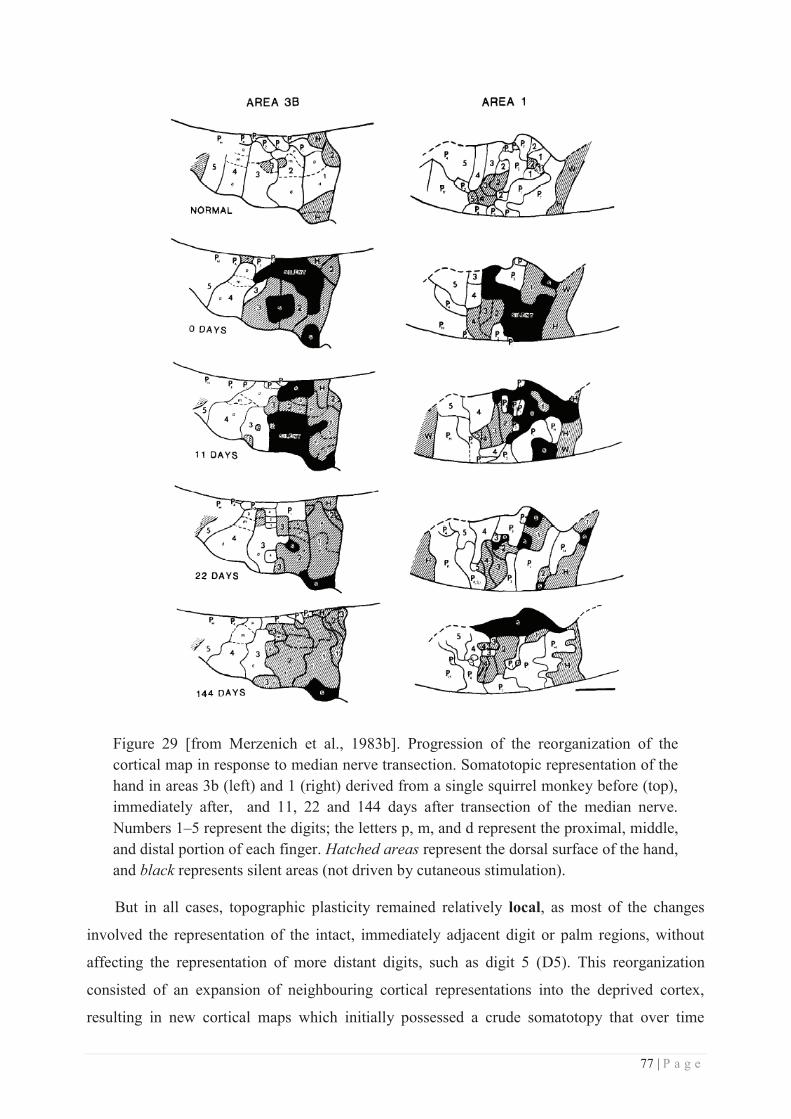
77 | P a g e
Figure 29 [from Merzenich et al., 1983b]. Progression of the reorganization of the cortical map in response to median nerve transection. Somatotopic representation of the hand in areas 3b (left) and 1 (right) derived from a single squirrel monkey before (top), immediately after, and 11, 22 and 144 days after transection of the median nerve. Numbers 1–5 represent the digits; the letters p, m, and d represent the proximal, middle, and distal portion of each finger. Hatched areas represent the dorsal surface of the hand, and black represents silent areas (not driven by cutaneous stimulation).
But in all cases, topographic plasticity remained relatively local, as most of the changes
involved the representation of the intact, immediately adjacent digit or palm regions, without
affecting the representation of more distant digits, such as digit 5 (D5). This reorganization
consisted of an expansion of neighbouring cortical representations into the deprived cortex,
resulting in new cortical maps which initially possessed a crude somatotopy that over time
78 | P a g e
transformed into a highly topographic representation. Some authors initially estimated that the
major topographic changes were limited to a cortical zone extending 500-700 μm on either side
of the initial boundaries of the amputated digits (Merzenich et al., 1984). In addition to this
apparent “spatial limit” of reorganization, significant residual cortically silent regions have
been found up to 2-8 months after multiple-digit amputation (Merzenich et al., 1984). This
indicates that the deprived cortex failed to completely regain responsiveness even several
months after the lesion, and suggests the existence of some additional limitations in the amount
of possible reorganization at the cortical level. Interestingly, and in contrast with the findings of
this multiple-digit amputation experiment (Merzenich et al., 1984), another monkey study found
no evidence of unresponsive cortex 2-5 months following transection of both median and ulnar
nerves, which deprives a larger cortical region of inputs from the glabrous surface of the entire
hand (Garraghty and Kaas, 1991). Despite the larger amount of deprivation, the corresponding
(deprived) cortical territories were in all cases responsive to the dorsal surface of the hand
and/or digits innervated by the intact radial nerve.
The incongruity of these results compared to those reported in cases of more restricted
“digit-amputation” (Rasmusson, 1982; Merzenich et al., 1983a, 1983b, 1984) led the authors to
investigate whether the pattern of peripheral deafferentation could explain these discrepancies in
the limits of cortical reorganization (Garraghty et al., 1994). To this aim, they induced in
monkeys a deafferentation mimicking multiple-digit amputation by transecting either radial and
ulnar nerves (D4-D5 amputation-like) or radial and median nerves (D1-D3 amputation-like).
With such deafferentation patterns, and in agreement with Merzenich and colleagues' studies,
the authors found that a large zone of the deprived area was still unresponsive 3-11 months post-
lesion. In light of the opposite results obtained following ulnar and median nerves transection
(Garraghty and Kaas, 1991), the authors thus concluded that incomplete reorganization occurs
(at least in monkeys) only if the deafferentation involves both glabrous and hairy skin surfaces.
Based on this interpretation, Garraghty and colleagues developed a model proposing the concept
of “dominant” and “latent” inputs reaching the cortex. According to this model, “inputs from
each of the three cutaneous nerves of the hand have a “dominant” cortical territory where
neurons are activated in the intact animal, and an additional “latent” cortical territory where
activation is possible after removal of competitively advantaged inputs” (see Garraghty et al.,
1994). Supported by the evidence that new RFs located exclusively on the dorsal surface of the
hand have been found in monkeys following median nerve transection (Merzenich et al., 1983a,
1983b), the authors suggested the existence of a preferential (and immediate) access of “latent”
inputs from the radial nerve (but not the ulnar nerve) to the deprived “median nerve cortex”,
79 | P a g e
supposedly via an “unmasking” of existing horizontal connections or thalamocortical inputs that
were previously suppressed by inhibitory circuitry. In line with the literature at this time, this
study raised the idea that the reorganization that can occur in somatosensory cortex following
peripheral sensory loss is constrained by the precise pattern of somatosensory deprivation,
meaning that there is a limitation to the set of new RFs that cortical neurons can acquire.
Moreover, this model also highlighted the idea of competition between inputs reaching the
cortex, usually represented between adjacent cortical areas.
Remarkably, reorganization over a much greater scale was reported by Pons and colleagues
in the early nineties, with the first demonstration of a massive cortical reorganization in monkey
SI spanning over 1-2 cm across the hand-face border (Pons et al., 1991), while the previously
reported reorganization following digit amputation (Merzenich et al., 1984) or median nerve
transection (Merzenich et al., 1983a, 1983b) did not exceed a few millimetres. In this study,
Pons and colleagues investigated the reorganizational changes within areas 3b and 1 of monkeys
that had undergone somatosensory deafferentation of an entire forelimb (and upper trunk) more
than 12 years earlier (via dorsal root transection at C2-T4 level, i.e. dorsal rhizotomy).
Typically, each side of the hand-face border region in macaque somatosensory cortex is
composed of the representation of the chin and lower jaw on the face side, and of the
representation of the thumb on the hand side (see Figure 12 and Figure 19). Electrophysiological
recordings revealed that the entire deprived arm area (10 mm in extent) had developed novel
responses to stimulation of neighbouring skin regions, including a relatively small portion of the
face (from the chin to the lower jaw). These results suggest that the cortical representation of
the face had “taken over” or “invaded” the deprived cortical region initially representing the
arm. Interestingly, the topographical organization was maintained within the reorganized/new
face map in a highly systematic manner. As mentioned earlier, different types of deprivations
can lead to different extents of reorganization. Just as deprivation induced by nerve transection
or digit amputation differs in apparently significant ways (see Garraghty et al, 1994), there are
also potentially significant differences between deprivations induced by rhizotomy and those
induced by transection of peripheral processes. For example, many, if not most, dorsal root
ganglion cells (and their central processes) survive section of their peripheral processes (see
Wall et al., 1988), while with dorsal rhizotomy, the central processes of the cells lying in the
rhizotomized ganglia degenerate, leaving vacated synaptic sites in central structures. This
argument was considered to be a good explanation for the astonishing large-scale reorganization
reported by Pons and colleagues (1991). However, similar large-scale plastic changes crossing
the hand-face border have been subsequently reported within monkey areas 3b and 1 following
80 | P a g e
long-lasting (1-13 years) hand or forelimb amputation (Florence and Kaas, 1995; Florence et
al., 1998, 2000). Thus the degeneration of dorsal root ganglion cells cannot fully account for this
cross-border plasticity. Rather, as this amount of reorganization goes beyond the estimated
limits of thalamocortical divergence (i.e., the maximal range of projection of a single
thalamocortical axon, see Merzenich et al., 1983a; Jones, 2000), it has been proposed that
sprouting at subcortical and/or cortical levels may account for the cortical magnification of
plasticity (see Mechanisms section, page 91). In line with the previously mentioned nerve injury
studies, these results suggest that the extent of cortical reorganization (and reactivation) depends
on the pattern of deprivation (and pre-existing innervation) rather than on the actual extent of
deprivation (at the skin and cortical level).
Similar to median nerve deprivation, compiling evidence comes from trigeminal nerves
lesion studies, especially in rodents, which typically exhibit a well-ordered cortical organization
of clearly distinguishable areas called barrels, each barrel processing the tactile information
from a single whisker (see Petersen, 2007; Feldmeyer et al., 2013 as reviews). Consequently,
lesions in the rat trigeminal system have become an important model for the study of CNS
organization and pattern generation (see Brecht et al., 2003; Wilent and Contreras, 2005;
Erzurumlu et al., 2006; Pouchelon et al., 2012; Ramirez et al., 2014 and Wu et al., 2011 as a
review) and its neuroplastic effects have been studied extensively (see Fox, 1992; Phoka et al.,
2012 and Feldman and Brecht, 2005; Frostig, 2006; Margolis et al., 2014 for reviews). It is well
demonstrated, for example, that if all the whiskers but one are removed - by follicle destruction,
plucking or trimming, which can be considered as an “amputation” - the cortical representation
of the spared whisker typically expands (thus overlapping with the adjacent ones) and becomes
more responsive (Fox, 1992, reviewed in Feldman and Brecht, 2005). Similarly, infraorbital
nerve crush1 immediately results in a large cortical area unresponsive to vibrissal deflection, but
instead responsive to stimulation of the forepaw digits (Kis et al., 1999), suggesting an
expansion of the digit representation into the barrel cortex. This expansion was still observed 3
weeks after injury and the cortical maps fully returned to their initial state 60 days after injury.
Together with the monkey literature on amputation, these results show that plasticity across the
cortical hand-face border is bidirectional, the face representation invading that of the hand
following its amputation/deafferentation, but the opposite being also possible, with the hand
representation invading that of the deprived face.
1 Nerve crush is a commonly used procedure in which a nerve is squeezed, thus blocking transiently the signal conduction, but without seectioning the nerve fibres, which allows for recovery and regeneration.
81 | P a g e
In humans, a similar large-scale remodelling occurs in somatosensory areas following
sensory deprivation, the one occurring across the hand-face border being particularly well
documented. Indeed, marked intrusion of the face representation into the former hand area has
been repeatedly found in the contralateral postcentral gyrus of upper-limb amputees using
EEG/MEG (Elbert et al., 1994; Yang et al., 1994; Elbert et al., 1997; Flor et al., 1995, 1998;
Knecht et al., 1996a; Birbaumer et al., 1997; Montoya et al., 1998; Grüsser et al., 2001a, 2001b;
Karl et al., 2001) and fMRI (Borsook et al., 1998). Moreover, the amount of cortical plasticity
found in humans (13-35mm in Yang et al., 1994; 13mm in Elbert et al., 1997; 17mm in Knecht
et al., 1996a), inferred from the amount of shift of the face representation into the deprived area,
was found to be similar to that observed in monkeys (1-2cm, Pons et al., 1991). The face regions
invading the deafferented arm/hand cortical area comprised alternatively the chin, lower jaw and
cheek (Yang et al., 1994), the chin (Elbert et al., 1994; Flor et al., 1995), the lip/corner of the
mouth (Flor et al., 1995, 1998; Birbaumer et al., 1997; Elbert et al., 1997; Montoya et al., 1998;
Grüsser et al., 2001a, 2001b). However, no systematic mapping of the face was performed in
these studies on amputees, which would provide a clearer idea of which face regions are
involved in such plastic changes and to which extent these changes occur. In addition, some
plasticity of the trunk representation, the other neighbour of the hand/arm representation, has
also been observed, in the form of an extension of its representation into the hand/arm
representation (Kew et al., 1997). The variability in the amount and in the topography of cortical
plasticity, on top of methodological differences across studies, is likely to arise from other
confounding variables such as the age at which the amputation occurred, the amount of time
since the amputation, the level of the amputation and thus the size of the residual limb, the cause
of the amputation (traumatic or for therapeutic reasons), and the presence of phantom sensations
and pain. Indeed, traumatic amputees experiencing phantom pain exhibit a higher amount of
plastic changes (22.2mm in Flor et al., 1998; 20.25mm in Birbaumer et al., 1997; Grüsser et al.,
2001a), than pain-free amputees (2.7mm in Flor et al., 1998; 3.36mm in Flor et al., 1995;
Birbaumer et al., 1997; Grüsser et al., 2001a). The amount of reorganization observed has also
been closely related to the degree of telescoping sensation and painful referred sensations
(Grüsser et al., 2001a) (see Functional consequences section, page 115).
82 | P a g e
Altogether, these studies in monkeys and humans reveal that a decrease in sensory input
following hand/arm amputation or deafferentation results in an “invasion” of the deprived
cortical representation primarily by the neighbouring cortical areas such as the face and the
trunk, whose innervation has remained intact. However, it is worth noting that in most of these
studies reporting a massive cortical reorganization, a massive loss of motor outputs co-occurs
with the loss of somatosensory inputs. Indeed, nerve injury and amputation of a limb involves
the complete and sudden truncation of all the afferent and efferent fibres that were innervating
this limb, triggering an extensive reorganization in the somatosensory cortex, but also in the
motor cortex (Ojemann and Silbergeld, 1995; Pascual-Leone et al., 1996). In both cases the
cortical regions surrounding the representation (including the face) of the deafferented/missing
limb expand into the deprived cortex. Given the close interaction/strong interconnectivity
between SI and M1 (Porter, 1997; Rocco and Brumberg, 2007; Catani et al., 2012), the
concurrently induced motor plasticity is likely to contribute extensively to the large-scale
cortical plasticity reported within SI, but also to the associated subcortical changes (see
Mechanisms section, page 91). In addition, and more importantly, cortical neuroplastic changes
are not restricted to the cortex contralateral to the deafferentation/amputation, but also affect the
ipsilateral hemisphere (i.e., “intact hemisphere”), taking the form of expressed as an expansion
of the intact hand’s representation (Calford and Tweedale, 1990; Elbert et al., 1997; Werhahn et
al., 2002). This remodelling is likely to arise from an inter-hemispheric disinhibition (Werhahn
et al., 2002; Simoes et al., 2012), but also from use-dependent plasticity induced by a
compensatory over-use of the intact limb (Elbert et al., 1997). Over-use of the remaining limb is
also the most likely explanation for the increased representation of the intact hand recently
reported within the deprived cortex of the ipsilateral hemisphere (i.e., contralateral to the
amputation; Frey et al., 2008; Bogdanov et al., 2012; Makin et al., 2013a). The fact that major
plastic changes also occur within the ipsilateral hemisphere has to be carefully kept in mind
when (re)reading the human studies referring to large-scale plastic changes. Indeed, many of
these studies (Elbert et al., 1994; Flor et al., 1995, 1998; Birbaumer et al., 1997; Grüsser et al.,
2001a; Karl et al., 2001) quantified the cortical changes by comparing both hemispheres,
because they assumed the ipsilateral one to be “intact” and unchanged. This could have led to
misleading results.
83 | P a g e
b. Central lesion or injury
One way of avoiding confusion in assessing plasticity comes from cases of partial or
complete transection of the dorsal columns, which prevents specifically the somatosensory
inflow from the spinal cord. Unilateral transection of the dorsal columns at the C3/C4 level
disrupts afferents from the entire hand (and lower body), while leaving intact some inputs from
the arm, as well as those from the face. Consequently, such a lesion performed in monkeys
extensively deprives portions of the forelimb, trunk, and hindlimb cortical representations in
area 3b (Jain et al., 1997). A large number of studies described massive reorganization following
such deafferentations (reviewed in Kaas et al., 2008; Xerri, 2012; Nardone et al., 2013; Qi et al.,
2014). In particular, large-scale cortical changes across the hand-face border similar to those
reported by Pons and colleagues (1991) were observed within BA3b of these monkeys 6 to 22
months and up to more than one year after the lesion using microelectrode recordings (Jain et
al., 1997, 2000, 2008; Tandon et al., 2009), and more than two years after lesion using fMRI
(Dutta et al., 2013). Here again, the reorganization was expressed as an “invasion” of the
deprived hand territory by the neighbouring cortical areas (namely the representations of the
face and arm), but dominantly by the face representation (see Figure 30 A-C). Interestingly, in
case of partial section preserving the afferents from digits 4 & 5 and the adjoining palm, these
afferents not only continued to activate neurons within their normal cortical target territories, but
after 5 or more weeks their area of activation greatly expanded, invading the deafferented
cortical areas initially dedicated to the other regions of the hand (see Figure 30 D&E, Jain et al.,
1997). Neurons in the reorganized parts of cortex exhibited large RFs and those responding to
stimulation of the face had RFs located either on the face alone, mostly on the chin, or on both
the hand and the face (Jain et al., 2008).
In rats, similar transection of the spinal cord, but at the midthoracic level, revealed that the
deafferented hindlimb regions in SI became responsive to electrical stimulation of the
unaffected forepaw as early as three days after the lesion (Endo et al., 2007). However, such
reorganization was not observed when the forepaw (and any other body part) was mechanically
stimulated (Jain et al., 1995). Indeed, these authors failed to detect any responses in the hindlimb
cortical representation deafferented as a consequence of unilateral section of the dorsal funiculus
at thoracic levels. Thus, in contrast to Endo’s study, Jain’s results suggest that forelimb inputs
do not substitute for missing hindlimb inputs in SI in rats. The discrepancy between these
studies may arise from the stimulation paradigms used to elicit post-lesion responses, the
electrocutaneous stimulation used in Endo’s study being likely to activate the spinothalamic
pathway in addition to the dorsal column pathways (Chang and Shyu, 2001). Interestingly, a
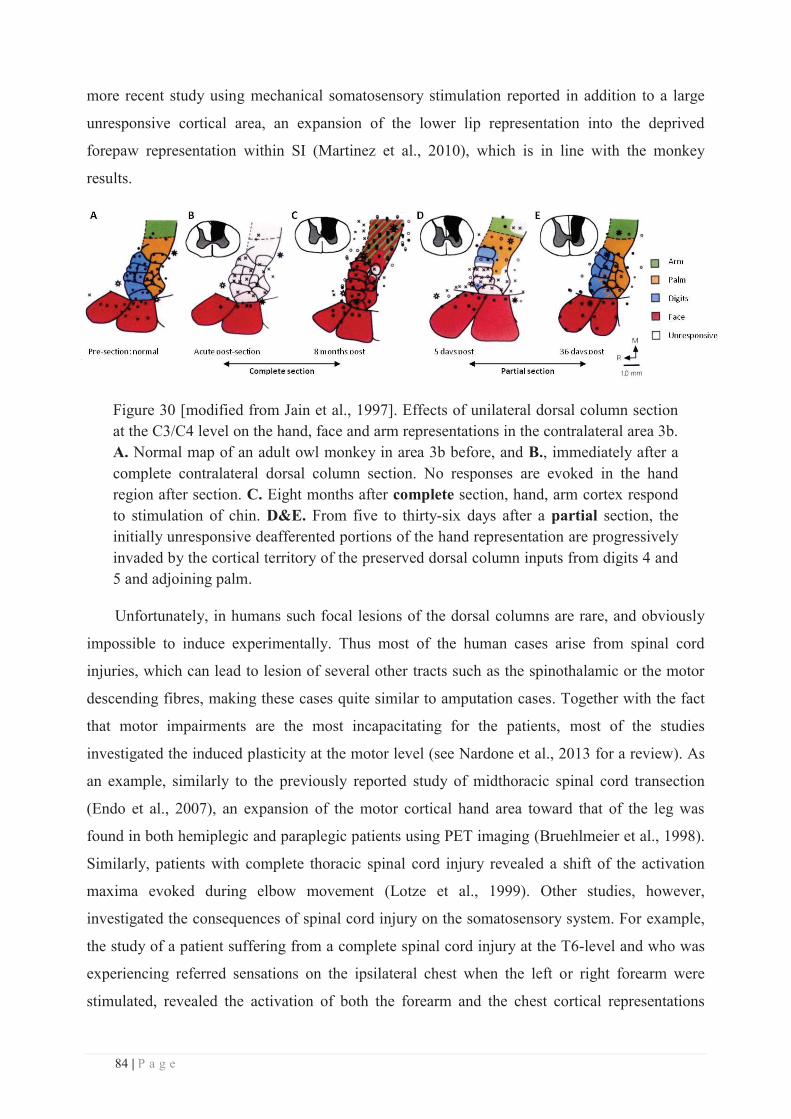
84 | P a g e
more recent study using mechanical somatosensory stimulation reported in addition to a large
unresponsive cortical area, an expansion of the lower lip representation into the deprived
forepaw representation within SI (Martinez et al., 2010), which is in line with the monkey
results.
Figure 30 [modified from Jain et al., 1997]. Effects of unilateral dorsal column section at the C3/C4 level on the hand, face and arm representations in the contralateral area 3b. A. Normal map of an adult owl monkey in area 3b before, and B., immediately after a complete contralateral dorsal column section. No responses are evoked in the hand region after section. C. Eight months after complete section, hand, arm cortex respond to stimulation of chin. D&E. From five to thirty-six days after a partial section, the initially unresponsive deafferented portions of the hand representation are progressively invaded by the cortical territory of the preserved dorsal column inputs from digits 4 and 5 and adjoining palm.
Unfortunately, in humans such focal lesions of the dorsal columns are rare, and obviously
impossible to induce experimentally. Thus most of the human cases arise from spinal cord
injuries, which can lead to lesion of several other tracts such as the spinothalamic or the motor
descending fibres, making these cases quite similar to amputation cases. Together with the fact
that motor impairments are the most incapacitating for the patients, most of the studies
investigated the induced plasticity at the motor level (see Nardone et al., 2013 for a review). As
an example, similarly to the previously reported study of midthoracic spinal cord transection
(Endo et al., 2007), an expansion of the motor cortical hand area toward that of the leg was
found in both hemiplegic and paraplegic patients using PET imaging (Bruehlmeier et al., 1998).
Similarly, patients with complete thoracic spinal cord injury revealed a shift of the activation
maxima evoked during elbow movement (Lotze et al., 1999). Other studies, however,
investigated the consequences of spinal cord injury on the somatosensory system. For example,
the study of a patient suffering from a complete spinal cord injury at the T6-level and who was
experiencing referred sensations on the ipsilateral chest when the left or right forearm were
stimulated, revealed the activation of both the forearm and the chest cortical representations
85 | P a g e
when the forearm regions inducing the referred sensation were stimulated (Moore et al., 2000).
This was not the case for other parts of the forearms which did not induce referred sensations.
Interestingly, these activation foci were separated by more than 1.6cm of nonresponsive cortex,
suggesting that cortical plasticity can be expressed between nonadjacent representations. Plastic
changes were also observed within SI following complete thoracic spinal cord injury, with the
representation of the little finger shifting ~13mm medially toward the deprived lower body
representation (Henderson et al., 2011). In addition, the amount of cortical reorganization was
positively correlated with the gray matter volume in the deprived cortical area, and negatively
correlated with the fractional anisotropy in the little finger representation.
Altogether, and despite some differences across species and the variability in the induced
lesion, one can appreciate that similar to the amputation and nerve injury cases, the
deafferentation induced by hemi-sectioning the spinal cord is followed by a massive
somatosensory and motor cortical reorganization, the deafferented area being progressively
invaded by its cortical neighbours. In particular, a lesion limited to the dorsal columns in
monkeys, revealed exactly the same pattern of large-scale plasticity across the hand-face border,
the face representation invading the deprived cortical area as soon as 6 months after
deafferentation. However, results of such experiments can be difficult to interpret because,
unlike nerve injury experiments, it is more difficult to consistently achieve the complete section
of the dorsal columns without damaging pathways in the adjacent lateral and ventral tracts and
the spinal gray matter. Conversely, it is also difficult to determine the extent and source of any
remaining fibres, particularly if there are only a few.
Another way of evaluating the patterns of cortical reorganization is to ablate a part of the
cortex dedicated to a body part to observe how the remaining cortex reacts (see Xerri, 2012 for
review of plasticity following stroke). For instance, weeks to months after removing all cortex
responsive to light touch on the glabrous surface of D3 in owl monkeys, some recording sites in
cortex next to the lesion that were formerly responsive to other parts of the hand become
responsive to D3 (Jenkins and Merzenich, 1987). Thus, there was recovery of some of the
cortical inputs previously removed by the lesion. Yet, the amount of cortex activated by inputs
from D3 remained relatively small, and larger lesions including the cortex devoted to digits 2-to-
5 were not followed by the recovery of representations of these digits. Thus, there was a
redistribution of the damaged representations that has been demonstrated both in the vicinity of
the injury, and in remote regions. Indeed, following stroke involving the representations in
cortical area 3b of specific skin surfaces in monkeys, a post-lesional re-emergence of the
representation of the fingertips, engaged in a behavioural task, was observed in novel locations
86 | P a g e
within area 3b. In monkeys who had reacquired sensorimotor skill after retraining, an
enlargement of the representation of the fingers in cortical area 1 was reported, as well as a
striking emergence of a new representation of the cutaneous fingertips in area 3a, predominantly
within zones that were previously excited only by proprioceptive inputs (Xerri et al., 1998).
These findings support the existence of an experience-dependent post-lesional plasticity.
Altogether, there is evidence that somatosensory deafferentation, induced either via
amputation, nerve injury or central lesions, induces massive cortical reorganization that is
capable of “crossing” the hand-face border. The possible mechanisms underlying such a large-
scale plasticity will be discussed later (see Mechanisms section page 91), but at this stage, one
has to consider the fact that this massive reorganization has been reported following extensive
lesions, which, as repeatedly mentioned along this section, brings some confounds as it removes
other components such as motor efferents in the case of amputation, nerve or spinal cord
injuries, but also proprioceptive and sometimes nociceptive afferents, and so on. Moreover, and
more importantly, a lesion by definition consists of the section or destruction of fibres, which is
likely to give rise to the death of their cell bodies and thus in turn leads to a massive atrophy and
neuronal loss along the somatosensory pathway. Note that depending on the manner and the
level at which the lesion is performed, the amount of neuronal loss is likely to vary, and thus
may account for some of the variability observed across deafferentation types. Consequently,
the plasticity observed following such deafferentations likely involves both specific and general
compensatory phenomena and the intrinsic plastic property of the healthy brain. In addition, all
the previously cited studies reporting large-scale plasticity across the hand-face border (except
Jain et al., 1997; Kis et al., 1999) referred to long-lasting deafferentations, which had occurred
at least 6 months before the related plasticity was investigated. Thus, in addition to its lesional
aspects, such “long-term” plasticity is likely to involve and to be mediated by multiple
mechanisms that may develop over time both sequentially and in parallel. Indeed, while several
electrophysiological studies investigated the time course of local plastic changes (see the
beginning of the section Peripheral lesion or injury; Rasmusson, 1982; Merzenich et al., 1983b),
few studies reporting large-scale reorganization investigated the time course of these changes.
Those who did confirmed the idea that different processes might be involved over time. For
instance, while an expansion of the face representation into the deafferented hand region was
reported within BA3b 6 months (Jain et al., 1997) or 22 to 23 months (Jain et al., 2008) after
complete or partial unilateral dorsal column lesion in monkeys, this same region was found
87 | P a g e
unresponsive immediately after the lesion (Jain et al., 1997, 2008), thus revealing no
reorganization at this early/acute stage. In contrast, a progressive reactivation of the deafferented
hand region by the spared hand/palm afferents (already described above, see Figure 30) was
observed 5 to 36 days after the lesion. That is, in-between the unresponsive state and the face
“invasion” phase described at 6 months even after partial section of the dorsal columns (similar
to the complete section case shown on the figure; Jain et al., 1997). Together with the studies on
local (small-range) plastic changes, these studies underline the critical importance of time when
considering plasticity, which intrinsically consists of ongoing processes. We should thus be
careful when interpreting the results of experiments which usually take a single snapshot of this
process at a given time point.
Having these caveats in mind, one could wonder what kind of plasticity occurs in an intact
brain following deprivation of somatosensory inputs, especially on a short time scale.
c. Sensory deprivation without lesion
The closest non-lesional cases of sensory “deprivation” are the cases of congenital
malformation or aplasia. In contrast to traumatic amputees, little or no cortical reorganization
was found in congenital aplasics (6.9mm in Flor et al., 1998; Montoya et al., 1998). But the
imaging resolution and the sample size used in these studies might not have been high enough to
unveil the related cortical changes. In contrast, electrophysiological and tracer recordings in a
monkey with congenital malformation of the left foot (missing toes 1, 3 and 5) revealed an
abnormal arrangement of the foot representation throughout the lemniscal pathway (from spinal
cord to area 3b) with an expanded representation of the plantar region, but also an abnormal
representation of the intact foot in the ipsilateral spinal cord and area 3b (Liao et al., 2014). Note
that this latter evidence of an ipsilateral reorganization is consistent with the previously raised
point regarding the “intact” hemisphere. While the plasticity observed in these congenital cases
is obviously non-lesional, it results from even longer time-scale changes that have taken place
since the earliest developmental stages. This leaves the matter of short-term effects of sensory-
deprivation unsolved.
A more viable way of answering such a question is to investigate the short-term
reorganization occurring after local anaesthesia of a body part. For instance, restricted
anaesthesia of a single toe in rats, leads to an expansion of the remaining toes RFs within 5min
of deafferentation, the deprived cortical area becoming responsive to stimulation of
neighbouring regions (Byrne and Calford, 1991; Calford and Tweedale, 1991). While these
initial changes were quite similar to those found following digit amputation, as soon as the
88 | P a g e
anaesthesia wore off (~10-30min after anaesthesia onset), RFs shrank but never returned back to
precisely the same boundaries as before anaesthesia. In addition, despite this shrinking, most of
the RFs remained larger than originally (Byrne and Calford, 1991; Calford and Tweedale,
1991), suggesting some consequences at a longer time-scale. Similar results were obtained
following local anaesthesia of the hindlimb (Panetsos et al., 1995), and anaesthesia of the
perioral region of rats, with an immediate reorganization of the deprived barrel cortex which
developed new (i.e., “unmasked”, see Mechanisms section page 91) tactile responses (Faggin et
al., 1997; Katz et al., 1999).
Another way of “simulating” deafferentation effects without damaging the neural structures
is via environmental impoverishment. Indeed, rats exposed for 80-115 days to an environment
that reduces the otherwise typical tactile inflow, the topographic cortical organization is
profoundly disrupted, with the forepaw representation in SI being interspersed with islets driven
by proprioceptive inputs (see Figure 31; Xerri et al., 1996). In addition, the RFs recorded in the
remaining cutaneous zones were drastically enlarged. Both cortical map shrinkage and RF
enlargement were also observed in rats subjected to 7 days of forelimb immobilization (see
Figure 31; Xerri et al., 1996) or to hindlimb unloading2 for 2 weeks (Langlet et al., 1999;
Dupont et al., 2001), which also dramatically decreases the rate of cutaneous stimulation. On a
much longer time-scale, age-related plasticity can be considered as an even more naturalistic
model of sensory deprivation. Indeed, when compared to young animal, similar RF
enlargements and disruption/fragmentation of the somatotopic organization of cortical maps
were reported in aged rats (Spengler et al., 1995; Coq and Xerri, 2000). The representational
degradation was found to be partially offset or accentuated by housing in enriched or
impoverished environments respectively (Coq and Xerri, 2001). In humans, an expansion of the
hand representation (as assessed by an increased distance between D2 and D5 dipoles) close to
40%, was found in elderly as compared to younger participants (Kalisch et al., 2009).
2 Hindlimb unloading consists in an experimental model of hindlimb sensory deprivation, which was commonly used in earth to mimic the effects of microgravity. This technic is characterized by the absence of weight-bearing and by a reduced motor activity, which also reduces considerably the activation of the cutaneous receptors located on the foot sole.
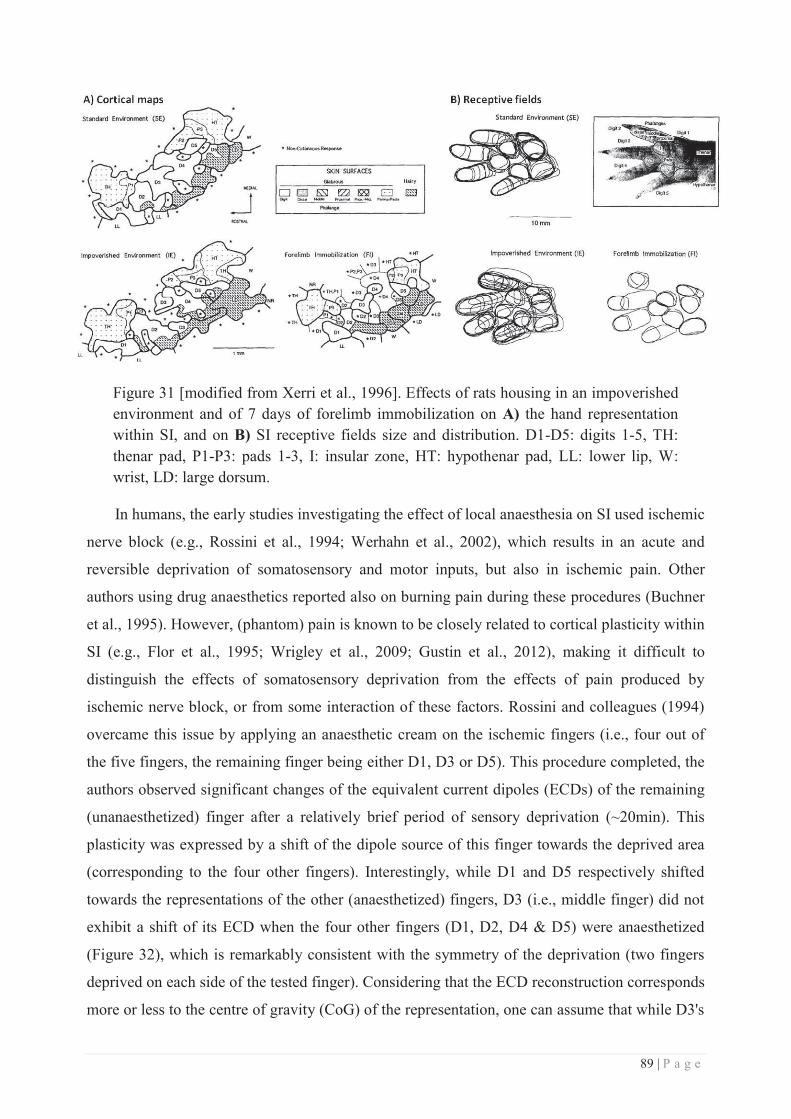
89 | P a g e
Figure 31 [modified from Xerri et al., 1996]. Effects of rats housing in an impoverished environment and of 7 days of forelimb immobilization on A) the hand representation within SI, and on B) SI receptive fields size and distribution. D1-D5: digits 1-5, TH: thenar pad, P1-P3: pads 1-3, I: insular zone, HT: hypothenar pad, LL: lower lip, W: wrist, LD: large dorsum.
In humans, the early studies investigating the effect of local anaesthesia on SI used ischemic
nerve block (e.g., Rossini et al., 1994; Werhahn et al., 2002), which results in an acute and
reversible deprivation of somatosensory and motor inputs, but also in ischemic pain. Other
authors using drug anaesthetics reported also on burning pain during these procedures (Buchner
et al., 1995). However, (phantom) pain is known to be closely related to cortical plasticity within
SI (e.g., Flor et al., 1995; Wrigley et al., 2009; Gustin et al., 2012), making it difficult to
distinguish the effects of somatosensory deprivation from the effects of pain produced by
ischemic nerve block, or from some interaction of these factors. Rossini and colleagues (1994)
overcame this issue by applying an anaesthetic cream on the ischemic fingers (i.e., four out of
the five fingers, the remaining finger being either D1, D3 or D5). This procedure completed, the
authors observed significant changes of the equivalent current dipoles (ECDs) of the remaining
(unanaesthetized) finger after a relatively brief period of sensory deprivation (~20min). This
plasticity was expressed by a shift of the dipole source of this finger towards the deprived area
(corresponding to the four other fingers). Interestingly, while D1 and D5 respectively shifted
towards the representations of the other (anaesthetized) fingers, D3 (i.e., middle finger) did not
exhibit a shift of its ECD when the four other fingers (D1, D2, D4 & D5) were anaesthetized
(Figure 32), which is remarkably consistent with the symmetry of the deprivation (two fingers
deprived on each side of the tested finger). Considering that the ECD reconstruction corresponds
more or less to the centre of gravity (CoG) of the representation, one can assume that while D3's
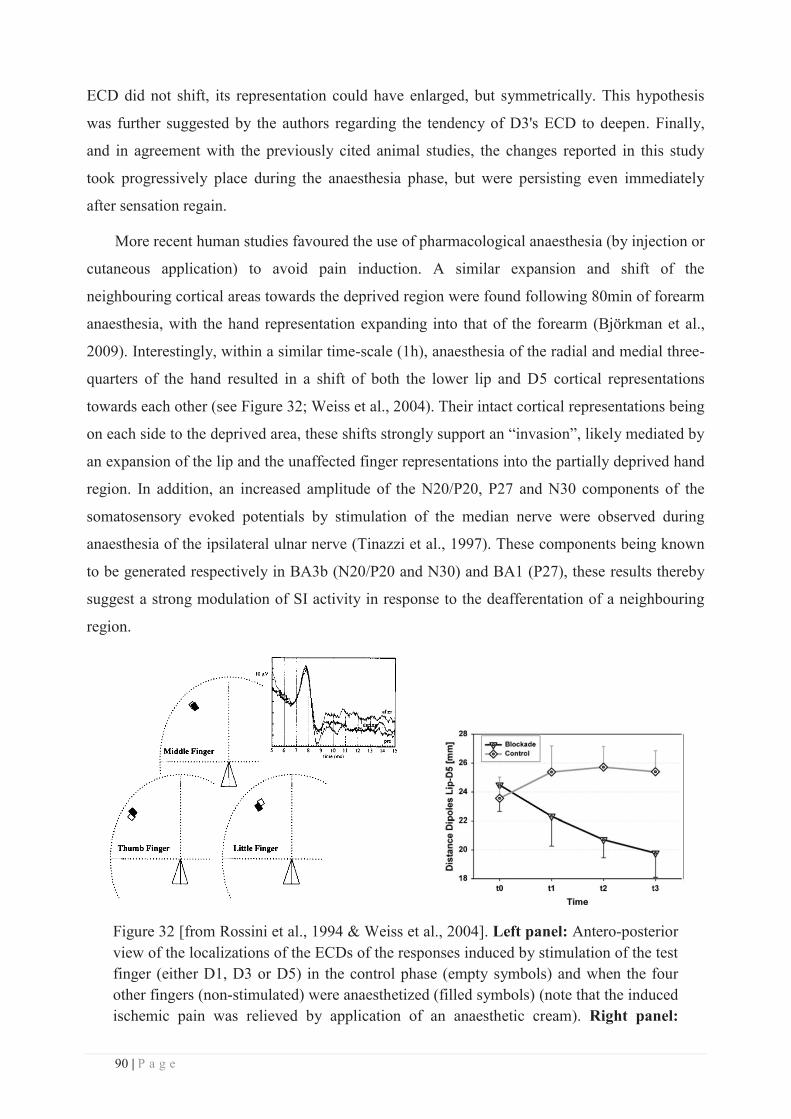
90 | P a g e
ECD did not shift, its representation could have enlarged, but symmetrically. This hypothesis
was further suggested by the authors regarding the tendency of D3's ECD to deepen. Finally,
and in agreement with the previously cited animal studies, the changes reported in this study
took progressively place during the anaesthesia phase, but were persisting even immediately
after sensation regain.
More recent human studies favoured the use of pharmacological anaesthesia (by injection or
cutaneous application) to avoid pain induction. A similar expansion and shift of the
neighbouring cortical areas towards the deprived region were found following 80min of forearm
anaesthesia, with the hand representation expanding into that of the forearm (Björkman et al.,
2009). Interestingly, within a similar time-scale (1h), anaesthesia of the radial and medial three-
quarters of the hand resulted in a shift of both the lower lip and D5 cortical representations
towards each other (see Figure 32; Weiss et al., 2004). Their intact cortical representations being
on each side to the deprived area, these shifts strongly support an “invasion”, likely mediated by
an expansion of the lip and the unaffected finger representations into the partially deprived hand
region. In addition, an increased amplitude of the N20/P20, P27 and N30 components of the
somatosensory evoked potentials by stimulation of the median nerve were observed during
anaesthesia of the ipsilateral ulnar nerve (Tinazzi et al., 1997). These components being known
to be generated respectively in BA3b (N20/P20 and N30) and BA1 (P27), these results thereby
suggest a strong modulation of SI activity in response to the deafferentation of a neighbouring
region.
Figure 32 [from Rossini et al., 1994 & Weiss et al., 2004]. Left panel: Antero-posterior view of the localizations of the ECDs of the responses induced by stimulation of the test finger (either D1, D3 or D5) in the control phase (empty symbols) and when the four other fingers (non-stimulated) were anaesthetized (filled symbols) (note that the induced ischemic pain was relieved by application of an anaesthetic cream). Right panel:
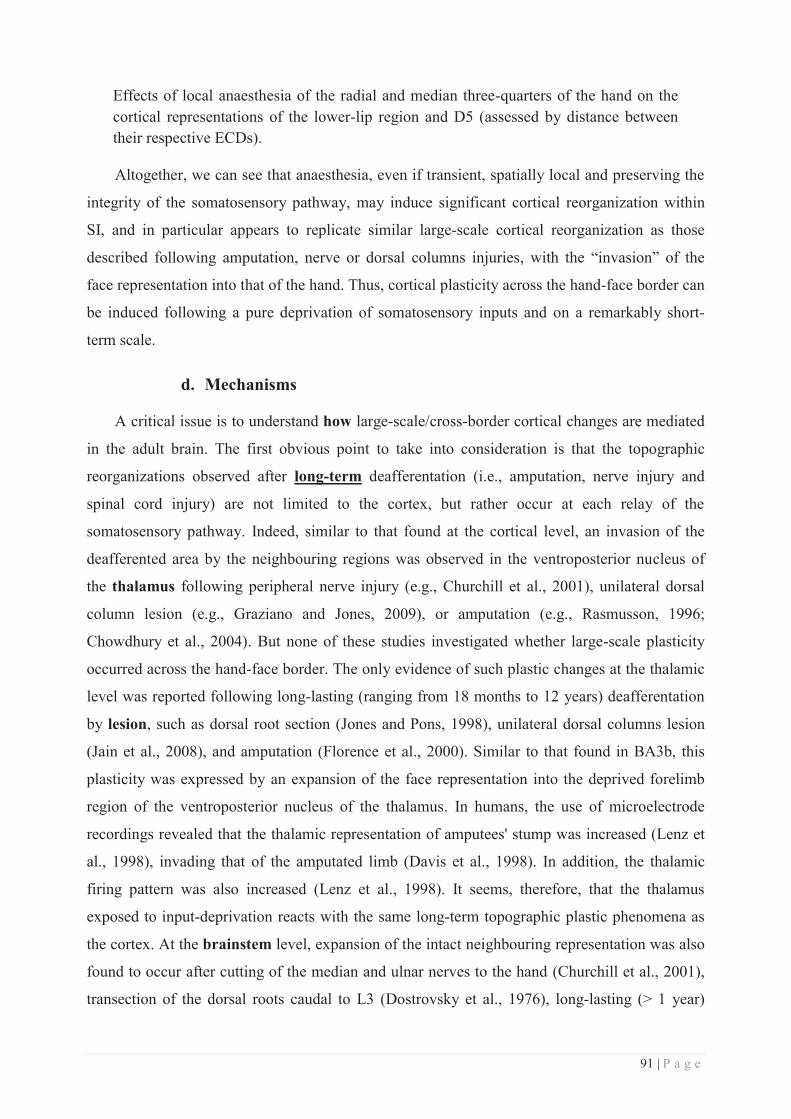
91 | P a g e
Effects of local anaesthesia of the radial and median three-quarters of the hand on the cortical representations of the lower-lip region and D5 (assessed by distance between their respective ECDs).
Altogether, we can see that anaesthesia, even if transient, spatially local and preserving the
integrity of the somatosensory pathway, may induce significant cortical reorganization within
SI, and in particular appears to replicate similar large-scale cortical reorganization as those
described following amputation, nerve or dorsal columns injuries, with the “invasion” of the
face representation into that of the hand. Thus, cortical plasticity across the hand-face border can
be induced following a pure deprivation of somatosensory inputs and on a remarkably short-
term scale.
d. Mechanisms
A critical issue is to understand how large-scale/cross-border cortical changes are mediated
in the adult brain. The first obvious point to take into consideration is that the topographic
reorganizations observed after long-term deafferentation (i.e., amputation, nerve injury and
spinal cord injury) are not limited to the cortex, but rather occur at each relay of the
somatosensory pathway. Indeed, similar to that found at the cortical level, an invasion of the
deafferented area by the neighbouring regions was observed in the ventroposterior nucleus of
the thalamus following peripheral nerve injury (e.g., Churchill et al., 2001), unilateral dorsal
column lesion (e.g., Graziano and Jones, 2009), or amputation (e.g., Rasmusson, 1996;
Chowdhury et al., 2004). But none of these studies investigated whether large-scale plasticity
occurred across the hand-face border. The only evidence of such plastic changes at the thalamic
level was reported following long-lasting (ranging from 18 months to 12 years) deafferentation
by lesion, such as dorsal root section (Jones and Pons, 1998), unilateral dorsal columns lesion
(Jain et al., 2008), and amputation (Florence et al., 2000). Similar to that found in BA3b, this
plasticity was expressed by an expansion of the face representation into the deprived forelimb
region of the ventroposterior nucleus of the thalamus. In humans, the use of microelectrode
recordings revealed that the thalamic representation of amputees' stump was increased (Lenz et
al., 1998), invading that of the amputated limb (Davis et al., 1998). In addition, the thalamic
firing pattern was also increased (Lenz et al., 1998). It seems, therefore, that the thalamus
exposed to input-deprivation reacts with the same long-term topographic plastic phenomena as
the cortex. At the brainstem level, expansion of the intact neighbouring representation was also
found to occur after cutting of the median and ulnar nerves to the hand (Churchill et al., 2001),
transection of the dorsal roots caudal to L3 (Dostrovsky et al., 1976), long-lasting (> 1 year)
92 | P a g e
amputation (Florence and Kaas, 1995; Jain et al., 2000), or dorsal columns lesion (Jain et al.,
2000). The latter two studies specifically reported a similar expansion of the brainstem face
representation into that of the deprived hand area.
Conversely, reorganization of the adult brain following hand deafferentation also takes
place in higher somatosensory areas such as SII and PV (Tandon et al., 2009). Interestingly,
while in BA3b the invasion concerned only the chin representation, at ~30% of the recording
sites in areas SII and PV the expanded face representation did not include chin inputs, but
included instead other parts of the face such as the upper-lip, the cheek or the whole hemiface,
which is consistent with the integrative property of these higher order areas. Similar differences
in the details of reorganization were reported between the ventro-posterior thalamic nucleus and
BA3b (Florence et al., 2000; Jain et al., 2008). Moreover, Tandon’s study also suggests that the
spinothalamic pathway, which remained intact, is unlikely to play a role in the observed large-
scale reorganization as its integrity did not prevent the large-scale expansion of the face
representation in SII and PV. Consequently, since there are two major inputs to area SII and PV
in primates, namely area 3b and direct thalamic inputs from the VPI nucleus (which receives
dense inputs from the spinothalamic tracts), the authors concluded that the reorganization
observed in areas SII and PV is likely to arise from and reflect changes in area 3b, which is the
only source of altered inputs to SII and PV.
Altogether, these findings show that the extensive reorganization following long-term
lesion-related deafferentation occurs at multiple levels along the neuraxis. This suggests that the
large-scale cortical reorganization is likely to reflect that observed in the ventroposterior
thalamic nucleus that may, in turn reflect that which occurs in the cuneate nucleus of the
brainstem. It has been proposed that such processes could be mediated by sprouting of new
connections targeting the dorsal horn of the spinal cord and the brainstem, as observed in adult
macaque monkeys after forelimb or hindlimb amputation (Florence and Kaas, 1995; Wu and
Kaas, 2002). In a similar way, neonatal forelimb removal (Lane et al., 1995) or dorsal root
avulsion (Sengelaub et al., 1997) in rats resulted respectively in invasion of the cuneate nucleus
by sciatic nerve primary afferents or by gracile projections. Interestingly, sprouting and growth
of intact face afferents was also reported from the trigeminal brainstem complex into the
cuneate nucleus (Jain et al., 2000). Similar connections from the trigeminal to the cuneate nuclei
have also been reported following injection of tracers in the trigeminal ganglion (Marfurt and
Rajchert, 1991). Although the spread of axon terminals in the cuneate nucleus is limited, it
undoubtedly activates a number of cuneate neurons, which relay to the contralateral
ventroposterior thalamic nucleus where an even larger area of the deprived nucleus may be
93 | P a g e
activated (Davis et al., 1998; Jones and Pons, 1998). Then, a relay from the ventroposterior
nucleus to area 3b probably further amplifies the process, so that an even more extensive
reorganization may occur in the cortex, likely with the help of other mechanisms, including
unmasking of previously existing connections at different processing levels (further described
below). In addition, sprouting has also been reported in the somatosensory cortex (Florence et
al., 1998), with expanded lateral connections in BA3b and BA1 following long-lasting
amputation and constraint forelimb. Thus the somatosensory cortical reorganization may benefit
from both local and bottom-up convergence/divergence processes along the somatosensory
pathway, relatively small modifications at the periphery ending up magnified at the cortical
level by the divergence of neuron projections (see Figure 33 and Kaas et al., 1999; Jones, 2000
for reviews). In agreement with this hypothesis, a slow but progressive withdrawal of lemniscal
and thalamocortical axons has been reported following cuneate tract section at the cervical level
in monkeys (Graziano and Jones, 2009), while dendritic arbors reorganization resulting in a
medial shift of the hand-face cortical border has been observed in rats following forepaw
deafferentation (Hickmott and Steen, 2005). Conversely, similar considerations have been
offered for the alterations at subcortical levels, which receive the strong top-down regulatory
influence of efferent connections from the sensory cortex to the thalamic and brainstem/spinal
relays (Ergenzinger et al., 1998; Kaas, 1999).
In humans, an abnormal pattern of intrinsic connectivity has been reported within the
deafferented SI hand/arm area of amputees (Kew et al., 1997). In addition, the reorganization
within SI induced by complete thoracic spinal cord injury was found to be negatively correlated
with local changes in fractional anisotropy (as SI reorganization increased, the extent of
“aligned structures” decreased) (Henderson et al., 2011), which could reflect intracortical
changes in fibre density, axonal diameter or myelination. These results support the idea that SI
reorganization results from sprouting of new lateral connections.
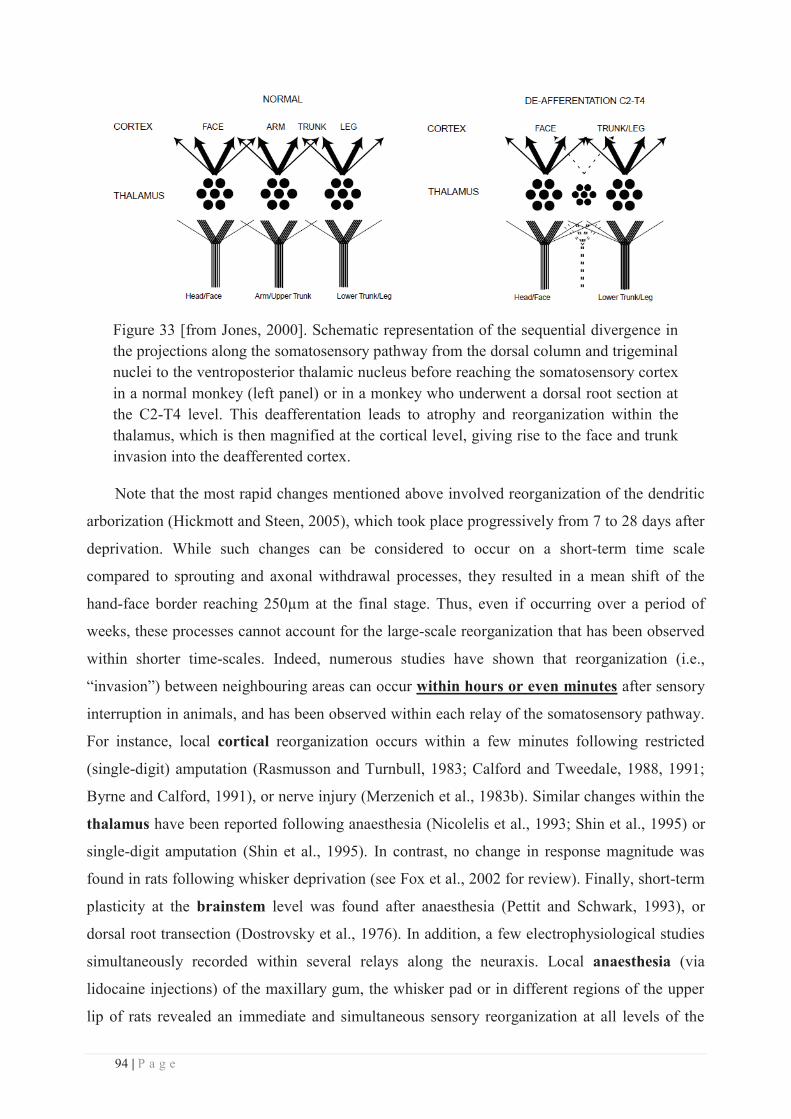
94 | P a g e
Figure 33 [from Jones, 2000]. Schematic representation of the sequential divergence in the projections along the somatosensory pathway from the dorsal column and trigeminal nuclei to the ventroposterior thalamic nucleus before reaching the somatosensory cortex in a normal monkey (left panel) or in a monkey who underwent a dorsal root section at the C2-T4 level. This deafferentation leads to atrophy and reorganization within the thalamus, which is then magnified at the cortical level, giving rise to the face and trunk invasion into the deafferented cortex.
Note that the most rapid changes mentioned above involved reorganization of the dendritic
arborization (Hickmott and Steen, 2005), which took place progressively from 7 to 28 days after
deprivation. While such changes can be considered to occur on a short-term time scale
compared to sprouting and axonal withdrawal processes, they resulted in a mean shift of the
hand-face border reaching 250μm at the final stage. Thus, even if occurring over a period of
weeks, these processes cannot account for the large-scale reorganization that has been observed
within shorter time-scales. Indeed, numerous studies have shown that reorganization (i.e.,
“invasion”) between neighbouring areas can occur within hours or even minutes after sensory
interruption in animals, and has been observed within each relay of the somatosensory pathway.
For instance, local cortical reorganization occurs within a few minutes following restricted
(single-digit) amputation (Rasmusson and Turnbull, 1983; Calford and Tweedale, 1988, 1991;
Byrne and Calford, 1991), or nerve injury (Merzenich et al., 1983b). Similar changes within the
thalamus have been reported following anaesthesia (Nicolelis et al., 1993; Shin et al., 1995) or
single-digit amputation (Shin et al., 1995). In contrast, no change in response magnitude was
found in rats following whisker deprivation (see Fox et al., 2002 for review). Finally, short-term
plasticity at the brainstem level was found after anaesthesia (Pettit and Schwark, 1993), or
dorsal root transection (Dostrovsky et al., 1976). In addition, a few electrophysiological studies
simultaneously recorded within several relays along the neuraxis. Local anaesthesia (via
lidocaine injections) of the maxillary gum, the whisker pad or in different regions of the upper
lip of rats revealed an immediate and simultaneous sensory reorganization at all levels of the
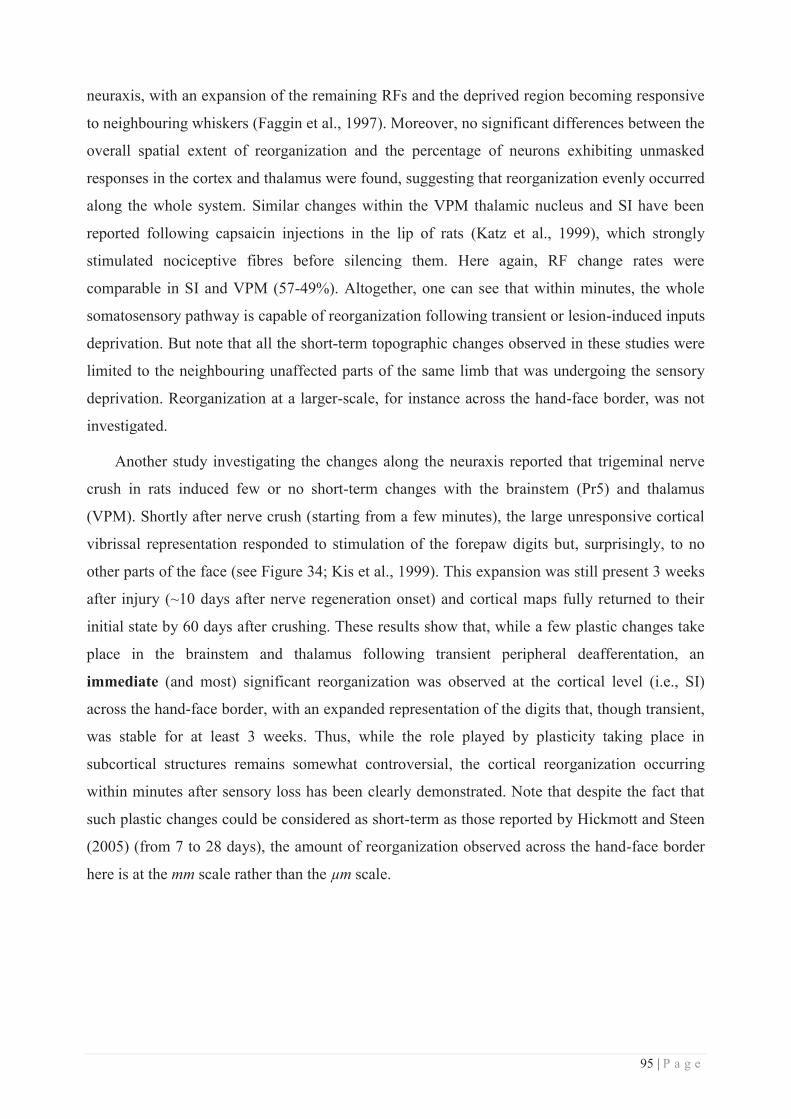
95 | P a g e
neuraxis, with an expansion of the remaining RFs and the deprived region becoming responsive
to neighbouring whiskers (Faggin et al., 1997). Moreover, no significant differences between the
overall spatial extent of reorganization and the percentage of neurons exhibiting unmasked
responses in the cortex and thalamus were found, suggesting that reorganization evenly occurred
along the whole system. Similar changes within the VPM thalamic nucleus and SI have been
reported following capsaicin injections in the lip of rats (Katz et al., 1999), which strongly
stimulated nociceptive fibres before silencing them. Here again, RF change rates were
comparable in SI and VPM (57-49%). Altogether, one can see that within minutes, the whole
somatosensory pathway is capable of reorganization following transient or lesion-induced inputs
deprivation. But note that all the short-term topographic changes observed in these studies were
limited to the neighbouring unaffected parts of the same limb that was undergoing the sensory
deprivation. Reorganization at a larger-scale, for instance across the hand-face border, was not
investigated.
Another study investigating the changes along the neuraxis reported that trigeminal nerve
crush in rats induced few or no short-term changes with the brainstem (Pr5) and thalamus
(VPM). Shortly after nerve crush (starting from a few minutes), the large unresponsive cortical
vibrissal representation responded to stimulation of the forepaw digits but, surprisingly, to no
other parts of the face (see Figure 34; Kis et al., 1999). This expansion was still present 3 weeks
after injury (~10 days after nerve regeneration onset) and cortical maps fully returned to their
initial state by 60 days after crushing. These results show that, while a few plastic changes take
place in the brainstem and thalamus following transient peripheral deafferentation, an
immediate (and most) significant reorganization was observed at the cortical level (i.e., SI)
across the hand-face border, with an expanded representation of the digits that, though transient,
was stable for at least 3 weeks. Thus, while the role played by plasticity taking place in
subcortical structures remains somewhat controversial, the cortical reorganization occurring
within minutes after sensory loss has been clearly demonstrated. Note that despite the fact that
such plastic changes could be considered as short-term as those reported by Hickmott and Steen
(2005) (from 7 to 28 days), the amount of reorganization observed across the hand-face border
here is at the mm scale rather than the μm scale.
96 | P a g e
Figure 34 [from Kis et al., 1999]. Reorganization in SI digit and whisker representations induced by crushing and subsequent regeneration of the contralateral infraorbital nerve. (A) Representation of the posterolateral border between digit and whisker representations at baseline. (B) Contralateral trigeminal nerve crush resulted in a large unresponsive area to whisker stimulation invaded by responses evoked by digit stimulation 3 days after nerve crush, resulting in a shift of the hand-face border into the deprived area. (C) The expanded digit representation and the return of whisker responses (at 7-10 days after crush) resulted in an overlapping zone exhibiting responses to both digital and vibrissal stimulation. (D) 60 days after crushing, the hand-face border almost regained its original location.
In humans, short-term plastic changes have been found at the cortical level following
anaesthesia of part of, or the whole upper-limb (Rossini et al., 1994; Tinazzi et al., 1997; Weiss
et al., 2004; Björkman et al., 2009; Petoe et al., 2013). But here again, few studies investigated
large-scale reorganization across body-parts. Björkman and colleagues reported an expansion of
the hand representation into that of the anaesthetized forearm around 80 minutes after
deprivation (the face representation was not investigated in this study). Weiss and colleagues
(2004) reported that the cortical representation of the lower-lip invaded the deprived D1/D2/D3
cortical region within one hour of pharmacological blockade (Weiss et al., 2004). Interestingly,
while long-term disruption of median nerve transmission due to carpal tunnel syndrome
(symptoms > 11 months) was associated with increased somatosensory evoked potentials
(SEPs) at the spinal, brainstem and cortical levels (Tinazzi et al., 1998), no change at the spinal
and subcortical levels were found following transient (non-lesional) anaesthesia of the ulnar
97 | P a g e
nerve (Tinazzi et al., 1997). Instead, markedly increased SEPs were reported at the cortical
level, with in particular, a more pronounced reorganization within BA3b as compared to BA1
(Tinazzi et al., 1997). This latter result is in agreement with electrophysiological results showing
more marked RF reorganization within area 3b than in area 1 (Merzenich et al., 1983a, 1983b).
Knowing that the carpal tunnel syndrome in the former study was associated with median nerve
lesions at the distal territories, the two studies suggest that different processes might subserve
the reorganization induced respectively by long-term lesional somatosensory disruptions (such
as nerve & spinal cord injuries, amputation) and short-term reversible interventions (such as
anaesthesia). Together with the electrophysiological results previously mentioned, the likely
contribution of subcortical structures to the cortical reorganization has to be further
demonstrated and clarified, especially following transient non-lesional deprivations. But apart
from this consideration, these studies all agree on the fact that somatosensory deprivation
induces a rapid cortical reorganization, which can occur over a large-scale.
Given that these short-term plastic changes occur too quickly to be subserved by collateral
sprouting, or any other changes in neuronal morphology, one potential explanation is the
unmasking of previously existing, but silent connections (Merzenich et al., 1984; Nicolelis et
al., 1993; Rossini et al., 1994; Faggin et al., 1997; Tinazzi et al., 1997; Katz et al., 1999). The
most likely mechanism for unmasking is a disinhibition of these previously silent connections
(Jacobs and Donoghue, 1991; Tremere et al., 2001a, 2001b; Weiss et al., 2004; Lu et al., 2014).
Indeed, the discreteness of cortical representations is actively maintained, at least in part, by
lateral intracortical inhibition (e.g. Tremere et al., 2001b) emanating from a cortical zone
receiving coherent input from regions of the body surface and exerting its influence on adjacent
regions. Somatosensory deprivation may thus lead to changes in the balance of excitatory and
inhibitory postsynaptic potentials with the neighbouring areas. Such changes have been found
mainly for the GABAergic system (e.g., Jones, 1993; Tremere et al., 2001a, 2001b; Jasmin et
al., 2003), GABA antagonists leading to a decrease of inhibition. Due to this disinhibition, the
relatively widespread and previously silent thalamocortical projections (e.g., Rausell et al.,
1998; Barbay et al., 1999) and cortico-cortical connections (Smits et al., 1991; Zarzecki et al.,
1993) may become functional. This disinhibition would account for the rapid rate at which
cortical reorganization can take place after a decrease in sensory inputs, by rendering the
deafferented neurons hypersensitive to and thus activated by weak inputs coming from adjacent
representations, which would otherwise be inhibited. This disinhibition is further supported by
the numerous reports of an enhanced spontaneous activity (i.e., hyperexcitability) following
deafferentation (e.g., Rasmusson et al, 1992; Taub et al, 1995; Knecht et al, 1996). The
98 | P a g e
disinhibition further implies an extended network of connectivity across somatosensory cortical
representations to structurally support such a process. This “unmasking” of latent connections
could later on be supplemented or even replaced by changes in synaptic efficacy, and/or by
growth processes, such as sprouting.
Altogether, the plastic changes observed following different ways of inducing
deafferentation (i.e., amputation, nerve and spinal cord injuries and anaesthesia), highlight that
the induced reorganization evolves with time, and may thus depend on different mechanisms
having different time courses, with short time-scale processes (minutes to hours), possibly
relying on the unmasking of pre-existing -but silent- thalamocortical and cortico-cortical
connections, and longer time-scale processes (weeks to months), possibly based upon the
sprouting of thalamocortical and cortico-cortical projections. To these mechanisms, homeostatic
processes can be added, aimed at regaining a balanced brain activity (Vitureira et al., 2012; Lu
et al., 2014).
However, I would like to emphasize that despite the fundamental differences between
somatosensory deprivation cases involving or not a lesion (already mentioned at the end of the
II.a. and II.b. sections), both cases are usually considered to be similar and are jointly mentioned
when referring to brain plasticity due to somatosensory deprivation. The processes subserving
the induced plasticity are, however, likely different. Thus, a direct comparison of these two
deprivation classes should be systematically investigated within the same species and obviously
at equal, but multiple, time-scales. For instance, to my knowledge the effects of long-term
anaesthesia at all levels of the neuraxis have not yet been investigated. In addition, while cortical
reorganization could result from subcortical plastic changes, the converse also holds, with the
effects observed at the subcortical level following anaesthesia possibly resulting from changes
in corticothalamic connections (top-down regulation processes). Indeed, simultaneous
recordings from the rat forepaw areas of both SI and VPL nucleus 20 minutes after anaesthesia
onset (by injection of lidocaine), revealed a massive decrease of the thalamocortical connectivity
and a small decrease of the corticothalamic (corticofugal) connectivity (Jung and Shin, 2002).
Conversely, a non negligible number of corticothalamic connections were potentiated following
anaesthesia onset (see Figure 35).
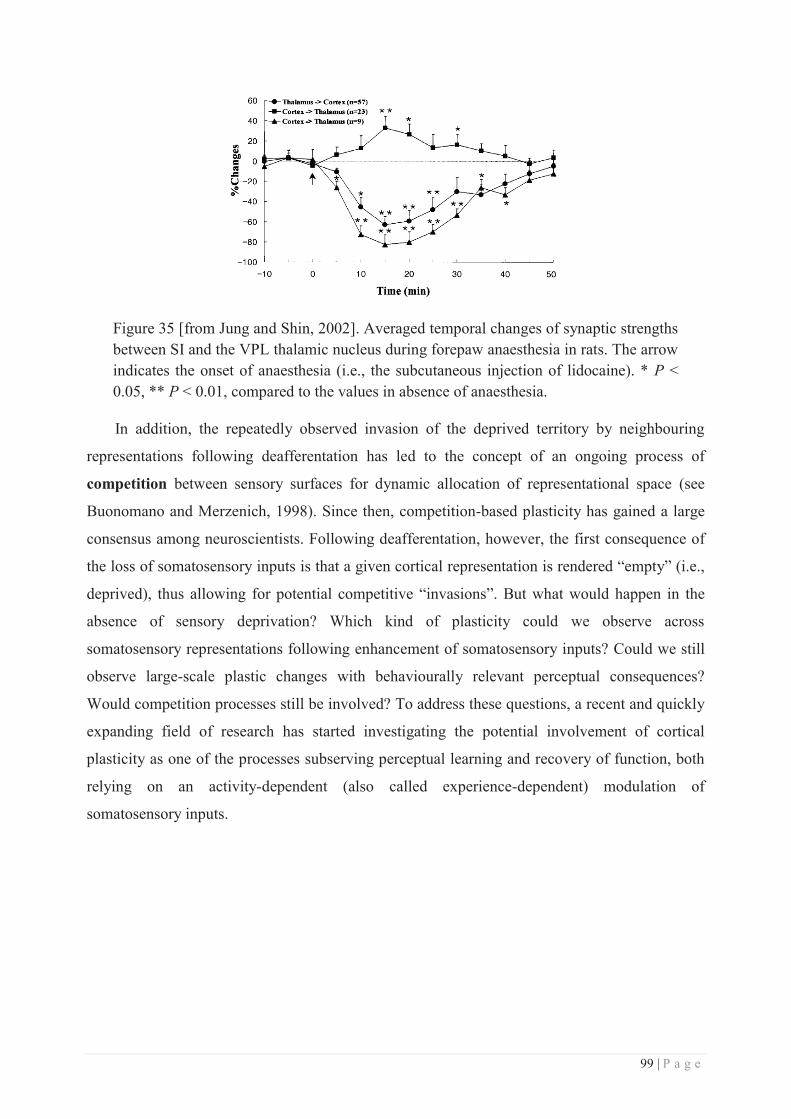
99 | P a g e
Figure 35 [from Jung and Shin, 2002]. Averaged temporal changes of synaptic strengths between SI and the VPL thalamic nucleus during forepaw anaesthesia in rats. The arrow indicates the onset of anaesthesia (i.e., the subcutaneous injection of lidocaine). * P < 0.05, ** P < 0.01, compared to the values in absence of anaesthesia.
In addition, the repeatedly observed invasion of the deprived territory by neighbouring
representations following deafferentation has led to the concept of an ongoing process of
competition between sensory surfaces for dynamic allocation of representational space (see
Buonomano and Merzenich, 1998). Since then, competition-based plasticity has gained a large
consensus among neuroscientists. Following deafferentation, however, the first consequence of
the loss of somatosensory inputs is that a given cortical representation is rendered “empty” (i.e.,
deprived), thus allowing for potential competitive “invasions”. But what would happen in the
absence of sensory deprivation? Which kind of plasticity could we observe across
somatosensory representations following enhancement of somatosensory inputs? Could we still
observe large-scale plastic changes with behaviourally relevant perceptual consequences?
Would competition processes still be involved? To address these questions, a recent and quickly
expanding field of research has started investigating the potential involvement of cortical
plasticity as one of the processes subserving perceptual learning and recovery of function, both
relying on an activity-dependent (also called experience-dependent) modulation of
somatosensory inputs.
100 | P a g e
III. Activity-dependent plasticity
a. Restoration & modification of peripheral inputs in the context of
rehabilitation
Complementarily to the deafferentation cases reported in the previous section, the most
intuitive cases to study in regard of activity-dependent plasticity are patients who have
undergone surgical restoration of peripheral inputs, either by allograft (transplantation) or nerve
regeneration/redirection, as these cases allow us to assess whether deprivation-induced plasticity
is reversible.
In monkeys, nerve regeneration following suture of a previously cut nerve is known to
result in reactivation of much of its original cortical territory (for reviews, see Merzenich and
Jenkins, 1993; Navarro, 2009). However, the somatotopic re-organization remains highly
abnormal (Florence et al., 1994), many neurons having multiple RFs such that neurons at the
same cortical site respond to stimulation of nonadjacent skin areas, and conversely, many parts
of the skin innervated by the regenerated nerve being represented in non-contiguous chunks of
cortex. In contrast, if a nerve is crushed instead of cut and allowed to regenerate, the axons
regenerate into their original fascicles, and a complete restoration of cortical maps is observed.
For instance following complete median nerve crush the digits’ somatotopic organization within
area 3b was fully restored 142 days after injury (Wall et al., 1983). Similarly, restoring inputs by
means of nerve redirection induces an expansion of the SI representation of the re-innervated
regions in rats (Marasco and Kuiken, 2010).
In humans, percutaneous microneurography performed 7 to 23 months following complete
transection with subsequent suture or graft of the median or ulnar nerves revealed significant
changes in RFs of SAI and FAI afferents, with multiple RFs innervated by a single afferent and
unusually small or large RFs (Mackel et al., 1985). At the cortical level, similar median nerve
transection and repair revealed that more than 1 year postoperatively the BOLD signal within SI
evoked by stimulation of the hand covered a smaller area located more superiorly than the area
activated in controls (Taylor et al., 2009). This decreased activity was co-localized with grey
matter reductions, which were negatively correlated with measures of sensory recovery
(mechanical and vibration detection). While these results from nerve repair cases clearly show
the occurrence of cortical plastic changes in these patients, they do not clearly address the
differential contribution of deprivation and repair-induced plastic changes. In contrast, allograft
of a limb following amputation was found to at least partially reverse the deprivation-induced
101 | P a g e
plasticity. For instance, Giraux and colleagues (2001) showed that after bilateral hand graft,
hand representations which were originally shifted towards that of the face due to deprivation,
expanded toward their normal location 6 months after transplantation. A similar “recapture” of
the pre-amputation SI hand territory was more recently found to occur as early as 4 months post-
transplantation (Frey et al., 2008). Similarly, toe-to-finger transplantation was found to result
in successful “substitution” of cortical representations in the long-term (average of 5 years post-
transplantation),the transplanted toe being located in the expected location of the previously
missing finger representation (Chen et al., 2006). In addition, the transplanted toe (now finger)
exhibited an expanded representation compared to the other (normal) fingers. Interestingly, a
quite recent study investigated the time course of cortical changes following similar
transplantation, but over a shorter time-scale (Hadoush et al., 2012). Somatosensory evoked
field (SEF) recordings revealed responses evoked by stimulation of the transplanted toe (now
D2) as soon as 4 weeks after surgery, and its representation was found very close to that of the
intact D5 of the same hand (ED = 3.7mm). But over time (weeks 12 and 24), this distance
increased (to 5.9mm and 7.4mm respectively) as did the dipole strength (from 9nAm at week 4
to 17.3 nAm at week 12 and to 18.6nAm at week 24), whereas latencies decreased (from 76.5ms
at week 4 to 69.7ms at week 12 and to 67ms at week 24). While these studies, both in animals
and in humans, show that deprivation-induced plasticity can be partially reversed by restoring
the missing inputs, the process of restoration and the end result could not be controlled which
means that the amount of input restored is thus difficult to quantify and thereby difficult to link
to the cortical reorganization induced by this restoration.
To overcome this issue, active increase of somatosensory inputs can be triggered in
monkeys to evaluate and quantify the subsequent restoration of cortical organization (for a
review, see Xerri, 2012). For instance, monkeys trained to perform a small-object retrieval
sensorimotor task after having undergone cortical microlesion of the glabrous finger
representation within area 3b, had a re-emergence of the representation of the fingertips engaged
in the task, but in novel locations in areas 3b and 3a (Xerri et al., 1998). Following median nerve
cut and repair, sensory enrichment was also found to increase the proportion of small and well
localized RFs compared to monkeys raised in non-enriched environments (see Figure 36;
Florence et al., 2001). Interestingly, these RF changes were consistently observed within area
3b, but not within the ventroposterior thalamic nucleus, suggesting that enhanced sensory inputs
primarily affect cortical maps.
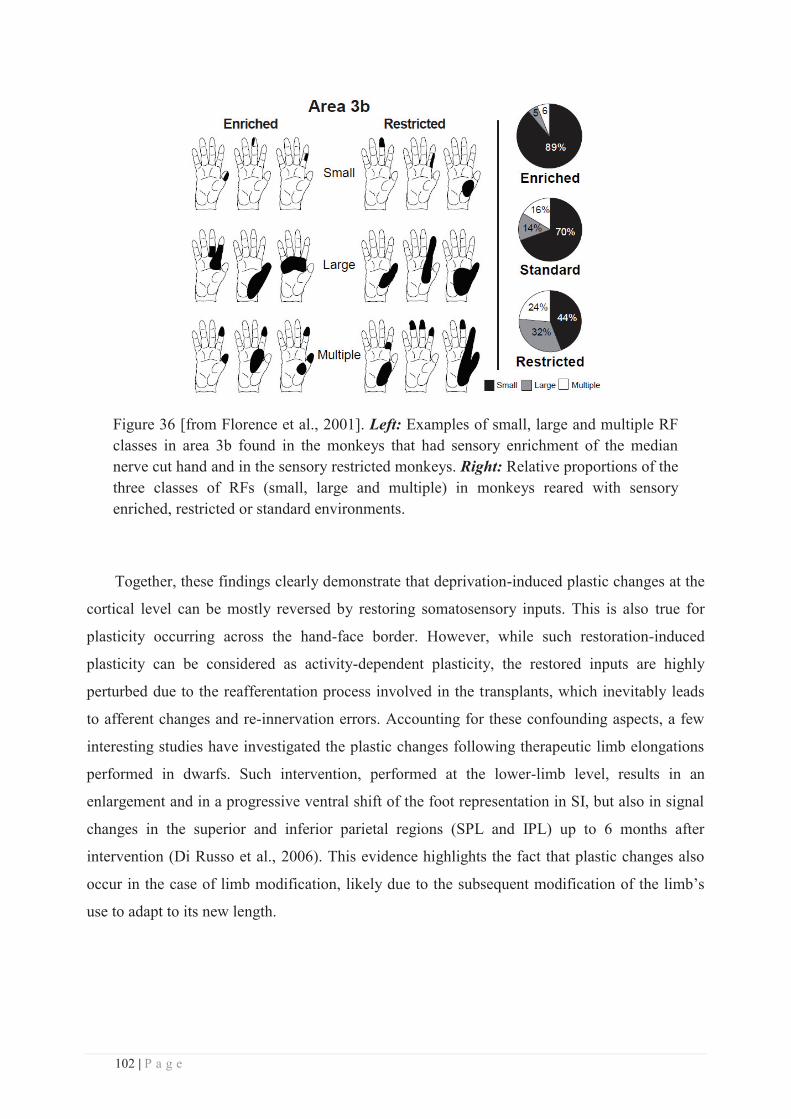
102 | P a g e
Figure 36 [from Florence et al., 2001]. Left: Examples of small, large and multiple RF classes in area 3b found in the monkeys that had sensory enrichment of the median nerve cut hand and in the sensory restricted monkeys. Right: Relative proportions of the three classes of RFs (small, large and multiple) in monkeys reared with sensory enriched, restricted or standard environments.
Together, these findings clearly demonstrate that deprivation-induced plastic changes at the
cortical level can be mostly reversed by restoring somatosensory inputs. This is also true for
plasticity occurring across the hand-face border. However, while such restoration-induced
plasticity can be considered as activity-dependent plasticity, the restored inputs are highly
perturbed due to the reafferentation process involved in the transplants, which inevitably leads
to afferent changes and re-innervation errors. Accounting for these confounding aspects, a few
interesting studies have investigated the plastic changes following therapeutic limb elongations
performed in dwarfs. Such intervention, performed at the lower-limb level, results in an
enlargement and in a progressive ventral shift of the foot representation in SI, but also in signal
changes in the superior and inferior parietal regions (SPL and IPL) up to 6 months after
intervention (Di Russo et al., 2006). This evidence highlights the fact that plastic changes also
occur in the case of limb modification, likely due to the subsequent modification of the limb’s
use to adapt to its new length.
103 | P a g e
b. Use-dependent plasticity: naturalistic cases
Similarly, extensive training leading to an expertise in a given domain is also accompanied
by use-dependent plastic changes. One type of expertise that has been studied is the one
acquired by musicians throughout practice. For instance, the cortical representation of the digits
of the left hand of string players, which are strongly solicited for rapid and precise individual
movements on the strings, were found to be larger than that of their right hand (less solicited), or
than the left fingers of non-musicians (Elbert et al., 1995). Interestingly, the amount of cortical
reorganization in the representation of the fingering digits was correlated with the age at which
the person had begun to play, but not with the amount of practice. This confirms the
involvement of the plastic capacity of the CNS at early stages of life in such learning, as half of
the studied musicians started to practice before the age of 10. A subsequent study further
revealed that in string players, D2 and D1 were located more anteriorly and the D2-D5 distance
was greater than in controls (Hashimoto et al., 2004). In the somatosensory modality, blind
people learning Braille develop a highly sophisticated perceptual skill when they become
proficient Braille readers. Using SEP recordings and transcranial magnetic stimulation (TMS), a
larger sensorimotor cortical representation was found for the right index reading finger as
compared with the left non-reading finger or with the right finger of non-Braille readers
(Pascual-Leone and Torres, 1993). In contrast, representations of parts of the hand that were not
solicited in Braille reading were smaller than in non-readers hands. Interestingly, in blind people
who use more than one finger to read Braille, in addition to a substantial enlargement of the
reading finger representations a disordered topographical arrangement of the finger
representations has also been observed within SI (Sterr et al., 1998a, 1998b). In contrast, neither
the disordered representations, nor comparable mislocalizations were observed in one-finger
Braille readers or in sighted controls. These few examples clearly demonstrate that cortical
representation changes not only follow sensory deprivation and can be reversed by restoring
sensory inputs, but they show that intense use and practicing in a healthy context also results in
plastic changes that seem to be the “inverse” of those observed after deprivation. But note that
these expertise-related plastic changes follow either long-term training/practice, usually initiated
during childhood when the brain exhibits higher plastic capacities, or are associated with long-
term cross-modal plasticity (i.e., from vision to touch). So these cases might reflect rather
extreme positions on the continuum of the plastic changes occurring in adult brain. Furthermore,
“over-use” can also result in pathological cases. For instance, individuals who perform high
precision hand movements such as musicians, engineers, architects and writers may become
affected by focal hand dystonia, which has been shown to be associated with reorganization of
104 | P a g e
the dystonic (Braun et al., 2003) and non-dystonic (Meunier et al., 2001) hand representations in
SI, but also with altered sensorimotor integration across fingers (Tamburin et al., 2002).
In animals, a similar naturalistic induction of use-dependent somatosensory plasticity can be
achieved through sensory enrichment. Following the early evidence that environmental
manipulations affect the areal organization of the cortex (e.g. Diamond et al, 1976), numerous
electrophysiological studies, mainly performed in rats, highlighted the influence and relevance
of naturalistic sensory solicitation. For instance, a pioneer study investigated the effects of
natural nursing behaviour in rats on the cortical representation of the ventrum surface (Xerri et
al., 1994; Rosselet et al., 2006). Compared to virgin or postpartum age-matched rats, lactating
rats exhibited an enlarged representation of the ventral trunk skin, especially of the nipple-
bearing skin (almost twofold), which was associated with a concomitant decrease in RF size.
Interestingly, these cortical changes did not alter the topographical organization of SI, which
remained well ordered. In monkeys, these authors described a similar expansion of the
representation of the fingertips that were highly solicited in a difficult small-object retrieval
task, with a closely corresponding reduction in RF size (Xerri et al., 1996). Similarly, rats
housed for 80 to 115 days in an enriched environment exhibited a substantial enlargement of the
cutaneous forepaw representation which was associated with smaller glabrous RFs and with
fewer representational discontinuities (see Figure 37; Xerri et al., 1996; Coq and Xerri, 1998;
see also Polley et al., 2004). Interestingly, this higher cortical magnification was predominant
for the protuberant glabrous skin, more likely to be stimulated (i.e., digit tips and palmar pads),
whereas the hairy skin representation remained unchanged (Coq and Xerri, 1998). Finally,
neurons were more sensitive to light tactile stimulation in rats exposed to an enriched
environment than in rats exposed to a standard environment. Altogether, these results
demonstrate the importance of sensory experience, even at the adult stage, in modifying cortical
representations, and corroborate the view that cortical representations are maintained in a
permanent state of use-dependent fluctuation (see next section).
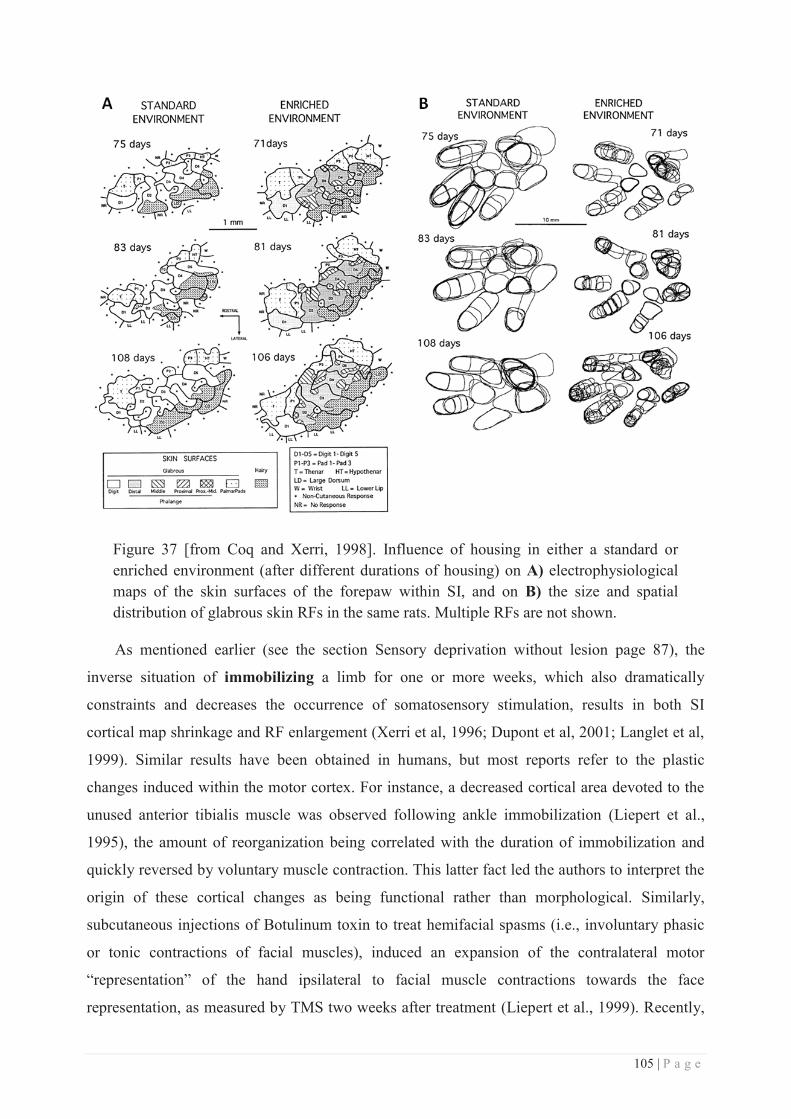
105 | P a g e
Figure 37 [from Coq and Xerri, 1998]. Influence of housing in either a standard or enriched environment (after different durations of housing) on A) electrophysiological maps of the skin surfaces of the forepaw within SI, and on B) the size and spatial distribution of glabrous skin RFs in the same rats. Multiple RFs are not shown.
As mentioned earlier (see the section Sensory deprivation without lesion page 87), the
inverse situation of immobilizing a limb for one or more weeks, which also dramatically
constraints and decreases the occurrence of somatosensory stimulation, results in both SI
cortical map shrinkage and RF enlargement (Xerri et al, 1996; Dupont et al, 2001; Langlet et al,
1999). Similar results have been obtained in humans, but most reports refer to the plastic
changes induced within the motor cortex. For instance, a decreased cortical area devoted to the
unused anterior tibialis muscle was observed following ankle immobilization (Liepert et al.,
1995), the amount of reorganization being correlated with the duration of immobilization and
quickly reversed by voluntary muscle contraction. This latter fact led the authors to interpret the
origin of these cortical changes as being functional rather than morphological. Similarly,
subcutaneous injections of Botulinum toxin to treat hemifacial spasms (i.e., involuntary phasic
or tonic contractions of facial muscles), induced an expansion of the contralateral motor
“representation” of the hand ipsilateral to facial muscle contractions towards the face
representation, as measured by TMS two weeks after treatment (Liepert et al., 1999). Recently,
106 | P a g e
however, similar injections (but for aesthetic purposes) were further associated with a reduction
of event-related potentials (ERPs) induced by tactile stimulation of both thumbs, but at longer
latencies (Haenzi et al., 2014). Thus, despite an obvious major contribution of reorganization of
motor efferent signals, the somatosensory components are also affected by such interventions.
But whether these changes arise from the direct “deprivation” of somatosensory inputs due to
immobilization, or whether they arise from a “second-order” plasticity resulting from the motor
reorganization remains unknown.
Altogether, the results mentioned in this section provide evidence that cortical
representations are strongly modulated by “naturalistic” variations of either the environment or
the use of a limb. But to my knowledge, in contrast with the deprivation-related plasticity cases,
no systematic investigation of the spatial limits of such activity- or use-dependent plasticity has
been attempted. However, note that both environmental- and use-related plastic changes involve
a strong contribution of the limb motor component, either transplanted, immobilized or
stimulated by its displacement in an enriched environment. Thus, even in these cases the pure
contribution of increased somatosensory inputs is difficult to isolate. Despite this, these results
provide a clear demonstration of the strong influence of both activity-dependent sensory inputs
and motor outputs in driving cortical plastic changes.
107 | P a g e
c. Training-dependent plasticity
Along the same lines, but focusing more specifically on the somatosensory modality,
changes in the somatotopic organization of cortical maps have been repeatedly observed
following tactile training, which is easy to implement in laboratory conditions. For instance,
reorganization of the hand representation was reported in monkeys who were trained over 10
days to maintain contact with a rotating disk, thus producing an extensive cutaneous stimulation
of a restricted part of the skin on the distal phalanges of one or two digits (Jenkins et al., 1990).
Similar to sensory enrichment cases, the observed reorganization was expressed in terms of an
expansion of the cortical representations of these stimulated digits, associated with reduced
cutaneous RF size. In addition, the borders between the representations of individual digits and
digit segments shifted in parallel. Interestingly, a significant lateral translocation of the borders
between the representations of the hand and the face was recorded in all cases, suggesting again
a close interaction between these representations. Finally, the rostral border of BA3b was also
shifted towards BA3a, which is normally activated by deep (proprioceptive) receptors,
suggesting a potentiation of cutaneous over deep receptor activation (Jenkins et al., 1990). This
latter hypothesis was then confirmed in animals trained to detect tactile frequency differences on
a single digit segment over a period of 20 weeks (Recanzone et al., 1992c), in which an
emergence of a large cutaneous representation of the trained cutaneous region was observed
within BA3a, replacing the normal representation of deep receptors in this field. Two other
studies from this series further investigated the cortical changes observed in these monkeys.
Electrophysiological mapping of their hand representations within BA3b confirmed the previous
report of Jenkins by revealing a 1.5- to 3-fold increase in the cortical representation of the
stimulated skin location (Recanzone et al., 1992d). This enlargement was also accompanied by
an increased topographic complexity, but also by larger and more overlapping RFs within the
trained region (Recanzone et al., 1992d). This enlargement of RFs, which strikingly contrasts
with the shrinkage repeatedly reported so far, is likely to arise from the fact that in this study,
somatosensory stimuli were invariantly delivered to the same skin location (see the end of the
section “Temporally paired cutaneous stimulation” for further discussion of this point, page
128). Additionally, the temporal response characteristics of neurons from BA3b revealed a
sharpening of their response that could be accounted for by a large subpopulation of neurons
that had highly coherent responses, suggesting an increased neuronal coherence (Recanzone et
al., 1992e). Thus, in contrast to BA3a neurons, frequency discrimination training led to an
alteration of spatial and temporal response properties of BA3b neurons, which was found to be
correlated with changes in frequency discrimination performance (Recanzone et al., 1992e).
108 | P a g e
Together, these results confirm the preponderant role of BA3b in processing tactile information
relevant for acuity performance and further demonstrate its involvement in tactile learning
processes through training. In addition, these reports clearly highlight that solely increasing
somatosensory input through training, even if at a restricted skin region, results in a consistent
enlargement of the representation of the stimulated regions within BA3b, which can lead to
alterations of the hand-face border.
In humans, a few studies investigated the cortical correlates of somatosensory training, but
with less clear results than those of animal studies. For instance, humans trained over a 22 days
period in a tactile frequency discrimination task similar to that used by Recanzone and
colleagues did not show any changes of the cortical representation of the trained finger (left-D4)
as assessed by MEG recordings, despite a steep and long-lasting behavioural improvement (Imai
et al., 2003). In the spatial domain, another study reported changes in effective connectivity
within both subcortical (bilateral insula, bilateral putamen, bilateral thalamus, and cerebellum)
and pre-SMA areas rather than somatosensory cortical regions in participants who underwent a
tactile microspatial discrimination training at the right-D2 fingertip over 14 sessions lasting ~1h
each (Sathian et al., 2013). This spatial stimulation pattern consisted of three aligned dots, with
the middle one being slightly off-set either towards the left or the right, yielding an arrow-like
pattern whose direction had to be discriminated. Thus, in contrast to the previously cited
monkey studies, the representational changes in humans induced by tactile training seem to be
more difficult to capture, likely due to the poor spatial resolution of brain imaging techniques
compared with invasive electrophysiological recordings. But despite this challenge, a larger
number of studies investigating the cortical correlates of tactile learning is indeed required.
Apart from these two studies in which a restricted cutaneous area was involved in the training
phase, numerous studies in the late 90's - early 2000's combined training (either temporal or
spatial) with what I will call “pairing” of different cutaneous regions, predominantly the
fingers. This enthusiasm for pairing procedures arose from earlier studies demonstrating the
crucial role of temporally correlated inputs in inducing macroscopic representational
reorganization (more detailed in the next section, page 112) both in monkeys (e.g., Clark et al.,
1988) and in humans (e.g., Mogilner et al., 1993), these studies having themselves inherited
from classical electrophysiological studies investigating pairing-induced LTP processes at the
synaptic level (i.e., Hebbian plasticity or spike-timing dependent plasticity, more detailed in
next chapter, page 125).
109 | P a g e
One of the first studies in which somatosensory training was combined with finger pairing
was performed by Wang and colleagues (1995) in adult owl monkeys. These authors had the
ingenious idea of “reversing” the natural pattern of tactile stimulation within the hand by
delivering a synchronous tactile stimulation across distal phalanges of several fingers (D2, D3 &
D4), while another synchronous stimulation was delivered to the middle or proximal segments
of the same digits, but both bars being jittered, thus inducing an abnormal asynchronous
stimulation of within-finger segments. In addition to these cross-finger pairing and within-finger
unpairing, monkeys were trained to temporally discriminate and recognize stimulation patterns
over 4-6 weeks. Using electrophysiological recordings the authors found that the synchronous
stimulation of the three fingers resulted in a “fusion” of their cortical representations in BA3b,
whereas the finger segments to which stimuli were applied asynchronously had representations
that were segregated more than usual (Wang et al., 1995). In addition, RFs corresponding to
these cortical regions were found to enlarge to span over the multiple stimulated digit segments.
Note that as in the study by Recanzone and colleagues (1992a, 1992b, 1992c, 1992d) described
above, this many-fold RF enlargement is likely arising from invariant stimulated skin locations
(discussed in section “Temporally paired cutaneous stimulation”, page 128). Interestingly, in
addition to SI, these authors also investigated the VPL thalamic nucleus, and reported no
changes at its level, supporting the idea that the induced representational changes are cortical in
origin. A similar protocol applied in humans over a 3-4 weeks period revealed, in addition to a
behavioural improvement, a significant raining-related decrease in the magnitude of the current
dipole strength corresponding to the source of the contralateral activity evoked by stimulation of
the trained hand (Spengler et al., 1997). This decreased dipole strength was interpreted by the
authors as either a decrease of the neuronal population contributing to the signal or a decrease in
the temporal and spatial coherence in the evoked activity. Remaining in the tactile temporal
domain, participants trained to detect changes in tactile frequency applied either to D2+D3+D4
or only to D2+D4 of the right hand, had modulated steady-state evoked responses for D3, which
varied across the three days of training (Liu et al., 2000). While the results were difficult to
interpret due to changes in strength of cortical activation across sessions, this study further
illustrates how SI representational maps can be dynamically modulated by use/activity-
dependent processes. Considering the fact that both sensory enrichment and training at a
restricted single cutaneous region seem to induce an enlargement of the stimulated region's
representation, an additional process is likely to be concurrently involved in the three previously
mentioned studies (Wang et al., 1995; Spengler et al., 1997; Liu et al., 2000), the synchronous
stimulation (or pairing) of non-adjacent cutaneous regions tending to move the stimulated
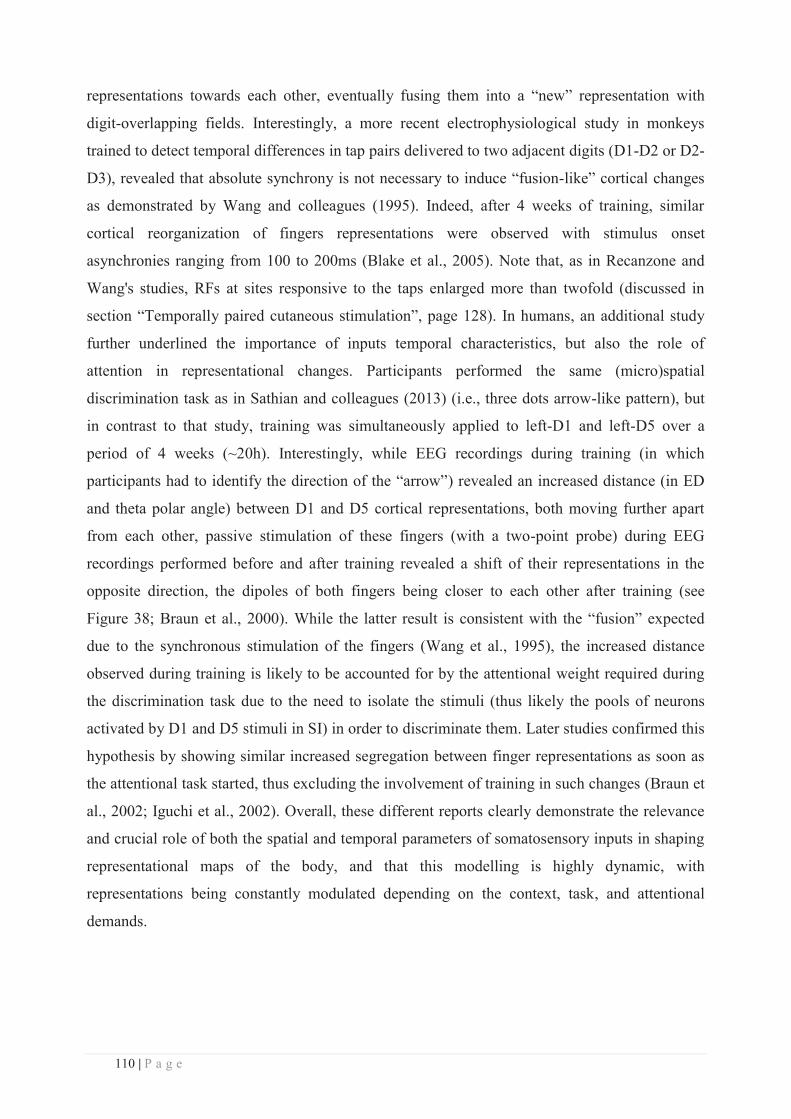
110 | P a g e
representations towards each other, eventually fusing them into a “new” representation with
digit-overlapping fields. Interestingly, a more recent electrophysiological study in monkeys
trained to detect temporal differences in tap pairs delivered to two adjacent digits (D1-D2 or D2-
D3), revealed that absolute synchrony is not necessary to induce “fusion-like” cortical changes
as demonstrated by Wang and colleagues (1995). Indeed, after 4 weeks of training, similar
cortical reorganization of fingers representations were observed with stimulus onset
asynchronies ranging from 100 to 200ms (Blake et al., 2005). Note that, as in Recanzone and
Wang's studies, RFs at sites responsive to the taps enlarged more than twofold (discussed in
section “Temporally paired cutaneous stimulation”, page 128). In humans, an additional study
further underlined the importance of inputs temporal characteristics, but also the role of
attention in representational changes. Participants performed the same (micro)spatial
discrimination task as in Sathian and colleagues (2013) (i.e., three dots arrow-like pattern), but
in contrast to that study, training was simultaneously applied to left-D1 and left-D5 over a
period of 4 weeks (~20h). Interestingly, while EEG recordings during training (in which
participants had to identify the direction of the “arrow”) revealed an increased distance (in ED
and theta polar angle) between D1 and D5 cortical representations, both moving further apart
from each other, passive stimulation of these fingers (with a two-point probe) during EEG
recordings performed before and after training revealed a shift of their representations in the
opposite direction, the dipoles of both fingers being closer to each other after training (see
Figure 38; Braun et al., 2000). While the latter result is consistent with the “fusion” expected
due to the synchronous stimulation of the fingers (Wang et al., 1995), the increased distance
observed during training is likely to be accounted for by the attentional weight required during
the discrimination task due to the need to isolate the stimuli (thus likely the pools of neurons
activated by D1 and D5 stimuli in SI) in order to discriminate them. Later studies confirmed this
hypothesis by showing similar increased segregation between finger representations as soon as
the attentional task started, thus excluding the involvement of training in such changes (Braun et
al., 2002; Iguchi et al., 2002). Overall, these different reports clearly demonstrate the relevance
and crucial role of both the spatial and temporal parameters of somatosensory inputs in shaping
representational maps of the body, and that this modelling is highly dynamic, with
representations being constantly modulated depending on the context, task, and attentional
demands.
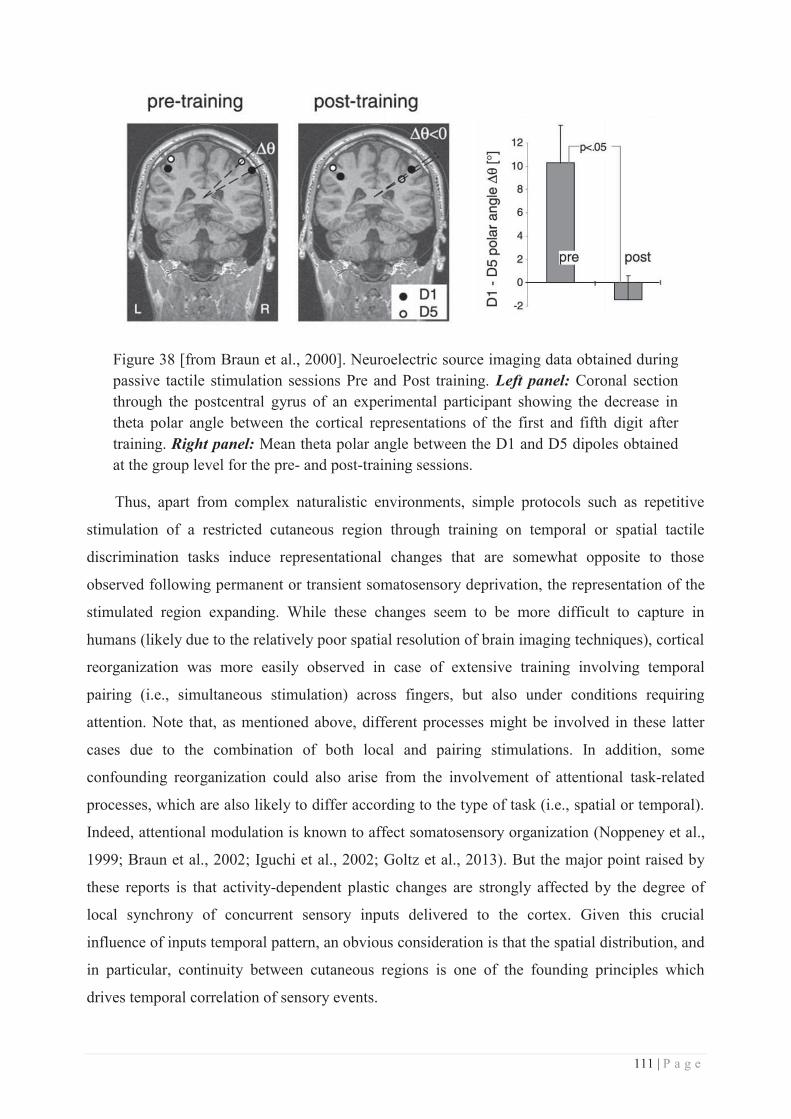
111 | P a g e
Figure 38 [from Braun et al., 2000]. Neuroelectric source imaging data obtained during passive tactile stimulation sessions Pre and Post training. Left panel: Coronal section through the postcentral gyrus of an experimental participant showing the decrease in theta polar angle between the cortical representations of the first and fifth digit after training. Right panel: Mean theta polar angle between the D1 and D5 dipoles obtained at the group level for the pre- and post-training sessions.
Thus, apart from complex naturalistic environments, simple protocols such as repetitive
stimulation of a restricted cutaneous region through training on temporal or spatial tactile
discrimination tasks induce representational changes that are somewhat opposite to those
observed following permanent or transient somatosensory deprivation, the representation of the
stimulated region expanding. While these changes seem to be more difficult to capture in
humans (likely due to the relatively poor spatial resolution of brain imaging techniques), cortical
reorganization was more easily observed in case of extensive training involving temporal
pairing (i.e., simultaneous stimulation) across fingers, but also under conditions requiring
attention. Note that, as mentioned above, different processes might be involved in these latter
cases due to the combination of both local and pairing stimulations. In addition, some
confounding reorganization could also arise from the involvement of attentional task-related
processes, which are also likely to differ according to the type of task (i.e., spatial or temporal).
Indeed, attentional modulation is known to affect somatosensory organization (Noppeney et al.,
1999; Braun et al., 2002; Iguchi et al., 2002; Goltz et al., 2013). But the major point raised by
these reports is that activity-dependent plastic changes are strongly affected by the degree of
local synchrony of concurrent sensory inputs delivered to the cortex. Given this crucial
influence of inputs temporal pattern, an obvious consideration is that the spatial distribution, and
in particular, continuity between cutaneous regions is one of the founding principles which
drives temporal correlation of sensory events.
112 | P a g e
d. Relevance of spatial/temporal dis/continuities
Accordingly, the earliest studies which originally investigated the relevance of the temporal
correlation of inputs in driving cortical changes, without the confound of training-induced
cortical reorganization, altered the temporal pattern of inputs by directly altering the spatial
cutaneous continuity, either by inducing syndactyly or by translocating skin islands. Given that
in primates, and especially humans, different fingers usually receives non-simultaneous
somatosensory inputs, partly due to their high dexterity and motor independence, a surgical
intervention fusing the skin of adjacent fingers would inevitably alter inputs coincidence and
thus produce abnormal input correlation patterns across digits. In monkeys, recordings made
from area 3b months after surgically-induced syndactyly revealed that instead of being restricted
to a single digit, a number of RFs extended across the line of the syndactyly onto the surgically
joined skin of both fused digits (Clark et al., 1988; Allard et al., 1991). Interestingly, the authors
showed that this could not be the result of a mechanical spread of the stimulus or of sprouting of
peripheral nerves across digits, since RFs remained on two digits when recordings were made
immediately after the digits were separated. In addition, this intervention resulted in the
disappearance of the normally present discontinuity between the representations of these digits,
suggesting their “fusion” or the apparition of a new representation dedicated to both digits
(Clark et al., 1988; Allard et al., 1991), likely reflecting also the induced changes in hand use.
Similar results were obtained at the synaptic level, with an increased incidence of excitatory
postsynaptic potentials (EPSPs) evoked from adjacent fingers within the fused finger
representations in SI (Zarzecki et al., 1993). Taken together, these results clearly support the
hypothesis that the somatotopic representation of the body-surface in the adult cortex is
influenced by the temporal correlation of afferent inputs, which primarily results from the
spatial continuity across skin regions. Horizontal corticocortical connections represent one of
the most likely substrates for mediating these activity-dependent plastic changes (Smits et al.,
1991; Zarzecki et al., 1993). In humans, disorganized finger representations were also observed
in patients with congenital syndactyly, their representations being unusually small and
overlapping (Mogilner et al., 1993). Conversely, surgical separation of the fused fingers of these
patients induced a segregation of their cortical representations within weeks of surgery, by 3 to 9
mm. Interestingly, a more recent study investigated the temporal dynamics of such cortical
changes by non-surgically (glove-based) webbing index-to-little fingers of healthy participants
for 5h (thus inducing an artificial, reversible syndactyly). This ingenious intervention revealed
an initial decrease in the distance between the representations of D2 and D5 after only 30 min of
webbing (B1 in Figure 39), followed by a subsequent increase that lasted for about 2h (B2-B4 in
113 | P a g e
Figure 39), before returning to baseline values after about 4h of finger webbing (B5 in Figure
39; Stavrinou et al., 2007). These observations further confirm that the mechanisms underlying
cortical reorganization are extremely rapid in their expression.
Figure 39 [from Stavrinou et al., 2007]. Mean Euclidean distance between D2 and D4 dipoles before (B0), during (every hour: B1-B5) and after (B6) finger webbing in humans, as measured by MEG. Statistical significance with respect to B0 is indicated.
Another way of disrupting the cutaneous continuity and thus of altering the temporal pattern
of somatosensory inputs is to translocate pieces of skin. In monkeys, transplantation of skin
and its neurovascular supply from one finger to an adjacent finger appeared to result in an
integration of the transplanted skin representation with that of surrounding skin to form the
cortical representation of the digits (Clark et al., 1986). More recently, Rosselet and colleagues
(2008) investigated the effects of rotating by 180° a vascularised and innervated pedicle flap of
the ventrum skin bearing nipples in rats on the somatotopic map organization. Two weeks after
parturition and nursing, electrophysiological mapping of the ventrum skin revealed that
compared with non-nursing rats, nursing rats had a reincorporation of the rotated skin flap
representation into an updated topographical organization of the cortical map, as well as a higher
incidence of neurons with split RFs resulting from the surgical separation of formerly adjoining
skin surfaces. This suggests that the nursing-induced cutaneous stimulation of this region helped
integrating the newly induced continuity of formerly separated skin surfaces. In line with this,
RFs that included newly adjacent skin surfaces on both sides of the scar line emerged in nursing
rats. Interestingly, subsequent local anaesthesia of the skin flap induced a RF translocation
within 2-3 min that reversed the nursing-induced RF changes, such that single RFs located on
the skin flap shifted back towards their original locations assessed before parturition (Rosselet et
al., 2008). The influence of the temporal pattern of somatosensory inputs has also been shown in
humans, a study revealing a reduction of D1-D3 cortical distance when stimulation during the
mapping procedure was delivered to digits 1, 3 and 5 in this fixed sequence, as compared to
114 | P a g e
randomly (Braun et al., 2000b). But it should be emphasized that the interstimulus intervals
(ISIs) used in this study were fixed at 250ms, which first, is likely to induce adaptation due to
stimulation repetition, and second, is highly similar to the study of Blake and colleagues (2005),
who found a fusion of cortical representations after stimulating two adjacent digits with ISIs of
200ms. A last remark concerns the matter of what should be considered synchronous or
asynchronous inputs. Obviously, purely coincident inputs correspond literally to what one refers
to when speaking about synchrony. But, should we consider the procedure of stimulation
employed in Braun et al, 2000b and Blake et al, 2005 as asynchronous? Or is the fact of
delivering a constant temporal pattern of stimuli (i.e., with fixed jittered stimuli) the relevant
feature captured by neuronal activity before leading to the observed representational changes?
Conversely, what can be considered an asynchronous stimulation? Purely randomized stimuli,
free of any repeated pattern?
Despite these last remarks, these studies performed either in rats, monkeys or humans,
clearly demonstrate the relevance of the body-surface spatial continuity in determining and
shaping the temporal pattern of afferent activity, which in turn also shapes the CNS
organization and in particular the cortical representational maps. Different mechanisms are
thought to subserve this activity-dependent plasticity, such as Hebbian-like spike-timing
dependent plasticity (STDP) involving changes in the excitatory-inhibitory balance through
long-term potentiation (LTP) and long-term depression (LTD) processes. These mechanisms
will be further discussed in the next chapter (Chapter 3: The Hebbian plasticity, page 125).
To conclude, we have seen throughout this chapter that cortical map reorganization within
the somatosensory system, and in particular cortical reorganization occurring across the hand-
face border, has been primarily demonstrated after permanently or transiently depriving the
cortex of its normal inputs either by lesioning afferents somewhere along the somatosensory
pathway, or by local anaesthesia of a cutaneous region. Then, we saw that these plastic changes
can be reversed by restoring inputs either through nerve or limb graft in humans, or through
training/sensory enrichment in animals. We also saw that under non-pathological conditions
(i.e., healthy subjects), increasing sensorimotor inputs/outputs either by undergoing an
extensive practice leading to a sensorimotor expertise or by evolving in an enriched
environment, also induces remarkable representational changes at the cortical level. Similarly,
increasing more specifically somatosensory inputs through training on a tactile task or by
delivering tactile stimuli with a specific temporal pattern also results in drastic changes in the
topographic organization of somatosensory cortical areas. However, to my knowledge, the limits
of such plastic changes have not been systematically investigated, in particular regarding their
115 | P a g e
possible spread across the hand-face border. In addition, the issue of understanding the
functional relevance of these cortical changes remains unsolved despite numerous attempts. A
short review of this literature will be described in the following section.
IV. Functional consequences/relevance
One of the most intriguing and yet unsolved challenges consists in understanding the
functional relevance of cortical plasticity. It is indeed important to establish whether the
observed changes in maps topography are associated with changes in cognitive or perceptual
performance. In addition, better understanding the functional consequences of such plastic
changes would help to develop new rehabilitative therapies targeting the induction of adaptive
plasticity to promote recovery. But so far, the links between cortical and behavioural changes
are far from being solved, numerous discrepant results having been reported, even at the level of
early somatosensory areas such as SI.
The cortical reorganization following transient or permanent suppression of somatosensory
inputs is thought to offer no benefit and has rather been associated with negative outcomes, such
as pain (Flor et al., 1995; Birbaumer et al., 1997; Karl et al., 2001), and has led to the idea of
“maladaptive” plasticity. In particular, large-scale SI reorganization observed across the hand-
face border in amputees/deafferented patients has been positively correlated with the intensity of
phantom limb pain (PLP) (Flor et al., 1995; Montoya et al., 1998; Karl et al., 2001). In favour of
such an association, a larger amount of cortical reorganization, as measured by face invasion,
was observed in traumatic amputees with PLP than in pain-free (congenital or traumatic)
amputees (Birbaumer et al., 1997; Flor et al., 1998; Montoya et al., 1998; Grüsser et al., 2001a).
Conversely, transient release of PLP induced by local anaesthesia of the stump (Birbaumer et
al., 1997) or by 4 weeks of mirror training (Foell et al., 2013) was associated with a reversal of
the cortical reorganization within SI, the lip representation shifting back to its original location.
In line with these studies, another interesting case report showed that local anaesthesia of the left
face in the context of dental treatments temporarily released the pain of a patient experiencing
severe neuropathic pain in his left upper-limb following brachial plexus avulsion (Hozumi et al.,
2011). This pain alleviation was further associated with the disappearance of the illusory finger
sensations evoked by face stimulation (i.e., referred sensations), and these effects lasted 2h, the
time for the anaesthesia to resorb. Since this patient reported the same referred sensation as that
reported in the literature showing hand/face border changes mainly following amputation (see
“Plasticity following sensory deprivation” section page 75), the authors speculated that local
anaesthesia of the mouth shrank the mouth/face representation and subsequently expanded the
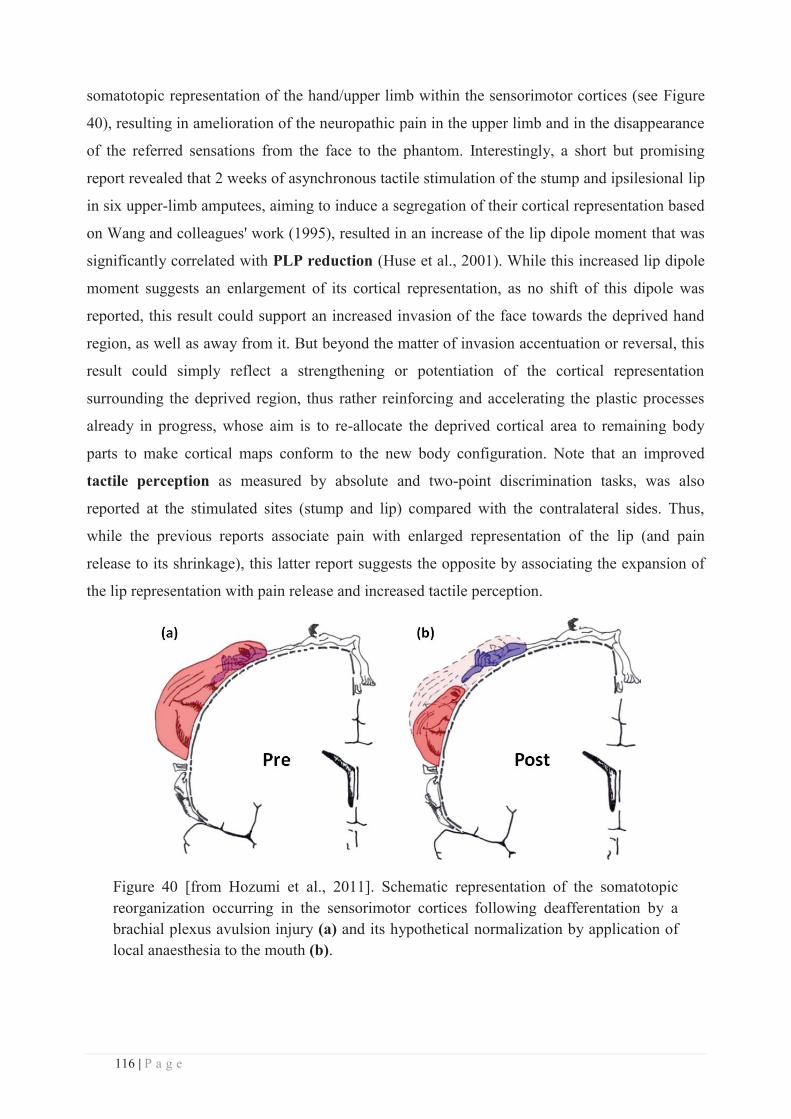
116 | P a g e
somatotopic representation of the hand/upper limb within the sensorimotor cortices (see Figure
40), resulting in amelioration of the neuropathic pain in the upper limb and in the disappearance
of the referred sensations from the face to the phantom. Interestingly, a short but promising
report revealed that 2 weeks of asynchronous tactile stimulation of the stump and ipsilesional lip
in six upper-limb amputees, aiming to induce a segregation of their cortical representation based
on Wang and colleagues' work (1995), resulted in an increase of the lip dipole moment that was
significantly correlated with PLP reduction (Huse et al., 2001). While this increased lip dipole
moment suggests an enlargement of its cortical representation, as no shift of this dipole was
reported, this result could support an increased invasion of the face towards the deprived hand
region, as well as away from it. But beyond the matter of invasion accentuation or reversal, this
result could simply reflect a strengthening or potentiation of the cortical representation
surrounding the deprived region, thus rather reinforcing and accelerating the plastic processes
already in progress, whose aim is to re-allocate the deprived cortical area to remaining body
parts to make cortical maps conform to the new body configuration. Note that an improved
tactile perception as measured by absolute and two-point discrimination tasks, was also
reported at the stimulated sites (stump and lip) compared with the contralateral sides. Thus,
while the previous reports associate pain with enlarged representation of the lip (and pain
release to its shrinkage), this latter report suggests the opposite by associating the expansion of
the lip representation with pain release and increased tactile perception.
Figure 40 [from Hozumi et al., 2011]. Schematic representation of the somatotopic reorganization occurring in the sensorimotor cortices following deafferentation by a brachial plexus avulsion injury (a) and its hypothetical normalization by application of local anaesthesia to the mouth (b).
117 | P a g e
When considering non-painful sensations, reports converge towards a much more
complicated pattern of relationships between cortical plasticity and perceptual changes. Indeed,
while it has been proposed (Ramachandran et al., 1992b; Ramachandran, 1993; Jain, 2002) that
the plasticity-induced overlap between face and hand regions within somatosensory cortices
may provide an anatomical and neurophysiological substrate for referred phantom sensations
that are experienced by patients with limb amputation (Ramachandran, 1993; Ramachandran
and Hirstein, 1998; Hozumi et al., 2011), and nerve or spinal cord injury (Moore et al., 2000;
Pourrier et al., 2010), the large-scale SI reorganization observed in amputees was not found to
be correlated with non-painful phantom sensations (Flor et al., 1995). However, the repeated
observations of referred sensations to the phantom fingers when stimulating the face in
amputees (see Figure 41; e.g., Ramachandran et al., 1992a, 1992b; Halligan et al., 1993;
Borsook et al., 1998) is strikingly congruent with the cortical plastic changes also repeatedly
observed across the hand-face border. In addition to pain, the reorganization observed in
amputees was also found to be correlated with the number of sites from which painful stimuli
evoked referred sensations (Knecht et al., 1996a, 1998), and with telescoping sensations (Katz,
1992; Grüsser et al., 2001a), but not with tactile thresholds (either thermal, electric or spatial)
assessed at the stump (Grüsser et al., 2001a). Thus, while a clear (and almost linear) link has
been observed between SI reorganization and pain, the link with other perceptual changes
remains largely unclear. However, it's worth noting that in all these studies, non-painful
mechanical stimulation was used during brain imaging procedures, yielding to the expectation of
repercussions primarily on non-nociceptive functions. In line with this, the presumed consistent
and reliable relationship between pain and plasticity has been recently questioned by a study
suggesting that PLP is rather related to a preserved hand representation, and to a reduced
sensorimotor connectivity (Makin et al., 2013b). Thus, both painful and some non-painful
sensations seem to be related to cortical changes, but through a complex association. In addition,
it is likely that the measure used to quantify the reorganization in most of the previous studies
was not precise enough to catch this relationship. Indeed, in amputees the plasticity was usually
quantified by the relative ED between the intact face and the mirrored projection of the intact
hand representation into the deprived hemisphere, which supposes first an initial "pseudo-
perfect" symmetry between hand representations (quite hazardous at the individual level), and
second the absence of reorganization of the intact hand representation, which has actually been
disconfirmed several times (see Elbert et al., 1997; Frey et al., 2008; Björkman et al., 2012;
Makin et al., 2013a; Moore et al., 2013). In agreement with these remarks, different results were
obtained with other approaches. For instance, fMRI recordings performed when inducing
118 | P a g e
referred sensations revealed different clusters of activation within SI corresponding to the
regions from which, but also to which referred sensations were evoked (Moore et al., 2000),
even if these body parts did not exist anymore (Björkman et al., 2012). Similarly, the use of a
higher fMRI resolution (3T) revealed a quite substantial cortical reorganization within SI and
M1 in pain-free lower-limb amputees experiencing phantom sensations (Simoes et al., 2012).
Finally, artificially-induced referred sensations in healthy participants using the rubber hand
illusion, were found to be positively correlated with an increased distance between the fingers
(D1 and D5) involved in the illusion (Schaefer et al., 2006). Thus, taken together these studies
stress the need for a more refined evaluation and quantification of plastic changes, by combining
methodological approaches but also by simultaneously observing the plastic changes from
different but complementary perspectives.
Some perceptual changes, such as referred sensations, may also arise from plastic changes
in higher integrative cortical areas, such as SII. Indeed, the sites from which referred sensations
were mainly reported in upper-limb amputees are a large part of the ipsilateral face that includes
the chin, upper lip, and cheek (Cronholm, 1951; Ramachandran et al., 1992a, 1992b). These face
regions correspond to those from which inputs have been found to invade the hand
representation within SI but also SII and PV in monkeys (i.e., OP1 and OP4 in humans)
(Tandon et al., 2009). Moreover, the one-to-one relationship between the stimulated face sites
and the phantom hand areas to which sensations were elicited (see Figure 41, Ramachandran et
al., 1992b; Halligan et al., 1993; Yang et al., 1994; Knecht et al., 1996a; Borsook et al., 1998),
strongly suggests the involvement of a somatotopically organized cortical area. Finally, these
referred sensation maps appear to be modality-specific - at least in the acute phase (Borsook et
al., 1998), and to evolve with time (Halligan et al., 1994; Knecht et al., 1998) in the same way
cortical maps do. The involvement of higher order cortical areas is consistent with the fact that
restoration of visuo-motor inputs/outputs alleviates PLP (see Flor and Diers, 2009 as a review
for rehabilitative sensorimotor training). However, referred sensations were also reported
following microstimulation of the deafferented thalamic region, which supports the contribution
of subcortical reorganization (Davis et al., 1998). As a corollary, these results also indicate that,
as for the issue of understanding which site along the neuraxis is responsible for the observed
large-scale cortical reorganization, the origin of the associated perceptual changes remains
unclear and is more likely to arise from the contribution of the different relays along the
somatosensory pathway rather than from one specific site.
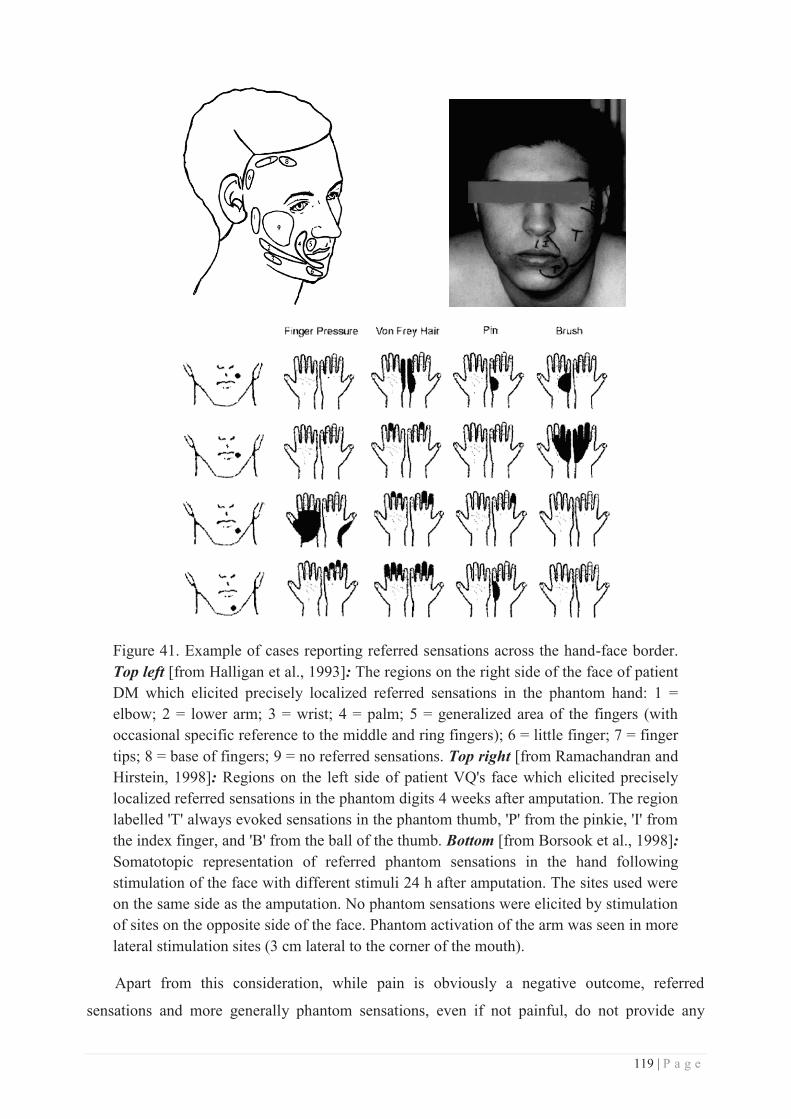
119 | P a g e
Figure 41. Example of cases reporting referred sensations across the hand-face border. Top left [from Halligan et al., 1993]: The regions on the right side of the face of patient DM which elicited precisely localized referred sensations in the phantom hand: 1 = elbow; 2 = lower arm; 3 = wrist; 4 = palm; 5 = generalized area of the fingers (with occasional specific reference to the middle and ring fingers); 6 = little finger; 7 = finger tips; 8 = base of fingers; 9 = no referred sensations. Top right [from Ramachandran and Hirstein, 1998]: Regions on the left side of patient VQ's face which elicited precisely localized referred sensations in the phantom digits 4 weeks after amputation. The region labelled 'T' always evoked sensations in the phantom thumb, 'P' from the pinkie, 'I' from the index finger, and 'B' from the ball of the thumb. Bottom [from Borsook et al., 1998]: Somatotopic representation of referred phantom sensations in the hand following stimulation of the face with different stimuli 24 h after amputation. The sites used were on the same side as the amputation. No phantom sensations were elicited by stimulation of sites on the opposite side of the face. Phantom activation of the arm was seen in more lateral stimulation sites (3 cm lateral to the corner of the mouth).
Apart from this consideration, while pain is obviously a negative outcome, referred
sensations and more generally phantom sensations, even if not painful, do not provide any
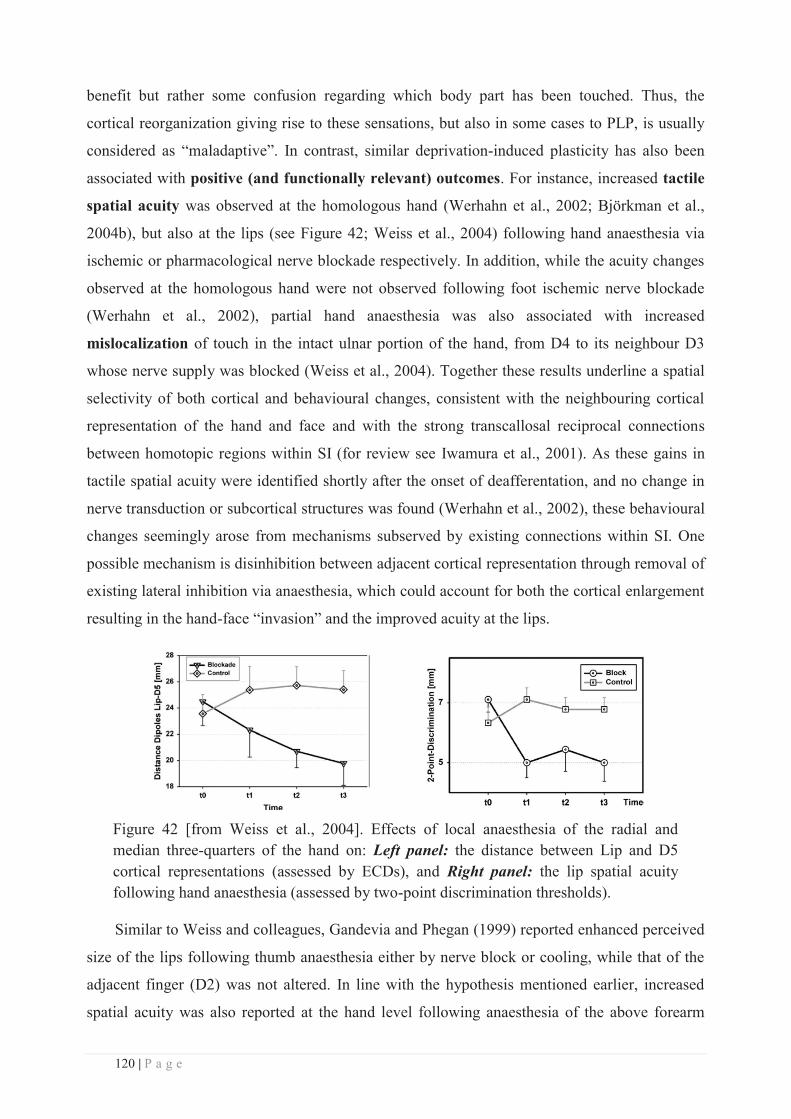
120 | P a g e
benefit but rather some confusion regarding which body part has been touched. Thus, the
cortical reorganization giving rise to these sensations, but also in some cases to PLP, is usually
considered as “maladaptive”. In contrast, similar deprivation-induced plasticity has also been
associated with positive (and functionally relevant) outcomes. For instance, increased tactile
spatial acuity was observed at the homologous hand (Werhahn et al., 2002; Björkman et al.,
2004b), but also at the lips (see Figure 42; Weiss et al., 2004) following hand anaesthesia via
ischemic or pharmacological nerve blockade respectively. In addition, while the acuity changes
observed at the homologous hand were not observed following foot ischemic nerve blockade
(Werhahn et al., 2002), partial hand anaesthesia was also associated with increased
mislocalization of touch in the intact ulnar portion of the hand, from D4 to its neighbour D3
whose nerve supply was blocked (Weiss et al., 2004). Together these results underline a spatial
selectivity of both cortical and behavioural changes, consistent with the neighbouring cortical
representation of the hand and face and with the strong transcallosal reciprocal connections
between homotopic regions within SI (for review see Iwamura et al., 2001). As these gains in
tactile spatial acuity were identified shortly after the onset of deafferentation, and no change in
nerve transduction or subcortical structures was found (Werhahn et al., 2002), these behavioural
changes seemingly arose from mechanisms subserved by existing connections within SI. One
possible mechanism is disinhibition between adjacent cortical representation through removal of
existing lateral inhibition via anaesthesia, which could account for both the cortical enlargement
resulting in the hand-face “invasion” and the improved acuity at the lips.
Figure 42 [from Weiss et al., 2004]. Effects of local anaesthesia of the radial and median three-quarters of the hand on: Left panel: the distance between Lip and D5 cortical representations (assessed by ECDs), and Right panel: the lip spatial acuity following hand anaesthesia (assessed by two-point discrimination thresholds).
Similar to Weiss and colleagues, Gandevia and Phegan (1999) reported enhanced perceived
size of the lips following thumb anaesthesia either by nerve block or cooling, while that of the
adjacent finger (D2) was not altered. In line with the hypothesis mentioned earlier, increased
spatial acuity was also reported at the hand level following anaesthesia of the above forearm
121 | P a g e
(Björkman et al., 2004a, 2009; Petoe et al., 2013), and was associated with an expansion of the
hand representation within SI (Björkman et al., 2009), and with increased intracortical inhibition
(Petoe et al., 2013). But changes on the homologous hand were not systematically observed
(Björkman et al., 2004a, 2009). Altogether, these results demonstrate that a similar event
triggering reorganization, in this case sensory deprivation, can be associated with both negative
and positive outcomes. However, note that since the origin of these cortical and functional
changes is by definition negative, both outcomes have been interpreted mainly in terms of
competition, with the absence of a given input releasing the lateral inhibition between adjacent
cortical regions, and resulting in both cortical and functional changes. But competitive processes
might by itself be regarded as negative, as the “winner” always wins to the detriment of another.
Conversely, an increase in sensory inputs (i.e., the opposite of deprivation) produces an
expansion in the corresponding cortical representation zone, similar to that observed for intact
cortical areas adjacent to a deprived region. But in the case of use-dependent or afferent-increase
cortical reorganization, this expansion has almost always been associated with the development
of skills and with outcomes that are advantageous to the individual. For instance, an expanded
hand representation was reported in string players (Elbert et al., 1995), supposedly subserving
the enhanced manual dexterity of these musicians. A greater absolute and spatial tactile acuity
was also recently reported in pain-free musicians as compared to non-musicians or to musicians
with chronic pain (Zamorano et al., 2015). Similarly, long-term training in Braille reading was
associated with enlarged cortical representations of the reading fingers (Pascual-Leone and
Torres, 1993; Sterr et al., 1998a, 1998b), which was linked with the fact that blind Braille
readers were found to outperform sighted people in terms of tactile acuity (Van Boven et al.,
2000; Goldreich and Kanics, 2003; Wan et al., 2010; Norman and Bartholomew, 2011; Wong et
al., 2011). However, as mentioned earlier, these initially adaptive plastic changes can result in
disadvantageous consequences due to over-use, such as, in the case of musicians, focal hand
dystonia due to the fusion of finger cortical representations (Elbert et al., 1998). Similarly in
blind Braille readers, representations of the reading fingers were found to be topographically
disordered (Pascual-Leone and Torres, 1993; Sterr et al., 1998a, 1998b), and an enhanced
frequency of mislocalization of tactile stimuli was further found between reading fingers in
multiple-digit blind readers (Sterr et al., 1998b, 2003). Thus, the functional benefits acquired by
extensive practice seem to have some “side-effects”, resulting in either pathological cases such
as dystonia, or in deficits in other tasks (i.e., tactile localization in blind Braille readers).
Together with the deprivation-related literature, this evidence suggests that use-dependent
122 | P a g e
cortical reorganization can also lead to negative outcomes, and thus can be sometimes as
“maladaptive” as the deprivation-induced reorganization.
Other reports of cortical representational expansion arise from rehabilitation cases. For
instance, the restoration of the hand cortical representation found by Giraux and colleagues
(2001) in an amputee who underwent bilateral hand graft, was found to be associated with
tactile extinction at the functional level (Farnè et al., 2002). The authors showed that
simultaneous stimulation of the ipsilateral face extinguished hand tactile perception soon after
the graft, in accordance with the face representation invading that of the deprived hand, and 6
months after, but no longer at 11 months post-operatively. The authors interpreted this ipsilateral
face-hand extinction as a perceptual counterpart of the remapping that occurs after allograft and
further stressed that such results highlight the inherently competitive nature of sensory
representations. Similar “tactile extinction” was observed in an earlier report describing the case
of an amputee whose referred sensations could be suppressed by simultaneously touching her
intact hand and the face evoking referred sensations (Ramachandran and Hirstein, 1998).
Interestingly, this extinction was not observed when the face was simultaneously touched with
other body-parts (i.e., contralateral shoulder, chest or thigh), suggesting here again a
somatotopy-based spatial selectivity but this time through topographically organized
transcallosal connections, known to be mostly inhibitory. Another interesting case report
concerns a patient who underwent a toe-to-index transplantation (Hadoush et al., 2012). MEG
recordings in this patient revealed a progressive recovery of the index finger representation over
time (weeks 12 and 24), as measured by an increased D2-D5 ED, together with an increased
strength and a decreased latency of D2’s dipole, and these cortical changes were paralleled by
recovery of hand sensitivity. Altogether, these three case reports tend to underline the adaptive
aspects of plastic changes in rehabilitation, increased cortical representation being associated
with sensory recovery, but also with tactile extinction in early recovery stages.
Focussing on the somatosensory level, while an improved temporal discrimination
associated with an enlarged finger representation was found in monkeys (Recanzone et al.,
1992a), the relationship between cortical changes and behavioural performance is less clear in
humans. Indeed, humans trained 3-4 weeks in a temporal discrimination task exhibited enhanced
performance with complete transfer of learning to the contralateral hand, and these changes
were associated with a unilateral decrease in the hand dipole strength (Spengler et al., 1997).
This dipole strength decrease was discussed by the authors as reflecting either a decrease of the
neuronal population contributing to the signal (i.e., representational shrinkage) or a decrease in
the temporal and spatial coherence in the evoked activity. But while the authors concluded that
123 | P a g e
the attenuation of SEFs and the complete learning transfer indicate learning in associative
cortical areas rather than plasticity in early sensory areas, I would consider an alternative simple
interpretation, which arises directly from the task used in their protocol. Indeed, participants
were instructed to localize a certain pattern of tactile stimulation (i.e., two consecutive
stimulations) either at the distal or at the proximal segments of D2-D4 (i.e., same protocol as
Wang et al., 1995). The task requiring a clear distinction between two locations, shrinkage of
their representations and RFs would thus help to perform the task. And such functional
shrinkage could be driven by task-related attentional modulation (Braun et al., 2002). In
addition, another report of improved performance in participants who trained for 30 days in a
frequency discrimination task, did not observe any cortical changes as assessed by MEG (Imai
et al., 2003). Finally, a study comparing the cortical correlates observed during and after spatial
tactile training revealed changes in opposite directions (Braun et al., 2000a). Indeed, while
during training the distance between the cortical representations of the fingers involved in the
task increased, this same distance decreased after training, when fingers were passively
stimulated. And this latter decrease was correlated with an increased frequency of
mislocalizations attributed to more distant fingers (Braun et al., 2000a; Schweizer et al., 2001).
The authors concluded that the discrimination training tended to isolate pools of neurons
activated by D1 or D5 stimuli in SI (likely thanks to attentional processes), whereas the passive
stimulation tended to enlarge/move the territories toward each other, possibly resulting in an
overlap increasing the probability of tactile mislocalizations. Altogether, while the functional
consequences of tactile training have been quite abundantly described in humans, their links to
the changes in cortical representational maps remain unclear. In addition, while animal studies
clearly suggest that tactile training and improved performance are related to enlarged cortical
representations (Jenkins et al., 1990; Recanzone et al., 1992a, 1992c, 1992d, 1992e), these
changes were not observed in humans following similar protocols.
Although it is outside the scope of the thesis, it should be recalled that age-dependent
changes also bring to cortical enlargement, but associated with opposite perceptual effects.
Indeed, a similar expansion of the hand cortical representation was reported in elderly (60-85
years old), but was associated with strong decline in tactile spatial acuity (Kalisch et al.,
2009). Similar results were observed with electrophysiological recordings in rats, enlarged SI
representations being correlated with sensorimotor deficits (Spengler et al., 1995). So in this
case, the enlargement of cortical representation was associated with negative outcomes and not
with enhanced acuity as in Recanzone's paper (1992a).
124 | P a g e
Altogether, in this section I reviewed findings showing that a given representational change
such as a cortical expansion has been associated with: (i) phantom sensations following
amputation and spinal cord injury, and (ii) sometimes pain release (PLP); (iii) increased tactile
acuity following anaesthesia or expertise (i.e., musician/Braille readers); (iv) enhanced
sensorimotor skills with expertise such as in musicians, Braille readers or any learner; (v)
sensorimotor recovery following graft or transplantation; but also (vi) different kinds of pain
such as phantom limb pain, back pain or neuropathic pain; (vii) increased mislocalization of
tactile stimuli following anaesthesia, over-use or tactile training; (viii) some pathologies such as
dystonia; and (ix) somatosensory deficits in elderly. Thus seemingly identical
‘phenomenological’ expressions of cortical plasticity within SI can be either associated with
“positive” (adaptive) or “negative” (maladaptive) outcomes, exhibiting sometimes entirely
opposite effects on a given task. Thus, whilst there is an intuitive advantage in developing a
larger cortical representation as a result of skill acquisition, this overview of some of its other
functional outcomes clearly underlines that the significance of cortical reorganization remains
largely unclear, and even questions the presence of a functional significance of cortical
plasticity. It could be that cortical reorganization per se is neither positive nor negative for
individuals, the valence of its effects being likely to depend on multiple factors, such as the
nature of the event triggering the reorganization, the context in which this event occurs, the level
at which the somatosensory pathway is affected and the environmental or task-related demands
placed upon the individual. Thus, if one wants to achieve a better understanding of the complex
relationships linking cortical and behavioural changes, all these potentially confusing factors
must be minimized or at least controlled, as much as possible. The work done in this thesis is an
attempt to contribute to this huge challenge faced by the scientific community, and in particular
here the somatosensory community. To avoid the confounding aspects of lesional and motor
contributions mentioned throughout the section “Plasticity following sensory deprivation” (page
75), we chose the model of activity-dependent plastic changes induced in a healthy population
and the use of a pure somatosensory protocol designed to precisely control for input pattern.
125 | P a g e
CHAPTER 3: THE HEBBIAN PLASTICITY
I. Concept
As briefly mentioned in the section “Relevance of spatial/temporal dis/continuities” of the
previous chapter, one of the most likely mechanisms underlying activity-dependent plastic
changes is based on Hebb’s postulate. Indeed, numerous investigations suggested the crucial
relevance of input temporal pattern for shaping and modulating the brain functional circuitry
(see Buonomano and Merzenich, 1998 for a review).
The idea of brain plasticity started to receive wide acceptance in the 1940s when the theory
of neural plasticity got some popularity thanks to Donald Hebb, who was claiming that ‘‘cells
that fire together, wire together’’. Hebb introduced a concept in which an increase in synaptic
efficacy arises from episodes of high temporal correlation between pre- and post-synaptic
activity (Hebb, 1949). Such a plastic mechanism is now known as ‘‘Hebbian learning’’ or
“Hebbian plasticity”. Later, Jacques Paillard supported the theory of brain plasticity by stating
that ‘‘The term plasticity is only appropriate in terms of the ability of a system to achieve novel
functions, either by transforming its internal connectivity or by changing the elements of which
it is made’’ (see Will et al., 2008 for an English translation and commentaries). New enthusiasm
for Hebb’s theory was then provided by the fundamental description of long-term potentiation
(LTP) and depression (LTD) mechanisms (Bliss and Lomo, 1973; Wigström and Gustafsson,
1986) and is now commonly advocated to explain some types of associative learning in which
simultaneous activation of cells leads to pronounced increases in synaptic strength. In addition
to LTP and LTD mechanisms, the crucial role of the relative timing between pre- and post-
synaptic activity led to the concept of spike-timing-dependent plasticity (STDP). STDP was
revealed by the demonstration that LTP is induced when pre-synaptic activity preceded post-
synaptic activity by tens of milliseconds, whereas LTD is induced when spiking occurs in the
reverse order (post-synaptic before pre-synaptic) (e.g., Markram et al., 1997; Feldman, 2000;
see Dan and Poo, 2004, 2006 for reviews). Although the preponderance of STDP processes in
driving activity-dependent plasticity has been recognized, their implementation was mostly done
in vitro and in vivo in animals, before being adapted to humans.
In this chapter, I will briefly describe the different protocols that have been used to induce
Hebbian plasticity by emphasizing how this plasticity, which was first described in vitro at the
synaptic level, was also reported following stimulation of parts of the cortex, and then peripheral
sensors. Consequently, I will first describe the principles of Hebbian synaptic plasticity, before
126 | P a g e
zooming out to the plastic changes observed following intracortical microstimulation (ICMS).
Then, I will describe how these protocols were adapted to non-invasive protocols that could be
applied in animals but also in humans, for which plastic changes are mainly investigated at the
level of the entire brain, leading to the observation of representational plasticity. Finally, I will
describe in more detail the perceptual and cortical consequences observed following the
protocol of repetitive somatosensory stimulation, which was used as a mean of inducing
transient plastic changes in the present work.
II. Induction: from synapses to the skin
a. Hebbian synaptic plasticity
As mentioned above, the Hebbian learning rule was first described and then investigated at
the synaptic level. This gave rise to the Hebbian synaptic plasticity, which was first reported in
hippocampal neurons (e.g. Kelso et al., 1986). When presynaptic input from CA3 axons was
paired with postsynaptic depolarization, the amplitude of the EPSPs was enhanced in a long-
lasting way and referred to as LTP. This form of associative plasticity is of particular interest
because it is an instantiation of Hebb’s postulate according to which simultaneous pre- and post-
synaptic activity results in the strengthening of the synaptic connection. A particular subtype of
the glutamate receptor, the N-methyl-D-aspartate (NMDA) receptor (see Fan et al., 2014 for a
review), mediates this process by permitting the influx of Ca2+, which in turn increases post-
synaptic excitation and is a critical early step in the induction of LTP, when a postsynaptic
depolarization arrives in presence of glutamate (see Bliss and Collingridge, 1993; Nicoll and
Malenka, 1995). LTP is also found at the cortical level, and, even if more complex, is highly
similar to that observed in the hippocampus and can be induced in both cortical slices and in
vivo. One of the first demonstrations of Hebbian synaptic plasticity in the cortex was with
intracellular recordings from cat motor cortex in vivo (Baranyi and Fehér, 1981), by pairing
synaptic input from the ventrolateral nucleus of the thalamus with stimulation of a second
pathway or intracellular depolarization. Three main protocols have been used to induce LTP at
the cortical level: (a) tetanus, often a 100-Hz, 1-s stimulus applied to the afferent pathway; (b)
theta-burst stimulation, in which 10 brief bursts at 5 bursts/s are applied, with each burst
consisting of 4 pulses at 100 Hz, again delivered to the afferent pathway; and (c) through
pairing, in which intracellular depolarization of the postsynaptic cell is paired with low-
frequency afferent stimulation. These protocols are likely to differ significantly in their
physiological relevance but the general hypothesis is that manipulations that decrease inhibition
or increase the NMDA current result in more robust LTP.
127 | P a g e
b. Intracortical microstimulation
One level of investigation above, in vivo ICMS has been successfully used to induce short-
term and reversible plastic changes in various cortical regions, including motor (e.g., Gu and
Fortier, 1996), somatosensory (Recanzone et al., 1992b; Dinse et al., 1993, 1997; Spengler and
Dinse, 1994; Benali et al., 2008), auditory (e.g., Sakai and Suga, 2001) and visual (e.g., Godde
et al., 2002) cortices. Typically, ICMS consists in repetitive electrical pulse trains that are
delivered intracortically via a microelectrode, and which activate a cortical volume of tens or
hundreds of microns depending on the intensity used. This stimulation results in nearly
simultaneous activation of all local pre- and post-synaptic elements as well as the modulatory
inputs projecting to that same cortical locus. Therefore, this stimulation generates the type of
temporally coincident responses necessary to induce Hebbian plastic changes. The short time
scale and reversibility of ICMS-induced changes support the idea that ICMS modulates synaptic
efficiency in neuronal networks.
Applied over the primary somatosensory cortex of monkeys or rats, ICMS has been shown
to induce transient changes in the somatotopic map in area 3b. For instance, significant
extension of the cortical representation of a restricted skin region was reported up to several
hundred microns away from the conditioning microstimulation site (Recanzone et al., 1992b;
Spengler and Dinse, 1994). Interestingly, these representational changes were reversible 6 to 8
hours after termination of ICMS (Spengler and Dinse, 1994), and were accompanied by changes
in RFs location and size following different patterns. Indeed, while some RFs shifted toward or
away from the microstimulation site, others shifted and expanded to include the RF of the
microstimulation site (Recanzone et al., 1992b). Interestingly, ICMS of SI in rats and of BA3b
in monkeys, revealed an increased correlation in the activity not only of neuron pairs separated
by about 250μm, but also of pairs separated by 300-800μm or more, revealing an emergence of
long-range functional coupling (Dinse et al., 1993). Furthermore, this increased coupling was
positively correlated with a several-fold increase of RFs overlap, changes in RF size and
response latency. These effects were initially detected 15min after ICMS.
Altogether, these results demonstrate that ICMS, which is considered to induce Hebbian-
like plastic changes, results in substantial changes in cortical representations, and notably in an
expansion of the stimulated representation. However, ICMS, as well as the “classical” protocols
used to induce LTP, can be regarded as artificial and non-physiological experimental
procedures, compared to natural cutaneous stimulations.
128 | P a g e
c. Temporally paired cutaneous stimulation
Under more ecological circumstances, similar Hebbian plastic changes occur when tactile
inputs are temporally paired. Indeed, given the somatotopic organization of the body surface at
the cortical level, two neighbouring cutaneous points that are stimulated in close temporal
proximity are more likely to elicit synchronous firing of neighbouring neurons. In terms of the
excitatory intracortical connections in cortical networks, Hebbian learning should drive neurons
engaged by behaviourally important stimuli to respond to them in a more temporally coherent
manner. This kind of synchronous stimulation, or pairing protocol, has been extensively used in
rodents, by trimming or plucking a subset of whiskers. Neural responses to deprived whiskers
rapidly decrease and cause the weakening and shrinking of the representation of deprived
whiskers within the map. In contrast, the responses to spared whiskers increase slowly, and lead
to the strengthening and expanding of the representation of spared whiskers within the map
(Fox, 1992; Diamond et al., 1993; Sellien and Ebner, 2007). The dynamic relocation of cortical
processing space from deprived inputs toward spared inputs will optimize sensory processing
(see Feldman and Brecht, 2005 for a review).
The induction of cortical reorganization following temporally paired cutaneous stimulations
was also described in monkeys (Recanzone et al., 1992c; Wang et al., 1995) and in humans
(Spengler et al., 1997; Liu et al., 2000) via training, and was initially tested by syndactyly and
webbing experiments (described in section Relevance of spatial/temporal dis/continuities, page
112). Interestingly, a study performed in both rats and humans using a pairing paradigm of
natural tactile stimulation revealed an expansion of the cortical representation of the stimulated
hindpaw in SI of rats associated with enlarged RFs, while a similar procedure resulted in an
enhanced tactile acuity at the stimulated fingers (Godde et al., 1996). This study was the first
suggesting the relevance of adapting somatosensory pairing protocols to humans, and provided
the evidence that such stimulation may have functional outcomes.
However, it is worth noting that the enlargement of RFs size observed in rats may appear
contradictory to the improved discrimination observed in humans. Indeed, given that tactile
acuity resolution is considered to be determined by the spacing between RF centres (Goodwin
and Wheat, 2004), a decrease in RFs size is usually expected to obtain an improved
discrimination. But, note that an enlarged cortical representation was also observed, suggesting
an increase in the number of neurons activated by the stimulation and thus processing the tactile
information. In addition, discrepancies in the direction of RF size changes has been frequently
observed. Among the possible explanations, the pattern and location of somatosensory
129 | P a g e
stimulation is thought to affect RFs size. Indeed, while studies in which stimuli were applied
with a significant trial-by-trial variability in location (e.g. Xerri et al., 1994) or in which stimuli
moved across the skin (e.g. Jenkins et al., 1990) repeatedly reported RFs size shrinkage
following training/stimulation exposure, studies in which stimuli were applied at an invariant
skin location (e.g. Recanzone et al., 1992a, 1992c, 1992d, 1992e; Wang et al., 1995) reported in
contrast enlarged RFs for the trained region (see section previous chapter). This was interpreted
as a consequence of the fact that by Hebbian plasticity, any input into the cortex driven from the
invariantly stimulated skin location would be integrated into a necessarily larger receptive field.
In contrast, when stimuli move across the hand (as in Jenkins et al., 1990) or are delivered to
inconstant skin locations (as in Xerri et al., 1994), each small sector of skin is an effective
source of competitive input for the Hebbian network, and receptive fields therefore shrink in
size as the zones of representation of the engaged skin surface grow in size. Note also that RFs
and cortical map changes induced by naturalistic sensory enrichment were found to follow
different time courses (Rosselet et al., 2006), the RF size reduction occurring earlier than map
expansion. Thus, the onset at which both are recorded must be taken into consideration.
Aside from this parenthetical remark about RFs, we can see that similarly to ICMS,
temporally paired cutaneous stimulation results in substantial reorganization of the cortical
representation of the stimulated site. In addition, applied in humans, such protocol appears to
alter tactile acuity. The paradigm introduced by Godde and colleagues, now commonly referred
as repetitive somatosensory stimulation, was then extensively used to investigate the link
between cortical plastic changes and perceptual changes in humans. This literature will be
described in the following section.
III. Repetitive somatosensory stimulation
a. Description
As underlined in the previous sections of this chapter, the preponderance of the temporal
coincidence to induce plastic changes has been widely demonstrated. Spike-timing-dependent
plasticity together with LTP and LTD of synaptic transmission are the most likely processes
driving activity-dependent plasticity. However, the induction of such processes is typically
performed invasively in animals, either in slice preparations or intracortically in vivo, which
makes its implementation in humans difficult, if not impossible. The paradigm introduced by
Godde and colleagues (1996), or repetitive somatosensory stimulation (RSS), corresponds to an
adaptation of the classical Hebbian protocols into an ecological stimulation that can be
130 | P a g e
implemented in humans, and which allow for a complete control of the timing and
spatiotemporal allocation of the stimulation in order to systematically study brain plasticity and
its functional relevance (see Beste and Dinse, 2013; Parianen Lesemann et al., 2015 for recent
reviews). Consistent with the Hebbian postulate, RSS consists in a passive simultaneous
stimulation of cutaneous receptive fields for a few hours. Since Godde and colleagues (1996), a
substantial number of studies confirmed that RSS induces cortical changes associated with
changes in tactile perceptual abilities comparable to those occurring after application of active
perceptual learning paradigms (described in detail below). However, in contrast to classical
training-dependent procedures, RSS presents the characteristic of being completely passive and
devoid of attentional or cognitive control processes (i.e., training-independent, Beste and Dinse,
2013).
Several lines of evidence strongly suggest that RSS relies on Hebbian synaptic plasticity
and reflects LTP-like plasticity in SI. First, RSS effects (both cortical and behavioural) were
found to be N-methyl-D-aspartate (NMDA) receptor-dependent (Dinse et al., 2003), this
receptor being known to be crucial for LTP induction. Similarly, RSS behavioural effects were
also found to be dependent on cholinergic mechanisms which are known to participate in
NMDA receptor-dependent neuroplasticity (Bliem et al., 2008). In addition, an Hebbian-like
“co-activation” of several RFs has been proven to be crucial for the induction of
plastic/behavioural changes (Pleger et al., 2003; Ragert et al., 2008). In line with this, opposite
perceptual changes have been reported following in vitro-like protocols of high- and low-
frequency RSS, discrimination being improved following high-frequency stimulation, whereas
low-frequency stimulation resulted in an impaired acuity (Ragert et al., 2008). These results
indicate that brief stimulation protocols resembling those used in cellular LTP and LTD studies
can induce meaningful and persistent alterations in tactile discrimination in humans. This
evidence further supports the Hebbian action of RSS. Finally, the short time-scale over which
RSS cortical and behavioural effects occur (up to 8 hours; Godde et al., 2000) further supports
the fact that RSS relies on Hebbian-like transient changes in synaptic efficiency.
Most studies using this protocol applied RSS on the tip of the right index finger (right-D2)
(Godde et al., 1996, 2000, 2003; Pleger et al., 2001, 2003; Dinse et al., 2003, 2006; Hodzic et
al., 2004; Ragert et al., 2008; Gibson et al., 2009; Schlieper and Dinse, 2012; Freyer et al., 2012,
2013; Höffken et al., 2012), while few other studies applied RSS on two- or more adjacent
fingers (Pilz et al., 2004; Kalisch et al., 2007, 2008; Smith et al., 2009; Kowalewski et al.,
2012), or on the whole hand with a specific glove (e.g., Golaszewski et al., 2012). I will describe
in the following sections the behavioural and cortical plastic changes obtained following RSS,
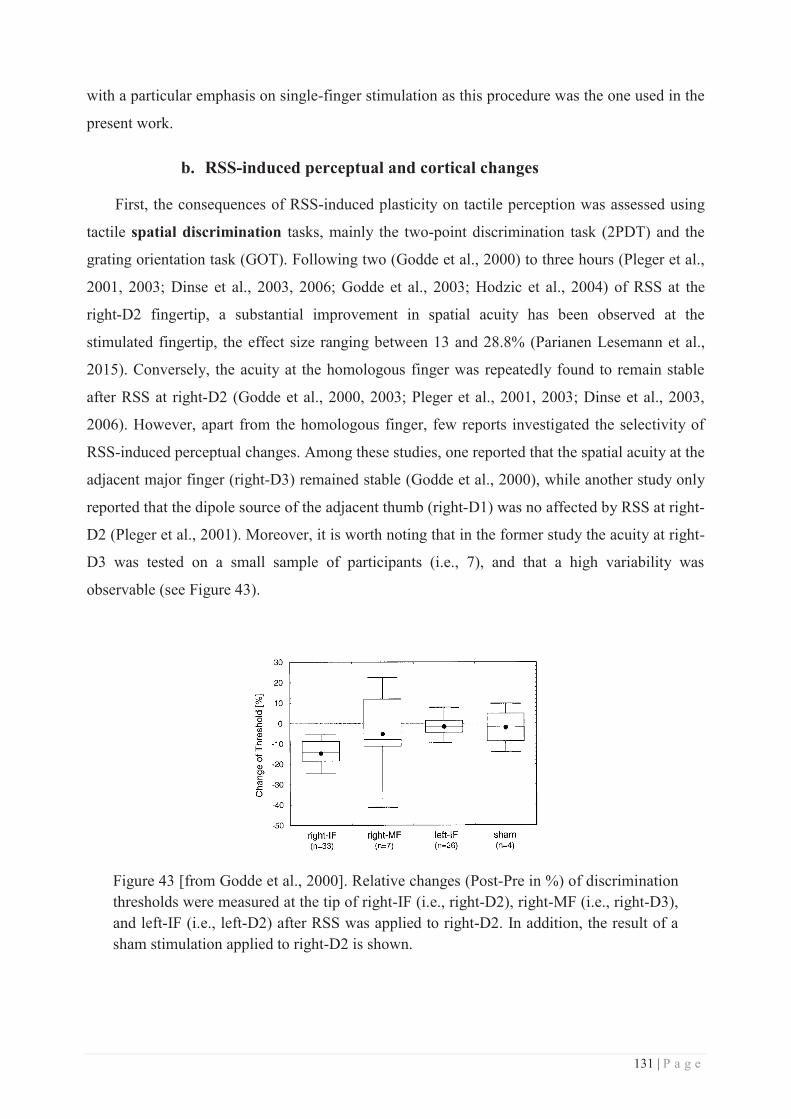
131 | P a g e
with a particular emphasis on single-finger stimulation as this procedure was the one used in the
present work.
b. RSS-induced perceptual and cortical changes
First, the consequences of RSS-induced plasticity on tactile perception was assessed using
tactile spatial discrimination tasks, mainly the two-point discrimination task (2PDT) and the
grating orientation task (GOT). Following two (Godde et al., 2000) to three hours (Pleger et al.,
2001, 2003; Dinse et al., 2003, 2006; Godde et al., 2003; Hodzic et al., 2004) of RSS at the
right-D2 fingertip, a substantial improvement in spatial acuity has been observed at the
stimulated fingertip, the effect size ranging between 13 and 28.8% (Parianen Lesemann et al.,
2015). Conversely, the acuity at the homologous finger was repeatedly found to remain stable
after RSS at right-D2 (Godde et al., 2000, 2003; Pleger et al., 2001, 2003; Dinse et al., 2003,
2006). However, apart from the homologous finger, few reports investigated the selectivity of
RSS-induced perceptual changes. Among these studies, one reported that the spatial acuity at the
adjacent major finger (right-D3) remained stable (Godde et al., 2000), while another study only
reported that the dipole source of the adjacent thumb (right-D1) was no affected by RSS at right-
D2 (Pleger et al., 2001). Moreover, it is worth noting that in the former study the acuity at right-
D3 was tested on a small sample of participants (i.e., 7), and that a high variability was
observable (see Figure 43).
Figure 43 [from Godde et al., 2000]. Relative changes (Post-Pre in %) of discrimination thresholds were measured at the tip of right-IF (i.e., right-D2), right-MF (i.e., right-D3), and left-IF (i.e., left-D2) after RSS was applied to right-D2. In addition, the result of a sham stimulation applied to right-D2 is shown.
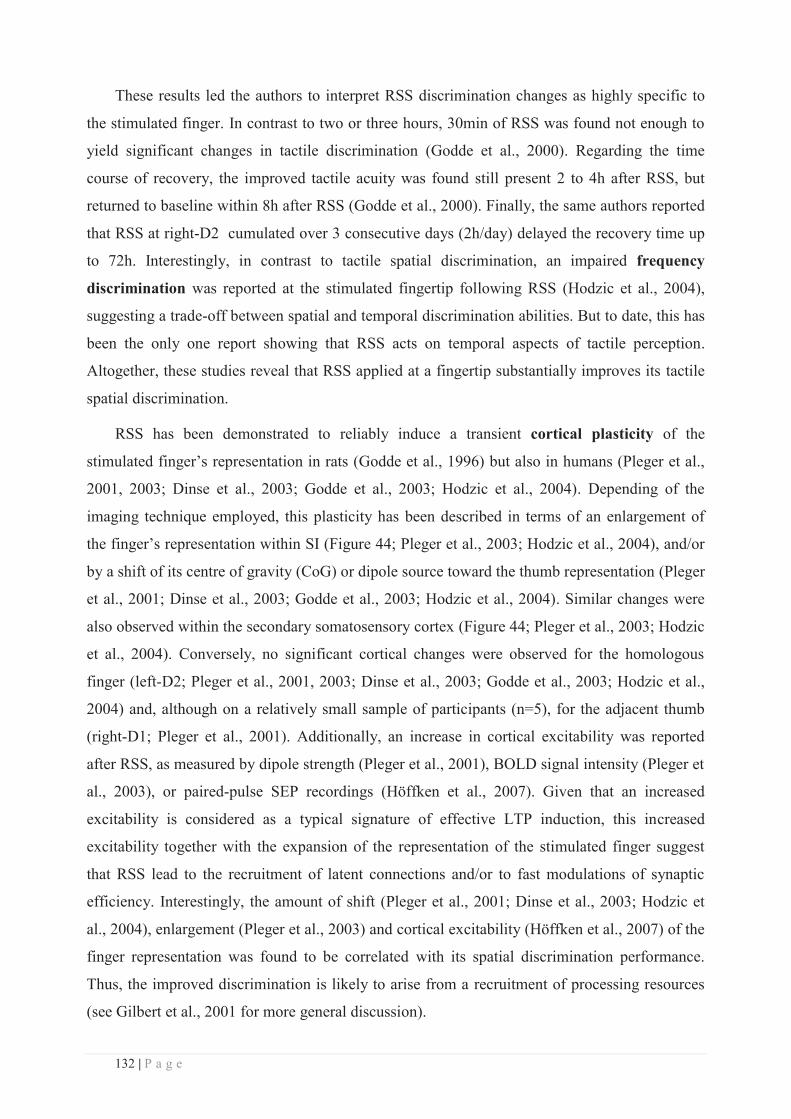
132 | P a g e
These results led the authors to interpret RSS discrimination changes as highly specific to
the stimulated finger. In contrast to two or three hours, 30min of RSS was found not enough to
yield significant changes in tactile discrimination (Godde et al., 2000). Regarding the time
course of recovery, the improved tactile acuity was found still present 2 to 4h after RSS, but
returned to baseline within 8h after RSS (Godde et al., 2000). Finally, the same authors reported
that RSS at right-D2 cumulated over 3 consecutive days (2h/day) delayed the recovery time up
to 72h. Interestingly, in contrast to tactile spatial discrimination, an impaired frequency
discrimination was reported at the stimulated fingertip following RSS (Hodzic et al., 2004),
suggesting a trade-off between spatial and temporal discrimination abilities. But to date, this has
been the only one report showing that RSS acts on temporal aspects of tactile perception.
Altogether, these studies reveal that RSS applied at a fingertip substantially improves its tactile
spatial discrimination.
RSS has been demonstrated to reliably induce a transient cortical plasticity of the
stimulated finger’s representation in rats (Godde et al., 1996) but also in humans (Pleger et al.,
2001, 2003; Dinse et al., 2003; Godde et al., 2003; Hodzic et al., 2004). Depending of the
imaging technique employed, this plasticity has been described in terms of an enlargement of
the finger’s representation within SI (Figure 44; Pleger et al., 2003; Hodzic et al., 2004), and/or
by a shift of its centre of gravity (CoG) or dipole source toward the thumb representation (Pleger
et al., 2001; Dinse et al., 2003; Godde et al., 2003; Hodzic et al., 2004). Similar changes were
also observed within the secondary somatosensory cortex (Figure 44; Pleger et al., 2003; Hodzic
et al., 2004). Conversely, no significant cortical changes were observed for the homologous
finger (left-D2; Pleger et al., 2001, 2003; Dinse et al., 2003; Godde et al., 2003; Hodzic et al.,
2004) and, although on a relatively small sample of participants (n=5), for the adjacent thumb
(right-D1; Pleger et al., 2001). Additionally, an increase in cortical excitability was reported
after RSS, as measured by dipole strength (Pleger et al., 2001), BOLD signal intensity (Pleger et
al., 2003), or paired-pulse SEP recordings (Höffken et al., 2007). Given that an increased
excitability is considered as a typical signature of effective LTP induction, this increased
excitability together with the expansion of the representation of the stimulated finger suggest
that RSS lead to the recruitment of latent connections and/or to fast modulations of synaptic
efficiency. Interestingly, the amount of shift (Pleger et al., 2001; Dinse et al., 2003; Hodzic et
al., 2004), enlargement (Pleger et al., 2003) and cortical excitability (Höffken et al., 2007) of the
finger representation was found to be correlated with its spatial discrimination performance.
Thus, the improved discrimination is likely to arise from a recruitment of processing resources
(see Gilbert et al., 2001 for more general discussion).
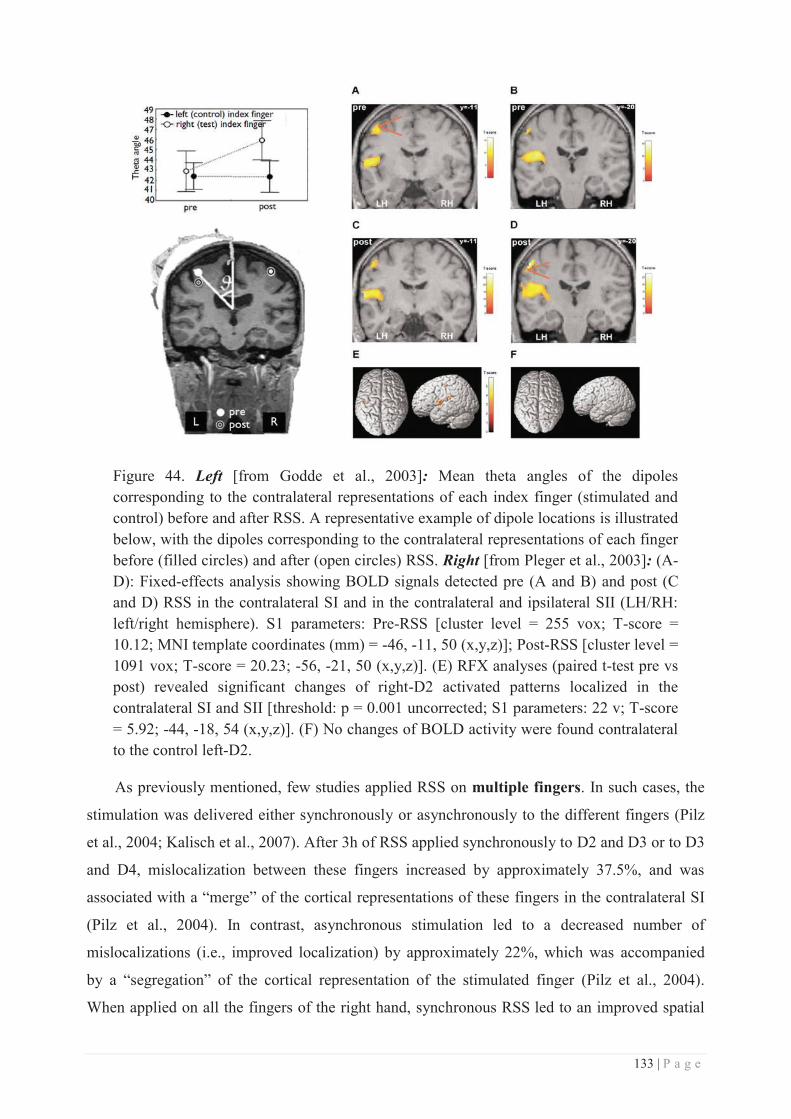
133 | P a g e
Figure 44. Left [from Godde et al., 2003]: Mean theta angles of the dipoles corresponding to the contralateral representations of each index finger (stimulated and control) before and after RSS. A representative example of dipole locations is illustrated below, with the dipoles corresponding to the contralateral representations of each finger before (filled circles) and after (open circles) RSS. Right [from Pleger et al., 2003]: (A-D): Fixed-effects analysis showing BOLD signals detected pre (A and B) and post (C and D) RSS in the contralateral SI and in the contralateral and ipsilateral SII (LH/RH: left/right hemisphere). S1 parameters: Pre-RSS [cluster level = 255 vox; T-score = 10.12; MNI template coordinates (mm) = -46, -11, 50 (x,y,z)]; Post-RSS [cluster level = 1091 vox; T-score = 20.23; -56, -21, 50 (x,y,z)]. (E) RFX analyses (paired t-test pre vs post) revealed significant changes of right-D2 activated patterns localized in the contralateral SI and SII [threshold: p = 0.001 uncorrected; S1 parameters: 22 v; T-score = 5.92; -44, -18, 54 (x,y,z)]. (F) No changes of BOLD activity were found contralateral to the control left-D2.
As previously mentioned, few studies applied RSS on multiple fingers. In such cases, the
stimulation was delivered either synchronously or asynchronously to the different fingers (Pilz
et al., 2004; Kalisch et al., 2007). After 3h of RSS applied synchronously to D2 and D3 or to D3
and D4, mislocalization between these fingers increased by approximately 37.5%, and was
associated with a “merge” of the cortical representations of these fingers in the contralateral SI
(Pilz et al., 2004). In contrast, asynchronous stimulation led to a decreased number of
mislocalizations (i.e., improved localization) by approximately 22%, which was accompanied
by a “segregation” of the cortical representation of the stimulated finger (Pilz et al., 2004).
When applied on all the fingers of the right hand, synchronous RSS led to an improved spatial
134 | P a g e
discrimination associated with an increased rate of mislocalization to more distant fingers,
whereas after asynchronous RSS no significant perceptual change was observed (Kalisch et al.,
2007). Interestingly, in contrast to spatial acuity, tactile sensitivity as assessed by absolute
thresholds was unaffected by RSS (Kalisch et al., 2007). Altogether, these studies suggest that
when several fingers are submitted to RSS, synchrony is necessary to drive spatial
discrimination improvement locally on each finger, whereas asynchrony seems to involve a
slightly different mechanism. It is worth noting here that when applied to several fingers, RSS
might act at two different scales: a first that I will consider as “local”, arising from the
synchronous stimulation of several RFs at each fingertip, and a second arising from the
synchronous or asynchronous across fingers. But this hypothesis needs further investigation.
c. Non-mechanical RSS protocols
In addition, while the stimulation of the RSS protocol was originally mechanical (Godde et
al., 1996, 2000, 2003; Pleger et al., 2001, 2003; Dinse et al., 2003; Höffken et al., 2007; Kalisch
et al., 2007; Ragert et al., 2008; Freyer et al., 2012, 2013), many studies used different variants
of RSS, and in particular electrical stimulation (Smith et al., 2009; Kalisch et al., 2010; Freyer
et al., 2012, 2013; Kowalewski et al., 2012; Schlieper and Dinse, 2012; Ladda et al., 2014). In
contrast to mechanical stimulation which is basically transmitted via Meissner or Merkel
mechanoreceptors, electrical stimulation activates much more afferents: Ia large muscle
afferents, group Ib afferents from Golgi, SAII and FAII tactile afferents (Campbell, 1999;
Kimura, 2013). This wide recruitment of afferents led electrical stimulation to be favoured in the
context of rehabilitation. For instance, electrical RSS of the fingers of stroke patients suffering
from sensory loss (Smith et al., 2009), or of elderly people affected by age-related
somatosensory decline (Kalisch et al., 2010), resulted in an improved sensory discrimination but
also in an enhanced sensorimotor performance.
To conclude, we saw in this chapter that altering the temporal pattern of somatosensory
inputs is an efficient way to drive activity-dependent plastic changes via Hebbian plasticity,
while avoiding the confounding aspects of lesional, motor and attentional contributions.
Adapted from classical pairing protocols, RSS has been proven to be efficient in inducing a
transient somatosensory plasticity in healthy population. Interestingly, this plasticity has been
associated with substantial changes, an notably improvements, in tactile perception.
135 | P a g e
SUMMARY & AIMS
As described in the introduction of this work, we know from the literature that the tactile
information arising from the hand and the face are cortically neighbours, and that in case of
sensory loss cortical plastic changes can occur across the hand-face border, but are associated
with different functional consequences (either adaptive or maladaptive). On the other hand,
restoring and more generally increasing somatosensory inputs also leads to cortical changes that
are more systematically associated with adaptive outcomes. Among the different alternatives
available to increase somatosensory inputs, RSS relies on the well-known Hebbian plasticity
processes and yields training-independent learning by passively increasing somatosensory
inputs. Applied at the right index fingertip RSS results in a substantial, though transient,
reorganization of the stimulated finger representation within SI, which is typically associated
with a local improvement in tactile spatial discrimination. However, the eventuality that RSS (or
any other activity-dependent protocol) may have remote effects to other body-parts, for instance
its cortical neighbour the face, has not been investigated so far. To address this question, while
also providing new elements aiming to better understand the perceptual relevance of cortical
plastic changes, we conducted three studies which will be described in the following section.
Briefly, a first behavioural study (study 1) was conducted in healthy participants to
investigate whether three hours of RSS applied at the index fingertip could alter tactile
discrimination at the face, and whether such transfer follows a pattern “competition-like”. Then,
two imaging studies were conducted to investigate the cortical correlates of RSS-induced
changes within SI. Ultra-high field (7T) functional magnetic resonance imaging (fMRI, study 2)
and magnetoencephalography (MEG, study 3) were respectively used due to their
complementarity.

136 | P a g e

137 | P a g e
EXPERIMENTAL CONTRIBUTIONS

138 | P a g e
139 | P a g e
STUDY 1: BEHAVIOURAL STUDY
Prior investigations of the topographical limits of the RSS-induced perceptual and cortical
changes only examined the hand, namely the fingers adjacent to the stimulated index finger
(Godde et al., 2000; Pleger et al., 2001) and the homologous finger on the opposite hand (e.g.,
Godde et al., 2000, 2003; Pleger et al., 2001, 2003), with the conclusion that RSS-induced
changes were largely local, both behaviourally and neurally. On the other hand, numerous
studies reported large-scale plastic changes across the hand-face border following
somatosensory deprivation (Pons et al., 1991; Elbert et al., 1994; Jain et al., 1997, 2008; Weiss
et al., 2004), which were associated with perceptual changes (Ramachandran et al., 1992b;
Halligan et al., 1993; Farnè et al., 2002; Weiss et al., 2004). Little is known, however, about
whether such cross-border changes can be induced by increasing afferent input under non-
pathological conditions, for instance through RSS-like learning processes.
Thus, in a first behavioural experiment, we investigated whether the RSS-induced
improvement of tactile acuity observed at the stimulated fingertip, could cross the hand-face
border and affect the face tactile acuity. To this aim, we assessed two-point discrimination
thresholds at both upper-lips and cheeks in addition to both index fingers, respectively before
and after RSS of the right index finger. To control for any contribution of training or of duration
of the experiment, a control group in which participants underwent the exact same procedure,
but with the RSS being off, was additionally tested.
The two-point discrimination threshold (2PDT) was first introduced by Weber in 1834
(Weber, 1996) as a measure of tactile spatial acuity, a measure that has subsequently become an
important, albeit highly controversial, measure of human hand function. This threshold is
defined as the shortest distance between two contact points that could be perceived as distinct,
as opposed to just one. Due to its easy implementation, the 2PD task has been widely used to
assess cutaneous innervation and central somatosensory function (Dellon and Kallman, 1983;
Van Boven and Johnson, 1994; Lundborg and Rosén, 2004; Parianen Lesemann et al., 2015). It
has been assumed that two points are distinguishable from one only when the two points are
sufficiently separated to evoke spatially distinct foci of neural activity (Vallbo and Johansson,
1978). Accordingly, the 2PDT has been assumed by many to reflect the size and spacing of
cutaneous RFs, particularly the innervation density of SAI afferents, which convey fine spatial
information (Johansson and Vallbo, 1979; Johnson, 2001).
140 | P a g e
However, the validity of 2PD task as a measure of spatial acuity has been questioned
(Johnson and Phillips, 1981; Craig and Johnson, 2000; Lundborg and Rosén, 2004; Tong et al.,
2013). This controversy arises from the fact that 2PDT has sometimes been reported to fall
under the receptor spacing (i.e., near 0 mm; Johnson and Phillips, 1981), suggesting that
participants may exploit a non-spatial cue to perform the 2PD task (Craig and Johnson, 2000).
Indeed, two closely spaced points elicit fewer action potentials in the underlying SAI afferents
than does a single point of equal indentation (Vega-Bermudez and Johnson, 1999).
Consequently, the overall response magnitude could provide a non-spatial cue (i.e., intensity
cue) helping to perform the 2PD task. This means that participants would be able to infer
whether a stimulus consisted of two closely spaced points or one without actually perceiving
two distinct points pressing against the skin. This makes 2PDT extremely dependent on the
criterion that participants adopt for responding that they perceive two points. Finally, another
issue arises from the lack of standardization of reliable technique of 2PD assessment.
The most prominent alternative to the classical 2PDT discussed in the literature is the
grating orientation threshold (GOT), in which a grating consisting of equidistant grooves and
ridges (with varying width) is presented in one of two orientations, which has to be
discriminated by the participant (Van Boven and Johnson, 1994; Craig and Johnson, 2000).
However, potential confounds in the GOT task are unknown contributions of visual cortical
processing (Sathian and Zangaladze, 2002) and anisotropy of the task performance (Vega-
Bermudez and Johnson, 2004; Gibson and Craig, 2005). But, despite these different critics and
the differences in the type of stimulation, 2PDT and GOT are roughly equivalent (Dinse et al.,
2006; Bruns et al., 2014).
Considering the controversy of GOT and the fact that 2PDT is probably the most used (and
known) method to evaluate tactile spatial acuity, we adopted several precautions regarding our
method of assessing 2PDT. First, home-made devices were used to deliver a reliable stimulation
with a constant application force. These devices also prevented participants to move the tested
area. Then, the instructions for the task were carefully delivered to the participants, to ensure the
use of a single criterion: to respond that they feel two points ONLY when clearly feeling two
distinct points, and not a larger point, bar or anything else. These simple precautions made our
2PDT assessment reliable, as repeatedly confirmed in the literature (Godde et al., 2000, 2003;
Pleger et al., 2001, 2003; Dinse et al., 2003, 2006). This method was kept similar across the
three studies reported here.
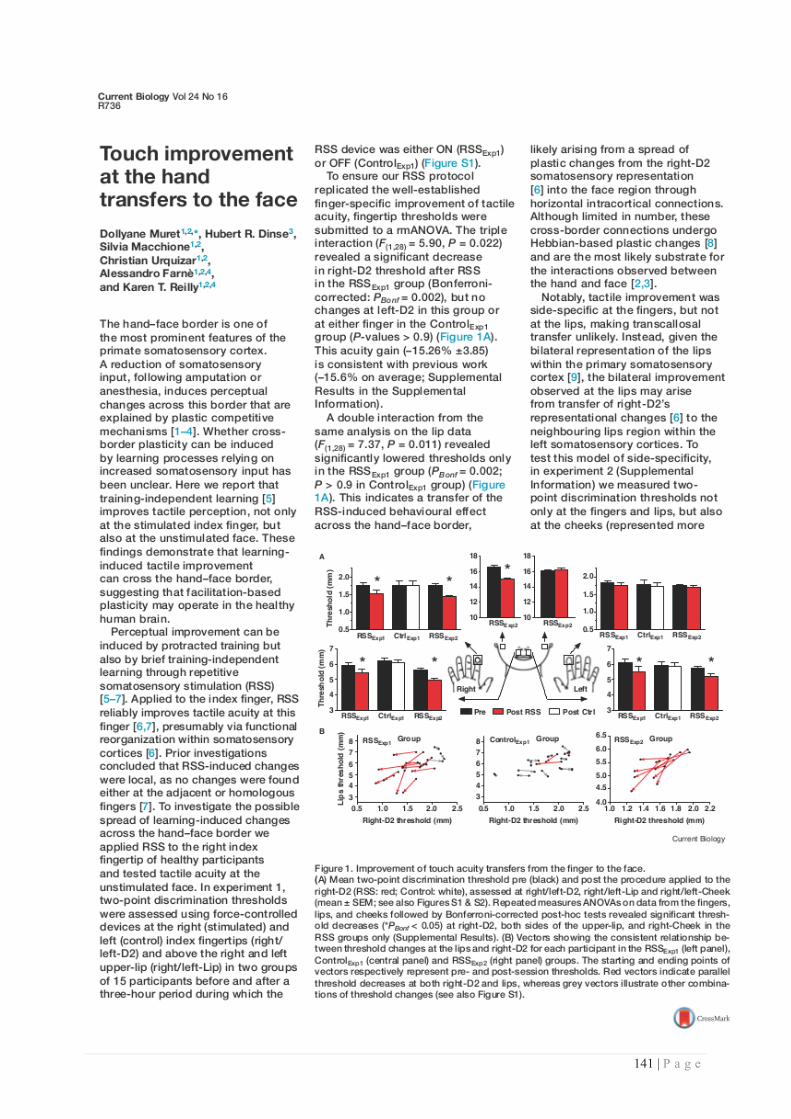
141 | P a g e
142 | P a g e

143 | P a g e
Supplemental Information:
Touch improvement at the hand transfers to the face
Dollyane Muret, Hubert R. Dinse, Silvia Macchione, Christian Urquizar,
Alessandro Farnè, Karen T. Reilly
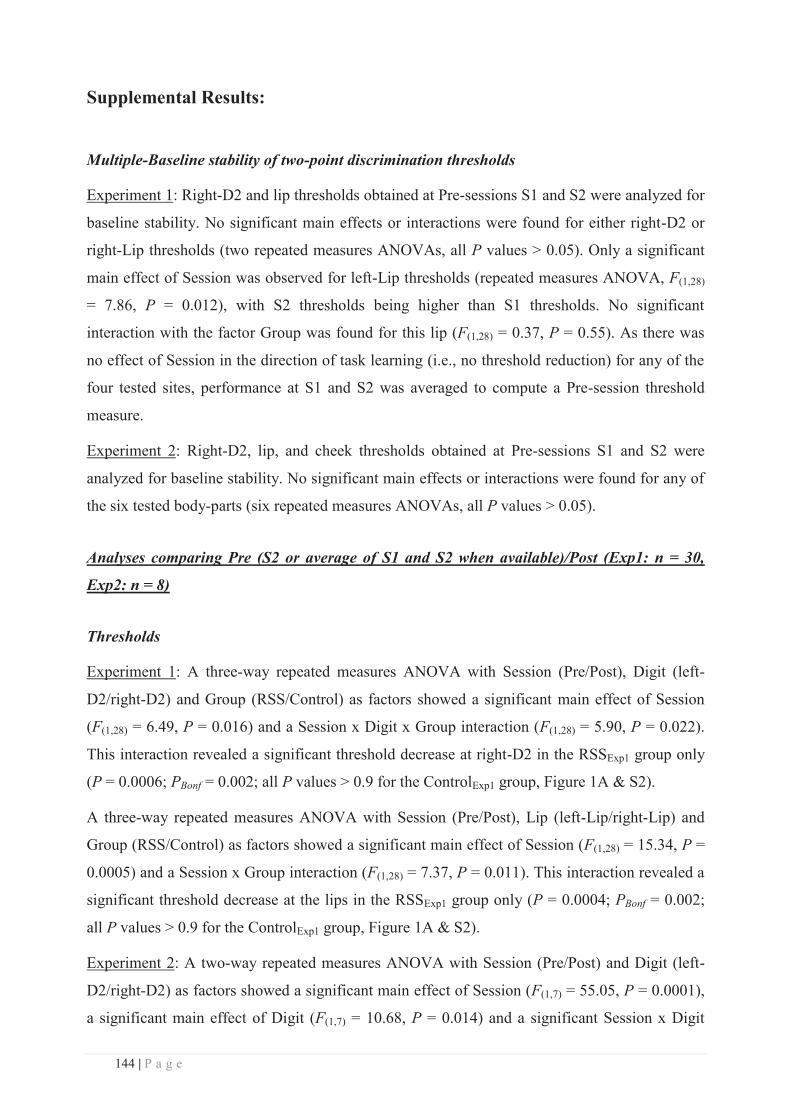
144 | P a g e
Supplemental Results:
Multiple-Baseline stability of two-point discrimination thresholds
Experiment 1: Right-D2 and lip thresholds obtained at Pre-sessions S1 and S2 were analyzed for
baseline stability. No significant main effects or interactions were found for either right-D2 or
right-Lip thresholds (two repeated measures ANOVAs, all P values > 0.05). Only a significant
main effect of Session was observed for left-Lip thresholds (repeated measures ANOVA, F(1,28)
= 7.86, P = 0.012), with S2 thresholds being higher than S1 thresholds. No significant
interaction with the factor Group was found for this lip (F(1,28) = 0.37, P = 0.55). As there was
no effect of Session in the direction of task learning (i.e., no threshold reduction) for any of the
four tested sites, performance at S1 and S2 was averaged to compute a Pre-session threshold
measure.
Experiment 2: Right-D2, lip, and cheek thresholds obtained at Pre-sessions S1 and S2 were
analyzed for baseline stability. No significant main effects or interactions were found for any of
the six tested body-parts (six repeated measures ANOVAs, all P values > 0.05).
Analyses comparing Pre (S2 or average of S1 and S2 when available)/Post (Exp1: n = 30,
Exp2: n = 8)
Thresholds
Experiment 1: A three-way repeated measures ANOVA with Session (Pre/Post), Digit (left-
D2/right-D2) and Group (RSS/Control) as factors showed a significant main effect of Session
(F(1,28) = 6.49, P = 0.016) and a Session x Digit x Group interaction (F(1,28) = 5.90, P = 0.022).
This interaction revealed a significant threshold decrease at right-D2 in the RSSExp1 group only
(P = 0.0006; PBonf = 0.002; all P values > 0.9 for the ControlExp1 group, Figure 1A & S2).
A three-way repeated measures ANOVA with Session (Pre/Post), Lip (left-Lip/right-Lip) and
Group (RSS/Control) as factors showed a significant main effect of Session (F(1,28) = 15.34, P =
0.0005) and a Session x Group interaction (F(1,28) = 7.37, P = 0.011). This interaction revealed a
significant threshold decrease at the lips in the RSSExp1 group only (P = 0.0004; PBonf = 0.002;
all P values > 0.9 for the ControlExp1 group, Figure 1A & S2).
Experiment 2: A two-way repeated measures ANOVA with Session (Pre/Post) and Digit (left-
D2/right-D2) as factors showed a significant main effect of Session (F(1,7) = 55.05, P = 0.0001),
a significant main effect of Digit (F(1,7) = 10.68, P = 0.014) and a significant Session x Digit
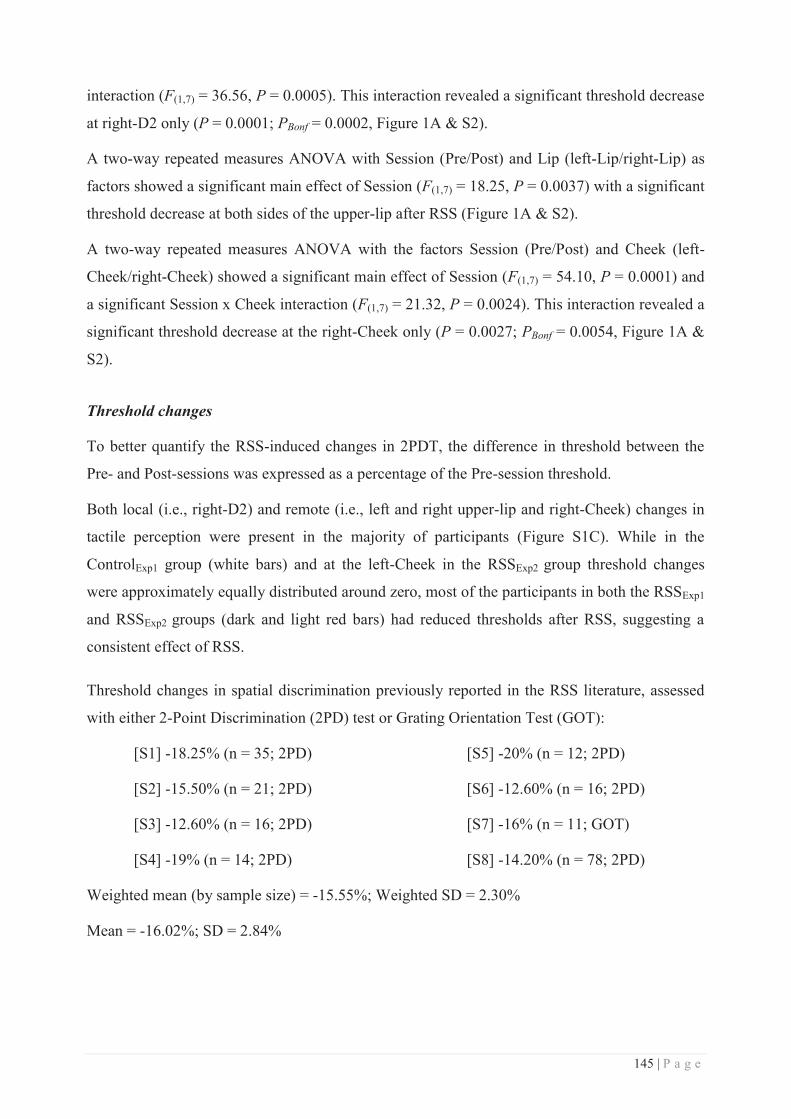
145 | P a g e
interaction (F(1,7) = 36.56, P = 0.0005). This interaction revealed a significant threshold decrease
at right-D2 only (P = 0.0001; PBonf = 0.0002, Figure 1A & S2).
A two-way repeated measures ANOVA with Session (Pre/Post) and Lip (left-Lip/right-Lip) as
factors showed a significant main effect of Session (F(1,7) = 18.25, P = 0.0037) with a significant
threshold decrease at both sides of the upper-lip after RSS (Figure 1A & S2).
A two-way repeated measures ANOVA with the factors Session (Pre/Post) and Cheek (left-
Cheek/right-Cheek) showed a significant main effect of Session (F(1,7) = 54.10, P = 0.0001) and
a significant Session x Cheek interaction (F(1,7) = 21.32, P = 0.0024). This interaction revealed a
significant threshold decrease at the right-Cheek only (P = 0.0027; PBonf = 0.0054, Figure 1A &
S2).
Threshold changes
To better quantify the RSS-induced changes in 2PDT, the difference in threshold between the
Pre- and Post-sessions was expressed as a percentage of the Pre-session threshold.
Both local (i.e., right-D2) and remote (i.e., left and right upper-lip and right-Cheek) changes in
tactile perception were present in the majority of participants (Figure S1C). While in the
ControlExp1 group (white bars) and at the left-Cheek in the RSSExp2 group threshold changes
were approximately equally distributed around zero, most of the participants in both the RSSExp1
and RSSExp2 groups (dark and light red bars) had reduced thresholds after RSS, suggesting a
consistent effect of RSS.
Threshold changes in spatial discrimination previously reported in the RSS literature, assessed
with either 2-Point Discrimination (2PD) test or Grating Orientation Test (GOT):
[S1] -18.25% (n = 35; 2PD)
[S2] -15.50% (n = 21; 2PD)
[S3] -12.60% (n = 16; 2PD)
[S4] -19% (n = 14; 2PD)
[S5] -20% (n = 12; 2PD)
[S6] -12.60% (n = 16; 2PD)
[S7] -16% (n = 11; GOT)
[S8] -14.20% (n = 78; 2PD)
Weighted mean (by sample size) = -15.55%; Weighted SD = 2.30%
Mean = -16.02%; SD = 2.84%
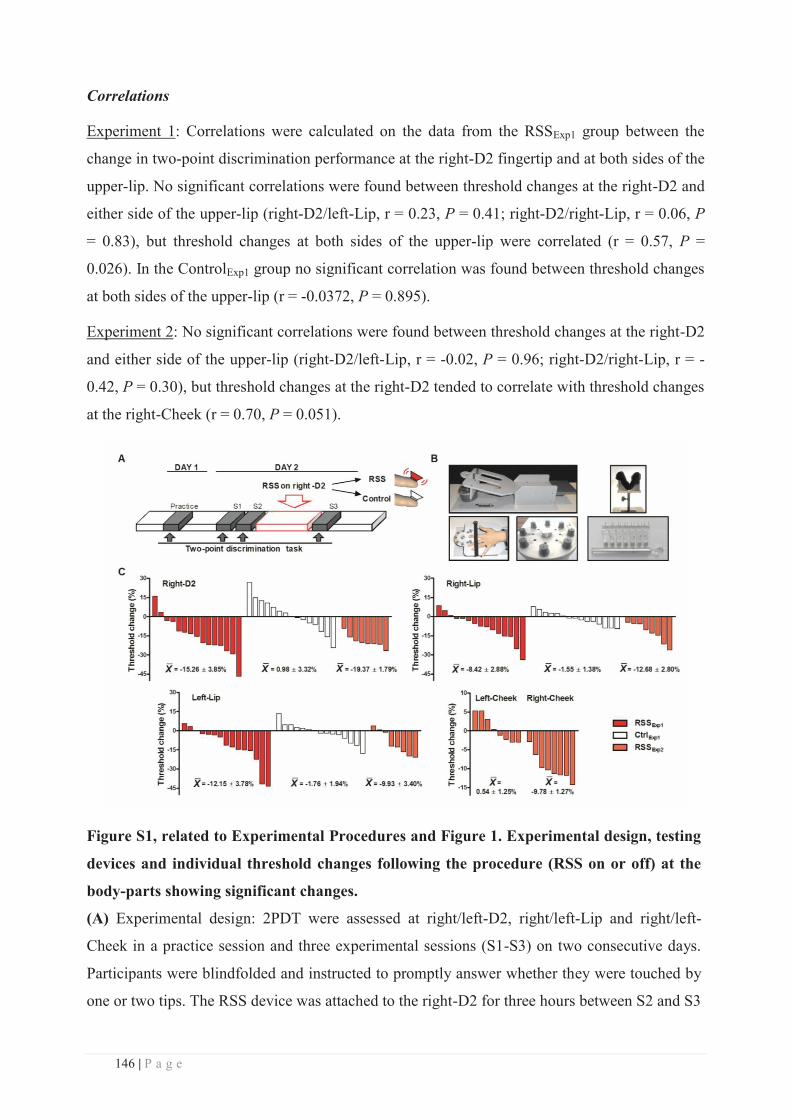
146 | P a g e
Correlations
Experiment 1: Correlations were calculated on the data from the RSSExp1 group between the
change in two-point discrimination performance at the right-D2 fingertip and at both sides of the
upper-lip. No significant correlations were found between threshold changes at the right-D2 and
either side of the upper-lip (right-D2/left-Lip, r = 0.23, P = 0.41; right-D2/right-Lip, r = 0.06, P
= 0.83), but threshold changes at both sides of the upper-lip were correlated (r = 0.57, P =
0.026). In the ControlExp1 group no significant correlation was found between threshold changes
at both sides of the upper-lip (r = -0.0372, P = 0.895).
Experiment 2: No significant correlations were found between threshold changes at the right-D2
and either side of the upper-lip (right-D2/left-Lip, r = -0.02, P = 0.96; right-D2/right-Lip, r = -
0.42, P = 0.30), but threshold changes at the right-D2 tended to correlate with threshold changes
at the right-Cheek (r = 0.70, P = 0.051).
Figure S1, related to Experimental Procedures and Figure 1. Experimental design, testing
devices and individual threshold changes following the procedure (RSS on or off) at the
body-parts showing significant changes.
(A) Experimental design: 2PDT were assessed at right/left-D2, right/left-Lip and right/left-
Cheek in a practice session and three experimental sessions (S1-S3) on two consecutive days.
Participants were blindfolded and instructed to promptly answer whether they were touched by
one or two tips. The RSS device was attached to the right-D2 for three hours between S2 and S3
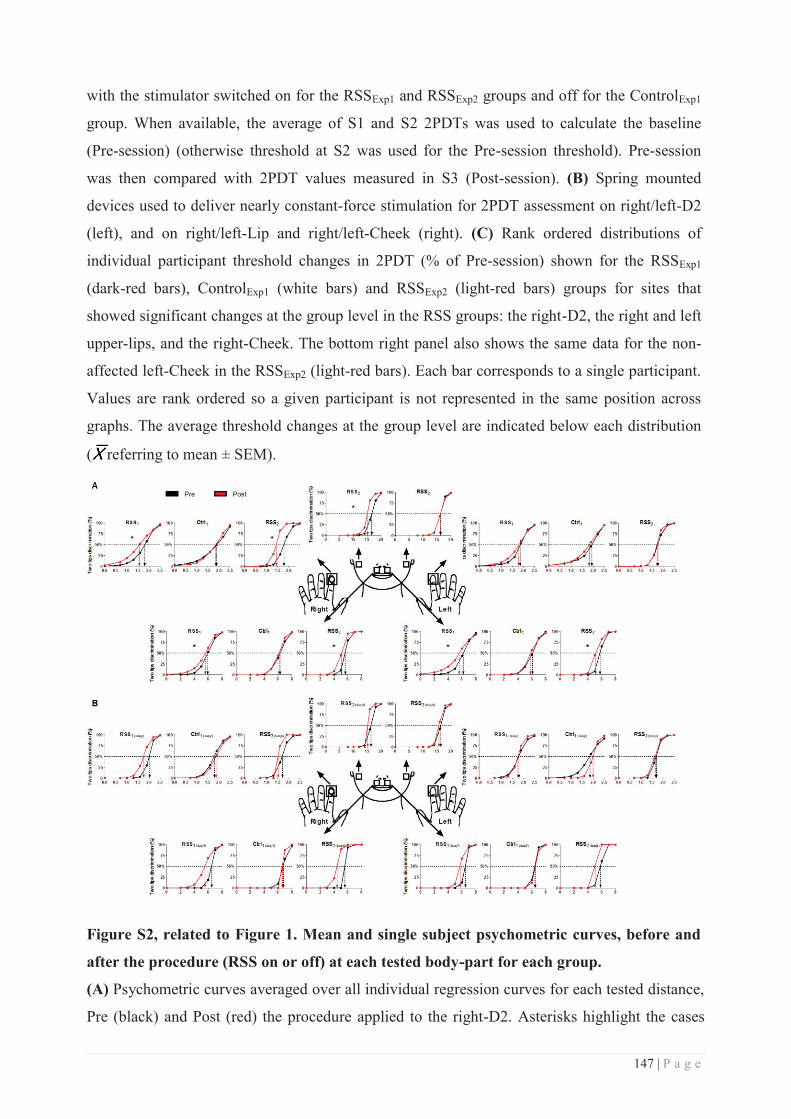
147 | P a g e
with the stimulator switched on for the RSSExp1 and RSSExp2 groups and off for the ControlExp1
group. When available, the average of S1 and S2 2PDTs was used to calculate the baseline
(Pre-session) (otherwise threshold at S2 was used for the Pre-session threshold). Pre-session
was then compared with 2PDT values measured in S3 (Post-session). (B) Spring mounted
devices used to deliver nearly constant-force stimulation for 2PDT assessment on right/left-D2
(left), and on right/left-Lip and right/left-Cheek (right). (C) Rank ordered distributions of
individual participant threshold changes in 2PDT (% of Pre-session) shown for the RSSExp1
(dark-red bars), ControlExp1 (white bars) and RSSExp2 (light-red bars) groups for sites that
showed significant changes at the group level in the RSS groups: the right-D2, the right and left
upper-lips, and the right-Cheek. The bottom right panel also shows the same data for the non-
affected left-Cheek in the RSSExp2 (light-red bars). Each bar corresponds to a single participant.
Values are rank ordered so a given participant is not represented in the same position across
graphs. The average threshold changes at the group level are indicated below each distribution
( referring to mean ± SEM).
Figure S2, related to Figure 1. Mean and single subject psychometric curves, before and
after the procedure (RSS on or off) at each tested body-part for each group.
(A) Psychometric curves averaged over all individual regression curves for each tested distance,
Pre (black) and Post (red) the procedure applied to the right-D2. Asterisks highlight the cases
148 | P a g e
where a significant threshold decrease was obtained (repeated measures ANOVAs on data from
the fingers, lips, and cheeks followed by Bonferroni-corrected post-hoc tests, *PBonf < 0.05, see
Figure 1A). (B) Single subject psychometric curves from individuals representative of each
group, Pre (black) and Post (red) the procedure applied to the right-D2. Arrows indicate
thresholds at 50% correct detection.
Analyses comparing S2/Post (Exp1: n = 30):
Thresholds
A three way repeated measures ANOVA with factors Session (S2/Post), Digit (left-D2/right-D2)
and Group (RSS/Control) showed a significant main effect of Session (F(1,28) = 5.47, P = 0.027)
and a Session x Digit x Group interaction (F(1,28) = 4.92, P = 0.035). This interaction revealed a
significant threshold decrease at right-D2 in the RSSExp1 group only (P = 0.006; PBonf = 0.026;
all P values > 0.9 for the ControlExp1 group).
A three way repeated measures ANOVAs with factors Session (S2/Post), Lip (left-Lip/right-
Lip) and Group (RSS/Control) showed a significant main effect of Session (F(1,28) = 24.57, P =
0.00003) and a Session x Group interaction (F(1,28) = 11.19, P = 0.002). This interaction revealed
a significant threshold decrease at both lips in the RSSExp1 group only (P = 0.00002; PBonf =
0.00006; all P values > 0.9 for the ControlExp1 group).
Threshold changes
RSSExp1 group:
Right-D2: -13.67 ± 3.92% (mean ± SEM).
Left-D2: -4.34 ± 2.90%.
Right-Lip: -10.86 ± 2.98%.
Left-Lip: -13.76 ± 3.53%.
ControlExp1 group:
Right-D2: 2.73 ± 3.36%.
Left-D2: -0.62 ± 6.41%.
Right-Lip: -1.46 ± 1.60%.
Left-Lip: -2.57 ± 2.00%.
Correlations
As for when they were calculated with respect to the average of S1 and S2, threshold changes
observed in the RSSExp1 group showed no significant correlations between changes at the right-
D2 and at either side of the upper-lip (right-D2/left-Lip, r = 0.29, P = 0.30; right-D2/right-Lip, r
149 | P a g e
= 0.02, P = 0.93). Again similar to the calculation based upon the S1-S2 average, threshold
changes at both sides of the upper-lip were correlated (r = 0.59, P = 0.02).
In the ControlExp1 group, no significant correlation was found either between right-D2 and either
side of the upper-Lip, nor between both sides of the upper-Lip (all P values > 0.08).
Analyses comparing Pre (average of S1 and S2) /Post for the lip data (RSSExp1: n = 11 ):
A two-way repeated measures ANOVA with Session (Pre/Post) and Lip (left-Lip/right-Lip) as
factors, showed a significant main effect of Lip (F(1,10) = 7.71, P = 0.02), the thresholds at the
right-Lip being smaller than at the left-Lip, and a significant main effect of Session (F(1,28) =
7.72, P = 0.02) reflecting a threshold decrease at both sides of the upper-lip after RSS.
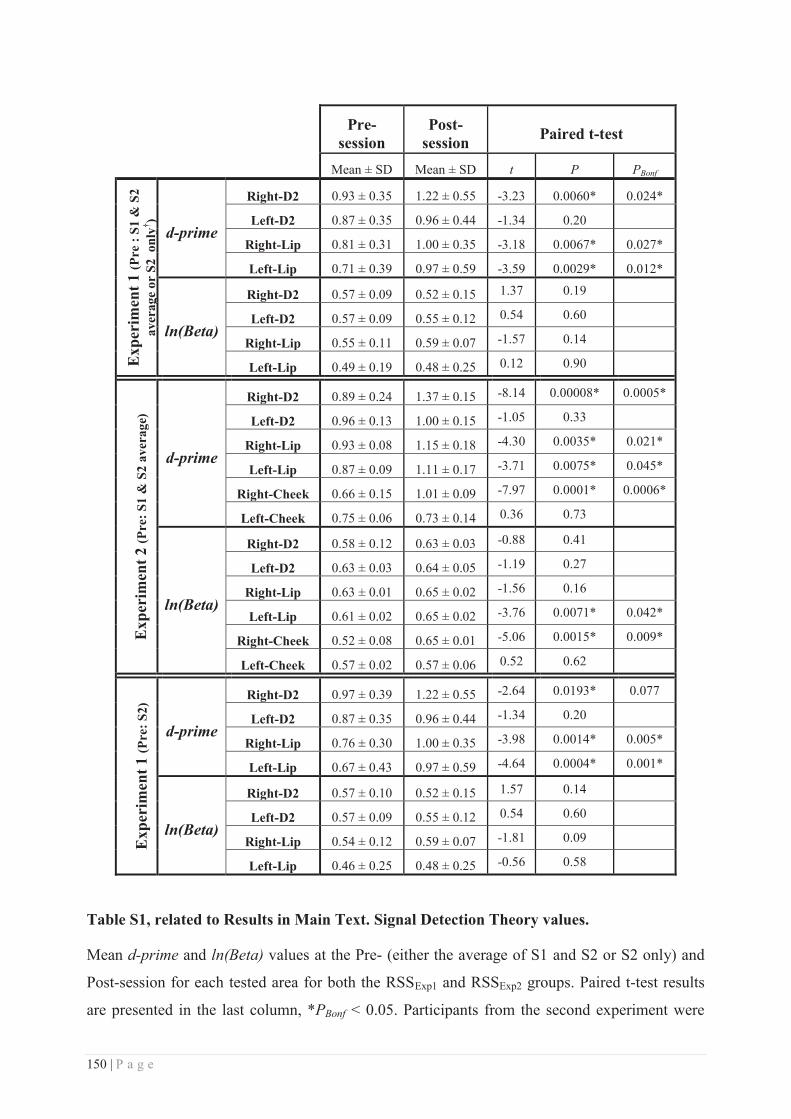
150 | P a g e
Pre-
session Post-
session Paired t-test
Mean ± SD Mean ± SD t P PBonf
Exp
erim
ent 1
(Pre
: S1
& S
2 av
erag
e or
S2
onl
y† )
d-prime
Right-D2 0.93 ± 0.35 1.22 ± 0.55 -3.23 0.0060* 0.024*
Left-D2 0.87 ± 0.35 0.96 ± 0.44 -1.34 0.20
Right-Lip 0.81 ± 0.31 1.00 ± 0.35 -3.18 0.0067* 0.027*
Left-Lip 0.71 ± 0.39 0.97 ± 0.59 -3.59 0.0029* 0.012*
ln(Beta)
Right-D2 0.57 ± 0.09 0.52 ± 0.15 1.37 0.19
Left-D2 0.57 ± 0.09 0.55 ± 0.12 0.54 0.60
Right-Lip 0.55 ± 0.11 0.59 ± 0.07 -1.57 0.14
Left-Lip 0.49 ± 0.19 0.48 ± 0.25 0.12 0.90
Exp
erim
ent 2
(Pre
: S1
& S
2 av
erag
e)
d-prime
Right-D2 0.89 ± 0.24 1.37 ± 0.15 -8.14 0.00008* 0.0005*
Left-D2 0.96 ± 0.13 1.00 ± 0.15 -1.05 0.33
Right-Lip 0.93 ± 0.08 1.15 ± 0.18 -4.30 0.0035* 0.021*
Left-Lip 0.87 ± 0.09 1.11 ± 0.17 -3.71 0.0075* 0.045*
Right-Cheek 0.66 ± 0.15 1.01 ± 0.09 -7.97 0.0001* 0.0006*
Left-Cheek 0.75 ± 0.06 0.73 ± 0.14 0.36 0.73
ln(Beta)
Right-D2 0.58 ± 0.12 0.63 ± 0.03 -0.88 0.41
Left-D2 0.63 ± 0.03 0.64 ± 0.05 -1.19 0.27
Right-Lip 0.63 ± 0.01 0.65 ± 0.02 -1.56 0.16
Left-Lip 0.61 ± 0.02 0.65 ± 0.02 -3.76 0.0071* 0.042*
Right-Cheek 0.52 ± 0.08 0.65 ± 0.01 -5.06 0.0015* 0.009*
Left-Cheek 0.57 ± 0.02 0.57 ± 0.06 0.52 0.62
Exp
erim
ent 1
(Pre
: S2)
d-prime
Right-D2 0.97 ± 0.39 1.22 ± 0.55 -2.64 0.0193* 0.077
Left-D2 0.87 ± 0.35 0.96 ± 0.44 -1.34 0.20
Right-Lip 0.76 ± 0.30 1.00 ± 0.35 -3.98 0.0014* 0.005*
Left-Lip 0.67 ± 0.43 0.97 ± 0.59 -4.64 0.0004* 0.001*
ln(Beta)
Right-D2 0.57 ± 0.10 0.52 ± 0.15 1.57 0.14
Left-D2 0.57 ± 0.09 0.55 ± 0.12 0.54 0.60
Right-Lip 0.54 ± 0.12 0.59 ± 0.07 -1.81 0.09
Left-Lip 0.46 ± 0.25 0.48 ± 0.25 -0.56 0.58
Table S1, related to Results in Main Text. Signal Detection Theory values.
Mean d-prime and ln(Beta) values at the Pre- (either the average of S1 and S2 or S2 only) and
Post-session for each tested area for both the RSSExp1 and RSSExp2 groups. Paired t-test results
are presented in the last column, *PBonf < 0.05. Participants from the second experiment were
151 | P a g e
more conservative (favouring 1 rather than 2 responses) after the RSS stimulation for the left-
Lip and the right-Cheek, which could have yielded higher thresholds. Instead, the observed
threshold decreased (confirmed by the significant increase in d-prime values). Therefore, in both
experiments we observed improved discrimination, with no slackening of response criterion.
The comparison of the S2 and Post sessions revealed significant d-prime increases at right-D2
(which did not survive the Bonferroni correction), right-Lip and left-Lip without criterion
changes, as for when the comparison was made between the Post-session and the average of S1
and S2.
†Average of S1 and S2 for all 30 subjects for the right-D2 and right-Lip and for 20 subjects for
the left-Lip. S2 only for 10 subjects for the left-Lip and for all 30 subjects for the left-D2.
Supplemental Experimental Procedures:
Participants
Thirty-two healthy volunteers participated in the first experiment. Participants were randomly
assigned to one of two groups: RSSExp1 or ControlExp1. Two participants (one from each group)
were excluded from the final analyses because their percent threshold change between S2 and
S3 was more than 2.5 SDs above the average threshold change in their group. Groups were
similar in terms of average age and number of males/females (RSSExp1: n = 15, mean age =
20.53 ± SD 2.26 years, 8 females. ControlExp1: n = 15, mean age = 23.42 ± SD 3.10 years, 8
females). Eight healthy volunteers participated in the second experiment (RSSExp2: mean age =
23.25 ± SD 1.67 years, 7 females).
All participants were right-handed according to the Edinburgh Handedness Inventory [S9]
(RSSExp1: mean score = 75.34 ± SD 20.65%; ControlExp1: mean score = 77.86 ± SD 15.78%;
RSSExp2: mean score = 73.75 ± SD 24.46%), and they all gave written informed consent before
participating. The protocol was approved by the ethics committee of Lyon, and was performed
in accordance with the Declaration of Helsinki.
Experimental Design
During the Practice session (Day1), detailed instructions were given, informed consent was
obtained, and two-point discrimination thresholds (2PDT) were measured. This session allowed
participants to become familiar with the task, but the data were not included in any analyses
152 | P a g e
(Figure S1A). This Practice session and sessions S1 and S2 ensured that discrimination
performance before RSS was stable and allowed us to separate RSS-induced changes from
potential changes related to familiarization with the task.
Based upon previous studies reporting no threshold change at left-D2 [S2-S6, S8], and because
we did not expect to see a threshold change on the left-Lip, the initial design of the first
experiment tested 2PDT at the left-D2 and left-Lip in S2 and S3 only. However, when a
preliminary analysis on the data from 4 participants from the RSSExp1 group revealed changes in
left-Lip threshold between S2 and S3 (i.e., after RSS), we modified our protocol to include
assessments of left-Lip threshold in all four sessions. Data from the new design were obtained
for 20 out of the 30 participants who participated in Experiment 1.
In the second experiment, thresholds of the six tested areas (left/right-D2, left/right-Lip and
left/right-Cheek) were assessed in all four sessions (Practice, S1, S2 and S3) in all participants.
Within a session, each area was tested in a separate block, and for a given participant the order
of blocks was maintained across sessions. Block order was randomized across participants.
Repetitive Somatosensory Stimulation (RSS) Protocol
We used an RSS protocol that is known to induce plastic changes in the somatosensory cortex
[S2-S7, S10-S12]. This method is effective and relatively simple to implement. It relies on the
Hebbian postulate as it simultaneously co-activates several cutaneous receptive fields, thus
producing temporally correlated inputs necessary to give rise to Hebbian plasticity [S13, S14].
In the three groups (RSSExp1, ControlExp1 and RSSExp2) a small 8 mm diameter solenoid
controlled by an MP3 player was taped to the volar surface of the right-D2 fingertip for three
hours. In both the RSSExp1 and RSSExp2 groups this solenoid delivered brief (10ms) supra-
threshold tactile stimuli with inter-stimulus intervals ranging from 100 to 3000 ms and
following a Poisson distribution (average stimulation frequency of 1Hz). In the ControlExp1
group the stimulation was turned off. All participants could freely move during the real and
control stimulation period (3 hours) and were instructed to continue with their daily activities
without paying attention to the device, but to avoid intensive use of their fingers (i.e. they were
not allowed to either write or type on a keyboard).
153 | P a g e
Two-point discrimination task
In Experiment 1 tactile two-point discrimination thresholds (2PDT) were assessed at four
locations using a two-alternative forced-choice task: the tips of both index fingers [distance from
fingertip: 5.40 ± 1.82 mm; distance from finger edge: 5.59 ± 0.69 mm (mean ± SD)], and both
sides of the upper-lip region [distance from mid-lip: 20.00 ± 4.52 mm (mean ± SD); midway
between the upper-lip and the base of the nose]. In Experiment 2, 2PDT were assessed at six
locations using the same paradigm: the tips of both index fingers [distance from fingertip: 6.25 ±
2.12 mm; distance from finger edge: 5.13 ± 1.64 mm (mean ± SD)], both sides of the upper-lip
region [distance from mid-lip: 10.00 ± 0.00 mm (mean ± SD); midway between upper-lip and
nose], and both cheeks [distance from the corner of the mouth: 5.13 ± 0.58 cm; midway between
the ear and the corner of the mouth at 46.09 ± 5.25% of the distance ear-mouth: 11.13 ± 0.44 cm
(mean ± SD)]. The tested lip areas are innervated by two independent nerves: each side of the
upper-lip is innervated by the medial branch of the superior labial branch of the infraorbital
nerve and these nerves never cross the midline [S15]. Thus, measurements at both sides of the
upper-lip could not influence each other at the peripheral level. For each participant the location
of each tested area was kept constant across sessions.
2PDT were assessed using eight probes, one with a single tip and seven with two tips separated
by various distances. Shaft length was 1.9 mm for the finger probes and 8 mm for the lip and
cheek probes. Shaft and tip diameters were identical for all probes (shaft: 0.7 mm; tip:
approximately 200 μm). The distances tested were predetermined and remained constant for all
participants but differed between fingertips (0.7, 1.0, 1.3, 1.6, 1.9, 2.2, 2.5 mm), lips (2, 3, 4, 5,
6, 7, 8 mm) and cheeks (8, 10, 12, 14, 16, 18, 20 mm) because of basic sensitivity differences
between these regions. For every site, each probe was tested 8 times in a pseudo-randomized
order (no more than two consecutive repetitions of the same probe), resulting in 64 trials
(approximately 10 minutes). Tips were always presented parallel to the longitudinal axis of the
fingers and face. To avoid the problem of variations in application pressure when using
handheld tips [S16, S17], we used two specially-designed spring-mounted apparatuses that
controlled application force across trials.
The left images in panel B of Figure S1 show the apparatus used to assess 2PDT at the index
fingertips. The eight probes were mounted on a rotatable disc which permitted rapid and
unpredictable switching between distances. The participant’s arm rested on the device with the
index finger positioned over a small hole and the index, middle, and ring fingers strapped down
to prevent them moving. Participants were instructed to relax the hand and the forearm, and to
154 | P a g e
remain still. The probes were brought into contact with the participant’s finger by the
experimenter pulling the device down towards the rotatable disc with an application force of
between 150 and 200 mN [S11]. The fingertip remained in contact with the probes for
approximately 1 second and participants were required to promptly give their oral response
(“one” or “two”). The experimenter then lifted up the participant's hand, rotated the disc to
present the next probe and continued until all probes had been presented eight times. Care was
taken to prevent participants from moving their finger or pressing it down on the probes.
The apparatus used to test 2PDT on the skin above the upper-lip and on the cheeks is shown in
the right images in panel B of Figure S1. The probes were mounted on individual plexiglass
sticks with ferromagnetic bases (4.5 cm long). Probes were applied by inserting them into the
end of a metal tube (length: 12.5 cm; diameter: 1.5 cm) which contained a spring that was
calibrated to obtain an almost constant application force (between 190 and 290 mN). When
applied to the skin, the plexiglass stick moved approximately 1 cm into the tube and a magnet
prevented it from rotating or tilting. The participant’s head was stabilized using a chin/head rest
and their hands rested on the table. They were instructed to keep their face and hands relaxed
and still. Stimulation was manually delivered by the experimenter perpendicularly to the skin
surface to ensure that both tips (for the seven two-tip probes) touched the skin’s surface at the
same time. After each trial the experimenter changed the plexiglass base and presented the next
probe until all probes had been presented eight times.
At the beginning of each finger, lip or cheek testing block the single probe and the two-tip probe
with the largest tip separation (2.5 mm for the fingertip; 8 mm for the lips; 20 mm for the
cheeks) were presented three times to the participant while the experimenter said "one" or
"two". Once participants declared that they clearly felt the difference between these two probes
the testing began and lasted approximately 10 minutes for each body-part.
Analyses
For each participant and for each area the mean of the verbal responses (‘one’ or ‘two’) was
plotted as a function of distance between the probes and the psychometric function was fitted
with a binary logistic regression [S8]. Threshold was determined from the fitted data and was
defined as the distance at which participants responded “two” 50% of the time.
S1 and S2 thresholds were statistically analyzed for stability using repeated measures ANOVAs
with, in Experiment 1, the two factors Group (Control/RSS) and Session (S1/S2) and in
Experiment 2, the factor Session (S1/S2). Separate ANOVAs were performed for the right-D2,
155 | P a g e
right-Lip, and left-Lip data (left-D2 data were not collected at S1) of Experiment 1 and for data
from each of the six tested body-parts (fingers, lips, cheeks) of Experiment 2.
Pre (average of S1 and S2 or S2 alone) and Post (S3) thresholds were statistically analyzed
using (for Experiment 1) two three-way repeated measures ANOVAs (one for the lips one for
the fingers) with factors Group (Control/RSS), Side (Left/Right), and Session (Pre/Post) or (for
Experiment 2) three two-way repeated measures ANOVAs (one for each pair of body-parts)
with factors Side (Left/Right) and Session (Pre/Post).
Threshold changes between Pre- and Post-sessions were determined for each subject as a
percentage of the Pre-session threshold (average of S1 and S2, or S2 alone):
. For each tested area the average threshold change was
calculated.
Three correlations were performed within the RSSExp1 group to compare threshold changes at
the left and right upper-lip and between each side of the upper-lip and the right-D2. Six
correlations were performed within the RSSExp2 group to compare threshold changes at the left
and right upper-lip, at the left and right-cheek and between each side of the upper-lip or cheek
and the right-D2 (4 correlations).
To test for changes in discrimination sensitivity and response criterion (Signal Detection
Theory), we calculated the false alarm and hit rates and using the MATLAB Palamedes toolbox
for one-alternative forced choice (PAL_SDT_1AFC_PHFtoDP, MATLAB v.r2010a) we
derived the discriminative index (d-prime value) and the criterion shift index (ln(Beta) value)
[S18]. Statistical analysis was performed using paired t-tests corrected for multiple comparisons
(Bonferroni), comparing sessions (Pre vs. Post) within both the RSSExp1 (four t-tests) and the
RSSExp2 (six t-tests) groups.
All statistical analyses were conducted using Statistica® (v.9.0, StatSoft). Data were checked for
normality using Kolmogorov-Smirnov tests. Bonferroni post-hoc analyses were performed and
corrected for multiple comparisons (Bonferroni). All data are expressed as mean ± standard
error of the mean (SEM).
156 | P a g e
Supplemental References:
S1. Godde, B., Spengler, F., and Dinse, H. R. (1996). Associative pairing of tactile stimulation induces somatosensory cortical reorganization in rats and humans. Neuroreport 8, 281–5.
S2. Godde, B., Stauffenberg, B., Spengler, F., and Dinse, H. R. (2000). Tactile coactivation-induced changes in spatial discrimination performance. J. Neurosci. 20, 1597–604.
S3. Pleger, B., Dinse, H. R., Ragert, P., Schwenkreis, P., Malin, J. P., and Tegenthoff, M. (2001). Shifts in cortical representations predict human discrimination improvement. Proc. Natl. Acad. Sci. U.S.A. 98, 12255–60.
S4. Pleger, B., Foerster, A.-F., Ragert, P., Dinse, H. R., Schwenkreis, P., Malin, J.-P., Nicolas, V., and Tegenthoff, M. (2003). Functional imaging of perceptual learning in human primary and secondary somatosensory cortex. Neuron 40, 643–53.
S5. Godde, B., Ehrhardt, J., and Braun, C. (2003). Behavioral significance of input-dependent plasticity of human somatosensory cortex. Neuroreport 14, 543–6.
S6. Dinse, H. R., Ragert, P., Pleger, B., Schwenkreis, P., and Tegenthoff, M. (2003). Pharmacological modulation of perceptual learning and associated cortical reorganization. Science 301, 91–4.
S7. Hodzic, A., Veit, R., Karim, A. A., Erb, M., and Godde, B. (2004). Improvement and decline in tactile discrimination behavior after cortical plasticity induced by passive tactile coactivation. J. Neurosci. 24, 442–6.
S8. Dinse, H. R., Kleibel, N., Kalisch, T., Ragert, P., Wilimzig, C., and Tegenthoff, M. (2006). Tactile coactivation resets age-related decline of human tactile discrimination. Ann. Neurol. 60, 88–94.
S9. Oldfield, R. C. (1971). The assessment and analysis of handedness: the Edinburgh inventory. Neuropsychologia 9, 97–113.
S10. Pilz, K., Veit, R., Braun, C., and Godde, B. (2004). Effects of co-activation on cortical organization and discrimination performance. Neuroreport 15, 2669.
S11. Kalisch, T., Tegenthoff, M., and Dinse, H. R. (2007). Differential effects of synchronous and asynchronous multifinger coactivation on human tactile performance. BMC Neurosci. 8, 58.
S12. Gibson, G. O., Makinson, C. D., and Sathian, K. (2009). Tactile co-activation improves detection of afferent spatial modulation. Exp. Brain Res. 194, 409–17.
S13. Clark, S. A., Allard, T., Jenkins, W. M., and Merzenich, M. M. (1988). Receptive fields in the body-surface map in adult cortex defined by temporally correlated inputs. Nature 332, 444–5.
S14. Wang, X., Merzenich, M. M., Sameshima, K., and Jenkins, W. M. (1995). Remodelling of hand representation in adult cortex determined by timing of tactile stimulation. Nature 378, 71–5.
S15. Hu, K.-S., Kwak, J., Koh, K.-S., Abe, S., Fontaine, C., and Kim, H.-J. (2007). Topographic distribution area of the infraorbital nerve. Surg. Radiol. Anat. 29, 383–88.
S16. Johnson, K. O., and Phillips, J. R. (1981). Tactile spatial resolution. I. Two-point discrimination, gap detection, grating resolution, and letter recognition. J. Neurophysiol. 46, 1177–92.
S17. Craig, J. C., and Johnson, K. O. (2000). The two-point threshold : not a measure of tactile spatial resolution. Curr. Dir. Psychol. Sci. 9, 29–32.
S18. Ragert, P., Kalisch, T., Bliem, B., Franzkowiak, S., and Dinse, H. R. (2008). Differential effects of tactile high- and low-frequency stimulation on tactile discrimination in human subjects. BMC Neurosci. 9, 9.
157 | P a g e
TRANSITION TO IMAGING STUDIES
Instead of an impaired tactile acuity, (as one may have expected from the tactile
improvement at the fingertip, based on the literature showing competitive processes between
neighbouring cortical areas), we report that increasing input at the right index finger of healthy
participants through RSS improved tactile perception not only at the stimulated fingertip, but
also at the unstimulated lips and cheek. These findings demonstrate that perceptual improvement
induced by finger stimulation crosses the face-hand border in a novel 'competition-free' manner,
and suggest that competition is not the only mechanism behind cross-border plasticity, but that
facilitation-based plasticity can be harnessed to produce large-scale changes in the healthy
human brain.
Together with the fact that an expansion and a shift of the cortical representation of the
RSS-stimulated finger (i.e., right-D2) has been extensively reported in SI (Pleger et al., 2001,
2003; Godde et al., 2003; Hodzic et al., 2004), the behavioural results of this first study bring to
the prediction that: (i) the lips representation may also be affected and enlarged after RSS of
right-D2, (ii) such an enlargement would possibly lead to a shift of their centre of gravity or
dipole sources, and (iii) these shifts might be toward the RSS-stimulated finger.
In order to investigate the cortical correlates of these behavioural changes, two imaging
studies were then performed with the same RSS protocol and behavioural task to allow a direct
comparison between perceptual and cortical changes. Among the neuroimaging techniques
available, fMRI and MEG exhibit the highest spatial resolution achievable non-invasively in
healthy participants, which makes them the most suitable to investigate the subtle changes we
are expecting.

158 | P a g e
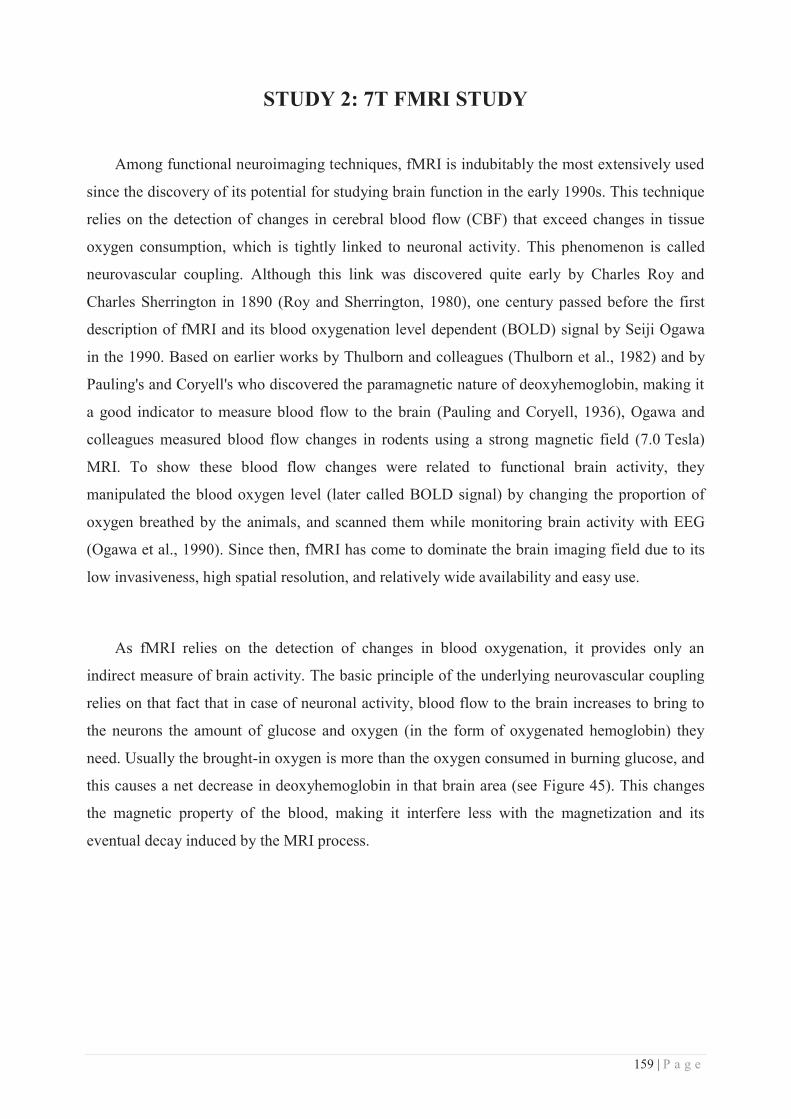
159 | P a g e
STUDY 2: 7T FMRI STUDY
Among functional neuroimaging techniques, fMRI is indubitably the most extensively used
since the discovery of its potential for studying brain function in the early 1990s. This technique
relies on the detection of changes in cerebral blood flow (CBF) that exceed changes in tissue
oxygen consumption, which is tightly linked to neuronal activity. This phenomenon is called
neurovascular coupling. Although this link was discovered quite early by Charles Roy and
Charles Sherrington in 1890 (Roy and Sherrington, 1980), one century passed before the first
description of fMRI and its blood oxygenation level dependent (BOLD) signal by Seiji Ogawa
in the 1990. Based on earlier works by Thulborn and colleagues (Thulborn et al., 1982) and by
Pauling's and Coryell's who discovered the paramagnetic nature of deoxyhemoglobin, making it
a good indicator to measure blood flow to the brain (Pauling and Coryell, 1936), Ogawa and
colleagues measured blood flow changes in rodents using a strong magnetic field (7.0 Tesla)
MRI. To show these blood flow changes were related to functional brain activity, they
manipulated the blood oxygen level (later called BOLD signal) by changing the proportion of
oxygen breathed by the animals, and scanned them while monitoring brain activity with EEG
(Ogawa et al., 1990). Since then, fMRI has come to dominate the brain imaging field due to its
low invasiveness, high spatial resolution, and relatively wide availability and easy use.
As fMRI relies on the detection of changes in blood oxygenation, it provides only an
indirect measure of brain activity. The basic principle of the underlying neurovascular coupling
relies on that fact that in case of neuronal activity, blood flow to the brain increases to bring to
the neurons the amount of glucose and oxygen (in the form of oxygenated hemoglobin) they
need. Usually the brought-in oxygen is more than the oxygen consumed in burning glucose, and
this causes a net decrease in deoxyhemoglobin in that brain area (see Figure 45). This changes
the magnetic property of the blood, making it interfere less with the magnetization and its
eventual decay induced by the MRI process.
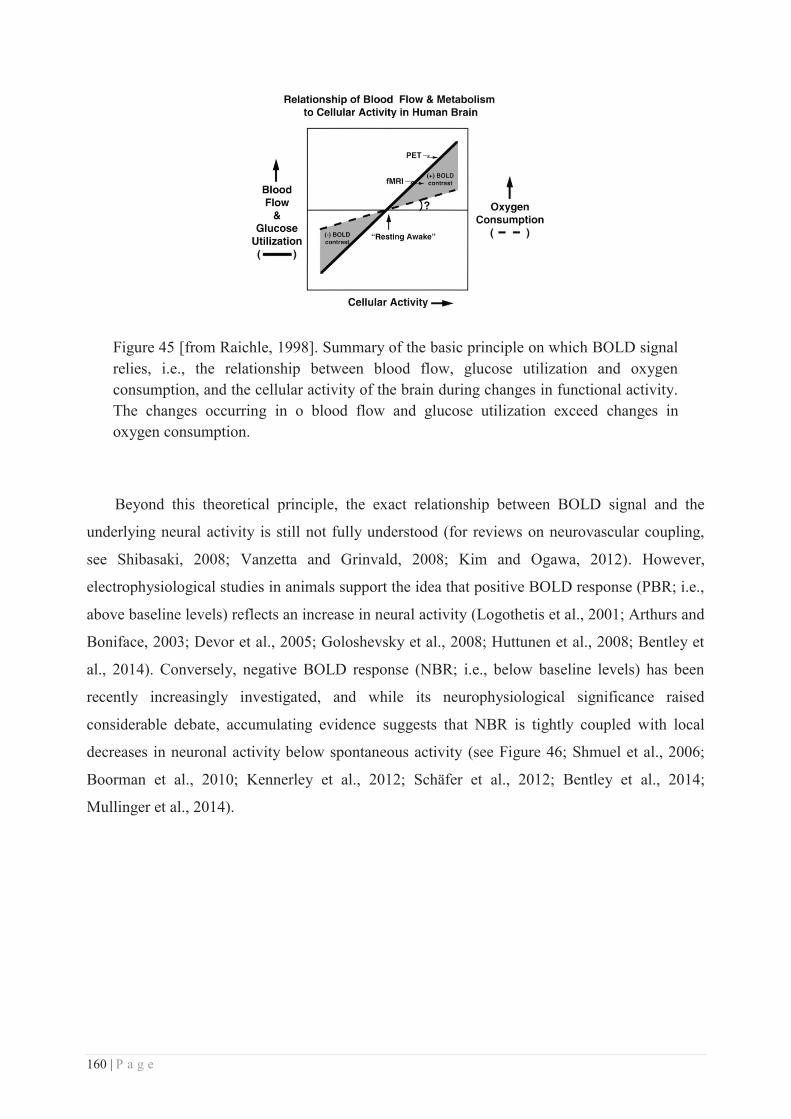
160 | P a g e
Figure 45 [from Raichle, 1998]. Summary of the basic principle on which BOLD signal relies, i.e., the relationship between blood flow, glucose utilization and oxygen consumption, and the cellular activity of the brain during changes in functional activity. The changes occurring in o blood flow and glucose utilization exceed changes in oxygen consumption.
Beyond this theoretical principle, the exact relationship between BOLD signal and the
underlying neural activity is still not fully understood (for reviews on neurovascular coupling,
see Shibasaki, 2008; Vanzetta and Grinvald, 2008; Kim and Ogawa, 2012). However,
electrophysiological studies in animals support the idea that positive BOLD response (PBR; i.e.,
above baseline levels) reflects an increase in neural activity (Logothetis et al., 2001; Arthurs and
Boniface, 2003; Devor et al., 2005; Goloshevsky et al., 2008; Huttunen et al., 2008; Bentley et
al., 2014). Conversely, negative BOLD response (NBR; i.e., below baseline levels) has been
recently increasingly investigated, and while its neurophysiological significance raised
considerable debate, accumulating evidence suggests that NBR is tightly coupled with local
decreases in neuronal activity below spontaneous activity (see Figure 46; Shmuel et al., 2006;
Boorman et al., 2010; Kennerley et al., 2012; Schäfer et al., 2012; Bentley et al., 2014;
Mullinger et al., 2014).
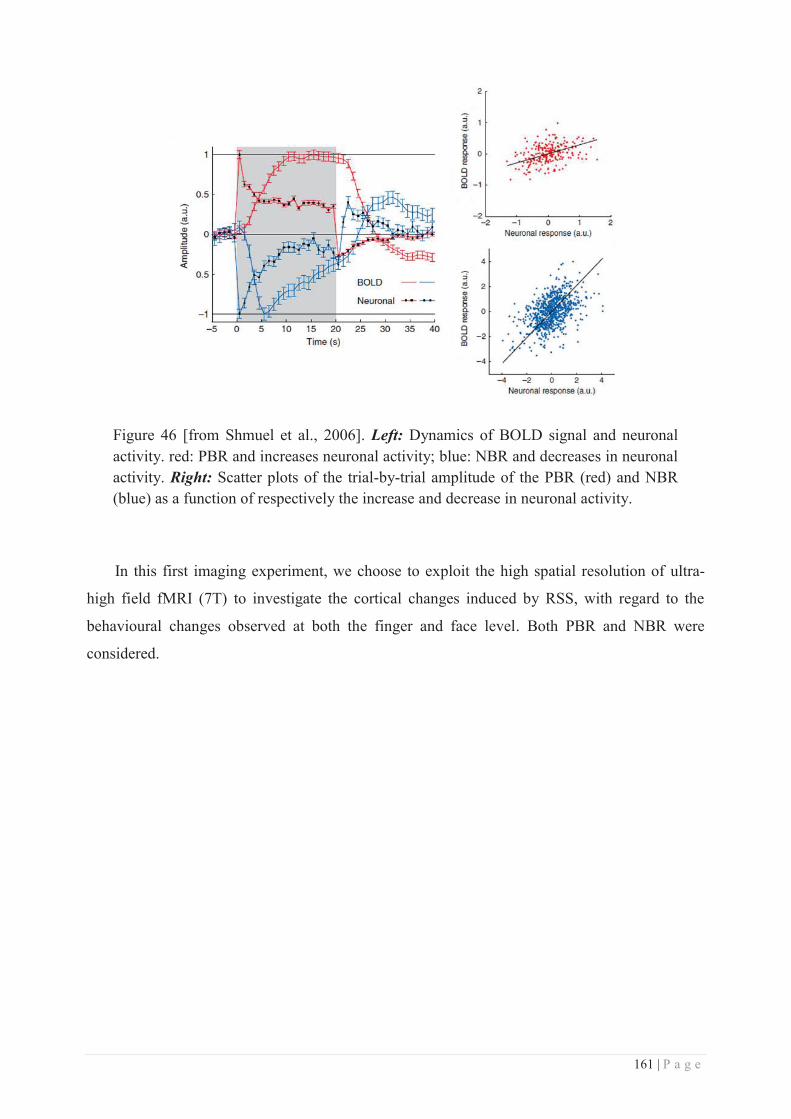
161 | P a g e
Figure 46 [from Shmuel et al., 2006]. Left: Dynamics of BOLD signal and neuronal activity. red: PBR and increases neuronal activity; blue: NBR and decreases in neuronal activity. Right: Scatter plots of the trial-by-trial amplitude of the PBR (red) and NBR (blue) as a function of respectively the increase and decrease in neuronal activity.
In this first imaging experiment, we choose to exploit the high spatial resolution of ultra-
high field fMRI (7T) to investigate the cortical changes induced by RSS, with regard to the
behavioural changes observed at both the finger and face level. Both PBR and NBR were
considered.

162 | P a g e
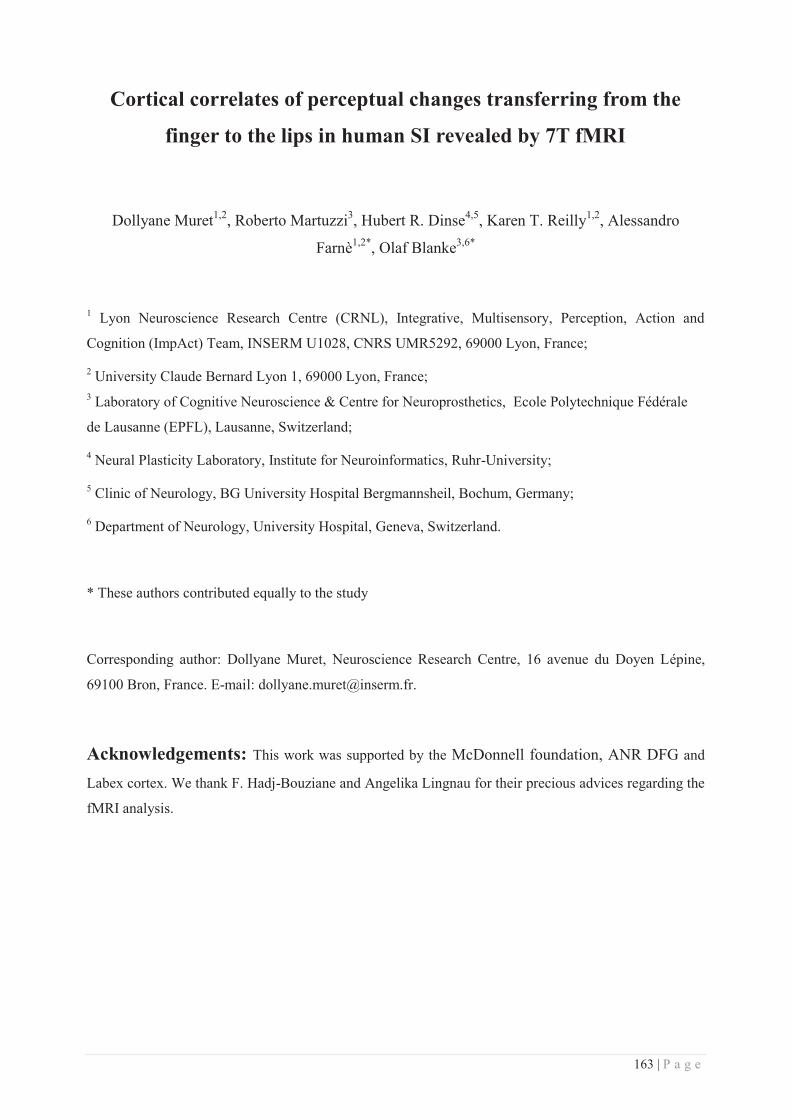
163 | P a g e
Cortical correlates of perceptual changes transferring from the
finger to the lips in human SI revealed by 7T fMRI
Dollyane Muret1,2, Roberto Martuzzi3, Hubert R. Dinse4,5, Karen T. Reilly1,2, Alessandro
Farnè1,2*, Olaf Blanke3,6*
1 Lyon Neuroscience Research Centre (CRNL), Integrative, Multisensory, Perception, Action and
Cognition (ImpAct) Team, INSERM U1028, CNRS UMR5292, 69000 Lyon, France;
2 University Claude Bernard Lyon 1, 69000 Lyon, France; 3 Laboratory of Cognitive Neuroscience & Centre for Neuroprosthetics, Ecole Polytechnique Fédérale
de Lausanne (EPFL), Lausanne, Switzerland;
4 Neural Plasticity Laboratory, Institute for Neuroinformatics, Ruhr-University;
5 Clinic of Neurology, BG University Hospital Bergmannsheil, Bochum, Germany;
6 Department of Neurology, University Hospital, Geneva, Switzerland.
* These authors contributed equally to the study
Corresponding author: Dollyane Muret, Neuroscience Research Centre, 16 avenue du Doyen Lépine,
69100 Bron, France. E-mail: [email protected].
Acknowledgements: This work was supported by the McDonnell foundation, ANR DFG and
Labex cortex. We thank F. Hadj-Bouziane and Angelika Lingnau for their precious advices regarding the
fMRI analysis.
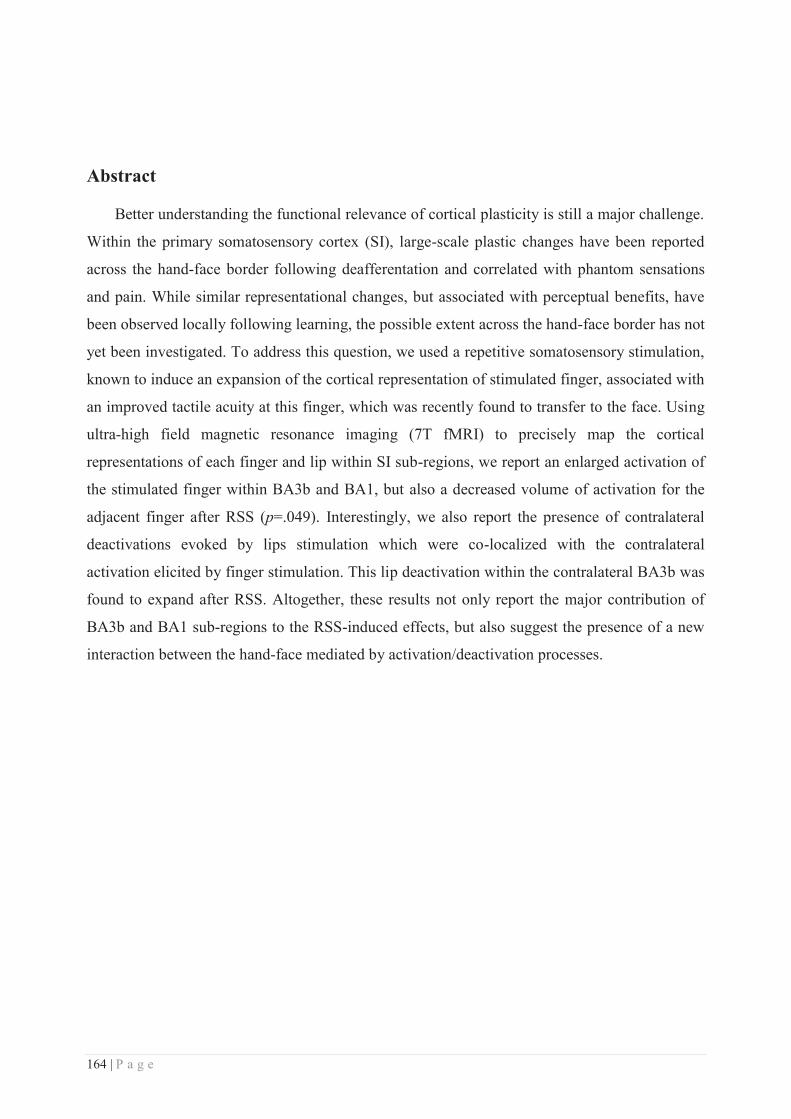
164 | P a g e
Abstract
Better understanding the functional relevance of cortical plasticity is still a major challenge.
Within the primary somatosensory cortex (SI), large-scale plastic changes have been reported
across the hand-face border following deafferentation and correlated with phantom sensations
and pain. While similar representational changes, but associated with perceptual benefits, have
been observed locally following learning, the possible extent across the hand-face border has not
yet been investigated. To address this question, we used a repetitive somatosensory stimulation,
known to induce an expansion of the cortical representation of stimulated finger, associated with
an improved tactile acuity at this finger, which was recently found to transfer to the face. Using
ultra-high field magnetic resonance imaging (7T fMRI) to precisely map the cortical
representations of each finger and lip within SI sub-regions, we report an enlarged activation of
the stimulated finger within BA3b and BA1, but also a decreased volume of activation for the
adjacent finger after RSS (p=.049). Interestingly, we also report the presence of contralateral
deactivations evoked by lips stimulation which were co-localized with the contralateral
activation elicited by finger stimulation. This lip deactivation within the contralateral BA3b was
found to expand after RSS. Altogether, these results not only report the major contribution of
BA3b and BA1 sub-regions to the RSS-induced effects, but also suggest the presence of a new
interaction between the hand-face mediated by activation/deactivation processes.
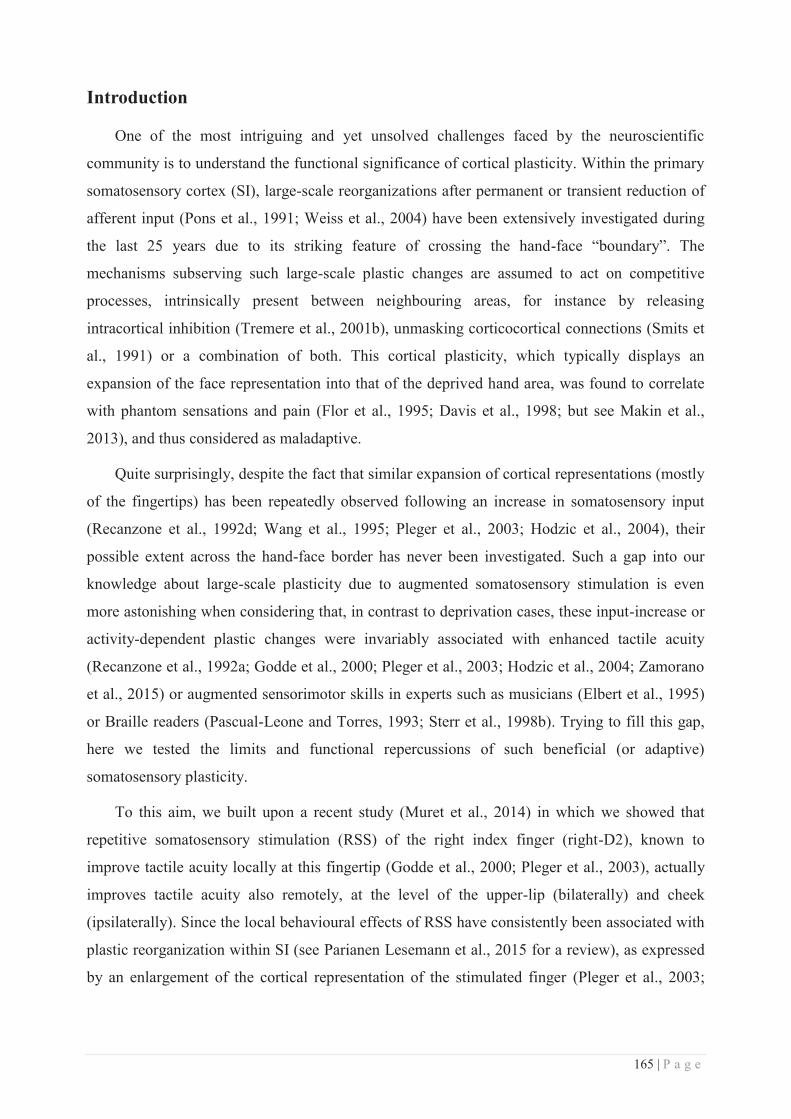
165 | P a g e
Introduction
One of the most intriguing and yet unsolved challenges faced by the neuroscientific
community is to understand the functional significance of cortical plasticity. Within the primary
somatosensory cortex (SI), large-scale reorganizations after permanent or transient reduction of
afferent input (Pons et al., 1991; Weiss et al., 2004) have been extensively investigated during
the last 25 years due to its striking feature of crossing the hand-face “boundary”. The
mechanisms subserving such large-scale plastic changes are assumed to act on competitive
processes, intrinsically present between neighbouring areas, for instance by releasing
intracortical inhibition (Tremere et al., 2001b), unmasking corticocortical connections (Smits et
al., 1991) or a combination of both. This cortical plasticity, which typically displays an
expansion of the face representation into that of the deprived hand area, was found to correlate
with phantom sensations and pain (Flor et al., 1995; Davis et al., 1998; but see Makin et al.,
2013), and thus considered as maladaptive.
Quite surprisingly, despite the fact that similar expansion of cortical representations (mostly
of the fingertips) has been repeatedly observed following an increase in somatosensory input
(Recanzone et al., 1992d; Wang et al., 1995; Pleger et al., 2003; Hodzic et al., 2004), their
possible extent across the hand-face border has never been investigated. Such a gap into our
knowledge about large-scale plasticity due to augmented somatosensory stimulation is even
more astonishing when considering that, in contrast to deprivation cases, these input-increase or
activity-dependent plastic changes were invariably associated with enhanced tactile acuity
(Recanzone et al., 1992a; Godde et al., 2000; Pleger et al., 2003; Hodzic et al., 2004; Zamorano
et al., 2015) or augmented sensorimotor skills in experts such as musicians (Elbert et al., 1995)
or Braille readers (Pascual-Leone and Torres, 1993; Sterr et al., 1998b). Trying to fill this gap,
here we tested the limits and functional repercussions of such beneficial (or adaptive)
somatosensory plasticity.
To this aim, we built upon a recent study (Muret et al., 2014) in which we showed that
repetitive somatosensory stimulation (RSS) of the right index finger (right-D2), known to
improve tactile acuity locally at this fingertip (Godde et al., 2000; Pleger et al., 2003), actually
improves tactile acuity also remotely, at the level of the upper-lip (bilaterally) and cheek
(ipsilaterally). Since the local behavioural effects of RSS have consistently been associated with
plastic reorganization within SI (see Parianen Lesemann et al., 2015 for a review), as expressed
by an enlargement of the cortical representation of the stimulated finger (Pleger et al., 2003;
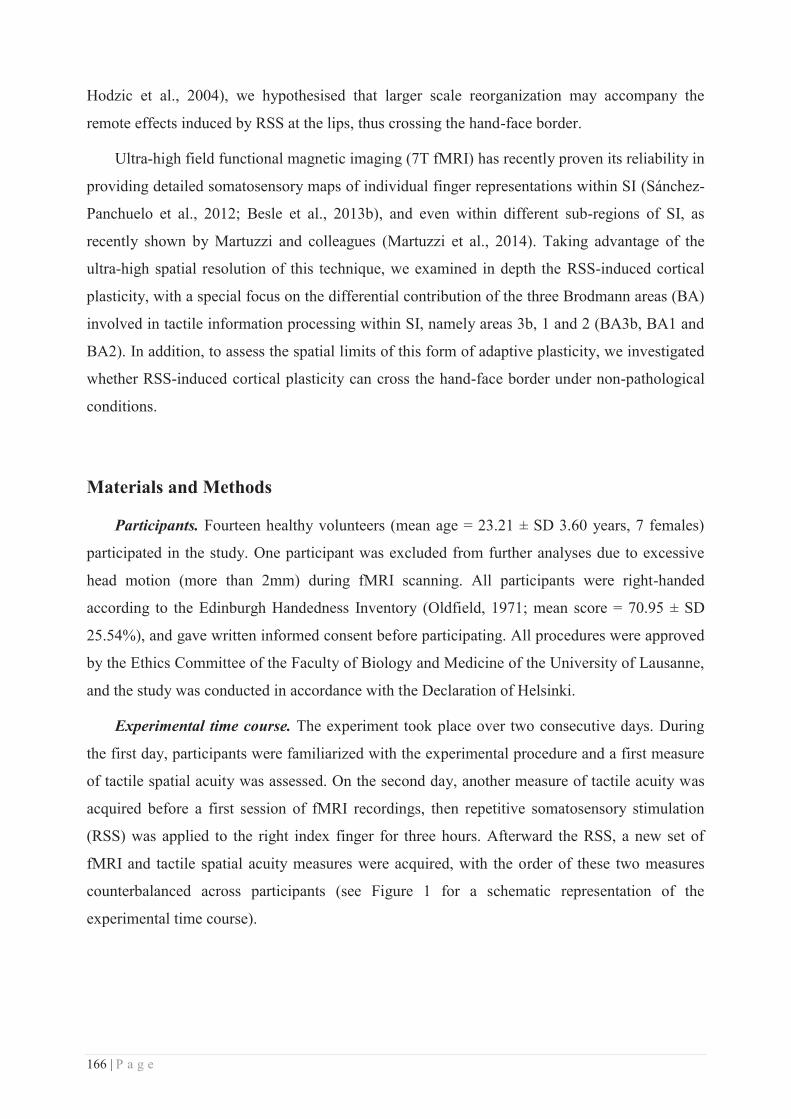
166 | P a g e
Hodzic et al., 2004), we hypothesised that larger scale reorganization may accompany the
remote effects induced by RSS at the lips, thus crossing the hand-face border.
Ultra-high field functional magnetic imaging (7T fMRI) has recently proven its reliability in
providing detailed somatosensory maps of individual finger representations within SI (Sánchez-
Panchuelo et al., 2012; Besle et al., 2013b), and even within different sub-regions of SI, as
recently shown by Martuzzi and colleagues (Martuzzi et al., 2014). Taking advantage of the
ultra-high spatial resolution of this technique, we examined in depth the RSS-induced cortical
plasticity, with a special focus on the differential contribution of the three Brodmann areas (BA)
involved in tactile information processing within SI, namely areas 3b, 1 and 2 (BA3b, BA1 and
BA2). In addition, to assess the spatial limits of this form of adaptive plasticity, we investigated
whether RSS-induced cortical plasticity can cross the hand-face border under non-pathological
conditions.
Materials and Methods
Participants. Fourteen healthy volunteers (mean age = 23.21 ± SD 3.60 years, 7 females)
participated in the study. One participant was excluded from further analyses due to excessive
head motion (more than 2mm) during fMRI scanning. All participants were right-handed
according to the Edinburgh Handedness Inventory (Oldfield, 1971; mean score = 70.95 ± SD
25.54%), and gave written informed consent before participating. All procedures were approved
by the Ethics Committee of the Faculty of Biology and Medicine of the University of Lausanne,
and the study was conducted in accordance with the Declaration of Helsinki.
Experimental time course. The experiment took place over two consecutive days. During
the first day, participants were familiarized with the experimental procedure and a first measure
of tactile spatial acuity was assessed. On the second day, another measure of tactile acuity was
acquired before a first session of fMRI recordings, then repetitive somatosensory stimulation
(RSS) was applied to the right index finger for three hours. Afterward the RSS, a new set of
fMRI and tactile spatial acuity measures were acquired, with the order of these two measures
counterbalanced across participants (see Figure 1 for a schematic representation of the
experimental time course).
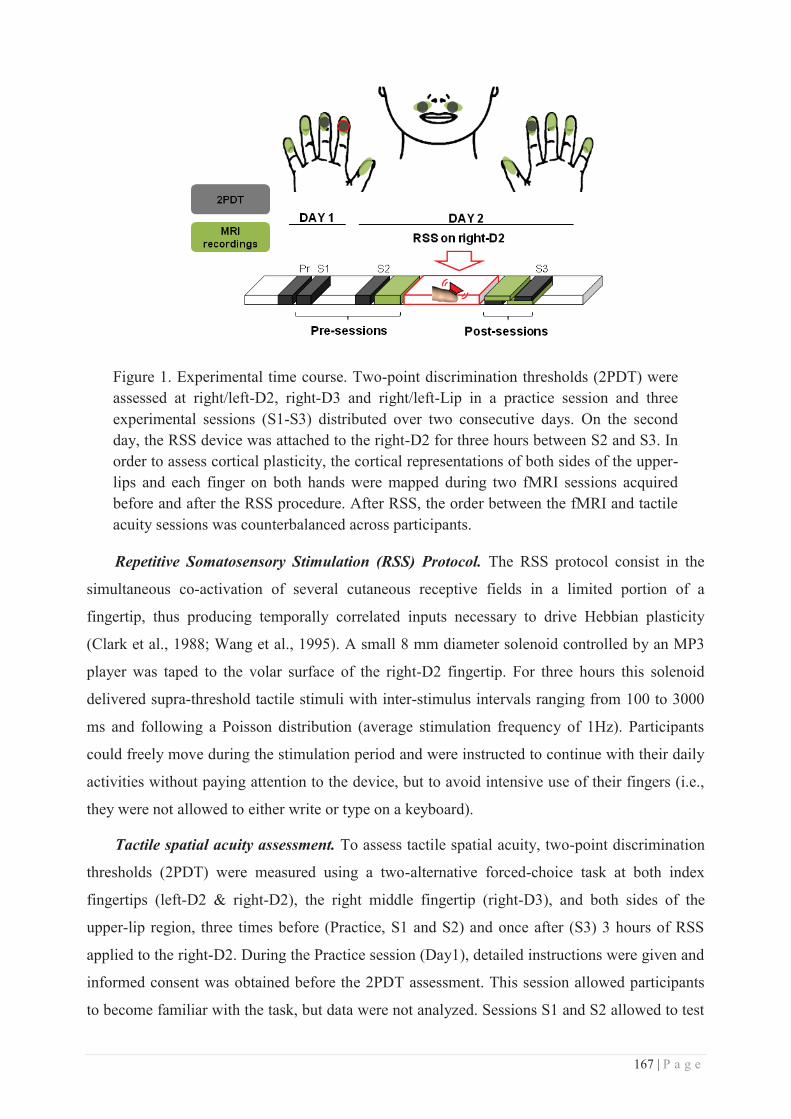
167 | P a g e
Figure 1. Experimental time course. Two-point discrimination thresholds (2PDT) were assessed at right/left-D2, right-D3 and right/left-Lip in a practice session and three experimental sessions (S1-S3) distributed over two consecutive days. On the second day, the RSS device was attached to the right-D2 for three hours between S2 and S3. In order to assess cortical plasticity, the cortical representations of both sides of the upper-lips and each finger on both hands were mapped during two fMRI sessions acquired before and after the RSS procedure. After RSS, the order between the fMRI and tactile acuity sessions was counterbalanced across participants.
Repetitive Somatosensory Stimulation (RSS) Protocol. The RSS protocol consist in the
simultaneous co-activation of several cutaneous receptive fields in a limited portion of a
fingertip, thus producing temporally correlated inputs necessary to drive Hebbian plasticity
(Clark et al., 1988; Wang et al., 1995). A small 8 mm diameter solenoid controlled by an MP3
player was taped to the volar surface of the right-D2 fingertip. For three hours this solenoid
delivered supra-threshold tactile stimuli with inter-stimulus intervals ranging from 100 to 3000
ms and following a Poisson distribution (average stimulation frequency of 1Hz). Participants
could freely move during the stimulation period and were instructed to continue with their daily
activities without paying attention to the device, but to avoid intensive use of their fingers (i.e.,
they were not allowed to either write or type on a keyboard).
Tactile spatial acuity assessment. To assess tactile spatial acuity, two-point discrimination
thresholds (2PDT) were measured using a two-alternative forced-choice task at both index
fingertips (left-D2 & right-D2), the right middle fingertip (right-D3), and both sides of the
upper-lip region, three times before (Practice, S1 and S2) and once after (S3) 3 hours of RSS
applied to the right-D2. During the Practice session (Day1), detailed instructions were given and
informed consent was obtained before the 2PDT assessment. This session allowed participants
to become familiar with the task, but data were not analyzed. Sessions S1 and S2 allowed to test
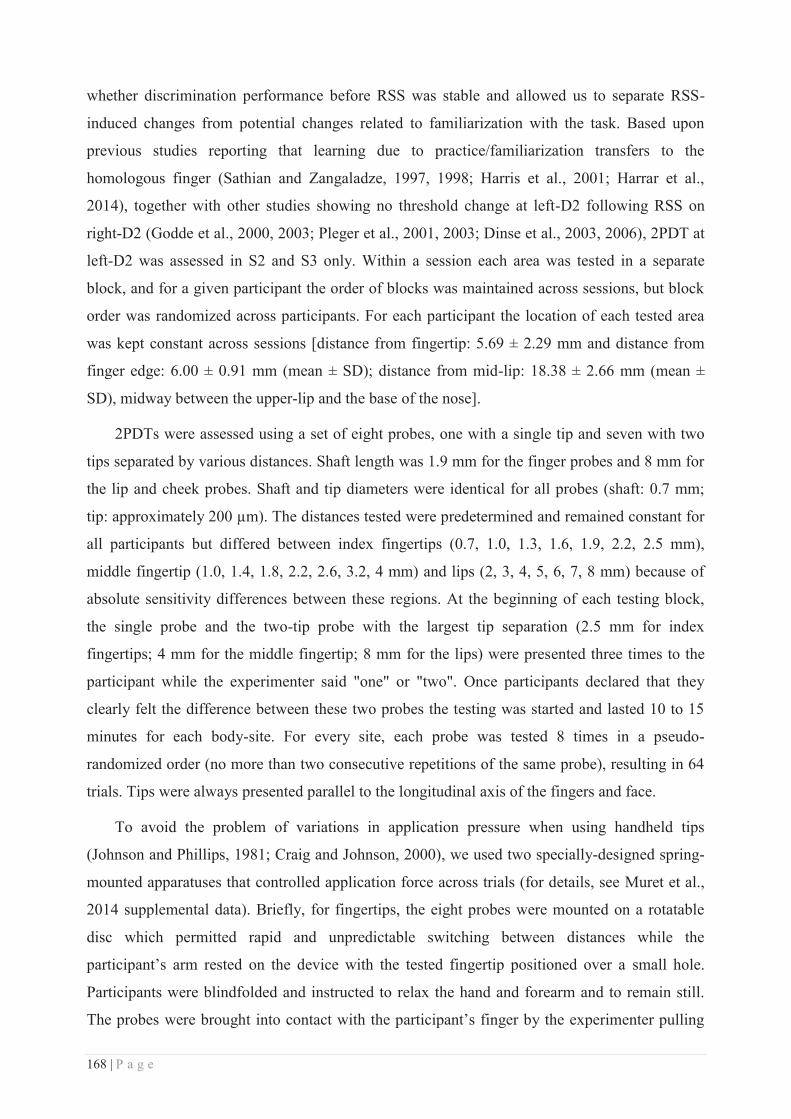
168 | P a g e
whether discrimination performance before RSS was stable and allowed us to separate RSS-
induced changes from potential changes related to familiarization with the task. Based upon
previous studies reporting that learning due to practice/familiarization transfers to the
homologous finger (Sathian and Zangaladze, 1997, 1998; Harris et al., 2001; Harrar et al.,
2014), together with other studies showing no threshold change at left-D2 following RSS on
right-D2 (Godde et al., 2000, 2003; Pleger et al., 2001, 2003; Dinse et al., 2003, 2006), 2PDT at
left-D2 was assessed in S2 and S3 only. Within a session each area was tested in a separate
block, and for a given participant the order of blocks was maintained across sessions, but block
order was randomized across participants. For each participant the location of each tested area
was kept constant across sessions [distance from fingertip: 5.69 ± 2.29 mm and distance from
finger edge: 6.00 ± 0.91 mm (mean ± SD); distance from mid-lip: 18.38 ± 2.66 mm (mean ±
SD), midway between the upper-lip and the base of the nose].
2PDTs were assessed using a set of eight probes, one with a single tip and seven with two
tips separated by various distances. Shaft length was 1.9 mm for the finger probes and 8 mm for
the lip and cheek probes. Shaft and tip diameters were identical for all probes (shaft: 0.7 mm;
tip: approximately 200 μm). The distances tested were predetermined and remained constant for
all participants but differed between index fingertips (0.7, 1.0, 1.3, 1.6, 1.9, 2.2, 2.5 mm),
middle fingertip (1.0, 1.4, 1.8, 2.2, 2.6, 3.2, 4 mm) and lips (2, 3, 4, 5, 6, 7, 8 mm) because of
absolute sensitivity differences between these regions. At the beginning of each testing block,
the single probe and the two-tip probe with the largest tip separation (2.5 mm for index
fingertips; 4 mm for the middle fingertip; 8 mm for the lips) were presented three times to the
participant while the experimenter said "one" or "two". Once participants declared that they
clearly felt the difference between these two probes the testing was started and lasted 10 to 15
minutes for each body-site. For every site, each probe was tested 8 times in a pseudo-
randomized order (no more than two consecutive repetitions of the same probe), resulting in 64
trials. Tips were always presented parallel to the longitudinal axis of the fingers and face.
To avoid the problem of variations in application pressure when using handheld tips
(Johnson and Phillips, 1981; Craig and Johnson, 2000), we used two specially-designed spring-
mounted apparatuses that controlled application force across trials (for details, see Muret et al.,
2014 supplemental data). Briefly, for fingertips, the eight probes were mounted on a rotatable
disc which permitted rapid and unpredictable switching between distances while the
participant’s arm rested on the device with the tested fingertip positioned over a small hole.
Participants were blindfolded and instructed to relax the hand and forearm and to remain still.
The probes were brought into contact with the participant’s finger by the experimenter pulling
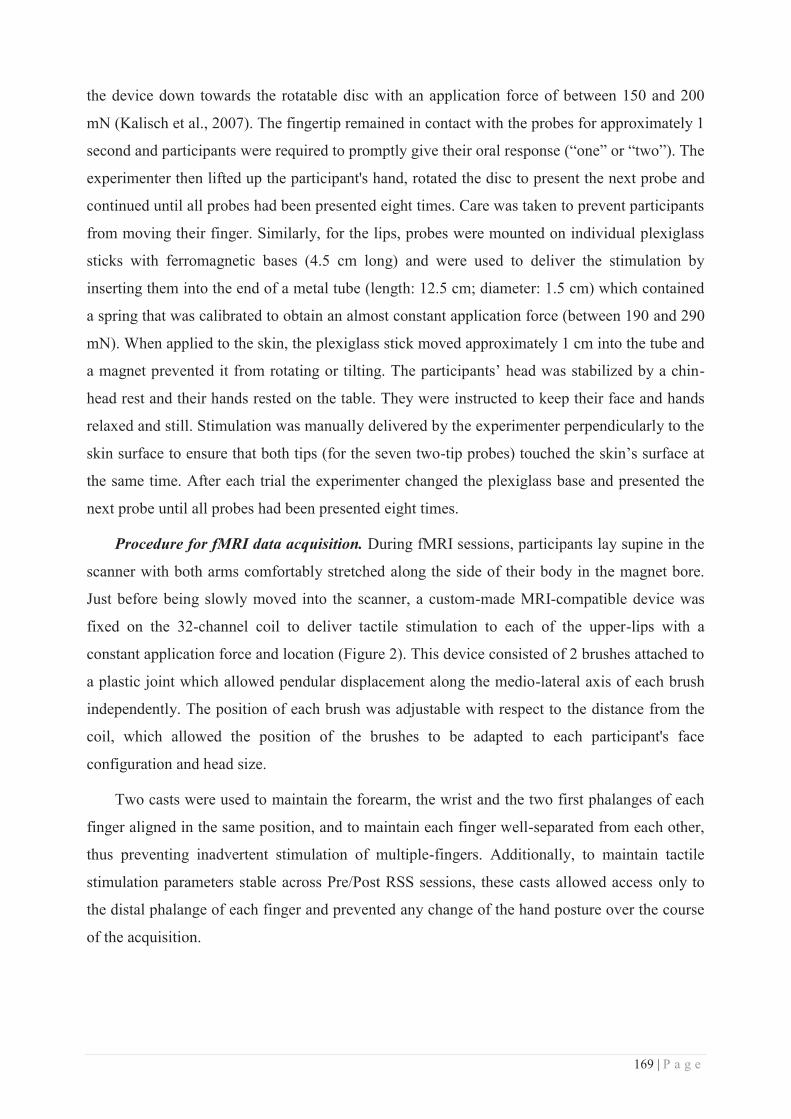
169 | P a g e
the device down towards the rotatable disc with an application force of between 150 and 200
mN (Kalisch et al., 2007). The fingertip remained in contact with the probes for approximately 1
second and participants were required to promptly give their oral response (“one” or “two”). The
experimenter then lifted up the participant's hand, rotated the disc to present the next probe and
continued until all probes had been presented eight times. Care was taken to prevent participants
from moving their finger. Similarly, for the lips, probes were mounted on individual plexiglass
sticks with ferromagnetic bases (4.5 cm long) and were used to deliver the stimulation by
inserting them into the end of a metal tube (length: 12.5 cm; diameter: 1.5 cm) which contained
a spring that was calibrated to obtain an almost constant application force (between 190 and 290
mN). When applied to the skin, the plexiglass stick moved approximately 1 cm into the tube and
a magnet prevented it from rotating or tilting. The participants’ head was stabilized by a chin-
head rest and their hands rested on the table. They were instructed to keep their face and hands
relaxed and still. Stimulation was manually delivered by the experimenter perpendicularly to the
skin surface to ensure that both tips (for the seven two-tip probes) touched the skin’s surface at
the same time. After each trial the experimenter changed the plexiglass base and presented the
next probe until all probes had been presented eight times.
Procedure for fMRI data acquisition. During fMRI sessions, participants lay supine in the
scanner with both arms comfortably stretched along the side of their body in the magnet bore.
Just before being slowly moved into the scanner, a custom-made MRI-compatible device was
fixed on the 32-channel coil to deliver tactile stimulation to each of the upper-lips with a
constant application force and location (Figure 2). This device consisted of 2 brushes attached to
a plastic joint which allowed pendular displacement along the medio-lateral axis of each brush
independently. The position of each brush was adjustable with respect to the distance from the
coil, which allowed the position of the brushes to be adapted to each participant's face
configuration and head size.
Two casts were used to maintain the forearm, the wrist and the two first phalanges of each
finger aligned in the same position, and to maintain each finger well-separated from each other,
thus preventing inadvertent stimulation of multiple-fingers. Additionally, to maintain tactile
stimulation parameters stable across Pre/Post RSS sessions, these casts allowed access only to
the distal phalange of each finger and prevented any change of the hand posture over the course
of the acquisition.
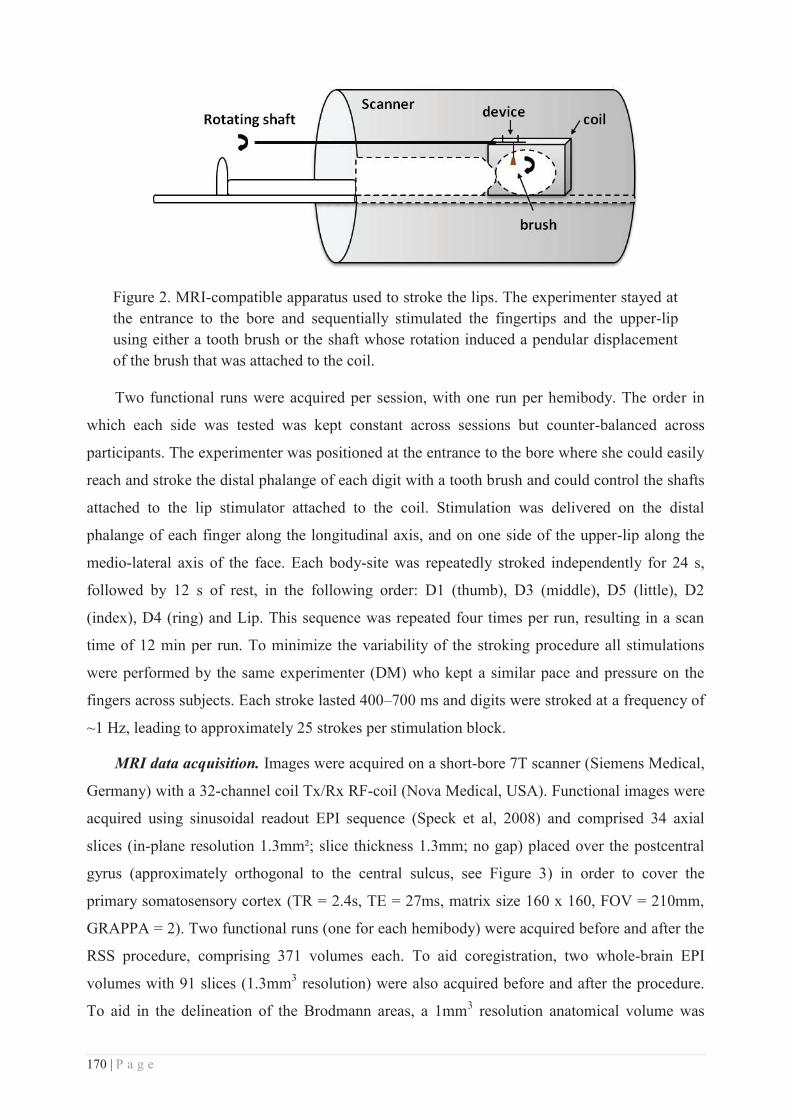
170 | P a g e
Figure 2. MRI-compatible apparatus used to stroke the lips. The experimenter stayed at the entrance to the bore and sequentially stimulated the fingertips and the upper-lip using either a tooth brush or the shaft whose rotation induced a pendular displacement of the brush that was attached to the coil.
Two functional runs were acquired per session, with one run per hemibody. The order in
which each side was tested was kept constant across sessions but counter-balanced across
participants. The experimenter was positioned at the entrance to the bore where she could easily
reach and stroke the distal phalange of each digit with a tooth brush and could control the shafts
attached to the lip stimulator attached to the coil. Stimulation was delivered on the distal
phalange of each finger along the longitudinal axis, and on one side of the upper-lip along the
medio-lateral axis of the face. Each body-site was repeatedly stroked independently for 24 s,
followed by 12 s of rest, in the following order: D1 (thumb), D3 (middle), D5 (little), D2
(index), D4 (ring) and Lip. This sequence was repeated four times per run, resulting in a scan
time of 12 min per run. To minimize the variability of the stroking procedure all stimulations
were performed by the same experimenter (DM) who kept a similar pace and pressure on the
fingers across subjects. Each stroke lasted 400–700 ms and digits were stroked at a frequency of
~1 Hz, leading to approximately 25 strokes per stimulation block.
MRI data acquisition. Images were acquired on a short-bore 7T scanner (Siemens Medical,
Germany) with a 32-channel coil Tx/Rx RF-coil (Nova Medical, USA). Functional images were
acquired using sinusoidal readout EPI sequence (Speck et al, 2008) and comprised 34 axial
slices (in-plane resolution 1.3mm²; slice thickness 1.3mm; no gap) placed over the postcentral
gyrus (approximately orthogonal to the central sulcus, see Figure 3) in order to cover the
primary somatosensory cortex (TR = 2.4s, TE = 27ms, matrix size 160 x 160, FOV = 210mm,
GRAPPA = 2). Two functional runs (one for each hemibody) were acquired before and after the
RSS procedure, comprising 371 volumes each. To aid coregistration, two whole-brain EPI
volumes with 91 slices (1.3mm3 resolution) were also acquired before and after the procedure.
To aid in the delineation of the Brodmann areas, a 1mm3 resolution anatomical volume was
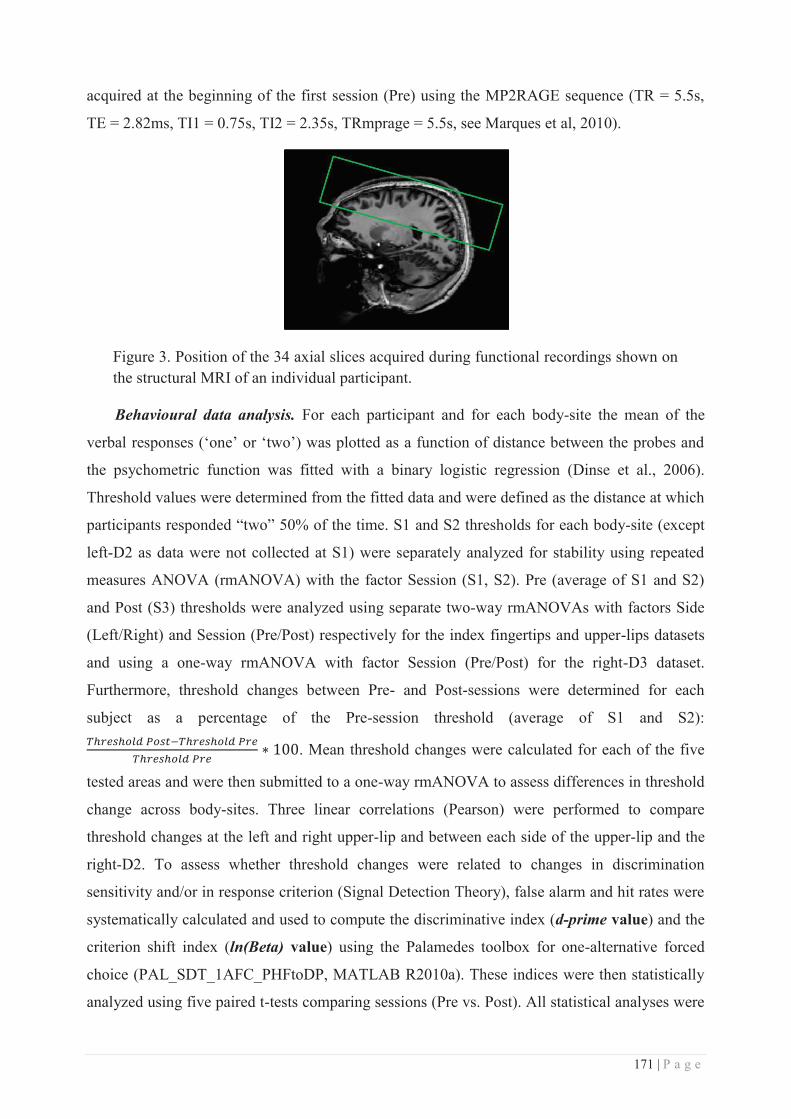
171 | P a g e
acquired at the beginning of the first session (Pre) using the MP2RAGE sequence (TR = 5.5s,
TE = 2.82ms, TI1 = 0.75s, TI2 = 2.35s, TRmprage = 5.5s, see Marques et al, 2010).
Figure 3. Position of the 34 axial slices acquired during functional recordings shown on the structural MRI of an individual participant.
Behavioural data analysis. For each participant and for each body-site the mean of the
verbal responses (‘one’ or ‘two’) was plotted as a function of distance between the probes and
the psychometric function was fitted with a binary logistic regression (Dinse et al., 2006).
Threshold values were determined from the fitted data and were defined as the distance at which
participants responded “two” 50% of the time. S1 and S2 thresholds for each body-site (except
left-D2 as data were not collected at S1) were separately analyzed for stability using repeated
measures ANOVA (rmANOVA) with the factor Session (S1, S2). Pre (average of S1 and S2)
and Post (S3) thresholds were analyzed using separate two-way rmANOVAs with factors Side
(Left/Right) and Session (Pre/Post) respectively for the index fingertips and upper-lips datasets
and using a one-way rmANOVA with factor Session (Pre/Post) for the right-D3 dataset.
Furthermore, threshold changes between Pre- and Post-sessions were determined for each
subject as a percentage of the Pre-session threshold (average of S1 and S2):
. Mean threshold changes were calculated for each of the five
tested areas and were then submitted to a one-way rmANOVA to assess differences in threshold
change across body-sites. Three linear correlations (Pearson) were performed to compare
threshold changes at the left and right upper-lip and between each side of the upper-lip and the
right-D2. To assess whether threshold changes were related to changes in discrimination
sensitivity and/or in response criterion (Signal Detection Theory), false alarm and hit rates were
systematically calculated and used to compute the discriminative index (d-prime value) and the
criterion shift index (ln(Beta) value) using the Palamedes toolbox for one-alternative forced
choice (PAL_SDT_1AFC_PHFtoDP, MATLAB R2010a). These indices were then statistically
analyzed using five paired t-tests comparing sessions (Pre vs. Post). All statistical analyses were
172 | P a g e
conducted using Statistica© (v.10, StatSoft). Data were checked for normality using
Kolmogorov-Smirnov tests. Post-hoc analyses were performed using Bonferroni tests
(mentioned in the text as pBonf). All group data are expressed as mean ± standard error of the
mean (SEM).
Imaging data analysis. Statistical analyses were conducted using SPM8© (v.5236,
Wellcome Trust Centre for Neuroimaging, London, UK). Functional volumes were temporally
realigned to the second slice acquired, spatially realigned to the average of both volumes using
6th degree B-spline interpolation, and the whole brain EPI was coregistered to this mean EPI
functional volume. The MP2RAGE volume was then coregistered to the whole brain EPI image
using rigid body transformations and 6th degree B-spline interpolation.
Functional analyses were conducted both in the MNI (Montreal Neurological Institute)
space for standard group analyses, and in the native space as proposed in Martuzzi et al. (2014),
in order to better take into account the inter-individual variability regarding both structural and
functional aspects of the data. In line with this, and with the idea of preserving the initial
resolution as much as possible, the realigned functional volumes were smoothed with a 4mm
(full-width half-maximum) isotropic Gaussian kernel (FWHM) for the MNI space analysis, but
with a 2mm FWHM isotropic Gaussian kernel for the native space analysis. In both cases
statistical analyses were then performed using the General Linear Model (GLM), which
included two regressors per region (the canonical hemodynamic response function: HRF and its
time derivative), the motion parameters as nuisance regressors, and also included a high-pass
filter set to 432s to filter low-frequency drifts. Using this model the response evoked by the
stimulation of each area was estimated independently from the others by means of t-contrasts
over the HRF regressors of each individual area. Both positive (activity > rest) and negative
(activity < rest) contrasts were computed. In addition, Post-Pre contrasts were computed to later
assess their possible co-variation with perceptual changes.
For the MNI space analysis contrasts from the Post-session were coregistered together with
the mean EPI functional volume of the Post-session, to the mean EPI functional volume of the
Pre-session, and resliced using 6th degree B-spline interpolation. The MP2RAGE volume was
then segmented and used to compute a template of the group normalized to the standard MNI
template using DARTEL algorithms. The resulting normalization parameters were then applied
to the previously computed t-contrasts with no additional smoothing (voxel size, 1mm3). These
normalized contrasts were inserted into a random-effect model to compute both one-sample
(activity > or < rest) and paired t-tests (Post > Pre or Post < Pre), the former contrasts being then
173 | P a g e
used to visually inspect data and to compute the centres of gravity (CoG) of the resulting
clusters, whereas the latter contrasts allowed evaluation of the RSS-induced changes. To assess
the relationship between individual RSS-induced changes in BOLD signal and perceptual
changes in discrimination thresholds, Pearson correlations were performed by entering the
individual (normalized) Post-Pre contrasts in a second level analysis, where 2PDT threshold
changes were inserted as covariates. Given our strong a priori predictions, the resulting
activation maps were examined within SI only using a composite of the BA3b, BA3a, BA2 and
BA1 maximum probabilistic maps available in the Anatomy Toolbox (Eickhoff et al., 2005,
2006b, 2007b) as region of interest (ROI), and thresholded at p < 0.001 uncorrected (due to the
use of ROI), with a minimum cluster size of 10 voxels.
For the native space analysis, the t-contrasts resulting from the GLM (smoothed at 2mm)
were used to compute positive and negative maps of each area (10 fingers and both lips) from
each session (Pre and Post), by selecting the voxels that survived a threshold of p < 0.05 (FDR
corrected). To assess whether the FDR-corrected thresholds used to compute the maps were
similar across areas and sessions, they were submitted to a three-way rmANOVA
(Session*Side*Area). The only significant difference observed was higher thresholds for D4
than for D1 and D2 (both pLSD values < 0.035), higher thresholds for D5 than for the other
fingers (all pLSD values < 0.05), and lower thresholds for the Lip than for the other areas (all pLSD
values < 0.002). No main effects or interactions between the factors Session or Side were
observed, suggesting that thresholds were comparable for both hemi-bodies before and after the
RSS procedure. This was further confirmed by separate two-way rmANOVAs (Session*Side)
applied on the FDR-corrected thresholds of each area, which revealed no main effect or
interaction with the factor Session. Each individual map (positive or negative) and contrast from
the Post-session was then coregistered together with the mean EPI functional volume of the
Post-session, to the mean EPI functional volume of the Pre-session, and resliced using nearest
neighbour and 6th degree B-spline interpolations respectively, the former one being used to
avoid any spillover effect due to interpolation. Anatomical masks were manually delineated for
each participant based on his/her own structural MRI, which was previously skull-stripped and
coregistered to the whole brain EPI before being both resliced to the mean EPI functional
volume using 6th degree B-spline interpolation. Delineation of BA3b, BA1 and BA2 was
performed using the guidelines provided by cytoarchitectonic studies (Geyer et al., 1999, 2000;
Grefkes et al., 2001), with BA3b being defined as the posterior bank of the central sulcus, BA1
as the crown of the postcentral gyrus, and BA2 as the posterior bank of the postcentral gyrus.
These masks, corresponding to our regions of interests (ROIs), were then applied on the
174 | P a g e
individual functional maps (positive or negative) to constrain the analyses to BA3b, BA1 and
BA2 anatomically defined at the individual level. Within each BA and body-site representation
the volume of activation was assessed by quantifying the number of voxels surviving the
threshold (pcorr < 0.05), and the volume of overlap between representations was also quantified.
To account for the fact that different levels of activation could arise between Pre and Post
sessions (e.g., from fatigue), but also between the two hemi-bodies (recorded in two separate
runs), we normalized activation volumes to the total volume of activation obtained for all body-
sites in a hemibody for each session, (i.e., sum of the volumes of activation obtained in both
hemispheres for the 6 areas of one side in a given session). This was done for each BA. The
CoG of each representation was also computed by weighting the coordinates of each voxel by its
beta value (i.e., BOLD signal intensity) and the Euclidean distance (ED) between CoGs of
different body-sites was calculated as following:
where x, y and z refer to the 3D Cartesian coordinates of the two body-sites a and b. Volumes
and ED differences across body-sites, BAs, and sessions were assessed using rmANOVAs
(detailed in the Results section), followed by LSD Fisher post-hoc tests (pLSD < 0.05).
Results
The thresholds obtained at right-D2, right-D3 and the lips in the pre-sessions S1 and S2
were analyzed to ascertain multiple baseline stability. No significant differences were found for
any of the body-sites (four rmANOVAs, all p values > 0.08). A two-way rmANOVA on two-
point discrimination thresholds of index fingertips, showed a significant interaction Side x
Session (F(1.12) = 13.35, p = 0.003). Bonferroni post-hoc tests revealed that thresholds at right-
D2 significantly decreased following the RSS procedure (pBonf = 0.014), whereas thresholds
obtained at left-D2 remained stable (pBonf > 0.90, Figure 4). The post-RSS threshold of right-D2
was also significantly smaller than that of its homologue post-RSS (pBonf = 0.028). A similar
analysis performed on thresholds of both sides of the upper-lips revealed a significant main
effect of Session (F(1.12) = 22.75, p < 0.0005), the thresholds from both upper-lips being
significantly smaller after RSS of right-D2 (Figure 4). Altogether, these results confirm our
previous findings (Muret et al., 2014) that three hours of RSS applied to the right-D2
significantly improves spatial discrimination not only locally, (i.e., at the stimulated fingertip),
but also remotely (i.e., at both sides of the upper-lip), without affecting the homologous index
fingertip (left-D2). In addition, the results from the present study further revealed that the
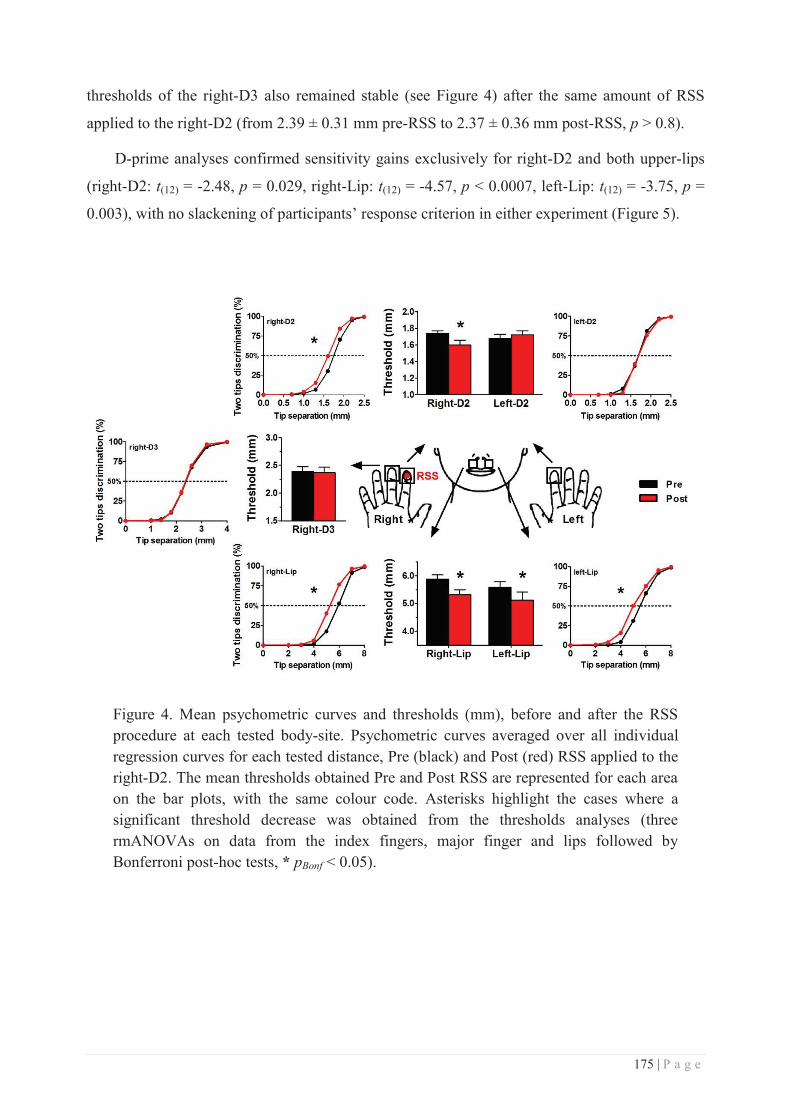
175 | P a g e
thresholds of the right-D3 also remained stable (see Figure 4) after the same amount of RSS
applied to the right-D2 (from 2.39 ± 0.31 mm pre-RSS to 2.37 ± 0.36 mm post-RSS, p > 0.8).
D-prime analyses confirmed sensitivity gains exclusively for right-D2 and both upper-lips
(right-D2: t(12) = -2.48, p = 0.029, right-Lip: t(12) = -4.57, p < 0.0007, left-Lip: t(12) = -3.75, p =
0.003), with no slackening of participants’ response criterion in either experiment (Figure 5).
Figure 4. Mean psychometric curves and thresholds (mm), before and after the RSS procedure at each tested body-site. Psychometric curves averaged over all individual regression curves for each tested distance, Pre (black) and Post (red) RSS applied to the right-D2. The mean thresholds obtained Pre and Post RSS are represented for each area on the bar plots, with the same colour code. Asterisks highlight the cases where a significant threshold decrease was obtained from the thresholds analyses (three rmANOVAs on data from the index fingers, major finger and lips followed by Bonferroni post-hoc tests, * pBonf < 0.05).
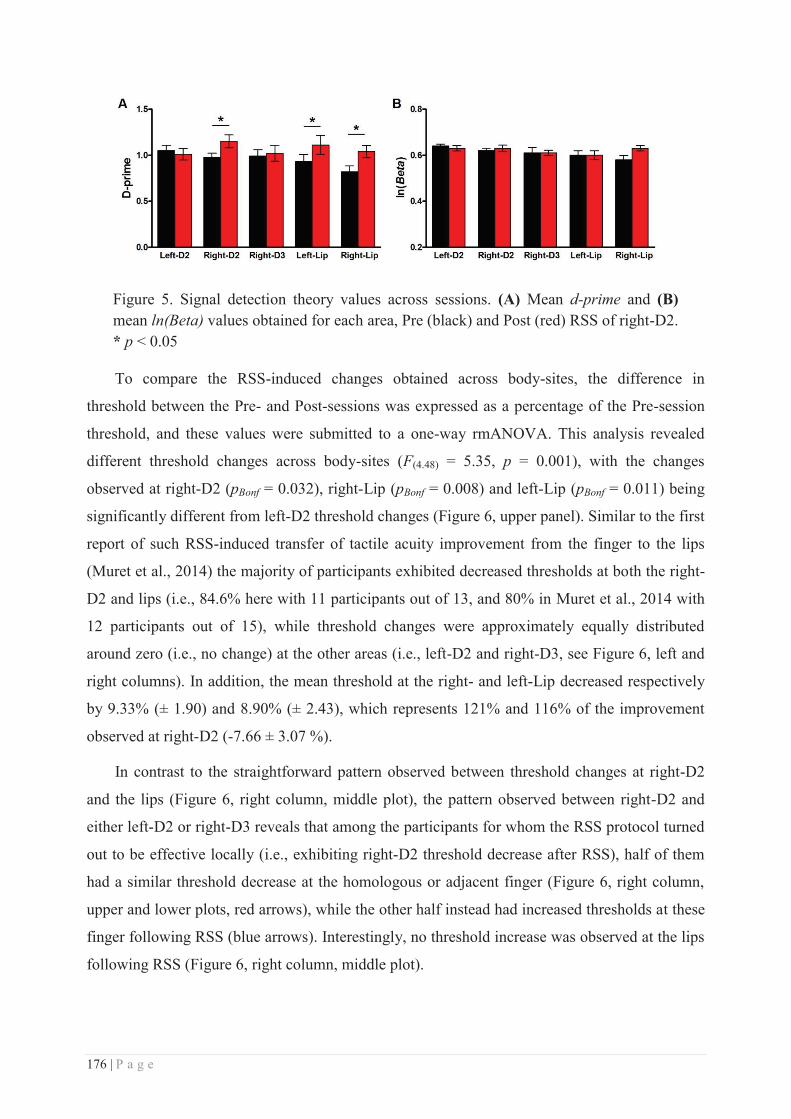
176 | P a g e
Figure 5. Signal detection theory values across sessions. (A) Mean d-prime and (B) mean ln(Beta) values obtained for each area, Pre (black) and Post (red) RSS of right-D2. * p < 0.05
To compare the RSS-induced changes obtained across body-sites, the difference in
threshold between the Pre- and Post-sessions was expressed as a percentage of the Pre-session
threshold, and these values were submitted to a one-way rmANOVA. This analysis revealed
different threshold changes across body-sites (F(4.48) = 5.35, p = 0.001), with the changes
observed at right-D2 (pBonf = 0.032), right-Lip (pBonf = 0.008) and left-Lip (pBonf = 0.011) being
significantly different from left-D2 threshold changes (Figure 6, upper panel). Similar to the first
report of such RSS-induced transfer of tactile acuity improvement from the finger to the lips
(Muret et al., 2014) the majority of participants exhibited decreased thresholds at both the right-
D2 and lips (i.e., 84.6% here with 11 participants out of 13, and 80% in Muret et al., 2014 with
12 participants out of 15), while threshold changes were approximately equally distributed
around zero (i.e., no change) at the other areas (i.e., left-D2 and right-D3, see Figure 6, left and
right columns). In addition, the mean threshold at the right- and left-Lip decreased respectively
by 9.33% (± 1.90) and 8.90% (± 2.43), which represents 121% and 116% of the improvement
observed at right-D2 (-7.66 ± 3.07 %).
In contrast to the straightforward pattern observed between threshold changes at right-D2
and the lips (Figure 6, right column, middle plot), the pattern observed between right-D2 and
either left-D2 or right-D3 reveals that among the participants for whom the RSS protocol turned
out to be effective locally (i.e., exhibiting right-D2 threshold decrease after RSS), half of them
had a similar threshold decrease at the homologous or adjacent finger (Figure 6, right column,
upper and lower plots, red arrows), while the other half instead had increased thresholds at these
finger following RSS (blue arrows). Interestingly, no threshold increase was observed at the lips
following RSS (Figure 6, right column, middle plot).
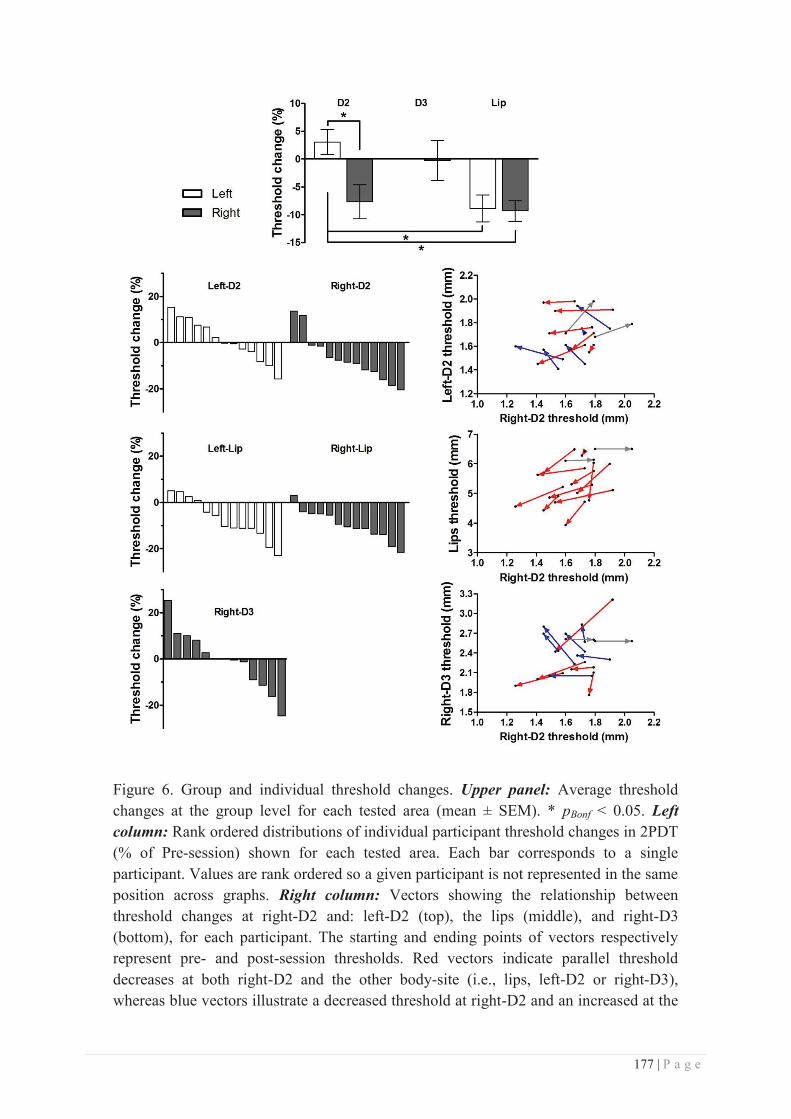
177 | P a g e
Figure 6. Group and individual threshold changes. Upper panel: Average threshold changes at the group level for each tested area (mean ± SEM). * pBonf < 0.05. Left column: Rank ordered distributions of individual participant threshold changes in 2PDT (% of Pre-session) shown for each tested area. Each bar corresponds to a single participant. Values are rank ordered so a given participant is not represented in the same position across graphs. Right column: Vectors showing the relationship between threshold changes at right-D2 and: left-D2 (top), the lips (middle), and right-D3 (bottom), for each participant. The starting and ending points of vectors respectively represent pre- and post-session thresholds. Red vectors indicate parallel threshold decreases at both right-D2 and the other body-site (i.e., lips, left-D2 or right-D3), whereas blue vectors illustrate a decreased threshold at right-D2 and an increased at the
178 | P a g e
other area. Grey vectors illustrate the two participants having an increased threshold at right-D2 after RSS.
Random-effect (RFX) analyses - Region of Interest (SI)
RFX analyses were first computed using one-sample t-tests to get a first qualitative
overview of the data at our group level. As expected, large positive BOLD responses (PBR,
activity > rest) were found in the postcentral gyrus, before and after RSS. These responses were
predominantly contralateral for the fingers, with the notable exception of the thumb, which also
exhibited a small but significant ipsilateral cluster. In contrast, touch evoked responses were
bilateral for the lips (see Figure S1 for whole-EPI and S2 for ROI maps). Similarly to Pleger and
colleagues (2003), an enlargement of the cluster size and an enhancement of the BOLD signal
amplitude were observed for right-D2 PBR following RSS (Figure 7; Pre: cluster-level = 1574
voxels (vox); T-score = 7.70; MNI template coordinates (mm): [-50 -20 52] [x y z]. Post: 5969
vox; T-score = 13.03; [-55 -21 45]). In addition, an ipsilateral cluster emerged at the Post-
session (see Figure 7, bottom right panel; 138 vox; T-score = 5.23; [53 -19 37]). In contrast, no
changes were observed for the homologous left-D2 PBR after RSS (Figure 8; Pre: 1403 vox; T-
score = 7.72; [51 -21 56]. Post: 1179 vox; T-score = 7.70; [51 -21 56]).
The CoG of each activation cluster was computed for each body-site and session. The
Euclidean Distance (ED) between Pre and Post CoGs was calculated and considered as a
measure of the CoG shift. In apparent contrast to Pleger et al. (2003), most of the body-sites
exhibited a shift of their CoG, ranging from 0.68 to 8.67mm (Table 1), but with no specific shift
of right-D2 CoG.
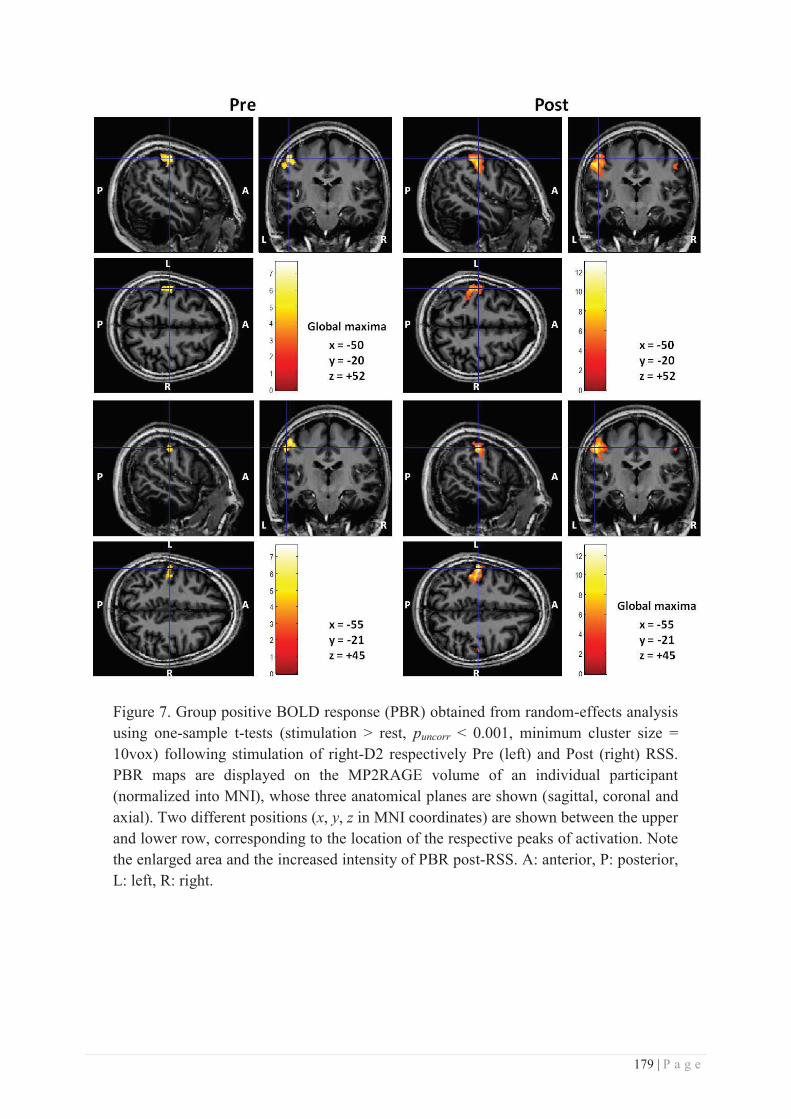
179 | P a g e
Figure 7. Group positive BOLD response (PBR) obtained from random-effects analysis using one-sample t-tests (stimulation > rest, puncorr < 0.001, minimum cluster size = 10vox) following stimulation of right-D2 respectively Pre (left) and Post (right) RSS. PBR maps are displayed on the MP2RAGE volume of an individual participant (normalized into MNI), whose three anatomical planes are shown (sagittal, coronal and axial). Two different positions (x, y, z in MNI coordinates) are shown between the upper and lower row, corresponding to the location of the respective peaks of activation. Note the enlarged area and the increased intensity of PBR post-RSS. A: anterior, P: posterior, L: left, R: right.
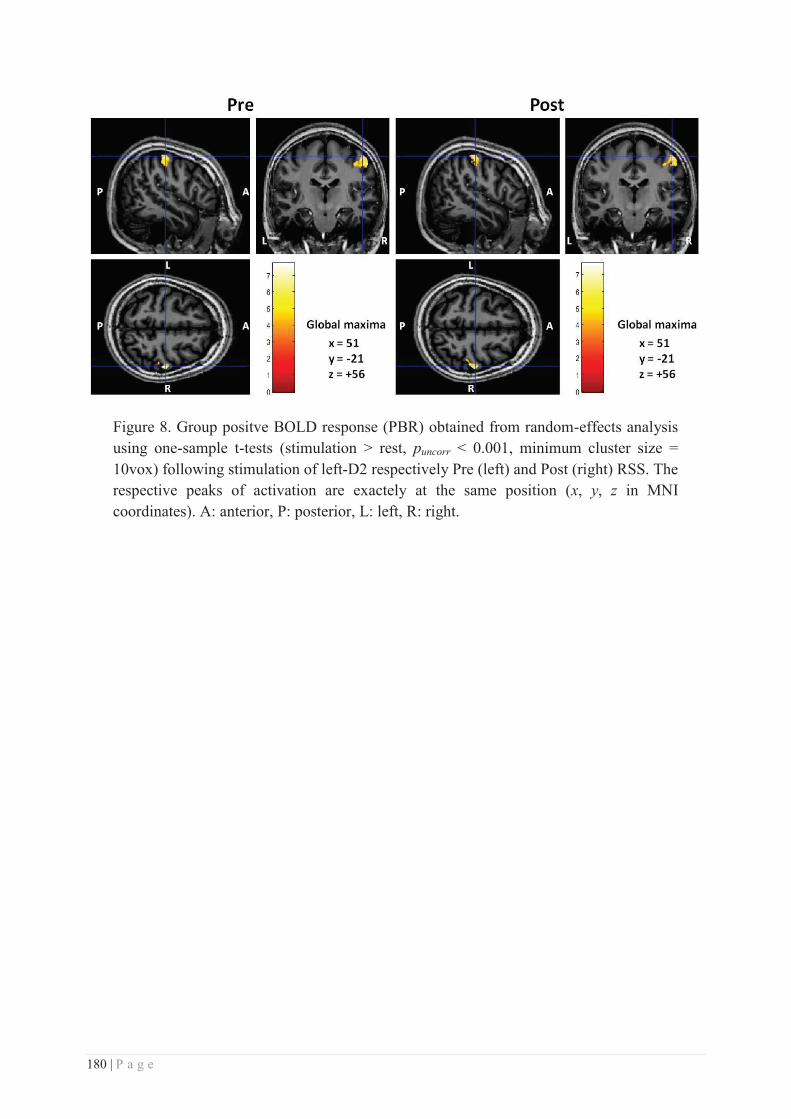
180 | P a g e
Figure 8. Group positve BOLD response (PBR) obtained from random-effects analysis using one-sample t-tests (stimulation > rest, puncorr < 0.001, minimum cluster size = 10vox) following stimulation of left-D2 respectively Pre (left) and Post (right) RSS. The respective peaks of activation are exactely at the same position (x, y, z in MNI coordinates). A: anterior, P: posterior, L: left, R: right.
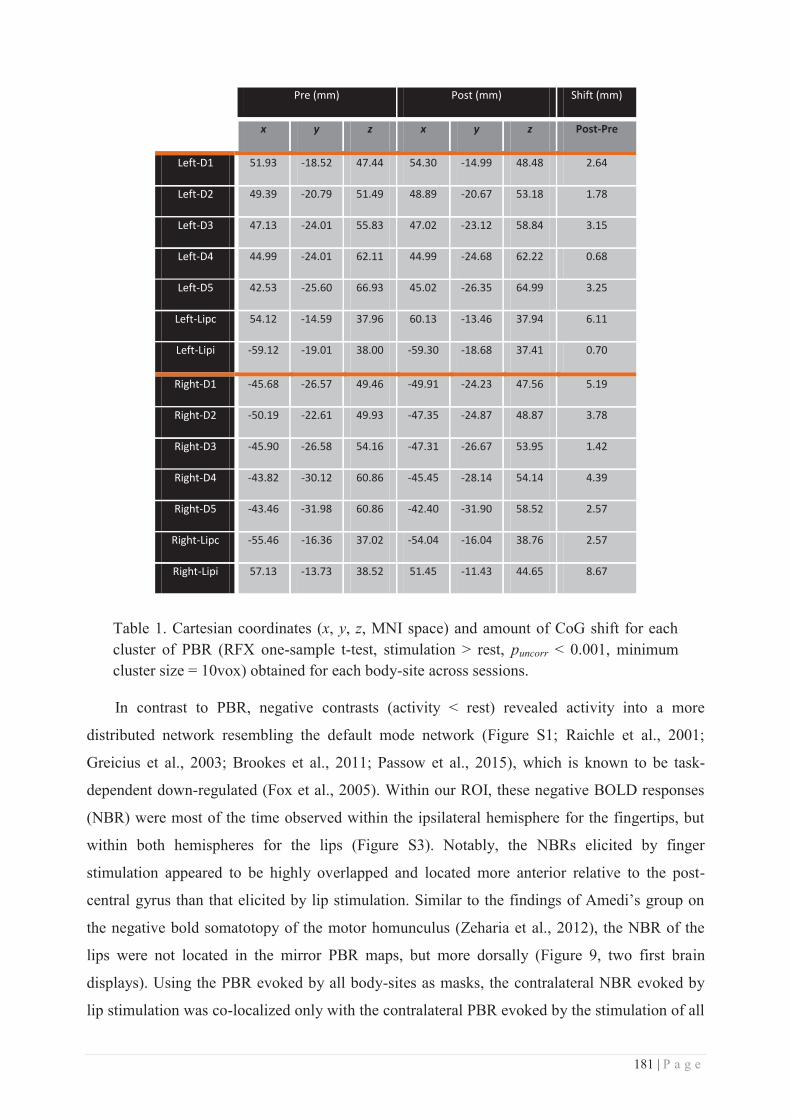
181 | P a g e
Pre (mm) Post (mm) Shift (mm)
x y z x y z Post-Pre
Left-D1 51.93 -18.52 47.44 54.30 -14.99 48.48 2.64
Left-D2 49.39 -20.79 51.49 48.89 -20.67 53.18 1.78
Left-D3 47.13 -24.01 55.83 47.02 -23.12 58.84 3.15
Left-D4 44.99 -24.01 62.11 44.99 -24.68 62.22 0.68
Left-D5 42.53 -25.60 66.93 45.02 -26.35 64.99 3.25
Left-Lipc 54.12 -14.59 37.96 60.13 -13.46 37.94 6.11
Left-Lipi -59.12 -19.01 38.00 -59.30 -18.68 37.41 0.70
Right-D1 -45.68 -26.57 49.46 -49.91 -24.23 47.56 5.19
Right-D2 -50.19 -22.61 49.93 -47.35 -24.87 48.87 3.78
Right-D3 -45.90 -26.58 54.16 -47.31 -26.67 53.95 1.42
Right-D4 -43.82 -30.12 60.86 -45.45 -28.14 54.14 4.39
Right-D5 -43.46 -31.98 60.86 -42.40 -31.90 58.52 2.57
Right-Lipc -55.46 -16.36 37.02 -54.04 -16.04 38.76 2.57
Right-Lipi 57.13 -13.73 38.52 51.45 -11.43 44.65 8.67
Table 1. Cartesian coordinates (x, y, z, MNI space) and amount of CoG shift for each cluster of PBR (RFX one-sample t-test, stimulation > rest, puncorr < 0.001, minimum cluster size = 10vox) obtained for each body-site across sessions.
In contrast to PBR, negative contrasts (activity < rest) revealed activity into a more
distributed network resembling the default mode network (Figure S1; Raichle et al., 2001;
Greicius et al., 2003; Brookes et al., 2011; Passow et al., 2015), which is known to be task-
dependent down-regulated (Fox et al., 2005). Within our ROI, these negative BOLD responses
(NBR) were most of the time observed within the ipsilateral hemisphere for the fingertips, but
within both hemispheres for the lips (Figure S3). Notably, the NBRs elicited by finger
stimulation appeared to be highly overlapped and located more anterior relative to the post-
central gyrus than that elicited by lip stimulation. Similar to the findings of Amedi’s group on
the negative bold somatotopy of the motor homunculus (Zeharia et al., 2012), the NBR of the
lips were not located in the mirror PBR maps, but more dorsally (Figure 9, two first brain
displays). Using the PBR evoked by all body-sites as masks, the contralateral NBR evoked by
lip stimulation was co-localized only with the contralateral PBR evoked by the stimulation of all
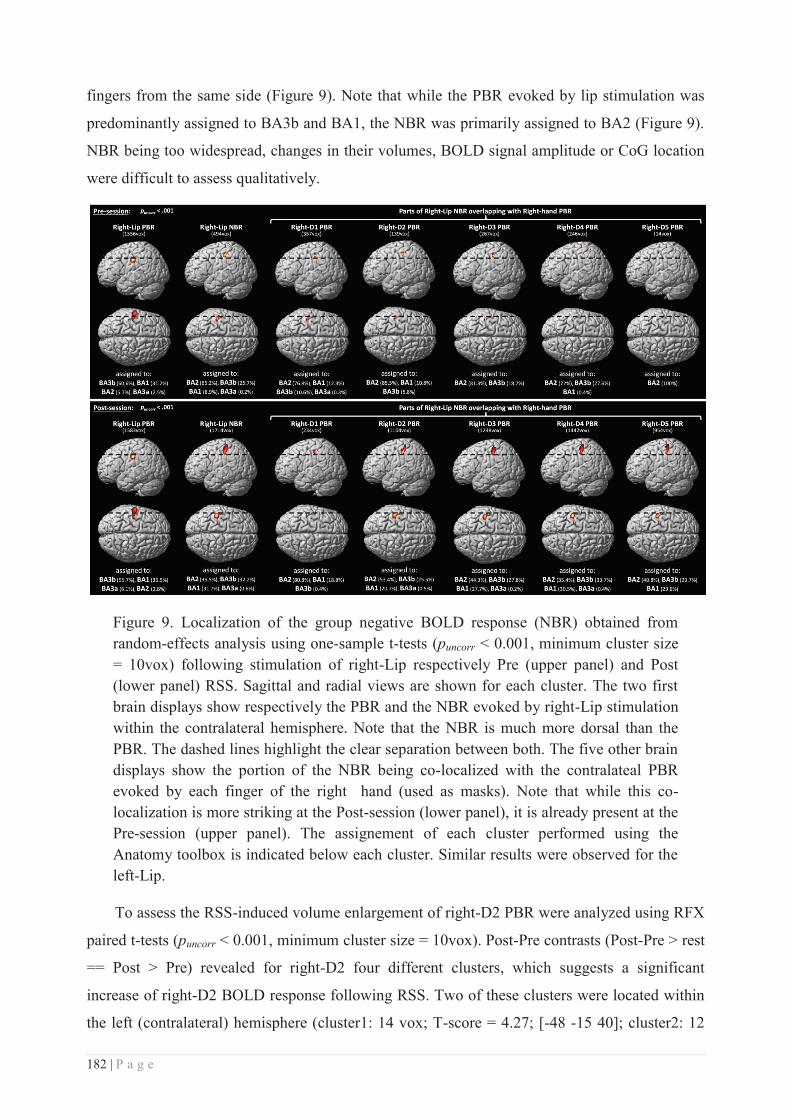
182 | P a g e
fingers from the same side (Figure 9). Note that while the PBR evoked by lip stimulation was
predominantly assigned to BA3b and BA1, the NBR was primarily assigned to BA2 (Figure 9).
NBR being too widespread, changes in their volumes, BOLD signal amplitude or CoG location
were difficult to assess qualitatively.
Figure 9. Localization of the group negative BOLD response (NBR) obtained from random-effects analysis using one-sample t-tests (puncorr < 0.001, minimum cluster size = 10vox) following stimulation of right-Lip respectively Pre (upper panel) and Post (lower panel) RSS. Sagittal and radial views are shown for each cluster. The two first brain displays show respectively the PBR and the NBR evoked by right-Lip stimulation within the contralateral hemisphere. Note that the NBR is much more dorsal than the PBR. The dashed lines highlight the clear separation between both. The five other brain displays show the portion of the NBR being co-localized with the contralateal PBR evoked by each finger of the right hand (used as masks). Note that while this co-localization is more striking at the Post-session (lower panel), it is already present at the Pre-session (upper panel). The assignement of each cluster performed using the Anatomy toolbox is indicated below each cluster. Similar results were observed for the left-Lip.
To assess the RSS-induced volume enlargement of right-D2 PBR were analyzed using RFX
paired t-tests (puncorr < 0.001, minimum cluster size = 10vox). Post-Pre contrasts (Post-Pre > rest
== Post > Pre) revealed for right-D2 four different clusters, which suggests a significant
increase of right-D2 BOLD response following RSS. Two of these clusters were located within
the left (contralateral) hemisphere (cluster1: 14 vox; T-score = 4.27; [-48 -15 40]; cluster2: 12
183 | P a g e
vox; T-score = 4.30; [-46 -17 35]), and the two others were within the right (ipsilateral)
hemisphere (cluster3: 17 vox; T-score = 4.60; [49 -16 44]; cluster4: 11 vox; T-score = 4.73; [41
-18 35]). With the use of cytoarchitectonic probabilistic maps, the contralateral clusters were
respectively assigned to BA3b with a probability of 100% for cluster1, and with a probability of
91.7% for cluster2, the remaining 8.3% assigning it to BA3a (Figure 10). Regarding the
ipsilateral clusters, they were respectively assigned with a 100% probability to BA3b (cluster3)
and to BA3a (cluster4) (Figure 10). Interestingly, using the group PBR maps resulting from the
one-sample t-tests (puncorr < 0.001) as masks, parts of the contralateral clusters were co-localized
with the right-D2 PBR within BA3b obtained at the Post-session (9 voxels from cluster1, and 3
voxels from cluster2), but other parts were additionally co-localized with the right-Lip PBR
within BA3b obtained at the Post-session (9 voxels from cluster1 and 11 voxels from cluster2).
In addition, parts of the ipsilateral cluster4 (7 voxels) were co-localized with the right-D1
ipsilateral NBR obtained within BA3a at the Post-session.
In contrast, no changes of BOLD activity were found for the homologous finger left-D2 or
for any other regions, except two ipsilateral clusters respectively for left and right-D5 (left-D5:
49 vox; T-score = 6.16; [-52 -36 52]. right-D5: 20 vox; T-score = 5.13; [50 -39 58]). While the
latter cluster was assigned at 100% to right BA1, the cluster obtained for left-D5 was assigned at
67.3% to left BA1 and at 32.7% to left BA2. The inverse paired t-test contrasts (Pre-Post > rest
== Post < Pre) were also computed. Among all the body-sites, only one significant cluster (14
vox; T-score = 4.94; [30 -42 72]) was found for right-D1 within the right hemisphere, thus
ipsilaterally to the stimulation. Using probabilistic maps, this cluster was assigned at 92.9% to
right BA1, and at 7.1% to right BA3b.
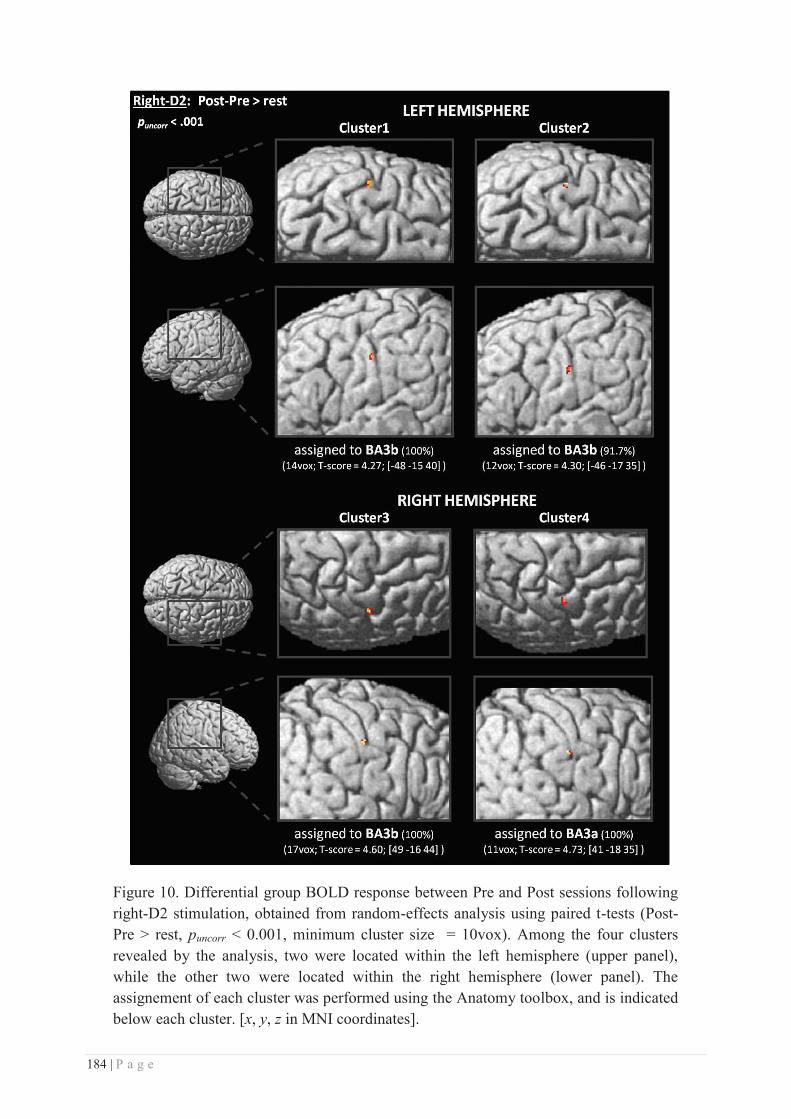
184 | P a g e
Figure 10. Differential group BOLD response between Pre and Post sessions following right-D2 stimulation, obtained from random-effects analysis using paired t-tests (Post-Pre > rest, puncorr < 0.001, minimum cluster size = 10vox). Among the four clusters revealed by the analysis, two were located within the left hemisphere (upper panel), while the other two were located within the right hemisphere (lower panel). The assignement of each cluster was performed using the Anatomy toolbox, and is indicated below each cluster. [x, y, z in MNI coordinates].
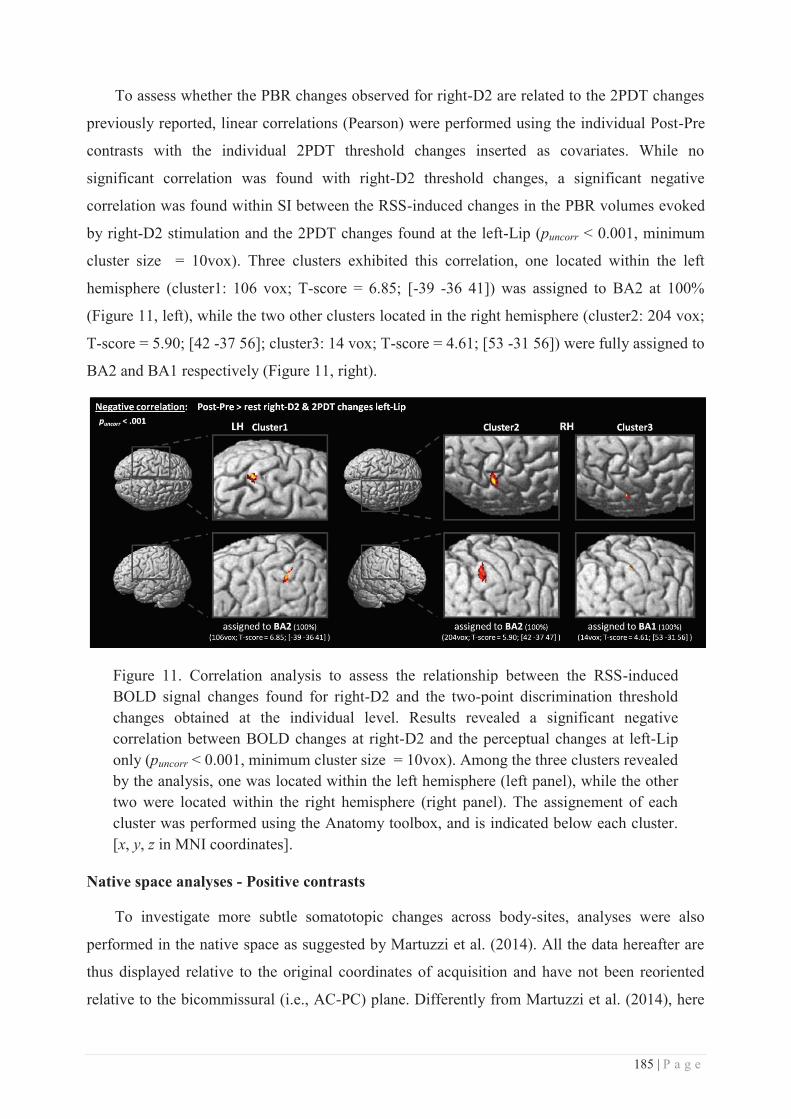
185 | P a g e
To assess whether the PBR changes observed for right-D2 are related to the 2PDT changes
previously reported, linear correlations (Pearson) were performed using the individual Post-Pre
contrasts with the individual 2PDT threshold changes inserted as covariates. While no
significant correlation was found with right-D2 threshold changes, a significant negative
correlation was found within SI between the RSS-induced changes in the PBR volumes evoked
by right-D2 stimulation and the 2PDT changes found at the left-Lip (puncorr < 0.001, minimum
cluster size = 10vox). Three clusters exhibited this correlation, one located within the left
hemisphere (cluster1: 106 vox; T-score = 6.85; [-39 -36 41]) was assigned to BA2 at 100%
(Figure 11, left), while the two other clusters located in the right hemisphere (cluster2: 204 vox;
T-score = 5.90; [42 -37 56]; cluster3: 14 vox; T-score = 4.61; [53 -31 56]) were fully assigned to
BA2 and BA1 respectively (Figure 11, right).
Figure 11. Correlation analysis to assess the relationship between the RSS-induced BOLD signal changes found for right-D2 and the two-point discrimination threshold changes obtained at the individual level. Results revealed a significant negative correlation between BOLD changes at right-D2 and the perceptual changes at left-Lip only (puncorr < 0.001, minimum cluster size = 10vox). Among the three clusters revealed by the analysis, one was located within the left hemisphere (left panel), while the other two were located within the right hemisphere (right panel). The assignement of each cluster was performed using the Anatomy toolbox, and is indicated below each cluster. [x, y, z in MNI coordinates].
Native space analyses - Positive contrasts
To investigate more subtle somatotopic changes across body-sites, analyses were also
performed in the native space as suggested by Martuzzi et al. (2014). All the data hereafter are
thus displayed relative to the original coordinates of acquisition and have not been reoriented
relative to the bicommissural (i.e., AC-PC) plane. Differently from Martuzzi et al. (2014), here
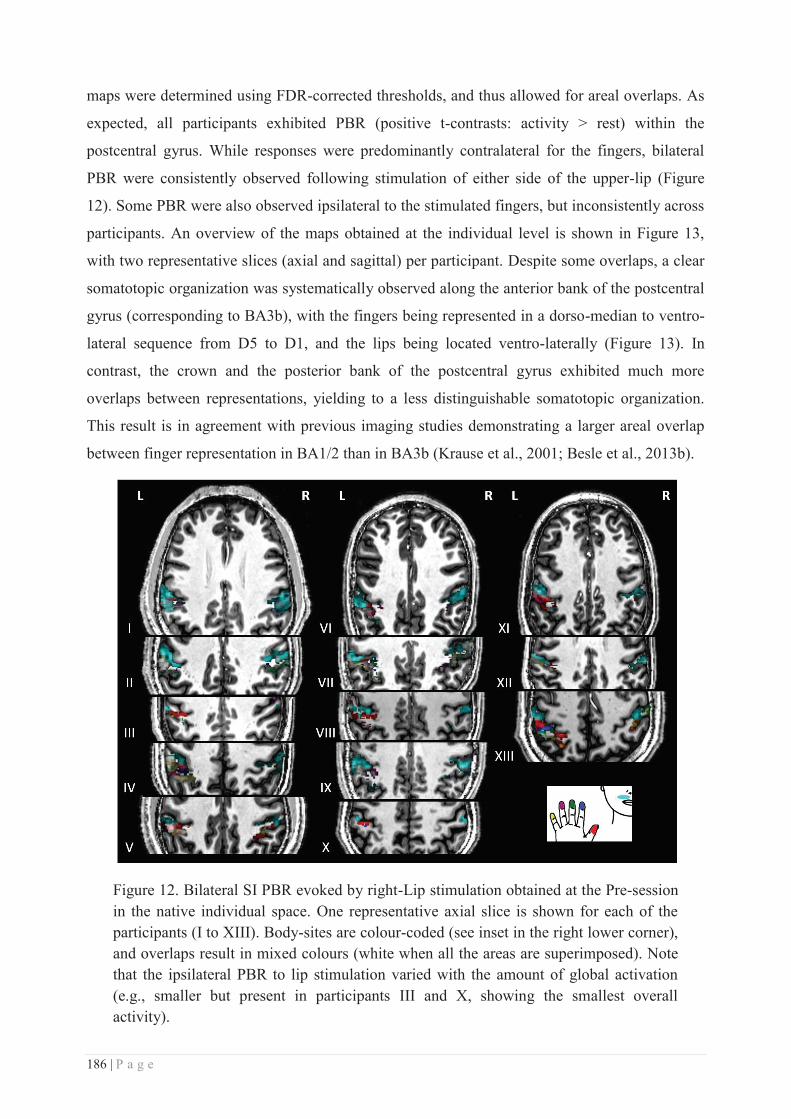
186 | P a g e
maps were determined using FDR-corrected thresholds, and thus allowed for areal overlaps. As
expected, all participants exhibited PBR (positive t-contrasts: activity > rest) within the
postcentral gyrus. While responses were predominantly contralateral for the fingers, bilateral
PBR were consistently observed following stimulation of either side of the upper-lip (Figure
12). Some PBR were also observed ipsilateral to the stimulated fingers, but inconsistently across
participants. An overview of the maps obtained at the individual level is shown in Figure 13,
with two representative slices (axial and sagittal) per participant. Despite some overlaps, a clear
somatotopic organization was systematically observed along the anterior bank of the postcentral
gyrus (corresponding to BA3b), with the fingers being represented in a dorso-median to ventro-
lateral sequence from D5 to D1, and the lips being located ventro-laterally (Figure 13). In
contrast, the crown and the posterior bank of the postcentral gyrus exhibited much more
overlaps between representations, yielding to a less distinguishable somatotopic organization.
This result is in agreement with previous imaging studies demonstrating a larger areal overlap
between finger representation in BA1/2 than in BA3b (Krause et al., 2001; Besle et al., 2013b).
Figure 12. Bilateral SI PBR evoked by right-Lip stimulation obtained at the Pre-session in the native individual space. One representative axial slice is shown for each of the participants (I to XIII). Body-sites are colour-coded (see inset in the right lower corner), and overlaps result in mixed colours (white when all the areas are superimposed). Note that the ipsilateral PBR to lip stimulation varied with the amount of global activation (e.g., smaller but present in participants III and X, showing the smallest overall activity).
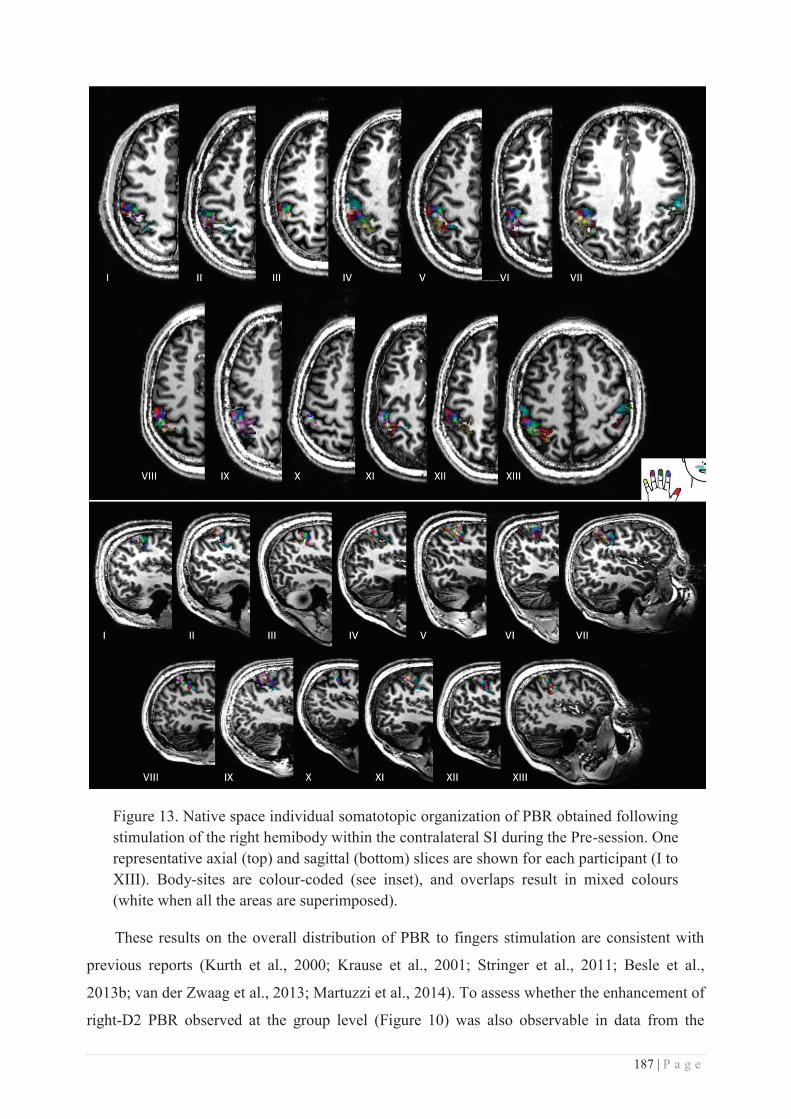
187 | P a g e
Figure 13. Native space individual somatotopic organization of PBR obtained following stimulation of the right hemibody within the contralateral SI during the Pre-session. One representative axial (top) and sagittal (bottom) slices are shown for each participant (I to XIII). Body-sites are colour-coded (see inset), and overlaps result in mixed colours (white when all the areas are superimposed).
These results on the overall distribution of PBR to fingers stimulation are consistent with
previous reports (Kurth et al., 2000; Krause et al., 2001; Stringer et al., 2011; Besle et al.,
2013b; van der Zwaag et al., 2013; Martuzzi et al., 2014). To assess whether the enhancement of
right-D2 PBR observed at the group level (Figure 10) was also observable in data from the
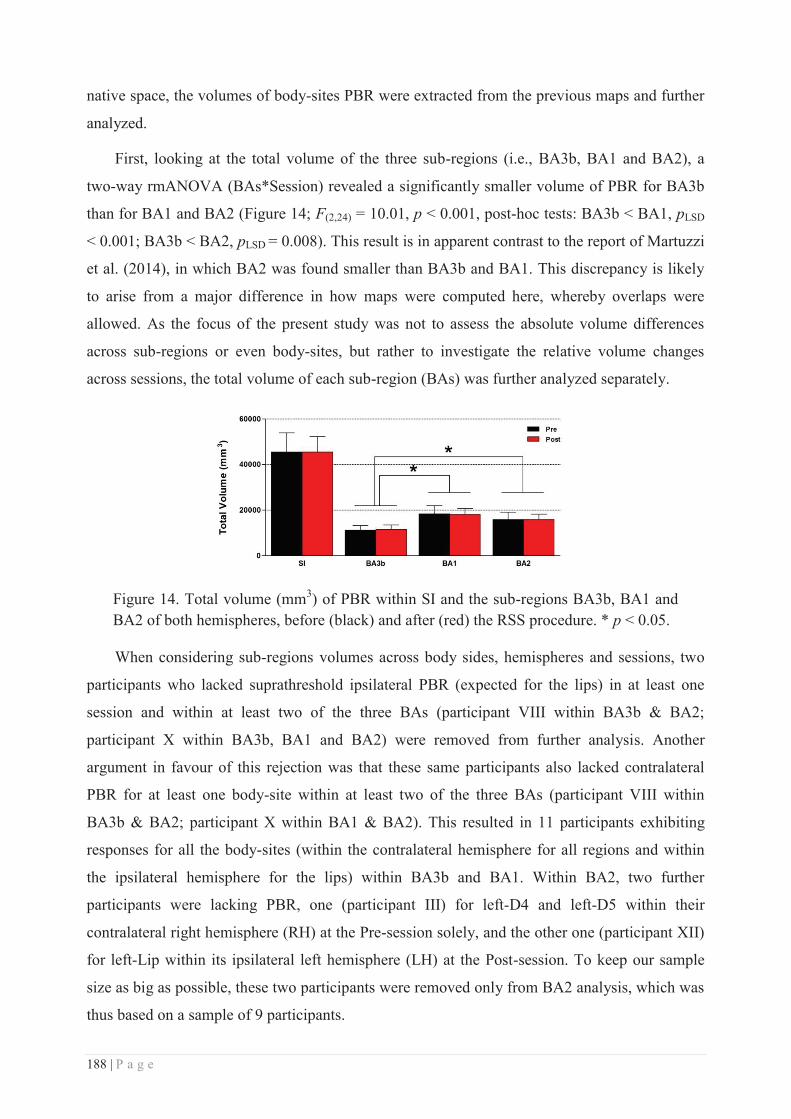
188 | P a g e
native space, the volumes of body-sites PBR were extracted from the previous maps and further
analyzed.
First, looking at the total volume of the three sub-regions (i.e., BA3b, BA1 and BA2), a
two-way rmANOVA (BAs*Session) revealed a significantly smaller volume of PBR for BA3b
than for BA1 and BA2 (Figure 14; F(2,24) = 10.01, p < 0.001, post-hoc tests: BA3b < BA1, pLSD
< 0.001; BA3b < BA2, pLSD = 0.008). This result is in apparent contrast to the report of Martuzzi
et al. (2014), in which BA2 was found smaller than BA3b and BA1. This discrepancy is likely
to arise from a major difference in how maps were computed here, whereby overlaps were
allowed. As the focus of the present study was not to assess the absolute volume differences
across sub-regions or even body-sites, but rather to investigate the relative volume changes
across sessions, the total volume of each sub-region (BAs) was further analyzed separately.
Figure 14. Total volume (mm3) of PBR within SI and the sub-regions BA3b, BA1 and BA2 of both hemispheres, before (black) and after (red) the RSS procedure. * p < 0.05.
When considering sub-regions volumes across body sides, hemispheres and sessions, two
participants who lacked suprathreshold ipsilateral PBR (expected for the lips) in at least one
session and within at least two of the three BAs (participant VIII within BA3b & BA2;
participant X within BA3b, BA1 and BA2) were removed from further analysis. Another
argument in favour of this rejection was that these same participants also lacked contralateral
PBR for at least one body-site within at least two of the three BAs (participant VIII within
BA3b & BA2; participant X within BA1 & BA2). This resulted in 11 participants exhibiting
responses for all the body-sites (within the contralateral hemisphere for all regions and within
the ipsilateral hemisphere for the lips) within BA3b and BA1. Within BA2, two further
participants were lacking PBR, one (participant III) for left-D4 and left-D5 within their
contralateral right hemisphere (RH) at the Pre-session solely, and the other one (participant XII)
for left-Lip within its ipsilateral left hemisphere (LH) at the Post-session. To keep our sample
size as big as possible, these two participants were removed only from BA2 analysis, which was
thus based on a sample of 9 participants.
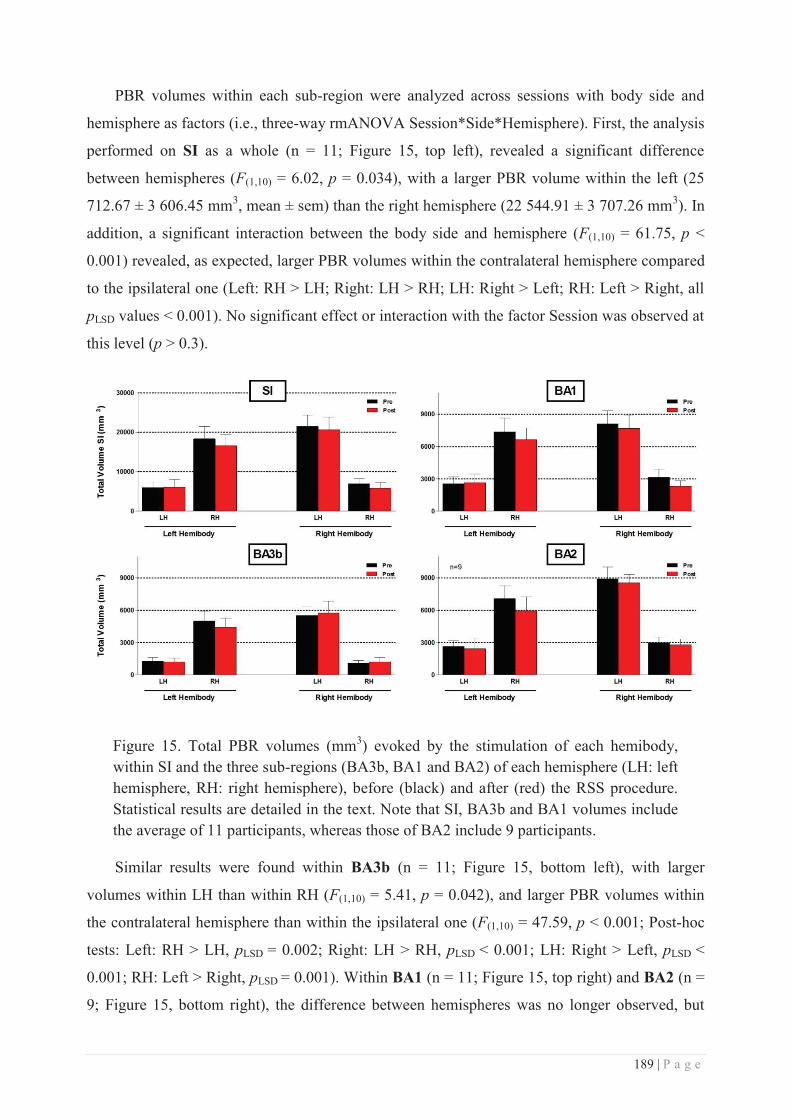
189 | P a g e
PBR volumes within each sub-region were analyzed across sessions with body side and
hemisphere as factors (i.e., three-way rmANOVA Session*Side*Hemisphere). First, the analysis
performed on SI as a whole (n = 11; Figure 15, top left), revealed a significant difference
between hemispheres (F(1,10) = 6.02, p = 0.034), with a larger PBR volume within the left (25
712.67 ± 3 606.45 mm3, mean ± sem) than the right hemisphere (22 544.91 ± 3 707.26 mm3). In
addition, a significant interaction between the body side and hemisphere (F(1,10) = 61.75, p <
0.001) revealed, as expected, larger PBR volumes within the contralateral hemisphere compared
to the ipsilateral one (Left: RH > LH; Right: LH > RH; LH: Right > Left; RH: Left > Right, all
pLSD values < 0.001). No significant effect or interaction with the factor Session was observed at
this level (p > 0.3).
Figure 15. Total PBR volumes (mm3) evoked by the stimulation of each hemibody, within SI and the three sub-regions (BA3b, BA1 and BA2) of each hemisphere (LH: left hemisphere, RH: right hemisphere), before (black) and after (red) the RSS procedure. Statistical results are detailed in the text. Note that SI, BA3b and BA1 volumes include the average of 11 participants, whereas those of BA2 include 9 participants.
Similar results were found within BA3b (n = 11; Figure 15, bottom left), with larger
volumes within LH than within RH (F(1,10) = 5.41, p = 0.042), and larger PBR volumes within
the contralateral hemisphere than within the ipsilateral one (F(1,10) = 47.59, p < 0.001; Post-hoc
tests: Left: RH > LH, pLSD = 0.002; Right: LH > RH, pLSD < 0.001; LH: Right > Left, pLSD <
0.001; RH: Left > Right, pLSD = 0.001). Within BA1 (n = 11; Figure 15, top right) and BA2 (n =
9; Figure 15, bottom right), the difference between hemispheres was no longer observed, but
190 | P a g e
larger volumes were still observed within the contralateral hemisphere compared to the
ipsilateral one (BA1: F(1,10) = 54.21, p < 0.001; Post-hoc tests: all pLSD values < 0.001 - BA2:
F(1,8) = 72.92, p < 0.001; Post-hoc tests: all pLSD values < 0.001). In addition, BA2 volumes
contralateral to the right hemibody (i.e., within LH) were significantly larger than that
contralateral to the left hemibody (i.e., within RH) (pLSD = 0.026). Altogether, these results
suggest a similar pattern between hemispheres and body sides for the three BAs, with larger
PBR volumes within the hemisphere contralateral to the stimulation than the ipsilateral one
being consistent across BAs.
As for SI, no significant changes were observed across sessions, suggesting no effect of
RSS over the global PBR volumes within either sub-region. More importantly, this finding
allows excluding any variation in response volumes potentially due to fatigue or other unspecific
factors between sessions. Because the two hemi-bodies were stimulated by the same
experimenter in two different runs with either her right or left hand, we refrain from interpreting
the larger volumes observed in the left hemisphere as compared to the right one. Instead, we
expressed the volumes obtained for each body-site as a percentage of the total volume obtained
for a given sub-region (BAs) after stimulating this hemibody, within the two hemispheres.
These volumes used to normalize body-site volumes (i.e., sum of the volumes of activation
within both hemispheres obtained for either hemibody) were statistically stable and similar
across sessions and hemibody sides (one two-way rmANOVAs Session*Side per BA).
From the resulting (normalized) volumes, those corresponding to the contralateral PBR for
the fingers and to the bilateral responses for the lips were selected (i.e., the only regions for
which all the 11 participants exhibited PBR). Separate analyses of the three BAs (three-way
rmANOVA Session*Hemisphere*Area) revealed volume differences between body-sites,
regardless of the hemisphere, or session (BA3b: F(6,60) = 7.936, p < 0.001; BA1: F(6,60) = 17.15,
p < 0.001; BA2: F(6,48) = 5.321, p < 0.001).
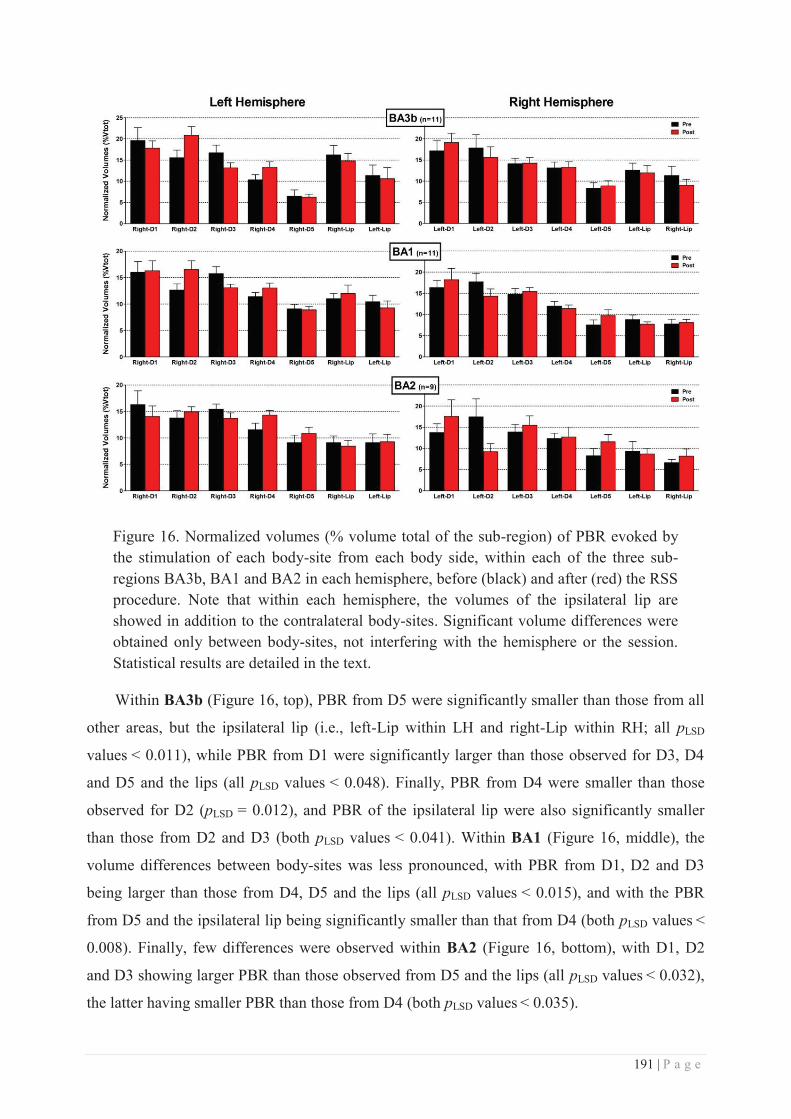
191 | P a g e
Figure 16. Normalized volumes (% volume total of the sub-region) of PBR evoked by the stimulation of each body-site from each body side, within each of the three sub-regions BA3b, BA1 and BA2 in each hemisphere, before (black) and after (red) the RSS procedure. Note that within each hemisphere, the volumes of the ipsilateral lip are showed in addition to the contralateral body-sites. Significant volume differences were obtained only between body-sites, not interfering with the hemisphere or the session. Statistical results are detailed in the text.
Within BA3b (Figure 16, top), PBR from D5 were significantly smaller than those from all
other areas, but the ipsilateral lip (i.e., left-Lip within LH and right-Lip within RH; all pLSD
values < 0.011), while PBR from D1 were significantly larger than those observed for D3, D4
and D5 and the lips (all pLSD values < 0.048). Finally, PBR from D4 were smaller than those
observed for D2 (pLSD = 0.012), and PBR of the ipsilateral lip were also significantly smaller
than those from D2 and D3 (both pLSD values < 0.041). Within BA1 (Figure 16, middle), the
volume differences between body-sites was less pronounced, with PBR from D1, D2 and D3
being larger than those from D4, D5 and the lips (all pLSD values < 0.015), and with the PBR
from D5 and the ipsilateral lip being significantly smaller than that from D4 (both pLSD values <
0.008). Finally, few differences were observed within BA2 (Figure 16, bottom), with D1, D2
and D3 showing larger PBR than those observed from D5 and the lips (all pLSD values < 0.032),
the latter having smaller PBR than those from D4 (both pLSD values < 0.035).
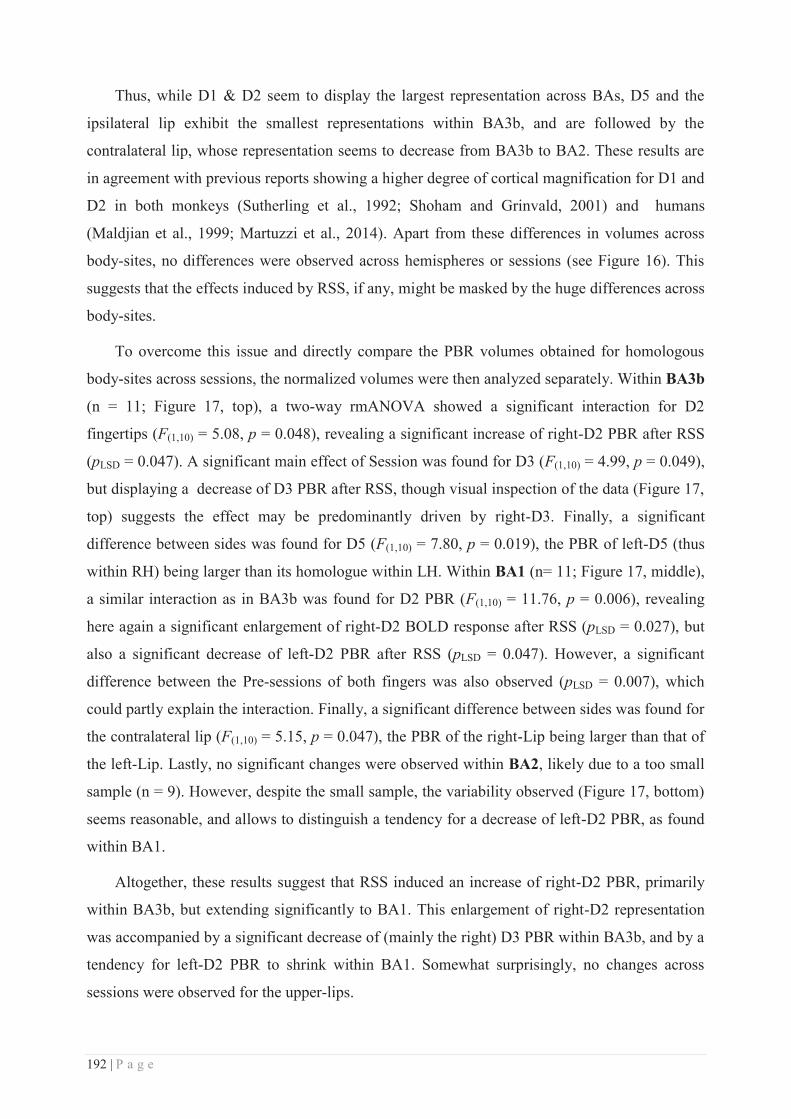
192 | P a g e
Thus, while D1 & D2 seem to display the largest representation across BAs, D5 and the
ipsilateral lip exhibit the smallest representations within BA3b, and are followed by the
contralateral lip, whose representation seems to decrease from BA3b to BA2. These results are
in agreement with previous reports showing a higher degree of cortical magnification for D1 and
D2 in both monkeys (Sutherling et al., 1992; Shoham and Grinvald, 2001) and humans
(Maldjian et al., 1999; Martuzzi et al., 2014). Apart from these differences in volumes across
body-sites, no differences were observed across hemispheres or sessions (see Figure 16). This
suggests that the effects induced by RSS, if any, might be masked by the huge differences across
body-sites.
To overcome this issue and directly compare the PBR volumes obtained for homologous
body-sites across sessions, the normalized volumes were then analyzed separately. Within BA3b
(n = 11; Figure 17, top), a two-way rmANOVA showed a significant interaction for D2
fingertips (F(1,10) = 5.08, p = 0.048), revealing a significant increase of right-D2 PBR after RSS
(pLSD = 0.047). A significant main effect of Session was found for D3 (F(1,10) = 4.99, p = 0.049),
but displaying a decrease of D3 PBR after RSS, though visual inspection of the data (Figure 17,
top) suggests the effect may be predominantly driven by right-D3. Finally, a significant
difference between sides was found for D5 (F(1,10) = 7.80, p = 0.019), the PBR of left-D5 (thus
within RH) being larger than its homologue within LH. Within BA1 (n= 11; Figure 17, middle),
a similar interaction as in BA3b was found for D2 PBR (F(1,10) = 11.76, p = 0.006), revealing
here again a significant enlargement of right-D2 BOLD response after RSS (pLSD = 0.027), but
also a significant decrease of left-D2 PBR after RSS (pLSD = 0.047). However, a significant
difference between the Pre-sessions of both fingers was also observed (pLSD = 0.007), which
could partly explain the interaction. Finally, a significant difference between sides was found for
the contralateral lip (F(1,10) = 5.15, p = 0.047), the PBR of the right-Lip being larger than that of
the left-Lip. Lastly, no significant changes were observed within BA2, likely due to a too small
sample (n = 9). However, despite the small sample, the variability observed (Figure 17, bottom)
seems reasonable, and allows to distinguish a tendency for a decrease of left-D2 PBR, as found
within BA1.
Altogether, these results suggest that RSS induced an increase of right-D2 PBR, primarily
within BA3b, but extending significantly to BA1. This enlargement of right-D2 representation
was accompanied by a significant decrease of (mainly the right) D3 PBR within BA3b, and by a
tendency for left-D2 PBR to shrink within BA1. Somewhat surprisingly, no changes across
sessions were observed for the upper-lips.
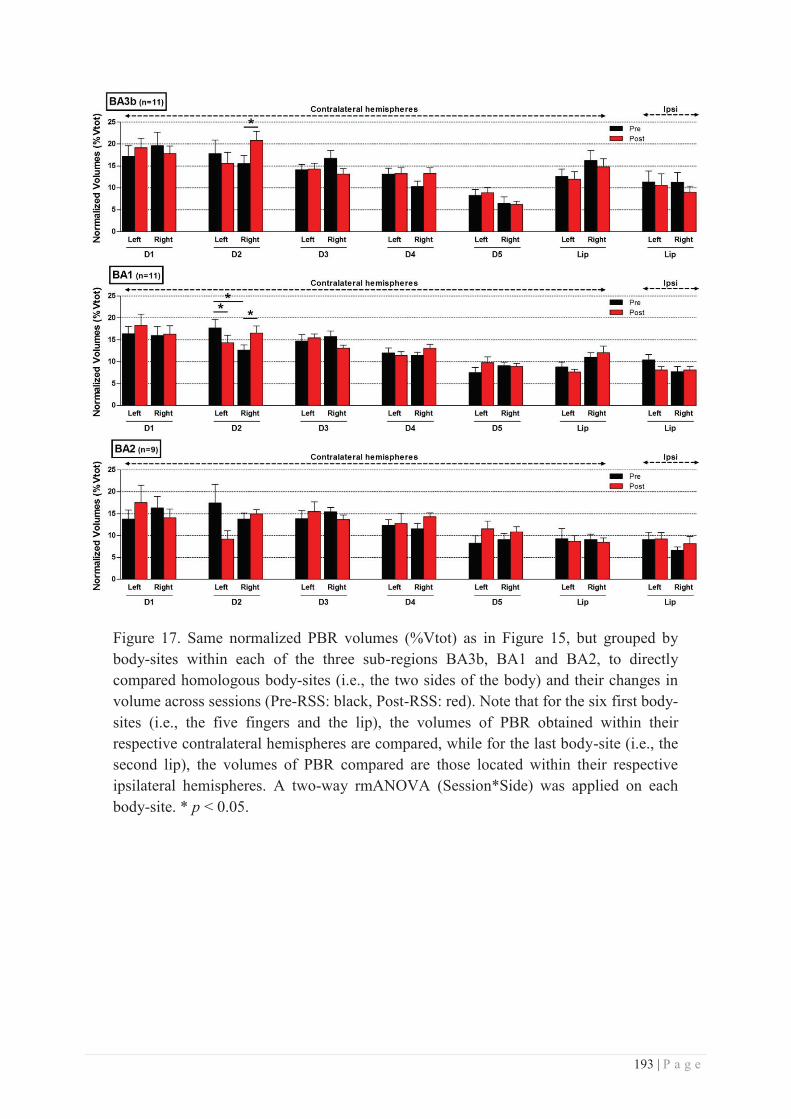
193 | P a g e
Figure 17. Same normalized PBR volumes (%Vtot) as in Figure 15, but grouped by body-sites within each of the three sub-regions BA3b, BA1 and BA2, to directly compared homologous body-sites (i.e., the two sides of the body) and their changes in volume across sessions (Pre-RSS: black, Post-RSS: red). Note that for the six first body-sites (i.e., the five fingers and the lip), the volumes of PBR obtained within their respective contralateral hemispheres are compared, while for the last body-site (i.e., the second lip), the volumes of PBR compared are those located within their respective ipsilateral hemispheres. A two-way rmANOVA (Session*Side) was applied on each body-site. * p < 0.05.
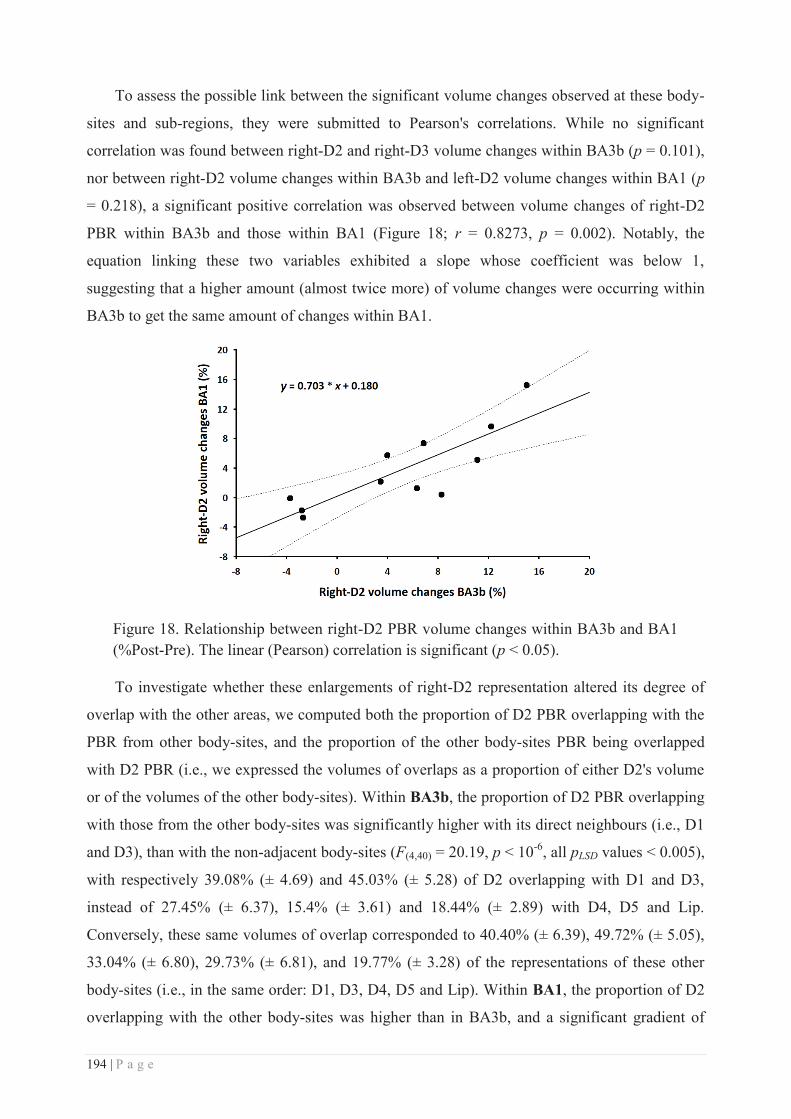
194 | P a g e
To assess the possible link between the significant volume changes observed at these body-
sites and sub-regions, they were submitted to Pearson's correlations. While no significant
correlation was found between right-D2 and right-D3 volume changes within BA3b (p = 0.101),
nor between right-D2 volume changes within BA3b and left-D2 volume changes within BA1 (p
= 0.218), a significant positive correlation was observed between volume changes of right-D2
PBR within BA3b and those within BA1 (Figure 18; r = 0.8273, p = 0.002). Notably, the
equation linking these two variables exhibited a slope whose coefficient was below 1,
suggesting that a higher amount (almost twice more) of volume changes were occurring within
BA3b to get the same amount of changes within BA1.
Figure 18. Relationship between right-D2 PBR volume changes within BA3b and BA1 (%Post-Pre). The linear (Pearson) correlation is significant (p < 0.05).
To investigate whether these enlargements of right-D2 representation altered its degree of
overlap with the other areas, we computed both the proportion of D2 PBR overlapping with the
PBR from other body-sites, and the proportion of the other body-sites PBR being overlapped
with D2 PBR (i.e., we expressed the volumes of overlaps as a proportion of either D2's volume
or of the volumes of the other body-sites). Within BA3b, the proportion of D2 PBR overlapping
with those from the other body-sites was significantly higher with its direct neighbours (i.e., D1
and D3), than with the non-adjacent body-sites (F(4,40) = 20.19, p < 10-6, all pLSD values < 0.005),
with respectively 39.08% (± 4.69) and 45.03% (± 5.28) of D2 overlapping with D1 and D3,
instead of 27.45% (± 6.37), 15.4% (± 3.61) and 18.44% (± 2.89) with D4, D5 and Lip.
Conversely, these same volumes of overlap corresponded to 40.40% (± 6.39), 49.72% (± 5.05),
33.04% (± 6.80), 29.73% (± 6.81), and 19.77% (± 3.28) of the representations of these other
body-sites (i.e., in the same order: D1, D3, D4, D5 and Lip). Within BA1, the proportion of D2
overlapping with the other body-sites was higher than in BA3b, and a significant gradient of
195 | P a g e
overlap was observed from D3, to D1, D4, D5 and Lip (F(4,40) = 58.45, p < 10-6, all pLSD values <
0.005), with respectively 67.71% (± 4.55), 57.70% (± 5.31), 48.23% (± 6.37), 37.04% (± 5.97)
and 21.24% (± 3.31) of overlap. Conversely, these same volumes of overlap corresponded to
67.36% (± 4.89), 59.96% (± 6.55), 58.13% (± 6.47), 56.42% (± 7.26), and 34.97% (± 5.97) of
the representations of these other body-sites (i.e., in the same order: D3, D1, D4, D5 and Lip).
These values reveal a gradient of overlap consistent with the literature for the adjacent fingers
(see Kurth et al., 2000). For the with non-adjacent body-sites, the proportion of relative overlaps
were slightly higher, but these values were calculated in a slightly different way. However, no
significant changes in the proportion of overlap were observed across sessions.
Despite the fact that similar behavioural results were found when analyzing data from the
11 participants used for BA3b and BA1 analyses, (i.e., significant threshold decreases for right-
D2 (F(1.10) = 13.70, p = 0.004, post-hoc: pBonf = 0.049) and both sides of the upper-lips (F(1.10) =
21.78, p < 0.001), whereas thresholds remained stable at left-D2 and right-D3 (both p values >
0.4)), no significant correlation between behavioural and PBR volume changes was found for
any of the affected body-sites, likely due to our too small sample size.
Native space analyses - Negative contrasts
All participants also showed NBR (activity < rest) within the postcentral gyrus.
Interestingly, these ‘negative maps’ were observed within both hemispheres. However, although
larger volumes were observed within the ipsilateral hemispheres (see Figure 22), contralateral
NBR were more consistent across individuals, making their statistical analysis possible. First, to
compare qualitatively the distribution of these negative maps with that of the positive maps
analyzed previously (see Figure 12 and Figure 13), we observed these maps at the same brain
slices. When considering the brain regions were the upper-lip PBR were found bilaterally
(Figure 12, cyan), few NBR were observed at the individual level (Figure 19, cyan). In contrast,
when considering the regions where hand PBR were observed (Figure 13, cyan), 11 out of the
13 participants exhibited large NBR evoked by upper-lip stimulation (Figure 20, cyan), and
these responses were predominantly contralateral. Concerning the fingertips, some NBR were
observable at this level, sometimes more ipsilaterally, sometimes more contralaterally
depending on participants (Figure 20). Larger NBR evoked by finger stimulation were found
slightly more dorsally. These observations suggest that NBR were located globally higher in the
brain than PBR, and notably, the NBR evoked by lip stimulation were observed at the same
brain levels as the fingers PBR. Note that the ipsilateral activity evoked by stimulating the
different body-sites was generally much more overlapping than the one evoked within the
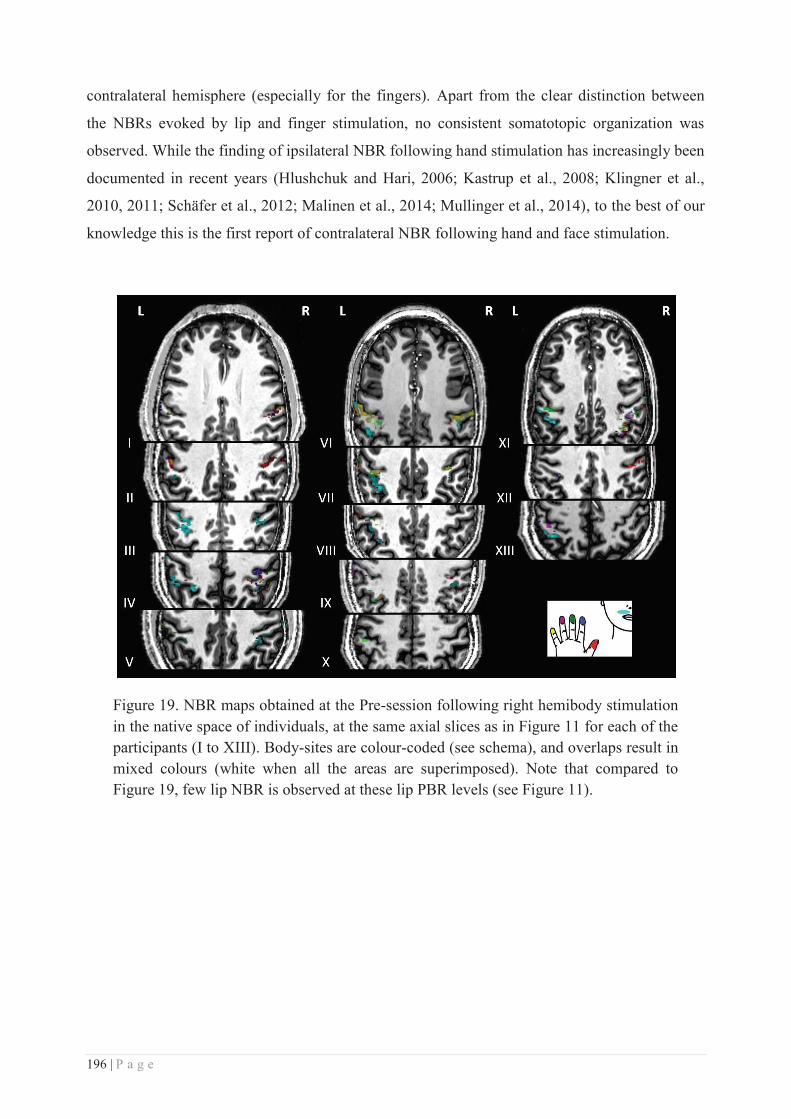
196 | P a g e
contralateral hemisphere (especially for the fingers). Apart from the clear distinction between
the NBRs evoked by lip and finger stimulation, no consistent somatotopic organization was
observed. While the finding of ipsilateral NBR following hand stimulation has increasingly been
documented in recent years (Hlushchuk and Hari, 2006; Kastrup et al., 2008; Klingner et al.,
2010, 2011; Schäfer et al., 2012; Malinen et al., 2014; Mullinger et al., 2014), to the best of our
knowledge this is the first report of contralateral NBR following hand and face stimulation.
Figure 19. NBR maps obtained at the Pre-session following right hemibody stimulation in the native space of individuals, at the same axial slices as in Figure 11 for each of the participants (I to XIII). Body-sites are colour-coded (see schema), and overlaps result in mixed colours (white when all the areas are superimposed). Note that compared to Figure 19, few lip NBR is observed at these lip PBR levels (see Figure 11).
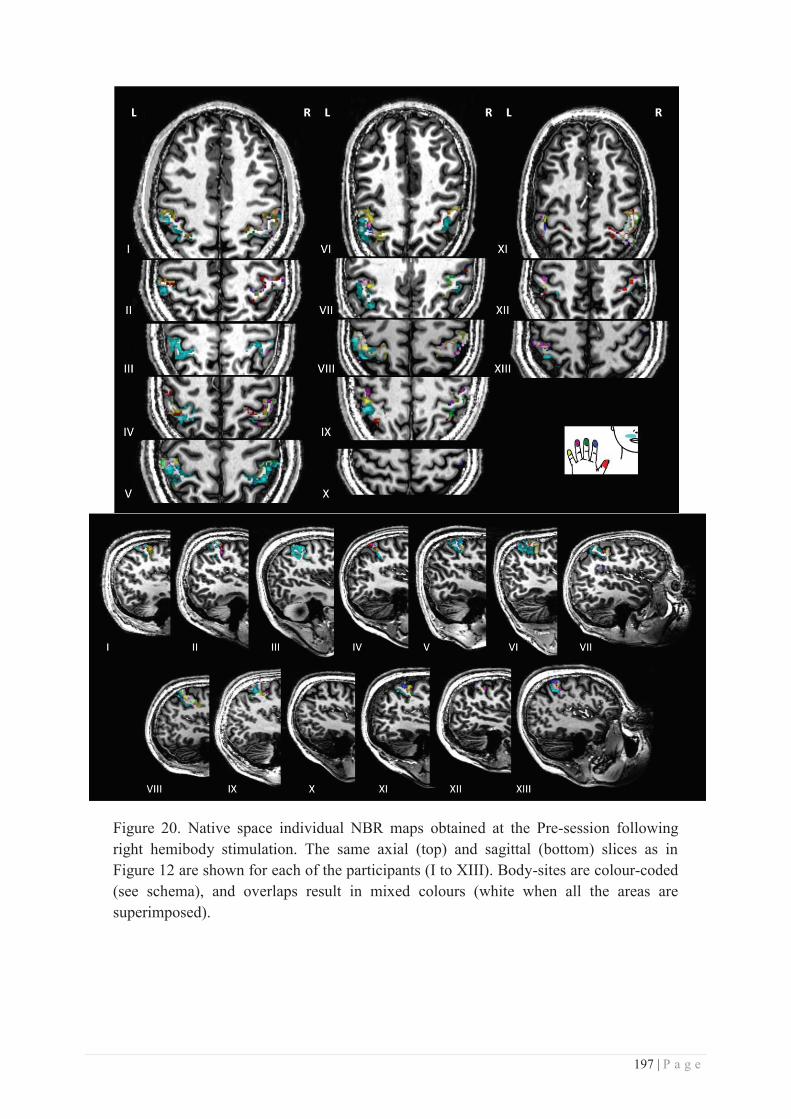
197 | P a g e
Figure 20. Native space individual NBR maps obtained at the Pre-session following right hemibody stimulation. The same axial (top) and sagittal (bottom) slices as in Figure 12 are shown for each of the participants (I to XIII). Body-sites are colour-coded (see schema), and overlaps result in mixed colours (white when all the areas are superimposed).
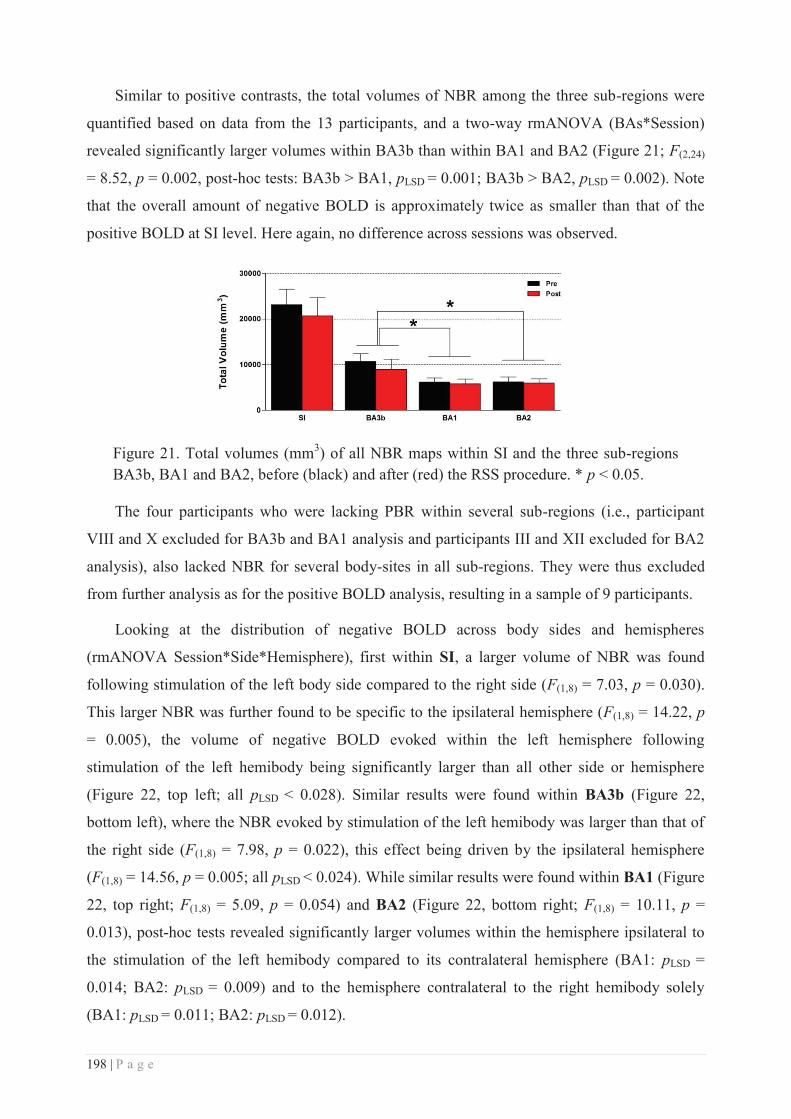
198 | P a g e
Similar to positive contrasts, the total volumes of NBR among the three sub-regions were
quantified based on data from the 13 participants, and a two-way rmANOVA (BAs*Session)
revealed significantly larger volumes within BA3b than within BA1 and BA2 (Figure 21; F(2,24)
= 8.52, p = 0.002, post-hoc tests: BA3b > BA1, pLSD = 0.001; BA3b > BA2, pLSD = 0.002). Note
that the overall amount of negative BOLD is approximately twice as smaller than that of the
positive BOLD at SI level. Here again, no difference across sessions was observed.
Figure 21. Total volumes (mm3) of all NBR maps within SI and the three sub-regions BA3b, BA1 and BA2, before (black) and after (red) the RSS procedure. * p < 0.05.
The four participants who were lacking PBR within several sub-regions (i.e., participant
VIII and X excluded for BA3b and BA1 analysis and participants III and XII excluded for BA2
analysis), also lacked NBR for several body-sites in all sub-regions. They were thus excluded
from further analysis as for the positive BOLD analysis, resulting in a sample of 9 participants.
Looking at the distribution of negative BOLD across body sides and hemispheres
(rmANOVA Session*Side*Hemisphere), first within SI, a larger volume of NBR was found
following stimulation of the left body side compared to the right side (F(1,8) = 7.03, p = 0.030).
This larger NBR was further found to be specific to the ipsilateral hemisphere (F(1,8) = 14.22, p
= 0.005), the volume of negative BOLD evoked within the left hemisphere following
stimulation of the left hemibody being significantly larger than all other side or hemisphere
(Figure 22, top left; all pLSD < 0.028). Similar results were found within BA3b (Figure 22,
bottom left), where the NBR evoked by stimulation of the left hemibody was larger than that of
the right side (F(1,8) = 7.98, p = 0.022), this effect being driven by the ipsilateral hemisphere
(F(1,8) = 14.56, p = 0.005; all pLSD < 0.024). While similar results were found within BA1 (Figure
22, top right; F(1,8) = 5.09, p = 0.054) and BA2 (Figure 22, bottom right; F(1,8) = 10.11, p =
0.013), post-hoc tests revealed significantly larger volumes within the hemisphere ipsilateral to
the stimulation of the left hemibody compared to its contralateral hemisphere (BA1: pLSD =
0.014; BA2: pLSD = 0.009) and to the hemisphere contralateral to the right hemibody solely
(BA1: pLSD = 0.011; BA2: pLSD = 0.012).
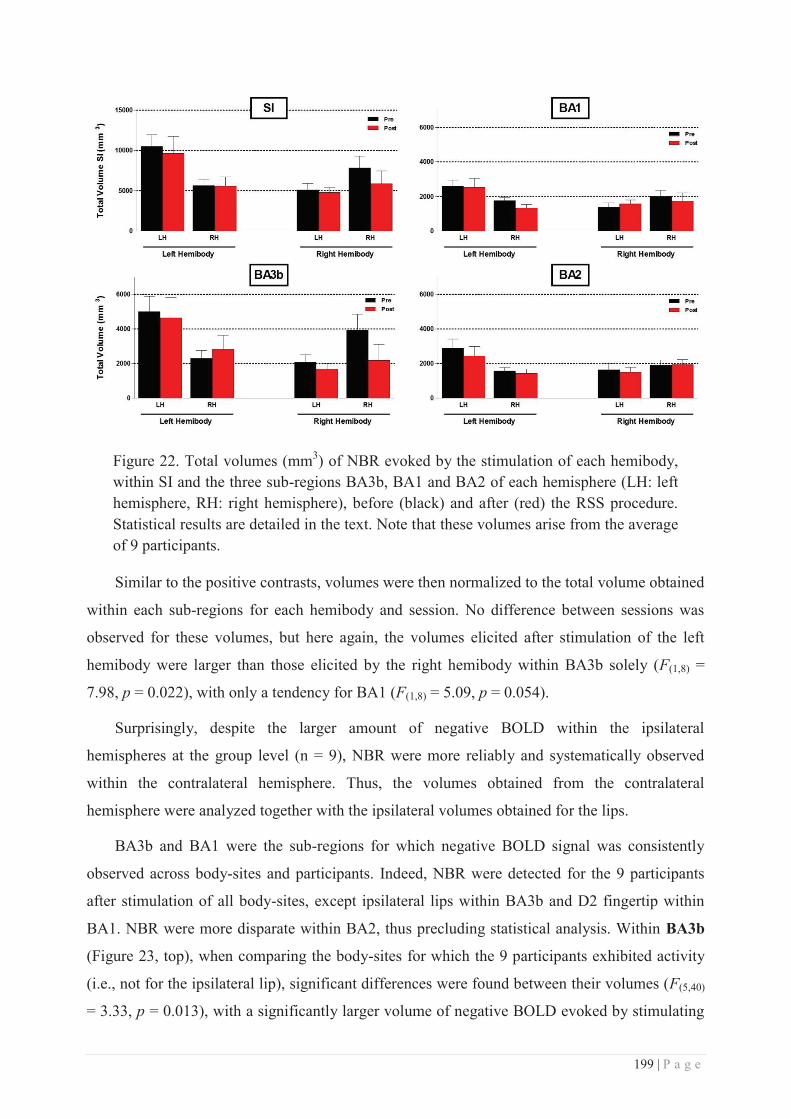
199 | P a g e
Figure 22. Total volumes (mm3) of NBR evoked by the stimulation of each hemibody, within SI and the three sub-regions BA3b, BA1 and BA2 of each hemisphere (LH: left hemisphere, RH: right hemisphere), before (black) and after (red) the RSS procedure. Statistical results are detailed in the text. Note that these volumes arise from the average of 9 participants.
Similar to the positive contrasts, volumes were then normalized to the total volume obtained
within each sub-regions for each hemibody and session. No difference between sessions was
observed for these volumes, but here again, the volumes elicited after stimulation of the left
hemibody were larger than those elicited by the right hemibody within BA3b solely (F(1,8) =
7.98, p = 0.022), with only a tendency for BA1 (F(1,8) = 5.09, p = 0.054).
Surprisingly, despite the larger amount of negative BOLD within the ipsilateral
hemispheres at the group level (n = 9), NBR were more reliably and systematically observed
within the contralateral hemisphere. Thus, the volumes obtained from the contralateral
hemisphere were analyzed together with the ipsilateral volumes obtained for the lips.
BA3b and BA1 were the sub-regions for which negative BOLD signal was consistently
observed across body-sites and participants. Indeed, NBR were detected for the 9 participants
after stimulation of all body-sites, except ipsilateral lips within BA3b and D2 fingertip within
BA1. NBR were more disparate within BA2, thus precluding statistical analysis. Within BA3b
(Figure 23, top), when comparing the body-sites for which the 9 participants exhibited activity
(i.e., not for the ipsilateral lip), significant differences were found between their volumes (F(5,40)
= 3.33, p = 0.013), with a significantly larger volume of negative BOLD evoked by stimulating
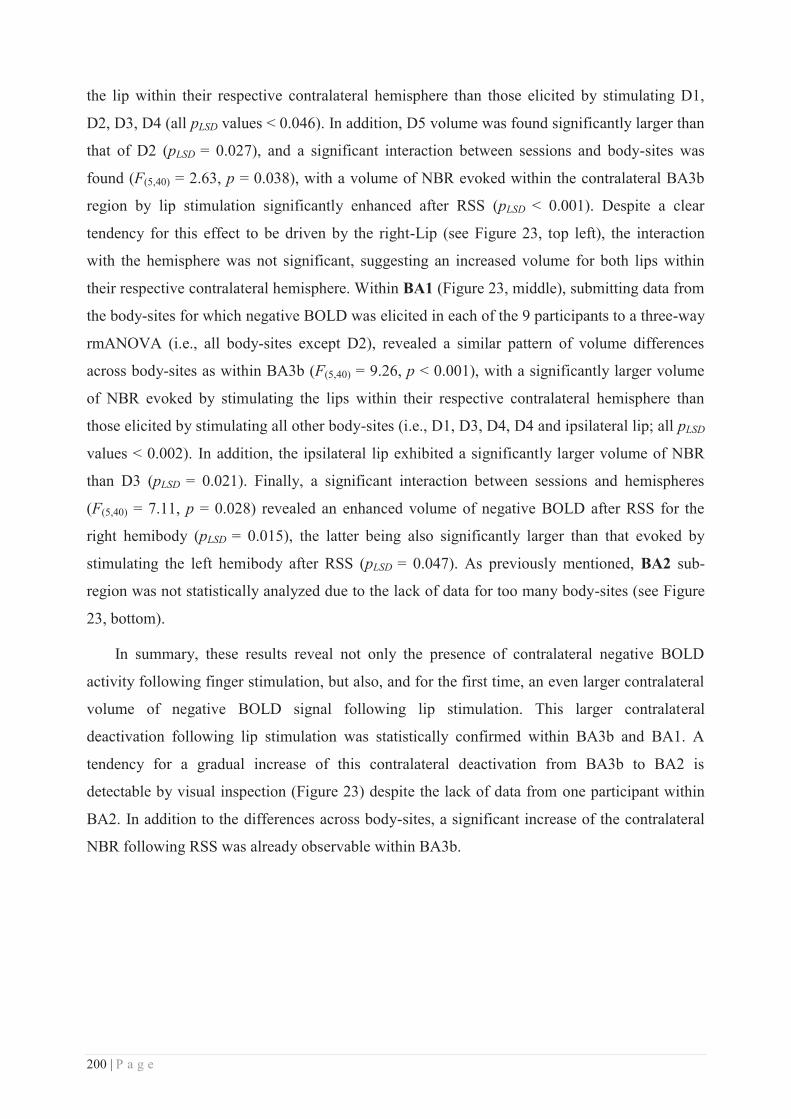
200 | P a g e
the lip within their respective contralateral hemisphere than those elicited by stimulating D1,
D2, D3, D4 (all pLSD values < 0.046). In addition, D5 volume was found significantly larger than
that of D2 (pLSD = 0.027), and a significant interaction between sessions and body-sites was
found (F(5,40) = 2.63, p = 0.038), with a volume of NBR evoked within the contralateral BA3b
region by lip stimulation significantly enhanced after RSS (pLSD < 0.001). Despite a clear
tendency for this effect to be driven by the right-Lip (see Figure 23, top left), the interaction
with the hemisphere was not significant, suggesting an increased volume for both lips within
their respective contralateral hemisphere. Within BA1 (Figure 23, middle), submitting data from
the body-sites for which negative BOLD was elicited in each of the 9 participants to a three-way
rmANOVA (i.e., all body-sites except D2), revealed a similar pattern of volume differences
across body-sites as within BA3b (F(5,40) = 9.26, p < 0.001), with a significantly larger volume
of NBR evoked by stimulating the lips within their respective contralateral hemisphere than
those elicited by stimulating all other body-sites (i.e., D1, D3, D4, D4 and ipsilateral lip; all pLSD
values < 0.002). In addition, the ipsilateral lip exhibited a significantly larger volume of NBR
than D3 (pLSD = 0.021). Finally, a significant interaction between sessions and hemispheres
(F(5,40) = 7.11, p = 0.028) revealed an enhanced volume of negative BOLD after RSS for the
right hemibody (pLSD = 0.015), the latter being also significantly larger than that evoked by
stimulating the left hemibody after RSS (pLSD = 0.047). As previously mentioned, BA2 sub-
region was not statistically analyzed due to the lack of data for too many body-sites (see Figure
23, bottom).
In summary, these results reveal not only the presence of contralateral negative BOLD
activity following finger stimulation, but also, and for the first time, an even larger contralateral
volume of negative BOLD signal following lip stimulation. This larger contralateral
deactivation following lip stimulation was statistically confirmed within BA3b and BA1. A
tendency for a gradual increase of this contralateral deactivation from BA3b to BA2 is
detectable by visual inspection (Figure 23) despite the lack of data from one participant within
BA2. In addition to the differences across body-sites, a significant increase of the contralateral
NBR following RSS was already observable within BA3b.
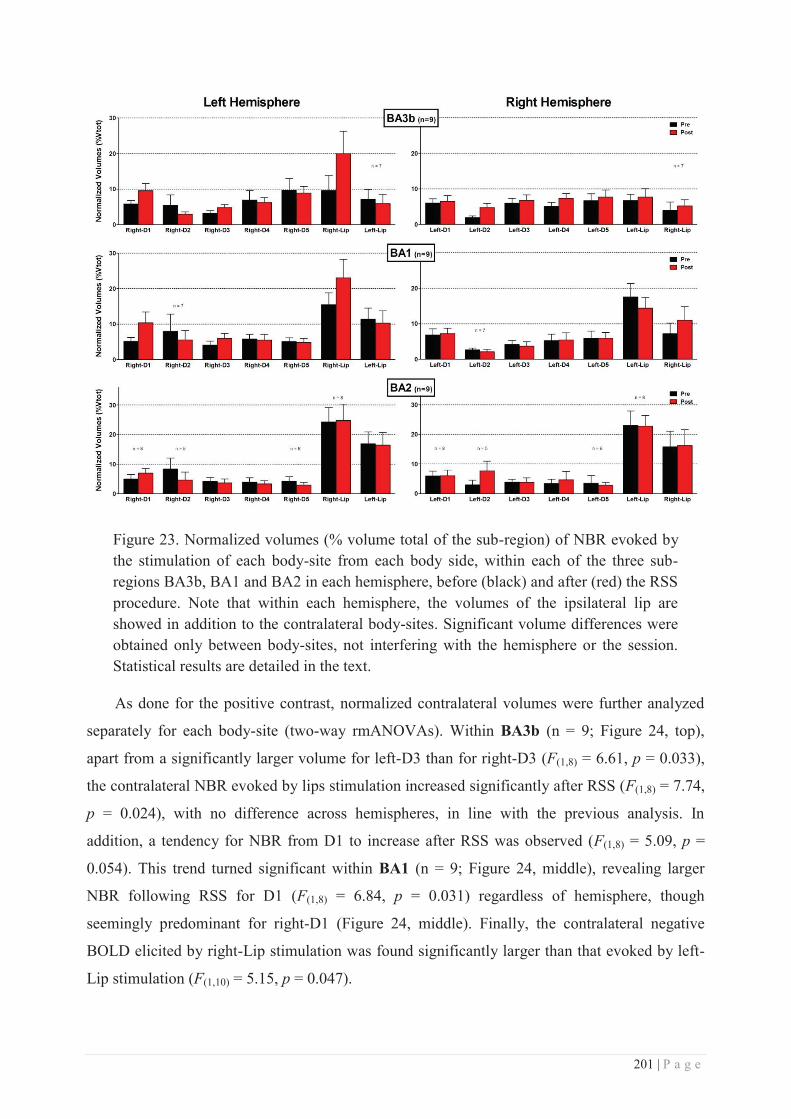
201 | P a g e
Figure 23. Normalized volumes (% volume total of the sub-region) of NBR evoked by the stimulation of each body-site from each body side, within each of the three sub-regions BA3b, BA1 and BA2 in each hemisphere, before (black) and after (red) the RSS procedure. Note that within each hemisphere, the volumes of the ipsilateral lip are showed in addition to the contralateral body-sites. Significant volume differences were obtained only between body-sites, not interfering with the hemisphere or the session. Statistical results are detailed in the text.
As done for the positive contrast, normalized contralateral volumes were further analyzed
separately for each body-site (two-way rmANOVAs). Within BA3b (n = 9; Figure 24, top),
apart from a significantly larger volume for left-D3 than for right-D3 (F(1,8) = 6.61, p = 0.033),
the contralateral NBR evoked by lips stimulation increased significantly after RSS (F(1,8) = 7.74,
p = 0.024), with no difference across hemispheres, in line with the previous analysis. In
addition, a tendency for NBR from D1 to increase after RSS was observed (F(1,8) = 5.09, p =
0.054). This trend turned significant within BA1 (n = 9; Figure 24, middle), revealing larger
NBR following RSS for D1 (F(1,8) = 6.84, p = 0.031) regardless of hemisphere, though
seemingly predominant for right-D1 (Figure 24, middle). Finally, the contralateral negative
BOLD elicited by right-Lip stimulation was found significantly larger than that evoked by left-
Lip stimulation (F(1,10) = 5.15, p = 0.047).
202 | P a g e
Altogether, these results suggest that RSS resulted in an increase of the NBR elicited by lips
stimulation within their respective contralateral BA3b sub-region, a similar RSS-induced
increase being observed following D1 stimulation within BA1. Moreover, despite the lack of
side differences, these changes were preferentially driven by the right side of the body.
No significant correlation (Pearson) was found between these negative BOLD volume
changes observed across BAs (all p values > 0.05).
To investigate whether the RSS-induced increase of the lips NBR altered its degree of
overlap with the NBR from other body-sites, we computed both the proportion of Lip NBR (the
contralateral response) overlapping with the NBR from other body-sites, and the proportion of
the other body-site NBR being overlapped with Lip NBR. Within BA3b, the proportion of Lip
NBR overlapping with those from the other body-sites was significantly different across body-
sites (F(4,32) = 4.97, p = 0.003). For instance, a higher overlap was found with D1 than with D3,
D4 and D5 (all pLSD values < 0.009), with respectively 15.40% (± 3.38) of Lip overlapping with
D1 instead of 5.03% (± 1.39), 6.27% (± 1.95) and 8.21% (± 1.97) with D3, D4 and D5. In
addition, the Lip NBR was significantly more overlapping with D2 NBR (10.53% ± 2.86) than
with D3 (pLSD = 0.042). Conversely, these same volumes of overlap corresponded to 22.80% (±
5.82), 23.92% (± 6.80), 10.08% (± 3.04), 10.36% (± 3.25), and 12.32% (± 4.06) of the NBR of
these other body-sites (i.e., in the same order: D1, D2, D3, D4 and D5). These latter proportions
were significantly higher for D1 and D2 than for the other fingers (F(4,32) = 10.36, p < 10-4, all
pLSD values < 0.001). However, no significant changes in the proportion of overlap were
observed across sessions.
Similar to PBRs, no correlation was found between 2PDT changes and NBR volume
changes for any of the affected body-sites (Lips in BA3b and D1 in BA1; all p values > 0.05).
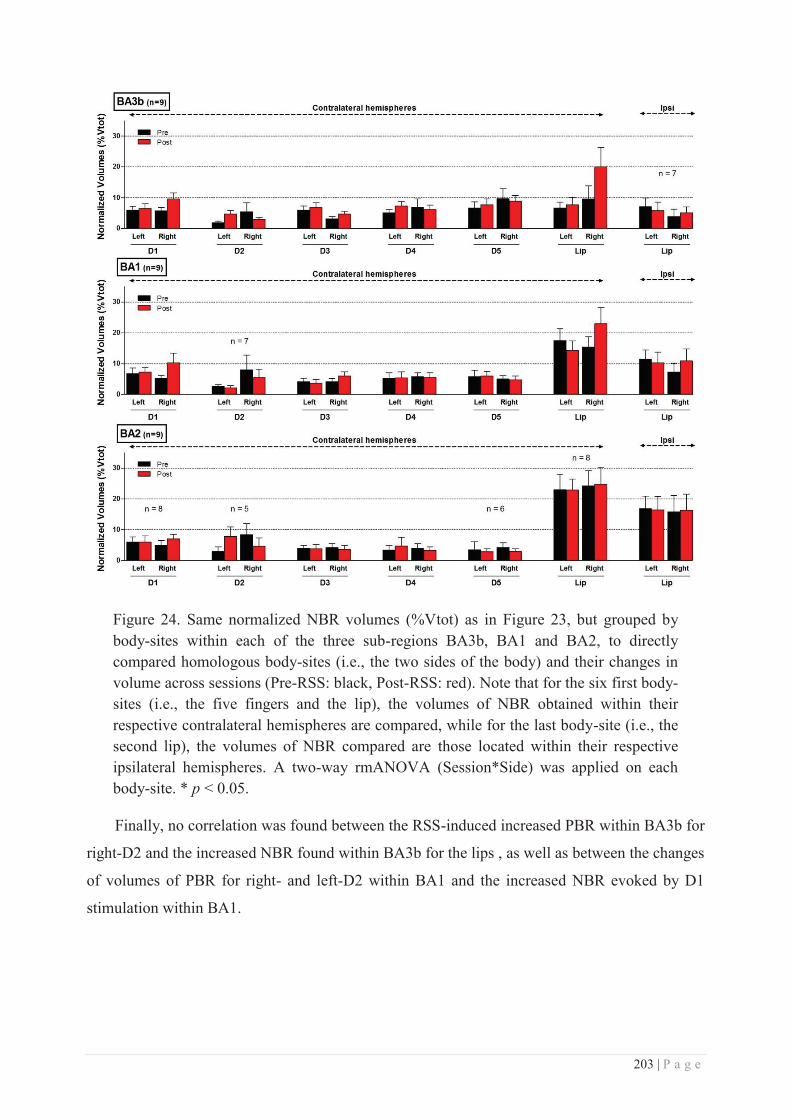
203 | P a g e
Figure 24. Same normalized NBR volumes (%Vtot) as in Figure 23, but grouped by body-sites within each of the three sub-regions BA3b, BA1 and BA2, to directly compared homologous body-sites (i.e., the two sides of the body) and their changes in volume across sessions (Pre-RSS: black, Post-RSS: red). Note that for the six first body-sites (i.e., the five fingers and the lip), the volumes of NBR obtained within their respective contralateral hemispheres are compared, while for the last body-site (i.e., the second lip), the volumes of NBR compared are those located within their respective ipsilateral hemispheres. A two-way rmANOVA (Session*Side) was applied on each body-site. * p < 0.05.
Finally, no correlation was found between the RSS-induced increased PBR within BA3b for
right-D2 and the increased NBR found within BA3b for the lips , as well as between the changes
of volumes of PBR for right- and left-D2 within BA1 and the increased NBR evoked by D1
stimulation within BA1.
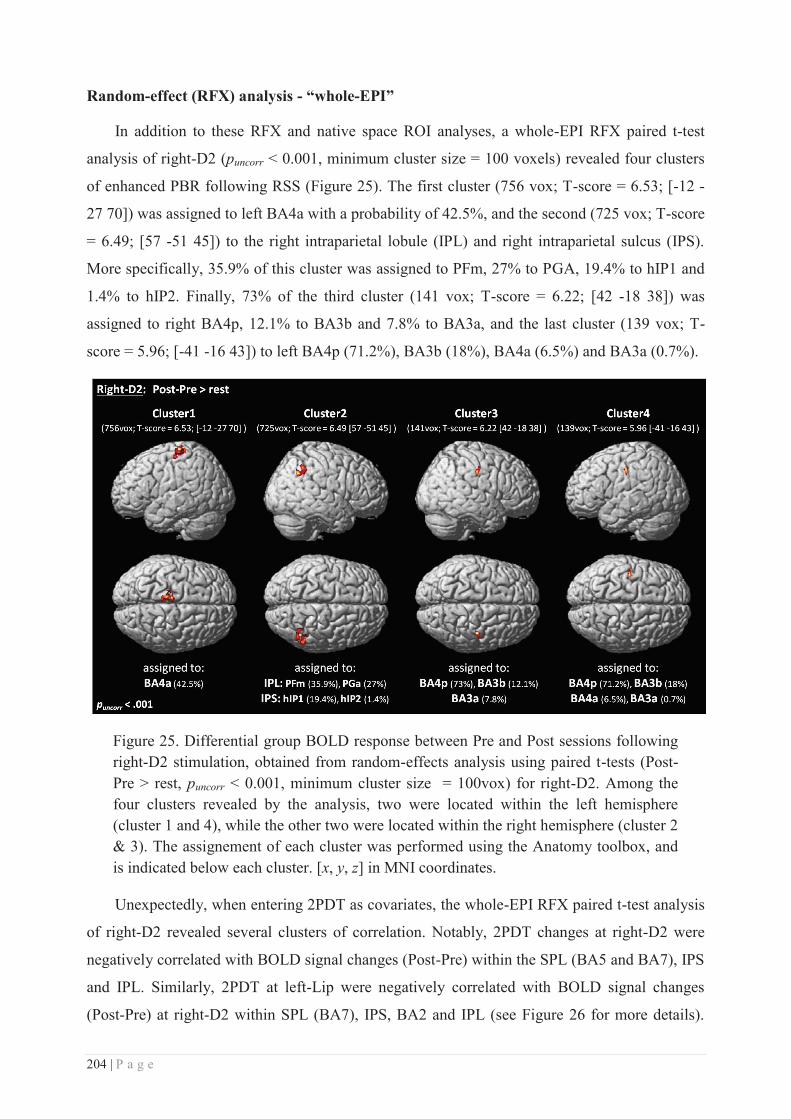
204 | P a g e
Random-effect (RFX) analysis - “whole-EPI”
In addition to these RFX and native space ROI analyses, a whole-EPI RFX paired t-test
analysis of right-D2 (puncorr < 0.001, minimum cluster size = 100 voxels) revealed four clusters
of enhanced PBR following RSS (Figure 25). The first cluster (756 vox; T-score = 6.53; [-12 -
27 70]) was assigned to left BA4a with a probability of 42.5%, and the second (725 vox; T-score
= 6.49; [57 -51 45]) to the right intraparietal lobule (IPL) and right intraparietal sulcus (IPS).
More specifically, 35.9% of this cluster was assigned to PFm, 27% to PGA, 19.4% to hIP1 and
1.4% to hIP2. Finally, 73% of the third cluster (141 vox; T-score = 6.22; [42 -18 38]) was
assigned to right BA4p, 12.1% to BA3b and 7.8% to BA3a, and the last cluster (139 vox; T-
score = 5.96; [-41 -16 43]) to left BA4p (71.2%), BA3b (18%), BA4a (6.5%) and BA3a (0.7%).
Figure 25. Differential group BOLD response between Pre and Post sessions following right-D2 stimulation, obtained from random-effects analysis using paired t-tests (Post-Pre > rest, puncorr < 0.001, minimum cluster size = 100vox) for right-D2. Among the four clusters revealed by the analysis, two were located within the left hemisphere (cluster 1 and 4), while the other two were located within the right hemisphere (cluster 2 & 3). The assignement of each cluster was performed using the Anatomy toolbox, and is indicated below each cluster. [x, y, z] in MNI coordinates.
Unexpectedly, when entering 2PDT as covariates, the whole-EPI RFX paired t-test analysis
of right-D2 revealed several clusters of correlation. Notably, 2PDT changes at right-D2 were
negatively correlated with BOLD signal changes (Post-Pre) within the SPL (BA5 and BA7), IPS
and IPL. Similarly, 2PDT at left-Lip were negatively correlated with BOLD signal changes
(Post-Pre) at right-D2 within SPL (BA7), IPS, BA2 and IPL (see Figure 26 for more details).
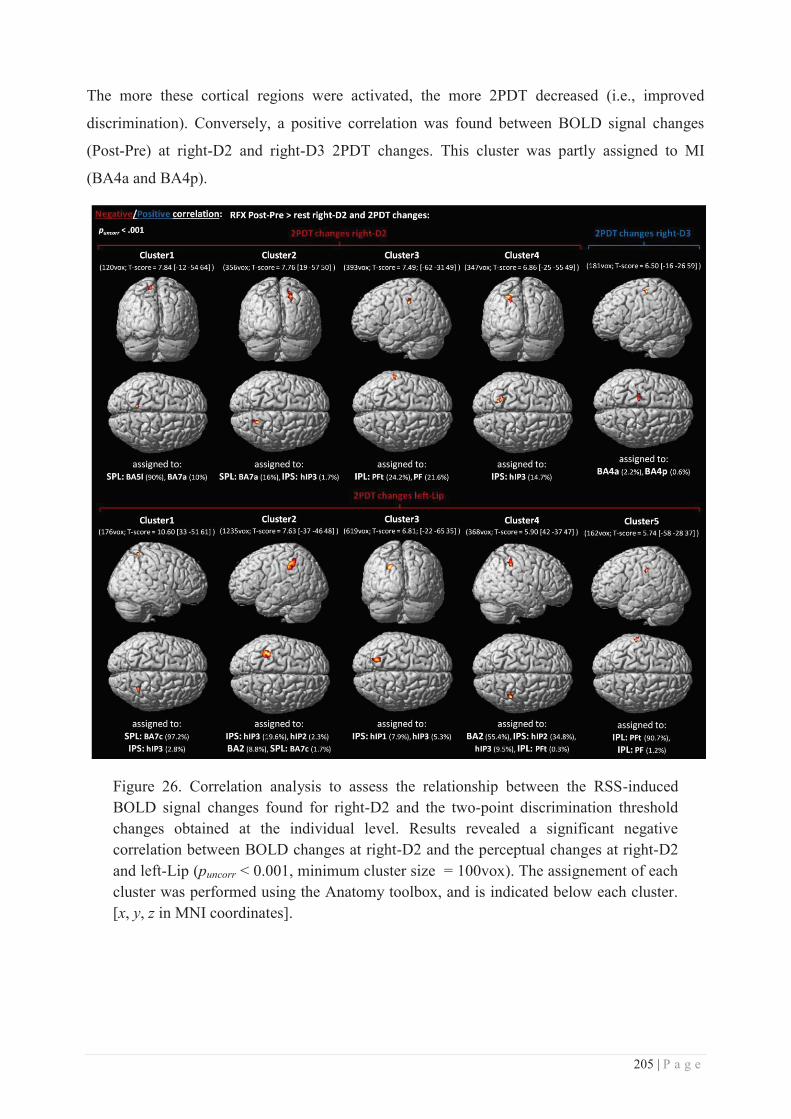
205 | P a g e
The more these cortical regions were activated, the more 2PDT decreased (i.e., improved
discrimination). Conversely, a positive correlation was found between BOLD signal changes
(Post-Pre) at right-D2 and right-D3 2PDT changes. This cluster was partly assigned to MI
(BA4a and BA4p).
Figure 26. Correlation analysis to assess the relationship between the RSS-induced BOLD signal changes found for right-D2 and the two-point discrimination threshold changes obtained at the individual level. Results revealed a significant negative correlation between BOLD changes at right-D2 and the perceptual changes at right-D2 and left-Lip (puncorr < 0.001, minimum cluster size = 100vox). The assignement of each cluster was performed using the Anatomy toolbox, and is indicated below each cluster. [x, y, z in MNI coordinates].
206 | P a g e
Discussion
The purpose of this study was to take advantage of ultra-high field fMRI to identify first,
the involvement of SI subregions BA3b, 1 and 2 in the somatosensory plastic changes that are
obtained through training-independent learning, such as RSS; Second to investigate whether the
recently reported remote changes induced by finger-RSS on the unstimulated region of the
upper-lips reflect not only a behavioural, but also functional plastic changes that cross the hand-
face border within SI sub-regions.
In agreement with our previous study (Muret et al., 2014), we found that three hours of RSS
of right-D2 fingertip improved the spatial acuity not only at this finger, but also at both sides of
the upper-lip. Additionally, this study provides the evidence that spatial acuity on right-D3 also
remained unchanged. In parallel with these behavioural effects, several RSS-induced BOLD
changes were observed at the cortical level. First, using standard group analysis (RFX) we
found that the right-D2 response expanded following RSS within both hemispheres. Similar
enhanced BOLD responses were also observed for both little fingers within their ipsilateral
hemispheres. Finally, a decreased BOLD response was observed after RSS for right-D1 within
the ipsilateral hemisphere. Second, a native space analysis similar to that proposed by Martuzzi
and colleagues (2014) also revealed an enlarged contralateral PBR for right-D2 after RSS. In
addition, decreased contralateral PBRs were found for right-D3 and for left-D2. Conversely,
enhanced contralateral NBRs after RSS were found for the lips and the thumbs. Finally,
exploration of the whole-EPI following RFX Post-Pre contrasts revealed large clusters located
within the anterior part of the left primary motor cortex (BA4a) and the right intraparietal lobule
and sulcus (IPL/IPS) for the stimulated finger (right-D2), and BOLD changes within these
regions covaried with the perceptual threshold changes.
Behavioural results
The changes in tactile spatial discrimination observed here support and confirm our
previous findings that RSS at right-D2 improves not only its tactile acuity, but also that of the
upper-lips (Muret et al., 2014). Compared with the first report of this finding, the overall amount
of threshold decrease for the three affected body-sites was smaller (right-D2: -7.66 ± 3.07 %
instead of -15.26 ± 3.85 %; Lips: -9.11 ± 1.76 % instead of -10.29 ± 2.96 %). In addition to
replicating these effects, the lack of threshold changes at the adjacent finger (i.e., right-D3)
confirms a previous report by Godde and colleagues in a smaller sample of participants (Godde
et al., 2000), and further defines a limit in the “spread” of the RSS-induced perceptual changes
within the hand region. In addition, the different patterns of threshold changes at the different
207 | P a g e
body-sites suggest that a decreased threshold at right-D2 is more likely to be associated with an
increased threshold at the adjacent finger than at the homologous finger. Together, these results
are consistent with the presence of intracortical inhibitory connections between adjacent
representations (Négyessy et al., 2013), and thus reinforce the hypothesis that short-range lateral
inhibition (Simões et al., 2001) might be one of the mechanisms limiting the spread of RSS-
induced effects between fingers. This is further supported by the previous report that the cortical
representation of the adjacent thumb remains unchanged after RSS of right-D2 (Pleger et al.,
2001). Conversely, the consistent decrease in lip thresholds suggests that different mechanisms
underlie lip threshold changes after RSS of the right-D2.
Positive and Negative BOLD significance
BOLD (i.e., blood oxygenation level-dependent) signal is the most commonly used measure
among the different possibilities provided by fMRI techniques. This signal is directly linked to
the level of deoxyhemoglobin content in the cerebral blood, which is indirectly related to neural
activity. The principle is quite simple: increased neural activity supposedly yields to a local
increase in cerebral blood flow (CBF) greater than the increase in oxygen consumption by the
neurons in activity, resulting in a decrease in deoxyhemoglobin content. As deoxyhemoglobin is
paramagnetic by nature, its decrease translates into an increased magnetic resonance signal
relative to the pre-stimulus baseline period (i.e., PBR). While the exact relationship between
BOLD signal and the underlying neural activity is still not fully understood (for reviews on
neurovascular coupling, see Shibasaki, 2008; Vanzetta and Grinvald, 2008; Kim and Ogawa,
2012), electrophysiological studies in animals support the idea that PBR reflects an increase in
neural activity. For instance, PBR amplitude has been shown to correlate with increases in
intracortical local field potential (LFP) (Logothetis et al., 2001; Devor et al., 2005; Bentley et
al., 2014), but also with increases in the amplitude of somatosensory evoked potentials (SEPs)
(Goloshevsky et al., 2008; Huttunen et al., 2008). A similar coupling between SI BOLD changes
and SEP amplitudes has been found in humans (Arthurs and Boniface, 2003), and more recently,
BOLD changes were associated with changes in the spectral profile of neuronal activity among
several spectral bands (Rosa et al., 2010).
In contrast to PBR, NBR consists in a decrease in BOLD signal below pre-stimulus baseline
levels. While this aspect of BOLD signal has long been disregarded, NBR has been increasingly
investigated over the last 10 years, and has raised considerable debate regarding the
underpinning mechanisms and its neurophysiological significance (see Kim and Ogawa, 2012).
However, accumulating evidence from recent electrophysiological studies suggests that NBR is
208 | P a g e
tightly coupled with local decreases in neuronal activity below spontaneous activity (Shmuel et
al., 2006), and with comparable decreases in LFP and multi-unit activity (Shmuel et al., 2006;
Boorman et al., 2010; Kennerley et al., 2012; Bentley et al., 2014). While deep cortical layers
were found to be involved (De Celis Alonso et al., 2008; Boorman et al., 2010), NBR is also
likely to reflect activity in astrocytes (e.g., Sloan et al., 2010). In humans, the NBR evoked
either by tactile or visual stimuli was found to be associated with decreases in CBF and oxygen
consumption in primary sensory cortices (Shmuel et al., 2002; Wade and Rowland, 2010;
Schäfer et al., 2012; Mullinger et al., 2014), and its average amplitude has been shown to
increase with increasing stimulus duration and intensity (Shmuel et al., 2002; Klingner et al.,
2010), analogous to the behaviour of the PBR. NBR within SI/MI has also been found to be
negatively correlated with both the mu (8-13Hz) power and SEP amplitude (Mullinger et al.,
2014). Altogether, these studies suggest that NBR may reflect inhibitory processes. Further
support for this view comes from increasing evidence that NBR is associated with an increase in
perceptual detection thresholds, suggesting that NBR reflects a functionally relevant measure of
neuronal deactivation (Bressler et al., 2007; Kastrup et al., 2008; Klingner et al., 2010; Schäfer
et al., 2012).
Positive BOLD distribution
Regardless of the analysis (RFX or native space), our mapping procedure revealed a
consistent PBR in the post-central gyrus contralaterally to the stroked finger, and in both
hemispheres following lip stroking. While the former is now well accepted, the bilateral
representation of the lips remains somewhat controversial as some imaging studies report no
ipsilateral activity following face stimulation (Stippich et al., 1999; Suzuki et al., 2004; Kopietz
et al., 2009). However, in agreement with several imaging studies of face regions (Nagamatsu et
al., 2000; Disbrow et al., 2003a; Nevalainen et al., 2006; Blatow et al., 2007; Eickhoff et al.,
2008; Lin et al., 2010; Nash et al., 2010), including the lips (Nagamatsu et al., 2000; Disbrow et
al., 2003a; Nevalainen et al., 2006; Blatow et al., 2007; Nash et al., 2010) our results bring
strong evidence in support of a bilateral representation of the upper-lip region within SI. The
lack of an ipsilateral representation in some of the previous studies might have arisen from
insufficient strength in tactile stimulation leading to low levels of activation (Stippich et al.,
1999; Kopietz et al., 2009), or from low signal to noise ratio particularly crucial for dipole
source reconstruction in electrophysiological imaging (Suzuki et al., 2004). It is worth noticing
that each side of the upper-lip is innervated by the medial branch of the superior labial branch of
the infraorbital nerve, which never crosses the midline (Hu et al., 2007). In addition, the tested
209 | P a g e
sites at the upper-lips were located away from the midline (average at 18.38 ± 2.66 mm) for the
behavioural testing, and the stroking never crossed the midline during the fMRI mapping. This
positioning ensures that the bilateral PBR that we report here in SI emerges from unilateral
peripheral innervation of the upper-lip. We also observed some ipsilateral PBR following finger
stimulation, but this was inconsistent across participants. While this has been a subject of
controversy, the existence of an ipsilateral representation of the hand within SI is now
relatively well accepted, since both electrophysiological studies in animals (Iwamura et al.,
1994; Zarei and Stephenson, 1996) and imaging studies in humans provide evidence in this
direction (Schnitzler et al., 1995; Hansson and Brismar, 1999; Nihashi et al., 2005; Sutherland
and Tang, 2006; Blatow et al., 2007).
The ipsilateral representations observed for both fingers and lips have two possible
origins, either subcortical or cortical. First, it has been proposed that uncrossed fibres directly
projecting to the ipsilateral SI or projections to both hemispheres may arise from the thalamus
(Hoshiyama et al., 1996). However, the former appears to be unlikely as unilateral stimulation
of the lip has been shown to elicit a strict contralateral activation within the ventroposterior
thalamus, but bilateral activations in SI (Nash et al., 2010). Similarly, while neurons with
bilateral RFs in the hindlimb region were found SI in awake macaque monkeys (Taoka et al.,
2000), microstimulation of the stump representation in the thalamus of amputees induced
referred sensation limited to the same hemi-body (Davis et al., 1998). While the available
evidence does not support a thalamic origin, the ipsilateral responses could be caused by spread
through transcallosal connections. Such callosal connections have been shown to vary in density
among SI sub-regions, with few between BA3b, more between BA1 and relatively dense
callosal connections between BA2 (Killackey et al., 1983; Manzoni et al., 1984; Iwamura, 2000;
Iwamura et al., 2001). Additionally, these connections were found to be much denser for the
representations of the face and trunk than for the glabrous hand (Killackey et al., 1983), which is
consistent with the stronger ipsilateral activation found for the lip than for the fingers reported
here and in previous studies (Blatow et al., 2007; Eickhoff et al., 2008; Nash et al., 2010)
In line with the literature (Penfield and Rasmussen, 1950; Nakamura et al., 1998), a
somatotopic organization of the PBRs was observed, the finger representations from D5 to D1
being sequentially more ventral and anterior, with the lip representations located more ventrally
and anterior than D1. This somatotopic organization was more distinguishable within BA3b
than BA1 and BA2, as confirmed by the increase in PBR overlap observed from BA3b to BA1.
Primarily found for the fingers, with larger areal overlap between finger representation in BA1/2
than in BA3b (Krause et al., 2001; Besle et al., 2013b; Martuzzi et al., 2014), similar results
210 | P a g e
were observed for the face with larger overlaps between the representations of the lower lip,
teeth and tongue in the portions of the post-central gyrus corresponding to BA1 and BA2
(Miyamoto et al., 2006). Notably, here we additionally report a substantial overlap between D2
and the Lip representations, which also increases from BA3b to BA1 (19.77% of the PBR from
the lip overlapping with that from D2 in BA3b, which turned to 34.97% in BA1). Finally, the
larger PBRs observed for D1 and D2 in the native space analysis suggest a higher magnification
of D1 and D2 across BAs, and a lower magnification of D5 and the ipsilateral Lip. These results
are in agreement with the literature showing a higher degree of cortical magnification of D1 and
D2 in monkeys (Sutherling et al., 1992; Shoham and Grinvald, 2001) and in humans (Maldjian
et al., 1999; Martuzzi et al., 2014).
Negative BOLD distribution
In contrast to PBR, negative contrasts revealed activity in a more distributed network
resembling the default mode network (Raichle et al., 2001; Greicius et al., 2003; Brookes et al.,
2011; Passow et al., 2015), which is known to be down-regulated in a task-dependent manner
(Fox et al., 2005). A similar widespread network has already been reported following electrical
median nerve stimulation (Taylor and Davis, 2009; Klingner et al., 2011), and is likely to reflect
a deactivation of the cortical regions not involved in tactile processing.
Within SI, RFX analyses revealed a consistent ipsilateral NBR following finger
stimulation. This ipsilateral deactivation has already been reported in the literature (Hlushchuk
and Hari, 2006; Arthurs et al., 2007; Eickhoff et al., 2008; Kastrup et al., 2008; Schäfer et al.,
2012; Mullinger et al., 2014), but most of the time following strong electrical median nerve
stimulation near motor (Kastrup et al., 2008; Schäfer et al., 2012; Mullinger et al., 2014) or pain
(Arthurs et al., 2007) thresholds. Here, we show that an ecological brushing stimulation of
individual fingers also results in ipsilateral NBRs. In previous reports this ipsilateral NBR has
mainly been observed within BA3b and BA1 sub-regions (Hlushchuk and Hari, 2006; Eickhoff
et al., 2008), where microelectrode recordings in monkeys revealed a predominant inhibition
(Lipton et al., 2006). In agreement with these findings, here we found that the ipsilateral NBRs
evoked by fingers brushing were located on the anterior wall of the post-central gyrus, and that
larger volumes of NBR were found in BA3b than BA1 and BA2. Given that in contrast to BA3b
and BA1, BA2 appears to contain a bilateral hand representation in monkeys (Iwamura et al.,
1994) or a bilateral PBR in humans (Nihashi et al., 2005; Eickhoff et al., 2008), but also dense
homologous callosal connections (Killackey et al., 1983), the ipsilateral NBR observed within
BA3b and BA1 has been hypothesized to arise from a “serial” process, the contralateral PBR
211 | P a g e
sequentially travelling from BA3b to BA1 and BA2 through inter-areal intracortical
connections, then transferring to the other hemisphere through BA2 transcallosal connections,
this ipsilateral PBR within BA2 being then likely responsible for the NBR in BA3b and BA1 via
inter-areal intracortical backward connections (Hlushchuk and Hari, 2006). This hypothetical
model of indirect interhemispheric inhibition still remains the most probable, but requires
further investigation.
A major novel finding of the current study is that it provides the first evidence for NBRs
across body-sites at the somatosensory level, allowing the assessment of their relative
distribution and possible somatotopic organization. At both group and individual levels,
ipsilateral NBRs elicited by finger stimulation were highly overlapping, suggesting no clear
somatotopic organization. Interestingly, while these ipsilateral NBRs were consistently observed
at the group level (RFX), their presence was less systematic across individuals and body-sites,
not all participants showing NBR for each body-site in all sessions. The presence of RFX
ipsilateral NBRs despite some inconsistencies across individuals is likely to arise from the fact
that these NBRs were large, highly overlapping and at relatively similar locations across
participants. This suggests that the NBRs evoked ipsilaterally following fingers stroking may
reflect a somatosensory deactivation processing that does not target any particular homotopic
regions. In contrast, contralateral NBRs were consistently observed across participants and
body-sites at the individual level, but not at the group level (RFX). This apparent discrepancy
most likely arises from the fact that these contralateral NBRs were substantially smaller than the
ipsilateral ones and not consistently distributed and localized, making it difficult to capture them
at the group level. To the best of our knowledge, such a somatosensory contralateral NBR was
previously reported only once, following imperceptible (subliminal) electrical finger stimulation
(Blankenburg et al., 2003b). These authors interpreted this NBR as reflecting an increased
activity of local inhibitory interneurons. While this contralateral NBR could be thought to arise
from vascular stealing due to the presence of juxtaposed PBR (see Harel et al., 2002;
Kannurpatti and Biswal, 2004), recent studies in rodents suggest that such NBR might rather
reflect surround inhibition (De Celis Alonso et al., 2008; Boorman et al., 2010; Kennerley et al.,
2012), a process that has been extensively studied in the barrel cortex (e.g., Derdikman et al.,
2003). To conclude on the NBR from the fingers, presuming that this negative BOLD reflects an
inhibition-like deactivation, the ipsilateral NBRs are likely to reflect a “global” somatosensory
inhibition of the homologous hand, not necessarily somatotopically organized, while the
contralateral NBR is more likely to reflect lateral-inhibition processes.
212 | P a g e
Another major novel finding of our study is that lip stimulation evoked large NBRs, within
both hemispheres. In addition, these NBRs were located more dorsal than the lip PBR and co-
localized with the PBR of the fingers/hand. In contrast to the hand, the NBR elicited by
stimulation of the face, and notably the lips, has never been investigated. The only study in
which both PBR and NBR elicited by cheek stimulation were assessed within SI reported a
strong bilateral PBR only (Eickhoff et al., 2008). However, it is worth noting that the authors
only investigated the ipsilateral hemisphere using ROIs defined based on the positive contrasts.
In agreement with their results, we observed only a few NBRs at the same localizations as PBRs
evoked by lip stimulation.
Thus, here we provide the first evidence that the somatosensory cortex might actually be
composed of two homunculi: the first one is the traditional homunculus based on activations,
while the second and new one would be a ‘negative’ version of the traditional homunculus,
which would be detectable only by analyzing NBRs. In addition, the new somatosensory
homunculus seems to be spatially inverted, as finger and lip regions appeared swopped. This
negative homunculus may arise from a direct (i.e., via thalamocortical projections) or indirect
increase in inhibitory interneuron activity, since electrophysiological studies demonstrated that
NBR is related to decreases in neural activity in deep cortical layers (De Celis Alonso et al.,
2008; Boorman et al., 2010), which are known to contain such interneurons (Gibson et al., 1999;
Swadlow, 2003). The precise nature and origin of such a negative homunculus remains to be
investigated, however. Interestingly, a similar negative based homunculus, which is also
swopped in term of somatotopy, has been recently reported for the primary motor cortex by
Zeharia and colleagues (Zeharia et al., 2012). Most interestingly in relation to the
neurofunctional mechanisms behind the behavioural transfer of plasticity from the finger to the
lips, here we found that, while the PBR evoked by lip stimulation was predominantly assigned
to BA3b and BA1, the NBR was primarily assigned to BA2, where neuronal excitation
(Iwamura et al., 1994) and PBR (Nihashi et al., 2005) were found bilaterally following hand
stimulation. This co-localization of lip NBR and fingers PBR may thus represent a novel
substrate for interactions between these two regions, without requiring the involvement of long-
range intracortical connections, which have been found to be rare, at least within BA3b (Manger
et al., 1996; Fang et al., 2002).
213 | P a g e
RSS-induced changes in SI
While this study provides novel evidence of differential patterns of NBR within SI, its
primary purpose was to assess how the RSS procedure may modulate somatotopic patterns both
locally at the stimulated finger and remotely at the unstimulated lips. As expected, the RFX
paired t-tests revealed an enlargement of the contralateral PBR associated with right-D2 stroking
(the finger that underwent RSS). This result is in keeping with those reported by Pleger and
colleagues (2003). However, in contrast to Pleger and colleagues who reported a lateral shift of
right-D2 by 11.9 mm, we found a non-selective shift for each tested body-site, with right-D2
shifting only by 3.78 mm. It is important to note, however, that Pleger and colleagues calculated
the shift based on a fixed-effect analysis, which does not take into consideration the inter-
individual variability, meaning that this large shift could be driven by only a few participants.
Inspection of their individual data suggests an average shift of only 6.80 ± 9.1 mm (± sd),
including one participant who had a 30mm shift (the others all shifting less than 13mm).
Notwithstanding this methodological consideration from previous fMRI data, a lateral shift of
the RSS-stimulated finger has been previously reported with other, electrophysiological imaging
techniques (Pleger et al., 2001; Dinse et al., 2003; Godde et al., 2003). Thus, considering the
significant enlargement of right-D2 PBR, the smaller shift reported here suggests a more
symmetrical enlargement than in previous studies. In addition, the current study is the first that
allows for comparison among the effects induced by RSS on the representation of the stimulated
finger with those of other unstimulated sites on the same hemi-body. In this respect, we
observed non-selective shifts of the PBR of other body-sites, which may underline the dynamic
property of cortical maps. Indeed, to our knowledge, no study systematically investigated the
test-retest reliability of the absolute localization of PBR CoGs. The only study reporting test-
retest data for finger PBRs (Martuzzi et al., 2014) revealed similar absolute and non-selective
shifts in the retest session (1.7 ± 1.2 mm for D1, 3.2 ± 3.1 mm for D2, 2.3 ± 1.3 mm for D3, 2.2
± 1.5 mm for D4, and 2.2 ± 2.5 mm for D5). Given the temporal dynamics of receptive fields
(see Nicolelis et al., 1997; Ramirez et al., 2014) and of transient plastic changes in SI (Stavrinou
et al., 2007), cortical maps could exhibit similar properties, making them to be constantly and
dynamically fluctuating. This could explain the non-selective shifts reported here. Also at odds
with Pleger and colleagues’ findings, we did not find a linear correlation between right-D2
acuity improvement and cortical enlargement. Again, methodological differences should be
underlined, as to avoid removing possible effects from the control homologous finger, here we
did not use side-corrected difference maps to perform the correlation, and found only a negative
correlation between right-D2 cortical changes (located within bilateral BA2 sub-region and right
214 | P a g e
BA1) and left-Lip threshold changes. Yet, at the behavioural level we observed a tendency
towards a positive correlation between right-D2 and left-Lip threshold changes (r = 0.52, p =
0.066). All in all, the present results substantiate the enlargement of right-D2 following RSS.
The purpose was then to use the ultra-high resolution of 7T fMRI to investigate in more detail
the contribution of SI sub-regions to this enlargement and to RSS-induced behavioural effects.
RSS-induced changes within BA3b
BA3b is considered to be the true primary somatosensory cortex as it receives the bulk of
thalamocortical projections. Within BA3b, a significant enlargement of right-D2 contralateral
PBR was observed with both RFX and native space analyses. Given that it has been suggested
that BOLD changes reflect the input and intracortical processing of a given area rather than its
spiking output (Logothetis et al., 2001), this increased PBR elicited by stimulation of the finger
that underwent RSS could either arise from an increased thalamocortical input, from an
increased intracortical processing, or both. Given that RSS drives Hebbian-like plastic changes,
this enlarged PBR is likely to reflect recruitment of cortical processing resources and/or an
enhanced synaptic efficacy through potentiation (see Beste and Dinse, 2013 for a review). In
line with this resource recruitment hypothesis, a decrease in D3's PBR that was mostly driven by
right-D3 was found after RSS in the native space analysis. This suggests that part of the
resources recruited to enhance the processing of tactile information on the right-D2 after RSS
might have been drawn from the adjacent right-D3 finger. Interestingly, although the cortical
changes for these two areas were not correlated, the cortical changes observed for right-D2 and
right-D3 are consistent with the behavioural data, which show improved tactile acuity for right-
D2 but not for right-D3.
In addition, an ipsilateral cluster emerged at the group level (RFX) after RSS when right-D2
was stroked. Given that hand stimulation evokes NBR in the ipsilateral BA3b (Hlushchuk and
Hari, 2006; Eickhoff et al., 2008) associated with local inhibition (Lipton et al., 2006), this
ipsilateral cluster resulting from the Post-Pre contrast is likely to reflect a decrease in NBR (i.e.,
less negative after RSS). This type of relationship between positive and negative BOLD
responses has recently been demonstrated by inducing somatosensory adaptation in humans
(Klingner et al., 2014). These authors found that a high frequency unilateral electrical
stimulation of the median nerve not only decreased the contralateral PBR (indicative of
adaptation), but also increased the ipsilateral NBR. Together, these results suggest the presence
of widespread changes in the excitatory/inhibitory balance between hemispheres.
215 | P a g e
Interestingly, the RFX analysis revealed that the cortical regions recruited in favour of
right-D2 after RSS were partly co-localized with the right-Lip PBR within the contralateral
BA3b at the Post-session. While this has to be confirmed with a more refined analysis in the
native space, based on the relationship found by Klingner with adaptation, it could be
hypothesized that due to this co-localization, the increased right-D2 PBR may have occurred to
the detriment of the right-Lip PBR which might then have resulted in an increased NBR within
the lip’s ipsilateral hemisphere. What we found, however, was an increased NBR for both lips
and within their contralateral hemispheres. While this bilateral effect is likely to arise from the
bilateral representation of the lips, based on the hypothesis presented above it is surprising that
we did not find a similar effect for the ipsilateral lip representation. These results suggest that
the interhemispheric balance in the processing of tactile information may be different for the
face. Indeed, the “hemispheric rivalry” observed for the hands (with the ipsilateral NBR in
BA3b and BA1) is likely to be related to the need to dissociate tactile information arising from
the two hands when manipulating objects (usually done bimanually). Instead, the use we make
of lips does not require such dissociation. This idea is consistent with the fact that in contrast to
the hand, the lips’ ipsilateral activity was found to be positive within all SI sub-regions
(Eickhoff et al., 2008). In addition, while the exact nature and interaction between SI sub-
regions regarding the processing of tactile information arising from the hands is still unclear
despite many investigations, that arising from the face is completely obscure. Our results
represent a starting point for such an investigation. Interestingly, despite the absence of a
correlation (likely due to the small sample size, n=9), the increased lip NBR following RSS of
right-D2 was bilateral, as was the acuity improvement. This hypothetical link between NBR and
tactile acuity is further supported by the recent evidence that the NBR elicited by hand
stimulation is associated with an increased detection threshold on the opposite hand (Kastrup et
al., 2008; Klingner et al., 2014).
Overall, we can see that as early as within BA3b, RSS-induced cortical changes are
observed for the body-sites exhibiting tactile threshold changes. But these cortical changes
affect both activation and deactivation processes, which suggests that RSS modulates a complex
excitatory/inhibitory balance across body-sites, SI sub-regions, and hemispheres.
RSS-induced changes within BA1
Within BA1 the native space analysis revealed an increase in PBR for right-D2, similar to
that observed in BA3b. Given the strong interconnectivity between SI sub-regions (Vogt and
Pandya, 1978; Burton and Fabri, 1995), this effect could arise from a transfer of the RSS-
216 | P a g e
induced effects from BA3b to BA1. But another possibility would be a direct effect of RSS on
BA1 via the thalamocortical projections reaching BA1 (Whitsel et al., 1978; Lin et al., 1979;
Nelson and Kaas, 1981). However, the positive linear correlation found between the changes
observed within BA3b and BA1 supports a transfer from BA3b to BA1. The slope of this
correlation further suggests that larger changes should occur within BA3b to get substantial
changes within BA1. Interestingly, this increased PBR for right-D2 was associated with a
significant decrease of the PBR evoked by stroking left-D2. This result suggests a transfer of the
RSS-induced effects to the other hemisphere (i.e., BA1), which is consistent with the
electrophysiological literature reporting more transcallosal connections between homologous
BA1 regions than between BA3b (Killackey et al., 1983; Manzoni et al., 1984; Iwamura, 2000;
Iwamura et al., 2001). The decrease in left-D2 PBR is also consistent with the increased activity
emerging within the ipsilateral BA3b (discussed above), and with the absence of threshold
changes at this fingertip. Together, these results are likely to reflect a homeostatic process that
counterbalances the RSS-induced increased response observed for right-D2, perhaps via indirect
interhemispheric inhibition. But the exact nature and interactions between homologous
representations within a given hemisphere remains to be clarified. Note that while a difference
between PBR volumes was also observed at baseline for left-D2 and right-D2, the same trend
was found within BA3b and BA2, suggesting general inter-hemispheric difference. In addition
to these PBR changes, the contralateral NBR elicited by thumb stroking increased following
RSS of right-D2. D1 being adjacent to the finger that underwent RSS, this increased NBR
within the contralateral hemisphere is likely to reflect an increased lateral inhibition (discussed
in the Negative BOLD distribution paragraph). But if this were the case then it should have also
been observed for right-D3, but there was only a tendency that did not reach significance. This
is likely due to the fact that the higher cortical magnification of the thumb and index fingers
means that their volumes represent a higher proportion of the total evoked activity, which makes
it easier to catch any changes.
In addition to these changes observed at the native space, RFX paired t-tests also revealed
an enhanced activity for both little fingers and a decreased activity (either decreased PBR or
increased NBR) for right-D1, all within their respective ipsilateral hemispheres. These
unexpected changes might reflect a “by-product” of the increased lateral inhibition suggested
above and of the increased ipsilateral activity observed for right-D2, though this possibility
awaits for further investigations. Here again, while this effect is likely to, an interpretation is
difficult and would be highly speculative.
217 | P a g e
To conclude, our results suggest that the RSS-induced effects reach BA1, likely through
BA3b, and reveal that in both BA1 and BA3b the pattern of changes for right-D2 is similar. Our
results also suggest the presence of some inhibition in BA1, both intra (right-D1) and
interhemispheric (mainly left-D2).
RSS-induced changes within BA2
While data from BA2 were not consistent enough to perform the native space analysis, RFX
analyses revealed no significant changes within this sub-region. However, this does not preclude
BA2 from being involved in the RSS-induced effects. Instead, the significant negative
correlation found between the RSS-induced changes for right-D2 BOLD signal and the
perceptual changes observed at left-Lip rather suggest the opposite. Two of the clusters were
localized within each BA2 sub-region, while the last one was assigned to right BA1. Altogether,
it is difficult to conclude about BA2’s role in RSS.
RSS-induced changes within BA3a
In addition to the three sub-regions described above, an increase in activity was also
observed within BA3a after RSS. This was observed for right-D2 within both hemispheres (with
8.3% of cluster2 and 100% of cluster4). While this result seems at first surprising, an emergence
of cutaneous responses in the hand representation of BA3a have been previously reported in
monkeys following training in tasks increasing tactile inputs (Recanzone et al., 1992c) or
sensorimotor skills (Xerri et al., 1998). While BA3a neurons are usually classified as “deep” in
origin because they respond specifically to inputs arising from muscle and joint spindles (Powell
and Mountcastle, 1959a), electrophysiological recordings have revealed sub-threshold responses
of BA3a neurons from cutaneous mechanoreceptors (Zarzecki and Wiggin, 1982; Zarzecki et
al., 1983; Kang et al., 1985), and cutaneous RFs are occasionally defined within BA3a (see
Tanji and Wise, 1981). Thus, RSS appears to also affect these neurons. This effect might be
linked to the previously reported RSS-induced haptic improvement (Kalisch et al., 2008, 2010;
Kowalewski et al., 2012). Indeed, the enhanced tactile acuity, associated with an enhanced
kinaesthesia, is likely to improve the integration of both object conformation hold by the fingers
and the finger/hand position, and movement to maintain fine grasping while performing arm
movements to end up with release of the object in a specific place (i.e., pegboard task).
218 | P a g e
RSS-induced changes within BA4a and PPC
While the previous analyses highlighted the contributions of SI sub-regions in the RSS-
induced cortical changes, some interesting hints about the implication of other cortical areas
arise from the whole-EPI analysis. Indeed, to the best our knowledge, this is the first evidence of
RSS-induced changes within BA4a and the posterior parietal cortex (PPC), including the
intraparietal sulcus (IPS) and the superior parietal lobule (SPL).
Even if primarily associated with the motor cortex, BA4a has been shown to be involved in
the processing of either purely somatosensory information, in case of complex tactile
stimulation such a moving pins (Terumitsu et al., 2009), or in haptic discrimination tasks (Geyer
et al., 1996; Eickhoff et al., 2005) involving somatosensory, proprioceptive and motor
processing. Regarding PPC, this region has been found to be activated in cases of complex
moving stimuli generating a texture sensation such as rubbing a sponge (Fabri et al., 1999,
2001), which is quite similar to the brushing used here for the fMRI mapping. The involvement
of SPL and IPS in tactile motion direction discrimination was also reported (Nakashita et al.,
2008). But occasionally, activation of PPC either ipsilateral (Del Gratta et al., 2000; Nihashi et
al., 2005) or contralateral (Forss et al., 1995; Mauguière et al., 1997) was found following
electrical stimulation. Previous studies have also implicated the superior parietal cortex in tactile
(and visual) spatial attention specifically when attention was focused close to the hands, in
peripersonal space (see Macaluso and Maravita, 2010 for a review), and in working memory
representations of actively explored tactile textures (Kaas et al., 2013b). Additionally, IPS and
SPL were found to be involved in macrospatial discrimination tasks such as the grating
orientation task, but also in microspatial spacing discrimination tasks resembling the 2PDT
(Sathian et al., 1997; Stoesz et al., 2003; Zhang et al., 2005). Still along these same lines, shape,
length and texture perception and discrimination were found to activate the anterior part of IPS
and SPL (Roland et al., 1998; Bodegård et al., 2001; Stoeckel et al., 2004). PPC was also
involved in two-point discrimination (Akatsuka et al., 2008). Thus the enhanced activity that we
report within BA4a and PPC following RSS of right-D2 appears to reveal changes in higher
order cortical areas, which may reflect or actually contribute to improved spatial discrimination
abilities following RSS. This seems to be confirmed by the negative correlations found between
the enhanced activity in bilateral PPC and both right-D2 and left-Lip acuity changes. In line
with this, the right posterior IPS was also found to be involved in tactile spatial discrimination
learning, within which the level of activity significantly predicted individual acuity thresholds
(Stilla et al., 2007).
219 | P a g e
Interestingly, although tactile stimuli were applied to the right hand of right-handed people,
the enhanced activity in PPC was found mainly in the right hemisphere. This may reflect right
cerebral hemisphere dominance. Similar right lateralization has been reported for tactile shape
perception (Sadato et al., 2000), somatosensory stimulation of different kinds (Coghill et al.,
2001; Hagen et al., 2002).
Conclusion
To conclude we found that three hours of RSS of right-D2 fingertip improved the spatial
acuity not only at this finger, but also at both sides of the upper-lip, while the acuity of left-D2
and right-D3 remained unchanged. In parallel with these behavioural effects, an expansion of
right-D2 response was found following RSS within the contralateral BA3b and BA1. In
addition, decreased contralateral PBRs were found for right-D3 and for left-D2 respectively
within the contralateral BA3b and BA1. Unexpectedly, we also report an enhanced contralateral
NBRs for the lips within BA3b, and for the thumbs within BA1. Interestingly, while no linear
correlation was found between PBR and NBR changes, the PBR changes observed within BA3b
and BA1 for right-D2 were positively correlated. Finally, exploration of the whole-EPI
following RFX Post-Pre contrasts revealed large clusters located within the anterior part of the
left primary motor cortex (BA4a) and the right intraparietal lobule and sulcus (IPL/IPS) for the
stimulated finger (right-D2), and BOLD changes within these regions covaried with the
perceptual threshold changes. Thus, in addition to replicating the well-established enlargement
of right-D2 representation, this study reports a differential contribution of SI sub-regions to
RSS-induced effects, and the possible involvement of higher-order cortical regions.
Furthermore, this study provides evidence for the existence of NBR evoked by lip stroking,
which in contrast to PBR, are co-localized with the hand PBR. This latter result asks for a
revision of the concepts of cortical “representations” and of their “borders”, the presence of
intermingled positive and negative responses making them more complex. Finally, this lip-
related NBR was modulated by RSS of the finger, suggesting the existence of remote cortical
effects of RSS, and further, that plastic changes observed across the hand-face border in the
literature could be related to modulations in NBR.
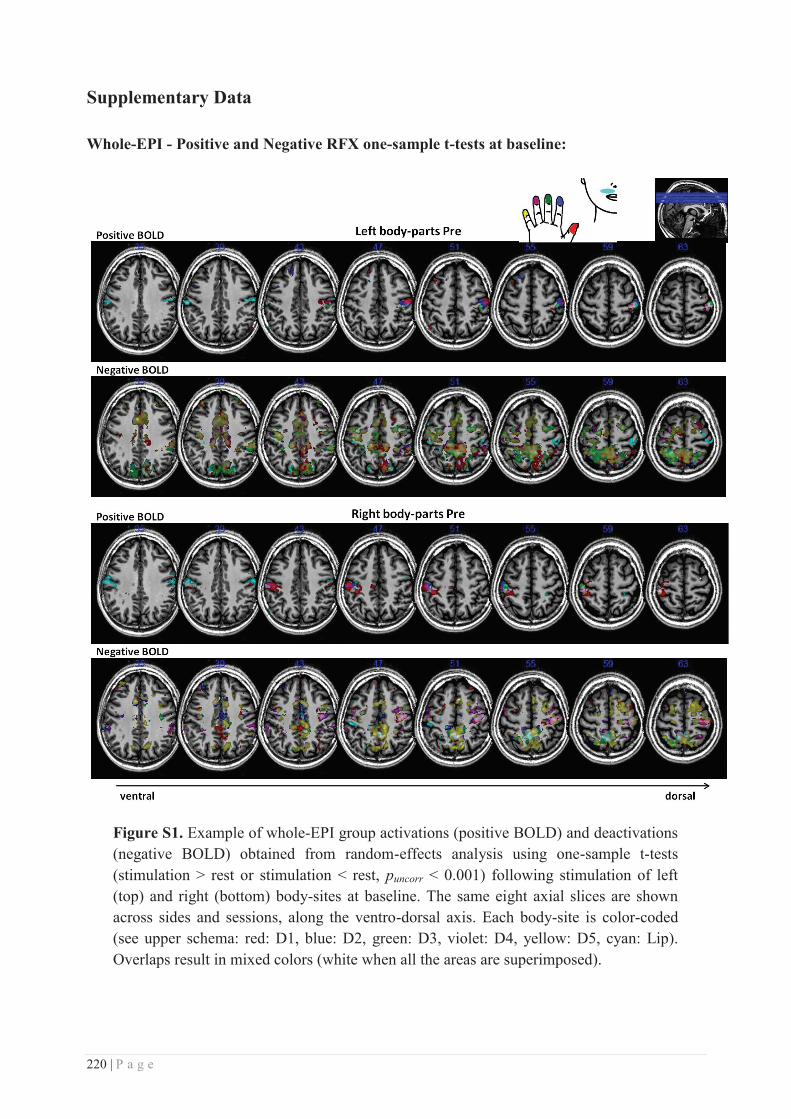
220 | P a g e
Supplementary Data
Whole-EPI - Positive and Negative RFX one-sample t-tests at baseline:
Figure S1. Example of whole-EPI group activations (positive BOLD) and deactivations (negative BOLD) obtained from random-effects analysis using one-sample t-tests (stimulation > rest or stimulation < rest, puncorr < 0.001) following stimulation of left (top) and right (bottom) body-sites at baseline. The same eight axial slices are shown across sides and sessions, along the ventro-dorsal axis. Each body-site is color-coded (see upper schema: red: D1, blue: D2, green: D3, violet: D4, yellow: D5, cyan: Lip). Overlaps result in mixed colors (white when all the areas are superimposed).
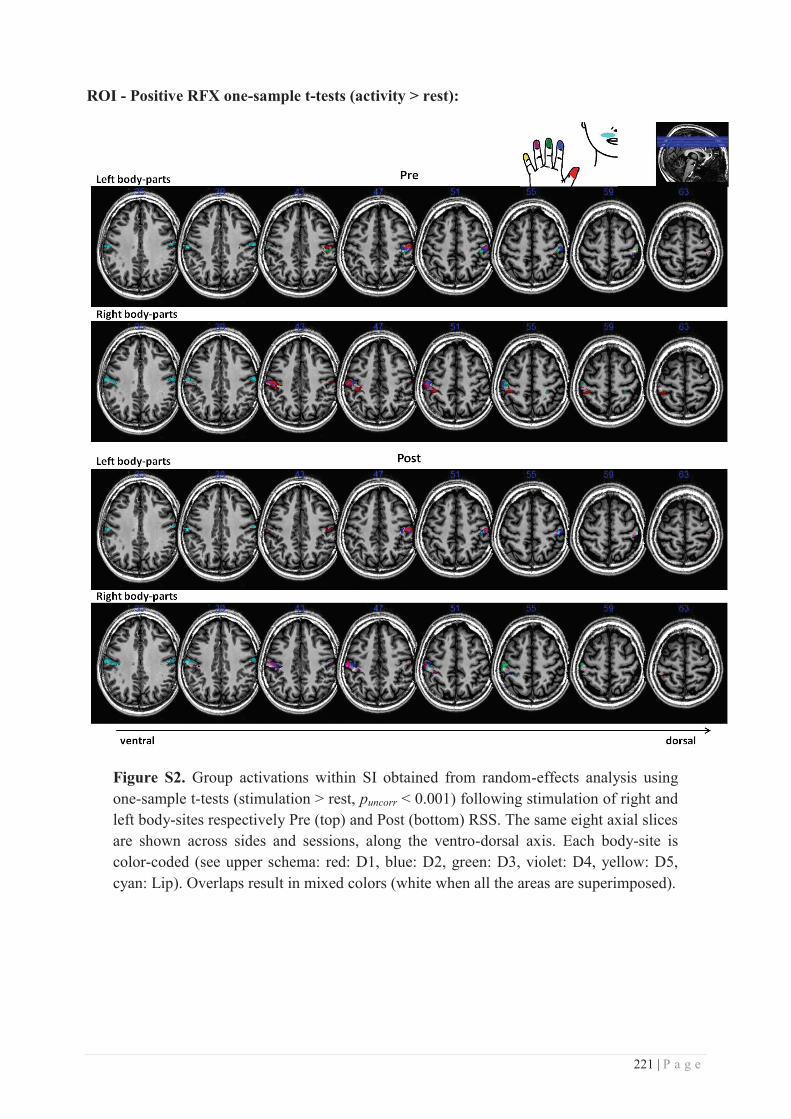
221 | P a g e
ROI - Positive RFX one-sample t-tests (activity > rest):
Figure S2. Group activations within SI obtained from random-effects analysis using one-sample t-tests (stimulation > rest, puncorr < 0.001) following stimulation of right and left body-sites respectively Pre (top) and Post (bottom) RSS. The same eight axial slices are shown across sides and sessions, along the ventro-dorsal axis. Each body-site is color-coded (see upper schema: red: D1, blue: D2, green: D3, violet: D4, yellow: D5, cyan: Lip). Overlaps result in mixed colors (white when all the areas are superimposed).
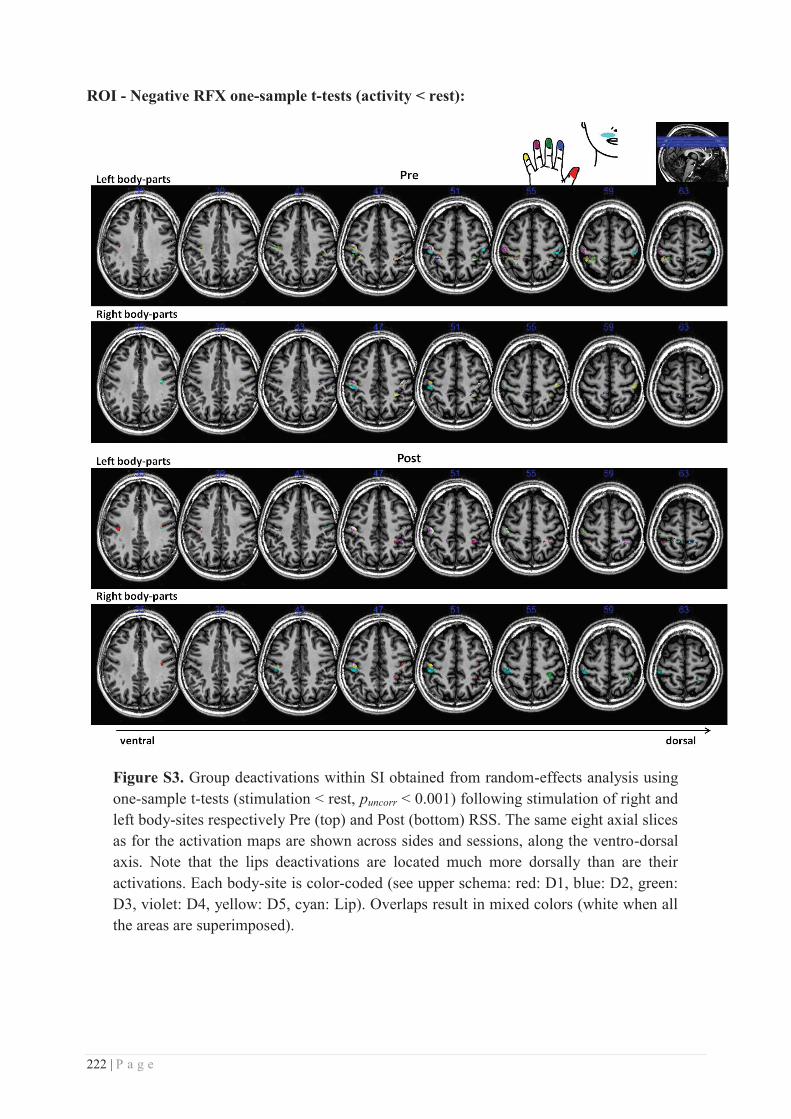
222 | P a g e
ROI - Negative RFX one-sample t-tests (activity < rest):
Figure S3. Group deactivations within SI obtained from random-effects analysis using one-sample t-tests (stimulation < rest, puncorr < 0.001) following stimulation of right and left body-sites respectively Pre (top) and Post (bottom) RSS. The same eight axial slices as for the activation maps are shown across sides and sessions, along the ventro-dorsal axis. Note that the lips deactivations are located much more dorsally than are their activations. Each body-site is color-coded (see upper schema: red: D1, blue: D2, green: D3, violet: D4, yellow: D5, cyan: Lip). Overlaps result in mixed colors (white when all the areas are superimposed).
223 | P a g e
References
Akatsuka K, Noguchi Y, Harada T, Sadato N, Kakigi R (2008) Neural codes for somatosensory two-point discrimination in inferior parietal lobule: An fMRI study. Neuroimage 40:852–858.
Arthurs O. J, Boniface S. J (2003) What aspect of the fMRI BOLD signal best reflects the underlying electrophysiology in human somatosensory cortex? Clin Neurophysiol 114:1203–1209.
Arthurs OJ, Donovan T, Spiegelhalter DJ, Pickard JD, Boniface SJ (2007) Intracortically distributed neurovascular coupling relationships within and between human somatosensory cortices. Cereb Cortex 17:661–668.
Bentley WJ, Li JM, Snyder AZ, Raichle ME, Snyder LH (2014) Oxygen level and LFP in task-positive and task-negative areas : bridging BOLD fMRI and electrophysiology. Cereb Cortex:1–12.
Besle J, Sánchez-Panchuelo R-M, Bowtell R, Francis S, Schluppeck D (2013) Event-related fMRI at 7T reveals overlapping cortical representations for adjacent fingertips in S1 of individual subjects. Hum Brain Mapp 35:2027–2043.
Beste C, Dinse HR (2013) Learning without training. Curr Biol 23:R489–R499.
Blankenburg F, Taskin B, Ruben J, Moosmann M, Ritter P, Curio G, Villringer A (2003) Imperceptible stimuli and sensory processing impediment. Science (80- ) 299:1864.
Blatow M, Nennig E, Durst A, Sartor K, Stippich C (2007) fMRI reflects functional connectivity of human somatosensory cortex. Neuroimage 37:927–936.
Bodegård A, Geyer S, Grefkes C, Zilles K, Roland PE (2001) Hierarchical processing of tactile shape in the human brain. Neuron 31:317–328.
Boorman L, Kennerley AJ, Johnston D, Jones M, Zheng Y, Redgrave P, Berwick J (2010) Negative blood oxygen level dependence in the rat: a model for investigating the role of suppression in neurovascular coupling. J Neurosci 30:4285–4294.
Bressler D, Spotswood N, Whitney D (2007) Negative BOLD fMRI response in the visual cortex carries precise stimulus-specific information. PLoS One 2.
Brookes M, Woolrich M, Luckhoo H, Price D, Hale, Stephenson M, Barnes G, Smith S, Morris P (2011) Investigating the electrophysiological basis of resting state networks using magnetoencephalography. PNAS 108:16783–16788.
Burton H, Fabri M (1995) Ipsilateral intracortical connections of physiologically defined cutaneous representations in areas 3b and 1 of macaque monkeys: projections in the vicinity of the central sulcus. J Comp Neurol 355:508–538.
Clark SA, Allard T, Jenkins WM, Merzenich MM (1988) Receptive fields in the body-surface map in adult cortex defined by temporally correlated inputs. Nature 332:444–445.
Coghill RC, Gilron I, Iadarola MJ (2001) Hemispheric lateralization of somatosensory processing. J Neurophysiol 85:2602–2612.
Craig JC, Johnson KO (2000) The Two-Point Threshold : Not a Measure of Tactile Spatial Resolution. Am Psychol Soc 9:29–32.
Davis KD, Kiss ZHT, Luo L, Tasker RR, Lozano AM, Dostrovsky JO (1998) Phantom sensations generated by thalamic microstimulation. Nature 391:385–387.
224 | P a g e
De Celis Alonso B, Lowe AS, Dear JP, Lee KC, Williams SCR, Finnerty GT (2008) Sensory inputs from whisking movements modify cortical whisker maps visualized with functional magnetic resonance imaging. Cereb Cortex 18:1314–1325.
Del Gratta C, Penna S Della, Tartaro A, Ferretti A, Torquati K, Bonomo L, Romani GL, Rossini PM (2000) Topographic organization of the human primary and secondary somatosensory areas. Neuroreport 11:2035–2043.
Derdikman D, Hildesheim R, Ahissar E, Arieli A, Grinvald A (2003) Imaging spatiotemporal dynamics of surround inhibition in the barrels somatosensory cortex. J Neurosci 23:3100–3105.
Devor A, Ulbert I, Dunn AK, Narayanan SN, Jones SR, Andermann ML, Boas D a, Dale AM (2005) Coupling of the cortical hemodynamic response to cortical and thalamic neuronal activity. PNAS 102:3822–3827.
Dinse HR, Kleibel N, Kalisch T, Ragert P, Wilimzig C, Tegenthoff M (2006) Tactile coactivation resets age-related decline of human tactile discrimination. Ann Neurol 60:88–94.
Dinse HR, Ragert P, Pleger B, Schwenkreis P, Tegenthoff M (2003) Pharmacological modulation of perceptual learning and associated cortical reorganization. Science 301:91–94.
Disbrow E a, Hinkley LBN, Roberts TPL (2003) Ipsilateral representation of oral structures in human anterior parietal somatosensory cortex and integration of inputs across the midline. J Comp Neurol 467:487–495.
Eickhoff SB, Grefkes C, Fink GR, Zilles K (2008) Functional lateralization of face, hand, and trunk representation in anatomically defined human somatosensory areas. Cereb cortex 18:2820–2830.
Eickhoff SB, Heim S, Zilles K, Amunts K (2006) Testing anatomically specified hypotheses in functional imaging using cytoarchitectonic maps. Neuroimage 32:570–582.
Eickhoff SB, Paus T, Caspers S, Grosbras M-H, Evans AC, Zilles K, Amunts K (2007) Assignment of functional activations to probabilistic cytoarchitectonic areas revisited. Neuroimage 36:511–521.
Eickhoff SB, Stephan KE, Mohlberg H, Grefkes C, Fink GR, Amunts K, Zilles K (2005) A new SPM toolbox for combining probabilistic cytoarchitectonic maps and functional imaging data. Neuroimage 25:1325–1335.
Elbert T, Pantev C, Wienbruch C, Rockstroh B, Taub E (1995) Increased cortical representation of the fingers of the left hand in string players. Science (80- ) 270:305–307.
Fabri M, Polonara G, Del Pesce M, Quattrini a, Salvolini U, Manzoni T (2001) Posterior corpus callosum and interhemispheric transfer of somatosensory information: an fMRI and neuropsychological study of a partially callosotomized patient. J Cogn Neurosci 13:1071–1079.
Fabri M, Polonara G, Quattrini A, Salvolini U, Del Pesce M, Manzoni T (1999) Role of the corpus callosum in the somatosensory activation of the ipsilateral cerebral cortex: An fMRI study of callosotomized patients. Eur J Neurosci 11:3983–3994.
Fang P, Jain N, Kaas JH (2002) Few intrinsic connections cross the hand-face border of area 3b of new world monkeys. J Comp Neurol 454:310–319.
Flor H, Elbert T, Knecht S, Wienbruch C, Pantev C, Birbaumer N, Larbig W, Taub E (1995) Phantom-limb pain as a perceptual correlate of cortical reorganization following arm amputation. Nature 375:482–484.
Forss N, Jousmäki V, Hari R (1995) Interaction between afferent input from fingers in human somatosensory cortex. Brain Res 685:68–76.
225 | P a g e
Fox MD, Snyder AZ, Vincent JL, Corbetta M, Van Essen DC, Raichle ME (2005) The human brain is intrinsically organized into dynamic, anticorrelated functional networks. PNAS 102:9673–9678.
Geyer S, Ledberg A, Schleicher A, Kinomura S, Schormann T, Bürgel U, Klingberg T, Larsson J, Zilles K, Roland PE (1996) Two different areas within the primary motor cortex of man. Nature 382:805–807.
Geyer S, Schleicher A, Zilles K (1999) Areas 3a, 3b, and 1 of human primary somatosensory cortex. Microstuctural organization and interindividual variability. Neuroimage 10:63–83.
Geyer S, Schormann T, Mohlberg H, Zilles K (2000) Areas 3a, 3b, and 1 of human primary somatosensory cortex. Spatial normalization to standard anatomical space. Neuroimage 11:684–696.
Gibson JR, Beierlein M, Connors BW (1999) Two networks of electrically coupled inhibitory neurons in neocortex. Nature 402:75–79.
Godde B, Ehrhardt J, Braun C (2003) Behavioral significance of input-dependent plasticity of human somatosensory cortex. Neuroreport 14:543–546.
Godde B, Stauffenberg B, Spengler F, Dinse HR (2000) Tactile coactivation-induced changes in spatial discrimination performance. J Neurosci 20:1597–1604.
Goloshevsky AG, Silva AC, Dodd SJ, Koretsky AP (2008) BOLD fMRI and somatosensory evoked potentials are well correlated over a broad range of frequency content of somatosensory stimulation of the rat forepaw. Brain Res 1195:67–76.
Grefkes C, Geyer S, Schormann T, Roland P, Zilles K (2001) Human somatosensory area 2: observer-independent cytoarchitectonic mapping, interindividual variability, and population map. Neuroimage 14:617–631.
Greicius MD, Krasnow B, Reiss AL, Menon V (2003) Functional connectivity in the resting brain: a network analysis of the default mode hypothesis. PNAS 100:253–258.
Hagen MC, Zald DH, Thornton T a, Pardo J V (2002) Somatosensory processing in the human inferior prefrontal cortex. J Neurophysiol 88:1400–1406.
Hansson T, Brismar T (1999) Tactile stimulation of the hand causes bilateral cortical activation: a functional magnetic resonance study in humans. Neurosci Lett 271:29–32.
Harel N, Lee S-P, Nagaoka T, Kim D-S, Kim S-G (2002) Origin of negative blood oxygenation level-dependent fMRI signals. J Cereb blood flow Metab 22:908–917.
Harrar V, Spence C, Makin TR (2014) Topographic generalization of tactile perceptual learning. J Exp Psychol Hum Percept Perform 40:15–23.
Harris JA, Harris IM, Diamond ME (2001) The topography of tactile learning in humans. J Neurosci 21:1056–1061.
Hlushchuk Y, Hari R (2006) Transient suppression of ipsilateral primary somatosensory cortex during tactile finger stimulation. J Neurosci 26:5819–5824.
Hodzic A, Veit R, Karim AA, Erb M, Godde B (2004) Improvement and decline in tactile discrimination behavior after cortical plasticity induced by passive tactile coactivation. J Neurosci 24:442–446.
Hoshiyama M, Ryusuke K, Koyama S, Kitamura Y, Shimojo M, Watanabe S, Kakigi R (1996) Somatosensory evoked magnetic fields following stimulation of the lip in humans. Electroencephalogr Clin Neurophysiol 100:96–104.
226 | P a g e
Hu K-S, Kwak J, Koh K-S, Abe S, Fontaine C, Kim H-J (2007) Topographic distribution area of the infraorbital nerve. Surg Radiol Anat 29:383–388.
Huttunen JK, Gröhn O, Penttonen M (2008) Coupling between simultaneously recorded BOLD response and neuronal activity in the rat somatosensory cortex. Neuroimage 39:775–785.
Iwamura Y (2000) Bilateral receptive field neurons and callosal connections in the somatosensory cortex. Philos Trans R Soc Lond B Biol Sci 355:267–273.
Iwamura Y, Iriki A, Tanaka M (1994) Bilateral hand representation in the postcentral somatosensory cortex. Nature 369:554–556.
Iwamura Y, Taoka M, Iriki A (2001) Bilateral activity and callosal connections in the somatosensory cortex. Neurosci 7:419–429.
Johnson KO, Phillips JR (1981) Tactile spatial resolution. I. Two-point discrimination, gap detection, grating resolution, and letter recognition. J Neurophysiol 46:1177–1192.
Kaas AL, van Mier H, Visser M, Goebel R (2013) The neural substrate for working memory of tactile surface texture. Hum Brain Mapp 34:1148–1162.
Kalisch T, Tegenthoff M, Dinse HR (2007) Differential effects of synchronous and asynchronous multifinger coactivation on human tactile performance. BMC Neurosci 8:58.
Kalisch T, Tegenthoff M, Dinse HR (2008) Improvement of sensorimotor functions in old age by passive sensory stimulation. Clin Interv Aging 3:673–690.
Kalisch T, Tegenthoff M, Dinse HR (2010) Repetitive electric stimulation elicits enduring improvement of sensorimotor performance in seniors. Neural Plast 2010:690531.
Kang R, Herman D, MacGillis M, Zarzecki P (1985) Convergence of sensory inputs in somatosensory cortex: interactions from separate afferent sources. Exp brain Res 57:271–278.
Kannurpatti SS, Biswal BB (2004) Negative functional response to sensory stimulation and its origins. J Cereb blood flow Metab 24:703–712.
Kastrup A, Baudewig J, Schnaudigel S, Huonker R, Becker L, Sohns JM, Dechent P, Klingner C, Witte OW (2008) Behavioral correlates of negative BOLD signal changes in the primary somatosensory cortex. Neuroimage 41:1364–1371.
Kennerley AJ, Mayhew JE, Boorman L, Zheng Y, Berwick J (2012) Is optical imaging spectroscopy a viable measurement technique for the investigation of the negative BOLD phenomenon? A concurrent optical imaging spectroscopy and fMRI study at high field (7 T). Neuroimage 61:10–20.
Killackey HP, Gould HJ, Cusick CG, Pons TP, Kaas JH (1983) The relation of corpus callosum connections to architectonic fields and body surface maps in sensorimotor cortex of new and old world monkeys. J Comp Neurol 219:384–419.
Kim S-G, Ogawa S (2012) Biophysical and physiological origins of blood oxygenation level-dependent fMRI signals. J Cereb Blood Flow Metab 32:1188–1206.
Klingner CM, Hasler C, Brodoehl S, Witte OW (2010) Dependence of the negative BOLD response on somatosensory stimulus intensity. Neuroimage 53:189–195.
Klingner CM, Hasler C, Brodoehl S, Witte OW (2014) Excitatory and inhibitory mechanisms underlying somatosensory habituation. Hum Brain Mapp 35:152–160.
227 | P a g e
Klingner CM, Huonker R, Flemming S, Hasler C, Brodoehl S, Preul C, Burmeister H, Kastrup A, Witte OW (2011) Functional deactivations: multiple ipsilateral brain areas engaged in the processing of somatosensory information. Hum Brain Mapp 32:127–140.
Kopietz R, Sakar V, Albrecht J, Kleemann AM, Schöpf V, Yousry I, Linn J, Fesl G, Wiesmann M (2009) Activation of primary and secondary somatosensory regions following tactile stimulation of the face. Clin Neuroradiol 19:135–144.
Kowalewski R, Kattenstroth J, Kalisch T, Dinse HR (2012) Improved acuity and dexterity but unchanged touch and pain thresholds following repetitive sensory stimulation of the fingers. Neural Plast 2012.
Krause T, Kurth R, Ruben J, Schwiemann J, Villringer K, Deuchert M, Moosmann M, Brandt S, Wolf K-J, Curio G, Villringer A (2001) Representational overlap of adjacent fingers in multiple areas of human primary somatosensory cortex depends on electrical stimulus intensity: an fMRI study. Brain Res 899:36–46.
Kurth R, Villringer K, Curio G, Wolf K-J, Krause T, Repenthin J, Schwiemann J, Deuchert M, Villringer A (2000) fMRI shows multiple somatotopic digit representations in human primary somatosensory cortex. Neuroreport 11:1487–1491.
Lin C-CK, Sun Y, Huang C-I, Yu C-Y, Ju M-S (2010) Cortical activation by tactile stimulation to face and anterior neck areas: an fMRI study with three analytic methods. Hum Brain Mapp 31:1876–1885.
Lin CS, Merzenich MM, Sur M, Kaas JH (1979) Connections of areas 3b and 1 of the parietal somatosensory strip with the ventroposterior nucleus in the owl monkey (Aotus trivirgatus). J Comp Neurol 185:355–372.
Lipton ML, Fu K-MG, Branch C a, Schroeder CE (2006) Ipsilateral hand input to area 3b revealed by converging hemodynamic and electrophysiological analyses in macaque monkeys. J Neurosci 26:180–185.
Logothetis NK, Pauls J, Augath M, Trinath T, Oeltermann A (2001) Neurophysiological investigation of the basis of the fMRI signal. Nature 412:150–157.
Macaluso E, Maravita A (2010) The representation of space near the body through touch and vision. Neuropsychologia 48:782–795.
Makin TR, Scholz J, Filippini N, Henderson Slater D, Tracey I, Johansen-Berg H (2013) Phantom pain is associated with preserved structure and function in the former hand area. Nat Commun 4:1–8.
Maldjian JA, Gottschalk A, Patel RS, Detre JA, Alsop DC (1999) The sensory somatotopic map of the human hand demonstrated at 4 Tesla. Neuroimage 10:55–62.
Malinen S, Renvall V, Hari R (2014) Functional parcellation of the human primary somatosensory cortex to natural touch. Eur J Neurosci 39:738–743.
Manger PR, Woods TM, Jones EG (1996) Representation of face and intra-oral structures in area 3b of macaque monkey somatosensory cortex. J Comp Neurol 371:513–521.
Manzoni T, Barbaresi P, Conti F (1984) Callosal mechanism for the interhemispheric transfer of hand somatosensory information in the monkey. Behav Brain Res 11:155–170.
Martuzzi R, van der Zwaag W, Farthouat J, Gruetter R, Blanke O (2014) Human finger somatotopy in areas 3b, 1, and 2: A 7T fMRI study using a natural stimulus. Hum Brain Mapp 35:213–226.
Mauguière F, Merlet I, Forss N, Vanni S, Jousmäki V, Adeleine P, Hari R (1997) Activation of a distributed somatosensory cortical network in the human brain. A dipole modelling study of
228 | P a g e
magnetic fields evoked by median nerve stimulation. Part I: Location and activation timing of SEF sources. Electroencephalogr Clin Neurophysiol 104:281–289.
Miyamoto JJ, Honda M, Saito DN, Okada T, Ono T, Ohyama K, Sadato N (2006) The representation of the human oral area in the somatosensory cortex: a functional MRI study. Cereb cortex 16:669–675.
Mullinger KJ, Mayhew SD, Bagshaw a P, Bowtell R, Francis ST (2014) Evidence that the negative BOLD response is neuronal in origin: a simultaneous EEG-BOLD-CBF study in humans. Neuroimage 94:263–274.
Muret D, Dinse HR, Macchione S, Urquizar C, Farnè A, Reilly KT (2014) Touch improvement at the hand transfers to the face. Curr Biol 24:R736–R737.
Nagamatsu K, Nakasato N, Hatanaka K, Kanno A, Iwasaki M, Yoshimoto T, Nakasato CAN (2000) Neuromagnetic localization of N15, the initial cortical response to lip stimulus. Neuroreport 12:1–5.
Nakamura A, Yamada T, Goto A, Kato T, Ito K, Abe Y, Kachi T, Kakigi R (1998) Somatosensory homunculus as drawn by MEG. Neuroimage 7:377–386.
Nakashita S, Saito DN, Kochiyama T, Honda M, Tanabe HC, Sadato N (2008) Tactile-visual integration in the posterior parietal cortex: a functional magnetic resonance imaging study. Brain Res Bull 75:513–525.
Nash PG, MacEfield VG, Klineberg IJ, Gustin SM, Murray GM, Henderson L a. (2010) Bilateral activation of the trigeminothalamic tract by acute orofacial cutaneous and muscle pain in humans. Pain 151:384–393.
Négyessy L, Pálfi E, Ashaber M, Palmer C, Jákli B, Friedman RM, Chen LM, Roe AW (2013) Intrinsic horizontal connections process global tactile features in the primary somatosensory cortex: neuroanatomical evidence. J Comp Neurol 521:2798–2817.
Nelson RJ, Kaas JH (1981) Connections of the ventroposterior nucleus of the thalamus with the body surface representations in cortical areas 3b and 1 of the cynomolgus macaque , (Maca ca fascicularis). J Comp Neurol 199:29–64.
Nevalainen P, Ramstad R, Isotalo E, Haapanen M-L, Lauronen L (2006) Trigeminal somatosensory evoked magnetic fields to tactile stimulation. Clin Neurophysiol 117:2007–2015.
Nicolelis M a. ., Ghazanfar A a, Faggin BM, Votaw S, Oliveira LM. (1997) Reconstructing the engram: simultaneous, multisite, many single neuron recordings. Neuron 18:529–537.
Nihashi T, Naganawa S, Sato C, Kawai H, Nakamura T, Fukatsu H, Ishigaki T, Aoki I (2005) Contralateral and ipsilateral responses in primary somatosensory cortex following electrical median nerve stimulation--an fMRI study. Clin Neurophysiol 116:842–848.
Oldfield RC (1971) The assessment and analysis of handedness: the Edinburgh inventory. Neuropsychologia 9:97–113.
Parianen Lesemann FH, Reuter E-M, Godde B (2015) Tactile stimulation interventions: Influence of stimulation parameters on sensorimotor behavior and neurophysiological correlates in healthy and clinical samples. Neurosci Biobehav Rev 51:126–137.
Pascual-Leone A, Torres F (1993) Plasticity of the sensorimotor cortex representation of the reading finger in Braille readers. Brain 116:39–52.
Passow S, Specht K, Adamsen TC, Biermann M, Brekke N, Craven AR, Ersland L, Grüner R, Kleven-Madsen N, Kvernenes O-H, Schwarzlmüller T, Olesen RA, Hugdahl K (2015) Default-mode network functional connectivity is closely related to metabolic activity. Hum Brain Mapp.
229 | P a g e
Penfield W, Rasmussen T (1950) The cerebral cortex of man: a clinical study of localization of function. New York Macmillan Compagny.
Pleger B, Dinse HR, Ragert P, Schwenkreis P, Malin JP, Tegenthoff M (2001) Shifts in cortical representations predict human discrimination improvement. Proc Natl Acad Sci USA 98:12255–12260.
Pleger B, Foerster A-F, Ragert P, Dinse HR, Schwenkreis P, Malin J-P, Nicolas V, Tegenthoff M (2003) Functional imaging of perceptual learning in human primary and secondary somatosensory cortex. Neuron 40:643–653.
Pons TP, Garraghty PE, Ommaya AK, Kaas JH, Taub E, Mishkin M (1991) Massive cortical reorganization after sensory deafferentation in adult macaques. Science 252:1857–1860.
Powell TPS, Mountcastle VB (1959) Some aspects of the functional organization of the cortex of the postcentral gyrus of the monkey: a correlation of findings obtained in a single unit analysis with cytoarchitecture. Bull Johns Hopkins Hosp 105:133–162.
Raichle ME, MacLeod a M, Snyder a Z, Powers WJ, Gusnard D a, Shulman GL (2001) A default mode of brain function. PNAS 98:676–682.
Ramirez A, Pnevmatikakis E a, Merel J, Paninski L, Miller KD, Bruno RM (2014) Spatiotemporal receptive fields of barrel cortex revealed by reverse correlation of synaptic input. Nat Neurosci 17:866–875.
Recanzone GH, Jenkins WM, Hradek GT, Merzenich MM (1992a) Progressive improvement in discriminative abilities in adult owl monkeys performing a tactile frequency discrimination task. J Neurophysiol 67:1015–1030.
Recanzone GH, Merzenich MM, Jenkins WM (1992b) Frequency discrimination training engaging a restricted skin surface results in an emergence of a cutaneous response zone in cortical area 3a. J Neurophysiol 67:1057–1070.
Recanzone GH, Merzenich MM, Jenkins WM, Grajski K a, Dinse HR (1992c) Topographic reorganization of the hand representation in cortical area 3b owl monkeys trained in a frequency-discrimination task. J Neurophysiol 67:1031–1056.
Roland PE, O’Sullivan B, Kawashima R (1998) Shape and roughness activate different somatosensory areas in the human brain. PNAS 95:3295–3300.
Rosa MJ, Kilner J, Blankenburg F, Josephs O, Penny W (2010) Estimating the transfer function from neuronal activity to BOLD using simultaneous EEG-fMRI. Neuroimage 49:1496–1509.
Sadato N, Ibañez V, Deiber MP, Hallett M (2000) Gender difference in premotor activity during active tactile discrimination. Neuroimage 11:532–540.
Sánchez-Panchuelo R-M, Besle J, Beckett A, Bowtell R, Schluppeck D, Francis S, Sanchez-panchuelo RM (2012) Within-digit functional parcellation of Brodmann areas of the human primary somatosensory cortex using functional magnetic resonance imaging at 7 tesla. J Neurosci 32:15815–15822.
Sathian K, Zangaladze A (1997) Tactile learning is task specific but transfers between fingers. Percept Psychophys 59:119–128.
Sathian K, Zangaladze A (1998) Perceptual learning in tactile hyperacuity : complete intermanual transfer but limited retention. Exp Brain Res 118:131–134.
230 | P a g e
Sathian K, Zangaladze C a a, Hoffman JM, Grafton ST (1997) Feeling with the mind ’ s eye. Neuroreport 8:3877–3881.
Schäfer K, Blankenburg F, Kupers R, Grüner JM, Law I, Lauritzen M, Larsson HBW (2012) Negative BOLD signal changes in ipsilateral primary somatosensory cortex are associated with perfusion decreases and behavioral evidence for functional inhibition. Neuroimage 59:3119–3127.
Schnitzler A, Salmelin R, Salenius S, Jousm V, Hari R (1995) Tactile information from the human hand reaches the ipsilateral primary somatosensory cortex. Neurosci Lett 200:25–28.
Shibasaki H (2008) Human brain mapping: Hemodynamic response and electrophysiology. Clin Neurophysiol 119:731–743.
Shmuel A, Augath M, Oeltermann A, Logothetis NK (2006) Negative functional MRI response correlates with decreases in neuronal activity in monkey visual area V1. Nat Neurosci 9:569–577.
Shmuel A, Yacoub E, Pfeuffer J, Van de Moortele PF, Adriany G, Hu X, Ugurbil K (2002) Sustained negative BOLD, blood flow and oxygen consumption response and its coupling to the positive response in the human brain. Neuron 36:1195–1210.
Shoham D, Grinvald A (2001) The cortical representation of the hand in macaque and human area S-I: high resolution optical imaging. J Neurosci 21:6820–6835.
Simões C, Mertens M, Forss N, Jousmäki V, Lange J, Lütkenhöner B, Hari R (2001) Functional overlap of finger representations in human SI and SII cortices. J Neurophysiol 86:1661–1665.
Sloan HL, Austin VC, Blamire a. M, Schnupp JWH, Lowe a. S, Allers K a., Matthews PM, Sibson NR (2010) Regional differences in neurovascular coupling in rat brain as determined by fMRI and electrophysiology. Neuroimage 53:399–411.
Smits E, Gordon DC, Witte S, Rasmusson DD, Zarzecki P (1991) Synaptic potentials evoked by convergent somatosensory and corticocortical inputs in raccoon somatosensory cortex : substrates for plasticity. J Neurophysiol 66:688–695.
Stavrinou ML, Penna S Della, Pizzella V, Torquati K, Cianflone F, Franciotti R, Bezerianos A, Romani GL, Rossini PM (2007) Temporal dynamics of plastic changes in human primary somatosensory cortex after finger webbing. Cereb Cortex 17:2134–2142.
Sterr A, Müller MM, Elbert T, Rockstroh B, Pantev C, Taub E (1998) Perceptual correlates of changes in cortical representation of fingers in blind multifinger Braille readers. J Neurosci 18:4417–4423.
Stilla R, Deshpande G, LaConte S, Hu X, Sathian K (2007) Posteromedial parietal cortical activity and inputs predict tactile spatial acuity. J Neurosci 27:11091–11102.
Stippich C, Hofmann R, Kapfer D, Hempel E, Heiland S, Jansen O, Sartor K (1999) Somatotopic mapping of the human primary somatosensory cortex by fully automated tactile stimulation using functional magnetic resonance imaging. Neurosci Lett 277:25–28.
Stoeckel MC, Pollok B, Schnitzler A, Witte OW, Seitz RJ (2004) Use-dependent cortical plasticity in thalidomide-induced upper extremity dysplasia: Evidence from somaesthesia and neuroimaging. Exp Brain Res 156:333–341.
Stoesz MR, Zhang M, Weisser VD, Prather SC, Mao H, Sathian K (2003) Neural networks active during tactile form perception: common and differential activity during macrospatial and microspatial tasks. Int J Psychophysiol 50:41–49.
Stringer EA, Chen LM, Friedman RM, Gatenby C, Gore JC (2011) Differentiation of somatosensory cortices by high-resolution fMRI at 7 T. Neuroimage 54:1012–1020.
231 | P a g e
Sutherland MT, Tang AC (2006) Reliable detection of bilateral activation in human primary somatosensory cortex by unilateral median nerve stimulation. Neuroimage 33:1042–1054.
Sutherling WW, Levesque MF, Baumgartner C (1992) Cortical sensory representation of the human hand: size of finger regions and nonoverlapping digit somatotopy. Neurology 42:1020–1028.
Suzuki T, Shibukawa Y, Kumai T, Shintani M (2004) Face area representation of primary somatosensory cortex in humans identified by whole-head magnetoencephalography. Jpn J Physiol 54:161–169.
Swadlow H a (2003) Fast-spike interneurons and feedforward inhibition in awake sensory neocortex. Cereb Cortex 13:25–32.
Tanji J, Wise SP (1981) Submodality distribution in sensorimotor cortex of the unanesthetized monkey. J Neurophysiol 45:467–481.
Taoka M, Toda T, Iriki a., Tanaka M, Iwamura Y (2000) Bilateral receptive field neurons in the hindlimb region of the postcentral somatosensory cortex in awake macaque monkeys. Exp Brain Res 134:139–146.
Taylor KS, Davis KD (2009) Stability of tactile- and pain-related fMRI brain activations: An examination of threshold-dependent and threshold-independent methods. Hum Brain Mapp 30:1947–1962.
Terumitsu M, Ikeda K, Kwee IL, Nakada T (2009) Participation of primary motor cortex area 4a in complex sensory processing: 3.0-T fMRI study. Neuroreport 20:679–683.
Tremere L, Hicks TP, Rasmusson DD (2001) Role of inhibition in cortical reorganization of the adult raccoon revealed by microiontophoretic blockade of GABA A receptors. J Neurophysiol 86:94–103.
Van der Zwaag W, Kusters R, Magill A, Gruetter R, Martuzzi R, Blanke O, Marques JP (2013) Digit somatotopy in the human cerebellum: a 7T fMRI study. Neuroimage 67:354–362.
Vanzetta I, Grinvald A (2008) Coupling between neuronal activity and microcirculation: implications for functional brain imaging. HFSP J 2:79–98.
Vogt B a, Pandya DN (1978) Cortico-cortical connections of somatic sensory cortex (areas 3, 1 and 2) in the rhesus monkey. J Comp Neurol 177:179–191.
Wade AR, Rowland J (2010) Early suppressive mechanisms and the negative blood oxygenation level-dependent response in human visual cortex. J Neurosci 30:5008–5019.
Wang X, Merzenich MM, Sameshima K, Jenkins WM (1995) Remodelling of hand representation in adult cortex determined by timing of tactile stimulation. Nature 378:71–75.
Weiss T, Miltner WHR, Liepert J, Meissner W, Taub E (2004) Rapid functional plasticity in the primary somatomotor cortex and perceptual changes after nerve block. Eur J Neurosci 20:3413–3423.
Whitsel BL, Rustioni A, Dreyer D a, Loe PR, Allen EE, Metz CB (1978) Thalamic projections to SI in macaque monkey. J Comp Neurol 178:385–410.
Xerri C, Merzenich MM, Peterson BE, Jenkins W (1998) Plasticity of primary somatosensory cortex paralleling sensorimotor skill recovery from stroke in adult monkeys. J Neurophysiol 79:2119–2148.
Zamorano AM, Riquelme I, Kleber B, Altenmüller E, Hatem SM, Montoya P (2015) Pain sensitivity and tactile spatial acuity are altered in healthy musicians as in chronic pain patients. Front Hum Neurosci 8:1–9.
232 | P a g e
Zarei M, Stephenson JD (1996) Ipsilateral and bilateral receptive fields in rat primary somatosensory cortex. Neuroreport 7:647–651.
Zarzecki P, Blum PS, Bakker DA, Herman D (1983) Convergence of sensoru inputs upon projection neurons of somatosensory cortex: vestibular, neck, head, and forelimb inputs. Exp brain Res 50:408–414.
Zarzecki P, Wiggin DM (1982) Convergence of sensory inputs upon projection neurons of somatosensory cortex. Exp brain Res 48:28–42.
Zeharia N, Hertz U, Flash T, Amedi A (2012) Negative blood oxygenation level dependent homunculus and somatotopic information in primary motor cortex and supplementary motor area. PNAS 109:18565–18570.
Zhang M, Mariola E, Stilla R, Stoesz M, Mao H, Hu X, Sathian K (2005) Tactile discrimination of grating orientation: fMRI activation patterns. Hum Brain Mapp 25:370–377.
233 | P a g e
STUDY 3: MEG STUDY
MEG is another functional neuroimaging technique whose use has been considerably rising
since the late 1990s. The increasing interest for this technique arises from several features of
MEG. First, unlike fMRI, MEG provides a direct measure of brain activity as it measures the
magnetic fields generated by the currents arising from neuronal activity. In addition, MEG also
has a higher temporal resolution, events with time scales on the order of milliseconds being
resolved. Even if slightly below than that of fMRI, the spatial resolution of MEG is still
excellent, sources can be localized with millimetre precision. This makes MEG highly
complementary to fMRI, which has a higher spatial resolution but a pretty low temporal
resolution.
Despite the fact that MEG was described earlier than fMRI, the first measure having been
done by the physicist David Cohen in 1968 (Cohen, 1968), MEG has long been less popular
than fMRI, likely due to the higher complexity of the signals and of the algorithms required to
analyze it. David Cohen later used the first superconducting sensor (or SQUID, superconducting
quantum interference devices) to improve MEG signal measurement (Cohen, 1972). This was
cumbersome, and, in the 80s, MEG manufacturers began to arrange multiple sensors into arrays
to cover a larger area of the head. Present-day MEG arrays are set in helmet-shaped dewar that
typically contain 300 sensors, covering most of the head. In this way, MEGs of a subject or
patient can now be accumulated rapidly and efficiently.
Magnetic fields are generated by current flows, which in the brain originate primarily from
intracellular currents flowing from the dendrites to the soma. Since current dipoles must have
similar orientations to generate magnetic fields that reinforce each other, it is often the layer of
pyramidal cells, which are situated perpendicular to the cortical surface, which gives rise to
measurable magnetic fields. To generate a signal that is detectable, approximately 50,000 active
neurons are needed (Okada, 1983). Despite the fact that magnetic fields pass unaffected trough
brain tissue and the skull, making it possible to be recorded outside of the head, these fields are
extremely small. To account for this, MEG signals are typically recorded by superconducting
sensors within a shielded room to eliminate the magnetic interference found in a typical urban
environment. Given that magnetic fields are orthogonally oriented relatively to the current flow
(Maxwell's equations), only the activity of neurons that are orientated tangentially to the scalp
surface project measurable portions of their magnetic fields outside of the head, thus measurable
with MEG sensors (see Figure 47). This limitation of MEG makes it sensitive mainly to neurons
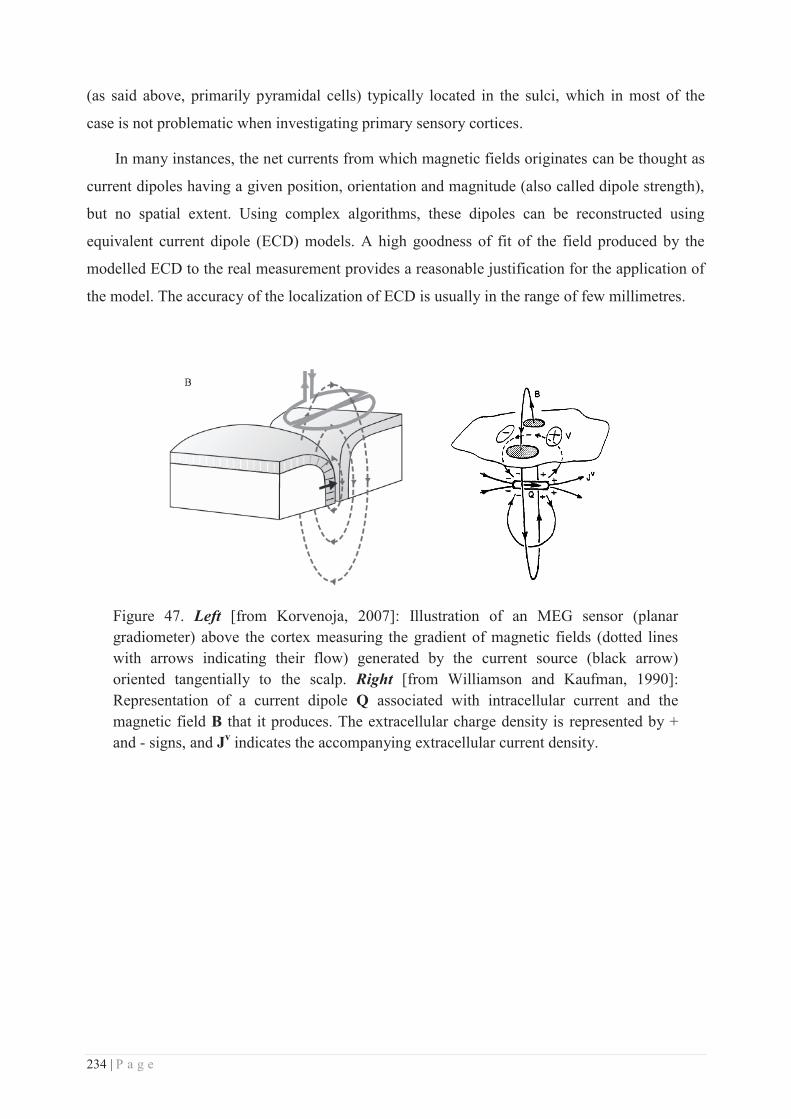
234 | P a g e
(as said above, primarily pyramidal cells) typically located in the sulci, which in most of the
case is not problematic when investigating primary sensory cortices.
In many instances, the net currents from which magnetic fields originates can be thought as
current dipoles having a given position, orientation and magnitude (also called dipole strength),
but no spatial extent. Using complex algorithms, these dipoles can be reconstructed using
equivalent current dipole (ECD) models. A high goodness of fit of the field produced by the
modelled ECD to the real measurement provides a reasonable justification for the application of
the model. The accuracy of the localization of ECD is usually in the range of few millimetres.
Figure 47. Left [from Korvenoja, 2007]: Illustration of an MEG sensor (planar gradiometer) above the cortex measuring the gradient of magnetic fields (dotted lines with arrows indicating their flow) generated by the current source (black arrow) oriented tangentially to the scalp. Right [from Williamson and Kaufman, 1990]: Representation of a current dipole Q associated with intracellular current and the magnetic field B that it produces. The extracellular charge density is represented by + and - signs, and Jv indicates the accompanying extracellular current density.
235 | P a g e
Neuromagnetic correlates of an adaptive plasticity across the hand-
face border in human somatosensory cortices
Dollyane Muret1,2*, Sébastien Daligault3, Hubert R. Dinse4,5, Claude Delpuech3, Jérémie
Mattout6, Karen T. Reilly1,2, Alessandro Farnè1,2.
1 INSERM U1028, CNRS UMR5292, Lyon Neuroscience Research Centre, Integrative, Multisensory,
Perception, Action and Cognition (ImpAct) Team, Lyon, France;
2 University Claude Bernard Lyon I, Lyon, France; 3 CERMEP, MEG Department, Bron, France;
4 Neural Plasticity Laboratory, Institute for Neuroinformatics, Ruhr-University;
5 Clinic of Neurology, BG University Hospital Bergmannsheil, Bochum, Germany;
6 INSERM U1028, CNRS UMR5292, Lyon Neuroscience Research Centre, Brain Dynamics and
Cognition (Dycog) Team, Lyon, France.
* E-mail: [email protected]
236 | P a g e
Abstract
It is well established that permanent or transient reduction of somatosensory inputs
(following deafferentation or anaesthesia) induces plastic changes across the hand-face border.
Whether such cross-border changes can be induced by increasing rather than decreasing afferent
inputs remains poorly understood. We recently found that a repetitive somatosensory
stimulation (RSS) at a fingertip, which is known to induce a local training-independent learning
paralleled by local plastic changes within the primary somatosensory cortex (see Beste & Dinse,
2013), induces plastic changes and a similar perceptual learning across the hand-face border,
altering the face representation (Muret et al., in preparation) and perception (Muret et al., 2014).
Here we used magnetoencephalography to provide a complementary view over the mechanisms
underlying RSS-induced cortical reorganization across the hand-face border, by investigating its
electrophysiological correlates. We report significant changes in dipole location after RSS, both
for the stimulated finger and for the lips. These results confirm the presence of plastic changes
crossing the hand-face border following an increase of inputs.
237 | P a g e
Introduction
Most of our knowledge about large-scale somatosensory plasticity comes from cases of
permanent or transient reduction of inputs. In particular, massive cortical reorganization has
been repeatedly observed across the face-hand border, with the representation of the face
expanding and shifting towards that of the deprived hand (Pons et al., 1991; Jain et al., 1997;
Weiss et al., 2004; Tandon et al., 2009; Dutta et al., 2013). Whether such cross-border changes
can be induced by increasing rather than decreasing afferent inputs remains poorly understood
despite its potential impact in promoting adaptive plasticity remotely. We recently found that
repetitive somatosensory stimulation (RSS) of a single fingertip, which has long been known to
induce both a local plasticity within the primary somatosensory cortex (SI) and a local
improvement in tactile acuity (for reviews see Beste and Dinse, 2013; Parianen Lesemann et al.,
2015), also alters remotely the face representation (Muret et al., in preparation) and improves its
tactile acuity (Muret et al., 2014). These observations suggest a transfer of plastic changes
across the hand-face border. Indeed, following RSS of the right index finger (right-D2) we
observed reorganization of the face representation within BA3b, which took the form of an
increase of the negative BOLD response (NBR) evoked by lip stimulation (Muret et al., in
preparation). Strikingly, this NBR was co-localized with the more “traditional” positive BOLD
response evoked by index finger stimulation in the contralateral hemisphere. Given that the
neurovascular coupling underlying such BOLD signal changes is still under investigation and
debated (Hoffmeyer et al., 2007; Huttunen et al., 2008; Moore and Cao, 2008; Rosa et al., 2010;
Devonshire et al., 2012), and that magnetoencephalography (MEG) allows for a direct measure
of neuronal activity with a sufficiently high spatial resolution to distinguish between lip and
finger somatosensory sources (Nakamura et al., 1998), we used MEG to further investigate the
neurophysiological substrates of these plastic changes, in order to provide a complementary
perspective over the mechanisms underlying RSS-induced cortical changes. The benefits of
comparing electrophysiological and functional magnetic resonance imaging signals have already
been proven (Thees et al., 2003; Tuunanen et al., 2003; Stoeckel et al., 2007).
Given that the local plasticity induced in the finger representation was previously found to
be expressed by a shift of the right-D2 equivalent current dipole (ECD) toward that of the thumb
(Pleger et al., 2001; Godde et al., 2003), we investigated whether RSS-induced cortical changes
across the hand-face border were accompanied by changes in the configuration of
neuromagnetic dipole sources.
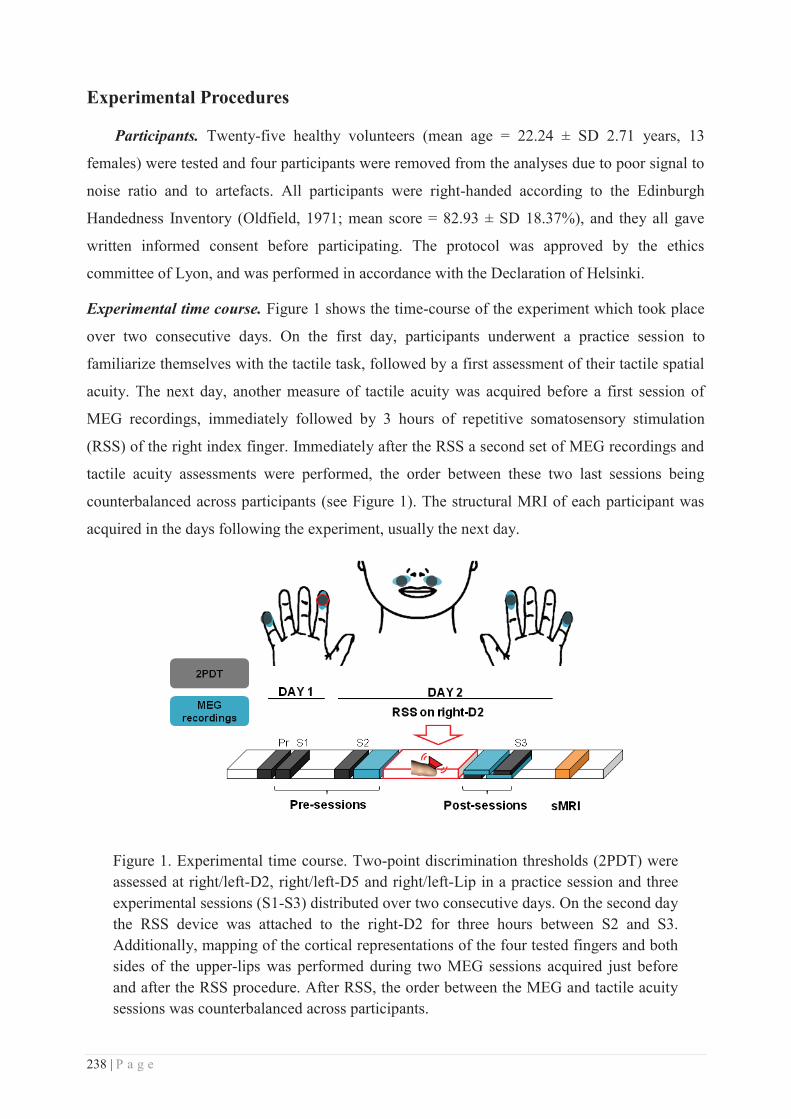
238 | P a g e
Experimental Procedures
Participants. Twenty-five healthy volunteers (mean age = 22.24 ± SD 2.71 years, 13
females) were tested and four participants were removed from the analyses due to poor signal to
noise ratio and to artefacts. All participants were right-handed according to the Edinburgh
Handedness Inventory (Oldfield, 1971; mean score = 82.93 ± SD 18.37%), and they all gave
written informed consent before participating. The protocol was approved by the ethics
committee of Lyon, and was performed in accordance with the Declaration of Helsinki.
Experimental time course. Figure 1 shows the time-course of the experiment which took place
over two consecutive days. On the first day, participants underwent a practice session to
familiarize themselves with the tactile task, followed by a first assessment of their tactile spatial
acuity. The next day, another measure of tactile acuity was acquired before a first session of
MEG recordings, immediately followed by 3 hours of repetitive somatosensory stimulation
(RSS) of the right index finger. Immediately after the RSS a second set of MEG recordings and
tactile acuity assessments were performed, the order between these two last sessions being
counterbalanced across participants (see Figure 1). The structural MRI of each participant was
acquired in the days following the experiment, usually the next day.
Figure 1. Experimental time course. Two-point discrimination thresholds (2PDT) were assessed at right/left-D2, right/left-D5 and right/left-Lip in a practice session and three experimental sessions (S1-S3) distributed over two consecutive days. On the second day the RSS device was attached to the right-D2 for three hours between S2 and S3. Additionally, mapping of the cortical representations of the four tested fingers and both sides of the upper-lips was performed during two MEG sessions acquired just before and after the RSS procedure. After RSS, the order between the MEG and tactile acuity sessions was counterbalanced across participants.
239 | P a g e
Repetitive Somatosensory Stimulation (RSS) Protocol. We used an RSS protocol that is
known to induce plastic changes in the somatosensory cortex (Godde et al., 2000, 2003; Pleger
et al., 2001, 2003; Dinse et al., 2003; Hodzic et al., 2004; Pilz et al., 2004; Kalisch et al., 2007;
Gibson et al., 2009). This method is effective, relatively simple to implement, and relies on
Hebbian-like plasticity processes as it simultaneously co-activates several cutaneous receptive
fields, thus producing temporally correlated inputs necessary to drive plasticity (Clark et al.,
1988; Wang et al., 1995). A small 8 mm diameter solenoid controlled by an MP3 player was
taped to the volar surface of the right-D2 fingertip for three hours. This solenoid delivered brief
(10ms) supra-threshold tactile stimuli with inter-stimulus intervals ranging from 100 to 3000 ms
and following a Poisson distribution (average stimulation frequency of 1Hz). Participants could
freely move during the stimulation period and were instructed to continue with their daily
activities without paying attention to the device, but to avoid intensive use of their fingers (i.e.,
they were not allowed to either write or type on a keyboard).
Tactile spatial acuity assessment. To assess tactile spatial acuity, two-point discrimination
thresholds (2PDT) were measured using a two-alternative forced-choice task and force-
controlled devices, at both index fingertips (left-D2 & right-D2), both little fingertips (left-D5 &
right-D5), and both sides of the upper-lip region, three times before (Practice, S1 and S2) and
once after (S3) 3 hours of RSS applied to the right-D2. During the Practice session (Day1),
detailed instructions were given and informed consent was obtained before 2PDT assessment.
This session allowed participants to become familiar with the task, but the data were not
included in any analyses. This Practice session and sessions S1 and S2 ensured that
discrimination performance before RSS was stable and allowed us to separate RSS-induced
changes from potential changes related to familiarization with the task. Based upon previous
studies reporting no threshold change at left-D2 following RSS on right-D2 (Godde et al., 2000,
2003; Pleger et al., 2001, 2003; Dinse et al., 2003, 2006), and on other studies showing that
learning due to practice/familiarization transfers to the homologous finger (Harris et al., 2001;
Harrar et al., 2014), 2PDT at left-D2 were assessed in S2 and S3 only. Within a session, each
area was tested in a separate block, and for a given participant the order of blocks was
maintained across sessions while block order was randomized across participants. For each
participant the location of each tested area was kept constant across sessions [distance from
fingertip: 5.17 ± 1.74 mm and distance from finger edge: 5.19 ± 1.13 mm (mean ± SD); distance
from mid-lip: 14.88 ± 0.82 mm (mean ± SD), midway between the upper-lip and the base of the
nose]. To ensure as precisely as possible that assessments were performed on a constant location
throughout sessions, the location of 2PDT assessment was marked on the first day before
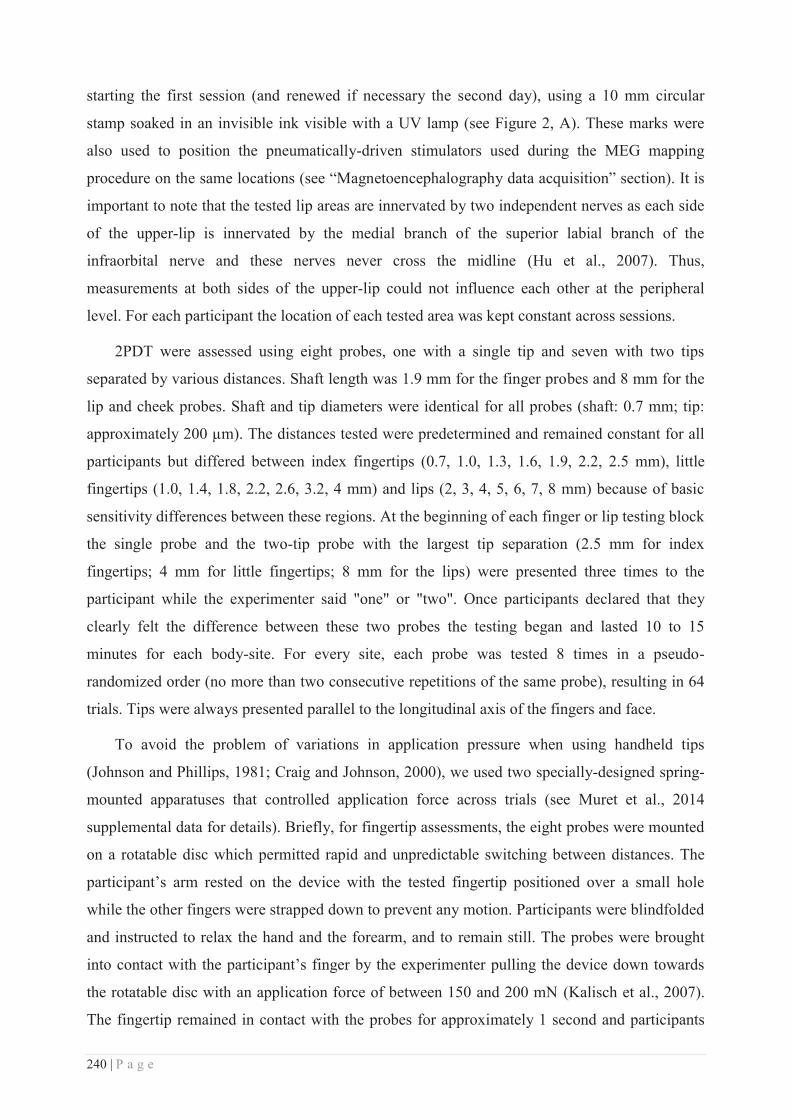
240 | P a g e
starting the first session (and renewed if necessary the second day), using a 10 mm circular
stamp soaked in an invisible ink visible with a UV lamp (see Figure 2, A). These marks were
also used to position the pneumatically-driven stimulators used during the MEG mapping
procedure on the same locations (see “Magnetoencephalography data acquisition” section). It is
important to note that the tested lip areas are innervated by two independent nerves as each side
of the upper-lip is innervated by the medial branch of the superior labial branch of the
infraorbital nerve and these nerves never cross the midline (Hu et al., 2007). Thus,
measurements at both sides of the upper-lip could not influence each other at the peripheral
level. For each participant the location of each tested area was kept constant across sessions.
2PDT were assessed using eight probes, one with a single tip and seven with two tips
separated by various distances. Shaft length was 1.9 mm for the finger probes and 8 mm for the
lip and cheek probes. Shaft and tip diameters were identical for all probes (shaft: 0.7 mm; tip:
approximately 200 μm). The distances tested were predetermined and remained constant for all
participants but differed between index fingertips (0.7, 1.0, 1.3, 1.6, 1.9, 2.2, 2.5 mm), little
fingertips (1.0, 1.4, 1.8, 2.2, 2.6, 3.2, 4 mm) and lips (2, 3, 4, 5, 6, 7, 8 mm) because of basic
sensitivity differences between these regions. At the beginning of each finger or lip testing block
the single probe and the two-tip probe with the largest tip separation (2.5 mm for index
fingertips; 4 mm for little fingertips; 8 mm for the lips) were presented three times to the
participant while the experimenter said "one" or "two". Once participants declared that they
clearly felt the difference between these two probes the testing began and lasted 10 to 15
minutes for each body-site. For every site, each probe was tested 8 times in a pseudo-
randomized order (no more than two consecutive repetitions of the same probe), resulting in 64
trials. Tips were always presented parallel to the longitudinal axis of the fingers and face.
To avoid the problem of variations in application pressure when using handheld tips
(Johnson and Phillips, 1981; Craig and Johnson, 2000), we used two specially-designed spring-
mounted apparatuses that controlled application force across trials (see Muret et al., 2014
supplemental data for details). Briefly, for fingertip assessments, the eight probes were mounted
on a rotatable disc which permitted rapid and unpredictable switching between distances. The
participant’s arm rested on the device with the tested fingertip positioned over a small hole
while the other fingers were strapped down to prevent any motion. Participants were blindfolded
and instructed to relax the hand and the forearm, and to remain still. The probes were brought
into contact with the participant’s finger by the experimenter pulling the device down towards
the rotatable disc with an application force of between 150 and 200 mN (Kalisch et al., 2007).
The fingertip remained in contact with the probes for approximately 1 second and participants
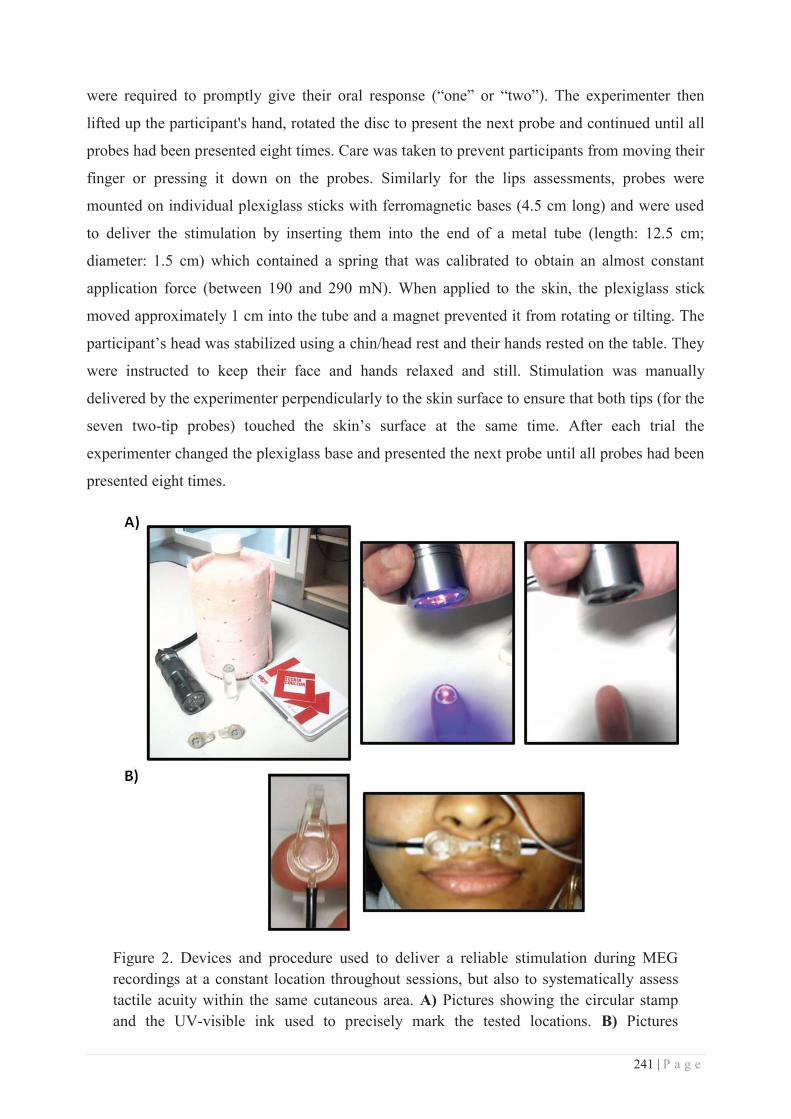
241 | P a g e
were required to promptly give their oral response (“one” or “two”). The experimenter then
lifted up the participant's hand, rotated the disc to present the next probe and continued until all
probes had been presented eight times. Care was taken to prevent participants from moving their
finger or pressing it down on the probes. Similarly for the lips assessments, probes were
mounted on individual plexiglass sticks with ferromagnetic bases (4.5 cm long) and were used
to deliver the stimulation by inserting them into the end of a metal tube (length: 12.5 cm;
diameter: 1.5 cm) which contained a spring that was calibrated to obtain an almost constant
application force (between 190 and 290 mN). When applied to the skin, the plexiglass stick
moved approximately 1 cm into the tube and a magnet prevented it from rotating or tilting. The
participant’s head was stabilized using a chin/head rest and their hands rested on the table. They
were instructed to keep their face and hands relaxed and still. Stimulation was manually
delivered by the experimenter perpendicularly to the skin surface to ensure that both tips (for the
seven two-tip probes) touched the skin’s surface at the same time. After each trial the
experimenter changed the plexiglass base and presented the next probe until all probes had been
presented eight times.
Figure 2. Devices and procedure used to deliver a reliable stimulation during MEG recordings at a constant location throughout sessions, but also to systematically assess tactile acuity within the same cutaneous area. A) Pictures showing the circular stamp and the UV-visible ink used to precisely mark the tested locations. B) Pictures
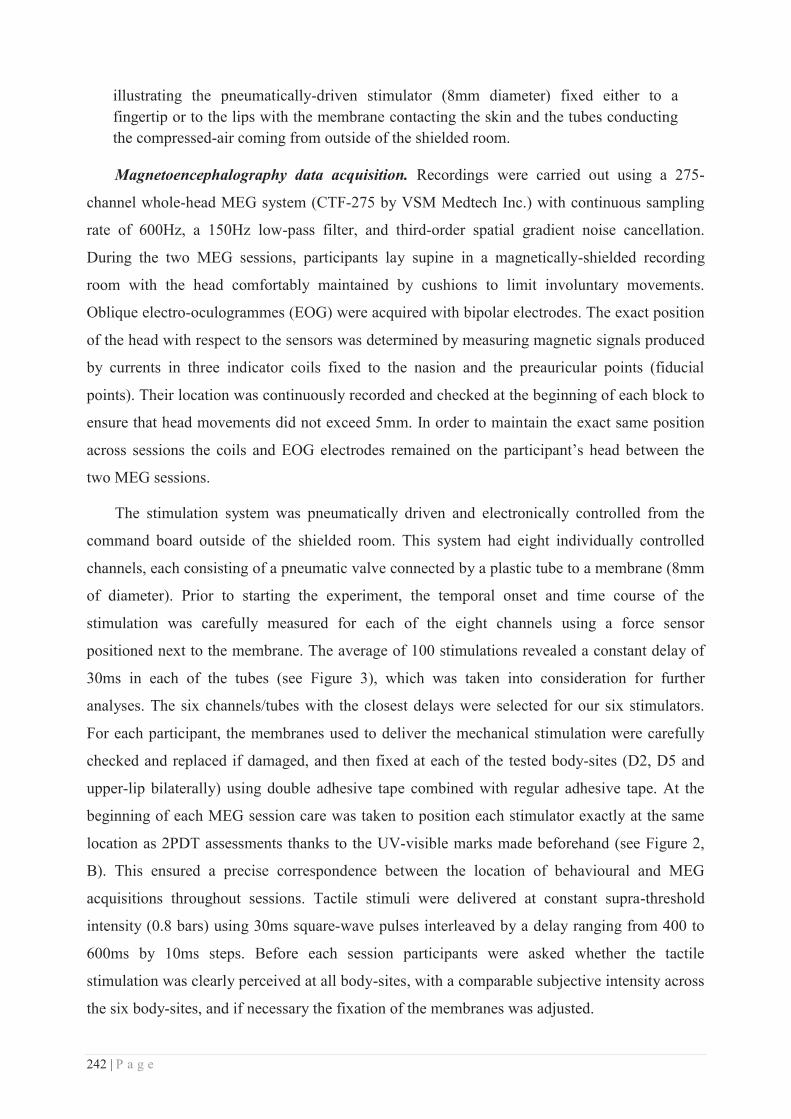
242 | P a g e
illustrating the pneumatically-driven stimulator (8mm diameter) fixed either to a fingertip or to the lips with the membrane contacting the skin and the tubes conducting the compressed-air coming from outside of the shielded room.
Magnetoencephalography data acquisition. Recordings were carried out using a 275-
channel whole-head MEG system (CTF-275 by VSM Medtech Inc.) with continuous sampling
rate of 600Hz, a 150Hz low-pass filter, and third-order spatial gradient noise cancellation.
During the two MEG sessions, participants lay supine in a magnetically-shielded recording
room with the head comfortably maintained by cushions to limit involuntary movements.
Oblique electro-oculogrammes (EOG) were acquired with bipolar electrodes. The exact position
of the head with respect to the sensors was determined by measuring magnetic signals produced
by currents in three indicator coils fixed to the nasion and the preauricular points (fiducial
points). Their location was continuously recorded and checked at the beginning of each block to
ensure that head movements did not exceed 5mm. In order to maintain the exact same position
across sessions the coils and EOG electrodes remained on the participant’s head between the
two MEG sessions.
The stimulation system was pneumatically driven and electronically controlled from the
command board outside of the shielded room. This system had eight individually controlled
channels, each consisting of a pneumatic valve connected by a plastic tube to a membrane (8mm
of diameter). Prior to starting the experiment, the temporal onset and time course of the
stimulation was carefully measured for each of the eight channels using a force sensor
positioned next to the membrane. The average of 100 stimulations revealed a constant delay of
30ms in each of the tubes (see Figure 3), which was taken into consideration for further
analyses. The six channels/tubes with the closest delays were selected for our six stimulators.
For each participant, the membranes used to deliver the mechanical stimulation were carefully
checked and replaced if damaged, and then fixed at each of the tested body-sites (D2, D5 and
upper-lip bilaterally) using double adhesive tape combined with regular adhesive tape. At the
beginning of each MEG session care was taken to position each stimulator exactly at the same
location as 2PDT assessments thanks to the UV-visible marks made beforehand (see Figure 2,
B). This ensured a precise correspondence between the location of behavioural and MEG
acquisitions throughout sessions. Tactile stimuli were delivered at constant supra-threshold
intensity (0.8 bars) using 30ms square-wave pulses interleaved by a delay ranging from 400 to
600ms by 10ms steps. Before each session participants were asked whether the tactile
stimulation was clearly perceived at all body-sites, with a comparable subjective intensity across
the six body-sites, and if necessary the fixation of the membranes was adjusted.
243 | P a g e
Each MEG session was subdivided into four blocks during which each body-site was
stimulated 125 times, resulting in 500 stimulations per area per session. The stimulated regions
and intervals between stimulations were pseudo-randomized, allowing no more than one
consecutive repetition at the same location or with the same ISI, and ensuring that the number of
repetitions (location or ISI) was equally distributed across body-sites and blocks. To mask the
noise made by the stimulators participants listened to 60 dB white noise presented binaurally
through air-conducting tubes with foam ear tips. Participants were instructed to remain as still as
possible, to fixate a cross drawn at the centre of a board positioned 50cm away from their eyes
(to avoid eye saccades), and to avoid blinking during the stimulation period. Every 30
stimulations the white noise was interrupted for 3s, notifying a rest period during which
participants were instructed/allowed to freely close the eyes and blink. Few minutes of rest were
additionally taken in between each block.
Figure 3. Mean onset and time course of the pneumatically-driven tactile stimulation used during MEG recordings as measured by a force captor positioned next to the membrane. The time course below the graph shows the onset of the stimulus trigger (0), the onset of the stimulus corrected for the delay (+30ms), and the peak of the stimulus force profile (+60ms) as well as the time window used for further analyses: [-70 +280]ms uncorrected to obtain a final analysis window [-100 +250]ms where 0 represents the onset of the tactile stimulation.
Behavioural data analysis. For each participant and for each area the mean of the verbal
responses (‘one’ or ‘two’) was plotted as a function of distance between the probes and the
psychometric function was fitted with a binary logistic regression (Dinse et al., 2006). Threshold
was determined from the fitted data and defined as the distance at which participants responded
“two” 50% of the time. S1 and S2 thresholds were statistically analysed for stability using
244 | P a g e
repeated measures ANOVAs (rmANOVAs) with the factor Session (S1/S2). Separate
rmANOVAs were performed for the right-D2, right-D5, right-Lip, and left-Lip data (left-D2 and
left-D5 data were not collected at S1). To assess whether the S2 session of left-D2 and left-D5
were different from the S2 session of right-D2 and right-D5, two paired t-tests were performed.
Pre (average of S1 and S2) and Post (S3) thresholds were analysed using three two-way
rmANOVAs (one for each pair of body-sites) with factors Side (Left/Right) and Session
(Pre/Post). Threshold changes between Pre- and Post-sessions were determined for each subject
as a percentage of the Pre-session threshold (average of S1 and S2):
. Mean threshold changes were calculated for each of the six
tested areas and were then submitted to a one-way rmANOVA to assess differences in threshold
change across regions. Three linear correlations (Pearson) were performed to compare threshold
changes at the left and right upper-lip and between each side of the upper-lip and the right-D2.
To assess whether threshold changes were related to changes in discrimination sensitivity and/or
in response criterion (Signal Detection Theory), false alarm and hit rates were systematically
calculated and used to compute the discriminative index (d-prime value) and the criterion shift
index (ln(Beta) value) using the Palamedes toolbox for one-alternative forced choice
(PAL_SDT_1AFC_PHFtoDP, MATLAB v.r2010a). These indices were then statistically
analyzed using five paired t-tests comparing sessions (Pre vs. Post), corrected for multiple
comparisons (Bonferroni). All statistical analyses were conducted using Statistica® (v.10,
StatSoft). Data were checked for normality using Kolmogorov-Smirnov tests. Post-hoc analyses
were performed using Bonferroni tests (mentioned in the text as pcorr). All group data are
expressed as mean ± standard error of the mean (SEM).
Magnetoencephalography data analysis. Neuromagnetic analyses were conducted using CTF
softwares (VSM Medtech Inc.). The first step in the offline processing involved visual
inspection of all datasets for muscle artefacts rejection. Datasets were then low-pass filtered to
100Hz before being segmented into epochs of 350ms including a period of 250ms post-stimulus
(corrected) and a pre-stimulus baseline of 100ms. Trials coinciding with eye movements (i.e.,
blink, saccades etc) were automatically rejected on the basis of EOG recordings, all trials with
EOG activity exceeding 20μV being rejected. Subsequently, all trials were visually inspected to
check and if necessary adjust trials rejection. Using the remaining trials, the mean head position
was calculated and trials in which head motion exceeded the average by 3mm were rejected.
Then the mean head position was re-calculated separately for each condition and used to correct
for head motion. These pre-processing steps resulted in an average of 404 (± 15.72) (out of 500)
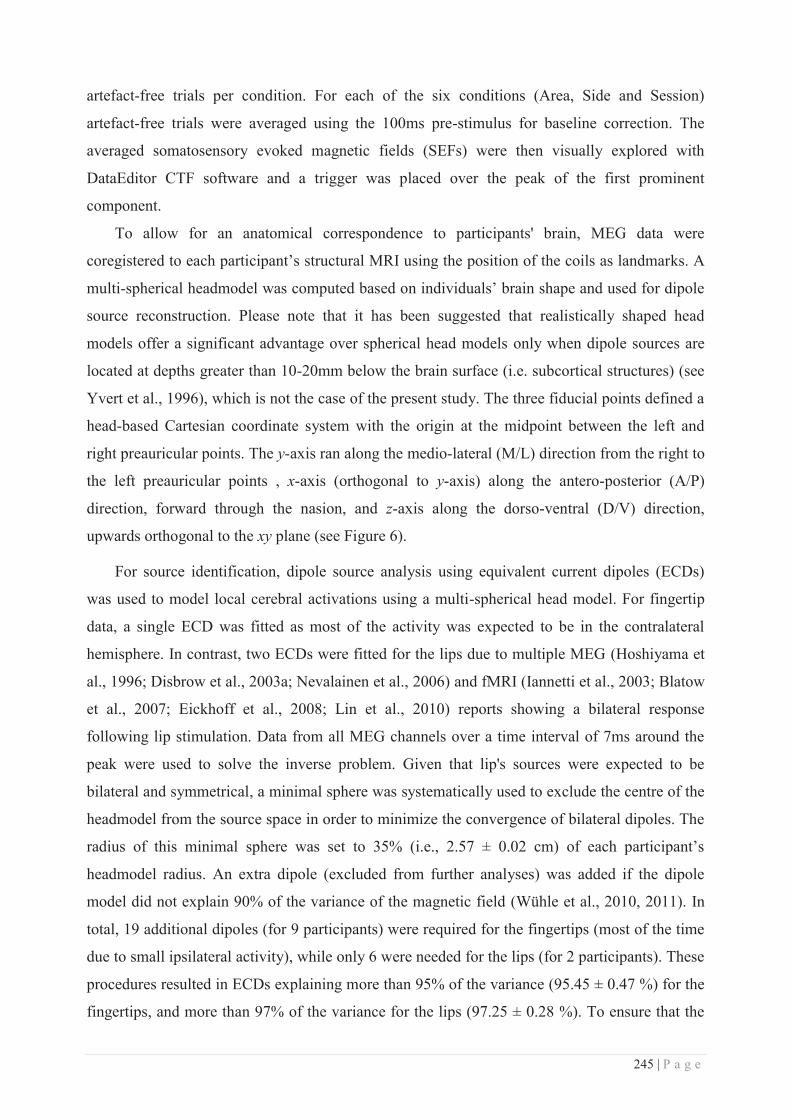
245 | P a g e
artefact-free trials per condition. For each of the six conditions (Area, Side and Session)
artefact-free trials were averaged using the 100ms pre-stimulus for baseline correction. The
averaged somatosensory evoked magnetic fields (SEFs) were then visually explored with
DataEditor CTF software and a trigger was placed over the peak of the first prominent
component.
To allow for an anatomical correspondence to participants' brain, MEG data were
coregistered to each participant’s structural MRI using the position of the coils as landmarks. A
multi-spherical headmodel was computed based on individuals’ brain shape and used for dipole
source reconstruction. Please note that it has been suggested that realistically shaped head
models offer a significant advantage over spherical head models only when dipole sources are
located at depths greater than 10-20mm below the brain surface (i.e. subcortical structures) (see
Yvert et al., 1996), which is not the case of the present study. The three fiducial points defined a
head-based Cartesian coordinate system with the origin at the midpoint between the left and
right preauricular points. The y-axis ran along the medio-lateral (M/L) direction from the right to
the left preauricular points , x-axis (orthogonal to y-axis) along the antero-posterior (A/P)
direction, forward through the nasion, and z-axis along the dorso-ventral (D/V) direction,
upwards orthogonal to the xy plane (see Figure 6).
For source identification, dipole source analysis using equivalent current dipoles (ECDs)
was used to model local cerebral activations using a multi-spherical head model. For fingertip
data, a single ECD was fitted as most of the activity was expected to be in the contralateral
hemisphere. In contrast, two ECDs were fitted for the lips due to multiple MEG (Hoshiyama et
al., 1996; Disbrow et al., 2003a; Nevalainen et al., 2006) and fMRI (Iannetti et al., 2003; Blatow
et al., 2007; Eickhoff et al., 2008; Lin et al., 2010) reports showing a bilateral response
following lip stimulation. Data from all MEG channels over a time interval of 7ms around the
peak were used to solve the inverse problem. Given that lip's sources were expected to be
bilateral and symmetrical, a minimal sphere was systematically used to exclude the centre of the
headmodel from the source space in order to minimize the convergence of bilateral dipoles. The
radius of this minimal sphere was set to 35% (i.e., 2.57 ± 0.02 cm) of each participant’s
headmodel radius. An extra dipole (excluded from further analyses) was added if the dipole
model did not explain 90% of the variance of the magnetic field (Wühle et al., 2010, 2011). In
total, 19 additional dipoles (for 9 participants) were required for the fingertips (most of the time
due to small ipsilateral activity), while only 6 were needed for the lips (for 2 participants). These
procedures resulted in ECDs explaining more than 95% of the variance (95.45 ± 0.47 %) for the
fingertips, and more than 97% of the variance for the lips (97.25 ± 0.28 %). To ensure that the
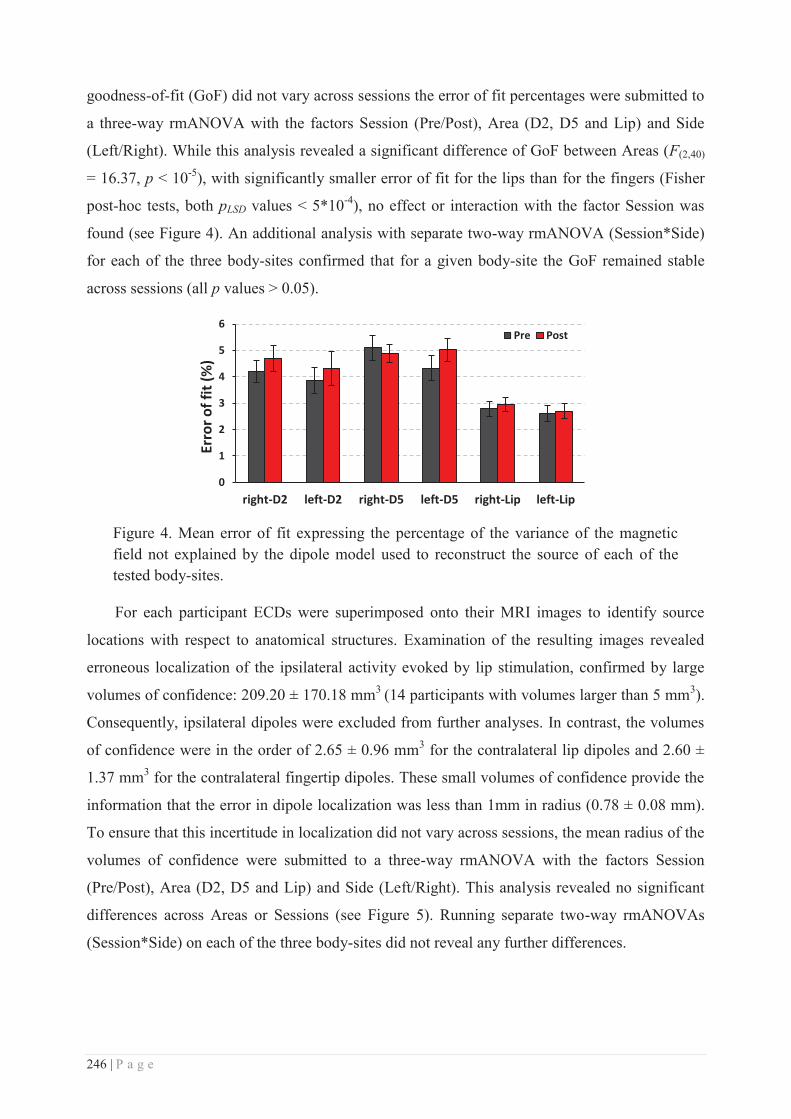
246 | P a g e
goodness-of-fit (GoF) did not vary across sessions the error of fit percentages were submitted to
a three-way rmANOVA with the factors Session (Pre/Post), Area (D2, D5 and Lip) and Side
(Left/Right). While this analysis revealed a significant difference of GoF between Areas (F(2,40)
= 16.37, p < 10-5), with significantly smaller error of fit for the lips than for the fingers (Fisher
post-hoc tests, both pLSD values < 5*10-4), no effect or interaction with the factor Session was
found (see Figure 4). An additional analysis with separate two-way rmANOVA (Session*Side)
for each of the three body-sites confirmed that for a given body-site the GoF remained stable
across sessions (all p values > 0.05).
Figure 4. Mean error of fit expressing the percentage of the variance of the magnetic field not explained by the dipole model used to reconstruct the source of each of the tested body-sites.
For each participant ECDs were superimposed onto their MRI images to identify source
locations with respect to anatomical structures. Examination of the resulting images revealed
erroneous localization of the ipsilateral activity evoked by lip stimulation, confirmed by large
volumes of confidence: 209.20 ± 170.18 mm3 (14 participants with volumes larger than 5 mm3).
Consequently, ipsilateral dipoles were excluded from further analyses. In contrast, the volumes
of confidence were in the order of 2.65 ± 0.96 mm3 for the contralateral lip dipoles and 2.60 ±
1.37 mm3 for the contralateral fingertip dipoles. These small volumes of confidence provide the
information that the error in dipole localization was less than 1mm in radius (0.78 ± 0.08 mm).
To ensure that this incertitude in localization did not vary across sessions, the mean radius of the
volumes of confidence were submitted to a three-way rmANOVA with the factors Session
(Pre/Post), Area (D2, D5 and Lip) and Side (Left/Right). This analysis revealed no significant
differences across Areas or Sessions (see Figure 5). Running separate two-way rmANOVAs
(Session*Side) on each of the three body-sites did not reveal any further differences.
0
1
2
3
4
5
6
right-D2 left-D2 right-D5 left-D5 right-Lip left-Lip
Erro
r of f
it (%
)
Pre Post
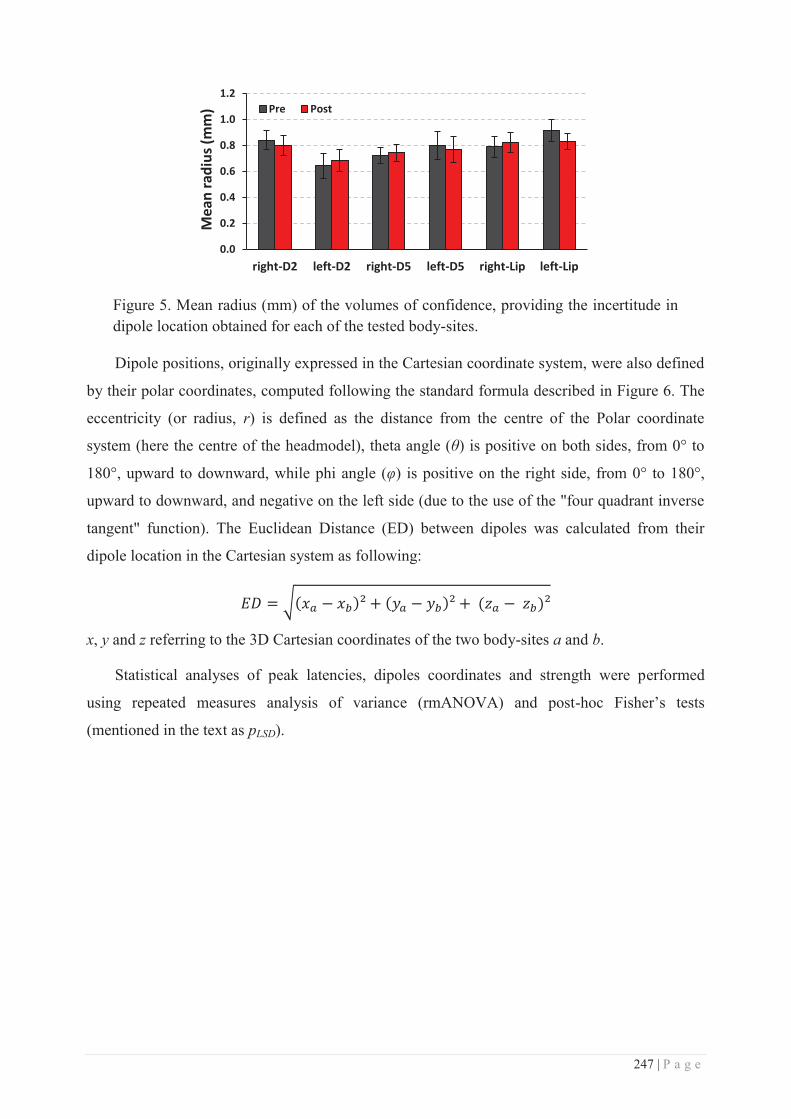
247 | P a g e
Figure 5. Mean radius (mm) of the volumes of confidence, providing the incertitude in dipole location obtained for each of the tested body-sites.
Dipole positions, originally expressed in the Cartesian coordinate system, were also defined
by their polar coordinates, computed following the standard formula described in Figure 6. The
eccentricity (or radius, r) is defined as the distance from the centre of the Polar coordinate
system (here the centre of the headmodel), theta angle (θ) is positive on both sides, from 0° to
180°, upward to downward, while phi angle (φ) is positive on the right side, from 0° to 180°,
upward to downward, and negative on the left side (due to the use of the "four quadrant inverse
tangent" function). The Euclidean Distance (ED) between dipoles was calculated from their
dipole location in the Cartesian system as following:
x, y and z referring to the 3D Cartesian coordinates of the two body-sites a and b.
Statistical analyses of peak latencies, dipoles coordinates and strength were performed
using repeated measures analysis of variance (rmANOVA) and post-hoc Fisher’s tests
(mentioned in the text as pLSD).
0.0
0.2
0.4
0.6
0.8
1.0
1.2
right-D2 left-D2 right-D5 left-D5 right-Lip left-Lip
Mea
n ra
dius
(mm
) Pre Post
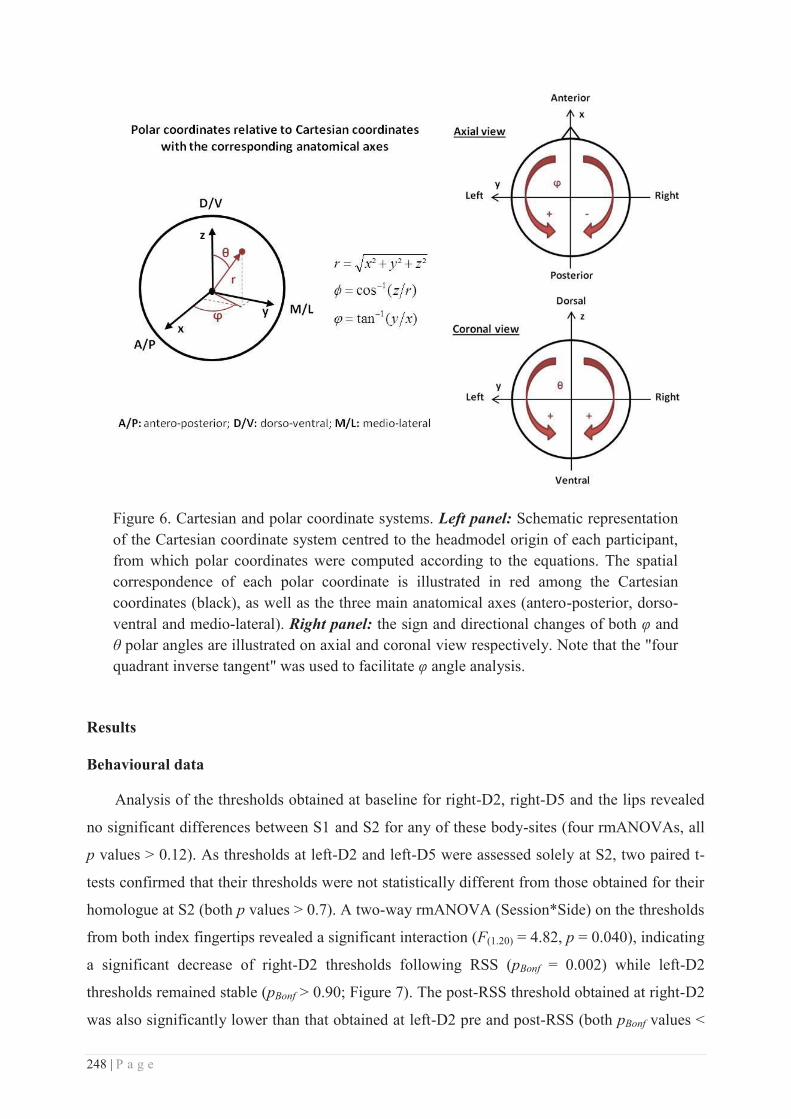
248 | P a g e
Figure 6. Cartesian and polar coordinate systems. Left panel: Schematic representation of the Cartesian coordinate system centred to the headmodel origin of each participant, from which polar coordinates were computed according to the equations. The spatial correspondence of each polar coordinate is illustrated in red among the Cartesian coordinates (black), as well as the three main anatomical axes (antero-posterior, dorso-ventral and medio-lateral). Right panel: the sign and directional changes of both φ and θ polar angles are illustrated on axial and coronal view respectively. Note that the "four quadrant inverse tangent" was used to facilitate φ angle analysis.
Results
Behavioural data
Analysis of the thresholds obtained at baseline for right-D2, right-D5 and the lips revealed
no significant differences between S1 and S2 for any of these body-sites (four rmANOVAs, all
p values > 0.12). As thresholds at left-D2 and left-D5 were assessed solely at S2, two paired t-
tests confirmed that their thresholds were not statistically different from those obtained for their
homologue at S2 (both p values > 0.7). A two-way rmANOVA (Session*Side) on the thresholds
from both index fingertips revealed a significant interaction (F(1.20) = 4.82, p = 0.040), indicating
a significant decrease of right-D2 thresholds following RSS (pBonf = 0.002) while left-D2
thresholds remained stable (pBonf > 0.90; Figure 7). The post-RSS threshold obtained at right-D2
was also significantly lower than that obtained at left-D2 pre and post-RSS (both pBonf values <
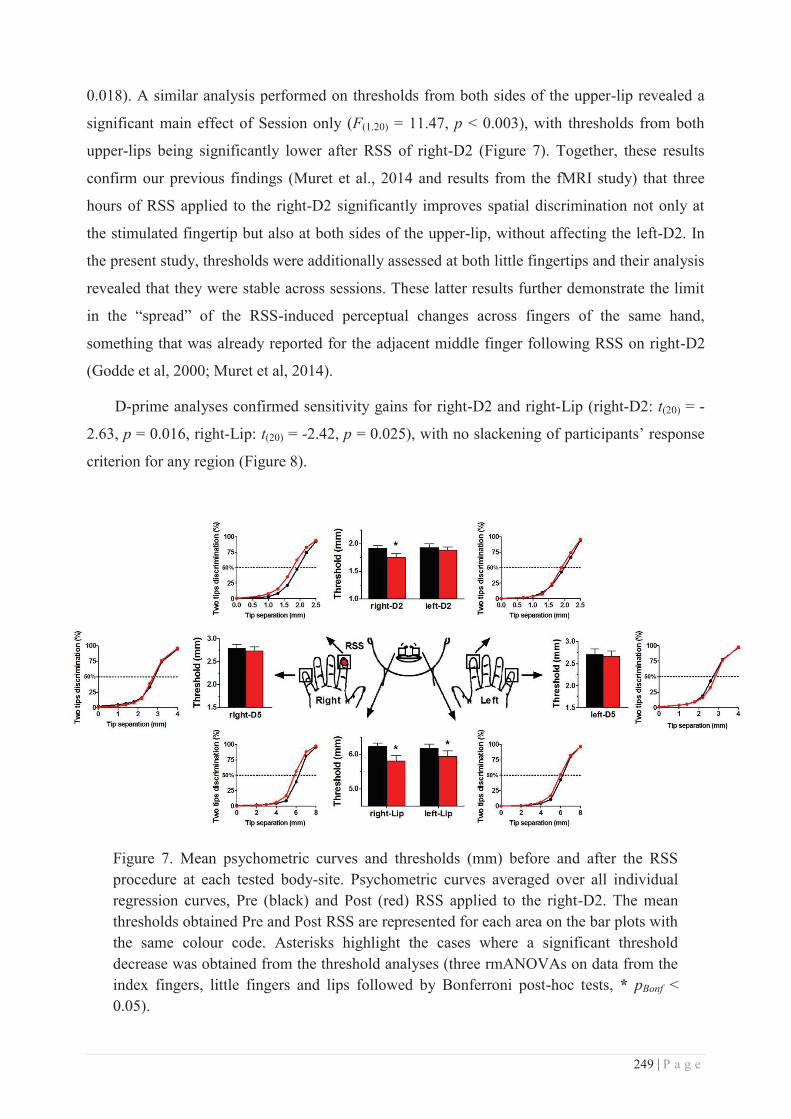
249 | P a g e
0.018). A similar analysis performed on thresholds from both sides of the upper-lip revealed a
significant main effect of Session only (F(1.20) = 11.47, p < 0.003), with thresholds from both
upper-lips being significantly lower after RSS of right-D2 (Figure 7). Together, these results
confirm our previous findings (Muret et al., 2014 and results from the fMRI study) that three
hours of RSS applied to the right-D2 significantly improves spatial discrimination not only at
the stimulated fingertip but also at both sides of the upper-lip, without affecting the left-D2. In
the present study, thresholds were additionally assessed at both little fingertips and their analysis
revealed that they were stable across sessions. These latter results further demonstrate the limit
in the “spread” of the RSS-induced perceptual changes across fingers of the same hand,
something that was already reported for the adjacent middle finger following RSS on right-D2
(Godde et al, 2000; Muret et al, 2014).
D-prime analyses confirmed sensitivity gains for right-D2 and right-Lip (right-D2: t(20) = -
2.63, p = 0.016, right-Lip: t(20) = -2.42, p = 0.025), with no slackening of participants’ response
criterion for any region (Figure 8).
Figure 7. Mean psychometric curves and thresholds (mm) before and after the RSS procedure at each tested body-site. Psychometric curves averaged over all individual regression curves, Pre (black) and Post (red) RSS applied to the right-D2. The mean thresholds obtained Pre and Post RSS are represented for each area on the bar plots with the same colour code. Asterisks highlight the cases where a significant threshold decrease was obtained from the threshold analyses (three rmANOVAs on data from the index fingers, little fingers and lips followed by Bonferroni post-hoc tests, * pBonf < 0.05).
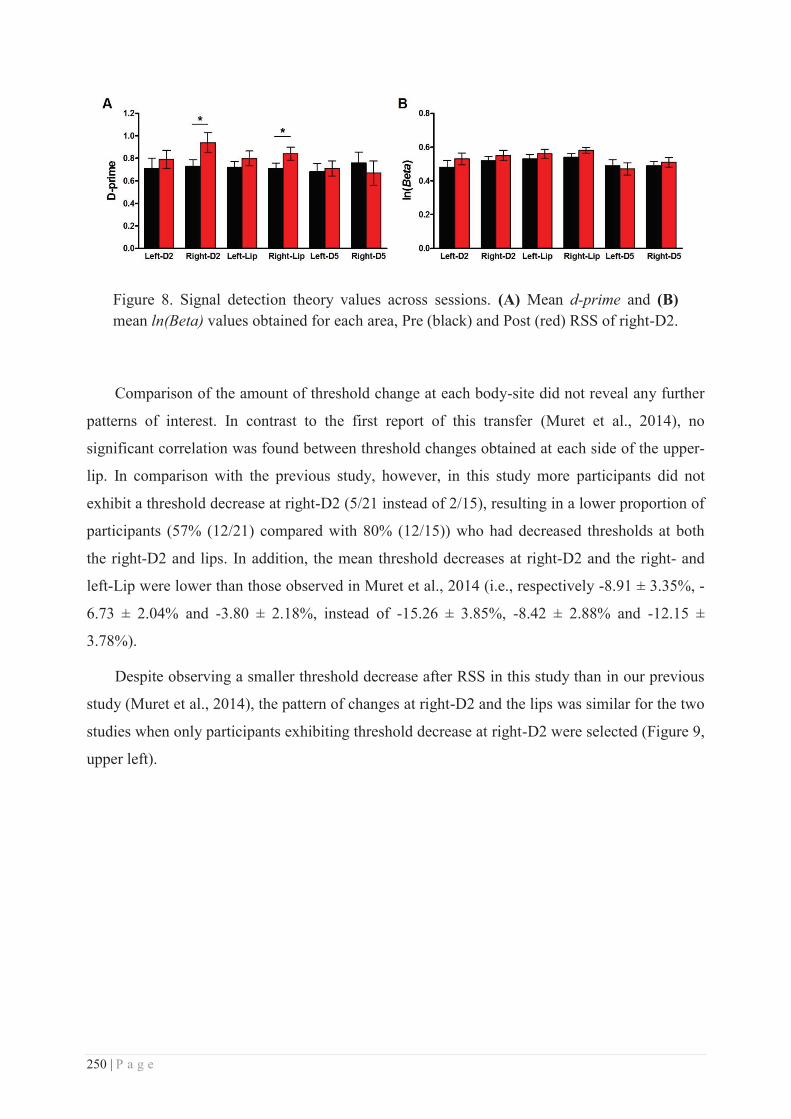
250 | P a g e
Figure 8. Signal detection theory values across sessions. (A) Mean d-prime and (B) mean ln(Beta) values obtained for each area, Pre (black) and Post (red) RSS of right-D2.
Comparison of the amount of threshold change at each body-site did not reveal any further
patterns of interest. In contrast to the first report of this transfer (Muret et al., 2014), no
significant correlation was found between threshold changes obtained at each side of the upper-
lip. In comparison with the previous study, however, in this study more participants did not
exhibit a threshold decrease at right-D2 (5/21 instead of 2/15), resulting in a lower proportion of
participants (57% (12/21) compared with 80% (12/15)) who had decreased thresholds at both
the right-D2 and lips. In addition, the mean threshold decreases at right-D2 and the right- and
left-Lip were lower than those observed in Muret et al., 2014 (i.e., respectively -8.91 ± 3.35%, -
6.73 ± 2.04% and -3.80 ± 2.18%, instead of -15.26 ± 3.85%, -8.42 ± 2.88% and -12.15 ±
3.78%).
Despite observing a smaller threshold decrease after RSS in this study than in our previous
study (Muret et al., 2014), the pattern of changes at right-D2 and the lips was similar for the two
studies when only participants exhibiting threshold decrease at right-D2 were selected (Figure 9,
upper left).
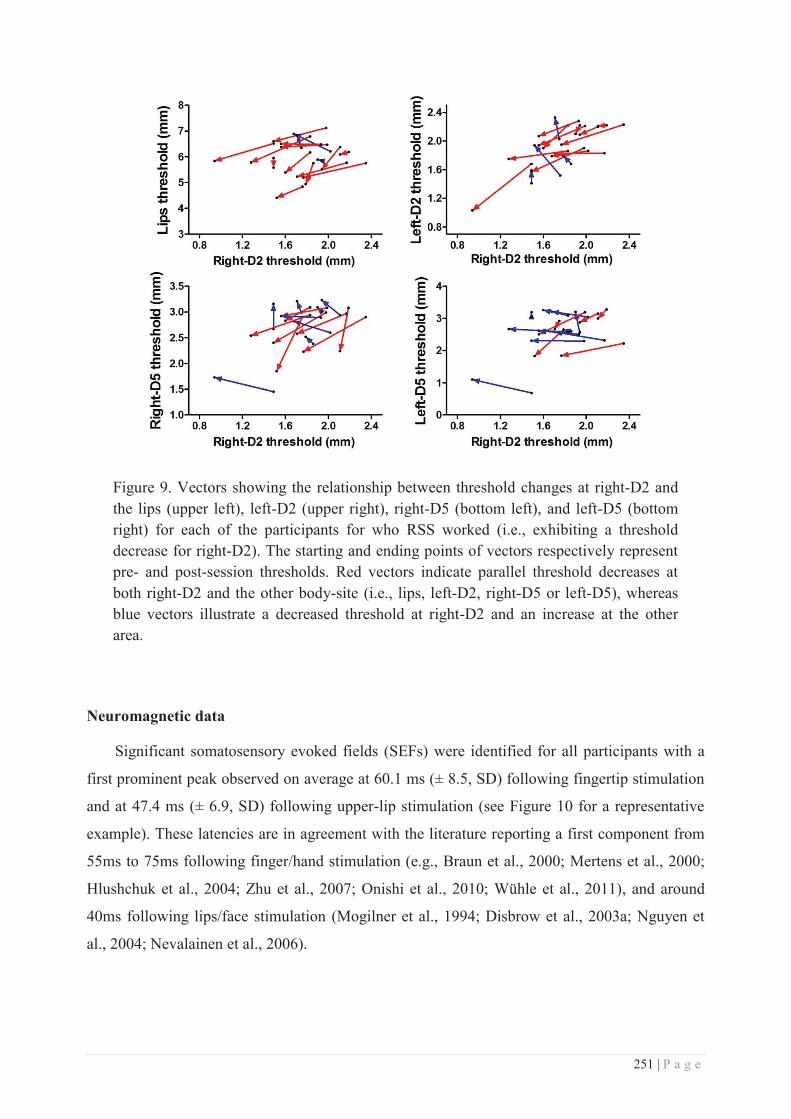
251 | P a g e
Figure 9. Vectors showing the relationship between threshold changes at right-D2 and the lips (upper left), left-D2 (upper right), right-D5 (bottom left), and left-D5 (bottom right) for each of the participants for who RSS worked (i.e., exhibiting a threshold decrease for right-D2). The starting and ending points of vectors respectively represent pre- and post-session thresholds. Red vectors indicate parallel threshold decreases at both right-D2 and the other body-site (i.e., lips, left-D2, right-D5 or left-D5), whereas blue vectors illustrate a decreased threshold at right-D2 and an increase at the other area.
Neuromagnetic data
Significant somatosensory evoked fields (SEFs) were identified for all participants with a
first prominent peak observed on average at 60.1 ms (± 8.5, SD) following fingertip stimulation
and at 47.4 ms (± 6.9, SD) following upper-lip stimulation (see Figure 10 for a representative
example). These latencies are in agreement with the literature reporting a first component from
55ms to 75ms following finger/hand stimulation (e.g., Braun et al., 2000; Mertens et al., 2000;
Hlushchuk et al., 2004; Zhu et al., 2007; Onishi et al., 2010; Wühle et al., 2011), and around
40ms following lips/face stimulation (Mogilner et al., 1994; Disbrow et al., 2003a; Nguyen et
al., 2004; Nevalainen et al., 2006).
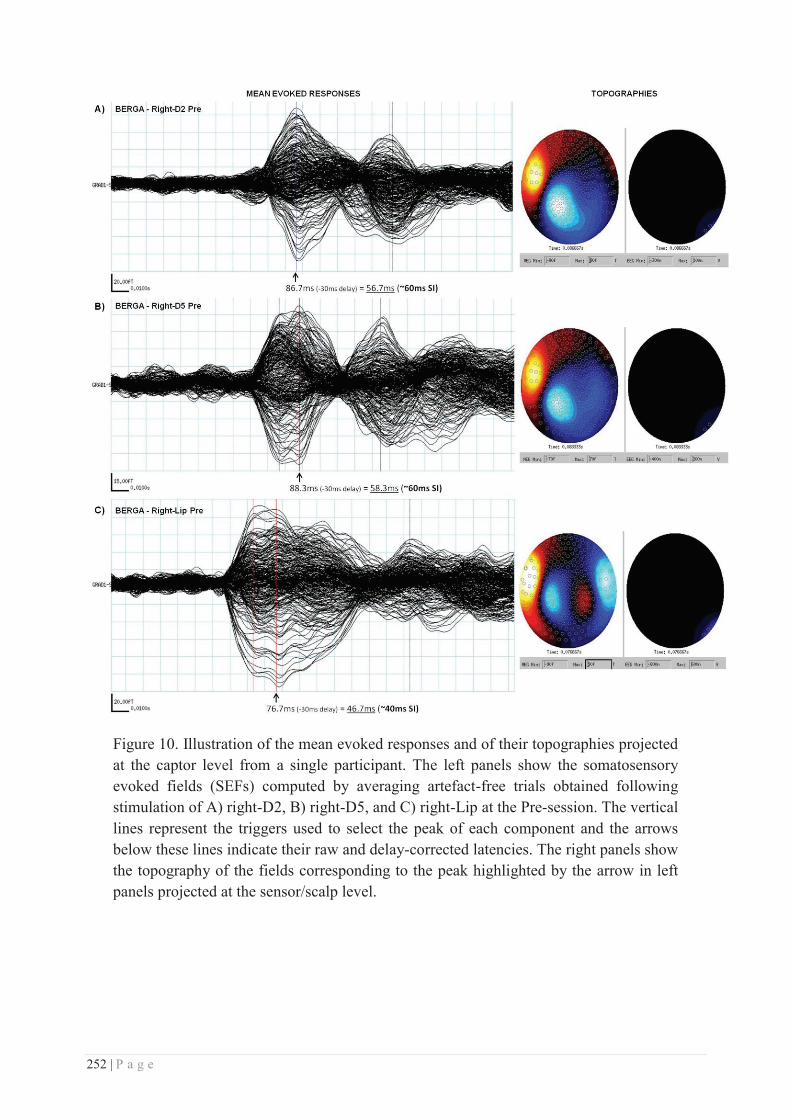
252 | P a g e
Figure 10. Illustration of the mean evoked responses and of their topographies projected at the captor level from a single participant. The left panels show the somatosensory evoked fields (SEFs) computed by averaging artefact-free trials obtained following stimulation of A) right-D2, B) right-D5, and C) right-Lip at the Pre-session. The vertical lines represent the triggers used to select the peak of each component and the arrows below these lines indicate their raw and delay-corrected latencies. The right panels show the topography of the fields corresponding to the peak highlighted by the arrow in left panels projected at the sensor/scalp level.
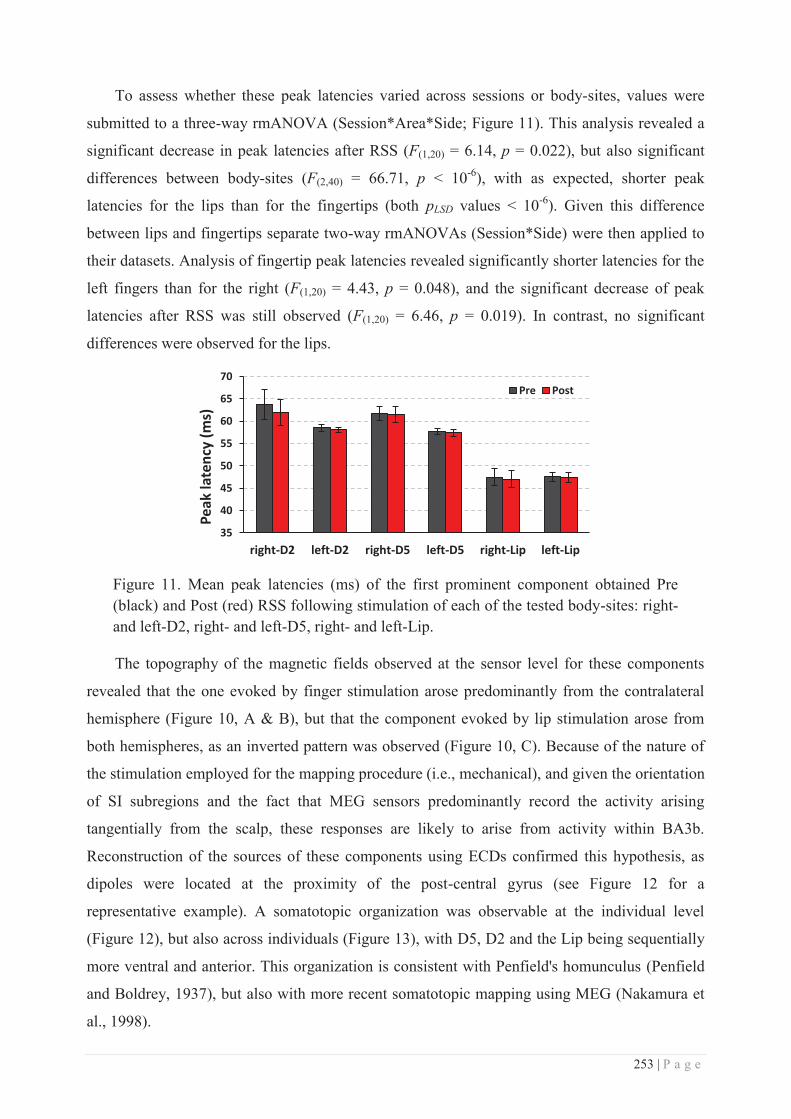
253 | P a g e
To assess whether these peak latencies varied across sessions or body-sites, values were
submitted to a three-way rmANOVA (Session*Area*Side; Figure 11). This analysis revealed a
significant decrease in peak latencies after RSS (F(1,20) = 6.14, p = 0.022), but also significant
differences between body-sites (F(2,40) = 66.71, p < 10-6), with as expected, shorter peak
latencies for the lips than for the fingertips (both pLSD values < 10-6). Given this difference
between lips and fingertips separate two-way rmANOVAs (Session*Side) were then applied to
their datasets. Analysis of fingertip peak latencies revealed significantly shorter latencies for the
left fingers than for the right (F(1,20) = 4.43, p = 0.048), and the significant decrease of peak
latencies after RSS was still observed (F(1,20) = 6.46, p = 0.019). In contrast, no significant
differences were observed for the lips.
Figure 11. Mean peak latencies (ms) of the first prominent component obtained Pre (black) and Post (red) RSS following stimulation of each of the tested body-sites: right- and left-D2, right- and left-D5, right- and left-Lip.
The topography of the magnetic fields observed at the sensor level for these components
revealed that the one evoked by finger stimulation arose predominantly from the contralateral
hemisphere (Figure 10, A & B), but that the component evoked by lip stimulation arose from
both hemispheres, as an inverted pattern was observed (Figure 10, C). Because of the nature of
the stimulation employed for the mapping procedure (i.e., mechanical), and given the orientation
of SI subregions and the fact that MEG sensors predominantly record the activity arising
tangentially from the scalp, these responses are likely to arise from activity within BA3b.
Reconstruction of the sources of these components using ECDs confirmed this hypothesis, as
dipoles were located at the proximity of the post-central gyrus (see Figure 12 for a
representative example). A somatotopic organization was observable at the individual level
(Figure 12), but also across individuals (Figure 13), with D5, D2 and the Lip being sequentially
more ventral and anterior. This organization is consistent with Penfield's homunculus (Penfield
and Boldrey, 1937), but also with more recent somatotopic mapping using MEG (Nakamura et
al., 1998).
35
40
45
50
55
60
65
70
right-D2 left-D2 right-D5 left-D5 right-Lip left-Lip
Peak
late
ncy
(ms)
Pre Post
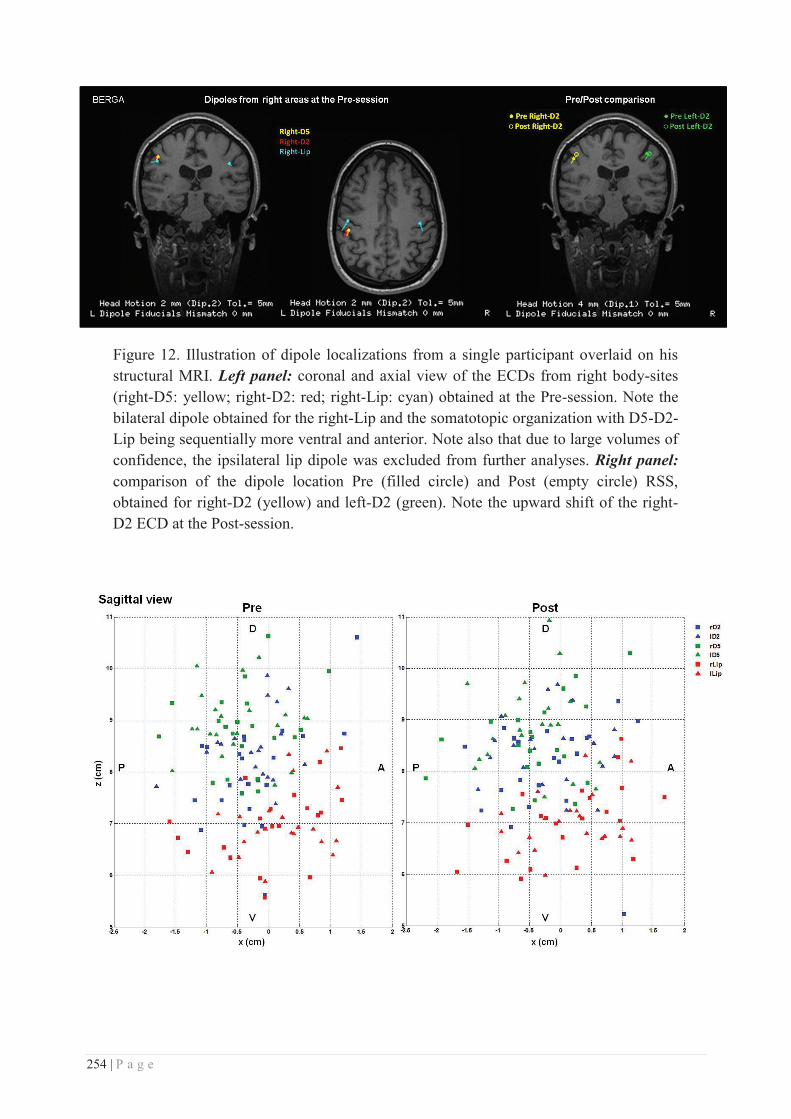
254 | P a g e
Figure 12. Illustration of dipole localizations from a single participant overlaid on his structural MRI. Left panel: coronal and axial view of the ECDs from right body-sites (right-D5: yellow; right-D2: red; right-Lip: cyan) obtained at the Pre-session. Note the bilateral dipole obtained for the right-Lip and the somatotopic organization with D5-D2-Lip being sequentially more ventral and anterior. Note also that due to large volumes of confidence, the ipsilateral lip dipole was excluded from further analyses. Right panel: comparison of the dipole location Pre (filled circle) and Post (empty circle) RSS, obtained for right-D2 (yellow) and left-D2 (green). Note the upward shift of the right-D2 ECD at the Post-session.
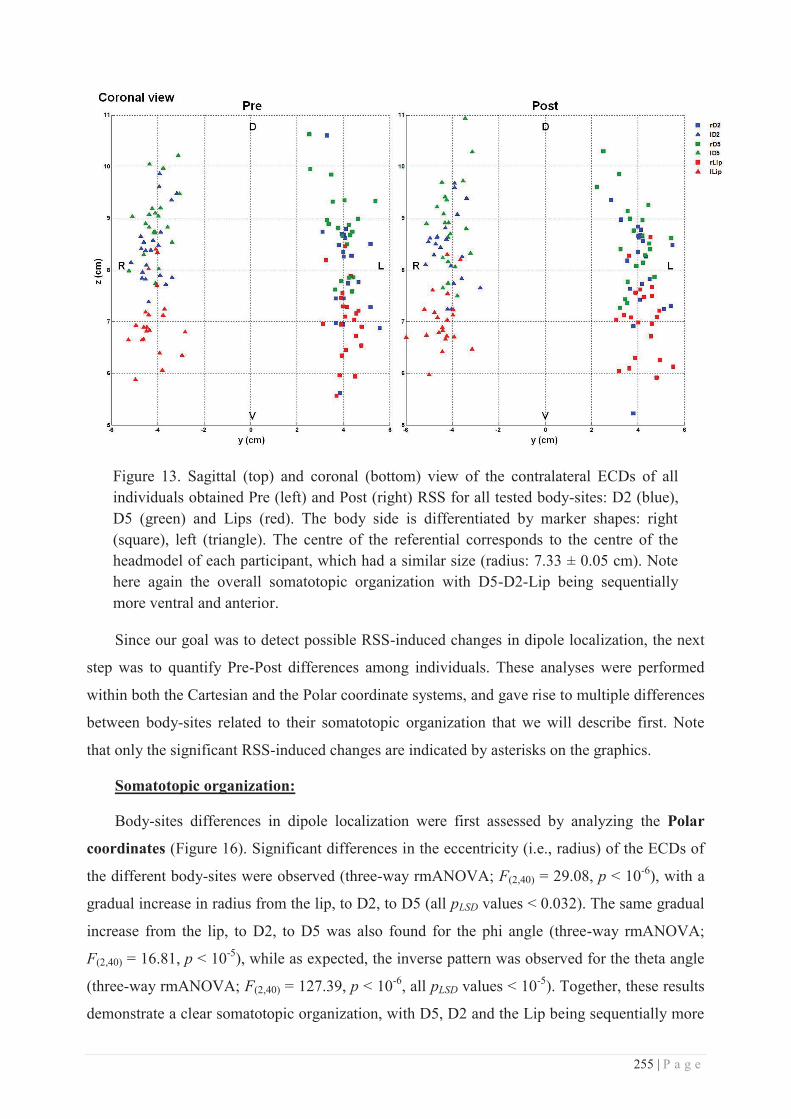
255 | P a g e
Figure 13. Sagittal (top) and coronal (bottom) view of the contralateral ECDs of all individuals obtained Pre (left) and Post (right) RSS for all tested body-sites: D2 (blue), D5 (green) and Lips (red). The body side is differentiated by marker shapes: right (square), left (triangle). The centre of the referential corresponds to the centre of the headmodel of each participant, which had a similar size (radius: 7.33 ± 0.05 cm). Note here again the overall somatotopic organization with D5-D2-Lip being sequentially more ventral and anterior.
Since our goal was to detect possible RSS-induced changes in dipole localization, the next
step was to quantify Pre-Post differences among individuals. These analyses were performed
within both the Cartesian and the Polar coordinate systems, and gave rise to multiple differences
between body-sites related to their somatotopic organization that we will describe first. Note
that only the significant RSS-induced changes are indicated by asterisks on the graphics.
Somatotopic organization:
Body-sites differences in dipole localization were first assessed by analyzing the Polar
coordinates (Figure 16). Significant differences in the eccentricity (i.e., radius) of the ECDs of
the different body-sites were observed (three-way rmANOVA; F(2,40) = 29.08, p < 10-6), with a
gradual increase in radius from the lip, to D2, to D5 (all pLSD values < 0.032). The same gradual
increase from the lip, to D2, to D5 was also found for the phi angle (three-way rmANOVA;
F(2,40) = 16.81, p < 10-5), while as expected, the inverse pattern was observed for the theta angle
(three-way rmANOVA; F(2,40) = 127.39, p < 10-6, all pLSD values < 10-5). Together, these results
demonstrate a clear somatotopic organization, with D5, D2 and the Lip being sequentially more
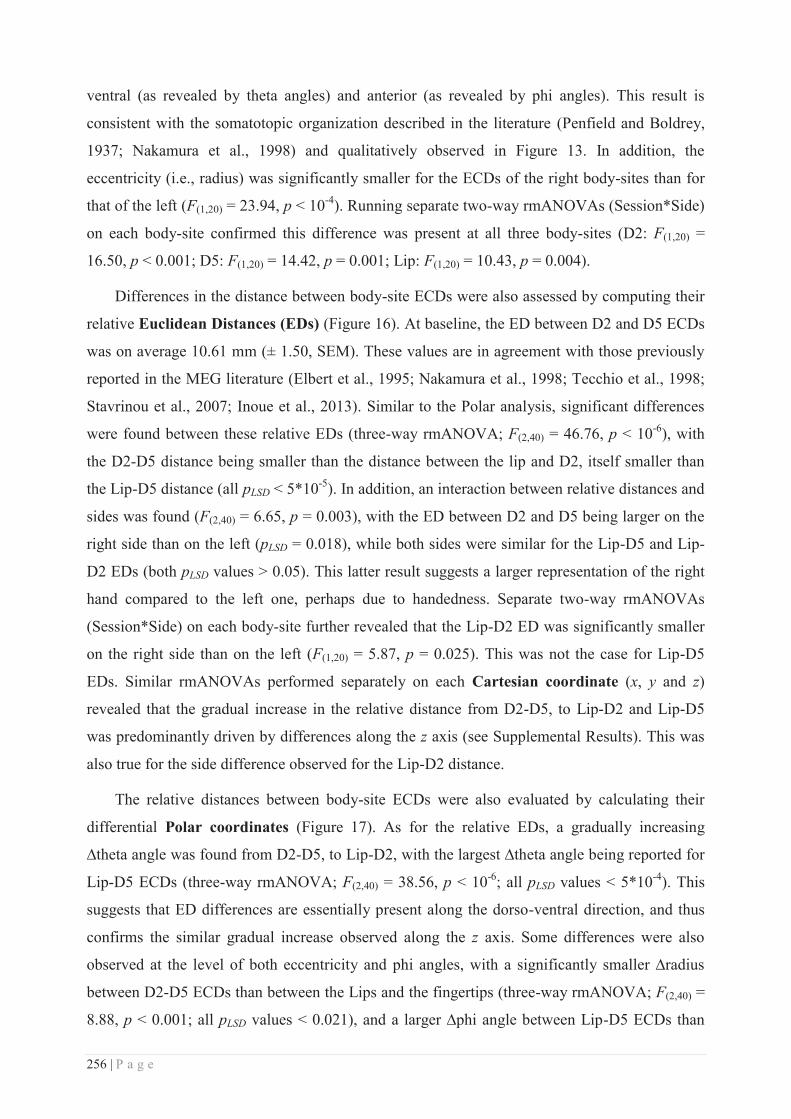
256 | P a g e
ventral (as revealed by theta angles) and anterior (as revealed by phi angles). This result is
consistent with the somatotopic organization described in the literature (Penfield and Boldrey,
1937; Nakamura et al., 1998) and qualitatively observed in Figure 13. In addition, the
eccentricity (i.e., radius) was significantly smaller for the ECDs of the right body-sites than for
that of the left (F(1,20) = 23.94, p < 10-4). Running separate two-way rmANOVAs (Session*Side)
on each body-site confirmed this difference was present at all three body-sites (D2: F(1,20) =
16.50, p < 0.001; D5: F(1,20) = 14.42, p = 0.001; Lip: F(1,20) = 10.43, p = 0.004).
Differences in the distance between body-site ECDs were also assessed by computing their
relative Euclidean Distances (EDs) (Figure 16). At baseline, the ED between D2 and D5 ECDs
was on average 10.61 mm (± 1.50, SEM). These values are in agreement with those previously
reported in the MEG literature (Elbert et al., 1995; Nakamura et al., 1998; Tecchio et al., 1998;
Stavrinou et al., 2007; Inoue et al., 2013). Similar to the Polar analysis, significant differences
were found between these relative EDs (three-way rmANOVA; F(2,40) = 46.76, p < 10-6), with
the D2-D5 distance being smaller than the distance between the lip and D2, itself smaller than
the Lip-D5 distance (all pLSD < 5*10-5). In addition, an interaction between relative distances and
sides was found (F(2,40) = 6.65, p = 0.003), with the ED between D2 and D5 being larger on the
right side than on the left (pLSD = 0.018), while both sides were similar for the Lip-D5 and Lip-
D2 EDs (both pLSD values > 0.05). This latter result suggests a larger representation of the right
hand compared to the left one, perhaps due to handedness. Separate two-way rmANOVAs
(Session*Side) on each body-site further revealed that the Lip-D2 ED was significantly smaller
on the right side than on the left (F(1,20) = 5.87, p = 0.025). This was not the case for Lip-D5
EDs. Similar rmANOVAs performed separately on each Cartesian coordinate (x, y and z)
revealed that the gradual increase in the relative distance from D2-D5, to Lip-D2 and Lip-D5
was predominantly driven by differences along the z axis (see Supplemental Results). This was
also true for the side difference observed for the Lip-D2 distance.
The relative distances between body-site ECDs were also evaluated by calculating their
differential Polar coordinates (Figure 17). As for the relative EDs, a gradually increasing
∆theta angle was found from D2-D5, to Lip-D2, with the largest ∆theta angle being reported for
Lip-D5 ECDs (three-way rmANOVA; F(2,40) = 38.56, p < 10-6; all pLSD values < 5*10-4). This
suggests that ED differences are essentially present along the dorso-ventral direction, and thus
confirms the similar gradual increase observed along the z axis. Some differences were also
observed at the level of both eccentricity and phi angles, with a significantly smaller ∆radius
between D2-D5 ECDs than between the Lips and the fingertips (three-way rmANOVA; F(2,40) =
8.88, p < 0.001; all pLSD values < 0.021), and a larger ∆phi angle between Lip-D5 ECDs than
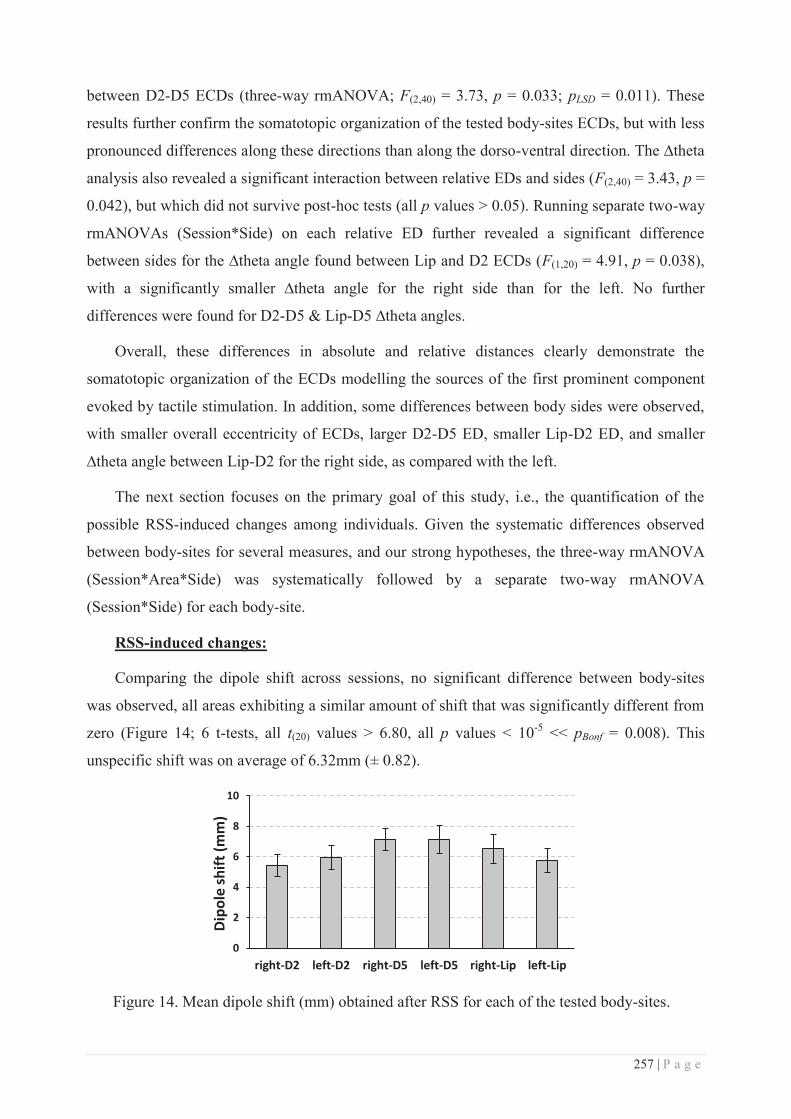
257 | P a g e
between D2-D5 ECDs (three-way rmANOVA; F(2,40) = 3.73, p = 0.033; pLSD = 0.011). These
results further confirm the somatotopic organization of the tested body-sites ECDs, but with less
pronounced differences along these directions than along the dorso-ventral direction. The ∆theta
analysis also revealed a significant interaction between relative EDs and sides (F(2,40) = 3.43, p =
0.042), but which did not survive post-hoc tests (all p values > 0.05). Running separate two-way
rmANOVAs (Session*Side) on each relative ED further revealed a significant difference
between sides for the ∆theta angle found between Lip and D2 ECDs (F(1,20) = 4.91, p = 0.038),
with a significantly smaller ∆theta angle for the right side than for the left. No further
differences were found for D2-D5 & Lip-D5 ∆theta angles.
Overall, these differences in absolute and relative distances clearly demonstrate the
somatotopic organization of the ECDs modelling the sources of the first prominent component
evoked by tactile stimulation. In addition, some differences between body sides were observed,
with smaller overall eccentricity of ECDs, larger D2-D5 ED, smaller Lip-D2 ED, and smaller
∆theta angle between Lip-D2 for the right side, as compared with the left.
The next section focuses on the primary goal of this study, i.e., the quantification of the
possible RSS-induced changes among individuals. Given the systematic differences observed
between body-sites for several measures, and our strong hypotheses, the three-way rmANOVA
(Session*Area*Side) was systematically followed by a separate two-way rmANOVA
(Session*Side) for each body-site.
RSS-induced changes:
Comparing the dipole shift across sessions, no significant difference between body-sites
was observed, all areas exhibiting a similar amount of shift that was significantly different from
zero (Figure 14; 6 t-tests, all t(20) values > 6.80, all p values < 10-5 << pBonf = 0.008). This
unspecific shift was on average of 6.32mm (± 0.82).
Figure 14. Mean dipole shift (mm) obtained after RSS for each of the tested body-sites.
0
2
4
6
8
10
right-D2 left-D2 right-D5 left-D5 right-Lip left-Lip
Dipo
le sh
ift (m
m)
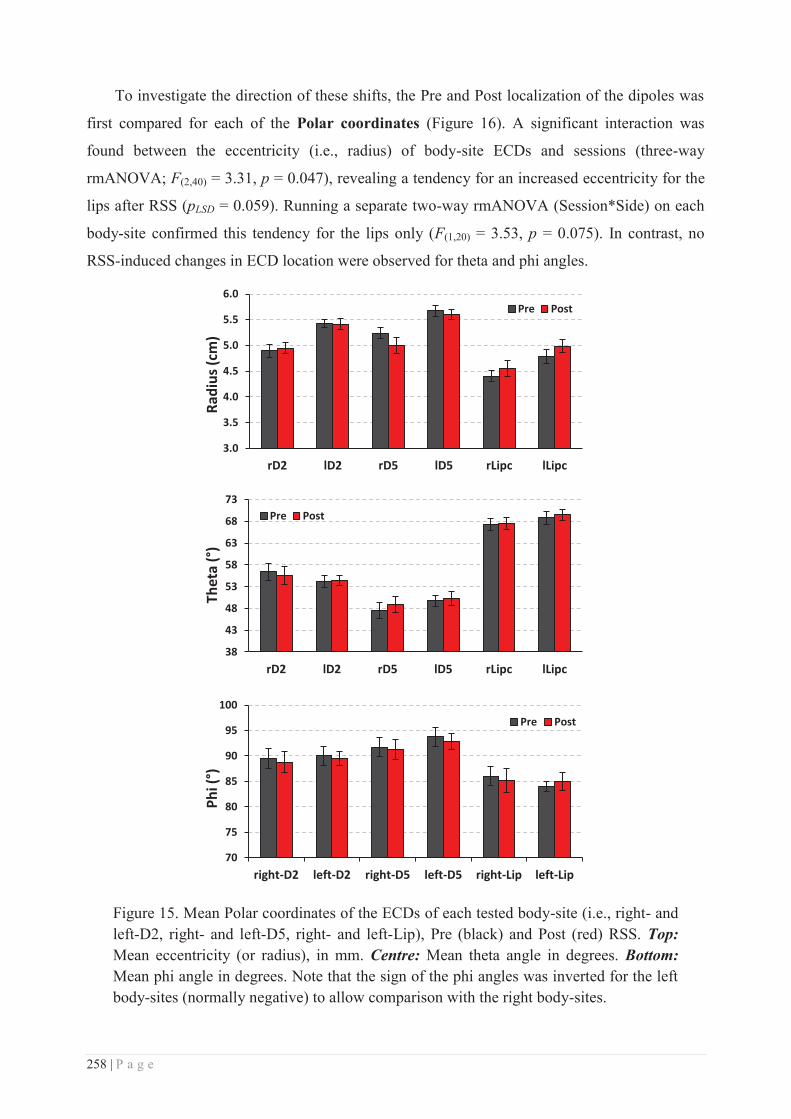
258 | P a g e
To investigate the direction of these shifts, the Pre and Post localization of the dipoles was
first compared for each of the Polar coordinates (Figure 16). A significant interaction was
found between the eccentricity (i.e., radius) of body-site ECDs and sessions (three-way
rmANOVA; F(2,40) = 3.31, p = 0.047), revealing a tendency for an increased eccentricity for the
lips after RSS (pLSD = 0.059). Running a separate two-way rmANOVA (Session*Side) on each
body-site confirmed this tendency for the lips only (F(1,20) = 3.53, p = 0.075). In contrast, no
RSS-induced changes in ECD location were observed for theta and phi angles.
Figure 15. Mean Polar coordinates of the ECDs of each tested body-site (i.e., right- and left-D2, right- and left-D5, right- and left-Lip), Pre (black) and Post (red) RSS. Top: Mean eccentricity (or radius), in mm. Centre: Mean theta angle in degrees. Bottom: Mean phi angle in degrees. Note that the sign of the phi angles was inverted for the left body-sites (normally negative) to allow comparison with the right body-sites.
3.0
3.5
4.0
4.5
5.0
5.5
6.0
rD2 lD2 rD5 lD5 rLipc lLipc
Radi
us (c
m)
Pre Post
38
43
48
53
58
63
68
73
rD2 lD2 rD5 lD5 rLipc lLipc
Thet
a (°
)
Pre Post
70
75
80
85
90
95
100
right-D2 left-D2 right-D5 left-D5 right-Lip left-Lip
Phi (
°)
Pre Post
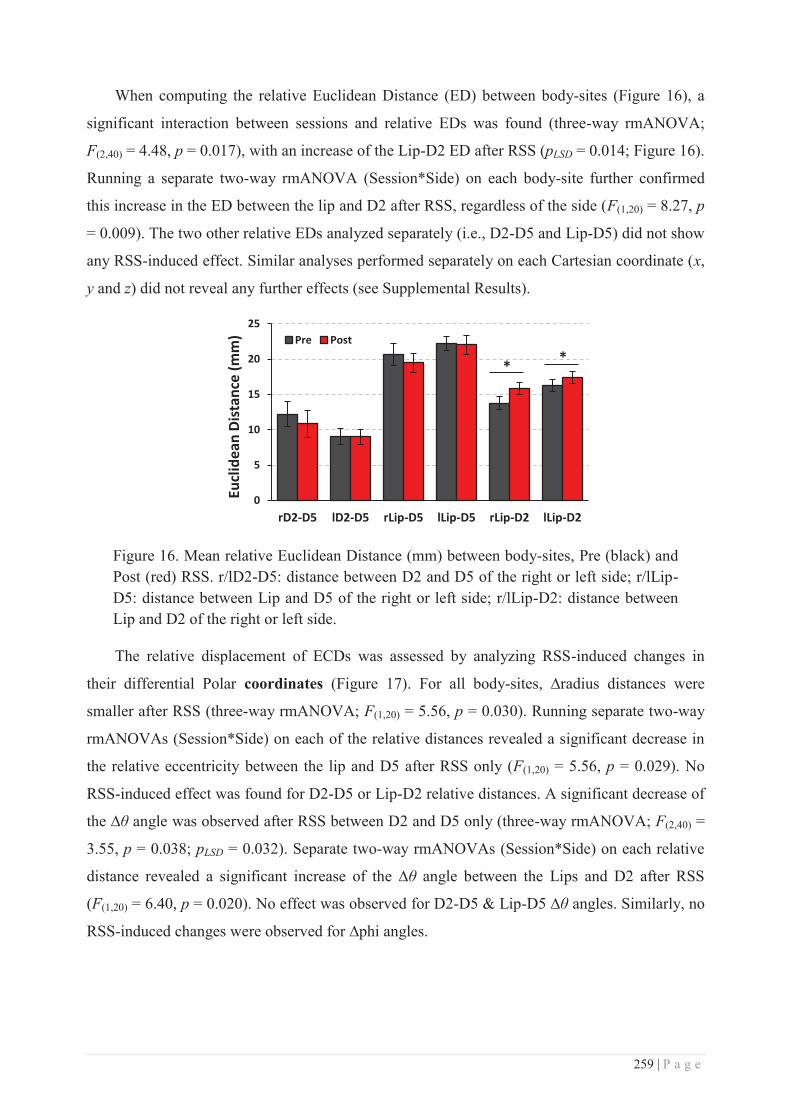
259 | P a g e
When computing the relative Euclidean Distance (ED) between body-sites (Figure 16), a
significant interaction between sessions and relative EDs was found (three-way rmANOVA;
F(2,40) = 4.48, p = 0.017), with an increase of the Lip-D2 ED after RSS (pLSD = 0.014; Figure 16).
Running a separate two-way rmANOVA (Session*Side) on each body-site further confirmed
this increase in the ED between the lip and D2 after RSS, regardless of the side (F(1,20) = 8.27, p
= 0.009). The two other relative EDs analyzed separately (i.e., D2-D5 and Lip-D5) did not show
any RSS-induced effect. Similar analyses performed separately on each Cartesian coordinate (x,
y and z) did not reveal any further effects (see Supplemental Results).
Figure 16. Mean relative Euclidean Distance (mm) between body-sites, Pre (black) and Post (red) RSS. r/lD2-D5: distance between D2 and D5 of the right or left side; r/lLip-D5: distance between Lip and D5 of the right or left side; r/lLip-D2: distance between Lip and D2 of the right or left side.
The relative displacement of ECDs was assessed by analyzing RSS-induced changes in
their differential Polar coordinates (Figure 17). For all body-sites, ∆radius distances were
smaller after RSS (three-way rmANOVA; F(1,20) = 5.56, p = 0.030). Running separate two-way
rmANOVAs (Session*Side) on each of the relative distances revealed a significant decrease in
the relative eccentricity between the lip and D5 after RSS only (F(1,20) = 5.56, p = 0.029). No
RSS-induced effect was found for D2-D5 or Lip-D2 relative distances. A significant decrease of
the ∆θ angle was observed after RSS between D2 and D5 only (three-way rmANOVA; F(2,40) =
3.55, p = 0.038; pLSD = 0.032). Separate two-way rmANOVAs (Session*Side) on each relative
distance revealed a significant increase of the ∆θ angle between the Lips and D2 after RSS
(F(1,20) = 6.40, p = 0.020). No effect was observed for D2-D5 & Lip-D5 ∆θ angles. Similarly, no
RSS-induced changes were observed for ∆phi angles.
0
5
10
15
20
25
rD2-D5 lD2-D5 rLip-D5 lLip-D5 rLip-D2 lLip-D2
Eucl
idea
n Di
stan
ce (m
m) Pre Post
* *
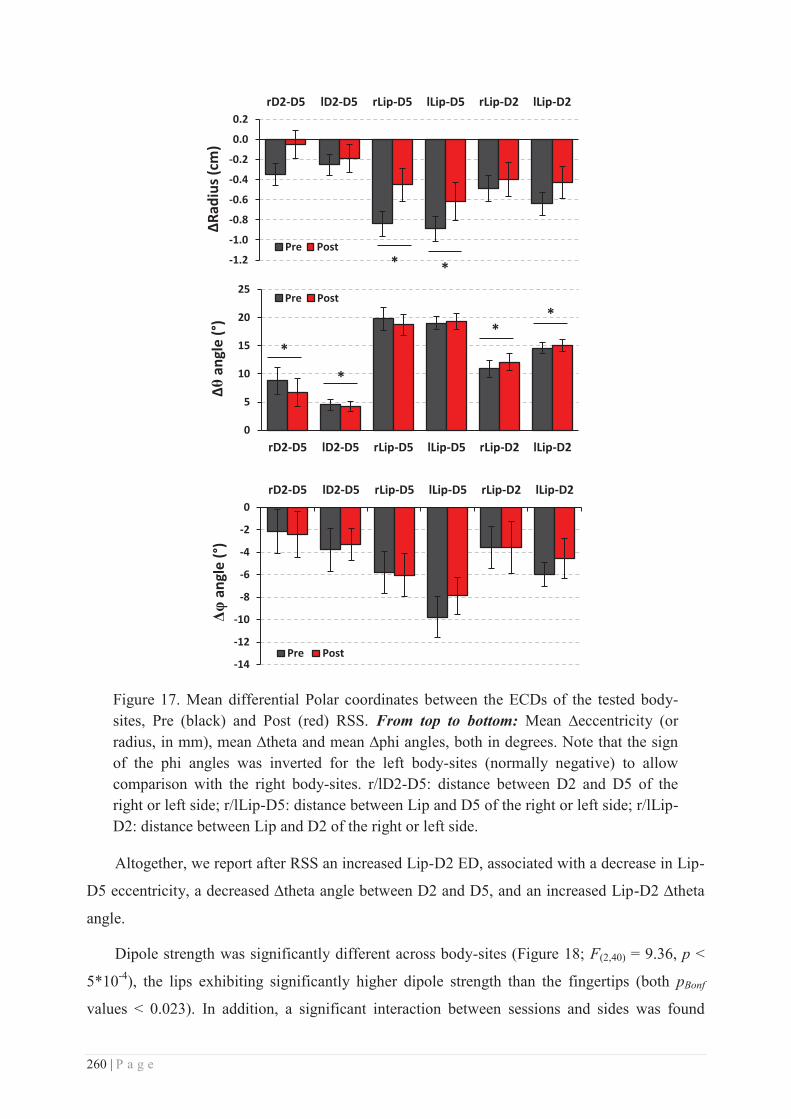
260 | P a g e
Figure 17. Mean differential Polar coordinates between the ECDs of the tested body-sites, Pre (black) and Post (red) RSS. From top to bottom: Mean ∆eccentricity (or radius, in mm), mean ∆theta and mean ∆phi angles, both in degrees. Note that the sign of the phi angles was inverted for the left body-sites (normally negative) to allow comparison with the right body-sites. r/lD2-D5: distance between D2 and D5 of the right or left side; r/lLip-D5: distance between Lip and D5 of the right or left side; r/lLip-D2: distance between Lip and D2 of the right or left side.
Altogether, we report after RSS an increased Lip-D2 ED, associated with a decrease in Lip-
D5 eccentricity, a decreased ∆theta angle between D2 and D5, and an increased Lip-D2 ∆theta
angle.
Dipole strength was significantly different across body-sites (Figure 18; F(2,40) = 9.36, p <
5*10-4), the lips exhibiting significantly higher dipole strength than the fingertips (both pBonf
values < 0.023). In addition, a significant interaction between sessions and sides was found
-1.2
-1.0
-0.8
-0.6
-0.4
-0.2
0.0
0.2 rD2-D5 lD2-D5 rLip-D5 lLip-D5 rLip-D2 lLip-D2
ΔRad
ius (
cm)
Pre Post * *
0
5
10
15
20
25
rD2-D5 lD2-D5 rLip-D5 lLip-D5 rLip-D2 lLip-D2
Δθ a
ngle
(°)
Pre Post
*
*
* *
-14
-12
-10
-8
-6
-4
-2
0 rD2-D5 lD2-D5 rLip-D5 lLip-D5 rLip-D2 lLip-D2
Δφ a
ngle
(°)
Pre Post
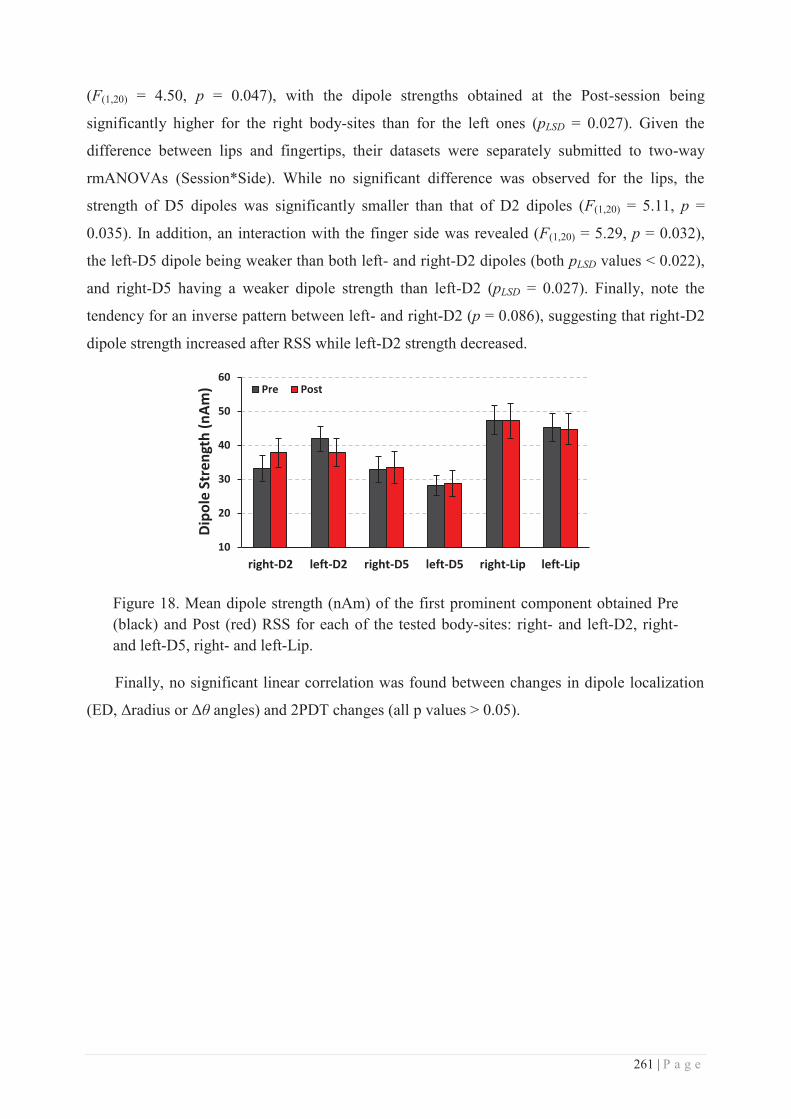
261 | P a g e
(F(1,20) = 4.50, p = 0.047), with the dipole strengths obtained at the Post-session being
significantly higher for the right body-sites than for the left ones (pLSD = 0.027). Given the
difference between lips and fingertips, their datasets were separately submitted to two-way
rmANOVAs (Session*Side). While no significant difference was observed for the lips, the
strength of D5 dipoles was significantly smaller than that of D2 dipoles (F(1,20) = 5.11, p =
0.035). In addition, an interaction with the finger side was revealed (F(1,20) = 5.29, p = 0.032),
the left-D5 dipole being weaker than both left- and right-D2 dipoles (both pLSD values < 0.022),
and right-D5 having a weaker dipole strength than left-D2 (pLSD = 0.027). Finally, note the
tendency for an inverse pattern between left- and right-D2 (p = 0.086), suggesting that right-D2
dipole strength increased after RSS while left-D2 strength decreased.
Figure 18. Mean dipole strength (nAm) of the first prominent component obtained Pre (black) and Post (red) RSS for each of the tested body-sites: right- and left-D2, right- and left-D5, right- and left-Lip.
Finally, no significant linear correlation was found between changes in dipole localization
(ED, Δradius or Δθ angles) and 2PDT changes (all p values > 0.05).
10
20
30
40
50
60
right-D2 left-D2 right-D5 left-D5 right-Lip left-Lip
Dipo
le S
tren
gth
(nAm
) Pre Post
262 | P a g e
Discussion
The purpose of this study was to assess the neurophysiological substrates underlying the
RSS-induced plastic changes recently observed across the hand-face border and to evaluate how
they relate to the perceptual changes. In agreement with our previous reports (Muret et al., 2014,
study 2 in this thesis), we found that three hours of RSS at the right-D2 fingertip improved
spatial acuity not only at this finger, but also at both sides of the upper-lip, while the
homologous left-D2 was unaffected. Additionally, in this present study we report for the first
time the absence of behavioural effects on both little fingers. In parallel with these behavioural
changes, dipole model source analyses revealed after RSS: (i) an increased distance between Lip
and D2 dipoles (ED and Δtheta angle), (ii) a decrease in Lip-D5 relative eccentricity, and (iii) a
decreased distance between D2 and D5 dipoles (∆theta angle). In addition, the dipole strengths
after RSS were found to be stronger for the right body-sites than for the left ones. Altogether,
these results first confirm the existence of cross-border changes following RSS, with relative
changes between the stimulated finger and the lip, but also suggest that changes are widespread
- reaching the other hemisphere. Finally, these results underline the dynamic property of
somatotopic maps, which likely fluctuate with time depending on the use, configuration, and
stimulation of body-sites.
Behavioural results
In agreement with our previous findings (Muret et al., 2014), we report that three hours of
RSS at right-D2 improved tactile acuity not only at this fingertip, but also at both sides of the
upper-lip. However, smaller behavioural effects were observed in the present study than in the
previous report (Muret et al., 2014). Indeed, a higher proportion of participants did not exhibit
the right-D2 threshold decrease, which is the marker of the effectiveness of the RSS procedure.
In addition, a lower proportion showed the mutual decrease at both right-D2 and the lips, and
the average threshold decreases were lower. Altogether, these facts suggest a lower efficiency of
the RSS procedure in this study, which resulted in a lower “transfer” of the effects towards the
face. A possible explanation arises from the type of stimulation used during the MEG mapping
procedure. Indeed, one has to consider that the repetitive stimulation performed during the MEG
mapping could have itself induced some cortical reorganization. More importantly, note that the
tapping-like pneumatic stimulation used during the mapping procedure with quite short and
jittered ISIs (400-600ms) is highly similar to the RSS procedure. The main difference between
these two procedures arises from the fact that instead of stimulating right-D2 only, during the
mapping body-sites were randomly stimulated, which could be considered as an “asynchronous”
263 | P a g e
stimulation of these regions. Given that asynchronous RSS protocols across fingers have been
shown to result in spatial acuity impairments (Hodzic et al., 2004; Kalisch et al., 2007), it is
possible that the mapping procedure somewhat interfered with the RSS procedure. This could
explain the lower RSS-induced behavioural changes reported here. Moreover, the longer time
interval between tactile threshold assessments and the RSS procedure due to the interleaved
MEG sessions (~1h instead of ~15min) could also have played a role in producing the smaller
behavioural effects. Indeed, while the threshold decrease has been reported to be significant 2h
after RSS (Godde et al., 2000), it was undoubtedly on the way back to baseline levels.
Despite the possible interfering factors described above, similar mean effects were observed
at the group level, as well as at the individual level when considering participants for whom RSS
was effective. In addition to replicating the effects at right-D2 and both sides of the upper-lip,
we report that similar to left-D2, RSS at right-D2 does not affect the thresholds at both little
fingers. This result is in line with previous reports of no change at the adjacent finger (right-D3;
Godde et al., 2000; Muret et al., in preparation), and supports the idea that RSS-induced
perceptual changes are limited to the stimulated finger and do not spread to other fingers within
the hand, likely through intracortical inhibitory connections underlying lateral inhibition
(Simões et al., 2001; Négyessy et al., 2013).
ECDs as a source model
The quality of the ECDs was confirmed by the high GoF observed across both body-sites
and sessions. This ensured that our models explained more than 95% of the variance, which is
the gold-standard in dipole model source analysis (see Hämäläinen et al., 1993; Kakigi et al.,
2000). Note that the higher GoF observed for the lips compared to the fingertips is likely to arise
from a systematic, even if small, ipsilateral activity induced by finger stimulation (Schnitzler et
al., 1995; Sutherland and Tang, 2006; Hadoush et al., 2010), which we did not systematically
model. In addition, the incertitude in our dipole localizations was on average below 1mm (i.e.,
5mm3 on average, 52mm3 maximum), which is relatively small considering the spatial resolution
that MEG offers and the values usually reported in the literature (i.e., Elbert et al., 1995; Flor et
al., 1995: < 300mm3; Hlushchuk et al., 2004; Suzuki et al., 2004: < 1cm3; Knecht et al., 1998: <
300cm3). Altogether, these parameters demonstrate the reliability of our ECDs to model the
relatively simple activity evoked within the primary somatosensory cortex following finger and
face stimulation.
Because of the nature of the stimulation employed for the mapping procedure (i.e.,
mechanical), and given the orientation of SI subregions and the fact that MEG sensors record
264 | P a g e
predominantly the activity arising tangentially from the scalp (Hämäläinen et al., 1993), these
responses are likely to arise from activity within BA3b (i.e., anterior wall of the post-central
gyrus) and BA2 (i.e., posterior wall of the post-central gyrus), with BA1 activity possibly
weighting the resulting fields. Intracranial recording studies have confirmed that BA3b and BA1
contribute the most to the peak in the type of evoked response examined here (Baumgartner et
al., 1993).
Somatotopic organization
Consistent with the classical somatotopic organization of the primary somatosensory cortex
(Penfield and Rasmussen, 1950; Nakamura et al., 1998), polar coordinates and Euclidean
distances revealed that dipoles of D5, D2 and the Lip were sequentially more ventral and
anterior. The largest differences between body-sites were observed along the dorso-ventral
direction (i.e., y axis and theta angle), and some differences between body sides were also
observed. First, dipole eccentricities were globally smaller for the right body side (i.e., left
hemisphere), than for the left (i.e., right hemisphere). This result suggests an asymmetry
between hemispheres, which has already been reported using MEG but following electrical
median nerve stimulation (Jung et al., 2003, 2008). Surprisingly, in contrast to the hemispheric
asymmetries reported in the primary motor cortex (e.g., Amunts et al., 1996), these studies also
showed that this asymmetry of somatosensory representations was not correlated with
handedness (Jung et al., 2003, 2008). Thus, the cause and functional relevance of such
interhemispheric asymmetry remains to be clarified for the somatosensory domain. In addition
to this overall asymmetry, the ED between D2 and D5 dipoles was significantly larger for the
right body-sites than for the left. This difference is consistent with previous reports (Imai et al.,
2003) and suggests a larger somatosensory representation of the dominant hand. Supporting this
view, it has been reported that the rostral area of the post-central gyrus is more extended in the
left than in the right hemisphere (Jung et al., 2003). Finally, there was also an asymmetry in
dipole localization between the lip and D2 finger, as several measures (ED, ∆theta and z)
revealed a smaller distance between their dipoles for the right side. Together with the larger D2-
D5 distance mentioned above and the absence of Lip-D5 asymmetry, this novel result suggests a
higher proximity between the lip and D2 representations in the left hemisphere, either due to a
smaller D1 representation in between them, to a smaller lip representation (but in this case we
would have expected differences in dipole strength), or more likely due to more overlapping
representations than in the right hemisphere. But this remains to be investigated.
265 | P a g e
As expected from the shorter conduction pathways, shorter peak latencies were observed for
the lips than for the fingers. But surprisingly, shorter latencies were observed for the left fingers
than for the right ones. This unexpected result could come from differences in the membrane
fixation since different experimenters fixed the membranes on the left and right body sites, or
from "lateralization" but in this case we might have expected to see shorter latencies for the
dominant hand). Note that even in the case of different fixations, this would have led to
differences in stimulation intensity, which typically alter the dipole strength and latency (the
higher the intensity, the higher the dipole strength and the lower the latency), but not
localization (e.g., Hoshiyama and Kakigi, 2001; Otsuru et al., 2011). All possible precautions
were taken to minimize the variability in stimulation location using the UV-visible marks.
Moreover, the relative comparison of sessions also account for such differences. Finally, the
dipole strength was larger for the lips compared to the fingertips, and - ignoring the differences
between body sides - also larger for D2 compared to D5. Given that the current dipole strength
is hypothesized to be an indicator of the net strength of cortical polarization, which reflects the
total number of synchronously firing neurons contributing to the stimulus-driven cortical
response (Williamson and Kaufman, 1990), these differences can reflect a larger/smaller
neuronal population (i.e., representation) for the lip/D5. Such differences in cortical
magnification are thought to be related to the differential sensitivity/acuity across body-sites,
arising from the differential densities of receptors embedded in the skin.
RSS-induced changes
Despite the reliability of our ECDs (see above), a shift of approximately 6mm was observed
across sessions for the ECDs of all body-sites. Such unspecific changes in dipole location could
arise from an altered re-positioning of the participant’s head inside the MEG helmet during the
two recording sessions, co-registration errors, or systematic head motion. However, since all
body-sites were stimulated within a given block, these possible causes can be excluded as one
would have expected the ECD locations for the different regions to be similarly affected at the
individual level, which was not the case. In line with this, a systematic shift at the individual
level would have left the relative distances unaltered, which is again not the case. Furthermore,
localization of head position was carefully checked at the beginning of each block ensuring the
stability of the head position throughout the recording. These causes excluded, one remaining
possibility is that the membranes/stimulators might have been attached slightly differently
across body-sites and sessions, resulting in slightly different intensities of stimulation. However,
changes in stimulation intensity have typically been shown to alter the dipole strength and
266 | P a g e
latency (the higher the intensity, the higher the dipole strength and the lower the latency), but
not its localization (e.g., Hoshiyama and Kakigi, 2001; Otsuru et al., 2011). These
methodological aspects being unlikely responsible for these 6mm shifts, our data suggest instead
a real shift of all body-sites in different directions, as we found changes in their relative
distances.
Similarly to the behavioural results, the repetitive stimulation performed during the MEG
mapping could have itself induced some cortical reorganization which could explain these shifts.
In line with this, task-free somatosensory stimulation paradigms have been shown to induce
cortical changes depending on their stimulus properties (Braun et al., 2000b). Thus, despite the
fact that each body-site received the exact same amount of stimuli and that stimuli were
randomized, this repetitive stimulation may have led to some cortical changes. More
importantly, note that the tapping-like pneumatic stimulation used during the mapping
procedure with quite short and jittered ISIs (400-600ms) is highly similar to the RSS procedure.
The main difference arises from the fact that body-sites were randomly stimulated instead of
solely right-D2, which could be considered as an “asynchronous” stimulation of these regions.
Given that such asynchronous stimulation were found to result in a segregation of cortical
representations (e.g., Hodzic et al., 2004), this may have interfered with the RSS-induced
cortical changes (as for the perceptual ones). Despite all these considerations, given that the
exact same procedure was followed during each session, the Pre/Post design of this study allow
for a direct estimation of the RSS-induced changes.
Following RSS at right-D2, a decrease in eccentricity was observed for all body-sites,
suggesting a “deepening” or downward shift of all dipoles. However, further analysis revealed
that this effect was mainly driven by a decreased eccentricity between the lip and D5 dipoles.
Given the sequential distribution of the dipoles, one possibility is that each body-site may have
slightly shifted down towards the lips, but that the “cumulative” effect made the shift significant
for D5 only. Consistent with the shift of D5 towards the lip, a decreased ∆theta angle was found
between D2 and D5 dipoles. Finally, an increased distance between the lip and D2 dipoles was
observed with two measures (∆theta and ED), suggesting that their dipoles moved apart from
each other. Thus, another possibility is that D2 and Lip dipoles shifted towards that of D5, but
that D2 shifted more than the lip. Given that an enlargement of the cortical representation of
right-D2 has been reported by our team and others using fMRI (Pleger et al, 2003; Hodzic et al,
2004; Muret et al, in preparation), a possible explanation is that the enlargement of right-D2
displaced the lip representation away from it, while D5 moved towards D2/Lip. The tendency
for an increased dipole strength for right-D2 is consistent with right-D2 enlargement. However,
267 | P a g e
given that the dipole strength for the lips and D5 did not change (not even a tendency), it is
unlikely that right-D2 enlargement occurred to the detriment of the lip and D5 representations,
as would be expected by the classically-defined “invasion” idea. Instead, these relative shifts are
likely to have not altered the adjacent representations, but rather their relative overlap.
Importantly, the RSS-induced effects reported here were not influenced by body sides,
suggesting changes in dipole location in both the left and right hemisphere. Given the strong
transcallosal connectivity (at least between BA2s), changes in the hemisphere ipsilateral to the
right-D2 which received the RSS may arise from a transfer, likely through right-D2
representations and/or the lips whose representations are known to be bilateral (more than
fingers). Another alternative would be that RSS induces plastic changes primarily within the
thalamus, then projecting to both hemispheres.
The only side-specific changes we observed were a higher dipole strength for the right
body-sites than the left after RSS. Given that the current dipole strength is hypothesized to be an
indicator of the net strength of cortical polarization, which reflects the total number of
synchronously firing neurons contributing to the stimulus-driven cortical response (Williamson
and Kaufman, 1990), these enhanced dipole strengths suggest a potentiation of the
representations among the left hemisphere. This is consistent with the postulated mechanisms
underlying RSS.
Conclusion
To conclude, in addition to the improved spatial discrimination at the RSS-stimulated finger
(right-D2) and to both sides of the upper-lip, the present study reveals that the tactile acuity at
both little fingers is not affected by the RSS procedure. Associated with these perceptual
changes, dipole source analysis revealed relative shifts of all dipoles (Lip, D2 and D5), resulting
in an increased distance between the sources of the Lips and D2, and a decreased distance
between the little fingers and both the Lip and D2. After RSS, dipole strengths for the right
body-sites (ipsilateral to RSS) were stronger than those of the left side. Altogether, these results
first confirm the existence of cross-border changes following RSS, with relative changes
between the stimulated finger and the lip, but also suggest that RSS induces widespread changes
reaching the other hemisphere.
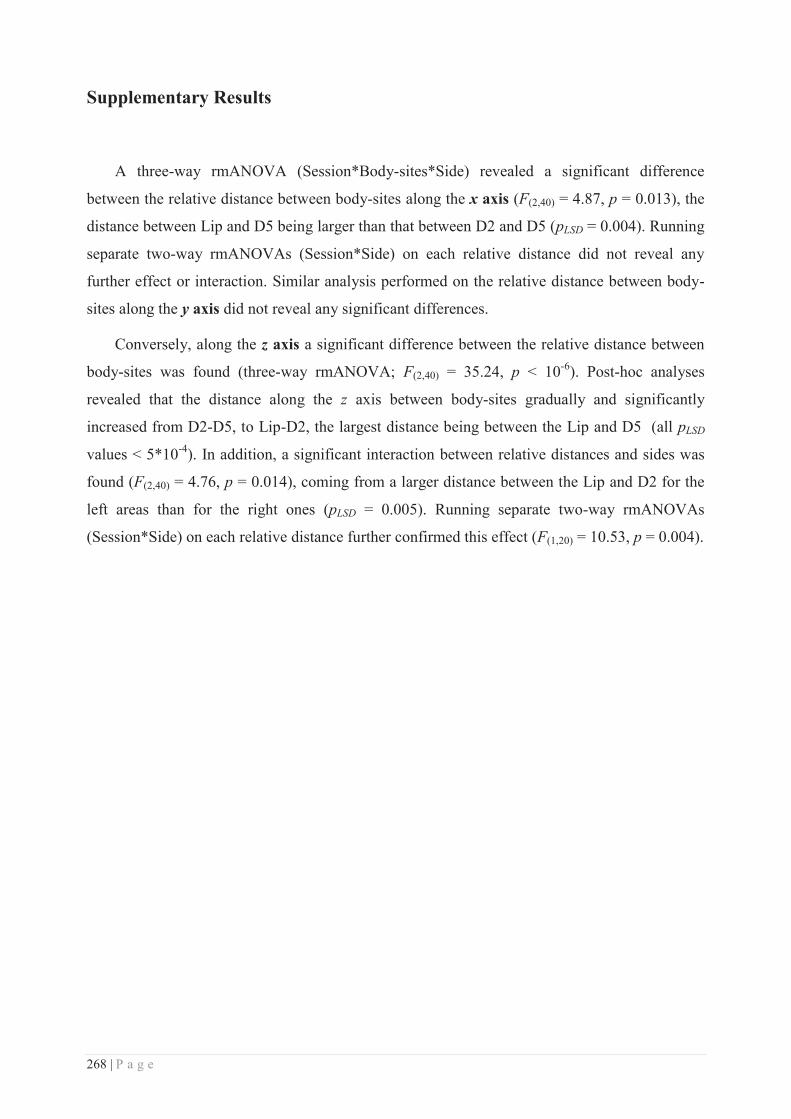
268 | P a g e
Supplementary Results
A three-way rmANOVA (Session*Body-sites*Side) revealed a significant difference
between the relative distance between body-sites along the x axis (F(2,40) = 4.87, p = 0.013), the
distance between Lip and D5 being larger than that between D2 and D5 (pLSD = 0.004). Running
separate two-way rmANOVAs (Session*Side) on each relative distance did not reveal any
further effect or interaction. Similar analysis performed on the relative distance between body-
sites along the y axis did not reveal any significant differences.
Conversely, along the z axis a significant difference between the relative distance between
body-sites was found (three-way rmANOVA; F(2,40) = 35.24, p < 10-6). Post-hoc analyses
revealed that the distance along the z axis between body-sites gradually and significantly
increased from D2-D5, to Lip-D2, the largest distance being between the Lip and D5 (all pLSD
values < 5*10-4). In addition, a significant interaction between relative distances and sides was
found (F(2,40) = 4.76, p = 0.014), coming from a larger distance between the Lip and D2 for the
left areas than for the right ones (pLSD = 0.005). Running separate two-way rmANOVAs
(Session*Side) on each relative distance further confirmed this effect (F(1,20) = 10.53, p = 0.004).
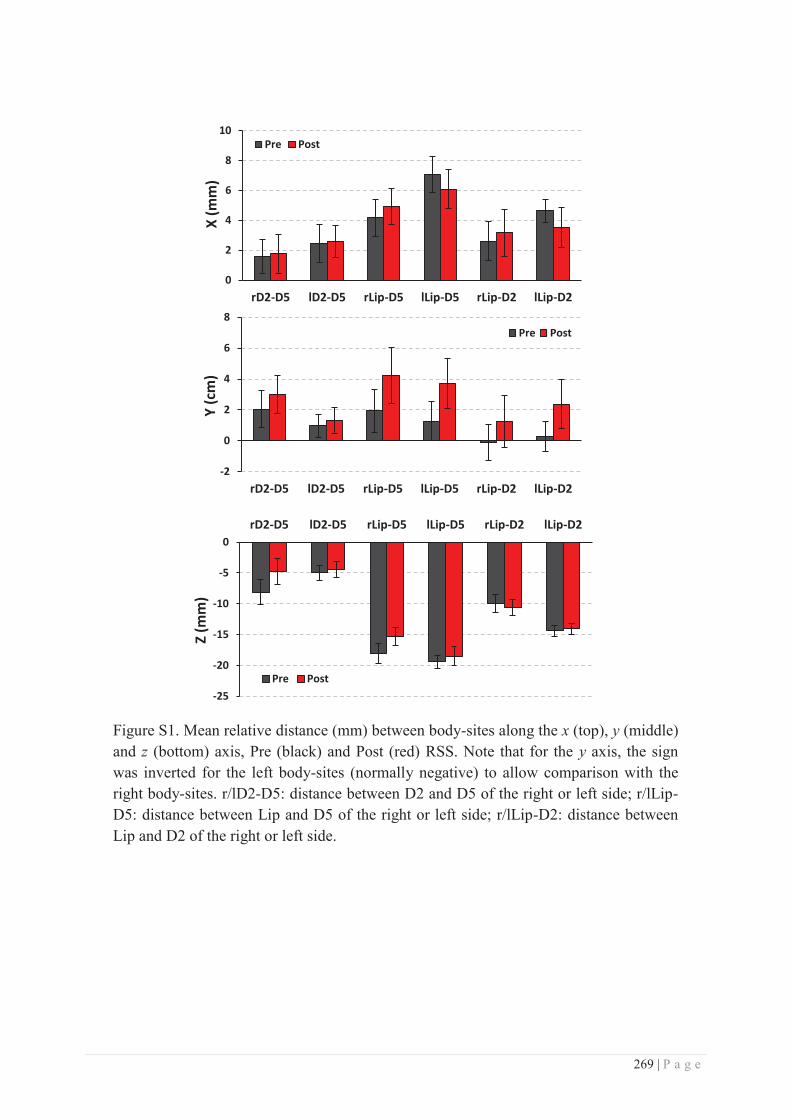
269 | P a g e
Figure S1. Mean relative distance (mm) between body-sites along the x (top), y (middle) and z (bottom) axis, Pre (black) and Post (red) RSS. Note that for the y axis, the sign was inverted for the left body-sites (normally negative) to allow comparison with the right body-sites. r/lD2-D5: distance between D2 and D5 of the right or left side; r/lLip-D5: distance between Lip and D5 of the right or left side; r/lLip-D2: distance between Lip and D2 of the right or left side.
0
2
4
6
8
10
rD2-D5 lD2-D5 rLip-D5 lLip-D5 rLip-D2 lLip-D2
X (m
m)
Pre Post
-2
0
2
4
6
8
rD2-D5 lD2-D5 rLip-D5 lLip-D5 rLip-D2 lLip-D2
Y (c
m)
Pre Post
-25
-20
-15
-10
-5
0 rD2-D5 lD2-D5 rLip-D5 lLip-D5 rLip-D2 lLip-D2
Z (m
m)
Pre Post
270 | P a g e
References
Amunts K, Schlaug G, Schleicher A, Steinmetz H, Dabringhaus A, Roland PE, Zilles K (1996) Asymmetry in the human motor cortex and handedness. Neuroimage 4:216–222.
Baumgartner C, Doppelbauer A, Sutherling WW, Lindinger G, Levesque MF, Aull S, Zeitlhofer J, Deecke L (1993) Somatotopy of human hand somatosensory cortex as studied in scalp EEG. Electroencephalogr Clin Neurophysiol 88:271–279.
Beste C, Dinse HR (2013) Learning without training. Curr Biol 23:R489–R499.
Blatow M, Nennig E, Durst A, Sartor K, Stippich C (2007) fMRI reflects functional connectivity of human somatosensory cortex. Neuroimage 37:927–936.
Braun C, Wilms A, Schweizer R, Godde B, Preissl H, Birbaumer N (2000) Activity patterns of human somatosensory cortex adapt dynamically to stimulus properties. Neuroreport 11:2977–2980.
Clark SA, Allard T, Jenkins WM, Merzenich MM (1988) Receptive fields in the body-surface map in adult cortex defined by temporally correlated inputs. Nature 332:444–445.
Craig JC, Johnson KO (2000) The Two-Point Threshold : Not a Measure of Tactile Spatial Resolution. Am Psychol Soc 9:29–32.
Devonshire IM, Papadakis NG, Port M, Berwick J, Kennerley AJ, Mayhew JEW, Overton PG (2012) Neurovascular coupling is brain region-dependent. Neuroimage 59:1997–2006.
Dinse HR, Kleibel N, Kalisch T, Ragert P, Wilimzig C, Tegenthoff M (2006) Tactile coactivation resets age-related decline of human tactile discrimination. Ann Neurol 60:88–94.
Dinse HR, Ragert P, Pleger B, Schwenkreis P, Tegenthoff M (2003) Pharmacological modulation of perceptual learning and associated cortical reorganization. Science 301:91–94.
Disbrow E a, Hinkley LBN, Roberts TPL (2003) Ipsilateral representation of oral structures in human anterior parietal somatosensory cortex and integration of inputs across the midline. J Comp Neurol 467:487–495.
Dutta A, Kambi N, Raghunathan P, Khushu S, Jain N (2013) Large-scale reorganization of the somatosensory cortex of adult macaque monkeys revealed by fMRI. Brain Struct Funct 219:1305–1320.
Eickhoff SB, Grefkes C, Fink GR, Zilles K (2008) Functional lateralization of face, hand, and trunk representation in anatomically defined human somatosensory areas. Cereb cortex 18:2820–2830.
Elbert T, Pantev C, Wienbruch C, Rockstroh B, Taub E (1995) Increased cortical representation of the fingers of the left hand in string players. Science (80- ) 270:305–307.
Flor H, Elbert T, Knecht S, Wienbruch C, Pantev C, Birbaumer N, Larbig W, Taub E (1995) Phantom-limb pain as a perceptual correlate of cortical reorganization following arm amputation. Nature 375:482–484.
Gibson GO, Makinson CD, Sathian K (2009) Tactile co-activation improves detection of afferent spatial modulation. Exp Brain Res 194:409–417.
Godde B, Ehrhardt J, Braun C (2003) Behavioral significance of input-dependent plasticity of human somatosensory cortex. Neuroreport 14:543–546.
Godde B, Stauffenberg B, Spengler F, Dinse HR (2000) Tactile coactivation-induced changes in spatial discrimination performance. J Neurosci 20:1597–1604.
271 | P a g e
Hadoush H, Inoue K, Nakanishi K, Kurumadani H, Sunagawa T, Ochi M (2010) Ipsilateral primary sensorimotor cortical response to mechanical tactile stimuli. Neuroreport 21:108–113.
Hämäläinen M, Hari R, Ilmoniemi RJ, Knuutila J, Lounasmaa O V (1993) Magnetoencephalography - theory, instrumentaton, and applications to noninvasive studies of the working human brain. Rev Mod Phys 65:413–497.
Harrar V, Spence C, Makin TR (2014) Topographic generalization of tactile perceptual learning. J Exp Psychol Hum Percept Perform 40:15–23.
Harris JA, Harris IM, Diamond ME (2001) The topography of tactile learning in humans. J Neurosci 21:1056–1061.
Hlushchuk Y, Forss N, Hari R (2004) Distal-to-proximal representation of volar index finger in human area 3b. Neuroimage 21:696–700.
Hodzic A, Veit R, Karim AA, Erb M, Godde B (2004) Improvement and decline in tactile discrimination behavior after cortical plasticity induced by passive tactile coactivation. J Neurosci 24:442–446.
Hoffmeyer HW, Enager P, Thomsen KJ, Lauritzen MJ (2007) Nonlinear neurovascular coupling in rat sensory cortex by activation of transcallosal fibers. J Cereb Blood Flow Metab 27:575–587.
Hoshiyama M, Kakigi R (2001) Two evoked responses with different recovery functions in the primary somatosensory cortex in humans. Clin Neurophysiol 112:1334–1342.
Hoshiyama M, Ryusuke K, Koyama S, Kitamura Y, Shimojo M, Watanabe S, Kakigi R (1996) Somatosensory evoked magnetic fields following stimulation of the lip in humans. Electroencephalogr Clin Neurophysiol 100:96–104.
Hu K-S, Kwak J, Koh K-S, Abe S, Fontaine C, Kim H-J (2007) Topographic distribution area of the infraorbital nerve. Surg Radiol Anat 29:383–388.
Huttunen JK, Gröhn O, Penttonen M (2008) Coupling between simultaneously recorded BOLD response and neuronal activity in the rat somatosensory cortex. Neuroimage 39:775–785.
Iannetti G., Porro C., Pantano P, Romanelli P., Galeotti F, Cruccu G (2003) Representation of different trigeminal divisions within the primary and secondary human somatosensory cortex. Neuroimage 19:906–912.
Imai T, Kamping S, Breitenstein C, Pantev C, Lütkenhöner B, Knecht S (2003) Learning of tactile frequency discrimination in humans. Hum Brain Mapp 18:260–271.
Inoue K, Nakanishi K, Hadoush H, Kurumadani H, Hashizume A, Sunagawa T, Ochi M (2013) Somatosensory mechanical response and digit somatotopy within cortical areas of the postcentral gyrus in humans: an MEG study. Hum Brain Mapp 34:1559–1567.
Jain N, Catania KC, Kaas JH (1997) Deactivation and reactivation of somatosensory cortex after dorsal spinal cord injury. Nature 386:495–498.
Johnson KO, Phillips JR (1981) Tactile spatial resolution. I. Two-point discrimination, gap detection, grating resolution, and letter recognition. J Neurophysiol 46:1177–1192.
Jung P, Baumgärtner U, Bauermann T, Magerl W, Gawehn J, Stoeter P, Treede R-D (2003) Asymmetry in the human primary somatosensory cortex and handedness. Neuroimage 19:913–923.
Jung P, Baumgärtner U, Magerl W, Treede R-D (2008) Hemispheric asymmetry of hand representation in human primary somatosensory cortex and handedness. Clin Neurophysiol 119:2579–2586.
272 | P a g e
Kakigi R, Hoshiyama M, Shimojo M, Naka D, Itomi K, Nakamura A, Yamasaki H, Watanabe S, Xiang J, Maeda K, Lam K (2000) The somatosensory evoked magnetic fields. Prog Neurobiol 61:495–523.
Kalisch T, Tegenthoff M, Dinse HR (2007) Differential effects of synchronous and asynchronous multifinger coactivation on human tactile performance. BMC Neurosci 8:58.
Knecht S, Henningsen H, Höhling C, Elbert T, Flor H, Pantev C, Taub E (1998) Plasticity of plasticity? Changes in the pattern of perceptual correlates of reorganization after amputation. Brain 121:717–724.
Lin C-CK, Sun Y, Huang C-I, Yu C-Y, Ju M-S (2010) Cortical activation by tactile stimulation to face and anterior neck areas: an fMRI study with three analytic methods. Hum Brain Mapp 31:1876–1885.
Mertens M, Lütkenhöner B, Lu B (2000) Efficient neuromagnetic determination of landmarks in the somatosensory cortex. Clin Neurophysiol 111:1478–1487.
Mogilner A, Nomura M, Ribary U, Jagow R, Lado F, Rusinek H, Llinás R (1994) Neuromagnetic studies of the lip area of primary somatosensory cortex in humans: evidence for an oscillotopic organization. Exp brain Res 99:137–147.
Moore CI, Cao R (2008) The hemo-neural hypothesis : on the role of blood flow in information processing. J Neurophysiol 99:2035–2047.
Muret D, Dinse HR, Macchione S, Urquizar C, Farnè A, Reilly KT (2014) Touch improvement at the hand transfers to the face. Curr Biol 24:R736–R737.
Muret D, Martuzzi R, Dinse HR, Reilly KT, Blanke O, Farnè A (n.d.) Cortical correlates of perceptual changes transferring from the finger to the lips in human SI revealed by 7T fMRI.
Nakamura A, Yamada T, Goto A, Kato T, Ito K, Abe Y, Kachi T, Kakigi R (1998) Somatosensory homunculus as drawn by MEG. Neuroimage 7:377–386.
Négyessy L, Pálfi E, Ashaber M, Palmer C, Jákli B, Friedman RM, Chen LM, Roe AW (2013) Intrinsic horizontal connections process global tactile features in the primary somatosensory cortex: neuroanatomical evidence. J Comp Neurol 521:2798–2817.
Nevalainen P, Ramstad R, Isotalo E, Haapanen M-L, Lauronen L (2006) Trigeminal somatosensory evoked magnetic fields to tactile stimulation. Clin Neurophysiol 117:2007–2015.
Nguyen BT, Tran TD, Hoshiyama M, Inui K, Kakigi R (2004) Face representation in the human primary somatosensory cortex. Neurosci Res 50:227–232.
Oldfield RC (1971) The assessment and analysis of handedness: the Edinburgh inventory. Neuropsychologia 9:97–113.
Onishi H, Oyama M, Soma T, Kubo M, Kirimoto H, Murakami H, Kameyama S (2010) Neuromagnetic activation of primary and secondary somatosensory cortex following tactile-on and tactile-off stimulation. Clin Neurophysiol 121:588–593.
Otsuru N, Inui K, Yamashiro K, Urakawa T, Keceli S, Kakigi R (2011) Effects of prior sustained tactile stimulation on the somatosensory response to the sudden change of intensity in humans: an magnetoencephalography study. Neuroscience 182:115–124.
Parianen Lesemann FH, Reuter E-M, Godde B (2015) Tactile stimulation interventions: Influence of stimulation parameters on sensorimotor behavior and neurophysiological correlates in healthy and clinical samples. Neurosci Biobehav Rev 51:126–137.
273 | P a g e
Penfield W, Boldrey E (1937) Somatic motor and sensory representation in the cerebral cortex of man as studied by electrical stimulation. Brain 60:389–443.
Penfield W, Rasmussen T (1950) The cerebral cortex of man: a clinical study of localization of function. New York Macmillan Compagny.
Pilz K, Veit R, Braun C, Godde B (2004) Effects of co-activation on cortical organization and discrimination performance. Neuroreport 15:2669–2672.
Pleger B, Dinse HR, Ragert P, Schwenkreis P, Malin JP, Tegenthoff M (2001) Shifts in cortical representations predict human discrimination improvement. Proc Natl Acad Sci USA 98:12255–12260.
Pleger B, Foerster A-F, Ragert P, Dinse HR, Schwenkreis P, Malin J-P, Nicolas V, Tegenthoff M (2003) Functional imaging of perceptual learning in human primary and secondary somatosensory cortex. Neuron 40:643–653.
Pons TP, Garraghty PE, Ommaya AK, Kaas JH, Taub E, Mishkin M (1991) Massive cortical reorganization after sensory deafferentation in adult macaques. Science 252:1857–1860.
Rosa MJ, Kilner J, Blankenburg F, Josephs O, Penny W (2010) Estimating the transfer function from neuronal activity to BOLD using simultaneous EEG-fMRI. Neuroimage 49:1496–1509.
Schnitzler A, Salmelin R, Salenius S, Jousm V, Hari R (1995) Tactile information from the human hand reaches the ipsilateral primary somatosensory cortex. Neurosci Lett 200:25–28.
Simões C, Mertens M, Forss N, Jousmäki V, Lange J, Lütkenhöner B, Hari R (2001) Functional overlap of finger representations in human SI and SII cortices. J Neurophysiol 86:1661–1665.
Stavrinou ML, Penna S Della, Pizzella V, Torquati K, Cianflone F, Franciotti R, Bezerianos A, Romani GL, Rossini PM (2007) Temporal dynamics of plastic changes in human primary somatosensory cortex after finger webbing. Cereb Cortex 17:2134–2142.
Stoeckel MC, Pollok B, Schnitzler A, Seitz RJ (2007) Studying the human somatosensory hand area: A new way to compare fMRI and MEG. J Neurosci Methods 164:280–291.
Sutherland MT, Tang AC (2006) Reliable detection of bilateral activation in human primary somatosensory cortex by unilateral median nerve stimulation. Neuroimage 33:1042–1054.
Suzuki T, Shibukawa Y, Kumai T, Shintani M (2004) Face area representation of primary somatosensory cortex in humans identified by whole-head magnetoencephalography. Jpn J Physiol 54:161–169.
Tandon S, Kambi N, Lazar L, Mohammed H, Jain N (2009) Large-scale expansion of the face representation in somatosensory areas of the lateral sulcus after spinal cord injuries in monkeys. J Neurosci 29:12009–12019.
Tecchio F, Rossini P., Pizzella V, Cassetta E, Pasqualetti P, Romani G. (1998) A neuromagnetic normative data set for hemispheric sensory hand cortical representations and their interhemispheric differences. Brain Res Protoc 2:306–314.
Thees S, Blankenburg F, Taskin B, Curio G, Villringer A (2003) Dipole source localization and fMRI of simultaneously recorded data applied to somatosensory categorization. Neuroimage 18:707–719.
Tuunanen PI, Kavec M, Jousmäki V, Usenius J-P, Hari R, Salmelin R, Kauppinen RA (2003) Comparison of BOLD fMRI and MEG characteristics to vibrotactile stimulation. Neuroimage 19:1778–1786.
Wang X, Merzenich MM, Sameshima K, Jenkins WM (1995) Remodelling of hand representation in adult cortex determined by timing of tactile stimulation. Nature 378:71–75.
274 | P a g e
Weiss T, Miltner WHR, Liepert J, Meissner W, Taub E (2004) Rapid functional plasticity in the primary somatomotor cortex and perceptual changes after nerve block. Eur J Neurosci 20:3413–3423.
Williamson SJ, Kaufman L (1990) Evolution of neuromagnetic topographic mapping. Brain Topogr 3:113–127.
Wühle A, Mertiens L, Rüter J, Ostwald D, Braun C (2010) Cortical processing of near-threshold tactile stimuli: an MEG study. Psychophysiology 47:523–534.
Wühle A, Preissl H, Braun C (2011) Cortical processing of near-threshold tactile stimuli in a paired-stimulus paradigm--an MEG study. Eur J Neurosci 34:641–651.
Yvert B, Bertrand O, Echallier JF, Pernier J (1996) Improved dipole localization using local mesh refinement of realistic head geometries: An EEG simulation study. Electroencephalogr Clin Neurophysiol 99:79–89.
Zhu Z, Disbrow E a, Zumer JM, McGonigle DJ, Nagarajan SS (2007) Spatiotemporal integration of tactile information in human somatosensory cortex. BMC Neurosci 8:1–14.
275 | P a g e
GENERAL DISCUSSION
I. Main results
In addition to its strong social and emotional valence, touch plays a critical role in our daily
life to grasp and manipulate objects, or simply walk. Touch was also one of the first senses to be
investigated in the brain of both human and non-human primates using intracranial recordings
and cortical stimulation procedures, due to the easy access to the post-central gyrus where the
primary somatosensory cortex (SI) is located. These early and groundbreaking experiments
revealed the peculiar somatotopic organization of the primary somatosensory areas, and gave
rise to the so-called Homunculus. However, while most of the tactile information arising from
our body surface is represented following an order similar to the physical continuity of our skin,
the hand and the face representations generate a major discontinuity within the homunculus by
their direct cortical proximity. The border separating these two representations has been widely
used as a somatotopic landmark to study one of the most fascinating features of our brain, its
capacity for reorganization. In the 90s, groundbreaking electrophysiological studies revealed
that deprivation-induced somatosensory plasticity, until then thought to be limited to a few
millimetres, could actually cross the hand-face border. While it has been known for a long time
that increasing inputs also leads to cortical changes typically associated with perceptual benefits,
whether such plasticity can cross the hand-face border remains unknown. My thesis work aimed
to investigate this question using a protocol of repetitive somatosensory stimulation (RSS)
known to induce transient somatosensory plasticity associated with tactile acuity improvements,
which until my work were thought to be largely local (i.e., finger-specific).
In a first behavioural study, we showed that three hours of RSS at the tip of the right index
finger improved tactile discrimination not only at the stimulated fingertip, but also at both sides
of the unstimulated upper-lip and at the right cheek. In contrast, the left index finger was
unaffected. These findings provide the first evidence that passively increasing input to the hand
can positively affect tactile perception at a region of the body that is cortically close, but
physically distant. Given that, although limited in number, horizontal intracortical connections
exist between the hand and face representations (Manger et al., 1997; Florence et al., 1998; Fang
et al., 2002), and can undergo hebbian-based plastic changes (Marik and Hickmott, 2009;
Paullus and Hickmott, 2011), we hypothesized that the remote behavioural changes induced by
RSS could arise from plastic changes spreading across the SI hand-face border via these
connections. Together with the fact that an expansion and a shift of the cortical representation of
276 | P a g e
the RSS-stimulated finger (i.e., right-D2) has been repeatedly reported in SI (Pleger et al., 2001,
2003; Godde et al., 2003; Hodzic et al., 2004), the behavioural results of this first study bring to
the following predictions: (i) the lip representations may also be affected and enlarged after RSS
at right-D2, (ii) such an enlargement would possibly lead to a shift of their centre of gravity or
dipole sources, and (iii) these shifts might be toward the RSS-stimulated finger.
To investigate these hypotheses two imaging studies were then conducted. In the first, ultra-
high field fMRI (7T) was used: 1) to more precisely examine the RSS-induced cortical plasticity
within SI, by allowing for a fine grained identification of the possibly differential contributions
of the three Brodmann areas involved in tactile information processing (BA 3b, 1 and 2); and 2)
to assess the spatial limits of this adaptive plasticity and whether it alters the representation of
other fingers or of the face. In addition to replicating the behavioural results of the first study,
we found a significant enlargement of right-D2 positive BOLD response (PBR) within the
contralateral SI, more specifically, within the BA3b and BA1 sub-regions. Additionally, a
decrease in right-D3 PBR and an increase in Lips negative BOLD response (NBR) were found
within the contralateral BA3b, while a decrease in left-D2 PBR and an increase in D1 NBR were
found within the contralateral BA1. These results clearly demonstrate a major contribution of
BA3b and BA1 SI sub-regions to RSS-induced effects, and reveal that these effects are not as
spatially limited as previously thought, given that changes were observed at body-parts that
were not RSS-stimulated. This study also provides evidence for the existence of a complex
pattern of intermingled positive and negative BOLD responses which could underlie RSS-
induced changes across the hand-face border. Finally, for the first time an increased BOLD
signal following RSS was reported within the contralateral BA4a area, and within the ipsilateral
PPC, and these activations were correlated both with right-D2 and left-Lip discrimination
improvements. This latter result suggests that a simple stimulation such as RSS may lead to
consistent changes in higher-order multi-sensory associative cortical areas, and thus opens-up a
new field of research to investigate the contribution of these areas to the RSS-induced increase
in tactile spatial discrimination.
Complementarily, MEG was used in the second imaging study to assess the
neurophysiological substrates of the RSS-induced plastic changes. The transfer of behavioural
improvement from the finger to the upper-lips was confirmed for the third time, and
neuromagnetic data analyzed using dipole source models revealed an increased distance
between Lip and D2 sources after RSS, and conversely a decreased distance between Lip-D5
and D2-D5 sources. While further analyses are required to fully clarify the origin of these
relative shifts, this last study supports the existence of cross-border changes following RSS of
277 | P a g e
right-D2, and confirms that the contralateral representation of each side of the upper-lip is
affected. Finally, given that an unspecific shift not explained by methodological considerations
was found, these results further suggest a dynamic modulation of somatotopic maps.
In addition to raising the question of assessing the cortical correlates of RSS-induced
changes, the first study also raised the question of whether RSS may affect the perception at
other fingers (i.e., what are the limits of the behavioural effects of RSS). While the first question
was addressed with the two imaging studies mentioned above, this second question was
addressed with a transversal approach through the two studies, the same critical body-sites as
those tested in the first study being retested each time together with new ones, in order to
respectively replicate and extend the behavioural results of study 1. These tests revealed a
relatively high finger-selectivity of RSS effects, as no perceptual changes were observed neither
at the adjacent finger (study 2), nor at both little fingers (study 5).
In the following sections, I will first underline some methodological aspects to take into
consideration regarding this work, then I will discuss the implications of our behavioural results
regarding the concept of learning, before discussing the possible mechanisms underlying RSS-
induced changes. Finally, I will close the discussion with a more speculative section underlining
some similarities between the status of the hand and the face regarding somatosensory
perception, and how these two body-parts are conjointly involved in some of our most
fundamental functions.
II. Methodological considerations
One of the limitations of the imaging studies arises from the stimulation used during the
mapping procedures. Indeed, concerning the fMRI study, while brushing was delivered to the
lips by rotating a shaft, the stimulation was manually delivered to the fingertips using a brush.
Thus, despite the invariant frequency of stimulation, the use of casts, and all the care in
delivering a nearly constant and reliable stimulation, some variability in the intensity of
stimulation may have occurred. In addition, the fact that the experimenter had to use different
hands to deliver the stimulation to each side of the participant's hand might also have
contributed to some differences across body sides. To circumvent this source of variability, we
expressed the amount of BOLD activation as a percentage of the total volume evoked by a given
body side (i.e. the sum of all body-parts from this hemi-body) and sessions. Moreover, even if
quite different from the RSS stimulation and equally administrated to all body-parts, the
stimulation performed during both mapping procedures might have altered or interfered with the
RSS-induced effects. In addition, note that we intentionally chose to perform a simple mapping
278 | P a g e
procedure using passive (i.e., brush or pneumatic) stimulation rather than involving a spatial
discrimination task. This choice was made in order to replicate the RSS-induced enlargement of
the right-D2 representation, which had been previously reported in a similar context (Pleger et
al., 2003).
Finally, the different types of tactile stimulation used across the different mapping
procedures (i.e., two sharp static probes for 2PDT, brushing involving tactile motion during
fMRI recordings, and tapping-like static stimulation during RSS and MEG recordings) could
differentially recruit tactile afferents. Indeed, according to the traditional view, the 2PDT task is
likely to preferentially involve slowly adapting afferents (SAI, Merkel cell-neurite complexes;
see Phillips and Johnson, 1981; Johnson and Hsiao, 1992), while the brushing stimuli performed
during the fMRI mapping procedure may preferentially recruit fast adapting afferents (FAI,
Meissner's corpuscules) due to their sensitivity to low-frequency moving stimulus (Lofvenberg
and Johansson, 1984). But the texture stimuli induced by the brush are likely to involve SAI
afferents too (Blake et al., 1997). Finally, the tapping stimulation delivered during the RSS
procedure may have preferentially recruited SAI and FAI afferents due to the fact that is was
delivered at a low-frequency feature and did not contain tactile motion (Lofvenberg and
Johansson, 1984). However, we can see that SAI afferents and slowly adapting afferents of type
II (SAII, Ruffini's corpuscules) are likely involved in all procedures due to their sensitivity to
skin stretch and sustained downward pressure (Knibestöl and Vallbo, 1970). And more
importantly, while the traditional view is that the different classes of afferents serve different
functions and lead to a segregation of these submodalities, recent evidence shows that most
afferent classes are excited by most tactile stimuli and that information from all afferent classes
are likely to converge and to be integrated together at least at the cortical level (for a review see
Saal and Bensmaia, 2014). This suggests that all afferent classes should be taken into account to
explain perceptual judgments. In addition, both mechanical stimulations are likely to provide
complementary views on the RSS-induced effects, given that brushing stimuli were more
complex and dynamic.
A last methodological consideration concerns the analysis of CoG. Indeed, given the large
variability in sulcal geometry across individuals, localization of group activation in S1 could
(and will) be optimized by implementing surface-based cortical mapping techniques, instead of
simply calculating the Euclidean distances.
279 | P a g e
III. Training-dependent vs training-independent learning
One of the main contributions of the present work arises from the demonstration that the
RSS-induced acuity improvement thought to be local, actually transfers from the hand to the
face without losing its beneficial aspect. At the perceptual level, any process leading to the
acquisition or reinforcement/improvement of a skill is commonly referred to as learning. While
it is well known that practice and training are usually required to learn a skill, for instance in
music and sport domains (e.g., Elbert et al., 1995; Draganski et al., 2004; Hashimoto et al.,
2004), perception and behaviour can also change simply via passive exposure to sensory
stimulation protocols (Recanzone et al., 1992a; Pleger et al., 2001, 2003; Dinse et al., 2003;
Seitz and Dinse, 2007; Ragert et al., 2008; Beste et al., 2011). Such procedures, of which RSS is
part, are referred to as training-independent learning processes (see Beste and Dinse, 2013 for a
review). Consequently, improvements in tactile acuity similar to those reported in this work
have also been reported following extensive somatosensory training, either over a life span such
as in Braille reading (Pascual-Leone and Torres, 1993; Sterr et al., 1998a, 1998b; Van Boven et
al., 2000; Goldreich and Kanics, 2003; Wan et al., 2010; Norman and Bartholomew, 2011;
Wong et al., 2011), or over shorter time-scales (Recanzone et al., 1992d; Wang et al., 1995;
Spengler et al., 1997; Harris et al., 2001). But several lines of evidence suggest that these
protocols do not tap into the same neural mechanisms as the training-independent protocol used
in the present study, which is completely passive and devoid of attentional or cognitive control
processes.
Unlike the rapid changes reported here and in previous work using the RSS paradigm
(Godde et al., 2000, 2003; Pleger et al., 2001, 2003; Dinse et al., 2006), training-induced
improvements typically require days or weeks of attention-demanding training and practice
(Spengler et al., 1997; Sathian and Zangaladze, 1998; Kaas et al., 2013a; Harrar et al., 2014).
Also, in contrast with the present and previous results of RSS studies, training-induced tactile
improvement has been found to transfer to the homologous finger on the opposite hand
(Spengler et al., 1997; Sathian and Zangaladze, 1998; Kaas et al., 2013a; Harrar et al., 2014).
Furthermore, while some perceptual learning studies report that improvement is transferred to
adjacent fingers (Sathian and Zangaladze, 1997; Harris et al., 2001; Harrar et al., 2014), the
possible transfer to other body-parts in the same hemi-body has rarely been investigated. The
one study in which changes at remote body-parts were examined found that expert Braille
readers (i.e. long-term trained) had enhanced tactile perception compared with controls at the
fingertips, but not at the lips (Wong et al., 2011). Thus, together with our results showing - in
280 | P a g e
agreement with the RSS literature (Godde et al., 2000; Pleger et al., 2001, 2003; Dinse et al.,
2006) - the absence of transfer of learning to the homologous and adjacent fingers, and with the
disengagement from attentional processes and repetitive training, the RSS-induced training-
independent learning seems to dissociate from training-dependent processes and might involve
different mechanisms. Disentangling between training-independent (i.e., RSS-like) and training-
dependent learning processes was further ensured by the control group in the first study that
enabled us to isolate the RSS-induced effects from any effects possibly due to familiarization by
repeated exposure to the 2PDT task, and additionally controlled for daily fluctuations in tactile
discrimination.
Perceptual learning specificity, and conversely generalization, is widely regarded as an
indication of the neurological site of the learning process. This translates into the following
reasoning: the more perceptual learning transfers (i.e., to other body-parts), the less
topographically organized and the more integrative are the brain areas involved in learning
processes. Alternatively, learning involving topographically organized somatosensory areas, or
higher order (non-primary) areas that are not necessarily topographically organized but receive
direct inputs from somatotopic areas, should either not transfer at all, or transfer but following a
“gradient-like” topographic pattern. Given that electrophysiological studies show a gradual
increase in RF complexity from BA3b to BA2, with RFs spanning over a single finger within
BA3b, adjacent fingers within BA3b and BA1, or adjacent and homologous fingers within BA2
(Hyvärinen and Poranen, 1978; Iwamura et al., 1980, 1993, 1994), the pattern of transfer of
training-dependent learning (Sathian and Zangaladze, 1998; Harris et al., 2001; Kaas et al.,
2013a; Harrar et al., 2014) suggests that plastic changes within BA1 and BA2 may underlie such
learning. In contrast, different patterns of transfer are reported with training-independent
learning, such as RSS. The present work contributes to investigating their limits, and extends
these patterns to more distant body-parts. In the following section, the pattern of
specificity/generalization of RSS-induced learning will be discussed in light of our
neuroimaging results and of the possible mechanisms subserving them.
281 | P a g e
IV. Underlying mechanisms:
a. RSS-induced local plasticity
RSS has been repeatedly used as a means to alter input statistics in order to study the plastic
mechanisms underlying somatosensory training-independent learning. RSS consists of an
ecological stimulation directly adapted from classical Hebbian protocols and relies on
mechanisms including spike-timing-dependent plasticity such as LTP & LTD of synaptic
transmission (see Chapter 3 of the Introduction, page 125). Among the arguments supporting
this notion is the short time-scale over which the RSS-induced changes occur, which excludes
any structural changes. Rather, together with the fact that RSS-induced changes were found to
be dependent on NMDA receptor activation (Dinse et al., 2003) - known to be involved in
synaptic plasticity (Bliss and Collingridge, 1993; Nicoll and Malenka, 1995) - and were
associated with an increased cortical excitability that is considered a typical signature of
effective LTP induction (Höffken et al., 2007), RSS is more likely to induce changes in synaptic
efficiency. This hypothesis is further supported by a recent modelling study showing that RSS-
like consecutive repetitions of temporally structured stimuli induce Hebbian-like long-term
modifications of synaptic weights (Phoka et al., 2012). Thus, the RSS-induced expansion of the
cortical representation of the stimulated finger, previously reported in SI (Pleger et al., 2001,
2003; Godde et al., 2003; Hodzic et al., 2004) and that we presently report in BA3b and BA1
(study 2), is likely to arise from recruitment of latent connections and/or from fast modulations
of local synaptic efficiency. The tendency for an increased dipole strength observed for the
stimulated finger (study 3) is also in line with this possibility. Such a recruitment of processing
resources is the likely substrate for the improved discrimination observed at the stimulated
fingertip, even if we did not replicate the previously reported correlation (Pleger et al., 2001,
2003). In addition to refining our knowledge about these local plastic changes, the present work
provides new evidence for a pattern of specificity and generalization of RSS-induced learning
that differs from classical training-dependent learning procedures.
b. Specificity/generalization of the RSS-induced learning
First, and in agreement with the RSS literature (Godde et al., 2000; Pleger et al., 2001,
2003; Dinse et al., 2003), no change in tactile discrimination was observed at the homologous
finger (i.e., left-D2; study 1, 2 and 3). Together with the absence of an effect on left-D5, which
has never been tested in previous reports, these results demonstrate that RSS-induced learning
does not transfer to the homologous hand. Given that we found most of the RSS-induced BOLD
282 | P a g e
signal changes within BA3b and BA1 (study 2), the lack of interhemispheric transfer of learning
is consistent with the fact that no or few bilateral RFs have been reported in these sub-regions
for the fingers (Iwamura et al., 1993, 2001; Iwamura, 2000). In addition, an increased ipsilateral
response was found for the stimulated finger (likely NBR), as well as a decreased contralateral
PBR for the homologous finger. These changes are likely to reflect interhemispheric
inhibition processes mediated by transcallosal reciprocal connections between homotopic
cortical areas (Schnitzler et al., 1995). This is further supported by the fact that BOLD changes
for the homologous finger were observed within BA1 where more transcallosal connections
have been reported than in BA3b (Killackey et al., 1983). These interhemispheric projections
make excitatory contacts onto pyramidal cells and interneurons, and thus give rise to both
excitation through the former cells, and inhibition through the inhibitory interneurons (Carr and
Sesack, 1998). In humans, the behavioural effects of this interhemispheric inhibition have been
revealed by the fact that anaesthesia of one hand improves tactile acuity in the homologous hand
(Werhahn et al., 2002; Björkman et al., 2004b).
Within the “stimulated” hand, our behavioural findings suggest that RSS does not affect the
other fingers, or at least the adjacent finger right-D3 (study 2) and the most distant right-D5
(study 3). While the former result corroborates the previous observation made on a small sample
of participants (Godde et al., 2000), we further report a decrease in the contralateral PBR (i.e.,
representation) for the adjacent finger after RSS (study 2). This response decrease was located in
BA3b, where an increased response was instead observed for the RSS-stimulated finger.
Altogether, these results suggest the involvement of lateral inhibition processes mediated by
intracortical horizontal connections (Jones and Powell, 1970) through GABAergic activity (Li et
al., 2002). Functionally, such processes are considered to subserve the suppressive interaction
over the brain response observed when, for instance, two fingers are simultaneously stimulated.
This suppressive interaction has been repeatedly observed both in non-human (e.g. Friedman et
al., 2008; Lipton et al., 2010), and human primates (Gandevia et al., 1983; Hoechstetter et al.,
2001; Simões et al., 2001; Tanosaki et al., 2002; Ruben et al., 2006; Severens et al., 2010), and
exhibits the feature of decreasing with distance (i.e., the more distant are the simultaneously
stimulated fingers, the less “interference”). However, this kind of suppressive interaction has
also been found between body-parts located farther from each other. For instance, simultaneous
tactile stimulation of the forearm and finger significantly reduces the finger’s evoked response
(Tanosaki et al., 2004). Similarly, anaesthesia of a limited portion of the right forearm by means
of a local anaesthetic cream results in tactile improvement on the right hand (Björkman et al.,
2004a). Interestingly, the existence of similar connections between hand and face
283 | P a g e
representations has also been demonstrated in BA3b, with stimulation of the face (forehead)
resulting in a significant attenuation of the SEFs evoked by concurrent stimulation of the thumb
(Tanosaki et al., 2003). Interestingly, this attenuation was observed only for the earliest
component (N20m), reflecting BA3b activity (Kakigi et al., 1996; Tanosaki et al., 2002). In
contrast, the next component (P30m) whose origin is less clear, was significantly enhanced by
concurrent tactile stimulation to the face, whereas it was systematically attenuated by tactile
stimulation to other digits (Tanosaki et al., 2002). This difference in the suppressive interaction
observed within the hand, and between the hand and the face, suggests the involvement of
different mechanisms subserving their interaction, and is consistent with the complex pattern of
PBR/NBR observed in our fMRI results (study 2). But before discussing this, I would like to
emphasize that the hypothesis that RSS-induced changes lateral inhibition processes is further
supported by recent studies showing that RSS modulates intracortical inhibition (Wilimzig et al.,
2012) and paired-pulse inhibition (Höffken et al., 2007).
Finally, one of the main results of the present work is that RSS at a fingertip results in an
improved discrimination at the face. This remote effect was found for both sides of the upper-lip
(study 1, 2, 3), and for the right-cheek (study 1). While this pattern may appear surprising at the
first glance, its origin may arise from some features of the SI face representation. Indeed, an
increasing number of studies (including our study 2) suggest that the tactile information arising
from the face and in particular the lips, is represented in both hemispheres (Nagamatsu et al.,
2000; Disbrow et al., 2003a; Nevalainen et al., 2006; Blatow et al., 2007; Nash et al., 2010).
This has been linked with the fact that body midline regions are represented in SI of both
hemispheres in cats (Manzoni et al., 1980), macaque monkeys (Taoka et al., 1998; Iwamura et
al., 2001) and humans (Fabri et al., 2005). In agreement with this, the cheek, which is located
farther from the body midline, was found to be more unilaterally represented than the lip
(Nevalainen et al., 2006). Notably, our study 2 also provides the first evidence of (i) NBRs
evoked by tactile stimulation of the upper-lips, which are (ii) co-localized with the classical (i.e.
PBR-based) hand representation, and (iii) expand in the contralateral BA3b sub-region
following RSS at the index finger. While the exact nature and distribution of these NBRs has to
be further investigated, the “special” pattern of hand-face suppressive interaction reported by
Tanosaki and colleagues (1993), together with the RSS-induced modulation of intracortical
inhibition (Höffken et al., 2007; Wilimzig et al., 2012), bring us to suggest that these Lip NBRs
may reflect processes resembling surround inhibition. Given the co-localization of these
responses with the hand representation and the overlaps observed at the SI hand-face junction,
the increased Lip NBRs may reflect an increased inhibition of the hand-face junction. This could
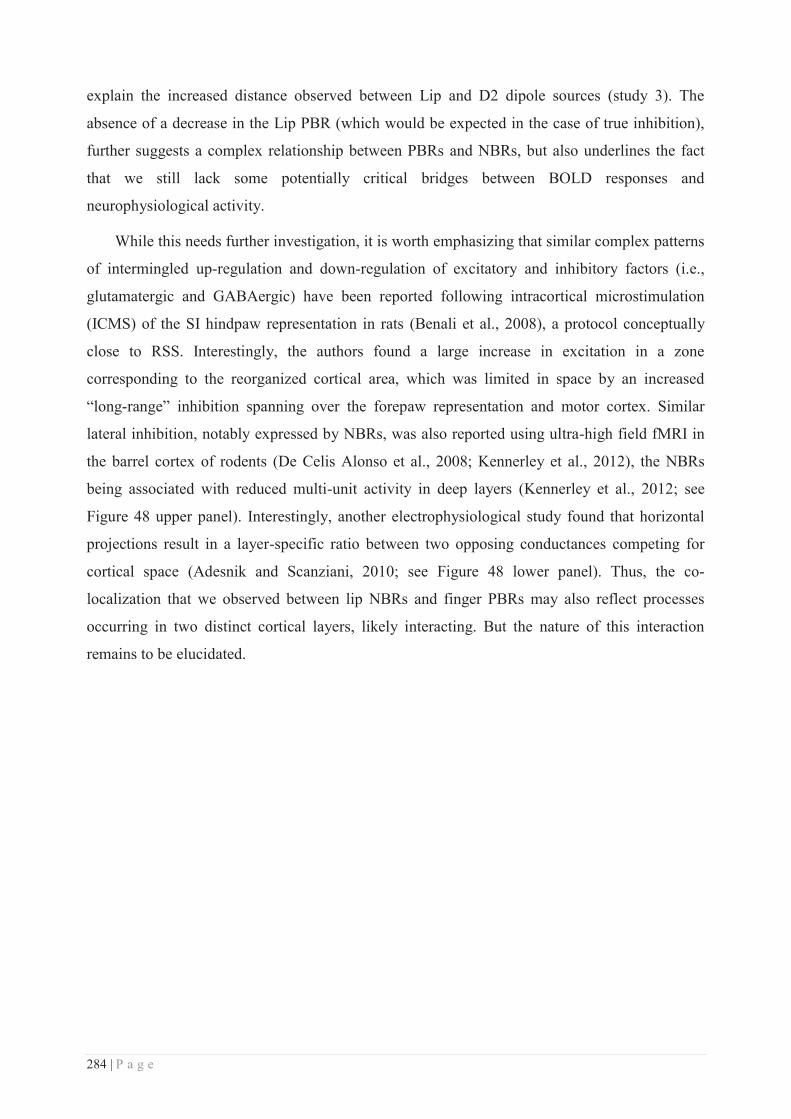
284 | P a g e
explain the increased distance observed between Lip and D2 dipole sources (study 3). The
absence of a decrease in the Lip PBR (which would be expected in the case of true inhibition),
further suggests a complex relationship between PBRs and NBRs, but also underlines the fact
that we still lack some potentially critical bridges between BOLD responses and
neurophysiological activity.
While this needs further investigation, it is worth emphasizing that similar complex patterns
of intermingled up-regulation and down-regulation of excitatory and inhibitory factors (i.e.,
glutamatergic and GABAergic) have been reported following intracortical microstimulation
(ICMS) of the SI hindpaw representation in rats (Benali et al., 2008), a protocol conceptually
close to RSS. Interestingly, the authors found a large increase in excitation in a zone
corresponding to the reorganized cortical area, which was limited in space by an increased
“long-range” inhibition spanning over the forepaw representation and motor cortex. Similar
lateral inhibition, notably expressed by NBRs, was also reported using ultra-high field fMRI in
the barrel cortex of rodents (De Celis Alonso et al., 2008; Kennerley et al., 2012), the NBRs
being associated with reduced multi-unit activity in deep layers (Kennerley et al., 2012; see
Figure 48 upper panel). Interestingly, another electrophysiological study found that horizontal
projections result in a layer-specific ratio between two opposing conductances competing for
cortical space (Adesnik and Scanziani, 2010; see Figure 48 lower panel). Thus, the co-
localization that we observed between lip NBRs and finger PBRs may also reflect processes
occurring in two distinct cortical layers, likely interacting. But the nature of this interaction
remains to be elucidated.
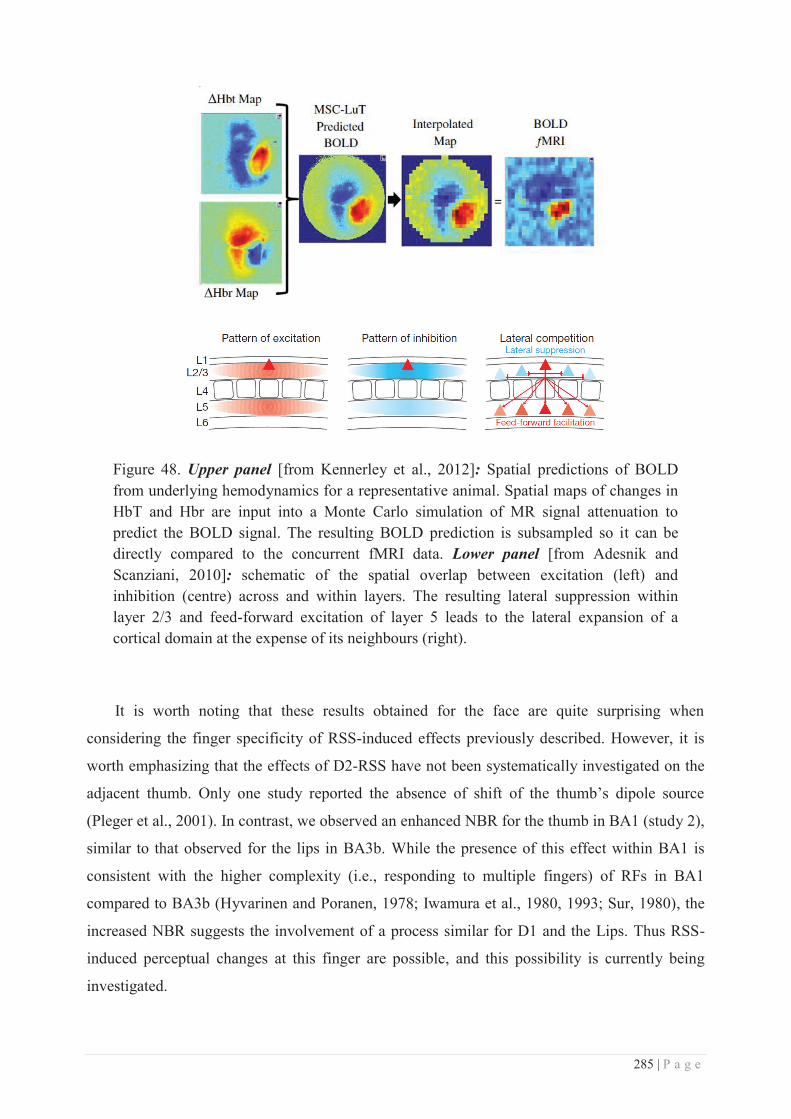
285 | P a g e
Figure 48. Upper panel [from Kennerley et al., 2012]: Spatial predictions of BOLD from underlying hemodynamics for a representative animal. Spatial maps of changes in HbT and Hbr are input into a Monte Carlo simulation of MR signal attenuation to predict the BOLD signal. The resulting BOLD prediction is subsampled so it can be directly compared to the concurrent fMRI data. Lower panel [from Adesnik and Scanziani, 2010]: schematic of the spatial overlap between excitation (left) and inhibition (centre) across and within layers. The resulting lateral suppression within layer 2/3 and feed-forward excitation of layer 5 leads to the lateral expansion of a cortical domain at the expense of its neighbours (right).
It is worth noting that these results obtained for the face are quite surprising when
considering the finger specificity of RSS-induced effects previously described. However, it is
worth emphasizing that the effects of D2-RSS have not been systematically investigated on the
adjacent thumb. Only one study reported the absence of shift of the thumb’s dipole source
(Pleger et al., 2001). In contrast, we observed an enhanced NBR for the thumb in BA1 (study 2),
similar to that observed for the lips in BA3b. While the presence of this effect within BA1 is
consistent with the higher complexity (i.e., responding to multiple fingers) of RFs in BA1
compared to BA3b (Hyvarinen and Poranen, 1978; Iwamura et al., 1980, 1993; Sur, 1980), the
increased NBR suggests the involvement of a process similar for D1 and the Lips. Thus RSS-
induced perceptual changes at this finger are possible, and this possibility is currently being
investigated.
286 | P a g e
Before finishing this section, I would like to underline the similarity between some of our
results and those reported by Jenkins and colleagues in 1990. Indeed, monkeys trained to
maintain contact with a rotating disk stimulating their fingertips exhibited an expansion of the
cortical representations of these stimulated digits similar to the one we found for right-D2 in
study 2. In addition, the borders between the representations of individual digits and digit
segments shifted in parallel. This resembles the unspecific and non monodirectional shifts of
fingers and lip dipole sources observed in study 3, and CoGs in study 2. Interestingly, Jenkins
and colleagues also recorded a significant lateral translocation of the borders between the
representations of the hand and the face, similar to the increased Lip-D2 distance observed in
study 3. Finally, the rostral border of BA3b was also shifted towards BA3a, which is normally
activated by deep (proprioceptive) receptors, suggesting a potentiation of cutaneous over deep
receptor activation, which is consistent with the increase in activity observed for right-D2 in
study 2.
c. Site of action of RSS
While RSS effects have been mainly investigated at the cortical level, the RSS-induced
cortical reorganization could arise from plastic changes induced in the thalamus. But several
lines of evidence suggest that this alternative is unlikely. First, a series of intracortical and
intrathalamic microstimulation (ICMS/ITMS) experiments (see Dinse et al., 1997) showed that:
(i) in contrast to the well-known extensive cortical reorganization following ICMS, using the
analogous protocol in VPL (ITMS) induced only moderate changes in the reorganization of the
somatosensory thalamic maps; and (ii) similar protocols, but designed to explore the capacities
of transfer of plastic changes either retrogradly (from VPL to SI) or anterogradely (from SI to
VPL), revealed an anterograde effect of ICMS over VPL RFs (enlarged), but no retrograde
effect of ITMS over SI. Taken together, these results reveal a small but significant
corticothalamic transfer of short-term plastic changes, but no substantial evidence for a
thalamocortical transfer. Given that ICMS protocols rely on the same Hebbian rules as RSS, the
thalamic contribution to the RSS-induced cortical reorganization is likely to be small. Second,
the activity-dependent expansion of digit RFs induced by coincident stimulation of multiple
adjacent fingers was reported in BA3b, but no apparent RF change was found in the thalamus of
the same monkeys (Wang et al., 1995). Finally, even if in a different context, RF changes
following sensory enrichment (after nerve cut and regeneration) were observed in monkeys at
the cortical level, but not at the thalamic level (Florence et al., 2001). Thus, while our results do
not preclude subcortical contributions, which remain to be investigated, these lines of evidence
287 | P a g e
suggest a rather small subcortical contribution to activity-dependent plastic changes observed at
the cortical level.
In contrast, given the consistent cortical reorganization reported following RSS here and in
the literature (Pleger et al., 2001, 2003; Godde et al., 2003; Hodzic et al., 2004), we propose that
the RSS-induced plastic changes arise predominantly from modulation of the activity within
both the finger and face (at least lips and cheek) cortical representations. In SI, the border
between these two representations, also called the hand/face junction, is characterized by the
presence of neurons that receive input from both the contralateral hand and face (Dreyer et al.,
1975; see Figure 49). This overlap between the hand and face representations was confirmed
and further associated with a strong interconnectivity between these representations through
horizontal intracortical connections (Manger et al., 1997; Florence et al., 1998; Fang et al.,
2002; Steen et al., 2007), which were found to overlap (Manger et al., 1997). Although more
limited in number in New World monkeys (Fang et al., 2002) than in macaque monkeys
(Manger et al., 1997; Florence et al., 1998) or rats (Steen et al., 2007), these connections are
likely to subserve the excitatory and inhibitory responses that can be evoked across the hand-
face border in rats (Hickmott and Merzenich, 1998; Burns and Hickmott, 2003). Interestingly,
these cross-border connections can undergo Hebbian plasticity induced by tetanic (Paullus and
Hickmott, 2011) or pairing protocols (Marik and Hickmott, 2009). Thus, we propose that the
local changes induced in the finger representation by RSS transfer to the lip representation
through these horizontal intracortical connections, whose strength might also be modulated.
Moreover, this model is further supported by the fact that LTP of these connections was found
to be dependent on NMDA receptors activation (Marik and Hickmott, 2009), as were the RSS-
induced cortical and perceptual changes (Dinse et al., 2003). Our results, and in particular the
intermingled positive and negative BOLD responses (study 2) may represent the first evidence
of cortical activity that could be assigned to such horizontal intracortical connections in humans,
but also of their involvement and/or modulation in/by training-independent learning (i.e., RSS),
which appears to result in adaptive perceptual changes at both sides of the hand-face border.
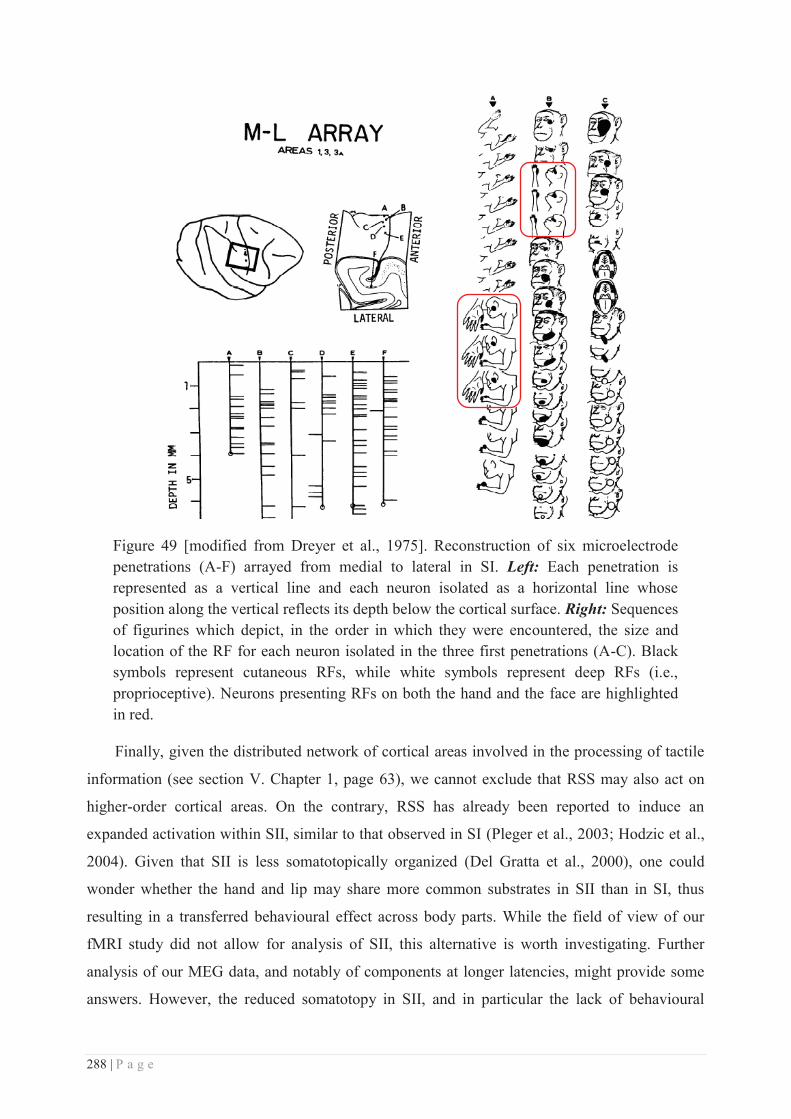
288 | P a g e
Figure 49 [modified from Dreyer et al., 1975]. Reconstruction of six microelectrode penetrations (A-F) arrayed from medial to lateral in SI. Left: Each penetration is represented as a vertical line and each neuron isolated as a horizontal line whose position along the vertical reflects its depth below the cortical surface. Right: Sequences of figurines which depict, in the order in which they were encountered, the size and location of the RF for each neuron isolated in the three first penetrations (A-C). Black symbols represent cutaneous RFs, while white symbols represent deep RFs (i.e., proprioceptive). Neurons presenting RFs on both the hand and the face are highlighted in red.
Finally, given the distributed network of cortical areas involved in the processing of tactile
information (see section V. Chapter 1, page 63), we cannot exclude that RSS may also act on
higher-order cortical areas. On the contrary, RSS has already been reported to induce an
expanded activation within SII, similar to that observed in SI (Pleger et al., 2003; Hodzic et al.,
2004). Given that SII is less somatotopically organized (Del Gratta et al., 2000), one could
wonder whether the hand and lip may share more common substrates in SII than in SI, thus
resulting in a transferred behavioural effect across body parts. While the field of view of our
fMRI study did not allow for analysis of SII, this alternative is worth investigating. Further
analysis of our MEG data, and notably of components at longer latencies, might provide some
answers. However, the reduced somatotopy in SII, and in particular the lack of behavioural
289 | P a g e
effect on the left cheek following RSS on right-D2 (Muret et al., 2014), do not seem to favour a
critical involvement of SII in our effects.
Interestingly, though unexpectedly, our second study also revealed RSS-induced changes in
the anterior part of the primary motor cortex (BA4a) and in the posterior parietal cortex (PPC).
While BA4a is primarily a motor area, its implication in tactile form discrimination has been
reported (Bodegård et al., 2001), as well as in the processing of complex tactile stimuli
(Terumitsu et al., 2009), and in haptic discrimination tasks (Geyer et al., 1996; Eickhoff et al.,
2005). In addition, even passive tactile stimulation engages the precentral gyrus (Francis et al.,
2000; Moore and Schady, 2000). However, the precise roles of motor areas in tactile perception
remain to be clarified. Interestingly, the enhanced activity that we report in BA4a might also be
the substrate for the improved sensorimotor performance reported after RSS (Kalisch et al.,
2008, 2010), and to be related to the RSS-induced changes in resting state connectivity (mu-
rhythm) observed within distributed sensorimotor cortical areas (Freyer et al., 2012). Lastly, the
increased activity observed within PPC, a highly associative area, opens up a multitude of
possible implications regarding the impact of RSS. Indeed, the wide range of functions
subserved by PPC includes multisensory (Huang et al., 2012; Sereno and Huang, 2014) and
sensorimotor integration, movement planning (Astafiev et al., 2003; Hanakawa et al., 2003;
Diedrichsen et al., 2004), but also the integration of visuo-tactile inputs to promote and guide
arm, hand but also face and lip movements and coordination (e.g., in reaching to grasp an
object). More closely related to the context in which we report this increased activity, in addition
to the apparent involvement of PPC in the perceptual changes induced by RSS (i.e., the
correlation we report), PPC has been found to be activated in cases of complex and moving
tactile stimulation (Fabri et al., 1999, 2001) similar to the brushing used in our fMRI mapping.
Thus, the enhanced PPC activation following RSS could reflect changes in the perception of
such complex tactile stimuli, an idea which has yet to be investigated. The emergence of an
enhanced PPC activity after RSS might also reflect changes in tactile remapping in external
space (Azañón et al., 2010), and more globally in higher-order body representation maps and in
the conscious body image (see Longo et al., 2010 for a review). Altogether, these different lines
of evidence suggest that RSS affects a rather widespread network of cortical areas, and thus
underlines its potential impact over higher functions than simply two-point tactile
discrimination, which might nevertheless improve performance on such a relatively simple
discriminative task.
290 | P a g e
It is worth noting that the emergence of an enhanced PPC activity after RSS might also
reflect tonically increased somatosensory attention (see Macaluso and Maravita, 2010).
Attention interacting with sensory processing has been found to promote learning transfer
(Ahissar and Hochstein, 1997; Weber et al., 2005). In addition, previous work demonstrated that
attentional demands can induce transient representational changes within SI (Iguchi et al., 2001,
2002; Braun et al., 2002). For instance, changes in the relative distance between finger ECDs
quite similar to those reported in our third study, were found during somatosensory tasks
involving global to local attentional demands (Braun et al., 2000a). This suggests that the
topographic organization of SI is dynamically modulated to achieve the best state (see Freyer et
al., 2013; Ritter et al., 2015) and distribution to perform a given somatosensory task. However,
neither the mapping procedures nor RSS involved attentional tasks, but the fact that right-D2
was the only body-site to be stimulated may have shifted the attention of participants towards
this body-part. If true, such an attentional shift could account for some of the acuity
improvement observed at this fingertip, but not for the improvement observed at the upper-lips.
In addition, previous reports including a previous study from our group (Muret et al, 2014),
reported no behavioural improvement in participants receiving either no stimulation (stimulator
off), or single-point-like stimulation (Pleger et al., 2003; Ragert et al., 2008). Thus, the
behavioural improvement as well as the cortical changes reported here cannot be explained by
spatial tactile attention processes.
Finally, RSS-induced plasticity could also start as early in the pathway as at the
mechanoreceptor level. Indeed, Merkel cells were recently found to actively tune the touch-
dome afferents (SAI) and thus the mechanosensory responses, to facilitate high spatio-temporal
acuity (Maksimovic et al., 2014). Given that Merkel cells make 'synapse-like' contacts with SAI
afferents (see Halata et al., 2003; Nakatani et al., 2014 for review), a potentiation of these
peripheral synapses may also happen and could be involved in Hebbian-like perceptual learning.
However, while such peripheral changes may partially contribute to local effects (i.e., those
induced on the RSS-stimulated site) their contribution can be readily ruled out in our studies for
the RSS-induced remote perceptual changes on the lips and cheek.
291 | P a g e
V. The hand and the face: evidence for a singular “coupling”?
In this section, I will shortly describe some evidence underlining that our hands and face
share a peculiar link along our life and in several of our daily-life activities. I allow myself here
a more speculative section to highlight what I personally consider to be a “singular relationship”
between these two body parts. If we consider the few points I will raise as the “visible part of
the iceberg”, one could speculate that the results found in the present work arise from the bottom
part of that iceberg, i.e., a hand-face interaction at one of their lowest somatosensory levels.
a. Foetal development, cortical magnification & sensitivity
Touch is the first sense to develop in utero, Montagu (1978, p. 195) reporting tactile
responses to a hair stroking the cheek of a foetus at around 8 weeks gestational age. Cutaneous
sensitivity of the embryonic body then extends to the genital area by week 10, to the palms by
week 11, the soles by week 12, the abdomen and buttocks by week 17, and by week 32 every
part of the body is responsive to the gentle stroke of a single hair. This developmental hierarchy
of tactile sensitivity is reflected by the fact that the earliest sites developing cutaneous sensitivity
also possess the greatest number and variety of sensory receptors in adults. Consequently, they
are also represented cortically with larger areas of primary somatosensory cortex. Among the
different body-parts, the face and the hand are the two regions that exhibit the highest cortical
magnification, and consequently the highest sensitivity and discrimination abilities (see Chapter
1, page 48). In addition, while most of the tactile information arising from our body surface is
represented following an order similar to the physical continuity of our skin, the hand and the
face representations generate a major discontinuity by their direct cortical proximity. While the
reason of such discontinuity remains unknown, one can assume that it should be functionally
relevant. Among the different hypotheses, Farah ( 1998) proposed that the discontinuity occurs
because “mechanisms of self-organization, in combination with the normal position of the foetus
in the womb will incline the map towards just this organization.” In the womb, the foetus
generally has its hands abutting its face, and its feet the genitalia, creating coactivations of the
respective body parts. But is this discontinuity present only because of this developmental
“coactivation”? Or is there other functions developing during adulthood that maintain a link
between hands and face? In the following sections I will briefly provide an overview of two
functions in which these two body parts are actively coupled: language and eating behaviour.
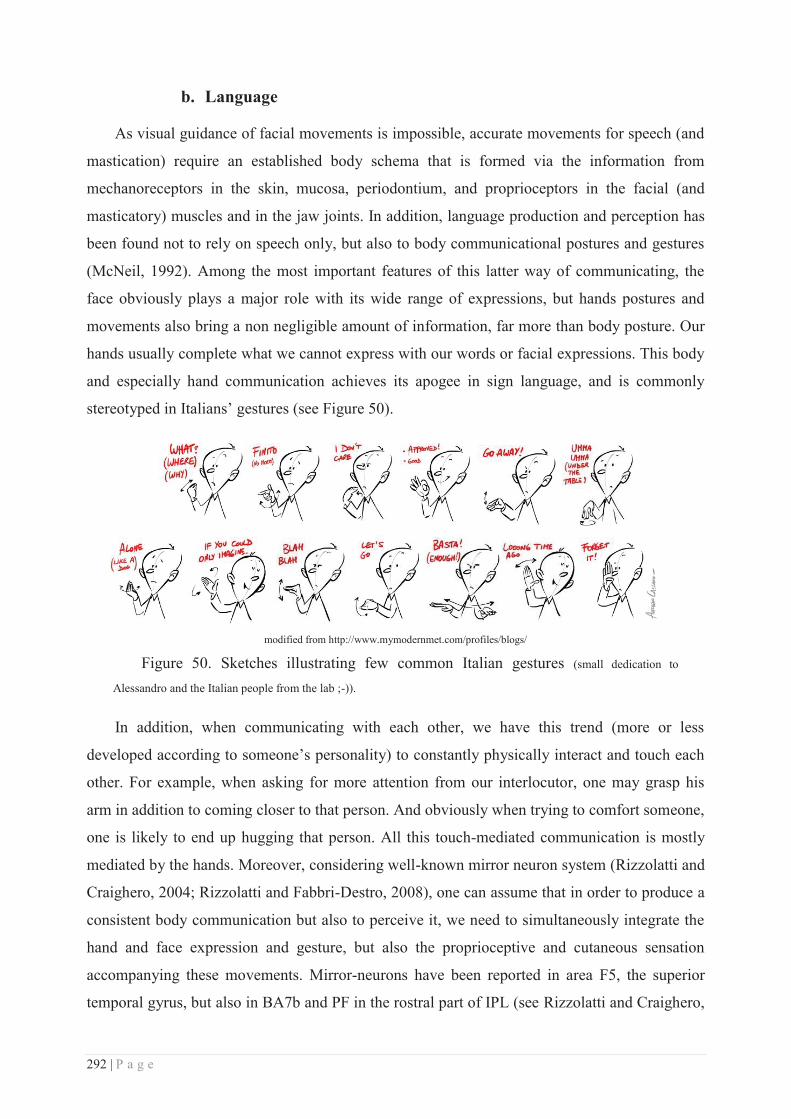
292 | P a g e
b. Language
As visual guidance of facial movements is impossible, accurate movements for speech (and
mastication) require an established body schema that is formed via the information from
mechanoreceptors in the skin, mucosa, periodontium, and proprioceptors in the facial (and
masticatory) muscles and in the jaw joints. In addition, language production and perception has
been found not to rely on speech only, but also to body communicational postures and gestures
(McNeil, 1992). Among the most important features of this latter way of communicating, the
face obviously plays a major role with its wide range of expressions, but hands postures and
movements also bring a non negligible amount of information, far more than body posture. Our
hands usually complete what we cannot express with our words or facial expressions. This body
and especially hand communication achieves its apogee in sign language, and is commonly
stereotyped in Italians’ gestures (see Figure 50).
modified from http://www.mymodernmet.com/profiles/blogs/
Figure 50. Sketches illustrating few common Italian gestures (small dedication to
Alessandro and the Italian people from the lab ;-)).
In addition, when communicating with each other, we have this trend (more or less
developed according to someone’s personality) to constantly physically interact and touch each
other. For example, when asking for more attention from our interlocutor, one may grasp his
arm in addition to coming closer to that person. And obviously when trying to comfort someone,
one is likely to end up hugging that person. All this touch-mediated communication is mostly
mediated by the hands. Moreover, considering well-known mirror neuron system (Rizzolatti and
Craighero, 2004; Rizzolatti and Fabbri-Destro, 2008), one can assume that in order to produce a
consistent body communication but also to perceive it, we need to simultaneously integrate the
hand and face expression and gesture, but also the proprioceptive and cutaneous sensation
accompanying these movements. Mirror-neurons have been reported in area F5, the superior
temporal gyrus, but also in BA7b and PF in the rostral part of IPL (see Rizzolatti and Craighero,
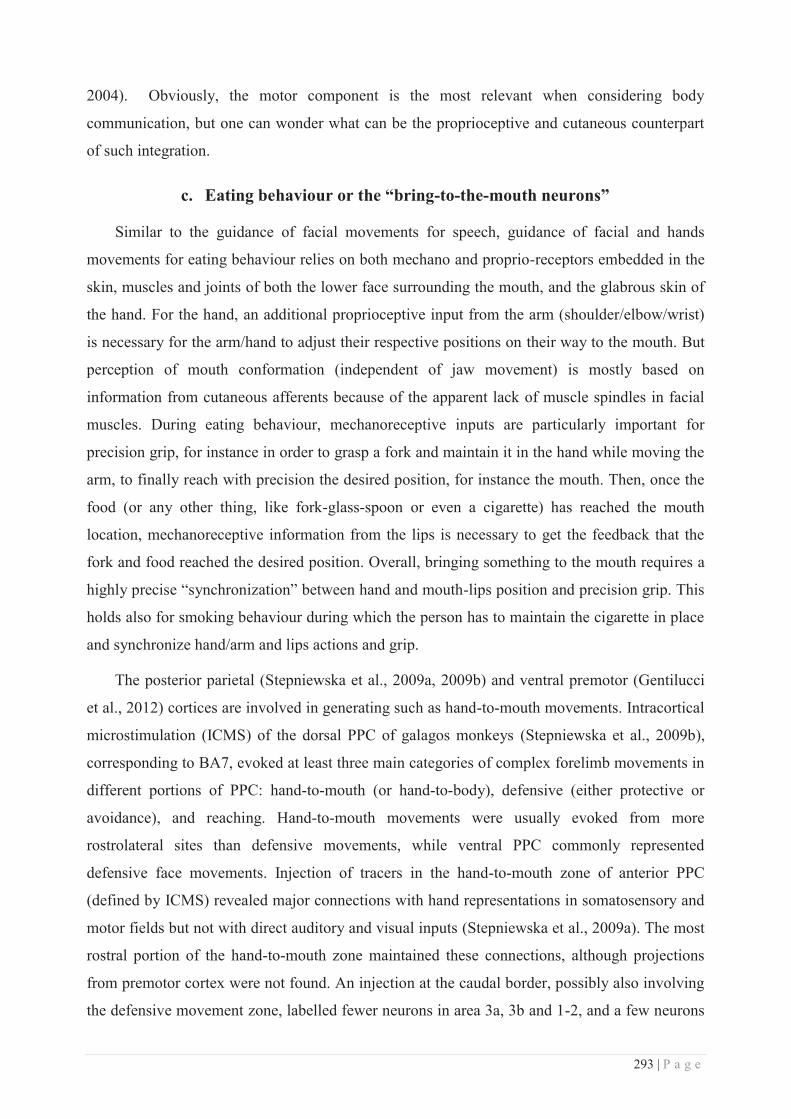
293 | P a g e
2004). Obviously, the motor component is the most relevant when considering body
communication, but one can wonder what can be the proprioceptive and cutaneous counterpart
of such integration.
c. Eating behaviour or the “bring-to-the-mouth neurons”
Similar to the guidance of facial movements for speech, guidance of facial and hands
movements for eating behaviour relies on both mechano and proprio-receptors embedded in the
skin, muscles and joints of both the lower face surrounding the mouth, and the glabrous skin of
the hand. For the hand, an additional proprioceptive input from the arm (shoulder/elbow/wrist)
is necessary for the arm/hand to adjust their respective positions on their way to the mouth. But
perception of mouth conformation (independent of jaw movement) is mostly based on
information from cutaneous afferents because of the apparent lack of muscle spindles in facial
muscles. During eating behaviour, mechanoreceptive inputs are particularly important for
precision grip, for instance in order to grasp a fork and maintain it in the hand while moving the
arm, to finally reach with precision the desired position, for instance the mouth. Then, once the
food (or any other thing, like fork-glass-spoon or even a cigarette) has reached the mouth
location, mechanoreceptive information from the lips is necessary to get the feedback that the
fork and food reached the desired position. Overall, bringing something to the mouth requires a
highly precise “synchronization” between hand and mouth-lips position and precision grip. This
holds also for smoking behaviour during which the person has to maintain the cigarette in place
and synchronize hand/arm and lips actions and grip.
The posterior parietal (Stepniewska et al., 2009a, 2009b) and ventral premotor (Gentilucci
et al., 2012) cortices are involved in generating such as hand-to-mouth movements. Intracortical
microstimulation (ICMS) of the dorsal PPC of galagos monkeys (Stepniewska et al., 2009b),
corresponding to BA7, evoked at least three main categories of complex forelimb movements in
different portions of PPC: hand-to-mouth (or hand-to-body), defensive (either protective or
avoidance), and reaching. Hand-to-mouth movements were usually evoked from more
rostrolateral sites than defensive movements, while ventral PPC commonly represented
defensive face movements. Injection of tracers in the hand-to-mouth zone of anterior PPC
(defined by ICMS) revealed major connections with hand representations in somatosensory and
motor fields but not with direct auditory and visual inputs (Stepniewska et al., 2009a). The most
rostral portion of the hand-to-mouth zone maintained these connections, although projections
from premotor cortex were not found. An injection at the caudal border, possibly also involving
the defensive movement zone, labelled fewer neurons in area 3a, 3b and 1-2, and a few neurons
294 | P a g e
in visual area dorsal V3 (Stepniewska et al., 2009a). Thus, associative areas such as PPC are
likely to affect lower relays of the somatosensory pathway, and may thus affect somatosensory
perception.
Figure 51 [modified from Stepniewska et al., 2009a]. Summary of corticocortical
connections (indicated by black lines) of the hand-to-mouth zone (filled with black) of
PPC in the galago monkey brain. Thick lines represent strong connections, and thin
lines represent weak connections. The hand-to-mouth zone has major connections with
somatosensory and motor fields, while being isolated from direct auditory and visual
inputs. Sulci are marked with dark gray, and the entire region explored by ICMS is
marked with light gray. A, aggressive; D, defensive forelimb or face; H-M, hand-to-
mouth; R, reach.
Altogether, these few lines of evidence point toward the fact that the hand and the face
interact together along the entire somatosensory pathway, correspondingly are both involved in
both low and high level functions.
295 | P a g e
CONCLUSION & FOLLOW-UP
To conclude, in contrast to the theoretical framework within which deprivation-induced
plastic changes across the hand-face border have been interpreted as a sign of ‘competition’, we
report a non-competitive and adaptive transfer of perceptual changes across the hand-face
border, with repetitive stimulation of the hand resulting in enhanced tactile performance at the
face. This finding suggests that cross-border plasticity mechanisms also include ‘facilitation-
based’ processes, revealed here through training-independent perceptual learning. We
additionally found that these behavioural results were accompanied by substantial cortical
changes involving a complex pattern of activation and deactivation potentially underlying
changes in the balance between excitatory and inhibitory processes. Finally, we report that
associative cortical areas may also be affected and involved in training-independent learning.
While further investigations are required to understand the exact nature of the pattern of cortical
activity in which we report changes, and the implication of associative areas, our results imply
that training-independent learning, appears to affect more cortical areas than previously thought
and promotes perceptual and cortical changes not only locally, but also remotely, and in
particular across the hand-face border. Such a pattern of transfer underlines the potentially
interesting impact of training-independent procedures in promoting adaptive plastic changes in
the context of rehabilitation. Indeed, if a passive stimulation of a given body part could help to
recover sensitivity from another body part, it would be useful to optimize this protocol to find
new therapeutic tools to help patients with somatosensory disorders, like stroke patients.
Some promising results going in this direction have shown that RSS improves sensorimotor
performance in stroke patients (Smith et al., 2009; Kattenstroth et al., 2012), but also
compensates for age-related declines in sensitivity (Kalisch et al., 2008, 2010, 2012a, 2012b). In
addition, given the passive feature of RSS, this protocol could be easily combined with other
rehabilitation methods. In line with this, a recent study showed that repetitive motor training
combined with RSS improves motor performance (Ladda et al., 2014). Thus, RSS appears to be
a potentially interesting method to efficiently enhance haptic and sensorimotor abilities.
Conversely, its potential impact on pain has not been investigated yet. The only hint regarding
this aspect is not very encouraging, given that RSS was found to improve finger dexterity, but
did not change pain thresholds (Kowalewski et al., 2012). However, the protocol of stimulation
may need to be slightly adapted as a function of the to-be-achieved aim. For instance, some
cases might require the implementation of asynchronous stimulation between body-parts instead
296 | P a g e
of synchronous. Some encouraging results going in this direction have been reported in
amputees, whose phantom limb pain was reduced following an asynchronous stimulation of
their residual limb and lip (Huse et al., 2001). Altogether, these lines of evidence point towards
the need to further investigate the potential outcomes of RSS for functional rehabilitation, and to
achieve a better understanding of the mechanisms subserving RSS training-independent
learning.
In this direction, it would be interesting to implement further analyses of our imaging data.
Regarding the fMRI study, a first step would be to confirm our results with a more robust
delineation of BAs based on cytoarchitectonic probabilistic maps. Then, it would be interesting
to directly compare positive and negative BOLD responses by analyzing their relative overlap at
the individual level. This would also allow confirmation of the co-localization of the lip negative
response within the hand positive response. For the MEG study, the analysis of dipole
orientation would provide some additional information regarding the contribution of the
different sub-regions (BAs). Indeed, if RSS differentially alters activity in BA3b, BA1, but also
BA2, the net extracellular current oriented tangentially to the scalp (i.e., detected by MEG
sensors) might be slightly modulated, which could result in dipole orientation changes. Another
direct follow-up would be to analyze the other SEF components, to investigate whether RSS
alters earlier or more associative brain areas, but also to compute the distributed sources of the
somatosensory evoked activity. This approach requires no apriori regarding the number of
sources generating the external field and thus would provide a reliable way of estimating the
sources involved and modulated by our procedure. Finally, a more exploratory analysis in the
time-frequency domain might also reveal an impact of RSS over some frequency bands, such as
the mu and beta bands involved in sensorimotor processing. For both fMRI and MEG data, the
analysis of CoG displacement could also be optimized by implementing surface-based cortical
mapping techniques.
Other possible follow-up imaging studies include recording brain activity while participants
are performing the two-point discrimination task, which would provide a complementary way of
evaluating the cortical substrates involved in the RSS-induced changes in tactile acuity. It would
be also interesting to investigate whether the functional but also resting state connectivity
between hand and face representations is modulated by RSS. Finally, the use SEP recordings in
the context of protocols of tactile interference would be interesting to further investigate the
existence of lateral inhibition processes between the hand and the face suggested by the present
work.

297 | P a g e
At the behavioural level, a direct follow-up would be to assess whether RSS at the index
finger affects tactile perception at the thumb. This point is currently being investigated. Then,
regarding the potential impact of RSS for somatosensory rehabilitation, it will be crucial to
investigate whether the application of RSS on the face can affect finger tactile acuity. Given that
the negative BOLD response obtained for the lip was co-localized with the positive response of
all fingers, such a protocol is likely to result in a non-selective effect on all fingers.

298 | P a g e
299 | P a g e
REFERENCES
Adesnik H, Scanziani M (2010) Lateral competition for cortical space by layer-specific horizontal circuits. Nature 464:1155–1160.
Ahissar M, Hochstein S (1997) Task difficulty and the specificity of perceptual learning. Nature 387:401–406.
Akatsuka K, Noguchi Y, Harada T, Sadato N, Kakigi R (2008) Neural codes for somatosensory two-point discrimination in inferior parietal lobule: An fMRI study. Neuroimage 40:852–858.
Allard T, Clark SA, Jenkins WM, Merzenich MM (1991) Reorganization of somatosensory area 3b representations in adult owl monkeys after digital syndactyly. J Neurophysiol 66:1048–1058.
Amunts K, Schlaug G, Schleicher A, Steinmetz H, Dabringhaus A, Roland PE, Zilles K (1996) Asymmetry in the human motor cortex and handedness. Neuroimage 4:216–222.
Andersen RA, Buneo CA (2002) Intentional maps in posterior parietal cortex. Annu Rev Neurosci 25:189–220.
Armstrong-James M, Fox K (1987) Spatiotemporal convergence and divergence in the rat S1 “barrel” cortex. J Comp Neurol 263:265–281.
Arthurs O. J, Boniface S. J (2003) What aspect of the fMRI BOLD signal best reflects the underlying electrophysiology in human somatosensory cortex? Clin Neurophysiol 114:1203–1209.
Arthurs OJ, Donovan T, Spiegelhalter DJ, Pickard JD, Boniface SJ (2007) Intracortically distributed neurovascular coupling relationships within and between human somatosensory cortices. Cereb Cortex 17:661–668.
Astafiev S V, Shulman GL, Stanley CM, Snyder AZ, Van Essen DC, Corbetta M (2003) Functional organization of human intraparietal and frontal cortex for attending, looking, and pointing. J Neurosci 23:4689–4699.
Avillac M, Ben Hamed S, Duhamel J-R (2007) Multisensory integration in the ventral intraparietal area of the macaque monkey. J Neurosci 27:1922–1932.
Azañón E, Longo MR, Soto-Faraco S, Haggard P (2010) The posterior parietal cortex remaps touch into external space. Curr Biol 20:1304–1309.
Backes W., Mess W., van Kranen-Mastenbroek V, Reulen JP. (2000) Somatosensory cortex responses to median nerve stimulation: fMRI effects of current amplitude and selective attention. Clin Neurophysiol 111:1738–1744.
Bao R, Wei P, Li K, Lu J, Zhao C, Wang Y, Zhang T (2012) Within-limb somatotopic organization in human SI and parietal operculum for the leg: an fMRI study. Brain Res 1445:30–39.
Baranyi A, Fehér O (1981) Synaptic facilitation requires paired activation of convergent pathways in the neocortex. Nature 290:413–415.
Barbay S, Peden EK, Falchook G, Nudo RJ (1999) Sensitivity of neurons in somatosensory cortex (S1) to cutaneous stimulation of the hindlimb immediately following a sciatic nerve crush. Somatosens Mot Res 16:103–114.
Batista AP, Buneo CA, Snyder LH, Andersen RA (1999) Reach plans in eye-centered coordinates. Science (80- ) 285:257–260.
300 | P a g e
Baumgartner C, Doppelbauer A, Deecke L, Barth DS, Zeitlhofer J, Lindinger G, Sutherling WW (1991) Neuromagnetic investigation of somatotopy of human hand somatosensory cortex. Exp Brain Res 87:641–648.
Baumgartner C, Doppelbauer A, Sutherling WW, Lindinger G, Levesque MF, Aull S, Zeitlhofer J, Deecke L (1993) Somatotopy of human hand somatosensory cortex as studied in scalp EEG. Electroencephalogr Clin Neurophysiol 88:271–279.
Baumgärtner U, Iannetti GD, Zambreanu L, Stoeter P, Treede R-D, Tracey I (2010) Multiple somatotopic representations of heat and mechanical pain in the operculo-insular cortex: a high-resolution fMRI study. J Neurophysiol 104:2863–2872.
Benali A, Weiler E, Benali Y, Dinse HR, Eysel UT (2008) Excitation and inhibition jointly regulate cortical reorganization in adult rats. J Neurosci 28:12284–12293.
Bentley WJ, Li JM, Snyder AZ, Raichle ME, Snyder LH (2014) Oxygen level and LFP in task-positive and task-negative areas : bridging BOLD fMRI and electrophysiology. Cereb Cortex:1–12.
Besle J, Sánchez-Panchuelo R-M, Bowtell R, Francis S, Schluppeck D (2013a) Single-subject fMRI mapping at 7 T of the representation of fingertips in S1: a comparison of event-related and phase-encoding designs. J Neurophysiol 109:2293–2305.
Besle J, Sánchez-Panchuelo R-M, Bowtell R, Francis S, Schluppeck D (2013b) Event-related fMRI at 7T reveals overlapping cortical representations for adjacent fingertips in S1 of individual subjects. Hum Brain Mapp 35:2027–2043.
Beste C, Dinse HR (2013) Learning without training. Curr Biol 23:R489–R499.
Beste C, Wascher E, Güntürkün O, Dinse HR (2011) Improvement and impairment of visually guided behavior through LTP- and LTD-like exposure-based visual learning. Curr Biol 21:876–882.
Birbaumer N, Lutzenberger W, Montoya P, Larbig W, Unertl K, Töpfner S, Grodd W, Taub E, Flor H (1997) Effects of regional anesthesia on phantom limb pain are mirrored in changes in cortical reorganization. J Neurosci 17:5503–5508.
Björkman A, Rosén B, Lundborg G (2004a) Acute improvement of hand sensibility after selective ipsilateral cutaneous forearm anaesthesia. Eur J Neurosci 20:2733–2736.
Björkman A, Rosén B, van Westen D, Larsson E-M, Lundborg G (2004b) Acute improvement of contralateral hand function after deafferentation. Neuroreport 15:1861–1865.
Björkman A, Weibull A, Olsrud J, Henrik Ehrsson H, Rosén B, Björkman-Burtscher IM (2012) Phantom digit somatotopy: a functional magnetic resonance imaging study in forearm amputees. Eur J Neurosci:1–9.
Björkman A, Weibull A, Rosén B, Svensson J, Lundborg G (2009) Rapid cortical reorganisation and improved sensitivity of the hand following cutaneous anaesthesia of the forearm. Eur J Neurosci 29:837–844.
Blake DT, Hsiao SS, Johnson KO (1997) Neural coding mechanisms in tactile pattern recognition: the relative contributions of slowly and rapidly adapting mechanoreceptors to perceived roughness. J Neurosci 17:7480–7489.
Blake DT, Strata F, Kempter R, Merzenich MM (2005) Experience-dependent plasticity in S1 caused by noncoincident inputs. J Neurophysiol 94:2239–2250.
301 | P a g e
Blankenburg F, Ruben J, Meyer R, Schwiemann J, Villringer A (2003a) Evidence for a rostral-to-caudal somatotopic organization in human primary somatosensory cortex with mirror-reversal in areas 3b and 1. Cereb Cortex 13:987–993.
Blankenburg F, Taskin B, Ruben J, Moosmann M, Ritter P, Curio G, Villringer A (2003b) Imperceptible stimuli and sensory processing impediment. Science (80- ) 299:1864.
Blatow M, Nennig E, Durst A, Sartor K, Stippich C (2007) fMRI reflects functional connectivity of human somatosensory cortex. Neuroimage 37:927–936.
Bliem B, Tegenthoff M, Dinse HR (2008) Cholinergic gating of improvement of tactile acuity induced by peripheral tactile stimulation. Neurosci Lett 434:129–132.
Bliss TVP, Lomo T (1973) Long-lasting potentiation of synaptic transmission in the dentate area of the unanaestetized rabbit following stimulation of the perforant path. J Physiol 232:357–374.
Bliss T V, Collingridge GL (1993) A synaptic model of memory: long-term potentiation in the hippocampus. Nature 361:31–39.
Bodegård A, Geyer S, Grefkes C, Zilles K, Roland PE (2001) Hierarchical processing of tactile shape in the human brain. Neuron 31:317–328.
Bogdanov S, Smith J, Frey SH (2012) Former hand territory activity increases after amputation during intact hand movements, but is unaffected by illusory visual feedback. Neurorehabil Neural Repair 26:604–615.
Boorman L, Kennerley AJ, Johnston D, Jones M, Zheng Y, Redgrave P, Berwick J (2010) Negative blood oxygen level dependence in the rat: a model for investigating the role of suppression in neurovascular coupling. J Neurosci 30:4285–4294.
Borsook D, Becerra L, Fishman S, Edwards A, Jennings CL, Stojanovic M, Papinicolas L, Ramachandran VS, Gonzalez RG, Breiter H (1998) Acute plasticity in the human somatosensory cortex following amputation. Neuroreport 9:1013–1017.
Borsook D, Burstein R, Becerra L (2004) Functional imaging of the human trigeminal system: Opportunities for new insights into pain processing in health and disease. J Neurobiol 61:107–125.
Braun C, Haug M, Wiech K, Birbaumer N, Elbert T, Roberts LE (2002) Functional organization of primary somatosensory cortex depends on the focus of attention. Neuroimage 17:1451–1458.
Braun C, Schweizer R, Elbert T, Birbaumer N, Taub E (2000a) Differential activation in somatosensory cortex for different discrimination tasks. J Neurosci 20:446–450.
Braun C, Schweizer R, Heinz U, Wiech K, Birbaumer N, Topka H (2003) Task-specific plasticity of somatosensory cortex in patients with writer’s cramp. Neuroimage 20:1329–1338.
Braun C, Wilms A, Schweizer R, Godde B, Preissl H, Birbaumer N (2000b) Activity patterns of human somatosensory cortex adapt dynamically to stimulus properties. Neuroreport 11:2977–2980.
Brecht M, Roth A, Sakmann B (2003) Dynamic receptive fields of reconstructed pyramidal cells in layers 3 and 2 of rat somatosensory barrel cortex. J Physiol 553:243–265.
Bressler D, Spotswood N, Whitney D (2007) Negative BOLD fMRI response in the visual cortex carries precise stimulus-specific information. PLoS One 2.
Brodmann K (1909) Vergleichende Lokalisationslehre der Grosshirnrinde in ihren Prinzipien dargestellt auf Grund des Zellenbaues. Johann Ambrosius Barth Verlag, Leipzig.
302 | P a g e
Brookes M, Woolrich M, Luckhoo H, Price D, Hale, Stephenson M, Barnes G, Smith S, Morris P (2011) Investigating the electrophysiological basis of resting state networks using magnetoencephalography. PNAS 108:16783–16788.
Brown PB, Pubols LM, Millecchial J, Gladfelter WE, Culberson JC, Covalt-Dunning D, Sonty R V., Millecchia RJ (1991) Somatotopic Organization of Single Primary Afferent Axon Projections to Cat Spinal Cord Dorsal Horn. J Neurosci 11:298–309.
Bruehlmeier M, Dietz V, Leenders KL, Roelcke U, Missimer J, Curt A (1998) How does the human brain deal with a spinal cord injury? Eur J Neurosci 10:3918–3922.
Bruns P, Camargo CJ, Campanella H, Esteve J, Dinse HR, Röder B (2014) Tactile Acuity Charts: A Reliable Measure of Spatial Acuity Sathian K, ed. PLoS One 9:e87384.
Buchner H, Kauert C, Radermacher I (1995) Short-term changes of finger representation at the somatosensory cortex in humans. Neurosci Lett 198:57–59.
Buonomano D V, Merzenich MM (1998) Cortical plasticity: from synapses to maps. Annu Rev Neurosci 21:149–186.
Burbaud P, Doegle C, Gross C, Bioulac B (1991) A quantitative study of neuronal discharge in areas 5 , 2 , and 4 of the monkey during fast arm movements. J Neurophysiol 66:429–443.
Burns S a., Hickmott PW (2003) Effect of representational borders on responses of supragranular neurons in rat somatosensory cortex. Brain Res 985:108–111.
Burton H, Fabri M (1995) Ipsilateral intracortical connections of physiologically defined cutaneous representations in areas 3b and 1 of macaque monkeys: projections in the vicinity of the central sulcus. J Comp Neurol 355:508–538.
Burton H, Fabri M, Alloway K (1995) Cortical areas within the lateral sulcus connected to cutaneous representations in areas 3b and 1: a revised interpretation of the second somatosensory area in macaque monkeys. J Comp Neurol 355:539–562.
Byrne J a., Calford MB (1991) Short-term expansion of receptive fields in rat primary somatosensory cortex after hindpaw digit denervation. Brain Res 565:218–224.
Calford MB, Tweedale R (1988) Immediate and chronic changes in responses of somatosensory cortex in adult flying-fox after digit amputation. Nature 332:446–448.
Calford MB, Tweedale R (1990) Interhemispheric transfer of plasticity in the cerebral cortex. Science (80- ) 249:805–807.
Calford MB, Tweedale R (1991) Acute changes in cutaneous receptive fields in primary somatosensory cortex after digit denervation in adult flying fox. J Neurophysiol 65:178–187.
Caminiti R, Ferraina S, Johnson PB (1996) The sources of visual information to the primate frontal lobe:A novel role for the superior parietla lobule. Cereb Cortex:319–328.
Campbell WW (1999) Guidelines in electrodiagnostic medicine. Muscle Nerve 8:171–205.
Cannestra AF, Black KL, Martin N a., Cloughesy T, Burton JS, Rubinstein E, Woods RP, Toga AW (1998) Topographical and temporal specificity of human intraoperative optical intrinsic signals. Neuroreport 9:2557–2563.
Carlson M (1981) Characteristics of sensory deficits following lesions of Brodmann’s areas 1 and 2 in the postcentral gyrus of Macaca mulatta. Brain Res 204:424–430.
303 | P a g e
Carr DB, Sesack SR (1998) Callosal terminals in the rat prefrontal cortex: Synaptic targets and association with GABA-immunoreactive structures. Synapse 29:193–205.
Castillo EM, Papanicolaou AC (2005) Cortical representation of dermatomes: MEG-derived maps after tactile stimulation. Neuroimage 25:727–733.
Catani M, Dell’Acqua F, Vergani F, Malik F, Hodge H, Roy P, Valabregue R, Thiebaut de Schotten M (2012) Short frontal lobe connections of the human brain. Cortex 48:273–291.
Cerkevich CM, Qi H-X, Kaas JH (2013) Thalamic input to representations of the teeth, tongue, and face in somatosensory area 3b of macaque monkeys. J Comp Neurol 521:3954–3971.
Chang C, Shyu BC (2001) A fMRI study of brain activations during non-noxious and noxious electrical stimulation of the sciatic nerve of rats. Brain Res 897:71–81.
Chapin JK (1986) Laminar differences in sizes, shapes, and response profiles of cutaneous receptive fields in the rat SI cortex. Exp Brain Res 62:549–559.
Chen CJ, Liu HL, Wei FC, Chu NS (2006) Functional MR imaging of the human sensorimotor cortex after toe-to-finger transplantation. Ajnr Am J Neuroradiol 27:1617–1621.
Chen LM, Friedman RM, Ramsden BM, LaMotte RH, Roe a W (2001) Fine-scale organization of SI (area 3b) in the squirrel monkey revealed with intrinsic optical imaging. J Neurophysiol 86:3011–3029.
Chen TL, Babiloni C, Ferretti A, Perrucci MG, Romani GL, Rossini PM, Tartaro A, Del Gratta C (2008) Human secondary somatosensory cortex is involved in the processing of somatosensory rare stimuli: an fMRI study. Neuroimage 40:1765–1771.
Chen TL, Babiloni C, Ferretti A, Perrucci MG, Romani GL, Rossini PM, Tartaro A, Del Gratta C (2010) Effects of somatosensory stimulation and attention on human somatosensory cortex: an fMRI study. Neuroimage 53:181–188.
Chowdhury S a, Greek K a, Rasmusson DD (2004) Changes in corticothalamic modulation of receptive fields during peripheral injury-induced reorganization. Proc Natl Acad Sci U S A 101:7135–7140.
Chung YG, Han SW, Kim H-S, Chung S-C, Park J-Y, Wallraven C, Kim S-P (2014) Intra- and inter-hemispheric effective connectivity in the human somatosensory cortex during pressure stimulation. BMC Neurosci 15:43.
Churchill JD, Arnold LL, Garraghty PE (2001) Somatotopic reorganization in the brainstem and thalamus following peripheral nerve injury in adult primates. Brain Res 910:142–152.
Clark SA, Allard T, Jenkins WM, Merzenich MM (1986) Cortical map reorganization following neurovascular island skin transfers on the hands of adult owl monkeys. Soc Neurosci Abstr 12:391.
Clark SA, Allard T, Jenkins WM, Merzenich MM (1988) Receptive fields in the body-surface map in adult cortex defined by temporally correlated inputs. Nature 332:444–445.
Coghill RC, Gilron I, Iadarola MJ (2001) Hemispheric lateralization of somatosensory processing. J Neurophysiol 85:2602–2612.
Cohen D (1968) Magnetoencephalography: evidence of magnetic fields produced by alpha-rhythm currents. Science (80- ) 161:784–786.
Cohen D (1972) Magnetoencephalography: detection of the brain’s electrical activity with a superconducting magnetometer. Science (80- ) 175:664–666.
304 | P a g e
Cohen YE, Andersen RA (2002) A common reference frame for movement plans in the posterior parietal cortex. Nat Rev Neurosci 3:553–562.
Cooke DF, Taylor CSR, Moore T, Graziano MSA (2003) Complex movements evoked by microstimulation of the ventral intraparietal area. Proc Natl Acad Sci U S A 100:6163–6168.
Coq J-O, Qi H, Collins CE, Kaas JH (2004) Anatomical and functional organization of somatosensory areas of the lateral fissure of the New World titi monkey (Callicebus moloch). J Comp Neurol 476:363–387.
Coq JO, Xerri C (1998) Environmental enrichment alters organizational features of the forepaw representation in the primary somatosensory cortex of adult rats. Exp brain Res 121:191–204.
Coq JO, Xerri C (2000) Age-related alteration of the forepaw representation in the rat primary somatosensory cortex. Neuroscience 99:403–411.
Coq JO, Xerri C (2001) Sensorimotor experience modulates age-dependent alterations of the forepaw representation in the rat primary somatosensory cortex. Neuroscience 104:705–715.
Craig AD (Bud) (2009) How do you feel--now? The anterior insula and human awareness. Nat Rev Neurosci 10:59–70.
Craig JC, Johnson KO (2000) The Two-Point Threshold : Not a Measure of Tactile Spatial Resolution. Am Psychol Soc 9:29–32.
Cronholm B (1951) Phantom limbs in amputees; a study of changes in the integration of centripetal impulses with special reference to referred sensations. Acta Psychiatr Neurol Scand Suppl 72:1–310.
Cusick CG, Gould HJ (1990) Connections between area 3b of the somatosensory cortex and subdivisions of the ventroposterior nuclear complex and the anterior pulvinar nucleus in squirrel monkeys. J Comp Neurol 292:83–102.
Cusick CG, Wall JT, Felleman DJ, Kaas JH (1989) Somatotopic organization of the lateral sulcus of owl monkeys : Area 3b , SII , and a ventral somatosensory area. J Comp Neurol 282:169–190.
Dan Y, Poo M (2006) Spike timing-dependent plasticity : from synapse to perception. Physiol Rev:1033–1048.
Dan Y, Poo M-M (2004) Spike timing-dependent plasticity of neural circuits. Neuron 44:23–30.
Darian-Smith I, Johnson KO (1977) Thermal sensibility and thermoreceptors. J Invest Dermatol 69:146–153.
DaSilva AFM, Becerra L, Makris N, Strassman AM, Gonzalez RG, Geatrakis N, Borsook D (2002) Somatotopic activation in the human trigeminal pain pathway. J Neurosci 22:8183–8192.
Davis KD, Kiss ZHT, Luo L, Tasker RR, Lozano AM, Dostrovsky JO (1998) Phantom sensations generated by thalamic microstimulation. Nature 391:385–387.
De Celis Alonso B, Lowe AS, Dear JP, Lee KC, Williams SCR, Finnerty GT (2008) Sensory inputs from whisking movements modify cortical whisker maps visualized with functional magnetic resonance imaging. Cereb Cortex 18:1314–1325.
Debowy DJ, Ghosh S, Ro JY, Gardner EP (2001) Comparison of neuronal firing rates in somatosensory and posterior parietal cortex during prehension. Exp Brain Res 137:269–291.
305 | P a g e
Del Gratta C, Della Penna S, Ferretti A, Franciotti R, Pizzella V, Tartaro A, Torquati K, Bonomo L, Romani GL, Rossini PM (2002) Topographic Organization of the Human Primary and Secondary Somatosensory Cortices: Comparison of fMRI and MEG Findings. Neuroimage 17:1373–1383.
Del Gratta C, Penna S Della, Tartaro A, Ferretti A, Torquati K, Bonomo L, Romani GL, Rossini PM (2000) Topographic organization of the human primary and secondary somatosensory areas. Neuroreport 11:2035–2043.
Dellon AL, Kallman CH (1983) Evaluation of functional sensation in the hand. J Hand Surg Am 8:865–870.
Derdikman D, Hildesheim R, Ahissar E, Arieli A, Grinvald A (2003) Imaging spatiotemporal dynamics of surround inhibition in the barrels somatosensory cortex. J Neurosci 23:3100–3105.
Devonshire IM, Papadakis NG, Port M, Berwick J, Kennerley AJ, Mayhew JEW, Overton PG (2012) Neurovascular coupling is brain region-dependent. Neuroimage 59:1997–2006.
Devor A, Ulbert I, Dunn AK, Narayanan SN, Jones SR, Andermann ML, Boas D a, Dale AM (2005) Coupling of the cortical hemodynamic response to cortical and thalamic neuronal activity. PNAS 102:3822–3827.
Di Russo F, Committeri G, Pitzalis S, Spitoni G, Piccardi L, Galati G, Catagni M, Nico D, Guariglia C, Pizzamiglio L (2006) Cortical plasticity following surgical extension of lower limbs. Neuroimage 30:172–183.
Diamond ME, Armstrong-James M, Ebner FF (1993) Experience-dependent plasticity in adult rat barrel cortex. PNAS 90:2082–26.
Diedrichsen J, Nambisan R, Kennerley SW, Ivry RB (2004) Independent on-line control of the two hands during bimanual reaching. Eur J Neurosci 19:1643–1652.
Dinse HR, Goode B, Hilger T, Haupt SS, Spengler F, Zepka R (1997) Short-term functional plasticity of cortical and thalamic sensory representations and its implication for information processing. Brain Plast Adv Neurol 73:159–178.
Dinse HR, Kleibel N, Kalisch T, Ragert P, Wilimzig C, Tegenthoff M (2006) Tactile coactivation resets age-related decline of human tactile discrimination. Ann Neurol 60:88–94.
Dinse HR, Ragert P, Pleger B, Schwenkreis P, Tegenthoff M (2003) Pharmacological modulation of perceptual learning and associated cortical reorganization. Science 301:91–94.
Dinse HR, Recanzone GH, Merzenich MM (1993) Alterations in correlated activity parallel ICMS-induced representational plasticity. Neuroreport 5:173–176.
Disbrow E a, Hinkley LBN, Roberts TPL (2003a) Ipsilateral representation of oral structures in human anterior parietal somatosensory cortex and integration of inputs across the midline. J Comp Neurol 467:487–495.
Disbrow E, Litinas E, Recanzone GH, Padberg J, Krubitzer L (2003b) Cortical connections of the second somatosensory area and the parietal ventral area in macaque monkeys. J Comp Neurol 462:382–399.
Disbrow E, Litinas E, Recanzone GH, Slutsky D, Krubitzer L (2002) Thalamocortical connections of the parietal ventral area (PV) and the second somatosensory area (S2) in macaque monkeys. Thalamus Relat Syst 1:289.
Disbrow E, Roberts TIM, Krubitzer L (2000) Somatotopic organization of cortical fields in the lateral sulcus of Homo sapiens : evidence for SII and PV. J Comp Neurol 418:1–21.
306 | P a g e
Dostrovsky JO, Millar J, Wall PD (1976) The immediate shift of afferent drive of dorsal column nucleus cells following deafferentation: a comparison of acute and chronic deafferentation in gracile nucleus and spinal cord. Exp Neurol 52:480–495.
Draganski B, Gaser C, Busch V, Schuierer G, Bogdahn U, May A (2004) Changes in grey matter induced by training. Nature 427:311–312.
Dreyer DA, Loe PR, Met CB, Whitsel BL (1975) Representation of head and face in postcentral gyrus of the macaque. J Neurophysiol 38:714–733.
Druschky K, Kaltenhäuser M, Hummel C, Druschky A, Pauli E, Huk WJ, Stefan H, Neundörfer B (2002) Somatotopic organization of the ventral and dorsal finger surface representations in human primary sensory cortex evaluated by magnetoencephalography. Neuroimage 15:182–189.
Dupont E, Canu MH, Langlet C, Falempin M (2001) Time course of recovery of the somatosensory map following hindpaw sensory deprivation in the rat. Neurosci Lett 309:121–124.
Dutta A, Kambi N, Raghunathan P, Khushu S, Jain N (2013) Large-scale reorganization of the somatosensory cortex of adult macaque monkeys revealed by fMRI. Brain Struct Funct 219:1305–1320.
Dykes RW, Sur M, Merzenich MM, Kaas JH, Nelson RJ (1981) Regional segregation of neurons responding to quickly adapting, slowly adapting, deep and pacinian receptors within thalamic ventroposterior lateral and ventroposterior inferior nuclei in the squirrel monkey. Neuroscience 6:1687–1692.
Eickhoff SB, Amunts K, Mohlberg H, Zilles K (2006a) The human parietal operculum. II. Stereotaxic maps and correlation with functional imaging results. Cereb Cortex 16:268–279.
Eickhoff SB, Grefkes C, Fink GR, Zilles K (2008) Functional lateralization of face, hand, and trunk representation in anatomically defined human somatosensory areas. Cereb cortex 18:2820–2830.
Eickhoff SB, Grefkes C, Zilles K, Fink GR (2007a) The somatotopic organization of cytoarchitectonic areas on the human parietal operculum. Cereb Cortex 17:1800–1811.
Eickhoff SB, Heim S, Zilles K, Amunts K (2006b) Testing anatomically specified hypotheses in functional imaging using cytoarchitectonic maps. Neuroimage 32:570–582.
Eickhoff SB, Paus T, Caspers S, Grosbras M-H, Evans AC, Zilles K, Amunts K (2007b) Assignment of functional activations to probabilistic cytoarchitectonic areas revisited. Neuroimage 36:511–521.
Eickhoff SB, Schleicher A, Zilles K, Amunts K (2006c) The human parietal operculum. I. Cytoarchitectonic mapping of subdivisions. Cereb Cortex 16:254–267.
Eickhoff SB, Stephan KE, Mohlberg H, Grefkes C, Fink GR, Amunts K, Zilles K (2005) A new SPM toolbox for combining probabilistic cytoarchitectonic maps and functional imaging data. Neuroimage 25:1325–1335.
Elbert T, Candia V, Altenmüller E, Rau H, Sterr A, Rockstroh B, Pantev C, Taub E (1998) Alteration of digital representations in somatosensory cortex in focal hand dystonia. Neuroreport 9:3571–3575.
Elbert T, Flor H, Birbaumer N, Knecht S, Hampson S, Larbig W, Taub E (1994) Extensive reorganization of the somatosensory cortex in adult humans after nervous system injury. Neuroreport 5:2593–2597.
Elbert T, Pantev C, Wienbruch C, Rockstroh B, Taub E (1995) Increased cortical representation of the fingers of the left hand in string players. Science (80- ) 270:305–307.
307 | P a g e
Elbert T, Sterr A, Flor H, Rockstroh B, Knecht S, Pantev C, Wienbruch C, Taub E (1997) Input-increase and input-decrease types of cortical reorganization after upper extremity amputation in humans. Exp brain Res 117:161–164.
Endo T, Spenger C, Tominaga T, Brené S, Olson L (2007) Cortical sensory map rearrangement after spinal cord injury: fMRI responses linked to Nogo signalling. Brain 130:2951–2961.
Ergenzinger ER, Glasier MM, Hahm JO, Pons TP (1998) Cortically induced thalamic plasticity in the primate somatosensory system. Nat Neurosci 1:226–229.
Erzurumlu RS, Chen Z-F, Jacquin MF (2006) Molecular determinants of the face map development in the trigeminal brainstem. Anat Rec A Discov Mol Cell Evol Biol 288:121–134.
Essick GK, Edin BB (1995) Receptor encoding of moving tactile stimuli in Humans. II. The mean response of individual low-threshold mechanoreceptors to motion across the receptive field. J Neurosci 15:848–864.
Essick GK, James A, McGlone FP (1999) Psychophysical assessment of the affective components of non-painful touch. Neuroreport 10:2083–2087.
Fabri M, Polonara G, Del Pesce M, Quattrini a, Salvolini U, Manzoni T (2001) Posterior corpus callosum and interhemispheric transfer of somatosensory information: an fMRI and neuropsychological study of a partially callosotomized patient. J Cogn Neurosci 13:1071–1079.
Fabri M, Polonara G, Quattrini A, Salvolini U, Del Pesce M, Manzoni T (1999) Role of the corpus callosum in the somatosensory activation of the ipsilateral cerebral cortex: An fMRI study of callosotomized patients. Eur J Neurosci 11:3983–3994.
Fabri M, Polonara G, Salvolini U, Manzoni T (2005) Bilateral cortical representation of the trunk midline in human first somatic sensory area. Hum Brain Mapp 25:287–296.
Faggin BM, Nguyen KT, Nicolelis MAL (1997) Immediate and simultaneous sensory reorganization at cortical and subcortical levels of the somatosensory system. PNAS 94:9428–9433.
Fan X, Jin WY, Wang YT (2014) The NMDA receptor complex: a multifunctional machine at the glutamatergic synapse. Front Cell Neurosci 8.
Fang P, Jain N, Kaas JH (2002) Few intrinsic connections cross the hand-face border of area 3b of new world monkeys. J Comp Neurol 454:310–319.
Farah MJ (1998) Why does the somatosensory homunculus have hands next to face and feet next to Genitals? A hypothesis. Neural Comput 10:1983–1985.
Farnè A, Roy AC, Giraux P, Dubernard JM, Sirigu A (2002) Face or hand, not both: perceptual correlates of reafferentation in a former amputee. Curr Biol 12:1342–1346.
Feldman DE (2000) Timing-based LTP and LTD at vertical inputs to layer II/III pyramidal cells in rat barrel cortex. Neuron 27:45–56.
Feldman DE, Brecht M (2005) Map plasticity in somatosensory cortex. Science (80- ) 310:810–815.
Feldmeyer D, Brecht M, Helmchen F, Petersen CCH, Poulet JF a, Staiger JF, Luhmann HJ, Schwarz C (2013) Barrel cortex function. Prog Neurobiol 103:3–27.
Ferretti A, Del Gratta C, Babiloni C, Caulo M, Arienzo D, Tartaro A, Rossini PM, Romani GL (2004) Functional topography of the secondary somatosensory cortex for nonpainful and painful stimulation of median and tibial nerve: an fMRI study. Neuroimage 23:1217–1225.
308 | P a g e
Fitzgerald PJ, Lane JW, Thakur PH, Hsiao SS (2006) Receptive field (RF) properties of the macaque second somatosensory cortex: RF size, shape and somatotopic organisation. J Neurosci 26:6485–6495.
Flor H, Diers M (2009) Sensorimotor training and cortical reorganization. NeuroRehabilitation 25:19–27.
Flor H, Elbert T, Knecht S, Wienbruch C, Pantev C, Birbaumer N, Larbig W, Taub E (1995) Phantom-limb pain as a perceptual correlate of cortical reorganization following arm amputation. Nature 375:482–484.
Flor H, Elbert T, Mühlnickel W, Pantev C, Wienbruch C, Taub E (1998) Cortical reorganization and phantom phenomena in congenital and traumatic upper-extremity amputees. Exp brain Res 119:205–212.
Florence SL, Boydston L a, Hackett T a, Lachoff HT, Strata F, Niblock MM (2001) Sensory enrichment after peripheral nerve injury restores cortical, not thalamic, receptive field organization. Eur J Neurosci 13:1755–1766.
Florence SL, Garraghty PE, Wall JT, Kaas JH (1994) Sensory afferent projections and area 3b somatotopy following median nerve cut and repair in macaque monkeys. Cereb Cortex 4:391–407.
Florence SL, Hackett T a, Strata F (2000) Thalamic and cortical contributions to neural plasticity after limb amputation. J Neurophysiol 83:3154–3159.
Florence SL, Kaas JH (1995) Large-scale reorganization at multiple levels of the somatosensory pathway follows therapeutic amputation of the hand in monkeys. J Neurosci 15:8083–8095.
Florence SL, Taub HB, Kaas JH (1998) Large-scale sprouting of cortical connections after peripheral injury in adult macaque monkeys. Science (80- ) 282:1117–1121.
Florence SL, Wall JT, Kaas JH (1989) Somatotopic organization of inputs from the hand to the spinal gray and cuneate nucleus of monkeys with observations on the cuneate nucleus of humans. J Comp Neurol 286:48–70.
Florence SL, Wall JT, Kaas JH (1991) Central projections from the skin of the hand in squirrel monkeys. J Comp Neurol 311:563–578.
Foell J, Bekrater-Bodmann R, Diers M, Flor H (2013) Mirror therapy for phantom limb pain: brain changes and the role of body representation. Eur J pain 18:729–739.
Fogassi L, Gallese V, Buccino G, Craighero L, Fadiga L, Rizzolatti G (2001) Cortical mechanism for the visual guidance of hand grasping movements in the monkey: A reversible inactivation study. Brain 124:571–586.
Forss N, Jousmäki V, Hari R (1995) Interaction between afferent input from fingers in human somatosensory cortex. Brain Res 685:68–76.
Fox K (1992) A critical period for experience-dependent synaptic plasticity in rat barrel cortex. J Neurosci 15:1826–1838.
Fox MD, Snyder AZ, Vincent JL, Corbetta M, Van Essen DC, Raichle ME (2005) The human brain is intrinsically organized into dynamic, anticorrelated functional networks. PNAS 102:9673–9678.
FoxFox K, WallaceWallace H, Glazewski S (32014BC) Is there a thalamic component to experience-dependent cortical plasticity? Philos Trans R Soc London Ser B, Biol Sci 357357:17091709–17091715.
309 | P a g e
Francis ST, Kelly EF, Bowtell R, Dunseath WJ, Folger SE, McGlone F (2000) fMRI of the responses to vibratory stimulation of digit tips. Neuroimage 11:188–202.
Frey SH, Bogdanov S, Smith JC, Watrous S, Breidenbach WC (2008) Chronically deafferented sensory cortex recovers a grossly typical organization after allogenic hand transplantation. Curr Biol 18:1530–1534.
Freyer F, Becker R, Dinse HR, Ritter P (2013) State-dependent perceptual learning. J Neurosci 33:2900–2907.
Freyer F, Reinacher M, Nolte G, Dinse HR, Ritter P (2012) Repetitive tactile stimulation changes resting-state functional connectivity — implications for treatment of sensorimotor decline. Medicine (Baltimore) 6:1–11.
Friedman DP, Murray E a (1986) Thalamic connectivity of the second somatosensory area and neighboring somatosensory fields of the lateral sulcus of the macaque. J Comp Neurol 252:348–373.
Friedman RM, Chen LM, Roe AW (2004) Modality maps within primate somatosensory cortex. Proc Natl Acad Sci U S A 101:12724–12729.
Friedman RM, Chen LM, Roe AW (2008) Responses of Areas 3b and 1 in Anesthetized Squirrel Monkeys to Single- and Dual-Site Stimulation of the Digits. :3185–3196.
Frostig RD (2006) Functional organization and plasticity in the adult rat barrel cortex: moving out-of-the-box. Curr Opin Neurobiol 16:445–450.
Gandevia SC, Burke D, McKeon BB (1983) Convergence in the somatosensory pathway between cutaneous afferents from the index and middle fingers in man. Exp brain Res 50:415–425.
Gandevia SC, Phegan CM (1999) Perceptual distortions of the human body image produced by local anaesthesia, pain and cutaneous stimulation. J Physiol 514:609–616.
Garraghty PE, Hanes DP, Florence SL, Kaas JH (1994) Pattern of peripheral deafferentation predicts reorganizational limits in adult primate somatosensory cortex. Somatosens Mot Res 11:109–117.
Garraghty PE, Kaas JH (1991) Large-scale functional reorganization in adult monkey cortex after peripheral nerve injury. Proc Natl Acad Sci U S A 88:6976–6980.
Gentilucci M, Benuzzi F, Gangitano M, Grimaldi S (2012) Grasp With Hand and Mouth : A Kinematic Study on Healthy Subjects Grasp With Hand and Mouth : A Kinematic Study on Healthy Subjects. J Neurophysiol:1685–1699.
Gentilucci M, Fogassi L, Luppino G, Matelli M, Camarda R, Rizzolatti G, Camarda R, Fogassi L, Gentilucci M, Luppino G, Matelli M (1988) Functional organization of inferior area 6 in the macaque monkey. Exp Brain Res 71:475–490.
Georgiadis JR, Kortekaas R, Kuipers R, Nieuwenburg A, Pruim J, Reinders a a TS, Holstege G (2006) Regional cerebral blood flow changes associated with clitorally induced orgasm in healthy women. Eur J Neurosci 24:3305–3316.
Geyer S, Ledberg A, Schleicher A, Kinomura S, Schormann T, Bürgel U, Klingberg T, Larsson J, Zilles K, Roland PE (1996) Two different areas within the primary motor cortex of man. Nature 382:805–807.
Geyer S, Schleicher A, Zilles K (1999) Areas 3a, 3b, and 1 of human primary somatosensory cortex. Microstuctural organization and interindividual variability. Neuroimage 10:63–83.
310 | P a g e
Geyer S, Schormann T, Mohlberg H, Zilles K (2000) Areas 3a, 3b, and 1 of human primary somatosensory cortex. Spatial normalization to standard anatomical space. Neuroimage 11:684–696.
Ghazanfar AA, Nicolelis MAL (1999) Spatiotemporal properties of layer V neurons of the rat primary somatosensory cortex. Cereb cortex 9:348–361.
Gibson GO, Craig JC (2005) Tactile spatial sensitivity and anisotropy. Percept Psychophys 67:1061–1079.
Gibson GO, Makinson CD, Sathian K (2009) Tactile co-activation improves detection of afferent spatial modulation. Exp Brain Res 194:409–417.
Gibson JR, Beierlein M, Connors BW (1999) Two networks of electrically coupled inhibitory neurons in neocortex. Nature 402:75–79.
Gilbert CD, Sigman M, Crist RE (2001) The neural basis of perceptual learning. Neuron 31:681–697.
Giraux P, Sirigu A, Schneider F, Dubernard JM (2001) Cortical reorganization in motor cortex after graft of both hands. Nat Neurosci 4:691–692.
Godde B, Berkefeld T, David-Jürgens M, Dinse HR (2002) Age-related changes in primary somatosensory cortex of rats: evidence for parallel degenerative and plastic-adaptive processes. Neurosci Biobehav Rev 26:743–752.
Godde B, Ehrhardt J, Braun C (2003) Behavioral significance of input-dependent plasticity of human somatosensory cortex. Neuroreport 14:543–546.
Godde B, Spengler F, Dinse HR (1996) Associative pairing of tactile stimulation induces somatosensory cortical reorganization in rats and humans. Neuroreport 8:281–285.
Godde B, Stauffenberg B, Spengler F, Dinse HR (2000) Tactile coactivation-induced changes in spatial discrimination performance. J Neurosci 20:1597–1604.
Golaszewski SM, Bergmann J, Christova M, Kunz AB, Kronbichler M, Rafolt D, Gallasch E, Staffen W, Trinka E, Nardone R (2012) Modulation of motor cortex excitability by different levels of whole-hand afferent electrical stimulation. Clin Neurophysiol 123:193–199.
Goldreich D, Kanics IM (2003) Tactile acuity is enhanced in blindness. J Neurosci 23:3439–3445.
Goloshevsky AG, Silva AC, Dodd SJ, Koretsky AP (2008) BOLD fMRI and somatosensory evoked potentials are well correlated over a broad range of frequency content of somatosensory stimulation of the rat forepaw. Brain Res 1195:67–76.
Goltz D, Pleger B, Thiel S, Villringer A, Müller MM (2013) Sustained spatial attention to vibrotactile stimulation in the flutter range: relevant brain regions and their interaction. PLoS One 8:e84196.
Goodwin AW, Wheat HE (2004) Sensory signals in neural populations underlying tactile perception and manipulation. Annu Rev Neurosci 27:53–77.
Graziano A, Jones EG (2009) Early withdrawal of axons from higher centers in response to peripheral somatosensory denervation. J Neurosci 29:3738–3748.
Graziano MS a, Cooke DF (2006) Parieto-frontal interactions, personal space, and defensive behavior. Neuropsychologia 44:2621–2635.
Greenspan JD (1997) Nociceptors and the peripheral nervous system’s role in pain. J Hand Ther 10:78–85.
311 | P a g e
Grefkes C, Fink GR (2005) The functional organization of the intraparietal sulcus in humans and monkeys. J Anat 207:3–17.
Grefkes C, Geyer S, Schormann T, Roland P, Zilles K (2001) Human somatosensory area 2: observer-independent cytoarchitectonic mapping, interindividual variability, and population map. Neuroimage 14:617–631.
Greicius MD, Krasnow B, Reiss AL, Menon V (2003) Functional connectivity in the resting brain: a network analysis of the default mode hypothesis. PNAS 100:253–258.
Grüsser SM, Winter C, Mühlnickel W, Denke C, Karl A, Villringer K, Flor H (2001a) The relationship of perceptual phenomena and cortical reorganization in upper extremity amputees. Neuroscience 102:263–272.
Grüsser SM, Winter C, Schaefer M, Fritzsche K, Benhidjeb T, Tunn P, Schlag PM, Flor H (2001b) Perceptual phenomena after unilateral arm amputation: a pre-post-surgical comparison. Neurosci Lett 302:13–16.
Gu X, Fortier P a (1996) Early enhancement but no late changes of motor responses induced by intracortical microstimulation in the ketamine-anesthetized rat. Exp Brain Res 108:119–128.
Guillery RW (1995) Anatomical evidence concerning the role of the thalamus in corticocortical communication : a brief review. J Anat 187:583–592.
Gustin SM, Peck CC, Cheney LB, Macey PM, Murray GM, Henderson L a (2012) Pain and plasticity: is chronic pain always associated with somatosensory cortex activity and reorganization? J Neurosci 32:14874–14884.
Hadoush H, Inoue K, Nakanishi K, Kurumadani H, Sunagawa T, Ochi M (2010) Ipsilateral primary sensorimotor cortical response to mechanical tactile stimuli. Neuroreport 21:108–113.
Hadoush H, Sunagawa T, Nakanishi K, Ochi M (2012) Somatosensory cortical plasticity after toe-to-index transfer. Neuroreport 23:1000–1005.
Haenzi S, Stefanics G, Lanaras T, Calcagni M, Ghosh A (2014) Altered cortical activation from the hand after facial botulinum toxin treatment. Ann Clin Transl Neurol 1:64–68.
Hagen MC, Zald DH, Thornton T a, Pardo J V (2002) Somatosensory processing in the human inferior prefrontal cortex. J Neurophysiol 88:1400–1406.
Haines DE (2003) Neuroanatomy: an atlas of structures, sections and systems (Wilkins LW&, ed)., 6th editio.
Haines DE (2013) Fundamental Neuroscience for Basic and Clinical Applications, 4th Editio. Elsevier.
Halata Z, Grim M, Bauman KI (2003) Friedrich Sigmund Merkel and his “Merkel cell”, morphology, development, and physiology: review and new results. Anat Rec Part A 271A:225–239.
Halligan PW, Marshall JC, Wade DT (1994) Sensory disorganization and perceptual plasticity after lmb amputation: a follwo-up study. Neuroreport.
Halligan PW, Marshall JC, Wade DT, Davey J, Morrison D (1993) Thumb in cheek? Sensory reorganization and perceptual plasticity after limb amputation. Neuroreport 4:233–236.
Hämäläinen M, Hari R, Ilmoniemi RJ, Knuutila J, Lounasmaa O V (1993) Magnetoencephalography - theory, instrumentaton, and applications to noninvasive studies of the working human brain. Rev Mod Phys 65:413–497.
312 | P a g e
Hanakawa T, Immisch I, Toma K, Dimyan M a, Van Gelderen P, Hallett M (2003) Functional properties of brain areas associated with motor execution and imagery. J Neurophysiol 89:989–1002.
Hansson T, Brismar T (1999) Tactile stimulation of the hand causes bilateral cortical activation: a functional magnetic resonance study in humans. Neurosci Lett 271:29–32.
Harel N, Lee S-P, Nagaoka T, Kim D-S, Kim S-G (2002) Origin of negative blood oxygenation level-dependent fMRI signals. J Cereb blood flow Metab 22:908–917.
Harrar V, Spence C, Makin TR (2014) Topographic generalization of tactile perceptual learning. J Exp Psychol Hum Percept Perform 40:15–23.
Harris J a, Miniussi C, Harris IM, Diamond ME (2002) Transient storage of a tactile memory trace in primary somatosensory cortex. J Neurosci 22:8720–8725.
Harris JA, Harris IM, Diamond ME (2001) The topography of tactile learning in humans. J Neurosci 21:1056–1061.
Hartline HK (1938) The response of single optic nerve fibers of the vertebrate eye to illumination of the retina. Am J Physiol 121:400–415.
Hashimoto I, Mashiko T, Kimura T, Imada T (1999a) Are there discrete distal-proximal representations of the index finger and palm in the human somatosensory cortex ? A neuromagnetic study. Clin Neurophysiol 110:430–437.
Hashimoto I, Saito Y, Iguchi Y, Kimura T, Fukushima T, Terasaki O, Sakuma K (1999b) Distal-proximal somatotopy in the human hand somatosensory cortex: a reappraisal. Exp Brain Res 129:467–472.
Hashimoto I, Suzuki A, Kimura T, Iguchi Y, Tanosaki M, Takino R, Haruta Y, Taira M (2004) Is there training-dependent reorganization of digit representations in area 3b of string players? Clin Neurophysiol 115:435–447.
Health M, Murray EA, Mishkin M (1984) Relative contributions of SII and area 5 to tactile discrimination in monkeys. Behav Brain Res 11:67–83.
Hebb DO (1949) The organization of behavior, New York: .
Henderson L a, Gustin SM, Macey PM, Wrigley PJ, Siddall PJ (2011) Functional reorganization of the brain in humans following spinal cord injury: evidence for underlying changes in cortical anatomy. J Neurosci 31:2630–2637.
Hickmott PW, Merzenich MM (1998) Single-cell correlates of a representational boundary in rat somatosensory cortex. J Neurosci 18:4403–4416.
Hickmott PW, Steen PA (2005) Large-scale changes in dendritic structure during reorganization of adult somatosensory cortex. Nat Neurosci 8:140–142.
Hlushchuk Y, Forss N, Hari R (2004) Distal-to-proximal representation of volar index finger in human area 3b. Neuroimage 21:696–700.
Hlushchuk Y, Hari R (2006) Transient suppression of ipsilateral primary somatosensory cortex during tactile finger stimulation. J Neurosci 26:5819–5824.
Hlustík P, Solodkin A, Gullapalli RP, Noll DC, Small SL (2001) Somatotopy in human primary motor and somatosensory hand representations revisited. Cereb cortex 11:312–321.
Hodzic A, Veit R, Karim AA, Erb M, Godde B (2004) Improvement and decline in tactile discrimination behavior after cortical plasticity induced by passive tactile coactivation. J Neurosci 24:442–446.
313 | P a g e
Hoechstetter K, Rupp A, Stancák A, Meinck HM, Stippich C, Berg P, Scherg M (2001) Interaction of tactile input in the human primary and secondary somatosensory cortex--a magnetoencephalographic study. Neuroimage 14:759–767.
Höffken O, Lenz M, Höckelmann N, Dinse HR, Tegenthoff M (2012) Noradrenergic modulation of human visual cortex excitability assessed by paired-pulse visual-evoked potentials. Neuroreport 23:707–711.
Höffken O, Veit M, Knossalla F, Lissek S, Bliem B, Ragert P, Dinse HR, Tegenthoff M (2007) Sustained increase of somatosensory cortex excitability by tactile coactivation studied by paired median nerve stimulation in humans correlates with perceptual gain. J Physiol 584:463–471.
Hoffmeyer HW, Enager P, Thomsen KJ, Lauritzen MJ (2007) Nonlinear neurovascular coupling in rat sensory cortex by activation of transcallosal fibers. J Cereb Blood Flow Metab 27:575–587.
Hoshiyama M, Kakigi R (2001) Two evoked responses with different recovery functions in the primary somatosensory cortex in humans. Clin Neurophysiol 112:1334–1342.
Hoshiyama M, Kakigi R, Koyama S, Kitamura Y, Shimoio M, Watanabe S (1995) Somatosensory evoked magnetic fields after mechanical stimulation of the scalp in humans. Neurosci Lett 195:29–32.
Hoshiyama M, Kakigi R, Koyama S, Watanabe S, Shimojo M (1997) Activity in posterior parietal cortex following somatosensory stimulation in man: magnetoencephalographic study using spatio-temporal source analysis. Brain Topogr 10:23–30.
Hoshiyama M, Ryusuke K, Koyama S, Kitamura Y, Shimojo M, Watanabe S, Kakigi R (1996) Somatosensory evoked magnetic fields following stimulation of the lip in humans. Electroencephalogr Clin Neurophysiol 100:96–104.
Hozumi J, Sumitani M, Yozu A, Tomioka T, Sekiyama H, Miyauchi S, Yamada Y (2011) Oral local anesthesia successfully ameliorated neuropathic pain in an upper limb suggesting pain alleviation through neural plasticity within the central nervous system: a case report. Anesthesiol Res Pract 2011:984281.
Hu K-S, Kwak J, Koh K-S, Abe S, Fontaine C, Kim H-J (2007) Topographic distribution area of the infraorbital nerve. Surg Radiol Anat 29:383–388.
Huang R-S, Chen C, Tran AT, Holstein KL, Sereno MI (2012) Mapping multisensory parietal face and body areas in humans. Proc Natl Acad Sci U S A 109:18114–18119.
Huffman KJ, Krubitzer L (2001) Area 3a: topographic organization and cortical connections in marmoset monkeys. Cereb Cortex 11:849–867.
Huse E, Preissl H, Larbig W, Birbaumer N (2001) Phantom limb pain. Lancet 358:2001.
Huttunen JK, Gröhn O, Penttonen M (2008) Coupling between simultaneously recorded BOLD response and neuronal activity in the rat somatosensory cortex. Neuroimage 39:775–785.
Hyvärinen J (1981) Regional distribution of functions in parietal association area 7 of the monkey. Brain Res 206:287–303.
Hyvärinen J, Poranen A (1978) Receptive field integration and submodality convergence in the hand area of the post-central gyrus of the alert monkey. J Physiol 283:539–556.
Iannetti G., Porro C., Pantano P, Romanelli P., Galeotti F, Cruccu G (2003) Representation of different trigeminal divisions within the primary and secondary human somatosensory cortex. Neuroimage 19:906–912.
314 | P a g e
Iguchi Y, Hoshi Y, Hashimoto I (2001) Selective spatial attention induces short-term plasticity in human somatosensory cortex. Neuroreport 12:3133–3136.
Iguchi Y, Hoshi Y, Tanosaki M, Taira M, Hashimoto I (2002) Selective attention regulates spatial and intensity information processing in the human primary somatosensory cortex. Neuroreport 13:2335–2339.
Imai T, Kamping S, Breitenstein C, Pantev C, Lütkenhöner B, Knecht S (2003) Learning of tactile frequency discrimination in humans. Hum Brain Mapp 18:260–271.
Inoue K, Nakanishi K, Hadoush H, Kurumadani H, Hashizume A, Sunagawa T, Ochi M (2013) Somatosensory mechanical response and digit somatotopy within cortical areas of the postcentral gyrus in humans: an MEG study. Hum Brain Mapp 34:1559–1567.
Itomi K, Kakigi R, Maeda K, Hoshiyama M (2000) Dermatome versus homunculus; detailed topography of the primary somatosensory cortex following trunk stimulation. Clin Neurophysiol 111:405–412.
Iwamura Y (1998) Hierarchical somatosensory processing. Curr Opin Neurobiol 8:522–528.
Iwamura Y (2000) Bilateral receptive field neurons and callosal connections in the somatosensory cortex. Philos Trans R Soc Lond B Biol Sci 355:267–273.
Iwamura Y, Iriki A, Tanaka M (1994) Bilateral hand representation in the postcentral somatosensory cortex. Nature 369:554–556.
Iwamura Y, Tanaka M (1978) Postcentral neurons in hand region of area 2: their possible role in the form discrimination of tactile objects. Brain Res 150:662–666.
Iwamura Y, Tanaka M, Hikosaka O (1980) Overlapping representation of fingers in the somatosensory cortex (area 2) of the conscious monkey. Brain Res 197:516–520.
Iwamura Y, Tanaka M, Sakamoto M, Hikosaka O (1993) Rostrocaudal gradients in the neuronal receptive field complexity in the finger region of the alert monkey’s postcentral gyrus. Exp Brain Res 92:360–368.
Iwamura Y, Taoka M, Iriki A (2001) Bilateral activity and callosal connections in the somatosensory cortex. Neurosci 7:419–429.
Jacobs K, Donoghue J (1991) Reshaping the cortical motor map by unmasking latent intracortical connections. Science (80- ) 251:944–947.
Jain N (2002) Adult brain plasticity - what is revealed is exciting, what is hidden is critical. J Biosci 27:439–442.
Jain N, Catania KC, Kaas JH (1997) Deactivation and reactivation of somatosensory cortex after dorsal spinal cord injury. Nature 386:495–498.
Jain N, Florence SL, Kaas JH (1995) Limits on plasticity in somatosensory cortex of adult rats: hindlimb cortex is not reactivated after dorsal column section. J Neurophysiol 73:1537–1546.
Jain N, Florence SL, Qi HX, Kaas JH (2000) Growth of new brainstem connections in adult monkeys with massive sensory loss. Proc Natl Acad Sci U S A 97:5546–5550.
Jain N, Qi H, Catania KC, Kaas JH (2001) Anatomic correlates of the face and oral cavity representations in the somatosensory cortical area 3b of monkeys. J Comp Neurol 429:455–468.
Jain N, Qi H-X, Collins CE, Kaas JH (2008) Large-scale reorganization in the somatosensory cortex and thalamus after sensory loss in macaque monkeys. J Neurosci 28:11042–11060.
315 | P a g e
Jamali S, Ross B (2013) Somatotopic finger mapping using MEG: toward an optimal stimulation paradigm. Clin Neurophysiol 124:1659–1670.
Jasmin L, Rabkin SD, Granato A, Boudah A, Ohara PT (2003) Analgesia and hyperalgesia from GABA-mediated modulation of the cerebral cortex. Nature 424:316–320.
Jenkins WM, Merzenich MM (1987) Reorganization of neocortical representations after brain injury: a neurophysiological model of the bases of recovery from stroke. Prog Brain Res 71:249–266.
Jenkins WM, Merzenich MM, Ochs MT, Allard T, Guíc-Robles E (1990) Functional reorganization of primary somatosensory cortex in adult owl monkeys after behaviorally controlled tactile stimulation. J Neurophysiol 63:82–104.
Johansson RS (1978) Tactile sensibility in the human hand: receptive fields charateristics of mechanoreceptive units in the glabrous skin area. J Physiol 281:101–123.
Johansson RS, Trulsson M, Olsson KA, Westberg KG (1988) Mechanoreceptor activity from the human face and oral mucosa. Exp brain Res 72:204–208.
Johansson RS, Vallbo AB (1979) Tactile sensibility in the human hand: relative and absolute densities of four types of mechanoreceptive units in glabrous skin. J Physiol:283–300.
Johnson KO (2001) The roles and functions of cutaneous mechanoreceptors. Curr Opin Neurobiol 11:455–461.
Johnson KO, Hsiao SS (1992) Neural mechanisms of tactual form and texture perception. Annu Rev Neurosci 15:227–250.
Johnson KO, Phillips JR (1981) Tactile spatial resolution. I. Two-point discrimination, gap detection, grating resolution, and letter recognition. J Neurophysiol 46:1177–1192.
Johnson PB, Ferraina S, Bianchi L, Caminiti R (1996) Cortical networks for visual reaching: Physiological and anatomical organization of frontal and parietal lobe arm regions. Cereb Cortex 6:102–119.
Jones EG (1993) GABAergic neurons and their role in cortical plasticity in primates. Cereb Cortex 3:361–372.
Jones EG (2000) Cortical and subcortical contributions to activity-dependent plasticity in primate somatosensory cortex. Annu Rev Neurosci 23:1–37.
Jones EG, Coulter JD, Hendry SHC (1978) lntracortical connectivity of architectonic fields in the somatic sensory , motor and parietal cortex of monkeys. J Comp Neurol 181:291–348.
Jones EG, Friedman DP (1982) Projection pattern of functional components of thalamic ventrobasal complex on monkey somatosensory cortex. J Neurophysiol 48:521–544.
Jones EG, Friedman DP, Hendry SHC (1982) Thalamic basis of place- and modality-specific columns in monkey somatosensory cortex : a correlative anatomical and physiological study. J Neurophysiol 48:545–568.
Jones EG, Pons TP (1998) Thalamic and brainstem contributions to large-scale plasticity of primate somatosensory cortex. Science (80- ) 282:1121–1125.
Jones EG, Powell TPS (1969) Connexions of the somatic sensory cortex of the rhesus monkey. II. Contralateral cortical connexions. Brain 92:717–730.
Jones EG, Powell TPS (1970) Connexions of the somatic sensory cortex of the rhesus monkey. III. Thalamic connexions. Brain 93:37–56.
316 | P a g e
Jung P, Baumgärtner U, Bauermann T, Magerl W, Gawehn J, Stoeter P, Treede R-D (2003) Asymmetry in the human primary somatosensory cortex and handedness. Neuroimage 19:913–923.
Jung P, Baumgärtner U, Magerl W, Treede R-D (2008) Hemispheric asymmetry of hand representation in human primary somatosensory cortex and handedness. Clin Neurophysiol 119:2579–2586.
Jung S-C, Shin H-C (2002) Reversible changes of presumable synaptic connections between primary somatosensory cortex and ventral posterior lateral thalamus of rats during temporary deafferentation. Neurosci Lett 331:111–114.
Kaas AL, van de Ven V, Reithler J, Goebel R, Ven V van de (2013a) Tactile perceptual learning: learning curves and transfer to the contralateral finger. Exp brain Res 224:477–488.
Kaas AL, van Mier H, Visser M, Goebel R (2013b) The neural substrate for working memory of tactile surface texture. Hum Brain Mapp 34:1148–1162.
Kaas JH (1999) Commentary: Is most of neural plasticity in the thalamus cortical ? PNAS 96:7622–7623.
Kaas JH (2005) The future of mapping sensory cortex in primates: three of many remaining issues. Philos Trans R Soc Lond B Biol Sci 360:653–664.
Kaas JH, Florence SL, Jain N (1999) Subcortical contributions to massive cortical reorganizations. Neuron 22:657–660.
Kaas JH, Nelson RJ, Sur M, Dykes RW, Merzenich MM (1984) The somatotopic organization of the ventroposterior thalamus of the squirrel monkey, Saimiri sciureus. J Comp Neurol 226:111–140.
Kaas JH, Nelson RJ, Sur M, Lin CS, Merzenichb MM (1979) Multiple representations of the body within the primary somatosensory cortex of primates. Science (80- ) 204:1977–1979.
Kaas JH, Pons TP (1988) The somatosensory system of primates. In: Steklis HD, Erwin J, editors. Neurosciences. New York: Alan R. Liss, pp 421–468.
Kaas JH, Qi H-X, Burish MJ, Gharbawie O a, Onifer SM, Massey JM, Massey M (2008) Cortical and subcortical plasticity in the brains of humans, primates, and rats after damage to sensory afferents in the dorsal columns of the spinal cord. Exp Neurol 209:407–416.
Kakigi R, Hoshiyama M, Shimojo M, Naka D, Itomi K, Nakamura A, Yamasaki H, Watanabe S, Xiang J, Maeda K, Lam K (2000) The somatosensory evoked magnetic fields. Prog Neurobiol 61:495–523.
Kakigi R, Koyama S, Hoshiyama M, Kitamura Y, Shimojo M, Watanabe S, Nakamura A (1996) Effects of tactile interference stimulation on somatosensory evoked magnetic fields. Neuroreport 7:405–408.
Kalisch T, Kattenstroth J, Kowalewski R, Tegenthoff M, R H, Dinse HR (2012a) Cognitive and tactile factors affecting human haptic performance in later life. PLoS One 7:e30420.
Kalisch T, Kattenstroth J-C, Kowalewski R, Tegenthoff M, Dinse HR (2012b) Age-related changes in the joint position sense of the human hand. Clin Interv Aging 7:499–507.
Kalisch T, Ragert P, Schwenkreis P, Dinse HR, Tegenthoff M (2009) Impaired tactile acuity in old age is accompanied by enlarged hand representations in somatosensory cortex. Cereb Cortex 19:1530–1538.
Kalisch T, Tegenthoff M, Dinse HR (2007) Differential effects of synchronous and asynchronous multifinger coactivation on human tactile performance. BMC Neurosci 8:58.
317 | P a g e
Kalisch T, Tegenthoff M, Dinse HR (2008) Improvement of sensorimotor functions in old age by passive sensory stimulation. Clin Interv Aging 3:673–690.
Kalisch T, Tegenthoff M, Dinse HR (2010) Repetitive electric stimulation elicits enduring improvement of sensorimotor performance in seniors. Neural Plast 2010:690531.
Kang R, Herman D, MacGillis M, Zarzecki P (1985) Convergence of sensory inputs in somatosensory cortex: interactions from separate afferent sources. Exp brain Res 57:271–278.
Kannurpatti SS, Biswal BB (2004) Negative functional response to sensory stimulation and its origins. J Cereb blood flow Metab 24:703–712.
Karl A, Birbaumer N, Lutzenberger W, Cohen LG, Flor H (2001) Reorganization of motor and somatosensory cortex in upper extremity amputees with phantom limb pain. J Neurosci 21:3609–3618.
Kastrup A, Baudewig J, Schnaudigel S, Huonker R, Becker L, Sohns JM, Dechent P, Klingner C, Witte OW (2008) Behavioral correlates of negative BOLD signal changes in the primary somatosensory cortex. Neuroimage 41:1364–1371.
Kattenstroth J-C, Kalisch T, Peters S, Tegenthoff M, Dinse HR (2012) Long-term sensory stimulation therapy improves hand function and restores cortical responsiveness in patients with chronic cerebral lesions. Three single case studies. Front Hum Neurosci 6:244.
Katz DB, Simon SA, Moody A, Nicolelis MAL (1999) Simultaneous reorganization in thalamocortical ensembles evolves over several hours after perioral capsaicin injections. J Neurophysiol 82:963–977.
Katz J (1992) Psychophysical correlates of phantom limb experience. J Neurol Neurosurg Psychiatry 55:811–821.
Kell CA, von Kriegstein K, Rösler A, Kleinschmidt A, Laufs H (2005) The sensory cortical representation of the human penis: revisiting somatotopy in the male homunculus. J Neurosci 25:5984–5987.
Kelso SR, Ganong a H, Brown TH (1986) Hebbian synapses in hippocampus. PNAS 83:5326–5330.
Kennerley AJ, Mayhew JE, Boorman L, Zheng Y, Berwick J (2012) Is optical imaging spectroscopy a viable measurement technique for the investigation of the negative BOLD phenomenon? A concurrent optical imaging spectroscopy and fMRI study at high field (7 T). Neuroimage 61:10–20.
Kenshalo DR, Giesler GJ, Leonard RB, Willis WD (1980) Responses of neurons in primate ventral posterior lateral nucleus to noxious stimuli. J Neurophysiol 43:1594–1614.
Kew JJ, Halligan PW, Marshall JC, Passingham RE, Rothwell JC, Ridding MC, Marsden CD, Brooks DJ (1997) Abnormal access of axial vibrotactile input to deafferented somatosensory cortex in human upper limb amputees. J Neurophysiol 77:2753–2764.
Killackey HP, Gould HJ, Cusick CG, Pons TP, Kaas JH (1983) The relation of corpus callosum connections to architectonic fields and body surface maps in sensorimotor cortex of new and old world monkeys. J Comp Neurol 219:384–419.
Kim S-G, Ogawa S (2012) Biophysical and physiological origins of blood oxygenation level-dependent fMRI signals. J Cereb Blood Flow Metab 32:1188–1206.
Kimura J (2013) Electrodiagnosis in diseases of nerve and muscle: principles and practice, Oxford Uni.
Kis Z, Farkas T, Rábl K, Kis E, Kóródi K, Simon L, Marusin I, Rojik I, Toldi J (1999) Comparative study of the neuronal plasticity along the neuraxis of the vibrissal sensory system of adult rat
318 | P a g e
following unilateral infraorbital nerve damage and subsequent regeneration. Exp brain Res 126:259–269.
Klingner CM, Hasler C, Brodoehl S, Witte OW (2010) Dependence of the negative BOLD response on somatosensory stimulus intensity. Neuroimage 53:189–195.
Klingner CM, Hasler C, Brodoehl S, Witte OW (2014) Excitatory and inhibitory mechanisms underlying somatosensory habituation. Hum Brain Mapp 35:152–160.
Klingner CM, Huonker R, Flemming S, Hasler C, Brodoehl S, Preul C, Burmeister H, Kastrup A, Witte OW (2011) Functional deactivations: multiple ipsilateral brain areas engaged in the processing of somatosensory information. Hum Brain Mapp 32:127–140.
Knecht S, Henningsen H, Elbert T, Flor H, Höhling C, Pantev C, Taub E, Hohling C (1996a) Reorganizational and perceptional changes after amputation. Brain 119:1213–1219.
Knecht S, Henningsen H, Höhling C, Elbert T, Flor H, Pantev C, Taub E (1998) Plasticity of plasticity? Changes in the pattern of perceptual correlates of reorganization after amputation. Brain 121:717–724.
Knecht S, Kunesch E, Schnitzler A (1996b) Parallel and serial processing of haptic information in man: Effects of parietal lesions on sensorimotor hand function. Neuropsychologia 34:669–687.
Knibestol M (1973) Stimulus-response functions of rapidly adapting mechanoreceptors in the human glabrous skin area. J Physiol 245:427–452.
Knibestöl M, Vallbo ÅB (1970) Single unit analysis of mechanoreceptor activity from the human glabrous skin. Acta Physiol Scand 80:178–195.
Kopietz R, Sakar V, Albrecht J, Kleemann AM, Schöpf V, Yousry I, Linn J, Fesl G, Wiesmann M (2009) Activation of primary and secondary somatosensory regions following tactile stimulation of the face. Clin Neuroradiol 19:135–144.
Korvenoja A (2007) Comparison and integration of MEG and fMRI in the study of somatosensory and motor systems.
Kowalewski R, Kattenstroth J, Kalisch T, Dinse HR (2012) Improved acuity and dexterity but unchanged touch and pain thresholds following repetitive sensory stimulation of the fingers. Neural Plast 2012.
Krause T, Kurth R, Ruben J, Schwiemann J, Villringer K, Deuchert M, Moosmann M, Brandt S, Wolf K-J, Curio G, Villringer A (2001) Representational overlap of adjacent fingers in multiple areas of human primary somatosensory cortex depends on electrical stimulus intensity: an fMRI study. Brain Res 899:36–46.
Krubitzer L a, Kaas JH (1987) Thalamic connections of three representations of the body surface in somatosensory cortex of gray squirrels. J Comp Neurol 265:549–580.
Krubitzer L a, Kaas JH (1992) The somatosensory thalamus of monkeys: cortical connections and a redefinition of nuclei in marmosets. J Comp Neurol 319:123–140.
Krubitzer L a, Sesma M a, Kaas JH (1986) Microelectrode maps, myeloarchitecture, and cortical connections of three somatotopically organized representations of the body surface in the parietal cortex of squirrels. J Comp Neurol 250:403–430.
Krubitzer L, Clarey J, Tweedale R, Elston G, Calford M (1995) A redefinition of somatosensory areas in the lateral sulcus of macaque monkeys. 15:3821–3839.
319 | P a g e
Kurth R, Villringer K, Curio G, Wolf K-J, Krause T, Repenthin J, Schwiemann J, Deuchert M, Villringer A (2000) fMRI shows multiple somatotopic digit representations in human primary somatosensory cortex. Neuroreport 11:1487–1491.
Lacour JP, Dubois D, Pisani A, Ortonne JP (1991) Anatomical mapping of Merkel cells in normal human adult epidermis. Br J Dermatol 125:535–542.
Ladda AM, Pfannmoeller JP, Kalisch T, Roschka S, Platz T, Dinse HR, Lotze M (2014) Effects of combining 2 weeks of passive sensory stimulation with active hand motor training in healthy adults. PLoS One 9:e84402.
Lane RD, Bennett-clarke CA, Chiaia NL, Killackeyt HP, Rhoades RW (1995) Lesion-induced reorganization in the brainstem is not completely expressed in somatosensory cortex. PNAS 92:4264–4268.
Langlet C, Canu MH, Falempin M (1999) Short-term reorganization of the rat somatosensory cortex following hypodynamia-hypokinesia. Neurosci Lett 266:145–148.
Leinonen L, Hyvärinen J, Nyman G, Linnankoski I (1979) I. Functional properties of neurons in lateral part of associative area 7 in awake monkeys. Exp Brain Res 34:321–333.
Lenz FA, Garonzik IM, Zirh TA, Dougherty PM (1998) Neuronal activity in the region of the thalamic principal sensory nucleus (ventralis caudalis) in patients with pain following amputations. Neuroscience 86:1065–1081.
Li CX, Callaway JC, Waters RS (2002) Removal of GABAergic inhibition alters subthreshold input in neurons in forepaw barrel subfield (FBS) in rat first somatosensory cortex (SI) after digit stimulation. Exp Brain Res 145:411–428.
Liao C-C, Qi H-X, Reed JL, Miller DJ, Kaas JH (2014) Congenital foot deformation alters the topographic organization in the primate somatosensory system. Brain Struct Funct Oct:1–24.
Liepert J, Oreja-Guevara C, Cohen LG, Tegenthoff M, Hallett M, Malin J-P (1999) Plasticity of cortical hand muscle representation in patients with hemifacial spasm. Neurosci Lett 272:33–36.
Liepert J, Tegenthoff M, Malin JP (1995) Changes of cortical motor area size during immobilization. Electroencephalogr Clin Neurophysiol 97:382–386.
Lin C-CK, Sun Y, Huang C-I, Yu C-Y, Ju M-S (2010) Cortical activation by tactile stimulation to face and anterior neck areas: an fMRI study with three analytic methods. Hum Brain Mapp 31:1876–1885.
Lin CS, Merzenich MM, Sur M, Kaas JH (1979) Connections of areas 3b and 1 of the parietal somatosensory strip with the ventroposterior nucleus in the owl monkey (Aotus trivirgatus). J Comp Neurol 185:355–372.
Lin L-D, Murray GM, Sessle BJ (1994) Functional properties of single neurons in the primate face primary somatosensory cortex. I. Relations with trained orofacial motor behaviors. J Neurosci 71:2377–2390.
Lipton ML, Fu K-MG, Branch C a, Schroeder CE (2006) Ipsilateral hand input to area 3b revealed by converging hemodynamic and electrophysiological analyses in macaque monkeys. J Neurosci 26:180–185.
Lipton ML, Liszewski MC, O’Connell MN, Mills A, Smiley JF, Branch C a, Isler JR, Schroeder CE (2010) Interactions within the hand representation in primary somatosensory cortex of primates. J Neurosci 30:15895–15903.
320 | P a g e
Liu LC, Gaetz WC, Bosnyak DJ, Roberts LE (2000) Evidence for fusion and segregation induced by 21 Hz multiple-digit stimulation in humans. Neuroreport 11:2313–2318.
Lockwood PL, Iannetti GD, Haggard P (2013) Transcranial magnetic stimulation over human secondary somatosensory cortex disrupts perception of pain intensity. Cortex 49:2201–2209.
Lofvenberg J, Johansson RS (1984) Regional differences and interindividual variability in sensitivity to vibration in the glabrous skin of the human hand. Brain Res 301:65–72.
Logothetis NK, Pauls J, Augath M, Trinath T, Oeltermann A (2001) Neurophysiological investigation of the basis of the fMRI signal. Nature 412:150–157.
Löken LS, Wessberg J, Morrison I, McGlone F, Olausson H (2009) Coding of pleasant touch by unmyelinated afferents in humans. Nat Neurosci 12:547–548.
Longo MR, Azañón E, Haggard P, Aza E (2010) More than skin deep: body representation beyond primary somatosensory cortex. Neuropsychologia 48:655–668.
Lorente de No R (1938) Architectonics and structure of the cerebral cortex. Physiol Nerv Syst:291–330.
Lotze M, Grodd W, Birbaumer N, Erb M, Huse E, Flor H (1999) Does use of a myoelectric prosthesis prevent cortical reorganization and phantom limb pain? Nat Neurosci 2:501–502.
Lu L, Gainey MA, Goldbeck JE, Feldman DE (2014) Rapid homeostasis by disinhibition during whisker map plasticity. Proc Natl Acad Sci U S A 111:1616–1621.
Lundborg G, Rosén B (2004) The two-point discrimination test - Time for a re-appraisal ? J Hand Surg Am 29B:418–422.
Macaluso E, Maravita A (2010) The representation of space near the body through touch and vision. Neuropsychologia 48:782–795.
Mackel R, Brink EE, Wittkowsky G (1985) Properties of cutaneous mechanosensitive afferents during the early stages of regeneration in man. Brain Res 329:49–69.
Maeda K, Kakigi R, Hoshiyama M, Koyama S (1999) Topography of the secondary somatosensory cortex in humans : a magnetoencephalographic study. Neuroreport 10:301–306.
Makin TR, Cramer AO, Scholz J, Hahamy A, Henderson Slater D, Tracey I, Johansen-Berg H (2013a) Deprivation-related and use-dependent plasticity go hand in hand. Elife 2:1–15.
Makin TR, Scholz J, Filippini N, Henderson Slater D, Tracey I, Johansen-Berg H (2013b) Phantom pain is associated with preserved structure and function in the former hand area. Nat Commun 4:1–8.
Maksimovic S, Nakatani M, Baba Y, Nelson AM, Marshall KL, Wellnitz SA, Firozi P, Woo S-H, Ranade S, Patapoutian A, Lumpkin EA (2014) Epidermal Merkel cells are mechanosensory cells that tune mammalian touch receptors. Nature 509:617–621.
Maldjian JA, Gottschalk A, Patel RS, Detre JA, Alsop DC (1999) The sensory somatotopic map of the human hand demonstrated at 4 Tesla. Neuroimage 10:55–62.
Malinen S, Renvall V, Hari R (2014) Functional parcellation of the human primary somatosensory cortex to natural touch. Eur J Neurosci 39:738–743.
Malinen S, Schürmann M, Hlushchuk Y, Forss N, Hari R (2006) Improved differentiation of tactile activations in human secondary somatosensory cortex and thalamus using cardiac-triggered fMRI. Exp brain Res 174:297–303.
321 | P a g e
Manger PR, Woods TM, Jones EG (1995) Representation of the face and intraoral structures in area 3b of the squirrel monkey (Saimiri sciureus) somatosensory cortex, with special reference to the ipsilateral representation. J Comp Neurol 362:597–607.
Manger PR, Woods TM, Jones EG (1996) Representation of face and intra-oral structures in area 3b of macaque monkey somatosensory cortex. J Comp Neurol 371:513–521.
Manger PR, Woods TM, Muñoz A, Jones EG (1997) Hand/face border as a limiting boundary in the body representation in monkey somatosensory cortex. J Neurosci 17:6338–6351.
Manzoni T, Barbaresi P, Bellardinelli E, Caminiti R (1980) Callosal projections from the two body midlines. Exp brain Res 39:1–9.
Manzoni T, Barbaresi P, Conti F (1984) Callosal mechanism for the interhemispheric transfer of hand somatosensory information in the monkey. Behav Brain Res 11:155–170.
Marasco PD, Kuiken TA (2010) Amputation with median nerve redirection (targeted reinnervation) reactivates forepaw barrel subfield in rats. J Neurosci 30:16008–16014.
Marfurt CF, Rajchert DM (1991) Trigeminal primary afferent projections to “non-trigeminal” areas of the rat central nervous system. J Comp Neurol 303:489–511.
Margolis DJ, Lütcke H, Helmchen F (2014) Microcircuit dynamics of map plasticity in barrel cortex. Curr Opin Neurobiol 24:76–81.
Marik SA, Hickmott PW (2009) Plasticity of horizontal connections at a functional border in adult rat somatosensory cortex. Neural Plast 2009:294192.
Markram H, Lübke J, Frotscher M, Sakmann B (1997) Regulation of synaptic efficacy by coincidence of postsynaptic APs and EPSPs. Science (80- ) 275:213–215.
Martinez M, Delcour M, Russier M, Zennou-Azogui Y, Xerri C, Coq J-O, Brezun J-M (2010) Differential tactile and motor recovery and cortical map alteration after C4-C5 spinal hemisection. Exp Neurol 221:186–197.
Martuzzi R, van der Zwaag W, Farthouat J, Gruetter R, Blanke O (2014) Human finger somatotopy in areas 3b, 1, and 2: A 7T fMRI study using a natural stimulus. Hum Brain Mapp 35:213–226.
Matthews PB (1988) Proprioceptors and their contribution to somatosensory mapping: complex messages require complex processing. Can J Physiol Pharmacol 66:430–438.
Mauguière F, Merlet I, Forss N, Vanni S, Jousmäki V, Adeleine P, Hari R (1997) Activation of a distributed somatosensory cortical network in the human brain. A dipole modelling study of magnetic fields evoked by median nerve stimulation. Part I: Location and activation timing of SEF sources. Electroencephalogr Clin Neurophysiol 104:281–289.
Maunsell JHR, van Essen DC (1983) The connections of the middle temporal visual area (MT) and their relationship to a cortical hierarchy in the macaque monkey. J Neurosci 3:2563–2586.
McGlone F, Kelly EF, Trulsson M, Francis ST, Westling G, Bowtell R (2002) Functional neuroimaging studies of human somatosensory cortex. Behav Brain Res 135:147–158.
McGlone F, Reilly D (2010) The cutaneous sensory system. Neurosci Biobehav Rev 34:148–159.
McNeil D (1992) Hand and mind (Press TU of C, ed). Chicago and London.
Mertens M, Lütkenhöner B, Lu B (2000) Efficient neuromagnetic determination of landmarks in the somatosensory cortex. Clin Neurophysiol 111:1478–1487.
322 | P a g e
Merzenich MM, Jenkins WM (1993) Reorganization of cortical representations of the hand following alterations of skin inputs induced by nerve injury, skin island transfers, and experience. J Hand Ther 6:89–104.
Merzenich MM, Kaas JH, Sur M, Lin CS (1978) Double representation of the body surface within cytoarchitectonic areas 3b and 1 in “ SI ” in the Owl monkey (Aotus trivirgatus). J Comp Neurol 181:41–74.
Merzenich MM, Kaas JH, Wall J, Nelson RJ, Sur M, Felleman D (1983a) Topographic reorganization of somatosensory cortical areas 3b and 1 in adult monkeys following restricted deafferentation. Neuroscience 8:33–55.
Merzenich MM, Kaas JH, Wall JT, Sur M, Nelson RJ, Felleman DJ, Francisco S (1983b) Progression of change following median nerve section in the cortical representation of the hand in areas 3b and 1 in adult owl and squirrel monkeys. Neuroscience 10:639–665.
Merzenich MM, Nelson RJ, Kaas JH, Stryker MP, Jenkins WM, Zook JM, Cynader MS, Schoppmann A (1987) Variability in hand surface representations in areas 3b and 1 in adult owl and squirrel monkeys. J Comp Neurol 258:281–296.
Merzenich MM, Nelson RJ, Stryker MP, Cynader MS, Schoppmann A, Zook JM (1984) Somatosensory cortical map changes following digit amputation in adult monkeys. J Comp Neurol 224:591–605.
Meunier S, Garnero L, Ducorps A, Mazières L, Lehéricy S, Tézenas du Montcel S, Renault B, Vidailhet M (2001) Human brain mapping in dystonia reveals both endophenotypic traits and adaptive reorganization. Ann Neurol 50:521–527.
Mima T, Nagamine T, Nakamura K, Shibasaki H (1998) Attention modulates both primary and second somatosensory cortical activities in humans : a magnetoencephalographic study. J Neurophysiol 80:2215–2221.
Miyamoto JJ, Honda M, Saito DN, Okada T, Ono T, Ohyama K, Sadato N (2006) The representation of the human oral area in the somatosensory cortex: a functional MRI study. Cereb cortex 16:669–675.
Mogilner A, Grossman JA, Ribary U, Joliot M, Volkmann J, Rapaport D, Beasley RW, Llinás RR (1993) Somatosensory cortical plasticity in adult humans revealed by magnetoencephalography. PNAS 90:3593–3597.
Mogilner A, Nomura M, Ribary U, Jagow R, Lado F, Rusinek H, Llinás R (1994) Neuromagnetic studies of the lip area of primary somatosensory cortex in humans: evidence for an oscillotopic organization. Exp brain Res 99:137–147.
Molander C, Grant G (1986) Laminar distribution and somatotopic organization of primary afferent fibers from hindlimb nerves in the dorsal horn. A study by transganglionic transport of horseradish peroxidase in the rat. Neuroscience 19:297–312.
Montagu A (1978) Touching - The Human Significance of the Skin, Second edi. Harper & Row, publishers.
Montoya P, Ritter K, Huse E, Larbig W, Braun C, To S, Lutzenberger W, Grodd W, Flor H, Birbaumer N, Töpfner S (1998) The cortical somatotopic map and phantom phenomena in subjects with congenital limb atrophy and traumatic amputees with phantom limb pain. Eur J Neurosci 10:1095–1102.
Moore CE., Schady W (2000) Investigation of the functional correlates of reorganization within the human somatosensory cortex. Brain 123:1883–1895.
323 | P a g e
Moore CI, Cao R (2008) The hemo-neural hypothesis : on the role of blood flow in information processing. J Neurophysiol 99:2035–2047.
Moore CI, Crosier E, Greve DN, Savoy R, Merzenich MM, Dale AM (2013) Neocortical correlates of vibrotactile detection in humans. J Cogn Neurosci 25:49–61.
Moore CI, Stern CE, Dunbar C, Kostyk SK, Gehi A, Corkin S (2000) Referred phantom sensations and cortical reorganization after spinal cord injury in humans. Proc Natl Acad Sci USA 97:14703-8.
Moulton EA, Pendse G, Morris S, Aiello-Lammens M, Becerra L, Borsook D (2009) Segmentally arranged somatotopy within the face representation of human primary somatosensory cortex. Hum Brain Mapp 30:757–765.
Mountcastle V (1997) The columnar organization of the neocortex. Brain 120:701–722.
Mountcastle VB, Lynch JC, Georgopoulos A, Sakata H, Acuna C (1975) Posterior parietal association cortex of the monkey: command functions for operations within extrapersonal space. J Neurophysiol 38:871–908.
Mullinger KJ, Mayhew SD, Bagshaw a P, Bowtell R, Francis ST (2014) Evidence that the negative BOLD response is neuronal in origin: a simultaneous EEG-BOLD-CBF study in humans. Neuroimage 94:263–274.
Muret D, Dinse HR, Macchione S, Urquizar C, Farnè A, Reilly KT (2014) Touch improvement at the hand transfers to the face. Curr Biol 24:R736–R737.
Muret D, Martuzzi R, Dinse HR, Reilly KT, Blanke O, Farnè A (n.d.) Cortical correlates of perceptual changes transferring from the finger to the lips in human SI revealed by 7T fMRI.
Myers MI, Peltier AC, Li J (2013) Evaluating dermal myelinated nerve fibers in skin biopsy. Muscle Nerve 47:1–11.
Nagamatsu K, Nakasato N, Hatanaka K, Kanno A, Iwasaki M, Yoshimoto T, Nakasato CAN (2000) Neuromagnetic localization of N15, the initial cortical response to lip stimulus. Neuroreport 12:1–5.
Nakamura A, Yamada T, Goto A, Kato T, Ito K, Abe Y, Kachi T, Kakigi R (1998) Somatosensory homunculus as drawn by MEG. Neuroimage 7:377–386.
Nakashita S, Saito DN, Kochiyama T, Honda M, Tanabe HC, Sadato N (2008) Tactile-visual integration in the posterior parietal cortex: a functional magnetic resonance imaging study. Brain Res Bull 75:513–525.
Nakatani M, Maksimovic S, Baba Y, Lumpkin E a (2014) Mechanotransduction in epidermal Merkel cells. Pflugers Arch.
Nardone R, Höller Y, Brigo F, Seidl M, Christova M, Bergmann J, Golaszewski S, Trinka E (2013) Functional brain reorganization after spinal cord injury: systematic review of animal and human studies. Brain Res 1504:58–73.
Nash PG, MacEfield VG, Klineberg IJ, Gustin SM, Murray GM, Henderson L a. (2010) Bilateral activation of the trigeminothalamic tract by acute orofacial cutaneous and muscle pain in humans. Pain 151:384–393.
Navarro X (2009) Neural plasticity after nerve injury and regeneration. Int Rev Neurobiol 87:483–505.
Neal JW, Pearson RC a, Powell TPS (1987) The cortico-cortical connections of area-7b, PF, in the parietal lobe of the monkey. Brain Res 419:341–346.
324 | P a g e
Neal JW, Pearson RCA, Powell TPS (1986) The organization of the corticocortical projection of area 5 upon area 7 in the parietal lobe of the monkey. Brain Res 381:164–167.
Négyessy L, Pálfi E, Ashaber M, Palmer C, Jákli B, Friedman RM, Chen LM, Roe AW (2013) Intrinsic horizontal connections process global tactile features in the primary somatosensory cortex: neuroanatomical evidence. J Comp Neurol 521:2798–2817.
Nelson AJ, Chen R (2008) Digit somatotopy within cortical areas of the postcentral gyrus in humans. Cereb cortex 18:2341–2351.
Nelson RJ, Kaas JH (1981) Connections of the ventroposterior nucleus of the thalamus with the body surface representations in cortical areas 3b and 1 of the cynomolgus macaque , (Maca ca fascicularis). J Comp Neurol 199:29–64.
Nelson RJ, Sur M, Felleman DJ, Kaas JH (1980) Representations of the body surface in postcentral parietal cortex of Macaca fascicularis. J Comp Neurol 192:611–643.
Nevalainen P, Ramstad R, Isotalo E, Haapanen M-L, Lauronen L (2006) Trigeminal somatosensory evoked magnetic fields to tactile stimulation. Clin Neurophysiol 117:2007–2015.
Nguyen BT, Inui K, Hoshiyama M, Nakata H, Kakigi R (2005) Face representation in the human secondary somatosensory cortex. Clin Neurophysiol 116:1247–1253.
Nguyen BT, Tran TD, Hoshiyama M, Inui K, Kakigi R (2004) Face representation in the human primary somatosensory cortex. Neurosci Res 50:227–232.
Nicolelis M a. ., Ghazanfar A a, Faggin BM, Votaw S, Oliveira LM. (1997) Reconstructing the engram: simultaneous, multisite, many single neuron recordings. Neuron 18:529–537.
Nicolelis MAL, Chapin JK (1994) Spatiotemporal structure ensembles of the thalamus of somatosensory in the rat ventral responses of posterior medial nucleus. J Neurosci 14:3511–3532.
Nicolelis MAL, Lin RCS, Woodward DJ, Chapin JK (1993) Induction of immediate spatiotemporal changes in thalamic networks by peripheral block of ascending cutaneous information. Nature 361:533–536.
Nicoll RA, Malenka RC (1995) Contrasting properties of two forms of long-term potentiation in the hippocampus. Nature 377:115–118.
Nihashi T, Naganawa S, Sato C, Kawai H, Nakamura T, Fukatsu H, Ishigaki T, Aoki I (2005) Contralateral and ipsilateral responses in primary somatosensory cortex following electrical median nerve stimulation--an fMRI study. Clin Neurophysiol 116:842–848.
Niu J, Ding L, Li JJ, Kim H, Liu J, Li H, Moberly A, Badea TC, Duncan ID, Son Y-J, Scherer SS, Luo W (2013) Modality-based organization of ascending somatosensory axons in the direct dorsal column pathway. J Neurosci 33:17691–17709.
Nolano M, Provitera V, Caporaso G, Stancanelli A, Leandri M, Biasiotta A, Cruccu G, Santoro L, Truini A (2013) Cutaneous innervation of the human face as assessed by skin biopsy. J Anat 222:161–169.
Nolano M, Provitera V, Crisci C, Stancanelli A, Wendelschafer-Crabb G, Kennedy WR, Santoro L (2003) Quantification of myelinated endings and mechanoreceptors in human digital skin. Ann Neurol 54:197–205.
Noppeney U, Waberski TD, Gobbelé R, Buchner H (1999) Spatial attention modulates the cortical somatosensory representation of the digits in humans. Neuroreport 10:3137–3141.
Nordin M (1990) Low-threshold mechanoreceptive and nociceptive units with unmyelinated (C) fibres in the human supraorbital nerve. J Physiol 426:229–240.
325 | P a g e
Norman JF, Bartholomew AN (2011) Blindness enhances tactile acuity and haptic 3-D shape discrimination. Attention, Perception, Psychophys 73:2323–2331.
Nyberg G, Blomqvist A (1985) The somatotopic organization of forelimb cutaneous nerves in the brachial dorsal horn: an anatomical study in the cat. J Comp Neurol 242:28–39.
Ogawa S, Lee TM, Kay AR, Tank DW (1990) Brain magnetic resonance imaging with contrast dependent on blood oxygenation. PNAS 87:9868–9872.
Ohye C, Shibazaki T, Hirato M, Kawashima Y, Matsumura M (1990) Strategy of selective VIM thalamotomy guided by microrecording. Stereotact Funct Neurosurg 54:186–191.
Ojemann JG, Silbergeld DL (1995) Cortical stimulation mapping of phantom limb rolandic cortex. J Neurosurg 82:641–644.
Okada Y (1983) Neurogenesis of evoked magnetic fields. Biomagn an interdiscipninary approach.
Olausson H, Lamarre Y, Backlund H, Morin C, Wallin BG, Starck G, Ekholm S, Strigo I, Worsley K, Vallbo ÅB, Bushnell MC (2002) Unmyelinated tactile afferents signal touch and project to insular cortex. Nat Neurosci 5:900–904.
Oldfield RC (1971) The assessment and analysis of handedness: the Edinburgh inventory. Neuropsychologia 9:97–113.
Onishi H, Oyama M, Soma T, Kubo M, Kirimoto H, Murakami H, Kameyama S (2010) Neuromagnetic activation of primary and secondary somatosensory cortex following tactile-on and tactile-off stimulation. Clin Neurophysiol 121:588–593.
Otsuru N, Inui K, Yamashiro K, Urakawa T, Keceli S, Kakigi R (2011) Effects of prior sustained tactile stimulation on the somatosensory response to the sudden change of intensity in humans: an magnetoencephalography study. Neuroscience 182:115–124.
Overduin S a, Servos P (2004) Distributed digit somatotopy in primary somatosensory cortex. Neuroimage 23:462–472.
Padberg J, Cerkevich C, Engle J, Rajan AT, Recanzone G, Kaas J, Krubitzer L (2009) Thalamocortical connections of parietal somatosensory cortical fields in macaque monkeys are highly divergent and convergent. Cereb cortex 19:2038–2064.
Padberg J, Franca JG, Cooke DF, Soares JGM, Rosa MGP, Fiorani M, Gattass R, Krubitzer L (2007) Parallel evolution of cortical areas involved in skilled hand use. J Neurosci 27:10106–10115.
Padberg J, Krubitzer L (2006) Thalamocortical connections of anterior and posterior parietal cortical areas in New World Titi monkeys. J Comp Neurol 497:416–435.
Pandya DN, Kuypers HGJM (1969) Cortico-cortical connections in the rhesus monkey. Brain Res 13:13–36.
Pandya DN, Seltzer B (1982) Intrinsic connections and architectonics of posterior parietal cortex in the rhesus monkey. J Comp Neurol 204:196–210.
Panetsos F, Nunez A, Avendano C (1995) Local anaesthesia induces immediate receptive fields changes in nucleus gracilis and cortex. Neuroreport 7:150–152.
Paré M, Smith AM, Rice FL (2002) Distribution and Terminal Arborizations of Cutaneous Mechanoreceptors in the Glabrous Finger Pads of the Monkey. J Comp Neurol 445:347–359.
326 | P a g e
Parianen Lesemann FH, Reuter E-M, Godde B (2015) Tactile stimulation interventions: Influence of stimulation parameters on sensorimotor behavior and neurophysiological correlates in healthy and clinical samples. Neurosci Biobehav Rev 51:126–137.
Pascual-Leone A, Peris M, Tormos JM, Pascual Pascual-Leone A, Catala MD (1996) Reorganization of human cortical motor output maps following traumatic forearm amputation. Neuroreport.
Pascual-Leone A, Torres F (1993) Plasticity of the sensorimotor cortex representation of the reading finger in Braille readers. Brain 116:39–52.
Passow S, Specht K, Adamsen TC, Biermann M, Brekke N, Craven AR, Ersland L, Grüner R, Kleven-Madsen N, Kvernenes O-H, Schwarzlmüller T, Olesen RA, Hugdahl K (2015) Default-mode network functional connectivity is closely related to metabolic activity. Hum Brain Mapp.
Paul RL, Merzenich M, Goodman H (1972) Representation of slowly and rapidly adapting cutaneous mechanoreceptors of the hand in Brodmann’s areas 3 and 1 of Macaca Mulatta. Brain Res 36:229–249.
Pauling L, Coryell CD (1936) The magnetic properties and structure of hemoglobin, oxyhemoglobin and carbonmonoxyhemoglobin. PNAS 22:210–216.
Paullus JR, Hickmott PW (2011) Diverse excitatory and inhibitory synaptic plasticity outcomes in complex horizontal circuits near a functional border of adult neocortex. Brain Res 1416:10–25.
Pei Y, Denchev P V, Hsiao SS, Craig JC, Bensmaia SJ (2009) Convergence of submodality-specific input onto neurons in primary somatosensory cortex. J Neurosci 102:1843–1853.
Penfield W, Boldrey E (1937) Somatic motor and sensory representation in the cerebral cortex of man as studied by electrical stimulation. Brain 60:389–443.
Penfield W, Jasper H (1954) Epilepsy and the functional anatomy of the human brain. London J A Churchill 159:105–106.
Penfield W, Rasmussen T (1950) The cerebral cortex of man: a clinical study of localization of function. New York Macmillan Compagny.
Petersen CCH (2007) The functional organization of the barrel cortex. Neuron 56:339–355.
Petoe MA, Jaque FAM, Byblow WD, Stinear CM (2013) Cutaneous anesthesia of the forearm enhances sensorimotor function of the hand. J Neurophysiol 109:1091–1096.
Pettit MJ, Schwark HD (1976) Receptive field reorganization in dorsal column nuclei during temporary denervation. Science 262(5142):2054–6.
Peyron R, Garcia-Larrea L, Grégoire M-C, Costes M, Convers P, Lavenne F, Mauguière F, Michel D, Laurent B (1999) Haemodynamic brain responses to acute pain in humans. Sensory and attentional networks. Brain 122:1765–1779.
Phillips CG, Powell TPS, Wiesendanger M (1971) Projection from low-threshold muscle afferents of hand and forearm to area 3a of baboon’s cortex. J Physiol 217:419–46.
Phillips JR, Johnson KO (1981) Tactile spatial resolution . II . Neural representation of bars, edges, and gratings in monkey primary afferents. J Neurophysiol 46:1192–203.
Phoka E, Wildie M, Schultz SR, Barahona M (2012) Sensory experience modifies spontaneous state dynamics in a large-scale barrel cortical model. J Comput Neurosci 33:323–39.
Pihko E, Lauronen L (2004) Somatosensory processing in healthy newborns. Exp Neurol 190:S2–S7.
327 | P a g e
Pilz K, Veit R, Braun C, Godde B (2004) Effects of co-activation on cortical organization and discrimination performance. Neuroreport 15:2669–2672.
Pleger B, Dinse HR, Ragert P, Schwenkreis P, Malin JP, Tegenthoff M (2001) Shifts in cortical representations predict human discrimination improvement. Proc Natl Acad Sci USA 98:12255–60.
Pleger B, Foerster A-F, Ragert P, Dinse HR, Schwenkreis P, Malin J-P, Nicolas V, Tegenthoff M (2003) Functional imaging of perceptual learning in human primary and secondary somatosensory cortex. Neuron 40:643–53.
Polley DB, Kvasnák E, Frostig RD (2004) Naturalistic experience transforms sensory maps in the adult cortex of caged animals. Nature 429:67–71.
Pons TP, Garraghty PE, Cusick CG, Kaas JH (1985) A sequential representation of the occiput, arm, forearm and hand across the rostrocaudal dimension of areas 1, 2 and 5 in macaque monkeys. Brain Res 335:350–353.
Pons TP, Garraghty PE, Friedman DP, Mishkin M (1987) Physiological evidence for serial processing in somatosensory cortex. Science (80- ) 237:417–20.
Pons TP, Garraghty PE, Mishkin M (1992) Serial and parallel processing of tactual information in somatosensory cortex of rhesus monkeys. J Neurophysiol 68:518–27.
Pons TP, Garraghty PE, Ommaya AK, Kaas JH, Taub E, Mishkin M (1991) Massive cortical reorganization after sensory deafferentation in adult macaques. Science 252:1857–60.
Pons TP, Kaas JH (1985) Connections of area 2 of somatosensory cortex with the anterior pulvinar and subdivisions of the ventroposterior complex in macaque monkeys. J Comp Neurol 240:16–36.
Pons TP, Kaas JH (1986) Corticocortical connections of area 2 of somatosensory cortex in macaque monkeys: a correlative anatomical and electrophysiological study. J Comp Neurol 248:313–335.
Porter LL (1997) Morphological characterization of a cortico-cortical relay in the cat sensorimotor cortex. Cereb cortex 7:100–9.
Pouchelon G, Frangeul L, Rijli FM, Jabaudon D (2012) Patterning of pre-thalamic somatosensory pathways. Eur J Neurosci 35:1533–9.
Pourrier SD, Nieuwstraten W, Cranenburgh B Van, Schreuders TAR, Stam HJ, Selles RW (2010) Three cases of referred sensation in traumatic nerve injury of the hand: implications for understanding central nervous system reorganziation. J Rehabil Med 42:357–61.
Powell TPS, Mountcastle VB (1959a) Some aspects of the functional organization of the cortex of the postcentral gyrus of the monkey: a correlation of findings obtained in a single unit analysis with cytoarchitecture. Bull Johns Hopkins Hosp 105:133–62.
Powell TPS, Mountcastle VB (1959b) The cytoarchitecture if the postcentral gyrus of the monkey Macaca mulatta. Bull Johns Hopkins Hosp 105:108–31.
Provitera V, Nolano M, Pagano A, Caporaso G, Stancanelli A, Santoro L (2007) Myelinated nerve endings in human skin. Muscle Nerve 35:767–75.
Purves D, Augustine GJ, Fitzpatrick D, Hall WC, LaMantia A-S, McNamara JO, Williams SM (2004) Neuroscience, third edition.
Qi H, Kaas JONH (2006) Organization of primary afferent projections to the gracile nucleus of the dorsal column system of primates. J Comp Neurol 499:183–217.
328 | P a g e
Qi H-X, Kaas JH, Reed JL (2014) The reactivation of somatosensory cortex and behavioral recovery after sensory loss in mature primates. Front Syst Neurosci 8:1–14.
Qi H-X, Lyon DC, Kaas JH (2002) Cortical and thalamic connections of the parietal ventral somatosensory area in marmoset monkeys (Callithrix jacchus). J Comp Neurol 443:168–82.
Ragert P, Kalisch T, Bliem B, Franzkowiak S, Dinse HR (2008) Differential effects of tactile high- and low-frequency stimulation on tactile discrimination in human subjects. BMC Neurosci 9:9.
Raichle ME (1998) Behind the scenes of functional brain imaging: a historical and physiological perspective. PNAS 95:765–72.
Raichle ME, MacLeod a M, Snyder a Z, Powers WJ, Gusnard D a, Shulman GL (2001) A default mode of brain function. PNAS 98:676–82.
Ramachandran VS (1993) Behavioral and magnetoencephalographic correlates of plasticity in the adult human brain. Proc Natl Acad Sci USA 90:10413–20.
Ramachandran VS, Hirstein W (1998) The perception of phantom limbs. The D. O. Hebb lecture. Brain 121:1603–30.
Ramachandran VS, Rogers-Ramachandran D, Stewart M (1992a) Perceptual correlates of massive cortical reorganization. Science (80- ) 258:1159–60.
Ramachandran VS, Stewart M, Rogers-Ramachandran DC (1992b) Perceptual correlates of massive cortical reorganization. Neuroreport 3:583–6.
Ramirez A, Pnevmatikakis E a, Merel J, Paninski L, Miller KD, Bruno RM (2014) Spatiotemporal receptive fields of barrel cortex revealed by reverse correlation of synaptic input. Nat Neurosci 17:866–875.
Randolph M, Semmes J (1974) Behavioral consequences of selective subcortical ablations in the postcentral gyrus of Macaca Mulatta. Brain Res 70:55–70.
Rasmusson D (1996) Changes in the organization of the ventroposterior lateral thalamic nucleus after digit removal in adult raccoon. J Comp Neurol 364:92–103.
Rasmusson DD (1982) Reorganization of raccoon somatosensory cortex following removal of the fifth digit. J Comp Neurol 205:313–326.
Rasmusson DD, Turnbull BG (1983) Immediate effects of digit amputation on SI cortex in the raccoon: unmasking of inhibitory fields. Brain Res 288:368–370.
Rausell E, Bickford L, Manger PR, Woods TM, Jones EG (1998) Extensive divergence and convergence in the thalamocortical projection to monkey somatosensory cortex. J Neurosci 18:4216–4232.
Recanzone GH, Jenkins WM, Hradek GT, Merzenich MM (1992a) Progressive improvement in discriminative abilities in adult owl monkeys performing a tactile frequency discrimination task. J Neurophysiol 67:1015–1030.
Recanzone GH, Merzenich MM, Dinse HR (1992b) Expansion of the cortical representation of a specific skin field in primary somatosensory cortex by intracortical microstimulation. Cereb cortex 2:181–196.
Recanzone GH, Merzenich MM, Jenkins WM (1992c) Frequency discrimination training engaging a restricted skin surface results in an emergence of a cutaneous response zone in cortical area 3a. J Neurophysiol 67:1057–1070.
329 | P a g e
Recanzone GH, Merzenich MM, Jenkins WM, Grajski K a, Dinse HR (1992d) Topographic reorganization of the hand representation in cortical area 3b owl monkeys trained in a frequency-discrimination task. J Neurophysiol 67:1031–1056.
Recanzone GH, Merzenich MM, Schreiner CE (1992e) Changes in the distributed temporal response properties of SI cortical neurons reflect improvements in performance on a temporally based tactile discrimination task. J Neurophysiol 67:1071–1091.
Reinisch CM, Tschachler E (2005) The touch dome in human skin is supplied by different types of nerve fibers. Ann Neurol 58:88–95.
Ritter P, Born J, Brecht M, Dinse HR, Heinemann U, Pleger B, Schmitz D, Schreiber S, Villringer A, Kempter R (2015) State-dependencies of learning across brain scales. Front Comput Neurosci 9:1–21.
Rizzolatti G, Craighero L (2004) The mirror-neuron system. Annu Rev Neurosci 27:169–192.
Rizzolatti G, Fabbri-Destro M (2008) The mirror system and its role in social cognition. Curr Opin Neurobiol 18:179–184.
Robinson CJ, Burton H (1980a) Somatic submodality distribution within the second somatosensory (SII), 7b, retroinsular, postauditory, and granular insular cortical areas of M. fascicularis. J Comp Neurol 192:93–108.
Robinson CJ, Burton H (1980b) Organization of somatosensory receptive fields in cortical areas 7b, retroinsular, postauditory and granular insula of M. fascicularis. J Comp Neurol 192:69–92.
Rocco MM, Brumberg JC (2007) The sensorimotor slice. J Neurosci Methods 162:139–147.
Roland PE, O’Sullivan B, Kawashima R (1998) Shape and roughness activate different somatosensory areas in the human brain. PNAS 95:3295–3300.
Rosa MJ, Kilner J, Blankenburg F, Josephs O, Penny W (2010) Estimating the transfer function from neuronal activity to BOLD using simultaneous EEG-fMRI. Neuroimage 49:1496–1509.
Rosselet C, Zennou-Azogui Y, Escoffier G, Kirmaci F, Xerri C (2008) Experience-dependent changes in spatiotemporal properties of cutaneous inputs remodel somatosensory cortical maps following skin flap rotation. Eur J Neurosci 27:1245–1260.
Rosselet C, Zennou-Azogui Y, Xerri C (2006) Nursing-induced somatosensory cortex plasticity: temporally decoupled changes in neuronal receptive field properties are accompanied by modifications in activity-dependent protein expression. J Neurosci 26:10667–10676.
Rossini PM, Martino G, Narici L, Pasquarelli A, Peresson M, Pizzella V, Tecchio F, Torrioli G, Romani GL (1994) Short-term brain “plasticity” in humans: transient finger representation changes in sensory cortex somatotopy following ischemic anesthesia. Brain Res 642:169–177.
Rothemund Y, Schaefer M, Grüsser SM, Flor H (2005) Localization of the human female breast in primary somatosensory cortex. Exp brain Res 164:357–364.
Rowe MJ, Turman AB, Murray GM, Zhang HQ (1996) Parallel organisation of somatosensory cortical areas I and II for tactile processing. Clin Exp Pharmacol Physiol 23:931–938.
Roy CS, Sherrington CS (1980) On the regulation of the blood-supply of the brain. J Physiol 11:85–158.
Ruben J, Krause T, Taskin B, Blankenburg F, Moosmann M, Villringer A (2006) Subarea-specific suppressive interaction in the BOLD responses to simultaneous finger stimulation in human primary somatosensory cortex: evidence for increasing rostral-to-caudal convergence. Cereb cortex 16:819–826.
330 | P a g e
Ruben J, Schwiemann J, Deuchert M, Meyer R, Krause T, Curio G, Villringer K, Kurth R, Villringer A (2001) Somatotopic organization of human secondary somatosensory cortex. Cereb Cortex 11:463–473.
Rushworth MFS, Nixon PD, Passingham RE (1997a) Parietal cortex and movement. I. Movement selection and reaching. Exp Brain Res 117:292–310.
Rushworth MFS, Nixon PD, Passingham RE (1997b) Parietal cortex and movement. II. Spatial representation. Exp Brain Res 117:311–323.
Saal HP, Bensmaia SJ (2014) Touch is a team effort : interplay of submodalities in cutaneous sensibility. Trends Neurosci 37:689–697.
Sadato N, Ibañez V, Deiber MP, Hallett M (2000) Gender difference in premotor activity during active tactile discrimination. Neuroimage 11:532–540.
Sakai M, Suga N (2001) Plasticity of the cochleotopic (frequency) map in specialized and nonspecialized auditory cortices. PNAS 98:3507–3512.
Sakamoto K, Nakata H, Kakigi R (2008) Somatosensory-evoked magnetic fields following stimulation of the tongue in humans. Clin Neurophysiol 119:1664–1673.
Sakata H, Taira M, Murata A, Mine S (1995) Neural mechanisms of visual guidance of hand action in the parietal cortex of the monkey. Cereb cortex 5:429–438.
Sakata H, Takaoka Y, Kawarasaki A, Shibutani H (1973) Somatosensory properties of neurons in the superior parietal cortex (area 5) of the rhesus monkey. Brain Res 64:85–102.
Sánchez-Panchuelo R-M, Besle J, Beckett A, Bowtell R, Schluppeck D, Francis S, Sanchez-panchuelo RM (2012) Within-digit functional parcellation of Brodmann areas of the human primary somatosensory cortex using functional magnetic resonance imaging at 7 tesla. J Neurosci 32:15815–15822.
Sánchez-Panchuelo R-M, Besle J, Mougin O, Gowland P, Bowtell R, Schluppeck D, Francis S (2014) Regional structural differences across functionally parcellated Brodmann areas of human primary somatosensory cortex. Neuroimage 93:221–230.
Sanchez-Panchuelo RM, Francis S, Bowtell R, Schluppeck D (2010) Mapping human somatosensory cortex in individual subjects with 7T functional MRI. J Neurophysiol 103:2544–2556.
Sathian K, Deshpande G, Stilla R (2013) Neural changes with tactile learning reflect decision-level reweighting of perceptual readout. J Neurosci 33:5387–5398.
Sathian K, Zangaladze A (1997) Tactile learning is task specific but transfers between fingers. Percept Psychophys 59:119–128.
Sathian K, Zangaladze A (1998) Perceptual learning in tactile hyperacuity : complete intermanual transfer but limited retention. Exp Brain Res 118:131–134.
Sathian K, Zangaladze A (2002) Feeling with the mind ’ s eye : contribution of v isual cortex to tactile perception. Behav Brain Res 135:127–132.
Sathian K, Zangaladze C a a, Hoffman JM, Grafton ST (1997) Feeling with the mind ’ s eye. Neuroreport 8:3877–3881.
Sato K, Nariai T, Sasaki S, Yazawa I, Mochida H, Miyakawa N, Momose-Sato Y, Kamino K, Ohta Y, Hirakawa K, Ohno K (2002) Intraoperative intrinsic optical imaging of neuronal activity from subdivisions of the human primary somatosensory cortex. Cereb cortex 12:269–280.
331 | P a g e
Sato K, Nariai T, Tanaka Y, Maehara T, Miyakawa N, Sasaki S, Momose-Sato Y, Ohno K (2005) Functional representation of the finger and face in the human somatosensory cortex: intraoperative intrinsic optical imaging. Neuroimage 25:1292–1301.
Schaefer M, Noennig N, Heinze H-J, Rotte M (2006) Fooling your feelings: artificially induced referred sensations are linked to a modulation of the primary somatosensory cortex. Neuroimage 29:67–73.
Schäfer K, Blankenburg F, Kupers R, Grüner JM, Law I, Lauritzen M, Larsson HBW (2012) Negative BOLD signal changes in ipsilateral primary somatosensory cortex are associated with perfusion decreases and behavioral evidence for functional inhibition. Neuroimage 59:3119–3127.
Schlieper S, Dinse HR (2012) Perceptual improvement following repetitive sensory stimulation depends monotonically on stimulation intensity. Brain Stimul 5:647–651.
Schneider RJ, Friedman DP, Mishkin M (1993) A modality-specific somatosensory area within the insula of the rhesus monkey. Brain Res 621:116–120.
Schnitzler A, Salmelin R, Salenius S, Jousm V, Hari R (1995) Tactile information from the human hand reaches the ipsilateral primary somatosensory cortex. Neurosci Lett 200:25–28.
Schouenborg J, Kalliomaki J, Gustavsson P, Rosén I (1986) Field potentials evoked in rat primary somatosensory cortex (SI) by impulses in cutaneous AB- and C-fibres. Brain Res 397:86–92.
Schwartz TH, Chen LM, Friedman RM, Spencer DD, Roe AW (2004) Intraoperative optical imaging of human face cortical topography: a case study. Neuroreport 15:1527–1531.
Schweisfurth M a, Frahm J, Schweizer R (2014) Individual fMRI maps of all phalanges and digit bases of all fingers in human primary somatosensory cortex. Front Hum Neurosci 8:658.
Schweisfurth M a, Schweizer R, Frahm J (2011) Functional MRI indicates consistent intra-digit topographic maps in the little but not the index finger within the human primary somatosensory cortex. Neuroimage 56:2138–2143.
Schweizer R, Braun C, Fromm C, Wilms A, Birbaumer N (2001) The distribution of mislocalizations across fingers demonstrates training-induced neuroplastic changes in somatosensory cortex. Exp Brain Res 139:435–442.
Schweizer R, Voit D, Frahm J (2008) Finger representations in human primary somatosensory cortex as revealed by high-resolution functional MRI of tactile stimulation. Neuroimage 42:28–35.
Seitz AR, Dinse HR (2007) A common framework for perceptual learning. Curr Opin Neurobiol 17:148–153.
Sellien H, Ebner FF (2007) Rapid plasticity follows whisker pairing in barrel cortex of the awake rat. Exp Brain Res 177:1–14.
Sengelaub D., Muja N, Mills A., Myers W., Churchill J., Garraghty P. (1997) Denervation-induced sprouting of intact peripheral afferents into the cuneate nucleus of adult rats. Brain Res 769:256–262.
Sereno MI, Huang R-S (2014) Multisensory maps in parietal cortex. Curr Opin Neurobiol 24:39–46.
Servos P, Engel S a, Gati J, Menon R (1999) fMRI evidence for an inverted face representation in human somatosensory cortex. Neuroreport 10:1393–1395.
Servos P, Zacks J, Rumelhart DE, Glover GH (1998) Somatotopy of the human arm using fMRI. Neuroreport 9:605–609.
332 | P a g e
Severens M, Farquhar J, Desain P, Duysens J, Gielen C (2010) Transient and steady-state responses to mechanical stimulation of different fingers reveal interactions based on lateral inhibition. Clin Neurophysiol 121:2090–2096.
Shanks MF, Powell TPS (1981) An electron microscopic study of the termination of thalamocortical fibres in area 3b, 1 and 2 of the somatic sensory cortex in the monkey. Brain Res 218:35–47.
Sherrington CS (1906) The integrative action of the nervous system. New York: C Scribner and Sons.
Shibasaki H (2008) Human brain mapping: Hemodynamic response and electrophysiology. Clin Neurophysiol 119:731–743.
Shimojo M, Kakigi R, Hoshiyama M, Koyama S, Kitamura Y, Watanabe S (1996) Differentiation of receptive fields in the sensory cortex following stimulation of various nerves of the lower limb in humans: a magnetoencephalographic study. J Neurosurg 85:255–262.
Shin H-C, Park S, Son J, Sohn J-H (1995) Responses from new receptive fields of VPL neurones following deafferentation. Neuroreport 7:33–36.
Shmuel A, Augath M, Oeltermann A, Logothetis NK (2006) Negative functional MRI response correlates with decreases in neuronal activity in monkey visual area V1. Nat Neurosci 9:569–577.
Shmuel A, Yacoub E, Pfeuffer J, Van de Moortele PF, Adriany G, Hu X, Ugurbil K (2002) Sustained negative BOLD, blood flow and oxygen consumption response and its coupling to the positive response in the human brain. Neuron 36:1195–1210.
Shoham D, Grinvald A (2001) The cortical representation of the hand in macaque and human area S-I: high resolution optical imaging. J Neurosci 21:6820–6835.
Simões C, Mertens M, Forss N, Jousmäki V, Lange J, Lütkenhöner B, Hari R (2001) Functional overlap of finger representations in human SI and SII cortices. J Neurophysiol 86:1661–1665.
Simoes EL, Bramati I, Rodrigues E, Franzoi A, Moll J, Lent R, Tovar-Moll F (2012) Functional expansion of sensorimotor representation and structural reorganization of callosal connections in lower limb amputees. J Neurosci 32:3211–3220.
Simons DJ (1978) Response properties of vibrissa units in rat SI somatosensory neocortex. J Neurophysiol 41:798–820.
Sloan HL, Austin VC, Blamire a. M, Schnupp JWH, Lowe a. S, Allers K a., Matthews PM, Sibson NR (2010) Regional differences in neurovascular coupling in rat brain as determined by fMRI and electrophysiology. Neuroimage 53:399–411.
Smith PS, Dinse HR, Kalisch T, Johnson M, Walker-Batson D (2009) Effects of repetitive electrical stimulation to treat sensory loss in persons poststroke. Arch Phys Med Rehabil 90:2108–2111.
Smits E, Gordon DC, Witte S, Rasmusson DD, Zarzecki P (1991) Synaptic potentials evoked by convergent somatosensory and corticocortical inputs in raccoon somatosensory cortex : substrates for plasticity. J Neurophysiol 66:688–695.
Snyder LH, Batista AP, Andersen RA (1997) Coding of intention in the posterior parietal cortex. Nature 386:167–170.
Spengler F, Dinse HR (1994) Reversible relocation of representational boundaries of adult rats by intracortical microstimulation. Neuroreport 5:949–953.
Spengler F, Godde B, Dinse HR (1995) Effects of ageing on topographic organization of somatosensory cortex. Neuroreport 6:469–473.
333 | P a g e
Spengler F, Roberts TPL, Poeppel D, Byl N, Wang X, Rowley HA, Merzenich MM (1997) Learning transfer and neuronal plasticity in humans trained in tactile discrimination. Neurosci Lett 232:151–154.
Squire LR, Bloom FE, Spitzer NC, du Lac S, Ghosh A, Berg D (2008) Fundamental Neuroscience, third edition.
Srinivasan MA, Whitehouse JM, LaMotte RH (1990) Tactile detection of slip: surface microgeometry and peripheral neural codes. J Neurophysiol 63:1323–1332.
Stanton GB, Cruce WL, Goldberg ME, Robinson DL (1977) Some ipsilateral projections to areas PF and PG of the inferior parietal lobule in monkeys. Neurosci Lett 6:243–250.
Stavrinou ML, Penna S Della, Pizzella V, Torquati K, Cianflone F, Franciotti R, Bezerianos A, Romani GL, Rossini PM (2007) Temporal dynamics of plastic changes in human primary somatosensory cortex after finger webbing. Cereb Cortex 17:2134–2142.
Steen PA, Mason M, Pham L, Lefebvre Y, Hickmott PW (2007) Axonal bias at a representational border in adult rat somatosensory cortex (S1). J Comp Neurol 500:634–645.
Stepniewska I, Cerkevich CM, Fang P-CY, Kaas JH (2009a) Organization of the posterior parietal cortex in galagos: II. Ipsilateral cortical connections of physiologically identified zones within anterior sensorimotor region. J Comp Neurol 517:783–807.
Stepniewska I, Fang P-CY, Kaas JH (2009b) Organization of the posterior parietal cortex in galagos: I. Functional zones identified by microstimulation. J Comp Neurol 517:765–782.
Sterr A, Green L, Elbert T (2003) Blind Braille readers mislocate tactile stimuli. Biol Psychol 63:117–27.
Sterr A, Müller MM, Elbert T, Rockstroh B (1998a) Changed perceptions in Braille readers. Nature 391:134–5.
Sterr A, Müller MM, Elbert T, Rockstroh B, Pantev C, Taub E (1998b) Perceptual correlates of changes in cortical representation of fingers in blind multifinger Braille readers. J Neurosci 18:4417–4423.
Stilla R, Deshpande G, LaConte S, Hu X, Sathian K (2007) Posteromedial parietal cortical activity and inputs predict tactile spatial acuity. J Neurosci 27:11091–11102.
Stippich C, Hofmann R, Kapfer D, Hempel E, Heiland S, Jansen O, Sartor K (1999) Somatotopic mapping of the human primary somatosensory cortex by fully automated tactile stimulation using functional magnetic resonance imaging. Neurosci Lett 277:25–28.
Stoeckel MC, Pollok B, Schnitzler A, Seitz RJ (2007) Studying the human somatosensory hand area: A new way to compare fMRI and MEG. J Neurosci Methods 164:280–291.
Stoeckel MC, Pollok B, Schnitzler A, Witte OW, Seitz RJ (2004) Use-dependent cortical plasticity in thalidomide-induced upper extremity dysplasia: Evidence from somaesthesia and neuroimaging. Exp Brain Res 156:333–341.
Stoesz MR, Zhang M, Weisser VD, Prather SC, Mao H, Sathian K (2003) Neural networks active during tactile form perception: common and differential activity during macrospatial and microspatial tasks. Int J Psychophysiol 50:41–49.
Stringer EA, Chen LM, Friedman RM, Gatenby C, Gore JC (2011) Differentiation of somatosensory cortices by high-resolution fMRI at 7 T. Neuroimage 54:1012–1020.
Sur M (1980) Receptive fields of neurons in areas 3b and 1 of somatosensory cortex in monkeys. Brain Res 198:465–471.
334 | P a g e
Sur M, Garraghty PE, Bruce CJ (1985) Somatosensory cortex in macaque monkeys: laminar differences in receptive field size in areas 3b and 1. Brain Res 342:391–395.
Sur M, Nelson RJ, Kaas JH (1982) Representations of the body surface in cortical areas 3b and 1 of squirrel monkeys: comparisons with other primates. J Comp Neurol 211:177–192.
Sur M, Wall JT, Kaas JH (1981) Modular segregation of functional cell classes within the postcentral somatosensory cortex of monkeys. Science (80- ) 212:1059–1061.
Sutherland MT, Tang AC (2006) Reliable detection of bilateral activation in human primary somatosensory cortex by unilateral median nerve stimulation. Neuroimage 33:1042–1054.
Sutherling WW, Levesque MF, Baumgartner C (1992) Cortical sensory representation of the human hand: size of finger regions and nonoverlapping digit somatotopy. Neurology 42:1020–1028.
Suzuki T, Shibukawa Y, Kumai T, Shintani M (2004) Face area representation of primary somatosensory cortex in humans identified by whole-head magnetoencephalography. Jpn J Physiol 54:161–169.
Swadlow H a (2003) Fast-spike interneurons and feedforward inhibition in awake sensory neocortex. Cereb Cortex 13:25–32.
Tamburin S, Manganotti P, Marzi CA, Fiaschi A, Zanette G (2002) Abnormal somatotopic arrangement of sensorimotor interactions in dystonic patients. Brain 125:2719–2730.
Tamura Y, Shibukawa Y, Shintani M, Kaneko Y, Ichinohe T (2008) Oral structure representation in human somatosensory cortex. Neuroimage 43:128–135.
Tandon S, Kambi N, Lazar L, Mohammed H, Jain N (2009) Large-scale expansion of the face representation in somatosensory areas of the lateral sulcus after spinal cord injuries in monkeys. J Neurosci 29:12009–12019.
Tanji J, Wise SP (1981) Submodality distribution in sensorimotor cortex of the unanesthetized monkey. J Neurophysiol 45:467–481.
Tanosaki M, Hashimoto I (2004) Serial N20m dipoles in somatosensory evoked magnetic fields move along the distal-proximal representation of the digit area 3b of the human cortex. Neurosci Lett 359:175–179.
Tanosaki M, Iguchi Y, Hoshi Y, Hashimoto I (2003) Tactile interference to the face affects magnetic responses elicited by electric thumb stimulation. Clin Neurophysiol 114:2118–2123.
Tanosaki M, Iguchi Y, Kimura T, Takino R, Hashimoto I (2004) Functional connectivity between forearm and digits representations in human somatosensory area 3b. Clin Neurophysiol 115:2638–2644.
Tanosaki M, Suzuki A, Takino R, Kimura T, Iguchi Y, Kurobe Y, Haruta Y, Hoshi Y, Hashimoto I (2002) Neural mechanisms for generation of tactile interference effects on somatosensory evoked magnetic fields in humans. Clin Neurophysiol 113:672–680.
Taoka M, Toda T, Iriki a., Tanaka M, Iwamura Y (2000) Bilateral receptive field neurons in the hindlimb region of the postcentral somatosensory cortex in awake macaque monkeys. Exp Brain Res 134:139–146.
Taoka M, Toda T, Iwamura Y (1998) Representation of the midline trunk, bilateral arms, and shoulders in the monkey postcentral somatosensory cortex. Exp Brain Res 123:315–322.
Taylor KS, Anastakis DJ, Davis KD (2009) Cutting your nerve changes your brain. Brain 132:3122–3133.
335 | P a g e
Taylor KS, Davis KD (2009) Stability of tactile- and pain-related fMRI brain activations: An examination of threshold-dependent and threshold-independent methods. Hum Brain Mapp 30:1947–1962.
Taylor MJ, Saliba E, Laugier J (1996) Use of evoked potentials in preterm neonates. Arch Dis Child 74:F70–F76.
Tecchio F, Rossini P., Pizzella V, Cassetta E, Pasqualetti P, Romani G. (1998) A neuromagnetic normative data set for hemispheric sensory hand cortical representations and their interhemispheric differences. Brain Res Protoc 2:306–314.
Terumitsu M, Ikeda K, Kwee IL, Nakada T (2009) Participation of primary motor cortex area 4a in complex sensory processing: 3.0-T fMRI study. Neuroreport 20:679–683.
Thees S, Blankenburg F, Taskin B, Curio G, Villringer A (2003) Dipole source localization and fMRI of simultaneously recorded data applied to somatosensory categorization. Neuroimage 18:707–719.
Thibodeau GA, Patton KT (1999) Anatomy & physiology.
Thulborn KR, Waterton JC, Matthews PM, Radda GK (1982) Oxygenation dependence of the transverse relaxation-time of water protons in whole-blood at high-field. Biochim Biophys Acta 714:265–270.
Tinazzi M, Zanette G, Polo A, Volpato D, Manganotti P, Bonato C, Testoni R, Fiaschi A (1997) Transient deafferentation in humans induces rapid modulation of primary sensory cortex not associated with subcortical changes: a somatosensory evoked potential study. Neurosci Lett 223:21–24.
Tinazzi M, Zanette G, Volpato D, Testoni R, Bonato C, Manganotti P, Miniussi C, Fiaschi A (1998) Neurophysiological evidence of neuroplasticity at multiple levels of the somatosensory system in patients with carpal tunnel syndrome. Brain 121:1785–1794.
Toda T, Taoka M (2002) Integration of the upper and lower lips in the postcentral area 2 of conscious macaque monkeys (Macaca fuscata). Arch Oral Biol 47:449–456.
Toda T, Taoka M (2004) Converging patterns of inputs from oral structures in the postcentral somatosensory cortex of conscious macaque monkeys. Exp brain Res 158:43–49.
Tong J, Mao O, Goldreich D (2013) Two-point orientation discrimination versus the traditional two-point test for tactile spatial acuity assessment. Front Hum Neurosci 7.
Tremere L, Hicks TP, Rasmusson DD (2001a) Expansion of receptive fields in raccoon somatosensory cortex in vivo by GABA A receptor antagonism: implications for cortical reorganization. Exp Brain Res 136:447–455.
Tremere L, Hicks TP, Rasmusson DD (2001b) Role of inhibition in cortical reorganization of the adult raccoon revealed by microiontophoretic blockade of GABA A receptors. J Neurophysiol 86:94–103.
Tuunanen PI, Kavec M, Jousmäki V, Usenius J-P, Hari R, Salmelin R, Kauppinen RA (2003) Comparison of BOLD fMRI and MEG characteristics to vibrotactile stimulation. Neuroimage 19:1778–1786.
Vallbo AB, Johansson RS (1978) The tactile sensory innervation of the glabrous skin of the human hand. In: Active Touch, the Mechanism of Recognition of Objects by Manipulation, pp 29–54.
Vallbo AB, Johansson RS (1984) Properties of cutaneous mechanoreceptors in the human hand related to touch sensation. Hum Neurobiol 3:3–14.
336 | P a g e
Vallbo ÅB, Olausson H, Wessberg J (1999) Unmyelinated afferents constitute a second system coding tactile stimuli of the human hairy skin. J Neurophysiol 81:2753–2763.
Van Boven RW, Hamilton RH, Kauffman T, Keenan JP, Pascual-Leone A (2000) Tactile spatial resolution in blind Braille readers. Neurology 54:2230–2236.
Van Boven RW, Johnson KO (1994) The limit of tactile spatial resolution in humans: Grating orientation discrimination at the lip, tongue, and finger. Neurology 44:2361–2366.
Van der Zwaag W, Kusters R, Magill A, Gruetter R, Martuzzi R, Blanke O, Marques JP (2013) Digit somatotopy in the human cerebellum: a 7T fMRI study. Neuroimage 67:354–362.
Van Westen D, Fransson P, Olsrud J, Rosén B, Lundborg G, Larsson E-M, Westen D Van (2004) Fingersomatotopy in area 3b: an fMRI-study. BMC Neurosci 5:28.
Vanzetta I, Grinvald A (2008) Coupling between neuronal activity and microcirculation: implications for functional brain imaging. HFSP J 2:79–98.
Vega-Bermudez F, Johnson KO (1999) Surround suppression in the responses of primate SA1 and RA mechanoreceptive afferents mapped with a probe array. J Neurophysiol 81:2711–2719.
Vega-Bermudez F, Johnson KO (2004) Fingertip skin conformance accounts, in part, for differences in tactile spatial acuity in young subjects, but not for the decline in spatial acuity with aging. Percept Psychophys 66:60–67.
Vingerhoets G (2014) Contribution of the posterior parietal cortex in reaching, grasping, and using objects and tools. Front Psychol 5:1–17.
Vitureira N, Letellier M, Goda Y (2012) Homeostatic synaptic plasticity: from single synapses to neural circuits. Curr Opin Neurobiol 22:516–521.
Vogt B a, Pandya DN (1978) Cortico-cortical connections of somatic sensory cortex (areas 3, 1 and 2) in the rhesus monkey. J Comp Neurol 177:179–191.
Vogt C, Vogt O (1919) Allgeimeinere Ergebnisse unserer Hirnforschung. J Psychol Neurol Leipzig 25:279–462.
Wade AR, Rowland J (2010) Early suppressive mechanisms and the negative blood oxygenation level-dependent response in human visual cortex. J Neurosci 30:5008–5019.
Wall JT (1988) Variable organization in cortical maps of the skin as an indication of the lifelong adaptive capacities of circuits in the mammalian brain. TINS 11:549–557.
Wall JT, Felleman DJ, Kaas JH (1983) Recovery of normal topography in the somatosensory cortex of monkeys after nerve crush and regeneration. Science (80- ) 221:771–773.
Wan CY, Wood AG, Reutens DC, Wilson SJ (2010) Congenital blindness leads to enhanced vibrotactile perception. Neuropsychologia 48:631–635.
Wang X, Merzenich MM, Sameshima K, Jenkins WM (1995) Remodelling of hand representation in adult cortex determined by timing of tactile stimulation. Nature 378:71–75.
Weber B, Treyer V, Oberholzer N, Jaermann T, Boesiger P, Brugger P, Regard M, Buck A, Savazzi S, Marzi C a (2005) Attention and interhemispheric transfer: a behavioral and fMRI study. J Cogn Neurosci 17:113–123.
Weber EH (1996) E. H. Weber on the Tactile Senses, Hove: Erlb.
Weiss T, Miltner WHR, Liepert J, Meissner W, Taub E (2004) Rapid functional plasticity in the primary somatomotor cortex and perceptual changes after nerve block. Eur J Neurosci 20:3413–3423.
337 | P a g e
Werhahn KJ, Mortensen J, Boven RW Van, Zeuner KE, Cohen LG (2002) Enhanced tactile spatial acuity and cortical processing during acute hand deafferentation. Nat Neurosci 5:936–938.
Whitsel BL, Rustioni A, Dreyer D a, Loe PR, Allen EE, Metz CB (1978) Thalamic projections to SI in macaque monkey. J Comp Neurol 178:385–410.
Wigström H, Gustafsson B (1986) Postsynaptic control of hippocampal long-term potentiation. J Physiol 81:228–236.
Wilent WB, Contreras D (2005) Dynamics of excitation and inhibition underlying stimulus selectivity in rat somatosensory cortex. Nat Neurosci 8:1364–1370.
Wilimzig C, Ragert P, Dinse HR (2012) Cortical topography of intracortical inhibition influences the speed of decision making. PNAS 109:3107–3112.
Will B, Dalrymple-Alford J, Wolff M, Cassel JC (2008) The concept of brain plasticity-Paillard’s systemic analysis and emphasis on structure and function (followed by the translation of a seminal paper by Paillard on plasticity). Behav Brain Res 192:2–7.
Williamson SJ, Kaufman L (1990) Evolution of neuromagnetic topographic mapping. Brain Topogr 3:113–127.
Wong M, Gnanakumaran V, Goldreich D (2011) Tactile spatial acuity enhancement in blindness: evidence for experience-dependent mechanisms. J Neurosci 31:7028–7037.
Woolsey CN, Fairman D (1946) Contralateral, ipsilateral, and bilateral representation of cutaneous receptors in somatic areas I and II of the cerebral cortex of pig, sheep, and other mammals. Surgery 19:684–702.
Wrigley PJ, Press SR, Gustin SM, Macefield VG, Gandevia SC, Cousins MJ, Middleton JW, Henderson L a, Siddall PJ (2009) Neuropathic pain and primary somatosensory cortex reorganization following spinal cord injury. Pain 141:52–59.
Wu C-S, Ballester Rosado CJ, Lu H-C (2011) What can we get from “barrels”: the rodent barrel cortex as a model for studying the establishment of neural circuits. Eur J Neurosci 34:1663–1676.
Wu CWH, Kaas JH (2002) The effects of long-standing limb loss on anatomical reorganization of the somatosensory afferents in the brainstem and spinal cord. Somatosens Mot Res 19:153–163.
Wühle A, Mertiens L, Rüter J, Ostwald D, Braun C (2010) Cortical processing of near-threshold tactile stimuli: an MEG study. Psychophysiology 47:523–534.
Wühle A, Preissl H, Braun C (2011) Cortical processing of near-threshold tactile stimuli in a paired-stimulus paradigm--an MEG study. Eur J Neurosci 34:641–651.
Xerri C (2012) Plasticity of cortical maps: multiple triggers for adaptive reorganization following brain damage and spinal cord injury. Neurosci 18:133–148.
Xerri C, Coq JO, Merzenich MM, Jenkins WM (1996) Experience-induced plasticity of cutaneous maps in the primary somatosensory cortex of adult monkeys and rats. J Physiol Paris 90:277–287.
Xerri C, Merzenich MM, Peterson BE, Jenkins W (1998) Plasticity of primary somatosensory cortex paralleling sensorimotor skill recovery from stroke in adult monkeys. J Neurophysiol 79:2119–2148.
Xerri C, Stern JM, Merzenich MM (1994) Alterations of the cortical representation of the rat ventrum induced by nursing behavior. J Neurosci 14:1710–1721.
338 | P a g e
Xu J, Wall JT (1999) Functional organization of tactile inputs from the hand in the cuneate nucleus and its relationship to organization in the somatosensory cortex. J Comp Neurol 411:369–389.
Yang TT, Gallen CC, Ramachandran VS, Cobb S, Schwartz BJ, Bloom FE (1994) Noninvasive detection of cerebral plasticity in adult human somatosensory cortex. Neuroreport 5:701–704.
Yang TT, Gallen CC, Schwartz BJ, Bloom FE (1993) Noninvasive somatosensory homunculus mapping in humans by using a large-array biomagnetometer. PNAS 90:3098–3102.
Yau JM, Connor CE, Hsiao SS (2013) Representation of tactile curvature in macaque somatosensory area 2. J Neurophysiol 109:2999–3012.
Yvert B, Bertrand O, Echallier JF, Pernier J (1996) Improved dipole localization using local mesh refinement of realistic head geometries: An EEG simulation study. Electroencephalogr Clin Neurophysiol 99:79–89.
Zamorano AM, Riquelme I, Kleber B, Altenmüller E, Hatem SM, Montoya P (2015) Pain sensitivity and tactile spatial acuity are altered in healthy musicians as in chronic pain patients. Front Hum Neurosci 8:1–9.
Zarei M, Stephenson JD (1996) Ipsilateral and bilateral receptive fields in rat primary somatosensory cortex. Neuroreport 7:647–651.
Zarzecki P et al. (1993) Synaptic mechanisms of cortical representational plasticity : somatosensory and corticocortical EPSPs in reorganized raccoon SI cortex. J Neurophysiol.
Zarzecki P, Blum PS, Bakker DA, Herman D (1983) Convergence of sensoru inputs upon projection neurons of somatosensory cortex: vestibular, neck, head, and forelimb inputs. Exp brain Res 50:408–414.
Zarzecki P, Wiggin DM (1982) Convergence of sensory inputs upon projection neurons of somatosensory cortex. Exp brain Res 48:28–42.
Zeharia N, Hertz U, Flash T, Amedi A (2012) Negative blood oxygenation level dependent homunculus and somatotopic information in primary motor cortex and supplementary motor area. PNAS 109:18565–18570.
Zhang M, Mariola E, Stilla R, Stoesz M, Mao H, Hu X, Sathian K (2005) Tactile discrimination of grating orientation: fMRI activation patterns. Hum Brain Mapp 25:370–377.
Zhu Z, Disbrow E a, Zumer JM, McGonigle DJ, Nagarajan SS (2007) Spatiotemporal integration of tactile information in human somatosensory cortex. BMC Neurosci 8:1–14.


