Embed Size (px)
Citation preview
arX
iv:a
stro
-ph/
0407
517v
1 2
6 Ju
l 200
4Accepted for Publication by the Astrophysical Journal July 14, 2004
Preprint typeset using LATEX style emulateapj v. 20/04/00
ON THE NATURE OF THE HEAT SOURCE FOR DAMPED Lyα SYSTEMS
ARTHUR M. WOLFE 1 & J. CHRISTOPHER HOWK 1
Department of Physics and Center for Astrophysics and Space Sciences;University of California, San Diego;
C–0424; La Jolla, CA [email protected], [email protected]
ERIC GAWISERDepartment of Astronomy;
Yale UniversityP.O. Box 208101
New Haven, CT [email protected]
JASON X. PROCHASKA1
UCO-Lick Observatory;University of California, Santa Cruz
Santa Cruz, CA; [email protected]
andSEBASTIAN LOPEZUniversidad de Chile;
Departamento de AstronomiaCasilla 36-D, Las Condes,
Santiago, [email protected]
Accepted for Publication by the Astrophysical Journal July 14, 2004
ABSTRACT
We investigate the heat source of the neutral gas comprising damped Lyα systems. Unlike the Lyαforest, where the extragalactic background radiation field ionizes and heats the gas, we find that grainphotoelectric heating by the FUV background is not sufficient to balance the C II 158 µm cooling rateinferred from damped Lyα systems In these systems, a local energy source is required. We show that inthe case of the z=1.919 damped Lyα system toward Q2206−19, the local source is FUV emission fromthe associated galaxy found by Møller et al. (2002): the mean intensity inferred from photometry is ingood agreement with the intensity Jstars
ν required to explain the cooling rate. The FUV mean intensitypredicted for a cold neutral medium (CNM) model, Jstars
ν =(1.7+2.7−1.0)×10−18ergs cm−2 s−1 Hz−1 sr−1
(95% c.l.), is the largest expected from our C II∗ study of 45 damped Lyα systems.This may explainwhy this is the only confirmed damped Lyα system yet detected in emission at z > 1.9. We argue thatin most damped Lyα systems with detected C II∗ absorption, Jstars
ν is between 10−19 and 10−18 ergscm−2 s−1 Hz−1 sr−1 and heats the gas which is a CNM. By contrast, in most damped Lyα systemswith upper limits on C II∗ absorption the gas is a warm neutral medium (WNM). Surprisingly, theupper limits are compatible with the same range of Jstars
ν values suggesting the majority of damped Lyαsystems are heated by radiation fields generated by a limited range of star formation rates per unit H Iarea, between 10−3 and 10−2. M⊙ yr−1 kpc−2. We also show that C II∗ absorption is unlikely to arisein gas that is ionized.
Subject headings: cosmology—galaxies: evolution—galaxies: quasars—absorption lines
1. INTRODUCTION
External background radiation is the widely acceptedheat source for the Lyα forest. Defined to have H I col-umn densities N(H I) < 1017 cm−2 the Lyα forest cloudsare optically thin at the Lyman limit. As a result, ioniz-ing background radiation, i.e., radiation with photon en-ergies hν > hνH = 13.6 eV, penetrates the interior ofthe clouds, ionizing them such that the neutral gas frac-tion n(H0)/n<10−5, and heats them to temperatures inexcess of 10000 K (Rauch 1998). Indeed, several authorshave constructed scenarios within the context of CDM cos-
1Visiting Astronomer, W.M. Keck Telescope. The Keck Obser-vatory is a joint facility of the University of California and the Cali-fornia Institute of Technology.
mogonies in which most of the baryons in the universe atz∼3 reside in the Lyα forest and are photoionized bybackground radiation (e.g., Miralda-Escude et al. 1996;Machacek et al. 2000).
Calculations by Haardt & Madau (1996; 2003) showthat radiation emitted from the integrated population ofQSOs and galaxies results in a mean background intensityJνH
∼ 10−21 ergs cm−2 s−1 Hz−1 sr−1 at z ∼ 3. Indepen-dent tests, such as the decrease with redshift of the numberof absorbers per unit redshift in the vicinity of the QSO,i.e., “the proximity effect”, indicate similar values for JνH
(e.g., Scott et al. 2002). Ionizing background radiationhas also been invoked to explain the ionization structureof metals in the Lyα forest, and in higher column-densityQSO absorption systems selected for C IV λλ 1548, 1551
1
2 STAR FORMATION IN DAMPED Lyα SYSTEMS
absorption (e.g. Mo & Miralda-Escude 1995), Lyman limitabsorption (Prochaska 1999), and Mg II λλ 2796, 2803absorption (e.g. Churchill, Vogt, & Charlton 2003). Thepredicted temperatures in these absorbers are also about10000 K and the neutral gas fraction, n(H0)/n << 1.
In this paper we consider the nature of the heat sourcefor another class of QSO absorption systems, the dampedLyα systems (see Storrie-Lombardi & Wolfe 2000). Whilethe damped Lyα systems are subject to the same exter-nal radiation fields as the other absorbers, they differ inone important respect: the gas is neutral (e.g. Vladiloet al. 2001; Prochaska et al. 2002). Defined to have HI column densities N(H I)≥2×1020 cm−2, damped Lyαsystems have Lyman-limit optical depths, τνH
≥1000. Asa result, the same photons that ionize and heat the Lyαforest do not penetrate the interior of the damped Lyαsystems. Rather, these gas layers are penetrated only bybackground radiation with photon energies hν & 400 eVand hν < hνH . While the low-energy FUV photons donot ionize H, they do ionize neutral species of atoms withionization potentials less than hνH such as C, Fe, and Zn,and more importantly, could contribute to the heat inputof damped Lyα systems through grain photoelectric heat-ing (Bakes & Tielens 1994). Similarly, X-ray photons canalso heat the gas though photoionization.
Does such background radiation dominate the heat in-put to the damped Lyα systems? We shall address thisquestion empirically since cooling rates have recently beenmeasured for a representative sample of ∼ 50 damped Lyαsystems (see Wolfe, Prochaska, & Gawiser 2003, hereafterreferred to as WPG, for a discussion of the original sam-ple of 33 damped Lyα systems). The answer has impor-tant implications. If heating by external sources does notmatch the measured cooling rates, then internal sourcesof heating must be found. This would distinguish dampedLyα systems from all other classes of QSO absorption sys-tems, which are plausibly heated by background radiation.
This paper is organized as follows. In § 2 we describe ourtechnique for obtaining the thermal equilibria of dampedLyα systems heated by external background radiation. Inparticular we compute the thermal equilibria of neutral gaslayers exposed to background radiation fields recently com-puted by Haardt & Madau (2003). These authors com-puted backgrounds originating from the integrated popu-lation of (1) QSOs alone, and (2) QSOs and galaxies. Tomaximize the heating rates we consider those backgroundsthat include galaxies because the galaxy contribution dom-inates at hν≤hνH , where FUV radiation (6 < hν < 13.6eV) heats the gas by the grain photoelectric mechanism(WPG). This is the same process by which the neutral ISMof the Galaxy is heated (e.g. Bakes & Tielens 1994), andit is relevant here given the evidence for dust in dampedLyα systems (Pettini et al. 1994; Pei & Fall 1995; WPG).At hν & 400 eV, soft X-rays heat the gas by photoionizingH, He, and abundant elements. X-ray heating occurs pri-marily through the photoionization of H and He becauseof the low metallicities of damped Lyα systems. In §3we apply these results to test the background heating hy-pothesis. We compare the predicted heating rates to the158 µm cooling rates deduced from the strength of C II∗
λ 1335.7 and damped Lyα absorption (see WPG). Westudy the multi-phase structure of the z = 1.919 damped
Lyα system toward Q2206−19, and then discuss resultsfor the full sample of 45 damped Lyα systems. In § 4we examine the nature of possible internal heat sourcesby focusing on the z=1.919 damped Lyα system towardQ2206−19. This damped Lyα system is ideal for such astudy because the presence of an associated galaxy at thesame redshift, which is detected via its rest-frame FUVemission (Møller et al. 2002), allows one to make an in-dependent estimate of the FUV radiation field incident onthe absorbing gas. Since Fe is believed to be depleted inthis DLA, the radiation is incident on dust, and the resultis grain photoelectric heating. WPG show how to deducethe local FUV radiation field from the strength of C II∗
absorption. In § 5 we investigate the energy input for allthe damped Lyα systems in our sample, i.e., those withpositive detections and those with upper limits on C II∗
absorption, to determine whether they are heated by back-ground radiation alone or require internal heat sources. In§ 6 we discuss the possibility that C II∗ absorption arisesin ionized gas. Finally, concluding remarks are given in §7.
Throughout this paper we adopt a cosmology consistentwith the WMAP (Bennett et al. 2003) results, (Ωm, ΩΛ,h) = (0.3, 0.7, 0.7).
2. THERMAL EQUILIBRIA OF BACKGROUND HEATEDDAMPED Lyα SYSTEMS
Consider a slab of neutral gas exposed to an isotropicbackground radiation field with mean intensity Jν . Wefirst compute the heating rates due to soft X-rays andFUV radiation. We then calculate the thermal equilibriaresulting from a balance between heating and cooling.
2.1. Heating
Wolfire et al. (1995; hereafter W95) find the primaryionization rate of atomic species i due to soft X-rays to be
ζiXR = 4π
∫
Jν
hνexp[−σνN
a(HI)]σνidν s−1 , (1)
where σiν is the photoionization cross-section per H atom
of species i and the factor σνNa(H I) is the optical depth
due to H, He, and abundant metals such as C, O, Fe, etc.in an attenuating column density Na(H I). To simulateconditions in the midplane of the gas layer we let Na(HI) = 0.5N(H I), where N(H I) is the H I column densitydetected along the line of sight. We compute the total ion-ization rate of H and He, including secondary ionizations,using the prescription of W95 including their modifica-tions of the results of Shull & van-Steenberg (1985). Theresulting heating rate is given by
ΓXR = 4π∑
i
∫
Jν
hνexp[−σνN
a(HI)]σνiEh(Ei, x)dν ,
(2)where the summation is over species suffering primary ion-ization, and Eh(Ei, x) is the energy deposited as heat bya primary electron originating from atomic species i withenergy Ei in gas with electron fraction x. We used the re-sults of Shull & van-Steenberg (1985) to compute Eh, andan updated version of the Morrison & McCammon (1983)results to compute σi
ν and σν (McCammon 2003).
Wolfe, Prochaska, & Gawiser 3
To compute the grain photoelectric heating rate due toFUV radiation we used the Weingartner & Draine (2001)expression
Γd = 10−26κG0f(G0
√T/ne, ci)exp(−τd
ν ) , (3)
where Γd is in units of ergs s−1 H−1, κ is the dust-to-gasratio of the damped Lyα system relative to that of theISM (ISM refers to the ISM of the Milky Way Galaxy) ,G0 is 4π
∫
Jνdν integrated between 6 and 13.6 eV and is inunits of 1.6×10⁻³ ergs s−1 cm−2, f , which is proportionalto the heating efficiency, is a function of G0
√T/ne and
the fitting constants, ci (where i=0→6), and τdν is the dust
optical depth corresponding to Na(H I).Weingartner & Draine (2001) show that Γd is especially
sensitive to two quantities: grain composition, i.e. thefraction of dust in silicate and carbonaceous grains, andthe fraction of dust in small grains (radius < 15 A). Bothare crucial because computations carried out so far showthat small carbonaceous grains are the most efficient sourcesof photoelectric heating. The detection of the 2175 A ab-sorption feature in two damped Lyα systems provide ev-idence for small carbonaceous grains at z < 1 (Junkkari-nen et al. 2004; Motta et al. 2002), but the evidenceis less clear for the redshift range of our sample. Pei,Fall, & Bechtold (1991) found no evidence for the 2175A feature, yet detection was expected based on their red-dening model. Thus damped Lyα systems with z > 2could be comprised of silicate dust alone. However, all thepublished models for grain photoelectric heating include apopulation of small carbonaceous grains.
To address this problem we consider models with a rangeof heating efficiencies that should include that of silicatedust. We adopt a model in which the fraction of car-bon locked in PAHs per H nucleus, bC=0, and extinctionratio RV =3.1, which is valid for the type of diffuse gasexpected in damped Lyα systems (see Table 2, row 19in Weingartner & Draine 2001); where RV ≡AV /EB−V ,AV is the visual extinction, and EB−V is the color ex-cess. We also assume a radiation spectrum approximat-ing Draine’s (1978) fit to the interstellar radiation field inwhich case G0≈Jν/(10−19 ergs cm−2 s−1 Hz−1 sr−1) at λ= 1500 A (see WPG). Application of this approximation to
Table 1
Parameters for Grain Heating Models
Name [C/H]a κb
bCc
RVd Referencee
WD-low [Si/H]−0.2 f 0 3.1 (1)WD-high [Si/H] g 6×10⁻⁵ 3.1 (1)BT [Si/H] g 1.26×10⁻⁶ ... (2)
aCarbon abundance relative to solar.bdust-to-gas ratio relative to the Milky Way ISMcAbundance of C atoms per interstellar H nucleus in PAHsdRV ≡ AV /EB−V , where AV is visual extinction
and EB−V is the color excess.e(1) Weingartner & Draine 2001; (2) Bakes & Tielens 1994f10[Si/H](10−0.2 − 10[Fe/Si])g10[Si/H](1−10[Fe/Si])
background radiation involves no loss in generality sincethe background and interstellar radiation fields at hν <hνH arise from similar stellar populations (e.g. Bruzual &Charlot 2003). The resulting heating efficiency is the low-est predicted for the Weingartner & Draine (2001) models.The highest heating efficiency is predicted for their modelwith RV =3.1, bC=6×10⁻⁵, and an interstellar radiationspectrum (see their Table 2, last row). We shall examinethe following three dust compositions: (1) a mix of sili-cate and carbonaceous grains in which bC=0 and RV =3.1,(2) a mix of silicate and carbonaceous grains in whichbC=6×10⁻⁵ and RV =3.1, and (3) carbonaceous grainsalone within the heating model of Bakes & Tielens (1994).In this way we shall test the sensitivity of our resultsto changes in grain properties. We show below that ourresults concerning the plausibility of background heatingare independent of the properties of the grains, and dependonly on the carbon abundance and assumptions aboutthermal equilibrium.
Next we use the WPG method for computing κ. Ourprescription computes the fraction of Fe in grains and thenassumes the number of depleted C or Si atoms per de-pleted Fe atom to be the same in damped Lyα systemsas in the Galaxy ISM. The depletion of Fe is calculatedfrom the ratio of the observed amount of Fe to an un-depleted element: Zn or S would be ideal for this pur-pose. WPG use Si because (i) Si is measured over a widerrange of redshifts than Zn, (ii) S is difficult to measuresince the observed S II transitions occur frequently in theLyα forest, and (iii) though Si is undoubtedly depleted,the observed depletion level is very low; i.e., [Si/S]≈0. 2
This does not lead to inconsistencies in the case of sili-cate dust because the computed values of κ are consis-tent with Si being depleted typically by less than 20 %.
WPG find κ = 10[Si/H]int
(
10[Fe/Si]int − 10[Fe/Si]gas
)
where
[Si/H]int is the intrinsic abundance of Si relative to H,[Fe/Si]int is the intrinsic abundance of Fe relative to Si,and [Fe/Si]gas is the measured abundance of Fe relativeto Si. Following WPG we assume minimal depletion oc-curs when [Fe/Si]int=−0.2, i.e., an intrinsic enhancementof α elements such as Si, and maximum depletion occurswhen [Fe/Si]int=0. Therefore, we adopt two Weingartner& Draine (2001) models, which should bracket a plausiblerange in heating rates. The “WD-low” model combinesdust composition (1) with minimal depletion: this modelis similar to one of the “SMC” models considered by WPGand results in the lowest heating rates. 3 The “WD-high”model combines dust composition (2) with maximal de-pletion: this model produces the highest heating rates.For completeness we combine the Bakes & Tielens (1994)model of carbonaceous grains with the assumption of max-imal depletion: this model, referred to as the “BT” model,produces heating rates between the predictions of the othertwo models, and is one of the “Gal” models considered byWPG. The properties of the models are summarized inTable 1.
The background mean intensities at redshift z, Jν(z),2The abundance ratio of elements X and Y is given by
[X/Y]=log10(X/Y)−log10(X/Y)⊙.3Minimal depletion does not apply to damped Lyα systems in
which [Fe/Si]gas > −0.2. For these objects the “WD low” model isa hybrid of bC=0 heating rates and maximal depletion.
4 STAR FORMATION IN DAMPED Lyα SYSTEMS
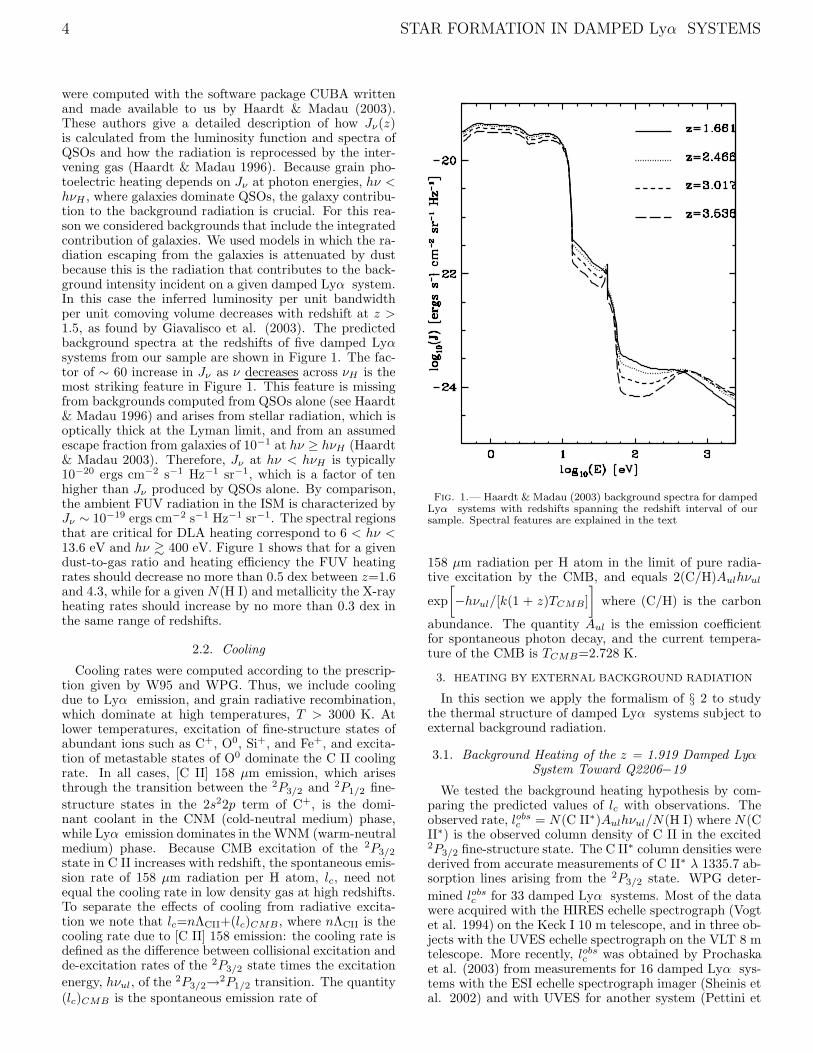
were computed with the software package CUBA writtenand made available to us by Haardt & Madau (2003).These authors give a detailed description of how Jν(z)is calculated from the luminosity function and spectra ofQSOs and how the radiation is reprocessed by the inter-vening gas (Haardt & Madau 1996). Because grain pho-toelectric heating depends on Jν at photon energies, hν <hνH , where galaxies dominate QSOs, the galaxy contribu-tion to the background radiation is crucial. For this rea-son we considered backgrounds that include the integratedcontribution of galaxies. We used models in which the ra-diation escaping from the galaxies is attenuated by dustbecause this is the radiation that contributes to the back-ground intensity incident on a given damped Lyα system.In this case the inferred luminosity per unit bandwidthper unit comoving volume decreases with redshift at z >1.5, as found by Giavalisco et al. (2003). The predictedbackground spectra at the redshifts of five damped Lyαsystems from our sample are shown in Figure 1. The fac-tor of ∼ 60 increase in Jν as ν decreases across νH is themost striking feature in Figure 1. This feature is missingfrom backgrounds computed from QSOs alone (see Haardt& Madau 1996) and arises from stellar radiation, which isoptically thick at the Lyman limit, and from an assumedescape fraction from galaxies of 10−1 at hν ≥ hνH (Haardt& Madau 2003). Therefore, Jν at hν < hνH is typically10−20 ergs cm−2 s−1 Hz−1 sr−1, which is a factor of tenhigher than Jν produced by QSOs alone. By comparison,the ambient FUV radiation in the ISM is characterized byJν ∼ 10−19 ergs cm−2 s−1 Hz−1 sr−1. The spectral regionsthat are critical for DLA heating correspond to 6 < hν <13.6 eV and hν & 400 eV. Figure 1 shows that for a givendust-to-gas ratio and heating efficiency the FUV heatingrates should decrease no more than 0.5 dex between z=1.6and 4.3, while for a given N(H I) and metallicity the X-rayheating rates should increase by no more than 0.3 dex inthe same range of redshifts.
2.2. Cooling
Cooling rates were computed according to the prescrip-tion given by W95 and WPG. Thus, we include coolingdue to Lyα emission, and grain radiative recombination,which dominate at high temperatures, T > 3000 K. Atlower temperatures, excitation of fine-structure states ofabundant ions such as C+, O0, Si+, and Fe+, and excita-tion of metastable states of O0 dominate the C II coolingrate. In all cases, [C II] 158 µm emission, which arisesthrough the transition between the 2P3/2 and 2P1/2 fine-
structure states in the 2s22p term of C+, is the domi-nant coolant in the CNM (cold-neutral medium) phase,while Lyα emission dominates in the WNM (warm-neutralmedium) phase. Because CMB excitation of the 2P3/2
state in C II increases with redshift, the spontaneous emis-sion rate of 158 µm radiation per H atom, lc, need notequal the cooling rate in low density gas at high redshifts.To separate the effects of cooling from radiative excita-tion we note that lc=nΛCII+(lc)CMB, where nΛCII is thecooling rate due to [C II] 158 emission: the cooling rate isdefined as the difference between collisional excitation andde-excitation rates of the 2P3/2 state times the excitation
energy, hνul, of the 2P3/2→2P1/2 transition. The quantity(lc)CMB is the spontaneous emission rate of
Fig. 1.— Haardt & Madau (2003) background spectra for dampedLyα systems with redshifts spanning the redshift interval of oursample. Spectral features are explained in the text
158 µm radiation per H atom in the limit of pure radia-tive excitation by the CMB, and equals 2(C/H)Aulhνul
exp
[
−hνul/[k(1 + z)TCMB]
]
where (C/H) is the carbon
abundance. The quantity Aul is the emission coefficientfor spontaneous photon decay, and the current tempera-ture of the CMB is TCMB=2.728 K.
3. HEATING BY EXTERNAL BACKGROUND RADIATION
In this section we apply the formalism of § 2 to studythe thermal structure of damped Lyα systems subject toexternal background radiation.
3.1. Background Heating of the z = 1.919 Damped LyαSystem Toward Q2206−19
We tested the background heating hypothesis by com-paring the predicted values of lc with observations. Theobserved rate, lobs
c = N(C II∗)Aulhνul/N(H I) where N(CII∗) is the observed column density of C II in the excited2P3/2 fine-structure state. The C II∗ column densities werederived from accurate measurements of C II∗ λ 1335.7 ab-sorption lines arising from the 2P3/2 state. WPG deter-
mined lobsc for 33 damped Lyα systems. Most of the data
were acquired with the HIRES echelle spectrograph (Vogtet al. 1994) on the Keck I 10 m telescope, and in three ob-jects with the UVES echelle spectrograph on the VLT 8 mtelescope. More recently, lobs
c was obtained by Prochaskaet al. (2003) from measurements for 16 damped Lyα sys-tems with the ESI echelle spectrograph imager (Sheinis etal. 2002) and with UVES for another system (Pettini et
Wolfe, Prochaska, & Gawiser 5
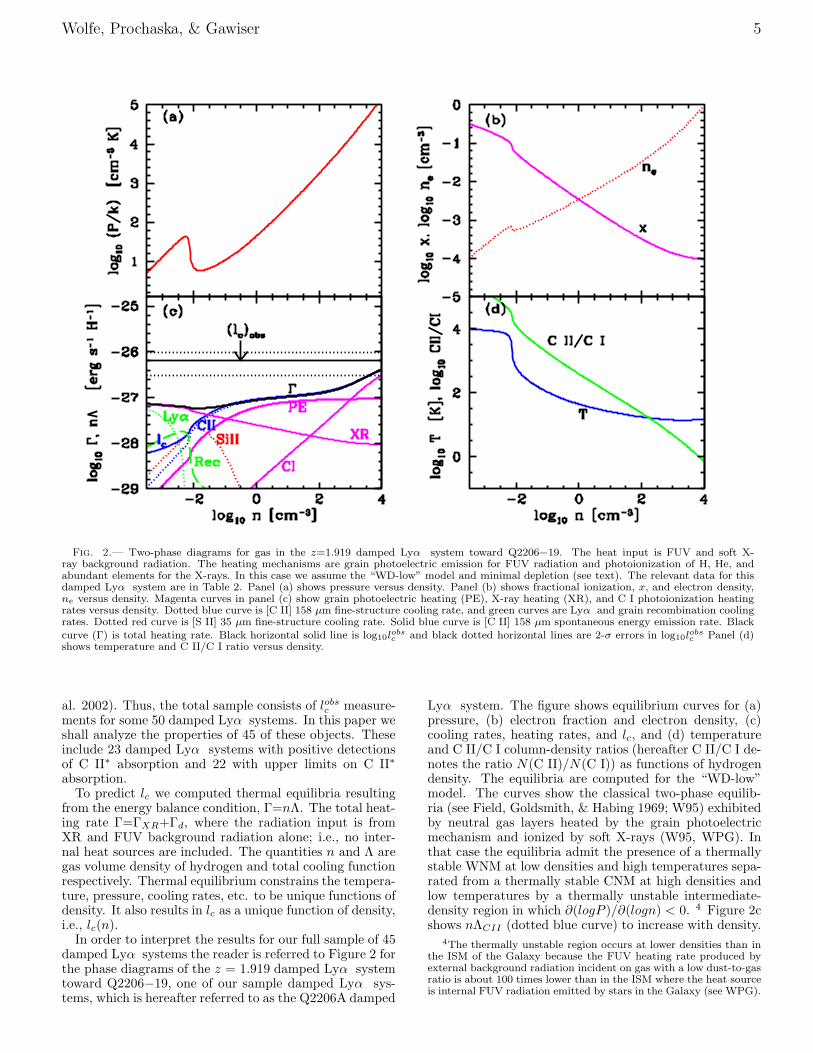
Fig. 2.— Two-phase diagrams for gas in the z=1.919 damped Lyα system toward Q2206−19. The heat input is FUV and soft X-ray background radiation. The heating mechanisms are grain photoelectric emission for FUV radiation and photoionization of H, He, andabundant elements for the X-rays. In this case we assume the “WD-low” model and minimal depletion (see text). The relevant data for thisdamped Lyα system are in Table 2. Panel (a) shows pressure versus density. Panel (b) shows fractional ionization, x, and electron density,ne versus density. Magenta curves in panel (c) show grain photoelectric heating (PE), X-ray heating (XR), and C I photoionization heatingrates versus density. Dotted blue curve is [C II] 158 µm fine-structure cooling rate, and green curves are Lyα and grain recombination coolingrates. Dotted red curve is [S II] 35 µm fine-structure cooling rate. Solid blue curve is [C II] 158 µm spontaneous energy emission rate. Blackcurve (Γ) is total heating rate. Black horizontal solid line is log10l
obsc and black dotted horizontal lines are 2-σ errors in log10l
obsc Panel (d)
shows temperature and C II/C I ratio versus density.
al. 2002). Thus, the total sample consists of lobsc measure-
ments for some 50 damped Lyα systems. In this paper weshall analyze the properties of 45 of these objects. Theseinclude 23 damped Lyα systems with positive detectionsof C II∗ absorption and 22 with upper limits on C II∗
absorption.To predict lc we computed thermal equilibria resulting
from the energy balance condition, Γ=nΛ. The total heat-ing rate Γ=ΓXR+Γd, where the radiation input is fromXR and FUV background radiation alone; i.e., no inter-nal heat sources are included. The quantities n and Λ aregas volume density of hydrogen and total cooling functionrespectively. Thermal equilibrium constrains the tempera-ture, pressure, cooling rates, etc. to be unique functions ofdensity. It also results in lc as a unique function of density,i.e., lc(n).
In order to interpret the results for our full sample of 45damped Lyα systems the reader is referred to Figure 2 forthe phase diagrams of the z = 1.919 damped Lyα systemtoward Q2206−19, one of our sample damped Lyα sys-tems, which is hereafter referred to as the Q2206A damped
Lyα system. The figure shows equilibrium curves for (a)pressure, (b) electron fraction and electron density, (c)cooling rates, heating rates, and lc, and (d) temperatureand C II/C I column-density ratios (hereafter C II/C I de-notes the ratio N(C II)/N(C I)) as functions of hydrogendensity. The equilibria are computed for the “WD-low”model. The curves show the classical two-phase equilib-ria (see Field, Goldsmith, & Habing 1969; W95) exhibitedby neutral gas layers heated by the grain photoelectricmechanism and ionized by soft X-rays (W95, WPG). Inthat case the equilibria admit the presence of a thermallystable WNM at low densities and high temperatures sepa-rated from a thermally stable CNM at high densities andlow temperatures by a thermally unstable intermediate-density region in which ∂(logP )/∂(logn) < 0. 4 Figure 2cshows nΛCII (dotted blue curve) to increase with density.
4The thermally unstable region occurs at lower densities than inthe ISM of the Galaxy because the FUV heating rate produced byexternal background radiation incident on gas with a low dust-to-gasratio is about 100 times lower than in the ISM where the heat sourceis internal FUV radiation emitted by stars in the Galaxy (see WPG).
6 STAR FORMATION IN DAMPED Lyα SYSTEMS
The increase is steep at n < 10−2 cm−3, very steep at n ≈10−2 cm−3, flatter at 10−2 < n < 10−1 cm−3, insensitiveto n at 10−1 < n < 10+2 cm−3, and steeper again at n >10+2 cm−3.
To understand this behavior we note that the coolingrate is dominated by processes other than 158 µm emissionat n < 10−1 cm−3. Consequently, nΛCII does not track thetotal heating rate, Γ, which is flat at the latter densities.The explicit form of nΛCII under these conditions is givenby
nΛCII ∝ ne(C/H)Ω(2P3/2,2 P1/2)T
−1/2exp(−hνul/kT ) ,(4)
where the collision strength, Ω(2P3/2,2 P1/2), is relatively
insensitive to changes in n and T (see Blum & Pradhan1992). At n < 10−2 cm−3 the increase in nΛCII is drivenprimarily by the increase in electron density with increas-ing n (see Figure 2b) because (1) the Boltzmann factor,exp(−hνul/kT ), is constant since T >> hνul/k= 92 K,and (2) T is insensitive to n at these densities (see Fig-ure 2d). At n ≈ 10−2 cm−3 the very steep drop in Tmarks the transition between WNM and CNM gas in theregion of thermal instability due to the shift from Lyαcooling to fine-structure line cooling by low ions of abun-dant elements. The sharp increase in nΛCII is due to theincrease in the T−1/2 factor because at these tempera-tures the Boltzmann factor is constant. The decrease inT also increases the radiative recombination coefficients,which cause the abrupt drops seen in x, ne, and C II/CI. When 10−2 < n < 10−1 cm−3 the increase in nΛCII
is modulated by the Boltzmann factor which decreases asT becomes comparable to hνul/k. However, at n > 10−1
cm−3 the dependence of nΛCII on n is dictated by thedensity dependence of the total heating rate, Γ(n), sincenΛCII dominates the cooling rate at these densities andthus equals the total heating rate. This accounts for theflat behavior of nΛCII at 10−1 < n < 10+2 cm−3 wherethe grain photoelectric heating rate dominates and is in-dependent of density, and the steep increase of nΛCII atn > 102 cm−3 where the C I photoionization heating rateper atom becomes dominant. Note that lc(n) departs fromnΛCII only at n < 10−2 cm−3 where radiative excitationsby CMB radiation dominate collisional excitations.
Comparison between predicted and observed values oflc in the case of the Q2206A damped Lyα system showsthat heating and ionization by background radiation can-not account for the observed 158 µm cooling rate unlessthe densities are higher than n > 103.4 cm−3 for the “WD-low” model shown in Figure 2 (specifically see Figure 2c).But in the case of FUV background heating alone, densi-ties this large are ruled out by the observational constraint,C II/C I > 2×10⁴. The connection between n and C II/C Ifollows from the condition of photoionization equilibrium,which implies
C II
C I∝ G0
α(CI)xn, (5)
where α(CI) is the C I radiative recombination coefficient.In thermal equilibrium C II/C I and x are functions ofn, which are plotted in Figure 2. The low value of G0
(=0.14) and the large lower limit on C II/C I combine toset an upper limit on density, n < 10−2 cm−3 for FUVbackground heating alone. From the lc(n) curve in Figure
2c we see this corresponds to lc < 10−27.8 ergs s−1 H−1
which should be compared to lobsc > 10−26.5 ergs s−1 H−1;
i.e., the 2−σ lower limit denoted by the lower dotted hor-izontal line. This demonstrates that background heatingalone cannot account for the value of lobs
c .Although this discrepancy was derived for the “WD-
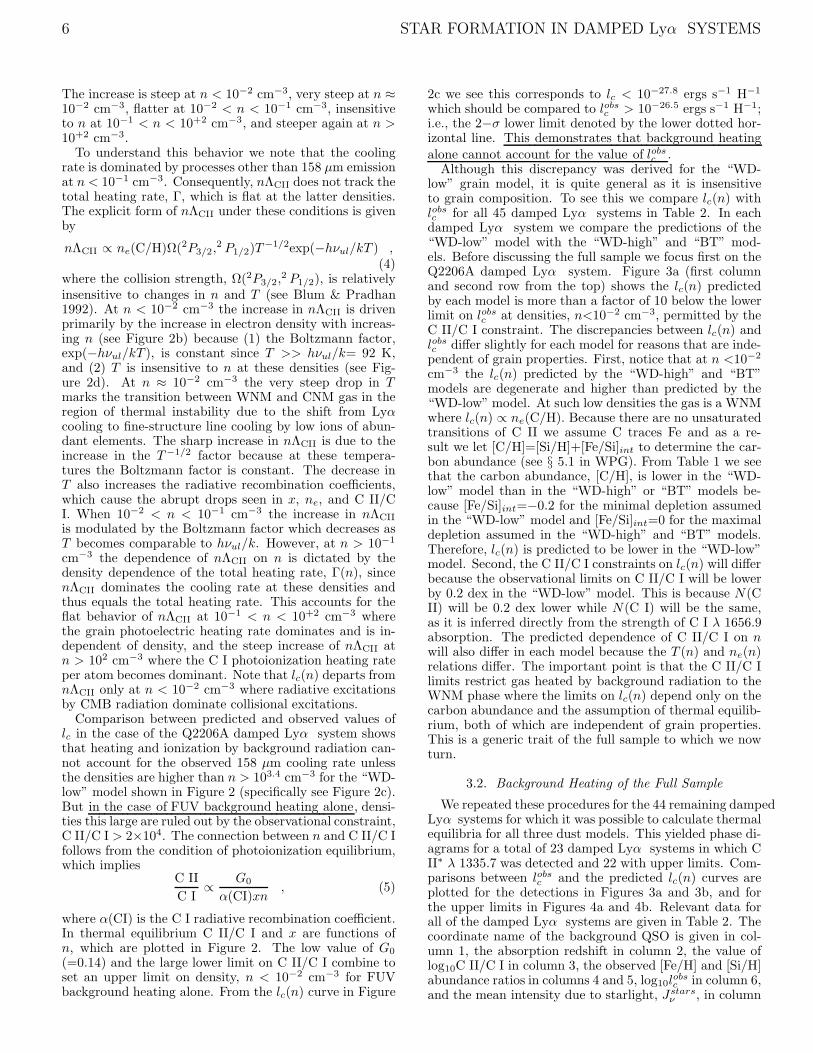
low” grain model, it is quite general as it is insensitiveto grain composition. To see this we compare lc(n) withlobsc for all 45 damped Lyα systems in Table 2. In eachdamped Lyα system we compare the predictions of the“WD-low” model with the “WD-high” and “BT” mod-els. Before discussing the full sample we focus first on theQ2206A damped Lyα system. Figure 3a (first columnand second row from the top) shows the lc(n) predictedby each model is more than a factor of 10 below the lowerlimit on lobs
c at densities, n<10−2 cm−3, permitted by theC II/C I constraint. The discrepancies between lc(n) andlobsc differ slightly for each model for reasons that are inde-pendent of grain properties. First, notice that at n <10−2
cm−3 the lc(n) predicted by the “WD-high” and “BT”models are degenerate and higher than predicted by the“WD-low” model. At such low densities the gas is a WNMwhere lc(n) ∝ ne(C/H). Because there are no unsaturatedtransitions of C II we assume C traces Fe and as a re-sult we let [C/H]=[Si/H]+[Fe/Si]int to determine the car-bon abundance (see § 5.1 in WPG). From Table 1 we seethat the carbon abundance, [C/H], is lower in the “WD-low” model than in the “WD-high” or “BT” models be-cause [Fe/Si]int=−0.2 for the minimal depletion assumedin the “WD-low” model and [Fe/Si]int=0 for the maximaldepletion assumed in the “WD-high” and “BT” models.Therefore, lc(n) is predicted to be lower in the “WD-low”model. Second, the C II/C I constraints on lc(n) will differbecause the observational limits on C II/C I will be lowerby 0.2 dex in the “WD-low” model. This is because N(CII) will be 0.2 dex lower while N(C I) will be the same,as it is inferred directly from the strength of C I λ 1656.9absorption. The predicted dependence of C II/C I on nwill also differ in each model because the T (n) and ne(n)relations differ. The important point is that the C II/C Ilimits restrict gas heated by background radiation to theWNM phase where the limits on lc(n) depend only on thecarbon abundance and the assumption of thermal equilib-rium, both of which are independent of grain properties.This is a generic trait of the full sample to which we nowturn.
3.2. Background Heating of the Full Sample
We repeated these procedures for the 44 remaining dampedLyα systems for which it was possible to calculate thermalequilibria for all three dust models. This yielded phase di-agrams for a total of 23 damped Lyα systems in which CII∗ λ 1335.7 was detected and 22 with upper limits. Com-parisons between lobs
c and the predicted lc(n) curves areplotted for the detections in Figures 3a and 3b, and forthe upper limits in Figures 4a and 4b. Relevant data forall of the damped Lyα systems are given in Table 2. Thecoordinate name of the background QSO is given in col-umn 1, the absorption redshift in column 2, the value oflog10C II/C I in column 3, the observed [Fe/H] and [Si/H]abundance ratios in columns 4 and 5, log10l
obsc in column 6,
and the mean intensity due to starlight, Jstarsν , in column
Wolfe, Prochaska, & Gawiser 7
Fig. 3.— lc(n) curves for 12 damped Lyα systems with positivedetections of C II∗ λ1335.7 absorption. The lc(n) are computedfrom thermal equilibria where heat input is from background radia-tion alone. Solid curves show lc(n) for the “WD-low” model, dashedcurves for the “BT” model, and dotted curves for the “WD-high”model. In all cases the heating mechanisms are grain photoelectricheating and X-ray photoionization. Data are shown as solid hori-zontal lines for log10l
obsc and dotted lines for 1−σ errors in log10l
obsc .
The solid horizontal lines in Q2206−19 and Q0458−02 damped Lyαsystems represent 2−σ lower limits on log10l
obsc . Arrows on lc(n)
curves are upper limits on n imposed by observed lower limit onC II/C I. These become data points and error bars for Q1232+08,Q1331+17, Q2231−00, and Q0812+32 where C II/C I is measured.
7 (see § 5).In Figures 3a and 3b we compare the predicted lc(n)
with lobsc for damped Lyα systems with positive detec-
tions. In every case in Figure 3a and in 9 out of 12 casesin Figure 3b the predictions fall significantly (more than4σlog10lc) below the observations at densities permitted bythe C II/C I ratios (shown as horizontal arrows directedtoward decreasing n). Most of the predicted lc(n) curvesexhibit behavior similar to that described for the Q2206Adamped Lyα system. Specifically, the “WD-high” and“BT” models are degenerate at low n, but diverge at nsufficiently large that lc(n) equals the grain photoelectricheating rate. At the latter densities lc(n) is higher forthe “WD-high” model than the “BT” model because ofthe difference in heating efficiencies. Furthermore, lc(n)for both “WD-high” and “BT” models are higher thanfor the “WD-low” models because the heating efficienciesand κ (Table 1) are higher in the “WD-high” and “BT”models. However, there are differences with the Q2206Aresult. First Figure 3b shows that in some damped Lyαsystems with very low dust-to-gas ratios (e.g. Q0953+47and Q0747+27) lc(n) decreases rather than increases withn above densities corresponding to the WNM−CNM transition zone. This behavior stems from the low values of κ,which suppress grain photo-electric heating in favor of
Fig3b
X-ray heating, which decreases with n (see Figure 2c).Second, lc(n) exhibits a flat plateau at low densities indamped Lyα systems with large redshifts since lc(n) ap-proaches (lc)CMB in the low density limit. Because (lc)CMB
<< lobsc , the CMB has only marginal effect on the [C II]
158 µm emission rate for every damped Lyα system inFigure 3a and most damped Lyα systems in Figure 3b.
On the other hand, background radiation is the likelysource of (lc)obs for two of the 11 positive detections inFigure 3b. Specifically, the CMB is the dominant factorfor the Q0255+00 and Q2241+13 damped Lyα systemswhere (lc)CMB ≈ (lc)obs. It accounts for lobs
c at all den-sities in all three grain models for Q2241+13 5 , and itaccounts for lobs
c in the “WD-high” and “BT” models forQ0255+00. But since the “WD-low” model predicts lc(n)to be 2.6σlog10lc below lobs
c at low n, a heat source in ad-dition to background radiation may be required for thelatter damped Lyα system. The CMB is unlikely to ex-plain lobs
c for any of the remaining damped Lyα systemswith positive detections of C II∗ absorption. Therefore,with one exception we find that log10l
obsc −log10lc(n) ≥
3σlog10lc at densities permitted by the C II/C I constraintwhen lc(n) is calculated under the assumption that exter-nal background radiation is the sole source of heating. Theexception is the Q1346−03 damped Lyα system (see Fig-ure 3b) in which heating by X-ray background radiationcan account for lobs
c when 1 < n < 25 cm−3. Therefore, weconclude that background radiation alone cannot explain
5The “WD-low” model for the Q2241+13 damped Lyα system isdegenerate with the “WD-high” and “BT” models in Figure 3b sincewe assumed maximal rather than minimal depletion. This occursbecause [Fe/Si]gas > − 0.2 in this and in the Q0201+11, Q1021+30,Q1506+52, and Q2344+12 damped Lyα systems.
8 STAR FORMATION IN DAMPED Lyα SYSTEMS
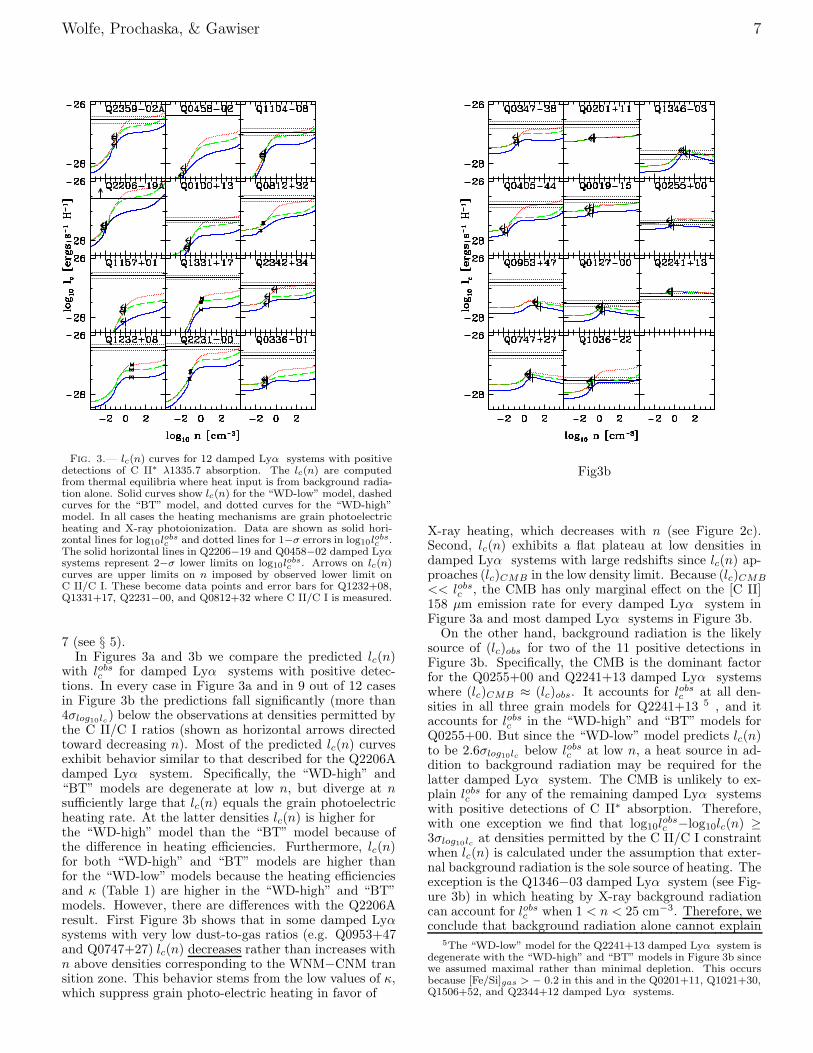
Table 2
DLA PROPERTY
log10(C II/C I)c [Fe/H] [Si/H] log10lc G0f
QSO zabs erg s−1 H−1
(1) (2) (3) (4) (5) (6) (7)
Q0019−15a 3.439 >3.44 −1.59±0.11 −1.06±0.11 −26.61±0.10 6.8Q0100+13a 2.309 >4.14 − 1.90±0.09 −1.46±0.08 −27.30±0.07 2.4
Q0127−00b 3.727 >2.87 − 2.60±0.09 −2.18±0.23 −27.53±0.12 1.5 (21.8)
Q0133+04Ab 3.773 >3.38 − 0.90±0.10 −0.64±0.10 < −25.92 ....
Q0133+04Bb 3.692 >2.30 − 2.69±0.10 −2.00±0.20 < −27.66 ....Q0149+33a 2.141 >2.80 − 1.77±0.10 −1.49±0.11 < −27.24 ....Q0201+11a 3.387 >3.22 − 1.41±0.11 −1.25±0.15 −26.67±0.14 5.4
Q0209+52b 3.864 >1.71 − 2.89±0.20 −2.65±0.10 < −27.12 ....Q0255+00a 3.915 >3.23 −2.05±0.10 −1.78±0.05 −27.38±0.07 1.1 (17.3)Q0307−49a 4.466 >2.79 − 1.96±0.22 −1.55±0.12 < −26.60 ....Q0336−01a 3.062 >3.86 −1.80±0.11 −1.41±0.10 −26.68±0.10 12.2Q0347−38a 3.025 >3.33 −1.62±0.08 −1.17±0.03 −26.68±0.03 6.8
Q0405−44b 2.595 > 4.58 −1.33±0.11 −0.96±0.19 −26.76±0.10 6.1Q0458−02a 2.039 > 4.60 −1.77±0.10 −1.19±0.09 > −26.38 >19.1Q0741+47a 3.017 >2.85 −1.93±0.10 −1.69±0.10 < −27.45 ....
Q0747+27b 3.900 >2.44 −2.53±0.10 −2.03±0.10 −26.67±0.14 17.3
Q0812+32b 2.626 4.07±0.10 −1.74±0.10 −0.96±0.10 −26.58±0.10 9.4Q0836+11a 2.465 >3.31 −1.40±0.10 −1.15±0.11 < −26.98 ....
Q0953+47b 4.244 >1.96 −2.50±0.17 −2.23±0.15 −26.82±0.21 17.3
Q1021+30b 2.949 >2.35 −2.32±0.12 −2.17±0.10 < −27.31 ....
Q1036−22b 2.773 >3.65 −1.82±0.10 −1.41±0.10 −27.65±0.14 (12.2)Q1104−18a 1.661 >3.87 −1.48±0.10 −1.04±0.10 −26.88±0.11 4.3Q1108+22a 3.608 >2.70 −2.12±0.10 −1.80±0.11 < −27.68 ....
Q1132+22b 2.783 >2.95 −2.48±0.10 −2.07±0.16 < −27.59 ....
Q1157+01b 1.944 >3.34 −1.81±0.11 −1.37±0.12 −26.58±0.13 15.3Q1202−07a 4.383 .....e −2.19±0.19 −1.81±0.14 < −27.06 ....Q1215+33a 1.999 >3.53 −1.70±0.09 −1.48±0.07 < −27.30 ....Q1223+17a 2.466 >4.07 −1.84±0.10 −1.59±0.10 < −27.02 ....Q1232+08a 2.337 2.41±0.10 −1.72±0.13 −1.22±0.15 −26.42±0.14 17.1Q1331+17a 1.776 2.93±0.10 −2.06±0.41 −1.45±0.04 −26.65±0.07 10.8
Q1337+11b 2.795 >2.59 −2.39±0.10 −1.79±0.15 < −27.38 ....Q1346−03a 3.736 >2.13 −2.63±0.10 −2.33±0.10 −27.69±0.15 0.35 (15.4)
Q1354−17b 2.780 >1.82 −2.43±0.17 −1.88±0.16 < −26.99 ....
Q1506+52b 3.224 >2.13 −2.46±0.10 −2.30±0.15 < −27.30 ....Q1946+76a 2.884 >2.83 −2.53±0.06 −2.23±0.06 < −27.33 ....
Q2206−19Aa 1.919 >4.48 −0.86±0.06 −0.42±0.07 −26.20+0.18−0.32
d 22.8
Q2206−19Bb 2.076 >2.22 −2.61±0.06 −2.31±0.07 < −26.80 ....Q2231−00a 2.066 3.58±0.10 −1.40±0.12 −0.88±0.10 −26.38±0.11 13.4Q2237−06a 4.080 .....e −2.14±0.17 −1.87±0.11 < −27.51 ....
Q2241+13b 4.282 >3.07 −1.90±0.11 −1.78±0.11 −27.29±0.14 ....
Q2334−09b 3.057 >3.29 −1.63±0.10 −1.15±0.12 < −27.04 ....
Q2342+34b 2.908 >3.59 −1.62±0.12 −1.19±0.11 −26.92±0.13 4.3
Q2344+12b 2.538 >2.41 −1.83±0.11 −1.74±0.12 < −26.93 ....Q2348−14a 2.279 >3.09 −2.24±0.08 −1.92±0.08 −26.88±0.12 10.9Q2359−02Aa 2.095 >3.52 −1.66±0.10 −0.78±0.10 −26.52±0.12 8.2
aData from WPGbData presented here for the first timecEstimates derived assuming [C/H]=[Si/H], which is appropriate for the “WD-high” and “BT” model. Estimates for the “WD-low” models are0.2 dex lower (see Table 1
dIn this case errors are 2−σeWavelength regions covering C I transitions not observedfEntries are CNM solutions for Jstars
ν ( in units of 10−19 ergs cm−2 s−1 Hz−1 sr−1) in damped Lyα systems with positive detections. Numbersin parentheses denote WNM solutions for cases where WNM hypothesis is plausible.
the inferred 158 µm emission in 20 out of the 23 positivedetections in Figures 3a and 3b. In each of the 20 casesan internal source of heating is required.
Figures 4a and 4b show lc(n) curves predicted for the 22damped Lyα systems with upper limits on lobs
c . As for thedamped Lyα systems with positive detections, lobs
c exceedslc(n) in most cases. But there is an important difference:since lobs
c in Figures 4a and 4b are upper limits, the dis-crepancy with the model predictions need not require thepresence of internal heat sources. Thus, if the true lobs
c re-vealed by future detections of C II∗ absorption intersectedthe lc(n) curves, then background heating could accountfor the C II cooling rates, provided the gas density sat-isfied the condition lc(n)=lobs
c , which defines the densityn=nBKD. Because nBKD lies in the WNM phase for everydamped Lyα system shown in Figure 4, the gas would bea WNM. Most of the damped Lyα systems illustrated inFigure 4 are candidates for this condition since the upperlimits on lobs
c are typically less than 0.2 dex above lc(n).But, internal heating would be required if the true lobs
c
remain above the lc(n) curves for all n. This is clearlypossible for the damped Lyα systems toward Q1223+17,Q2348−14, Q2206−19A, and Q0209+52 where the upperlimits on lobs
c are typically more than 0.5 dex above thepeaks in the lc(n) curves. In § 5.2 we show that internalheating may also be present even when lobs
c dips below thepeaks of the lc(n) curves, which we emphasize are pre-dicted for the case of background heating alone.
To summarize, the evidence discussed so far suggests thefollowing: Most damped Lyα systems with positive detections of C II∗ absorption require internal heat sources,and we are able to rule out the hypothesis that dampedLyα systems with upper limits on C II∗ absorption consistof CNM gas heated by background radiation alone. In§ 4 we discuss independent evidence for internal heatingby starlight for one damped Lyα system in which C II∗
absorption is detected. In § 5 we consider this possibilityfor all the damped Lyα systems in Table 2, includingthose with upper limits on C II∗ absorption.
Wolfe, Prochaska, & Gawiser 9
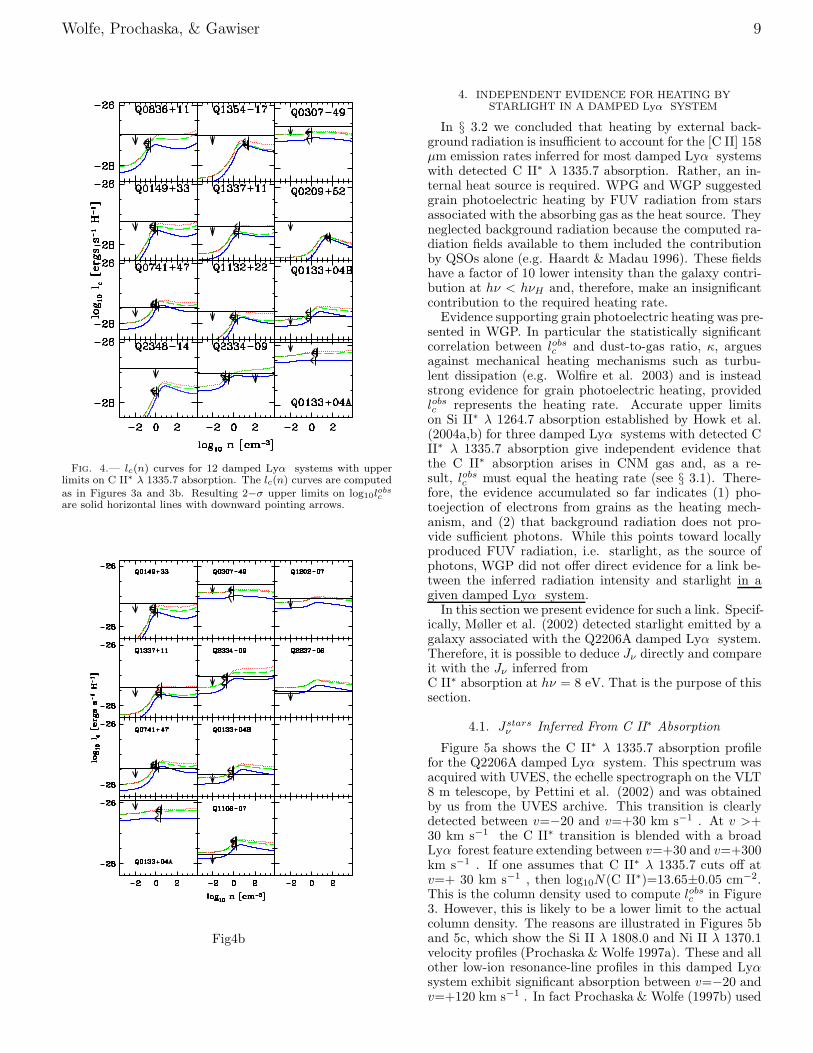
Fig. 4.— lc(n) curves for 12 damped Lyα systems with upperlimits on C II∗ λ 1335.7 absorption. The lc(n) curves are computedas in Figures 3a and 3b. Resulting 2−σ upper limits on log10l
obsc
are solid horizontal lines with downward pointing arrows.
Fig4b
4. INDEPENDENT EVIDENCE FOR HEATING BYSTARLIGHT IN A DAMPED Lyα SYSTEM
In § 3.2 we concluded that heating by external back-ground radiation is insufficient to account for the [C II] 158µm emission rates inferred for most damped Lyα systemswith detected C II∗ λ 1335.7 absorption. Rather, an in-ternal heat source is required. WPG and WGP suggestedgrain photoelectric heating by FUV radiation from starsassociated with the absorbing gas as the heat source. Theyneglected background radiation because the computed ra-diation fields available to them included the contributionby QSOs alone (e.g. Haardt & Madau 1996). These fieldshave a factor of 10 lower intensity than the galaxy contri-bution at hν < hνH and, therefore, make an insignificantcontribution to the required heating rate.
Evidence supporting grain photoelectric heating was pre-sented in WGP. In particular the statistically significantcorrelation between lobs
c and dust-to-gas ratio, κ, arguesagainst mechanical heating mechanisms such as turbu-lent dissipation (e.g. Wolfire et al. 2003) and is insteadstrong evidence for grain photoelectric heating, providedlobsc represents the heating rate. Accurate upper limitson Si II∗ λ 1264.7 absorption established by Howk et al.(2004a,b) for three damped Lyα systems with detected CII∗ λ 1335.7 absorption give independent evidence thatthe C II∗ absorption arises in CNM gas and, as a re-sult, lobs
c must equal the heating rate (see § 3.1). There-fore, the evidence accumulated so far indicates (1) pho-toejection of electrons from grains as the heating mech-anism, and (2) that background radiation does not pro-vide sufficient photons. While this points toward locallyproduced FUV radiation, i.e. starlight, as the source ofphotons, WGP did not offer direct evidence for a link be-tween the inferred radiation intensity and starlight in agiven damped Lyα system.
In this section we present evidence for such a link. Specif-ically, Møller et al. (2002) detected starlight emitted by agalaxy associated with the Q2206A damped Lyα system.Therefore, it is possible to deduce Jν directly and compareit with the Jν inferred fromC II∗ absorption at hν = 8 eV. That is the purpose of thissection.
4.1. Jstarsν Inferred From C II∗ Absorption
Figure 5a shows the C II∗ λ 1335.7 absorption profilefor the Q2206A damped Lyα system. This spectrum wasacquired with UVES, the echelle spectrograph on the VLT8 m telescope, by Pettini et al. (2002) and was obtainedby us from the UVES archive. This transition is clearlydetected between v=−20 and v=+30 km s−1 . At v >+30 km s−1 the C II∗ transition is blended with a broadLyα forest feature extending between v=+30 and v=+300km s−1 . If one assumes that C II∗ λ 1335.7 cuts off atv=+ 30 km s−1 , then log10N(C II∗)=13.65±0.05 cm−2.This is the column density used to compute lobs
c in Figure3. However, this is likely to be a lower limit to the actualcolumn density. The reasons are illustrated in Figures 5band 5c, which show the Si II λ 1808.0 and Ni II λ 1370.1velocity profiles (Prochaska & Wolfe 1997a). These and allother low-ion resonance-line profiles in this damped Lyαsystem exhibit significant absorption between v=−20 andv=+120 km s−1 . In fact Prochaska & Wolfe (1997b) used
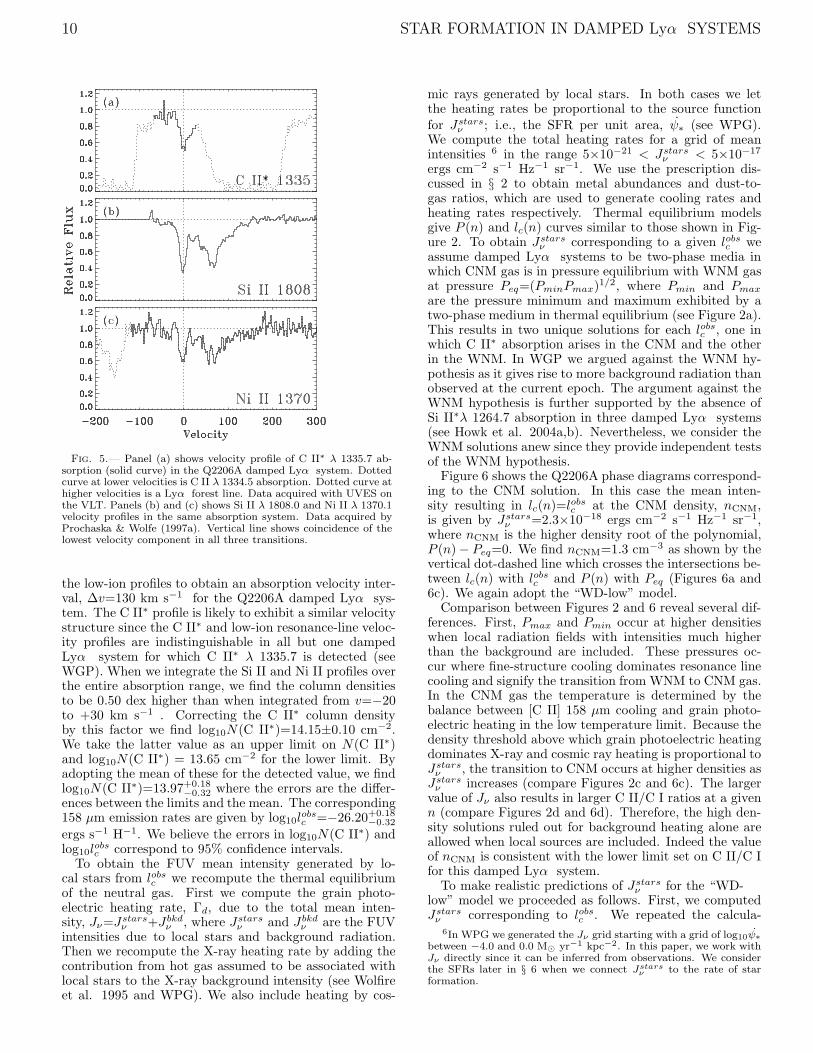
10 STAR FORMATION IN DAMPED Lyα SYSTEMS
Fig. 5.— Panel (a) shows velocity profile of C II∗ λ 1335.7 ab-sorption (solid curve) in the Q2206A damped Lyα system. Dottedcurve at lower velocities is C II λ 1334.5 absorption. Dotted curve athigher velocities is a Lyα forest line. Data acquired with UVES onthe VLT. Panels (b) and (c) shows Si II λ 1808.0 and Ni II λ 1370.1velocity profiles in the same absorption system. Data acquired byProchaska & Wolfe (1997a). Vertical line shows coincidence of thelowest velocity component in all three transitions.
the low-ion profiles to obtain an absorption velocity inter-val, ∆v=130 km s−1 for the Q2206A damped Lyα sys-tem. The C II∗ profile is likely to exhibit a similar velocitystructure since the C II∗ and low-ion resonance-line veloc-ity profiles are indistinguishable in all but one dampedLyα system for which C II∗ λ 1335.7 is detected (seeWGP). When we integrate the Si II and Ni II profiles overthe entire absorption range, we find the column densitiesto be 0.50 dex higher than when integrated from v=−20to +30 km s−1 . Correcting the C II∗ column densityby this factor we find log10N(C II∗)=14.15±0.10 cm−2.We take the latter value as an upper limit on N(C II∗)and log10N(C II∗) = 13.65 cm−2 for the lower limit. Byadopting the mean of these for the detected value, we findlog10N(C II∗)=13.97+0.18
−0.32 where the errors are the differ-ences between the limits and the mean. The corresponding158 µm emission rates are given by log10l
obsc =−26.20+0.18
−0.32
ergs s−1 H−1. We believe the errors in log10N(C II∗) andlog10l
obsc correspond to 95% confidence intervals.
To obtain the FUV mean intensity generated by lo-cal stars from lobs
c we recompute the thermal equilibriumof the neutral gas. First we compute the grain photo-electric heating rate, Γd, due to the total mean inten-sity, Jν=Jstars
ν +Jbkdν , where Jstars
ν and Jbkdν are the FUV
intensities due to local stars and background radiation.Then we recompute the X-ray heating rate by adding thecontribution from hot gas assumed to be associated withlocal stars to the X-ray background intensity (see Wolfireet al. 1995 and WPG). We also include heating by cos-
mic rays generated by local stars. In both cases we letthe heating rates be proportional to the source functionfor Jstars
ν ; i.e., the SFR per unit area, ψ∗ (see WPG).We compute the total heating rates for a grid of meanintensities 6 in the range 5×10⁻²¹ < Jstars
ν < 5×10⁻¹⁷
ergs cm−2 s−1 Hz−1 sr−1. We use the prescription dis-cussed in § 2 to obtain metal abundances and dust-to-gas ratios, which are used to generate cooling rates andheating rates respectively. Thermal equilibrium modelsgive P (n) and lc(n) curves similar to those shown in Fig-ure 2. To obtain Jstars
ν corresponding to a given lobsc we
assume damped Lyα systems to be two-phase media inwhich CNM gas is in pressure equilibrium with WNM gasat pressure Peq=(PminPmax)1/2, where Pmin and Pmax
are the pressure minimum and maximum exhibited by atwo-phase medium in thermal equilibrium (see Figure 2a).This results in two unique solutions for each lobs
c , one inwhich C II∗ absorption arises in the CNM and the otherin the WNM. In WGP we argued against the WNM hy-pothesis as it gives rise to more background radiation thanobserved at the current epoch. The argument against theWNM hypothesis is further supported by the absence ofSi II∗λ 1264.7 absorption in three damped Lyα systems(see Howk et al. 2004a,b). Nevertheless, we consider theWNM solutions anew since they provide independent testsof the WNM hypothesis.
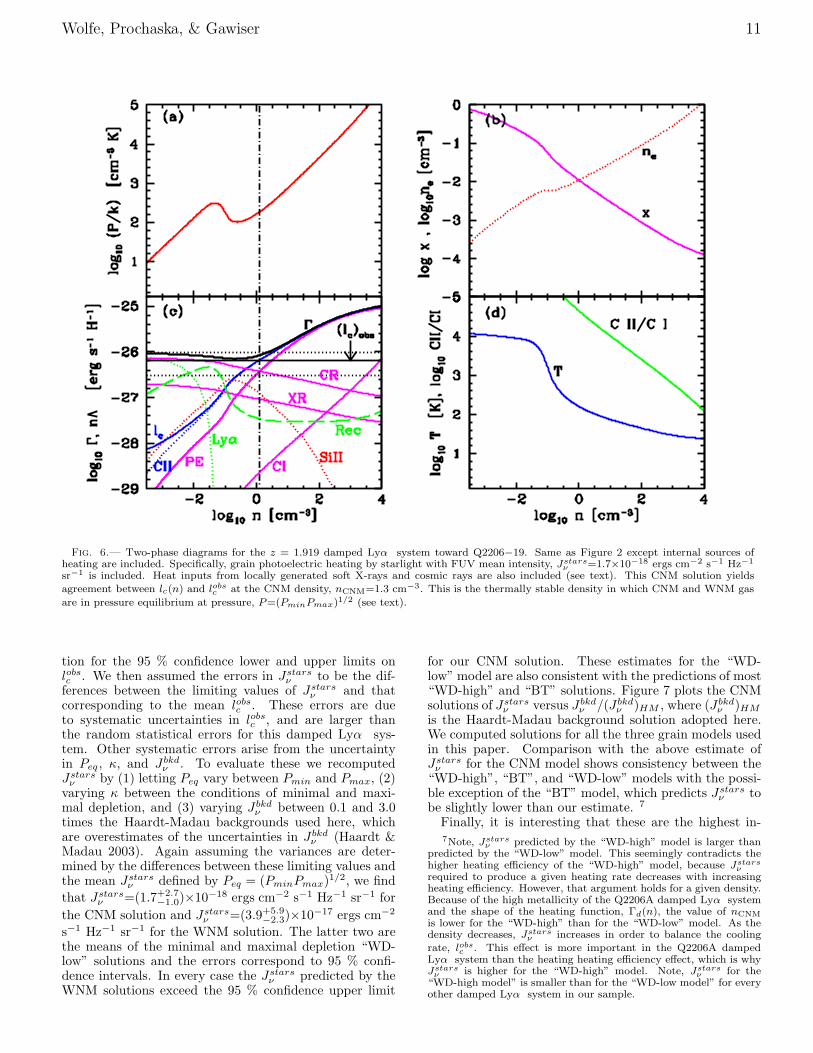
Figure 6 shows the Q2206A phase diagrams correspond-ing to the CNM solution. In this case the mean inten-sity resulting in lc(n)=lobs
c at the CNM density, nCNM,is given by Jstars
ν =2.3×10⁻¹⁸ ergs cm−2 s−1 Hz−1 sr−1,where nCNM is the higher density root of the polynomial,P (n) − Peq=0. We find nCNM=1.3 cm−3 as shown by thevertical dot-dashed line which crosses the intersections be-tween lc(n) with lobs
c and P (n) with Peq (Figures 6a and6c). We again adopt the “WD-low” model.
Comparison between Figures 2 and 6 reveal several dif-ferences. First, Pmax and Pmin occur at higher densitieswhen local radiation fields with intensities much higherthan the background are included. These pressures oc-cur where fine-structure cooling dominates resonance linecooling and signify the transition from WNM to CNM gas.In the CNM gas the temperature is determined by thebalance between [C II] 158 µm cooling and grain photo-electric heating in the low temperature limit. Because thedensity threshold above which grain photoelectric heatingdominates X-ray and cosmic ray heating is proportional toJstars
ν , the transition to CNM occurs at higher densities asJstars
ν increases (compare Figures 2c and 6c). The largervalue of Jν also results in larger C II/C I ratios at a givenn (compare Figures 2d and 6d). Therefore, the high den-sity solutions ruled out for background heating alone areallowed when local sources are included. Indeed the valueof nCNM is consistent with the lower limit set on C II/C Ifor this damped Lyα system.
To make realistic predictions of Jstarsν for the “WD-
low” model we proceeded as follows. First, we computedJstars
ν corresponding to lobsc . We repeated the calcula-
6In WPG we generated the Jν grid starting with a grid of log10ψ∗
between −4.0 and 0.0 M⊙ yr−1 kpc−2. In this paper, we work withJν directly since it can be inferred from observations. We considerthe SFRs later in § 6 when we connect Jstars
ν to the rate of starformation.
Wolfe, Prochaska, & Gawiser 11
Fig. 6.— Two-phase diagrams for the z = 1.919 damped Lyα system toward Q2206−19. Same as Figure 2 except internal sources ofheating are included. Specifically, grain photoelectric heating by starlight with FUV mean intensity, Jstars
ν =1.7×10⁻¹⁸ ergs cm−2 s−1 Hz−1
sr−1 is included. Heat inputs from locally generated soft X-rays and cosmic rays are also included (see text). This CNM solution yieldsagreement between lc(n) and lobs
c at the CNM density, nCNM=1.3 cm−3. This is the thermally stable density in which CNM and WNM gas
are in pressure equilibrium at pressure, P=(PminPmax)1/2 (see text).
tion for the 95 % confidence lower and upper limits onlobsc . We then assumed the errors in Jstars
ν to be the dif-ferences between the limiting values of Jstars
ν and thatcorresponding to the mean lobs
c . These errors are dueto systematic uncertainties in lobs
c , and are larger thanthe random statistical errors for this damped Lyα sys-tem. Other systematic errors arise from the uncertaintyin Peq , κ, and Jbkd
ν . To evaluate these we recomputedJstars
ν by (1) letting Peq vary between Pmin and Pmax, (2)varying κ between the conditions of minimal and maxi-mal depletion, and (3) varying Jbkd
ν between 0.1 and 3.0times the Haardt-Madau backgrounds used here, whichare overestimates of the uncertainties in Jbkd
ν (Haardt &Madau 2003). Again assuming the variances are deter-mined by the differences between these limiting values andthe mean Jstars
ν defined by Peq = (PminPmax)1/2, we find
that Jstarsν =(1.7+2.7
−1.0)×10−18 ergs cm−2 s−1 Hz−1 sr−1 for
the CNM solution and Jstarsν =(3.9+5.9
−2.3)×10−17 ergs cm−2
s−1 Hz−1 sr−1 for the WNM solution. The latter two arethe means of the minimal and maximal depletion “WD-low” solutions and the errors correspond to 95 % confi-dence intervals. In every case the Jstars
ν predicted by theWNM solutions exceed the 95 % confidence upper limit
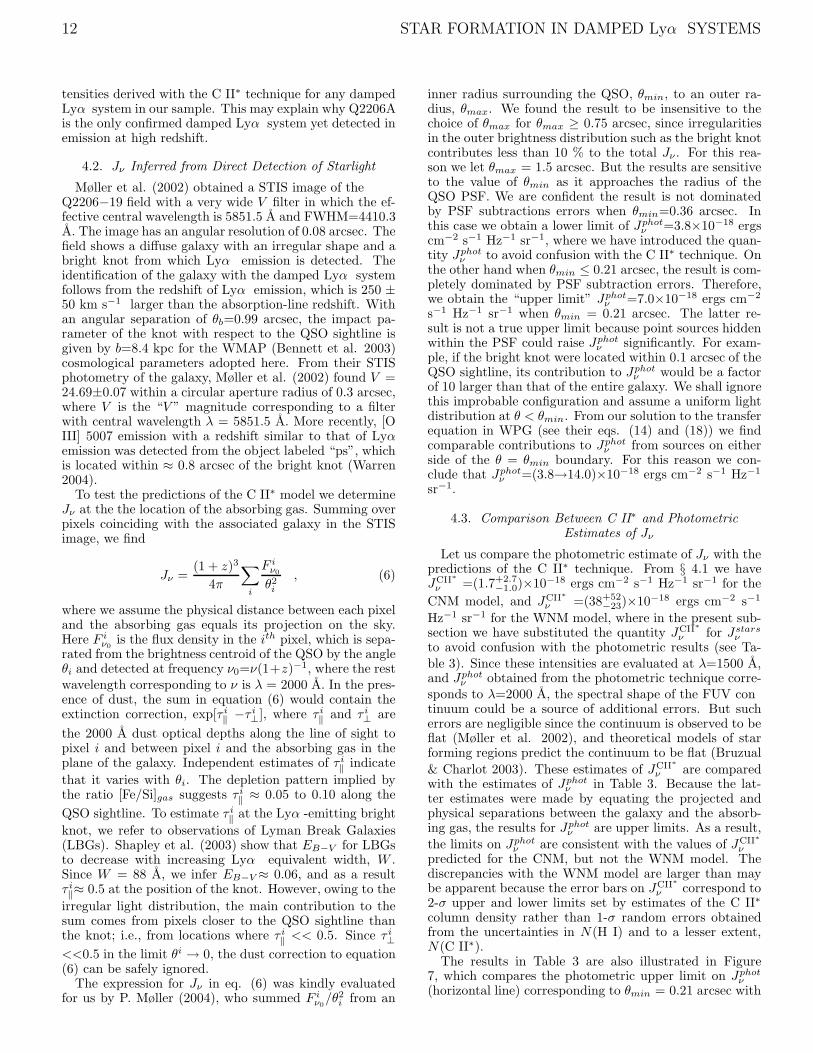
for our CNM solution. These estimates for the “WD-low” model are also consistent with the predictions of most“WD-high” and “BT” solutions. Figure 7 plots the CNMsolutions of Jstars
ν versus Jbkdν /(Jbkd
ν )HM , where (Jbkdν )HM
is the Haardt-Madau background solution adopted here.We computed solutions for all the three grain models usedin this paper. Comparison with the above estimate ofJstars
ν for the CNM model shows consistency between the“WD-high”, “BT”, and “WD-low” models with the possi-ble exception of the “BT” model, which predicts Jstars
ν tobe slightly lower than our estimate. 7
Finally, it is interesting that these are the highest in-7Note, Jstars
ν predicted by the “WD-high” model is larger thanpredicted by the “WD-low” model. This seemingly contradicts thehigher heating efficiency of the “WD-high” model, because Jstars
νrequired to produce a given heating rate decreases with increasingheating efficiency. However, that argument holds for a given density.Because of the high metallicity of the Q2206A damped Lyα systemand the shape of the heating function, Γd(n), the value of nCNMis lower for the “WD-high” than for the “WD-low” model. As thedensity decreases, Jstars
ν increases in order to balance the coolingrate, lobs
c . This effect is more important in the Q2206A dampedLyα system than the heating heating efficiency effect, which is whyJstars
ν is higher for the “WD-high” model. Note, Jstarsν for the
“WD-high model” is smaller than for the “WD-low model” for everyother damped Lyα system in our sample.
12 STAR FORMATION IN DAMPED Lyα SYSTEMS
tensities derived with the C II∗ technique for any dampedLyα system in our sample. This may explain why Q2206Ais the only confirmed damped Lyα system yet detected inemission at high redshift.
4.2. Jν Inferred from Direct Detection of Starlight
Møller et al. (2002) obtained a STIS image of theQ2206−19 field with a very wide V filter in which the ef-fective central wavelength is 5851.5 A and FWHM=4410.3A. The image has an angular resolution of 0.08 arcsec. Thefield shows a diffuse galaxy with an irregular shape and abright knot from which Lyα emission is detected. Theidentification of the galaxy with the damped Lyα systemfollows from the redshift of Lyα emission, which is 250 ±50 km s−1 larger than the absorption-line redshift. Withan angular separation of θb=0.99 arcsec, the impact pa-rameter of the knot with respect to the QSO sightline isgiven by b=8.4 kpc for the WMAP (Bennett et al. 2003)cosmological parameters adopted here. From their STISphotometry of the galaxy, Møller et al. (2002) found V =24.69±0.07 within a circular aperture radius of 0.3 arcsec,where V is the “V ” magnitude corresponding to a filterwith central wavelength λ = 5851.5 A. More recently, [OIII] 5007 emission with a redshift similar to that of Lyαemission was detected from the object labeled “ps”, whichis located within ≈ 0.8 arcsec of the bright knot (Warren2004).
To test the predictions of the C II∗ model we determineJν at the the location of the absorbing gas. Summing overpixels coinciding with the associated galaxy in the STISimage, we find
Jν =(1 + z)3
4π
∑
i
F iν0
θ2i, (6)
where we assume the physical distance between each pixeland the absorbing gas equals its projection on the sky.Here F i
ν0is the flux density in the ith pixel, which is sepa-
rated from the brightness centroid of the QSO by the angleθi and detected at frequency ν0=ν(1+z)−1, where the restwavelength corresponding to ν is λ = 2000 A. In the pres-ence of dust, the sum in equation (6) would contain theextinction correction, exp[τ i
‖ −τ i⊥], where τ i
‖ and τ i⊥ are
the 2000 A dust optical depths along the line of sight topixel i and between pixel i and the absorbing gas in theplane of the galaxy. Independent estimates of τ i
‖ indicate
that it varies with θi. The depletion pattern implied bythe ratio [Fe/Si]gas suggests τ i
‖ ≈ 0.05 to 0.10 along the
QSO sightline. To estimate τ i‖ at the Lyα -emitting bright
knot, we refer to observations of Lyman Break Galaxies(LBGs). Shapley et al. (2003) show that EB−V for LBGsto decrease with increasing Lyα equivalent width, W .Since W = 88 A, we infer EB−V ≈ 0.06, and as a resultτ i‖≈ 0.5 at the position of the knot. However, owing to the
irregular light distribution, the main contribution to thesum comes from pixels closer to the QSO sightline thanthe knot; i.e., from locations where τ i
‖ << 0.5. Since τ i⊥
<<0.5 in the limit θi → 0, the dust correction to equation(6) can be safely ignored.
The expression for Jν in eq. (6) was kindly evaluatedfor us by P. Møller (2004), who summed F i
ν0/θ2i from an
inner radius surrounding the QSO, θmin, to an outer ra-dius, θmax. We found the result to be insensitive to thechoice of θmax for θmax ≥ 0.75 arcsec, since irregularitiesin the outer brightness distribution such as the bright knotcontributes less than 10 % to the total Jν . For this rea-son we let θmax = 1.5 arcsec. But the results are sensitiveto the value of θmin as it approaches the radius of theQSO PSF. We are confident the result is not dominatedby PSF subtractions errors when θmin=0.36 arcsec. Inthis case we obtain a lower limit of Jphot
ν =3.8×10⁻¹⁸ ergscm−2 s−1 Hz−1 sr−1, where we have introduced the quan-tity Jphot
ν to avoid confusion with the C II∗ technique. Onthe other hand when θmin ≤ 0.21 arcsec, the result is com-pletely dominated by PSF subtraction errors. Therefore,we obtain the “upper limit” Jphot
ν =7.0×10⁻¹⁸ ergs cm−2
s−1 Hz−1 sr−1 when θmin = 0.21 arcsec. The latter re-sult is not a true upper limit because point sources hiddenwithin the PSF could raise Jphot
ν significantly. For exam-ple, if the bright knot were located within 0.1 arcsec of theQSO sightline, its contribution to Jphot
ν would be a factorof 10 larger than that of the entire galaxy. We shall ignorethis improbable configuration and assume a uniform lightdistribution at θ < θmin. From our solution to the transferequation in WPG (see their eqs. (14) and (18)) we findcomparable contributions to Jphot
ν from sources on eitherside of the θ = θmin boundary. For this reason we con-clude that Jphot
ν =(3.8→14.0)×10−18 ergs cm−2 s−1 Hz−1
sr−1.
4.3. Comparison Between C II∗ and PhotometricEstimates of Jν
Let us compare the photometric estimate of Jν with thepredictions of the C II∗ technique. From § 4.1 we haveJCII∗
ν =(1.7+2.7−1.0)×10−18 ergs cm−2 s−1 Hz−1 sr−1 for the
CNM model, and JCII∗
ν =(38+52−23)×10−18 ergs cm−2 s−1
Hz−1 sr−1 for the WNM model, where in the present sub-section we have substituted the quantity JCII∗
ν for Jstarsν
to avoid confusion with the photometric results (see Ta-ble 3). Since these intensities are evaluated at λ=1500 A,and Jphot
ν obtained from the photometric technique corre-sponds to λ=2000 A, the spectral shape of the FUV continuum could be a source of additional errors. But sucherrors are negligible since the continuum is observed to beflat (Møller et al. 2002), and theoretical models of starforming regions predict the continuum to be flat (Bruzual
& Charlot 2003). These estimates of JCII∗
ν are comparedwith the estimates of Jphot
ν in Table 3. Because the lat-ter estimates were made by equating the projected andphysical separations between the galaxy and the absorb-ing gas, the results for Jphot
ν are upper limits. As a result,the limits on Jphot
ν are consistent with the values of JCII∗
νpredicted for the CNM, but not the WNM model. Thediscrepancies with the WNM model are larger than maybe apparent because the error bars on JCII∗
ν correspond to2-σ upper and lower limits set by estimates of the C II∗
column density rather than 1-σ random errors obtainedfrom the uncertainties in N(H I) and to a lesser extent,N(C II∗).
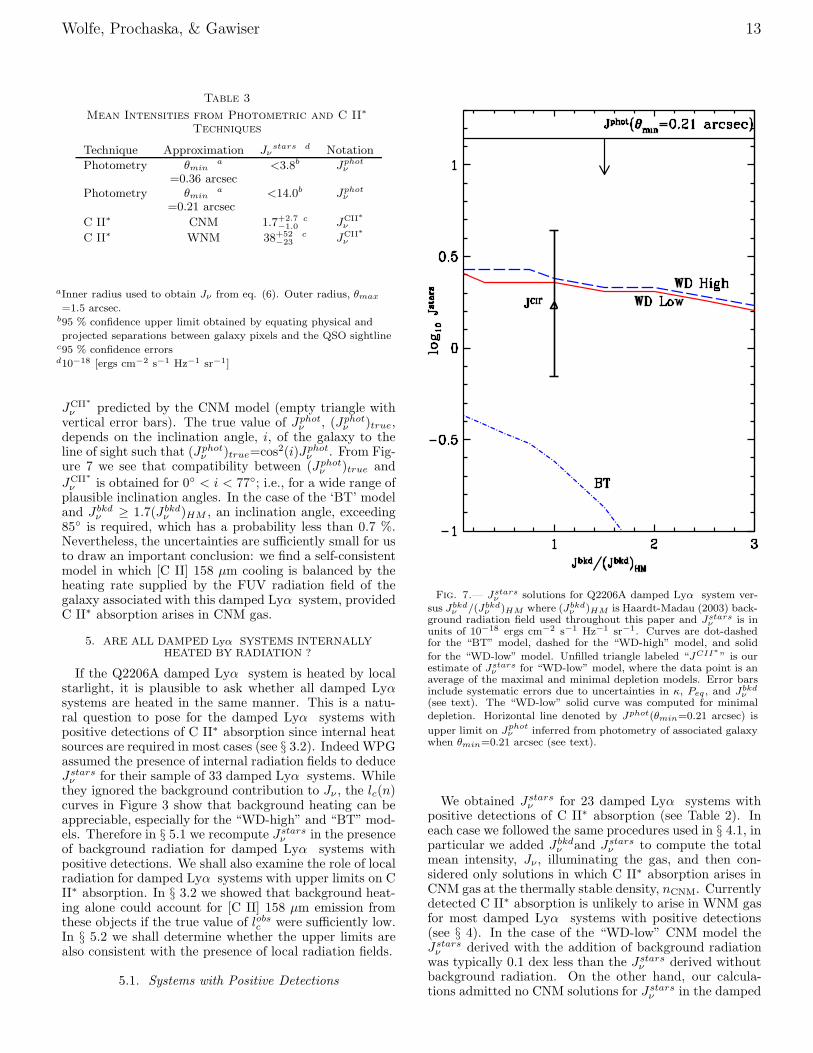
The results in Table 3 are also illustrated in Figure7, which compares the photometric upper limit on Jphot
ν(horizontal line) corresponding to θmin = 0.21 arcsec with
Wolfe, Prochaska, & Gawiser 13
Table 3
Mean Intensities from Photometric and C II∗
Techniques
Technique Approximation Jνstars d Notation
Photometry θmina
<3.8bJ
photν
=0.36 arcsecPhotometry θmin
a<14.0b
Jphotν
=0.21 arcsec
C II∗ CNM 1.7+2.7−1.0
cJ
CII∗
ν
C II∗ WNM 38+52−23
cJ
CII∗
ν
aInner radius used to obtain Jν from eq. (6). Outer radius, θmax
=1.5 arcsec.b95 % confidence upper limit obtained by equating physical and
projected separations between galaxy pixels and the QSO sightlinec95 % confidence errorsd10−18 [ergs cm−2 s−1 Hz−1 sr−1]
JCII∗
ν predicted by the CNM model (empty triangle withvertical error bars). The true value of Jphot
ν , (Jphotν )true,
depends on the inclination angle, i, of the galaxy to theline of sight such that (Jphot
ν )true=cos2(i)Jphotν . From Fig-
ure 7 we see that compatibility between (Jphotν )true and
JCII∗
ν is obtained for 0 < i < 77; i.e., for a wide range ofplausible inclination angles. In the case of the ‘BT’ modeland Jbkd
ν ≥ 1.7(Jbkdν )HM , an inclination angle, exceeding
85 is required, which has a probability less than 0.7 %.Nevertheless, the uncertainties are sufficiently small for usto draw an important conclusion: we find a self-consistentmodel in which [C II] 158 µm cooling is balanced by theheating rate supplied by the FUV radiation field of thegalaxy associated with this damped Lyα system, providedC II∗ absorption arises in CNM gas.
5. ARE ALL DAMPED Lyα SYSTEMS INTERNALLYHEATED BY RADIATION ?
If the Q2206A damped Lyα system is heated by localstarlight, it is plausible to ask whether all damped Lyαsystems are heated in the same manner. This is a natu-ral question to pose for the damped Lyα systems withpositive detections of C II∗ absorption since internal heatsources are required in most cases (see § 3.2). Indeed WPGassumed the presence of internal radiation fields to deduceJstars
ν for their sample of 33 damped Lyα systems. Whilethey ignored the background contribution to Jν , the lc(n)curves in Figure 3 show that background heating can beappreciable, especially for the “WD-high” and “BT” mod-els. Therefore in § 5.1 we recompute Jstars
ν in the presenceof background radiation for damped Lyα systems withpositive detections. We shall also examine the role of localradiation for damped Lyα systems with upper limits on CII∗ absorption. In § 3.2 we showed that background heat-ing alone could account for [C II] 158 µm emission fromthese objects if the true value of lobs
c were sufficiently low.In § 5.2 we shall determine whether the upper limits arealso consistent with the presence of local radiation fields.
5.1. Systems with Positive Detections
Fig. 7.— Jstarsν solutions for Q2206A damped Lyα system ver-
sus Jbkdν /(Jbkd
ν )HM where (Jbkdν )HM is Haardt-Madau (2003) back-
ground radiation field used throughout this paper and Jstarsν is in
units of 10−18 ergs cm−2 s−1 Hz−1 sr−1. Curves are dot-dashedfor the “BT” model, dashed for the “WD-high” model, and solid
for the “WD-low” model. Unfilled triangle labeled “JCII∗
” is ourestimate of Jstars
ν for “WD-low” model, where the data point is anaverage of the maximal and minimal depletion models. Error barsinclude systematic errors due to uncertainties in κ, Peq , and Jbkd
ν(see text). The “WD-low” solid curve was computed for minimaldepletion. Horizontal line denoted by Jphot(θmin=0.21 arcsec) is
upper limit on Jphotν inferred from photometry of associated galaxy
when θmin=0.21 arcsec (see text).
We obtained Jstarsν for 23 damped Lyα systems with
positive detections of C II∗ absorption (see Table 2). Ineach case we followed the same procedures used in § 4.1, inparticular we added Jbkd
ν and Jstarsν to compute the total
mean intensity, Jν , illuminating the gas, and then con-sidered only solutions in which C II∗ absorption arises inCNM gas at the thermally stable density, nCNM. Currentlydetected C II∗ absorption is unlikely to arise in WNM gasfor most damped Lyα systems with positive detections(see § 4). In the case of the “WD-low” CNM model theJstars
ν derived with the addition of background radiationwas typically 0.1 dex less than the Jstars
ν derived withoutbackground radiation. On the other hand, our calcula-tions admitted no CNM solutions for Jstars
ν in the damped
14 STAR FORMATION IN DAMPED Lyα SYSTEMS
Lyα systems toward Q2241+13 and Q1036−22: this isnot surprising in view of the significant contribution of thehigh redshift CMB radiation to the lc(n) solutions shownin Figure 3b. The largest discrepancies for damped Lyαsystems that admitted CNM solutions were Q1346−03 andQ0255+00 for which Jstars
ν with background radiation was0.55 dex and 0.15 dex less than without background radi-ation. However, these four damped Lyα systems moreclosely resemble most systems with upper limits becauselobsc is less than or equal to the peak of the predicted lc(n)curve. In § 5.2 we show that in systems like this, the line ofsight likely passes through WNM gas subjected to a rangeof Jstars
ν including those inferred for the CNM solutions.Because of the low fraction of discrepant estimates of
Jstarsν and since the discrepancies are confined to objects
with the lowest values determined for Jstarsν , we conclude
that background radiation has little effect on the SFRsderived by WPG for the “WD-low” model. Specifically,the average Jstars
ν decreased by only 0.04 dex when back-ground radiation was included in the models. This quan-tity has cosmological significance since the average Jstars
νcan be used to deduce the average SFR per unit area fromwhich one can deduce the global SFR per unit comov-ing volume (see WGP). The same qualitative argumentshold for the “WD-high” and “BT” models. The averageJstars
ν decreased by 0.15 dex when background radiationwas included in the “BT” model and by 0.3 dex for the“WD-high” model.
5.2. Systems With Upper Limits
The nature of damped Lyα systems with upper limitson C II∗ absorption is determined by the ratio of the truevalue of lobs
c to the peak value of lc(n) predicted for back-ground heating alone, lpeak
c . This point is illustrated inFigure 8, which shows lc(n) curves predicted by the “WD-low” model for the Q2348−14 and Q2237−06 damped Lyαsystems. These objects were selected to represent the high-est and lowest values of the ratio lobs
c /lpeakc in Figure 4. We
computed lc(n) curves for the case Jν=Jbkdν . This results
in the lowest lc(n) curves in Figure 8 (shown as red dottedcurves), which correspond to background heating alone.We then let Jν=Jbkd
ν +Jstarsν to account for the presence
of local radiation and computed lc(n) for the same grid of
SFRs per unit area, −4.0 < log10ψ∗ < 0.0 M⊙ yr−1 kpc−2,used to find Jstars
ν for the Q2206A damped Lyα system.This corresponds to mean intensities in the range 5×10⁻²¹
< Jstarsν < 5×10⁻¹⁷ ergs cm−2 s−1 Hz−1 sr−1 at λ = 1500
A (see WPG and § 5.1). By comparison, Jbkdν = 2.7×10⁻²⁰
and 2.0×10⁻²⁰ ergs cm−2 s−1 Hz−1 sr−1 at the redshifts ofthe Q2348−14 and Q2237−06 damped Lyα systems. Thelc(n) solutions including Jstars
ν are shown as solid curvesin the Figure 8.
First, we consider the results shown in Figure 8a forQ2348−14. In this case the upper limit on lobs
c (10−26.9
ergs s−1 H−1) is significantly higher than lpeakc (10−27.4
ergs s−1 H−1). If future spectroscopy shows the true valueof lobs
c to remain above lpeakc , then lobs
c could intersectWNM or CNM thermally stable solutions correspondingto a wide range of Jstars
ν : the (n,lc) coordinates of thesestable solutions are respectively shown as the steeply ris-ing dot-dashed and solid curves in Figure 8a. The crossesin Figure 8a depict upper limits on n set by the
C II/C I constraints for each lc(n) curve. Because thesedensity limits are less than nCNM, they appear to ruleout the CNM solutions. However, WGP showed the lim-its to be sensitive to local input parameters such as X-ray and cosmic-ray ionization rates. For these reasons wemake the conservative estimate that the CNM models arenot excluded for upper limits on n exceeding ≈ 0.2nCNM
Therefore, if lobsc > lpeak
c , the CNM and WNM models arein principle equally plausible for this damped Lyα sys-tem. But, because we have found direct evidence againstthe WNM hypothesis for other damped Lyα systems withsimilar ratios of lobs
c to lpeakc (see Howk et al. 2004 a,b)
we believe the CNM hypothesis to be more likely in thesecases.
On the other hand, the CNM solutions for Q2348−14are implausible if lobs
c < lpeakc . The presence of background
radiation causes a significant increase in lc(n) for low val-ues of Jstars
ν . The result shown in Figure 8a is that nothermally stable CNM solutions are possible for lobs
c lessthan the intersection of the background heated lc(n) andthe locus of thermally stable CNM solutions; i.e., whenlobsc < 10−27.5 ergs s−1 H−1. By contrast, the WNMsolutions, thermally stable or otherwise, are consistentwith the condition lobs
c < lpeakc for the entire grid of Jstars
ν .The low densities, n < 1 cm−3, predicted for models withlarge values of Jstars
ν argue in favor of moderate valuesof Jstars
ν (< 10−18 ergs cm−2 s−1 Hz−1 sr−1). Otherwisethe linear dimensions of the absorbing gas clouds wouldbecome implausibly large. It is important to note thatX-ray heating dominates grain photoelectric heating in allthe WNM solutions, and that the Xray background domi-nates local X-ray sources for Jstars
ν < 5×10⁻¹⁹ ergs cm−2
s−1 Hz−1 sr−1.To investigate the effect of background radiation on these
conclusions, we recomputed the lc(n) curves with the sameprocedures, but excluded all radiation backgrounds. Theresults are shown in Figure 8b. Without background heat-ing no lower bound on thermally stable CNM solutionsexists; i.e., the thermally stable CNM locus can extendto arbitrarily low values of lc(n). Therefore, when the ef-fects of background radiation are omitted, CNM solutionswith lobs
c < lpeakc can exist in principle. But when back-
ground radiation is present and lobsc < lpeak
c , the C II/C Iconstraint results in upper limits on n < 0.03nCNM (Fig-ure 8a). Because this discrepancy is larger than allowedby model uncertainties, we conclude that thermally stableCNM solutions are ruled out when lobs
c < lpeakc .
Next we consider the results for Q2237−06 in Figure 8c.In this case the existing upper limit on lobs
c is less than lpeakc
and as a result all of the CNM solutions are ruled out. Be-cause of the large redshift, z=4.080, the CMB dominatesthe behavior of lc(n) for low values of Jstars
ν . This is illus-trated in Figure 8d, which plots the lc(n) curves that resultin the absence of background radiation. Comparison withFigure 8c reveals two features caused by background radi-ation: a low-density asymptote at lc(n)=10−27.6 ergs s−1
H−1 due to CMB radiation, and an increased peak value,lpeakc =10−27.3 ergs s−1 H−1, due to the combination ofCMB and X-ray background radiation. Again, Figure 8dshows that without background radiation, thermally sta-ble CNM solutions would be possible. Note, the absenceof density limits is due to the lack of a C II/C I constraint
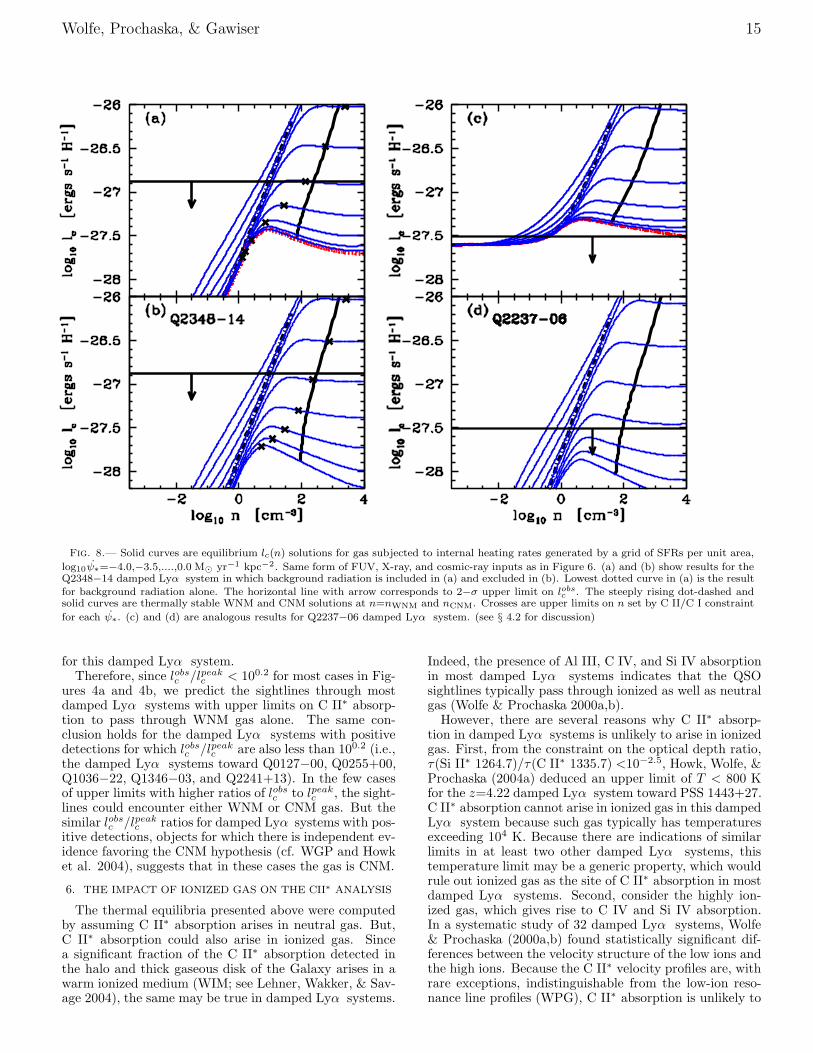
Wolfe, Prochaska, & Gawiser 15
Fig. 8.— Solid curves are equilibrium lc(n) solutions for gas subjected to internal heating rates generated by a grid of SFRs per unit area,
log10ψ∗=−4.0,−3.5,....,0.0 M⊙ yr−1 kpc−2. Same form of FUV, X-ray, and cosmic-ray inputs as in Figure 6. (a) and (b) show results for theQ2348−14 damped Lyα system in which background radiation is included in (a) and excluded in (b). Lowest dotted curve in (a) is the resultfor background radiation alone. The horizontal line with arrow corresponds to 2−σ upper limit on lobs
c . The steeply rising dot-dashed andsolid curves are thermally stable WNM and CNM solutions at n=nWNM and nCNM. Crosses are upper limits on n set by C II/C I constraint
for each ψ∗. (c) and (d) are analogous results for Q2237−06 damped Lyα system. (see § 4.2 for discussion)
for this damped Lyα system.Therefore, since lobs
c /lpeakc < 100.2 for most cases in Fig-
ures 4a and 4b, we predict the sightlines through mostdamped Lyα systems with upper limits on C II∗ absorp-tion to pass through WNM gas alone. The same con-clusion holds for the damped Lyα systems with positivedetections for which lobs
c /lpeakc are also less than 100.2 (i.e.,
the damped Lyα systems toward Q0127−00, Q0255+00,Q1036−22, Q1346−03, and Q2241+13). In the few casesof upper limits with higher ratios of lobs
c to lpeakc , the sight-
lines could encounter either WNM or CNM gas. But thesimilar lobs
c /lpeakc ratios for damped Lyα systems with pos-
itive detections, objects for which there is independent ev-idence favoring the CNM hypothesis (cf. WGP and Howket al. 2004), suggests that in these cases the gas is CNM.
6. THE IMPACT OF IONIZED GAS ON THE CII∗ ANALYSIS
The thermal equilibria presented above were computedby assuming C II∗ absorption arises in neutral gas. But,C II∗ absorption could also arise in ionized gas. Sincea significant fraction of the C II∗ absorption detected inthe halo and thick gaseous disk of the Galaxy arises in awarm ionized medium (WIM; see Lehner, Wakker, & Sav-age 2004), the same may be true in damped Lyα systems.
Indeed, the presence of Al III, C IV, and Si IV absorptionin most damped Lyα systems indicates that the QSOsightlines typically pass through ionized as well as neutralgas (Wolfe & Prochaska 2000a,b).
However, there are several reasons why C II∗ absorp-tion in damped Lyα systems is unlikely to arise in ionizedgas. First, from the constraint on the optical depth ratio,τ(Si II∗ 1264.7)/τ(C II∗ 1335.7) <10−2.5, Howk, Wolfe, &Prochaska (2004a) deduced an upper limit of T < 800 Kfor the z=4.22 damped Lyα system toward PSS 1443+27.C II∗ absorption cannot arise in ionized gas in this dampedLyα system because such gas typically has temperaturesexceeding 104 K. Because there are indications of similarlimits in at least two other damped Lyα systems, thistemperature limit may be a generic property, which wouldrule out ionized gas as the site of C II∗ absorption in mostdamped Lyα systems. Second, consider the highly ion-ized gas, which gives rise to C IV and Si IV absorption.In a systematic study of 32 damped Lyα systems, Wolfe& Prochaska (2000a,b) found statistically significant dif-ferences between the velocity structure of the low ions andthe high ions. Because the C II∗ velocity profiles are, withrare exceptions, indistinguishable from the low-ion reso-nance line profiles (WPG), C II∗ absorption is unlikely to
16 STAR FORMATION IN DAMPED Lyα SYSTEMS
originate in highly ionized gas. This has interesting impli-cations. The presence of narrow C IV absorption components with FWHM < 30 km s−1 implies T < 2×10⁵
K, which indicates CIV is photoionized in damped Lyαsystems. To summarize, although hot gas may be present,comparison between the velocity structure of the C IV andC II∗ absorption profiles suggests the two ions do not co-exist in the same gas, and the narrow C IV line widthsindicate C IV is not directly tracing hot gas nor its inter-action with cool gas.
On the other hand, Lehner, Wakker, & Savage (2004)present convincing evidence that a significant fraction ofC II∗ absorption lines in the ISM arises in the WIM. Sincethe WIM of the ISM of the Galaxy is also the site of Al IIIabsorption (Savage & Edgar 1990), the implication is thatthe gas giving rise to Al III absorption is also the site of CII∗ absorption. Because Al III absorption is a generic fea-ture in the spectra of damped Lyα systems, and becauseof the similarity between the centroids of the multiple ve-locity components in the Al III and low-ion profiles (Wolfe& Prochaska 2000a), the close resemblance between the CII∗ and low-ion profiles suggests that C II∗ absorption indamped Lyα systems also arises in a WIM. However, thisis unlikely. First, in some instances the ratio of Al IIIto low-ion column densities varies strongly with velocity(Wolfe & Prochaska 2000), indicating that Al III may notbe an accurate tracer of C II∗ absorption in damped Lyαsystems. Second, even if Al III does trace the low ions,Al III need not trace WIM gas in damped Lyα systems,since there are other means of producing Al III than stel-lar photons. At high redshifts a primarily neutral gas cancontain significantly higher column densities of Al III thanat z=0; i.e., at high z the presence of Al III need not be asignature of a WIM. This is due to the predicted increasewith z of the soft X-ray background intensity (Haardt &Madau 2003): at z > 2 the background intensity at 0.5 keV(shown in Figure 1) should be more than 30 times higherthan at z = 0. As a result, more radiation is availablefor photoionizing Al II (IP=18.8 eV) to Al III (IP=28.4eV) than at z=0. Prochaska et al. (2002) find empiricalevidence for this in the z=2.62 damped Lyα system to-ward Q1759+75, where comparison between intermediateand low-ion velocity profiles shows significant Al III absorption at the position of the velocity component associatedwith neutral gas.
These points are illustrated in Figure 9, which showsthe results of a CLOUDY (Ferland 2001) photoionizationcalculation in which we simulated the damped Lyα sys-tem toward Q2206A with a slab with N(H I) = 1020.5
cm−2, n=0.1 cm−3, and [Fe/H]=−1. The slab is sub-jected to the same Haardt-Madau backgrounds (2003) asshown in Figure 1. While local inputs were neglected,these will have negligible effect on the Al II/Al III ratioor the (CI+CII)/C ratio. The x axis is the ionization pa-rameter, the blue curve shows the [Al III/Al II] ratio, thered curve shows the linear neutral gas fraction, 1−x, andthe orange curve shows log10(CII/C). Since we have notmeasured Al II 1670 (which is undoubtedly saturated) weassume [Al II/Fe II]=0 which is found for the few dampedLyα systems in which Al II 1670 is unsaturated. In thatcase the observed ratio, [Al II/Al III] = 0.58 dex. Thedotted vertical lines show that value ± 0.1 dex. The cor-
responding neutral gas fraction, 1−x, runs from 0.86 to0.95. Therefore, one can accommodate a fairly large AlIII column density in a mainly neutral gas, which pro-duces significant amounts of C II. Furthermore, Figure 9reveals a subtle but important point on the multi-phasenature of the damped Lyα system. If one assumes a singlephase, then the gas is ≈ 10% ionized and cannot be con-sidered a cold neutral medium. This result contradicts ourassessment of the C II∗ profile and we are driven to a two-phase solution (WNM+CNM) in order to accommodatethe Al III and C II∗ measurements. Assuming compara-ble H I column densities for the WNM and CNM phases,we find a solution with logU ≈ −4.5 for the CNM andlogU ≈ −3 for the WNM, which gives an average Al II/AlIII ratio consistent with our observations. Adopting JνH
≈ 10−21.5 for the ionizing background radiation, we findthe implied density values are consistent with the modelpresented in Figure 6, e.g., log10nCNM ≈ 0.2cm−3. Notethat this relatively low density for the CNM is due to thehigh metallicity of the system. In summation, the pres-ence of Al III does not require a WIM and in fact theobserved Al II/Al III ratio is consistent with one’s expec-tation based on the two-phase models derived from theC II∗ observations.
Further evidence against the ionized gas hypothesis forC II∗ absorption can be found in Figure 10, which plotslobsc versus N(H I) for the sample of damped Lyα systemsin Table 2. The data show no evidence for correlationsbetween lobs
c and N(H I): the Kendall tau test reveals theprobability for the null hypothesis of no correlations to be65 %. By contrast, in a recent study of C II∗ absorption inthe ISM, Lehner, Wakker, & Savage (2004) find a system-atic increase in lobs
c with decreasing N(H I), which theyreasonably attribute to an increase in ionization level insystems with low N(H I). To understand this we note thatin the absence of radiative excitation, lobs
c =nΛCII(1−x)−1,where nΛCII is the 158 µm cooling rate per particle. Inthe low-density, high-ionization limit applicable here, lobs
c∝ JνH
, where JνHis the radiation mean intensity at the
Lyman limit. As a result, lobsc will increase with increasing
JνH, which causes N(H I) to decrease for a
fixed total column density. By contrast, we find no con-vincing evidence for such an anti-correlation at N(H I) ≥2×1020 cm−2, which is additional evidence supporting thehypothesis that C II∗ absorption in damped Lyα systemsarises in mostly neutral gas.
Finally, our arguments against background radiation asthe heat source source for damped Lyα systems with pos-itive detections of lobs
c depended on the upper limits onthe total density, n, inferred from photoionization equilib-rium between C II and C I. The C II/C I ratios and theresultant density limits were computed for gas that wasmainly neutral, and in the WNM phase for most cases.While ionized gas may not be the site of C II∗ absorption,it may still be present and could contribute to the totalN(C II). Taking the results discussed above for Q2206A,in which x < 0.14, and assuming N(C I)=0 and N(CII)=(C/H)N(H)WIM for the WIM (where N(H) is the to-tal column density of H), then the total C II column den-sity, N(C II)=(C/H)(N(H)WIM +N(H)WNM )≈(1/0.86)×(C/H)N(H I) = 1.16(C/H)N(H I). Since the results arethe same for N(C I), the change in the C II/C I ratio will
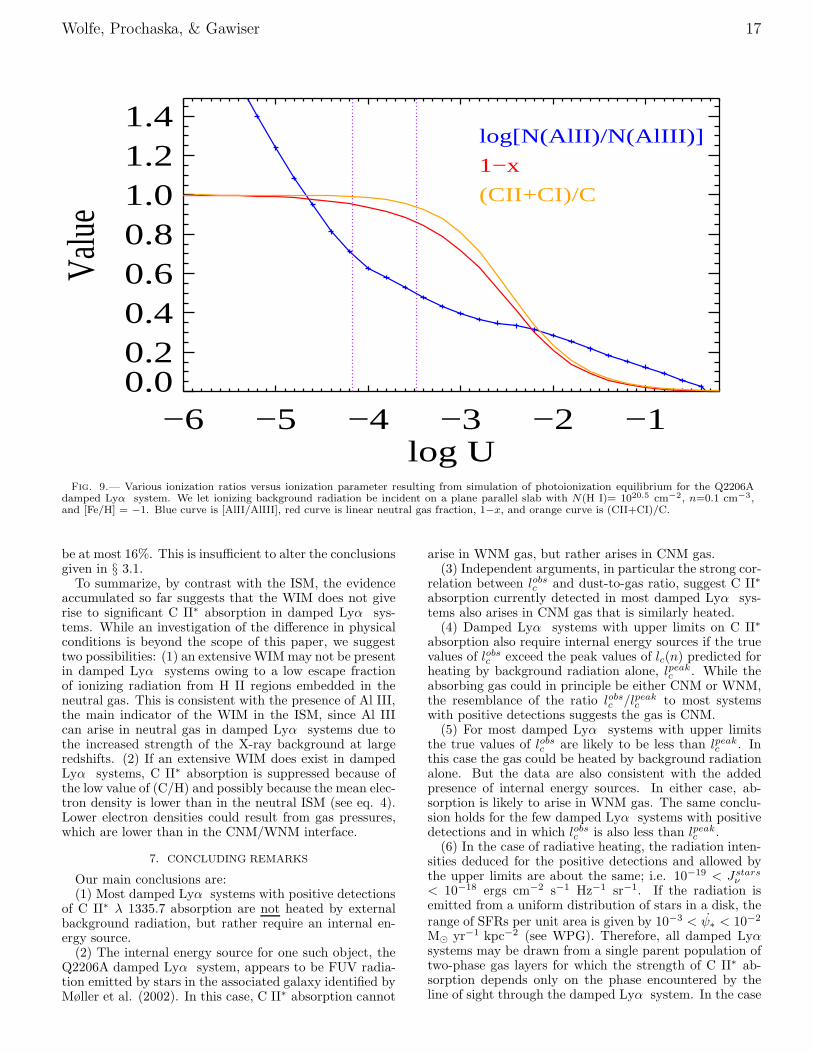
Wolfe, Prochaska, & Gawiser 17
−6 −5 −4 −3 −2 −1log U
0.00.20.40.60.81.01.21.4
Valu
elog[N(AlII)/N(AlIII)]
1−x
(CII+CI)/C
Fig. 9.— Various ionization ratios versus ionization parameter resulting from simulation of photoionization equilibrium for the Q2206Adamped Lyα system. We let ionizing background radiation be incident on a plane parallel slab with N(H I)= 1020.5 cm−2, n=0.1 cm−3,and [Fe/H] = −1. Blue curve is [AlII/AlIII], red curve is linear neutral gas fraction, 1−x, and orange curve is (CII+CI)/C.
be at most 16%. This is insufficient to alter the conclusionsgiven in § 3.1.
To summarize, by contrast with the ISM, the evidenceaccumulated so far suggests that the WIM does not giverise to significant C II∗ absorption in damped Lyα sys-tems. While an investigation of the difference in physicalconditions is beyond the scope of this paper, we suggesttwo possibilities: (1) an extensive WIM may not be presentin damped Lyα systems owing to a low escape fractionof ionizing radiation from H II regions embedded in theneutral gas. This is consistent with the presence of Al III,the main indicator of the WIM in the ISM, since Al IIIcan arise in neutral gas in damped Lyα systems due tothe increased strength of the X-ray background at largeredshifts. (2) If an extensive WIM does exist in dampedLyα systems, C II∗ absorption is suppressed because ofthe low value of (C/H) and possibly because the mean elec-tron density is lower than in the neutral ISM (see eq. 4).Lower electron densities could result from gas pressures,which are lower than in the CNM/WNM interface.
7. CONCLUDING REMARKS
Our main conclusions are:(1) Most damped Lyα systems with positive detections
of C II∗ λ 1335.7 absorption are not heated by externalbackground radiation, but rather require an internal en-ergy source.
(2) The internal energy source for one such object, theQ2206A damped Lyα system, appears to be FUV radia-tion emitted by stars in the associated galaxy identified byMøller et al. (2002). In this case, C II∗ absorption cannot
arise in WNM gas, but rather arises in CNM gas.(3) Independent arguments, in particular the strong cor-
relation between lobsc and dust-to-gas ratio, suggest C II∗
absorption currently detected in most damped Lyα sys-tems also arises in CNM gas that is similarly heated.
(4) Damped Lyα systems with upper limits on C II∗
absorption also require internal energy sources if the truevalues of lobs
c exceed the peak values of lc(n) predicted forheating by background radiation alone, lpeak
c . While theabsorbing gas could in principle be either CNM or WNM,the resemblance of the ratio lobs
c /lpeakc to most systems
with positive detections suggests the gas is CNM.(5) For most damped Lyα systems with upper limits
the true values of lobsc are likely to be less than lpeak
c . Inthis case the gas could be heated by background radiationalone. But the data are also consistent with the addedpresence of internal energy sources. In either case, ab-sorption is likely to arise in WNM gas. The same conclu-sion holds for the few damped Lyα systems with positivedetections and in which lobs
c is also less than lpeakc .
(6) In the case of radiative heating, the radiation inten-sities deduced for the positive detections and allowed bythe upper limits are about the same; i.e. 10−19 < Jstars
ν< 10−18 ergs cm−2 s−1 Hz−1 sr−1. If the radiation isemitted from a uniform distribution of stars in a disk, therange of SFRs per unit area is given by 10−3 < ψ∗ < 10−2
M⊙ yr−1 kpc−2 (see WPG). Therefore, all damped Lyαsystems may be drawn from a single parent population oftwo-phase gas layers for which the strength of C II∗ ab-sorption depends only on the phase encountered by theline of sight through the damped Lyα system. In the case
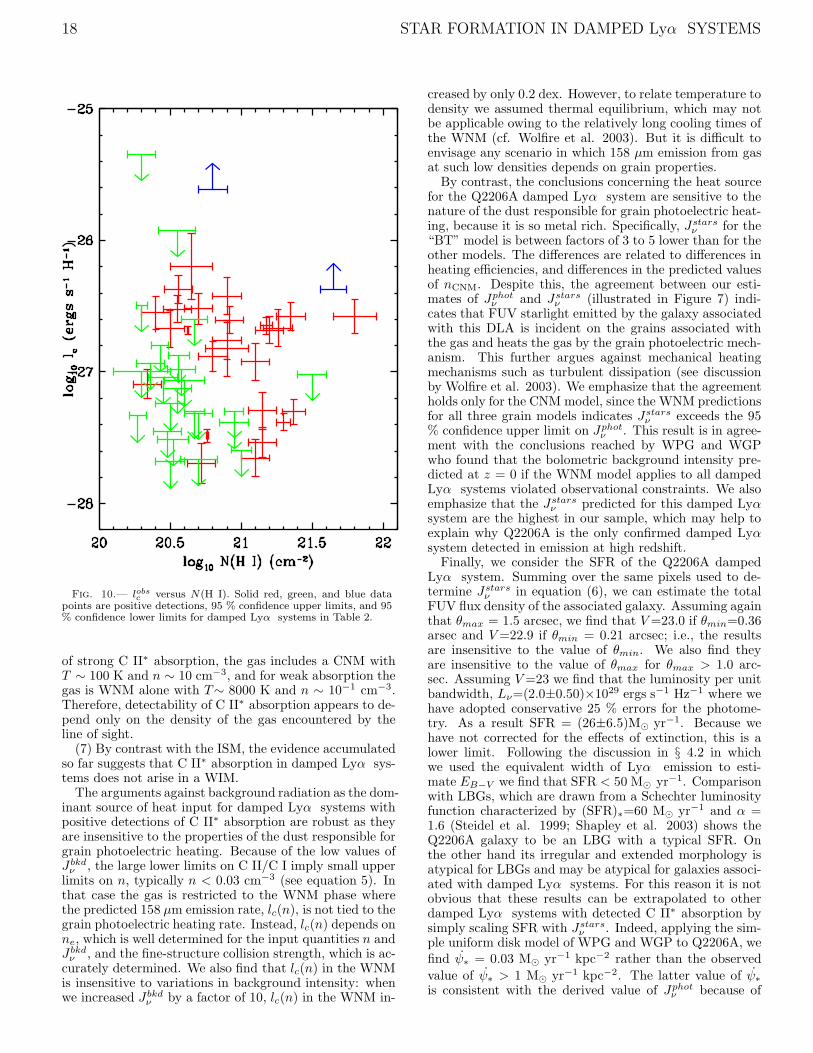
18 STAR FORMATION IN DAMPED Lyα SYSTEMS
Fig. 10.— lobsc versus N(H I). Solid red, green, and blue data
points are positive detections, 95 % confidence upper limits, and 95% confidence lower limits for damped Lyα systems in Table 2.
of strong C II∗ absorption, the gas includes a CNM withT ∼ 100 K and n ∼ 10 cm−3, and for weak absorption thegas is WNM alone with T∼ 8000 K and n ∼ 10−1 cm−3.Therefore, detectability of C II∗ absorption appears to de-pend only on the density of the gas encountered by theline of sight.
(7) By contrast with the ISM, the evidence accumulatedso far suggests that C II∗ absorption in damped Lyα sys-tems does not arise in a WIM.
The arguments against background radiation as the dom-inant source of heat input for damped Lyα systems withpositive detections of C II∗ absorption are robust as theyare insensitive to the properties of the dust responsible forgrain photoelectric heating. Because of the low values ofJbkd
ν , the large lower limits on C II/C I imply small upperlimits on n, typically n < 0.03 cm−3 (see equation 5). Inthat case the gas is restricted to the WNM phase wherethe predicted 158 µm emission rate, lc(n), is not tied to thegrain photoelectric heating rate. Instead, lc(n) depends onne, which is well determined for the input quantities n andJbkd
ν , and the fine-structure collision strength, which is ac-curately determined. We also find that lc(n) in the WNMis insensitive to variations in background intensity: whenwe increased Jbkd
ν by a factor of 10, lc(n) in the WNM in-
creased by only 0.2 dex. However, to relate temperature todensity we assumed thermal equilibrium, which may notbe applicable owing to the relatively long cooling times ofthe WNM (cf. Wolfire et al. 2003). But it is difficult toenvisage any scenario in which 158 µm emission from gasat such low densities depends on grain properties.
By contrast, the conclusions concerning the heat sourcefor the Q2206A damped Lyα system are sensitive to thenature of the dust responsible for grain photoelectric heat-ing, because it is so metal rich. Specifically, Jstars
ν for the“BT” model is between factors of 3 to 5 lower than for theother models. The differences are related to differences inheating efficiencies, and differences in the predicted valuesof nCNM. Despite this, the agreement between our esti-mates of Jphot
ν and Jstarsν (illustrated in Figure 7) indi-
cates that FUV starlight emitted by the galaxy associatedwith this DLA is incident on the grains associated withthe gas and heats the gas by the grain photoelectric mech-anism. This further argues against mechanical heatingmechanisms such as turbulent dissipation (see discussionby Wolfire et al. 2003). We emphasize that the agreementholds only for the CNM model, since the WNM predictionsfor all three grain models indicates Jstars
ν exceeds the 95% confidence upper limit on Jphot
ν . This result is in agree-ment with the conclusions reached by WPG and WGPwho found that the bolometric background intensity pre-dicted at z = 0 if the WNM model applies to all dampedLyα systems violated observational constraints. We alsoemphasize that the Jstars
ν predicted for this damped Lyαsystem are the highest in our sample, which may help toexplain why Q2206A is the only confirmed damped Lyαsystem detected in emission at high redshift.
Finally, we consider the SFR of the Q2206A dampedLyα system. Summing over the same pixels used to de-termine Jstars
ν in equation (6), we can estimate the totalFUV flux density of the associated galaxy. Assuming againthat θmax = 1.5 arcsec, we find that V=23.0 if θmin=0.36arsec and V=22.9 if θmin = 0.21 arcsec; i.e., the resultsare insensitive to the value of θmin. We also find theyare insensitive to the value of θmax for θmax > 1.0 arc-sec. Assuming V=23 we find that the luminosity per unitbandwidth, Lν=(2.0±0.50)×1029 ergs s−1 Hz−1 where wehave adopted conservative 25 % errors for the photome-try. As a result SFR = (26±6.5)M⊙ yr−1. Because wehave not corrected for the effects of extinction, this is alower limit. Following the discussion in § 4.2 in whichwe used the equivalent width of Lyα emission to esti-mate EB−V we find that SFR < 50 M⊙ yr−1. Comparisonwith LBGs, which are drawn from a Schechter luminosityfunction characterized by (SFR)∗=60 M⊙ yr−1 and α =1.6 (Steidel et al. 1999; Shapley et al. 2003) shows theQ2206A galaxy to be an LBG with a typical SFR. Onthe other hand its irregular and extended morphology isatypical for LBGs and may be atypical for galaxies associ-ated with damped Lyα systems. For this reason it is notobvious that these results can be extrapolated to otherdamped Lyα systems with detected C II∗ absorption bysimply scaling SFR with Jstars
ν . Indeed, applying the sim-ple uniform disk model of WPG and WGP to Q2206A, wefind ψ∗ = 0.03 M⊙ yr−1 kpc−2 rather than the observed
value of ψ∗ > 1 M⊙ yr−1 kpc−2. The latter value of ψ∗
is consistent with the derived value of Jphotν because of
Wolfe, Prochaska, & Gawiser 19
the small solid angle subtended by the FUV continuumsources from the location of the absorbing gas. Of coursethe SFR per unit H I area would be considerably lowerif the star forming region were embedded in a larger HI envelope. Interestingly, at least 50 % of the remainingdamped Lyα systems with detected C II∗ absorption arepredicted to have Jstars
ν within a factor of 3 of the Jstarsν
inferred for the Q2206A damped Lyα system. It is notclear at this time whether or not their SFRs are within afactor of 3 of the SFR derived for the Q2206A galaxy. Weare pursuing a program with the ACS aboard the HST toinvestigate this question.
The authors wish to recognize and acknowledge the verysignificant cultural role and reverence that the summit ofMauna Kea has always had within the indigenous Hawai-ian community. We are most fortunate to have the oppor-tunity to conduct observations from this mountain. Wethank Francesco Haardt and Piero Madau for providingus with their calculations of background intensities andfor helpful discussions, and Bruce Draine and Pale Møllerfor helpful discussions. We thank Dan McCammon forgiving us his updated tabulation of X-ray photoionizationcross-sections. AMW and JXP are partially supported byNSF grant AST0307824.
REFERENCES
Bakes, E. L. O. & Tielens, A. G. G. M. 1994, ApJ, 427, 822Bennett, C. L., Halpern, M., Hinshaw, G., Jarosik, N., Kogut, A.,
Limin, M., Meyer, S. S., Page, L., Spergel, D. N., Tucker, G. S.,Wollack, E., Wright, E. L., Barnes, C., Greason, M. R., Hill, R.S., Komatsu, E., Nolta, M. R., Odegard, N., Peiris, H. V., Verde,L., & Weiland, J. L., 2003, ApJS, 148, 1
Blum, R. D. & Pradhan, A. K. 1992, ApJS, 80, 425Bruzual, G. & Charlot, S., 2003, MNRAS, 344, 1000Churchill, C. W., Vogt, S. S., & Charlton, J. C., 2003, AJ, 125, 98Cooke, J., Wolfe, A. M., Howk, J. C., Prochaska, J. X. & Gawiser,
E. 2004, in preparation.Draine, B. T. 1978, ApJS, 36, 595Erb, D. K., Shapley, A. E., Steidel, C. C., Pettini, M., Adelberger,
K. L., Hunt, M. P., Moorwood, A. F. M., & Cuby, J.-G. 2003,ApJ, 591, 101
Field, G. B., Goldsmith, D. W., & Habing, H. J. 1969, ApJ, 155,L149
Giavalisco, M., Dickinson, M., Ferguson, H. C., Ravindranath,S., Kretchmer, C., Moustakas, L. A., Madau, P., Fall, S. M.,Gardner, J. P., Livio, M., Papovich, C., Renzini, A., Spinrad, H.,& Riess, A. 2004, ApJ, 600, L103
Haardt, F. & Madau, P. 1996, ApJ, 461, 20Haardt, F. & Madau, P. 2003,
http://pitto.mib.infn.it/ haardt/cosmology.htmlHowk, J. C., Wolfe, A. M., & Prochaska, J. X. 2004a ApJ,
submitted (astro-ph/0404005)Howk, J. C., Wolfe, A. M., Prochaska, J. X. & Gawiser, E. 2004b,
in preparationJunkkarinen, V. T., cohen, R. D., Beaver, E. A., Burbidge,
E. M., Lyons, R. W., & Madejski, G. 2004, ApJ, in press(astro-ph/0407281)
Kennicutt, R. C. Jr. 1998, ARA&A, 36, 189Kulkarni, V. P., Hill, H. M., Schneider, G., Weymann, R. J.,
Storrie-Lombardi, L. J., Rieke, M. J., Thompson, R. I. 2001, &Jannuzi, B. T. 2000, ApJ, 536, 36
Kulkarni, V. P., Hill, H. M., Schneider, G., Weymann, R. J.,Storrie-Lombardi, L. J., Rieke, M. J., & Thompson, R. I. 2001,ApJ, 551, 37
Lehner, N., Wakker, B., & Savage, B.D. 2004, preprintMachacek, M. E., Bryan, G. L., Meiksin, A., Anninos, P., Thayer,
D., Norman, M. L., & Zhang, Y. 2000, ApJ, 532, 118Madau, P., Ferguson, H. C., Dickinson, M. E., Giavalisco, M.,
Steidel, C. C., & Fruchter, A. 1996, MNRAS, 283, 1388Madau, P., & Pozzetti, L. 2000, MNRAS, 312, L9McCammon, D. 2003, private communication
Miralda-Escude, J., Cen, R., Ostriker, J. P. O, & Rauch, M. 1996,ApJ, 471, 582
Mo, H.J., & Miralda-Escude, J. 1996, ApJ, 469, 589Moller, P., Warren, S. J., Fall, S. M., Fynbo, J. U., & Jakobsen, P.
2002, ApJ, 574,51Morrison, R., & McCammon, D. 1983, ApJ, 270, 119Motta, V., Mediavilla, E., Munoz, J. A., Falco, E., Kochanek, c. S.,
Arribas, S., Garcia-Lorenzo, B., Oscoz, A., & Serra-Ricart, M.2002, ApJ, 574, 719
Pei, Y. C., Fall, S. M., & Bechtold, J. 1991, ApJ, 378, 6Pei, Y. C., & Fall, S. M. 1995, ApJ, 454, 69Pettini, M., Smith, L. J., Hunstead, R. W., & King, D. L. 1994,
ApJ, 426, 79Pettini, M., Shapley A. E., Steidel, C. C., Cuby, J.-G., Dickinson,
M., Moorwood, A. F. M., Adelberger, K. L., & Giavalisco, M.2001, ApJ, 554, 981
Pettini, M., Ellison, S. L., Bergeron, J., & Petitjean, P. 2002, a,391, 21
Prochaska, J. X. and Wolfe, A. M. 1997a, ApJ, 474, 140Prochaska, J. X. and Wolfe, A. M. 1997b, ApJ, 487, 73Prochaska, J. X. 1999, ApJ, 511, 71Prochaska, J. X., Howk, J. C., O’Meara, J. M., Tytler, D., Wolfe,
A. M., Kirkman, D., Lubin, D., & Suzuki, N. 2002, ApJ, 571, 693Prochaska, J. X., Castro, S., & Djorgovski, S. G., 2003 ApJS, 148,
317Rauch, M. 1998, ARA&A, 36, 267Scott, J., Bechtold, J., Morita, M., Dobrzycki, A.,. & Kulkarni, V.
2002, ApJ, 571, 665Shapley, A. E., Steidel, C. C., Pettini, M., & Adelberger, K. L.
2003, ApJ, 588, 65Sheinis, A.I., Miller, J., Bigelow, B., Bolte, M., Epps, H., Kibrick,
R., Radovan, M., & Sutin, B. 2002, PASP, 114, 851Shull, J. M. & Van Steenberg, M. E. 1985, ApJ, 298, 268Steidel, C. C., Adelberger, K. L., Giavalisco, M., Dickinson, M., &
Pettini, M. 1999, ApJ, 519, 1Storrie-Lombardi, L.J., & Wolfe, A. M. ApJ, 543, 552Vogt, S. S., Allen, S. L., Bigelow, B. C., Bresee, L., Brown, B.,
Cantrall, T., Conrad, A., Couture, M., Delaney, C., Epps, H.W., Hilyard, D. F., Horn, E., Jern, N., Kanto, Dl, Keane, M.J., Kibrick, R. I., Lewis, J. W., Osborne, J. Pardeilhan, G. H.,Pfister, T., Ricketts, T., Robinson, L. B., Stover, R. J., Tucker,D., Ward, J., & Wei. M. Z. 1994, SPIE, 2198, 362
Vladilo, G., Centurion, M., Bonifacio, P. & Howk, J. C. 2001, ApJ,557, 1007
Warren, S. 2004, private communication.Weingartner, J. C. & Draine, B. T. 2001a, ApJS, 134, 263Wolfe, A. M., & Prochaska, J. X. 2000a, ApJ, 545, 591Wolfe, A. M., & Prochaska, J. X. 2000b, ApJ, 545, 503Wolfe, A. M., Prochaska, J. X., & Gawiser, E. 2003 ApJ, 593, 215
(WPG)Wolfe, A. M., Gawiser, E., & Prochaska, J. X., 2003 ApJ, 593, 235
(WGP)Wolfire, M. G., Hollenbach, D., McKee, C. F., Tielens, A. G. G. M.,
& Bakes, E. L. O. 1995, ApJ, 443, 152 (W95)Wolfire, M. G., McKee, C. F., Hollenbach, D., & Tielens, A. G. G.
M. 2003, ApJ, 587, 278


