Embed Size (px)
Citation preview

On the role of chromosomal rearrangements in evolution: Reconstruction of genome reshuffling in rodents and analysis
of Robertsonian fusions in a house mouse chromosomal polymorphism zone
byLaia Capilla Pérez
A thesis submitted for the degree of Doctor of Philosophy in Animal Biology
Supervisors:Dra. Aurora Ruiz-Herrera Moreno and Dr. Jacint Ventura Queija
Institut de Biotecnologia i Biomedicina (IBB)Departament de Biologia Cel·lular, Fisiologia i Immunologia Departament de Biologia Animal, Biologia Vegetal i Ecologia
Universitat Autònoma de Barcelona
Supervisor Supervisor PhD candidate
Aurora Ruiz-Herrera Moreno Jacint Ventura Queija Laia Capilla Pérez
Bellaterra, 2015


A la mare
Al pare
Al mano


“Visto a la luz de la evolución, la biología es, quizás, la ciencia más satisfactoria e inspiradora. Sin
esa luz, se convierte en un montón de hechos varios, algunos de ellos interesantes o curiosos, pero
sin formar ninguna visión conjunta.”
Theodosius Dobzhansky
“La evolución es tan creativa. Por eso tenemos jirafas.”
Kurt Vonnegut


This thesis was supported by grants from:
• Ministerio de Economía y Competitividad (CGL2010-15243 and CGL2010-20170).
• GeneralitatdeCatalunya,GRQ1057.• Ministerio de Economía y Competitividad. Beca de Formación de Personal
Investigador(FPI)(BES-2011-047722).• MinisteriodeEconomíayCompetitividad.Becaparalarealizacióndeestancias
breves(EEBB-2011-07350).
Coversdesignedbycintamontserrat.blogspot.com


Abstract 15-17
Acronyms 19-20
1. GENERAL INTRODUCTION 21-60
1.1Chromosomalrearrangements 23-46 1.1.1Typesofchromosomalrearrangements 23-25
1.1.2Originofchromosomalrearrangements:MechanismsofDNArepair 26-27
1.1.3DNAsequencesassociatedwithCRs 27-32
1.1.3.1Segmentalduplications 28 1.1.3.2Transposableelements 28-30
1.1.3.3Tandemrepeats 30-31
1.1.3.4Telomericrepeats 31-32 1.1.4HowtodetectCRsamongtaxa 33-36
1.1.4.1Comparativecytogenetics 33-34
1.1.4.2Geneticmapping 34-35
1.1.4.3Comparativegenomics 35-36
1.1.5ModelsofditributionofCRswithingenomes 37-42
1.1.5.1Therandombreakagemodel 37
1.1.5.2Thefragilebrakagemodel 37-38
1.1.5.3Theintergenicbreakagemodel 38-39
1.1.5.4Theintegrativebreakagemodel 39-42
1.1.6TheroleofCRsinspeciation 42-46
1.1.6.1Thehybriddysfunctionmodel 42-43 1.1.6.2Thesupressedrecombinationmodel43-44 1.1.6.3Bateson-Dobzhansky-MullerIncompatibilities45-46 1.2Meioticrecombinationandspeciation 48-56
1.2.1Meiosis 48-50
1.2.2Variationofrecombinationrateswithingenomes 52-53
1.2.3Variationofrecombinationrateswithinandamongspecies 53-561.2.4TheroleofPrdm9geneinmeioticrecombinationand
speciation 56-60
INDEX

1.3Thewesternhousemouseasamodelforchromosomalspeciation 56-60 1.3.1Thewesternhousemousechromosomalvariability57 1.3.2TheBarcelonaRbsystem 58-59 1.3.3PreviousstudiesinhousemouseRbpopulations59-60
2. OBJECTIVES 61-63
3. MATERIALS AND METHODS 65-90
3.1Bioinformaticanalysis 67-72
3.1.1Alignmentofmammaliangenomes 67
3.1.2Detectionofregionsofsynteny(HSBsandSFs) 68
3.1.3DetectionandclassificationofEBRs 68-69
3.1.4Analysisofgenomicfeatures 70-71
3.1.4.1Genecontentandontology 70
3.1.4.2Recombinationrates 71
3.1.4.3Cosntitutivelaminaassocaiteddomains(cLADs)71 3.1.5Permutationtests 72
3.2Biologicalsamples 72-73
3.3Molecularbiologytechinques 73-79
3.3.1Bacterialartificialchromosomes(BACs)selectionand purification 73-75
3.3.1.1VectorplasmidcultureandDNAextraction73-74 3.3.1.2DNAlabellingbynicktranslation 75
3.3.2GenomicDNApurification75-77 3.3.3Prdm9amplification 77-78
3.3.4DNApurificationfromgelbandsandSangersequencing 79
3.4Cellbiologytechniques 80-90
3.4.1Cellculturesandchromosomeharvest 80-81
3.4.2Spermatocytespreads 82
3.4.3Immunofluorescence(IF) 83-84
3.4.4Fluorescenceinsituhybridization(FISH) 84-89
3.4.4.1FISHwithchromosomepaintingsonmetaphase chromosomes 85-86
3.4.4.2FISHwithBACsonspermatocytes 86-88
3.4.4.3Quantitative-fluorescenceinsituhybridization(Q- FISH)onmetaphasechromosomes 88-89
3.4.5Imageprocessingandanalysis 89-90

4. RESULTS 91-163
4.1. RECONSTRUCTION OF GENOME RESHUFFLING IN RODENTS 93-125
4.1.1 Comparativeanalysisofrodentgenomesreveals evolutionarysignaturesofgenomereshuffling 95-125 4.1.1.1Introduction 95-97
4.1.1.2Materialsandmethods 97-101
4.1.1.2.1Wholegenomecomparisons97-98 4.1.1.2.2Genecontentandontology 99-100
4.1.1.2.3Recombinationrates 100
4.1.1.2.4Constitutivelaminaassociateddomains (cLADs) 100-101
4.1.2.5Statisticalanalysis 101
4.1.1.3Results 101-109
4.1.1.3.1GenomereshufflinginRodentia 101-104
4.1.1.3.2RodentiaEBRsaregene-richregions104-107 4.1.1.3.3RodentiaEBRscorrespondtoregionsoflow recombinationrates 108
4.1.1.3.4RodentiaEBRsaredepletedincLADs108-109 4.1.1.4Dicussion 109-112
4.1.1.5Acknowledgments112-113 4.1.1.6Bibliography 113-117
4.1.2Supplementaryinformation 118-125
4.2. STUDY OF THE ROLE OF TELOMERES IN THE FORMATION OF RB FUSIONS IN THE BARCELONA RB POLYMORPHISM SYSTEM 127-137
4.2.1OntheoriginofRobertsonianfusionsinnature:evidenceof telomereshorteninginwildhousemice 129-137
4.3. ANALYZING THE ROLE OF RB FUSIONS AND PRDM9 SEQUENCE ON THE MEIOTIC DYNAMICS OF THE BARCELONA RB POLYMORPHISM SYSTEM 139-163 4.3.1GeneticrecombinationvariationinwildRobertsonian mice:ontheroleofchromosomalfusionsandPrdm9allelic background141-149 4.3.2Supplementaryinformation 150-163 4.3.2.1Supplementarymaterialsandmethods 150-153
4.3.2.1.1Animalsandchromosomal

characterization 150
4.3.2.1.2Immunofluorescence 150
4.3.2.1.3Fluorescenceinsituhybridization 151 4.3.2.1.4Imageprocessinganddataanalysis151-152 4.3.2.1.5Prdm9genotyping 152-153
4.3.2.2SupplementaryfiguresandTables 153-162
4.3.2.3Supplementaryreferences 163
5.GENERAL DISCUSSION 165-184
5.1GenomereshufflinginRodentia:causesandconsequencesofthe genomicdistributionofEBRs 166-173
5.1.1Functionalconstrains 169-172
5.1.2Chromatinstructure:anewplayerinevolutionarygenome reshuffling? 172-173
5.2TheBarcelonaRbpolymorphismsystemasamodelforthestudy ofCRs 173-184
5.2.1TheroleoftelomereshorteningontheoriginofRbfusions 174-176 5.2.2TheeffectofRbfusionsonfertility 177-184
5.2.2.1Rbfusionsandmeioticrecombination 178-181
5.2.2.2Prdm9andthestudyofchromosomalevolution 181-184
6. CONCLUSIONS 185-188
7.BIBLIOGRAPHY 189-216

15
Abstract
In order to understand the evolutionary dynamics of mammalian genomes, is necessary to analyze chromosome configuration as well as the genomic changes that haveoccurredata large-scale (in the formofchromosomalrearrangements)andatamicro-scale(intheformofnucleotidechanges)withinspecies.Chromosomalrearrangements(i.e., inversions,translocations,fusionsorfissions)haveplayedacrucial role during evolution as they have led to genomic changes with consequences for the species differentiation. Within mammals, rodents represent the most specious taxon with a wide spectrum of karyotypes. In this thesis, we have first analyzed the chromosomal reorganizations along rodents evolution together with the factors that have been involved in the distribution of chromosomal rearrangements. Taking advantage of the increasing numberofavailablewhole-genomessequenced,wehavecompared thegenomesofsixrodentspecies(includingthemousegenomeasareference)andsixoutgroupspecies corresponding to different mammalian taxa (Primates, Artiodactyla,Carnivora and Perissodactyla).We have identified genomic regions of homology(orhomologous syntenyblocks,HSBs) and the regions of syntenydisruption (orEvolutionaryBreakpointregions,EBRs)amongrodents.Moreover,thelocalizationofEBRshaspermittedustoanalyzethegenomicfeaturesthatcouldbeinvolvedintheoriginofchromosomalrearrangements.OurresultsshowedthatEBRspresentanon-homogeneusdistributionacrossthemousegenome.Additionally,EBRsarecharacterized by specific genomic features such as higher gene content, lower recombination rates and low proportion of lamina associated domains (cLADs)compared with the rest of the mouse genome. Secondly, it is known that the western house mouse (Mus musculusdomesticus)naturalpopulationspresentawidevarietyofdiploidnumbersduetothepresenceofRobertsonian(Rb)fusions.Withinallthesepopulationsanalyzed,oneofthem, localized intheBarcelona,LleidaandGironaprovinces,presentsaspecificstructure, where no metacentric race has been described, being the Rb fusionsfound in a polymorphic state. This chromosomal polymorphism zone is known as TheBarcelonaRbsystem.Givingthespecificcharacteristicsofthispopulation,wehave:(i)analyzedtheroleoftelomeresintheoccurrenceoftheRbfusionsand(ii)studiedtheeffectoftheRbfusionsandPrdm9 gene on meiotic recombination. We have detected that telomere shortening in acrocentric p-arms can be one of thefactorsthatcouldexplaintheoccurrenceofRbfusionsbypromotingtheinteractionbetween chromosomal ends and thus, to the fusion events. Moreover, we have

16
observed that the presence of Rb fusions leads to a decrease in recombinationratesdue toa re-distributionof crossovers towards the telomeres inmetacentricchromosomes.Furthermore,wehavedetectedthatthisphenomenonisduetoaninterference effect of the centromere in metacentric chromosomes, which acts suppressing recombination within the pericentromeric regions. Additionally, we have also characterized the Prdm9 allelic distribution within the Barcelona Rbpolymorphism system, as well as an effect of the Prdm9 sequence on recombination rates. Therefore, and in the light of our results, we propose that the effect of suppressionofrecombinationonindividualswithRbfusionsisduetoamechanicstic(by thecentromeric interferenceeffect)andgenetic (thePrdm9 allelic sequence)factors. These results, together with the characterization of the genomic features that have been involved in the occurrence of evolutionary chromosomal rearrangements in rodents, would help us to understand the dynamics of chromosomal speciation along evolution and how chromosomal rearrangements occur in natural populations.
Resum
Per tal de poder entendre la dinàmica evolutiva dels genomes de mamífers és necessari estudiar l’estructura dels cromosomes i quins han estat els canvis que s’handonattantagranescala(enformadereorganitzacionscromosòmiques)coma petita escala (en forma demutacions d’un sol nucleòtid). Les reorganitzacionscromosòmiqueshan jugatunpapercrucialenelprocésevolutiu jaqueelscanvisa quèhandonat lloc (inversions, translocacions, fusions o fissions)hanprovocatcanvisgenòmicsambconseqüènciesperaladiferenciaciódelesespècies.Dinsdelsmamífers, a més, els rosegadors són el grup que presenta més diversitat d’espècies amb un ampli espectre de cariotips. Enaquestatesi,enprimerllochemestudiatlesreorganitzacionscromosòmiquesal llarg de l’evolució dels rosegadors així com els factors que han condicionat la distribuciógenòmicadelesreorganitzacions.Gràciesalacreixentdisponibilitatdegenomesseqüenciats,hempogutcompararelsgenomesdesisespèciesderosegadors(incloentcomareferènciaeldelratolí)idesisoutgrups corresponents a diferents taxonsdinsdelsmamífers(Primats,Carnivora,ArtiodactylaiPerissodactyla).Ambaquest anàlisi hem identificat les regions d’homologia (o Homologous SyntenyBlocks;HSBs)ilesregionsdedisrupcióotrencamentdel’homologia(oEvolutionaryBreakpointRegions;EBRs)que s’handonat al llargde l’evoluciódels rosegadors.La localització de les EBRs ens ha permès, doncs, estudiar les característiques

17
genòmiquesdelesregionsd’inestabilitatquehandonatllocalesreorganitzacionscromosòmiquesenelgenomaderatolíiques’handonatalllargdel’evoluciódelsrosegadors. Els nostres resultatsmostren que les EBRs presenten una distribucióno-homogènea i es caracteritzen per presentar un alt contingut gènic, taxes derecombinaciómeiòticamésbaixesiunaproporciómésbaixadelamina associated domains(cLADs),comparantamblarestadelgenomaderatolí. D’altra banda, està descrita la tendència de poblacions naturals de ratolí domèsticoccidental(Musmusculusdomesticus)a presentar una gran diversitat de nombresdiploidesacausadel’apariciódefusionsRobertsonianes(Rb).Detoteslespoblacions estudiades fins al moment, n’hi ha una, localitzada a les províncies de Barcelona,LleidaiGirona,quepresentaunaestructuradiferentalarestajaquenoexisteixenellaunaraçametacèntricailesfusionsRbdetectadesestrobenenunestatdepolimorfisme,previalasevafixació:AquestazonadepolimorfismecromosòmicesconeixambelnomdesystemaRobertsoniàdeBarcelona. En segon lloc, donades les característiques úniques d’aquest sistemaRobertsoniàhemanalitzat:(i)elpaperquepodienjugarelstelòmersenl’apariciódelesfusionsRbi(ii)l’efected’aquestesfusionsidelgenPrdm9 sobre la recombinació meiòtica.Enelnostretreballhemdetectatquel’escurçamenttelomèricdelsbraçosp dels cromosomes acrocèntrics podria ser un dels factors que explicarien la aparició delesfusionsRbjaqueafavoririenlasevainteraccióilaposteriorfusióentreells. D’altrabanda,emvistquelapresènciadelesfusionsRbprovocaunabaixadaen la taxa de recombinació que es deu a una redistribució dels crossovers (opuntsderecombinacióhomòloga)capaltelòmersenelscromosomesfusionats.Hemdetectat,amés, que aquest fenomen es deu a un efecte d’interferència del centròmer quesuprimeix la recombinació a la zona pericentromèrica. A més, també hem analitzat la distribució allèlica del gen Prdm9 enelsistemaRobertsoniàdeBarcelona,aixícomunpossibleefectedelaseqüènciad’aquestgensobrelataxaderecombinació. Per tant, donats els nostres resultats, proposem que l’efecte de supressió de la recombinacióquehemdetectatenelsindividusambfusionsRbésacausad’unfactormecànic(comes l’efected’interferènciacentromèrica) id’unfactorgenètic(comeslaseqüenciaal·lèlicadelgenPrdm9).Aquestsresultatsaportenunainformacióesencial per entendre la dinàmica dels processos d’especiació cromosòmica enpoblacions naturals.

18

19
ACs-AstrocytesAlt-EJ-AlternativeEndJoiningATM-AtaxiaTelangiectasiaMutatedATR-ATM-Rad3-RelatedBAC-BacterialArtificialChromosomeBDMIs–Bateson-Dobzhansky-MullerincompatibilitiesBSA-BovineSerumAlbuminCHORI-Children’sHospitalOaklandResearchInstitutecLAD-ConstitutiveLaminaAssociatedDomaincM-CentimorganCO-CrossoverCR-ChromosomalRearrangementsCREST–ComplicationofRaynaud’sphenomenon,Esophagealdysfunction,Sclerodactily and Telangiectasia CTCF-CCCCTC-bindingfactorCT-ChromosomalTerritoryCy3-Cyanine3Cy5 -Cyanine5DAPI-4‘,6-diamino-2-fenilindolDAVID-DatabaseforAnnotation,Visualization and Integrated DiscoverydHJ-DoublehollidayJunctionDIG -DigoxigeninDIRS-DictyosteliumIntermediateRepeatSequenceDMC1-DisruptedMeioticcDNA1DMEM-Dulbecco’sModifiedEagleMediumDMSO -DimethylSulfoxidedNTP-DeoxynucleotideTriphosphate
DSB -DoubleStrandBreakdUTP-DeoxyuridineTriphosphatedUTP-DIG – dUTP DigoxigenindUTP-Cy3–dUTPCyanine3EASE-ExpressionAnalysisSystematicExplorerEBA-EvolutionaryBreakpointAnalyzerEBR-EvolutionaryBreakpointRegionEDTA-Ethylenediamine-TetraaceticAcidEH –EvolutionHighwayComparativeChromosomeBrowserEtBr–EthidiumBromideFBS -FoetalBovineSerumFISH -Fluorescencein situ HybridizationFITC-FluoresceinIsothiocianateFoSTeS-ForkStallingandTemplateSwitchingGCD–GermCellDeathGEO-GeneExpressionOmnibusGO-GeneOntologyH3K4–Histone3methylatedatlysine4H3K9me3 -Histone3trimethylatedatlysine 9HSB-HomologousSyntenyBlockHst1-Hybridsterility1IF-ImmunofluorescenceITS -InterstitialTelomericSequencesKbp-KilobasepairsKRAB –Krueppel-AssociatedBoxLB-Luria-BertaniLcn-LipocalinLCRs-LowCopyRepeatsLD -LinkageDisequilibrium
Acronyms

20
LINEs-LongInterspersedNuclearElementsLTR-LongTerminalrepeatLTR-ERV 1-LongTerminalRepeatEndogenousRetrovirus1MajSat-MajorSatelliteDNAMbp–MegabasepairsMEFs-MouseEmbryonicFibroblastsMeisetz-MeiosisinducedfactorcontainingaPR/SETdomainandzincfingermotifMinSat-MinisatelliteDNAMLH1-MuTLHomolog1MLH3-MuTLHomolog3MMBIR-Microhomology-MediatedBreak-InducedRepairMMEJ -Microhomology-MediatedEndJoiningMSH4-MutSHomologs4MSH5 -MutSHomologs5Myr -MillionYearsNAHR-Non-AllelicHomologousRecombinationNCO-Non-CrossoverNHEJ-Non-HomologousEndJoiningNL-NuclearLaminaNPCs-NeuralPrecursorCellsOds -OdysseusOkt1Ko MEFs-Oct1KnockoutMouseEmbrionicFibroblastsOvd-OverdirvePBS-PhosphateSerumSalinePLE-Penelope-LikeElementPNA–PeptideNucleicAcidPrdm9-PRdomaincontaining9Q-FISH-QuantitativeFluorescencein situ HybridizationQTL -QuantitativeTraitLocus
Rad51-Radiationsensitive51Rb-RobertsonianRPA-ReplicationProteinARpm-RevolutionsperminuteSC-SynaptonemalComplexSD-SegmentalDuplicationsSDSA-Synthesis-DependentStrandAnnealingSF-SyntenicFragmentSINEs-ShortinterspersedNuclearElementsSNP-SingleNucleotidePolymorphismSS-SatsumaSyntenySSA-SingleStrandAnnealingSSC-SalineSodiumCitratessDNA-single-strandedDNAST-SyntenyTrackerSYCP1-SynaptonemalComplexProtein1SYCP2-SynaptonemalComplexProtein2SYCP3-SynaptonemalComplexProtein3TAD-TopologicalAssociatedDomainTE-TransposableElementTFU–TelomereFluorescenceUnitsTIR-TerminalInvertedRepeatstL1–MinisatelliteL1TLCSat-TelocentricsatelliteTR-TandemRepeatsWART-Whole-ArmReciprocalTranslocationZnF-ZincfingerγH2AX -PhosphorylationofHistoneH2AXonserine139

21
1.
GENERALINTRODUCTION

22

23
GENERALINTRODUCTION
Understanding the mechanisms by which speciation takes place has been a topicofdiscussionsinceCharlesDarwinproposed its revolutionary theoryof theoriginof the species in 1859 toexplain thediversityof the livingworld (“On the Origin of Species”,1859)andsettingthebasesforthemodernevolutionarybiology.In these early days, species were seen as arbitrary constructs made by humans (Darwin1859).However,thisdiscussionseemedtobeunproductiveuntil(Mayr1942)proposedthe“BiologicalSpeciesConcept”,definingspeciesas“groupsofactuallyor potentially inbreeding natural populations, which are reproductively isolated fromothersuchgroups”.Mayr,alongwithT.Dobzhansky(Dobzhansky1937;1951),definedthemodernsynthesisofevolutionarytheory,integratingMendel’slawsofinheritance with Darwin’s view by placing the emphasis on the genetic relationships among populations. Thus, what reproductive isolation consists of and which are its genetic consequences? T. Dobzhansky (1937, 1951) greatly contributed to ourunderstandingofthemechanismsthatare involvedinreproductive isolation(seeBOX1)and,withthe“BiologicalSpeciesConcept”asthecenterofdiscussion,thefirst models of speciation were focused on elucidating the mechanisms underlying speciation barriers.
1.1Chromosomalrearrangements
Earlyobservationson thecorrelationbetweenkaryotypediversityand thepresence of Chromosomal Rearrangements (CRs) in different taxa (White 1973),triggeredthedevelopmentofdifferentspeciationmodelsinvolvingCRsinordertoexplaintheevolutionofspecies.CRsconstitutethebasisofgenomevariability,sincethey contribute to genome reshuffling, providing new chromosomal forms on which naturalselectioncanact.AsPengandcollaborators(2006)postedit,CRs“compriseevolutionary “earthquakes” that dramatically change de landscape”. This is well exemplified by mammals, a taxonomic group characterized by a high diversity of karyotypes,withdiploidnumbersrangingfrom2n=6intheIndianMuntjakfemale(Muntiacusmuntjak)(WursterandBenirschke1970)to2n=102inthecaseoftheRedvizcacharat(Octomys mimax)(Contrerasetal.1994).
1.1.1Typesofchromosomalrearrangements
Chromosomalrearrangementsconsistoflarge-scalereorganizationsthatcanoccur within or among chromosomes. They encompass different types of events

24
affecting from a few Kilobase pairs(Kbp)towholechromosomes,beinggenerallyclassifiedasbalancedorunbalancedCRs(Griffithsetal.1999). Balanced CRs include those rearrangements that do not change the finalgene dosage and include inversions, reciprocal translocations, fusions and fissions (Figure 1.1). Inversions occurwhen an internal region of a chromosome changesits orientation with respect to flanking regions and can involve the centromere (pericentric inversion, Figure 1.1A) or not (paracentric inversion). Reciprocaltranslocations, on the other hand, consist of the exchange of two genomic regions betweentwodifferentchromosomes(Figure1.1B).Thisrearrangementcanalsobeunbalanced, when one chromosomal region is inserted into a different chromosome (non-reciprocaltranslocation)(Griffithsetal.1999).
BOX1:Barriersthatcontributetoreproductiveisolation
Reproductive barriers can be initiated by divergent selection (ecological or sexual selection) or by genetic drift (as a direct consequence of evolution or through the accumulation of genetic incompatibilities) (Dobzhansky 1937; Dobzhansky 1951; Coyne and Orr 2004) and include:
Prezygotic isolation barriers: They act before fertilization of the oocyte.Premating isolation: Barriers act before the transference of the sperm to the oocyte and comprise: - Behavioral isolation: The mechanism by which there is a lack of cross-interaction between
individuals. - Ecological isolation: Based on the ecological differences between species that are products of
the adaptation to the local environment, and this can be: • Habitatisolation:Thespeciesoccupydifferenthabitatsduringthematingperiod. • Temporalisolation:Thespeciesmatingperiodaredevelopedatdifferenttimes. - Mechanical isolation: Incompatibility between reproductive structures that avoid the mating
process.Postmating isolation: Mechanisms that act after the sperm transfer but before fertilization. - Copulatory behavioral isolation: The behavior of an individual during copulation avoids
fertilization. - Gametic isolation: Sperm cannot fertilize the oocyte.
Postzygotic isolation barriers: They act after the fertilization of the oocyte.Extrinsic postzygotic isolation: This mechanism depends on the environment conditions (either biotic or abiotic). -Ecologicalinviability:Hybridsdevelopnormallybuttheysufferlowviability,astheycannot
find an appropriate ecological niche to develop. -Behavioralsterility:Hybridshavenormalgametogenesisbuttheirreproductiveefficiencyis
low, as they cannot find appropriate mates.Intrinsic postzygotic isolation -Hybridinviability:Hybridssufferdevelopmentaldifficultiescausingfullorpartiallethality. -Hybridsterility:Hybridspresentmeioticproblemsthataffecttotheproperdevelopmentof
gametes.
GENERALINTRODUCTION

25
Chromosomal fusions occur when two non-homologous chromosomesare combined to form a new chromosome. One of the most common type of chromosomalfusionfoundinnatureistheso-calledcentricfusionorRobertsonian (Rb)fusion(Robertson1916).Inthislatercase,twoacrocentricchromosomesfusebyits centromeric region following the breakage within the microsatellite sequences, leadingtotheformationofsinglemetacentricchromosome(Figure1.1C).Thistypeof rearrangement does not affect gene dosage although they can induce variation in diploidnumbers.Finally,chromosomalfissionsalsoleadtochangesinchromosomenumbers by transforming one initial chromosome into two (see the example ofcentricfission,Figure1.1D). UnbalancedCRs,ontheotherhand,encompassthetypeofrearrangementwhere gene dosage is altered, either as a gain (duplication) or loss (deletion) ofgeneticmaterial.Duplicated regionscanbe localizedadjacent toeachother (i.e.,tandemduplication),inanovellocationwithinthesamechromosome,orinanotherchromosome(i.e.,insertionalduplication)(Griffithsetal.1999).Deletions,onthecontrary, occur when chromosomal fragments or whole chromosomes are lost (Griffithsetal.1999).
Figure 1.1. Representation of the different types of CRs: For each type of rearrangement, the initial state of thechromosome, the localization of chromosomal breakages and the resulting rearranged chromosome are represented foran(A)pericentricinversion,(B)reciprocaltranslocation,(C)Robertsonianfusionand(D)fission.
GENERALINTRODUCTION

26
1.1.2Originofchromosomalrearrangements:mechanisms
ofDNArepair
Chromosomal rearrangements that are shaping mammalian genomes areoriginated by Double Strand Breaks(DSBs).Thistypeoflesionisgeneratedeitherbyexogenousfactors(ionizingradiationand/orchemicalagents),endogenousagents(freeradicalsorstallofthereplicationfork)orbyhighlyspecializedcellularprocessessuchasmeiosis.Inallcases,DSBsarerepairedthroughdifferentmechanisms,asitwillbeexplainedbelow.Whenanyofthesemechanismsfail,DSBsareillrepaired,whichcanleadtocelldeathorlarge-scaleCRsthatenhancegenomeinstability.Ifthese new chromosomal forms are produced in the germ line, they will have the probability to be fixed in the population providing new variability and eventually contributing to the formation of new species. DNA repair mechanisms are classified into two main groups, dependingonthetypeofsequences(homologousornon-homologous)usedastemplate(seeOnishi-SeebacherandKorbel2011,andreferencestherein).DNArepairmediatedby homologous sequences include twomechanisms: (i) Single Strand Annealing (SSA) (Lee2014)and (ii)Non-Allelic Homologous Recombination (NAHR) (Sasakietal.2010).Themechanismsmediatedbynon-homologousregionsor regionsofmicrohomologyaremorediverseandcomprise: (i)Non Homologous End Joining (NHEJ) (Lieber 2010), (ii) Alternative End Joining (Alt-EJ) (Frit et al. 2014), (iii)Microhomology-Mediated End Joining (MMEJ) (McVey and Lee 2008), (iv)Microhomology-Mediated Break-Induced Repair (MMBIR) (Yu andMcVey 2010),(v)Fork Stalling and Template Switching(FoSTeS) (Hastingsetal.2009)and(vi)chromothripsis(Stephensetal.2011;Kloostermanetal.2012). WithintheDNArepairmechanismsthataremediatedbyhomologoussequences,SSA occurswhen twohomologous sequences are incorrectly annealed (normallyrepetitivesequences)withoutinvolvingDNAstrandinvasions,andnormally,leadsto deletions (Heyer et al. 2010). RegardingNAHR or ectopic recombination, thistakes place by three different pathways, depending on the relative position of the homologous sequences. In the first case, when the sequences that recombine are adjacent with the same orientation, the result is either a duplication or deletion. Conversely, in thecasewherehomologousregionsare found innon-homologouschromosomes, it results in a translocation. Finally, if the homologous sequencesare found in the same chromosome but with inverted orientations, the result is an inversion(reviewedinBaileyandEichler2006).
GENERALINTRODUCTION

27
Regardingnon-homologyormicrohomology-mediatedmechanisms,NEHJconstitutesaDSBsrepairpathwaythatinvolvesthejoiningoftwofreeendsthrougha process that is independent of sequence homology and, therefore, produce junctionsthatcanvaryintheirsequencecomposition(between1bpand4bpinsize)(Takata et al. 1998; Hefferin and Tomkinson 2005). Alt-EJ and MMEJ constitutealternativerepairpathwaysofDSBsfreeendsbymicrohomologythatdiffer fromNEHJbythesizeoftheregioninvolved(between5bpto25bpinthiscase)(Hastingset al. 2009). AdditionallyMMBIR/FoSTeSmechanisms have been proposedmorerecently in order to explain the occurrence of some types of rearrangements that could not be explained by any of the previously mentioned pathways and would be involvedingenomicinstabilityrelatedwithspecifichumandiseases(Leeetal.2007;Zhangetal.2009).ThismechanismtakesplaceduringDNAreplication.Inthiscase,the replication fork can stall and switch different templates using complementary templatemicrohomology to anneal and primeDNA replication. Thismechanisminvolves the insertion of small portions of non-homologous regions within thereplicationfork(Hastingsetal.2009). Finally,chromothripsis(alsoknownaschromosomeshattering)referstothelarge amount of genomic breakages observed in several cancers and human genomic disorders(Stephensetal.2011).Thisphenomenonisconsideredasachromosomal“disaster” and was defined on the basis of three main characteristics: (i) theoccurrence of remarkable numbers of rearrangements in localized chromosomal regions, (ii) a low number of copy number states across the rearranged region;and (iii) alternation in the chromothriptic areas of regionswhere heterozygosityis preservedwith regions presenting loss of heterozygosity (Stephens et al. 2011;Formentetal.2012).
1.1.3DNAsequencesassociatedwithCRs
SpecificDNAfeatureshavebeenassociatedwiththeoccurrenceofCRs,eitheras the mechanism of origin or as the result of the reorganization. This is the case of repetitive elements and telomeric repeats. Three types of repetitive sequences have been described to play a role in genome reshuffling: Segmental Duplications(SDs),Transposable Elements(TEs)andTandem Repeats(TRs).
GENERALINTRODUCTION

28
1.1.3.1SegmentalDuplications
Segmental Duplications (SDs), also known as Low Copy Repeats (LCRs),consistofduplicatedDNAfragmentslargerthan1Kbpinsizethatspreadacrossthegenome.SDspresentanon-randomgenomedistribution,clusteringatsubtelomericandpericentromericregions(BaileyandEichler2006;Sheetal.2008),althoughtheycanalsobepresentineuchromaticregionsofspecificchromosomes(Sheetal.2004).Theyshow>90%ofsequencehomology(BaileyandEichler2006),whichexplainthepropensityoftheseregionstopromoteNAHR.However,thereisevidencethatsupporttheinvolvementofSDsinhomology-independentDNArepairmechanisms,suchasNHEJ(KoszulandFischer2009;Quinlanetal.2010). Given their repetitive nature, SDs are an important source of genomicinstability by birthing new genes, favoring functional diversification and expansion ofgenefamilies(Newmanetal.2005;Wilsonetal.2006).SDscanencodeproteinproducts that, although are not necessarily essential for the viability of the organism, canbe relevant for speciesadaptation (DudaandPalumbi 1999;ChangandDuda2012).Infact,commonlyduplicatedgenesinmammalsincludethoseassociatedwithinnate immunity, digestion, drug detoxification, olfaction, and sperm competition (Beckmannetal.2007;Liuetal.2009). Moreover,SDsarealsoinvolvedintheoccurrenceofCRsimplicatedinhumandisorders(Lupski1998;Pollacketal.2002;Sharpetal.2006;Uddinetal.2011)andchromosomal evolution (Murphy et al. 2005b; Elsik et al. 2009). The correlationbetweenSDsandevolutionaryCRshasbeendescribedinsomemammalianspecies(Murphy et al. 2005b), such asmouse (Armengol et al. 2003; Bailey et al. 2004;Armengoletal.2005),rat(ZhaoandBourque2009),dog(ZhaoandBourque2009)andprimates(Carboneetal.2006;Kehrer-SawatzkiandCooper2008b;Girirajanet al. 2009;Marques-Bonet et al. 2009; Capozzi et al. 2012; Carbone et al. 2014).Overall,nearly40%ofevolutionaryCRshavebeenfoundtobeassociatedwithSDsinmammals(BaileyandEichler2006).
1.1.3.2TransposableElements Transposable Elements(TEs)werediscoveredbyBarbaraMcClintock(1984)in maize and since then, they have been found in almost all organisms, from prokaryotestoeukaryotes(Capy1998).Theyareclassifiedintotwolargefamilies:
GENERALINTRODUCTION

29
(i)retrotransposons(classIelements)and(ii)DNAtransposons(classIIelements)(Richardetal.2008). Retrotransposons,alsoknownasclassIelements,formagroupofTEsintegratedbyavarietyofdifferentrepeats(Wickeretal.2007).Theyarecharacterizedbytheabsenceofintrons,anadenine-richtailanddirectrepeatslocalizedintheadjacentregions, that are produced by transposition, and include: Long Terminal Repeats (LTRs), Long Interspersed Nuclear Elements (LINEs), Short Interspersed Nuclear Elements(SINEs)(thatincludesAluelementsdescribedinprimates),Dictyostelium Intermediate Repeat Sequence (DIRS-like elements) andPenelope-Like Elements (PLE)(Wickeretal.2007).Theirmechanismoftranspositionconsistsoftheretro-transcriptionofitssequencestoRNAthatissubsequentlytransformedtoDNAbyaninverse transcriptase, a process that can be auto regulated by the retrotransposon itself.Ontheotherhand,classIIelements,orDNAtransposons,consistofmobileDNArepeatsthatcodifyforatransposasethatsplitfromtheDNAsequenceandusesinglestrandbreaksorDSBstotransposeitselfinanewgenomicregionbyrepairingthe breaks, using the sister chromatid or homologous chromosomal region as template(Wickeretal.2007).Thisgroupincludesseveraltypesoftransposonssuchas Terminal Inverted Repeats(TIR),Crypton,ElitronandMaverickrepeats(Wickeretal.2007). Due to their interspersed sequence homology, TEs would favor genomeinstability involved both in genomic disorders and species adaptation, mirroring whathasbeendescribedforSDs(DeiningerandBatzer1999;Schibleretal.2006;Leeetal.2008;Kehrer-SawatzkiandCooper2008b;Longoetal.2009;Farréetal.2011).Additionally, theyalsoplayan importantrole inenvironmentaladaptationby facilitating the acquisition of new genetic material (reviewed in CasacubertaandGonzález2013).TheformationofCRstriggeredbyTEscanbeduetotheresultof either indirect (homologous recombination) or directDNA repairmechanisms(alternative transposition process) (Wicker et al. 2007; Richard et al. 2008). Inthe first case, CRs can result from recombination between non-allelic sequencesbetween TEs interspersed across the genome, either byNAHR or SSA (Sen et al.2006). NAHR is thought to be the source ofmany TE-related instability events,particularlythoseresultinginduplicationsandtranslocations(Elliottetal.2005).Inhumans, most of the Alu-mediateddeletioneventsareconsistentwitheitherNAHRorSSAmechanisms(Senetal.2006).ThishasbeenthecasealsoforSaccharomyces, where recombination events between transposons have been described probably duetotheirhighsequencehomology(Fischeretal.2000). Transposable elements, as with SDs, have the capacity to influence genome
GENERALINTRODUCTION

30
plasticity.Thiscanbedone,forexample,by(i)thealterationofthegenefunctionandregulation,(ii)contributingtothecreationofnewgenes,and(iii)inducingCRs(seeFeschotteandPritham2007;CordauxandBatzer2009, for reviews). In fact,genomereshufflingtriggeredbyTEshavebeenextensivelyrecordedbothinplantsandanimals(Walkeretal.1995;Delpratetal.2009).Inthecaseofmammals,thisisexemplifiedbyprimates(Kehrer-SawatzkiandCooper2008a;Leeetal.2008;Farréetal.2011;Carboneetal.2014),Cetartyodactyla(Groenenetal.2012)andmarsupials(Longoetal.2009),wherelineage-specificCRshavebeenfoundtobeenrichedinTEs.
1.1.3.3TandemRepeats
Tandem Repeats (TRs) consist of a large series of repeated sequencessequentially distributed or clustered in specific regions of the genome. They follow ahead-to-tail-fashiondistribution,beingalso called“direct repeats” (Richardetal. 2008). TRs canbe classified into twogroups: (i)minisatellites,which containrepeatunitslargerthan7bp,and(ii)microsatellites,withrepeatunitsfrom1bpto6bp(Näslundetal.2005). AlongwithTEs,TRshavebeenreportedasanimportantsourceofDNAvariationandmutation (Armour 2006). TRs can form different secondary DNA structuresfromtheWatson-Crickclassicalconformationsuchashairpins,cruciformortriplexconformationsthatwouldpromotegenomicinstability(Bacollaetal.2008;Kolbetal.2009).TheseDNAstructuresareassociatedwithDNAreplicationmalfunctionsand meiotic recombination (Usdin and Grabczyk 2000; Shaw and Lupski 2004;Kelkaretal.2008).ExpansionsoftherepeatarrayoccurwhenanunusualsecondarystructureisformedinthelaggingdaughterstrandduringDNAreplication.Deletions,on the other hand, occur when an unusual configuration develops in the template for lagging-strandDNAsynthesis(UsdinandGrabczyk2000).Thus,TRsarerelevantfacilitators of CRs involved inmany diseases (Campuzano et al. 1996;Usdin andGrabczyk2000).Fromanevolutionaryperspective,TRswereinitiallyshowntobeconcentrated in evolutionary chromosomal regions in thehumangenome (Ruiz-Herreraetal.2006)aswellasinprimate-specificchromosomalbreakpointregions(Farréetal.2011).Inprimates,certainTRs(thatpresentsAAATmotif)areenrichedin Alu elements, suggesting the involvement of these elements in primate evolution (Farréetal.2011).However,giventheAAATmotifissimilartotheinsertionmotif5’-TTAAA-3’(Jurka1997)andthatAlu elements are capable of insertion at target
GENERALINTRODUCTION

31
sitesthatareslightlydifferent(althoughalwaysAT-rich)(Levyetal.2010),theAAATmotifcouldbesite-specificforAlu insertion in primate evolutionary breakpoints. This is consistent with the observations that young AlufamilieswerelocatedinAT-richregionsinthehumangenome(KvikstadandMakova2010),orthepresenceofLTR Endogenous Retrovirus 1 (LTR-ERV1), satellite repeats and tRNAGlu-derivedSINEsincertartiodactyla-specificEBRs(Groenenetal.2012).
1.1.3.4 Telomericrepeats
Telomeric repeats have been also described to be involved in genome reshuffling(Nergadzeetal.2004;Ruiz-Herreraetal.2008).Telomeresarespecializedribonucleoprotein structures localized at the end of chromosomes, composed of tandemTTAGGGrepeats,boundtospecificproteinsformingtheshelterincomplex(Moyzisetal.1988;deLange2005)andassociatedwithspecificnon-codingtelomericRNAmoleculescalledTERRA(Azzalinetal.2007;SchoeftnerandBlasco2008;Reig-Viaderetal.2014).TelomeresprotectchromosomalendstoberecognizedasDSBsor“freeends”andthuspreventtheformationofchromosomalfusions(Zakian1997),recombinationbetweentelomeresandDNAerosion(Lietal.1998).Telomeresbalancetheend-replicationproblem,whichconsistsoftelomericDNAshorteningineachroundofreplicationcausedbytheinabilityofpolymerasestoreplicateDNA.Thisprocesscanberevertedbytheactionofeitherarecombination-basedmechanismor an enzymatic strategy based on the action of telomerase, a ribonucleoprotein DNApolymerasethataddstelomericrepeatsatchromosomalends(O’SullivanandKarlseder2010). Given the importance of telomeres in maintaining genome integrity,alterationsoftheirstructureareoftenrelatedtotheoccurrenceofCRs,suchasRbfusions(Blascoetal.1997;Slijepcevicetal.1997;Slijepcevic1998).Inthiscontext,theformationofRbfusionswouldrequireeithertheeliminationorinactivationoftelomerespriortothereorganization(Ruiz-Herreraetal.2008).Moreover,providedthatRbfusionsareextendedinnaturalpopulationsfromseveralmammalianspeciesrepresentativeofbovids,cervidsandrodents(Piáleketal.2005;Pagacovaetal.2009;Gauthieretal.2010;RobinsonandRopiquet2011;Aquinoetal.2013),thestudyoftelomere dynamics represents an important challenge for the understanding of the roleofRbfusionsinspeciation.Inthiscontext,threedifferentmechanismshavebeenproposedtoexplaintheoccurrenceandfixationofRbfusionsinnaturalpopulationsinrelationtothepresence/absenceoftelomericsequencesintheresultantmetacentric
GENERALINTRODUCTION

32
Initial studies regarding theroleof telomereshortening in theoriginofRbfusions originated from laboratory observations using telomerase knockout mice as models(Blascoetal.1997).Blascoandcollaborators(1997)observedahighdegreeofchromosome fusions in tumor cell cultures that presented telomerase inactivation (Blascoetal.1997),aprocessalsoobservedinhumans(Harleyetal.1990;Allsoppetal.1992)andMusspretusprimarycells(ProwseandGreider1995).Theseobservationssuggest that short telomeres would lose the capacity to protect chromosomes from fusions(Figure1.2A).Despitesuchevidence,whetherthisphenomenonoccursinnatural populations remains to be tested. Robertsonianfusionscanalsooccurwhentelomericsequencesarelostduetochromosomalbreakagewithinminorsatellitesequencesatthecentromere(Figure1.2B). This phenomenon was proposed to occur in wild-derived house mouse(Garagnaetal.1995;Nandaetal.1995;Garagnaetal.2001).Inthiscase,breakageleads to the loss of both telomeres and satellite repeats and, in both cases, the absence oftelomericrepeatscouldpromoteillDNArepairthatcouldleadtothejoiningoftwoacrocentric or telocentric chromosomes, leading to the formation of a metacentric (Figure1.2B). And finally, it has been reported that Rb fusions can occur without thelossof telomeric repeats (Figure 1.2C).Theobservationof chromosomesofmanyvertebrates with the presence of Interstitial Telomeric Sequences (ITSs) supportsthisview(Meyneetal.1990;Ruiz-Herreraetal.2008;Bruschietal.2014).Inthiscase, the presence of telomeric repeats at fusion regions would be inconsistent with thepresenceoffunctionaltelomeres,asSlipjecevicsuggested(Slijepcevic1998).
Figure 1.2. Types of Rb fusions and their mechanisms of origin: Telomeresaredepicted inblue. (A)Rbfusionbytelomereshortening(B)Rbfusionbychromosomebreakagewithinminorsatellitesequencesand(C)Rbfusionbytelomereinactivation.AdaptedfromSlijepcevic(1998).
chromosome(Slijepcevic1998):(i)telomereshortening,(ii)chromosomebreakagewithinminorsatellitesequencesand(iii)telomereinactivation(Figure1.2).
GENERALINTRODUCTION

33
1.1.4HowtodetectCRsamongtaxa
The study of genome organization and themechanisms bywhich CRs areinvolved in speciation and adaptation are both key points to better understand the evolutionary dynamics of genomes. In order to investigate the causes and evolutionary consequences of CRs, different approaches have been developed tostudy genome reshuffling among taxa.
1.1.4.1Comparativecytogenetics
Since the first human karyotype was described contemporarily by two research groups (Ford and Hamerton 1956; Tjio and Levan 2010), relevanttechnological advances have been achieved in the study of CRs and karyotypediversity.Initialcytogeneticapproachesinthelate1960swerefocusedonbandingpatternscomparisons(G-andR-banding)thatpermittedtoidentifyanddifferentiatechromosomes between species (Caspersson et al. 1970; de Grouchy et al. 1972;Egozcueetal.1973a;Egozcueetal.1973b;Lentziosetal.1980).Thiswasthecaseofearlykaryotypecomparisonsingreatapes(Egozcueetal.1973a;Egozcueetal.1973b;Dutrillauxetal.1975;YunisandPrakash1982;Clementeetal.1990).Thesubsequentlydevelopment of molecular cytogenetics techniques, such as Fluorescence in situ Hybridization (FISH), allowed researchers to refine the resolution at which CRscanbeidentifiedamongdifferentspecies.ThisapproachreliesontheuseofDNAprobes corresponding to whole chromosomes (chromosome painting probes)that canbehybridizedonchromosomepreparationsof target species (Scherthanetal.1994).Inthisway,itispossibletoestablishconservedchromosomalregionsbetweentwogivenspecies,basedonDNAsequencehomology.Suchinformation,framed inanevolutionarycontext (i.e.,byusing theappropriateoutgroups),hasallowedtheidentificationoftheevolutionarydirectionofCRs.Infact,usingwhole-chromosomal paintings, Zoo-FISH has been used to compare a large amount ofmammalianspeciesrepresentativeof themajorphylogeneticgroups (Chowdharyetal.1998;Froenickeetal.2005).Thesespecies includedprimates(e.g.,Stanyonetal.2000;2004;Garcíaetal.2000;Ruiz-Herreraetal.2002;Venturaetal.2007;Kehrer-SawatzkiandCooper2008b;Girirajanetal.2009),rodents(Veyrunesetal.2006;Graphodatskyetal.2008;Trifonovetal.2010;Di-Nizoetal.2015),afrotherian(Yang et al. 2003;Frönicke et al. 2003;Pardini et al. 2007), equids (Pawlina andBugno-Poniewierska2012;Musilovaetal.2013),carnivores(Perelmanetal.2012)
GENERALINTRODUCTION

34
andbirds(Guttenbachetal.2003;Griffinetal.2008;deOliveiraetal.2010).Inthisway,threedifferenttypesofchromosomeconservedregionscanbeidentified:(i)whole chromosomes that remain intact in the ancestral karyotype as a single block, (ii)fragmentsofchromosomescorrespondingtoasinglechromosomeancestor,and(iii) chromosomal associations (i.e., synteny), that is, chromosomal fragmentsorwhole chromosomes that are now present in independent chromosomes, but were represented as a single chromosomal form in a recent common ancestor. But, despite these methodological advances, molecular cytogeneticmethodologiespresentsomelimitations,asFISHprobescanonlyhybridizebetweenclosely related species and the lack of resolution that it presents does not allow for the detailed characterization of chromosomal breakpoints, at a sequence level, in distantly related species. Thus, additional comparative approaches have been developed to fill this gap.
1.1.4.2Geneticmapping
Genetic mapping has been broadly used to identify chromosomal regionsof homology among species. It is based on the experimental obtaining of the gene order between two species assuming that its conservation corresponds to regions of homology. Genetic maps can follow two different strategies: (i) high-densitymolecularlinkagemapsor(ii)radiationhybridmaps. On one hand, the characterization of the relative position of two loci based on the frequency they are observed together in gametes is the approximation used in linkage maps. If this frequency is high, this indicates that loci are closely located. Conversely,lowfrequenciesindicatedistantpositionsbetweenloci. This approach was initially used to define regions of homology between human and mouse genomes (Lalleyetal.1978),butwasrapidlyextendedtootherspeciessuchascatanddog(O’Brienetal.1995;O’Brienetal.1997),horse(Caetano1999),chimpanzee(Crouau-Royetal.1996),baboon(Rogersetal.1995),vole(McGrawetal.2011),flycatcherandzebrafinch(Kawakamietal.2014),amongothers. On the other hand, radiation hybrid maps, are based on the ionizing irradiation of genomes, followed by cell hybridization (Cox et al. 1990). By this approach,chromosomes are broken into fragments that can be studied in hybrid cells. The estimation of the distance between two loci is calculated based on the frequency these two loci arefoundinthesamecell.Radiationhybridmapshavebeenconstructedinhuman(Gyapayetal.1996),rat(Watanabeetal.1999),dog(Mellershetal.2000),cow(Bandetal.2000),pig(Hawkenetal.1999),cat(Murphyetal.2000),rhesus
GENERALINTRODUCTION
35
macaque(Murphyetal.2005a)andzebrafish(Geisleretal.1999)amongothers.
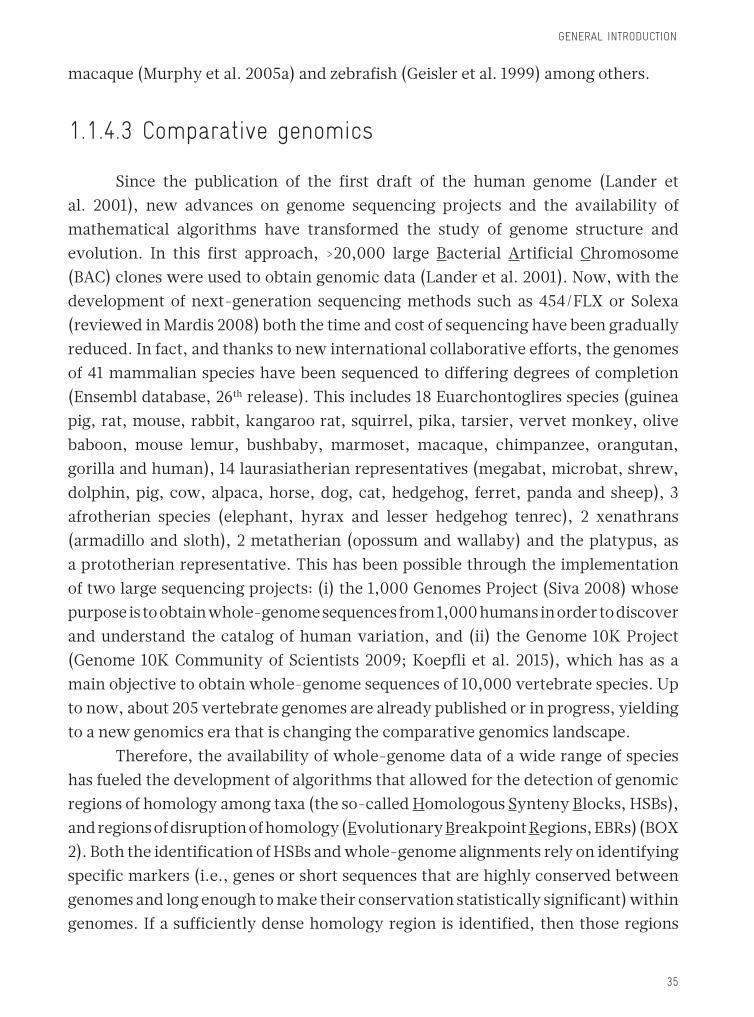
1.1.4.3Comparativegenomics
Since the publication of the first draft of the human genome (Lander etal. 2001), new advances on genome sequencing projects and the availability ofmathematical algorithms have transformed the study of genome structure and evolution. In this first approach, >20,000 large Bacterial Artificial Chromosome (BAC)cloneswereusedtoobtaingenomicdata(Landeretal.2001).Now,withthedevelopment of next-generation sequencingmethods such as 454/FLX or Solexa(reviewedinMardis2008)boththetimeandcostofsequencinghavebeengraduallyreduced. In fact, and thanks to new international collaborative efforts, the genomes of41mammalianspecieshavebeensequencedtodifferingdegreesofcompletion(Ensembldatabase,26threlease).Thisincludes18Euarchontogliresspecies(guineapig, rat, mouse, rabbit, kangaroo rat, squirrel, pika, tarsier, vervet monkey, olive baboon, mouse lemur, bushbaby, marmoset, macaque, chimpanzee, orangutan, gorillaandhuman),14laurasiatherianrepresentatives(megabat,microbat,shrew,dolphin,pig,cow,alpaca,horse,dog,cat,hedgehog, ferret,pandaandsheep),3afrotherian species (elephant, hyrax and lesser hedgehog tenrec), 2 xenathrans(armadilloand sloth), 2metatherian (opossumandwallaby)and theplatypus,asa prototherian representative. This has been possible through the implementation oftwolargesequencingprojects:(i)the1,000GenomesProject(Siva2008)whosepurposeistoobtainwhole-genomesequencesfrom1,000humansinordertodiscoverandunderstand the catalogofhumanvariation, and (ii) theGenome 10KProject(Genome 10KCommunity of Scientists 2009;Koepfli et al. 2015),whichhas as amainobjectivetoobtainwhole-genomesequencesof10,000vertebratespecies.Uptonow,about205vertebrategenomesarealreadypublishedorinprogress,yieldingto a new genomics era that is changing the comparative genomics landscape. Therefore,theavailabilityofwhole-genomedataofawiderangeofspecieshas fueled the development of algorithms that allowed for the detection of genomic regionsofhomologyamongtaxa(theso-calledHomologous Synteny Blocks,HSBs),andregionsofdisruptionofhomology(Evolutionary Breakpoint Regions,EBRs)(BOX2).BoththeidentificationofHSBsandwhole-genomealignmentsrelyonidentifyingspecificmarkers(i.e.,genesorshortsequencesthatarehighlyconservedbetweengenomesandlongenoughtomaketheirconservationstatisticallysignificant)withingenomes. If a sufficiently dense homology region is identified, then those regions
GENERALINTRODUCTION

36
BOX2.GraphicalrepresentationofHomologousSyntenyBlocks(HSBs)andEvolutionaryBreakpointRegions(EBRs)Homologoussyntenyblocksconsistofconservedgenomicregionsbetween twoormorespecies.Theyaredefined as a minimun of two adjacent markers without homology interruption on the same chromosome or in different chromosomes of two species. Conversely, EBRs are considered as the interval between two contigous HSBsorregionsofdisruptionofhomologythatresultfromareorganization(Figure1.3).Theirdetectionisuseful for evolutionary studies as they allow for the reconstruction of the origin of mammalian genomes and the evolutionaryforcesthathaveshapedthem(Murphyetal.2005b;Ruiz-Herreraetal.2006;Larkinetal.2009).
Figure 1.3: HSBs(ingreen)andEBRsdetectedbetweentwochromosomesfromtwospecies(AandB).
areconsideredasHSBs.Algorithmsdevelopedforgenomealignments inordertodetectHSBs andEBRs generally usemarkers as anchors (i.e., fixed references inthealignment)and thesemarkersareusuallyorthologousgenes,k-mersorevennucleotide sequences. Some examples of these algorithms include MGR (Bourqueand Pevzner 2002), GRIMM (Tesler 2002), GRIMM-synteny (Pevzner and Tesler2003a), CHAINNET (Kent et al. 2003), CASSIS (Baudet et al. 2010), Cyntenator (RödelspergerandDieterich2010),Synteny Tracker(Donthuetal.2009),Satsuma Synteny (Grabherr et al. 2010) and i-ADHoRe (Proost et al. 2012), amongothers.These algorithms have been used in a wide range of comparative studies, mainly in mammals. In this way, a large number of syntenic regions have been identified at differentdegreesofresolution(NadeauandTaylor1984;PevznerandTesler2003a;Bourqueetal.2004;Larkinetal.2009;SkinnerandGriffin2012;Zhangetal.2014). However,althoughallthesemethodshavebeendeeplyimprovedinrecentyears, such as the approaches tonarrowEBRs coordinates (Lemaitre et al. 2008;Larkinetal.2009)thereisstillaninaccurateidentificationofCRsdependingonthedetectingresolutionsusedineachapproach(Lemaitreetal.2008;Attieetal.2011).This lack of consensus between different methods makes that still nowadays new approachesarebeingdevelopedinordertoidentifyCRs,HSBsandEBRswithhighresolution and maximum confidence.
GENERALINTRODUCTION

37
1.1.5ModelsofdistributionofCRswithingenomes
Bytheuseofallthemethodologicalapproachesdescribedabove,thestudyofchromosomal variability among taxa as a result of genome reshuffling has been an exciting issue in evolutionary biology and different models have been proposed in ordertoexplainthedistributionofEBRsacrossgenomes.
1.1.5.1Therandombreakagemodel
The random breakage model has been the dominant paradigm of genome reshufflingsinceitwasfirstproposedinthelate80’sbyNadeauandTaylor(1984),basedonapreviousworkbyOhno,yearsbefore (Ohno1973).Their thesis reliedon twomain assumptions: (i) thatmany chromosomal segments are expected tobe conserved among species, and (ii) that CRs are randomly distributed withingenomes.Intheirwork,NadeauandTaylor(1984)comparedthemouseandhumanlinkagemapsbasedonthecorrespondenceof83orthologousgenesanddescribedthe presence of approximately 180 HSBs between both genomes. Additionally,they hypothesized that the distribution of the conserved regions sizes followed an exponential function as a result of a random process. Therefore, they proposed that CRsweredistributeduniformlyacrossgenomes.Thisviewwasgenerallyacceptedfor many years, supported by additional data of new described orthologous genes betweenmouseandhumangenomes(Sankoffetal.1997).
1.1.5.2Thefragilebreakagemodel
Several years after Nadeau and Taylor proposed their model, genomesequencingeffortsandthedevelopmentofnewmathematicalalgorithmsforwhole-genome analysis, proved that the first assumption was true: there is a conservation of large genomic regions among mammalian species (Froenicke et al. 2006;Robinsonetal.2006).Regardingthesecondpostulate,itwasquestionedbyPevznerandTesler(2003b)whoproposedthe fragile breakage model, arguing against the randomdistribution ofCRswithin genomes. In theirwork, theGRIMM-Synteny algorithm was used to characterize regions of homology between the human and mousegenomes,identifying281HSBs.Thisanalysisalsorevealedanunexpectedlylargenumber of small and closely localizedHSBs thatwerenot describedbeforeand whose lengths followed an exponential distribution, a circumstance that could
GENERALINTRODUCTION

38
not be explained by the random breakage model. This new evidence yielded to an intensediscussiononthesuitabilityofbothmodels(SankoffandTrinh2005;Pengetal.2006;Sankoff2006;BeckerandLenhard2007)althoughpreviousexperimentaldata inmammalssupportedthenon-randomnessofEBRsdistribution(Froenicke2005; Ruiz-Herrera et al. 2005). Subsequently, comparative studies have givensupport to the fragile breakage model; that is, there are regions throughout the mammalian genome that are prone to break and reorganize (Pevzner and Tesler2003b;Bourqueetal.2004;Zhaoetal.2004;Murphyetal.2005;Ruiz-Herreraetal.2006;Pengetal.2006;Sankoff2006;BeckerandLenhard2007;Kemkemeretal.2009;Lemaitreetal.2009;Larkinetal.2009;Gordonetal.2009;AlekseyevandPevzner2010;Mlynarskietal.2010).ThesestudiesalsoreportedthatsomeEBRsthatoccurredduringmammalianevolutionwerereused(i.e.,thatwereinvolvedinCRsindependentlyintwodifferentlineageswithoutarecentcommonancestor)(e.g.,PevznerandTesler2003b;Murphyetal.2005b;Sankoff2006;Larkinetal.2009;AlekseyevandPevzner2010;Farréetal.2011)acircumstancethatalsosupportstheFragilebreakagemodel. This view is also supported by the presence of repetitive sequencesassociatedtoCRs(seesection1.1.3).
1.1.5.3Theintergenicbreakagemodel
Following the efforts made by evolutionary biologists to understand whyspecificgenomicregionsarepronetobreak,Pengandcollaborators(2006)provideda new approximation to the field by proposing the intergenic breakage model.Bysimulating randomCRs in the human andmouse genomes and by analyzing thegenomic distribution of both intergenic and gene regulatory regions, they proposed that the combination of long regulatory regions and the distribution of intergenic regions sizes can be considered a conditional factor for the genomic distribution of EBRs. This model also suggests that selection would avoid the presence ofEBRs within genes that could affect their expression causing deleterious effects.Consequently,undertheintergenic breakage model,EBRsareconsideredregionsofgenomicinstabilitynotbecauseoftheirintrinsicDNApropertiesbutduetotheirgenecomposition as they are localized in regions where negative selection is minimal. Thus,thismodelpredictsthatDSBs,astheoriginofEBRs,wouldappeartohavearandomdistribution,butonlythoseDSBsthatdonothavedeleteriouseffectswouldbecome fixed within populations. Data supporting this hypothesis has been provided indifferentmodels. For example,Mongin and collaborators (2009) analyzedCRsthat occurred along the human lineage when compared with the opossum genome,
GENERALINTRODUCTION

39
showingthatlong-rangetranscriptionalregulationplayedaroleinthefixationofchromosome breaks. Inthiscontext,itcanbehypothesizedthatCRstendtolocalizeinintergenicregions in order to escape from negative selection (Peng et al. 2006; Farré etal. 2015).Whichmeans that if a CR disrupts an important gene involved in cellmaintenance or development, the deleterious effect of that affection would have as a result its elimination from the population.Notwithstanding the existence ofevidencesupportingthisview,thepresenceofEBRsinhigh-densitygenicregionshasbeendescribedinmammals(Murphyetal.2005b;Larkinetal.2009;Zhangetal.2014).GenesfoundwithinEBRsinspeciesaspigandmacacahavebeenfoundto be associated with adaptive responses to external factors such as inflammatory andimmuneresponseaswellasmusclecontraction(Groenenetal.2012;Ullastreset al. 2014). Conversely, genes localized within highly conserved regions ofgenomes present an enrichment of genes involved in cell cycle and nervous system development (Larkinet al. 2009).This is also supportedby thecasedescribed inmouse, were the presence of housekeeping genes near the centromeres avoid the fixationofRbfusionsinnaturalpopulations(Ruiz-Herreraetal.2010).Accordingly,thesefindingssuggeststhatEBRswouldbeunderstrongpositiveselectionmeaningthat the fitness cost of a deleterious rearrangements would be high and thus, this would only be transmitted to the offspring in the case any important developmental gene is disrupted.
1.1.5.4Theintegrativebreakagemodel Despite their apparent discrepancies, the fragile breakage model and the intergenic breakage model are not mutually exclusive, as several works published in the recent years have presented supporting data for different aspects of both (Murphyetal.2001;Ruiz-Herreraetal.2006;Larkinetal.2009;Larkin2010;Farréetal.2011).ThisincludestheroleofrepetitivesequencesandfunctionalconstrainsinthegenomiclocalizationofEBRs(Armengoletal.2005;Ruiz-Herreraetal.2006;Elsiketal.2009;Larkinetal.2009;Farréetal.2011).Inadditiontothesefactors,several lines of evidence suggest that chromatin structure is probably also affecting genome plasticity as the permissiveness of some regions of the genome to undergo CRs couldbedeterminedby changes in chromatin conformation (Lemaitre et al.2009;Carboneetal.2009).Basedonthesefindings,thereisevidencetosupportthatcertainpropertiesoflocalDNAsequences(i.e.,repetitivesequences,section1.1.3),
GENERALINTRODUCTION

40
together with the epigenetic state of the chromatin, could promote the change of chromatin contributing to theoriginofCRs. In this context, anewmodelhasrecently been proposed to integrate this view, the integrative breakage model(Farréetal.2015).Thismodelproposesthat,genomereshufflingwouldoccurinregionsthat(i)physicallyinteractinsidethe3Dnuclearspace(the“nucleome”),(ii)haveanaccessiblechromatinstatethatpromotesgenomicinstabilityand(iii)donotdisruptessential genes and/or their associationwith long-range cis-regulatory elements(Farréetal.2015). Chromatin organization is basically composed by several superimposedlayersthatinclude:(i)chemicalmodificationsoftheDNAorepigeneticsignaturessuch as acetylation andmethylation, (ii) the presence of nucleosomes thatwrapthe DNA around an octomer of eight histones (two copies of each four histoneproteins:H2A,H2B,H3andH4)joinedtoeachotherbyalinkerhistone(H1)andaninterveningstretchofDNA(Woodcock2006),(iii)thehigh-orderorganizationofthechromatincompartments insidethenucleus(suchaschromosomalterritoriesoropen/closechromatinconformation),and(iv)geneexpressionduringcellcycleanddevelopment.Takingthisintoaccount,Farréandcollaborators(2015)focusedtheir attention on four different levels of hierarchical genome organization in order toexplaintheroleofchromatinarchitectureingenomeplasticity:(i)Chromosomal Territories (CTs), (ii) open/closed compartments, (iii) Topological Associated Domains(TADs),and(iv)loopinginteractions(Dekkeretal.2013;Noraetal.2013;Phillips-Cremins2014)(Figure1.4). Chromosomal territories were initially described by FISH with whole-chromosome painting probes that showed that chromosomes localize within the interphase nucleus as discrete globular domains (Mora et al. 2006; Cremer et al.2008).Thislocalizationisnon-random,asbigchromosomestendtolocalizeinthenuclear periphery whereas small chromosomes are positioned towards the center (Cremer and Cremer 2001; Parada and Misteli 2002; Kozubek et al. 2002; Moraet al. 2006) a conformation that is evolutionary conserved inmammals (Tanabeet al. 2002;Mora et al. 2006). Inside CTs, chromatin can present open or closedconformationstates.Openchromatin(termed“A”conformation)providesaccesstoarangeofDNAbindingproteins,necessaryforgeneticregulationprocessessuchastranscription,DNArepairandrecombination,beingassociatedwithregulatoryelements (i.e., promoters and enhancers). On the other hand, closed chromatin(termed“B”conformation)doesnotfacilitateaccesstoproteinbinding(Lieberman-Aiden et al. 2009). These conformation states are regulated by specific histonemodifications such as acetylations and methylations in specific residues of the
GENERALINTRODUCTION

41
histones,aswellassimilartypeofchangesatDNAcytosineresidues(Barskietal.2007).MarkersforopenchromatinstatesincludeH3K9ac,H3K27ac,H3K4me3andmonomethylations of H3K27, H3K9, H4K20, H3K79 andH2BK5,whereas closedchromatinstatesmainlyincludetrimethylationssuchasH3K27me3,H3K9me3andH3K79 (Barski et al. 2007; Chai et al. 2013). Additional genomic signatures havealsobeenco-localizedwithopenchromatinregionssuchashighgenedensity,CpGislands(Terrenoireetal.2010),DNaseIhypersensitivesites(Birneyetal.2007)andnuclear Lamina-Associated Domains(LADs)(Peric-Hupkesetal.2010).Thelastofthese is strongly associated with the nuclear periphery and contains around half of thehumangenomewithsizesrangingbetween40Kbpand15Mbp(Megabase pairs)(Guelenetal.2008)thatarehighlyconservedbetweenspeciesandhavebeenshowntobedepletedofEBRs(Meulemanetal.2013). The development of high-throughput methodologies to study chromatininteractionssuchasChIP-seqand,morerecently,thechromosomeconformationcapture (3C)method and its derivatives (such as Hi-C), permitted to determinehistoneinteractionsaswellasthedescriptionofgenome-widechromatininteractionmaps (Lieberman-Aiden et al. 2009;Dekker et al. 2013;Dekker 2014). 3C-basedtechniques revealed thepresenceof sub-Mbpstructures referredasTADs,whichconstitute discrete, contiguous regions (of 800Kbpmedium length) that containloci with a higher tendency to interact among themselves than with loci outside the region(Dixonetal.2012;Sextonetal.2012).Interestingly,somegenomicfeatures,such as the CCCCTC-binding Factor (CTCF) and cohesins have been found to beenrichedatTADsboundaries(Schmidtetal.2012;Raoetal.2014)(Figure1.4).
Figure 1.4. Model of chromatin structure within interphase nucleus in eukaryotic cells: Chromosomalterritories(CTs,depictedindifferentcolors)occupyspecificregionswithin thenucleusand are compartmentalized into open (‘‘A’’) orclosed(‘‘B’’)chromatinstates.Bothcompartmentscontain Topological Associated Domains (TADs)delimited by cohesins and CTCF factors. DSBscan occur between two TADs and can recombine leadingtoCRs.
GENERALINTRODUCTION

42
In this context, and according to the IntergenicBreakageModel,DSBsthatleadtoCRsareexpectedtooccurinspecificopen-chromatinregionswhereDNAsequences are accessible to theproteinDNA repairmachinery (Farré et al. 2015)(Figure1.4)andseverallinesofevidencesupportthisinterpretation.InitialstudiesshowedthatEBRstendtolocalizeinregionsofhightranscriptionalactivityduetotheopenchromatinconformations(Lemaitreetal.2009).Also,ithasbeenshownthat regions involved in chromosomal translocations had a close localization within thenucleus inmouse (Véronetal. 2011;Zhangetal. 2012)and,more recently,astudycomparinghigh-resolutionEBRsdetectionbetweenfivemammalianspeciesandchromatinstatesprofiles,revealedthatdistributionofCRscouldbeaccuratelyexplainedasmis-repairedbreaksbetweenopenchromatinregionsthatwereboughtintocontact(Berthelotetal.2015).Takingtogether,allthisevidencepointouttothe importance of the study of epigenetic features and chromatin state in order to understandthemechanismunderlyingtheformationofCRs.
1.1.6TheroleofCRsinspeciation
T. Dobzhansky, in his “Genetics and the Origin of Species” (Dobzhansky1937;1951),identifiedtheexistenceoftwomaincomponentsinvolvedintheoriginof reproductive isolation between species: CRs (chromosomal speciation) andgeneticdivergence(geneticspeciation) (Dobzhansky1937;1951;DobzhanskyandSturtevant1938).Whetherchromosomalspeciationandgeneticspeciationactsolelyor in combination by promoting divergence between populations is a hot debate stillunderdiscussion(Fariaetal.2011).Inthiscontext,twomainmodelshavebeenproposedtoexplaintheroleofCRsinthespeciationprocess:thehybrid dysfunction model and the suppressed recombination model.
1.1.6.1Thehybriddysfunctionmodel
ThismodelwasinitiallyproposedbyWhite(1969,1978),whohypothesizedthatspeciationtakesplacewhenstructuralCRsbecomefixedinapopulation.Thisprocess is likely to occur in small populations with high consanguinity where the presenceofCRsinthehybridwouldreducefertilitybythegenerationofunbalancedgametesduetomeiosis impairment.Accordingtothisview,CRsaredividedintothreefunctionalcategories:(i)deleteriousrearrangementsthatwouldbeeliminatedfrom the population by natural selection, (ii) CRs that are capable of giving risetobalancedpolymorphisms, and (iii)CRs that reduceheterozygous fertility and,
GENERALINTRODUCTION

43
Figure 1.5. Chromosomal speciation models: In both models the CRs represented is an inversion. Followinghybridizationbetween the parental form (A) and the reorganizedchromosome(B),aheterokaryotypehybridresults(F1). (C)The hybrid dysfunction model postulates that the hybrid will experience underdominance, whereas the suppressed recombination model (D) postulates inverted regions willexperience suppressed recombination thus facilitating the accumulation of genic incompatibilities. Adapted from BrownandO’Neill(2010).
1.1.6.2Thesuppressedrecombinationmodel
In order to overcome the initial limitations of the hybrid disfunction model, newstudieshaveproposedthatCRscouldpotentiallycontributetospeciationnotthrough the underdominance of the hybrid but by the suppression of recombination in thepresenceof gene flow (either inparapatryor sympatry) (Noor et al. 2001;Rieseberg2001).Inthisway,CRsdonotnecessarilyaffectfertility,buttheycontributeto gene flow reduction within populations by suppression of meiotic recombination withinrearrangedregions(Rieseberg2001)(Figure1.5).Thiseffectwouldincrease
therefore, would be playing a role in generating reproductive isolation. This later effect in hybrid sterility has been classically known as the underdominance effect (Figure1.5). The hybrid dysfunction model was initially considered to explain the presenceofCRsinnaturalpopulations.Thiswasthecaseofspeciesthatpresentedmonobranchial fusions (that is, Rb fusions with homology in one arm) such asSorex, Castor and Mus (Baker and Bickham 1986), or Australian grasshoppers(Vandiemenella),whicharecharacterizedbyanextensivechromosomalvariationdue to fusions, fissions, translocations and inversions (King 1993).However, thehybrid dysfunction model received several criticisms due to the fact that the spread andsubsequentfixationofanunderdominantCRisproblematicfromapopulationgeneticsperspective,representinganunresolvedparadox:IfCRsareunderdominant,it is unlikely that they would be fixed in the population as they would be eliminated ofthepopulationbynaturalselection(Wright1941;Lande1985).
GENERALINTRODUCTION

44
divergenceinthegenomicregionsaffectedbytheCRs,favoringtheaccumulationofgenic incompatibilities that could lead, eventually, to the fixation of locally adapted genes and produce, in the long term, a partial reproductive isolation. In this context, threemainconditionsneedtobemet:(i)CRsmustsuppressrecombination,(ii)geneflow suppression within rearranged regions must play a major role in reproductive isolationand(iii)theremustbedifferentCRsinsistertaxa(FariaandNavarro2010).Although this model was initially proposed to explain the presence of inversions (Rieseberg2001;Nooretal.2001),newevidenceissuggestingitsapplicabilitytoRbfusions(DumasandBritton-Davidian2002;Franchinietal.2010). Evidenceforthesuppressionofrecombinationcanbeextractedfromhighlydiversemodel systems andmethodologies. Cytogenetic approaches inmammalsdescribed this phenomenon within pericentric inversions in different rodent species, suchas the sand rat (Ashley et al. 1981), and thedeermice (GreenbaumandReed1984;Hale1986).ThisreductioninmeioticrecombinationwasdescribedlaterinthecaseofRbfusionsoccurringinnaturalpopulationsofcommonshrews(Borodinetal.2008),housemice(CastigliaandCapanna2002;DumasandBritton-Davidian2002;Dumasetal.2015)andtuco-tucos(Bashevaetal.2014).Similarresultshave been obtained when studying sequence divergence (patterns of nucleotidedifferentiation)betweenspeciesasanindirectestimationofrecombination(seeBOX3).Riesebergandcollaborators(1995,1999)observedinisolatedhybridpopulationsof the sunflower genera Helianthus that the rate of introgression was lower within rearrangedchromosomesthanincollinearchromosomes.Inthesamevein,Besanskyandcollaborators(2003)foundhighsequencedivergencerateswithinaninversionintheXchromosomeofAnopheles mosquitoes, mirroring what has been described in Drosophila,ingenomicregionsclosetoinversions(Navarroetal.1997;Brownetal.2004;Nooretal.2007).Studiesofnucleotidedifferentiationdue to inversionsin mammals have resulted in more heterogeneous results. In the case of primates, NavarroandBarton(2003a)foundahigherrateofproteinevolution(measuredbydN/dSratios)withinrearrangedgenomicregionsbetweenchimpanzeeandhuman.More recently, Farré and collaborators (2013) performed a comparison betweenhuman and chimpanzee recombination maps, detecting recombination suppression in inverted regions compared to non-inverted regions. Mirroring this pattern,several studies using microsatellites in small mammals have shown restricted geneflownearthecentromeresofchromosomesresultingfromRbfusionsamongdifferentchromosomalracesinthecommonshrew(Bassetetal.2006;Yannicetal.2009)andthehousemouse(Franchinietal.2010;Giménezetal.2013;Janoušeketal.2015).
GENERALINTRODUCTION

45
1.1.6.3Bateson-Dobzhansky-MullerIncompatibilities
Asaresultof recombinationsuppression,genomicregions involved inCRs(eitherinversionsorfusions)canaccumulatehighratesofgeneticdifferentiation,also referred as “islands of speciation” (Turner et al. 2005; Harr 2006; Federand Nosil 2009). These regions are attributed to have limited gene flow, due toreduced recombination and/or diversifying selection in sympatry (reviewed inButlin 2005; Feder et al. 2012). Therefore, restricted recombination preservesand generalizes the effects of diminished gene flow and, thus, the accumulation of genomic incompatibilities within reorganized regions (Navarro and Barton2003b). This phenomenonwas already proposed by Bateson (1909) and later byDobzhansky(1937)andMuller(1942)intheformoftheBateson-Dobzhansky-Muller Incompatibilities(BDMIs) model in order to explain sequence divergence between isolated populations, where the appearance of point mutations at specific sites over generations can generate incompatible alleles. This model is based on the epistatic interactionsbetweengenesthatactwhenagenecanallow(epistasis)ordisallow(negative-epistasis)thephenotypicexpressionofanothergene(Figure1.6).
Figure 1.6. The Bateson-Dobzhansky–Muller incompatibilities model: In an ancestral population (top) two epistatic genes,AAandBB, arehomozygous.Followingmutationand fixationin two distinct populations, each population now carries a variation of these, aaBB and AAbb. In an inter/intraspecifichybrid, the diverged alleles are now present in a heterozygote as AaBb.Whereas alleles A and B are still capable of epistaticinteraction,astheywereinthecommonancestor,Ab,aB,andab are no longer in epistasis and hybrid incompatibility results. AdaptedfromBrownandO’Neill(2010).
AsimpletheoreticalexampletoexplainthisprocessisrepresentedinFigure1.6.OnepopulationpresentsallelesAAandBB (considered theancestralalleles).After a process of mutation and fixation, two populations in allopatry (derivedfrom the ancestral population that evolved independently) would present the
GENERALINTRODUCTION

46
combination of the ancestral and derived genes, aaBB and AAbb. Later on, in ahypothetic sympatry scenario, these two populations would produce heterozygotes withthecombinationAaBb.Inthiscase,theABcombinationstillpresentsepistaticinteractionswhereasAb,aBandabcombinationswillshowincompatibilities.Thesegenetic incompatibilities would then produce hybrid sterility caused by negative epistatic interactions between loci, thus acting as an intrinsic postzygotic isolation barrier. Different loci causing hybrid incompatibilities have been identified in the literature and genes responsible for this effect have been defined as “speciation genes”. Several specific speciation genes have been described in different Drosophila species: Odisseus(Ods),mappedinchromosomeXinD. simulans (Perezetal.1993;Ting1998),JYAlpha,mappedinchromosome4inD.Melanogaster(Maslyetal.2006)and Overdrive (Ovd),mapped inX chromosome inD.pseudoobscura subspecies(PhadnisandOrr2009).Allthreegeneshavebeensuggestedtoplayanimportantroleinsegregationdistortion(meioticdrive)andhybridsterility(PhadnisandOrr2009). Inthecaseofmousesubspecies,Forejt(1996)initiallydescribedoneoftheloci responsible for hybrid sterility between Musm.musculus and Musm.domesticus, theso-calledHybrid Sterility 1(Hst1).Thisloci was later identified as the PR domain containing 9(Prdm9)gene(Miholaetal.2009),andwassubsequentlydescribedinmammalianspeciessuchasprimates(Myersetal.2010)androdents(Oliveretal.2009),amongothers.Thesefindingsareinagreementwiththestudiesperformedinhousemousehybridnatural populations (i.e., regions of contact between twodistinct chromosomal races) (Hauffe et al. 2012) in which researchers examinedthe exchange of genetic variation between the two subspecies and detected the presence of several autosomal regions exhibiting epistasis (Payseur et al. 2004;Teeteretal.2008;Janoušeketal.2012),thussuggestingtheroleofspecificlociinreproductiveisolation.SubsequentgeneticmappingstudiesusingF1andF2hybridsfrom laboratory crosses have identified additional loci and genic interactions that aremostprobablycontributingtosterilityphentoypes(Storchováetal.2004;Goodetal.2008;Whiteetal.2011;Dzur-Gejdosovaetal.2012).Infact,recentevidencesuggest the existence of Quantitative Trait Locus(QTL)interactionsthatcaninducevariations in gene expression affecting fertility in M.musculus and M.domesticus F1 hybrids (Bhattacharyya et al. 2013; Turner et al. 2014; Turner andHarr 2014;Janoušeketal.2015).AsimilareffecthasbeenobservedinDrosophila subspecies hybrids(MoránandFontdevila2014).Therefore,reproductiveisolationisrevealingitselfasamultigenictrait(e.g.,Whiteetal.2011).
GENERALINTRODUCTION

47
BOX3:Methodologicalapproachesusedforthestudyof
recombinationCytological approaches
Giemsastaining has been traditionally used to identify meiotic chromosomes for the study of bivalents andchiasmata inmetaphase I, especially inmammals (e.g.,Castiglia andCappana2002) (Figure 1.7A).However,iftheobjectiveistoanalyzetherecombinationprocessasitoccurs,alternativemethods,suchas the in situ immunolocalization of recombination proteins on spermatocyte spreads can be applied (Froenickeetal.2002;Lynnetal.2002).ThisallowsfortheanalysisofthedistributionofMLH1 foci in each cellindividuallyatpachynema,asaproxyofrecombinationevents(Figure1.7B).Thisapproachprovidewithrecombinationmapsatlarge-scaleresolutions(Mbp).
Figure 1.7. (A) Chiasmata detectionby uniform staining (from Dumasand Britton Davidian, 2005). (B)Immunedetection of MLH1 (in green),SYCP3 (in red) and centromeres (inblue; Capilla et al., unpublished). Bothimages correspond to spermatocyte preparationsfrommicewithRbfusions.
High-resolution and population genetic approaches
Pedigree analyses estimaterecombinationratesbyexaminingparent-to-offspringtransmissionofallelesat specific loci. This method provides estimates of current recombination rates per physical distance unit (cM,centimorgansperMbp) in thepopulationunder study andcan serve todetermine recombinationhotspots.EstimatesofLinkage Disequilibrium(LD)throughpopulationgeneticanalyses,estimatehistoricalrecombination events expressed as 4Ner/Kbp (Brunschwig et al. 2012). This approach represents anintegrationofpopulation-levelprocessesoverseveralgenerationsfromSingleNucleotide Polymorphisms (SNPs)data(Clarketal.2010)(Figure1.8).Thismethodpresentsthedifficultytodetect low-frequencyeventsand thevariableresultscanbeobtaineddependingon thedensityofmarkersused (Arnheimetal. 2003).Sperm typing analysis, on the other hand, directly detects recombinantDNAmolecules andconsistsofallele-specificPCRamplificationfromspermDNAbyusingSNPsasanchors.TheadvantageofthisapproachisthatitallowsthescreeningoflargeamountsofrecombinantDNAfromsingleindividuals(Wuetal.2010),althoughtheresolutioncanbea limitationdependingonmarkerdensity,thenumberof individuals analyzed, and the sizeof the amplifiable target (<15Kbp). Finally, the analysis ofgenetic differentiation(expressedasFstvalues)usingmarkerssuchasmicrosatellitesorSNPsbetweenpopulationscan be considered as a proxy of recombination. If the recombination is reduced or suppressed, then, higher sequencedivergencesareexpected(e.g.,Giménezetal.2013).
Figure 1.8. Standardizedrecombinationratesacrosshumanchromosome4estimatedbyLDanalysis.Recombi-nationratesdataextractedfromKongandcollaborators(2010).
GENERALINTRODUCTION
48
1.2Meioticrecombinationandspeciation
All speciation genes characterized so far (Ovd, Ods, JYAlpha and Prdm9)present common functional features such as being involved in DNA binding,epigenetic modifications and gene expression regulation, specially in meiosis (Presgraves2010).Therefore,theunderstandingoftherecombinationprocess,thattakesplaceduringmeiosis, is of relevance for the studyof the roleofCRs in thespeciation process.
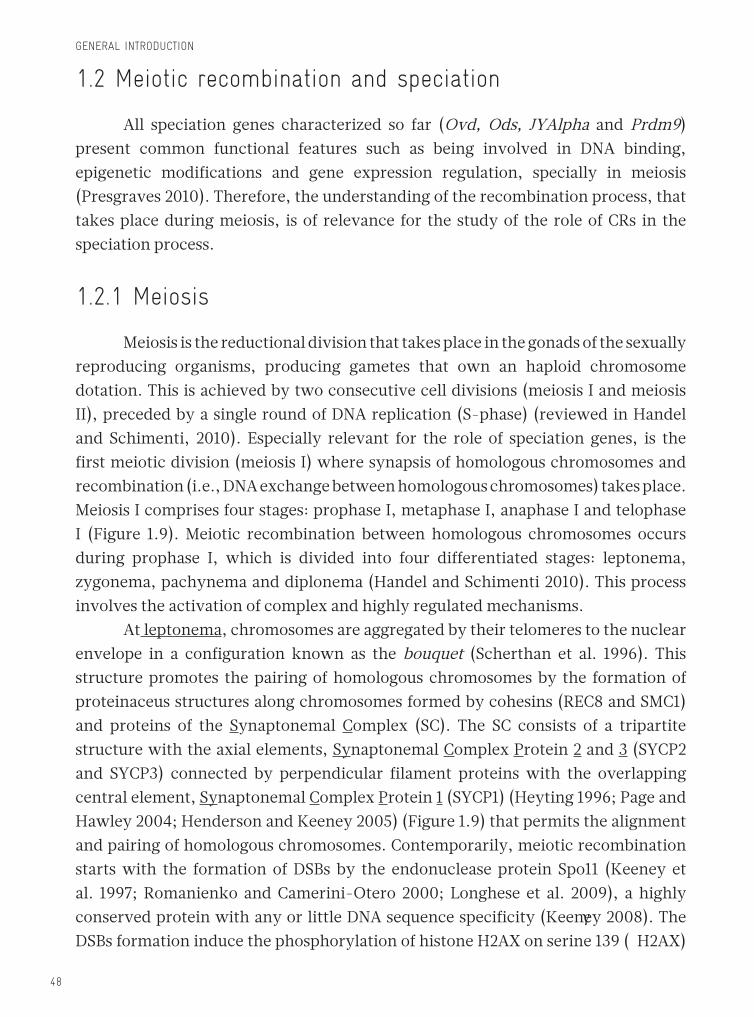
1.2.1Meiosis
Meiosisisthereductionaldivisionthattakesplaceinthegonadsofthesexuallyreproducing organisms, producing gametes that own an haploid chromosome dotation.Thisisachievedbytwoconsecutivecelldivisions(meiosisIandmeiosisII),precededbyasingleroundofDNAreplication(S-phase)(reviewedinHandeland Schimenti, 2010). Especially relevant for the role of speciation genes, is thefirstmeioticdivision(meiosisI)wheresynapsisofhomologouschromosomesandrecombination(i.e.,DNAexchangebetweenhomologouschromosomes)takesplace.MeiosisIcomprisesfourstages:prophaseI,metaphaseI,anaphaseIandtelophaseI (Figure 1.9). Meiotic recombination between homologous chromosomes occursduring prophase I, which is divided into four differentiated stages: leptonema, zygonema,pachynemaanddiplonema(HandelandSchimenti2010).Thisprocessinvolves the activation of complex and highly regulated mechanisms. At leptonema, chromosomes are aggregated by their telomeres to the nuclear envelope in a configuration known as the bouquet (Scherthan et al. 1996). Thisstructure promotes the pairing of homologous chromosomes by the formation of proteinaceusstructuresalongchromosomesformedbycohesins(REC8andSMC1)and proteins of the Synaptonemal Complex (SC). The SC consists of a tripartitestructure with the axial elements, Synaptonemal Complex Protein 2 and 3(SYCP2and SYCP3) connected by perpendicular filament proteins with the overlappingcentral element, Synaptonemal Complex Protein 1(SYCP1)(Heyting1996;PageandHawley2004;HendersonandKeeney2005)(Figure1.9)thatpermitsthealignmentandpairingofhomologouschromosomes.Contemporarily,meioticrecombinationstartswith the formation of DSBs by the endonuclease protein Spo11 (Keeney etal. 1997; Romanienko andCamerini-Otero 2000; Longhese et al. 2009), a highlyconservedproteinwithanyorlittleDNAsequencespecificity(Keeney2008).TheDSBsformationinducethephosphorylationofhistoneH2AXonserine139(H2AX)
γ
GENERALINTRODUCTION

49
by the proteins Ataxia Telangiectasia Mutated(ATM)andATM-Rad3-Related(ATR)(Rogakouetal.1998;Burmaetal.2001;KuoandYang2008)thatconstitutesthefirststepinrecruitingproteinsinvolvedinDSBsrepair. At zygonema, DSBs are repaired leading to synapsis between homologouschromosomes producing, either Crossovers(COs)orNon-Crossovers(NCOs)(AllersandLichten2001;HunterandKleckner2001;BaudatanddeMassy2007).Inbothcases,afterH2AXphosphorylationat leptonema,theReplication Protein A (RPA)bindstothe3’strandoverhangsofDSBs(Heetal.1995).RPAisthendisplacedbythe protein Radiation sensitive51(Rad51)and/orDisrupted Meiotic cDNA1(DMC1)(Pittman et al. 1998; Yoshida et al. 1998) that form nucleoprotein filaments thatcatalyzestrandinvasion.InthecaseofCOsformation,aD-loopiscreatedcapturingthesecond3’endofthehomologouschromosome,andaftertheDNAsynthesisandligation, a double Holliday Junction (dHJ), with heteroduplex DNA flanking theDSBssite,isproduced(CollinsandNewlon1994;SchwachaandKleckner1995).Thisstructure is then resolved by the cleavage and ligation of strands of same polarities at identical positions,whichgeneratesCOs. In this case,COs formation involvesthe invasionof thehomologous chromosomesby the single end createdbyDSB,leading to the formation of chiasmata connecting both homologous chromosomes. Mismatchrepairofheteroduplexescanleadtoeither,geneconversionorrestorationdependingonthechoiceofthecorrectedstrand.However,inmostorganisms,thenumberofDSBs largelyexceeds thenumberof resultingCOs, indicating that themajorityofDSBsisresolvedasNCOs.Forexample,inmiceabout250-300DSBsareinitiated,butonlyaboutone-tenthofthemareprocessedintoCOs(Koehleretal.2002a;Moensetal.2007;MurakamiandKeeney2008).NCOproductsarethoughttobegeneratedbyeitheradHJorbyamechanismcalledSynthesis-Dependent Strand Annealing(SDSA) (McMahilletal.2007). InSDSA, theD-loop isdisassembledbydisplacementofthenewlysynthesizedstrand,whichannealswiththeotherDSBend.DSBsrepairiscompletedwithDNAsynthesisbyaDNApolymerase(usingthehomologous sequence as template) followed by a ligation to the original strand.In this case, mismatch repair of heteroduplex generates gene conversion without resultinginaCO(Figure1.9). Is at pachynemawhen recombination is resolved. The SCs are completelyestablishedcreatingbivalentstructures(Oudetal.1979;Speed1982)andCOsareresolved by the repair pathway directed by proteins MutS Homologs 4 and 5(MSH4andMSH5) (thatappearearlierat zygonema)andMutL Homologs 1 and 3 (MLH1andMLH3)(Bakeretal.1996;Kneitzetal.2000;Santucci-Darmanin2000;Lipkinetal.2002;Snowdenetal.2004).Finally,atdiplonema, homologous chromosomes
GENERALINTRODUCTION

50
start to segregate by the disegregation of SCs. Homologous chromosomes willkeepcontactonlyintheCOsitesuntilanaphasebythechiasmatastructures(Oudetal. 1979;Speed 1982).With thisprocess,prophase I endsandstartsmetaphaseI, where the nuclear envelope disappears and the chromosomes, which are totally condensed, migrate to the equatorial plane of the cell. At telophase I, daughter cells are generated with haploid chromosome dotation and genetically different to each other due to genetic recombination process.
Figure 1.9. Schematic representation of the molecular and chromosomal events occurring during prophase I: Eachsubstagesof meiosis I prophase is represented. During leptonema, pairing of homologous chromosomes starts, although they are not completelypaireduntilpachynema.TheSCisbeingformedbytheloadoflateralelements(SYCP3andSYCP2)andchromatidsexperiencetheformationofDSBs,inducedbySpo11.DSBsarerecognizedbythehomologousrecombinationrepairmachineryincludingphosphorylationofhistoneH2AXbyATM,whichtriggersthebindingofproteinsDMC1andRAD51,amongothers.Atzygonema,homologouschromosomesarecompletelypairedbythecentralelementofSC(SYCP1)andsynapsisisinitiated.PachynemaisdefinedbycompletionofsynapsisandincludestherepairofDSBsresultinginthematurationofasubsetthatareresolvedintoCOs,markedbythemismatchrepairproteinsMLH1andMLH3.Afterrecombinationiscompleted,chromosomesundergo desynapsis and condense during the final diplonema substage. Image extracted and modified from Cohen andHolloway(2010).
1.2.2Variationofrecombinationrateswithingenomes
ItiswellknownthatCOsdonotdistributerandomlyacrossthegenome,butratheratpreferredlocationsknownasrecombinationhotspots(reviewedinPetes2001).Hotspotsspanacrosssmall regionsof thegenome(1-2Kbp length)andaresurrounded by areas where recombination is normally suppressed (reviewed inKauppietal.2004).Evidencefromstudiesinmanyorganismsusingbothcytologicalandgeneticapproaches(seeBOX3),havedescribedthisnon-randomdistributionofrecombinationevents(deMassy2003).However,themechanismsresponsibleof
GENERALINTRODUCTION

51
theformationandgenomicdistributionofDSBsandthus,ofrecombinationhotspots,are not fully understood. ThedistributionofCOsacrossthegenomeiscarefullyregulatedbymeiotichomeostasis, which is conditioned by different mechanistic and genetic factors depending on the organism studied (Cole et al. 2012). However, it is generallyaccepted that COs distribution presents three main characteristics: (i) COs takeplace indiscreteregionsof thegenome, (ii) there isat leastoneCOperbivalent,theso-called“obligatorychiasma”asitspresenceensuresthepropersegregationofhomologouschromosomes(BishopandZickler2004;Kauppietal.2004),and(iii)iftherearetwoormoreCOsalongabivalenttheytendnottoappearclosetoeachother,aphenomenonknownas“COinterference”(Kauppietal.2004;BerchowitzandCopenhaver2010). ObservationsinmammalianspeciessuggestthatthetotalnumberofCOspercellisgenerallycorrelatedwiththenumberofchromosomalarms(Pardo-ManueldeVillenaandSapienza2001;LiandFreudenberg2009;Seguraetal.2013).Moreover,the total number of COs on each chromosome is restricted by CO interference,which prevents COs from occurring near each other, operating over distancesspanningtensofmegabases(Bromanetal.2002;Petkovetal.2007).Therefore,therequirementofhavingaminimumofoneCOperchromosome,butlimitedbythedensity interference, results in a strong tendency for shorter chromosomes to have moreCOsperunitlengththanlargerchromosomes(Kabacketal.1992;Lynnetal.2002).ThisinterferencehasnotonlybeenobservedbetweenCOsbutalsonearthecentromeres, that produces an increasing pattern of recombination rates towards thetelomeres(reviewedinNishantandRao2006). Additionally, other specific genomic features have been described to play a role inCOspositioningalongbivalents.Forexample, recombinationhotspotsareassociatedwiththeGCcontentbeinghighrecombinationratesassociatedwithGC-richregions (Kauppietal.2004;CoopandPrzeworski2007;BuardanddeMassy2007).ItisknownthatrecombinationinfluenceGC-contentevolutionbyfavoringthefixationofGandCallelesthroughtheincreasingrateofA/TtoG/Csubstitutionsbygeneconversion(ClémentandArndt2013).Thisphenomenonhasbeendescribedinhumans(Eisenbarth2001)aswellasinSaccharomyces (Gertonetal.2000)andpig(Tortereauetal.2012).TheseGC-richregionsareorganizedinchromosomedomainsorisochores(Bernardi2000)alsocorrespondingtogene-richregionsthatpresentdifferent chromatin features inside the nucleus such as high transcriptional activity (Jabbari and Bernardi 1998). Moreover, and depending on the species analyzed,recombination hotspots have been found to be associated with specific consensus
GENERALINTRODUCTION

52
sequencemotifswhichhavebeenfoundtobespecies-specificand,apercentageofthem,associatedwiththefunctionofameiosis-specificgene:Prdm9. In humans, a 13-mermotifhasbeenobservedassociatedwith40%oftherecombinationhotspots(Myersetal.2008).Similarpredictionshavebeenobservedinyeast,althoughthemotifpresentedwasdifferent(beinginthiscase18-mer)(SteinerandSmith2005),andmice(Buardetal.2009;Smagulovaetal.2011)wherethemotifrecognizedis12-mer(althoughvariabilityhasbeendescribed).Therefore,theseobservationsinvolvetheroleofspecificgenesonthelocalizationofCOsinmammals(seesection1.2.4).
1.2.3 Variation of recombination rates within and among
species
Variability in recombination rates has been observed among species and among individuals of the same species. Within the same species, recombination presents a sex-bias (malesvs. females) (LenormandandDutheil2005;CoopandPrzeworski2007).Inhumans,forexample,thegeneticmaplengthinfemalesis1.6timeslongerthaninmales(Bromanetal.1998;Kongetal.2010).Differencesbetweensexesarealso found when analyzing chiasmata distributions, being in males localized near the telomeres (Tease and Hultén 2004) whereas female recombination is moreevenlydistributedacrossthegenome(Froenickeetal.2002;Lynnetal.2005).Thispattern has also been observed not only in mouse, where female recombination mapsare1.09timeslongerthaninmales(Lawrieetal.1995;Coxetal.2009),butalsoinpigs(Tortereauetal.2012)andArabidopsis (Girautetal.2011).HypothesistoexplainthesedifferenceswerefirstproposedbyHaldane(1922)whosuggestedthattheheterogameticsexhadlowCOsratesasaconsequenceofselectionagainstrecombination between the sex chromosomes. However, this rule has not beensupported by empirical data. Strikingly, other factors have been claimed to involve sexrecombinationdifferencessuchasCOsinterference,whichoperatesovershortergenomicdistancesinfemalesthaninmales(deBoeretal.2006;Petkovetal.2007;Girautetal.2011)andarerelatedtotheSClengthbeingalsodifferentbetweensexes(TeaseandHultén2004).However,meioticdimorphismbetweensexesisstillunderdiscussionasdifferentothergeneticfactorscouldbeinvolved,suchasGCcontent. Recombinationmaps have been constructed formany species by differentapproaches(reviewedinSmukowskiandNoor2011)(seeBOX3).Thishasbeenthecaseofyeast(deCastroetal.2012;Liuetal.2012),plants(Harushimaetal.1998;vanOsetal.2006), invertebratessuchasDrosophila (Santos-Colaresetal.2004;
GENERALINTRODUCTION

53
Kulathinaletal.2008),grasshoppers(Taffareletal.2015)andhoneybees(Wilfertet al. 2007; Meznar et al. 2010) and higher vertebrates, including birds such aszebrafinch(Backströmetal.2010)orchicken(Groenenetal.2009;Elferinketal.2010).Regardingmammals,meioticstudieshaveincludedhumanandnon-humanprimates(Sunetal.2005;Hassoldetal.2009;Garcia-Cruzetal.2011;Autonetal.2012;Munchetal.2014),mouse(Froenickeetal.2002;Koehleretal.2002b;Paigenetal.2008;Coxetal.2009;Dumontetal.2011;Brunschwigetal.2012),commonshrews(Borodinetal.2008),horse(Lindgrenetal.1998;Al-Jaruetal.2014)anddog(Wongetal.2010),amongothers. Although the use of different methodological approaches can result in different recombination resolutions (Kbp vs. Mbp) (reviewed in Butlin, 2005), adegree of correspondence have been described in orthologous chromosomes from different species (Garcia-Cruz et al. 2011). Conservation in both location and theintensity of recombinationhotspots has been reported in yeast (S. paradaous vs. S. cerevisiae)(Tsaietal.2010).Inmammals,however,theconventionalargumenthas been that although recombination rates may vary considerably between species when comparinghigh-resolution (Kbp), these differences disappear at a broaderscale(Mbp).Infact,recentstudies inmice(DumontandPayseur2008),primates(Garcia-Cruzetal.2011)andothermammalianspeciesrepresentativeofAfrotheria,Euachontoglires and Laurasiatheria (Segura et al. 2013), have suggested thatclosely related species tend to have similar average rates of recombination. These observations suggested that phylogenetic dimension might also play an important roleonmeioticrecombination(Seguraetal.2013).
1.2.4TheroleofthePrdm9geneinmeioticrecombination
andspeciation
Asexplainedinsection1.1.6.3,mouseHst1 was first defined as a hybrid sterility loci responsible for male sterility in hybrids between M.musculussubspecies(Forejt1996).Itwasinitiallymappedinmousechromosome17atageneticdistanceof8.4cMfromthecentromere(between15,545,119and15,564,354bp,extractedfromMouseGenomeInformatics–www.informatics.jax.org)(Forejtetal.1991;GregorováandForejt2000).Lateron,thegenecorrespondingtothisloci, also known as Meisetz (Meiosis induced factor containing a PR/SET domain and zinc fingermotif),wasfoundtocodifyforaPRdomain9protein(PRDM9)(Miholaetal.2009).The PRDM9 protein presents a Krueppel-Associated Box (KRAB) domain in the
GENERALINTRODUCTION

54
N-terminal region which behaves as a transcriptional repressor domain (seeUrrutia2003,andreferencestherein),aSETdomainwithhistone3lysine4(H3K4)methyltransferase activity and an arrayofC2H2Zinc Finger (ZnF) repeats in theC-terminaldomainthatrecognizesaDNA-specificrepeatsequence(Figure1.10A).The Prdm9 structure has been described in several mammalian species, such as humans(Baudatetal.2010;Jeffreysetal.2013),non-humanprimates(Oliveretal.2009;Schwartzetal.2014),mouse(Baudatetal.2010),otherrodentspeciessuchas Musmusculus castaneus,Musmacedonicus,Mus spicilegus, Coelomys pahari,Apodemussylvaticus,Merionesunguiculateus,Peromyscusleucopus,Peromyscusmaniculatus, Peromyscus polionotus, Microtus agrestis and Arvicola terrestris (Oliveretal.2009)andequids(SteinerandRyder2013),amongothers.Moreover,Prdm9 expression has also been detected in the germ line of additonal metazoan speciessuchastrout,cattle,pig,seaurchin,andthegastropodsnail(Oliveretal.2009).Exceptionally, indogs, thegenewasearly inactivatedduring itsevolution(Axelssonetal.2012).
Figure 1.10. Prdm9 structure and function: (A)ThePrdm9genecodifiesforaproteinwithdifferentdomains,suchasaKRABdomainintheN-terminalregion,followedbyaSETdomainwithmethyltransferaseactivityandaZnFarrayof12repeatsintheC-terminalregion(inthecaseofthemousereferenceallele).(B)ThePRDM9proteinrecognizesaspecificDNAsequenceinthegenomethroughitsZnFdomainandmethylateslysine4ofhistone3.ThisepigeneticmarkrecruitsSpo11thatwillinducetheformationofDSBsinearlymeiosis.
GENERALINTRODUCTION

55
Prdm9 is expressed only during early stages of meiosis in testis and ovaries (Hayashi et al. 2005) and it was first described as a marker of transcriptionrecognitionsites(Bricketal.2012).ThemechanismbywhichPrdm9 controls the distribution pattern of meiotic recombination is still largely unknown, but it has been postulatedthatitoccursbytherecognitionofadegeneratedDNAmotifbyitsC2H2ZnFdomain(Figure1.10A),whichis,asitasbeenexplainedabove,species-specific(Baudatetal.2010).OncetheDNAmotifisrecognized,theSETdomainleavesanepigenetic signature (H3K4me3)andrecruits theproteinSpo11 responsibleof theformationofDSBs(Keeneyetal. 1997) (seesection1.2.1,Figure1.10B). Inmouse,Parvanov and collaborators (2010) also identifiedPrdm9 as the gene that would control the distribution of recombination hotspots by mapping this gene region in a inter-subspeciesmousecross,dataalsosupportedbytheenrichmentofH3K4me3observedwithinmousehotspots(Baudatetal.2010). What is relevant about this gene from an evolutionary perspective is that the ZnFarrayischaracterizedbyahighvariabilityinboththenumberandthesequenceoftheZnFrepeats(Oliveretal.2009;Baudatetal.2010).Thesedifferencesinsizeandsequencehavebeendescribedbetweencloselyrelatedspecies(Oliveretal.2009;Schwartzetal.2014)andevenwithinthesamespecies(Oliveretal.2009;Buardetal.2014;Konoetal.2014;Prattoetal.2014).Interestingly,modificationsoftheZnFdomaincanbetranslatedintoare-distributionoftherecombinationsites(Baudatetal.2010).ThiseffectwasinitiallydescribedinmousebyBrickandcollaborators(2012)by comparing two close related Prdm9alleles(with9and13repeats,9Rand13R),whichsharedonly1.1%ofrecombinationhotspotspositionsduetothedifferencesofPrdm9 sequence.Theauthors,proposedthatasingleamino-acidchangewithintheZnFdomaincouldleadtonewPrdm9variantswithnovelDNAbindingspecificitythat,inturn,couldpotentiallycreateanewgenome-widedistributionofhotspots(Bricketal.2012).Infact,recentstudiesinhumans(Prattoetal.2014)determinedthatthreedifferentallelesresultedindifferentdistributionofDSBs,although,theimplication of additional factors other than Prdm9 in modulating the frequencies of recombination initiation cannot be ruled out. In fact, recombination hotspots distribution have been proposed to be affected by a complex interplay between the cis-actingDNAsequenceathotspots (or thegene conversion bias of COs repairing mechanisms) and the trans-acting factorthatbindstothatDNAsequence(beinginthiscasethePRDM9function).Differentstudies have identified that one of the two chromatids present a higher probability of undergoing gene conversion, where the donor chromatid is used as the template to repair theDNAsequence lost fromtheactivepartner in thecourseofcreating
GENERALINTRODUCTION

56
theDSB(BaudatanddeMassy2007;Paigenetal.2008;Bergetal.2011).Therefore,this biased gene conversion predicts that hotspots should undergo evolutionary erosion, aphenomenonknownas the“hotspotparadox” (CoopandMyers 2007;Bakeretal.2015)as ifhotspotsdrive themselves toextinction, its seemsdifficultthat recombination persists. However, PRDM9 function brings a solution to thisparadox, as its rapid evolutionary change can overcome hotspots loss by undergoing mutationsalteringitsZnFarray,andthus,changingthegenomewidedistributionofhotpots.However,thequestionofwhyPrdm9 is evolving so fast it is still under discussion. One of the current explanations is that Prdm9 is under positive selection, associatedwiththerapidevolutionofitsbindingsites(CoopandMyers2007).
1.3Thewesternhousemouseasamodelforchromosomal
speciation
The western house mouse, M.musculusdomesticus(SchwarzandSchwarz1943) taxonomically belongs to the Subfamily Murinae, one of the taxa of theFamilyMuridae.AsotherMusrepresentatives, western house mice are ecologically highly opportunistic animals and, in general, strictly commensal, although some populations have undergone a secondary feralization and colonized several outdoor habitats.Theyaresmall-sizedrodents,showingbodymass,headandbodylengthvariability,rangingbetween12.5-29gand73-101.5mm,respectively(Sans-Fuentes2004).Commensalindividualsshowarelativelydarkercolorationthanferalmice,with the back, tail and legs dark grey-brown, the ventral region slightly clearerthan the back, and without a conspicuous delimitation between the coloration of the upper and lower parts. They are mainly crepuscular or nocturnal animals, however they alternate periods of activity during the day related with the search for food (Ballenger1999). The western house mouse has been localized in Western Europe, AfricaandMiddle East (e.g., Guénet and Bonhomme 2003), and due to its commensalassociationwithhumansitarrivedtoAmerica,Australia(Auffrayetal.1990)andAntartica(JansenvanVuurenandChown2006).Itconstitutesasignificantpestinmany areas, producing economic wastage by distorting and contaminating stored foodsandcropsandotherkindsofdamage.Nevertheless,housemice(sensu lato)also constitute one of the most important model organisms in biology and medicine. A striking characteristic of M.m.domesticus is its exceptionally variable karyotype throughout its range of distribution compared to other house mouse subspecies.
GENERALINTRODUCTION

57
1.3.1Thewesternhousemousechromosomalvariability
The genus Mus is characterized by having a standard karyotype of 40acrocentricchromosomes(19pairsofautosomalandonepairofsexchromosomes)(Groppet al. 1972;Zimaet al. 1990;Boursot et al. 1993)with ahighly conservedbanding pattern between the 14 species that comprises (Veyrunes et al. 2006).Additionally to the standard karyotype, many M.m.domesticus populations show metacentricchromosomesderivedfromRbfusions(Piáleketal.2005).Additionally,the metacentrics could evolve into new combinations of chromosomes by Whole-Arm Reciprocal Translocations (WARTs), which consist of the exchange of onearm of a metacentric chromosome by other arm of a metacentric or acrocentric chromosome (Searle 1993;CapannaandRedi 1995).As a result, ahighvarietyofdiploidnumbershavebeendescribed innaturalpopulations, ranging from2n=22(thatis,alltheautosomalchromosomesfused)to2n=40(Piáleketal.2005;Hauffeetal. 2012).Rb fusionscanbe fixed inhomozygous state inpopulationsofawelllimited geographic area forming a chromosomal race, also called metacentric race, whichdiffersfromothersuchracesbyitsspecificsetofmetacentrics(Hausseretal.1994;NachmanandSearle1995).Insomecases,onemetacentricracecancontactwith the standard or other metacentric races resulting in the presence of hybrids with an intermediate karyotype. These contact regions have been well studied andarecalledhybridzones(Searle1993;Hauffeetal.2012).Almost100differentmetacentricpopulationshavebeendescribedinwesternEuropeandnorth-Africaarea(Piáleketal.2005;Hauffeetal.2012),presentingoverall101ofthe171possiblecombinationsofmetacentrics(Hauffeetal.2012)anddistributedinseveralhighlylocalized systems identified in Scotland, Denmark, northern Switzerland, southern Switzerland,northernItaly,Croatia,Spain,central-southernItaly,Peloponnesus,mainlandGreeceandMadeiraIsland(Figure1.11).
GENERALINTRODUCTION

58
Figure 1.11. Map showing thelocation of metacentric populations describeduntil2005inEuropeandNorth Africa. Image adapted fromPiálekandcollaborators(2005)
M. m. domesticus is a primary model system for studies of chromosomal speciation, (i.e., reproductive isolationpromotedby thepresenceofCRs, section1.1.6)(King1993).Whentwochromosomalracesthatdifferinonlyfewmetacentricscontact,geneflowcanoccurwithoutsignificantrestrictions(Wallaceetal.2002).Nevertheless,theaccumulationofarelativelyhighnumberofRbfusionsisrelatedto hybrid subfertility or even sterility as a result of malsegregation during meiosis (Wallaceetal.1992;CastigliaandCapanna2002).Additionally,highheterozygosityforCRs is expected to reduce fitness of hybridmice, thus limiting the gene flowbetweenraces(HauffeandSearle1998;Nunesetal.2011).
1.3.2TheBarcelonaRbsystem
The Barcelona Rb system is located within the provinces of Barcelona,TarragonaandLleida(northeasternIberianPeninsula)wherehousemicepresentingdiploidnumbersrangingbetween2n=27and2n=40havebeendescribed(seeMedardeetal.2012andreferencestherein).Inthispopulation,sevendifferentmetacentricchromosomes, [Rb(3.8), (4.14), (5.15), (6.10), (7.17), (9.11)and(12.13)]havebeenfoundinanareaofapproximately5,000km2. One exciting characteristic of this zone isthatitconstitutesauniqueexamplewithinallhousemouseRbzonesreportedtodate lackingaRb race (Hauffeet al. 2012).Theirmetacentricsaregeographicallydistributed with a staggered fashion leading to a progressive reduction in the diploid numbers towards the center of the Rb polymorphism zone (Gündüz et al. 2001;Sans-Fuentesetal.2007;Medardeetal.2012).Otherparticularcharacteristicsof
GENERALINTRODUCTION
59
this zoneare that it showsahighgradeof structuralheterozygositywithup to7fusions in heterozygous state (Sans-Fuentes 2004) and the clinal distributionof themetacentric chromosomeshasnotvaried in adecade (Gündüzet al. 2001;Gündüzetal.2010;Medardeetal.2012).Forallthis,thisareaisconsideredtobeaRbpolymorphismzoneratherthanatypicalhybridzonewhichisaproductofthecontactoftwometacentricraces(Sans-Fuentesetal.2007),takingintoaccountthedefinitionofRbsystemgivenbyPiálekandcollaborators(2005)(i.e.,“agroupofRbpopulations from a restricted geographical region and sharing a set of metacentrics withanapparentlycommonevolutionaryorigin”). Therefore,ithasbeenconsideredthattheBarcelonaRbsystemisaparticularRbscenariothathasbeenoriginatedbyprimaryintergradation,althoughsecondarycontactcannotbeexcludedinprinciple(Gündüzetal.2001).Consequently,itmayrepresent an example of raciation process eventually leading to the formation of a Rb racewithout geographic isolation (Sans-Fuentes et al. 2009). In concordancewiththishypotheses,previousstudieshaveshowedthatthenumberofRbfusionsand/orthelevelofstructuralheterozygosityaltersomesensitivesystems,suchasskeletal morphology (Muñoz-Muñoz et al. 2006; 2011; Sans-Fuentes et al. 2009;Martínez-Vargasetal.2014),circadianrhythmofmotoractivity(Sans-Fuentesetal.2005),spermatogenesis(Sans-Fuentesetal.2010;Medardeetal.2015),andspermsizeandshape(Medarde2013;Medardeetal.2013).Acommonresultofall thesestudiesisthatstandardmice(2n=40)showsignificantdifferencesagainstRbmice,particularly against those with a high number of fusions and a relatively high level of heterozygosity.
1.3.3PreviousstudiesinhousemouseRbpopulations
According to Hewitt (1988), hybrid zones are “natural laboratories forevolutionary studies” as they permit the investigation of a speciation process in progress and, in this case, a previous step that permits to understand which are the forcesthatleadtothefixationofCRsinnature.Manyworkshavebeenperformedinordertotestbothmodelsofchromosomalspeciation(hybrid dysfunction model vs. suppressed recombination model; seesection1.1.6)byusinghousemice fromdifferentmetacentricraces(Groppetal.1982;TichyandVucak1987;HübnerandKoulischer1990;Searle1991;CapannaandRedi1995;CastigliaandCapanna2000;Britton-Davidianetal.2002;Britton-Davidianetal.2005;Solanoetal.2008;Sans-Fuentesetal.2010;Medardeetal.2015).SomeofthesestudiesdealwiththeeffectsofRbfusionsonthesubfertilityorsterilityphenotypesinhybridsbetweenchromosomal
GENERALINTRODUCTION

60
races. Although there is some controversy on the effect of these mutations when its number is relativelymoderate (Searle 1993;HauffeandSearle 1998;CastigliaandCapanna2000;Piáleketal.2001;Sans-Fuentesetal.2007),Moreover,significantlyreducedfertilityhasbeendetectedinindividualswithahighnumberofRbfusions(Searle1993;HauffeandSearle1998;CastigliaandCapanna2000;Piáleketal.2001),suggesting the role of this mutations as postzygotic barrier. In the light of these results, therecombinationdynamicshasstartedtobetested inRbpopulationsofM.m.domesticus. Initial studies of chiasmata frequencies revealed the existence of asignificantdecrease intherecombinationrates inRbhybrids(Bidauetal.2001;CastigliaandCapanna2002;DumasandBritton-Davidian2002)andapossiblehighermechanical interference of the metacentric centromeres has been proposed as the possible cause of this reduction (Dumas and Britton-Davidian 2002). Subsequentstudies have been focused on the incidence of asynapsis during meiosis in mice carryingmultipleRb fusions (Manterola et al. 2009;Vasco et al. 2012),however,themeioticandrecombinationdynamicsinapolymorphicRbsystemwithoutthepresence of a metacentric race, together with the possible influence of specific genetic factors such as Prdm9 in these systems remains to be elucidated.
GENERALINTRODUCTION

61
2.
OBJECTIVES

62

63
The research activity of our group is focused on the study of genome evolution and, more specifically, on the mechanisms responsible for genome reshuffling in mammals. By investigating the plasticity of mammalian genomes, much can belearned about its significance in speciation.
Despitelong-standingdiscussionsontheroleofCRsinspeciation,empiricalevidence contrasting chromosomal speciationmodels (hybrid dysfunction model vs. suppressed recombination model) is still scarce in nature. Moreover, therecent description of mammalian hybrid sterility genes is balancing the focus on the importance of meiosis and, more specifically, recombination in evolutionary biology. In this context, the existence of house mouse wild populations with the presenceofRbfusions,offersaninestimableopportunityforthestudyoftheroleofCRsinspeciationandthemechanismsthatpromotetheirappearanceandfixationinnature.
Giventhisbackground,themainaimofthisworkwastostudythemechanismsthat are involved in genome reshuffling using rodents, and more specifically the house mouse as model species. This has been achieved taking advantage of the availability of whole-genome sequences of severalmammalian species, togetherwiththeanalysisofahousemouseRbpopulation,theBarcelonaRbsystem.
In order to reach the main goal, three specific objectives have been delineated:
1. Toreconstructgenomereshufflinginrodents,payingspecialattentiontothespecific genomic signatures that characterize the distribution of evolutionary breakpointregions(EBRs).
2. To elucidate the role of telomeres in the occurrence of Rb fusions in theBarcelonaRbsystem.
3. ToanalyzetheroleofRbfusionsandPrdm9 sequence on meiotic dynamics andrecombinationratesintheBarcelonaRbsystem.
OBJECTIVES

64

65
3.
MATERIALS ANDMETHODS

66

67
3.1Bioinformaticanalysis
3.1.1Alignmentofmammaliangenomes
Eleven sequenced genomes representative of different mammalian orderssuch asRodentia (Spalax galilii, Jaculus jaculus,Heterocephalus glaber,Microtusochrogaster, Rattus norvegicus and Mus musculus), Primates (Homo sapiens,Macacamulatta, and Pongo pygmaeus),Artiodactyla (Equus caballus), Carnivora(Feliscatus)andPerissodactyla(Bostaurus)wereincludedinourstudy(section4.1).These species were selected on the grounds of the quality of their genomes; that is, theypresentedN50values>2Mbp,beingtheN50valueastatisticthatrepresentsanapproximate estimation of the mean scaffold lengths of a given genome. Out of all genomes analyzed, eight (M. ochrogaster, R. norvegicus, M.musculus,H.sapiens,M.mulatta,P.pygmaeus,E.caballus,F.catus and B.taurus)wereassembledintochromosomeswhereastheremaining(S.galilii,J.jaculus and H.glaber)consistedofscaffold-basedgenomes(section4.1,TableS1).AllgenomesweredownloadedfromtheGenBankFTPsite(ftp://ftp.ncbi.nih.gov/)exceptforS. galilii thatwasobtainedfromtheoriginalpaper(Fangetal.2014). Whole-genome alignments were performed using Satsuma Synteny (SS)(Grabherr et al. 2010) created by the Vertebrate Genome Biology Program fromthe Broad Institute of MIT and Harvard (https://www.broadinstitute.org/). Thisalgorithmperformshigh-sensitivitywhole-genomealignmentsbetweenareferencegenomeand a target through cross-correlation (Figure 3.1A). Thus, it establisheshomologies betweenDNA regions that have diverged over time by ameasure ofsimilarity between sequences. In the present work, the analyses were performed consideringthemouseasthereferencegenome(NCBIm37assembly).Inallcases,themousegenomewascomparedwitheachoftherestofthegenomes(i.e.,targetgenome)inapair-wisemanner(Figure3.1A).Foreachpair-wisegenomecomparison,an output with the aligned sequences was obtained for each chromosome that was thencleanedforoverlappingmatchesusinganin-houseperlscript.
MATERIALSANDMETHODS

68
3.1.2Detectionofregionsofsynteny(HSBsandSFs)
Inordertocharacterizeregionsofhomologybetweenpair-wisealignmentsSynteny Tracker(ST)(Donthuetal.2009)wasused.Thisalgorithmidentifiesandunifies sequence alignment homologies between two genomes establishing blocks ofhomology(i.e.,syntenicregions)(seeBOX2andFigure3.1B).Basedonthetypeofthetargetgenome,twotypesofsyntenicregionswereobtained:(i)HSBswhenthetargetgenomewasassembledintochromosomes,and(ii)Syntenic Fragments (SFs)whenthetargetgenomewasonlyavailable intoscaffolds. Ineachcase, thesizes defined for each syntenic region were established depending on a minimum size threshold. Inthepresentwork,theanalysisforeachpair-wisecomparisonwasperformedbytriplicate,settingthreedifferentminimumsizes forsyntenicregions: 100Kbp,300Kbpand500Kbp.Thisanalysisatdifferentresolutionsalsoallowedustoinferthe quality of the target genomes. In the case the number of regions of homology detected was proportional between the three resolutions (100Kbp, 300Kbp and500Kbp),thenthetargetgenomewasconsideredtopresenthighsequencingquality(section4.1,FigureS1).
3.1.3DetectionandclassificationofEBRs
Once HSBs and SFs were detected, the program Evolutionary Breakpoint Analyzer (EBA)(Farréetal.,underrevision)wasusedinordertocharacterizeandclassifyEBRsinaphylogeneticcontext.EBAisaperl-basedalgorithmthatidentifiesthecoordinatesofallEBRs(definedastheintervaldelimitedbytwoadjacentHSBboundaries) thathaveoccurredduring the evolutionof the species analyzed andclassifies them in a phylogenetic context. In the case of the genomes consisting of scaffolds(S.galilii,J.jaculusand H.glaber),EBAonlyconsidersthepresenceofanEBRwhenSFsboundariesarelocatedwithinthesamescaffold. Inthepresentwork,analyseswereperformedusingtheHSBsdatasetobtainedwith ST for all pair-wise comparisons, based on the more recent mammalianphylogeneticrelationships(section4.1,Figure1)(Meredithetal.2011;dosReisetal.2012).EBAwasusedtodetectandclassifyEBRsbytheirtimeofappearanceineach phylogenetic lineage (Figure 3.1C), providing a score of reliability for eachEBRdetectedasaratioofclassificationconfidenceaswellasthenumberofspeciesthatpresentthesameEBRrespecttotheonesthatpresentagenomicgap(regions
MATERIALSANDMETHODS

69
withoutsequencingdata).BothvaluesprovideanestimationofreliabilityforeachEBR,avoidingfalsepositives. EBAwasrunbyusingsyntenicregionsdata(HSBsandSFs)at300Kbpasthereferenceblocksizeresolutionchosen(giventhatitrepresentsthemeanthresholdvalue)andaphylogenetictreeinput.Inordertoavoidfalsepositives,thefinalsetofEBRswasobtainedbyfixingthereliabilityscorethresholdat≥34andthepercentageofspecieswiththeEBRat≥60%(taking intoaccountthetotalnumberofspeciesincludedinthestudy). OnceEBRscoordinateswereestablished,theEvolution HighwayComparativeChromosomeBrowser(EH)(http://evolutionhighway.ncsa.uiuc.edu/)wasusedinordertovisualizeallEBRsdetectedineachphylogeneticlineage.EHisatoolthatcreates graphic representations for comparative genomic data for each reference chromosomes, in our case the mouse genome, compared with the target species in a pair-wisemanner (Figure 3.1D).Additionally, this representation allows theconfirmationofeachEBRclassificationcharacterizedbyEBA.
Figure 3.1. Schematic representation of the analysis performed by each bioinformatic tool used in this study: (A)Satsuma Syntenyidentifiessequencehomologies(depictedwithagreenline)betweenareferencegenome(mouse)andatargetgenome.(B)Synteny Trackerunifiesgenomesequencehomologiesinsyntenicblocks:HomologousSyntenyBlocks(HSBs)orSyntenicFragments(SFs)dependingonhowthetargetgenomeisassembled(intochromosomesorscaffold-based,respectively).Inthiscase,HSBsarerepresentedingreen.(C)EvolutionaryBreakpointAnalyzer(EBA)identifiestheregionsofdisruptionofhomologyasEBRs(depictedinyellow)andclassifiestheminaphylogeneticcontextbasedonaspeciestreeprovided.(D)EvolutionHighwaychromosomerepresentationwithofhomologyregions (HSBsandSFs, ingrey)andEBRs (inwhite)ofmousechromosome10witheachofthetargetgenomesstudiedinthisanalysis
MATERIALSANDMETHODS

70
3.1.4 Analysisofgenomicfeatures
Byusinganin-housePerlscript,themousegenomewasdividedinto10Kbpnon-overlappingwindowsandmergedwiththeEBRsandHSBscoordinatesresultedfromtheanalysisusingSTandEBA.With thisapproach, themousegenomewasclassified into four different genomic regions: (i) EBRs, (ii)HSBs, (iii) interphaseregions (genomic 10Kbpnon-overlappingwindowsoverlappingwith the startortheendcoordinatesofanyEBR)and(iv)100KbpregionsupstreamordownstreamtheEBRscoordinates (section4.1,Figure3A).This filewasmergedwith thedataobtained for different genomic features (gene content, recombination rates andconstitutiveLADs),asexplainedbelow,inordertofurtheranalyzetheirdistributionacross the mouse genome.
3.1.4.1Genecontentandontology
DatausedforthegenecontentanalysiswasobtainedfromtheBiomartportal(http://www.ensembl.org/biomart/martview/)andconsistedoftwomainfiles:(i)allmouseRefSeqgenesand(ii)allmouseprotein-codinggenesdatasets(NCBIm37release).Genecoordinateswere thenmergedacross themousegenome in10Kbpnon-overlapping windows previously classified as EBRs, HSBs, interphases and100Kbp upstream or downstreamEBRs. Kruskal-Wallis non-parametric testwasperformedwithJMPstatisticalpackage(release7.1)inordertocomparemeangenenumber for each genomic region. Subsequently, gene ontology analyses were performed with the Database for Annotation, Visualization and Integrated Discovery (DAVID,Huang et al. 2009).DAVID is an integrated database and analytic tool that permits the extraction of biological features or enrichments associated with a specific gene list query. Thus, it is a useful tool for the identification of overrepresented biological terms contained in any given region compared to the rest of the genome. Additionally, DAVID provides Benjamini’s statistical test to control false positives and sort biological terms byits degree of enrichment and the Expression Analysis Systematic Explorer score (EASEscore)amodifiedFisher’sexactp-value,asthethresholdtoconsideratermsignificantlyoverrepresented(fixedon<0.05).
MATERIALSANDMETHODS

71
3.1.4.2 Recombinationrates
GeneticmapsofrecombinationratesforthehousemousewasextractedfromBrunschwigandcollaborators(2012)whoprovidedhigh-resolutionrecombinationratesestimatesacrossthemousegenomebySNPsmappingthatweregeneratedaspart of the Mouse Genome Project (http://www.sanger.ac.uk/resources/mouse/genomes/). Two different datasets were used to detect recombination hotspots.ThefirstofthemincludedSNPsdataobtainedfrom12mouse-inbredstrains(129S5/SvEvBrd,AKR/J,A/J,BALB/cJ,C3H/HeJ,C57BL/6NJ,CBA/J,DBA/2J,LP/J,NOD/ShiLtJ, NZO/HILtJ, and WSB/EiJ). The second dataset consisted of 100 classicalstrainsgenotypedwiththeMouseDiversityArray(Yangetal.2011). Meanrecombinationrates(expressedas4Ner/Kbp)(seeBOX3)weredistributedinto10Kbpnon-overlappingwindowsandmergedwiththefourgenomicregionsdescribedabove(section3.1.4).Kruskal-Wallisnon-parametrictestwasperformedwithJMPstatisticalpackage(release7.1)inordertocomparemeanrecombinationratesbetweenEBRs,interphases,100KbpadjacentregionsandHSBs.
3.1.4.3Constitutivelaminaassociateddomains(cLADs)
Lamina associated domains are genomic regions associated to the Nuclear Lamina(NL),aproteinliningthenuclearenvelopeofeukaryoticcells.TheseregionsprovideinformationregardingthespatialarchitectureoftheDNAinsidethenucleusgiventhatgenomicregionsincontactwiththeNLarenormallypositionedintheperipheryofthecellnucleus.Meulemanandcollaborators(2013)publishedarefinedmapofthegenomicregionsassociatedtotwotypesofNL(AandB)infourdifferentmousecelltypes(LaminaAinastrocytesandneuralprecursorcellsandB1inwildtypeandOct1knockoutembryonicfibroblasts).Thoselaminaregionsthatwerecommonin all cell types were considered as constitutive LADs(cLADs).Inourstudy,cLADsgenomiccoordinateswereextractedfromMeulemanandcollaborators(2013)anddistributed in 10Kbp non-overlappingwindows using in-house Perl scripts. Thisdataset was merged with the four genomic regions described above and statistically analyzed as it was done with gene density and recombination rates.
MATERIALSANDMETHODS

72
3.1.5Permutationtests
Genome-wide association analysis of each genomic signatures included inour study (gene density, recombination rates and cLADS) were performed withRegioneR (Diez-Villanueva et al. 2015), a R-implemented algorithm. RegioneRcompares, through randomization tests, the number of overlaps between a query and a reference region set to the distribution of the number of overlaps obtained byrandomizingtheregionsofinterestforeachchromosome(http://gattaca.imppc.org/regioner/).Inthiswork,10,000permutationtestswererunperchromosomeforthefollowinggenomicsignaturescoordinates:(i)allRefSeqgenes,(ii)proteincodinggenes(iii)recombinationratesand(iv)cLADsbycomparingthemwithEBRsandHSBscoordinates.Inallcases,significancewasconsideredwhenp<0.05.
3.2Biologicalsamples
Atotalnumberof31specimensofM.m.domesticuswerelive-trappedin10differentpopulationsbelongingtotheBarcelonaRbpolimorphismsystem(Figure3.2).Thesampledareaconsistedoffourpopulations(CastellfollitdelBoix,Vacarisses,ArbecaandSantaPerpètuadelaMogoda)withstandardkaryotype(2n=40)andsixpopulations(L’AmetlladeSegarra,SantSadurníd’Anoia,ElPapiol,Viladecans,PratdeLlobregatandCastelldefels)withRbmicewithfusionsrangingfrom1to12(2n=28-39).SpecimenswerecapturedusingShermananimaltrapsthatwereplacedattheevening in different locations inside the farms and collected the next morning. Legal permissionforanimalcapturewasgrantedbythe“DepartamentdeMediAmbient”ofthe“GeneralitatdeCatalunya”.
Figure 3.2. Map of the Barcelona Rb system: All sampled popula-tions in this study are represented differentiating standard popu-lations(ingreen)andRbpopulations(inred).Foreachpopulation,the diploid number range is indicated.
MATERIALSANDMETHODS

73
All captured mice were immediately transferred to the laboratory in order to house them under controlled conditions for three days. The following samples were obtained for each specimen: testicular tissue, muscle from posterior leg and conjunctivetissuefromintercostalmuscle.AnimalswerehandledbyDr.Medarde(seeMedarde2013) incompliancewiththeguidelinesandethicalapprovalof the“Comissió d’Ètica en L’Experimentació Animal i Humana” of the UniversitatAutònomadeBarcelonaandbythe“Departamentd’Agricultura,Ramaderia,Pesca,Alimentació i Medi Natural” of the “Generalitat de Catalunya” (reference of theexperimentalprocedureauthorization:DAAM6328).
3.3Molecularbiologytechniques
3.3.1BacterialArtificialChromosome(BAC)selectionand
purification
Bacterial Artificial Chromosomes (BACs) are constructs that allow cloningDNAfragmentsof interest, ranging insize from150Kbpto350Kbp, inabacterialvector(normallyE.coli).ByusingBACsasaprobeinFISHexperiments,theregionof interest can be identified on chromosomal preparations. In the present work, this method was used to identify meiotic chromosomes on mouse spermatocyte spreadspreviouslytreatedwithImmunofluorescence(IF)(seesection3.4.3).BACscorrespondingtomousechromosomes4,9,11,12,13and14wereselectedfromtheUCSCgenomeBrowser(http://genome.ucsc.edu).Foreachmousechromosome,asetofoverlappingBACcloneswerepurchasedfromtheBACPACresourcescenterinChildren‘sHospital Oakland Research Institute(CHORI,https://bacpac.chori.org/).
3.3.1.1VectorplasmidcultureandDNAextraction
Materials− PlasmidvectorsuppliedbyCHORIinLuria-Bertani(LB)brothagarstab− LBmediumpowder(Liofilchem)− Agarpowder(SigmaAldrich)− Cloramphenicolsolution(34mg/ml,SigmaAldrich)− Glycerolsolution(60%,SigmaAldrich)
MATERIALSANDMETHODS
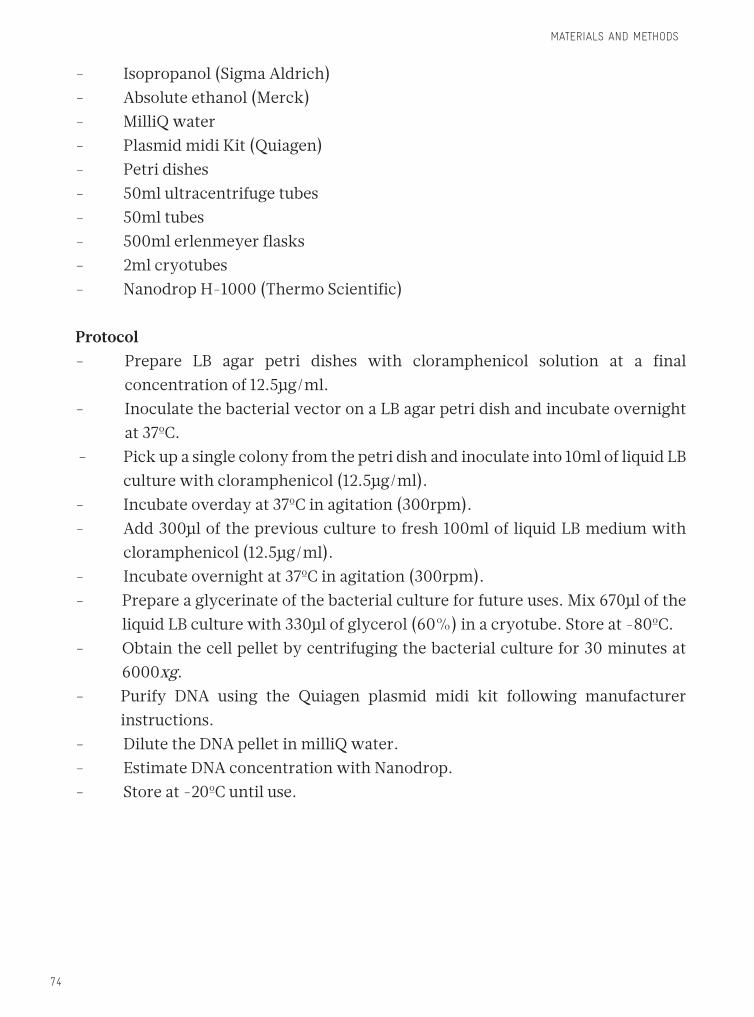
74
− Isopropanol(SigmaAldrich)− Absoluteethanol(Merck)− MilliQwater− PlasmidmidiKit(Quiagen)− Petri dishes − 50mlultracentrifugetubes− 50mltubes− 500mlerlenmeyerflasks− 2mlcryotubes− NanodropH-1000(ThermoScientific) Protocol− Prepare LB agar petri dishes with cloramphenicol solution at a final
concentrationof12.5µg/ml.− InoculatethebacterialvectoronaLBagarpetridishandincubateovernight
at37ºC.− Pickupasinglecolonyfromthepetridishandinoculateinto10mlofliquidLB
culturewithcloramphenicol(12.5µg/ml).− Incubateoverdayat37ºCinagitation(300rpm).− Add300µlofthepreviousculturetofresh100mlof liquidLBmediumwith
cloramphenicol(12.5µg/ml).− Incubateovernightat37ºCinagitation(300rpm).− Prepareaglycerinateofthebacterialcultureforfutureuses.Mix670µlofthe
liquidLBculturewith330µlofglycerol(60%)inacryotube.Storeat-80ºC.− Obtainthecellpelletbycentrifugingthebacterialculturefor30minutesat
6000xg. − Purify DNA using the Quiagen plasmid midi kit following manufacturer
instructions.− DilutetheDNApelletinmilliQwater.− EstimateDNAconcentrationwithNanodrop.− Storeat-20ºCuntiluse.
MATERIALSANDMETHODS
75
3.3.1.2 DNAlabelingbynicktranslation
MaterialsDNAsolution(>50ng/µl)− Buffer 10X: tris-HCl (0.5M),MgCl2 (50mM), Bovine Serum Albumin (BSA,
0.5mg/ml)− Deoxynucleotide Triphosphate(dNTP)mix:dATP(0.5mM),dCTP(0.5mM),dGTP(0.5mM)anddTTP(0.1mM)− ß-mercaptoethanol(10mM,SigmaAldrich)− Klenowenzyme(RocheDiagnostics)− DNase(2000U/ml,RocheDiagnostics)− Deoxyuridine Triphosphate-Digoxigenin(dUTP-DIG,RocheDiagnostics)or
dUTP-Cyanine 3(dUTP-Cy3,GEHealthcare)− MilliQwater− Ethylenediamine-tetraacetic acid(EDTA0.5M,SigmaAldrich)− 1.5mleppendorftubes− Thermoblock(Eppendorf) ProtocolPrepare nick translation mix:− 1µgofDNA− 5µlofbuffer10X− 5µlofß-mercaptoethanol− 5µlofdNTPmix− 2.5µlofdUTP-DIGordUTP-Cy3− 1µlofDNase− 1µlofKlenowenzyme− MilliQwateruptoatotalvolumeof50µl− Incubateovernightat15ºCinathermoblock.− Stopthereactionwith1µlofEDTA(0.5M).− Storeat-20ºCuntiluse.
3.3.2GenomicDNApurification
MousegenomicDNAwasobtainedfromeithercellcultures(seesection3.4.1)ormuscletissue(storedinethanolat-20ºC)usingthestandardphenol-chloroform
MATERIALSANDMETHODS

76
protocol as follows.
Materials− Extraction buffer: Tris-HCl (10mM, pH 8.0), EDTA (10mM, pH 8.0), NaCl
(150mM),SDS(0.5%)− RNasecocktail(Ambion)− ProteinaseK(Ambion)− Phenol solution: equilibratedwith Tris HCl (10mM, pH 8.0), EDTA (1mM,
SigmaAldrich)− Phenol-Chloroform:IAAMBGrade(Ambion)− Chloroform:IAAMBgrade(SigmaAldrich)− Sodiumacetatebuffersolution(NaAc,3M,pH5.2,SigmaAldrich)− Absoluteethanol(Merck)− Ethanol70%− MilliQwater− 2mleppendorftubes− 1.5mleppendorftubes− Centrifuge15mltubes− Eppendorfcentrifuge− Thermoblock(Eppendorf)− NanodropH-1000(ThermoScientific)
Protocol− Add0.75mlofextractionbuffer,2.5µlofRNasecocktailand3.75µlofproteinase
Kto2mleppendorftubecontainingthesample.− Incubateinathermoblockovernightat37ºCinagitation(300rpm).− Add0.75mlofphenolsolution.− Mixbyhanduntilthetwophasesaremixed.− Centrifuge15minutesat5000xg. − Recovertheaqueousphase(theupperone)andtransfertoanew2mltube.− Add0.75mlofphenolsolution.− Mixbyhanduntilthetwophasesaremixed.− Centrifuge15minutesat5000xg.− Recovertheaqueousphase(theupperone)andtransfertoanew2mltube.− Add 0.75ml of phenol-chloroform and swirl gently by hand until the two
phases are mixed.− Centrifuge10minutesat5000xg.
MATERIALSANDMETHODS

77
− Recovertheaqueousphase(theupperone)andtransfertoanew2mltube.− Add0.75mlofchloroform:IAAMBgradeandswirlgentlybyhanduntilthe
complete emulsion of the two phases.− Centrifuge10minutesat5000xg.− Recovertheaqueousphaseandtransfertoa15mltube.− Add0.1volumesofNaAc(3M)and2volumesofabsoluteethanolandtransfer
thesolutiontoanew1.5mleppendorf.− MixslowlybyinversionuntilDNAprecipitates.− Centrifuge1minuteat5000xg.− Eliminatesupernatantandadd0.75mlof70%ethanol.− Centrifuge1minuteat5000xg.− Eliminatethesupernatantandleavetoairdryforafewminutes.− DilutetheDNApelletinsterilemilliQwater.− EstimateDNAconcentrationwithNanodrop.− Storeat-20ºCuntiluse.
3.3.3Prdm9amplification
In thiswork,exon12of thePrdm9gene, fromrepeat#2 to theC-terminaldomain, was amplified and sequenced by Sanger sequencing in all the mice specimens includedinthestudy.Exon12containstheZnFdomainarraythatrecognizesandmethylatesthespecificDNAsequences(Parvanovetal.2010).
Materials- DNAsolution(>50ng/µl)− MilliQwater− Buffer10X(20mM,TakaraBioInc.)− dNTPmix(2.5mMeachdNTP,Invitrogen)− Primer5’,fl1822U24(10µM,Invitrogen)− Primer3’,2848L23(10µM,Invitrogen)− Dimethyl Sulfoxide(DMSO,SigmaAldrich)− ExTaq(TaKaRaExtaqTM,TakaraBioinc.)− AgaroseD1lowEEO(Condalab)− Ethidium Bromide(EtBr,SigmaAldrich)− Buffer1XTAEforelectrophoresis− DNAladder100bp(Invitrogen)
MATERIALSANDMETHODS

78
− LoadingBuffer− 1.5mleppendorftubes− 0.2eppendorftubes(FisherScientific)− PCRthermocycler(Bio-Rad)
PCR amplification protocol− Mixthefollowingreagentsina1.5mleppendorftube(volumesareindicated
forasinglesample): o 4µlofbuffer10X o 3.2µlofdNTPmix o 1µlofeachprimer(5’and3’) o 1.6µlofDMSO o 0.25µlofExTaq− MilliQwateruptoatotalvolumeof36µl− Ina96wellplate,add36μlofPCRmixtoeachwell,whichalreadycontains
3µlofDNAsamplepreviouslyadded.− Runthefollowingprograminthethermocycler: o Initialdenaturation:95ºC,3minutes o Denaturation:95ºC,30seconds o Annealing:56ºC,30seconds repeat30cycles o Elongation:72ºC,90seconds o Finalelongation:72ºC,10minutes o Infinitehold:10ºC− Storeat4ºCuntiluse.
Genotyping protocol− Preparea2Xagarosegelforelectrophoresis:100mlTAEbuffer1X,2gagarose,
2µlofEtBr.− Preparesamples:5µlofloadingbuffer,5µlofDNAsample.− PrepareDNAladdersolution:2µlofloadingbuffer,1µlofDNAladder(100bp).− Runthegelfor2.5hoursat75V.− Capturegelimage.− Identify different alleles by size.
MATERIALSANDMETHODS

79
3.3.4DNApurificationfromgelbandsandSangersequencing
Depending on whether the specimen was homozygote or heterozygote for the Prdm9allele,differentprocedureswerefollowedtoobtainDNAforsubsequentsequencing. In the case that mice were heterozygous for the Prdm9 allele, amplified bandswerecutfromtheagarosegelandDNAwaspurifiedusingaDNAextractionkit (IllustraTMGFXTM). In the case of sampleshomozygote for thePrdm9 gene, SangersequencingwasperformeddirectlyfromPCRproducts.
Materials− Surgical blade− Transilluminator UV− DNAextractionkit (IllustraTMGFXTMPCRDNAandgelbandpurification
kit,GEHealthcare)− 1.5mleppendorftubes− 0.2eppendorftubes(FisherScientific)− NanodropH-1000(ThermoScientific)
DNA purification from gel bands protocol− Localize the bands corresponding to heterozygote samples with a UV
transilluminator.− Cutthebandswithasurgicalbladeandtransfertoa1.5mleppendorftube.− Storethebandsfor1weekmaximumat-20ºCuntilDNAextraction.− PurifyDNA by using gel bandDNA extraction kit (IllustraTMGFXTMPCR
DNAandgel bandpurificationkit,GEHealthcare) followingmanufacturerinstructions.
− CalculateDNAconcentrationwithNanodrop.− StoreDNAat-20ºCuntilsequencing.
Sequencing Samples were sent to Macrogen Europe (https://dna.macrogen.com/) forSanger sequencing procedure. All reads (forward and reverse reads) and theircorresponding chromatograms were analyzed with Bioedit sequence alignmenteditor(version7.2.5).
MATERIALSANDMETHODS
80
3.4Cellbiologytechniques
3.4.1Cellculturesandchromosomeharvest
FibroblastprimarycelllineswereestablishedfrommicefromtheBarcelonaRb system using conjunctive tissue biopsy obtained from the intercostal muscleasdescribedbelow.Forthoseanimalsfromwhichcelllineswerenotsuccessfullyestablished, chromosomes were obtained from bone marrow as previously described (Medarde2013).
Materials− Transport medium: 100ml Dulbecco’s Modified Eagle Medium (DMEM,
Life technologies), 10ml Foetal Bovine Serum (FBS, Life technologies),1ml antibiotic-antimycotic (Life technologies), 0.7ml gentamicin (Lifetechnologies)
− Washingmedium:100mlofPhosphate Serum Saline1X(PBS),0.3gBSA(SigmaAldrich), 0.1g glucose (Sigma Aldrich), 0.7g gentamicin, 1ml antibiotic-antimycotic
− Cellculturemedium(DMEM)− Sterile1XPBS(Lifetechnologies)− Trypsin-EDTA(Lifetechnologies)− DMSO(SigmaAldrich)− Colcemid(KarioMax®,Invitrogen)− Hypotonicsolution(KCl,0.075M)− Fixativesolution:Methanol(Merck),AceticAcid(Merck)at3:1concentration
(freshlyprepared)− Absoluteethanol(Merck)− 1.5mleppendorftubes− Superfrostslides(WaldemarKnittel)− Surgical blade− T25cellcultureflasks(OrangeScientific)− Centrifuge15mltubes− Laminar flow cabin for cell culture− Centrifuge
MATERIALSANDMETHODS

81
Cell culture protocol− Immediately after the specimen was sacrificed, a conjunctive tissue sample
from the intercostal muscle was collected and transported in ice to the cell culturelaboratoryina15mltubewith5mloftransportmedium.
− Working in a laminar flow cabin for cell culture, wash the tissue three times in washing medium.
− Cutthetissueintosmallexplantswithasurgicalbladeandplacetheminsidea cell culture flask.
− Add10mlofDMEMsupplementedwith15%ofFBSandincubateat37ºC(CO2
10%).− Once fibroblasts start to grow in monolayer from the tissue, remove the
explants. − Whencellculturereachesconfluence,trypsinizeandexpand(1:2)intwoT25
flasks.− Explants andcellswere cryo-preserved in liquidnitrogenwithDMSO:FBS
(concentration1:9)atearlypassages.
Chromosome harvest protocol− Inordertoarrestcellcycleatmetaphasestage,add80µlofcolcemid(10μg/
ml)to10mlmediumwhenculturesareat80%ofconfluence.− Incubatefor2hoursat37ºC.− Trypsinizethecellcultureandcentrifugeina15mltube(5minutesat1400rpm).− Breakthecellpelletbyvortexingandadd10mlofhypotonicsolution(pre-
warmedat37ºC)veryslowly.− Incubatethecellsfor25minutesat37ºCinvertingevery5minutes.− Centrifuge5minutesat1400rpm.− Add5mloffixativesolution.− Centrifuge5minutesat1400rpm.− Wash the pellet twice by adding 5ml of fixative solution and centrifuge (5
minutesat1400rpm).− Dilutethecellsin1mloffixativesolutionandstoreat-20ºCinaneppendorf
tube until use.− Prepare chromosomal spreads by placing a drop (approximately 20µl) of
chromosome suspension on a superfrost slide.− Leavethefixativesolutiontoairdryandstoretheslidesat-20ºCuntiluse.
MATERIALSANDMETHODS

82
3.4.2Spermatocytespreads
Micetesticularbiopsieswereobtainedimmediatelyafteranimaldissection,andmaintained at -80ºwith isopentane (SigmaAldrich) for the first 24hours inorder to avoid temperature fluctuations.
Materials− Buffer1XPBS(pH7.2-7.4)− Fixative solution: Paraformaldehyd (4%, pH 9.8, Sigma Aldrich), Triton
X-100(0.15%)inmilliQwater− Lypsol1%freshlypreparedinmilliQwater− Washingsolution:1%PhotoFlo(Kodak)inmilliQwater− 4’,6-diamidino-2-phenylindole(DAPI)solution:DAPI(125ng/ml)inantifade
(Vectashield,VectorLaboratories)− Humidifiedchamber− Superfrostadhesiveslides(WaldemarKnittel)− 22X60coverslips− Surgical blade− Petri dishes
Protocol− Obtain a cell suspension from the testicular biopsy by scattering the tissue in a
petridishin20µlofcold1XPBS.− Transfer the cell suspension on cold superfrost slides.− Add90µloflypsol1%andleaveitfor14minutesinahumidifiedchamber.− Add100µlofparaformaldehyd4%andleaveitfor20minutesinahumidified
chamber.− Lettheslidestoairdryfor30minutes.Itisimportantnottoletallthesolution
to dry completely as the proteins could be damaged. − Washtheslides3timeswithwashingsolutionandletthemtoairdry.− Add20µlofDAPIandplaceacoverslip.− Verifywithanepifluorescencemicroscopethequalityofthespreads(number
andmorphologyofcells).− Storeat-20ºCuntiluse.
MATERIALSANDMETHODS

83
3.4.3Immunofluorescence(IF)
The IF technique allows the identification of proteins of interest by usingdifferent sets of primary antibodies that recognize protein epitopes. Such epitopes are subsequently revealed with fluorescent secondary antibodies. In this work, different proteins involved in meiotic division process were analyzed on mouse spermatocytes. These proteins included:
− MLH1:proteininvolvedinrecombinationCOsatpachynemastage(Andersonetal.1999).
− SYCP3:thisproteinformsthelateralelementoftheSC(HendersonandKeeney2005).
− Histone 3 trimethylated at lysine 9 (H3K9me3): is considered amarker ofconstitutiveheterochromatin(Hublitzetal.2009).
− RPA: recognizes single stranded DNA (ssDNA) during DSBs formation andcontributes to the replication process with the homologous chromosome duringmeioticrecombination(Plugetal.1997).
− H2AX:thisproteinisphosphorylatedduringtheformationofDSBsanditisinvolvedingeneinactivationofasynapsedregions(Baarendsetal.2005).
− Serum CREST: Human serum of Complication of Raynaud’s phenomenon, Esophaegal dysfunction, Sclerodactily and Telangiectasia (CREST) usuallyusedfortheidentificationofcentromeres.InthiscaseweidentificateCENP-Bprotein,usedtoidentifythecentromere(Fachinettietal.2013)
Materials− Blockingsolution(PTBG):1XPBS,Tween-20(0.05%,SigmaAldrich)− Fixativesolution:formaldehyd1%(Scharlau)in1XPBS− MilliQwater− Buffer1XPBS(pH7.2-7.4)− BufferSaline Sodium Citrate2X(2XSSC,pH7)− DAPIsolution:DAPI(125ng/ml)inantifade(Vectashield,VectorLaboratories)− Set of primary antibodies. All antibodies were purchased from Abcam, except
the H2AXthatwasobtainedfromMillipore.TheserumCRESTwaskindlydonatedbyDr.M.Fritzler(CalgaryUniversity,Canada):
o Anti-SYCP3 (mouse or rabbit, concentration 1:400 and 1:600,
γ
γ
MATERIALSANDMETHODS
84
respectively) o Anti-H3K9me3(rabbit,concentration1:50) o Anti-MLH1(mouse,concentration1:100) o Anti-RPA(mouse,concentration1:200) o Anti-γH2AX(mouse,concentration1:200) o SerumCREST(human,concentration1:200)− Set of secondary antibodies conjugated with Cyanine 3(Cy3),Cyanine 5(Cy5)
or Fluorescein Isothiocyanate(FITC).AllsecondaryantibodieswerepurchasedfromJacksonImmunoresearchandwereappliedataconcentrationof1:200.
o Anti-RabbitCy3 o Anti-RabbitFITC o Anti-MouseFITC o Anti-HumanCy5− Humidifiedchamber− Parafilm
Protocol− RemovethecoverslipbywashingtheslidesinmilliQwaterfor10minutesin
agitation(100rpm).− Washtheslidefor10minuteswithPTBGinagitation(100rpm).− Apply 100µl per slide of the primary antibodies diluted in PTBG, place a
parafilmcoverslipandincubateovernightinahumidchamber(4ºC).− Washtheslidestwicefor5minutesinPTBGat37ºCinagitation(100rpm).− Apply 100µlper slideof the secondaryantibodiesmixwithPTBG, cover it
withapieceofparafilmandincubate1hourinahumidifiedchamberat37ºC.− Washtheslidestwicefor5minutesinPTBGinagitation(100rpm).− Washtheslides10minutesinfixativesolution.− Washtheslidesin1XPBSfor5minutestwice.− Add20µlperslideofDAPIsolution.
3.4.4FluorescenceinsituHybridization(FISH)
DifferentFISHprotocolswereused inthisstudy,dependingonthetypeofsampleused (mitotic ormeiotic chromosomes) and the typeof probehybridized(commercialwhole-chromosomepaintings,BACprobesortelomericprobes).
MATERIALSANDMETHODS

85
3.4.4.1 FISH with chromosome painting on metaphase
chromosomes
In this protocol, commercial whole-chromosome painting probes werehybridized on mouse metaphase chromosomes in order to identify specific chromosomesinvolvedinRbfusions.
Materials- Pepsinsolution:pepsin(0.5%,SigmaAldrich)inHCl(0.01M)- Mouse painting probes for chromosomes 4, 9, 11, 12, 13 and 14 (XCyting,
MetaSystems)- Buffer1XPBS(pH7.2-7.4)− MgCl2solution:MgCl210%in1XPBS− Fixativesolution:Paraformaldehyd50%,MgCl210%in1XPBS− Dehydrationethanols(70%,90%and100%)− Washingsolution1:0.4XSSC(pH7-7.5)− Washingsolution2:2XSSC,Tween-20(0.05%,pH7.0)− MilliQwater− DAPIsolution:DAPI(125ng/ml)inantifade(Vectashield,VectorLaboratories)− 22X22coverslips− Thermoblock(Eppendorf)− Humidifiedchamber
Slides pre-treatment protocol− Incubateslidesat65ºCfor2hours.− Incubateslidesfor30minutesinpepsinsolutionpre-warmedat37ºC.− Washin1XPBSfor2minutes.− WashinMgCl2solutionfor5minutes.− Washinfixativesolutionfor5minutes.− Washin1XPBSfor5minutes.− Dehydrate the slides in a gradient of ethanol (70%, 90% and 100%) for 2
minutes each.− Storeincoldabsoluteethanol(4ºC)untiluse.
Hybridization protocol
MATERIALSANDMETHODS

86
− Let slides to air dry.− Add10µlofthecommercialprobemixture(5µlprobe,5µlbuffer,allsupplied
bythemanufacturer)onthemetaphaseslideandcoverwithasmallcoverslip(22X22mm).
− Denatureonathermoblockat75ºCfor3minutes.− Incubateinahumidifiedchamberat37ºCovernight.− Removethecoverslipwithwashingsolution1at72ºCfor2minutes.− Rinsetheslidefor30secondswithwashingsolution2.− Apply20µlofDAPIsolutionandaddacoverslip.
3.4.4.2FISHwithBACsonspermatocytes
ThisprotocolwasappliedtohybridizemouseBACprobespreviouslyselected(section3.3.1)andfluorescentlylabeled(seesection3.3.2)onmousespermatocytespreads. This allowed for the identification of specific meiotic chromosomes that werepreviouslyanalyzedbyIF(seesection3.4.3).
Materials− Buffer1XPBS(pH7.2-7.4)− Buffer2XSSC(pH7)− MouseDNACOT-1(Invitrogen)− SalmonspermDNA(Invitrogen)− NaAc(3M)− Absoluteethanol(Merck)− Dehydrationethanols(70%,90%and100%)− Ethanol70%at4ºC− Denaturationsolution:Formamide(70%)in1XPBS(pH=7.4).− Washingsolution:Formamide(50%)in1XPBS(pH=7.4).− Hybridizationbuffer:Formamide(50%),dextransulfate(1%)in20XSSC.− PBD buffer: 1l of milliQ water, 1g Na2CO3, 5ml Igepal (CA-630®, Sigma
Aldrich).− DAPIsolution:DAPI(125ng/ml)inantifade(Vectashield,VectorLaboratories).− DNAprobelabeledwithDigoxigenin(DIG)orCy3(seesection3.3.1.2)− Anti-DIG-FITCin1XPBSwithBSA(concentration1:150).− Parafilm− 1.5mleppendorftubes
MATERIALSANDMETHODS

87
− 20x60coverslips− Humidifiedchamber(37ºC)− Thermoblock(Eppendorf)
DNA probe denaturation protocol− DNAprecipitationmix: o 1µgofthelabeledDNA o 10µlofmouseDNACOT-1 o 10µlofsalmonspermDNA o 0.1volumesofNaAc3M o 3volumesofEtOH100%− Incubateat-20ºCovernight.− Centrifugeat13,300rpmfor30minutes.− WashtheDNApellettwicewithethanol70%andlettoairdry.− Add14µlofhybridizationbuffer.− Denaturefor8minutesat74ºCinthethermoblock.
Spermatocyte slides treatment and hybridization- Rinsetheslidesin1XPBSinagitation(100rpm).- Washin1XPBSfor5minutesinagitation(100rpm).- Rinseinthedehydrationethanols(70%,90%and100%)for2minutesineach
solution.- Denaturetheslidesindenaturationsolutionat74ºCfor3minutes.- Immediatelyafterdenaturation,washtheslidesincoldethanol(70%)for2
minutes.− Dehydrate the slides in a gradient of ethanol (70%, 90% and 100%) for 2
minutes each.− Add 14µl of DNA probe mix on the slide and place a coverslip. Incubate
overnightinahumidifiedchamberat37ºC.
Post-hybridization washes protocol− Removethecoverslipcarefullyandwashtheslides3timesfor5minutesin washingsolutionat45ºC.− Repeatthe3washesin2XSSCat45ºC.− IftheprobeisdirectlylabeledwithCy3: o Letslidestoairdryandadd20µlofDAPIsolutionandaddacoverslip.− IftheprobeisconjugatedwithDIG:
MATERIALSANDMETHODS

88
o Add100µlofanti-DIG-FITCandplaceaparafilmcoverslip. o Incubateinadarkhumidifiedchamberat37ºCfor30minutes. o WashtheslidesinPBDbuffertwicefor3minutes. o Let slides to air dry. o Add20µlofDAPIsolutionperslideandaddacoverslip.
3.4.4.3 Quantitative-Fluorescence in situ Hybridization
(Q-FISH)onmetaphasechromosomes
TheQ-FISHisatechniquethatallowstheanalysisofDNAtelomericlengthdirectly on metaphase chromosomes. This technique is based on fluorescence in situ hybridizationof labeledsyntheticDNAmimicscalledPeptide Nucleic Acid(PNA)oligonucleotides. The measuring of fluorescence intensity signal using an specific software is used as an estimation of telomeric length (TFL-TeloV2, BC CancerResearchCenter,Canada)(Poonetal.1999).
Materials- Chromosomespreadspreviouslyfixedandstoredat-20ºC(seesection3.4.1)- Pepsinsolution:pepsin(0.5%,Sigma-Aldrich)inHCl(0.01M)- Formaldehyd37%(Scharlau)- Buffer1XPBS(pH7.2-7.4)- Buffer2XSSC(pH7)− Dehydrationethanols(70%,85%and100%,at4ºC)− PNAprobe(CCCTAA)3(TelC)(Panagene)− Hybridizationbuffer:NaHPO4(10mM,pH7.4),NaCl(10mM),Tris(20mM,pH
7.5),formamide(70%,SigmaAldrich)− Washingsolution1:Tween-20(0.1%)in1XPBS− Washingsolution2:Tween-20(0.1%)in2XSSC− DAPIsolution:DAPI(125ng/ml)inantifade(Vectashield,VectorLaboratories)− 22X22mmcoverslips− Humidifiedchamber− Thermoblock(Epperndorf)
Protocol
MATERIALSANDMETHODS

89
− Incubatetheslidesfor10minutesat67ºC.− Rehydratetheslidesin1XPBSfor15minutes.− Fixthecellswithformaldehyde4%in1XPBSfor4minutes.− Washtheslides5minutesin1XPBS(twice).− Incubatetheslidesinpepsinsolutionfor4minutesat37ºC.− Washin1XPBSfor3minutestwice.− Dehydrate the slides in a gradient of ethanol (70%, 90% and 100%) for 1
minute in each solution.− Let the slides to air dry.− Add15µlofPNAprobeat800ng/mlinhybridizationbufferandaddacoverslip.− Denatureinathermoblockfor5minutesat80ºC.− Incubatefor90minutesinahumidifiedchamber.− Rinseinwashingbuffer1andremovethecoverslip.− Incubateinwashingbuffer1for20minutesat57ºC.− Rinseinwashingbuffer2for1minute.− Add20µlofDAPIsolutionperslideandaddacoverslip.
3.4.5Imageprocessingandanalysis
Microscopy image capturing and processing AllchromosomalpreparationsobtainedfrombothIFandFISHprotocolswerevisualizedwithanepifluorescencemicroscope(modelZeissAxioskop)equippedwiththeappropriatefiltersforFITC,Cy3,Cy5andDAPIdetectiontogetherwithachargedcoupleddevicecamera(ProgResRCS10Plus,Jenoptik).ImageswerecapturedandproducedwiththeProgResRsoftware(2.7.7).Allanalyseswereperformedblindly(anumericalcodewasassignedtoeachspecimen inorder toavoidunintentionalscoresbias)withAdobePhotoshopCS(version8.0).
Recombination analysis The analysis of meiotic DSBs and COs distribution in mouse meioticchromosomes was performed using Micromeasure(version3.3)(Reeves2001),atooldesigned to provide quantitative distance estimations from cytogenetic microscopic images. Micromeasure was used to obtain recombination maps of the mouse chromosomesidentifiedbyFISH(4,9,11,12,13and14)(seesection3.4.4.2).Thus,it permitted to calculate themediumrelativedistance (as apercentageof the SClength)tothecentromereforeachMLH1orRPAfoci analyzed. These data were used
MATERIALSANDMETHODS

90
to construct cumulative sequence plots in order to obtain chromosomal distributions ofMLH1andRPAfocialongSCs.DistributionplotswerethencomparedbyusingKolmogorov-Smirnov Test. Micromeasure was also used for the analysis of the signalareaofH3K9me3overlappingtheSCforeachchromosomalarm(measuredinmicrometers).
Telomere length analysis TheTFL-TeloV2software(BC,CancerResearchCenter,Canada)(Poonetal.1999)isdesignedtocalculatetelomerelength(expressedasTelomere Fluorescence Units,TFUs)fromQ-FISHimages.Itcomparestheintensityofeachtelomererespectto the intensity of the background and gives the telomere length estimation for each cellanalyzed.Thisprogramallowedcomparingq-andp-armstelomereslengthforeachmetaphasegivingtheestimationoftelomerelengthinTFUs.
MATERIALSANDMETHODS

91
4.
RESULTS

92

93
4.1 Reconstruction of genome reshuffling in rodents
The reconstruction of genome reshuffling during the evolution of species is of special interest for understanding the mechanisms that promote genome evolution. Although several theoretical models have tried to explain the role of different factors in genome reshuffling, evidence is still scarce in mammals, especially in rodents. In this work, we analyzed the genomic distribution of genome reshuffling across rodentsevolution, takingadvantageofwhole-genomesequencesavailable in thedatabases.WeidentifiedRodentiaspecificEBRstogetherwiththegenomicfeaturesthat could be involved in their origin, including gene content, recombination rates and chromatin structure.
Comparative genomics data of this work was obtained during a research stagegrantedby travel fellowshipby“MinisteriodeEconomíayCompetitividad” (ref.EEBB-I-13-07350)inthelaboratoryofDr.DenisM.LarkininAberystwythUniversity(Wales,UK).Thismanuscriptiscurrentlyunderpreparation.
RESULTS

94

95
4.1.1 Comparative analysis of rodent genomes reveals
evolutionarysignaturesofgenomereshuffling
CapillaL1,2,Sánchez-GuillénRA1,FarréM3,Alföldi J4,Lindblad-TohK4,MalinverniR5,Ventura J2,
LarkinDM3,Ruiz-HerreraA1,6*1GenomeIntegrityandInstabilityGroup,InstitutdeBiotecnologiaiBiomedicina(IBB),UniversitatAutònomadeBarcelona
(UAB),Barcelona,Spain.2DepartamentdeBiologiaAnimal,BiologiaVegetaliEcologia,UniversitatAutònomadeBarcelona
(UAB), Barcelona, Spain. 3Department of Comparative Biomedical Sciences, The Royal Veterinary College, London, UK.
4VertebrateGenomeBiology.BroadInstituteofMITandHarvard,USA.5InstituteofPredictiveandPersonalizedMedicineof
Cancer (IMPPC),Barcelona,Spain. 6DepartamentdeBiologiaCel·lular,Fisiologia i Immunologia,UniversitatAutònomade
Barcelona(UAB),Barcelona,Spain
*Correspondingauthor:[email protected]
4.1.1.1Introduction
Unlocking the genetic basis of speciation is of crucial importance to explain species diversity and adaptation to a changing environment. Similarly, understanding therolethatlarge-scalechromosomalchangesplayinreproductiveisolationhasbeenafocusofevolutionarybiologists(White1978;AyalaandColuzzi2005).Particularly,whether these act as barriers to gene flow (Rieseberg 2001; Navarro and Barton2003;FariaandNavarro2010)orbymodifyingboth thestructureandregulationofgeneslocatedat,ornear,theaffectedregions(Murphyetal.2001;Larkinetal.2009;Ullastresetal.2014).Themainmotivationbehindthesestudieshasbeentofind evidence of the adaptive value of genome reshuffling and of the mechanisms ofitsformationduringmammaliandiversification.Compellingevidencehasshedlightongenomicfeaturesthatcharacterizeevolutionarybreakpointregions(EBRs)(i.e.,regionsofdisruptionofgenomehomologies)andtheirgenomicdistribution.Repetitive elements including segmental duplications (SDs) (Bailey and Eichler2006;Kehrer-SawatzkyandCooper2007;ZhaoandBourque2009),tandemrepeats(TRs)(Kehrer-Sawatzkietal.2005;Ruiz-Herreraetal.2006;Farréetal.2011)andtransposable elements (TEs) (Longo et al. 2009; Carbone et al. 2009; Farré et al.2011)haveallbeenassociatedwiththeirpresence.However,giventhediversityofrepetitiveelementsfoundwithinEBRsitislikelythatsequencecompositionisnotaloneininfluencinggenomeinstability.Infact,itwasinitiallyreportedthatEBRsare locatedingene-richregions(Murphyetal.2005;Lemaitreetal.2009),those
RESULTS

96
containing gene functional process networks, such as genes related to the immune system(Groenenetal.2012;Ullastresetal.2014).Thissuggeststhatchangesingeneexpression caused by genome reshuffling could reflect a selective advantage through thedevelopmentofnewadaptivecharacters(Larkinetal.2009;Groenenetal.2012;Ullastresetal.2014).Buthowuniversalthispatternisamongothermammals,needsfurther validation. Rodentia is themostdiverseandspeciesrichmammalianorderwithmorethan2,000definedspecies (CarletonandMusser2005) thatoccupyawiderangeof habitats and adaptive features. Although the rodent phylogeny has been hotly contesteddue to its complexity, it iswidely accepted thatRodentia canbeclassified into three major clades: the mouse-related clade (Anomaluromorpha,Castorimorpha and Myomorpha), the squirrel-related clade (Sciuromorpha) andCtenohystrica (Hystricomorpha) (Huchon et al. 2002; Montgelard et al. 2008;Blanga-Kanfietal.2009;Churakovetal.2010)Rodentiaaregenerallyconsideredtopresentspecificfeaturessuchashigherratesofnucleotidesubstitution(WuandLi1985),lowerrecombinationratesandhighergenomereshufflingrates[althoughthisismainlybasedonMus(Stanyonetal.1999;Veyrunesetal.2006)]thanwhencompared tootherLaurasiatheria (DumontandPayseur2011;Seguraetal. 2013).In fact, one of the most intriguing features that characterize rodents is the high chromosomal variability. This is exemplified by a wide range of diploid numbers rangingfrom2n=10inAkodon spp.(Myodontaclade)to2n=102inTympanoctomys barerae (Ctenohystrica clade) (Silva andYonenaga-Yassuda, 1998;Gallardo et al.2004).Previouscomparative studieshaveprovided relevant informationonbothancestralkaryotypereconstructionsforthegroup(Bourqueetal.2004;Froenickeetal.2006;Maetal.2006;Graphodatskyetal.2008;Mlynarskietal.2010;Romanenkoetal.2012)andspecificlarge-scalerearrangements(PevznerandTesler2003;Zhaoetal.2004;Froenickeetal.2006;Mlynarskietal.2010).Inparticular,ithasbeenproposedthatmouse-specificrearrangementsaremostlyinter-chromosomal(suchasfissionsorfusions)whileratspecificrearrangementsareintra-chromosomal(suchasinversions)(Zhaoetal.2004).However,thereason(s)behindtheextremelyhighrate of genome reshuffling has, and continues, to puzzle evolutionary biologists. Therefore, a more comprehensive picture of rodent genome evolution at a finer scale remains to be uncovered. With the availability of fully sequenced genomes from several different rodent species, we can now delineate the evolutionary history of genomic reshuffling in rodents in order to better understand both the adaptive value of chromosomal rearrangements within the group and the mechanisms underlying this pattern.
RESULTS

97
Herewe present a refined analysis of the Rodentia EBRs as an estimationof genome reshuffling in the mouse by comparing six rodent genomes and six mammalianoutgroupspecies.Thishaspermitted theexaminationofEBRsacrossRodentiaphylogeny,thatwereanalyzedforgenecontent,recombinationratesandcLADs.Our resultsprovideevidence for thepresenceof rodent-specificgenomicsignatures, reinforcing the adaptive role of genome reshuffling and highlighting the influence of chromatin spatial organization in the formation of large-scaleevolutionary chromosomal changes.
4.1.1.2 Materialsandmethods
4.1.1.2.1Whole-genomecomparisons
Pair-wise alignmentswereestablishedbetween thegenomesof themouse(NCBIm37 assembly) and 11 representative species of mammalian phylogeny bySatsuma Synteny (Grabherretal.2010)(TableS1).Basedonthesequencehomologiesprovided by Satsuma Synteny, the Synteny Trackeralgorithm(Donthuetal.2009)wasused toestablish regionsofhomology (syntenic regions)between themousegenome (reference genome) and each of themammalian species included in theanalysis based on a minimum block size threshold. We differentiated two types of syntenicregions:(i)HomologousSyntenyBlocks(HSBs)whenpair-wisecomparisonswereestablishedbetweengenomesassembledintochromosomes,and(ii)SyntenyFragments(SFs), forpair-wisecomparisonsbetweengenomesonlyavailable intoscaffolds (TableS2).Foreachpair-wisealignment, threedifferent syntenicblocksizes(includingbothHSBsandSFs)werecompared(100Kbp,300Kbpand500Kbp)(TableS3;FigureS1).Thisallowedustoevaluategenomeassemblyreliability.WhenthenumberofHSBsorSFswasnotproportionalbetweenthethreeresolutions,itwas assumed that the genome contained structural assembly errors.Once syntenic regions were established for all species, EBRs were defined andclassified by the Evolutionary Breakpoint Analyzer (EBA) algorithm (Farré et al2015,submitted)using300Kbpasthereferenceblocksizeresolution.EBAprovidesallEBRsdetectedineachpair-wisecomparisonandgivesareliabilityscoreforeachclassification. The main values are determined by the ratio of the scores and the percentageofspecieswithbreakpointswithrespecttogenomicgaps.Bytakingthetotal number of species used in our analysis into account and the percentage of species
RESULTS

98
thatpresentedthegenomeinscaffolds,thethresholdwasfixedataratio≥34,andapercentage>60%.Then,twodifferentgroupsofEBRswereestablished:(i)EBRscorresponding to any of the 11 species studied (hereafter, lineage-specific EBRs)and(ii)EBRsthatappearedinanyofthedifferentiationnodesofthephylogenetictree(hereafter,clade-specificEBRs,Figure1;TableS4). Infact,andbasedonthephylogenetic relationships among the species included in our analysis, ten different nodes/cladeswereconsidered(Figure1):Clade1-Boreoeutheria,whichincludedall mammalian species compared in our analysis; Clade 2 - Euarchontoglires,including all rodent and primate species; Clade 3 - Catarrhini, which includedHomosapiens,Macacamulatta, and Pongo pygmaeus;Clade4-Hominoidea,withonly H. sapiensand P. pygmaeus;Clade5 -Rodentia,which includedall rodentspeciescomparedinourstudy;Clade6-Myodonta,allrodentsspeciescompared,except Heterocephalus glaber; Clade 7 - Muroidea, with Spalax galilii, Microtusochrogaster,Rattusnorvegicus and Musmusculus;Clade8–Cricetidae+Muridae,including M.ochrogaster,R.norvegicusand M.musculus;Clade9-Muridae,withR.norvegicus and M.musculus;andClade10-Laurasiatheria,withBostaurus,EquuscaballusandFeliscatus.InordertoestimatetheaveragerateofEBRsoccurringforeachphylogeneticbranch (numberofEBRspermillionyears -Myr),divergencetimes (autocorrelated rates and hard-bounded constraints) were extracted from(Meredithetal.2011) foreach lineageandcladephylogeneticbranches,with theexceptionofMuridae.Inthislatterinstance,dataprovidedby(dosReisetal.2012)wasused(TableS5).
RESULTS

99
Figure 1. EBRs mapped in the time tree of the mammalian species included in the study: Time tree was based on divergence times(autocorrelatedratesandhard-boundedconstraints)describedbyMeredithetal.(2011), withtheexceptionoftwospecies(M.musculusand R.norvegicus)andoneclade(Muridae)whichwereestimatedbyusingdosReisetal.(2012)timetree.Intheuppersectionofeachbranch,themeanrateofEBRsperMyrandtherange(inbrackets)isshown.Numbersframedin squares representmammalian phylogenetic nodes: 1-Boreoeutheria; 2-Euarchontoglires; 3-Catarrhini; 4-Hominoidea;5-Rodentia;6-Myodonta;7-Muroidea;8-Cricetidae+Muridae;9-Muridae;10-Laurasiatheria.
4.1.1.2.2Genecontentandontology
SequencecoordinatesofallmousegeneswereobtainedfromBioMart(RefSeqgenes, NCBIm37). Genes were clustered into two groups: (i) total genes, whichincludedprotein-codinggenes,novelgeneswithunknownfunction,pseudogenesand RNA genes and (ii) protein coding genes, which included only genes withknownfunction.GeneswereassignedeithertoHSBsorEBRswhencoordinatesfellwithintheseregions.EBRsusedinthisandsubsequentanalysiswerespecificallyallrodentsclade-specificandmouse lineage-specific.Genedensitywasanalyzedbycalculating themeannumberofgenescontained innon-overlappingwindowsof10Kbpacrossthemousegenomeaspreviouslydescribed(Ullastresetal.2014).Fourdifferentgenomicregionsweretakenintoaccount:(i)HSBs,(ii)EBRs,(iii)interphaseregions(regionsofoverlappingwithinthestartortheendcoordinatesofanygivenEBRs)and(iv)100KbpregionsupstreamordownstreamfromtheEBRscoordinates.Giventhehighincidenceofassemblyerrorsatthetelomeres/subtelomeresandthecentromeric/pericentromericareas,weexcluded3Mbpsectionofeachregionfromthe analysis.
RESULTS

100
ThefunctionalannotationandclusteringtoolDAVID(DatabaseforAnnotation,Visualization, and Integrated Discovery, v6.7) (Huang et al. 2009) was used toidentifyoverrepresentedbiologicaltermscontainedinEBRs.Functionalannotationclustering allows for the biological interpretation and functional annotation charts identifyingthemostrelevant(overrepresented)biologicaltermsassociatedwithagivengene list (Huangetal. 2009).Weused theBenjamini’s test tocontrol falsepositives.Thiscomparestheproportionofgenesintheanalyzedregions(i.e.,EBRs)totheproportionofthegenesoftherestofthegenome(i.e.,HSBs),andproducesanEASEscore.EASEscores≤0.05andcontainingaminimumoftwoGeneOntology(GO)termswereconsideredsignificantlyoverrepresented.
4.1.1.2.3Recombinationrates
Themousegeneticmapwasextracted from (Brunschwiget al. 2012).Thiscontainshigh-resolution recombination rate estimates across themousegenome(the autosomic chromosomes) based on 12 classically sequenced mouse strains(129S5/SvEvBrd,AKR/J,A/J,BALB/cJ,C3H/HeJ,C57BL/6NJ,CBA/J,DBA/2J,LP/J,NOD/ShiLtJ,NZO/HILtJ,andWSB/EiJ).Fromthismap,weestimatedrecombinationratesfornon-overlappingwindowsof10Kbpacrossthemousegenomeaspreviouslydescribed(Farréetal.2013).Foreach10Kbpwindow,therecombinationratewascalculated as the average of all recombination rates. These values were subsequently merged with the genomic positions from the four different genomic regions included inthegenedensityanalysisusingin-housePerlscripts.Centromericandtelomericregions were not included in the analysis.
4.1.1.2.4Constitutivelaminaassociateddomains(cLADs)
GenomicdataformouseLaminaAssociatedDomains(LADs)wasextractedfrom(Meulemanetal.2013)availableattheNCBIGeneExpressionOmnibus(GEO)(accession number GSE36132). LADs were obtained using DamID maps (Peric-HupkesandvanSteensel2010)of laminaAinmouseastrocytes(ACs)andneuralprecursor cells (NPCs) and Lamina B1 in wild type and Oct1 knockout mouseembryonic fibroblasts (MEFs and Oct1koMEFs respectively). Constitutive LADs(cLADs)resultedfromselectinglaminaregionsthatwereidentifiedinallcelltypesof cells analyzed. Once cLADs positions were obtained, their genomic distribution wasanalyzedinnon-overlappingwindowsof10Kbpasdescribedabove.Each10Kbp
RESULTS

101
window was subsequently classified into different genomic regions as was done in thegenecontentandrecombinationanalyses(EBRs,HSBs,interphasesand100Kbpadjacentregions)describedabove.
4.1.1.2.5Statisticalanalysis
The genome-wide distribution of EBRs was estimated using an averagefrequency across the mouse genome and by assuming a homogeneous distribution ofalldetectedEBRs.Weusedaχ2 testwithaBonferronicorrectiontoassessanypossible deviation from the homogeneous distribution. Mean comparison of gene density, recombination rates and cLADs with thegenomewidedivisionof10KbpwindowswasperformedwithKruskal-Wallisnon-parametrictestusingJMPstatisticalpackage(release7.1).Genome-wideassociationanalysisbetweenEBRs,genecontentandcLADswereobtainedusingRegioneR—anRpackagebasedonpermutationtests(PhipsonandSmyth2010;Diez-Villanuebaetal.2015)(http://gattaca.imppc.org/regioner/).RegioneRcomparesthenumberofobservedoverlapsbetweenaqueryandareferenceregion-settothedistributionofthenumberofoverlapsobtainedbyrandomizingtheregions-setoverthegenomeforeachchromosome.Weperformed10,000permutationswithrandomizationforeachanalysis.Thethresholdwasfixedinthe5%,thereforep-values<0.05indicatesignificantassociation.Genecontent,recombinationrateandcLADswereanalyzedusingSpearmancorrelationtestusingtheJMPstatisticalpackage(release7.1).
4.1.1.3Results
4.1.1.3.1GenomereshufflinginRodentia
Defining syntenic regions and EBRs in Rodentia. In order to determine the evolutionary genomic landscape in Rodentia, we compared the mouse genometo those of five rodent species: one representative of the Hystricomorpha clade(H.glaber)andfourspeciesbelongingtotheMyodontaclade(J. jaculus,S.galilii,M. ochrogaster and R. norvegicus). In addition, the inclusion of sixmammalianspeciesfromPrimates(H.sapiens,M.mulatta, and P. pygmaeus),Artiodactyla(B.taurus),Carnivora(F.catus)andPerissodactyla(E.caballus)allowedustorefinethecharacterizationofEBRsinaphylogeneticcontext.
RESULTS

102
Wefirstdeterminedthesyntenicregions(HSBsandSFs)inallspecies(TableS2), identifyingatotalof3,392HSBswithameansizerangingfrom13.22MbpinR.norvegicus,to5.56MbpinB.taurus(TableS2).Wedetectedatotalof3,142SFs,withameansizerangingfrom1.14MbpinS. galilii,to5.14MbpinH.glaber(TableS2).ThenumberofestimatedHSBsdiffereddependingonspeciesandrangedfrom280HSBs(representingthe95.60%ofthemousegenome)betweenmouseandrat,to521HSBs(representing91.11%of themousegenome)betweenmouseandcow(TableS2).Inthecaseofscaffold-basedgenomiccomparisons,thenumberofSFswas slightly higher in J.jaculus(559)andH.glaber(598)andespeciallypronouncedin S. galilii (1,985).Thesyntenicregionsdetectedrepresented>80%ofthemousegenome,reaching95.6%inthemouse/ratcomparison,and93.5%forthemouse/horsecomparison(TableS2).This isareflectionof thehighconservationof theirgenomes. Once the syntenic regions were determined for all species, we estimated the numberandgenomicdistributionofEBRsinthemousegenomeandclassifedthembasedontheirappearanceduringRodentiaevolution.Wedetectedatotalof1,333EBRs,themajorityofwhich(1,179)wereclassifiedasuniqueEBRs(i.e.,EBRsthatappearedonlyonceduringRodentiaevolution,inaspecielineageorclade)(Figure1andTableS3).Therest,representing154EBRs,wereclassifiedasreused(i.e.,EBRsthat are shared by a subset of species from the same clade).Of the unique EBRsdetected, 1,024were lineage-specific (i.e., specific for each of the specieswhencompared to themouse genome), and the remaining 130EBRswere classified asclade-specific (Primate,Hominoidea, Laurasiatheria, Euarchontoglires,Rodentia,Myodonta,Muroidea,Cricetidae+MuridaeandMuridae)(TableS3).Thenumberoflineage-specificEBRswasvariableandrangedfrom8EBRsinP. pygmaeusto360EBRsinS. galilii.Inthecaseoftheclade-specificEBRs,thenumberofevolutionaryregionsrangedfrom2EBRsinEuarchontogliresto33EBRsinCatharrini(TableS3).Likewise,EBRsmeansizedependedonthepair-wisespeciescomparison(TableS3).InordertocorroboratetheEBRestimations,weanalyzedthenumberofsyntenicblocks obtained at 100Kbp, 300Kbp and 500Kbp resolutions for all pair-wisecomparisons. With the exception of R.norvegicus, the number of syntenic blocks was proportional between the three levels of resolution (Figure S1 andTable S4)supportingthereliabilityofgenomeassembliesandEBRestimations. To provide an estimation of the genome reshuffling rate (expressed as thenumberofEBRsdetected in eachphylogeneticbranchperMyr) thatoccurred inRodentia,weplacedthetotalestimatedEBRsinaphylogeneticcontextconsideringthespeciesincludedinthestudy(Figure1).WedetectedthatthepresenceofEBRsin
RESULTS

103
Rodentiawashigher(1.21EBRs/Myr)thanintherestofmajormammalianclades(i.e.,0.79EBRs/MyrforLaurasiatheriaor0.11EBRs/MyrforEuarchontoglires)(Figure1).Thisobservationcorroboratesthelong-standingviewthatpointsrodentsasoneofthe mammalian orders with the highest genome reshuffling rates. There is, however, variabilityamongRodentiaclades—thehighestrateofthegenomereshufflingwasdetectedinthemouse-likegroup(Muridae,1.47EBRs/Myr)whilealowerratewasdetected in Muroidea (0.22 EBRs/Myr). In terms of the species-specific genomereshuffling rates, rodents in general showed higher rates that any other mammalian speciesincludedinthestudy(Figure1).Thatwasthecase,forexample,ofJ.jaculus(2.44EBRs/Myr),M.ochrogaster(5.66EBRs/Myr),R.norvegicus(6.41EBRs/Myr)and S. galilii (8.47 EBRs/Myr).However,weneed to be conservative in defininggenome reshuffling rates in R.norvegicussincethenumberofHSBsdetectedwasnotproportionalinthethreedifferentresolutionsofST(100Kbp,300Kbpand500Kbp,FigureS1). Genome-wide distribution of Rodentia EBRs. GiventhatourmaingoalwastodefinegenomereshufflinginRodentia,andmorespecifically,todeterminethepresence of genomic signatures that occurred during mouse evolution, we focused oureffortsonanalyzingthedistributionofbothRodentiaclade-specificEBRsandmouse-specific EBRs across themouse genome.Of the 655 EBRs detected in therodentspeciesanalyzed,105(covering0.31%ofthemousegenome)appearedinthelineageleadingtotheMus.Theseincluded75clade-specificEBRs:15EBRsdefinedRodentia,14Myodonta,3Muroidea,28Cricetidae+Muridae,15Muridaeand30EBRswere specific to Musmusculus(Figure1andTableS4).Assumingahomogeneousdistribution across the genome, we observed that EBRs were not randomlydistributedthroughoutthemousegenome(Figure2andFigureS2). In fact, threechromosomes(MMU8,MMU17andMMU18)appearedtocontainsignificantlymoreEBRs than expected under a random distribution (MMU17: χ2 = 13.57, p-value <0.001andMMU18:χ2=14.96,p-value<0.001;FigureS2).Additionally,threeotherchromosomes(MMU4,MMU16andMMUX)containedlessEBRsthanexpectedunderarandomdistribution(MMU4:χ2=4.54,p-value<0.05;MMU16:χ2=3.93,p-value<0.05;andMMUX:χ2 =4.81,p-value<0.05;FigureS2).Moreover,EBRsappearedtobelocalizedinclusters(i.e.,genomicregionswithahigherdensityofEBRsperMbp),forexampleinMMU8andMMU17(Figure2).
RESULTS

104
4.1.1.3.2RodentiaEBRsaregene-richregions
We further examined the genomic characteristics of EBRs that lead to themouse differentiation, searching for the presence of specific evolutionary signatures. Tothisend,wefirstanalyzedthegenome-widedistributionofgenes,payingspecialattentiontoGO.Atotalof36,381geneswereidentifiedandincludedintheanalysis.Theseweredividedintotwogroups:(i)allgenes(n=36,381)and(ii)proteincodinggenes(n=22,352).Themeandistributionofgenes(includingprotein-codinggenes,non-coding RNA genes and pseudogenes) found in themouse genomewas 0.09genes per 10Kbp, although these were non-homogeneously distributed acrosschromosomes (Kruskal-Wallis test, p-value<0.001). Mouse chromosomes 7, and11aregene-rich(0.14genesper10Kbpinbothcases)whereaschromosomes12,18andX(0.06genesper10Kbpinallcases)arelowongenes.WethenanalyzedgenedensityforallRodentiaEBRsdetected(includingclade-specificandthosethatare
RESULTS
Figure 2. EBRs mapped in the mouse genome: ThepositionsofeachEBRs(lineageandclade-specific)arecolor-coded(seeinsetlegend).Numberofprotein-codinggenesdetectedwithineachEBRsaredepictedontherightofeachmouseEBR.

105
Protein-‐coding genes EBR type p-‐value z-‐score
Mouse specific 0.029* 2.53 Muridae specific 0.009** 1.43 Cricetidae+Muridae specific 0.049* 2.95 Muroidea specific 0.004** 3.81 Myodonta specific 0.009** 2.93 Rodentia specific 0.003** 3.21 All EBRs 0.001** 6.25
Table 1. Gene clusters found enriched within EBRs: ForeachEBRwehavespecifiedthemousechromosome(chr),thestartandendposition(inbp),thecorrespondinggeneenrichmentclusterorgenefamilyname,theIDandGOtermsandthedistanceofthegenestartfromtheup-streamregionoftheEBR(inKbp).
Since chromosomal rearrangements can potentially affect the structure and regulation of genes in or nearby the affected regions, we focused on the adaptive roleofEBRsbyanalyzinggeneontologyofthe107proteincodinggenesdetectedwithinRodentiaEBRsinthemousegenome.Wefoundtwogenefamilieslocalizedwithin specific EBRs. Moreover, there was one enrichment cluster in EBRs thatpresented the highest statistical support when compared to the rest of the genome (n=3;EASE≤0.05)(TableS7).ThefirstgenefamilyincludedtheCalycinsuperfamilyandmore specifically theLipocalins (Lcn) thatwere localizedwithin twonearbyEBRs (oneRodentia-specificandonemouse-specificEBR) inmousechromosome
RESULTS
mouselineage-specific).OurresultsshowedthatEBRsaregene-richregionswithanaveragedensityof0.18genesper10Kbpcomparedtotherestofthegenome(0.09genes per 10Kbp, Kruskal-Wallis test, p<0.001). This enrichmentwas confirmedusing a genome-wide permutation test (based on 10,000 permutations withrandomization,p<0.05)(Table1;Figure3B).WhenanalyzingthegenedensityatthevicinityofEBRs(Figure3A),weobservedthattheseflankingregionshaveahighconcentrationofgeneswhencomparedtotherestofthegenome(HSBs)(Kruskal-Wallistest,p-value<0.001,Figure3A),especiallysoinregionsthatareup-streamEBRs. Additionally, we studied the presence of protein coding genes (n=22,352)overlapping either the start or the end coordinates of the analyzed EBRs (bothclade-andmouse-specific).ThisallowedustodetectwhethergenesequencesweredisruptedbythepresenceoftheestimatedEBRscoordinates.Intotal,wedetected63protein-codinggenesthatweredisrupted(35genesatthestartand28attheendofEBRs)representingalltypesofclade-specificandinmouse-specificEBRs(TableS6).Ofthese,55genesweredisruptedinintronicregions(87.5%).Inonly8instancesEBRcoordinatesfoundtobepositionedinsideanexon(TableS6).

106
2.Inparticular,wedetectedLcngenesthatwereinvolvedinthetransportationoflipophilicmolecules(Lcn4,withtheexpressionlimitedtothevomeronasalorgan),male fertility (Lcn13), spermmaturation and retinoid carrier proteinswithin theepididymis (Lcn5)andodorantbindingproteins (Lcn14).The secondgene familyfoundwaslocalizedinmousechromosome11andincludedfivegenesbelongingtothehaemoglobin(Hb)family(involvedinbindingand/ortransportingoxygen).AllfourgeneswereHbsubunitsandlocalizedinamouse-specificEBRwhichincludedHbX,Hbalfa(Hb-alfa,chains1and2),andhaemoglobinthetaAandB(Hb-Theta,1Band1A).
Lastly, and most intriguing, the only statistically significant enrichment cluster foundinouranalysis(Benjaminitest,p-value=0.02;TableS7)includedfivegenesclusteredas aKrueppel-associatedbox (KRAB) thatwere localized in threeEBRs(classifiedasmouse-andMuridae-specific)anddistributedinthreedifferentmousechromosomes.KRABproteinsaretranscriptionfactorswithZnFbindingdomains(KnightandShimeld2001)thataremainlyexpressedduringmeioticprocess(Baudatetal.2010;Parvanovetal.2010)andinclude,amongothers,Prdm9, the only known speciation-associated gene described for mammals, initially described in mice(Miholaetal.2009;Capillaetal.2014).Moreover,ouranalysisrevealedgenesfromtheLcnfamilyintheoldestRodentiaEBRs(Rodentia-specific),whereas,boththehaemoglobin family and the transcription regulation gene enrichment cluster were localized in theEBRs leading to themouse lineage (transcription regulationgenecluster;n=8genes,enrichmentscore=2.39;Benjaminitest,p-value=0.18).
RESULTS

107
Figure 3. Gene content and recombination rates around EBRs: (A)Schematicrepresentationofthegenomicregionsconsideredfortheanalysis (seematerialandmethodsfordetails). (B)Distributionofproteincodinggenes.TheX-axisrepresentsthegenomic regionsanalyzed,whereas theY-axisdisplay themeannumberofgenesdetectedper 10Kbp. (C)Distributionofrecombinationrates.TheX-axisrepresentsthegenomicregionsanalyzed,whereastheY-axisdisplaythemeanrecombinationratedetectedper10Kbp.(D)DistributionofconstitutiveLaminaAssociatedDomains(cLADs).TheX-axisrepresentsdegenomicregionsanalyzed,whereasthey-axisdisplaythemeannumberofcLADsidentifiedpereach10Kbpwindows.Standarderrorbarsare represented.Punctuated lines representgenome-widemeans.Asterisk indicates statistical significance (Kruskal-Wallistest,**p-value<0.001).

108
4.1.1.3.3 Rodentia EBRs correspond to regions of low
recombinationrates
It isknownthatgenomereshufflingaffectsrecombination(Rieseberg2001;NavarroandBarton2003;NoorandBennett2009),butdataontheinterplaybetweenEBRsandrecombinationisrestrictedtofewstudies(Navarroetal.1997;Farréetal.2013).Toaddressthis,weanalyzedthegenome-widedistributionofrecombinationratesinthemousegenomeandtestedwhethertherewasacorrelationwithEBRs.We found that recombination rates were not homogeneously distributed across themousegenome.Chromosomes 17and 19had thehighest recombination rates(0.015 4Ner/Kbp in both cases)while the chromosome 8 showed the lowest rate(0.003 4Ner/Kbp). The mean genome-wide recombination rate was 0.019 4Ner/Kbp. These observations corroborate previous data in mammals that showed smaller chromosomes to have higher recombination rates than large chromosomes, thereby ensuring their correct segregationduringmeiosis (Sun et al. 2005; Farréet al. 2013). Moreover, our analysis indicated that Rodentia EBRs presented asignificantlylowermeanrecombinationrate(0.0164Ner/Kbp)comparedtotherestof thegenome(0.0194Ner/Kbp,Kruskal-Wallis test,p<0.001).To furtherexploretheseobservationsweestimated themeanrecombination rates forclade-specificandmouse-specificEBRsandfoundasignificantlylowerrecombinationrateinthemouse-specificandMuridae-specificEBRs(0.013and0.0064Ner/Kbprespectively,Kruskal-Wallistest,p<0.001).MoreoverwealsoanalyzedmeanrecombinationratesaroundtheEBRs(Figure3C).TheanalysissuggestedatendencyforthepresenceoflowrecombinationratesinEBRsflankingregions(0.014and0.0124Ner/Kbp)andthenanincrementinthefollowing100KbpsurroundingEBRs(0.021and0.0194Ner/Kbp)thattendtoreachthevaluesobservedforHSBs(Figure3C).
4.1.1.3.4RodentiaEBRsaredepletedinLADs
We further investigated whether the distribution of EBRs in the mousegenome was influenced by the spatial organization of the chromatin. We analyzed thedistributionofcLADsandfoundthatthetotal715,804cLADsdescribedinthemouse, were not homogenously distributed across the genome, but were inversely correlated with gene distribution (Figure S3A) thus mirroring similar studieson human cells (Guelen et al. 2008). The X chromosome had the highest cLADsdensity(3.75cLADs/10Kbp),whereaschromosomes11and19hadthelowest(1.80
RESULTS

109
and1.72cLADs/10Kbp,respectively)(Kurskal-Wallis test,p<0.001).Genedensitywas inversely correlated to cLADs density per chromosome, the only exceptions beingchromosomes4,15and16(FigureS3B).Whenlookingatthegenome-widedistributionofcLADsineachchromosome,thesamepatternwasobserved(FigureS3B).WesubsequentlyanalyzedtherelationshipbetweenEBRs(bothRodentiaandmouselineagespecificEBRs)andcLADs.OurresultsindicatedasignificantdecreaseincLADsdensityinallEBRs(2cLADs/10Kbp)aswellasininterphaseregions(1.62and1.90cLADs/10Kbp)whencomparedtotherestofthegenome(2.68cLADs/10Kbp;Kruskal-Wallis test, p<0.001; Figure 3D). This pattern was corroborated bypermutation test (based on 10,000 permutations with randomization, z-score=-2.46;p<0.05). Finally,therelationshipsbetweenthethreegenomiccharacteristicsstudiedinthiswork(genecontent,recombinationrateandcLADs)wereexaminedusingpair-wise correlations between all three variables. This indicated a significantnegative correlation between the number of cLADs and the number of coding genes (Spearmancorrelationtest,p=-0.093;p-value<0.001)andlessbutalsosignificantbetweencLADsandtherecombinationrates(Spearmancorrelationtest,p=-0.015;p-value<0.001).
4.1.1.4Discussion
The genome comparative analysis of six rodent species representative of two ofthethreemajorcladesthatincludeallrodents(HystricomorphaandMyodontaclades)togetherwithelevenmammalianrepresentativespecieshasallowedustoreconstruct the most detailed comprehensive picture of the evolutionary rodent genomereshuffling.Wehavebeenabletoidentifylineageandclade-specificEBRsamong the Rodentia species analyzed and to compare their rate of chromosomebreakage(numberofEBRs/Myr)asanestimateofgenomereshuffling,withrespectto other mammalian outgroups such as Primates, Perissodactyla, Artyodactila andCarnivora.OurresultsareinagreementwithpreviousstudiesthatreflectedahighgenomereshufflingratewithinRodentiadifferentiation(either in thecladesandspeciesdifferentiation)(Murphyetal.2005;Larkinetal.2009).Infact,whenconsidering the main mammalian diversification nodes, Rodentia presentedapproximately two orders of magnitude increase in EBRs per Myr, than eitherEuarchontoglires or Laurasiathera. But, more intriguingly, this rate increasedwhen analyzing lineage-specific EBRs. Previous cytogenetic studies indicated
RESULTS

110
that themyomorph rodents showedmorehighly reorganizedpatterns (reviewedinRomanenkoet al. 2012),whereas thecomparativegenomeanalysisperformedhere,showedtheMuroideaspecies(S.galilii,M.ochrogaster,R.norvegicus and M.musculus)withthehighestratesofgenomereshuffling(a2-to5-foldincreasewhencomparedtoothereutherianmammals). In searching for signatures that characterize evolutionary genome reshuffling we detected a significantly higher gene density in EBRs when compared to therest of the mouse genome. Although others before us have detected this trend in othermammalianspecies (Murphyetal.2005;Lemaitreetal.2009;Larkinetal.2009;Groenenetal.2012),thereasonsbehindthispatternhaveremainedunclear.Our results offer a material advance in that they suggest that both the state of the chromatinand theadaptive roleofEBRsaremostprobablyaffecting itsgenomicdistribution in the mouse genome and it seems likely that this will hold for other mammalian orders. First,wedetectedthatrodentEBRsweredepletedincLADsandthatthesestructuralgenomicregionsnegativelycorrelatedwithgenecontent.Nuclearlamina(NL)anchorchromosomaldomains inmammalianchromatinby interactingwithcLADs.Previously iswas thought thatcLADs interactwiththeNL independentlyof cell type and are conserved inhumanandmouse (Meulemanet al. 2013). Thepattern that we observed is most probably related with the fact that the chromatin statusincLADsismostlytranscriptionallyinactiveandsilenced(Reddyetal.2008;Peric-Hupkesetal.2010;KindandvanSteensel2010;Kohwietal.2013).Therefore,genomic regions outside cLADs are expected to be more exposed to the transcription machinery. As a consequence of this spatial chromatin organization and according tothenewintegrativebreakagemodelforgenomeevolution(Farréetal.2015)gene-richregionswouldbemoresusceptibletotheoccurrenceoflarge-scalechromosomalreorganizations, due to their accessibility. Our observation of a depletion of cLADs in rodent EBRs, in conjunction with a high-density of protein-coding genes,supports this view. That is, “open” chromatin configurations in regions with high transcriptionalactivityaregene-richandmaydrivegenomereshuffling. Additionally, and despite the possibility that genome reshuffling would disrupt genes essential for survival, and therefore be subject to purifying selection, EBRscanrepresentopportunitiesforthedevelopmentofnovelfunctionsthatmaypromote the adaptation of species. This is consistent with the idea that there is a connectionbetweenmammalianEBRsandthedevelopmentofnewadaptivegenefunctions,suchasintheimmunesystemorolfactoryreceptors(Larkinetal.2009;Groenenetal.2012;Ullastresetal.2014).Inthiscontext,rodentsareaparticularly
RESULTS

111
useful model since they are the largest mammalian order, whose species show an enormous array of evolutionary adaptations. We detected the presence of two gene families in our rodent data (Lcn andHb) and one functional enrichment cluster(KRABgenes)withinclade-and lineage-specificEBRs intheRodentiaphylogenythat might support the adaptive hypothesis of genome reshuffling. Lipocalins are globular secreted proteins involved in many biological processes, especially in rodents(Stopkováetal.2009).ThelipocalinsfoundwithinrodentEBRsbelongtotwomainfunctionalgroups:(i)odor-bindingproteins(OBPs)involvedinchemicalcommunication (Snyder et al. 1989), and (ii) epididymal retinoic acid bindingproteins(ERABP),whicharespecificallyexpressedintheepididymisand,therefore,relevantforassuringfertilitythroughspermmaturationacquire(Suzukietal.2007).Given thatchemicalcommunication inrodents isextremely important for sexualreproductiondrivingmatechoicebetween individuals (Hurst andBeynon2004),the original function of lipocalins may have been favored by natural selection during theevolutionofthechemicalcommunicationinmice(Stopkováetal.2009).Infact,although lipocalins are poorly conserved at the sequence level, their folding pattern andstructureisverywellconservedacrossspecies(Flower1996;BeynonandHurst2004).Inadditiontothisobservation,theimpairmentofantioxidativemechanismsin rodents have been also described to be adaptive under uncertain conditions, such as altitudeor extreme thermal conditions, amongothers (Storz et al. 2007; Storzetal.2009).Inthiscontext,developingnewvariantsofhaemoglobincanprovideselective advantage, exemplified by the high levels of haemoglobin polymorphisms thathavebeendescribedinrodentspecies(Natarajanetal.2013;Kotlíketal.2014).But perhaps themost relevant resultwas the presence of an enrichment clusterin rodent EBRs that included KRAB-ZnF genes, a group of transcription factorswithZnFdomains.MostoftheKRAB-ZnFproteins,withtheexceptionofPrdm9, are not functionally fully characterized, but are known to be organized in clusters (Huntleyetal.2006;Dingetal.2009)andarethoughttoplayaroleinspeciationgiventheirroleinreproductiveisolation(Nowicketal.2013;Turneretal.2014).Infact,studiesinmicehaveshownthatthePRDM9protein,ameiotic-specifichistonemethyltransferase,determinesthepositionwhererecombinationoccurs(Bricketal.2012)aswellasdeterminingrecombinationratesinmicenaturalpopulations(Capillaetal.2014).KRAB-ZnFgenesare,indeed,fastevolving(forareviewseeNowicketal.2013)and, inthecaseofPrdm9, a large diversity in the number and sequence ofZnFhavebeenreported(Oliveretal.2009;SteinerandRyder2013;Buardetal.2014;Konoetal.2014;Capillaetal.2014).Strikingly,wefoundPrdm9 together with poorlycharacterizedKRABgenes, suchasZfp169,Zfp182andZfp300 indifferent
RESULTS

112
RodentiaEBRs.Itmaybepossiblethattherapidevolutioncharacterizingthisgenefamily might be related to the instability created by genome reshuffling within these regions and occurs by altering both sequence composition and expression patterns ofthegeneslocatedwithinEBRs. As a consequence, can evolutionary breakpoint regions be considered “genomic islandsof speciation” (as referredbyTurner et al. 2005)?While initialstudies have found that EBRs tend to show higher divergence rates than otherregions in the genome (Navarro et al. 1997; Marques-Bonet and Navarro 2005),others have detected lower recombination rates (Farré et al. 2013). Mirroringthese results, we detected a significant reduction on recombination rates within EBRswhen compared to the rest of themouse genome. This reductionwas onlymaintainedinEBRscorrespondingtothemouselineageandtheMuridaeclade,inconsonance with the short effect of chromosomal rearrangements on recombination ratesalongthespeciesevolution(CoopandMyers2007).But,onemayaskwhetherthepresenceofspeciationgeneswithinEBRs(hereexemplifiedbyPrdm9)withlowrecombination rates, give rise to linkage disequilibrium that facilitate selection. Genesinvolvedinreproductiveisolationareexpectedtobefoundinregionsoflowrecombination(Rieseberg2001;Noor2002;NavarroandBarton2003).Infact,geneincompatibilities, reduced introgression and higher differentiation are associated withgenomicregionswithreducedrecombination(Geraldesetal.2011;Seehausenet al. 2014; Janoušek et al. 2015). Therefore,we propose that low recombinationratesinEBRscouldleadtoahighgenomicdifferentiationandthefixationofnewmutationsingenesrelatedtothespecies-specificphenotypes(suchasgenesinvolvedinmatingandindividualrecognition,reproductiveisolationandoxidativestress),thereby reinforcing the adaptive value of genome reshuffling. In conclusion, our results support the new multidisciplinary Integrative BreakageModelforthestudyofgenomeevolution(Farréetal.2015).Thatis,tofullyunderstandthemechanism(s)shapingmammaliangenomesanddrivingspeciation,it is necessary to take not only the functional constrains that would accompany genomereshuffling,butalsotheanalysisofthehigh-levelstructuralorganizationofgenomes into consideration.
4.1.1.5Acknowledgments
LCisthebeneficiaryofaFPIpredoctoralfellowship(BES-2011-047722).RASGhasapostdoctoralgrantfrom“Alianza4Universidades”.Thisstudywassupported
RESULTS

113
Ayala FJ, Coluzzi M (2005) Chromosome speciation:humans, Drosophila,andmosquitoes.ProcNatlAcadSci102Suppl:6535–42.
Bailey JA, Eichler EE (2006) Primate segmentalduplications: crucibles of evolution, diversity and disease.NatRevGenet7:552–64.
Baudat F, Buard J, Grey C, et al (2010) PRDM9 is amajor determinant of meiotic recombination hotspots inhumansandmice.Science327:836–40.
Beynon RJ, Hurst JL (2004) Urinary proteins andthe modulation of chemical scents in mice and rats. Peptides25:1553–63.
Blanga-KanfiS,MirandaH,PennO,etal(2009)Rodentphylogeny revised: analysis of six nuclear genes from allmajorrodentclades.BMCEvolBiol9:71.
BourqueG,PevznerPA,TeslerG(2004)Reconstructingthe genomic architecture of ancestral mammals: lessons from human, mouse, and rat genomes. GenomeRes14:507–16.
Brick K, Smagulova F, Khil P, et al (2012) Geneticrecombination is directed away from functional genomicelementsinmice.Nature485:642–5.
BrunschwigH,LeviL,Ben-DavidE,etal(2012)Fine-scale maps of recombination rates and hotspots in the mousegenome.Genetics191:757–64.
BuardJ,RivalsE,DunoyerdeSegonzacD,etal(2014)Diversity of Prdm9 zinc finger array in wild mice unravels new facets of the evolutionary turnover of thiscodingminisatellite.PLoSOne9:e85021.
CapillaL,MedardeN,Alemany-SchmidtA,etal(2014)GeneticrecombinationvariationinwildRobertsonianmice: on the role of chromosomal fusions and Prdm9 allelicbackground.ProcBiolSci.281:20140297.Carbone L, Harris RA, Vessere GM, et al (2009)Evolutionary breakpoints in the gibbon suggestassociation between cytosine methylation and karyotypeevolution.PLoSGenet5:e1000538.
CarletonMD,Musser GG (2005)Order Rodentia. In:Mammal Species of the World. The Johns HopkinsUniversityPress,pp745–752.
Churakov G, Sadasivuni MK, Rosenbloom KR, et al(2010) Rodent evolution: back to the root. Mol BiolEvol27:1315–26.
Coop G, Myers SR (2007) Live hot, die young:transmission distortion in recombination hotspots. PLoSGenet3:e35.
Diez-Villanueva, A Malinverni R, Gel B (2015)regioneR: Association analysis of genomic regionsbasedonpermutationtests.Rpackageversion1.0.3.
Ding G, Lorenz P, KreutzerM, et al (2009) SysZNF:theC2H2zincfingergenedatabase.NucleicAcidsRes37:D267–73.
4.1.1.6BIBLIOGRAPHY
byaresearchgrantfromtheMinisteriodeEconomiayCompetitividad(MINECO,CGL-2010-20170)toARH.GenomesequencingandassemblyoftheJ.jaculus, and M.ochrogastergenomesbytheBroadInstituteofMITandHarvardweresupportedbygrantsfromtheNationalHumanGenomeResearchInstitute(NHGRI).T.J.Robinsonis acknowledged for comments on the draft of this manuscript.
RESULTS

114
Donthu R, Lewin H a, Larkin DM (2009)SyntenyTracker: a tool for defining homologous synteny blocks using radiation hybrid maps and whole-genomesequence.BMCResNotes2:148.
Dos Reis M, Inoue J, Hasegawa M, et al (2012)Phylogenomic datasets provide both precision and accuracy in estimating the timescale of placental mammalphylogeny.ProcBiolSci279:3491–500.
Dumont BL, Payseur B a (2011) Genetic analysis ofgenome-scale recombination rateevolution inhousemice.PLoSGenet7:e1002116.
Faria R, Navarro A (2010) Chromosomal speciationrevisited: rearranging theory with pieces of evidence. TrendsEcolEvol25:660–9.Farré M, Bosch M, López-Giráldez F, et al (2011)Assessing the role of tandem repeats in shaping the genomicarchitectureofgreatapes.PLoSOne6:e27239.
Farré M, Micheletti D, Ruiz-Herrera A (2013)Recombinationratesandgenomicshufflinginhumanand chimpanzee-a new twist in the chromosomalspeciationtheory.MolBiolEvol30:853–64.
Farré M, Robinson TJ, Ruiz-Herrera A (2015) AnIntegrative Breakage Model of genome architecture,reshuffling and evolution: The Integrative BreakageModelofgenomeevolution,anovelmultidisciplinaryhypothesis for the study of genome plasticity. Bioessays37:479–88.
FinlanLE,SproulD,ThomsonI,etal(2008)Recruitmentto the nuclear periphery can alter expression of genes inhumancells.PLoSGenet4:e1000039.
Flower DR (1996) The lipocalin protein family:structureandfunction.BiochemJ318:1–14.
FroenickeL,CaldésMG,GraphodatskyA,etal(2006)Are molecular cytogenetics and bioinformatics suggesting diverging models of ancestral mammalian genomes?GenomeRes16:306–10.
Gallardo M, Garrido O, Bahamonde R, et al (1994)
Gametogenesis and nucleotypic effects in thetetraploid red vizcacha rat, Tympanoctomys barrerae (Rodentia,Octodontidae)BiologicalRes37:767-75.
Garcia-Cruz R, Pacheco S, Brieño MA, et al (2011)A comparative study of the recombination pattern in three species of Platyrrhini monkeys (primates).Chromosoma120:521–30.
GeraldesA,BassetP,SmithKL,NachmanMW(2011)Higherdifferentiationamongsubspeciesofthehousemouse (Musmusculus) in genomic regionswith lowrecombination.MolEcol20:4722–36.
GrabherrMG,RussellP,MeyerM,etal(2010)Genome-wide synteny through highly sensitive sequence alignment:Satsuma.Bioinformatics26:1145–51.
Graphodatsky AS, Yang F, Dobigny G, et al (2008)Tracking genome organization in rodents by Zoo-FISH.ChromosomeRes16:261–74.
GroenenMAM,ArchibaldAL,UenishiH,etal (2012)Analyses of pig genomes provide insight into porcine demographyandevolution.Nature491:393–8.
Guelen L, Pagie L, Brasset E, et al (2008) Domainorganization of human chromosomes revealed by mapping of nuclear lamina interactions. Nature453:948–51.
Huang DW, Sherman BT, Lempicki R a (2009)Systematic and integrative analysis of large gene lists using DAVID bioinformatics resources. Nat Protoc4:44–57.
HuchonD,MadsenO,SibbaldMJJB,etal(2002)RodentPhylogenyandaTimescalefortheEvolutionofGlires:Evidence from an Extensive Taxon Sampling UsingThreeNuclearGenes.MolBiolEvol19:1053–1065.
Huntley S, BaggottDM,HamiltonAT, et al (2006)Acomprehensive catalog of human KRAB-associatedzinc finger genes: insights into the evolutionary history of a large family of transcriptional repressors. GenomeRes16:669–77.
RESULTS

115
Hurst JL, Beynon RJ (2004) Scent wars: thechemobiology of competitive signalling in mice. Bioessays26:1288–98.
Janoušek V, Munclinger P, Wang L, et al (2015)Functionalorganizationofthegenomemayshapethespecies boundary in the housemouse.Mol Biol Evol32:1208–20.
Kehrer-Sawatzki H, Sandig C, Chuzhanova N, etal (2005) Breakpoint analysis of the pericentricinversiondistinguishinghumanchromosome4 fromthehomologouschromosomeinthechimpanzee(Pan troglodytes).HumMutat25:45–55.
Kehrer-Sawatzky HK, Cooper DN (2007)Understanding the Recent Evolution of the HumanGenome: Insights from Human – ChimpanzeeGenomeComparisons.HumanMutation28(2):99-130KindJ,vanSteenselB(2010)Genome-nuclearlaminainteractionsandgeneregulation.CurrOpinCellBiol22:320–5.
Knight RD, Shimeld SM (2001) Identification ofconserved C2H2 zinc-finger gene families in theBilateria.GenomeBiol2:RESEARCH0016.
Kohwi M, Lupton JR, Lai S-L, et al (2013)Developmentally regulated subnuclear genome reorganization restricts neural progenitor competence in Drosophila.Cell152:97–108.
Kono H, Tamura M, Osada N, et al (2014) Prdm9 polymorphism unveils mouse evolutionary tracks. DNARes21:315–26.
Kotlík P,Marková S,Vojtek L, et al (2014)Adaptivephylogeography: functional divergence between haemoglobins derived from different glacial refugia in thebankvole.ProcBiolSci.281:1786
LarkinDM,PapeG,DonthuR,etal(2009)Breakpointregions and homologous synteny blocks in chromosomes have different evolutionary histories. GenomeRes19:770–7.
LemaitreC,ZaghloulL,SagotM-F,etal(2009)Analysis
of fine-scale mammalian evolutionary breakpointsprovides new insight into their relation to genome organisation.BMCGenomics10:335.
LongoMS,CaroneDM,GreenED,etal(2009)Distinctretroelement classes define evolutionary breakpoints demarcating sites of evolutionary novelty. BMCGenomics10:334.
Ma J, Zhang L, Suh BB, et al (2006) Reconstructingcontiguous regions of an ancestral genome. GenomeRes16:1557–65.
Marques-Bonet T, Navarro A (2005) Chromosomalrearrangements are associated with higher rates of molecularevolutioninmammals.Gene353:147–54.
Meredith RW, Janečka JE, Gatesy J, et al (2011)Impactsof theCretaceousTerrestrialRevolutionandKPg extinction on mammal diversification. Science 334:521–4.
Meuleman W, Peric-hupkes D, Kind J, et al (2013)Constitutive nuclear lamina – genome interactionsare highly conserved and associated with A/T-richsequence.23:270–280.
Mihola O, Trachtulec Z, Vlcek C, et al (2009) Amouse speciationgeneencodesameiotichistoneH3methyltransferase.Science323:373–5.
Mlynarski EE, Obergfell CJ, O’Neill MJ, O’Neill RJ(2010) Divergent patterns of breakpoint reuse inMuroidrodents.MammGenome21:77–87.
Montgelard C, Forty E, Arnal V, Matthee CA (2008)Suprafamilial relationships among Rodentia andthe phylogenetic effect of removing fast-evolvingnucleotides in mitochondrial, exon and intron fragments.BMCEvolBiol8:321.
MurphyWJ, Stanyon R,O’Brien SJ (2001) Evolutionof mammalian genome organization inferred from comparative gene mapping. Genome Biol2:REVIEWS0005.
Murphy WJ, Larkin DM, Everts-van der Wind A,
RESULTS

116
et al (2005) Dynamics of mammalian chromosomeevolution inferred from multispecies comparative maps.Science309:613–7.
Natarajan C, Inoguchi N, Weber RE, et al (2013)Epistasis among adaptive mutations in deer mousehemoglobin.Science340:1324–7.
Navarro A, Betrán E, Barbadilla A, Ruiz A (1997)Recombination and gene flux caused by geneconversion and crossing over in inversion heterokaryotypes.Genetics146:695–709.
NavarroA,BartonNH(2003)Chromosomalspeciationand molecular divergence-accelerated evolution inrearrangedchromosomes.Science300:321–4.
Noor M a, Grams KL, Bertucci L a, Reiland J (2001)Chromosomal inversions and the reproductiveisolationofspecies.ProcNatlAcadSci98:12084–8.NoorMaF,BennettSM(2009)Islandsofspeciationormiragesinthedesert?Examiningtheroleofrestrictedrecombination in maintaining species. Heredity103:439–44.
Nowick K, Carneiro M, Faria R (2013) A prominentroleofKRAB-ZNFtranscriptionfactorsinmammalianspeciation?TrendsGenet29:130–9.
Oliver PL, Goodstadt L, Bayes JJ, et al (2009)Accelerated evolution of the Prdm9 speciation gene acrossdiversemetazoantaxa.PLoSGenet5:e1000753.
Parvanov ED, Petkov PM, Paigen K (2010) Prdm9 controls activation of mammalian recombination hotspots.Science327:835.
Peric-Hupkes D,MeulemanW, Pagie L, et al (2010)Molecular maps of the reorganization of genome-nuclear lamina interactions during differentiation. MolCell38:603–13.
Peric-Hupkes D, van Steensel B (2010) Role of thenuclear lamina in genome organization and gene expression.ColdSpringHarbSympQuantBiol75:517–24.
PevznerP,TeslerG(2003)Humanandmousegenomicsequences reveal extensive breakpoint reuse in mammalianevolution.ProcNatlAcadSci100:7672–7.
Phipson B, Smyth GK (2010) Permutation P-valuesshouldneverbezero:calculatingexactP-valueswhenpermutations are randomly drawn. Stat Appl GenetMolBiol9:Article39.
Reddy KL, Zullo JM, Bertolino E, Singh H (2008)Transcriptional repression mediated by repositioning ofgenestothenuclearlamina.Nature452:243–7.
Rieseberg LH (2001) Chromosomal rearrangementsandspeciation.TrendsEcolEvol16:351–358.
Romanenko SA, Perelman PL, Trifonov VA,Graphodatsky AS (2012) Chromosomal evolution inRodentia.Heredity108:4–16.
Ruiz-Herrera A, Garcia F, Frönicke L, et al (2004)Conservation of aphidicolin-induced fragile sitesin Papionini (Primates) species and humans.ChromosomeRes12:683–90.
Ruiz-Herrera A, Castresana J, Robinson TJ (2006) Ismammalian chromosomal evolution driven by regions ofgenomefragility?GenomeBiol7:R115.
ScallyA,Dutheil JY,HillierLW, et al (2012) Insightsinto hominid evolution from the gorilla genome sequence.Nature483:169–75.
SeehausenO,ButlinRK,KellerI,etal(2014)Genomicsandtheoriginofspecies.NatRevGenet15:176–92.
Segura J, Ferretti L, Ramos-onsins S, et al (2013)Evolution of recombination in eutherian mammals:insights into mechanisms that affect recombination rates and crossover interference. Proc R Soc B280:20131945.
Silva M, Yonenaga-Yassuda Y (1998) Karyotypeand chromosomal polymorphism of an undescribed AkodonfromCentralBrazil,aspecieswiththelowestknown diploid chromosome number in rodents.
RESULTS

117
CytogenetCellGenet81:46-50.
Snyder SH, Sklar PB, Hwang PM, Pevsner J (1989)Molecularmechanisms of olfaction. TrendsNeurosci12:35–8.
StanyonR,YangF,CavagnaP,etal(1999)Reciprocalchromosome painting shows that genomic rearrangement between rat and mouse proceeds ten timesfasterthanbetweenhumansandcats.CytogenetCellGenet84:150–5.
SteinerCC,RyderOA(2013)CharacterizationofPrdm9 inequidsandsterilityinmules.PLoSOne8:e61746.
StopkováR,HladovcováD,KokavecJ,VyoralD(2009)Multiple roles of secretory lipocalins (Mup, Obp) inmice.58:29–40.
Storz JF, SabatinoSJ,HoffmannFG, et al (2007)Themolecular basis of high-altitude adaptation in deermice.PLoSGenet3:e45.Storz JF, Runck AM, Sabatino SJ, et al (2009)Evolutionary and functional insights into themechanism underlying high-altitude adaptationof deer mouse hemoglobin. Proc Natl Acad Sci106:14450–5.
Sun F, Oliver-Bonet M, Liehr T, et al (2005)Discontinuities and unsynapsed regions in meiotic chromosomes have a cis effect on meiotic recombinationpatternsinnormalhumanmales.HumMolGenet14:3013–8.
SuzukiK,YuX,ChaurandP,etal(2007)Epididymis-specificlipocalinpromoters.AsianJAndrol9:515–21.
Turner LM, White MA, Tautz D, Payseur BA (2014)Genomic networks of hybrid sterility. PLoS Genet10:e1004162.
Turner TL,HahnMW,Nuzhdin SV (2005)Genomicislands of speciation in Anopheles gambiae.PLoSBiol3:e285.
UllastresA,FarréM,CapillaL,Ruiz-HerreraA(2014)Unraveling the effect of genomic structural changes
intherhesusmacaque-implicationsfortheadaptiveroleofinversions.BMCGenomics15:530.
Veyrunes F, Dobigny G, Yang F, et al (2006)PhylogenomicsofthegenusMus(Rodentia;Muridae):extensive genome repatterning is not restricted to the housemouse.ProcBiolSci273:2925–34.
WhiteMJD(1978)ModesofSpeciation.W.H.Freeman&Co.
Wu CI, Li WH (1985) Evidence for higher rates ofnucleotide substitution in rodents than in man. Proc NatlAcadSci82:1741–1745.
Zhao H, Bourque G (2009) Recovering genomerearrangements in the mammalian phylogeny. GenomeRes19:934–42.
ZhaoS,ShettyJ,HouL,etal (2004)Human,mouse,andratgenomelarge-scalerearrangements:stabilityversusspeciation.GenomeRes14:1851–60.
Reeves A (2001) Micromeasure: a new computerprogram for the collection and analysis of cytogenetic data.Genome44:439–443.
RESULTS

118
Table S1. Species included in the analysis:Dataregardingtaxonomyclassification,genomeversion,N50anddiploidnumber(2n)areincluded.ThemajorityofthespeciespresentedtheirgenomesassembledinchromosomeswiththeexceptionofH.glaber,J.jaculus and S. galilii, whose genomes were only available into scaffolds. In the case of M.ochrogasterwe considered alldataavailable (assembledchromosomesand linkagegroups).Allgenomes,except forS. galilii, were downloaded from GenbankFTPsite(ftp://ftp.ncbi.nlm.nih.gov).
Order Family Species Genome Version N50 2n Artiodactyla Bovidae Bos taurus Bos_taurus_UMD_3.1 Chromosomes 60 Perissodactyla Equidae Equus caballus EquCab2.0 Chromosomes 66 Carnivora Felidae Felis catus Felis_catus_6.4 Chromosomes 68 Primates Hominidae Homo sapiens GRCh37.p10 Chromosomes 46 Primates Hominidae Pongo pygmaeus P_pygmaeus_2.0.2 Chromosomes 48 Primates Cercopithecidae Macaca mulatta Mmul_p51212 Chromosomes 42 Rodentia Bathyergidae Heterocephalus glaber HetGla_female_1.0 20.53Mb 60 Rodentia Dipodidae Jaculus jaculus JacJac1.0 22.08Mb 48 Rodentia Spalacidae Spalax galilii Fang et al. 2014 3.6Mbp 60 Rodentia Cricetidae Microtus ochrogaster MicOch1.0 Chromosomes 54 Rodentia Muridae Mus musculus NCBIm37 Chromosomes 40 Rodentia Muridae Rattus norvegicus Rnor5.0 Chromosomes 42
Table S2. List of HSBs and SFs obtained for each pair-wise comparison (300Kbp resolution): In all cases, the mouse genome wasusedasreference(versionNCBIm37).“N”denotesthenumberofHSBsandSFsdetectedand“type”referstothetypeofsyntenicregion.Total,mean,maximumandminimumlengthsareexpressedinMbp.
Species N Type Length (Mbp) % Genome Compared
Total Mean Minimum Maximum R. norvegicus 280 HSB 2,512.37 13.22 0.30 127.98 95.60 M. ochrogaster 459 HSB 2,370.98 6.43 0.31 60.48 90.22 S. galilii 1985 SF 2,153.00 1.14 0.30 10.91 81.93 J. jaculus 598 SF 2,385.86 4.70 0.30 43.68 90.79 H. glaber 559 SF 2,410.46 5.14 0.31 30.23 91.72 P. pygmaeus 420 HSB 2,446.09 7.41 0.30 52.69 93.08 H. sapiens 459 HSB 2,421.46 6.56 0.31 66.22 92.14 M. mulatta 437 HSB 2,454.65 7.07 0.30 52.06 93.41 F. catus 391 HSB 2,428.35 8.07 0.30 59.58 92.41 E. caballus 425 HSB 2,457.01 7.33 0.30 71.36 93.49 B. taurus 521 HSB 2,394.30 5.56 0.31 58.78 91.11
4.1.2Supplementaryinformation
RESULTS

119
Table S3. EBRs identified: Twelvelineage-specific(R.norvegicus,M.ochrogaster,S.galilii,J.jaculus,H.glaber,P.pygmaeus,H.sapiens,M.mulatta,F.catus,E.caballus and B.taurus)andeightclade-specific(Muridae,Cricetidae+Muridae,Muroidea,Myodonta,Rodentia,Hominoidea,Catarrhini,Laurasiatheria, and Euarchontoglires)pair-wisecomparisonswereestablishedusing M.musculusasthereferencegenome.ReusedEBRssharedbyanyofthe11speciesusedinthestudyarealsoshown.NdenotesthenumberofEBRsdetected.Total,mean,minimumandmaximumlengthsareexpressedinKbp.
Type Species/Clade N Length (Kbp) % Genome Total Mean Minimum Maximum Coverage
Lineage-‐specific M. musculus 30 2.388 79.62 8.64 336.15 0.09
R. norvegicus 66 8.766 132.82 28.88 1,129.23 0.33
M. ochrogaster 133 12.313 92.58 4.44 344.28 0.47
S. galilii 360 51.682 143.56 10.72 1,306.54 1.97
J. jaculus 128 13.372 104.47 2.49 557.17 0.51
H. glaber 91 10.186 111.94 1.36 666.99 0.39
P. pygmaeus 8 1.137 142.20 42.03 288.52 0.04
H. sapiens 29 4.216 145.39 39.52 1,150.26 0.16
M. mulatta 26 3.948 151.87 30.72 776.72 0.15
F. catus 24 2.49 103.79 24.46 498.64 0.09
E. caballus 36 3.145 87.37 4.31 415.19 0.12
B. taurus 118 13.484 114.28 5.39 780.16 0.51 Clade-‐specific Murinae 15 833 55.58 5.08 102.59 0.03
Muridae 28 2.48 88.6 29.31 303.16 0.09
Muroidea 3 230 76.70 2.16 149.04 0.01
Myodonta 14 1.372 98.00 22.37 394.80 0.05
Rodentia 15 1.053 70.21 35.65 132.51 0.04
Hominoidea 8 710 88.76 22.46 173.28 0.03
Catarrhini 33 2.036 61.71 9.27 148.24 0.08
Laurasiatheria 12 1.552 129.41 15.00 466.36 0.06
Euarchontoglires 2 270 135.32 34.21 236.44 0.01 Reused 154 17.462 113.39 0.154 3,056.91 0.66
Table S4. HSBs and SFs at different resolutions: ComparisonofthenumberofHSBsandSFsforeachSynteny Trackerpair-wisecomparisonandforeachresolution(100Kbp,300Kbpand500Kbp).
Species 100Kbp 300Kbp 500Kbp Felis catus 371 281 245 Bos taurus 560 411 344 Equus caballus 437 315 270 Pongo pygmaeus 439 310 277 Macaca mulatta 472 327 283 Homo sapiens 496 349 292 Heterocephalus glaber 535 449 416 Jaculus jaculus 600 488 437 Spalax galilii 2417 1876 1477 Microtus ochorgaster 431 350 327 Rattus norvegicus 577 170 109
RESULTS

120
Table S5: Divergence times.PhylogeneticdistancesdescribedbyMeredithetal.(2011)(autocorrelatedratesandhard-boundedconstraints)andbydosReisetal.(2012)(marginalpriordivergencetimes)“na”denotesdatanotavailable.Valuesaremeanand95%CI(inbrackets).
Divergence Times (Myr)
Clade Meredith et al. (2011) dos Reis et al. (2012)
Placentalia 96.4 (92.12-‐99.29) 124.1 (102.1-‐139.2) Laurasiatheria 81.32 (78.46-‐83.28) 114.6 (87.4-‐133.3) Euarchontoglires 78.45 (74.08-‐80.12) 114 (87.4-‐133.3) Catarrhini 20.85 (20.56-‐21.65) 29.5 (23.7-‐34.1) Hominoidea 15.98 (14.41-‐17.54) na na
Rodentia 66.03 (64.12-‐66.70) 61.1 (56.0-‐65.8) Myodonta 52.42 (50.34-‐54.06) na na Muroidea 42.48 (40.73-‐44.42) na na Muridae 23.48 (21.09-‐25.74) na na Murinae na na 12.2 (10.4-‐14.0)
RESULTS

121
Tabl
e S6
: Lis
t of d
isru
pted
gen
es
chr
gene (ncbim37)
gene start
gene end
EBR start
(bp)
EBR end
(bp)
phylogenetic
group
disruption site
disruption site
Nam
e
1 EN
SMUS
G000
0002
6095
53
3823
51
5340
9596
53
3836
43
5347
7238
m
ouse
3'
regi
on
3' re
gion
As
nsd1
-‐001
1 EN
SMUS
G000
0002
6401
13
2285
103
1323
1958
6 13
2241
026
1323
1325
0 m
urid
ae
INTR
ON
INTR
ON 5
-‐6
Daf2
-‐001
1 EN
SMUS
G000
0003
8633
18
4205
903
1842
1293
5 18
4079
303
1842
1181
2 ro
dent
IN
TRON
IN
TRON
1-‐2
De
gs1-‐
001
2 EN
SMUS
G000
0003
6449
25
5086
40
2551
1737
25
5107
22
2561
5814
ro
dent
EX
ON
EXON
4
Lcn8
-‐001
2 EN
SMUS
G000
0002
6753
39
0498
74
3908
1971
39
0551
48
3911
5672
m
urid
ae
EXON
EX
ON 7
Pp
p6c-‐
001
2 EN
SMUS
G000
0002
6825
32
1639
91
3220
8849
32
0855
80
3216
4488
m
uroi
dea
EXON
EX
ON 2
1 Dn
m1-‐
005
3 EN
SMUS
G000
0007
4655
28
7915
39
2882
5646
28
7413
02
2879
7838
m
ouse
IN
TRON
IN
TRON
3-‐4
m
1527
-‐201
5 EN
SMUS
G000
0002
8999
23
2935
29
2332
6187
23
2957
29
2337
5080
m
urid
ae
INTR
ON
INTR
ON 2
-‐3
Rint
1-‐00
1
5 EN
SMUS
G000
0001
4956
32
7613
47
3281
9806
32
7655
94
3310
1739
m
ouse
IN
TRON
IN
TRON
1-‐2
Pp
p1cb
-‐001
5 EN
SMUS
G000
0002
3452
33
0789
49
3312
8295
32
7655
94
3310
1739
m
ouse
IN
TRON
IN
TRON
3-‐4
Pi
sd-‐0
01
5 EN
SMUS
G000
0002
9507
11
1202
686
1112
0967
8 11
1208
811
1112
8323
4 g1
EX
ON
EXON
2
Pus1
-‐002
5 EN
SMUS
G000
0002
9521
11
1269
036
1113
0315
2 11
1208
811
1112
8323
4 g1
IN
TRON
IN
TRON
5-‐6
Ch
ek2-‐
201
5 EN
SMUS
G000
0004
2216
11
3672
240
1137
3980
6 11
3709
212
1138
2829
0 g2
IN
TRON
IN
TRON
10-‐
11
Sgsm
1-‐00
1
5 EN
SMUS
G000
0007
2694
11
5258
705
1152
7347
7 11
5271
581
1153
7761
2 g2
di
scre
panc
ies
in
gene
pos
ition
v37
??
? 15
0001
1B03
Rik-‐
001
5 EN
SMUS
G000
0004
1827
11
5373
249
1153
8792
4 11
5271
581
1153
7761
2 g2
IN
TRON
IN
TRON
1-‐2
Oa
sl1-‐
002
5 EN
SMUS
G000
0002
9727
13
8334
160
1383
6284
7 13
8302
234
1383
4044
5 m
ouse
IN
TRON
IN
TRON
10-‐
11
Cyp3
a13-‐
001
6 EN
SMUS
G000
0003
0089
90
5547
19
9059
6406
90
5657
60
9063
9578
g2
IN
TRON
IN
TRON
2-‐3
Sl
c41a
3-‐00
1
6 EN
SMUS
G000
0007
2623
11
8411
968
1184
2933
8 11
8413
942
1185
4683
2 g2
EX
ON
EXON
6
Zfp9
-‐001
6 EN
SMUS
G000
0003
0180
12
0314
117
1203
9459
2 12
0363
590
1204
4331
1 g2
IN
TRON
IN
TRON
19-‐
20
Kdm
5a-‐2
01
6 EN
SMUS
G000
0003
0107
12
1195
924
1212
2093
4 12
1207
056
1216
0185
7 g2
IN
TRON
IN
TRON
4-‐5
Us
p18-‐
201
6 EN
SMUS
G000
0002
4104
11
6158
051
1162
1268
6 11
6114
690
1161
8825
7 g1
IN
TRON
IN
TRON
19
Fam
21-‐2
01
6 EN
SMUS
G000
0003
0111
12
1586
191
1216
2925
5 12
1207
056
1216
0185
7 g2
IN
TRON
IN
TRON
14-‐
15
A2m
-‐201
6 EN
SMUS
G000
0003
0359
12
8433
585
1284
7673
8 12
8399
721
1284
6483
1 ro
dent
IN
TRON
IN
TRON
10-‐
11
Pzp-‐
201
7 EN
SMUS
G000
0003
0835
53
2890
66
5333
9582
53
3087
44
5337
4272
m
urid
ae
INTR
ON
INTR
ON 1
1-‐12
N
omo1
-‐001
7 EN
SMUS
G000
0003
0781
13
5409
171
1354
1594
4 13
5411
640
1355
2401
1 g1
IN
TRON
IN
TRON
5-‐6
Sl
c5a2
-‐001
RESULTS

122
7 EN
SMUS
G00000030844
135517135
135562272
135411640
135524011
g1
INTR
ON
INTR
ON 3-‐4
Rgs10-‐001
8 EN
SMUS
G00000031574
26918946
26925782
26920431
26998236
g2
INTR
ON
INTR
ON 3-‐4
Star-‐001
8 EN
SMUS
G00000031805
74200195
74214474
74213382
74365250
mouse
INTR
ON
INTR
ON 24-‐25
Jak3-‐001
8 EN
SMUS
G00000079019
74213113
74214474
74213382
74365250
mouse
INTR
ON
INTR
ON 1-‐2
Insl3-‐001
8 EN
SMUS
G00000031622
75247187
75282102
75281769
75321990
mouse
INTR
ON
INTR
ON 19
Sin3b-‐201
8 EN
SMUS
G00000031967
126001803
126027816
126027276
126184642
g1
INTR
ON
INTR
ON 17
Afg3l1-‐001
8 EN
SMUS
G00000039960
126177829
126187784
126027276
126184642
g1
INTR
ON
INTR
ON 2-‐3
Rhou-‐001
9 EN
SMUS
G00000041986
53759267
53823108
53801032
53902951
g1
INTR
ON
INTR
ON 1-‐2
Elmod1-‐201
9 EN
SMUS
G00000074345
53873413
53916218
53801032
53902951
g1
INTR
ON
INTR
ON 1-‐2
Tnfaip8l3-‐201
9 EN
SMUS
G00000037493
54392601
54408025
54342642
54407473
g1
INTR
ON
INTR
ON 1-‐2
Cib2-‐001
9 EN
SMUS
G00000037410
90096885
90165642
90140251
90222237
g1
INTR
ON
INTR
ON 2-‐3
Tbc1d2b-‐001
9 EN
SMUS
G00000020258
106055188
106060469
105997280
106058783
rodent
INTR
ON
INTR
ON 3
Glyctk-‐002
9 EN
SMUS
G00000032496
110921796
110945270
110937469
111018429
g2
INTR
ON
INTR
ON 13-‐14
Ltf-‐2
01
9 EN
SMUS
G00000032446
118387330
118395250
118392005
118440224
g2
INTR
ON
INTR
ON 5-‐6
Eomes-‐001
10
ENSM
USG0
0000062593
51200446
51216419
51207626
51285212
mouse
INTR
ON
INTR
ON 4-‐5
Lilrb4-‐201
11
ENSM
USG0
0000020268
54640368
54674418
54655891
54724903
rodent
INTR
ON
INTR
ON 4-‐5
Lyrm
7-‐005
12
ENSM
USG0
0000001627
40928154
40975091
40859948
40930665
rodent
INTR
ON
INTR
ON 10-‐11
Ifrd1-‐001
12
ENSM
USG0
0000021076
72038844
72065705
71998160
72057812
g1
INTR
ON
INTR
ON 10-‐11
Actr10-‐201
13
ENSM
USG0
0000021500
55736388
55782617
55680231
55754460
rodent
INTR
ON
INTR
ON 8-‐9
Ddx46-‐202
14
ENSM
USG0
0000021982
60179733
60216673
60185855
60253528
g2
INTR
ON
INTR
ON 9-‐10
Cdadc1-‐203
14
ENSM
USG0
0000021810
21139081
21167343
20839441
21142605
g1
INTR
ON
INTR
ON 13-‐14
Ecd-‐201
15
ENSM
USG0
0000018893
76845919
76881100
76768807
76848361
g1
EXON
EX
ON 2
Mb-‐203
17
ENSM
USG0
0000073471
8138518
8172689
8146616
8220308
mouse
INTR
ON
INTR
ON 2-‐3
Rsph3a-‐201
17
ENSM
USG0
0000060475
13159662
13185412
13179122
13269924
mouse
INTR
ON
INTR
ON 1-‐2
Wtap-‐002
17
ENSM
USG0
0000055602
13253977
13275347
13179122
13269924
mouse
INTR
ON
INTR
ON 9-‐10
Tcp10b-‐003
17
ENSM
USG0
0000024188
26389855
26422449
26394039
26490733
mouse
INTR
ON
INTR
ON 2-‐3
Luc7l-‐0
03
17
ENSM
USG0
0000024193
27070072
27074835
27006215
27074393
mouse
EXON
EX
ON 15
Phf1-‐201
RESULTS

123
17
ENSM
USG0
0000
0240
27
3103
8785
31
0734
55
3104
5859
31
1211
58
g1
INTR
ON
INTR
ON 2-‐3
Glp1
r-‐20
1
17
ENSM
USG0
0000
0541
34
3109
1624
31
1476
53
3104
5859
31
1211
58
g1
INTR
ON
INTR
ON 9-‐10
Umodl1-‐203
17
ENSM
USG0
0000
0381
46
3225
7765
32
3038
25
3220
9345
32
2875
88
mouse
EXON
EX
ON 15
Notch3-‐00
1
17
ENSM
USG0
0000
0418
81
3396
1559
33
9752
58
3396
1996
34
0416
18
mouse
INTR
ON
INTR
ON 1-‐2
Ndu
fa7-‐00
1
17
ENSM
USG0
0000
0240
56
7184
5440
71
8761
97
7186
5642
71
9322
56
mouse
INTR
ON
INTR
ON 7-‐8
Ndc80
-‐201
17
ENSM
USG0
0000
0525
25
7190
1401
71
9388
73
7186
5642
71
9322
56
mouse
INTR
ON
INTR
ON 6-‐7
Spdya-‐20
1
18
ENSM
USG0
0000
0242
31
3382
986
3436
698
3409
154
3481
072
g2
INTR
ON
INTR
ON 2-‐3
Cul2-‐001
18
ENSM
USG0
0000
0058
73
3450
4543
34
5330
69
3453
2486
34
5994
06
rodent
INTR
ON
INTR
ON 1-‐2
Reep5-‐20
1
18
ENSM
USG0
0000
0242
59
3173
9822
31
7701
83
3169
0467
31
7632
55
g1
INTR
ON
INTR
ON 4-‐5
Slc25a46
-‐201
18
ENSM
USG0
0000
0145
03
3456
9077
34
6024
45
3453
2486
34
5994
06
rodent
INTR
ON
INTR
ON 14-‐15
Pkd2
l2-‐201
19
ENSM
USG0
0000
0248
63
3030
7418
30
3141
75
3031
0005
30
3323
71
g2
INTR
ON
INTR
ON 4-‐5
Mbl2-‐20
1
RESULTS

124
Category Term
Cluster 1: enrichment Score: 4.51
INTERPRO Calycin INTERPRO Lipocalin INTERPRO Lipocalin-‐related protein and Bos/Can/Equ allergen INTERPRO Von Ebner’s gland protein/Bos/Can allergen Cluster 2: enrichment Score: 3.6 INTERPRO Hemoglobin, alpha GOTERM_CC_FAT Hemoglobin complex GOTERM_BP_FAT Oxygen transport INTERPRO Globin, subset INTERPRO Globin GOTERM_MF_FAT Oxygen transporter activity GOTERM_MF_FAT Oxygen transport SP_PIR_KEYWORDS Gas transport GOTERM_BP_FAT Oxygen binding GOTERM_MF_FAT Cytosolic part GOTERM_CC_FAT Iron SP_PIR_KEYWORDS Iron ion binding GOTERM_MF_FAT Heme binding GOTERM_MF_FAT Heme SP_PIR_KEYWORDS Tetrapyrrole binding GOTERM_MF_FAT cytosol Cluster 3: enrichment score: 1.69 SMART KRAB GOTERM_BP_FAT Regulation of transcription, DNA dependent GOTERM_BP_FAT Regulation of RNA metabolic process INTERPRO Krueppel-‐associated box
Figure S1. HSBs and SFs: NumberofHSBsandSFsdetectedbySynteny Trackerforeachofthepair-wisecomparisonsandforeachresolution(100Kbp,300Kbpand500Kbp).
Table S7. Enriched functional annotation charts in all Rodentia EBRs:
RESULTS

125
Figure S2. Distribution of unique EBRs across the mouse genome:FrequencyofEBRsinthemousegenome(lineageandclade-specific)(n=105)detectedforeachchromosome.DottedlinerepresentstheestimatedfrequencyofEBRsinthemousegenomeassumingahomogeneousdistribution.(χ2test,**p-value<0.001).
Figure S3. Genome-wide distribution of cLADs and genes in the mouse genome:(A)Numberofproteincodinggenes(blue)andcLADs(red)pereachmousechromosome.Meanvaluesofgenes(blueline)andcLADs(redline)per10Kbpwindowsarerepresentedinthey-axis.(B)Genomedistributionofproteincodinggenes(red)andcLADs(blue)alongmousechromosome17.Numberofgenes(blueline)andcLADs(redline)per10Kpbwindowsarerepresentedinthey-axis.ArrowsindicatethepositionofestimatedEBRsinthiswork.
RESULTS

126

127
4.2 Study of the role of telomeres in the formation of Rb
fusions in the Barcelona Rb system
Despite the role of chromosomal rearrangements (such as Rb fusions) inspeciation has been long discussed in evolutionary biology, the mechanisms involved in their origin and fixation in nature remain largely unexplored. The wide distribution of Rb fusions in mice natural populations represents an interestingmodeltoanalyzethemechanismsthataredrivingitsoriginandfixation.Here,wehaveanalyzedtheroleoftelomereshorteningintheoriginofRbfusionsbyusingasamodeltheBarcelonaRbpolymorphismzone.
4.2.1OntheoriginofRobertsonianfusionsinnature:evidence
oftelomereshorteninginwildhousemouse
Sánchez-GuillénRA,CapillaL,Reig-ViaderR,Martínez-PlanaM,Pardo-CamachoC,Andrés-NietoM,VenturaJ,Ruiz-HerreraA(2015)On the origin of Robertsonian fusions in nature: evidence of telomere shortening in wild house mouse.JournalofEvolutionaryBiology.28:241-249.
Impactfactor:3.48Q1inEcologyQ2inEvolutionaryBiologyQ2inGeneticsandHeredity
RESULTS

128
RESULTS

129
On the origin of Robertsonian fusions in nature: evidence oftelomere shortening in wild house mice
R. A. S �ANCHEZ-GUILL �EN*, L . CAPILLA*† , R . RE IG-V IADER*‡ , M. MART�INEZ-PLANA*‡ ,C . PARDO-CAMACHO*‡ , M. ANDR �ES-NIETO*‡ , J . VENTURA† & A. RUIZ-HERRERA*‡*Genome Integrity and Instability Group, Institut de Biotecnologia i Biomedicina (IBB), Universitat Aut�onoma de Barcelona, Barcelona, Spain
†Departament de Biologia Animal, Biologia Vegetal i Ecologia, Universitat Aut�onoma de Barcelona, Barcelona, Spain
‡Departament de Biologia Cel lular, Fisiologia i Immunologia, Universitat Aut�onoma de Barcelona, Barcelona, Spain
Keywords:
chromosomal evolution;
Robertsonian fusions;
telomere shortening;
western house mouse.
Abstract
The role of telomere shortening to explain the occurrence of Robertsonian
(Rb) fusions, as well as the importance of the average telomere length vs.
the proportion of short telomeres, especially in nature populations, is largely
unexplored. In this study, we have analysed telomere shortening in nine
wild house mice from the Barcelona Rb system with diploid numbers rang-
ing from 29 to 40 chromosomes. We also included two standard (2n = 40)
laboratory mice for comparison. Our data showed that the average telomere
length (considering all chromosomal arms) is influenced by both the diploid
number and the origin of the mice (wild vs. laboratory). In detail, we
detected that wild mice from the Rb Barcelona system (fused and standard)
present shorter telomeres than standard laboratory mice. However, only
wild mice with Rb fusions showed a high proportion of short telomeres
(only in p-arms), thus revealing the importance of telomere shortening in
the origin of the Rb fusions in the Barcelona system. Overall, our study con-
firms that the number of critically short telomeres, and not a simple reduc-
tion in the average telomere length, is more likely to lead to the origin of
Rb fusions in the Barcelona system and ultimately in nature.
Introduction
Chromosomal rearrangements in the form of inver-
sions, translocations and chromosome fusions/fissions
are key factors for evolution. This evolutionary role is
especially true for Robertsonian (Rb) fusions, whose
importance is revealed by its occurrence in taxa as
diverse as mammals, reptiles, insects or mollusks
(White, 1973; King, 1995). For instance, Rb fusions,
together with inversions, contribute to chromosomal
speciation through underdominance and/or by
suppression of recombination when they are present in
heterozygous form (Rieseberg, 2001; Dumas & Britton-
Davidian, 2002; Faria & Navarro, 2010; Farr�e et al.,
2013; Capilla et al., 2014). Although most of the recent
literature has been focused on the diversity of factors
influencing the fixation of chromosomal rearrange-
ments within populations (Faria & Navarro, 2010 and
references therein), the mechanism(s) responsible for
the origin of Rb fusions have received less attention.
Robertsonian fusions occur when two telocentric or
acrocentric chromosomes fuse resulting in one meta-
centric chromosome (Robertson, 1916). Several factors
have been invoked for the appearance of Rb fusions in
mammalian species; these include chromosome size,
GC and DNA content, gene density, illegitimate recom-
bination between repetitive sequences and telomere
loss or inactivation (Slijepcevic, 1998; Garagna et al.,
2001; Ruiz-Herrera et al., 2010; Wesche & Robinson,
2012). Telomeres are ribonucleoprotein structures com-
posed of TTAGGG tandem repeats, a protein complex
(shelterin) and noncoding telomeric RNA (TERRA) that
cap the ends of eukaryotic chromosomes to protect
them from being recognized as double-strand breaks
(DSBs) (Azzalin et al., 2007; O’Sullivan & Karlseder,
2010; Reig-Viader et al., 2014). Therefore, Rb fusions
Correspondence: Rosa A. Sanch�ez-Guill�en and A. Ruiz-Herrera, Genome
Integrity and Instability Group, Institut de Biotecnologia i Biomedicina
(IBB), Universitat Aut�onoma de Barcelona, Campus UAB, 08193
Barcelona, Spain.
Tel.: +34 93 5811379, +34 93 5812051; fax: +34 93 581 3357; e-mails:
[email protected] and [email protected]
ª 2014 EUROPEAN SOC I E TY FOR EVOLUT IONARY B IOLOGY . J . E VOL . B I O L . 2 8 ( 2 0 1 5 ) 2 4 1 – 24 9
241JOURNAL OF EVOLUT IONARY B IO LOGY ª 20 1 4 EUROPEAN SOC I E TY FOR EVOLUT IONARY B IO LOGY
doi: 10.1111/jeb.12568
RESULTS
130
would require either the elimination or the inactivation
of telomeres prior to the chromosomal rearrangement.
In this context, three different mechanisms have been
formally proposed to explain the origin of Rb fusions in
relation to the presence/absence of telomeric sequences
in the resultant fused chromosome: (i) telomeric inacti-
vation, (ii) chromosomal breakage within centromeric
satellite sequences and (iii) telomeric shortening (Sli-
jepcevic, 1998).
The first mechanism assumes the occurrence of chro-
mosomal fusions by telomere inactivation without loss
of telomeric repeats (Slijepcevic, 1998), and occasion-
ally, the fused chromosomes would exhibit large blocks
of telomeric repeats that would be retained and/or
amplified in the pericentromeric regions (see Ruiz-Her-
rera et al., 2008 for a review). In fact, the presence of
telomeres with an altered structure is common in many
vertebrates (see Slijepcevic, 1998), with numerous
examples of end-to-end telomere fusions in the absence
of significant telomere shortening (e.g. Bailey et al.,
1999; Espejel & Blasco, 2002). According to the second
mechanism (chromosomal breakage in small satellite
sequences), chromosomal breaks within centromeric
repetitive sequences would result in the total loss of
telomeres of the p-arms, promoting fusion of the chro-
mosomal ends. This mechanism has been proposed to
explain chromosomal evolution in several rodent spe-
cies (Nanda et al., 1995; Garagna et al., 2001). The last
of the suggested mechanisms (telomeric shortening)
proposes that Rb fusions could result from progressive
telomere shortening due to the ‘end of replication prob-
lem’ (Allsopp et al., 1995). This states that due to the
inefficiency of DNA polymerase to replicate the whole
telomeric sequences of the lagging strand during the S-
phase of mitotic division, telomeres progressively
shorten, resulting in loss of the telomeric DNA and
reaching critical length in the absence of telomere elon-
gation mechanisms. This would precipitate the fusion of
chromosomal ends (Slijepcevic, 1998). Knockout mice
lacking telomerase in successive generations represent a
good example of chromosomal fusion due to telomere
shortening (Blasco et al., 1997). In fact, Hemann et al.
(2001) detected a preference for the fusion of chromo-
somes with short telomeres in telomerase-null mice.
They predict that as telomeres shorten, chromosomes
undergo fusion. Nevertheless, and despite the experi-
mental evidence, telomere length has never been for-
mally studied in natural Rb populations.
The western house mouse (Mus musculus domesticus) is
arguably the best studied and understood model of Rb
variation in nature. The accumulation of Rb fusions is
thought to encompass the past 10 000 years (Auffray,
1993). The standard karyotype of the house mouse
consists of all acrocentric chromosomes (2n = 40); how-
ever, a wide range of diploid numbers (2n) (from 22 to
39) has been described in the literature (Pi�alek et al.,
2005). In fact, 106 different Rb fusion combinations are
distributed across Europe and the Mediterranean basin.
One of these Rb systems, the Barcelona Rb system, has
diploid numbers ranging from 27 to 39 chromosomes
(Medarde et al., 2012 and references therein). This sys-
tem occurs in a 5000 km2 area of Barcelona province
(Spain) and is characterized by a high level of chromo-
somal polymorphisms [i.e. seven different Rb chromo-
somes including Rb (3.8), (4.14), (5.15), (6.10), (7.17),
(9.11) and (12.13) showing nongeographically coinci-
dent clines] (Medarde et al., 2012) and low recombina-
tion rates (Capilla et al., 2014). To disentangle the
mechanism(s) responsible for the formation of Rb
fusions in natural populations, we have investigated
telomere shortening in the Barcelona Rb system. To
this end, telomere length and the proportion of short
telomeres were measured in standard and Rb mice from
the system, and compared to standard laboratory mice
(C57BL/6; B6). Our results indicate that telomere short-
ening can explain the origin of the Rb fusions in the
Barcelona system and thus confirm the role of telomere
shortening in shaping the occurrence of Rb fusions in
nature.
Materials and methods
Cell cultures and chromosome extraction
Primary fibroblast cell lines were previously established
[from nine wild male mice livetrapped in commensal
habitats from five different localities representative of
the Barcelona Rb system] (Fig. 1a) and karyotyped by
Capilla et al. (2014). Cell lines were characterized by
diploid numbers that ranged from 29 to 40 (2n = 40,
three mice; 2n = 38, one mouse; 2n = 37, one mouse;
2n = 31, one mouse; 2n = 30, two mice; and 2n = 29,
one mouse) (Table 1). In addition, two primary fibro-
blast cell lines were established from two laboratory
mice (2n = 40, B6), which together with HeLa cells
(human cells with known telomere length) were
included in the analysis as internal controls for telo-
mere length measurements. Tissue culture protocols fol-
lowed Capilla et al. (2014). Chromosome preparations
were obtained at early passages in culture (from 2th to
7th).
Quantitative-fluorescence in situ hybridization (Q-FISH)
Q-FISH method on metaphases was used based on its
high sensitivity, which allows the quantification of indi-
vidual telomeres in single cells, as well as the identifica-
tion of short telomeres (telomeric repeats < 0.15 kbp,
the so-called ‘signal-free ends’; Poon et al., 1999; Au-
bert et al., 2012), which appear as telomeres without
FISH signal. Metaphase chromosomes were hybridized
using the peptide–nucleic acid-FISH (PNA-FISH) prepa-
ration method described by the manufacturer
ª 2014 EUROPEAN SOC I E TY FOR EVOLUT IONARY B IO LOGY . J . E VOL . B I OL . 2 8 ( 2 0 1 5 ) 2 4 1 – 24 9
JOURNAL OF EVOLUT IONARY B IOLOGY ª 2014 EUROPEAN SOC I E TY FOR EVOLUT IONARY B IO LOGY
242 R. A. S �ANCHEZ-GUILL �EN ET AL.
RESULTS

131
(www.panagene.com). The FAM-conjugated
(CCCTAA)3 PNA probe (telo C) (Panagen) was used to
label telomeres; DNA counterstaining was performed
using DAPI (40,6-diamidino-2-phenylindole). For each
Q-FISH experiment, an internal control consisting of
HeLa cells derived from the same chromosome extrac-
tion (i.e. same passage) was included.
Telomere length measurements
Chromosomal preparations were visualized with a Zeiss
Axioskop epifluorescence microscope equipped with the
appropriate filters for FAM/DAPI detection and a
charged coupled device camera (ProgResR CS10plus,
Jenoptik, Jena, Germany). Images were captured and
produced by the PROGRESR software (2.7.7), maintaining
the same exposure time. Fluorescence intensities of
telomeres were analysed with the TFLTELO-V2 software
package (Terry Fox Laboratory, BC Cancer Research
Centre, Vancouver, BC, Canada) (Poon et al., 1999).
Analyses of telomere fluorescence were carried out
maintaining the same tolerance threshold values. At
least 28 metaphases were analysed per cell line (Table 1)
given that this sample size gives comparable results to
conventional southern analysis (Poon et al., 1999; Vera
& Blasco, 2012). Telomere lengths were obtained in
terms of arbitrary telomere fluorescence units (TFUs)
following previous studies (Reig-Viader et al., 2014).
We investigated the phenomenon of telomere short-
ening in terms of telomere length and proportion of
short telomeres, which normally participate in end-
to-end fusions. To this end, q- and p-arms of each
acrocentric and metacentric (fused) chromosome were
identified in each metaphase and their telomere
lengths and proportion of short telomeres were mea-
sured. In this study, telomeres of metacentric chromo-
somes were always considered as q-arm telomeres.
Analyses were performed following three approaches.
Firstly, we considered only the type of chromosome
arm (q-arms vs. p-arms). Secondly, we considered only
diploid numbers, and thus we included six groups: (i)
2n = 40, (ii) 2n = 38, (ii) 2n = 37, (iv) 2n = 31, (v)
2n = 30 and (vi) 2n = 29. Thirdly, analyses were per-
formed considering both origin and type of mice: (i)
Laboratory-standard, which included B6 laboratory
mice (2n = 40, B6, two mice); (ii) Rb-standard, which
included standard wild mice from the Rb system
(2n = 40, three mice) and (iii) Rb-fused, which
included wild mice from the Rb system with Rb fusions
(2n = 29 to 2n = 38, six mice).
Correlation between q- and p-arm telomeres
Telomere length data were normally distributed, and
thus we used an ANOVA (as implemented in JMP 11th
version) to compare q- and p-arm telomere lengths and
also to test whether p-arms are more prone to loss telo-
mere FISH signals (Almeida & Ferreira, 2013). Addi-
tionally, we investigated whether telomere shortening
is similarly affecting q- and p-arms. To this end, length
ratio (q-arm/p-arm) in the three types of mice was
investigated using an ANOVA.
(a) (b)
(c) (d)
Fig. 1 Distribution and type of Rb
fusions. (a) Sample distribution in the
Barcelona chromosomal polymorphic
zone. Diploid numbers are shown for
standard (green) and Rb (dark red)
animals of the Rb system. (b–d)Examples of Q-FISH experiments
performed on metaphases of specimens
with (b) three fusions, specimen SS18,
(c) standard karyotype from a B6
mouse and (d) ten fusions, specimen
968. Telomeres are shown in green
(TEL) and chromosomes are stained in
blue (DAPI).
ª 2014 EUROPEAN SOC I E TY FOR EVOLUT IONARY B IOLOGY . J . E VOL . B I O L . 2 8 ( 2 0 1 5 ) 2 4 1 – 24 9
JOURNAL OF EVOLUT IONARY B IO LOGY ª 20 1 4 EUROPEAN SOC I E TY FOR EVOLUT IONARY B IO LOGY
Telomere shortening in wild Rb mice 243
RESULTS

132
Telomere shortening: average telomere length andproportion of short telomeres
The relationship between telomere length and: (i) type
of chromosomal arm (q- and p-arms), (ii) diploid num-
ber (from 2n = 29 to 2n = 40) and (iii) type of mice
(Laboratory-standard, Rb-standard and Rb-fused) was
examined using general linear models (GLMs) as imple-
mented in JMP 11th version. Telomere length
(expressed as TFUs) was analysed with a GLM using a
normal distribution and an identity-link function, with
telomere length (TFUs) as the response variable and the
type of arm, diploid number and the group of animals
as predictor variables. The significance of parameters
was determined from the Wald chi-square statistic.
Additionally, the relationship between the proportion
of short telomeres and: (i) type of chromosomal arm,
(ii) diploid number and (iii) the type of mice was anal-
ysed using a GLM with a binomial distribution (assign-
ing 1 for telomeres without signal telomeres and 0 for
telomeres with signal) and a logit-link function with
the number of short telomeres as the response variable,
and the type of chromosomal arm, diploid number and
group of animals as predictors.
ANOVA test (telomere length) and Kruskal–Wallis
(short telomeres) and subsequent post hoc analysis
were applied to investigate response variables (type of
chromosomal arm and group of animals) with a signifi-
cant effect over telomere length and/or over the pro-
portion of short telomeres. Additionally, the correlation
(Pearson’s) between diploid number and telomere
length and/or proportion of short telomeres was tested
by a post hoc linear regression with telomere length or
with the proportion of short telomeres as the response
variable and the diploid number as the predictor
variable.
Results
Data description
We studied the effect of telomere shortening in the
occurrence of Rb fusions in nature by analysing a total
of 44 295 telomeres including 11 mice (28–33 meta-
phases of each cell line; Fig. 1, Table 1). Telomere
lengths followed a normal distribution in all cell lines,
including HeLa control cell line (Fig. 2).
Telomere length (TFUs) of the laboratory mice
(Laboratory-standard) (mean � SE per population =1898 � 8.83 TFUs; n = 7899 telomeres) ranged from
91.81 to 5806.23 TFUs, of the standard mice from the
Rb system (Rb-standard) (mean � SE per popula-
tion = 1658 � 6.02 TFUs; n = 14040 telomeres) ranged
from 104.4 to 12383 TFUs and of the Rb mice from
the Rb system (Rb-fused) (mean � SE per popula-
tion = 1216 � 3.9 TFUs; n = 21800 telomeres) ranged
from 18.0 to 9383.23 TFUs. Table 1 summarizes all data
Table
1Data
characteristicsofthespecimensanalysed:locality,groupofanim
als,diploid
number(2n),
numberofmetaphasesandtelomeresanalysed,meantelomere
lengths
(expressedasTFUs),proportionofshort
telomeres(S.T.)
andproportionofmetacentric
(Meta)ch
romosomes.
Specim
en
Locality
Group
2n
Metaphases
(telomeres
scored)
Mean
TFUsper
cell
Acrocentric
chromoso
mes
Metacentric
chromoso
mes
Q-arm
P-arm
Meta
(%)
Q-arm
Mean�
SE(TFUs)
S.T.
(%)
Mean�
SE(TFUs)
S.T.
(%)
Mean�
SE(TFUs)
S.T.
(%)
B6-1
Labstrain
Laboratory-standard
40
30(3944)
1852.63
2311.80�
19.62
0.05
1569.76�
16.06
2.23
0.00
0.00
0.00
B6-3
Labstrain
Laboratory-standard
40
31(4036)
1944.87
2041.34�
15.46
0.64
1662.98�
13.80
1.14
0.00
0.00
0.00
900
Santa
Perp� etua
dela
Mogoda
Rb-standard
40
30(3944)
1746.66
1932.05�
15.28
0.48
1557.75�
13.16
2.34
0.00
0.00
0.00
VA4
Vacarisses
Rb-standard
40
31(4036)
1795.77
2007.40�
16.86
0.47
1580.29�
14.25
2.24
0.00
0.00
0.00
927
Badalona
Rb-standard
40
33(4624)
1441.24
1647.99�
12.35
0.45
1232.35�
9.83
1.48
0.00
0.00
0.00
SS7
SantSadurn� ıd’Anoia
Rb-fused
38
32(4724)
1121.74
1228.69�
10.05
0.82
1017.37�
9.19
1.89
6.06
1093.29�
25.90
2.69
SS18
SantSadurn� ıd’Anoia
Rb-fused
37
30(4868)
1316.49
1508.59�
14.46
0.33
1114.33�
11.05
2.02
8.56
1351.74�
27.87
0.35
CS10
Castelldefels
Rb-fused
31
30(4176)
827.59
922.02�
13.31
2.46
735.29�
9.73
9.29
31.12
818.01�
11.37
2.71
955
Castelldefels
Rb-fused
30
33(3352)
1393.75
1466.19�
19.17
2.22
1180.71�
16.57
8.10
28.00
1588.20�
31.31
0.00
968
Castelldefels
Rb-fused
30
28(3668)
1386.60
1446.44�
18.15
0.42
1153.02�
17.10
5.53
33.61
1452.32�
15.63
1.54
967
Castelldefels
Rb-fused
29
32(3923)
1366.19
1475.92�
19.09
1.38
1044.35�
15.79
4.45
38.02
1335.59�
17.47
2.04
ª 2014 EUROPEAN SOC I E TY FOR EVOLUT IONARY B IO LOGY . J . E VOL . B I OL . 2 8 ( 2 0 1 5 ) 2 4 1 – 24 9
JOURNAL OF EVOLUT IONARY B IOLOGY ª 2014 EUROPEAN SOC I E TY FOR EVOLUT IONARY B IO LOGY
244 R. A. S �ANCHEZ-GUILL �EN ET AL.
RESULTS

133
(telomeres scored, mean and SE (TFUs), percentage of
short arms and percentage of metacentric chromo-
somes) per specimen and type of chromosomal arm.
We found that mouse cells showed wider telomere
length ranges and higher mean telomeric lengths than
human (HeLa) cells confirming previous observations
(Zijlmans et al., 1997; Reig-Viader et al., 2014).
Correlation between q- and p-arm telomeres
It is known that, in wild-type mice, p-arm telomeres are
significantly shorter than q-arm telomeres (see Zijlmans
et al., 1997). Our analysis confirmed this trend given
that telomere lengths were significantly different
between q- and p-arms (ANOVA: F = 1697; P < 0.0001).
Our analysis confirmed that acrocentric p-arm
telomeres are significantly shorter (mean � SD:
1310.93 � 627.85) than their q-arm counterparts
(1699.27 � 775.05) (t = 54.46, P < 0.0001; Fig. 3a) and
significantly similar to the telomere length of q-arms of
metacentric chromosomes (1312.93 � 747.24) (t = 1.02,
P = 0.84; Fig. 3a). However, acrocentric q-arms have
significantly higher telomere lengths than metacentric
q-arms (t = 37.58, P < 0.0001; Fig. 3a).
Thus, if p-arm telomeres are significantly shorter
than q-arm telomeres, they may be more sensitive to
lose telomeric repeats than q-arm telomeres (Blasco
et al., 1997). According to this view, the proportion of
short telomeres was significantly different between
q- and p-arms of acrocentric and metacentric
chromosomes (v²=286.64, P < 0.0001; Fig. 3b). P-arms
of acrocentric chromosomes have a higher proportion
of short telomeres (3.16%) than q-arms of the meta-
centrics (2.07%) (Fig. 3b), and both, have higher
proportion of short telomeres than q-arms of the acro-
centric chromosomes (0.77%) (Fig. 3b).
Q-arm/p-arm telomere length ratio among type of
mice (Laboratory-standard, Rb-standard and Rb-fused)
was also significantly different (ANOVA: F = 14.31,
P < 0.0001). This ratio was significantly lower in the
standard mice from the Rb system (mean � SD:
1.50 � 0.94) (t = 4.74, P < 0.0001) than both labora-
tory mice (1.62 � 1.30) and Rb mice from the Rb sys-
tem (1.59 � 01.61) (t = 4.29, P < 0.0001), but not
significantly different between laboratory and Rb mice
(t = 1.24, P = 0.21). The decrease of the q-arm/p-arm
telomere length ratio in the standard mice from the Rb
system is consistent with a significant correlation
(r = 0.156, P < 0.001) between q- and p-arms, in both
laboratory mice (r = 0.114, P < 0.0001) and Rb mice
from the Rb system (r = 0.108, P < 0.0001).
Telomere shortening: average telomere length andproportion of short telomeres
To examine the role of telomeric shortening on the ori-
gin of the Rb fusions in the Barcelona Rb system, telo-
mere length and proportion of short telomeres were
analysed with GLMs. Table 2 includes Wald chi-square
values, degrees of freedom and P values.
Overall, we observed that average telomere length
was influenced by the type of chromosomal arm (q
and p), the group of mice (Laboratory-standard, Rb-
standard and Rb-fused) and the diploid number (from
2n = 29 to 2n = 40) (Table 2). In Rb-fused mice, the
average telomere length (mean � SD) (q-arm =1333.63 � 604.24 and p-arm = 1036.32 � 488.40) was
significantly shorter than both, the average telomere
Fig. 2 Telomere length distribution.
Distribution of telomeres for each
measured TFUs in the specimens
analysed. Lab strain (individuals from
laboratory strain) (dark blue), Rb-
standard (individuals from the Rb
population with standard karyotype)
(green), Rb-fused (individuals from the
Rb population with Rb fusions) (dark
red) and HeLa (grey) lines.
ª 2014 EUROPEAN SOC I E TY FOR EVOLUT IONARY B IOLOGY . J . E VOL . B I O L . 2 8 ( 2 0 1 5 ) 2 4 1 – 24 9
JOURNAL OF EVOLUT IONARY B IO LOGY ª 20 1 4 EUROPEAN SOC I E TY FOR EVOLUT IONARY B IO LOGY
Telomere shortening in wild Rb mice 245
RESULTS

134
length of the Rb-standard mice (q-arm = 1859.80
� 739.83 and p-arm = 1453.19 � 622.64) (q-arm:
t = 46.55, P < 0.0001; p-arm: t = 43.90, P < 0.0001;
Fig. 3c) and the Laboratory-standard mice (q-
arm = 2175.40 � 797.26 and p-arm = 1617.17 � 662.99)
(q-arm: t = 62.49, P < 0.0001; p-arm: t = 51.44,
P < 0.0001; Fig. 3c). Moreover, average telomere length
of Rb-standard mice was significantly shorter than
average telomere length of the Laboratory-standard
mice (q-arm: t = 22.80, P < 0.0001; p-arm: t = 14.18,
P < 0.0001; Fig. 3c). Finally, and only in the case of
Rb-fused mice, due to their unique composition of
metacentric and acrocentric q-arms, when comparing
average telomere length of acrocentric
(1333.63 � 604.24) and metacentric chromosomes
in Rb mice (1300.05 � 747.44), we detected that
metacentric q-arms were significantly shorter (t = 3.38,
P = 0.0007).
Moreover, diploid numbers correlated significantly
with telomere length of both type of chromosomal
arms (q-arm: r = 0.103, P < 0.0001; p-arm: r = 0.092,
P < 0.0001), that is, shorter average telomeres appeared
in mice with lower diploid numbers (with more Rb
fusions) (Fig. 4a,b). However, only telomere length of
q-arms correlated with number of fusions (q-arm:
r = 0.0006, P = 0.02; p-arm: r = 0.0001, P = 0.35).
Conversely, the proportion of short telomeres was
influenced by both, the type of chromosomal arm and
the diploid number but not by the type of mice (see
Table 2). The percentage of short telomeres in both
chromosomal arms (q- and p-arms) was significantly
correlated with the diploid number (q-arm: r = 0.003,
P < 0.0001; p-arm: r = 0.013, P < 0.0001; Fig. 4c,d)
and also with the number of fusions (q-arm: r = 0.002,
P < 0.0001; p-arm: r = 0.011, P < 0.0001).
Discussion
The role of telomere shortening to explain Rb fusions
in natural populations, as well as the importance of the
average telomere length vs. the proportion of short
(a) (b)
(c)
Fig. 3 Telomere shortening analysis. (a) Mean telomere lengths (in TFUs) for each type of chromosomal arms: p-arms of acrocentric
chromosomes (p-acro), q-arms of acrocentric chromosomes (q-acro) and q-arms of metacentric chromosomes (q-meta) (Student’s t-test, **P-value < 0.001). (b) Percentage of short telomeres for each type of chromosomal arms: p-arms of acrocentric chromosomes (p-acro), q-
arms of acrocentric chromosomes (q-acro) and q-arms of metacentric chromosomes (q-meta) (Student’s t-test, ** P-value < 0.001). (c)
Mean telomere lengths (in TFUs) for each type of chromosomal arms (p- and q-arms) for the three different animal groups compared:
laboratory mice (Lab-standard), standard mice from the Rb system (Rb-standard) and Rb mice from the Rb system (Rb-fused) (Student’s t-
test, ** P-value < 0.001).
Table 2 Generalized linear model for telomere length and
proportion of short telomeres according to diploid number (2n),
group of animals (Laboratory-standard, Rb-Standard and
Rb-Fused) and chromosome arm (q- and p-arms).
Fixed effects
Telomere length Short telomeres
v2 d.f. P v2 d.f. P
2n 11.97 1 0.0005* 113.17 1 < 0.0001*
Group 3390.67 2 < 0.0001* 2.44 2 0.2953
Arm 3351.69 2 < 0.0001* 353.00 2 < 0.0001*
P refers to type II deviance values. * indicates statistical signifi-
cance.
ª 2014 EUROPEAN SOC I E TY FOR EVOLUT IONARY B IO LOGY . J . E VOL . B I OL . 2 8 ( 2 0 1 5 ) 2 4 1 – 24 9
JOURNAL OF EVOLUT IONARY B IOLOGY ª 2014 EUROPEAN SOC I E TY FOR EVOLUT IONARY B IO LOGY
246 R. A. S �ANCHEZ-GUILL �EN ET AL.
RESULTS

135
telomeres is yet under discussion. It is known that
telomere length can vary among species, individuals
and even among telomeres within the same cell (Zijl-
mans et al., 1997; Canela et al., 2007). As the genera-
tion of Rb fusions due to telomere shortening has been
observed exclusively in vitro (i.e. in tissue cultures
established from telomerase-null mice) (Blasco et al.,
1997), the occurrence of such mechanisms in nature,
together with the stabilization of the resultant chromo-
somes through subsequent generations, needs further
validation. Here, we provide the first evidence of telo-
mere shortening, in terms of telomere length and per-
centage of short telomeres, in a wild house mouse Rb
system. We detected that both types of wild mice from
the Barcelona Rb system (with Rb fusions and stan-
dards) presented, on average, significantly lower telo-
mere lengths than laboratory standard mice, and this
correlation held when considering p- and q-arms. Addi-
tionally, and more interestingly, the percentage of short
telomeres was (in this case, only for the q-arms) nega-
tively correlated to the diploid number, but was influ-
enced by the type of mice, because only mice with Rb
fusions showed high proportions of short telomeres.
It is well established that mouse p-arm telomeres are
shorter than their q-arm counterparts (Zijlmans et al.,
1997). We found that the length of telomeres on q-
and p-arms differed among the three groups of mice
analysed and that this was influenced by the diploid
number. In fact, in wild mice from the Barcelona Rb
system, p-arm telomeres were significantly shorter than
their q-arm counterparts and presented a higher pro-
portion of short telomeres than their q-arm counter-
parts. Additionally, and consistently with Nanda et al.
(1995) study on laboratory mice strains with Rb
fusions, we did not detect telomeric signals at the cen-
tromeres of the metacentric chromosomes in the analy-
sed specimens. Moreover, we observed that the average
telomere length of the metacentric chromosomes was
more similar (although significantly higher) to the
average length of the q-arms telomeres of the acrocen-
tric chromosomes, than to the average length of their
p-arm telomeres. Therefore, these results indicate that
Rb fusion formation between p-arms would most prob-
ably be triggered by the loss of whole p-arm telomeres.
Previous studies on telomerase-null mice (Blasco
et al., 1997; Hemann et al., 2001) showed that chromo-
somes with short telomeres have a preference for
fusion, and based on this finding, they predict that as
telomeres shorten, chromosomes would undergo
fusions as a way to stabilize chromosomal ends. Consis-
tent with this prediction, we have similarly detected
that wild mice with Rb fusions have shorter telomeres
(q- and p-arms) than standard mice (from the Rb sys-
tem and laboratory mice), and the diploid number was
negatively correlated with the proportion of short telo-
meres. Therefore, considering the three different mech-
anisms that have been proposed to explain the origin of
Rb fusions in relation to the presence/absence of telo-
meric repeats in the resultant chromosome, we suggest
that telomere shortening is involved in the formation
of Rb fusions in natural populations. Known as the
widespread distribution of Rb fusions in the Barcelona
polymorphic zone (Medarde et al., 2012 and references
therein), Rb fusions would represent an effective way
to stabilize the progressive loss of telomeric sequences
within the population.
The fact that mice from the Barcelona Rb system,
and especially those with Rb fusions, present shorter
telomeres when compared to standard laboratory mice
is an intriguing result and highlights the importance of
focusing on natural populations. Some studies have
suggested that telomere length is under genetic control,
for example humans (Slagboom et al., 1994; Jeanclos
et al., 2000; Vasa-Nicotera et al., 2005) and mice (Zhu
et al., 1998; Ding et al., 2004). Zhu et al. (1998) showed,
based on the telomere length polymorphism
R2 = 0.103, P < 0.001 R2 = 0.003, P < 0.001
R2 = 0.092, P < 0.001 R2 = 0.013, P < 0.001
Mea
n TF
Us
Mea
n TF
Us
% S
hort
telo
mer
es%
Sho
rt te
lom
eres
Diploid numberDiploid number
(a)
(b)
(c)
(d)
Fig. 4 Karyotype and telomere length.
Correlation analysis between diploid
number and mean telomere length
(expressed as TFUs) for each type of
chromosomal arms: (a) q-arms and (b)
p-arms. Correlation analysis between
diploid numbers expressed percentage
of short telomeres of (c) q-arms and (d)
p-arms.
ª 2014 EUROPEAN SOC I E TY FOR EVOLUT IONARY B IOLOGY . J . E VOL . B I O L . 2 8 ( 2 0 1 5 ) 2 4 1 – 24 9
JOURNAL OF EVOLUT IONARY B IO LOGY ª 20 1 4 EUROPEAN SOC I E TY FOR EVOLUT IONARY B IO LOGY
Telomere shortening in wild Rb mice 247
RESULTS

136
between mice of the interfertile species Mus spretus and
M. musculus, that an unidentified gene located in a
region on distal chromosome 2 regulates telomere
length in mice. More recently, Ding et al. (2004) identi-
fied Rtel (a ‘regulator of the telomere gene’) that is
thought to codify a helicase which is implicated in telo-
mere length regulation and prevents genetic instability.
We detected that standard mice from the Rb system
had shorter telomere lengths in both q- and p-arms but
similar proportions of short telomeres than the standard
mice from the laboratory strain. The low average length
of both types of wild mice from the Barcelona Rb sys-
tems (standard and fused) could be explained by the
presence and/or dominance of an allelic variant of gene
(s) coding for protein(s) involved in telomere length
maintenance. In this way, chromosome fusions would
take place when telomere length reached the threshold
recognized by the DSBs repair machinery.
Apart from telomerase activity, the so-called alterna-
tive lengthening of telomeres (ALT) has been reported
as an additional telomerase-independent mechanism
involved in telomere lengthening and maintenance
through homologous recombination (HR) between telo-
meres (Cesare & Reddel, 2010). Although this mecha-
nism has been mainly described in tumour cell lines
(Bryan et al., 1995; Dunham et al., 2000), it has been
reported that short telomeres have an increased level of
telomere recombination in primary cells (i.e. in the
absence of telomerase), suggesting that the ALT mecha-
nism can be present as a way to stabilize telomeric-free
ends (Neumann et al., 2013). Recently, we have
reported a displacement of recombination events to
telomeres in fused metacentric chromosomes of sper-
matocytes of Rb wild mice from the Barcelona Rb sys-
tem (Capilla et al., 2014). Such observation, together
with the fact that telomeres are significantly shorter in
wild mice (standard and fused) from the Barcelona Rb
system compared to standard laboratory mice, suggests
that the HR could be contributing to telomere length
maintenance in the Barcelona Rb system, maybe by the
ALT mechanism. Therefore, telomeres would be main-
tained to avoid telomeric lengths below 15 kbp (which
would be close to the critic length that leads telomeres
to be recognized as DSBs by the repair machinery). In
this way, cells avoid fusions between all acrocentric
chromosomes in Rb mice and would delay the genera-
tion of fused metacentric chromosomes in standard
mice.
In conclusion, we detected that Rb-fused mice pres-
ent shorter q- and p-arms telomeres and higher per-
centage of short telomeres (only in p-arms) than the
standard mice. However, standard mice from the Barce-
lona Rb system showed, on average, shorter telomeres,
but similar proportion of short telomeres than the stan-
dard mice from the B6 laboratory strain. This fact sug-
gests that the number of critically short telomeres, and
not the reduction in the telomere length per se, is
probably the responsible of the occurrence of Rb
fusions in wild mice from the Barcelona Rb system.
Acknowledgments
The authors acknowledge T. J. Robinson for insightful
comments on earlier versions of the manuscript and to
Francisca Garcia and Francisco Cort�es from the SCAC
(Servei de Cultius Cel.lulars, Universitat Aut�onoma de
Barcelona) for their assistance with the cell lines. We are
also grateful to Nuria Medarde for her contribution in
the fieldwork. RAS-G was supported by a postdoctoral
grant from ‘Alianza 4 Universidades’, LC is the benefi-
ciary of a FPI predoctoral fellowship (BES-2011-047722),
and RRV was supported by a Personal Investigador en
Formaci�o (PIF) fellowship of the Universitat Aut�onoma
de Barcelona. This study was partially supported by a
grant from the Ministerio de Economia y Competitividad
(MINECO, CGL-2010-20170) to ARH. The capture of
mice in the wild was supported by a grant from the Min-
isterio de Economia y Competitividad (MINECO,
CGL2010-15243) to JV.
References
Allsopp, R.C., Chang, E., Kashefi-Aazam, M., Rogaev, E., Piat-
yszek, M.A., Shay, J.W. et al. 1995. Telomere shortening is
associated with cell division in vitro and in vivo. Exp. Cell Res.
220: 194–200.Almeida, H. & Ferreira, M.G. 2013. Spontaneous telomere to
telomere fusions occur in unperturbed fission yeast cells.
Nucleic Acids Res. 41: 3056–3067.Aubert, G., Hills, M. & Lansdorp, P.M. 2012. Telomere length
measurement-caveats and a critical assessment of the avail-
able technologies and tools. Mutat. Res. 730: 59–67.Auffray, J.-C. 1993. Chromosomal divergence in house mice
in the light of palaeontology: a colonization-related event?
Quatern. Int. 19: 21–25.Azzalin, C.M., Reichenbach, P., Khoriauli, L., Giulotto, E. &
Lingner, J. 2007. Telomeric repeat containing RNA and RNA
surveillance factors at mammalian chromosome ends. Science
318: 798–801.Bailey, S.M., Meyne, J., Chen, D.J., Kurimasa, A., Li, G.C.,
Lehnert, B.E. et al. 1999. DNA double-strand break repair
proteins are required to cap the ends of mammalian chromo-
somes. Proc. Natl. Acad. Sci. U.S.A. 96: 14899–14904.Blasco, M.A., Lee, H.W., Hande, M.P., Samper, E., Lansdorp,
P.M., DePinho, R.A. et al. 1997. Telomere shortening and
tumor formation by mouse cells lacking telomerase. Cell 91:
25–34.Bryan, T.M., Englezou, A., Gupta, J.Y., Bacchetti, S. & Reddel,
R.R. 1995. Telomere elongation in immortal human cells
without detectable telomerase activity. EMBO J. 14: 4240.
Canela, A., Vera, E., Klatt, P. & Blasco, M.A. 2007.
High-throughput telomere length quantification by FISH and
its application to human population studies. Proc. Natl. Acad.
Sci. U.S.A. 104: 5300–5305.Capilla, L., Medarde, N., Alemany-Schmidt, A., Oliver-Bonet,
M., Ventura, J. & Ruiz-Herrera, A. 2014. Genetic
ª 2014 EUROPEAN SOC I E TY FOR EVOLUT IONARY B IO LOGY . J . E VOL . B I OL . 2 8 ( 2 0 1 5 ) 2 4 1 – 24 9
JOURNAL OF EVOLUT IONARY B IOLOGY ª 2014 EUROPEAN SOC I E TY FOR EVOLUT IONARY B IO LOGY
248 R. A. S �ANCHEZ-GUILL �EN ET AL.
RESULTS

137
recombination variation in wild Robertsonian mice: on the
role of chromosomal fusions and Prdm9 allelic background.
Proc. R. Soc. B 281: 20140297.
Cesare, A.J. & Reddel, R.R. 2010. Alternative lengthening of
telomeres: models, mechanisms and implications. Nat. Rev.
Genet. 11: 319–330.Ding, H., Schertzer, M., Wu, X., Gertsenstein, M., Selig, S.,
Kammori, M. et al. 2004. Regulation of murine telomere
length by Rtel: an essential gene encoding a helicase-like
protein. Cell 117: 873–886.Dumas, D. & Britton-Davidian, J. 2002. Chromosomal rear-
rangements and evolution of recombination: comparison of
chiasma distribution patterns in standard and Robertsonian
populations of the house mouse. Genetics 162: 1355–1366.Dunham, M.A., Neumann, A.A., Fasching, C.L. & Reddel, R.R.
2000. Telomere maintenance by recombination in human
cells. Nat. Genet. 26: 447–450.Espejel, S. & Blasco, M.A. 2002. Identification of telo-
mere-dependent “senescence-like” arrest in mouse embry-
onic fibroblasts. Exp. Cell Res. 276: 242–248.Faria, R. & Navarro, A. 2010. Chromosomal speciation revis-
ited: rearranging theory with pieces of evidence. Trends Ecol.
Evol. 25: 660–669.Farr�e, M., Micheletti, D. & Ruiz-Herrera, A. 2013. Recombina-
tion rates and genomic shuffling in human and chimpan-
zee–a new twist in the chromosomal speciation theory. Mol.
Biol. Evol. 30: 853–864.Garagna, S., Marziliano, N., Zuccotti, M., Searle, J.B., Capan-
na, E. & Redi, C.A. 2001. Pericentromeric organization at
the fusion point of mouse Robertsonian translocation chro-
mosomes. Proc. Natl. Acad. Sci. U.S.A. 98: 171–175.Hemann, M.T., Strong, M.A., Hao, L.Y. & Greider, C.W. 2001.
The shortest telomere, not average telomere length, is critical
for cell viability and chromosome stability. Cell 107: 67–77.
Jeanclos, E., Schork, N.J., Kyvik, K.O., Kimura, M., Skurnick,
J.H. & Aviv, A. 2000. Telomere length inversely correlates
with pulse pressure and is highly familial. Hypertension 36:
195–200.King, M. 1995. Species evolution: the role of chromosome
change. Syst. Biol. 44: 578.
Medarde, N., L�opez-Fuster, M.J., Mu~noz-Mu~noz, F. & Ventura,
J. 2012. Spatio-temporal variation in the structure of a chro-
mosomal polymorphism zone in the house mouse. Heredity
109: 78–89.Nanda, I., Schneider-Rasp, S., Winking, H. & Schmid, M.
1995. Loss of telomeric sites in the chromosomes of Mus
musculus domesticus (Rodentia: Muridae) during Robertsonian
rearrangements. Chromosome Res. 3: 399–409.Neumann, A.A., Watson, C.M., Noble, J.R., Pickett, H.A., Tam,
P.P. & Reddel, R.R. 2013. Alternative lengthening of telo-
meres in normal mammalian somatic cells. Genes Dev. 27:
18–23.O’Sullivan, R.J. & Karlseder, J. 2010. Telomeres: protecting
chromosomes against genome instability. Nat. Rev. Mol. Cell
Biol. 11: 171–181.
Pi�alek, J., Hauffe, H.C. & Searle, J.B. 2005. Chromosomal vari-
ation in the house mouse. Biol. J. Linn. Soc. 84: 535–563.Poon, S.S., Martens, U.M., Ward, R.K. & Lansdorp, P.M. 1999.
Telomere length measurements using digital fluorescence
microscopy. Cytometry 36: 267–278.Reig-Viader, R., Vila-Cejudo, M., Vitelli, V., Busc�a, R., Sabat�e,
M., Giulotto, E. et al. 2014. Telomeric repeat-containing
RNA (TERRA) and telomerase are components of telomeres
during mammalian gametogenesis. Biol. Reprod. 90: 103.
Rieseberg, L.H. 2001. Chromosomal rearrangements and speci-
ation. Trends Ecol. Evol. 16: 351–358.Robertson, W. 1916. Chromosome studies. I. Taxonomic rela-
tionships shown in the chromosomes of Tettigidae and
Acrididae. V-shaped chromosomes and their significance in
Acrididae, Locustidae and Gryllidae: chromosome and varia-
tion. J. Morphol. 27: 179–331.Ruiz-Herrera, A., Nergadze, S.G., Santagostino, M. & Giulotto,
E. 2008. Telomeric repeats far from the ends: mechanisms of
origin and role in evolution. Cytogenet. Genome Res. 122: 219–228.
Ruiz-Herrera, A., Farr�e, M., Pons�a, M. & Robinson, T.J. 2010.
Selection against Robertsonian fusions involving housekeep-
ing genes in the house mouse: integrating data from gene
expression arrays and chromosome evolution. Chromosome
Res. 18: 801–808.Slagboom, P.E., Droog, S. & Boomsma, D.I. 1994. Genetic
determination of telomere size in humans: a twin study of
three age groups. Am. J. Hum. Genet. 55: 876–882.Slijepcevic, P. 1998. Telomeres and mechanisms of Robertso-
nian fusion. Chromosoma 107: 136–140.Vasa-Nicotera, M., Brouilette, S., Mangino, M., Thompson,
J.R., Braund, P., Clemitson, J.R. et al. 2005. Mapping of a
major locus that determines telomere length in humans. Am.
J. Hum. Genet. 76: 147–151.Vera, E. & Blasco, M. 2012. Beyond average: potential for
measurement of short telomeres. Aging 4: 379–392.Wesche, P.L. & Robinson, T.J. 2012. Different patterns of Rob-
ertsonian fusion pairing in Bovidae and the house mouse:
the relationship between chromosome size and nuclear terri-
tories. Genet. Res. 94: 97–111.White, M.J.D. (1973). Animal Cytology and Evolution, 3rd edn
(N.). Cambridge University Press, Cambridge.
Zhu, L., Hathcock, K.S., Hande, P., Lansdorp, P.M., Seldin,
M.F. & Hodes, R.J. 1998. Telomere length regulation in mice
is linked to a novel chromosome locus. Proc. Natl. Acad. Sci.
U.S.A. 95: 8648–8653.Zijlmans, J.M., Martens, U.M., Poon, S.S., Raap, A.K., Tanke,
H.J., Ward, R.K. et al. 1997. Telomeres in the mouse have
large inter-chromosomal variations in the number of T2AG3
repeats. Proc. Natl. Acad. Sci. U.S.A. 94: 7423–7428.
Received 6 October 2014; revised 21 November 2014; accepted 23
November 2014
ª 2014 EUROPEAN SOC I E TY FOR EVOLUT IONARY B IOLOGY . J . E VOL . B I O L . 2 8 ( 2 0 1 5 ) 2 4 1 – 24 9
JOURNAL OF EVOLUT IONARY B IO LOGY ª 20 1 4 EUROPEAN SOC I E TY FOR EVOLUT IONARY B IO LOGY
Telomere shortening in wild Rb mice 249
RESULTS

138
RESULTS

139
4.3 Analyzing the role of Rb fusions and Prdm9 sequence on
the meiotic dynamics of the Barcelona Rb system
Since it was initially proposed (Rieseberg 2001; Noor 2001), the suppressedrecombination model has been considered as a relevant framework to explain the role of chromosomal rearrangements in speciation. However empirical evidencethat support thismodel is scarce inmammals.Here,wehave tested theeffectofchromosomalrearrangements(Rbfusions)onmeioticrecombinationbyusingasamodeltheBarcelonaRbsystem,ahousemousepopulationcharacterizedbyahighrateofkaryotypediversityduetothepresenceofRbfusionsinapolymorphicstate.Additionally we also have analyzed the gene Prdm9 in the same population, a genetic factor that has been seen to be involved in the distribution of meiotic recombination.
4.3.1GeneticrecombinationvariationinwildRobertsonian
mice:ontheroleofchromosomalfusionsandPrdm9allelic
backgorund
CapillaL,MedardeN,Alemany-SchmidtA,Oliver-BonetM,VenturaJ,Ruiz-HerreraA(2014).Genetic recombination variation in wild Robertsonian mice: on the role of chromosomal fusions and Prdm9 allelic background.Proceedingsof theRoyalSocietyofBiologicalSciences281:20140297.
Impactfactor:5.29Q1inBiologyQ1inEcologyQ1inEvolutionaryBiology
RESULTS

140
RESULTS

141
rspb.royalsocietypublishing.org
ResearchCite this article: Capilla L, Medarde N,Alemany-Schmidt A, Oliver-Bonet M, Ventura J,
Ruiz-Herrera A. 2014 Genetic recombination
variation in wild Robertsonian mice: on the
role of chromosomal fusions and Prdm9 allelic
background. Proc. R. Soc. B 281: 20140297.http://dx.doi.org/10.1098/rspb.2014.0297
Received: 5 February 2014
Accepted: 24 April 2014
Subject Areas:evolution, genetics
Keywords:house mouse, Robertsonian fusion, speciation,
heterochromatinization, recombination, Prdm9
Authors for correspondence:Jacint Ventura
e-mail: [email protected]
Aurora Ruiz-Herrera
e-mail: [email protected]
Electronic supplementary material is available
at http://dx.doi.org/10.1098/rspb.2014.0297 or
via http://rspb.royalsocietypublishing.org.
Genetic recombination variation inwild Robertsonian mice: on therole of chromosomal fusions and Prdm9allelic background
Laia Capilla1,2, Nuria Medarde2, Alexandra Alemany-Schmidt4,Maria Oliver-Bonet4, Jacint Ventura2 and Aurora Ruiz-Herrera1,3
1Institut de Biotecnologia i Biomedicina (IBB), 2Departament de Biologia Animal, Biologia Vegetal i Ecologia,and 3Departament de Biologia Cel.lular, Fisiologia i Immunologia, Universitat Autonoma de Barcelona,Campus UAB 08193, Barcelona, Spain4Unitat d’Investigacio, Hospital Universitari Son Espases, Ctra Valldemossa 79, Palma 07010, Spain
Despite the existence of formal models to explain how chromosomalrearrangements can be fixed in a population in the presence of gene flow,few empirical data are available regarding the mechanisms by whichgenome shuffling contributes to speciation, especially in mammals. Inorder to shed light on this intriguing evolutionary process, here we presenta detailed empirical study that shows how Robertsonian (Rb) fusions alterthe chromosomal distribution of recombination events during the formationof the germline in a Rb system of the western house mouse (Mus musculusdomesticus). Our results indicate that both the total number of meiotic cross-overs and the chromosomal distribution of recombination events arereduced in mice with Rb fusions and that this can be related to alterationsin epigenetic signatures for heterochromatinization. Furthermore, wedetected novel house mouse Prdm9 allelic variants in the Rb system.Remarkably, mean recombination rates were positively correlated with adecrease in the number of ZnF domains in the Prdm9 gene. The suggestionthat recombination can be modulated by both chromosomal reorganizationsand genetic determinants that control the formation of double-strandedbreaks during meiosis opens new avenues for understanding the role ofrecombination in chromosomal speciation.
1. IntroductionThe role of chromosomal reorganizations in speciation has been a long-standingquestion in biology. Understanding the genetic and mechanistic basis of theseprocesses will provide insights into how biodiversity originates and is main-tained. Compelling evidence supports that chromosomal rearrangements mayreduce gene flow and therefore potentially contribute to speciation by the sup-pression of recombination [1–3]. Under this ‘suppressed recombination’ model,chromosome reorganizations in heterokaryotypes have a minimal influence onfitness, but rather affect recombination thus contributing to a reduction of geneflow within these genomic regions and the consequent accumulation of geneticincompatibilities [3]. Data supporting recombination suppression by inversionshave been reported in different model organisms (see [4] and referencestherein), whereas studies regarding the effects of fusions have been restrictedto the western house mouse, Mus musculus domesticus [5–14] and thecommon shrew, Sorex araneus [15,16]. The general view is that chromosomalreorganizations disturb the chromosomal distribution of recombinationalevents altering, in the long term, the final outcome of crossovers (COs). Ifthis phenomenon was perpetuated within the population for long periods oftime, gene flow within the reorganized regions would be reduced, thus
& 2014 The Author(s) Published by the Royal Society. All rights reserved.
on June 8, 2015http://rspb.royalsocietypublishing.org/Downloaded from
RESULTS

142
eventually contributing to the establishment of geneticincompatibilities and subsequent progress towards completereproductive isolation [3]. Despite recent progress in the field,the mechanisms and the genetic basis underlying the processremain elusive. In this regard, recent attention has focused onthe Prdm9 gene, the only known speciation-associated genedescribed for mammals. The protein encoded by this gene,the PR domain zinc finger 9 (PRDM9) [17], is a meiotic-specific histone (H3) methyltransferase with a C-terminaltandem repeat zinc finger (ZnF) domain that accumulates atrecombination sites through its recognition of a species-specific and highly mutagenic repetitive DNA motif [17–19]. In humans, the high nucleotide variation detected atthis locus suggests that the protein (together with the repeti-tive DNA motif that it recognizes) is highly mutable enablingbinding to new motifs as soon as they are formed [20,21].Studies in laboratory strains of mice, moreover, have revealedthat the PRDM9 protein could be directly involved in therecruitment of the recombination initiation machineryduring meiosis [22]. It has also been reported that variationsin the Prdm9 sequence affect the positioning of meioticdouble-stranded breaks (DSBs), in the same way that thenumber and sequence of ZnF could determine the strengthand specificity of DNA binding [19,22].
Despite the existence of formal models to explain how chro-mosomal rearrangements could be fixed in two parapatricallydistributed populations under divergent selection, and bywhich mechanisms these may contribute to speciation [23],few empirical data are available, especially in mammals (see[4] and references therein). Therefore, the appreciation of howmeiotic recombination is controlled during meiosis and howchromosomal reorganization affects the process is of criticalimportance for our understanding of speciation mechanisms.In this context, natural populations represent an excellent scen-ario for determining the genetic and mechanistic factorsunderlying the origin of meiotic disturbances triggered bychromosomal reorganizations. The standard karyotype ofM. musculus domesticus consists of all-acrocentric chromosomes(2n ¼ 40). However, a wide range of diploid numbers (from 22to 40) have been described in natural populations resultingfrom the occurrence of Robertsonian (Rb) fusions and/orwhole arm reciprocal translocations [24,25]. According toPialek et al. [25], a Rb system is defined as a series of housemouse populations from a restricted geographical area thatshare a set of metacentrics with an apparently common evol-utionary origin. In this context, a total of 97 Rb systemsdistributed across Europe, and the Mediterranean basin hasbeen formally recognized [25]. Among them, the BarcelonaRb system is found in the provinces of Barcelona, Tarragonaand Lleida (Spain), extending over approximately 5000 km2
(figure 1a). Diploid numbers (2n) range from 27 to 39 chromo-somes, with the lowest 2n values observed at sites locatedapproximately 30 km west of the city of Barcelona ([26] andreferences therein). This Rb system is characterized by a highlevel of chromosomal polymorphism, with seven different Rbchromosomes (Rb (3.8), (4.14), (5.15), (6.10), (7.17), (9.11) and(12.13)) showing non-geographically coincident (staggered)clines ([26] and references therein). Owing to the absence of aRb race, as defined by Hausser et al. [27], this system hasbeen considered to be a Rb polymorphism zone rather thanbe a typical hybrid zone ([26] and references therein). Althoughthe chromosomal composition and structure of the BarcelonaRb system are known [26,28], the meiotic dynamics and genetic
recombination of the mice that comprise it remain elusive.Here, we have studied the recombination features of this Rbsystem with two specific aims: (i) to analyse the effect of Rbfusions on both recombination rate and its chromosomal distri-bution, and (ii) to determine the genetic and mechanisticfactors that are shaping the process.
2. Results(a) Recombination events are reduced in Robertsonian
miceWe studied the effect of Rb fusions on meiotic recombinationby analysing the variation in the number of autosomalMLH1 foci (marker of COs) detected at pachynema in males(figure 1a–c and the electronic supplementary material, tableS1). The average of MLH1 foci per cell observed ranged from20.16 (+1.18) to 21.65 (+2.43) in wild mice with standard(St) karyotype (2n ¼ 40), and from 18.13 (+1.78) to 20.57(+1.90) in Rb mice (figure 1d and the electronic supplemen-tary material, table S1). Wild St mice presented, on average,significantly less COs (20.88+1.83) per cell than did micederived from laboratory strains (21.32+2.12; Mann–WhitneyU-test, p � 0.05; figure 1d and the electronic supplementarymaterial, table S1). More importantly, mice with Rb fusionsshowed significantly smaller mean number of COs thanwild St mice (Kruskal–Wallis test, p � 0.001; figure 1d andthe electronic supplementary material, table S1). Among Rbmice, we could distinguish two different groups (Mann–Whitney U-test, p � 0.001): mice with high diploid numbers(2n ¼ 39–37, 19.93+1.77 COs per cell) and mice with lowdiploid numbers (2n ¼ 32–28, 19.39+1.68 COs per cell).These results indicate that Rb mice have a significant decreasein the overall number of recombination events per bivalent asa result of the presence of fused chromosomes.
In order to disentangle the effect of different factors onthe decreased number of COs observed in Rb mice, weevaluated correlations between diploid number and thedegree of heterozygosity in terms of rearrangements(heterokaryotypes). Owing to the absence of a fixedmetacentric race and the high level of chromosomal poly-morphisms that characterizes this Rb system, we pooledRb compositions in three categories: one, two and threeRb fusions in heterozygote state. When considering bothSt and Rb animals, we found a positive correlationbetween the mean number of COs and the diploidnumber (Spearman correlation test r ¼ 0.757, p � 0.001;electronic supplementary material, figure S1); however,when applying the same correlation only among the Rbspecimens, this was not significant (Spearman correlationtests r ¼ 0.236, p ¼ 0.315). Additionally, the comparison ofthe mean number of COs in Rb mice revealed that recombi-nation was not affected by the degree of heterozygosity(Kruskal–Wallis test, p ¼ 0.345). These results suggest thatadditional factors (other than diploid number reductionand the degree of heterozygosity) play a role in the finaloutcome of COs in this Rb system.
Considering the low mean values of COs observed in Rbmice, we investigated whether a similar pattern was reflectedby the proteins implicated in the repair of DSBs in the earlystages of prophase I (early pachynema). Meiotic recombina-tion is initiated by DSBs generated by the protein Spo11
rspb.royalsocietypublishing.orgProc.R.Soc.B281:20140297
2
on June 8, 2015http://rspb.royalsocietypublishing.org/Downloaded from
eventually contributing to the establishment of geneticincompatibilities and subsequent progress towards completereproductive isolation [3]. Despite recent progress in the field,the mechanisms and the genetic basis underlying the processremain elusive. In this regard, recent attention has focused onthe Prdm9 gene, the only known speciation-associated genedescribed for mammals. The protein encoded by this gene,the PR domain zinc finger 9 (PRDM9) [17], is a meiotic-specific histone (H3) methyltransferase with a C-terminaltandem repeat zinc finger (ZnF) domain that accumulates atrecombination sites through its recognition of a species-specific and highly mutagenic repetitive DNA motif [17–19]. In humans, the high nucleotide variation detected atthis locus suggests that the protein (together with the repeti-tive DNA motif that it recognizes) is highly mutable enablingbinding to new motifs as soon as they are formed [20,21].Studies in laboratory strains of mice, moreover, have revealedthat the PRDM9 protein could be directly involved in therecruitment of the recombination initiation machineryduring meiosis [22]. It has also been reported that variationsin the Prdm9 sequence affect the positioning of meioticdouble-stranded breaks (DSBs), in the same way that thenumber and sequence of ZnF could determine the strengthand specificity of DNA binding [19,22].
Despite the existence of formal models to explain how chro-mosomal rearrangements could be fixed in two parapatricallydistributed populations under divergent selection, and bywhich mechanisms these may contribute to speciation [23],few empirical data are available, especially in mammals (see[4] and references therein). Therefore, the appreciation of howmeiotic recombination is controlled during meiosis and howchromosomal reorganization affects the process is of criticalimportance for our understanding of speciation mechanisms.In this context, natural populations represent an excellent scen-ario for determining the genetic and mechanistic factorsunderlying the origin of meiotic disturbances triggered bychromosomal reorganizations. The standard karyotype ofM. musculus domesticus consists of all-acrocentric chromosomes(2n ¼ 40). However, a wide range of diploid numbers (from 22to 40) have been described in natural populations resultingfrom the occurrence of Robertsonian (Rb) fusions and/orwhole arm reciprocal translocations [24,25]. According toPialek et al. [25], a Rb system is defined as a series of housemouse populations from a restricted geographical area thatshare a set of metacentrics with an apparently common evol-utionary origin. In this context, a total of 97 Rb systemsdistributed across Europe, and the Mediterranean basin hasbeen formally recognized [25]. Among them, the BarcelonaRb system is found in the provinces of Barcelona, Tarragonaand Lleida (Spain), extending over approximately 5000 km2
(figure 1a). Diploid numbers (2n) range from 27 to 39 chromo-somes, with the lowest 2n values observed at sites locatedapproximately 30 km west of the city of Barcelona ([26] andreferences therein). This Rb system is characterized by a highlevel of chromosomal polymorphism, with seven different Rbchromosomes (Rb (3.8), (4.14), (5.15), (6.10), (7.17), (9.11) and(12.13)) showing non-geographically coincident (staggered)clines ([26] and references therein). Owing to the absence of aRb race, as defined by Hausser et al. [27], this system hasbeen considered to be a Rb polymorphism zone rather thanbe a typical hybrid zone ([26] and references therein). Althoughthe chromosomal composition and structure of the BarcelonaRb system are known [26,28], the meiotic dynamics and genetic
recombination of the mice that comprise it remain elusive.Here, we have studied the recombination features of this Rbsystem with two specific aims: (i) to analyse the effect of Rbfusions on both recombination rate and its chromosomal distri-bution, and (ii) to determine the genetic and mechanisticfactors that are shaping the process.
2. Results(a) Recombination events are reduced in Robertsonian
miceWe studied the effect of Rb fusions on meiotic recombinationby analysing the variation in the number of autosomalMLH1 foci (marker of COs) detected at pachynema in males(figure 1a–c and the electronic supplementary material, tableS1). The average of MLH1 foci per cell observed ranged from20.16 (+1.18) to 21.65 (+2.43) in wild mice with standard(St) karyotype (2n ¼ 40), and from 18.13 (+1.78) to 20.57(+1.90) in Rb mice (figure 1d and the electronic supplemen-tary material, table S1). Wild St mice presented, on average,significantly less COs (20.88+1.83) per cell than did micederived from laboratory strains (21.32+2.12; Mann–WhitneyU-test, p � 0.05; figure 1d and the electronic supplementarymaterial, table S1). More importantly, mice with Rb fusionsshowed significantly smaller mean number of COs thanwild St mice (Kruskal–Wallis test, p � 0.001; figure 1d andthe electronic supplementary material, table S1). Among Rbmice, we could distinguish two different groups (Mann–Whitney U-test, p � 0.001): mice with high diploid numbers(2n ¼ 39–37, 19.93+1.77 COs per cell) and mice with lowdiploid numbers (2n ¼ 32–28, 19.39+1.68 COs per cell).These results indicate that Rb mice have a significant decreasein the overall number of recombination events per bivalent asa result of the presence of fused chromosomes.
In order to disentangle the effect of different factors onthe decreased number of COs observed in Rb mice, weevaluated correlations between diploid number and thedegree of heterozygosity in terms of rearrangements(heterokaryotypes). Owing to the absence of a fixedmetacentric race and the high level of chromosomal poly-morphisms that characterizes this Rb system, we pooledRb compositions in three categories: one, two and threeRb fusions in heterozygote state. When considering bothSt and Rb animals, we found a positive correlationbetween the mean number of COs and the diploidnumber (Spearman correlation test r ¼ 0.757, p � 0.001;electronic supplementary material, figure S1); however,when applying the same correlation only among the Rbspecimens, this was not significant (Spearman correlationtests r ¼ 0.236, p ¼ 0.315). Additionally, the comparison ofthe mean number of COs in Rb mice revealed that recombi-nation was not affected by the degree of heterozygosity(Kruskal–Wallis test, p ¼ 0.345). These results suggest thatadditional factors (other than diploid number reductionand the degree of heterozygosity) play a role in the finaloutcome of COs in this Rb system.
Considering the low mean values of COs observed in Rbmice, we investigated whether a similar pattern was reflectedby the proteins implicated in the repair of DSBs in the earlystages of prophase I (early pachynema). Meiotic recombina-tion is initiated by DSBs generated by the protein Spo11
rspb.royalsocietypublishing.orgProc.R.Soc.B
281:20140297
2
on June 8, 2015http://rspb.royalsocietypublishing.org/Downloaded from
RESULTS

143
[29]. The replication protein A (RPA protein) associates withsingle-stranded DNA following DSBs formation and sub-sequently accumulates at the DSB sites [30]. Therefore, byanalysing the number of RPA foci in early pachynema, wecan determine the progression of DSBs as early recombina-tional nodules. If the final outcome of CO events observedin Rb mice is directly related to the initial DSBs formed inearly stages of prophase I, then we would expect to find areduced number of RPA foci when compared with St mice.We found that the mean number of RPA foci per cell atearly pachynema was similar in wild St (67.49+18.55) andRb mice (64.83+17.40; Mann–Whitney test, p ¼ 0.536).However, wild St and Rb mice differed significantly withrespect to laboratory mice (83.32+ 19.92; Kruskal–Wallistest, p � 0.001; electronic supplementary material, figureS2), suggesting that the difference between wild and labora-tory mice is probably related with a reduction in the initialnumber of DSBs at early meiosis (exemplified here as RPAfoci, representative of early nodules).
(b) Robertsonian fusions alter the chromosomaldistribution of recombination events
Moved by this striking pattern, we tested whether the overalldecrease in recombination events observed was as a result ofa reduction of COs in reorganized chromosomes. We analysedthe percentage of chromosomal arms showing 0, 1 or 2 MLH1foci considering three different groups based on the state of thechromosome (acrocentric, Ac, or metacentric, Met) and thetype of specimen (St or Rb): (i) chromosomal arms involvedin Rb fusions in Rb mice (Met), (ii) chromosomal arms notinvolved in Rb fusions belonging to wild St mice (Ac_St),and (iii) chromosomal arms not involved in Rb fusions in Rbmice (Ac_Rb; figure 1e and the electronic supplementarymaterial, table S2). Our results show that when chromosomesare involved in Rb fusions (Met) the frequency of chromosomalarms with two COs decreases significantly when comparedwith acrocentric chromosomes (Kruskal–Wallis test, p �0.001; figure 1e and the electronic supplementary material,
10lab_strain standard Rb,
2n = 39–37Rb,
2n = 32–28
* **
**
0Ac_St
**
Ac_Rb Met
102030405060708090
100
Viladecans(2n = 28–32)
Castelldefels(2n = 28–32)
El Papiol(2n = 38)
MLH1
Chr4Chr14
SYCP3CenP
(a)
(d) (e)
0S
E
N
O
40 km
(b)
(c)
Ametlla deSegarra(2n = 39)
El Prat de Llobregat(2n = 30–31)
BARCELONA
Arbeca(2n = 40)
Castellfollit del Boix(2n = 40)
Vacarisses(2n = 40)
Santa Perpètuade la Mogoda(2n = 40)
Sant Sadurnid¢Anoia
(2n = 37–39)
15
20
ML
H1
foci
per
cel
l
% o
f ch
rom
osom
al a
rms
2 MLH1 foci 1 MLH1 foci 0 MLH1 foci
25
30
35
Figure 1. Genetic recombination diversity in the Barcelona chromosomal polymorphism zone. (a) Map showing the sampling distribution. Diploid numbers are shown foreach locality (see the electronic supplementary material, table S1). Locations with standard and Rb individuals are indicated in red and black, respectively. (b) Example ofimmunolocalization of meiotic recombination events in mouse spermatocytes at pachynema from Rb5 (2n ¼ 37). MLH1 foci are depicted in green, centromeres in blueand the synaptomenal complexes in red. Asterisks indicate trivalent structures. (c) Fluorescence in situ hybridization on a metaphase spread from Rb3 (2n ¼ 38) withthe chromosomes involved in the Rb fusion painted in green (chromosome 4) and red (chromosome 14). (d ) Distribution of the mean numbers of MLH1 foci per cellobserved in the specimens analysed (n ¼ 34): lab_strain, standard mice from laboratory strain (n ¼ 310 cells); standard, wild standard mice (n ¼ 349 cells); Rb, 2n ¼39–37, Rb mice with diploid numbers between 2n ¼ 37–39 (n ¼ 270 cells); and Rb, 2n ¼ 32–28, Rb mice with diploid numbers between 2n ¼ 28–32 (n ¼ 333cells). Asterisks indicate statistical significance (Mann–Whitney U-test or Kruskal–Wallis test; *p-value � 0.05, **p-value � 0.001). (e) Percentage of chromosomalarms showing 0, 1 or 2 MLH1 foci. Three groups are differentiated: Ac_St, all acrocentric chromosomes belonging to standard wild mice (n ¼ 1197); Ac_Rb, all acrocentricchromosomes from Rb mice (n ¼ 2211); and Met, all chromosomal arms involved in Rb fusions (n ¼ 2056). Asterisk indicates statistical significance (Kruskal–Wallis test,**p-value � 0.001).
rspb.royalsocietypublishing.orgProc.R.Soc.B
281:20140297
3
on June 8, 2015http://rspb.royalsocietypublishing.org/Downloaded from
RESULTS
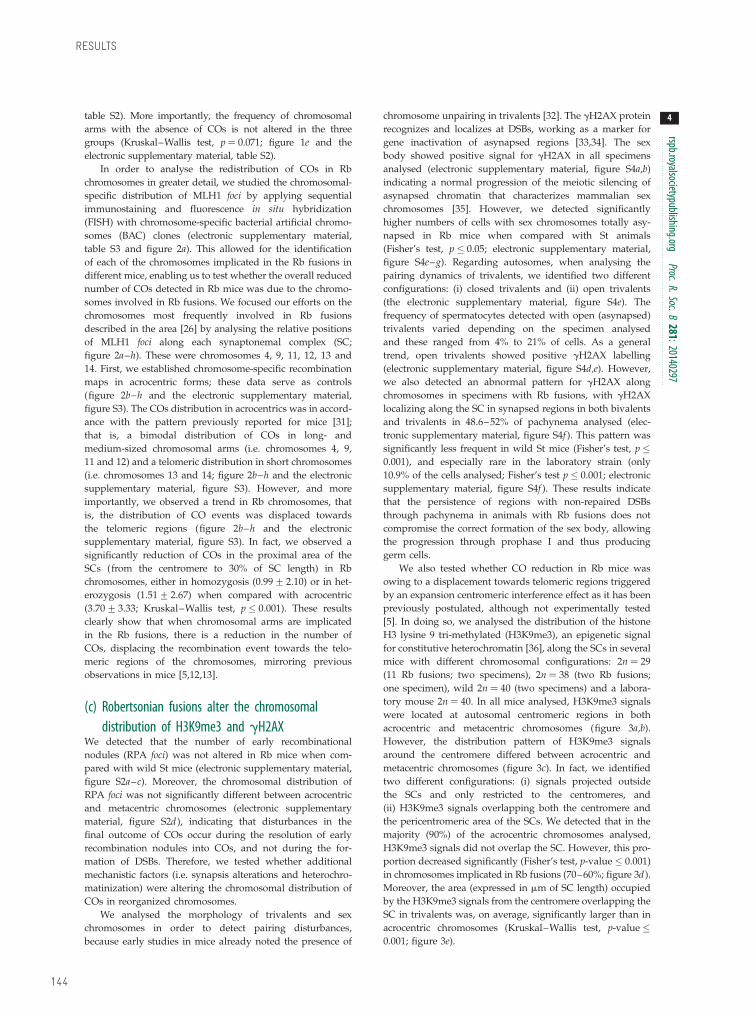
144
table S2). More importantly, the frequency of chromosomalarms with the absence of COs is not altered in the threegroups (Kruskal–Wallis test, p ¼ 0.071; figure 1e and theelectronic supplementary material, table S2).
In order to analyse the redistribution of COs in Rbchromosomes in greater detail, we studied the chromosomal-specific distribution of MLH1 foci by applying sequentialimmunostaining and fluorescence in situ hybridization(FISH) with chromosome-specific bacterial artificial chromo-somes (BAC) clones (electronic supplementary material,table S3 and figure 2a). This allowed for the identificationof each of the chromosomes implicated in the Rb fusions indifferent mice, enabling us to test whether the overall reducednumber of COs detected in Rb mice was due to the chromo-somes involved in Rb fusions. We focused our efforts on thechromosomes most frequently involved in Rb fusionsdescribed in the area [26] by analysing the relative positionsof MLH1 foci along each synaptonemal complex (SC;figure 2a–h). These were chromosomes 4, 9, 11, 12, 13 and14. First, we established chromosome-specific recombinationmaps in acrocentric forms; these data serve as controls(figure 2b–h and the electronic supplementary material,figure S3). The COs distribution in acrocentrics was in accord-ance with the pattern previously reported for mice [31];that is, a bimodal distribution of COs in long- andmedium-sized chromosomal arms (i.e. chromosomes 4, 9,11 and 12) and a telomeric distribution in short chromosomes(i.e. chromosomes 13 and 14; figure 2b–h and the electronicsupplementary material, figure S3). However, and moreimportantly, we observed a trend in Rb chromosomes, thatis, the distribution of CO events was displaced towardsthe telomeric regions (figure 2b–h and the electronicsupplementary material, figure S3). In fact, we observed asignificantly reduction of COs in the proximal area of theSCs (from the centromere to 30% of SC length) in Rbchromosomes, either in homozygosis (0.99+ 2.10) or in het-erozygosis (1.51+ 2.67) when compared with acrocentric(3.70+3.33; Kruskal–Wallis test, p � 0.001). These resultsclearly show that when chromosomal arms are implicatedin the Rb fusions, there is a reduction in the number ofCOs, displacing the recombination event towards the telo-meric regions of the chromosomes, mirroring previousobservations in mice [5,12,13].
(c) Robertsonian fusions alter the chromosomaldistribution of H3K9me3 and gH2AX
We detected that the number of early recombinationalnodules (RPA foci) was not altered in Rb mice when com-pared with wild St mice (electronic supplementary material,figure S2a–c). Moreover, the chromosomal distribution ofRPA foci was not significantly different between acrocentricand metacentric chromosomes (electronic supplementarymaterial, figure S2d ), indicating that disturbances in thefinal outcome of COs occur during the resolution of earlyrecombination nodules into COs, and not during the for-mation of DSBs. Therefore, we tested whether additionalmechanistic factors (i.e. synapsis alterations and heterochro-matinization) were altering the chromosomal distribution ofCOs in reorganized chromosomes.
We analysed the morphology of trivalents and sexchromosomes in order to detect pairing disturbances,because early studies in mice already noted the presence of
chromosome unpairing in trivalents [32]. The gH2AX proteinrecognizes and localizes at DSBs, working as a marker forgene inactivation of asynapsed regions [33,34]. The sexbody showed positive signal for gH2AX in all specimensanalysed (electronic supplementary material, figure S4a,b)indicating a normal progression of the meiotic silencing ofasynapsed chromatin that characterizes mammalian sexchromosomes [35]. However, we detected significantlyhigher numbers of cells with sex chromosomes totally asy-napsed in Rb mice when compared with St animals(Fisher’s test, p � 0.05; electronic supplementary material,figure S4e–g). Regarding autosomes, when analysing thepairing dynamics of trivalents, we identified two differentconfigurations: (i) closed trivalents and (ii) open trivalents(the electronic supplementary material, figure S4e). Thefrequency of spermatocytes detected with open (asynapsed)trivalents varied depending on the specimen analysedand these ranged from 4% to 21% of cells. As a generaltrend, open trivalents showed positive gH2AX labelling(electronic supplementary material, figure S4d,e). However,we also detected an abnormal pattern for gH2AX alongchromosomes in specimens with Rb fusions, with gH2AXlocalizing along the SC in synapsed regions in both bivalentsand trivalents in 48.6–52% of pachynema analysed (elec-tronic supplementary material, figure S4f ). This pattern wassignificantly less frequent in wild St mice (Fisher’s test, p �0.001), and especially rare in the laboratory strain (only10.9% of the cells analysed; Fisher’s test p � 0.001; electronicsupplementary material, figure S4f ). These results indicatethat the persistence of regions with non-repaired DSBsthrough pachynema in animals with Rb fusions does notcompromise the correct formation of the sex body, allowingthe progression through prophase I and thus producinggerm cells.
We also tested whether CO reduction in Rb mice wasowing to a displacement towards telomeric regions triggeredby an expansion centromeric interference effect as it has beenpreviously postulated, although not experimentally tested[5]. In doing so, we analysed the distribution of the histoneH3 lysine 9 tri-methylated (H3K9me3), an epigenetic signalfor constitutive heterochromatin [36], along the SCs in severalmice with different chromosomal configurations: 2n ¼ 29(11 Rb fusions; two specimens), 2n ¼ 38 (two Rb fusions;one specimen), wild 2n ¼ 40 (two specimens) and a labora-tory mouse 2n ¼ 40. In all mice analysed, H3K9me3 signalswere located at autosomal centromeric regions in bothacrocentric and metacentric chromosomes (figure 3a,b).However, the distribution pattern of H3K9me3 signalsaround the centromere differed between acrocentric andmetacentric chromosomes (figure 3c). In fact, we identifiedtwo different configurations: (i) signals projected outsidethe SCs and only restricted to the centromeres, and(ii) H3K9me3 signals overlapping both the centromere andthe pericentromeric area of the SCs. We detected that in themajority (90%) of the acrocentric chromosomes analysed,H3K9me3 signals did not overlap the SC. However, this pro-portion decreased significantly (Fisher’s test, p-value � 0.001)in chromosomes implicated in Rb fusions (70–60%; figure 3d).Moreover, the area (expressed in mm of SC length) occupiedby the H3K9me3 signals from the centromere overlapping theSC in trivalents was, on average, significantly larger than inacrocentric chromosomes (Kruskal–Wallis test, p-value �0.001; figure 3e).
rspb.royalsocietypublishing.orgProc.R.Soc.B
281:20140297
4
on June 8, 2015http://rspb.royalsocietypublishing.org/Downloaded from
RESULTS

145
(d) Prdm9 allelic background and recombination ratesTo directly assay the genetic basis underlying the alterations inthe number and distribution of COs observed in Rb mice, wescreened our sample for new Prdm9 allelic variants that mightaccount for such diversity. Prdm9 plays a key role in determin-ing the patterning of recombination events [22]; therefore, ourworking hypothesis was to consider that the observed diver-sity in recombination rates (figure 1 and the electronicsupplementary material, table S1) was related to the Prdm9genetic background. With this in mind, we sequenced thePrmd9 exon 12 containing the Zn finger domain from Znrepeat þ3 towards the C-terminal domain in 27 mice fromour sample (electronic supplementary material, table S1). Wedetected that 20 specimens had alleles of the same length,whereas the remaining specimens had alleles of two differentlengths (electronic supplementary material, table S1 andfigure S5). Our genetic screening detected five Prdm9 allelicvariants present in the study area, which differed both innucleotide sequences and the number of Zn finger repeatsfrom previous studies [17,37]. These were referred to as 10A,10B, 11B, 12B and 12C (electronic supplementary material,
figures S6 and S7). The alleles 12B and 12C shared the samenumber of ZnF domains as the alleles previously describedin M. musculus domesticus [17,37], but differed in the DNAsequence of the ZnF domains (electronic supplementarymaterial, figures S7 and S8). The allele 11B shared the samenumber of ZnF domains as previously described in Musmusculus castaneus [37], but, as with the above, differed inthe DNA sequence of ZnF domains (electronic supplementarymaterial, figure S7). More importantly, we detected two alleleswith 10 ZnF repeats (allele 10A and 10B), which are specific forthe Barcelona chromosomal polymorphism zone (electronicsupplementary material, figures S6–S8). The analysis of thenucleotide and amino acid sequence revealed that the highestreplacement rates for all alleles were detected at positions21, þ3 and þ6, all regions that were previously described asbeing highly polymorphic (electronic supplementary material,figures S7 and S8). These positions correspond to the aminoacids that recognize the DNA repeat sequence-specific for thePrdm9 protein in the mouse.
Allele frequency and distribution varied among specimensand among localities (electronic supplementary material,
010proximal
0
5
10
15
20Ac
**
Met_Het Met_Hom
interstitial distal 20 30 40 50 60distance from centromere (%)
chromosome 13 chromosome 14
chromosome 11 chromosome 12
chromosome 4 chromosome 9
70 80 90100 10 20 30 40 50 60distance from centromere (%)
70 80 90100
0.8
0.6
0.4
0.2
cum
ulat
ive
freq
uenc
y
freq
uenc
y
1.0
0
0.8
0.6
0.4
0.2cu
mul
ativ
e fr
eque
ncy 1.0
0
0.8
0.6
0.4
0.2
cum
ulat
ive
freq
uenc
y 1.0(a) (c) (d)
(e) ( f )
(g)
(b)
(h)
MLH1
RP24-362|10
SYCP3
SYCP3
CenP
Figure 2. Cumulative frequencies of MLH1 foci in chromosomes implicated in Rb fusions. (a) Sequential image of a mouse spermatocyte at pachynema depicting atriple immunostaining with SYCP3 (red), MLH1 (green) and centromeres (blue) (upper panel) and fluorescent in situ hybridization (FISH; bottom panel) with a BACprobe corresponding to mouse chromosome 11 (RP23–362I10) in green. (b) Representation of the MLH1 foci frequencies obtained after merging data for allchromosomes analysed (no. 4, no. 9, no. 11, no. 12, no. 13 and no. 14). MLH1 foci frequencies along the SCs are shown for three regions depending on therelative distance from the centromere: (i) proximal, from the centromere to 30% of the SC; (ii) interstitial, between 30% and 70% of SC; and (iii) distal, from70% to telomeric region (Kruskal–Wallis test; **p-value � 0.001). Three different groups were considered: Ac, chromosomes in acrocentric form; Met_Hom,chromosomes involved in Rb fusions in homozygosis; and Met_Het, chromosomes involved in Rb fusions in heterozygosis. (c–h) Cumulative frequency plotsrepresenting the CO distribution of specific mouse chromosomes. In all instances, blue lines indicate chromosomes in the acrocentric form (n ¼ 38 cells analysedfor no. 4, n ¼ 25 for no. 9, n ¼ 36 for no. 11, n ¼ 31 for no. 12, n ¼ 71 for no. 13 and n ¼ 46 for no. 14). Green lines represent the distribution whenchromosomes are involved in Rb fusions in homozygosis (n ¼ 21 cells analysed for no. 4, n ¼ 22 for no. 9 n ¼ 30 for no. 11, n ¼ 21 for no. 12, n ¼ 20for no. 13 and n ¼ 36 for no. 14) and red lines when in heterozygosis (n ¼ 86 cells analysed for no. 4, n ¼ 22 for no. 9, n ¼ 20 for no. 11, n ¼ 28 forno. 12, n ¼ 26 for no. 13, n ¼ 73 for no. 14).
rspb.royalsocietypublishing.orgProc.R.Soc.B
281:20140297
5
on June 8, 2015http://rspb.royalsocietypublishing.org/Downloaded from
RESULTS

146
figure S6a,b). Allele 10A was the most frequently observed(77.77%) in our sample followed by 12B (14.81%), 12C(3.70%) and to a lesser extent 11B (1.85%) and 10B (1.85%; elec-tronic supplementary material, figure S6a). The highestnumber of different alleles was observed within St wild micethat surrounded the localities containing Rb mice (electronicsupplementary material, figure S6b and table S1). Remarkably,these Rb mice were genetically more homogeneous, beingmostly homozygous for allele 10A (electronic supplementarymaterial, figure S6b and table S1).
We additionally investigated whether Prdm9 geneticbackground influences recombination, as has been pre-viously shown in humans [38]. As it has been suggestedthat low numbers of ZnF repeats are correlated with lowerrecombination rates [38], three different groups were con-sidered: mice carrying two common 10 alleles (10/10), micecarrying one non-10 allele (10/N) and mice carrying twonon-10 alleles (N/N). The comparison of CO frequency(mean number of MLH1 foci/cell) in specimens with 10/10,10/N and N/N genotypes revealed that those carrying the10 alleles in homozygosis state showed, on average, a signifi-cantly lower number of COs than N/10 and N/N mice
(Kruskal–Wallis test, p-value � 0.001; electronic supple-mentary material, figure S6c). Moreover, we applieddifferent correlation analysis between Prdm9 allelic diversity,diploid number and mean number of MLH1 foci per cell. Wedetected a highly similar correlation value between thesethree factors: r ¼ 0.56 between total number of PRDM9 ZnFdomains and recombination rate ( p-value , 0.05), r ¼ 0.58between total number of PRDM9 ZnF domains and diploidnumber ( p-value , 0.05), and r ¼ 0.75 between diploidnumber and recombination rate ( p-value , 0.001), suggestingthat the three (mechanistic factors, genetic factors andrecombination rates) are somehow related.
3. DiscussionIn an evolutionary context, our study represents a detailedempirical demonstration that Rb fusions affect meioticrecombination and that this can be related to alterations in epi-genetic signatures for heterochromatinization. Although someanalyses performed were based on a limited number of indi-viduals, this is, to our knowledge, the first meiotic study on
0Ac
non-overlappingH3K9me3
overlappingH3K9me3
Met_Hom
Ac Met_Hom
Met_Het
Met_Het
0.2
0.4
0.8
1.0**
**
10
20% o
f ch
rom
osom
al a
rms
mea
n si
ze o
f H
3K9m
e3 s
igna
ls30
40
50
60
70
80
90
100(i)
(ii)
(iii)
H3K9me3
SYCP3
CenP
H3K9me3
SYCP3
CenP
(a)
(c) (d) (e)
(b)
Figure 3. Chromosomal distribution of H3K9me3 signals. (a,b) Examples of mouse spermatocytes from standard (a) and Rb (b) mice displaying the H3K9me3distribution (red) with SC (green) and centromeres (blue). (c) Representation of the different H3K9me3 signal patterns observed in the sample: (i) acrocentricchromosomes, (ii) heterozygote metacentric, and (iii) homozygote metacentric. In all cases, H3K9me3 signals (red) were found in two different situations: over-lapping and not-overlapping the SC. (d ) Frequency of chromosomal arms with H3K9me3 signal overlapping (green) or non-overlapping (orange) the SC inacrocentric (Ac, n ¼ 392) homozygote metacentric (Met_Hom, n ¼ 172) and heterozygote metacentric chromosomal arms (Met_Het, n ¼ 71). (e) Distributionof the mean size (expressed in mm of SC length) of the H3K9me3 signals overlapping the SC measured in the centromeric area (n ¼ 78) in the three types ofchromosomal arms described in (c,d). Asterisks indicate statistical significance (Fisher’s test, **p-value � 0.001; Kruskal–Wallis test, **p-value � 0.001).
rspb.royalsocietypublishing.orgProc.R.Soc.B
281:20140297
6
on June 8, 2015http://rspb.royalsocietypublishing.org/Downloaded from
RESULTS

147
a Rb polymorphism zone. This has allowed us to detect impor-tant trends. First, we found that Rb males have significantlylower recombination rates that wild St mice, despite the varia-bility observed in diploid numbers. Second, our resultssuggest that Rb fusions indeed have an effect on the chromo-somal distribution of COs, altering their chromosomaldistribution. The average number of recombination events isreduced in chromosomal arms involved in Rb fusions whencompared with acrocentrics, reflecting a reduction in the per-centage of chromosomal arms with two COs in Rb animals.These data add to preliminary observations that have reporteda reduction in chiasmata number (in latter stages of meiosis;i.e. metaphase II) and MLH1 foci in different house mice popu-lations with Rb fusions [5,6,11–13]. Our approach, however,provided a more detailed and chromosomal-specific analysisof CO redistribution. In fact, we observed that the distributionof COs along chromosomal arms that occur in acrocentrics isaltered in Rb chromosomes; recombinational events closer tothe centromeric region are frequently lost and COs tend tobe more terminal in metacentrics. It is well known that meioticrecombination is repressed close to the centromere, a patternthat has been conserved in all eukaryote species. This isbecause COs occurring close to centromere interfere withnormal chromatid segregation, inducing aneuploidy [39].Although the molecular mechanisms underlying centromereinterference are still largely unknown, pericentric heterochro-matin formation (here exemplified by H3K9me3 signals) isconsidered crucial for the process [40]. In fact, the epigeneticstatus of the chromatin is, in general, important for recombina-tion. Meiotic DSBs tend to occur in open and highly transcribedeuchromatic regions [19], whereas DNA methylation sup-presses CO formation. Recent studies in plants havesuggested that DNA methylation can affect the distribution ofrecombination events in cis, this alteration being chromoso-mal-dependent [41]. This fact has important implications forour observations given that chromosomes involved in the Rbfusions locally affect the overall reduction of COs detected inRb mice. We observed larger and more expanded H3K9me3signals over the SC in trivalents, which are characterized bythe presence of three centromeres non-completely aligned.These results, together with the presence of altered gH2AX pat-tern along the SC in synapsed regions in both bivalents andtrivalents in Rb mice, suggest that DSBs are not properlyrepaired, especially in trivalent structures, affecting the finaloutcome of COs.
We also detected that the formation of the sex body atpachynema is not compromised in the Rb males by eitherthe presence of asynapsed regions or asynapsed sex chromo-somes. But more importantly, the number of chromosomalarms with no CO is not significantly altered when comparingacrocentric and metacentric chromosomes in Rb animals. COsare highly regulated in mammals to ensure the proper dis-junction of homologous chromosomes during meiosis [42]and mammalian species normally present (on average) oneCO per chromosomal arm [43,44]. Our observations haveimportant implications for CO homeostasis [42], indicat-ing that cells carrying Rb fusions modulate the final COoutcome without losing the obligatory one chiasmata perarm necessary to allow even chromosomal segregation, thusnot compromising the viability of germ cells. Therefore, anddespite the presence of unrepaired DNA regions in bothopen trivalents and synapsed autosomes at pachynema inRb mice, the sex body is probably established and cells
escape the pachytene checkpoint [34]. Given the widespreaddistribution of Rb animals in the Barcelona chromosomalpolymorphic zone, the low recombination rates observedand the presence of asynapsed regions in the trivalents prob-ably would have a mild negative effect on fertility, mirroringprevious observations [34]. This interpretation is in line withanalyses performed on mice from the Barcelona Rb system[26,45,46], which suggest that Rb fusions have a reducedeffect on mice fertility, thus permitting the de novooccurrence of chromosomal rearrangements within this zone.
Together with the CO mechanistic disturbances observed,the Prdm9 allelic diversity has been revealed as an additionalfactor modulating genetic recombination. The PRDM9protein is directly involved in the recruitment of the recombi-nation initiation machinery during meiosis [22]. Previousstudies have described the presence of four different haplo-types in mice with differences in the number of Zn fingers:9-Zn fingers, 11-Zn fingers, 12-Zn fingers, 13-Zn fingersand 14-Zn fingers [17,19,37], and our data add new Prdm9allelic variants to the picture, confirming the high Prdm9sequence variability in nature. More importantly, our resultssuggest that the number and sequence of Zn fingers mightinfluence meiotic recombination outcome, most probably byregulating strength and specificity of DNA binding, thus inagreement with what has been reported in humans andmice [17,19,38,47]. Mice carrying the 10 allele showed, onaverage, a significantly lower number of COs than micewith longer Zn finger repeats. In fact, the allele 10A was themost frequently observed in the Barcelona chromosomalpolymorphism zone (16 of 18 were homozygote for 10A).Despite this, we still could distinguish two different groupsamong Rb mice in terms of MLH1 mean values, irrespec-tive of their Prmd9 allelic composition: mice with high(2n ¼ 37–39) and low diploid numbers (2n ¼ 28–32). Thefact that both groups did not differ in genetic background(i.e. homozygote for 10A) suggests that additional factors(rather than genetic ones) could explain such differences.Further analysis of the population structure of the BarcelonaRb system would reveal novel Prdm9 allelic variants, as wellas possible demographic or stochastic effects underling itsallelic distribution and the genetic modulation of recombina-tion. In fact, our analysis of RPA foci (representative of earlynodules) indicated that both wild St and Rb mice (carryingthe 10 allele) presented a similar pattern in terms of overallnumbers of RPA foci per cell detected, but different withrespect to the laboratory mouse strain, suggesting that micefrom the Barcelona chromosomal polymorphic zone have aunique genetic background that is affecting recombination.
Which are the evolutionary implications of our results?Here, we demonstrate that the average number of recombina-tion events is indeed reduced in chromosomal arms involvedin the Rb fusions when compared with acrocentric chromo-somes, especially in proximal chromosomal regions, andthat this can be related to alterations in epigenetic signaturesfor heterochromatinization. In mammals, recent studieshave detected reduced recombination rates and gene flowwithin reorganized regions [8,14,16]. This has been the caseof inversions, where recombination is specially reduced inheterokaryotypes [1–4]. By contrast, the effect of Rb fusionsbased on the state of the fusion (hetero- versus homozygous)has been less explored [5,6,8,11,12]. The fact that we observeda reduction in recombination in both heterokaryotypesand homokaryotypes suggest that fusions might evolve
rspb.royalsocietypublishing.orgProc.R.Soc.B
281:20140297
7
on June 8, 2015http://rspb.royalsocietypublishing.org/Downloaded from
RESULTS

148
differently than inversions do. Although at this stage itwould be premature to discuss the evolutionary forcesbehind this pattern, both the absence of a fixed metacentricrace and the high level of chromosomal polymorphismsthat characterizes the Barcelona Rb system highlights itsimportance as an informative model. Further analysis of thegenetic structure of this system would help us to elucidatewhether suppressed recombination triggered by Rb fusionsis indeed leaving a signature of genetic divergence.
4. ConclusionHere, we show that mice with Rb fusions present a substan-tially reduced number of the total recombinational events as aresult of a redistribution of COs in those chromosomal armsinvolved in Rb fusions. Moreover, the detection of novelPrdm9 allelic variants in the Barcelona Rb polymorphiczone has permitted the examination of recombination varia-bility observed within the population. Overall, our resultssuggest that changes in both number and distribution ofrecombination events are probably modulated by heterochro-matinization disturbances produced by Rb fusions andinfluenced by the Prdm9 genetic background.
5. Material and methodsA total of 31 wild male mice (2n ¼ 40, 11 mice; 2n ¼ 39, 2 mice;2n ¼ 38, 3 mice; 2n ¼ 37, 3 mice; 2n ¼ 32, 2 mice; 2n ¼ 31,
3 mice; 2n ¼ 30, 4 mice; 2n ¼ 29, 2 mice; 2n ¼ 28, 1 mouse)were live-trapped in commensal habitats from 10 differentlocalities representative of the Barcelona Rb system (figure 1and the electronic supplementary material, table S1). See the elec-tronic supplementary material for details on sample processing,immunofluorescence, FISH, image processing and data analysis,and Prdm9 genotyping.
Permission to capture was granted by the Departament de MediAmbient of the Generaltitat de Catalunya (Spain). Animals werehandled in compliance with the guidelines and ethical approval bythe Comissio d’Etica en l’Experimentacion Animal y Humana(CEEAH) of the Universitat Autonoma de Barcelona and by theDepartament d’Agriculta, Romaderia, Pesca, Alimentacio i MediNatural (Direccio General de Medi Natural i Biodiversitat) of theGeneralitat de Catalunya.
Acknowledgements. The authors acknowledge Josep Medarde for hisvaluable help in the fieldwork and J. Davidian-Britton, T. J. Robinsonand M. Garcıa-Caldes for insightful comments on earlier versions ofthe manuscript and to M. Fritzler for the sclerodactyly and telangiec-tasia (CREST) serum.Funding statement. Financial support from Ministerio de Economia yCompetitividad is gratefully acknowledged (CGL2010-15243 to J.V.and CGL-2010-20170 to A.R.H.). M.O.B. is supported by Institutode Salud Carlos III (CP07/ 0258 and PI08/1185). L.C. is the benefi-ciary of an FPI pre-doctoral fellowship (BES-2011-047722), whereasA.A.S. is sponsored by a pre-doctoral fellowship from the Conselleriad’Educacio, Cultura i Universitats (Govern Illes Balears) and FonsSocial Europeu.
References
1. Rieseberg LH. 2001 Chromosomal rearrangementsand speciation. Trends Ecol. Evol. 16, 351–358.(doi:10.1016/S0169-5347(01)02187-5)
2. Faria R, Navarro A. 2010 Chromosomal speciationrevisited: rearranging theory with pieces ofevidence. Trends Ecol. Evol. 25, 660–669. (doi:10.1016/j.tree.2010.07.008)
3. Navarro A, Barton NH. 2003 Chromosomalspeciation and molecular divergence-acceleratedevolution in rearranged chromosomes. Science 300,321–324. (doi:10.1126/science.1080600)
4. Farre M, Micheletti D, Ruiz-Herrera A. 2013Recombination rates and genomic shuffling inhuman and chimpanzee: a new twist in thechromosomal speciation theory. Mol. Biol. Evol. 30,853–864. (doi:10.1093/molbev/mss272)
5. Dumas D, Britton-Davidian J. 2002 Chromosomalrearrangements and evolution of recombination:comparison of chiasma distribution patterns instandard and Robertsonian populations of thehouse mouse. Genetics 162, 1355–1366.
6. Castiglia R, Capanna E. 2002 Chiasma repatterningacross a chromosomal hybrid zone betweenchromosomal races of Mus musculus domesticus.Genetica 114, 35–40. (doi:10.1023/A:1014626330022)
7. Ruiz-Herrera A, Farre M, Ponsa M, Robinson TJ. 2010Selection against Robertsonian fusions involvinghousekeeping genes in the house mouse: integratingdata from gene expression arrays and chromosome
evolution. Chromosome Res. 18, 801–808. (doi:10.1007/s10577-010-9153-8)
8. Franchini P, Colangelo P, Solano E, Capanna E,Verheyen E, Castiglia R. 2010 Reduced gene flow atpericentromeric loci in a hybrid zone involvingchromosomal races of the house mouse Musmusculus domesticus. Evolution 64, 2020–2032.(doi:10.1111/j.1558-5646.2010.00964.x)
9. Nunes AC, Catalan J, Lopez J, Ramalhinho MDG,Mathias MDL, Britton-Davidian J. 2011 Fertilityassessment in hybrids between monobrachiallyhomologous Rb races of the house mouse from theisland of Madeira: implications for modes ofchromosomal evolution. Heredity 106, 348–356.(doi:10.1038/hdy.2010.74)
10. Forster DW, Mathias ML, Britton-Davidian J, SearleJB. 2013 Origin of the chromosomal radiation ofMadeiran house mice: a microsatellite analysis ofmetacentric chromosomes. Heredity 110, 380–388.(doi:10.1038/hdy.2012.107)
11. Merico V, Gimenez MD, Vasco C, Zuccotti M, SearleJB, Hauffe HC, Garagna S. 2013 Chromosomalspeciation in mice: a cytogenetic analysis ofrecombination. Chromosome Res. 21, 523–533.(doi:10.1007/s10577-013-9377-5)
12. Bidau CJ, Gimenez MD, Palmer CL, Searle JB. 2001The effects of Robertsonian fusions on chiasmafrequency and distribution in the house mouse (Musmusculus domesticus) from a hybrid zone in
northern Scotland. Heredity 87, 305–313. (doi:10.1046/j.1365-2540.2001.00877.x)
13. Merico V, Pigozzi MI, Esposito A, Merani MS,Garagna S. 2003 Meiotic recombination andspermatogenic impairment in Mus musculusdomesticus carrying multiple simple Robertsoniantranslocations. Cytogenet. Genome Res. 103,321–329. (doi:10.1159/000076820)
14. Gimenez MD, White TA, Hauffe HC, Panithanarak T,Searle JB. 2013 Understanding the basis ofdiminished gene flow between hybridizingchromosome races of the house mouse. Evolution67, 1446–1462. (doi:10.1111/evo.12054)
15. Borodin PM, Karamysheva TV, Belonogova NM,Torgasheva AA, Rubtsov NB, Searle JB. 2008Recombination map of the common shrew, Sorexaraneus (Eulipotyphla, Mammalia). Genetics 178,621–632. (doi:10.1534/genetics.107.079665)
16. Yannic G, Basset P, Hausser J. 2009 Chromosomalrearrangements and gene flow over time in aninter-specific hybrid zone of the Sorex araneusgroup. Heredity 102, 616–625. (doi:10.1038/hdy.2009.19)
17. Mihola O, Trachtulec Z, Vlcek C, Schimenti JC, ForejtJ. 2009 A mouse speciation gene encodes a meiotichistone H3 methyltransferase. Science 323,373–375. (doi:10.1126/science.1163601)
18. Baudat F, Buard J, Grey C, Fledel-Alon A, Ober C,Przeworski M, Coop G, de Massy B. 2010 PRDM9 is
rspb.royalsocietypublishing.orgProc.R.Soc.B
281:20140297
8
on June 8, 2015http://rspb.royalsocietypublishing.org/Downloaded from
RESULTS

149
a major determinant of meiotic recombinationhotspots in humans and mice. Science 327,836–840. (doi:10.1126/science.1183439)
19. Smagulova F, Gregoretti IV, Brick K, Khil P,Camerini-Otero RD, Petukhova GV. 2011 Genome-wide analysis reveals novel molecular features ofmouse recombination hotspots. Nature 472,375–378. (doi:10.1038/nature09869)
20. Wegmann D et al. 2011 Recombination rates inadmixed individuals identified by ancestry-basedinference. Nat. Genet. 43, 847–853. (doi:10.1038/ng.894)
21. Jeffreys AJ, Cotton VE, Neumann R, Lam KG. 2013Recombination regulator PRDM9 influences theinstability of its own coding sequence in humans.Proc. Natl Acad. Sci. USA 110, 600–605. (doi:10.1073/pnas.1220813110)
22. Brick K, Smagulova F, Khil P, Camerini-Otero RD,Petukhova GV. 2012 Genetic recombination isdirected away from functional genomic elements inmice. Nature 485, 642–645. (doi:10.1038/nature11089)
23. Kirkpatrick M, Barton N. 2006 Chromosomeinversions, local adaptation and speciation.Genetics 173, 419–434. (doi:10.1534/genetics.105.047985)
24. Gazave E, Catalan J, Da Graca Ramalhinho M, Da LuzMathias M, Claudia Nunes A, Dumas D, Britton-Davidian J, Auffray J-C. 2003 The non-randomoccurrence of Robertsonian fusion in the housemouse. Genet. Res. 81, 33–42. (doi:10.1017/S001667230200602X)
25. Pialek J, Hauffe HC, Searle JB. 2005 Chromosomalvariation in the house mouse. Biol. J. Linn. Soc.84, 535–563. (doi:10.1111/j.1095-8312.2005.00454.x)
26. Medarde N, Lopez-Fuster MJ, Munoz-Munoz F,Ventura J. 2012 Spatio-temporal variation in thestructure of a chromosomal polymorphism zone inthe house mouse. Heredity 109, 78–89. (doi:10.1038/hdy.2012.16)
27. Hausser J, Fedyk S, Fredga K, Searle JB, VolobouevV, Wojcik JM, Zima J. 1994 Definition andnomenclature of the chromosome races of SorexAraneus. Folia Zool. 43, 1–9.
28. Gunduz I, Lopez-Fuster MJ, Ventura J, Searle JB.2001 Clinal analysis of a chromosomal hybrid zonein the house mouse. Genet. Res. 77, 41–51.(doi:10.1017/S0016672300004808)
29. Keeney S, Giroux CN, Kleckner N. 1997 Meiosis-specific DNA double-strand breaks are catalyzed bySpo11, a member of a widely conserved proteinfamily. Cell 88, 375–384. (doi:10.1016/S0092-8674(00)81876-0)
30. Moens PB, Marcon E, Shore JS, Kochakpour N,Spyropoulos B. 2007 Initiation and resolution ofinterhomolog connections: crossover and non-crossover sites along mouse synaptonemalcomplexes. J. Cell Sci. 120, 1017–1027. (doi:10.1242/jcs.03394)
31. Froenicke L, Anderson LK, Wienberg J, Ashley T. 2002Male mouse recombination maps for each autosomeidentified by chromosome painting. Am. J. Hum.Genet. 71, 1353–1368. (doi:10.1086/334714)
32. Wallace BM, Searle JB, Everett CA. 1992 Malemeiosis and gametogenesis in wild house mice(Mus musculus domesticus) from a chromosomalhybrid zone; a comparison between ‘simple’Robertsonian heterozygotes and homozygotes.Cytogenet. Cell Genet. 61, 211–220. (doi:10.1159/000133410)
33. Matveevsky SN, Pavlova SV, Acaeva MM, KolomietsOL. 2012 Synaptonemal complex analysis ofinterracial hybrids between the Moscow andNeroosa chromosomal races of the common shrewSorex araneus showing regular formation of acomplex meiotic configuration (ring-of-four). Comp.Cytogenet. 6, 301–314. (doi:10.3897/compcytogen.v6i3.3701)
34. Manterola M et al. 2009 A high incidence of meioticsilencing of unsynapsed chromatin is not associatedwith substantial pachytene loss in heterozygousmale mice carrying multiple simple Robertsoniantranslocations. PLoS Genet. 5, e1000625. (doi:10.1371/journal.pgen.1000625)
35. Burgoyne PS, Mahadevaiah SK, Turner JM. 2009 Theconsequences of asynapsis for mammalian meiosis.Nat. Rev. Genet. 10, 207–216. (doi:10.1038/nrg2505)
36. Hublitz P, Albert M, Peters AH. 2009 Mechanisms oftranscriptional repression by histone lysinemethylation. Int. J. Dev. Biol. 53, 335–354. (doi:10.1387/ijdb.082717ph)
37. Parvanov ED, Petkov PM, Paigen K. 2010 Prdm9controls activation of mammalian recombinationhotspots. Science 327, 835. (doi:10.1126/science.1181495)
38. Berg IL, Neumann R, Lam K-WG, Sarbajna S,Odenthal-Hesse L, May CA, Jeffreys AJ. 2010 PRDM9
variation strongly influences recombination hot-spotactivity and meiotic instability in humans. Nat.Genet. 42, 859–863. (doi:10.1038/ng.658)
39. Lynn A, Ashley T, Hassold T. 2004 Variation inhuman meiotic recombination. Annu. Rev. GenomicsHum. Genet. 5, 317–349. (doi:10.1146/annurev.genom.4.070802.110217)
40. Bernard P, Maure JF, Partridge JF, Genier S, JaverzatJP, Allshire RC. 2001 Requirement ofheterochromatin for cohesion at centromeres.Science 294, 2539–2542. (doi:10.1126/science.1064027)
41. Mirouze M, Lieberman-Lazarovich M, Aversano R,Bucher E, Nicolet J, Reinders J, Paszkowski J.2012 Loss of DNA methylation affects therecombination landscape in Arabidopsis. Proc.Natl Acad. Sci. USA 109, 5880–5885. (doi:10.1073/pnas.1120841109)
42. Cole F, Kauppi L, Lange J, Roig I, Wang R, Keeney S,Jasin M. 2012 Homeostatic control of recombinationis implemented progressively in mouse meiosis.Nat. Cell Biol. 14, 424–430. (doi:10.1038/ncb2451)
43. Garcia-Cruz R, Pacheco S, Brieno MA, Steinberg ER,Mudry MD, Ruiz-Herrera A, Garcia-Caldes M. 2011 Acomparative study of the recombination pattern inthree species of Platyrrhini monkeys ( primates).Chromosoma 120, 521–530. (doi:10.1007/s00412-011-0329-6)
44. Segura J et al. 2013 Evolution of recombination ineutherian mammals: insights into mechanisms thataffect recombination rates and crossoverinterference. Proc. R. Soc. B 280, 20131945. (doi:10.1098/rspb.2013.1945)
45. Sans-Fuentes MA, Garcıa-Valero J, Ventura J,Lopez-Fuster MJ. 2010 Spermatogenesis in housemouse in a Robertsonian polymorphism zone.Reproduction 140, 569–581. (doi:10.1530/REP-10-0237)
46. Medarde N, Munoz-Munoz F, Lopez-Fuster MJ,Ventura J. 2013 Variational modularity at the celllevel: insights from the sperm head of the housemouse. BMC Evol. Biol. 13, 179. (doi:10.1186/1471-2148-13-179)
47. Berg IL, Neumann R, Sarbajna S, Odenthal-Hesse L,Butler NJ, Jeffreys AJ. 2011 Variants of the proteinPRDM9 differentially regulate a set of humanmeiotic recombination hotspots highly active inAfrican populations. Proc. Natl Acad. Sci. USA 108,12 378–12 383. (doi:10.1073/pnas.1109531108)
rspb.royalsocietypublishing.orgProc.R.Soc.B
281:20140297
9
on June 8, 2015http://rspb.royalsocietypublishing.org/Downloaded from
RESULTS

150
4.3.2Supplementaryinformation
4.3.2.1Supplementarymaterialsandmethods
4.3.2.1.1Animalsandchromosomalcharacterization
Atotalof31wildmalemicewerelive-trappedincommensalhabitatsfrom10differentlocalitiesrepresentativesoftheBarcelonaRbsystem(TableS1andFigureS1).ThreemalesfromthelaboratorystrainC57BL6werealsoincludedintheanalysisforcomparison.Mitoticmetaphasespreadswereobtainedfromfibroblastculturesandbonemarrowcells.Cellcultureswerederivedfromfreshtissuessamplesandthe harvesting of cells followed standard procedures. Karyotypes were determined by analyzing G-banded chromosomal preparations (Scally et al. 2012). WhenG-bandingidentificationwasnotsufficientforchromosomalidentification,weusedcommercial mouse chromosome-specific painting probes (Cambio, Cambridge,UK) to confirmG-banding homologies following (Ruiz-Herrera et al. 2004). TheEthicsCommitteeoftheUniversitatAutònomadeBarcelonaapprovedtheanimaltreatment protocols adopted herein.
4.3.2.1.2Immunoflourescence
Immunofluorescence(IF)ofspermatocytespreadswasperformedfollowing(Garcia-Cruzetal.2011).Differentsetsofantibodieswereused:mousemonoclonalantibodyagainstMLH1(BDPharmigen)forthedetectionofcrossovers(COs),rabbitpolyclonal serum against central element protein of the synaptonemal complex (SC) (SYCP3, Abcam), human calcinosis, Raynaud’s phenomenon, esophagealdysfunction,sclerodactylyandtelangiectasia(CREST)serumforthedetectionofthecentromeres, mouse γH2AX(Millipore),rabbitH3K9me3(Abcam)andmouseRPA(Abcam).Corresponding secondaryantibodieswere:anti-mouseconjugatedwithFITC, anti-mouse conjugatedwithCy3, anti-rabbit Cy3 and anti-humanCy5 (allpurchasedfromJacksonImmunoresearch).
RESULTS

151
4.3.2.1.3Fluorescenceinsituhybridization
With the aim of identifying the chromosomes implicated in Rb fusions,fluorescence in situhybridization(FISH)wasperformedonpreviouslyimmunostainedpreparationsusingBacterialArtificialChromosome(BAC)probesforspecificmousechromosomes (chromosomes 4, 9, 11, 12, 13 and 14). BAC cloneswhere selectedfrom the UCSC genome browser (http://genome.ucsc.edu) and purchased fromCHORI(http://bacpac.chori.org)(TableS3).DNAwaspurifiedfrombacterialpelletsusingaMidiprepextractionkit(Quiagen).FISHwasperformedonbothmetaphasechromosomesandspermatocytespreadsaspreviouslydescribed(Ruiz-Herreraetal.2004;Garcia-Cruzetal.2011),withmodifications.Briefly,1µgof theplasmidDNAwas labeledwithdUTP-digoxigeninusinganicktranslationkit (Abbot)andethanolprecipitatedwithcompetitorDNA(COT-1MouseDNA,Invitrogen,1mg/ml),salmonspermDNA(Invitrogen,10mg/ml)and1/10volumeof3mol/Lsodiumacetateovernightat-20ºC.Theslidesweredehydratedinanethanolscalecontaining70%formamideat74ºCbefore,andafterthedenaturation.Theprobewasprecipitatedandwashedtwicewith70%ethanolandthendilutedin15ulofhybridizationbuffer(50%deionizedformamide,10%dextransulfate,2XSSCand0.5mol/Lphosphate).Chromosomesweredenaturedat 74ºatwhichpoint theprobehybridizationmixwasplaceddirectlyontheslides,whichwerecover-slippedandincubatedO/Nat37ºC inahumidchamber.Washeswereperformedwith2Xsaline sodiumcitrate(SSC)and50%formamidesolutionbeforeapplyingtheanti-digoxigeninconjugatedwithFITC.
4.3.2.1.4Imageprocessinganddataanalysis
Preparations were visualized using a Zeiss Axioskop epifluorescencemicroscope equipped with the appropriate filters and a charged coupled device camera (ProgRes® CS10plus, Jenoptik). Images were captured and producedby the ProgRes® software (2.7.7). Images for each specimenwere taken blindly(i.e., specimens were numerically assigned irrespectively of their chromosomalcomposition)inordertoavoidagainstunintentionalbiasesinMLH1scores. TheMicromeasure3.3software (http://www.colostate.edu/Depts/Biology/MicroMeasure) (Reeves 2001) was used for the analysis of recombination maps(basedonthedistancesbetweenadjacentMLH1andRPA foci).Foreachchromosomeanalyzed, the position of each focus (MLH1 and RPA)was recorded as a relative
RESULTS

152
position(percentageofthesynaptonemalcomplextotallength)fromthecentromere,identifiedbytheCRESTsignalineachpreparation.ThepositionsofMLH1/RPAfoci werecalculatedforeachchromosomeusingthecentromereasreferencepoint,(i.e.,from the centromere to the telomere in theq-arm).Thus for comparison amongchromosomes,thepositionsofMLH1foci were expressed as the relative position of eachCOtothelengthofthechromosome(thelengthofeachSCwasdividedinto10%intervals).ThesedatawereusedtoconstructcumulativefrequencydistributionplotsandwecomparedthedifferentdistributionsusingaKolmogorov-Smirnovtest(KStest).Moreover,weanalyzedthefrequenciesofMLH1foci alongSCsbydividingtheminthreeregionsdependingontherelativedistancefromthecentromere:(i)proximal(fromthecentromereto30%oftheSC)(ii)interstitial(between30%-70%ofSC)and(iii)distal(from70%totelomericregion).FortheanalysisofH3K9me3chromosomal distribution, theMicromeasure softwarewas used to calculate thesignalarea (measured inmicrometers)overlapping theSC foreachchromosomalarm analyzed. ThestatisticalanalysiswascarriedoutbymeansofPAWSStatistics18©andJMP7softwarepackage.Giventhatthedistributionofcrossoversperspecimendidnot follow a normal distribution (Shapiro-Wilk test, p-value≤0.001),we appliednonparametricanalysis,suchasMann–WhitneyUtestorKruskal–Wallis test formean comparison and Spearman test for correlations.
4.3.2.1.5Prdm9genotyping
Genomic DNA was extracted and purified from cell cultures derivedfrommice of the Rb polymorphism zone (n=27) following the standard phenol-chloroform protocol. We sequenced the Prmd9exon12,fromZnrepeat+3towardsthec-terminaldomain.Thisexoncontains theZnFdomainarray that recognizesandmethylatesthespecificDNAsequences(Miholaetal.2009;Baudatetal.2010).PRDM9zincfingerarrayswereamplifiedbyPCRusingExTaq™(Takara),with4%DMSO,primersfl1500U20and2848L23(Miholaetal.2009)asfollows:95ºC(3min),30cyclesof95ºC (30s);56ºC (30s); 72ºC (90s).PCRproductswere run ina2%agarosegelinordertodistinguishdifferenthaplotypes(FigureS5).Whenmicehadalleles of the same length (length homozygotes, n=20), PCR amplified fragmentswerepurifiedwiththeGeneJET™PCRpurificationkit(Fermentas).Formicewithallelesoftwodifferentlengths(lengthheterozygotes,n=7),bandswerecutfromtheagarosegelandpurifiedusingtheGeneJET™GelExtractionKit(Fermentas).Inboth
RESULTS

153
cases, purified gene products were subjected to bidirectional Sanger sequencing with primers fl1822U24and2848L23 (Baudat et al. 2010) and readswere subsequentlyanalyzedusing theCLCbioMainWorkbenchprogram, version 6.8 (Aarhus,DK).Forthoseanimalsfoundheterozygotesforallelesofthesamelength,twodifferentsoftwares were used in order to distinguish allelic variants and define the haplotypes: Phase (http://stephenslab.uchicago.edu/software.html) and Champuru v1.0(http://www.mnhn.fr/jfflot/champuru/).Inanycase,allnewallelicvariantswereconfirmedbyre-sequencingandre-analyzed.
4.3.2.2SupplementaryFiguresandTablesTable S1: List of specimens, localities,diploidnumber (2n), chromosomal characteristics,meannumberofMLH1 foci/cell(± standarddeviation),numberof cells analyzed in the recombination study (N)andPrdm9 genotyping of mice from the chromosomalpolymorphismareaofBarcelonaincludedinthestudy.St=micewithstandardkaryotype(2n=40).Rb=micewithRobertsonianfusions.n.a.=DNAnotavailableforgenotyping.
Specimen Location 2n Fusions Mean MLH1 foci/cell ±SD N Prdm9
alleles St 1 Arbeca 40 -‐ 21.65 ± 2.43 55 n.a. St 2 Vacarisses 40 -‐ 21.16 ± 2.23 89 n.a. St 3 Castellfollit del Boix 40 -‐ 20.90 ± 1.74 20 10A/12B St 4 Castellfollit del Boix 40 -‐ 20.80 ± 1.43 21 12B/12B St 5 Castellfollit del Boix 40 -‐ 20.68 ± 1.35 22 10A/10A St 6 Castellfollit del Boix 40 -‐ 20.68 ± 1.43 25 10A/12B St 7 Castellfollit del Boix 40 -‐ 20.57 ± 0.87 21 10A/12C St 8 Castellfollit del Boix 40 -‐ 20.57 ± 1.45 14 10A/12C St 9 Castellfollit del Boix 40 -‐ 20.27 ± 1.40 26 12B/12B St 10 Castellfollit del Boix 40 -‐ 20.16 ± 1.17 25 10A/10A St 11 Santa P. de Mogoda 40 -‐ 20.58 ± 1.02 31 10B/11B Rb 1 Sant Sadurní d'Anoia 39 Rb (12.13) 20.26 ± 1.68 27 n.a. Rb 2 Sant Sadurní d'Anoia 37 Rb (4.14)+2(9.11) 19.71 ± 2.22 40 10A/10A Rb 3 Sant Sadurní d'Anoia 38 Rb (4.14)+(9.11) 19.71 ± 1.65 46 10A/10A Rb 4 Sant Sadurní d'Anoia 37 Rb (4.14)+(9.11)+(12.13) 20.57 ± 1.90 46 n.a. Rb 5 Sant Sadurní d'Anoia 37 Rb (4.14)+(9.11)+(12.13) 20.26 ± 1.86 47 10A /10A Rb 6 El Papiol 38 Rb (4.14)+(12.13) 19.39 ± 1.19 37 10A /10A Rb 7 El Papiol 38 Rb (4.14)+(12.13) 19.64 ± 1.27 11 10A/10A Rb 8 Ametlla de Segarra 39 Rb (4.14) 18.93 ± 0.68 16 10A/10A Rb 9 Castelldefels 29 Rb 2(4.14)+2(9.11)+2(12.13)+2(3.8)+2(5.15)+(6.10) 19.95 ± 1.67 44 10A/10A Rb 10 Castelldefels 32 Rb 2(4.14)+(9.11)+2(12.13)+2(5.15)+(6.10) 19.92 ± 1.59 40 10A/10A Rb 11 Castelldefels 30 Rb 2(4.14)+(9.11)+2(12.13)+2(3.8)+2(5.15)+(6.10) 19.85 ± 1.61 27 10A/10A Rb 12 Castelldefels 30 Rb 2(4.14)+2(9.11)+2(12.13)+(3.8)+2(5.15)+(6.10) 19.59 ± 1.53 37 10A/10A Rb 13 Castelldefels 28 Rb 2(4.14)+2(9.11)+2(12.13)+2(3.8)+2(5.15)+2(6.10) 20.23 ± 1.81 18 10A/10A Rb 14 Castelldefels 30 Rb 2(4.14)+2(9.11)+2(12.13)+ (3.8)+2(5.15)+(6.10) 19.00 ± 0.94 19 10A/10A Rb 15 Castelldefels 29 Rb 2(4.14)+2(9.11)+2(12.13)+2(3.8)+2(5.15)+(6.10) 18.95 ± 1.25 22 10A/10A Rb 16 Castelldefels 30 Rb 2(4.14)+2(9.11)+2(12.13)+(3.8)+2(5.15)+(6.10) 18.73 ± 1.33 34 10A/10A Rb 17 Castelldefels 31 Rb 2(4.14)+(9.11)+2(12.13)+(3.8)+2(5.15)+(6.10) 18.12 ± 1.70 16 10A/10A Rb 18 Prat de Llobregat 31 Rb 2(4.14)+(9.11)+2(12.13)+2(5.15)+2(6.10) 18.78 ± 1.12 14 10A/12B Rb 19 Prat de Llobregat 32 Rb 2(4.14)+2(9.11)+(12.13)+2(5.15)+(6.10) 19.75 ± 1.99 40 10A/12B Rb 20 Viladecans 31 Rb 2(4.14)+2(9.11)+(12.13)+2(3.8)+(5.15)+(6.10) 18.65 ± 2.20 22 10A/10A
RESULTS

154
Table S3: ListofmouseBACsusedinthestudy.
Moue Chr BAC clonea Genomic position b Start (bp) End (bp)
4 RP23-‐173N19 108,976,146 109,191,836 9 RP23-‐85H15 25,021,396 25,255,853 11 RP24-‐362I10 31,158,081 31,334,208 12 RP23-‐178L21 66,948,885 67,164,057 13 RP24-‐248P14 66,986,750 67,156,572 14 RP23-‐16H17 41,847,042 42,078,689 a Clones obtained from the mouse library RPCI-‐23 (female C57BL/6 Mus musculus). BACPAC Resources Center (BPRC), CHORI. b According to NCBI37/mm9.
Figure S1. Correlation between the number of MLH1 foci per cell and the diploid number per individual analyzed: SeeTable1foradditionalinformationonindividualsanalyzed(Spearmancorrelationtest,=0.75,p≤0.001).ρ
RESULTS
Table S2: Absolutenumber(andrelativeproportion)ofchromosomalarmswith0,1and2MLH1foci per chromosomal arm for eachofthefollowinggroups:chromosomalarmsinvolvedinRbfusions(Met),acrocentricarmsfromstandardmice(AcSt)andacrocentricarmsfromRobertsonianmice(AcRb).Fisher’stest,**p-value≤0.001.
Number of MLH1 foci/chr arm
Nº (%) chr arms Ac St Ac Rb Met
0 33 (2.6%) 113 (5.11%) 129 (6.27%) 1 1042 (87.05%) 1831 (82.81%) 1799 (87.50%) 2 122 (10.19%) 267 (12.08%) 128 (6.23%)**

155
Figure S2. Analysis of the chromosomal distribution of RPA foci.: (A-B)Examples of immunolocalizationof earlymeioticrecombinationnodules(RPAfoci)inmousespermatocytesatpachynema.RPAisshowedinred,centromeresinblueandthesynaptonemalcomplexesingreen.(A)Specimenwith2n=40.(B)Specimenwith2n=38,Rb(4.14)+(9.11).(C)MeannumberofRPAfoci detectedpercellinthelaboratorystrain(Labstrain,n=37cells,N=1mouse),wildstandard(St,n=38cells,N=2mice)andRobertsonian(Rb,n=48cells,N=3mice)specimens. (D)Cumulative frequenciesofRPA foci along chromosomal arms involvedinRbfusions(Met,inred,n=468chromosomalarms)andinchromosomalarmsnotinvolvedinRbfusions(Acr,inblue,n=900chromosomalarms).Chromosomalarmsaredividedinto10%intervalsofSClength.Asteriskindicatesstatisticalsignificance(Kruskal-Wallistest,**p-value≤0.001).
RESULTS

156
Figure S3. Chromosomal distributions of recombination events: DistributionofCOsalongtheSCofsixchromosomesinvolvedinRbfusions:Chr4,Chr9,Chr11,Chr12,Chr13andChr14.TheX-axisrepresentsthelengthofthesynaptonemalcomplex(SC)fromthecentromeretothetelomere,whiletheY-axisshowsthepercentageoftotalMLH1foci foundperSC.Eachchromosomeisdividedinto5%intervalsofSClength.Bluelinesindicatechromosomesinacrocentricform(n=38cellsanalyzedforChr4,n=25forChr9,n=36forChr11,n=31forChr12,n=71forChr13andn=46forChr14).GreenlinesrepresentthedistributionofMLH1foci whenchromosomesare involvedinRbfusions inhomozygosis[(n=35cellsanalyzedforRb(4.14),n=52Rb(9.11),n=41Rb(12.13)]andredlineswhentheRbfusionsarepresentinheterozygosis[(n=159cellsanalyzedforRb(4.14),n=42forRb(9.11)andn=54forRb(12.13)].ArrowsintheX-axisshowthepositionofthecentromere.
RESULTS
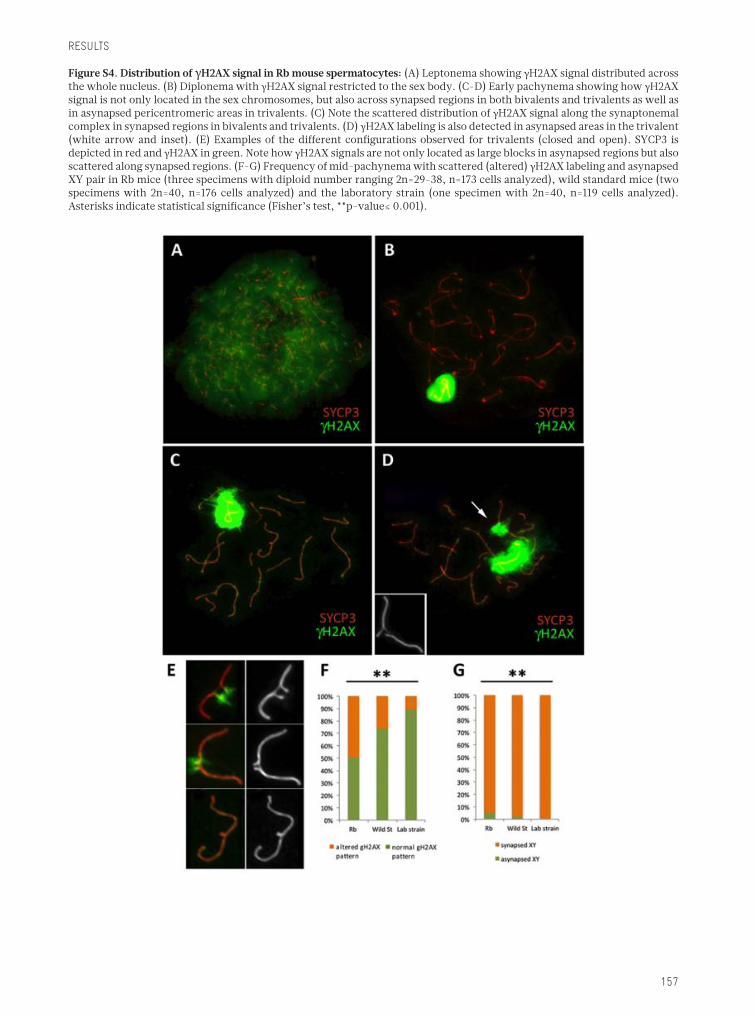
157
Figure S4. Distribution of γH2AX signal in Rb mouse spermatocytes: (A)LeptonemashowingγH2AXsignaldistributedacrossthewholenucleus.(B)DiplonemawithγH2AXsignalrestrictedtothesexbody.(C-D)EarlypachynemashowinghowγH2AXsignal is not only located in the sex chromosomes, but also across synapsed regions in both bivalents and trivalents as well as inasynapsedpericentromericareasintrivalents.(C)NotethescattereddistributionofγH2AXsignalalongthesynaptonemalcomplexinsynapsedregionsinbivalentsandtrivalents.(D)γH2AXlabelingisalsodetectedinasynapsedareasinthetrivalent(white arrowand inset). (E) Examples of thedifferent configurations observed for trivalents (closed andopen). SYCP3 isdepicted in red and γH2AXingreen.NotehowγH2AXsignalsarenotonlylocatedaslargeblocksinasynapsedregionsbutalsoscatteredalongsynapsedregions.(F-G)Frequencyofmid-pachynemawithscattered(altered)γH2AXlabelingandasynapsedXYpairinRbmice(threespecimenswithdiploidnumberranging2n=29-38,n=173cellsanalyzed),wildstandardmice(twospecimenswith 2n=40, n=176 cells analyzed) and the laboratory strain (one specimenwith 2n=40, n=119 cells analyzed).Asterisksindicatestatisticalsignificance(Fisher’stest,**p-value≤0.001).
RESULTS

158
Figure S5. Prdm9 haplotypes: Agarose gel showing a set of different haplotypes found in the Barcelona chromosomalpolymorphismzone.Eachwellcorrespondstoadifferentspecimen:St9(9),Rb19(10),Rb20(11),Rb14(13),Rb16(14),Rb17(15),Rb11(16),St9(17),St5(18),Rt7(19),St8(20),St6(21),St11(22),St3(23),St4(24),Rb10(25),Rb12(26).SeeTable1foradditional information on the individuals analyzed.
Zigure S6. Prdm9 allelic diversity: (A)Graphic representation of thePrdm9 reference allele described for mouse and the differentallelespresentintheBarcelonaRbpolymorphismzone.ZnFrepeatsarecolor-coded.AllelicfrequenciesfoundintheBarcelonaRbpolymorphismzonearealsoshown.(B)GeographicaldistributionofPrdm9 alleles. Locations with standard and Rbindividualsareshowedinredandblack,respectively(C)CorrelationbetweenPrdm9 alleles and recombination frequency expressedinmeannumberofMLH1focipercelldetectedforeachgroup(N/N,n=47;10/N,n=151;10/10,n=537)(Kruskal-Wallistest,**p-value≤0.001).
RESULTS

159
Figure S7. DNA sequence alignments of all different Prdm9 haplotypes found in the Barcelona Rb polymorphism zone: The numberoftherepeatindicatedintheleftsideofthefigureindicatesthetypeofZnFrepeatsfoundinthisstudy.
RESULTS

160
Figure S8. Haplotypes of the Zn finger domains of Prdm9 found in the Barcelona Rb polymorphism zone compared with the alleles described in the literature (Parvanov et al. 2010):Variationsinaminoacidsamongrepeatsarecoloredingrey.NumbersontherightofeachdomainindicatethetypeofZnrepeatsfoundinthisstudy,basedontheDNAsequence.
Zn=10
Allele 10A (this study)
CRECGRGFTQNSHLIQHQRTHTGEKPYV 3 CRECGRGFTQKSDLIKHQRTHTGEKPYV 4 CRECGRGFTQKSDLIKHQRTHTGEKPYV 4 CRECGRGFTAKSVLIQHQRTHTGEKPYV 8 CRECGRGFTQNSHLIQHQRTHTGEKPYV 3 CRECGRGFTQKSDLIKHQRTHTGEKPYV 4 CRECGRGFTAKSNLIQHQRTHTGEKPYV 9 CRECGRGFTQKSNLIKHQRTHTGEKPYV 12 CRECGWGFTQKSDLIQHQRTHTREK* 13
Zn=10
Allele 10B (this study)
CRECGRGFTQKSDLIQHQRTHTGEKPYV 15 CRECGRGFTVKSNLIQHQRTHTGEKPYV 16 CRECGRGFTAKSSLIKHQRTHTGEKPYV 17 CRECGRGFTVKSVLIQHQRTHTGEKPYV 18 CRECGRGFTEKSSLIKHQRTHTGEKPYV 19 CRECGRGFTQKSDLIKHQRTHTGEKPYV 4 CRECGRGFTQKSNLIQHQRTHTGEKPYV 20 CRECGRGFTANSNLIQHQRTHTGEKPYV 21 CRECGWGFTQKSDLIQHQRTHTREK* 13
Zn=11
Allele 11B (this study) Allele 11A [7]
CRECGRGFTQNSHLIQHQRTHTGEKPYV 3 CRECGRGFTAKSNLIQHQRTHTGEKPYV CRECGRGFTQKSDLIKHQRTHTGEKPYV 4 CRECGRGFTQKSVLIQHQRTHTGEKPYV CRECGRGFTVKSVLIKHQRTHTGEKPYV 14 CRECGRGFTQKSDLIKHQRTHTGEKPYV CRECGRGFTQNSHLIQHQRTHTGEKPYV 3 CRECGRGFTAKSNLIQHQRTHTGEKPYV CRECGRGFTAKSVLIQHQRTHTGEKPYV 8 CRECGRGFTEKSSLIKHQRTHTGEKPYV CRECGRGFTQNSHLIQHQRTHTGEKPYV 3 CRECGRGFTAKSNLIQHQRTHTGEKPYV CRECGRGFTQKSDLIKHQRTHTGEKPYV 4 CRECGRGFTQKSSLIKHQRTHTGEKPYV CRECGRGFTQKSVLIKHQRTHTGEKPYV 6 CRECGRGFTAKSNLIQHQRTHTGEKPYV CRECGRGFTQKSNLIKHQRTHTGEKPYV 12 CRECGWGFTQKSNLIKHQRTHTGEKPYV CRECGWGFTQKSDLIQHQRTHTREK* 13 CRECGWGFTQKSDLIQHQRTHTREK*
RESULTS

161
Zn=12
Allele 12B (this study) Allele 12A [7]
CRECGRGFTQNSHLIQHQRTHTGEKPYV 3 CRECGRGFTQNSHLIQHQRTHTGEKPYV CRECGRGFTQKSDLIKHQRTHTGEKPYV 4 CRECGRGFTQKSDLIKHQRTHTGEKPYV CRECGRGFTQKSDLIKHQRTHTGEKPYV 4 CRECGRGFTQKSDLIKHQRTHTGEKPYV CRECGRGFTQKSVLIKHQRTHTGEKPYV 6 CRECGRGFTQKSVLIKHQRTHTGEKPYV CRECGRGFTQKSDLIKHQRTHTGEKPYV 4 CRECGRGFTQKSVLIKHQRTHTGEKPYV CRECGRGFTAKSVLIQHQRTHTGEKPYV 8 CRECGRGFTAKSVLIQHQRTHTGEKPYV CRECGRGFTAKSNLIQHQRTHTGEKPYV 9 CRECGRGFTAKSNLIQHQRTHTGEKPYV CRECGRGFTAKSVLIQHQRTHTGEKPYV 8 CRECGRGFTAKSVLIQHQRTHTGEKPYV CRECGRGFTQNSHLIQHQRTHTGEKPYV 3 CRECGRGFTAKSVLIQHQRTHTGEKPYV CRECGRGFTQKSNLIKHQRTHTGEKPYV 12 CRECGRGFTQKSNLIKHQRTHTGEKPYV CRECGWGFTQKSDLIQHQRTHTREK* 13 CRECGWGFTQKSDLIQHQRTHTREK*
Allele 12C (this study)
CRECGRGFTQNSHLIQHQRTHTGEKPYV 3 CRECGRGFTQKSDLIKHQRTHTGEKPYV 4 CRECGRGFTVKSVLIKHQRTHTGEKPYV 14 CRECGRGFTQNSHLIQHQRTHTGEKPYV 3 CRECGRGFTAKSVLIQHQRTHTGEKPYV 8 CRECGRGFTQNSHLIQHQRTHTGEKPYV 3 CRECGRGFTQKSDLIKHQRTHTGEKPYV 4 CRECGRGFTQKSDLIQHQRTHTGEKPYV 15 CRECGRGFTAKSNLIQHQRTHTGEKPYV 9 CRECGRGFTQKSNLIKHQRTHTGEKPYV 12 CRECGWGFTQKSDLIQHQRTHTREK* 13
Zn= 13
Allele 13A [7]
CRECGRGFTQNSHLIQHQRTHTGEKPYV CRECGRGFTQKSDLIKHQRTHTGEKPYV CRECGRGFTQKSDLIKHQRTHTGEKPYV CRECGRGFTQKSVLIKHQRTHTGEKPYV CRECGRGFTQKSVLIKHQRTHTGEKPYV CRECGRGFTAKSVLIQHQRTHTGEKPYV CRECGRGFTAKSNLIQHQRTHTGEKPYV CRECGRGFTAKSVLIQHQRTHTGEKPYV CRECGRGFTAKSVLIQHQRTHTGEKPYV CRECGRGFTAKSVLIQHQRTHTGEKPYV CRECGRGFTQKSNLIKHQRTHTGEKPYV CRECGWGFTQKSDLIQHQRTHTREK*
RESULTS

162
Zn= 14
Allele 14A [7]
CRECGRGFTQKSDLIKHQRTHTGEKPYV CRECGRGFTQKSVLIKHQRTHTGEKPYV CRECGRGFTQKSDLIKHQRTHTGEKPYV CRECGRGFTAKSNLIQHQRTHTGEKPYV CRECGRGFTAKSVLIQHQRTHTGEKPYV CRECGRGFTQKSDLIKHQRTHTGEKPYV CRECGRGFTAKSNLIQHQRTHTGEKPYV CRECGRGFTEKSSLIKHQRTHTGEKPYV CRECGRGFTAKSNLIQHQRTHTGEKPYV CRECGRGFTQKSVLIKHQRTHTGEKPYV CRECGRGFTAKSVLIQHQRTHTGEKPYV CRECGWGFTQKSNLIKHQRTHTGEKPYV CRECGWGFTQKSDLIQHQRTHTREK*
Allele 14B [7]
CRECGRGFTQKSDLIKHQRTHTGEKPYV CRECGRGFTQKSVLIKHQRTHTGEKPYV CRECGRGFTQKSDLIKHQRTHTGEKPYV CRECGRGFTAKSNLIQHQRTHTGEKPYV CRECGRGFTAKSVLIQHQRTHTGEKPYV CRECGRGFTQKSDLIKHQRTHTGEKPYV CRECGRGFTAKSNLIQHQRTHTGEKPYV CRECGRGFTAKSVLIQHQRTHTGEKPYV CRECGRGFTEKSSLIKHQRTHTGEKPYV CRECGRGFTQKSNLIKHQRTHTGEKPYV CRECGRGFTAKSVLIQHQRTHTGEKPYV CRECGWGFTQKSNLIKHQRTHTGEKPYV CRECGWGFTQKSDLIQHQRTHTREK*
RESULTS

163
4.3.2.3Supplementaryreferences
BaudatF,Buard J,GreyC, et al (2010)PRDM9 is amajordeterminantofmeiotic recombinationhotspots inhumansandmice.Science327,836–40.
Garcia-CruzR,PachecoS,BrieñoMA,etal(2011)AcomparativestudyoftherecombinationpatterninthreespeciesofPlatyrrhinimonkeys(Primates).Chromosoma120,521–30.
Mihola O, Trachtulec Z, Vlcek C, et al (2009) A mouse speciation gene encodes a meiotic histone H3methyltransferase.Science323,373-5.
ParvanovED,PetkovPM,PaigenK(2010)Prdm9 controls activation of mammalian recombination hotspots. Science327,835.
ReevesA(2001)MicroMeasure:Anewcomputerprogramforthecollectionandanalysisofcytogeneticdata.Genome44,439-43.
ScallyA,Dutheil J,HillierL, et al (2012) Insights intohominidevolution from thegorillagenomesequence.Nature483:169-75
Ruiz-HerreraA,GarciaF,FrönickeL,etal(2004)Conservationofaphidicolin-inducedfragilesitesinPapionini(Primates)speciesandhumans.ChromosomeRes.12,683–90.
RESULTS

164

165
5.
GENERAL DISCUSSION

166
GENERALDISCUSSION

167
5.1GenomereshufflinginRodentia:causesandconsequences
ofthegenomicdistributionofEBRs
Chromosomal rearrangementshaveshaped thearchitectureofmammaliangenomes, giving as a result the current genome diversity. Therefore, analyzing the mechanisms that are involved in genome reshuffling will help us to understand the driving forces of the evolutionary process. In this way, comparative genomic studies have facilitated this task. The availability of an increasing number of sequenced genomes, together with the development of new advanced algorithms has allowed thedetection,atahighresolution,ofthegenomicregionsinvolvedinlarge-scalereorganizations. Relevant advances have been achieved in the recent years thathavepermittedthedetectionofregionsofhomology(HSBs)betweenmammalianspecies. These include the application of different algorithms such as the GRIMM-Synteny(PevznerandTesler2003),Satsuma Synteny(Grabherretal.2010),Synteny Tracker (Donthuetal.2009)andCASSIS(Baudetetal.2010).SuchapproacheshavenotonlyimprovedtheresolutionatwhichHSBscanbenowcharacterizedbutalsohave permitted multispecies comparisons, providing with the possibility to establish genomicmaps of large-scale rearrangements within several taxa (Murphy et al.2005b;Ruiz-Herreraetal.2006;Kemkemeretal.2009;Lemaitreetal.2009;Larkinetal.2009;Farréetal.2011;Zhangetal.2014). Among mammals, rodents represent the most specious taxon (with morethan2,000speciesdescribedso far)withawidediversityofphenotypesthathasbeentranslatedintoabroadrangeofadaptationstotheenvironment(Storzetal.2009;Fangetal.2014).Duetothecomplexityoftheirevolutionaryhistory,rodents(withtheexceptionofmouseandrat)havebeenoftenoverlookedfromcomparativegenomic studies. In fact, rodents are characterized by specific features, such as highratesofgenomereshuffling(reviewedinRomanenkoetal.2012),highratesofnucleotidesubstitution(WuandLi1985),andlowrecombinationrates(DumontandPayseur2011;Seguraetal.2013)whencomparedtoothermammalianspecies.InthecaseofCRs,previouscomparative studiesprovidedrelevant informationonboththemost parsimonious ancestral karyotype (Bourque et al. 2004;Ma et al. 2006;Graphodatskyetal.2008;Mlynarskietal.2010;Trifonovetal.2010;Romanenkoetal.2012;RomanenkoandVolobouev2012)andthespecificlarge-scalerearrangementsofRodentia(PevznerandTesler2003;Zhaoetal.2004;Mlynarskietal.2010). Inthe house mouse, for example, fissions and fusions are the most common specific rearrangements,whileinversionsaremorefrequentlyobservedinrats(Zhaoetal.
GENERALDISCUSSION

168
2004).However,theresolutionatwhichlarge-scalereorganizationsweredetectedwas still poor and, therefore, the general picture of the genomic rearrangements of Rodentiaatafinerscaleremainedtobeuncovered. In order to overcome this limitation, we have reconstructed, for the first time in the literature, a detailed map of the genomic regions involved in evolutionary reshuffling in rodents (section 4.1). This has been possible due to: (i) the use ofalgorithmsthatidentifysequencehomologiesbetweengenomesestablishingHSBs(SSandST,seesection3.1.1and3.1.2),(ii)thedetectionandclassificationofEBRsinaphylogeneticcontext(EBA,seesection3.1.3)and(iii)theuseofanunprecedentedlarge amount of Rodentia species representative of the major groups, such asHystricomorpha(H.glaber)andMyodonta(J.jaculus,S.galilii,M.ochorgaster,R.norvegicus and M.musculus)inadditiontosixmammalsbelongingtoPrimates(H.sapiens,M.mulattaand P. pygmaeus),Carnivora(F.catus),Artyodactyla(B.taurus)andPerissodactyla(E.caballus),thatservedasoutgroupspecies.Thiscomparativeapproachhaspermittedthedetectionofmultispeciesregionsofhomology(HSBsandSFs,seesection3.1.2)andEBRsatahighresolutionduetothepair-wisecomparisonsmadeatasequencelevel.Intotal,weidentified3,392HSBs,3,142SFsand1,333EBRsamong all species analyzed. Our analysis showed that, overall, Rodentia speciespresenthighratesofgenomereshuffling(rangingfrom1.38EBRs/MyrinH.glaber to8.47EBRs/MyrinS. galiliiinlineage-specificEBRs)comparedtoothermammals(ranging from 0.50 EBRs/Myr in P.pygmaeus to 1.81 EBRs/Myr in H. Sapiens)(section4.1;Figure1).Theseresultssupportpreviousstudies,usingbothcytogenetic(Stanyonetal.1999;Murphyetal.2005b;Mlynarskietal.2010;Romanenkoetal.2012)andcomparativegenomicsapproaches(PevznerandTesler2003a;Bourqueetal.2004;Zhaoetal.2004;Lewinetal.2009).But,moreimportantly,ourapproachhasprovidedwithaninnovativeclassificationofRodentiaEBRsinaphylogeneticcontextbytheuseoftheEBAalgorithm(section3.1.3).ThisalgorithmpermitstoclassifyEBRsas lineage-specific (EBRs thatappeared ina specific-species lineagedifferentiation, suchasmouse lineage-specificEBRs)orclade-specific (EBRs thatappeared during a clade differentiation, such as Muroidea clade-specific EBRs).This fact has important implications for the study of genome reshuffling in rodents evolution.ThephylogeneticdeterminationofEBRs (i.e.,determiningwhenEBRsoccurred) can provide valuable information on the specific features that couldfavor the origin and fixation of CRs. Moreover, further studies focused on thedeterminationof theancestralRodentiakaryotypeata fine-scale,willhelpus togaininsightsintothedirectionalityofthespecificlarge-scalerearrangements(suchasinversions,fusionsortranslocations)thatoccurredalongRodentiaevolutionand
GENERALDISCUSSION

169
their implication for species differentiation.
5.1.1Functionalconstraints
The observation of high rates of genome reshuffling in rodent species lead us to investigate the existence of particular genomic features that might have contributed to thispattern, specifically in theEBRs that lead to thehousemousedifferentiation.AndthisgroupofEBRsincludeallclade-specificandmouselineage-specific EBRs. First,weobserved that EBRswerenothomogeneouslydistributedacrossthemousegenome(section4.1;Figure2),astheytendtolocalizeinspecificmouse chromosomes and in specific regions within these chromosomes. This is the caseofchromosome16,whichdoesnotpresentanyEBR.Onthecontrary, therewere several chromosomes with a high number of EBRs. This was the case, forexample,ofchromosomes17and18with11EBRs,presentingaclustereddistributionofEBRsinspecificchromosomalregions.Ourresultsaddtopreviousobservationsofthesamepatterninseveralnon-rodentmammalianspecies(Murphyetal.2005b;Ruiz-Herrera et al. 2006;Larkin et al. 2009;Farré et al. 2011).Thepresenceof anon-homogeneousdistributionofEBRsinthemousegenomeledustoinvestigatethemechanisms responsible of this pattern.Are EBRs physically unstable due tosequencecompositionand/orgenomeorganization,ordotheyrepresentgenomicareas where the selection against breakpoints is minimal? Previous studies comparing human, mouse and rat genomes showed that mouseEBRsarecharacterizedbyanenrichmentofrepetitivesequences,andmorespecificallySDsandTRs(Armengoletal.2003;2005),mirroringwhatithasbeendescribedforprimates(Gemayeletal.2010;Farréetal.2011).However,evidenceof the influence of additional features, such as gene content, was not available mainlyduetoalackofadetailedmapofEBRswithinRodentia.Thedelineationofsuchamap(section4.1)permittedustoanalyzethesequestionsmoreintodetail.WefirstdetectedthatrodentEBRs(allclade-specificandmouselineage-specific)presentedahighergenedensitythantotherestofthemousegenome(section4.1;Figure3B),mirroringwhathasbeendescribedinothermammalianspecies(Murphyetal.2005b;Elsiketal.2009;Larkinetal.2009;Farréetal.2011;Ullastresetal.2014).Thispatternwasaccompaniedbyadecreaseinrecombinationrates(section4.1.3.3).Basedonpreviousobservations(Geraldesetal.2011;Seehausenetal.2014;Janoušeketal.2015),itisplausiblethatlowrecombinationratesinEBRscouldleadtoa high genomic differentiation and the fixation of new mutations in genes related to
GENERALDISCUSSION

170
thespecies-specificphenotypes,therebyreinforcingtheadaptivevalueofgenomereshuffling. In fact, genes under strong selective constraints (i.e., genes locatedwithin EBRs ormodified as the result of large-scale rearrangements) can conferselective advantage as they also show extensive divergence due to the reduction of recombination(Riesebergetal.1999;Yatabeetal.2007).Thishasbeenthecase,forexample, of Anopheles where certain inversions have been associated to ecotypic speciation (Manoukis et al. 2008) such as resistance to insecticides (Mosna et al.1958),differentialmatingbehavior(Ayalaetal.2011)oradaptationtoenvironmentalchanges(seeAyalaetal.2014andreferencestherein).Thesamepatternhasbeenrecently described in Drosophilawhereaspecificinversion(3RP)wasdescribedtobe involved in climate change adaptation in a recent invasion event into Australia (Raneetal.2015).Inthiscontext,ourresultsshowingthelocalizationoftwogenefamilies(LcnandHbgenefamilies)andageneenrichmentcluster(KRABZnFgenes)withinRodentiaEBRs,canbeaddedtosuchobservations. The Lcn family includes small and highly conserved extracellular proteins that bind and transport various types of ligands. In rodents, they regulate a wide variety of processes including chemical communication, reproduction, immune response, cancer development (Bratt 2000; Chamero et al. 2007; Stopková et al.2009) andeven insulin sensitivityandnutrientmetabolism inobesity (Choet al.2011; Zhou andRui 2013).Our analysis detected the Lcn gene familywithin twoEBRsinmousechromosome2,locatedspecificallywithinoneRodentia-specificEBR(containing5differentLcngenes) andonemouse-specificEBR (containing 1Lcngene).Importantly,thesespecificgenesaremostlyexpressedwithintheepididymis(thereforerelatedtoreproductivefunctions)andinvolvedinchemoreception(Suzukietal.2004).Strikingly,thisgenefamilyhassufferedanimportantexpansionduringRodentiaevolutionduetotandemduplications(Waterstonetal.2002;Suzukietal.2004;Grzybetal.2006;Stopkováetal.2009;2014).Thus,theparticularstructureofduplicated genes could have played a role in the evolutionary instability of this region as it has been previously reported for the β-globinchaininrodents(Hoffmannetal.2008).Infact,thecaseoftheHbsubunitscanalsoexemplifythisphenomenon.TheHbfamilywaslocalizedwithinamouse-specificEBRswhichcontainedfivegenesinvolvedinoxygenmetabolism,twoofthemcodifyingfortheHb-chainsubunits.Hb genes have been generated by gene duplications during vertebrate evolution(reviewed inStorzetal.2013))withdifferenthaplotypepolymorphisms inhousemousepopulations (Erhart et al. 1987) characterizedbydifferent oxygenbindingaffinities(D’surneyandPopp,1992).Interestingly,the-chainiscomposedbythreegenes in rat, as a product of tandem duplications, and two genes in mouse, with the
α
α
GENERALDISCUSSION

171
thirdgenelocatedinotherchromosomeduetoatranslocation(Storzetal.2007),thus suggesting that this region has suffered genome reshuffling during rodents evolution. Of special relevance is the presence of the enrichment cluster localized within EBRscontainingagenefamilyofDNAbindingproteinsandtranscriptionfactors:theKRABgenes.Thisgenefamilyisconsideredthelargestoftranscriptionfactorsin mammals and, although some of them present a clustered distribution across the genome,theyalsooccurindividuallyinspecificregions(Waterstonetal.2002).ThecurrentviewisthattheKRAB-ZnFgenefamilyhasundergoneamassiveexpansionduringtetrapodvertebratesevolution,primarilybytandemduplications(Loomanet al. 2002; Hamilton et al. 2003; Urrutia 2003; Shannon et al. 2003) to providevertebrateswithkeyfunctionsthatunderlietheirdevelopment(Urrutia2003).Thisphenomenonoccurredinaspecies-specificmanner,showingdifferencesincloselyrelatedspeciessuchasmouseandratorhumanandchimpanzee(Tadepallyetal.2008).However, although their structure iswell known indifferentmammalianspecies(especiallyinmouseandhuman),theKRAB-ZnFgenefamilyisstillunderstudy as the functions are already not well described, except in few cases where their biochemical functions of its proteins are critical to their cellular roles. These include: celldifferentiationand/orproliferation,apopotosisandneoplastictransformation,spermatogenesisand/orsexdifferentiation,amongothers(Urrutia2003;Nowicketal.2013).Inourstudywehavedetectedanenrichmentclusterwithintwomouse-specific EBRs and one Muridae-specific EBR, corresponding to three differentchromosomes(11,17andX)andincludingsevenZnFgenes,mostofthemarestillnotwelldescribed (suchasZfp169,Zfp182 and Zfp300).Notwithstanding,oneofthe genes detected is Prdm9,ameiosis-specificgenethathasbeendescribedtobeinvolved in spermatogenesis and have been proposed as the first mammalian hybrid sterility gene (Forejt 1996; Emerson and Thomas 2009; Nowick et al. 2013) (seesection1.2.4).ThepresenceofthisgenewithinanevolutionaryunstableregionasanEBR,isinconsonancewiththerapidevolutionatasequencelevelandthestrongpositiveselectionthatthisgenepresents(Nowicketal.2013). Overall,wedetectedthatgeneslocatedwithinRodentiaclade-specificEBRsandthemouselineage-specificEBRsaremostlyinvolvedinadaptationtochangesofexternalfactorspheromonedetectionandmating(lipocalins),oxygenmetabolism(haemoglobins)andinreproductiveisolation(KRAB-ZnFproteins).Therefore,wecan hypothesize that the presence of these genes in unstable evolutionary regions could provide selective advantage during the evolutionary history of rodents. Additionally, the low recombination rates described in section 4.1 within EBRs
GENERALDISCUSSION

172
respect to the rest of the genome, also suggests for an adaptive role of the genes located within these regions as low recombination promotes higher sequence divergence that would help to establish new genic functions to adapt to the environment.
5.1.2 Chromatin structure: a new player in evolutionary
genomereshuffling?
More recently, several lines of evidence have suggested the existence ofadditional factors, independent of the DNA sequence, that are also probablyaffectinggenomeplasticity (reviewed inFarréetal.2015).This isexemplifiedbythe involvement of chromatin conformation changes on the permissiveness of some regions of the genome to undergo chromosomal breakage (Lemaitre et al. 2009;Carboneetal.2009;Véronetal.2011;Zhangetal.2012).Basedonthesefindingsand the recent results obtained by our group (Farré et al, 2011 and results fromsection 4.1), there are evidence suggesting the role of certain properties of localDNAsequences togetherwith theepigeneticstateof thechromatin inpromotingchanges of chromatin organization to open configurations (Farré et al. 2015). Infact,aswedescribedintheintroduction(section1.1.5.4),mammaliangenomesarenot justamatterof linearDNAsequences;theDNAispackagedintoachromatinstructure, the regulation of which depends on several superimposed layers of organization,makingthehigh-orderchromatinorganizationanimportantplayer,sofaroverlooked,incomparativegenomicstudies.Atthemolecularlevel,CRsarethoughttoresult fromerrors inDSBsrepairpathwayswhensimultaneousbreaksoccurincloseproximitywithinthenucleus(LupskiandStankiewicz2005;Meaburnetal.2007;Korbeletal.2007;Quinlanetal.2010;Zhangetal.2012).Inthisway,ouranalysisrevealedthatEBRsweredepletedoncLADs(orregionsthatarelinkedtothenuclearenvelope)(section4.1)andthus,suggestingthatEBRstendtolocalizeinthecentralregionsofthenucleusalsobeingopen-chromatinregions.Itisimportanttopointout thatduringthepreparationof this thesisBerthelotandcollaborators(2015)analyzedthegenomicdistributionofEBRscorrespondingtofivemammalianand three yeast genomes by employing ancestral genome reconstructions and statistical modeling. Their results are in consonance with our observations. They observedthatbothchromatinstructure(specifically,theopen-chromatinregions)together with depletion of coding genes, could explain the functional constrains of the distribution of evolutionary fragile breakage regions within these genomes. In thisway,ourresultsprovidenewdataontherelationshipofEBRsandthechromatin
GENERALDISCUSSION

173
conformation, supporting the role of the nuclear structure in the formation of CRs. Further studies that incorporate the study of the epigeneticmarks (such asmethylations or acetylations of the different histones that integrate the nucleosome structure)andadetailedanalysisofselectivepressureontheroleofadaptationofgeneslocatedwithinEBRs,willprovidenewinsightsintotheprocessesunderlyinggenomic rearrangements.
5.2TheBarcelonaRbsystemasamodelforthestudyof
CRs
Since the first models initially proposed to explain the genetic basis of evolution,muchhasbeenlearnedontheroleofCRsinpopulationdifferentiation(Whiteetal.1967;Rieseberg2001;Nooretal.2001;FariaandNavarro2010).Twohypotheses have been put forward in order to texplain chromosomal speciation: the hybrid dysfunction model and the suppressed recombination model (see section1.1.6).Empiricaldatasupportingthesuppressed recombination model in the case of inversionsisabundantintheliterature(GreenbaumandReed1984;Hale1986;Riesebergetal.1995;1999;Besanskyetal.2003;MartíandBidau2004;Farréetal.2011;Ullastres et al. 2014).However, evidence for this effect in thecaseofothertypesofCRs,suchasRbfusions,isstillscarce,especiallyinnaturalpopulations. Rb fusionsare themostwidespreadCRsdescribed inmammals (Qumsiyeh1994)includingthehousemouse.Since1972,therehavebeennumerousreportsofwild-caughthousemicewithkaryotypescontainingfewerthan40chromosomesbeing the first report focused on mice captured from the “Valle di Poschiavo” in southeasternSwitzerland(Groppetal.1972).Rbmetacentricpopulationsdescribedsofarpresentasimilarstructure:ametacentricrace(withasetofRbfusionsfixedinthepopulationinhomozygosis)andanhybridzoneasaproductofthecontactbetween themetacentric and standard races (Hauffe et al. 2012). The BarcelonaRbsystem,thefocusofthepresentstudy, isanexceptiontothisrule. Itpresentsa striking structure where no metacentric races exists and fused chromosomes are geographically distributed in a staggered fashion leading to a progressive reduction indiploidnumberstowardsthecentreofthedistributionarea.Thus,Rbfusionsarenot fixed in the population, being in a polymorphism state that is not the product of themixingofpreviouschromosomalraces(Gündüzetal.2001;Medardeetal.2012).Inanevolutionarycontext,thisRbsystempresentsauniquescenarioforthestudyofthepreviousstatetothefixationofRbfusions;however,itsevolutionarystructure
GENERALDISCUSSION

174
is still not fully understood. In this context, and mainly due to the persistence of chromosomalpolymorphisms,theBarcelonaRbsystemprovidesanopportunitytounderstandtheoriginandevolutionofRbfusionsonthepreviousstagetofixation.
5.2.1TheroleoftelomereshorteningontheoriginofRb
fusions
GiventhehighincidenceofRbfusionsinthehousemouse,alterationofthetelomeric structure of acrocentric chromosomes has been proposed in the literature as apossibletriggerforthistypeofCRs(Bouffleretal.1996;Kalitsisetal.2006)(section1.1.3.4).Acrocentricp-armsofthehousemouse(Figure5.1)arecharacterizedbythepresenceofhighly-repetitiveDNAfamilies,rangingfrom50Kbpto150Kbp(KiplingandCooke1990).Fromtheterminalp-armtelomerestowardsthecentromerewecanfind:(i)atruncatedhighlyconservedminisatelliteL1(tL1),(ii)aregionofTRswithamotifof146bpthatvaries inlengthamongchromosomes,theTeLoCentricsatellite(TLCSat),(iii)aMinisatelliteDNAsequence(MinSat)and(iv)aMajorsatelliteDNAsequence(MajSat).Thesetwosequences(MinSatandMajSat)contributetothecentromeric and pericentromeric region in all house mouse chromosomes, except theYchromosome(Kalitsisetal.2006;Garagnaetal.2014,andreferencestherein).
Figure 5.1. Structure of the p-arm region of the mouse chromosomes (except Y): CentromericregionintegratesMinisatellite(MinSat)andMajorsatellite(MajSat)sequencesasthebindingsitesofthecentromericproteins.Moredistally,TeLoCentricsatellite (TLCSat) is followed by minisatellite L1 (tL1) and the telomeric sequences. Image adapted from Garagna andcollaborators(2014).
InitialcytogeneticstudiesfocusedonthemechanisticfactorsunderlyingRbfusions found that telomeric sequences were completely lost in the centromeric regionsoffusedchromosomes,althoughsomeMinSatDNAsequenceswereretainedinthepericentromericarea(Garagnaetal.1995;Nandaetal.1995).Lateron,theseresultsweresupportedinwildmicefromItaly[correspondingtoPoschiavo(2n=26)andCremona(2n=22)chromosomalraces]wherethetwoacrocentricchromosomes
GENERALDISCUSSION

175
that fuse contribute symmetrically in the amount of MinSat DNA found in theresultingmetacentricchromosome(Garagnaetal.2001).Thus,theresultingfusedchromosomenoonlylacksthetelomericsequencesbutalsothetL1,theTLCSatandpartoftheMinSatsequences(Garagnaetal.2001). Asdetailedintheintroduction(section1.1.3.4),threedifferentmechanismshavebeenproposedtoexplaintheoccurrenceandfixationofRbfusionsinnaturalpopulationsinrelationtothepresence/absenceoftelomericsequencesintheresultantmetacentricchromosome(Slijepcevic1998):(i)chromosomebreakagewithinminorsatellitesequences(ii)telomereshortening,and(iii)telomereinactivation(Figure1.2).Thehighlyrepetitivenatureofpericentromericandtelomericsequenceshavebeen proposed as the possible mechanism of the origin of chromosomal breakage withinminor satellite sequences (Holmquist andDancis 1979; Redi andCapanna1988; Redi et al. 1990; Page et al. 1996) as they would constitute themolecularsubstrate for a aberrant recombination between non-homologous chromosomes(reviewedinGaragnaetal.2014).AsallacrocentricchromosomessharesimilarDNAsequences(Gazaveetal.2003),theinvolvementinRbfusionsofchromosomearmsshould be random in this case, having all mouse chromosomes the same probability tobefused.However,this isnotthecase inhousemousenaturalpopulations.Ofthe 171 different possiblemetacentric combinations, 106 have been described inwildpopulations(Gazaveetal.2003;Pialeketal.2005).Thisindicatesthatnotallchromosomes contribute equally to the observed chromosomal variation, begging for the need to explain this bias. Previous studies have suggested that selection against breakpoints occurring in regions that are enriched for housekeeping genes canplayarole(Ruiz-Herreraetal.2010).Inthiscontext,weinvestigatedwhethertelomereshorteningcouldexplainthedistributionofRbfusions. Initial observations in laboratory mice already detected that telomere shorteningcouldbeinvolvedintheoriginofRbfusions(Saltmanetal.1993;Blascoetal.1997;Slijepcevicetal.1997).Insection4.2weanalyzed,forthefirsttimeintheliterature,thisphenomenonintheBarcelonaRbsystem(section4.2).WedetectedthatRbmice(withdiploidnumbersrangingfrom2n=29to2n=39)have,onaverage,shortertelomerelengthsthanstandardmice(2n=40)(Figure3Cfromsection4.2)andthatboth(Rbandstandardwildmice)presentedsignificantlyshortertelomerelengths than laboratorystrain mice (Figure 3C from section 4.2). These results,although intriguing, could help us to explain why the wild mice present genome instabilityintheformofRbfusionsandnotlaboratorystrainmice(as,inprinciple,they present the same molecular centromeric characteristics), highlighting theimportance of conducting more studies focused on natural populations.
GENERALDISCUSSION

176
Moreover, telomeres fromp-armswere, in average, shorter in length thattheirq-armcounterparts,aphenomenonpreviouslydescribedinlaboratorymice(Zijlmansetal.1997)supportingtheobservationthatp-armsaremorepronetolosetelomeres thanq-arms (Blasco et al. 1997).More interestingly, the proportion ofshorttelomeres(containinglessthan15Kbp)wasalsoincreasedinRbspecimens,whichwerehigherthanstandardindividualsfromtheBarcelonaRbsystem(Figure2Bfromsection4.2).Butmoreimportantly,weobservedthatstandardmicefromtheBarcelonaRb systemhave, on average, shorter telomeric lengths but similarpercentages of short telomeres than mice from laboratory strains. These results suggestthatshorttelomeresinmicefromtheBarcelonaRbsystemcouldlosetheircapacitytoprotectacrocentricchromosomesfromfusions(seesection1.1.3.4). In this context, and, in the light of our results and the available literature, the occurrenceofRbfusionsinthehousemousecouldbetheresultofacombinationofdifferent factors that involve: (i) erosionof telomeric repeats in thep-armsofacrocentricchromosomesand(ii)thepresenceofMinSatandMajSatrepeatsequencesatthefusionpoints(bringingthemolecularsubstratefortheillrepairingofDSBs)(Garagnaetal.2002;2014)asaresultofrecombinationbetweennon-homologoussequences. Additionally, the bouquet configuration that occurs during prophase I, clusters all telomeres of acrocentric chromosomes together, anchoring them to the innernuclearenvelope(Scherthanetal.1996).Therefore,thisconfigurationwouldalso promote a physical proximity between pericentromeric regions of acrocentric chromosomesduringmeiosis,andthus,theinteractionbetweenthem(thatwouldhadpreviouslylostorshortentheirtelomericrepeats)(Berríosetal.2014). Thus, telomere shortening can be considered as one of the candidates to further investigatemoreintodetailtherateofoccurrenceofRbfusionsinnature.ThiswilladdtothemodelsthatexplainthefactorsthatpromotethefixationofCRsdependenton drift, population structure, and the level of the selective disadvantage they confer (seeDobignyetal.2015andreferencestherein).Inourstudyweprovidedwithanoverall survey of telomere lengths considering the complete set of chromosomes as awhole.FuturestudiesontheanalysisoftelomerelengthofspecificchromosomesinvolvedinRbwillhelpustoelucidatetowhatextenttelomerelengthistriggeringthe proneness of certain chromosomes to fuse.
GENERALDISCUSSION

177
5.2.2TheeffectofRbfusionsonfertility
Chromosomal rearrangements have been classically consideredunderdominant mutations associated with deleterious meiotic effects, such as problems originated during chromosome pairing and segregation, leading to subfertilityorsterility(King1993).Therefore,earlyinvestigationsontheroleofRbfusions in speciationwere focusedon the effectof this typeofCRon fertility, asthe hybrid dysfunction modelproposes(White1969;1978).Initialstudiesanalyzeddifferent parameters related with spermatogenic activity in heterokaryotypes for multipleRbfusions,astheywereexpectedtoshowsubfertilityphenotypes(White1978;GroppandWinking1981;RediandCapanna1988).Thesestudies,however,obtainedcontrastingresultsasinsomecasesnon-disjunctionwasobservedataveryhighrates(GroppandWinking1981)whereasinothercasesnoevidenceforasevereprimaryimpairmentingametogenesiswasfound(RediandCapanna1988). Subsequent studies in common shrews analyzing fertility features such as testes weight, Germ Cell Death (GCD) or the structure of seminiferous tubules,observed defective seminiferous tubules and lower testis weights in individuals withmultipleRbfusionsinheterozygosis(Garagnaetal.1989).Inthecaseofhousemouse, negative effects on fertility have been reported in mice with high number ofchromosomesimplicatedinRbfusions.Forexample,adelayinspermatogenesistogetherwithanincreaseofapoptoticcellswasdetectedinhybridswith9and8fusionsinheterozygosis(fromwild-derivedstrains),suggestingthelossofspermatocytesduringthefirstmeioticdivision(Redietal.1985;Mericoetal.2003;Manterolaetal.2009).Howeverinthecaseofaneuploidydetectioninthegermline,nosignificantdifferences were detected in mice with 8 fusions from wild-derived lanoratorystrains(Manieuetal.2014).Notwithstanding,previousstudiesinspecimensfromtheBarcelonaRbsystemwith uptothreefusionsinheterozygosisdidnotdetectspermatogenesis impairment (Sans-Fuentes et al. 2010), although the number ofRb fusions and/or level ofheterozygosityhad an influence in several parametersas the size and shapeof the spermhead (Medarde et al. 2013).Moreover, higherratesofGCDweredetected in individualswith threeRb fusions inheterozygosis(Sans-Fuentesetal.2010)orwithahighnumberofmetacentricsatthehomozygousstate(Medardeetal.,2015),althoughnosubfertilitywasobserved(Sans-Fuenteset al. 2010;Medardeetal. 2015).Nevertheless, thegeographicdistributionof themetacentricchromosomesalongtheBarcelonaRbsystemindicatedthatalthoughspermatogenic alterations could act as partial barriers to gene flow, they are not sufficient topreventRbchromosomes.Consequently, andbasedon theavailable
GENERALDISCUSSION

178
data, subfertility effects are related with the number of fusions and the complexity ofthemeioticfigures(inthecaseofquadrivalentsfrommonobranchialhomologies)(reviewed inGaragnaetal.2014).This is thecase, forexample,of thehybridsofthemetacentric races inMadeira,which presentmonobranchial homologies andshowedareductionof50%offertilityinmales(Nunesetal.2011). Therefore, in the case of natural Rb populationswhere the distribution ofmetacentrics is so spread, the presence of heterokaryoptypes with high number ofRbfusionsorcomplexheterozygotesarenotexpectedtobecommon.Andthisis in consonance with the limitations of the hybrid dysfunction model, as a high frequencyofRbfusionswouldnotoccurinnaturalpopulationsduetotheirstrongunderdominanteffects.AsDobignyandcollaborators(2015)recentlyexposed,thehighertheunderdominanceofCRs,themoreextremethedemographicconditionsrequired for fixation; that is, there is low probability of being recorded. On the contrary,thelowerthedegreeofunderdominanceassociatedwithaCR,thehighertheprobabilitytobepresentinpolymorphicstate.ThepresenceofpolymorphicRbfusionsintheBarcelonaRbsystemcanberelatedtothislattercase.Inthissense,Dobignyandcollaborators(2015) distinguishedtwocategoriesofpolymorphismsdependingontheselectiveforcesinvolved:(i)onlymoderateunderdominanceisplayaroleintheprocess,and(ii)underdominanceiscompensatedbymeioticadaptations(i.e., meiotic drive) or selective advantage (i.e., favorable allelic combinationsprotected from recombination). In this context, the suppressed recombination model presents an alternative or a complement to explain this phenomenon.
5.2.2.1Rbfusionsandmeioticrecombination
Are, therefore, Rb fusions affecting the first meiotic division (includingtherecombinationprocess)andifso,inwhichdegree?Inordertoshedlightintothisprocess,weinvestigatedtheeffectofRbfusionsintheearlystagesofmeiosis(prophaseI)(section4.3).InitialstudiesinwildmicepopulationswereperformedintheJohnO’Groatschromosomalracesanditscorrespondinghybridzone(Wallaceetal.1992;Bidauetal.2001),revealingareductioninthenumberofchiasmataaswell as a re-distribution of the remaining chiasmata towards telomeric regionsinRb individuals. Inthesameline,studiesonthemetacentricraces fromTunisia(2n=22and2n=40)(DumasandBritton-Davidian2002;Dumasetal.2015)andItaly(CastigliaandCapanna2002)reportedthesamepattern.Inbothcases,dataobtainedsuggestedadecreaseofCOsduetothepresenceofRbfusions.Lateron,analysisbased
GENERALDISCUSSION

179
onthedetectionofMLH1foci inwildderivedstrainsfromtheMilanoIIchromosomalraces,revealedlowerfrequencyofMLH1foci in both homozygote and heterozygote individualswhencomparedtoall-acrocentricmice(Mericoetal.2003;Dumasetal,2015).Moreover,studiesinpentavalentsduetomultiplemonobranchialhomologiesonhybridsfromPoschiavoandUpperValtellinapopulations(Italy)alsopresentedadecreaseandre-distributionofCOstowardstelomeres(Mericoetal.2013). BythestudyofmicerepresentativeoftheBarcelonaRbsystem,weestimatedrecombinationratesbytheanalysisofthemeannumberofMLH1foci per cell. We detected a decrease in the number of COs events inRbmicewhen compared tostandardanimals(Figure1Dfromsection4.3).Moreover,weobservedthattheoveralldecreaseofCOspercellwasduetoadecreaseofMLH1foci within the metacentric chromosomes.Wedetected lessnumberofmetacentricswithmultipleMLH1 foci (normally2MLH1fociperarm)andanincreaseofthepercentageofchromosomalarmswithoneMLH1foci, when compared to acrocentric chromosomes. Importantly, the frequency of chromosomal arms with the absence of COs was not alteredin Rbmice (Figure 1E from section 4.3). Taking together, these results not onlyindicateadecreaseinthenumberofCOsinmetacentricscomparedtoacrocentricchromosomes(inbothhomozygotesandheterozygotes)butalsothat,despitethisdecreaseinCOsduetothepresenceofRbfusions,noimportantchangeshavebeenobserved in thepercentageof chromosomal armswithoneCO.This observationhas important implications since it suggest that meiosis is not largely compromised inRbmice fromtheBarcelonaRbsystem,asproperdisjunctionofchromosomesrequiresthepresenceofatleastoneCOperchromosomalarm(Hassoldetal.2000).Moreover, our analysis of chromosomal-specific recombination maps revealedthat metacentric chromosomes presented a re-distribution of COs towards thetelomereswhencomparedtoacrocentricchromosomes(inbothhomozygotesandheterozygotes;Figure2B-HandsupplementaryFigureS3fromsection4.3). Dumas andBritton-Davidian (2002) initially proposed threehypotheses toexplainthere-distributionofCOsduetothepresenceofRbfusions:(i)thelossofcentromeric heterochromatin, that is known to buffer recombination suppression effectsonadjacenteuchromatin(YamamotoandMiklos1978;JohnandKing1985),(ii) thepresenceofonlyonekinetochore in themetacentrics thatcould lead toareductionoftheefficiencyofmicrotubuleattachment,and(iii)thelossoftelomericsequences which are involved to the attachment to the inner nuclear membrane leading to a modification of the spatial arrangement of chromosomes in the first meioticprophase (Scherthanetal. 1996;Garagnaetal. 2001). In themomentweinitiated this study, empirical evidence on the genetic and mechanistic factors
GENERALDISCUSSION

180
that were shaping this process were scarce. Therefore, we further studied this phenomenon by analyzing a marker of constitutive heterochromatin, the histone H3trimethylatedatlysine9(section3.4.3).Constitutiveheterochromatinlocatedwithin the centromere has been described to repress recombination in yeast (Ellermeier et al. 2010) and rodents, where a specific gene, the Smc6, has been pointedtoplayaroleonthisrepression(Ververetal.2013).Byusingthisapproach,we could observe a bigger overlapping of constitutive heterochromatin along the SCsofthemetacentricchromosomeswhencomparedtotheacrocentrics(Figure3fromsection4.3).Theseresultssuggestthatcentromericinterferenceinmetacentricchromosomes is probably affecting the overall decrease in recombination observed inRbindividualsasDumasandBritton-Davidianproposed(2002).Strikingly,wehavefoundsimilarreductionandre-distributionofCOsinbothhomozygotesandheterozygotessupportingpreviousobservationsinhousemouse(Mericoetal.2003;Merico et al. 2013;Dumas et al. 2015).However, although some correspondencecanbeobservedintherecombinationeffectbetweenRbfusionsandothertypeofrearrangement, such as inversions, in this later case, inversions have been seen to reducerecombinationonlyinheterozygotes(Stevisonetal.2011). Additionally, we also analyzed the pairing dynamics of the bivalents along the firstmeiotic division in the specimens of the Barcelona Rb system. Previousanalysis showed that trivalents can present open configurations in several cases, thus acquiring the same epigenetic configurations of the sex chromosomes in the form of Meiotic Silencing of Unsynapsed Chromosomes(MSUC)(Turneretal.2005;Baarendsetal.2005;Manterolaetal.2009).MSUChasbeenproposedtoconstitutean important factor in triggering meiotic arrest in the case of chromosomal abnormalities(reviewedinGaragnaetal.2014).InthecaseofRbfusionsManterolaandcollaborators(2004)analyzedthismechanisminsimplemultipleheterozygoteswith 8 Rb fusions visualizing a highMSUC signals but nomeiotic arrest. In ourstudy we used the γH2AXasamarkerforunrepairedDSBs,whichisaccumulatedin latter stages of prophase I in asynapsed regions and the sex body. We analyzed the distribution pattern of γH2AXinmicewiththepresenceofupto3trivalentspercell, which presented γH2AXsignalsmainlyinthecentromericregionsoftrivalents(supplementaryFigureS1F fromsection4.3).However, althoughwedetectedanincrease of open trivalents suggesting the persistence of non-repairedDSBs, thisdidnotcompromisethecorrectformationofthesexbody(supplementaryFigureS1G from section 4.3) allowing, as a consequence, the progression of the cellthrough prophase I. Therefore, as these cells finally achieve the completion of the correct synapsis, these results would be suggesting a possible delay of the pairing
GENERALDISCUSSION

181
dynamics of trivalents at pachytene stage. This would be in consonance with the nucleardispositionoftheRbchromosomesduringmeiosis. InRbindividuals,thepericentromeric region of metacentric chromosomes localize in centric regions of the nucleus in prophase I, whereas pericentromeric regions of acrocentric chromosomes are distributed to the periphery. Therefore the synapsis of the trivalents necessarily involves the movement of the metacentric to the nuclear periphery, leading to a causeofdelayinthecompletionofsynapsis(Berríosetal.2014;reviewedinGaragnaetal.2014). Inthelightofourresults,wecanconcludethat,althoughRbfusionsdonothaveastrongeffectonfertility,theyaffectmeioticrecombinationintheBarcelonaRbsystem, thus supporting the suppressed recombination model. Under this scenario, a decrease in meiotic recombination can lead to an increase in genetic divergence within the regions affected, and this effect could lead to the accumulation of genetic incompatibilitiesandpossiblytoageneticisolationbetweenpopulations(Rieseberg2001;Noor2001;FariaandNavarro2010).Thesignificantmorphological(Muñoz-Muñozetal.2006;Sans-Fuentesetal.2009;Muñoz-Muñozetal.2011;Martínez-Vargasetal.2014)andethologicaldifferences(Sans-Fuentesetal.2005)reporteduptonowbetweenstandardandRbmicefromtheBarcelonaRbsystemcouldberelated with the reduction of gene flow explained by the suppressed recombination model. In fact, thenon-deleterious effect ofRb fusions is in consonancewith itswidespreaddistributionintheBarcelonaRbsystem,leadingtothediscussionontheforces that may favor their positive selection. Some studies have been conducted in ordertounderstandthepossibleselectiveadvantageofRbfusionsinnature.Inthiscontext,GuerreroandKirkpatrick(2014)proposedatheoreticalmodelthatcouldexplainthefixationofRbfusionsbythelinkageoflocallyadaptedloci in reorganized chromosomes that were previously unlinked when in acrocentric form, conferring a beneficial effect, and thus, facilitating the spread of the fusions within populations. Thus, following this model, the fixation of chromosomal fusions in nature would involve local adaptation of specific genes.However, to this extend, if Rb fusionsconfer a selective advantage remains unclear at this stage.
5.2.2.2.Prdm9andthestudyofchromosomalevolution
At this point, the description of the genetic factors that could be playing an role on the distribution of recombination events has been taking force in the recent years. Prdm9 has been described to be involved in the speciation process as a hybrid
GENERALDISCUSSION

182
sterilitygene(Miholaetal.2009;Flachsetal.2012;Bhattacharyyaetal.2013)asitsactivityduringmeiosis involvestherecruitmentoftheDSBsrepairmachinery(Baudatetal.2010;Myersetal.2010;Parvanovetal.2010;Greyetal.2011;Billingsetal.2013).Thus,changesintheZnFsequencearetranslatedintoare-distributionof recombinationsites (Bricketal.2012;Nowicketal.2013). In thiscontext, theunderstanding of its sequence variability and the forces that are driving its rapid evolution can bring valuable information on its role in the speciation process. Here, andwith the aim to elucidate the influence of genetic factors, suchas Prdm9, on recombination, we analyzed the Prdm9 allelic background in the BarcelonaRbsystem(section4.3).WeconductedthemostcomprehensivestudyofPrdm9 variability in a single natural population of house mouse. We detected novel housemousevariantsintheBarcelonaRbsystem(10A,10B,11B,12B and 12C)thatdifferedinboththenumberofZnFrepeats(rangingfrom10to12repeats)andtheirsequence (describing 21 different repeat sequences). Thus, these results supportthehighlypolymorphicnatureofthisgene(Oliveretal.2009;Nowicketal.2013)(Supplementary Figure S6A from section 4.3). Strikingly, the distribution of thedifferent alleles presented a specific pattern, where the higher number of different alleleswasobservedinstandardmice(2n=40,with5differentallelesintwodifferentlocations). Rbmice, on the other hand, presentedmore sequence homogeneity,showing almost 95% frequency of the allele 10A (2n=28-39, with two alleles in5 different locations of the population). In fact, we observed an homogeneouspresence of this allele,10A,inallRbpopulations(supplementaryFigureS6Bfromsection4.3).Duringthedevelopmentofthiswork,tworecentpublications(Buardetal.2014;Konoetal.2014)describedthePrdm9allelicdiversityfromalmost100micedistributedacrossallcontinents(exceptAmerica).ThisanalysispermittedtoobservetheuniquealleliccharacteristicsoftheBarcelonaRbsystem,asonlytwoalleles(11Band 12B)weresharedwiththepopulationsdescribedinthesesurveys.Importantly, the observation that the allele 10A is present in all populations within theRbsystemanditisnotsharedwithothermousepopulationsanalyzed,suggestsa possible in situoriginofthisalleleintheBarcelonaRbsystem. Moreover,ourresultsrevealedastrikingcorrelationbetweenrecombinationrates and the number of Prdm9 ZnF,meaning that individualswith lessnumberofZnF repeats (10)presented less recombination rates thanmicewithmoreZnFrepeats (supplementary Figure S6C from section 4.3). These results suggest apossible role of Prdm9 gene in the distribution of recombination sites in natural populations,supportingpreviousdatainlaboratorystrainspecimens(BaudatanddeMassy2007;Bricketal.2012;Billingsetal.2013;Bakeretal.2015).Itmightseem
GENERALDISCUSSION

183
contradictorythatmicewithlessnumberofZnFrepeats(10A)andthus,lowratesofrecombinationcouldbeselectedinthepopulation.However,wehavetotakeintoaccount that the widespread distribution of allele 10AinRbindividualsalsosuggeststhe possibility that this specific allele would have developed different recognition sitesthatmaybewouldreflectthere-distributionofrecombinationsitesobservedinourMLH1analysis. Which are, then, the factors responsible for the widespread distribution of the 10AalleleintheBarcelonaRbsystemifitappearsthatmiceowingthe10A allele have,onaverage, lessCOsthanmicewithadifferentPrdm9 allelic composition? It is possible that the 10Aallele issomehowadvantageous for thepopulation.Forexample, that this new allele has evolved rapidly in order to recognize with strongest affinity new DNAmotifs. As we explained in the introduction (section 1.2.4), aprocessofbiasedgeneconversionoccursduringtherepairingofCOsatprophaseI,giving as a consequence, changes in the sequence of the hotspots that would undergo theself-destructionoftherecombinationrecognitionsites(Boultonetal.1997).Inthisway,therapidevolutionoftheZnFsequencewouldleadtorapidchangesinthedistributionoftherecombinationsitesbyrecognizingwithstrongeraffinitynewDNAmotifs that would compensate the loss of the primary hotspots by gene conversion. Additionally, Prdm9 has been described to be under strong positive selection in both primate and mouse populations, resulting in many different alleles that contain substitutions in the ZnF domains at each of the three amino-acid positions thatcontrolDNAbinding specificity (Thomaset al. 2009;Oliver et al. 2009;Buardetal.2014;Schwartzetal.2014;Konoetal.2014).Therefore,Prdm9 10A allele could besomehowadvantageousformiceintheRbsystem,thusfacilitatingitsselectionand spread.Thisphenomenoncouldbeexplained,as the lackofCOsaround thecentromereobservedinRbmiceisprobablytheresultofmechanisticdisturbancesduring early meiosis. Therefore, it is possible that new alleles with stronger affinity to new motifs distributed towards more telomeric regions, have been developed in RbmiceinordertoassuretheminimumnumberofCOsnecessarytopropermeiosisprogression. However,ontheotherhand,wecannotdiscardthepossibilitythatthepatternobserved in Prdm9allelicfrequencieswithintheBarcelonaRbsystemcouldbetheresult of its specific population genetic structure, yet to be described into detail. As ithasbeensuggested,theBarcelonaRbsystemisaparticularRbscenariothathasbeen originated by primary intergradation, although secondary contact cannot be excluded(Gündüzetal.2001;Gündüzetal.2010).Therefore,takingintoaccounttherapidchangeofZnFsequences(Thomasetal.2009;Nowicketal.2013;Prattoetal.
GENERALDISCUSSION

184
2014b),itisplausiblethatolderpopulations(2n=40)wouldpresenthighernumberofalleles,whereasmorerecentpopulations(Rbmice)wouldpresentahomogeneousdistribution with predominance allele 10A due to a foundational effect. In the light of our results, therefore, further studies at a finer scale of the population structureof theBarcelonaRb systemareneeded inorder toelucidateits role on the distribution of the Prdm9 alleles across the population.However,futuresurveysontheanalysisofthespecificDNAmotifsrecognizedbyallele10Aand its distribution across the genome would bring inestimable information on the characteristics of this allele that favored its widespread distribution within the BarcelonaRbsystem.
GENERALDISCUSSION

185
6.
CONCLUSIONS

186
CONCLUSIONS

187
1. Wehave reconstructed a detailedmap of the genomic regions involved inevolutionary reshuffling in rodents. This has permitted the delineation of 3,392 Homologous Synteny Blocks, 3,142 Syntenic Fragments and 1,333EvolutionaryBreakpointRegionsamongelevenmammalianspecies,includingsixrodentspecies(Jaculusjaculus,Spalaxgalilii,Microtusochorgaster,Rattusnorvegicus and Musmusculus). Importantly, rodents present an increasedrateofgenomereshuffling(estimatedasthenumberofEBRsperMyr)whencomparedtothemammalianspecies includedinthisstudy(Homosapiens,Macacamulatta,Pongopygmaeus,Feliscatus,Bostaurus and Equuscaballus).
2. Evolutionary Breakpoint Regions are not homogenously distributed acrossthe mouse genome, as they tend to localize in specific mouse chromosomes and in specific chromosomal regions within these chromosomes. This genomicdistributionisconditionedbyspecificgenomicconstrains(asgeneenrichment and lower recombination rates) and to the nuclear chromatinstructure(beinglocatedincentralopen-chromatinregions).
3. Rodentia clade-specific evolutionary breakpoint regions and the mouselineage-specific evolutionary breakpoint regions are enriched for specificgenefunctionssuchaspheromonedetectionandmating(lipocalins),oxygenmetabolism (haemoglobins) and in reproductive isolation (Krueppel-Associated Box Zinc finger proteins). In this context, EBRs can presentopportunities for the development of novel functions that may promote the adaptation of species.
4. RobertsonianmicefromtheBarcelonaRbsystemhave,onaverage,shortertelomericlengths(inbothp-andq-arms)andahigherpercentageofshorttelomeres(onlyinthep-arms)thanstandardindividuals.Moreover,standardmice have, on average, shorter telomeric lengths but similar percentages of short telomeres than mice from laboratory strains. This indicates that telomere shortening in the form of critically short telomeres is probably playing a role intheoccurrenceofRbfusionsintheBarcelonaRbsystem.
5. Robertsonian mice from the Barcelona Rb system present a significantreductioninthenumberoftotalMLH1foci per cell analyzed. This reduction was due to a decrease in the number of total MLH1 foci detected in the metacentric chromosomes.
6. Metacentric chromosomes present a re-distribution of MLH1 foci towards the telomeric regions of the chromosomes, being the first crossover localized further from the centromere, when compared to acrocentric chromosomes. Theconstructionofchromosome-specificrecombinationmapsindicatedthat
CONCLUSIONS

188
thisre-distributionofMLH1foci in metacentric chromosomes was observed eitherinhomozygosis(bivalents)orheterozygosis(trivalents)state.
7. TheanalysisofthedistributionofthehistoneH3trimethylatedat lysine9,anepigeneticsignalforconstitutiveheterochromatin,indicatedthatthere-distribution of MLH1 foci in metacentric chromosomes was caused, most probably, due to an interference effect of the centromeric heterochromatin that generates a higher suppression of recombination in the adjacent euchromatin.
8. Robertsonian fusions alter the distribution of the γH2AX, a marker ofnon-repaired double strand breaks, in the autosomes.We detect a higherfrequency of both bivalents and trivalents with asynapsed regions, indicating the persistence of regions with non-repaired DSBs through pachynema.This situation, however, did not affect the normal progression of the meiotic silencing of asynapsed chromatin that characterized sex chromosomes as we detected that the sex body showed positive signals for γH2AXinRbmice.
9. The Prdm9 gene presents a high allelic diversity within the different locations sampled in theBarcelonaRbsystem,differing inboth thenumberand thesequence zinc finger repeats. In fact, five new Prdm9 allelic variants ranging from10to12zincfingerrepeatsweredetected.
10. BoththeallelefrequencyanddistributionofPrdm9 varied among specimens and localities sampled. Standard mice presented the highest allelic diversity whereasRbmice showedapredominantpresenceof theallele 10A, which were found in all the locations sampled within the population. Additionally, the allele 10A presents a specific zinc finger repeat sequence when compared to the rest of the mouse populations described so far, thus reinforcing the particularityoftheBarcelonaRbsystem.
11. Thenumberofzincfingerrepeatswascorrelatedwithrecombinationrates.Thus, Prdm9couldbeageneticfactorthatplaysaroleinthere-distributionofCOswithintheBarcelonaRbsystem.
12. We propose that both mechanistic (meiotic disturbances affected by thepresenceofRbfusions),andgenetic(Prdm9)factorswouldbeplayingaroleinthesuppressionofrecombinationobservedintheBarcelonaRbsystem.
CONCLUSIONS

189
7.
BIBLIOGRAPHY

190
BIBLIOGRAPHY

191
Al-Jarua,GoodwinW,SkidmoreJ,KhazanehdariK (2014) Distribution of MLH1 foci in horse male synaptonemal complex. Cytogenet Genome Res142:87–94.
Alekseyev M a, Pevzner P a (2010) Comparativegenomics reveals birth and death of fragile regions in mammalianevolution.GenomeBiol11:R117.
Allers T, Lichten M (2001) Differential Timing andControlofNoncrossoverandCrossoverRecombinationduringMeiosis.Cell106:47–57.
AllsoppRC,VaziriH,PattersonC,etal(1992)Telomerelength predicts replicative capacity of human fibroblasts.ProcNatlAcadSci89:10114–8.
Anderson LK, Reeves A,Webb LM, Ashley T (1999)Distribution of crossing over on mouse synaptonemal complexes using immunofluorescent localization of MLH1protein.Genetics151:1569–79.
Aquino CI, Abril V V, Duarte JMB (2013) Meioticpairing of B chromosomes, multiple sexual system,and Robertsonian fusion in the red brocket deerMazamaamericana(Mammalia,Cervidae).GenetMolRes12:3566–74.
ArmengolL,Marquès-BonetT,CheungJ,etal(2005)Murine segmental duplications are hot spots forchromosomeandgene evolution.Genomics 86:692–700.
Armengol L, Pujana MA, Cheung J, et al (2003)Enrichment of segmental duplications in regions ofbreaks of synteny between the human and mouse genomes suggest their involvement in evolutionary rearrangements.HumMolGenet12:2201–8.
Armour JAL (2006) Tandemly repeated DNA: whyshouldanyonecare?MutatRes598:6–14.
ArnheimN,CalabreseP,NordborgM(2003)Hotandcold spots of recombination in the human genome: the reason we should find them and how this can be achieved.AmJHumGenet73:5–16.
AshleyT,MosesMJ,SolariAJ(1981)Finestructureandbehaviour of a pericentric inversion in the sand rat, Psammomys obesus.JCellSci50:105–19.
Attie O, Darling AE, Yancopoulos S (2011) The riseand fall of breakpoint reuse depending on genome resolution.BMCBioinformatics12Suppl9:S1.
AuffrayJC,MarshallJT,ThalerL,BonhommeF(1990)Focus on the nomenclature of European species ofMus.MouseGenome88:7–8.
AutonA,Fledel-AlonA,PfeiferS,etal(2012)Afine-scale chimpanzee genetic map from population sequencing.Science336:193–8.
AxelssonE,WebsterMT,RatnakumarA, et al (2012)Death of PRDM9 coincides with stabilization of therecombinationlandscapeinthedoggenome.GenomeRes22:51–63.
Ayala D, Fontaine MC, Cohuet A, et al (2011)Chromosomal inversions, natural selection andadaptation in the malaria vector Anopheles funestus. MolBiolEvol28:745–58.
Ayala D, Ullastres A, González J (2014) Adaptationthrough chromosomal inversions in Anopheles.FrontGenet5:129.
Azzalin CM, Reichenbach P, Khoriauli L, et al(2007) Telomeric repeat containing RNA and RNAsurveillance factors at mammalian chromosome ends. Science318:798–801.
BaarendsWM,WassenaarE,vanderLaanR,etal(2005) Silencing of unpaired chromatin and histoneH2A ubiquitination in mammalian meiosis. Mol CellBiol25:1041–53.
BackströmN,ForstmeierW,SchielzethH,etal(2010)The recombination landscape of the zebra finch Taeniopygia guttatagenome.GenomeRes20:485–95.
BacollaA,LarsonJE,CollinsJR,etal(2008)Abundance
BIBLIOGRAPHY

192
and length of simple repeats in vertebrate genomes are determined by their structural properties. GenomeRes18:1545–53.
BaileyJA,ChurchDM,VenturaM,etal(2004)Analysisof segmental duplications and genome assembly in the mouse.GenomeRes14:789–801.
Bailey JA, Eichler EE (2006) Primate segmentalduplications: crucibles of evolution, diversity and disease.NatRevGenet7:552–64.
Baker CL, Kajita S, Walker M, et al (2015) PRDM9Drives Evolutionary Erosion of Hotspots in Musmusculus through Haplotype-Specific Initiation ofMeioticRecombination.PLoSGenet11:e1004916.
Baker RJ, Bickham JW (1986) Speciation bymonobrachial centric fusions. Proc Natl Acad Sci83:8245–8.
BakerSM,PlugAW,ProllaTA,etal(1996)InvolvementofmouseMlh1 inDNAmismatch repair andmeioticcrossingover.NatGenet13:336–42.
BallengerL (1999)“Musmusculus, animal diversity” web.http://www.biokids.umich.edu/accounts/Mus_musculus/.Webpage.
BandMR,LarsonJH,RebeizM,etal(2000)Anorderedcomparative map of the cattle and human genomes. GenomeRes10:1359–68.
Barski A, Cuddapah S, Cui K, et al (2007) High-resolution profiling of histone methylations in the humangenome.Cell129:823–37.
Basheva EA, Torgasheva AA, Gomez Fernandez MJ,etal(2014)Chromosomesynapsisandrecombinationin simple and complex chromosomal heterozygotes of tuco-tuco (Ctenomys talarum: Rodentia:Ctenomyidae).ChromosomeRes22:351–63.
Basset P, Yannic G, Brünner H, Hausser J (2006)Restricted gene flow at specific parts of the shrewgenomeinchromosomalhybridzones.60:1718–1730.
BatesonW (1909)Heredity and variation inmodernlights. In: Darwin and modern science. CambridgeUniversityPress,Cambridge,pp85–101.
Baudat F, de Massy B (2007) Regulating double-strandedDNAbreakrepairtowardscrossoverornon-crossover during mammalian meiosis. ChromosomeRes15:565–77.
Baudat F, Buard J, Grey C, et al (2010) PRDM9 is amajor determinant of meiotic recombination hotspots inhumansandmice.Science327:836–40.
Baudet C, Lemaitre C, Dias Z, et al (2010) Cassis:detection of genomic rearrangement breakpoints. Bioinformatics26:1897–8.
BeckerTS,LenhardB(2007)Therandomversusfragilebreakage models of chromosome evolution: a matter ofresolution.MolGenetGenomics278:487–91.
BeckmannJS,EstivillX,AntonarakisSE(2007)Copynumber variants and genetic traits: closer to the resolutionofphenotypictogenotypicvariability.NatRevGenet8:639–46.
Berchowitz LE, Copenhaver GP (2010) Geneticinterference:don’tstandsoclosetome.CurrGenomics11:91–102.
BergIL,NeumannR,SarbajnaS,etal(2011)Variantsof the protein PRDM9 differentially regulate a set ofhuman meiotic recombination hotspots highly active inAfricanpopulations.ProcNatlAcadSci108:12378–83.
Bernardi G (2000) Isochores and the evolutionarygenomicsofvertebrates.Gene241:3–17.
Berríos S, Manieu C, López-Fenner J, et al (2014)Robertsonian chromosomes and the nucleararchitecture of mouse meiotic prophase spermatocytes. BiolRes47:16.
BerthelotC,MuffatoM,Abecassis J,RoestCrolliusH(2015) The 3D Organization of Chromatin ExplainsEvolutionary Fragile Genomic Regions. Cell Rep
BIBLIOGRAPHY

193
10:1913–1924.
BesanskyNJ,Krzywinski J, LehmannT, et al (2003)Semipermeable species boundaries between Anopheles gambiae and Anopheles arabiensis: evidence from multilocus DNA sequence variation. Proc Natl AcadSci100:10818–23.
BhattacharyyaT,GregorovaS,MiholaO,etal (2013)Mechanisticbasisofinfertilityofmouseintersubspecifichybrids.ProcNatlAcadSci110:E468-77
BidauCJ,GiménezMD,PalmerCL,SearleJB(2001)TheeffectsofRobertsonianfusionsonchiasmafrequencyand distribution in the housemouse (Musmusculusdomesticus)fromahybridzoneinnorthernScotland.Heredity87:305–13.
Billings T, Parvanov ED, Baker CL, et al (2013)DNA binding specificities of the long zinc-fingerrecombinationproteinPRDM9.GenomeBiol14:R35.
BirneyE,StamatoyannopoulosJA,DuttaA,etal(2007)Identification and analysis of functional elements in 1%ofthehumangenomebytheENCODEpilotproject.Nature447:799–816.
BishopDK,ZicklerD (2004)EarlyDecision:MeioticCrossoverInterferencepriortoStableStrandExchangeandSynapsis.Cell117:9–15.
BlascoMA,LeeH-W,HandeMP,etal(1997)TelomereShortening and Tumor Formation by Mouse CellsLackingTelomeraseRNA.Cell91:25–34.
Borodin PM, Karamysheva T V, Belonogova NM, etal(2008)Recombinationmapofthecommonshrew,Sorex araneus (Eulipotyphla, Mammalia). Genetics178:621–32.
Bouffler SD, Morgan WF, Pandita TK, Slijepcevic P(1996) The involvement of telomeric sequences inchromosomal aberrations. Mutat Res Genet Toxicol366:129–135.
BoultonA,MyersRS,RedfieldRJ (1997)Thehotspotconversion paradox and the evolution of meiotic
recombination.ProcNatlAcadSci94:8058–63.
Bourque G, Pevzner PA (2002) Genome-ScaleEvolution: Reconstructing Gene Orders in theAncestralSpecies.GenomeRes12:26–36.
BourqueG,PevznerPA,TeslerG(2004)Reconstructingthe genomic architecture of ancestral mammals: lessonsfromhuman,mouse,andratgenomes.GenomeRes14:507–16.
BoursotP,AuffrayJC,Britton-DavidianJ,BonhommeF(1993)TheEvolutionofHouseMice.AnnuRevEcolSyst24:119–152.
BrattT(2000)Lipocalinsandcancer.BiochimBiophysActa-ProteinStructMolEnzymol1482:318–326.
Brick K, Smagulova F, Khil P, et al (2012) Geneticrecombination is directed away from functional genomicelementsinmice.Nature485:642–5.
Britton-Davidian J, Catalan J, Belkhir K (2002)Chromosomalandallozymeanalysisofahybridzonebetween parapatric Robertsonian races of the housemouse:acaseofmonobrachialhomology.CytogenetGenomeRes96:75–84.
Britton-DavidianJ,CatalanJ,daGraçaRamalhinhoM,etal(2005)ChromosomalphylogenyofRobertsonianraces of the house mouse on the island of Madeira:testing between alternative mutational processes. GenetRes86:171–83.
Broman KW, Murray JC, Sheffield VC, et al (1998)Comprehensivehumangeneticmaps: individual andsex-specific variation in recombination. Am J HumGenet63:861–9.
Broman KW, Rowe LB, Churchill GA, Paigen K(2002)Crossoverinterferenceinthemouse.Genetics160:1123–31.
Brown JD,O’Neill RJ (2010) Chromosomes, conflict,and epigenetics: chromosomal speciation revisited. AnnuRevGenomicsHumGenet11:291–316.
BIBLIOGRAPHY

194
BrownKM,BurkLM,HenaganLM,NoorMAF(2004)A test of the chromosomal rearrangement model of speciation in Drosophila pseudoobscura. Evolution58:1856–1860.
BrunschwigH,LeviL,Ben-DavidE,etal(2012)Fine-scale maps of recombination rates and hotspots in the mousegenome.Genetics191:757–64.
BruschiDP,RiveraM,LimaAP,etal(2014)InterstitialTelomericSequences (ITS)andmajor rDNAmappingreveal insights into the karyotypical evolution of Neotropicalleaffrogsspecies(Phyllomedusa,Hylidae,Anura).MolCytogenet7:22.
BuardJ,BarthèsP,GreyC,deMassyB(2009)Distincthistone modifications define initiation and repair of meioticrecombinationinthemouse.EMBOJ28:2616–24.
BuardJ,deMassyB(2007)Playinghideandseekwithmammalianmeioticcrossoverhotspots.TrendsGenet23:301–9.
BuardJ,RivalsE,DunoyerdeSegonzacD,etal(2014)Diversity of Prdm9 zinc finger array in wild mice unravels new facets of the evolutionary turnover of thiscodingminisatellite.PLoSOne9:e85021.
Burma S, Chen BP, Murphy M, et al (2001) ATMphosphorylates histone H2AX in response to DNAdouble-strandbreaks.JBiolChem276:42462–7.
ButlinRK (2005)Recombinationand speciation.MolEcol14:2621–35.
Caetanoa.R(1999)AComparativeGeneMapoftheHorse(Equuscaballus).GenomeRes9:1239–1249.
CampuzanoV,MonterminiL,MoltòMD,etal (1996)Friedreich’s ataxia: autosomal recessive diseasecaused by an intronic GAA triplet repeat expansion.Science271:1423–7.
Capanna E, Redi CA (1995) Whole-arm reciprocaltranslocation (WART) between Robertsonian
chromosomes:findingofaRobertsonianheterozygousmouse with karyotype derived through WARTs.ChromosomeRes3:135–7.
Capozzi O, Carbone L, Stanyon RR, et al (2012) Acomprehensive molecular cytogenetic analysis of chromosomerearrangementsingibbons.GenomeRes22:2520–8.
Capy P (1998) Evolutionary genomics. A plasticgenome.Nature396:522-3
Carbone L,Harris RA, Gnerre S, et al (2014) Gibbongenome and the fast karyotype evolution of small apes.Nature513:195–201.
CarboneL,VessereGM,tenHallersBFH,etal(2006)Ahigh-resolutionmapofsyntenydisruptionsingibbonandhumangenomes.PLoSGenet2:e223.
Carbone L, Harris RA, Vessere GM, et al (2009)Evolutionary breakpoints in the gibbon suggestassociation between cytosine methylation and karyotypeevolution.PLoSGenet5:e1000538.
Casacuberta E, González J (2013) The impact oftransposable elements in environmental adaptation. MolEcol22:1503–17.
CasperssonT,ZechL,JohanssonC(1970)Analysisofhuman metaphase chromosome set by aid of DNA-bindingfluorescentagents.ExpCellRes62:490–492.
Castiglia R, Capanna E (2002) Chiasma repatterningacross a chromosomal hybrid zone between chromosomal races of Mus musculus domesticus. Genetica114:35–40.
CastigliaR,CapannaE (2000)Contact zonebetweenchromosomal races of Mus musculus domesticus. 2.Fertility and segregation in laboratory-reared andwild mice heterozygous for multiple Robertsonianrearrangements.Heredity85:147–156.
ChaiX,NagarajanS,KimK,etal(2013)Regulationofthe boundaries of accessible chromatin. PLoS Genet9:e1003778.
BIBLIOGRAPHY
195
Chamero P, Marton TF, Logan DW, et al (2007)Identification of protein pheromones that promote aggressivebehaviour.Nature450:899–902.
Chang D, Duda TF (2012) Extensive and continuousduplication facilitates rapid evolution and diversificationofgenefamilies.MolBiolEvol29:2019–29.
ChoKW,ZhouY,ShengL,RuiL (2011)Lipocalin-13regulates glucose metabolism by both insulin-dependentandinsulin-independentmechanisms.MolCellBiol31:450–7.
Chowdhary BP, Raudsepp T, Frönicke L, ScherthanH (1998) Emerging patterns of comparative genomeorganization in some mammalian species as revealed byZoo-FISH.GenomeRes8:577–89.
ClarkAG,WangX,MatiseT(2010)Contrastingmethodsof quantifying fine structure of human recombination. AnnuRevGenomicsHumGenet11:45–64.
Clément Y, Arndt PF (2013) Meiotic recombinationstrongly influences GC-content evolution in shortregionsinthemousegenome.MolBiolEvol30:2612–8.
Clemente IC, Ponsà M, García M, Egozcue J (1990)Evolution of the Simiiformes and the phylogeny ofhumanchromosomes.HumGenet84:493–506.
Cohen PE, Holloway JK (2010) Predicting genenetworks in human oocyte meiosis. Biol Reprod82:469–72.
Cole F, Kauppi L, Lange J, et al (2012) Homeostaticcontrol of recombination is implemented progressively inmousemeiosis.NatCellBiol14:424–30.
CollinsI,NewlonCS(1994)Meiosis-specificformationof joint DNA molecules containing sequences fromhomologouschromosomes.Cell76:65–75.
Contreras LC, Torres-Mura JC, Spotorno AE,Walker LI (1994) Chromosomes of Octomys mimax and Octodontomys gliroides and Relationships of
OctodontidRodents.JMammal75:768–774.
Coop G, Myers SR (2007) Live hot, die young:transmission distortion in recombination hotspots. PLoSGenet3:e35.
CoopG,PrzeworskiM(2007)Anevolutionaryviewofhumanrecombination.NatRevGenet8:23–34.
Cordaux R, Batzer M a (2009) The impact ofretrotransposons on human genome evolution. NatRevGenet10:691–703.
CoxDR,BurmeisterM,PriceER,etal(1990)Radiationhybrid mapping: a somatic cell genetic method for constructing high-resolution maps of mammalianchromosomes.Science250:245–50.
CoxA,Ackert-BicknellCL,DumontBL,etal(2009)Anew standard genetic map for the laboratory mouse. Genetics182:1335–44.
Coyne JA, Orr HA (2004) Speciation. SinauerAssociates, Sunderland.
CremerM,GrasserF,LanctôtC,etal(2008)Multicolor3D fluorescence in situ hybridization for imaging interphasechromosomes.MethodsMolBiol463:205–39.
Cremer T, Cremer C (2001) Chromosome territories,nuclear architecture and gene regulation in mammaliancells.NatRevGenet2:292–301.
Crouau-Roy B, Service S, Slatkin M, Freimer N(1996) A fine-scale comparison of the human andchimpanzee genomes: linkage, linkage disequilibrium andsequenceanalysis.HumMolGenet5:1131–7.
DarwinCR(1859)OntheOriginof theSpecies.P.F.Collier&Son,NewYork.
DeBoerE,StamP,DietrichAJJ,etal(2006)Twolevelsof interference in mouse meiotic recombination. Proc NatlAcadSci103:9607–12.
BIBLIOGRAPHY

196
De Castro E, Soriano I, Marín L, et al (2012)Nucleosomal organization of replication origins andmeioticrecombinationhotspotsinfissionyeast.EMBOJ31:124–37.De Grouchy J, Turleau C, RoubinM, Klein M (1972)Karyotypic evolution in man and chimpanzees. A comparative study of band topographies after controlleddenaturation.Anngénétique15:79–84.
DeLangeT(2005)Shelterin:theproteincomplexthatshapes and safeguards human telomeres. Genes Dev19:2100–10.
De Massy B (2003) Distribution of meioticrecombinationsites.TrendsGenet19:514–22.
DeOliveiraEHC,TagliariniMM,RissinoJD,etal(2010)Reciprocalchromosomepaintingbetweenwhitehawk(Leucopternisalbicollis) and chicken reveals extensive fusions and fissions during karyotype evolution of accipitridae (Aves,Falconiformes).ChromosomeRes18:349–55.
Deininger PL, Batzer MA (1999) Alu Repeats andHumanDisease.MolGenetMetab67:183–193.
DekkerJ,Marti-RenomMA,MirnyLA(2013)Exploringthe three-dimensional organization of genomes:interpreting chromatin interaction data. Nat RevGenet14:390–403.
DekkerJ(2014)Twowaystofoldthegenomeduringthe cell cycle: insights obtained with chromosome conformationcapture.EpigeneticsChromatin7:25.
Delprat A, Negre B, Puig M, Ruiz A (2009) Thetransposon Galileo generates natural chromosomalinversions in Drosophila by ectopic recombination. PLoSOne4:e7883.
Di-Nizo CB, Ventura K, Ferguson-Smith MA, et al(2015) Comparative chromosome painting in sixspecies of Oligoryzomys (Rodentia, Sigmodontinae)and the karyotype evolution of the genus. PLoS One 10:e0117579.
Diez-Villanueva, A Malinverni R, Gel B (2015)
regioneR: Association analysis of genomic regionsbasedonpermutationtests.Rpackageversion1.0.3.
Dixon JR, Selvaraj S, Yue F, et al (2012) Topologicaldomains in mammalian genomes identified by analysis ofchromatininteractions.Nature485:376–80.
Dobigny G, Britton-Davidian J, Robinson T (2015)Chromosomal polymorphism in mammals: anevolutionary perspective. Biol Rev Camb Philos Soc.On-line.
Dobzhansky T (1937) Genetics and the Origin ofSpecies.ColumbiaUniversityPress,NewYork.
Dobzhansky T (1951) Genetics and the Origin ofSpecies, 3rd edn. Columbia University Press, NewYork.
DobzhanskyT,SturtevantAH(1938)InversionsintheChromosomesofDrosophila Pseudoobscura.Genetics23:28–64.
Donthu R, Lewin H a, Larkin DM (2009)SyntenyTracker: a tool for defining homologous synteny blocks using radiation hybrid maps and whole-genomesequence.BMCResNotes2:148.
Dos Reis M, Inoue J, Hasegawa M, et al (2012)Phylogenomic datasets provide both precision and accuracy in estimating the timescale of placental mammalphylogeny.ProcBiolSci279:3491–500.
Duda TF, Palumbi SR (1999) Molecular genetics ofecological diversification: Duplication and rapid evolution of toxin genes of the venomous gastropod Conus.ProcNatlAcadSci96:6820–6823.
Dumas D, Britton-Davidian J (2002) Chromosomalrearrangements and evolution of recombination: comparison of chiasma distribution patterns in standard and robertsonian populations of the house mouse.Genetics162:1355–66.
DumasD,CatalanJ,Britton-DavidianJ(2015)Reducedrecombination patterns in Robertsonian hybridsbetween chromosomal races of the house mouse:
BIBLIOGRAPHY

197
chiasmaanalyses.Heredity114:56–64.
Dumont BL, Payseur B a (2008) Evolution of thegenomicrateofrecombinationinmammals.Evolution62:276–94.
Dumont BL, Payseur B a (2011) Genetic analysis ofgenome-scale recombination rateevolution inhousemice.PLoSGenet7:e1002116.
DumontBL,WhiteMa,SteffyB,etal(2011)Extensiverecombination rate variation in the house mouse species complex inferred from genetic linkage maps. GenomeRes21:114–25.
DutrillauxB,RethoréMO,LejeuneJ(1975)Comparisonofthekaryotypeoftheorangutan(Pongo pygmaeus)to those of man, chimpazee, and gorilla. Ann génétique 18:153–61.
Dzur-Gejdosova M, Simecek P, Gregorova S, et al(2012)DissectingthegeneticarchitectureofF1hybridsterilityinhousemice.Evolution66:3321–35.
Egozcue J, Aragonés J, Caballín MR, Goday C(1973a)Bandingpatternsofthechromosomesofmanandgorilla.Anngénétique16:207–10.
Egozcue J, Caballìn MR, Goday C (1973b) Bandingpatterns of the chromosomes of man and the chimpanzee.Humangenetik18:77–80.
EisenbarthI(2001)Long-rangesequencecompositionmirrors linkage disequilibrium pattern in a 1.13 Mbregion of human chromosome 22. Hum Mol Genet10:2833–2839.
Elferink MG, van As P, Veenendaal T, et al (2010)Regional differences in recombination hotspotsbetweentwochickenpopulations.BMCGenet11:11.
EllermeierC,HiguchiEC,PhadnisN,etal(2010)RNAiand heterochromatin repress centromeric meiotic recombination.ProcNatlAcadSci107:8701–5.
ElliottB,RichardsonC,JasinM(2005)Chromosomal
translocation mechanisms at intronic alu elements in mammalian cells.MolCell 17:885–94.doi: 10.1016/j.molcel.2005.02.028
Elsik CG, Tellam RL, Worley KC, et al (2009) Thegenome sequence of taurine cattle: a window to ruminantbiologyandevolution.Science324:522–8.
Emerson RO, Thomas JH (2009) Adaptive evolutionin zinc finger transcription factors. PLoS Genet5:e1000325.
Fachinetti D, Folco HD, Nechemia-Arbely Y,et al (2013) A two-step mechanism for epigeneticspecificationofcentromereidentityandfunction.NatCellBiol15:1056–66.
Fang X, Nevo E, Han L, et al (2014) Genome-wideadaptive complexes to underground stresses in blind moleratsSpalax.NatCommun5:3966.
Faria R, Navarro A (2010) Chromosomal speciationrevisited: rearranging theory with pieces of evidence. TrendsEcolEvol25:660–9.
Faria R, Neto S, Noor M, Navarro A (2011) Role ofNaturalSelectioninChromosomalSpeciation.eLS
Farré M, Bosch M, López-Giráldez F, et al (2011)Assessing the role of tandem repeats in shaping the genomicarchitectureofgreatapes.PLoSOne6:e27239.
Farré M, Micheletti D, Ruiz-Herrera A (2013)Recombinationratesandgenomicshufflinginhumanand chimpanzee-a new twist in the chromosomalspeciationtheory.MolBiolEvol30:853–64.
Farré M, Robinson TJ, Ruiz-Herrera A (2015) AnIntegrative Breakage Model of genome architecture,reshuffling and evolution: The Integrative BreakageModelofgenomeevolution,anovelmultidisciplinaryhypothesis for the study of genome plasticity. Bioessays37:479–88.
Feder JL, Egan SP, Nosil P (2012) The genomics ofspeciation-with-gene-flow.TrendsGenet28:342–50.
BIBLIOGRAPHY

198
FederJL,NosilP(2009)Chromosomalinversionsandspecies differences: when are genes affecting adaptive divergence and reproductive isolation expected to residewithininversions?Evolution63:3061–75.
FeschotteC,PrithamEJ(2007)DNAtransposonsandtheevolutionofeukaryoticgenomes.AnnuRevGenet41:331–68.
Fischer G, James SA, Roberts IN, et al (2000)Chromosomal evolution in Saccharomyces. Nature405:451–4.
FlachsP,MiholaO,SimečekP,etal(2012)Interallelicand intergenic incompatibilities of the Prdm9 (Hst1)geneinmousehybridsterility.PLoSGenet8:e1003044.
Ford CE, Hamerton JL (1956) The Chromosomes ofMan.Nature178:1020–1023.doi:10.1038/1781020a0
ForejtJ,VincekV,KleinJ,etal(1991)Geneticmappingof the t-complex region on mouse chromosome 17includingtheHybridsterility-1gene.MammGenome1:84–91.
Forejt J (1996)Hybrid sterility in themouse. TrendsGenet12:412–7.
FormentJV,KaidiA,JacksonSP(2012)Chromothripsisand cancer: causes and consequences of chromosome shattering.NatRevCancer12:663–70.
Franchini P, Colangelo P, Solano E, et al (2010)Reducedgeneflowatpericentromericlociinahybridzone involving chromosomal races of the house mouse Musmusculusdomesticus.Evolution64:2020–32.
Frit P, Barboule N, Yuan Y, et al (2014) Alternativeend-joining pathway(s): bricolage at DNA breaks.DNARepair17:81–97.
Froenicke L, Anderson LK, Wienberg J, Ashley T(2002) Male Mouse Recombination Maps for EachAutosome IdentifiedbyChromosomePainting.AmJHumGenet71:1353–1368.
FrönickeL,WienbergJ,StoneG,etal(2003)Towards
the delineation of the ancestral eutherian genome organization: comparative genome maps of human and theAfrican elephant (Loxodonta africana) generatedbychromosomepainting.ProcBiolSci270:1331–40.
FroenickeL (2005)Originsofprimate chromosomes-asdelineatedbyZoo-FISHandalignmentsofhumanand mouse draft genome sequences. CytogenetGenomeRes108:122–38.
FroenickeL,CaldésMG,GraphodatskyA,etal(2006)Are molecular cytogenetics and bioinformatics suggesting diverging models of ancestral mammalian genomes?GenomeRes16:306–10.
Garagna S, Broccoli D, Redi CA, et al (1995)Robertsonian metacentrics of the house mouse losetelomeric sequences but retain some minor satellite DNA in the pericentromeric area. Chromosoma103:685–92.
Garagna S, Marziliano N, Zuccotti M, et al (2001)Pericentromeric organization at the fusion point of mouse Robertsonian translocation chromosomes.ProcNatlAcadSci98:171–5.
GaragnaS,Page J,Fernandez-DonosoR,etal (2014)TheRobertsonian phenomenon in the housemouse:mutation, meiosis and speciation. Chromosoma123:529–44.
Garagna S, Zuccotti M, Capanna E, Redi C a (2002)High-resolutionorganizationofmousetelomericandpericentromericDNA.CytogenetGenomeRes96:125–9.
Garagna S, Zuccotti M, Searle JB, et al (1989)Spermatogenesis in heterozygotes for Robertsonianchromosomal rearrangements from natural populations of the common shrew, Sorex araneus. JReprodFertil87:431–8.
GarcíaF,NoguésC,PonsàM,etal(2000)Chromosomalhomologies between humans and Cebus apella(Primates) revealed by ZOO-FISH. Mamm Genome
BIBLIOGRAPHY

199
11:399–401.
Garcia-Cruz R, Pacheco S, Brieño MA, et al (2011)A comparative study of the recombination pattern in three species of Platyrrhini monkeys (primates).Chromosoma120:521–30.
GauthierP,HimaK,DobignyG (2010)Robertsonianfusions, pericentromeric repeat organization and evolution: a case study within a highly polymorphic rodent species, Gerbillus nigeriae. Chromosome Res18:473–86.
Gazave E, Catalan J, Da Graça Ramalhinho M, et al(2003) The non-randomoccurrence of Robertsonianfusioninthehousemouse.GenetRes81:33–42.
GeislerR,RauchGJ,BaierH,etal (1999)Aradiationhybridmapofthezebrafishgenome.NatGenet23:86–9.
Gemayel R, Vinces MD, Legendre M, Verstrepen KJ(2010)VariableTandemRepeatsAccelerateEvolutionofCodingandRegulatorySequences.AnnuRevGenet44:455-77.
Genome10KCommunityofScientistsGenome10K:aproposaltoobtainwhole-genomesequencefor10,000vertebratespecies(200)JHered100:659–74.
Gerton JL, DeRisi J, Shroff R, et al (2000) Globalmapping of meiotic recombination hotspots and coldspots in the yeast Saccharomyces cerevisiae. Proc NatlAcadSci97:11383–90.
Giménez MD, White T a, Hauffe HC, et al (2013)Understanding the basis of diminished gene flow between hybridizing chromosome races of the house mouse.Evolution67:1446–62.
GirautL,FalqueM,DrouaudJ,etal(2011)Genome-widecrossover distribution in Arabidopsis thaliana meiosis reveals sex-specific patterns along chromosomes.PLoSGenet7:e1002354.
GirirajanS,ChenL,GravesT,etal(2009)Sequencinghuman-gibbonbreakpointsofsyntenyrevealsmosaic
new insertions at rearrangement sites. Genome Res19:178–90.
GoodJM,DeanMD,NachmanMW(2008)AcomplexgeneticbasistoX-linkedhybridmalesterilitybetweentwospeciesofhousemice.Genetics179:2213–28.
Gordon JL, Byrne KP, Wolfe KH (2009) Additions,losses, and rearrangements on the evolutionary route from a reconstructed ancestor to the modern Saccharomyces cerevisiae genome. PLoS Genet5:e1000485.
GrabherrMG,RussellP,MeyerM,etal(2010)Genome-wide synteny through highly sensitive sequence alignment:Satsuma.Bioinformatics26:1145–51.
Graphodatsky AS, Yang F, Dobigny G, et al (2008)Tracking genome organization in rodents by Zoo-FISH.ChromosomeRes16:261–74.
Greenbaum IF, Reed MJ (1984) Evidence forheterosynaptic pairing of the inverted segment in pericentric inversion heterozygotes of the deer mouse (Peromyscus maniculatus). Cytogenet Cell Genet38:106–11.
Gregorová S, Forejt J (2000) PWD/Ph and PWK/Phinbred mouse strains of Musm.musculussubspecies--a valuable resource of phenotypic variations andgenomicpolymorphisms.FoliaBiol46:31–41.
GreyC,BarthèsP,Chauveau-LeFriecG, et al (2011)Mouse PRDM9 DNA-binding specificity determinessitesofhistoneH3lysine4trimethylationforinitiationofmeioticrecombination.PLoSBiol9:e1001176.
Griffin DK, Robertson LB, Tempest HG, et al (2008)Whole genome comparative studies between chicken and turkey and their implications for avian genome evolution.BMCGenomics9:168.
Griffiths AJ, Gelbart WM, Miller JH, Lewontin RC(1999)ModernGeneticAnalysis.WHFreeman.
GroenenMAM,ArchibaldAL,UenishiH,etal (2012)Analyses of pig genomes provide insight into porcine
BIBLIOGRAPHY

200
demographyandevolution.Nature491:393–8.
GroenenMAM,WahlbergP,FoglioM,etal (2009)Ahigh-density SNP-based linkagemap of the chickengenome reveals sequence features correlated with recombinationrate.GenomeRes19:510–9.
Gropp a., Winking H, Zech L, Müller H (1972)Robertsonian chromosomal variation andidentification of metacentric chromosomes in feral mice.Chromosoma39:265–288.
GroppA,WinkingH(1981)Robertsoniantranslocations:cytology, meiosis, segregation patterns and biological consequences of heterozygosity. In: Symposium of the ZoologicalSocietyofLondon.pp47,141–181
Gropp A, Winking H, Redi C (1982) Consequencesof Robertsonian heterozygosity: segregationalimpairment of fertility versus male limited sterility. In:Geneticcontrolofgameteproductionandfunction.AcademicPress/GruneandStratton.
GrzybJ,LatowskiD,StrzałkaK(2006)Lipocalins-afamilyportrait.JPlantPhysiol163:895–915.
Guelen L, Pagie L, Brasset E, et al (2008) Domainorganization of human chromosomes revealed by mapping of nuclear lamina interactions. Nature453:948–51.
GuénetJ-L,BonhommeF(2003)Wildmice:anever-increasing contribution to a popular mammalian model.TrendsGenet19:24–31.
Guerrero RF, Kirkpatrick M (2014) Local adaptationand the evolution of chromosome fusions. Evolution68:2747–56.
GündüzI,López-FusterMJ,VenturaJ,SearleJB(2001)Clinal analysis of a chromosomal hybrid zone in thehousemouse.GenetRes77:41–51.
Gündüz İ, Pollock CL, Giménez MD, et al (2010)Staggered Chromosomal Hybrid Zones in the HouseMouse: Relevance to Reticulate Evolution andSpeciation.Genes1:193–209.
GuttenbachM, Nanda I, FeichtingerW, et al (2003)Comparative chromosome painting of chickenautosomal paints 1-9 in nine different bird species.CytogenetGenomeRes103:173–84.
Gyapay G, Schmitt K, Fizames C, et al (1996) Aradiationhybridmapofthehumangenome.HumMolGenet5:339–46.
Haldane JBS (1922) Sex ratio and unisexualsterilityinhybridanimals.JGenet12:101–109.
Hale DW (1986) Heterosynapsis and suppression ofchiasmata within heterozygous pericentric inversions oftheSitkadeermouse.Chromosoma94:425–32.
HamiltonAT,HuntleyS,KimJ,etal(2003)Lineage-specific expansionofKRAB zinc-finger transcriptionfactor genes: implications for the evolution of vertebrate regulatory networks. Cold Spring HarbSympQuantBiol68:131–40.
Handel MA, Schimenti JC (2010) Genetics ofmammalian meiosis: regulation, dynamics and impact onfertility.NatRevGenet11:124–36.
HarleyCB,FutcherAB,GreiderCW(1990)Telomeresshorten during ageing of human fibroblasts. Nature345:458–60.
Harr B (2006) Genomic islands of differentiationbetween house mouse subspecies. Genome Res16:730–7.
HarushimaY,YanoM,ShomuraA,etal(1998)AHigh-DensityRiceGeneticLinkageMapwith2275MarkersUsingaSingleF2Population.Genetics148:479–494.
Hassold T, Hansen T, Hunt P, VandeVoort C (2009)Cytologicalstudiesofrecombinationinrhesusmales.CytogenetGenomeRes124:132–8.
Hassold T, Sherman S, Hunt P (2000) Countingcross-overs:characterizingmeioticrecombinationinmammals.HumMolGenet9:2409–19.
BIBLIOGRAPHY
201
Hastings PJ, Lupski JR, Rosenberg SM, Ira G (2009)Mechanismsofchangeingenecopynumber.NatRevGenet10:551–64.
HauffeHC,GiménezMD,SearleJB(2012)Chromosomalhybridzonesinthehousemouse.In:Evolutionofthehousemouse.CambridgeUniversityPress,Cambridge,pp407–430.
Hauffe HC, Searle JB (1998) Chromosomalheterozygosity and fertility in house mice (Musmusculus domesticus) fromNorthern Italy. Genetics150:1143–1154.
Hausser J, FedykS,FredgaK, et al (1994)Definitionand nomenclature of chromosome races of Sorex araneus.FoliaZool43:1–9.
Hawken RJ,Murtaugh J, Flickinger GH, et al (1999)A first-generation porcine whole-genome radiationhybridmap.MammGenome10:824–30.
HayashiK,YoshidaK,MatsuiY (2005)AhistoneH3methyltransferase controls epigenetic events required formeioticprophase.Nature438:374–8.
HeZ,HenricksenLA,WoldMS,InglesCJ(1995)RPAinvolvement in thedamage-recognitionand incisionstepsofnucleotideexcisionrepair.Nature374:566–9.
HefferinML,TomkinsonAE(2005)MechanismofDNAdouble-strand break repair by non-homologous endjoining.DNARepair4:639–48.
Henderson KA, Keeney S (2005) Synaptonemalcomplex formation: where does it start? Bioessays27:995–8.
Hewitt GM (1988) Hybrid zones-natural laboratoriesforevolutionarystudies.TrendsEcolEvol3:158–67.
HeyerW-D, Ehmsen KT, Liu J (2010) Regulation ofhomologous recombination ineukaryotes.AnnuRevGenet44:113–39.
HeytingC(1996)Synaptonemalcomplexes:structure
andfunction.CurrOpinCellBiol8:389–396.
Hoffmann FG,Opazo JC, Storz JF (2008) New genesoriginated via multiple recombinational pathways in thebeta-globingenefamilyofrodents.MolBiolEvol25:2589–600.
HolmquistGP,DancisB (1979)Telomere replication,kinetochore organizers, and satelliteDNA evolution.ProcNatlAcadSci76:4566–70.
HublitzP,AlbertM,PetersAHFM(2009)Mechanismsof transcriptional repression by histone lysine methylation.IntJDevBiol53:335–54.
HübnerR,KoulischerL(1990)CytogeneticstudiesonwildhousemicefromBelgium.Genetica80:93–100.
HunterN,KlecknerN(2001)TheSingle-EndInvasion.Cell106:59–70.
Jabbari K, Bernardi G (1998) CpG doublets, CpGislandsandAlurepeatsinlonghumanDNAsequencesfromdifferentisochorefamilies.Gene224:123–128.
Janoušek V, Munclinger P, Wang L, et al (2015)Functionalorganizationofthegenomemayshapethespecies boundary in the housemouse.Mol Biol Evol32:1208–20.
Janoušek V, Wang L, Luzynski K, et al (2012)Genome-wide architecture of reproductive isolationin a naturally occurring hybrid zone between Musmusculus musculus and M.m. domesticus.Mol Ecol21:3032–47.
Jansen van Vuuren B, Chown SL (2006) Geneticevidence confirms the origin of the house mouse on sub-AntarcticMarionIsland.PolarBiol30:327–332.
Jeffreys AJ, Cotton VE, Neumann R, Lam KG (2013)Recombination regulator PRDM9 influences theinstability of its own coding sequence in humans.
John B, King M (1985) The inter-relationshipbetween heterochromatin distribution and chiasma
BIBLIOGRAPHY

202
distribution.Genetica66:183–194.
JurkaJ(1997)Sequencepatternsindicateanenzymaticinvolvement in integration of mammalian retroposons. ProcNatlAcadSci94:1872–7.
KabackD, Guacci V, Barber D,Mahon J (1992)Chromosome size-dependent control of meioticrecombination.Science256:228–232.
Kalitsis P, Griffiths B, Choo KHA (2006) Mousetelocentric sequences reveal a high rate of homogenization and possible role in Robertsoniantranslocation.ProcNatlAcadSci103:8786–91.
Kauppi L, Jeffreys AJ, Keeney S (2004) Where thecrossovers are: recombination distributions in mammals.NatRevGenet5:413–24.
Kawakami T, Smeds L, Backström N, et al (2014) Ahigh-densitylinkagemapenablesasecond-generationcollared flycatcher genome assembly and reveals the patterns of avian recombination rate variation and chromosomalevolution.MolEcol23:4035–58.
Keeney S (2008) Spo11 and the Formation of DNADouble-Strand Breaks in Meiosis. Genome Dyn Stab2:81–123.
Keeney S, Giroux CN, Kleckner N (1997) Meiosis-Specific DNA Double-Strand Breaks Are Catalyzedby Spo11, a Member of a Widely Conserved ProteinFamily.Cell88:375–384.
Kehrer-SawatzkiH,CooperDN(2008a)Comparativeanalysis of copy number variation in primate genomes. CytogenetGenomeRes123:288–96.
Kehrer-Sawatzki H, Cooper DN (2008b) Molecularmechanisms of chromosomal rearrangement during primateevolution.ChromosomeRes16:41–56.
Kelkar YD, Tyekucheva S, Chiaromonte F, MakovaKD(2008)Thegenome-widedeterminantsofhumanandchimpanzeemicrosatelliteevolution.GenomeRes18:30–38.
KemkemerC,KohnM,CooperDN,etal(2009)Genesynteny comparisons between different vertebrates provide new insights into breakage and fusion events during mammalian karyotype evolution. BMC EvolBiology9:84.
KentWJ,BaertschR,HinrichsA,etal(2003)Evolution’scauldron: duplication, deletion, and rearrangement in themouse and human genomes. Proc Natl Acad Sci100:11484–9.
KingM(1993)Speciesevolution.CambridgeUniversityPress,Cambridge.
KiplingD,CookeHJ (1990)Hypervariableultra-longtelomeresinmice.Nature347:400–2.
KloostermanWP,Tavakoli-YarakiM,vanRoosmalenMJ, et al (2012) Constitutional chromothripsisrearrangements involve clustered double-strandedDNAbreaksandnonhomologousrepairmechanisms.CellRep1:648–55.
Kneitz B, Cohen PE, Avdievich E, et al (2000)MutShomolog 4 localization to meiotic chromosomes isrequired for chromosome pairing during meiosis in male and female mice. Genes & Dev 14:1085–1097.
KoehlerKE,CherryJP,LynnA,etal(2002a)Geneticcontrol of mammalian meiotic recombination. I. Variation in exchange frequencies among males from inbredmousestrains.Genetics162:297–306.
Koehler KE, Millie EA, Cherry JP, et al (2002b)Sex-specific differences in meiotic chromosomesegregation revealed by dicentric bridge resolution in mice.Genetics162:1367–79.
KoepfliK-P,PatenB,O’Brien SJ (2015) TheGenome10KProject:AWayForward.AnnuRevAnimBiosci3:57–111.
KolbJ,ChuzhanovaNa,HögelJ,etal(2009)Cruciform-forming inverted repeats appear to have mediated many of the microinversions that distinguish the
BIBLIOGRAPHY

203
human and chimpanzee genomes. Chromosome Res17:469–83.
KongA,ThorleifssonG,GudbjartssonDF,etal(2010)Fine-scale recombination rate differences betweensexes,populationsandindividuals.Nature467:1099–103.
Kono H, Tamura M, Osada N, et al (2014) Prdm9 polymorphism unveils mouse evolutionary tracks. DNARes21:315–26.
KorbelJO,UrbanAE,AffourtitJP,etal(2007)Paired-end mapping reveals extensive structural variation in thehumangenome.Science318:420–6.
Koszul R, Fischer G (2009) A prominent role forsegmental duplications in modeling eukaryotic genomes.CRBiol332:254–66.
Kozubek S, Lukásová E, Jirsová P, et al (2002) 3DStructure of the human genome: order in randomness. Chromosoma111:321–31.
KulathinalRJ, Bennett SM,FitzpatrickCL,NoorMaF (2008) Fine-scale mapping of recombination ratein Drosophila refines its correlation to diversity and divergence.ProcNatlAcadSci105:10051–6.
Kuo LJ, Yang L-X (2008) -gamma-H2AX - A NovelBiomarker for DNA Double-strand Breaks. In Vivo22:305–309.
Kvikstad EM,MakovaKD (2010) The (r)evolution ofSINE versus LINE distributions in primate genomes:sexchromosomesareimportant.GenomeRes20:600–13
Lalley PA, Minna JD, Francke U (1978)Conservation of autosomal gene synteny groups inmouseandman.Nature274:160–3.
Lande R (1985) The fixation of chromosomalrearrangements in a subdivided population with local extinctionandcolonization.Heredity54(Pt3):323–32.
Lander ES, Linton LM, Birren B, et al (2001) Initialsequencingandanalysisofthehumangenome.Nature409:860–921.
LarkinDM(2010)Roleofchromosomalrearrangementsand conserved chromosome regions in amniote evolution.MolGenetMicrobiolVirol25:1–7.
LarkinDM,PapeG,DonthuR,etal(2009)Breakpointregions and homologous synteny blocks in chromosomes have different evolutionary histories. GenomeRes19:770–7.
Lawrie NM, Tease C, Hultén MA (1995) Chiasmafrequency, distribution and interference maps of mouseautosomes.Chromosoma104:308–14.
Lee J, Han K, Meyer TJ, et al (2008) ChromosomalInversionsbetweenHumanandChimpanzeeLineagesCausedbyRetrotransposons.PLoSOne3:e4047.
Lee JA, Carvalho CMB, Lupski JR (2007) A DNAreplication mechanism for generating nonrecurrent rearrangements associated with genomic disorders. Cell131:1235–47.
Lee SE (2014) Single-Strand Annealing. Mol life Sci10:1–77.
Lemaitre C, Tannier E, Gautier C, SagotM-F (2008)Precise detection of rearrangement breakpoints in mammalianchromosomes.BMCBioinformatics9:286.
LemaitreC,ZaghloulL,SagotM-F,etal(2009)Analysisof fine-scale mammalian evolutionary breakpointsprovides new insight into their relation to genome organisation.BMCGenomics10:335.
Lenormand T, Dutheil J (2005) Recombinationdifference between sexes: a role for haploid selection. PLoSBiol3:e63.
Lentzios G, Stocker AJ, Martin J (1980) C-bandingand chromosome evolution in some related species of Australianchironominae.Genetica54:51–68.
BIBLIOGRAPHY

204
LevyA,SchwartzS,AstG(2010)Large-scalediscoveryof insertion hotspots and preferential integration sites of human transposed elements. Nucleic Acids Res38:1515–30.
LewinH a, Larkin DM, Pontius J, O’Brien SJ (2009)Every genome sequenceneeds a goodmap.GenomeRes19:1925–8.
LiL,LejnineS,MakarovV,LangmoreJP(1998)Invitroand in vivo reconstitution and stability of vertebrate chromosomeends.NucleicAcidsRes26:2908–2908.
Li W, Freudenberg J (2009) Two-parametercharacterizationofchromosome-scalerecombinationrate.GenomeRes19:2300–7.
Lieber MR (2010) The mechanism of double-strandDNA break repair by the nonhomologousDNA end-joiningpathway.AnnuRevBiochem79:181–211.
Lieberman-Aiden E, van Berkum NL, Williams L,et al (2009) Comprehensive mapping of long-rangeinteractions reveals folding principles of the human genome.Science326:289–93.
Lindgren G, Sandberg K, Persson H, et al (1998) Aprimary male autosomal linkage map of the horse genome.GenomeRes8:951–66.
Lipkin SM,Moens PB,Wang V, et al (2002) Meioticarrest and aneuploidy in MLH3-deficient mice. NatGenet31:385–90.
Liu G, Liu J, Cui X, Cai L (2012) Sequence-dependent prediction of recombination hotspots in Saccharomyces cerevisiae. JTheorBiol293:49–54.
LiuGE,VenturaM,CellamareA,etal(2009)Analysisofrecent segmental duplications in the bovine genome. BMCGenomics10:571.
LongheseMP,BonettiD,Guerini I, et al (2009)DNAdouble-strand breaks in meiosis: checking theirformation,processingandrepair.DNARepair8:1127–38.
LongoMS,CaroneDM,GreenED,etal(2009)Distinctretroelement classes define evolutionary breakpoints demarcating sites of evolutionary novelty. BMCGenomics10:334.
LoomanC,AbrinkM,MarkC,HellmanL(2002)KRABzinc finger proteins: an analysis of the molecular mechanisms governing their increase in numbers and complexity during evolution.Mol Biol Evol 19:2118–30.
LupskiJR(1998)Genomicdisorders:structuralfeaturesof the genome can lead toDNA rearrangements andhumandiseasetraits.TrendsGenet14:417–22.
Lupski JR, Stankiewicz P (2005) Genomic disorders:molecular mechanisms for rearrangements and conveyedphenotypes.PLoSGenet1:e49.
LynnA,KoehlerKE,JudisL,etal(2002)Covariationof synaptonemal complex length and mammalian meioticexchangerates.Science296:2222–5.
Lynn A, Schrump S, Cherry J, et al (2005) Sex, notgenotype, determines recombination levels in mice. AmJHumGenet77:670–5.
MaJ,ZhangL,SuhBB,etal(2006)Reconstructingcontiguous regions of an ancestral genome. GenomeRes16:1557–65.
Manieu C, González M, López-Fenner J (2014)Aneuploidy in spermatids of Robertsonian (Rb)chromosome heterozygous mice. Chromosome Res22:545-57.
ManoukisNC,PowellJR,TouréMB,etal(2008)Atestof the chromosomal theory of ecotypic speciation in Anopheles gambiae.ProcNatlAcadSci105:2940–5.
Manterola M, Page J, Vasco C, et al (2009) A highincidence of meiotic silencing of unsynapsed chromatin is not associated with substantial pachytene loss in heterozygous male mice carrying multiple simple robertsoniantranslocations.PLoSGenet5:e1000625.
BIBLIOGRAPHY

205
Mardis ER (2008) Next-generation DNA sequencingmethods.AnnuRevGenomicsHumGenet9:387–402.
Marques-BonetT,KiddJM,VenturaM,etal(2009)Aburst of segmental duplications in the genome of the Africangreatapeancestor.Nature457:877–81.
Martí DA, Bidau CJ (2004) Synapsis in RobertsonianHeterozygotes and Homozygotes of Dichroplus Pratensis (Melanoplinae, Acrididae) and ItsRelationship with Chiasma Patterns. Hereditas134:245–254.
Martínez-Vargas J, Muñoz-Muñoz F, Medarde N, etal (2014) Effect of chromosomal reorganizations onmorphological covariation of the mouse mandible: insightsfromaRobertsoniansystemofMusmusculusdomesticus. FrontZool11:51.
Masly JP, Jones CD, Noor MAF, et al (2006) Genetransposition as a cause of hybrid sterility in Drosophila.Science313:1448–50.
MayrE (1942)SystematicsandtheOriginofSpecies,fromtheViewpointofaZoologist.HarvardUniversityPress.
McClintockB (1984)The significanceof responsesofthegenometochallenge.Science226:792–801.
McGraw LA, Davis JK, Young LJ, Thomas JW (2011)A genetic linkage map and comparative mapping of theprairievole(Microtusochrogaster)genome.BMCGenet12:60.
McMahillMS,ShamCW,BishopDK(2007)Synthesis-dependent strand annealing in meiosis. PLoS Biol5:e299.
McVey M, Lee SE (2008) MMEJ repair of double-strandbreaks(director’scut):deletedsequencesandalternativeendings.TrendsGenet24:529–38.
Meaburn KJ, Misteli T, Soutoglou E (2007) Spatialgenome organization in the formation of chromosomal translocations.SeminCancerBiol17:80–90.
MedardeN(2013)Lazonadepolimorfismocromosómico“Barcelona” de Mus musculus domesticus Schwarzy Schwarz, 1943: dinámica espaciotemporal de suestructura y efecto de las fusiones robertsonianas sobre la espermatogénesis. Doctoral Thesis.
Medarde N, López-Fuster MJ, Muñoz-Muñoz F,Ventura J (2012) Spatio-temporal variation in thestructure of a chromosomal polymorphism zone in the housemouse.Heredity109:78–89.
Medarde N,Merico V, López-FusterMJ, et al (2015)Impactof thenumberofRobertsonianchromosomeson germ cell death in wild male house mice. ChromosomeRes23:159–69.
Medarde N, Muñoz-Muñoz F, López-Fuster MJ,Ventura J (2013) Variational modularity at the celllevel: insights from the sperm head of the house mouse.BMCEvolBiol13:179.
Mellersh CS, Hitte C, Richman M, et al (2000) Anintegratedlinkage-radiationhybridmapofthecaninegenome.MammGenome11:120–30.
Meredith RW, Janečka JE, Gatesy J, et al (2011)Impactsof theCretaceousTerrestrialRevolutionandKPg extinction on mammal diversification. Science 334:521–4.
Merico V, Giménez MD, Vasco C, et al (2013)Chromosomal speciation in mice: a cytogeneticanalysis of recombination.ChromosomeRes 21:523–33.
MericoV,PigozziMI,EspositoA,etal(2003)Meioticrecombination and spermatogenic impairment in Musmusculus domesticus carryingmultiple simpleRobertsonian translocations. Cytogenet Genome Res103:3–4.
Meuleman W, Peric-hupkes D, Kind J, et al (2013)Constitutive nuclear lamina – genome interactionsarehighly conservedandassociatedwithA /T-richsequence.270–280.
MeyneJ,BakerRJ,HobartHH,etal(1990)Distribution
BIBLIOGRAPHY

206
of non-telomeric sites of the (TTAGGG)n telomericsequence in vertebrate chromosomes. Chromosoma99:3–10.
Meznar ER, Gadau J, Koeniger N, Rueppell O (2010)Comparative linkage mapping suggests a highrecombinationrateinallhoneybees.JHered101Suppl:S118–26.
Mihola O, Trachtulec Z, Vlcek C, et al (2009) Amouse speciationgeneencodesameiotichistoneH3methyltransferase.Science323:373–5.
Mlynarski EE, Obergfell CJ, O’Neill MJ, O’Neill RJ(2010) Divergent patterns of breakpoint reuse inMuroidrodents.MammGenome21:77–87.
MoensPB,MarconE,ShoreJS,etal (2007) Initiationand resolution of interhomolog connections: crossover and non-crossover sites along mouse synaptonemalcomplexes.JCellSci120:1017–27.
MonginE,DewarK,BlanchetteM(2009)Long-rangeregulation is a major driving force in maintaining genomeintegrity.BMCEvolBiol9:203.
Mora L, Sánchez I, Garcia M, Ponsà M (2006)Chromosome territory positioning of conservedhomologous chromosomes in different primate species.Chromosoma115:367–75.
MoránT,FontdevilaA(2014)Genome-widedissectionof hybrid sterility in Drosophila confirms a polygenic thresholdarchitecture.JHered105:381–96.
Mosna E, Rivosechi L, Ascher KR (1958) Studies oninsecticide-resistant anophelines. I. Chromosomearrangementsinadieldrin-selectedstrainofAnopheles atroparvus.BullWorldHealthOrgan19:297–301.
MoyzisRK,Buckingham JM,CramLS, et al (1988)AhighlyconservedrepetitiveDNAsequence,(TTAGGG)n, present at the telomeres of human chromosomes. ProcNatlAcadSci85:6622–6.
MullerHJ(1942)Isolatingmechanisms,evolutionandtemperature.BiolSymp6:71–125.
MunchK,MailundT,DutheilJY,SchierupMH(2014)A fine-scale recombination map of the human-chimpanzee ancestor reveals faster change in humans thaninchimpanzeesandastrongimpactofGC-biasedgeneconversion.GenomeRes24:467–74.
Muñoz-MuñozF,Sans-FuentesMa.,Lopez-FusterMJ,Ventura J (2006)Variation in fluctuating asymmetrylevelsacrossaRobertsonianpolymorphiczoneofthehousemouse.JZoolSystEvolRes44:236–250.
Muñoz-Muñoz F, Sans-Fuentes MA, López-FusterMJ, Ventura J (2011) Evolutionarymodularity of themouse mandible: dissecting the effect of chromosomal reorganizations and isolation by distance in a Robertsonian system ofMusmusculus domesticus. JEvolBiol24:1763–76.
Murakami H, Keeney S (2008) Regulating theformation of DNA double-strand breaks in meiosis.GenesDev22:286–92.
MurphyWJ,AgarwalaR,SchäfferAA,etal(2005a)Arhesus macaque radiation hybrid map and comparative analysiswiththehumangenome.Genomics86:383–95.
MurphyWJ, Larkin DM, Everts-van derWind A, etal (2005b) Dynamics of mammalian chromosomeevolution inferred from multispecies comparative maps.Science309:613–7.
MurphyWJ, Stanyon R,O’Brien SJ (2001) Evolutionof mammalian genome organization inferred from comparative gene mapping. Genome Biol2:REVIEWS0005.
MurphyWJ, Sun S, Chen Z, et al (2000)A radiationhybrid map of the cat genome: implications for comparativemapping.GenomeRes10:691–702.
Musilova P, Kubickova S, Vahala J, Rubes J (2013)Subchromosomal karyotype evolution in Equidae.ChromosomeRes21:175–87.
MyersS,BowdenR,TumianA,etal(2010)Driveagainst
BIBLIOGRAPHY
207
hotspotmotifsinprimatesimplicatesthePRDM9geneinmeioticrecombination.Science327:876–9.
MyersS,FreemanC,AutonA,etal(2008)Acommonsequence motif associated with recombination hot spots and genome instability in humans. Nat Genet40:1124–9.
Nachman MW, Searle JB (1995) Why is thehousemousekaryotypesovariable?TrendsEcolEvol10:397–402.
NadeauJH,TaylorBa(1984)Lengthsofchromosomalsegments conserved since divergence of man and mouse.ProcNatlAcadSci81:814–8.Nanda I, Schneider-Rasp S, Winking H, Schmid M(1995)Lossof telomeric sites in thechromosomesofMusmusculusdomesticus(Rodentia:Muridae)duringRobertsonian rearrangements. Chromosome Res3:399–409.
Näslund K, Saetre P, von Salomé J, et al (2005)Genome-widepredictionofhumanVNTRs.Genomics85:24–35.
NavarroA,BartonNH(2003a)Chromosomalspeciationand molecular divergence--accelerated evolution inrearrangedchromosomes.Science300:321–4.
Navarro A, Barton NH (2003b) AccumulatingPostzygoticIsolationGenesinParapatry:aNewTwistonChromosomalSpeciation.Evolution57:447.
Navarro A, Betrán E, Barbadilla A, Ruiz A (1997)Recombination and gene flux caused by geneconversion and crossing over in inversion heterokaryotypes.Genetics146:695–709.
Nergadze SG, Rocchi M, Azzalin CM, et al (2004)Insertion of telomeric repeats at intrachromosomal break sites during primate evolution. Genome Res14:1704–10.
Newman TL, Tuzun E, Morrison VA, et al (2005) Agenome-widesurveyofstructuralvariationbetweenhumanandchimpanzee.GenomeRes15:1344–56.
Nishant KT, Rao MRS (2006) Molecular features ofmeioticrecombinationhotspots.Bioessays28:45–56.
Noor M a, Grams KL, Bertucci L a, Reiland J (2001)Chromosomal inversions and the reproductiveisolationofspecies.ProcNatlAcadSci98:12084–8.
Noor MAF, Garfield DA, Schaeffer SW, MachadoCA (2007) Divergence between the Drosophila pseudoobscura and D. persimilis genome sequences in relation to chromosomal inversions. Genetics177:1417–28.
NoraEP,DekkerJ,HeardE(2013)Segmentalfoldingof chromosomes: A basis for structural and regulatory chromosomalneighborhoods?BioEssays35:818–828.
Nowick K, Carneiro M, Faria R (2013) A prominentroleofKRAB-ZNFtranscriptionfactorsinmammalianspeciation?TrendsGenet29:130–9.
Nunes a C, Catalan J, Lopez J, et al (2011) Fertilityassessment in hybrids between monobrachially homologous Rb races of the house mouse fromthe island of Madeira: implications for modes ofchromosomalevolution.Heredity106:348–56.
O’BrienSJ,CevarioSJ,MartensonJS,etal(1995)Comparativegenemappinginthedomesticcat(Feliscatus).JHered88:408–14.
O’BrienSJ,WienbergJ,LyonsLA(1997)Comparativegenomics:lessonsfromcats.TrendsGenet13:393–9.
O’SullivanRJ,KarlsederJ(2010)Telomeres:protectingchromosomesagainstgenomeinstability.NatRevMolCellBiol11:171–81.
Oliver PL, Goodstadt L, Bayes JJ, et al (2009)Accelerated evolution of the Prdm9 speciation gene acrossdiversemetazoantaxa.PLoSGenet5:e1000753.
Onishi-Seebacher M, Korbel JO (2011) Challengesin studying genomic structural variant formation mechanisms: the short-read dilemma and beyond.
BIBLIOGRAPHY

208
Bioessays33:840–50.
Ohno S (1973) Ancient linkage groups and frozenaccidents.Nature244:259–62.
Oud JL, de Jong JH, deRooijDG (1979)A sequentialanalysis of meiosis in the male mouse using a restricted spermatocytepopulationobtainedbyahydroxyurea/triaziquonetreatment.Chromosoma71:237–48.
Pagacova E, Cernohorska H, Kubickova S, etal (2009) Centric fusion polymorphism in captiveanimalsoffamilyBovidae.ConservGenet12:71–77.
PageSL,HawleyRS(2004)Thegeneticsandmolecularbiologyofthesynaptonemalcomplex.AnnuRevCellDevBiol20:525–58.
Page SL, Shin JC, Han JY, et al (1996) Breakpointdiversity illustrates distinct mechanisms for Robertsoniantranslocationformation.HumMolGenet5:1279–88.
PaigenK,SzatkiewiczJP,SawyerK,etal(2008)Therecombinational anatomy of a mouse chromosome. PLoSGenet4:e1000119.
ParadaL,MisteliT(2002)Chromosomepositioningintheinterphasenucleus.TrendsCellBiol12:425–32.
PardiniAT,O’BrienPCM,FuB,etal(2007)ChromosomepaintingamongProboscidea,HyracoideaandSirenia:supportforPaenungulata(Afrotheria,Mammalia)butnotTethytheria.ProcBiolSci274:1333–40.
Pardo-Manuel de Villena F, Sapienza C (2001)Recombination is proportional to the number ofchromosome arms in mammals. Mamm Genome12:318–22.
Parvanov ED, Petkov PM, Paigen K (2010) Prdm9 controls activation of mammalian recombination hotspots.Science327:835.
Pawlina K, Bugno-Poniewierska M (2012) Theapplication of zoo-fish technique for analysis
of chromosomal rearrangements in the equidae family. AnnAnimSci12:5–13.
Payseur BA, Krenz JG, Nachman MW (2004)Differential patterns of introgression across the Xchromosome in a hybrid zone between two species of housemice.Evolution58:2064–2078.
Peng Q, Pevzner PA, Tesler G (2006) The fragilebreakage versus random breakage models of chromosomeevolution.PLoSComputBiol2:e14.
Perelman PL, Beklemisheva VR, Yudkin D V, et al(2012)ComparativechromosomepaintinginCarnivoraandPholidota.CytogenetGenomeRes137:174–93.
Perez DE, Wu CI, Johnson NA, Wu ML (1993)Genetics of reproductive isolation in the Drosophila simulans clade: DNA marker-assisted mapping andcharacterization of a hybrid-male sterility gene,Odysseus(Ods).Genetics134:261–75.
Peric-Hupkes D,MeulemanW, Pagie L, et al (2010)Molecular maps of the reorganization of genome-nuclear lamina interactions during differentiation. MolCell38:603–13.
PetesTD(2001)Meioticrecombinationhotspotsandcoldspots.NatRevGenet2:360–9.
Petkov PM, Broman KW, Szatkiewicz JP, Paigen K(2007)Crossoverinterferenceunderliessexdifferencesinrecombinationrates.TrendsGenet23:539–42.
Pevzner P, Tesler G (2003a) Human and mousegenomic sequences reveal extensive breakpoint reuse inmammalianevolution.ProcNatlAcadSci100:7672–7.
PevznerP,TeslerG(2003b)GenomeRearrangementsinMammalian Evolution: Lessons FromHuman andMouseGenomes.GenomeResearch13:37-45.
PhadnisN,OrrHA (2009)A singlegenecausesbothmale sterility and segregation distortion in Drosophila hybrids.Science323:376–9.
BIBLIOGRAPHY

209
Phillips-CreminsJE(2014)Unravelingarchitectureofthe pluripotent genome. Curr Opin Cell Biol 28:96–104.
Piálek J, Hauffe HC, Rodríguez-Clark KM, Searle JB(2001)RaciationandspeciationinhousemicefromtheAlps:theroleofchromosomes.MolEcol10:613–25.
Piálek J,HauffeHC, Searle JB (2005) The genusMusas a model for evolutionary studies Chromosomalvariationinthehousemouse.535–563.
PittmanDL,CobbJ,SchimentiKJ,etal(1998)MeioticProphaseArrestwithFailureofChromosomeSynapsisinMiceDeficientforDmc1,aGermline-SpecificRecAHomolog.MolCell1:697–705.
PlugAW,PetersAH,XuY,etal(1997)ATMandRPAinmeioticchromosomesynapsisandrecombination.NatGenet17:457–61.
PollackJR,SørlieT,PerouCM,etal(2002)Microarrayanalysis reveals a major direct role of DNA copynumber alteration in the transcriptional program of humanbreasttumors.ProcNatlAcadSci99:12963–8.
Poon SSS, Martens UM, Ward RK, Lansdorp PM(1999) Telomere length measurements using digitalfluorescencemicroscopy.Cytometry36:267–278.
PrattoF,BrickK,KhilP,etal(2014a)Recombinationinitiation maps of individual human genomes. Science 346:1256442–1256442.
PresgravesDC (2010) Speciation genetics: search forthemissingsnowball.CurrBiol20:R1073–4.
ProostS,FostierJ,DeWitteD,etal(2012)i-ADHoRe3.0-fastandsensitivedetectionofgenomichomologyinextremelylargedatasets.NucleicAcidsRes40:e11.
Prowse KR, Greider CW (1995) Developmental andtissue-specific regulation of mouse telomerase andtelomerelength.ProcNatlAcadSci92:4818–22.
QuinlanAR,ClarkRA,SokolovaS,etal(2010b)Genome-wide mapping and assembly of structuralvariant breakpoints in the mouse genome. GenomeRes20:623–35.
Qumsiyeh MB (1994) Evolution of number andmorphology of mammalian chromosomes. J Hered85:455–65.
RaneRV,RakoL,KapunM,etal(2015)Genomicevidence for role of inversion 3RP of Drosophila melanogaster in facilitating climate change adaptation. MolEcol24:2423–32.
RaoSSP,HuntleyMH,DurandNC,etal(2014)A3DMapoftheHumanGenomeatKilobaseResolutionRevealsPrinciplesofChromatinLooping.Cell159:1665–80.
RediCA,CapannaE(1988)Robertsonianheterozygotesin the house mouse and the fate of their germ cells. In: TheCytogeneticsofMammalianRearrangements.pp315–359
Redi CA, Garagna S, Capanna E (1990) Nature’sexperiment with in situ hybridization? A hypothesis forthemechanismofRbfusion.JEvolBiol3:133–137.
Redi CA, Garagna S, Hilscher B, Winking H (1985)The effects of some Robertsonian chromosomecombinations on the seminiferous epithelium of the mouse.JEmbryolExpMorphol85:1–19.
Reeves A (2001) MicroMeasure: A new computerprogram for the collection and analysis of cytogenetic data.Genome44:439-43.
Reig-Viader R, Vila-CejudoM, Vitelli V, et al (2014)Telomeric repeat-containing RNA (TERRA) andtelomerase are components of telomeres during mammaliangametogenesis.BiolReprod90:103.
RichardG-F,KerrestA,DujonB(2008)ComparativegenomicsandmoleculardynamicsofDNArepeats ineukaryotes.MicrobiolMolBiolRev72:686–727.
BIBLIOGRAPHY

210
Rieseberg LH (2001) Chromosomal rearrangementsandspeciation.TrendsEcolEvol16:351–358.
Rieseberg LH, Archer MA, Wayne RK (1999)Transgressive segregation, adaptation and speciation. Heredity83:363–72.
RiesebergLH,LinderCR,SeilerGJ(1995)Chromosomaland genic barriers to introgression in Helianthus.Genetics141:1163–71.
Robertson WRB (1916) Chromosome studies. I.Taxonomic relationships shown in the chromosomes of tettigidae and acrididae: V-shaped chromosomesand their significance in acrididae, locustidae, and gryllidae: Chromosomes and variation. J Morphol27:179–331.
Robinson TJ, Ropiquet A (2011) Examination ofhemiplasy, homoplasy and phylogenetic discordance in chromosomal evolution of the Bovidae. Syst Biol60:439–50.
Robinson TJ, Ruiz-Herrera A, Froenicke L (2006)Dissectingthemammaliangenome--newinsightsintochromosomalevolution.TrendsGenet22:297–301.
Rödelsperger C, Dieterich C (2010) CYNTENATOR:progressive gene order alignment of 17 vertebrategenomes.PLoSOne5:e8861.
Rogakou EP, Pilch DR, Orr a. H, et al (1998) DNADouble-stranded Breaks Induce Histone H2AXPhosphorylationonSerine139.JBiolChem273:5858–5868.
Rogers J, Witte SM, Kammerer CM, et al (1995)Linkage mapping in Papio baboons: conservation of a syntenic group of six markers on human chromosome 1.Genomics28:251–4.
Romanenko SA, Perelman PL, Trifonov VA,Graphodatsky AS (2012) Chromosomal evolution inRodentia.Heredity108:4–16.
RomanenkoSA,VolobouevV(2012)Non-Sciuromorphrodent karyotypes in evolution. Cytogenet Genome
Res137:233–45.
RomanienkoPJ,Camerini-OteroRD(2000)TheMouseSpo11 Gene Is Required for Meiotic ChromosomeSynapsis.MolCell6:975–987.
Ruiz-Herrera a, Nergadze SG, Santagostino M,GiulottoE(2008)Telomericrepeatsfarfromtheends:mechanismsoforiginandroleinevolution.CytogenetGenomeRes122:219–28.
Ruiz-Herrera A, Castresana J, Robinson TJ (2006) Ismammalian chromosomal evolution driven by regions ofgenomefragility?GenomeBiol7:R115.
Ruiz-HerreraA,FarréM,PonsàM,RobinsonTJ(2010)Selection against Robertsonian fusions involvinghousekeeping genes in the house mouse: integrating data from gene expression arrays and chromosome evolution.ChromosomeRes18:801–8.
Ruiz-Herrera A, García F, Mora L, et al (2005)Evolutionary conserved chromosomal segmentsin the human karyotype are bounded by unstable chromosomebands.CytogenetGenomeRes108:161–74.
Ruiz-HerreraA,PonsàM,GarcíaF,etal(2002)Fragilesites in human and Macacafascicularis chromosomes are breakpoints in chromosome evolution. ChromosomeRes10:33–44.
Saltman D, Morgan R, Cleary ML, de Lange T(1993)Telomericstructure incellswithchromosomeendassociations.Chromosoma102:121–128.
Sankoff D (2006) The signal in the genomes. PLoSComputBiol2:e35.
Sankoff D, Ferretti V, Nadeau JH (1997) Conservedsegmentidentification.JComputBiol4:559–65.
Sankoff D, Trinh P (2005) Chromosomal breakpointreuse in genome sequence rearrangement. J ComputBiol12:812–21.
BIBLIOGRAPHY

211
Sans-Fuentes MA (2004) Estudio Biologico de MusdomesticusRutty, 1772enunazonadepolimorfismoRobertsoniano.DoctoralThesis.
Sans-FuentesMA,García-ValeroJ,VenturaJ,López-FusterMJ (2010)Spermatogenesis inhousemouse ina Robertsonian polymorphism zone. Reproduction140:569–81.
Sans-FuentesMA, López-FusterMJ, Ventura J, et al(2005) Effect of Robertsonian translocations on themotor activity rhythm in the house mouse. BehavGenet35:603–13.
Sans-FuentesMA,Muñoz-MuñozF,VenturaJ,López-FusterMJ(2007)Rb(7.17),arareRobertsonianfusionin wild populations of the house mouse. Genet Res89:207–13.
Sans-FuentesMA,VenturaJ,López-FusterMJ,CortiM(2009)MorphologicalvariationinhousemicefromtheRobertsonianpolymorphismareaofBarcelona.Biol JLinnSoc97:555–570.
Santos-Colares MC dos, Degrandi TH, Valente VLS(2004) Cytological Detection ofMale Recombinationin Drosophila willistoni.Cytologia69:359–365.
Santucci-DarmaninS(2000)MSH4actsinconjunctionwith MLH1 during mammalian meiosis. FASEB J14:1539–1547.
Sasaki M, Lange J, Keeney S (2010) Genomedestabilization by homologous recombination in the germline.NatRevMolCellBiol11:182–95.
Scherthan H, Cremer T, Arnason U, et al (1994)Comparative chromosome painting discloseshomologous segments in distantly related mammals. NatGenet6:342–7.
Scherthan H, Weich S, Schwegler H, et al (1996)Centromere and telomere movements during earlymeiotic prophase of mouse and man are associated with the onset of chromosome pairing. J Cell Biol134:1109–25.
Schibler L, Roig A, Mahe M-F, et al (2006) High-resolution comparative mapping among man, cattle and mouse suggests a role for repeat sequences in mammaliangenomeevolution.BMCGenomics7:194.
Schmidt D, Schwalie PC, Wilson MD, et al (2012)Waves of retrotransposon expansion remodel genome organizationandCTCFbindinginmultiplemammalianlineages.Cell148:335–48.
Schoeftner S, Blasco MA (2008) Developmentallyregulated transcription of mammalian telomeres by DNA-dependent RNA polymerase II. Nat Cell Biol10:228–36.
Schwacha A, Kleckner N (1995) Identification ofdouble holliday junctions as intermediates in meiotic recombination.Cell83:783–791.
SchwartzJJ,RoachDJ,ThomasJH,ShendureJ(2014)Primate evolution of the recombination regulator PRDM9.NatCommun5:4370.
Schwarz E, Schwarz HK (1943) The Wild andCommensalStocksoftheHouseMouse,Musmusculus Linnaeus.JMammal24:59–72.
Searle JB (1991) A hybrid zone comprising staggeredchromosomalclinesinthehousemouse(Musmusculusdomesticus).ProcBiolSci246:47–52.
Searle JB (1993) Chromosomal hybrid zones ineutherian mammals. In: Hybrid zones and theevolutionary process. Oxford University Press, NewYork,pp309–353
Segura J, Ferretti L, Ramos-onsins S, et al (2013)Evolution of recombination in eutherian mammals:insights into mechanisms that affect recombination rates and crossover interference. Proc R Soc B280:20131945.
SenSK,HanK,WangJ,etal(2006)Humangenomicdeletions mediated by recombination between Alu elements.AmJHumGenet79:41–53.
SextonT,KurukutiS,MitchellJA,etal(2012)Sensitive
BIBLIOGRAPHY

212
detection of chromatin coassociations using enhanced chromosome conformation capture on chip. NatProtoc7:1335–50.
Shannon M, Hamilton AT, Gordon L, et al (2003)Differential expansion of zinc-finger transcriptionfactor loci in homologous human and mouse gene clusters.GenomeRes13:1097–110.
SharpAJ,HansenS,SelzerRR,etal(2006)Discoveryof previously unidentified genomic disorders from the duplication architecture of the human genome. NatGenet38:1038–42.
Shaw CJ, Lupski JR (2004) Implications of humangenome architecture for rearrangement-baseddisorders: the genomic basis of disease. Hum MolGenet13SpecNo:R57–64.
SheX,ChengZ,ZöllnerS,etal(2008)Mousesegmentalduplication and copy number variation. Nat Genet40:909–14.
SheX,JiangZ,ClarkRA,etal(2004)Shotgunsequenceassembly and recent segmental duplications within thehumangenome.Nature431:927–30.
SivaN (2008) 1000Genomesproject.NatBiotechnol26:256.
Skinner BM, Griffin DK (2012) Intrachromosomalrearrangements in avian genome evolution: evidence forregionspronetobreakpoints.Heredity108:37–41.
Slijepcevic P (1998) Chromosoma Focus TelomeresandmechanismsofRobertsonianfusion.Chromosoma136–141.
Slijepcevic P, Hande MP, Bouffler SD, et al (1997)Telomere length, chromatin structure and chromosome fusigenic potential. Chromosoma106:413–421.
Smagulova F, Gregoretti I V, Brick K, et al (2011)Genome-wide analysis reveals novel molecularfeatures of mouse recombination hotspots. Nature472:375–8.
SmukowskiCS,NoorMaF(2011)Recombinationratevariationincloselyrelatedspecies.Heredity107:496–508.
SnowdenT,AcharyaS,ButzC, et al (2004)hMSH4-hMSH5 recognizes Holliday Junctions and formsa meiosis-specific sliding clamp that embraceshomologouschromosomes.MolCell15:437–51.0
SolanoE,CastigliaR,CapannaE(2008)Chromosomalevolution of the house mouse, Mus musculusdomesticus,intheAeolianArchipelago(Sicily,Italy).BiolJLinnSoc96:194–202.
SpeedRM(1982)Meiosisinthefoetalmouseovary.I.Ananalysisatthelightmicroscopelevelusingsurface-spreading.Chromosoma85:427–37.
Stanyon R, Bigoni F, Slaby T, et al (2004) Multi-directional chromosome painting maps homologies between species belonging to three genera of NewWorldmonkeysandhumans.Chromosoma113:305–15.
Stanyon R, Consigliere S, Müller S, et al (2000)Fluorescence in situ hybridization (FISH) mapschromosomal homologies between the dusky titi and squirrelmonkey.AmJPrimatol50:95–107.
StanyonR,YangF,CavagnaP,etal(1999)Reciprocalchromosome painting shows that genomic rearrangement between rat and mouse proceeds ten timesfasterthanbetweenhumansandcats.CytogenetCellGenet84:150–5.
SteinerCC,RyderOA(2013)CharacterizationofPrdm9 inequidsandsterilityinmules.PLoSOne8:e61746.
Steiner WW, Smith GR (2005) Optimizing thenucleotide sequence of a meiotic recombination hotspot in Schizosaccharomyces pombe. Genetics169:1973–83.
Stephens PJ, Greenman CD, Fu B, et al (2011)Massivegenomic rearrangement acquired in a singlecatastrophic event during cancer development. Cell
BIBLIOGRAPHY

213
144:27–40.
Stevison LS, Hoehn KB, Noor M a F (2011) Effectsof inversions on within- and between-speciesrecombination and divergence. Genome Biol Evol3:830–41.
StopkováR,DudkováB,HájkováP, StopkaP (2014)Complementaryrolesofmouselipocalinsinchemicalcommunication and immunity. Biochem Soc Trans42:893–8.
StopkováR,HladovcováD,KokavecJ,VyoralD(2009)Multiple roles of secretory lipocalins (Mup, Obp) inmice.58:29–40.
Storchová R, Gregorová S, Buckiová D, et al (2004)Genetic analysis of X-linked hybrid sterility in thehousemouse.MammGenome.
Storz JF, Baze M, Waite JL, et al (2007) Complexsignatures of selection and gene conversion in the duplicated globin genes of house mice. Genetics177:481–500.
Storz JF, Opazo JC, Hoffmann FG (2013) Geneduplication, genome duplication, and the functional diversification of vertebrate globins.Mol PhylogenetEvol66:469–78.
Storz JF, Runck AM, Sabatino SJ, et al (2009)Evolutionary and functional insights into themechanism underlying high-altitude adaptationof deer mouse hemoglobin. Proc Natl Acad Sci106:14450–5.
SunF,TrpkovK,RademakerA,etal(2005)Variationin meiotic recombination frequencies among human males.HumGenet116:172–8.
SuzukiK,LareyreJ-J,SánchezD,etal(2004)Molecularevolution of epididymal lipocalin genes localized on mousechromosome2.Gene339:49–59.
Tadepally HD, Burger G, Aubry M (2008)Evolution of C2H2-zinc finger genes and subfamilies
inmammals: species-specific duplication and loss ofclusters, genes and effector domains. BMC Evol Biol8:176.
TaffarelAL,LaudioCJ,ArdoDA (2015)Chromosomefusion polymorphisms in the grasshopper , Dichroplus fuscus ( Orthoptera: Acrididae: Melanoplinae ):Insightsonmeioticeffects.112:11–19.
TakataM,SasakiMS,SonodaE,etal(1998)Homologousrecombination and non-homologous end-joiningpathways of DNA double-strand break repair haveoverlapping roles in the maintenance of chromosomal integrityinvertebratecells.EMBOJ17:5497–508.
TanabeH,MüllerS,NeusserM,etal(2002)Evolutionaryconservation of chromosome territory arrangements incellnucleifromhigherprimates.ProcNatlAcadSci99:4424–9.
Tease C, Hultén MA (2004) Inter-sex variation insynaptonemal complex lengths largely determine the different recombination rates in male and female germ cells.CytogenetGenomeRes107:208–15.
Teeter KC, Payseur BA, Harris LW, et al (2008)Genome-wide patterns of gene flow across a housemousehybridzone.67–76.
Terrenoire E, McRonald F, Halsall JA, et al (2010)Immunostaining of modified histones defines high-level features of the human metaphase epigenome. GenomeBiol11:R110.
TeslerG(2002)GRIMM:genomerearrangementswebserver.Bioinformatics18:492–3.
Thomas JH, Emerson RO, Shendure J (2009)Extraordinary molecular evolution in the PRDM9fertilitygene.PLoSOne4:e8505.
TichyH,VucakI(1987)Chromosomalpolymorphismin the housemouse (Mus domesticus) ofGreece andYugoslavia.Chromosoma95:31–6.
TingC(1998)ARapidlyEvolvingHomeoboxattheSiteof a Hybrid Sterility Gene. Science (80- ) 282:1501–
BIBLIOGRAPHY
214
1504.
TjioJH,LevanA(2010)TheChromosomeNumberofMan.Hereditas42:1–6.
Tortereau F, Servin B, Frantz L, et al (2012) A highdensity recombination map of the pig reveals a correlation between sex-specific recombination andGCcontent.BMCGenomics13:586.
Trifonov VA, Kosyakova N, Romanenko SA, et al(2010) New insights into the karyotypic evolutionin muroid rodents revealed by multicolor banding applyingmurineprobes.ChromosomeRes18:265–75.
Tsai IJ,BurtA,KoufopanouV(2010)Conservationofrecombination hotspots in yeast. Proc Natl Acad Sci107:7847–52.
Turner JM a, Mahadevaiah SK, Fernandez-CapetilloO, et al (2005a) Silencing of unsynapsed meioticchromosomesinthemouse.NatGenet37:41–7.
TurnerLM,HarrB(2014)Genome-widemappinginahouse mouse hybrid zone reveals hybrid sterility loci andDobzhansky-Mullerinteractions.Elife3:e02504.
Turner LM, White MA, Tautz D, Payseur BA (2014)Genomic networks of hybrid sterility. PLoS Genet10:e1004162.
TurnerTL,HahnMW,NuzhdinSV(2005b)Genomicislands of speciation in Anopheles gambiae.PLoSBiol3:e285.
Uddin M, Sturge M, Peddle L, et al (2011)Genome-widesignaturesof“rearrangementhotspots”within segmental duplications in humans. PLoS One 6:e28853.
UllastresA,FarréM,CapillaL,Ruiz-HerreraA(2014)Unraveling the effect of genomic structural changes intherhesusmacaque-implicationsfortheadaptiveroleofinversions.BMCGenomics15:530.
Urrutia R (2003) KRAB-containing zinc-finger
repressorproteins.GenomeBiol4:231.
UsdinK, Grabczyk E (2000) DNA repeat expansionsandhumandisease.CellMolLifeSci57:914–931.
VanOsH,AndrzejewskiS,BakkerE,etal(2006)Construction of a 10,000-marker ultradense geneticrecombination map of potato: providing a framework for accelerated gene isolation and a genomewide physicalmap.Genetics173:1075–87.
VascoC,ManterolaM,PageJ,etal(2012)Thefrequencyof heterologous synapsis increases with aging in Robertsonian heterozygousmalemice. ChromosomeRes20:269–78.
Ventura M, Antonacci F, Cardone MF, et al (2007)Evolutionary formation of new centromeres inmacaque.Science316:243–6.
VéronAS,LemaitreC,GautierC,etal(2011)Close3Dproximity of evolutionary breakpoints argues for the notionofspatialsynteny.BMCGenomics12:303.
Verver DE, van Pelt AMM, Repping S, Hamer G(2013) Role for rodent Smc6 in pericentromericheterochromatin domains during spermatogonial differentiationandmeiosis.CellDeathDis4:e749.
Veyrunes F, Dobigny G, Yang F, et al (2006)PhylogenomicsofthegenusMus(Rodentia;Muridae):extensive genome repatterning is not restricted to the housemouse.ProcBiolSci273:2925–34.
WalkerEL,RobbinsTP,BureauTE,etal(1995)Transposon-mediated chromosomal rearrangementsand gene duplications in the formation of the maize R-rcomplex.EMBOJ14:2350–63.
WallaceBMN,SearleJB,EverettCa.(2002)Theeffectof multiple simple Robertsonian heterozygosity onchromosomepairingandfertilityofwild-stockhousemice(Musmusculusdomesticus).CytogenetGenomeRes96:276–286.
BIBLIOGRAPHY

215
Wallace BMN, Searle JB, Everett CA (1992) Malemeiosis and gametogenesis inwild housemice (Musmusculus domesticus) from a chromosomal hybridzone; a comparison between “simple” Robertsonianheterozygotes and homozygotes. Cytogenet GenomeRes61:211–220.
WatanabeTK,BihoreauMT,McCarthyLC,etal(1999)A radiation hybrid map of the rat genome containing 5,255markers.NatGenet22:27–36.
WaterstonRH,Lindblad-TohK,BirneyE,etal(2002)Initial sequencing and comparative analysis of the mousegenome.Nature420:520–562.
White M, Blackith R, Blackith R, Cheney J (1967)Cytogenetics of the viatica group morabinegrasshoppers.I.Thecoastalspecies.AustJZool15:263.
White MA, Steffy B, Wiltshire T, Payseur BA (2011)Genetic dissection of a key reproductive barrierbetween nascent species of house mice. Genetics189:289–304.
White MJ. (1973) Animal Cytology and Evolution.CambridgeUniversityPress,London.
WhiteMJD(1969)ChromosomalRearrangementsandSpeciationinAnimals.AnnuRevGenet3:75–98.
WhiteMJD(1978)Modesofspeciation.W.H.Freeman&Co.WickerT,SabotF,Hua-VanA,etal(2007)Aunifiedclassification system for eukaryotic transposable elements.NatRevGenet8:973–82
WilfertL,GadauJ,Schmid-HempelP(2007)Variationin genomic recombination rates among animal taxa andthecaseofsocialinsects.Heredity98:189–97.
Wilson GM, Flibotte S, Missirlis PI, et al (2006)Identification by full-coverage array CGH of humanDNA copy number increases relative to chimpanzeeandgorilla.GenomeRes16:173–81.
Wong AK, Ruhe AL, Dumont BL, et al (2010) Acomprehensive linkage map of the dog genome.
Genetics184:595–605.
Woodcock CL (2006) Chromatin architecture. CurrOpinStructBiol16:213–20.
Wright S (1941) On the probability of fixation ofreciprocaltranslocations.AmNat75:531–522.
Wu CI, Li WH (1985) Evidence for higher rates ofnucleotide substitution in rodents than in man. Proc NatlAcadSci82:1741–1745.
WuZK,GetunIV.,BoisPRJ(2010)Anatomyofmouserecombinationhotspots.NucleicAcidsRes38:2346–2354.
Wurster DH, Benirschke K (1970) Indian Momtjac,Muntiacus muntiak: A Deer with a Low DiploidChromosomeNumber.Science168:1364–1366.
YamamotoM,MiklosGL (1978) Genetic studieson heterochromatin in Drosophila melanogaster and their implications for the functions of satellite DNA.Chromosoma66:71–98.
Yang F, Alkalaeva EZ, Perelman PL, et al (2003)Reciprocal chromosome painting among human,aardvark, and elephant (superorder Afrotheria)reveals the likely eutherian ancestral karyotype. Proc NatlAcadSci100:1062–6.
YangH,Wang JR,Didion JP, et al (2011) Subspecificorigin and haplotype diversity in the laboratory mouse.NatGenet43:648–55.
Yannic G, Basset P, Hausser J (2009) Chromosomalrearrangementsandgeneflowovertimeinaninter-specific hybrid zone of the Sorex araneus group. Heredity102:616–25.
Yatabe Y, Kane NC, Scotti-Saintagne C, RiesebergLH (2007) Rampant gene exchange across a strongreproductive barrier between the annual sunflowers, Helianthus annuus and H. petiolaris. Genetics175:1883–93.
BIBLIOGRAPHY
216
Yoshida K, Kondoh G, Matsuda Y, et al (1998)The Mouse RecA-like Gene Dmc1 Is Required forHomologous Chromosome Synapsis during Meiosis.MolCell1:707–718.
Yu AM, McVey M (2010) Synthesis-dependentmicrohomology-mediated end joining accounts formultiple types of repair junctions.NucleicAcidsRes38:5706–17.
Yunis JJ, Prakash O (1982) The origin of man: achromosomalpictoriallegacy.Science215:1525–30.
Zakian VA (1997) Life and cancer withouttelomerase.Cell91:1–3.
ZhangF,KhajaviM,ConnollyAM,etal(2009)TheDNAreplication FoSTeS/MMBIRmechanism can generategenomic, genic and exonic complex rearrangements inhumans.NatGenet41:849–53.
ZhangG,LiC,LiQ,etal(2014)Comparativegenomicsreveals insights into avian genome evolution and adaptation.Science346:1311–1320.
Zhang Y, McCord RP, Ho Y-J, et al (2012) Spatialorganization of the mouse genome and its role in recurrentchromosomaltranslocations.Cell148:908–21.
Zhao H, Bourque G (2009) Recovering genomerearrangements in the mammalian phylogeny. GenomeRes19:934–42.
ZhaoS,ShettyJ,HouL,etal (2004)Human,mouse,andratgenomelarge-scalerearrangements:stabilityversusspeciation.GenomeRes14:1851–60.
ZhouY,RuiL(2013)Lipocalin13regulationofglucoseandlipidmetabolisminobesity.VitamHorm91:369–83.
Zijlmans JM, Martens UM, Poon SS, et al (1997)Telomeresinthemousehavelargeinter-chromosomalvariationsinthenumberofT2AG3repeats.ProcNatlAcadSci94:7423–8.
ZimaJ,GaichenkoVa,MacholánM,etal (1990)AreRobertsonian variations a frequent phenomenon inmousepopulationsinEurasia?BiolJLinnSoc41:229–233.
BIBLIOGRAPHY

217

218

219


