Embed Size (px)
Citation preview
Optimal conditions of Al and Fe extraction from laterite soil usingD-optimal design
Abbas F. M. Alkarkhi • Yusri Yusup •
Tjoon Tow Teng
Published online: 9 August 2012
� Springer Science+Business Media, LLC 2012
Abstract This paper reports pioneering work in identi-
fying an alternative coagulation agent of wastewater treat-
ment, given the availability of commonly used agents are of
a higher cost relative to more natural sources, such as soil.
The alternative proposed is laterite soil from northern
Malaysia because it contains high amounts of Al and Fe,
which are well-known coagulants. The soil was grinded and
sieved to obtain uniform particle sizes of\250 lm. Al and
Fe were extracted from the soil. Extraction agents: (1) HCl,
(2) NaOH, and (3) HCl ? NaCl were chosen. It was found
that the most effective agent to extract Fe was 5 N HCl
while to extract Al was HCl ? NaCl, 2 and 4 N, respec-
tively. D-optimal design observed that extraction time t,
temperature T, and ratio of amount of laterite soil to amount
of extractants r, showed a significant effect on Al extrac-
tion. In contrast, the combination of factors t and r exhibited
insignificant effect on Fe extraction while other factors were
significant. The optimum conditions for extraction of both
Al and Fe were 90 �C, 40 min, for r = 1:15, which gave
[Fe] = 1,870 mg/l and [Al] = 0.17 mg/l and 90 �C,
90 min, for r = 1:10, which gave [Fe] = 2,900 mg/l and
[Al] = 0.130 mg/l. Since concentration of Fe extracted
from laterite soil was high, it was concluded that laterite soil
can be considered as an alternative and novel source of
coagulant applicable in a wastewater treatment coagulation
process.
Keywords Alternative coagulant � Laterite soil �Wastewater treatment � Liquid extraction
1 Wastewater treatment and laterite soil
The human population is increasing exponentially with
time whereas the amount of usable water to sustain this
population remains limited. Aside from domestic use, the
rapid growth of industrialization also contributes to the
large consumption of fresh water and the consequent
transformation to wastewater. In order to protect water
resources from exhaustion, treatment of generated waste-
water is employed. These treatment techniques include
adsorption, precipitation, coagulation-flocculation, filtra-
tion, chemical oxidation, electro-dialysis, flotation, and
ultra filtration. Among these methods, the coagulation-
flocculation process is a common treatment technology
with a wide range of applications in water supply and
wastewater treatment facilities.
1.1 Al and Fe in coagulation-flocculation in wastewater
treatment: an overview
Coagulation-flocculation is widely used for water treatment
since it is efficient and simple to operate. In this process,
many factors influence its efficiency, i.e., the type and dosage
of coagulant and flocculant, mixing speed and time, pH,
temperature, and retention time. Coagulation is considered
to encompass all reactions and mechanisms, which results in
particle aggregation within the liquid (water) being treated,
as well as in situ coagulant formation (when applicable),
chemical particle destabilization, and physical inter-particle
contacts. On the other hand, flocculation refers to the
bridging between particles by a polymer chain, which causes
the particles to form ‘‘flocs’’ or ‘‘aggregates’’. These flocs
float or sink, making them accessible to be removed physi-
cally from the water treatment system. The commonly used
metal coagulants fall into two general groups, those based
A. F. M. Alkarkhi � Y. Yusup (&) � T. T. Teng
Environmental Technology, School of Industrial Technology,
Universiti Sains Malaysia, 11800 USM, Penang, Malaysia
e-mail: [email protected]
123
Environmentalist (2012) 32:453–463
DOI 10.1007/s10669-012-9410-9
on: (1) Al and (2) Fe. Examples of Al coagulants include
aluminum sulfate, aluminum chloride, sodium aluminate,
aluminum chlorohydrate, poly-aluminum chloride, etc.,
whereas the Fe coagulants include ferric sulfate, ferrous
sulfate, ferric chloride, poly-ferric sulfate, etc. Other chem-
icals used as coagulants are hydrated lime, magnesium car-
bonate (Bratby 2006), and magnesium chloride (Pang et al.
2009; Tan et al. 2000).
1.2 Laterite soil
Laterite soils are generally found in warm, humid, and
tropical areas of the world. ‘‘Red soil’’ is a generic name
used to identify any soil exhibiting yellowish to reddish
color. The term is frequently used to express an image of
red, infertile, and acidic soils in the tropics (Siradz 2008).
The main elements present in laterite soil are Fe, which is
responsible for the reddish color of the soil, and Al. Other
elements existing in laterite soil are K and Ca. The
chemical properties of laterite soils are also characterized
by low pH and low cation exchange capacity (CEC).
Generally, soil pH values are low, ranging from 4.4–6.6
while the CEC ranges from 2.23 to 20.3 cmolc kg-1 and in
most soils the exchangeable acidity is high, reflecting their
acidic pH (Wilson et al. 2004). Proportions vary from
80–90 % oxides of Fe with 5–10 % Al. Small amounts of
titanium oxide, typically 1–5 % are usually present. Ca,
Mg, K, Na, and Mn vary from 0 to\1 %. Fe is entirely in
ferric forms, mainly goethite (FeO OH), haematite (Fe2O3),
and amorphous oxides while Al exists as gibbsite
(Al2O3.3H2O) and boehmite (Al2O3 H2O) (Young 1976).
The geotechnical properties of laterite soils are rela-
tively different from those of soils produced in temperate
or cold regions of the globe since soil is influenced by
climate, geology, and the degree of weathering (Mahal-
inga-Iyer and Williams 1991; Ko et al. 2006). Laterite
soils are the product of thorough weathering (high tem-
perature, rainfall, and humidity conditions) called ‘‘lateri-
zation’’ under tropical and sub-tropical climatic conditions.
Laterization is defined as a process of leaching out of Si
and alkali and also the accumulation of hydrated Fe and
oxides of Al (Mahalinga-Iyer and Williams 1991), result-
ing in high contents of sesquioxides. Furthermore, under
this condition, exchangeable bases and silicon will ulti-
mately be eliminated and only the more resistant minerals
such as iron and aluminum oxides will remain in the soil
profile.
The total area of laterite soil in zones all over the world
is approximately 64 million ha, accounting for 45.2 % of
the earth’s total land area, with 2.5 billion people, or 48 %
of the global population (Shui et al. 2008). Laterite soils are
primarily found in South America, Central Africa, South
and Southeast Asia, China, India, Japan, and Australia
(Wilson et al. 2004). In the United States soil taxonomy,
laterite soils are usually classified under the orders of
Oxisols, Ultisols, and occasionally Alfisols, Mollosols, and
even Inceptisols (refer to Table 1).
The rapid weathering in the tropical environment of
Malaysia results in soils dominated by kaolinite and oxides
of Al and Fe. According to soil taxonomy, these soils have
been classified as ‘‘Oxisols’’. These soils are often deep,
friable red soils, which initially appeared excellent for
agriculture. Upon close scrutiny, they are often rich in Fe
and Al, excessively drained, and have a very low CEC.
Most of the physico–chemical properties of these soils are
related to their mineralogy. These soils are in oxic stage of
soil formation and are dominated by oxides and oxyhy-
drate-gibbsite, goethite, and haematite, with kaolinite as
the dominant aluminosilicate mineral. As these minerals
have low nutrient retention properties, this implies that
with progressive weathering, the soil is reduced almost to
an inert medium. Besides the low fertility status, many
such soils also have a high Fe content. Chemically, these
Oxisols present problems, as the mineralogical composi-
tion gives special charge characteristics to the soil. In some
Oxisols in Malaysia, the net charge is low or even positive,
indicating low nutrient retention capacity. The charge in
these Oxisols is dominated by a high pH-dependent or
variable charge. They are often excessively dry, so the
crops grown on them experience moisture stress, especially
young, developing plants. Even cover crops for plantation
agriculture find it difficult to thrive. The low cation
retention of these soils also results in most of the cations
such as K? from fertilizers being easily lost through
leaching. The high iron content also results in phosphorus
fixation problems. Hence, the highly weathered Oxisols of
Malaysia can be considered problem soils. However, these
laterite soils are still considered as Class 1 or 2 soils and
limited to rubber, oil palm, cocoa, and tropical fruit trees
plantations (Wilson et al. 2004).
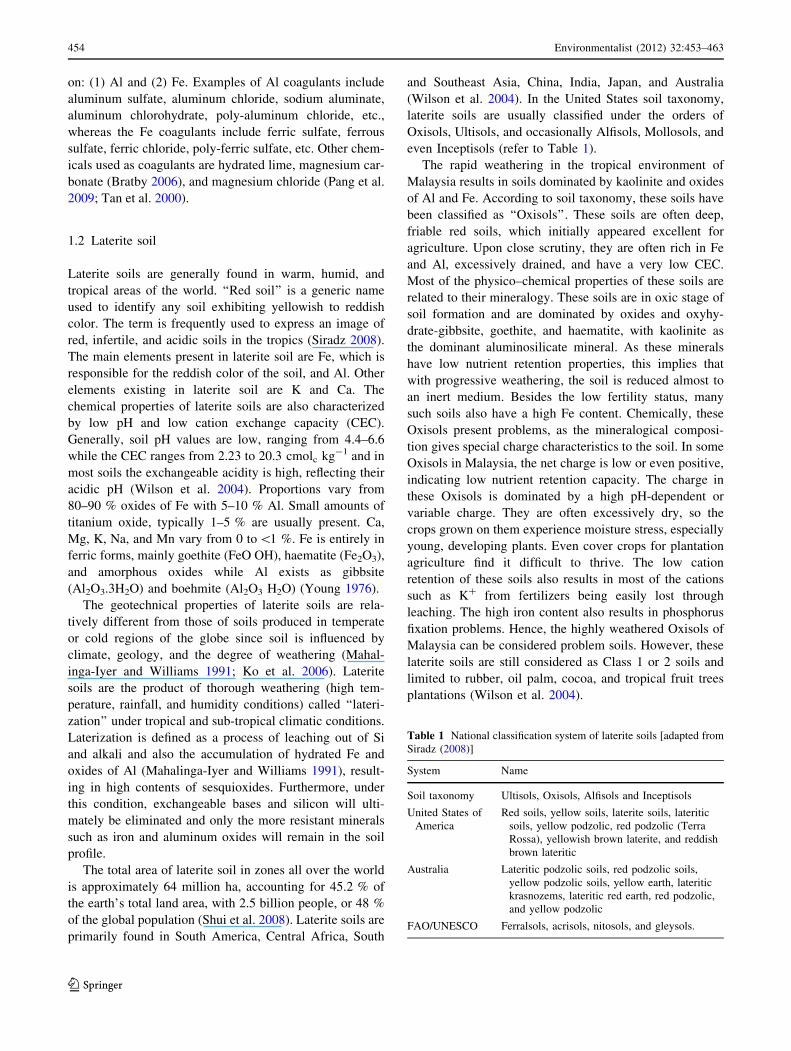
Table 1 National classification system of laterite soils [adapted from
Siradz (2008)]
System Name
Soil taxonomy Ultisols, Oxisols, Alfisols and Inceptisols
United States of
America
Red soils, yellow soils, laterite soils, lateritic
soils, yellow podzolic, red podzolic (Terra
Rossa), yellowish brown laterite, and reddish
brown lateritic
Australia Lateritic podzolic soils, red podzolic soils,
yellow podzolic soils, yellow earth, lateritic
krasnozems, lateritic red earth, red podzolic,
and yellow podzolic
FAO/UNESCO Ferralsols, acrisols, nitosols, and gleysols.
454 Environmentalist (2012) 32:453–463
123
1.3 Liquid extraction process
Single extraction procedures are broadly used in soil sci-
ence. These procedures consist of several single extractions
on separate soil samples to determine the mobility of the
various forms of the element under study (Walna et al.
2005). According to Bhattacharya (2007), single extraction
includes a large spectrum of extractants. They range from
very strong acids, such as aqua regia, HNO3 or HCl, to
neutral unbuffered salt solutions, mainly CaCl2 or NaNO3.
The chemical reactions between the solid phases and the
extraction agents are dependent on different parameters,
such as concentration, pH, temperature, reaction time, and
intensity (Bhattacharya 2007). The extraction process can
range from the simple, adding the extractant to the soil
sample in an Erlenmeyer flask and mixing (shaking or
stirred), to the complex, involving Soxhlet extractor,
ultrasonic, microwave-assisted, accelerated solvent, or
supercritical fluid extraction.
According to Rao et al. (2010), extractants can be
divided into several categories: (1) mild extractants, (2)
complexing extractants, and (3) acid extractants. The mild
extractants are NaNO3, CaCl2, and NH4NO3. It was
reported that the extraction yields are very low and when
detected are usually\1 % of the pseudo total content. The
complexing extractants, the chelating agents, such as eth-
ylenediamine tetra-acetate (EDTA) and diethylenetriamine
penta-acetate (DTPA) have been used in other works.
Relevant to the current work, two acid extractants, acetic
acid and HCl have been used by other researchers since
dilute acid extractions provide a more sensitive means of
assessing the environmentally labile and biologically
available fraction of soils due to the fact that concentrated
acid extractions often do not differentiate between residual
and labile fractions. The HCl reagent had been studied
extensively and the 4-h extraction time gave the most
consistent results. The extraction yields vary widely from
element to element and also between samples.
Specifically, there are many Al-extracting agents, e.g.,
KCl, NH4Cl, CaCl2, BaCl2, CuCl2, Na2S2O4, EDTA, HCl,
and DTPA (Matus et al. 2006). The concentrations: 0.5 mol/l
NaOH, 1 mol/l HCl, 1 mol/l KCl, 1 mol/l NH4Ac, and
0.1 mol/l BaCl2, are usually used to extract Al3? in soil.
However, 0.5 mol/l of NaOH is usually used for leaching
Al3? in Chinese soils, which are quite different from Euro-
pean soils. The presence of high content of Cl-, from salt
compounds such as NaCl or KCl, in addition to acidic con-
ditions, increases the solubility capacity of Fe and Al (Poulin
et al. 2008). The majority of Chinese soil has variable
charges and also consists of red soil. The content of Fe2O3 is
about 8 % in red soil. Fe3? is extracted from red soil solution
with 1 mol/l HCl where the concentration of Fe3? ranges
from 30–50 mg/ml. Consequently, Fe(OH)3 (precipitates)
will be formed when the pH is adjusted to 5. This, in turn,
adsorbs some Al3? and affects its extraction (Luo and Bi
2003).
According to Poulin et al. (2008), HCl gave better
extraction efficiency than H2SO4. An increase in leaching
time, acid concentration, and temperature generally resulted
in an increase in Fe and Al extracted from red mud. However,
leaching time has the least effect on the Al and Fe solubili-
zation. Additionally, Al solubilization is less affected by
these parameters than Fe solubilization. They also showed
that HCl is an effective leaching agent for Fe and Al.
1.4 Justification and objectives of research
The commercially available wastewater coagulants are
based on Al and Fe. Accordingly, many researchers have
successfully produced coagulant from clay (another soil
type similar to laterite) (Jiang et al. 2004; Lee et al. 2004).
Since laterite soil is rich in Fe and Al, it can be conjectured
that this soil has the capacity to act as a comparable,
alternative, and novel raw material in producing another
class of coagulant. Likewise, laterite soil is a natural
resource and abundant in Malaysia and other similar-cli-
mate countries. Research on extraction of Al and Fe from
‘‘red mud’’ is more widespread (Poulin et al. 2008) com-
pared to laterite soil, which is less frequent, thus justifying
the need of this research direction. From yet-to-be pub-
lished results of a preliminary study in our laboratory on
directly applying ‘‘raw’’ laterite soil to treat wastewater, it
was found to produce less sludge compared to the com-
mercially available ‘‘alum’’ with almost similar efficacy. In
addition, silica is also naturally present in this soil, which
can act as a flocculant.
In Peninsular Malaysia, more than 70 % of the total land
area is covered by acidic soils of which Ultisols and Oxi-
sols are the most abundant. As stated previously, the highly
acidic laterite soil can be considered inapplicable to the
general agricultural environment. Extraction of Al and Fe
from laterite soil to act as coagulants is another option in
exploiting the relatively ineffectual laterite soil (Wilson
et al. 2004), which is copious in Malaysia. Thus, the
objectives of this study are:
I. To determine the best extractant to use in extracting
[Al] and [Fe] (brackets denoting concentration) from
laterite soil.
II. To investigate the effect of three factors: (1) temper-
ature T, (2) time t, and (3) ratio of amount of red soil
to amount of extractants (weight/volume) r, on Fe and
Al extracted from laterite soil.
III. To determine the optimal conditions to extract Fe and
Al simultaneously from laterite soil using D-optimal
statistical design.
Environmentalist (2012) 32:453–463 455
123
2 Materials and methods
2.1 Preparation of laterite soil
Laterite soil was collected from Sungai Petani, Kedah,
Malaysia. The collected laterite soil was dried in an oven at
80 �C for 48 h. The dried laterite soil was then ground into
powder using a mortar grinder and sieved using a vibrator
sieve shaker to ensure that the particle size was consistently
\250 lm. Finally, the finely ground and sieved laterite soil
sample was stored in a sealed plastic container.
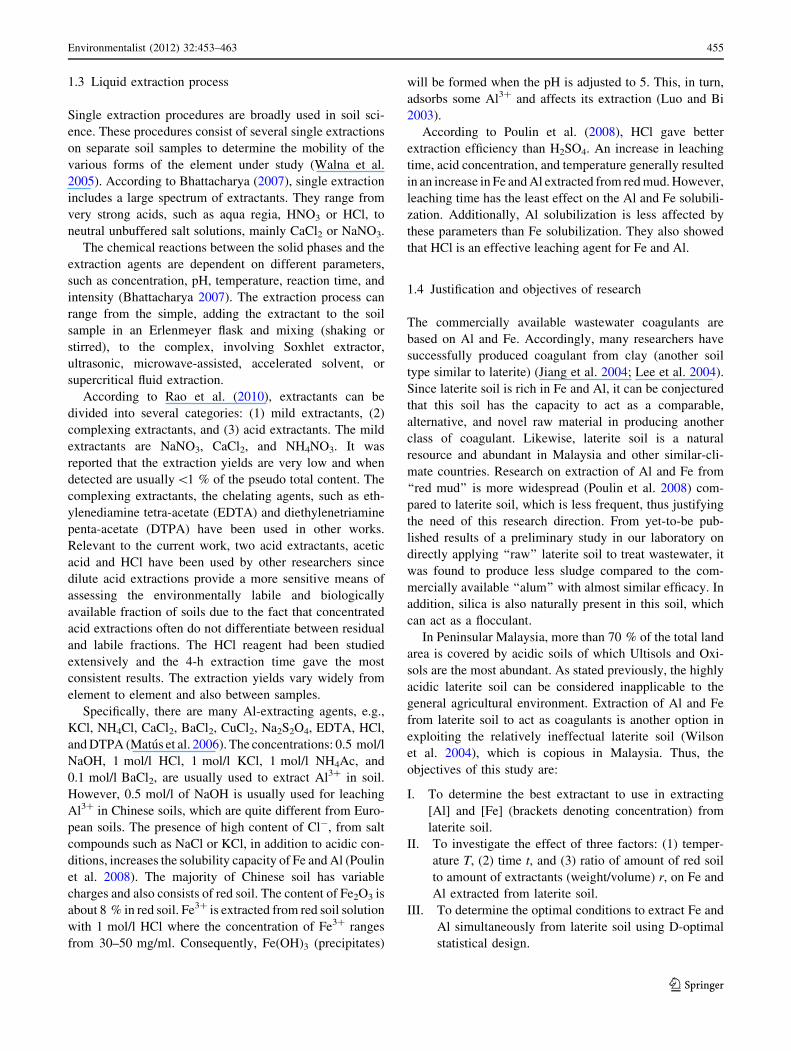
2.2 Materials and chemicals used
Materials, chemicals, equipment, and instruments used in
this study are summarized in Tables 2 and 3.
2.2.1 Extractant preparation: hydrochloric acid, HCl
1, 2, 3, 4, and 5 N concentrations of HCl aqueous solutions
from Qrec with an assay of 37.0 % were prepared. For 1 N
concentration, 83.5 ml of HCl was added into distilled water
and topped up to 1 l. For the concentration of 2 N, 167 ml of
HCl was required whereas 251 ml of HCl was required for
the concentration of 3 N. In addition, the concentration of
4 N needed 334 ml of HCl while 418 ml of HCl was required
for the concentration of 5 N.
2.2.2 Extractant preparation: sodium chloride, NaCl
Similarly, 1, 2, 3, 4, and 5 N concentrations of NaCl
solutions from Merck KGaA with an assay of 99.5 % were
prepared. For 1 N concentration, 58.5 g NaCl was added
into distilled water and topped up to 1 l. For the concen-
tration of 2 N, 117 g of NaCl was required whereas 176 g
NaCl was required for 3 N. Furthermore, for the 4 N
concentrations, 234 g NaCl was required while 293 g NaCl
was required for the 5 N concentrations.
2.2.3 Extractant preparation: sodium hydroxide, NaOH
1, 2, 3, 4, and 5 N concentrations of NaOH from Systerm
with an assay of 99.0 % were prepared. For 1 N concen-
tration, 40 g NaOH was added into distilled water and
topped up to 1 l. For 2 N concentrations, 80 g NaOH was
required whereas 120 g NaOH was needed for 3 N con-
centrations. Lastly, for the 4 N concentrations, 160 g
NaOH was required while 200 g NaOH was acquired for
the 5 N concentrations.
Table 2 Materials and chemicals used
Materials and
chemicals
Formula Assays Supplier Purpose
Filter paper – Grade 1 Whatman To separate
soil and
filtrate
Hydrochloric
acid
HCl 37.0 % Qrec An extracting
agent
Sodium
chloride
NaCl 99.5 % Merck
KGaA
An extracting
agent
Sodium
hydroxide
NaOH 99.0 % Systerm An extracting
agent
AluVer� 3
aluminum
reagent
powder
pillow
– – HACH To determine
aluminum
concentration
Ascorbic acid
powder
pillow
– – HACH To determine
aluminum
concentration
Bleaching 3
reagent
powder
pillow
– – HACH To determine
aluminum
concentration
Fe – 1,000 mg/
l
Merck
KGaA
Calibration for*AAS
analysis
* Atomic absorption spectroscopy
Table 3 Equipment and instruments used
Equipment
and instruments
Model Brand Purpose
Oven – Binder To remove the
moisture content of
laterite soil
Mortar grinder – Pascall To grind the laterite
soil into smaller
particle sizes
Vibrator sieve
shaker
AS 200 Retsch To obtain uniform
particle size of
laterite soil
Analytical balance AL 204 Mettler
Toledo
To measure the weight
of laterite soil
Electrical shaker – Wiseshake To shake the mixture
of laterite soil and
extracting agent
Incubated shaker KBLee
1001
DAIKI To shake the mixture
of laterite soil and
extracting agent with
constant temperature
Spectrophotometer DR/
2010
HACH To determine
aluminum
concentration
Atomic absorption
spectroscopy
(AAS)
Perkin-
Elmer
P.E.
AAnalyst
100
To determine iron
concentration
456 Environmentalist (2012) 32:453–463
123
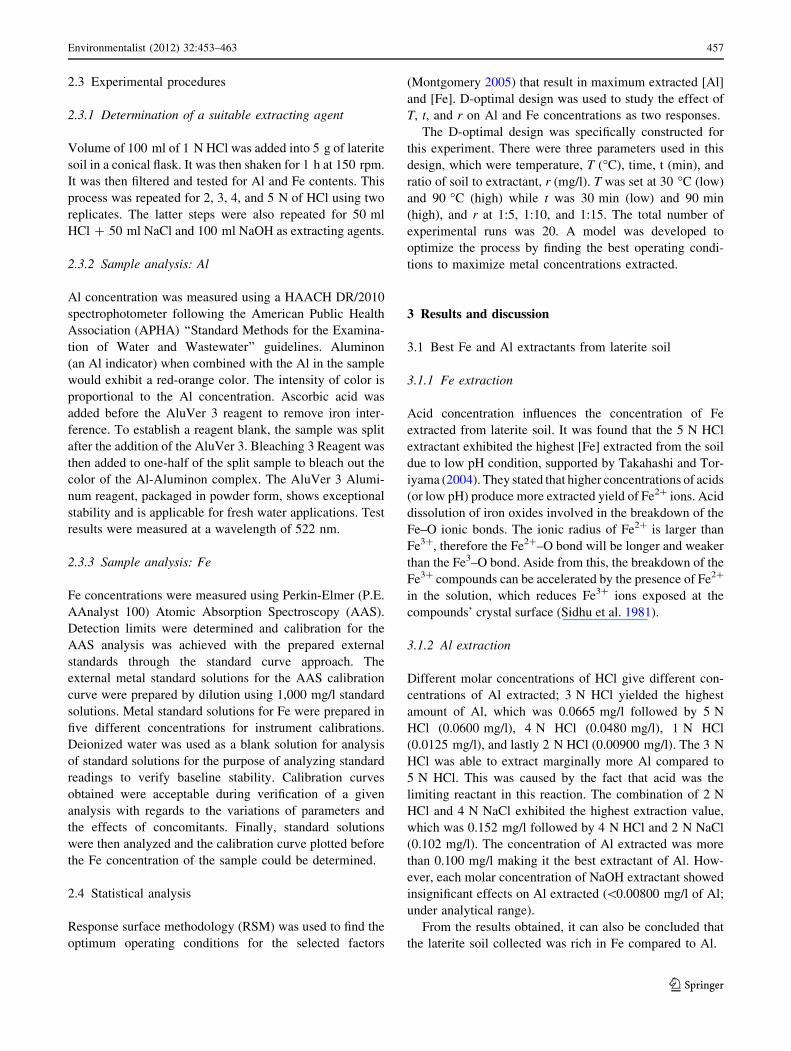
2.3 Experimental procedures
2.3.1 Determination of a suitable extracting agent
Volume of 100 ml of 1 N HCl was added into 5 g of laterite
soil in a conical flask. It was then shaken for 1 h at 150 rpm.
It was then filtered and tested for Al and Fe contents. This
process was repeated for 2, 3, 4, and 5 N of HCl using two
replicates. The latter steps were also repeated for 50 ml
HCl ? 50 ml NaCl and 100 ml NaOH as extracting agents.
2.3.2 Sample analysis: Al
Al concentration was measured using a HAACH DR/2010
spectrophotometer following the American Public Health
Association (APHA) ‘‘Standard Methods for the Examina-
tion of Water and Wastewater’’ guidelines. Aluminon
(an Al indicator) when combined with the Al in the sample
would exhibit a red-orange color. The intensity of color is
proportional to the Al concentration. Ascorbic acid was
added before the AluVer 3 reagent to remove iron inter-
ference. To establish a reagent blank, the sample was split
after the addition of the AluVer 3. Bleaching 3 Reagent was
then added to one-half of the split sample to bleach out the
color of the Al-Aluminon complex. The AluVer 3 Alumi-
num reagent, packaged in powder form, shows exceptional
stability and is applicable for fresh water applications. Test
results were measured at a wavelength of 522 nm.
2.3.3 Sample analysis: Fe
Fe concentrations were measured using Perkin-Elmer (P.E.
AAnalyst 100) Atomic Absorption Spectroscopy (AAS).
Detection limits were determined and calibration for the
AAS analysis was achieved with the prepared external
standards through the standard curve approach. The
external metal standard solutions for the AAS calibration
curve were prepared by dilution using 1,000 mg/l standard
solutions. Metal standard solutions for Fe were prepared in
five different concentrations for instrument calibrations.
Deionized water was used as a blank solution for analysis
of standard solutions for the purpose of analyzing standard
readings to verify baseline stability. Calibration curves
obtained were acceptable during verification of a given
analysis with regards to the variations of parameters and
the effects of concomitants. Finally, standard solutions
were then analyzed and the calibration curve plotted before
the Fe concentration of the sample could be determined.
2.4 Statistical analysis
Response surface methodology (RSM) was used to find the
optimum operating conditions for the selected factors
(Montgomery 2005) that result in maximum extracted [Al]
and [Fe]. D-optimal design was used to study the effect of
T, t, and r on Al and Fe concentrations as two responses.
The D-optimal design was specifically constructed for
this experiment. There were three parameters used in this
design, which were temperature, T (�C), time, t (min), and
ratio of soil to extractant, r (mg/l). T was set at 30 �C (low)
and 90 �C (high) while t was 30 min (low) and 90 min
(high), and r at 1:5, 1:10, and 1:15. The total number of
experimental runs was 20. A model was developed to
optimize the process by finding the best operating condi-
tions to maximize metal concentrations extracted.
3 Results and discussion
3.1 Best Fe and Al extractants from laterite soil
3.1.1 Fe extraction
Acid concentration influences the concentration of Fe
extracted from laterite soil. It was found that the 5 N HCl
extractant exhibited the highest [Fe] extracted from the soil
due to low pH condition, supported by Takahashi and Tor-
iyama (2004). They stated that higher concentrations of acids
(or low pH) produce more extracted yield of Fe2? ions. Acid
dissolution of iron oxides involved in the breakdown of the
Fe–O ionic bonds. The ionic radius of Fe2? is larger than
Fe3?, therefore the Fe2?–O bond will be longer and weaker
than the Fe3–O bond. Aside from this, the breakdown of the
Fe3? compounds can be accelerated by the presence of Fe2?
in the solution, which reduces Fe3? ions exposed at the
compounds’ crystal surface (Sidhu et al. 1981).
3.1.2 Al extraction
Different molar concentrations of HCl give different con-
centrations of Al extracted; 3 N HCl yielded the highest
amount of Al, which was 0.0665 mg/l followed by 5 N
HCl (0.0600 mg/l), 4 N HCl (0.0480 mg/l), 1 N HCl
(0.0125 mg/l), and lastly 2 N HCl (0.00900 mg/l). The 3 N
HCl was able to extract marginally more Al compared to
5 N HCl. This was caused by the fact that acid was the
limiting reactant in this reaction. The combination of 2 N
HCl and 4 N NaCl exhibited the highest extraction value,
which was 0.152 mg/l followed by 4 N HCl and 2 N NaCl
(0.102 mg/l). The concentration of Al extracted was more
than 0.100 mg/l making it the best extractant of Al. How-
ever, each molar concentration of NaOH extractant showed
insignificant effects on Al extracted (\0.00800 mg/l of Al;
under analytical range).
From the results obtained, it can also be concluded that
the laterite soil collected was rich in Fe compared to Al.
Environmentalist (2012) 32:453–463 457
123
3.2 D-optimal statistical design
Once the best extractants and their concentrations have
been established for Al and Fe extraction, respectively,
other factors were studied to determine their role in the
extraction process of Al and Fe from laterite soil. Three
factors were thought to be influential on the concentrations
of Al and Fe extracted from laterite soil from literature
(as discussed previously). The factors were T (30, 90 �C),
t (30, 90 min), and r (1:5, 1:10, and 1:15). The levels of the
selected factors were chosen based on logical ranges of
values (as well as literature) and preliminary experiments.
Response surface methodology (RSM) was carried out
to investigate the effect of selected factors on [Fe] and [Al].
D-optimal design with 20 runs was used to cover all pos-
sible combination of the selected factor levels. All exper-
iments were conducted in random order.
The results of 20 run D-optimal design with three factors
are given in Table 4 including the levels of the selected
factors and observed (experimental) values for [Fe] and [Al].
The results obtained from D-optimal design were analyzed
using analysis of variance (ANOVA) and a regression model
was built for [Fe] and [Al] to explore the effects of selected
factors (T, t, and r) on these two responses.
3.2.1 Regression models of [Fe] and [Al]
Regression models for [Fe] and [Al] extracted from laterite
soil were derived to describe the behavior of [Fe] and [Al]
at different levels of selected factors in order to optimize
the process by finding the best settings of T, t, and r.
Regression models for [Fe] and [Al] in terms of coded
variables are given in Eqs. (1) and (2), respectively.
½Al� ¼ 0:160� 0:0100 T � 0:0130 t � ð5:50� 10�3Þ r1
þ ð9:50� 10�3Þ r2 � 0:0140 T t þ 0:0190 T r1
� ð9:80� 10�3Þ T r2 þ ð7:80� 10�3Þ t r1
þ 0:0130 t r2 ð1Þ
Table 4 The results of D-optimal design
Input variable Responses
T (�C) t (min) *r (mg/l) [Al] (mg/l) [Fe] (mg/l)
30 60 1 0.130 168
90 30 2 0.150 843
30 30 3 0.200 316
90 90 2 0.140 298
90 90 3 0.0800 324
90 30 3 0.190 147
30 90 2 0.190 257
30 30 2 0.170 235
60 60 3 0.180 126
60 30 1 0.140 259
60 90 1 0.160 779
90 60 1 0.150 1,310
60 45 2 0.190 677
30 30 1 0.160 148
90 30 1 0.200 533
30 90 1 0.150 165
90 30 3 0.180 1,730
90 90 3 0.0800 3,260
30 30 3 0.170 322
30 90 2 0.200 266
* r, 1 = 1:5; 2 = 1:10; 3 = 1:15
Fig. 1 Normal probability plot
of the studentized residuals for
(a) [Fe] and (b) [Al]
458 Environmentalist (2012) 32:453–463
123
½Fe� ¼ 1010þ 839 T þ 414 t � 335 r1 þ 36:8 r2 þ 461 T t
� 271 T r1 þ 0:550 T r2 � 72:8 t r1 þ 131 t r2 ð2Þ
(Note: Subscripts 1 and 2 denote codes of ‘‘dummy vari-
ables’’ where ratio 1 (1:5), r1 = 1; r2 = 0; ratio 2 (1:10),
r1 = 0; r2 = 1; ratio 3 (1:15), r1 = 0; r2 = 0).
The models obtained for [Fe] and [Al] were satisfactory
since the values of the coefficient of determinations (R2)
were high. Close to 1 values of R2 indicate that the model
fitted the data reasonably. The values of R2 for the [Fe] and
[Al] models were 0.99 and 0.82. This suggested that
0.82–0.99 of the total variation was explained by the
models. All terms were included in the model to keep the
model hierarchical. The positive sign (?) of the coeffi-
cients in the regression model indicates that the factor has
synergistic effects on the responses ([Al] and [Fe]) while
the negative sign (-) indicates that the factor has antago-
nistic effects.
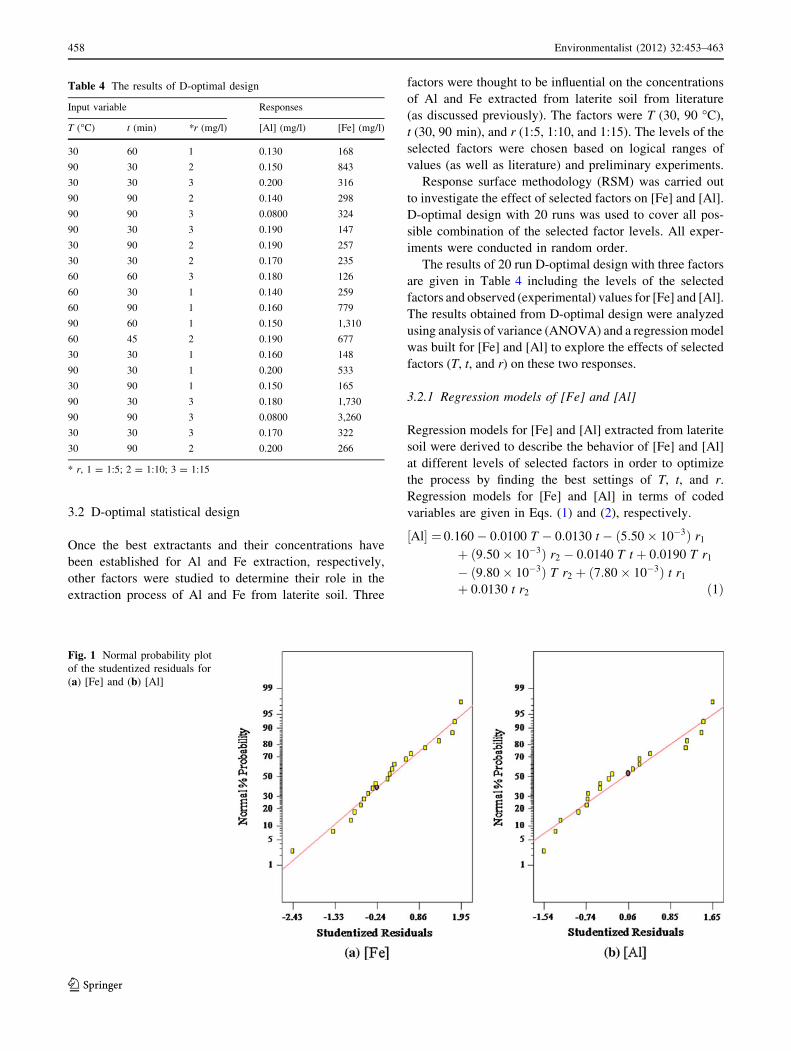
3.2.2 Model checking
The following is the quality check conducted on the
regression models developed. The regression models
obtained (Eqs. 1 and 2) were checked for the normality
assumption through the normal probability plot for the
studentized residual as shown in Fig. 1a, b. All points were
located along the straight line with the range of studentized
residuals ±3. This indicates that there was no doubt on the
violation of the normality assumption for both [Fe] and
[Al].
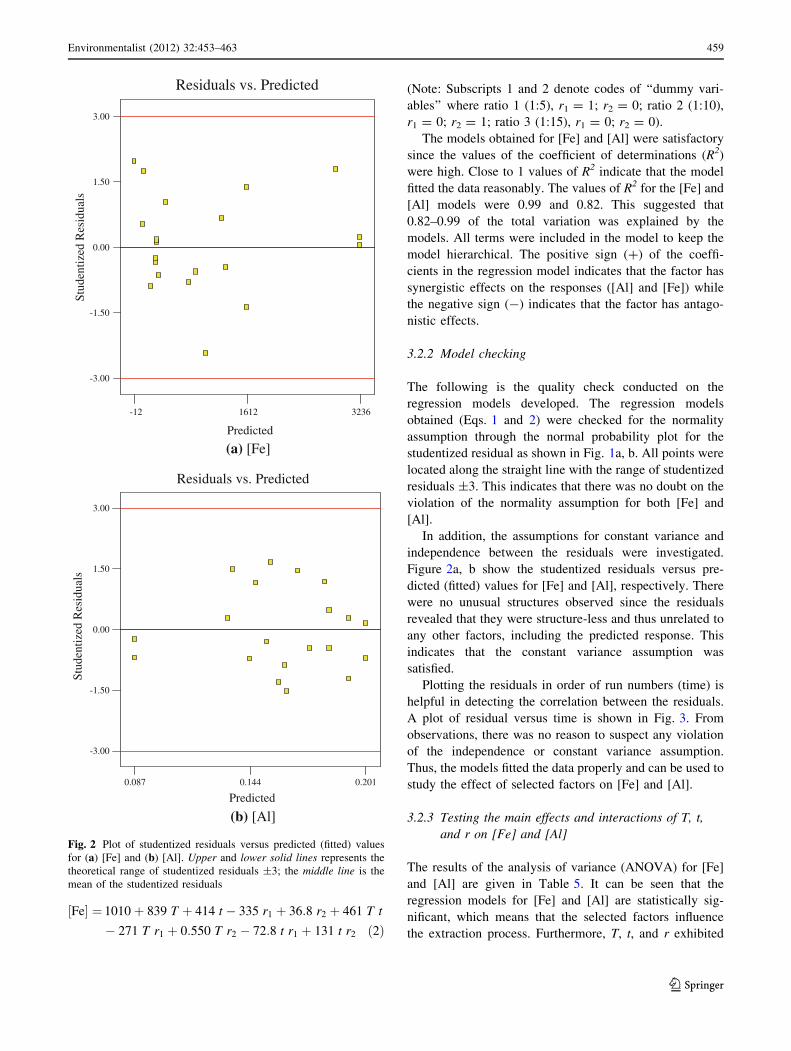
In addition, the assumptions for constant variance and
independence between the residuals were investigated.
Figure 2a, b show the studentized residuals versus pre-
dicted (fitted) values for [Fe] and [Al], respectively. There
were no unusual structures observed since the residuals
revealed that they were structure-less and thus unrelated to
any other factors, including the predicted response. This
indicates that the constant variance assumption was
satisfied.
Plotting the residuals in order of run numbers (time) is
helpful in detecting the correlation between the residuals.
A plot of residual versus time is shown in Fig. 3. From
observations, there was no reason to suspect any violation
of the independence or constant variance assumption.
Thus, the models fitted the data properly and can be used to
study the effect of selected factors on [Fe] and [Al].
3.2.3 Testing the main effects and interactions of T, t,
and r on [Fe] and [Al]
The results of the analysis of variance (ANOVA) for [Fe]
and [Al] are given in Table 5. It can be seen that the
regression models for [Fe] and [Al] are statistically sig-
nificant, which means that the selected factors influence
the extraction process. Furthermore, T, t, and r exhibited
Predicted
Stud
entiz
ed R
esid
uals
Residuals vs. Predicted
-3.00
-1.50
0.00
1.50
3.00
-12 1612 3236
(a) [Fe]
Predicted
Stud
entiz
ed R
esid
uals
Residuals vs. Predicted
-3.00
-1.50
0.00
1.50
3.00
0.087 0.144 0.201
(b) [Al]
Fig. 2 Plot of studentized residuals versus predicted (fitted) values
for (a) [Fe] and (b) [Al]. Upper and lower solid lines represents the
theoretical range of studentized residuals ±3; the middle line is the
mean of the studentized residuals
Environmentalist (2012) 32:453–463 459
123
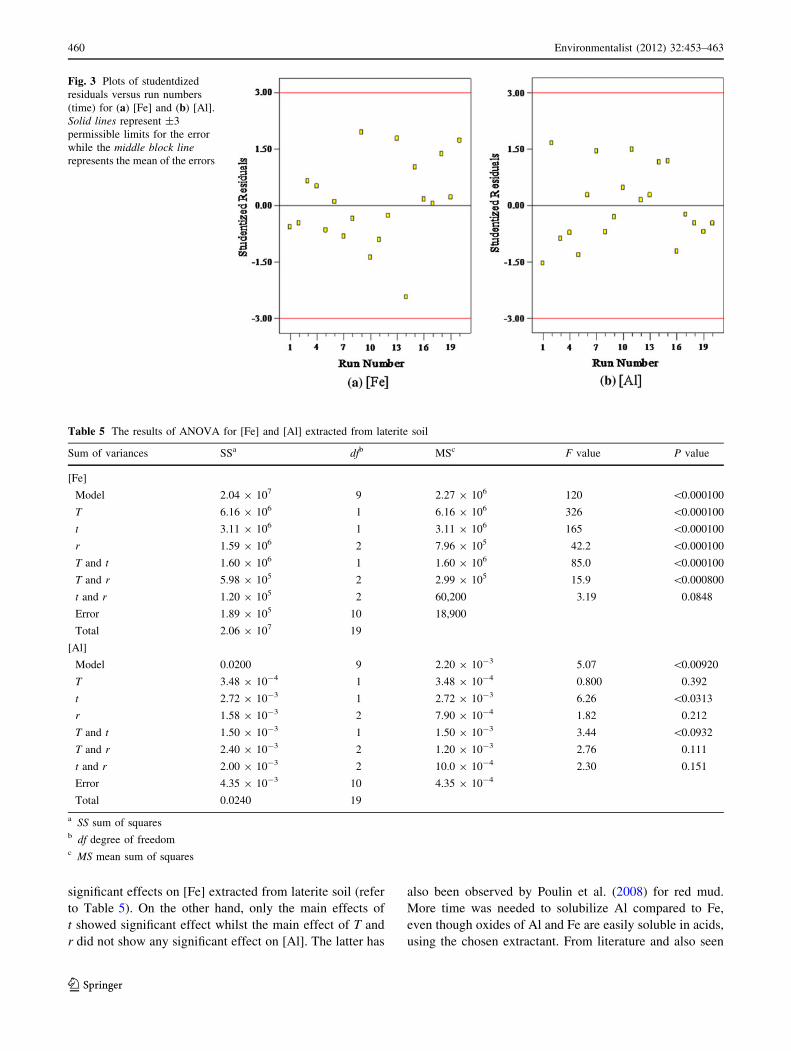
significant effects on [Fe] extracted from laterite soil (refer
to Table 5). On the other hand, only the main effects of
t showed significant effect whilst the main effect of T and
r did not show any significant effect on [Al]. The latter has
also been observed by Poulin et al. (2008) for red mud.
More time was needed to solubilize Al compared to Fe,
even though oxides of Al and Fe are easily soluble in acids,
using the chosen extractant. From literature and also seen
Fig. 3 Plots of studentdized
residuals versus run numbers
(time) for (a) [Fe] and (b) [Al].
Solid lines represent ±3
permissible limits for the error
while the middle block linerepresents the mean of the errors
Table 5 The results of ANOVA for [Fe] and [Al] extracted from laterite soil
Sum of variances SSa dfb MSc F value P value
[Fe]
Model 2.04 9 107 9 2.27 9 106 120 \0.000100
T 6.16 9 106 1 6.16 9 106 326 \0.000100
t 3.11 9 106 1 3.11 9 106 165 \0.000100
r 1.59 9 106 2 7.96 9 105 42.2 \0.000100
T and t 1.60 9 106 1 1.60 9 106 85.0 \0.000100
T and r 5.98 9 105 2 2.99 9 105 15.9 \0.000800
t and r 1.20 9 105 2 60,200 3.19 0.0848
Error 1.89 9 105 10 18,900
Total 2.06 9 107 19
[Al]
Model 0.0200 9 2.20 9 10-3 5.07 \0.00920
T 3.48 9 10-4 1 3.48 9 10-4 0.800 0.392
t 2.72 9 10-3 1 2.72 9 10-3 6.26 \0.0313
r 1.58 9 10-3 2 7.90 9 10-4 1.82 0.212
T and t 1.50 9 10-3 1 1.50 9 10-3 3.44 \0.0932
T and r 2.40 9 10-3 2 1.20 9 10-3 2.76 0.111
t and r 2.00 9 10-3 2 10.0 9 10-4 2.30 0.151
Error 4.35 9 10-3 10 4.35 9 10-4
Total 0.0240 19
a SS sum of squaresb df degree of freedomc MS mean sum of squares
460 Environmentalist (2012) 32:453–463
123
in this work, Fe showed obvious extracted differential
changes in extracted quantities at low temperature (circa
50 �C) that became less apparent with higher temperatures
([100 �C) (Poulin et al. 2008). Furthermore, oxides of Fe
is readily more soluble in acids than oxides of Al, thus it is
intuitive that it becomes more dependent on other physical
parameters, i.e., T (by the second law of thermodynamics)
and r (more volume), plus the differential changes more
evident than what can be seen for Al.
In addition to the main effects, the interactions among T,
t, and r were studied. Interactions between T and t and
between T and r exhibited strong significant effect on [Fe]
extracted from laterite soil; the interaction between r and
t was significant at p \ 0.0850 (refer to Table 5). However,
the effect of factors interactions exhibited different
behavior on [Al] also shown in Table 5. The interactions
showed less effect on [Al] compared to [Fe] since the
interaction between T and t was significant at p \ 0.0900
and the p value for other interactions was higher than
0.100. These results reinforced the explanation given in the
previous paragraph.
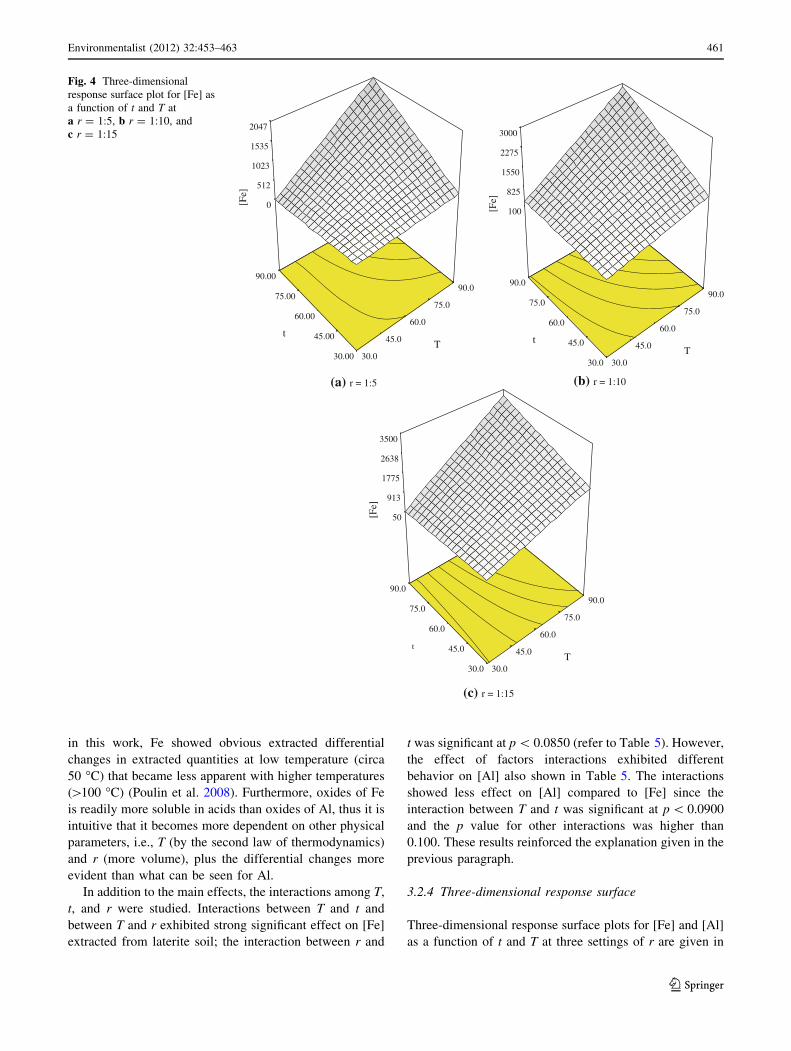
3.2.4 Three-dimensional response surface
Three-dimensional response surface plots for [Fe] and [Al]
as a function of t and T at three settings of r are given in
0
512
1023
1535
2047
[Fe
]
30.0
45.0
60.0
75.0
90.0
30.00
45.00
60.00
75.00
90.00
T t
(a) r = 1:5
100
825
1550
2275
3000
[Fe
]
30.0
45.0
60.0
75.0
90.0
30.0
45.0
60.0
75.0
90.0
T t
(b) r = 1:10
50
913
1775
2638
3500
[Fe
]
30.0
45.0
60.0
75.0
90.0
30.0
45.0
60.0
75.0
90.0
T t
(c) r = 1:15
Fig. 4 Three-dimensional
response surface plot for [Fe] as
a function of t and T at
a r = 1:5, b r = 1:10, and
c r = 1:15
Environmentalist (2012) 32:453–463 461
123
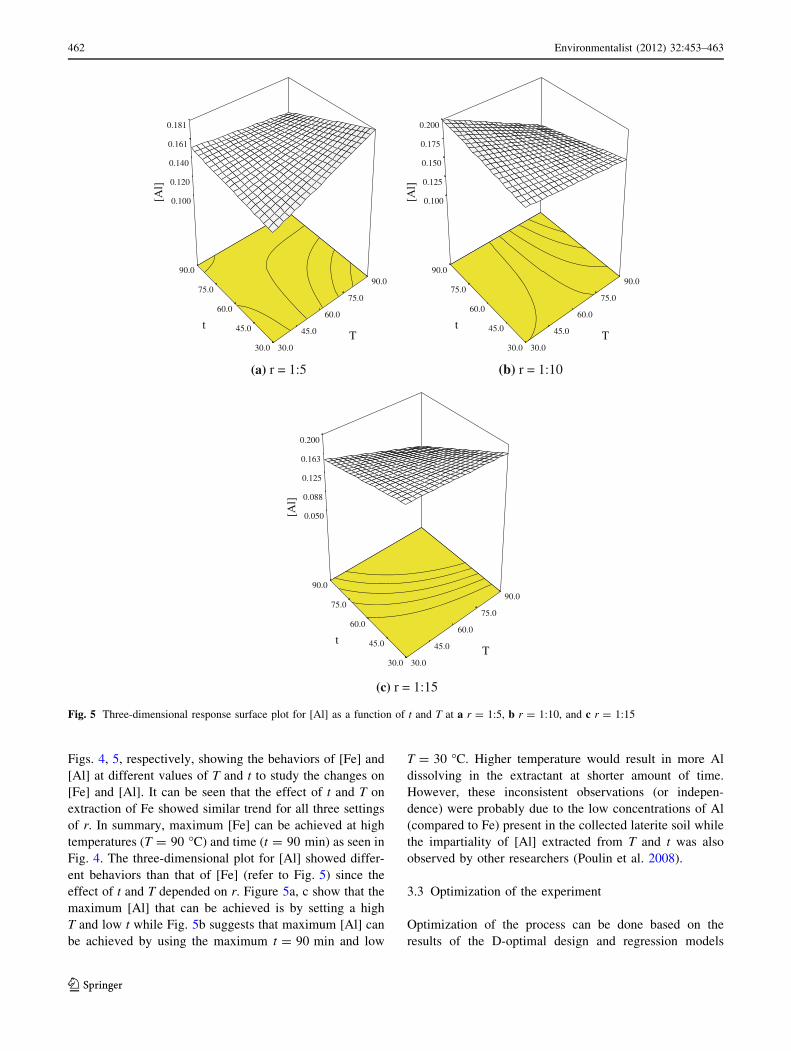
Figs. 4, 5, respectively, showing the behaviors of [Fe] and
[Al] at different values of T and t to study the changes on
[Fe] and [Al]. It can be seen that the effect of t and T on
extraction of Fe showed similar trend for all three settings
of r. In summary, maximum [Fe] can be achieved at high
temperatures (T = 90 �C) and time (t = 90 min) as seen in
Fig. 4. The three-dimensional plot for [Al] showed differ-
ent behaviors than that of [Fe] (refer to Fig. 5) since the
effect of t and T depended on r. Figure 5a, c show that the
maximum [Al] that can be achieved is by setting a high
T and low t while Fig. 5b suggests that maximum [Al] can
be achieved by using the maximum t = 90 min and low
T = 30 �C. Higher temperature would result in more Al
dissolving in the extractant at shorter amount of time.
However, these inconsistent observations (or indepen-
dence) were probably due to the low concentrations of Al
(compared to Fe) present in the collected laterite soil while
the impartiality of [Al] extracted from T and t was also
observed by other researchers (Poulin et al. 2008).
3.3 Optimization of the experiment
Optimization of the process can be done based on the
results of the D-optimal design and regression models
0.100
0.120
0.140
0.161
0.181
[A
l]
30.0
45.0
60.0
75.0
90.0
30.0
45.0
60.0
75.0
90.0
T t
(a) r = 1:5
0.100
0.125
0.150
0.175
0.200
[A
l]
30.0
45.0
60.0
75.0
90.0
30.0
45.0
60.0
75.0
90.0
T t
(b) r = 1:10
0.050
0.088
0.125
0.163
0.200
[A
l]
30.0
45.0
60.0
75.0
90.0
30.0
45.0
60.0
75.0
90.0
T t
(c) r = 1:15
Fig. 5 Three-dimensional response surface plot for [Al] as a function of t and T at a r = 1:5, b r = 1:10, and c r = 1:15
462 Environmentalist (2012) 32:453–463
123
developed. Once the models have been derived and
checked for adequacy, the optimization criteria can be set
to determine the optimum operating conditions. The goal
was to maximize [Fe] and [Al] extracted from laterite soil.
Thus, the optimum operating conditions to obtain maxi-
mum [Fe] and [Al] simultaneously were: high T (90 �C)
and t (40 min) with r = 1:15 and the results were
1,870 mg/l [Fe] and 0.170 mg/l [Al]. At a lower ratio of
r = 1:10, the settings of the combined factors were high
T = 90 �C and t = 90 min, which resulted in 2,900 mg/l
[Fe] and 0.130 mg/l [Al].
4 Conclusions
The 5 N HCl extractant was found to exhibit the highest
[Fe] extracted from laterite soil while the combination of
2 N HCl and 4 N NaCl exhibited the highest extraction
value for [Al]. NaOH was not effective in extracting Al or
Fe from the soil. Temperature T, time t, and extractant-to-
soil ratio r, (and their interactions) were found to affect
concentration of Fe extracted. However, only time was
significant for Al. From D-optimal statistical design,
extraction settings based on the above factors were deter-
mined to maximize extracted Al and Fe concentrations
simultaneously, which were: (1) r = 1:10; T = 90 �C;
t = 40 min and (2) r = 1:15; T = 90 �C; t = 90 min.
Acknowledgments The authors would like to thank Universiti
Sains Malaysia for providing the infrastructure and financial assis-
tance that made this work possible. The authors would also like to
acknowledge the meticulous laboratory work done by Tan Lean Ping
and the effort given by Lim Han Khim.
References
Bhattacharya P (2007) Arsenic in soil and groundwater environment:
biogeochemical interactions, health effects and remediation.
Trace metals and other contaminants in the environment, vol 9.
Elsevier, Amsterdam
Bratby J (2006) Coagulation and flocculation in water and wastewater
treatment, 2nd edn. IWA Pub, Seattle, WA
Jiang JQ, Zeng ZQ, Pearce P (2004) Evaluation of modified clay
coagulant for sewage treatment. Chemosphere 56(2):181–185.
doi:10.1016/j.chemosphere.2004.03.007
Ko T-H, Chu H, Lin H-P, Peng C-Y (2006) Red soil as a regenerable
sorbent for high temperature removal of hydrogen sulfide from
coal gas. J Hazard Mater 136(3):776–783. doi:10.1016/j.jhazmat.
2006.01.010
Lee JF, Liao PM, Lee CK, Chao HP, Peng CL, Chiou CT (2004)
Clay-catalyzed reactions of coagulant polymers during water
chlorination. J Colloid Interface Sci 270(2):381–387. doi:10.10
16/j.jcis.2003.08.065
Luo M, Bi S (2003) Solid phase extraction-spectrophotometric
determination of dissolved aluminum in soil extracts and ground
waters. J Inorg Biochem 97(1):173–178. doi:10.1016/s0162-013
4(03)00243-5
Mahalinga-Iyer U, Williams DJ (1991) Engineering properties of a
lateritic soil profile. Eng Geol 31(1):45–58. doi:10.1016/0013-79
52(91)90056-q
Matus P, Kubova J, Bujdos M, Medved J (2006) Free aluminium
extraction from various reference materials and acid soils with
relation to plant availability. Talanta 70(5):996–1005. doi:10.101
6/j.talanta.2006.05.045
Montgomery DC (2005) Design and analysis of experiments, 6th edn.
Wiley, Hoboken, NJ
Pang FM, Teng SP, Teng TT, Kadir MOA (2009) Heavy metals removal
by hydroxide precipitation and coagulation-flocculation methods
from aqueous solutions. Water Qual Res J Can 44:174–182
Poulin E, Blais J-F, Mercier G (2008) Transformation of red mud
from aluminium industry into a coagulant for wastewater
treatment. Hydrometallurgy 92(1–2):16–25. doi:10.1016/j.hydr
omet.2008.02.004
Rao CRM, Sahuquillo A, Lopez-Sanchez JF (2010) Comparison of
single and sequential extraction procedures for the study of rare
earth elements remobilisation in different types of soils. Anal
Chim Acta 662(2):128–136. doi:10.1016/j.aca.2010.01.006
Shui J-G, Wang Q-Z, Liao G-Q, Au J, Allard JL (2008) Ecological
and economic benefits of vegetation management measures in
citrus orchards on red soils. Pedosphere 18(2):214–221. doi:
10.1016/s1002-0160(08)60009-0
Sidhu PS, Gilkes RJ, Cornell RM, Posner AM, Quirk JP (1981)
Dissolution of iron oxides and oxyhydroxides in hydrochloric
and perchloric acids. Clays Clay Miner 29(6):269–276
Siradz SA (2008) Mineralogy and chemistry of red soils of Indonesia:
I. General soil properties. Jurnal Ilmu Tanah dan Linkungan 8(1):
16–32
Takahashi T, Toriyama K (2004) Method to evaluate ‘‘uplandization’’
in converted field from a paddy based on crystallinity of free iron
oxides, vol 38. vol 3. Ministry of Agriculture, Forestry, and
Fisheries, Ibaraki, Japan
Tan BH, Teng TT, Omar AKM (2000) Removal of dyes and industrial
dye wastes by magnesium chloride. Water Res 34(2):597–601.
doi:10.1016/s0043-1354(99)00151-7
Walna B, Spychalski W, Siepak J (2005) Assessment of potentially
reactive pools of aluminium in poor forest soils using two
methods of fractionation analysis. J Inorg Biochem 99(9):
1807–1816. doi:10.1016/j.jinorgbio.2005.06.026
Wilson MJ, He Z, Yang X (2004) The red soils of China: their nature,
management, and utilization. Kluwer, Dordrecht
Young A (1976) Tropical soils and soil survey. Cambridge geo-
graphical studies, vol 9. Cambridge University Press, Cam-
bridge, NY
Environmentalist (2012) 32:453–463 463
123


