Embed Size (px)
Citation preview

J. Math. Biology 10, 209-256 (1980) Journal o[ Mathematical
Biology �9 by Springer-Verlag 1980
Optimal Strategies in Immunology Ill. The IgM-IgG Switch*
Alan S. Perelson 1'2, Byron Goldstein 1, and Sol Rocklin 3'**
Theoretical Division, University of California, Los Alamos Scientific Laboratory, Los Alamos, NM 87545, USA
z Division of Biology and Medicine, Brown University, Providence, RI 02912, USA 3 Division of Entomology, University of California, Berkeley, CA 94720, USA
Summary. During a primary immune response generally two classes of antibody are produced, immunogtobulin M (IgM) and immunoglobulin G (IgG). It is currently thought that some lymphocytes which initially produce IgM switch to the production of IgG with the same specificity for antigen. During a secondary immune response IgG is the predominant antibody made throughout the response. In this paper we address the question of why such apparently complicated modes of response should have been adapted by evolution.
We construct mathematical models of the immune response to growing antigens which incorporate complement dependent cell lysis. By comparing the times required to eliminate antigen we show that under certain conditions it is advantageous for an animal to switch some of its lymphocytes from IgM to IgG production during a primary response, but yet to secrete only IgG during a secondary response. The sensitivity of such a conclusion to parameter variations is studied and the biological basis and implications of our models are fully discussed.
Key words: Optimal control theory - B lymphocytes - IgM-IgG switch - Immunoglobulin M - Immunoglobulin G
Table of Contents
I. Introduction . . . . . . . . . . . . . . . . . . . . . . . . . . . . . . . . . . . . . . . . . . . 210 II. Biological Features of the IgM-IgG Switch and Complement Dependent Lysis . . . . . . 214
A. IgM-IgG Switch . . . . . . . . . . . . . . . . . . . . . . . . . . . . . . . . . . . . . . 214 B. Complement Dependent Lysis . . . . . . . . . . . . . . . . . . . . . . . . . . . . . . . 216
* Portions of this work were performed under the auspices of the U.S. Department of Energy. A.S.P. was also supported by the National Science Foundation under Grant No. ENG-7904852 and BRSG grant S07 RR05664-11 awarded by the Biomedical Research Support Grant Program, Division of Research Resources, National Institute of Health. A.S.P. is the recepient of an NIH Research Career Development Award 1K04 AI 00357-01. S.R. was a recipient of NIH Fellowship 5 F32 AI05107-02 ** Current Address: M.I.T.-Lincoln Laboratory, Lexington, MA, USA
0303-6812/80/0010/0209/$09.60

210 A.S. Perelson et al.
III. Models . . . . . . . . . . . . . . . . . . . . . . . . . . . . . . . . . . . . . . . . . . . . . . 217 A. Simplest Model . . . . . . . . . . . . . . . . . . . . . . . . . . . . . . . . . . . . . . . 217 B. Control Problem . . . . . . . . . . . . . . . . . . . . . . . . . . . . . . . . . . . . . . 220 C. A Logistic Model . . . . . . . . . . . . . . . . . . . . . . . . . . . . . . . . . . . . . . 221 D. A Model with Opsonization . . . . . . . . . . . . . . . . . . . . . . . . . . . . . . . . 222 E. Parameter Values . . . . . . . . . . . . . . . . . . . . . . . . . . . . . . . . . . . . . . 222
IV. Will the Antigen Win? . . . . . . . . . . . . . . . . . . . . . . . . . . . . . . . . . . . . . 228 V. Simulation Results . . . . . . . . . . . . . . . . . . . . . . . . . . . . . . . . . . . . . . . 232
A. Nonlogistic Model . . . . . . . . . . . . . . . . . . . . . . . . . . . . . . . . . . . . . 232 B. Singular Control . . . . . . . . . . . . . . . . . . . . . . . . . . . . . . . . . . . . . . 240 C. Logistic Model . . . . . . . . . . . . . . . . . . . . . . . . . . . . . . . . . . . . . . . 241 D. Effects of Opsonization . . . . . . . . . . . . . . . . . . . . . . . . . . . . . . . . . . 241
VI. Discussion . . . . . . . . . . . . . . . . . . . . . . . . . . . . . . . . . . . . . . . . . . . . 243 Appendix A. Singular Perturbation Analysis of IgG Binding . . . . . . . . . . . . . . . . . . 249
I. Introduction
One curious feature of an animal ' s immune response to its first encounter with an ant igen (the pr imary i m m u n e response) is that under most circumstances two distinct classes of an t ibody are secreted, immunog lobu l in M (IgM) and i m m u n o - globulin G (IgG). If the amount s of IgM and IgG in the blood serum of an animal are measured as funct ions of time after inocula t ion of antigen; one finds that IgM is detected in the blood serum first and IgG is detected after some delay. Other analyses, which we shall detail later, have shown that there are single B lymphocytes which first make IgM molecules and then later in the response switch to the product ion of IgG molecules with the same specificity for antigen. Dur ing an immune response generated by an animal ' s second encounter with ant igen (the secondary i m m u n e response) IgG is the p redominan t an t ibody detected dur ing the complete course of the response. Figure 1 summarizes these findings.
T l T T T 1 t
PRIMARY RESPONSE SECONDARY RESPONSE
I,OOO - - IgG _
IOO
Antigen Antigen
I0
IgM '
0 7 14 21 2:8 35 42 49 56
Time ( doys|
Fig. l. Kinetics of IgM and IgG appearance in the serum during the primary and secondary immune responses (adapted from Hood et al., 1978). The concentration of antibody is expressed in arbitrary units

IgM-IgG Switch 211
These observations raise the following questions which we shall address in this paper: 1) Why should a cell make two different types of antibody with the same specificity for antigen ? 2) Why should a cell first make one class of antibody (IgM) and then switch to the production of another class (IgG) later in a primary immune response? 3) Why should the response pattern (i.e. the timing of the types and amounts of antibody made) of a secondary immune response be different than that of a primary immune response?
Since biological systems are the result of hundreds of millions of years of evolution by natural selection, it is reasonable to hypothesize that the IgM-IgG switch provides some advantage to an animal during a primary immune response. In order to examine this possibility, we have constructed a mathematical model of the interaction of the immune system with a growing antigen and have attempted to optimize the performance of the model immune system in eliminating the antigen with respect to various strategies of IgM and IgG production. Although there are many dangers in using optimization arguments to predict the course of evolution (Oster and Wilson, 1978), the evolutionary stability of the vertebrate immune system and the magnitude of the selective forces acting upon it give one some confidence in the predictions of optimization procedures (see Paper I1). Further, we incorporate into the model our present knowledge of the composition of the immune system and thus we do not attempt the impossible task of predicting the structure of the best possible immune system evolution could have designed. Also we constrain the model parameters to take on experimentally observed values. Thus, for example, we shall take as given that a cell can produce either IgM or IgG and shall not attempt to predict on an apriori basis that evolution should have lead to an immune system utilizing multiple antibody classes. Further, we shall assume IgM and IgG synthesis rates are fixed at their measured values, and thus we do not examine "optimal" strategies which involve increasing the antibody secretion rate. The only latitude that we will allow in our model relates to the operational choices of which class of antibody should be secreted at a particular time. It seems reasonable that evolution could lead to the local optimization of such decisions, given that different strategies lead to different abilities to cope with infectious disease.
Many suggestions have been put forward to explain the IgM-IgG switch. We shall briefly mention the most widely discussed explanations in order to provide some perspective from which to view our model. First, IgM is the most primitive antibody, having arisen over 400 million years ago. The cyclostomes, the lamprey and the hagfish, believed to be the most primitive vertebrates in existence today, exhibit a humoral immune response with the production of IgM-type antibodies (Hildemann, 1972; Finstad and Good, 1966). Immunoglobulin classes distinct from IgM emerged at least 60 million years later at the phylogenetic level of the teleosts (Marchalonis and Cone, 1973; Litman et al., 1971). Thus, if the ontogenic development of a B cell follows its phylogenic development one might expect B cells to secrete IgM before a "developmental switch" is thrown which turns on IgG
1 Papers I and II of this series are Perelson, A. S., Mirmirani, M., Oster, G. F. : Optimal strategies in immunology, I. B-cell differentiation and proliferation. J. Math. Biol. 3, 3 2 5 - 3 6 7 (1976); ibid II. B memory cell production. J. Math. Biol. 5, 2 1 3 - 2 5 6 (1978)
212 A.S. Perelson et al.
production (Bauer et al., 1963; see Gould, 1977, for a general discussion of ontogeny and phylogeny). Second, IgG can pass through the placenta and provide protection to a newborn animal, whereas IgM cannot. Thus, at least in eutheria (placental mammals) there would be a selection pressure favoring IgG. Again, if IgM were developmentally locked in as the first product of antibody secretion then one might expect a switch. Of course, one might ask why IgG simply did not replace IgM.
The explanation of the IgM-IgG switch that we favor involves the ability of the immune system to kill cells labelled as foreign, i.e., pathogenic organisms. There are many host defenses that act against disease causing organisms (cf. Mires, 1976). Here we shall only discuss two defense mechanisms, complement dependent cell lysis and phagocytosis. Besides directly interacting with antigen to form large antibody-antigen aggregates, antibody also acts as a tag, marking cells as foreign. Once a cell is so marked it may be rapidly engulfed by a large migratory phagocytic cell, such as a neutrophil or macrophage, or it may be attacked by a series of eleven serum glycoproteins known as the complement system. The complement com- ponents insert themselves into the plasma membrane of a cell, disrupt the membrane, and in some cases cause the formation of a lesion through which water can flow, lysing the cell by osmotic forces (cf. Mayer, 1973). Not all cells are susceptible to complement-dependent killing (some cells may be able to repair the damage to their membranes), but those which complement can kill include the gram-negative enteric bacteria, such as Salmonella typhi (Muschel et al., 1958); cholera vibrios (Zinsser et al., 1939; Muschel and Fong, 1977); and the bacterium Treponema pallidum (Nelson and Mayer, 1949) which causes syphilis. Other susceptible bacteria are leptrospirae (Johnson and Muschel, 1966); hemophilus (Dingle et al., 1938); gonococcus (Glynn and Ward, 1970); meningococcus (Goldschneider et al., 1969; Nicholson and Lepow, 1979); mycoplasma (Gale and Kenny, 1970; Barker and Patt, 1970; Lin and Kass, 1970; Brunner et al., 1971 ; D6rner et al., 1976); and pseudomonas (Muschel et al., 1969). Some classes of pathogenic viruses whose envelopes contain lipoproteins are also susceptible to complement-dependent lysis (Almeida and Waterson, 1969). Virally infected cells (Porter, 1971), tumor cells (Green et al., 1959; Old et al., 1967; Kassel et al., 1973), protozoa (Anziano et al., 1972), and some metazoan parasites (Kassis and Tanner, 1977) also can be lysed by complement.
The cascade of complement reactions which eventually can lead to cell lysis is initiated by the first complement component, C1, binding to one IgM or two or more IgG molecules in close proximity on the cell membrane (Borsos and Rapp, 1965a, b; Humphrey and Dourmashkin, 1965 ; Cohen, 1968). Studies by Humphrey and Dourmashkin (1965), and Humphrey (1967), on the complement dependent lysis of red blood cells showed that about 800 IgG molecules would be required to bind to the cell surface before there was an even chance that two such molecules would be at adjacent sites. Although it is difficult to extrapolate to other cell types it seems clear that many more IgG molecules are required to bind to a cell than IgM molecules in order to initiate the complement reactions. Thus, at first sight it would seem best if the immune system secreted only IgM. Bretscher (1977) has suggested that because of the great potency of IgM there is a commensurate danger of lysing self components. A single IgM could bind to many cell types either cytophilicaUy or

lgM-IgG Switch 213
via a cross-reacting antigen and cause the destruction of the cell by complement. Thus Bretscher suggested that the immune system should only secrete IgM during the early phase of an infection when there would not be enough IgG to expect that adjacent sites on the antigen would be bound, and then to switch to IgG production once enough time has elapsed for IgG antibody to be made in large quantities. Our main objection to Bretscher's argument is that it is inconsonant with the usual trends of evolution. That is, it seems unlikely that a defense system based on IgM and complement would have evolved and been retained if it posed a serious danger to an individual and hence to the species. Experimental evidence also speaks against it. The immune response to a class of polymeric antigens, known as T-independent antigens, is generally a pure IgM response (Basten and Howard, 1973) and yet is not accompanied by massive self destruction. Moreover, it is not clear that Bretscher's premise that IgM is more dangerous to self than IgG is true. For example, in human autoimmune hemolytic anemia usually IgG rather than IgM is the predominant antibody (cf. Rosse, 1973). Since we cannot retrodict evolution, there is no incontrovertible method of disproving Bretscher's proposal. Bretscher, in fact, may be correct or partially correct, since there is no denying the existence of autoimmune disease. Tradeoffs must have been made during the evolutionary design of the immune system which have allowed a risk of self damage to arise in pathological situations. However, we believe such risks are present when either IgM or IgG plus complement is used as a defense mechanism. In light of our misgivings about Bretscher's hypothesis, we propose and analyze here a related model in which there is a direct selective advantage to employing an IgM-IgG switch, but which does not presuppose that the immune system is necessarily dangerous to self.
Although IgM and IgG have the same specificity for antigen, they need not bind to a cell with equal efficiencies. As shown in Fig. 2, IgG has two binding sites and IgM has ten. Evidence based upon the binding kinetics of IgM and IgG to red blood cells in the hemolytic plaque assay, indicates that under many circumstances IgM only uses one of its ten sites in binding to the red cell surface, whereas IgG uses both of its sites (DeLisi, 1976; Goldstein, 1978). As a consequence, IgG can bind to cells more avidly than IgM. (Additional evidence on this key point will be presented in section III.E.) If we assume that the overall equilibrium constant governing the binding of IgG to cells is substantially greater than that for IgM, then a red cell in a solution containing equal concentrations of IgG and IgM may well be more likely to have 800 IgG molecules than 1 IgM molecule on its surface. A similar argument applies to any pathogen with the required number of IgG molecules needed for lysis depending upon the pathogen's surface area. (For a bacterium we compute (see Sec. III.E) that approximately 60 IgG molecules would be needed.) Thus when the net binding constant or avidity of IgG is much greater than that of IgM, it would seem advantageous if the immune system secreted only IgG. However, as Bretscher (1977) pointed out, during the initial stages of an immune response there may not be a sufficient amount of antibody available to put enough IgG on each pathogen's surface to fix complement. During this initial period only IgM can lead to cell lysis and thus first producing IgM and then producing IgG may be an advantageous strategy. We shall explore under what circumstances this is the case, and in particular we shall show that for a large range of antigen doses, during a primary immune response it is better first to secrete IgM and then have some cells switch to

214 A.S. Perelson et al.
IgG secretion, than to secrete only IgM or only IgG. We shall also show that for secondary humoral immune responses in which greater concentrations of antibody are secreted early, only IgG need be made. Our results support the suggestion of Humphrey and Dourmashkin (1965) that complement dependent lysis might account for the evolutionary persistance of the early, transient IgM response.
Hoffma.nn (1978, 1979) also suggests that complement dependent lysis may be related to the IgM-IgG switch. In his network model of the immune response, Hoffmann includes linear and quadratic death terms representing killing by IgM and complement and IgG and complement. From his analysis of the model he argues that a switch is needed for network stability.
Another host defense strategy, phagocytosis, may also relate to the IgM-IgG switch. The binding of IgG or the third complement component, C3, but not IgM, to the surface of a cell renders the cell more readily ingested by phagocytic cells (of. Griffin, 1977). This phenomena, called opsonization by Wright and Douglas (1903), may increase the usefulness of IgG late in an immune response. Once a pathogenic organism is killed by complement, the organism although dead can continue to bind more antibody. Thus dead organisms act as competitive inhibitors for further complement dependent killing of live cells. Switching from IgM to IgG production during a primary immune response may then lead to an enhanced elimination of dead cells by phagocytosis and a diminution of this competitive effect.
In section II we shall discuss in more detail some of the biological features of the IgM-IgG switch, and the complement system. In section III we shall present our model of the interaction of the immune system with a growing antigen and discuss the experimentally determined values of the parameters. We devote considerable attention to this topic because our conclusions are based on numerical studies. As we all know the immune system does not always conquer disease. In section IV we obtain sufficient conditions for the immune system to eliminate the antigen and devise an approximate condition under which the antigen can grow in the face of an immune attack. In section V we use numerical methods to compare various immune system strategies. In sectiin VI we discuss these results and compare them with experimental evidence.
II. Biological Features of the IgM-IgG Switch and Complement Dependent Lysis
A. IgM-IgG Switch
During the primary immune response IgM antibodies are generally detected earlier than IgG molecules. This has been observed in humans (Lo Spalluto et al., 1962; Fink et al., t962; Uhr et al., 1962), mice (Wortis et al., 1966), rats (Nossal et al., 1964), rabbits (Stelos and Taliaferro, 1959; Bauer and Stavitsky, 1961 ; Benedict et al., 1962; Bauer et al., 1963 ; Beltanti et al., 1963; Svehag and Mandel, 1964), guinea pigs (Uhr et al., 1962; Uhr and Finkelstein, 1963) and several nonmammalian vertebrates (Uhr et al., 1962), indicating that this temporal sequency of immuno- globulin production may occur among all vertebrates. In Fig. 1 we show a representative example of the sequential changes in antibody class made after immunization. Notice that it is only in the primary response that IgM is seen before IgG; in the secondary response both IgM and IgG increase immediately after

IgM-IgG Switch 215
antigen injection. During all primary responses IgM appears to be produced, but in the response to some thymus independent antigens IgG is never detected (Basten and Howard, 1973).
For the purposes of this paper we shall call the early production of IgM followed by production of IgG the "IgM-IgG switch". There are two possible mechanisms which can explain the IgM-IgG switch: 1) individual B cells first produce IgM and then shift to the synthesis of IgG; 2) there are two distinct populations of B cells, one of which secretes exclusively IgM and the other of which secretes only IgG. We favor the first mechanism and summarize below some of the experimental results supporting this view.
Evidence that a single cell might switch from IgM to IgG production first came from experiments of No ssal et al. (1964) in which rare individual cells secreting both IgM and IgG antibodies were found. These double producers were detected only at times when the switch from IgM to IgG production was occurring, which led the investigators to propose the following explanation. When antigen is first injected, all cells capable of responding begin IgM production. Some of these mature, produce IgM, and die. However, after some IgM has been formed, a proportion of the proliferating cells switch to the production of IgG. Thus there is a short period during which cells undergoing the switch contain both types of antibody. When the change is complete, a cell only produces lgG. In the secondary response, some stimulated cells go through the same transition, but more rapidly. Others, perhaps the progeny of cells which switched during the primary response, may form IgG ab initio. This scenario of Nossal et al.'s (1964) will form the basis of the models in section II1.
More recent evidence for an IgM-IgG switch at the single cell level has come from a variety of different experimental systems (cf. Sterzl and Nordin, 197t; Nossal et al., 1971 ; Bleux et al., 1977; Andersson et al., 1978; Wabl et al., 1978; Van der Loo et al., 1979). For example, in the experiments of Bleux et al. (1977) adult mice were given a single injection of sheep erythrocytes (SRBC). After 2 - 5 days their spleens were removed and placed in mass cell culture. Cells were removed after 1 day in culture and tested for IgM secretion via the hemolytic plaque assay. Cells which were found to be secreting IgM directed against SRBC were further cultured individually for 1 day and their progeny were tested for IgM or IgG secretion. It was found that parent cells secreting IgM gave rise to daughter cells secreting either IgM or IgG with the same antigen specificity. In our view this establishes that single cells can switch from IgM to IgG production and strongly suggests that at least some IgM producers generate IgG producing cells in response to antigen. 2
An antibody molecule is composed of heavy and light polypeptide chains (see Fig. 2). The heavy chains in IgM and IgG are called #-chains and y-chains, respectively. Each chain is composed of two regions, a variable region and a constant region. The variable regions of the heavy and light chains form the antigen binding sites of the antibody molecule while the constant regions determine
2 The culture medium used in these experiments contained lipopolysaccharide (LPS), a mitogenic substance which has been shown to accelerate expression of surface and cytoplasmic IgG. Although one could not exclude LPS as the inducer of the switch, in vitro IgG sec~-etion is usually not seen until 2 weeks after LPS stimulus (Zauderer and Askonas, 1976), whereas in these experiments the switch to IgG took 1 day

216 A.S. Perelson et al.
,...jl -F~
, - \ vc
IgM IgG
Fig. 2. The structure of IgM and IgG. IgM contains five subunits joined by disulfide bridges (circular dashed line) and a J chain (not shown). Each subunit is similar to a single IgG but contains a larger and different heavy chain constant region, When a cell switches from IgM to IgG production, both immunoglobulins are believed to contain identical antigen binding fragments (Fab), but different crystallizable fragments (Fc). The complement binding sites are located on the Fc portions of the immunoglobulin molecule
the effector functions of the molecule (e.g. the ability to fix complement), and the antibody class (e.g. whether it is IgM or IgG). Recent experiments have shown that not only can a single cell or clone of cells derived from a single stimulated precursor produce both IgM and IgG antibody, but that the variable regions of such molecules are identical (Press and Klinman, 1973; Gearhart et al., 1975). Using recombinant DNA and hybridization techniques the detailed genetic mechanism underlying the switch in the constant region is being elucidated (Honjo and Kataoka, 1978; Rabbitts et al., 1980). If only the constant region changes, one might surmise that during the IgM-IgG switch the specificity for antigen is precisely maintained. Consequently, any evolutionary significance for the switch lies predominantly in the effector functions of the constant regions of the antibody molecule. Complement dependent lysis and opsonization are the principal antibody effector functions and are the ones which we examine in this paper.
B. Complement Dependent Lysis
The complement system is composed of a series of serum glycoproteins or "components" termed C1, C2 . . . . , C9, and a series of inhibitors or inactivators which influence the complement components. Like many of the blood clotting factors, the complement components reside in the blood as inactive precursors which are activated by specific biochemical mechanisms. There are two activation pathways, the classical pathway, initiated by antibody of either the IgM or IgG class, and the alternate pathway, initiated by antibody-antigen complexes or, in the absence of immunoglobulin by certain chemical configurations, especially repeat- ing polysaccharide subunits such as are found in bacterial cell walls (Osler and Sandberg, 1973). Here we restrict our attention to the antibody dependent classical pathway.

IgM-IgG Switch 217
When IgM or IgG binds to antigens on a cell surface a conformational change apparently takes place, which allows the first complement component C1 to bind via ionic linkages to the Fc portion of these immunoglobulin molecules (Pecht et al., 1977). C1 is composed of three subunits; C1 q, r, and s, held together by a calcium ion (Mayer, 1973). Electron microscopic examination of C1 q, the portion of C1 that binds to the Fc portion of antibody, has shown that the molecule has a central core with six filaments extending outward, each ending in a podlike structure (Porter, 1977). The podlike structures at the ends of the filaments attach to the Fc portion of antibody. Multiple attachments are required for stable binding, thus explaining why a single IgM with its five Fc portions can bind C1, whereas for IgG at least two molecules in close proximity are required.
The binding of Clq to antibody on a cell surface initiates a complex sequence of interactions in which the remaining components of complement eventually all participate. The result of these interactions is the formation of a lesion in the cell membrane which can lead to the death of the cell (for a summary of the complement system see Mayer, 1973; 1978). The complement system is an exquisitely designed amplification system, based upon a reaction cascade, that allows a cell with a single IgM or a pair of closely associated IgG molecules to be lysed.
IlL Models
A. Simplest Model
In papers I and II we presented a detailed model of B lymphocyte proliferation and differentiation which included small lymphocytes, large lymphocytes, plasma cells and memory cells. Here we are not concerned with the different cellular stages of B cell proliferation, but only with the type of antibody they secrete. Thus we shall consider two populations of lymphocytes, one of which, L~t, consists of cells that
Fig. 3. Block diagram of complement dependent killing. Cell populations L M and Lo secrete IgM(M) and IgG(G) at rates s and 7s, respectively. Free antibody binds to both live antigen a, and dead antigen h (the details of the binding are not shown in the diagram). When IgM (IgG) combines with live antigen, the antigen is killed with a probabilitypM(pG) that depends upon the number of IgM (IgG) mole- cules bound. Dead antigen and antibody bound to dead cells are eliminated by phagocytosis
bu bv
d(I-v)
r I

218 A.S . Perelson et al.
secrete only IgM, and the other of which, LG, consists of cells that secrete only IgG. At any time t, we shall assume that a fraction, u(t), of the L~ cells are proliferating and that the remaining fraction, 1 - u(t), are differentiating into La cells. We shall also allow for the possibility of LG cells differentiating into LM cells. Thus we assume that a fraction, v(t), of the LG cells are proliferating and the remaining fraction, 1 - v(t), are differentiating in LM cells (Fig. 3). Since LM and LG cells are only distinguished by the antibody molecule they secrete, we assume both cell types divide, differentiate, and die at the same per capita rates b, d, and #L, respectively. We further assume L~t cells secrete IgM at rate s and LG cells secrete IgG at rate 7s. The factor y is introduced to account for possible differences in the secretion rates of IgM and IgG. Free antibody is eliminated from the blood serum with rates which depend on the antibody class. We let #M and #o represent the IgM and IgG removal rates, respectively.
We assume the antigen, a, in the absence of antibody and complement grows at a per capita net rate r, where the net growth rate r is the intrinsic birth rate of the population minus the death rate due to all causes other than antibody and complement. (In a later model we shall assume logistic growth.) The antigen is also killed at a per capita rate #a multiplied by Pk~, the probability of complement dependent lysis. Once complement has acted to kill a cellular antigen, the dead cell, ~, is assumed to remain in the system until it is removed, say by phagocytosis, at per capita rate/~a.
To complete the model we need to specify how IgM and IgG bind to cells and the probability of a cell being killed by complement dependent lysis. Every antigenic organism has on its surface a number of molecules or portions of molecules called antigenic determinants which label the organism as foreign. The antibodies secreted by the immune system are directed against, and are specific, for these antigenic determinants. The surface of an organism, such as a bacterium, contains many different antigenic determinants and thus a whole spectrum of different antibodies are secreted against the organism. For simplicity we shall not distinguish different determinants and only assume that each cell has a total of t~o sites at which antibody can bind. Similarly, we shall not distinguish the antibody molecules directed at different determinants or different antibodies directed at the same determinant. We let pM and Pc be the concentrations of sites bound by IgM and IgG, respectively, on live antigens, and we let tSM and ~ G be the corresponding bound site concentrations on dead antigens. IgM is assumed to bind to a cell with only one of its ten sites. The sites are assumed to be identical, each characterized by the same forward rate constant, kM, for binding and rate constant, k~t, for dissociation. IgG is assumed to bind to a cell in two steps. First, one of its arms binds the cell and then in a second reaction the other arm binds. Here we shall only follow the net binding reaction; k~ is the rate constant for attachment of IgG by both of its sites and k' is the G dissociation constant for the complete molecule. Later we shall relate k~ and k~ to the four rate constants which characterize the two step binding reaction. Using these assumptions we obtain the following state equations:
L~t = bu(t)LM - d[-1 - u( t ) ]L~ + d[1 - v( t ) ]L6 - #LLM, (1)
L~ = bv( t )L~ - d[ l - v( t ) ]La + d[1 - u(t)]LM -- #LLa, (2)
= s / ~ , - # M M - ~ot~M, ( 3 )

IgM-IgG Switch 219
= ~2sLc - - # c , G - f i ~ c / 2 , (4)
d = ra - #,apknl, (5) , i
a = # a a p k i l l - - f ia ~l, (6)
ISM = 1 0 k , ( M - PM - ~ t ) ( ~ o a - PM - P c ) - k 'MPM - - #~PMPkm, (7)
~ = I O k M ( M - pM - ~ , ) ( ~ o ~ - ~M - ~ ) - k ~ ; M + m O ~ P ~ -- f ~ ~ (8)
k ' tSc =- 2 k c ( G - 0 ~ / 2 - ~ a / 2 ) ( D o a - PM - - P c ) - - G P c - - I~ ,PcPkin, (9) �9 t A
~ c -- 2 ~ c ( a - o c / 2 - ~G/Z)(D0~ - ~M - t~c) - kcO~ + m O ~ P ~ H - ~ . t ~ , (10)
where 0 ~< u( t ) ~ 1, 0 <~ v ( t ) ~< 1 and Pkm is a function of a, PM and Pc as defined below.
To make explicit our notation, notice we have used the superscript ^ to denote a quantity associated with a dead cell, e.g.,/~,, ~3~t, and/3G, and the superscript " to denote a quantity per cell, e.g., P0. We shall also make use of the intensive quantities
D~t A p M / a and DIG ~= p c / a . (11)
Antibody that is on dead cells is assumed to be lost from the system when dead cells are phagocytosed. IgM is bound to a dead cell by a single site, whereas IgG is bound to 2 sites. Since dead cells are eliminated at rate ~,~, and the amounts of IgM and IgG per dead cell are PM/a and r c/2cl, respectively, the rates of antibody loss are ~pM and/~r This is indicated in Eqs. (3) and (4). As IgM and IgG are lost on dead cells, bound IgM and IgG sites are lost at r a t e s / ) ~ and fio/3a, respectively, as shown in Eqs. (8) and (10).
Equations (7) and (8) contain the kinetics of IgM binding. The binding to dead cells is completely analogous to the binding to live cells, so we shall only discuss the latter�9 Since IgM binds to a single site, the concentration of bound IgM molecules is PM + r and consequently M - p M - tim is the concentration of free IgM molecules. An antigenic site may be bound with either IgM or IgG, thus the total concentration of free antigenic sites on live cells is Doa - p~ - PG. Any of the 10 free sites on a free IgM molecule can bind a free antigenic determinant, and therefore the rate at which IgM binds to a live antigen is 10kM(M- p~t -/5~t) x ( f ioa - p M - P c ) . The rate at which IgM dissociates is k 'MpM.
The kinetics of IgG binding are somewhat different as shown by Eqs. (9) and (10). Again we shall only discuss the binding to live cells. Since IgG binds by two sites we now have to distinguish between binding of IgG molecules and binding of sites. We have chosen to follow the binding of sites�9 The number of free IgG molecules is G - pc/2 - r c/2, and the concentration of free antigenic determinants is as before p o a - PM - PG. Since each free molecule has two free sites, the rate at which antigen sites become filled by IgG is 2 k c ( G - p a / 2 - r - p~ - pc). The rate at which antigenic sites bound with IgG become free is k ' o p c . The concentration of IgG molecules bound to live antigen is p a l 2 . We define Nc as the number of IgG molecules bound per hve antigen, 1.e. Nc = pc~2 .
The probability of an antigen being killed by complement, Pkm, is given by
Pkm = 1 -- (1 -- pM)(1 - - PC) = P~t + P a - - P~, tPc, (12)

220 A.S. Perelson et al.
where PM and pc are the probabilities of an antigen being killed with complement and IgM, and complement and IgG, respectively. Assuming only 1 IgM needs to bind to a cell to effect its killing by complement,
Pu = i=i \ tSo / t30/ Po/
where ~M/tSo = pM/a~o is the probability of an antigenic site on a particular cell having an IgM bound. For large Po and small PM one can approximate the binomial distribution by a Poisson distribution and hence
PM ~ 1 -- exp(-- PM). (14)
For a red cell tSo is of order 105. For other cells we expect iS0 to be at least 103. Lysis occurs when tSM is of order 1 and hence Eq. (14) is an excellent approximation.
To calculate Pc we assume that a cell is killed by complement once two IgG molecules are in the correct spatial location to fix C1. Thus Pc is simply the probability that two IgG molecules are in close proximity, given that a total of ~% IgG molecules are bound to a cell of a given size. Humphrey and Dourmashkin (1965), using a lattice model, estimated this probability. However, their results depended on the type of lattice chosen and ignored the geometry of the cell. Perelson and Wiegel (1979) assume that A% points are randomly distributed on the surface of a sphere and then attempt to calculate the probability that at least two points are separated by a distance r, r ~< e, where e is a given constant representing the maximum distance between two IgG molecules that can simultaneously bind C1 q. Computing this probability is a classic and unsolved problem in geometrical probability (G.-C. Rota, personal communication). However, Perelson and Wiegel (1979) and Moran (1979) show that when 6 ~= A/~z~ 2 >> Arc, where A is the surface area of the cell, an excellent approximation to this probability is given by
Pc = 1 - e x p [ - No(No - 1)/26] = 1 - e x p [ - ~c(tSc - 2)/86]. (15a)
For /5c >> 1,
Pc ~- 1 - exp(/5~/86). (15b)
In subsequent calculations we shall assume Pc is given by Eq. (15a) or Eq. (15b).
B. Control Problem
The class of antigens we wish to consider are pathogenic organisms. Because of their ability to cause disease in the host we shall assume that natural selection generated strategies which minimize the time to eliminate the antigen. Thus the control problem we shall study is minimize the time, i.e.
m i n J ~ = f l d t , (16)
to go from the initial state
LM(O) = LMO, Lc(O) = Leo, M(O) = G(O) = O, a(0) = ao,
~(0) = pM(0) = pG(0) = r =/5c(0) = 0, (17)

IgM-IgG Switch 221
to the final manifold
a(T) - a* = O, (18)
subject to the dynamic constraints of Eqs. (1)- (10) and the static constraints
.0 <, u(t) ~ 1, 0 < v(t) ~< 1, te l0, T]. (19)
The initial state we have specified is one in which there is no dead antigen, no antibody, and no sites bound by antibody. Initial populations of live antigen and lymphocytes are specified. The final concentration of antigen, a*, will not be chosen as zero since with linear equations concentrations decay exponentially and hence it would take infinite time to reach a = 0. However, we can still ensure the complete elimination of antigen by choosing a final concentration which corresponds to say 0.99 organisms per animal.
The initial antigen concentration ao does not symbolize the dose of antigen given to an animal, but rather represents the concentration of antigen present in the animal at the time the humoral immune response begins. There is generally a delay of about 1 day before large lymphocytes are formed and antibody production begins. Thus ao may be substantially larger than typical experimental doses of antigen.
Rather than minimize the functional J with respect to all piecewise continuous controls [u('), v(.)] which take on values in [0, 1] x [0, 1], we shall adopt the mathematically more modest goal of comparing the values of J obtained by realistic biological strategies such as secrete only IgM, secrete only IgG, secrete IgM and then switch to IgG production, and secrete IgG and then switch to IgM production. We shall also briefly examine some mixed strategies where say 10% of the LM population is following one strategy, while the other 90% is following a different strategy. These mixed strategies correspond to "singular controls" in which u and v take on values other than 0 and 1 and might occur if the LM population were not homogeneous. There is some experimental evidence that only part of the L~r population switches (Andersson et al., 1978; Sterzl and Nordin, 1971).
We are not solving for the optimal or even extremal control, in the usual control theoretic sense, which given the complex nonlinear nature of the state equations could only be done numerically. Our goals here are to assess the strategy of employing an IgM-IgG switch relative to other strategies. If we computed the optimal control we might simply find that the IgM-IgG switch was not optimal and gain no further information about the evolutionary rationale for the switch.
C. A Logist ie M o d e l
When antigen grows in vivo there are factors which eventually will limit its growth. Thus rather than using pure exponential growth for antigen in Eq. (5) it is more realistic to utilize a density dependent growth equation such as the logistic equation. Thus we replace Eq. (5) by
(t = ra(1 - a/amax) - /Gapkm, (5')
where amax represents the carrying capacity of the host. Here antigen can never win in the sense that it grows without bound, and the state equations (1) -(10) with (5) replaced by (5') always will predict that the immune system eventually brings a

222 A.S. Perelson et al.
down to a*. As the simulation results in section V will show, at worst the antigen grows to amax and remains there until the lymphocytes grow and secrete enough antibody to kill the antigen. Of course, one can allow the antigen to win by defining an antigen level, which if attained, will kill the host or by assuming the antigen secretes a toxic product which must be eliminated in some fixed time or before it reaches some specified level.
D. A Model with Opsonization
Developing a realistic model of phagocytosis is beyond the scope of this paper. However, since the presence of IgG, but not IgM, on the surface of a cell, is known to increase the rate at which a cell is phagocytosed, one might expect this to affect the IgM-IgG switch. In fact, it seems to us that late IgG production would promote the removal of cells already killed by complement. If these cells remained in the system, they would bind antibody and decrease the amount available for reaction with live cells. In order to assess this effect we have assumed that the rate of phagocytosis of dead cells, ~,, can be augmented by opsonization. This rate should increase monotonically withfG = t)G/~o~, the fraction of sites on dead cells taken up by IgG. As a model for opsonization we replace/~, in Eqs. (1 ) - (10) by the particular function
~o{1 + r [1 - e x p ( - crfo/1 - fG) ]} ,
where F is a constant representing the maximum increase in cell removal by phagocytosis, o is a constant which is a measure of the fraction of bound sites needed to obtain appreciable facilitation, and 1 - e x p ( - a f o / 1 - f o ) is a mo- notonically increasing function offo that is 0 whenfo = 0, and is 1 whenfo = 1. To see the usefulness of introducing the factor ~, notice that 1 - exp( - fG/1 - fG) = 1, only whenfo = 1. At, say,fo = 0.3 this term has value 0.65 and thus/~, is increased by 0.65F due to opsonization if a = 1. As fo ~ 1, this increase will approach F. However, it may turn out that when fo > 0.3 no increase in opsonization is observed. By setting tr to a value greater than 1, say 10, this term will take on the value 0.99 when fG = 0.3. Thus a can be adjusted to allow for maximum opsonization at f o < 1.
E. Parameter Values
The relative efficiencies of IgM and IgG in providing protection against an antigen will depend on the system parameters. Here we summarize typical ranges of parameter values.
Large B lymphocytes have generation times between 6 and 48 h (Eisen, 1973; p. 457), whereas mature plasma cells probably do not divide. The B lymphocyte populations we are considering, LM and La, are a mixture of mature plasma cells, immature plasma cells which divide slowly, and large lymphocytes which divide rapidly. For large lymphocytes, the per capita birth rate b is between 0.02 h - 1 and 0.2 h - 1. To take into consideration the possible presence of slower dividing cells one can allow b to range between 0.002 h - 1 and 0.2 h - 1. However, during the initial phase of the immune response we expect few plasma cells (see papers I and II) and

IgM-IgG Switch 223
rather rapid lymphocyte growth. Thus as a typical value in studies dealing with the first few days of an immune response we shall choose b = 0.1 h - ~. This is consistent with studies such as that of Tannenberg and Malaviya (1968) or Perkins et al. (1969) in which a plot of the logarithm of the number of plaque forming cells (cells which secrete antibody at rates sufficiently high to be detected by the hemolytic plaque assay) versus time after antigen injection is a straight line, f rom whose slope one determines b ~ 0.1 h 1 (doubling times of 6 - 7 h). Such measurements are particularly appropriate since they do not distinguish large lymphocytes from plasma cells nor do they separate out the effects of cell division from recruitment of newly stimulated cells, a phenomenon ignored in our simple model.
We expect differentiation of an LM cell into an LE cell, or vice versa, to take place on the order of one cell generation time. As an estimate we shall choose d = b in our simulation studies.
The lifetimes of B cells are not known precisely. Large lymphocytes divide and differentiate so it is difficult to estimate their natural death rate, #L. However, it seems reasonable to suppose that this death rate is negligible compared with b and d. Plasma cells have lifetimes estimated to be between a few days and a few weeks, although there have been reports of even longer lived plasma cells. Thus plasma cell death rates can vary between 0.002 h-1 and 0.02 h-~. For the mixed population studied here PL might range between 10-3 h-1 and 10-2 h-1. We shall always choose b and #L so that there is a net growth in the lymphocyte population, i.e., bL = b - #L > 0, during the initial phases of an immune response. Since #L only enters the theory in combination with b and d, its exact value will not be important as long as b >> #L and d >> ]A L.
The number of cells stimulated by a particular antigen, LM0 and LEo, depends upon the antigen, its dose, and method of entry into the body. Typical values for the initial lymphocyte population responding to an optimal antigen dose during a primary response is 10- 4 _ 10- 5 of the total population (Edelman, 1974; Jerne, 1974). Thus, for a mouse with 4 x 10 s B lymphocytes, L~to and LEo typically can have maximum values between 4 x 10³ and 4 x 10⁴. During a secondary response both virgin and memory cells become stimulated. Generally there is little IgM memory and LM0 should remain the same, but LEo would increase, typically by one or two orders of magnitude.
The secretion rates of plasma cells and large lymphocytes in vivo are not accurately known. Measurements of the rate of antibody secretion by single cells in vitro range between 1500 antibodies (Ab) cell - 1 s - 1 and 100 Ab cell - 1 s - 1 (Nossal and Mfikel/i, 1962; Fahey and Finegold, 1967; Hiramoto et al., 1972; Hiramoto et al., 1972), whereas Conrad and Ingraham (1974) found values ranging between 8,000 and 20,000 Ab cell- 1 s - 1 in vivo. Jones et al. (1976) found that the average secretion rate per cell may change during the course of a primary immune response; increasing for the first few days and then slowly decreasing. Klinman et al. (1974) showed that during a secondary response the secretion rate per cell is higher than during the primary response. Jerne (1967) has estimated that a lymphocyte produces 1000 - 2000 Ab s - ~. As an order of magnitude estimate, we shall assume s = 103 Ab s - ~ = 3.6 x 10⁶ Ab h - 1 during a primary response and s = 3.6 x 10⁷ Ab h-1 for a secondary response. Since we are unaware of any measurements comparing the IgM and IgG secretion rates, we shall choose V = l or V = 5. The

224 A.S. Perelson et al.
latter value is used to explore the assumption that IgG being a monomer can be produced and hence secreted five times as fast as the pentamer, IgM.
The average lifetime of serum IgM and IgG is well known. For mice the half- lives of IgM and the major IgG subclass which fixes complement, IgG2a, are 1 day and 5 days, respectively (Spiegelberg, 1974); thus #M = 0.03 h-1 a n d / ~ = 0.006 h-X.
The IgG killing function, pa, contains a parameter ~ which depends on the surface area of the cell being attacked by complement. Humphrey (1967) found that approximately 800 IgG molecules were required to attach to a sheep RBC for complement dependent killing to occur. Assuming that his measurements of killing correspond to PG = 0.5, then from Eq. (15a) with NG ---- 800
_ N a ( N a - 1 ) _ 4 . 6 x l0 s . 21n2
Because ~ = A/Tze 2, where e is a constant characteristic of the distance between IgG molecules required for complement fixation, 6 will scale with the surface area of the cell. Ponder (1948) reports that A = 67# 2 for a sheep erythrocyte. Humphrey and Dourmashkin (1965) in an electron microscopic study of complement dependent lysis of sheep erythrocytes determined a mean area of 25.8# 2. Since one might expect some membrane shrinkage during sample preparation, we shall assume the actual surface area is somewhat larger and take A ~- 50# 2 for a sheep red cell. As Perelson and Wiegel (1979) argue, e is of the order 300 ~, the approximate diameter o fa Clq molecule (Shelton et al., 1976), and therefore we expect c5 = 1.8 x 10 4. The actual c5 for a red cell is probably somewhere between 1.8 x 10⁴ and the value 4.6 x 10⁵ obtained above. For a bacterium with a surface area of say 1# 2, the range of 6 values scales to between 3.6 x 10² and 9.2 x 10³. As a typical value we shall choose ~ = 2.5 x 10 a implying that about 60 IgG molecules must bind to a bacterium to obtain a probability of lysis equal to 0.5.
The density of a number of different antigenic determinants on red blood cells have been determined (cf. Jerne et al., 1974). Typically such determinants are present at densities of order 105 per cell. Assuming a bacterium has a similar density of determinants, and has a surface area 1/50 of that of a red cell, we choose r = 2 x 10³ as a typical value. Considering that the immune response can be simultaneously directed against many determinants, r o could be higher, say 104.
The growth rate of antigen, r, of course depends upon the antigen. A bacterium under optimal conditions in vitro can double as fast as every 20 min, which corresponds to r = 2 h - 1. In vivo, where conditions are not expected to be ideal, r might be 0.5 h - 1 or less. Diplococcuspneumoniae, for example, double every 42 rain when grown in broth, whereas in the lungs of rats doubling times of 170 rain (r = 0.24 h - 1) were observed (Johanson et al., 1974). Jay et al. (1976) found that the doubling times of interpulmonary bacteria in mice were 310 min for Streptococcus pneumoniae, 217 min for Klebsiella pneumoniae and 212 min for Escherichia coli. These doubling times correspond to growth rates between 0.13 h - 1 and 0.19 h - 1 From data of Hau et al. (1978) for E. coli growing in the peritoneal cavity of rats, one can estimate r as 0.75 h - 1. For slower growing organisms, such as tumor cells, protozoa, or metozoan parasites r could be substantially less. Since faster growing organisms would pose more of a biological threat, we shall typically choose

IgM-IgG Switch 225
r = 0.5 h - 1, although values as small as 0.05 h - 1 might be reasonable. For similar reasons we shall choose typical values for other antigenic parameters that are characteristic of a bacterium.
Experiments performed in vitro on red blood cells show that complement dependent lysis at physiological temperatures with undiluted or somewhat diluted serum occurs on a time scale of minutes. For example, Pruitt et al. (1974) report that with human serum diluted 20 fold, 50~ lysis of sheep erythrocytes occurs in 5 min and 100~ lysis in 10 min. Similarly, from Siedentopf, Lauenstein and Fischer's (1965) data one sees that red cell lysis at 37~ with undiluted serum takes place with a time constant of order minutes. Since in vitro experiments are typically done under optimal conditions, we shall assume that in vivo a typical lysis half time is 20 min, corresponding to #a = 2 h-1.
The rate /~a at which dead cells are removed from the system is difficult to estimate. Rates at which dead or nondividing bacteria are cleared from the lung in experimental animals have been measured. Ansfield et al. (1977) measured a bacterial removal rate,/~, = 0.54 h-1, in rats given tetracycline 1 h before they received an injection of S. pneumoniae in the lung. Similarly, Johanson et al. (1974) using D. pneumoniae found a net elimination rate of 1.43 h - 1 in tetracycline treated rats. Jay et al. (1976) introduced into mice radiolabeled dead bacteria in an aerosol and found removal rates between 0.07 h -1 and 0.13 h -1, depending upon the bacterial species. However, they attributed this removal to mucociliary clearance rather than phagocytosis. Green and Kass (1964) found that about 50~ of staphylococci deposited in the lung by aerosol challenge are phagocytosed in 30 min, corresponding to/~, = 1.39 h-1. Interpreting these measurements is difficult. The lung has a special mucociliary system for eliminating particles, which other tissues lack. Also assigning a net removal rate to phagocytosis is complicated by the multistage nature of the process: chemotaxis toward bacteria, ingestion, and intracellular killing, each stage of which can be modulated by complement components and/or the presence of antigen-antibody complexes on the cell surface (Mollison, 1965; Boyden et al., 1965; Frank, 1977). For our purposes we shall choose /~ = 0.69 h 1, corresponding to a half time for dead cell removal of 1 h.
The parameters which characterize the kinetics of IgM and IgG binding to cells are extremely important to the model. Unfortunately there is relatively little data on binding of antibodies to cells and we must rely to some extent on kinetic data for binding of antibodies to haptens in solution. Pecht and Lancet (1977) found that for the binding of two different anti-lactose IgMs with a lactose-dye conjugate, kM = 1.1 x 1 0 6 M - l s - l a n d k M 5 s - l f o r o n e a n d k M 3.9 x 1 0 6 M - I s - l a n d k~t = 29 s -1 for the other. Kim and Karush (1973, 1974) determined from equilibrium dialysis measurements that the intrinsic affinity, KM = kM/k~, of anti- lactose IgM ranged between 105 M -1 and 4 x 10⁵ M -1. Hornick and Karush (1972) report intrinsic affinities of anti-dinitrophenyl (DNP) IgM from rabbit as < 10 6 M - 1, from chicken as ~< 4 x 10 4 M - 1, and from shark a s 10 4 M - 1, whereas Mukkur et al. (1974) found KM = 3.9 x 10⁵ M -1 for anti-DNP IgM. For our simulation studies we shall choose as typical values kM = 105 M - 1 s- 1, k~ t = 1 s- 1 and thus KM = 105 M - I s -1
In our model, Eqs. (9) and (10), we have assumed that IgG binds bivalently to cells. Actually, IgG first binds by a single site and then singly bound antibody reacts

226 A.S. Perelson et al.
further to become doubly bound. If the singly bound molecule is short-lived it is reasonable to neglect it and simply model the process as one in which free IgG binds to cells bivalently. The conditions under which the singly bound molecule rapidly reacts can be derived by considering the reaction between a fixed total con- centration of IgG, Go, and a fixed total concentration of antigenic determinants, 4o = tSoao. DeLisi (1976) does a similar analysis for a more complex problem involving the neutralization of bacteriophage by bivalent antibody.
Let Go, Ga, and G2 denote the concentration of free, singly bound and doubly bound IgG. Further let ~ be the concentration of free epitopes or antigenic determinants. Then for the reactions
we have
k~ k2
Go + ~ ~-~-GI ~--G2 k-1 k-2
Go = - 2klGo~ + k 1G1, (20)
Gj = 2klGo~ - (k-~ + k2)G1 + 2k-zG2, (21)
G2 = k2G1 - 2k-2Gz, (22)
= - 2kiGo~ + (k -a - kz)G1 + 2k 2G2. (23)
Using singular perturbation theory (see Appendix A) one can show that when 2k_ 2/k2 << l , the complete reaction can be approximated by the overall reaction,
k~
Go + 24 ~ G2, k~
where
2k l k z kG - k_ 1 + k z ' (24)
2k_ l k- 2 (25) kS k_l + k2
This result was obtained by Eigen (1974) in another context. From Eq. (24) and (25) we obtain the association constant for IgG binding to cells
t KG = ~ kG/k G = K1K2, (26)
where K1 ~= k l / k - 1 and K2 & k2/k_ 2. Since K1 is the intrinsic affinity of an IgG site for an antigenic determinant, we see that the ability of IgG to bind bivalently enhances its association constant by the factor K2. This enhancement factor has been measured by Greenbury et al. (1965) for IgG binding to natural determinants on red blood cells and was found to be approximately 400. Hornick and Karush (1972) and Gopalakrishnan and Karush (1974) found enhancement factors of 1 0 3 - 104 for IgG binding to heavily haptenated bacteriophage qSX174. From these experimental measurements we conclude 2/K2 << 1 and thus the assumption, 2k_ 2/kz << 1, is a very good one.

IgM-IgG Switch 227
The rate at which one arm of IgG dissociates from a cell should be roughly the same for singly bound and doubly bound IgG, i.e.,
k_ 1 ~ k_ 2- (27)
If k_ 1 = k_ e, then the assumption 2k_ : / kz << 1 used in obtaining Eq. (24) and (25) implies k_ 1 << k2 and hence
ko ~ 2k l , (28)
2k_ 1 !
k o , , ~ - (29) K2
Since the IgM-IgG switch does not change the antigen combining site of the ! antibody, it seems reasonable to assume kl = kM and k_ 1 = kM in our simulations.
The enhanced ability of IgG to bind cells is determined by/s In our simulations we choose K2 = 40,400, 4000 and 40,000 to show the effects of bivalent IgG binding on the switch. These choices enter the model only via Eq. (29).
The density of antigenic determinants is obviously of importance in determining whether or not IgG can bind bivalently to a cell. If the antigenic determinants are further apart than the maximum span of the arms of the IgG molecule, then relatively few IgG molecules will bind bivalently. This, in fact, is the case for the Rh antigens. The dependence of Kz on the density of determinants has been studied by Crothers and Metzger (1972) and DeLisi (1976). Using assumption (27) we can derive their result in a very simple manner as follows:
The rate k2 G1, at which singly bound IgG becomes doubly bound is given by the rate constant for reactions between antibody sites and antigenic determinants, ka, times the concentration of free antibody sites, G1, times the concentration of free antigen sites in the region of the membrane. Assuming ( r ) is the average distance between the antibody combining sites and that the free arm of a singly bound antibody can be anywhere in a hemisphere above the cell surface, then ~z(r)2~ is the mean number of antigenic determinants within the range of the antibody; i.e. in the volume 2~(r)3/3. Thus the effective concentration of free antigen sites is 3~/2(r) and the rate of formation of doubly bound antibody is
3kinG1 k2Gt -
2 ( r )
Hence
3k1~ k2 - 2 ( r ) " (3O)
Dividing by k_ 2 = k_ 1, we obtain
3~K1 K2 - 2 ( r ) ' (31)
a result which differs from the Crothers-Metzger estimate by a factor of 2. This difference derives from the fact that Crothers and Metzger assume the free arm of a

228 A.S. Perelson et al.
singly bound antibody can be anywhere in a sphere and not a hemisphere, of radius (r).
Crothers and Metzger (1972) estimate ( r ) = 8.7 x 10⁻⁷ cm for a fully flexible IgG molecule. Using this estimate for ( r ) and K1 = l0 s M -1 we obtain Kz = 87 when ~ = 3 x 101~ cm -2 (5 x 10⁵ epitopes/RBC with a red blood cell surface area of 1.65 x 10 -6 cm2). This is only somewhat smaller than the experimentally determined value of ~ 400 for human RBC (Greenbury et al., 1965).
In our model we assume that IgM binds monovalently. This assumption is a central assumption of the model and underlies the reason for switching to IgG. From a simple look at the structure of IgM, it might be expected that IgM should go through three binding regimes as a function of epitope density. At low densities it should bind by single site attachment, at moderate densities it should bind by double site attachment with one of its five arms filling both its sites, and at high densities it should bind by multisite attachment with more than one of its arms participating. The last type of binding requires that IgM undergoes a confor- mational change from its planar structure in solution to a "staple"-like con- figuration so that more than one of its five arms can be brought in contact with the surface (Metzger, 1974).
Experimentally, IgM has been observed to bind at low epitope densities by single site attachment and at high epitope densities by multisite attachments. Hornick and Karush (1972) showed that IgM bound with an enhancement factor of 10 6 to heavily haptenated bacteriophage. This was 103 times greater than the enhancement factor they measured for IgG. Binding has so far not been observed where the enhancement factor is approximately the same for IgM and IgG, as one would expect if one arm of IgM was forming a double attachment.
It is known that IgM is much less flexible in the hinge region than IgG because of the presence of the J-chain and extra disulfide bridges required to stabilize the pentameric form of IgM. Van Oss et al. (1973) studied the binding of dextrans with different molecular weights to both rabbit IgM and IgG. Steric hindrance in the binding of the dextrans to IgM was observed over almost the entire range of molecular weights studied, causing IgM to behave as if it only contained 5 rather than 10 binding sites. However, only at the highest molecular weight, 1.9 x 10 6
daltons, was steric hindrance observed for IgG. Our view and that of DeLisi's (1975a) based on plaque inhibition experiments is
that over a wide range of epitope densities, much wider than for IgG, IgM binds reversibly to cell surfaces and forms predominately single site attachments. For example, to natural determinants on red blood cells it appears that IgM forms single site attachments (DeLisi, 1975a; Goldstein, 1978) while at least to some of these determinants IgG forms multisite attachments (Greenbury et al., 1965). It has not been shown, but we assume, that this is also true for determinants on many pathogenic organisms.
IV. Will the Antigen Win?
For some sets of initial conditions and parameter values the complement dependent killing of antigen will be ineffectual, and the immune system will never be able to bring the antigen concentration down to a*. Rather the antigen will grow without

IgM-IgG Switch 229
bound. In such a case we say the antigen "wins". Conversely, if the immune system succeeds in bringing the antigen concentration to a* we say the immune system "wins". Here we shall give sufficient conditions for the immune system to win and give necessary conditions under which the antigen wins.
Rewriting Eq. (5) as
gt = (r - #aPkm)a (32)
we notice that if r > bta the antigen will always win since ~ > 0 for all a0 > 0. When r < ~t, the immune system can eliminate the antigen ifPkin is sufficiently close to 1. Initiallypkin = 0 since there is no antibody present, and consequently d(0) > 0. If at a later timepkilt > r/#~, then ~ < 0 and the antigen population will decrease. Since in this simple model lymphocytes grow exponentially, the amount of antibody in the system continually increases (the degradation rates/~M and/ZG are sufficiently slow so that this is the case). Thus once pkm(t) > r/#a killing should become more and more efficient as time goes on. Hence i fPkil l(T) > r/kta we expectpkm(t) > r/#, for all t > T, and d(t) < 0 for t > T. We wish to define a time Tk to be the first time at which Pkill > r/fla. To do this rigorously, let
Y = {TlPkill(T ) > r/~,}
and let
(33)
{~eatest lower bound for ~-, if ~- r O, Tk = . if J = O , (34)
where 0 denotes the empty set. Thus the immune system will eventually bring a(t) down to a* if Tk is finite. If Tk is infinite the antigen wins. Because of the nonlinear nature of the state equations and killing functions we cannot find Tk exactly. However, as we show below T~ can be found approximately.
First we consider a response in which the cells present secrete IgM. This analysis will also apply to cases in which a switch to IgG production occurs after Tk.
As a simplification, we shall replace the continuous IgM killing function, PM = 1 -- exp(-- PM) by a step function which is 0 when PM < r/#a and which is 1 when PM >~ r/#a ; i.e., let
p ~ t = H @ ~ t _ l n#~#a ) _ r ' (35)
where
10 if x ~ O H(x) = if x < 0
is the Heavyside function. Let T~ be the value of Tk obtained whenpM is replaced by a Heavyside function. Considering that some killing actually occurs before Pkill = PM = r/#a, T~ > Tk. Since Tk is infinite if the antigen wins, a necessary, but not sufficient condition for the antigen to overcome the immune system is T~ = ~ . Simulations, discussed in section V, show that T~ = ~ very closely defines a region, [2, in parameter space for which the antigen wins; it is only near the boundary of ~2 that the approximate procedure is inaccurate. It is easy to see that

230 A.S. Perelson et al.
the approximation ofpkm by a Heavyside function does not effect the conclusion that the immune system wins if T~ is finite.
Before killing begins we see from the state equations (1)-(10) with u(t) - 1, LMo r 0, LGo = 0, ao r 0, and bm ~= b - #m that
LM(t) = LMo exp(bmt), (36)
SLMo M(t) - [exp(bmt) -- exp(-- #Mt)], (37)
#M + bm
a(t) = ao exp(rt), (38)
LG(t) = G(t) = pG(t) = ~ ( t ) = tiM(t) = 0 (39)
and Eq. (7) for PM becomes
pM = lOk~t[M(t) - pM][~oa(t) - PM] - k~pM. (40)
From experimental information given in section III.E, IgM is known to establish single site binding equilibrium on a time scale of the order of seconds. Since the other processes of interest (e.g. antigen and lymphocyte growth, and complement dependent killing) occur on a time scale of order minutes to hours, we shall assume chemical equilibrium has been established, and tS~ = 0. Further, since killing has not begun, PM < a ln(# , / (#a- r)) and ~ o a - ~Ma ~ ~oa. This approximation is excellent considering Po is typically greater than 103, whereas ln(#a/(# , - r)) is typically of order 1. From Eq. (40) we now obtain
K~t~oM( t)a( t) pM(t) - 1 + KM~oa(t)' (41)
where KM ~= lOkM/k~. If killing is to begin then pM(t)/a(t) = r/pa or
KM[~osLMo [ l [ l + K M ~ o a o e x p ( r t ) ] = O " #M+bL [exp(bct)--exp(--#Mt)]-- In #" #, - r
(42)
Thus if a solution to Eq. (42) exists, T~ is finite and antigen is sure to be killed off. Conversely, if no solution exists, T~ = 0% and the antigen will probably grow without bound.
For realistic parameter values KM~oao >> 1 and Eq. (42) can be rewritten as
f ( t ) ~= exp( - rt)[exp(bgt) -- exp(-- #Mt)] -- ao(#M + bt,)In #~ A__ h. (43) sLMo #~ -- r
In Fig. 4 the left side of Eq. (43), f ( t ) is plotted. If h, the constant value of the right side of Eq. (43) is greater than fmax, the maximum value o f f , no solution exists. When bL > r, f increases without bound and a solution always exists. Of greater interest is the case in which the antigen grows faster than the lymphocytes, i.e., r > b > bL. The maximum value of f then occurs at t = tin, where
1 ln~#M + r-]. (44) t " - - b m + # ~ [ r - - b m J

IgM-IgG Switch 231
21
.10
,09
. 0 8
.07
.OE Fig. 4. A plot of f ( t ) versus t for r = 0.5 h -1, bL=0.1 h 1 and PM=0.03 h -1. When the constant h defined by the right .o5 side of Eq. (43) is less than the maximum value of f , the immune system will even- .o4 tually eliminate the antigen. For these values of r, bL and pM and p, = 2.0 h - ~, .0~ LMo = 104 and s = 3.6 x 10⁶ h -a, the three straight lines are the h = constant .02 curves for ao = 5 x 101~ 7.5 x 10 ~~ and 1 x 10 ~1 cells/cm 3. Notice, for these pa- .ol rameter values the h = constant curves intersect thef( t ) curve for ao < 10 H and o thus the immune system wins when o ao < 10 ~
I I I h = 0 . 1 0 4
h = 0 .078
' 5 I 0 15
t M t ( h r )
Thus, if h <~ f ( t m ) , or equivalently, if
ao 1 - - < [-exp((bL -- r)tM) -- e x p ( - - (#M + r ) tM)] , (45) SLMo #s
(P~t + b L ) l n - - Ps - r
Tff is finite and is given by the first intersection of h with the graph of f . Eq. (45) provides a sufficient condition for the immune system to win.
When ao/(SLMo) is greater than the right side of Eq. (45), n . T k is infinite. This is a necessary condition for the antigen to win. Using the typical parameter values given in the caption of Fig. 4, one finds tm = 0.103 h and ao >~ 1011 is the necessary condition for antigen winning. Simulations, reported on in detail in the next section, show that the antigen in fact wins when ao > 2 x 10¹¹. Thus, our approximation procedure based on computing T~ gives a good order of magnitude estimate for the value of ao needed for antigen conquest over the immune system.
Next, consider the case in which there are only LG cells present. Again we replacepkiH by a step function which is 1 whenpG ~> r/us and 0 whenpG < r/us, i.e., we le~ Pe = H[~G - ( 8 ( ~ l n ( # a / ( I . t s - r))l/2]. [This follows from Eq. (15b)]. The solutions to the state equations, (1)- (10) , before killing begins with v ( t ) = 1, Leo r 0, ao v a 0 and LMO = 0 are
Le( t ) = Leo exp(bLt), (46)
sTLeo G(t) - [exp(bLt) -- exp(-- u j ) ] , (47)
#e + bL
a(t) = ao exp(rt), (48)
L~t(t) = M(t) = pM(t) = tSM(t) = f3G(t) = 0. (49)

232 A.S. Perelson et al.
Equation (9) for PG becomes
~ = [2G(t) - pa][~oa(t) -- Pa] -- k'~pG (50)
where G(t) and a(t) are given by Eqs. (47) and (48). Before killing begins pG/a <</5o. For example, for red blood cells before substantial killing by IgG starts, PG < 103 while r ~ 105. If we restrict ourselves to the case where pG/a << r Eq. (50) becomes
15~ = - A(t)p~ + B(t) (51)
where
A(t) a , = k G + kG~oao exp(rt), (52)
B(t) ~= 2kG~osyLGoao exp(rt) [-exp(bu) - exp( - UGt)]. (53) #6 + bL
For pG(0) = 0 , Eq. (51) has the solution
pG(t) = e x P I - f [ A(z)dzl f ' o e X p I f l A(Odz]B(t ')dt ' , (54)
where
f ' A(O = kG~oao(e rt - 1)/r + k'Gt. dr 0
When killing "begins"
~G(t) = [8~ln #~ ] 1/2, ll~ -- r
i.e.
pG(t) = aoert[861n Iza ]1/2. (55) Pa -- r
If there is a value of t such that Eqs. (54) and (55) have a solution, then the immune system will win with a pure IgG response.
V. Results
A. Non-Logistic Model
By numerically integrating the system of 10 ordinary differential equations given by Eqs. (1) - (10) with the killing function defined by Eqs. (12), (14) and (15) we have compared the times, T, needed to reach a* for the following strategies: 1) secrete only IgM, 2) secrete IgM and then switch to IgG secretion, 3) secrete only IgG, 4) secrete IgG and then switch to IgM production. The computations were performed on a CDC 6600 computer using a modified Gear's method for integrating systems of stiff differential equations.
For a primary immune response a typical set of parameter values is listed in Table 1. Concentrations are expressed in molecules or cells per cm 3. We have
IgM-IgG Switch 233
Table 1. Typical parameter values of a primary immune response
Parameter Symbol Value
Lymphocyte birth rate b Lymphocyte death rate" #a Lymphocyte differentiation rate d IgM secretion rate s Ratio of IgG to IgM secretion rates 7 IgM removal rate in absence of antigen #M IgG removal rate in absence of antigen #G Net antigen growth rate in the absence of r
complement Maximal antigen killing rate #o Removal rate of dead antigen /~a Forwar4 rate constant for binding of IgM to kM
antigenic determinants on live or dead antigen
Reverse rate constant for dissociation of IgM k~ from antigenic determinants on live or dead antigen
Net forward rate constant for bivalent bind- kG ing of IgG to two antigenic determinants on live or dead antigen
Net reverse rate constant for dissociation of k' G bivalently bound IgG from live on dead antigen
Number of antigenic determinants per cell of r live or dead antigen
Ratio of antigen surface area to area in which 6 a pair of IgG molecules must lie in order to fix complement
0.1 h - 1
l0 -6 h 1 0.1 h -1 3.6 x 10 6 antibodies h -1 cell -1 5.0 0.03 h - 1 0.006 h - 1 0.5 h -1
2 .0h 1 0.69 h - 1 6 .0x 10-13 cm3 molecule l h 1
3.6 x 10 a h -1
1.2 x 10⁻¹² cm 3 molecule h 1
0.18 h 1
2 x 10³
2.5 x 10³
assumed the immune response is occurr ing in a mouse with a serum volume of 1.25 cm 3 (Fahey and Rob inson , 1963) and have used this vo lume to conver t quant i t ies per an imal to concent ra t ions . The chosen rate cons tants co r re spond to K2 = 40,000. Therefore I g G should b ind much more efficiently than IgM. In our s imula t ions all pa rame te r s were set to the values listed in Table 1 unless s ta ted otherwise.
Us ing these pa rame te r values we first s tudied how the final t ime, T, varies with the t ime ts at which the con t ro l switches f rom u = 1, v = 0 to u = 0, v = 1 for vary ing init ial concen t ra t ions of ao, with LM(0) = LMo and LG(0) = LG0 = 0. F o r t < ts, Eqs. (1) and (2) imply
LM = bLLM + dLG, (56)
L a = - (d + #DL6, (57)
where bL = b - #L. Wi th LG(0) = 0 the solut ion to Eq. (57) is LG(t) = 03, 0 ~< t < ts and hence Eq. (56) becomes
3 The same equation results irrespective of the value of v( t ) , t < t , . We have chosen v = 0 so that when Eq, (57) is integrated numerically any errors will decay exponentially

234 A . S . Perelson et al.
LM = bLLM, LM(O) = LMo.
For t > t~, Eqs. (1) and (2) become
LM = - (d + ~DLM,
LG = bLLG + dLM.
(58)
(59)
(60)
Consequently, before the switch at ts, LM cells proliferate and die in the absence of LG cells. At t = ts a differentiation switch is thrown so that for t > t~, LM cells no longer proliferate but rather die or differentiate into proliferating L~ cells. This switch from the proliferation of LM cells to their differentiation into proliferating L~ cells is our mathematical representation of the IgM-IgG switch. These features of the switch are shown in Fig. 5 where we illustrate the computed dynamics of a typical primary response employing an IgM-IgG switch according to Eqs. (1) - (10) with the parameter values listed in Table 1 and with LMo = 1 • 10 4, Lao = 0, and
5.0
4.0
d
2
50
2.0
1.0'
0 0
12.0
a ' I ' I
L M
LG --
I0 2 0 I s T
t (hr)
I0.0
8.0
6.0
4.0
2.0
, L , I I0 t~ 20
t {hr )
' I ' 1
'o x
(n
B
8
3.0
2 .5
2.0
1.5
1,0
0.5
0 0
b
? _o x
_ M I
t= t (hr)
Fig. 5. Computed dynamics of a typical prin~ response employing an IgM-IgG switch. The para: ter values are listed in Table 1. The initial condifi are L M o = I x 104 cells/cm 3, L o o = 0 , a0 = 1 x 101~ cells/cm a. The switching time t~ = I a The cell populations Lu and Lo versus time. h ' total concentrations of IgM(M) and IgG(G) an t ib in the animal versus time. e The concentrations of (a) and dead (4) antigen versus t ime
IgM-IgG Switch 235
ao = 1 x 101~ Before the switch only LM cells and their secreted product , IgM, are present. Antigen first grows and then is killed by IgM, causing dead antigen, ~, to accumulate. The dead antigen is eliminated by phagocytosis. After the switch, LM cells convert to LG cells, IgG appears, and antigen killing continues at a rapid pace. Finally, the live antigen concentra t ion reaches a* at time T = 23.4 h.
Figure 6 shows how the final time T varies with the switching time ts and the initial antigen concentra t ion ao for immune responses that begin with only LM cells. For pure IgM responses, ts = o% i.e. there is no switch. However, since the response ends at t = T, it suffices to set ts = Tin order to simulate a pure IgM response. Thus the last point on each curve in Fig. 6 represents the total time for a response in which only IgM is produced. For ao > 2 x 10 ix cells/cm 3 the antigen grows without bound for all values o f ts and Tk = T~ = oo. With somewhat smaller values of ao the antigen can be destroyed, but only if the switch to IgG product ion is delayed beyond some critical time, e.g. 1.6 h for ao = 5 x 10 l~ cells/cm 3. For ts less than this critical value, T = oo. Thus early I gM product ion is crucial in controll ing large infections. For ao ~< 2 x 10 l~ cells/cm 3 the immune system eliminates the antigen for all switching times, a l though again one sees for high antigen doses (e.g. 1 x 10 ~~ cells/cm 3) the response time is longest when IgM product ion is quickly abrogated, i.e. ts = 0. For each antigen concentra t ion there is some optimal time to switch to I gG product ion which minimizes the total response time T. When ao ~< 1 x 10⁹ cells/cm 3 the optimal switching time is 0, whereas for ao = 1 x 101~ 5 x 101~ and 7.5 x 101~ cells/cm 3 the opt imal switching times are roughly 8 h, 12 h and 16 h, respectively.
The curves in Fig. 6 allow us to answer the question of whether a strategy involving an I g M - I g G switch is better than a pure IgM response. At low antigen doses, say a0 = 1 x 10⁴ cells/cm 3, a pure IgM response takes approximately 13.7 h, while a response employing an I g M - I g G switch with ts = 0 takes approximately 9.0 h, a 34% reduction. With these parameter values the absolute time saved is rather small, but for a response of 1 - 2 weeks durat ion such a savings would be rather substantial. At higher antigen doses the savings is not as great,
Fig. 6. IgM to IgG switch during a primary response. The computed final time, T, (i.e. the time to eliminate the antigen) versus the switching time, t,, for various values of the antigen concentration, ao. Parameter values are listed in Table 1, Luo = 1 x 10 4 cells/cm 3 and LGo = 0. At time ts the con- trois switch from u = 1, v = 0 to u = 0, v = l
30
I.-
20
40
.._-.--- I.OX I0 4
I0 ~ I.OXlO 2
0 I I I0 20
I I t
5.0x I0 tO
I.OXlO I0
I.OxlO 8
0 0 = 1.0 X IO II
i I 50 40
l l (hr) 50

236 A .S . Perelson et al.
approximately 23~ at ao = 1 x l0 s cells/cm 3. For ao > 1 x 10 l~ cells/cm a, the difference between using an IgM-IgG switch with ts at its optimal value and using a pure IgM response is a negligible savings of time.
In Fig. 7 we illustrate the effects of beginning an immune response with cells that secrete IgG and switch at time ts to the production of LM cells, i.e. u(t) = O, v( t) = 1, 0 <~ t < ts; u( t ) = 1, v( t) = O, ts < t <~ T; LMO = 0 and LGo = 1 x 10⁴ cells/cm 3. The other parameters are our standard ones and thus are the same as in Fig. 6. With a0 ~> 2 x 10 l~ cells/cm 3 (not shown) for a pure IgG response, or for any choice of switching time, the antigen grows without bound. Thus the ability to cope with high infectious doses is reduced when a primary immune response is initiated with LG cells. For a0 = 1 x 10 l~ cells/cm ~ the antigen can be controlled only if a switch to IgM production is made during the first 1.5 h of the response. When ao ~< 1 x 10 9
cells/cm a, IgG alone can destroy the antigen and switching to IgM has no effect on the total response time. For this dose regime PkiH = PC = 1 for almost all of the response and thus having PM = 0 or PM = 1 has no effect.
Comparing Figs. 6 and 7 one notices that for ao ~< 1 x 10⁸ cells/cm 3 the total response time, T, is less for a pure IgG response than one employing an IgM-IgG switch (this is in fact true for all ao ~< 2 x 10⁹ cells/cm3). Thus for " low" antigen doses it is better to secrete only IgG, whereas for "high" antigen doses it is better to first secrete IgM and then later in the response switch to IgG production. In fact, employing a pure IgG response at high antigen doses can be a fatal mistake. I f the strategy for a primary response is genetically programmed and, hence fixed, we
i -
5 0
4 0
/ O o = 5,0 x lO ~
2O
I0
I.OXlO 9
IDXlO s
[ .Ox I0 e
I .OxlO S'
I ,OXlO l
I I I0 20
Oo=4 .0x lO s
50
Fig. 7. IgG to IgM switch during a primary response. The computed final time, T, versus the switching time, ts, for various values of the antigen concentration, ao. Parameter values are listed in Table 1, LMo = 0 and LGo = 1 x 10 ~ cells/cm a. At time ts the controls switch from u = 0, v = l t o u = l , v = O

IgM-IgG Switch 237
expect that natural selection would tend to favor an IgM-IgG switch over a pure IgG response, since it is high antigen doses which are most dangerous to the animal, and consequently provide the greatest selection pressure.
If an IgM-IgG switch is the preferred strategy for a primary response, why is it not employed during secondary responses ? During a secondary response not only are cells which have never seen the antigen before (virgin cells) stimulated, but also a large population of memory cells respond (see Paper II for further details about B memory cells). Additionally, evidence of Klinman et al. (1974) suggests that stimulated memory cells secrete antibody more rapidly than stimulated virgin cells. The average affinity of IgG secreted by memory cells is substantially higher than that of IgG produced by virgin cells (Eisen, 1973). In order to examine if these effects could lead to a preference of the pure IgG response over the IgM-IgG switch for all reasonable antigen concentrations and not only "low" doses, we recomputed the T vs. ts curves of Fig. 7 using parameters representing a secondary response: s increased by 10, LMo and Loo increased fifty-fold and k~ decreased by 10. Figure 8 illustrates that with these parameter values a pure IgG secondary response can handle all reasonable antigen doses (ao <~ 1 x 10¹² cells/cm3). Switching from IgG to IgM during a secondary response to any reasonable antigen dose provides no advantage to the organism. This is reflected in the flat T vs. t~ curves in Fig. 8. Further, simulations of secondary responses that begin only with LM cells which can then differentiate into LG cells at various switching times give flat T vs. ts curves which are indistinguishable from those in Fig. 8. (For ao ~< 1011 cells/cm 3, Tis at most 1X smaller than the values given in Fig. 8). We thus conclude that with the parameters representative of a secondary response there is no significant difference in the antigen elimination time among strategies employing a pure IgG response, a pure IgM response, a switch from IgG to IgM, or a switch from IgM to I g G - a l l strategies lead to quick and efficient removal of the antigen. If there is no advantage to be gained by switching during a secondary response, one would expect a cell to employ either a pure IgM or IgG response, especially when one considers that there must be genetic and energetic costs involved in maintaining and operating a switch mechanism. Further, from our evolutionary viewpoint it seems reasonable that once a cell switched its commitment from IgM synthesis to IgG synthesis during a
Fig. 8. I g G to IgM switch du r ing a second- ary response. The c o m p u t e d f inal t ime, T, versus the switch t ime, ts, for var ious values of the ant igen concen t ra t ion , a0. Pa ramete r values differ s o m e w h a t f rom those l isted in Table 1. Here s = 3.6 x 10 7 an t ibodies h - l , k ~ = 1.8 x 1 0 - Z h .1 and Loo = 5 x 10 s cel ls /cm 3
20
I0 I X l O 6
- - I X l O 4
- - I x l O 2
I I0
o o = I • IO J2
5 • IO n
ixiO rl
ixlo Io
iXlO 9
I x l O e
20 I s ( h r )
30

238 A.S. Perelson et al.
pr imary response it would continue to secrete I gG during the secondary response, because it would gain no advantage by switching back to IgM production. We conclude that it is reasonable f rom an evolut ionary viewpoint that secondary responses are pure IgG responses while pr imary responses employ a switch mechanism.
H o w robust are our conclusions to changes in parameter values ? In Fig. 9 we show for ao = 1 x 101~ cells/cm 3 the effects of changing K 2 o n the pr imary response. Recall 1(2 measures the increase in the intrinsic affinity (binding constant) of I gG relative to IgM due to bivalent binding. We see that as/(2 increases, the final time is decreased for responses which switch to IgG product ion early (below 14 h in this example). Increasing 1(2 f rom 4 x 10 3 to 4 x 10⁴ has no descernible effect and the curves for these two values of K2 are superimposed in Fig. 9. We expect/(2 to be at least 400 (see section III .E). Because this value lies in the region in which the final time is relatively insensitive to changes in 1(2, our ignorance o f the exact value o f K2 should have no bearing on the qualitative conclusions we draw about the I g M - I g G switch.
Figure 10 illustrates the effect of changing #a, the rate of complement dependent killing. Solving Eq. (5) one finds a(t) = ao e x p [ - ( 1 2 a P k i l l - - r)t]. Once killing has begun, i.e. once PaPkm - r > 0, the antigen concentrat ion will decrease exponen- tially. Ifpk,l ~ 1 then (pa - r ) - 1 is a characteristic time for a to reach a*. With our s tandard parameter value o f r = 0.5 h - 1, changing #, f rom 2 h - 1 to say 6 h 1 increases the characteristic time by 3.67 and thus should decrease T by the same amount . However, Pkm ~ 1 over the whole response and thus, we expect a somewhat smaller decrease in T due to this change in #~. The simulations, as illustrated in Fig. 10, bear this out and show a decrease in T of about 2.4.
3, L
3 2
3O
2 8
v
2 6
2 4
ZZ
20
' I
K 2 = 4 0
4 0 0 0
' I
t I I I I0 20
t s (hr)
Fig. 9. The sensitivity of the antigen elimination time, T, of a primary response employing an IgM-IgG switch to changes in K2, the ratio of the IgG to the IgM binding constant. The values of Kz are indicated on the figure. The curve for/'22 = 40,000 (not shown) is indistinguishable from the curve for K2 = 4,000. The parameter values were chosen as in Table 1, except to generate the curves corresponding to K2 = 4,000, 400 and 40, k~ was given the values 1.8 h -j, 18 h -1 and 180 h -1, respectively. The initial conditions were LMo = 1 x 10⁴ cells/cm 3, L60 = 0 and ao = 1 x 101~ cells/cm 3
IgM-IgG Switch 239
Changing the growth rate of the antigen also affects the length of the response by influencing the characteristic antigen decay time. Antigens with r < 0.5 h - i will not behave very differently from the cases reported in Figs. 6 and 7, because #a -- r will not change substantially in value as r decreases from 0.5 h - 1, assuming #a ~> 2 h - 1. The data summarized in section III.E suggests that in vivo r is always less than 0.5 h-1. If antigens could grow faster in vivo, or if #, were smaller so that #a -- r were smaller, the response would lengthen. For r ~> #a the antigen would never be controlled, i.e. the antigen would win. A simulation with r -- 1.6 h - 1 and #a = 2.0 h -1 shows that the antigen wins if ao ~> 3 x 10⁷. For ao = 1 x 10⁶ a pure lgM response takes 63.5 h when r = 1.6 h - 1 as compared with 16.9 h when r = 0.5 h - 1.
Our standard parameter values assume 7 = 5, i.e. IgG secretion is five times as fast as IgM secretion. Although this amplification seems reasonable on a molecular weight basis, we know of no evidence for it. If we choose 7 = 1, then the switching
Fig. 10. The sensitivity of the antigen elimination time, T, of a primary response employing an IgM-IgG switch to changes in #,, the maximal rate of antigen killing. The initial conditions were Luo = 1 x 10 4 cells/cm 3, Loo=O, and a o = 1 x 101~ cells/cm 3. The values of all other parame- ters except #a were as listed in Table 1
50
20
I0
I I
#==2.0
4.0
/ ~ 6,0
I I I 0 2 0
I s ( h r )
30
Fig. 11. The sensitivity of the antigen elim- ination time, T, of a pr imary response employ- ing an IgM-IgG switch to changes in Luo, the initial concentration of responding lym- phocytes for a0 = 1 x 101~ cells/cm 3. Other parameter values were chosen as listed in Table 1
40
T (hr) 5(
20
' I i I '
a o = I x I0 I~
\ LMO=5.0x lO ~
LO x 104
f 5,0 x 10⁴
1.0 x I~ 5 5.0 x I0 ~
I I ~ I t I0 20
I s (hr) :30
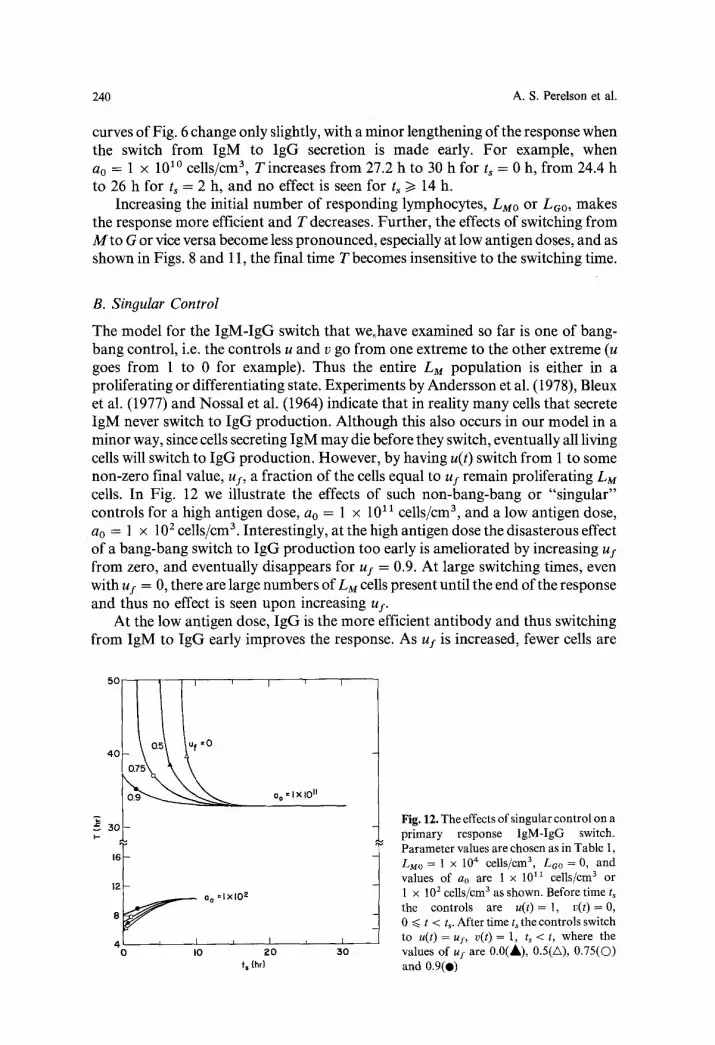
240 A.S. Perelson et al.
curves of Fig. 6 change only slightly, with a minor lengthening of the response when the switch from IgM to IgG secretion is made early. For example, when a0 = 1 • 10 l~ cells/cm 3, Tincreases from 27.2 h to 30 h for ts = 0 h, from 24.4 h to 26 h for ts = 2 h, and no effect is seen for t~ >~ 14 h.
Increasing the initial number of responding lymphocytes, LMo or LGo, makes the response more efficient and T decreases. Further, the effects of switching from M to G or vice versa become less pronounced, especially at low antigen doses, and as shown in Figs. 8 and 11, the final time T becomes insensitive to the switching time.
B. Singular Control
The model for the IgM-IgG switch that we, have examined so far is one of bang- bang control, i.e. the controls u and v go from one extreme to the other extreme (u goes from 1 to 0 for example). Thus the entire LM population is either in a proliferating or differentiating state. Experiments by Andersson et al. (1978), Bleux et al. (1977) and Nossal et al. (1964) indicate that in reality many cells that secrete IgM never switch to IgG production. Although this also occurs in our model in a minor way, since cells secreting IgM may die before they switch, eventually all living cells will switch to IgG production. However, by having u(t) switch from 1 to some non-zero final value, u:, a fraction of the cells equal to u: remain proliferating LM cells. In Fig. 12 we illustrate the effects of such non-bang-bang or "singular" controls for a high antigen dose, ao = 1 • 1011 cells/cm 3, and a low antigen dose, a o = 1 • 102 cells/cm 3. Interestingly, at the high antigen dose the disasterous effect of a bang-bang switch to IgG production too early is ameliorated by increasing u: from zero, and eventually disappears for u: = 0.9. At large switching times, even with u: = 0, there are large numbers of LM cells present until the end of the response and thus no effect is seen upon increasing u I.
At the low antigen dose, IgG is the more efficient antibody and thus switching from IgM to IgG early improves the response. As u: is increased, fewer cells are
5 0
4 0
30 =
16
uf =0
a o = I X I0 II
o o = l x l O 2
8
0 I0 2 0 3 0
t s (hr}
Fig. 12. The effects of singular control on a primary response IgM-IgG switch. Parameter values are chosen as in Table 1, LM0= 1 • 10 ~ cells/cm 3, LGo=0, and values of a0 are 1 • 1011 cells/cm 3 or 1 x 10² cells/cm 3 as shown. Before time ts the controls are u(t) = 1, v(t) = O, 0 ~< t < ts. After time ts the controls switch to u ( t ) = u:, v ( t ) = 1, t~ < t, where the values of u: are 0.0(A), 0.5(A), 0.75(0) and 0.9(e)

IgM-IgG Switch 241
converted into IgG production and T is increased slightly. However, notice that even with u j- = 0.9 it is best to switch at t = 0, and switching remains a much better strategy than secreting pure IgM.
For the parameter values used in our simulations uf = 0.9 seem to provide the best compromise strategy. By employing only this partial switch the antigen cannot escape at high doses and the substantial benefit of switching early for low antigen doses is retained.
C. Logistic Model
In vivo antigen cannot be expected to grow exponentially for long periods of time. In Fig. 13a we show the effect on the lgM-IgG switch of using a logistic model for antigen growth. As we would expect T is always finite, since the lymphocyte population which grows exponentially will eventually secrete enough antibody to elimil~ate any finite antigen concentration. For example, we saw in Fig. 6 that exponentially growing antigen will defeat the immune system if ao = 1 x 10 I1 cells/cm 3 and the switch from IgM to IgG production is thrown at t = 0. However, as shown in Fig. 13b, if the antigen grows logistically its concentration simply approaches a~ax and remains there until the immune defenses build up to the point where they can quickly defeat the antigen. This occurs at around 40 h in this example. If the antigen secreted a toxin or could otherwise harm the host during this 40 h delay, the animal might not survive. Many infectious diseases seem to have periods of crisis which resemble this, with recovery occurring rapidly once the "crisis" has passed.
The number of B lymphocytes in a mouse is limited to approximately 5 • 108 and thus lymphocyte growth must also be density dependent. We have consistently used a non-logistic model because in general LM and LG do not get near their density dependent limits as exemplified by Fig. 5a. In simulation studies, incorporating a logistic growth term for lymphocytes can easily be implemented and in some contexts should prove useful.
D. Effects of Opsonization
When cells are coated with IgG their ability to be phagocytosed and their rate of phagocytosis by neutrophils and macrophages is increased. The presence of IgM on the surface of cells does not have this opsonizing effect. The model developed in section III.D took into account the effects of the opsonization on the IgM to IgG switch during the primary response. For illustrative purposes we choose a large value for the parameter, F, which represents the maximum increase in dead cell removal rate by phagocytosis, and a large value of a, so that only a small fraction of the cell's potential binding sites need be filled with IgG for efficient opsonization. As one can see in Fig. 14, with F = 100 and o- = 10, the total response time for large antigen doses decreases when ts is small, i.e. in cases in which there is large IgG production. When t, is large, little IgG is made and no effect is seen. Also, the optimum switching time shifts to somewhat earlier times, so that more IgG is produced. However, the net improvement in total response time is rather small, leading one to surmise that the opsonization of dead cells was possibly not of

242 A, S. Perelson et al.
I"*-
60
50
4.0
30
20
I0
Ct
IXlO z
a o = 1,0 x I0" - ~
l.OXlO i~
IxlO e
IxlO 4
o l I 0 I0 20
t= (hr )
IxlO e
3 0
Fig. 13a

I g M - I g G Switch 243
b i i I i I
12.0 -
I0.O o
8.0
c < 6 . 0
s 8' 4.0 - J
2.0--
0 I I i I0 20 30 40 50
t s T Fig. 13b t ( h r l
Fig. 13. Pa ramete r values are as in Table l, am,x = 5 x 10 j l cells/cm 3, LMO = 1 x 10⁴ cells/cm 3, Lao = 0, ao = 1 x 10¹¹ cells/cm 3. Logist ic ant igen growth, a The final time, T, plot ted aga ins t the switching time, 4, for a p r imary i m m u n e response with an I g M - I g G switch, b The concen t ra t ions of live ant igen a, and dead ant igen fi, plot ted aga ins t t ime dur ing the response. The switching t ime t~ = 0
28
"2
I--
' I
i I lO
i I 2O
t (hrl
Fig. 14. Opsoniza t ion of dead bacteria. The final t ime, T, plot ted agains t the switching time, 4, for an I g M - I g G switch with F = 0, no opsoniza t ion , and F = 100, a = 10, considerable opsoni- zation. The pa ramete r values are as in Table 1, L~to : 1 • 104 cells/cm% Lao = 0, and a0 = 1 x 101~ cel ls /cm 3
primary importance in the evolutionary drive toward IgG production. The opsonization of live pathogens, not explicitly considered here, is a significant immune defense mechanism and probably is of greater evolutionary importance.
VI. D i scuss ion
We have developed a mathematical model of the antibody response to a growing antigen. One unique feature of the model is that it incorporates the killing of antigen by complement and antibody. We have used the model to explore the possibility that the switch from IgM to IgG secretion may have provided an evolutionary advantage to organisms that employed it and thus may have been fixed by natural selection. The basis for our model is the observation that one molecule of IgM on a cell's surface can fix complement and lead to the lysis of the cell. IgG is much less efficient at fixing complement and it is believed that at least two IgG molecules must be in close proximity on a cell's surface to activate complement. On this basis one would expect IgM to be more effective than IgG in protecting an animal against

244 A .S . Perelson et al.
pathogenic organisms. However, evidence from the analysis of hemolytic plaque data and viral neutralization studies suggest that IgG binds bivalently to cells, whereas IgM binds monovalently. If this is also the case for binding to pathogenic organisms, then at high enough concentrations it will be more likely that many IgG molecules will be attached to a cell than one IgM molecule. Despite this, early in an immune response, there may be far fewer IgG antibodies per antigen than are required to initiate complement dependent lysis and thus, only IgM could cause cell death. In our model, IgM is the most effective antibody early in an immune response. Late in the response this changes, and IgG becomes more effective than IgM.
This model is based upon a number of assumptions. First, that IgG has a higher avidity for cells than IgM. The validity of this assumption will depend upon the density of antigenic determinants on the surface of the antigen. Clearly, if the density of determinants is very low, then IgM and IgG can only bind to cells monovalently. In such circumstances IgG will meet our criteria of binding more avidly than IgM only if its binding sites have a higher intrinsic affinity. This is frequently observed to be the case when the antibodies in the serum of an animal are analyzed. However, a single cell when switching from IgM to IgG production appears to employ the same variable region in both molecules and thus there is no reason to expect a difference in affinity at the single cell level. The observed affinity difference is probably a result of cell selection during the course of the immune response (cf. Siskind and Benacerraf, 1969) and thus not relevant to our argument. At intermediate densities of antigenic determinants both IgG and IgM can in principle bind bivalently. However, under such conditions IgM is not observed to do so (van Oss et al., 1973), possibly due to a lack of flexibility in its hinge region (DeLisi, 1975a). IgG does bind bivalently in these circumstances, and we computed (see Eq. (31)) the expected increase in avidity as a function of the density of determinants. At even higher densities IgM binds multivalently and our assumption may no longer be true (Hornick and Karush, 1972).
Two conformations have been reported for IgM, planar and "staple-like" (Feinstein et al., 1971). In the staple form IgM has its Fab arms folded down out of a plane formed by a central disk of Fc units (Fig. 2) and should easily be able to bind to a surface in a multipoint fashion. In fact, the staple form has only been observed when the molecule is bound to a surface (Metzger, 1978). Hemolytic plaque inhibition data however indicates that IgM does not bind multivalently during a plaque experiment and consequently DeLisi (1975a) has suggested that the time needed for the conformational change to the staple form may be of order hours. If this is the case, then even at high densities of antigenic determinants, single site binding may prevail on the time-scale of complement-dependent lysis.
A second assumption implicit in our model is that an IgM molecule bound by a Single site to a cell is capable of fixing complement. Indirect evidence from hemolytic plaque studies suggest that this is so. Recently, it has been shown that IgM in solution interacting with an antigen at a single site can fix complement (Brown and Koshland, 1975 ; Chiang and Koshland, 1979). Results shedding doubt on this assumption also have been reported (Cuniff and Stollar, 1968; Ishizaka et al., 1968; Humphries and McConnell, 1977) and its validity remains unresolved (see Feinstein and Beale, 1977; Metzger, 1978 and Fewtrell et al., 1979 for recent
IgM-IgG Switch 245
discussions). If this assumption turns out to be false, it need not disprove our model. All that is essential to our argument is that IgM when bound to a cell in a low avidity state be able to fix complement. Hemolytic plaque data strongly indicates that this is the case (DeLisi, 1975a, b; Goldstein, 1978).
Our model also assumes that all cell bound IgG is effective in mediating complement fixation. Experiments of Parce et al. (1978) and Pecht et al. (1977) indicate that IgG tan only fix complement when both of its sites are bound to the surface of a cell. Since our model assumes that all IgG is bound bivalently, our treatment of complement fixation by IgG seems to be in agreement with the available experimental information.
Third, our model assumes that once complement is fixed, cell lysis necessarily occurs. For some nucleated cells this is not true; complement caused damage may be repaired, or the insertion of some components of the complement cascade into the cell membrane may be interfered with (Ohanian and Borsos, 1977).
In. the model we relate the total number of IgM and IgG molecules on the cell surface to the probability of complement fixation and, by the above assumption, to lysis. For IgM there is excellent evidence for a one-hit mechanism (Mayer, 1961 ; Borsos and Rapp, 1965a). For IgG the situation is not as clear, but it is thought that two or more molecules in close proximity are required to fix complement (Borsos and Rapp, 1965b; Cohen, 1968; Hyslop et al., 1970; Goers et al., 1975). We employed the probability based model of Perelson and Wiegel (1979) to determine the likelihood of at least two IgG molecules being a distance e or less apart when a total ofNG IgG molecules are bound at random to a cell's surface. This estimate of the fixation probability depends on the total surface area of the cell, smaller antigens requiring fewer IgG molecules to obtain two in close proximity. The assumption of random binding is an approximation which may be more valid for some antigens than others.
In analyzing the model, we assume that an animal is infected with an antigen dose sufficient to stimulate an immune response. Because the details of B cell stimulation remain unresolved, we have chosen to begin our analysis at the stage of the response when antibody secreting cells, large lymphocytes and plasma cells, appear. Thus at t = 0, we assume a0 replicating antigens and LMo and LG0 antibody secreting cells are present. In principle, the number of stimulated antibody secreting cells should be a function of the antigen concentration, e.g. Luo = Luo(ao), but given our incomplete knowledge about B cell stimulation and tolerance induction, we have treated these parameters as independent. This is clearly a deficiency in our model.
For a given value of LMo and LG0 we have simulated the immune response to a range of antigen doses (see, for example, Fig. 6). Each of these doses almost assuredly does not stimulate precisely LMo or LG0 cells. However, our standard initial value of 104 lymphocytes/cm 3 is a reasonable estimate for the number of antibody secreting cells generated by an immunogenic dose of antigen in a mouse. Consequently, we have interpreted the T* vs. ts curves in Fig. 6 as if all the indicated antigen doses stimulate 104 cells/cm 3. Depending upon the antigen, its dose, and its mode of introduction into the animal either fewer or greater numbers of lymphocytes might be stimulated, and our interpretation of these curves may be somewhat in error. For this reason, we tend to speak only about trends in the curves

246 A.S . Perelson et al.
for "high" doses or "low" doses, but not about specific dose dependencies. Further, what we call a high dose or low dose response needs to be judged relative to the initial level of stimulated lymphocytes. Thus, we show in Fig. 11 how a high dose curve in Fig. 6 can be converted into a low dose curve by increasing LMo.
A crucial parameter in the model is the antigen concentration. We assume that the antigen can grow and thus the immune system can be overwhelmed by high doses of ahtigen. An aspect of our work which is of interest in its own light is the analysis of conditions under which the immune system can protect an animal from disease. Because the antigen grows, the strategy that the immune system employs early in the response can be of critical importance. For example, as shown in Fig. 6, switching from IgM to IgG production too early in a response against a high antigen concentration can be a fatal mistake.
In attempting to access the biological implications of our model one needs to estimate the antigen concentrations an animal is likely to encounter. Our simulations encompassed what we considered to be the total range of possible antigen concentrations in vivo. For a bacterium one can estimate, based on size, that 5 x 10¹² cells/cm 3 is an upper concentration limit. 4 A more realistic upper limit would be somewhat smaller. Gallis (1976) estimates that feces, which is about 20% bacteria, contains 1011 organisms/gin wet weight. We take 1011 cells/cm 3 as our upper limit. In our simulations we utilized the parameter ao, the concentration of antigen at the time antibody secreting cells appear. Thus ao would be larger than a typical dose of antigen injected into an animal and smaller than or equal to the limit of 1011 cells/cm 3. From Fig. 6 we see that all values of ao up to 1011 cells/cm 3 can be handled by a primary immune response that begins with 104 LM cells/cm 3. However, when a0 ~< 2 x 101~ cells/cm 3 a response that begins with 104 L~ cells/cm 3 is incapable of fighting off the disease (Fig. 7). Thus if animals must be able to respond to values of a0 as high as 1011 cells/cm 3 it seems necessary to first secrete IgM during a primary immune response. This conclusion can also be reached for responses to lower values of ao, if the antigen is less immunogenic and stimulates fewer than the 104 lymphocytes/cm 3. For example if 5 x 10³ Lo cells/cm 3 are stimulated, a pure IgG response cannot handle antigen concentrations greater than 5 x 10 9 cells/cm 3.
If it is necessary for a primary response to begin with cells that secrete IgM, two possibilities remain: the response continues with IgM or a switch to IgG secretion occurs. For high antigen levels we see from Fig. 6 that a switch should either take place late in the response or not at all. Further, there exists a range of equally good times at which the switch could occur. At low antigen doses the situation is decidedly different. A switch very early in the response provides a definite advantage to the organism. Thus on the basis of the primary response alone our model predicts an evolutionary advantage for organisms that utilize an IgM-IgG switch whose characteristics are dose dependent. That is, the switch should occur early in response to low antigen doses, whereas the switch should occur late or not at all in response to high doses.
4 Assume a typical bacterium is a cylinder 1/~ high and 0.25# in radius. Then its volume is 2 • 10-13 c m 3
and at most one could have 5 • 1012 cells/cm 3

IgM-IgG Switch 247
Experiments by Wortis, Taylor and Dresser (1966) provide some confirmation of these predictions. Doses of sheep red blood cells varying from 4 x l02 to 4 x 10⁹
were injected intravenously into mice and the number of cells secreting IgM and IgG were enumerated at various times by the hemolytic plaque assay. The peak in the number of IgG secreting cells increased from 4 days after antigen injection at the lowest dose to 6 days at the highest dose used. Thus the switching time appeared to increase with dose as predicted by our theory.
Contrary to our notion that the IgM-IgG switch provides optimal response characteristics for all values of ao, one notices by comparing Figs. 6 and 7 that at low antigen doses a primary response in which only IgG is secreted is slightly more efficient than one in which an IgM-IgG switch is used. In order to protect an animal against large antigen doses we have argued that the response should start with LM cells, and thus a pure IgG primary response is impossible. The best an animal can do in such circumstances is to immediately switch to the differentiation of IgG secreting cells, i.e. choose ts = 0. Fig. 6 shows that this is the best strategy for small a0. Here we see, as in paper II, that there are competing influences and it is impossible for evolution to simultaneously optimize the strategy for handling large and small values of ao. Because low doses of antigen are less dangerous than high doses, it appears reasonable that natural selection would lead to responses which are non-optimal in handling low values of ao.
Our simulations show that there is an evolutionary disadvantage to having the IgM-IgG switch occur equally throughout the lymphocyte population. If 1 - u(t), the fraction of LM cells which differentiate into LG cells, changes discontinuously from 0 to 1, all LM cells will eventually become IgG secreters. A control u(t) that only takes on its extreme values, 0 and 1 in this case, rather than intermediate values is called a bang-ban9 control. In papers I and II of this series we established that bang-bang controls provide the optimal method of controlling B cell differentiation into plasma cells and memory cells in an immune response generated by a T- independent antigen. For the model of the IgM-IgG switch developed in this paper, we were not able to compute the optimal response, and thus we have simply computed the effects of various strategies. From Fig. 6 we see that using a bang- bang strategy to control the IgM-IgG switch can place an animal in the situation of being overwhelmed by an antigen if the switch occurs too early. However, this disadvantage can easily be overcome by employing a non-bang-bang control. In Fig. 12 we show that if only 10~ rather than 100~o of the LM cells switch (i.e. u s = 0.9), then a response to a0 ~< 1011 antigens/cm 3 can be defeated with any switching time. Furthermore, for ao = 1011 cells/cm 3 the total response time, T, decreases, or stays the same, as the percentage of cells which switch decreases. When all cells do not switch, there is a slight lengthening of the optimal response time toward low doses of antigen, but since it is the high dose response which should provide the selective pressure driving the development of the switch control mechanism, we predict that only a small fraction of the LM cells should become IgG secreters. This prediction has also been verified.
Bleux et al. (1977) reported that only 19 - 12.5~ of the progeny of IgM secreting cells on days 2 and 3 after immunization secreted IgG. This frequency declined thereafter. Andersson et al. (1978) using an in vitro culture system found that 10~o of mitogen induced IgM secreting clones switch to IgG secretion. These estimates

248 A.S. Perelson et al,
are in agreement with results obtained by Nossal et al. (1964) and Sterzl and Nordin (1971), in which 10- 14~o of IgM secreting clones also contained IgG secreting cells.
If only 10~ of LM cells switch to IgG secretion, why does the concentration of IgM fall below that of IgG late in a primary response as shown in Fig. 1 ? Nossal et al. (1964), for example, found that by two weeks after immunization only IgG secreters could be detected, and interpreted this to mean that cells which only produce IgM mature to plasma cells and die, leaving those cells which switched to IgG production. This is in direct accord with the optimal strategy for differentiation to plasma cells predicted in paper I.
The experiments by Andersson et al. (1978) also provide other interesting confirmations of our theoretical predictions. By examining the distributions of IgM and IgG secreting cells in individual cultures they concluded that after growth for a few days, the IgM secreting B cells within one clone switch at different times to IgG secretion. This is in accord with the predictions of Fig. 6 for responses to high antigen doses. No switch should occur very early in the response, but after some critical period there is little advantage to one switching time over another. Thus our simulations indicate that switching can occur any time after some initial period with no loss of fitness.
Our model was based on the presumption that L~ cells arise only by differentiation from L~t cells. Andersson et al. (1978) also tested this hypothesis for mitogen stimulated B cell clones. They calculated, for two separate experiments, that the probability of IgG secreters arising independently of IgM secreters to be 3 x 10 .7 and 4 x 10 -9, and consequently concluded that all IgG cells developed by switching from IgM secreting cells.
We believe the differences in switching behavior observed during primary and secondary responses can be explained on the basis of the higher number of lymphocytes stimulated during a secondary response. Figures 8 and 11 show that when L~to or LG0 is large, secreting either IgM or IgG is equally efficient at killing the antigen. At the time of'an animal's second encounter with antigen two types of lymphocytes will be present, virgin lymphocytes in the LM population which have never seen the antigen and memory cells in the L~ population which were generated by the IgM-IgG switch during the primary response. These memory cells should greatly outnumber the virgin LM cells and when stimulated by antigen produce IgG. Given their high concentration there would be no advantage in their switching to IgM production and the secondary response should therefore be mainly an IgG response. IgM would also be produced throughout the response by the virgin LM cells, 90~o of which might never switch to IgG production.
Comparing Fig. 8 with Figs. 6 and 7 we see that the secondary response is enormously more efficient than the primary response. First, for all values of a0 examined the immune system eliminates the antigen. Second, the time for eliminating the antigen decreases substantially. For example, when ao = 1 x 10¹¹ cells/era 3, the fastest elimination time for a primary response using an IgM-IgG switch is T = 32.8 h. For a primary response that began with L~ cells the antigen would win, whereas for a secondary response beginning with LG cells, T = 17.1 h.
The results of our simulations also show one obvious deficiency of the model. With the parameter values we have chosen, the time to eliminate the antigen in a

IgM-IgG Switch 249
typical primary response is of the order of one day. Even considering that our simulations begin with the appearance of antibody secreting cells, which usually occurs one day after antigen encounter, the response is too fast. Observed primary responses take anywhere from 4 - 5 days to a month. The quantity /~a- r determines the rate of antigen elimination and hence the length of the response in our model (see Fig. 10). The values we have chosen for r are based on in vivo measurements and presumably are representative of many antigens. Additionally, setting r = 0 to represent the response to a non-growing antigen also gives responses that are much too fast. From this we conclude that /~a, the rate of complement dependent-killing is too large. This may be due to a number of factors. Our estimate of #~ was based on in vitro measurements in the hemolytic plaque assay. The in vivo activity of complement might be much lower than that observed in vitro. More significantly, our model assumes the animal is a well-mixed compartment, with complement and antibody always accessible to the antigen. Sequestration of antigen within tissues and organs, or with some antigens such as viruses, within cells, may reduce or eliminate contact with antibody and comple- ment. Further, concentrations of antibody and complement are presumably much lower in tissues than in the circulatory and lymphatic systems.
Our model does not exhibit for high doses of antigen a clear cut advantage of the IgM-IgG switch over a pure IgM response. The minima observed in the T vs. ts curves of Fig. 6 for ao ~> 101~ cells/cm ~ are biologically insignificant. Thus a pure IgM response would do as well as a response employing a switch mechanism. Our model would have provided a much stronger evolutionary rationale for the switch if the higher antigen dose responses were improved by the switch. Including within the model additional advantages of having IgG would strengthen the evolutionary argument for developing a switch. Figure 14 shows that the incorporation of opsonization of dead antigen by IgG gives rise to a noticeable minimum in the Tvs. ts curve. We feel that opsonization of live bacteria, a feature not in our model, would more profoundly affect the response. Having a second mechanism of killing antigen that depended only on the presence of IgG would clearly favor either a switch mechanism or a pure IgG primary response, and would most certainly tip the balance in favor of a pure IgG secondary response. The detailed analysis of this situation await the development of a more realistic model of phagocytosis and opsonization.
Acknowledgment. The authors thank Dr. George Bell for his critical comments.
Appendix
A. Singular Perturbation Analysis of IgG Binding
The binding of IgG to epitopes on the surfaces of RBCs occurs in two steps. First one arm of the IgG molecule binds to an epitope and then the second arm of the molecule binds. The reversible kinetics of this binding process can be represented by Eqs. ( 2 0 ) - (23). We shall now establish the conditions under which the complete reaction can be approximated by the overall reaction

250 A.S. Perelson et al.
kG
Go + 24 ,-~ G2 (A. 1) k;
with kinetics given by
G2 ~-- kGGo~ - k'GG2. (A.2)
Recall Go, G1 and G2 denote the concentrations of free, singly bound and doubly bound IgG and ~ is the concentration of free epitopes. If all cell bound IgG is doubly bound then G2 = pG/2 and Eq. (A.2) can be rewritten as
~ = 2k~Go~ - k'~p~,
showing that kG and k S are the same rate constants as found in Eqs. (9) and (10). We non-dimensionalize Eqs. (20)- (23) by introducing the variables:
k - z k - l G 2 k- lG1 G2 - ~ = ~/~o, "{= 2k_zt,
00 = Go~G, 01 - 2klG~o ' kzklG~o ' (A.3)
where G is the total concentration of IgG in the system, and 4o = ~oao is the total concentration of epitopes. In these variables Eqs. (20)- (2) become
dOo ki lo - - - ( - Go~ § G 1 ) , ( A . 4 ) d7 k-2
2k_2 d01 _ k-1 (Goff- Gi) - (01 - G2), (A.5) k2 d'{ k2 "
dG2 - G 1 - 0 2 , ( A . 6 )
d7
d~ klG d7 - ~ ( - Go~ + 01). (A.7)
Let e = 2k_ 2/k2 and assume e << 1. Then expanding Go, G~, G2, and ~in powers of a, we find to zeroth order in
k 10o~" + k~O~ G1 = , (A.8)
k2 §
dG2 k_ I(Go~ - 02) - ( A . 9 )
d7 k2 + k_ i '
dOo ( - Oo; + o2) d7 - k-2 \ - / c ~ k - 1 ] ' (a.10)
d'~ 2k2klG ( - 0 0 ~ ' + ~ 2 ~ (A.I1) k~--2 \ k 2 + k - 1 ]"
Writing Eq. (A.9) in dimensional form and comparing it with Eq. (A.2) we find
2klk2 2k_ i k_ 2 - , ' - ( A . 1 2 )
kG k_ 1 § k2 k6 k_ 1 § k2

IgM-IgG Switch 251
A d d i t i o n a l l y , in d i m e n s i o n a l f o r m Eqs . ( A . 9 ) - ( A . 1 l ) o b e y t he r e l a t i o n s
dGo 1 d~ dG2
dt 2 dt dt
as a n t i c i p a t e d .
References
Almeida, J. D., Waterson, A. P. : The morphology of virus-antibody interactions. Adv. Virus Res. 15, 307-338 (1969)
Andersson, J., Coutinho, A., Melchers, F. : The switch from IgM to IgG secretion in single mitogen- stimulated B-cell clones. J. Exp. Med. 147, 1744- 1754 (1978)
Ansfield, M. J., Woods, D. E., Johanson, W. G., Jr. : Lung bacterial clearance in murine pneumoccal pneumonia. Infect. Immun. 17, 195-204 (1977)
Anziano, D. F., Dalmasso, A. P., Lelchuk, R., Vasquez, C. : Role of complement in immune lysis of Trypanosoma cruzi. Infect. Immun. 6, 860-864 (1972)
Barker, L. F., Patt, J. K. : Role of complement in immune inactivation of mycoplasma gallisepticum. J. Bacteriol. 94, 403-408 (1970)
Basten, A., Howard, J. G. : Thymus independence. Contemp. Topics Immunobiol. 2, 265 - 291 (1973) Bauer, D. C., Stavitsky, A. B. : On the different molecular forms of antibody synthesized by rabbits
during the early response to a single injection of protein and cellular antigens. Proc. Nat. Acad. Sci. USA 47, 1667- 1680 (1961)
Bauer, D. C., Mathies, M. J., Stavitsky, A. B.: Sequence of synthesis of y-1 macroglobulin and 7-2 globulin antibodies during primary and secondary responses to proteins, salmonella antigens, and phage. J. Exp. Med. 117, 889-907 (1963)
Bellanti, J. A., Eitzman, D. W., Robbins, J. B., Smith, R. T. : The development of the immune response. Studies on the agglutinin response to Salmonella flagella antigens in the newborn rabbit. J. Exp. Med. 117, 479-496 (1963)
Benedict, A. A., Brown, R. J., Ayengar, R. : Physical properties of antibody to bovine serum albumin as demonstrated by hemagglutination. J. Exp. Med. 115, 195-208 (1962)
Bleux, C., Ventura, M., Liacopoulos, P. : IgM-IgG switch-over among antibody-forming cells in the mouse. Nature 267, 709-711 (1977)
Borsos, T., Rapp, H. J.: Hemolysin titration based on fixation of the activated first component of complement: Evidence that one molecule of hemolysin suffices to sensitize an erythrocyte. J. Immunol. 95, 559-566 (1965a)
Borsos, T., Rapp, H. J. : Complement fixation on cell surfaces by 19S and 7S antibodies. Science 150, 505-506 (1965b)
Boyden, S. V, North, R. J., Faulkner, S. M.: Complement and the activity of phagocytes. In: Complement (G. E. W. Wolstenholme and J. Knight, eds.). Ciba Found. Symp. Boston: Little, Brown and Co. 1965
Bretscher, P. A.: An integration of B and T lymphocytes in immune activation. In : B and T ceils in immune recognition (F. Loor and G. E. Roelants, eds.), pp. 457-495. New York: Wiley 1977
Brown, J. C., Koshland, M. E. : Activation of antibody Fc function by antigen induced conformational changes. Proc. Nat. Acad. Sci., USA 76, 5111- 5115 (1975)
Brunner, H., Razin, S., Kalica, A. R., Chanock, R. M. : Lysis and death of Mycoplasma pneumoniae by antibody and complement. J. Immunol. 106, 907-916 (1971)
Chiang, H., Koshland, M. E. : Antigen-induced conformationaI changes in IgM antibody. I. The role of the antigenic determinant. J. Biol. Chem. 254, 2736-2741 (1979)
Cohen, S. : The requirement for the association of two adjacent rabbit yG-antibody molecules in. the fixation of complement by immune complexes. J. Immunol. 100, 407-413 (1968)
Conrad, R. E., Ingraham, J. S. : Rate of hemolytic antibody production by single cells in vivo in rabbits. J. Immunol. 112, 17-25 (1974)
Crothers, D. M., Metzger, H.: The influence of polyvalency on the binding properties of antibodies. Immunochem. 9, 341-357 (1972)
Cunniff, R. V., Stollar, B. D. : Properties of 19 S antibodies in complement fixation. I. Temperature dependence and role of antigen structure. J. Immunol. 100, 7 - 14 (1968)

252 A.S. Perelson et al.
DeLisi, C. : The kinetics of hemolytic plaque formation. IV. IgM plaque inhibition. J. Theor. Biol. 52, 419-440 (1975a)
DeLisi, C. : The kinetics of hemolytic plaque formation. V. The influence of geometry on plaque growth. J. Math. Biol. 2, 317-331 (1975b)
DeLisi, C. : Antigen antibody interactions. Lecture Notes in Biomathematics, Vol. 8. New York: Springer Verlag 1976
DeLisi, C. : Detection and analysis of recognition and selection in the immune response. Bull. Math. Biol. 39, 705-719 (1977)
Dingle, J. H., Fothergill, L. D., Chandler, C. A. : Studies on Haemophilus influenza. III. The failure of complement of some animal species, notably the guinea pig, to activate the bactericidal function of sera of certain other species. J. Immunol. 34, 357-391 (1938)
D6rner, I., Brunner, H., Schiefer, H. G., Wellensick, H. J.: Complement-mediated killing of Acholeplasma laidlawii by antibodies to various membrane components. Infect. Immun. 13, 1663 - 1670 (1976)
Edelman, G. M. : Origins and mechanisms of specificity in clonal selection. In: Cellular selection and regulation in the immune system (G. M. Edelman, ed.). New York: Raven Press 1974
Eigen, M. : Diffusion control in biochemical reactions. In: Quantum statistical mechanics in natural sciences (S. L. Mintz and S. M. Weidermayer, eds.). New York: Plenum Press 1974
Eisen, H. N. : Immunology. In: Microbiology (2nd edition: B. D. Davis, R. Dulbecco, H. N. Eisen, H. S. Ginsberg, and W. B. Wood, eds.). New York: Harper and Row 1973
Fahey, J. L:, Finegold, I. : Synthesis of immunoglobulins in human lymphoid cell lines. Cold Spring Harbor Symp. Quant. Biol. 32, 283-289 (1967)
Fahey, J. L., Robinson, A. G. : Factors controlling serum y-globulin concentration. J. Exp. Med. 118, 845- 868 (1963)
Feinstein, A., Beale, D.: Models of immunoglobulins and antigen-antibody complexes. In: Immunochemistry: An advanced textbook (L. E. Glynn and M. W. Steward, eds.), pp. 263- 306. Chichester: Wiley 1977
Feinstein, A., Munn, E. A., Richardson, N. E. : The three dimensional conformation of 7M and 7A globulin molecules. Ann. N.Y. Acad. Sci. 190, 104- 121 (1971)
Fewtrell, C., Geier, M., Goetze, A., Holowka, D., Isenman, D. E., Jones, J. F., Metzger, H., Navia, M., Sieckmann, D., Silverton, E., Stein, K. : Mediation of effector functions by antibodies: Report of a workshop. Molec. Immunol. 16, 741-754 (1979)
Fink, C. W., Miller, W., Jr., Dorward, B., Lo Spalluto, J. : The formation of macroglobulin antibodies. II. Studies on neonatal'infants and older children. J. Clin. Invest. 41, 1422- 1427 (1962)
Finstad, J., Good, R. A. : Phylogenetic studies of adaptive immune response in the lower vertebrates. In : Phylogeny of immunity (R. T. Smith, P. A. Miescher, and R. A. Good, eds.). Gainesville: University of Florida Press 1966
Frank, M. M.: Pathophysiology of immune hemolytic anemia. Ann. Intern. Med. 87, 210-222 (1977)
Gale, J. L., Kenny, G. E. : Complement dependent killing of Mycoplasma pneumoniae by antibody: Kinetics of the reaction. J. Immunol. 104, 1175- 1183 (1970)
Gallis, H. A. : Microbial ecology and normal flora of the human body. In: Zinsser microbiology (W. K. Joklik and H. P. Willett, eds.), pp. 404-411. New York: Appleton-Century Crofts 1976
Gearhart, P. J., Sigal, N. H., Klinman, N. R. : Production of antibodies of identical idiotype but diverse immunoglobulin classes by cells derived from a single stimulated B cell. Proc. Nat. Acad. Sci. USA 72, 1707-1711 (1975)
Glynn, A. A., Ward, M. E. : Nature and heterogeneity of the antigens of Neisseria 9onorrhoeae involved in the serum bactericidal reaction. Infect. Immun. 2, 162- 168 (1970)
Goers, J. W., Schumaker, V. N., Glovesky, M. M., Rebek, J., M/iller-Eberhard, H. J. : Complement activation by a univalent hapten-antibody complex. J. Biol. Chem. 250, 4918-4925 (1975)
Goldschneider, I., Gotschlich, E. C., Artenstein, M. S. : Human immunity to meningococcus. I. The role of humoral antibodies. J. Exp. Med. 129, 1307-1326 (1969)
Goldstein, B. : Limitations of the Jerne hemolytic plaque assay. In: Theoretical immunology (G. I. Bell, A. S. Perelson, and G. H. Pimbley, Jr., eds.), pp. 8 9 - ! 19. New York: Marcel Dekker 1978
Gopalakrishnan, P. V., Karush, F. : Antibody affinity: VII. Multivalent interaction of anti-lactoside antibody. J. Immunol. 113, 769-778 (1974)
Gould, S. : Ontogeny and Phylogeny. Cambridge, Massachusetts: Belknap Press 1977

IgM-IgG Switch 253
Green, G. M., Kass, E. H. : Factors influencing the clearance of bacteria by the lung. J. Clin. Invest. 43, 769 - 776 (1964)
Green, H., Fleischer, R. A., Barrow, P., Goldberry, B. : The cytotoxic action of immune gamma globulin and complement on Krebs ascites tumor cells. II. Chemical studies. J. Exp. Med. 109, 511 -521 (1959)
Greenbury, C. L., Moore, D. H., Nunn, L. A. C. : The reaction with red cells of 7S rabbit antibody, its subunits and their recombinants. Immunology 8, 420-431 (1965)
Griffin, F. M., Jr. : Opsonization. In : Biological amplication systems in immunology (N. K. Day and R. A. Good, eds.). New York: Plenum 1977
Hau, T., Hoffman, R., Simmons, R. L. : Mechanisms of the adjuvant effect of hemoglobulin in experimental peritonitis. I. In vivo inhibition of peritoneal leukocytosis. Surg. 83, 223-229 (1978)
Hildemann, W. H. : Phylogeny of transplantation reactivity. In: Transplantation antigens (B. D. Kahan and R. A. Reisfeld, eds.). New York: Academic Press 1972
Hiramoto, R. N., McGhee, J. R., Hamlin, N. M. : Measurement of antibody release from single cells. I. ~J. Immunol. 109, 961-967 (1972)
Hiramoto, R. N., Hamlin, N. M., McGhee, J. R. : Measurement of antibody release from single cells. II. J. Immunol. 109, 968-973 (1972)
Hoffmann, G. W. : Mathematical modeling of a network theory of self-regulation in the immune system. In: Proc. 1978 IEEE Conf. on Decision and Control. New York: Springer-Verlag 1978
Hoffmann, G. W. : A mathematical model of the stable states of a network theory of self-regulation. In: Systems theory of immunology (C. Bruni, G. Doria, G. Koch, and R. Strom, eds). Lecture Notes in Biomathematics, vol. 32. pp. 239-257. New York: Springer-Verlag 1979
Honjo, T., Kataoka, T. : Organization ofimmunoglobulin heavy chain genes and allelic deletion model. Proc. Nat. Acad. Sci. USA 75, 2140-2144 (1978)
Hood, L. E., Weissman, I. L., Wood, W. D.: Immunology. Menlo Park, California: Benjamin/ Cummings 1978
Hornick, C. L., Karush, F. : Antibody affinity. III. The role of multivalency. Immunochem. 9, 325 - 340 (1972)
Humphrey, J. H. : Haemolytic efficiency of rabbit IgG anti-Forssman antibody and its augmentation by anti-rabbit IgG. Nature 216, 1295-1296 (1967)
Humphrey, J. H., Dourmashkin, R. R.: Electron microscope studies of immune cell lysis. In: Complement (G. E. W. Wolstenholme and J. Knight, eds.). Ciba Foundation Symposium, London: Churchill 1965
Humphries, G. K., McConnell, H. M. : Membrane-controlled depletion of complement activity by spin- label-specific IgM. Proc. Nat. Acad. Sci. USA 74, 3537-3541 (1977)
Hyslop, N. E., Jr., Dourmashkin, R. R., Green, N. M., Porter, R. R. : The fixation of complement and the activated first component (C1) of complement by complexes formed between antibody and divalent hapten. J. Exp. Med. 131,783-802 (1970)
Ishizaka, T., Tada, T., Ishizaka, K.: Fixation of C' and C'la by rabbit 7G- and 7M-antibodies with particulate and soluble antigens. J. Immunol. 100, 1145-1153 (1968)
Jay, S. J., Johanson, W. G., Jr., Pierce, A. K., Reisch, J. S. : Determinants of lung bacterial clearance in normal mice. J. Clin. Invest. 57, 811-817 (1976)
Jerne, N. K. : Summary: Waiting for the end. Cold Spring Harbor Symp. Quant. Biol. 32, 591-603 (1967)
Jerne, N. K. : Clonal selection in a lymphocyte network. In: Cellular selection and regulation in the immune system (G. M. Edelman, ed.). New York: Raven 1974
Jerne, N. K., Nordin, A. A., Fugi, H., Koros, A. M. C., Lefkovits, I.: Plaque forming cells: Methodology and theory. Transplant. Rev. 18, 130-191 (1974)
Johanson, W. G., Jr., Jay, S. J., Pierce, A. K. : Bacterial growth in vivo. An important determinant of the pulmonary clearance of Diplococcus pneurnoniae in rats. J. Clin. Invest. 53, 1320-1325 (1974)
Johnson, R. C., Muschel, L. H.: Antileptospiral activity of serum. I. Normal and immune serum. J. Bacteriol. 91, 1403-1409 (1966)
Jones, J. M., Amsbaugh, D. F., Prescott, B. : Kinetics of the antibody response to type III pneumococcal polysaccharide. II. Factors influencing the serum antibody levels after immunization with an optimally immnnogenic dose of antigen. J. Immunol. 116, 5 2 - 6 4 (1976)

254 A.S . Perelson et al.
Kassel, R. L., Old, L. J., Carswell, E. A., Fiore, N. C., Hardy, W. D., Jr. : Serum-mediated leukemia cell destruction in AKR mice. J. Exp. Med. 138, 925 -938 (1973)
Kassis, A. I., Tanner, C. E. : Host serum proteins in Echinococcus multilocularis: Complement activation via the classical pathway. Immunology 33, 1 - 9 (1977)
Kim, Y. D., Karush, F.: Equine anti-hapten antibody-VII. Anti-lactoside antibody induced by a bacterial vaccine. Immunochem. 10, 3 6 5 - 371 (1973)
Kim, Y. D., Karush, F. : Equine anti-hapten antibody-VIII. Isoelectric fractions of IgM and 7S anti- lactose antibody. Immunochem. 11, 147 -152 (1974)
Klinman, N. R., Press, J. L., Pickard, A. R., Woodland, R. T., Dewey, A. F. : Biography of the B cell. In: The immune system: Genes, receptors, signals (E. E. Sercarz, A. R. Williamson, and C. F. Fox, eds.). New York: Academic Press 1974
Lin, J. S., Kass, E. H. : Immune inactivation of T-strain mycoptasmas. J. Infect. Dis. 122, 93 - 9 5 (1970) Litman, G. W., Frommel, D., Chartrand, S., Finstad, J., Good, R. A. : Significance of heavy chain mass
and antigenic relationship in immuuoglobulin evolution. Immunochem. 8, 3 4 5 - 349 (1971) Lo Spalluto, J., Miller, W., Jr., Dorward, B., Fink, C. W. : The formation of macroglobulin antibodies. I.
Studies on adult humans. J. Clin. Invest. 41, 1415 - 1421 (1962) Marchalonis, J. J., Cone, R. W. : The phylogenetic emergence of vertebrate immunity. Aust. J. Exp.
Med. Sci. 51, 4 6 1 - 4 8 8 (1973) Mayer, M. M.: Development of the one-hit theory of immune hemolysis. In: Immunochemical
approaches to problems in microbiology (M. Heidelberger and O. J. Plescia, eds.). New Brunswick, New Jersey: Rutgers University Press 1961
Mayer, M. : The complement system. Sci. Am. 229 (5), 5 4 - 6 6 (1973) Mayer, M. : Complement, past and present. Harvey Lectures 72, 139-193 (1978) Metzger, H. : Effect of antigen binding on the properties of antibody. Adv. Immunol. 18, 167 - 207
(1974) Metzger, H. : The effect of antigen on antibodies: Recent studies. In : Contemporary topics in molecular
immunology, Vol. 7 (R. A. Reisfield and F. P. Inman, eds.), pp. 119-152. New York: Plenum 1978
Mims, C. A.: The pathogenesis of infectious disease. London: Academic 1976 Motlison, P. L. : The role of complement in haemolytic processes in vivo. In: Complement (G. E. W.
Wolstenholme and J. Knight, eds.). Ciba Found. Symp., Boston: Little, Brown and Co. 1965 Moran, P. A. P.: The closest pair of N random points on the surface of a sphere. Biometrika 66,
158 - 162 (1979) Mukker, T. K., Szewczuk, M. R., Schmidt, D. E. : Determination of total affinity constant for
heterogeneous hapten-antibody interaction. Immunochem. 11, 9 - 13 (1974) Muschel, L. H., Fong, J. S. C. : Serum bactericidal activity and complement. In: Biological amplification
systems in immunology (N. K. Day and R. A. Good, eds.). New York: Plenum 1977 Muschel, L. H., Ahl, A., Fisher, W. W. : Sensitivity of Pseudomonas aeruoinosa to normal serum and to
polymyxin. J. Bacteriol. 98, 4 5 3 - 4 5 7 (1969) Muschel, L. H., Chamberlin, R. H., Osawa, E. : Bactericidal activity of normal serum against bacterial
cultures. I. Activity against Salmonella typhi strains. Proc. Soc. Exp. Biol. Med. 97, 3 7 6 - 382 (1958)
Nelson, R. A., Mayer, M. M. : Immobilization of Treponema pallidztm in syphilitic infection. J. Exp. Med. 89, 369 -393 (1949)
Nicholson, A., Lepow, I. H. : Host defense against Neisseria meningitidis requires a complement- dependent bactericidal activity. Science 205, 2 9 8 - 2 9 9 (1979)
Nossal, G. J. V., Ada, G. L., Austin, C. M.: Antigens in immunity. II. Immunogenic properties of flagella, polymerized flagellin and flagellin in the primary response. Aust. J. Exp. Biol. Med. Sci. 42, 2 8 3 - 2 9 4 (1964)
Nossal, G. J. V., Mfikelfi, O. : Elaboration of antibodies by single cells. Ann. Review Microbiol. 16, 5 3 - 7 4 (1962)
Nossal, G. J. V., Szenberg, A., Ada, G. L., Austin, C. M. : Single cell studies on 19S antibody formation. J. Exp. Med. 119, 4 8 5 - 5 0 2 (1964)
Nossal, G. J. V., Warner, N. L., Lewis, H. : Incidence of cells simultaneously secreting IgM and IgG antibody to sheep erthrocytes. Cell Immunol. 2, 4 1 - 53 (1971)
Ohanian, S. H., Borsos, T.: Killing of nucleated cells by antibody and complement. In: Biological amplification systems in immunology (N. K. Day and R. A. Good, eds.). New York: Plenum 1977

IgM-IgG Switch 255
Old, L. J., Stockert, E., Boyse, E. A., Geering, G.: A study of passive immunization against a transplanted G+ leukemia with specific antisera. Proc. Soc. Exp. Biol. Med. 124, 6 3 - 68 (1967)
Osler, A. G.: Complement: Mechanisms and function. Englewood Cliffs, N J: Prentice Hall 1976 Osler, A. G., Sandberg, A. L. : Alternate complement pathways. Prog. Allergy 17, 51 -92 (1973) Oster, G. F., Wilson, E. O.: Ecology and evolution of castes in social insects. Princeton: Princeton
University Press 1978 Parce, J. W., Henry, N., McConnell, H. M.: Specific antibody-dependent binding of complement
component Clq to hapten-sensitized lipid vesicels. Proc. Nat. Acad. Sci. USA 75, 1515-1518 (1978)
Pecht, I., Lancet, D. : Kinetics of antibody-hapten interactions. In: Chemical relaxation in molecular biology (I. Pecht and R. Rigler, eds.). New York: Springer-Verlag 1977
Pecht, I., Ehrenberg, B., Calef, E., Arnon, R.: Conformational changes and complement activation induced upon antigen bindijag to antibodies. Biochem. Biophys. Res. Comm. 74, 1302-1310 (1977)
Perelson, A. S. : The IgM-IgG switch looked at from a control theoretic viewpoint. In : Lecture notes in control and information sciences (Vol. 6), Optimization techniques, Wtirzburg, Part t (J. Stoer, ed.). Berlin: Springer-Verlag 1978
Perelson, A. S., Wiegel, F. W. : A calculation of the number of IgG molecules required per cell to fix complement. J. Theor. Biol. 79, 317-332 (1979)
Perelson, A. S., Mirmirani, M., Oster, G. : Optimal strategies in immunology. I. B-cell differentiation and proliferation. J. Math. Biol. 3, 325-367 (1976)
Perelson, A. S., Mirmirani, M., Oster, G.: Optimal strategies immunology. II. B memory cell production. J. Math. Biol. 5, 213-256 (1978)
Perkins, E. H., Sado, T., Makinodan, T.: Recruitment and proliferation of immunocompetent cells during the log phase of the primary antibody response. J. Immunol. 103, 668- 678 (1969)
Ponder, E. : Hemolysis and related phenomena. New York: Grune and Stratton 1948 Porter, D. D. : Destruction of virus-infected cells by immunological mechanisms. Ann. Rev. Microbiol.
25, 283-290 (1971) Porter, R. R.: Structure and activation of the early components of complement. Fed. Proc. 36,
2191-2196 (1977) Press, J., Klinman, N. R. : Monoclonal production of both IgM and IgG1 antihapten antibody. J. Exp.
Med. 138, 300-325 (1973) Pruitt, K. M., Turner, M. E., Boackle, R. J.: A kinetic model for the quantitative analysis of
complement. J. Theor. Biol. 44, 207-217 (1974) Rabbitts, T. H., Forster, A., Dunnick, W., Bentley, D. L.: The role of gene deletion in the
immunoglobulin heavy chain switch. Nature 283, 351- 356 (1980) Rosse, W. F. : Correlation of in vivo and in vitro measurements of hemolysis in hemolytic anemia due to
immune reactions. Prog. Hematology 8, 51 -75 (1973) Shelton, E., Yonemasu, K., Stroud, R. M. : Ultrastructure of the human complement component C1 q.
Proc. Nat. Acad. Sci. USA 69, 6 5 - 6 8 (1972) Siedentopf, H. G., Lauenstein, K., Fischer, H. : Uber die automatische Registrierung der H/imolyse
durch Serumkomplement und Lysolecithin. Z. Naturf. 20B, 569-571 (1965) Siskind, G. W., Benacerraf, B. : Cell selection by antigen in the immune response. Adv. Immunol. 10,
1 - 50 (1969) Spiegelberg, H. L. : Biological activities of immunoglobulin in different classes and subclasses. Adv.
Immunol. 19, 259-294 (1974) Stelos, P., Taliaferro, W. H.: Comparative study of rabbit hemolysins to various antigens. II.
Hemolysins to the Forssman antigen of guinea pig kidney, human type A red cells, and sheep red cells. J. Infect. Dis. 104, 105-118 (1959)
Sterzl, J., Nordin, A. : The common cell precursor for cells producing different immunoglobulins. In : Cell interactions and receptor antibodies in immune responses (O. Mfikelfi, A. Cross, and T. U. Kosunen, eds.), pp. 213-229. London: Academic Press 1971
Svehag, S.-E., Mandel, B. : The formation and properties of polio virus neutralizing antibody. I. 19S and 7S antibody formation : differences in kinetics and antigen dose requirement for induction. J. Exp. Med. 119, I - 1 9 (1964)
Tannenberg, W. L K., Malaviya, A. N. : The life cycle of antibody forming cells. I. The generation time of i9S hemolytic plaque-forming cells during the primary and secondary responses. J. Exp. Med. 128, 895-921 (1968)
256 A.S. Perelson et al.
Uhr, J. W., Finkelstein, M. S. : Antibody formation. IV. Formation of rapidly and slowly sedimenting antibodies and immunological memory to bacteriophage ~bX 174. J. Exp. Med. 117, 457-477 (1963)
Uhr, J. W., Finkelstein, M. S., Franklin, E. C.: Antibody response to bacteriophage q~X 174 in nonmammalian vertebrates. Proc. Soc. Exp. Biol. Med. 111, 13-15 (1962)
Van der Loo, W.0 Gronowicz, E. S., Strober, S., Herzenberg, L. A. : Cell differentiation in the presence of cytochalasin B: Studies on the "switch" to IgG secretion after polyclonal B cell activation. J. Immunol. 122, 1203-1208 (1979)
Van Oss, C. J., Edberg, S. C., Bronson, P. M. : Valency of IgM. In: Specific receptors of antibodies, antigens and cells. 3rd Int. Convoc. Immunol. Buffalo, NY, pp. 60-68. Basel: Karger 1973
Wabl, M. R., Forni, L., Loor, F. : Switch in immunoglobulin class production observed in single clones of committed lymphocytes. Science 199, 1078- 1080 (1978)
Wortis, H. H., Taylor, R. B., Dresser, D. W. : Antibody production studied by means of the LHG assay. I. The splenic response of CBA mice to sheep erythrocyte s. Immunology 11, 603-616 (1966)
Wright, A. E., Douglas, S. R. : An experimental investigation of the role of the body fluids in connection with phagocytosis. Proc. Roy. Soc. London 72, 357-370 (1903)
Zanderer, M., Askonas, B. A. : Several proliferative phases preceed maturation of IgG-secreting cells in mitogen stimulated clones. Nature 260, 611-613 (1976)
Zinsser, H., Enders, J. F., Fothergill, L. D. : Immunity: Principles and application in medicine and public health. New York: Macmillan 1939
Received September 10, 1979/Revised March 17, 1980


![[Monoclonal antibodies in clinical immunology]](https://img.pdfslide.net/doc/110x75/63375eff20d9c9602f0b4441/monoclonal-antibodies-in-clinical-immunology.jpg)


