Embed Size (px)
Citation preview

This article was published in an Elsevier journal. The attached copyis furnished to the author for non-commercial research and
education use, including for instruction at the author’s institution,sharing with colleagues and providing to institution administration.
Other uses, including reproduction and distribution, or selling orlicensing copies, or posting to personal, institutional or third party
websites are prohibited.
In most cases authors are permitted to post their version of thearticle (e.g. in Word or Tex form) to their personal website orinstitutional repository. Authors requiring further information
regarding Elsevier’s archiving and manuscript policies areencouraged to visit:
http://www.elsevier.com/copyright

Author's personal copy
Optimum gas turbine cycle for combined cycle power plant
A.L. Polyzakis a, C. Koroneos b,*, G. Xydis b
a Prefecture of Western Macedonia, Department of Public Works Administration, Epivaton 39, Ptolemaida 50200, Greeceb Laboratory of Heat Transfer and Environmental Engineering, Aristotle University of Thessaloniki, P.O. Box 483, GR 54124,
Thessaloniki, Greece
Received 30 January 2006; received in revised form 17 January 2007; accepted 19 August 2007Available online 1 October 2007
Abstract
The gas turbine based power plant is characterized by its relatively low capital cost compared with the steam power plant. It has envi-ronmental advantages and short construction lead time. However, conventional industrial engines have lower efficiencies, especially atpart load. One of the technologies adopted nowadays for efficiency improvement is the ‘‘combined cycle’’. The combined cycle technol-ogy is now well established and offers superior efficiency to any of the competing gas turbine based systems that are likely to be availablein the medium term for large scale power generation applications. This paper has as objective the optimization of a combined cycle powerplant describing and comparing four different gas turbine cycles: simple cycle, intercooled cycle, reheated cycle and intercooled andreheated cycle. The proposed combined cycle plant would produce 300 MW of power (200 MW from the gas turbine and 100 MW fromthe steam turbine). The results showed that the reheated gas turbine is the most desirable overall, mainly because of its high turbineexhaust gas temperature and resulting high thermal efficiency of the bottoming steam cycle. The optimal gas turbine (GT) cycle will leadto a more efficient combined cycle power plant (CCPP), and this will result in great savings. The initial approach adopted is to investigateindependently the four theoretically possible configurations of the gas plant. On the basis of combining these with a single pressure Ran-kine cycle, the optimum gas scheme is found. Once the gas turbine is selected, the next step is to investigate the impact of the steam cycledesign and parameters on the overall performance of the plant, in order to choose the combined cycle offering the best fit with the objec-tives of the work as depicted above.
Each alterative cycle was studied, aiming to find the best option from the standpoint of overall efficiency, installation and operationalcosts, maintainability and reliability for a combined power plant working in base load. Several schemes are proposed for investigation. Inparticular, four configurations were studied: simple cycle (SC), intercooled cycle (IC), reheated cycle (RH) and intercooled and reheatedcycle (IC/RH).� 2007 Elsevier Ltd. All rights reserved.
Keywords: Combined cycle; Gas turbine; Simple cycle; Intercooled cycle; Reheated cycle
1. Introduction
The gas turbine (GT) is known to feature low capitalcost to power ratio, high flexibility, high reliability withoutcomplexity [1], short delivery time, early commissioningand commercial operation and fast starting–accelerating.The gas turbine is further recognized for its better environ-
mental performance, manifested in the curbing of air pollu-tion and reducing greenhouse gases [2].
Open cycle gas turbine engines exhaust higher gradeheat to the atmosphere, which can alternatively be usedto produce additional electric power via a steam cycle.The combined cycle (CC) uses the exhaust heat from thegas turbine engine to increase the power plant outputand boost the overall efficiency to more than 50% [3,4],substantially above that of the simple cycle and even higherthan that of supercritical pressure reheat steam powerplants. These combined cycle power plants (CCPP)
0196-8904/$ - see front matter � 2007 Elsevier Ltd. All rights reserved.
doi:10.1016/j.enconman.2007.08.002
* Corresponding author. Tel.: +30 231 0995968; fax: +30 231 0996012.E-mail address: [email protected] (C. Koroneos).
www.elsevier.com/locate/enconman
Available online at www.sciencedirect.com
Energy Conversion and Management 49 (2008) 551–563

Author's personal copy
generate electric power at lower costs than that of conven-tional steam plants of the same rating [5].
Gas turbines in simple cycle (SC) mode have long beenused by utilities for limited peak power generation. In addi-tion, industrial facilities use gas turbine units for on sitepower generation, usually in combination with processheat production, such as hot water and process steam. Inrecent years, the performance of industrial gas turbineshas been improved, due to considerable investments inresearch and development, in terms of fuel to electricityconversion efficiency, plant capacity, availability and reli-ability. The greater availability of fuel resources, such asnatural gas (NG), the significant reduction in capital costsand the introduction of advanced cycles, have also been asuccess factor for increased deployment of gas turbinesfor base load applications [5].
In the late eighties, natural gas prices fell and gas tur-bine technologies improved. The upsurge in the use ofindustrial gas turbines is mostly focused on the CCPPusing the simple cycle for the GT. Combined cycle plantsreached thermal efficiencies of more than 40% in the lateeighties, with the figure climbing to 50% for a generalelectric (GE) plant opened in South Korea. Asea BrownBoveri (ABB) announced plans for a 53% efficient com-bined cycle plant. It is thought that within the next dec-ade and even by the turn of the century, it will bepossible to produce a CCPP with thermal efficienciesclose to 60%. The current state of the art is 55% thermalefficiency [6,7].
Numerous investigations, as well as experience withactual plants, have showed that the split of power outputbetween the gas turbine and the steam turbine of a com-bined cycle power plant should be approximately 2:1,resulting in a gas turbine of 200 MW GT output, and100 MW ST output with a total of 300 MW. The latestdevelopments of the major GT manufacturers are of thatorder of magnitude, e.g., general electric: 9FA series226.5 MW, A sea Brown Boveri: GT26 240 MW [6,7].
2. Theoretical Brayton cycles and combined cycle
For years, the gas turbine has mainly been operated in asimple cycle. Fig. 1a shows the temperature–entropy dia-gram of the basic isentropic Brayton cycle. It consists ofone stage of compression, a single heat input stage and sim-ple expansion through a turbine. Possible additions to thiscycle are intercooling, reheat or a combination of these.The various options are displayed in Fig. 1b–e. The dashedheat rejection lines indicate that it is an open cycle, mean-ing that new working fluid (i.e., air) and fuel are continu-ously put through the cycle. Although this is, by far, themost common practice, closed gas turbine cycles wherethe heat is supplied through a heat exchanger (so calledindirectly fired cycles) are gaining renewed interest [1,8].
When considering a combined cycle including a gas tur-bine, the Rankine steam cycle is simply added underneaththe Brayton cycle, as shown in Fig. 2. The Brayton toppingcycle rejects its heat to the Rankine bottoming cycle to raisesteam, instead of directing it to the atmosphere as in the sin-gle cycle configuration. For obvious reasons, this principleis called ‘‘waste heat recovery’’ and the steam raising devicesubstituting for the boiler of a conventional steam plant iscalled the heat recovery steam generator (HRSG).
The combined cycle plant thermal efficiency is definedby
gCC ¼ðwork outputÞCC
ðheat inputÞ GT
¼ net GT workþ net ST work
fuel energy input into GTð1Þ
Clearly, the efficiency of the combined gas/steam cycle ishigher than that of the gas turbine by itself. However,where the optimization of one cycle was relatively simple,i.e., a matter of raising the mean temperature of heat recep-tion and lowering that of heat rejection, the optimization ofthe CC is a more complicated matter. To investigate this
Nomenclature
CC combined cycleCCPP combined cycle power plantsDP design pointg efficiencyEGT exhaust gas temperatureGT gas turbineHRSG heat recovery steam generatorHP high pressureIC/RH intercooled and reheated cycleIC intercooled cycleIC/RH/HX intercooled, reheated and regenerative cycleLP low pressure
NG natural gasOD off designRc overall pressure ratioPT power turbineRH reheated cycleSC simple cyclesfc specific fuel consumptionCP specific heatSP specific powerTstack stack gas temperatureTET turbine entry temperatureXACT wetness
552 A.L. Polyzakis et al. / Energy Conversion and Management 49 (2008) 551–563

Author's personal copy
issue further, the first four potential (SC, IC, RH, IC/RH)gas turbine topping cycles were analysed for their suitabil-ity for combined cycle application (Fig. 1).
The cycle incorporating intercooling, reheat and regen-eration (IC/RH/HX) is not likely to be efficient in CCapplication, despite the high GT efficiency [9]. This is dueto the fact that the heat exchanger lowers the temperatureof the exhaust gases too much for the steam cycle to be ofsufficiently high thermal efficiency.
A gas turbine simulation software program called Tur-boMatch has been used to simulate the performance ofthe different cycles. This program has been developed and
refined over many years in the Department of Propulsion,Power and Automotive Engineering of Cranfield Univer-sity [10]. It facilitates design point (DP) and off design(OD) performance calculations of aero and industrialengines of any layout. By means of ‘‘codewords’’, variouspre-programmed routines, known as ‘bricks’, can be com-bined to build a model of the desired gas turbine. Basically,the characteristics of each brick, representing an actualcomponent of the engine, are determined by several param-eters that are relevant to the function of the component.
TurboMatch uses these data to simulate the interactionof the different components of the modelled engine. It
Fig. 1. Temperature–entropy diagrams of theoretical Brayton cycles: (a) SC, (b) IC, (c) RH, (d) IC/RH and (e) IC/RH/HX.
Fig. 2. Combined cycle: combination oi simple Brayton cycle and Rankine cycle.
A.L. Polyzakis et al. / Energy Conversion and Management 49 (2008) 551–563 553

Author's personal copy
generates output in terms of delivered engine thrust (whenmodelling aero engines) or shaft power, specific fuel con-sumption etc. with details of the individual component per-formances and of the gas path parameters at variousstations within the machine.
The output performance parameters of the gas turbinewere input in a steam cycle calculation process. Gas turbineefficiency, exhaust gas mass flow and temperature and gasturbine power output were combined with appropriatesteam data. A single pressure steam cycle was then simu-lated, the main outcomes being the steam power output,steam cycle efficiency and overall combined cycle efficiency.The single pressure level combined cycles are the simplestform of combined cycle. Even with improvements madefor arriving at more complex systems, they still remain inthe market place. The following values were adopted forthe steam calculations:
• Evaporator pinch point 30 K.• Minimum stack gas temperature 160 K.• steam turbine constant isentropic efficiency 0.85.• Maximum superheated steam temperature
650 �C = 923 K and minimum exhaust gas temperature(EGT) 550 �C = 823 K.
• Maximum boiler pressure 160 bar.• Minimum condenser pressure 0.03 bar.• The dryness fraction of the steam at the exit of the steam
turbine is an important parameter from a maintenancepoint of view. When the dryness fraction is too low, gen-erally defined as below 0.87 (87% dryness or 13% wet-ness), the last stage turbine blades suffer excessiveerosion, which may lead to reduced efficiency and maybeeven mechanical failure of the turbine.
• An average constant value of specific heat (CP) of airwas adopted, in accordance with the following formula
CP ¼ 1020þ 420 � e�800T m ð2Þ
in which Tm is the mean gas temperature through theboiler, given by
T m ¼EGTþ T stack
2ð3Þ
It was assumed that fresh, good quality river water wasavailable for cooling purposes. Hence, an open condensingcycle was supposed, and a very low condenser pressure wasused.
For performance of the steam and combined cycle opti-mization, a computer model is used, so that changingparameters could be investigated. Steam performance cal-culations can be calculated from the input of data takenfrom existing engines or via the gas turbine engine moduleof the TurboMatch. The steam plant model is based onconservation of energy through the boiler. Steam mass flowcan be calculated from an energy balance across the evap-orator and superheater section. With steam mass flow cal-culated and steam turbine efficiencies known, the poweroutput can be calculated [11].
3. Simple cycle
The configuration of the engine is shown in Fig. 3.The DP performance specifications of the engine follow
those shown in Table 1, and they are similar to those givenby most important manufacturers.
The results from the design point calculations are shownin Fig. 4. If operating the engine in open cycle, from thisplot of specific fuel consumption (sfc) versus specific power(SP), it would be possible to select a suitable engine for aparticular application.
Fig. 3. Simple cycle GT layout. ‘‘Brick’’ and ‘‘station vector’’ model.
Table 1GT’s specifications (design point, DP)
Simple cycle Intercooled cycle Reheated cycle Interc./reh. cycle
Ambient conditions 15�C = 288 K,1 atm = 101 kPa
15�C = 288K,1 atm = 101 kPa
15�C = 288 K,1 atm = 101 kPa
15�C = 288 K,1 atm = 101 kPa
Intake efficiency (%) 100 100 100 100Compressor isentr. effic.
(%)86 86 86 86
Fuel (NG) (MJ/kgr) 43 43 43 43Combustion effic. (%) 99 99 99 99Burner pressure loss (%) 5 5 5 5Turbine isentropic effic.
(%)87 87 87 87
TET (HPT, LPT and PT) 1288�C = 1561 K 1288�C = 1561 K 1288�C = 1561 K 1288�C = 1508 KTurbine cooling air (%) 25 25 15, 10 15, 10Exhaust pressure (atm) 1.02 1.02 1.02 1.02Intercooler effic. – 99% – 99%Interc. pres. loss – 0% – 0%
554 A.L. Polyzakis et al. / Energy Conversion and Management 49 (2008) 551–563

Author's personal copy
Off design performance is determined to assess theengines’ performance over the complete range of operatingconditions that the engine could experience. These includevarying the ambient temperature conditions (�20, 0, 15,40 �C), altitude (500, 1500, 2500 m) and reducing theTET to assess the engine’s performance at part load.
Figs. 5 and 6 show the variation of power versus TETfor varying ambient temperature and altitude, respectively.
It can be seen that the power output decreases as TET isreduced as would be expected. Varying the ambient tem-perature affects the power output. As the ambient temper-ature increases, the air density falls; hence, for a given TET,the mass flow through the engine is reduced. As a conse-quence, the engine output power is lower. An increase inaltitude gives rise to the same result as can be seen inFig. 6. It is worth noting that these figures indicate a con-tinued increase in power with reduced ambient tempera-tures and increased TET. In the real situation, this wouldnot be permitted due to stress limitations. Rotors and discswill be mechanically designed to withstand momentaryoverspeeds of up to 110% [11].
The variation of gGT versus TET for varying ambienttemperature and altitude gGT are shown in Figs. 7 and 8,respectively. It can be seen that the efficiency reduces rap-idly with a reduction in TET. Thermal efficiency equatesto useful work output divided by heat input. Work outputis found to decrease more rapidly than the reduction inheat input, and therefore, thermal efficiency decreases.
However, when steam and gas cycles are combined toascertain the best combination, a suitable steam cycle mustalso be considered. In Table 2, it can be seen that the
66
67
68
69
70
71
72
73
74
75
250 255 260 265 270 275 280 285 290 295
Specific Power (kW/(kgr/s))
sfc
(gr/
MJ)
TET=1508 KTET=1561 KTET=1600 KRc=12Rc=16Rc=20
Fig. 4. Simple cycle design point performance.
80
100
120
140
160
180
200
220
240
260
280
300
1350 1375 1400 1425 1450 1475 1500 1525 1550 1575 1600
TET (K)
Po
wer
(M
W)
Tamb=-20°CTamb=0°CTamb=15°CTamb=40°C
Fig. 5. Power versus TET varying Tamb (SC).
1350 1375 1400 1425 1450 1475 1500 1525 1550 1575 1600
TET (K)
100
120
140
160
180
200
220
Po
wer
(M
W)
Altitude=500 m
Altitude=1500 m
Altitude=2500m
Fig. 6. Power versus TET varying altitude (SC).
20
25
30
35
40
1350 1375 1400 1425 1450 1475 1500 1525 1550 1575 1600
TET (K)
Eff
icie
ncy
(%
)
Tamb=-20°C
Tamb=0°C
Tamb=15°C
Tamb=40°C
Fig. 7. Efficiency versus TET varying Tamb (SC).
26
27
28
29
30
31
32
33
34
35
36
1350 1375 1400 1425 1450 1475 1500 1525 1550 1575 1600
TET (K)
Eff
icie
ncy
(%
)
Altitude=2500 m
Altitude=1500 m
Altuitude=500 m
Fig. 8. Efficiency versus TET varying altitude (SC).
A.L. Polyzakis et al. / Energy Conversion and Management 49 (2008) 551–563 555

Author's personal copy
optimum pressure ratio (RC) for the CC occurs in theregion of 16.
4. Intercooled cycle
A gas turbine with one stage of intercooling inherentlycontains two compression stages. One turbine can be usedto drive both compressors, with a second expansion stagethrough a power turbine (PT) (two shaft configuration).The configuration of the engine is shown in Fig. 9.
The DP performance specifications of the engine followthose shown in Table 1, and they are similar to those givenfor the simple cycle. The results from design point calcula-tions can be seen in Fig. 10. As the first approach, in Fig. 9,the RC,total is split.
The fact that the cycle in question incorporates inter-cooled compression implies that the GT contains two com-pression stages. For a given overall pressure ratio, if thelow pressure compressor (LPC) operates at a high pressureratio and the high pressure compressor (HPC), therefore,operates at a relatively low pressure ratio, the exit temper-ature of the HPC will be relatively low, which means that,to achieve a given TET, a lot of heat must be supplied inthe combustor, resulting in high fuel consumption. Theopposite is true for a small pressure rise in the LPC sectionand a high pressure ratio in the HPC, namely this willresult in a lower fuel consumption. The latter configurationcan, therefore, be expected to be the more favourable one.
A range of overall pressure ratios was investigated withequal pressure ratio splits. This should result [1,12] in thehighest efficiency attainable with that particular overallpressure ratio. Bases on this, pressure ratios ranging from42 to 90 were selected for more detailed examination, i.e.,
with various pressure ratio splits. Each data point consti-tutes a particular pressure ratio split between the LP andHP compressors. From this plot, Fig. 10, it can be estab-lished that an overall pressure ratio of 74 gives the best per-formance in terms of specific fuel consumption. Thepressure ratio split that gives minimum sfc is found to beRLPC = 3 and, consequently, RHPC = 24. This is very differ-ent from the thermodynamically ideal situation ofRLPC = RHPC = 8.5. The explanation for this lies in the factthat the ideal case assumes perfect components. As soon ascomponent efficiencies are introduced, the efficiency rises asthe LP ratio drops.
As already mentioned, the gas turbine selection for CCduty differs greatly from the optimum single cycle machinepresented above. The EGT of the latter is 300 �C = 573 K.This is far too low for efficient heat recovery in a steam bot-toming cycle. Suffice it to say that the overall pressure ratiohas to be much lower so as to end up with a much higherEGT. Gas turbines with pressure ratios between 8 and 24were simulated in TurboMatch, which brought the EGTup to values of 500–600 �C (773–873 K).
The choice of configuration will influence the DP perfor-mance inasmuch as the number of components, and there-fore, the cumulative losses induced by all the components,as well as the complexity and inherent cost, varies from oneoption to the other. As far as OD performance is con-
Table 2Selection of optimum simple cycle GT (TET = 1561 K)
RC,TOTAL gGT (%) SPGT (J/kgr) Exh. flow (kgr/s) EGT (K) St. flow (kgr/s) XACT (%) gST (%) PSTEAM (MW) CCPP (MW) gCCPP (%)
12 31.67 284900 716.6 833.4 98.97 12.8 36.0 117.6 317.6 50.3013 32.24 285714 714.3 822.0 96.98 12.9 35.5 112.1 312.1 50.3114 32.69 285714 714.2 811.8 94.49 12.9 35.2 108.3 308.3 50.3915 33.09 285307 715.0 802.5 92.24 12.8 35.0 104.9 304.9 50.4516 33.46 284697 716.4 793.7 91.16 12.8 34.5 101.1 301.1 50.47
17 33.76 283688 718.7 785.7 89.12 12.8 34.4 98.8 298.8 50.4418 34.04 282486 721.6 778.2 88.21 12.9 34.1 96.2 296.2 50.4119 34.25 280899 725.5 771.4 87.69 12.9 33.7 93.5 293.5 50.2620 34.46 279330 729.5 764.8 85.90 12.8 33.7 92.2 292.2 50.3422 34.78 275672 738.8 752.9 85.06 12.8 32.9 87.9 287.9 50.0624 35.01 271592 749.6 742.3 83.05 12.8 32.9 85.9 285.9 50.0426 35.16 267201 761.7 732.8 82.67 12.8 32.3 83.1 283.1 49.77
Fig. 9. Intercooled cycle GT layout. ‘‘Brick’’ and ‘‘station vector’’ model.
TET=1561 K
64
66
68
70
72
74
76
78
280 290 300 310 320 330 340 350 360Specific Power (kW/(kgr/s))
sfc
(gr/
MJ)
Rc,total=9
Rc,total=12.6
Rc,total=16
RLPC risingRHPC dropping
Fig. 10. Intercooled cycle design point performance.
556 A.L. Polyzakis et al. / Energy Conversion and Management 49 (2008) 551–563

Author's personal copy
cerned, it can be said that a multi-shaft machine, in general,is more flexible than a single shaft machine, because its gasgenerator is allowed to operate at a different rotationalspeed from that required for the PT. When the machineis used for heavy duty base load power generation, thePT speed is fixed by the required frequency of the electricoutput from the generator. A gearbox is not desirable,for it would introduce additional cost and losses and nega-tively influence the performance. An engine with a PTobtains its power variation by varying the gas generatorspeed. This means that torque (i.e., load output) changesare inherently slow and dependent on rotor inertia, surgemargin and temperature limits. On the other hand, singleshaft engines can handle rapid load changes once syn-chronised, as the rotational speed will always remainunchanged, and therefore, there is no rotor inertia to over-come. Furthermore, it has a higher resistance to speedchange in the case of an unexpected change in electric loadbecause of its high rotor inertia. Summarising, a singleshaft machine is more speed stable, and therefore, easierto regulate, while at part load, a two shaft engine gives bet-ter performance [8,13].
As in the case of the simple cycle, OD performance simu-lation was performed. The simulation refers to the variationof ambient temperature, altitude and TET (Figs. 11–14).
Similar to the simple cycle, the optimum design point ofthe GT alone is very different from the one eventuallyselected for combined cycle duty (Table 3). There is anoptimum solution where neither the GT thermal efficiencynor the steam plant power output are the best achievablebut which yields optimum CC thermal efficiency. The rea-son for this is the fact that when the efficiency of a GTdrops, its exhaust gas temperature increases. The addi-tional heat allows more steam to be generated in theHRSG, thereby increasing the steam turbine power output.It must also be noted that the selection of the more suitableengine is taking into account the possible aerodynamicproblems that might occur in the GT compressor whenthe overall RC is divided in an extremely unequal waybetween the two compressors. From Table 3, it can be seen
that the optimum pressure ratio (RC) for the CC occurs inthe region of 12.6.
5. Reheated cycle
A substantial increase in specific work output can beobtained by splitting the expansion and reheating the gas
50
75
100
125
150
175
200
225
250
275
1350 1375 1400 1425 1450 1475 1500 1525 1550 1575 1600
TET (K)
Po
wer
(M
W)
Tamb=-20°CTamb=0°CTamb=15°CTamb=40°C
Fig. 11. Power versus TET varying Tamb (IC).
70
90
110
130
150
170
190
210
1350 1375 1400 1425 1450 1475 1500 1525 1550 1575 1600
TET (K)
Po
wer
(M
W)
Altitude=500 mAltitude=1500 mAltitude=2500 m
Fig. 12. Power versus TET varying altitude (IC).
20
25
30
35
40
1350 1375 1400 1425 1450 1475 1500 1525 1550 1575 1600
TET (K)
Eff
icie
ncy
(%
)
Tamb=-20°CTamb=0°CTamb=15°CTamb=40°C
Fig. 13. Efficiency versus TET varying Tamb (IC).
26
27
28
29
30
31
32
33
34
35
36
Eff
icie
ncy
(%
)
Altitude=2500 m
Altitude=1500 m
Altitude=500 m
1350 1375 1400 1425 1450 1475 1500 1525 1550 1575 1600
TET (K)
Fig. 14. Efficiency versus TET varying altitude (IC).
A.L. Polyzakis et al. / Energy Conversion and Management 49 (2008) 551–563 557

Author's personal copy
between the high pressure and low pressure turbines. At thesame time, the thermal efficiency of the GT will be reduced,but on the other hand, the heat ‘‘rejected’’ to the HRSGwill be increased due to the increased exhaust gas temper-ature (EGT). The configuration of the engine is shown inFig. 15. As a first approach, the RC,total is split.
The specifications of the engine follow those shown inTable 1. This makes the specifications of the engine thesame as those of the state of the art, and it gives the oppor-tunity of a comparison between the results of the designproject with the manufacturers specifications. The resultsfrom design point calculations can be seen in Fig. 16.
From the point of view of aerodynamical and mechan-ical design of the compressors, it is better to split the over-
all RC as equal as possible 7 · 7 rather than 35 · 1.4. Thisis because the LPC will experience more severe surgeproblems and the LPC is more sensitive in such sort ofproblems than the HPC. On the other hand, even withthe split 7 · 7, variable guide vanes should be used forboth compressors (due to RC > 5 in both of them), butthe surge problems will not be so severe for the LPC aspreviously. However, from the design point of view, thehigher is the LPC pressure ratio, the better is the efficiency[1,12,14].
Having decided on the design point, the next step is toinvestigate the behaviour of the engine, how it would per-form over a wide range of ambient temperatures, altitudeand different loads (TETs) (Figs. 17–20).
Table 3Selection of optimum intercooled cycle GT (TET = 1561 K)
RC,TOTAL RC,LPC · RC,HPC gGT (%) Exh. flow (kgr/s) EGT (K) XACT (%) PSTEAM (MW) CCPP (MW) gCCPP (%)
8 1.25 · 6.4 29.33 715.2 885 12.0 122.8 322.8 47.31.333 · 6 29.4 707.1 884 12.0 121.2 321.2 47.21.6 · 5 29.48 688.3 880 12.0 117.2 317.2 46.81.8 · 4.444 29.42 679.8 878 11.9 115.3 315.3 46.42 · 4 29.31 673.9 876 11.9 113.9 313.9 46.02.2 · 3636 29.14 670.4 875 11.9 113.0 313.0 45.62.5 · 3.2 28.85 667.9 872 11.9 112.1 312.1 45.02.83 · 2.83 28.49 667.7 870 11.9 111.6 311.6 44.4
10 1.25 · 8 31.53 687.7 849.1 11.8 110.4 310.4 48.91.5 · 6.667 31.75 664.6 845.5 11.7 105.9 305.9 48.61.725 · 5.8 31.76 651.6 842.9 11.7 103.3 303.3 48.22 · 5 31.64 641.4 840.3 11.7 101.2 301.2 47.62.25 · 4.444 31.46 635.7 838.2 11.7 99.8 299.8 47.22.5 · 4 31.23 632.4 836.4 11.7 104.3 304.3 47.52.75 · 3.636 30.97 631.0 834.9 11.8 103.6 303.6 47.03 · 3.333 30.69 630.7 833.5 11.9 103.1 303.1 46.5
12.6 1.26 · 10 33.59 669.8 813.5 12.8 103.1 303.1 50.91.4 · 9 33.79 654.2 811.4 12.9 100.0 300.0 50.7
1.575 · 8 33.91 639.7 809.0 13.0 97.1 297.1 50.42.1 · 6 33.80 615.3 803.8 13.2 91.8 291.8 49.32.52 · 5 33.47 606.5 800.6 13.4 89.6 289.6 48.53.15 · 4 32.81 602.1 797.0 13.6 88.0 288.0 47.23.55 · 3.55 32.35 605.5 795.1 13.7 87.5 287.5 46.5
16 1.25 · 12.8 35.40 664.9 778.7 14.5 91.5 291.5 51.61.6 · 10 35.87 627.4 773.7 14.8 84.9 284.9 51.12 · 8 35.89 604.5 769.5 15.0 80.6 280.6 50.42.4 · 6.667 35.67 591.9 766.3 15.1 78.1 278.1 49.63.2 · 5 34.90 581.8 761,5. 15.4 75.5 275.5 48.13.6 · 4.444 34.46 580.7 759.6 15.5 74.8 274.8 47.44 · 4 34.00 581.2 758.0 15.6 74.5 274.5 46.7
Fig. 15. Reheated cycle GT layout. ‘‘Brick’’ and ‘‘station vector’’ model.
558 A.L. Polyzakis et al. / Energy Conversion and Management 49 (2008) 551–563

Author's personal copy
The selection of the appropriate engine is based on thecomparison of the performance of different GTs withreheat engine, Based on the GT output simulation data,steam single cycle calculations have been performed. InTable 4, the overall results of the GT cycle, steam cycle(steam flow, steam cycle efficiency, steam wetness, steamcycle power output) and the overall CCPP power and effi-
ciency are included. It can be seen that the optimum pres-sure ratio (RC) for the CC occurs in the region of 49.
6. Intercooled reheated cycle
There are several possible engine configurations corre-sponding to the IC/RH cycle. The one investigated hereis shown in Fig. 21.
The DP performance specifications of the engine followthose shown in Table 1, and they are similar to those givenfor the simple cycle. The results from design point calcula-tions can be referenced in Fig. 22.
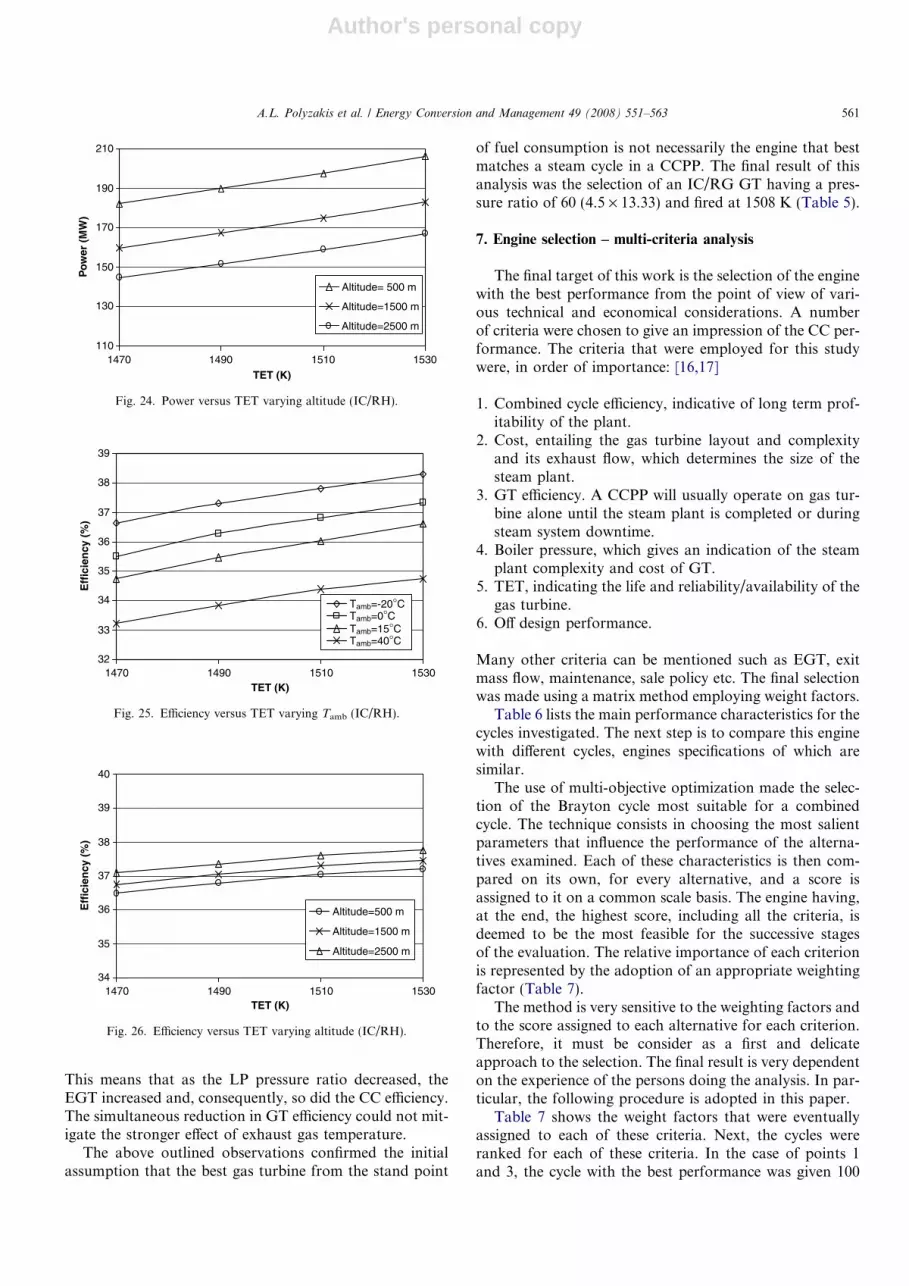
Once the optimum IC/RH gas turbine was selected, theanalysis of the OD performance behaviour of the enginewas conducted. A wide range of operational conditions(ambient temperature, altitude, TET) were investigated(Figs. 23–26).
Nonetheless, by assuming, for the sake of the compari-son, that the overall pressure ratio was split into equal pro-portions between the two compressors, some trends can bedisclosed.
Firstly, as the overall pressure ratio increases, the gasturbine efficiency increases, and simultaneously, the EGT
TET=1561 K
62
64
66
68
70
72
74
240 260 280 300 320 340 360 380 400
Specifc Power (kW/(kgr/s))
sfc
(gr/
MJ)
Rc,total=42Rc,total=49Rc,total=54
RLPC dropping
RHPC rising
Fig. 16. Reheated cycle design point performance.
50
100
150
200
250
300
1450 1475 1500 1525 1550 1575 1600
TET (K)
Po
wer
(M
W)
Tamb=-20°CTamb=0°CTamb=15°CTamb=40°C
Fig. 17. Power versus TET varying Tamb (RH).
90
110
130
150
170
190
210
1450 1475 1500 1525 1550 1575 1600
TET (K)
Po
wer
(M
W)
Altitude=500 m
Altitude=1500 m
Altitude=2500 m
Fig. 18. Power versus TET varying altitude (RH).
26
28
30
32
34
36
38
40
1450 1475 1500 1525 1550 1575 1600
TET (K)
Eff
icie
ncy
(%
)
Tamb=-20°CTamb=0°CTamb=15°CTamb=40°C
Fig. 19. Efficiency versus TET varying Tamb (RH).
26
27
28
29
30
31
32
33
34
35
36
37
1450 1475 1500 1525 1550 1575 1600
TET (K)
Eff
icie
ncy
(%
)
Altitude=2500 m
Altitude=1500 m
Altitude=500 m
Fig. 20. Efficiency versus TET varying altitude (RH).
A.L. Polyzakis et al. / Energy Conversion and Management 49 (2008) 551–563 559

Author's personal copy
decreases. The two effects have contradictory influences inthe CC efficiency and tend to balance each other, produc-ing a maximum at an intermediate value of pressure ratio.
Secondly, as the overall pressure ratio increase, specificpower increases and so does the CC efficiency. This is validuntil a certain value of pressure ratio is reached, beyondwhich the EGT reduction starts counteracting and the effi-ciency begin to decrease. At the same time, the steampower output continuously decreases as the pressure ratioincreases due to the diminishing of the exhaust gas massflow. On the other hand, if the overall pressure ratio is keptconstant at values lower than 50, the gas SP seems to play arole in the CC efficiency. This increases as the gas specific
power increases [15]. The reason for this is related to thesimultaneous increasing of the EGT, which means thatmore heat was still available to be transformed into usefulpower in the steam turbine.
For high values of overall pressure ratio, things wererather different. In this case, a relationship between theLP compressor pressure ratio and CC efficiency was readilyvisible. The lower is the LP pressure ratio, the higher is theCC efficiency. This tendency was valid independently of thevalue of overall pressure ratio. Because a reheating systemwas working at the inlet of the LP turbine, the EGT couldonly be influenced by the LP compressor pressure ratio.
Table 4Selection of optimum GT with reheat (TET = 1561 K)
RC (overall) RC,LPC · RC, HPC gGT (%) Exh. flow(kgr/s)
EGT (K) St. flow(kgr/s)
XACT
(%)gSTEAM
(%)PSTEAM
(MW)CCPP(MW)
gCCPP
(%)
30 15 · 2 35.87 551.9 869.5 80.47 9.9 36.1 99.3 299.3 53.742 11.05 · 3.8 34.86 527.8 915.5 82.17 7.8 36.6 107.2 307.2 53.542 14 · 3 35.70 540.0 885.0 80.77 9.2 36.3 101.3 301.3 53.849 11.66 · 4.2 34.56 534.9 917.6 84.17 7.7 36.7 109.2 309.2 53.4
12.25 · 4 34.80 536.3 911.1 83.54 8.0 36.6 107.7 307.7 53.5
22.27 · 2.2 36.68 582.7 823.6 78.22 12.0 35.5 91.9 291.9 53.554 13.5 · 4 34.81 544.3 902.0 83.62 8.4 36.5 106.7 306.7 53.457 14.25 · 4 34.76 550.3 897.6 83.97 8.6 36.4 106.7 306.7 53.364 16 · 4 34.65 563.4 887.6 84.62 9.1 36.3 106.4 306.4 53.164 21.33 · 3 35.84 582.9 841.8 60.97 11.2 35.7 97.0 297.0 53.2
Fig. 21. Intercooled reheated cycle GT layout. ‘Brick’ and ‘station vector’ model.
TET=1508 K
RLPC droppingRHPC rising
60
61
62
63
64
65
66
67
68
69
440 450 460 470 480 490 500 510
Specific Power (kW/(kgr/s))
sfc
(gr/
MJ)
Rc,total=50Rc,total=60Rc,total=70
Fig. 22. Intercooled reheated cycle design point performance.
70
90
110
130
150
170
190
210
230
250
1470 1490 1510 1530TET (K)
Po
wer
(M
W)
Tamb=-20°C
Tamb=0°C
Tamb=15°C
Tamb=40°C
Fig. 23. Power versus TET varying Tamb (IC/RH).
560 A.L. Polyzakis et al. / Energy Conversion and Management 49 (2008) 551–563
Author's personal copy
This means that as the LP pressure ratio decreased, theEGT increased and, consequently, so did the CC efficiency.The simultaneous reduction in GT efficiency could not mit-igate the stronger effect of exhaust gas temperature.
The above outlined observations confirmed the initialassumption that the best gas turbine from the stand point
of fuel consumption is not necessarily the engine that bestmatches a steam cycle in a CCPP. The final result of thisanalysis was the selection of an IC/RG GT having a pres-sure ratio of 60 (4.5 · 13.33) and fired at 1508 K (Table 5).
7. Engine selection – multi-criteria analysis
The final target of this work is the selection of the enginewith the best performance from the point of view of vari-ous technical and economical considerations. A numberof criteria were chosen to give an impression of the CC per-formance. The criteria that were employed for this studywere, in order of importance: [16,17]
1. Combined cycle efficiency, indicative of long term prof-itability of the plant.
2. Cost, entailing the gas turbine layout and complexityand its exhaust flow, which determines the size of thesteam plant.
3. GT efficiency. A CCPP will usually operate on gas tur-bine alone until the steam plant is completed or duringsteam system downtime.
4. Boiler pressure, which gives an indication of the steamplant complexity and cost of GT.
5. TET, indicating the life and reliability/availability of thegas turbine.
6. Off design performance.
Many other criteria can be mentioned such as EGT, exitmass flow, maintenance, sale policy etc. The final selectionwas made using a matrix method employing weight factors.
Table 6 lists the main performance characteristics for thecycles investigated. The next step is to compare this enginewith different cycles, engines specifications of which aresimilar.
The use of multi-objective optimization made the selec-tion of the Brayton cycle most suitable for a combinedcycle. The technique consists in choosing the most salientparameters that influence the performance of the alterna-tives examined. Each of these characteristics is then com-pared on its own, for every alternative, and a score isassigned to it on a common scale basis. The engine having,at the end, the highest score, including all the criteria, isdeemed to be the most feasible for the successive stagesof the evaluation. The relative importance of each criterionis represented by the adoption of an appropriate weightingfactor (Table 7).
The method is very sensitive to the weighting factors andto the score assigned to each alternative for each criterion.Therefore, it must be consider as a first and delicateapproach to the selection. The final result is very dependenton the experience of the persons doing the analysis. In par-ticular, the following procedure is adopted in this paper.
Table 7 shows the weight factors that were eventuallyassigned to each of these criteria. Next, the cycles wereranked for each of these criteria. In the case of points 1and 3, the cycle with the best performance was given 100
110
130
150
170
190
210
1470 1490 1510 1530
TET (K)
Po
wer
(M
W)
Altitude= 500 m
Altitude=1500 m
Altitude=2500 m
Fig. 24. Power versus TET varying altitude (IC/RH).
32
33
34
35
36
37
38
39
1470 1490 1510 1530TET (K)
Eff
icie
ncy
(%
)
Tamb=-20°CTamb=0°CTamb=15°CTamb=40°C
Fig. 25. Efficiency versus TET varying Tamb (IC/RH).
34
35
36
37
38
39
40
1470 1490 1510 1530TET (K)
Eff
icie
ncy
(%
)
Altitude=500 m
Altitude=1500 m
Altitude=2500 m
Fig. 26. Efficiency versus TET varying altitude (IC/RH).
A.L. Polyzakis et al. / Energy Conversion and Management 49 (2008) 551–563 561

Author's personal copy
points and the others were scaled according to their relativeperformance. The cost was evaluated by giving the cyclewith the simplest layout the highest points, simple cycle
10 points, IC 8 points, RH 6 points and IC/RH 4 points.Then, these numbers were multiplied by factors expressingthe relative size of the steam plant. This factor was calcu-lated by dividing the smallest mass flow by each exhaustmass flow. The OD performance was taken into accountby giving 10, 9, 8 and 7 points to the IC/RH, IC, RHand simple cycle gas turbines, respectively.
Finally, these rankings were all scaled to give the samesum of all individual rankings for each column, i.e., 385.They were then multiplied by the appropriate weight factorand added for each cycle configuration. The cycle with themost points is the most favourable according to this anal-ysis. It is clear that the reheated gas turbine cycle emergesas the most suitable cycle for the CCPP.
In the case of the GT with reheat, the problem lies in thepart load. The problem is located mainly with the LPC,which is forced to go towards the surge line. There are
Table 5Selection of optimum intercooled reheated cycle GT (TET = 1508 K)
RC,TOTAL RC,LPC · RC,HPC gGT
(%)SPGT
(J/kgr)Exh. flow(kgr/s)
EGT(K)
St. flow(kgr/s)
XACT
(%)gSTEAM
(%)PSTEAM
(MW)CCPP(MW)
gCCPP
(%)
40 2 · 20 29.98 413,200 448.3 1059 1059 13 35.56 116.1 316.1 47.395 · 8 35.92 480,800 505.7 874 874 11.3 35.59 90.7 290.7 50.226.32 · 6.32 35.73 475,100 433.4 842 842 11.3 35.53 71.8 271.8 48.557 · 5.71 35.49 470,600 438.1 829 829 11.1 35.50 70.1 270.1 47.9310 · 4 33.83 444,400 442.2 789 789 11.0 34.92 62.3 262.3 44.37
50 2 · 25 28.85 400,800 450.3 1077 1077 13.1 35.59 12.3 320.3 46.15 · 10 36.57 492,600 520.2 871 871 11.3 35.58 92.7 292.7 50.526.5 · 7.69 36.68 490,200 421.8 831 831 11.2 35.51 67.9 267.9 49.127.07 · 7.07 36.50 486,600 424.7 820 820 11.2 35.49 66.3 266.3 48.618 · 6.25 36.18 480,800 427.8 804 804 11.0 35.09 63.2 263.2 47.62
60 3 · 20 34.96 463,000 449.9 978 449.9 12.5 37.71 106.8 306.8 53.635 · 12 36.92 500,000 416.7 871 416.7 11 36.93 77.0 277.0 51.14
6 · 10 37.22 501,300 415.6 840 415.6 10.9 35.75 68.9 268.9 50.047.74 · 7.74 37.04 495,000 420.6 802 420.6 10.9 35.07 61.8 261.8 48.4810 · 6 36.06 478,500 422.7 771 422.7 10.6 33.96 54.9 254.9 45.96
70 4 · 17.5 35.40 490,200 425.1 919 425.1 12 36.94 87.6 287.6 50.917 · 10 37.60 506,300 411.4 815 411.4 11.2 35.61 63.6 263.6 49.568.36 · 8.36 37.33 500,000 416.5 789 416.5 10.9 34.92 58.7 258.7 48.2810 · 7 36.79 490,200 424.1 765 424.1 10.8 33.62 53.5 253.5 46.6311 · 6.36 36.27 481,900 431.9 754 431.9 10.8 33.49 52.4 252.4 45.7817.5 · 4 32.76 430,100 483.2 706 483.2 10.5 31.29 46.4 246.4 40.35
Table 6Comparison of gas turbine cycles for CCPP
Simple cycle Intercooler Reheat Interc./Reh.
RC(overall) (–) 16 12.6 49 60Exh. flow (kgr/s) 716.4 654.2 536 418.5gGT (%) 33.46 33.79 34.8 36.89gST (%) 34.5 35.6 36.6 36.93Boiler pressure (bar) 80 80 80 80Cont. pressure (bar) 0.06 0.04 0.045 0.005XACT (%) 12.8 12.9 8 11CCPP power (MW) 301.1 300.0 307.7 277gCCPP (%) 50.37 50.7 53.5 51.14
Table 7Selection of optimum GT cycle for CCPP
gCC Cost gGT Boiler pr. TET OD perform. Total
Rank 1 2 3 4 5 6Weight factor 0.296 0.222 0.185 0.185 0.074 0.038 1.0SC 94 115 93 90 94 79 2
27.88 25.54 17.15 16.74 6.92 3.01 97.24
IC 95 76 93 113 94 102 328.06 16.77 17.24 20.93 6.92 3.87 93.79
RC 100 123 96 90 94 90 129.60 27.29 17.83 16.74 6.92 3.44 101.82
IC/RH 96 71 102 91 104 113 428.30 15.80 18.91 16.75 7.69 4.30 91.75
562 A.L. Polyzakis et al. / Energy Conversion and Management 49 (2008) 551–563

Author's personal copy
two solutions to that problem. The first is to put bleedducts at the end of the LPC, extracting the excess amountof air. This solution is simple and it has low initial cost butreduces the thermal efficiency of the GT, because power isconsumed to compress all the LPC air and some amount ofthis compressed air simply goes away. The second, which isalso relatively simple and the more appropriate solution, isto install at the inlet of the LPC variable guide varies. Therequirement of decreased non-dimensional mass flow andhigher surge margin is achieved without waste of energy.
The reheated GT cycle came out to be the most suitablecycle for the CC application.
9. Conclusions
Gas turbines will certainly play a major role in futurepower generation and several well justified concepts havebeen developed or are the subject of major feasibility stud-ies. However, the combined cycle is now well establishedand offers superior performance to any of the competingsystems that are likely to be available in the medium termfor large scale power generation applications. This workcontains an optimization analysis of four potential GTcycles, namely single cycle (SC), intercooled cycle (IC),reheated cycle (RH) and intercooled and reheated cycle(IC/RH).
The design point and off design point performances ofthe four cycles alone or in combination with the steamcycle have been investigated. The three options, SC, ICand RH perform very similarly OD. The thermal efficien-cies and specific power outputs are not the optimum valuesthey would be for GT cycle operation. Furthermore, theIC/RH engine was run differently from the IC one. Whenthe ambient temperature changes, it is prudent to assumethat the intercooler exit temperature changes simulta-neously. Cooling is usually achieved with water or airdrawn from the environment, which will vary in tempera-ture. This aspect was included in the IC gas turbine ODsimulation but not in the other two machines incorporatingintercooling. This explains the remarkably better perfor-mance of the latter two. At elevated ambient temperature,the cooling water temperature would increase simulta-neously. Consequently, the HP compressor inlet tempera-ture would be higher than in the DP situation. Thisadversely affects the gas turbine performance.
The optimum gas turbine cycle to operate in a combinedcycle power plant came out to be the reheated cycle. This is
due to the high EGT = 911.1 K and steam flow =83.54 kgr/s, resulting in the steam cycle efficiency of36.6% and the overall efficiency of 53.5%. It is worth men-tioning that a fraction of wetness of 8.0% is much lowerthan the acceptable limit of 13%, which simply meanslonger life for the installation. That parameter and alsothe increased surge problems of the LPC, made the 14 · 3GT reheated option not so attractive as the one that wasselected. The total power output is 307.7 MW, exceedingthe need of 300 MW and that gives the opportunity to‘‘scale’’ downwards since the size of the GT will decreasecosts.
References
[1] Saravanamutoo H, Rogers C, Cohen H. GT theory. fifth ed. NewYork: Logmann Scientific & Technical; 2001.
[2] Mahi P, Gibson C, Morton A. CCGTs: have they improved theenvironmental situation in the UK. In: Proceedings: IMechE seminar,Commissioning and Operation of Combined Cycle Plant, November;1994.
[3] Bolland O. A comparative evaluation of advanced combined cyclealternatives. J Eng Gas Turb Power 1991;113:190–7.
[4] Najjar YSH. Efficient use of energy by utilizing gas turbine combinedsystems. Appl Therm Eng 2001(21):407–38.
[5] Poulikas A. An overview and future sustainable gas turbine technol-ogies. Renew Sustain Energ Rev 2004(9):409–43.
[6] GE Gas Turbines, MS9001FA, for Twenty-First Century 50 HzPowerplants, GE Industrial & Power Systems Publications; 2004.
[7] Asea Brown Boveri. Power generation review and specificationsbrochures; 2004.
[8] Polyzakis AL. GT performance and applications. Kozani: Kozani’sInstitute of Technology Publications; 2005.
[9] Tinsley DG. Performance of industrial GT for CCPP, MSc thesis,Cranfield University; 1995.
[10] Palrner JR. The TurboMatch scheme for gas turbine performancecalculations – user’s guide. U.K: Cranfield University; 1995.
[11] Fielden C. Industrial GT for combined power generation–optimiza-tion issues, MSc thesis, Cranfield University; 1995.
[12] Pilidis P. GT performance lecture notes. Cranfield: Cranfield Uni-versity; 2006.
[13] Leenhouts F. Industrial GT for combined power generation andother advanced power generation systems, MSc thesis, CranfieldUniversity; 1995.
[14] Polyzakis A. Performance of industrial GT for CCPP, MSc thesis,Cranfield University; 1995.
[15] Velez L. Industrial GT for combined cycle power plant, MSc thesis,Cranfield University; 1995.
[16] Kim TS, Oh CH, Ro ST. Comparative analysis of the off designperformance for gas turbine cogeneration systems 1994;14(2):153–63.
[17] Polyzakis A. Technoeconomic evaluation of trigeneraton plant: gasturbine performance, absorption cooling and district heating, PhDthesis, Cranfield University; 2006.
A.L. Polyzakis et al. / Energy Conversion and Management 49 (2008) 551–563 563