Embed Size (px)
Citation preview
Opting for Science and Technology!Introduction
From an international perspective, the Dutcheconomy is struggling with sluggish growthin productivity. In its policy recommenda-tion Towards a plan for productivity in theDutch production industry the Foundationfor Industrial Policy and Communication (SIC,2003) points out that the low level of ex-penditure on research and development(R&D) is one of the causes. Research furtherindicates that the effectiveness of technolo-gy grants provided to stimulate R&D wouldbe greater with a larger supply of knowledgeworkers with a science/technology (sci/techin short) background. Not only are moretechnicians needed, the technological changesnotably require technicians also to be morehighly educated. This is particularly so if theNetherlands wants to reach its goal of be-coming one of the leaders of the Europeanknowledge-based economy.
The Netherlands is not alone, though, inwanting to increase the science and tech-nology content of the working population.On 5 May 2003, the European ministers ofeducation issued a joint declaration in Brus-sels to the effect that more science and tech-nology students will be needed to maintainthe required level of the knowledge-basedeconomy (Education Council, 2003). TheCouncil wants to increase the number of rel-evant students by 15 % between now and2010, while giving appropriate attention toimproving the man/woman ratio. The com-muniqué does not indicate, however, ex-actly how this increase is to be realised.
The problem of shortages in science andtechnology has not arisen overnight. InNovember 1992, The Economist reportedthat: ‘... universities continue to churn outhumanities-trained generalists at a time ofsoaring demand for scientists and engineers’.In the Netherlands over the past 10 years,the alarm has been sounding over the prob-lem of the (insufficient) influx into sci-ence/technology. In 2003, industry was stillcomplaining about (threatening) shortagesof technically trained personnel. At the sametime, universities feared underutilisation and
the eventual abolition of courses in scienceand technology. With the prospect of thedramatic outflow of university staff reach-ing pensionable age in the coming years,this development is cause for alarm.
Certain actions were taken in addition tosounding the alarm. For example, more than10 years ago, the government conducted thenot very successful campaign Kies Exact(Choose Science). Recently the system ofsecondary professional education was re-structured with a view to stimulating thenumber of students choosing science/tech-nology, though its success is controversial.The government and employers have joint-ly carried out a large number of projectsaimed at promoting science/technology ineducation, and with the implied need to en-gage seriously in full implementation of thebest practices found. Following the Con-federation of Netherlands Industry and Em-ployers VNO-NCW, the government has start-ed a Delta Plan for science and technology,and funds are available for this purpose.
In this article, we will be seeking an answerto the question: ‘How much sci/tech talentis actually available in the Netherlands?’ Thatnot all talent will opt for a technical edu-cation should be considered obvious. Aftershowing the extent of talent available, thequestion is how this talent can be inducedto opt for technology. The work is based ondata from different databases (see Annex 1).
Definitions
In the Netherlands the system of higher ed-ucation is split between professional high-er education (PHE) and academic higher ed-ucation (AHE). The latter is generally moretheoretical and considered superior. Pupilsfrom pre-university secondary education(VWO) can, after graduation, choose be-tween PHE and AHE. In contrast, pupils witha diploma from intermediate vocational ed-ucation (MBO) or senior general educa-tion (HAVO) can only enrol in PHE. In An-nex II the Dutch education system is de-scribed in more detail.
VOCATIONAL TRAINING NO 35 EUROPEAN JOURNAL
Cedefop
28
MaartenBiermansResearcher SEO
AmsterdamEconomics
Efforts aimed at solving theenormous shortage of high-er education graduates in sci-ence and technology in theNetherlands should start byevaluating what is availablein this area. Research showsthat the country’s vast re-sources include considerablereserves of science and tech-nology talent. These reservescomprise students who, al-though having met the entryrequirements, ultimately didnot opt for a technical or sci-ence study programme. Sev-eral measures could mobilisethese reserves; some are pre-sented in this article alongwith the influence they areestimated to have. Although
Uulkje deJong
Senior researcherSCO-Kohnstamm
Institute, Faculty ofSocial and
Behavioural Sciences,University ofAmsterdam
Marko vanLeeuwen
Deputy director SEOAmsterdamEconomics
JaapRoeleveld
Senior researcherSCO-Kohnstamm
Institute, Faculty ofSocial and
Behavioural Sciences,University ofAmsterdam
Journal EN Nr 35.qxd 16-11-05 11:40 Page 28
Talent
Before being able to deal with the questionof whether there is sci/tech talent in theNetherlands, we first need to define the con-cept of sci/tech talent. It takes little effort toagree the designation ‘talent’ in this context.When, in this paper, reference is made tosci/tech talent, this means that the pupil whogoes to secondary school studies (or, for stu-dents, has studied) the right range of sub-jects to be admitted to studies in scienceor technology. This may conceivably belinked to a quality requirement: for exam-ple, the condition that the final marks ob-tained for these subjects meet at least a cer-tain minimum.
Prior to introducing optional subject clus-ters in secondary education, the require-ment for admission to studies in science ortechnology used to be at least mathemat-ics and physics among the subjects chosen.Research into files of first-year students ofthe 1991 cohort showed that, in additionto the number of sci/tech subjects, theaverage final examination mark increasesthe chance of obtaining the first-year cer-tificate of a study in science or technology(de Jong et al., 1998).
The most recent students entering highereducation had not chosen any specific sub-jects in secondary education, as they wouldhave under the old system, but rather a par-ticular subject cluster. The first of two de-cision points which could lead to educationin science/technology, coincides with themoment pupils must choose a subject clus-ter in secondary school. The second is choos-ing the particular study option. So, in ad-dition to delineating talent among studentsin higher education, we can also distinguishsci/tech potential among pupils in second-ary education. To this effect, we select pupilswith the optional nature and technologyor nature and health subject cluster.
Reserves
To gain a proper picture of the scienceand/or technology potential available in theNetherlands, we also look at the group ofpupils/students who, although meeting theadmission requirements, do not chooseto pursue a technical education or studiesin science. When such talent decides notto engage in studies in science/technolo-gy, they are allocated to the so-called sci/tech
reserves. In this article, sci/tech studies areunderstood to refer to courses in the na-ture and technology sectors, and laborato-ry courses at universities of professionaleducation. According to this definition,courses in the agriculture and health sec-tors are not counted among the sci/techstudies.
Are there actually reserves ofsci/tech talent?
In the second half of the 1990s, it was shownin various ways that there are large reservesof sci/tech talent in the Netherlands (1). Theactual volume depends on the definitionused for sci/tech talent, for which a dis-tinction can be made between pupils andstudents.
Pupils in secondary education
In their third year, pupils in the Netherlandsmust choose one of four subject clusters (2):
❑ nature and technology (N&T)❑ nature and health (N&H)❑ economics and society (E&M)❑ culture and society (C&M)
The central idea behind this classification isto make pupils reflect at a rather young ageon the direction in which they want to befurther educated. To generate sufficient in-flux into technical studies, a requisite num-ber of pupils will have to opt for the prepara-tory nature and technology subject cluster.
In the Netherlands, sci/tech talent is certainlyadequately available, but in many cases thechoice of a non-technical education is madeon economically rational grounds. The in-flux into the nature and technology sub-ject cluster steadily declined during the 1990s,but has stabilised in recent years (Figure 1).At the same time, the nature and health sub-ject cluster clearly gained in popularity.So, we observe a shift towards ‘more-hu-man-oriented’ technology. An experimentcalled ‘Human Technology’ successfully con-ducted at the Hanze PHE Institute demon-strates that students transferring from thenon-nature and technology subject clus-ters can successfully complete studies intechnology in PHE.
When looking at secondary-school pupil de-cision-making on the subject cluster to betaken, it turns out that the choice is partic-
VOCATIONAL TRAINING NO 35 EUROPEAN JOURNAL
Cedefop
29
the effect of these measuresseems to be substantial, theyleave much to be desired interms of cost-effectiveness.Moreover, they are still sim-ulations, and the measureshave not (yet) been tested inpractice. Therefore, additional(experimental) research onsuch policy measures con-tinues to be desirable.
(1) Hop et al., (1999); Roeleveld(1999); Bloemen and Dellaert (2000);De Jong et al. (2001).
(2) The main inflow in higher edu-cation in the Netherlands runs through5-year general secondary education(HAVO) and 6-year pre-universityeducation (VWO).
Journal EN Nr 35.qxd 16-11-05 11:40 Page 29
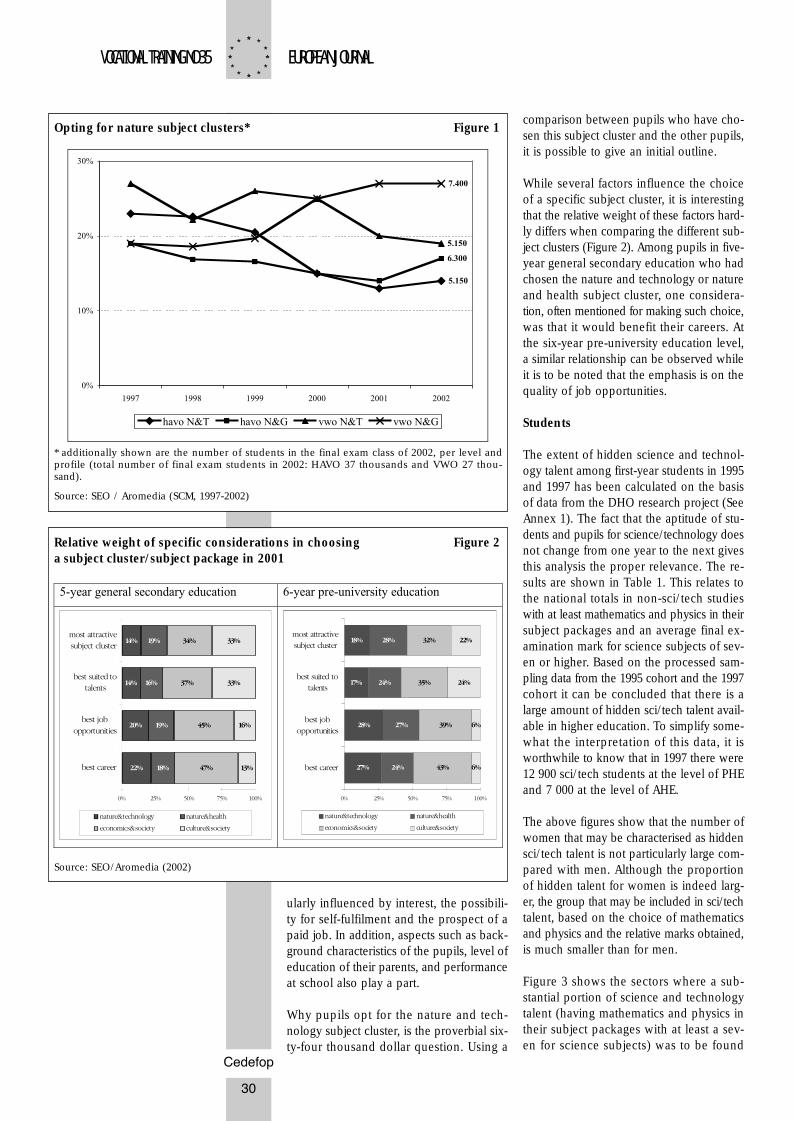
ularly influenced by interest, the possibili-ty for self-fulfilment and the prospect of apaid job. In addition, aspects such as back-ground characteristics of the pupils, level ofeducation of their parents, and performanceat school also play a part.
Why pupils opt for the nature and tech-nology subject cluster, is the proverbial six-ty-four thousand dollar question. Using a
comparison between pupils who have cho-sen this subject cluster and the other pupils,it is possible to give an initial outline.
While several factors influence the choiceof a specific subject cluster, it is interestingthat the relative weight of these factors hard-ly differs when comparing the different sub-ject clusters (Figure 2). Among pupils in five-year general secondary education who hadchosen the nature and technology or natureand health subject cluster, one considera-tion, often mentioned for making such choice,was that it would benefit their careers. Atthe six-year pre-university education level,a similar relationship can be observed whileit is to be noted that the emphasis is on thequality of job opportunities.
Students
The extent of hidden science and technol-ogy talent among first-year students in 1995and 1997 has been calculated on the basisof data from the DHO research project (SeeAnnex 1). The fact that the aptitude of stu-dents and pupils for science/technology doesnot change from one year to the next givesthis analysis the proper relevance. The re-sults are shown in Table 1. This relates tothe national totals in non-sci/tech studieswith at least mathematics and physics in theirsubject packages and an average final ex-amination mark for science subjects of sev-en or higher. Based on the processed sam-pling data from the 1995 cohort and the 1997cohort it can be concluded that there is alarge amount of hidden sci/tech talent avail-able in higher education. To simplify some-what the interpretation of this data, it isworthwhile to know that in 1997 there were12 900 sci/tech students at the level of PHEand 7 000 at the level of AHE.
The above figures show that the number ofwomen that may be characterised as hiddensci/tech talent is not particularly large com-pared with men. Although the proportionof hidden talent for women is indeed larg-er, the group that may be included in sci/techtalent, based on the choice of mathematicsand physics and the relative marks obtained,is much smaller than for men.
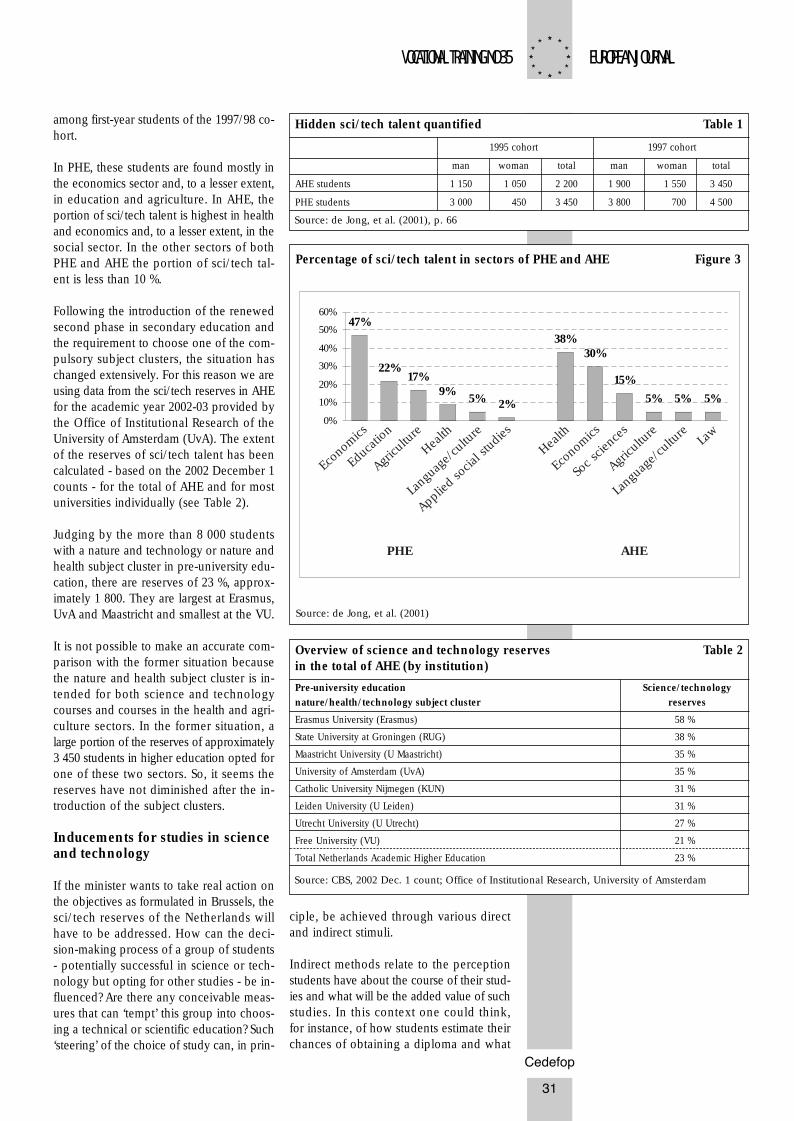
Figure 3 shows the sectors where a sub-stantial portion of science and technologytalent (having mathematics and physics intheir subject packages with at least a sev-en for science subjects) was to be found
VOCATIONAL TRAINING NO 35 EUROPEAN JOURNAL
Cedefop
30
Opting for nature subject clusters* Figure 1
* additionally shown are the number of students in the final exam class of 2002, per level andprofile (total number of final exam students in 2002: HAVO 37 thousands and VWO 27 thou-sand).
Source: SEO / Aromedia (SCM, 1997-2002)
Relative weight of specific considerations in choosing Figure 2a subject cluster/subject package in 2001
Source: SEO/Aromedia (2002)
Journal EN Nr 35.qxd 16-11-05 11:40 Page 30
VOCATIONAL TRAINING NO 35 EUROPEAN JOURNAL
Cedefop
31
among first-year students of the 1997/98 co-hort.
In PHE, these students are found mostly inthe economics sector and, to a lesser extent,in education and agriculture. In AHE, theportion of sci/tech talent is highest in healthand economics and, to a lesser extent, in thesocial sector. In the other sectors of bothPHE and AHE the portion of sci/tech tal-ent is less than 10 %.
Following the introduction of the renewedsecond phase in secondary education andthe requirement to choose one of the com-pulsory subject clusters, the situation haschanged extensively. For this reason we areusing data from the sci/tech reserves in AHEfor the academic year 2002-03 provided bythe Office of Institutional Research of theUniversity of Amsterdam (UvA). The extentof the reserves of sci/tech talent has beencalculated - based on the 2002 December 1counts - for the total of AHE and for mostuniversities individually (see Table 2).
Judging by the more than 8 000 studentswith a nature and technology or nature andhealth subject cluster in pre-university edu-cation, there are reserves of 23 %, approx-imately 1 800. They are largest at Erasmus,UvA and Maastricht and smallest at the VU.
It is not possible to make an accurate com-parison with the former situation becausethe nature and health subject cluster is in-tended for both science and technologycourses and courses in the health and agri-culture sectors. In the former situation, alarge portion of the reserves of approximately3 450 students in higher education opted forone of these two sectors. So, it seems thereserves have not diminished after the in-troduction of the subject clusters.
Inducements for studies in scienceand technology
If the minister wants to take real action onthe objectives as formulated in Brussels, thesci/tech reserves of the Netherlands willhave to be addressed. How can the deci-sion-making process of a group of students- potentially successful in science or tech-nology but opting for other studies - be in-fluenced? Are there any conceivable meas-ures that can ‘tempt’ this group into choos-ing a technical or scientific education? Such‘steering’ of the choice of study can, in prin-
ciple, be achieved through various directand indirect stimuli.
Indirect methods relate to the perceptionstudents have about the course of their stud-ies and what will be the added value of suchstudies. In this context one could think,for instance, of how students estimate theirchances of obtaining a diploma and what
Hidden sci/tech talent quantified Table 1
1995 cohort 1997 cohort
man woman total man woman total
AHE students 1 150 1 050 2 200 1 900 1 550 3 450
PHE students 3 000 450 3 450 3 800 700 4 500
Source: de Jong, et al. (2001), p. 66
22%
5% 2%
30%
15%
5% 5% 5%9%
47%
38%
17%
0%
10%
20%
30%
40%
50%
60%
PHE AHE
Econ
omics
Econ
omics
Educ
ation
Agric
ulture
Agric
ulture
Health
Health
Lang
uage
/culture
Lang
uage
/culture
Applied
socia
l studies
Soc s
cienc
esLa
w
Percentage of sci/tech talent in sectors of PHE and AHE Figure 3
Source: de Jong, et al. (2001)
Overview of science and technology reserves Table 2in the total of AHE (by institution)
Pre-university education Science/technology
nature/health/technology subject cluster reserves
Erasmus University (Erasmus) 58 %
State University at Groningen (RUG) 38 %
Maastricht University (U Maastricht) 35 %
University of Amsterdam (UvA) 35 %
Catholic University Nijmegen (KUN) 31 %
Leiden University (U Leiden) 31 %
Utrecht University (U Utrecht) 27 %
Free University (VU) 21 %
Total Netherlands Academic Higher Education 23 %
Source: CBS, 2002 Dec. 1 count; Office of Institutional Research, University of Amsterdam
Journal EN Nr 35.qxd 16-11-05 11:40 Page 31
they believe will be their position in thelabour market.
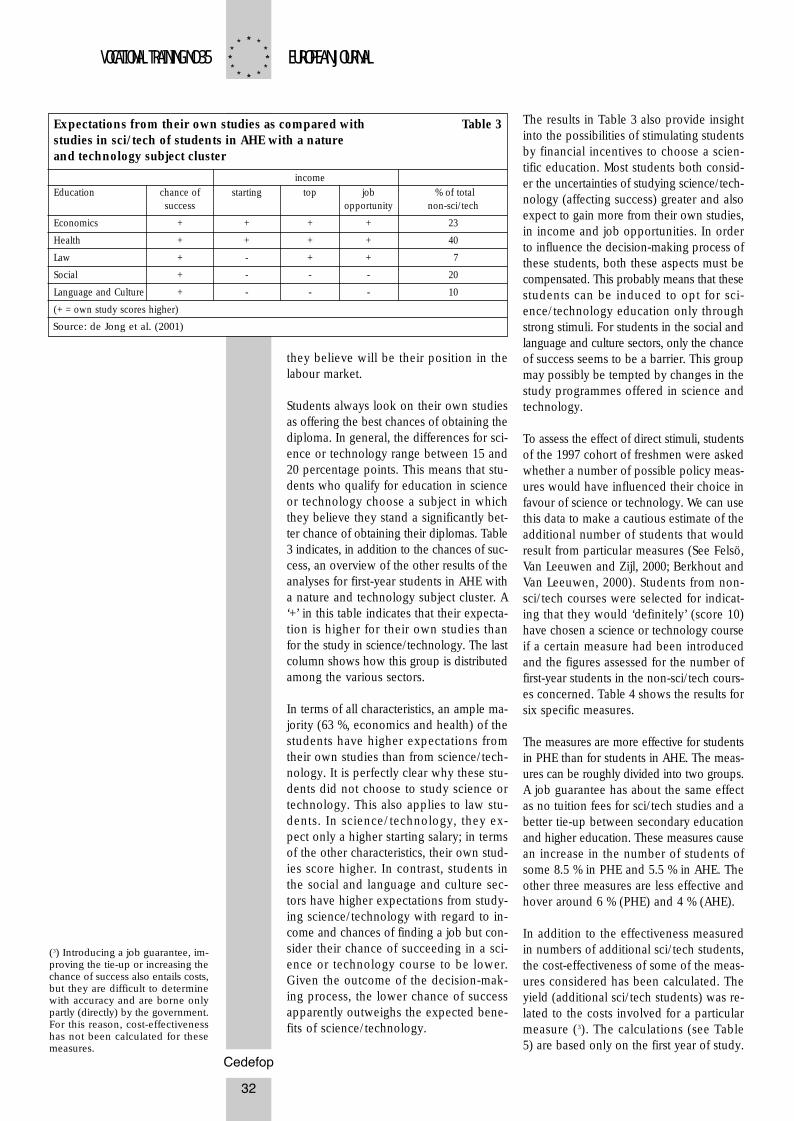
Students always look on their own studiesas offering the best chances of obtaining thediploma. In general, the differences for sci-ence or technology range between 15 and20 percentage points. This means that stu-dents who qualify for education in scienceor technology choose a subject in whichthey believe they stand a significantly bet-ter chance of obtaining their diplomas. Table3 indicates, in addition to the chances of suc-cess, an overview of the other results of theanalyses for first-year students in AHE witha nature and technology subject cluster. A‘+’ in this table indicates that their expecta-tion is higher for their own studies thanfor the study in science/technology. The lastcolumn shows how this group is distributedamong the various sectors.
In terms of all characteristics, an ample ma-jority (63 %, economics and health) of thestudents have higher expectations fromtheir own studies than from science/tech-nology. It is perfectly clear why these stu-dents did not choose to study science ortechnology. This also applies to law stu-dents. In science/technology, they ex-pect only a higher starting salary; in termsof the other characteristics, their own stud-ies score higher. In contrast, students inthe social and language and culture sec-tors have higher expectations from study-ing science/technology with regard to in-come and chances of finding a job but con-sider their chance of succeeding in a sci-ence or technology course to be lower.Given the outcome of the decision-mak-ing process, the lower chance of successapparently outweighs the expected bene-fits of science/technology.
The results in Table 3 also provide insightinto the possibilities of stimulating studentsby financial incentives to choose a scien-tific education. Most students both consid-er the uncertainties of studying science/tech-nology (affecting success) greater and alsoexpect to gain more from their own studies,in income and job opportunities. In orderto influence the decision-making process ofthese students, both these aspects must becompensated. This probably means that thesestudents can be induced to opt for sci-ence/technology education only throughstrong stimuli. For students in the social andlanguage and culture sectors, only the chanceof success seems to be a barrier. This groupmay possibly be tempted by changes in thestudy programmes offered in science andtechnology.
To assess the effect of direct stimuli, studentsof the 1997 cohort of freshmen were askedwhether a number of possible policy meas-ures would have influenced their choice infavour of science or technology. We can usethis data to make a cautious estimate of theadditional number of students that wouldresult from particular measures (See Felsö,Van Leeuwen and Zijl, 2000; Berkhout andVan Leeuwen, 2000). Students from non-sci/tech courses were selected for indicat-ing that they would ‘definitely’ (score 10)have chosen a science or technology courseif a certain measure had been introducedand the figures assessed for the number offirst-year students in the non-sci/tech cours-es concerned. Table 4 shows the results forsix specific measures.
The measures are more effective for studentsin PHE than for students in AHE. The meas-ures can be roughly divided into two groups.A job guarantee has about the same effectas no tuition fees for sci/tech studies and abetter tie-up between secondary educationand higher education. These measures causean increase in the number of students ofsome 8.5 % in PHE and 5.5 % in AHE. Theother three measures are less effective andhover around 6 % (PHE) and 4 % (AHE).
In addition to the effectiveness measuredin numbers of additional sci/tech students,the cost-effectiveness of some of the meas-ures considered has been calculated. Theyield (additional sci/tech students) was re-lated to the costs involved for a particularmeasure (3). The calculations (see Table5) are based only on the first year of study.
VOCATIONAL TRAINING NO 35 EUROPEAN JOURNAL
Cedefop
32
Expectations from their own studies as compared with Table 3studies in sci/tech of students in AHE with a natureand technology subject cluster
income
Education chance of starting top job % of totalsuccess opportunity non-sci/tech
Economics + + + + 23
Health + + + + 40
Law + - + + 7
Social + - - - 20
Language and Culture + - - - 10
(+ = own study scores higher)
Source: de Jong et al. (2001)
(3) Introducing a job guarantee, im-proving the tie-up or increasing thechance of success also entails costs,but they are difficult to determinewith accuracy and are borne onlypartly (directly) by the government.For this reason, cost-effectivenesshas not been calculated for thesemeasures.
Journal EN Nr 35.qxd 16-11-05 11:40 Page 32
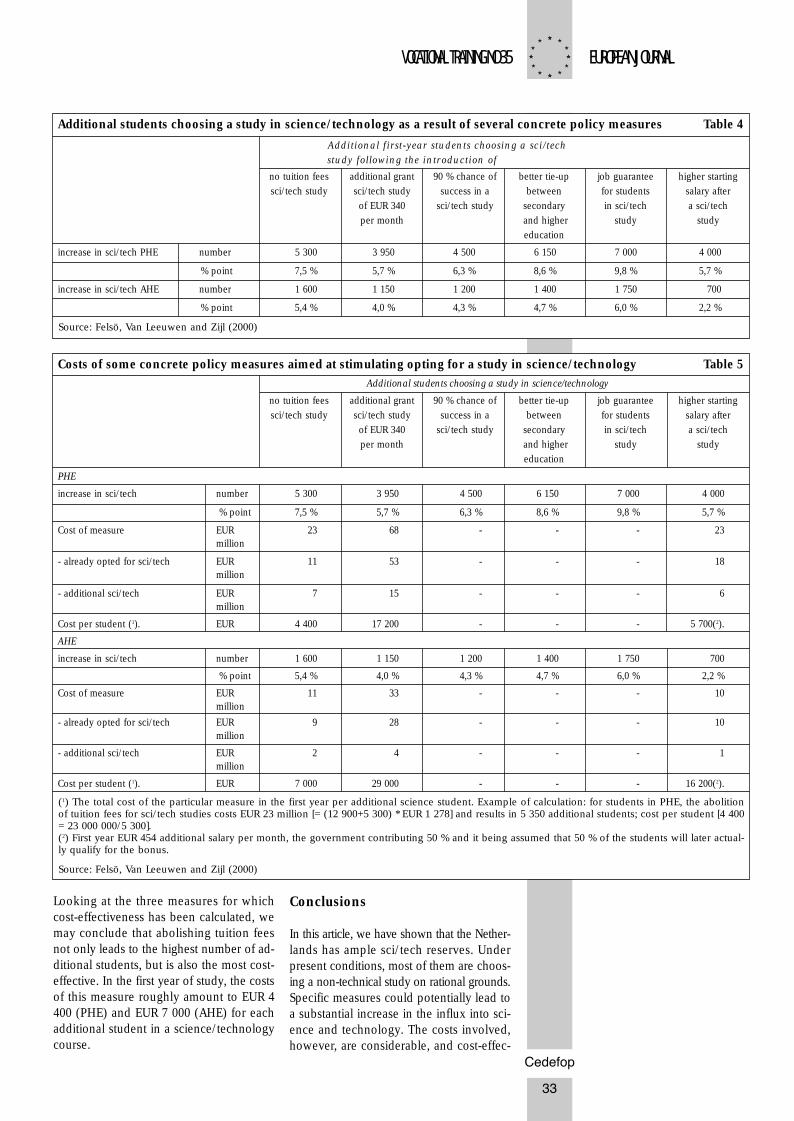
Looking at the three measures for whichcost-effectiveness has been calculated, wemay conclude that abolishing tuition feesnot only leads to the highest number of ad-ditional students, but is also the most cost-effective. In the first year of study, the costsof this measure roughly amount to EUR 4400 (PHE) and EUR 7 000 (AHE) for eachadditional student in a science/technologycourse.
Conclusions
In this article, we have shown that the Nether-lands has ample sci/tech reserves. Underpresent conditions, most of them are choos-ing a non-technical study on rational grounds.Specific measures could potentially lead toa substantial increase in the influx into sci-ence and technology. The costs involved,however, are considerable, and cost-effec-
VOCATIONAL TRAINING NO 35 EUROPEAN JOURNAL
Cedefop
33
Additional students choosing a study in science/technology as a result of several concrete policy measures Table 4
Additional first-year students choosing a sci/tech
study following the introduction of
no tuition fees additional grant 90 % chance of better tie-up job guarantee higher starting
sci/tech study sci/tech study success in a between for students salary after
of EUR 340 sci/tech study secondary in sci/tech a sci/tech
per month and higher study study
education
increase in sci/tech PHE number 5 300 3 950 4 500 6 150 7 000 4 000
% point 7,5 % 5,7 % 6,3 % 8,6 % 9,8 % 5,7 %
increase in sci/tech AHE number 1 600 1 150 1 200 1 400 1 750 700
% point 5,4 % 4,0 % 4,3 % 4,7 % 6,0 % 2,2 %
Source: Felsö, Van Leeuwen and Zijl (2000)
Costs of some concrete policy measures aimed at stimulating opting for a study in science/technology Table 5
Additional students choosing a study in science/technology
no tuition fees additional grant 90 % chance of better tie-up job guarantee higher starting
sci/tech study sci/tech study success in a between for students salary after
of EUR 340 sci/tech study secondary in sci/tech a sci/tech
per month and higher study study
education
PHE
increase in sci/tech number 5 300 3 950 4 500 6 150 7 000 4 000
% point 7,5 % 5,7 % 6,3 % 8,6 % 9,8 % 5,7 %
Cost of measure EUR 23 68 - - - 23million
- already opted for sci/tech EUR 11 53 - - - 18million
- additional sci/tech EUR 7 15 - - - 6million
Cost per student (1). EUR 4 400 17 200 - - - 5 700(2).
AHE
increase in sci/tech number 1 600 1 150 1 200 1 400 1 750 700
% point 5,4 % 4,0 % 4,3 % 4,7 % 6,0 % 2,2 %
Cost of measure EUR 11 33 - - - 10million
- already opted for sci/tech EUR 9 28 - - - 10million
- additional sci/tech EUR 2 4 - - - 1million
Cost per student (1). EUR 7 000 29 000 - - - 16 200(2).
(1) The total cost of the particular measure in the first year per additional science student. Example of calculation: for students in PHE, the abolitionof tuition fees for sci/tech studies costs EUR 23 million [= (12 900+5 300) * EUR 1 278] and results in 5 350 additional students; cost per student [4 400= 23 000 000/5 300].(2) First year EUR 454 additional salary per month, the government contributing 50 % and it being assumed that 50 % of the students will later actual-ly qualify for the bonus.
Source: Felsö, Van Leeuwen and Zijl (2000)
Journal EN Nr 35.qxd 16-11-05 11:40 Page 33
tiveness is usually low. Also, the measuresstudied have not been tested in practice andthe margin of uncertainty is wide. Both thegovernment and industry have called for aDelta Plan to be drawn up for science/tech-nology. In this respect, it is important to re-flect on a stimulating policy focused on ed-ucational institutions (adoption of best prac-tices), pupils (inducing them to choose tech-nology) and enterprises (offering entrantsexperience-gaining opportunities and career
prospects). Since we still do not know enoughabout the degree to which study options canbe influenced, several studies notwithstanding,the effects of any adaptation of the studentgrant system are uncertain. Policy changesand investments in education should, there-fore, be coupled with scientifically controlledexperiments, the effects of which are eval-uated. We shall then know in a few yearshow all this works out and which measuresmay be expected to have an effect.
Berkhout, E. E.; van Leeuwen, M. J. Wie kiezener voor techniek?: instroom en doorstroom inhoger natuur en techniek onderwijs en uitstroomnaar de arbeidsmarkt. AXIS rapport no. 00-11.Amsterdam: Stichting voor Economisch Onder-zoek, 2000. Available from Internet: http://www.seo.nl/assets/binaries/pdf/rapport561.pdf [cited 27/04/2005].
Bloemen, H.; Dellaert, B. De studiekeuze vanmiddelbare scholieren: een analyse van motieven,percepties en preferenties. OSA-publicatie A176.The Hague: OSA, 2000.
de Boom, J. et al. Studentenmonitor: studentenin het hoger onderwijs. Beleidsgerichte StudiesHoger onderwijs en Wetenschappelijk onderzoek.The Hague: Ministerie van Onderwijs, Cultuur enWetenschap, 2003.
Education Council. Education Council agreeson European benchmarks. Brussels: EuropeanCommission, 2003. Available from Internet:http://www.europa.eu.int/rapid/start/cgi/guesten.ksh?p_action.gettxt=gt&doc=IP/03/620|0|RAPID&lg=EN&display= [cited 27/04/2005].
Education Council. Europeans and lifelong learn-ing: main findings of a Eurobarometer survey.Brussels: European Commission, 2003. Avail-able from Internet: http://europa.eu.int/rapid/start/cgi/guesten.ksh?p_action.gettxt=gt&doc=IP/03/619|0|RAPID&lg=EN&display= [cited 27/04/2005].
Felsö, F.; van Leeuwen, M.; Zijl M. Verkennin-gen van stimulansen voor het keuzegedrag vanleerlingen en studenten. Beleidsgerichte StudiesHoger onderwijs en Wetenschappelijk onderzoek74. The Hague: Ministerie van Onderwijs, Cul-tuur en Wetenschap, 2000.
Hop, J. et al. Studiekeuze en studiemotieven vanleerlingen in het Voortgezet onderwijs en eerste-jaars studenten cohort 1997/98. Serie Deelnameaan Hoger onderwijs. Deel 3. SCO-rapport 563/SEO-rapport 508. Amsterdam: Stichting voor EconomischOnderzoek, 1999.
de Jong, U. et al. Studiekeuze en motieven vaneerstejaars 1995/96. Serie Deelname aan Hogeronderwijs. Deel 1. SCO-rapport 458/ SEO-rapport530. Amsterdam: Stichting voor Economisch On-derzoek, 1998.
de Jong, U. et al. Deelname aan Hoger onder-wijs: toegankelijkheid in beweging: kiezen voorhoger onderwijs 1995-2000. Beleidsgerichte Stud-ies Hoger onderwijs en Wetenschappelijk onder-zoek 81. The Hague: Ministerie van Onderwijs,Cultuur en Wetenschap, 2001.
Roeleveld, J. Kiezen voor technisch Mbo?: on-derwijsloopbanen in de jaren negentig. Amster-dam: Max Goote Kenniscentrum, UvA, 1999.
SEO/Aromedia. Studie keuze monitor 2002. Am-sterdam: Stichting voor Economisch Onderzoek,2002. Available from Internet: http://www.studiekeuzemonitor.nl/ [cited 27/04/2005].
Stichting voor Industriebeleid en Communicatie.Naar een plan voor de productiviteit in de Ned-erlandse maakindustrie. Hoofddorp: SIC, 2003.Available from Internet: www.industriebeleid.nl/documenten/BAP_jan2003.doc [cited 27/04/2005].
Webbink, H. D. Student decisions and conse-quences. Dissertation. Amsterdam: University ofAmsterdam, 1999.
VOCATIONAL TRAINING NO 35 EUROPEAN JOURNAL
Cedefop
34
Key words
Educational policy,labour demand,science policy,motivation,choice of studies,higher education.
Bibliography
The annual Student monitor (de Boom et al., 2003)publishes data on students based on a repre-sentative sampling from the entire Dutch studentpopulation in higher education. This samplingis used to outline a reliable, year-on-year pictureof students in Dutch higher education. This isdone on the basis of a sampling that is stratifiedby type of higher education (PHE/AHE), academicyears and sectors.
The Study choice monitor (SCM) is the productof cooperation between Aromedia and SEO Am-sterdam Economics. In the SCM, pupils’ behav-iour in choosing their studies is charted from aquestionnaire to be completed by the pupils bycomputer. They are assisted in this by the careersmaster. The population investigated comprisesthe pupils of the final two school years in five-
year general secondary education and six-yearpre-university education. The SCM started in 1996with a total response from over 5 000 pupils. To-day, more than 6 000 pupils complete the ques-tionnaire each year (more than 11 % of the totalpopulation).
In the research project Participation in higher ed-ucation (DHO), SEO Amsterdam Economics andSCO-Kohnstamm Institute, both of the Universi-ty of Amsterdam, gathered data on students inhigher education who had enrolled for the firsttime at an AHE or a PHE institute in the academicyears 1995/96 and 1997/98. Both samplings arestratified by type of education (PHE/AHE) andsectors (eight PHE and eight AHE). The respon-dents were approached in their first and secondyears of study.
Annex I
Journal EN Nr 35.qxd 16-11-05 11:40 Page 34
VOCATIONAL TRAINING NO 35 EUROPEAN JOURNAL
Cedefop
35
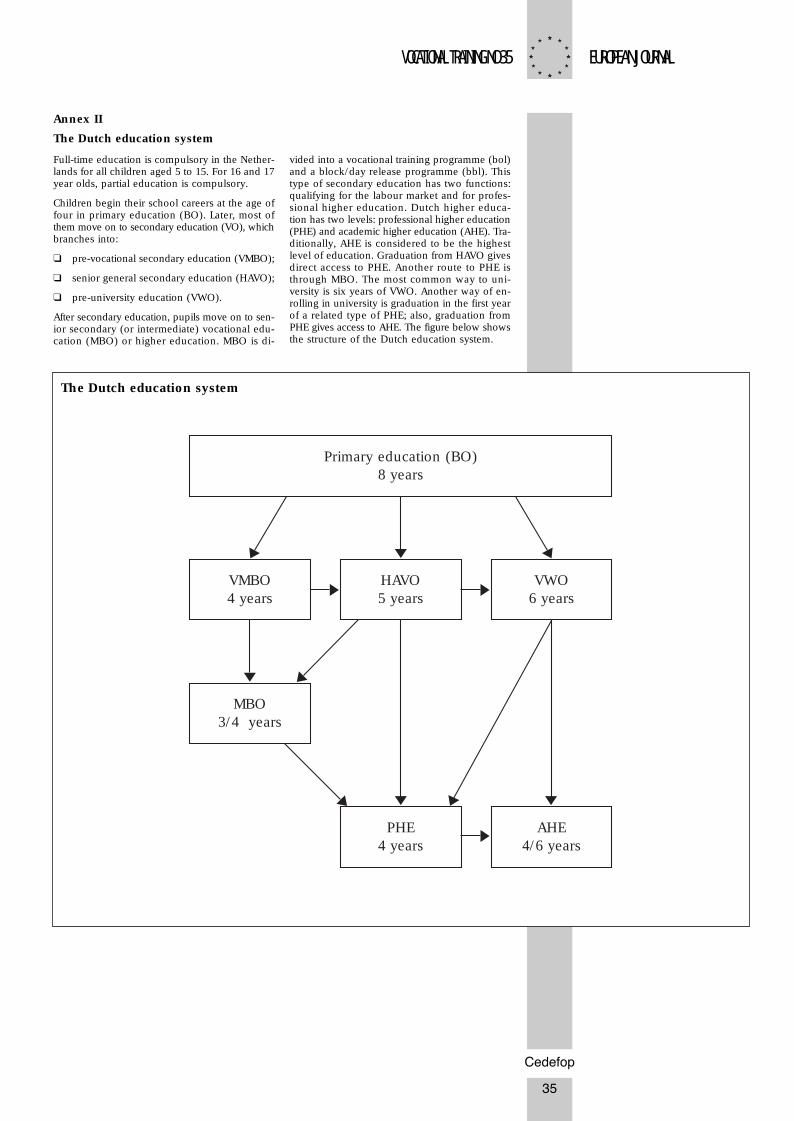
Full-time education is compulsory in the Nether-lands for all children aged 5 to 15. For 16 and 17year olds, partial education is compulsory.
Children begin their school careers at the age offour in primary education (BO). Later, most ofthem move on to secondary education (VO), whichbranches into:
❑ pre-vocational secondary education (VMBO);
❑ senior general secondary education (HAVO);
❑ pre-university education (VWO).
After secondary education, pupils move on to sen-ior secondary (or intermediate) vocational edu-cation (MBO) or higher education. MBO is di-
vided into a vocational training programme (bol)and a block/day release programme (bbl). Thistype of secondary education has two functions:qualifying for the labour market and for profes-sional higher education. Dutch higher educa-tion has two levels: professional higher education(PHE) and academic higher education (AHE). Tra-ditionally, AHE is considered to be the highestlevel of education. Graduation from HAVO givesdirect access to PHE. Another route to PHE isthrough MBO. The most common way to uni-versity is six years of VWO. Another way of en-rolling in university is graduation in the first yearof a related type of PHE; also, graduation fromPHE gives access to AHE. The figure below showsthe structure of the Dutch education system.
Annex II
The Dutch education system
Primary education (BO)8 years
VMBO4 years
HAVO5 years
VWO6 years
MBO3/4 years
PHE4 years
AHE4/6 years
The Dutch education system
Journal EN Nr 35.qxd 16-11-05 11:40 Page 35
VOCATIONAL TRAINING NO 35 EUROPEAN JOURNAL
Cedefop
36
Journal EN Nr 35.qxd 16-11-05 11:40 Page 36
VOCATIONAL TRAINING NO 35 EUROPEAN JOURNAL
Cedefop
37
Journal EN Nr 35.qxd 16-11-05 11:40 Page 37
VOCATIONAL TRAINING NO 35 EUROPEAN JOURNAL
Cedefop
38
Journal EN Nr 35.qxd 16-11-05 11:40 Page 38
VOCATIONAL TRAINING NO 35 EUROPEAN JOURNAL
Cedefop
39
Journal EN Nr 35.qxd 16-11-05 11:40 Page 39
VOCATIONAL TRAINING NO 35 EUROPEAN JOURNAL
Cedefop
40
Journal EN Nr 35.qxd 16-11-05 11:40 Page 40
VOCATIONAL TRAINING NO 35 EUROPEAN JOURNAL
Cedefop
41
Journal EN Nr 35.qxd 16-11-05 11:40 Page 41
VOCATIONAL TRAINING NO 35 EUROPEAN JOURNAL
Cedefop
42
Journal EN Nr 35.qxd 16-11-05 11:40 Page 42


