Embed Size (px)
Citation preview

Astronomy & Astrophysics manuscript no. 7335 c© ESO 2008February 1, 2008
Outflow or galactic wind: The fate of ionized gas in the halos ofdwarf galaxies
J. van Eymeren1, D. J. Bomans1, K. Weis1,2, and R.–J. Dettmar1
1 Astronomisches Institut der Ruhr-Universitat Bochum, Universitatsstraße 150, D-44780 Bochume-mail: [email protected]
2 Lise Meitner Fellowship
Received date; accepted date
ABSTRACT
Context. Hα images of star bursting irregular galaxies reveal a large amount of extended ionized gas structures, in some cases at kpc-distanceaway from any place of current star forming activity. A kinematic analysis of especially the faint structures in the halo of dwarf galaxies allowsinsights into the properties and the origin of this gas component. This is important for the chemical evolution of galaxies, the enrichment of theintergalactic medium, and for the understanding of the formation of galaxies in the early universe.Aims. We want to investigate whether the ionized gas detected in two irregular dwarf galaxies (NGC 2366 and NGC 4861) stays gravitationallybound to the host galaxy or can escape from it by becoming a freely flowing wind.Methods. Very deep Hα images of NGC 2366 and NGC 4861 were obtained to detect and catalog both small and large scale ionized gasstructures down to very low surface brightnesses. Subsequently, high-resolution long-slit echelle spectroscopy of the Hα line was performedfor a detailed kinematic analysis of the most prominent filaments and shells. To calculate the escape velocity of both galaxies and to compareit with the derived expansion velocities of the detected filaments and shells, we used dark matter halo models.Results. We detected a huge amount of both small scale (up to a few hundred pc) and large scale (about 1–2 kpc of diameter or length) ionizedgas structures on our Hα images. Many of the fainter ones are new detections. The echelle spectra reveal outflows and expanding bubbles/shellswith velocities between 20 and 110 km/s. Several of these structures are in accordance with filaments in the Hα images. A comparison with theescape velocities of the galaxies derived from the NFW dark matter halo model shows that all gas features stay gravitationally bound.
Key words. galaxies: irregular – galaxies: ISM – galaxies: kinematics and dynamics – galaxies: structure
1. Introduction
Irregular dwarf galaxies can be the sites of giant star formationregions. The interplay between massive stars and the interstel-lar medium (ISM) has a large effect on the formation and theevolution of galaxies. Thereby, dwarf galaxies provide a per-fect environment for this interaction as they are simple systems,fragile and hence likely to be strongly affected by both externaland internal processes (e.g., Gallagher & Hunter 1984). Theygenerally have low metalicities, which may be a result of theirinability to retain newly synthesized metals. Additionally, theirsurface brightness is very low, which could be due to an ex-pansion of the whole galaxy following the loss of a substantialfraction of its mass or due to the cessation of star formation re-sulting from the loss of its ISM.Numerous ionized gas structures up to kpc-size in and aroundthe galactic plane of dwarf galaxies were found (e.g., Bomanset al. 1997; Hunter & Gallagher 1997; Martin 1998; Bomans2001). These structures can be divided into long, narrow fila-ments and ring-like structures. Using the definition of Bomans
et al. (1997), we refer to all ring-like structures with radiismaller than 500 pc as superbubbles (SB). All ring-like struc-tures larger than 500 pc are called supergiant shells (SGS).Some of these gas features could be the relicts of former shellstructures. Others mark the edges of shells that were producedby stellar winds and supernova explosions. Generally, thesestructures enclose large concentrations of massive stars, so-called OB associations. In this case, the ionization mechanismsare relatively well understood: Kinetic energy and momentumare delivered by massive stars to their surroundings throughstellar winds and supernova explosions. A hot superbubble thenexpands into the ISM and sweeps up the ambient gas whichforms a thin, dense shell detectable in optical emission line im-ages. Having a sufficiently energetic and long-lasting starburst,this shell can fragment, which allows the gas of the hot bubbleto escape.However, ionized gas structures also exist at kpc-distancesaway from any place of current star formation or hot massivestars (e.g., Hunter et al. 1993). In this case, the ionization mech-anisms are not obvious. Shock waves that are driven by a con-
arX
iv:0
709.
2974
v1 [
astr
o-ph
] 1
9 Se
p 20
07

2 J. van Eymeren et al.: Outflow or galactic wind: The fate of ionized gas in the halos of dwarf galaxies
Fig. 1. R band images of NGC 2366 (on the left) and NGC 4861 (on the right). The GEHRs are marked in white. The whiteshadow on the top of NGC 4861 was caused by the pick up arm of the guider tracking a bright star in the northern part of thegalaxy and also affects the Hα image (see Fig. 3). Therefore, the northern-most part of the galaxy is missing. Nevertheless, it isthe deepest R band exposure of NGC 4861 available so far.
centration of massive stars may sweep the interstellar gas outof the star forming region, which leads to the formation of acavity. Due to lower densities than usual in the ISM, the pho-tons can travel larger distances and can ionize much more dis-tant neutral gas (e.g., Hunter & Gallagher 1997). Apart fromphotoionization and shock ionization, turbulent mixing layers(Slavin et al. 1993) and magnetic reconnection (Birk et al.1998) are additional, possible excitation mechanisms.In theoretical models, the gas, most likely driven by collectivesupernovae, is expelled into the halos of the galaxies. Norman& Ikeuchi (1989) developed a theory in which the gas is trans-ported through tunnel-like features into the halo, called chim-neys. Depending on the strength of the gravitational potential,the gas may be able to fall back onto the galactic disk, whichis described in the galactic fountain scenario (Shapiro & Field1976).All these theories are based upon models which try to explainthe observations. Several studies also show blowout scenariosby using numerical simulations. Mac Low & Ferrara (1999)developed hydrodynamic models of dwarf galaxies by vary-ing the energy input, the mass of the galaxy and the metal-licity. They address analytically and numerically the questionshow supernova explosions effect the interstellar medium ofdwarf galaxies and what happens to the gas, particularly to themetals. Their simulations show that only in low mass galax-ies (∼ 106 M�) the probability of gas being able to leave thegravitational potential increases. Silich & Tenorio-Tagle (2001)came to very similar results in their numerical experiments andanalytical estimates.While hunting for ionized gas structures, the vicinity of theGiant Extragalactic H Regions (GEHR) is of huge interest.
GEHRs exceed normal H regions in size, luminosity and ve-locity dispersion. Usually, they harbor several concentrationsof massive stars. Therefore, a lot of excitation should take placein and around these regions during the lifetime of the OB as-sociations. Our results will show that the presence of excitedgas around GEHRs does not necessarily correlate with the ageof the OB assocations and is sometimes not limited to the exis-tence of OB associations.Most of the ionized gas structures seem to expand from theirplace of birth into the ISM. As the relatively low escape ve-locity of the dwarfs will facilitate the removal of substantialamounts of interstellar matter, the question comes up whetherthese gaseous features stay gravitationally bound to the galac-tic disk (outflow) or whether they can escape from the gravi-tational potential by becoming a freely flowing wind (galacticwind). This is of special importance for the chemical evolutionof galaxies, the enrichment of the intergalactic medium (IGM),and for the understanding of the formation of galaxies in theearly universe (e.g., Recchi et al. 2004). The relative veloci-ties of the ionized structures within about 1 kpc around the starforming regions are quite low (e.g., Martin 1998). Therefore,the gas appears to stay gravitationally bound to the host galax-ies. No convincing case for a galactic wind has been found ina dwarf galaxy up to now (Bomans 2005). Nevertheless, galac-tic winds are generally regarded as a necessary ingredient tochemical and chemodynamical models of dwarf galaxies (e.g.,Hensler et al. 2004). This apparent contradiction is most proba-bly due to the previous inability to detect the faintest filamentsat large distances from the host galaxies. The fastest movingshells most likely have the lowest densities, which correspondsto very low surface brightness in Hα.

J. van Eymeren et al.: Outflow or galactic wind: The fate of ionized gas in the halos of dwarf galaxies 3
Table 1. The sample of galaxies
Parameters [unit] NGC 2366 NGC 4861 References
Hubble Typea IB(s)m SB(s)mmB [mag] −16.63 −16.62 (1)D [Mpc] 3.44 7.5 (2), (3)va
sys [km/s] 80 833vrot,H i [km/s] 67 54 (4)< σ >H i [km/s] 7.7 8.4 (4)σPeak,H i [km/s] 14.3 19 (4)i [◦] 59 82 (4)MH i
[109 M�
]0.57 1.14 (4)
a Data from NED
References. (1) Bomans (2001); (2) Tolstoy et al. (1995); (3)de Vaucouleurs et al. (1991); (4) Thuan et al. (2004)
We examined ionized gas structures around two dwarf galax-ies which are very similar in mass, luminosity and shape. Verydeep Hα images show previously undocumented ionized struc-tures, some of them with sizes of several kpcs, located in thehalos (e.g., van Eymeren et al. 2005). Furthermore, we per-formed high-resolution long-slit echelle spectroscopy coveringseveral of the identified filaments in order to measure their gaskinematics. The most relevant parameters of the galaxies arelisted in Table 1.The distance of NGC 2366 and its position on the sky place thisgalaxy into the M 81 group. Nevertheless, it can be regarded asan isolated galaxy. Its appearance in Hα is dominated by theGEHR NGC 2363 in the south-western end of the galaxy. ThisGEHR harbors two large OB associations, one in the core withan age of 1 Myr and one in the eastern part of the core withan age of 3 − 5 Myr (Drissen et al. 2001). NGC 4861 is verysimilar to NGC 2366 concerning its shape. It is also dominatedby a GEHR in the south-west, I Zw 49, where most of the starformation occurs. A chain of small H regions extends to thenorth-east. Although the galaxy shows almost no evidence forthe existence of spiral structures (Wilcots et al. 1996), it is clas-sified as SB(s)m. Its distance is more than twice the distance ofNGC 2366 (see Table 1). Figure 1 shows our R band images ofboth galaxies.This paper is organized as follows. The observations and thedata reduction are described in § 2. Sect. 3 presents the resultsof the imaging data. The catalog of the Hα filaments and shellscan be found in Appendix A. In § 4, the analysis of the echellespectra including the detection of expanding material follows.A discussion of the results is presented in Sect. 5. § 6 summer-izes the main results.
2. Observation and Data Reduction
2.1. Optical Imaging
Hα narrowband CCD images of the two irregular dwarf galax-ies were required to establish a catalog of the Hα structuresand to relate the slit positions of the spectra to the galax-
ies. Therefore, we used our image from the 3.5 m telescopeof the Calar Alto Observatory (NGC 2366)1 and archival datafrom the 3.6 m Canada France Hawaii Telescope (NGC 4861)2,and from the HST (NGC 2363). After the standard data reduc-tion with the software package IRAF, the corresponding con-tinuum images were subtracted to produce images of the Hαline emission. In the case of the HST image of NGC 2363, nocontinuum-subtraction was done because no red continuum im-age was available. The image was flux-calibrated by using thephotflam value for the Hα filter3. To estimate the contributionof the continuum and to define an error for the energy calcula-tion in Sect. 5.1.1, we took a different continuum filter F547M,that was observed together with the F656N, scaled the flux ofthe stars to the stars in the Hα image and subtracted it fromHα. A comparison of the flux of the faint Hα filaments beforethe continuum-subtraction and afterwards shows that the fluxis roughly 6% lower after the subtraction. As we expect that acontinuum subtraction with a red filter is much more efficientthan the one we did with F547M, the 6% give us an upper limitfor the error. In Sect. 5.1.1, we calculate the energy by takinginto account this uncertainty.Finally, we used an adaptive filter which is based on the H-transform (Richter et al. 1991) to emphasize the weakest ion-ized gas features and to differentiate them from the noise.Table 2 gives a short overview about the images.
2.2. Echelle spectroscopy of the Hα line
High-resolution long-slit echelle spectroscopy of both galaxieswas performed with the 4 m telescope of the Kitt Peak NationalObservatory from March 18th to 20th 1998. Inserting a post-slitHα filter with a width of 75 Å and replacing the cross disper-sion grating by a flat mirror, we selected the Hα line at 6563 Åand the two [NII] lines at 6548 Å and 6583 Å. We picked the79 lines mm−1 echelle grating with a blaze angle of 63◦. Theslit-width is about 240 µm (corresponding to 1.′′6), which leadsto an instrumental FWHM at the Hα line of about 13 km/s.All data were recorded with the long focus red camera and a2048 x 2048 Tek2 CCD. The pixel size is 0.08 Å along the dis-persion and 0.′′26 along the spatial axis. The slit-length was lim-ited to 4′46′′. The seeing was about 1′′. For geometric distor-tion corrections we used star spectra, for the wavelength cali-bration we used spectra of a Thorium-Argon comparison lamp.Close to the Hα emission of both galaxies, we additionally de-tected four night sky lines. In the spectra of NGC 4861 theycould be subtracted by using the IRAF task background. Forthis correction Hα line-free parts along the spatial axis areneeded. In the spectra of NGC 2366 the Hα emission is tooextended to define an Hα line-free area and therefore to re-move the night sky lines properly. However, due to the different
1 Based on observations collected at the Centro AstronomicoHispano Aleman (CAHA) at Calar Alto.
2 Guest User, Canadian Astronomy Data Center, which is operatedby the Dominion Astrophysical Observatory for the National ResearchCouncil of Canada’s Herzberg Institute of Astrophysics.
3 WFPC2 Data Handbook chapter 5, URL:http://www.stsci.edu/instruments/wfpc2

4 J. van Eymeren et al.: Outflow or galactic wind: The fate of ionized gas in the halos of dwarf galaxies
Table 2. Imaging – some observational parameters
Parameters [unit] NGC 2366 NGC 2363 NGC 4861
Date 14.01.91 08.01.96 12.03.00Telescope/Instrument 3.5m Calar Alto Prime Focus HST WFPC2 3.6m CFHT OSISFilter 658/10, Johnson R F656N 6570/48, 6493/1305Exposure Time [s] 1200, 200 1500 900, 300Scale [arcsec/pix] 0.38 0.1 0.15FWHM [arcsec] 1.1 0.2 0.8
redshifts of both galaxies, only the Hα emission of NGC 4861is affected by one of these night sky lines. In the case ofNGC 2366 the Hα emission lies clearly separated between twonight sky lines so that this correction can be neglected.The right panels of Figures 2 and 3 show the slit positions ofthe spectra on the underlying continuum-subtracted Hα image.We obtained five spectra of each galaxy with small offsets fromeach other and with an exposure time of 1800 s (NGC 4861 allslits, NGC 2366 slit 01 and 02) or 2400 s (NGC 2366 slit 03,04, and 05). The position angles were 40◦ for NGC 2366 and0◦ for NGC 4861.For the measurement of the emission lines the spectra werebinned in the spatial direction by four pixels, which corre-sponds to about 1′′ matching the seeing. At positions of veryweak emission, we summed up over ten pixels and used theIRAF task splot in the interactive mode to determine the peakwavelength and the Full Width at Half Maximum (FWHM). Atmany locations, the emission line profile was double- or triple-peaked with clear minima in the intensity between these peaks.We fitted such profiles with two or three Gaussian components.The measured peak wavelengths were then converted into he-liocentric velocities.
2.3. H data
For a comparison of the measured Hα velocities with rotationcurves derived from H data, we used published H momentmaps by Thuan et al. (2004) (their Fig. 1 and Fig. 7, bottomleft panel). They used archival VLA data with a spatial resolu-tion of 12.′′5 (NGC 2366) and 15.′′2 (NGC 4861). We copied thevelocity information for the corresponding slit positions, whichgives us a rough estimate for the behaviour of the neutral gasin comparison to the ionized gas.
3. Results – The catalog of filaments
Both galaxies show remarkable Hα features partly of kpc-size.We divided them into small scale (about a few hundred pc) andlarge scale structures (about 1 kpc and larger).In the following subsections the structures of each galaxy arediscussed. A complete catalog of the Hα structures can befound in Appendix A. All features were detectect by visual in-spection on our fully-reduced Hα images (see Fig. A.1 andFig. A.2) and afterwards measured manually. Only structuresabove a 3σ detection limit were considered for this analysis.To measure the diameter of the superbubbles and supergiant
shells, we began with the intensity maximum on one side of thering and ended on the intensity maximum on the other side ofthe ring. The lengths of the filaments were measured by start-ing from one end at an intensity larger than 3σ and stopping atthe other end before the intensity drops below 3σ. The errorsfor both measurements are about 0.′′5 for each galaxy, whichleads to 8 pc in the case of NGC 2366 and and 17 pc in the caseof NGC 4861. The lower detection limit depends on the resolu-tion and is 17 pc in the case of NGC 2366 (FWHM of 1.′′1, seeTable 2) and 27 pc in the case of NGC 4861 (FWHM of 0.′′8).
3.1. NGC 2366
3.1.1. Small scale structures
NGC 2366 shows a wealth of small structures especiallyaround the GEHR NGC 2363 and in the north-eastern part ofits tail (Fig. A.1). These filaments have sizes of about a fewhundred pc (see Table A.1). Most of them surround NGC 2363and seem to connect the GEHR to the small H region in thewest. All filaments in the eastern part of NGC 2363 are locatedat the inner edge of the supergiant shell SGS1. Another impor-tant structure is the diffuse ionized gas in the north-western partof NGC 2363. It is represented by a few small filaments (e.g.,FIL14 and FIL15) which are all perpendicular to the major axisof NGC 2366. FIL14 and FIL15 form the edges of an enormousoutflow, which is discussed in Sect. 4.1.1.Altogether it seems that many of the smaller filaments connectthe GEHR to the large scale structures (e.g., SGS1) or to otherH regions.
3.1.2. Large scale structures
The largest structure in NGC 2366 is the above mentioned su-pergiant shell SGS1 which was detected before by Bomans &Hopp (1992) – their shell 1 –, Hunter et al. (1993) – their fea-tures 1 and 2 –, and Martin (1998) – her feature A –. It is lo-cated at the north-eastern part of the GEHR at a distance ofabout 850 pc from the center of NGC 2363 and has a diameterof about 900 pc. It is connected to the GEHR via the smaller fil-aments as discussed above. FIL6 and FIL7 together with FIL13in the northern part of the galaxy may form the edge of a gi-ant shell which has fragmented as described in Sect. 1. It thenwould have had a diameter of about 1 kpc.

J. van Eymeren et al.: Outflow or galactic wind: The fate of ionized gas in the halos of dwarf galaxies 5
Fig. 2. NGC 2366. Left panel: Continuum-subtracted Hα image with the continuum contours overlaid in blue (grey). Right panel:Continuum-subtracted Hα image with the five slit positions indicated by white lines and the most important ionized gas structuresalso indicated by white lines. The upper end of each line representing a slit position indicates the end of the true slit. The truelower end of these slits as well as upper and lower end of the slits in NGC 4861 (see Fig. 3) are located outside of the Hα images.
Fig. 3. NGC 4861. Left panel: Continuum-subtracted Hα image with the continuum contours overlaid in blue (grey). Right panel:Continuum-subtracted Hα image with the five slit positions indicated by white lines (the numbers are rising from 01 on the leftto 06 on the right side of the image) and with the largest structures marked in white. The quality of slit 02 is too poor to give anyreasonable results so that its position is left out on the right panel. The white shadow on the top was again caused by the pick uparm of the guiding camera (see Fig. 1) and hides the northern part of the galaxy.
3.2. NGC 4861
3.2.1. Small scale structures
Comparable to NGC 2366, NGC 4861 shows a high amountof smaller structures around its GEHR I Zw 49 (Fig. A.2,Table A.2). But in this case, a lack of ionized filaments exists in
the north-eastern part of the GEHR. In the western part, a com-plex web of filaments is visible on the Hα image, which wedetected as expanding material in our spectra. Especially FIL9to FIL11 at the western part of the tail, which extend perpendic-ular to the major axis of NGC 4861, seem to form a connectionto the large scale structure mentioned below.

6 J. van Eymeren et al.: Outflow or galactic wind: The fate of ionized gas in the halos of dwarf galaxies
The upper part of the tail of NGC 4861 mainly consists of smallH regions and shows no diffuse filamentary emission. Thewhite shadow on the top of the image was caused by the pick uparm of the guiding camera tracking a bright star in the northernpart of the galaxy. This does not affect the analysis because, asmentioned above, no ionized gas structures were found aroundthis area.
3.2.2. Large scale structures
The most prominent features in NGC 4861 are the kpc-sized fil-aments extending from the north to the west of I Zw 49 (SGS1-3, FIL1, see Fig. 3 right panel). Assuming that SGS1, SGS2and SGS3 belong to one single shell, it would have a diameterlarger than 2 kpc.
4. Results – The kinematics of the ionized gas
Figure B.1 presents the echellograms grouped by galaxy andarranged in a spatial sequence. A first glance reveals a largeamount of velocity structures. In a first step, we looked for ex-panding gas and tried to connect the emission features to thecataloged structures. Partially, a Doppler ellipse as describedin Martin (1998) was detected, which gives evidence for an ex-panding shell structure. In some cases, we only detected emis-sion at a constant wavelength which is Doppler-shifted withrespect to the rest wavelength of the galaxy (measured in H ).This indicates an expanding outflow. The following sectionspresent the results of our search.
4.1. Detections of expanding material in the individualgalaxies
4.1.1. NGC 2366
Figure 4 shows the position-velocity (pv) diagram of the Hαemission in NGC 2366, Figure 5 shows an enlargement of thecore region in slits 01 and 02. The solid line marks the veloc-ities of the H gas which are derived from the H maps ofThuan et al. (2004) and which represent the circular velocity ofthe galaxy (corrected for the redshift of the galaxy). The crossmarks define the heliocentric Hα velocities corrected for theredshift of the galaxy, which indicates the radial expansion ve-locities of the ionized gas compared to the H velocities. Thelocation of the continuum emission in slit 01 indicating starsand therefore the center of the GEHR is set to 0′′.Generally, the velocity of the Hα emission agrees with the ve-locity of the neutral hydrogen, which means that it takes part inthe rotational motion of the galaxy. But at some positions thereare significant deviations from the H velocities. Spectrum 05shows a blue-shifted component with a length of about 700 pcand an expansion velocity of about 30 km/s (marked as OFin Fig. 4). As mentioned above, this outflow is directly cor-related with some of our detected filaments on the Hα image(especially with FIL14 and FIL15). Probably, there is a con-nection between the outflow and some detections of the Hαemission leaving the GEHR NGC 2363 to the north-west (Royet al. 1991; Martin 1998), which means that the ionized gas
Fig. 4. NGC 2366: Position-velocity diagrams of all slits ar-ranged in a spatial sequence. The crosses mark the Hα veloci-ties, the solid line represents the rotational motion of the galaxyderived from H maps by Thuan et al. (2004). The most promi-nent ionized gas structures are marked in blue (grey). Referringto the position: Positive values go to the north-east. The mea-surement of the Hα peak velocity is very accurate and errors areonly about few km/s, here indicated by the size of the crosses.The errors of the H velocity are smaller than 5 km/s.
J. van Eymeren et al.: Outflow or galactic wind: The fate of ionized gas in the halos of dwarf galaxies 7
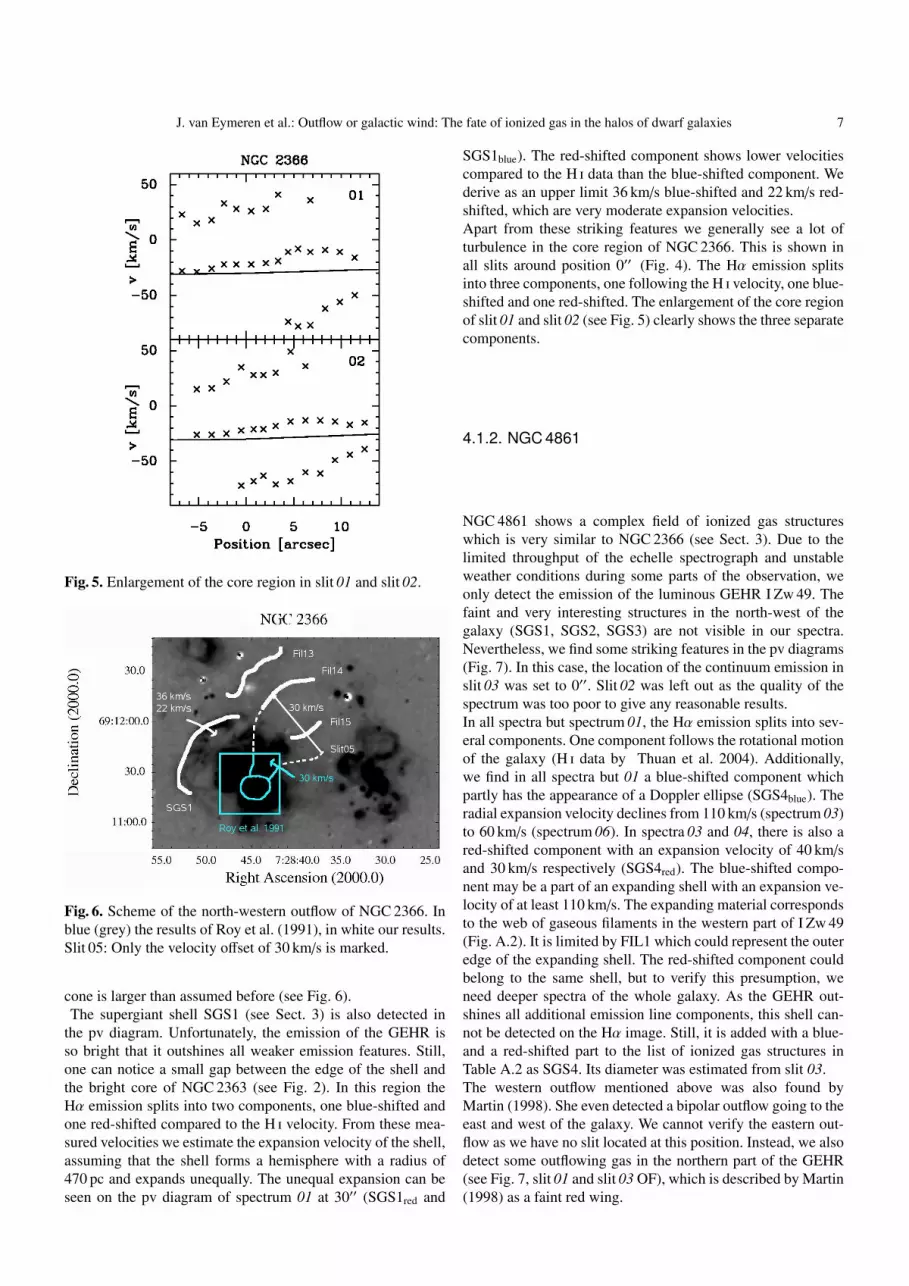
Fig. 5. Enlargement of the core region in slit 01 and slit 02.
Fig. 6. Scheme of the north-western outflow of NGC 2366. Inblue (grey) the results of Roy et al. (1991), in white our results.Slit 05: Only the velocity offset of 30 km/s is marked.
cone is larger than assumed before (see Fig. 6).The supergiant shell SGS1 (see Sect. 3) is also detected in
the pv diagram. Unfortunately, the emission of the GEHR isso bright that it outshines all weaker emission features. Still,one can notice a small gap between the edge of the shell andthe bright core of NGC 2363 (see Fig. 2). In this region theHα emission splits into two components, one blue-shifted andone red-shifted compared to the H velocity. From these mea-sured velocities we estimate the expansion velocity of the shell,assuming that the shell forms a hemisphere with a radius of470 pc and expands unequally. The unequal expansion can beseen on the pv diagram of spectrum 01 at 30′′ (SGS1red and
SGS1blue). The red-shifted component shows lower velocitiescompared to the H data than the blue-shifted component. Wederive as an upper limit 36 km/s blue-shifted and 22 km/s red-shifted, which are very moderate expansion velocities.Apart from these striking features we generally see a lot ofturbulence in the core region of NGC 2366. This is shown inall slits around position 0′′ (Fig. 4). The Hα emission splitsinto three components, one following the H velocity, one blue-shifted and one red-shifted. The enlargement of the core regionof slit 01 and slit 02 (see Fig. 5) clearly shows the three separatecomponents.
4.1.2. NGC 4861
NGC 4861 shows a complex field of ionized gas structureswhich is very similar to NGC 2366 (see Sect. 3). Due to thelimited throughput of the echelle spectrograph and unstableweather conditions during some parts of the observation, weonly detect the emission of the luminous GEHR I Zw 49. Thefaint and very interesting structures in the north-west of thegalaxy (SGS1, SGS2, SGS3) are not visible in our spectra.Nevertheless, we find some striking features in the pv diagrams(Fig. 7). In this case, the location of the continuum emission inslit 03 was set to 0′′. Slit 02 was left out as the quality of thespectrum was too poor to give any reasonable results.In all spectra but spectrum 01, the Hα emission splits into sev-eral components. One component follows the rotational motionof the galaxy (H data by Thuan et al. 2004). Additionally,we find in all spectra but 01 a blue-shifted component whichpartly has the appearance of a Doppler ellipse (SGS4blue). Theradial expansion velocity declines from 110 km/s (spectrum 03)to 60 km/s (spectrum 06). In spectra 03 and 04, there is also ared-shifted component with an expansion velocity of 40 km/sand 30 km/s respectively (SGS4red). The blue-shifted compo-nent may be a part of an expanding shell with an expansion ve-locity of at least 110 km/s. The expanding material correspondsto the web of gaseous filaments in the western part of I Zw 49(Fig. A.2). It is limited by FIL1 which could represent the outeredge of the expanding shell. The red-shifted component couldbelong to the same shell, but to verify this presumption, weneed deeper spectra of the whole galaxy. As the GEHR out-shines all additional emission line components, this shell can-not be detected on the Hα image. Still, it is added with a blue-and a red-shifted part to the list of ionized gas structures inTable A.2 as SGS4. Its diameter was estimated from slit 03.The western outflow mentioned above was also found byMartin (1998). She even detected a bipolar outflow going to theeast and west of the galaxy. We cannot verify the eastern out-flow as we have no slit located at this position. Instead, we alsodetect some outflowing gas in the northern part of the GEHR(see Fig. 7, slit 01 and slit 03 OF), which is described by Martin(1998) as a faint red wing.

8 J. van Eymeren et al.: Outflow or galactic wind: The fate of ionized gas in the halos of dwarf galaxies
Fig. 7. NGC 4861: Position-velocity diagrams of all slits ar-ranged in a spatial sequence. The crosses mark the Hα veloci-ties, the solid line represents the rotational motion of the galaxyderived from H maps by Thuan et al. (2004). The most promi-nent ionized gas structures are marked in blue (grey). Referringto the position: Positive values go to the north. The measure-ment of the Hα peak velocity is very accurate and errors areonly about few km/s, here indicated by the size of the crosses.The errors of the H velocity are smaller than 5 km/s.
5. Discussion
5.1. A complex web of filaments and their kinematics
We found ionized shells and filaments in both galaxies,whereby the amount of shell-like structures in comparison tothe amount of filaments is very small, although some of the fil-aments could be the relicts of former shell structures.We divided all ionized gas features into small and large scalestructures. Many small scale structures are larger than 300 pc,and we detected several large scale structures up to a size of 2kpc. In many cases it seems that in both galaxies the smallerfilaments connect the prominent H region to the large scalestructures or to smaller H regions as in the case of NGC 2366.Both galaxies contain some kpc-sized filaments which are par-allel to their major axes (e.g., SGS1-3 in NGC 4861). H in-tensity maps (Thuan et al. 2004) show that the neutral gas ismuch more extended than the ionized gas. That implies that theionized shells are running into an extended H envelope, whichleads to some interaction between both phases. Unfortunately,our echelle spectra do not give any kinematic information aboutthose shells so that we cannot make any statements on whichprocesses happen in the halo. Deeper spectra and Fabry-Perotinterferometry are proposed to improve the sensitivity of ourobservations.Kpc-scale expanding shells which are elongated in the generaldirection of the H minor axis were found before in amorphousdwarfs (Marlowe et al. 1995) and in I Zw 18 (Martin 1996).Furthermore, narrow elongated filaments which seem to con-nect the disk with the halo were recently detected in spiralgalaxies by Rossa et al. (2004).Especially NGC 4861 shows these huge supergiant shells(SGS1-3) and several finger-like structures (FIL9-11) whichemanate from the disk into the halo and seem to connect thedisk with the shells. The chimney scenario (see Sect. 1) is onepossible explanation. Another explanation are Rayleigh-Taylorinstabilities. If two neighboring gas layers of different densityare perturbed, potential energy is released in the sense that theheavier material moves down under the gravitational field andthe lighter material is displaced upwards. That means in ourcase that under the assumption that SGS1-3 have once formeda single shell, this shell has ruptured at some points and the gasis now falling down. This downfalling gas has the appearanceof a finger, which is exactly what we see on the Hα image.Referring to these large scale structures, we have to check theirexpansion velocities by obtaining deeper spectra than the cur-rently available echelle spectra. Only then we can make pre-cise statements on their evolution. The spectra of NGC 2366already indicate that the gas near the perpendicular filamentsexpands from the GEHR, whereas we have no such informa-tion on NGC 4861.Most of the smaller and disk-near expanding ionized gas struc-tures which we found in the echelle spectra can be correlated tothe identified features in the Hα images. Some of the featureshave the appearance of a Doppler ellipse in the pv diagram orthey form at least a part of a Doppler ellipse as can be seenin e.g., Figures B.1 and 7, slit 05 of NGC 4861. At many otherpositions, we just detect a constant, Doppler-shifted component

J. van Eymeren et al.: Outflow or galactic wind: The fate of ionized gas in the halos of dwarf galaxies 9
(e.g., Fig. 4 slit 03).The expansion velocities are usually very moderate (up to50 km/s), but in NGC 4861, we found an expanding shell witha velocity of about 110 km/s.
5.1.1. The origin of the expanding shells
We want to study one of our detected shells in more detail:SGS1 in NGC 2366 is found to expand unequally with verymoderate velocities (see Sect. 4.1.1). One reason for an un-equally expanding shell are possible density inhomogeneities.Probably, the gas density behind the shell is higher than in frontof it (along our line of sight). Thus, the ionized gas shell has topush more material if the density is higher, which leads to adeceleration of its expansion velocity. We also estimated thekinetic energy of this shell under the assumption of a very thinhemisphere of radius r = 470 pc and thickness δr = 5 pc. Themass was calculated from the flux-calibrated HST image (seeSect. 2.1). We get a kinetic energy of E(H+) = 4.6 · 1050 ergs.This is just an upper limit as we overestimate the Hα flux (seeSect. 2.1). Taking into account the error of the flux calibration,we get a value that is 3% lower.The age of expansion can be estimated (under the assumptionof a constant expansion) from t ≈ R
vexp, which gives us about
107 years. Comparing this to the ages of the two local star clus-ters (1 and 5 Myr old respectively) results in the conclusion thatwe do need a former star formation event. Nevertheless, theremust be another excitation or ionization mechanism whichkeeps the shell expanding. This could possibly be done by stel-lar winds from the two current star clusters.
5.1.2. Large line widths in NGC 2366 and NGC 4861
The shells and filaments and especially the GEHRs of bothgalaxies show a Full Width at Half Maximum (FWHM) ofabout 30 to 50 km/s (corrected for instrumental broadening).This gives us a velocity dispersion of 11 to 19 km/s. These val-ues are comparable to those of GEHRs (Hunter & Gallagher1997). But GEHRs harbor large OB associations as energysource, whereas no such energy sources exist around mostof the detected filaments. Hunter & Gallagher (1997) explainsuch a high dispersion with a high dispersion of the H gas.Looking at the velocity dispersion of the neutral hydrogen(see Table 1), the Hα dispersion is higher than the averageH dispersion, but fits well the peak dispersion (NGC 2366:14.3 km/s, NGC 4861: 19 km/s). A comparison with the H peak dispersion is more reliable as we trace Hα only in the cen-tral regions of the galaxies. Therefore, our observations provethe statement of Hunter & Gallagher (1997).The question is now why especially the GEHRs of both galax-ies show such a high FWHM (e.g., the GEHR of NGC 2366splits into three different components). A work by Yang et al.(1996) examined the most luminous H region NGC 604 inM 33. They also found broadened Hα lines with FWHMs ofabout 40 km/s. If one assumes the thermal component of Hαto be 20 km/s, these high FWHMs cannot only be explainedby thermal broadening. Other mechanisms which are suggested
and discussed by Yang et al. (1996) are stellar winds, and su-pernova remnants.
5.2. Outflow or galactic wind?
Our results of both Hα imaging and echelle spectroscopy leadto the question of the fate of the expanding gas. To determinewhether it can escape from the gravitational potential (galacticwind) or not (outflow), we compared its expansion velocity tothe escape velocity calculated by using the dark matter halomodel by Navarro et al. (1996), for short NFW-model. In thismodel, the galaxy is dominated by a halo of dark matter, andthe baryonic matter of the disk is neglected. The circular andthe escape velocity were calculated by
vrot =
√G Ms
3r
r + rs
2(1)
and
vesc =
√2
∣∣∣∣∣∣−G Ms
rlog
(1 +
rrs
)∣∣∣∣∣∣ (2)
We compiled the pv diagrams of NGC 2366 and NGC 4861,where position 0 corresponds to the dynamic center of thegalaxies and all velocities are corrected for the redshift.In the case of both galaxies, we used the H data by Thuan et al.(2004). By varying the reference mass Ms and the virial radiusrs, we calculated the rotation curves (using Eq. 1) in order toget the best approximation to the H data. In Figures 8 and 9,two different parameter sets (Ms and rs) for each galaxy areshown. Using the same reference masses and virial radii thanfor the rotation curves, we calculated the escape velocities byEq. 2. Additionally, we plotted the expansion velocities of ourdetected outflows at the corresponding distance from the dy-namic center of the galaxies.Tables A.1 and A.2 show several filaments and shells that couldalso be detected on the slit spectra. In most of the cases, oneprominent structure is based on several smaller structures, e.g.,in NGC 2366 all filaments from FIL24 to FIL28 belong to thesupergiant shell SGS1. Therefore, we only consider the mostprominent structures for our analysis, i.e. the hemisphere lim-ited by SGS1 (the radial velocities have been estimated inSect. 4.1.1) and the north-western outflow marked by FIL14and FIL15 in NGC 2366 and the supergiant shell visible on thepv diagrams in NGC 4861 (see Sect. 4.1.2). All other structuresare not well-defined so that we cannot tell anything about theirsymmetry and therefore about their true expansion velocity.As we assume a spherical symmetry for both expanding shellsaround the GEHRs of NGC 2366 and NGC 4861, the expan-sion velocities do not need to be corrected for the inclinationof the galaxies. At every position where we intersect the shellswe get the true expansion velocity. In the case of the outflow inNGC 2366, we cannot define a geometry. But if one assumes aninclination angle of 59◦, measured from H observations (seeTable 1), we get an expansion velocity of 35 km/s instead ofour measured value of 30 km/s, which gives a velocity increaseof only 17 %, still far below the derived escape velocity of thegalaxy.

10 J. van Eymeren et al.: Outflow or galactic wind: The fate of ionized gas in the halos of dwarf galaxies
The chosen size of the reference mass is in all cases by ordersone or two higher than the H mass derived from the H ve-locity maps (see Table 1). That means that the determination ofthe mass of the galaxy from the H velocities is only a roughestimate.A comparison of the H data with the rotation curves derivedfrom Eq. 1 shows that neglecting the cores of dwarf galaxiesleads to a discrepancy between the dark matter halo rotationcurves and the observed H data at small distances from the dy-namic center. That means that the baryonic matter in the diskhas a significant influence on the rotation of the galaxy nearthe dynamic center. In the outer parts, dwarf galaxies are dom-inated by the dark matter halo.
5.2.1. NGC 2366
NGC 2366 is dominated by the GEHR NGC 2363. Several ion-ized structures emanate from this actively star-forming region.Both the expansion velocities of the shell SGS1 and the outflowto the north-west of NGC 2363 are shown in Figure 8. Plottedare the beginning and the end point of the structures corre-sponding to their distances from the dynamic center. SGS1 ispresented with both expansion velocities. As we had to choosevery high reference masses in comparison to the H mass of thegalaxies to fit the rotation curve to the H data, we get very highescape velocities of about 200 km/s and higher. The expansionvelocities are moderate and remain far below the escape veloc-ities. That means that the gas is still gravitationally bound tothe galaxy.One has to have in mind that at least the velocity of the westernoutflow is just a radial velocity. The real velocity will be higherso that our values just represent a lower limit of the expansionvelocities.
5.2.2. NGC 4861
In NGC 4861 (Fig. 9) we have a similar situation as inNGC 2366. We found one large outflow which probably formsan expanding shell. The value of the red-shifted component ismoderate (< 40 km/s) and remains far below the escape veloc-ity of the galaxy. The blue-shifted component of the outflow ex-pands with a much higher velocity (about 110 km/s) and there-fore nearly reaches the escape velocity, at least in the case ofthe lower values for mass and virial radius. But when look-ing at the corresponding rotation curve it becomes obvious thatchoosing a low mass and a low virial radius gives us a verypoor model to the H velocities of Thuan et al. (2004). Froma distance r of 2.5 kpc on, which corresponds to the positionof the outflow, the H rotation curve and the model are not ingood agreement. Only by going to higher masses and highervirial radii, this fit can be improved, which implies that the es-cape velocity is rising and that therefore the faster expandingpart of the shell definitely stays below the escape velocity.
Fig. 8. Position-velocity diagram of NGC 2366. Different ve-locities are plotted versus the distance from the dynamic centerof the galaxy. The solid and dashed lines represent two differentparameter sets of the mass and the radius. The rotation curvesfollow more or less the H position-velocity data described inThuan et al. (2004), here drawn as open symbols. The lines inthe upper part show the escape velocity. The expansion veloc-ities of our detected shells and outflows are presented as solidsymbols (beginning and end point of each structure). Referringto the velocity, the sizes of the solid and open symbols show theerrors which are about 5 km/s for measuring the expansion ve-locity and about 10 km/s for the H velocities. Positional errorsare negligible. Therefore, they are not presented here.
Fig. 9. Position-velocity diagram of NGC 4861. The same as inFigure 8. The H data are again taken from Thuan et al. (2004).
5.3. Outflow!
Both galaxies show outflows with expansion velocities between20 and 110 km/s. Generally, these velocities stay below the es-cape velocities of the galaxies derived from the NFW-model.A comparison of our results with the 1d chemodynamical mod-els of Hensler et al. (2004) shows that in the end the dark matterdefines the fate of the expanding gas. Their models predict thatmost of the gas (galaxy mass of ∼ 109 M�) or even all the gas(galaxy mass of ∼ 1010 M�) can leave the gravitational poten-

J. van Eymeren et al.: Outflow or galactic wind: The fate of ionized gas in the halos of dwarf galaxies 11
tial as a galactic wind by neglecting the dark matter. Therefore,no further star formation due to a new collapse of the gas ispossible. However, the presence of dark matter increases the es-cape velocity of the galaxy. The gas cannot flow out that easilyso that the galaxy is enriched by metals and further star forma-tion can take place. This could be true for our sample galaxies.In both of them we detected gas which seems to flow out of thegalactic disk, but stays closely to the galaxy (see Sect. 3). Wemeasured the expansion velocities of some of these structures,which are relatively moderate and not sufficient for a galacticwind. A comparison with the models of Mac Low & Ferrara(1999) (Sect. 1) confirms our results.Martin (1998) also used dark matter halo models to comparethe escape velocity of the galaxies to the expansion velocitiesof the shells. She showed that only the smallest galaxies of hersample, Sextans A and I Zw 18, have shells with expansion ve-locities comparable to the escape velocities. Otherwise, the ex-pansion velocities lie far below the escape velocities.That means that we have to look at galaxies of very low masswhen hunting for galactic wind structures. On the other hand,it is not clear yet what happens to the large scale structures atkpc distances from the galactic disk. Neither Martin (1998) norwe were able to detect them in the spectra.Therefore, our next steps are further investigations of these twoand other dwarf galaxies. We especially have to find a methodto detect the weakest emission in the halos of the galaxies.
6. Summary
We examined two irregular dwarf galaxies which are verysimilar according to their mass, shape and luminosity.First, we used Hα images to create a catalog of shells andfilaments (see Appendix A). We performed high-resolutionlong-slit echelle spectroscopy of the most prominent emissionfeatures in order to analyze their kinematics. Finally, we useddark matter halo models to get an idea whether the expandingstructures can leave the gravitational potential or not.
In both galaxies we found both small scale (up to a fewhundred pc) and large scale (about 1–2 kpc) ionized gasstructures. The GEHRs are mainly surrounded by smallerfilaments which sometimes seem to connect the GEHRs tothe large scale filaments or to neighboring H regions (e.g.,in NGC 2366). Especially in the outer parts of the galaxies,the filaments have large scale sizes. They are located atdistances up to several kpc away from any place of current starformation. Thus, one has to think about the ionizing processes.Probably, the ionizing OB association has already died andthe shells and filaments are only some relicts of a former starformation event. This would give us direct hints with respectto the age and the development of galaxies.Furthermore, we need to explain the disrupted structure ofthe giant shells and the connecting filaments between the diskand the halo. As we do not have any kinematic information,we cannot prove whether these structures can be caused byRayleigh-Taylor instabilities, finger-like emanating gas ac-cording to the chimney model or interaction with a surroundingH envelope, just to mention a few possible scenarios. This has
to be investigated in more detail with much deeper data.Both galaxies show outflowing material. The expansion ve-locity varies from 20 km/s to 110 km/s. Using the dark matterhalo model by Navarro et al. (1996) in order to compare theexpansion velocities to the escape velocities of the galaxies, wefound that in all cases the expansion velocity stays below theescape velocity. This result fits to the predictions of Mac Low& Ferrara (1999) and the studies of Martin (1998), but it doesnot fit to the 1d chemodynamical models of Hensler et al.(2004). It draws our attention to the faint large scale structuresin the outer parts of the galaxies and to mass-poor galaxieswith a low gravitational potential.
Acknowledgements. The authors would like to thank U. Hopp for pro-viding his image of NGC 2366. We thank Lutz Haberzettl, ChaitraNarayan, and Clemens Trachternach for helpful comments and usefuldiscussions.This research made use of the NASA’s Astrophysics Data SystemAbstract Service, the LEDA database (http://leda.univ-lyon1.fr), andthe NASA/IPAC Extragalactic Database (NED) which is operated bythe Jet Propulsion Laboratory, California Institute of Technology, un-der contract with NASA.
References
Birk, G. T., Lesch, H., & Neukirch, T. 1998, MNRAS, 296, 165Bomans, D. J. 2001, ApSS, 276, 783Bomans, D. J. 2005, in AIP Conf. Proc. 783: The Evolution of
Starbursts, 98Bomans, D. J., Chu, Y., & Hopp, U. 1997, AJ, 113, 1678Bomans, D. J. & Hopp, U. 1992, in Evolution of Interstellar
Matter and Dynamics of Galaxies, ed. J. Palous, W. B.Burton, & P. O. Lindblad, 63
de Vaucouleurs, G., de Vaucouleurs, A., Corwin, H. G.,et al. 1991, Third Reference Catalogue of Bright Galaxies(Volume 1-3, XII, 2069 pp. 7 figs.. Springer-Verlag BerlinHeidelberg New York)
Drissen, L., Crowther, P. A., Smith, L. J., et al. 2001, ApJ, 546,484
Gallagher, J. S. & Hunter, D. A. 1984, ARAA, 22, 37Hensler, G., Theis, C., & Gallagher, J. S., I. 2004, AAP, 426,
25Hunter, D. A. & Gallagher, J. S. 1997, ApJ, 475, 65Hunter, D. A., Hawley, W. N., & Gallagher, J. S. 1993, AJ, 106,
1797Mac Low, M. & Ferrara, A. 1999, ApJ, 513, 142Marlowe, A. T., Heckman, T. M., Wyse, R. F. G., & Schommer,
R. 1995, ApJ, 438, 563Martin, C. L. 1996, ApJ, 465, 680Martin, C. L. 1998, ApJ, 506, 222Navarro, J. F., Frenk, C. S., & White, S. D. M. 1996, ApJ, 462,
563Norman, C. A. & Ikeuchi, S. 1989, ApJ, 345, 372Recchi, S., Matteucci, F., D’Ercole, A., & Tosi, M. 2004, AAP,
426, 37Richter, G. M., Lorenz, H., Bohm, P., & Priebe, A. 1991,
Astronomische Nachrichten, 312, 345Rossa, J., Dettmar, R.-J., Walterbos, R. A. M., & Norman, C. A.
2004, AJ, 128, 674

12 J. van Eymeren et al.: Outflow or galactic wind: The fate of ionized gas in the halos of dwarf galaxies
Roy, J., Boulesteix, J., Joncas, G., & Grundseth, B. 1991, ApJ,367, 141
Shapiro, P. R. & Field, G. B. 1976, ApJ, 205, 762Silich, S. & Tenorio-Tagle, G. 2001, ApJ, 552, 91Slavin, J. D., Shull, J. M., & Begelman, M. C. 1993, ApJ, 407,
83Thuan, T. X., Hibbard, J. E., & Levrier, F. 2004, AJ, 128, 617Tolstoy, E., Saha, A., Hoessel, J. G., & McQuade, K. 1995, AJ,
110, 1640van Eymeren, J., Bomans, D. J., & Weis, K. 2005, in AIP Conf.
Proc. 783: The Evolution of Starbursts, 116Wilcots, E. M., Lehman, C., & Miller, B. 1996, AJ, 111, 1575Yang, H., Chu, Y.-H., Skillman, E. D., & Terlevich, R. 1996,
AJ, 112, 146
Appendix A: The Hα images and catalogs
Here, we present the continuum-subtracted Hα images ofNGC 2366 and NGC 4861 with the ionized gas structuresmarked in white. Additionally, the identified gas features arelisted in the following tables. We measured the angular sizes ofthe ring-like structures and the filaments and converted themto linear sizes assuming the distances given in Table 1. For thedetection method and the measurements of the structures seeSect. 3.For all structures we could identify in our spectra the valuesof the heliocentric velocity and the FWHM (corrected forinstrumental broadening) are also presented in Table A.1 andA.2.

J. van Eymeren et al.: Outflow or galactic wind: The fate of ionized gas in the halos of dwarf galaxies 13
Table A.1. The most prominent structures and their sizes inNGC 2366.
Source Diameter Diameter vhelio FWHM[′′] [pc] [km/s] [km/s]
SGS1 59 940 49/99 26/38SB1 11 180SB2 19 300SB3 9 150
Source Length Length vhelio FWHM[′′] [pc] [km/s] [km/s]
FIL1 7 110FIL2 32 510FIL3 14 230FIL4 9 140FIL5 10 160FIL6 23 370FIL7 17 270FIL8 19 300FIL9 7 110FIL10 9 150FIL11 21 330FIL12 15 240FIL13 51 820 95 33FIL14 19 300 107 29FIL15 23 360 92 46FIL16 11 180FIL17 18 280FIL18 21 330FIL19 37 590FIL20 6 100FIL21 10 160FIL22 17 270FIL23 12 190FIL24 11 180 81 37FIL25 25 400 78 50FIL26 13 200 84 40FIL27 5 80 83 41FIL28 6 100 79 33
NOTE: vexp and the FWHM (corrected for instrumental broadening)are added when the ionized gas features were also detected in the spec-tra. The first part of the table contains the ring-like features which aredivided into superbubbles (SB, with a diameter smaller than 500 pc)and supergiant shells (SGS, with a diameter larger than 500 pc). Allother structures are presented in the second part of the table as fil-aments (FIL, all lengths). The same classification is also used forTable A.2.
Appendix B: The echellograms
Figure B.1 shows the echellograms obtained with the KPNO4 m telescope and its echelle spectrograph. The position withrespect to the center of the GEHRs is drawn over the veloc-ity with respect to the Hα line and corrected for the systemicvelocity of the galaxies.
Table A.2. The most prominent structures and their sizes inNGC 4861.
Source Diameter Diameter vhelio FWHM[′′] [pc] [km/s] [km/s]
SGS1 22 800SGS2 20 730SGS3 24 890SGS4a 30 1091 699/842 22/55SB1 8 300 836 40SB2 4 140 814 38
Source Length Length vhelio FWHM[′′] [pc] [km/s] [km/s]
FIL1 49 1770FIL2 5 170FIL3 29 1070FIL4 11 400 799 41FIL5 18 640 823 31FIL6 3 110FIL7 2 70FIL8 5 170FIL9 12 440FIL10 18 650FIL11 26 940 842 36FIL12 6 200FIL13 4 130FIL14 5 190FIL15 13 470FIL16 7 270FIL17 7 240FIL18 4 140FIL19 5 180FIL20 5 180FIL21 5 170FIL22 15 530FIL23 17 620 793 40FIL24 6 220FIL25 13 480 751 36FIL26 9 330FIL27 3 100FIL28 2 70 797 28FIL29 9 340 794 40FIL30 6 200 797 36FIL31 5 180
a This shell was not detected on the Hα image of NGC 4861 be-cause the GEHR outshines all additional emission. The diame-ter of SGS4 was therefore estimated from the Doppler ellipse inslit 03.

14 J. van Eymeren et al.: Outflow or galactic wind: The fate of ionized gas in the halos of dwarf galaxies
Fig. A.1. Continuum-subtracted Hα image of NGC 2366: position and designation of the filaments and shells are superimposedin white for better visibility. The contrast was chosen in a way to demonstrate the small scale structures. For a presentation of thelarge scale filaments see Figure 2. A measure in pc to estimate the size of the structures is given in the lower left corner of theimage. The distance of NGC 2366 is given in Table 1.
Fig. A.2. Continuum-subtracted Hα image of NGC 4861: position and designation of the filaments and shells are superimposedin white for better visibility. Again we chose a contrast for stressing the small scale structures. The large scale structure is shownin Figure 3. To estimate the size of the structures, a measure in pc is given in the lower left corner of the image. The distance ofNGC 4861 can be found in Table 1.

J. van Eymeren et al.: Outflow or galactic wind: The fate of ionized gas in the halos of dwarf galaxies 15
Fig. B.1. All echelle spectra of NGC 2366 and NGC 4861 arranged in a spatial sequence and centered on the Hα line which iscorrected for the systemic velocity of each galaxy.


