Embed Size (px)
Citation preview
R.C.S Luxembourg B-55740
OYSTER
UNAUDITED SEMI ANNUAL REPORTAS AT 30 JUNE 2019
No subscription can be accepted based on the financial reports. Subscriptions are valid only if they are received based on the prospectus accompanied by the most recent annual report and, after its publication, the most recent semi-annual report. Additional information for investors in Germany: units of the following funds, which are not registered for Distribution, are not publicly offered for sale in accordance with the investment law: OYSTER Absolute Return GBP, OYSTER Continental European Income, OYSTER Continental European Selection and OYSTER USD Bonds.
OYSTER SicavBoulevard de la Foire 11-13 | L – 1528 Luxembourg www.oysterfunds.com
Member of the SYZ Group Geneva | Zurich | Lugano | LocarnoLondon | Paris | Brussels | Luxembourg | Milan | MadridNassau
OYSTER An open-ended mutual investment fund with sub-funds – Luxembourg
UNAUDITED SEMI ANNUAL REPORT AS AT 30 JUNE 2019
3
Contents
Board of Directors and Administration 4
General Information 6
Consolidated statement of net assets as at 30 June 2019 7
Consolidated statement of changes in net assets for the period ended as at 30 June 2019 15
Statistics 23
Portfolio statements as at 30 June 2019 27
Notes to the financial statements as at 30 June 2019 135
Additional information 152
Pages
OYSTER
Board of Directors and Administration
R.C.S. Luxembourg B-55740
4
Chairman
Mr. Alexandre Pierron Senior Executive SYZ Asset Management (Luxembourg) S.A., Luxembourg
Directors
Dr. Frédéric Henri Lenoir, CFA General Counsel SYZ Asset Management (Switzerland) Ltd, Geneva Mr. Massimo Paolo Gentili Partner Gentili & Partners, Luxembourg
Mr. Alexandre Pierron Senior Executive SYZ Asset Management (Luxembourg) S.A., Luxembourg Mr. Claude Kremer Partner Arendt & Medernach Luxembourg
Registered office
11/13, Boulevard de la Foire L-1528 Luxembourg
Management Company
SYZ Asset Management (Luxembourg) S.A. 54, rue Charles Martel L-2134 Luxembourg
Depositary Bank
RBC Investor Services Bank S.A. (also referred to as RBC IS Bank S.A.) 14, Porte de France, L-4360 Esch-sur-Alzette
Central Administration
RBC Investor Services Bank S.A. 14, Porte de France, L-4360 Esch-sur-Alzette
Agent for transfer and registry
RBC Investor Services Bank S.A. 14, Porte de France, L-4360 Esch-sur-Alzette
Auditor
PricewaterhouseCoopers, Société coopérative 2, rue Gerhard Mercator, L-2182 Luxembourg
Board of Directors and Administration
R.C.S. Luxembourg B-55740
5
Paying and Representative agent in Germany
ODDO-BHF Aktiengesellschaft Bockenheimer Landstraße 10, 60323 Frankfurt am Main
Representative agent for Switzerland
SYZ Asset Management (Suisse) S.A. 6, Rue François-Diday, CH-1204 Genève
Paying agent in Switzerland
Banque SYZ S.A. 1, Quai des Bergues, Case Postale 5015 CH-1211 Geneva 11
Legal Adviser
Arendt & Medernach 41A, Avenue J.F. Kennedy, L-2082 Luxembourg The articles of association, full prospectus, Key Investor Information Document, annual and semi-annual reports as well as the list of purchases and sales may be obtained free of charge from the Swiss representative agent and from the SICAV’s registered office.
General Information
6
The net asset value per share of each sub-fund, the issue, redemption and conversion prices are published on each valuation date at the registered office of the Company in Luxembourg and of the Representative in Switzerland. They are also the subject in Switzerland of an insertion in www.fundinfo.com. The financial year starts on 1st January each year and ends on 31st December of the same year. The Company publishes a detailed annual report on its activities and the management of its assets, which includes its financial statements expressed in USD, the detailed breakdown of assets for each sub-fund, and the audit report. In addition, the Company publishes an unaudited semi-annual report after the end of each half-year. The Shareholders’ Annual General Meeting is held every year at the Company’s registered office, or in any other location in Luxembourg as specified on the convening notice. The Shareholders' Annual General Meeting is held on the third Thursday in April at 3 p.m., or if this day is a public holiday, on the following bank business day. Notice of all General Meetings is sent by post to all registered shareholders at the address mentioned on the shareholders’ register, at least eight days prior to the General Meeting. This notice will indicate the time and place of the General Meeting and the admission conditions, the agenda and requirements under Luxembourg law regarding the necessary quorum and majority. Notices may also be published in the case of the Grand Duchy of Luxembourg and Switzerland in the “RESA” and in a Luxembourg newspaper (the Luxemburger Wort), and on the website www.fundinfo.com respectively as well as in the press or in any other media selected by the Board of Directors, respectively the Management Company, in the countries in which the Fund is marketed, and on www.fundsquare.net. Requirements regarding participation, quorum and majority at all General Meetings are those set out in articles 67 and 67-1 (as amended) of the law dated 10th August 1915 relating to commercial companies, and in the Company’s Articles of Association.
The statement of changes in transferable securities and other net assets made to the portfolio during the year may be obtained upon request and free of charge from the Depositary bank or from the Paying and Information agent in Germany. As regards the commercialisation of the Company in Germany, the parties elect domicile at the registered office of the Paying and Information agent and the relevant courts of the registered office will be the only authorised entities in the event of a dispute. The paying and information agent in the Federal Republic of Germany is ODDO-BHF Aktiengesellschaft, Bockenheimer Landstraße 10, D-60323 Frankfurt am Main (hereafter “the German paying and information agent”). A list of the changes to the investment portfolio is available free of charge from the German paying and information agent, the SICAV's registered office and the Swiss representative. Requests for redemption or conversion of shares of one sub-fund into shares of another sub-fund can be submitted to the German paying and information agent. Redemption proceeds, possible distributions and any other payments to the shareholders carried out by the German paying and information agent may be paid out in cash in euros upon demand by the shareholders. The prospectus, the Key Investor Information Document, the investment company’s articles of association, annual and semi-annual reports, subscription and redemption prices, as well as any notices to shareholders are available to shareholders free of charge from the German paying and information agent. The subscription and redemption prices are published on the website:
http://fondscontainer.vwd.de/ Any notices to shareholders are published on the websites: www.fundinfo.com and www.fundsquare.net.
Consolidated statement of net assetsas at 30 June 2019
8
Consolidated statement of net assetsas at 30 June 2019
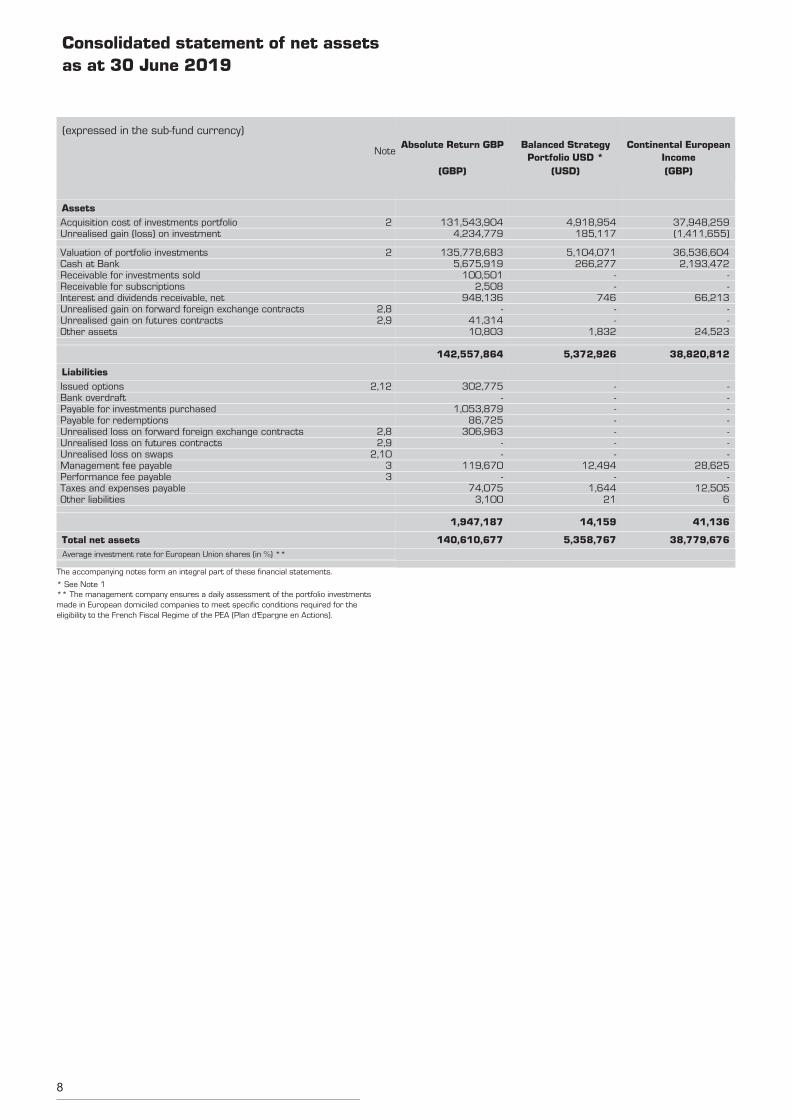
(expressed in the sub-fund currency)
Note
Assets Acquisition cost of investments portfolio 2 Unrealised gain (loss) on investment
Valuation of portfolio investments 2 Cash at Bank Receivable for investments sold Receivable for subscriptions Interest and dividends receivable, net Unrealised gain on forward foreign exchange contracts 2,8 Unrealised gain on futures contracts 2,9 Other assets
Liabilities Issued options 2,12 Bank overdraft Payable for investments purchased Payable for redemptions Unrealised loss on forward foreign exchange contracts 2,8 Unrealised loss on futures contracts 2,9 Unrealised loss on swaps 2,10 Management fee payable 3 Performance fee payable 3 Taxes and expenses payable Other liabilities
Total net assets
* See Note 1
The accompanying notes form an integral part of these financial statements.
** The management company ensures a daily assessment of the portfolio investmentsmade in European domiciled companies to meet specific conditions required for theeligibility to the French Fiscal Regime of the PEA (Plan d'Epargne en Actions).
Average investment rate for European Union shares (in %) **
Absolute Return GBP
(GBP)
131,543,9044,234,779
135,778,6835,675,919
100,5012,508
948,136-
41,31410,803
142,557,864
302,775-
1,053,87986,725
306,963--
119,670-
74,0753,100
1,947,187
140,610,677
Balanced StrategyPortfolio USD *
(USD)
4,918,954185,117
5,104,071266,277
--
746--
1,832
5,372,926
-------
12,494-
1,64421
14,159
5,358,767
Continental EuropeanIncome(GBP)
37,948,259(1,411,655)
36,536,6042,193,472
--
66,213--
24,523
38,820,812
-------
28,625-
12,5056
41,136
38,779,676
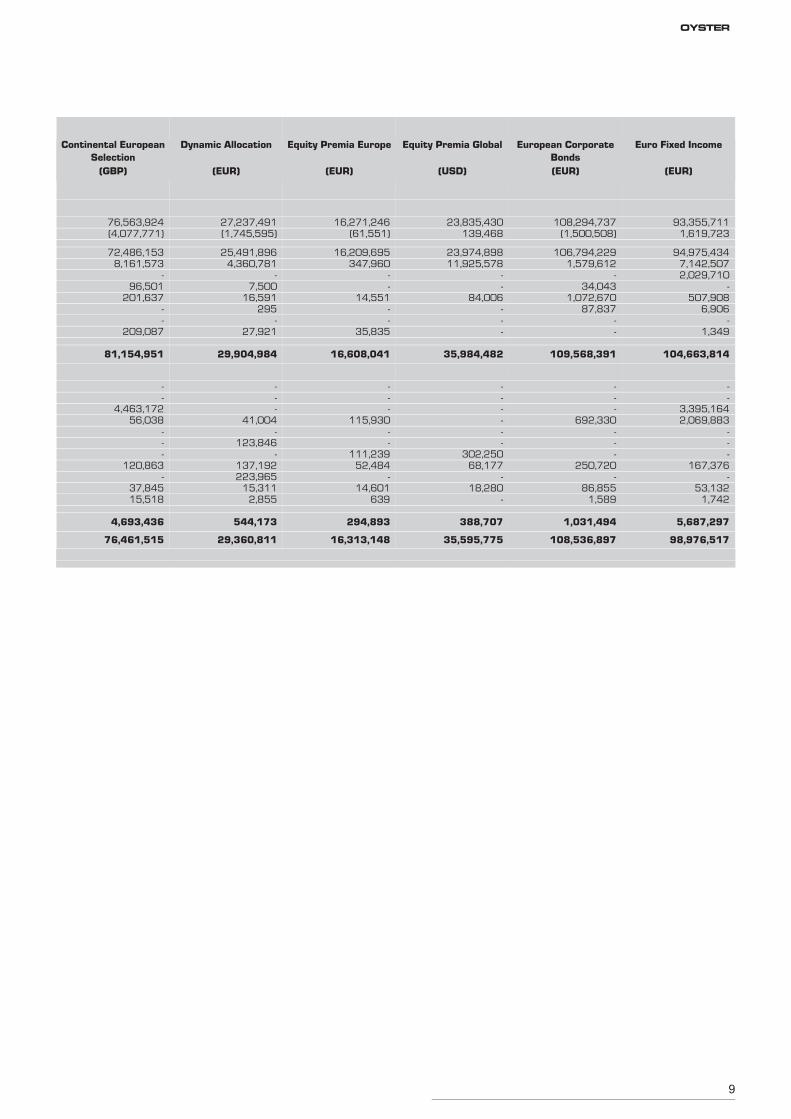
9
OYSTER
Continental EuropeanSelection
(GBP)
76,563,924 (4,077,771)
72,486,153 8,161,573
- 96,501
201,637 - -
209,087
81,154,951
- -
4,463,172 56,038
- - -
120,863 -
37,845 15,518
4,693,436
76,461,515
Dynamic Allocation
(EUR)
27,237,491(1,745,595)
25,491,8964,360,781
-7,500
16,591295
-27,921
29,904,984
---
41,004-
123,846-
137,192223,965
15,3112,855
544,173
29,360,811
Equity Premia Europe
(EUR)
16,271,246(61,551)
16,209,695347,960
--
14,551--
35,835
16,608,041
---
115,930--
111,23952,484
-14,601
639
294,893
16,313,148
Equity Premia Global
(USD)
23,835,430139,468
23,974,89811,925,578
--
84,006---
35,984,482
------
302,25068,177
-18,280
-
388,707
35,595,775
European CorporateBonds(EUR)
108,294,737(1,500,508)
106,794,2291,579,612
-34,043
1,072,67087,837
--
109,568,391
---
692,330---
250,720-
86,8551,589
1,031,494
108,536,897
Euro Fixed Income
(EUR)
93,355,7111,619,723
94,975,4347,142,5072,029,710
-507,908
6,906-
1,349
104,663,814
--
3,395,1642,069,883
---
167,376-
53,1321,742
5,687,297
98,976,517
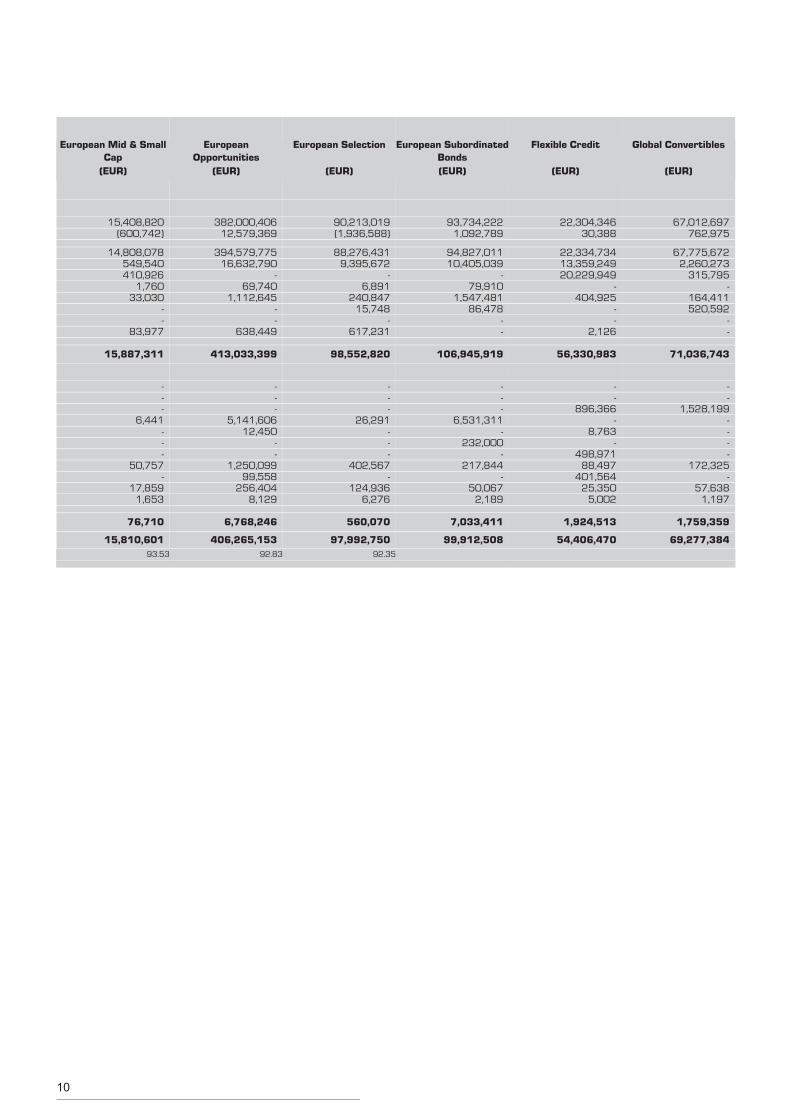
10
European Mid & SmallCap
(EUR)
15,408,820
(600,742)
14,808,078 549,540 410,926
1,760 33,030
- -
83,977
15,887,311
- - -
6,441 - - -
50,757 -
17,859 1,653
76,710
15,810,601 93.53
EuropeanOpportunities
(EUR)
382,000,40612,579,369
394,579,77516,632,790
-69,740
1,112,645--
638,449
413,033,399
---
5,141,60612,450
--
1,250,09999,558
256,4048,129
6,768,246
406,265,15392.83
European Selection
(EUR)
90,213,019(1,936,588)
88,276,4319,395,672
-6,891
240,84715,748
-617,231
98,552,820
---
26,291---
402,567-
124,9366,276
560,070
97,992,75092.35
European SubordinatedBonds(EUR)
93,734,2221,092,789
94,827,01110,405,039
-79,910
1,547,48186,478
--
106,945,919
---
6,531,311-
232,000-
217,844-
50,0672,189
7,033,411
99,912,508
Flexible Credit
(EUR)
22,304,34630,388
22,334,73413,359,24920,229,949
-404,925
--
2,126
56,330,983
--
896,366-
8,763-
498,97188,497
401,56425,350
5,002
1,924,513
54,406,470
Global Convertibles
(EUR)
67,012,697762,975
67,775,6722,260,273
315,795-
164,411520,592
--
71,036,743
--
1,528,199----
172,325-
57,6381,197
1,759,359
69,277,384
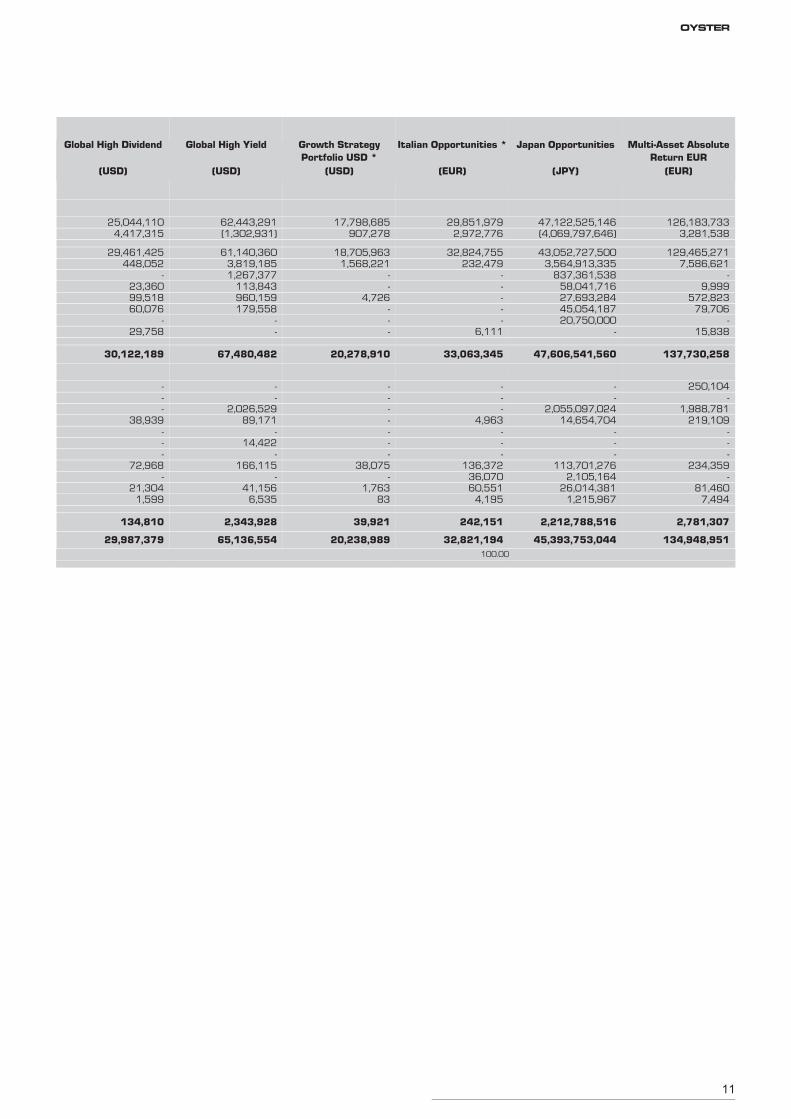
11
OYSTER
Global High Dividend
(USD)
25,044,110
4,417,315
29,461,425 448,052
- 23,360 99,518 60,076
- 29,758
30,122,189
- - -
38,939 - - -
72,968 -
21,304 1,599
134,810
29,987,379
Global High Yield
(USD)
62,443,291(1,302,931)
61,140,3603,819,1851,267,377
113,843960,159179,558
--
67,480,482
--
2,026,52989,171
-14,422
-166,115
-41,156
6,535
2,343,928
65,136,554
Growth StrategyPortfolio USD *
(USD)
17,798,685907,278
18,705,9631,568,221
--
4,726---
20,278,910
-------
38,075-
1,76383
39,921
20,238,989
Italian Opportunities *
(EUR)
29,851,9792,972,776
32,824,755232,479
-----
6,111
33,063,345
---
4,963---
136,37236,07060,551
4,195
242,151
32,821,194100.00
Japan Opportunities
(JPY)
47,122,525,146(4,069,797,646)
43,052,727,5003,564,913,335
837,361,53858,041,71627,693,28445,054,18720,750,000
-
47,606,541,560
--
2,055,097,02414,654,704
---
113,701,2762,105,164
26,014,3811,215,967
2,212,788,516
45,393,753,044
Multi-Asset AbsoluteReturn EUR
(EUR)
126,183,7333,281,538
129,465,2717,586,621
-9,999
572,82379,706
-15,838
137,730,258
250,104-
1,988,781219,109
---
234,359-
81,4607,494
2,781,307
134,948,951
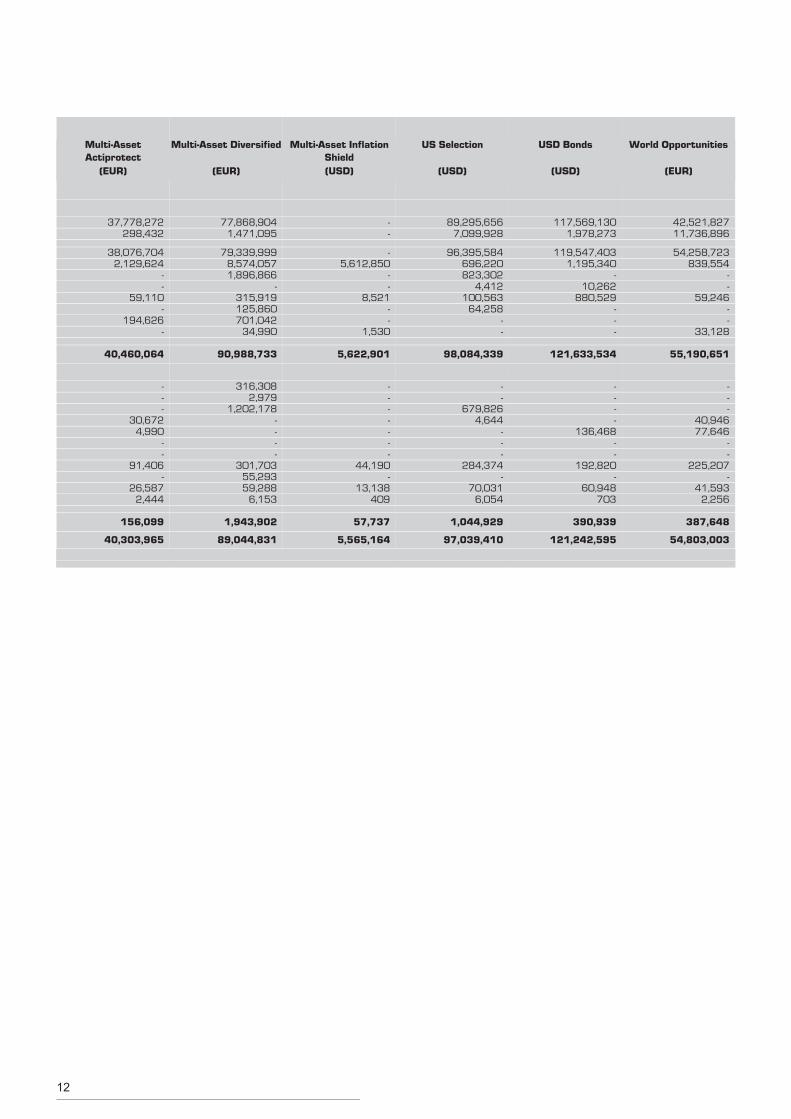
12
Multi-AssetActiprotect
(EUR)
37,778,272
298,432
38,076,704 2,129,624
- -
59,110 -
194,626 -
40,460,064
- - -
30,672 4,990
- -
91,406 -
26,587 2,444
156,099
40,303,965
Multi-Asset Diversified
(EUR)
77,868,9041,471,095
79,339,9998,574,0571,896,866
-315,919125,860701,042
34,990
90,988,733
316,3082,979
1,202,178----
301,70355,29359,288
6,153
1,943,902
89,044,831
Multi-Asset InflationShield(USD)
--
-5,612,850
--
8,521--
1,530
5,622,901
-------
44,190-
13,138409
57,737
5,565,164
US Selection
(USD)
89,295,6567,099,928
96,395,584696,220823,302
4,412100,563
64,258--
98,084,339
--
679,8264,644
---
284,374-
70,0316,054
1,044,929
97,039,410
USD Bonds
(USD)
117,569,1301,978,273
119,547,4031,195,340
-10,262
880,529---
121,633,534
----
136,468--
192,820-
60,948703
390,939
121,242,595
World Opportunities
(EUR)
42,521,82711,736,896
54,258,723839,554
--
59,246--
33,128
55,190,651
---
40,94677,646
--
225,207-
41,5932,256
387,648
54,803,003
13
OYSTER
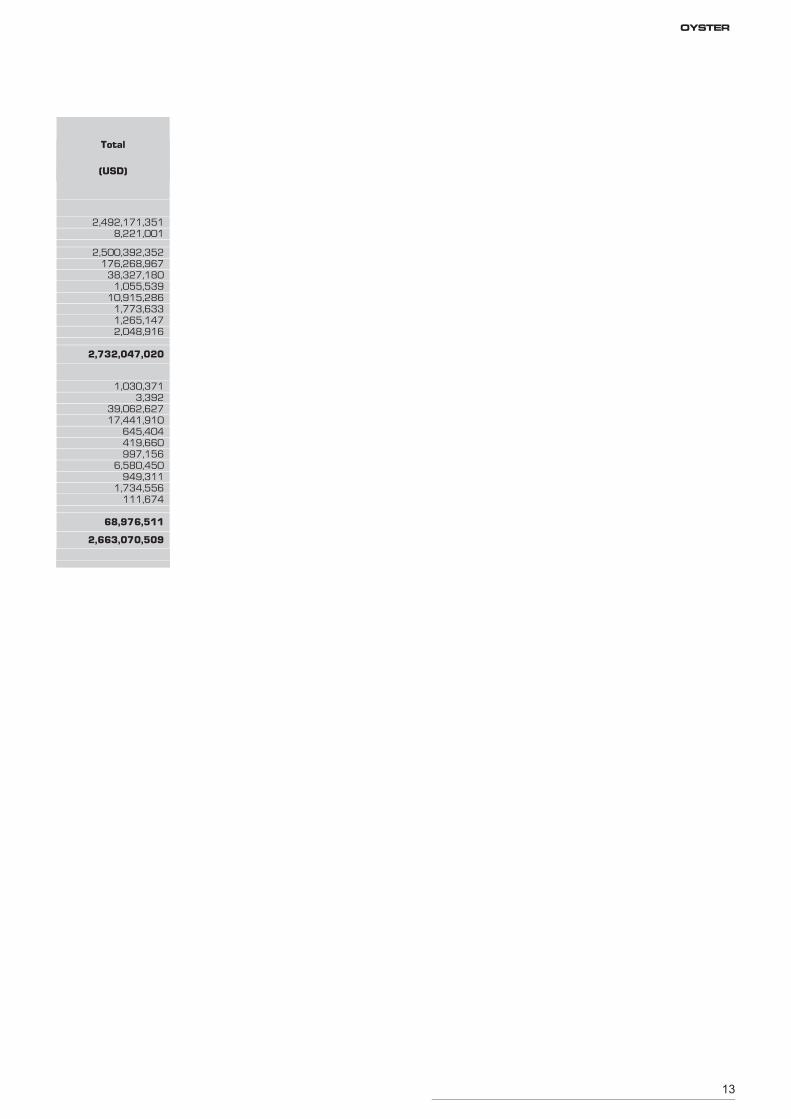
(USD)
Total
2,492,171,351
8,221,001
2,500,392,352 176,268,967
38,327,180 1,055,539
10,915,286 1,773,633 1,265,147 2,048,916
2,732,047,020
1,030,371
3,392 39,062,627 17,441,910
645,404 419,660 997,156
6,580,450 949,311
1,734,556 111,674
68,976,511
2,663,070,509

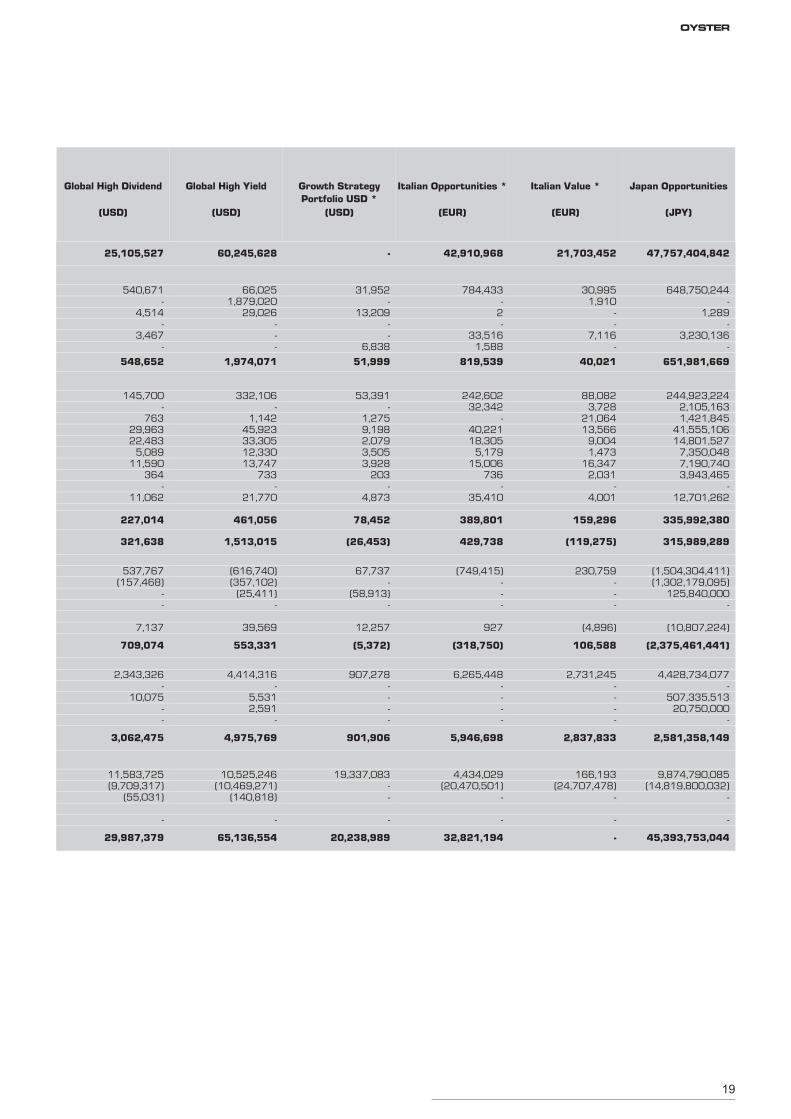
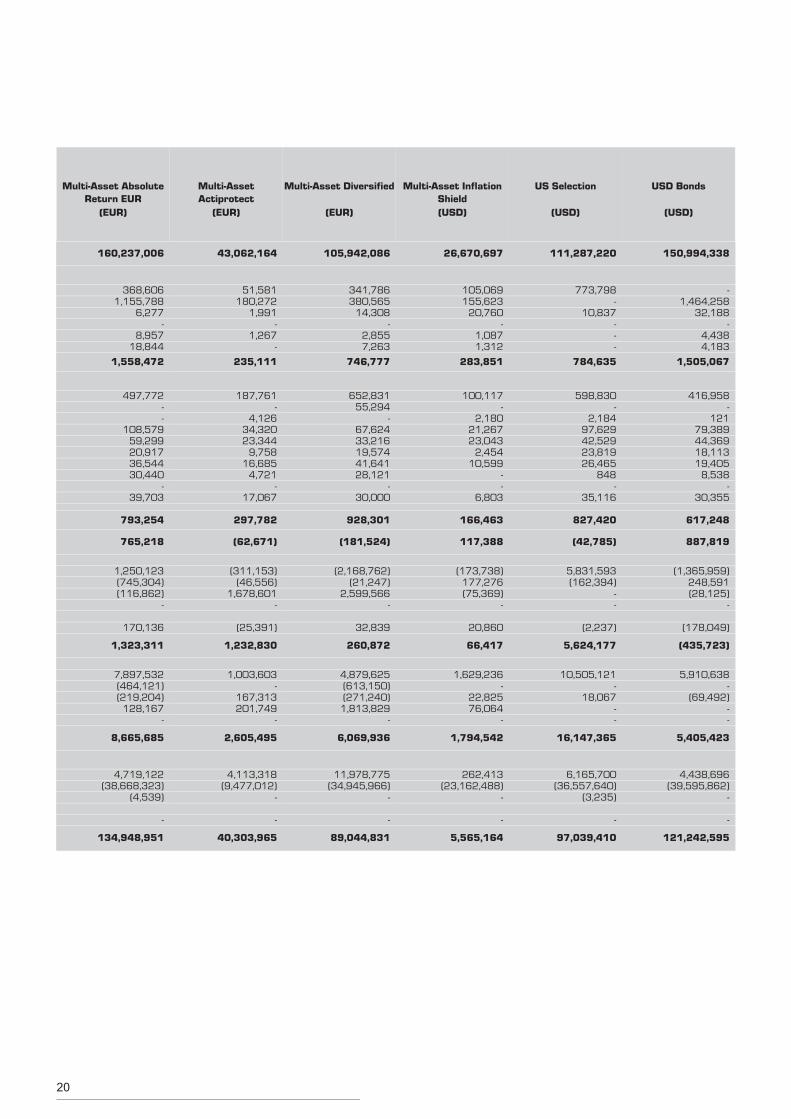
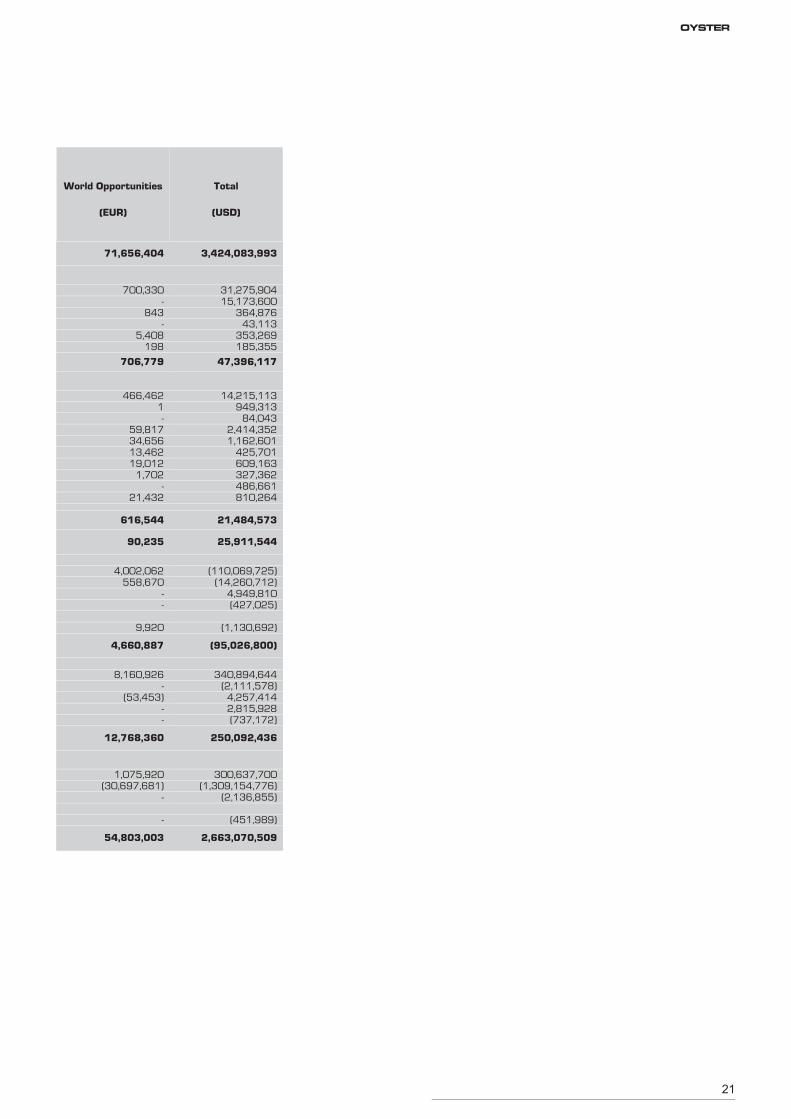
Consolidated statement of changes in net assetsfor the period ended
as at 30 June 2019
16
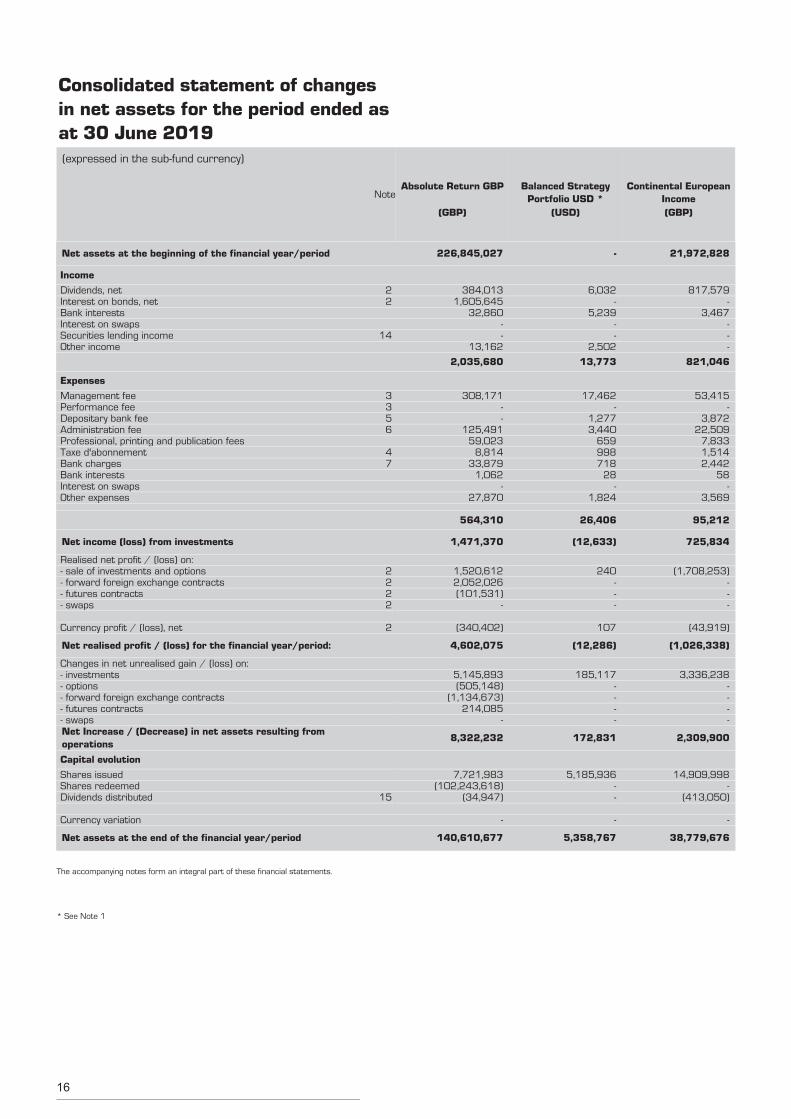
Consolidated statement of changesin net assets for the period ended asat 30 June 2019(expressed in the sub-fund currency)
Note
Net assets at the beginning of the financial year/period
Income
Dividends, net 2Interest on bonds, net 2Bank interestsInterest on swapsSecurities lending income 14Other income
Expenses
Management fee 3Performance fee 3Depositary bank fee 5Administration fee 6Professional, printing and publication feesTaxe d'abonnement 4Bank charges 7Bank interestsInterest on swapsOther expenses
Net income (loss) from investments
Realised net profit / (loss) on:- sale of investments and options 2- forward foreign exchange contracts 2- futures contracts 2- swaps 2
Currency profit / (loss), net 2
Net realised profit / (loss) for the financial year/period:
Changes in net unrealised gain / (loss) on:- investments- options- forward foreign exchange contracts- futures contracts- swapsNet Increase / (Decrease) in net assets resulting fromoperations
Capital evolution
Shares issuedShares redeemedDividends distributed 15
Currency variation
Net assets at the end of the financial year/period
Absolute Return GBP
(GBP)
226,845,027
384,0131,605,645
32,860--
13,162
2,035,680
308,171--
125,49159,023
8,81433,879
1,062-
27,870
564,310
1,471,370
1,520,6122,052,026(101,531)
-
(340,402)
4,602,075
5,145,893(505,148)
(1,134,673)214,085
-
8,322,232
7,721,983(102,243,618)
(34,947)
-
140,610,677
Balanced StrategyPortfolio USD *
(USD)
-
6,032-
5,239--
2,502
13,773
17,462-
1,2773,440
659998718
28-
1,824
26,406
(12,633)
240---
107
(12,286)
185,117----
172,831
5,185,936--
-
5,358,767
Continental EuropeanIncome(GBP)
21,972,828
817,579-
3,467---
821,046
53,415-
3,87222,509
7,8331,5142,442
58-
3,569
95,212
725,834
(1,708,253)---
(43,919)
(1,026,338)
3,336,238----
2,309,900
14,909,998-
(413,050)
-
38,779,676
The accompanying notes form an integral part of these financial statements.
* See Note 1
17
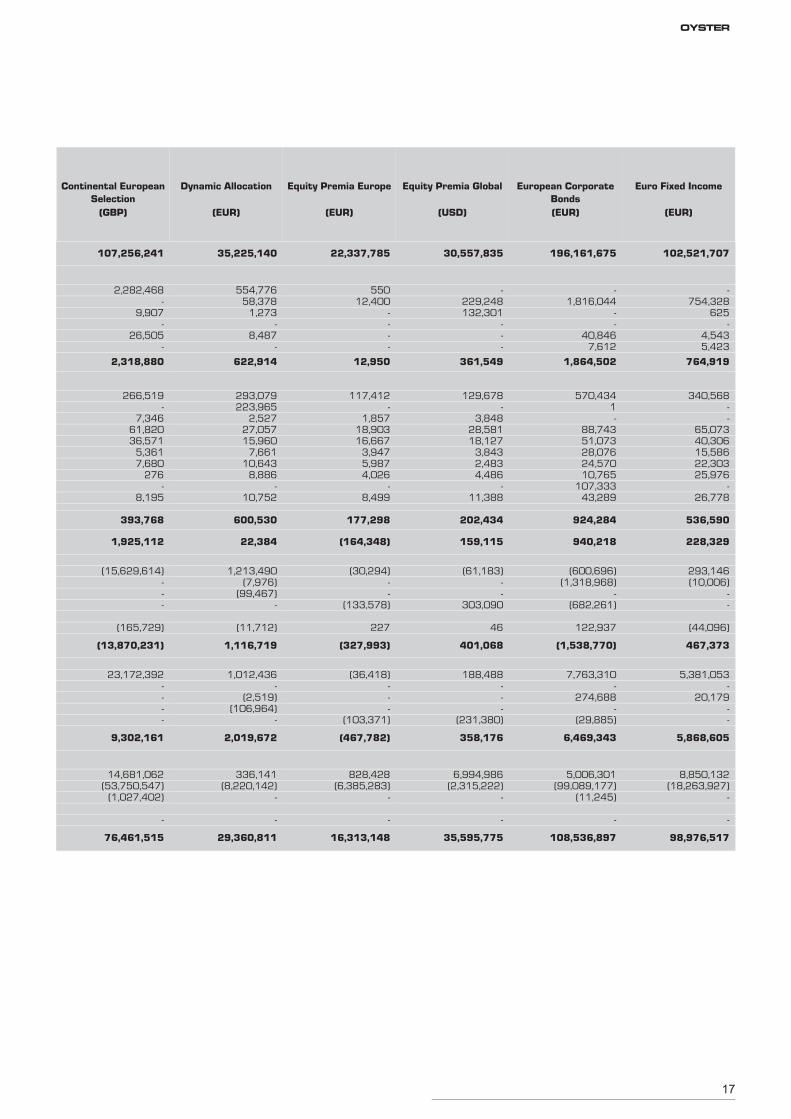
Continental EuropeanSelection
(GBP)
107,256,241
2,282,468 -
9,907 -
26,505 -
2,318,880
266,519 -
7,346 61,820 36,571
5,361 7,680
276 -
8,195
393,768
1,925,112
(15,629,614)
- - -
(165,729)
(13,870,231)
23,172,392
- - - -
9,302,161
14,681,062 (53,750,547)
(1,027,402)
-
76,461,515
Dynamic Allocation
(EUR)
35,225,140
554,77658,378
1,273-
8,487-
622,914
293,079223,965
2,52727,05715,960
7,66110,643
8,886-
10,752
600,530
22,384
1,213,490(7,976)
(99,467)-
(11,712)
1,116,719
1,012,436-
(2,519)(106,964)
-
2,019,672
336,141(8,220,142)
-
-
29,360,811
Equity Premia Europe
(EUR)
22,337,785
55012,400
----
12,950
117,412-
1,85718,90316,667
3,9475,9874,026
-8,499
177,298
(164,348)
(30,294)--
(133,578)
227
(327,993)
(36,418)---
(103,371)
(467,782)
828,428(6,385,283)
-
-
16,313,148
Equity Premia Global
(USD)
30,557,835
-229,248132,301
---
361,549
129,678-
3,84828,58118,127
3,8432,4834,486
-11,388
202,434
159,115
(61,183)--
303,090
46
401,068
188,488---
(231,380)
358,176
6,994,986(2,315,222)
-
-
35,595,775
European CorporateBonds(EUR)
196,161,675
-1,816,044
--
40,8467,612
1,864,502
570,4341-
88,74351,07328,07624,57010,765
107,33343,289
924,284
940,218
(600,696)(1,318,968)
-(682,261)
122,937
(1,538,770)
7,763,310-
274,688-
(29,885)
6,469,343
5,006,301(99,089,177)
(11,245)
-
108,536,897
Euro Fixed Income
(EUR)
102,521,707
-754,328
625-
4,5435,423
764,919
340,568--
65,07340,30615,58622,30325,976
-26,778
536,590
228,329
293,146(10,006)
--
(44,096)
467,373
5,381,053-
20,179--
5,868,605
8,850,132(18,263,927)
-
-
98,976,517
OYSTER
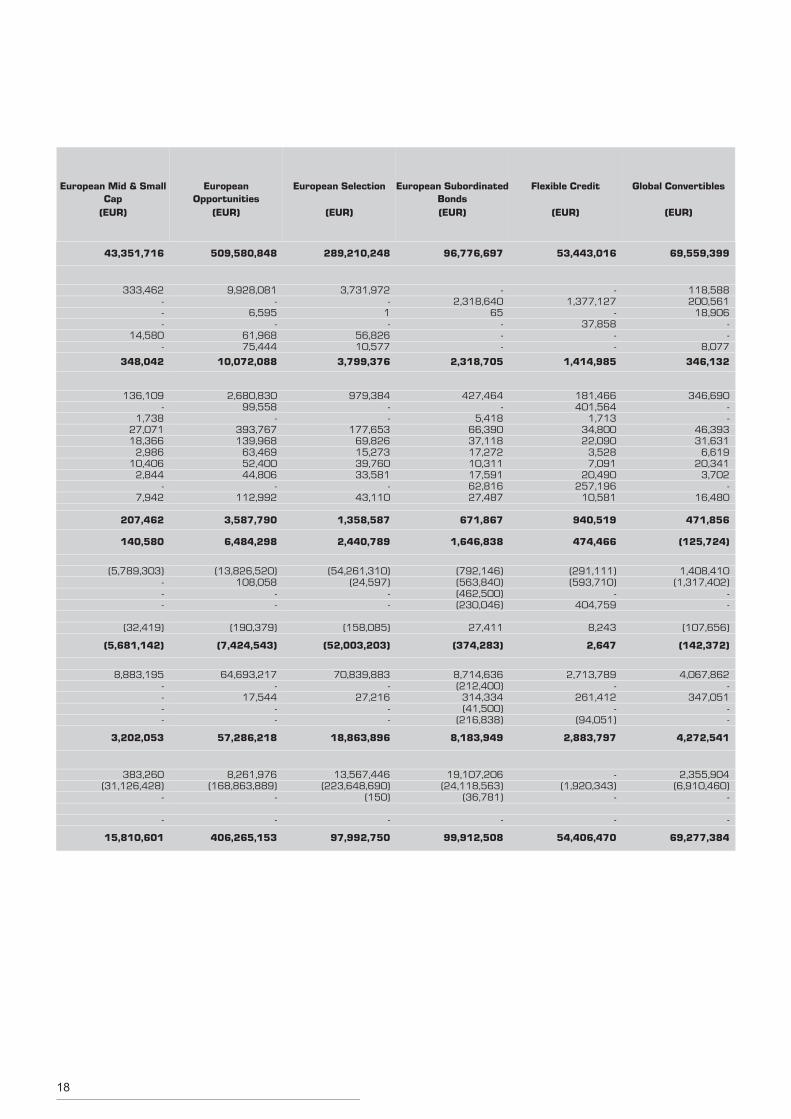
18
European Mid & SmallCap
(EUR)
43,351,716
333,462 - - -
14,580 -
348,042
136,109 -
1,738 27,071 18,366
2,986 10,406
2,844 -
7,942
207,462
140,580
(5,789,303)
- - -
(32,419)
(5,681,142)
8,883,195
- - - -
3,202,053
383,260 (31,126,428)
-
-
15,810,601
EuropeanOpportunities
(EUR)
509,580,848
9,928,081-
6,595-
61,96875,444
10,072,088
2,680,83099,558
-393,767139,968
63,46952,40044,806
-112,992
3,587,790
6,484,298
(13,826,520)108,058
--
(190,379)
(7,424,543)
64,693,217-
17,544--
57,286,218
8,261,976(168,863,889)
-
-
406,265,153
European Selection
(EUR)
289,210,248
3,731,972-
1-
56,82610,577
3,799,376
979,384--
177,65369,82615,27339,76033,581
-43,110
1,358,587
2,440,789
(54,261,310)(24,597)
--
(158,085)
(52,003,203)
70,839,883-
27,216--
18,863,896
13,567,446(223,648,690)
(150)
-
97,992,750
European SubordinatedBonds(EUR)
96,776,697
-2,318,640
65---
2,318,705
427,464-
5,41866,39037,11817,27210,31117,59162,81627,487
671,867
1,646,838
(792,146)(563,840)(462,500)(230,046)
27,411
(374,283)
8,714,636(212,400)
314,334(41,500)
(216,838)
8,183,949
19,107,206(24,118,563)
(36,781)
-
99,912,508
Flexible Credit
(EUR)
53,443,016
-1,377,127
-37,858
--
1,414,985
181,466401,564
1,71334,80022,090
3,5287,091
20,490257,196
10,581
940,519
474,466
(291,111)(593,710)
-404,759
8,243
2,647
2,713,789-
261,412-
(94,051)
2,883,797
-(1,920,343)
-
-
54,406,470
Global Convertibles
(EUR)
69,559,399
118,588200,561
18,906--
8,077
346,132
346,690--
46,39331,631
6,61920,341
3,702-
16,480
471,856
(125,724)
1,408,410(1,317,402)
--
(107,656)
(142,372)
4,067,862-
347,051--
4,272,541
2,355,904(6,910,460)
-
-
69,277,384
19
Global High Dividend
(USD)
25,105,527
540,671 -
4,514 -
3,467 -
548,652
145,700 -
763 29,963 22,483
5,089 11,590
364 -
11,062
227,014
321,638
537,767
(157,468) - -
7,137
709,074
2,343,326
- 10,075
- -
3,062,475
11,583,725 (9,709,317)
(55,031)
-
29,987,379
Global High Yield
(USD)
60,245,628
66,0251,879,020
29,026---
1,974,071
332,106-
1,14245,92333,30512,33013,747
733-
21,770
461,056
1,513,015
(616,740)(357,102)
(25,411)-
39,569
553,331
4,414,316-
5,5312,591
-
4,975,769
10,525,246(10,469,271)
(140,818)
-
65,136,554
Growth StrategyPortfolio USD *
(USD)
-
31,952-
13,209--
6,838
51,999
53,391-
1,2759,1982,0793,5053,928
203-
4,873
78,452
(26,453)
67,737-
(58,913)-
12,257
(5,372)
907,278----
901,906
19,337,083--
-
20,238,989
Italian Opportunities *
(EUR)
42,910,968
784,433-
2-
33,5161,588
819,539
242,60232,342
-40,22118,305
5,17915,006
736-
35,410
389,801
429,738
(749,415)---
927
(318,750)
6,265,448----
5,946,698
4,434,029(20,470,501)
-
-
32,821,194
Italian Value *
(EUR)
21,703,452
30,9951,910
--
7,116-
40,021
88,0823,728
21,06413,566
9,0041,473
16,3472,031
-4,001
159,296
(119,275)
230,759---
(4,896)
106,588
2,731,245----
2,837,833
166,193(24,707,478)
-
-
-
Japan Opportunities
(JPY)
47,757,404,842
648,750,244-
1,289-
3,230,136-
651,981,669
244,923,2242,105,1631,421,845
41,555,10614,801,527
7,350,0487,190,7403,943,465
-12,701,262
335,992,380
315,989,289
(1,504,304,411)(1,302,179,095)
125,840,000-
(10,807,224)
(2,375,461,441)
4,428,734,077-
507,335,51320,750,000
-
2,581,358,149
9,874,790,085(14,819,800,032)
-
-
45,393,753,044
OYSTER
20
Multi-Asset AbsoluteReturn EUR
(EUR)
160,237,006
368,606 1,155,788
6,277 -
8,957 18,844
1,558,472
497,772 - -
108,579 59,299 20,917 36,544 30,440
- 39,703
793,254
765,218
1,250,123 (745,304) (116,862)
-
170,136
1,323,311
7,897,532 (464,121) (219,204)
128,167 -
8,665,685
4,719,122 (38,668,323)
(4,539)
-
134,948,951
Multi-AssetActiprotect
(EUR)
43,062,164
51,581180,272
1,991-
1,267-
235,111
187,761-
4,12634,32023,344
9,75816,685
4,721-
17,067
297,782
(62,671)
(311,153)(46,556)
1,678,601-
(25,391)
1,232,830
1,003,603-
167,313201,749
-
2,605,495
4,113,318(9,477,012)
-
-
40,303,965
Multi-Asset Diversified
(EUR)
105,942,086
341,786380,565
14,308-
2,8557,263
746,777
652,83155,294
-67,62433,21619,57441,64128,121
-30,000
928,301
(181,524)
(2,168,762)(21,247)
2,599,566-
32,839
260,872
4,879,625(613,150)(271,240)1,813,829
-
6,069,936
11,978,775(34,945,966)
-
-
89,044,831
Multi-Asset InflationShield(USD)
26,670,697
105,069155,623
20,760-
1,0871,312
283,851
100,117-
2,18021,26723,043
2,45410,599
--
6,803
166,463
117,388
(173,738)177,276(75,369)
-
20,860
66,417
1,629,236-
22,82576,064
-
1,794,542
262,413(23,162,488)
-
-
5,565,164
US Selection
(USD)
111,287,220
773,798-
10,837---
784,635
598,830-
2,18497,62942,52923,81926,465
848-
35,116
827,420
(42,785)
5,831,593(162,394)
--
(2,237)
5,624,177
10,505,121-
18,067--
16,147,365
6,165,700(36,557,640)
(3,235)
-
97,039,410
USD Bonds
(USD)
150,994,338
-1,464,258
32,188-
4,4384,183
1,505,067
416,958-
12179,38944,36918,11319,405
8,538-
30,355
617,248
887,819
(1,365,959)248,591(28,125)
-
(178,049)
(435,723)
5,910,638-
(69,492)--
5,405,423
4,438,696(39,595,862)
-
-
121,242,595
21
World Opportunities
(EUR)
71,656,404
700,330 -
843 -
5,408 198
706,779
466,462 1 -
59,817 34,656 13,462 19,012
1,702 -
21,432
616,544
90,235
4,002,062
558,670 - -
9,920
4,660,887
8,160,926
- (53,453)
- -
12,768,360
1,075,920 (30,697,681)
-
-
54,803,003
(USD)
Total
3,424,083,993
31,275,90415,173,600
364,87643,113
353,269185,355
47,396,117
14,215,113949,313
84,0432,414,3521,162,601
425,701609,163327,362486,661810,264
21,484,573
25,911,544
(110,069,725)(14,260,712)
4,949,810(427,025)
(1,130,692)
(95,026,800)
340,894,644(2,111,578)
4,257,4142,815,928(737,172)
250,092,436
300,637,700(1,309,154,776)
(2,136,855)
(451,989)
2,663,070,509
OYSTER


Statistics
24
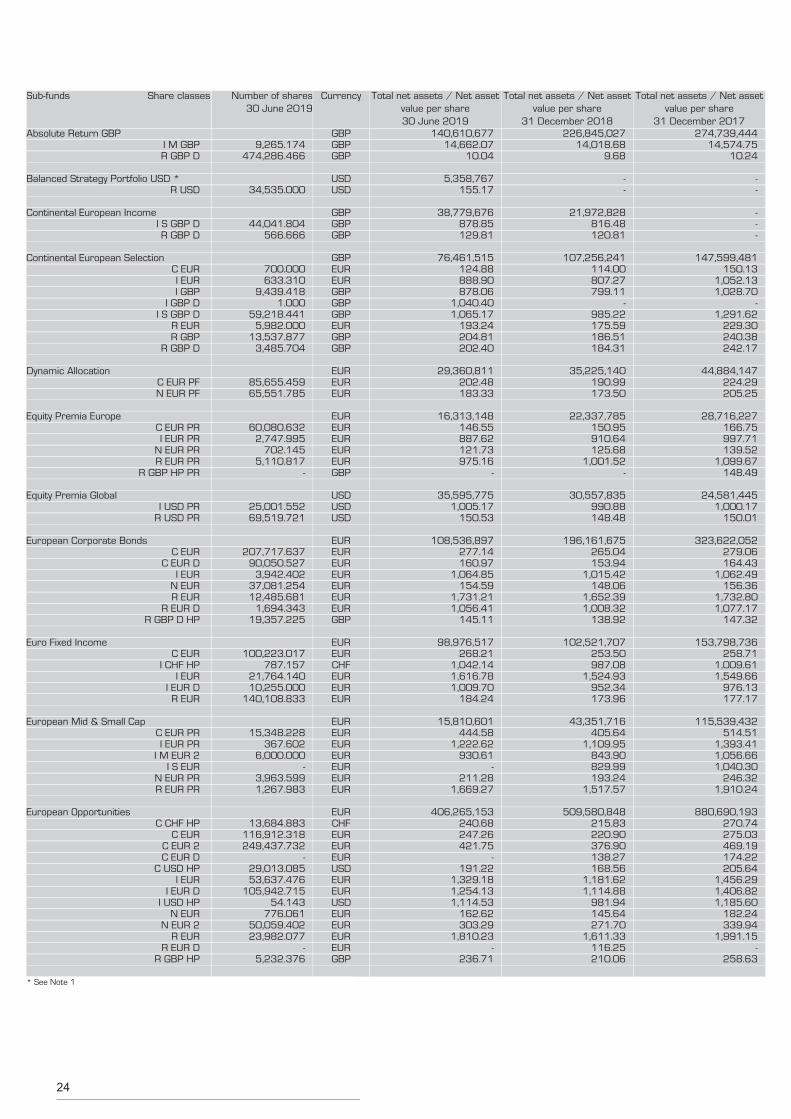
Number of shares30 June 2019
Currency Total net assets / Net assetvalue per share 30 June 2019
Total net assets / Net assetvalue per share
31 December 2018
Total net assets / Net assetvalue per share
31 December 2017
Share classesSub-funds
Absolute Return GBPI M GBPR GBP D
9,265.174474,286.466
GBPGBP
GBP14,662.07
10.04
140,610,67714,018.68
9.68
226,845,02714,574.75
10.24
274,739,444
Balanced Strategy Portfolio USD *R USD 34,535.000 USD
USD155.17
5,358,767--
--
Continental European IncomeI S GBP DR GBP D
44,041.804566.666
GBPGBP
GBP878.85129.81
38,779,676816.48120.81
21,972,828--
-
Continental European SelectionC EURI EURI GBP
I GBP DI S GBP D
R EURR GBP
R GBP D
700.000633.310
9,439.4181.000
59,218.4415,982.000
13,537.8773,485.704
EUREURGBPGBPGBPEURGBPGBP
GBP124.88888.90878.06
1,040.401,065.17
193.24204.81202.40
76,461,515114.00807.27799.11
-985.22175.59186.51184.31
107,256,241150.13
1,052.131,028.70
-1,291.62
229.30240.38242.17
147,599,481
Dynamic AllocationC EUR PFN EUR PF
85,655.45965,551.785
EUREUR
EUR202.48183.33
29,360,811190.99173.50
35,225,140224.29205.25
44,884,147
Equity Premia EuropeC EUR PRI EUR PR
N EUR PRR EUR PR
R GBP HP PR
60,080.6322,747.995
702.1455,110.817
-
EUREUREUREURGBP
EUR146.55887.62121.73975.16
-
16,313,148150.95910.64125.68
1,001.52-
22,337,785166.75997.71139.52
1,099.67148.49
28,716,227
Equity Premia GlobalI USD PR
R USD PR25,001.55269,519.721
USDUSD
USD1,005.17
150.53
35,595,775990.88148.48
30,557,8351,000.17
150.01
24,581,445
European Corporate BondsC EUR
C EUR DI EUR
N EURR EUR
R EUR DR GBP D HP
207,717.63790,050.527
3,942.40237,081.25412,485.681
1,694.34319,357.225
EUREUREUREUREUREURGBP
EUR277.14160.97
1,064.85154.59
1,731.211,056.41
145.11
108,536,897265.04153.94
1,015.42148.06
1,652.391,008.32
138.92
196,161,675279.06164.43
1,062.49156.36
1,732.801,077.17
147.32
323,622,052
Euro Fixed IncomeC EUR
I CHF HPI EUR
I EUR DR EUR
100,223.017787.157
21,764.14010,255.000
140,108.833
EURCHFEUREUREUR
EUR268.21
1,042.141,616.781,009.70
184.24
98,976,517253.50987.08
1,524.93952.34173.96
102,521,707258.71
1,009.611,549.66
976.13177.17
153,798,736
European Mid & Small CapC EUR PRI EUR PR
I M EUR 2I S EUR
N EUR PRR EUR PR
15,348.228367.602
6,000.000-
3,963.5991,267.983
EUREUREUREUREUREUR
EUR444.58
1,222.62930.61
-211.28
1,669.27
15,810,601405.64
1,109.95843.90829.99193.24
1,517.57
43,351,716514.51
1,393.411,056.661,040.30
246.321,910.24
115,539,432
European OpportunitiesC CHF HP
C EURC EUR 2C EUR D
C USD HPI EUR
I EUR DI USD HP
N EURN EUR 2
R EURR EUR D
R GBP HP
13,684.883116,912.318249,437.732
-29,013.08553,637.476
105,942.71554.143
776.06150,059.40223,982.077
-5,232.376
CHFEUREUREURUSDEUREURUSDEUREUREUREURGBP
EUR240.68247.26421.75
-191.22
1,329.181,254.131,114.53
162.62303.29
1,810.23-
236.71
406,265,153215.83220.90376.90138.27168.56
1,181.621,114.88
981.94145.64271.70
1,611.33116.25210.06
509,580,848270.74275.03469.19174.22205.64
1,456.291,406.821,185.60
182.24339.94
1,991.15-
258.63
880,690,193
* See Note 1
25
OYSTER
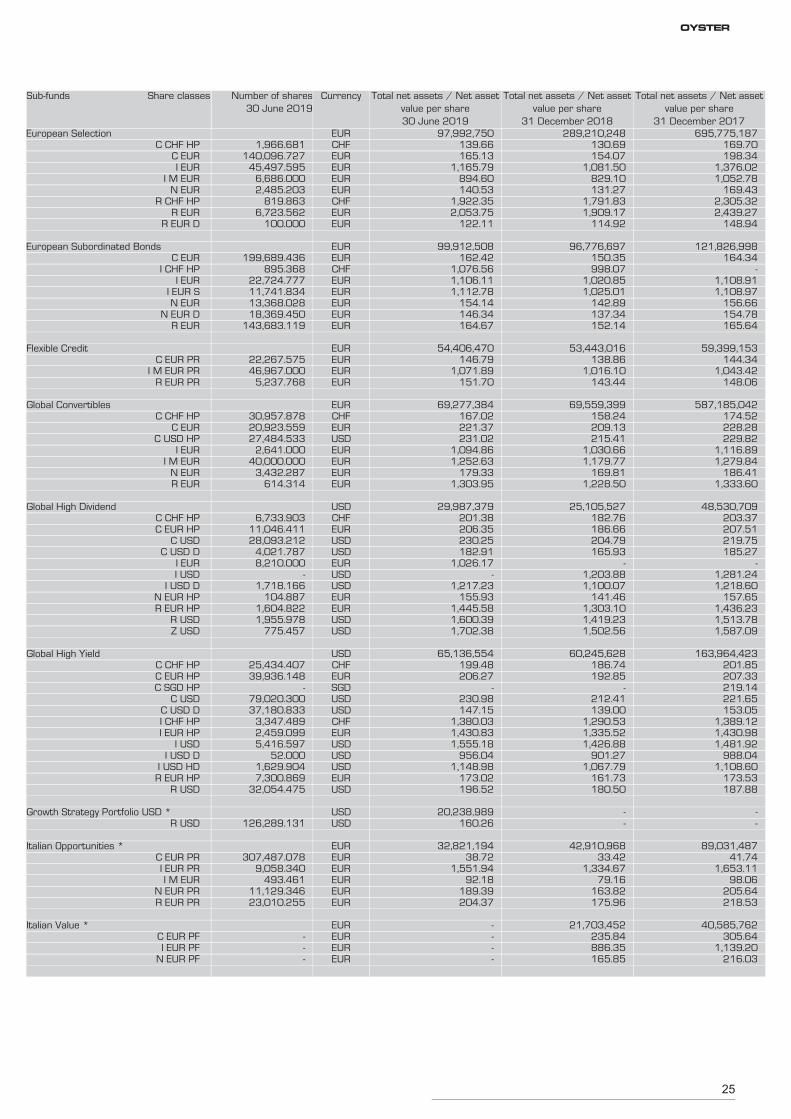
Number of shares30 June 2019
Currency Total net assets / Net assetvalue per share 30 June 2019
Total net assets / Net assetvalue per share
31 December 2018
Total net assets / Net assetvalue per share
31 December 2017
Share classesSub-funds
European SelectionC CHF HP
C EURI EUR
I M EURN EUR
R CHF HPR EUR
R EUR D
1,966.681140,096.727
45,497.5956,686.0002,485.203
819.8636,723.562
100.000
CHFEUREUREUREURCHFEUREUR
EUR139.66165.13
1,165.79894.60140.53
1,922.352,053.75
122.11
97,992,750130.69154.07
1,081.50829.10131.27
1,791.831,909.17
114.92
289,210,248169.70198.34
1,376.021,052.78
169.432,305.322,439.27
148.94
695,775,187
European Subordinated BondsC EUR
I CHF HPI EUR
I EUR SN EUR
N EUR DR EUR
199,689.436895.368
22,724.77711,741.83413,368.02818,369.450
143,683.119
EURCHFEUREUREUREUREUR
EUR162.42
1,076.561,106.111,112.78
154.14146.34164.67
99,912,508150.35998.07
1,020.851,025.01
142.89137.34152.14
96,776,697164.34
-1,108.911,108.97
156.66154.78165.64
121,826,998
Flexible CreditC EUR PR
I M EUR PRR EUR PR
22,267.57546,967.000
5,237.768
EUREUREUR
EUR146.79
1,071.89151.70
54,406,470138.86
1,016.10143.44
53,443,016144.34
1,043.42148.06
59,399,153
Global ConvertiblesC CHF HP
C EURC USD HP
I EURI M EUR
N EURR EUR
30,957.87820,923.55927,484.533
2,641.00040,000.000
3,432.287614.314
CHFEURUSDEUREUREUREUR
EUR167.02221.37231.02
1,094.861,252.63
179.331,303.95
69,277,384158.24209.13215.41
1,030.661,179.77
169.811,228.50
69,559,399174.52228.28229.82
1,116.891,279.84
186.411,333.60
587,185,042
Global High DividendC CHF HPC EUR HP
C USDC USD D
I EURI USD
I USD DN EUR HPR EUR HP
R USDZ USD
6,733.90311,046.41128,093.212
4,021.7878,210.000
-1,718.166
104.8871,604.8221,955.978
775.457
CHFEURUSDUSDEURUSDUSDEUREURUSDUSD
USD201.38206.35230.25182.91
1,026.17-
1,217.23155.93
1,445.581,600.391,702.38
29,987,379182.76186.66204.79165.93
-1,203.881,100.07
141.461,303.101,419.231,502.56
25,105,527203.37207.51219.75185.27
-1,281.241,218.60
157.651,436.231,513.781,587.09
48,530,709
Global High YieldC CHF HPC EUR HPC SGD HP
C USDC USD DI CHF HPI EUR HP
I USDI USD D
I USD HDR EUR HP
R USD
25,434.40739,936.148
-79,020.30037,180.833
3,347.4892,459.0995,416.597
52.0001,629.9047,300.869
32,054.475
CHFEURSGDUSDUSDCHFEURUSDUSDUSDEURUSD
USD199.48206.27
-230.98147.15
1,380.031,430.831,555.18
956.041,148.98
173.02196.52
65,136,554186.74192.85
-212.41139.00
1,290.531,335.521,426.88
901.271,067.79
161.73180.50
60,245,628201.85207.33219.14221.65153.05
1,389.121,430.981,481.92
988.041,108.60
173.53187.88
163,964,423
Growth Strategy Portfolio USD *R USD 126,289.131 USD
USD160.26
20,238,989--
--
Italian Opportunities *C EUR PRI EUR PRI M EUR
N EUR PRR EUR PR
307,487.0789,058.340
493.46111,129.34623,010.255
EUREUREUREUREUR
EUR38.72
1,551.9492.18
189.39204.37
32,821,19433.42
1,334.6779.16
163.82175.96
42,910,96841.74
1,653.1198.06
205.64218.53
89,031,487
Italian Value *C EUR PFI EUR PF
N EUR PF
---
EUREUREUR
EUR---
-235.84886.35165.85
21,703,452305.64
1,139.20216.03
40,585,762
26
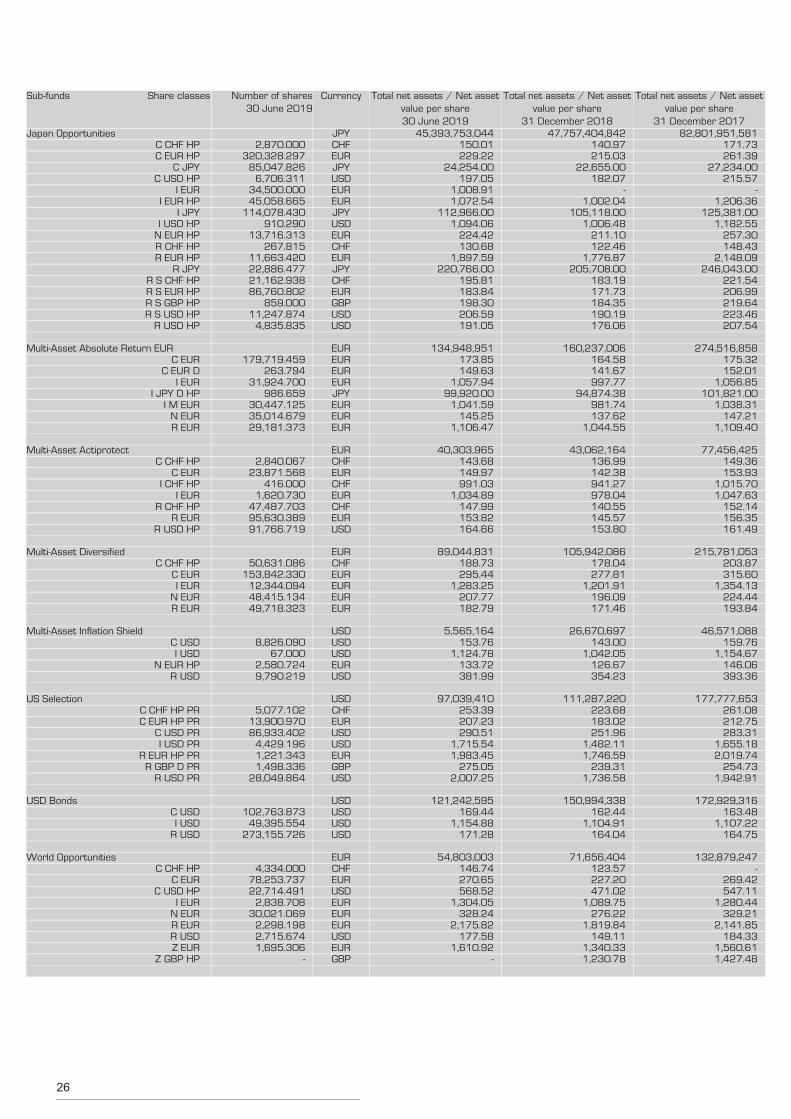
Number of shares30 June 2019
Currency Total net assets / Net assetvalue per share 30 June 2019
Total net assets / Net assetvalue per share
31 December 2018
Total net assets / Net assetvalue per share
31 December 2017
Share classesSub-funds
Japan OpportunitiesC CHF HPC EUR HP
C JPYC USD HP
I EURI EUR HP
I JPYI USD HP
N EUR HPR CHF HPR EUR HP
R JPYR S CHF HPR S EUR HPR S GBP HPR S USD HP
R USD HP
2,870.000320,328.297
85,047.8266,706.311
34,500.00045,058.665
114,078.430910.290
13,716.313267.815
11,663.42022,886.47721,162.93886,760.802
859.00011,247.874
4,835.835
CHFEURJPYUSDEUREURJPYUSDEURCHFEURJPYCHFEURGBPUSDUSD
JPY150.01229.22
24,254.00197.05
1,008.911,072.54
112,966.001,094.06
224.42130.68
1,897.59220,766.00
195.81183.84198.30206.59191.05
45,393,753,044140.97215.03
22,655.00182.07
-1,002.04
105,118.001,006.48
211.10122.46
1,776.87205,708.00
183.19171.73184.35190.19176.06
47,757,404,842171.73261.39
27,234.00215.57
-1,206.36
125,381.001,182.55
257.30148.43
2,148.09246,043.00
221.54206.99219.64223.46207.54
82,801,951,581
Multi-Asset Absolute Return EURC EUR
C EUR DI EUR
I JPY D HPI M EUR
N EURR EUR
179,719.459263.794
31,924.700986.659
30,447.12535,014.67929,181.373
EUREUREURJPYEUREUREUR
EUR173.85149.63
1,057.9499,920.00
1,041.59145.25
1,106.47
134,948,951164.58141.67997.77
94,874.38981.74137.62
1,044.55
160,237,006175.32152.01
1,056.85101,821.00
1,038.31147.21
1,109.40
274,516,858
Multi-Asset ActiprotectC CHF HP
C EURI CHF HP
I EURR CHF HP
R EURR USD HP
2,840.06723,871.568
416.0001,620.730
47,487.70395,630.38991,766.719
CHFEURCHFEURCHFEURUSD
EUR143.68149.97991.03
1,034.89147.99153.82164.66
40,303,965136.99142.38941.27978.04140.55145.57153.80
43,062,164149.36153.93
1,015.701,047.63
152.14156.35161.49
77,456,425
Multi-Asset DiversifiedC CHF HP
C EURI EUR
N EURR EUR
50,631.086153,842.330
12,344.09448,415.13449,718.323
CHFEUREUREUREUR
EUR188.73295.44
1,283.25207.77182.79
89,044,831178.04277.81
1,201.91196.09171.46
105,942,086203.87315.60
1,354.13224.44193.84
215,781,053
Multi-Asset Inflation ShieldC USDI USD
N EUR HPR USD
8,826.09067.000
2,580.7249,790.219
USDUSDEURUSD
USD153.76
1,124.78133.72381.99
5,565,164143.00
1,042.05126.67354.23
26,670,697159.76
1,154.67146.06393.36
46,571,088
US SelectionC CHF HP PRC EUR HP PR
C USD PRI USD PR
R EUR HP PRR GBP D PR
R USD PR
5,077.10213,900.97086,933.402
4,429.1961,221.3431,498.336
28,049.864
CHFEURUSDUSDEURGBPUSD
USD253.39207.23290.51
1,715.541,983.45
275.052,007.25
97,039,410223.68183.02251.96
1,482.111,746.59
239.311,736.58
111,287,220261.08212.75283.31
1,655.182,019.74
254.731,942.91
177,777,653
USD BondsC USDI USD
R USD
102,763.87349,395.554
273,155.726
USDUSDUSD
USD169.44
1,154.88171.28
121,242,595162.44
1,104.91164.04
150,994,338163.48
1,107.22164.75
172,929,316
World OpportunitiesC CHF HP
C EURC USD HP
I EURN EURR EURR USDZ EUR
Z GBP HP
4,334.00078,253.73722,714.491
2,838.70830,021.069
2,298.1982,715.6741,695.306
-
CHFEURUSDEUREUREURUSDEURGBP
EUR146.74270.65568.52
1,304.05328.24
2,175.82177.58
1,610.92-
54,803,003123.57227.20471.02
1,089.75276.22
1,819.84149.11
1,340.331,230.78
71,656,404-
269.42547.11
1,280.44329.21
2,141.85184.33
1,560.611,427.48
132,879,247

Portfolio statementsas at 30 June 2019
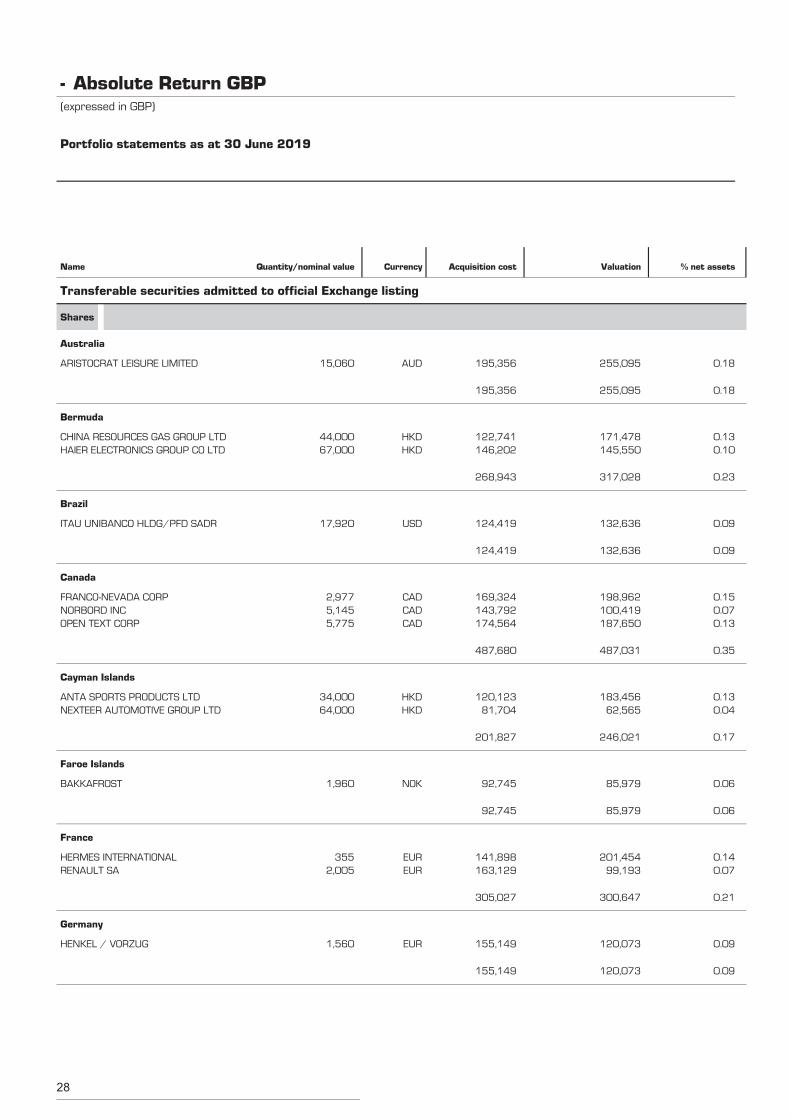
28
ARISTOCRAT LEISURE LIMITED 15,060 255,095 0.18AUD 195,356
Transferable securities admitted to official Exchange listing
Shares
Australia
255,095 0.18195,356
CHINA RESOURCES GAS GROUP LTD 44,000 171,478 0.13HKD 122,741
Bermuda
HAIER ELECTRONICS GROUP CO LTD 67,000 145,550 0.10HKD 146,202
317,028 0.23268,943
ITAU UNIBANCO HLDG/PFD SADR 17,920 132,636 0.09USD 124,419
Brazil
132,636 0.09124,419
FRANCO-NEVADA CORP 2,977 198,962 0.15CAD 169,324
Canada
NORBORD INC 5,145 100,419 0.07CAD 143,792OPEN TEXT CORP 5,775 187,650 0.13CAD 174,564
487,031 0.35487,680
ANTA SPORTS PRODUCTS LTD 34,000 183,456 0.13HKD 120,123
Cayman Islands
NEXTEER AUTOMOTIVE GROUP LTD 64,000 62,565 0.04HKD 81,704
246,021 0.17201,827
BAKKAFROST 1,960 85,979 0.06NOK 92,745
Faroe Islands
85,979 0.0692,745
HERMES INTERNATIONAL 355 201,454 0.14EUR 141,898
France
RENAULT SA 2,005 99,193 0.07EUR 163,129
300,647 0.21305,027
HENKEL / VORZUG 1,560 120,073 0.09EUR 155,149
Germany
120,073 0.09155,149
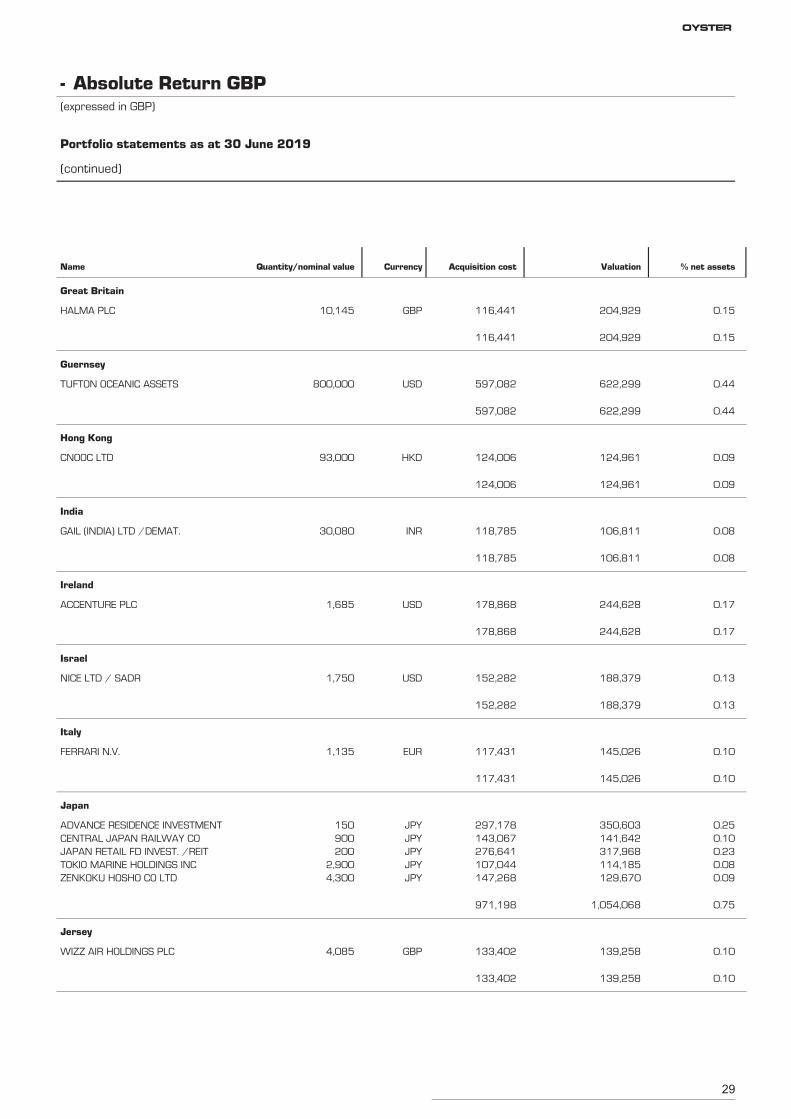
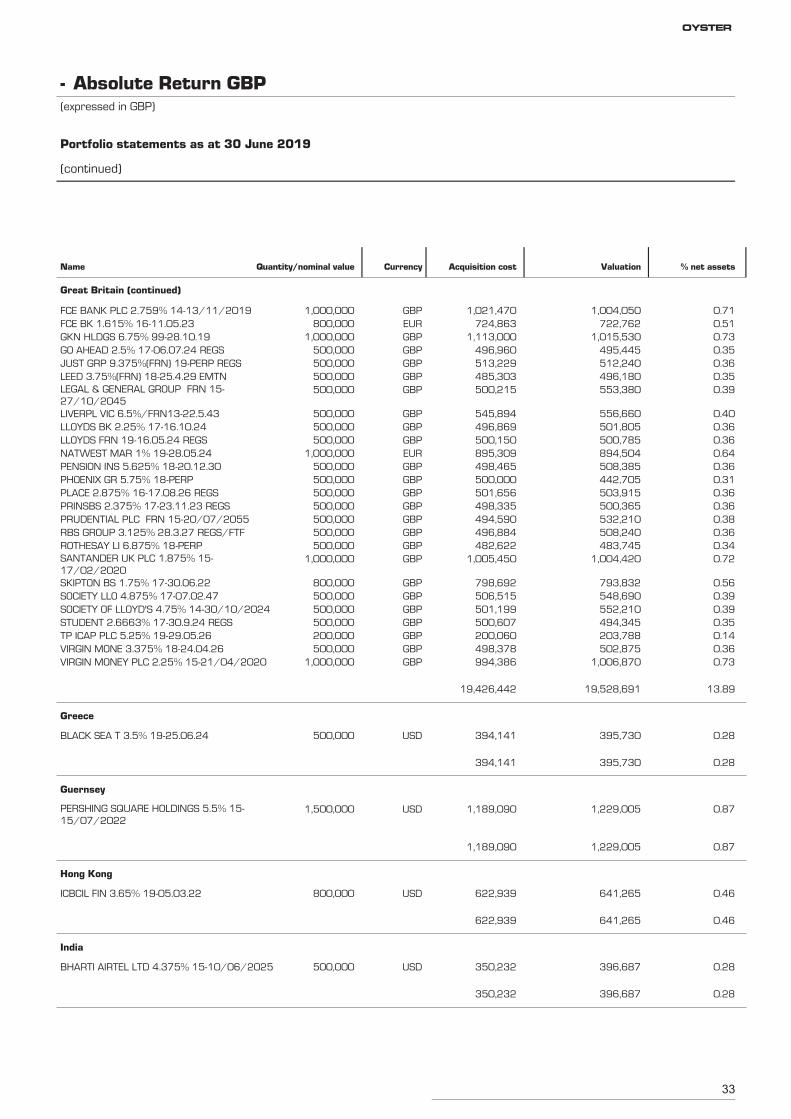
Absolute Return GBP-(expressed in GBP)
Portfolio statements as at 30 June 2019
Name Quantity/nominal value Currency Acquisition cost Valuation % net assets
29
HALMA PLC 10,145 204,929 0.15GBP 116,441
Great Britain
204,929 0.15116,441
TUFTON OCEANIC ASSETS 800,000 622,299 0.44USD 597,082
Guernsey
622,299 0.44597,082
CNOOC LTD 93,000 124,961 0.09HKD 124,006
Hong Kong
124,961 0.09124,006
GAIL (INDIA) LTD /DEMAT. 30,080 106,811 0.08INR 118,785
India
106,811 0.08118,785
ACCENTURE PLC 1,685 244,628 0.17USD 178,868
Ireland
244,628 0.17178,868
NICE LTD / SADR 1,750 188,379 0.13USD 152,282
Israel
188,379 0.13152,282
FERRARI N.V. 1,135 145,026 0.10EUR 117,431
Italy
145,026 0.10117,431
ADVANCE RESIDENCE INVESTMENT 150 350,603 0.25JPY 297,178
Japan
CENTRAL JAPAN RAILWAY CO 900 141,642 0.10JPY 143,067JAPAN RETAIL FD INVEST. /REIT 200 317,968 0.23JPY 276,641TOKIO MARINE HOLDINGS INC 2,900 114,185 0.08JPY 107,044ZENKOKU HOSHO CO LTD 4,300 129,670 0.09JPY 147,268
1,054,068 0.75971,198
WIZZ AIR HOLDINGS PLC 4,085 139,258 0.10GBP 133,402
Jersey
139,258 0.10133,402
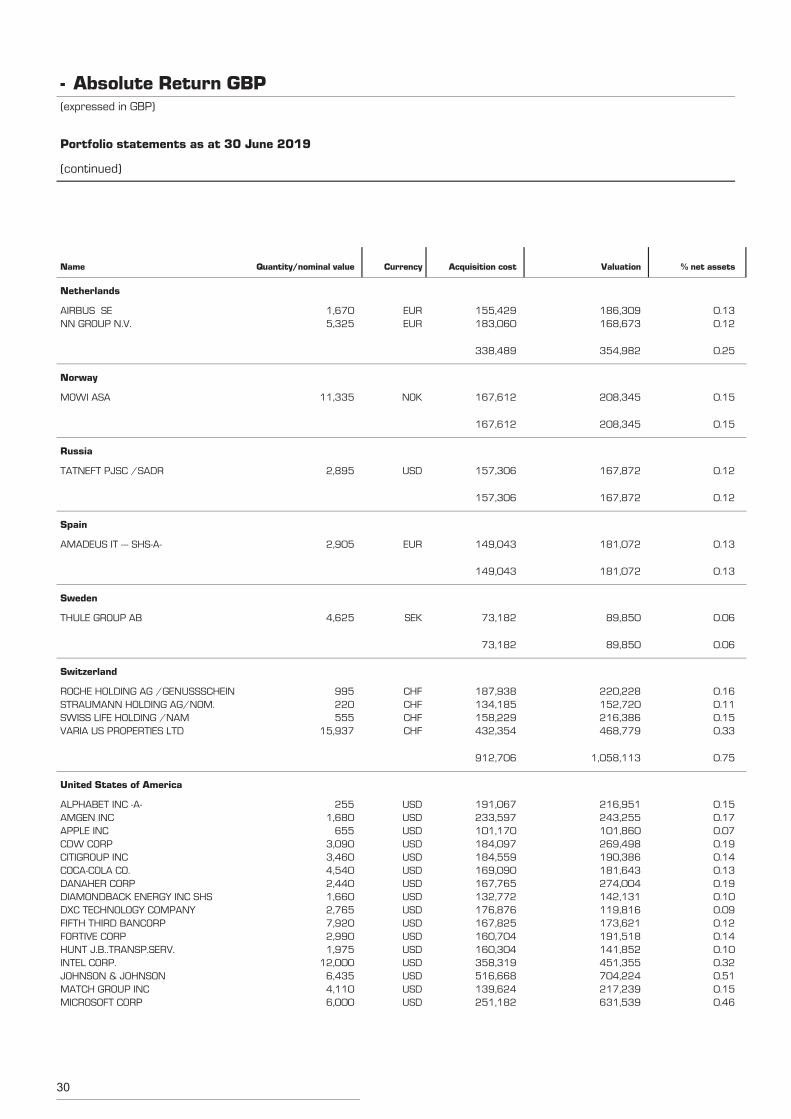
Absolute Return GBP-(expressed in GBP)
Portfolio statements as at 30 June 2019
(continued)
Name Quantity/nominal value Currency Acquisition cost Valuation % net assets
OYSTER
30
AIRBUS SE 1,670 186,309 0.13EUR 155,429
Netherlands
NN GROUP N.V. 5,325 168,673 0.12EUR 183,060
354,982 0.25338,489
MOWI ASA 11,335 208,345 0.15NOK 167,612
Norway
208,345 0.15167,612
TATNEFT PJSC /SADR 2,895 167,872 0.12USD 157,306
Russia
167,872 0.12157,306
AMADEUS IT --- SHS-A- 2,905 181,072 0.13EUR 149,043
Spain
181,072 0.13149,043
THULE GROUP AB 4,625 89,850 0.06SEK 73,182
Sweden
89,850 0.0673,182
ROCHE HOLDING AG /GENUSSSCHEIN 995 220,228 0.16CHF 187,938
Switzerland
STRAUMANN HOLDING AG/NOM. 220 152,720 0.11CHF 134,185SWISS LIFE HOLDING /NAM 555 216,386 0.15CHF 158,229VARIA US PROPERTIES LTD 15,937 468,779 0.33CHF 432,354
1,058,113 0.75912,706
ALPHABET INC -A- 255 216,951 0.15USD 191,067
United States of America
AMGEN INC 1,680 243,255 0.17USD 233,597APPLE INC 655 101,860 0.07USD 101,170CDW CORP 3,090 269,498 0.19USD 184,097CITIGROUP INC 3,460 190,386 0.14USD 184,559COCA-COLA CO. 4,540 181,643 0.13USD 169,090DANAHER CORP 2,440 274,004 0.19USD 167,765DIAMONDBACK ENERGY INC SHS 1,660 142,131 0.10USD 132,772DXC TECHNOLOGY COMPANY 2,765 119,816 0.09USD 176,876FIFTH THIRD BANCORP 7,920 173,621 0.12USD 167,825FORTIVE CORP 2,990 191,518 0.14USD 160,704HUNT J.B..TRANSP.SERV. 1,975 141,852 0.10USD 160,304INTEL CORP. 12,000 451,355 0.32USD 358,319JOHNSON & JOHNSON 6,435 704,224 0.51USD 516,668MATCH GROUP INC 4,110 217,239 0.15USD 139,624MICROSOFT CORP 6,000 631,539 0.46USD 251,182
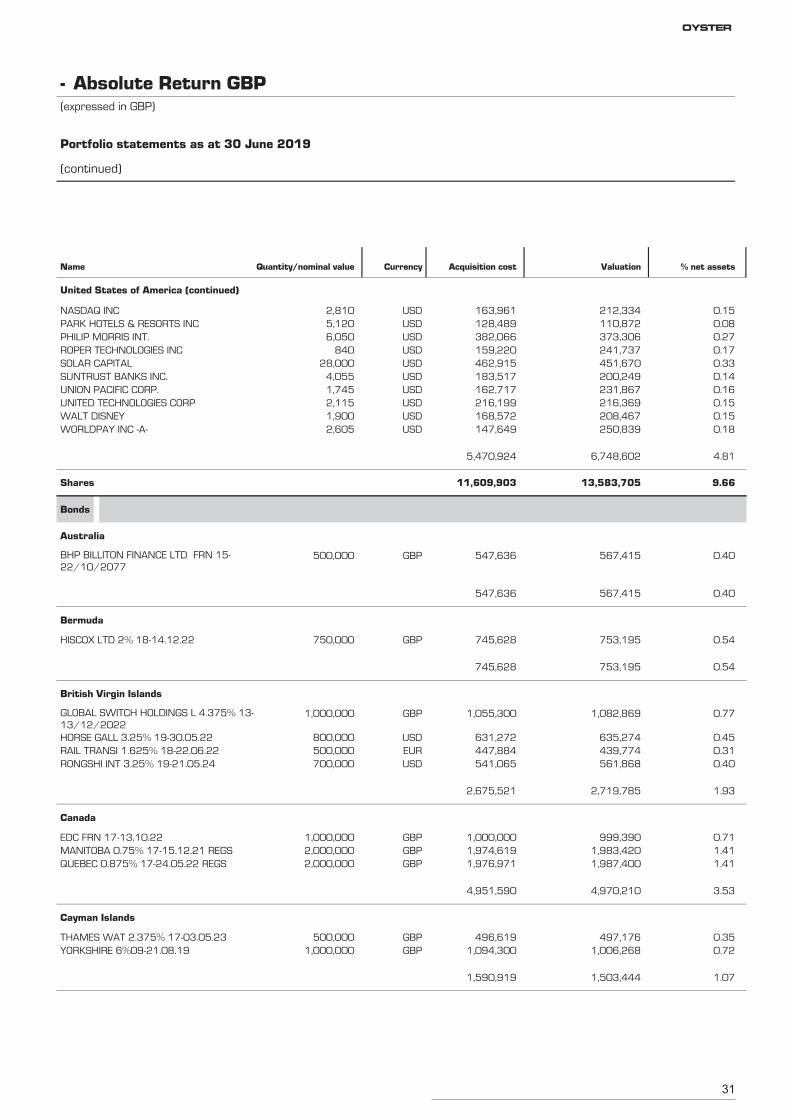
Absolute Return GBP-(expressed in GBP)
Portfolio statements as at 30 June 2019
(continued)
Name Quantity/nominal value Currency Acquisition cost Valuation % net assets
31
NASDAQ INC 2,810 212,334 0.15USD 163,961
United States of America (continued)
PARK HOTELS & RESORTS INC 5,120 110,872 0.08USD 128,489PHILIP MORRIS INT. 6,050 373,306 0.27USD 382,066ROPER TECHNOLOGIES INC 840 241,737 0.17USD 159,220SOLAR CAPITAL 28,000 451,670 0.33USD 462,915SUNTRUST BANKS INC. 4,055 200,249 0.14USD 183,517UNION PACIFIC CORP. 1,745 231,867 0.16USD 162,717UNITED TECHNOLOGIES CORP 2,115 216,369 0.15USD 216,199WALT DISNEY 1,900 208,467 0.15USD 168,572WORLDPAY INC -A- 2,605 250,839 0.18USD 147,649
6,748,602 4.815,470,924
Shares 13,583,705 9.6611,609,903
BHP BILLITON FINANCE LTD FRN 15-22/10/2077
500,000 567,415 0.40GBP 547,636
Bonds
Australia
567,415 0.40547,636
HISCOX LTD 2% 18-14.12.22 750,000 753,195 0.54GBP 745,628
Bermuda
753,195 0.54745,628
GLOBAL SWITCH HOLDINGS L 4.375% 13-13/12/2022
1,000,000 1,082,869 0.77GBP 1,055,300
British Virgin Islands
HORSE GALL 3.25% 19-30.05.22 800,000 635,274 0.45USD 631,272RAIL TRANSI 1.625% 18-22.06.22 500,000 439,774 0.31EUR 447,884RONGSHI INT 3.25% 19-21.05.24 700,000 561,868 0.40USD 541,065
2,719,785 1.932,675,521
EDC FRN 17-13.10.22 1,000,000 999,390 0.71GBP 1,000,000
Canada
MANITOBA 0.75% 17-15.12.21 REGS 2,000,000 1,983,420 1.41GBP 1,974,619QUEBEC 0.875% 17-24.05.22 REGS 2,000,000 1,987,400 1.41GBP 1,976,971
4,970,210 3.534,951,590
THAMES WAT 2.375% 17-03.05.23 500,000 497,176 0.35GBP 496,619
Cayman Islands
YORKSHIRE 6%09-21.08.19 1,000,000 1,006,268 0.72GBP 1,094,300
1,503,444 1.071,590,919
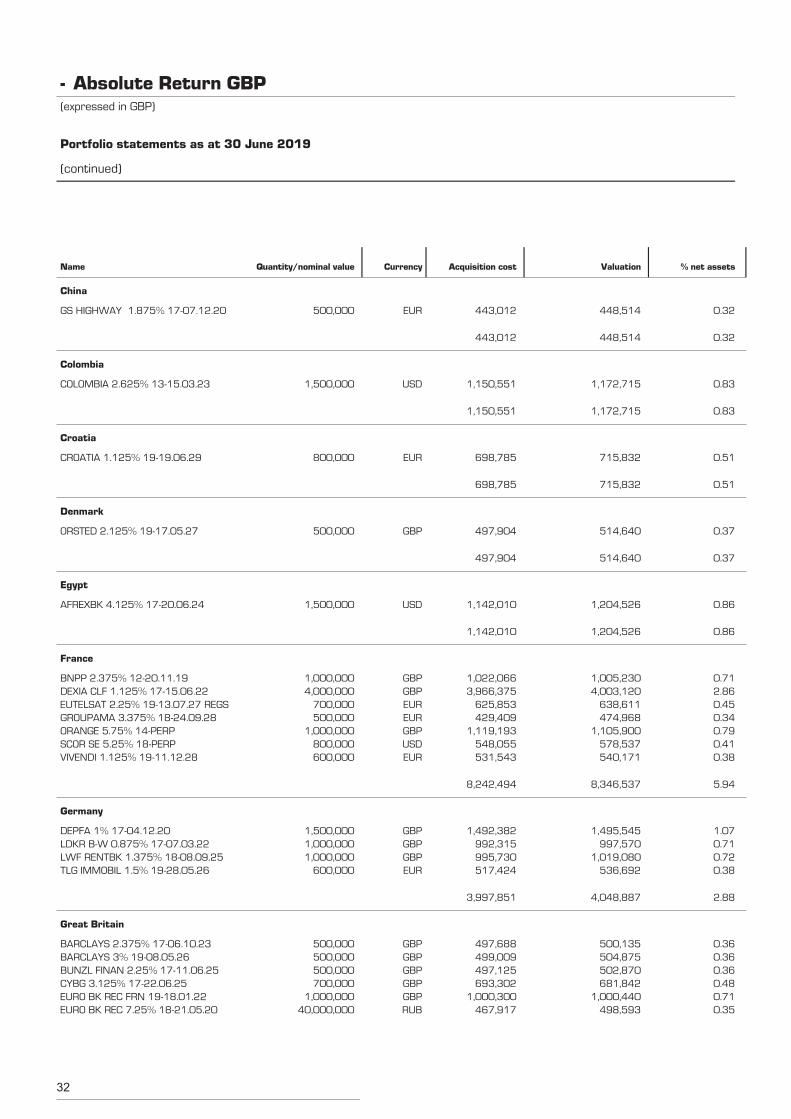
Absolute Return GBP-(expressed in GBP)
Portfolio statements as at 30 June 2019
(continued)
Name Quantity/nominal value Currency Acquisition cost Valuation % net assets
OYSTER
32
GS HIGHWAY 1.875% 17-07.12.20 500,000 448,514 0.32EUR 443,012
China
448,514 0.32443,012
COLOMBIA 2.625% 13-15.03.23 1,500,000 1,172,715 0.83USD 1,150,551
Colombia
1,172,715 0.831,150,551
CROATIA 1.125% 19-19.06.29 800,000 715,832 0.51EUR 698,785
Croatia
715,832 0.51698,785
ORSTED 2.125% 19-17.05.27 500,000 514,640 0.37GBP 497,904
Denmark
514,640 0.37497,904
AFREXBK 4.125% 17-20.06.24 1,500,000 1,204,526 0.86USD 1,142,010
Egypt
1,204,526 0.861,142,010
BNPP 2.375% 12-20.11.19 1,000,000 1,005,230 0.71GBP 1,022,066
France
DEXIA CLF 1.125% 17-15.06.22 4,000,000 4,003,120 2.86GBP 3,966,375EUTELSAT 2.25% 19-13.07.27 REGS 700,000 638,611 0.45EUR 625,853GROUPAMA 3.375% 18-24.09.28 500,000 474,968 0.34EUR 429,409ORANGE 5.75% 14-PERP 1,000,000 1,105,900 0.79GBP 1,119,193SCOR SE 5.25% 18-PERP 800,000 578,537 0.41USD 548,055VIVENDI 1.125% 19-11.12.28 600,000 540,171 0.38EUR 531,543
8,346,537 5.948,242,494
DEPFA 1% 17-04.12.20 1,500,000 1,495,545 1.07GBP 1,492,382
Germany
LDKR B-W 0.875% 17-07.03.22 1,000,000 997,570 0.71GBP 992,315LWF RENTBK 1.375% 18-08.09.25 1,000,000 1,019,080 0.72GBP 995,730TLG IMMOBIL 1.5% 19-28.05.26 600,000 536,692 0.38EUR 517,424
4,048,887 2.883,997,851
BARCLAYS 2.375% 17-06.10.23 500,000 500,135 0.36GBP 497,688
Great Britain
BARCLAYS 3% 19-08.05.26 500,000 504,875 0.36GBP 499,009BUNZL FINAN 2.25% 17-11.06.25 500,000 502,870 0.36GBP 497,125CYBG 3.125% 17-22.06.25 700,000 681,842 0.48GBP 693,302EURO BK REC FRN 19-18.01.22 1,000,000 1,000,440 0.71GBP 1,000,300EURO BK REC 7.25% 18-21.05.20 40,000,000 498,593 0.35RUB 467,917
Absolute Return GBP-(expressed in GBP)
Portfolio statements as at 30 June 2019
(continued)
Name Quantity/nominal value Currency Acquisition cost Valuation % net assets
33
FCE BANK PLC 2.759% 14-13/11/2019 1,000,000 1,004,050 0.71GBP 1,021,470
Great Britain (continued)
FCE BK 1.615% 16-11.05.23 800,000 722,762 0.51EUR 724,863GKN HLDGS 6.75% 99-28.10.19 1,000,000 1,015,530 0.73GBP 1,113,000GO AHEAD 2.5% 17-06.07.24 REGS 500,000 495,445 0.35GBP 496,960JUST GRP 9.375%(FRN) 19-PERP REGS 500,000 512,240 0.36GBP 513,229LEED 3.75%(FRN) 18-25.4.29 EMTN 500,000 496,180 0.35GBP 485,303LEGAL & GENERAL GROUP FRN 15-27/10/2045
500,000 553,380 0.39GBP 500,215
LIVERPL VIC 6.5%/FRN13-22.5.43 500,000 556,660 0.40GBP 545,894LLOYDS BK 2.25% 17-16.10.24 500,000 501,805 0.36GBP 496,869LLOYDS FRN 19-16.05.24 REGS 500,000 500,785 0.36GBP 500,150NATWEST MAR 1% 19-28.05.24 1,000,000 894,504 0.64EUR 895,309PENSION INS 5.625% 18-20.12.30 500,000 508,385 0.36GBP 498,465PHOENIX GR 5.75% 18-PERP 500,000 442,705 0.31GBP 500,000PLACE 2.875% 16-17.08.26 REGS 500,000 503,915 0.36GBP 501,656PRINSBS 2.375% 17-23.11.23 REGS 500,000 500,365 0.36GBP 498,335PRUDENTIAL PLC FRN 15-20/07/2055 500,000 532,210 0.38GBP 494,590RBS GROUP 3.125% 28.3.27 REGS/FTF 500,000 508,240 0.36GBP 496,884ROTHESAY LI 6.875% 18-PERP 500,000 483,745 0.34GBP 482,622SANTANDER UK PLC 1.875% 15-17/02/2020
1,000,000 1,004,420 0.72GBP 1,005,450
SKIPTON BS 1.75% 17-30.06.22 800,000 793,832 0.56GBP 798,692SOCIETY LLO 4.875% 17-07.02.47 500,000 548,690 0.39GBP 506,515SOCIETY OF LLOYD'S 4.75% 14-30/10/2024 500,000 552,210 0.39GBP 501,199STUDENT 2.6663% 17-30.9.24 REGS 500,000 494,345 0.35GBP 500,607TP ICAP PLC 5.25% 19-29.05.26 200,000 203,788 0.14GBP 200,060VIRGIN MONE 3.375% 18-24.04.26 500,000 502,875 0.36GBP 498,378VIRGIN MONEY PLC 2.25% 15-21/04/2020 1,000,000 1,006,870 0.73GBP 994,386
19,528,691 13.8919,426,442
BLACK SEA T 3.5% 19-25.06.24 500,000 395,730 0.28USD 394,141
Greece
395,730 0.28394,141
PERSHING SQUARE HOLDINGS 5.5% 15-15/07/2022
1,500,000 1,229,005 0.87USD 1,189,090
Guernsey
1,229,005 0.871,189,090
ICBCIL FIN 3.65% 19-05.03.22 800,000 641,265 0.46USD 622,939
Hong Kong
641,265 0.46622,939
BHARTI AIRTEL LTD 4.375% 15-10/06/2025 500,000 396,687 0.28USD 350,232
India
396,687 0.28350,232
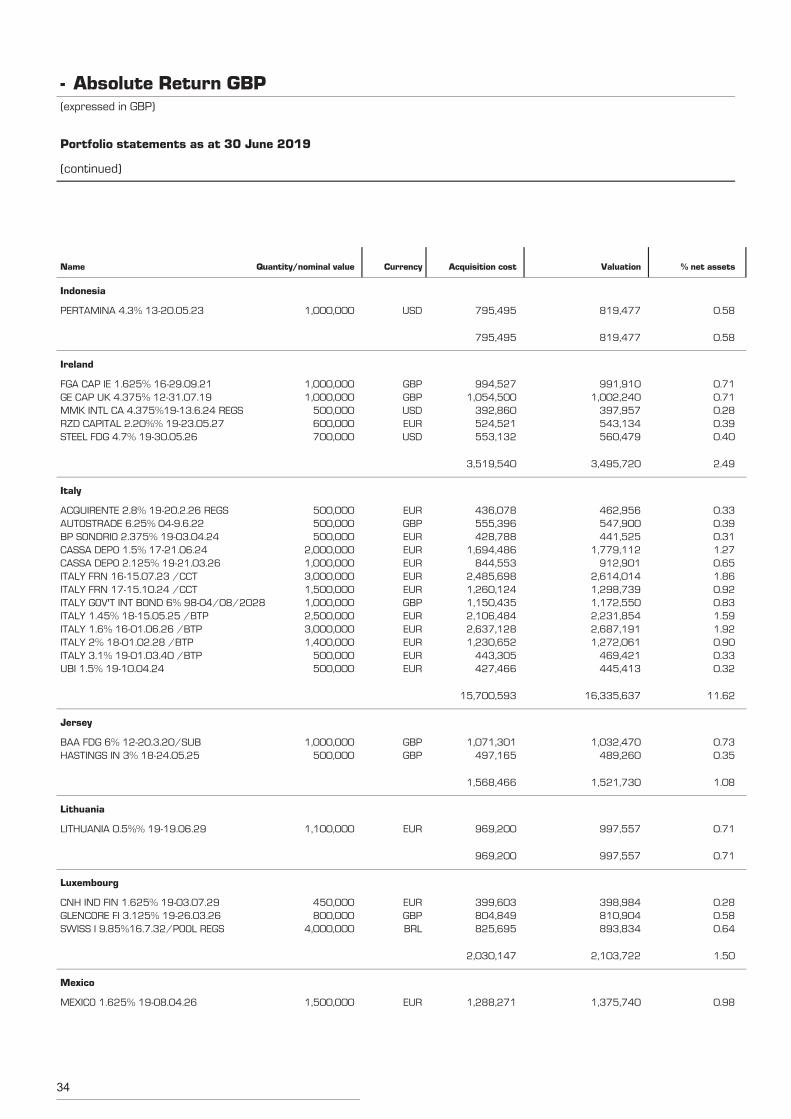
Absolute Return GBP-(expressed in GBP)
Portfolio statements as at 30 June 2019
(continued)
Name Quantity/nominal value Currency Acquisition cost Valuation % net assets
OYSTER
34
PERTAMINA 4.3% 13-20.05.23 1,000,000 819,477 0.58USD 795,495
Indonesia
819,477 0.58795,495
FGA CAP IE 1.625% 16-29.09.21 1,000,000 991,910 0.71GBP 994,527
Ireland
GE CAP UK 4.375% 12-31.07.19 1,000,000 1,002,240 0.71GBP 1,054,500MMK INTL CA 4.375%19-13.6.24 REGS 500,000 397,957 0.28USD 392,860RZD CAPITAL 2.20%% 19-23.05.27 600,000 543,134 0.39EUR 524,521STEEL FDG 4.7% 19-30.05.26 700,000 560,479 0.40USD 553,132
3,495,720 2.493,519,540
ACQUIRENTE 2.8% 19-20.2.26 REGS 500,000 462,956 0.33EUR 436,078
Italy
AUTOSTRADE 6.25% 04-9.6.22 500,000 547,900 0.39GBP 555,396BP SONDRIO 2.375% 19-03.04.24 500,000 441,525 0.31EUR 428,788CASSA DEPO 1.5% 17-21.06.24 2,000,000 1,779,112 1.27EUR 1,694,486CASSA DEPO 2.125% 19-21.03.26 1,000,000 912,901 0.65EUR 844,553ITALY FRN 16-15.07.23 /CCT 3,000,000 2,614,014 1.86EUR 2,485,698ITALY FRN 17-15.10.24 /CCT 1,500,000 1,298,739 0.92EUR 1,260,124ITALY GOV'T INT BOND 6% 98-04/08/2028 1,000,000 1,172,550 0.83GBP 1,150,435ITALY 1.45% 18-15.05.25 /BTP 2,500,000 2,231,854 1.59EUR 2,106,484ITALY 1.6% 16-01.06.26 /BTP 3,000,000 2,687,191 1.92EUR 2,637,128ITALY 2% 18-01.02.28 /BTP 1,400,000 1,272,061 0.90EUR 1,230,652ITALY 3.1% 19-01.03.40 /BTP 500,000 469,421 0.33EUR 443,305UBI 1.5% 19-10.04.24 500,000 445,413 0.32EUR 427,466
16,335,637 11.6215,700,593
BAA FDG 6% 12-20.3.20/SUB 1,000,000 1,032,470 0.73GBP 1,071,301
Jersey
HASTINGS IN 3% 18-24.05.25 500,000 489,260 0.35GBP 497,165
1,521,730 1.081,568,466
LITHUANIA 0.5%% 19-19.06.29 1,100,000 997,557 0.71EUR 969,200
Lithuania
997,557 0.71969,200
CNH IND FIN 1.625% 19-03.07.29 450,000 398,984 0.28EUR 399,603
Luxembourg
GLENCORE FI 3.125% 19-26.03.26 800,000 810,904 0.58GBP 804,849SWISS I 9.85%16.7.32/POOL REGS 4,000,000 893,834 0.64BRL 825,695
2,103,722 1.502,030,147
MEXICO 1.625% 19-08.04.26 1,500,000 1,375,740 0.98EUR 1,288,271
Mexico
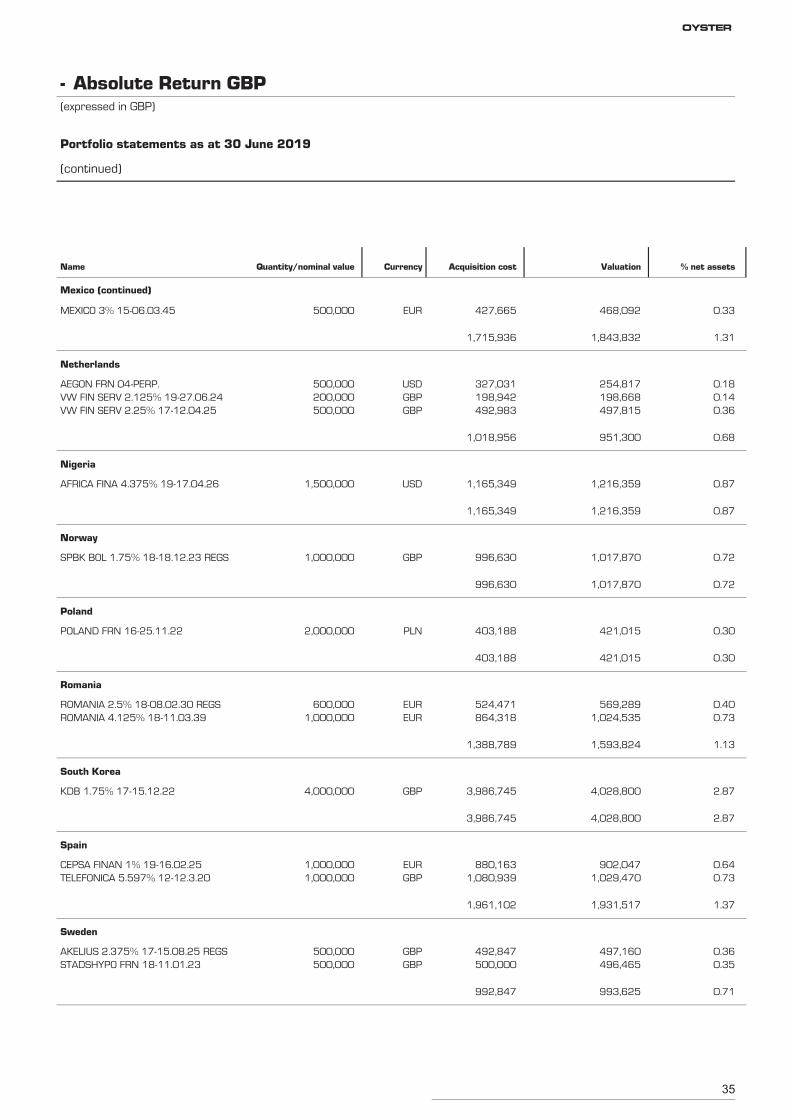
Absolute Return GBP-(expressed in GBP)
Portfolio statements as at 30 June 2019
(continued)
Name Quantity/nominal value Currency Acquisition cost Valuation % net assets
35
MEXICO 3% 15-06.03.45 500,000 468,092 0.33EUR 427,665
Mexico (continued)
1,843,832 1.311,715,936
AEGON FRN 04-PERP. 500,000 254,817 0.18USD 327,031
Netherlands
VW FIN SERV 2.125% 19-27.06.24 200,000 198,668 0.14GBP 198,942VW FIN SERV 2.25% 17-12.04.25 500,000 497,815 0.36GBP 492,983
951,300 0.681,018,956
AFRICA FINA 4.375% 19-17.04.26 1,500,000 1,216,359 0.87USD 1,165,349
Nigeria
1,216,359 0.871,165,349
SPBK BOL 1.75% 18-18.12.23 REGS 1,000,000 1,017,870 0.72GBP 996,630
Norway
1,017,870 0.72996,630
POLAND FRN 16-25.11.22 2,000,000 421,015 0.30PLN 403,188
Poland
421,015 0.30403,188
ROMANIA 2.5% 18-08.02.30 REGS 600,000 569,289 0.40EUR 524,471
Romania
ROMANIA 4.125% 18-11.03.39 1,000,000 1,024,535 0.73EUR 864,318
1,593,824 1.131,388,789
KDB 1.75% 17-15.12.22 4,000,000 4,028,800 2.87GBP 3,986,745
South Korea
4,028,800 2.873,986,745
CEPSA FINAN 1% 19-16.02.25 1,000,000 902,047 0.64EUR 880,163
Spain
TELEFONICA 5.597% 12-12.3.20 1,000,000 1,029,470 0.73GBP 1,080,939
1,931,517 1.371,961,102
AKELIUS 2.375% 17-15.08.25 REGS 500,000 497,160 0.36GBP 492,847
Sweden
STADSHYPO FRN 18-11.01.23 500,000 496,465 0.35GBP 500,000
993,625 0.71992,847
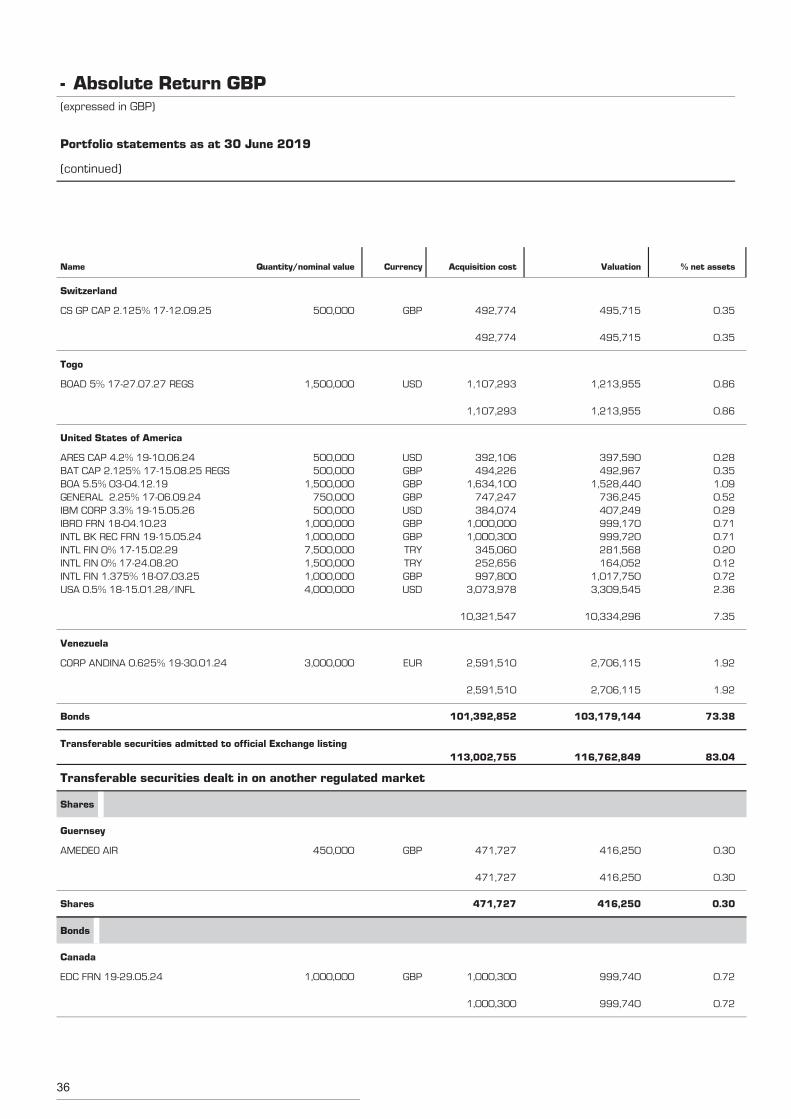
Absolute Return GBP-(expressed in GBP)
Portfolio statements as at 30 June 2019
(continued)
Name Quantity/nominal value Currency Acquisition cost Valuation % net assets
OYSTER
36
CS GP CAP 2.125% 17-12.09.25 500,000 495,715 0.35GBP 492,774
Switzerland
495,715 0.35492,774
BOAD 5% 17-27.07.27 REGS 1,500,000 1,213,955 0.86USD 1,107,293
Togo
1,213,955 0.861,107,293
ARES CAP 4.2% 19-10.06.24 500,000 397,590 0.28USD 392,106
United States of America
BAT CAP 2.125% 17-15.08.25 REGS 500,000 492,967 0.35GBP 494,226BOA 5.5% 03-04.12.19 1,500,000 1,528,440 1.09GBP 1,634,100GENERAL 2.25% 17-06.09.24 750,000 736,245 0.52GBP 747,247IBM CORP 3.3% 19-15.05.26 500,000 407,249 0.29USD 384,074IBRD FRN 18-04.10.23 1,000,000 999,170 0.71GBP 1,000,000INTL BK REC FRN 19-15.05.24 1,000,000 999,720 0.71GBP 1,000,300INTL FIN 0% 17-15.02.29 7,500,000 281,568 0.20TRY 345,060INTL FIN 0% 17-24.08.20 1,500,000 164,052 0.12TRY 252,656INTL FIN 1.375% 18-07.03.25 1,000,000 1,017,750 0.72GBP 997,800USA 0.5% 18-15.01.28/INFL 4,000,000 3,309,545 2.36USD 3,073,978
10,334,296 7.3510,321,547
CORP ANDINA 0.625% 19-30.01.24 3,000,000 2,706,115 1.92EUR 2,591,510
Venezuela
2,706,115 1.922,591,510
Bonds 103,179,144 73.38101,392,852
Transferable securities admitted to official Exchange listing116,762,849 83.04113,002,755
AMEDEO AIR 450,000 416,250 0.30GBP 471,727
Transferable securities dealt in on another regulated market
Shares
Guernsey
416,250 0.30471,727
Shares 416,250 0.30471,727
EDC FRN 19-29.05.24 1,000,000 999,740 0.72GBP 1,000,300
Bonds
Canada
999,740 0.721,000,300
Absolute Return GBP-(expressed in GBP)
Portfolio statements as at 30 June 2019
(continued)
Name Quantity/nominal value Currency Acquisition cost Valuation % net assets
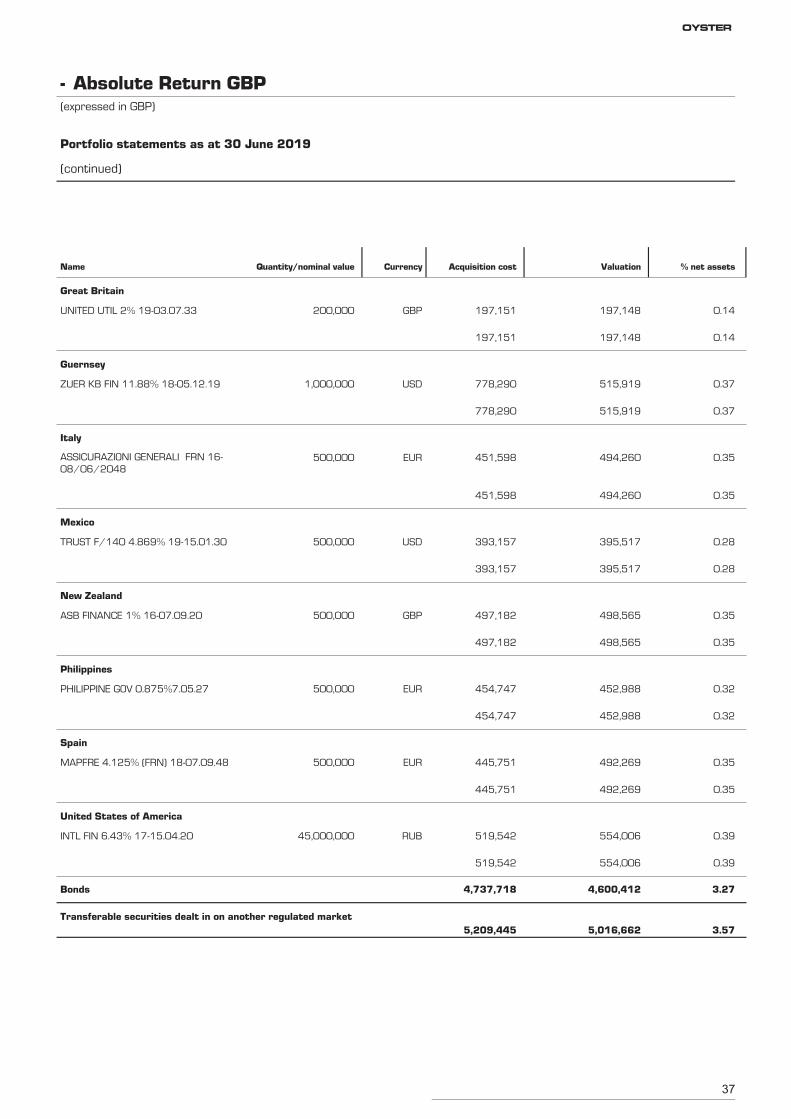
37
UNITED UTIL 2% 19-03.07.33 200,000 197,148 0.14GBP 197,151
Great Britain
197,148 0.14197,151
ZUER KB FIN 11.88% 18-05.12.19 1,000,000 515,919 0.37USD 778,290
Guernsey
515,919 0.37778,290
ASSICURAZIONI GENERALI FRN 16-08/06/2048
500,000 494,260 0.35EUR 451,598
Italy
494,260 0.35451,598
TRUST F/140 4.869% 19-15.01.30 500,000 395,517 0.28USD 393,157
Mexico
395,517 0.28393,157
ASB FINANCE 1% 16-07.09.20 500,000 498,565 0.35GBP 497,182
New Zealand
498,565 0.35497,182
PHILIPPINE GOV 0.875%7.05.27 500,000 452,988 0.32EUR 454,747
Philippines
452,988 0.32454,747
MAPFRE 4.125% (FRN) 18-07.09.48 500,000 492,269 0.35EUR 445,751
Spain
492,269 0.35445,751
INTL FIN 6.43% 17-15.04.20 45,000,000 554,006 0.39RUB 519,542
United States of America
554,006 0.39519,542
Bonds 4,600,412 3.274,737,718
Transferable securities dealt in on another regulated market5,016,662 3.575,209,445
Absolute Return GBP-(expressed in GBP)
Portfolio statements as at 30 June 2019
(continued)
Name Quantity/nominal value Currency Acquisition cost Valuation % net assets
OYSTER
38
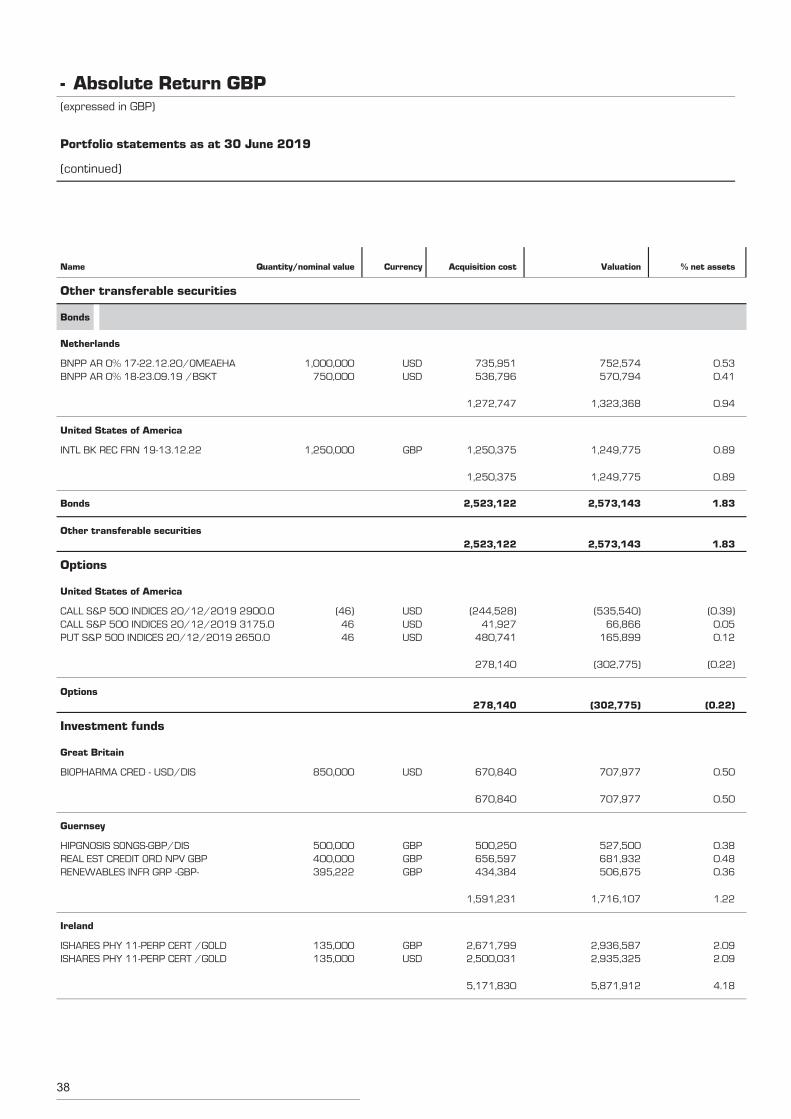
BNPP AR 0% 17-22.12.20/OMEAEHA 1,000,000 752,574 0.53USD 735,951
Other transferable securities
Bonds
Netherlands
BNPP AR 0% 18-23.09.19 /BSKT 750,000 570,794 0.41USD 536,796
1,323,368 0.941,272,747
INTL BK REC FRN 19-13.12.22 1,250,000 1,249,775 0.89GBP 1,250,375
United States of America
1,249,775 0.891,250,375
Bonds 2,573,143 1.832,523,122
Other transferable securities2,573,143 1.832,523,122
CALL S&P 500 INDICES 20/12/2019 2900.0 (46) (535,540) (0.39)USD (244,528)
Options
United States of America
CALL S&P 500 INDICES 20/12/2019 3175.0 46 66,866 0.05USD 41,927PUT S&P 500 INDICES 20/12/2019 2650.0 46 165,899 0.12USD 480,741
(302,775) (0.22)278,140
Options(302,775) (0.22)278,140
BIOPHARMA CRED - USD/DIS 850,000 707,977 0.50USD 670,840
Investment funds
Great Britain
707,977 0.50670,840
HIPGNOSIS SONGS-GBP/DIS 500,000 527,500 0.38GBP 500,250
Guernsey
REAL EST CREDIT ORD NPV GBP 400,000 681,932 0.48GBP 656,597RENEWABLES INFR GRP -GBP- 395,222 506,675 0.36GBP 434,384
1,716,107 1.221,591,231
ISHARES PHY 11-PERP CERT /GOLD 135,000 2,936,587 2.09GBP 2,671,799
Ireland
ISHARES PHY 11-PERP CERT /GOLD 135,000 2,935,325 2.09USD 2,500,031
5,871,912 4.185,171,830
Absolute Return GBP-(expressed in GBP)
Portfolio statements as at 30 June 2019
(continued)
Name Quantity/nominal value Currency Acquisition cost Valuation % net assets
39
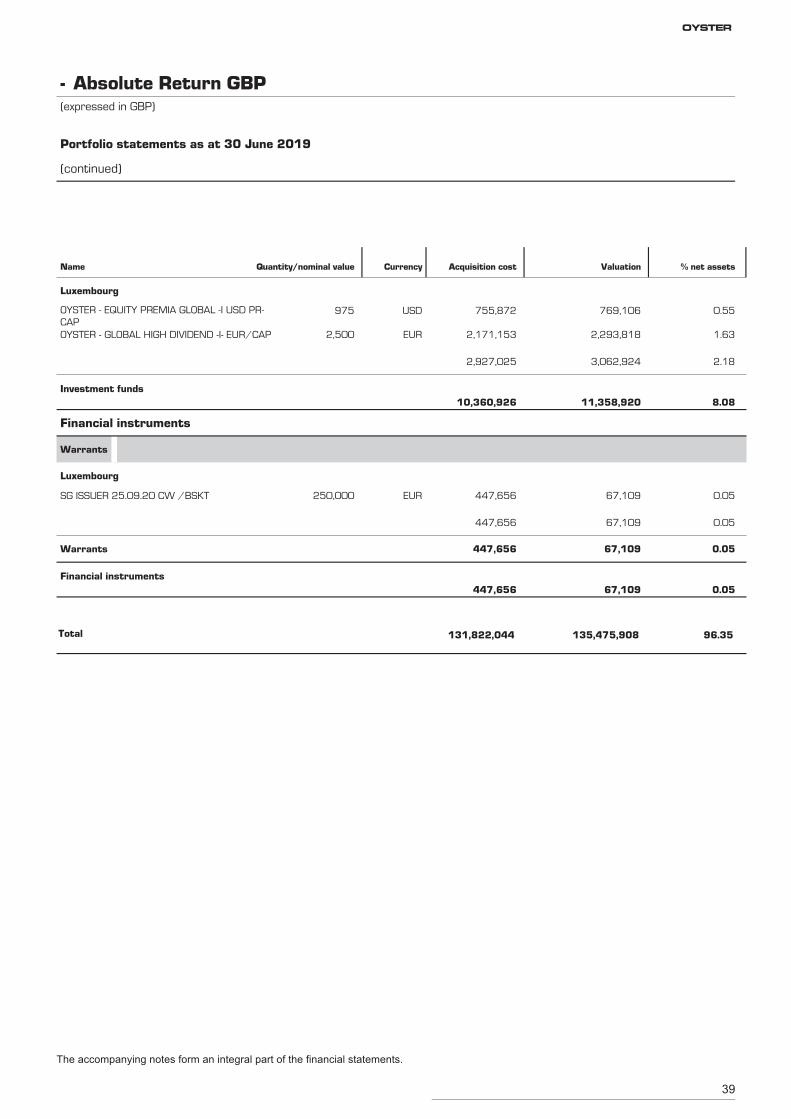
OYSTER - EQUITY PREMIA GLOBAL -I USD PR-CAP
975 769,106 0.55USD 755,872
Luxembourg
OYSTER - GLOBAL HIGH DIVIDEND -I- EUR/CAP 2,500 2,293,818 1.63EUR 2,171,153
3,062,924 2.182,927,025
Investment funds11,358,920 8.0810,360,926
SG ISSUER 25.09.20 CW /BSKT 250,000 67,109 0.05EUR 447,656
Financial instruments
Warrants
Luxembourg
67,109 0.05447,656
Warrants 67,109 0.05447,656
Financial instruments67,109 0.05447,656
Total 135,475,908 96.35131,822,044
Absolute Return GBP-(expressed in GBP)
Portfolio statements as at 30 June 2019
(continued)
Name Quantity/nominal value Currency Acquisition cost Valuation % net assets
The accompanying notes form an integral part of the financial statements.
OYSTER
40
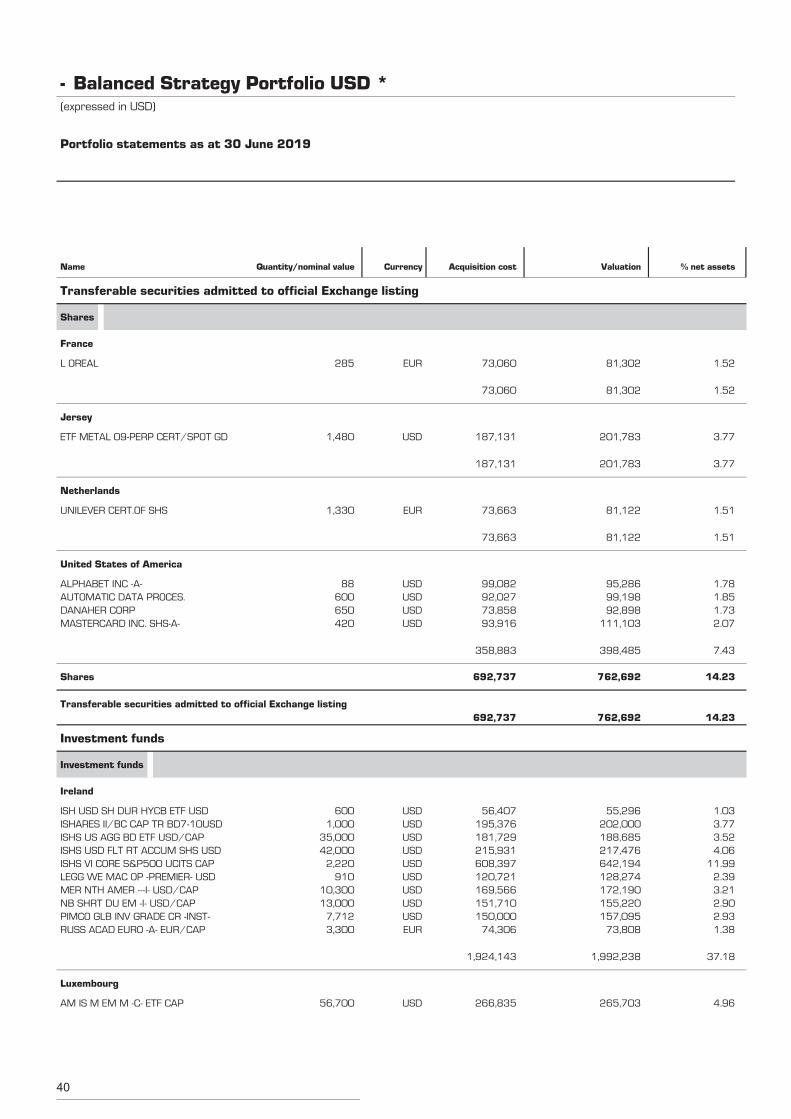
L OREAL 285 81,302 1.52EUR 73,060
Transferable securities admitted to official Exchange listing
Shares
France
81,302 1.5273,060
ETF METAL 09-PERP CERT/SPOT GD 1,480 201,783 3.77USD 187,131
Jersey
201,783 3.77187,131
UNILEVER CERT.OF SHS 1,330 81,122 1.51EUR 73,663
Netherlands
81,122 1.5173,663
ALPHABET INC -A- 88 95,286 1.78USD 99,082
United States of America
AUTOMATIC DATA PROCES. 600 99,198 1.85USD 92,027DANAHER CORP 650 92,898 1.73USD 73,858MASTERCARD INC. SHS-A- 420 111,103 2.07USD 93,916
398,485 7.43358,883
Shares 762,692 14.23692,737
Transferable securities admitted to official Exchange listing762,692 14.23692,737
ISH USD SH DUR HYCB ETF USD 600 55,296 1.03USD 56,407
Investment funds
Investment funds
Ireland
ISHARES II/BC CAP TR BD7-10USD 1,000 202,000 3.77USD 195,376ISHS US AGG BD ETF USD/CAP 35,000 188,685 3.52USD 181,729ISHS USD FLT RT ACCUM SHS USD 42,000 217,476 4.06USD 215,931ISHS VI CORE S&P500 UCITS CAP 2,220 642,194 11.99USD 608,397LEGG WE MAC OP -PREMIER- USD 910 128,274 2.39USD 120,721MER NTH AMER ---I- USD/CAP 10,300 172,190 3.21USD 169,566NB SHRT DU EM -I- USD/CAP 13,000 155,220 2.90USD 151,710PIMCO GLB INV GRADE CR -INST- 7,712 157,095 2.93USD 150,000RUSS ACAD EURO -A- EUR/CAP 3,300 73,808 1.38EUR 74,306
1,992,238 37.181,924,143
AM IS M EM M -C- ETF CAP 56,700 265,703 4.96USD 266,835
Luxembourg
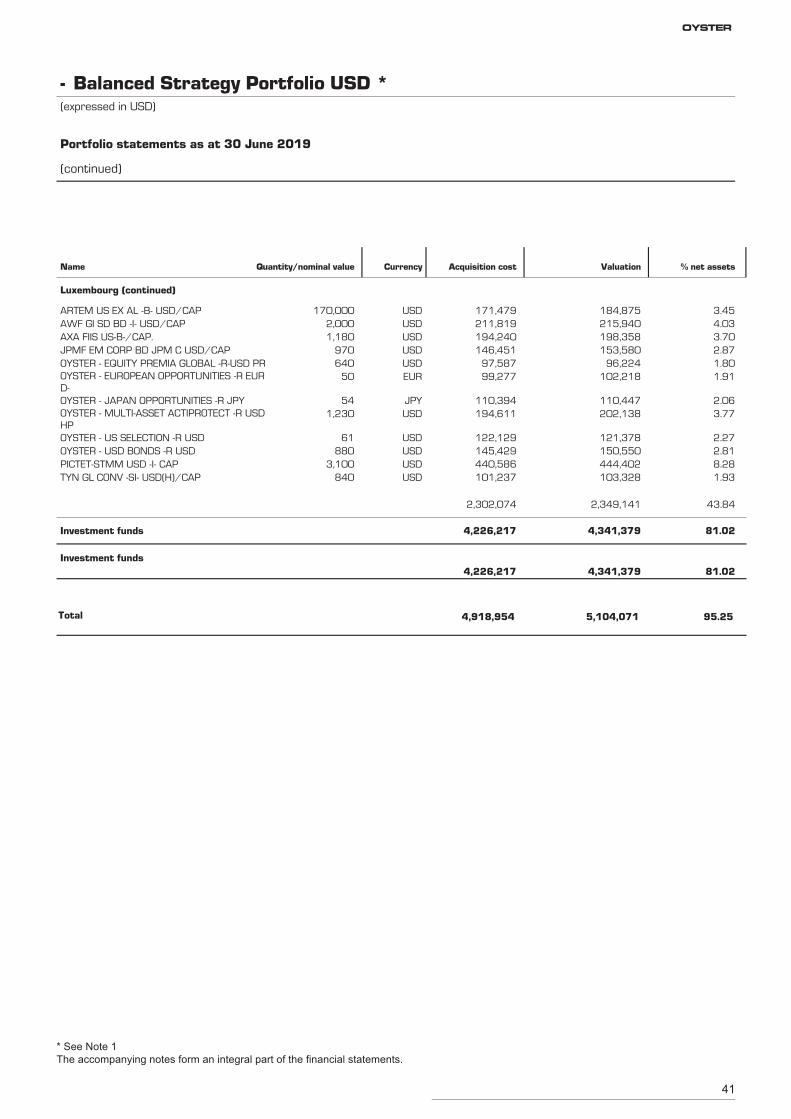
Balanced Strategy Portfolio USD *-(expressed in USD)
Portfolio statements as at 30 June 2019
Name Quantity/nominal value Currency Acquisition cost Valuation % net assets
41
ARTEM US EX AL -B- USD/CAP 170,000 184,875 3.45USD 171,479
Luxembourg (continued)
AWF GI SD BD -I- USD/CAP 2,000 215,940 4.03USD 211,819AXA FIIS US-B-/CAP. 1,180 198,358 3.70USD 194,240JPMF EM CORP BD JPM C USD/CAP 970 153,580 2.87USD 146,451OYSTER - EQUITY PREMIA GLOBAL -R-USD PR 640 96,224 1.80USD 97,587OYSTER - EUROPEAN OPPORTUNITIES -R EURD-
50 102,218 1.91EUR 99,277
OYSTER - JAPAN OPPORTUNITIES -R JPY 54 110,447 2.06JPY 110,394OYSTER - MULTI-ASSET ACTIPROTECT -R USDHP
1,230 202,138 3.77USD 194,611
OYSTER - US SELECTION -R USD 61 121,378 2.27USD 122,129OYSTER - USD BONDS -R USD 880 150,550 2.81USD 145,429PICTET-STMM USD -I- CAP 3,100 444,402 8.28USD 440,586TYN GL CONV -SI- USD(H)/CAP 840 103,328 1.93USD 101,237
2,349,141 43.842,302,074
Investment funds 4,341,379 81.024,226,217
Investment funds4,341,379 81.024,226,217
Total 5,104,071 95.254,918,954
Balanced Strategy Portfolio USD *-(expressed in USD)
Portfolio statements as at 30 June 2019
(continued)
Name Quantity/nominal value Currency Acquisition cost Valuation % net assets
* See Note 1The accompanying notes form an integral part of the financial statements.
OYSTER
42
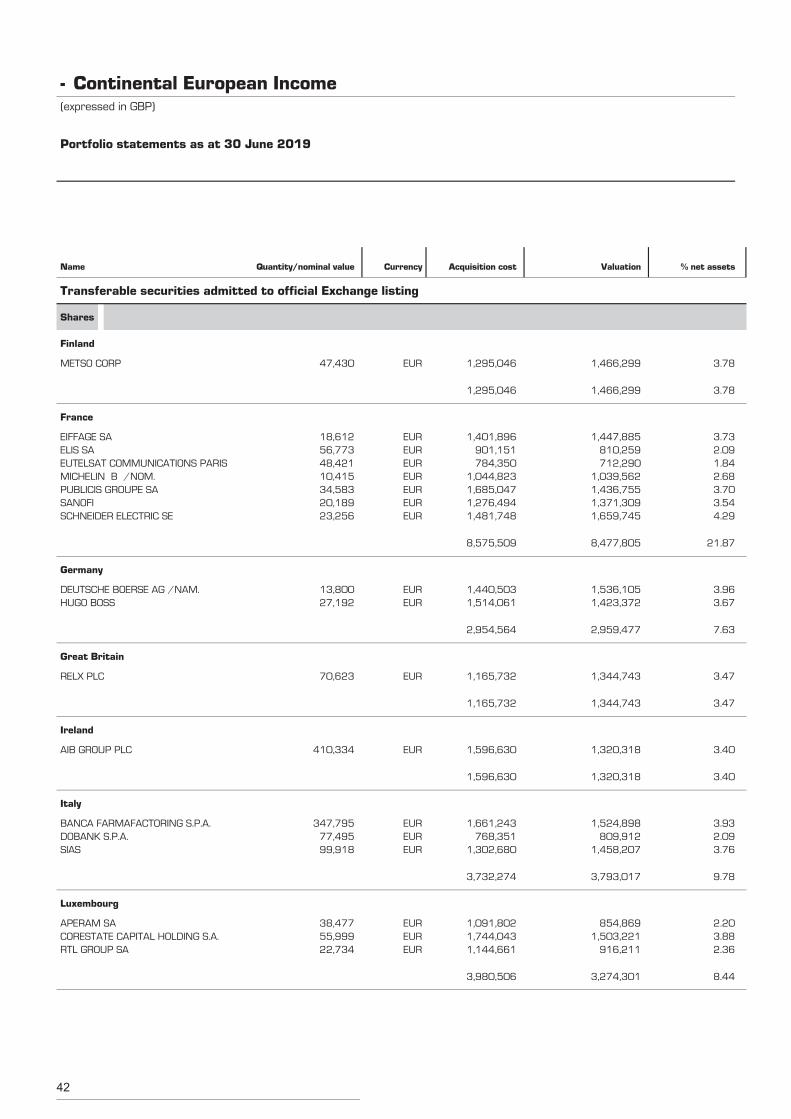
METSO CORP 47,430 1,466,299 3.78EUR 1,295,046
Transferable securities admitted to official Exchange listing
Shares
Finland
1,466,299 3.781,295,046
EIFFAGE SA 18,612 1,447,885 3.73EUR 1,401,896
France
ELIS SA 56,773 810,259 2.09EUR 901,151EUTELSAT COMMUNICATIONS PARIS 48,421 712,290 1.84EUR 784,350MICHELIN B /NOM. 10,415 1,039,562 2.68EUR 1,044,823PUBLICIS GROUPE SA 34,583 1,436,755 3.70EUR 1,685,047SANOFI 20,189 1,371,309 3.54EUR 1,276,494SCHNEIDER ELECTRIC SE 23,256 1,659,745 4.29EUR 1,481,748
8,477,805 21.878,575,509
DEUTSCHE BOERSE AG /NAM. 13,800 1,536,105 3.96EUR 1,440,503
Germany
HUGO BOSS 27,192 1,423,372 3.67EUR 1,514,061
2,959,477 7.632,954,564
RELX PLC 70,623 1,344,743 3.47EUR 1,165,732
Great Britain
1,344,743 3.471,165,732
AIB GROUP PLC 410,334 1,320,318 3.40EUR 1,596,630
Ireland
1,320,318 3.401,596,630
BANCA FARMAFACTORING S.P.A. 347,795 1,524,898 3.93EUR 1,661,243
Italy
DOBANK S.P.A. 77,495 809,912 2.09EUR 768,351SIAS 99,918 1,458,207 3.76EUR 1,302,680
3,793,017 9.783,732,274
APERAM SA 38,477 854,869 2.20EUR 1,091,802
Luxembourg
CORESTATE CAPITAL HOLDING S.A. 55,999 1,503,221 3.88EUR 1,744,043RTL GROUP SA 22,734 916,211 2.36EUR 1,144,661
3,274,301 8.443,980,506
Continental European Income-(expressed in GBP)
Portfolio statements as at 30 June 2019
Name Quantity/nominal value Currency Acquisition cost Valuation % net assets
43
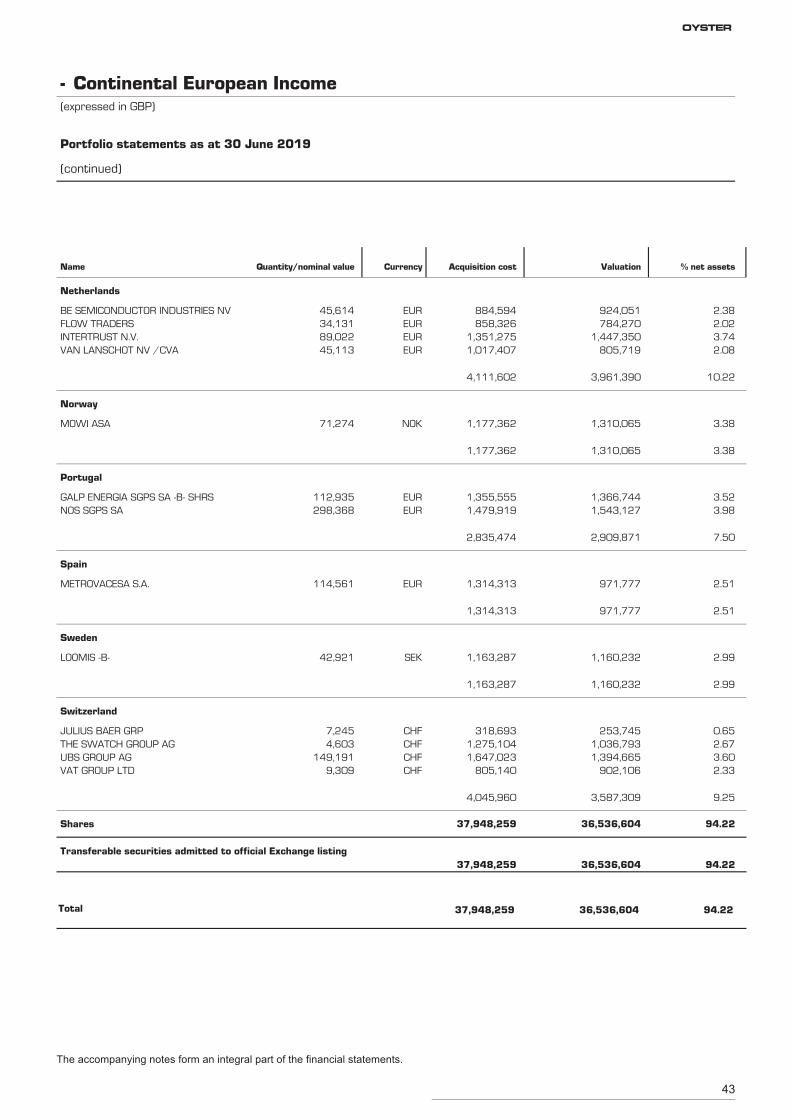
BE SEMICONDUCTOR INDUSTRIES NV 45,614 924,051 2.38EUR 884,594
Netherlands
FLOW TRADERS 34,131 784,270 2.02EUR 858,326INTERTRUST N.V. 89,022 1,447,350 3.74EUR 1,351,275VAN LANSCHOT NV /CVA 45,113 805,719 2.08EUR 1,017,407
3,961,390 10.224,111,602
MOWI ASA 71,274 1,310,065 3.38NOK 1,177,362
Norway
1,310,065 3.381,177,362
GALP ENERGIA SGPS SA -B- SHRS 112,935 1,366,744 3.52EUR 1,355,555
Portugal
NOS SGPS SA 298,368 1,543,127 3.98EUR 1,479,919
2,909,871 7.502,835,474
METROVACESA S.A. 114,561 971,777 2.51EUR 1,314,313
Spain
971,777 2.511,314,313
LOOMIS -B- 42,921 1,160,232 2.99SEK 1,163,287
Sweden
1,160,232 2.991,163,287
JULIUS BAER GRP 7,245 253,745 0.65CHF 318,693
Switzerland
THE SWATCH GROUP AG 4,603 1,036,793 2.67CHF 1,275,104UBS GROUP AG 149,191 1,394,665 3.60CHF 1,647,023VAT GROUP LTD 9,309 902,106 2.33CHF 805,140
3,587,309 9.254,045,960
Shares 36,536,604 94.2237,948,259
Transferable securities admitted to official Exchange listing36,536,604 94.2237,948,259
Total 36,536,604 94.2237,948,259
Continental European Income-(expressed in GBP)
Portfolio statements as at 30 June 2019
(continued)
Name Quantity/nominal value Currency Acquisition cost Valuation % net assets
The accompanying notes form an integral part of the financial statements.
OYSTER
44
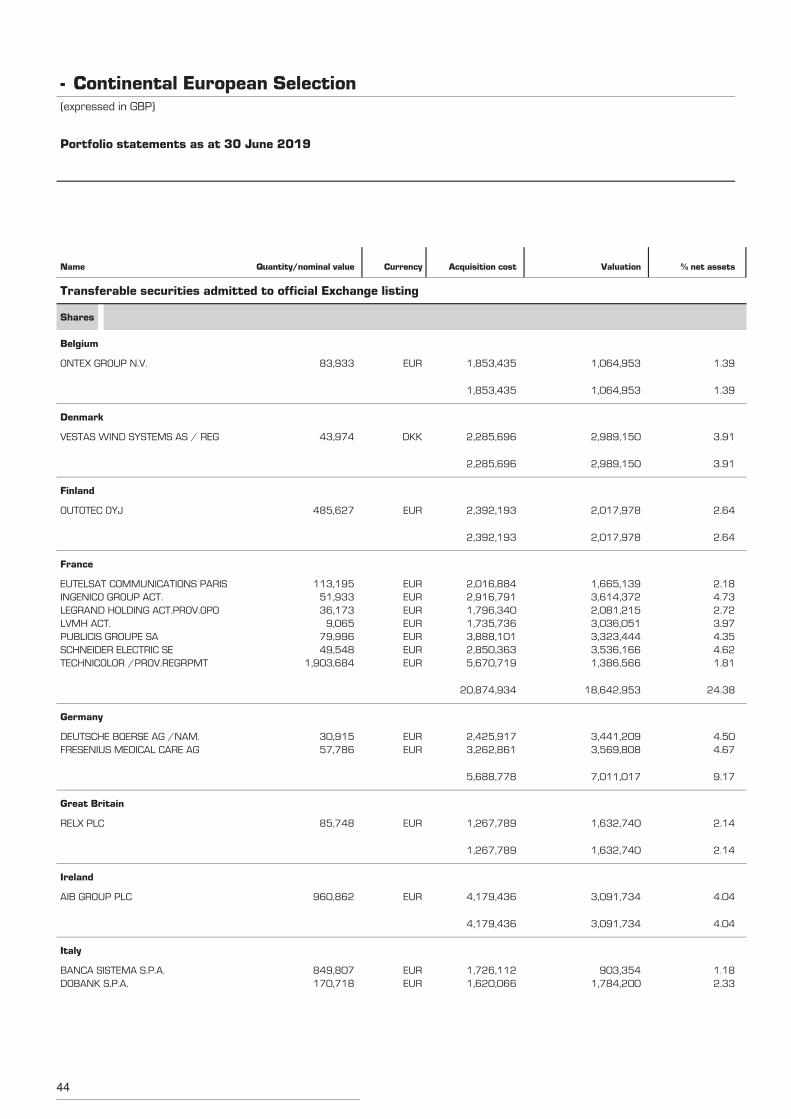
ONTEX GROUP N.V. 83,933 1,064,953 1.39EUR 1,853,435
Transferable securities admitted to official Exchange listing
Shares
Belgium
1,064,953 1.391,853,435
VESTAS WIND SYSTEMS AS / REG 43,974 2,989,150 3.91DKK 2,285,696
Denmark
2,989,150 3.912,285,696
OUTOTEC OYJ 485,627 2,017,978 2.64EUR 2,392,193
Finland
2,017,978 2.642,392,193
EUTELSAT COMMUNICATIONS PARIS 113,195 1,665,139 2.18EUR 2,016,884
France
INGENICO GROUP ACT. 51,933 3,614,372 4.73EUR 2,916,791LEGRAND HOLDING ACT.PROV.OPO 36,173 2,081,215 2.72EUR 1,796,340LVMH ACT. 9,065 3,036,051 3.97EUR 1,735,736PUBLICIS GROUPE SA 79,996 3,323,444 4.35EUR 3,888,101SCHNEIDER ELECTRIC SE 49,548 3,536,166 4.62EUR 2,850,363TECHNICOLOR /PROV.REGRPMT 1,903,684 1,386,566 1.81EUR 5,670,719
18,642,953 24.3820,874,934
DEUTSCHE BOERSE AG /NAM. 30,915 3,441,209 4.50EUR 2,425,917
Germany
FRESENIUS MEDICAL CARE AG 57,786 3,569,808 4.67EUR 3,262,861
7,011,017 9.175,688,778
RELX PLC 85,748 1,632,740 2.14EUR 1,267,789
Great Britain
1,632,740 2.141,267,789
AIB GROUP PLC 960,862 3,091,734 4.04EUR 4,179,436
Ireland
3,091,734 4.044,179,436
BANCA SISTEMA S.P.A. 849,807 903,354 1.18EUR 1,726,112
Italy
DOBANK S.P.A. 170,718 1,784,200 2.33EUR 1,620,066
Continental European Selection-(expressed in GBP)
Portfolio statements as at 30 June 2019
Name Quantity/nominal value Currency Acquisition cost Valuation % net assets
45
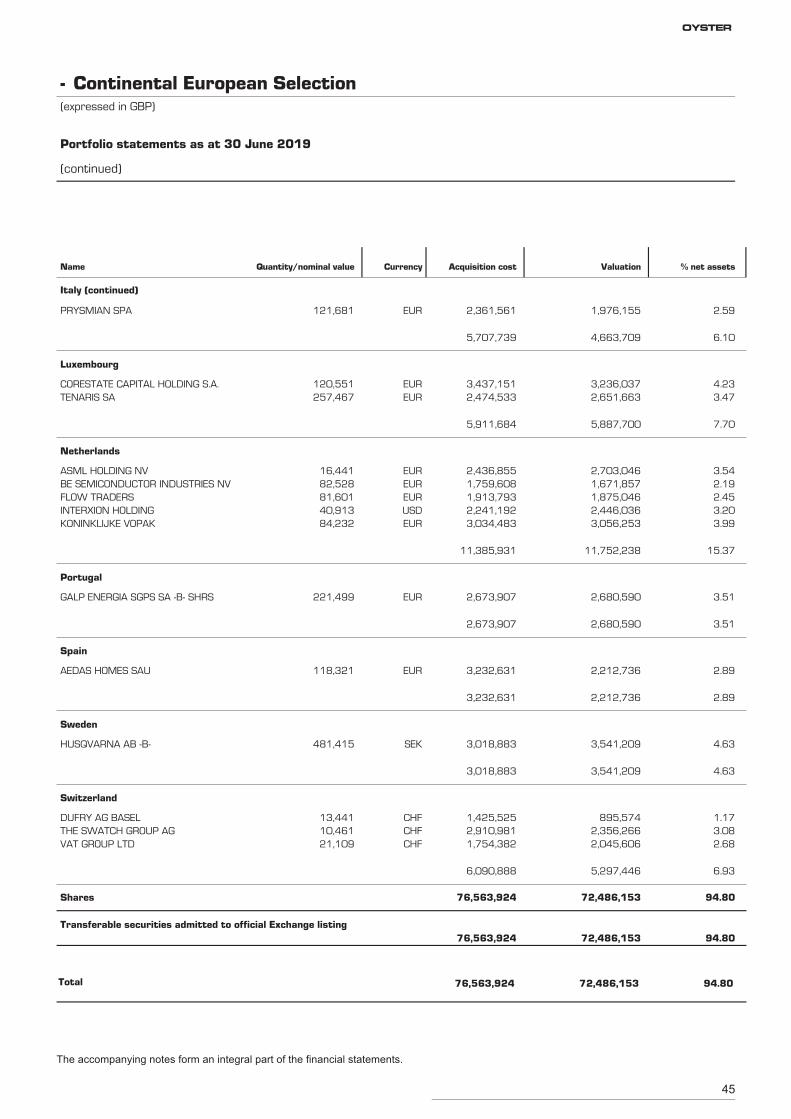
PRYSMIAN SPA 121,681 1,976,155 2.59EUR 2,361,561
Italy (continued)
4,663,709 6.105,707,739
CORESTATE CAPITAL HOLDING S.A. 120,551 3,236,037 4.23EUR 3,437,151
Luxembourg
TENARIS SA 257,467 2,651,663 3.47EUR 2,474,533
5,887,700 7.705,911,684
ASML HOLDING NV 16,441 2,703,046 3.54EUR 2,436,855
Netherlands
BE SEMICONDUCTOR INDUSTRIES NV 82,528 1,671,857 2.19EUR 1,759,608FLOW TRADERS 81,601 1,875,046 2.45EUR 1,913,793INTERXION HOLDING 40,913 2,446,036 3.20USD 2,241,192KONINKLIJKE VOPAK 84,232 3,056,253 3.99EUR 3,034,483
11,752,238 15.3711,385,931
GALP ENERGIA SGPS SA -B- SHRS 221,499 2,680,590 3.51EUR 2,673,907
Portugal
2,680,590 3.512,673,907
AEDAS HOMES SAU 118,321 2,212,736 2.89EUR 3,232,631
Spain
2,212,736 2.893,232,631
HUSQVARNA AB -B- 481,415 3,541,209 4.63SEK 3,018,883
Sweden
3,541,209 4.633,018,883
DUFRY AG BASEL 13,441 895,574 1.17CHF 1,425,525
Switzerland
THE SWATCH GROUP AG 10,461 2,356,266 3.08CHF 2,910,981VAT GROUP LTD 21,109 2,045,606 2.68CHF 1,754,382
5,297,446 6.936,090,888
Shares 72,486,153 94.8076,563,924
Transferable securities admitted to official Exchange listing72,486,153 94.8076,563,924
Total 72,486,153 94.8076,563,924
Continental European Selection-(expressed in GBP)
Portfolio statements as at 30 June 2019
(continued)
Name Quantity/nominal value Currency Acquisition cost Valuation % net assets
The accompanying notes form an integral part of the financial statements.
OYSTER
46
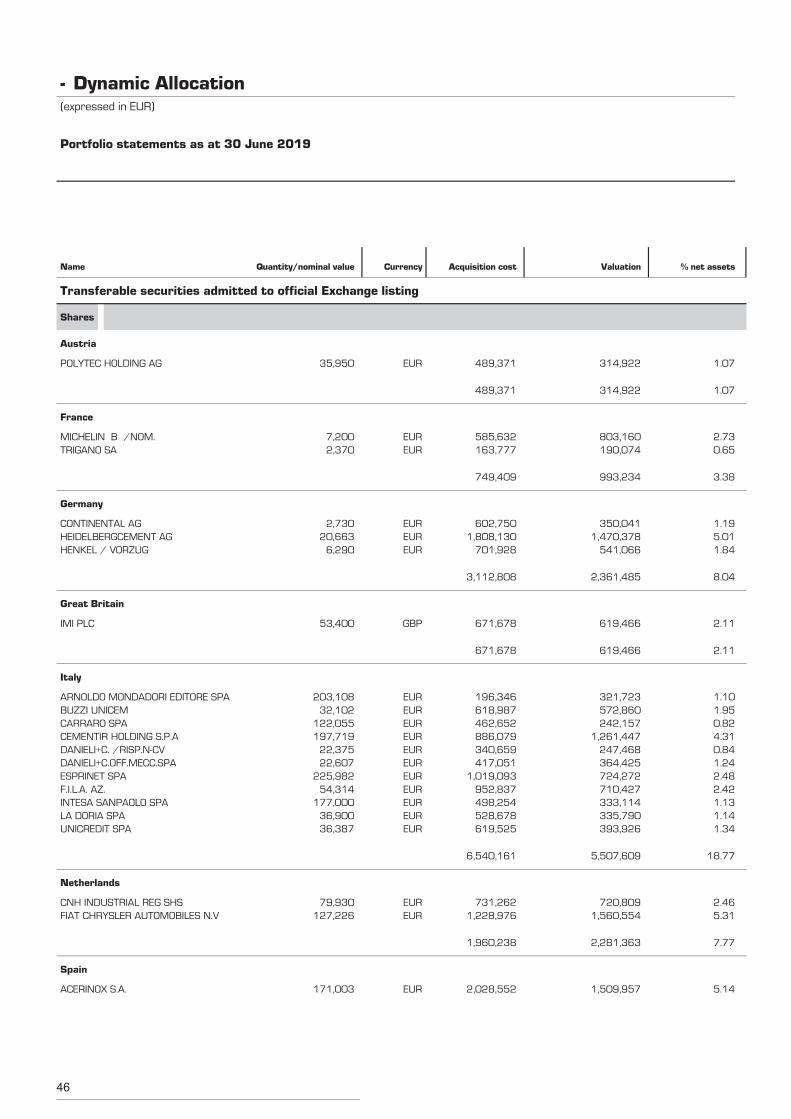
POLYTEC HOLDING AG 35,950 314,922 1.07EUR 489,371
Transferable securities admitted to official Exchange listing
Shares
Austria
314,922 1.07489,371
MICHELIN B /NOM. 7,200 803,160 2.73EUR 585,632
France
TRIGANO SA 2,370 190,074 0.65EUR 163,777
993,234 3.38749,409
CONTINENTAL AG 2,730 350,041 1.19EUR 602,750
Germany
HEIDELBERGCEMENT AG 20,663 1,470,378 5.01EUR 1,808,130HENKEL / VORZUG 6,290 541,066 1.84EUR 701,928
2,361,485 8.043,112,808
IMI PLC 53,400 619,466 2.11GBP 671,678
Great Britain
619,466 2.11671,678
ARNOLDO MONDADORI EDITORE SPA 203,108 321,723 1.10EUR 196,346
Italy
BUZZI UNICEM 32,102 572,860 1.95EUR 618,987CARRARO SPA 122,055 242,157 0.82EUR 462,652CEMENTIR HOLDING S.P.A 197,719 1,261,447 4.31EUR 886,079DANIELI+C. /RISP.N-CV 22,375 247,468 0.84EUR 340,659DANIELI+C.OFF.MECC.SPA 22,607 364,425 1.24EUR 417,051ESPRINET SPA 225,982 724,272 2.48EUR 1,019,093F.I.L.A. AZ. 54,314 710,427 2.42EUR 952,837INTESA SANPAOLO SPA 177,000 333,114 1.13EUR 498,254LA DORIA SPA 36,900 335,790 1.14EUR 528,678UNICREDIT SPA 36,387 393,926 1.34EUR 619,525
5,507,609 18.776,540,161
CNH INDUSTRIAL REG SHS 79,930 720,809 2.46EUR 731,262
Netherlands
FIAT CHRYSLER AUTOMOBILES N.V 127,226 1,560,554 5.31EUR 1,228,976
2,281,363 7.771,960,238
ACERINOX S.A. 171,003 1,509,957 5.14EUR 2,028,552
Spain
Dynamic Allocation-(expressed in EUR)
Portfolio statements as at 30 June 2019
Name Quantity/nominal value Currency Acquisition cost Valuation % net assets
47
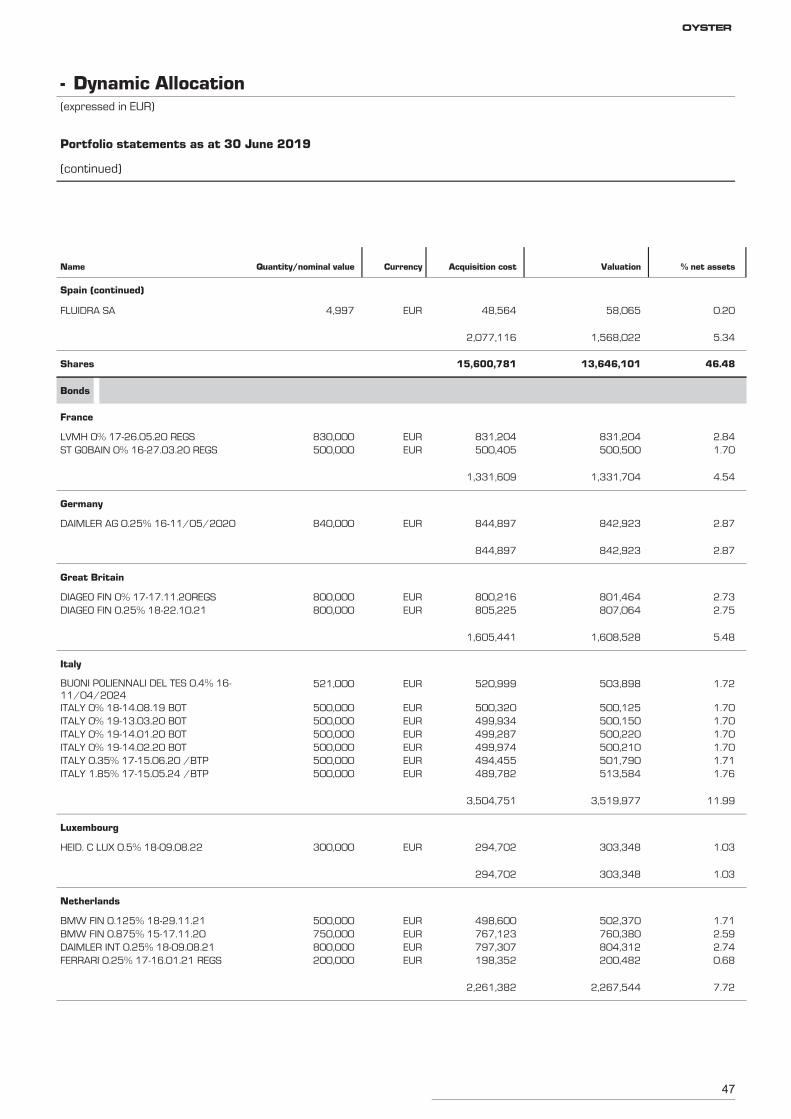
FLUIDRA SA 4,997 58,065 0.20EUR 48,564
Spain (continued)
1,568,022 5.342,077,116
Shares 13,646,101 46.4815,600,781
LVMH 0% 17-26.05.20 REGS 830,000 831,204 2.84EUR 831,204
Bonds
France
ST GOBAIN 0% 16-27.03.20 REGS 500,000 500,500 1.70EUR 500,405
1,331,704 4.541,331,609
DAIMLER AG 0.25% 16-11/05/2020 840,000 842,923 2.87EUR 844,897
Germany
842,923 2.87844,897
DIAGEO FIN 0% 17-17.11.20REGS 800,000 801,464 2.73EUR 800,216
Great Britain
DIAGEO FIN 0.25% 18-22.10.21 800,000 807,064 2.75EUR 805,225
1,608,528 5.481,605,441
BUONI POLIENNALI DEL TES 0.4% 16-11/04/2024
521,000 503,898 1.72EUR 520,999
Italy
ITALY 0% 18-14.08.19 BOT 500,000 500,125 1.70EUR 500,320ITALY 0% 19-13.03.20 BOT 500,000 500,150 1.70EUR 499,934ITALY 0% 19-14.01.20 BOT 500,000 500,220 1.70EUR 499,287ITALY 0% 19-14.02.20 BOT 500,000 500,210 1.70EUR 499,974ITALY 0.35% 17-15.06.20 /BTP 500,000 501,790 1.71EUR 494,455ITALY 1.85% 17-15.05.24 /BTP 500,000 513,584 1.76EUR 489,782
3,519,977 11.993,504,751
HEID. C LUX 0.5% 18-09.08.22 300,000 303,348 1.03EUR 294,702
Luxembourg
303,348 1.03294,702
BMW FIN 0.125% 18-29.11.21 500,000 502,370 1.71EUR 498,600
Netherlands
BMW FIN 0.875% 15-17.11.20 750,000 760,380 2.59EUR 767,123DAIMLER INT 0.25% 18-09.08.21 800,000 804,312 2.74EUR 797,307FERRARI 0.25% 17-16.01.21 REGS 200,000 200,482 0.68EUR 198,352
2,267,544 7.722,261,382
Dynamic Allocation-(expressed in EUR)
Portfolio statements as at 30 June 2019
(continued)
Name Quantity/nominal value Currency Acquisition cost Valuation % net assets
OYSTER
48
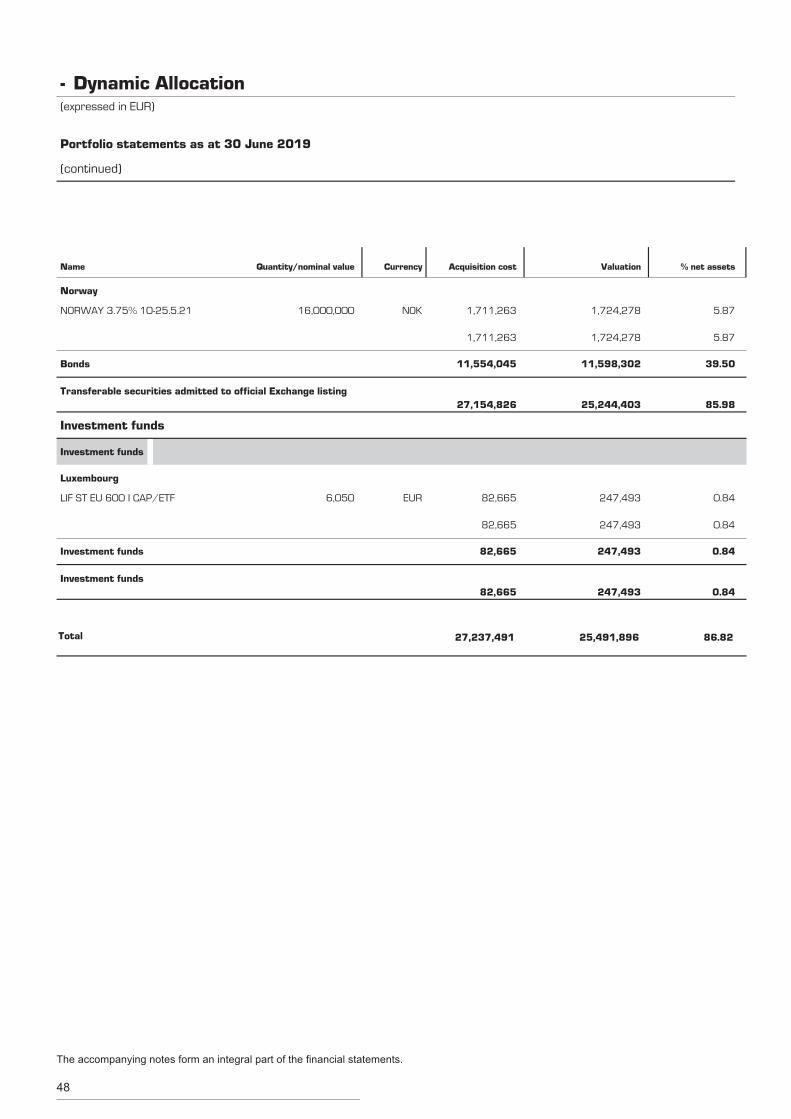
NORWAY 3.75% 10-25.5.21 16,000,000 1,724,278 5.87NOK 1,711,263
Norway
1,724,278 5.871,711,263
Bonds 11,598,302 39.5011,554,045
Transferable securities admitted to official Exchange listing25,244,403 85.9827,154,826
LIF ST EU 600 I CAP/ETF 6,050 247,493 0.84EUR 82,665
Investment funds
Investment funds
Luxembourg
247,493 0.8482,665
Investment funds 247,493 0.8482,665
Investment funds247,493 0.8482,665
Total 25,491,896 86.8227,237,491
Dynamic Allocation-(expressed in EUR)
Portfolio statements as at 30 June 2019
(continued)
Name Quantity/nominal value Currency Acquisition cost Valuation % net assets
The accompanying notes form an integral part of the financial statements.
49
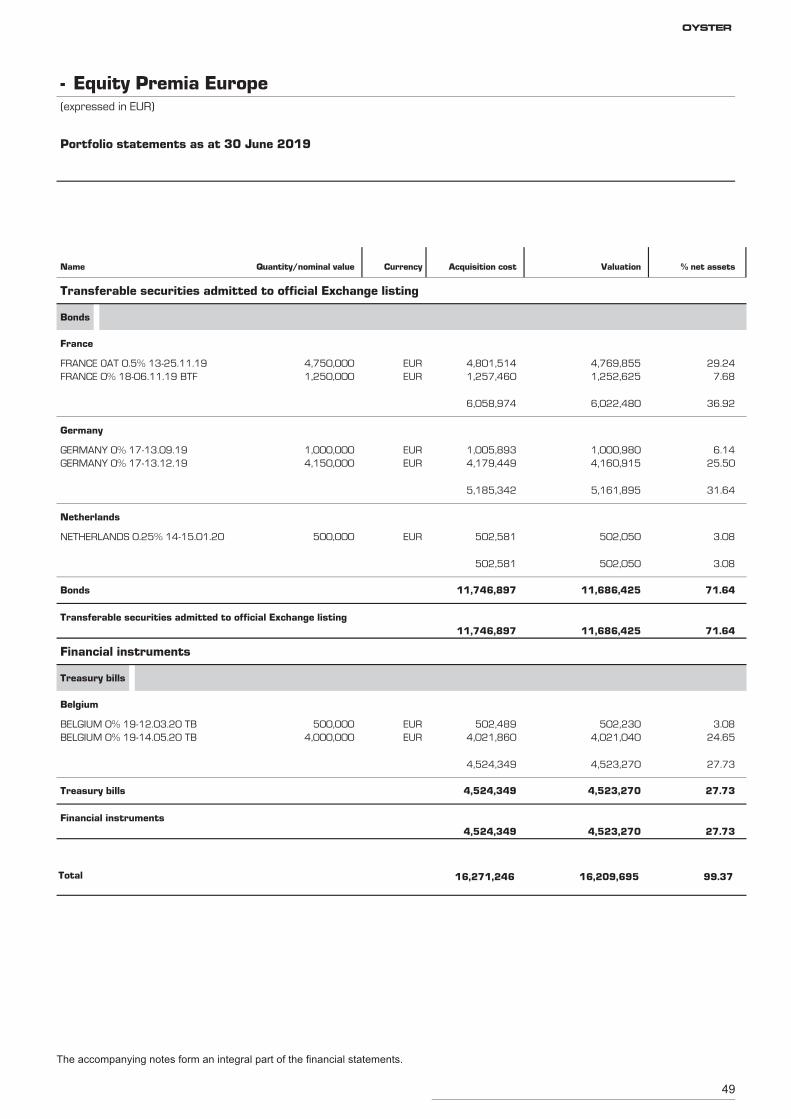
FRANCE OAT 0.5% 13-25.11.19 4,750,000 4,769,855 29.24EUR 4,801,514
Transferable securities admitted to official Exchange listing
Bonds
France
FRANCE 0% 18-06.11.19 BTF 1,250,000 1,252,625 7.68EUR 1,257,460
6,022,480 36.926,058,974
GERMANY 0% 17-13.09.19 1,000,000 1,000,980 6.14EUR 1,005,893
Germany
GERMANY 0% 17-13.12.19 4,150,000 4,160,915 25.50EUR 4,179,449
5,161,895 31.645,185,342
NETHERLANDS 0.25% 14-15.01.20 500,000 502,050 3.08EUR 502,581
Netherlands
502,050 3.08502,581
Bonds 11,686,425 71.6411,746,897
Transferable securities admitted to official Exchange listing11,686,425 71.6411,746,897
BELGIUM 0% 19-12.03.20 TB 500,000 502,230 3.08EUR 502,489
Financial instruments
Treasury bills
Belgium
BELGIUM 0% 19-14.05.20 TB 4,000,000 4,021,040 24.65EUR 4,021,860
4,523,270 27.734,524,349
Treasury bills 4,523,270 27.734,524,349
Financial instruments4,523,270 27.734,524,349
Total 16,209,695 99.3716,271,246
Equity Premia Europe-(expressed in EUR)
Portfolio statements as at 30 June 2019
Name Quantity/nominal value Currency Acquisition cost Valuation % net assets
The accompanying notes form an integral part of the financial statements.
OYSTER
50
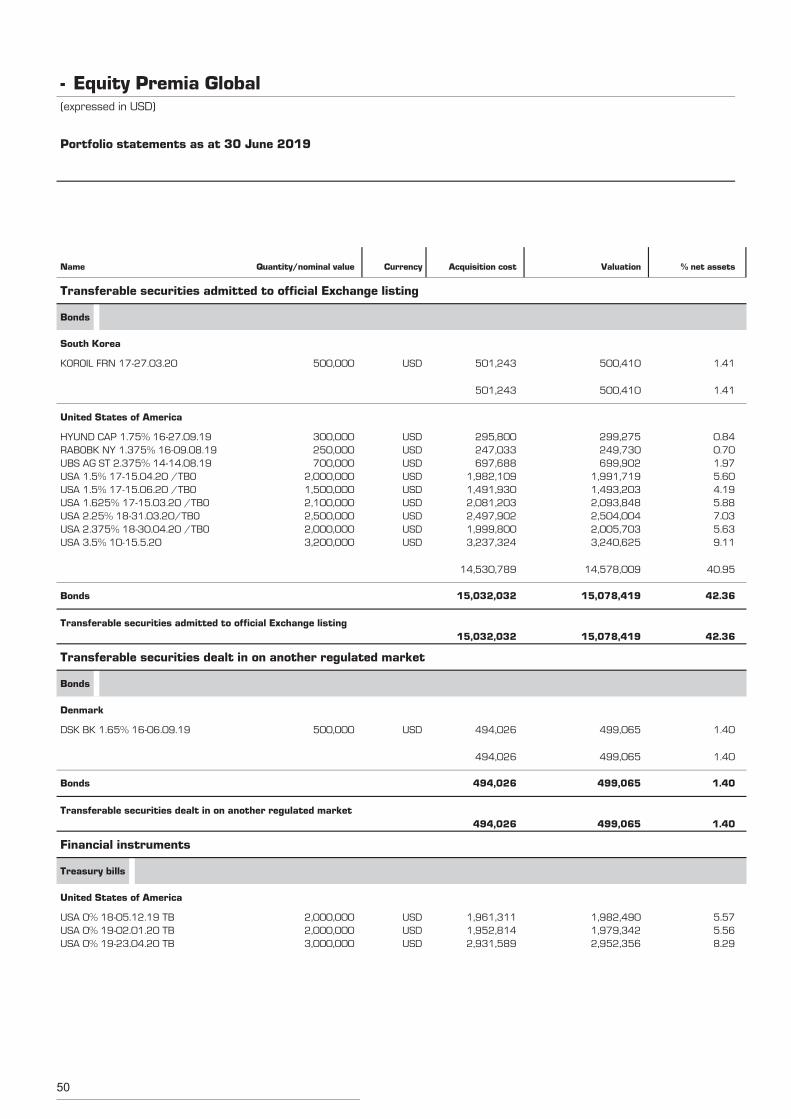
KOROIL FRN 17-27.03.20 500,000 500,410 1.41USD 501,243
Transferable securities admitted to official Exchange listing
Bonds
South Korea
500,410 1.41501,243
HYUND CAP 1.75% 16-27.09.19 300,000 299,275 0.84USD 295,800
United States of America
RABOBK NY 1.375% 16-09.08.19 250,000 249,730 0.70USD 247,033UBS AG ST 2.375% 14-14.08.19 700,000 699,902 1.97USD 697,688USA 1.5% 17-15.04.20 /TBO 2,000,000 1,991,719 5.60USD 1,982,109USA 1.5% 17-15.06.20 /TBO 1,500,000 1,493,203 4.19USD 1,491,930USA 1.625% 17-15.03.20 /TBO 2,100,000 2,093,848 5.88USD 2,081,203USA 2.25% 18-31.03.20/TBO 2,500,000 2,504,004 7.03USD 2,497,902USA 2.375% 18-30.04.20 /TBO 2,000,000 2,005,703 5.63USD 1,999,800USA 3.5% 10-15.5.20 3,200,000 3,240,625 9.11USD 3,237,324
14,578,009 40.9514,530,789
Bonds 15,078,419 42.3615,032,032
Transferable securities admitted to official Exchange listing15,078,419 42.3615,032,032
DSK BK 1.65% 16-06.09.19 500,000 499,065 1.40USD 494,026
Transferable securities dealt in on another regulated market
Bonds
Denmark
499,065 1.40494,026
Bonds 499,065 1.40494,026
Transferable securities dealt in on another regulated market499,065 1.40494,026
USA 0% 18-05.12.19 TB 2,000,000 1,982,490 5.57USD 1,961,311
Financial instruments
Treasury bills
United States of America
USA 0% 19-02.01.20 TB 2,000,000 1,979,342 5.56USD 1,952,814USA 0% 19-23.04.20 TB 3,000,000 2,952,356 8.29USD 2,931,589
Equity Premia Global-(expressed in USD)
Portfolio statements as at 30 June 2019
Name Quantity/nominal value Currency Acquisition cost Valuation % net assets
51
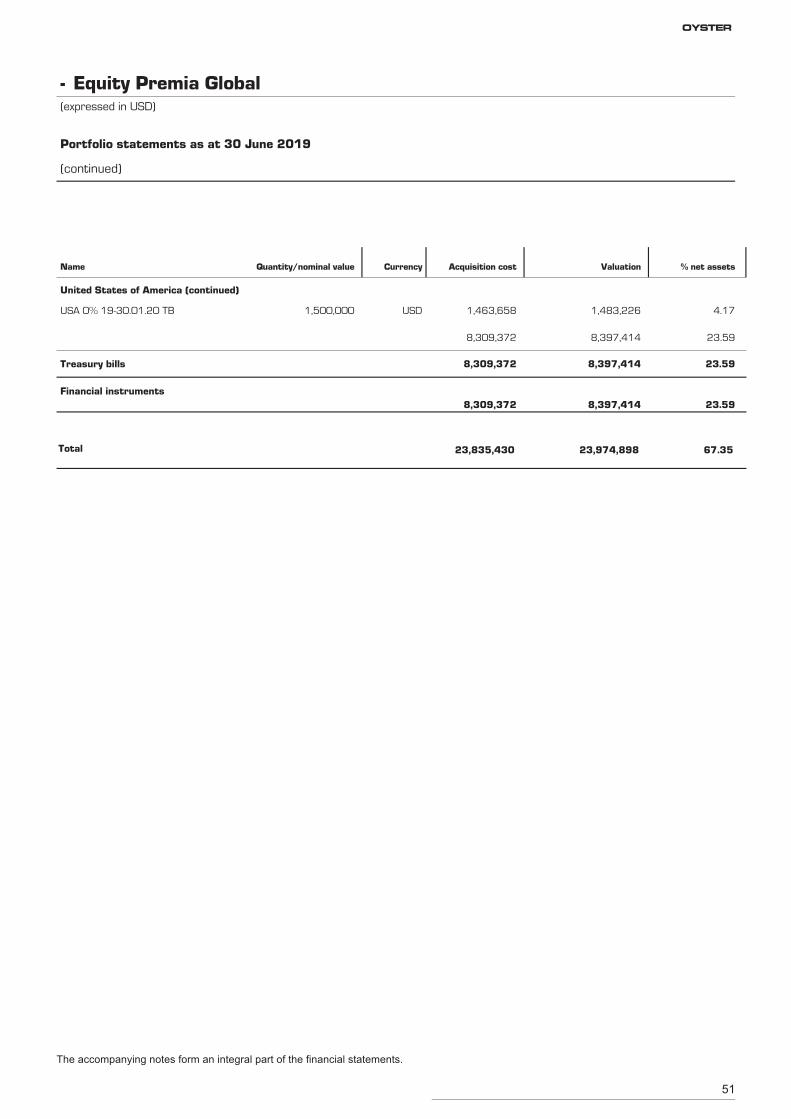
USA 0% 19-30.01.20 TB 1,500,000 1,483,226 4.17USD 1,463,658
United States of America (continued)
8,397,414 23.598,309,372
Treasury bills 8,397,414 23.598,309,372
Financial instruments8,397,414 23.598,309,372
Total 23,974,898 67.3523,835,430
Equity Premia Global-(expressed in USD)
Portfolio statements as at 30 June 2019
(continued)
Name Quantity/nominal value Currency Acquisition cost Valuation % net assets
The accompanying notes form an integral part of the financial statements.
OYSTER
52
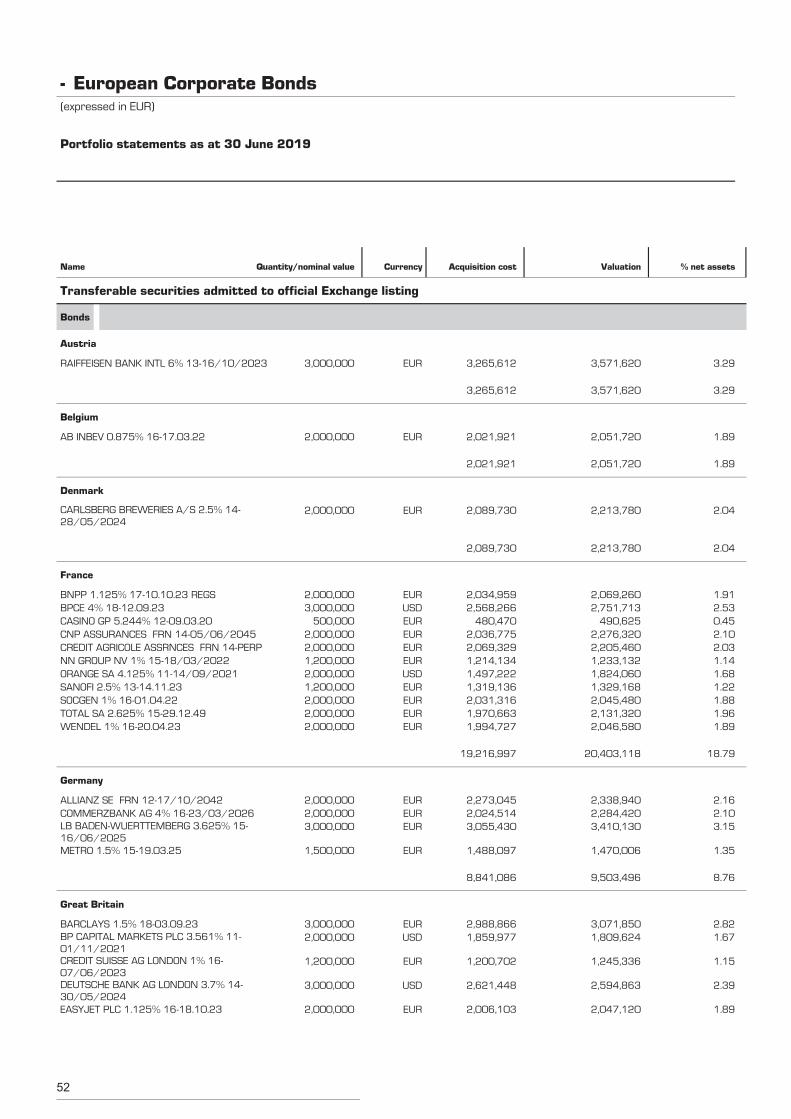
RAIFFEISEN BANK INTL 6% 13-16/10/2023 3,000,000 3,571,620 3.29EUR 3,265,612
Transferable securities admitted to official Exchange listing
Bonds
Austria
3,571,620 3.293,265,612
AB INBEV 0.875% 16-17.03.22 2,000,000 2,051,720 1.89EUR 2,021,921
Belgium
2,051,720 1.892,021,921
CARLSBERG BREWERIES A/S 2.5% 14-28/05/2024
2,000,000 2,213,780 2.04EUR 2,089,730
Denmark
2,213,780 2.042,089,730
BNPP 1.125% 17-10.10.23 REGS 2,000,000 2,069,260 1.91EUR 2,034,959
France
BPCE 4% 18-12.09.23 3,000,000 2,751,713 2.53USD 2,568,266CASINO GP 5.244% 12-09.03.20 500,000 490,625 0.45EUR 480,470CNP ASSURANCES FRN 14-05/06/2045 2,000,000 2,276,320 2.10EUR 2,036,775CREDIT AGRICOLE ASSRNCES FRN 14-PERP 2,000,000 2,205,460 2.03EUR 2,069,329NN GROUP NV 1% 15-18/03/2022 1,200,000 1,233,132 1.14EUR 1,214,134ORANGE SA 4.125% 11-14/09/2021 2,000,000 1,824,060 1.68USD 1,497,222SANOFI 2.5% 13-14.11.23 1,200,000 1,329,168 1.22EUR 1,319,136SOCGEN 1% 16-01.04.22 2,000,000 2,045,480 1.88EUR 2,031,316TOTAL SA 2.625% 15-29.12.49 2,000,000 2,131,320 1.96EUR 1,970,663WENDEL 1% 16-20.04.23 2,000,000 2,046,580 1.89EUR 1,994,727
20,403,118 18.7919,216,997
ALLIANZ SE FRN 12-17/10/2042 2,000,000 2,338,940 2.16EUR 2,273,045
Germany
COMMERZBANK AG 4% 16-23/03/2026 2,000,000 2,284,420 2.10EUR 2,024,514LB BADEN-WUERTTEMBERG 3.625% 15-16/06/2025
3,000,000 3,410,130 3.15EUR 3,055,430
METRO 1.5% 15-19.03.25 1,500,000 1,470,006 1.35EUR 1,488,097
9,503,496 8.768,841,086
BARCLAYS 1.5% 18-03.09.23 3,000,000 3,071,850 2.82EUR 2,988,866
Great Britain
BP CAPITAL MARKETS PLC 3.561% 11-01/11/2021
2,000,000 1,809,624 1.67USD 1,859,977
CREDIT SUISSE AG LONDON 1% 16-07/06/2023
1,200,000 1,245,336 1.15EUR 1,200,702
DEUTSCHE BANK AG LONDON 3.7% 14-30/05/2024
3,000,000 2,594,863 2.39USD 2,621,448
EASYJET PLC 1.125% 16-18.10.23 2,000,000 2,047,120 1.89EUR 2,006,103
European Corporate Bonds-(expressed in EUR)
Portfolio statements as at 30 June 2019
Name Quantity/nominal value Currency Acquisition cost Valuation % net assets
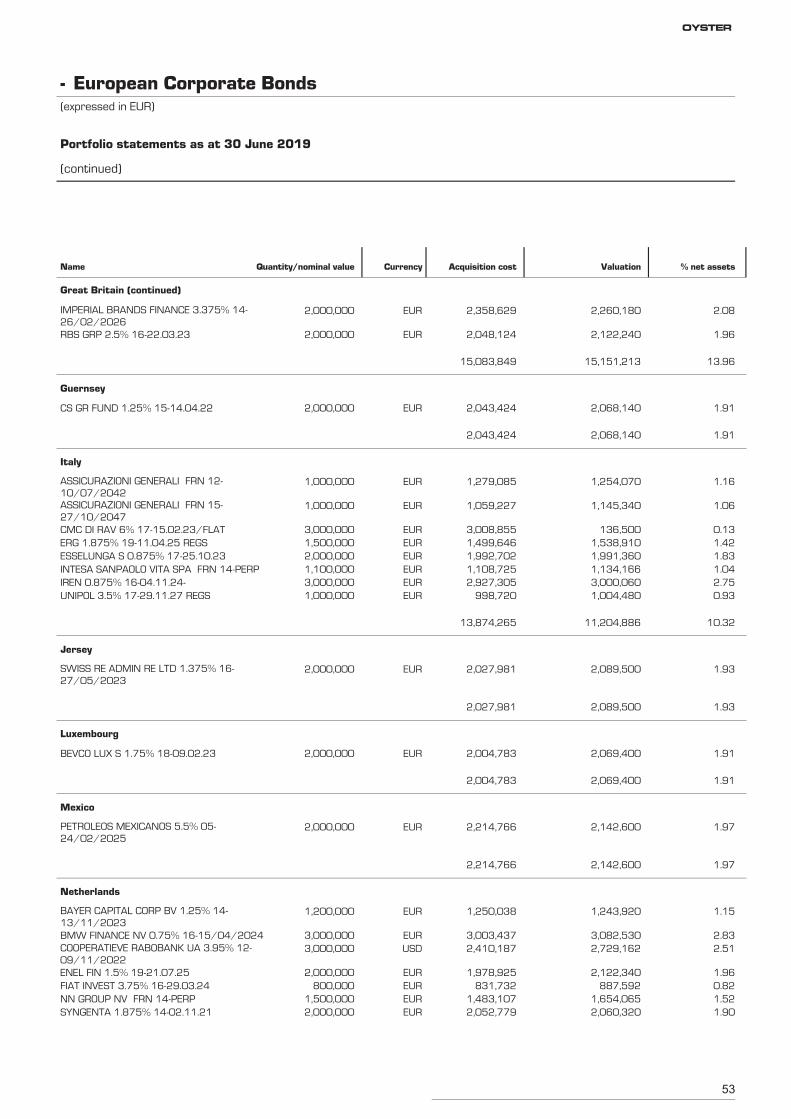
53
IMPERIAL BRANDS FINANCE 3.375% 14-26/02/2026
2,000,000 2,260,180 2.08EUR 2,358,629
Great Britain (continued)
RBS GRP 2.5% 16-22.03.23 2,000,000 2,122,240 1.96EUR 2,048,124
15,151,213 13.9615,083,849
CS GR FUND 1.25% 15-14.04.22 2,000,000 2,068,140 1.91EUR 2,043,424
Guernsey
2,068,140 1.912,043,424
ASSICURAZIONI GENERALI FRN 12-10/07/2042
1,000,000 1,254,070 1.16EUR 1,279,085
Italy
ASSICURAZIONI GENERALI FRN 15-27/10/2047
1,000,000 1,145,340 1.06EUR 1,059,227
CMC DI RAV 6% 17-15.02.23/FLAT 3,000,000 136,500 0.13EUR 3,008,855ERG 1.875% 19-11.04.25 REGS 1,500,000 1,538,910 1.42EUR 1,499,646ESSELUNGA S 0.875% 17-25.10.23 2,000,000 1,991,360 1.83EUR 1,992,702INTESA SANPAOLO VITA SPA FRN 14-PERP 1,100,000 1,134,166 1.04EUR 1,108,725IREN 0.875% 16-04.11.24- 3,000,000 3,000,060 2.75EUR 2,927,305UNIPOL 3.5% 17-29.11.27 REGS 1,000,000 1,004,480 0.93EUR 998,720
11,204,886 10.3213,874,265
SWISS RE ADMIN RE LTD 1.375% 16-27/05/2023
2,000,000 2,089,500 1.93EUR 2,027,981
Jersey
2,089,500 1.932,027,981
BEVCO LUX S 1.75% 18-09.02.23 2,000,000 2,069,400 1.91EUR 2,004,783
Luxembourg
2,069,400 1.912,004,783
PETROLEOS MEXICANOS 5.5% 05-24/02/2025
2,000,000 2,142,600 1.97EUR 2,214,766
Mexico
2,142,600 1.972,214,766
BAYER CAPITAL CORP BV 1.25% 14-13/11/2023
1,200,000 1,243,920 1.15EUR 1,250,038
Netherlands
BMW FINANCE NV 0.75% 16-15/04/2024 3,000,000 3,082,530 2.83EUR 3,003,437COOPERATIEVE RABOBANK UA 3.95% 12-09/11/2022
3,000,000 2,729,162 2.51USD 2,410,187
ENEL FIN 1.5% 19-21.07.25 2,000,000 2,122,340 1.96EUR 1,978,925FIAT INVEST 3.75% 16-29.03.24 800,000 887,592 0.82EUR 831,732NN GROUP NV FRN 14-PERP 1,500,000 1,654,065 1.52EUR 1,483,107SYNGENTA 1.875% 14-02.11.21 2,000,000 2,060,320 1.90EUR 2,052,779
European Corporate Bonds-(expressed in EUR)
Portfolio statements as at 30 June 2019
(continued)
Name Quantity/nominal value Currency Acquisition cost Valuation % net assets
OYSTER
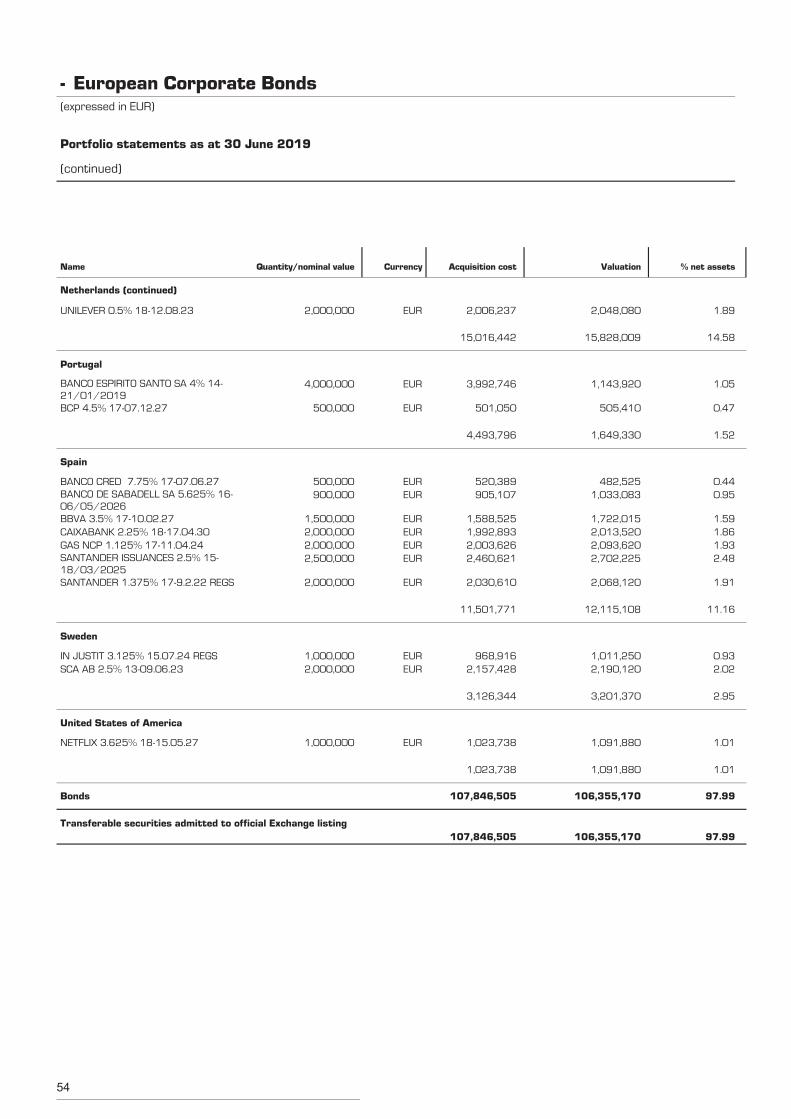
54
UNILEVER 0.5% 18-12.08.23 2,000,000 2,048,080 1.89EUR 2,006,237
Netherlands (continued)
15,828,009 14.5815,016,442
BANCO ESPIRITO SANTO SA 4% 14-21/01/2019
4,000,000 1,143,920 1.05EUR 3,992,746
Portugal
BCP 4.5% 17-07.12.27 500,000 505,410 0.47EUR 501,050
1,649,330 1.524,493,796
BANCO CRED 7.75% 17-07.06.27 500,000 482,525 0.44EUR 520,389
Spain
BANCO DE SABADELL SA 5.625% 16-06/05/2026
900,000 1,033,083 0.95EUR 905,107
BBVA 3.5% 17-10.02.27 1,500,000 1,722,015 1.59EUR 1,588,525CAIXABANK 2.25% 18-17.04.30 2,000,000 2,013,520 1.86EUR 1,992,893GAS NCP 1.125% 17-11.04.24 2,000,000 2,093,620 1.93EUR 2,003,626SANTANDER ISSUANCES 2.5% 15-18/03/2025
2,500,000 2,702,225 2.48EUR 2,460,621
SANTANDER 1.375% 17-9.2.22 REGS 2,000,000 2,068,120 1.91EUR 2,030,610
12,115,108 11.1611,501,771
IN JUSTIT 3.125% 15.07.24 REGS 1,000,000 1,011,250 0.93EUR 968,916
Sweden
SCA AB 2.5% 13-09.06.23 2,000,000 2,190,120 2.02EUR 2,157,428
3,201,370 2.953,126,344
NETFLIX 3.625% 18-15.05.27 1,000,000 1,091,880 1.01EUR 1,023,738
United States of America
1,091,880 1.011,023,738
Bonds 106,355,170 97.99107,846,505
Transferable securities admitted to official Exchange listing106,355,170 97.99107,846,505
European Corporate Bonds-(expressed in EUR)
Portfolio statements as at 30 June 2019
(continued)
Name Quantity/nominal value Currency Acquisition cost Valuation % net assets
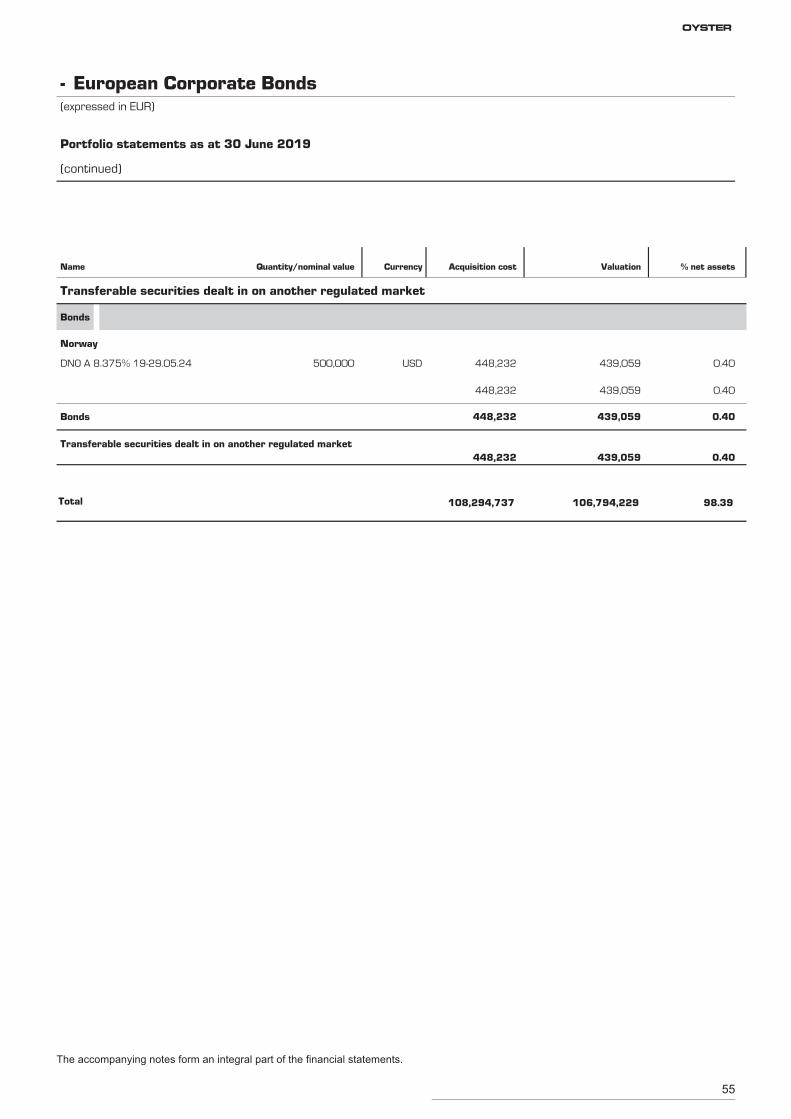
55
DNO A 8.375% 19-29.05.24 500,000 439,059 0.40USD 448,232
Transferable securities dealt in on another regulated market
Bonds
Norway
439,059 0.40448,232
Bonds 439,059 0.40448,232
Transferable securities dealt in on another regulated market439,059 0.40448,232
Total 106,794,229 98.39108,294,737
European Corporate Bonds-(expressed in EUR)
Portfolio statements as at 30 June 2019
(continued)
Name Quantity/nominal value Currency Acquisition cost Valuation % net assets
The accompanying notes form an integral part of the financial statements.
OYSTER
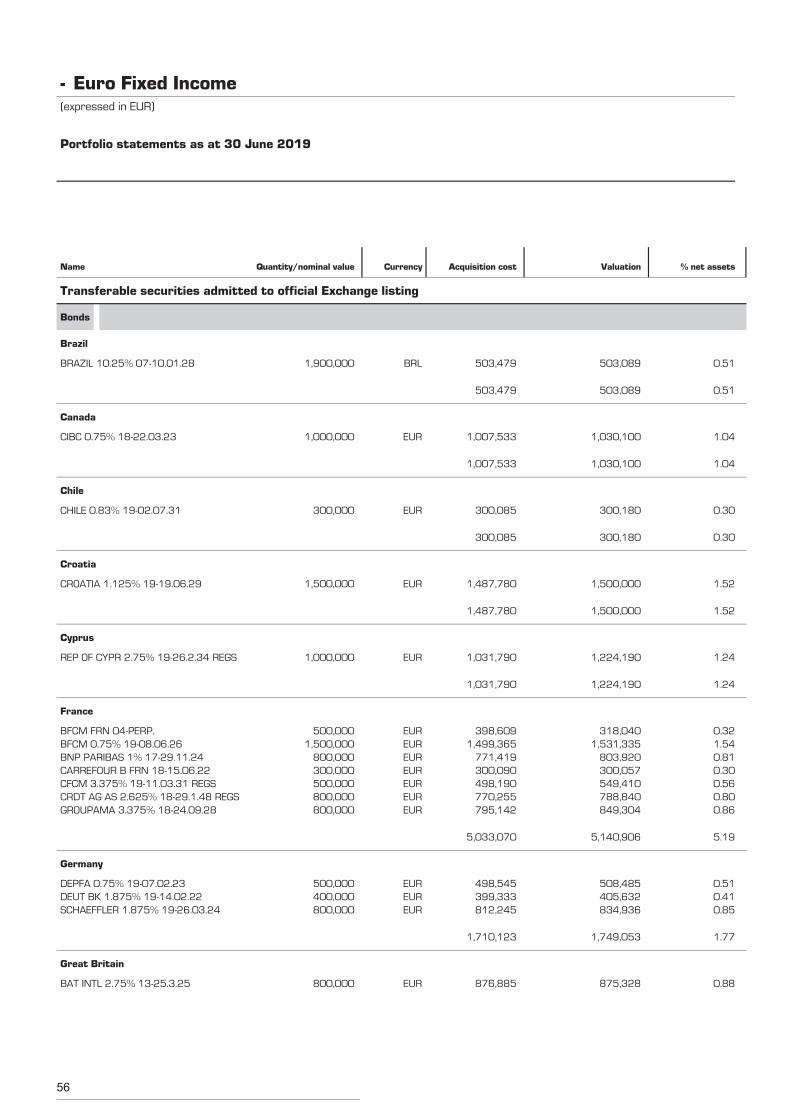
56
BRAZIL 10.25% 07-10.01.28 1,900,000 503,089 0.51BRL 503,479
Transferable securities admitted to official Exchange listing
Bonds
Brazil
503,089 0.51503,479
CIBC 0.75% 18-22.03.23 1,000,000 1,030,100 1.04EUR 1,007,533
Canada
1,030,100 1.041,007,533
CHILE 0.83% 19-02.07.31 300,000 300,180 0.30EUR 300,085
Chile
300,180 0.30300,085
CROATIA 1.125% 19-19.06.29 1,500,000 1,500,000 1.52EUR 1,487,780
Croatia
1,500,000 1.521,487,780
REP OF CYPR 2.75% 19-26.2.34 REGS 1,000,000 1,224,190 1.24EUR 1,031,790
Cyprus
1,224,190 1.241,031,790
BFCM FRN 04-PERP. 500,000 318,040 0.32EUR 398,609
France
BFCM 0.75% 19-08.06.26 1,500,000 1,531,335 1.54EUR 1,499,365BNP PARIBAS 1% 17-29.11.24 800,000 803,920 0.81EUR 771,419CARREFOUR B FRN 18-15.06.22 300,000 300,057 0.30EUR 300,090CFCM 3.375% 19-11.03.31 REGS 500,000 549,410 0.56EUR 498,190CRDT AG AS 2.625% 18-29.1.48 REGS 800,000 788,840 0.80EUR 770,255GROUPAMA 3.375% 18-24.09.28 800,000 849,304 0.86EUR 795,142
5,140,906 5.195,033,070
DEPFA 0.75% 19-07.02.23 500,000 508,485 0.51EUR 498,545
Germany
DEUT BK 1.875% 19-14.02.22 400,000 405,632 0.41EUR 399,333SCHAEFFLER 1.875% 19-26.03.24 800,000 834,936 0.85EUR 812,245
1,749,053 1.771,710,123
BAT INTL 2.75% 13-25.3.25 800,000 875,328 0.88EUR 876,885
Great Britain
Euro Fixed Income-(expressed in EUR)
Portfolio statements as at 30 June 2019
Name Quantity/nominal value Currency Acquisition cost Valuation % net assets
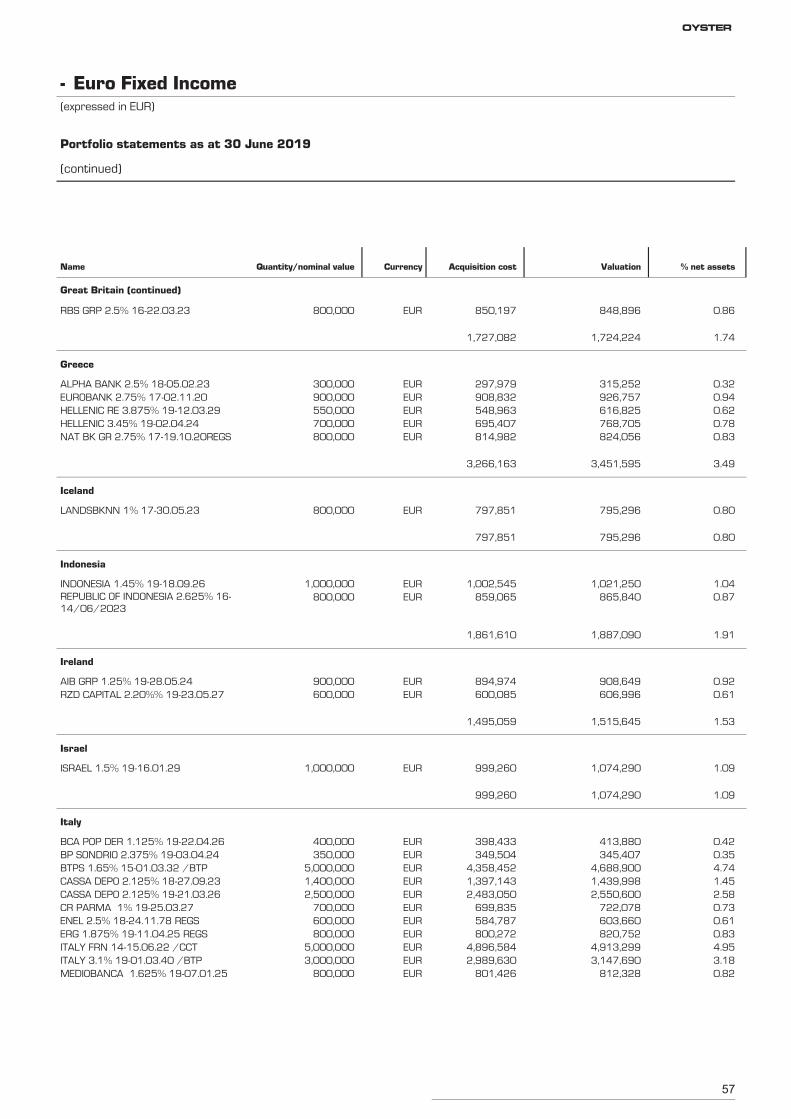
57
RBS GRP 2.5% 16-22.03.23 800,000 848,896 0.86EUR 850,197
Great Britain (continued)
1,724,224 1.741,727,082
ALPHA BANK 2.5% 18-05.02.23 300,000 315,252 0.32EUR 297,979
Greece
EUROBANK 2.75% 17-02.11.20 900,000 926,757 0.94EUR 908,832HELLENIC RE 3.875% 19-12.03.29 550,000 616,825 0.62EUR 548,963HELLENIC 3.45% 19-02.04.24 700,000 768,705 0.78EUR 695,407NAT BK GR 2.75% 17-19.10.20REGS 800,000 824,056 0.83EUR 814,982
3,451,595 3.493,266,163
LANDSBKNN 1% 17-30.05.23 800,000 795,296 0.80EUR 797,851
Iceland
795,296 0.80797,851
INDONESIA 1.45% 19-18.09.26 1,000,000 1,021,250 1.04EUR 1,002,545
Indonesia
REPUBLIC OF INDONESIA 2.625% 16-14/06/2023
800,000 865,840 0.87EUR 859,065
1,887,090 1.911,861,610
AIB GRP 1.25% 19-28.05.24 900,000 908,649 0.92EUR 894,974
Ireland
RZD CAPITAL 2.20%% 19-23.05.27 600,000 606,996 0.61EUR 600,085
1,515,645 1.531,495,059
ISRAEL 1.5% 19-16.01.29 1,000,000 1,074,290 1.09EUR 999,260
Israel
1,074,290 1.09999,260
BCA POP DER 1.125% 19-22.04.26 400,000 413,880 0.42EUR 398,433
Italy
BP SONDRIO 2.375% 19-03.04.24 350,000 345,407 0.35EUR 349,504BTPS 1.65% 15-01.03.32 /BTP 5,000,000 4,688,900 4.74EUR 4,358,452CASSA DEPO 2.125% 18-27.09.23 1,400,000 1,439,998 1.45EUR 1,397,143CASSA DEPO 2.125% 19-21.03.26 2,500,000 2,550,600 2.58EUR 2,483,050CR PARMA 1% 19-25.03.27 700,000 722,078 0.73EUR 699,835ENEL 2.5% 18-24.11.78 REGS 600,000 603,660 0.61EUR 584,787ERG 1.875% 19-11.04.25 REGS 800,000 820,752 0.83EUR 800,272ITALY FRN 14-15.06.22 /CCT 5,000,000 4,913,299 4.95EUR 4,896,584ITALY 3.1% 19-01.03.40 /BTP 3,000,000 3,147,690 3.18EUR 2,989,630MEDIOBANCA 1.625% 19-07.01.25 800,000 812,328 0.82EUR 801,426
Euro Fixed Income-(expressed in EUR)
Portfolio statements as at 30 June 2019
(continued)
Name Quantity/nominal value Currency Acquisition cost Valuation % net assets
OYSTER
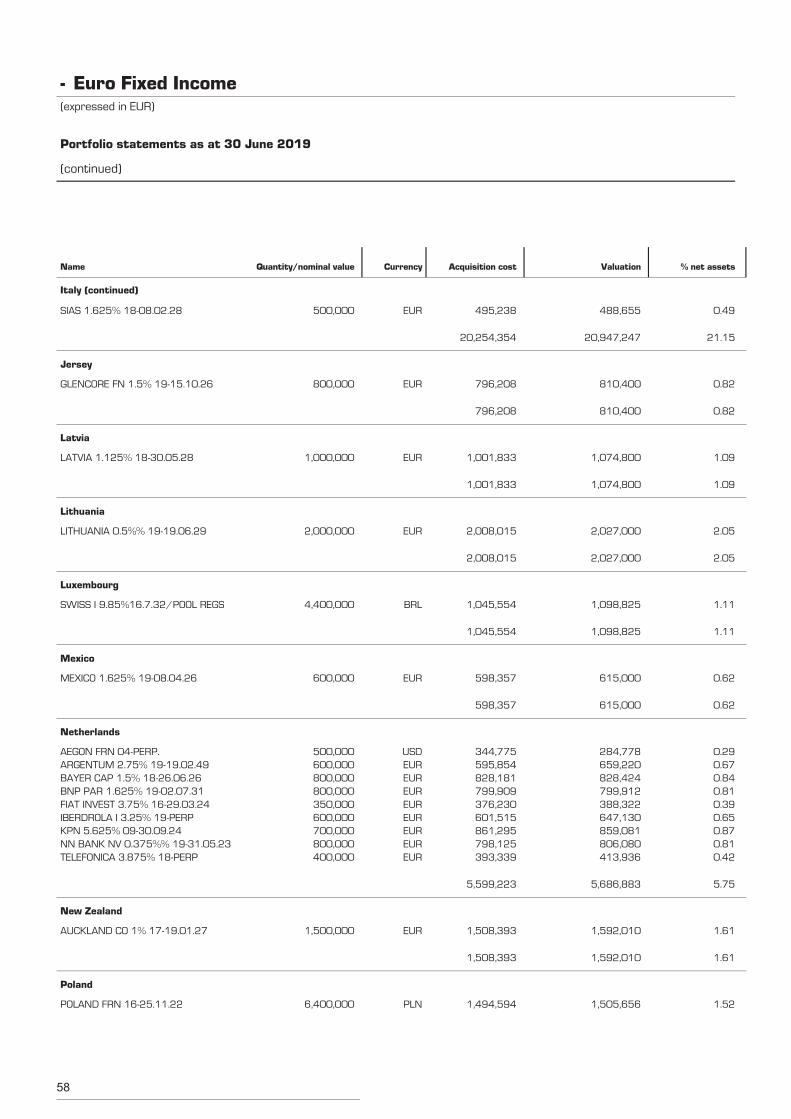
58
SIAS 1.625% 18-08.02.28 500,000 488,655 0.49EUR 495,238
Italy (continued)
20,947,247 21.1520,254,354
GLENCORE FN 1.5% 19-15.10.26 800,000 810,400 0.82EUR 796,208
Jersey
810,400 0.82796,208
LATVIA 1.125% 18-30.05.28 1,000,000 1,074,800 1.09EUR 1,001,833
Latvia
1,074,800 1.091,001,833
LITHUANIA 0.5%% 19-19.06.29 2,000,000 2,027,000 2.05EUR 2,008,015
Lithuania
2,027,000 2.052,008,015
SWISS I 9.85%16.7.32/POOL REGS 4,400,000 1,098,825 1.11BRL 1,045,554
Luxembourg
1,098,825 1.111,045,554
MEXICO 1.625% 19-08.04.26 600,000 615,000 0.62EUR 598,357
Mexico
615,000 0.62598,357
AEGON FRN 04-PERP. 500,000 284,778 0.29USD 344,775
Netherlands
ARGENTUM 2.75% 19-19.02.49 600,000 659,220 0.67EUR 595,854BAYER CAP 1.5% 18-26.06.26 800,000 828,424 0.84EUR 828,181BNP PAR 1.625% 19-02.07.31 800,000 799,912 0.81EUR 799,909FIAT INVEST 3.75% 16-29.03.24 350,000 388,322 0.39EUR 376,230IBERDROLA I 3.25% 19-PERP 600,000 647,130 0.65EUR 601,515KPN 5.625% 09-30.09.24 700,000 859,081 0.87EUR 861,295NN BANK NV 0.375%% 19-31.05.23 800,000 806,080 0.81EUR 798,125TELEFONICA 3.875% 18-PERP 400,000 413,936 0.42EUR 393,339
5,686,883 5.755,599,223
AUCKLAND CO 1% 17-19.01.27 1,500,000 1,592,010 1.61EUR 1,508,393
New Zealand
1,592,010 1.611,508,393
POLAND FRN 16-25.11.22 6,400,000 1,505,656 1.52PLN 1,494,594
Poland
Euro Fixed Income-(expressed in EUR)
Portfolio statements as at 30 June 2019
(continued)
Name Quantity/nominal value Currency Acquisition cost Valuation % net assets
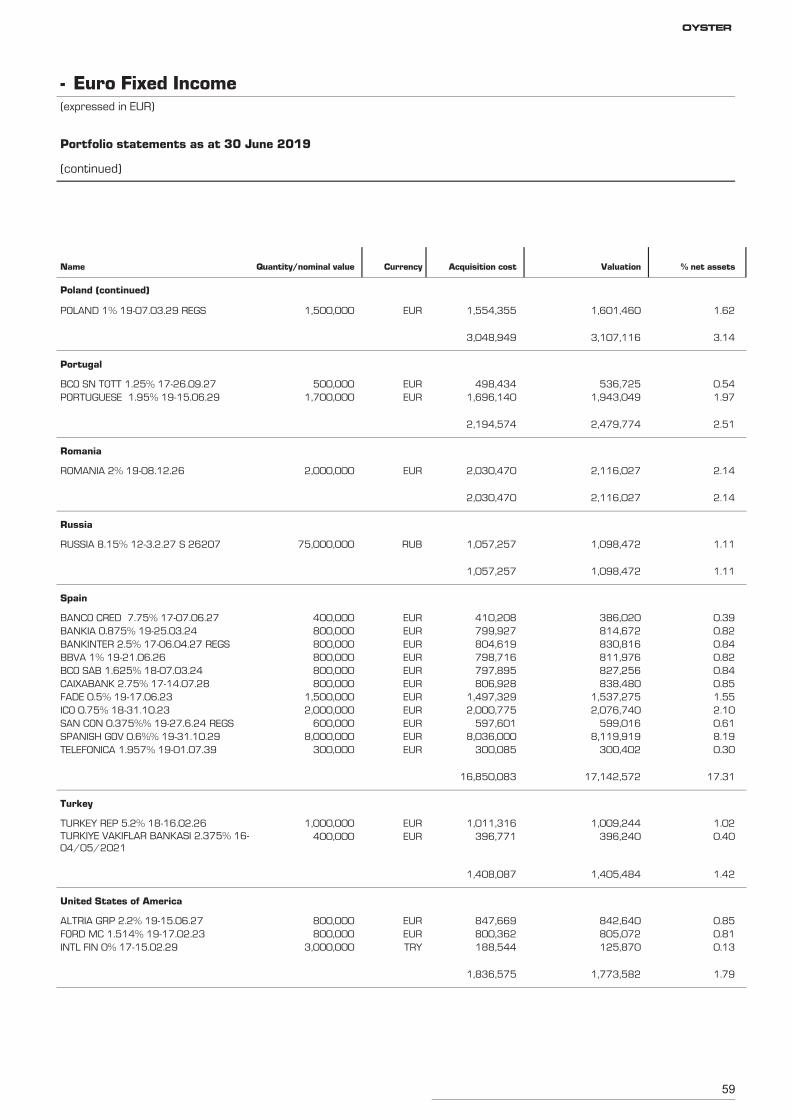
59
POLAND 1% 19-07.03.29 REGS 1,500,000 1,601,460 1.62EUR 1,554,355
Poland (continued)
3,107,116 3.143,048,949
BCO SN TOTT 1.25% 17-26.09.27 500,000 536,725 0.54EUR 498,434
Portugal
PORTUGUESE 1.95% 19-15.06.29 1,700,000 1,943,049 1.97EUR 1,696,140
2,479,774 2.512,194,574
ROMANIA 2% 19-08.12.26 2,000,000 2,116,027 2.14EUR 2,030,470
Romania
2,116,027 2.142,030,470
RUSSIA 8.15% 12-3.2.27 S 26207 75,000,000 1,098,472 1.11RUB 1,057,257
Russia
1,098,472 1.111,057,257
BANCO CRED 7.75% 17-07.06.27 400,000 386,020 0.39EUR 410,208
Spain
BANKIA 0.875% 19-25.03.24 800,000 814,672 0.82EUR 799,927BANKINTER 2.5% 17-06.04.27 REGS 800,000 830,816 0.84EUR 804,619BBVA 1% 19-21.06.26 800,000 811,976 0.82EUR 798,716BCO SAB 1.625% 18-07.03.24 800,000 827,256 0.84EUR 797,895CAIXABANK 2.75% 17-14.07.28 800,000 838,480 0.85EUR 806,928FADE 0.5% 19-17.06.23 1,500,000 1,537,275 1.55EUR 1,497,329ICO 0.75% 18-31.10.23 2,000,000 2,076,740 2.10EUR 2,000,775SAN CON 0.375%% 19-27.6.24 REGS 600,000 599,016 0.61EUR 597,601SPANISH GOV 0.6%% 19-31.10.29 8,000,000 8,119,919 8.19EUR 8,036,000TELEFONICA 1.957% 19-01.07.39 300,000 300,402 0.30EUR 300,085
17,142,572 17.3116,850,083
TURKEY REP 5.2% 18-16.02.26 1,000,000 1,009,244 1.02EUR 1,011,316
Turkey
TURKIYE VAKIFLAR BANKASI 2.375% 16-04/05/2021
400,000 396,240 0.40EUR 396,771
1,405,484 1.421,408,087
ALTRIA GRP 2.2% 19-15.06.27 800,000 842,640 0.85EUR 847,669
United States of America
FORD MC 1.514% 19-17.02.23 800,000 805,072 0.81EUR 800,362INTL FIN 0% 17-15.02.29 3,000,000 125,870 0.13TRY 188,544
1,773,582 1.791,836,575
Euro Fixed Income-(expressed in EUR)
Portfolio statements as at 30 June 2019
(continued)
Name Quantity/nominal value Currency Acquisition cost Valuation % net assets
OYSTER
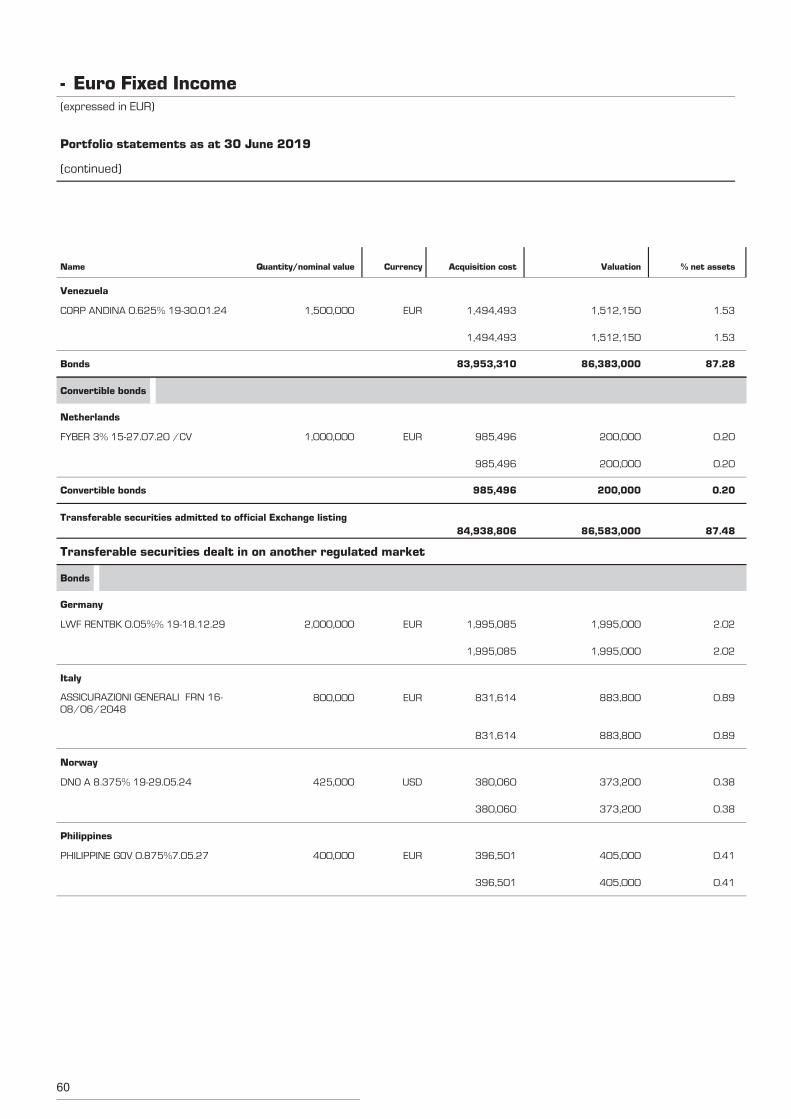
60
CORP ANDINA 0.625% 19-30.01.24 1,500,000 1,512,150 1.53EUR 1,494,493
Venezuela
1,512,150 1.531,494,493
Bonds 86,383,000 87.2883,953,310
FYBER 3% 15-27.07.20 /CV 1,000,000 200,000 0.20EUR 985,496
Convertible bonds
Netherlands
200,000 0.20985,496
Convertible bonds 200,000 0.20985,496
Transferable securities admitted to official Exchange listing86,583,000 87.4884,938,806
LWF RENTBK 0.05%% 19-18.12.29 2,000,000 1,995,000 2.02EUR 1,995,085
Transferable securities dealt in on another regulated market
Bonds
Germany
1,995,000 2.021,995,085
ASSICURAZIONI GENERALI FRN 16-08/06/2048
800,000 883,800 0.89EUR 831,614
Italy
883,800 0.89831,614
DNO A 8.375% 19-29.05.24 425,000 373,200 0.38USD 380,060
Norway
373,200 0.38380,060
PHILIPPINE GOV 0.875%7.05.27 400,000 405,000 0.41EUR 396,501
Philippines
405,000 0.41396,501
Euro Fixed Income-(expressed in EUR)
Portfolio statements as at 30 June 2019
(continued)
Name Quantity/nominal value Currency Acquisition cost Valuation % net assets
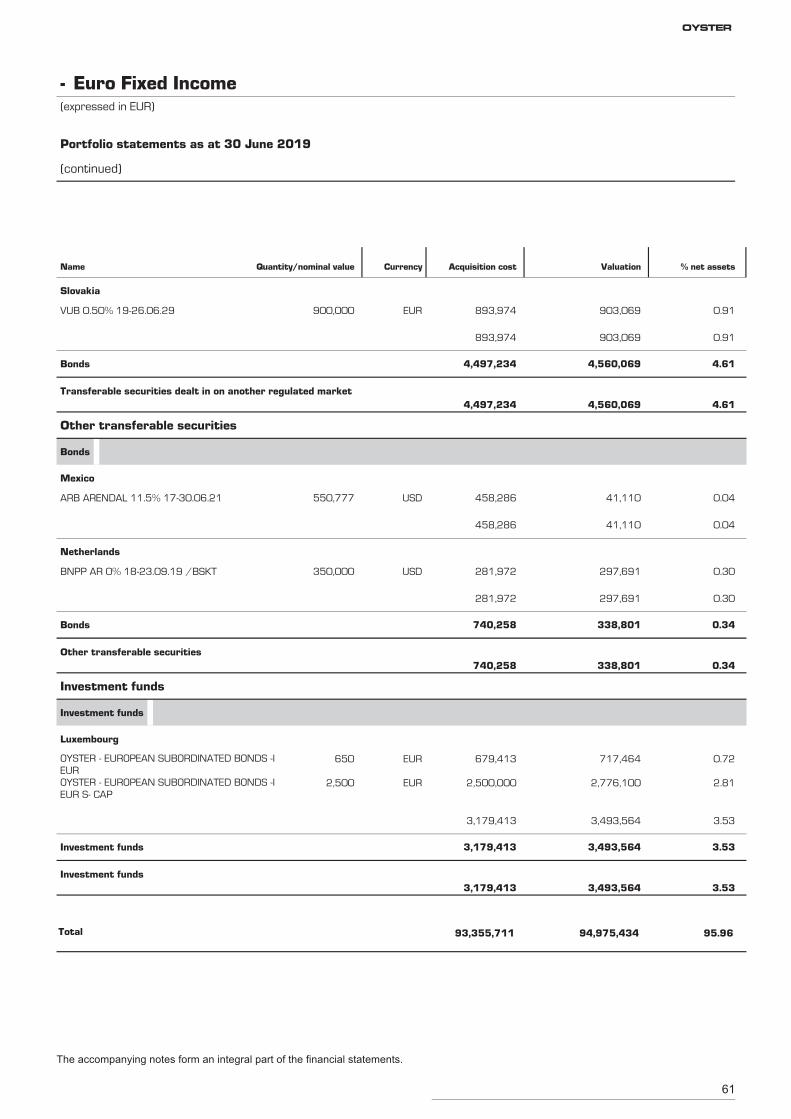
61
VUB 0.50% 19-26.06.29 900,000 903,069 0.91EUR 893,974
Slovakia
903,069 0.91893,974
Bonds 4,560,069 4.614,497,234
Transferable securities dealt in on another regulated market4,560,069 4.614,497,234
ARB ARENDAL 11.5% 17-30.06.21 550,777 41,110 0.04USD 458,286
Other transferable securities
Bonds
Mexico
41,110 0.04458,286
BNPP AR 0% 18-23.09.19 /BSKT 350,000 297,691 0.30USD 281,972
Netherlands
297,691 0.30281,972
Bonds 338,801 0.34740,258
Other transferable securities338,801 0.34740,258
OYSTER - EUROPEAN SUBORDINATED BONDS -IEUR
650 717,464 0.72EUR 679,413
Investment funds
Investment funds
Luxembourg
OYSTER - EUROPEAN SUBORDINATED BONDS -IEUR S- CAP
2,500 2,776,100 2.81EUR 2,500,000
3,493,564 3.533,179,413
Investment funds 3,493,564 3.533,179,413
Investment funds3,493,564 3.533,179,413
Total 94,975,434 95.9693,355,711
Euro Fixed Income-(expressed in EUR)
Portfolio statements as at 30 June 2019
(continued)
Name Quantity/nominal value Currency Acquisition cost Valuation % net assets
The accompanying notes form an integral part of the financial statements.
OYSTER
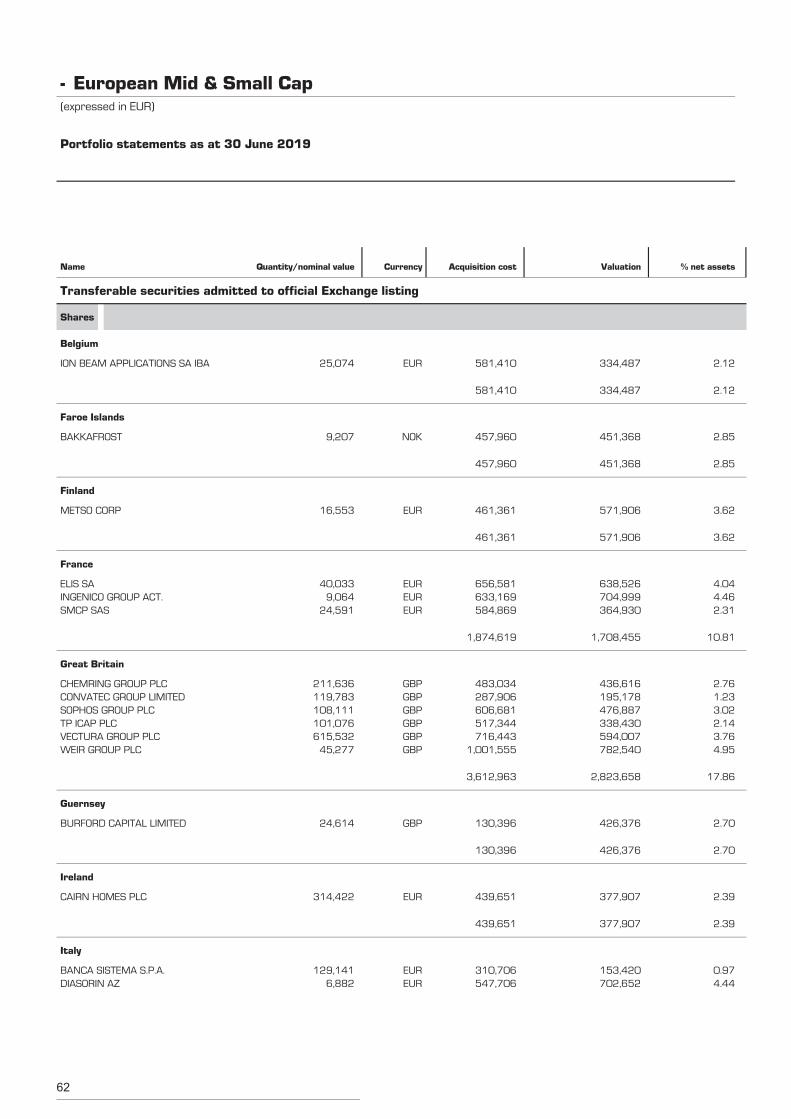
62
ION BEAM APPLICATIONS SA IBA 25,074 334,487 2.12EUR 581,410
Transferable securities admitted to official Exchange listing
Shares
Belgium
334,487 2.12581,410
BAKKAFROST 9,207 451,368 2.85NOK 457,960
Faroe Islands
451,368 2.85457,960
METSO CORP 16,553 571,906 3.62EUR 461,361
Finland
571,906 3.62461,361
ELIS SA 40,033 638,526 4.04EUR 656,581
France
INGENICO GROUP ACT. 9,064 704,999 4.46EUR 633,169SMCP SAS 24,591 364,930 2.31EUR 584,869
1,708,455 10.811,874,619
CHEMRING GROUP PLC 211,636 436,616 2.76GBP 483,034
Great Britain
CONVATEC GROUP LIMITED 119,783 195,178 1.23GBP 287,906SOPHOS GROUP PLC 108,111 476,887 3.02GBP 606,681TP ICAP PLC 101,076 338,430 2.14GBP 517,344VECTURA GROUP PLC 615,532 594,007 3.76GBP 716,443WEIR GROUP PLC 45,277 782,540 4.95GBP 1,001,555
2,823,658 17.863,612,963
BURFORD CAPITAL LIMITED 24,614 426,376 2.70GBP 130,396
Guernsey
426,376 2.70130,396
CAIRN HOMES PLC 314,422 377,907 2.39EUR 439,651
Ireland
377,907 2.39439,651
BANCA SISTEMA S.P.A. 129,141 153,420 0.97EUR 310,706
Italy
DIASORIN AZ 6,882 702,652 4.44EUR 547,706
European Mid & Small Cap-(expressed in EUR)
Portfolio statements as at 30 June 2019
Name Quantity/nominal value Currency Acquisition cost Valuation % net assets
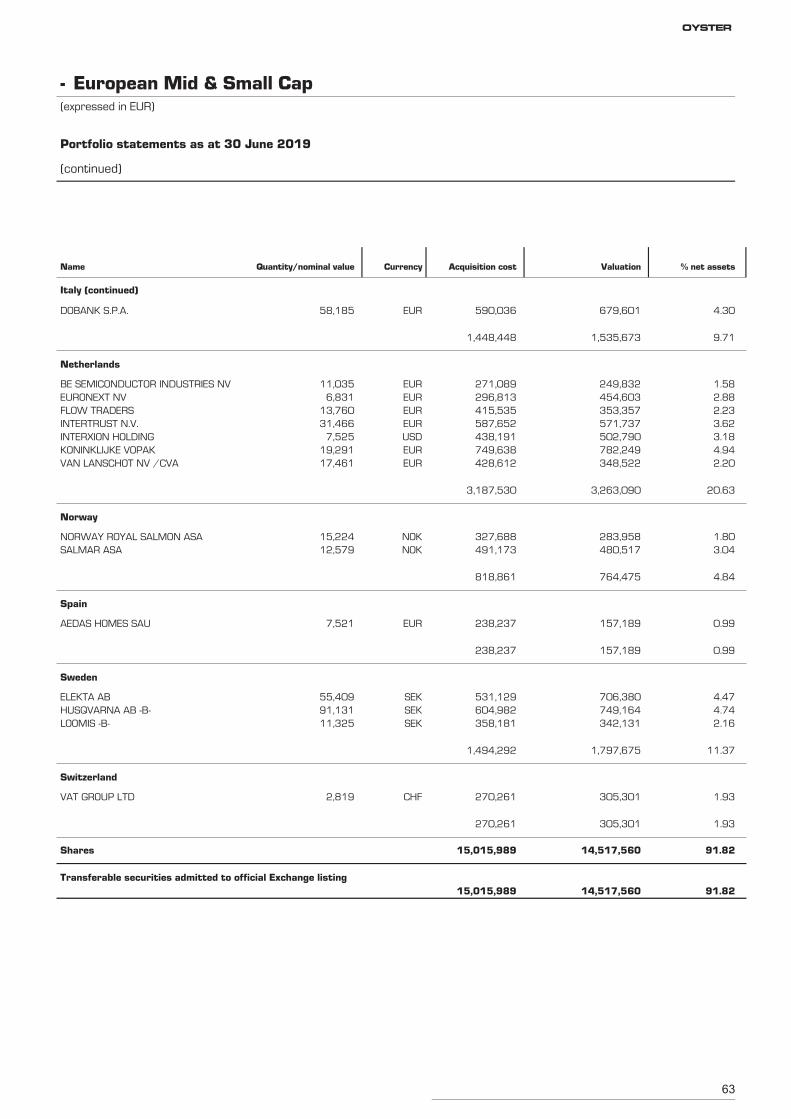
63
DOBANK S.P.A. 58,185 679,601 4.30EUR 590,036
Italy (continued)
1,535,673 9.711,448,448
BE SEMICONDUCTOR INDUSTRIES NV 11,035 249,832 1.58EUR 271,089
Netherlands
EURONEXT NV 6,831 454,603 2.88EUR 296,813FLOW TRADERS 13,760 353,357 2.23EUR 415,535INTERTRUST N.V. 31,466 571,737 3.62EUR 587,652INTERXION HOLDING 7,525 502,790 3.18USD 438,191KONINKLIJKE VOPAK 19,291 782,249 4.94EUR 749,638VAN LANSCHOT NV /CVA 17,461 348,522 2.20EUR 428,612
3,263,090 20.633,187,530
NORWAY ROYAL SALMON ASA 15,224 283,958 1.80NOK 327,688
Norway
SALMAR ASA 12,579 480,517 3.04NOK 491,173
764,475 4.84818,861
AEDAS HOMES SAU 7,521 157,189 0.99EUR 238,237
Spain
157,189 0.99238,237
ELEKTA AB 55,409 706,380 4.47SEK 531,129
Sweden
HUSQVARNA AB -B- 91,131 749,164 4.74SEK 604,982LOOMIS -B- 11,325 342,131 2.16SEK 358,181
1,797,675 11.371,494,292
VAT GROUP LTD 2,819 305,301 1.93CHF 270,261
Switzerland
305,301 1.93270,261
Shares 14,517,560 91.8215,015,989
Transferable securities admitted to official Exchange listing14,517,560 91.8215,015,989
European Mid & Small Cap-(expressed in EUR)
Portfolio statements as at 30 June 2019
(continued)
Name Quantity/nominal value Currency Acquisition cost Valuation % net assets
OYSTER
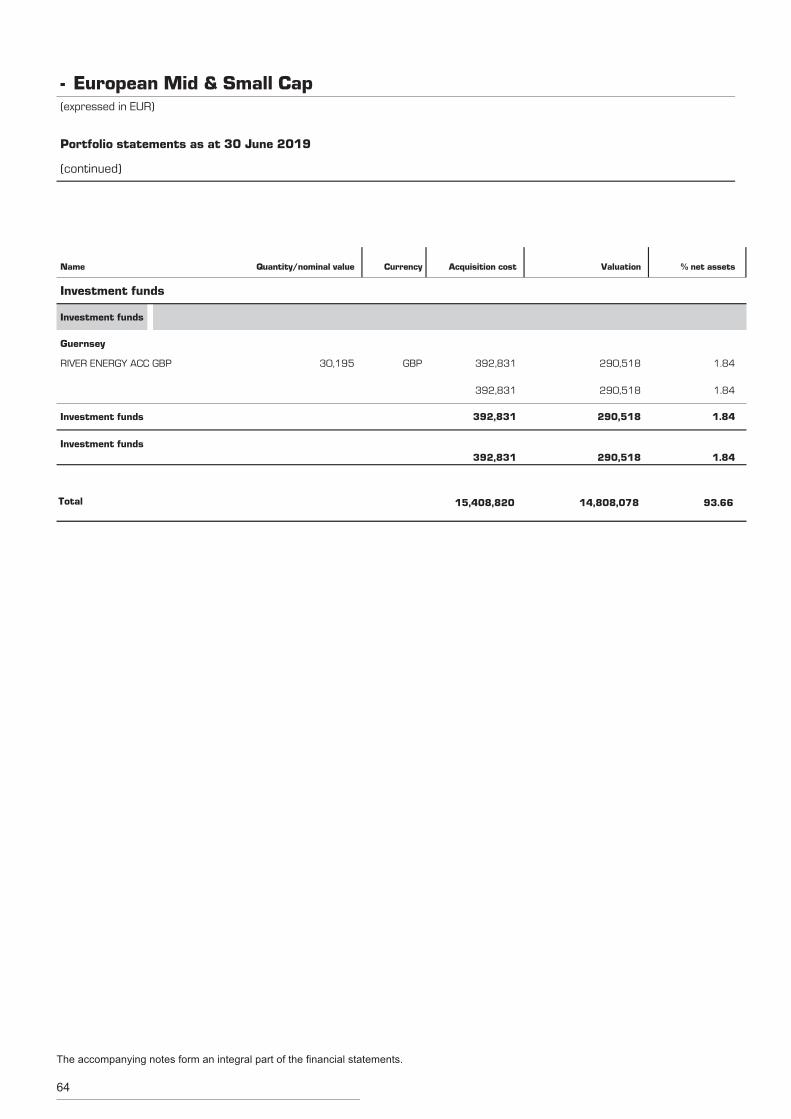
64
RIVER ENERGY ACC GBP 30,195 290,518 1.84GBP 392,831
Investment funds
Investment funds
Guernsey
290,518 1.84392,831
Investment funds 290,518 1.84392,831
Investment funds290,518 1.84392,831
Total 14,808,078 93.6615,408,820
European Mid & Small Cap-(expressed in EUR)
Portfolio statements as at 30 June 2019
(continued)
Name Quantity/nominal value Currency Acquisition cost Valuation % net assets
The accompanying notes form an integral part of the financial statements.
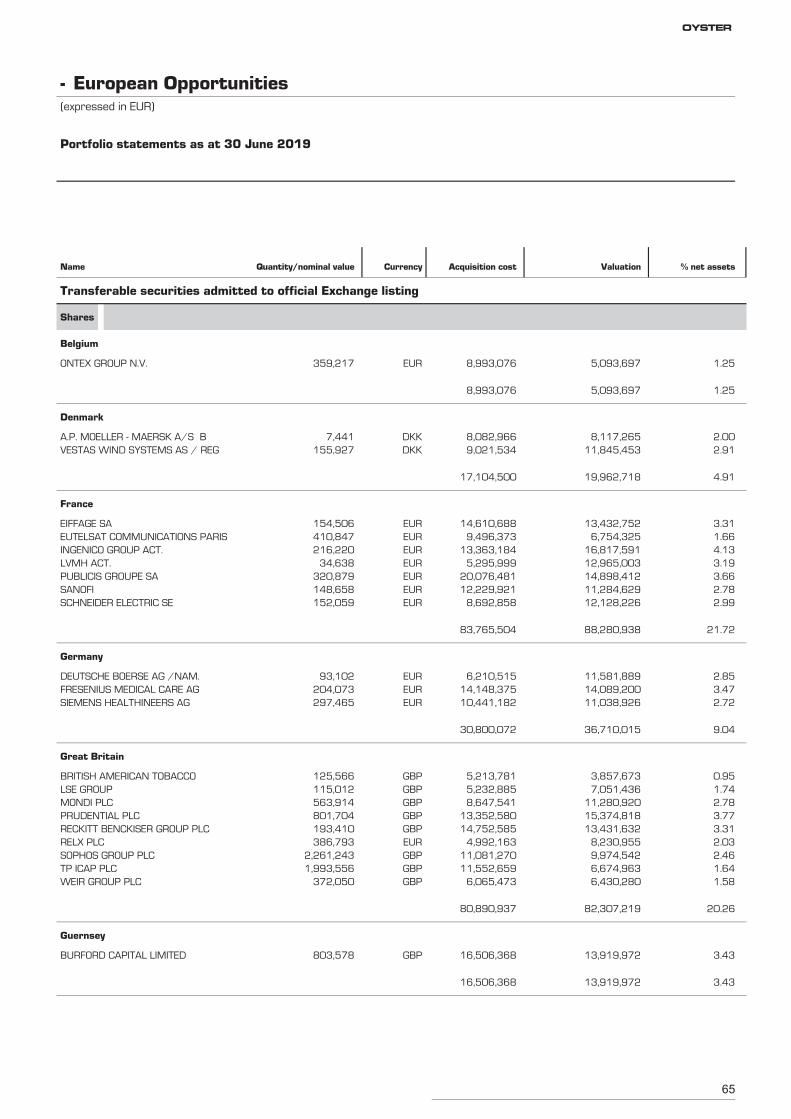
65
ONTEX GROUP N.V. 359,217 5,093,697 1.25EUR 8,993,076
Transferable securities admitted to official Exchange listing
Shares
Belgium
5,093,697 1.258,993,076
A.P. MOELLER - MAERSK A/S B 7,441 8,117,265 2.00DKK 8,082,966
Denmark
VESTAS WIND SYSTEMS AS / REG 155,927 11,845,453 2.91DKK 9,021,534
19,962,718 4.9117,104,500
EIFFAGE SA 154,506 13,432,752 3.31EUR 14,610,688
France
EUTELSAT COMMUNICATIONS PARIS 410,847 6,754,325 1.66EUR 9,496,373INGENICO GROUP ACT. 216,220 16,817,591 4.13EUR 13,363,184LVMH ACT. 34,638 12,965,003 3.19EUR 5,295,999PUBLICIS GROUPE SA 320,879 14,898,412 3.66EUR 20,076,481SANOFI 148,658 11,284,629 2.78EUR 12,229,921SCHNEIDER ELECTRIC SE 152,059 12,128,226 2.99EUR 8,692,858
88,280,938 21.7283,765,504
DEUTSCHE BOERSE AG /NAM. 93,102 11,581,889 2.85EUR 6,210,515
Germany
FRESENIUS MEDICAL CARE AG 204,073 14,089,200 3.47EUR 14,148,375SIEMENS HEALTHINEERS AG 297,465 11,038,926 2.72EUR 10,441,182
36,710,015 9.0430,800,072
BRITISH AMERICAN TOBACCO 125,566 3,857,673 0.95GBP 5,213,781
Great Britain
LSE GROUP 115,012 7,051,436 1.74GBP 5,232,885MONDI PLC 563,914 11,280,920 2.78GBP 8,647,541PRUDENTIAL PLC 801,704 15,374,818 3.77GBP 13,352,580RECKITT BENCKISER GROUP PLC 193,410 13,431,632 3.31GBP 14,752,585RELX PLC 386,793 8,230,955 2.03EUR 4,992,163SOPHOS GROUP PLC 2,261,243 9,974,542 2.46GBP 11,081,270TP ICAP PLC 1,993,556 6,674,963 1.64GBP 11,552,659WEIR GROUP PLC 372,050 6,430,280 1.58GBP 6,065,473
82,307,219 20.2680,890,937
BURFORD CAPITAL LIMITED 803,578 13,919,972 3.43GBP 16,506,368
Guernsey
13,919,972 3.4316,506,368
European Opportunities-(expressed in EUR)
Portfolio statements as at 30 June 2019
Name Quantity/nominal value Currency Acquisition cost Valuation % net assets
OYSTER
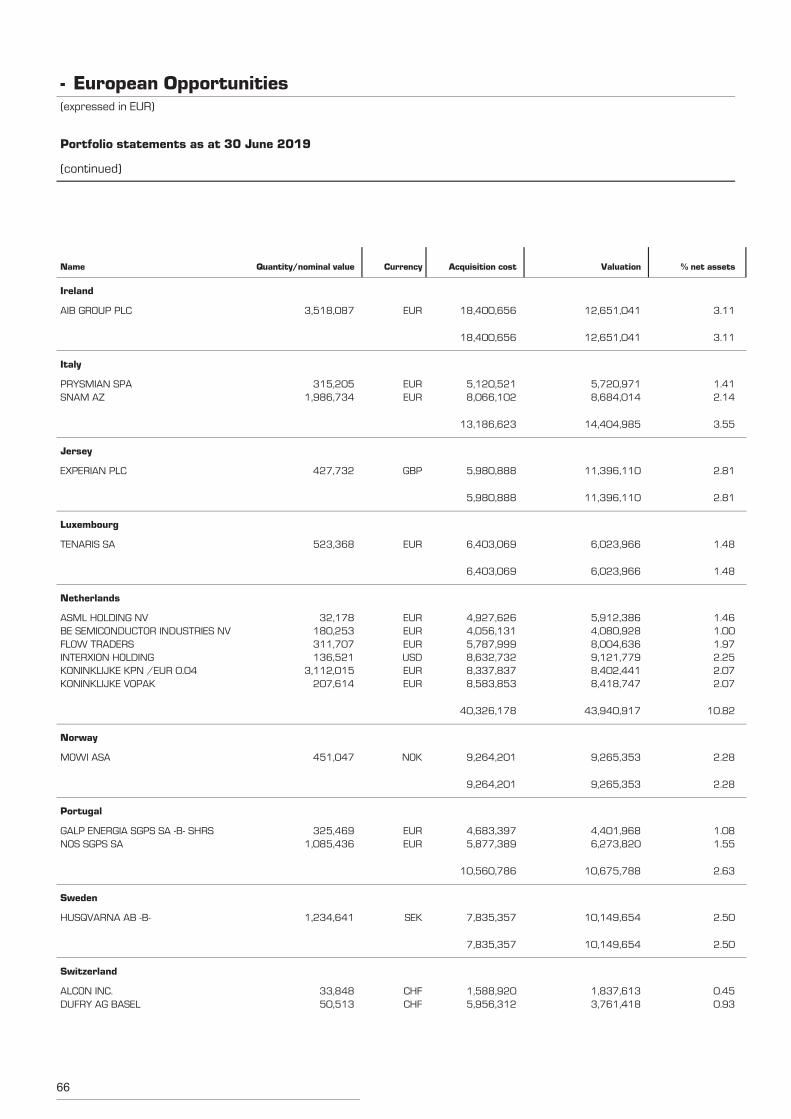
66
AIB GROUP PLC 3,518,087 12,651,041 3.11EUR 18,400,656
Ireland
12,651,041 3.1118,400,656
PRYSMIAN SPA 315,205 5,720,971 1.41EUR 5,120,521
Italy
SNAM AZ 1,986,734 8,684,014 2.14EUR 8,066,102
14,404,985 3.5513,186,623
EXPERIAN PLC 427,732 11,396,110 2.81GBP 5,980,888
Jersey
11,396,110 2.815,980,888
TENARIS SA 523,368 6,023,966 1.48EUR 6,403,069
Luxembourg
6,023,966 1.486,403,069
ASML HOLDING NV 32,178 5,912,386 1.46EUR 4,927,626
Netherlands
BE SEMICONDUCTOR INDUSTRIES NV 180,253 4,080,928 1.00EUR 4,056,131FLOW TRADERS 311,707 8,004,636 1.97EUR 5,787,999INTERXION HOLDING 136,521 9,121,779 2.25USD 8,632,732KONINKLIJKE KPN /EUR 0.04 3,112,015 8,402,441 2.07EUR 8,337,837KONINKLIJKE VOPAK 207,614 8,418,747 2.07EUR 8,583,853
43,940,917 10.8240,326,178
MOWI ASA 451,047 9,265,353 2.28NOK 9,264,201
Norway
9,265,353 2.289,264,201
GALP ENERGIA SGPS SA -B- SHRS 325,469 4,401,968 1.08EUR 4,683,397
Portugal
NOS SGPS SA 1,085,436 6,273,820 1.55EUR 5,877,389
10,675,788 2.6310,560,786
HUSQVARNA AB -B- 1,234,641 10,149,654 2.50SEK 7,835,357
Sweden
10,149,654 2.507,835,357
ALCON INC. 33,848 1,837,613 0.45CHF 1,588,920
Switzerland
DUFRY AG BASEL 50,513 3,761,418 0.93CHF 5,956,312
European Opportunities-(expressed in EUR)
Portfolio statements as at 30 June 2019
(continued)
Name Quantity/nominal value Currency Acquisition cost Valuation % net assets
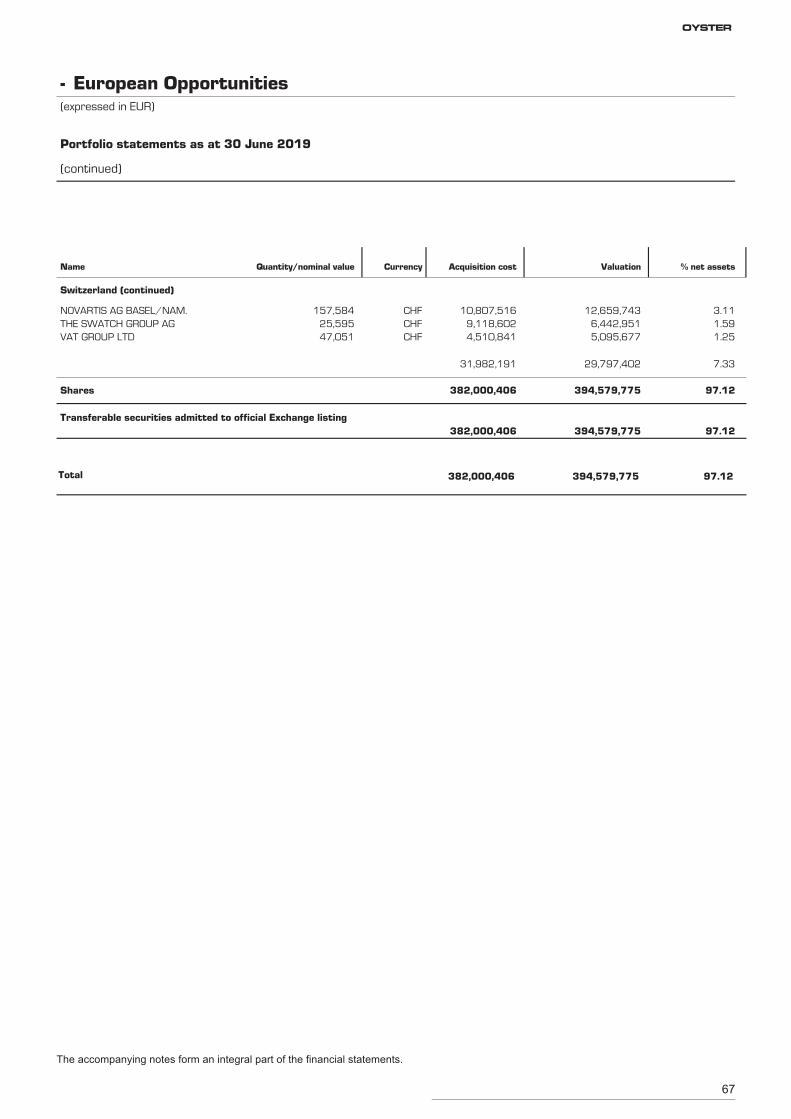
67
NOVARTIS AG BASEL/NAM. 157,584 12,659,743 3.11CHF 10,807,516
Switzerland (continued)
THE SWATCH GROUP AG 25,595 6,442,951 1.59CHF 9,118,602VAT GROUP LTD 47,051 5,095,677 1.25CHF 4,510,841
29,797,402 7.3331,982,191
Shares 394,579,775 97.12382,000,406
Transferable securities admitted to official Exchange listing394,579,775 97.12382,000,406
Total 394,579,775 97.12382,000,406
European Opportunities-(expressed in EUR)
Portfolio statements as at 30 June 2019
(continued)
Name Quantity/nominal value Currency Acquisition cost Valuation % net assets
The accompanying notes form an integral part of the financial statements.
OYSTER
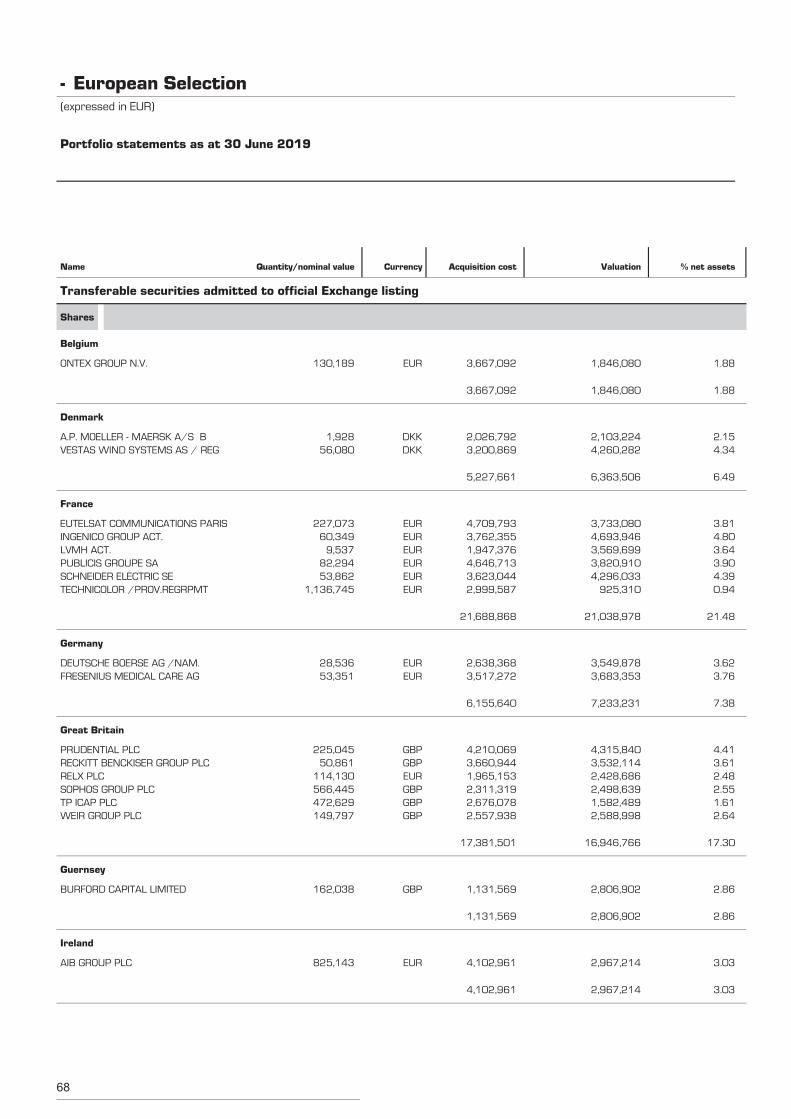
68
ONTEX GROUP N.V. 130,189 1,846,080 1.88EUR 3,667,092
Transferable securities admitted to official Exchange listing
Shares
Belgium
1,846,080 1.883,667,092
A.P. MOELLER - MAERSK A/S B 1,928 2,103,224 2.15DKK 2,026,792
Denmark
VESTAS WIND SYSTEMS AS / REG 56,080 4,260,282 4.34DKK 3,200,869
6,363,506 6.495,227,661
EUTELSAT COMMUNICATIONS PARIS 227,073 3,733,080 3.81EUR 4,709,793
France
INGENICO GROUP ACT. 60,349 4,693,946 4.80EUR 3,762,355LVMH ACT. 9,537 3,569,699 3.64EUR 1,947,376PUBLICIS GROUPE SA 82,294 3,820,910 3.90EUR 4,646,713SCHNEIDER ELECTRIC SE 53,862 4,296,033 4.39EUR 3,623,044TECHNICOLOR /PROV.REGRPMT 1,136,745 925,310 0.94EUR 2,999,587
21,038,978 21.4821,688,868
DEUTSCHE BOERSE AG /NAM. 28,536 3,549,878 3.62EUR 2,638,368
Germany
FRESENIUS MEDICAL CARE AG 53,351 3,683,353 3.76EUR 3,517,272
7,233,231 7.386,155,640
PRUDENTIAL PLC 225,045 4,315,840 4.41GBP 4,210,069
Great Britain
RECKITT BENCKISER GROUP PLC 50,861 3,532,114 3.61GBP 3,660,944RELX PLC 114,130 2,428,686 2.48EUR 1,965,153SOPHOS GROUP PLC 566,445 2,498,639 2.55GBP 2,311,319TP ICAP PLC 472,629 1,582,489 1.61GBP 2,676,078WEIR GROUP PLC 149,797 2,588,998 2.64GBP 2,557,938
16,946,766 17.3017,381,501
BURFORD CAPITAL LIMITED 162,038 2,806,902 2.86GBP 1,131,569
Guernsey
2,806,902 2.861,131,569
AIB GROUP PLC 825,143 2,967,214 3.03EUR 4,102,961
Ireland
2,967,214 3.034,102,961
European Selection-(expressed in EUR)
Portfolio statements as at 30 June 2019
Name Quantity/nominal value Currency Acquisition cost Valuation % net assets
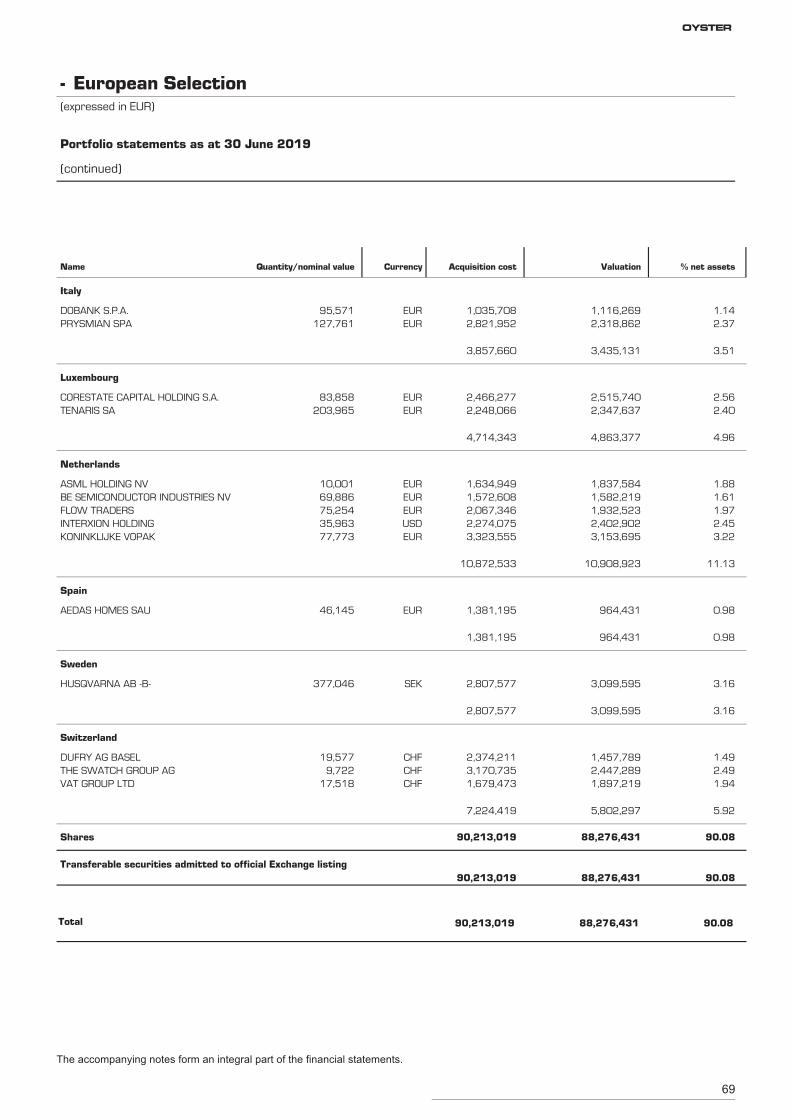
69
DOBANK S.P.A. 95,571 1,116,269 1.14EUR 1,035,708
Italy
PRYSMIAN SPA 127,761 2,318,862 2.37EUR 2,821,952
3,435,131 3.513,857,660
CORESTATE CAPITAL HOLDING S.A. 83,858 2,515,740 2.56EUR 2,466,277
Luxembourg
TENARIS SA 203,965 2,347,637 2.40EUR 2,248,066
4,863,377 4.964,714,343
ASML HOLDING NV 10,001 1,837,584 1.88EUR 1,634,949
Netherlands
BE SEMICONDUCTOR INDUSTRIES NV 69,886 1,582,219 1.61EUR 1,572,608FLOW TRADERS 75,254 1,932,523 1.97EUR 2,067,346INTERXION HOLDING 35,963 2,402,902 2.45USD 2,274,075KONINKLIJKE VOPAK 77,773 3,153,695 3.22EUR 3,323,555
10,908,923 11.1310,872,533
AEDAS HOMES SAU 46,145 964,431 0.98EUR 1,381,195
Spain
964,431 0.981,381,195
HUSQVARNA AB -B- 377,046 3,099,595 3.16SEK 2,807,577
Sweden
3,099,595 3.162,807,577
DUFRY AG BASEL 19,577 1,457,789 1.49CHF 2,374,211
Switzerland
THE SWATCH GROUP AG 9,722 2,447,289 2.49CHF 3,170,735VAT GROUP LTD 17,518 1,897,219 1.94CHF 1,679,473
5,802,297 5.927,224,419
Shares 88,276,431 90.0890,213,019
Transferable securities admitted to official Exchange listing88,276,431 90.0890,213,019
Total 88,276,431 90.0890,213,019
European Selection-(expressed in EUR)
Portfolio statements as at 30 June 2019
(continued)
Name Quantity/nominal value Currency Acquisition cost Valuation % net assets
The accompanying notes form an integral part of the financial statements.
OYSTER
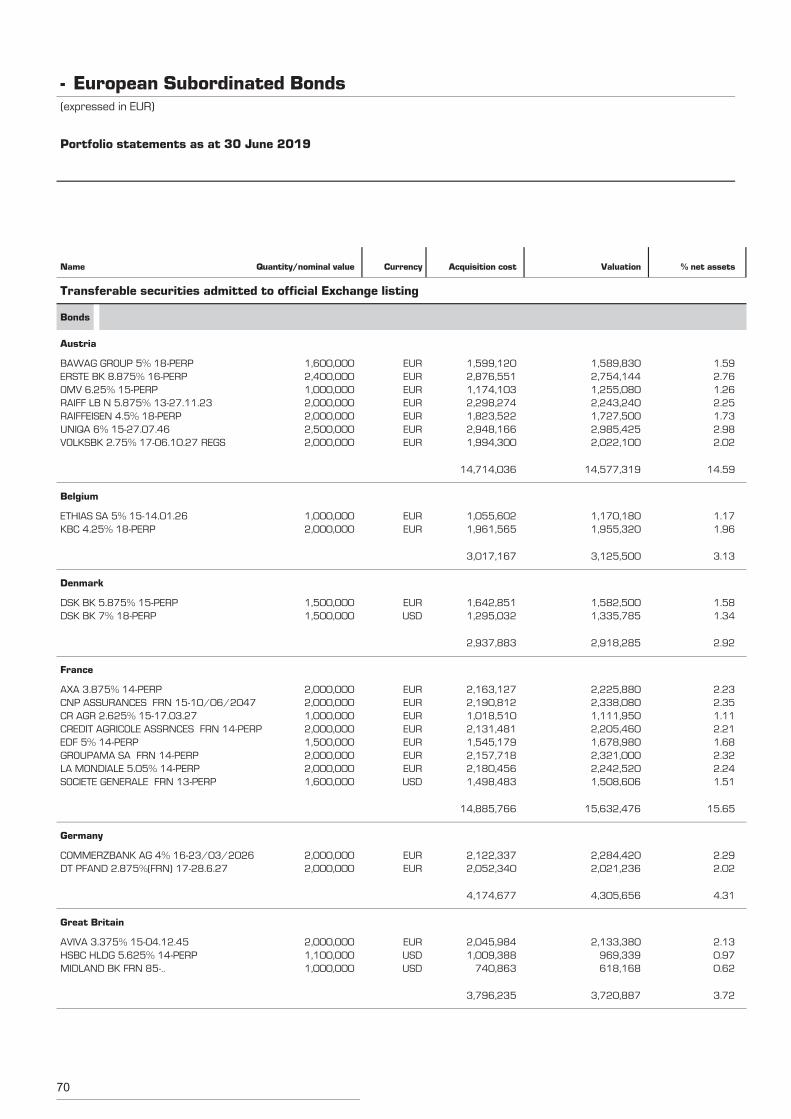
70
BAWAG GROUP 5% 18-PERP 1,600,000 1,589,830 1.59EUR 1,599,120
Transferable securities admitted to official Exchange listing
Bonds
Austria
ERSTE BK 8.875% 16-PERP 2,400,000 2,754,144 2.76EUR 2,876,551OMV 6.25% 15-PERP 1,000,000 1,255,080 1.26EUR 1,174,103RAIFF LB N 5.875% 13-27.11.23 2,000,000 2,243,240 2.25EUR 2,298,274RAIFFEISEN 4.5% 18-PERP 2,000,000 1,727,500 1.73EUR 1,823,522UNIQA 6% 15-27.07.46 2,500,000 2,985,425 2.98EUR 2,948,166VOLKSBK 2.75% 17-06.10.27 REGS 2,000,000 2,022,100 2.02EUR 1,994,300
14,577,319 14.5914,714,036
ETHIAS SA 5% 15-14.01.26 1,000,000 1,170,180 1.17EUR 1,055,602
Belgium
KBC 4.25% 18-PERP 2,000,000 1,955,320 1.96EUR 1,961,565
3,125,500 3.133,017,167
DSK BK 5.875% 15-PERP 1,500,000 1,582,500 1.58EUR 1,642,851
Denmark
DSK BK 7% 18-PERP 1,500,000 1,335,785 1.34USD 1,295,032
2,918,285 2.922,937,883
AXA 3.875% 14-PERP 2,000,000 2,225,880 2.23EUR 2,163,127
France
CNP ASSURANCES FRN 15-10/06/2047 2,000,000 2,338,080 2.35EUR 2,190,812CR AGR 2.625% 15-17.03.27 1,000,000 1,111,950 1.11EUR 1,018,510CREDIT AGRICOLE ASSRNCES FRN 14-PERP 2,000,000 2,205,460 2.21EUR 2,131,481EDF 5% 14-PERP 1,500,000 1,678,980 1.68EUR 1,545,179GROUPAMA SA FRN 14-PERP 2,000,000 2,321,000 2.32EUR 2,157,718LA MONDIALE 5.05% 14-PERP 2,000,000 2,242,520 2.24EUR 2,180,456SOCIETE GENERALE FRN 13-PERP 1,600,000 1,508,606 1.51USD 1,498,483
15,632,476 15.6514,885,766
COMMERZBANK AG 4% 16-23/03/2026 2,000,000 2,284,420 2.29EUR 2,122,337
Germany
DT PFAND 2.875%(FRN) 17-28.6.27 2,000,000 2,021,236 2.02EUR 2,052,340
4,305,656 4.314,174,677
AVIVA 3.375% 15-04.12.45 2,000,000 2,133,380 2.13EUR 2,045,984
Great Britain
HSBC HLDG 5.625% 14-PERP 1,100,000 969,339 0.97USD 1,009,388MIDLAND BK FRN 85-.. 1,000,000 618,168 0.62USD 740,863
3,720,887 3.723,796,235
European Subordinated Bonds-(expressed in EUR)
Portfolio statements as at 30 June 2019
Name Quantity/nominal value Currency Acquisition cost Valuation % net assets
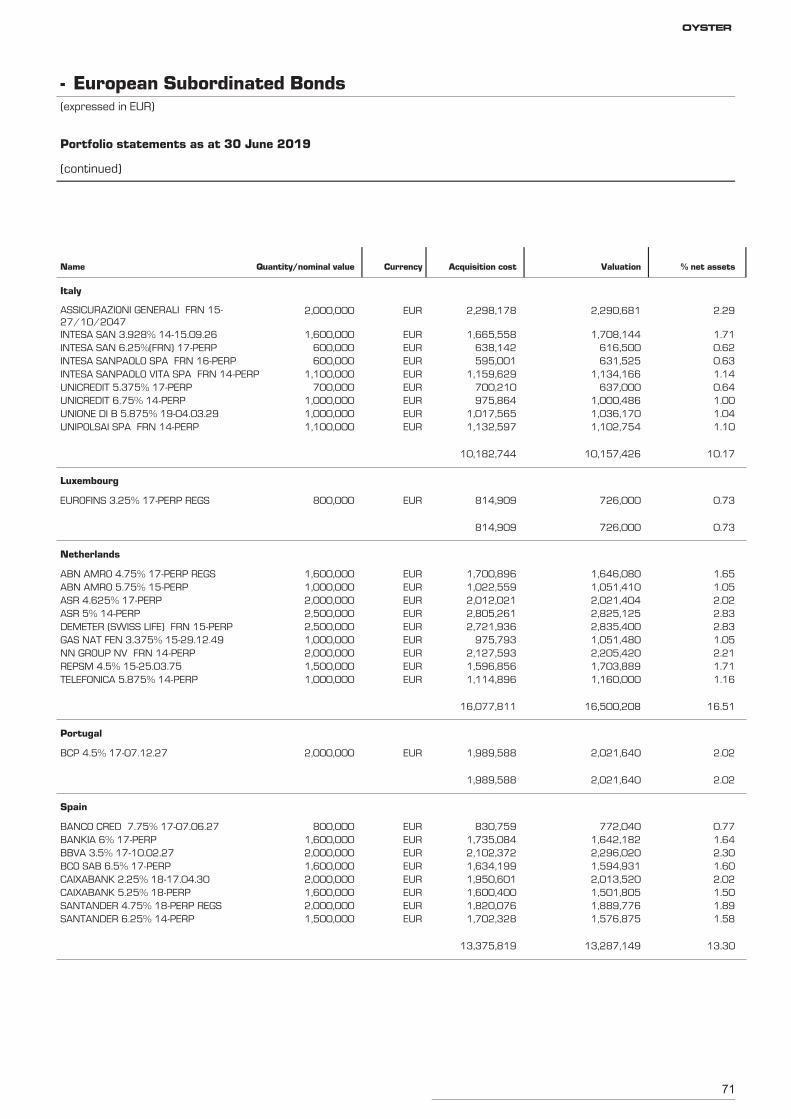
71
ASSICURAZIONI GENERALI FRN 15-27/10/2047
2,000,000 2,290,681 2.29EUR 2,298,178
Italy
INTESA SAN 3.928% 14-15.09.26 1,600,000 1,708,144 1.71EUR 1,665,558INTESA SAN 6.25%(FRN) 17-PERP 600,000 616,500 0.62EUR 638,142INTESA SANPAOLO SPA FRN 16-PERP 600,000 631,525 0.63EUR 595,001INTESA SANPAOLO VITA SPA FRN 14-PERP 1,100,000 1,134,166 1.14EUR 1,159,629UNICREDIT 5.375% 17-PERP 700,000 637,000 0.64EUR 700,210UNICREDIT 6.75% 14-PERP 1,000,000 1,000,486 1.00EUR 975,864UNIONE DI B 5.875% 19-04.03.29 1,000,000 1,036,170 1.04EUR 1,017,565UNIPOLSAI SPA FRN 14-PERP 1,100,000 1,102,754 1.10EUR 1,132,597
10,157,426 10.1710,182,744
EUROFINS 3.25% 17-PERP REGS 800,000 726,000 0.73EUR 814,909
Luxembourg
726,000 0.73814,909
ABN AMRO 4.75% 17-PERP REGS 1,600,000 1,646,080 1.65EUR 1,700,896
Netherlands
ABN AMRO 5.75% 15-PERP 1,000,000 1,051,410 1.05EUR 1,022,559ASR 4.625% 17-PERP 2,000,000 2,021,404 2.02EUR 2,012,021ASR 5% 14-PERP 2,500,000 2,825,125 2.83EUR 2,805,261DEMETER (SWISS LIFE) FRN 15-PERP 2,500,000 2,835,400 2.83EUR 2,721,936GAS NAT FEN 3.375% 15-29.12.49 1,000,000 1,051,480 1.05EUR 975,793NN GROUP NV FRN 14-PERP 2,000,000 2,205,420 2.21EUR 2,127,593REPSM 4.5% 15-25.03.75 1,500,000 1,703,889 1.71EUR 1,596,856TELEFONICA 5.875% 14-PERP 1,000,000 1,160,000 1.16EUR 1,114,896
16,500,208 16.5116,077,811
BCP 4.5% 17-07.12.27 2,000,000 2,021,640 2.02EUR 1,989,588
Portugal
2,021,640 2.021,989,588
BANCO CRED 7.75% 17-07.06.27 800,000 772,040 0.77EUR 830,759
Spain
BANKIA 6% 17-PERP 1,600,000 1,642,182 1.64EUR 1,735,084BBVA 3.5% 17-10.02.27 2,000,000 2,296,020 2.30EUR 2,102,372BCO SAB 6.5% 17-PERP 1,600,000 1,594,931 1.60EUR 1,634,199CAIXABANK 2.25% 18-17.04.30 2,000,000 2,013,520 2.02EUR 1,950,601CAIXABANK 5.25% 18-PERP 1,600,000 1,501,805 1.50EUR 1,600,400SANTANDER 4.75% 18-PERP REGS 2,000,000 1,889,776 1.89EUR 1,820,076SANTANDER 6.25% 14-PERP 1,500,000 1,576,875 1.58EUR 1,702,328
13,287,149 13.3013,375,819
European Subordinated Bonds-(expressed in EUR)
Portfolio statements as at 30 June 2019
(continued)
Name Quantity/nominal value Currency Acquisition cost Valuation % net assets
OYSTER
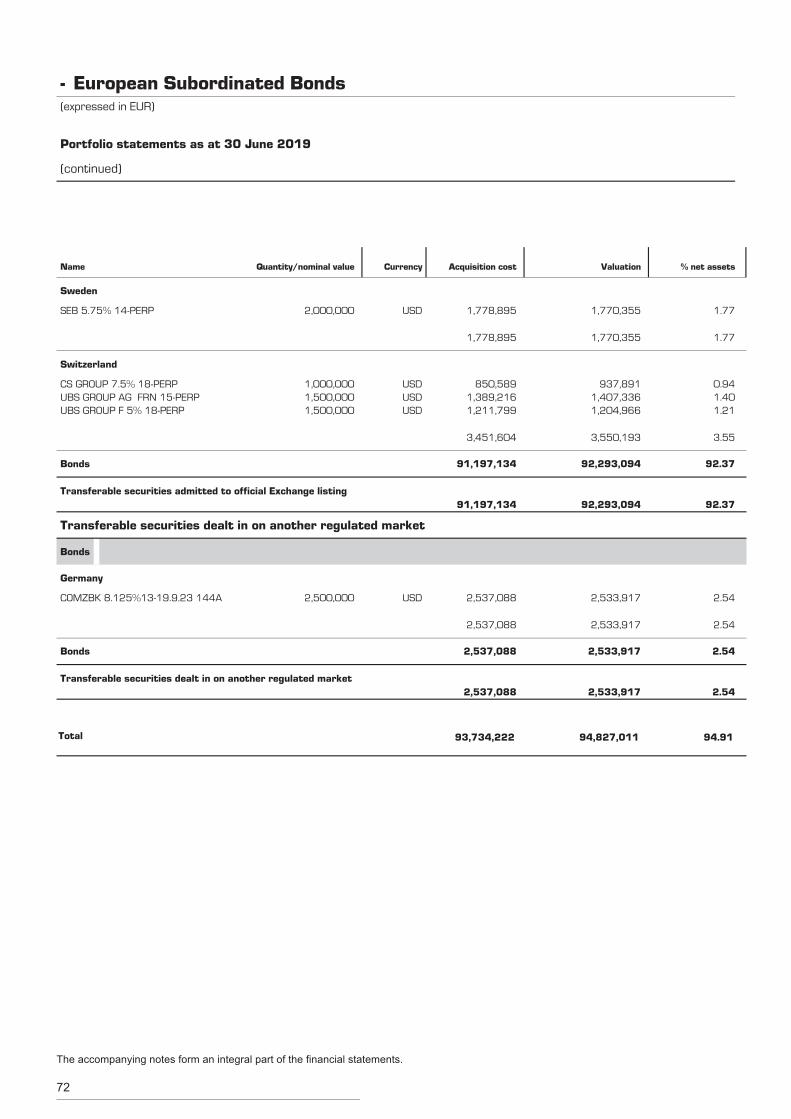
72
SEB 5.75% 14-PERP 2,000,000 1,770,355 1.77USD 1,778,895
Sweden
1,770,355 1.771,778,895
CS GROUP 7.5% 18-PERP 1,000,000 937,891 0.94USD 850,589
Switzerland
UBS GROUP AG FRN 15-PERP 1,500,000 1,407,336 1.40USD 1,389,216UBS GROUP F 5% 18-PERP 1,500,000 1,204,966 1.21USD 1,211,799
3,550,193 3.553,451,604
Bonds 92,293,094 92.3791,197,134
Transferable securities admitted to official Exchange listing92,293,094 92.3791,197,134
COMZBK 8.125%13-19.9.23 144A 2,500,000 2,533,917 2.54USD 2,537,088
Transferable securities dealt in on another regulated market
Bonds
Germany
2,533,917 2.542,537,088
Bonds 2,533,917 2.542,537,088
Transferable securities dealt in on another regulated market2,533,917 2.542,537,088
Total 94,827,011 94.9193,734,222
European Subordinated Bonds-(expressed in EUR)
Portfolio statements as at 30 June 2019
(continued)
Name Quantity/nominal value Currency Acquisition cost Valuation % net assets
The accompanying notes form an integral part of the financial statements.
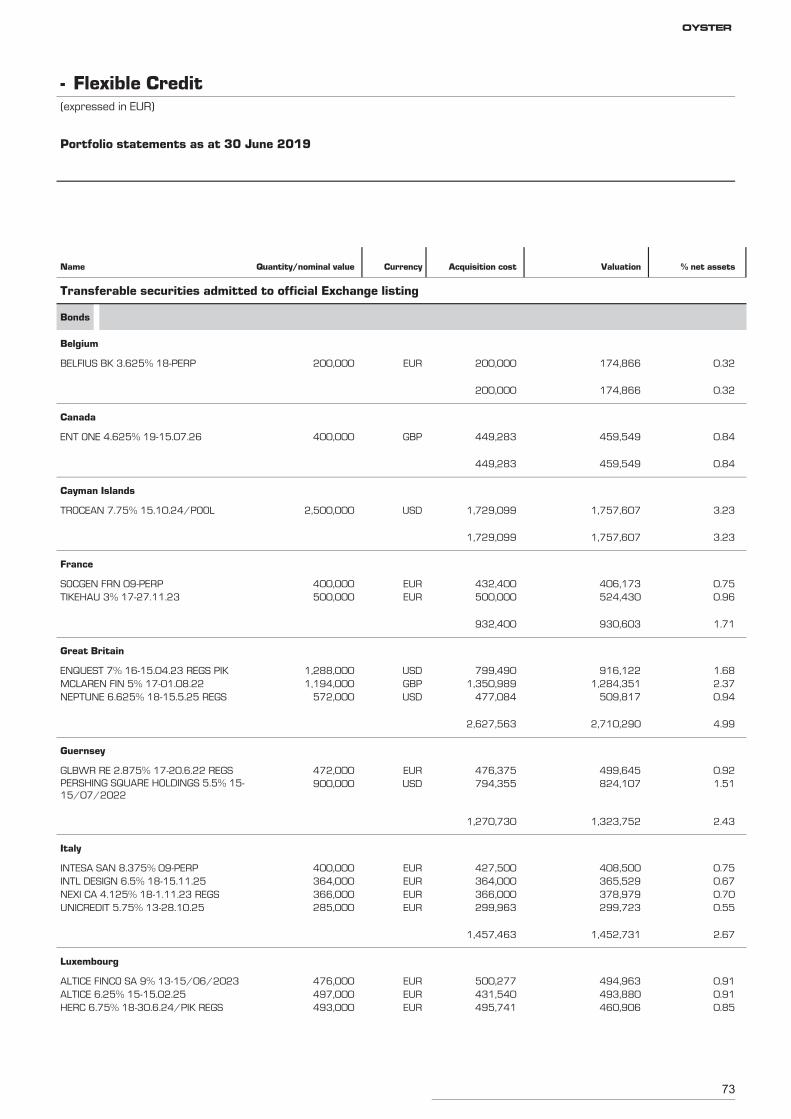
73
BELFIUS BK 3.625% 18-PERP 200,000 174,866 0.32EUR 200,000
Transferable securities admitted to official Exchange listing
Bonds
Belgium
174,866 0.32200,000
ENT ONE 4.625% 19-15.07.26 400,000 459,549 0.84GBP 449,283
Canada
459,549 0.84449,283
TROCEAN 7.75% 15.10.24/POOL 2,500,000 1,757,607 3.23USD 1,729,099
Cayman Islands
1,757,607 3.231,729,099
SOCGEN FRN 09-PERP 400,000 406,173 0.75EUR 432,400
France
TIKEHAU 3% 17-27.11.23 500,000 524,430 0.96EUR 500,000
930,603 1.71932,400
ENQUEST 7% 16-15.04.23 REGS PIK 1,288,000 916,122 1.68USD 799,490
Great Britain
MCLAREN FIN 5% 17-01.08.22 1,194,000 1,284,351 2.37GBP 1,350,989NEPTUNE 6.625% 18-15.5.25 REGS 572,000 509,817 0.94USD 477,084
2,710,290 4.992,627,563
GLBWR RE 2.875% 17-20.6.22 REGS 472,000 499,645 0.92EUR 476,375
Guernsey
PERSHING SQUARE HOLDINGS 5.5% 15-15/07/2022
900,000 824,107 1.51USD 794,355
1,323,752 2.431,270,730
INTESA SAN 8.375% 09-PERP 400,000 408,500 0.75EUR 427,500
Italy
INTL DESIGN 6.5% 18-15.11.25 364,000 365,529 0.67EUR 364,000NEXI CA 4.125% 18-1.11.23 REGS 366,000 378,979 0.70EUR 366,000UNICREDIT 5.75% 13-28.10.25 285,000 299,723 0.55EUR 299,963
1,452,731 2.671,457,463
ALTICE FINCO SA 9% 13-15/06/2023 476,000 494,963 0.91EUR 500,277
Luxembourg
ALTICE 6.25% 15-15.02.25 497,000 493,880 0.91EUR 431,540HERC 6.75% 18-30.6.24/PIK REGS 493,000 460,906 0.85EUR 495,741
Flexible Credit-(expressed in EUR)
Portfolio statements as at 30 June 2019
Name Quantity/nominal value Currency Acquisition cost Valuation % net assets
OYSTER
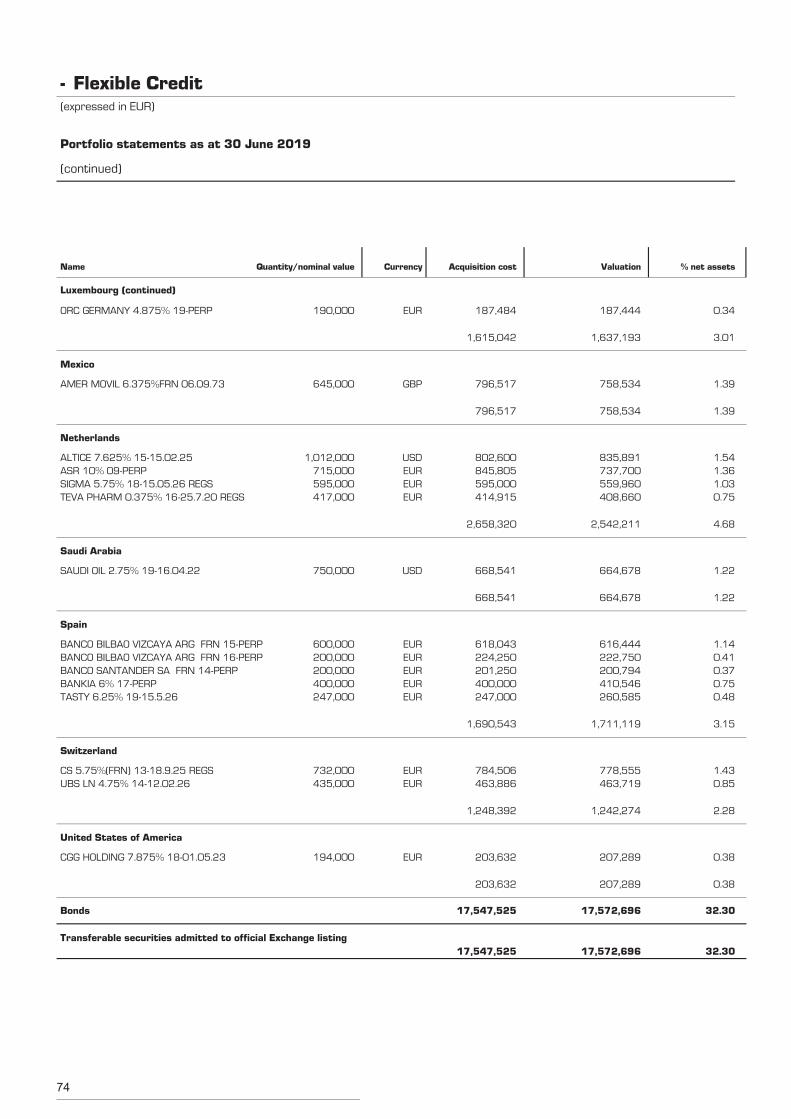
74
ORC GERMANY 4.875% 19-PERP 190,000 187,444 0.34EUR 187,484
Luxembourg (continued)
1,637,193 3.011,615,042
AMER MOVIL 6.375%FRN 06.09.73 645,000 758,534 1.39GBP 796,517
Mexico
758,534 1.39796,517
ALTICE 7.625% 15-15.02.25 1,012,000 835,891 1.54USD 802,600
Netherlands
ASR 10% 09-PERP 715,000 737,700 1.36EUR 845,805SIGMA 5.75% 18-15.05.26 REGS 595,000 559,960 1.03EUR 595,000TEVA PHARM 0.375% 16-25.7.20 REGS 417,000 408,660 0.75EUR 414,915
2,542,211 4.682,658,320
SAUDI OIL 2.75% 19-16.04.22 750,000 664,678 1.22USD 668,541
Saudi Arabia
664,678 1.22668,541
BANCO BILBAO VIZCAYA ARG FRN 15-PERP 600,000 616,444 1.14EUR 618,043
Spain
BANCO BILBAO VIZCAYA ARG FRN 16-PERP 200,000 222,750 0.41EUR 224,250BANCO SANTANDER SA FRN 14-PERP 200,000 200,794 0.37EUR 201,250BANKIA 6% 17-PERP 400,000 410,546 0.75EUR 400,000TASTY 6.25% 19-15.5.26 247,000 260,585 0.48EUR 247,000
1,711,119 3.151,690,543
CS 5.75%(FRN) 13-18.9.25 REGS 732,000 778,555 1.43EUR 784,506
Switzerland
UBS LN 4.75% 14-12.02.26 435,000 463,719 0.85EUR 463,886
1,242,274 2.281,248,392
CGG HOLDING 7.875% 18-01.05.23 194,000 207,289 0.38EUR 203,632
United States of America
207,289 0.38203,632
Bonds 17,572,696 32.3017,547,525
Transferable securities admitted to official Exchange listing17,572,696 32.3017,547,525
Flexible Credit-(expressed in EUR)
Portfolio statements as at 30 June 2019
(continued)
Name Quantity/nominal value Currency Acquisition cost Valuation % net assets
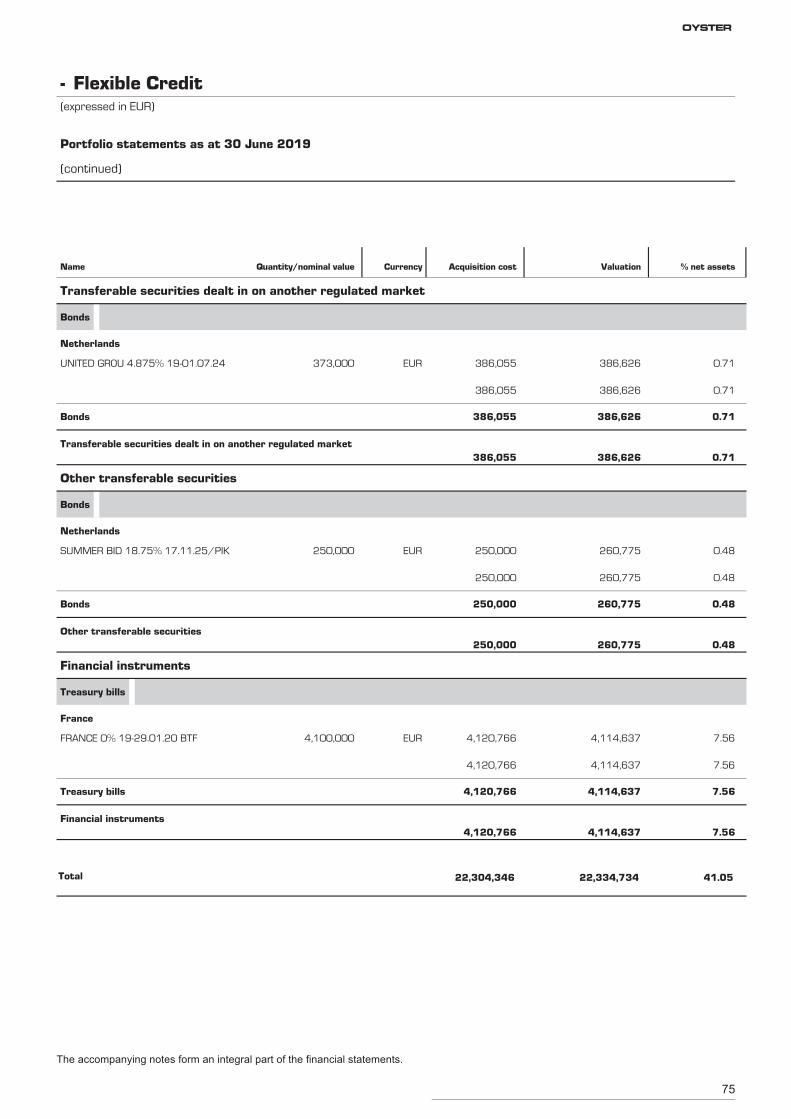
75
UNITED GROU 4.875% 19-01.07.24 373,000 386,626 0.71EUR 386,055
Transferable securities dealt in on another regulated market
Bonds
Netherlands
386,626 0.71386,055
Bonds 386,626 0.71386,055
Transferable securities dealt in on another regulated market386,626 0.71386,055
SUMMER BID 18.75% 17.11.25/PIK 250,000 260,775 0.48EUR 250,000
Other transferable securities
Bonds
Netherlands
260,775 0.48250,000
Bonds 260,775 0.48250,000
Other transferable securities260,775 0.48250,000
FRANCE 0% 19-29.01.20 BTF 4,100,000 4,114,637 7.56EUR 4,120,766
Financial instruments
Treasury bills
France
4,114,637 7.564,120,766
Treasury bills 4,114,637 7.564,120,766
Financial instruments4,114,637 7.564,120,766
Total 22,334,734 41.0522,304,346
Flexible Credit-(expressed in EUR)
Portfolio statements as at 30 June 2019
(continued)
Name Quantity/nominal value Currency Acquisition cost Valuation % net assets
The accompanying notes form an integral part of the financial statements.
OYSTER
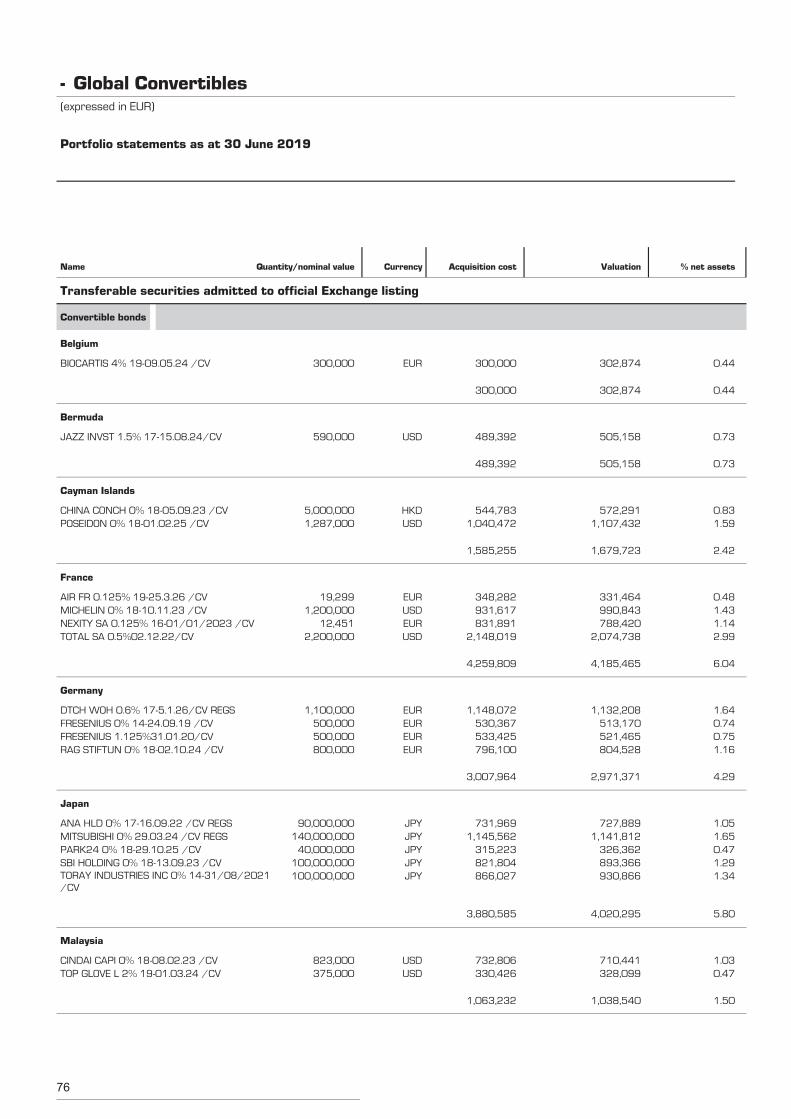
76
BIOCARTIS 4% 19-09.05.24 /CV 300,000 302,874 0.44EUR 300,000
Transferable securities admitted to official Exchange listing
Convertible bonds
Belgium
302,874 0.44300,000
JAZZ INVST 1.5% 17-15.08.24/CV 590,000 505,158 0.73USD 489,392
Bermuda
505,158 0.73489,392
CHINA CONCH 0% 18-05.09.23 /CV 5,000,000 572,291 0.83HKD 544,783
Cayman Islands
POSEIDON 0% 18-01.02.25 /CV 1,287,000 1,107,432 1.59USD 1,040,472
1,679,723 2.421,585,255
AIR FR 0.125% 19-25.3.26 /CV 19,299 331,464 0.48EUR 348,282
France
MICHELIN 0% 18-10.11.23 /CV 1,200,000 990,843 1.43USD 931,617NEXITY SA 0.125% 16-01/01/2023 /CV 12,451 788,420 1.14EUR 831,891TOTAL SA 0.5%02.12.22/CV 2,200,000 2,074,738 2.99USD 2,148,019
4,185,465 6.044,259,809
DTCH WOH 0.6% 17-5.1.26/CV REGS 1,100,000 1,132,208 1.64EUR 1,148,072
Germany
FRESENIUS 0% 14-24.09.19 /CV 500,000 513,170 0.74EUR 530,367FRESENIUS 1.125%31.01.20/CV 500,000 521,465 0.75EUR 533,425RAG STIFTUN 0% 18-02.10.24 /CV 800,000 804,528 1.16EUR 796,100
2,971,371 4.293,007,964
ANA HLD 0% 17-16.09.22 /CV REGS 90,000,000 727,889 1.05JPY 731,969
Japan
MITSUBISHI 0% 29.03.24 /CV REGS 140,000,000 1,141,812 1.65JPY 1,145,562PARK24 0% 18-29.10.25 /CV 40,000,000 326,362 0.47JPY 315,223SBI HOLDING 0% 18-13.09.23 /CV 100,000,000 893,366 1.29JPY 821,804TORAY INDUSTRIES INC 0% 14-31/08/2021/CV
100,000,000 930,866 1.34JPY 866,027
4,020,295 5.803,880,585
CINDAI CAPI 0% 18-08.02.23 /CV 823,000 710,441 1.03USD 732,806
Malaysia
TOP GLOVE L 2% 19-01.03.24 /CV 375,000 328,099 0.47USD 330,426
1,038,540 1.501,063,232
Global Convertibles-(expressed in EUR)
Portfolio statements as at 30 June 2019
Name Quantity/nominal value Currency Acquisition cost Valuation % net assets
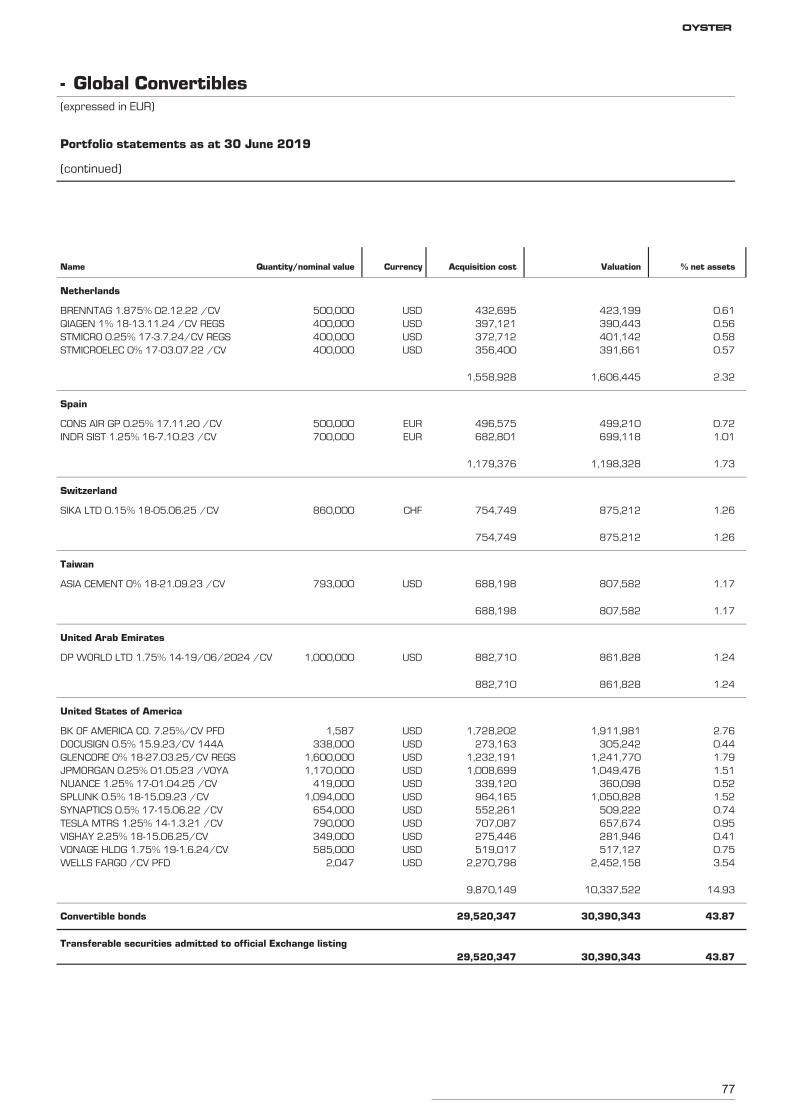
77
BRENNTAG 1.875% 02.12.22 /CV 500,000 423,199 0.61USD 432,695
Netherlands
QIAGEN 1% 18-13.11.24 /CV REGS 400,000 390,443 0.56USD 397,121STMICRO 0.25% 17-3.7.24/CV REGS 400,000 401,142 0.58USD 372,712STMICROELEC 0% 17-03.07.22 /CV 400,000 391,661 0.57USD 356,400
1,606,445 2.321,558,928
CONS AIR GP 0.25% 17.11.20 /CV 500,000 499,210 0.72EUR 496,575
Spain
INDR SIST 1.25% 16-7.10.23 /CV 700,000 699,118 1.01EUR 682,801
1,198,328 1.731,179,376
SIKA LTD 0.15% 18-05.06.25 /CV 860,000 875,212 1.26CHF 754,749
Switzerland
875,212 1.26754,749
ASIA CEMENT 0% 18-21.09.23 /CV 793,000 807,582 1.17USD 688,198
Taiwan
807,582 1.17688,198
DP WORLD LTD 1.75% 14-19/06/2024 /CV 1,000,000 861,828 1.24USD 882,710
United Arab Emirates
861,828 1.24882,710
BK OF AMERICA CO. 7.25%/CV PFD 1,587 1,911,981 2.76USD 1,728,202
United States of America
DOCUSIGN 0.5% 15.9.23/CV 144A 338,000 305,242 0.44USD 273,163GLENCORE 0% 18-27.03.25/CV REGS 1,600,000 1,241,770 1.79USD 1,232,191JPMORGAN 0.25% 01.05.23 /VOYA 1,170,000 1,049,476 1.51USD 1,008,699NUANCE 1.25% 17-01.04.25 /CV 419,000 360,098 0.52USD 339,120SPLUNK 0.5% 18-15.09.23 /CV 1,094,000 1,050,828 1.52USD 964,165SYNAPTICS 0.5% 17-15.06.22 /CV 654,000 509,222 0.74USD 552,261TESLA MTRS 1.25% 14-1.3.21 /CV 790,000 657,674 0.95USD 707,087VISHAY 2.25% 18-15.06.25/CV 349,000 281,946 0.41USD 275,446VONAGE HLDG 1.75% 19-1.6.24/CV 585,000 517,127 0.75USD 519,017WELLS FARGO /CV PFD 2,047 2,452,158 3.54USD 2,270,798
10,337,522 14.939,870,149
Convertible bonds 30,390,343 43.8729,520,347
Transferable securities admitted to official Exchange listing30,390,343 43.8729,520,347
Global Convertibles-(expressed in EUR)
Portfolio statements as at 30 June 2019
(continued)
Name Quantity/nominal value Currency Acquisition cost Valuation % net assets
OYSTER
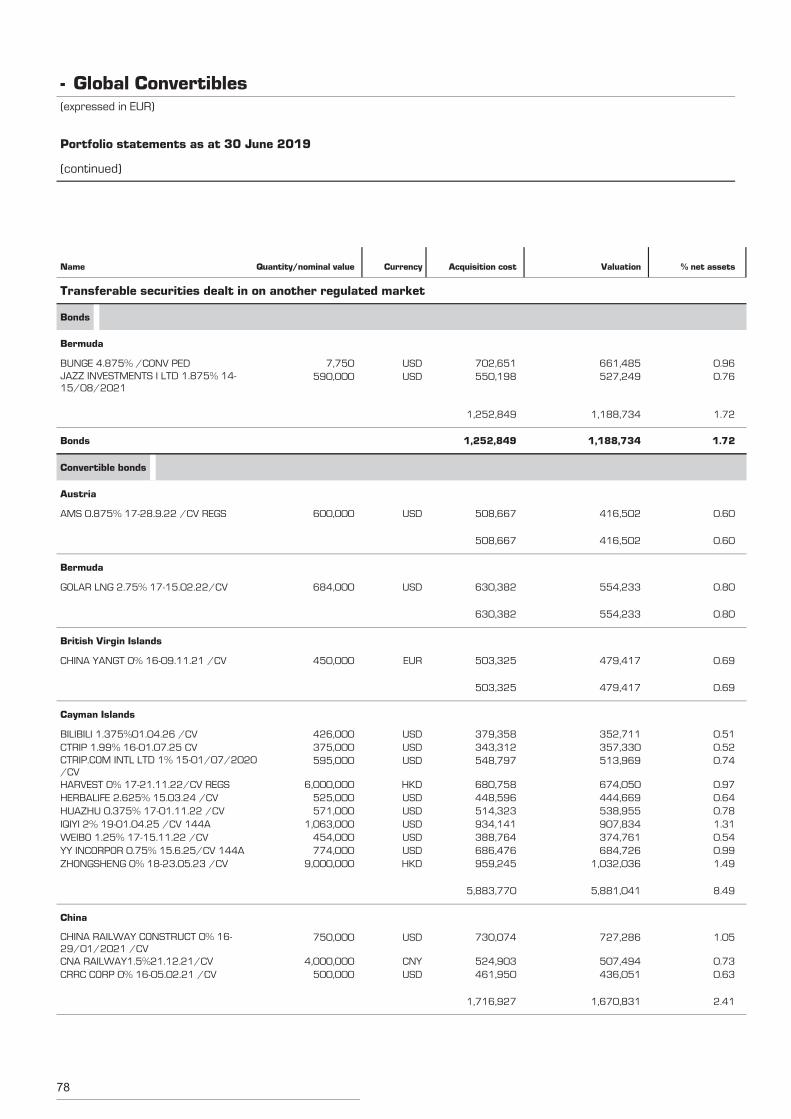
78
BUNGE 4.875% /CONV PED 7,750 661,485 0.96USD 702,651
Transferable securities dealt in on another regulated market
Bonds
Bermuda
JAZZ INVESTMENTS I LTD 1.875% 14-15/08/2021
590,000 527,249 0.76USD 550,198
1,188,734 1.721,252,849
Bonds 1,188,734 1.721,252,849
AMS 0.875% 17-28.9.22 /CV REGS 600,000 416,502 0.60USD 508,667
Convertible bonds
Austria
416,502 0.60508,667
GOLAR LNG 2.75% 17-15.02.22/CV 684,000 554,233 0.80USD 630,382
Bermuda
554,233 0.80630,382
CHINA YANGT 0% 16-09.11.21 /CV 450,000 479,417 0.69EUR 503,325
British Virgin Islands
479,417 0.69503,325
BILIBILI 1.375%01.04.26 /CV 426,000 352,711 0.51USD 379,358
Cayman Islands
CTRIP 1.99% 16-01.07.25 CV 375,000 357,330 0.52USD 343,312CTRIP.COM INTL LTD 1% 15-01/07/2020/CV
595,000 513,969 0.74USD 548,797
HARVEST 0% 17-21.11.22/CV REGS 6,000,000 674,050 0.97HKD 680,758HERBALIFE 2.625% 15.03.24 /CV 525,000 444,669 0.64USD 448,596HUAZHU 0.375% 17-01.11.22 /CV 571,000 538,955 0.78USD 514,323IQIYI 2% 19-01.04.25 /CV 144A 1,063,000 907,834 1.31USD 934,141WEIBO 1.25% 17-15.11.22 /CV 454,000 374,761 0.54USD 388,764YY INCORPOR 0.75% 15.6.25/CV 144A 774,000 684,726 0.99USD 686,476ZHONGSHENG 0% 18-23.05.23 /CV 9,000,000 1,032,036 1.49HKD 959,245
5,881,041 8.495,883,770
CHINA RAILWAY CONSTRUCT 0% 16-29/01/2021 /CV
750,000 727,286 1.05USD 730,074
China
CNA RAILWAY1.5%21.12.21/CV 4,000,000 507,494 0.73CNY 524,903CRRC CORP 0% 16-05.02.21 /CV 500,000 436,051 0.63USD 461,950
1,670,831 2.411,716,927
Global Convertibles-(expressed in EUR)
Portfolio statements as at 30 June 2019
(continued)
Name Quantity/nominal value Currency Acquisition cost Valuation % net assets
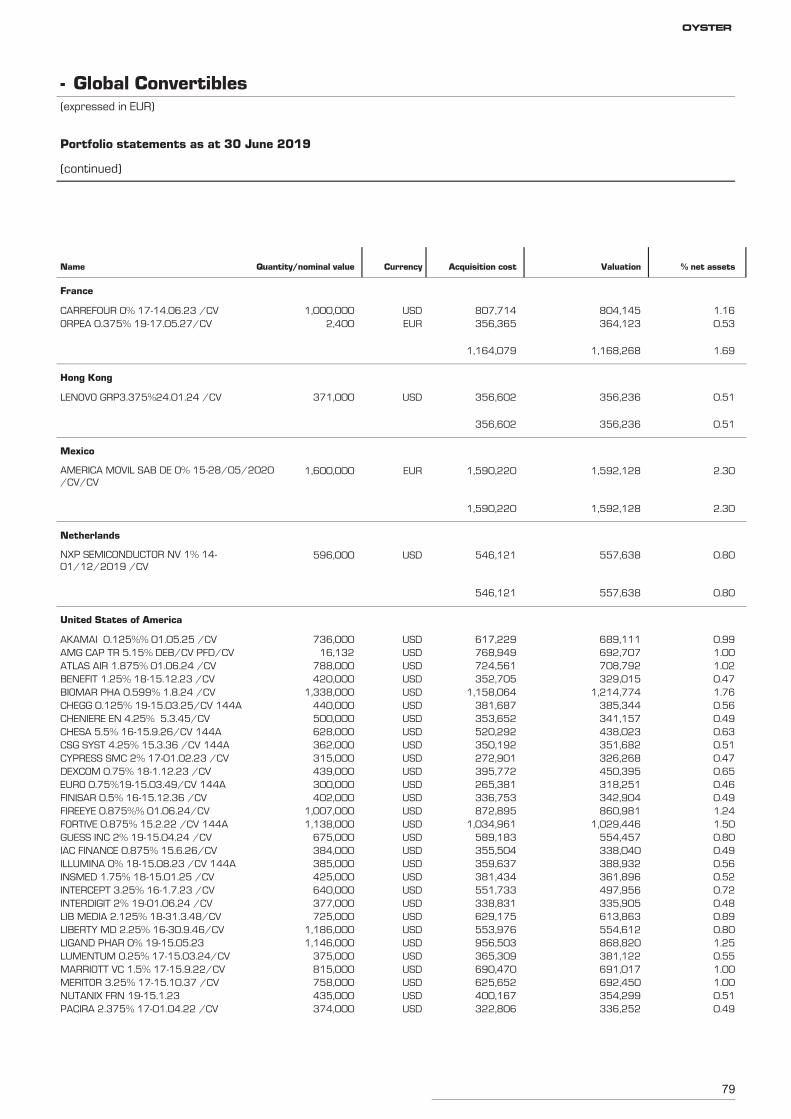
79
CARREFOUR 0% 17-14.06.23 /CV 1,000,000 804,145 1.16USD 807,714
France
ORPEA 0.375% 19-17.05.27/CV 2,400 364,123 0.53EUR 356,365
1,168,268 1.691,164,079
LENOVO GRP3.375%24.01.24 /CV 371,000 356,236 0.51USD 356,602
Hong Kong
356,236 0.51356,602
AMERICA MOVIL SAB DE 0% 15-28/05/2020/CV/CV
1,600,000 1,592,128 2.30EUR 1,590,220
Mexico
1,592,128 2.301,590,220
NXP SEMICONDUCTOR NV 1% 14-01/12/2019 /CV
596,000 557,638 0.80USD 546,121
Netherlands
557,638 0.80546,121
AKAMAI 0.125%% 01.05.25 /CV 736,000 689,111 0.99USD 617,229
United States of America
AMG CAP TR 5.15% DEB/CV PFD/CV 16,132 692,707 1.00USD 768,949ATLAS AIR 1.875% 01.06.24 /CV 788,000 708,792 1.02USD 724,561BENEFIT 1.25% 18-15.12.23 /CV 420,000 329,015 0.47USD 352,705BIOMAR PHA 0.599% 1.8.24 /CV 1,338,000 1,214,774 1.76USD 1,158,064CHEGG 0.125% 19-15.03.25/CV 144A 440,000 385,344 0.56USD 381,687CHENIERE EN 4.25% 5.3.45/CV 500,000 341,157 0.49USD 353,652CHESA 5.5% 16-15.9.26/CV 144A 628,000 438,023 0.63USD 520,292CSG SYST 4.25% 15.3.36 /CV 144A 362,000 351,682 0.51USD 350,192CYPRESS SMC 2% 17-01.02.23 /CV 315,000 326,268 0.47USD 272,901DEXCOM 0.75% 18-1.12.23 /CV 439,000 450,395 0.65USD 395,772EURO 0.75%19-15.03.49/CV 144A 300,000 318,251 0.46USD 265,381FINISAR 0.5% 16-15.12.36 /CV 402,000 342,904 0.49USD 336,753FIREEYE 0.875%% 01.06.24/CV 1,007,000 860,981 1.24USD 872,895FORTIVE 0.875% 15.2.22 /CV 144A 1,138,000 1,029,446 1.50USD 1,034,961GUESS INC 2% 19-15.04.24 /CV 675,000 554,457 0.80USD 589,183IAC FINANCE 0.875% 15.6.26/CV 384,000 338,040 0.49USD 355,504ILLUMINA 0% 18-15.08.23 /CV 144A 385,000 388,932 0.56USD 359,637INSMED 1.75% 18-15.01.25 /CV 425,000 361,896 0.52USD 381,434INTERCEPT 3.25% 16-1.7.23 /CV 640,000 497,956 0.72USD 551,733INTERDIGIT 2% 19-01.06.24 /CV 377,000 335,905 0.48USD 338,831LIB MEDIA 2.125% 18-31.3.48/CV 725,000 613,863 0.89USD 629,175LIBERTY MD 2.25% 16-30.9.46/CV 1,186,000 554,612 0.80USD 553,976LIGAND PHAR 0% 19-15.05.23 1,146,000 868,820 1.25USD 956,503LUMENTUM 0.25% 17-15.03.24/CV 375,000 381,122 0.55USD 365,309MARRIOTT VC 1.5% 17-15.9.22/CV 815,000 691,017 1.00USD 690,470MERITOR 3.25% 17-15.10.37 /CV 758,000 692,450 1.00USD 625,652NUTANIX FRN 19-15.1.23 435,000 354,299 0.51USD 400,167PACIRA 2.375% 17-01.04.22 /CV 374,000 336,252 0.49USD 322,806
Global Convertibles-(expressed in EUR)
Portfolio statements as at 30 June 2019
(continued)
Name Quantity/nominal value Currency Acquisition cost Valuation % net assets
OYSTER
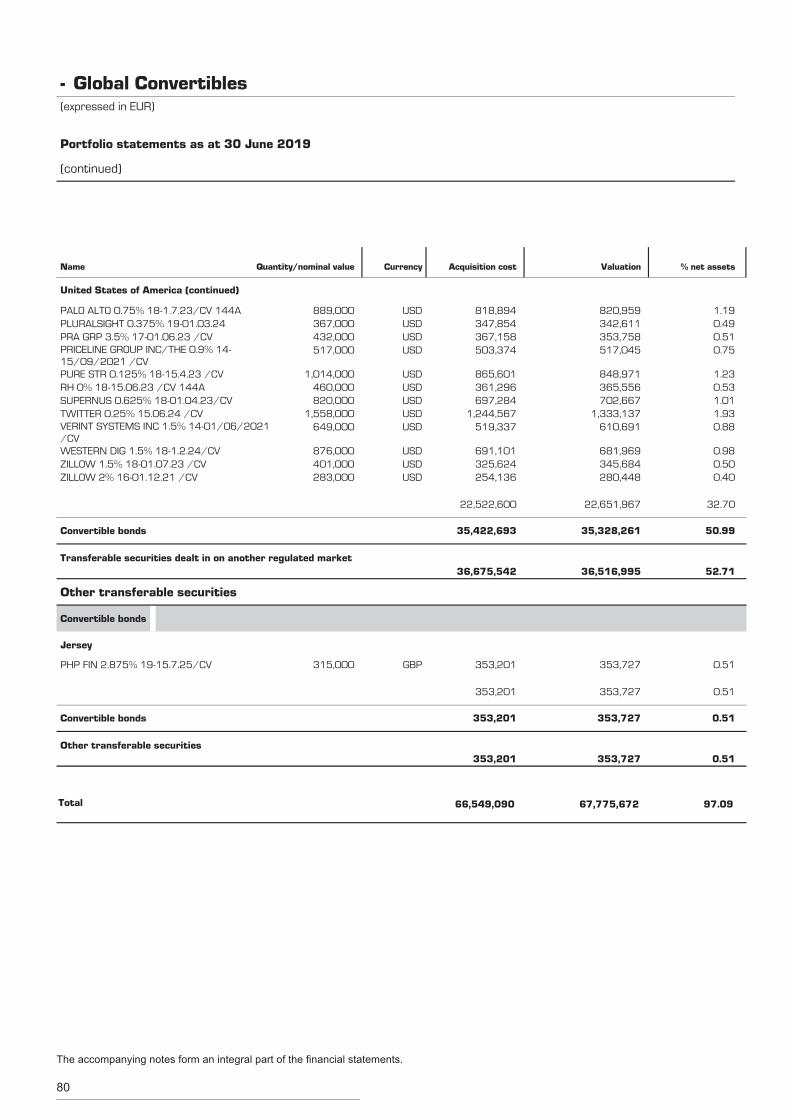
80
PALO ALTO 0.75% 18-1.7.23/CV 144A 889,000 820,959 1.19USD 818,894
United States of America (continued)
PLURALSIGHT 0.375% 19-01.03.24 367,000 342,611 0.49USD 347,854PRA GRP 3.5% 17-01.06.23 /CV 432,000 353,758 0.51USD 367,158PRICELINE GROUP INC/THE 0.9% 14-15/09/2021 /CV
517,000 517,045 0.75USD 503,374
PURE STR 0.125% 18-15.4.23 /CV 1,014,000 848,971 1.23USD 865,601RH 0% 18-15.06.23 /CV 144A 460,000 365,556 0.53USD 361,296SUPERNUS 0.625% 18-01.04.23/CV 820,000 702,667 1.01USD 697,284TWITTER 0.25% 15.06.24 /CV 1,558,000 1,333,137 1.93USD 1,244,567VERINT SYSTEMS INC 1.5% 14-01/06/2021/CV
649,000 610,691 0.88USD 519,337
WESTERN DIG 1.5% 18-1.2.24/CV 876,000 681,969 0.98USD 691,101ZILLOW 1.5% 18-01.07.23 /CV 401,000 345,684 0.50USD 325,624ZILLOW 2% 16-01.12.21 /CV 283,000 280,448 0.40USD 254,136
22,651,967 32.7022,522,600
Convertible bonds 35,328,261 50.9935,422,693
Transferable securities dealt in on another regulated market36,516,995 52.7136,675,542
PHP FIN 2.875% 19-15.7.25/CV 315,000 353,727 0.51GBP 353,201
Other transferable securities
Convertible bonds
Jersey
353,727 0.51353,201
Convertible bonds 353,727 0.51353,201
Other transferable securities353,727 0.51353,201
Total 67,775,672 97.0966,549,090
Global Convertibles-(expressed in EUR)
Portfolio statements as at 30 June 2019
(continued)
Name Quantity/nominal value Currency Acquisition cost Valuation % net assets
The accompanying notes form an integral part of the financial statements.
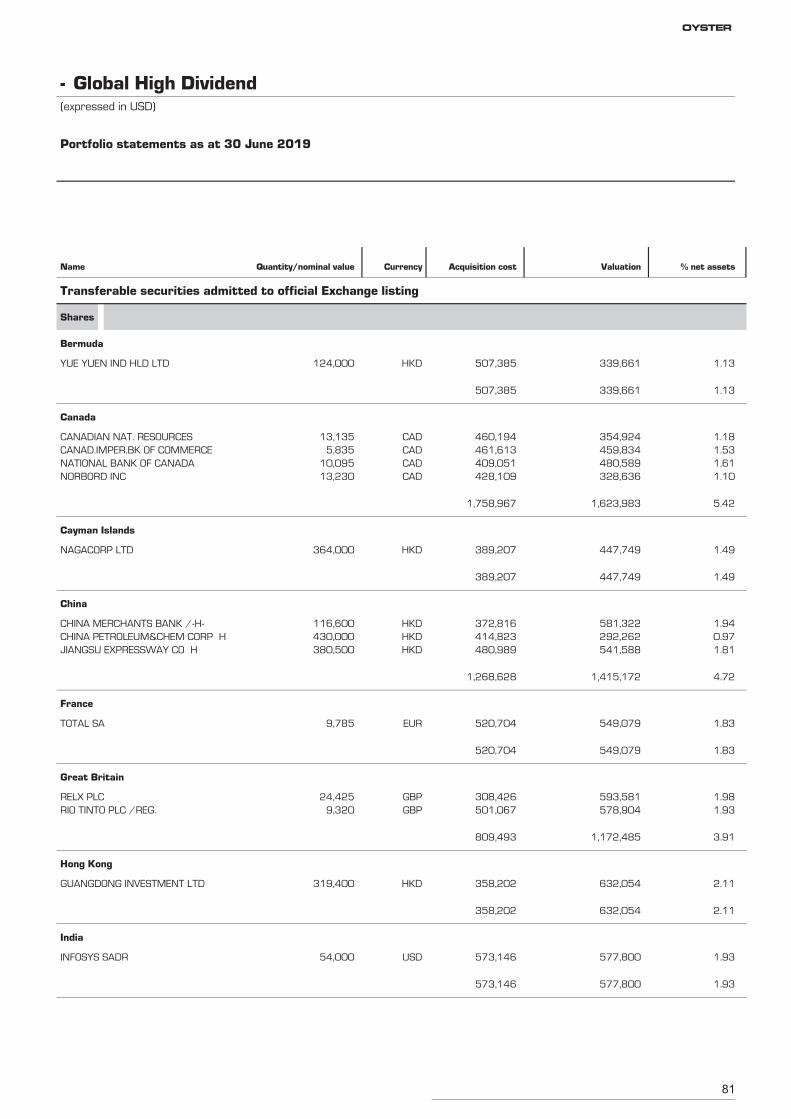
81
YUE YUEN IND HLD LTD 124,000 339,661 1.13HKD 507,385
Transferable securities admitted to official Exchange listing
Shares
Bermuda
339,661 1.13507,385
CANADIAN NAT. RESOURCES 13,135 354,924 1.18CAD 460,194
Canada
CANAD.IMPER.BK OF COMMERCE 5,835 459,834 1.53CAD 461,613NATIONAL BANK OF CANADA 10,095 480,589 1.61CAD 409,051NORBORD INC 13,230 328,636 1.10CAD 428,109
1,623,983 5.421,758,967
NAGACORP LTD 364,000 447,749 1.49HKD 389,207
Cayman Islands
447,749 1.49389,207
CHINA MERCHANTS BANK /-H- 116,600 581,322 1.94HKD 372,816
China
CHINA PETROLEUM&CHEM CORP H 430,000 292,262 0.97HKD 414,823JIANGSU EXPRESSWAY CO H 380,500 541,588 1.81HKD 480,989
1,415,172 4.721,268,628
TOTAL SA 9,785 549,079 1.83EUR 520,704
France
549,079 1.83520,704
RELX PLC 24,425 593,581 1.98GBP 308,426
Great Britain
RIO TINTO PLC /REG. 9,320 578,904 1.93GBP 501,067
1,172,485 3.91809,493
GUANGDONG INVESTMENT LTD 319,400 632,054 2.11HKD 358,202
Hong Kong
632,054 2.11358,202
INFOSYS SADR 54,000 577,800 1.93USD 573,146
India
577,800 1.93573,146
Global High Dividend-(expressed in USD)
Portfolio statements as at 30 June 2019
Name Quantity/nominal value Currency Acquisition cost Valuation % net assets
OYSTER
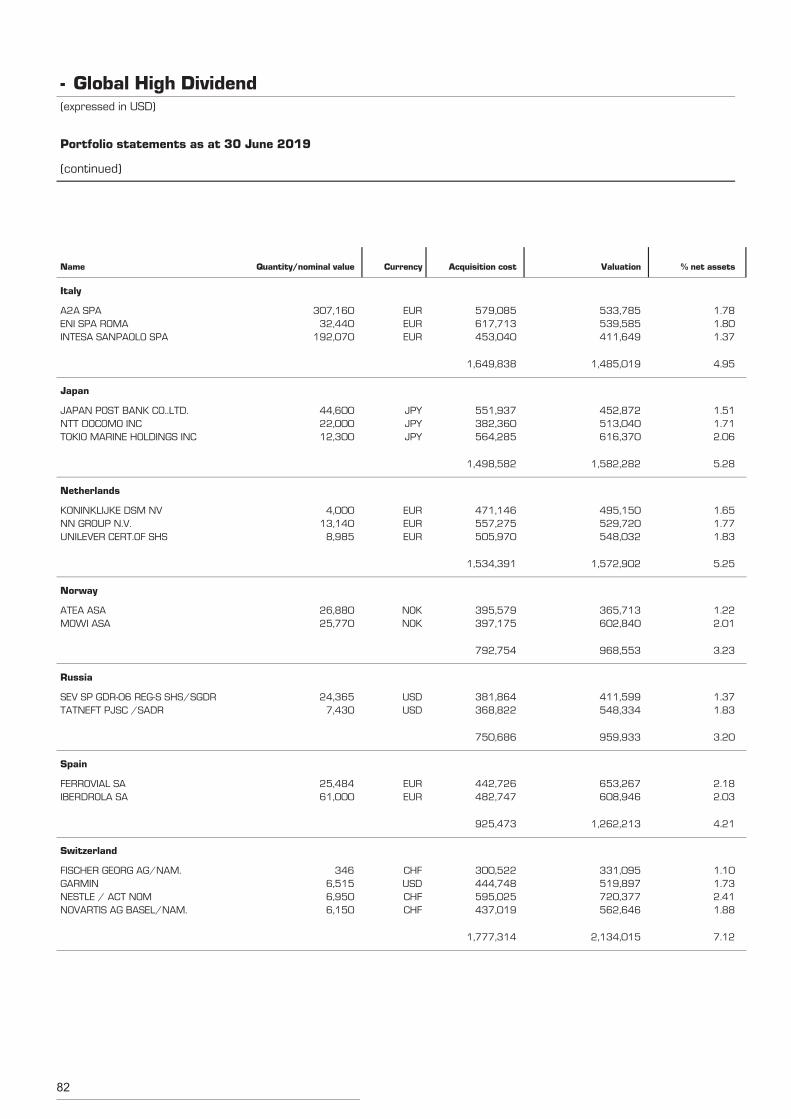
82
A2A SPA 307,160 533,785 1.78EUR 579,085
Italy
ENI SPA ROMA 32,440 539,585 1.80EUR 617,713INTESA SANPAOLO SPA 192,070 411,649 1.37EUR 453,040
1,485,019 4.951,649,838
JAPAN POST BANK CO..LTD. 44,600 452,872 1.51JPY 551,937
Japan
NTT DOCOMO INC 22,000 513,040 1.71JPY 382,360TOKIO MARINE HOLDINGS INC 12,300 616,370 2.06JPY 564,285
1,582,282 5.281,498,582
KONINKLIJKE DSM NV 4,000 495,150 1.65EUR 471,146
Netherlands
NN GROUP N.V. 13,140 529,720 1.77EUR 557,275UNILEVER CERT.OF SHS 8,985 548,032 1.83EUR 505,970
1,572,902 5.251,534,391
ATEA ASA 26,880 365,713 1.22NOK 395,579
Norway
MOWI ASA 25,770 602,840 2.01NOK 397,175
968,553 3.23792,754
SEV SP GDR-06 REG-S SHS/SGDR 24,365 411,599 1.37USD 381,864
Russia
TATNEFT PJSC /SADR 7,430 548,334 1.83USD 368,822
959,933 3.20750,686
FERROVIAL SA 25,484 653,267 2.18EUR 442,726
Spain
IBERDROLA SA 61,000 608,946 2.03EUR 482,747
1,262,213 4.21925,473
FISCHER GEORG AG/NAM. 346 331,095 1.10CHF 300,522
Switzerland
GARMIN 6,515 519,897 1.73USD 444,748NESTLE / ACT NOM 6,950 720,377 2.41CHF 595,025NOVARTIS AG BASEL/NAM. 6,150 562,646 1.88CHF 437,019
2,134,015 7.121,777,314
Global High Dividend-(expressed in USD)
Portfolio statements as at 30 June 2019
(continued)
Name Quantity/nominal value Currency Acquisition cost Valuation % net assets
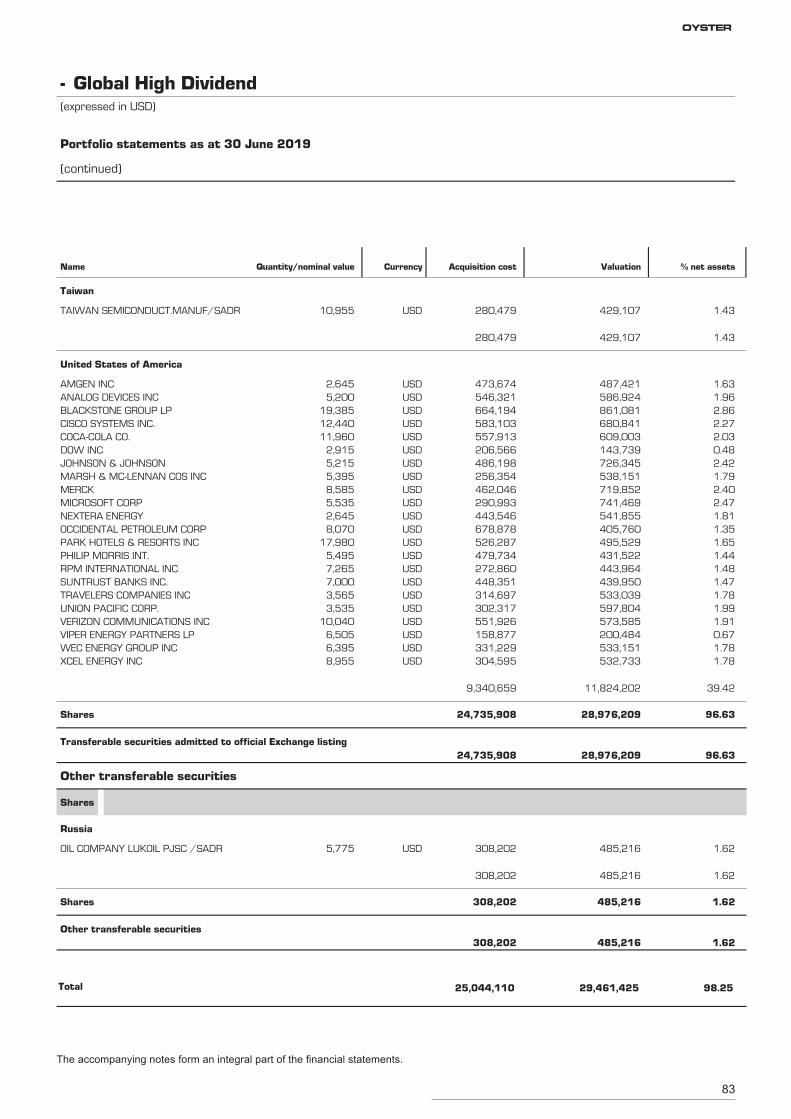
83
TAIWAN SEMICONDUCT.MANUF/SADR 10,955 429,107 1.43USD 280,479
Taiwan
429,107 1.43280,479
AMGEN INC 2,645 487,421 1.63USD 473,674
United States of America
ANALOG DEVICES INC 5,200 586,924 1.96USD 546,321BLACKSTONE GROUP LP 19,385 861,081 2.86USD 664,194CISCO SYSTEMS INC. 12,440 680,841 2.27USD 583,103COCA-COLA CO. 11,960 609,003 2.03USD 557,913DOW INC 2,915 143,739 0.48USD 206,566JOHNSON & JOHNSON 5,215 726,345 2.42USD 486,198MARSH & MC-LENNAN COS INC 5,395 538,151 1.79USD 256,354MERCK 8,585 719,852 2.40USD 462,046MICROSOFT CORP 5,535 741,469 2.47USD 290,993NEXTERA ENERGY 2,645 541,855 1.81USD 443,546OCCIDENTAL PETROLEUM CORP 8,070 405,760 1.35USD 678,878PARK HOTELS & RESORTS INC 17,980 495,529 1.65USD 526,287PHILIP MORRIS INT. 5,495 431,522 1.44USD 479,734RPM INTERNATIONAL INC 7,265 443,964 1.48USD 272,860SUNTRUST BANKS INC. 7,000 439,950 1.47USD 448,351TRAVELERS COMPANIES INC 3,565 533,039 1.78USD 314,697UNION PACIFIC CORP. 3,535 597,804 1.99USD 302,317VERIZON COMMUNICATIONS INC 10,040 573,585 1.91USD 551,926VIPER ENERGY PARTNERS LP 6,505 200,484 0.67USD 158,877WEC ENERGY GROUP INC 6,395 533,151 1.78USD 331,229XCEL ENERGY INC 8,955 532,733 1.78USD 304,595
11,824,202 39.429,340,659
Shares 28,976,209 96.6324,735,908
Transferable securities admitted to official Exchange listing28,976,209 96.6324,735,908
OIL COMPANY LUKOIL PJSC /SADR 5,775 485,216 1.62USD 308,202
Other transferable securities
Shares
Russia
485,216 1.62308,202
Shares 485,216 1.62308,202
Other transferable securities485,216 1.62308,202
Total 29,461,425 98.2525,044,110
Global High Dividend-(expressed in USD)
Portfolio statements as at 30 June 2019
(continued)
Name Quantity/nominal value Currency Acquisition cost Valuation % net assets
The accompanying notes form an integral part of the financial statements.
OYSTER
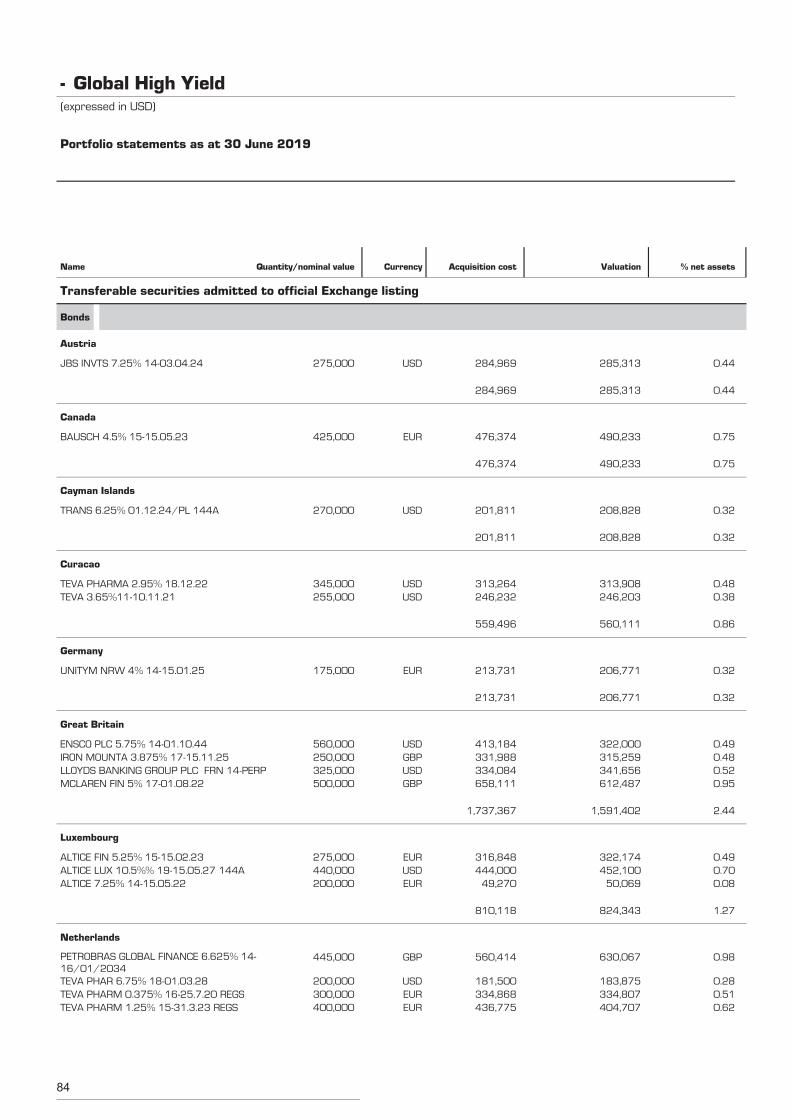
84
JBS INVTS 7.25% 14-03.04.24 275,000 285,313 0.44USD 284,969
Transferable securities admitted to official Exchange listing
Bonds
Austria
285,313 0.44284,969
BAUSCH 4.5% 15-15.05.23 425,000 490,233 0.75EUR 476,374
Canada
490,233 0.75476,374
TRANS 6.25% 01.12.24/PL 144A 270,000 208,828 0.32USD 201,811
Cayman Islands
208,828 0.32201,811
TEVA PHARMA 2.95% 18.12.22 345,000 313,908 0.48USD 313,264
Curacao
TEVA 3.65%11-10.11.21 255,000 246,203 0.38USD 246,232
560,111 0.86559,496
UNITYM NRW 4% 14-15.01.25 175,000 206,771 0.32EUR 213,731
Germany
206,771 0.32213,731
ENSCO PLC 5.75% 14-01.10.44 560,000 322,000 0.49USD 413,184
Great Britain
IRON MOUNTA 3.875% 17-15.11.25 250,000 315,259 0.48GBP 331,988LLOYDS BANKING GROUP PLC FRN 14-PERP 325,000 341,656 0.52USD 334,084MCLAREN FIN 5% 17-01.08.22 500,000 612,487 0.95GBP 658,111
1,591,402 2.441,737,367
ALTICE FIN 5.25% 15-15.02.23 275,000 322,174 0.49EUR 316,848
Luxembourg
ALTICE LUX 10.5%% 19-15.05.27 144A 440,000 452,100 0.70USD 444,000ALTICE 7.25% 14-15.05.22 200,000 50,069 0.08EUR 49,270
824,343 1.27810,118
PETROBRAS GLOBAL FINANCE 6.625% 14-16/01/2034
445,000 630,067 0.98GBP 560,414
Netherlands
TEVA PHAR 6.75% 18-01.03.28 200,000 183,875 0.28USD 181,500TEVA PHARM 0.375% 16-25.7.20 REGS 300,000 334,807 0.51EUR 334,868TEVA PHARM 1.25% 15-31.3.23 REGS 400,000 404,707 0.62EUR 436,775
Global High Yield-(expressed in USD)
Portfolio statements as at 30 June 2019
Name Quantity/nominal value Currency Acquisition cost Valuation % net assets
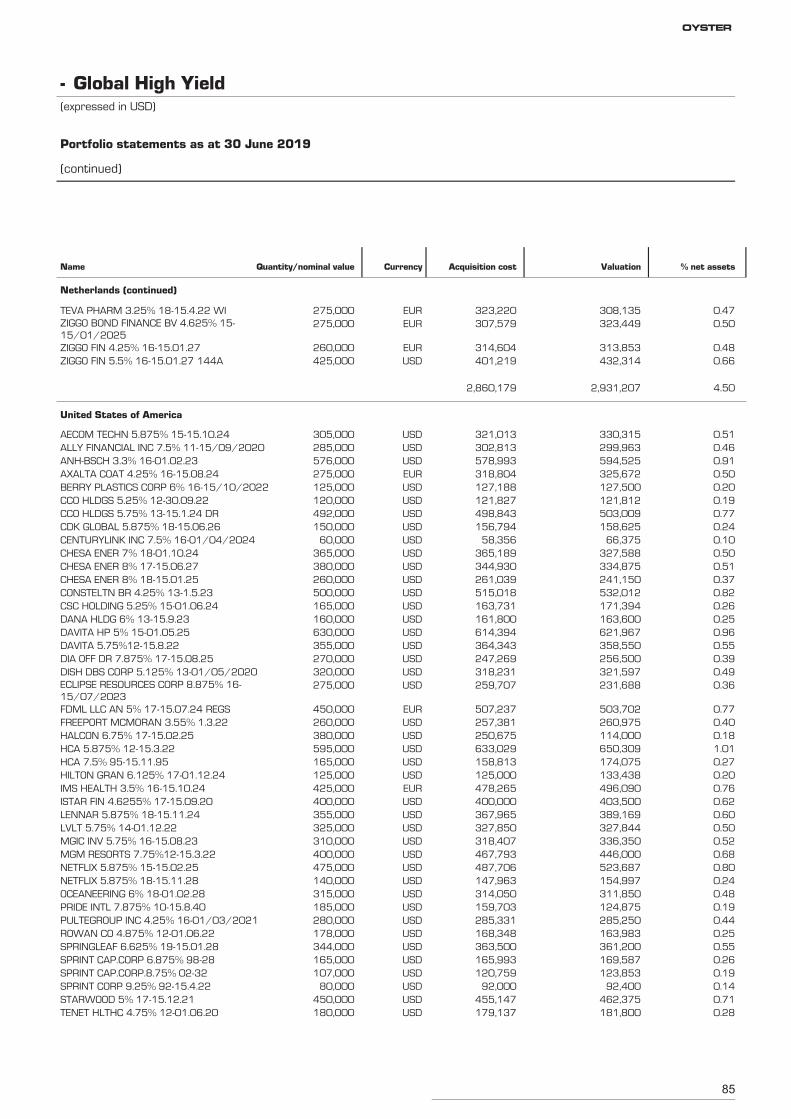
85
TEVA PHARM 3.25% 18-15.4.22 WI 275,000 308,135 0.47EUR 323,220
Netherlands (continued)
ZIGGO BOND FINANCE BV 4.625% 15-15/01/2025
275,000 323,449 0.50EUR 307,579
ZIGGO FIN 4.25% 16-15.01.27 260,000 313,853 0.48EUR 314,604ZIGGO FIN 5.5% 16-15.01.27 144A 425,000 432,314 0.66USD 401,219
2,931,207 4.502,860,179
AECOM TECHN 5.875% 15-15.10.24 305,000 330,315 0.51USD 321,013
United States of America
ALLY FINANCIAL INC 7.5% 11-15/09/2020 285,000 299,963 0.46USD 302,813ANH-BSCH 3.3% 16-01.02.23 576,000 594,525 0.91USD 578,993AXALTA COAT 4.25% 16-15.08.24 275,000 325,672 0.50EUR 318,804BERRY PLASTICS CORP 6% 16-15/10/2022 125,000 127,500 0.20USD 127,188CCO HLDGS 5.25% 12-30.09.22 120,000 121,812 0.19USD 121,827CCO HLDGS 5.75% 13-15.1.24 DR 492,000 503,009 0.77USD 498,843CDK GLOBAL 5.875% 18-15.06.26 150,000 158,625 0.24USD 156,794CENTURYLINK INC 7.5% 16-01/04/2024 60,000 66,375 0.10USD 58,356CHESA ENER 7% 18-01.10.24 365,000 327,588 0.50USD 365,189CHESA ENER 8% 17-15.06.27 380,000 334,875 0.51USD 344,930CHESA ENER 8% 18-15.01.25 260,000 241,150 0.37USD 261,039CONSTELTN BR 4.25% 13-1.5.23 500,000 532,012 0.82USD 515,018CSC HOLDING 5.25% 15-01.06.24 165,000 171,394 0.26USD 163,731DANA HLDG 6% 13-15.9.23 160,000 163,600 0.25USD 161,800DAVITA HP 5% 15-01.05.25 630,000 621,967 0.96USD 614,394DAVITA 5.75%12-15.8.22 355,000 358,550 0.55USD 364,343DIA OFF DR 7.875% 17-15.08.25 270,000 256,500 0.39USD 247,269DISH DBS CORP 5.125% 13-01/05/2020 320,000 321,597 0.49USD 318,231ECLIPSE RESOURCES CORP 8.875% 16-15/07/2023
275,000 231,688 0.36USD 259,707
FDML LLC AN 5% 17-15.07.24 REGS 450,000 503,702 0.77EUR 507,237FREEPORT MCMORAN 3.55% 1.3.22 260,000 260,975 0.40USD 257,381HALCON 6.75% 17-15.02.25 380,000 114,000 0.18USD 250,675HCA 5.875% 12-15.3.22 595,000 650,309 1.01USD 633,029HCA 7.5% 95-15.11.95 165,000 174,075 0.27USD 158,813HILTON GRAN 6.125% 17-01.12.24 125,000 133,438 0.20USD 125,000IMS HEALTH 3.5% 16-15.10.24 425,000 496,090 0.76EUR 478,265ISTAR FIN 4.6255% 17-15.09.20 400,000 403,500 0.62USD 400,000LENNAR 5.875% 18-15.11.24 355,000 389,169 0.60USD 367,965LVLT 5.75% 14-01.12.22 325,000 327,844 0.50USD 327,850MGIC INV 5.75% 16-15.08.23 310,000 336,350 0.52USD 318,407MGM RESORTS 7.75%12-15.3.22 400,000 446,000 0.68USD 467,793NETFLIX 5.875% 15-15.02.25 475,000 523,687 0.80USD 487,706NETFLIX 5.875% 18-15.11.28 140,000 154,997 0.24USD 147,963OCEANEERING 6% 18-01.02.28 315,000 311,850 0.48USD 314,050PRIDE INTL 7.875% 10-15.8.40 185,000 124,875 0.19USD 159,703PULTEGROUP INC 4.25% 16-01/03/2021 280,000 285,250 0.44USD 285,331ROWAN CO 4.875% 12-01.06.22 178,000 163,983 0.25USD 168,348SPRINGLEAF 6.625% 19-15.01.28 344,000 361,200 0.55USD 363,500SPRINT CAP.CORP 6.875% 98-28 165,000 169,587 0.26USD 165,993SPRINT CAP.CORP.8.75% 02-32 107,000 123,853 0.19USD 120,759SPRINT CORP 9.25% 92-15.4.22 80,000 92,400 0.14USD 92,000STARWOOD 5% 17-15.12.21 450,000 462,375 0.71USD 455,147TENET HLTHC 4.75% 12-01.06.20 180,000 181,800 0.28USD 179,137
Global High Yield-(expressed in USD)
Portfolio statements as at 30 June 2019
(continued)
Name Quantity/nominal value Currency Acquisition cost Valuation % net assets
OYSTER
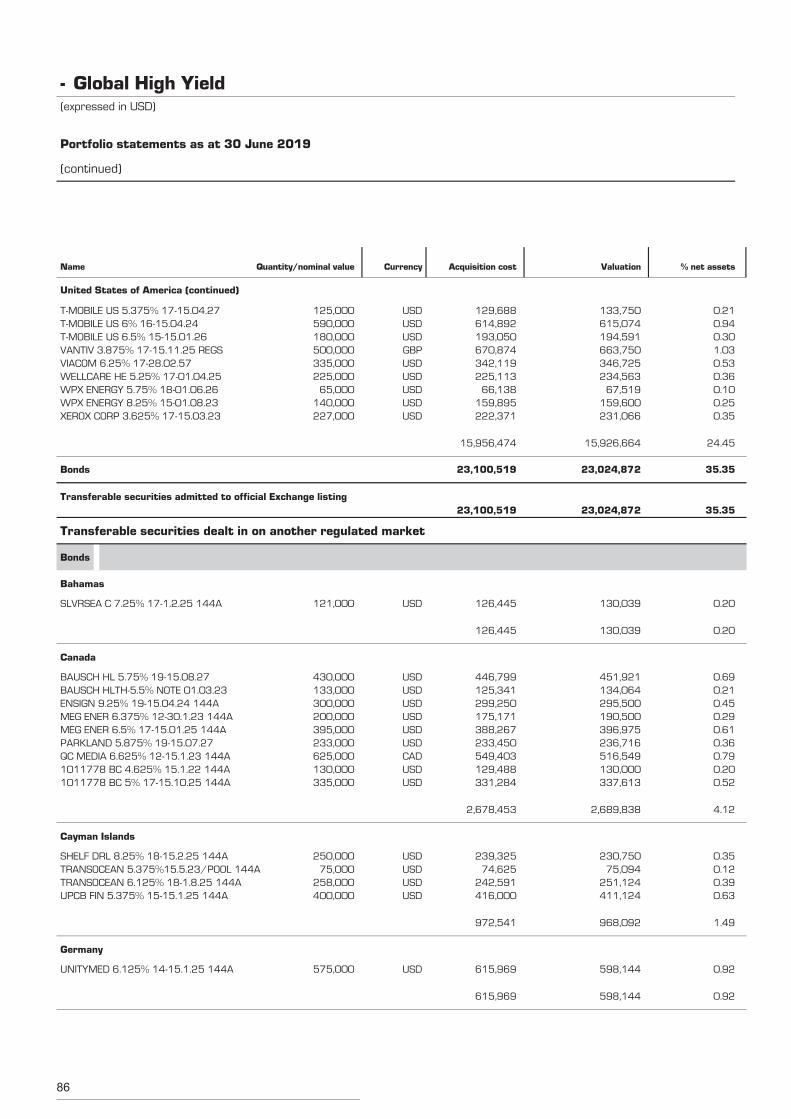
86
T-MOBILE US 5.375% 17-15.04.27 125,000 133,750 0.21USD 129,688
United States of America (continued)
T-MOBILE US 6% 16-15.04.24 590,000 615,074 0.94USD 614,892T-MOBILE US 6.5% 15-15.01.26 180,000 194,591 0.30USD 193,050VANTIV 3.875% 17-15.11.25 REGS 500,000 663,750 1.03GBP 670,874VIACOM 6.25% 17-28.02.57 335,000 346,725 0.53USD 342,119WELLCARE HE 5.25% 17-01.04.25 225,000 234,563 0.36USD 225,113WPX ENERGY 5.75% 18-01.06.26 65,000 67,519 0.10USD 66,138WPX ENERGY 8.25% 15-01.08.23 140,000 159,600 0.25USD 159,895XEROX CORP 3.625% 17-15.03.23 227,000 231,066 0.35USD 222,371
15,926,664 24.4515,956,474
Bonds 23,024,872 35.3523,100,519
Transferable securities admitted to official Exchange listing23,024,872 35.3523,100,519
SLVRSEA C 7.25% 17-1.2.25 144A 121,000 130,039 0.20USD 126,445
Transferable securities dealt in on another regulated market
Bonds
Bahamas
130,039 0.20126,445
BAUSCH HL 5.75% 19-15.08.27 430,000 451,921 0.69USD 446,799
Canada
BAUSCH HLTH-5.5% NOTE 01.03.23 133,000 134,064 0.21USD 125,341ENSIGN 9.25% 19-15.04.24 144A 300,000 295,500 0.45USD 299,250MEG ENER 6.375% 12-30.1.23 144A 200,000 190,500 0.29USD 175,171MEG ENER 6.5% 17-15.01.25 144A 395,000 396,975 0.61USD 388,267PARKLAND 5.875% 19-15.07.27 233,000 236,716 0.36USD 233,450QC MEDIA 6.625% 12-15.1.23 144A 625,000 516,549 0.79CAD 549,4031011778 BC 4.625% 15.1.22 144A 130,000 130,000 0.20USD 129,4881011778 BC 5% 17-15.10.25 144A 335,000 337,613 0.52USD 331,284
2,689,838 4.122,678,453
SHELF DRL 8.25% 18-15.2.25 144A 250,000 230,750 0.35USD 239,325
Cayman Islands
TRANSOCEAN 5.375%15.5.23/POOL 144A 75,000 75,094 0.12USD 74,625TRANSOCEAN 6.125% 18-1.8.25 144A 258,000 251,124 0.39USD 242,591UPCB FIN 5.375% 15-15.1.25 144A 400,000 411,124 0.63USD 416,000
968,092 1.49972,541
UNITYMED 6.125% 14-15.1.25 144A 575,000 598,144 0.92USD 615,969
Germany
598,144 0.92615,969
Global High Yield-(expressed in USD)
Portfolio statements as at 30 June 2019
(continued)
Name Quantity/nominal value Currency Acquisition cost Valuation % net assets
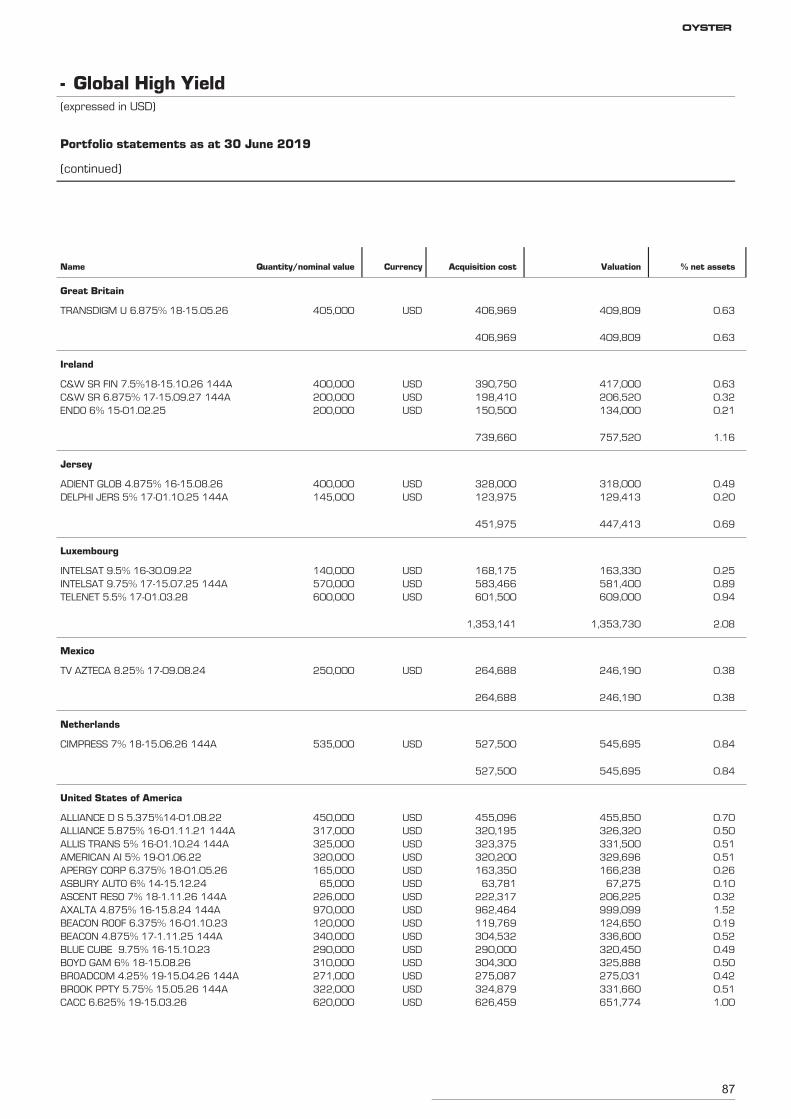
87
TRANSDIGM U 6.875% 18-15.05.26 405,000 409,809 0.63USD 406,969
Great Britain
409,809 0.63406,969
C&W SR FIN 7.5%18-15.10.26 144A 400,000 417,000 0.63USD 390,750
Ireland
C&W SR 6.875% 17-15.09.27 144A 200,000 206,520 0.32USD 198,410ENDO 6% 15-01.02.25 200,000 134,000 0.21USD 150,500
757,520 1.16739,660
ADIENT GLOB 4.875% 16-15.08.26 400,000 318,000 0.49USD 328,000
Jersey
DELPHI JERS 5% 17-01.10.25 144A 145,000 129,413 0.20USD 123,975
447,413 0.69451,975
INTELSAT 9.5% 16-30.09.22 140,000 163,330 0.25USD 168,175
Luxembourg
INTELSAT 9.75% 17-15.07.25 144A 570,000 581,400 0.89USD 583,466TELENET 5.5% 17-01.03.28 600,000 609,000 0.94USD 601,500
1,353,730 2.081,353,141
TV AZTECA 8.25% 17-09.08.24 250,000 246,190 0.38USD 264,688
Mexico
246,190 0.38264,688
CIMPRESS 7% 18-15.06.26 144A 535,000 545,695 0.84USD 527,500
Netherlands
545,695 0.84527,500
ALLIANCE D S 5.375%14-01.08.22 450,000 455,850 0.70USD 455,096
United States of America
ALLIANCE 5.875% 16-01.11.21 144A 317,000 326,320 0.50USD 320,195ALLIS TRANS 5% 16-01.10.24 144A 325,000 331,500 0.51USD 323,375AMERICAN AI 5% 19-01.06.22 320,000 329,696 0.51USD 320,200APERGY CORP 6.375% 18-01.05.26 165,000 166,238 0.26USD 163,350ASBURY AUTO 6% 14-15.12.24 65,000 67,275 0.10USD 63,781ASCENT RESO 7% 18-1.11.26 144A 226,000 206,225 0.32USD 222,317AXALTA 4.875% 16-15.8.24 144A 970,000 999,099 1.52USD 962,464BEACON ROOF 6.375% 16-01.10.23 120,000 124,650 0.19USD 119,769BEACON 4.875% 17-1.11.25 144A 340,000 336,600 0.52USD 304,532BLUE CUBE 9.75% 16-15.10.23 290,000 320,450 0.49USD 290,000BOYD GAM 6% 18-15.08.26 310,000 325,888 0.50USD 304,300BROADCOM 4.25% 19-15.04.26 144A 271,000 275,031 0.42USD 275,087BROOK PPTY 5.75% 15.05.26 144A 322,000 331,660 0.51USD 324,879CACC 6.625% 19-15.03.26 620,000 651,774 1.00USD 626,459
Global High Yield-(expressed in USD)
Portfolio statements as at 30 June 2019
(continued)
Name Quantity/nominal value Currency Acquisition cost Valuation % net assets
OYSTER
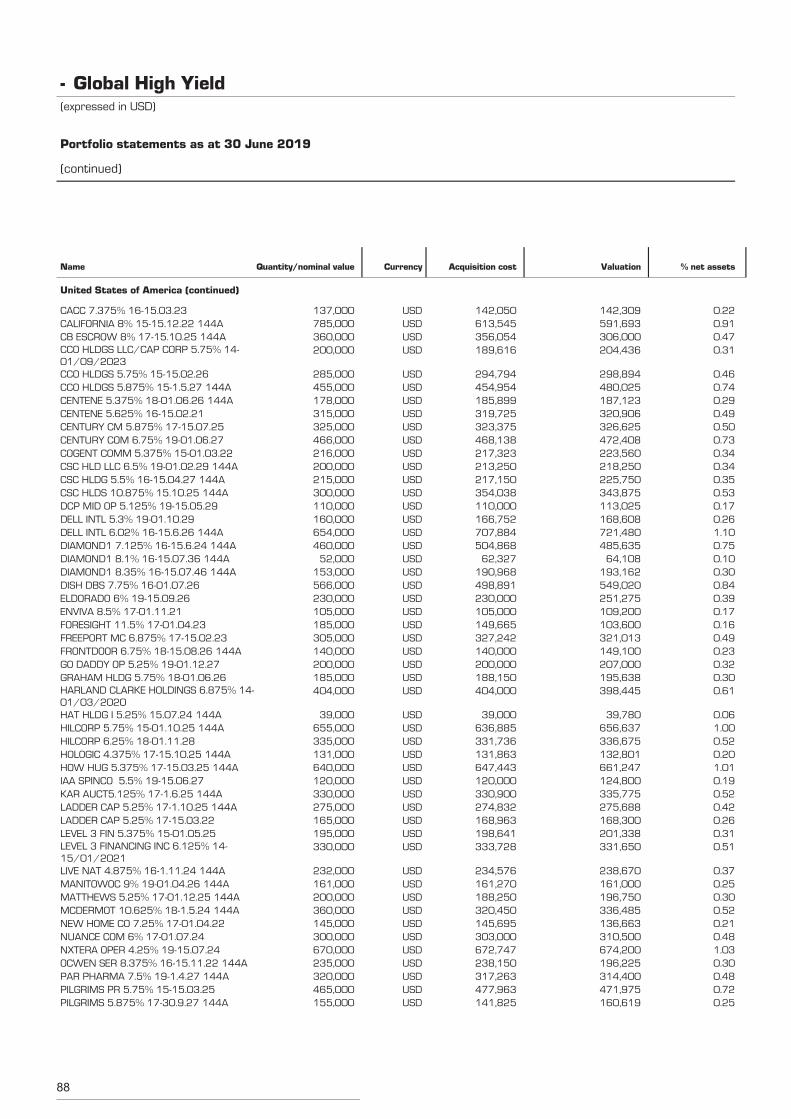
88
CACC 7.375% 16-15.03.23 137,000 142,309 0.22USD 142,050
United States of America (continued)
CALIFORNIA 8% 15-15.12.22 144A 785,000 591,693 0.91USD 613,545CB ESCROW 8% 17-15.10.25 144A 360,000 306,000 0.47USD 356,054CCO HLDGS LLC/CAP CORP 5.75% 14-01/09/2023
200,000 204,436 0.31USD 189,616
CCO HLDGS 5.75% 15-15.02.26 285,000 298,894 0.46USD 294,794CCO HLDGS 5.875% 15-1.5.27 144A 455,000 480,025 0.74USD 454,954CENTENE 5.375% 18-01.06.26 144A 178,000 187,123 0.29USD 185,899CENTENE 5.625% 16-15.02.21 315,000 320,906 0.49USD 319,725CENTURY CM 5.875% 17-15.07.25 325,000 326,625 0.50USD 323,375CENTURY COM 6.75% 19-01.06.27 466,000 472,408 0.73USD 468,138COGENT COMM 5.375% 15-01.03.22 216,000 223,560 0.34USD 217,323CSC HLD LLC 6.5% 19-01.02.29 144A 200,000 218,250 0.34USD 213,250CSC HLDG 5.5% 16-15.04.27 144A 215,000 225,750 0.35USD 217,150CSC HLDS 10.875% 15.10.25 144A 300,000 343,875 0.53USD 354,038DCP MID OP 5.125% 19-15.05.29 110,000 113,025 0.17USD 110,000DELL INTL 5.3% 19-01.10.29 160,000 168,608 0.26USD 166,752DELL INTL 6.02% 16-15.6.26 144A 654,000 721,480 1.10USD 707,884DIAMOND1 7.125% 16-15.6.24 144A 460,000 485,635 0.75USD 504,868DIAMOND1 8.1% 16-15.07.36 144A 52,000 64,108 0.10USD 62,327DIAMOND1 8.35% 16-15.07.46 144A 153,000 193,162 0.30USD 190,968DISH DBS 7.75% 16-01.07.26 566,000 549,020 0.84USD 498,891ELDORADO 6% 19-15.09.26 230,000 251,275 0.39USD 230,000ENVIVA 8.5% 17-01.11.21 105,000 109,200 0.17USD 105,000FORESIGHT 11.5% 17-01.04.23 185,000 103,600 0.16USD 149,665FREEPORT MC 6.875% 17-15.02.23 305,000 321,013 0.49USD 327,242FRONTDOOR 6.75% 18-15.08.26 144A 140,000 149,100 0.23USD 140,000GO DADDY OP 5.25% 19-01.12.27 200,000 207,000 0.32USD 200,000GRAHAM HLDG 5.75% 18-01.06.26 185,000 195,638 0.30USD 188,150HARLAND CLARKE HOLDINGS 6.875% 14-01/03/2020
404,000 398,445 0.61USD 404,000
HAT HLDG I 5.25% 15.07.24 144A 39,000 39,780 0.06USD 39,000HILCORP 5.75% 15-01.10.25 144A 655,000 656,637 1.00USD 636,885HILCORP 6.25% 18-01.11.28 335,000 336,675 0.52USD 331,736HOLOGIC 4.375% 17-15.10.25 144A 131,000 132,801 0.20USD 131,863HOW HUG 5.375% 17-15.03.25 144A 640,000 661,247 1.01USD 647,443IAA SPINCO 5.5% 19-15.06.27 120,000 124,800 0.19USD 120,000KAR AUCT5.125% 17-1.6.25 144A 330,000 335,775 0.52USD 330,900LADDER CAP 5.25% 17-1.10.25 144A 275,000 275,688 0.42USD 274,832LADDER CAP 5.25% 17-15.03.22 165,000 168,300 0.26USD 168,963LEVEL 3 FIN 5.375% 15-01.05.25 195,000 201,338 0.31USD 198,641LEVEL 3 FINANCING INC 6.125% 14-15/01/2021
330,000 331,650 0.51USD 333,728
LIVE NAT 4.875% 16-1.11.24 144A 232,000 238,670 0.37USD 234,576MANITOWOC 9% 19-01.04.26 144A 161,000 161,000 0.25USD 161,270MATTHEWS 5.25% 17-01.12.25 144A 200,000 196,750 0.30USD 188,250MCDERMOT 10.625% 18-1.5.24 144A 360,000 336,485 0.52USD 320,450NEW HOME CO 7.25% 17-01.04.22 145,000 136,663 0.21USD 145,695NUANCE COM 6% 17-01.07.24 300,000 310,500 0.48USD 303,000NXTERA OPER 4.25% 19-15.07.24 670,000 674,200 1.03USD 672,747OCWEN SER 8.375% 16-15.11.22 144A 235,000 196,225 0.30USD 238,150PAR PHARMA 7.5% 19-1.4.27 144A 320,000 314,400 0.48USD 317,263PILGRIMS PR 5.75% 15-15.03.25 465,000 471,975 0.72USD 477,963PILGRIMS 5.875% 17-30.9.27 144A 155,000 160,619 0.25USD 141,825
Global High Yield-(expressed in USD)
Portfolio statements as at 30 June 2019
(continued)
Name Quantity/nominal value Currency Acquisition cost Valuation % net assets
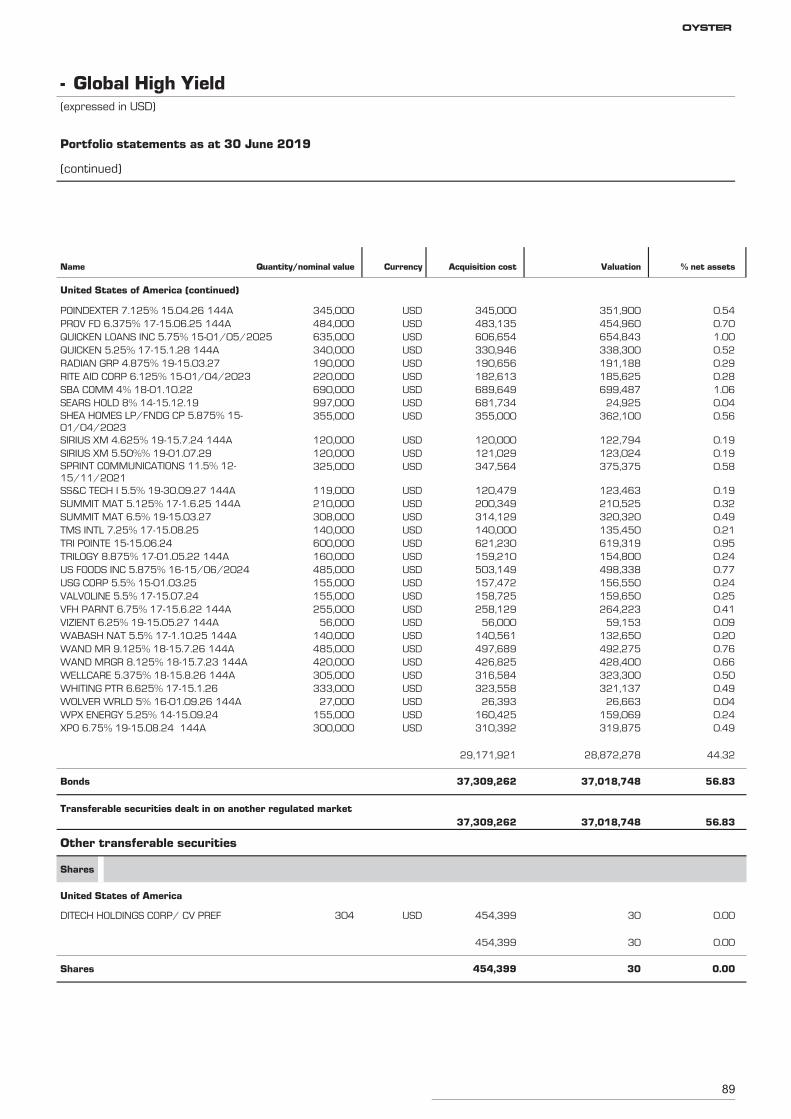
89
POINDEXTER 7.125% 15.04.26 144A 345,000 351,900 0.54USD 345,000
United States of America (continued)
PROV FD 6.375% 17-15.06.25 144A 484,000 454,960 0.70USD 483,135QUICKEN LOANS INC 5.75% 15-01/05/2025 635,000 654,843 1.00USD 606,654QUICKEN 5.25% 17-15.1.28 144A 340,000 338,300 0.52USD 330,946RADIAN GRP 4.875% 19-15.03.27 190,000 191,188 0.29USD 190,656RITE AID CORP 6.125% 15-01/04/2023 220,000 185,625 0.28USD 182,613SBA COMM 4% 18-01.10.22 690,000 699,487 1.06USD 689,649SEARS HOLD 8% 14-15.12.19 997,000 24,925 0.04USD 681,734SHEA HOMES LP/FNDG CP 5.875% 15-01/04/2023
355,000 362,100 0.56USD 355,000
SIRIUS XM 4.625% 19-15.7.24 144A 120,000 122,794 0.19USD 120,000SIRIUS XM 5.50%% 19-01.07.29 120,000 123,024 0.19USD 121,029SPRINT COMMUNICATIONS 11.5% 12-15/11/2021
325,000 375,375 0.58USD 347,564
SS&C TECH I 5.5% 19-30.09.27 144A 119,000 123,463 0.19USD 120,479SUMMIT MAT 5.125% 17-1.6.25 144A 210,000 210,525 0.32USD 200,349SUMMIT MAT 6.5% 19-15.03.27 308,000 320,320 0.49USD 314,129TMS INTL 7.25% 17-15.08.25 140,000 135,450 0.21USD 140,000TRI POINTE 15-15.06.24 600,000 619,319 0.95USD 621,230TRILOGY 8.875% 17-01.05.22 144A 160,000 154,800 0.24USD 159,210US FOODS INC 5.875% 16-15/06/2024 485,000 498,338 0.77USD 503,149USG CORP 5.5% 15-01.03.25 155,000 156,550 0.24USD 157,472VALVOLINE 5.5% 17-15.07.24 155,000 159,650 0.25USD 158,725VFH PARNT 6.75% 17-15.6.22 144A 255,000 264,223 0.41USD 258,129VIZIENT 6.25% 19-15.05.27 144A 56,000 59,153 0.09USD 56,000WABASH NAT 5.5% 17-1.10.25 144A 140,000 132,650 0.20USD 140,561WAND MR 9.125% 18-15.7.26 144A 485,000 492,275 0.76USD 497,689WAND MRGR 8.125% 18-15.7.23 144A 420,000 428,400 0.66USD 426,825WELLCARE 5.375% 18-15.8.26 144A 305,000 323,300 0.50USD 316,584WHITING PTR 6.625% 17-15.1.26 333,000 321,137 0.49USD 323,558WOLVER WRLD 5% 16-01.09.26 144A 27,000 26,663 0.04USD 26,393WPX ENERGY 5.25% 14-15.09.24 155,000 159,069 0.24USD 160,425XPO 6.75% 19-15.08.24 144A 300,000 319,875 0.49USD 310,392
28,872,278 44.3229,171,921
Bonds 37,018,748 56.8337,309,262
Transferable securities dealt in on another regulated market37,018,748 56.8337,309,262
DITECH HOLDINGS CORP/ CV PREF 304 30 0.00USD 454,399
Other transferable securities
Shares
United States of America
30 0.00454,399
Shares 30 0.00454,399
Global High Yield-(expressed in USD)
Portfolio statements as at 30 June 2019
(continued)
Name Quantity/nominal value Currency Acquisition cost Valuation % net assets
OYSTER
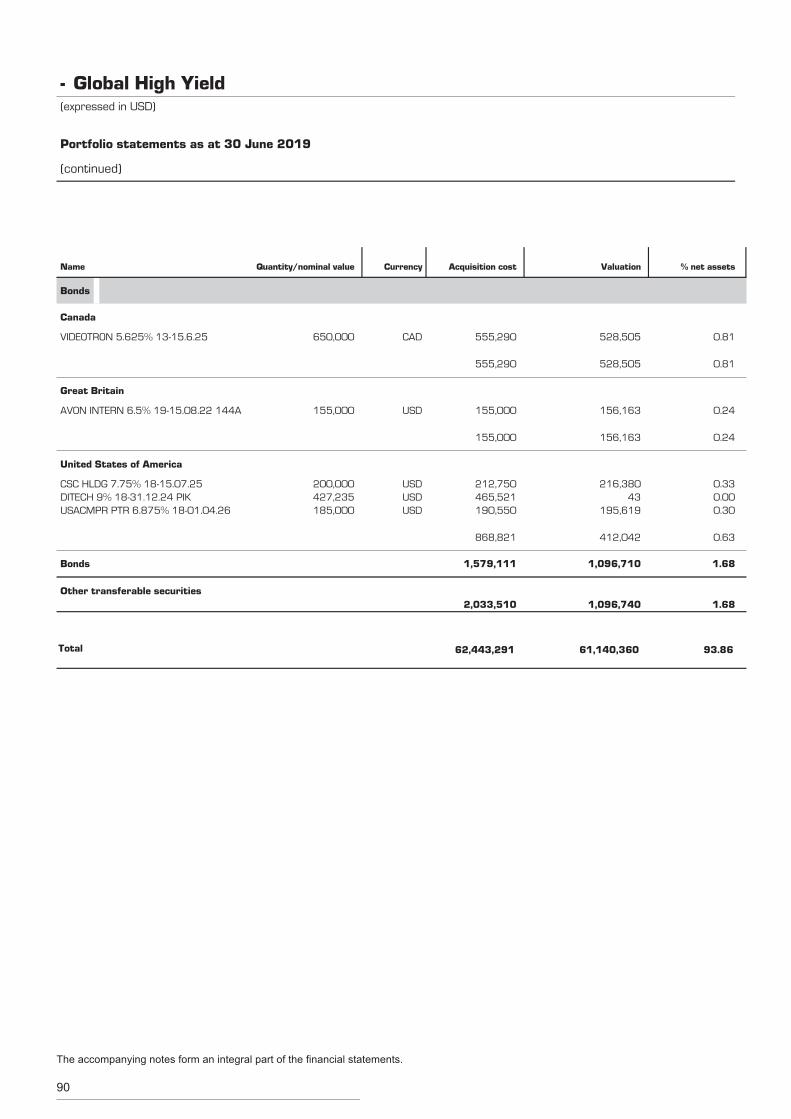
90
VIDEOTRON 5.625% 13-15.6.25 650,000 528,505 0.81CAD 555,290
Bonds
Canada
528,505 0.81555,290
AVON INTERN 6.5% 19-15.08.22 144A 155,000 156,163 0.24USD 155,000
Great Britain
156,163 0.24155,000
CSC HLDG 7.75% 18-15.07.25 200,000 216,380 0.33USD 212,750
United States of America
DITECH 9% 18-31.12.24 PIK 427,235 43 0.00USD 465,521USACMPR PTR 6.875% 18-01.04.26 185,000 195,619 0.30USD 190,550
412,042 0.63868,821
Bonds 1,096,710 1.681,579,111
Other transferable securities1,096,740 1.682,033,510
Total 61,140,360 93.8662,443,291
Global High Yield-(expressed in USD)
Portfolio statements as at 30 June 2019
(continued)
Name Quantity/nominal value Currency Acquisition cost Valuation % net assets
The accompanying notes form an integral part of the financial statements.
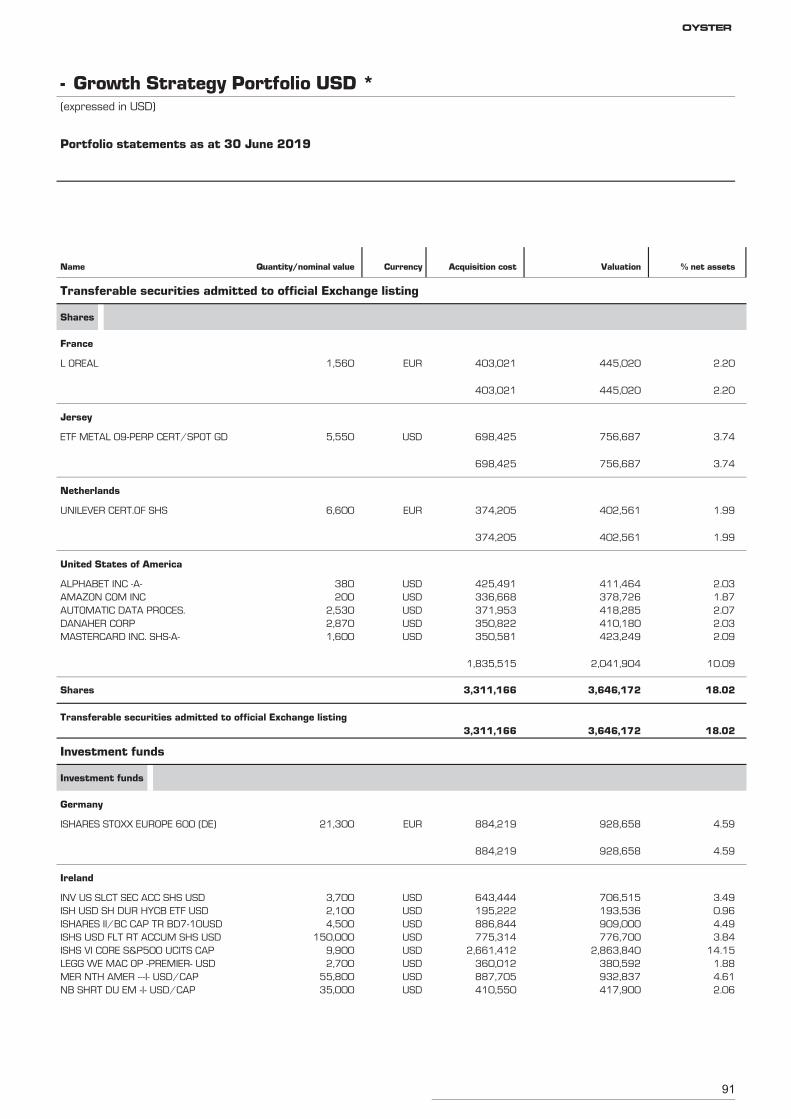
91
L OREAL 1,560 445,020 2.20EUR 403,021
Transferable securities admitted to official Exchange listing
Shares
France
445,020 2.20403,021
ETF METAL 09-PERP CERT/SPOT GD 5,550 756,687 3.74USD 698,425
Jersey
756,687 3.74698,425
UNILEVER CERT.OF SHS 6,600 402,561 1.99EUR 374,205
Netherlands
402,561 1.99374,205
ALPHABET INC -A- 380 411,464 2.03USD 425,491
United States of America
AMAZON COM INC 200 378,726 1.87USD 336,668AUTOMATIC DATA PROCES. 2,530 418,285 2.07USD 371,953DANAHER CORP 2,870 410,180 2.03USD 350,822MASTERCARD INC. SHS-A- 1,600 423,249 2.09USD 350,581
2,041,904 10.091,835,515
Shares 3,646,172 18.023,311,166
Transferable securities admitted to official Exchange listing3,646,172 18.023,311,166
ISHARES STOXX EUROPE 600 (DE) 21,300 928,658 4.59EUR 884,219
Investment funds
Investment funds
Germany
928,658 4.59884,219
INV US SLCT SEC ACC SHS USD 3,700 706,515 3.49USD 643,444
Ireland
ISH USD SH DUR HYCB ETF USD 2,100 193,536 0.96USD 195,222ISHARES II/BC CAP TR BD7-10USD 4,500 909,000 4.49USD 886,844ISHS USD FLT RT ACCUM SHS USD 150,000 776,700 3.84USD 775,314ISHS VI CORE S&P500 UCITS CAP 9,900 2,863,840 14.15USD 2,661,412LEGG WE MAC OP -PREMIER- USD 2,700 380,592 1.88USD 360,012MER NTH AMER ---I- USD/CAP 55,800 932,837 4.61USD 887,705NB SHRT DU EM -I- USD/CAP 35,000 417,900 2.06USD 410,550
Growth Strategy Portfolio USD *-(expressed in USD)
Portfolio statements as at 30 June 2019
Name Quantity/nominal value Currency Acquisition cost Valuation % net assets
OYSTER
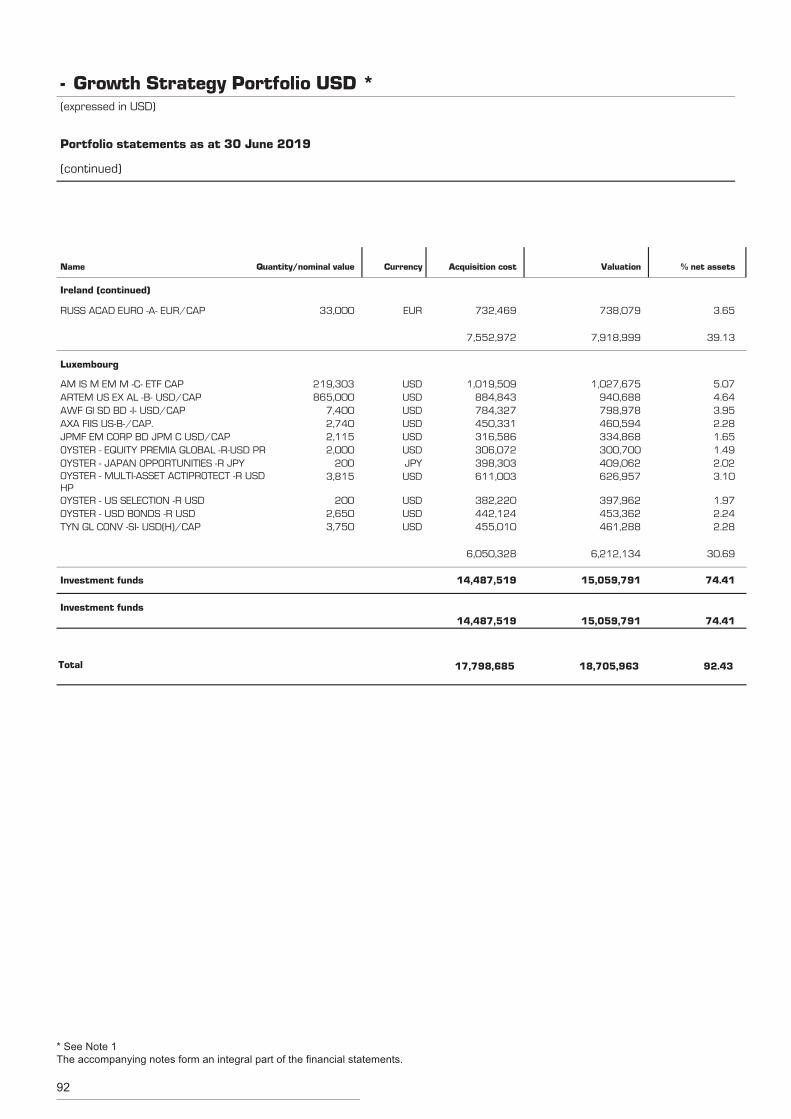
92
RUSS ACAD EURO -A- EUR/CAP 33,000 738,079 3.65EUR 732,469
Ireland (continued)
7,918,999 39.137,552,972
AM IS M EM M -C- ETF CAP 219,303 1,027,675 5.07USD 1,019,509
Luxembourg
ARTEM US EX AL -B- USD/CAP 865,000 940,688 4.64USD 884,843AWF GI SD BD -I- USD/CAP 7,400 798,978 3.95USD 784,327AXA FIIS US-B-/CAP. 2,740 460,594 2.28USD 450,331JPMF EM CORP BD JPM C USD/CAP 2,115 334,868 1.65USD 316,586OYSTER - EQUITY PREMIA GLOBAL -R-USD PR 2,000 300,700 1.49USD 306,072OYSTER - JAPAN OPPORTUNITIES -R JPY 200 409,062 2.02JPY 398,303OYSTER - MULTI-ASSET ACTIPROTECT -R USDHP
3,815 626,957 3.10USD 611,003
OYSTER - US SELECTION -R USD 200 397,962 1.97USD 382,220OYSTER - USD BONDS -R USD 2,650 453,362 2.24USD 442,124TYN GL CONV -SI- USD(H)/CAP 3,750 461,288 2.28USD 455,010
6,212,134 30.696,050,328
Investment funds 15,059,791 74.4114,487,519
Investment funds15,059,791 74.4114,487,519
Total 18,705,963 92.4317,798,685
Growth Strategy Portfolio USD *-(expressed in USD)
Portfolio statements as at 30 June 2019
(continued)
Name Quantity/nominal value Currency Acquisition cost Valuation % net assets
* See Note 1The accompanying notes form an integral part of the financial statements.
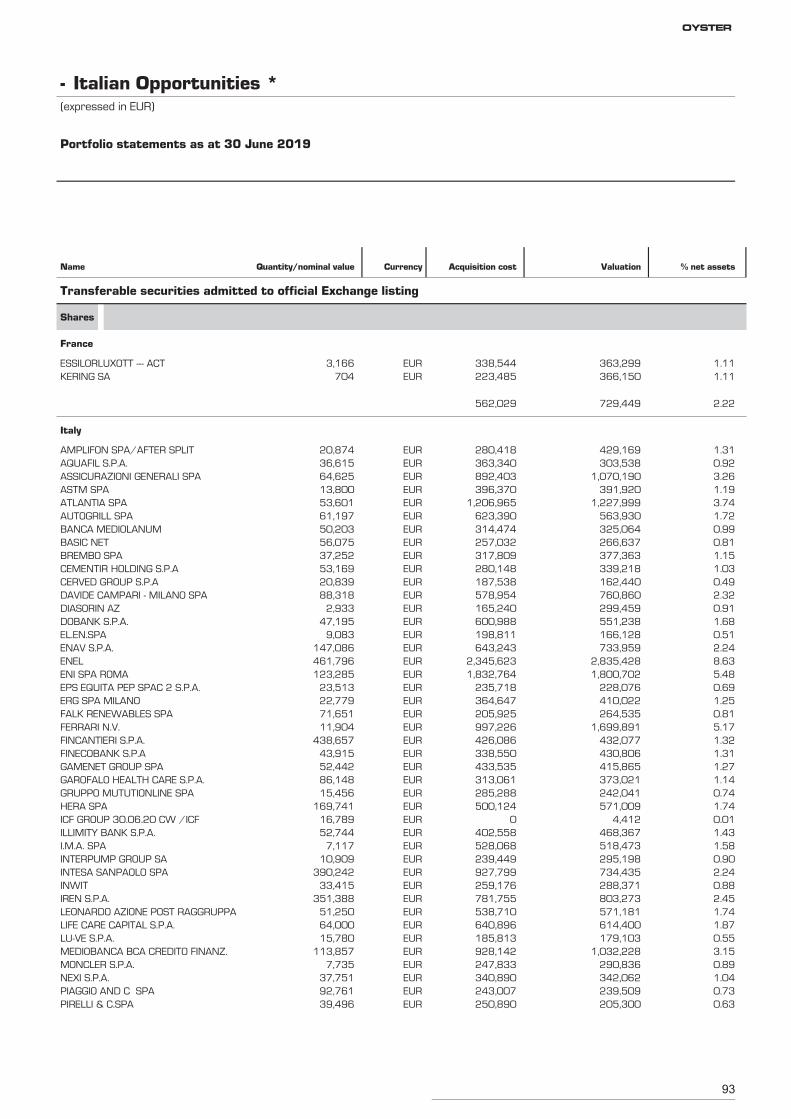
93
ESSILORLUXOTT --- ACT 3,166 363,299 1.11EUR 338,544
Transferable securities admitted to official Exchange listing
Shares
France
KERING SA 704 366,150 1.11EUR 223,485
729,449 2.22562,029
AMPLIFON SPA/AFTER SPLIT 20,874 429,169 1.31EUR 280,418
Italy
AQUAFIL S.P.A. 36,615 303,538 0.92EUR 363,340ASSICURAZIONI GENERALI SPA 64,625 1,070,190 3.26EUR 892,403ASTM SPA 13,800 391,920 1.19EUR 396,370ATLANTIA SPA 53,601 1,227,999 3.74EUR 1,206,965AUTOGRILL SPA 61,197 563,930 1.72EUR 623,390BANCA MEDIOLANUM 50,203 325,064 0.99EUR 314,474BASIC NET 56,075 266,637 0.81EUR 257,032BREMBO SPA 37,252 377,363 1.15EUR 317,809CEMENTIR HOLDING S.P.A 53,169 339,218 1.03EUR 280,148CERVED GROUP S.P.A 20,839 162,440 0.49EUR 187,538DAVIDE CAMPARI - MILANO SPA 88,318 760,860 2.32EUR 578,954DIASORIN AZ 2,933 299,459 0.91EUR 165,240DOBANK S.P.A. 47,195 551,238 1.68EUR 600,988EL.EN.SPA 9,083 166,128 0.51EUR 198,811ENAV S.P.A. 147,086 733,959 2.24EUR 643,243ENEL 461,796 2,835,428 8.63EUR 2,345,623ENI SPA ROMA 123,285 1,800,702 5.48EUR 1,832,764EPS EQUITA PEP SPAC 2 S.P.A. 23,513 228,076 0.69EUR 235,718ERG SPA MILANO 22,779 410,022 1.25EUR 364,647FALK RENEWABLES SPA 71,651 264,535 0.81EUR 205,925FERRARI N.V. 11,904 1,699,891 5.17EUR 997,226FINCANTIERI S.P.A. 438,657 432,077 1.32EUR 426,086FINECOBANK S.P.A 43,915 430,806 1.31EUR 338,550GAMENET GROUP SPA 52,442 415,865 1.27EUR 433,535GAROFALO HEALTH CARE S.P.A. 86,148 373,021 1.14EUR 313,061GRUPPO MUTUTIONLINE SPA 15,456 242,041 0.74EUR 285,288HERA SPA 169,741 571,009 1.74EUR 500,124ICF GROUP 30.06.20 CW /ICF 16,789 4,412 0.01EUR 0ILLIMITY BANK S.P.A. 52,744 468,367 1.43EUR 402,558I.M.A. SPA 7,117 518,473 1.58EUR 528,068INTERPUMP GROUP SA 10,909 295,198 0.90EUR 239,449INTESA SANPAOLO SPA 390,242 734,435 2.24EUR 927,799INWIT 33,415 288,371 0.88EUR 259,176IREN S.P.A. 351,388 803,273 2.45EUR 781,755LEONARDO AZIONE POST RAGGRUPPA 51,250 571,181 1.74EUR 538,710LIFE CARE CAPITAL S.P.A. 64,000 614,400 1.87EUR 640,896LU-VE S.P.A. 15,780 179,103 0.55EUR 185,813MEDIOBANCA BCA CREDITO FINANZ. 113,857 1,032,228 3.15EUR 928,142MONCLER S.P.A. 7,735 290,836 0.89EUR 247,833NEXI S.P.A. 37,751 342,062 1.04EUR 340,890PIAGGIO AND C SPA 92,761 239,509 0.73EUR 243,007PIRELLI & C.SPA 39,496 205,300 0.63EUR 250,890
Italian Opportunities *-(expressed in EUR)
Portfolio statements as at 30 June 2019
Name Quantity/nominal value Currency Acquisition cost Valuation % net assets
OYSTER
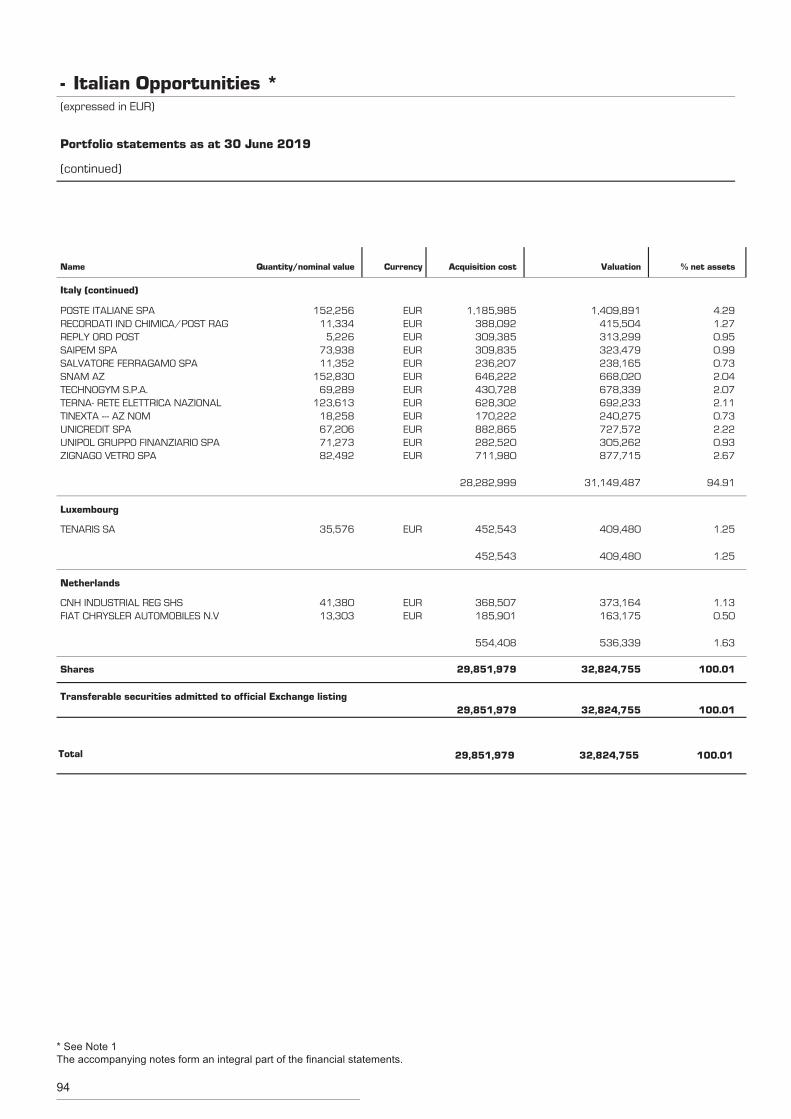
94
POSTE ITALIANE SPA 152,256 1,409,891 4.29EUR 1,185,985
Italy (continued)
RECORDATI IND CHIMICA/POST RAG 11,334 415,504 1.27EUR 388,092REPLY ORD POST 5,226 313,299 0.95EUR 309,385SAIPEM SPA 73,938 323,479 0.99EUR 309,835SALVATORE FERRAGAMO SPA 11,352 238,165 0.73EUR 236,207SNAM AZ 152,830 668,020 2.04EUR 646,222TECHNOGYM S.P.A. 69,289 678,339 2.07EUR 430,728TERNA- RETE ELETTRICA NAZIONAL 123,613 692,233 2.11EUR 628,302TINEXTA --- AZ NOM 18,258 240,275 0.73EUR 170,222UNICREDIT SPA 67,206 727,572 2.22EUR 882,865UNIPOL GRUPPO FINANZIARIO SPA 71,273 305,262 0.93EUR 282,520ZIGNAGO VETRO SPA 82,492 877,715 2.67EUR 711,980
31,149,487 94.9128,282,999
TENARIS SA 35,576 409,480 1.25EUR 452,543
Luxembourg
409,480 1.25452,543
CNH INDUSTRIAL REG SHS 41,380 373,164 1.13EUR 368,507
Netherlands
FIAT CHRYSLER AUTOMOBILES N.V 13,303 163,175 0.50EUR 185,901
536,339 1.63554,408
Shares 32,824,755 100.0129,851,979
Transferable securities admitted to official Exchange listing32,824,755 100.0129,851,979
Total 32,824,755 100.0129,851,979
Italian Opportunities *-(expressed in EUR)
Portfolio statements as at 30 June 2019
(continued)
Name Quantity/nominal value Currency Acquisition cost Valuation % net assets
* See Note 1The accompanying notes form an integral part of the financial statements.
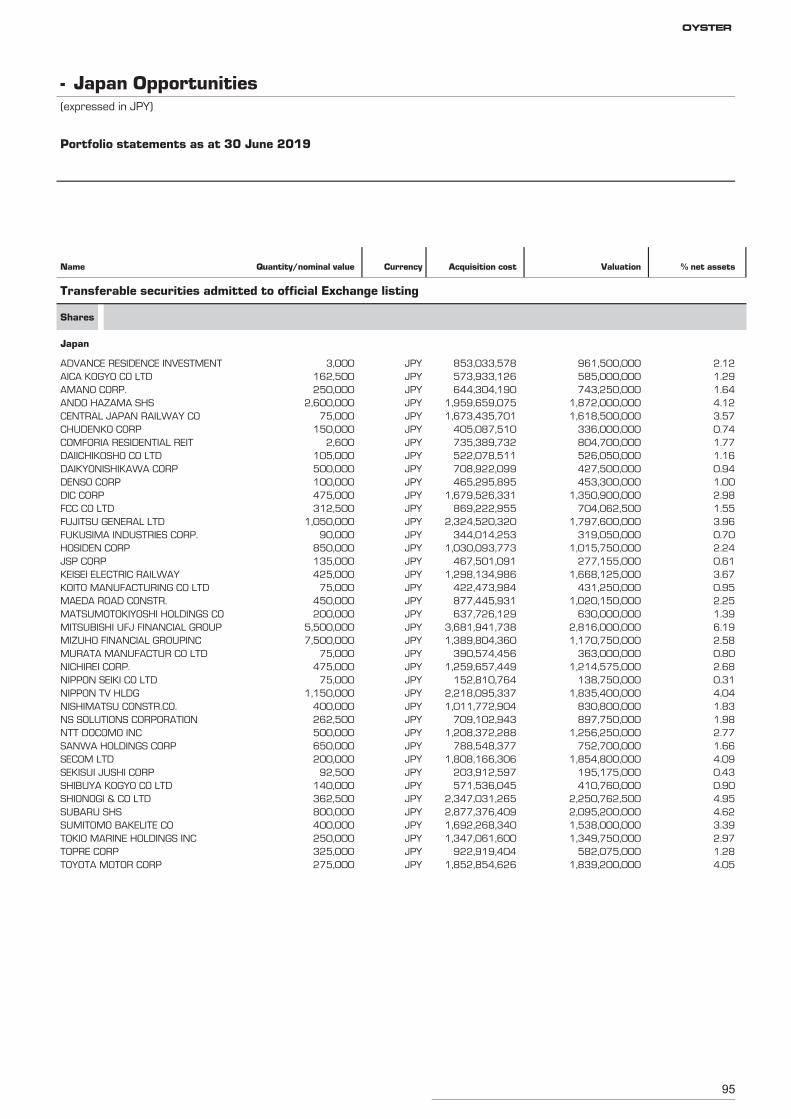
95
ADVANCE RESIDENCE INVESTMENT 3,000 961,500,000 2.12JPY 853,033,578
Transferable securities admitted to official Exchange listing
Shares
Japan
AICA KOGYO CO LTD 162,500 585,000,000 1.29JPY 573,933,126AMANO CORP. 250,000 743,250,000 1.64JPY 644,304,190ANDO HAZAMA SHS 2,600,000 1,872,000,000 4.12JPY 1,959,659,075CENTRAL JAPAN RAILWAY CO 75,000 1,618,500,000 3.57JPY 1,673,435,701CHUDENKO CORP 150,000 336,000,000 0.74JPY 405,087,510COMFORIA RESIDENTIAL REIT 2,600 804,700,000 1.77JPY 735,389,732DAIICHIKOSHO CO LTD 105,000 526,050,000 1.16JPY 522,078,511DAIKYONISHIKAWA CORP 500,000 427,500,000 0.94JPY 708,922,099DENSO CORP 100,000 453,300,000 1.00JPY 465,295,895DIC CORP 475,000 1,350,900,000 2.98JPY 1,679,526,331FCC CO LTD 312,500 704,062,500 1.55JPY 869,222,955FUJITSU GENERAL LTD 1,050,000 1,797,600,000 3.96JPY 2,324,520,320FUKUSIMA INDUSTRIES CORP. 90,000 319,050,000 0.70JPY 344,014,253HOSIDEN CORP 850,000 1,015,750,000 2.24JPY 1,030,093,773JSP CORP 135,000 277,155,000 0.61JPY 467,501,091KEISEI ELECTRIC RAILWAY 425,000 1,668,125,000 3.67JPY 1,298,134,986KOITO MANUFACTURING CO LTD 75,000 431,250,000 0.95JPY 422,473,984MAEDA ROAD CONSTR. 450,000 1,020,150,000 2.25JPY 877,445,931MATSUMOTOKIYOSHI HOLDINGS CO 200,000 630,000,000 1.39JPY 637,726,129MITSUBISHI UFJ FINANCIAL GROUP 5,500,000 2,816,000,000 6.19JPY 3,681,941,738MIZUHO FINANCIAL GROUPINC 7,500,000 1,170,750,000 2.58JPY 1,389,804,360MURATA MANUFACTUR CO LTD 75,000 363,000,000 0.80JPY 390,574,456NICHIREI CORP. 475,000 1,214,575,000 2.68JPY 1,259,657,449NIPPON SEIKI CO LTD 75,000 138,750,000 0.31JPY 152,810,764NIPPON TV HLDG 1,150,000 1,835,400,000 4.04JPY 2,218,095,337NISHIMATSU CONSTR.CO. 400,000 830,800,000 1.83JPY 1,011,772,904NS SOLUTIONS CORPORATION 262,500 897,750,000 1.98JPY 709,102,943NTT DOCOMO INC 500,000 1,256,250,000 2.77JPY 1,208,372,288SANWA HOLDINGS CORP 650,000 752,700,000 1.66JPY 788,548,377SECOM LTD 200,000 1,854,800,000 4.09JPY 1,808,166,306SEKISUI JUSHI CORP 92,500 195,175,000 0.43JPY 203,912,597SHIBUYA KOGYO CO LTD 140,000 410,760,000 0.90JPY 571,536,045SHIONOGI & CO LTD 362,500 2,250,762,500 4.95JPY 2,347,031,265SUBARU SHS 800,000 2,095,200,000 4.62JPY 2,877,376,409SUMITOMO BAKELITE CO 400,000 1,538,000,000 3.39JPY 1,692,268,340TOKIO MARINE HOLDINGS INC 250,000 1,349,750,000 2.97JPY 1,347,061,600TOPRE CORP 325,000 582,075,000 1.28JPY 922,919,404TOYOTA MOTOR CORP 275,000 1,839,200,000 4.05JPY 1,852,854,626
Japan Opportunities-(expressed in JPY)
Portfolio statements as at 30 June 2019
Name Quantity/nominal value Currency Acquisition cost Valuation % net assets
OYSTER
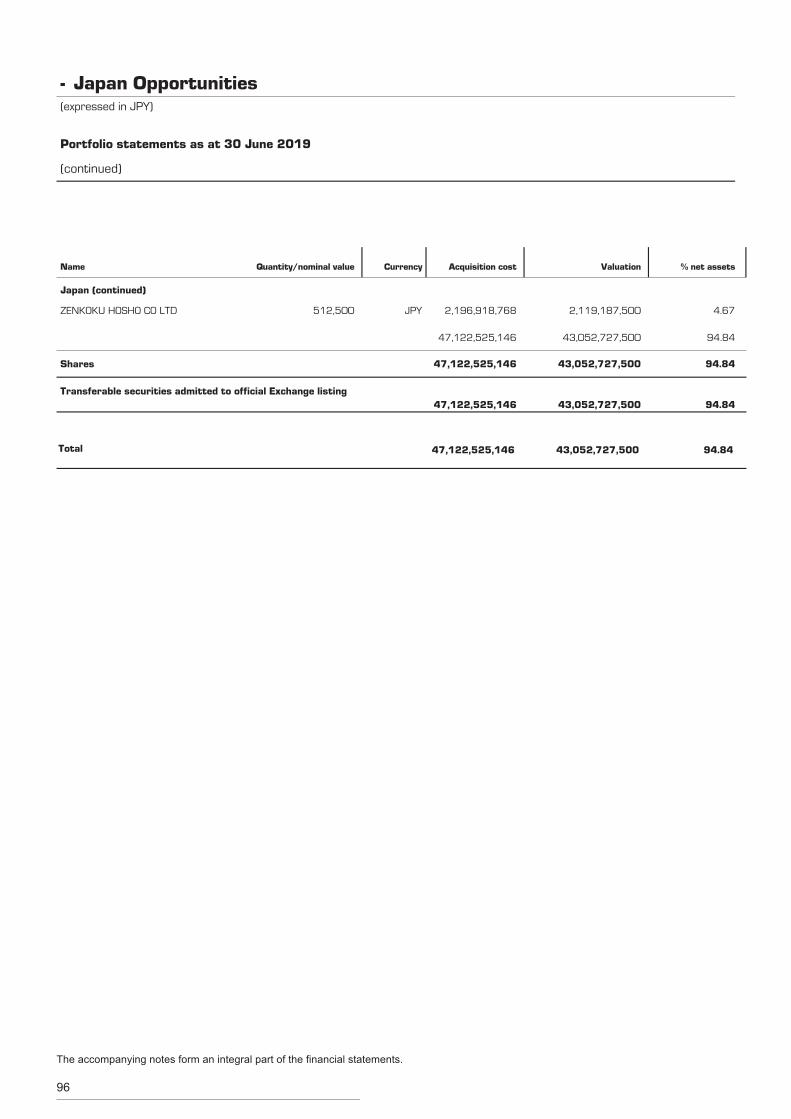
96
ZENKOKU HOSHO CO LTD 512,500 2,119,187,500 4.67JPY 2,196,918,768
Japan (continued)
43,052,727,500 94.8447,122,525,146
Shares 43,052,727,500 94.8447,122,525,146
Transferable securities admitted to official Exchange listing43,052,727,500 94.8447,122,525,146
Total 43,052,727,500 94.8447,122,525,146
Japan Opportunities-(expressed in JPY)
Portfolio statements as at 30 June 2019
(continued)
Name Quantity/nominal value Currency Acquisition cost Valuation % net assets
The accompanying notes form an integral part of the financial statements.
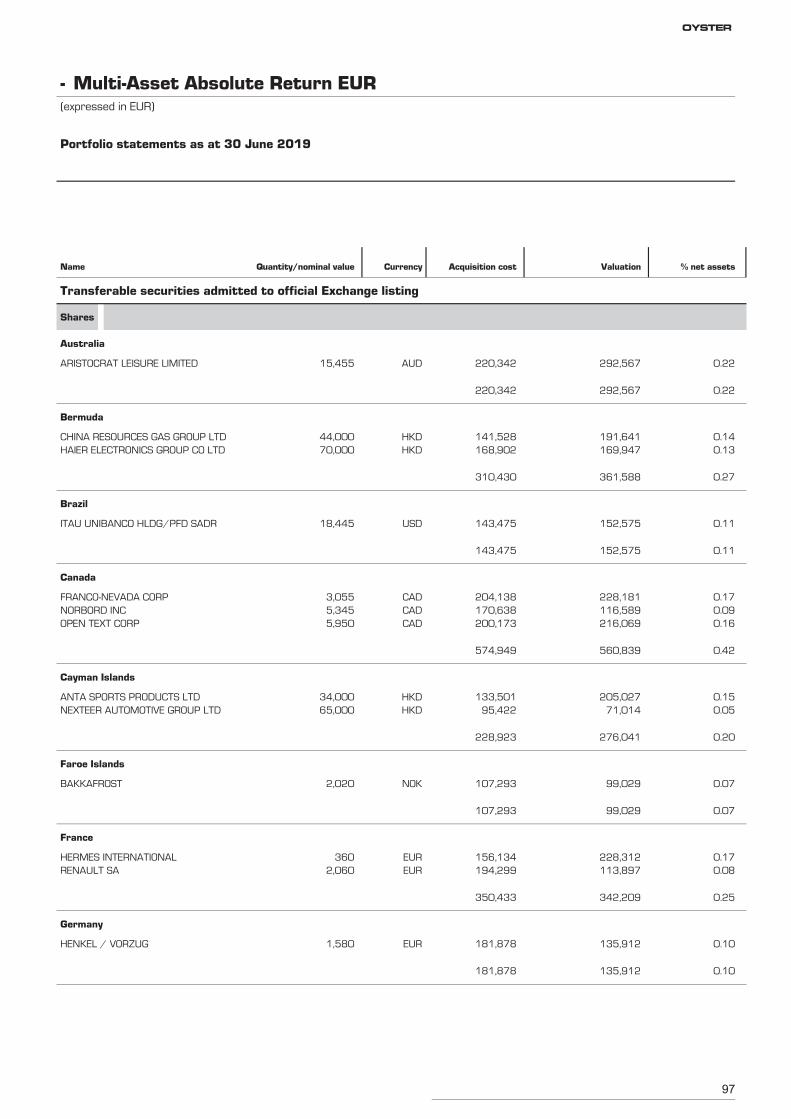
97
ARISTOCRAT LEISURE LIMITED 15,455 292,567 0.22AUD 220,342
Transferable securities admitted to official Exchange listing
Shares
Australia
292,567 0.22220,342
CHINA RESOURCES GAS GROUP LTD 44,000 191,641 0.14HKD 141,528
Bermuda
HAIER ELECTRONICS GROUP CO LTD 70,000 169,947 0.13HKD 168,902
361,588 0.27310,430
ITAU UNIBANCO HLDG/PFD SADR 18,445 152,575 0.11USD 143,475
Brazil
152,575 0.11143,475
FRANCO-NEVADA CORP 3,055 228,181 0.17CAD 204,138
Canada
NORBORD INC 5,345 116,589 0.09CAD 170,638OPEN TEXT CORP 5,950 216,069 0.16CAD 200,173
560,839 0.42574,949
ANTA SPORTS PRODUCTS LTD 34,000 205,027 0.15HKD 133,501
Cayman Islands
NEXTEER AUTOMOTIVE GROUP LTD 65,000 71,014 0.05HKD 95,422
276,041 0.20228,923
BAKKAFROST 2,020 99,029 0.07NOK 107,293
Faroe Islands
99,029 0.07107,293
HERMES INTERNATIONAL 360 228,312 0.17EUR 156,134
France
RENAULT SA 2,060 113,897 0.08EUR 194,299
342,209 0.25350,433
HENKEL / VORZUG 1,580 135,912 0.10EUR 181,878
Germany
135,912 0.10181,878
Multi-Asset Absolute Return EUR-(expressed in EUR)
Portfolio statements as at 30 June 2019
Name Quantity/nominal value Currency Acquisition cost Valuation % net assets
OYSTER
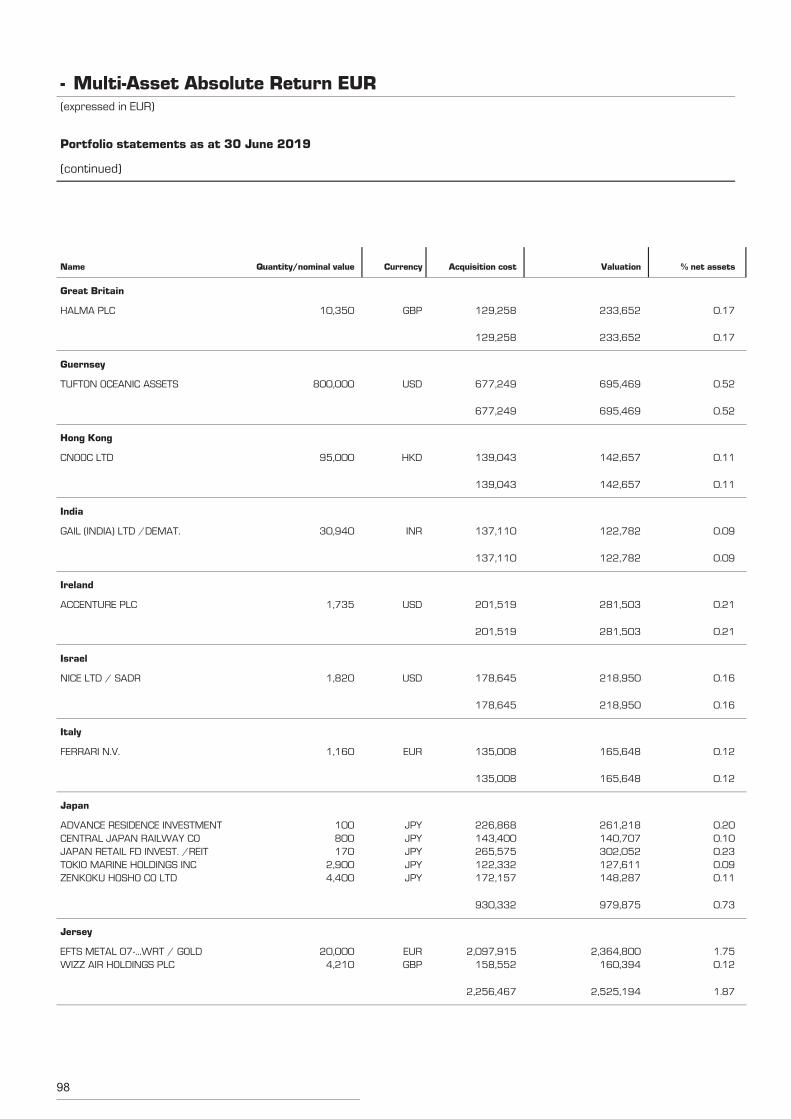
98
HALMA PLC 10,350 233,652 0.17GBP 129,258
Great Britain
233,652 0.17129,258
TUFTON OCEANIC ASSETS 800,000 695,469 0.52USD 677,249
Guernsey
695,469 0.52677,249
CNOOC LTD 95,000 142,657 0.11HKD 139,043
Hong Kong
142,657 0.11139,043
GAIL (INDIA) LTD /DEMAT. 30,940 122,782 0.09INR 137,110
India
122,782 0.09137,110
ACCENTURE PLC 1,735 281,503 0.21USD 201,519
Ireland
281,503 0.21201,519
NICE LTD / SADR 1,820 218,950 0.16USD 178,645
Israel
218,950 0.16178,645
FERRARI N.V. 1,160 165,648 0.12EUR 135,008
Italy
165,648 0.12135,008
ADVANCE RESIDENCE INVESTMENT 100 261,218 0.20JPY 226,868
Japan
CENTRAL JAPAN RAILWAY CO 800 140,707 0.10JPY 143,400JAPAN RETAIL FD INVEST. /REIT 170 302,052 0.23JPY 265,575TOKIO MARINE HOLDINGS INC 2,900 127,611 0.09JPY 122,332ZENKOKU HOSHO CO LTD 4,400 148,287 0.11JPY 172,157
979,875 0.73930,332
EFTS METAL 07-...WRT / GOLD 20,000 2,364,800 1.75EUR 2,097,915
Jersey
WIZZ AIR HOLDINGS PLC 4,210 160,394 0.12GBP 158,552
2,525,194 1.872,256,467
Multi-Asset Absolute Return EUR-(expressed in EUR)
Portfolio statements as at 30 June 2019
(continued)
Name Quantity/nominal value Currency Acquisition cost Valuation % net assets
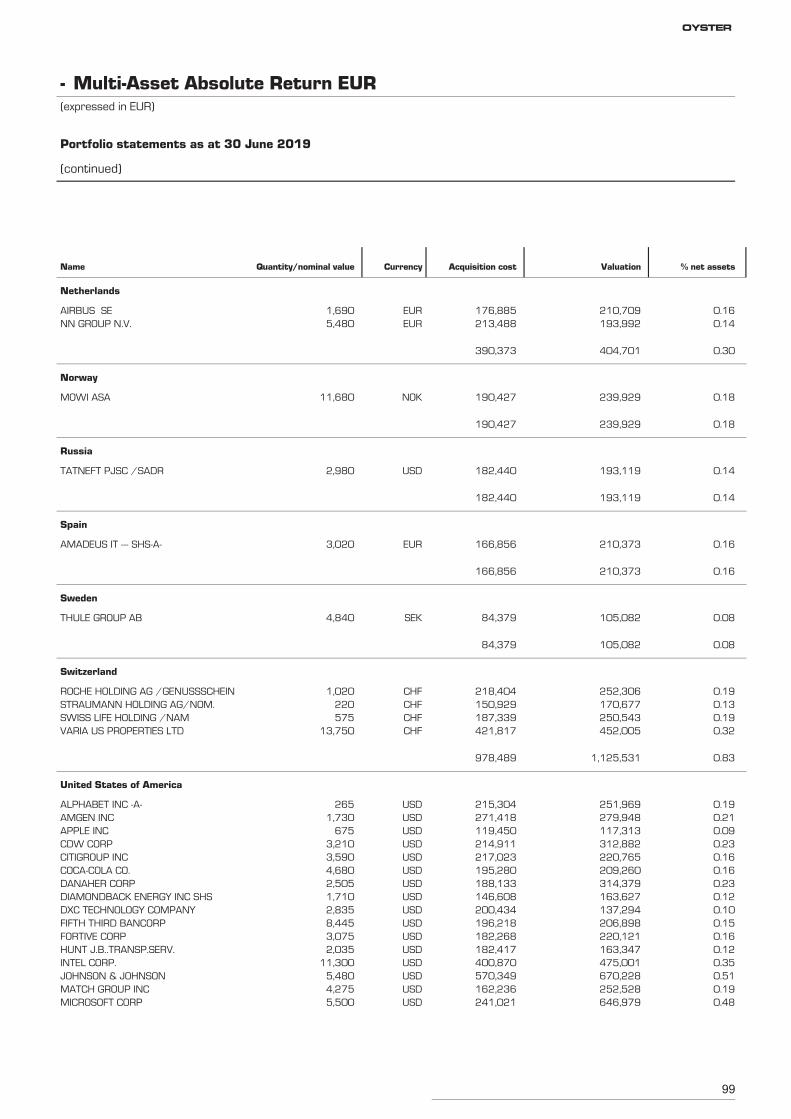
99
AIRBUS SE 1,690 210,709 0.16EUR 176,885
Netherlands
NN GROUP N.V. 5,480 193,992 0.14EUR 213,488
404,701 0.30390,373
MOWI ASA 11,680 239,929 0.18NOK 190,427
Norway
239,929 0.18190,427
TATNEFT PJSC /SADR 2,980 193,119 0.14USD 182,440
Russia
193,119 0.14182,440
AMADEUS IT --- SHS-A- 3,020 210,373 0.16EUR 166,856
Spain
210,373 0.16166,856
THULE GROUP AB 4,840 105,082 0.08SEK 84,379
Sweden
105,082 0.0884,379
ROCHE HOLDING AG /GENUSSSCHEIN 1,020 252,306 0.19CHF 218,404
Switzerland
STRAUMANN HOLDING AG/NOM. 220 170,677 0.13CHF 150,929SWISS LIFE HOLDING /NAM 575 250,543 0.19CHF 187,339VARIA US PROPERTIES LTD 13,750 452,005 0.32CHF 421,817
1,125,531 0.83978,489
ALPHABET INC -A- 265 251,969 0.19USD 215,304
United States of America
AMGEN INC 1,730 279,948 0.21USD 271,418APPLE INC 675 117,313 0.09USD 119,450CDW CORP 3,210 312,882 0.23USD 214,911CITIGROUP INC 3,590 220,765 0.16USD 217,023COCA-COLA CO. 4,680 209,260 0.16USD 195,280DANAHER CORP 2,505 314,379 0.23USD 188,133DIAMONDBACK ENERGY INC SHS 1,710 163,627 0.12USD 146,608DXC TECHNOLOGY COMPANY 2,835 137,294 0.10USD 200,434FIFTH THIRD BANCORP 8,445 206,898 0.15USD 196,218FORTIVE CORP 3,075 220,121 0.16USD 182,268HUNT J.B..TRANSP.SERV. 2,035 163,347 0.12USD 182,417INTEL CORP. 11,300 475,001 0.35USD 400,870JOHNSON & JOHNSON 5,480 670,228 0.51USD 570,349MATCH GROUP INC 4,275 252,528 0.19USD 162,236MICROSOFT CORP 5,500 646,979 0.48USD 241,021
Multi-Asset Absolute Return EUR-(expressed in EUR)
Portfolio statements as at 30 June 2019
(continued)
Name Quantity/nominal value Currency Acquisition cost Valuation % net assets
OYSTER
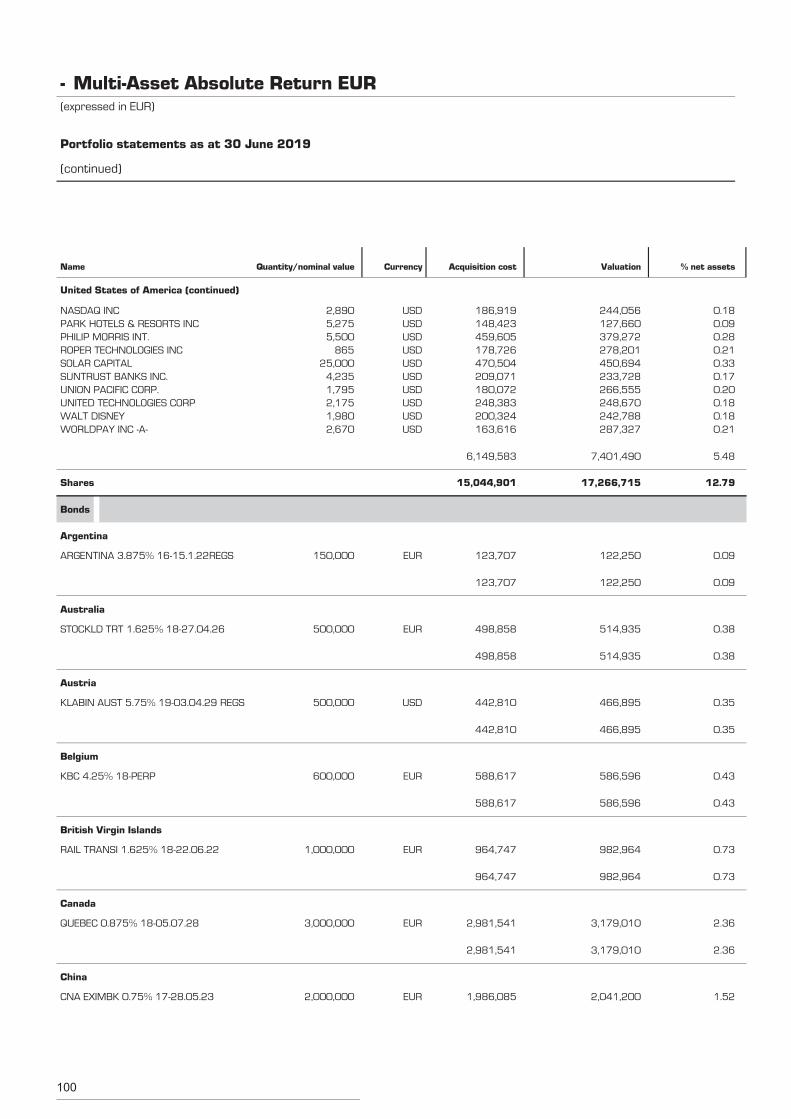
100
NASDAQ INC 2,890 244,056 0.18USD 186,919
United States of America (continued)
PARK HOTELS & RESORTS INC 5,275 127,660 0.09USD 148,423PHILIP MORRIS INT. 5,500 379,272 0.28USD 459,605ROPER TECHNOLOGIES INC 865 278,201 0.21USD 178,726SOLAR CAPITAL 25,000 450,694 0.33USD 470,504SUNTRUST BANKS INC. 4,235 233,728 0.17USD 209,071UNION PACIFIC CORP. 1,795 266,555 0.20USD 180,072UNITED TECHNOLOGIES CORP 2,175 248,670 0.18USD 248,383WALT DISNEY 1,980 242,788 0.18USD 200,324WORLDPAY INC -A- 2,670 287,327 0.21USD 163,616
7,401,490 5.486,149,583
Shares 17,266,715 12.7915,044,901
ARGENTINA 3.875% 16-15.1.22REGS 150,000 122,250 0.09EUR 123,707
Bonds
Argentina
122,250 0.09123,707
STOCKLD TRT 1.625% 18-27.04.26 500,000 514,935 0.38EUR 498,858
Australia
514,935 0.38498,858
KLABIN AUST 5.75% 19-03.04.29 REGS 500,000 466,895 0.35USD 442,810
Austria
466,895 0.35442,810
KBC 4.25% 18-PERP 600,000 586,596 0.43EUR 588,617
Belgium
586,596 0.43588,617
RAIL TRANSI 1.625% 18-22.06.22 1,000,000 982,964 0.73EUR 964,747
British Virgin Islands
982,964 0.73964,747
QUEBEC 0.875% 18-05.07.28 3,000,000 3,179,010 2.36EUR 2,981,541
Canada
3,179,010 2.362,981,541
CNA EXIMBK 0.75% 17-28.05.23 2,000,000 2,041,200 1.52EUR 1,986,085
China
Multi-Asset Absolute Return EUR-(expressed in EUR)
Portfolio statements as at 30 June 2019
(continued)
Name Quantity/nominal value Currency Acquisition cost Valuation % net assets
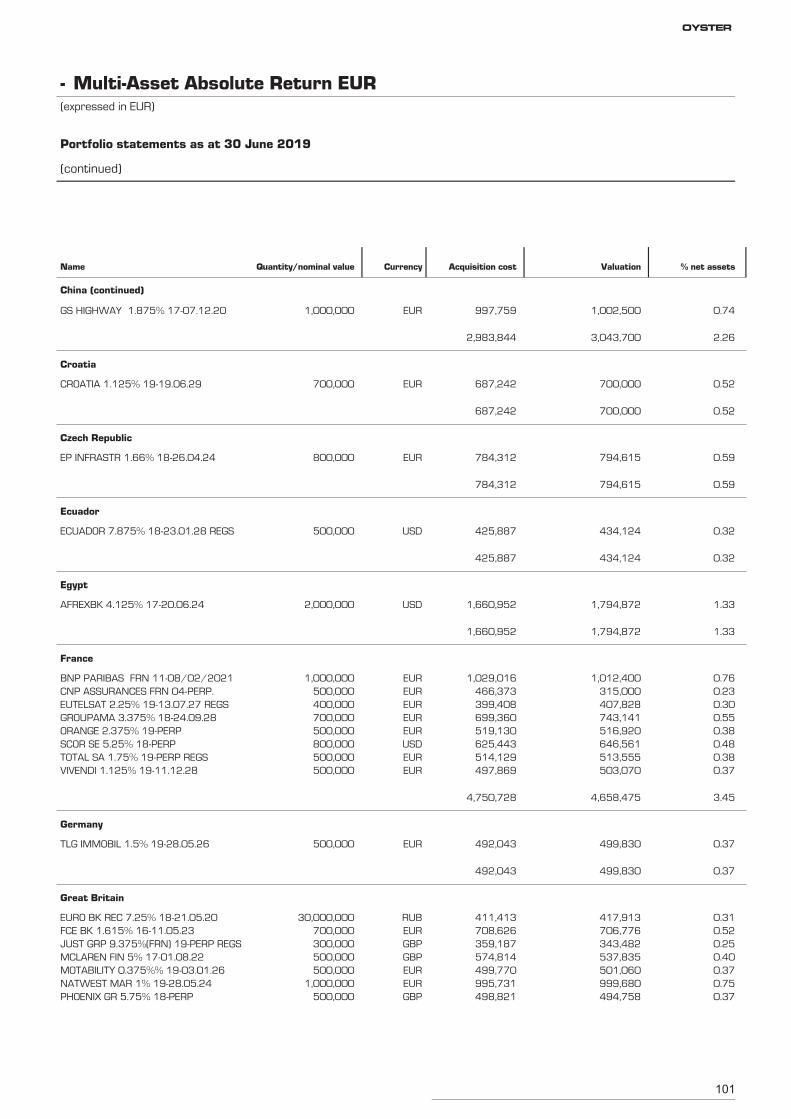
101
GS HIGHWAY 1.875% 17-07.12.20 1,000,000 1,002,500 0.74EUR 997,759
China (continued)
3,043,700 2.262,983,844
CROATIA 1.125% 19-19.06.29 700,000 700,000 0.52EUR 687,242
Croatia
700,000 0.52687,242
EP INFRASTR 1.66% 18-26.04.24 800,000 794,615 0.59EUR 784,312
Czech Republic
794,615 0.59784,312
ECUADOR 7.875% 18-23.01.28 REGS 500,000 434,124 0.32USD 425,887
Ecuador
434,124 0.32425,887
AFREXBK 4.125% 17-20.06.24 2,000,000 1,794,872 1.33USD 1,660,952
Egypt
1,794,872 1.331,660,952
BNP PARIBAS FRN 11-08/02/2021 1,000,000 1,012,400 0.76EUR 1,029,016
France
CNP ASSURANCES FRN 04-PERP. 500,000 315,000 0.23EUR 466,373EUTELSAT 2.25% 19-13.07.27 REGS 400,000 407,828 0.30EUR 399,408GROUPAMA 3.375% 18-24.09.28 700,000 743,141 0.55EUR 699,360ORANGE 2.375% 19-PERP 500,000 516,920 0.38EUR 519,130SCOR SE 5.25% 18-PERP 800,000 646,561 0.48USD 625,443TOTAL SA 1.75% 19-PERP REGS 500,000 513,555 0.38EUR 514,129VIVENDI 1.125% 19-11.12.28 500,000 503,070 0.37EUR 497,869
4,658,475 3.454,750,728
TLG IMMOBIL 1.5% 19-28.05.26 500,000 499,830 0.37EUR 492,043
Germany
499,830 0.37492,043
EURO BK REC 7.25% 18-21.05.20 30,000,000 417,913 0.31RUB 411,413
Great Britain
FCE BK 1.615% 16-11.05.23 700,000 706,776 0.52EUR 708,626JUST GRP 9.375%(FRN) 19-PERP REGS 300,000 343,482 0.25GBP 359,187MCLAREN FIN 5% 17-01.08.22 500,000 537,835 0.40GBP 574,814MOTABILITY 0.375%% 19-03.01.26 500,000 501,060 0.37EUR 499,770NATWEST MAR 1% 19-28.05.24 1,000,000 999,680 0.75EUR 995,731PHOENIX GR 5.75% 18-PERP 500,000 494,758 0.37GBP 498,821
Multi-Asset Absolute Return EUR-(expressed in EUR)
Portfolio statements as at 30 June 2019
(continued)
Name Quantity/nominal value Currency Acquisition cost Valuation % net assets
OYSTER
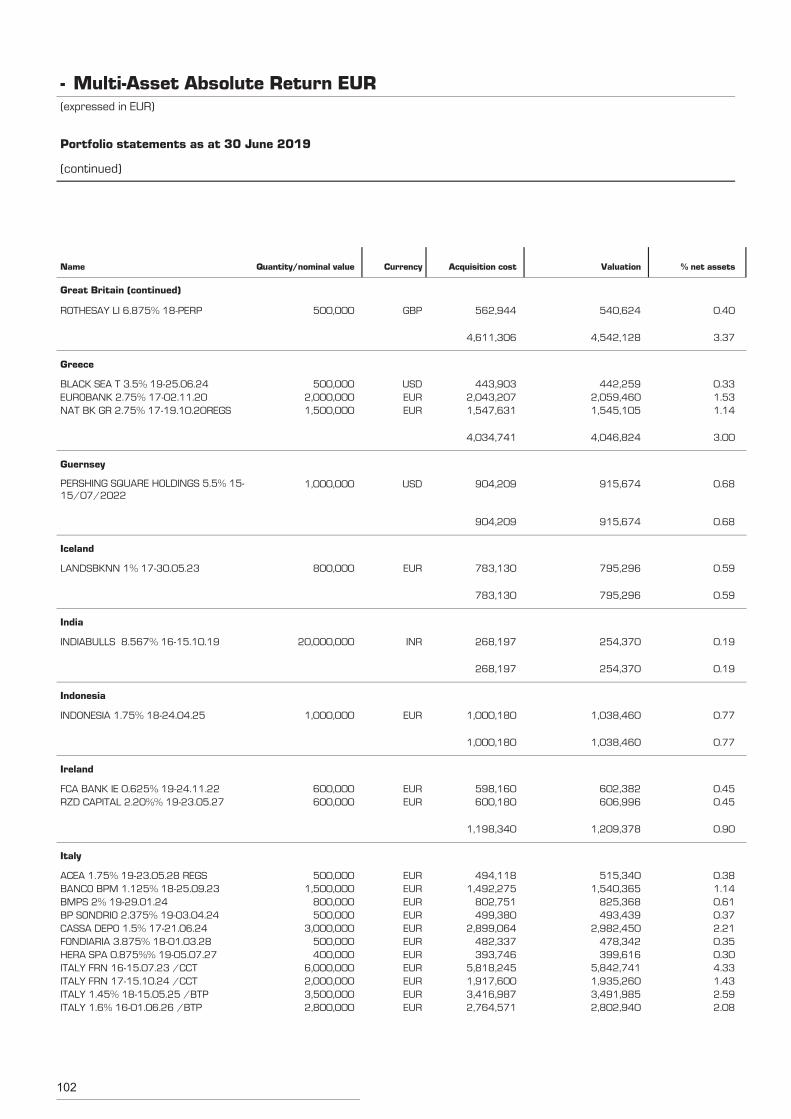
102
ROTHESAY LI 6.875% 18-PERP 500,000 540,624 0.40GBP 562,944
Great Britain (continued)
4,542,128 3.374,611,306
BLACK SEA T 3.5% 19-25.06.24 500,000 442,259 0.33USD 443,903
Greece
EUROBANK 2.75% 17-02.11.20 2,000,000 2,059,460 1.53EUR 2,043,207NAT BK GR 2.75% 17-19.10.20REGS 1,500,000 1,545,105 1.14EUR 1,547,631
4,046,824 3.004,034,741
PERSHING SQUARE HOLDINGS 5.5% 15-15/07/2022
1,000,000 915,674 0.68USD 904,209
Guernsey
915,674 0.68904,209
LANDSBKNN 1% 17-30.05.23 800,000 795,296 0.59EUR 783,130
Iceland
795,296 0.59783,130
INDIABULLS 8.567% 16-15.10.19 20,000,000 254,370 0.19INR 268,197
India
254,370 0.19268,197
INDONESIA 1.75% 18-24.04.25 1,000,000 1,038,460 0.77EUR 1,000,180
Indonesia
1,038,460 0.771,000,180
FCA BANK IE 0.625% 19-24.11.22 600,000 602,382 0.45EUR 598,160
Ireland
RZD CAPITAL 2.20%% 19-23.05.27 600,000 606,996 0.45EUR 600,180
1,209,378 0.901,198,340
ACEA 1.75% 19-23.05.28 REGS 500,000 515,340 0.38EUR 494,118
Italy
BANCO BPM 1.125% 18-25.09.23 1,500,000 1,540,365 1.14EUR 1,492,275BMPS 2% 19-29.01.24 800,000 825,368 0.61EUR 802,751BP SONDRIO 2.375% 19-03.04.24 500,000 493,439 0.37EUR 499,380CASSA DEPO 1.5% 17-21.06.24 3,000,000 2,982,450 2.21EUR 2,899,064FONDIARIA 3.875% 18-01.03.28 500,000 478,342 0.35EUR 482,337HERA SPA 0.875%% 19-05.07.27 400,000 399,616 0.30EUR 393,746ITALY FRN 16-15.07.23 /CCT 6,000,000 5,842,741 4.33EUR 5,818,245ITALY FRN 17-15.10.24 /CCT 2,000,000 1,935,260 1.43EUR 1,917,600ITALY 1.45% 18-15.05.25 /BTP 3,500,000 3,491,985 2.59EUR 3,416,987ITALY 1.6% 16-01.06.26 /BTP 2,800,000 2,802,940 2.08EUR 2,764,571
Multi-Asset Absolute Return EUR-(expressed in EUR)
Portfolio statements as at 30 June 2019
(continued)
Name Quantity/nominal value Currency Acquisition cost Valuation % net assets
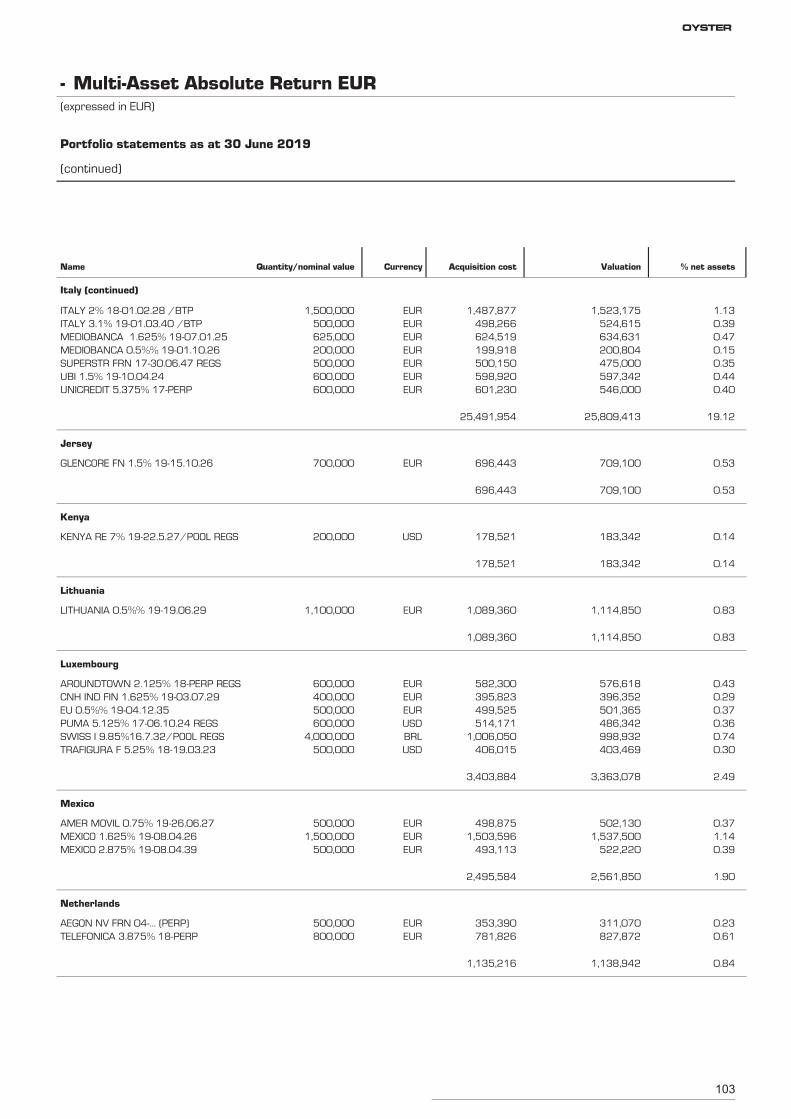
103
ITALY 2% 18-01.02.28 /BTP 1,500,000 1,523,175 1.13EUR 1,487,877
Italy (continued)
ITALY 3.1% 19-01.03.40 /BTP 500,000 524,615 0.39EUR 498,266MEDIOBANCA 1.625% 19-07.01.25 625,000 634,631 0.47EUR 624,519MEDIOBANCA 0.5%% 19-01.10.26 200,000 200,804 0.15EUR 199,918SUPERSTR FRN 17-30.06.47 REGS 500,000 475,000 0.35EUR 500,150UBI 1.5% 19-10.04.24 600,000 597,342 0.44EUR 598,920UNICREDIT 5.375% 17-PERP 600,000 546,000 0.40EUR 601,230
25,809,413 19.1225,491,954
GLENCORE FN 1.5% 19-15.10.26 700,000 709,100 0.53EUR 696,443
Jersey
709,100 0.53696,443
KENYA RE 7% 19-22.5.27/POOL REGS 200,000 183,342 0.14USD 178,521
Kenya
183,342 0.14178,521
LITHUANIA 0.5%% 19-19.06.29 1,100,000 1,114,850 0.83EUR 1,089,360
Lithuania
1,114,850 0.831,089,360
AROUNDTOWN 2.125% 18-PERP REGS 600,000 576,618 0.43EUR 582,300
Luxembourg
CNH IND FIN 1.625% 19-03.07.29 400,000 396,352 0.29EUR 395,823EU 0.5%% 19-04.12.35 500,000 501,365 0.37EUR 499,525PUMA 5.125% 17-06.10.24 REGS 600,000 486,342 0.36USD 514,171SWISS I 9.85%16.7.32/POOL REGS 4,000,000 998,932 0.74BRL 1,006,050TRAFIGURA F 5.25% 18-19.03.23 500,000 403,469 0.30USD 406,015
3,363,078 2.493,403,884
AMER MOVIL 0.75% 19-26.06.27 500,000 502,130 0.37EUR 498,875
Mexico
MEXICO 1.625% 19-08.04.26 1,500,000 1,537,500 1.14EUR 1,503,596MEXICO 2.875% 19-08.04.39 500,000 522,220 0.39EUR 493,113
2,561,850 1.902,495,584
AEGON NV FRN 04-... (PERP) 500,000 311,070 0.23EUR 353,390
Netherlands
TELEFONICA 3.875% 18-PERP 800,000 827,872 0.61EUR 781,826
1,138,942 0.841,135,216
Multi-Asset Absolute Return EUR-(expressed in EUR)
Portfolio statements as at 30 June 2019
(continued)
Name Quantity/nominal value Currency Acquisition cost Valuation % net assets
OYSTER
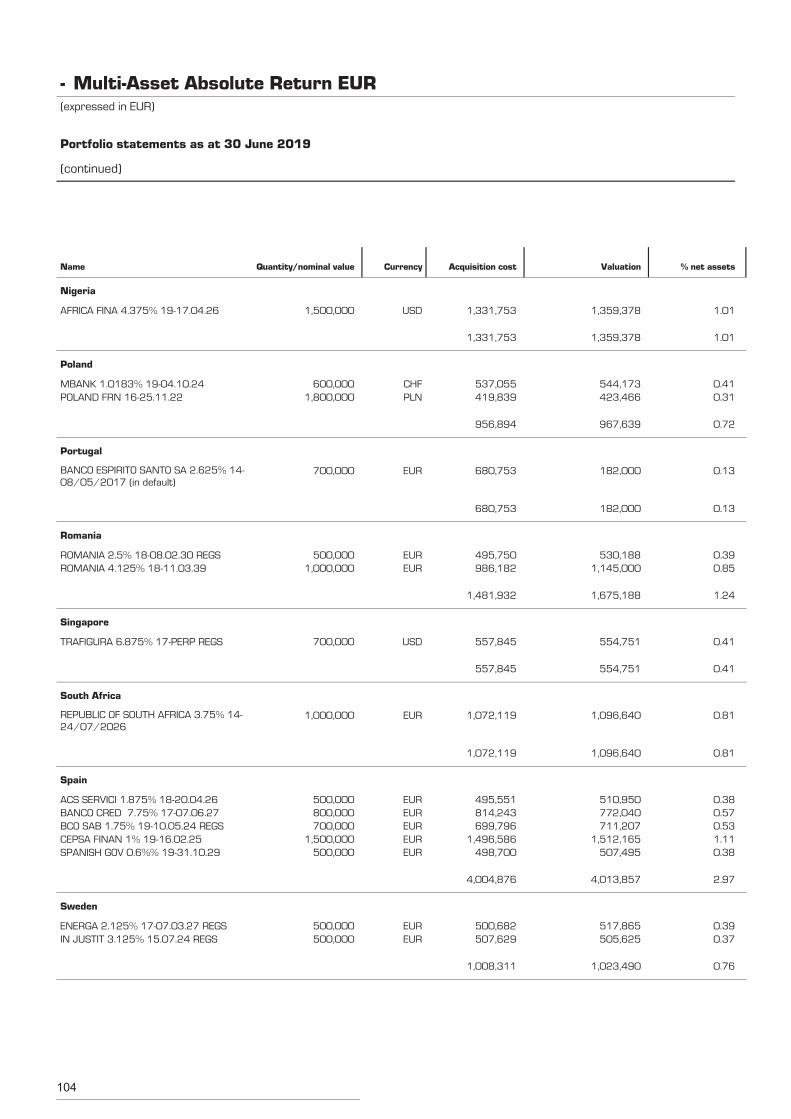
104
AFRICA FINA 4.375% 19-17.04.26 1,500,000 1,359,378 1.01USD 1,331,753
Nigeria
1,359,378 1.011,331,753
MBANK 1.0183% 19-04.10.24 600,000 544,173 0.41CHF 537,055
Poland
POLAND FRN 16-25.11.22 1,800,000 423,466 0.31PLN 419,839
967,639 0.72956,894
BANCO ESPIRITO SANTO SA 2.625% 14-08/05/2017 (in default)
700,000 182,000 0.13EUR 680,753
Portugal
182,000 0.13680,753
ROMANIA 2.5% 18-08.02.30 REGS 500,000 530,188 0.39EUR 495,750
Romania
ROMANIA 4.125% 18-11.03.39 1,000,000 1,145,000 0.85EUR 986,182
1,675,188 1.241,481,932
TRAFIGURA 6.875% 17-PERP REGS 700,000 554,751 0.41USD 557,845
Singapore
554,751 0.41557,845
REPUBLIC OF SOUTH AFRICA 3.75% 14-24/07/2026
1,000,000 1,096,640 0.81EUR 1,072,119
South Africa
1,096,640 0.811,072,119
ACS SERVICI 1.875% 18-20.04.26 500,000 510,950 0.38EUR 495,551
Spain
BANCO CRED 7.75% 17-07.06.27 800,000 772,040 0.57EUR 814,243BCO SAB 1.75% 19-10.05.24 REGS 700,000 711,207 0.53EUR 699,796CEPSA FINAN 1% 19-16.02.25 1,500,000 1,512,165 1.11EUR 1,496,586SPANISH GOV 0.6%% 19-31.10.29 500,000 507,495 0.38EUR 498,700
4,013,857 2.974,004,876
ENERGA 2.125% 17-07.03.27 REGS 500,000 517,865 0.39EUR 500,682
Sweden
IN JUSTIT 3.125% 15.07.24 REGS 500,000 505,625 0.37EUR 507,629
1,023,490 0.761,008,311
Multi-Asset Absolute Return EUR-(expressed in EUR)
Portfolio statements as at 30 June 2019
(continued)
Name Quantity/nominal value Currency Acquisition cost Valuation % net assets
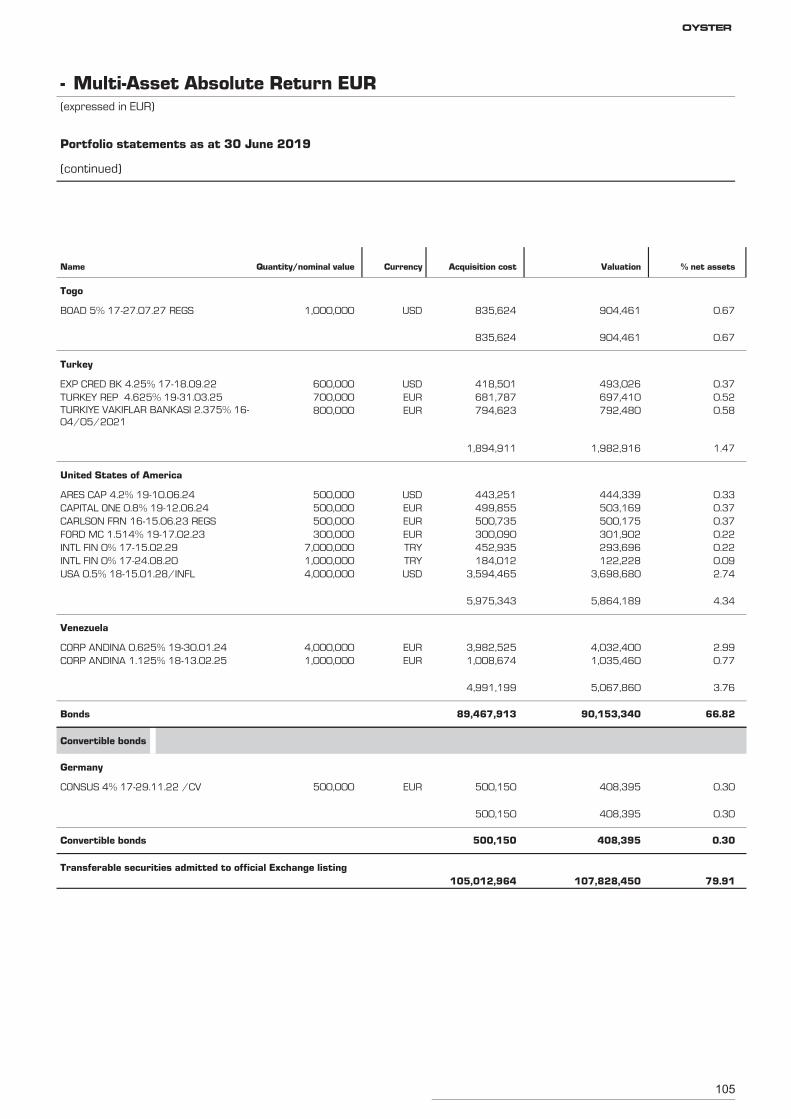
105
BOAD 5% 17-27.07.27 REGS 1,000,000 904,461 0.67USD 835,624
Togo
904,461 0.67835,624
EXP CRED BK 4.25% 17-18.09.22 600,000 493,026 0.37USD 418,501
Turkey
TURKEY REP 4.625% 19-31.03.25 700,000 697,410 0.52EUR 681,787TURKIYE VAKIFLAR BANKASI 2.375% 16-04/05/2021
800,000 792,480 0.58EUR 794,623
1,982,916 1.471,894,911
ARES CAP 4.2% 19-10.06.24 500,000 444,339 0.33USD 443,251
United States of America
CAPITAL ONE 0.8% 19-12.06.24 500,000 503,169 0.37EUR 499,855CARLSON FRN 16-15.06.23 REGS 500,000 500,175 0.37EUR 500,735FORD MC 1.514% 19-17.02.23 300,000 301,902 0.22EUR 300,090INTL FIN 0% 17-15.02.29 7,000,000 293,696 0.22TRY 452,935INTL FIN 0% 17-24.08.20 1,000,000 122,228 0.09TRY 184,012USA 0.5% 18-15.01.28/INFL 4,000,000 3,698,680 2.74USD 3,594,465
5,864,189 4.345,975,343
CORP ANDINA 0.625% 19-30.01.24 4,000,000 4,032,400 2.99EUR 3,982,525
Venezuela
CORP ANDINA 1.125% 18-13.02.25 1,000,000 1,035,460 0.77EUR 1,008,674
5,067,860 3.764,991,199
Bonds 90,153,340 66.8289,467,913
CONSUS 4% 17-29.11.22 /CV 500,000 408,395 0.30EUR 500,150
Convertible bonds
Germany
408,395 0.30500,150
Convertible bonds 408,395 0.30500,150
Transferable securities admitted to official Exchange listing107,828,450 79.91105,012,964
Multi-Asset Absolute Return EUR-(expressed in EUR)
Portfolio statements as at 30 June 2019
(continued)
Name Quantity/nominal value Currency Acquisition cost Valuation % net assets
OYSTER
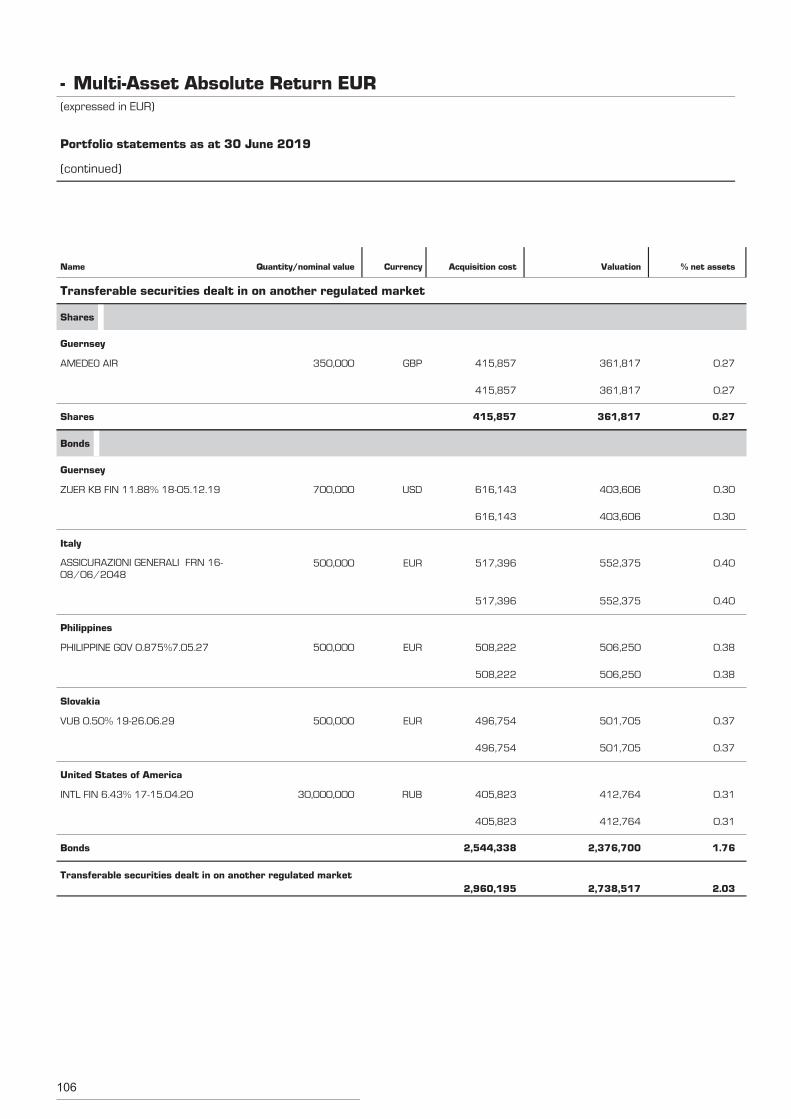
106
AMEDEO AIR 350,000 361,817 0.27GBP 415,857
Transferable securities dealt in on another regulated market
Shares
Guernsey
361,817 0.27415,857
Shares 361,817 0.27415,857
ZUER KB FIN 11.88% 18-05.12.19 700,000 403,606 0.30USD 616,143
Bonds
Guernsey
403,606 0.30616,143
ASSICURAZIONI GENERALI FRN 16-08/06/2048
500,000 552,375 0.40EUR 517,396
Italy
552,375 0.40517,396
PHILIPPINE GOV 0.875%7.05.27 500,000 506,250 0.38EUR 508,222
Philippines
506,250 0.38508,222
VUB 0.50% 19-26.06.29 500,000 501,705 0.37EUR 496,754
Slovakia
501,705 0.37496,754
INTL FIN 6.43% 17-15.04.20 30,000,000 412,764 0.31RUB 405,823
United States of America
412,764 0.31405,823
Bonds 2,376,700 1.762,544,338
Transferable securities dealt in on another regulated market2,738,517 2.032,960,195
Multi-Asset Absolute Return EUR-(expressed in EUR)
Portfolio statements as at 30 June 2019
(continued)
Name Quantity/nominal value Currency Acquisition cost Valuation % net assets
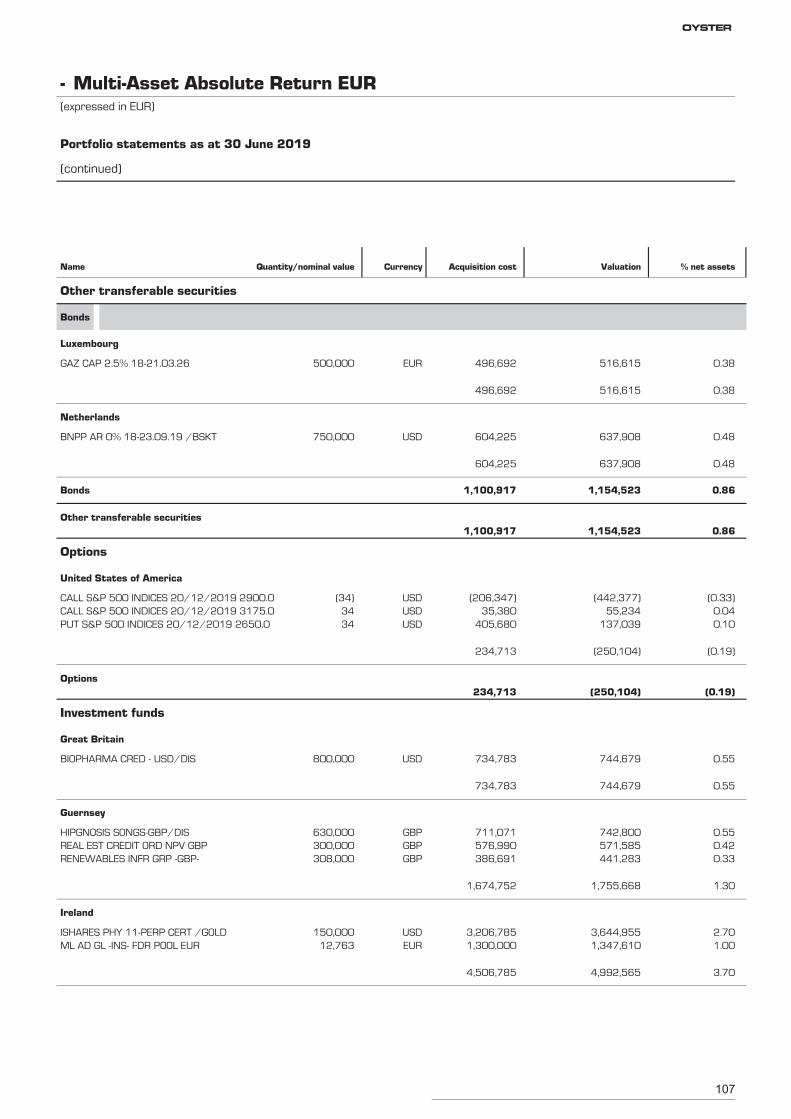
107
GAZ CAP 2.5% 18-21.03.26 500,000 516,615 0.38EUR 496,692
Other transferable securities
Bonds
Luxembourg
516,615 0.38496,692
BNPP AR 0% 18-23.09.19 /BSKT 750,000 637,908 0.48USD 604,225
Netherlands
637,908 0.48604,225
Bonds 1,154,523 0.861,100,917
Other transferable securities1,154,523 0.861,100,917
CALL S&P 500 INDICES 20/12/2019 2900.0 (34) (442,377) (0.33)USD (206,347)
Options
United States of America
CALL S&P 500 INDICES 20/12/2019 3175.0 34 55,234 0.04USD 35,380PUT S&P 500 INDICES 20/12/2019 2650.0 34 137,039 0.10USD 405,680
(250,104) (0.19)234,713
Options(250,104) (0.19)234,713
BIOPHARMA CRED - USD/DIS 800,000 744,679 0.55USD 734,783
Investment funds
Great Britain
744,679 0.55734,783
HIPGNOSIS SONGS-GBP/DIS 630,000 742,800 0.55GBP 711,071
Guernsey
REAL EST CREDIT ORD NPV GBP 300,000 571,585 0.42GBP 576,990RENEWABLES INFR GRP -GBP- 308,000 441,283 0.33GBP 386,691
1,755,668 1.301,674,752
ISHARES PHY 11-PERP CERT /GOLD 150,000 3,644,955 2.70USD 3,206,785
Ireland
ML AD GL -INS- FDR POOL EUR 12,763 1,347,610 1.00EUR 1,300,000
4,992,565 3.704,506,785
Multi-Asset Absolute Return EUR-(expressed in EUR)
Portfolio statements as at 30 June 2019
(continued)
Name Quantity/nominal value Currency Acquisition cost Valuation % net assets
OYSTER
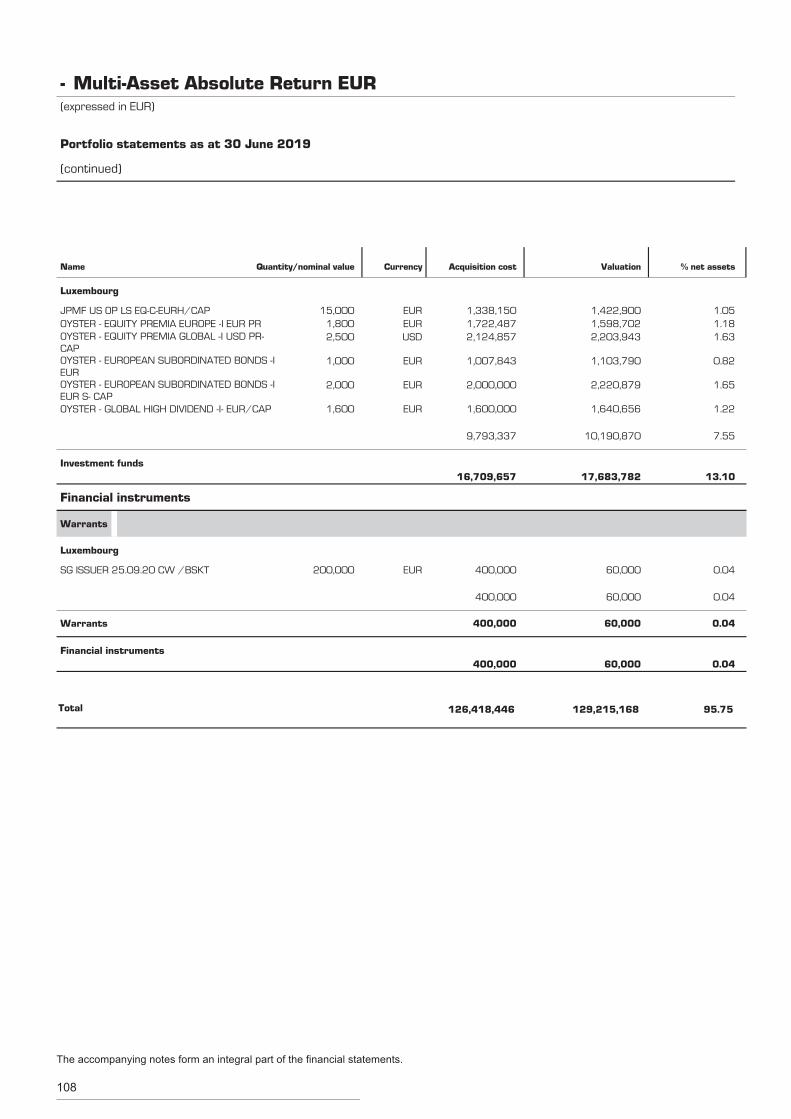
108
JPMF US OP LS EQ-C-EURH/CAP 15,000 1,422,900 1.05EUR 1,338,150
Luxembourg
OYSTER - EQUITY PREMIA EUROPE -I EUR PR 1,800 1,598,702 1.18EUR 1,722,487OYSTER - EQUITY PREMIA GLOBAL -I USD PR-CAP
2,500 2,203,943 1.63USD 2,124,857
OYSTER - EUROPEAN SUBORDINATED BONDS -IEUR
1,000 1,103,790 0.82EUR 1,007,843
OYSTER - EUROPEAN SUBORDINATED BONDS -IEUR S- CAP
2,000 2,220,879 1.65EUR 2,000,000
OYSTER - GLOBAL HIGH DIVIDEND -I- EUR/CAP 1,600 1,640,656 1.22EUR 1,600,000
10,190,870 7.559,793,337
Investment funds17,683,782 13.1016,709,657
SG ISSUER 25.09.20 CW /BSKT 200,000 60,000 0.04EUR 400,000
Financial instruments
Warrants
Luxembourg
60,000 0.04400,000
Warrants 60,000 0.04400,000
Financial instruments60,000 0.04400,000
Total 129,215,168 95.75126,418,446
Multi-Asset Absolute Return EUR-(expressed in EUR)
Portfolio statements as at 30 June 2019
(continued)
Name Quantity/nominal value Currency Acquisition cost Valuation % net assets
The accompanying notes form an integral part of the financial statements.
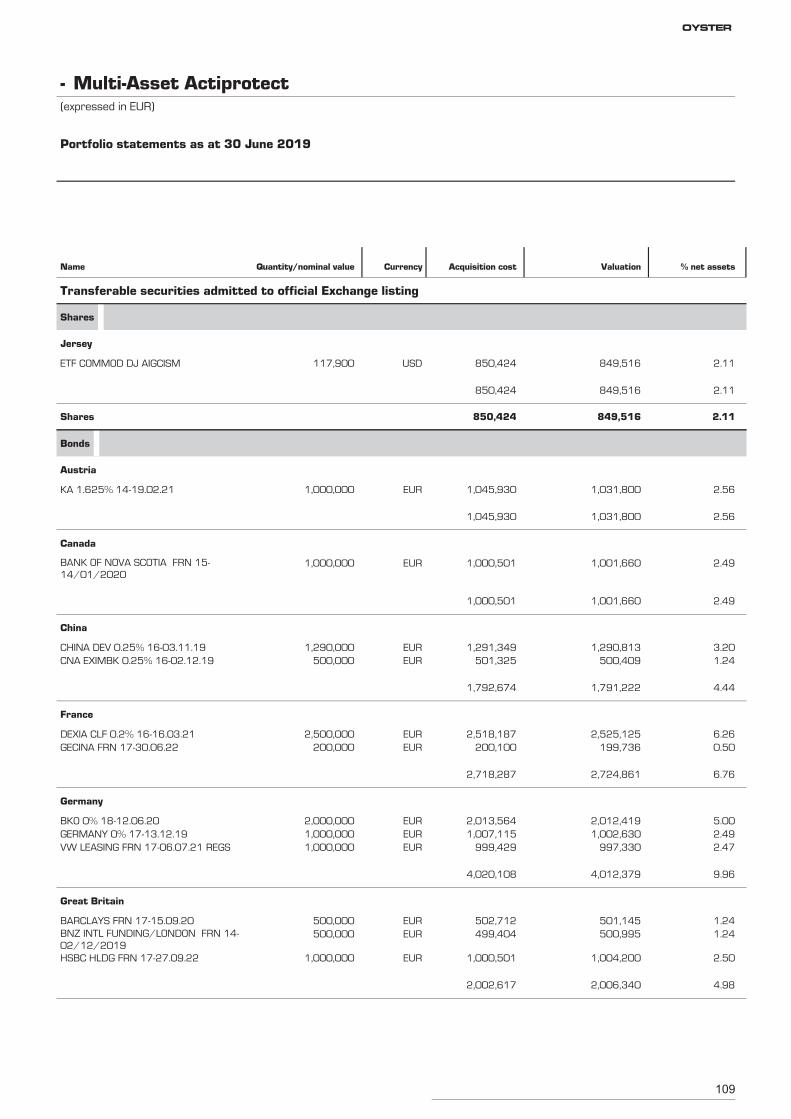
109
ETF COMMOD DJ AIGCISM 117,900 849,516 2.11USD 850,424
Transferable securities admitted to official Exchange listing
Shares
Jersey
849,516 2.11850,424
Shares 849,516 2.11850,424
KA 1.625% 14-19.02.21 1,000,000 1,031,800 2.56EUR 1,045,930
Bonds
Austria
1,031,800 2.561,045,930
BANK OF NOVA SCOTIA FRN 15-14/01/2020
1,000,000 1,001,660 2.49EUR 1,000,501
Canada
1,001,660 2.491,000,501
CHINA DEV 0.25% 16-03.11.19 1,290,000 1,290,813 3.20EUR 1,291,349
China
CNA EXIMBK 0.25% 16-02.12.19 500,000 500,409 1.24EUR 501,325
1,791,222 4.441,792,674
DEXIA CLF 0.2% 16-16.03.21 2,500,000 2,525,125 6.26EUR 2,518,187
France
GECINA FRN 17-30.06.22 200,000 199,736 0.50EUR 200,100
2,724,861 6.762,718,287
BKO 0% 18-12.06.20 2,000,000 2,012,419 5.00EUR 2,013,564
Germany
GERMANY 0% 17-13.12.19 1,000,000 1,002,630 2.49EUR 1,007,115VW LEASING FRN 17-06.07.21 REGS 1,000,000 997,330 2.47EUR 999,429
4,012,379 9.964,020,108
BARCLAYS FRN 17-15.09.20 500,000 501,145 1.24EUR 502,712
Great Britain
BNZ INTL FUNDING/LONDON FRN 14-02/12/2019
500,000 500,995 1.24EUR 499,404
HSBC HLDG FRN 17-27.09.22 1,000,000 1,004,200 2.50EUR 1,000,501
2,006,340 4.982,002,617
Multi-Asset Actiprotect-(expressed in EUR)
Portfolio statements as at 30 June 2019
Name Quantity/nominal value Currency Acquisition cost Valuation % net assets
OYSTER
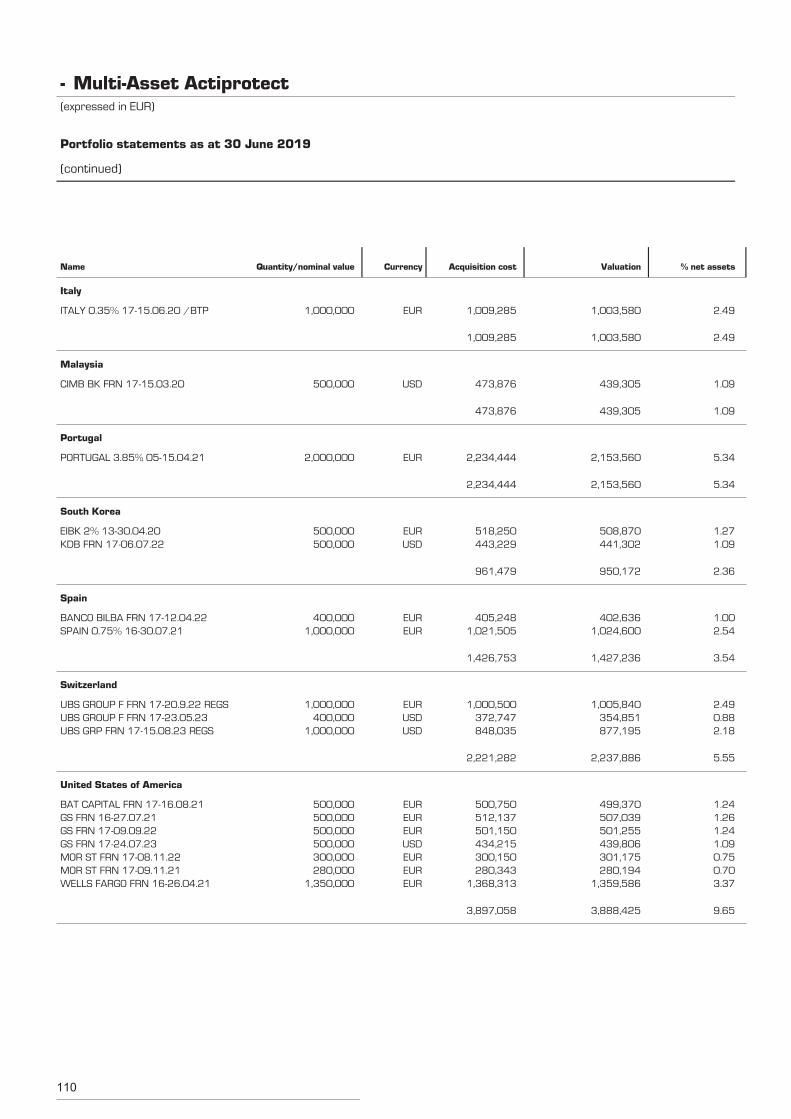
110
ITALY 0.35% 17-15.06.20 /BTP 1,000,000 1,003,580 2.49EUR 1,009,285
Italy
1,003,580 2.491,009,285
CIMB BK FRN 17-15.03.20 500,000 439,305 1.09USD 473,876
Malaysia
439,305 1.09473,876
PORTUGAL 3.85% 05-15.04.21 2,000,000 2,153,560 5.34EUR 2,234,444
Portugal
2,153,560 5.342,234,444
EIBK 2% 13-30.04.20 500,000 508,870 1.27EUR 518,250
South Korea
KDB FRN 17-06.07.22 500,000 441,302 1.09USD 443,229
950,172 2.36961,479
BANCO BILBA FRN 17-12.04.22 400,000 402,636 1.00EUR 405,248
Spain
SPAIN 0.75% 16-30.07.21 1,000,000 1,024,600 2.54EUR 1,021,505
1,427,236 3.541,426,753
UBS GROUP F FRN 17-20.9.22 REGS 1,000,000 1,005,840 2.49EUR 1,000,500
Switzerland
UBS GROUP F FRN 17-23.05.23 400,000 354,851 0.88USD 372,747UBS GRP FRN 17-15.08.23 REGS 1,000,000 877,195 2.18USD 848,035
2,237,886 5.552,221,282
BAT CAPITAL FRN 17-16.08.21 500,000 499,370 1.24EUR 500,750
United States of America
GS FRN 16-27.07.21 500,000 507,039 1.26EUR 512,137GS FRN 17-09.09.22 500,000 501,255 1.24EUR 501,150GS FRN 17-24.07.23 500,000 439,806 1.09USD 434,215MOR ST FRN 17-08.11.22 300,000 301,175 0.75EUR 300,150MOR ST FRN 17-09.11.21 280,000 280,194 0.70EUR 280,343WELLS FARGO FRN 16-26.04.21 1,350,000 1,359,586 3.37EUR 1,368,313
3,888,425 9.653,897,058
Multi-Asset Actiprotect-(expressed in EUR)
Portfolio statements as at 30 June 2019
(continued)
Name Quantity/nominal value Currency Acquisition cost Valuation % net assets
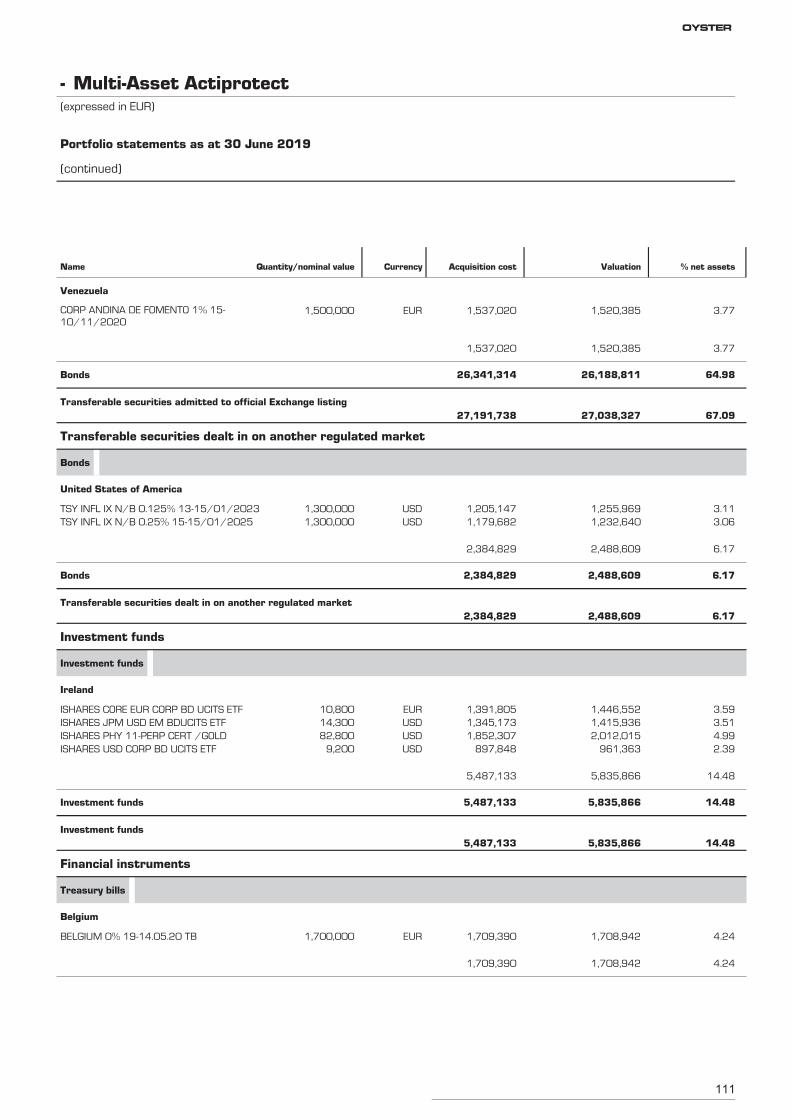
111
CORP ANDINA DE FOMENTO 1% 15-10/11/2020
1,500,000 1,520,385 3.77EUR 1,537,020
Venezuela
1,520,385 3.771,537,020
Bonds 26,188,811 64.9826,341,314
Transferable securities admitted to official Exchange listing27,038,327 67.0927,191,738
TSY INFL IX N/B 0.125% 13-15/01/2023 1,300,000 1,255,969 3.11USD 1,205,147
Transferable securities dealt in on another regulated market
Bonds
United States of America
TSY INFL IX N/B 0.25% 15-15/01/2025 1,300,000 1,232,640 3.06USD 1,179,682
2,488,609 6.172,384,829
Bonds 2,488,609 6.172,384,829
Transferable securities dealt in on another regulated market2,488,609 6.172,384,829
ISHARES CORE EUR CORP BD UCITS ETF 10,800 1,446,552 3.59EUR 1,391,805
Investment funds
Investment funds
Ireland
ISHARES JPM USD EM BDUCITS ETF 14,300 1,415,936 3.51USD 1,345,173ISHARES PHY 11-PERP CERT /GOLD 82,800 2,012,015 4.99USD 1,852,307ISHARES USD CORP BD UCITS ETF 9,200 961,363 2.39USD 897,848
5,835,866 14.485,487,133
Investment funds 5,835,866 14.485,487,133
Investment funds5,835,866 14.485,487,133
BELGIUM 0% 19-14.05.20 TB 1,700,000 1,708,942 4.24EUR 1,709,390
Financial instruments
Treasury bills
Belgium
1,708,942 4.241,709,390
Multi-Asset Actiprotect-(expressed in EUR)
Portfolio statements as at 30 June 2019
(continued)
Name Quantity/nominal value Currency Acquisition cost Valuation % net assets
OYSTER
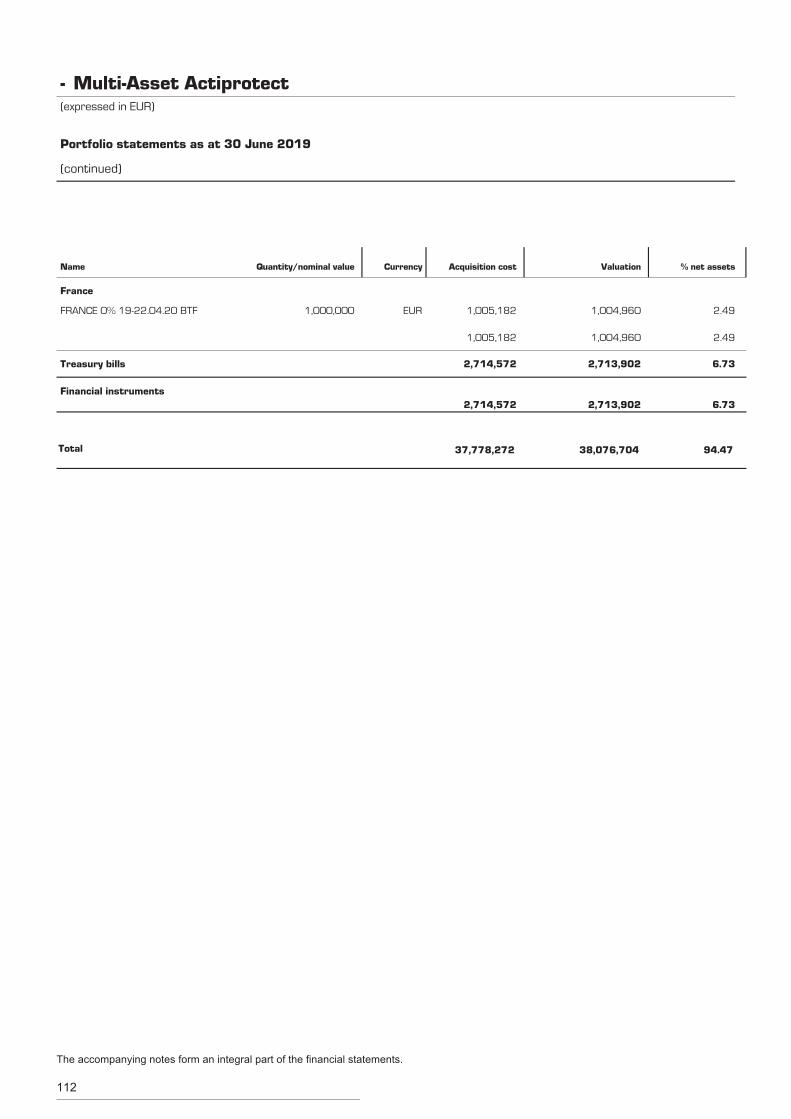
112
FRANCE 0% 19-22.04.20 BTF 1,000,000 1,004,960 2.49EUR 1,005,182
France
1,004,960 2.491,005,182
Treasury bills 2,713,902 6.732,714,572
Financial instruments2,713,902 6.732,714,572
Total 38,076,704 94.4737,778,272
Multi-Asset Actiprotect-(expressed in EUR)
Portfolio statements as at 30 June 2019
(continued)
Name Quantity/nominal value Currency Acquisition cost Valuation % net assets
The accompanying notes form an integral part of the financial statements.
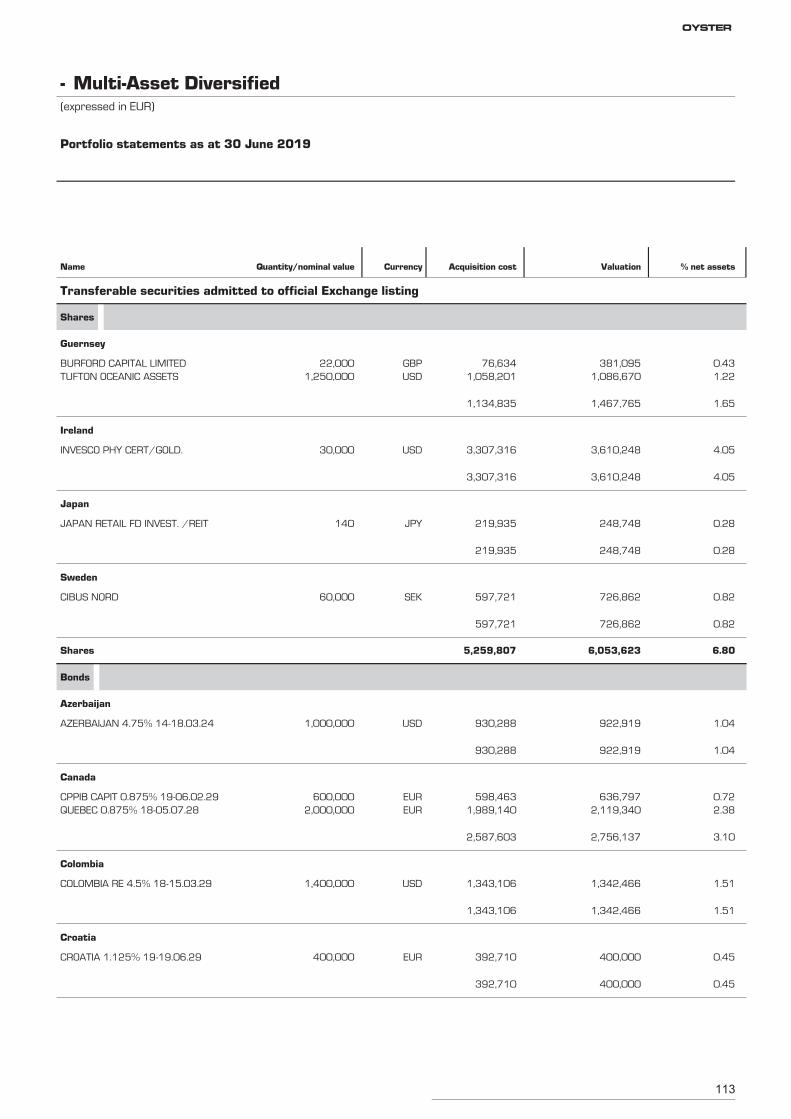
113
BURFORD CAPITAL LIMITED 22,000 381,095 0.43GBP 76,634
Transferable securities admitted to official Exchange listing
Shares
Guernsey
TUFTON OCEANIC ASSETS 1,250,000 1,086,670 1.22USD 1,058,201
1,467,765 1.651,134,835
INVESCO PHY CERT/GOLD. 30,000 3,610,248 4.05USD 3,307,316
Ireland
3,610,248 4.053,307,316
JAPAN RETAIL FD INVEST. /REIT 140 248,748 0.28JPY 219,935
Japan
248,748 0.28219,935
CIBUS NORD 60,000 726,862 0.82SEK 597,721
Sweden
726,862 0.82597,721
Shares 6,053,623 6.805,259,807
AZERBAIJAN 4.75% 14-18.03.24 1,000,000 922,919 1.04USD 930,288
Bonds
Azerbaijan
922,919 1.04930,288
CPPIB CAPIT 0.875% 19-06.02.29 600,000 636,797 0.72EUR 598,463
Canada
QUEBEC 0.875% 18-05.07.28 2,000,000 2,119,340 2.38EUR 1,989,140
2,756,137 3.102,587,603
COLOMBIA RE 4.5% 18-15.03.29 1,400,000 1,342,466 1.51USD 1,343,106
Colombia
1,342,466 1.511,343,106
CROATIA 1.125% 19-19.06.29 400,000 400,000 0.45EUR 392,710
Croatia
400,000 0.45392,710
Multi-Asset Diversified-(expressed in EUR)
Portfolio statements as at 30 June 2019
Name Quantity/nominal value Currency Acquisition cost Valuation % net assets
OYSTER
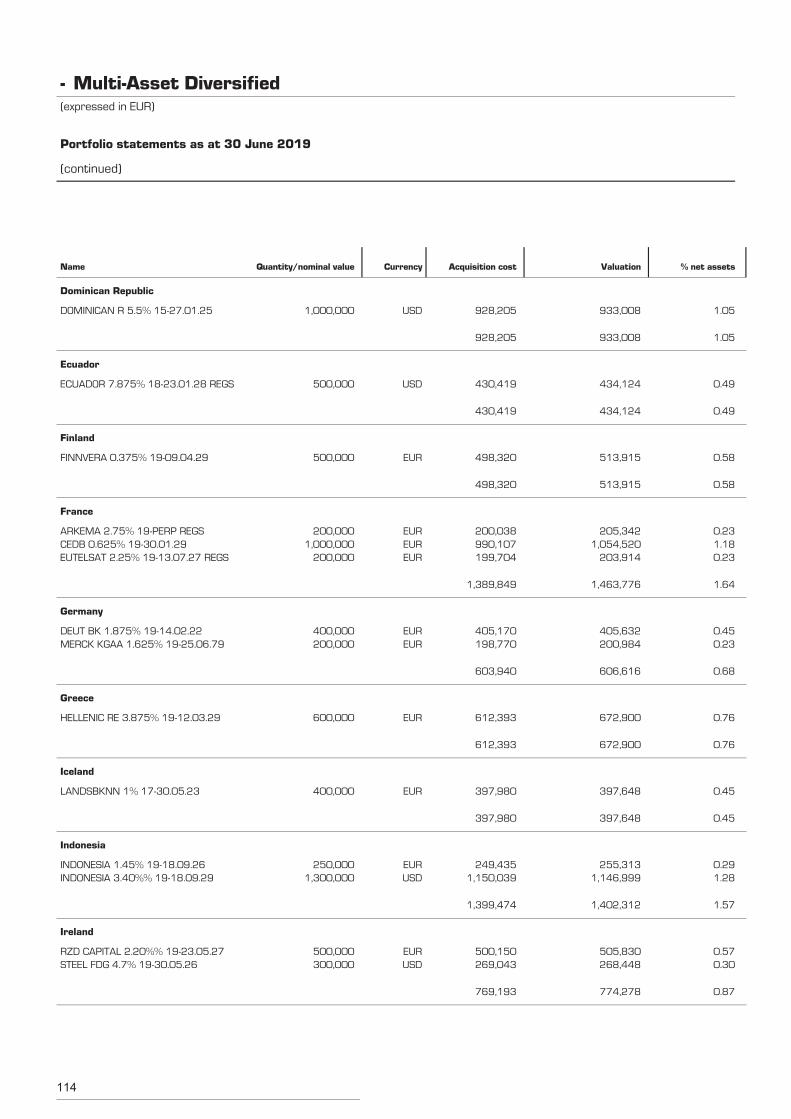
114
DOMINICAN R 5.5% 15-27.01.25 1,000,000 933,008 1.05USD 928,205
Dominican Republic
933,008 1.05928,205
ECUADOR 7.875% 18-23.01.28 REGS 500,000 434,124 0.49USD 430,419
Ecuador
434,124 0.49430,419
FINNVERA 0.375% 19-09.04.29 500,000 513,915 0.58EUR 498,320
Finland
513,915 0.58498,320
ARKEMA 2.75% 19-PERP REGS 200,000 205,342 0.23EUR 200,038
France
CEDB 0.625% 19-30.01.29 1,000,000 1,054,520 1.18EUR 990,107EUTELSAT 2.25% 19-13.07.27 REGS 200,000 203,914 0.23EUR 199,704
1,463,776 1.641,389,849
DEUT BK 1.875% 19-14.02.22 400,000 405,632 0.45EUR 405,170
Germany
MERCK KGAA 1.625% 19-25.06.79 200,000 200,984 0.23EUR 198,770
606,616 0.68603,940
HELLENIC RE 3.875% 19-12.03.29 600,000 672,900 0.76EUR 612,393
Greece
672,900 0.76612,393
LANDSBKNN 1% 17-30.05.23 400,000 397,648 0.45EUR 397,980
Iceland
397,648 0.45397,980
INDONESIA 1.45% 19-18.09.26 250,000 255,313 0.29EUR 249,435
Indonesia
INDONESIA 3.40%% 19-18.09.29 1,300,000 1,146,999 1.28USD 1,150,039
1,402,312 1.571,399,474
RZD CAPITAL 2.20%% 19-23.05.27 500,000 505,830 0.57EUR 500,150
Ireland
STEEL FDG 4.7% 19-30.05.26 300,000 268,448 0.30USD 269,043
774,278 0.87769,193
Multi-Asset Diversified-(expressed in EUR)
Portfolio statements as at 30 June 2019
(continued)
Name Quantity/nominal value Currency Acquisition cost Valuation % net assets
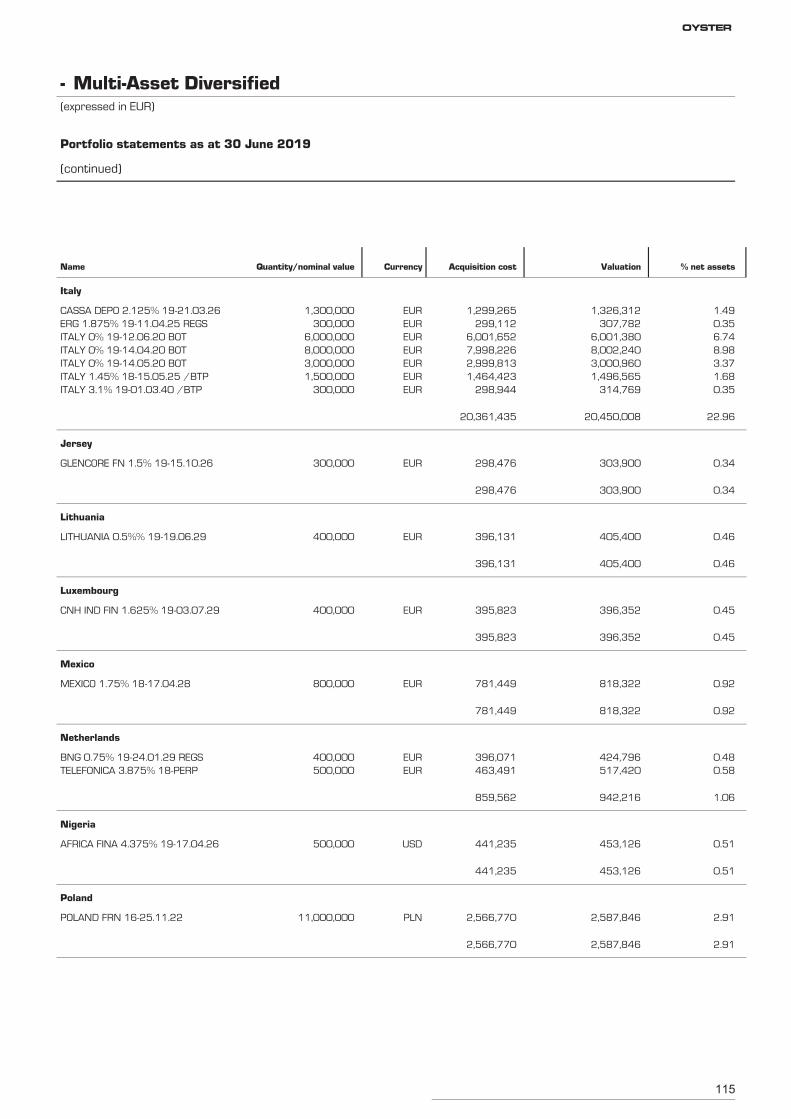
115
CASSA DEPO 2.125% 19-21.03.26 1,300,000 1,326,312 1.49EUR 1,299,265
Italy
ERG 1.875% 19-11.04.25 REGS 300,000 307,782 0.35EUR 299,112ITALY 0% 19-12.06.20 BOT 6,000,000 6,001,380 6.74EUR 6,001,652ITALY 0% 19-14.04.20 BOT 8,000,000 8,002,240 8.98EUR 7,998,226ITALY 0% 19-14.05.20 BOT 3,000,000 3,000,960 3.37EUR 2,999,813ITALY 1.45% 18-15.05.25 /BTP 1,500,000 1,496,565 1.68EUR 1,464,423ITALY 3.1% 19-01.03.40 /BTP 300,000 314,769 0.35EUR 298,944
20,450,008 22.9620,361,435
GLENCORE FN 1.5% 19-15.10.26 300,000 303,900 0.34EUR 298,476
Jersey
303,900 0.34298,476
LITHUANIA 0.5%% 19-19.06.29 400,000 405,400 0.46EUR 396,131
Lithuania
405,400 0.46396,131
CNH IND FIN 1.625% 19-03.07.29 400,000 396,352 0.45EUR 395,823
Luxembourg
396,352 0.45395,823
MEXICO 1.75% 18-17.04.28 800,000 818,322 0.92EUR 781,449
Mexico
818,322 0.92781,449
BNG 0.75% 19-24.01.29 REGS 400,000 424,796 0.48EUR 396,071
Netherlands
TELEFONICA 3.875% 18-PERP 500,000 517,420 0.58EUR 463,491
942,216 1.06859,562
AFRICA FINA 4.375% 19-17.04.26 500,000 453,126 0.51USD 441,235
Nigeria
453,126 0.51441,235
POLAND FRN 16-25.11.22 11,000,000 2,587,846 2.91PLN 2,566,770
Poland
2,587,846 2.912,566,770
Multi-Asset Diversified-(expressed in EUR)
Portfolio statements as at 30 June 2019
(continued)
Name Quantity/nominal value Currency Acquisition cost Valuation % net assets
OYSTER
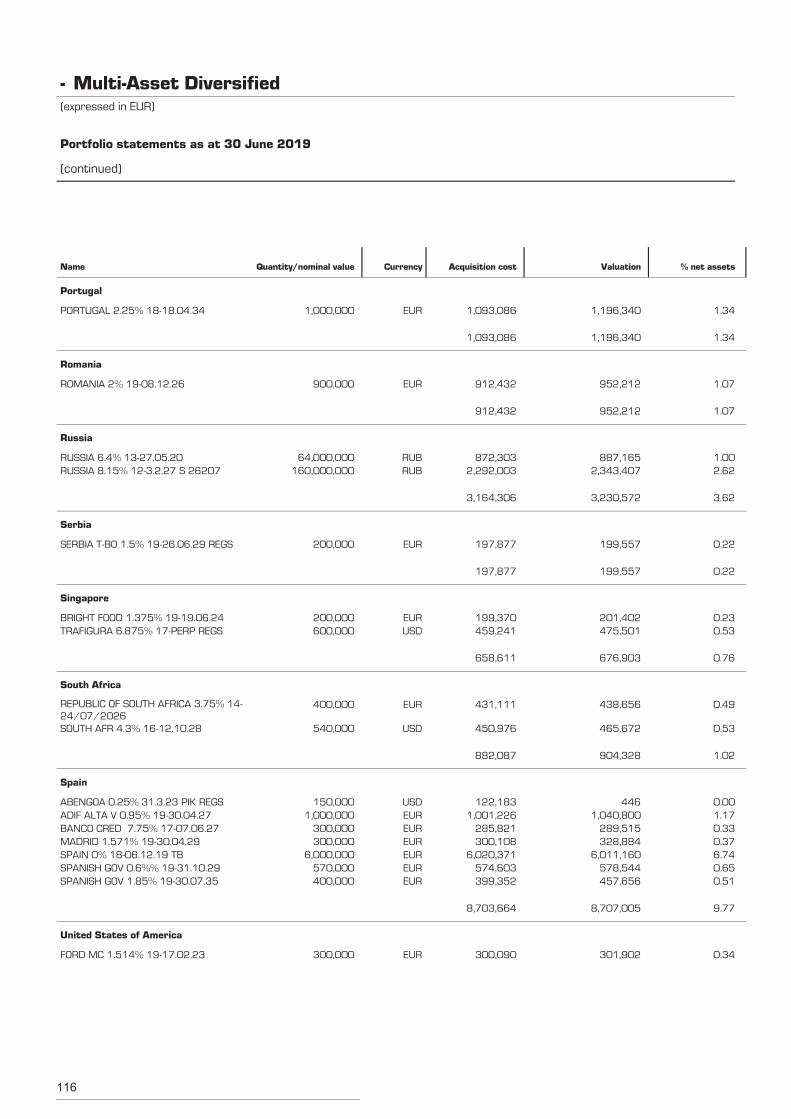
116
PORTUGAL 2.25% 18-18.04.34 1,000,000 1,196,340 1.34EUR 1,093,086
Portugal
1,196,340 1.341,093,086
ROMANIA 2% 19-08.12.26 900,000 952,212 1.07EUR 912,432
Romania
952,212 1.07912,432
RUSSIA 6.4% 13-27.05.20 64,000,000 887,165 1.00RUB 872,303
Russia
RUSSIA 8.15% 12-3.2.27 S 26207 160,000,000 2,343,407 2.62RUB 2,292,003
3,230,572 3.623,164,306
SERBIA T-BO 1.5% 19-26.06.29 REGS 200,000 199,557 0.22EUR 197,877
Serbia
199,557 0.22197,877
BRIGHT FOOD 1.375% 19-19.06.24 200,000 201,402 0.23EUR 199,370
Singapore
TRAFIGURA 6.875% 17-PERP REGS 600,000 475,501 0.53USD 459,241
676,903 0.76658,611
REPUBLIC OF SOUTH AFRICA 3.75% 14-24/07/2026
400,000 438,656 0.49EUR 431,111
South Africa
SOUTH AFR 4.3% 16-12.10.28 540,000 465,672 0.53USD 450,976
904,328 1.02882,087
ABENGOA 0.25% 31.3.23 PIK REGS 150,000 446 0.00USD 122,183
Spain
ADIF ALTA V 0.95% 19-30.04.27 1,000,000 1,040,800 1.17EUR 1,001,226BANCO CRED 7.75% 17-07.06.27 300,000 289,515 0.33EUR 285,821MADRID 1.571% 19-30.04.29 300,000 328,884 0.37EUR 300,108SPAIN 0% 18-06.12.19 TB 6,000,000 6,011,160 6.74EUR 6,020,371SPANISH GOV 0.6%% 19-31.10.29 570,000 578,544 0.65EUR 574,603SPANISH GOV 1.85% 19-30.07.35 400,000 457,656 0.51EUR 399,352
8,707,005 9.778,703,664
FORD MC 1.514% 19-17.02.23 300,000 301,902 0.34EUR 300,090
United States of America
Multi-Asset Diversified-(expressed in EUR)
Portfolio statements as at 30 June 2019
(continued)
Name Quantity/nominal value Currency Acquisition cost Valuation % net assets
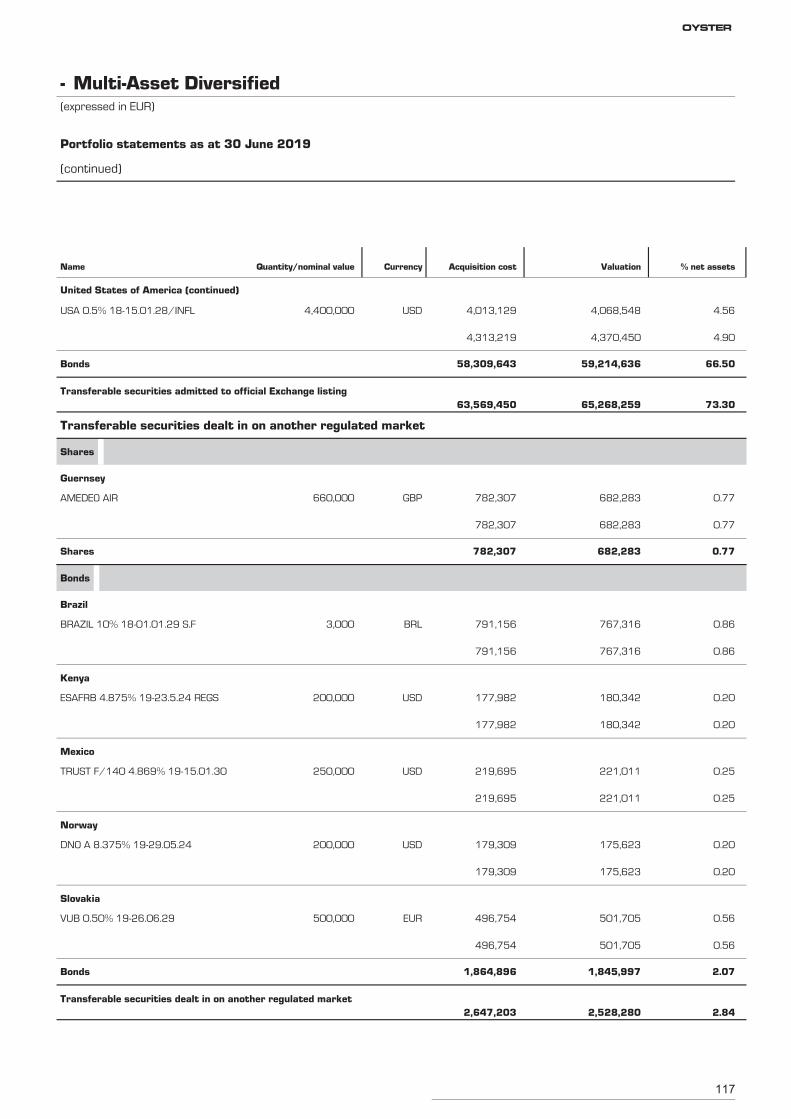
117
USA 0.5% 18-15.01.28/INFL 4,400,000 4,068,548 4.56USD 4,013,129
United States of America (continued)
4,370,450 4.904,313,219
Bonds 59,214,636 66.5058,309,643
Transferable securities admitted to official Exchange listing65,268,259 73.3063,569,450
AMEDEO AIR 660,000 682,283 0.77GBP 782,307
Transferable securities dealt in on another regulated market
Shares
Guernsey
682,283 0.77782,307
Shares 682,283 0.77782,307
BRAZIL 10% 18-01.01.29 S.F 3,000 767,316 0.86BRL 791,156
Bonds
Brazil
767,316 0.86791,156
ESAFRB 4.875% 19-23.5.24 REGS 200,000 180,342 0.20USD 177,982
Kenya
180,342 0.20177,982
TRUST F/140 4.869% 19-15.01.30 250,000 221,011 0.25USD 219,695
Mexico
221,011 0.25219,695
DNO A 8.375% 19-29.05.24 200,000 175,623 0.20USD 179,309
Norway
175,623 0.20179,309
VUB 0.50% 19-26.06.29 500,000 501,705 0.56EUR 496,754
Slovakia
501,705 0.56496,754
Bonds 1,845,997 2.071,864,896
Transferable securities dealt in on another regulated market2,528,280 2.842,647,203
Multi-Asset Diversified-(expressed in EUR)
Portfolio statements as at 30 June 2019
(continued)
Name Quantity/nominal value Currency Acquisition cost Valuation % net assets
OYSTER
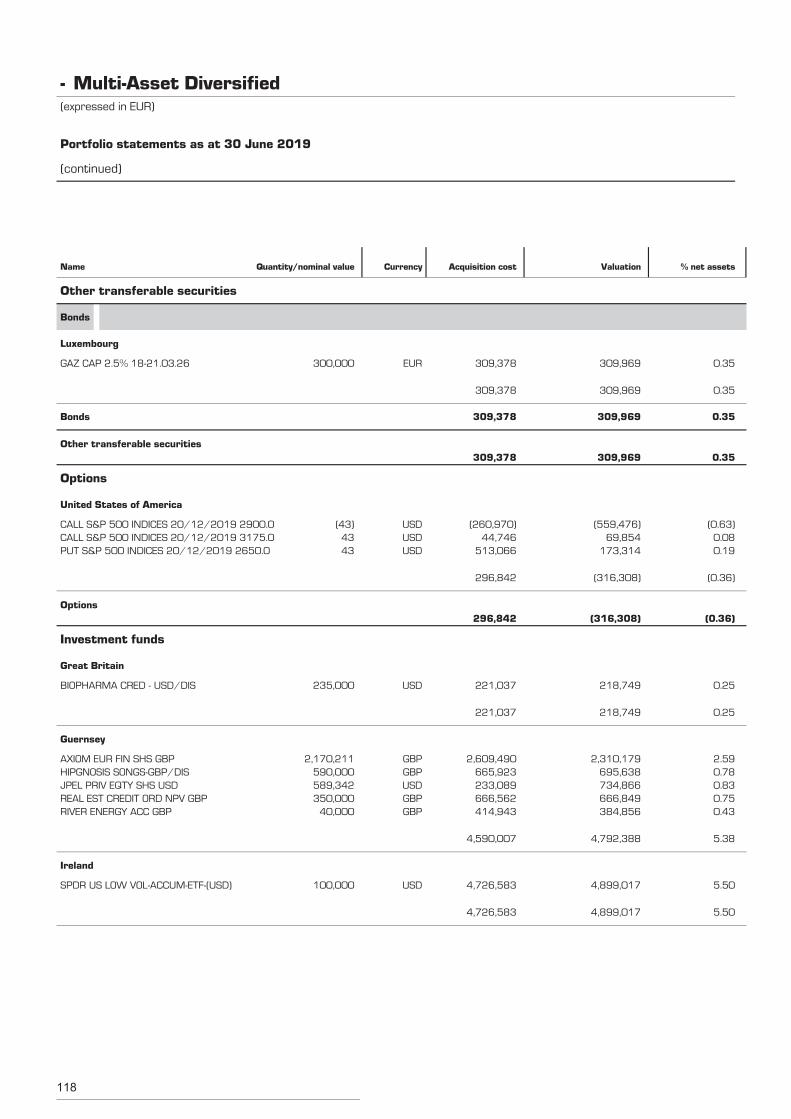
118
GAZ CAP 2.5% 18-21.03.26 300,000 309,969 0.35EUR 309,378
Other transferable securities
Bonds
Luxembourg
309,969 0.35309,378
Bonds 309,969 0.35309,378
Other transferable securities309,969 0.35309,378
CALL S&P 500 INDICES 20/12/2019 2900.0 (43) (559,476) (0.63)USD (260,970)
Options
United States of America
CALL S&P 500 INDICES 20/12/2019 3175.0 43 69,854 0.08USD 44,746PUT S&P 500 INDICES 20/12/2019 2650.0 43 173,314 0.19USD 513,066
(316,308) (0.36)296,842
Options(316,308) (0.36)296,842
BIOPHARMA CRED - USD/DIS 235,000 218,749 0.25USD 221,037
Investment funds
Great Britain
218,749 0.25221,037
AXIOM EUR FIN SHS GBP 2,170,211 2,310,179 2.59GBP 2,609,490
Guernsey
HIPGNOSIS SONGS-GBP/DIS 590,000 695,638 0.78GBP 665,923JPEL PRIV EQTY SHS USD 589,342 734,866 0.83USD 233,089REAL EST CREDIT ORD NPV GBP 350,000 666,849 0.75GBP 666,562RIVER ENERGY ACC GBP 40,000 384,856 0.43GBP 414,943
4,792,388 5.384,590,007
SPDR US LOW VOL-ACCUM-ETF-(USD) 100,000 4,899,017 5.50USD 4,726,583
Ireland
4,899,017 5.504,726,583
Multi-Asset Diversified-(expressed in EUR)
Portfolio statements as at 30 June 2019
(continued)
Name Quantity/nominal value Currency Acquisition cost Valuation % net assets
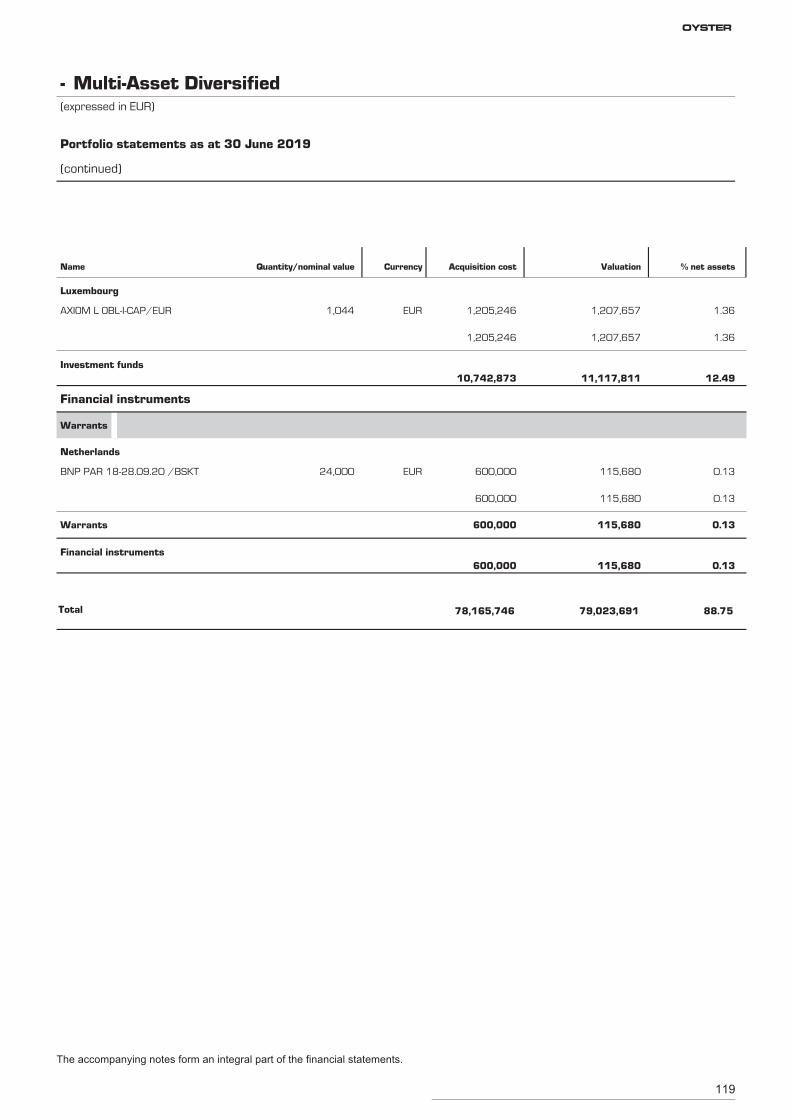
119
AXIOM L OBL-I-CAP/EUR 1,044 1,207,657 1.36EUR 1,205,246
Luxembourg
1,207,657 1.361,205,246
Investment funds11,117,811 12.4910,742,873
BNP PAR 18-28.09.20 /BSKT 24,000 115,680 0.13EUR 600,000
Financial instruments
Warrants
Netherlands
115,680 0.13600,000
Warrants 115,680 0.13600,000
Financial instruments115,680 0.13600,000
Total 79,023,691 88.7578,165,746
Multi-Asset Diversified-(expressed in EUR)
Portfolio statements as at 30 June 2019
(continued)
Name Quantity/nominal value Currency Acquisition cost Valuation % net assets
The accompanying notes form an integral part of the financial statements.
OYSTER
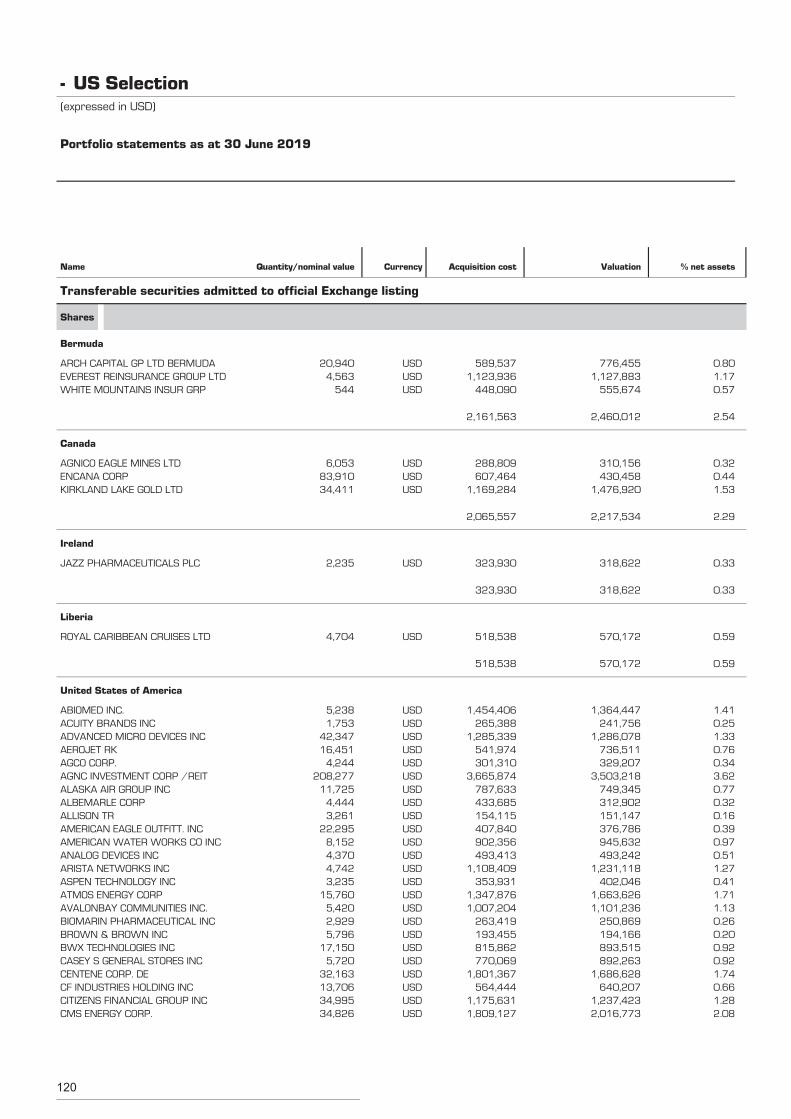
120
ARCH CAPITAL GP LTD BERMUDA 20,940 776,455 0.80USD 589,537
Transferable securities admitted to official Exchange listing
Shares
Bermuda
EVEREST REINSURANCE GROUP LTD 4,563 1,127,883 1.17USD 1,123,936WHITE MOUNTAINS INSUR GRP 544 555,674 0.57USD 448,090
2,460,012 2.542,161,563
AGNICO EAGLE MINES LTD 6,053 310,156 0.32USD 288,809
Canada
ENCANA CORP 83,910 430,458 0.44USD 607,464KIRKLAND LAKE GOLD LTD 34,411 1,476,920 1.53USD 1,169,284
2,217,534 2.292,065,557
JAZZ PHARMACEUTICALS PLC 2,235 318,622 0.33USD 323,930
Ireland
318,622 0.33323,930
ROYAL CARIBBEAN CRUISES LTD 4,704 570,172 0.59USD 518,538
Liberia
570,172 0.59518,538
ABIOMED INC. 5,238 1,364,447 1.41USD 1,454,406
United States of America
ACUITY BRANDS INC 1,753 241,756 0.25USD 265,388ADVANCED MICRO DEVICES INC 42,347 1,286,078 1.33USD 1,285,339AEROJET RK 16,451 736,511 0.76USD 541,974AGCO CORP. 4,244 329,207 0.34USD 301,310AGNC INVESTMENT CORP /REIT 208,277 3,503,218 3.62USD 3,665,874ALASKA AIR GROUP INC 11,725 749,345 0.77USD 787,633ALBEMARLE CORP 4,444 312,902 0.32USD 433,685ALLISON TR 3,261 151,147 0.16USD 154,115AMERICAN EAGLE OUTFITT. INC 22,295 376,786 0.39USD 407,840AMERICAN WATER WORKS CO INC 8,152 945,632 0.97USD 902,356ANALOG DEVICES INC 4,370 493,242 0.51USD 493,413ARISTA NETWORKS INC 4,742 1,231,118 1.27USD 1,108,409ASPEN TECHNOLOGY INC 3,235 402,046 0.41USD 353,931ATMOS ENERGY CORP 15,760 1,663,626 1.71USD 1,347,876AVALONBAY COMMUNITIES INC. 5,420 1,101,236 1.13USD 1,007,204BIOMARIN PHARMACEUTICAL INC 2,929 250,869 0.26USD 263,419BROWN & BROWN INC 5,796 194,166 0.20USD 193,455BWX TECHNOLOGIES INC 17,150 893,515 0.92USD 815,862CASEY S GENERAL STORES INC 5,720 892,263 0.92USD 770,069CENTENE CORP. DE 32,163 1,686,628 1.74USD 1,801,367CF INDUSTRIES HOLDING INC 13,706 640,207 0.66USD 564,444CITIZENS FINANCIAL GROUP INC 34,995 1,237,423 1.28USD 1,175,631CMS ENERGY CORP. 34,826 2,016,773 2.08USD 1,809,127
US Selection-(expressed in USD)
Portfolio statements as at 30 June 2019
Name Quantity/nominal value Currency Acquisition cost Valuation % net assets
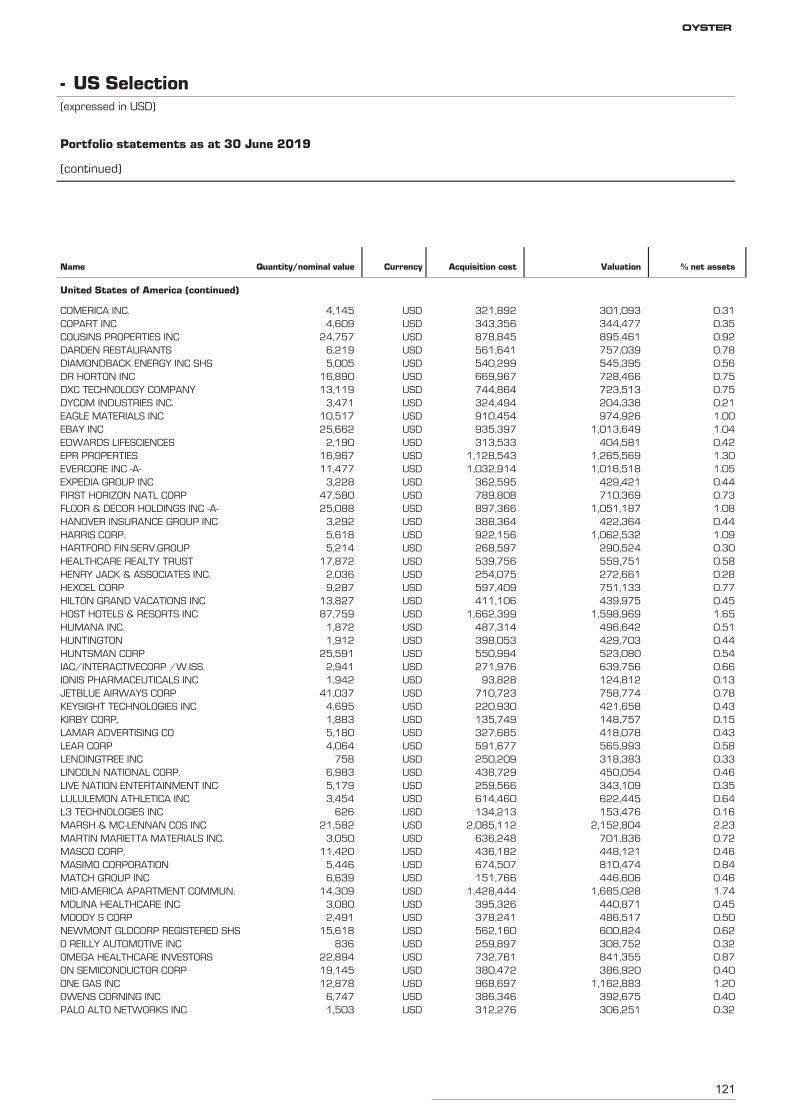
121
COMERICA INC. 4,145 301,093 0.31USD 321,892
United States of America (continued)
COPART INC 4,609 344,477 0.35USD 343,356COUSINS PROPERTIES INC 24,757 895,461 0.92USD 878,845DARDEN RESTAURANTS 6,219 757,039 0.78USD 561,641DIAMONDBACK ENERGY INC SHS 5,005 545,395 0.56USD 540,299DR HORTON INC 16,890 728,466 0.75USD 669,967DXC TECHNOLOGY COMPANY 13,119 723,513 0.75USD 744,864DYCOM INDUSTRIES INC. 3,471 204,338 0.21USD 324,494EAGLE MATERIALS INC 10,517 974,926 1.00USD 910,454EBAY INC 25,662 1,013,649 1.04USD 935,397EDWARDS LIFESCIENCES 2,190 404,581 0.42USD 313,533EPR PROPERTIES 16,967 1,265,569 1.30USD 1,128,543EVERCORE INC -A- 11,477 1,016,518 1.05USD 1,032,914EXPEDIA GROUP INC 3,228 429,421 0.44USD 362,595FIRST HORIZON NATL CORP 47,580 710,369 0.73USD 789,808FLOOR & DECOR HOLDINGS INC -A- 25,088 1,051,187 1.08USD 897,366HANOVER INSURANCE GROUP INC 3,292 422,364 0.44USD 388,364HARRIS CORP. 5,618 1,062,532 1.09USD 922,156HARTFORD FIN.SERV.GROUP 5,214 290,524 0.30USD 268,597HEALTHCARE REALTY TRUST 17,872 559,751 0.58USD 539,756HENRY JACK & ASSOCIATES INC. 2,036 272,661 0.28USD 254,075HEXCEL CORP 9,287 751,133 0.77USD 597,409HILTON GRAND VACATIONS INC 13,827 439,975 0.45USD 411,106HOST HOTELS & RESORTS INC 87,759 1,598,969 1.65USD 1,662,399HUMANA INC. 1,872 496,642 0.51USD 487,314HUNTINGTON 1,912 429,703 0.44USD 398,053HUNTSMAN CORP 25,591 523,080 0.54USD 550,994IAC/INTERACTIVECORP /W.ISS. 2,941 639,756 0.66USD 271,976IONIS PHARMACEUTICALS INC 1,942 124,812 0.13USD 93,828JETBLUE AIRWAYS CORP 41,037 758,774 0.78USD 710,723KEYSIGHT TECHNOLOGIES INC 4,695 421,658 0.43USD 220,930KIRBY CORP. 1,883 148,757 0.15USD 135,749LAMAR ADVERTISING CO 5,180 418,078 0.43USD 327,685LEAR CORP 4,064 565,993 0.58USD 591,677LENDINGTREE INC 758 318,383 0.33USD 250,209LINCOLN NATIONAL CORP. 6,983 450,054 0.46USD 438,729LIVE NATION ENTERTAINMENT INC 5,179 343,109 0.35USD 259,566LULULEMON ATHLETICA INC 3,454 622,445 0.64USD 614,460L3 TECHNOLOGIES INC 626 153,476 0.16USD 134,213MARSH & MC-LENNAN COS INC 21,582 2,152,804 2.23USD 2,085,112MARTIN MARIETTA MATERIALS INC. 3,050 701,836 0.72USD 636,248MASCO CORP. 11,420 448,121 0.46USD 436,182MASIMO CORPORATION 5,446 810,474 0.84USD 674,507MATCH GROUP INC 6,639 446,606 0.46USD 151,766MID-AMERICA APARTMENT COMMUN. 14,309 1,685,028 1.74USD 1,428,444MOLINA HEALTHCARE INC 3,080 440,871 0.45USD 395,326MOODY S CORP 2,491 486,517 0.50USD 378,241NEWMONT GLDCORP REGISTERED SHS 15,618 600,824 0.62USD 562,160O REILLY AUTOMOTIVE INC 836 308,752 0.32USD 259,897OMEGA HEALTHCARE INVESTORS 22,894 841,355 0.87USD 732,761ON SEMICONDUCTOR CORP 19,145 386,920 0.40USD 380,472ONE GAS INC 12,878 1,162,883 1.20USD 968,697OWENS CORNING INC 6,747 392,675 0.40USD 386,346PALO ALTO NETWORKS INC 1,503 306,251 0.32USD 312,276
US Selection-(expressed in USD)
Portfolio statements as at 30 June 2019
(continued)
Name Quantity/nominal value Currency Acquisition cost Valuation % net assets
OYSTER
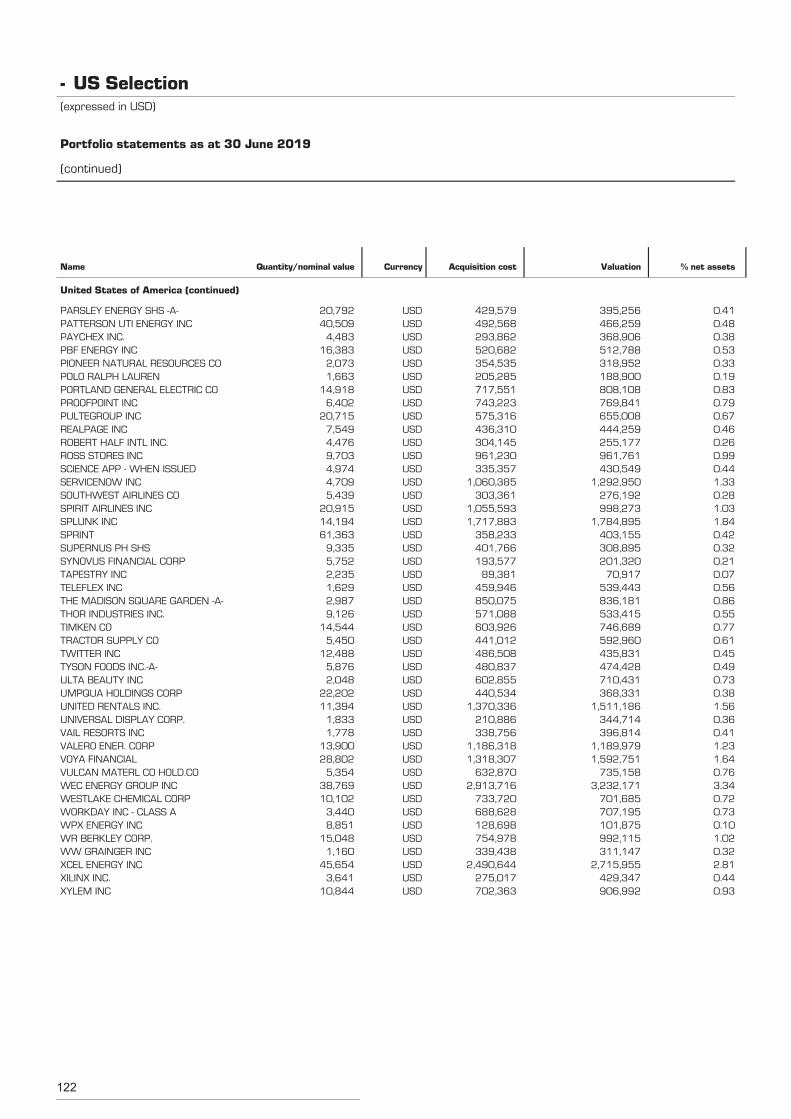
122
PARSLEY ENERGY SHS -A- 20,792 395,256 0.41USD 429,579
United States of America (continued)
PATTERSON UTI ENERGY INC 40,509 466,259 0.48USD 492,568PAYCHEX INC. 4,483 368,906 0.38USD 293,862PBF ENERGY INC 16,383 512,788 0.53USD 520,682PIONEER NATURAL RESOURCES CO 2,073 318,952 0.33USD 354,535POLO RALPH LAUREN 1,663 188,900 0.19USD 205,285PORTLAND GENERAL ELECTRIC CO 14,918 808,108 0.83USD 717,551PROOFPOINT INC 6,402 769,841 0.79USD 743,223PULTEGROUP INC 20,715 655,008 0.67USD 575,316REALPAGE INC 7,549 444,259 0.46USD 436,310ROBERT HALF INTL INC. 4,476 255,177 0.26USD 304,145ROSS STORES INC 9,703 961,761 0.99USD 961,230SCIENCE APP - WHEN ISSUED 4,974 430,549 0.44USD 335,357SERVICENOW INC 4,709 1,292,950 1.33USD 1,060,385SOUTHWEST AIRLINES CO 5,439 276,192 0.28USD 303,361SPIRIT AIRLINES INC 20,915 998,273 1.03USD 1,055,593SPLUNK INC 14,194 1,784,895 1.84USD 1,717,883SPRINT 61,363 403,155 0.42USD 358,233SUPERNUS PH SHS 9,335 308,895 0.32USD 401,766SYNOVUS FINANCIAL CORP 5,752 201,320 0.21USD 193,577TAPESTRY INC 2,235 70,917 0.07USD 89,381TELEFLEX INC 1,629 539,443 0.56USD 459,946THE MADISON SQUARE GARDEN -A- 2,987 836,181 0.86USD 850,075THOR INDUSTRIES INC. 9,126 533,415 0.55USD 571,088TIMKEN CO 14,544 746,689 0.77USD 603,926TRACTOR SUPPLY CO 5,450 592,960 0.61USD 441,012TWITTER INC 12,488 435,831 0.45USD 486,508TYSON FOODS INC.-A- 5,876 474,428 0.49USD 480,837ULTA BEAUTY INC 2,048 710,431 0.73USD 602,855UMPQUA HOLDINGS CORP 22,202 368,331 0.38USD 440,534UNITED RENTALS INC. 11,394 1,511,186 1.56USD 1,370,336UNIVERSAL DISPLAY CORP. 1,833 344,714 0.36USD 210,886VAIL RESORTS INC 1,778 396,814 0.41USD 338,756VALERO ENER. CORP 13,900 1,189,979 1.23USD 1,186,318VOYA FINANCIAL 28,802 1,592,751 1.64USD 1,318,307VULCAN MATERL CO HOLD.CO 5,354 735,158 0.76USD 632,870WEC ENERGY GROUP INC 38,769 3,232,171 3.34USD 2,913,716WESTLAKE CHEMICAL CORP 10,102 701,685 0.72USD 733,720WORKDAY INC - CLASS A 3,440 707,195 0.73USD 688,628WPX ENERGY INC 8,851 101,875 0.10USD 128,698WR BERKLEY CORP. 15,048 992,115 1.02USD 754,978WW GRAINGER INC 1,160 311,147 0.32USD 339,438XCEL ENERGY INC 45,654 2,715,955 2.81USD 2,490,644XILINX INC. 3,641 429,347 0.44USD 275,017XYLEM INC 10,844 906,992 0.93USD 702,363
US Selection-(expressed in USD)
Portfolio statements as at 30 June 2019
(continued)
Name Quantity/nominal value Currency Acquisition cost Valuation % net assets
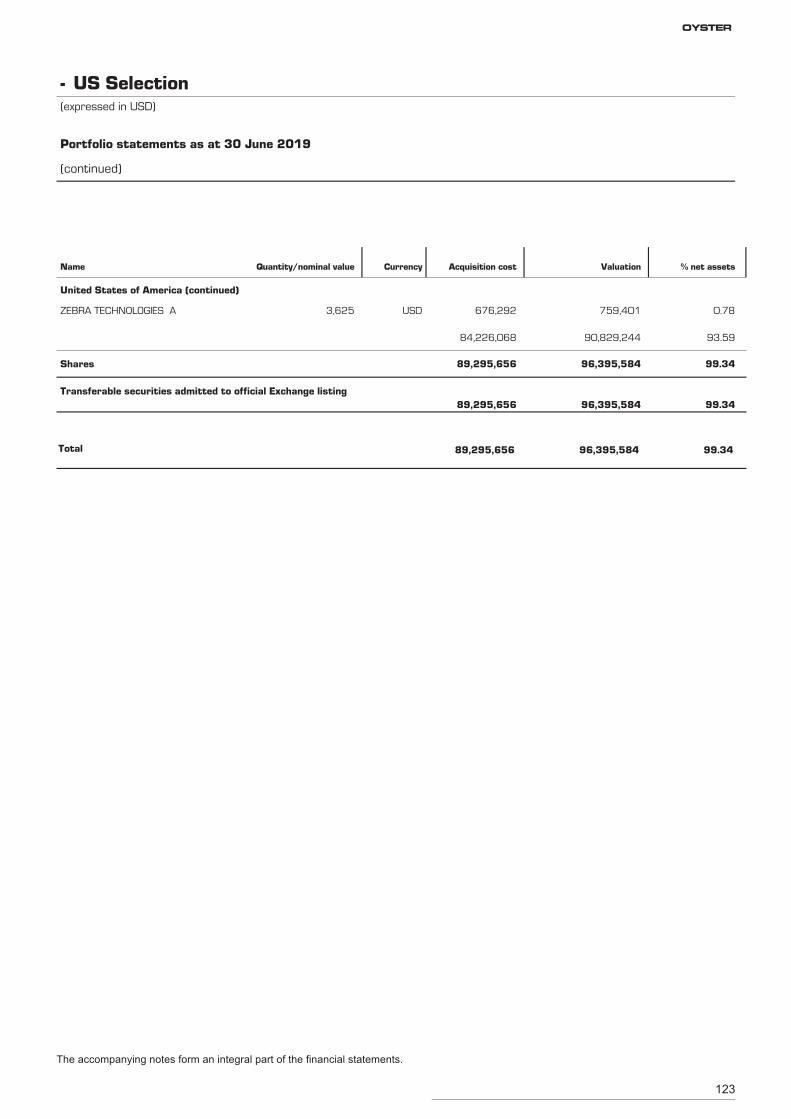
123
ZEBRA TECHNOLOGIES A 3,625 759,401 0.78USD 676,292
United States of America (continued)
90,829,244 93.5984,226,068
Shares 96,395,584 99.3489,295,656
Transferable securities admitted to official Exchange listing96,395,584 99.3489,295,656
Total 96,395,584 99.3489,295,656
US Selection-(expressed in USD)
Portfolio statements as at 30 June 2019
(continued)
Name Quantity/nominal value Currency Acquisition cost Valuation % net assets
The accompanying notes form an integral part of the financial statements.
OYSTER
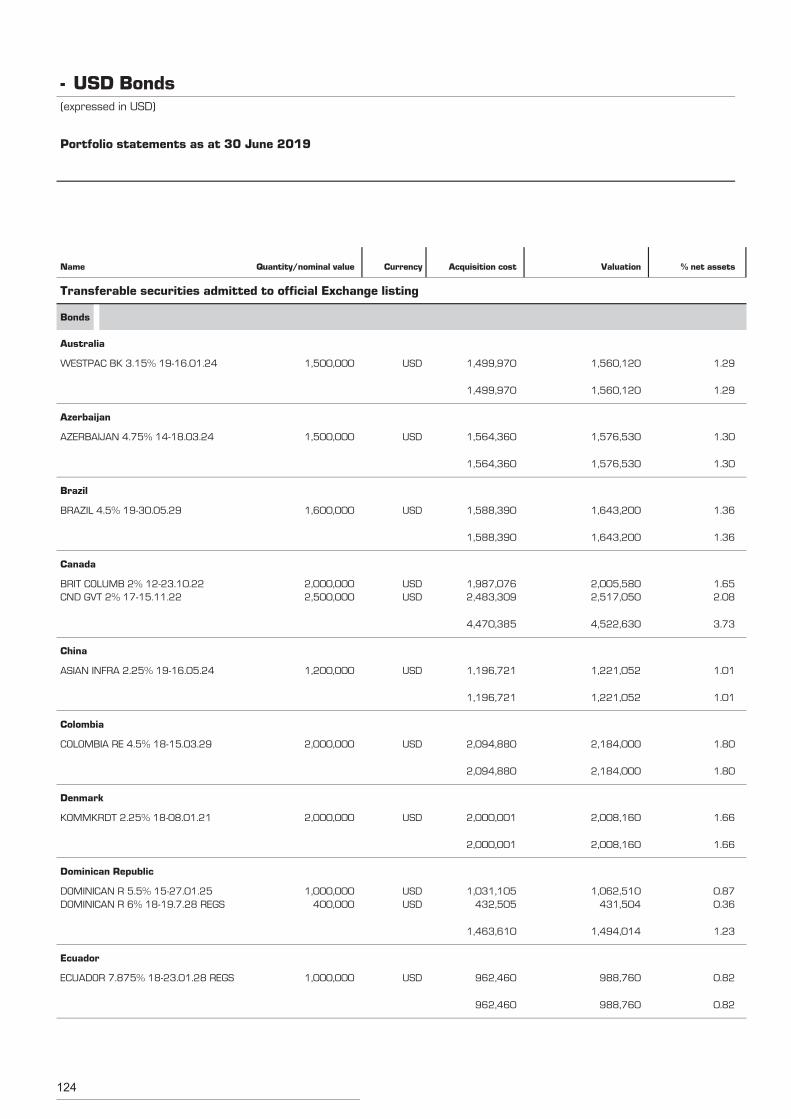
124
WESTPAC BK 3.15% 19-16.01.24 1,500,000 1,560,120 1.29USD 1,499,970
Transferable securities admitted to official Exchange listing
Bonds
Australia
1,560,120 1.291,499,970
AZERBAIJAN 4.75% 14-18.03.24 1,500,000 1,576,530 1.30USD 1,564,360
Azerbaijan
1,576,530 1.301,564,360
BRAZIL 4.5% 19-30.05.29 1,600,000 1,643,200 1.36USD 1,588,390
Brazil
1,643,200 1.361,588,390
BRIT COLUMB 2% 12-23.10.22 2,000,000 2,005,580 1.65USD 1,987,076
Canada
CND GVT 2% 17-15.11.22 2,500,000 2,517,050 2.08USD 2,483,309
4,522,630 3.734,470,385
ASIAN INFRA 2.25% 19-16.05.24 1,200,000 1,221,052 1.01USD 1,196,721
China
1,221,052 1.011,196,721
COLOMBIA RE 4.5% 18-15.03.29 2,000,000 2,184,000 1.80USD 2,094,880
Colombia
2,184,000 1.802,094,880
KOMMKRDT 2.25% 18-08.01.21 2,000,000 2,008,160 1.66USD 2,000,001
Denmark
2,008,160 1.662,000,001
DOMINICAN R 5.5% 15-27.01.25 1,000,000 1,062,510 0.87USD 1,031,105
Dominican Republic
DOMINICAN R 6% 18-19.7.28 REGS 400,000 431,504 0.36USD 432,505
1,494,014 1.231,463,610
ECUADOR 7.875% 18-23.01.28 REGS 1,000,000 988,760 0.82USD 962,460
Ecuador
988,760 0.82962,460
USD Bonds-(expressed in USD)
Portfolio statements as at 30 June 2019
Name Quantity/nominal value Currency Acquisition cost Valuation % net assets
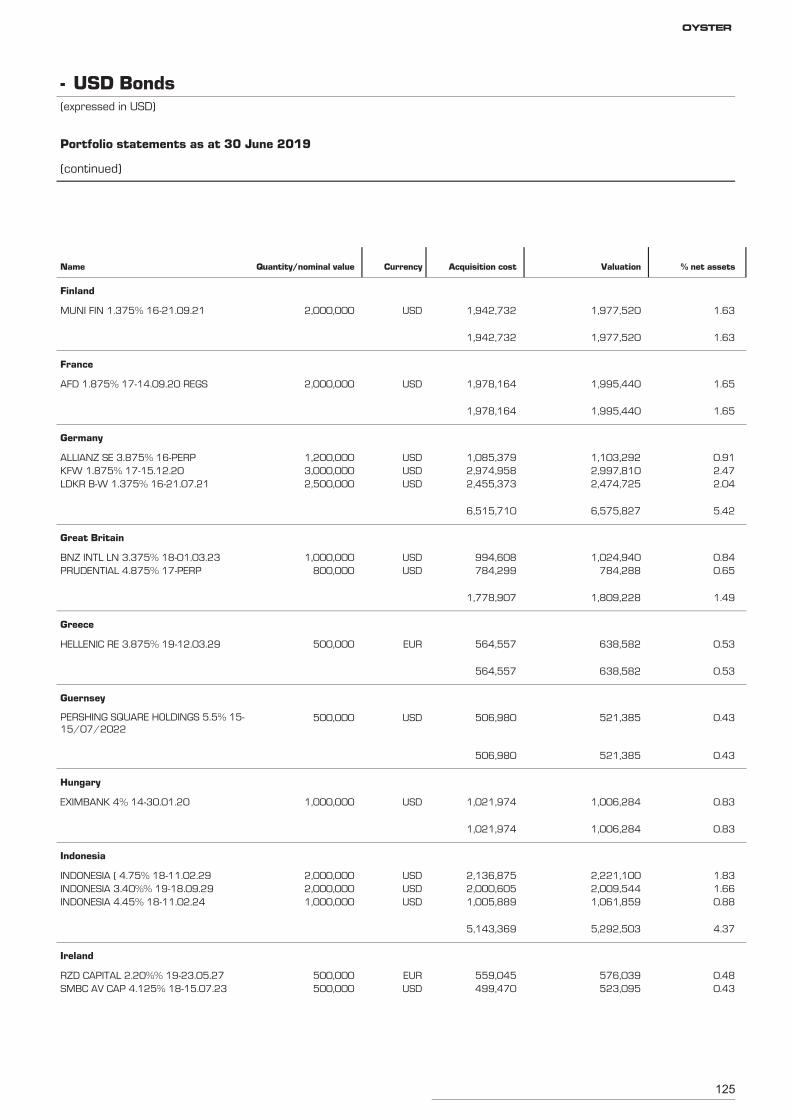
125
MUNI FIN 1.375% 16-21.09.21 2,000,000 1,977,520 1.63USD 1,942,732
Finland
1,977,520 1.631,942,732
AFD 1.875% 17-14.09.20 REGS 2,000,000 1,995,440 1.65USD 1,978,164
France
1,995,440 1.651,978,164
ALLIANZ SE 3.875% 16-PERP 1,200,000 1,103,292 0.91USD 1,085,379
Germany
KFW 1.875% 17-15.12.20 3,000,000 2,997,810 2.47USD 2,974,958LDKR B-W 1.375% 16-21.07.21 2,500,000 2,474,725 2.04USD 2,455,373
6,575,827 5.426,515,710
BNZ INTL LN 3.375% 18-01.03.23 1,000,000 1,024,940 0.84USD 994,608
Great Britain
PRUDENTIAL 4.875% 17-PERP 800,000 784,288 0.65USD 784,299
1,809,228 1.491,778,907
HELLENIC RE 3.875% 19-12.03.29 500,000 638,582 0.53EUR 564,557
Greece
638,582 0.53564,557
PERSHING SQUARE HOLDINGS 5.5% 15-15/07/2022
500,000 521,385 0.43USD 506,980
Guernsey
521,385 0.43506,980
EXIMBANK 4% 14-30.01.20 1,000,000 1,006,284 0.83USD 1,021,974
Hungary
1,006,284 0.831,021,974
INDONESIA ( 4.75% 18-11.02.29 2,000,000 2,221,100 1.83USD 2,136,875
Indonesia
INDONESIA 3.40%% 19-18.09.29 2,000,000 2,009,544 1.66USD 2,000,605INDONESIA 4.45% 18-11.02.24 1,000,000 1,061,859 0.88USD 1,005,889
5,292,503 4.375,143,369
RZD CAPITAL 2.20%% 19-23.05.27 500,000 576,039 0.48EUR 559,045
Ireland
SMBC AV CAP 4.125% 18-15.07.23 500,000 523,095 0.43USD 499,470
USD Bonds-(expressed in USD)
Portfolio statements as at 30 June 2019
(continued)
Name Quantity/nominal value Currency Acquisition cost Valuation % net assets
OYSTER
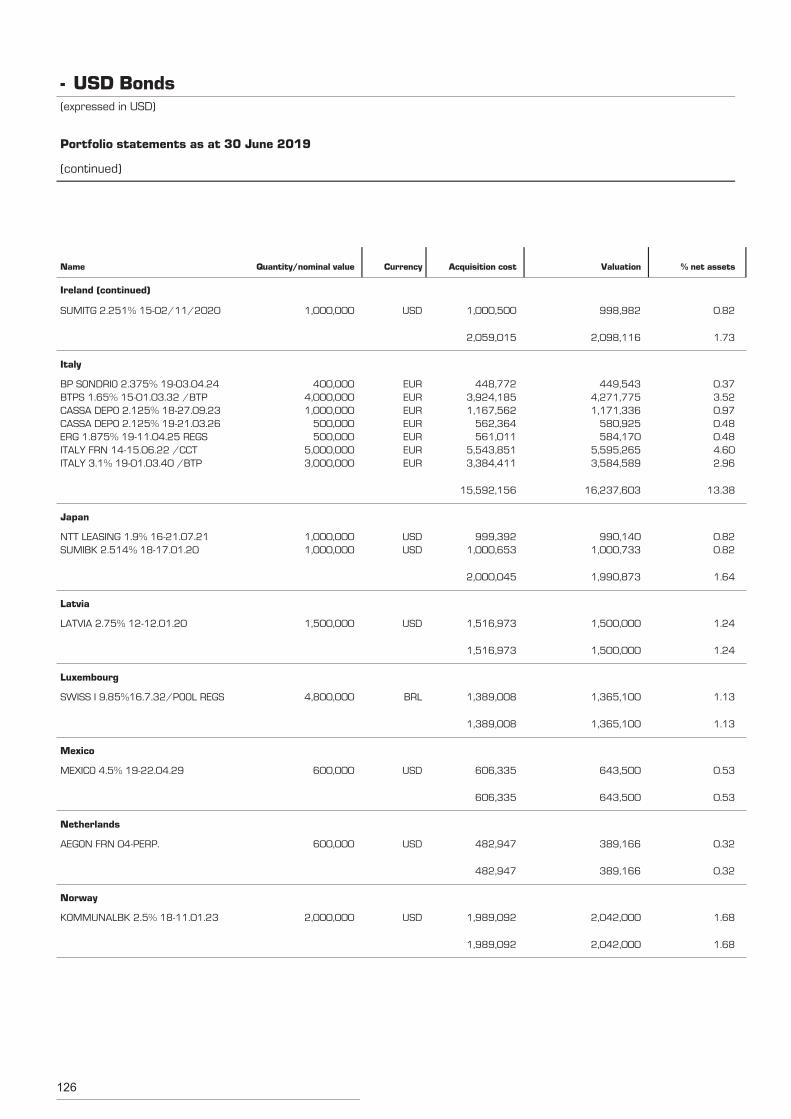
126
SUMITG 2.251% 15-02/11/2020 1,000,000 998,982 0.82USD 1,000,500
Ireland (continued)
2,098,116 1.732,059,015
BP SONDRIO 2.375% 19-03.04.24 400,000 449,543 0.37EUR 448,772
Italy
BTPS 1.65% 15-01.03.32 /BTP 4,000,000 4,271,775 3.52EUR 3,924,185CASSA DEPO 2.125% 18-27.09.23 1,000,000 1,171,336 0.97EUR 1,167,562CASSA DEPO 2.125% 19-21.03.26 500,000 580,925 0.48EUR 562,364ERG 1.875% 19-11.04.25 REGS 500,000 584,170 0.48EUR 561,011ITALY FRN 14-15.06.22 /CCT 5,000,000 5,595,265 4.60EUR 5,543,851ITALY 3.1% 19-01.03.40 /BTP 3,000,000 3,584,589 2.96EUR 3,384,411
16,237,603 13.3815,592,156
NTT LEASING 1.9% 16-21.07.21 1,000,000 990,140 0.82USD 999,392
Japan
SUMIBK 2.514% 18-17.01.20 1,000,000 1,000,733 0.82USD 1,000,653
1,990,873 1.642,000,045
LATVIA 2.75% 12-12.01.20 1,500,000 1,500,000 1.24USD 1,516,973
Latvia
1,500,000 1.241,516,973
SWISS I 9.85%16.7.32/POOL REGS 4,800,000 1,365,100 1.13BRL 1,389,008
Luxembourg
1,365,100 1.131,389,008
MEXICO 4.5% 19-22.04.29 600,000 643,500 0.53USD 606,335
Mexico
643,500 0.53606,335
AEGON FRN 04-PERP. 600,000 389,166 0.32USD 482,947
Netherlands
389,166 0.32482,947
KOMMUNALBK 2.5% 18-11.01.23 2,000,000 2,042,000 1.68USD 1,989,092
Norway
2,042,000 1.681,989,092
USD Bonds-(expressed in USD)
Portfolio statements as at 30 June 2019
(continued)
Name Quantity/nominal value Currency Acquisition cost Valuation % net assets
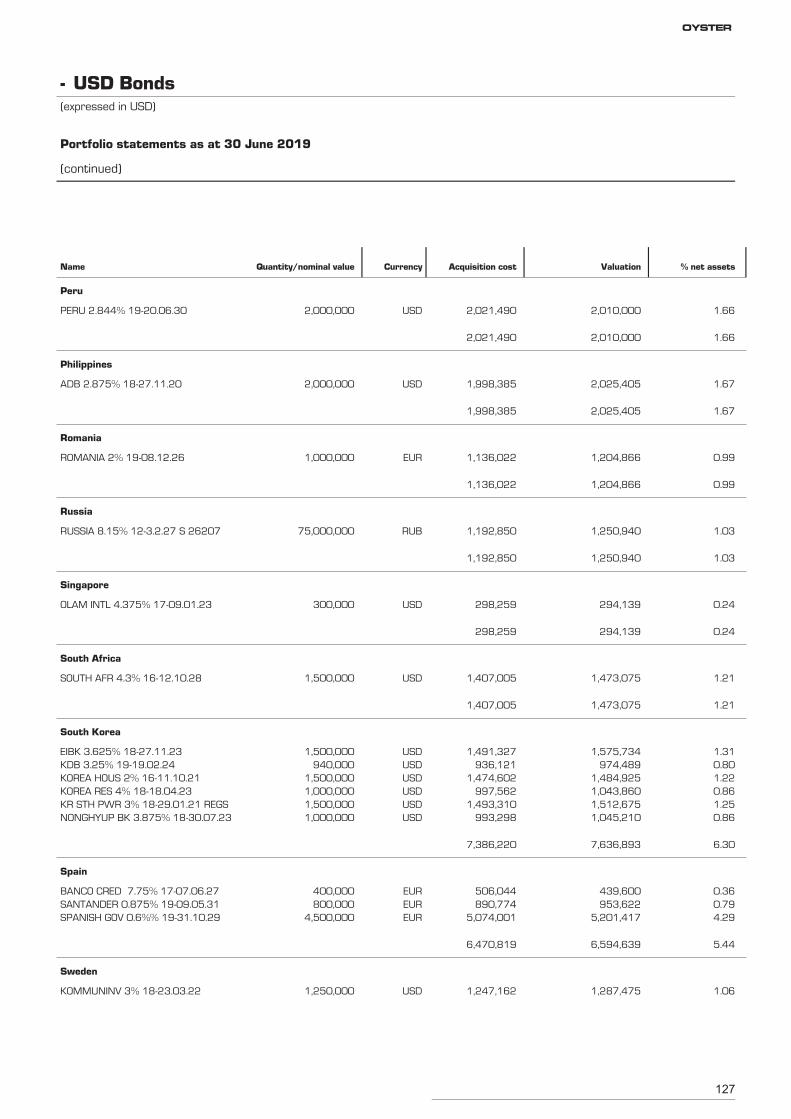
127
PERU 2.844% 19-20.06.30 2,000,000 2,010,000 1.66USD 2,021,490
Peru
2,010,000 1.662,021,490
ADB 2.875% 18-27.11.20 2,000,000 2,025,405 1.67USD 1,998,385
Philippines
2,025,405 1.671,998,385
ROMANIA 2% 19-08.12.26 1,000,000 1,204,866 0.99EUR 1,136,022
Romania
1,204,866 0.991,136,022
RUSSIA 8.15% 12-3.2.27 S 26207 75,000,000 1,250,940 1.03RUB 1,192,850
Russia
1,250,940 1.031,192,850
OLAM INTL 4.375% 17-09.01.23 300,000 294,139 0.24USD 298,259
Singapore
294,139 0.24298,259
SOUTH AFR 4.3% 16-12.10.28 1,500,000 1,473,075 1.21USD 1,407,005
South Africa
1,473,075 1.211,407,005
EIBK 3.625% 18-27.11.23 1,500,000 1,575,734 1.31USD 1,491,327
South Korea
KDB 3.25% 19-19.02.24 940,000 974,489 0.80USD 936,121KOREA HOUS 2% 16-11.10.21 1,500,000 1,484,925 1.22USD 1,474,602KOREA RES 4% 18-18.04.23 1,000,000 1,043,860 0.86USD 997,562KR STH PWR 3% 18-29.01.21 REGS 1,500,000 1,512,675 1.25USD 1,493,310NONGHYUP BK 3.875% 18-30.07.23 1,000,000 1,045,210 0.86USD 993,298
7,636,893 6.307,386,220
BANCO CRED 7.75% 17-07.06.27 400,000 439,600 0.36EUR 506,044
Spain
SANTANDER 0.875% 19-09.05.31 800,000 953,622 0.79EUR 890,774SPANISH GOV 0.6%% 19-31.10.29 4,500,000 5,201,417 4.29EUR 5,074,001
6,594,639 5.446,470,819
KOMMUNINV 3% 18-23.03.22 1,250,000 1,287,475 1.06USD 1,247,162
Sweden
USD Bonds-(expressed in USD)
Portfolio statements as at 30 June 2019
(continued)
Name Quantity/nominal value Currency Acquisition cost Valuation % net assets
OYSTER
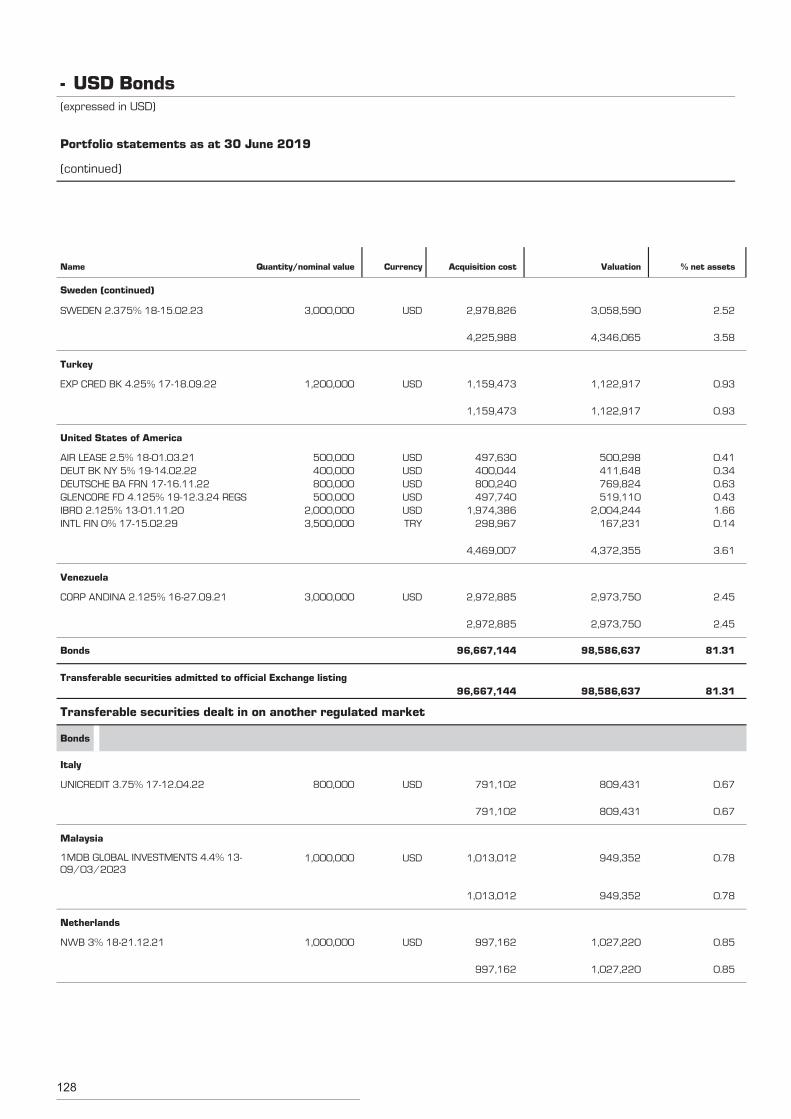
128
SWEDEN 2.375% 18-15.02.23 3,000,000 3,058,590 2.52USD 2,978,826
Sweden (continued)
4,346,065 3.584,225,988
EXP CRED BK 4.25% 17-18.09.22 1,200,000 1,122,917 0.93USD 1,159,473
Turkey
1,122,917 0.931,159,473
AIR LEASE 2.5% 18-01.03.21 500,000 500,298 0.41USD 497,630
United States of America
DEUT BK NY 5% 19-14.02.22 400,000 411,648 0.34USD 400,044DEUTSCHE BA FRN 17-16.11.22 800,000 769,824 0.63USD 800,240GLENCORE FD 4.125% 19-12.3.24 REGS 500,000 519,110 0.43USD 497,740IBRD 2.125% 13-01.11.20 2,000,000 2,004,244 1.66USD 1,974,386INTL FIN 0% 17-15.02.29 3,500,000 167,231 0.14TRY 298,967
4,372,355 3.614,469,007
CORP ANDINA 2.125% 16-27.09.21 3,000,000 2,973,750 2.45USD 2,972,885
Venezuela
2,973,750 2.452,972,885
Bonds 98,586,637 81.3196,667,144
Transferable securities admitted to official Exchange listing98,586,637 81.3196,667,144
UNICREDIT 3.75% 17-12.04.22 800,000 809,431 0.67USD 791,102
Transferable securities dealt in on another regulated market
Bonds
Italy
809,431 0.67791,102
1MDB GLOBAL INVESTMENTS 4.4% 13-09/03/2023
1,000,000 949,352 0.78USD 1,013,012
Malaysia
949,352 0.781,013,012
NWB 3% 18-21.12.21 1,000,000 1,027,220 0.85USD 997,162
Netherlands
1,027,220 0.85997,162
USD Bonds-(expressed in USD)
Portfolio statements as at 30 June 2019
(continued)
Name Quantity/nominal value Currency Acquisition cost Valuation % net assets
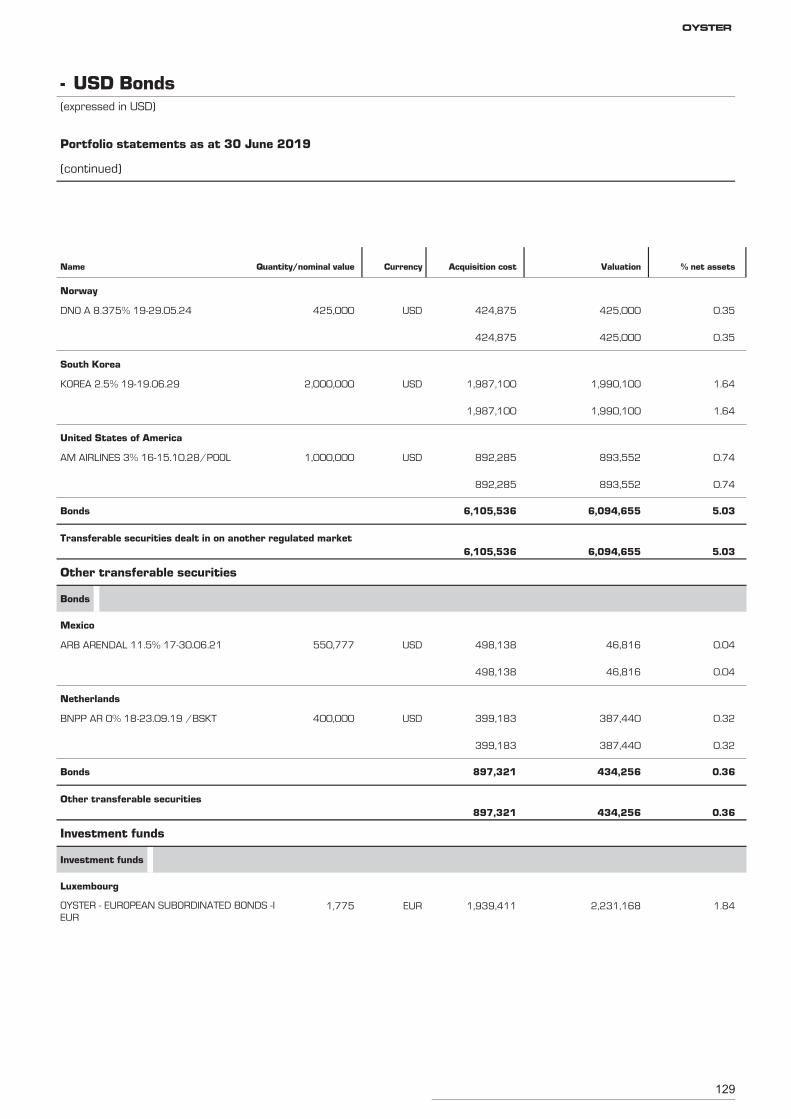
129
DNO A 8.375% 19-29.05.24 425,000 425,000 0.35USD 424,875
Norway
425,000 0.35424,875
KOREA 2.5% 19-19.06.29 2,000,000 1,990,100 1.64USD 1,987,100
South Korea
1,990,100 1.641,987,100
AM AIRLINES 3% 16-15.10.28/POOL 1,000,000 893,552 0.74USD 892,285
United States of America
893,552 0.74892,285
Bonds 6,094,655 5.036,105,536
Transferable securities dealt in on another regulated market6,094,655 5.036,105,536
ARB ARENDAL 11.5% 17-30.06.21 550,777 46,816 0.04USD 498,138
Other transferable securities
Bonds
Mexico
46,816 0.04498,138
BNPP AR 0% 18-23.09.19 /BSKT 400,000 387,440 0.32USD 399,183
Netherlands
387,440 0.32399,183
Bonds 434,256 0.36897,321
Other transferable securities434,256 0.36897,321
OYSTER - EUROPEAN SUBORDINATED BONDS -IEUR
1,775 2,231,168 1.84EUR 1,939,411
Investment funds
Investment funds
Luxembourg
USD Bonds-(expressed in USD)
Portfolio statements as at 30 June 2019
(continued)
Name Quantity/nominal value Currency Acquisition cost Valuation % net assets
OYSTER
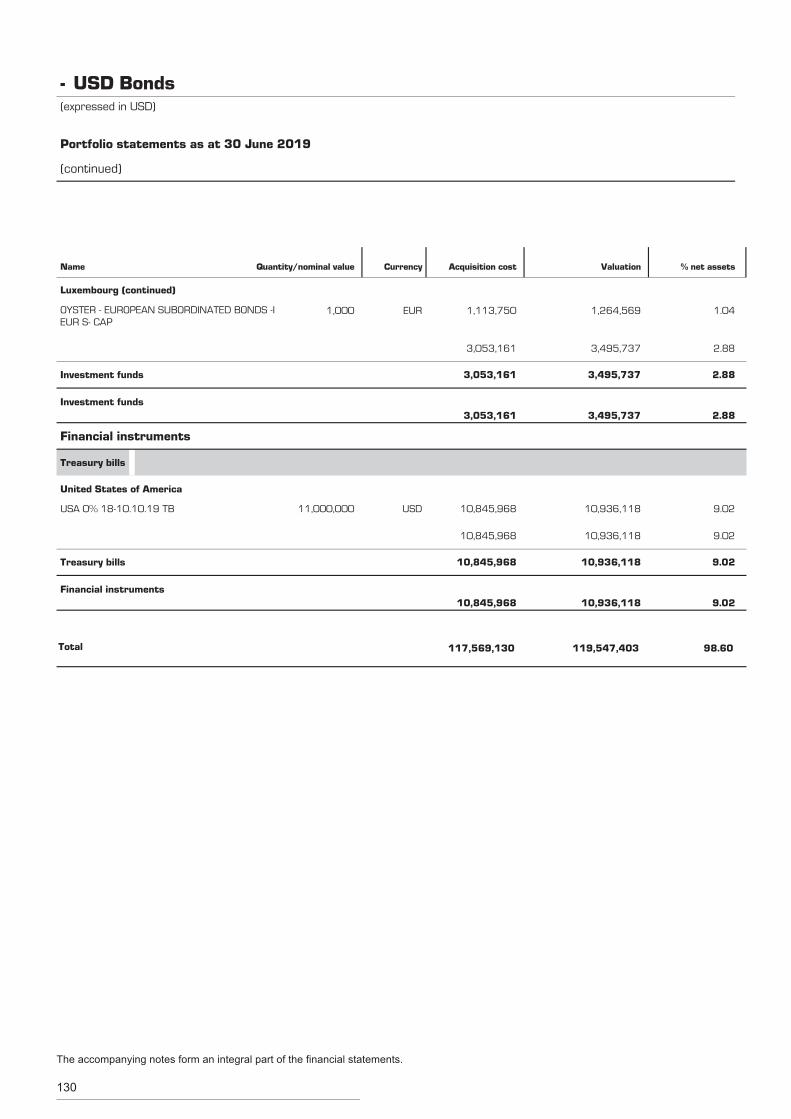
130
OYSTER - EUROPEAN SUBORDINATED BONDS -IEUR S- CAP
1,000 1,264,569 1.04EUR 1,113,750
Luxembourg (continued)
3,495,737 2.883,053,161
Investment funds 3,495,737 2.883,053,161
Investment funds3,495,737 2.883,053,161
USA 0% 18-10.10.19 TB 11,000,000 10,936,118 9.02USD 10,845,968
Financial instruments
Treasury bills
United States of America
10,936,118 9.0210,845,968
Treasury bills 10,936,118 9.0210,845,968
Financial instruments10,936,118 9.0210,845,968
Total 119,547,403 98.60117,569,130
USD Bonds-(expressed in USD)
Portfolio statements as at 30 June 2019
(continued)
Name Quantity/nominal value Currency Acquisition cost Valuation % net assets
The accompanying notes form an integral part of the financial statements.
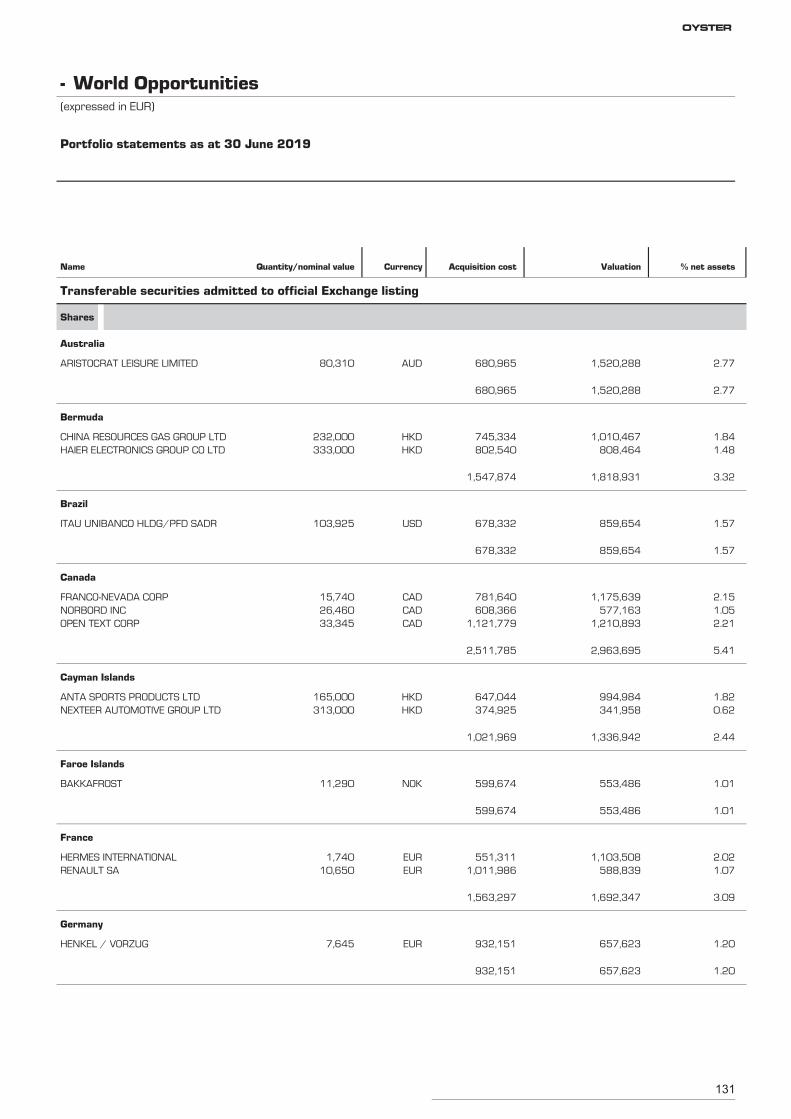
131
ARISTOCRAT LEISURE LIMITED 80,310 1,520,288 2.77AUD 680,965
Transferable securities admitted to official Exchange listing
Shares
Australia
1,520,288 2.77680,965
CHINA RESOURCES GAS GROUP LTD 232,000 1,010,467 1.84HKD 745,334
Bermuda
HAIER ELECTRONICS GROUP CO LTD 333,000 808,464 1.48HKD 802,540
1,818,931 3.321,547,874
ITAU UNIBANCO HLDG/PFD SADR 103,925 859,654 1.57USD 678,332
Brazil
859,654 1.57678,332
FRANCO-NEVADA CORP 15,740 1,175,639 2.15CAD 781,640
Canada
NORBORD INC 26,460 577,163 1.05CAD 608,366OPEN TEXT CORP 33,345 1,210,893 2.21CAD 1,121,779
2,963,695 5.412,511,785
ANTA SPORTS PRODUCTS LTD 165,000 994,984 1.82HKD 647,044
Cayman Islands
NEXTEER AUTOMOTIVE GROUP LTD 313,000 341,958 0.62HKD 374,925
1,336,942 2.441,021,969
BAKKAFROST 11,290 553,486 1.01NOK 599,674
Faroe Islands
553,486 1.01599,674
HERMES INTERNATIONAL 1,740 1,103,508 2.02EUR 551,311
France
RENAULT SA 10,650 588,839 1.07EUR 1,011,986
1,692,347 3.091,563,297
HENKEL / VORZUG 7,645 657,623 1.20EUR 932,151
Germany
657,623 1.20932,151
World Opportunities-(expressed in EUR)
Portfolio statements as at 30 June 2019
Name Quantity/nominal value Currency Acquisition cost Valuation % net assets
OYSTER
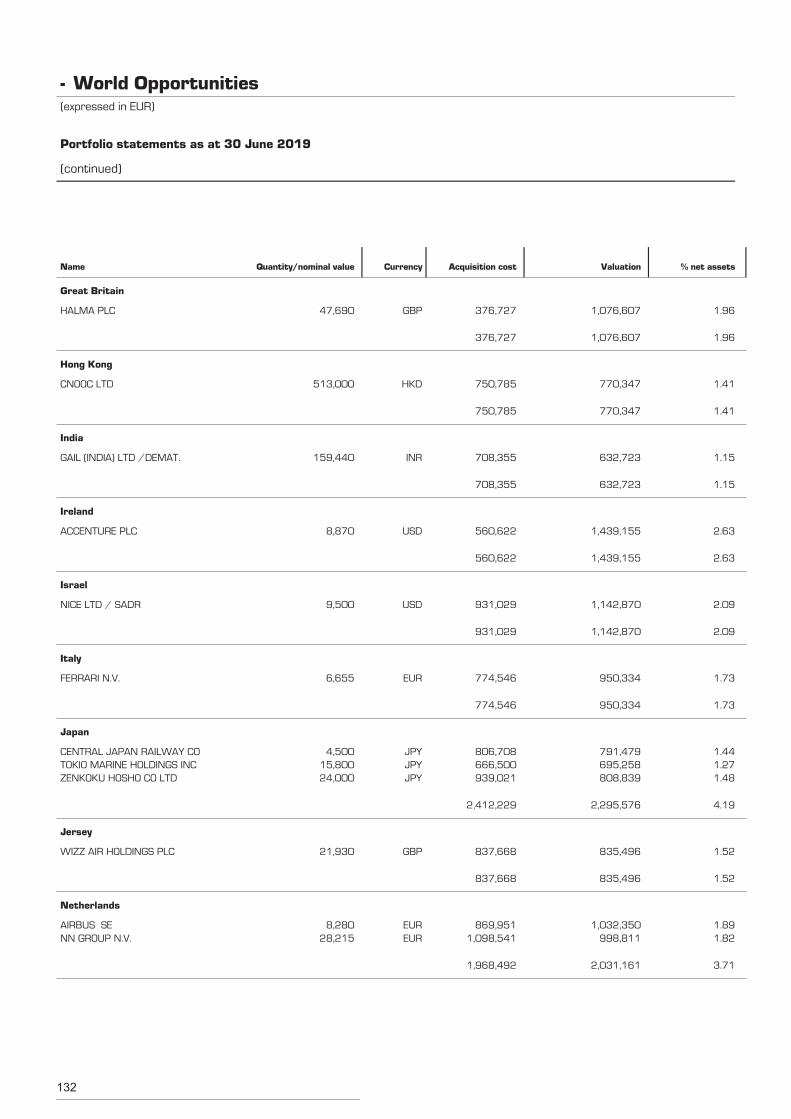
132
HALMA PLC 47,690 1,076,607 1.96GBP 376,727
Great Britain
1,076,607 1.96376,727
CNOOC LTD 513,000 770,347 1.41HKD 750,785
Hong Kong
770,347 1.41750,785
GAIL (INDIA) LTD /DEMAT. 159,440 632,723 1.15INR 708,355
India
632,723 1.15708,355
ACCENTURE PLC 8,870 1,439,155 2.63USD 560,622
Ireland
1,439,155 2.63560,622
NICE LTD / SADR 9,500 1,142,870 2.09USD 931,029
Israel
1,142,870 2.09931,029
FERRARI N.V. 6,655 950,334 1.73EUR 774,546
Italy
950,334 1.73774,546
CENTRAL JAPAN RAILWAY CO 4,500 791,479 1.44JPY 806,708
Japan
TOKIO MARINE HOLDINGS INC 15,800 695,258 1.27JPY 666,500ZENKOKU HOSHO CO LTD 24,000 808,839 1.48JPY 939,021
2,295,576 4.192,412,229
WIZZ AIR HOLDINGS PLC 21,930 835,496 1.52GBP 837,668
Jersey
835,496 1.52837,668
AIRBUS SE 8,280 1,032,350 1.89EUR 869,951
Netherlands
NN GROUP N.V. 28,215 998,811 1.82EUR 1,098,541
2,031,161 3.711,968,492
World Opportunities-(expressed in EUR)
Portfolio statements as at 30 June 2019
(continued)
Name Quantity/nominal value Currency Acquisition cost Valuation % net assets
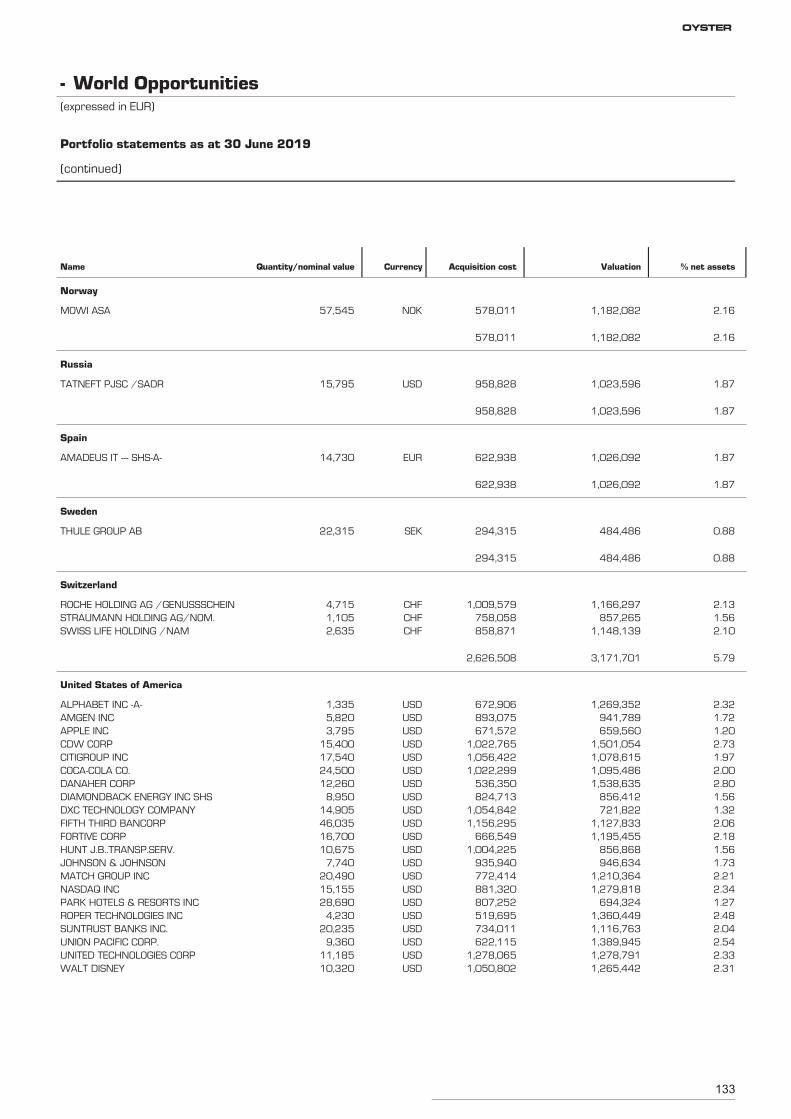
133
MOWI ASA 57,545 1,182,082 2.16NOK 578,011
Norway
1,182,082 2.16578,011
TATNEFT PJSC /SADR 15,795 1,023,596 1.87USD 958,828
Russia
1,023,596 1.87958,828
AMADEUS IT --- SHS-A- 14,730 1,026,092 1.87EUR 622,938
Spain
1,026,092 1.87622,938
THULE GROUP AB 22,315 484,486 0.88SEK 294,315
Sweden
484,486 0.88294,315
ROCHE HOLDING AG /GENUSSSCHEIN 4,715 1,166,297 2.13CHF 1,009,579
Switzerland
STRAUMANN HOLDING AG/NOM. 1,105 857,265 1.56CHF 758,058SWISS LIFE HOLDING /NAM 2,635 1,148,139 2.10CHF 858,871
3,171,701 5.792,626,508
ALPHABET INC -A- 1,335 1,269,352 2.32USD 672,906
United States of America
AMGEN INC 5,820 941,789 1.72USD 893,075APPLE INC 3,795 659,560 1.20USD 671,572CDW CORP 15,400 1,501,054 2.73USD 1,022,765CITIGROUP INC 17,540 1,078,615 1.97USD 1,056,422COCA-COLA CO. 24,500 1,095,486 2.00USD 1,022,299DANAHER CORP 12,260 1,538,635 2.80USD 536,350DIAMONDBACK ENERGY INC SHS 8,950 856,412 1.56USD 824,713DXC TECHNOLOGY COMPANY 14,905 721,822 1.32USD 1,054,842FIFTH THIRD BANCORP 46,035 1,127,833 2.06USD 1,156,295FORTIVE CORP 16,700 1,195,455 2.18USD 666,549HUNT J.B..TRANSP.SERV. 10,675 856,868 1.56USD 1,004,225JOHNSON & JOHNSON 7,740 946,634 1.73USD 935,940MATCH GROUP INC 20,490 1,210,364 2.21USD 772,414NASDAQ INC 15,155 1,279,818 2.34USD 881,320PARK HOTELS & RESORTS INC 28,690 694,324 1.27USD 807,252ROPER TECHNOLOGIES INC 4,230 1,360,449 2.48USD 519,695SUNTRUST BANKS INC. 20,235 1,116,763 2.04USD 734,011UNION PACIFIC CORP. 9,360 1,389,945 2.54USD 622,115UNITED TECHNOLOGIES CORP 11,185 1,278,791 2.33USD 1,278,065WALT DISNEY 10,320 1,265,442 2.31USD 1,050,802
World Opportunities-(expressed in EUR)
Portfolio statements as at 30 June 2019
(continued)
Name Quantity/nominal value Currency Acquisition cost Valuation % net assets
OYSTER
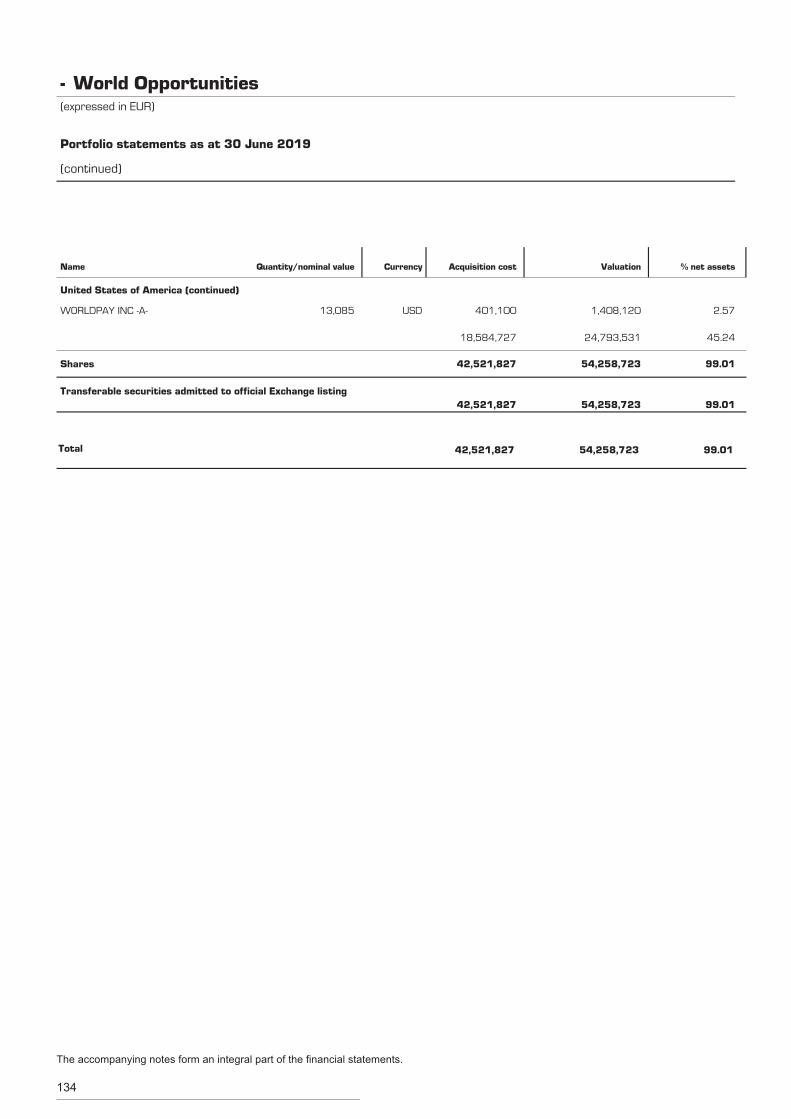
134
WORLDPAY INC -A- 13,085 1,408,120 2.57USD 401,100
United States of America (continued)
24,793,531 45.2418,584,727
Shares 54,258,723 99.0142,521,827
Transferable securities admitted to official Exchange listing54,258,723 99.0142,521,827
Total 54,258,723 99.0142,521,827
World Opportunities-(expressed in EUR)
Portfolio statements as at 30 June 2019
(continued)
Name Quantity/nominal value Currency Acquisition cost Valuation % net assets
The accompanying notes form an integral part of the financial statements.
Notes to the financial statementsas at 30 June 2019
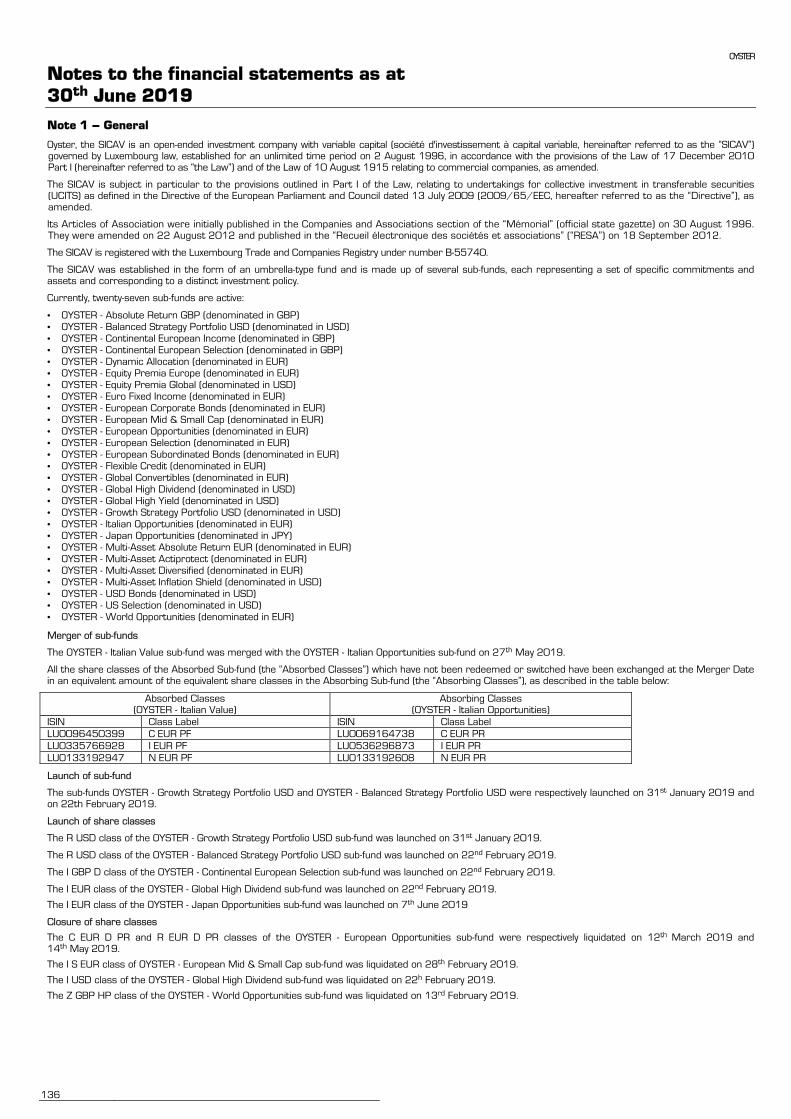
OYSTER
Notes to the financial statements as at 30th June 2019
136
Note 1 – General
Oyster, the SICAV is an open-ended investment company with variable capital (société d'investissement à capital variable, hereinafter referred to as the “SICAV”) governed by Luxembourg law, established for an unlimited time period on 2 August 1996, in accordance with the provisions of the Law of 17 December 2010 Part I (hereinafter referred to as “the Law”) and of the Law of 10 August 1915 relating to commercial companies, as amended.
The SICAV is subject in particular to the provisions outlined in Part I of the Law, relating to undertakings for collective investment in transferable securities (UCITS) as defined in the Directive of the European Parliament and Council dated 13 July 2009 (2009/65/EEC, hereafter referred to as the “Directive”), as amended.
Its Articles of Association were initially published in the Companies and Associations section of the “Mémorial” (official state gazette) on 30 August 1996. They were amended on 22 August 2012 and published in the “Recueil électronique des sociétés et associations” (“RESA”) on 18 September 2012.
The SICAV is registered with the Luxembourg Trade and Companies Registry under number B-55740.
The SICAV was established in the form of an umbrella-type fund and is made up of several sub-funds, each representing a set of specific commitments and assets and corresponding to a distinct investment policy.
Currently, twenty-seven sub-funds are active:
• OYSTER - Absolute Return GBP (denominated in GBP) • OYSTER - Balanced Strategy Portfolio USD (denominated in USD) • OYSTER - Continental European Income (denominated in GBP) • OYSTER - Continental European Selection (denominated in GBP) • OYSTER - Dynamic Allocation (denominated in EUR) • OYSTER - Equity Premia Europe (denominated in EUR) • OYSTER - Equity Premia Global (denominated in USD) • OYSTER - Euro Fixed Income (denominated in EUR) • OYSTER - European Corporate Bonds (denominated in EUR) • OYSTER - European Mid & Small Cap (denominated in EUR) • OYSTER - European Opportunities (denominated in EUR) • OYSTER - European Selection (denominated in EUR) • OYSTER - European Subordinated Bonds (denominated in EUR) • OYSTER - Flexible Credit (denominated in EUR) • OYSTER - Global Convertibles (denominated in EUR) • OYSTER - Global High Dividend (denominated in USD) • OYSTER - Global High Yield (denominated in USD) • OYSTER - Growth Strategy Portfolio USD (denominated in USD) • OYSTER - Italian Opportunities (denominated in EUR) • OYSTER - Japan Opportunities (denominated in JPY) • OYSTER - Multi-Asset Absolute Return EUR (denominated in EUR) • OYSTER - Multi-Asset Actiprotect (denominated in EUR) • OYSTER - Multi-Asset Diversified (denominated in EUR) • OYSTER - Multi-Asset Inflation Shield (denominated in USD) • OYSTER - USD Bonds (denominated in USD) • OYSTER - US Selection (denominated in USD) • OYSTER - World Opportunities (denominated in EUR)
Merger of sub-funds
The OYSTER - Italian Value sub-fund was merged with the OYSTER - Italian Opportunities sub-fund on 27th May 2019.
All the share classes of the Absorbed Sub-fund (the “Absorbed Classes”) which have not been redeemed or switched have been exchanged at the Merger Date in an equivalent amount of the equivalent share classes in the Absorbing Sub-fund (the “Absorbing Classes”), as described in the table below:
Absorbed Classes (OYSTER - Italian Value)
Absorbing Classes (OYSTER - Italian Opportunities)
ISIN Class Label ISIN Class Label
LU0096450399 C EUR PF LU0069164738 C EUR PR
LU0335766928 I EUR PF LU0536296873 I EUR PR
LU0133192947 N EUR PF LU0133192608 N EUR PR
Launch of sub-fund
The sub-funds OYSTER - Growth Strategy Portfolio USD and OYSTER - Balanced Strategy Portfolio USD were respectively launched on 31st January 2019 and on 22th February 2019.
Launch of share classes
The R USD class of the OYSTER - Growth Strategy Portfolio USD sub-fund was launched on 31st January 2019.
The R USD class of the OYSTER - Balanced Strategy Portfolio USD sub-fund was launched on 22nd February 2019.
The I GBP D class of the OYSTER - Continental European Selection sub-fund was launched on 22nd February 2019.
The I EUR class of the OYSTER - Global High Dividend sub-fund was launched on 22nd February 2019.
The I EUR class of the OYSTER - Japan Opportunities sub-fund was launched on 7th June 2019
Closure of share classes
The C EUR D PR and R EUR D PR classes of the OYSTER - European Opportunities sub-fund were respectively liquidated on 12th March 2019 and 14th May 2019.
The I S EUR class of OYSTER - European Mid & Small Cap sub-fund was liquidated on 28th February 2019.
The I USD class of the OYSTER - Global High Dividend sub-fund was liquidated on 22h February 2019.
The Z GBP HP class of the OYSTER - World Opportunities sub-fund was liquidated on 13rd February 2019.
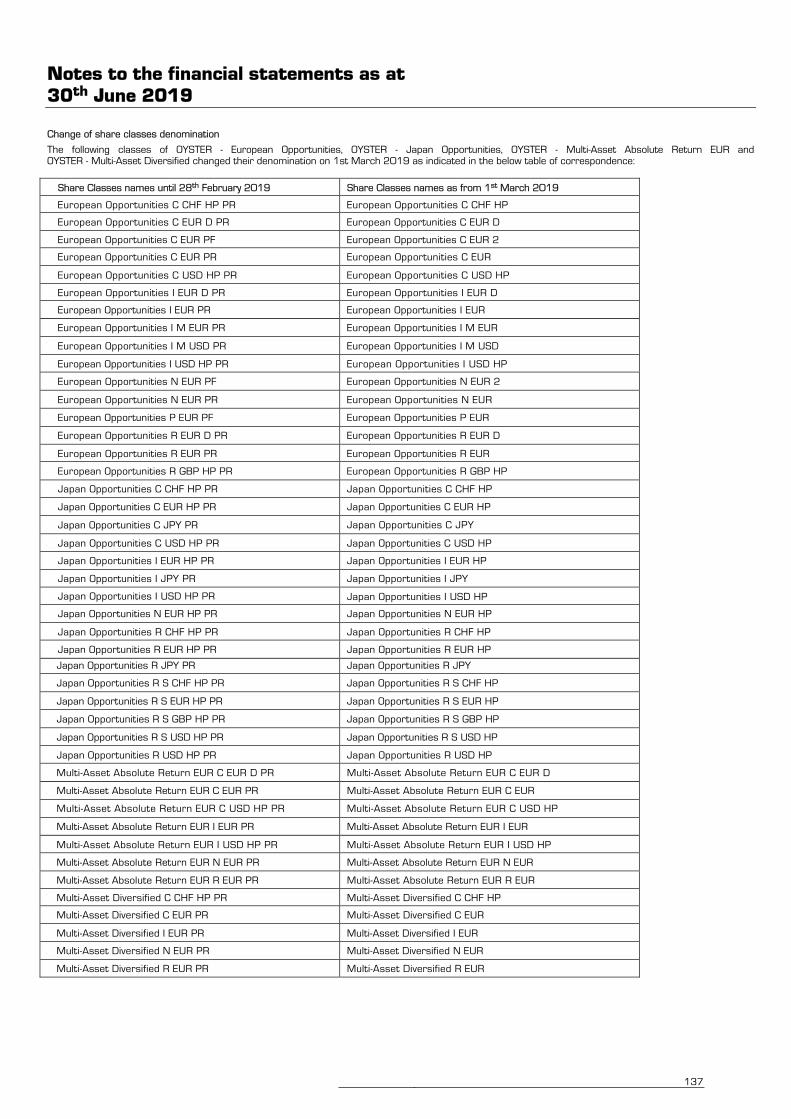
Notes to the financial statements as at 30th June 2019
137
Change of share classes denomination
The following classes of OYSTER - European Opportunities, OYSTER - Japan Opportunities, OYSTER - Multi-Asset Absolute Return EUR and OYSTER - Multi-Asset Diversified changed their denomination on 1st March 2019 as indicated in the below table of correspondence:
Share Classes names until 28th February 2019 Share Classes names as from 1st March 2019
European Opportunities C CHF HP PR European Opportunities C CHF HP
European Opportunities C EUR D PR European Opportunities C EUR D
European Opportunities C EUR PF European Opportunities C EUR 2
European Opportunities C EUR PR European Opportunities C EUR
European Opportunities C USD HP PR European Opportunities C USD HP
European Opportunities I EUR D PR European Opportunities I EUR D
European Opportunities I EUR PR European Opportunities I EUR
European Opportunities I M EUR PR European Opportunities I M EUR
European Opportunities I M USD PR European Opportunities I M USD
European Opportunities I USD HP PR European Opportunities I USD HP
European Opportunities N EUR PF European Opportunities N EUR 2
European Opportunities N EUR PR European Opportunities N EUR
European Opportunities P EUR PF European Opportunities P EUR
European Opportunities R EUR D PR European Opportunities R EUR D
European Opportunities R EUR PR European Opportunities R EUR
European Opportunities R GBP HP PR European Opportunities R GBP HP
Japan Opportunities C CHF HP PR Japan Opportunities C CHF HP
Japan Opportunities C EUR HP PR Japan Opportunities C EUR HP
Japan Opportunities C JPY PR Japan Opportunities C JPY
Japan Opportunities C USD HP PR Japan Opportunities C USD HP
Japan Opportunities I EUR HP PR Japan Opportunities I EUR HP
Japan Opportunities I JPY PR Japan Opportunities I JPY
Japan Opportunities I USD HP PR Japan Opportunities I USD HP
Japan Opportunities N EUR HP PR Japan Opportunities N EUR HP
Japan Opportunities R CHF HP PR Japan Opportunities R CHF HP
Japan Opportunities R EUR HP PR Japan Opportunities R EUR HP
Japan Opportunities R JPY PR Japan Opportunities R JPY
Japan Opportunities R S CHF HP PR Japan Opportunities R S CHF HP
Japan Opportunities R S EUR HP PR Japan Opportunities R S EUR HP
Japan Opportunities R S GBP HP PR Japan Opportunities R S GBP HP
Japan Opportunities R S USD HP PR Japan Opportunities R S USD HP
Japan Opportunities R USD HP PR Japan Opportunities R USD HP
Multi-Asset Absolute Return EUR C EUR D PR Multi-Asset Absolute Return EUR C EUR D
Multi-Asset Absolute Return EUR C EUR PR Multi-Asset Absolute Return EUR C EUR
Multi-Asset Absolute Return EUR C USD HP PR Multi-Asset Absolute Return EUR C USD HP
Multi-Asset Absolute Return EUR I EUR PR Multi-Asset Absolute Return EUR I EUR
Multi-Asset Absolute Return EUR I USD HP PR Multi-Asset Absolute Return EUR I USD HP
Multi-Asset Absolute Return EUR N EUR PR Multi-Asset Absolute Return EUR N EUR
Multi-Asset Absolute Return EUR R EUR PR Multi-Asset Absolute Return EUR R EUR
Multi-Asset Diversified C CHF HP PR Multi-Asset Diversified C CHF HP
Multi-Asset Diversified C EUR PR Multi-Asset Diversified C EUR
Multi-Asset Diversified I EUR PR Multi-Asset Diversified I EUR
Multi-Asset Diversified N EUR PR Multi-Asset Diversified N EUR
Multi-Asset Diversified R EUR PR Multi-Asset Diversified R EUR
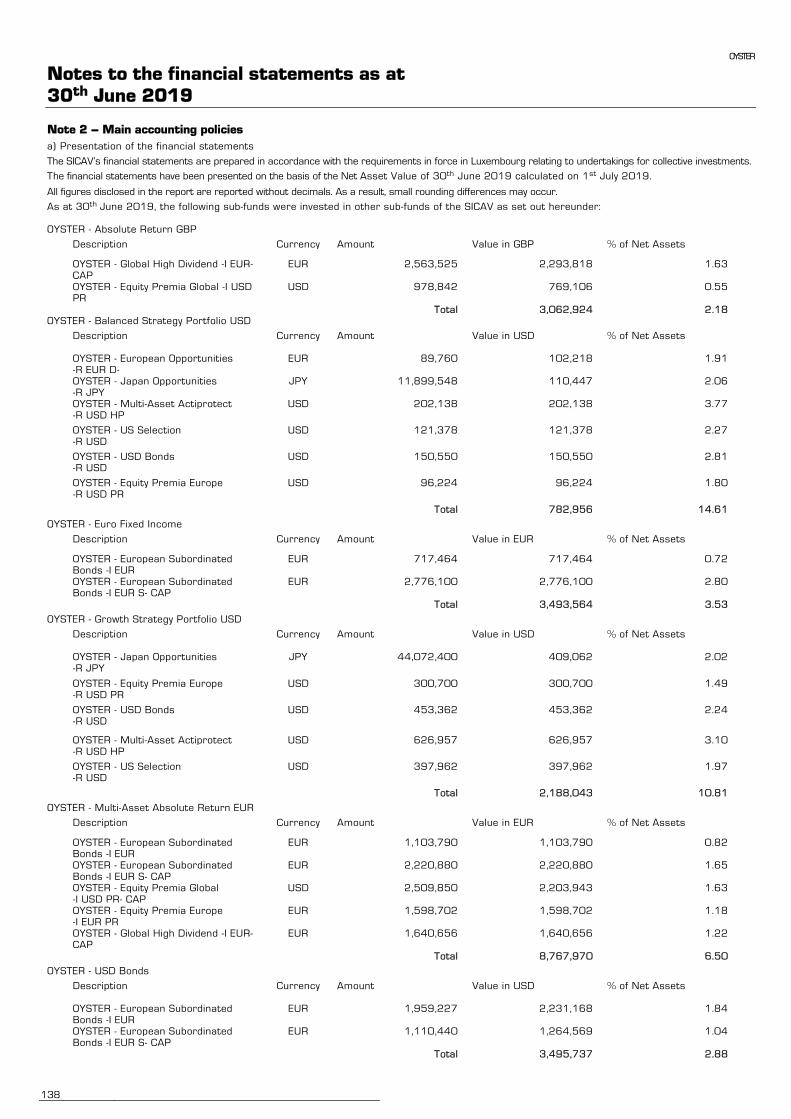
OYSTER
Notes to the financial statements as at 30th June 2019
138
Note 2 – Main accounting policies
a) Presentation of the financial statements
The SICAV’s financial statements are prepared in accordance with the requirements in force in Luxembourg relating to undertakings for collective investments.
The financial statements have been presented on the basis of the Net Asset Value of 30th June 2019 calculated on 1st July 2019.
All figures disclosed in the report are reported without decimals. As a result, small rounding differences may occur.
As at 30th June 2019, the following sub-funds were invested in other sub-funds of the SICAV as set out hereunder: OYSTER - Absolute Return GBP
Description
Currency Amount Value in GBP % of Net Assets
OYSTER - Global High Dividend -I EUR- CAP
EUR 2,563,525 2,293,818 1.63
OYSTER - Equity Premia Global -I USD PR
USD 978,842 769,106 0.55
Total 3,062,924 2.18 OYSTER - Balanced Strategy Portfolio USD
Description
Currency Amount Value in USD % of Net Assets
OYSTER - European Opportunities -R EUR D-
EUR 89,760 102,218 1.91
OYSTER - Japan Opportunities -R JPY
JPY 11,899,548 110,447 2.06
OYSTER - Multi-Asset Actiprotect -R USD HP
USD 202,138 202,138 3.77
OYSTER - US Selection -R USD
USD 121,378 121,378 2.27
OYSTER - USD Bonds -R USD
USD 150,550 150,550 2.81
OYSTER - Equity Premia Europe -R USD PR
USD 96,224 96,224 1.80
Total 782,956 14.61
OYSTER - Euro Fixed Income
Description
Currency Amount Value in EUR % of Net Assets
OYSTER - European Subordinated Bonds -I EUR
EUR 717,464 717,464 0.72
OYSTER - European Subordinated Bonds -I EUR S- CAP
EUR 2,776,100 2,776,100 2.80
Total 3,493,564 3.53
OYSTER - Growth Strategy Portfolio USD
Description
Currency Amount Value in USD % of Net Assets
OYSTER - Japan Opportunities -R JPY
JPY 44,072,400 409,062 2.02
OYSTER - Equity Premia Europe -R USD PR
USD 300,700 300,700 1.49
OYSTER - USD Bonds -R USD
USD 453,362 453,362 2.24
OYSTER - Multi-Asset Actiprotect -R USD HP
USD 626,957 626,957 3.10
OYSTER - US Selection -R USD
USD 397,962 397,962 1.97
Total 2,188,043 10.81
OYSTER - Multi-Asset Absolute Return EUR
Description
Currency Amount Value in EUR % of Net Assets
OYSTER - European Subordinated Bonds -I EUR
EUR 1,103,790 1,103,790 0.82
OYSTER - European Subordinated Bonds -I EUR S- CAP
EUR 2,220,880 2,220,880 1.65
OYSTER - Equity Premia Global -I USD PR- CAP
USD 2,509,850 2,203,943 1.63
OYSTER - Equity Premia Europe -I EUR PR
EUR 1,598,702 1,598,702 1.18
OYSTER - Global High Dividend -I EUR- CAP
EUR 1,640,656 1,640,656 1.22
Total 8,767,970 6.50
OYSTER - USD Bonds
Description
Currency Amount Value in USD % of Net Assets
OYSTER - European Subordinated Bonds -I EUR
EUR 1,959,227 2,231,168 1.84
OYSTER - European Subordinated Bonds -I EUR S- CAP
EUR 1,110,440 1,264,569 1.04
Total 3,495,737 2.88
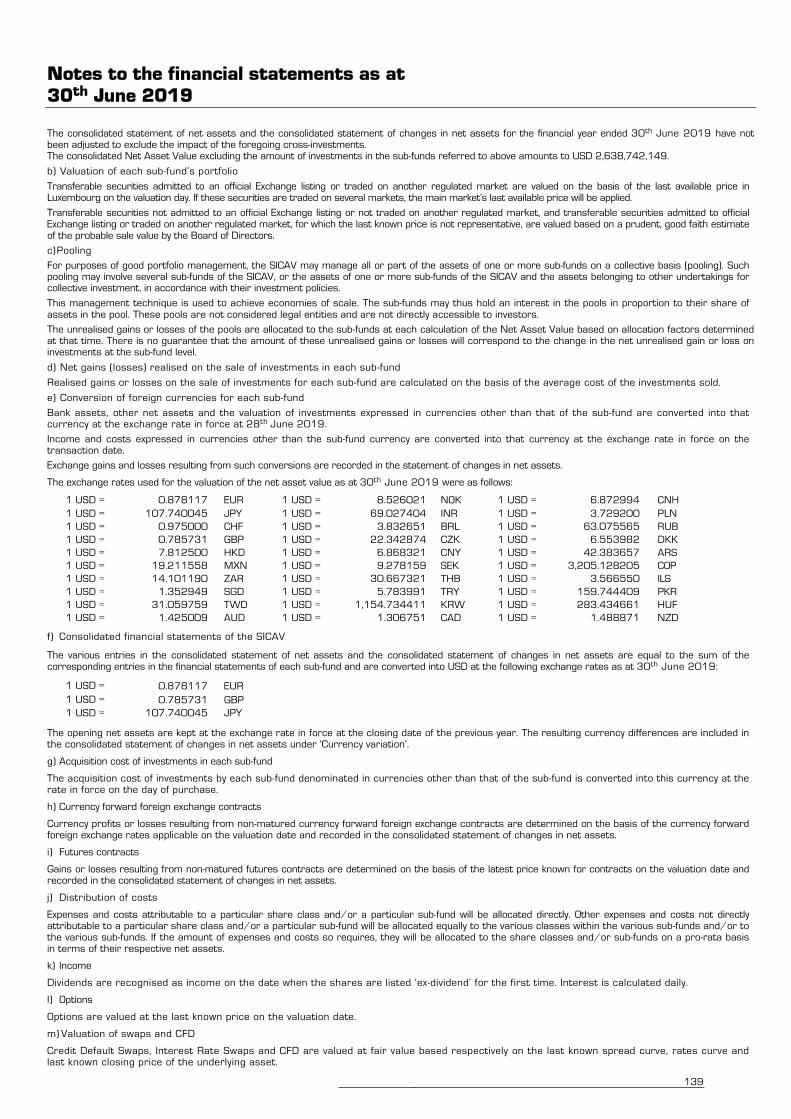
Notes to the financial statements as at 30th June 2019
139
The consolidated statement of net assets and the consolidated statement of changes in net assets for the financial year ended 30th June 2019 have not been adjusted to exclude the impact of the foregoing cross-investments. The consolidated Net Asset Value excluding the amount of investments in the sub-funds referred to above amounts to USD 2,638,742,149.
b) Valuation of each sub-fund’s portfolio
Transferable securities admitted to an official Exchange listing or traded on another regulated market are valued on the basis of the last available price in Luxembourg on the valuation day. If these securities are traded on several markets, the main market’s last available price will be applied.
Transferable securities not admitted to an official Exchange listing or not traded on another regulated market, and transferable securities admitted to official Exchange listing or traded on another regulated market, for which the last known price is not representative, are valued based on a prudent, good faith estimate of the probable sale value by the Board of Directors.
c) Pooling
For purposes of good portfolio management, the SICAV may manage all or part of the assets of one or more sub-funds on a collective basis (pooling). Such pooling may involve several sub-funds of the SICAV, or the assets of one or more sub-funds of the SICAV and the assets belonging to other undertakings for collective investment, in accordance with their investment policies.
This management technique is used to achieve economies of scale. The sub-funds may thus hold an interest in the pools in proportion to their share of assets in the pool. These pools are not considered legal entities and are not directly accessible to investors.
The unrealised gains or losses of the pools are allocated to the sub-funds at each calculation of the Net Asset Value based on allocation factors determined at that time. There is no guarantee that the amount of these unrealised gains or losses will correspond to the change in the net unrealised gain or loss on investments at the sub-fund level.
d) Net gains (losses) realised on the sale of investments in each sub-fund
Realised gains or losses on the sale of investments for each sub-fund are calculated on the basis of the average cost of the investments sold.
e) Conversion of foreign currencies for each sub-fund
Bank assets, other net assets and the valuation of investments expressed in currencies other than that of the sub-fund are converted into that currency at the exchange rate in force at 28th June 2019.
Income and costs expressed in currencies other than the sub-fund currency are converted into that currency at the exchange rate in force on the transaction date.
Exchange gains and losses resulting from such conversions are recorded in the statement of changes in net assets.
The exchange rates used for the valuation of the net asset value as at 30th June 2019 were as follows:
1 USD = 0.878117 EUR 1 USD = 8.526021 NOK 1 USD = 6.872994 CNH
1 USD = 107.740045 JPY 1 USD = 69.027404 INR 1 USD = 3.729200 PLN
1 USD = 0.975000 CHF 1 USD = 3.832651 BRL 1 USD = 63.075565 RUB
1 USD = 0.785731 GBP 1 USD = 22.342874 CZK 1 USD = 6.553982 DKK
1 USD = 7.812500 HKD 1 USD = 6.868321 CNY 1 USD = 42.383657 ARS
1 USD = 19.211558 MXN 1 USD = 9.278159 SEK 1 USD = 3,205.128205 COP
1 USD = 14.101190 ZAR 1 USD = 30.667321 THB 1 USD = 3.566550 ILS
1 USD = 1.352949 SGD 1 USD = 5.783991 TRY 1 USD = 159.744409 PKR
1 USD = 31.059759 TWD 1 USD = 1,154.734411 KRW 1 USD = 283.434661 HUF
1 USD = 1.425009 AUD 1 USD = 1.306751 CAD 1 USD = 1.488871 NZD
f) Consolidated financial statements of the SICAV
The various entries in the consolidated statement of net assets and the consolidated statement of changes in net assets are equal to the sum of the corresponding entries in the financial statements of each sub-fund and are converted into USD at the following exchange rates as at 30th June 2019:
1 USD = 0.878117 EUR
1 USD = 0.785731 GBP
1 USD = 107.740045 JPY
The opening net assets are kept at the exchange rate in force at the closing date of the previous year. The resulting currency differences are included in the consolidated statement of changes in net assets under ‘Currency variation’.
g) Acquisition cost of investments in each sub-fund
The acquisition cost of investments by each sub-fund denominated in currencies other than that of the sub-fund is converted into this currency at the rate in force on the day of purchase.
h) Currency forward foreign exchange contracts
Currency profits or losses resulting from non-matured currency forward foreign exchange contracts are determined on the basis of the currency forward foreign exchange rates applicable on the valuation date and recorded in the consolidated statement of changes in net assets.
i) Futures contracts
Gains or losses resulting from non-matured futures contracts are determined on the basis of the latest price known for contracts on the valuation date and recorded in the consolidated statement of changes in net assets.
j) Distribution of costs
Expenses and costs attributable to a particular share class and/or a particular sub-fund will be allocated directly. Other expenses and costs not directly attributable to a particular share class and/or a particular sub-fund will be allocated equally to the various classes within the various sub-funds and/or to the various sub-funds. If the amount of expenses and costs so requires, they will be allocated to the share classes and/or sub-funds on a pro-rata basis in terms of their respective net assets.
k) Income
Dividends are recognised as income on the date when the shares are listed ‘ex-dividend’ for the first time. Interest is calculated daily.
l) Options
Options are valued at the last known price on the valuation date.
m) Valuation of swaps and CFD
Credit Default Swaps, Interest Rate Swaps and CFD are valued at fair value based respectively on the last known spread curve, rates curve and last known closing price of the underlying asset.
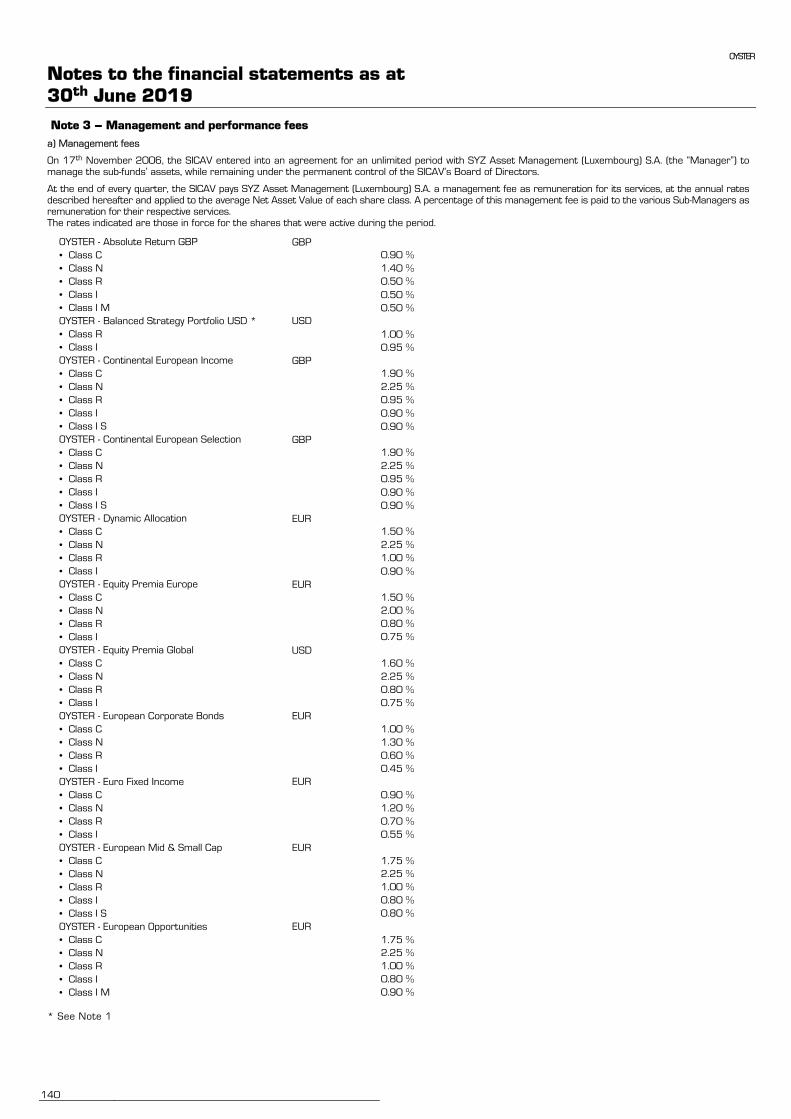
OYSTER
Notes to the financial statements as at 30th June 2019
140
Note 3 – Management and performance fees
a) Management fees
On 17th November 2006, the SICAV entered into an agreement for an unlimited period with SYZ Asset Management (Luxembourg) S.A. (the “Manager”) to manage the sub-funds’ assets, while remaining under the permanent control of the SICAV’s Board of Directors.
At the end of every quarter, the SICAV pays SYZ Asset Management (Luxembourg) S.A. a management fee as remuneration for its services, at the annual rates described hereafter and applied to the average Net Asset Value of each share class. A percentage of this management fee is paid to the various Sub-Managers as remuneration for their respective services. The rates indicated are those in force for the shares that were active during the period.
OYSTER - Absolute Return GBP GBP
• Class C 0.90 %
• Class N 1.40 %
• Class R 0.50 %
• Class I 0.50 %
• Class I M 0.50 %
OYSTER - Balanced Strategy Portfolio USD * USD
• Class R 1.00 %
• Class I 0.95 %
OYSTER - Continental European Income GBP
• Class C 1.90 %
• Class N 2.25 %
• Class R 0.95 %
• Class I 0.90 %
• Class I S 0.90 %
OYSTER - Continental European Selection GBP
• Class C 1.90 %
• Class N 2.25 %
• Class R 0.95 %
• Class I 0.90 %
• Class I S 0.90 %
OYSTER - Dynamic Allocation EUR
• Class C 1.50 %
• Class N 2.25 %
• Class R 1.00 %
• Class I 0.90 %
OYSTER - Equity Premia Europe EUR
• Class C 1.50 %
• Class N 2.00 %
• Class R 0.80 %
• Class I 0.75 %
OYSTER - Equity Premia Global USD
• Class C 1.60 %
• Class N 2.25 %
• Class R 0.80 %
• Class I 0.75 %
OYSTER - European Corporate Bonds EUR
• Class C 1.00 %
• Class N 1.30 %
• Class R 0.60 %
• Class I 0.45 %
OYSTER - Euro Fixed Income EUR
• Class C 0.90 %
• Class N 1.20 %
• Class R 0.70 %
• Class I 0.55 %
OYSTER - European Mid & Small Cap EUR
• Class C 1.75 %
• Class N 2.25 %
• Class R 1.00 %
• Class I 0.80 %
• Class I S 0.80 %
OYSTER - European Opportunities EUR
• Class C 1.75 %
• Class N 2.25 %
• Class R 1.00 %
• Class I 0.80 %
• Class I M 0.90 %
* See Note 1
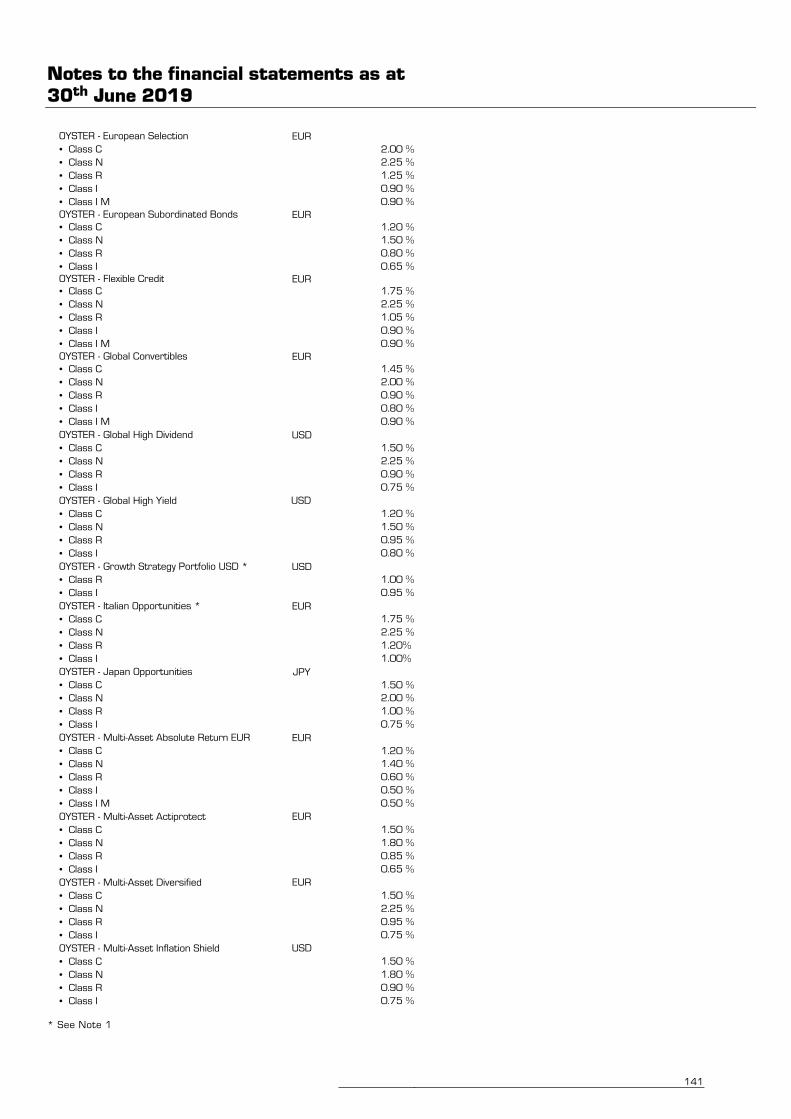
Notes to the financial statements as at 30th June 2019
141
OYSTER - European Selection EUR
• Class C 2.00 %
• Class N 2.25 %
• Class R 1.25 %
• Class I 0.90 %
• Class I M 0.90 %
OYSTER - European Subordinated Bonds EUR
• Class C 1.20 %
• Class N 1.50 %
• Class R 0.80 %
• Class I 0.65 %
OYSTER - Flexible Credit EUR
• Class C 1.75 %
• Class N 2.25 %
• Class R 1.05 %
• Class I 0.90 %
• Class I M 0.90 %
OYSTER - Global Convertibles EUR
• Class C 1.45 %
• Class N 2.00 %
• Class R 0.90 %
• Class I 0.80 %
• Class I M 0.90 %
OYSTER - Global High Dividend USD
• Class C 1.50 %
• Class N 2.25 %
• Class R 0.90 %
• Class I 0.75 %
OYSTER - Global High Yield USD
• Class C 1.20 %
• Class N 1.50 %
• Class R 0.95 %
• Class I 0.80 %
OYSTER - Growth Strategy Portfolio USD * USD
• Class R 1.00 %
• Class I 0.95 %
OYSTER - Italian Opportunities * EUR
• Class C 1.75 %
• Class N 2.25 %
• Class R 1.20%
• Class I 1.00%
OYSTER - Japan Opportunities JPY
• Class C 1.50 %
• Class N 2.00 %
• Class R 1.00 %
• Class I 0.75 %
OYSTER - Multi-Asset Absolute Return EUR EUR
• Class C 1.20 %
• Class N 1.40 %
• Class R 0.60 %
• Class I 0.50 %
• Class I M 0.50 %
OYSTER - Multi-Asset Actiprotect EUR
• Class C 1.50 %
• Class N 1.80 %
• Class R 0.85 %
• Class I 0.65 %
OYSTER - Multi-Asset Diversified EUR
• Class C 1.50 %
• Class N 2.25 %
• Class R 0.95 %
• Class I 0.75 %
OYSTER - Multi-Asset Inflation Shield USD
• Class C 1.50 %
• Class N 1.80 %
• Class R 0.90 %
• Class I 0.75 %
* See Note 1
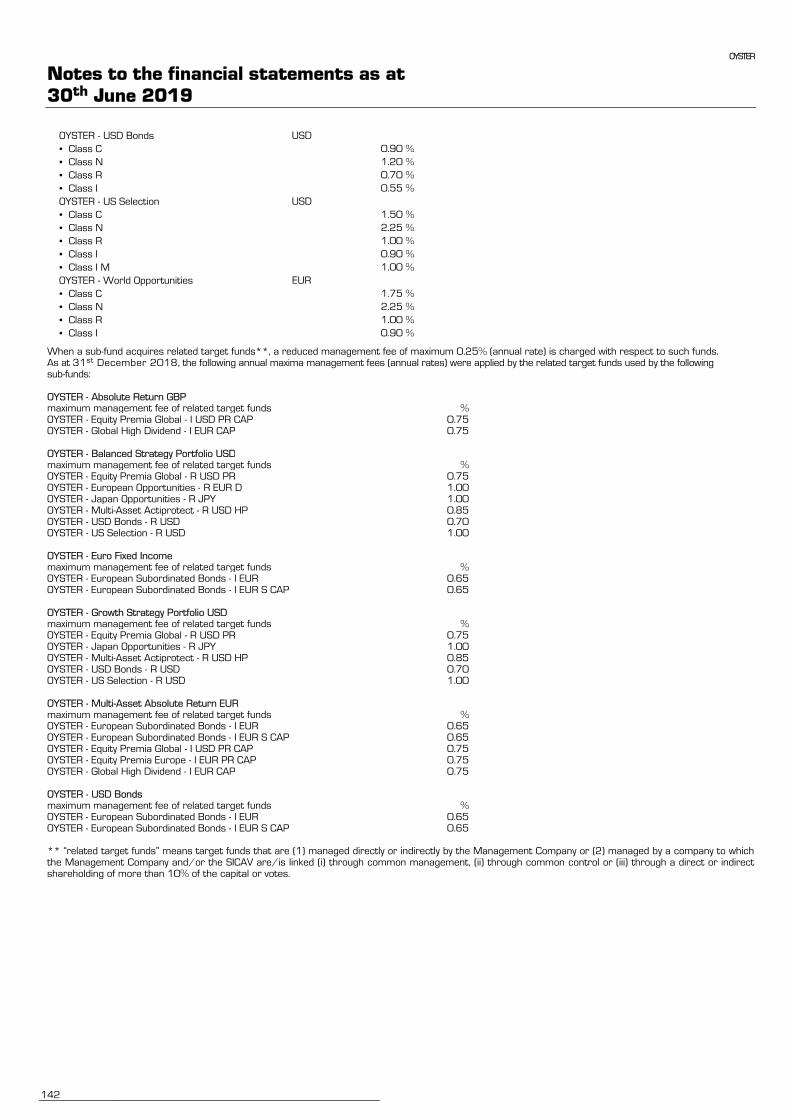
OYSTER
Notes to the financial statements as at 30th June 2019
142
OYSTER - USD Bonds USD
• Class C 0.90 %
• Class N 1.20 %
• Class R 0.70 %
• Class I 0.55 %
OYSTER - US Selection USD
• Class C 1.50 %
• Class N 2.25 %
• Class R 1.00 %
• Class I 0.90 %
• Class I M 1.00 %
OYSTER - World Opportunities EUR
• Class C 1.75 %
• Class N 2.25 %
• Class R 1.00 %
• Class I 0.90 %
When a sub-fund acquires related target funds**, a reduced management fee of maximum 0.25% (annual rate) is charged with respect to such funds. As at 31st December 2018, the following annual maxima management fees (annual rates) were applied by the related target funds used by the following sub-funds: OYSTER - Absolute Return GBP maximum management fee of related target funds % OYSTER - Equity Premia Global - I USD PR CAP 0.75 OYSTER - Global High Dividend - I EUR CAP 0.75 OYSTER - Balanced Strategy Portfolio USD maximum management fee of related target funds % OYSTER - Equity Premia Global - R USD PR 0.75 OYSTER - European Opportunities - R EUR D 1.00 OYSTER - Japan Opportunities - R JPY 1.00 OYSTER - Multi-Asset Actiprotect - R USD HP 0.85 OYSTER - USD Bonds - R USD 0.70 OYSTER - US Selection - R USD 1.00 OYSTER - Euro Fixed Income maximum management fee of related target funds % OYSTER - European Subordinated Bonds - I EUR 0.65 OYSTER - European Subordinated Bonds - I EUR S CAP 0.65 OYSTER - Growth Strategy Portfolio USD maximum management fee of related target funds % OYSTER - Equity Premia Global - R USD PR 0.75 OYSTER - Japan Opportunities - R JPY 1.00 OYSTER - Multi-Asset Actiprotect - R USD HP 0.85 OYSTER - USD Bonds - R USD 0.70 OYSTER - US Selection - R USD 1.00 OYSTER - Multi-Asset Absolute Return EUR maximum management fee of related target funds % OYSTER - European Subordinated Bonds - I EUR 0.65 OYSTER - European Subordinated Bonds - I EUR S CAP 0.65 OYSTER - Equity Premia Global - I USD PR CAP 0.75 OYSTER - Equity Premia Europe - I EUR PR CAP 0.75 OYSTER - Global High Dividend - I EUR CAP 0.75 OYSTER - USD Bonds maximum management fee of related target funds % OYSTER - European Subordinated Bonds - I EUR 0.65 OYSTER - European Subordinated Bonds - I EUR S CAP 0.65 ** “related target funds” means target funds that are (1) managed directly or indirectly by the Management Company or (2) managed by a company to which the Management Company and/or the SICAV are/is linked (i) through common management, (ii) through common control or (iii) through a direct or indirect shareholding of more than 10% of the capital or votes.
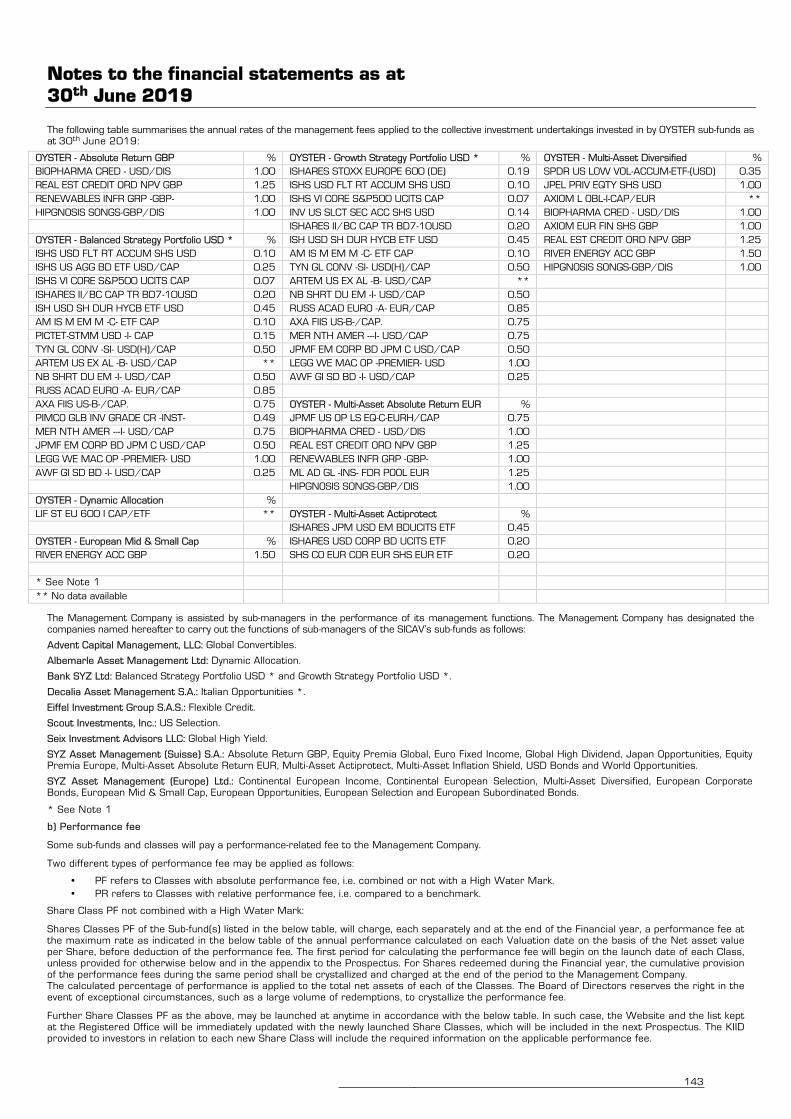
Notes to the financial statements as at 30th June 2019
143
The following table summarises the annual rates of the management fees applied to the collective investment undertakings invested in by OYSTER sub-funds as at 30th June 2019:
OYSTER - Absolute Return GBP % OYSTER - Growth Strategy Portfolio USD * % OYSTER - Multi-Asset Diversified %
BIOPHARMA CRED - USD/DIS 1.00 ISHARES STOXX EUROPE 600 (DE) 0.19 SPDR US LOW VOL-ACCUM-ETF-(USD) 0.35
REAL EST CREDIT ORD NPV GBP 1.25 ISHS USD FLT RT ACCUM SHS USD 0.10 JPEL PRIV EQTY SHS USD 1.00
RENEWABLES INFR GRP -GBP- 1.00 ISHS VI CORE S&P500 UCITS CAP 0.07 AXIOM L OBL-I-CAP/EUR **
HIPGNOSIS SONGS-GBP/DIS 1.00 INV US SLCT SEC ACC SHS USD 0.14 BIOPHARMA CRED - USD/DIS 1.00
ISHARES II/BC CAP TR BD7-10USD 0.20 AXIOM EUR FIN SHS GBP 1.00
OYSTER - Balanced Strategy Portfolio USD * % ISH USD SH DUR HYCB ETF USD 0.45 REAL EST CREDIT ORD NPV GBP 1.25
ISHS USD FLT RT ACCUM SHS USD 0.10 AM IS M EM M -C- ETF CAP 0.10 RIVER ENERGY ACC GBP 1.50
ISHS US AGG BD ETF USD/CAP 0.25 TYN GL CONV -SI- USD(H)/CAP 0.50 HIPGNOSIS SONGS-GBP/DIS 1.00
ISHS VI CORE S&P500 UCITS CAP 0.07 ARTEM US EX AL -B- USD/CAP **
ISHARES II/BC CAP TR BD7-10USD 0.20 NB SHRT DU EM -I- USD/CAP 0.50
ISH USD SH DUR HYCB ETF USD 0.45 RUSS ACAD EURO -A- EUR/CAP 0.85
AM IS M EM M -C- ETF CAP 0.10 AXA FIIS US-B-/CAP. 0.75
PICTET-STMM USD -I- CAP 0.15 MER NTH AMER ---I- USD/CAP 0.75
TYN GL CONV -SI- USD(H)/CAP 0.50 JPMF EM CORP BD JPM C USD/CAP 0.50
ARTEM US EX AL -B- USD/CAP ** LEGG WE MAC OP -PREMIER- USD 1.00
NB SHRT DU EM -I- USD/CAP 0.50 AWF GI SD BD -I- USD/CAP 0.25
RUSS ACAD EURO -A- EUR/CAP 0.85
AXA FIIS US-B-/CAP. 0.75 OYSTER - Multi-Asset Absolute Return EUR %
PIMCO GLB INV GRADE CR -INST- 0.49 JPMF US OP LS EQ-C-EURH/CAP 0.75
MER NTH AMER ---I- USD/CAP 0.75 BIOPHARMA CRED - USD/DIS 1.00
JPMF EM CORP BD JPM C USD/CAP 0.50 REAL EST CREDIT ORD NPV GBP 1.25
LEGG WE MAC OP -PREMIER- USD 1.00 RENEWABLES INFR GRP -GBP- 1.00
AWF GI SD BD -I- USD/CAP 0.25 ML AD GL -INS- FDR POOL EUR 1.25
HIPGNOSIS SONGS-GBP/DIS 1.00
OYSTER - Dynamic Allocation %
LIF ST EU 600 I CAP/ETF ** OYSTER - Multi-Asset Actiprotect %
ISHARES JPM USD EM BDUCITS ETF 0.45
OYSTER - European Mid & Small Cap % ISHARES USD CORP BD UCITS ETF 0.20
RIVER ENERGY ACC GBP 1.50 SHS CO EUR COR EUR SHS EUR ETF 0.20
* See Note 1
** No data available
The Management Company is assisted by sub-managers in the performance of its management functions. The Management Company has designated the companies named hereafter to carry out the functions of sub-managers of the SICAV’s sub-funds as follows:
Advent Capital Management, LLC: Global Convertibles.
Albemarle Asset Management Ltd: Dynamic Allocation.
Bank SYZ Ltd: Balanced Strategy Portfolio USD * and Growth Strategy Portfolio USD *.
Decalia Asset Management S.A.: Italian Opportunities *.
Eiffel Investment Group S.A.S.: Flexible Credit.
Scout Investments, Inc.: US Selection.
Seix Investment Advisors LLC: Global High Yield.
SYZ Asset Management (Suisse) S.A.: Absolute Return GBP, Equity Premia Global, Euro Fixed Income, Global High Dividend, Japan Opportunities, Equity Premia Europe, Multi-Asset Absolute Return EUR, Multi-Asset Actiprotect, Multi-Asset Inflation Shield, USD Bonds and World Opportunities.
SYZ Asset Management (Europe) Ltd.: Continental European Income, Continental European Selection, Multi-Asset Diversified, European Corporate Bonds, European Mid & Small Cap, European Opportunities, European Selection and European Subordinated Bonds.
* See Note 1
b) Performance fee
Some sub-funds and classes will pay a performance-related fee to the Management Company.
Two different types of performance fee may be applied as follows:
• PF refers to Classes with absolute performance fee, i.e. combined or not with a High Water Mark.
• PR refers to Classes with relative performance fee, i.e. compared to a benchmark.
Share Class PF not combined with a High Water Mark:
Shares Classes PF of the Sub-fund(s) listed in the below table, will charge, each separately and at the end of the Financial year, a performance fee at the maximum rate as indicated in the below table of the annual performance calculated on each Valuation date on the basis of the Net asset value per Share, before deduction of the performance fee. The first period for calculating the performance fee will begin on the launch date of each Class, unless provided for otherwise below and in the appendix to the Prospectus. For Shares redeemed during the Financial year, the cumulative provision of the performance fees during the same period shall be crystallized and charged at the end of the period to the Management Company. The calculated percentage of performance is applied to the total net assets of each of the Classes. The Board of Directors reserves the right in the event of exceptional circumstances, such as a large volume of redemptions, to crystallize the performance fee.
Further Share Classes PF as the above, may be launched at anytime in accordance with the below table. In such case, the Website and the list kept at the Registered Office will be immediately updated with the newly launched Share Classes, which will be included in the next Prospectus. The KIID provided to investors in relation to each new Share Class will include the required information on the applicable performance fee.
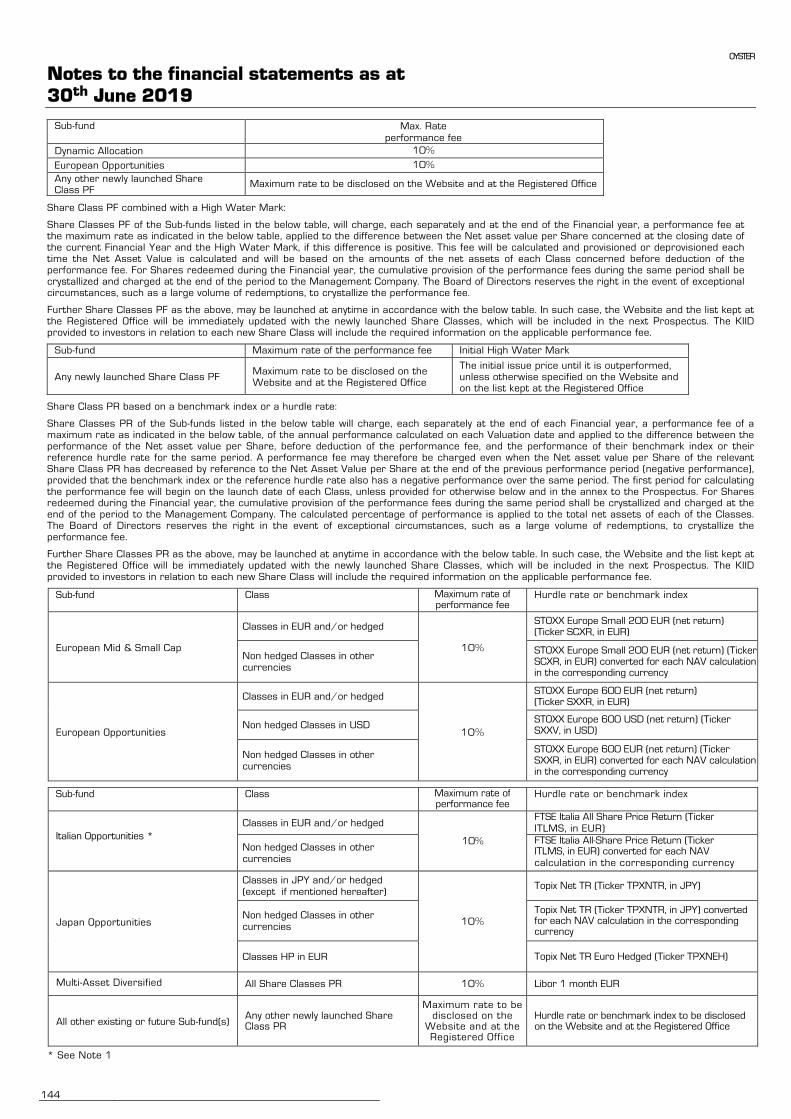
OYSTER
Notes to the financial statements as at 30th June 2019
144
Sub-fund Max. Rate performance fee
Dynamic Allocation 10%
European Opportunities 10%
Any other newly launched Share Class PF
Maximum rate to be disclosed on the Website and at the Registered Office
Share Class PF combined with a High Water Mark:
Share Classes PF of the Sub-funds listed in the below table, will charge, each separately and at the end of the Financial year, a performance fee at the maximum rate as indicated in the below table, applied to the difference between the Net asset value per Share concerned at the closing date of the current Financial Year and the High Water Mark, if this difference is positive. This fee will be calculated and provisioned or deprovisioned each time the Net Asset Value is calculated and will be based on the amounts of the net assets of each Class concerned before deduction of the performance fee. For Shares redeemed during the Financial year, the cumulative provision of the performance fees during the same period shall be crystallized and charged at the end of the period to the Management Company. The Board of Directors reserves the right in the event of exceptional circumstances, such as a large volume of redemptions, to crystallize the performance fee.
Further Share Classes PF as the above, may be launched at anytime in accordance with the below table. In such case, the Website and the list kept at the Registered Office will be immediately updated with the newly launched Share Classes, which will be included in the next Prospectus. The KIID provided to investors in relation to each new Share Class will include the required information on the applicable performance fee.
Sub-fund Maximum rate of the performance fee Initial High Water Mark
Any newly launched Share Class PF Maximum rate to be disclosed on the Website and at the Registered Office
The initial issue price until it is outperformed, unless otherwise specified on the Website and on the list kept at the Registered Office
Share Class PR based on a benchmark index or a hurdle rate:
Share Classes PR of the Sub-funds listed in the below table will charge, each separately at the end of each Financial year, a performance fee of a maximum rate as indicated in the below table, of the annual performance calculated on each Valuation date and applied to the difference between the performance of the Net asset value per Share, before deduction of the performance fee, and the performance of their benchmark index or their reference hurdle rate for the same period. A performance fee may therefore be charged even when the Net asset value per Share of the relevant Share Class PR has decreased by reference to the Net Asset Value per Share at the end of the previous performance period (negative performance), provided that the benchmark index or the reference hurdle rate also has a negative performance over the same period. The first period for calculating the performance fee will begin on the launch date of each Class, unless provided for otherwise below and in the annex to the Prospectus. For Shares redeemed during the Financial year, the cumulative provision of the performance fees during the same period shall be crystallized and charged at the end of the period to the Management Company. The calculated percentage of performance is applied to the total net assets of each of the Classes. The Board of Directors reserves the right in the event of exceptional circumstances, such as a large volume of redemptions, to crystallize the performance fee.
Further Share Classes PR as the above, may be launched at anytime in accordance with the below table. In such case, the Website and the list kept at the Registered Office will be immediately updated with the newly launched Share Classes, which will be included in the next Prospectus. The KIID provided to investors in relation to each new Share Class will include the required information on the applicable performance fee.
Sub-fund Class Maximum rate of performance fee
Hurdle rate or benchmark index
European Mid & Small Cap
Classes in EUR and/or hedged
10%
STOXX Europe Small 200 EUR (net return) (Ticker SCXR, in EUR)
Non hedged Classes in other currencies
STOXX Europe Small 200 EUR (net return) (Ticker SCXR, in EUR) converted for each NAV calculation in the corresponding currency
European Opportunities
Classes in EUR and/or hedged
10%
STOXX Europe 600 EUR (net return) (Ticker SXXR, in EUR)
Non hedged Classes in USD STOXX Europe 600 USD (net return) (Ticker SXXV, in USD)
Non hedged Classes in other currencies
STOXX Europe 600 EUR (net return) (Ticker SXXR, in EUR) converted for each NAV calculation in the corresponding currency
Sub-fund
Sub-fund
Class Maximum rate of performance fee
Hurdle rate or benchmark index
Italian Opportunities *
Classes in EUR and/or hedged
10%
FTSE Italia All Share Price Return (Ticker ITLMS, in EUR)
Non hedged Classes in other currencies
FTSE Italia All-Share Price Return (Ticker ITLMS, in EUR) converted for each NAV calculation in the corresponding currency
Japan Opportunities
Classes in JPY and/or hedged (except if mentioned hereafter)
10%
Topix Net TR (Ticker TPXNTR, in JPY)
Non hedged Classes in other currencies
Topix Net TR (Ticker TPXNTR, in JPY) converted for each NAV calculation in the corresponding currency
Classes HP in EUR Topix Net TR Euro Hedged (Ticker TPXNEH)
Multi-Asset Diversified All Share Classes PR 10% Libor 1 month EUR
All other existing or future Sub-fund(s) Any other newly launched Share Class PR
Maximum rate to be disclosed on the
Website and at the Registered Office
Hurdle rate or benchmark index to be disclosed on the Website and at the Registered Office
* See Note 1
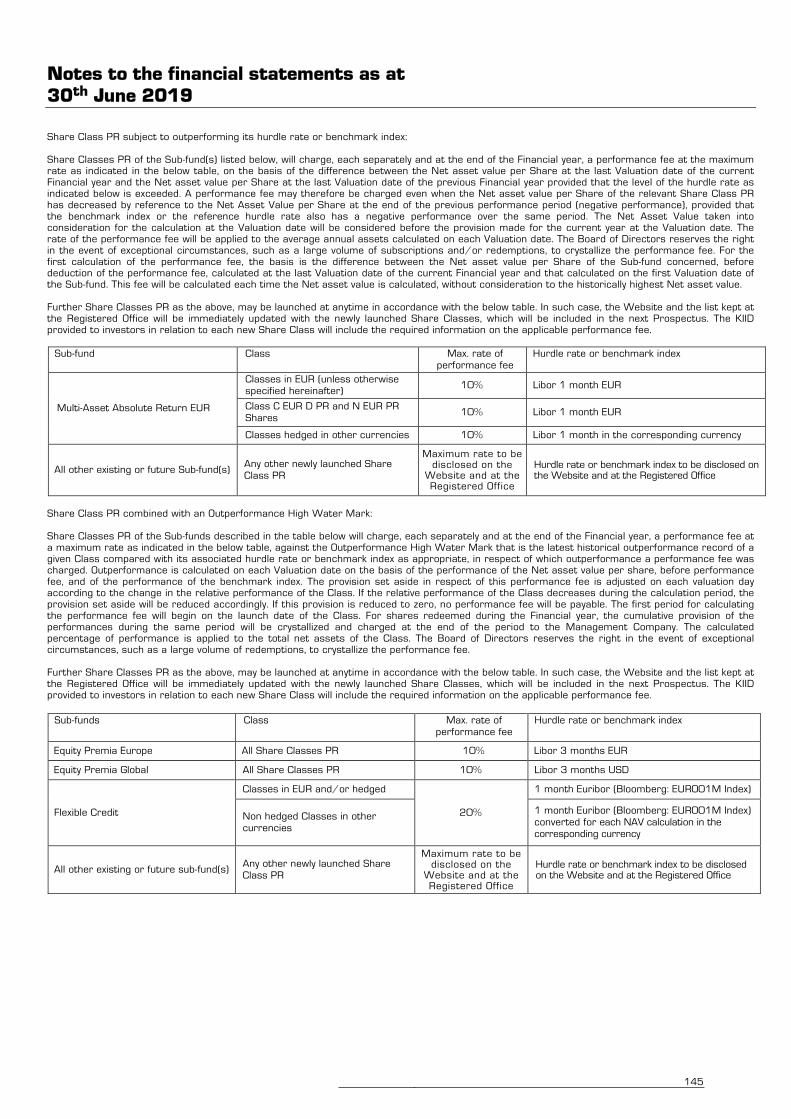
Notes to the financial statements as at 30th June 2019
145
Share Class PR subject to outperforming its hurdle rate or benchmark index: Share Classes PR of the Sub-fund(s) listed below, will charge, each separately and at the end of the Financial year, a performance fee at the maximum rate as indicated in the below table, on the basis of the difference between the Net asset value per Share at the last Valuation date of the current Financial year and the Net asset value per Share at the last Valuation date of the previous Financial year provided that the level of the hurdle rate as indicated below is exceeded. A performance fee may therefore be charged even when the Net asset value per Share of the relevant Share Class PR has decreased by reference to the Net Asset Value per Share at the end of the previous performance period (negative performance), provided that the benchmark index or the reference hurdle rate also has a negative performance over the same period. The Net Asset Value taken into consideration for the calculation at the Valuation date will be considered before the provision made for the current year at the Valuation date. The rate of the performance fee will be applied to the average annual assets calculated on each Valuation date. The Board of Directors reserves the right in the event of exceptional circumstances, such as a large volume of subscriptions and/or redemptions, to crystallize the performance fee. For the first calculation of the performance fee, the basis is the difference between the Net asset value per Share of the Sub-fund concerned, before deduction of the performance fee, calculated at the last Valuation date of the current Financial year and that calculated on the first Valuation date of the Sub-fund. This fee will be calculated each time the Net asset value is calculated, without consideration to the historically highest Net asset value. Further Share Classes PR as the above, may be launched at anytime in accordance with the below table. In such case, the Website and the list kept at the Registered Office will be immediately updated with the newly launched Share Classes, which will be included in the next Prospectus. The KIID provided to investors in relation to each new Share Class will include the required information on the applicable performance fee.
Sub-fund Class Max. rate of performance fee
Hurdle rate or benchmark index
Multi-Asset Absolute Return EUR
Classes in EUR (unless otherwise specified hereinafter)
10% Libor 1 month EUR
Class C EUR D PR and N EUR PR Shares
10% Libor 1 month EUR
Classes hedged in other currencies 10% Libor 1 month in the corresponding currency
All other existing or future Sub-fund(s) Any other newly launched Share Class PR
Maximum rate to be disclosed on the
Website and at the Registered Office
Hurdle rate or benchmark index to be disclosed on the Website and at the Registered Office
Share Class PR combined with an Outperformance High Water Mark: Share Classes PR of the Sub-funds described in the table below will charge, each separately and at the end of the Financial year, a performance fee at a maximum rate as indicated in the below table, against the Outperformance High Water Mark that is the latest historical outperformance record of a given Class compared with its associated hurdle rate or benchmark index as appropriate, in respect of which outperformance a performance fee was charged. Outperformance is calculated on each Valuation date on the basis of the performance of the Net asset value per share, before performance fee, and of the performance of the benchmark index. The provision set aside in respect of this performance fee is adjusted on each valuation day according to the change in the relative performance of the Class. If the relative performance of the Class decreases during the calculation period, the provision set aside will be reduced accordingly. If this provision is reduced to zero, no performance fee will be payable. The first period for calculating the performance fee will begin on the launch date of the Class. For shares redeemed during the Financial year, the cumulative provision of the performances during the same period will be crystallized and charged at the end of the period to the Management Company. The calculated percentage of performance is applied to the total net assets of the Class. The Board of Directors reserves the right in the event of exceptional circumstances, such as a large volume of redemptions, to crystallize the performance fee. Further Share Classes PR as the above, may be launched at anytime in accordance with the below table. In such case, the Website and the list kept at the Registered Office will be immediately updated with the newly launched Share Classes, which will be included in the next Prospectus. The KIID provided to investors in relation to each new Share Class will include the required information on the applicable performance fee.
Sub-funds Class Max. rate of performance fee
Hurdle rate or benchmark index
Equity Premia Europe All Share Classes PR 10% Libor 3 months EUR
Equity Premia Global All Share Classes PR 10% Libor 3 months USD
Flexible Credit
Classes in EUR and/or hedged
20%
1 month Euribor (Bloomberg: EUR001M Index)
Non hedged Classes in other currencies
1 month Euribor (Bloomberg: EUR001M Index) converted for each NAV calculation in the corresponding currency
All other existing or future sub-fund(s) Any other newly launched Share Class PR
Maximum rate to be disclosed on the
Website and at the Registered Office
Hurdle rate or benchmark index to be disclosed on the Website and at the Registered Office
OYSTER
Notes to the financial statements as at 30th June 2019
146
c) Miscellaneous provisions The Board of Directors reserves the right to change the characteristics of the performance fee, particularly if the benchmark or reference index were to cease to exist.
The Board of Directors eventually reserves the right to stop charging a performance fee in respect of any Share Class, in which case the performance fee will be calculated according to the above sections as appropriate, up to the date the performance fee is no longer charged and paid at the end of the relevant Financial year.
In all the cases above, the performance fee Variable Characteristic of the relevant Share Class will be immediately updated, the investors will be given appropriate information and prior notice (where necessary), and the next Prospectus will be duly amended.
d) Specific fee for management of the duration risk of the Class HD Shares
By way of remuneration for the services described for these Classes, the Class HD Shares may pay, each separately, at the end of each quarter, a duration risk management fee at the maximum annual rate of 0.05% and applied to the average Net Asset Value of each Class HD Share. This fee shall be payable to the sub-manager of the sub-fund concerned and/or to the entity in charge of the management of the duration.
In accordance with the ESMA’s Opinion ESMA34-43-296 dated 30th January 2017 on “Share classes of UCITS”, the Share Classes with an HD Variable Characteristic have been subject to a Soft-Closure since 30th July 2017. Existing investors at that date, that choose to remain invested in these Share Classes will be able to top-up their investment and reinvest dividends, if any, until 30th July 2018, on which date these Share Classes will be eventually subject to a Hard Closure (no further subsequent subscription will be allowed).
e) Specific fee for management of the foreign exchange risk of the Class HA and HP shares
By way of remuneration for the services described for these Classes, the Class HA and HP Shares may pay, each separately, at the end of each quarter, a foreign exchange risk management fee at the maximum annual rate of 0.10% and applied to the average Net asset value per Share of each Class HA or HP Share. This fee shall be payable to the entity in charge of the management of the foreign exchange.
Note 4 – Subscription tax
The SICAV is governed by Luxembourg tax laws.
Pursuant to the legislation and regulations currently in force, the SICAV is subject in Luxembourg to an annual tax of 0.05%, the subscription tax, payable quarterly and calculated on each of the SICAV sub-funds’ net assets at the end of each quarter.
This tax is limited to 0.01% of the asset value for share classes reserved to institutional investors.
No additional tax is due on the assets held in units of other Ucits which are already subject to this tax in Luxembourg.
Note 5 – Depositary bank fee
The SICAV pays the Depositary Bank an annual fee which varies between 0.012% and 0.20% of the Net Asset Value of each sub-fund. These fees are payable monthly and do not include transaction fees or fees of sub-custodians or similar agents. The Depositary Bank is also entitled to be reimbursed for reasonable expenses and disbursements that are not included in the expenses referred to hereunder.
Note 6 – Administration fee An annual administration fee representing a maximum of 0.45% of the net assets of each sub-fund will be paid quarterly to the Management Company in consideration for the services it provides to the SICAV. This fee will also allow the Management Company to remunerate RBC Investor Services Bank S.A. for its services as central administrator and transfer and register agent.
Note 7 – Bank charges This entry includes bank costs and transaction fees (excluding brokerage fees) paid by the SICAV to RBC Investor Services Bank S.A. for each securities transaction.
Note 8 – Forward foreign exchange contracts
A forward exchange contract is a special type of foreign currency transaction. Forward exchange contracts are agreements between two parties to exchange two designated currencies at a specific time in the future. These contracts always take place on a date after the date that the spot contract settles and are used to protect the buyer from fluctuations in currency prices.
As at 30th June 2019, the sub-funds listed below had the following forward foreign exchange contracts outstanding:
• Absolute Return GBP
Maturity Sales Purchases
13/09/2019 GBP 250,396 BRL 1,230,000 13/09/2019 AUD 400,000 GBP 217,785 13/09/2019 BRL 3,325,000 GBP 668,950 13/09/2019 CAD 850,000 GBP 500,943 13/09/2019 CHF 1,150,000 GBP 911,346 13/09/2019 EUR 36,480,000 GBP 32,535,857 13/09/2019 HKD 5,250,000 GBP 524,685 13/09/2019 JPY 150,000,000 GBP 1,088,329 13/09/2019 NOK 5,300,000 GBP 480,985 13/09/2019 SEK 800,000 GBP 66,700 13/09/2019 USD 36,310,000 GBP 28,383,162 13/09/2019 GBP 173,794 NOK 1,880,000 13/09/2019 GBP 949,980 USD 1,200,000
The unrealised net loss on these forward foreign exchange contracts as at 30th June 2019 is GBP (306,963) and is shown in the consolidated statement of net assets.
Notes to the financial statements as at 30th June 2019
147
• Dynamic Allocation
Maturity Sales Purchases
30/08/2019 USD 300,000 EUR 266,128 30/08/2019 EUR 265,852 USD 300,000
The unrealised net gain on these forward foreign exchange contracts as at 30th June 2019 is EUR 295 and is shown in the consolidated statement of net assets.
• European Corporate Bonds
Maturity Sales Purchases
17/07/2019 GBP 43,871 EUR 49,000 17/07/2019 EUR 3,154,000 GBP 2,819,035 19/07/2019 USD 16,000,000 EUR 14,119,931
The unrealised net gain on these forward foreign exchange contracts as at 30th June 2019 is EUR 87,837 and is shown in the consolidated statement of net assets.
• Euro Fixed Income
Maturity Sales Purchases
17/07/2019 EUR 723,700 CHF 811,055
The unrealised net gain on this forward foreign exchange contract as at 30th June 2019 is EUR 6,906 and is shown in the consolidated statement of net assets.
• European Opportunities
Maturity Sales Purchases
17/07/2019 EUR 2,862,500 CHF 3,209,206 17/07/2019 GBP 38,051 EUR 42,500 17/07/2019 EUR 1,382,500 GBP 1,233,321 17/07/2019 EUR 4,877,930 USD 5,522,451
The unrealised net loss on these forward foreign exchange contracts as at 30th June 2019 is EUR (12,450) and is shown in the consolidated statement of net assets.
• European Selection
Maturity Sales Purchases
17/07/2019 EUR 1,597,000 CHF 1,790,333
The unrealised net gain on this forward foreign exchange contract as at 30th June 2019 is EUR 15,748 and is shown in the consolidated statement of net assets.
• European Subordinated Bonds
Maturity Sales Purchases
17/07/2019 EUR 843,500 CHF 945,498 17/07/2019 CHF 764,256 EUR 688,000 19/07/2019 USD 13,500,000 EUR 11,913,692
The unrealised net gain on these forward foreign exchange contracts as at 30th June 2019 is EUR 86,478 and is shown in the consolidated statement of net assets.
• Flexible Credit
Maturity Sales Purchases
26/07/2019 GBP 3,558,000 EUR 3,967,020 26/07/2019 NOK 7,000,000 EUR 721,524 26/07/2019 USD 9,205,000 EUR 8,060,857
The unrealised net loss on these forward foreign exchange contracts as at 30th June 2019 is EUR (8,763) and is shown in the consolidated statement of net assets.
• Global Convertibles
Maturity Sales Purchases
05/07/2019 CHF 1,077,000 EUR 964,250 05/07/2019 GBP 315,000 EUR 354,149 05/07/2019 HKD 19,991,000 EUR 2,259,419 05/07/2019 JPY 483,200,000 EUR 3,960,688 05/07/2019 USD 60,348,000 EUR 53,447,894 17/07/2019 EUR 4,468,900 CHF 5,010,173 17/07/2019 EUR 5,604,000 USD 6,344,457
The unrealised net gain on these forward foreign exchange contracts as at 30th June 2019 is EUR 520,592 and is shown in the consolidated statement of net assets.
• Global High Dividend
Maturity Sales Purchases
17/07/2019 USD 1,335,500 CHF 1,321,982 17/07/2019 USD 5,142,850 EUR 4,542,073
The unrealised net gain on these forward foreign exchange contracts as at 30th June 2019 is USD 60,076 and is shown in the consolidated statement of net assets.
OYSTER
Notes to the financial statements as at 30th June 2019
148
• Global High Yield
Maturity Sales Purchases
17/07/2019 USD 9,672,000 CHF 9,568,434 17/07/2019 USD 14,585,400 EUR 12,883,149 17/07/2019 EUR 106,212 USD 120,000 13/09/2019 USD 125,400 EUR 110,000 13/09/2019 CAD 1,400,000 USD 1,044,940 13/09/2019 EUR 4,025,000 USD 4,558,715 13/09/2019 GBP 1,770,000 USD 2,252,661
The unrealised net gain on these forward foreign exchange contracts as at 30th June 2019 is USD 179,558 and is shown in the consolidated statement of net asset.
• Japan Opportunities
Maturity Sales Purchases
17/07/2019 JPY 501,873,500 CHF 4,593,211 17/07/2019 JPY 20,081,742,300 EUR 164,044,366 17/07/2019 JPY 23,970,500 GBP 174,776 17/07/2019 CHF 8,439 JPY 929,900 17/07/2019 EUR 3,755,120 JPY 456,040,000 17/07/2019 GBP 5,687 JPY 775,000 17/07/2019 USD 146,537 JPY 15,814,000 17/07/2019 JPY 607,021,000 USD 5,614,698
The unrealised net gain on these forward foreign exchange contracts as at 30th June 2019 is JPY 45,054,187 and is shown in the consolidated statement of net assets.
• Multi-Asset Absolute Return EUR
Maturity Sales Purchases
17/07/2019 EUR 794,700 JPY 97,266,005 13/09/2019 AUD 400,000 EUR 244,376 13/09/2019 BRL 2,700,000 EUR 610,817 13/09/2019 CAD 720,000 EUR 476,272 13/09/2019 CHF 1,850,000 EUR 1,645,262 13/09/2019 GBP 3,000,000 EUR 3,365,587 13/09/2019 HKD 7,450,000 EUR 835,295 13/09/2019 JPY 122,000,000 EUR 993,437 13/09/2019 NOK 5,350,000 EUR 544,546 13/09/2019 SEK 900,000 EUR 84,220 13/09/2019 USD 32,820,000 EUR 28,775,362 13/09/2019 EUR 201,234 NOK 1,950,000 13/09/2019 EUR 1,235,877 USD 1,400,000 15/10/2019 INR 15,000,000 EUR 170,136
The unrealised net gain on these forward foreign exchange contracts as at 30th June 2019 is EUR 79,706 and is shown in the consolidated statement of net assets.
• Multi-Asset Actiprotect
Maturity Sales Purchases
17/07/2019 EUR 7,045,300 CHF 7,898,627 17/07/2019 EUR 12,860,000 USD 14,559,192 26/07/2019 EUR 1,351,268 AUD 2,200,000 26/07/2019 EUR 504,959 CHF 560,000 26/07/2019 USD 6,400,000 EUR 5,618,915 26/07/2019 EUR 1,394,156 GBP 1,250,000 26/07/2019 EUR 1,888,644 JPY 231,000,000 13/09/2019 USD 2,860,000 EUR 2,507,540
The unrealised net loss on these forward foreign exchange contracts as at 30th June 2019 is EUR (4,990) and is shown in the consolidated statement of net assets.
• Multi-Asset Diversified
Maturity Sales Purchases
17/07/2019 EUR 8,225,500 CHF 9,221,773 16/09/2019 GBP 4,500,000 EUR 5,040,210 16/09/2019 SEK 6,500,000 EUR 606,493 16/09/2019 USD 15,600,000 EUR 13,669,261 16/09/2019 EUR 1,329,983 USD 1,500,000 17/09/2019 EUR 8,559,462 JPY 1,050,000,000
The unrealised net gain on these forward foreign exchange contracts as at 30th June 2019 is EUR 125,860 and is shown in the consolidated statement of net assets.
• US Selection
Maturity Sales Purchases
17/07/2019 USD 1,280,500 CHF 1,267,535 17/07/2019 USD 5,749,000 EUR 5,078,039
The unrealised net gain on these forward foreign exchange contracts as at 30th June 2019 is USD 64,258 and is shown in the consolidated statement of net assets.
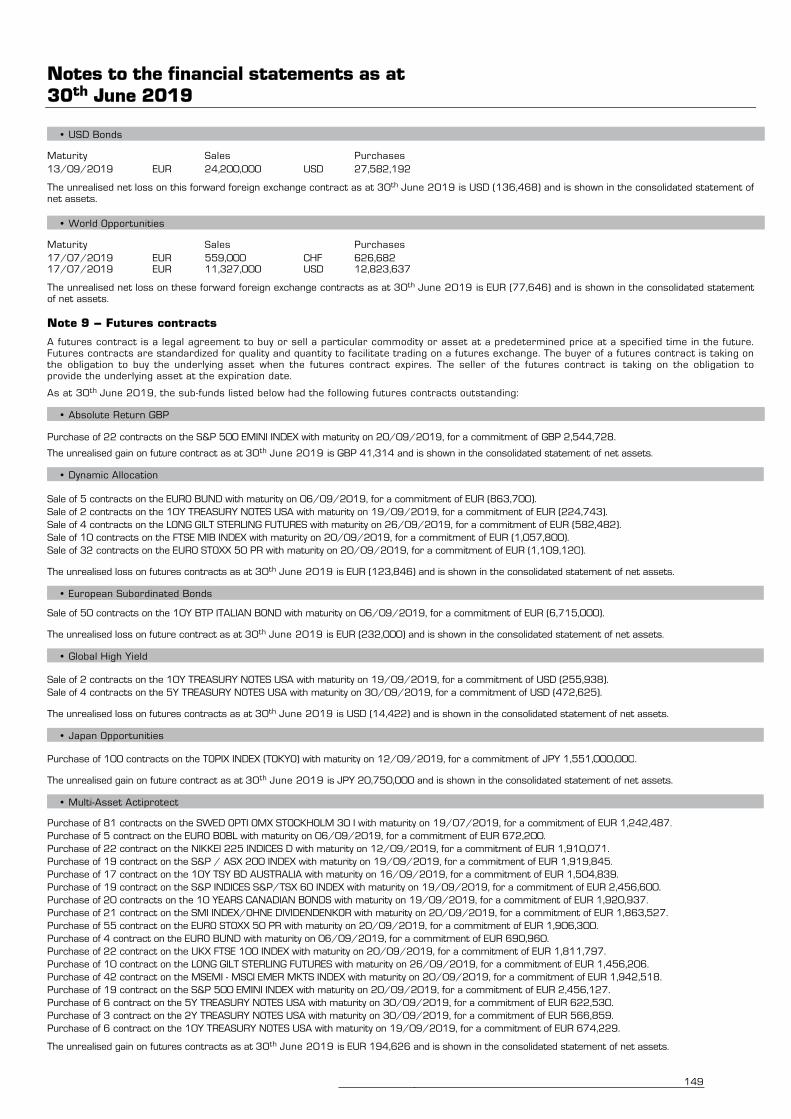
Notes to the financial statements as at 30th June 2019
149
• USD Bonds
Maturity Sales Purchases
13/09/2019 EUR 24,200,000 USD 27,582,192
The unrealised net loss on this forward foreign exchange contract as at 30th June 2019 is USD (136,468) and is shown in the consolidated statement of net assets.
• World Opportunities
Maturity Sales Purchases
17/07/2019 EUR 559,000 CHF 626,682 17/07/2019 EUR 11,327,000 USD 12,823,637
The unrealised net loss on these forward foreign exchange contracts as at 30th June 2019 is EUR (77,646) and is shown in the consolidated statement of net assets. Note 9 – Futures contracts
A futures contract is a legal agreement to buy or sell a particular commodity or asset at a predetermined price at a specified time in the future. Futures contracts are standardized for quality and quantity to facilitate trading on a futures exchange. The buyer of a futures contract is taking on the obligation to buy the underlying asset when the futures contract expires. The seller of the futures contract is taking on the obligation to provide the underlying asset at the expiration date.
As at 30th June 2019, the sub-funds listed below had the following futures contracts outstanding:
• Absolute Return GBP
Purchase of 22 contracts on the S&P 500 EMINI INDEX with maturity on 20/09/2019, for a commitment of GBP 2,544,728.
The unrealised gain on future contract as at 30th June 2019 is GBP 41,314 and is shown in the consolidated statement of net assets.
• Dynamic Allocation
Sale of 5 contracts on the EURO BUND with maturity on 06/09/2019, for a commitment of EUR (863,700).
Sale of 2 contracts on the 10Y TREASURY NOTES USA with maturity on 19/09/2019, for a commitment of EUR (224,743).
Sale of 4 contracts on the LONG GILT STERLING FUTURES with maturity on 26/09/2019, for a commitment of EUR (582,482).
Sale of 10 contracts on the FTSE MIB INDEX with maturity on 20/09/2019, for a commitment of EUR (1,057,800).
Sale of 32 contracts on the EURO STOXX 50 PR with maturity on 20/09/2019, for a commitment of EUR (1,109,120).
The unrealised loss on futures contracts as at 30th June 2019 is EUR (123,846) and is shown in the consolidated statement of net assets.
• European Subordinated Bonds
Sale of 50 contracts on the 10Y BTP ITALIAN BOND with maturity on 06/09/2019, for a commitment of EUR (6,715,000).
The unrealised loss on future contract as at 30th June 2019 is EUR (232,000) and is shown in the consolidated statement of net assets.
• Global High Yield
Sale of 2 contracts on the 10Y TREASURY NOTES USA with maturity on 19/09/2019, for a commitment of USD (255,938).
Sale of 4 contracts on the 5Y TREASURY NOTES USA with maturity on 30/09/2019, for a commitment of USD (472,625).
The unrealised loss on futures contracts as at 30th June 2019 is USD (14,422) and is shown in the consolidated statement of net assets.
• Japan Opportunities
Purchase of 100 contracts on the TOPIX INDEX (TOKYO) with maturity on 12/09/2019, for a commitment of JPY 1,551,000,000.
The unrealised gain on future contract as at 30th June 2019 is JPY 20,750,000 and is shown in the consolidated statement of net assets.
• Multi-Asset Actiprotect
Purchase of 81 contracts on the SWED OPTI OMX STOCKHOLM 30 I with maturity on 19/07/2019, for a commitment of EUR 1,242,487.
Purchase of 5 contract on the EURO BOBL with maturity on 06/09/2019, for a commitment of EUR 672,200.
Purchase of 22 contract on the NIKKEI 225 INDICES D with maturity on 12/09/2019, for a commitment of EUR 1,910,071.
Purchase of 19 contract on the S&P / ASX 200 INDEX with maturity on 19/09/2019, for a commitment of EUR 1,919,845.
Purchase of 17 contract on the 10Y TSY BD AUSTRALIA with maturity on 16/09/2019, for a commitment of EUR 1,504,839.
Purchase of 19 contract on the S&P INDICES S&P/TSX 60 INDEX with maturity on 19/09/2019, for a commitment of EUR 2,456,600.
Purchase of 20 contracts on the 10 YEARS CANADIAN BONDS with maturity on 19/09/2019, for a commitment of EUR 1,920,937.
Purchase of 21 contract on the SMI INDEX/OHNE DIVIDENDENKOR with maturity on 20/09/2019, for a commitment of EUR 1,863,527.
Purchase of 55 contract on the EURO STOXX 50 PR with maturity on 20/09/2019, for a commitment of EUR 1,906,300.
Purchase of 4 contract on the EURO BUND with maturity on 06/09/2019, for a commitment of EUR 690,960.
Purchase of 22 contract on the UKX FTSE 100 INDEX with maturity on 20/09/2019, for a commitment of EUR 1,811,797.
Purchase of 10 contract on the LONG GILT STERLING FUTURES with maturity on 26/09/2019, for a commitment of EUR 1,456,206.
Purchase of 42 contract on the MSEMI - MSCI EMER MKTS INDEX with maturity on 20/09/2019, for a commitment of EUR 1,942,518.
Purchase of 19 contract on the S&P 500 EMINI INDEX with maturity on 20/09/2019, for a commitment of EUR 2,456,127.
Purchase of 6 contract on the 5Y TREASURY NOTES USA with maturity on 30/09/2019, for a commitment of EUR 622,530.
Purchase of 3 contract on the 2Y TREASURY NOTES USA with maturity on 30/09/2019, for a commitment of EUR 566,859.
Purchase of 6 contract on the 10Y TREASURY NOTES USA with maturity on 19/09/2019, for a commitment of EUR 674,229. The unrealised gain on futures contracts as at 30th June 2019 is EUR 194,626 and is shown in the consolidated statement of net assets.
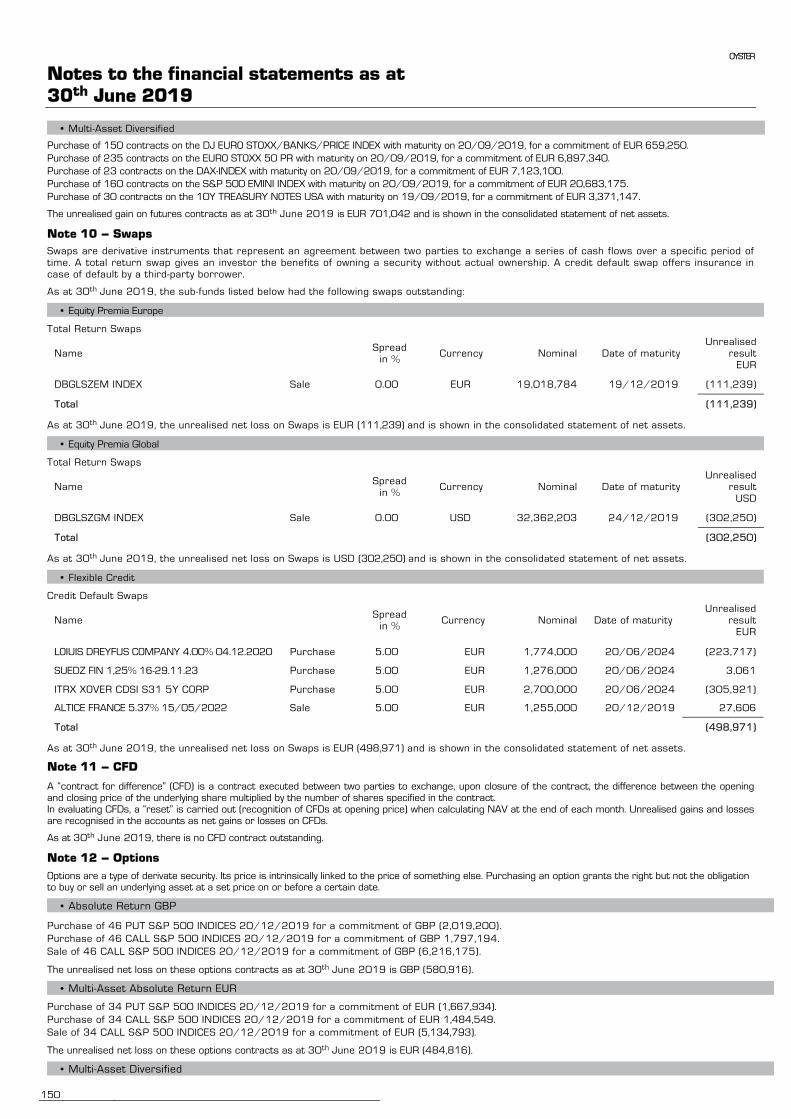
OYSTER
Notes to the financial statements as at 30th June 2019
150
• Multi-Asset Diversified
Purchase of 150 contracts on the DJ EURO STOXX/BANKS/PRICE INDEX with maturity on 20/09/2019, for a commitment of EUR 659,250.
Purchase of 235 contracts on the EURO STOXX 50 PR with maturity on 20/09/2019, for a commitment of EUR 6,897,340.
Purchase of 23 contracts on the DAX-INDEX with maturity on 20/09/2019, for a commitment of EUR 7,123,100.
Purchase of 160 contracts on the S&P 500 EMINI INDEX with maturity on 20/09/2019, for a commitment of EUR 20,683,175.
Purchase of 30 contracts on the 10Y TREASURY NOTES USA with maturity on 19/09/2019, for a commitment of EUR 3,371,147.
The unrealised gain on futures contracts as at 30th June 2019 is EUR 701,042 and is shown in the consolidated statement of net assets.
Note 10 – Swaps
Swaps are derivative instruments that represent an agreement between two parties to exchange a series of cash flows over a specific period of time. A total return swap gives an investor the benefits of owning a security without actual ownership. A credit default swap offers insurance in case of default by a third-party borrower.
As at 30th June 2019, the sub-funds listed below had the following swaps outstanding:
• Equity Premia Europe
Total Return Swaps
Name Spread
in % Currency Nominal Date of maturity
Unrealised result EUR
DBGLSZEM INDEX Sale 0.00 EUR 19,018,784 19/12/2019 (111,239)
Total (111,239)
As at 30th June 2019, the unrealised net loss on Swaps is EUR (111,239) and is shown in the consolidated statement of net assets.
• Equity Premia Global
Total Return Swaps
Name Spread
in % Currency Nominal Date of maturity
Unrealised result USD
DBGLSZGM INDEX Sale 0.00 USD 32,362,203 24/12/2019 (302,250)
Total (302,250)
As at 30th June 2019, the unrealised net loss on Swaps is USD (302,250) and is shown in the consolidated statement of net assets.
• Flexible Credit
Credit Default Swaps
Name Spread
in % Currency Nominal Date of maturity
Unrealised result EUR
LOIUIS DREYFUS COMPANY 4.00% 04.12.2020 Purchase 5.00 EUR 1,774,000 20/06/2024 (223,717)
SUEDZ FIN 1,25% 16-29.11.23 Purchase 5.00 EUR 1,276,000 20/06/2024 3,061
ITRX XOVER CDSI S31 5Y CORP Purchase 5.00 EUR 2,700,000 20/06/2024 (305,921)
ALTICE FRANCE 5.37% 15/05/2022 Sale 5.00 EUR 1,255,000 20/12/2019 27,606
Total (498,971)
As at 30th June 2019, the unrealised net loss on Swaps is EUR (498,971) and is shown in the consolidated statement of net assets.
Note 11 – CFD
A “contract for difference” (CFD) is a contract executed between two parties to exchange, upon closure of the contract, the difference between the opening and closing price of the underlying share multiplied by the number of shares specified in the contract. In evaluating CFDs, a “reset” is carried out (recognition of CFDs at opening price) when calculating NAV at the end of each month. Unrealised gains and losses are recognised in the accounts as net gains or losses on CFDs.
As at 30th June 2019, there is no CFD contract outstanding.
Note 12 – Options
Options are a type of derivate security. Its price is intrinsically linked to the price of something else. Purchasing an option grants the right but not the obligation to buy or sell an underlying asset at a set price on or before a certain date.
• Absolute Return GBP
Purchase of 46 PUT S&P 500 INDICES 20/12/2019 for a commitment of GBP (2,019,200).
Purchase of 46 CALL S&P 500 INDICES 20/12/2019 for a commitment of GBP 1,797,194.
Sale of 46 CALL S&P 500 INDICES 20/12/2019 for a commitment of GBP (6,216,175).
The unrealised net loss on these options contracts as at 30th June 2019 is GBP (580,916).
• Multi-Asset Absolute Return EUR Purchase of 34 PUT S&P 500 INDICES 20/12/2019 for a commitment of EUR (1,667,934).
Purchase of 34 CALL S&P 500 INDICES 20/12/2019 for a commitment of EUR 1,484,549.
Sale of 34 CALL S&P 500 INDICES 20/12/2019 for a commitment of EUR (5,134,793).
The unrealised net loss on these options contracts as at 30th June 2019 is EUR (484,816).
• Multi-Asset Diversified
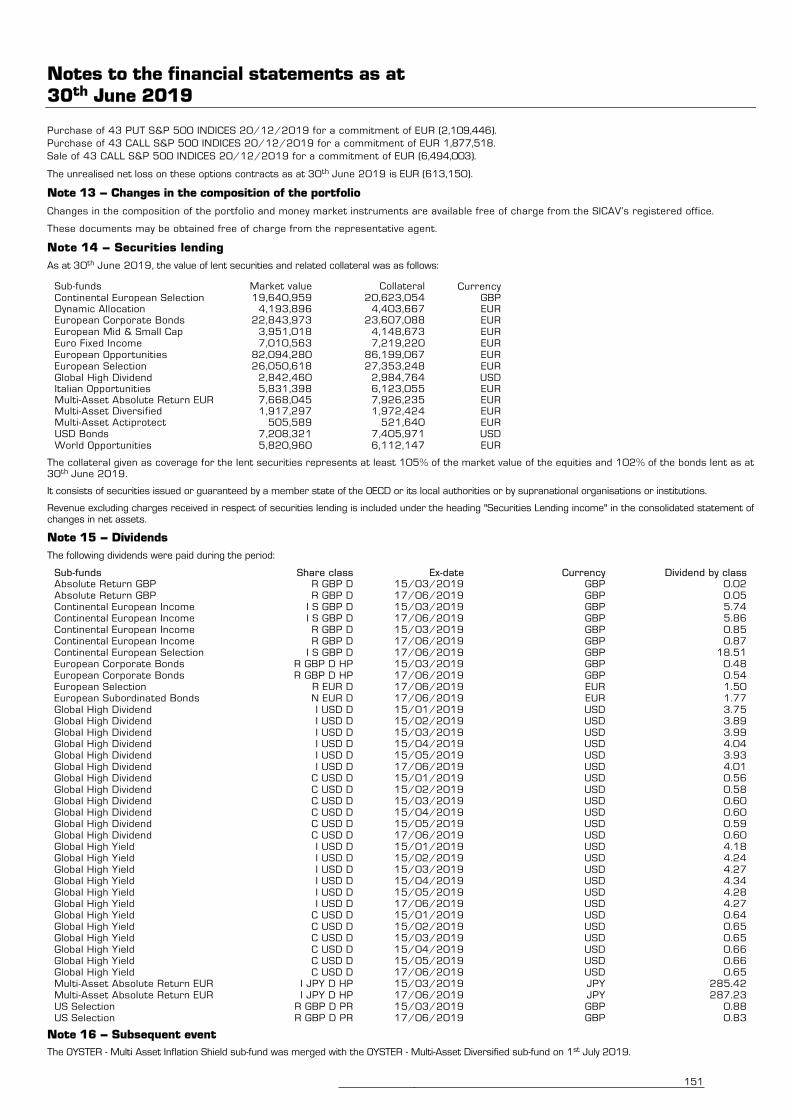
Notes to the financial statements as at 30th June 2019
151
Purchase of 43 PUT S&P 500 INDICES 20/12/2019 for a commitment of EUR (2,109,446).
Purchase of 43 CALL S&P 500 INDICES 20/12/2019 for a commitment of EUR 1,877,518.
Sale of 43 CALL S&P 500 INDICES 20/12/2019 for a commitment of EUR (6,494,003).
The unrealised net loss on these options contracts as at 30th June 2019 is EUR (613,150).
Note 13 – Changes in the composition of the portfolio
Changes in the composition of the portfolio and money market instruments are available free of charge from the SICAV’s registered office.
These documents may be obtained free of charge from the representative agent.
Note 14 – Securities lending
As at 30th June 2019, the value of lent securities and related collateral was as follows:
Sub-funds Market value Collateral Currency Continental European Selection 19,640,959 20,623,054 GBP Dynamic Allocation 4,193,896 4,403,667 EUR European Corporate Bonds 22,843,973 23,607,088 EUR European Mid & Small Cap 3,951,018 4,148,673 EUR Euro Fixed Income 7,010,563 7,219,220 EUR European Opportunities 82,094,280 86,199,067 EUR European Selection 26,050,618 27,353,248 EUR Global High Dividend 2,842,460 2,984,764 USD Italian Opportunities 5,831,398 6,123,055 EUR Multi-Asset Absolute Return EUR 7,668,045 7,926,235 EUR Multi-Asset Diversified 1,917,297 1,972,424 EUR Multi-Asset Actiprotect 505,589 521,640 EUR USD Bonds 7,208,321 7,405,971 USD World Opportunities 5,820,960 6,112,147 EUR
The collateral given as coverage for the lent securities represents at least 105% of the market value of the equities and 102% of the bonds lent as at 30th June 2019.
It consists of securities issued or guaranteed by a member state of the OECD or its local authorities or by supranational organisations or institutions.
Revenue excluding charges received in respect of securities lending is included under the heading "Securities Lending income" in the consolidated statement of changes in net assets.
Note 15 – Dividends
The following dividends were paid during the period:
Sub-funds Share class Ex-date Currency Dividend by class Absolute Return GBP R GBP D 15/03/2019 GBP 0.02 Absolute Return GBP R GBP D 17/06/2019 GBP 0.05 Continental European Income I S GBP D 15/03/2019 GBP 5.74 Continental European Income I S GBP D 17/06/2019 GBP 5.86 Continental European Income R GBP D 15/03/2019 GBP 0.85 Continental European Income R GBP D 17/06/2019 GBP 0.87 Continental European Selection I S GBP D 17/06/2019 GBP 18.51 European Corporate Bonds R GBP D HP 15/03/2019 GBP 0.48 European Corporate Bonds R GBP D HP 17/06/2019 GBP 0.54 European Selection R EUR D 17/06/2019 EUR 1.50 European Subordinated Bonds N EUR D 17/06/2019 EUR 1.77 Global High Dividend I USD D 15/01/2019 USD 3.75 Global High Dividend I USD D 15/02/2019 USD 3.89 Global High Dividend I USD D 15/03/2019 USD 3.99 Global High Dividend I USD D 15/04/2019 USD 4.04 Global High Dividend I USD D 15/05/2019 USD 3.93 Global High Dividend I USD D 17/06/2019 USD 4.01 Global High Dividend C USD D 15/01/2019 USD 0.56 Global High Dividend C USD D 15/02/2019 USD 0.58 Global High Dividend C USD D 15/03/2019 USD 0.60 Global High Dividend C USD D 15/04/2019 USD 0.60 Global High Dividend C USD D 15/05/2019 USD 0.59 Global High Dividend C USD D 17/06/2019 USD 0.60 Global High Yield I USD D 15/01/2019 USD 4.18 Global High Yield I USD D 15/02/2019 USD 4.24 Global High Yield I USD D 15/03/2019 USD 4.27 Global High Yield I USD D 15/04/2019 USD 4.34 Global High Yield I USD D 15/05/2019 USD 4.28 Global High Yield I USD D 17/06/2019 USD 4.27 Global High Yield C USD D 15/01/2019 USD 0.64 Global High Yield C USD D 15/02/2019 USD 0.65 Global High Yield C USD D 15/03/2019 USD 0.65 Global High Yield C USD D 15/04/2019 USD 0.66 Global High Yield C USD D 15/05/2019 USD 0.66 Global High Yield C USD D 17/06/2019 USD 0.65 Multi-Asset Absolute Return EUR I JPY D HP 15/03/2019 JPY 285.42 Multi-Asset Absolute Return EUR I JPY D HP 17/06/2019 JPY 287.23 US Selection R GBP D PR 15/03/2019 GBP 0.88 US Selection R GBP D PR 17/06/2019 GBP 0.83
Note 16 – Subsequent event
The OYSTER - Multi Asset Inflation Shield sub-fund was merged with the OYSTER - Multi-Asset Diversified sub-fund on 1st July 2019.
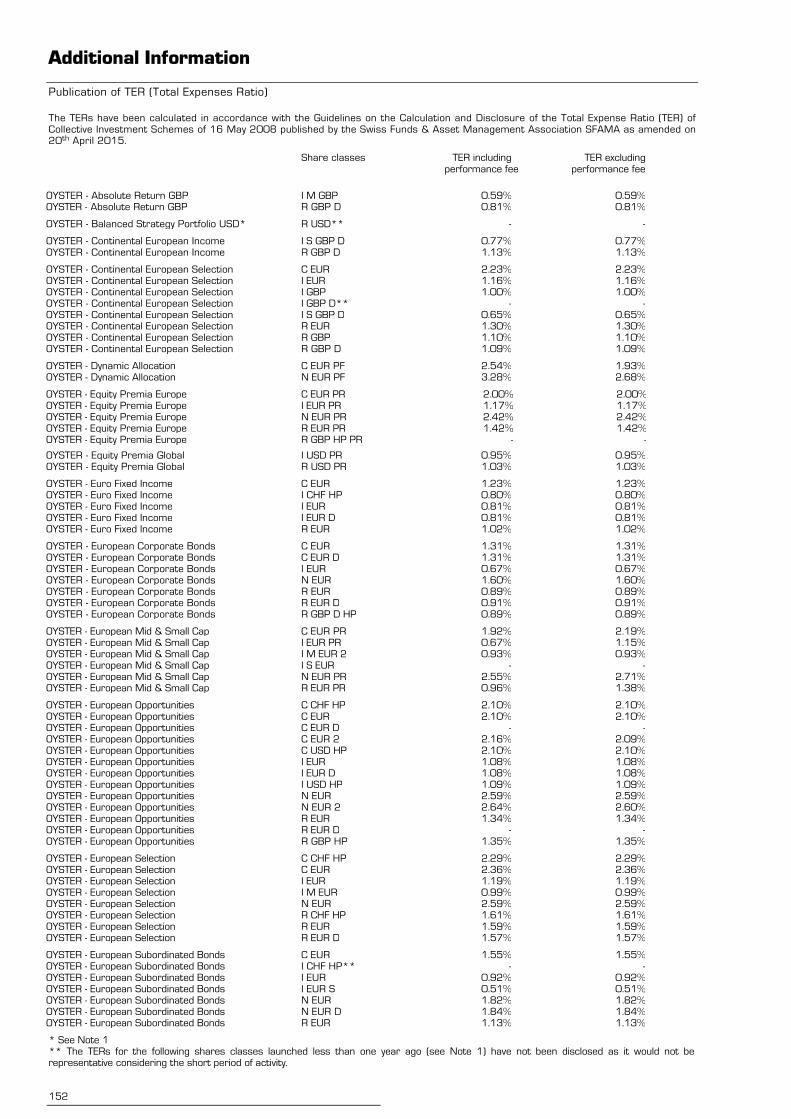
Additional Information
Publication of TER (Total Expenses Ratio)
152
The TERs have been calculated in accordance with the Guidelines on the Calculation and Disclosure of the Total Expense Ratio (TER) of Collective Investment Schemes of 16 May 2008 published by the Swiss Funds & Asset Management Association SFAMA as amended on 20th April 2015.
Share classes TER including performance fee
TER excluding performance fee
OYSTER - Absolute Return GBP I M GBP 0.59% 0.59% OYSTER - Absolute Return GBP R GBP D 0.81% 0.81%
OYSTER - Balanced Strategy Portfolio USD* R USD** - -
OYSTER - Continental European Income I S GBP D 0.77% 0.77% OYSTER - Continental European Income R GBP D 1.13% 1.13%
OYSTER - Continental European Selection C EUR 2.23% 2.23% OYSTER - Continental European Selection I EUR 1.16% 1.16% OYSTER - Continental European Selection I GBP 1.00% 1.00% OYSTER - Continental European Selection I GBP D** - - OYSTER - Continental European Selection I S GBP D 0.65% 0.65% OYSTER - Continental European Selection R EUR 1.30% 1.30% OYSTER - Continental European Selection R GBP 1.10% 1.10% OYSTER - Continental European Selection R GBP D 1.09% 1.09%
OYSTER - Dynamic Allocation C EUR PF 2.54% 1.93% OYSTER - Dynamic Allocation N EUR PF 3.28% 2.68%
OYSTER - Equity Premia Europe C EUR PR 2.00% 2.00% OYSTER - Equity Premia Europe I EUR PR 1.17% 1.17% OYSTER - Equity Premia Europe N EUR PR 2.42% 2.42% OYSTER - Equity Premia Europe R EUR PR 1.42% 1.42% OYSTER - Equity Premia Europe R GBP HP PR - -
OYSTER - Equity Premia Global I USD PR 0.95% 0.95% OYSTER - Equity Premia Global R USD PR 1.03% 1.03%
OYSTER - Euro Fixed Income C EUR 1.23% 1.23% OYSTER - Euro Fixed Income I CHF HP 0.80% 0.80% OYSTER - Euro Fixed Income I EUR 0.81% 0.81% OYSTER - Euro Fixed Income I EUR D 0.81% 0.81% OYSTER - Euro Fixed Income R EUR 1.02% 1.02%
OYSTER - European Corporate Bonds C EUR 1.31% 1.31% OYSTER - European Corporate Bonds C EUR D 1.31% 1.31% OYSTER - European Corporate Bonds I EUR 0.67% 0.67% OYSTER - European Corporate Bonds N EUR 1.60% 1.60% OYSTER - European Corporate Bonds R EUR 0.89% 0.89% OYSTER - European Corporate Bonds R EUR D 0.91% 0.91% OYSTER - European Corporate Bonds R GBP D HP 0.89% 0.89%
OYSTER - European Mid & Small Cap C EUR PR 1.92% 2.19% OYSTER - European Mid & Small Cap I EUR PR 0.67% 1.15% OYSTER - European Mid & Small Cap I M EUR 2 0.93% 0.93% OYSTER - European Mid & Small Cap I S EUR - - OYSTER - European Mid & Small Cap N EUR PR 2.55% 2.71% OYSTER - European Mid & Small Cap R EUR PR 0.96% 1.38%
OYSTER - European Opportunities C CHF HP 2.10% 2.10% OYSTER - European Opportunities C EUR 2.10% 2.10% OYSTER - European Opportunities C EUR D - - OYSTER - European Opportunities C EUR 2 2.16% 2.09% OYSTER - European Opportunities C USD HP 2.10% 2.10% OYSTER - European Opportunities I EUR 1.08% 1.08% OYSTER - European Opportunities I EUR D 1.08% 1.08% OYSTER - European Opportunities I USD HP 1.09% 1.09% OYSTER - European Opportunities N EUR 2.59% 2.59% OYSTER - European Opportunities N EUR 2 2.64% 2.60% OYSTER - European Opportunities R EUR 1.34% 1.34% OYSTER - European Opportunities R EUR D - - OYSTER - European Opportunities R GBP HP 1.35% 1.35%
OYSTER - European Selection C CHF HP 2.29% 2.29% OYSTER - European Selection C EUR 2.36% 2.36% OYSTER - European Selection I EUR 1.19% 1.19% OYSTER - European Selection I M EUR 0.99% 0.99% OYSTER - European Selection N EUR 2.59% 2.59% OYSTER - European Selection R CHF HP 1.61% 1.61% OYSTER - European Selection R EUR 1.59% 1.59% OYSTER - European Selection R EUR D 1.57% 1.57%
OYSTER - European Subordinated Bonds C EUR 1.55% 1.55% OYSTER - European Subordinated Bonds I CHF HP** - - OYSTER - European Subordinated Bonds I EUR 0.92% 0.92% OYSTER - European Subordinated Bonds I EUR S 0.51% 0.51% OYSTER - European Subordinated Bonds N EUR 1.82% 1.82% OYSTER - European Subordinated Bonds N EUR D 1.84% 1.84% OYSTER - European Subordinated Bonds R EUR 1.13% 1.13%
* See Note 1 ** The TERs for the following shares classes launched less than one year ago (see Note 1) have not been disclosed as it would not be representative considering the short period of activity.
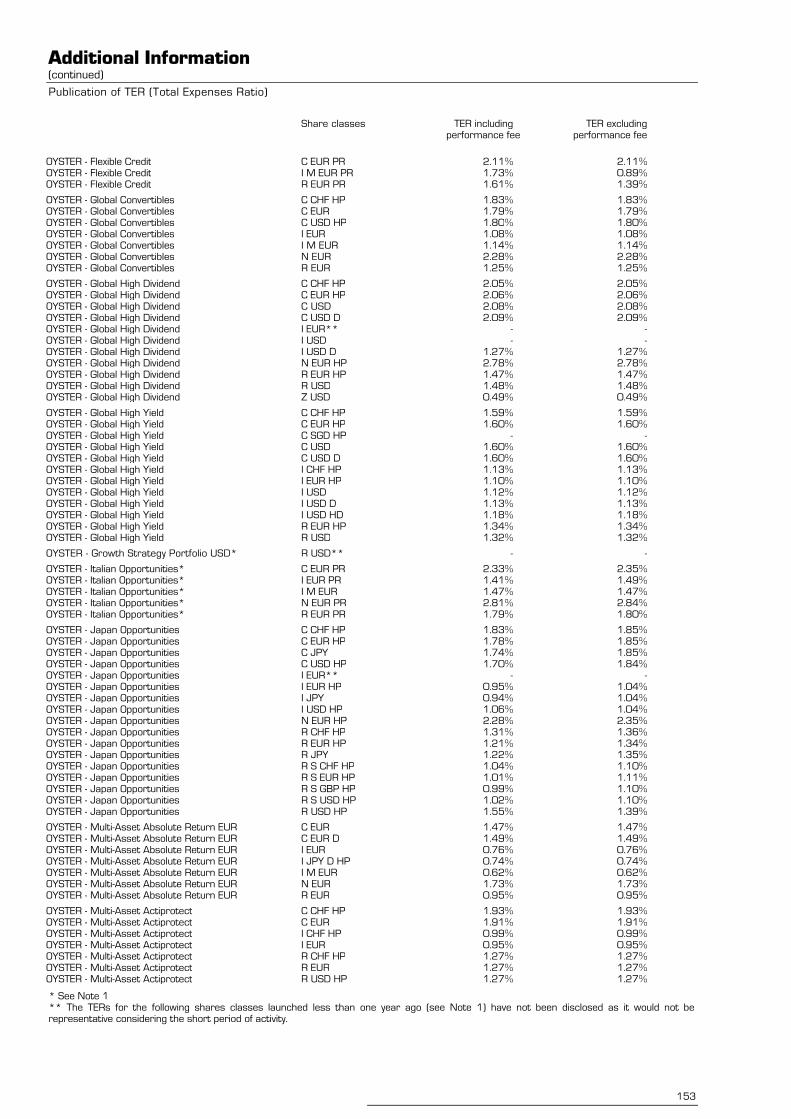
Additional Information (continued)
Publication of TER (Total Expenses Ratio)
153
Share classes TER including performance fee
TER excluding performance fee
OYSTER - Flexible Credit C EUR PR 2.11% 2.11% OYSTER - Flexible Credit I M EUR PR 1.73% 0.89% OYSTER - Flexible Credit R EUR PR 1.61% 1.39%
OYSTER - Global Convertibles C CHF HP 1.83% 1.83% OYSTER - Global Convertibles C EUR 1.79% 1.79% OYSTER - Global Convertibles C USD HP 1.80% 1.80% OYSTER - Global Convertibles I EUR 1.08% 1.08% OYSTER - Global Convertibles I M EUR 1.14% 1.14% OYSTER - Global Convertibles N EUR 2.28% 2.28% OYSTER - Global Convertibles R EUR 1.25% 1.25%
OYSTER - Global High Dividend C CHF HP 2.05% 2.05% OYSTER - Global High Dividend C EUR HP 2.06% 2.06% OYSTER - Global High Dividend C USD 2.08% 2.08% OYSTER - Global High Dividend C USD D 2.09% 2.09% OYSTER - Global High Dividend I EUR** - - OYSTER - Global High Dividend I USD - - OYSTER - Global High Dividend I USD D 1.27% 1.27% OYSTER - Global High Dividend N EUR HP 2.78% 2.78% OYSTER - Global High Dividend R EUR HP 1.47% 1.47% OYSTER - Global High Dividend R USD 1.48% 1.48% OYSTER - Global High Dividend Z USD 0.49% 0.49%
OYSTER - Global High Yield C CHF HP 1.59% 1.59% OYSTER - Global High Yield C EUR HP 1.60% 1.60% OYSTER - Global High Yield C SGD HP - - OYSTER - Global High Yield C USD 1.60% 1.60% OYSTER - Global High Yield C USD D 1.60% 1.60% OYSTER - Global High Yield I CHF HP 1.13% 1.13% OYSTER - Global High Yield I EUR HP 1.10% 1.10% OYSTER - Global High Yield I USD 1.12% 1.12% OYSTER - Global High Yield I USD D 1.13% 1.13% OYSTER - Global High Yield I USD HD 1.18% 1.18% OYSTER - Global High Yield R EUR HP 1.34% 1.34% OYSTER - Global High Yield R USD 1.32% 1.32%
OYSTER - Growth Strategy Portfolio USD* R USD** - -
OYSTER - Italian Opportunities* C EUR PR 2.33% 2.35% OYSTER - Italian Opportunities* I EUR PR 1.41% 1.49% OYSTER - Italian Opportunities* I M EUR 1.47% 1.47% OYSTER - Italian Opportunities* N EUR PR 2.81% 2.84% OYSTER - Italian Opportunities* R EUR PR 1.79% 1.80%
OYSTER - Japan Opportunities C CHF HP 1.83% 1.85% OYSTER - Japan Opportunities C EUR HP 1.78% 1.85% OYSTER - Japan Opportunities C JPY 1.74% 1.85% OYSTER - Japan Opportunities C USD HP 1.70% 1.84% OYSTER - Japan Opportunities I EUR** - - OYSTER - Japan Opportunities I EUR HP 0.95% 1.04% OYSTER - Japan Opportunities I JPY 0.94% 1.04% OYSTER - Japan Opportunities I USD HP 1.06% 1.04% OYSTER - Japan Opportunities N EUR HP 2.28% 2.35% OYSTER - Japan Opportunities R CHF HP 1.31% 1.36% OYSTER - Japan Opportunities R EUR HP 1.21% 1.34% OYSTER - Japan Opportunities R JPY 1.22% 1.35% OYSTER - Japan Opportunities R S CHF HP 1.04% 1.10% OYSTER - Japan Opportunities R S EUR HP 1.01% 1.11% OYSTER - Japan Opportunities R S GBP HP 0.99% 1.10% OYSTER - Japan Opportunities R S USD HP 1.02% 1.10% OYSTER - Japan Opportunities R USD HP 1.55% 1.39%
OYSTER - Multi-Asset Absolute Return EUR C EUR 1.47% 1.47% OYSTER - Multi-Asset Absolute Return EUR C EUR D 1.49% 1.49% OYSTER - Multi-Asset Absolute Return EUR I EUR 0.76% 0.76% OYSTER - Multi-Asset Absolute Return EUR I JPY D HP 0.74% 0.74% OYSTER - Multi-Asset Absolute Return EUR I M EUR 0.62% 0.62% OYSTER - Multi-Asset Absolute Return EUR N EUR 1.73% 1.73% OYSTER - Multi-Asset Absolute Return EUR R EUR 0.95% 0.95%
OYSTER - Multi-Asset Actiprotect C CHF HP 1.93% 1.93% OYSTER - Multi-Asset Actiprotect C EUR 1.91% 1.91% OYSTER - Multi-Asset Actiprotect I CHF HP 0.99% 0.99% OYSTER - Multi-Asset Actiprotect I EUR 0.95% 0.95% OYSTER - Multi-Asset Actiprotect R CHF HP 1.27% 1.27% OYSTER - Multi-Asset Actiprotect R EUR 1.27% 1.27% OYSTER - Multi-Asset Actiprotect R USD HP 1.27% 1.27%
* See Note 1 ** The TERs for the following shares classes launched less than one year ago (see Note 1) have not been disclosed as it would not be representative considering the short period of activity.
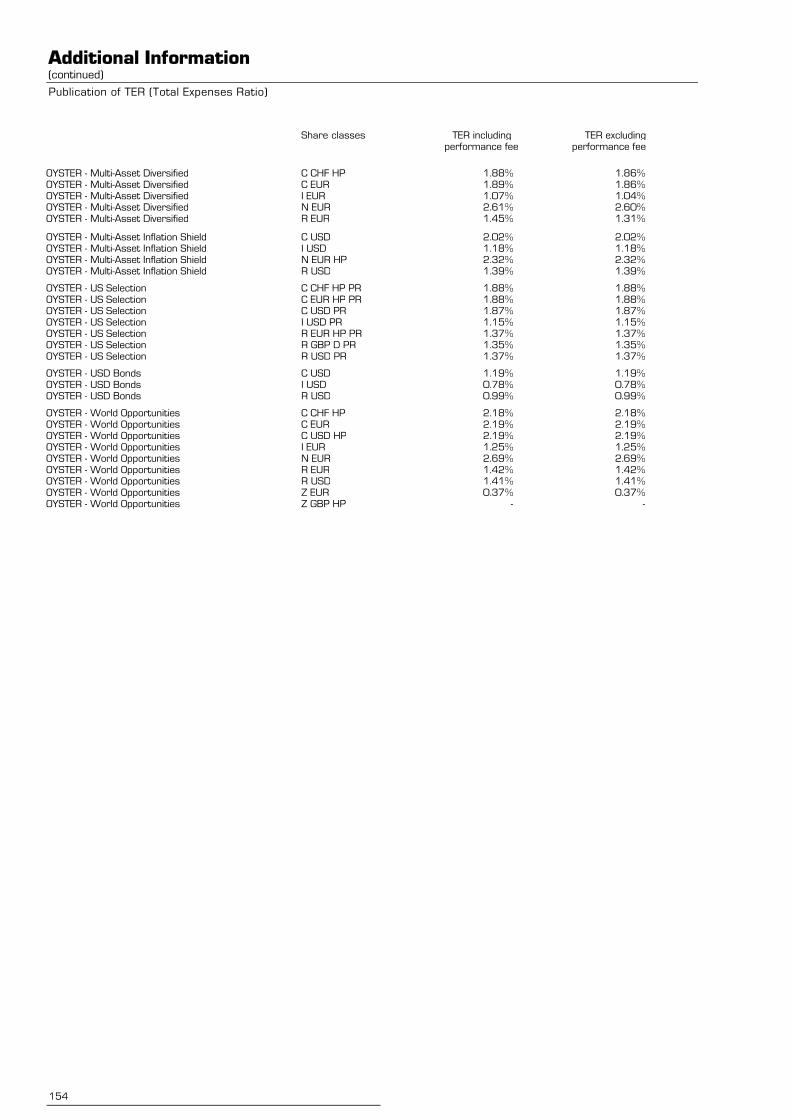
Additional Information (continued)
Publication of TER (Total Expenses Ratio)
154
Share classes TER including performance fee
TER excluding performance fee
OYSTER - Multi-Asset Diversified C CHF HP 1.88% 1.86% OYSTER - Multi-Asset Diversified C EUR 1.89% 1.86% OYSTER - Multi-Asset Diversified I EUR 1.07% 1.04% OYSTER - Multi-Asset Diversified N EUR 2.61% 2.60% OYSTER - Multi-Asset Diversified R EUR 1.45% 1.31%
OYSTER - Multi-Asset Inflation Shield C USD 2.02% 2.02% OYSTER - Multi-Asset Inflation Shield I USD 1.18% 1.18% OYSTER - Multi-Asset Inflation Shield N EUR HP 2.32% 2.32% OYSTER - Multi-Asset Inflation Shield R USD 1.39% 1.39%
OYSTER - US Selection C CHF HP PR 1.88% 1.88% OYSTER - US Selection C EUR HP PR 1.88% 1.88% OYSTER - US Selection C USD PR 1.87% 1.87% OYSTER - US Selection I USD PR 1.15% 1.15% OYSTER - US Selection R EUR HP PR 1.37% 1.37% OYSTER - US Selection R GBP D PR 1.35% 1.35% OYSTER - US Selection R USD PR 1.37% 1.37%
OYSTER - USD Bonds C USD 1.19% 1.19% OYSTER - USD Bonds I USD 0.78% 0.78% OYSTER - USD Bonds R USD 0.99% 0.99%
OYSTER - World Opportunities C CHF HP 2.18% 2.18% OYSTER - World Opportunities C EUR 2.19% 2.19% OYSTER - World Opportunities C USD HP 2.19% 2.19% OYSTER - World Opportunities I EUR 1.25% 1.25% OYSTER - World Opportunities N EUR 2.69% 2.69% OYSTER - World Opportunities R EUR 1.42% 1.42% OYSTER - World Opportunities R USD 1.41% 1.41% OYSTER - World Opportunities Z EUR 0.37% 0.37% OYSTER - World Opportunities Z GBP HP - -
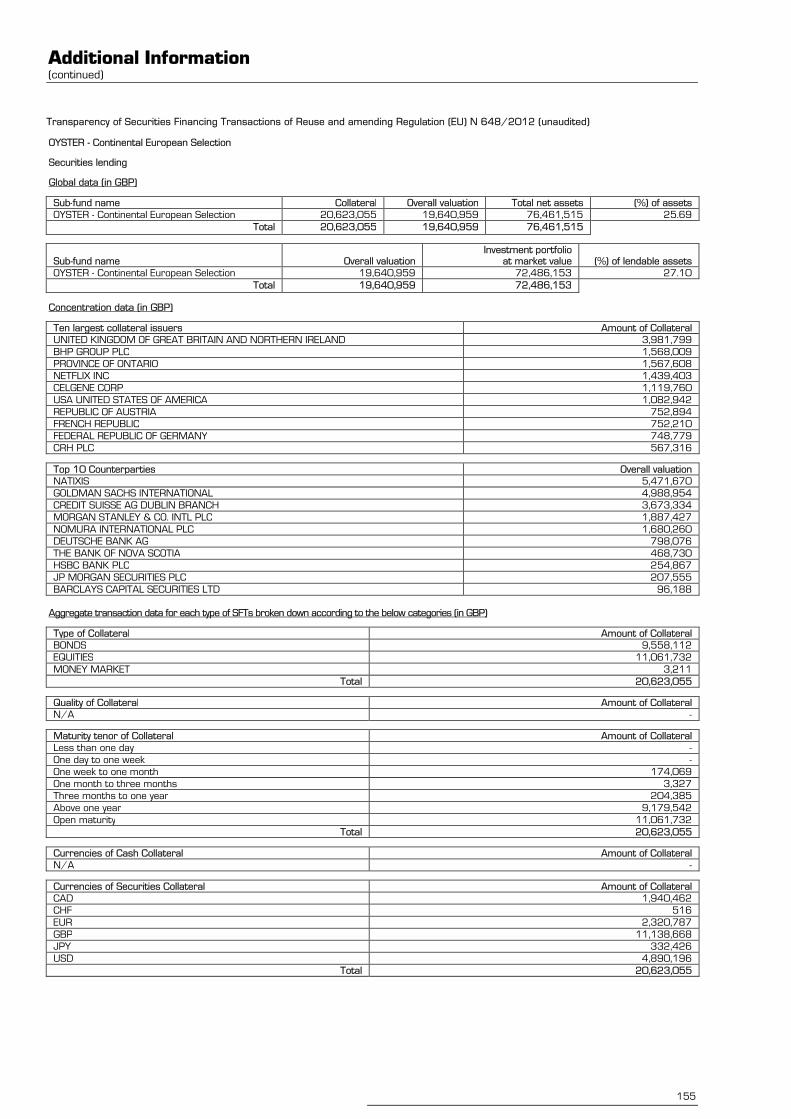
Additional Information (continued)
155
Transparency of Securities Financing Transactions of Reuse and amending Regulation (EU) N°648/2012 (unaudited)
OYSTER - Continental European Selection
Securities lending
Global data (in GBP)
Sub-fund name Collateral Overall valuation Total net assets (%) of assets
OYSTER - Continental European Selection 20,623,055 19,640,959 76,461,515 25.69
Total 20,623,055 19,640,959 76,461,515
Sub-fund name Overall valuation Investment portfolio
at market value (%) of lendable assets
OYSTER - Continental European Selection 19,640,959 72,486,153 27.10
Total 19,640,959 72,486,153
Concentration data (in GBP)
Ten largest collateral issuers Amount of Collateral
UNITED KINGDOM OF GREAT BRITAIN AND NORTHERN IRELAND 3,981,799
BHP GROUP PLC 1,568,009
PROVINCE OF ONTARIO 1,567,608
NETFLIX INC 1,439,403
CELGENE CORP 1,119,760
USA UNITED STATES OF AMERICA 1,082,942
REPUBLIC OF AUSTRIA 752,894
FRENCH REPUBLIC 752,210
FEDERAL REPUBLIC OF GERMANY 748,779
CRH PLC 567,316
Top 10 Counterparties Overall valuation
NATIXIS 5,471,670
GOLDMAN SACHS INTERNATIONAL 4,988,954
CREDIT SUISSE AG DUBLIN BRANCH 3,673,334
MORGAN STANLEY & CO. INTL PLC 1,887,427
NOMURA INTERNATIONAL PLC 1,680,260
DEUTSCHE BANK AG 798,076
THE BANK OF NOVA SCOTIA 468,730
HSBC BANK PLC 254,867
JP MORGAN SECURITIES PLC 207,555
BARCLAYS CAPITAL SECURITIES LTD 96,188
Aggregate transaction data for each type of SFTs broken down according to the below categories (in GBP)
Type of Collateral Amount of Collateral
BONDS 9,558,112
EQUITIES 11,061,732
MONEY MARKET 3,211
Total 20,623,055
Quality of Collateral Amount of Collateral
N/A -
Maturity tenor of Collateral Amount of Collateral
Less than one day -
One day to one week -
One week to one month 174,069
One month to three months 3,327
Three months to one year 204,385
Above one year 9,179,542
Open maturity 11,061,732
Total 20,623,055
Currencies of Cash Collateral Amount of Collateral
N/A -
Currencies of Securities Collateral Amount of Collateral
CAD 1,940,462
CHF 516
EUR 2,320,787
GBP 11,138,668
JPY 332,426
USD 4,890,196
Total 20,623,055
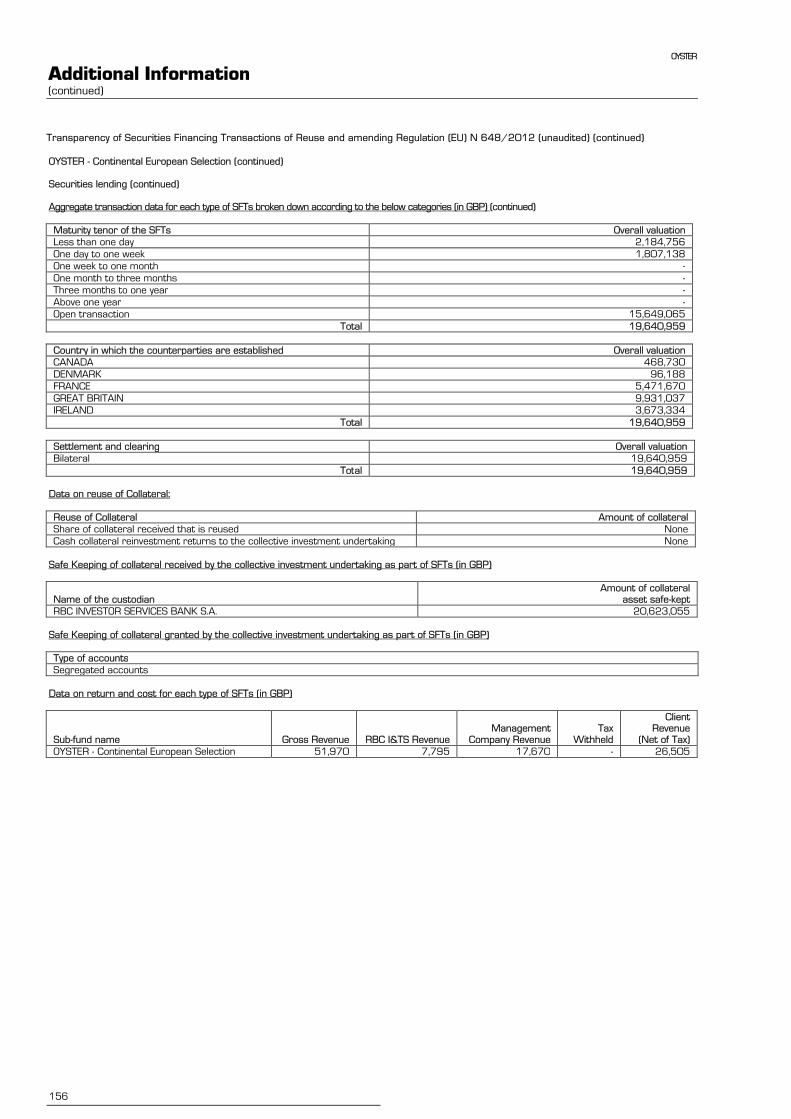
OYSTER
Additional Information (continued)
156
Transparency of Securities Financing Transactions of Reuse and amending Regulation (EU) N°648/2012 (unaudited) (continued)
OYSTER - Continental European Selection (continued) Securities lending (continued) Aggregate transaction data for each type of SFTs broken down according to the below categories (in GBP) (continued)
Maturity tenor of the SFTs Overall valuation
Less than one day 2,184,756
One day to one week 1,807,138
One week to one month -
One month to three months -
Three months to one year -
Above one year -
Open transaction 15,649,065
Total 19,640,959
Country in which the counterparties are established Overall valuation
CANADA 468,730
DENMARK 96,188
FRANCE 5,471,670
GREAT BRITAIN 9,931,037
IRELAND 3,673,334
Total 19,640,959
Settlement and clearing Overall valuation
Bilateral 19,640,959
Total 19,640,959
Data on reuse of Collateral:
Reuse of Collateral Amount of collateral
Share of collateral received that is reused None
Cash collateral reinvestment returns to the collective investment undertaking None
Safe Keeping of collateral received by the collective investment undertaking as part of SFTs (in GBP)
Name of the custodian Amount of collateral
asset safe-kept
RBC INVESTOR SERVICES BANK S.A. 20,623,055
Safe Keeping of collateral granted by the collective investment undertaking as part of SFTs (in GBP)
Type of accounts
Segregated accounts
Data on return and cost for each type of SFTs (in GBP)
Sub-fund name Gross Revenue RBC I&TS Revenue Management
Company Revenue Tax
Withheld
Client Revenue
(Net of Tax)
OYSTER - Continental European Selection 51,970 7,795 17,670 - 26,505
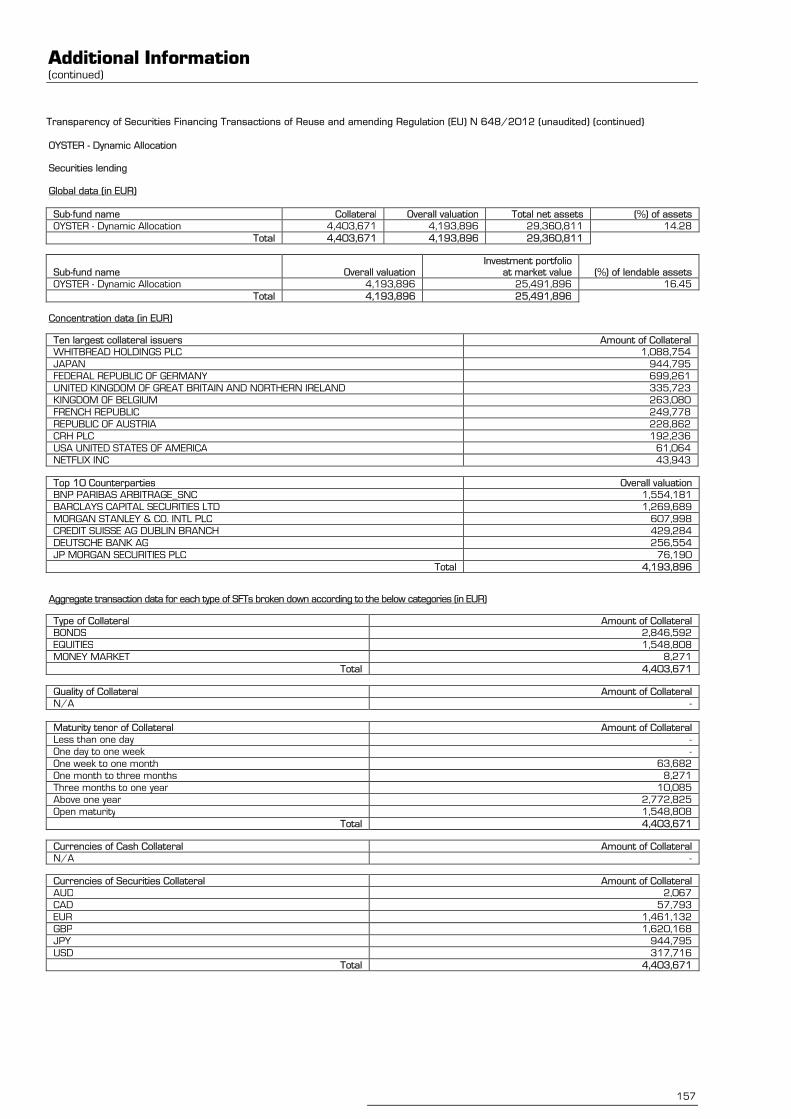
Additional Information (continued)
157
Transparency of Securities Financing Transactions of Reuse and amending Regulation (EU) N°648/2012 (unaudited) (continued)
OYSTER - Dynamic Allocation Securities lending Global data (in EUR)
Sub-fund name Collateral Overall valuation Total net assets (%) of assets
OYSTER - Dynamic Allocation 4,403,671 4,193,896 29,360,811 14.28
Total 4,403,671 4,193,896 29,360,811
Sub-fund name Overall valuation Investment portfolio
at market value (%) of lendable assets
OYSTER - Dynamic Allocation 4,193,896 25,491,896 16.45
Total 4,193,896 25,491,896
Concentration data (in EUR)
Ten largest collateral issuers Amount of Collateral
WHITBREAD HOLDINGS PLC 1,088,754
JAPAN 944,795
FEDERAL REPUBLIC OF GERMANY 699,261
UNITED KINGDOM OF GREAT BRITAIN AND NORTHERN IRELAND 335,723
KINGDOM OF BELGIUM 263,080
FRENCH REPUBLIC 249,778
REPUBLIC OF AUSTRIA 228,862
CRH PLC 192,236
USA UNITED STATES OF AMERICA 61,064
NETFLIX INC 43,943
Top 10 Counterparties Overall valuation
BNP PARIBAS ARBITRAGE_SNC 1,554,181
BARCLAYS CAPITAL SECURITIES LTD 1,269,689
MORGAN STANLEY & CO. INTL PLC 607,998
CREDIT SUISSE AG DUBLIN BRANCH 429,284
DEUTSCHE BANK AG 256,554
JP MORGAN SECURITIES PLC 76,190
Total 4,193,896
Aggregate transaction data for each type of SFTs broken down according to the below categories (in EUR)
Type of Collateral Amount of Collateral
BONDS 2,846,592
EQUITIES 1,548,808
MONEY MARKET 8,271
Total 4,403,671
Quality of Collateral Amount of Collateral
N/A -
Maturity tenor of Collateral Amount of Collateral
Less than one day -
One day to one week -
One week to one month 63,682
One month to three months 8,271
Three months to one year 10,085
Above one year 2,772,825
Open maturity 1,548,808
Total 4,403,671
Currencies of Cash Collateral Amount of Collateral
N/A -
Currencies of Securities Collateral Amount of Collateral
AUD 2,067
CAD 57,793
EUR 1,461,132
GBP 1,620,168
JPY 944,795
USD 317,716
Total 4,403,671
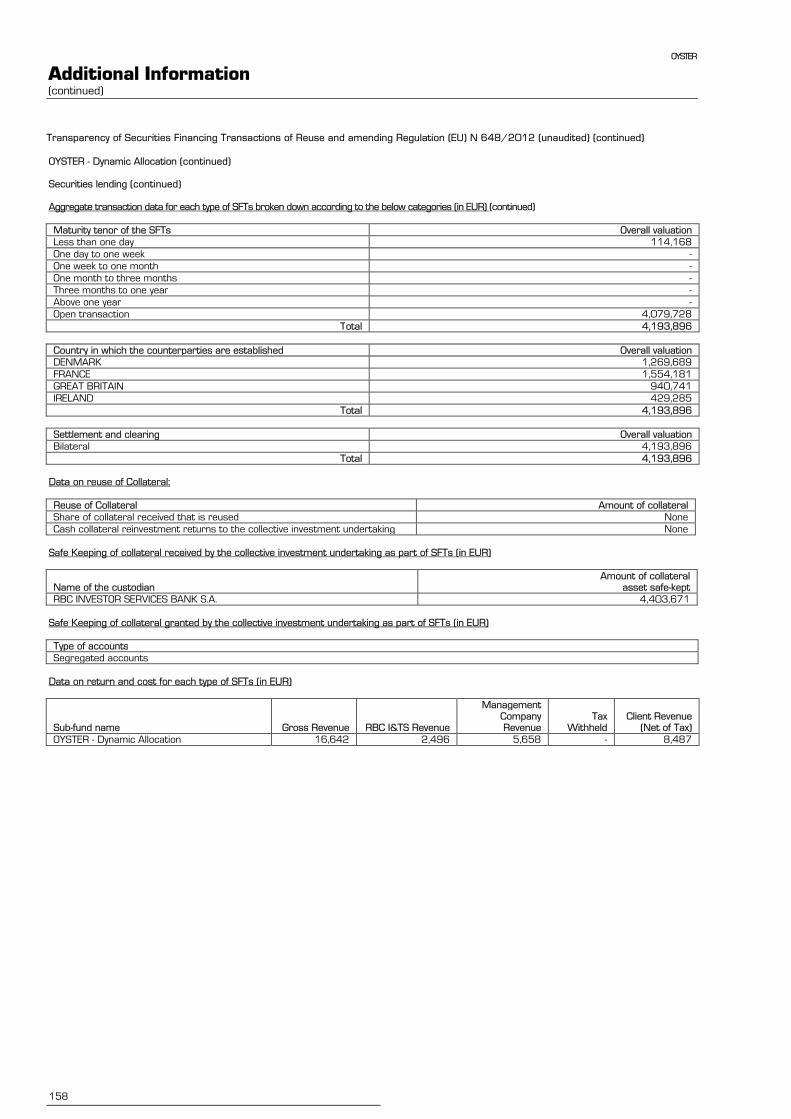
OYSTER
Additional Information (continued)
158
Transparency of Securities Financing Transactions of Reuse and amending Regulation (EU) N°648/2012 (unaudited) (continued)
OYSTER - Dynamic Allocation (continued) Securities lending (continued) Aggregate transaction data for each type of SFTs broken down according to the below categories (in EUR) (continued)
Maturity tenor of the SFTs Overall valuation
Less than one day 114,168
One day to one week -
One week to one month -
One month to three months -
Three months to one year -
Above one year -
Open transaction 4,079,728
Total 4,193,896
Country in which the counterparties are established Overall valuation
DENMARK 1,269,689
FRANCE 1,554,181
GREAT BRITAIN 940,741
IRELAND 429,285
Total 4,193,896
Settlement and clearing Overall valuation
Bilateral 4,193,896
Total 4,193,896
Data on reuse of Collateral:
Reuse of Collateral Amount of collateral
Share of collateral received that is reused None
Cash collateral reinvestment returns to the collective investment undertaking None
Safe Keeping of collateral received by the collective investment undertaking as part of SFTs (in EUR)
Name of the custodian Amount of collateral
asset safe-kept
RBC INVESTOR SERVICES BANK S.A. 4,403,671
Safe Keeping of collateral granted by the collective investment undertaking as part of SFTs (in EUR)
Type of accounts
Segregated accounts
Data on return and cost for each type of SFTs (in EUR)
Sub-fund name Gross Revenue RBC I&TS Revenue
Management Company Revenue
Tax Withheld
Client Revenue (Net of Tax)
OYSTER - Dynamic Allocation 16,642 2,496 5,658 - 8,487
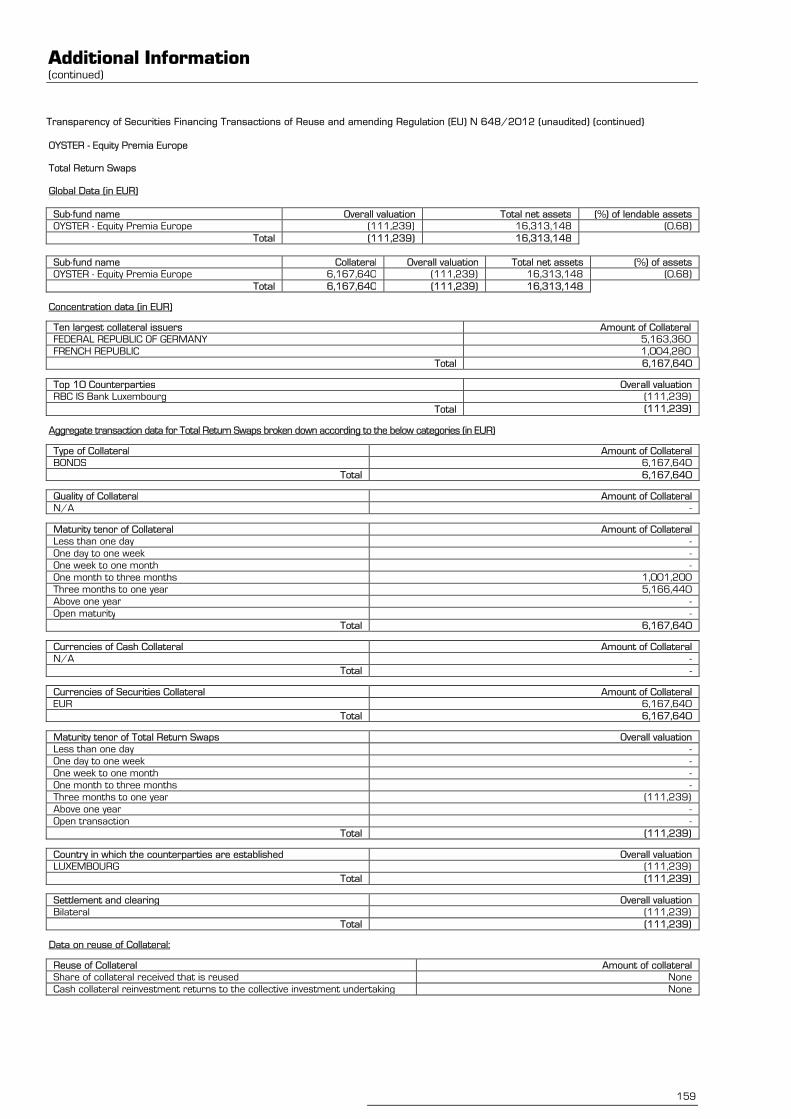
Additional Information (continued)
159
Transparency of Securities Financing Transactions of Reuse and amending Regulation (EU) N°648/2012 (unaudited) (continued)
OYSTER - Equity Premia Europe Total Return Swaps Global Data (in EUR)
Sub-fund name Overall valuation Total net assets (%) of lendable assets
OYSTER - Equity Premia Europe (111,239) 16,313,148 (0.68)
Total (111,239) 16,313,148
Sub-fund name Collateral Overall valuation Total net assets (%) of assets
OYSTER - Equity Premia Europe 6,167,640 (111,239) 16,313,148 (0.68)
Total 6,167,640 (111,239) 16,313,148
Concentration data (in EUR)
Ten largest collateral issuers Amount of Collateral
FEDERAL REPUBLIC OF GERMANY 5,163,360
FRENCH REPUBLIC 1,004,280
Total 6,167,640
Top 10 Counterparties Overall valuation
RBC IS Bank Luxembourg (111,239)
Total (111,239)
Aggregate transaction data for Total Return Swaps broken down according to the below categories (in EUR)
Type of Collateral Amount of Collateral
BONDS 6,167,640
Total 6,167,640
Quality of Collateral Amount of Collateral
N/A -
Maturity tenor of Collateral Amount of Collateral
Less than one day -
One day to one week -
One week to one month -
One month to three months 1,001,200
Three months to one year 5,166,440
Above one year -
Open maturity -
Total 6,167,640
Currencies of Cash Collateral Amount of Collateral
N/A -
Total -
Currencies of Securities Collateral Amount of Collateral
EUR 6,167,640
Total 6,167,640
Maturity tenor of Total Return Swaps Overall valuation
Less than one day -
One day to one week -
One week to one month -
One month to three months -
Three months to one year (111,239)
Above one year -
Open transaction -
Total (111,239)
Country in which the counterparties are established Overall valuation
LUXEMBOURG (111,239)
Total (111,239)
Settlement and clearing Overall valuation
Bilateral (111,239)
Total (111,239)
Data on reuse of Collateral:
Reuse of Collateral Amount of collateral
Share of collateral received that is reused None
Cash collateral reinvestment returns to the collective investment undertaking None

OYSTER
Additional Information (continued)
160
Transparency of Securities Financing Transactions of Reuse and amending Regulation (EU) N°648/2012 (unaudited) (continued)
OYSTER - Equity Premia Europe (continued) Total Return Swaps (continued) Safe Keeping of collateral received by the collective investment undertaking as part of Total Return Swaps (in EUR)
Name of the custodian Amount of collateral
asset safe-kept
RBC INVESTOR SERVICES BANK S.A. 6,167,640
Safe Keeping of collateral granted by the collective investment undertaking as part of Total Return Swaps (in EUR)
Type of accounts
Segregated accounts
Data return and cost
Sub-fund Revenues
N/A -
Total -
Additional information
The above disclosure of swaps collateral data shows the complete collateral situation for all OTC for any counterparty for the SICAV. As a global market practice, collateralization process is done against the net exposure of OTC.
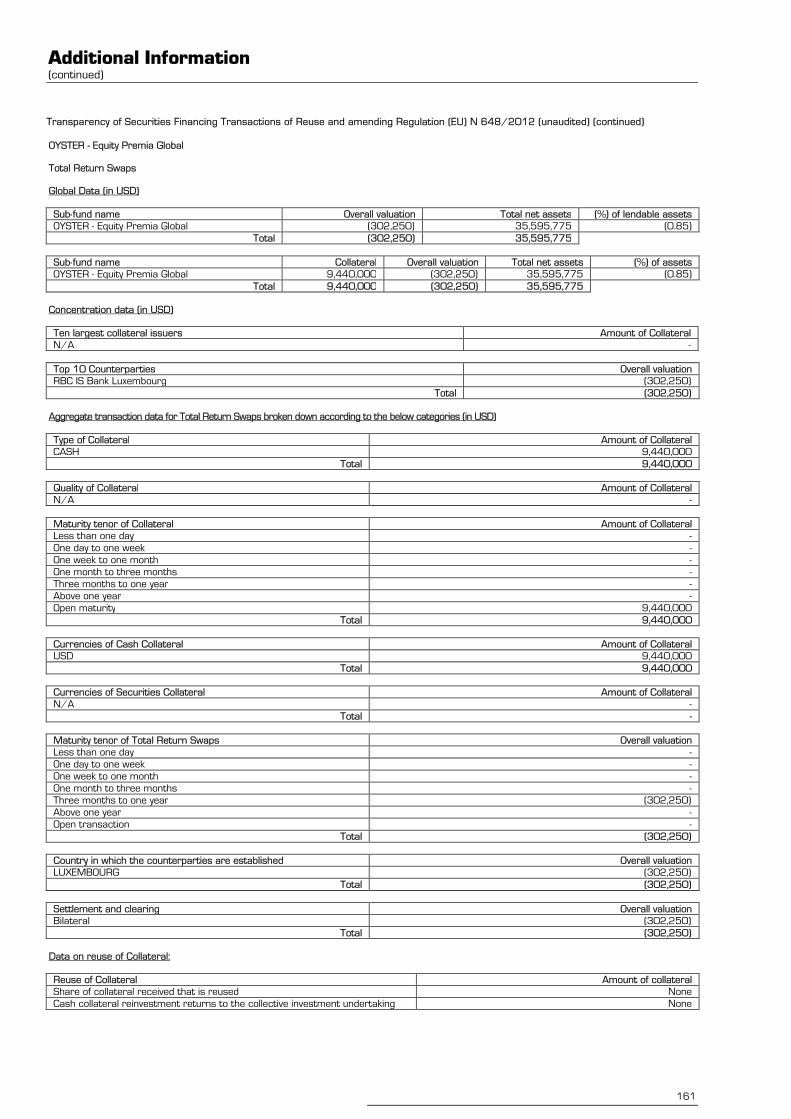
Additional Information (continued)
161
Transparency of Securities Financing Transactions of Reuse and amending Regulation (EU) N°648/2012 (unaudited) (continued)
OYSTER - Equity Premia Global Total Return Swaps Global Data (in USD)
Sub-fund name Overall valuation Total net assets (%) of lendable assets
OYSTER - Equity Premia Global (302,250) 35,595,775 (0.85)
Total (302,250) 35,595,775
Sub-fund name Collateral Overall valuation Total net assets (%) of assets
OYSTER - Equity Premia Global 9,440,000 (302,250) 35,595,775 (0.85)
Total 9,440,000 (302,250) 35,595,775
Concentration data (in USD)
Ten largest collateral issuers Amount of Collateral
N/A -
Top 10 Counterparties Overall valuation
RBC IS Bank Luxembourg (302,250)
Total (302,250)
Aggregate transaction data for Total Return Swaps broken down according to the below categories (in USD)
Type of Collateral Amount of Collateral
CASH 9,440,000
Total 9,440,000
Quality of Collateral Amount of Collateral
N/A -
Maturity tenor of Collateral Amount of Collateral
Less than one day -
One day to one week -
One week to one month -
One month to three months -
Three months to one year -
Above one year -
Open maturity 9,440,000
Total 9,440,000
Currencies of Cash Collateral Amount of Collateral
USD 9,440,000
Total 9,440,000
Currencies of Securities Collateral Amount of Collateral
N/A -
Total -
Maturity tenor of Total Return Swaps Overall valuation
Less than one day -
One day to one week -
One week to one month -
One month to three months -
Three months to one year (302,250)
Above one year -
Open transaction -
Total (302,250)
Country in which the counterparties are established Overall valuation
LUXEMBOURG (302,250)
Total (302,250)
Settlement and clearing Overall valuation
Bilateral (302,250)
Total (302,250)
Data on reuse of Collateral:
Reuse of Collateral Amount of collateral
Share of collateral received that is reused None
Cash collateral reinvestment returns to the collective investment undertaking None
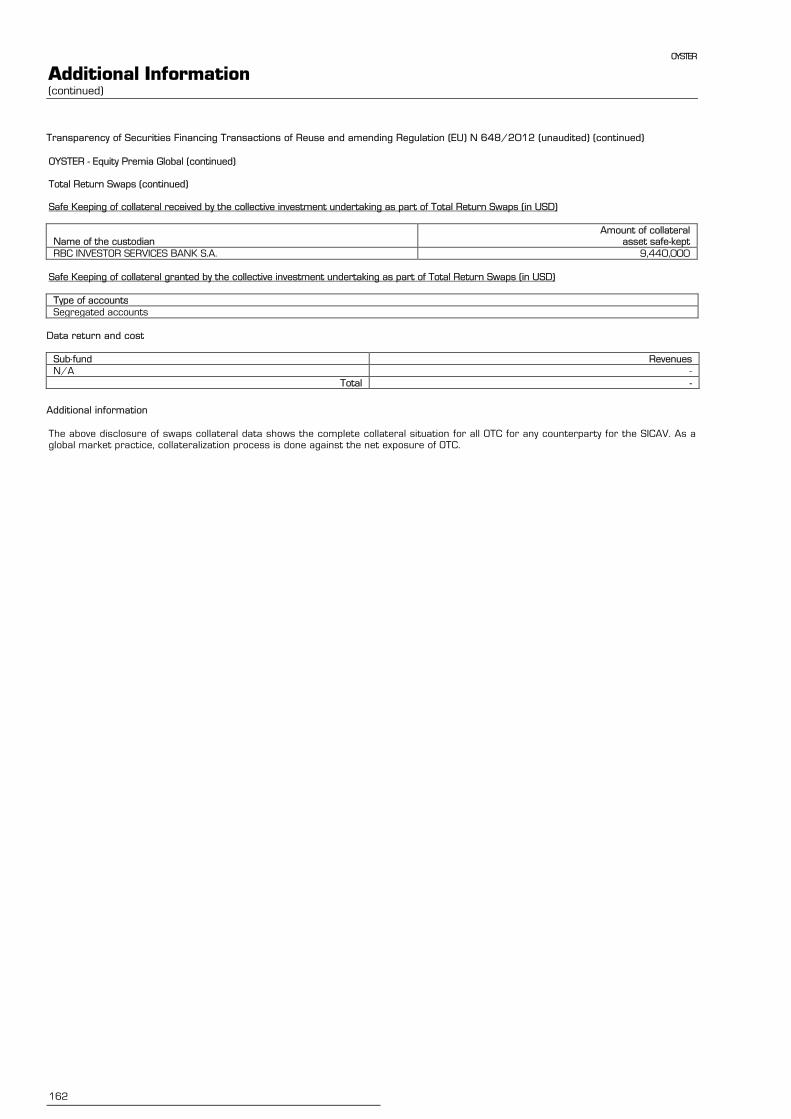
OYSTER
Additional Information (continued)
162
Transparency of Securities Financing Transactions of Reuse and amending Regulation (EU) N°648/2012 (unaudited) (continued)
OYSTER - Equity Premia Global (continued) Total Return Swaps (continued) Safe Keeping of collateral received by the collective investment undertaking as part of Total Return Swaps (in USD)
Name of the custodian Amount of collateral
asset safe-kept
RBC INVESTOR SERVICES BANK S.A. 9,440,000
Safe Keeping of collateral granted by the collective investment undertaking as part of Total Return Swaps (in USD)
Type of accounts
Segregated accounts
Data return and cost
Sub-fund Revenues
N/A -
Total -
Additional information
The above disclosure of swaps collateral data shows the complete collateral situation for all OTC for any counterparty for the SICAV. As a global market practice, collateralization process is done against the net exposure of OTC.
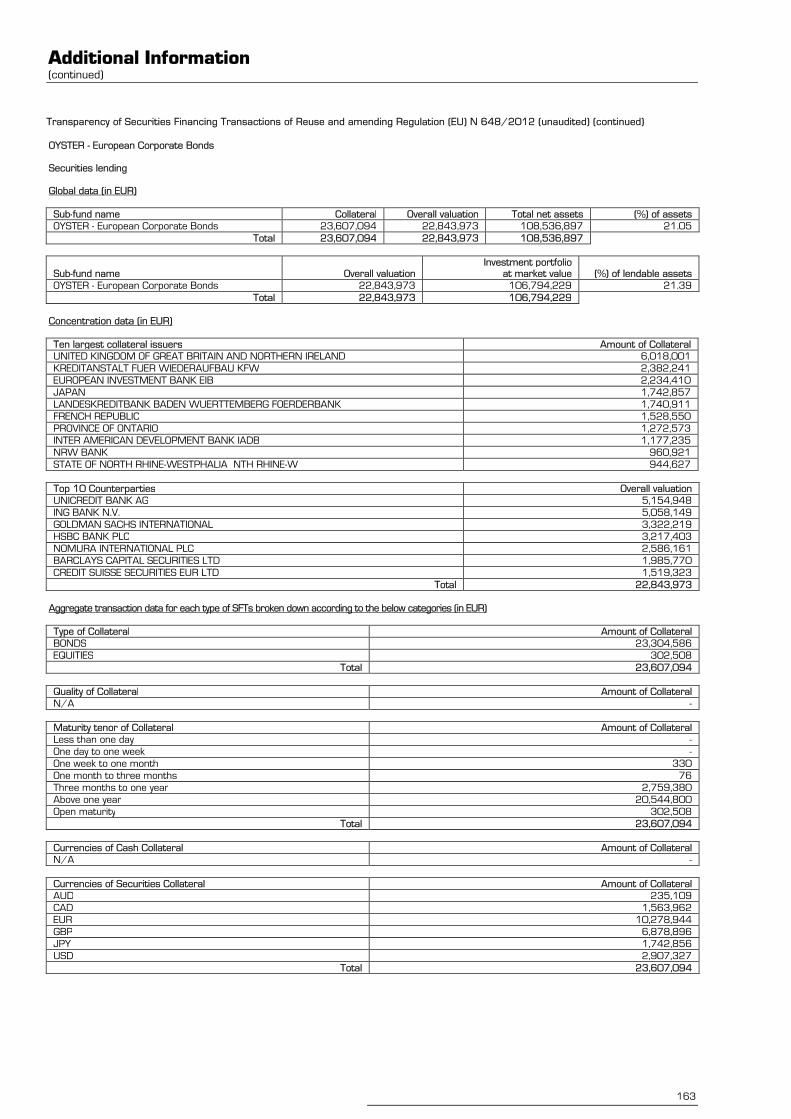
Additional Information (continued)
163
Transparency of Securities Financing Transactions of Reuse and amending Regulation (EU) N°648/2012 (unaudited) (continued)
OYSTER - European Corporate Bonds Securities lending Global data (in EUR)
Sub-fund name Collateral Overall valuation Total net assets (%) of assets
OYSTER - European Corporate Bonds 23,607,094 22,843,973 108,536,897 21.05
Total 23,607,094 22,843,973 108,536,897
Sub-fund name Overall valuation Investment portfolio
at market value (%) of lendable assets
OYSTER - European Corporate Bonds 22,843,973 106,794,229 21.39
Total 22,843,973 106,794,229
Concentration data (in EUR)
Ten largest collateral issuers Amount of Collateral
UNITED KINGDOM OF GREAT BRITAIN AND NORTHERN IRELAND 6,018,001
KREDITANSTALT FUER WIEDERAUFBAU KFW 2,382,241
EUROPEAN INVESTMENT BANK EIB 2,234,410
JAPAN 1,742,857
LANDESKREDITBANK BADEN WUERTTEMBERG FOERDERBANK 1,740,911
FRENCH REPUBLIC 1,528,550
PROVINCE OF ONTARIO 1,272,573
INTER AMERICAN DEVELOPMENT BANK IADB 1,177,235
NRW BANK 960,921
STATE OF NORTH RHINE-WESTPHALIA NTH RHINE-W 944,627
Top 10 Counterparties Overall valuation
UNICREDIT BANK AG 5,154,948
ING BANK N.V. 5,058,149
GOLDMAN SACHS INTERNATIONAL 3,322,219
HSBC BANK PLC 3,217,403
NOMURA INTERNATIONAL PLC 2,586,161
BARCLAYS CAPITAL SECURITIES LTD 1,985,770
CREDIT SUISSE SECURITIES EUR LTD 1,519,323
Total 22,843,973
Aggregate transaction data for each type of SFTs broken down according to the below categories (in EUR)
Type of Collateral Amount of Collateral
BONDS 23,304,586
EQUITIES 302,508
Total 23,607,094
Quality of Collateral Amount of Collateral
N/A -
Maturity tenor of Collateral Amount of Collateral
Less than one day -
One day to one week -
One week to one month 330
One month to three months 76
Three months to one year 2,759,380
Above one year 20,544,800
Open maturity 302,508
Total 23,607,094
Currencies of Cash Collateral Amount of Collateral
N/A -
Currencies of Securities Collateral Amount of Collateral
AUD 235,109
CAD 1,563,962
EUR 10,278,944
GBP 6,878,896
JPY 1,742,856
USD 2,907,327
Total 23,607,094

OYSTER
Additional Information (continued)
164
Transparency of Securities Financing Transactions of Reuse and amending Regulation (EU) N°648/2012 (unaudited) (continued)
OYSTER - European Corporate Bonds (continued) Securities lending (continued) Aggregate transaction data for each type of SFTs broken down according to the below categories (in EUR) (continued)
Maturity tenor of the SFTs Overall valuation
Less than one day -
One day to one week -
One week to one month -
One month to three months -
Three months to one year -
Above one year -
Open transaction 22,843,973
Total 22,843,973
Country in which the counterparties are established Overall valuation
DENMARK 1,985,770
GERMANY 5,154,948
GREAT BRITAIN 15,703,255
Total 22,843,973
Settlement and clearing Overall valuation
Bilateral 22,843,973
Total 22,843,973
Data on reuse of Collateral:
Reuse of Collateral Amount of collateral
Share of collateral received that is reused None
Cash collateral reinvestment returns to the collective investment undertaking None
Safe Keeping of collateral received by the collective investment undertaking as part of SFTs (in EUR)
Name of the custodian Amount of collateral
asset safe-kept
RBC INVESTOR SERVICES BANK S.A. 23,607,094
Safe Keeping of collateral granted by the collective investment undertaking as part of SFTs (in EUR)
Type of accounts
Segregated accounts
Data on return and cost for each type of SFTs (in EUR)
Sub-fund name Gross Revenue RBC I&TS Revenue Management
Company Revenue Tax
Withheld
Client Revenue
(Net of Tax)
OYSTER - European Corporate Bonds 80,090 12,013 27,231 - 40,846
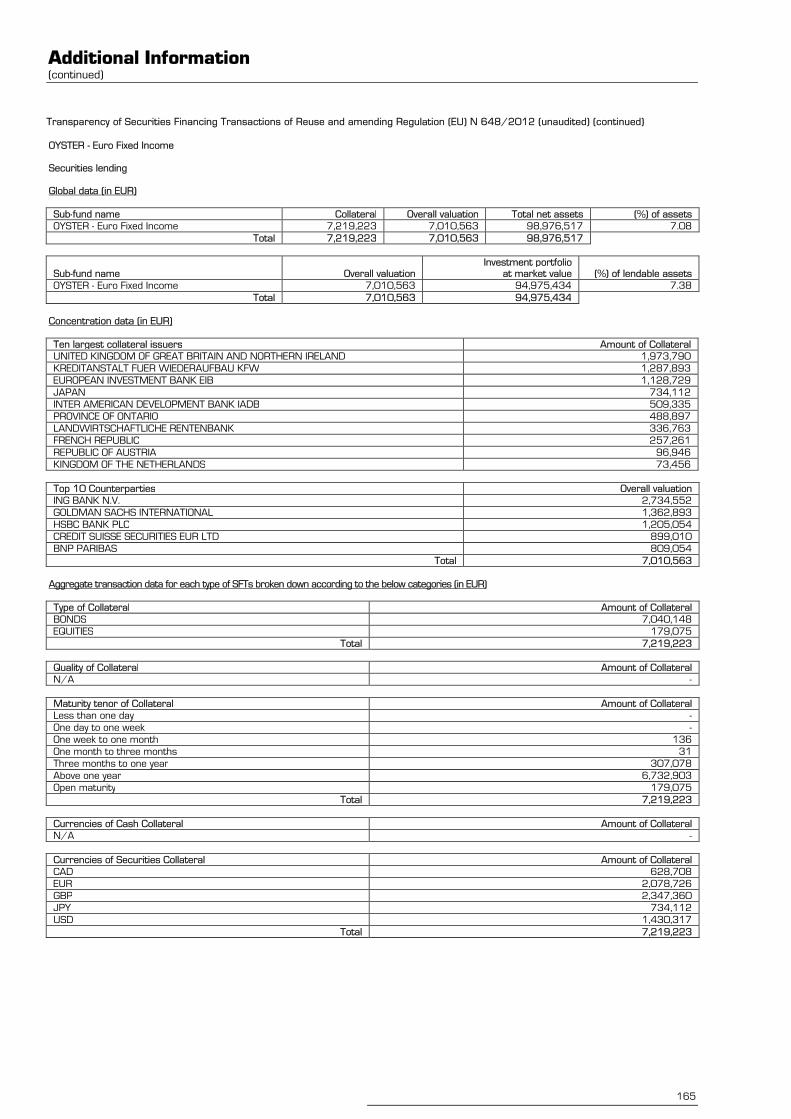
Additional Information (continued)
165
Transparency of Securities Financing Transactions of Reuse and amending Regulation (EU) N°648/2012 (unaudited) (continued)
OYSTER - Euro Fixed Income Securities lending Global data (in EUR)
Sub-fund name Collateral Overall valuation Total net assets (%) of assets
OYSTER - Euro Fixed Income 7,219,223 7,010,563 98,976,517 7.08
Total 7,219,223 7,010,563 98,976,517
Sub-fund name Overall valuation Investment portfolio
at market value (%) of lendable assets
OYSTER - Euro Fixed Income 7,010,563 94,975,434 7.38
Total 7,010,563 94,975,434
Concentration data (in EUR)
Ten largest collateral issuers Amount of Collateral
UNITED KINGDOM OF GREAT BRITAIN AND NORTHERN IRELAND 1,973,790
KREDITANSTALT FUER WIEDERAUFBAU KFW 1,287,893
EUROPEAN INVESTMENT BANK EIB 1,128,729
JAPAN 734,112
INTER AMERICAN DEVELOPMENT BANK IADB 509,335
PROVINCE OF ONTARIO 488,897
LANDWIRTSCHAFTLICHE RENTENBANK 336,763
FRENCH REPUBLIC 257,261
REPUBLIC OF AUSTRIA 96,946
KINGDOM OF THE NETHERLANDS 73,456
Top 10 Counterparties Overall valuation
ING BANK N.V. 2,734,552
GOLDMAN SACHS INTERNATIONAL 1,362,893
HSBC BANK PLC 1,205,054
CREDIT SUISSE SECURITIES EUR LTD 899,010
BNP PARIBAS 809,054
Total 7,010,563
Aggregate transaction data for each type of SFTs broken down according to the below categories (in EUR)
Type of Collateral Amount of Collateral
BONDS 7,040,148
EQUITIES 179,075
Total 7,219,223
Quality of Collateral Amount of Collateral
N/A -
Maturity tenor of Collateral Amount of Collateral
Less than one day -
One day to one week -
One week to one month 136
One month to three months 31
Three months to one year 307,078
Above one year 6,732,903
Open maturity 179,075
Total 7,219,223
Currencies of Cash Collateral Amount of Collateral
N/A -
Currencies of Securities Collateral Amount of Collateral
CAD 628,708
EUR 2,078,726
GBP 2,347,360
JPY 734,112
USD 1,430,317
Total 7,219,223
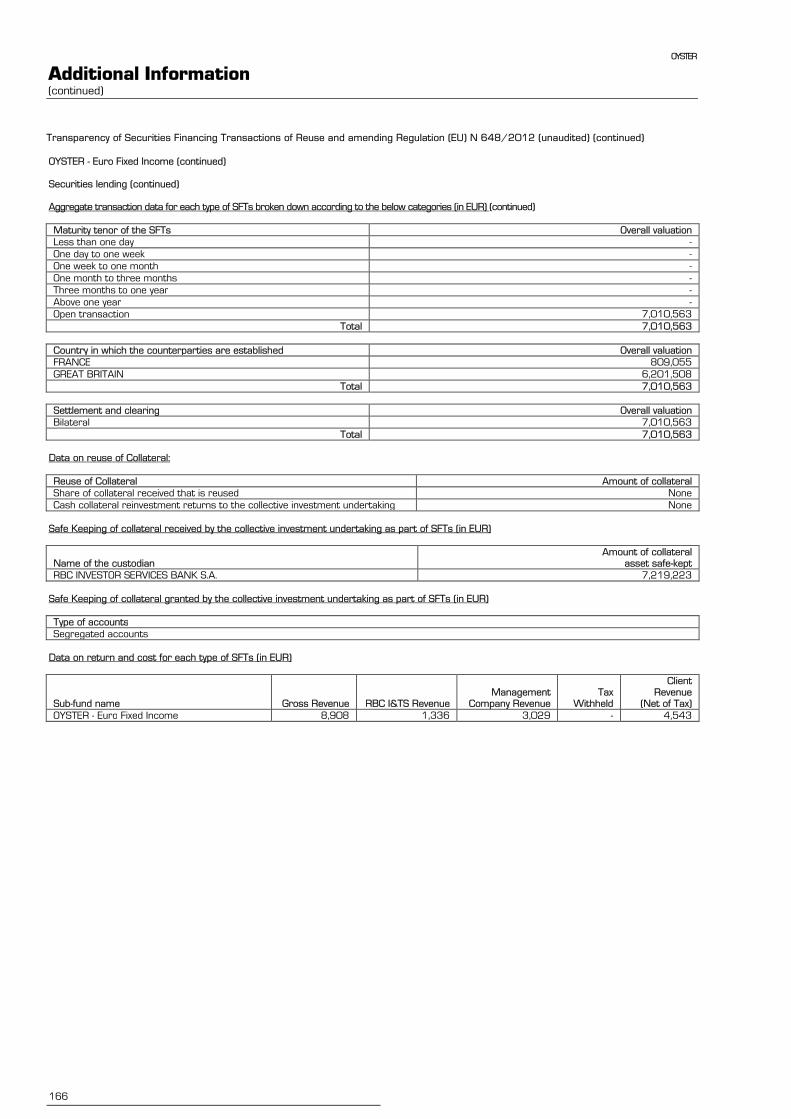
OYSTER
Additional Information (continued)
166
Transparency of Securities Financing Transactions of Reuse and amending Regulation (EU) N°648/2012 (unaudited) (continued)
OYSTER - Euro Fixed Income (continued) Securities lending (continued) Aggregate transaction data for each type of SFTs broken down according to the below categories (in EUR) (continued)
Maturity tenor of the SFTs Overall valuation
Less than one day -
One day to one week -
One week to one month -
One month to three months -
Three months to one year -
Above one year -
Open transaction 7,010,563
Total 7,010,563
Country in which the counterparties are established Overall valuation
FRANCE 809,055
GREAT BRITAIN 6,201,508
Total 7,010,563
Settlement and clearing Overall valuation
Bilateral 7,010,563
Total 7,010,563
Data on reuse of Collateral:
Reuse of Collateral Amount of collateral
Share of collateral received that is reused None
Cash collateral reinvestment returns to the collective investment undertaking None
Safe Keeping of collateral received by the collective investment undertaking as part of SFTs (in EUR)
Name of the custodian Amount of collateral
asset safe-kept
RBC INVESTOR SERVICES BANK S.A. 7,219,223
Safe Keeping of collateral granted by the collective investment undertaking as part of SFTs (in EUR)
Type of accounts
Segregated accounts
Data on return and cost for each type of SFTs (in EUR)
Sub-fund name Gross Revenue RBC I&TS Revenue Management
Company Revenue Tax
Withheld
Client Revenue
(Net of Tax)
OYSTER - Euro Fixed Income 8,908 1,336 3,029 - 4,543
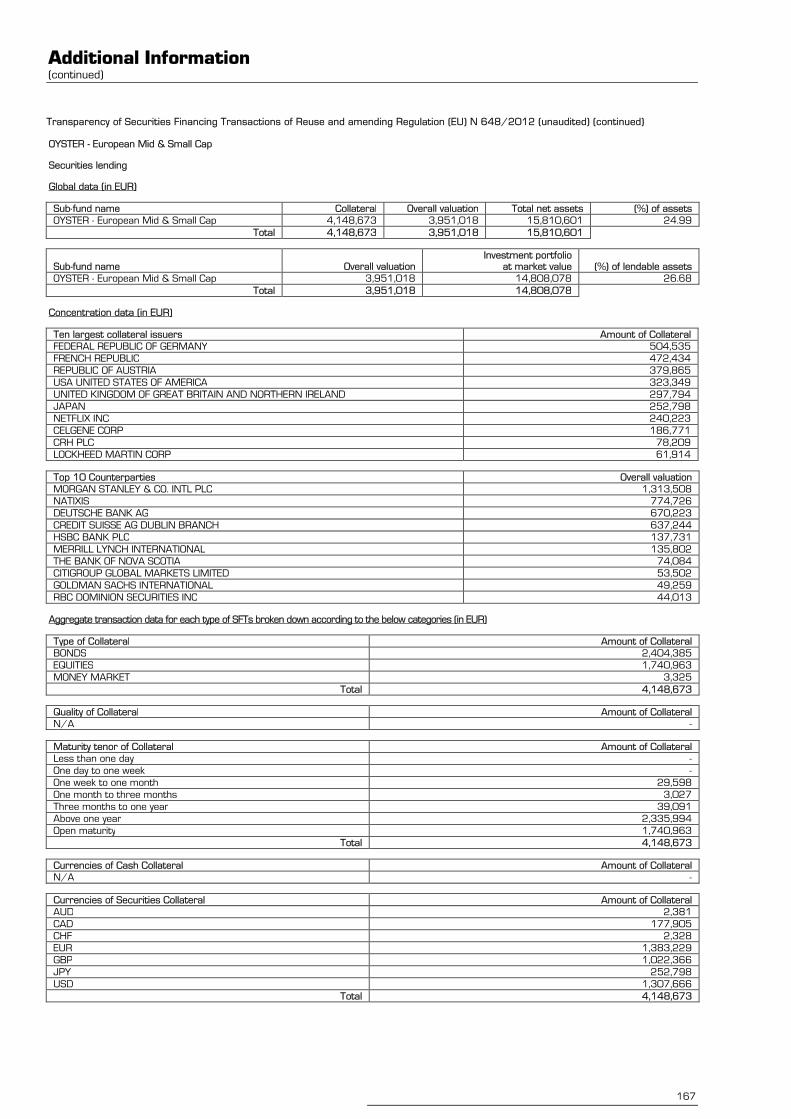
Additional Information (continued)
167
Transparency of Securities Financing Transactions of Reuse and amending Regulation (EU) N°648/2012 (unaudited) (continued)
OYSTER - European Mid & Small Cap
Securities lending
Global data (in EUR)
Sub-fund name Collateral Overall valuation Total net assets (%) of assets
OYSTER - European Mid & Small Cap 4,148,673 3,951,018 15,810,601 24.99
Total 4,148,673 3,951,018 15,810,601
Sub-fund name Overall valuation Investment portfolio
at market value (%) of lendable assets
OYSTER - European Mid & Small Cap 3,951,018 14,808,078 26.68
Total 3,951,018 14,808,078
Concentration data (in EUR)
Ten largest collateral issuers Amount of Collateral
FEDERAL REPUBLIC OF GERMANY 504,535
FRENCH REPUBLIC 472,434
REPUBLIC OF AUSTRIA 379,865
USA UNITED STATES OF AMERICA 323,349
UNITED KINGDOM OF GREAT BRITAIN AND NORTHERN IRELAND 297,794
JAPAN 252,798
NETFLIX INC 240,223
CELGENE CORP 186,771
CRH PLC 78,209
LOCKHEED MARTIN CORP 61,914
Top 10 Counterparties Overall valuation
MORGAN STANLEY & CO. INTL PLC 1,313,508
NATIXIS 774,726
DEUTSCHE BANK AG 670,223
CREDIT SUISSE AG DUBLIN BRANCH 637,244
HSBC BANK PLC 137,731
MERRILL LYNCH INTERNATIONAL 135,802
THE BANK OF NOVA SCOTIA 74,084
CITIGROUP GLOBAL MARKETS LIMITED 53,502
GOLDMAN SACHS INTERNATIONAL 49,259
RBC DOMINION SECURITIES INC 44,013
Aggregate transaction data for each type of SFTs broken down according to the below categories (in EUR)
Type of Collateral Amount of Collateral
BONDS 2,404,385
EQUITIES 1,740,963
MONEY MARKET 3,325
Total 4,148,673
Quality of Collateral Amount of Collateral
N/A -
Maturity tenor of Collateral Amount of Collateral
Less than one day -
One day to one week -
One week to one month 29,598
One month to three months 3,027
Three months to one year 39,091
Above one year 2,335,994
Open maturity 1,740,963
Total 4,148,673
Currencies of Cash Collateral Amount of Collateral
N/A -
Currencies of Securities Collateral Amount of Collateral
AUD 2,381
CAD 177,905
CHF 2,328
EUR 1,383,229
GBP 1,022,366
JPY 252,798
USD 1,307,666
Total 4,148,673

OYSTER
Additional Information (continued)
168
Transparency of Securities Financing Transactions of Reuse and amending Regulation (EU) N°648/2012 (unaudited) (continued)
OYSTER - European Mid & Small Cap (continued) Securities lending (continued) Aggregate transaction data for each type of SFTs broken down according to the below categories (in EUR) (continued)
Maturity tenor of the SFTs Overall valuation
Less than one day 26,772
One day to one week -
One week to one month -
One month to three months -
Three months to one year -
Above one year -
Open transaction 3,924,246
Total 3,951,018
Country in which the counterparties are established Overall valuation
CANADA 118,096
FRANCE 774,726
GREAT BRITAIN 2,420,951
IRELAND 637,245
Total 3,951,018
Settlement and clearing Overall valuation
Bilateral 3,951,018
Total 3,951,018
Data on reuse of Collateral:
Reuse of Collateral Amount of collateral
Share of collateral received that is reused None
Cash collateral reinvestment returns to the collective investment undertaking None
Safe Keeping of collateral received by the collective investment undertaking as part of SFTs (in EUR)
Name of the custodian Amount of collateral
asset safe-kept
RBC INVESTOR SERVICES BANK S.A. 4,148,673
Safe Keeping of collateral granted by the collective investment undertaking as part of SFTs (in EUR)
Type of accounts
Segregated accounts
Data on return and cost for each type of SFTs (in EUR)
Sub-fund name Gross Revenue RBC I&TS Revenue Management
Company Revenue Tax
Withheld
Client Revenue
(Net of Tax)
OYSTER - European Mid & Small Cap 28,637 4,296 9,737 - 14,605
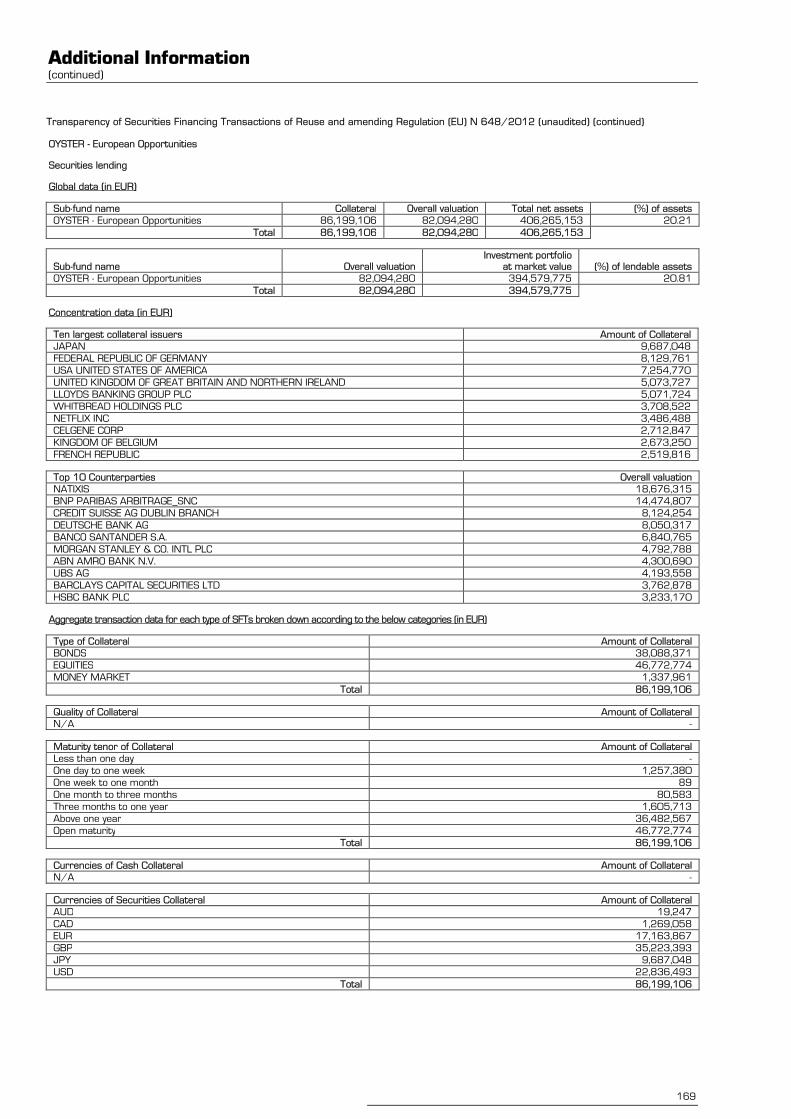
Additional Information (continued)
169
Transparency of Securities Financing Transactions of Reuse and amending Regulation (EU) N°648/2012 (unaudited) (continued)
OYSTER - European Opportunities
Securities lending
Global data (in EUR)
Sub-fund name Collateral Overall valuation Total net assets (%) of assets
OYSTER - European Opportunities 86,199,106 82,094,280 406,265,153 20.21
Total 86,199,106 82,094,280 406,265,153
Sub-fund name Overall valuation Investment portfolio
at market value (%) of lendable assets
OYSTER - European Opportunities 82,094,280 394,579,775 20.81
Total 82,094,280 394,579,775
Concentration data (in EUR)
Ten largest collateral issuers Amount of Collateral
JAPAN 9,687,048
FEDERAL REPUBLIC OF GERMANY 8,129,761
USA UNITED STATES OF AMERICA 7,254,770
UNITED KINGDOM OF GREAT BRITAIN AND NORTHERN IRELAND 5,073,727
LLOYDS BANKING GROUP PLC 5,071,724
WHITBREAD HOLDINGS PLC 3,708,522
NETFLIX INC 3,486,488
CELGENE CORP 2,712,847
KINGDOM OF BELGIUM 2,673,250
FRENCH REPUBLIC 2,519,816
Top 10 Counterparties Overall valuation
NATIXIS 18,676,315
BNP PARIBAS ARBITRAGE_SNC 14,474,807
CREDIT SUISSE AG DUBLIN BRANCH 8,124,254
DEUTSCHE BANK AG 8,050,317
BANCO SANTANDER S.A. 6,840,765
MORGAN STANLEY & CO. INTL PLC 4,792,788
ABN AMRO BANK N.V. 4,300,690
UBS AG 4,193,558
BARCLAYS CAPITAL SECURITIES LTD 3,762,878
HSBC BANK PLC 3,233,170
Aggregate transaction data for each type of SFTs broken down according to the below categories (in EUR)
Type of Collateral Amount of Collateral
BONDS 38,088,371
EQUITIES 46,772,774
MONEY MARKET 1,337,961
Total 86,199,106
Quality of Collateral Amount of Collateral
N/A -
Maturity tenor of Collateral Amount of Collateral
Less than one day -
One day to one week 1,257,380
One week to one month 89
One month to three months 80,583
Three months to one year 1,605,713
Above one year 36,482,567
Open maturity 46,772,774
Total 86,199,106
Currencies of Cash Collateral Amount of Collateral
N/A -
Currencies of Securities Collateral Amount of Collateral
AUD 19,247
CAD 1,269,058
EUR 17,163,867
GBP 35,223,393
JPY 9,687,048
USD 22,836,493
Total 86,199,106
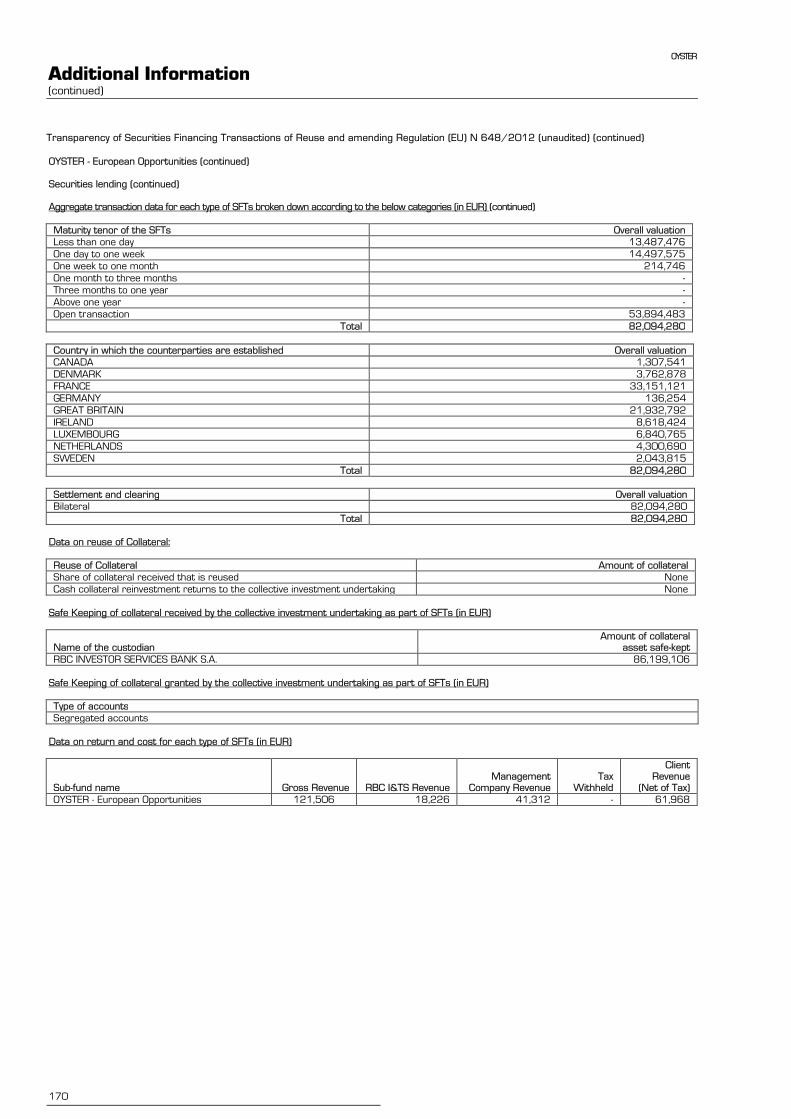
OYSTER
Additional Information (continued)
170
Transparency of Securities Financing Transactions of Reuse and amending Regulation (EU) N°648/2012 (unaudited) (continued)
OYSTER - European Opportunities (continued) Securities lending (continued) Aggregate transaction data for each type of SFTs broken down according to the below categories (in EUR) (continued)
Maturity tenor of the SFTs Overall valuation
Less than one day 13,487,476
One day to one week 14,497,575
One week to one month 214,746
One month to three months -
Three months to one year -
Above one year -
Open transaction 53,894,483
Total 82,094,280
Country in which the counterparties are established Overall valuation
CANADA 1,307,541
DENMARK 3,762,878
FRANCE 33,151,121
GERMANY 136,254
GREAT BRITAIN 21,932,792
IRELAND 8,618,424
LUXEMBOURG 6,840,765
NETHERLANDS 4,300,690
SWEDEN 2,043,815
Total 82,094,280
Settlement and clearing Overall valuation
Bilateral 82,094,280
Total 82,094,280
Data on reuse of Collateral:
Reuse of Collateral Amount of collateral
Share of collateral received that is reused None
Cash collateral reinvestment returns to the collective investment undertaking None
Safe Keeping of collateral received by the collective investment undertaking as part of SFTs (in EUR)
Name of the custodian Amount of collateral
asset safe-kept
RBC INVESTOR SERVICES BANK S.A. 86,199,106
Safe Keeping of collateral granted by the collective investment undertaking as part of SFTs (in EUR)
Type of accounts
Segregated accounts
Data on return and cost for each type of SFTs (in EUR)
Sub-fund name Gross Revenue RBC I&TS Revenue Management
Company Revenue Tax
Withheld
Client Revenue
(Net of Tax)
OYSTER - European Opportunities 121,506 18,226 41,312 - 61,968
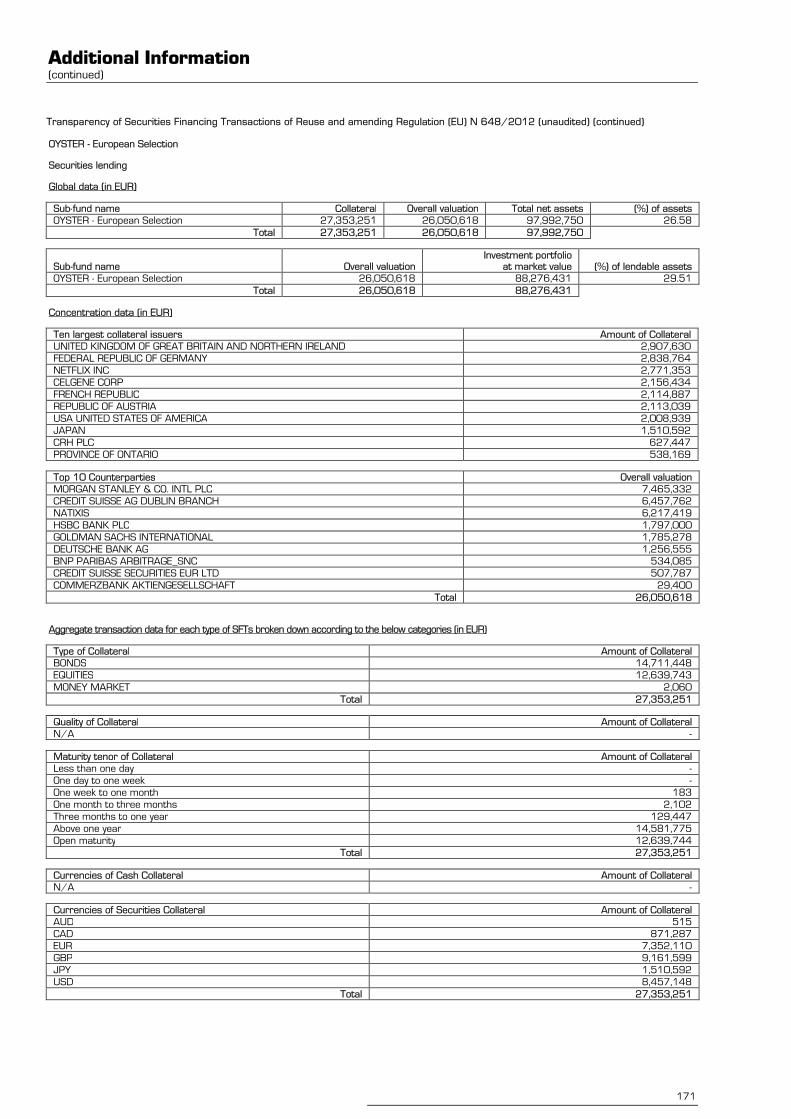
Additional Information (continued)
171
Transparency of Securities Financing Transactions of Reuse and amending Regulation (EU) N°648/2012 (unaudited) (continued)
OYSTER - European Selection
Securities lending
Global data (in EUR)
Sub-fund name Collateral Overall valuation Total net assets (%) of assets
OYSTER - European Selection 27,353,251 26,050,618 97,992,750 26.58
Total 27,353,251 26,050,618 97,992,750
Sub-fund name Overall valuation Investment portfolio
at market value (%) of lendable assets
OYSTER - European Selection 26,050,618 88,276,431 29.51
Total 26,050,618 88,276,431
Concentration data (in EUR)
Ten largest collateral issuers Amount of Collateral
UNITED KINGDOM OF GREAT BRITAIN AND NORTHERN IRELAND 2,907,630
FEDERAL REPUBLIC OF GERMANY 2,838,764
NETFLIX INC 2,771,353
CELGENE CORP 2,156,434
FRENCH REPUBLIC 2,114,887
REPUBLIC OF AUSTRIA 2,113,039
USA UNITED STATES OF AMERICA 2,008,939
JAPAN 1,510,592
CRH PLC 627,447
PROVINCE OF ONTARIO 538,169
Top 10 Counterparties Overall valuation
MORGAN STANLEY & CO. INTL PLC 7,465,332
CREDIT SUISSE AG DUBLIN BRANCH 6,457,762
NATIXIS 6,217,419
HSBC BANK PLC 1,797,000
GOLDMAN SACHS INTERNATIONAL 1,785,278
DEUTSCHE BANK AG 1,256,555
BNP PARIBAS ARBITRAGE_SNC 534,085
CREDIT SUISSE SECURITIES EUR LTD 507,787
COMMERZBANK AKTIENGESELLSCHAFT 29,400
Total 26,050,618
Aggregate transaction data for each type of SFTs broken down according to the below categories (in EUR)
Type of Collateral Amount of Collateral
BONDS 14,711,448
EQUITIES 12,639,743
MONEY MARKET 2,060
Total 27,353,251
Quality of Collateral Amount of Collateral
N/A -
Maturity tenor of Collateral Amount of Collateral
Less than one day -
One day to one week -
One week to one month 183
One month to three months 2,102
Three months to one year 129,447
Above one year 14,581,775
Open maturity 12,639,744
Total 27,353,251
Currencies of Cash Collateral Amount of Collateral
N/A -
Currencies of Securities Collateral Amount of Collateral
AUD 515
CAD 871,287
EUR 7,352,110
GBP 9,161,599
JPY 1,510,592
USD 8,457,148
Total 27,353,251
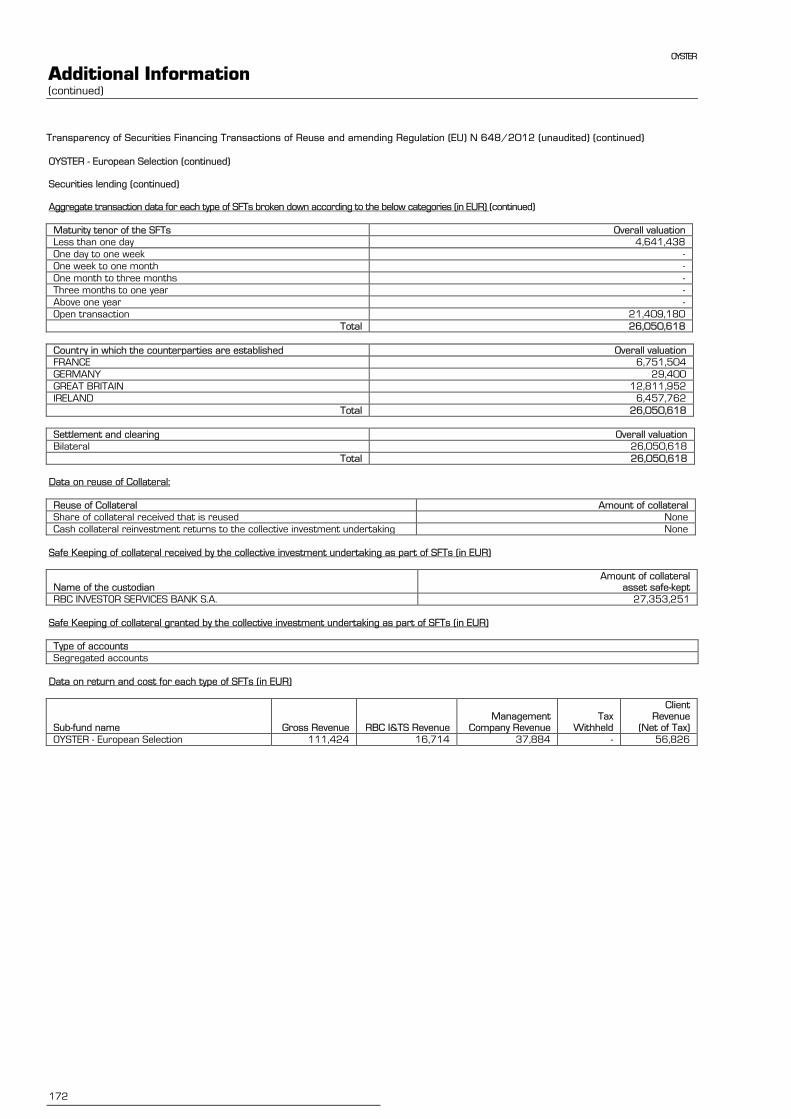
OYSTER
Additional Information (continued)
172
Transparency of Securities Financing Transactions of Reuse and amending Regulation (EU) N°648/2012 (unaudited) (continued)
OYSTER - European Selection (continued) Securities lending (continued) Aggregate transaction data for each type of SFTs broken down according to the below categories (in EUR) (continued)
Maturity tenor of the SFTs Overall valuation
Less than one day 4,641,438
One day to one week -
One week to one month -
One month to three months -
Three months to one year -
Above one year -
Open transaction 21,409,180
Total 26,050,618
Country in which the counterparties are established Overall valuation
FRANCE 6,751,504
GERMANY 29,400
GREAT BRITAIN 12,811,952
IRELAND 6,457,762
Total 26,050,618
Settlement and clearing Overall valuation
Bilateral 26,050,618
Total 26,050,618
Data on reuse of Collateral:
Reuse of Collateral Amount of collateral
Share of collateral received that is reused None
Cash collateral reinvestment returns to the collective investment undertaking None
Safe Keeping of collateral received by the collective investment undertaking as part of SFTs (in EUR)
Name of the custodian Amount of collateral
asset safe-kept
RBC INVESTOR SERVICES BANK S.A. 27,353,251
Safe Keeping of collateral granted by the collective investment undertaking as part of SFTs (in EUR)
Type of accounts
Segregated accounts
Data on return and cost for each type of SFTs (in EUR)
Sub-fund name Gross Revenue RBC I&TS Revenue Management
Company Revenue Tax
Withheld
Client Revenue
(Net of Tax)
OYSTER - European Selection 111,424 16,714 37,884 - 56,826
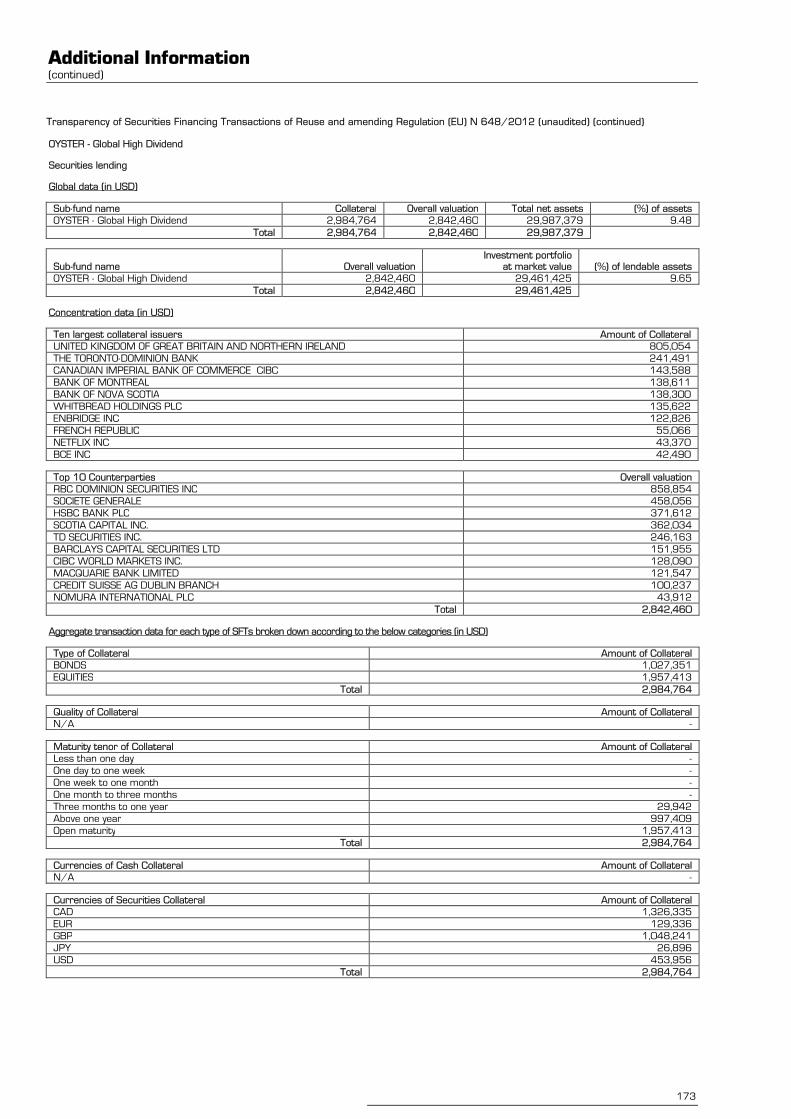
Additional Information (continued)
173
Transparency of Securities Financing Transactions of Reuse and amending Regulation (EU) N°648/2012 (unaudited) (continued)
OYSTER - Global High Dividend
Securities lending
Global data (in USD)
Sub-fund name Collateral Overall valuation Total net assets (%) of assets
OYSTER - Global High Dividend 2,984,764 2,842,460 29,987,379 9.48
Total 2,984,764 2,842,460 29,987,379
Sub-fund name Overall valuation Investment portfolio
at market value (%) of lendable assets
OYSTER - Global High Dividend 2,842,460 29,461,425 9.65
Total 2,842,460 29,461,425
Concentration data (in USD)
Ten largest collateral issuers Amount of Collateral
UNITED KINGDOM OF GREAT BRITAIN AND NORTHERN IRELAND 805,054
THE TORONTO-DOMINION BANK 241,491
CANADIAN IMPERIAL BANK OF COMMERCE CIBC 143,588
BANK OF MONTREAL 138,611
BANK OF NOVA SCOTIA 138,300
WHITBREAD HOLDINGS PLC 135,622
ENBRIDGE INC 122,826
FRENCH REPUBLIC 55,066
NETFLIX INC 43,370
BCE INC 42,490
Top 10 Counterparties Overall valuation
RBC DOMINION SECURITIES INC 858,854
SOCIETE GENERALE 458,056
HSBC BANK PLC 371,612
SCOTIA CAPITAL INC. 362,034
TD SECURITIES INC. 246,163
BARCLAYS CAPITAL SECURITIES LTD 151,955
CIBC WORLD MARKETS INC. 128,090
MACQUARIE BANK LIMITED 121,547
CREDIT SUISSE AG DUBLIN BRANCH 100,237
NOMURA INTERNATIONAL PLC 43,912
Total 2,842,460
Aggregate transaction data for each type of SFTs broken down according to the below categories (in USD)
Type of Collateral Amount of Collateral
BONDS 1,027,351
EQUITIES 1,957,413
Total 2,984,764
Quality of Collateral Amount of Collateral
N/A -
Maturity tenor of Collateral Amount of Collateral
Less than one day -
One day to one week -
One week to one month -
One month to three months -
Three months to one year 29,942
Above one year 997,409
Open maturity 1,957,413
Total 2,984,764
Currencies of Cash Collateral Amount of Collateral
N/A -
Currencies of Securities Collateral Amount of Collateral
CAD 1,326,335
EUR 129,336
GBP 1,048,241
JPY 26,896
USD 453,956
Total 2,984,764

OYSTER
Additional Information (continued)
174
Transparency of Securities Financing Transactions of Reuse and amending Regulation (EU) N°648/2012 (unaudited) (continued)
OYSTER - Global High Dividend (continued) Securities lending (continued) Aggregate transaction data for each type of SFTs broken down according to the below categories (in USD) (continued)
Maturity tenor of the SFTs Overall valuation
Less than one day -
One day to one week -
One week to one month -
One month to three months 458,056
Three months to one year -
Above one year -
Open transaction 2,384,404
Total 2,842,460
Country in which the counterparties are established Overall valuation
CANADA 1,595,141
DENMARK 151,955
FRANCE 458,056
GREAT BRITAIN 537,071
IRELAND 100,237
Total 2,842,460
Settlement and clearing Overall valuation
Bilateral 2,842,460
Total 2,842,460
Data on reuse of Collateral:
Reuse of Collateral Amount of collateral
Share of collateral received that is reused None
Cash collateral reinvestment returns to the collective investment undertaking None
Safe Keeping of collateral received by the collective investment undertaking as part of SFTs (in USD)
Name of the custodian Amount of collateral
asset safe-kept
RBC INVESTOR SERVICES BANK S.A. 2,984,764
Safe Keeping of collateral granted by the collective investment undertaking as part of SFTs (in USD)
Type of accounts
Segregated accounts
Data on return and cost for each type of SFTs (in USD)
Sub-fund name Gross Revenue RBC I&TS Revenue Management
Company Revenue Tax
Withheld
Client Revenue
(Net of Tax)
OYSTER - Global High Dividend 6,807 1,021 2,314 - 3,471
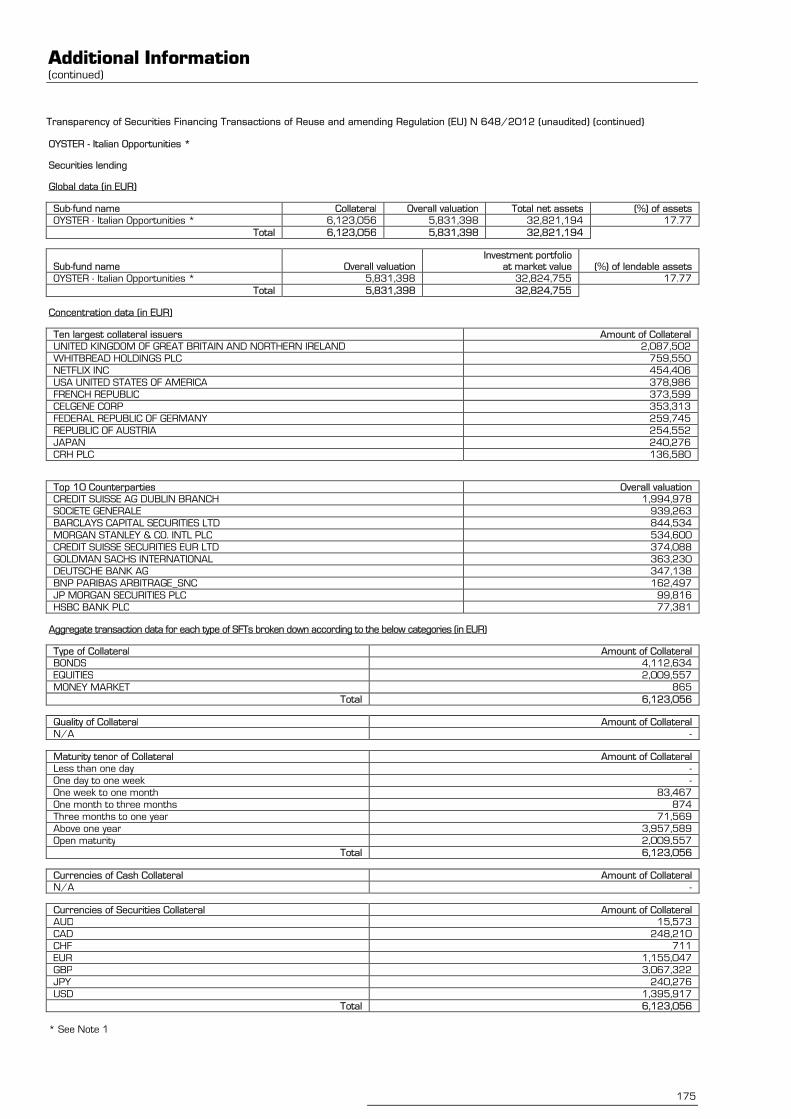
Additional Information (continued)
175
Transparency of Securities Financing Transactions of Reuse and amending Regulation (EU) N°648/2012 (unaudited) (continued)
OYSTER - Italian Opportunities *
Securities lending
Global data (in EUR)
Sub-fund name Collateral Overall valuation Total net assets (%) of assets
OYSTER - Italian Opportunities * 6,123,056 5,831,398 32,821,194 17.77
Total 6,123,056 5,831,398 32,821,194
Sub-fund name Overall valuation Investment portfolio
at market value (%) of lendable assets
OYSTER - Italian Opportunities * 5,831,398 32,824,755 17.77
Total 5,831,398 32,824,755
Concentration data (in EUR)
Ten largest collateral issuers Amount of Collateral
UNITED KINGDOM OF GREAT BRITAIN AND NORTHERN IRELAND 2,087,502
WHITBREAD HOLDINGS PLC 759,550
NETFLIX INC 454,406
USA UNITED STATES OF AMERICA 378,986
FRENCH REPUBLIC 373,599
CELGENE CORP 353,313
FEDERAL REPUBLIC OF GERMANY 259,745
REPUBLIC OF AUSTRIA 254,552
JAPAN 240,276
CRH PLC 136,580
Top 10 Counterparties Overall valuation
CREDIT SUISSE AG DUBLIN BRANCH 1,994,978
SOCIETE GENERALE 939,263
BARCLAYS CAPITAL SECURITIES LTD 844,534
MORGAN STANLEY & CO. INTL PLC 534,600
CREDIT SUISSE SECURITIES EUR LTD 374,088
GOLDMAN SACHS INTERNATIONAL 363,230
DEUTSCHE BANK AG 347,138
BNP PARIBAS ARBITRAGE_SNC 162,497
JP MORGAN SECURITIES PLC 99,816
HSBC BANK PLC 77,381
Aggregate transaction data for each type of SFTs broken down according to the below categories (in EUR)
Type of Collateral Amount of Collateral
BONDS 4,112,634
EQUITIES 2,009,557
MONEY MARKET 865
Total 6,123,056
Quality of Collateral Amount of Collateral
N/A -
Maturity tenor of Collateral Amount of Collateral
Less than one day -
One day to one week -
One week to one month 83,467
One month to three months 874
Three months to one year 71,569
Above one year 3,957,589
Open maturity 2,009,557
Total 6,123,056
Currencies of Cash Collateral Amount of Collateral
N/A -
Currencies of Securities Collateral Amount of Collateral
AUD 15,573
CAD 248,210
CHF 711
EUR 1,155,047
GBP 3,067,322
JPY 240,276
USD 1,395,917
Total 6,123,056
* See Note 1
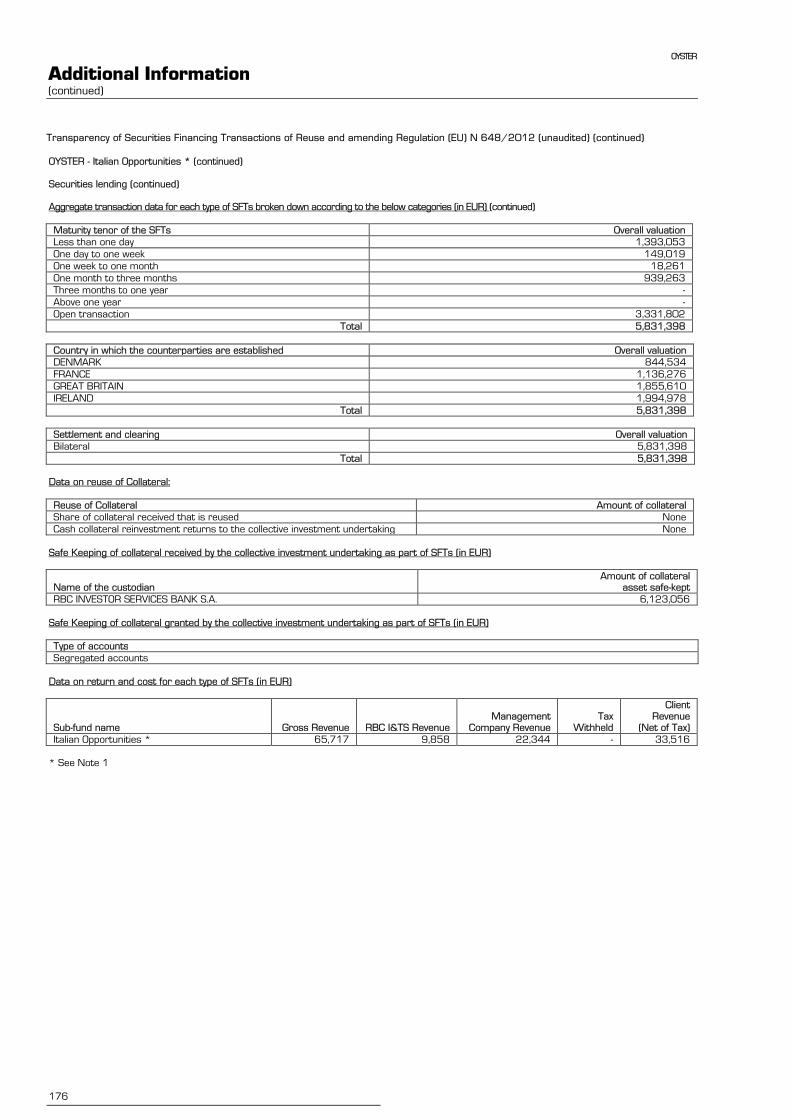
OYSTER
Additional Information (continued)
176
Transparency of Securities Financing Transactions of Reuse and amending Regulation (EU) N°648/2012 (unaudited) (continued)
OYSTER - Italian Opportunities * (continued) Securities lending (continued) Aggregate transaction data for each type of SFTs broken down according to the below categories (in EUR) (continued)
Maturity tenor of the SFTs Overall valuation
Less than one day 1,393,053
One day to one week 149,019
One week to one month 18,261
One month to three months 939,263
Three months to one year -
Above one year -
Open transaction 3,331,802
Total 5,831,398
Country in which the counterparties are established Overall valuation
DENMARK 844,534
FRANCE 1,136,276
GREAT BRITAIN 1,855,610
IRELAND 1,994,978
Total 5,831,398
Settlement and clearing Overall valuation
Bilateral 5,831,398
Total 5,831,398
Data on reuse of Collateral:
Reuse of Collateral Amount of collateral
Share of collateral received that is reused None
Cash collateral reinvestment returns to the collective investment undertaking None
Safe Keeping of collateral received by the collective investment undertaking as part of SFTs (in EUR)
Name of the custodian Amount of collateral
asset safe-kept
RBC INVESTOR SERVICES BANK S.A. 6,123,056
Safe Keeping of collateral granted by the collective investment undertaking as part of SFTs (in EUR)
Type of accounts
Segregated accounts
Data on return and cost for each type of SFTs (in EUR)
Sub-fund name Gross Revenue RBC I&TS Revenue Management
Company Revenue Tax
Withheld
Client Revenue
(Net of Tax)
Italian Opportunities * 65,717 9,858 22,344 - 33,516
* See Note 1
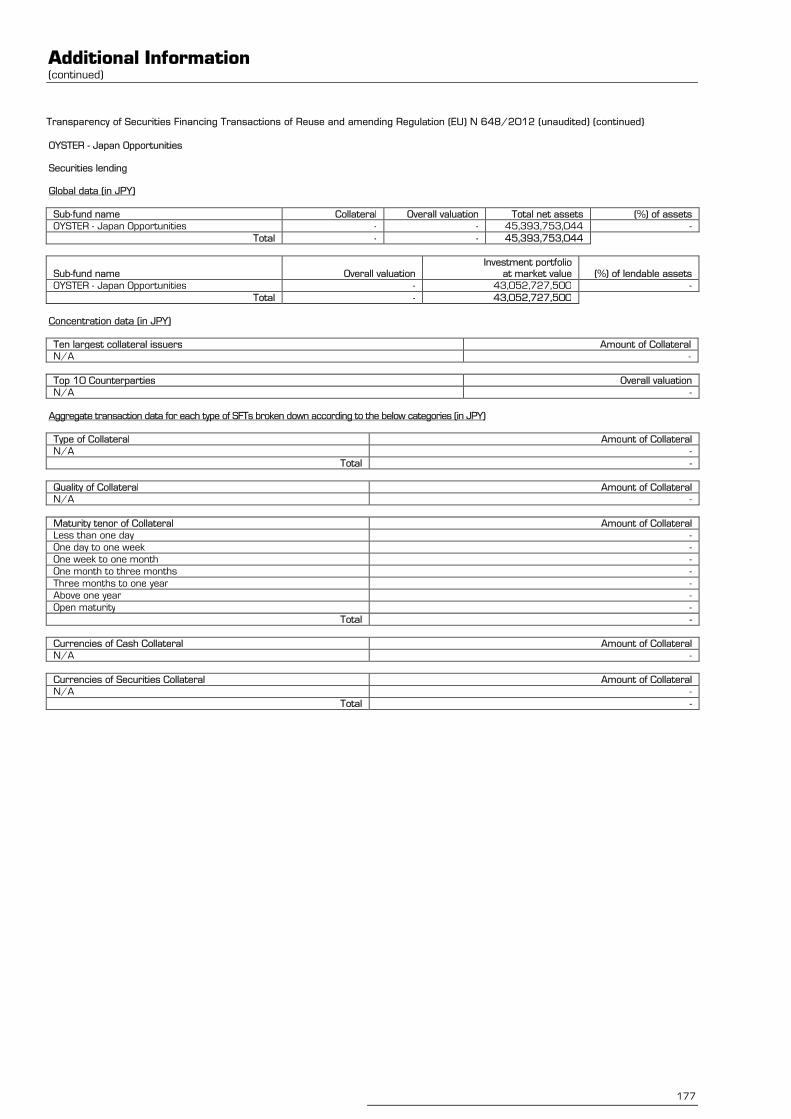
Additional Information (continued)
177
Transparency of Securities Financing Transactions of Reuse and amending Regulation (EU) N°648/2012 (unaudited) (continued)
OYSTER - Japan Opportunities Securities lending Global data (in JPY)
Sub-fund name Collateral Overall valuation Total net assets (%) of assets
OYSTER - Japan Opportunities - - 45,393,753,044 -
Total - - 45,393,753,044
Sub-fund name Overall valuation Investment portfolio
at market value (%) of lendable assets
OYSTER - Japan Opportunities - 43,052,727,500 -
Total - 43,052,727,500
Concentration data (in JPY)
Ten largest collateral issuers Amount of Collateral
N/A -
Top 10 Counterparties Overall valuation
N/A -
Aggregate transaction data for each type of SFTs broken down according to the below categories (in JPY)
Type of Collateral Amount of Collateral
N/A -
Total -
Quality of Collateral Amount of Collateral
N/A -
Maturity tenor of Collateral Amount of Collateral
Less than one day -
One day to one week -
One week to one month -
One month to three months -
Three months to one year -
Above one year -
Open maturity -
Total -
Currencies of Cash Collateral Amount of Collateral
N/A -
Currencies of Securities Collateral Amount of Collateral
N/A -
Total -
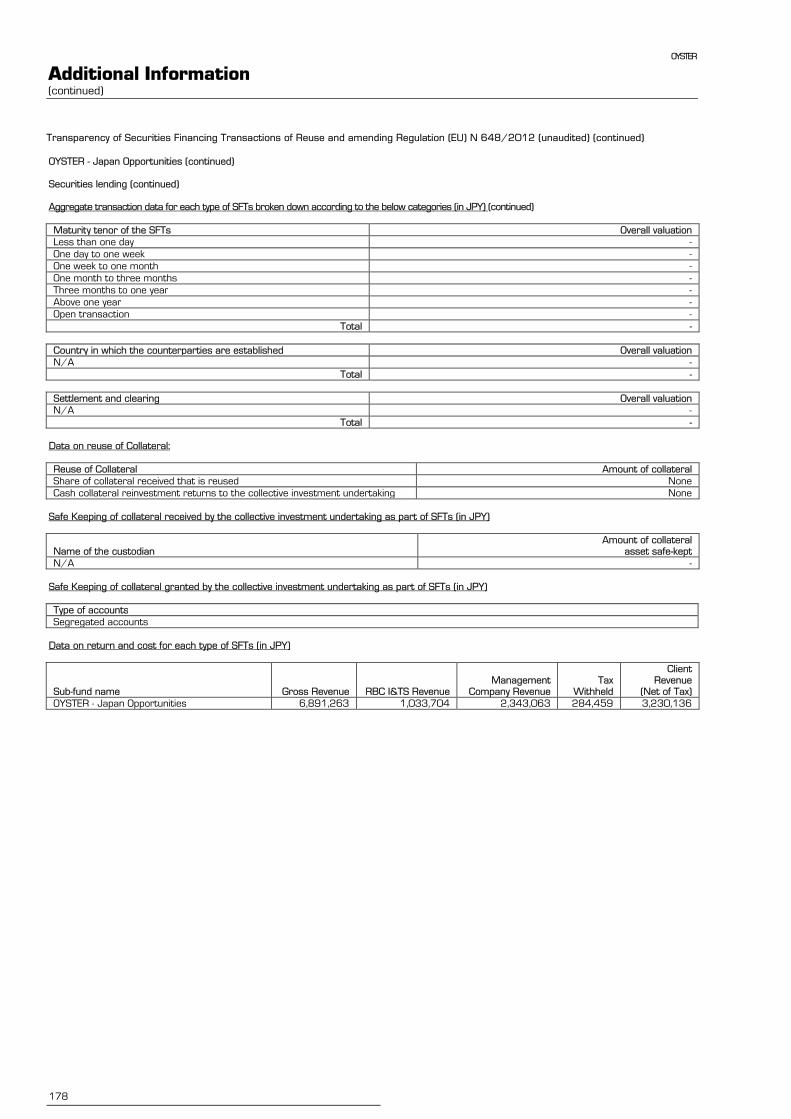
OYSTER
Additional Information (continued)
178
Transparency of Securities Financing Transactions of Reuse and amending Regulation (EU) N°648/2012 (unaudited) (continued)
OYSTER - Japan Opportunities (continued) Securities lending (continued) Aggregate transaction data for each type of SFTs broken down according to the below categories (in JPY) (continued)
Maturity tenor of the SFTs Overall valuation
Less than one day -
One day to one week -
One week to one month -
One month to three months -
Three months to one year -
Above one year -
Open transaction -
Total -
Country in which the counterparties are established Overall valuation
N/A -
Total -
Settlement and clearing Overall valuation
N/A -
Total -
Data on reuse of Collateral:
Reuse of Collateral Amount of collateral
Share of collateral received that is reused None
Cash collateral reinvestment returns to the collective investment undertaking None
Safe Keeping of collateral received by the collective investment undertaking as part of SFTs (in JPY)
Name of the custodian Amount of collateral
asset safe-kept
N/A -
Safe Keeping of collateral granted by the collective investment undertaking as part of SFTs (in JPY)
Type of accounts
Segregated accounts
Data on return and cost for each type of SFTs (in JPY)
Sub-fund name Gross Revenue RBC I&TS Revenue Management
Company Revenue Tax
Withheld
Client Revenue
(Net of Tax)
OYSTER - Japan Opportunities 6,891,263 1,033,704 2,343,063 284,459 3,230,136
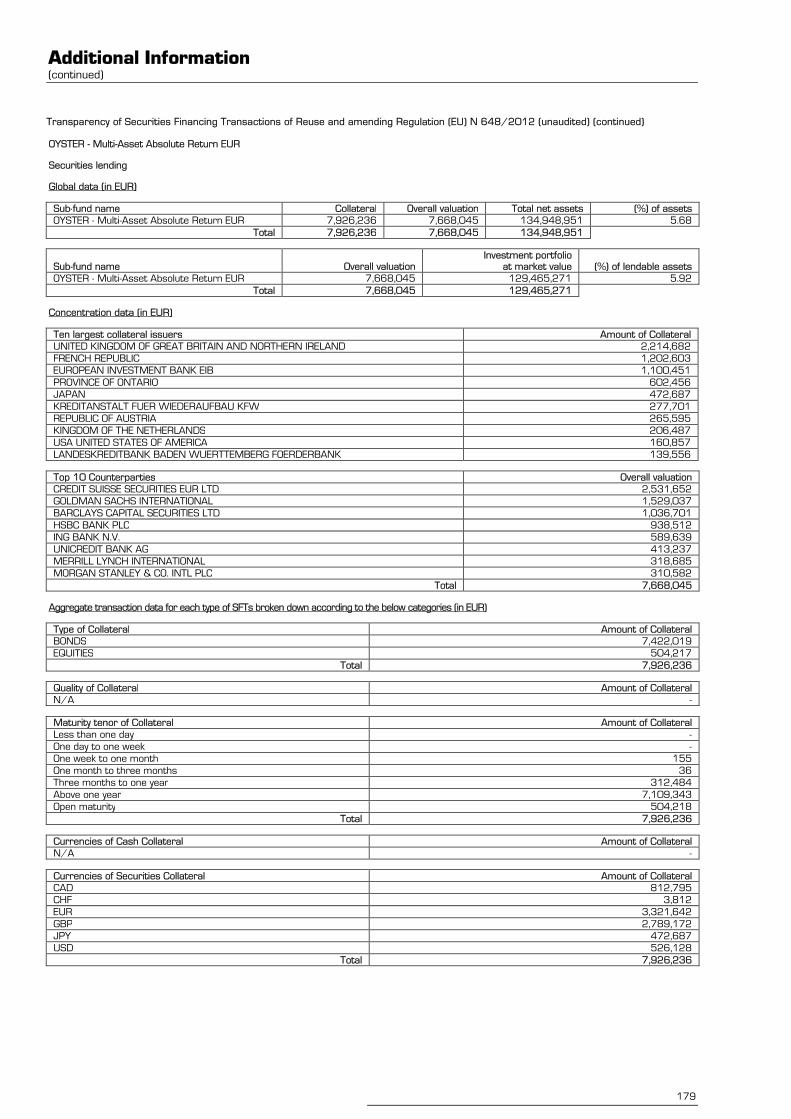
Additional Information (continued)
179
Transparency of Securities Financing Transactions of Reuse and amending Regulation (EU) N°648/2012 (unaudited) (continued)
OYSTER - Multi-Asset Absolute Return EUR
Securities lending
Global data (in EUR)
Sub-fund name Collateral Overall valuation Total net assets (%) of assets
OYSTER - Multi-Asset Absolute Return EUR 7,926,236 7,668,045 134,948,951 5.68
Total 7,926,236 7,668,045 134,948,951
Sub-fund name Overall valuation Investment portfolio
at market value (%) of lendable assets
OYSTER - Multi-Asset Absolute Return EUR 7,668,045 129,465,271 5.92
Total 7,668,045 129,465,271
Concentration data (in EUR)
Ten largest collateral issuers Amount of Collateral
UNITED KINGDOM OF GREAT BRITAIN AND NORTHERN IRELAND 2,214,682
FRENCH REPUBLIC 1,202,603
EUROPEAN INVESTMENT BANK EIB 1,100,451
PROVINCE OF ONTARIO 602,456
JAPAN 472,687
KREDITANSTALT FUER WIEDERAUFBAU KFW 277,701
REPUBLIC OF AUSTRIA 265,595
KINGDOM OF THE NETHERLANDS 206,487
USA UNITED STATES OF AMERICA 160,857
LANDESKREDITBANK BADEN WUERTTEMBERG FOERDERBANK 139,556
Top 10 Counterparties Overall valuation
CREDIT SUISSE SECURITIES EUR LTD 2,531,652
GOLDMAN SACHS INTERNATIONAL 1,529,037
BARCLAYS CAPITAL SECURITIES LTD 1,036,701
HSBC BANK PLC 938,512
ING BANK N.V. 589,639
UNICREDIT BANK AG 413,237
MERRILL LYNCH INTERNATIONAL 318,685
MORGAN STANLEY & CO. INTL PLC 310,582
Total 7,668,045
Aggregate transaction data for each type of SFTs broken down according to the below categories (in EUR)
Type of Collateral Amount of Collateral
BONDS 7,422,019
EQUITIES 504,217
Total 7,926,236
Quality of Collateral Amount of Collateral
N/A -
Maturity tenor of Collateral Amount of Collateral
Less than one day -
One day to one week -
One week to one month 155
One month to three months 36
Three months to one year 312,484
Above one year 7,109,343
Open maturity 504,218
Total 7,926,236
Currencies of Cash Collateral Amount of Collateral
N/A -
Currencies of Securities Collateral Amount of Collateral
CAD 812,795
CHF 3,812
EUR 3,321,642
GBP 2,789,172
JPY 472,687
USD 526,128
Total 7,926,236
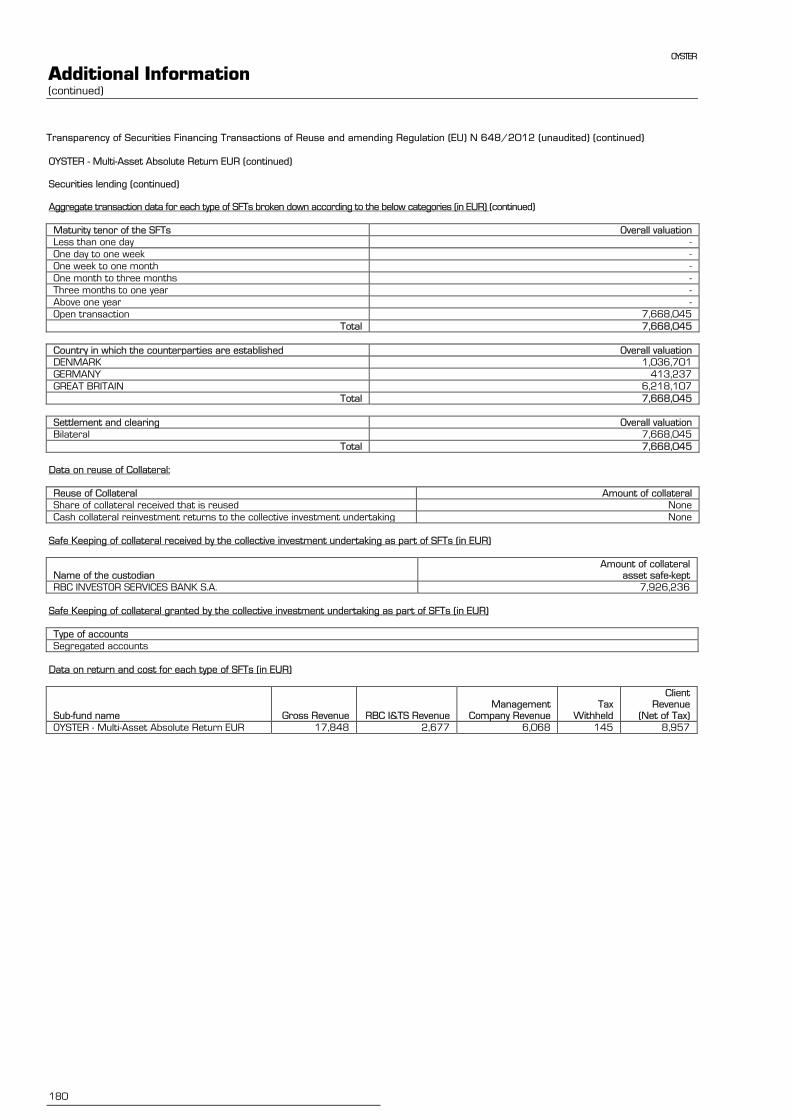
OYSTER
Additional Information (continued)
180
Transparency of Securities Financing Transactions of Reuse and amending Regulation (EU) N°648/2012 (unaudited) (continued)
OYSTER - Multi-Asset Absolute Return EUR (continued) Securities lending (continued) Aggregate transaction data for each type of SFTs broken down according to the below categories (in EUR) (continued)
Maturity tenor of the SFTs Overall valuation
Less than one day -
One day to one week -
One week to one month -
One month to three months -
Three months to one year -
Above one year -
Open transaction 7,668,045
Total 7,668,045
Country in which the counterparties are established Overall valuation
DENMARK 1,036,701
GERMANY 413,237
GREAT BRITAIN 6,218,107
Total 7,668,045
Settlement and clearing Overall valuation
Bilateral 7,668,045
Total 7,668,045
Data on reuse of Collateral:
Reuse of Collateral Amount of collateral
Share of collateral received that is reused None
Cash collateral reinvestment returns to the collective investment undertaking None
Safe Keeping of collateral received by the collective investment undertaking as part of SFTs (in EUR)
Name of the custodian Amount of collateral
asset safe-kept
RBC INVESTOR SERVICES BANK S.A. 7,926,236
Safe Keeping of collateral granted by the collective investment undertaking as part of SFTs (in EUR)
Type of accounts
Segregated accounts
Data on return and cost for each type of SFTs (in EUR)
Sub-fund name Gross Revenue RBC I&TS Revenue Management
Company Revenue Tax
Withheld
Client Revenue
(Net of Tax)
OYSTER - Multi-Asset Absolute Return EUR 17,848 2,677 6,068 145 8,957
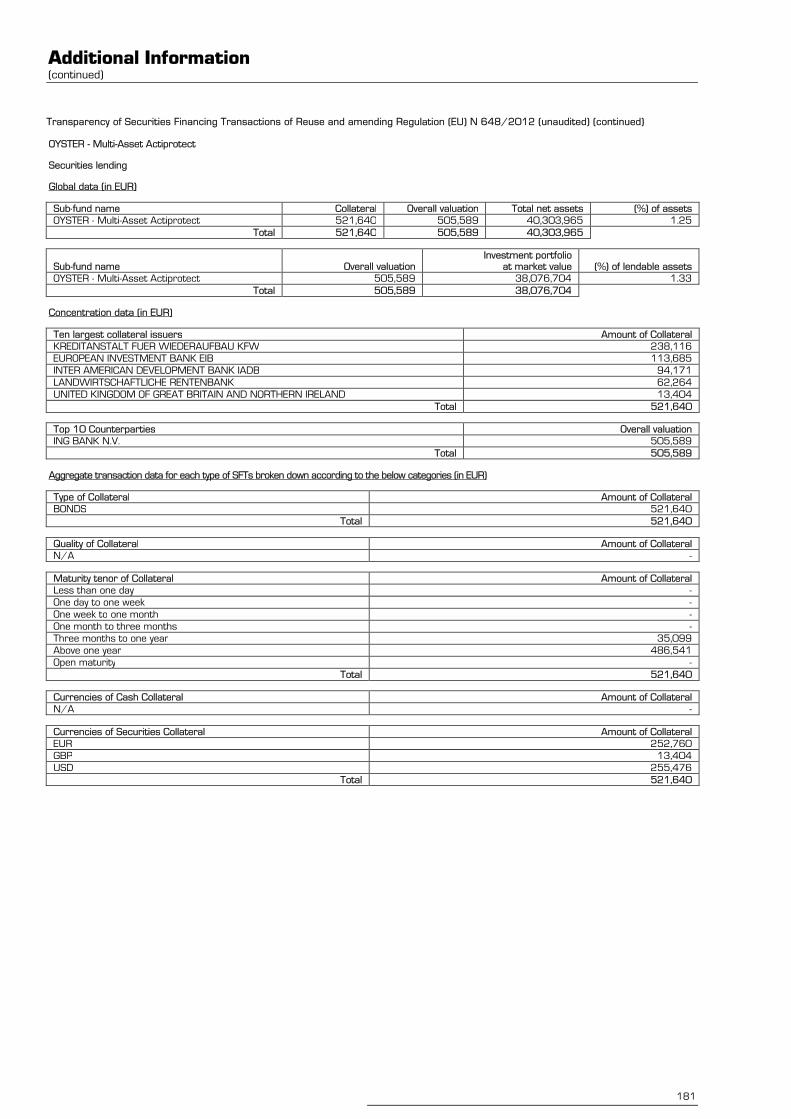
Additional Information (continued)
181
Transparency of Securities Financing Transactions of Reuse and amending Regulation (EU) N°648/2012 (unaudited) (continued)
OYSTER - Multi-Asset Actiprotect
Securities lending
Global data (in EUR)
Sub-fund name Collateral Overall valuation Total net assets (%) of assets
OYSTER - Multi-Asset Actiprotect 521,640 505,589 40,303,965 1.25
Total 521,640 505,589 40,303,965
Sub-fund name Overall valuation Investment portfolio
at market value (%) of lendable assets
OYSTER - Multi-Asset Actiprotect 505,589 38,076,704 1.33
Total 505,589 38,076,704
Concentration data (in EUR)
Ten largest collateral issuers Amount of Collateral
KREDITANSTALT FUER WIEDERAUFBAU KFW 238,116
EUROPEAN INVESTMENT BANK EIB 113,685
INTER AMERICAN DEVELOPMENT BANK IADB 94,171
LANDWIRTSCHAFTLICHE RENTENBANK 62,264
UNITED KINGDOM OF GREAT BRITAIN AND NORTHERN IRELAND 13,404
Total 521,640
Top 10 Counterparties Overall valuation
ING BANK N.V. 505,589
Total 505,589
Aggregate transaction data for each type of SFTs broken down according to the below categories (in EUR)
Type of Collateral Amount of Collateral
BONDS 521,640
Total 521,640
Quality of Collateral Amount of Collateral
N/A -
Maturity tenor of Collateral Amount of Collateral
Less than one day -
One day to one week -
One week to one month -
One month to three months -
Three months to one year 35,099
Above one year 486,541
Open maturity -
Total 521,640
Currencies of Cash Collateral Amount of Collateral
N/A -
Currencies of Securities Collateral Amount of Collateral
EUR 252,760
GBP 13,404
USD 255,476
Total 521,640
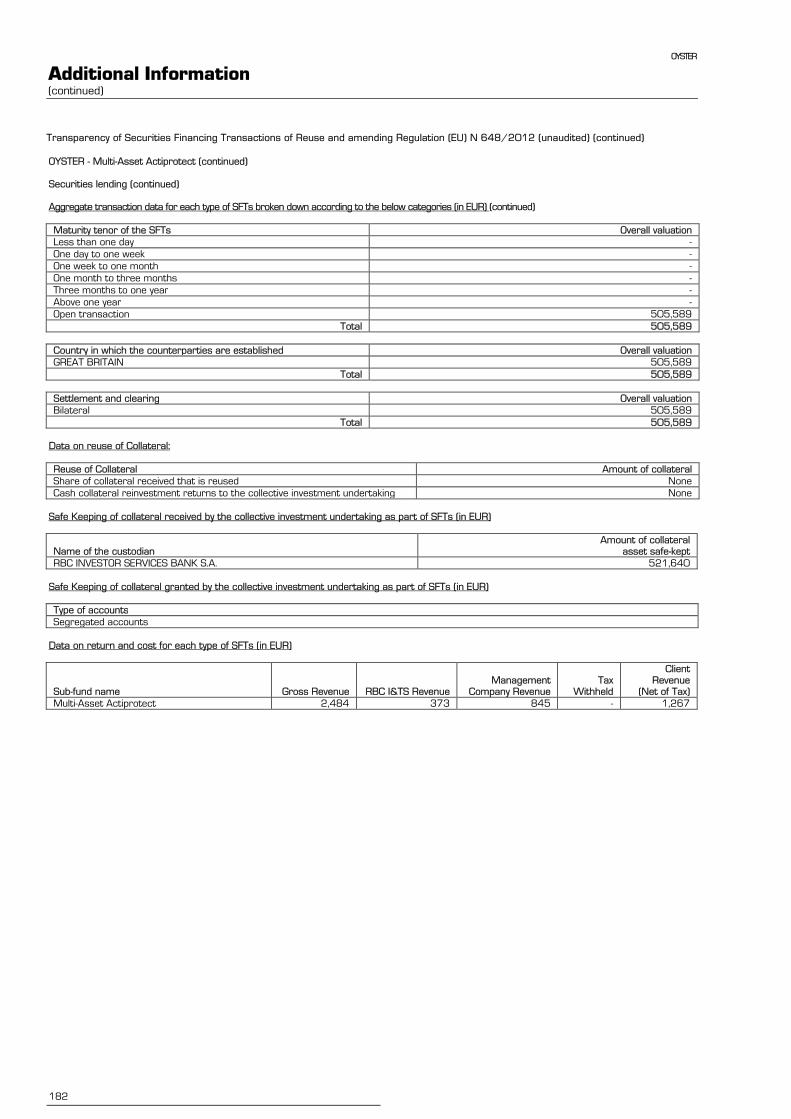
OYSTER
Additional Information (continued)
182
Transparency of Securities Financing Transactions of Reuse and amending Regulation (EU) N°648/2012 (unaudited) (continued)
OYSTER - Multi-Asset Actiprotect (continued) Securities lending (continued) Aggregate transaction data for each type of SFTs broken down according to the below categories (in EUR) (continued)
Maturity tenor of the SFTs Overall valuation
Less than one day -
One day to one week -
One week to one month -
One month to three months -
Three months to one year -
Above one year -
Open transaction 505,589
Total 505,589
Country in which the counterparties are established Overall valuation
GREAT BRITAIN 505,589
Total 505,589
Settlement and clearing Overall valuation
Bilateral 505,589
Total 505,589
Data on reuse of Collateral:
Reuse of Collateral Amount of collateral
Share of collateral received that is reused None
Cash collateral reinvestment returns to the collective investment undertaking None
Safe Keeping of collateral received by the collective investment undertaking as part of SFTs (in EUR)
Name of the custodian Amount of collateral
asset safe-kept
RBC INVESTOR SERVICES BANK S.A. 521,640
Safe Keeping of collateral granted by the collective investment undertaking as part of SFTs (in EUR)
Type of accounts
Segregated accounts
Data on return and cost for each type of SFTs (in EUR)
Sub-fund name Gross Revenue RBC I&TS Revenue Management
Company Revenue Tax
Withheld
Client Revenue
(Net of Tax)
Multi-Asset Actiprotect 2,484 373 845 - 1,267
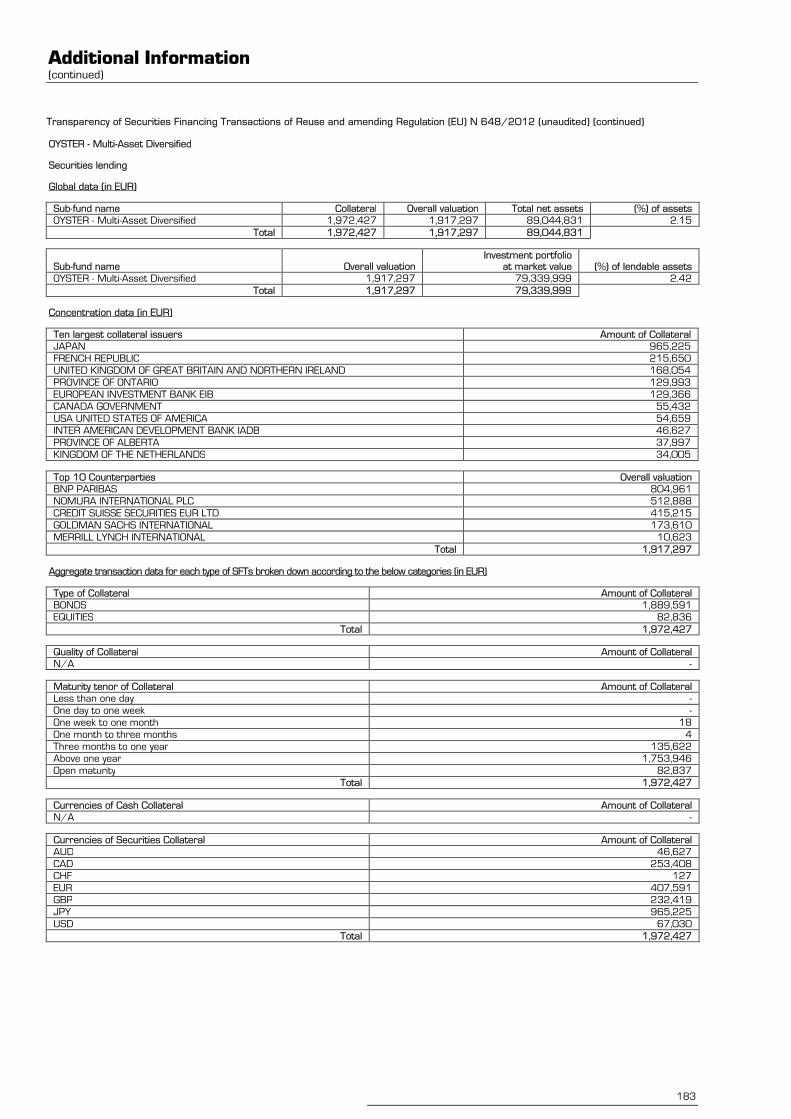
Additional Information (continued)
183
Transparency of Securities Financing Transactions of Reuse and amending Regulation (EU) N°648/2012 (unaudited) (continued)
OYSTER - Multi-Asset Diversified
Securities lending
Global data (in EUR)
Sub-fund name Collateral Overall valuation Total net assets (%) of assets
OYSTER - Multi-Asset Diversified 1,972,427 1,917,297 89,044,831 2.15
Total 1,972,427 1,917,297 89,044,831
Sub-fund name Overall valuation Investment portfolio
at market value (%) of lendable assets
OYSTER - Multi-Asset Diversified 1,917,297 79,339,999 2.42
Total 1,917,297 79,339,999
Concentration data (in EUR)
Ten largest collateral issuers Amount of Collateral
JAPAN 965,225
FRENCH REPUBLIC 215,650
UNITED KINGDOM OF GREAT BRITAIN AND NORTHERN IRELAND 168,054
PROVINCE OF ONTARIO 129,993
EUROPEAN INVESTMENT BANK EIB 129,366
CANADA GOVERNMENT 55,432
USA UNITED STATES OF AMERICA 54,659
INTER AMERICAN DEVELOPMENT BANK IADB 46,627
PROVINCE OF ALBERTA 37,997
KINGDOM OF THE NETHERLANDS 34,005
Top 10 Counterparties Overall valuation
BNP PARIBAS 804,961
NOMURA INTERNATIONAL PLC 512,888
CREDIT SUISSE SECURITIES EUR LTD 415,215
GOLDMAN SACHS INTERNATIONAL 173,610
MERRILL LYNCH INTERNATIONAL 10,623
Total 1,917,297
Aggregate transaction data for each type of SFTs broken down according to the below categories (in EUR)
Type of Collateral Amount of Collateral
BONDS 1,889,591
EQUITIES 82,836
Total 1,972,427
Quality of Collateral Amount of Collateral
N/A -
Maturity tenor of Collateral Amount of Collateral
Less than one day -
One day to one week -
One week to one month 18
One month to three months 4
Three months to one year 135,622
Above one year 1,753,946
Open maturity 82,837
Total 1,972,427
Currencies of Cash Collateral Amount of Collateral
N/A -
Currencies of Securities Collateral Amount of Collateral
AUD 46,627
CAD 253,408
CHF 127
EUR 407,591
GBP 232,419
JPY 965,225
USD 67,030
Total 1,972,427

OYSTER
Additional Information (continued)
184
Transparency of Securities Financing Transactions of Reuse and amending Regulation (EU) N°648/2012 (unaudited) (continued)
OYSTER - Multi-Asset Diversified (continued) Securities lending (continued) Aggregate transaction data for each type of SFTs broken down according to the below categories (in EUR) (continued)
Maturity tenor of the SFTs Overall valuation
Less than one day -
One day to one week -
One week to one month -
One month to three months -
Three months to one year -
Above one year -
Open transaction 1,917,297
Total 1,917,297
Country in which the counterparties are established Overall valuation
FRANCE 804,961
GREAT BRITAIN 1,112,336
Total 1,917,297
Settlement and clearing Overall valuation
Bilateral 1,917,297
Total 1,917,297
Data on reuse of Collateral:
Reuse of Collateral Amount of collateral
Share of collateral received that is reused None
Cash collateral reinvestment returns to the collective investment undertaking None
Safe Keeping of collateral received by the collective investment undertaking as part of SFTs (in EUR)
Name of the custodian Amount of collateral
asset safe-kept
RBC INVESTOR SERVICES BANK S.A. 1,972,427
Safe Keeping of collateral granted by the collective investment undertaking as part of SFTs (in EUR)
Type of accounts
Segregated accounts
Data on return and cost for each type of SFTs (in EUR)
Sub-fund name Gross Revenue RBC I&TS Revenue Management
Company Revenue Tax
Withheld
Client Revenue
(Net of Tax)
OYSTER - Multi-Asset Diversified 5,625 844 1,913 14 2,855
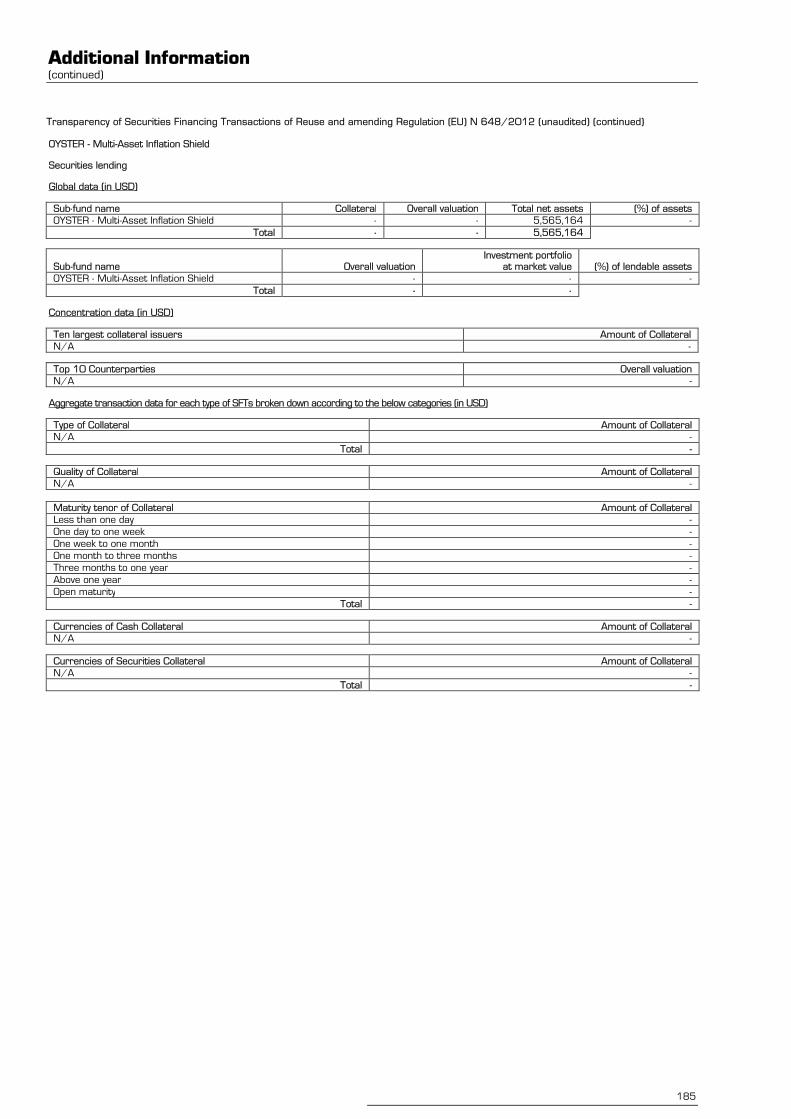
Additional Information (continued)
185
Transparency of Securities Financing Transactions of Reuse and amending Regulation (EU) N°648/2012 (unaudited) (continued)
OYSTER - Multi-Asset Inflation Shield
Securities lending
Global data (in USD)
Sub-fund name Collateral Overall valuation Total net assets (%) of assets
OYSTER - Multi-Asset Inflation Shield - - 5,565,164 -
Total - - 5,565,164
Sub-fund name Overall valuation Investment portfolio
at market value (%) of lendable assets
OYSTER - Multi-Asset Inflation Shield - - -
Total - -
Concentration data (in USD)
Ten largest collateral issuers Amount of Collateral
N/A -
Top 10 Counterparties Overall valuation
N/A -
Aggregate transaction data for each type of SFTs broken down according to the below categories (in USD)
Type of Collateral Amount of Collateral
N/A -
Total -
Quality of Collateral Amount of Collateral
N/A -
Maturity tenor of Collateral Amount of Collateral
Less than one day -
One day to one week -
One week to one month -
One month to three months -
Three months to one year -
Above one year -
Open maturity -
Total -
Currencies of Cash Collateral Amount of Collateral
N/A -
Currencies of Securities Collateral Amount of Collateral
N/A -
Total -
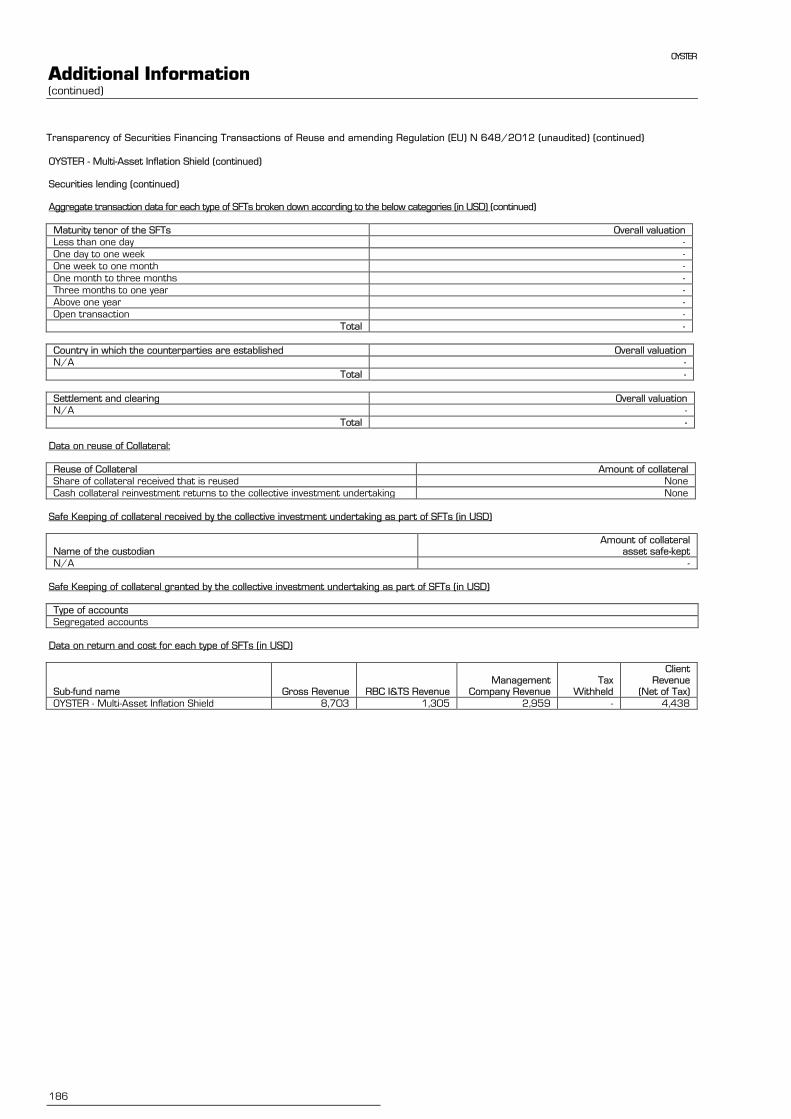
OYSTER
Additional Information (continued)
186
Transparency of Securities Financing Transactions of Reuse and amending Regulation (EU) N°648/2012 (unaudited) (continued)
OYSTER - Multi-Asset Inflation Shield (continued) Securities lending (continued) Aggregate transaction data for each type of SFTs broken down according to the below categories (in USD) (continued)
Maturity tenor of the SFTs Overall valuation
Less than one day -
One day to one week -
One week to one month -
One month to three months -
Three months to one year -
Above one year -
Open transaction -
Total -
Country in which the counterparties are established Overall valuation
N/A -
Total -
Settlement and clearing Overall valuation
N/A -
Total -
Data on reuse of Collateral:
Reuse of Collateral Amount of collateral
Share of collateral received that is reused None
Cash collateral reinvestment returns to the collective investment undertaking None
Safe Keeping of collateral received by the collective investment undertaking as part of SFTs (in USD)
Name of the custodian Amount of collateral
asset safe-kept
N/A -
Safe Keeping of collateral granted by the collective investment undertaking as part of SFTs (in USD)
Type of accounts
Segregated accounts
Data on return and cost for each type of SFTs (in USD)
Sub-fund name Gross Revenue RBC I&TS Revenue Management
Company Revenue Tax
Withheld
Client Revenue
(Net of Tax)
OYSTER - Multi-Asset Inflation Shield 8,703 1,305 2,959 - 4,438
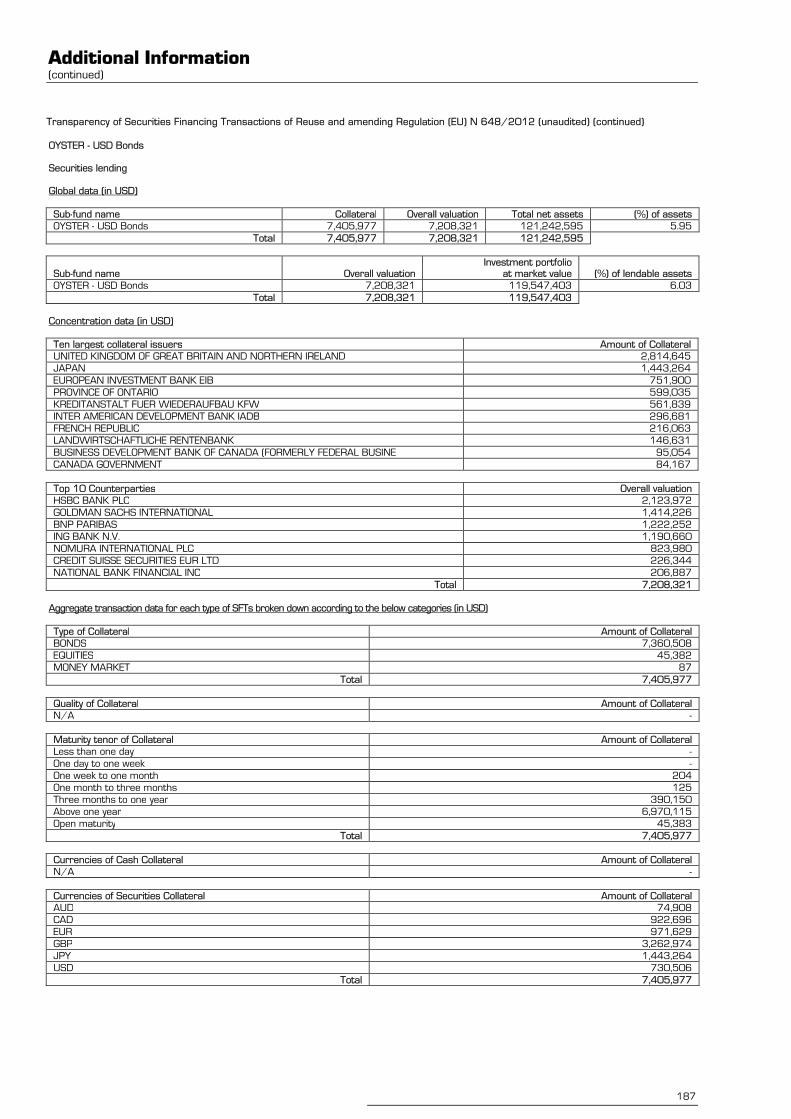
Additional Information (continued)
187
Transparency of Securities Financing Transactions of Reuse and amending Regulation (EU) N°648/2012 (unaudited) (continued)
OYSTER - USD Bonds Securities lending Global data (in USD)
Sub-fund name Collateral Overall valuation Total net assets (%) of assets
OYSTER - USD Bonds 7,405,977 7,208,321 121,242,595 5.95
Total 7,405,977 7,208,321 121,242,595
Sub-fund name Overall valuation Investment portfolio
at market value (%) of lendable assets
OYSTER - USD Bonds 7,208,321 119,547,403 6.03
Total 7,208,321 119,547,403
Concentration data (in USD)
Ten largest collateral issuers Amount of Collateral
UNITED KINGDOM OF GREAT BRITAIN AND NORTHERN IRELAND 2,814,645
JAPAN 1,443,264
EUROPEAN INVESTMENT BANK EIB 751,900
PROVINCE OF ONTARIO 599,035
KREDITANSTALT FUER WIEDERAUFBAU KFW 561,839
INTER AMERICAN DEVELOPMENT BANK IADB 296,681
FRENCH REPUBLIC 216,063
LANDWIRTSCHAFTLICHE RENTENBANK 146,631
BUSINESS DEVELOPMENT BANK OF CANADA (FORMERLY FEDERAL BUSINE 95,054
CANADA GOVERNMENT 84,167
Top 10 Counterparties Overall valuation
HSBC BANK PLC 2,123,972
GOLDMAN SACHS INTERNATIONAL 1,414,226
BNP PARIBAS 1,222,252
ING BANK N.V. 1,190,660
NOMURA INTERNATIONAL PLC 823,980
CREDIT SUISSE SECURITIES EUR LTD 226,344
NATIONAL BANK FINANCIAL INC 206,887
Total 7,208,321
Aggregate transaction data for each type of SFTs broken down according to the below categories (in USD)
Type of Collateral Amount of Collateral
BONDS 7,360,508
EQUITIES 45,382
MONEY MARKET 87
Total 7,405,977
Quality of Collateral Amount of Collateral
N/A -
Maturity tenor of Collateral Amount of Collateral
Less than one day -
One day to one week -
One week to one month 204
One month to three months 125
Three months to one year 390,150
Above one year 6,970,115
Open maturity 45,383
Total 7,405,977
Currencies of Cash Collateral Amount of Collateral
N/A -
Currencies of Securities Collateral Amount of Collateral
AUD 74,908
CAD 922,696
EUR 971,629
GBP 3,262,974
JPY 1,443,264
USD 730,506
Total 7,405,977
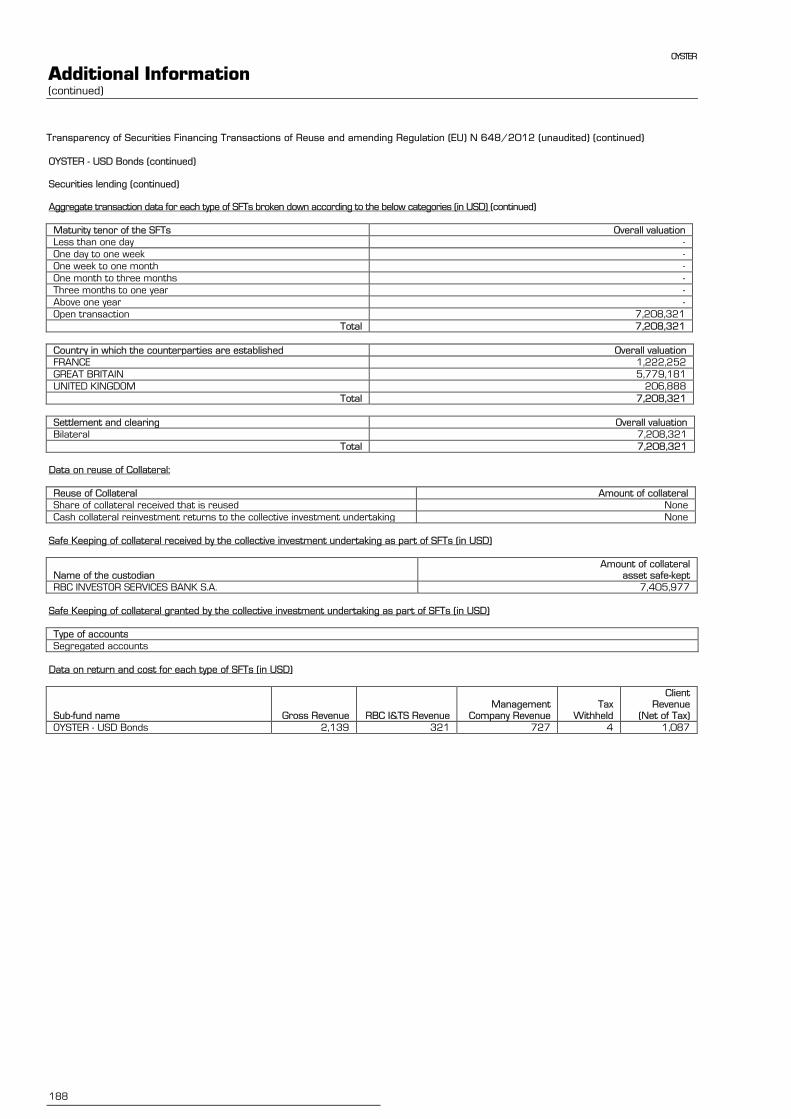
OYSTER
Additional Information (continued)
188
Transparency of Securities Financing Transactions of Reuse and amending Regulation (EU) N°648/2012 (unaudited) (continued)
OYSTER - USD Bonds (continued) Securities lending (continued) Aggregate transaction data for each type of SFTs broken down according to the below categories (in USD) (continued)
Maturity tenor of the SFTs Overall valuation
Less than one day -
One day to one week -
One week to one month -
One month to three months -
Three months to one year -
Above one year -
Open transaction 7,208,321
Total 7,208,321
Country in which the counterparties are established Overall valuation
FRANCE 1,222,252
GREAT BRITAIN 5,779,181
UNITED KINGDOM 206,888
Total 7,208,321
Settlement and clearing Overall valuation
Bilateral 7,208,321
Total 7,208,321
Data on reuse of Collateral:
Reuse of Collateral Amount of collateral
Share of collateral received that is reused None
Cash collateral reinvestment returns to the collective investment undertaking None
Safe Keeping of collateral received by the collective investment undertaking as part of SFTs (in USD)
Name of the custodian Amount of collateral
asset safe-kept
RBC INVESTOR SERVICES BANK S.A. 7,405,977
Safe Keeping of collateral granted by the collective investment undertaking as part of SFTs (in USD)
Type of accounts
Segregated accounts
Data on return and cost for each type of SFTs (in USD)
Sub-fund name Gross Revenue RBC I&TS Revenue Management
Company Revenue Tax
Withheld
Client Revenue
(Net of Tax)
OYSTER - USD Bonds 2,139 321 727 4 1,087
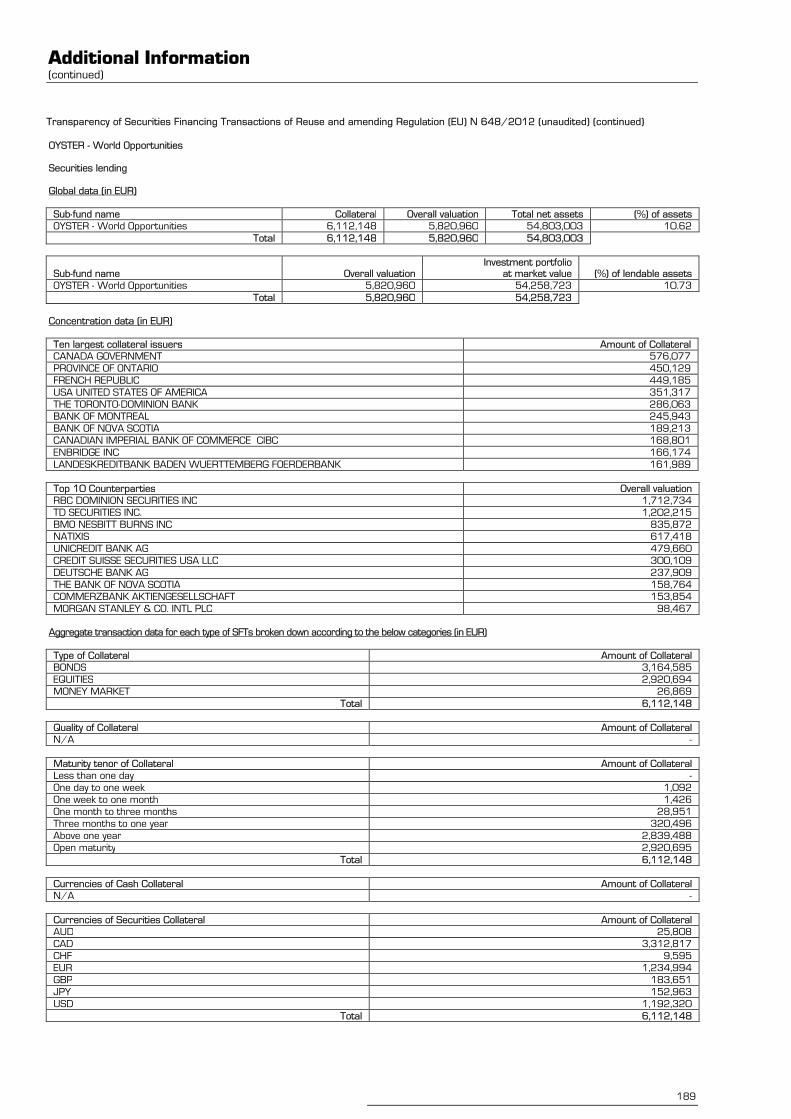
Additional Information (continued)
189
Transparency of Securities Financing Transactions of Reuse and amending Regulation (EU) N°648/2012 (unaudited) (continued)
OYSTER - World Opportunities Securities lending Global data (in EUR)
Sub-fund name Collateral Overall valuation Total net assets (%) of assets
OYSTER - World Opportunities 6,112,148 5,820,960 54,803,003 10.62
Total 6,112,148 5,820,960 54,803,003
Sub-fund name Overall valuation Investment portfolio
at market value (%) of lendable assets
OYSTER - World Opportunities 5,820,960 54,258,723 10.73
Total 5,820,960 54,258,723
Concentration data (in EUR)
Ten largest collateral issuers Amount of Collateral
CANADA GOVERNMENT 576,077
PROVINCE OF ONTARIO 450,129
FRENCH REPUBLIC 449,185
USA UNITED STATES OF AMERICA 351,317
THE TORONTO-DOMINION BANK 286,063
BANK OF MONTREAL 245,943
BANK OF NOVA SCOTIA 189,213
CANADIAN IMPERIAL BANK OF COMMERCE CIBC 168,801
ENBRIDGE INC 166,174
LANDESKREDITBANK BADEN WUERTTEMBERG FOERDERBANK 161,989
Top 10 Counterparties Overall valuation
RBC DOMINION SECURITIES INC 1,712,734
TD SECURITIES INC. 1,202,215
BMO NESBITT BURNS INC 835,872
NATIXIS 617,418
UNICREDIT BANK AG 479,660
CREDIT SUISSE SECURITIES USA LLC 300,109
DEUTSCHE BANK AG 237,909
THE BANK OF NOVA SCOTIA 158,764
COMMERZBANK AKTIENGESELLSCHAFT 153,854
MORGAN STANLEY & CO. INTL PLC 98,467
Aggregate transaction data for each type of SFTs broken down according to the below categories (in EUR)
Type of Collateral Amount of Collateral
BONDS 3,164,585
EQUITIES 2,920,694
MONEY MARKET 26,869
Total 6,112,148
Quality of Collateral Amount of Collateral
N/A -
Maturity tenor of Collateral Amount of Collateral
Less than one day -
One day to one week 1,092
One week to one month 1,426
One month to three months 28,951
Three months to one year 320,496
Above one year 2,839,488
Open maturity 2,920,695
Total 6,112,148
Currencies of Cash Collateral Amount of Collateral
N/A -
Currencies of Securities Collateral Amount of Collateral
AUD 25,808
CAD 3,312,817
CHF 9,595
EUR 1,234,994
GBP 183,651
JPY 152,963
USD 1,192,320
Total 6,112,148

OYSTER
Additional Information (continued)
190
Transparency of Securities Financing Transactions of Reuse and amending Regulation (EU) N°648/2012 (unaudited) (continued)
OYSTER - World Opportunities (continued) Securities lending (continued) Aggregate transaction data for each type of SFTs broken down according to the below categories (in EUR) (continued)
Maturity tenor of the SFTs Overall valuation
Less than one day -
One day to one week -
One week to one month -
One month to three months -
Three months to one year 617,418
Above one year -
Open transaction 5,203,542
Total 5,820,960
Country in which the counterparties are established Overall valuation
CANADA 3,073,714
FRANCE 617,418
GERMANY 633,514
GREAT BRITAIN 336,376
IRELAND 23,958
UNITED STATES (U.S.A.) 1,135,980
Total 5,820,960
Settlement and clearing Overall valuation
Bilateral 5,820,960
Total 5,820,960
Data on reuse of Collateral:
Reuse of Collateral Amount of collateral
Share of collateral received that is reused None
Cash collateral reinvestment returns to the collective investment undertaking None
Safe Keeping of collateral received by the collective investment undertaking as part of SFTs (in EUR)
Name of the custodian Amount of collateral
asset safe-kept
RBC INVESTOR SERVICES BANK S.A. 6,112,148
Safe Keeping of collateral granted by the collective investment undertaking as part of SFTs (in EUR)
Type of accounts
Segregated accounts
Data on return and cost for each type of SFTs (in EUR)
Sub-fund name Gross Revenue RBC I&TS Revenue Management
Company Revenue Tax
Withheld
Client Revenue
(Net of Tax)
OYSTER - World Opportunities 10,671 1,601 3,628 34 5,408
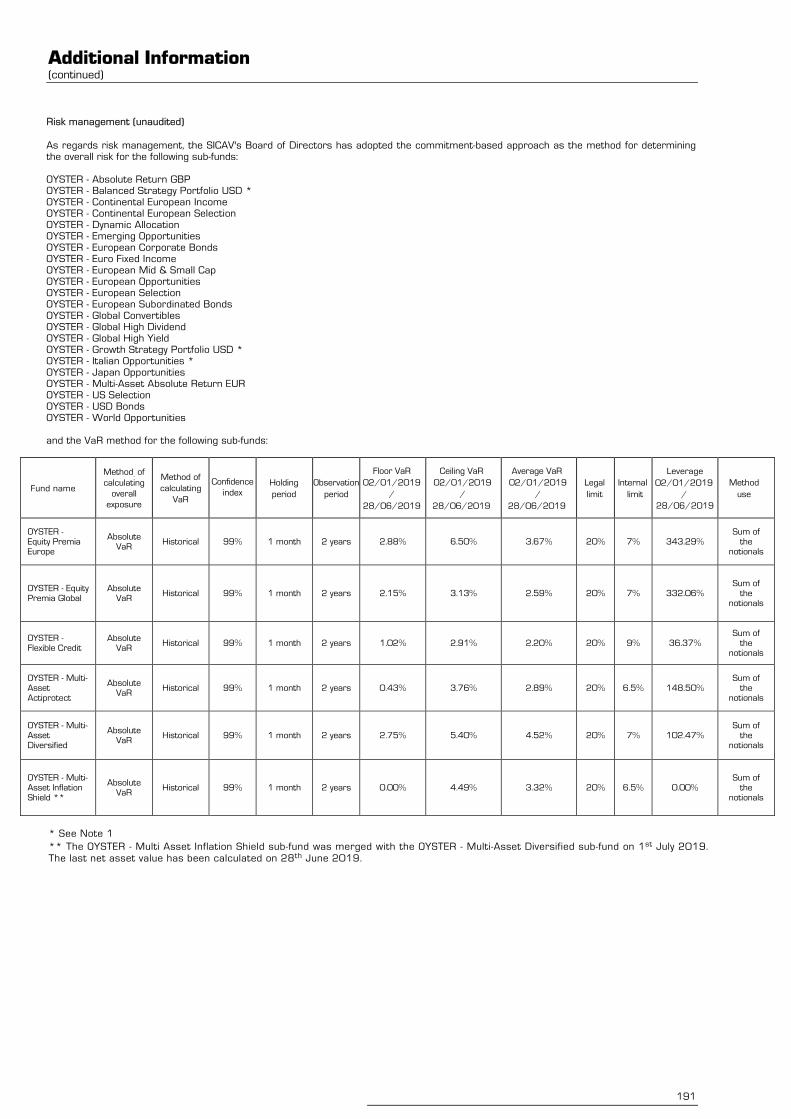
Additional Information (continued)
191
Risk management (unaudited)
As regards risk management, the SICAV's Board of Directors has adopted the commitment-based approach as the method for determining the overall risk for the following sub-funds: OYSTER - Absolute Return GBP OYSTER - Balanced Strategy Portfolio USD * OYSTER - Continental European Income OYSTER - Continental European Selection OYSTER - Dynamic Allocation OYSTER - Emerging Opportunities OYSTER - European Corporate Bonds OYSTER - Euro Fixed Income OYSTER - European Mid & Small Cap OYSTER - European Opportunities OYSTER - European Selection OYSTER - European Subordinated Bonds OYSTER - Global Convertibles OYSTER - Global High Dividend OYSTER - Global High Yield OYSTER - Growth Strategy Portfolio USD * OYSTER - Italian Opportunities * OYSTER - Japan Opportunities OYSTER - Multi-Asset Absolute Return EUR OYSTER - US Selection OYSTER - USD Bonds OYSTER - World Opportunities and the VaR method for the following sub-funds:
Fund name
Method. of
calculating
overall
exposure
Method of
calculating
VaR
Confidence
index Holding
period
Observation
period
Floor VaR
02/01/2019
/
28/06/2019
Ceiling VaR
02/01/2019
/
28/06/2019
Average VaR
02/01/2019
/
28/06/2019
Legal
limit
Internal
limit
Leverage
02/01/2019
/
28/06/2019
Method
use
OYSTER - Equity Premia Europe
Absolute VaR
Historical 99% 1 month 2 years 2.88% 6.50% 3.67% 20% 7% 343.29% Sum of
the notionals
OYSTER - Equity Premia Global
Absolute VaR
Historical 99% 1 month 2 years 2.15% 3.13% 2.59% 20% 7% 332.06% Sum of
the notionals
OYSTER - Flexible Credit
Absolute VaR
Historical 99% 1 month 2 years 1.02% 2.91% 2.20% 20% 9% 36.37% Sum of
the notionals
OYSTER - Multi-Asset Actiprotect
Absolute VaR
Historical 99% 1 month 2 years 0.43% 3.76% 2.89% 20% 6.5% 148.50% Sum of
the notionals
OYSTER - Multi-Asset Diversified
Absolute VaR
Historical 99% 1 month 2 years 2.75% 5.40% 4.52% 20% 7% 102.47% Sum of
the notionals
OYSTER - Multi-Asset Inflation Shield **
Absolute VaR
Historical 99% 1 month 2 years 0.00% 4.49% 3.32% 20% 6.5% 0.00% Sum of
the notionals
* See Note 1
** The OYSTER - Multi Asset Inflation Shield sub-fund was merged with the OYSTER - Multi-Asset Diversified sub-fund on 1st July 2019. The last net asset value has been calculated on 28th June 2019.


