Embed Size (px)
Citation preview
Pacific Alliance as a platform for greater economic relations with East Asia
September 2014Carlos Aquino
Web site: http://carloskobe2005.wix.com/economia-asiatica
E-mail: [email protected]
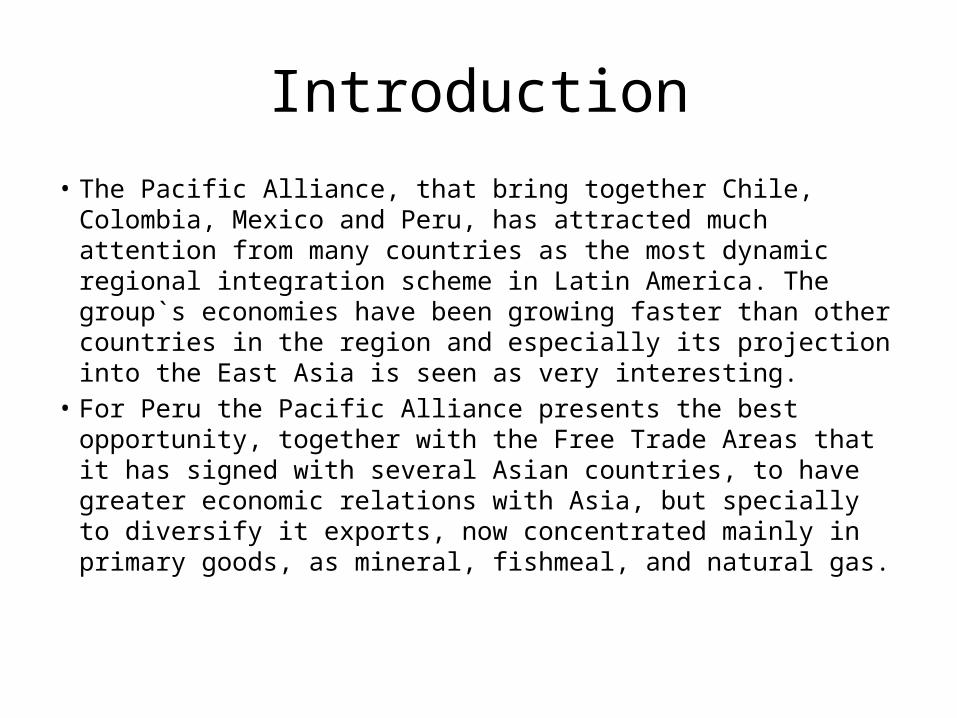
Introduction• The Pacific Alliance, that bring together Chile, Colombia, Mexico and Peru, has attracted much attention from many countries as the most dynamic regional integration scheme in Latin America. The group`s economies have been growing faster than other countries in the region and especially its projection into the East Asia is seen as very interesting.
• For Peru the Pacific Alliance presents the best opportunity, together with the Free Trade Areas that it has signed with several Asian countries, to have greater economic relations with Asia, but specially to diversify it exports, now concentrated mainly in primary goods, as mineral, fishmeal, and natural gas.
Index• 1. About the Pacific Alliance• 2. Why the Pacific Alliance could work when other Latin American schemes have failed?
• 3. Challenges of the Pacific Alliance
• 4. How can Peru use the Pacific Alliance as a platform for greater economic relations with East Asia
• 5. Conclusions and recommendations
1. About the Pacific Alliance• Established in June 6, 2012 when the Presidents of Colombia, Chile, Mexico and Peru signed the Pacific Alliance Framework Agreement, in the fourth Summit of the Pacific Alliance in Chile, this block constitute 35% of Latin America GDP, its economic size is around US$2.2 trillion. They have a combined population of 209 million, 36% of Latin America, with a GDP per capita of US$10,000. The group economic growth rate is the highest in Latin America. In 2012 it was 5%, higher than the global average of 3.2%.
• They account for 50% of trade in the region, with exports of US$556 billion and imports of US$551 billion in 2012. They represent 26% of investments flows in Latin America
• The Pacific Alliance has raised great interest and has many countries as observer states, and seven are from Asia: China, India, Japan, Korea, Australia, New Zealand and Singapore (plus Turkey and Israel).
The main achievements of PA are said to be:
• “- Elimination of the visa requirement for Colombian and Peruvian nationals travelling to Mexico to undertake remunerated activities for up to 180 days.
• - Establishment of the Platform for academic and student mobility. In 2014, up to 100 scholarships were given per country for undergraduate and postgraduate students and professors.
• - Creation of the Pacific Alliance Business Council, with the objective of promoting the Pacific Alliance, as well as make issue recommendations and suggestions for improved integration, and encourage joint actions towards third party markets, especially the Asia Pacific.
• - Coordination among the four trade promotion agencies of the Pacific Alliance (ProMexico, Promperu, ProChile and Proexport) for joint activities. Among the progress achieved in this area, the agreement to share offices should be highlighted. The first of these is already operating in Istanbul, Turkey”.
2. Why the Pacific Alliance could work when other Latin American schemes have failed?
• First, PA countries have similar political systems, democratic institutions. Compared to several other Latin American countries, as a group Pacific Alliance countries are more politically and economically stable. As somebody said, it is based on affinity rather than proximity.
• Second, they are more or less open economies, especially Chile and Peru. Mexico and Colombia are following closely. They have achieved macroeconomic stability and improved governance.
• Third, they share an interest in having close relationship with Asian countries, the region with the fastest economic growth in the world. Most of them have already Free Trade Area agreements with several Asian countries.
Challenges of the Pacific Alliance• First, improvement in physical infrastructure is needed. Connectivity is a problem. Ports, airports, Roads, Telecommunications networks are still insufficient in some countries. Also, a more educated workforce is needed, to attract investment in manufacture.
• Second, more direct transportation links to Asia is needed, with more shipping and airline connections.
• Third, more efforts to promote the country’s image and increase its trade, tourism, and investment in Asia is needed. More commercial offices there for this effort are necessary
• Fourth, a kind of policy to promote the production of more value added goods for export to Asia or among them is needed. Formation of a regional value chain, as seen in the East Asia region for example, is needed.
4. How can Peru use the Pacific Alliance as a platform for greater economic relations with East
Asia• 4.1 Peru trade with PA members• Trade with other PA member countries accounted for 9% of Peru´s total trade in the year 2013. Around 8.2% of Peru´s total exports went to the three countries of Chile, Colombia and Mexico, and 10.6% of Peru´s imports come from them. Chile is Peru biggest trade partner in the PA, with nearly US$3 billion in trade.
• In Peru global trade Chile was the seventh most important export market in 2013. In the import side Mexico was the fifth most important source of foreign goods for Peru.
• Peru mainly exports primary goods to its partners in PA (but with increasing exports of more value added goods, especially to Colombia) and imports from them mostly manufactured goods.
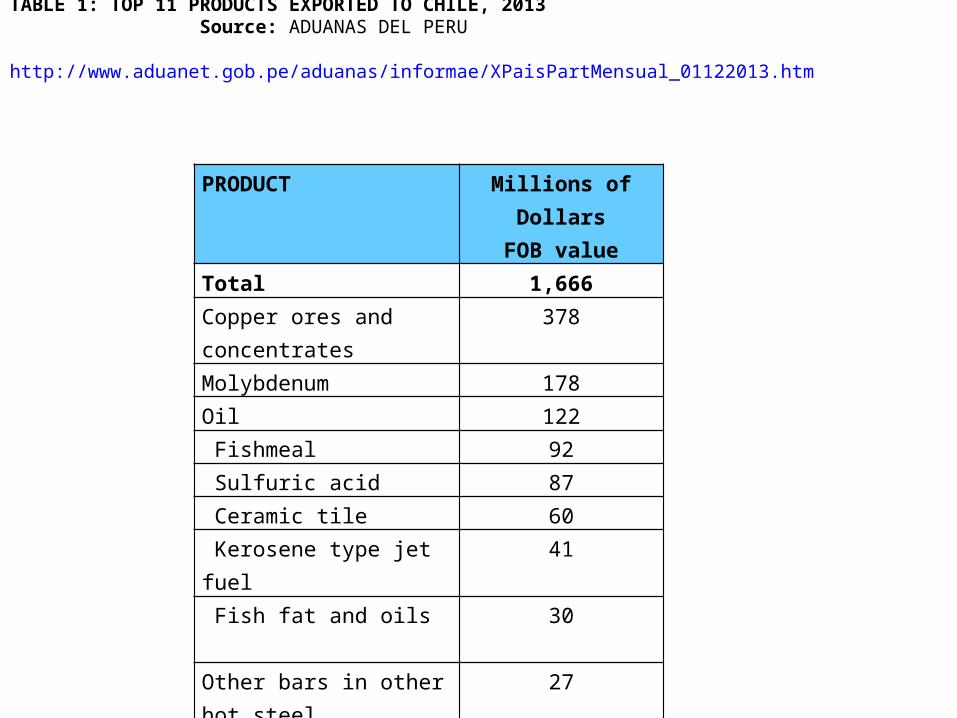
PRODUCT Millions of Dollars
FOB valueTotal 1,666Copper ores and concentrates
378
Molybdenum 178Oil 122 Fishmeal 92 Sulfuric acid 87 Ceramic tile 60 Kerosene type jet fuel
41
Fish fat and oils
30
Other bars in other hot steel
27
Vehicles for transport of more than 16 persons
27
Kerosene 20
TABLE 1: TOP 11 PRODUCTS EXPORTED TO CHILE, 2013 Source: ADUANAS DEL PERU http://www.aduanet.gob.pe/aduanas/informae/XPaisPartMensual_01122013.htm
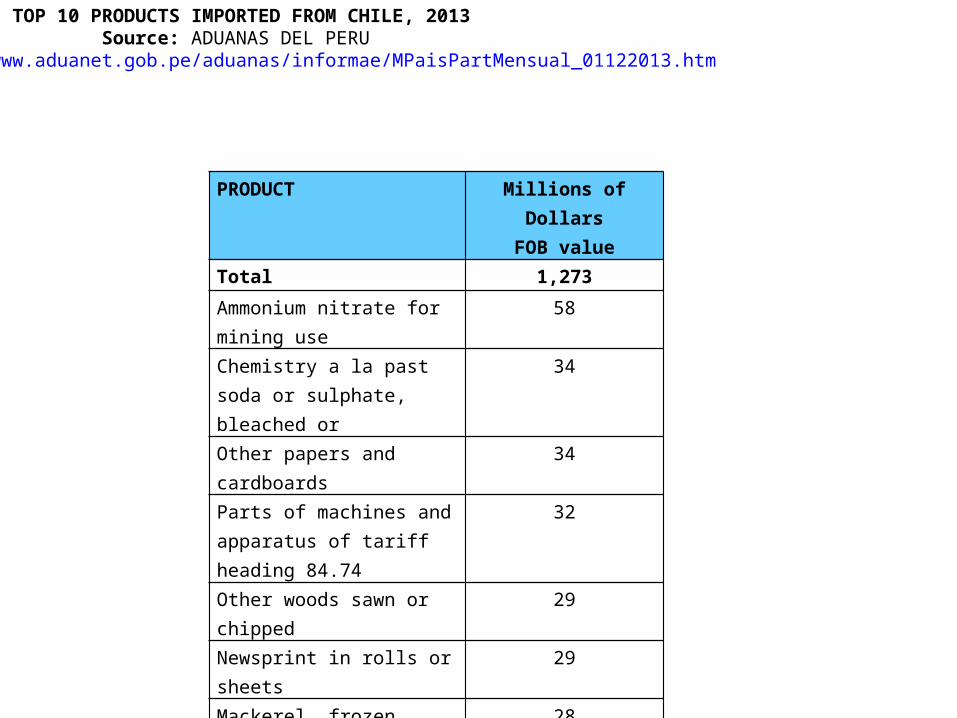
PRODUCT Millions of Dollars
FOB valueTotal 1,273Ammonium nitrate for mining use
58
Chemistry a la past soda or sulphate, bleached or
34
Other papers and cardboards
34
Parts of machines and apparatus of tariff heading 84.74
32
Other woods sawn or chipped
29
Newsprint in rolls or sheets
29
Mackerel, frozen 28Malta unroasted 26Fresh apples 26Other preparation of tariff heading 210690290
27
TABLE 6: TOP 10 PRODUCTS IMPORTED FROM CHILE, 2013 Source: ADUANAS DEL PERUhttp://www.aduanet.gob.pe/aduanas/informae/MPaisPartMensual_01122013.htm
4.2 Peru trade with Asian countries
• One of the aims of the Pacific Alliance is to increase its trade with Asian countries. Peru in the 1990`s decided to put emphasis in its relationship with these countries. In 1998 Peru became a member of Asia Pacific Economic Cooperation forum, APEC, and from the last decade Free Trade Area, FTA agreements, were signed with several of them. In 2010 it was with China, in the year 2011 with Korea and in 2012 with Japan. Also partial FTA agreements are in force with Singapore and Thailand.
• Besides this Peru is in negotiations in the Trans Pacific Partnership Agreement, TPP, and if this concludes successfully, it will have FTA agreements with Malaysia and Vietnam for example (There are twelve members’ countries in the TPP: Australia, Brunei, Canada, Chile, Japan, Malaysia, Mexico, New Zealand, Peru, Singapore, USA, and Vietnam).
• It should be noted also that of the 4 members of Pacific Alliance three, Chile, Mexico and Peru are members of APEC and as said these three also have several FTA agreements with some Asian countries.
• Peru trade with Asia has increased specially from the last decade. Exports of primary goods, minerals and fishmeal, has leaped to the point that China become Peru biggest export destination and trade partner three years ago (2011)
COUNTRY 2010 2010 2011 2011 2012 2012 2013 2013
Exports
Imports
Exports
Imports
Exports
Imports
Exports
Imports
1. U.S.A 6,087
5,811 5,903 7,35
0 6,175 7,916 7,306 8,783
1. China 5,436
5,140 6,963 6,32
5 7,848 7,802 7,331 8,379
1. Japan 1,790
1,336 2,174 1,31
4 2,575 1,499 2,226 1,433
1. Canada 3,329 539 4,232 583 3,445 588 2,692 615
1. Switzerland
3,845 118 5,937 150 5,074 154 2,967 158
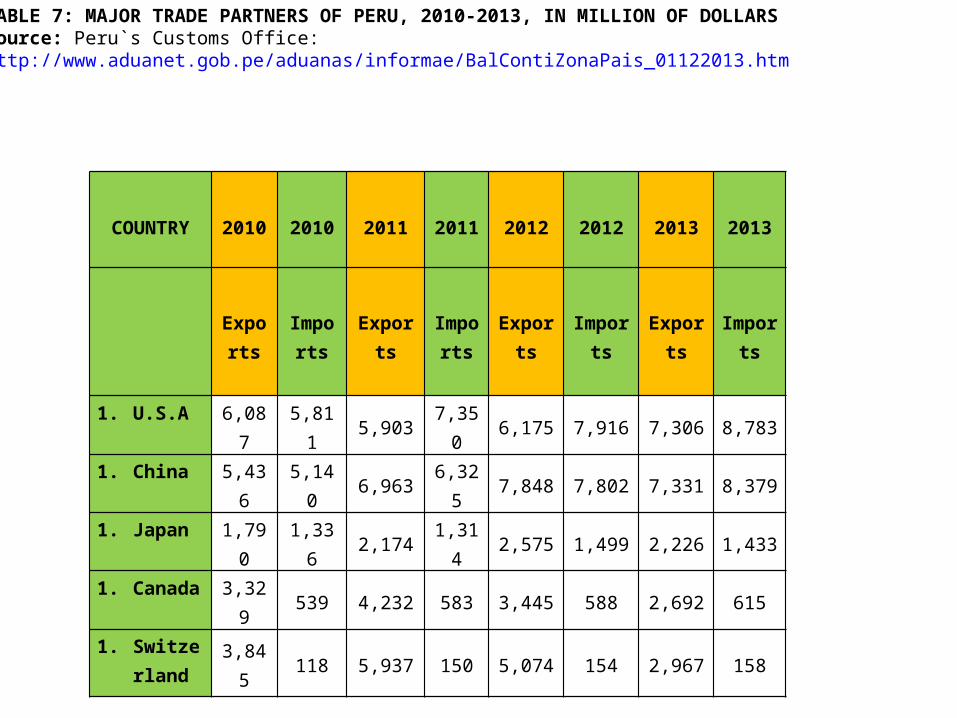
TABLE 7: MAJOR TRADE PARTNERS OF PERU, 2010-2013, IN MILLION OF DOLLARSSource: Peru`s Customs Office:http://www.aduanet.gob.pe/aduanas/informae/BalContiZonaPais_01122013.htm
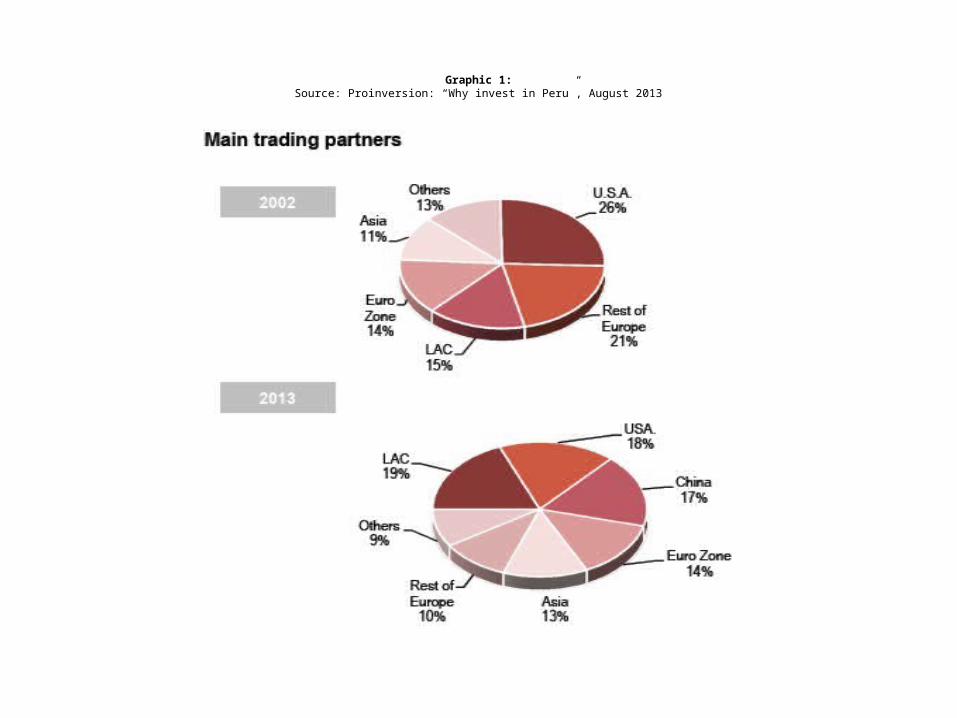
Graphic 1:Source: Proinversion: “Why invest in Peru”, August 2013
Country/Economy
1993 1997 2003 2010 2011 2012 2013
World Total 3,344.40 6,741.75 8,939.82
35,073.25
46,386.03
45,846.18
41,511.7
Australia 14.99 16.31 53.12 117.5 115.35 99.50 130.37South Korea 59.36 91.50 176.34 894.9 1,696.09 1,545.35 1,536.38China 140.84 490.06 676.96 5,425.9 6,972.64 7,848.97 7,331.44Philippines 31.99* 47.96 11.06 123.41 109.75 55.23 128.11Hong-Kong 28.60 68.82 30.31 78.5 93.24 96.54 84.22Indonesia 32.62* 36.33 22.67 36.61 61.49 101.18 105.31Japan 299.04 473.57 391.16 1,790.4 2,174.76 2,575.33 2,226.72Malaysia 57.33* 59.77 5.51 8.43 6.75 27.68 56.29New Zealand 1.50 - 3.72 13.5 18.63. 25.82 22.55Russia 9.90 9.48 14.18 57.9 78.80 88.43 149.76Singapore 1.68* 11.96* 16.15 6.66 7.94 21.46 20.18Thailand 11.71* 36.23 26.71 98.10 264.76 234.06 138.25Taiwan (Chinese Taipei)
118.78 159.11 147.28 293.0 365.28 261.10 211.29
Vietnam 1.62* 2.56 10.64 63.89 77.72 90.43 44.80
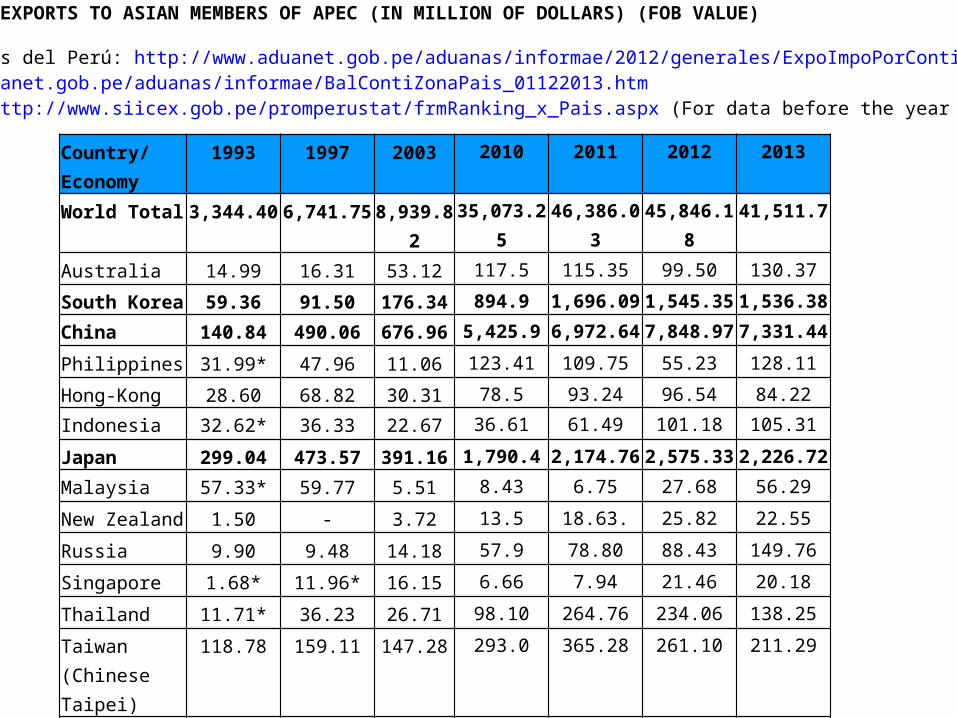
TABLE 8: PERU EXPORTS TO ASIAN MEMBERS OF APEC (IN MILLION OF DOLLARS) (FOB VALUE)*Year1994Source: Aduanas del Perú: http://www.aduanet.gob.pe/aduanas/informae/2012/generales/ExpoImpoPorContiZonaPais.htmlhttp://www.aduanet.gob.pe/aduanas/informae/BalContiZonaPais_01122013.htmPROMPERUSTAT http://www.siicex.gob.pe/promperustat/frmRanking_x_Pais.aspx (For data before the year 2000)
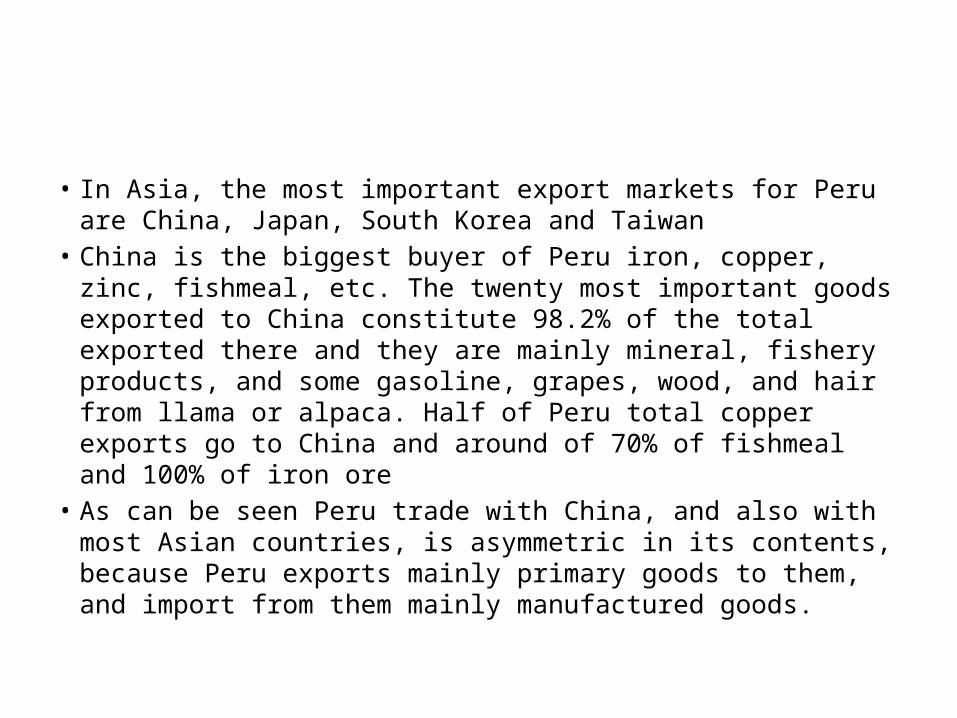
• In Asia, the most important export markets for Peru are China, Japan, South Korea and Taiwan
• China is the biggest buyer of Peru iron, copper, zinc, fishmeal, etc. The twenty most important goods exported to China constitute 98.2% of the total exported there and they are mainly mineral, fishery products, and some gasoline, grapes, wood, and hair from llama or alpaca. Half of Peru total copper exports go to China and around of 70% of fishmeal and 100% of iron ore
• As can be seen Peru trade with China, and also with most Asian countries, is asymmetric in its contents, because Peru exports mainly primary goods to them, and import from them mainly manufactured goods.
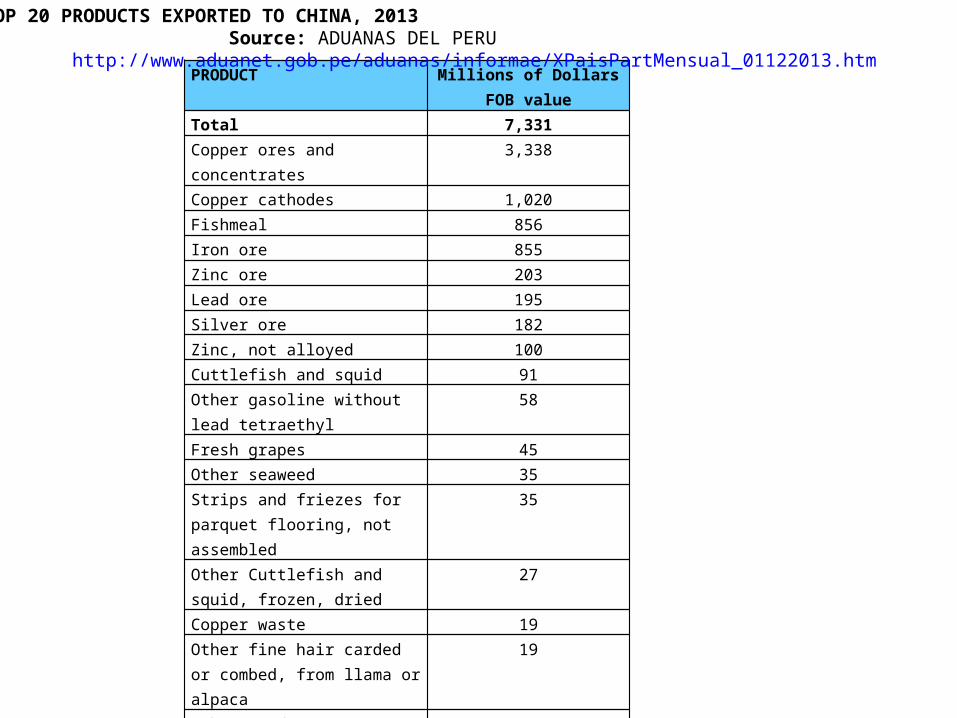
PRODUCT Millions of DollarsFOB value
Total 7,331Copper ores and concentrates
3,338
Copper cathodes 1,020Fishmeal 856Iron ore 855Zinc ore 203Lead ore 195Silver ore 182Zinc, not alloyed 100Cuttlefish and squid 91Other gasoline without lead tetraethyl
58
Fresh grapes 45Other seaweed 35Strips and friezes for parquet flooring, not assembled
35
Other Cuttlefish and squid, frozen, dried
27
Copper waste 19Other fine hair carded or combed, from llama or alpaca
19
Other wood swan or chipped lengthwise, sliced or peeled
17
Other polyethylene terephthalate with titanium dioxide
17
Fish fats and oil 16Copper anodes for electrolytic refining
16
TABLE 9: TOP 20 PRODUCTS EXPORTED TO CHINA, 2013 Source: ADUANAS DEL PERU http://www.aduanet.gob.pe/aduanas/informae/XPaisPartMensual_01122013.htm
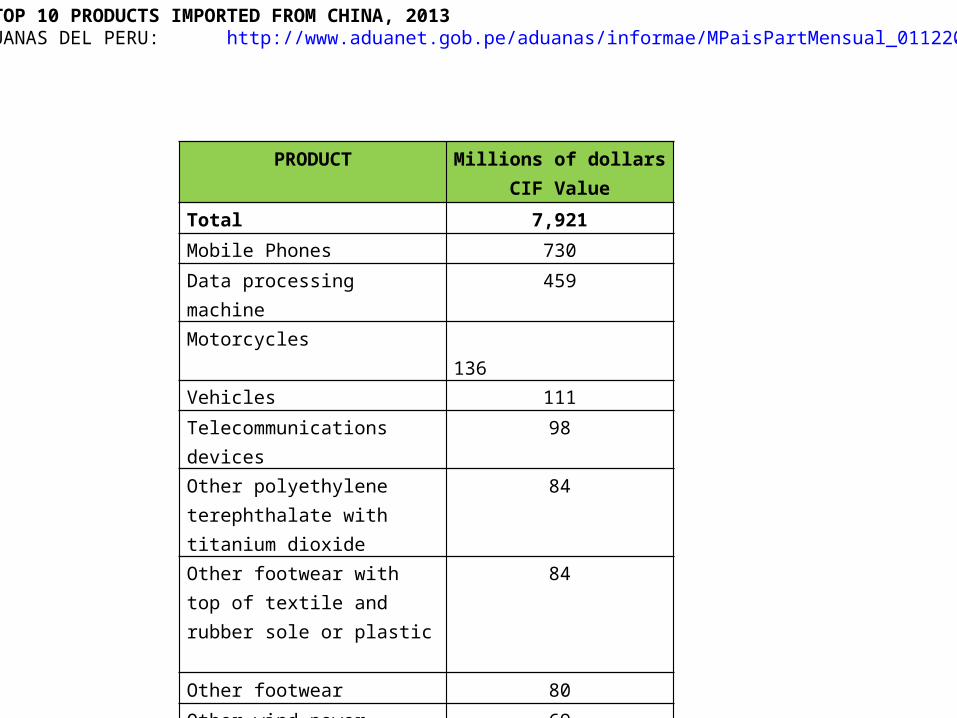
PRODUCT Millions of dollars CIF Value
Total 7,921Mobile Phones 730Data processing machine
459
Motorcycles 136
Vehicles 111Telecommunications devices
98
Other polyethylene terephthalate with titanium dioxide
84
Other footwear with top of textile and rubber sole or plastic
84
Other footwear 80Other wind power generators
69
Other TV sets 76
TABLE 10: TOP 10 PRODUCTS IMPORTED FROM CHINA, 2013Source: ADUANAS DEL PERU: http://www.aduanet.gob.pe/aduanas/informae/MPaisPartMensual_01122013.htm
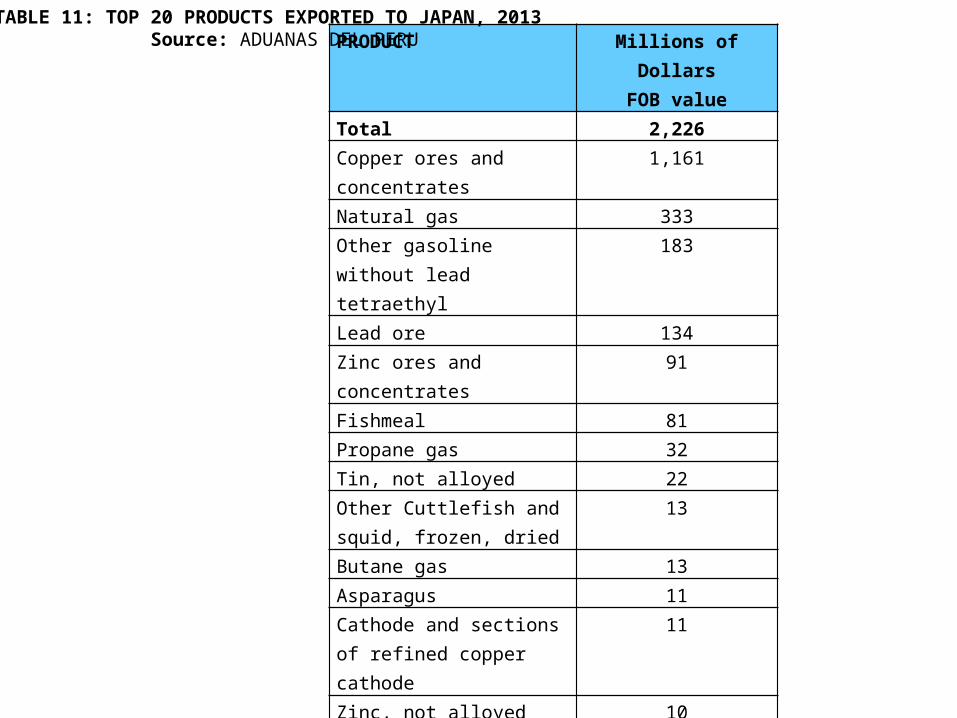
PRODUCT Millions of Dollars
FOB valueTotal 2,226Copper ores and concentrates
1,161
Natural gas 333Other gasoline without lead tetraethyl
183
Lead ore 134Zinc ores and concentrates
91
Fishmeal 81Propane gas 32Tin, not alloyed 22Other Cuttlefish and squid, frozen, dried
13
Butane gas 13Asparagus 11Cathode and sections of refined copper cathode
11
Zinc, not alloyed 10Other coffee 9Cuttlefish and squid 7Fish fats and oil 7Asparagus fresh and refrigerated
6
Other Zinc not alloyed
6
Other fish meat 5Bananas 4
TABLE 11: TOP 20 PRODUCTS EXPORTED TO JAPAN, 2013 Source: ADUANAS DEL PERU
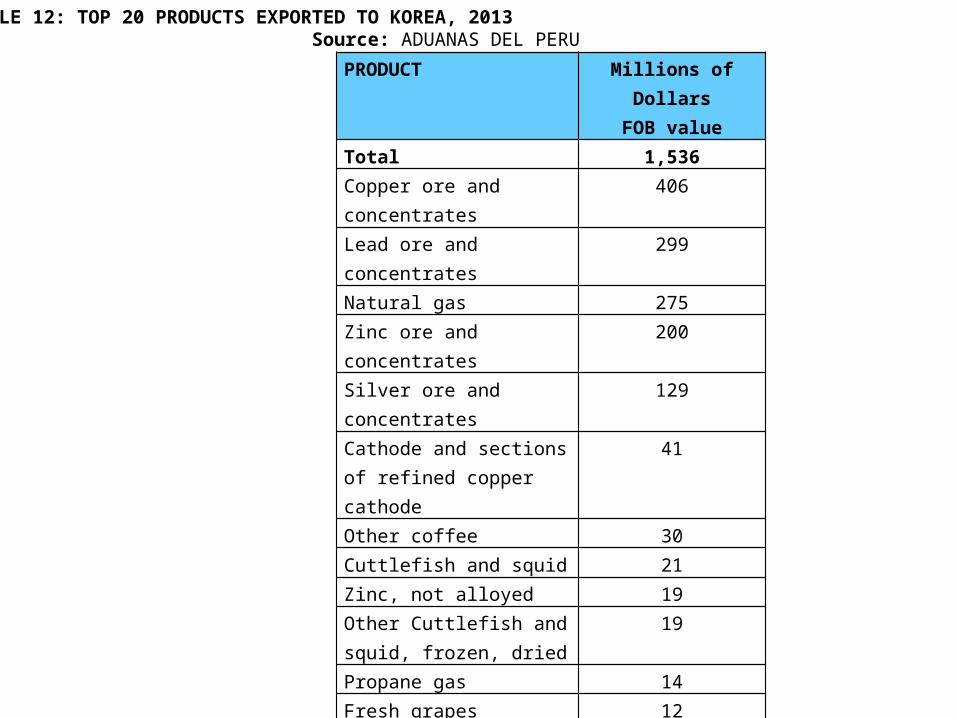
PRODUCT Millions of Dollars
FOB valueTotal 1,536Copper ore and concentrates
406
Lead ore and concentrates
299
Natural gas 275Zinc ore and concentrates
200
Silver ore and concentrates
129
Cathode and sections of refined copper cathode
41
Other coffee 30Cuttlefish and squid 21Zinc, not alloyed 19Other Cuttlefish and squid, frozen, dried
19
Propane gas 14Fresh grapes 12Copper matte 7Refined unwrought lead
7
Butane gas 6Copper waste 6Other frozen steaks, tents, eels
4
Fish fats and oil 3Other frozen fish 2Fishmeal and pellets 2
TABLE 12: TOP 20 PRODUCTS EXPORTED TO KOREA, 2013 Source: ADUANAS DEL PERU
• What can Peru export besides primary goods to Asia?• In the last years Peru is experiencing a process of diversification of its exports. New products, so called non-traditional exports, are being sold abroad. Among them are chemical, textiles, but also from the agro industrial and fishery sectors. As can be seen in Graphic 2, the amount exported of these products increased five times from 2003 to 2013, from around 2,000 million dollars to 10,000 million dollars.
• Some of the products that Peru export to markets in Europe, North America and still do not export or does very little to Asia are the ones show in Table 13:
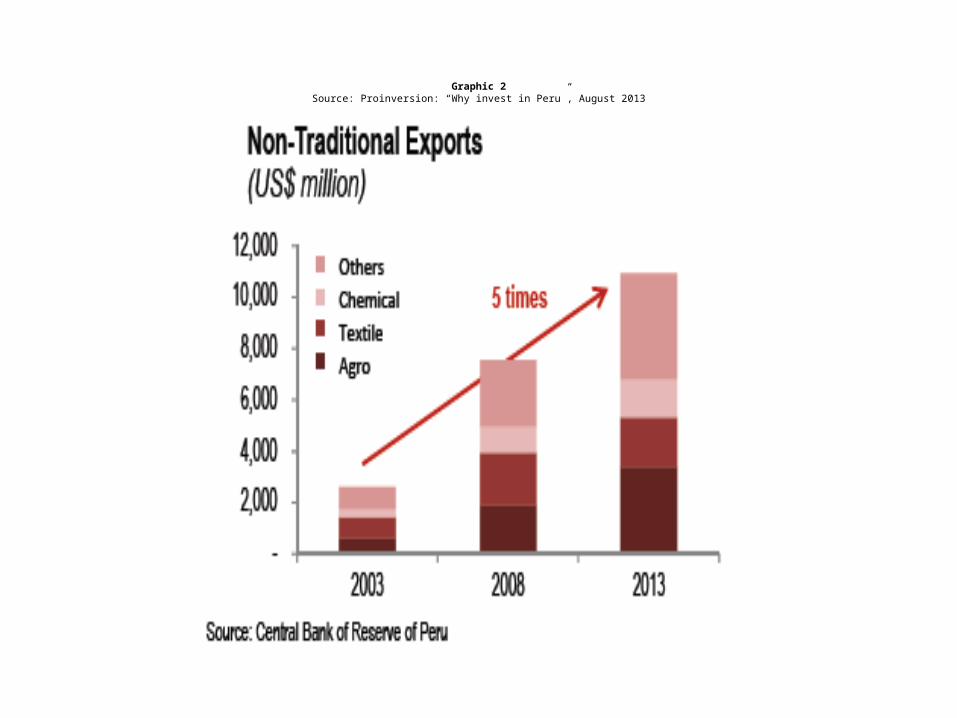
Graphic 2Source: Proinversion: “Why invest in Peru”, August 2013
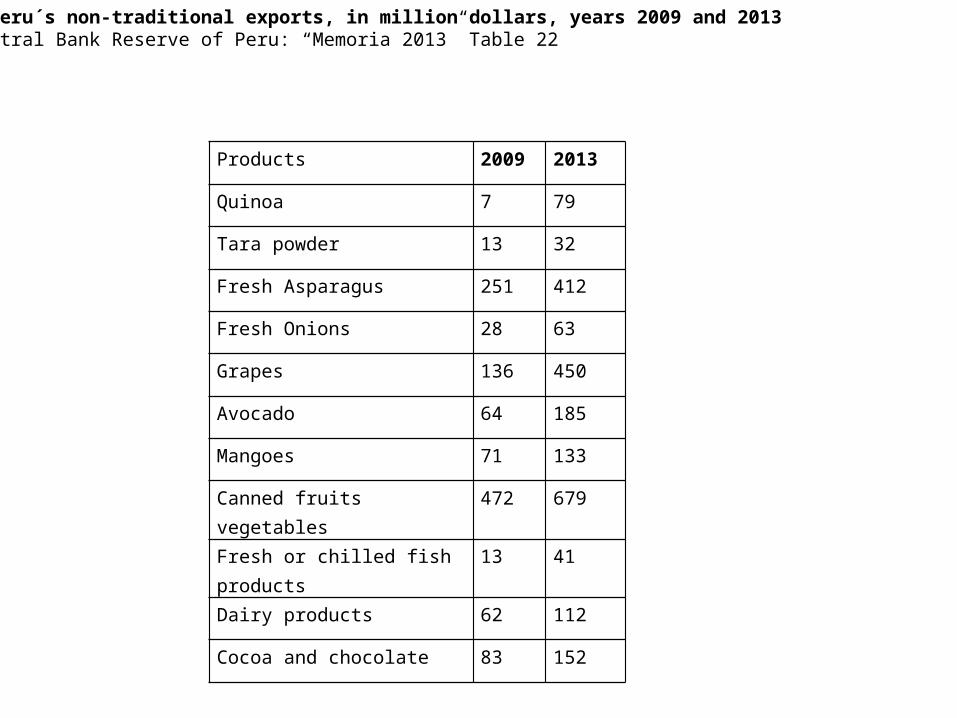
Products 2009 2013
Quinoa 7 79
Tara powder 13 32
Fresh Asparagus 251 412
Fresh Onions 28 63
Grapes 136 450
Avocado 64 185
Mangoes 71 133
Canned fruits vegetables
472 679
Fresh or chilled fish products
13 41
Dairy products 62 112
Cocoa and chocolate 83 152
Table 13: Peru´s non-traditional exports, in million dollars, years 2009 and 2013Source: Central Bank Reserve of Peru: “Memoria 2013” Table 22
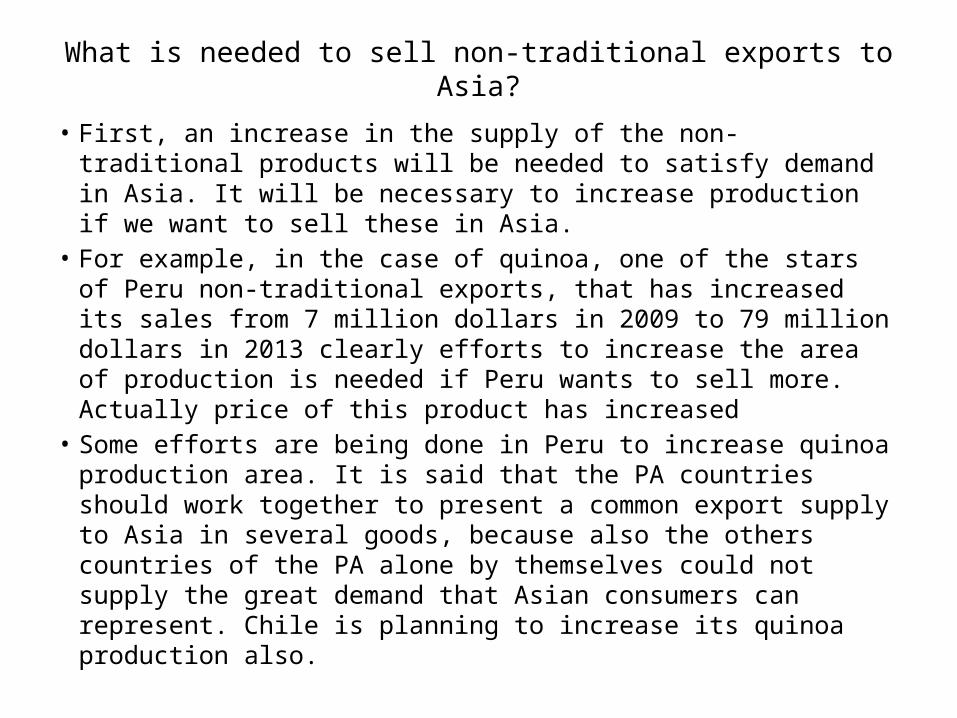
What is needed to sell non-traditional exports to Asia?
• First, an increase in the supply of the non-traditional products will be needed to satisfy demand in Asia. It will be necessary to increase production if we want to sell these in Asia.
• For example, in the case of quinoa, one of the stars of Peru non-traditional exports, that has increased its sales from 7 million dollars in 2009 to 79 million dollars in 2013 clearly efforts to increase the area of production is needed if Peru wants to sell more. Actually price of this product has increased
• Some efforts are being done in Peru to increase quinoa production area. It is said that the PA countries should work together to present a common export supply to Asia in several goods, because also the others countries of the PA alone by themselves could not supply the great demand that Asian consumers can represent. Chile is planning to increase its quinoa production also.
• Second, to export products like agricultural ones is necessary to comply with the phytosanitary requirements that Asian countries demand. Some products from Peru have achieved this in some markets in Asia. Perhaps at the level of the Pacific Alliance some common experiences could be shared by some members in this regards, as in the case of Chile that already export several agricultural goods to Asia and has approved these phytosanitary requirements
• Third, to be able to sell to Asia promotion of the exportable supply is necessary, given that Asian consumers do not know Peru products. Then the establishment of commercial offices, participation in food fairs for example, and marketing campaigns are needed.
• Peru has few commercial offices in Asia compared for example with Chile. There is a commercial office in Taipei (since 1992) in Tokyo (since 2000), in China in Beijing (since 2002) and Shanghai. New ones are being opened in Seoul, Jakarta and New Delhi this year. Also there is a new one in Istanbul and another in Dubai.
• Regarding this aspect of the promotion effort in Asia the Pacific Alliance is doing some efforts to work together to jointly promote the group export supply in Asia. Joint participation of PA countries in food fairs, as has been done in SIAL China 2014 and in Food Taipei is something that would help in this aim.
• Fourth, efforts to attract investment from Asia to the production of goods for non-traditional exports should be done. There is a growing investment from Asia in Peru in the last years but sill this is concentrated mainly in the primary sector, especially in the mineral one.
Investment from Pacific Alliance countries
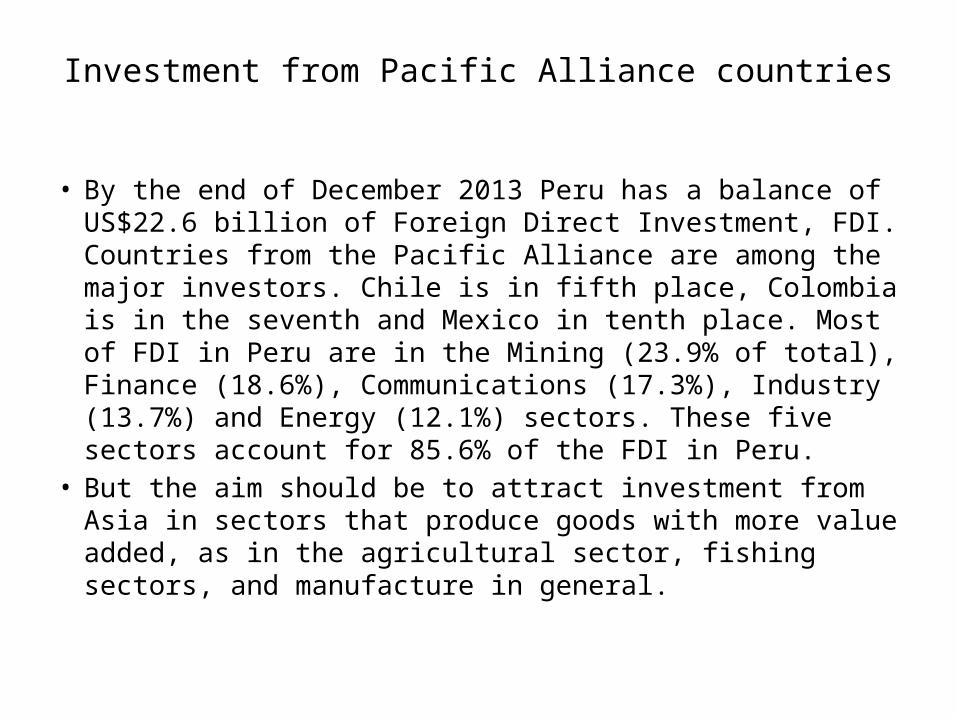
• By the end of December 2013 Peru has a balance of US$22.6 billion of Foreign Direct Investment, FDI. Countries from the Pacific Alliance are among the major investors. Chile is in fifth place, Colombia is in the seventh and Mexico in tenth place. Most of FDI in Peru are in the Mining (23.9% of total), Finance (18.6%), Communications (17.3%), Industry (13.7%) and Energy (12.1%) sectors. These five sectors account for 85.6% of the FDI in Peru.
• But the aim should be to attract investment from Asia in sectors that produce goods with more value added, as in the agricultural sector, fishing sectors, and manufacture in general.
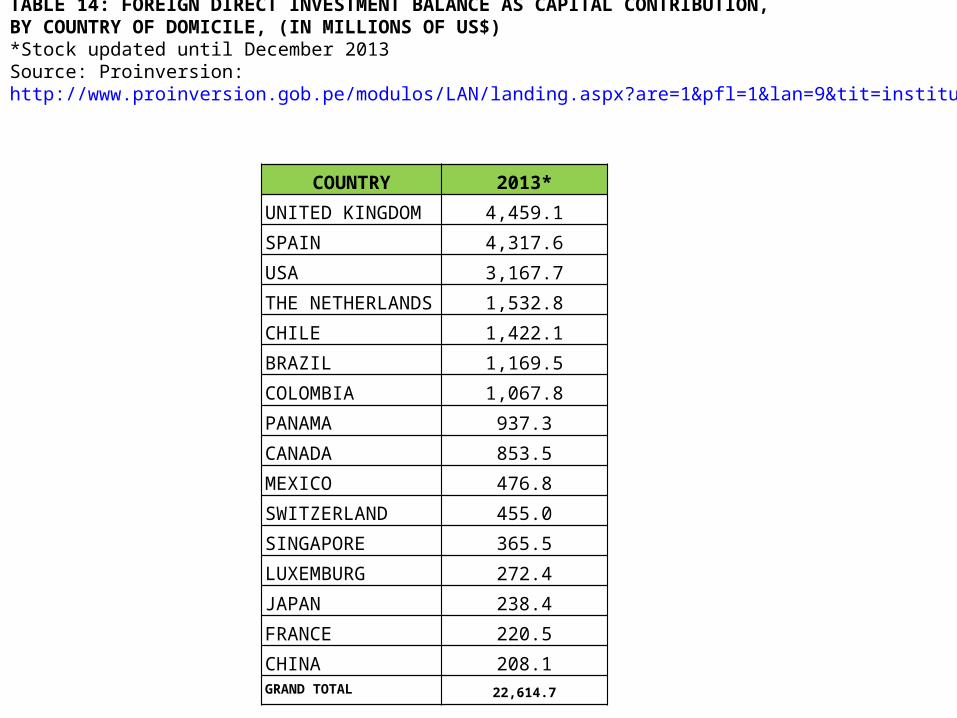
COUNTRY 2013*UNITED KINGDOM 4,459.1SPAIN 4,317.6USA 3,167.7THE NETHERLANDS 1,532.8CHILE 1,422.1BRAZIL 1,169.5COLOMBIA 1,067.8PANAMA 937.3CANADA 853.5MEXICO 476.8SWITZERLAND 455.0SINGAPORE 365.5LUXEMBURG 272.4JAPAN 238.4FRANCE 220.5CHINA 208.1GRAND TOTAL 22,614.7
TABLE 14: FOREIGN DIRECT INVESTMENT BALANCE AS CAPITAL CONTRIBUTION, BY COUNTRY OF DOMICILE, (IN MILLIONS OF US$)*Stock updated until December 2013Source: Proinversion: http://www.proinversion.gob.pe/modulos/LAN/landing.aspx?are=1&pfl=1&lan=9&tit=institucional
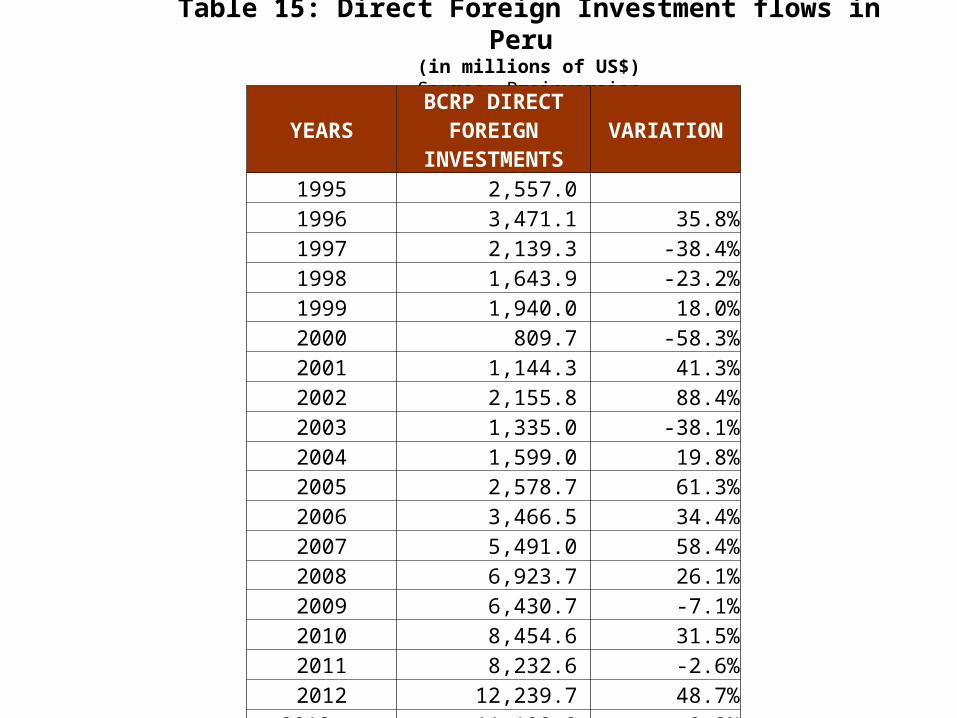
Table 15: Direct Foreign Investment flows in Peru
(in millions of US$)Source: Proinversion
YEARSBCRP DIRECT
FOREIGN INVESTMENTS
VARIATION
1995 2,557.0 1996 3,471.1 35.8%1997 2,139.3 -38.4%1998 1,643.9 -23.2%1999 1,940.0 18.0%2000 809.7 -58.3%2001 1,144.3 41.3%2002 2,155.8 88.4%2003 1,335.0 -38.1%2004 1,599.0 19.8%2005 2,578.7 61.3%2006 3,466.5 34.4%2007 5,491.0 58.4%2008 6,923.7 26.1%2009 6,430.7 -7.1%2010 8,454.6 31.5%2011 8,232.6 -2.6%2012 12,239.7 48.7%
2013 2/ 11,108.0 -9.2%2014 2/ 9,400.0 -15.4%2015 2/ 9,435.0 0.4%
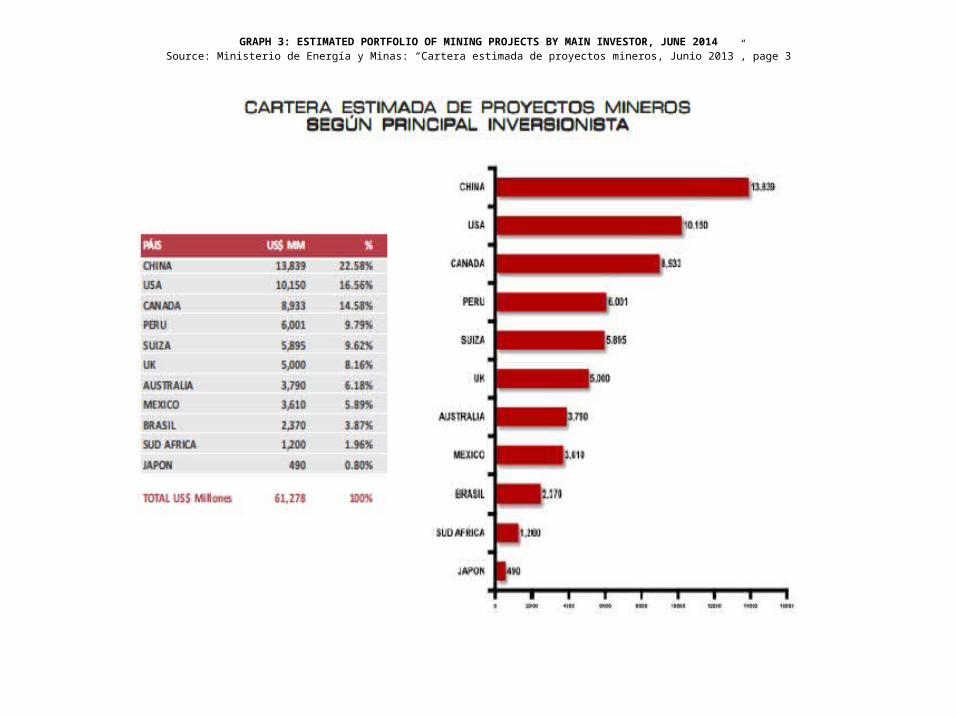
GRAPH 3: ESTIMATED PORTFOLIO OF MINING PROJECTS BY MAIN INVESTOR, JUNE 2014Source: Ministerio de Energía y Minas: “Cartera estimada de proyectos mineros, Junio 2013”, page 3
• But then a labor of investment promotion is necessary to let know Asian investors that Peru is a country where not only natural resources can be extracted.
• In general Peru and the rest of members of Pacific Alliance are not well known in the Asia region and in this regard the investment road shows jointly organized in Asia to promote these countries image are a good way to fulfill that need.
• In Seoul one of these events, a workshop on promotion of investment opportunities in the PA countries was celebrated last September 2nd, as was done one another last year.
• Recently, Peru government has announced a Productive Diversification Plan, to promote activities with more value added, in sectors like the mining sector, the agro industrial sector, the fishery sector, textile and garments, chemical sector, etc.
• The government is looking for do this by working in three fields: reduction of cost overruns, the elimination of excessive regulations to make easier to do business and promote investment (simplifying administrative procedures); the improvement of competitiveness of the industry through the promotion of the adoption of modern machinery and improvement in labor force skills (Peru has few graduate in technical areas, engineering and physical sciences), and the diversification of national production to sectors that create more value added. .
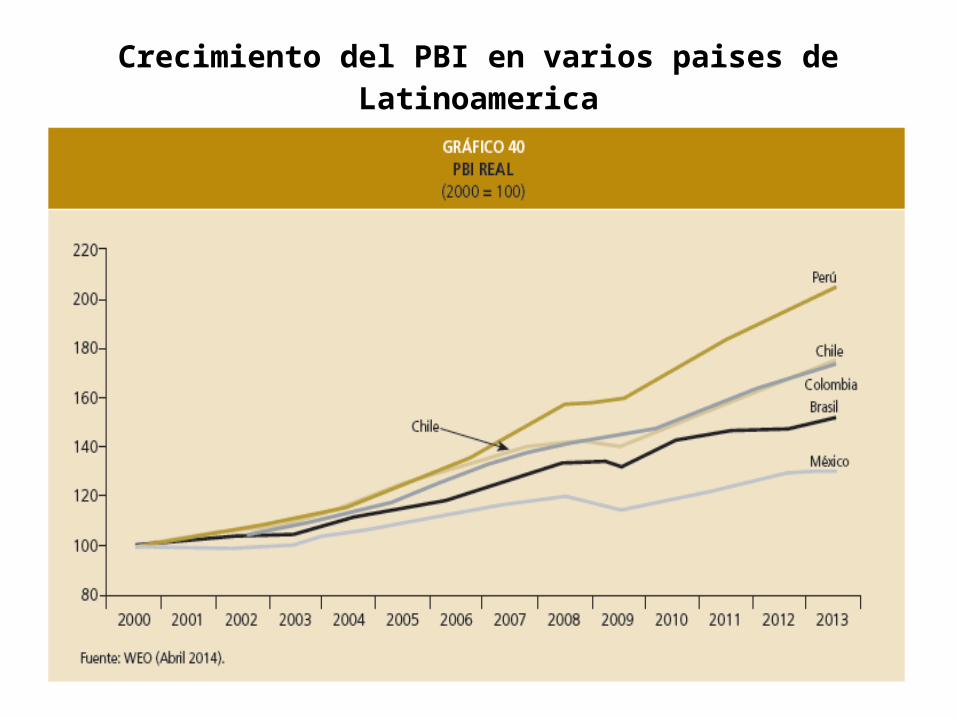
Crecimiento del PBI en varios paises de Latinoamerica
http://www.bcrp.gob.pe/publicaciones/memoria-anual/memoria-2013.html
• The idea behind the plan is to introduce new engines to the economic growth that Peru is experiencing in the last years, to reduce the dependence in the export of primary goods, and to create employment of better quality.
• One of the central ideas of the Productive Diversification Plan is the development of clusters in the mining, fishing, agribusiness, tourism, jewelry, apparel. The one existing are based heavily on natural endowments, with a need of further upgrading, they are also shallow, with weak supplier bases and supporting institutions, and there is a poor coordination between the private and public sectors
• The formation of clusters or value global chains could be done at the level of Pacific Alliance also. But improvement of physical infrastructure, connectivity and skilled labor force is needed.
• There is a need for private businessman to get more involved in dealing with Asia. The need to known Asia culture, consumer’s tastes, and Asia businessman idiosyncrasy is necessary to do business in this region.
• One sector that still is not benefiting from increased integration with Asia is the tourism sector. In Peru the number of tourists coming to visit the country many natural and historical attractions increase year by year. In 2013 nearly 3.2 million tourist arrived, but few come from Asia
• Improvement of facilities for Asian tourists and better connectivity is needed
5. Conclusions and recommendations
• The PA is an interesting mechanism that compared with existing economic integration schemes in Latin America has more probabilities of being successful. Especially its declared aim for better economic integration with Asia presents a good opportunity for Peru to achieve just that.
• Peru exports to Asian countries have increased in the last years but more than 95% of these are primary goods. The challenge is to export goods with more value added. For this to happen, increase in the supply of non-traditional exports that are being already sold in other foreign markets is need. Also the promotion of these new goods in Asian markets, where there is no much knowledge of them is necessary. And the attraction of investment from Asia to the production of more value added goods also should be done.
• The Pacific Alliance as a group can work in trying to meet those challenges through the joint supply of goods, the joint promotion of the export supply, and the common promotion of investment opportunities in the PA countries.
• But the improvement of physical and human infrastructure, the elimination of remaining barriers to trade, the improvement in the institutional environment (better judicial system, a better political system, etc.), and the need to know better the Asian markets are further challenges ahead
• If these can be overcome, the PA could be more competitive and fulfill its aim of bringing more prosperity to its citizens.
• In a world where prices of commodities no longer will be at higher levels, something that benefited Latin American countries like those of the Pacific Alliance, the future growth should come from productivity, investment and efficiency, something that this group hope to achieve