Embed Size (px)
Citation preview
2021
Cover photo by Ben Wilinsky
Paradise Broadband Feasibility Study
1
Contents
Acknowledgements ............................................................................................................................................ 3
Project Background ........................................................................................................................................... 4
Town of Paradise ............................................................................................................................................... 5
Executive Summary ........................................................................................................................................... 6
Methodology ....................................................................................................................................................... 7
Survey Methodology ...................................................................................................................................... 7
Projection Methodology ............................................................................................................................... 7
Economic and Social Impacts of Broadband ................................................................................................ 8
Survey Analysis and Summary ....................................................................................................................... 11
Projections ........................................................................................................................................................ 15
Residential/Population Projections .......................................................................................................... 15
School Enrollment Projections .................................................................................................................. 15
Public Safety Workforce Projections ........................................................................................................ 16
Business Projections .................................................................................................................................... 16
Health Care ................................................................................................................................................... 17
Smart City Assessment and Recommendations .......................................................................................... 18
Parks: ............................................................................................................................................................. 19
Waste Management: .................................................................................................................................... 22
Emergency Management and Public Safety: ............................................................................................ 23
Surveillance and Sensors ............................................................................................................................. 23
Fire: ................................................................................................................................................................ 23
Air Quality: ................................................................................................................................................... 24
Transportation and Traffic Management: ................................................................................................ 25
Public Services .............................................................................................................................................. 25
Data Centers ................................................................................................................................................. 25
Partnerships .................................................................................................................................................. 25
Inventory of Internet Service Providers, Technologies, and Speeds ....................................................... 27
Fixed Consumer Broadband Maximum Advertised Downstream Speed ........................................... 29
Fixed Consumer Broadband Served Status ............................................................................................. 30
AT&T California .......................................................................................................................................... 31
Comcast ......................................................................................................................................................... 35
Digital Path ................................................................................................................................................... 36
2
Shastabeam ................................................................................................................................................... 37
Inventory of Town-Owned Assets................................................................................................................ 38
Public Private Right of Way Assessment ..................................................................................................... 39
High-level Fiber-Optic Network Design...................................................................................................... 40
Estimated Deployment, Operation, and Maintenance of the Fiber-Optic Network ............................ 41
Assessment of Partnership Approaches for Deployment, Operations, and Maintenance of the Fiber
Optic Network ................................................................................................................................................. 42
Recommendations for Economic Development Opportunities Locally and Regionally ..................... 43
Industry Growth/Benefits of High-Speed Broadband .......................................................................... 43
Costs and Benefits of Undergrounding .................................................................................................... 43
Access to Broadband and a Younger Workforce ................................................................................... 44
Access to Broadband and Families with Children in School ................................................................ 45
Internal Benefits of Coworking Spaces .................................................................................................... 45
External Benefits of Coworking Spaces ................................................................................................... 45
Coworking Spaces and Broadband ........................................................................................................... 46
Grant Funding/Financing Opportunities .................................................................................................... 47
Eligible Areas for CPUC CASF Broadband Infrastructure Grants ..................................................... 47
Eligible Areas for USDA Reconnect Program ........................................................................................ 48
References ......................................................................................................................................................... 52
Appendices ........................................................................................................................................................ 59
Appendix A: Projection Methodology ..................................................................................................... 59
Appendix B: Survey Questions .................................................................................................................. 62

3
Acknowledgements
The North State Planning and Development Collective (the Collective) is the overarching nonprofit entity housing the Center for Economic Development (CED, est. 1986), the Geographical Information Center (GIC, est. 1988) and the Northeastern and Upstate California Connect Broadband Consortia. The Collective is an auxiliary 501(c)(3) organization of the Chico State Enterprises (formerly the CSU, Chico Research Foundation).
4
Project Background
In 2020, the Town of Paradise released a Request for Proposals (RFP) for agencies to
produce a feasibility study examining the demand and viability of installing high-speed broadband
infrastructure within the Town. The Geographical Information Center (GIC), at Chico State
Enterprises submitted a proposal to the Town of Paradise that was approved by the city council in
the summer of 2020. The goal of this feasibility study is to determine the demand for and cost of
installing broadband infrastructure in the Town of Paradise. This study also aims to provide the
basis for the Town’s future Request for Information (RFI).
This report focuses on the demand within the Town of Paradise for high-speed broadband
services. Included in this report are the results of the survey GIC staff administered to residents of
Paradise as well as summary and analysis of these results. In addition, GIC staff prepared
educational, public safety workforce (fire and police), population, and business projections for the
Town of Paradise to provide insight into future demand for broadband services based on growth
within those sectors that present greater demand for such services.
5
Town of Paradise
In the wake of the Camp Fire, the Town of Paradise faces numerous hurdles on its road to
recovery. The full impact of the Camp Fire on the Town of Paradise will not be clear for some time,
but many of the immediate challenges of rebuilding the Town are more evident. Among the most
substantial obstacles facing the Town of Paradise are several concerning housing, health care, senior
care, homelessness, and children and youth issues, including education (North State Community
Foundation).
The Camp Fire resulted in a total loss of 14,600 housing units and more than 27% of the
Butte County's mobile homes were lost as well (North State Community Foundation). The US
Department of Health and Human Services has projected an increase in homelessness and a sharp
increase in home prices in the region as a direct result of the Camp Fire. This is all despite an overall
net population loss of 11,153 individuals in Butte County since the fire (U.S. Department of
Housing and Urban Development’s Office of Policy Development and Research). Additionally, the
US Department of Health and Human Services also projected a loss of workforce across all industry
sectors in the region, including a significant loss of its highly skilled workforce, as many of these
residents moved out of the area after the Camp Fire.
Many of the issues faced by the Town of Paradise are endemic to Butte County as a whole.
Additionally, several areas within Butte County meet shortage criteria for primary care and dental
care, while all of Butte County faces mental health shortages (Butte County Public Health). In
addition to the barriers to health care access in Butte County, the composition of the County’s
population also presents several health care challenges and specialized health care needs. Butte
County has a significantly higher percentage of individuals between the ages of 18-64 with
disabilities when compared to California as a whole. Individuals with disabilities often face many
barriers to proper health care and “report having poorer overall health, less access to adequate health
care, limited access to health insurance, skipping medical care because of cost, and engaging in risky
health behaviors including smoking and physical inactivity” (Butte County Public Health). Butte
County also has a greater percentage of individuals over the age of 65 than California as a whole,
and almost twice the percentage of grandparents within Butte County are responsible for their
grandchildren when compared to California as a whole. Additionally, homelessness in Butte County
has been increasing since 2015 (Butte County Public Health), and Butte County faces “substantial
substance abuse issues'' (US Department of Health and Human Services). Additional Public Health
and Environmental Health and Safety Issues identified by the US Department of Health and Human
Services include increased disease communicability as a result of increased homelessness, increased
housing density, and increased substance abuse, health care worker shortages, and potential health
ramifications of poor air quality as a result of the fire. According to Butte Countywide Homeless
Continuum of Car, 31% of homeless individuals in Chico are homeless due to Camp Fire and 80%
of these individuals are unsheltered.
6
Executive Summary
This report seeks to provide the Town of Paradise with assistance determining the level of
demand for broadband among its citizens and businesses. In preparing this report, GIC staff
conducted literature review, mined existing databases, administered surveys to over 1,000 former
and current residents of the Town of Paradise, and prepared educational, public safety workforce
(fire and police), population, and business projections for the Town of Paradise through 2027. The
results of these combined research efforts were aggregated, culled, and analyzed by GIC staff with a
particular focus on indicators of broadband demand within the community. Based on the research
presented in this document and the appendices that follow, GIC staff conclude that:
● Market demand for the high-speed broadband exists among Paradise’s citizens and
businesses.
● Development of high-speed broadband infrastructure within the Town of Paradise will
provide long-term economic benefits to the Town and region.
● Demand for broadband services within the Town of Paradise will increase is the future.
● Paradise households with children who need the internet for school have a significant need
for improved broadband services.
● Leverage Town assets for future broadband deployment and to promote provider
competition to increase economic innovation.
7
Methodology
Survey Methodology
In summer of 2020, the Geographical Information Center (GIC) and the Center for
Economic Development (CED) at CSU, Chico conducted a survey of current and former Paradise
residents and businesses to assess the demand for high-speed broadband internet in the Town of
Paradise. Outreach and advertisements were performed by the Town of Paradise. The survey was
developed by GIC/CED staff. The survey captured 1,178 respondents. The survey contained a
series of twenty-eight questions aimed at assessing the current state of internet service in Paradise
and the demand for broadband.
Additionally, GIC/CED staff cross tabulated responses from multiple survey questions to
determine correlations that might shed further light on not only the extent of demand for
broadband services in the Town of Paradise, but also details regarding the type, source, and
demographics of demand. During these cross tabulations, CED Staff focused on correlations
between satisfaction/desire to upgrade service and multiple variables related to respondents’ current
internet service. In doing so, GIC/CED staff were able to determine the various conditions and
scenarios in relation to internet service that led to respondents desiring upgraded service. It should
be noted that while the sample size of the survey was relatively large, these cross tabulations filtered
out non-relevant responses, reducing the practical sample size for particular comparisons. While this
filtering has resulted in some data points not being statistically significant enough to establish strong
correlations, these comparisons do offer an initial assessment of potential demand for high-speed
broadband in the Town of Paradise.
The complete survey can be found in Appendix B.
Projection Methodology
A series of demographic projections were prepared by GIC/CED staff to assess the
potential change in demand for broadband service among the populace of the Town of Paradise
through 2027. Using historical data, GIC/CED staff were able to determine the likely rate of growth
in school enrollment, public safety workforce, business, and population in the Town of Paradise.
Projection methodologies for each sector were developed by GIC/CED staff after an extensive
literature review of related projection methodologies. Projections were developed using data
provided by the Town of Paradise and other public sources including the Census.
More detailed descriptions of the methodology of the projections prepared by GIC/CED
within this report may be found in Appendix A.
8
Economic and Social Impacts of Broadband
When it comes to the effect broadband has on economic development, the literature on the
subject is varied and somewhat inconsistent. There is a significant amount of literature claiming
many positive impacts of broadband on economic development, while others question whether
increased economic development spurs on the growth of broadband. Numerous studies claim that
increased access to high-speed internet service positively impacts GDP, employment, income,
productivity, and quality of life. Others have claimed that broadband increases the desirability of a
city, which can increase migration to the city and bolstering the local workforce and serves as a
significant draw for businesses. While it is mostly agreed upon that broadband access can help
economic development, the exact effects of broadband on economic activity remain unclear.
The trouble with determining the exact impact of broadband on economic development
stems from the plethora of variables that affect economic development and the lack of universally
apt methods for measuring broadband access. Some metrics, like download speed, show little to no
correlation with economic development, while others, such as broadband adoption, show
correlation to some aspects of economic development and not others. In a study compiling 10
different broadband-related metrics at the county-level to see their impact on job productivity,
researchers found that advertised speed variables had little to no impact on job productivity, while
several other broadband-related variables showed significant influence over job productivity
(Gallardo et. al., 2020). Though the significance of broadband’s impact on local economies are still
widely debated, one must also consider the many social welfare benefits of broadband as well.
Broadband can greatly enhance emergency response times and preparedness, provide medical care
to rural and remote areas, and provide residents with access to a wide range of online services. While
there may not be a consensus regarding broadband’s influence over economic development it
remains worthwhile to examine the claims of positive relationships between broadband and
economic development made by those investigating this relationship.
A 2009 study by the World Bank examined the impact of information and communication
technologies (ICT), namely broadband, on GDP growth from 1980-2006 for 120 countries (Qiang
et al.). The study found that broadband raises productivity and lowers costs when implemented and
integrated into businesses effectively (Qiang et al.). The study also showed a correlation between a
1.21% increase in GDP growth for every 10% increase in broadband adoption in developed
countries (Qiang et al.). When effectively and fully implemented, broadband helps to improve
business processes, introduce new business models, drive innovation, and extend business links
(Qiang et al.). Additionally, in the World Development Report 2016: Digital Dividends prepared by Michael
Minges; the author reviewed a multitude of studies on the economic impact of broadband. Almost
every study the author reviewed showed a positive correlation between broadband adoption and
positive economic outcomes (Minges, 2016).
According to a study prepared by Dr. Raul Katz, Director of Business Strategy Research at
the Columbia Institute for Tele-Information (CITI) at Columbia University, broadband has several
positive effects on regional economies, including jobs created by the necessary construction of
broadband networks, the adoption of broadband within firms, which leads to a substantial increase
9
in productivity, which in turn contributes to the growth of GDP, and increase in household income
(Katz 2012).
A case study of the Actnow Programme in Cornwall (UK) prepared by Dr. Martin Fornefeld
on behalf of the European Commission shows how ubiquitous regional broadband can positively
affect the regional economy and quality of life. In 2005, the Actnow Programme administered a
survey to regional businesses hoping to gain insight on the various impacts the Actnow had on local
firms. Of the survey’s 700 respondents, over seventy-five percent indicated that Actnow had
resulted in lower telephone, mail, and printing costs and expressed an overall improvement to their
business performance due to the availability of broadband. Eighty-one percent of respondents
indicated that broadband was crucial for their business activities (Fornefeld, 2008).
Along with the more direct benefits to local businesses and residents, the Actnow
Programme also helped to improve the overall image of Cornwall. The Actnow Programme helped
to change the image of Cornwall from a rural region that was behind on the times, to an attractive
region with innovative businesses. According to Actnow, approximately 4,300 broadband-related
jobs have been created in Cornwall since 2002 (Fornefeld, 2008).
Leveraging Competition for an Innovative Economy
The Town of Paradise has a valuable asset in owning its underground conduit that can be
utilized for broadband fiber deployment. The Town of Paradise has an opportunity to leverage this
asset to promote competition among current and future internet providers. The lack of competition
among broadband providers is a real and pressing issue. Over 70% of American households live in
an area with either no choice in provider, or only one choice. Monopolies and duopolies create
artificially high prices. This is reflected in the Office of Economic and Community Development’s
(OECD) data that ranks the U.S. as the country with the second highest broadband prices among
developed nations in 2017. In markets with a limited number of providers, prices can easily be
coordinated to maximize profit at the expense of the consumer. Highly concentrated and
coordinated markets restrict the presence of new entrants (Sallet, 2019). High prices due to lack of
provider choices are more likely to impact low-income, rural communities. On average, the bottom
10 percent of the least densely populated areas pays 37 percent more for residential wired broadband
at 25/3 than those at the top 10 percent of the most dense areas. Data from a 2018 study from
Harvard’s Berkman Klein Center for Internet & Society found that the entry of an additional
provider resulted in customer savings up to 50 percent (Sallet, 2019). Stronger competition would
incentivize companies to improve services, lower prices, and be more consumer-friendly. The
following people and communities are most likely to be impacted by limited competition:
Middle-Class Households: BroadbandNow found that households in states with a
median household income of less than $60,000 (approximately the national median)
frequently pay more for the same 25/3 Mbps service than do households in states
with a median household income of more than $60,000. Households in the lower-
income states are 40 percent less likely to be obtaining that service for $60 per
month or less.
10
Rural America: BroadbandNow also found that the least dense 10 percent of areas
defined by zip code pay an average of 37 percent more for residential wired
broadband at 25/3 than those in the 10 percent most dense areas.313 And only 4
percent of rural households have the choice of more than two options for 100 Mbps
broadband; that drops to 1 percent in tribal areas.
People with Lower Incomes: Wealthier communities are approximately two to three
times as likely to have more than two choices as communities with lower-than-
average household incomes (Sallet, 2019).
The Town has an opportunity to develop high-performance broadband in its community
and for surrounding areas and deliver the economic and social benefits for its residents and
businesses. Local leaders, private industry, nonprofits, and government work together to identify
community needs, local resources and assets and steps necessary to deploy broadband networks.
The Town can adopt a package of economic-development incentives, redesign local administrative
processes to streamline deployment logistics, or otherwise reduce barriers to entry. The ability for
future providers to access the Town’s conduit is important for new entrants. In addition to the
accessible, built infrastructure, speeding and easing the process for approval of construction permits
and providing accurate, easy to-use infrastructure maps and a streamlined application review process
reduce the length and cost of deployments. Google’s initial fiber deployment into Kansas City
served as an early indication of how this cooperative process between a municipality and a new
broadband provider could improve the economics of deployment (Sallet, 2019).
Consumers and communities benefit from more competition. Constricted broadband
competition—without regard to its cause—therefore curbs the economic and social progress that
broadband can help deliver.
Further economic benefits of broadband, including those related to specific industries, are
discussed later in this document.
11
Survey Analysis and Summary
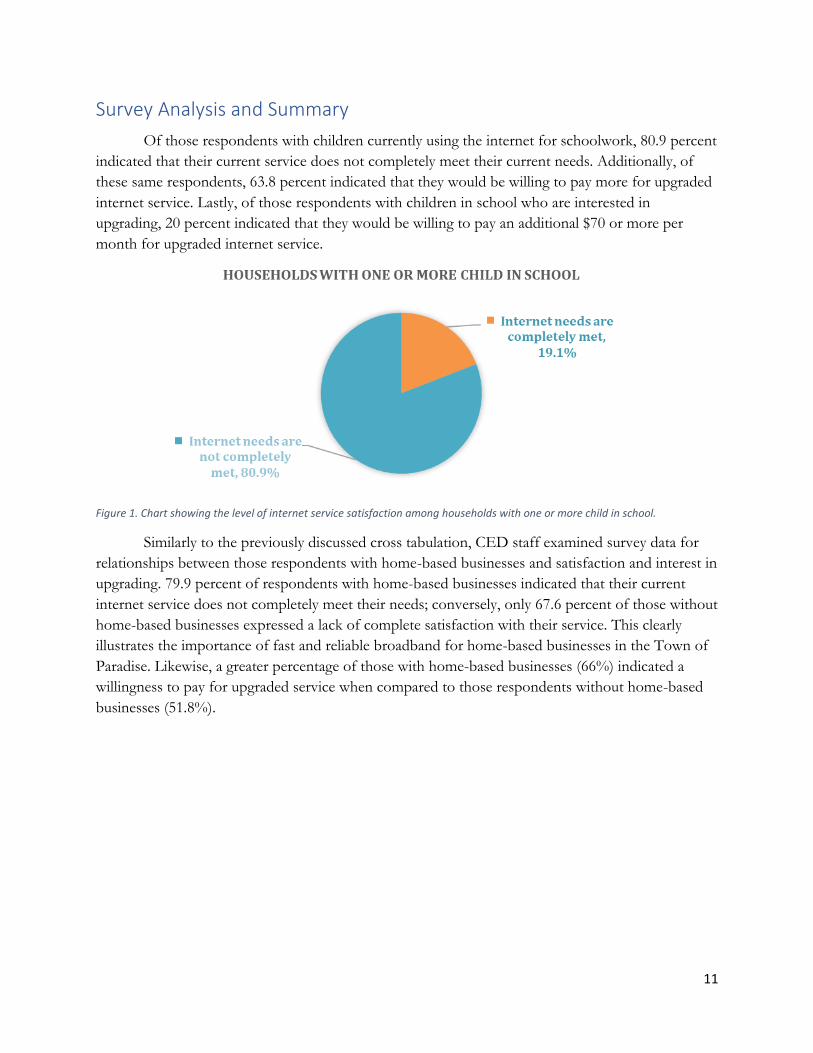
Of those respondents with children currently using the internet for schoolwork, 80.9 percent
indicated that their current service does not completely meet their current needs. Additionally, of
these same respondents, 63.8 percent indicated that they would be willing to pay more for upgraded
internet service. Lastly, of those respondents with children in school who are interested in
upgrading, 20 percent indicated that they would be willing to pay an additional $70 or more per
month for upgraded internet service.
Figure 1. Chart showing the level of internet service satisfaction among households with one or more child in school.
Similarly to the previously discussed cross tabulation, CED staff examined survey data for
relationships between those respondents with home-based businesses and satisfaction and interest in
upgrading. 79.9 percent of respondents with home-based businesses indicated that their current
internet service does not completely meet their needs; conversely, only 67.6 percent of those without
home-based businesses expressed a lack of complete satisfaction with their service. This clearly
illustrates the importance of fast and reliable broadband for home-based businesses in the Town of
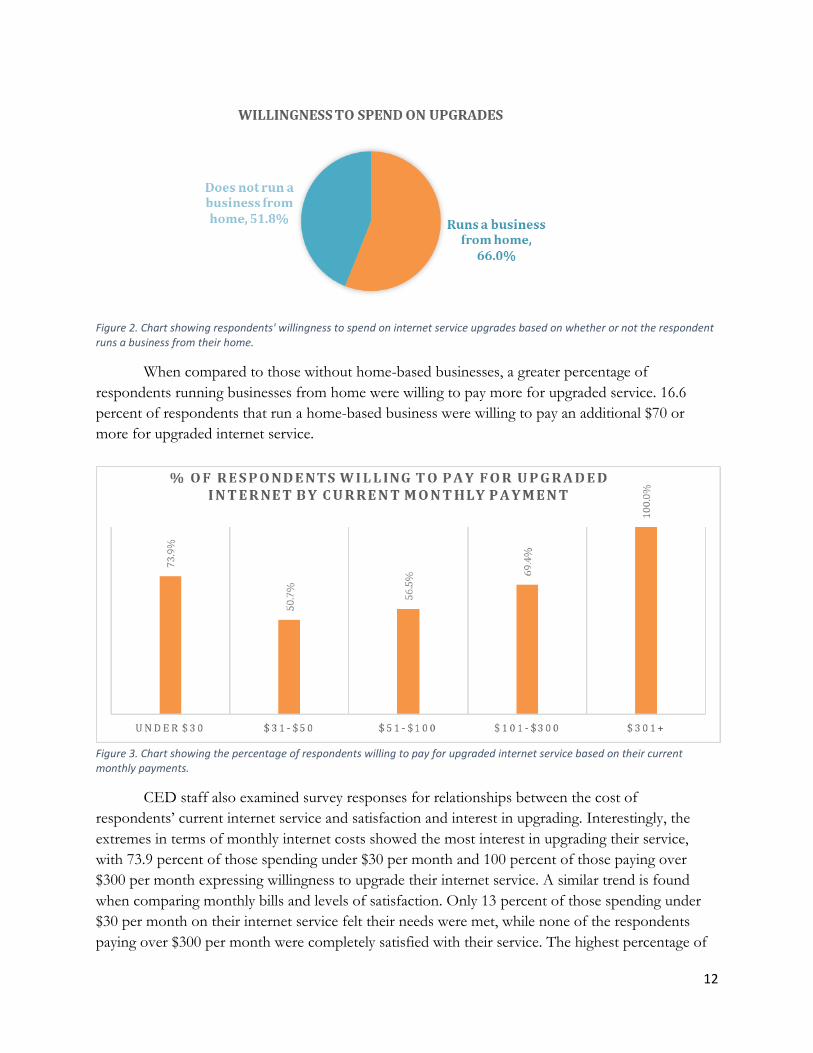
Paradise. Likewise, a greater percentage of those with home-based businesses (66%) indicated a
willingness to pay for upgraded service when compared to those respondents without home-based
businesses (51.8%).
12
Figure 2. Chart showing respondents' willingness to spend on internet service upgrades based on whether or not the respondent runs a business from their home.
When compared to those without home-based businesses, a greater percentage of
respondents running businesses from home were willing to pay more for upgraded service. 16.6
percent of respondents that run a home-based business were willing to pay an additional $70 or
more for upgraded internet service.
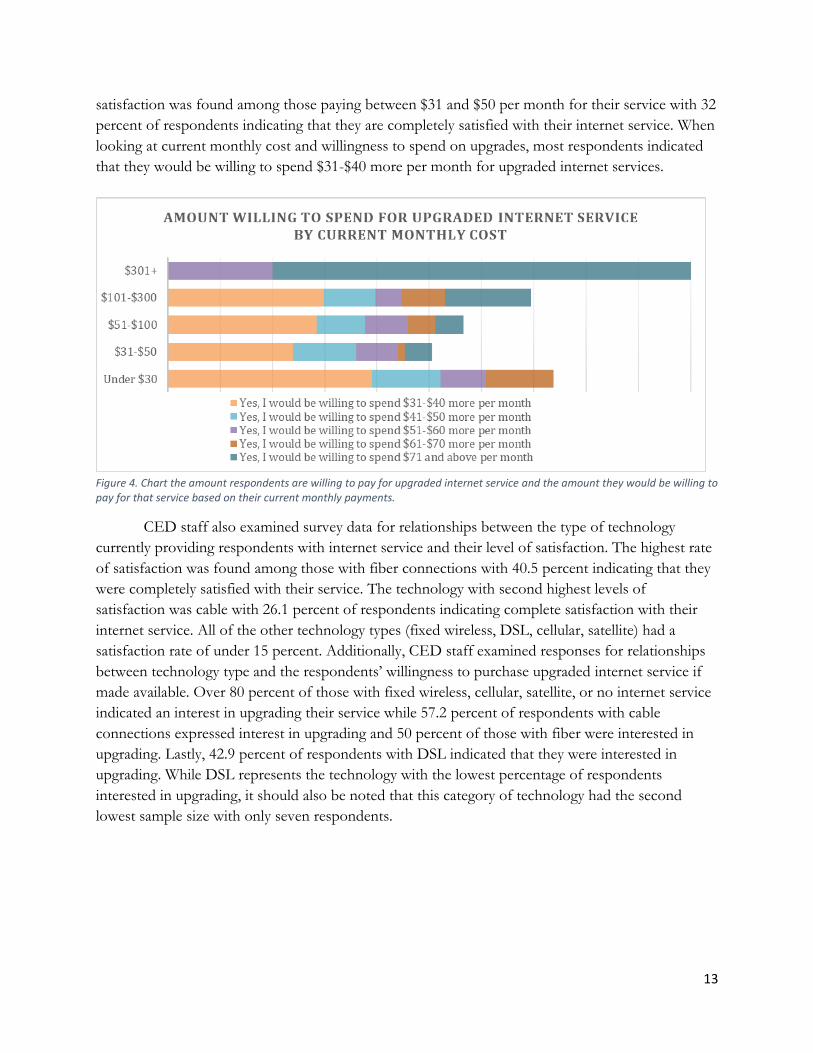
Figure 3. Chart showing the percentage of respondents willing to pay for upgraded internet service based on their current monthly payments.
CED staff also examined survey responses for relationships between the cost of
respondents’ current internet service and satisfaction and interest in upgrading. Interestingly, the
extremes in terms of monthly internet costs showed the most interest in upgrading their service,
with 73.9 percent of those spending under $30 per month and 100 percent of those paying over
$300 per month expressing willingness to upgrade their internet service. A similar trend is found
when comparing monthly bills and levels of satisfaction. Only 13 percent of those spending under
$30 per month on their internet service felt their needs were met, while none of the respondents
paying over $300 per month were completely satisfied with their service. The highest percentage of
13
satisfaction was found among those paying between $31 and $50 per month for their service with 32
percent of respondents indicating that they are completely satisfied with their internet service. When
looking at current monthly cost and willingness to spend on upgrades, most respondents indicated
that they would be willing to spend $31-$40 more per month for upgraded internet services.
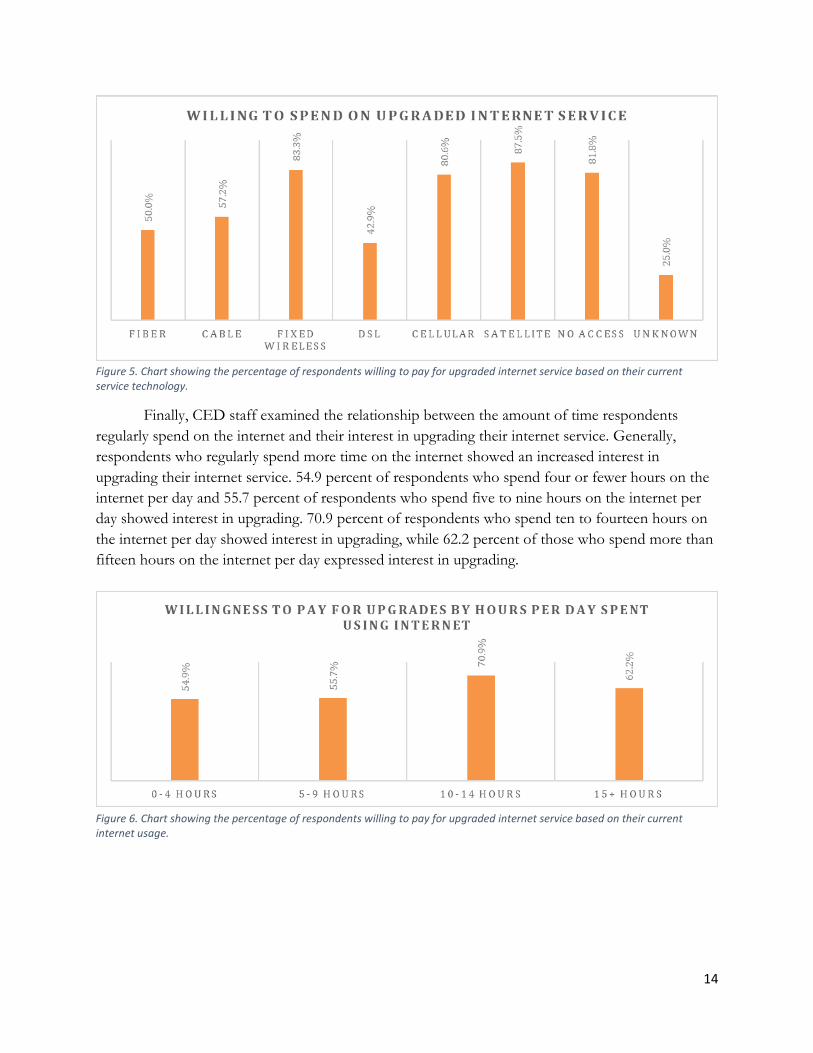
Figure 4. Chart the amount respondents are willing to pay for upgraded internet service and the amount they would be willing to pay for that service based on their current monthly payments.
CED staff also examined survey data for relationships between the type of technology
currently providing respondents with internet service and their level of satisfaction. The highest rate
of satisfaction was found among those with fiber connections with 40.5 percent indicating that they
were completely satisfied with their service. The technology with second highest levels of
satisfaction was cable with 26.1 percent of respondents indicating complete satisfaction with their
internet service. All of the other technology types (fixed wireless, DSL, cellular, satellite) had a
satisfaction rate of under 15 percent. Additionally, CED staff examined responses for relationships
between technology type and the respondents’ willingness to purchase upgraded internet service if
made available. Over 80 percent of those with fixed wireless, cellular, satellite, or no internet service
indicated an interest in upgrading their service while 57.2 percent of respondents with cable
connections expressed interest in upgrading and 50 percent of those with fiber were interested in
upgrading. Lastly, 42.9 percent of respondents with DSL indicated that they were interested in
upgrading. While DSL represents the technology with the lowest percentage of respondents
interested in upgrading, it should also be noted that this category of technology had the second
lowest sample size with only seven respondents.
14
Figure 5. Chart showing the percentage of respondents willing to pay for upgraded internet service based on their current service technology.
Finally, CED staff examined the relationship between the amount of time respondents
regularly spend on the internet and their interest in upgrading their internet service. Generally,
respondents who regularly spend more time on the internet showed an increased interest in
upgrading their internet service. 54.9 percent of respondents who spend four or fewer hours on the
internet per day and 55.7 percent of respondents who spend five to nine hours on the internet per
day showed interest in upgrading. 70.9 percent of respondents who spend ten to fourteen hours on
the internet per day showed interest in upgrading, while 62.2 percent of those who spend more than
fifteen hours on the internet per day expressed interest in upgrading.
Figure 6. Chart showing the percentage of respondents willing to pay for upgraded internet service based on their current internet usage.
15
Projections
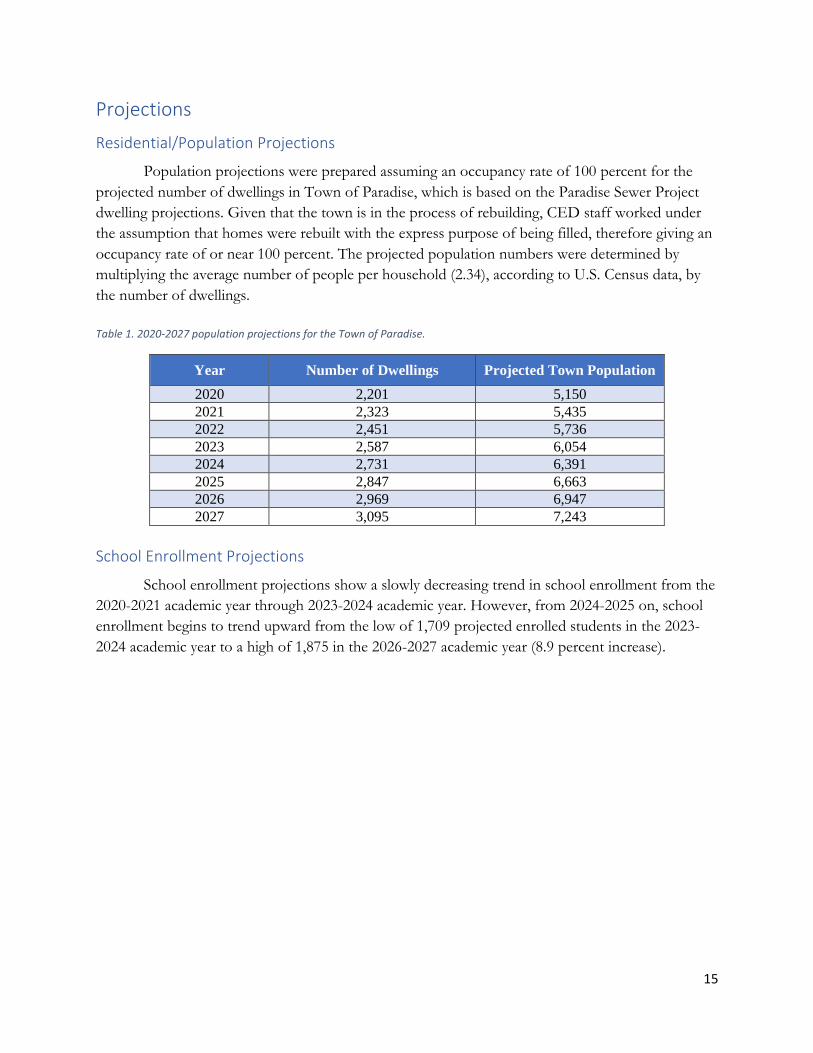
Residential/Population Projections
Population projections were prepared assuming an occupancy rate of 100 percent for the
projected number of dwellings in Town of Paradise, which is based on the Paradise Sewer Project
dwelling projections. Given that the town is in the process of rebuilding, CED staff worked under
the assumption that homes were rebuilt with the express purpose of being filled, therefore giving an
occupancy rate of or near 100 percent. The projected population numbers were determined by
multiplying the average number of people per household (2.34), according to U.S. Census data, by
the number of dwellings.
Table 1. 2020-2027 population projections for the Town of Paradise.
Year Number of Dwellings Projected Town Population
2020 2,201 5,150
2021 2,323 5,435
2022 2,451 5,736
2023 2,587 6,054
2024 2,731 6,391
2025 2,847 6,663
2026 2,969 6,947
2027 3,095 7,243
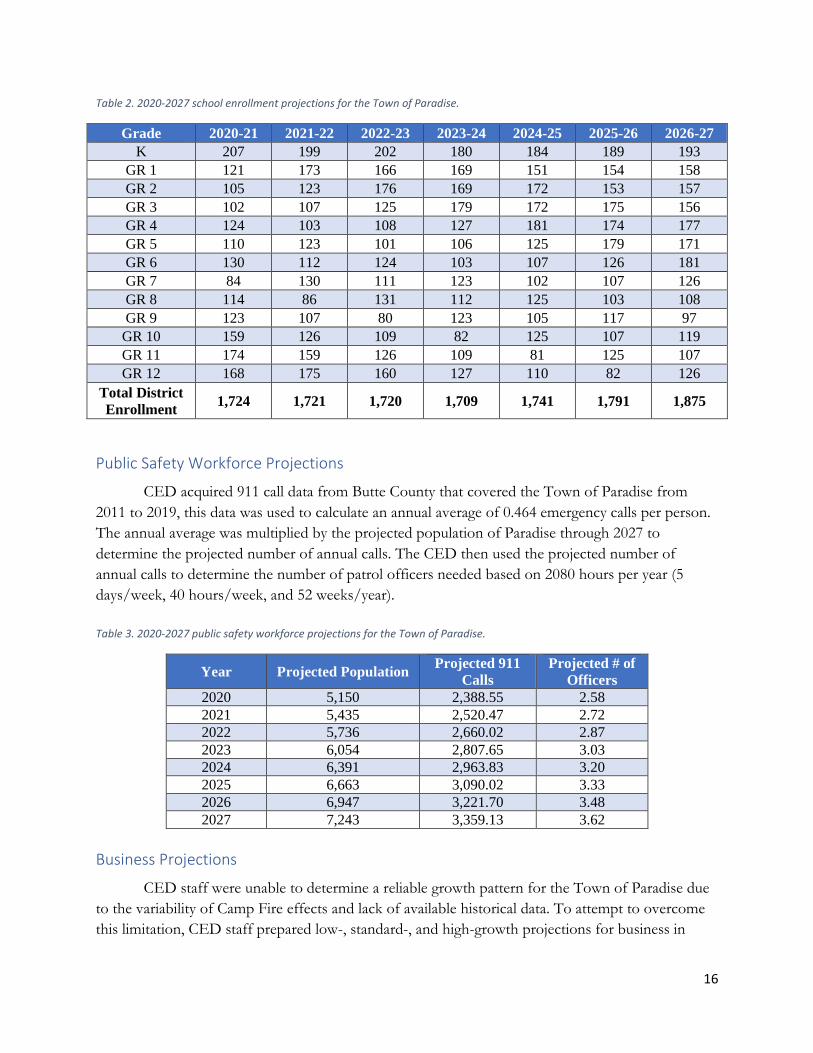
School Enrollment Projections
School enrollment projections show a slowly decreasing trend in school enrollment from the
2020-2021 academic year through 2023-2024 academic year. However, from 2024-2025 on, school
enrollment begins to trend upward from the low of 1,709 projected enrolled students in the 2023-
2024 academic year to a high of 1,875 in the 2026-2027 academic year (8.9 percent increase).
16
Table 2. 2020-2027 school enrollment projections for the Town of Paradise.
Grade 2020-21 2021-22 2022-23 2023-24 2024-25 2025-26 2026-27
K 207 199 202 180 184 189 193
GR 1 121 173 166 169 151 154 158
GR 2 105 123 176 169 172 153 157
GR 3 102 107 125 179 172 175 156
GR 4 124 103 108 127 181 174 177
GR 5 110 123 101 106 125 179 171
GR 6 130 112 124 103 107 126 181
GR 7 84 130 111 123 102 107 126
GR 8 114 86 131 112 125 103 108
GR 9 123 107 80 123 105 117 97
GR 10 159 126 109 82 125 107 119
GR 11 174 159 126 109 81 125 107
GR 12 168 175 160 127 110 82 126
Total District
Enrollment 1,724 1,721 1,720 1,709 1,741 1,791 1,875
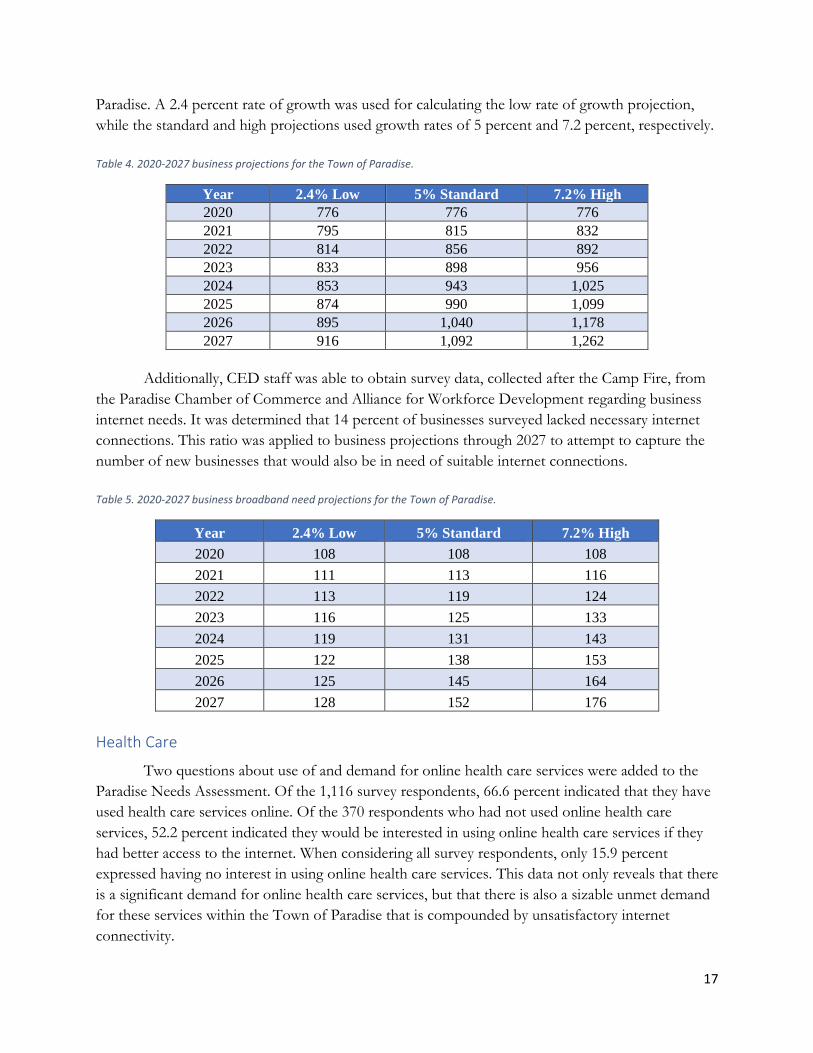
Public Safety Workforce Projections
CED acquired 911 call data from Butte County that covered the Town of Paradise from
2011 to 2019, this data was used to calculate an annual average of 0.464 emergency calls per person.
The annual average was multiplied by the projected population of Paradise through 2027 to
determine the projected number of annual calls. The CED then used the projected number of
annual calls to determine the number of patrol officers needed based on 2080 hours per year (5
days/week, 40 hours/week, and 52 weeks/year).
Table 3. 2020-2027 public safety workforce projections for the Town of Paradise.
Year Projected Population Projected 911
Calls
Projected # of
Officers
2020 5,150 2,388.55 2.58
2021 5,435 2,520.47 2.72
2022 5,736 2,660.02 2.87
2023 6,054 2,807.65 3.03
2024 6,391 2,963.83 3.20
2025 6,663 3,090.02 3.33
2026 6,947 3,221.70 3.48
2027 7,243 3,359.13 3.62
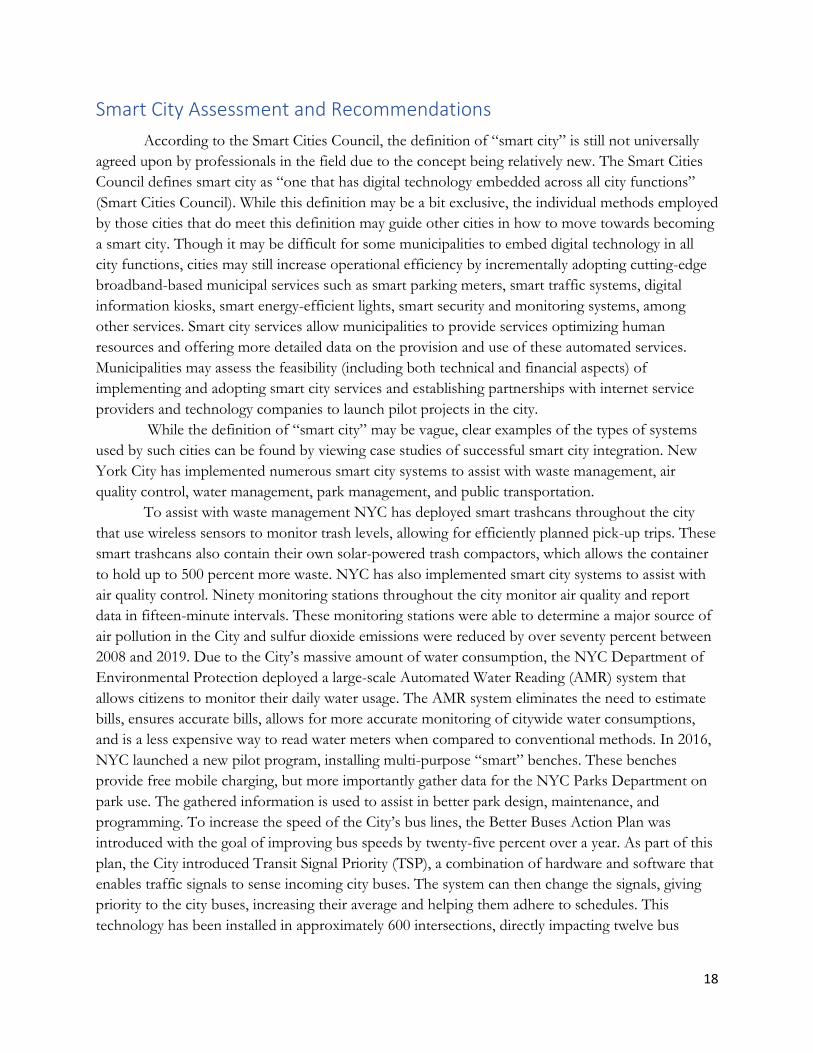
Business Projections
CED staff were unable to determine a reliable growth pattern for the Town of Paradise due
to the variability of Camp Fire effects and lack of available historical data. To attempt to overcome
this limitation, CED staff prepared low-, standard-, and high-growth projections for business in
17
Paradise. A 2.4 percent rate of growth was used for calculating the low rate of growth projection,
while the standard and high projections used growth rates of 5 percent and 7.2 percent, respectively.
Table 4. 2020-2027 business projections for the Town of Paradise.
Year 2.4% Low 5% Standard 7.2% High
2020 776 776 776
2021 795 815 832
2022 814 856 892
2023 833 898 956
2024 853 943 1,025
2025 874 990 1,099
2026 895 1,040 1,178
2027 916 1,092 1,262
Additionally, CED staff was able to obtain survey data, collected after the Camp Fire, from
the Paradise Chamber of Commerce and Alliance for Workforce Development regarding business
internet needs. It was determined that 14 percent of businesses surveyed lacked necessary internet
connections. This ratio was applied to business projections through 2027 to attempt to capture the
number of new businesses that would also be in need of suitable internet connections.
Table 5. 2020-2027 business broadband need projections for the Town of Paradise.
Year 2.4% Low 5% Standard 7.2% High
2020 108 108 108
2021 111 113 116
2022 113 119 124
2023 116 125 133
2024 119 131 143
2025 122 138 153
2026 125 145 164
2027 128 152 176
Health Care
Two questions about use of and demand for online health care services were added to the
Paradise Needs Assessment. Of the 1,116 survey respondents, 66.6 percent indicated that they have
used health care services online. Of the 370 respondents who had not used online health care
services, 52.2 percent indicated they would be interested in using online health care services if they
had better access to the internet. When considering all survey respondents, only 15.9 percent
expressed having no interest in using online health care services. This data not only reveals that there
is a significant demand for online health care services, but that there is also a sizable unmet demand
for these services within the Town of Paradise that is compounded by unsatisfactory internet
connectivity.
18
Smart City Assessment and Recommendations
According to the Smart Cities Council, the definition of “smart city” is still not universally
agreed upon by professionals in the field due to the concept being relatively new. The Smart Cities
Council defines smart city as “one that has digital technology embedded across all city functions”
(Smart Cities Council). While this definition may be a bit exclusive, the individual methods employed
by those cities that do meet this definition may guide other cities in how to move towards becoming
a smart city. Though it may be difficult for some municipalities to embed digital technology in all
city functions, cities may still increase operational efficiency by incrementally adopting cutting-edge
broadband-based municipal services such as smart parking meters, smart traffic systems, digital
information kiosks, smart energy-efficient lights, smart security and monitoring systems, among
other services. Smart city services allow municipalities to provide services optimizing human
resources and offering more detailed data on the provision and use of these automated services.
Municipalities may assess the feasibility (including both technical and financial aspects) of
implementing and adopting smart city services and establishing partnerships with internet service
providers and technology companies to launch pilot projects in the city.
While the definition of “smart city” may be vague, clear examples of the types of systems
used by such cities can be found by viewing case studies of successful smart city integration. New
York City has implemented numerous smart city systems to assist with waste management, air
quality control, water management, park management, and public transportation.
To assist with waste management NYC has deployed smart trashcans throughout the city
that use wireless sensors to monitor trash levels, allowing for efficiently planned pick-up trips. These
smart trashcans also contain their own solar-powered trash compactors, which allows the container
to hold up to 500 percent more waste. NYC has also implemented smart city systems to assist with
air quality control. Ninety monitoring stations throughout the city monitor air quality and report
data in fifteen-minute intervals. These monitoring stations were able to determine a major source of
air pollution in the City and sulfur dioxide emissions were reduced by over seventy percent between
2008 and 2019. Due to the City’s massive amount of water consumption, the NYC Department of
Environmental Protection deployed a large-scale Automated Water Reading (AMR) system that
allows citizens to monitor their daily water usage. The AMR system eliminates the need to estimate
bills, ensures accurate bills, allows for more accurate monitoring of citywide water consumptions,
and is a less expensive way to read water meters when compared to conventional methods. In 2016,
NYC launched a new pilot program, installing multi-purpose “smart” benches. These benches
provide free mobile charging, but more importantly gather data for the NYC Parks Department on
park use. The gathered information is used to assist in better park design, maintenance, and
programming. To increase the speed of the City’s bus lines, the Better Buses Action Plan was
introduced with the goal of improving bus speeds by twenty-five percent over a year. As part of this
plan, the City introduced Transit Signal Priority (TSP), a combination of hardware and software that
enables traffic signals to sense incoming city buses. The system can then change the signals, giving
priority to the city buses, increasing their average and helping them adhere to schedules. This
technology has been installed in approximately 600 intersections, directly impacting twelve bus
19
routes. Additionally, the NYC Department of Transportation has installed over 750 high-speed
cameras at intersections to assist with traffic enforcement.
In 2014, New York City initiated LinkNYC, a unique communications network that replaced
the City’s pay phones with kiosks called Links. The Links are equipped with free high-speed wireless
internet, phones, a tablet featuring maps and city services, and charging stations for devices. There
are currently over 2,200 Links in the City. LinkNYC is free to users and is funded entirely through
advertising revenue. Lastly, through the use of LED lighting retrofits to existing municipal buildings
and street lighting, New York City has been able to save over $800,000 dollars a year in energy
savings.
While investment in new technologies and enhancements to existing infrastructure are
necessary components of smart city development, such advancements also require “a willingness
from the city authorities to embrace new ways of working, to make data publicly available where
possible, to encourage new ideas and to stimulate the deployment of shared infrastructures such as
wireless networks and fiber backhaul” (Toh 2019).
The Brookings Institution’s Metropolitan Policy Program co-hosted a forum bringing
together officials from cities throughout Europe, Canada and the United States to better understand
the potential and practice for smart cities. While the concept of harnessing the aspects of smart cities
to promote economic prosperity and innovation is exciting, there is still much work to be done to
make smart city development the norm rather than the exception. The Town of Paradise is well-
positioned to incorporate its ability to achieve smart city status in its current and future development
plans. However, simply drafting a technology-focused economic vision is not enough.
A successful vision or plan will use technology to pursue three drivers for an economy that
creates jobs, spurs investment, and provides greater economic and workforce development
opportunities. The first is productivity and should support aggregate economic growth and promote
efficiencies throughout the public and private sectors. As an example, this study identifies smart city
attributes and opportunities for the Town to consider. The second is inclusivity and should support
opportunity for all firms and citizens. As stated, broadband is equally important to the future
economic success of households, businesses, education, workforce training, and remote access. The
third is resiliency and must support more than a sustainable built environment. The rebuild of the
Town will be more energy efficient by design. However, often city/town cores generate more
aggregate carbon than other parts. Additionally, the community will still be susceptible to natural
disasters and other long-term environmental concerns related to climate change. A smart city will
understand its global responsibility to adopt sustainable policies and make environmentally-friendly
investments (Tomer and Puentes, 2014).
Parks:
Smart parks use technology to improve park services, community health, safety, water and
energy efficiency, and decrease long-term costs. Like many smart city improvements, smart park
technology often requires substantial initial investment, but the long-term reduction in the costs of
running and maintaining the parks make up for these initial capital investments. These cost
reductions are achieved by technology assisting park management personnel in efficiently
20
maintaining and operating parks while conserving water and energy resources (Loukaitou-Sideris
2019).
The publication, “SMART Parks: A Toolkit,” produced by the Luskin Center for Innovation
at UCLA provides extensive and detailed descriptions of the technologies that can be implemented
in SMART Parks. The Toolkit includes a wide variety of technologies to improve efficiency and
operations in the areas of landscaping, irrigation, stormwater, hardscaping, activity spaces, urban
furniture and amenities, lighting, and “digiscapes.”
Technologies that can improve landscaping in Paradise parks include automatic lawn
mowers, near infrared photography, green walls, air-pruning plant containers, and vibrating
pollinators. Automatic lawn mowers are electric, reducing air pollution, carbon dioxide emissions,
and energy costs. Additionally, automatic lawn mowers can reduce the cost of hands-on
maintenance and landscaping. Near infrared photography is effective at measuring photosynthesis
levels and thus plant health in large parks. Green walls include growing vegetation on any vertical
wall or structure and increase planted areas, contribute to the park and ecosystem, offer cooling
effects, and enhance visitor experience (Loukaitou-Sideris 2019). Air-pruning containers can be used
to improve plant health and ability to withstand stress, while simultaneously reducing the need for
repotting, resulting in reduced maintenance costs (Loukaitou-Sideris 2019). Lastly, vibrating
pollinators can improve parks with edible food gardens by increasing yield and can be used as
educational tools (Loukaitou-Sideris 2019).
Park irrigation in Paradise may be improved through such technologies as smart water
controllers, low-pressure and rotating sprinklers, subsurface drip irrigation, smart water metering,
and greywater recycling (Loukaitou-Sideris 2019). Smart water controllers can help manage and
reduce water usage, as well as maintenance costs (Loukaitou-Sideris 2019). Low-pressure and
rotating sprinklers can be installed without extensive infrastructure upgrades and can help conserve
water. Subsurface irrigation can also greatly increase water efficiency, especially when paired with
other smart irrigation technologies (Loukaitou-Sideris 2019). The amount and types of data smart
water meters collect is dependent on the type of meter used. Less expensive systems collect data on
water usage, while more expensive smart water meters can also detect leaks or other irrigation
problems (Loukaitou-Sideris 2019). Lastly, greywater recycling, which uses wastewater as a
replacement for potable water for irrigation, can extend the value of used water, enhance plant
growth, and reduce overall water use in parks (Loukaitou-Sideris 2019).
There are several technologies that can assist Paradise park managers with stormwater
management, such as engineered soils, real-time control and continuous monitoring and adaptive
control (CMAC), rainwater harvesting, and underground storage basins (Loukaitou-Sideris 2019).
Engineered soils can improve the treatment of pollutants and infiltration of water (Loukaitou-Sideris
2019). Real-Time Control and CMAC systems “can control the function of infrastructure based on
weather predictions and real-time data to effectively utilize capacity, capture water, and remove
pollutants” (Loukaitou-Sideris 2019). Rainwater capture systems can help manage stormwater and
conserve water for irrigation (Loukaitou-Sideris 2019). Lastly, underground basins, when combined
with rainwater capture and irrigation technologies can help manage floods and reduce water costs
(Loukaitou-Sideris 2019).
21
Utilizing technology to capture, monitor and control water functions can also contribute to
“regenerative firescaping”. For example, orchards can provide ember traps provided that the tree
spacings are offset from one row to the next Irrigated orchards increase moisture and decrease the
intensity of an advancing fire front. Fruit and nut bearing trees are typically quite sappy and have
high moisture content. Though they may be damaged or killed in the fire, orchards can provide a
tremendous boost to structure survivability (7th Generation Design, 2019).
There are a number of technologies that can be used to improve the hardscaping of Paradise
parks, including cross-laminated timber, pervious paving, piezoelectric energy-harvesting tiles, self-
healing concrete, photocatalytic titanium dioxide coating, daylight fluorescent aggregate, and carbon
upcycled concrete (Loukaitou-Sideris 2019). Cross-laminated timber can be used to replace standard
wood, steel, and concrete materials, reducing carbon emissions and cost (Loukaitou-Sideris 2019).
Permeable pavement can be used in place of traditional concrete or asphalt and allows water
infiltration into the soil (Loukaitou-Sideris 2019). Piezoelectric tiles generate electricity from
mechanical pressure and can be installed in highly trafficked areas to supplement park energy costs,
while also collecting information on park visitors (Loukaitou-Sideris 2019). Self-healing concrete can
be used to prevent and fix microcracks in traditional concrete, reducing maintenance costs and
prolonging the lifespan of park hardscaping (Loukaitou-Sideris 2019). Photocatalytic titanium
dioxide-coated surfaces are self-cleaning, kill bacteria and mold, and remove pollutants from the air
(Loukaitou-Sideris 2019). Ultimately, Photocatalytic titanium dioxide-coated surfaces reduce water
use and maintenance costs while also providing the health benefits associated with the removal of
pollutants Photocatalytic titanium dioxide-coated surfaces. Daytime fluorescent aggregates can
provide electricity-free illumination when used as a coating for surfaces and paths (Loukaitou-Sideris
2019). Lastly, carbon upcycled concrete can be used in place of traditional concrete, is nearly carbon
neutral, and can be prefabricated using 3D-printing technology, reducing construction time and cost
(Loukaitou-Sideris 2019).
There are also many technologies that can create more attractive and successful activity
spaces in city parks, including interactive play structures, high-performance track surfaces, pool
ozonation, energy-generating exercise equipment, and hard-surface testing equipment (Loukaitou-
Sideris 2019). Interactive play structures can serve as educational tools, improve citizen health by
promoting physical activity, and increase access to parks for children with disabilities (Loukaitou-
Sideris 2019). High-performance track surfaces impart health benefits to park users by decreasing
the strain on users’ joints while also being weather-resistant, reducing long-term upkeep costs
(Loukaitou-Sideris 2019). Pool ozonation can replace traditional chlorine-based pool cleaning
methods, uses less water, and requires less maintenance than traditional methods (Loukaitou-Sideris
2019). Energy-generating exercise equipment can be used to provide power to other electronic
amenities, like phone chargers, while also encouraging visitors to use the equipment (Loukaitou-
Sideris 2019). Lastly, hard-surface impact testing equipment can be used to assess and improve park
safety (Loukaitou-Sideris 2019).
Park furniture and amenities can also be improved by technologies, such as smart benches,
solar shade structures, solar-powered trash compactors, smart water fountains, and automatic bicycle
and pedestrian counters (Loukaitou-Sideris 2019). Smart benches can provide park visitors with
22
internet access, track park usage, and gather environmental data, resulting in more efficient park
management (Loukaitou-Sideris 2019). Solar shade structures provide protection from the sun like
traditional shade structures while also generating electricity and provide services, such as phone
charging (Loukaitou-Sideris 2019). Solar-powered trash compactors can be installed in receptacles to
enhance collection and prevent overflows, among other benefits (Loukaitou-Sideris 2019). Smart
water fountains can save energy and reduce costs while also promoting public confidence in water
quality (Loukaitou-Sideris 2019). Lastly, automatic bicycle and pedestrian counters can assist in park
management by tracking the usage of parks (Loukaitou-Sideris 2019).
Park lighting can also be improved through smart technologies, such as motion-activated
sensors, LED and fiber optic lighting, and off-grid light fixtures (Loukaitou-Sideris 2019). Motion-
activated lights can increase park security while also using less energy than standard lighting. LED
and fiber optic lighting can be used to minimize energy consumption while also enhancing park
aesthetics (Loukaitou-Sideris 2019). Off-grid lighting with renewable energy sources can actually be
cheaper to install than traditional lighting and reduces long-term energy costs (Loukaitou-Sideris
2019).
Parks can also be improved using “digiscapes,” technologies that collect data on park use
and visitors that can then be used to improve park services, access, safety, programming, and
operations (Loukaitou-Sideris 2019). These technologies include Wi-Fi and geographic information
systems and services, among others. Free public Wi-Fi has the potential to attract many more
citizens to parks and can also provide reliable communication during emergencies or when cellular
networks are down (Loukaitou-Sideris 2019). GIS mapping technology can be used to streamline
and improve many park functions and assist in park management and planning (Loukaitou-Sideris
2019).
Waste Management:
Waste management is another aspect of municipal operations that the Town of Paradise may
find benefits from smart technology improvements. Integrating smart technologies into Paradise’s
waste management system can help to improve efficiency, reduce costs, and enhance the beauty of
public areas (“Smart City Waste Management” 2020). The various technologies that can improve
waste management include Internet of Things (IoT) sensors, high-performance networks,
management platforms, and data analytic software (“Smart City Waste Management” 2020). Smart
waste management uses IoT technology, such as specialized sensors and wireless communication
technology to provide waste management staff with detailed information regarding trash and
recycling bins, including when they need to be emptied, when odor has become a problem, when
bins have been tipped over, and the temperature inside the bins (“Smart City Waste Management”
2020). This information helps waste management staff perform their jobs more effectively and
efficiently and can be used to improve the living conditions of residents (“A Smart Waste
Management Solution . . .” 2020). Smart waste management systems require high-speed networks to
transmit the data collected by IoT sensors, while waste management personnel require suitable
management platforms and data analytics to receive and review this data effectively (“Smart City
Waste Management” 2020).
23
The various benefits of using smart technologies to improve waste management include
lower costs, reduced maintenance, cleaner public spaces, reduced traffic congestion and carbon
emissions, and more effective management (“Smart City Waste Management” 2020). IoT sensors
can eliminate unnecessary waste pick-ups, reducing operating and maintenance costs (“Smart Cities
Readiness Guide” 2020). Fewer pick-ups also mean a longer lifespan for department vehicles and
equipment (“Smart City Waste Management” 2020). With sensors that can detect and alert waste
management staff of overflowing or malodorous trash bins cities can quickly address these issues
before they become more problematic (“Smart City Waste Management” 2020). Fewer pick-ups also
mean fewer garbage vehicles on the road causing traffic congestion and also reduces the amount of
fuel used and thus carbon emissions released into the atmosphere (“Smart City Waste Management”
2020). Smart waste management technologies can also be used to monitor the extent to which
Paradise residents participate in waste reduction programs and practices, such as recycling (“Smart
Cities Readiness Guide” 2020). Smart technologies also help public works departments manage and
communicate with the vendors employed to assist with garbage and recycling collection and
processing (“Smart City Waste Management” 2020).
Emergency Management and Public Safety:
Smart city technologies can be utilized to increase the efficiency of emergency response and
manage safety systems. Smart technologies integrated into buildings can actively communicate with
nearby buildings and with emergency facilities in a constant network. This means that everything
involved in the emergency response process, detectors, alarms, camera systems, traffic systems, call
centers, and responders could be constantly monitored and synchronized to maximize coordination
and virtually eliminate communication lag (Schwichtenberg).
Surveillance and Sensors
Traditionally, video monitoring is the primary method of citywide surveillance. Video
surveillance has been a powerful tool for preventing and solving crimes in many cities by identifying
perpetrators and suspects. While video surveillance remains an effective law enforcement tool, new
technologies have also been implemented to assist local police in preventing and responding to
potential criminal activity. In some cities, new types of sensors are being deployed, including sensors
that can detect gunshots and locate their source using sophisticated audio techniques (“Guide to
Fiber Optics and Premises Cabling”).
Fire:
Internet of Things networks in smart cities create a wide-reaching network of low power
sensors that can transmit various data from a large number of devices quickly over wide distances.
Such a system has considerable potential for any emergency, but its application for fighting fires
stands out. Smoke and temperature detectors can actively communicate with emergency workers
and people in potential danger to ensure quick response times and efficient evacuations (Murphy
and Tracy). A network of heat-resistant temperature sensors can also monitor growth patterns of
spreading fires so that they can be combated more efficiently, potentially decreasing the damage
24
caused in these events (Goldstein). The status of detectors can also be constantly monitored,
ensuring that they are all operating properly at any given time. IoT sensors on firefighters themselves
can be used to communicate their location and vital statistics in real time and reduce the risk
imposed on them, and the systems in place at the location of a fire, be it a high-rise or a forest, can
help emergency workings in mapping and traversing otherwise unknown environments (Goldstein).
Smart systems within buildings can also be used to eliminate the need for firefighter intervention at
all using smart sprinkler systems that can localize spray in rooms where the fire is present while also
monitoring the current status of that fire and communicating that information to those on the
outside (Goldstein).
Air Quality:
Health complications due to poor air quality are common and kill millions of people around
the world every year. In California, where air quality is notoriously poor, the use of smart
technologies to monitor and communicate air quality information could be used to great effect in
reducing a population’s exposure to harmful air.
Air quality is not constant across regions and can experience considerable variation within
the space of several city blocks. Therefore, the small number of sensors most cities utilize are not
sufficient to gauge air quality (Samms). The implementation of a network of sensors can provide
many benefits by communicating current air quality in real time to public and private individuals by
neighborhood instead of by city and by identifying “hot spots” that are prone to poor air quality.
The data these sensors gather can also be accumulated across months and years to gain a better
understanding of how air quality affects local health.
A city has several options on how to implement air quality sensors. The first and most
commonly used method is simply adding more sensors to static infrastructure such as buildings and
utility poles. This technology allows for reliable and complex measurements that can track changes
in air quality and composition instantaneously and across time. These static sensors tend to be
expensive per unit primarily due to installation and maintenance costs, though the benefits could be
increased if the sensors are utilized in a fire-monitoring network as well (Bousquet). Another option
is to install much smaller and less expensive sensors onto mobile structures such as police vehicles,
drones, or bicycles (Samms). These devices can then collect data across the entire city using fewer
units; however, this method does not allow for constant measurement in individual areas like a static
sensor (Bousquet). Pairing either of these sensor types with the mobile phones of residents can
provide further understanding by recording where common foot travel takes place. If it appears to
be the case the people are regularly being exposed to poor air quality, then mitigation efforts can be
directed with greater focus (Samms). Another option that cities have used involves taking data from
a smaller number of fixed sensors and using advanced modeling from environmental data
companies to accurately predicted air quality in areas where there are no sensors (Samms).
25
Transportation and Traffic Management:
There are several smart technologies that can assist city staff with transportation and traffic
management, including smart traffic signals, video and radar traffic monitoring, and creating a
communications environment that facilitates future autonomous traffic using vehicle-to-vehicle and
vehicle-to-infrastructure feedback. While autonomous vehicles have many advanced technologies
allowing them to drive without user input, many engineers involved in developing smart cities
suggest that these vehicles will be most effective and safer if they are able to communicate with
smart city services such as smart traffic signals, traffic signs, information from video surveillance
(“Guide to Fiber Optics and Premises Cabling”).
Public Services
Smart city technologies can also be used to monitor and control public utilities. Smart
technologies used to manage electricity, water, sewer, gas, etc. can make them more efficient and
economical. Electrical grids can be improved with smart technologies to allow for the integration of
alternative energy sources into traditional generation and distribution (“Guide to Fiber Optics and
Premises Cabling”).
Data Centers
To make full use of the plethora of available smart city technologies, the Town of Paradise
may require a data center with sufficient storage, computing power, and communication capabilities
to process, analyze, and transmit the data generated by the town’s smart technologies. The data
center could be a city facility, but it could also be a cloud service hosted in the city. Such a data
center would require a high-speed and stable internet connection (“Guide to Fiber Optics and
Premises Cabling”).
Partnerships
Effective implementation of smart city technologies requires cooperation. While the services
mentioned already exist in some cities, they are often privately owned and operated. Synergistic
implementation of smart technologies as well as partnering efforts are highly recommended. For
example, through proper partnering efforts and coordinated installations, streetlights could fulfill
numerous functions, including providing lighting, video and/or radar for surveillance and traffic
management, Wi-Fi for private and public use including vehicle communications, locations for small
cell telecommunications, and weather and pollution monitoring (Guide to Fiber Optics and
Premises Cabling”).
Public Engagement and Privacy Concerns
For the implementation of smart city technologies to be successful, municipalities must
engage with the community to make the benefits of these technologies clear, and to promote an
atmosphere of transparency (“What’s Fueling the Smart City Backlash?”). Citizens can often be wary
of data collecting smart city technologies, as they fear these tools may invade their privacy (Stone).
26
Whether cameras used to deter and monitor crime or IoT sensors collecting data on resident
activities, many citizens can be resistant to the installation of these devices (Stone). One method of
alleviating these concerns is proper transparency and education regarding these technologies (Stone).
Additionally, local governments should implement data privacy policies directly addressing the
concerns of their citizenry regarding smart technologies (Oliveira, Oliver, and Ramalhinho).
London’s congestion charging model is a prime example of smart city implementation that
received significant public resistance and scrutiny, but was ultimately successful due to a detailed
implementation strategy, and careful stakeholder management (“Congestion Charging . . .”).
London’s congestion charging model, intended to reduce congestion by bringing about a modal shift
away from single passenger vehicles in central London (“Congestion Charging . . .”). The ultimate
success of the plan was due to a detailed implementation strategy, and careful stakeholder
management. The model was designed to reduce traffic congestion by charging a fee to single-
passenger vehicles in central London using cameras and an Automatic Number Plate Recognition
(ANPR) system (“Congestion Charging . . .”). City staff, including the mayor, developed a method
of gaining support from stakeholders by engaging with them throughout the design of the model
(“Congestion Charging . . .”). The mayor released a discussion paper titled, “Hearing London’s
Views,” to nearly 400 key stakeholders in 2000 (“Congestion Charging . . .”). This was then followed
by a second paper, “Transport Strategy,” being released for public consultation. The second paper
received approximately 8,000 responses (“Congestion Charging . . .”). By taking this transparent
approach to the development and implementation of their plan, the City of London was able to
modify the plan to both meet the cities goals while also addressing a host of public concerns
(“Congestion Charging . . .”)
27
Inventory of Internet Service Providers, Technologies, and Speeds
In this section, we have provided an inventory of broadband assets in the Town of Paradise.
We have included an inventory of regional ISPs and their maximum advertised download speeds.
Also included is the served status of Paradise residents, households, housing units, and census
blocks. To provide visual reference for consumer broadband coverage in Paradise, a series of maps
depicting coverage by ISP and technology type have been included. Additionally, an aggregate
coverage map and map displaying the served status of areas within Paradise have been included.
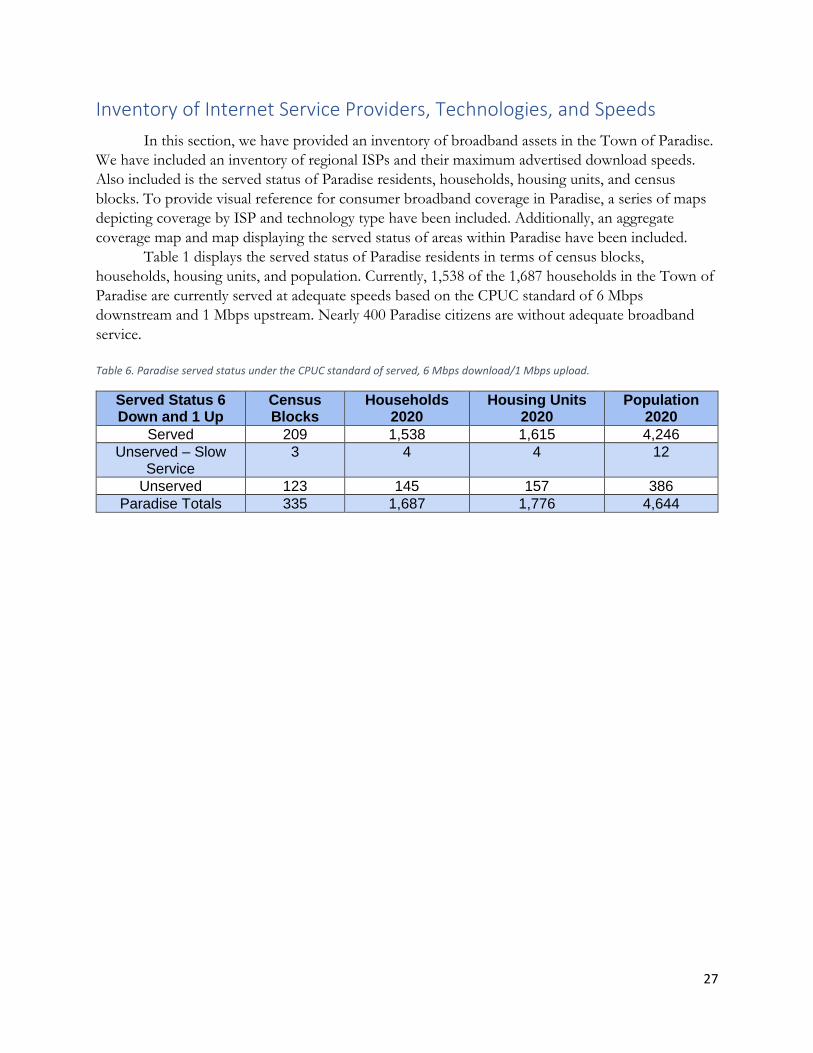
Table 1 displays the served status of Paradise residents in terms of census blocks,
households, housing units, and population. Currently, 1,538 of the 1,687 households in the Town of
Paradise are currently served at adequate speeds based on the CPUC standard of 6 Mbps
downstream and 1 Mbps upstream. Nearly 400 Paradise citizens are without adequate broadband
service.
Table 6. Paradise served status under the CPUC standard of served, 6 Mbps download/1 Mbps upload.
Served Status 6 Down and 1 Up
Census Blocks
Households 2020
Housing Units 2020
Population 2020
Served 209 1,538 1,615 4,246
Unserved – Slow Service
3 4 4 12
Unserved 123 145 157 386
Paradise Totals 335 1,687 1,776 4,644
28
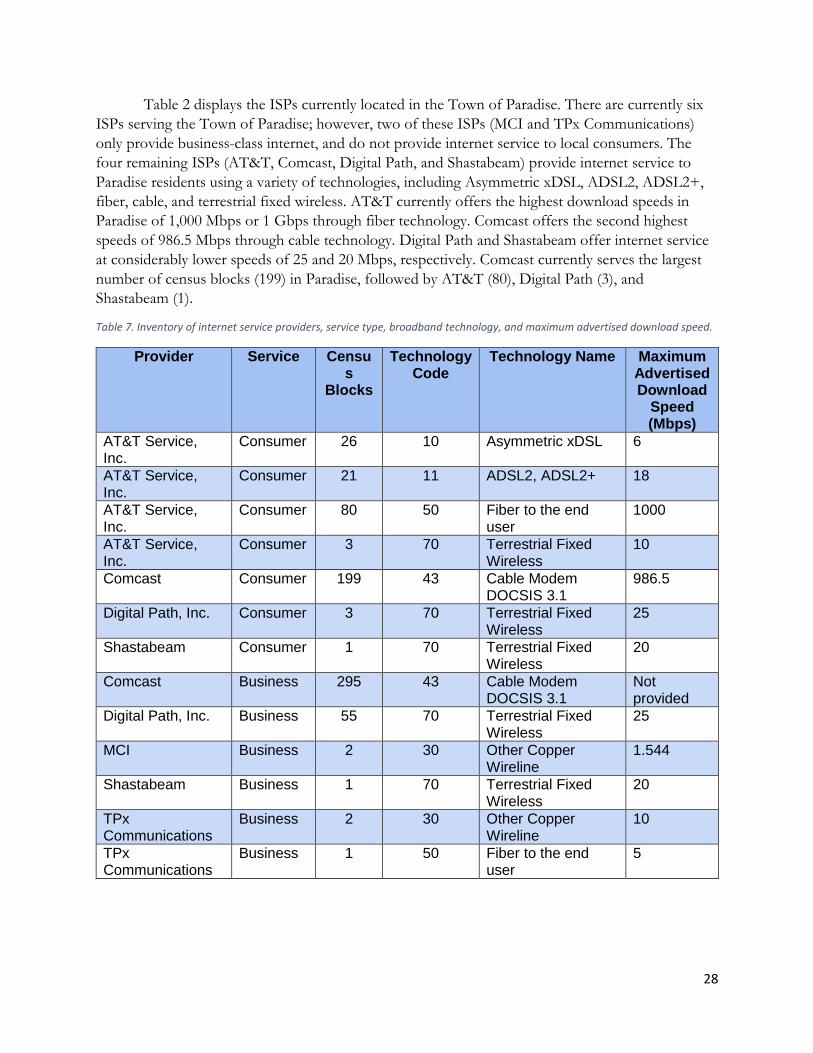
Table 2 displays the ISPs currently located in the Town of Paradise. There are currently six
ISPs serving the Town of Paradise; however, two of these ISPs (MCI and TPx Communications)
only provide business-class internet, and do not provide internet service to local consumers. The
four remaining ISPs (AT&T, Comcast, Digital Path, and Shastabeam) provide internet service to
Paradise residents using a variety of technologies, including Asymmetric xDSL, ADSL2, ADSL2+,
fiber, cable, and terrestrial fixed wireless. AT&T currently offers the highest download speeds in
Paradise of 1,000 Mbps or 1 Gbps through fiber technology. Comcast offers the second highest
speeds of 986.5 Mbps through cable technology. Digital Path and Shastabeam offer internet service
at considerably lower speeds of 25 and 20 Mbps, respectively. Comcast currently serves the largest
number of census blocks (199) in Paradise, followed by AT&T (80), Digital Path (3), and
Shastabeam (1).
Table 7. Inventory of internet service providers, service type, broadband technology, and maximum advertised download speed.
Provider Service Census
Blocks
Technology Code
Technology Name Maximum Advertised Download
Speed (Mbps)
AT&T Service, Inc.
Consumer 26 10 Asymmetric xDSL 6
AT&T Service, Inc.
Consumer 21 11 ADSL2, ADSL2+ 18
AT&T Service, Inc.
Consumer 80 50 Fiber to the end user
1000
AT&T Service, Inc.
Consumer 3 70 Terrestrial Fixed Wireless
10
Comcast Consumer 199 43 Cable Modem DOCSIS 3.1
986.5
Digital Path, Inc. Consumer 3 70 Terrestrial Fixed Wireless
25
Shastabeam Consumer 1 70 Terrestrial Fixed Wireless
20
Comcast Business 295 43 Cable Modem DOCSIS 3.1
Not provided
Digital Path, Inc. Business 55 70 Terrestrial Fixed Wireless
25
MCI Business 2 30 Other Copper Wireline
1.544
Shastabeam Business 1 70 Terrestrial Fixed Wireless
20
TPx Communications
Business 2 30 Other Copper Wireline
10
TPx Communications
Business 1 50 Fiber to the end user
5
29
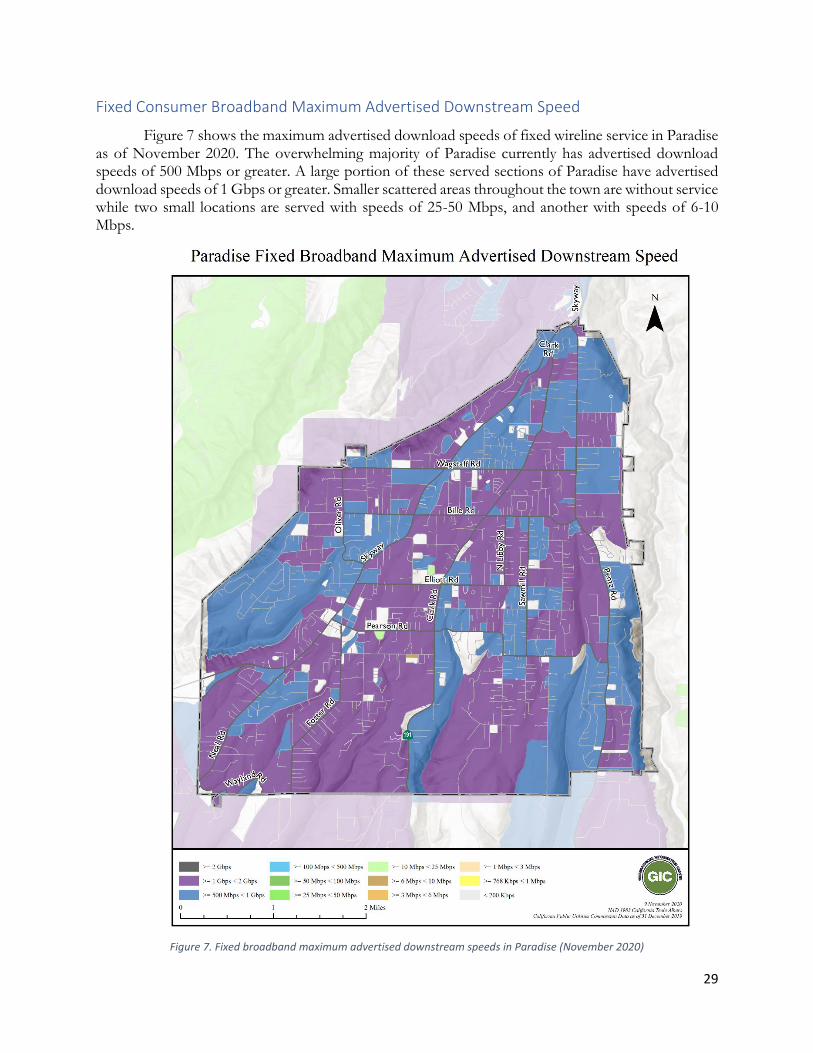
Fixed Consumer Broadband Maximum Advertised Downstream Speed
Figure 7 shows the maximum advertised download speeds of fixed wireline service in Paradise as of November 2020. The overwhelming majority of Paradise currently has advertised download speeds of 500 Mbps or greater. A large portion of these served sections of Paradise have advertised download speeds of 1 Gbps or greater. Smaller scattered areas throughout the town are without service while two small locations are served with speeds of 25-50 Mbps, and another with speeds of 6-10 Mbps.
Figure 7. Fixed broadband maximum advertised downstream speeds in Paradise (November 2020)
30
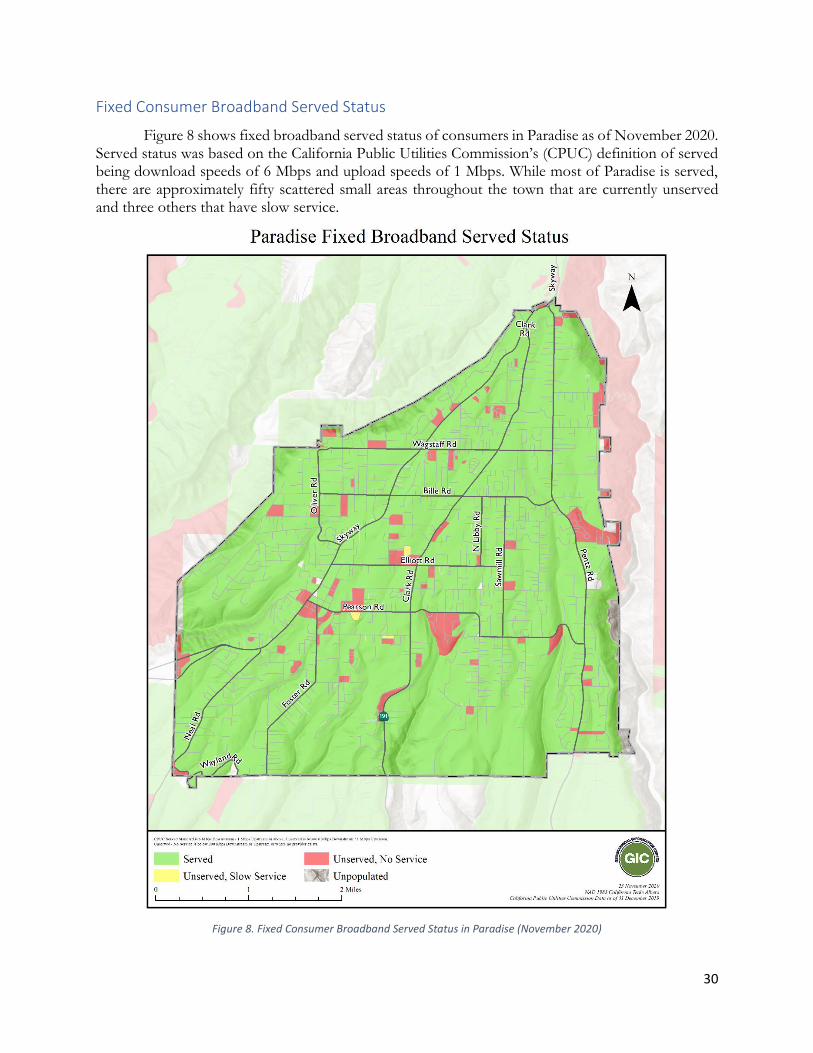
Fixed Consumer Broadband Served Status
Figure 8 shows fixed broadband served status of consumers in Paradise as of November 2020. Served status was based on the California Public Utilities Commission’s (CPUC) definition of served being download speeds of 6 Mbps and upload speeds of 1 Mbps. While most of Paradise is served, there are approximately fifty scattered small areas throughout the town that are currently unserved and three others that have slow service.
Figure 8. Fixed Consumer Broadband Served Status in Paradise (November 2020)
31
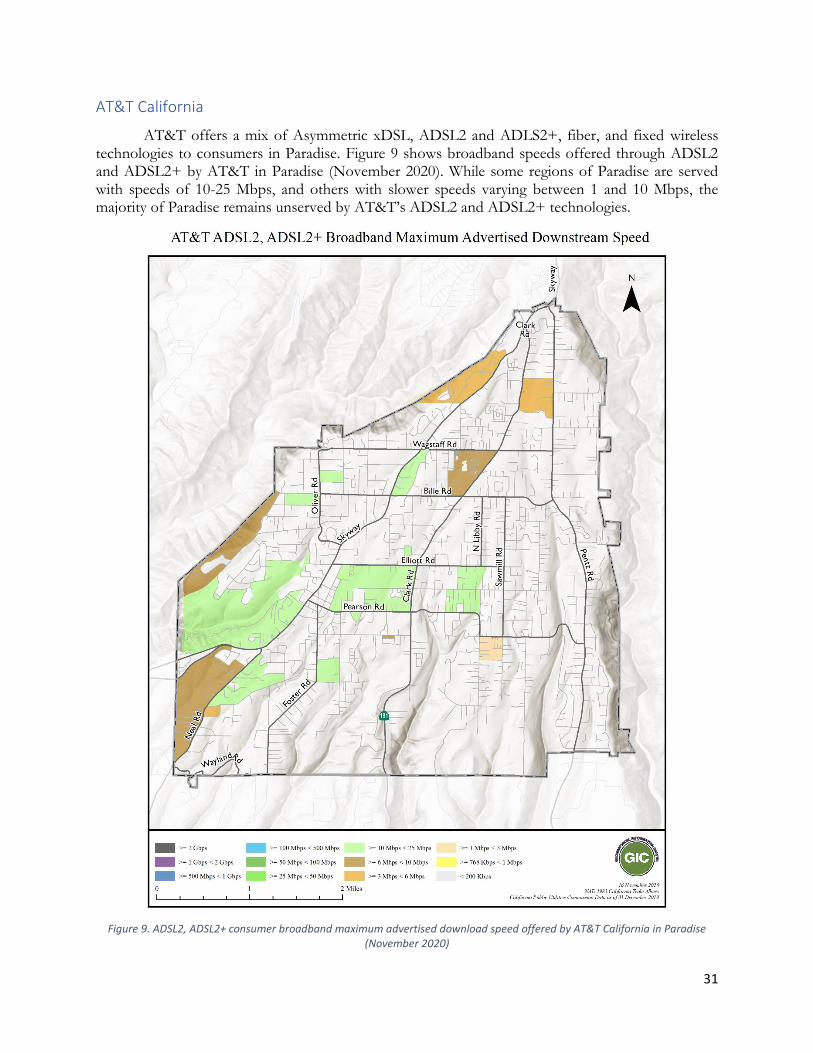
AT&T California
AT&T offers a mix of Asymmetric xDSL, ADSL2 and ADLS2+, fiber, and fixed wireless technologies to consumers in Paradise. Figure 9 shows broadband speeds offered through ADSL2 and ADSL2+ by AT&T in Paradise (November 2020). While some regions of Paradise are served with speeds of 10-25 Mbps, and others with slower speeds varying between 1 and 10 Mbps, the majority of Paradise remains unserved by AT&T’s ADSL2 and ADSL2+ technologies.
Figure 9. ADSL2, ADSL2+ consumer broadband maximum advertised download speed offered by AT&T California in Paradise (November 2020)
32
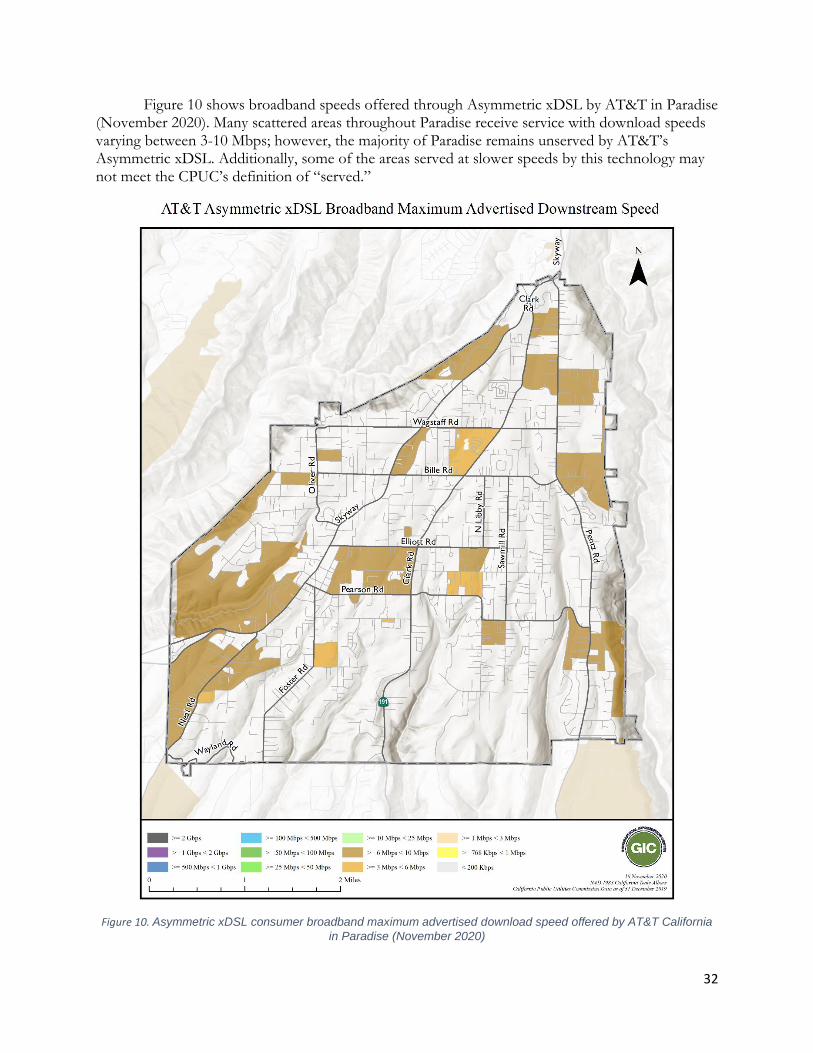
Figure 10 shows broadband speeds offered through Asymmetric xDSL by AT&T in Paradise (November 2020). Many scattered areas throughout Paradise receive service with download speeds varying between 3-10 Mbps; however, the majority of Paradise remains unserved by AT&T’s Asymmetric xDSL. Additionally, some of the areas served at slower speeds by this technology may not meet the CPUC’s definition of “served.”
Figure 10. Asymmetric xDSL consumer broadband maximum advertised download speed offered by AT&T California
in Paradise (November 2020)
33
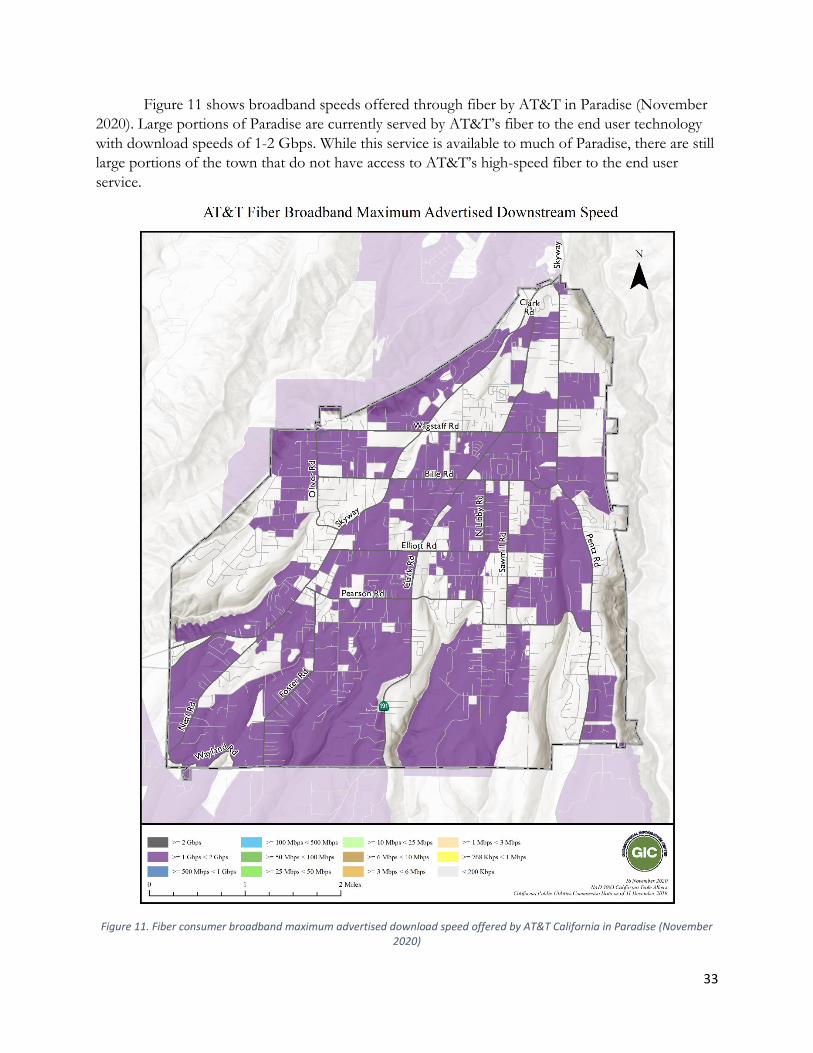
Figure 11 shows broadband speeds offered through fiber by AT&T in Paradise (November
2020). Large portions of Paradise are currently served by AT&T’s fiber to the end user technology
with download speeds of 1-2 Gbps. While this service is available to much of Paradise, there are still
large portions of the town that do not have access to AT&T’s high-speed fiber to the end user
service.
Figure 11. Fiber consumer broadband maximum advertised download speed offered by AT&T California in Paradise (November 2020)
34
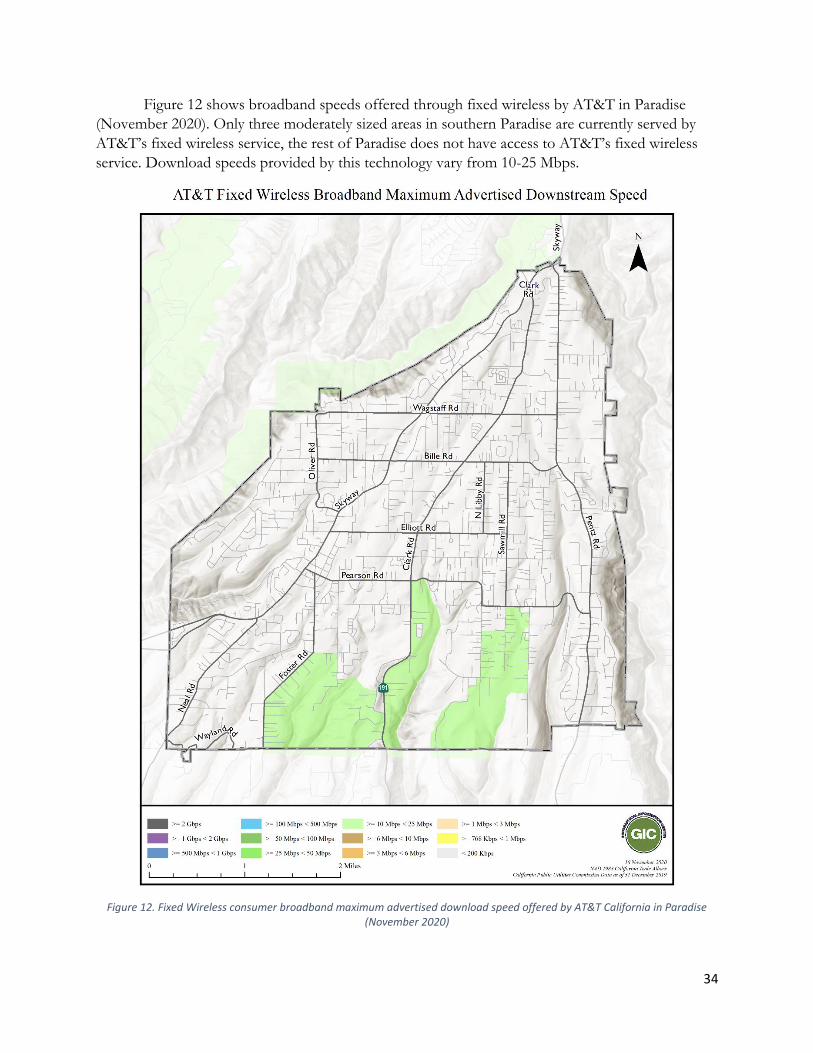
Figure 12 shows broadband speeds offered through fixed wireless by AT&T in Paradise
(November 2020). Only three moderately sized areas in southern Paradise are currently served by
AT&T’s fixed wireless service, the rest of Paradise does not have access to AT&T’s fixed wireless
service. Download speeds provided by this technology vary from 10-25 Mbps.
Figure 12. Fixed Wireless consumer broadband maximum advertised download speed offered by AT&T California in Paradise (November 2020)
35
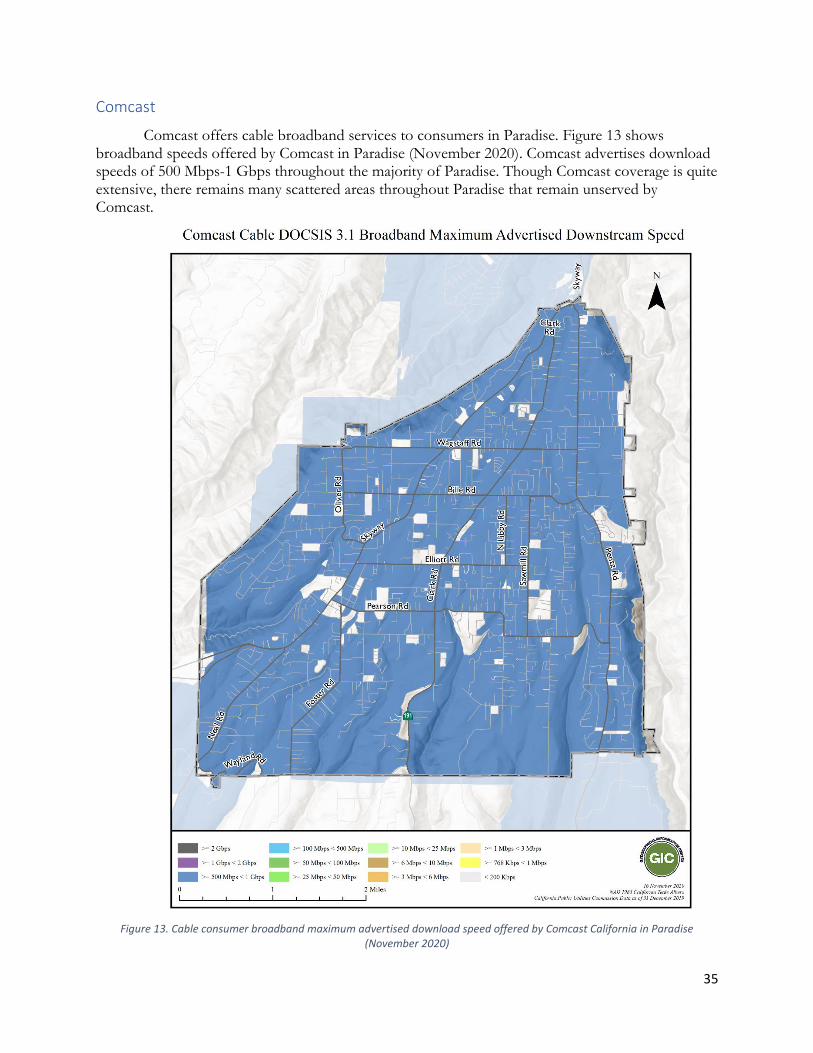
Comcast
Comcast offers cable broadband services to consumers in Paradise. Figure 13 shows broadband speeds offered by Comcast in Paradise (November 2020). Comcast advertises download speeds of 500 Mbps-1 Gbps throughout the majority of Paradise. Though Comcast coverage is quite extensive, there remains many scattered areas throughout Paradise that remain unserved by Comcast.
Figure 13. Cable consumer broadband maximum advertised download speed offered by Comcast California in Paradise (November 2020)
36
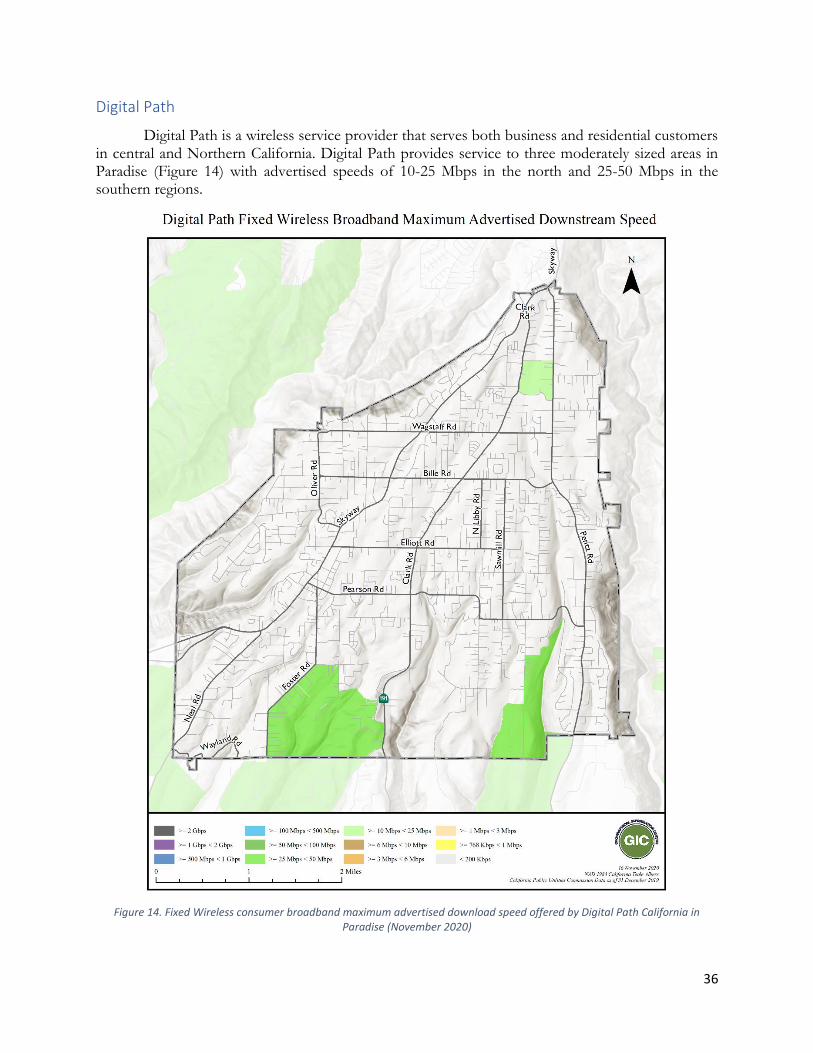
Digital Path
Digital Path is a wireless service provider that serves both business and residential customers in central and Northern California. Digital Path provides service to three moderately sized areas in Paradise (Figure 14) with advertised speeds of 10-25 Mbps in the north and 25-50 Mbps in the southern regions.
Figure 14. Fixed Wireless consumer broadband maximum advertised download speed offered by Digital Path California in Paradise (November 2020)
37
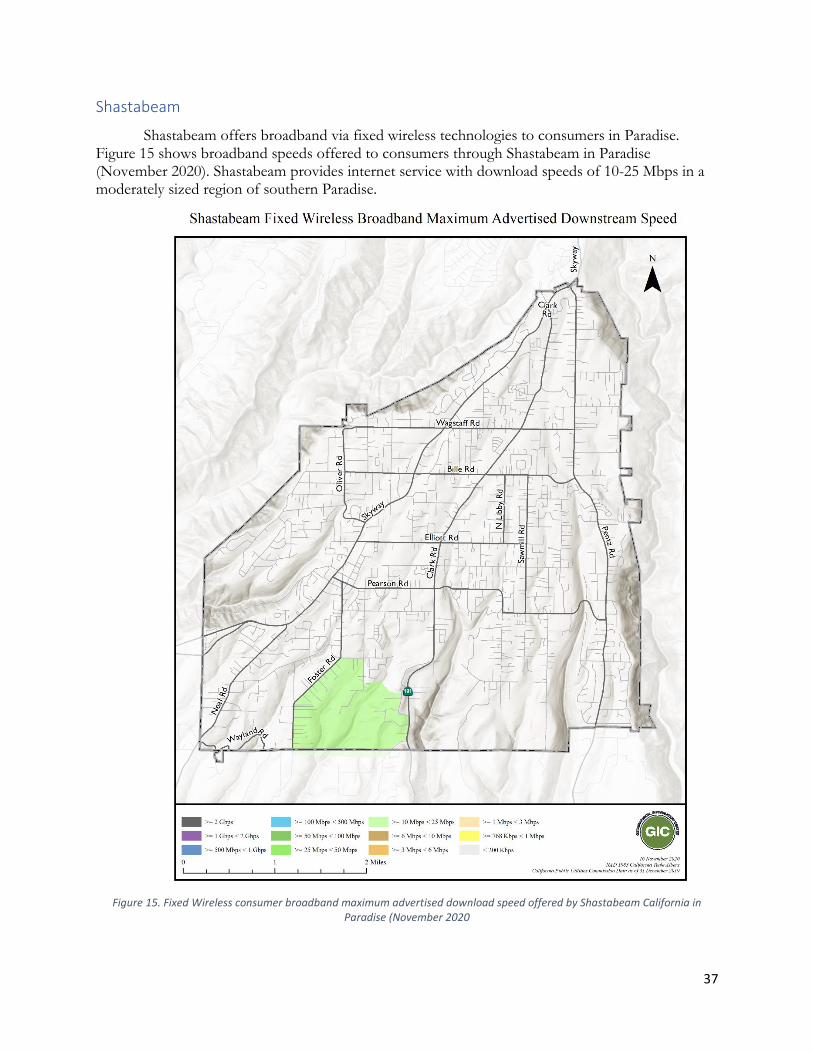
Shastabeam
Shastabeam offers broadband via fixed wireless technologies to consumers in Paradise. Figure 15 shows broadband speeds offered to consumers through Shastabeam in Paradise (November 2020). Shastabeam provides internet service with download speeds of 10-25 Mbps in a moderately sized region of southern Paradise.
Figure 15. Fixed Wireless consumer broadband maximum advertised download speed offered by Shastabeam California in Paradise (November 2020
38
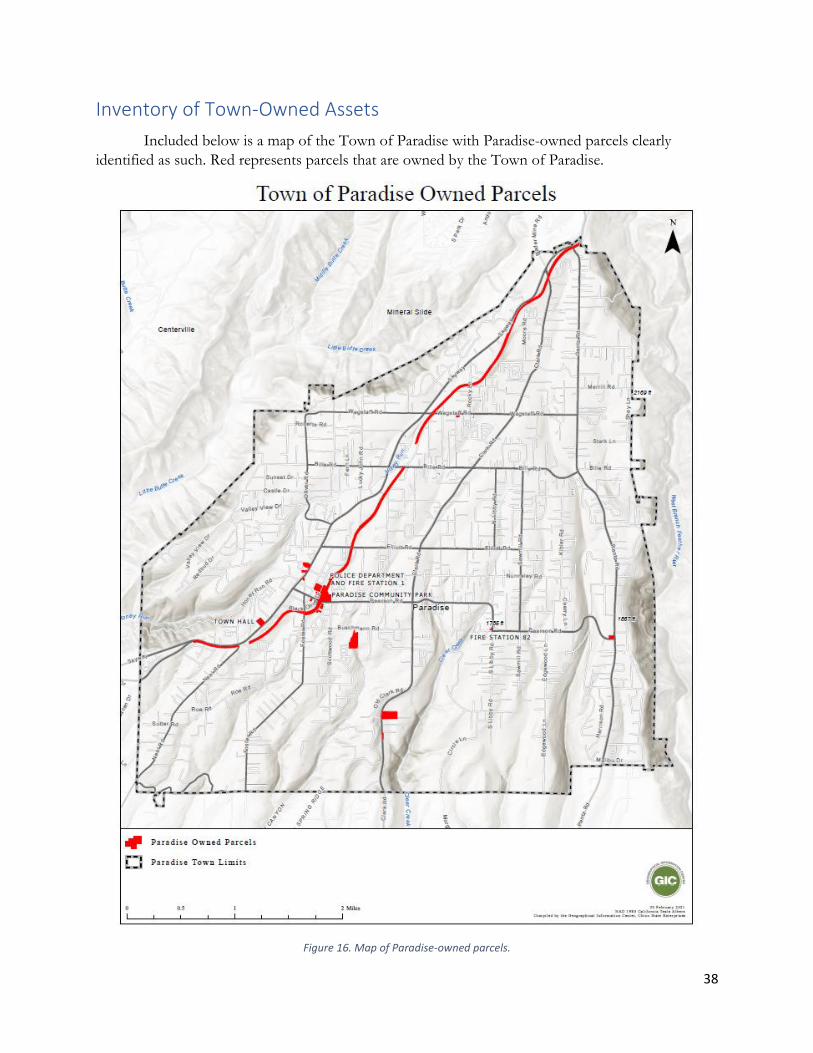
Inventory of Town-Owned Assets
Included below is a map of the Town of Paradise with Paradise-owned parcels clearly
identified as such. Red represents parcels that are owned by the Town of Paradise.
Figure 16. Map of Paradise-owned parcels.
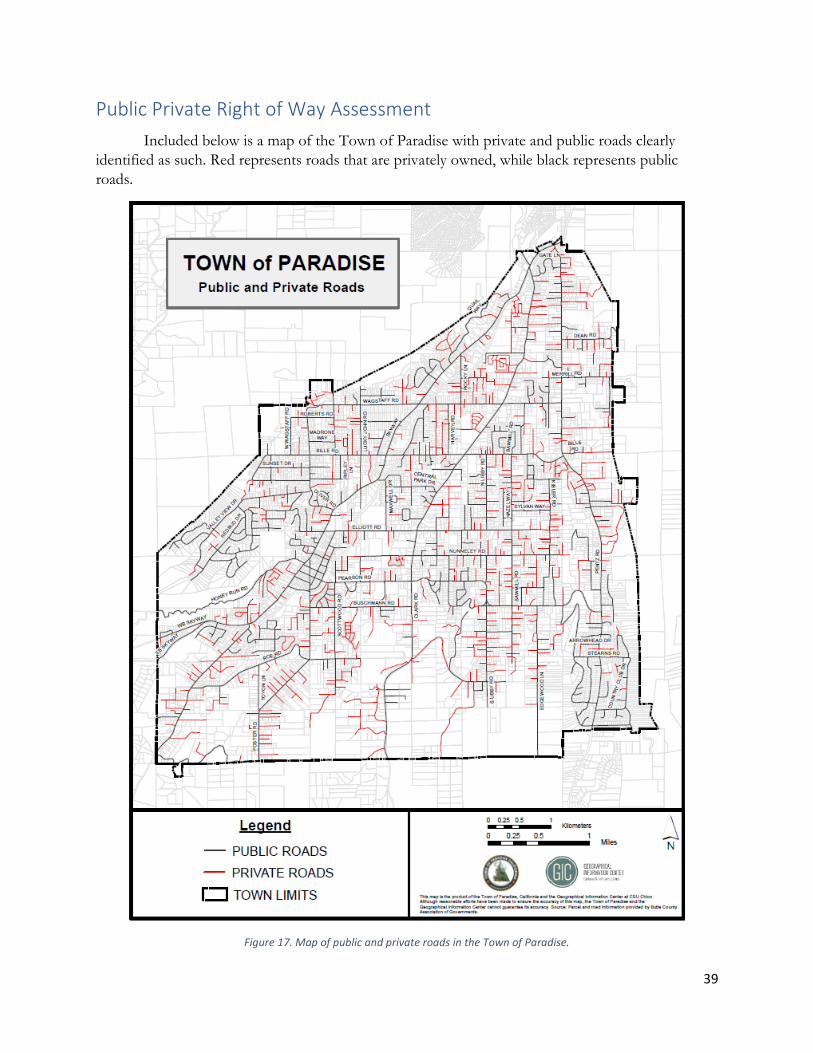
39
Public Private Right of Way Assessment
Included below is a map of the Town of Paradise with private and public roads clearly
identified as such. Red represents roads that are privately owned, while black represents public
roads.
Figure 17. Map of public and private roads in the Town of Paradise.
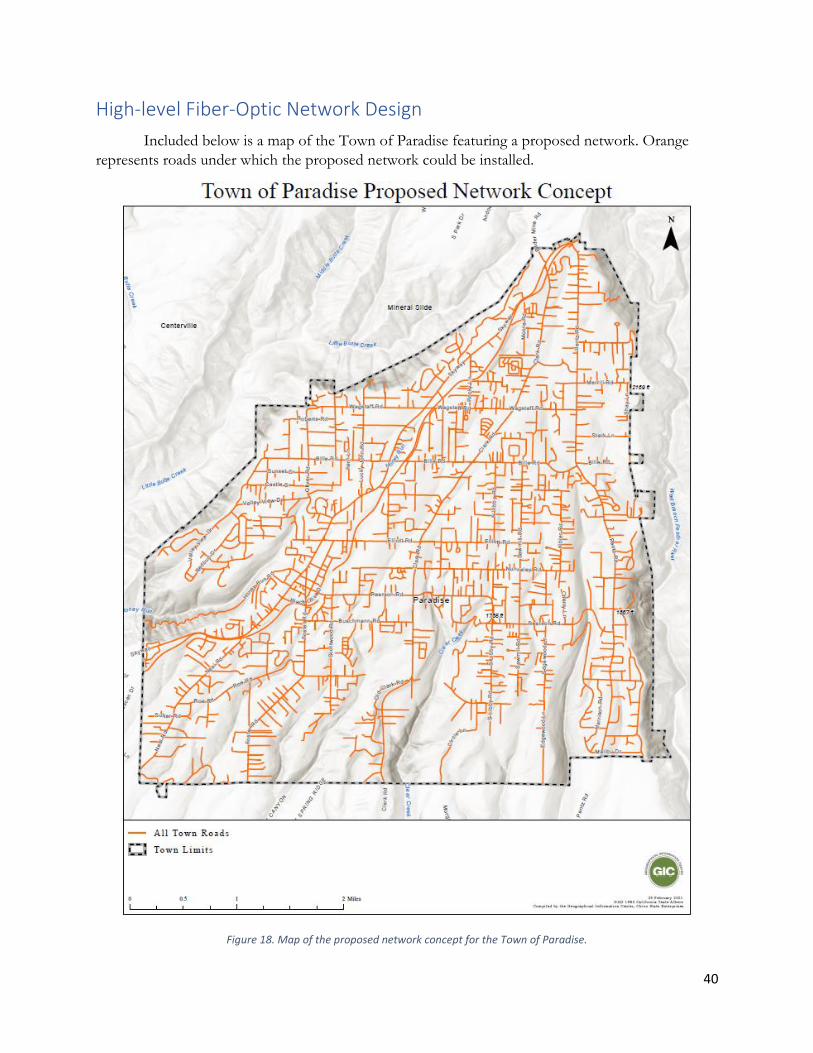
40
High-level Fiber-Optic Network Design
Included below is a map of the Town of Paradise featuring a proposed network. Orange
represents roads under which the proposed network could be installed.
Figure 18. Map of the proposed network concept for the Town of Paradise.

41
Estimated Deployment, Operation, and Maintenance of the Fiber-Optic
Network
Deliverables from sub-consultant forthcoming regarding cost sheets for three alternative networks:
on premise, commercial/industrial, and/or town asset only.

42
Assessment of Partnership Approaches for Deployment, Operations, and
Maintenance of the Fiber Optic Network
Deliverables reliant of outcomes forthcoming from sub-consultant.
43
Recommendations for Economic Development Opportunities Locally and
Regionally
Industry Growth/Benefits of High-Speed Broadband
The growth of the internet has led to a rapid change in how the economy conducts itself:
which industries have grown or shrunk, and where labor has migrated. Regions that have not kept
pace with this change risk being left behind. Laid out below are the various ways the economy has
changed with respect to growth in high-speed broadband in the previous years.
Some industries have seen wage and employment growth that is correlated with the rise in
broadband internet. Due to different studies classifying industries differently, or using different
metrics for conveying growth rates, it is difficult to identify with perfect accuracy the industries that
experienced the greatest employment growth; however, we can garner a good, generalized idea. With
relative consistency, the number of knowledge-based jobs and jobs in service industries grew
alongside broadband internet (Stockinger, 2019). These include, among others, technical, internet,
educational, financial, and managerial services (Atasoy, 2013, Kolko, 2012, & Crandall et al., 2007).
Most industries that saw employment growth also saw wage and output growth, though this
was not universally the case. The technical services industry experienced an increase in employment
while seeing a decrease in wage growth (Atasoy, 2013). The overwhelming majority of studies show
that increases to broadband availability leads to an increase in overall wage growth. Most available
studies look at industry growth, but some evidence of industry shrinkage attributable to broadband
growth exists as well. The wholesale, transportation, health care, and administrative services
industries had seen some drop in wage growth, employment growth, or both (Atasoy, 2013).
The cutting edge of industries’ intersection with the internet can be seen in the growth of
internet-connected technologies commonly referred to as the internet of Things. Many industries are
adopting these technologies as the status quo. Some of the industries that are rapidly adopting and
implementing new digital technologies include the healthcare industry, manufacturing, digital
media/technology, transportation, retail, finance, and energy/utilities (Tel, 2019, “Which Industries
will be most . . .,” 2015, ''The 6 Top Industries . . .,” 2017, DeNisco-Rayome, 2017, Dvurechenski,
2019, Matthews, 2018).
Costs and Benefits of Undergrounding
There are many variables to consider when installing underground utility and communication
lines as opposed to overhead lines. To assist Paradise personnel in their future determinations, CED
staff have researched the various benefits and costs associated with transitioning overhead lines to
underground or choosing to install new underground lines.
One of the first and most obvious benefits of undergrounding is improved aesthetics. Areas
that are not cluttered with power lines are more attractive and increase social welfare (California
Public Utilities Commission). The true value of this would be difficult to measure exactly but can be
proxied by property value premiums in neighborhoods that lack overhead power lines. One study
found that 31 percent of households in a middle-income suburban neighborhood were willing to pay
44
an $11,700 premium for property with underground utilities compared to similar properties with
overhead utilities (McNair & Ableson, 2010). However, these benefits to property values may not be
immediately realized, as overhead lines may not be removed immediately unless all services that
might use the overhead lines (power, internet, cable television, etc.) are able to be undergrounded at
once.
The most considerable benefit of undergrounding lines is the vastly reduced outage periods
caused by vehicle collisions or storms when using overhead lines. These costs can be significant,
with both consumers and utility suppliers incurring them, which can effectively double the initial
cost-per-mile of basic overhead lines over the course of their lifespans (expected to be about 40
years) (Glass & Glass, 2019). Underground power lines also dramatically decrease the likelihood of
wildfire, though other alternatives such as installing metal poles with new conductor coverings can
be quite effective as well while also being far less expensive.
Price of installation is the greatest cost of undergrounding, and it is far greater than the cost
of installing alternatives. There is no universal cost of installation, as it can vary greatly depending on
the numerous unique factors that come with each location. However, even the lowest estimates
exceed the cost of metal poles by a considerable margin, and some of the highest estimates run as
much as 12 times the initial cost per mile. Ultimately, whether or not these costs are warranted is
contingent on local need and their respective costs (California Public Utilities Commission). In
urban and suburban regions prone to outages, the cost to utility providers and consumers from
overhead lines could likely exceed the costs of undergrounding due to the increased frequency of
maintenance costs and the number of affected consumers per mile of line. However, in more rural
areas that are not prone to power outages, it may be incredibly difficult to justify the transition to
underground lines considering the costs (Larson, 2016).
An additional, lesser cost to consider with underground lines is that when outages occur,
though less frequently, it takes maintenance workers much longer to get the system back online.
This is due to issues being much more difficult to identify and fix, given many components are
hidden beneath the earth (California Public Utilities Commission).
Access to Broadband and a Younger Workforce
Young people are more likely to have internet services and interact in today’s digital world.
78 percent of millennials (aged 23 to 38) say they subscribe to broadband service (Vogels, 2019). 80
percent of Americans aged 18 to 29 have broadband access compared with 43 percent of those aged
65 and older (U.S. Department of Housing and Urban Development’s Office of Policy
Development and Research). When millennials live in remote rural areas, they are more likely to
reside in a county that has better digital access. Any community attempting to retain or attract
millennials needs to address the digital divide (Gallardo et. al., 2018).
39 percent of millennials have indicated a preference for living in a small town over a big city
in recent years. For attracting millennials, priorities for relocating are broadband and the ability to
work remotely. 36 percent of people surveyed cited bad or limited internet access as the primary
obstacle preventing them from moving to more rural areas, and 67 percent agreed that internet
availability is affecting their decision to move somewhere rural (Cooke, 2020).
45
Access to Broadband and Families with Children in School
Parents with minor children at home are more likely than average to have broadband at
home, by a 75-65 percent margin (Horrigan, 2010, p 7). Nine out of ten households with children
under age 18 at home have internet access, and 74 percent have broadband at home (Horrigan,
2010). 15 percent of U.S. households with school-age children do not have high-speed internet
connections at home. Survey findings have also shown that some teens are more likely to face digital
hurdles when trying to complete their homework (Anderson and Perrin, 2018).
Home internet can reduce time and monetary costs of working by allowing individuals to
work from home, reduce search frictions in the labor market by connecting potential employees to
employers, and save users time in home production tasks like shopping and paying bills, freeing up
time to engage in market work. The most significant impact on labor force participation due to high-
speed internet usage is seen among college-educated women with children. High-speed internet also
increases hours and employment rates among married women. Data on internet usage, telework,
employment histories, and time use provide suggestive evidence that telework, and time saved in
home production can explain the estimated change in labor supply for women (Dettling, Lisa J,
2015).
Internal Benefits of Coworking Spaces
People who use coworking spaces see their work as meaningful. They believe that they have
more job control and autonomy. They also feel like part of a community. Connections are a big
factor to why people pay to work in a communal space, as opposed to working from home or
renting an office. Spending time away from a traditional office, in a coworking space, can spark new
ideas and creativity (Spreitzer, 2015).
Coworking spaces can offer some promising characteristics. According to a survey of
coworking space users produced by Swantje Robeleski and published in the International Journal of
Environmental Research and Public Health, 71.9 percent of participants agreed or totally agreed that
they can better concentrate at the coworking space. 81.3 percent agreed or totally agreed that their
overall job satisfaction is higher. 92.2 percent agreed or totally agreed that they have more social
interaction at work. 85.9 percent agreed or totally agreed that they can separate their personal life
from work-life better. 41.3 percent agreed or totally agreed that the workplace is more ergonomic
(e.g. office furniture, lighting, etc.). 71.9 percent agreed or totally agreed that they can concentrate
better, and 89.1 percent agreed or totally agreed that they are more productive. 92.2 percent agreed
or totally agreed that they had an easier time in regard to self-organization (Robelski et. al., 2019,
page 13).
External Benefits of Coworking Spaces
By utilizing coworking office spaces, a business could save up to 75 percent in total costs
(Starbuck and Nerdwallet, 2015). Coworking spaces are flexible, allowing the potential to deliver the
best return for businesses now and into the future. There is less risk because businesses can adjust
46
their workspace according to what their business needs at the given time. Flexible workspaces can
help companies reduce capital expenditures, stabilize expenses, and only pay for the space they need.
Coworking Spaces and Broadband
About half of Americans (48 percent) at the end of 2020 said that if they were able to live
anywhere, they would choose a town or rural area rather than a city or suburb. (Saad, 2021). A
significant factor influencing the shift away from large cities is the ability to work remotely.
Broadband is a prerequisite for promoting a community as a remote work location (Drew, 2020).
While 84 percent of remote workers work primarily from home, a recent survey revealed that 51
percent note coffee shops and coworking spaces as the second most common location from which
they work. Remote workers sometimes need a change in scenery (Drew, 2020). To attract remote
workers, common tactics include providing coworking spaces and building a community of remote
workers (Qatalist Research Group, 2020). For coworking and alternative workspaces, this does not
have to mean a formal coworking space. Small towns can start identifying and sharing alternative
workspaces from within the community. Communities can get creative with their coworking spaces,
including leveraging public libraries, businesses that are not using all their space, church fellowship
halls, youth centers, or other pre-established spaces with regular vacancies (Qatalist Research Group,
2020).
To attract workers who can work anywhere, communities could take a more active role in
placemaking aimed at remote workers by investing or supporting development of a coworking space
to serve as a hub or catalyst for the remote working community to come together (Oliver et. al.,
2016, page 12).
47
Grant Funding/Financing Opportunities
To assist the Town of Paradise in its planning and decision-making process, included in this
section is an inventory of broadband-based funding opportunities. The inventory is limited to
funding opportunities for which the Town of Paradise is most eligible. The inventory is presented in
tables 8a-8c below. These tables include the name of the program, the agency that administers the
funding, the most recent application dates and deadlines, funding range, funding priorities, type of
funding, eligibility criteria, and web links to the appropriate website when available. Additionally, a
more in-depth review of two particularly apt funding options, California Advanced Services Fund
(CASF) Infrastructure Grants and USDA ReConnect Program grants and loans, have been
provided.
Eligible Areas for CPUC CASF Broadband Infrastructure Grants
AB 1665, approved by the Governor on October 2017, extends the date of the CASF goal
(deploying broadband internet service at speeds of 6/1 Mbps to 98 percent of household in each
consortium region) from 2015 to 2022 and authorizes the CPUC to collect an additional $300
million to the CASF Broadband Infrastructure Grant Account. In December 2018, the CPUC
approved the new rules for the Infrastructure Grant Account (Proceeding R1210012). As per the
new rules, the CPUC is allowed to fund all or a portion of a project, on a case-by-case basis. To
determine the funding level (ranging from 60% to 100%) for a project, the Commission will
consider the following factors:
● Baseline (60%): Areas served at speeds below 6 Mbps downstream and 1 Mbps upstream. Areas with only dial-up or no internet connectivity (up to +40%)
● Low-income service (median household income no greater than $50,200) (up to +40%)
● Location and accessibility of the area meeting two of the following five characteristics (up to +10%):
1. Rugged or difficult terrain (e.g., mountains, desert, national or state forest);
2. Unincorporated community;
3. More than 10 miles from the nearest hospital;
4. More than 10 miles from the nearest state or federal highway; and/or
5. Rural census block, as defined by the U.S. Census Bureau.
● Existence of communication facilities that may be upgraded to deploy broadband (up to +10%)
● Project makes a significant contribution to achieving the program goal (up to +10%)
Eligible applicants for the CASF Infrastructure Account grant include:
● Entities with a Certificate of Public Convenience and Necessity (CPCN) that qualify as a “telephone corporation” as defined under Public Utilities (Pub. Util.) Code section 234;

48
● Wireless carriers who are registered with the Commission (i.e., hold a Wireless Identification Registration (WIR))—wireless carriers need not obtain a CPCN to qualify for CASF funding;
● Non-telephone corporations that are facilities-based broadband service providers—the Commission uses the NTIA definition of a facilities-based broadband service provider, which is generally defined as any entity providing internet access service or middle mile transport, over its own fixed or wireless facilities to residence, businesses, or other institution;
● A local governmental agency if no other eligible entity applied.
Eligible Areas for USDA Reconnect Program
The USDA ReConnect Program is a pilot program that offers federal financing and funding options in the form of loans ($200M), grants ($200M), and loan/grant combinations ($200M) to facilitate broadband deployment in areas that don’t currently have sufficient access to broadband (10 Mbps/1 Mbps). This pilot program allows applicants to deploy broadband infrastructure to provide high-speed internet e-Connectivity to as many rural premises as possible, including homes, community facilities for health care and public safety, schools, libraries, farms, ranches, factories, and other production sites.
For a geographic area to be eligible to receive funds from this pilot program, it must meet two criteria:
1. It must be rural: Service areas are not located in a city, town, or incorporated area that has a population greater than 20,000 or an urbanized area adjacent to a city or town with a population greater than 50,000 people. Eligible areas must be completely contained within a rural area or composed of multiple rural areas.
2. Most households must currently have insufficient internet service: At least 90 percent of households in the proposed area must not have sufficient access to broadband service (fixed terrestrial broadband service at 10 Mbps downstream and 1 Mbps upstream).
Eligible applicants for the USDA Reconnect Program must be able to supply retail broadband to customers. Applicants include:
● Cooperatives, nonprofits, or mutual associations
● For-profit corporations or limited liability companies
● States, local governments, or any agency, subdivision, instrumentality, or political subdivision thereof
● A territory or possession of the U.S.
● An Indian tribe
The various details for the recommended funding opportunities have been split between three tables for improved legibility.
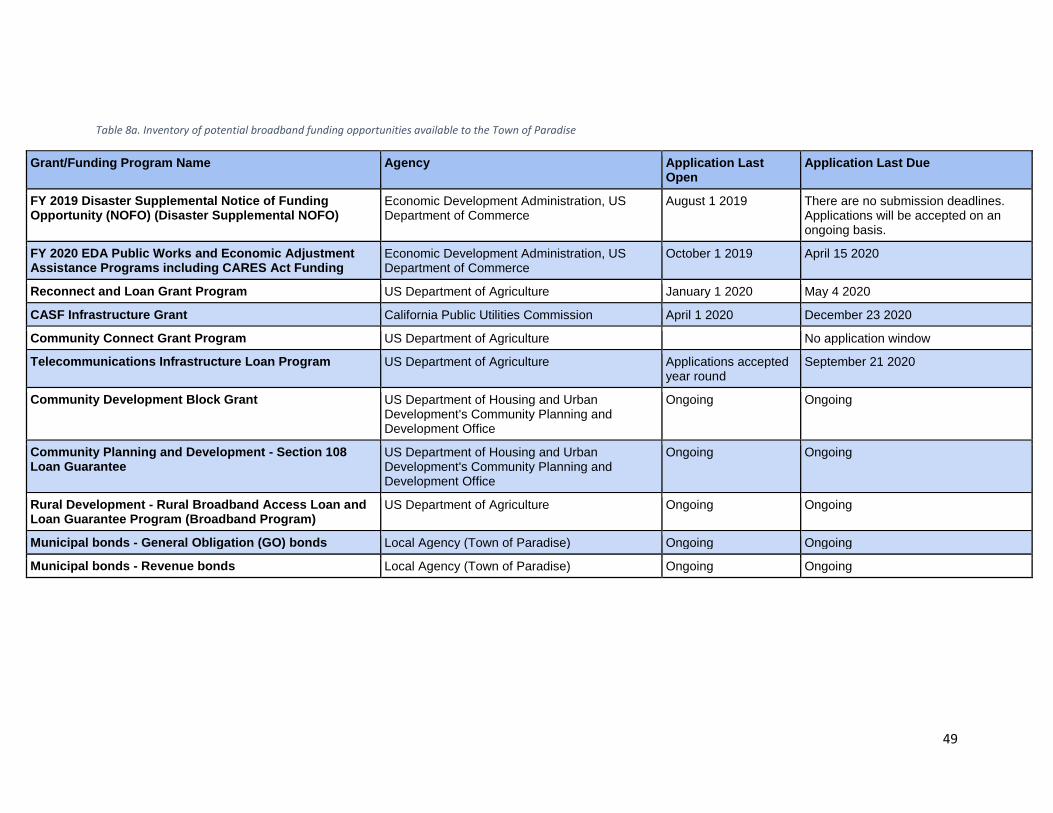
49
Table 8a. Inventory of potential broadband funding opportunities available to the Town of Paradise
Grant/Funding Program Name Agency Application Last Open
Application Last Due
FY 2019 Disaster Supplemental Notice of Funding Opportunity (NOFO) (Disaster Supplemental NOFO)
Economic Development Administration, US Department of Commerce
August 1 2019 There are no submission deadlines. Applications will be accepted on an ongoing basis.
FY 2020 EDA Public Works and Economic Adjustment Assistance Programs including CARES Act Funding
Economic Development Administration, US Department of Commerce
October 1 2019 April 15 2020
Reconnect and Loan Grant Program US Department of Agriculture January 1 2020 May 4 2020
CASF Infrastructure Grant California Public Utilities Commission April 1 2020 December 23 2020
Community Connect Grant Program US Department of Agriculture No application window
Telecommunications Infrastructure Loan Program US Department of Agriculture Applications accepted year round
September 21 2020
Community Development Block Grant US Department of Housing and Urban Development's Community Planning and Development Office
Ongoing Ongoing
Community Planning and Development - Section 108 Loan Guarantee
US Department of Housing and Urban Development's Community Planning and Development Office
Ongoing Ongoing
Rural Development - Rural Broadband Access Loan and Loan Guarantee Program (Broadband Program)
US Department of Agriculture Ongoing Ongoing
Municipal bonds - General Obligation (GO) bonds Local Agency (Town of Paradise) Ongoing Ongoing
Municipal bonds - Revenue bonds Local Agency (Town of Paradise) Ongoing Ongoing
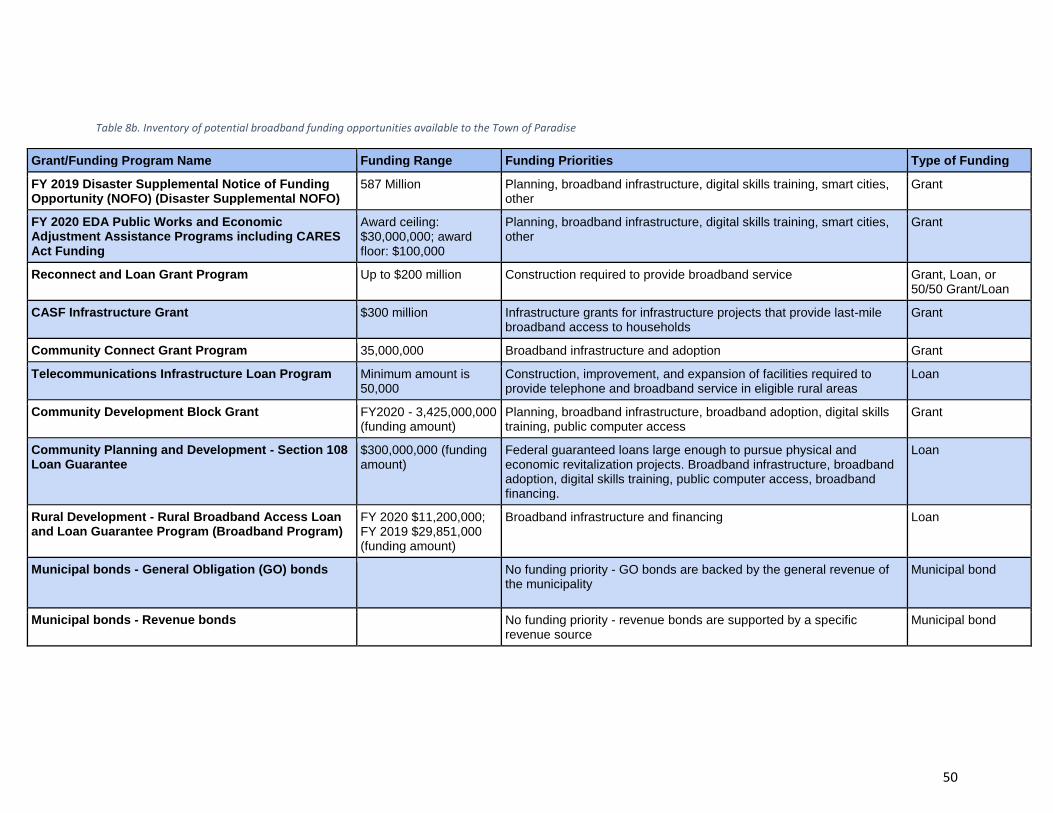
50
Table 8b. Inventory of potential broadband funding opportunities available to the Town of Paradise
Grant/Funding Program Name Funding Range Funding Priorities Type of Funding
FY 2019 Disaster Supplemental Notice of Funding Opportunity (NOFO) (Disaster Supplemental NOFO)
587 Million Planning, broadband infrastructure, digital skills training, smart cities, other
Grant
FY 2020 EDA Public Works and Economic Adjustment Assistance Programs including CARES Act Funding
Award ceiling: $30,000,000; award floor: $100,000
Planning, broadband infrastructure, digital skills training, smart cities, other
Grant
Reconnect and Loan Grant Program Up to $200 million Construction required to provide broadband service Grant, Loan, or 50/50 Grant/Loan
CASF Infrastructure Grant $300 million Infrastructure grants for infrastructure projects that provide last-mile broadband access to households
Grant
Community Connect Grant Program 35,000,000 Broadband infrastructure and adoption Grant
Telecommunications Infrastructure Loan Program Minimum amount is 50,000
Construction, improvement, and expansion of facilities required to provide telephone and broadband service in eligible rural areas
Loan
Community Development Block Grant FY2020 - 3,425,000,000 (funding amount)
Planning, broadband infrastructure, broadband adoption, digital skills training, public computer access
Grant
Community Planning and Development - Section 108 Loan Guarantee
$300,000,000 (funding amount)
Federal guaranteed loans large enough to pursue physical and economic revitalization projects. Broadband infrastructure, broadband adoption, digital skills training, public computer access, broadband financing.
Loan
Rural Development - Rural Broadband Access Loan and Loan Guarantee Program (Broadband Program)
FY 2020 $11,200,000; FY 2019 $29,851,000 (funding amount)
Broadband infrastructure and financing Loan
Municipal bonds - General Obligation (GO) bonds No funding priority - GO bonds are backed by the general revenue of the municipality
Municipal bond
Municipal bonds - Revenue bonds No funding priority - revenue bonds are supported by a specific revenue source
Municipal bond
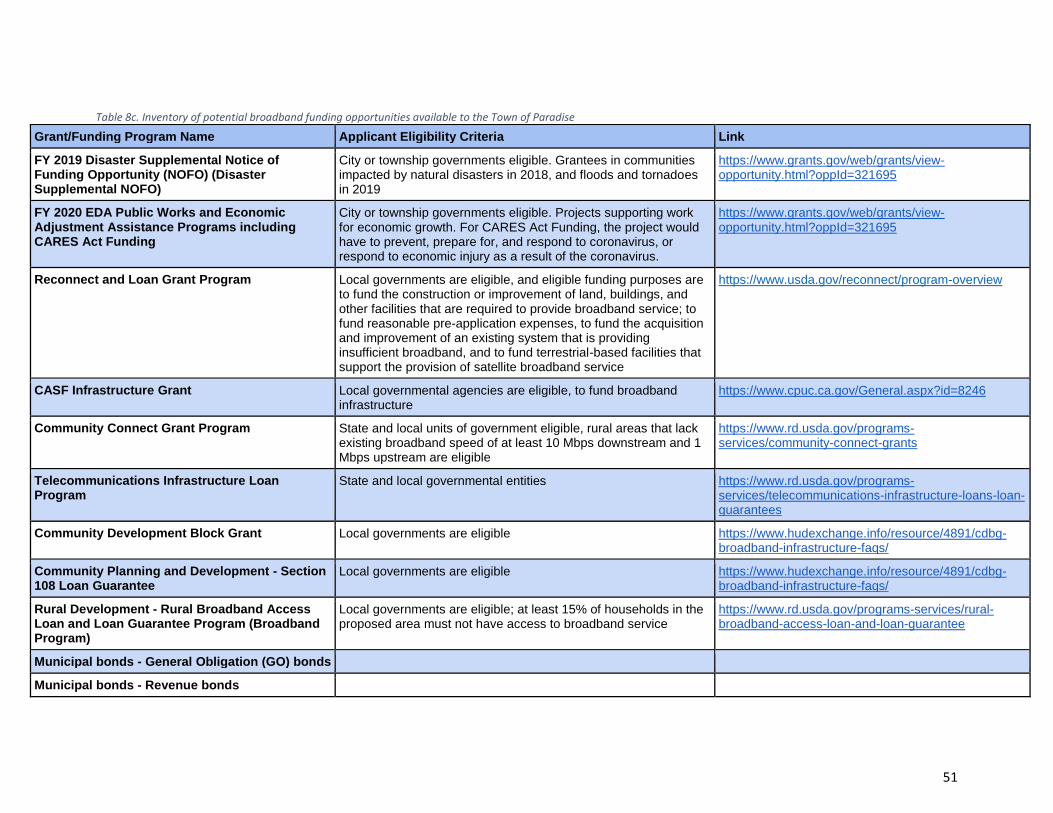
51
Table 8c. Inventory of potential broadband funding opportunities available to the Town of Paradise
Grant/Funding Program Name Applicant Eligibility Criteria Link
FY 2019 Disaster Supplemental Notice of Funding Opportunity (NOFO) (Disaster Supplemental NOFO)
City or township governments eligible. Grantees in communities impacted by natural disasters in 2018, and floods and tornadoes in 2019
https://www.grants.gov/web/grants/view-opportunity.html?oppId=321695
FY 2020 EDA Public Works and Economic Adjustment Assistance Programs including CARES Act Funding
City or township governments eligible. Projects supporting work for economic growth. For CARES Act Funding, the project would have to prevent, prepare for, and respond to coronavirus, or respond to economic injury as a result of the coronavirus.
https://www.grants.gov/web/grants/view-opportunity.html?oppId=321695
Reconnect and Loan Grant Program Local governments are eligible, and eligible funding purposes are to fund the construction or improvement of land, buildings, and other facilities that are required to provide broadband service; to fund reasonable pre-application expenses, to fund the acquisition and improvement of an existing system that is providing insufficient broadband, and to fund terrestrial-based facilities that support the provision of satellite broadband service
https://www.usda.gov/reconnect/program-overview
CASF Infrastructure Grant Local governmental agencies are eligible, to fund broadband infrastructure
https://www.cpuc.ca.gov/General.aspx?id=8246
Community Connect Grant Program State and local units of government eligible, rural areas that lack existing broadband speed of at least 10 Mbps downstream and 1 Mbps upstream are eligible
https://www.rd.usda.gov/programs-services/community-connect-grants
Telecommunications Infrastructure Loan Program
State and local governmental entities https://www.rd.usda.gov/programs-services/telecommunications-infrastructure-loans-loan-guarantees
Community Development Block Grant Local governments are eligible https://www.hudexchange.info/resource/4891/cdbg-broadband-infrastructure-faqs/
Community Planning and Development - Section 108 Loan Guarantee
Local governments are eligible https://www.hudexchange.info/resource/4891/cdbg-broadband-infrastructure-faqs/
Rural Development - Rural Broadband Access Loan and Loan Guarantee Program (Broadband Program)
Local governments are eligible; at least 15% of households in the proposed area must not have access to broadband service
https://www.rd.usda.gov/programs-services/rural-broadband-access-loan-and-loan-guarantee
Municipal bonds - General Obligation (GO) bonds
Municipal bonds - Revenue bonds
52
References
“A Smart Waste Management Solution Geared towards Citizens.” National Center for
Biotechnology Information, U.S. National Library of Medicine, 2020.
https://www.ncbi.nlm.nih.gov/pmc/articles/PMC7219336/
Anderson, Monica and Perrin, Andrew. “Nearly one-in-five teens can’t always finish their
homework because of the digital divide.” Pew Research Center. October 26, 2018.
https://www.pewresearch.org/fact-tank/2018/10/26/nearly-one-in-five-teens-cant-always-
finish-their-homework-because-of-the-digital-divide/.
Atasoy, Hilal. “The Effects of Broadband Internet Expansion on Labor Market Outcomes.”
Industrial and Labor Relations Review. 2013, 334-341.
http://citeseerx.ist.psu.edu/viewdoc/download?doi=10.1.1.1016.9618&rep=rep1&type=pd
f.
Bousquet, Chris. “How Cities Are Using the Internet of Things to Map Air Quality.” Data-smart
City Solutions, 2017. https://datasmart.ash.harvard.edu/news/article/how-cities-are-using-
the-internet-of-things-to-map-air-quality-1025
Butte Countywide Homeless Continuum of Car, “2019 Point-in-Time Jurisdictional Breakouts.”
2019.
http://www.buttehomelesscoc.com/uploads/1/1/7/5/117500423/chicobreakoutsummaryf
inal12.31.2019.pdf
Butte County Public Health, “Community Health Assessment.” 2019.
https://www.buttecounty.net/Portals/21/Admin/Accreditation/Public/CHA2019.pdf
Crandall, Robert, William Lehr, and Robert Litan. “The Effects of Broadband Deployment on
Output and Employment: A Cross-sectional Analysis of US Data.” The Brookings Institution.
2007. https://www.brookings.edu/wp-content/uploads/2016/06/06labor_crandall.pdf.
“Congestion Charging Cuts Car Usage in Central London.” Smart City Smart Nation Client Stories
in Action. Deloitte Development, LLC.
https://www2.deloitte.com/content/dam/Deloitte/us/Documents/process-and-
operations/us-cons-smart-cities-client-stories-in-action.pdf
Cooke, Kristin. “WHF Survey Shows Better Internet in Rural Areas Would Attract New Residents.”
Satellite Internet. October 26 2020. https://www.satelliteinternet.com/resources/wfh-internet-
survey/.
“COVID-19 Has Heightened the Interest of Communities in Attracting Remote Workers.” Qatalyst
Research Group. 2020. https://qatalyst.ca/blog/file/AttractingRemoteWorkers.pdf.
53
“CPUC Undergrounding Programs.” California Public Utilities Commission.
https://www.cpuc.ca.gov/General.aspx?id=4403.
DeNisco-Rayome, Alison. “The five industries leading the IoT revolution.” ZDNet. February 1
2017. https://www.zdnet.com/article/the-five-industries-leading-the-iot-revolution/.
Dettling, Lisa J. “Broadband in the Labor Market: The Impact of Residential High-Speed Internet
on Married Women’s Labor Force Participation.” Federal Reserve Board. February 2015.
https://www.federalreserve.gov/pubs/feds/2013/201365/201365pap.pdf.
Dvurechenski, Dmytro. “7 Industries that Will Benefit the Most from Applying IoT in 2020.”
openGeeksLab. November 1 2019. https://opengeekslab.medium.com/7-industries-that-will-
benefit-the-most-from-applying-iot-in-2020-f49e0f1184fc.
Fornefeld, Martin, Gilles Delaunay, and Dieter Elixmann. “The Impact of Broadband on Growth
and Productivity.” MICUS Management Consulting, 2008. Accessed September 24, 2020.
https://www8.gsb.columbia.edu/citi/sites/citi/files/Panel%203.Martin%20Fornefeld%20p
aper.pdf
Gallardo, Robert, Robert Bell, and Norman Jacknis. “When It Comes to Broadband, Millennials
Vote with Their Feet.” The Daily Yonder: Keep It Rural. April 11, 2018.
https://dailyyonder.com/comes-broadband-millennials-vote-feet/2018/04/11/.
Gallardo, Robert, Brain Whitacre, Indraneel Kumar, and Sreedhar Upendram. “Research Report:
Broadband and Job Productivity – What Matters?” The Daily Yonder. 2020.
https://dailyyonder.com/research-report-broadband-and-job-productivity-what-
matters/2020/08/05/
Glass, Ephram and Glass, Victor. “Underground power lines can be the least cost option when
study biases are corrected.” The Electricity Journal. January 28 2019. https://bit.ly/392rQ9I.
Goldstein, Phil. “Fire Technology in Smart Cities and Beyond: How IoT Helps Fight Fires.”
StateTech, 2020. https://statetechmagazine.com/article/2020/08/fire-technology-smart-
cities-and-beyond-how-iot-helps-fight-fires-
perfcon#:~:text=IoT%20sensors%20and%20devices%20can,suppression%20in%20the%20
form%20of
“Guide to Fiber Optics and Premises Cabling.” The Fiber Optic Association, Inc. 2017.
https://foa.org/tech/ref/appln/smartcities.html
Horrigan, John B. “Broadband Adoption and Use in America.” Federal Communications Commission.
2010. https://online.wsj.com/public/resources/documents/FCCSurvey.pdf.
Katz, Raul. “Impact of Broadband on the Economy.” Regulatory and Market Environment.
Telecommunications Development Sector, 2012. Accessed September 24, 2020.
54
https://www.itu.int/ITU-D/treg/broadband/ITU-BB-Reports_Impact-of-Broadband-on-
the-Economy.pdf
Kolko, Jed. “Does Broadband Boost Local Economic Development?” Public Policy Institute of
California. Public Policy Institute of California. 2010.
https://www.ppic.org/content/pubs/report/R_110JKR.pdf.
Kolko, Jed. “Broadband and local growth.” Journal of Urban Economics. 2011.
https://www.ppic.org/content/pubs/report/R_110JKR.pdf.
Larsen, Peter H. “A method to estimate the costs and benefits of undergrounding electricity
transmission and distribution lines.” Energy Economics. September 2016.
http://bit.ly/3ixijKX.
LinkNYC, 2019, https://www.link.nyc/faq.html#linknyc. Accessed 9 Sept. 2020.
Loukaitou-Sideris, Anastasia. “SMART Parks: A Toolkit.” Luskin Center for Innovation, UCLA,
2019. https://innovation.luskin.ucla.edu/wp-content/uploads/2019/03/Smart_Parks-
A_Toolkit.pdf
Matthews, Kayla. “5 Industries That Are Winning with IoT”. DMN. May 2018.
https://www.dmnews.com/data/article/13034551/5-industries-that-are-winning-with-iot.
Mccray, Becky. “Zoom Towns: attracting and supporting remote workers in rural small towns.”
Small Biz Survival. 2020. https://smallbizsurvival.com/2020/12/zoom-towns-attracting-and-
supporting-remote-workers-in-rural-small-towns.html.
Mcnair, Ben and Abelson, Peter. “Estimating the Value of Undergrounding Electricity and
Telecommunications Networks.” The Australian Economic Review. 2010. https://onlinelibrary-
wiley-com.mantis.csuchico.edu/doi/epdf/10.1111/j.1467-8462.2010.00608.x.
Minges, Michael. “Exploring the Relationship Between Broadband and Economic Growth.” World
Development Report 2016 Digital Dividends. The World Bank, 2016.
http://pubdocs.worldbank.org/en/391452529895999/WDR16-BP-Exploring-the-
Relationship-between-Broadband-and-Economic-Growth-Minges.pdf
Murphy, Jack J. and Jerry Tracy. “Leveraging Building Intelligence: Smart Firefighting and Smart
Cities.” Fire Engineering, 2021.
https://www.fireengineering.com/2020/06/19/489809/leveraging-building-intelligence-
smart-firefighting-and-smart-cities/#gref
North State Community Foundation, “Rising from the Ashes: A six-month progress report on
Camp Fire relief and recovery.” 2019. https://92834669-3457-4909-bc7c-
6e94197d5ac5.filesusr.com/ugd/26589b_072478376bdd43fab8b8bb881c4bbf16.pdf
55
North State Community Foundation, “Strengthening the Safety Net in Butte County: Findings and
Recommendations” 2019. https://92834669-3457-4909-bc7c-
6e94197d5ac5.filesusr.com/ugd/26589b_072478376bdd43fab8b8bb881c4bbf16.pdf
NYC Gov Parks. New York City Department of Parks and Recreation.
https://www.nycgovparks.org/.
NYC Environmental Protection. New York City Official website, 2020.
https://www1.nyc.gov/site/dep/pay-my-bills/automated-meter-reading-frequently-asked-
questions.page.
Oliveira, Thays A., Miquel Oliver, and Helena Ramalhinho. “Challenges for Connecting Citizens and
Smart Cities: ICT, E-Governance and Blockchain.” MDPI. 2020.
https://www.mdpi.com/2071-1050/12/7/2926/pdf
Oliver, Zachary; Schoewe, Dana; and Lawrence, Sara. “Attracting Talent Who Can Live and Work
Anywhere.” RTI International. October 2016.
https://www.darenc.com/home/showdocument?id=1239.
Qiang, Christine Zhen-Wei, Carlo M. Rossotto, and Kaoru Kimura. “Economic Impacts of
Broadband.” Information and Communications for Development: Extending Reach and Increasing
Impact. The World Bank. (2009): 35-50. Accessed September 24, 2020.
http://documents1.worldbank.org/curated/en/645821468337815208/pdf/487910PUB0EP
I1101Official0Use0Only1.pdf
Repp, Drew. “How Communities Can Attract and Retain Remote Workers.” Emsi. March 30 2020.
https://www.economicmodeling.com/attract-and-retain-remote-workers/.
Robelski, Swantje; Keller, Helena; Harth, Volker; and Mache, Stefanie. “Coworking Spaces: The
Better Home Office? A psychosocial and Health-Related Perspective on an Emerging Work
Environment.” International Journal of Environmental Research and Public Health. 2019.
https://www.ncbi.nlm.nih.gov/pmc/articles/PMC6651795/pdf/ijerph-16-02379.pdf.
Saad, Lydia. “Country Living Enjoys Renewed Appeal in U.S.” Gallup. January 5, 2021.
https://news.gallup.com/poll/328268/country-living-enjoys-renewed-appeal.aspx.
Sallet, Jonathan. “Broadband for America’s Futer: A Vision for the 2020s”.
https://www.benton.org/sites/default/files/BBA_full_F5_10.30.pdf.
Samms, Grant. “3 ways smart cities can improve air quality.” Smart Cities Dive, 2020.
https://www.smartcitiesdive.com/news/3-ways-smart-cities-can-improve-air-
quality/580519/
7th Generation Design. https://www.7thgenerationdesign.com/living-with-fire-part-2-regenerative-
firescaping/
56
Schwichtenberg, Heiko. “Smart City Perspectives: Rethinking Security and Life Safety Solutions.”
FeuerTrutz International, 2019. https://www.feuertrutz.com/smart-city-perspectives-
rethinking-security-and-life-safety-solutions/150/66990/
Shah, Jigar, et al. “A Survey of Smart City infrastructure via Case study on New York.”
Sciencedirect, 2019.
https://www.sciencedirect.com/science/article/pii/S1877050919317247.
“Six financial reasons why businesses choose WeWork” WeWork. August 27, 2019.
https://www.wework.com/ideas/growth-innovation/financial-reasons-why-businesses-
choose-wework.
Smart Cities Council. Smart Cities Council, 2020, https://smartcitiescouncil.com/.
“Smart Cities Readiness Guide.” Smart Cities Council, 2020.
https://rg.smartcitiescouncil.com/readiness-guide/article/waste-management-waste-
management?page=0%2C3
“Smart City Waste Management.” Spectrum, 2020. https://spectrumsmartcities.com/articles/smart-
city-waste-
management.html#:~:text=Smart%20city%20waste%20management%20technology%20all
ows%20crews%20to%20empty%20bins,be%20treated%20to%20eliminate%20odors.
Spreitzer, Gretchen; Bacevice, Peter; Garrett, Lyndon. “Why People Thrive in Coworking Space.”
Harvard Business Review. September 2015. https://hbr.org/2015/05/why-people-thrive-in-
coworking-spaces.
Starbuck, Emily and Nerdwallet. “7 benefits of using a co-working space.” Chicago Tribune. July 27
2015. https://www.chicagotribune.com/business/blue-sky/ct-nerdwallet-coworking-space-
benefits-bsi-hub-20150727-story.html.
“State of Remote Work.” Buffer. 2019. https://buffer.com/state-of-remote-work-2019.
Stockinger, Bastian. “Broadband Internet Availability and Establishments’ Employment Growth in
Germany: Evidence from Instrumental Variables Estimations.” Journal for Labour Market
Research. 2019. https://search-proquest-
com.mantis.csuchico.edu/docview/2226004026?accountid=10346&pq-origsite=primo
Stone, Sydney. “Key Challenges of Smart Cities & How to Overcome Them.” ubidots. 2018.
https://ubidots.com/blog/the-key-challenges-for-smart-cities/
Tel, Sierra. “5 Industries That Need High-Speed Internet Access the Most.” Connect2Local. 2019.
https://connect2local.com/l/411425/c/621034/5-industries-that-need-high-speed-internet-
access-the-most.
57
“The 6 Top Industries That Are Driving Greater Interconnection.” Equinox Interconnections. August
22 2017. https://blog.equinix.com/blog/2017/08/22/the-6-top-industries-that-are-driving-
greater-interconnection/
“Three surprising ways enterprise companies benefit from using WeWork” WeWork. August 13
2019. https://www.wework.com/ideas/office-design-space/enterprise-companies-benefit-
from-wework.
Toh, Chai Keong, and William Webb. “Introduction to IET Smart Cities.” IET Smart Cities.
Volume 1, Issue 1, 2019, https://digital-library.theiet.org/content/journals/10.1049/iet-
smc.2019.0031.
Tomer, Adie, and Robert Puentes. “Getting Smarter About Smart Cities.” April 23, 2014.
https://www.brookings.edu/research/getting-smarter-about-smart-cities/
Treacy, Ann. “Millennials are ready to move and 39% prefer small towns - how can you attract
them?” Blandin Foundation. August 31 2020.
https://blandinonbroadband.org/2020/08/31/millennials-are-ready-to-move-and-39-
prefer-small-towns-how-can-you-attract-them/.
U.S. Department of Health and Human Services, “Butte County Recovery Forum Summary
Report.” 2019. https://drive.google.com/file/d/1kllTGCkPNb7M2lb-iGqT3ObIF-
EukkzI/view
U.S. Department of Housing and Urban Development’s Office of Policy Development and
Research, “Market at a Glance.” 2020.
https://www.huduser.gov/portal/MCCharts/countyCharts_hc_new.html?countyID=06007
&countyName=Butte%20County%2C%20CA&dt=July%2015,%202020
U.S. Department of Housing and Urban Development’s Office of Policy Development and
Research. “Understanding the Broadband Access Gap.” U.S. Department of Housing and Urban
Development.
https://www.huduser.gov/portal/pdredge/pdr_edge_featd_article_100614.html.
Vogels, Emily. “Millennials stand out for the technology use, but older generations also embrace
digital life.” Pew Research Center. 2019. https://www.pewresearch.org/fact-
tank/2019/09/09/us-generations-technology-use/.
“What’s Fueling the Smart City Backlash?” Wharton, University of Pennsylvania. 2019.
https://knowledge.wharton.upenn.edu/article/whats-behind-backlash-smart-cities/
“Which Industries will be most affected by the rise in broadband speeds over the next decade?” In
the Black. April 1 2015. https://www.intheblack.com/articles/2015/04/01/which-industries-
will-be-most-affected-by-the-rise-in-broadband-speeds-over-the-next-decade.

58
59
Appendices
Appendix A: Projection Methodology
School Enrollment Projections
To calculate the enrollment projections for Paradise Unified School District, the Grade
Progression Ratio/Cohort Survival Rate methodology was used. In this approach, historical
enrollment data was collected from all schools within the District for the 2010-’11 academic year
through the 2019-’20 academic year. These enrollment numbers were then summed by grade level
for each academic year to create district total enrollment by grade level. From this, a number called
the Cohort Survival Rate (CSR) was then calculated by dividing the “current” school year/cohort by
the “previous” school year/cohort. For example, to calculate the CSR for 2019-’20 12th grade, the
district’s 12th grade enrollment in 2019-’20 would be divided by the enrollment for 11th grade in
2018-’19.
To project kindergarten enrollment, a ratio was calculated for the number of live births to
the number of kindergarten enrollments five years later (the assumption was made that all children
are enrolled in kindergarten at 5 years old). Due to data availability, this ratio was constructed for
kindergarten enrollments in years 2018-’19 and 2019-’20. These two ratios were then averaged, and
then applied to the remaining years of live birth data for the area, resulting in kindergarten
enrollment projections through the 2023-’24 school year. Kindergarten enrollment for the remaining
three projected years (through 2026-’27 school year) were determined by using an average of the
year to year (for years 2010-’11 through 2018-’19) percent change in kindergarten enrollment, which
was roughly 2%. Therefore, kindergarten enrollment beyond the 2023-24 school year is projected to
increase by roughly 2%.
After calculating the CSR for each grade level for each of the years of historic data, a
measurement called the Grade Progression Ratio (GPR) was then calculated; this is done by taking
the average of 5 years of CSR measurements for each cohort. For these projections, the 2014-’15
through 2018-’19 school years were used for the GPR calculations to avoid including the external
shock of the Camp Fire on enrollment numbers in the 2019-’20 school year.
Projections for the enrollment period of 2020-’21 through 2026-’27 were then calculated using the
found Grade Progression Ratios. The GPR for a cohort in question was multiplied by the previous
year/cohort’s projected enrollment. The total enrollments per year were summed across cohorts to
provide a total for projected district enrollment.
It should be noted that while the Paradise Unified School District does have their own enrollment
projections through the 2022-’23 academic year, their projections differ slightly from those found in
this report. This is due to differences in methodology; while their projections seem to rely on
predicting a 2% decrease in annual enrollment, the method described above calculates a trend that
varies slightly from year to year.
Public Safety Workforce Projections
60
To project the public safety workforce for the Town of Paradise, a method was established
using annual data for 9-1-1 calls. The first step was determining the historical number of calls that
resulted in incidents requiring a police response, and then dividing this number by the annual
population for the Town. By doing this for several years preceding the Camp Fire and then
averaging this number per resident, a measure for the average annual number of 9-1-1 calls per
person was established. This average per person was then multiplied by the annual projected
population per year to determine the projected number of 9-1-1 calls that would merit a police
response per year for the study period through 2027.
The projected number of annual calls was then used to calculate the number of patrol units
that would need to be staffed to meet the public safety demands of Paradise. The projected annual
number of calls was multiplied by .75 to account for the average length of time needed to respond
to emergency calls (45 minutes is the widely accepted average). This was then multiplied by 3 to
account for a buffer (time used on regular patrols and other preventative routines). This resulting
number represents the total number of patrol units that would need to be staffed. The number of
patrol units is then divided by 3,650 (accounting for 10 hours, 365 days per year) to show the
number of annual hours worked by a basic patrol unit. To determine the projected number of
officers needed to staff the department overall, the projected number of basic patrol units was
multiplied by 1.75 (1.75 =3,650 (annual hours per basic patrol unit)/2,080 (annual hours per police
officer); this represents officers working 5 days per week, 40 hours per week, for 52 weeks per year).
These calculations were repeated for each projected year, using the year’s respective projected
population.
Residential/Population Projections
Because the number of residences in the Town of Paradise was so drastically changed as a
result of the Camp Fire, common growth rate methodology did not seem feasible in predicting the
population for Paradise. Therefore, the future population was projected using average household
size and the projected number of residences in the Town of Paradise. The number of future
residences was projected by the Geographical Information Center for the Paradise Sewer Project;
average household size was obtained from 2018 5-year American Community Survey estimates.
Population through 2027 for the Town of Paradise was calculated by multiplying the household size
estimate with the projected number of residences for each year. It should be noted that occupancy
was assumed to be 100 percent for Paradise, operating under the assumption that people would only
rebuild their homes if they either had the intention to move back, or knew that they would be able
to find a renter for their property. In addition, it should be noted that another assumption in this
calculation is that each of these residences is a single-family dwelling.
Business Projections
To calculate the business presence in the Paradise area, use of preexisting business data and
newly created raw survey data from the Paradise Ridge Chamber of Commerce was used. Ratios
obtained from respondents to a survey of Paradise Ridge businesses in January of 2020 were
correlated with pre-Camp Fire business numbers to project the baseline number of businesses in the

61
first year of the study period. An estimated number of businesses that existed pre-Camp Fire was
provided by the Chamber (1,200 businesses).
For the remainder of the study period, a spread of possible new business formation rates
was used to calculate possible growth of the business community in the Paradise area. An estimated
number of businesses that existed pre-Camp Fire was provided by the Chamber (1,200 businesses).
The business characteristics (i.e., full or part time employment and internet needs) were calculated
based on their initial ratio to the number of businesses.
Ratios for the internet requirements of businesses was gleaned from a Butte County
Business Recovery survey conducted on Paradise Ridge businesses.

62
Appendix B: Survey Questions
Question 1: What is the current ZIP Code for the city you are residing in?
Question 2: What is your current residency status in relation to the Town of Paradise?
Question 3: How many people in your household are using the internet on a daily basis?
Question 4: How many total children (under 18) live in your household?
Question 5: What grade level are the children (under 18) in your household? Please check all that
apply.
Question 6: Do the children (under 18) in your household need access to the internet to complete
their schoolwork?
Question 7: Of the people in your household, how many students are using the internet for
schoolwork?
Question 8: Of the people in your household, how many people are currently or will be using the
internet to work remotely/run a home-based business?
Question 9: On average, how many hours a day is your household spending (combined) on the
internet?
Question 10: How many hours do you spend on the internet per session?
Question 11: Do the people in your household use health care services online?
Question 12: Would you consider using online health care services if you had better access to the
internet?
Question 13: How many hours a day do you spend on the internet doing the following?
Question 14: How do you access the internet at home?
Question 15: Who is your home internet provider?
Question 16: What is/are the reason(s) that you do not have broadband internet access at your
home?
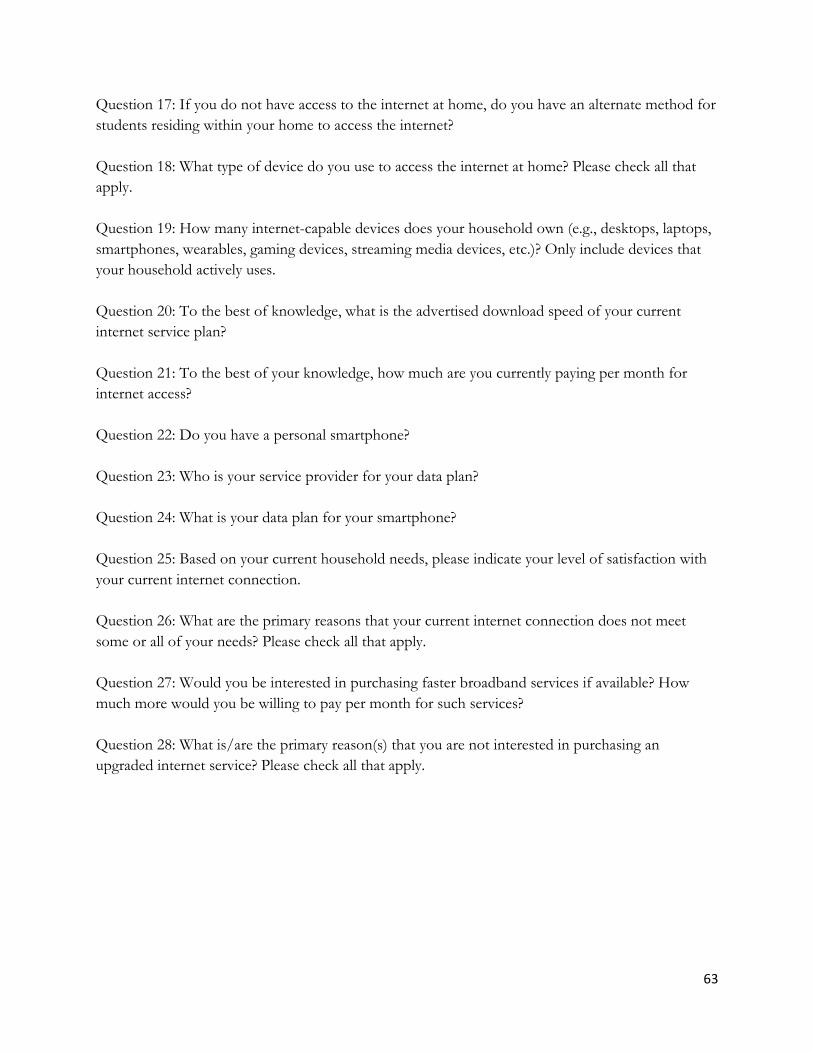
63
Question 17: If you do not have access to the internet at home, do you have an alternate method for
students residing within your home to access the internet?
Question 18: What type of device do you use to access the internet at home? Please check all that
apply.
Question 19: How many internet-capable devices does your household own (e.g., desktops, laptops,
smartphones, wearables, gaming devices, streaming media devices, etc.)? Only include devices that
your household actively uses.
Question 20: To the best of knowledge, what is the advertised download speed of your current
internet service plan?
Question 21: To the best of your knowledge, how much are you currently paying per month for
internet access?
Question 22: Do you have a personal smartphone?
Question 23: Who is your service provider for your data plan?
Question 24: What is your data plan for your smartphone?
Question 25: Based on your current household needs, please indicate your level of satisfaction with
your current internet connection.
Question 26: What are the primary reasons that your current internet connection does not meet
some or all of your needs? Please check all that apply.
Question 27: Would you be interested in purchasing faster broadband services if available? How
much more would you be willing to pay per month for such services?
Question 28: What is/are the primary reason(s) that you are not interested in purchasing an
upgraded internet service? Please check all that apply.