Embed Size (px)
Citation preview

i
COVER PAGE
PATTERN OF ANAEMIA AMONG
PREGNANT WOMEN ATTENDING
ANTENATAL CLINIC OF FAITH
MEDIPLEX, BENIN CITY
A DISSERTATION SUBMITTED TO THE NATIONAL
POSTGRADUATE MEDICAL COLLEGE OF NIGERIA
IN PARTIAL FULFILMENT OF THE REQUIREMENT
FOR THE AWARD OF FELLOWSHIP IN FAMILY
MEDICINE
BY
DR. OBIDIGBO, RAYMOND OBIEKWE
(MBBS UNN, 1990)
MAY, 2014

ii
DECLARATION
I declare that this Dissertation is an original work and has not been submitted to
any other College for any award or journal for publication.
………………………………………………..
Dr. Obidigbo, Raymond Obiekwe

iii
ATTESTATION
I hereby attest that the work presented was physically done by Dr. Obidigbo,
Raymond Obiekwe, a Senior Registrar in Family Medicine department of Faith
Mediplex, Benin City.
…………………………………..
Dr S.E. Osagiede
Medical Director

iv
CERTIFICATION
This is to certify that this research was carried out by Dr. Obidigbo, Raymond
Obiekwe at Faith Mediplex, Benin City under our supervision.
________________________ ______________________________
Dr. M. A Odewale (FMCGP) Dr. E.M. Obazee (FMCGP, FWACP, MBA)
Trainer Director of Postgraduate Training

v
DEDICATION
This work is dedicated to the Almighty God whose grace saw me through
residency training in Family Medicine.

vi
ACKNOWLEDGMENTS
First and foremost, I want to thank the Almighty God for seeing me through the
writing of this dissertation.
I wish to thank my Trainers and Consultants in Family Medicine Unit of the
hospital: Dr E.M. Obazee and Dr M.A. Odewale, Consultants in other specialties
especially Dr O. Eborieme and Dr C. Obaseki for their wonderful support and
encouragement at different stages of this writing.
Special appreciation and thanks to the Medical Director, management and staff,
Chairman and Board of Trustees of Faith Mediplex, especially Prof. M. Babo and
Prof. (Mrs) D. Babo for their inestimable support.
My gratitude also go to all doctors, nurses and laboratory staff of Faith
Mediplex, Benin City especially Mrs C. Kasia (Lab. Scientist) for their invaluable
support.
Also not left out is Mrs. D. Oviawe and most importantly my brother and
friend, Mr. Emeka Anyanwu for working on the manuscript tireless till it became a
readable showpiece. May God and friends be there always for you in times of your
need.
Finally, I wish to thank my wife, Mrs Irene Ify Obidigbo and children for their
wonderful understanding and support all this while.

vii
TABLE OF CONTENTS
CONTENT PAGE
COVER PAGE ........................................................................................................................................ i
DECLARATION .................................................................................................................................... ii
ATTESTATION .................................................................................................................................... iii
CERTIFICATION ................................................................................................................................. iv
DEDICATION ........................................................................................................................................ v
ACKNOWLEDGMENTS ..................................................................................................................... vi
TABLE OF CONTENTS ...................................................................................................................... vii
LIST OF TABLES ................................................................................................................................. ix
LIST OF FIGURES ................................................................................................................................ x
LIST OF ABBREVIATIONS ................................................................................................................ xi
SUMMARY .......................................................................................................................................... xii
CHAPTER ONE ..................................................................................................................................... 1
1.0 Introduction ............................................................................................................................ 1
1.1 Statement of the Problem ....................................................................................................... 3
1.2 Relevance to Family Medicine ............................................................................................... 4
1.3 General Objective ................................................................................................................... 5
1.3.1 Specific Objectives ................................................................................................................. 5
CHAPTER TWO .................................................................................................................................... 6
2.0 Literature Review ................................................................................................................... 6
2.1 Definition and Classification of Anaemia in Pregnancy ........................................................ 6
2.2 Epidemiology.......................................................................................................................... 8
2.3 Prevalence of Anaemia in Nigeria .......................................................................................... 9
2.4 Aetiology of Anaemia in Pregnancy ..................................................................................... 14
2.4.1 Nutritional Deficiencies ........................................................................................................ 14
2.4.1.1 Iron Deficiency and Anaemia in Pregnancy ......................................................................... 14
2.4.1.2 Folate Deficiency and Anaemia in Pregnancy ...................................................................... 17
2.4.1.3 Vitamin B12 Deficiency and Anaemia in Pregnancy ............................................................ 18
2.4.1.4 Vitamin A Deficiency and Anaemia in Pregnancy……………………………………………………………..19
2.4.2 Infections/Infestations .......................................................................................................... 20
2.4.2.1 Malaria and Anaemia in Pregnancy ...................................................................................... 20
2.4.2.2 HIV/AIDS and Anaemia in Pregnancy................................................................................. 23
2.4.2.3 Hookworm Infestation and Anaemia in Pregnancy .............................................................. 24
2.4.3 Haemoglobinopathy and Anaemia in Pregnancy ................................................................. 25
2.5 Clinical Presentation ............................................................................................................. 27
2.6 Laboratory Diagnosis ........................................................................................................... 27
2.7 Complications ....................................................................................................................... 29
2.8 Management ......................................................................................................................... 31
CHAPTER THREE .............................................................................................................................. 34
3.0 Materials and Methods ......................................................................................................... 34
3.1 Background of the study site ................................................................................................ 34

viii
3.2 Ethical Considerations .......................................................................................................... 35
3.3 Study Design ........................................................................................................................ 35
3.4 Study Population................................................................................................................... 36
3.4.1 Inclusion Criteria .................................................................................................................. 36
3.4.2 Exclusion Criteria……………………………………………………………………………………………………………….36
3.4.3 Determination of Sample Size .............................................................................................. 36
3.5 Administration of Questionnaire .......................................................................................... 37
3.5.1 Scoring System for Section A .............................................................................................. 38
3.6 Physical Examination ........................................................................................................... 38
3.7 Laboratory Analysis ............................................................................................................. 39
3.7.1 Sample Collection................................................................................................................. 39
3.7.2 Sample Processing ................................................................................................................ 40
3.7.3 Sample Testing ..................................................................................................................... 42
3.8 Data Analysis ........................................................................................................................ 46
CHAPTER FOUR ................................................................................................................................. 50
4.0 Results .................................................................................................................................. 50
4.1 Socio-demographic Characteristics of the Patients .............................................................. 50
4.2 Test of Significance .............................................................................................................. 58
4.3 Prevalence of Anaemia ......................................................................................................... 62
CHAPTER FIVE .................................................................................................................................. 67
5.0 Discussion ............................................................................................................................. 67
5.1 Demographic Characteristics of the Patients. ....................................................................... 67
5.1.1 Age Group ............................................................................................................................ 67
5.1.2 Marital Status. ....................................................................................................................... 68
5.1.3. Socioeconomic status ........................................................................................................... 68
5.2 Prevalence of Anaemia…………………………………………………………………………………………………… 68
5.2.1. Age and Prevalence of Anaemia........................................................................................... 69
5.2.2. Anaemia and Gestational Age .............................................................................................. 70
5.2.3 Anaemia and Gravidity. ........................................................................................................ 71
5.2.4. Socioeconomic Status and Anaemia in Pregnancy ............................................................... 71
5.2.5 Parity and Anaemia in Pregnancy......................................................................................... 72
5.2.6 Malaria and Anaemia in Pregnancy ...................................................................................... 73
5.2.7 Human Immunodeficiency virus (HIV) and Anaemia in Pregnancy ................................... 73
5.2.8 Distribution by Peripheral Smear ......................................................................................... 74
5.2.9 Distribution by Haemoglobin Genotype ............................................................................... 75
5.3 Relevance of the study to Family Medicine ......................................................................... 76
CHAPTER SIX ..................................................................................................................................... 78
6.0 Conclusion and Recommendations....................................................................................... 78
6.1 Conclusion ............................................................................................................................ 78
6.2 Limitations of the study ........................................................................................................ 78
6.3. Recommendations ................................................................................................................ 79
6.4 Further research needs .......................................................................................................... 80
REFERENCES ..................................................................................................................................... 81
APPENDIXES ...................................................................................................................................... 90

ix
Questionnaire ........................................................................................................................................ 90
Consent form…………………………………………………………………………………………………………………………………..92 Approval letter for Dissertation……………………………………………………………………………………………………….93 Letter for Ethical Approval……………………………………………………………………………………………………………….94
LIST OF TABLES
TABLE PAGE
Table 4.1 Socio-demographic Characteristics of the Respondents .............................................. 51
Table 4.2 Socio-demographic Characteristics of the Respondents with Anaemia ....................... 52
Table 4.3 Contingency table for X2 test of relationship between gravidity and gestational
anaemia ......................................................................................................................... 58
Table 4.4 Contingency table for X2 test of relationship between gestational age (trimester)
and gestational anaemia ................................................................................................ 58
Table 4.5 Contingency table for X2 test of relationship between respondents’ age and
gestational anaemia ...................................................................................................... 59
Table 4.6 Contingency table for X2 test of relationship between socioeconomic status and
gestational anaemia ...................................................................................................... 59
Table 4.7 Contingency table for X2 test of relationship between parity and gestational
anaemia ......................................................................................................................... 60
Table 4.8 Contingency table for X2 test of relationship between malaria and gestational
anaemia ......................................................................................................................... 60
Table 4.9 Contingency table for X2 test of relationship between HIV and gestational
anaemia ......................................................................................................................... 61
Table 4.10 Contingency table for X2 test of relationship between Haemoglobin genotype and
anaemia ......................................................................................................................... 61
Table 4.11 Prevalence rates of anaemia at various trimesters ........................................................ 62
Table 4.12 Prevalence rates of anaemia among various gravidae .................................................. 63
Table 4.13 Prevalence rates among respondents with anaemia at various Parity........................... 63
Table 4.14 Prevalence rates of anaemia among pregnant women of different socio-economic
status ............................................................................................................................. 64
Table 4.15 Prevalence rates of anaemia among respondents based on HIV Status........................ 64
Table 4.16 Prevalence rates of anaemia among respondents with various genotypes ................... 65
Table 4.17 Prevalence rates of anaemic among respondents with malaria fever ........................... 65
Table 4.18 The distribution of various types of anaemia among the respondents ......................... 66
Table 4.19 Distribution of the degree of anaemia among the anaemic respondents ...................... 66

x
LIST OF FIGURES
FIGURE PAGE
Fig. 4.1 Bar chart showing the age distribution of the respondents ................................................ 53
Fig. 4.2 Bar Chart showing the Gravidity of the Respondents ....................................................... 53
Fig. 4.3 Bar Chart showing the Parity Distribution of the Respondents ......................................... 54
Fig. 4.4 Bar Chart showing the Trimester of the Respondents ....................................................... 54
Fig. 4.5 Pie Chart showing the percentage of the various socioeconomic classes of the
Respondents ....................................................................................................................... 55
Fig. 4.6 Bar Chart showing age distribution of the respondents with anaemia .............................. 55
Fig. 4.7 Bar Chart showing Gravidity of the respondents with anaemia ........................................ 56
Fig. 4.8 Bar Chart showing the Parity of respondents with anaemia .............................................. 56
Fig. 4.9 Bar Chart showing the Trimesters of the respondents with anaemia ................................ 57
Fig. 4.10 Bar Chart showing the Socio-economic Status of the Respondents with Anaemia .......... 57

xi
LIST OF ACCRONYMS
ABBREVIATIONS MEANINGS
ACT Artemisinin combination Therapy
ANC Antenatal care
CDC Centre for Disease Control
EDTA Ethylene Diamine Tetraacetic Acid
HCT HIV Counselling and Testing
HAART Highly Active Anti Retroviral Therapy
ITN Insecticide Treated Net
MCH Mean Corpusular haemoglobin
MCHC Mean Corpuscular haemoglobin concentration
MCV Mean Corpusular Volume
PEPFAR The US President’s Emergency Plan For AIDS Relief
PMTCT Prevention of Maternal To Child Transmission
QBC Quality Buffercoat Analyser
SCD Sickle cell disease
TBA Traditional Birth attendant
WBC White Blood Cell
WHO World Health Organisation
X2 Chi-square.

xii
SUMMARY
This study was conducted in order to find out the pattern and prevalence of anaemia
in pregnancy among pregnant women attending antenatal clinic in Faith Mediplex, Benin
City.
Background: Anaemia in pregnancy is a common problem in most developing
countries and a major cause of morbidity and mortality especially in malaria endemic areas.
A deliberate desire to know the current situation and pattern of this condition in our
environment prompted this study. This knowledge will motivate the antenatal care givers
towards early detection and prompt management of anaemia in pregnancy
Objective: The objective was to establish the characteristics of antenatal attendees in
Faith Mediplex, Benin City who have anaemia. The study will also determine the
relationship between gestational anaemia and some aetiological factors in order to make
practical recommendations that will improve the management of this condition.
Study Design: The study was a descriptive, cross- sectional study and the sampling
method was convenient (non-probability) sampling
Method: This study was conducted among 400 pregnant women at booking in
antenatal clinic of Faith Mediplex, Benin City from August to Novermber 2010. A
questionnaire was used to obtain sociodemographic data of each respondent. Physical
examination was done measuring weight, height, blood pressure, and symphysio-fundal
height. Blood was collected for haemoglobin concentration estimation, genotype, malaria
parasite, HIV test and peripheral smear. Analysis of data was done using statistical package
for social sciences. Version 16.0 (SPSS 16.0)
Results: The prevalence of anaemia in pregnancy was 58.0% (Hb < 11 gm/dl) among
antenatal patient in Faith Mediplex, Benin City. There was association between gestational

xiii
anaemia and socioeconomic status, gestational age and malaria which were statistically
significant. Multiple logistic regression analysis revealed only malaria as a good predictor of
anaemia in pregnancy. There were no specific trends between anaemia in pregnancy and
maternal age, parity and trimester at booking, HIV and haemoglobinopathy. Peripheral smear
showed that majority of the respondents (69:2%, N=155) had microcytic, hypochromic
anaemia which is a qualitative marker for iron deficiency anaemia. With reference to degree
of anaemia, half of the pregnant women had mild anaemia while 7.1% were of severe variety.
Conclusion / Recommendations: Prevalence of anaemia in pregnancy was very high
among pregnant women attending antenatal clinic in Faith Mediplex, Benin City. Majority
had microcytic hypochromic anaemia indicative of iron deficiency anaemia. Most of the
women with gestational anaemia are of mild degree while good number had severe variety.
Gestational anaemia had statistically significant relationship with socio-economic status,
gestational age at booking and malaria. Logistic regression analysis showed that only malaria
was found to be a good predictor of gestational anaemia. A robust public health education to
encourage preconception counselling, early prenatal booking with iron supplement,
educational and economic empowerment for all women, and promoting preventive measures
against malaria (chemoprophylaxis [IPTp] and use of insecticide treated bednets at home)
were strongly recommended. All these will ensure considerable reduction in gravid anaemia
and safe motherhood.
Keywords: Anaemia, Pregnant women, Antenatal care, Prevalence, Pattern.

1
CHAPTER ONE
1.0 Introduction
Anaemia in pregnancy is a major health problem in the world. It contributes immensely
to high prevalence of maternal and perinatal mortality, premature delivery, low birth weight, and
other adverse outcomes1. In developing countries, the prevalence rate of anaemia among
pregnant women is estimated to be in the range of 35% - 72% for Africa, 37%-75% for Asia and
37% - 52% for America2. Fifty-six percent of pregnant women in West African subregion are
expected to have anaemia3.
Anaemia even when mild is associated with reduced productivity at work. During
pregnancy, severe anaemia may result in circulatory changes that are associated with increased
risk of heart failure. During labour, women with severe anaemia are less able to tolerate even
moderate blood loss. Consequently they are at a higher risk of requiring blood transfusion and
blood related infections like Human Immunodeficiency Virus, Hepatitis B virus etc.
Furthermore, severe gestational anaemia is an important direct and indirect cause of maternal
death 1. This also affect the foetus leading to intrauterine growth restriction, still birth and low
birth weight4,5.
Estimation of maternal mortality resulting from anaemia range from 34 per 100,000 live
births in Nigeria to as high as 194 per 100,000 live births in Pakistan2,6. The high mortality ratio
in developing countries was found to be related primarily to differences in available obstetric
care for women living in areas with inadequate antenatal and delivery care facilities. This is one
the cardinal issue being addressed by the Millennium Development Goal (MDG) programme
geared towards reduction of maternal and infant mortality rate by fifty percent in 20157.

2
In 1983, World Bank ranked anaemia as the eighth leading cause of disease in girls and
women in developing countries8. Consequent upon this, some developing nations have worked
out short and long term development programme towards improving the well being of girl child
and quality of life in women. Anaemia in pregnancy, according to World Health Organisation
(WHO), is defined as a pregnant woman with haemoglobin concentration below 11 gramme per
decilitre (g/dl) at normal sea level. This presupposes that a different definition will be applied to
pregnant women living in high altitude. Anaemia is further classified into mild anaemia (Hb =
10. – 10.9 g/dl), moderate anaemia (Hb =7.0-9.9 g/dl) and severe anaemia (Hb less than 7g/dl).
This is an arbitrary classification since its application varies from one region of the world to
another and from developed to developing nations.
It is however very useful to have an internationally agreed cut-off points especially for
the purpose of being able to compare outcome of studies conducted at different locations of the
world. For the purpose of this study a WHO definition was adapted. The use of haemoglobin
concentration for diagnosis of anaemia in pregnancy is preferred to packed cell volume (PCV).
This is due to physiological changes in pregnancy resulting in expansion of red cell mass (18-
25%) and plasma volume (46-55%)9. This observation has made haematocrit to be unreliable in
the diagnosis of gestational anaemia.
The pattern of anaemia in pregnancy refers to a broad picture of anaemia with reference
to presentation, classification and associated factors. The most cost effective and beneficial
screening method for anaemia in pregnancy depends on the local pattern. A study designed to
establish the link between these variables with a view to producing a predictive value will help in
initiation of health intervention. For instance, the presence of established factors associated with
a class of anaemia will prompt an early intervention.

3
The predisposing factors have been identified to include nutritional deficiencies like iron,
folate, vitamin B12, vitamin A, malarial infestation, human immunodeficiency virus,
haemoglobinopathy, grandmultiparity, low socioeconomic status, late prenatal booking and
inadequate child spacing5,6,.
Anaemia in pregnancy is a common health problem seen by Primary Care Physicians.
The pattern of this condition varies from developed to developing countries. The reasons for
variation can be attributed to many factors which include nutritional status, cultural practices,
religious belief, socioeconomic factors and level of health awareness among the population.
The multifactorial aetiology of maternal anaemia demand for an assessment of the pattern
which will give a broad and vivid picture of this condition. The clear perspective will guide in
elucidating the scope of this health challenge plaguing the pregnant women in our environment.
There are a few studies on the pattern of anaemia in pregnancy in Nigeria. Some of the studies
available were carried out in tertiary healthcare centres. This then supports the need for such a
study in secondary non-governmental, faith-based hospital like ours. Such studies will lead to
formulation of a balanced policy that will be transformed into effective and sustainable
intervention and control programmes for our pregnant women. A study of aetiological pattern of
anaemia in pregnancy will bring to light the most common factors associated with maternal
anaemia in our area. This will also underscore the need for further research with a view to
establish a clear casual relationship.
1.1 Statement of the Problem
The present study will therefore attempt to answer the following questions:
a) What is the most common class of anaemia among our pregnant women?

4
b) Which are the common associated factors of anaemia?
Finally, the implications of the findings in Family medicine towards meeting the
enormous challenges to the health of our pregnant women are discussed.
1.2 Relevance to Family Medicine
It is pertinent to note here that most women in reproductive age group visit primary and
secondary health care centres. Consequently, most ante-natal needs are managed in primary and
secondary health care centres. Family Physicians who are mostly at this level of health care are
better placed to identify some of the risk factors of anaemia during routine clinical care. An early
detection and prompt commencement of corrective measures will help to reduce the prevalence
of anaemia in pregnancy.
Furthermore, an astute frontline Doctor is better equipped to offer prenatal counselling to
the women in reproductive age group. This is very apt in view of the fact that most women only
visit the Gynaecologist/Obstetrician when they are already pregnant. The high cost of
consultation and limited number of Specialist Obstetrician vis-à-vis the pregnant women put the
Primary Care Doctor in a position to manage most of the pregnant women.
This study will attempt to identify the local pattern of anaemia which will help the
Family Physician to make better assessment and recognise the factors that can predispose to
anaemia in pregnancy. This will lead to giving early corrective measures and subsequent
prevention of anaemia and its adverse effect to the foetus and mother.

5
1.3 General Objective
To determine the pattern of anaemia among pregnant women booking at ante-natal clinic
of Faith Mediplex, Benin city in order to make recommendations for early diagnosis, prompt
management and prevention of this condition.
1.3.1 Specific Objectives
1. To determine the prevalence of anaemia among pregnant women at booking in ante-natal
clinic of Faith Mediplex, Benin City.
2. To assess the pattern of anaemia among pregnant women booking at ante-natal clinic in
Faith Mediplex, Benin City
3. To evaluate factors associated with anaemia in pregnancy.

6
CHAPTER TWO
2.0 Literature Review
Anaemia in pregnancy has been researched by various authors from different dimensions
and geographical locations. Though the primary objective was not always to determine the
pattern, most of these studies reported pattern as a co-output.
2.1 Definition and Classification of Anaemia in Pregnancy
As a result of the normal physiological changes in pregnancy, plasma volume expands by
46-55% whereas red cell volume expands by 18-25% 9. The resulting haemodilution has perhaps
been wrongly termed “physiological anaemia of pregnancy”. There are insufficient data to give
accurate physiological limits for the expected haemodilution. In most reviewed studies, the
mean normal haemoglobin concentration in healthy pregnant women living at sea level is 11.0 –
12.0 g/dl10,11. The mean minimum haemoglobin concentration by WHO criteria is taken to be
11.0 g/dl in the first half of the pregnancy and 10.5 g/dl in the second half of pregnancy2. The
cut-off point for defining anaemia is still controversial and debatable.
In a study carried out among 1371 asymptomatic pregnant women at their first prenatal
visit, to recommend a cut off value 11, it was discovered that anaemia in pregnancy using a cut
off of 11.0g/dl and 10.0 g/dl gave prevalence of 23.2% and 6.7% respectively. It was also
observed that the pregnant women with haemoglobin values around 10.0 g/dl are apparently
healthy. It therefore recommended that a cut off value of 10.0 g/dl may be considered ideal for
defining anaemia in pregnancy in developing countries. The study population were pregnant
women in urban area which cannot reflect the situation among pregnant women in rural areas
where most of the women reside.

7
Another study also showed that a Hb of <10 g/dl is the level widely used for defining
gestational anaemia in Trinidad and Tobago12. In this study, therefore, a haemoglobin
concentration of less than 11mg/dl in line with WHO recommendation will be used as cut off for
anaemia.
Classification
There are various classification of anaemia recorded in standard textbooks, published
studies and in different regions of the world. One group classified anaemia into moderate (if
haemoglobin(hb) concentration is 7-10 g/dl), severe (if hb is < 7 g/dl) and very severe (if hb is
less than or equal to 4g/dl).
Anaemia was also classified morphologically or kinetically13. The three main
morphological distinctions (Based on normal RBC shape and colour) are:
1. Normocytic and normochronic anaemia e.g. Dilutional (Physiological) anaemia of
pregnancy.
2. Microcytic and hypochromic anaemia e.g. Iron deficiency.
3. Macrocytic anaemia e.g. Folate and/or Vitamin B12 deficiency.
Kinetically (based on conditions/factors that affect number of RBC in circulation),
anaemia may be due to:
1. Excessive loss of red cells as in acute bleeding e.g. Abortion, Antepartum haemorrhage
(APH), Postpartum haemorrhage (PPH).
2. Chronic bleeding e.g. hookworm infestation, bleeding haaemorrhoid etc.
3. Excessive destruction of red blood cells as in haemolysis such as:
a) Inherited – sickle cell disease, G6PD deficiency, hereditary spherocytosis.

8
b) Acquired – idiopathic, diseases (leukaemias, lymphomas, haemorrhagic viral
infections) drugs (penicillins, sulphur drugs, quinidine) and collagen
vascular diseases (SLE).
4. Inadequate production as occurs in:
a) Factor deficiencies like iron, folate, vitamin B12, protein etc.
World Health Organisation (WHO) also categorized anaemia into: mild anaemia
(haemoglobin 10-10.9 g/dl), moderate anaemia (hb 7.0-9.9 g /dl) and severe anaemia
(hb<7 g/dl) 2.
The definition of severe anaemia in the published literatures varies. Some studies defined
severe anaemia as haemoglobin of less than 8 gramme per deciliter (hb < 8.0g/dl) 12,14. It has
been noted that the cut – off points for severe and/or moderate anaemia are not indicative of
specific increased risk of mortality or morbidity either to the mother or her baby15.
The relationship of anaemia as a risk factor for maternal or child mortality have recently
been reviewed. One major setback with previous studies is that no randomised controlled trials
have been conducted to establish the effect of interventions on cause specific mortality13,16,17,18,19.
Anaemia is usually of multiple aetiology in developing countries. It therefore becomes difficult
to establish attributable risk for specific cases.
2.2 Epidemiology
Anaemia in pregnancy is considered to be one of the most common problems affecting
pregnant women in developing countries. It has been estimated that over half of the pregnant
women in the world have a haemoglobin level indicative of anaemia3.

9
Data collected from all over the world indicate that a total of 2170 million people (men, women
and children) are anaemic by WHO criteria (Hb < 11g/dl). The most affected groups, in
approximately descending order are pregnant women, the elderly, school children and adult men.
In developing countries, prevalence rates in pregnant women are commonly estimated to be in
the range of 40% -60%.
In industrialized countries, anaemia in pregnancy occurs in less than 20% of women. However
this has reached the prevalence level that is of public health significance (greater than 10%)3.
The greatest burden of anaemia is borne by Asia and Africa where it is estimated that
60% and 52% of women respectively are anaemic2. Some of the published studies done in
African countries gave a prevalence range of 36.1% to 60.0% 13, 14, 16, 17, 19, 20. The unacceptably
high prevalence of anaemia in pregnancy in developing countries including Africa could be an
under estimation since up to date information from many countries are not available. The
available data are therefore mostly hospital based.
2.3 Prevalence of Anaemia in Nigeria
There are several studies related to anaemia in pregnancy conducted in Nigeria and other
parts of the world. Some of the works reported prevalence directly while others presented
prevalence as a secondary output. Two studies specifically measured prevalence and risk factors
for anaemia in pregnancy. The studies had large sample sizes. While one was conducted in a
tertiary hospital setting11, the other was community based20. The prevalence rate for overall
anaemia (Hb<11g/dl) in a population of urban women (n=1371) was 23.2% and prevalence rate
for anaemia and severe anaemia among the rural pregnant women (n=2850) were 56.1% and
6.7% respectively.

10
A second group of published studies were all hospital based in urban areas 5,20,21,22. They
reported a prevalence of anaemia in pregnancy in the range of 40.4% to 76.9% and the
prevalence rate for severe anaemia was 1.8% -1.9%. Other studies that reported prevalence of
anaemia as secondary outcome measure found a prevalence rate ranging from 32.8% to
62.2% 23,24,25.
In all the studies, Haematocrit level(less than 30.0%) was used to diagnose anaemia in
pregnancy. It was noted that apart from study at Kwale which assessed the effect of season on
prevalence and all year round measurement, other studies described small sample sizes, usually
hospital based population with few community based surveys.
Although anaemia is assumed to be less common in non-pregnant women, there is lack of
data on the prevalence of anaemia in this non – pregnant group in Nigeria. Studies are also
needed to assess the association between anaemia in pregnancy and pre-pregnancy haemoglobin
levels. The effect of singleton or multiple pregnancies on gravidae anaemia was reviewed. The
women with multiple pregnancies are at increased risk of anaemia. This was found to be due to
increased red cell mass and the extent of the increase is related to the size and number of foetus 9.
A published work on the relationship between age of the pregnant woman and
occurrence of anaemia was analyzed. A study that assessed the risk of anaemia among pregnant
women in Tanzania, reported a higher risk of anaemia with higher maternal age (1.2 times
increase risk per 5 years)7. In this study, a risk of anaemia is defined as haemoglobin of less than
9 g/dl. Another study in Abeokuta, Nigeria discovered that all severely anaemic pregnant women
were under 30 years of age4.
Other published studies at Enugu and Sudan showed that age was not significantly
associated with gestational anaemia5,22.

11
Two studies carried out in Malawi by van den Broek et al and Verhoeff et al showed an
increased risk of anaemia for women under 20 years of age, but when corrected for gravidity and
trimester at enrollment, the increased risk with young age no longer existed10,17.
Studies on prevalence and risk factors of anaemia in pregnancy had information on
how gravidity influences the degree of anaemia. The biological mechanism through which
gravidity is associated with anaemia is unclear. The studies carried out in Abeokuta and Kwale
showed that severe anaemia are more common among primigravidae than multigravidae4,26. The
reason adduced was because malaria, a major cause of anaemia in pregnancy in endemic areas is
known to be more severe among primigravidae. A review of another published study in Malawi
showed that the increased risk of anaemia for primipara when compared with the women in the
second, third and fourth pregnancy was relatively small and not statistically significant except for
overall anaemia16.
The reviewed studies in Sudan, Ethiopia and Singapore recorded that the prevalence of
gestational anaemia was significantly high among the grandmultigravidae23,24,27. They concluded
that multiparity, low socioeconomic status and late booking were the reasons for this
observation.
Analysis of the 4104 pregnant women attending prenatal care in Malawi reported that the
mean haemoglobin concentration was significantly lower in primi-gravidae (8.7g/dl) compared
to secundae-gravidae (9.g/dl) or multi-gravidae (10.0g/dl). A significant prevalence was
observed only between primigravid and multigravid adolescents28.
The gestational age at the first antenatal visit has been associated with anaemia in
pregnancy. A WHO report indicated that anaemia is significantly higher in the third trimester of
pregnancy than the first two trimesters2.

12
In a cross sectional study among 530 apparently healthy pregnant women at their prenatal
enrollment in Enugu, Dim et al reported that the prevalence of anaemia at booking was
significantly higher in those who registered for antenatal care in third trimester than those who
registered in the second trimester5. Similar studies among pregnant women in Ilesa, Maiduguri
and Lagos also showed that advanced gestational age at booking significantly influence the
prevalence of anaemia23,29,30.
The above report were collaborated by studies carried out in Bukinafaso, Ethiopia and
Bangkok, Thailand21,23,31. However, studies carried out in Abeokuta, Abakaliki and Ghana
reported that a significantly higher prevalence of anaemia was observed among pregnant women
who enrolled for prenatal care in second trimester than those that registered in third trimester
4,24,32. The explanation adduced was that the second trimester coincides with the period when
haemodilution is at its peak. They concluded that high prevalence of anaemia in this trimester
indicate that anaemia is further aggravated by haemodilution of pregnancy. The absence of a
preconception haemoglobin concentration prior to booking called for further research. This will
in no doubt be an uphill task when considered that most of our women are yet to embrace the
preconception counseling care.
Lower socioeconomic status has been found to be associated with gestational anaemia. In
a study conducted among 2667 pregnant women in Bukinafaso by Ditrame study group, the
logistic regression analysis showed that anaemia was significantly and independently related to
low socioeconomic status among others21.
Another study in Ethiopia among pregnant women who were of low socioeconomic
status and usually illiterates showed that anaemia were more common in them (53.7%) when
compared with literate pregnant women with anaemia (35.9%)23.

13
Similar studies in Gombe , Abeokuta and Lagos reported that majority of the anaemic gravidae
were in the low socioeconomic class 4,22,33. This class of pregnant women is usually associated
with illiteracy, low educational status, poverty and malnutrition.
A short birth interval between pregnancies was associated with anaemia in pregnancy.
Published studies carried out in Lagos, Maiduguri and Ethiopia confirmed this22,23,29. The non-
acceptance and poor attitude to and lack of knowledge of available conception control were
identified as the major reasons for this finding among the pregnant women. A study by Dim CC
et al at Enugu however reported that the interval between the last confinement and index
pregnancy had no significant relation with the haemoglobin concentration of pregnant women at
booking5. The above study however, was a retrospective study which relies on case notes with its
attendant documentation inadequacies.
The season of the year has been implicated in the study of maternal anaemia. A study
carried out in Kwale zone of Delta State, Nigeria among pregnant women for one year duration
discovered that the independent risk factors for maternal anaemia in the zone were
primigravidity, late prenatal booking and wet season26. The study explained that the wet season
is associated scarcity of food stuff occasioned by poor or non availability of good storage
facilities for harvested food crops. Another study in Tanzania however discovered that
prevalence of maternal anaemia was associated with rainy season and high altitude7. The study
found that anaemia was more common in the area of high altitude when compared to those at
normal sea level. This was attributed to physiological changes associated with oxygen
concentration in high altitude. The higher prevalence of anaemia during rainy season was
attributed to food shortage as a result of shifting of attention to planting of new crops during the

14
season and prudent rationing of limited preserved food stuff from previous harvest season. The
non-availability of good storage facilities for food stuff was also noted.
2.4 Aetiology of Anaemia in Pregnancy
The aetiology of gestational anaemia was found to be multifactorial in the developing
countries3. Any of the various causes of anaemia in the general population can cause anaemia in
pregnant women. The aetiological pattern is often complex such that, for example infection and
nutritional deficiencies can co-exist. The contribution of each causative factor is difficult to
assess in pregnancy because maternal physiological changes alter indexes used to diagnose
anaemia and nutritional deficiencies.
The causes of anaemia in pregnancy can be grouped into the following:
a) Nutritional deficiencies
b) Infections/infestations
c) Haemoglobinopathies
2.4.1 Nutritional Deficiencies
In many regions of tropical Africa, nutrition is a major challenge and with the increased
nutritional demands in pregnancy, nutritional anaemia is very common19. The common
nutritional deficiencies encountered in pregnancy include iron, folate, vitamin B12 and vitamin A.
2.4.1.1 Iron Deficiency and Anaemia in Pregnancy
Iron deficiency is the most common cause of anaemia in pregnancy15. It may co-exist
with other aetiological factors. It is estimated that iron deficiency affects as many as 200 million
people in the world probably making this the commonest nutritional deficiency in the world34.
There is often an evidence of iron deficiency before a drop in haemogblobin concentration is

15
noted. There is an additional demands placed on maternal iron stores by the growing foetus,
placenta and increased maternal red cell mass which leads to increased demand of iron in
pregnancy15. This situation is partially offset by amenorrhoea and increase absorption of iron in
pregnancy. The total iron requirement over the whole pregnancy has been estimated to be about
1000mg34.
Iron deficiency is often nutritional in origin. Iron is obtained in the form of non-haem
iron from vegetable and as haem iron from meat. One major contributory factor to iron
deficiency in developing countries is the consumption of plant based food containing insufficient
iron16. Haem iron is absorbed two to three times better than non-haem iron. A small amount of
haem iron in the diet will improve the absorption of non-haem iron9. Iron is stored in the reticulo
endothelial system as ferritin and haemosiderin.
Studies that have tried to assess iron deficiency in pregnancy in Nigeria and Africa are
limited. This was due to non availability of laboratory facilities and reagents in the region when
compared to developed nations. In a study in Northern Nigeria, Isah et al reported that the
frequency of biochemical diagnosis of iron deficiency rose from 25% in the first trimester to
40% in the third trimester and from 18% in primigravida to 35% in mutilgravida34. This is still
grossly inadequate when compared with the colossal effect of iron deficiency on pregnant
women in our environment.
In Sudan, a study of anaemia among 530 pregnant women was conducted in 1998 using
serum ferritin level24. The serum concentration of ferritin was used to diagnose iron deficiency.
Depending on the cut off used (either 12 microgram or 30microgram per litre) the prevalence of
iron deficiency ranges of between 5% and 46% were reported. It was also noted that ferritin
levels were considerably influenced by malaria and inflammatory processes.
16
Another study was carried out among 4104 pregnant women in Malawi between March
1993 and June 1994 in which assessment of zinc protoporphrin level was used to estimate iron
level16. Subjects found to have less than 3.1gramme of zinc protoporphrin per gramme of
Haemoglobin were considered iron deficient. Primigravidae were reported to have greater
evidence of iron deficiency than secundae- or multi-gravidae. The impact of diet on maternal
anaemia was studied by Huddle et al among 152 rural pregnant women35. Iron deficiency
anaemia (based on serum ferritin less than 30 microgram per litre and Haemoglobin less than 11
g/dl) during pregnancy was partly attributed to inadequate dietary intake and partly to malaria
infestation.
A study of 150 anaemic women attending antenatal care was done to determine the
presence of iron deficiency using serum ferritin and bone marrow iron16. For all the women,
using serum ferritin, 55 percent were deficient (cut off less than 30microgram/L). Only 21%
were classified as iron deficient when a cut off of 12microgram/L was applied. Bone marrow
aspiration and analysis were done for 93 anaemic women. The result showed that thirty-five
women (37.7%) had sufficient iron in form of haemosiderin in their marrows. A total of 43
women (46.2%) and 15 women (16.21%) showed insufficient and no traces of iron respectively
in their marrows. The study concluded that the percentage of iron deficiency among this cohort
of women was between 46% and 55%. A similar study was carried out in Bangkok among 1307
pregnant women, serum Iron and ferritin estimation were used to detect iron deficiency36. At the
end of the study, iron deficiency anaemia, by means of serum ferritin was detected in 32 cases
(19.9%).
Finally, a study in Singapore on anaemia in pregnancy showed that 81.3% of anaemia women
had iron deficiency27. The finding was attributed to inadequate intake of food rich in iron.

17
The above reports confirm that iron deficiency is an important contributing factor to
anaemia in pregnancy worldwide especially in developing countries.
2.4.1.2 Folate Deficiency and Anaemia in Pregnancy
Folates are heat labile, light sensitive family of water soluble vitamin essential for red
blood cell maturation. Folates are present in all foods but more plentiful in liver, kidneys and
dark green vegetables. Some important staple foods in the developing countries such as rice,
cassava, millet, maize and sorghum are poor sources of folic acid9. Folic acid deficiency
complicates nearly one third of all pregnancies in developing countries33.
Besides deficient dietary intake, other causes of folic acid deficiency include pregnancy
and lactation, tobacco smoking, malaborsorption syndrome (coeliac disease), kidney dialysis,
liver diseases, sickle cell disease, drugs (phenytoin, metformin, methotrexate)36.
Folic acid deficiency results in megaloblastic anaemia characterized by presence of many
immature red blood cells (megaloblasts) in the bone marrow during pregnancy especially in the
last trimester and the puerperium37. Since body stores are limited and dietary intake is likely to
be insufficient in developing countries, anemia is therefore very common33. Women with folate
deficiency who become pregnant are more likely to give birth to low birth weight and premature
infants, Infants with neural tube defects like spina bifida15. Many studies have demonstrated a
steady fall in serum folate levels throughout pregnancy especially in women from poor
socioeconomic group, in multigravidae, and in women with twin gestations37.
In a study on aetiological factors associated with anaemia in pregnancy involving 150
pregnant women in Southern Malawi, thirty four percent of the women were found to be folate
deficiency (serum folate less than 9.1 microgram/litre).
18
Out of the 25 folate deficient women, 10 (40%) were iron deficient, 4 (16%) were vitamin B12
deficient, 4 (16%) had low serum ferritin concentration16. It concluded by acknowledging the
difficulty in establishing whether folate deficiency in this population was primarily the result of
dietary insufficiency, problems with absorption or presence of concomitant infection like
malaria.
In a study in Ibadan, South-western Nigeria, it recorded that folic acid requirement are
increased during pregnancy for the growth of the foetus, placenta, maternal red cells mass and
myometruim37. The study also noted that folate deficiency has also been documented during
pregnancy. This often lead to a combined iron-folate deficiency anaemia, particularly among
socioeconomic groups consuming mostly cereal-based diets (poor in folate) aggravated by
prolonged cooking of food and reheating of liquid preparation.
2.4.1.3 Vitamin B12 Deficiency and Anaemia in Pregnancy
Vitamin B12 was discovered from its relationship to the disease, Pernicious anaemia
which is an autoimmune disease that destroys the parietal cells of the stomach that secrete the
intrinsic factor9. Intrinsic factor is crucial for normal absorption of vitamin B12 in amount that
occurs in foods. The lack of intrinsic factor as seen in pernicious anaemia, causes a vitamin B12
deficiency. Muscles, red cell and serum vitamin B12 concentrations fall during pregnancy36.
The megaloblastic anaemia which develops is due to long standing vitamin B12 and folate
deficiencies. The recommended intake of vitamin B12 is 0.3 microgram per day during
pregnancy38. This requirement will be met by any diet which contains animal products (fish,
meat, egg, milk) but strict vegetarians may have a deficient intake of vitamin B12.

19
Other causes of vitamin B12 deficiency include malabsorption from wide surgical resection of
terminal ileum and drugs (Metformin).
A study by van den Broek et al showed that one third of anaemic women had serum
vitamin B12 concentrations less than 148 micromol/L which is the accepted lower limit outside
pregnancy16. In that study also, when deficiency was defined as serum vitamin B12 less than 52
micro mol/L, reflecting the observed decreases toward the end of pregnancy resulting from the
active transplacental transfer from mother to foetus and the added effect of haemodilution, 16%
were deficient. Five (24%) of these vitamin B12 deficient women were also folate deficient. An
association was noted between vitamin B12 concentrations and megaloblastic changes observed
in the bone marrow which was linear and highly significant.
2.4.1.4 Vitamin A Deficiency and Anaemia in Pregnancy
Vitamin A is a fat soluble vitamin which is obtained from the diet on preformed vitamin
A (retinal) and from some of the carotenoids pigments in food that can be cleaved in the body to
give retinol. Preformed vitamin A occurs naturally only in animals and the richest dietary
sources are liver, fish oils and dairy products36. Carotenoids mainly from plant foods such as
carrots and dark leafy vegetables can be converted to vitamin in the liver where vitamin A is
stored. Vitamin A deficiency is thought to be common in many developing countries39. It is
believed to be essential for normal embryogenesis, haematopoiesis, growth and epithelial
differentiation. In pregnancy, extra vitamin A is required for growth and tissue maintenance in
the foetus, for providing it with reserves and for maternal metabolism. Basal requirement is 370
microgram per day in pregnancy. Conversely a relationship has been suggested between the
incidence of birth defects and high vitamin A intakes during pregnancy with an apparent
20
threshold of 10,000 iu per day38. However, a daily doses of up to 10,000iu or weekly doses of
25,000 iu after day 60 of pregnancy are safe especially in vitamin A deficiency endemic areas.
Vitamin A is essential for haematopoiesis. A diet devoid of vitamin A results in decreased
haemoglobin levels35,37.
It has been documented that vitamin A supplementation especially in women with low or
borderline serum retinol tend to improve mobilization of iron stores19. It has been observed that
for women in whom bone marrow iron was more than adequate but had evidence of anaemia and
inflammation; anaemia could have resulted from blockage of the incorporation of iron into haem.
It was therefore proposed that vitamin A may work by counteracting this “block” thereby
facilitating iron incorporation into haem.
In a study of 150 anaemic pregnant women, 39% were vitamin A deficient17. Fifty-two
percent of these women were iron deficient. Vitamin A deficiency was the only micro nutrient
deficiency in 15% of all women possibly making this the second most frequent single micro
nutrient deficiency after iron deficiency in this group of anaemic women. Much of the work on
prevalence has been in children. There is comparatively little information about occurrence in
pregnancy. Estimates of the number of people at risk of vitamin A deficiency are often
approximation.
2.4.2 Infections/Infestations
2.4.2.1 Malaria and Anaemia in Pregnancy
Malaria in pregnancy is a major contributor to adverse maternal and perinatal outcome.
It is currently regarded as the most common and potentially the most serious infection occurring
in pregnancy in many Sub Saharan African countries3. Malaria due to Plasmodium falciparum
may cause severe anaemia in pregnancy.

21
It is estimated that in Sub Saharan Africa, 23 million pregnant women are exposed to malaria
infection annually2. Women in their first and second pregnancies living in an endemic area are
at higher risk of acquiring malaria than multigravidae or non-pregnant women due to reduction
of an appropriate immune response to the malaria parasite13.
Anaemia associated with malaria is caused by haemolysis of the red blood cells. Several
studies have shown that protection against malaria contributes to the prevention of anaemia in
pregnancy28,40. The adverse effects of malaria on maternal and foetal well being are thought to
be for the most part due to the associated severe anaemia. In a study on malaria and anaemia in
pregnancy carried in Abakaliki town among 193 pregnant women, 29% prevalence of malaria
was detected and more common among the primigravidae40. A similar study conducted among
1371 pregnant women in Port Harcourt showed that 20.3% had plasmodium falciparum in their
blood11. Malaria infection may have been underestimated because diagnosis was by examination
of one thick blood film only taken at the time of recruitment. In addition, it was of short duration
and may have been conducted in the season of low malaria transmission.
In a study by Ogbodo et al, screening for malaria and anaemia was performed over a 15
month period to ascertain the prevalence of asymptomatic parasitaemia among pregnant women
in a rural setting41. A total number of 272 pregnant women were screened for malaria,
haemoglobin and packed cell volume using standard methods. The prevalence of malaria was
59%. Mean haemoglobin concentration were lower in women with malaria (10.3g/dl) than
aparasitaemic women (10.8g/dl).
There was evidence of correlation between decreased haemoglobin concentration and increased
parasite count. Also women with malaria were more likely to be moderately or severely anaemic.
This relationship was seen in both primigravidae and multigravidae.

22
A total 25.4% of primigravidae with malaria were moderately or severely anaemic whereas only
14.7% of aparasitaemic primigravidae were moderately or severely anaemic. In multigravidae
20.4% of parasitaemic and 14.8% of aparasitaemic women had moderate or severe anaemia.
The impact of malaria on gestational anaemia was evaluated among pregnant women in
Ghana42. The prevalence of malaria was 63% while maternal anaemia was 54%. Those women
who had a positive peripheral blood film for malaria at booking had significantly lower mean
haemoglobin compared to those with a negative film (9.1g/dl vs 10.8g/dl). Likewise the
prevalence of anaemia was significantly higher among those with a positive malaria film when
compared with a negative film at enrolment (76.5% vs. 61.8%).
A study of malaria infection in pregnancy carried out among 1118 women in Cameroun
gave a maternal anaemia prevalence of 68.9% with malaria prevalence of 52.1% 43. The mean
haemoglobin level of malaria parasite positive pregnant women was significantly lower than
those who were malaria parasite free. Similarly the mean haemoglobin concentration of
primigravidae at antenatal enrolment was markedly lower than that of multigravidae or
grandmultigravidae. The study also discovered that the prevalence of anaemia was significantly
high in mothers whose peripheral samples were free of malaria parasites. This suggests the
existence of other causes of anaemia in the community. It concluded that the observation is
important in developing a strategy and interventions for control of anaemia in the community.
Some reviewed studies on malaria and anaemia among antenatal women reported that
malaria can induce iron deficiency which is the commonest cause of maternal anaemia28,44.
The various mechanisms for the observation could be possibly through immobilization of iron in
haemoglobin complexes, a loss of urinary iron or reducing intestinal absorption of iron during
the acute illness period.
23
2.4.2.2 HIV/AIDS and Anaemia in Pregnancy
The HIV/ AIDS epidemics intersect with the problem of maternal mortality in many
circumstances in SubSaharan Africa. HIV impacts on direct (obstetrical) causes of maternal
mortality by an associated increase in pregnancy related complications such as anaemia,
postpartum haemorrhage and puerperal sepsis 32,38. A relationship between HIV seropositivity
and a decreased haemglobin (Hb) concentration in pregnancy has been suggested and confirmed.
Thus an inclusion of HIV screening in differential diagnosis of anaemia is recommended.
Transmission of HIV infection by blood transfusion is possible in developing countries
where there is high prevalence of HIV positivity among donors and where the ability to screen
for HIV is sub optimal.
In a study that examined the detailed aetiological factors associated with anaemia in
pregnancy, one of the factors studied was HIV seropositivity38. The observed prevalence of HIV
seropositivity among women with anaemia was 47.1%. This was significantly higher than the
HIV prevalence in the whole antenatal population (30.1% P= 0.001). The mean haemoglobin
concentration for HIV seropositive participants was 8.1g/dl which was significantly lower than
8.8g/dl for seronegative women (P= 0.001).
Meda et al, in a study that evaluated the effect of HIV infection on the severity of
anaemia among 2667 pregnant women in Burkinafaso revealed that the prevalence of anaemia
was 78.4% in HIV infected women versus 64.7% in HIV-seronegative women21. The relative
risk of HIV seropositivity increased with severity of anaemia, however no significant association
was found between degree of anaemia and HIV sero status among study women with anaemia.
Logistic regression analysis showed that anaemia was significantly and independently related to
HIV infection. The study concluded that although, HIV infected women had higher anaemia

24
prevalence, severe anaemia was infrequent, possibly because few women were in the advanced
stage of HIV disease.
Study of prevalence and risk factors among pregnant women in Port Harcourt showed
that 8.5% of the women are HIV seropositive 11. It also observed that the HIV seropositive
women has lower haemoglobin concentration than the seronegative anaemia women.
Dim et al in Enugu identified a significant statistical relationship between HIV infection
and a high prevalence of anaemia in pregnancy5. They adduced that the increased prevalence of
anaemia among pregnant women living with HIV/AIDS may be explained by the finding that
HIV infection is associated with lower serum folate and serum ferritin in pregnancy38.
2.4.2.3 Hookworm Infestation and Anaemia in Pregnancy
Hookworm infestation is described to be one of the principal causes of iron deficiency
anaemia in developing countries especially in children. It is prevalent throughout the tropics and
sub tropics wherever there is faecal contamination of the environment45. It is acquired mainly by
skin contact with contaminated soil or vegetation. Adult hook worm live in duodenum and
jejunum of human attached to the intestinal mucosa and suck blood. Once they leave the attached
site this causes chronic blood loss from the mucosa45.
In people whose dietary intake of iron is low or whose blood iron stores are already depleted,
hookworm infection can presumably give rise to iron deficiency anaemia in just few weeks. This
can occur in pregnancy when iron requirements are increased46.
A study of 150 anaemic pregnant women showed that 6% had hookworm infection and
none had a high density infestation17. It concluded that the intestinal parasites are unlikely to
have contributed significantly to the presence of anaemia in that population.

25
A systematic review by Brocker et al found that increasing intensity of infection was
associated with lower levels of haemoglobin45. The authors estimated that 37.7 million women
of reproductive age and 6.9 million pregnant women in Sub Saharan Africa were infected with
hookworm in 2005 and were therefore at risk of anaemia. They concluded with observation that
many developing countries had a policy that pregnant women receive deworming treatment but
in practice coverage rates are often unacceptably low.
The World Health Organisation recommended that infected pregnant women be treated
after the first trimester 3,46. Regardless of these recommendations; many countries are yet to add
deworming to their antenatal care programmes. Thus lack of deworming of pregnant women is
explained by the fact that most individuals still fear that antihelmintic treatment will result in
adverse birth outcomes. However the study by Laroque et al illustrated that treatment for
hookworm infection actually led to positive health results in the infant47. This study concluded
that treatment with mebendazole plus iron supplements during antenatal care significantly
reduced the proportion of very low birth weight infants when compared with placebo group.
2.4.3 Haemoglobinopathy and Anaemia in Pregnancy
Haemoglobinopathy are group inherited haematological disorders due to alteration in
the genetically determined molecular structure or function of haemoglobin with characteristic
clinical and laboratory abnormalities48. The abnormality may occur in the heterozygous or
homozygous form. Common haemoglobinopathy include sickle cell disease(HbSS), Sickle cell
trait(HbAS), Haemogobin C disease (HbAC) and Haemoglobin SC disease (HbSC). Sickle cell
disease is a haemoglobin disorder with substituted amino acid sequence (glutamic acid with
valine) at the B-globin chain as opposed to thalassaemia in which there is reduced or absent

26
synthesis of one or more normal polypeptide chains48. A haemoglobin electrophoresis is done in
the laboratory to determine the genotype of the person. Pregnancy in women with sickle cell
disease (SCD) is associated with increased maternal and foetal morbidity and mortality48.
Complications and increased risk to the mother include anaemia, recurrent malaria, infections
especially of the lungs and urinary tract and gall bladder disease including gall stones. The
common complications and increased risks for the foetus include abortions, intrauterine growth
restriction, preterm birth, low birth weight, stillbirth, neonatal death.
Most of the published studies on sickle cell disease in pregnancy were retrospective
surveys with its limitations. Ogedengbe et al in the study of pattern of sickle cell disease in
pregnancy in Lagos found that the complication rate was higher in HbSS pregnant women than
the HbSC women49. It also showed that maternal and perinatal deaths occurred more in those
who had no preconception specialist care than those that received specialist care. Consequent
upon this, they recommended that preconception specialist care, early and regular prenatal care is
important for women with sickle cell disease to ensure close monitoring and good birth outcome.
In various studies on pregnancy outcome among women with sickle cell disease carried
out in Lagos, Benin and Enugu, the common maternal complications observed were acute
haemolysis with anaemia, bone pain crisis, maternal mortality, lobar pneumomia, recurrent
malaria attacks, systemic infections, pseudotoxaemia and pre-eclampsia50,51,52.
The commonly observed foetal complications recorded in the above studies include
intrauterine foetal death, low birth weights and abnormal presentations. Generally the number of
pregnant women with sickle cell disease in the reviewed studies had sample size in the range of
10-60. The small sample size could be due to the fact that many females with sickle cell disease
barely survived to reach the reproductive age especially in the developing countries48.

27
A recent prospective study however reported 85% survival up to age of 18 years53. This was a
prospective study involving 700 children from birth to age of 18 years.
2.5 Clinical Presentation
Anaemia in pregnancy is often asymptomatic. However the following are the most
common presentation, which include tiredness (fatigue), difficulty in breathing (dyspnoea),
palpitations and dizziness13. The physical examination may reveal pallor of varied degree
depending on severity of anaemia. There could be pedal oedema, tachypnoea, dyspnoea and
somnolence. A systemic examination may reveal tachycardia and haemic murmur on
auscultation9,13.
2.6 Laboratory Diagnosis
The general laboratory investigations done include full blood count, packed cell volume,
haemoglobin concentration, reticulocyte count, red blood cell count, red blood cell indices
[Mean Corpuscular Volume (MCV), Mean Corpuscular Haemoglobin (MCH), Mean
Corpuscular Haemoglobin Concentration (MCHC)]13. A haemoglobin concentration of less than
11g/dl is considered as anaemia2. A low red cell count,MCV and MCH can be due to deficiency
of iron, folate and Vitamin B1236. A high reticulocycte count can be caused by iron deficiency
while a reduced count is seen as folate and vitamin B12 deficiency. A reduced mean corpuscular
haemoglobin concentration and normal platelet count is associated with iron deficiency15.
Elevated eosinophil can suggest Hookworm infestation45.
The diagnosis of anaemia lies on identifying the specific causes. The nutritional anaemia is
caused by iron, folate, vitamin A and protein deficiencies36.

28
Iron deficiency is suspected when the red cell indices such as mean corpuscular volume
(MCV) are low. It is also suspected when the microcytic hypochromic red blood cells are seen in
peripheral blood smear34. However, a presence of microcytic hypochromic red cells with mean
corpuscular volume of less than 80 is also suggestive of Thalassaemia48. Haemoglobin
electrophoresis should then be performed to differentiate iron deficiency from Thalassaemia.
Both conditions may sometimes coexist. Other parameters used in identifying iron deficiency in
pregnancy include serum iron, zinc protoporphrin, total iron binding capacity, serum ferritin, and
bone marrow aspirate for stored iron (Haemosiderin)16,24,27,36. The gold standard for diagnosis of
iron deficiency in pregnancy is the examination of suitably stained bone marrow aspirate for
stored iron inform of haemosiderin. This method is however invasive and not suitable for a large
population screening. Serum ferritin has been found to be a good measurement of storage iron
16,24. However serum ferritin is an acute phase protein which is raised in both acute and chronic
infections. These studies also found that serum iron, zinc protoporphrin and Mean Corpuscular
Volume (MCV) have low accuracy as methods of diagnosis of iron deficiency in pregnancy.
An assessment of serum folate level and serum homocysteine is commonly done in the
diagnosis of folate deficiency15,37. Fall in serum folate and increased serum homocysteine
suggests folic acid deficiency. The gold standard of diagnosis of vitamin B12 deficiency is a low
blood level of B1216. A measurement of methylmalonic acid can provide an indirect method for
partially differentiating vitamin B12 and folate deficiencies. The level of methylmalonic acid is
not elevated in folic acid deficiency. Schilling test used in the past is no longer done because of
non availability of radioactive vitamin B12. However an advantage of Schilling test was that it
often included B12 with intrinsic factor.

29
An assessment of Vitamin A status is done by determination of serum retinol16. It was
observed that the serum retinol is under strict homeostatic control. The more accurate ways of
diagnosing Vitamin A deficiency include dose response which assesses vitamin A stores in the
liver. The diagnosis of malaria can be done using a stained thick blood film. The malaria can also
be identified and characterized using stained peripheral blood smear analysis41. The diagnosis of
Human Immuno Deficiency Virus infection is done by detecting the virus in the serum using
HIV capillus rapid test kit (sensitivity 100%, specifically 98% and predictive value – 98% and
rechecking with the Determine HIV 1/2 Assay32,38. The test is usually preceded by pretest
counseling and an informed consent. The hookworm infestation can be detected by stool analysis
for cyst or ova of the hookworm46.
2.7 Complications
Anaemia in pregnancy usually results in diverse complications which can be immediate
or delay in occurrence. The severity and manifestation of these complications borders on
different circumstances. The degree of access to emergency obstetric care, skilled assistance
during delivery, the quality and promptness of attention received are of prime importance.
A study by Munasinghe et al illustrated the much higher risk of maternal death in anaemic
women from rural areas than urban areas possibly as a result of problems with timely access to
obstetric care43. It must also be noted here that the pregnancy outcome is related to the
underlying causes of anaemia e.g. HIV infection, iron deficiency, recurrent antepartum
haemorrhage etc32,38.
Iron deficiency anaemia leads to abnormalities in host defence and neurological
dysfunction15. Increased risks of premature labour and low birth weight have also been reported

30
in association with anaemia in pregnancy10. Folate deficiency during human pregnancy has been
associated with increased risk of infant neural defects such as Spinal bifida37. Deficiency of
vitamin B12 and folic acid has been associated with cerebral dysfunction which leads to disorder
like depression15. The most common cause of blindness in developing countries is vitamin A
deficiency. Night blindness and its worsened condition, xerophthalmia are markers of vitamin A
deficiency36. This deficiency can also lead to impaired immune function, cancer and birth
defects.
Malaria in pregnancy has been associated with abortion, intrauterine growth retardation,
stillbirths, intrauterine death and low birth weight 35. It is also known to cause deficiency in some
micronutrients such as iron, folic acid and vitamin B12 in acute episode due to decreased dietary
intake36.
Human Immunodeficiency Virus infection impacts on maternal mortality by an
associated increase in the pregnancy related complications such as anaemia, postpartum
haemorrhage and puerperal sepsis32. The mechanism by which HIV infection cause anaemia is
not fully understood. Some suggested mechanisms include a direct effect of the virus itself, bone
marrow suppression as a result of cytokine release, anaemia arising from chronic inflammation
or opportunistic infection, reduced erythropoietin production and response. The complications
associated with haemoglobinopathy like sickle cell disease can be maternal or foetal . Maternal
complications include infections like urinary tract infection and pneumonia, gall bladder diseases
like gall stones and cardiac problem like heart failure48,49. The foetal complications include
miscarriage, foetal growth restriction, preterm birth, stillbirth and neonatal death 48,49.

31
2.8 Management
The management of anaemia in pregnancy includes both general and specific measures.
These measures should commence at preconceptions, during conception and puerperal period.
The preconception period is aimed at boosting up the general well being of the woman which
include adequate and varied dietary intake, supplementing diet with iron, vitamins and especially
folic acid which reduced the risk of spina bifida. It is now routine to recommend to women
planning a pregnancy to take a folic acid supplement for the first 12 weeks of pregnancy and to
continue up to 4 months of the pregnancy3,14.
During conception, tests such as packed cell volume, haemoglobin concentration are
done along with other tests as part of prenatal registration to detect anaemia usually diagnosed
when haemoglobin level is less than 11 gramme per decilitre2. In developing countries, the iron
and folic acid supplement are commenced in view of poor dietary intake, dietary restriction in
some cultures and effect of concurrent infections like malaria, HIV/AIDS, hookworm
infestation1,13. For most women, the dose of folic acid is 400 microgram per day. A need for
higher dose may be predicated on certain conditions. This include a previous baby with spinal
cord problem, where index woman, her partner or first degree relative have a spinal cord
problem, history of diabetes, sickle cell anaemia, thalassaemia, coeliac disease, drugs like
anticonvulsants (phenytoin), antidiabetic (metformin) and alcohol 9,13.
In industrialized countries, women should receive 85mg elemental iron daily while in
developing nations, 120-140mg per day of elemental iron because of increased severity of
absorption. Recent research shows oral iron plus folate to be more effective than iron alone
irrespective of serum folate level54. The Vitamin B12 can be supplemented by oral pill, sublingual

32
pill, liquid or strip, intranasal spray or by injection. Vitamin B12 is available singly or in
combination with other supplements. Oral treatment is given as 250microgram to 1gm per day.
Vitamin B12 can be given as intra-muscular or subcutaneous injections of hydroxy
cobalamin, methylcobalamin or cyanocobalamin36. Vitamin A is given in an oral capsule
form at regulated dose in pregnancy. This is because a high dose supplementation of pregnant
women can cause miscarriage and birth defects36. Malaria is a common occurrence in pregnancy
in SubSaharan Africa. Various control measures and treatment modalities have been proposed
and been implemented for this menace. These include use insecticide treated bed nets,
intermitted preventive therapy and active treatment of confirmed malaria in pregnancy55. The
commonly used regime for intermittent preventive therapy is sulphadoxine/pyrimethamine
combination55.
The management of HIV infection in pregnancy includes the need for partner
counseling/testing, making informed acceptance of PMTCT services and complaint with
HAART given and follow-up visit32,55. It also involves family education with reference to
disclosure, stigma and acceptance.
The treatment for hookworm infection in pregnancy is by use of mebendazole 400mg
single dose given after three months of gestation as recommended by the World Health
Organisation 3,47. The management of sickle cell disease in pregnancy includes early and regular
prenatal care for close monitoring of the disease and of foetal well being.
General pregnancy care given includes healthy diet, prenatal vitamins, folic acid supplements,
preventing dehydration and intermittent preventive therapy for malaria55. Some of them may
require blood transfusion. This will help to increase the blood’s ability to carry oxygen and
decrease number of sickle red blood cells.

33
There is also a need to monitor foetal well-being and growth using periodic
ultrasonography 50,51,52. During labor, intravenous fluids are given to help to prevent dehydration.
Intermittent intranasal oxygen is given for the mother and foetus especially if there is any sign of
foetal distress. There is no special recommendation for the mode of delivery as most of them can
deliver vaginally except there are other complications. The analysis of the aforementioned
studies showed that most of them were carried out in tertiary health facilities. This study will
help to reduce the gap arising from paucity of data from mission hospital which contribute
significantly to the healthcare delivery services in Nigeria.

34
CHAPTER THREE
3.0 Materials and Methods
3.1 Background of the study site
The study was carried out in Faith Mediplex, located at 1, Giwa Amu/Airport
Road, Benin City, Edo State. It is a 60 – bedded hospital established by Late Archbishop
Benson Idahosa in July 1989 in partnership with City of Faith Medical Centre Tulsa,
Oklahoma, United States Of America. The hospital provides both primary and secondary
healthcare services in the following areas: Medicine, Obstetrics and Gynaecology,
Paediatrics/Neonatology, Surgery (General, Orthopaedic, ENT), Ophthalmology,
Dentistry, Radiology and Family Medicine. It is an accredited training centre by the
National Postgraduate Medical College of Nigeria for Family Medicine.
It is a PEPFAR/CDC centre for comprehensive antiretroviral care and therapy.
The hospital runs antenatal and postnatal clinics twice a week under a Consultant
Obstetrician and Gynaecologist. A total of 1332 new pregnant women registered for
antenatal clinic annually with an average monthly registration of over 100 pregnant
women.
Benin City is an ancient and cultural city in South – South geopolitical zone of
Nigeria. Its unique location marks it out as a transient passage for people travelling from
the Northern and Western regions to the Southern part of the country. The city is made up
of three local government areas namely: Oredo, Ikpoba – Okha and Egor. The inhabitants
include people from the different ethnic groups of Nigeria and foreigners of diverse
socioeconomic status. The surrounding rural communities were made up of farmers and
artisans.

35
The hospital is strategically located to allow access to both urban and rural dwellers.
It is also an approved centre that provides primary and secondary healthcare services
under the National Health Insurance Scheme (NHIS) and Private Health Management
Organisations (HMO) with clients from many corporate organisations. The laboratory
unit of the hospital provides both general and specialised services in
Heamatology/Serology, Microbiology and Chemical Pathology. The staff of the
laboratory unit were made up of six (6) Laboratory Technicians, two (2) Chemical
Pathologists, a microbiologist and two (2) Heamatologists/Serologists. One of the
Haematologists assisted the author in running the laboratory tests required for this
research.
3.2 Ethical Considerations
A written permission and approval was obtained from the Research and Ethical
Committee of Faith Mediplex, Benin City (See Appendix). A written consent was also
obtained from each of the pregnant women after a careful explanation of the nature, aim
and objectives of the study (See Appendix). The proposal of this study was also
submitted to the Faculty of Family Medicine, National Postgraduate Medical College of
Nigeria and a written approval obtained (See Appendix).
3.3 Study Design
This study was carried out between July and October 2010. It was a descriptive
cross – sectional study limited to history taking, physical examination and collection of
blood samples for haemoglobin concentration estimation, Hb genotype, HIV test,
peripheral smear and malaria parasite test.

36
The sampling method was convenience sampling. The subjects were selected because
they were present on the day of the study. It is a non – probability sampling method.
3.4 Study Population
The study population was made up of women attending antenatal clinic of Faith
Mediplex, Benin City, who presented during the period of the study (July to October
2010) and met the inclusion criteria.
3.4.1 Inclusion Criteria
1. All pregnant women at their prenatal booking who gave their consent were
included in the study.
2. All pregnant women who are not on haematinics at the time of the study.
3.4.2 Exclusion Criteria
1. All non – consenting pregnant women.
2. All pregnant women presently on haematinics
3. Women with pseudocyesis
4. All pregnant women who are on treatment for malaria, HIV/AIDS, cancer,
chronic renal failure, etc.
3.4.3 Determination of Sample Size
The minimum sample size was calculated using the following formulae57:
2
2
D
qPZn
Where
n = Minimum sample size when the population is less than 10,000.

37
P = Estimate of prevalence of anaemia in pregnancy. Prevalence value of 45.7%
obtained from literatures was adopted for this study.
Z = 1.96 at a confidence level of 5%
q = 1 – P (54.3)
D = degree of accuracy desired = 0.05.
Sample size (n) =
2
2
05.0
0.543 0.457 x 96.1
= 0025.0
0.543 0.457 x 3.8416
= 0025.0
0.9532969
= 381.32
With 5% attrition, it gives 400 which was the total numer of respondents recruited
for the study.
3.5 Administration of Questionnaire
A pretested, structured questionnaire was administered by the researcher (by
direct approach interview) to each participant to obtain the relevant information. The
questionnaire was divided into four sections. Section A (Biodata) was for the patient’s
socio – demographic data, Section B was for patient’s obstetric and family history while
Sections C and D were for physical examinations and laboratory investigations
respectively.

38
3.5.1 Scoring System for Section A
The social class of each of the pregnant women was assessed using
socioeconomic status evaluation method described by Oyedeji58. Socioeconomic index
of each of the respondents was based on the husband’s occupation and wife’s educational
status. In the occupational scale, Class I was awarded to professionals, managers, senior
public servants, businessmen and contractors; Class II to intermediate grade public
servants and senior secondary school teachers; Class III to junior workers, Junior
secondary and primary school teachers; Class IV to labourers, messengers and artisans
and Class V to unemployed, full time housewife, students and subsistent farmers.
In the educational scale, Class I was ascribed to university graduates including
HND and higher degrees; Class II to National Diploma (ND), National Certificate on
Education (NCE), School of Nursing/Midwifery Certificates and other professional
certificates; Class III to senior secondary school certificate, NABTEB, City & Guild,
TCII; Class IV to junior secondary school and Primary six certificates and Class V to
primary six dropouts and illiterates.
Socioeconomic score was obtained from the addition of the husband’s
occupational score and respondent (wife)’s educational score which ranges from 2 to 10.
A value range of 2 – 3 was classified as upper class; 4 – 6 was middle class while that of
7 – 10 was lower class.
3.6 Physical Examination
The respondents had their axillary temperatures taken in degree centigrade (oC)
using a clinical thermometer and the blood pressures measured while in upright posture

39
with Sphygmomanometer placed at their heart level by a Nurse. The radial pulses, height
and body weights were also recorded. The abdominal examination was done by the
researcher to obtain the foetal heart tone using pinar foetal stethoscope and measure the
symphysiofundal height. The respondents were seen a week after during which the
results of the laboratory tests were discussed.
3.7 Laboratory Analysis
3.7.1 Sample Collection
The researcher worked closely with the Haematologist and two other Laboratory
Technicians. They were fully intimated on the aim and objectives of the research and the
need for extra precaution in order to minimise errors in the collection, processing and the
final result of the tests.
A blood sample was collected from the respondents for haemoglobin
concentration, genotype, HIV test, malaria parasite and peripheral smear. Incidentally,
haemoglobin concentration, genotype and HIV test are among the routine tests carried
out for all pregnant women at their prenatal registration in the hospital.
Quality Assurance and Control Procedure for Blood Sample Collection
The following procedures and precautions were taken to reduce contamination
during blood sample collection.
1. A tourniquet was tied above the elbow of the respondents.
2. The skin was cleaned with methylated spirit to remove fats and bacteria of the
skin.

40
3. A fresh hypodynamic syringe with detachable needle was used to pierce the vein
and draw about 5 – 10ml of blood.
4. The syringe with the drawn blood was carefully withdrawn, a dry clean cotton
wool was applied on the site and the tourniquet released.
5. The collected blood sample was shared out into EDTA bottles for haemoglobin,
genotype, HIV and malaria parasite tests and vacutainer bottle for peripheral
smear.
6. The containers were properly labelled with the name of each respondent and
required test clearly written.
7. The collected samples were sent to the Haematologist for processing.
3.7.2 Sample Processing
Preparation of Blood Films
Blood films or smears were prepared for microscopic examination of blood cells
(red blood cells and differential leucocyte counts) and special examination of
haemoparasites such as for malaria parasite, microfilarial worm, etc.
The following were required in preparation of blood films namely: clean, grease –
free microscope slide, spreader, Pasteur pipette, blood sample and staining reagents.
Preparation of Thick Blood Film for Malaria Parasite The procedure involved the following steps:
1. A drop of well – mixed EDTA blood sample was placed on clean, grease – free
microscopic slide.
2. The base of a plastic pipette was used to rock round the drop sample on the slide.

41
3. The rocked sample was air – dried for 10 minutes.
4. The slide was then stained with Field’s stain A and B as follows:
a) Fields stain A was applied on the slide and allowed for 2 minutes.
b) It was washed under a running tap water.
c) Fields stain B was applied and allowed for 5 – 7 minutes.
d) It was washed on a running water and air – dried for 2 minutes.
Preparation of Thin Blood Film for Peripheral Smear
The following steps were carefully taken:
1. A drop of well – mixed EDTA blood sample was placed on a clean, dry, grease –
free microscopic slide using Pasteur pipette at about 1cm away from the edge of
the slide.
2. A spreader was placed at the edge of the dropped blood sample and allowed to
spread at the edge of the slide.
3. The spreader was placed as an angle of 25o – 45o and drawn backward and
forward with firm and smooth pressure.
4. The prepared film was air – dried by waving the slide in the air.
5. The prepared slide was carefully labelled with the patients’ laboratory number.
Staining of Thin Blood Films
Romanowsky stains were used in Haematology Laboratory for staining thin blood
films. All Romanowsky stains have two major components, namely acidic and basic
components.
Example of such stains includes Leishman stains, Wright stains, Giemsa stain, etc.

42
Procedure for staining Thin Blood Films with Leishman Stain
Requirements: Leishman stain, Sorenson’s buffer or buffered distilled water,
staining rack and prepared slides.
1. The prepared slide was placed on a staining rack.
2. The surface of the film was flooded with Leishman stain and allowed to fix for 2
minutes.
3. The stain on the slide was diluted with equal volume of buffered distilled water
(Sorenson’s buffer) and allowed to stand for 8 – 10 minutes for staining reaction
to take place.
4. The stain was washed under a running tap water and left for 1 minute.
5. The excess buffer on the slide was drained and back of the slide cleaned.
6. The slide was allowed to air – dry for 2 minutes.
3.7.3 Sample Testing
Examination of thick film for Malaria Parasite
The slide from the thick blood film preparation was mounted on a microscope and
observed under x 100 oil immersion objective lens for malaria parasite. The following
stages of malaria were identified in the slides namely:
a) Ring form or Signet dot
b) Trophozoites
c) Gametocytes
Examination of Peripheral Blood Film
The slide from the thin blood film preparation was then mounted on microscope
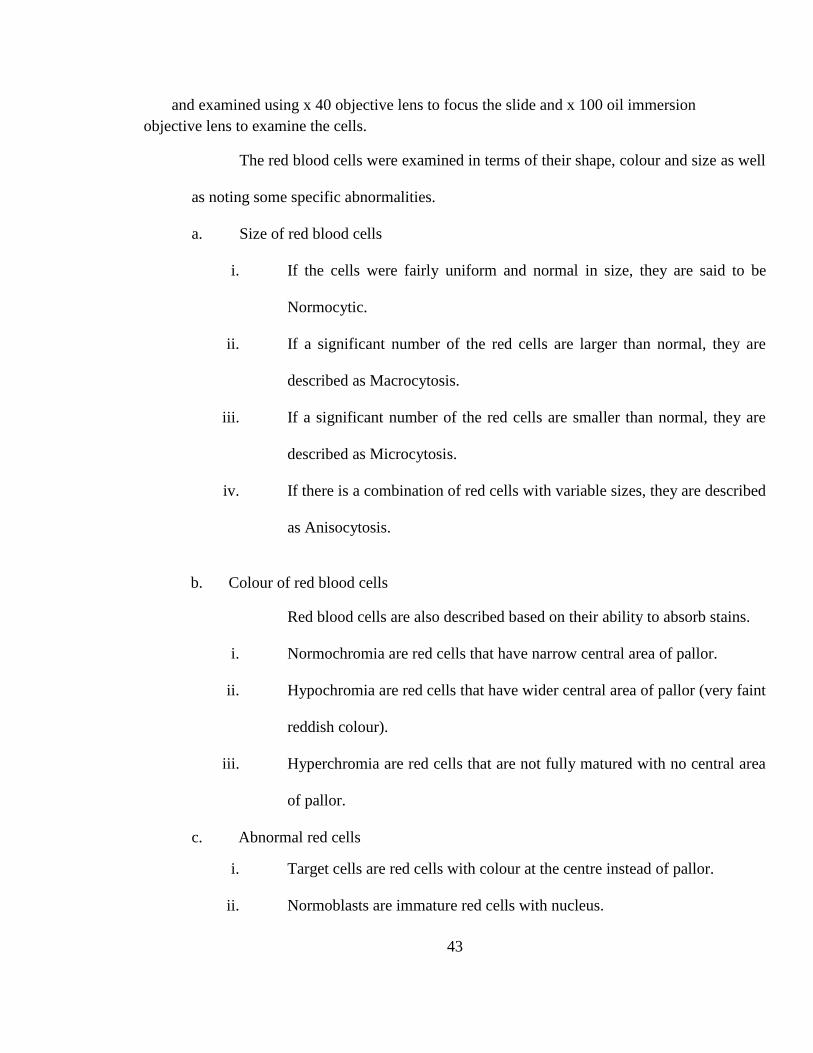
43
and examined using x 40 objective lens to focus the slide and x 100 oil immersion
objective lens to examine the cells.
The red blood cells were examined in terms of their shape, colour and size as well
as noting some specific abnormalities.
a. Size of red blood cells
i. If the cells were fairly uniform and normal in size, they are said to be
Normocytic.
ii. If a significant number of the red cells are larger than normal, they are
described as Macrocytosis.
iii. If a significant number of the red cells are smaller than normal, they are
described as Microcytosis.
iv. If there is a combination of red cells with variable sizes, they are described
as Anisocytosis.
b. Colour of red blood cells
Red blood cells are also described based on their ability to absorb stains.
i. Normochromia are red cells that have narrow central area of pallor.
ii. Hypochromia are red cells that have wider central area of pallor (very faint
reddish colour).
iii. Hyperchromia are red cells that are not fully matured with no central area
of pallor.
c. Abnormal red cells
i. Target cells are red cells with colour at the centre instead of pallor.
ii. Normoblasts are immature red cells with nucleus.

44
iii. Reticulocytes are immature red cells without nucleus.
d. Shape of red blood cells
The normal red blood cells have roughly spherical shape. The term
pokilocytosis refer to red blood cells with varied shapes. These include
fragmented cells (Schistocytes), ellitocytes, tear drop, acanthocytes, ovalocytes,
etc.
HIV Testing
Each respondent was sent to HIV Counselling and Testing (HCT) Unit. The following
steps were carried out.
1. Pre-test counselling was given to each respondent.
2. A need to invite their spouses for counselling and testing was strongly advised.
3. A HIV test was carried with determine test kit using the earlier collected blood
sample.
4. The post test counselling with disclosure of results to respondents.
5. Those with positive results were encouraged to invite their spouses for
counselling and testing.
Test for Haemoglobin Concentration
The following steps were carried out. This was done with Quality Buffy Coat
Analyser (QBC) which is an automated machine. It takes about 2 minutes to analyse each
sample inserted using QBC capillary tubes.
It has the advantage of analysing many samples within a short a period with sensitivity of
99.95% and specificity of 99.91% when compared with the usual manual type of

45
haemoglobin estimation. It is however expensive to run and maintain steady, easily
disabled by power fluctuation and cannot be used for very large population survey
because of huge cost implication.
1. QBC capillary tube was used to collect the required blood sample.
2. The collected sample was centrifuged using haemoglobin centrifuge. This allowed
the separation of the blood into its various components namely: serum, white
blood, red blood cells, platelets, etc.
3. Then the various components are displayed on screen.
4. The haemoglobin button was pressed twice which was followed by display of the
haemoglobin concentration value on the screen. This was recorded by the
haematologist.
Test for genotype
The following steps were carried out:
1. A whole blood sample was collected with EDTA bottle. EDTA is an
anticoagulant.
2. A plastic pipette was used to draw the blood from the EDTA into a test tube.
3. A drop of water was added to the test tube to lyse the blood.
4. An applicator was used to apply a control samples which include AS and SS on
an acetate paper.
5. An applicator was then used to apply the prepared sample in the test tube to the
acetate paper. A gap of at least 2 cm was given to avoid mixing of the control and
collected sample during floating.
46
6. The acetate was transferred into the electrophoretic tank which contained thrice
buffer solution.
7. The tank was switched on and allowed for 5 – 7 minutes.
8. It was switched off and the reading of the test done. Usually the control samples
separates with S – gene to the left and A – gene to the right.
Interpretation of the test was done as follows:
a. If the testing sample is SS, the bar will move to the left side of the acetate
paper.
b. If the testing sample is AA, the bar will move to the right side of the
acetate paper.
c. If testing sample is AS, it will split into two bars.
d. If testing sample is AC, the separated bars will be wider than AS.
e. If testing sample is SC, the separated bars will be wider than AC.
3.8 Data Analysis
Prevalence rate was calculated based on the number of respondents with anaemia
when compared with the total number of respondents observed for the overall prevalence
and the number of respondents at risk for the differential prevalence. Other data were
calculated as percentages and presented in the forms of tables and graphs. The test of
significance with Chi – square was carried out where appropriate and logistic regression
analysis was also carried out.
Prevalence
This is a measure of the number of people in a population that have the disease, in this case

47
anaemia in pregnancy at a given point in time (point prevalence) or over a period of time (period
prevalence).57
In other words, it is a measure of the current status of the disease in a population at
a fixed point in time or during a specified period.
It is usually expressed as a percentage of the population under study and is
calculated as follows:
Point Prevalence = 100 x meat that ti population Total
given time aat cases ofnumber Total
Period Prevalence = 100 x that timeduring population Total
timeof period specified a duringcondition disease of TNC
Where TNC = Total number of cases (old/new)
Chi – square
Chi – square test is a particularly useful technique for testing whether observed
data are representative of a particular distribution. This is a test of statistical significance
that is used with data in the form of frequencies or data that can be readily transformed
into frequencies.51 Most of the data obtained in this study fall into this category.
The general formula for Chi – square is:
EFX
2
2 EF - OF
Where
OF = Observed Frequency
EF = Expected Frequency

48
Total Overall
TotalColumn x Total Row Frequency Expected
For theoretical Chi – square, the degree of freedom (df) in a contingency table can be computed
from the number of rows and columns.
df = (r – 1) (c – 1)
Where r = number of rows c = number of columns
Where there is only one degree of freedom, an adjustment known as Yates
correction for continuity must be applied. It is also used when at least one cell of the table
has an expected count lower than 5.
To use this correction, the absolute value (irrespective of algebraic sign) of the numerator
contribution of each cell to the above basic computational formulae.
The basic Chi – square computational formulae then becomes:
EFX
2
2 0.5 - EF - OF
In order to interpret Chi – square, a null hypothesis is stated, usually that there
will be no difference in the frequencies observed. This is usually calculated to the 95%
confidence limit (P value = 0.05). In this study, the null hypothesis is that there is no
relationship between anaemia in pregnancy and respondents’ age, gravidity, gestational
age, parity, socio – economic status and aetiological factors (MF, HIV, Hb genotype and
vitamin deficiency). The alternative hypothesis is that there is a relationship between
anaemia in pregnancy and respondents’ age, gravidity, gestational age, parity, socio –

49
economic status and aetiological factors (MF, HIV, Hb genotype and vitamin deficiency).
Inference was drawn as follows:
1. If the value of the calculated X2 is greater than the theoretical X2 obtained from
Chi – square statistical table (i.e. P value > 0.05), the null hypothesis is rejected
and the alternative hypothesis is accepted (significant relationship).
2. If the value of the calculated X2 is less than the theoretical X2 obtained from Chi
– square statistical table (i.e. P value > 0.05), the null hypothesis is accepted and
the alternative hypothesis is rejected (no relationship).
Probability values (P values) for the variables were calculated using a Statistical
Package: Statistical Package for Social Sciences Version 16.0 (SPSS 16.0).
50
CHAPTER FOUR
4.0 Results
Four hundred copies of questionnaires were administered to the pregnant women in the
sample population. All the questionnaires were properly filled and collated given a response rate
of 100%.
4.1 Socio-demographic Characteristics of the Patients
Four hundred (400) pregnant women who booked for antenatal care within the period of August
to October 2010 were recruited for this study. Three hundred and ninety – five (98.8%) were
married while only five were single contributing 1.2% of the respondents. The age distribution
was from 18 years to 40 years with a mean of 27.5±1.1. Most of the respondents fall within the
age group of 26 – 30 years (43.5%).
Two hundred and forty – five (61.3%) of the respondents were multipara while 150
(37.5%) and 5 (1.3%) were nullipara and grandimultipara respectively.
Two hundred and thirty – four (58.4%) of the respondents were in their second trimester
while 83 (20.8%) were in their first trimester and 83 (20.8%) were in their third trimester.
Analysis of socioeconomic status showed that 246 (61.5%) of respondents were in the
middle class while 129 (32.5%) were in the upper class and 24 (6.0%) in lower class. The details
of socio-demographic characteristics of the respondents are shown in Table 4.1 while socio-
demographic characteristics of the respondents with anaemia are presented in Table 4.2.

51
Table 4.1: Socio-demographic Characteristics of the Respondents.
Characteristics Number of Respondents Percentage
Age (Years) 15 – 20 2 0.5
21 – 25 65 16.3
26 – 30 174 43.5
31 – 35 117 29.2
36 – 40 38 9.5
> 40 4 1.0
Mean Age±SD 27.5±1.1 - -
Marital Status Single 5 1.2
Married 395 98.8
Religion Christian 397 99.3
Moslem 3 0.7
Gravidity Primigravida 150 37.5
Multigravida 245 61.3
Grand Multigravida 5 1.2
Parity Primipara (0) 172 43.0
Multipara (1-4) 191 47.7
Grand mulitpara (> 4) 37 9.3
Trimester First 83 20,8
(Gestational Age) Second 234 58.4
Third 83 20.8
Type of family Monogamy 394 98.5
Polygamy 6 1.5
Type of Accommodation One Room 45 11.3
2 -3 bedrooms 343 85.7
Duplex ≥ 4 Rooms 12 3.0
Socioeconomic Status Upper 130 32.5
Middle 246 61.5
Lower 24 6.0

52
Table 4.2: Socio-demographic Characteristics of the Respondents with Anaemia
Characteristics Number of
Respondents
Number of Anaemic
Respondents
Percentage
Age (Years) 15 – 20 2 1 50.0
21 – 25 65 39 60.0
26 – 30 174 91 52.3
31 – 35 117 75 64.1
36 – 40 38 24 63.2
> 40 4 2 50.0
Marital Status Single 5 3 60.0
Married 395 229 58.0
Gravidity Primigravida 150 78 52.0
Multigravida 245 152 62.0
Grand Multigravida 5 2 40.0
Parity Primipara (0) 172 90 52.3
Multipara (1-4) 191 116 60.7
Grand mulitpara (>
4)
37 26 70.3
Trimester First 83 45 54.2
(Gestational
Age)
Second 234 135 57.7
Third 83 52 62.7
Type of family Monogamy 394 230 58.4
Polygamy 6 2 33.3
Type of
Accommodation
One Room 45 21 46.7
2 -3 bedrooms 343 202 59.2
Duplex ≥ 4 Rooms 12 9 75.0
Socioeconomic
Status
Upper 130 73 56.2
Middle 246 143 58.1
Lower 24 16 66.7

53
Figure 4.1 shows the age distribution of the respondents. The x – axis represents the age
groups while the y – axis represents the frequency. Most respondents (174) fall within the age
group of 26 – 30 years contributing 43.5%, followed by 31 – 35 years age group contributing
29.2% from 117 respondents.
Fig. 4.1: Bar Chart showing the Age Distribution of the Respondents.
Figure 4.2 shows the gravidity distribution of the respondents. Majority of the
respondents are multigravidae accounting for 61.3% while primigravidae and
grandmultigravidae accounted for 37.5% and 1.3% respectively.
Fig. 4.2: Bar Chart showing the Gravidity of the Respondents
2
65
174
117
38
4
0
20
40
60
80
100
120
140
160
180
200
15 - 20 21 - 25 26 - 30 31 - 35 36 - 40 40 +
Fre
qu
ency
Age (Years)
150
245
50
50
100
150
200
250
300
Primagravida Multigravida Grandmultigravida
Fre
qu
ency
Gravidity

54
Figure 4.3 shows the parity distribution of the respondents. The y-axis represents the
number of respondents in that category while the x-axis represents the parity of respondents. The
multiparas constitute the majority of the respondents with a total of 47.7% while primapara
followed closely with 43.0%.
Fig. 4.3: Bar Chart showing the Parity Distribution of the Respondents
Figure 4.4 is a bar chart showing the trimester of the respondents. Majority of the
respondents were in their second trimester which account for 58.4% of all the respondents.
Fig. 4.4: Bar Chart showing the Trimester of the Respondents.
172191
37
0
50
100
150
200
250
Primapara (0) Multipara (1-4) Grandmultipara (>4)
Fre
qu
ency
Parity
83
234
83
0
50
100
150
200
250
First Second Third
Fre
qu
en
cy
Trimester
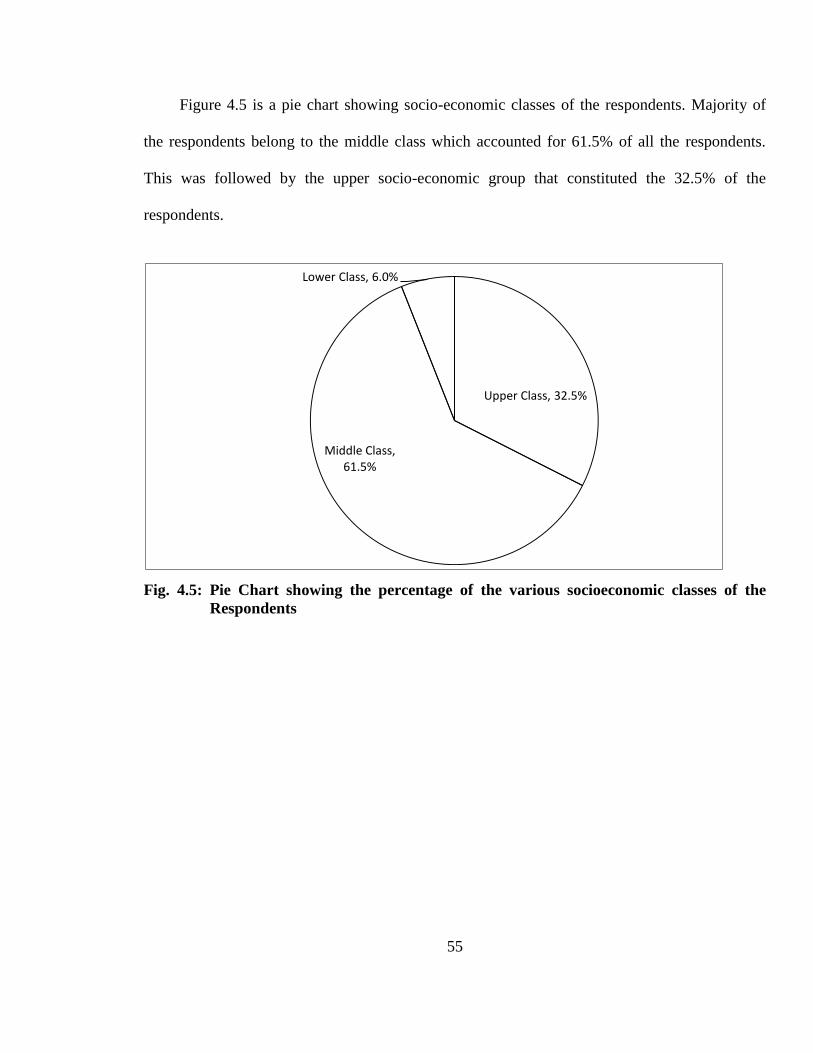
55
Figure 4.5 is a pie chart showing socio-economic classes of the respondents. Majority of
the respondents belong to the middle class which accounted for 61.5% of all the respondents.
This was followed by the upper socio-economic group that constituted the 32.5% of the
respondents.
Fig. 4.5: Pie Chart showing the percentage of the various socioeconomic classes of the
Respondents
Upper Class, 32.5%
Middle Class, 61.5%
Lower Class, 6.0%

56
Figure 4.6 shows age distribution of the respondents with anaemia. The x-axis represents the age
group in years while y-axis represents the percentages. Most (64.1%) of the respondents with
anaemia are within the age group 31 – 35 years.
Fig. 4.6: Bar Chart showing age distribution of the respondents with anaemia.
Figure 4.7 is a bar chart showing the gravidity of the respondents with anaemia. The x-
axis represents gravidity while the y-axis represents the percentage. Greater percentage of the
respondents with anaemia (62.0%) are multigravidae.
Fig. 4.7: Bar Chart showing Gravidity of the respondents with anaemia.
50
60
52.3
64.1 63.2
50
0
10
20
30
40
50
60
70
15 - 20 21 - 25 26 - 30 31 - 35 36 - 40 40 +
Pe
rcen
tage
Age (Years)
52
62
40
0
10
20
30
40
50
60
70
Primigravida Multigravida Grandmultigravida
Pe
rcen
tage
Gravidity

57
Figure 4.8 is a bar chart showing the parity of the respondents with anaemia. The x-axis
represents the parity while y-axis represents the percentage. Higher percentage of the
respondents in grandmultipara group (70.3%) was anaemic.
Fig. 4.8: Bar Chart showing the Parity of respondents with anaemia.
Figure 4.9 is a bar chart showing the trimesters of the respondents with anaemia. The x-axis
represents the trimester of the respondents while y-axis represents percentage. Greater
percentage of the respondents in third trimester (62.7%) was anaemic.
Fig. 4.9: Bar Chart showing the Trimesters of the respondents with anaemia.
52
60.7
70.3
0
10
20
30
40
50
60
70
80
Primipara (0) Multipara (1-4) Grandmultipara (>4)
Pe
rcen
etag
e
Parity
54.2
57.7
62.7
48
50
52
54
56
58
60
62
64
First Second Third
Pe
rcen
tage
Trimester

58
Figure 4.10 is a bar chart showing socioeconomic status of the respondents with anaemia.
The x-axis represents the socioeconomic classes while y-axis represents the percentages. Greater
percentage of the respondents in the lower socioeconomic class had anaemia.
Fig. 4.10: Bar Chart showing the Socio-economic Status of the Respondents with Anaemia.
4.2 Test of Significance
The Chi-square (X2) contingency tables for test of relationship between gestational
anaemia and gravidity, gestational age (trimester), age, socio-economic status, parity, malaria,
HIV/AIDS and Haemoglobin genotype are presented in Tables 4.3 – 4.10.
Table 4.3: Contingency table for X2 test of relationship between gravidity and gestational
anaemia
Parameter Primigravida Multi-gravida Grandmultigravida Total
Anaemic 78 152 2 232
Non – Anaemic 72 93 3 168
Total 150 245 5 400
The calculated chi – square for test of relationship between gestational anaemia and
gravidity is 4.48 while the tabulated chi – square under df = 2 and p = 0.05 is 5.99. Since the
66.7
58.1
56.2
50
52
54
56
58
60
62
64
66
68
Lower Middle Third
Pe
rcen
tage
Socio-economic Class

59
calculated p – value is less than the theoretical p – value (0.05), we accept null hypothesis and
conclude that there is no statistically significant association between gravidity and anaemia.
Table 4.4: Contingency table for X2 test of relationship between gestational age (trimester)
and gestational anaemia
Parameter First Trimester Second Trimester Third Trimester Total
Anaemic 45 135 52 232
Non – Anaemic 38 99 31 168
Total 83 234 83 400
The calculated chi – square for test of relationship between gestational age (trimester)
and gestational anaemia is 7.25 while the tabulated chi – square under df = 2 and p = 0.05 is
5.99. Since the calculated p – value is greater than the theoretical p – value (0.05), null
hypothesis stating that there is no relationship between gestational age and anaemia is rejected.
There is therefore statistically significant association between gestational age and anaemia.
Table 4.5: Contingency table for X2 test of relationship between respondents’ age and
gestational anaemia
Parameter 15 – 20yrs 21 – 25yrs 26 – 30yrs 31 – 35yrs 36 – 40yrs >40 Total
Anaemic 1 39 91 75 24 2 232
Non – Anaemic 1 26 83 42 14 2 168
Total 2 65 174 117 38 4 400
The calculated chi – square for test of relationship between respondents’ age and
gestational anaemia is 7.66 while the tabulated chi – square under df = 4 and p = 0.05 is 9.49.
Since the calculated p – value is less than the theoretical p – value (0.05), null hypothesis is
accepted and alternative hypothesis rejected; therefore there is no statistically significant
association between respondents’ age and anaemia in pregnancy.

60
Table 4.6: Contingency table for X2 test of relationship between socioeconomic status and
gestational anaemia
Parameter Upper Class Middle Class Lower Class Total
Anaemic 73 143 16 232
Non – Anaemic 57 103 8 168
Total 130 246 24 400
The calculated chi – square for test of relationship between socioeconomic status and
gestational anaemia is 6.82 while the tabulated chi – square under df = 2 and p = 0.05 is 5.99.
Since the calculated p – value is greater than the theoretical p – value (0.05), therefore the null
hypothesis is rejected and alternative hypothesis upheld; it means that there is an association
between socioeconomic status and anaemia in pregnancy.
Table 4.7: Contingency table for X2 test of relationship between parity and gestational
anaemia
Parameter Primipara Multipara Grandmultipara Total
Anaemic 90 116 26 232
Non – Anaemic 82 75 11 168
Total 172 191 37 400
The calculated chi – square for test of relationship between parity and anaemia is 5.70
while the tabulated chi – square under df = 2 and p = 0.05 is 5.99. Since the calculated p – value
is less than the theoretical p – value (0.05), we accept null hypothesis and rejecting alternative
hypothesis; thereby concluded that there is no statistically significant association between parity
and anaemia.

61
Table 4.8: Contingency table for X2 test of relationship between malaria and gestational
anaemia
Parameter Malaria Total
Positive Negative
Anaemic 92 139 231
Non – Anaemic 25 144 169
Total 117 283 400
The calculated chi – square for test of relationship between malaria and gestational
anaemia is 4.82 while the tabulated chi – square under df = 1 and p = 0.05 is 3.84. Since the
calculated p – value is greater than the theoretical p – value (0.05), we reject null hypothesis and
accepted the alternative hypothesis; thereby concluded that there is statistically significant
association between malaria and anaemia.
Table 4.9: Contingency table for X2 test of relationship between HIV and gestational
anaemia
Parameter HIV Total
Positive Negative
Anaemic 9 145 154
Non – Anaemic 5 241 246
Total 14 386 400
The calculated chi – square using Yates Correction Factor for the test of relationship
between HIV and gestational anaemia is 3.24 while the theoretical chi – square from statistical
table under df = 1 and P = 0.05 is 3.84. Since the calculated p – value is less than the theoretical
p – value, null hypothesis is therefore accepted. This means that there is no significant
relationship between gestational anaemia and HIV infection.
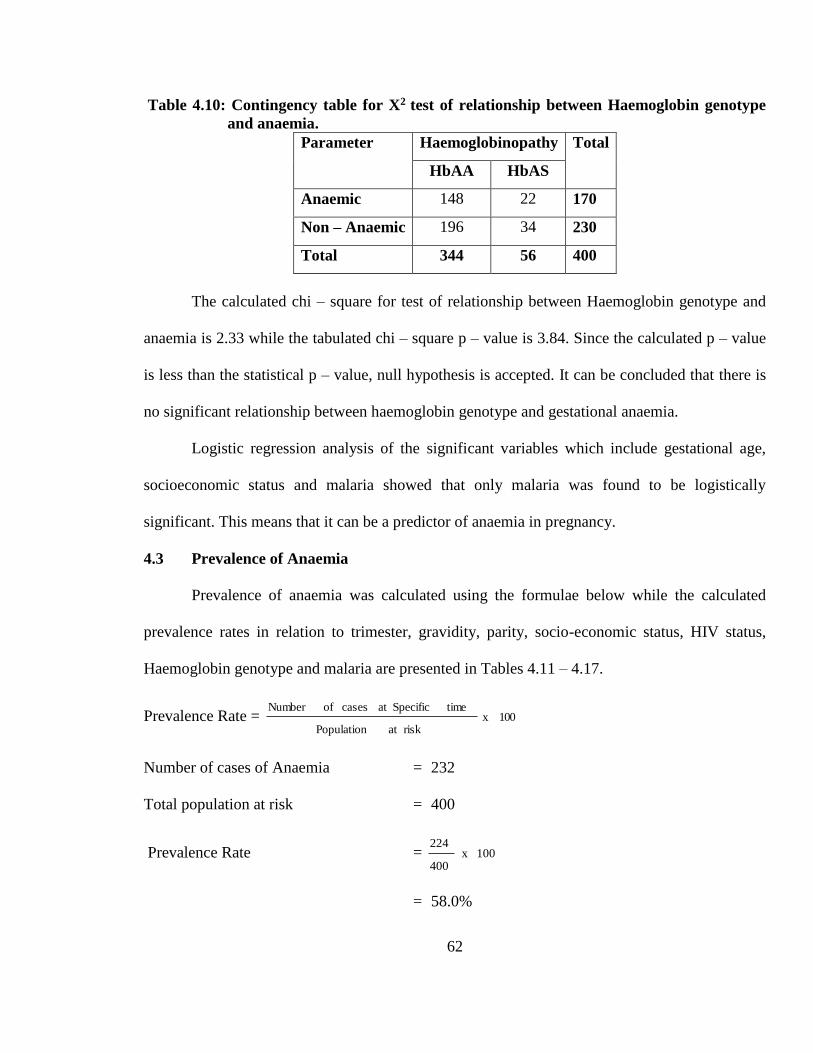
62
Table 4.10: Contingency table for X2 test of relationship between Haemoglobin genotype
and anaemia.
Parameter Haemoglobinopathy Total
HbAA HbAS
Anaemic 148 22 170
Non – Anaemic 196 34 230
Total 344 56 400
The calculated chi – square for test of relationship between Haemoglobin genotype and
anaemia is 2.33 while the tabulated chi – square p – value is 3.84. Since the calculated p – value
is less than the statistical p – value, null hypothesis is accepted. It can be concluded that there is
no significant relationship between haemoglobin genotype and gestational anaemia.
Logistic regression analysis of the significant variables which include gestational age,
socioeconomic status and malaria showed that only malaria was found to be logistically
significant. This means that it can be a predictor of anaemia in pregnancy.
4.3 Prevalence of Anaemia
Prevalence of anaemia was calculated using the formulae below while the calculated
prevalence rates in relation to trimester, gravidity, parity, socio-economic status, HIV status,
Haemoglobin genotype and malaria are presented in Tables 4.11 – 4.17.
Prevalence Rate = 100 x riskat Population
timeSpecificat cases ofNumber
Number of cases of Anaemia = 232
Total population at risk = 400
Prevalence Rate = 100 x 400
224
= 58.0%

63
Table 4.11: Prevalence rates of anaemia at various trimesters (gestational age)
Trimester Number of Respondents Number of respondents
with anaemia
Percentage
(Prevalence Rate)
First 83 45 54.2
Second 234 135 57.9
Third 83 52 62.7
Table 4.11 above showed the differential prevalence rates of anaemia at various
trimesters. Prevalence of anaemia was highest in the third trimester (62.7%) while it is 57.9%
and 54.2% in the second and first trimesters respectively.
Table 4.12: Prevalence rates of anaemia among various gravidae
Gravidity Number of Respondents Number of respondents
with anaemia
Percentage
(Prevalence Rate)
Primigravidae 150 78 52.0
Multigravidae 245 152 62.0
Grandmultigravidae 5 2 40.0
Table 4.12 above showed the differential prevalence rates of anaemia among various
gravidity of the respondents. Multigravidae had the highest prevalence rate of anaemia (62.0%)
among the respondents.
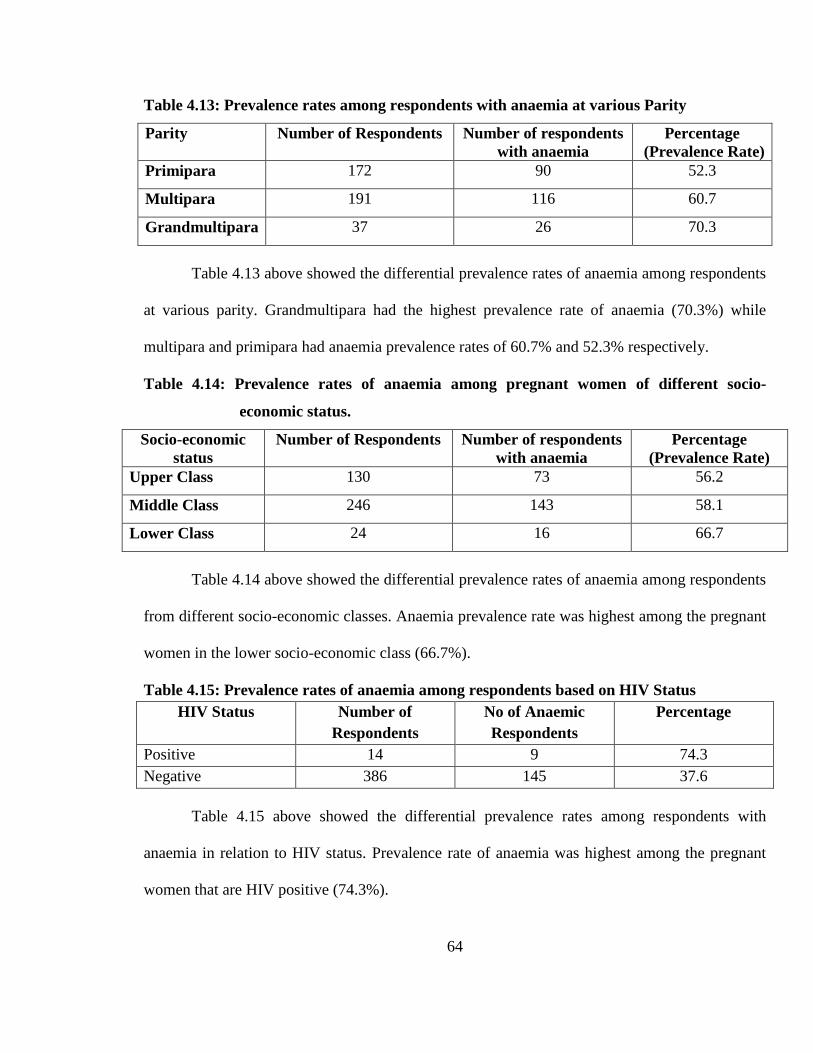
64
Table 4.13: Prevalence rates among respondents with anaemia at various Parity
Parity Number of Respondents Number of respondents
with anaemia
Percentage
(Prevalence Rate)
Primipara 172 90 52.3
Multipara 191 116 60.7
Grandmultipara 37 26 70.3
Table 4.13 above showed the differential prevalence rates of anaemia among respondents
at various parity. Grandmultipara had the highest prevalence rate of anaemia (70.3%) while
multipara and primipara had anaemia prevalence rates of 60.7% and 52.3% respectively.
Table 4.14: Prevalence rates of anaemia among pregnant women of different socio-
economic status.
Socio-economic
status
Number of Respondents Number of respondents
with anaemia
Percentage
(Prevalence Rate)
Upper Class 130 73 56.2
Middle Class 246 143 58.1
Lower Class 24 16 66.7
Table 4.14 above showed the differential prevalence rates of anaemia among respondents
from different socio-economic classes. Anaemia prevalence rate was highest among the pregnant
women in the lower socio-economic class (66.7%).
Table 4.15: Prevalence rates of anaemia among respondents based on HIV Status
HIV Status Number of
Respondents
No of Anaemic
Respondents
Percentage
Positive 14 9 74.3
Negative 386 145 37.6
Table 4.15 above showed the differential prevalence rates among respondents with
anaemia in relation to HIV status. Prevalence rate of anaemia was highest among the pregnant
women that are HIV positive (74.3%).
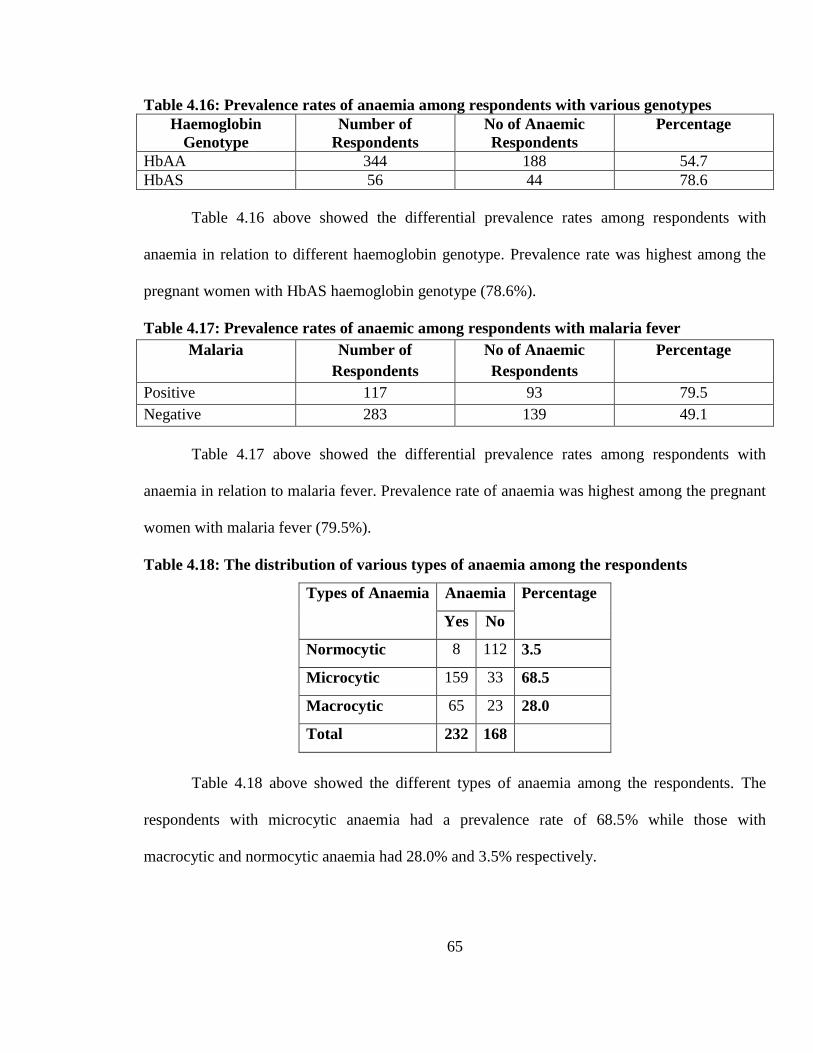
65
Table 4.16: Prevalence rates of anaemia among respondents with various genotypes
Haemoglobin
Genotype
Number of
Respondents
No of Anaemic
Respondents
Percentage
HbAA 344 188 54.7
HbAS 56 44 78.6
Table 4.16 above showed the differential prevalence rates among respondents with
anaemia in relation to different haemoglobin genotype. Prevalence rate was highest among the
pregnant women with HbAS haemoglobin genotype (78.6%).
Table 4.17: Prevalence rates of anaemic among respondents with malaria fever
Malaria Number of
Respondents
No of Anaemic
Respondents
Percentage
Positive 117 93 79.5
Negative 283 139 49.1
Table 4.17 above showed the differential prevalence rates among respondents with
anaemia in relation to malaria fever. Prevalence rate of anaemia was highest among the pregnant
women with malaria fever (79.5%).
Table 4.18: The distribution of various types of anaemia among the respondents
Types of Anaemia Anaemia Percentage
Yes No
Normocytic 8 112 3.5
Microcytic 159 33 68.5
Macrocytic 65 23 28.0
Total 232 168
Table 4.18 above showed the different types of anaemia among the respondents. The
respondents with microcytic anaemia had a prevalence rate of 68.5% while those with
macrocytic and normocytic anaemia had 28.0% and 3.5% respectively.

66
Table 4.19: Distribution of the degree of anaemia among the anaemic
respondents
Severity Number of
Respondents
Percentage
Mild 116 50.0
Moderate 98 42.2
Severe 18 7.8
Total 232 100
Table 4.19 above showed the distribution of the degree of anaemia among the anaemic
respondents. The respondents with mild anaemia had a prevalence rate of 50.0% while those
with moderate and severe anaemia had 42.9% and 7.8% respectively.

67
CHAPTER FIVE
5.0 Discussion
The routine antenatal tests done in Faith Mediplex Benin- City include screening for anaemia at
booking. There are challenges associated with it. Firstly, it was done using haematocrit (packed
cell volume) which is not a reliable test for anaemia in pregnancy due to haemodilution.
Inaddition, this test was done at booking and repeated every four weeks untill delivery. The more
appropriate and diagnostic test for screening for anaemia is haemoglobin concentration.
However, the simple haemoglobin concentration estimation will not provide all necessary
information without knowledge of pattern of anaemia among these pregnant women.
5.1 Demographic Characteristics of the Patients.
5.1.1 Age Group
The mean age of participants in the study was 27.5 + 3.2 years while the average of the
group with anaemia was 25.5+2.8 year. This is similar to the report of studies done at Ilesa30
which recorded a mean age of 25.99+ 4.98 years and Enugu5 which documented an average of
30.2+ 5.2 years. The two pregnant women in the lower age group 15- 20 years were single and
victims of teenage pregnancy which might be a reflection of poor knowledge of sex education
and safe sex measures among the youths. The finding of one percent of those in the age group of
over 40 years could be that in the study centre, there are few cases of advanced maternal age
among the obstetric population. It could also mean that most of them have relatively small family
size or that most women complete their family size in good time. Majority of the respondents
are in the age of 26- 30 years. This is similar to findings of a study in Oyo25 and Ilesha30 where
25- 30 years were the dominant age group among the pregnant women.

68
This could be because teenage marriage is not the usual practice in our area and that girls are
usually given out in marriage after higher school education.
5.1.2 Marital Status.
Almost all (99%) of the pregnant women were married. The finding could be as a result
of the religious background of the attendees of the hospital. It might also mean that single
prospective mothers do not come for prenatal clinic either because of the stigma or that they do
not have enough money. Nevertheless, pregnancy in a single parent especially teenage pregnancy
is a high risk pregnancy that requires full benefits of antenatal care in the hospital.
5.1.3. Socioeconomic status
This study revealed that 32.5% (n=130) and 61.5% (n=246) of the respondents belong to
upper and middle socio economic groups respectively. Only twenty four (6.0%) of the
respondents were in the lower socioeconomic class. This is in contrast with findings of a study in
Gombe33 where 63.5% of women were of lower socioeconomic class. The paucity of number
found in lower socioeconomic class in this study could be due to the fact that people in that cadre
believe erroneously that healthcare services are cheaper in the private clinics and maternity
homes than the regular hospitals. They also tend to patronize traditional birth attendants as
confirmed by Idowu et al4 in their study of anaemia prevalence among pregnant women at
Abeokuta. Involvement in delivery by traditional midwives at home and worship centres is also a
common practice among this group.
5.2 Prevalence of Anaemia
In this study, the prevalence of anaemia among the respondents was 58.0%. This was
high when compared with similar studies carried out in Port Harcourt11, Lagos22 and Oyo25 but
was close to findings of similar researches conducted at Maiduguri29, Ilesha30 and Kwale 26, with
69
prevalence range of 51.8 to 62.2%. Incidentally and unlike the finding of a study done in Enugu5,
where all anaemic pregnant women were of mild to moderate variety with no case of severe
anaemia, this study recorded 7.1% of respondents with severe anaemia..
This was however in tandem with the studies in Abeokuta4 and Kwale26 which recorded a severe
anaemia prevalence of 1.9% and 6.7% respectively. The reasons for these findings were however
attributed to the study population and location of the studies. In Abeokuta study, respondents
were recruited from traditional birth attendants centre and Federal medical centre while the
Kwale study was carried out among the semi- urban pregnant women. Also in southern
Malawi10, 3.6% of anaemic pregnant women were of the severity variety (Hb less than 7.0g/dl).
The findings of this study was attributed to haemodilution of pregnancy and non- compliance to
a routine haematinics given at the antenatal clinic.
5.2.1. Age and Prevalence of Anaemia
Among the respondents that had anaemia, 174(39.2%) were in the age group of 26 - 30
years. The proportion rose from 26 - 30 years age group and peaked at 31 - 35 age group and
declined sharply. This was however not statistically significant (P= 0.525). This was consistent
with findings of Dim et al 5 and van den Broek et al10 where there was no association of maternal
age with anaemia. In this study, 26 - 30 age group accounted for 22.8% of total study population
with anaemia probably skewing prevalence to this group. While some researchers showed that
highest gestational anaemia prevalence was in the younger group24,36, others showed that it is
highest in the older age group4,18. On the whole, age does not seem to have a consistent effect in
the prevalence of anaemia in pregnancy.
70
5.2.2. Anaemia and Gestational Age
This study showed that 58.4% (n=234) of the respondents registered for antenatal care at
second trimester while the same number of the respondents (n=83) registered at first and third
trimesters. This is in consonance with findings of studies conducted by Bukar et al in
Maiduguri33 and Komolafe et al in Ilesa30 where more than sixty percents of the women
registered for prenatal care in second trimester. This finding was probably due to the wrong
notion that early antenatal registration would translate to more antenatal visits and increased cost
of healthcare. This discovery differed greatly from studies done in Enugu5, Lagos22, Oyo25 and
Kwale26 where most of the pregnant women booked for prenatal care in third trimesters. The
studies attributed this finding to the absence of symptoms of ill health, financial constraints and
belief that third trimester is best time to register because the pressure symptoms of the pregnancy
are at its maximum. By and large, it has been widely documented that gestational age at booking
has been associated with gestational anaemia. This fact was collaborated by a prospective study
in Ethiopia23 which reported that the percentage anaemia in pregnancy increases with gestational
age (13 weeks= 7.7%, 25 weeks= 36%, 32weeks=50%). The findings of this study showed that
gestational age (trimester) at booking was significantly associated with gestational anaemia
(P<0.05). This was in tandem with reports from similar studies in Burkina faso21 and Bangkok,
Thailand31. The late antenatal registration may have contributed to the high prevalence of
anaemia (58.0%) recorded in this study since early prenatal care results in better monitoring and
early detection of anaemia and its correction by supplementation.

71
5.2.3 Anaemia and Gravidity.
Multigravidae consists of 152(65.5%) out of 232 respondents with anaemia when
compared with primigravidae 33.6 %( n=78) and grandmultiparity 0.9% (n=2). The result was
not statistically significant. (P > 0.05). This analysis may have been affected by few numbers of
respondents who are primigravidae and grand multigravidae. This finding was in contrast with
reports of other studies conducted at Abeokuta4, Lagos22 and Kwale26, which documented that
gestational anaemia was found to be more common among primigravidae than multi- and
grandmultigravidae. The reason alluded to this report was because malaria, a major cause of
anaemia in pregnancy in endemic areas is known to be more common among primigravidae.
This report was collaborated by Munasinghe et al43 in Malawi who observed a statistically
significant difference in the anaemia prevalence between primigravidae (8g/dl) and
multigravidae(10.10g/dl).
5.2.4. Socioeconomic Status and Anaemia in Pregnancy
Seventy three (56.2%) out of the 130 participants in the upper socioeconomic class had
anaemia in pregnancy. For the middle socioeconomic class, One hundred and forty three out of
246 respondents had anaemia representing 58.2% of the class. Also 16 out of 24 respondents in
the lower socioeconomic group (66.7%) had anaemia. The proportion of those with anaemia is
lowest among the upper social class, which was found to be statistically significant (P value <
0.05). This finding agreed with the report of similar researches done in Lagos22 and Gombe33
where low socioeconomic status was significantly associated with gestational anaemia. Others
studies in Abeokuta4 using occupation of respondents and Bangkok31 using educational status of
the participants agreed with the above findings.

72
A high proportion of the respondents in this study are in the upper (32.5%) and middle (61.6%)
socioeconomic classes. Only 6.0% of the respondents are in the lower socioeconomic class. This
is probably due to the fact that people in the lower social class with limited economic
empowerment and educational attainment are more likely to patronise patent medicine dealer,
drug hawkers, traditional birth attendants’ centres, private and religious maternity homes rather
than accessing care at the secondary and tertiary health care facilities.
5.2.5 Parity and Anaemia in Pregnancy
Ninety respondents (52.3%) out of 172 primipara were anaemic. For the multipara,
60.7% (n =116) had anaemia. Out of 37 respondents who are grand multiparas, 26(70.3%) had
anaemia in this study. Though the study showed various proportions among the respondents,
gestational anaemia and parity were however not statistically significant or related.
This agreed with a result of the study done by Dim et al in Enugu5 among pregnant antenatal
women. Inaddition, the finding of a proportional increase in anaemia prevalence with parity was
in tandem with the report of a similar prospective work done by Desolegn in Ethopia 23 where he
reported serial increase in the prevalence of gestational anaemia with parity(Primipara= 28%,
Multipara 43.6%, grandmultipara 53.3%). This report was also supported by research findings
carried out in Ilesa30 and Singapore27. Another study in Namibia18 documented that pregnant
women with a least one birth (multiparous) were 3.2 times more likely to have moderate to
severe anaemia than nulliparous women. This was attributed to the fact that prior births do
deplete maternal iron stores due to the increased nutritional demands of pregnancy and puerperal
loss. It all means that any pregnant woman of any parity is prone to anaemia in view of the above
fact.

73
5.2.6 Malaria and Anaemia in Pregnancy
From this study, more than three quarter of pregnant women (78.6%) with malaria had
anaemia when compared with 49.1% of non- malaria pregnant women with anaemia. This was
found to be statistically significant (P< 0.05). The prevalence of malaria among the study
population was 23.0%. This was in consonance with the reports of a similar studies at Port
harcourt11 and Abakaliki40 with malaria prevalence of 20.3% and 29% respectively. The finding
of this study was however at variant with the report of malaria prevalence carried out at a rural
community in Ebonyi state41, Ghana42 and Southern Malawi43 where the malaria prevalence in
pregnancy of between 59.9% and 65.2% were recorded. The reason for this finding stems from
the fact that the study was carried out among a rural populace and malaria is endemic in our
environment and has been ranked as the commonest cause of anaemia in pregnancy with its
attendant adverse maternal and prenatal outcome 28,35. The prevalence of malaria in this study
may probably have contributed to high prevalence of gestational anaemia recorded in this study.
Logistic regression analysis done in this study showed presence of malaria as the only
statistically significant factor that can predict anaemia in pregnancy.
The other statistically significant factors associated with anaemia in this study were socio
economic status and trimesters. They were however found to be poor predictors of anaemia in
pregnancy.
5.2.7 Human Immunodeficiency virus (HIV) and Anaemia in Pregnancy
In this study, 53.8 percent ( n=215) of the respondents were seronegative for HIV test. Only
2.3% (n=9) of the respondents were seropositive for HIV test. HIV disease during pregnancy has
been associated with an increased risk of anaemia related maternal death in developing country
settings due to increasing severity of anaemia or in combination with other infections32.
74
This finding however was found not statistically significant. It was also at variant with study of
HIV among pregnant women in Enugu5, Portharcourt11, Malawi16, Burkinafaso21 and
Abakaliki32 . The finding of this could be attributed to the fact that some of the pregnant women
may have been assessing antiretroviral therapy and are excluded from the study. Secondly, the
results of this study were probably affected by the fact that the study was done within a period of
three months using pregnant women at booking. A study that will give a true prevalence of such
pandemic like HIV will need a long time for recruitment of study population to allow for true
representation.
5.2.8 Distribution by Peripheral Smear
In this study, peripheral smear was done using blood collected from the respondents. One
hundred and fifty five (69.2%) out of two hundred and twenty four respondents with anaemia
had microcytic hypochromic anaemia. For macrocytic anaemia, 28.1 %( n=63) had this type of
anaemia while only 2.7%(n=6) had normocytic, normochronic anaemia.
Hypochromic and microcytic anaemia is associated with Iron deficiency anaemia which
has been recorded as the commonest cause of nutritional deficiency anaemia in pregnancy by
studies in Singapore27, Bangkok31, and Malawi36 by estimation of the serum ferritin. A study by
Monkenhaupt et al in Ghana42 reported a prevalence of iron deficiency among five hundred and
thirty anaemia pregnant women ranging from 5 to 46 percent. They also observed that serum
ferritin levels were considerably influenced by malaria and inflammatory processes (measured
by estimation of C- reactive protein). This report was collaborated by Huddle et al35 who studied
anaemia in pregnancy in Malawi and documented that iron deficiency anaemia (serum ferritin
50microgm/l and Hb less than 11.0gm/dl) during pregnancy was attributed partly to inadequate
dietary intake of iron and partly secondary to malarial parasitaemia.

75
This therefore calls to question a need for a gold standard for measurement of iron that ensure
accurate and reliable diagnosis of iron deficiency especially in malaria endemic region. In an
attempt to answer this question, van den Broek et al16 studied one hundred and fifty anaemic
pregnant women and test for iron deficiency was by bone marrow aspirate to estimate
haemosiderin content. The result was found to be more reliable and without confounding of
malaria and inflammatory processes. More recently, the measurement of serum transferrin
receptors and the serum transferrin receptor/ ferritin ratio have been proposed as new indices of
iron deficiency36. It can be argued that assessment of iron status at the tissue level is of more
functional importance when examining the effects of iron depletion on the body than assessment
of iron stores.
Macrocytic hypochromasia are associated with folate and /or vitamin B12 deficiency state.
This study showed that 28.1% of respondents whose peripheral smear showed macrocytosis may
have folate and/or vitamin B12 deficiency. This deficiency also called megaloblastic anaemia is
common in pregnancy especially in women from poor socioeconomic groups, multigravidae, and
smokers during pregnancies. van den Broek documented that 34% of the pregnant women in
Blantyre were folate deficient (9mol/l) while 24% of them had multiple micronutrients (folate,
VitaminB12, and Iron) deficiency 16.
The high proportion of microcyctic and macrocytic anaemia may have contributed to the high
anaemia prevalence observed in this study.
5.2.9 Distribution by Haemoglobin Genotype
From the study, one hundred and eighty-eight out of three hundred and forty four
respondents with genotype AA(HbAA) had anaemia prevalence of 54.7%. Among 56
respondents with genotype AS (HbAS), 44 had anaemia prevalence of 78.6%.

76
None of the respondents had a genotype SS (HbSS). The findings were not statistically
significant (P> 0.05). This showed that haemoglobinopathy might not have contributed
significantly to anaemia prevalence found among the respondents in this study. This is at variant
with study by Pichai et al31 in Bangkok, Thailand where anaemia prevalence among pregnant
women with haemoglobinopathy was 28.1%. The difference in finding might probably be due to
the study population from different geographical location. Another study in Ghana42 documented
that haemoglobinopathies are common but do not substantially contribute to anaemia in
pregnancy except for homozygous variant,. This finding was in consonace with the findings of
the studies done at Enugu50, Lagos51, and Benin52. They reported that haemoglobinopathy
especially homozygous sickle cell genotype in pregnancy are associated with serious maternal
and foetal complications. However they acknowledged a paucity of the sample size which was
probably due to the fact that limited few survived to adulthood and delay in getting a marriage
partner because of their health conditions. Their reports also noted marked improvement in the
outcome of the pregnancy compared to the report of the past. However, all the studies were
retrospective with the attendant documentary inadequacies. Incidentally, this study had no
homozygous haemoglobinopathy. This could be ascribed to reasons mentioned above.
5.3 Relevance of the study to Family Medicine
Anaemia in pregnancy is a condition that can easily be ignored because the symptoms
may remain obscured until it has become severe. The main purpose of detecting and treating
anaemia in pregnancy is to forestall its adverse effect on both mother and unborn child. The
Family physician who among others has an important role in health promotion and disease
prevention is therefore better positioned to screen and detect anaemia even at pre conceptual
level. The need to estimate the cost effectiveness of screening for and treating gestational

77
anaemia underscores the importance of this study. The relevance of this study to primary care is
in area of general health promotion , adoption of healthy life style, early diagnosis , prompt and
appropriate treatment. Before this study, no study has been done in this environment to
determine the pattern of anaemia in pregnancy. Studies done at various centres in Nigeria such as
Abeokuta4, Enugu5, Port Harcourt10, Lagos21, Kwale25 and Gombe32 sought to establish only the
prevalence, risk factors and sociodemographic factors associated with anaemia in pregnancy.
The outcome of this study therefore, will be used to develop strategies for better evaluation and
management of this condition in our environment.
The finding of gestational anaemia prevalence rate of 58.0 percent in Faith Mediplex,
Benin City is high and demands for a concerted effort to intensify screening for this condition
among our antenatal attendees. This will aid to prevent and reduce its contribution to maternal
and perinatal morbidity and mortality in our environment.
The lack of relationship between anaemia in pregnancy and maternal age and parity
observed in this study showed that all pregnant women are vulnerable. The study has also given
a hint that more researches need to be done in the areas of cost benefit analysis of screening for
anaemia in pregnancy and the use of other screening indicators for anaemia other than
haemoglobin which could give equal or better diagnostic accuracy but less expensive and
complex.

78
CHAPTER SIX
6.0 Conclusion and Recommendations.
6.1 Conclusion
The prevalence of anaemia in pregnancy among women attending antenatal clinic in
Faith Mediplex, Benin City is very high considering the role of anaemia in maternal and
perinatal morbidity and mortality. Inaddition, the multigravidae were identified to be more at
risk of anaemia than the primigravidae. Most of the respondents with anaemia belong to mild
variety but a good number of the respondents had severe anaemia. Majority of the respondents
had microcytic hypochromic anaemia, a qualitative indicator of iron deficiency anaemia. The
gestational anaemia had statistically significant association with socioeconomic status,
gestational age at booking and malaria. However a multiple logistic regression analysis showed
that apart from malaria, gestational age and socio economic factors are poor predictors of
anaemia in pregnancy. There was no specific trend between gestational anaemia and maternal
age, parity, gravidity, HIV infection and haemoglobin genotype. Anaemia in pregnancy are
largely preventable which demands a joint effort to reduce this menace plaguing our pregnant
women.
6.2 Limitations of the study
1. This study was a hospital based which may not represent the actual situation in
the community especially in the developing countries. Community- based studies
are needed in order to accommodate pregnant women who do not attend antenatal
clinic in the hospitals.

79
2. The study was not a randomized control trial and obtaining information by direct
contact interview approach from the participants is subjects to human bias. These
factors limit the strength of this study.
3. Financial constraints limited the scope and tools used in this study. My inability
to asses other possible factors that may contribute significantly to anaemia during
pregnancy is a major drawback to this investigation. For instance lack of Iron
deficiency indicator like serum ferritin or serum transferrin receptor is a major
limitation of this study.
4. The timing of the screening for anaemia which was done at booking does not seem
appropriate. This is because it cannot establish or explain whether the women got
pregnant already anaemic or anaemia develops primarily during pregnancy
6.3. Recommendations
1. There is a need for educational and economic empowerment of our women
through girl-child education, wage employment, female representation in
governance and legislative houses in line with millennium development goals.
After all, if you educate a girl-child, you educate a nation.
2. The benefits of early commencements of antenatal care must be emphasized in
public health education programmes. An early introduction of iron supplements is
highly recommended. This will reduce the proportion of women coming into
antenatal clinics late in their pregnancy with anaemia
3. To encourage accessibility and regular use of insecticide treated bednets by
pregnant women especially in first trimester and children in line with role back

80
malaria initiative to reduce mosquito-man contact. The use of antimalaria
chemoprophylaxis in pregnancy (IPTp) usually after first trimester is hereby
highly advocated.
4 Finally more efficient prenatal practices and community partnerships should be
fostered. A provision of free or subsidised antenatal care and regular training of
doctors, midwives and birth attendants by government will further improve the
accessibility, affordability and quality of antenatal care services offered to our
pregnant women.
6.4 Further research needs
1. Further research incorporating all factors that are associated with gestational
anaemia preferably multi-centre and community based population to properly
evaluate the risk factors of anaemia in our environment.
2. Studies on how to measure haemoglobin levels prospectively before and during
pregnancy to help in the management of gestational anaemia.
3. In many pregnant women, anaemia is probably caused by a combination of
diseases including both micronutrients deficiency and infection. The complex
pattern of interaction between the two requires further study

81
REFERENCES
1. Farah W, Rahat N, Faran E. Maternal Anaemia and its impact on perinatal
outcome. Trop. Med. & Int. Health. 2004 April; 9(4); 485-490)
2. World Health Organization. The prevalence of anaemia in women: a tabulation of
available information. Geneva, Switzerland: WHO, 2000 WHO/MCH/MSM/92.2
3. World Health Organisation. Prevention and Management of Severe Anaemia in
Pregnancy, WHO. 2002. WHO/FHE/MSM/93-5.
4. Idowu OA, Mafiana CF, Sotiloye D. Anaemia in pregnancy: A Survey of
pregnant women in Abeokuta, Nigeria. Afr Health Sci 2005 December; 5 (4):
295-299
5. Dim. CC, Onah HC, The Prevalance of Anaemia among pregnant women of
booking in Enugu South Eastern, Nigeria. J. Gen Med. 2007; 9(3): 11-17.
6. Hinderaker SG, Olsen BE, Bergsjo et al. Anaemia in Pregnancy in the highlands
of Tanzania. Acta Obstet Gynaecol Scand. 2003, Jan; 80(1): 18 -26.
7. UNDP-MilleniumDevelopmentGoals,2000.
www.un.org/milleniumgoals/maternal.shtml
8. World Bank, World Development report: investing in Health. New York: Oxford
University Press, 1999; P.329.
82
9. Letsky E. A. Blood volume, Haematinics, Anaemia. In: de Swiet M.(ed) Medical
Disorder in Obstertrics Practice, 3rd edition:Oxford: Blackwell Science,2002:33-
70
10. Van den Broek NR, Rogerson SJ, Mbango CG et al. Anaemia in Pregnancy in
Southern Malawi: Prevalence and risk factors. British J. of Obstet & Gynaecol
2004;107 (4): 445 -51
11. Buseri FI, Uko EK, Jeremiah ZA, Usanga EA. Prevalence and risk factors of
anaemia among pregnant women in Nigeria. Bentham Open Access, Bentham
Science Publishers 2009, PP 14 -19.
12. Uche-Nwachi EO, Odekunle A, Jacinto S, Burnett M, Clapperton M, David Y et
al Anaemia in pregnancy in primary health care clinic in Trinidad and Tobago.
Afr Health Sci. 2010 March; 10(1): 66-70
13. Aqua-Kwesi DU Anaemia in pregnancy In: Kwawukume EY, Emuveyan EE
(Eds.) Comprehensive Obstetrics in the tropics, 2nd Edition: Ghana: Asante and
Hittscher Printing Press Ltd, 2002:297 301.
14. Brabin BJ, Prinson-Geedings PD, Verhoeff FH, Kazembe PS Anaemia
prevention for reduction of mortality in mothers and children. Trans of the Royal
Soc of Trop Med and Hyg 2003; 97 (1): 36-8.
15. Fernado, EV, The consequences of iron and other nutrient deficiencies anaemia
in pregnancy on maternal health, the foetus and the infant In: L Alien L, King J

83
and Lonnerdal B. (Eds.) Nutrient Regulation during pregnancy, lactation and
infant growth. Plenium Press, New York. 2003: 121 -133
16. Van den Broek NR, Letsky AE. Aetiology of Anaemia in pregnancy in South
Malawi. Am. J. Clin. Nutr. 2005; 72: 247 -56
17. Verhoeff EH, Brabin BJ, Chimsuku L. Kazembe P. An Broadhead RL. An
analysis of determinants of anaemia in pregnant women in Malawi. Annals of
Trop Med Parasit 2002; 93 (2):19 -33
18. Thomson J. Anaemia in pregnant women in Eastern Caprivi. Namibia, South
Africa. Med J. 2008 Nov; 87 (11): 1544 -7.
19. World Health Organisation. Nutrition for Health and Development. A Global
Agenda for combating malnutrition 2000; Geneva: WHO.
20. Verhoeff FH, Brabin BJ, Chimsukui, Kerzembe P, Broadhead RL. An analysis of
determinants of anaemia in pregnant women in rural Malawi. A basis for action.
Annals of Trop Med Parasit 2004; 93 (2): 119 -33.
21. Meda N, Mandelbot G, Cartoux M. Anaemia during pregnancy in Burkina Faso,
West Africa : Prevalence and associated factors. DITRAME Study Group. Bull
World Health Organisation. 2000; 7(7):916 -22
22. Anorlu RI, Oluwole AA, Abudu OO. Sociodemographic factors in Anaemia in
pregnancy at booking in Lagos, Nigeria. J.Instit of Obstet & Gynaecol 2006; 26
(8):773-776

84
23. Desolegn S. Prevalence of anaemia in pregnancy in Jima town, South – Western
Ethiopia. Ethiop Med J. 2003 October, 31 94): 251 – 8
24. Adam I, Khamis Ah, Elbashir MI. Prevalence and risk factors for anaemia in
pregnant women of Eastern Sudan. Trans R Soc Trop Med Hyg. 2005 October;
99 (10):739-43.
25. Dairo MD, Lawyin T. O. Sociodemographic determinants of anaemia in
pregnancy at primary case level: a study in Urban and Rural Oyo State, Nigeria.
Africa J. Med. Sci 2004 Sep; 33 (3): 213 -7
26. Oboro VO, Tabowei TO, JemiKalajah J. Prevalence and risk factors for anaemia
in pregnancy in South Southern Nigeria. J. Obstet. Gynaecol. 2004 Nov; 22 (6):
610-3
27. Singh K, Fong YF, Ruikumaran S. Anaemia in Pregnancy – a cross-sectional
study in Singapore. Eur J. Clin Nutr. 2008 Jan; 52(1):65-70.
28. Rogerson SJ, Van de Broek, Chaluluka E, Qondwane, C, Mhango CG, Molyneux
ME, Malaria and Anaemia in antenatal women in Blantyre, Malawi; A twelve
months survey Am J Trop Med and Hyg 2004, 62(3) 335-345.
29. Kagu MB, Kawuwa MB, Gadzama GB. Anaemia in Pregnancy. A cross-
sectional study of pregnant women in Sahelian Teritary hospital in North –
eastern Nigeria Trans R. Soc Trop Med Hyg. 2005; 99:739 -743.

85
30. Komolafe JO Kuti, O, Oni O, Egbawale BE Sociodemographic characteristics of
anaemic gravidae at booking: a preliminary study at Ilesa, Western Nigeria.
Niger J Med. 2005 April – June; 14 (2) : 151 – 4
31. Pichai C., Sompop L, Pongsak C. The Prevalence and risk factors of Anaemia in
pregnant women. Chotmai Het Thang Phaet 2003; 86: 1001-1007
32. Uneke CJ, Duhlinska DD, Igbinedion EB Prevalence and Public Health
Significance of HIV Infection and Anaemia among pregnant women attending
Antenatal clinics in South – Eastern, Nigeria Health Popul Nutr. 2007 September;
25 (3); 328 -335.
33. Bukar M, audu BN, Yahaya UR, Melah GS. Anaemia in pregnancy at booking
in Gombe North Eastern Nigeria. J. Obstet Gynaecol. 2008 Nov; 28 (8): 775 -8.
34. Isah HS, Fleming AF, Ujah IA, Ekwenpu CC Anaemia and iron status of
pregnant and non-pregnant in the Guinea Savana of Nigeria. Annals of Trop Med
and Parasitol 2005; 79:485 – 493
35. Huddle JM, Gibson RS, Culliana TR. The impact of malaria infection and diet on
the anaemia status of rural pregnant Malawian women. Eur J. Clin. Nutr. 2004;
53 (10) 792 -801.
36. Van den Broek, NR Anaemia and micronutrient deficiencies. British Med Bull
2003; 67:140-160

86
37. Fleming AF. A study of Anaemia of pregnancy in Ibadan, Western Nigeria, with
special reference to folic acid deficiency. MD Thesis, University of Cambridge.
In: Hughes A (Ed.) Anaemia of pregnancy, Maternal Health and Safe
motherhood. WHO 1999.
38. Friis H, Gomo. E, Kaestel P. HIV and other predictors of serum folate, serum
ferritin and haemoglobin in pregnancy: a cross-sectional study in Zimbabwe: AM
J Clin Nutr. 2005; 73: 1066 -73
39. Stoitz RJ, Hakimi M, Miller KW et al. High dose Vitamin A supplementation of
Breast feeding Indonesian mothers: effect on vitamin A status of mother and
infant J. Nutr 2008; 123 (4): 666-75.
40. Nwonwu EU, Ibekwe PC, Ugwuji AO, Ohazulike TC and Nwagbara, OC.
Prevalence of malaria parasitaemia and malaria related anaemia among pregnant
women in Abakaliki, South East, Nigeria. Niger J.Clin Pract. 2009 : 12(2) 182 -6.
41. Ogbodo SO, Nwagha UI,Okaka AN, Ogenyi SC, Okoko RO,Nwagha TU
Malaria parasitaemia among pregnant women in a rural community of
eastern,Nigeria; Need for combined measures. Niger J Physiol Sci. 2009
Dec;24(2):95-100
42. Mockenhaupt FP, Rong B, Gunther M., Becks S, Kohne E, Thompson WN et al.
Anaemia in pregnancy Ghanaian women. Importance of malaria, iron deficiency
and haemoglobinopathies. Trans Royal Soc Trop Med Hyg. 2006 September –
October; 94 (5): 477 – 8

87
43. Achidi EA, Kuoh AJ, Minang JT, Ngum B, Achibom BM, Motaze SC et al
Malaria infection in pregnancy and its effect on haemoglobin levels in women
from a malaria endemic area of Fako division, South-western province,
Cameroon J. Obstet Gynaecol 2005; 25(3): 235-40
44. Munasinghe S., Van den broek NR. Malaria in pregnancy in Malawi – A Review
Malawi Medical Journal. Dec. 2006; 18(4) 160 -174
45. Bethony J. Brookers S, Albonico M,Geiger SM, Loukas A. Soil-Transmitted
helminth infections: ascariasis, trichuriasis and hookworm. The Lancet 2006 367
(9521): 1521 – 32
46. Brocker S, Hotez PJI Bundy Dap. Hookworm related Anaemia among pregnant
women: A systematic Review PLOS Negleced Women: Diseases.2008; 2(9): e
291 DOI:10.1371.
47. Laroque R, Casapia M. Grotuzzo E, A double blind Randomized controlled trail
of mebendazole to reduce low birth weight in a hookworm endemic area of Peru.
Trop Med Int Health 2006; 11 (10); 1485 95
48. Edward JB Haemoglobinopathies In: Kelly WN. ed. Textbook of Internal
Medicine 2nd edition. New York; JP Lippincott company 2000: 1293 -1300
49. Ogedengbe OK, Akinyanju O. The pattern of sickle cell disease in pregnancy in
Lagos, Nigeria, West Africa J Med. 2003 April – June; 12 (2):96 – 100

88
50. Ocheni S, Onah HE, Ibegbulam G, Eze MI. Pregnancy outcomes in patients with
sickle cell disease in Enugu, Nigeria. Nig J Med. 2007 July-Sept; 16 (3):227 – 30
51. Odum CU, Anorlu RI, Dim SI, Oyekan T. Pregnancy outcome in Hbss – sickle
cell disease in Lagos, Nigeria. West Afri J Med. 2004 Jan – Mar; 21 (1); 19 -23.
52. Omo-Aghoja, Okonofua FE. Pregnancy outcome in women with sickle cell-a
five year review. Niger Postgrad Med J. 2007 June; 14 (2) 151 -4.
53. Olatunji, PO. Sickle-cell disease in developing countries: Magnitude and
challenges. Postgrad Doct Afr 2003; 25(3):61-64
54. Jauvez-Vazquez J,Bonizzoni E, Scott A, Iron plus folate is more effective than
iron alone in the treatment of iron deficiency anaemia in pregnancy: a
randomized, double blinded clinical trial, British J Obstet Gynaecol 2005
Sept,;109(9):1009-14
55. FMOH National guidelines and strategies for malaria prevention and control
during pregnancy. Federal Ministry of Health , Nigeria. 2005. 1-50
56. FMOH National guidelines for the implementation of prevention of mother to
child transmission (PMTCT) of HIV/AIDS. Nigeria. Federal Ministry of Health
and Social Services. 2005
57. Araoye M.O. Research Methodology with statistics for Health and Social
sciences. Sawmill-Ilorin: Nathadex; 2004 March:119-144

89
58. Oyedeji G.A. Socioeconomic and cultural background of hospitalised children
in Ilesha. Nigerian Journal of Paediatrics 2002; 12(4): 111 – 117.

90
APPENDIXES
Questionnaire
Code Number ___________
Age __________
Address________________________________
Occupation ______________________
Husband’s Occupation _________________
Marital Status:
Single____ Married_____Divorced_____ Widow______ Others________
History of Present Pregnancy:
Last Menstrual Period ________________
Gestational Age at Booking _____________
Parity ______________________
Age of last child_______
Educational Status:
Primary ______ Secondary _______ University/Polytechnic _____ Others _____
Religion:
Christianity _____ Moslem ______ Traditional ______ Others _____
Type of Family:
Monogamy ___________ Polygamy________ Others________
How many children do you have ________
Number of persons in the same house: _______

91
Type of Accommodation:
Single Room_______
2-Bedded Room_______
3-Bedded Room_______
Duplex_______
Others_______
Clinical Evaluation
Weight______kg Height___________ cm
Physical Examination: Pallor__ Temperature__
Pulse___ Blood Pressure_______mmHg
Fundal Height________cm
Foetal Heart Rate_________beats/Minute
Laboratory Investigations
Haemoglobin Concentration__________g/dl
Malaria parasite__________
HIV test_______________


