Embed Size (px)
Citation preview

Putwain, DW, von der Embse, NP, Rainbird, E and West, G
The Development and Validation of a new Multidimensional Test Anxiety Scale(MTAS)
http://researchonline.ljmu.ac.uk/id/eprint/13215/
Article
LJMU has developed LJMU Research Online for users to access the research output of the University more effectively. Copyright © and Moral Rights for the papers on this site are retained by the individual authors and/or other copyright owners. Users may download and/or print one copy of any article(s) in LJMU Research Online to facilitate their private study or for non-commercial research.You may not engage in further distribution of the material or use it for any profit-making activities or any commercial gain.
The version presented here may differ from the published version or from the version of the record. Please see the repository URL above for details on accessing the published version and note that access may require a subscription.
For more information please contact [email protected]
http://researchonline.ljmu.ac.uk/
Citation (please note it is advisable to refer to the publisher’s version if you intend to cite from this work)
Putwain, DW, von der Embse, NP, Rainbird, E and West, G (2020) The Development and Validation of a new Multidimensional Test Anxiety Scale (MTAS). European Journal of Psychological Assessment, 37. pp. 236-246. ISSN 1015-5759
LJMU Research Online

Running head: THE MULTIDIMENSIONAL TEST ANXIETY SCALE
The Development and Validation of a new Multidimensional Test Anxiety Scale
(MTAS)

THE MULTIDIMENSIONAL TEST ANXIETY SCALE 1
Abstract
Although test anxiety has a long history in the educational and psychological
literature there is a lack of census over its dimensionality. The aim of the present study was to
clarify the dimensionality of test anxiety and develop a new instrument to reflect this
dimensionality. Across two empirical studies we tested and refined a new multidimensional
instrument comprising of two cognitive dimensions (Worry and Cognitive Interference) and
two affective-physiological dimensions (Tension and Physiological Indicators). In both
studies four-correlated-factors and higher-order models showed a good fit to the data. Test
anxiety was positively related to an existing test anxiety measure (the Test Anxiety
Inventory) and an elevated risk of mental health problems, and negatively related to school
wellbeing and examination performance. This new instrument will prove a welcome addition
for practitioners, to assist in the identification of highly test anxious students who may
require support or intervention, and test anxiety researchers.
Keywords: test anxiety, achievement, wellbeing, mental health risk

THE MULTIDIMENSIONAL TEST ANXIETY SCALE 2
Introduction
Test anxiety has long been considered an important factor in the educational and
psychological literature. The relevance of test anxiety has been primarily determined through
negative associations with achievement and test performance (e.g., von der Embse, Jester,
Roy, & Post, 2018) and student wellbeing (e.g., Herzer, Wendt, & Hamm, 2014). Although
many well-established and appropriately validated psychometric instruments for measuring
test anxiety (e.g., Benson, Moulin-Julian, Schwarzer, Seipp, & El-Zahhar, 1992; Spielberger,
1980) exist, there is little consistency over what components should be included within the
construct of test anxiety. Furthermore, tools for practitioners, where instruments are
accompanied with norms and/ or cut scores to guide the identification of individuals for
support or intervention, are generally lacking and outdated. The most widely used tool with
norms (the Test Anxiety Inventory) is, at the time of writing, now 40 years old. In the present
study, we sought to clarify the test anxiety construct based upon recent research and theory,
and subsequently develop, pilot and evaluate the psychometric properties of a new test
anxiety instrument in secondary school students, and provide data to guide decision making.
Measurement Models of Test Anxiety
Test anxiety is defined as a situation-specific trait; the stable tendency, or
predisposition, to appraise performance-evaluative situations (those in which one’s
performance is judged in some way) as threatening and react with elevated state anxiety
(Spielberger & Vagg, 1995). As trait anxiety is multidimensional, highly trait test anxious
persons will not necessarily respond to non performance-evaluative situations (such as those
associated with physical danger, ambiguity, separation, or daily routines) with consistently
high state anxiety (Endler, & Kocovski, 2001). Furthermore, elevated state anxiety is more
likely to consistently follow high trait test anxiety in performance-evaluative situations when
underpinned by a Furthermore, elevated state anxiety is more likely to consistently follow

THE MULTIDIMENSIONAL TEST ANXIETY SCALE 3
high trait test anxiety in performance-evaluative situations when underpinned by a stable
antecedents (Bertrams, Englert, & Dickhäuser, 2010).
Early measurement models of test anxiety were unidimensional (e.g., Mandler &
Sarason, 1952). A landmark development was the identification of distinct cognitive and
affective-physiological components of test anxiety (Liebert & Morris, 1967). The cognitive
dimension, referred as worry, referred to negative thoughts and self-cognitions concerning
failure. The affective-physiological dimension, referred to emotionality, referred to
perceptions of one’s autonomic arousal. This distinction was fundamental to two of the most
well-known and widely-used instruments: The Worry-Emotionality Questionnaire (WEQ:
Liebert & Morris, 1967), a state measure, and the Test Anxiety Inventory (TAI: Spielberger,
1980), a trait measure.
Subsequent to the WEQ and the TAI, measurement models of test have incorporated
the distinction between cognitive and affective-physiological forms of anxiety often in
conjunction with add additional components (see Supplementary Materials for a description
and review of these models). Additional cognitive components to worry have included test-
irrelevant thoughts (Sarason, 1984), cognitive interference (Friedman & Bendas-Jacob,
1997), and distraction (Hodapp, 1996). Some instruments have defined worry narrowly to
focus solely on failure and its consequences. Others conceptualise worry broadly to include
low self-confidence (Hodapp, 1996) and social anxieties, or include social anxieties as a
discrete component (Donolato, Marci, Altoè, & Mammarella, 2019; Friedman & Bendas-
Jacob, 1997; Lowe et al., 2008). The affective-physiological component is represented in
some instruments as a single component (e.g., Friedman & Bendas-Jacob, 1997; Lowe et al.,
2008; Wren & Benson, 2003), bifurcated in other instruments into separate affective and
perceived physiological elements (Pekrun, Goetz, Perry, Kramer, & Hochstadt, 2004;
Sarason, 1984), or omitted completely (Cassady & Johnson, 2002). Furthermore, behavioural

THE MULTIDIMENSIONAL TEST ANXIETY SCALE 4
(Wren & Benson, 2004), motivational (Pekrun et al., 2004), and facilitating (Lowe et al.,
2008), components have been proposed.
Jingle-Jangle, Agreement, and Disagreement
The lack of consensus over the definition and dimensionality of test anxiety could
potentially contribute to jingle-jangle fallacies (see Kelly, 1927). Different terms could be
used to describe the same construct (jangle). Emotionality, emotion, tenseness, and
autonomic reactions are seemingly used to refer to the affective-physiological component of
test anxiety. Similarly, social humiliation and social derogation are used to refer to the social
component of test anxiety, and distraction and test-irrelevant thinking to refer to non-task
non-worry cognitions. There is also the possibility that the same term is being used to refer to
different things (jingle). Worry has been used to refer to failure, the consequences of failure,
one’s performance, and test arrangements. The only point of agreement is that test anxiety is
a multidimensional phenomenon that at a minimum includes cognitive and affective-
physiological components.
Clarifying the Domains of Test Anxiety
Following the principles of content validation (Haynes, Richard, & Kubany, 1995)
our solution to this lack of consensus is twofold. First, we drew on psychological theory to
inform which components should be included within the test anxiety construct. Second, we
conducted a survey of test anxiety experts to judge the relevance of items to the various
components of test anxiety. Our starting point, following Spielberger and Vagg’s (1995)
aforementioned definition, is that indicators of test anxiety represent should only represent
evaluative threat in performance-evaluative situations and not to antecedents or outcomes. It
follows, therefore, that non-threat related cognitions, such as test-irrelevant thinking, should
not be included within the construct of test anxiety.

THE MULTIDIMENSIONAL TEST ANXIETY SCALE 5
In contemporary models of test anxiety (Lowe et al., 2008; Segool, von der Embse,
Mata & Gallant, 2014; Ziedner & Matthews, 2005) the appraisal of a performance-evaluative
situation as a threat depends, in part, on poor self-perceptions of academic competence.
Including such perceptions within the test anxiety construct risks confounding indicators of
test anxiety with antecedents. Thus, subscales such as lack of confidence should be excluded
from the test anxiety construct. There is no doubt that highly test anxious persons also
experience myriad social worries about being negatively judged by family, peers, and
teachers (e.g., Putwain, 2009). Negative judgements from others, however, are a reason why
an evaluative situation can be judged as threatening and social worries, therefore, represent
an antecedent, rather than an indicator, of test anxiety. Furthermore, including a social
component within test anxiety risks blurring the boundaries between social anxiety and test
anxiety, thus contributing to further jingle-jangle. We therefore exclude social anxiety from
the test anxiety construct.
A behavioural component of test anxiety is highly plausible. The difficulty with such
a component, however, comes from defining behaviours solely as indicators of anxiety. The
same behaviours (e.g., playing with one’s pencil, staring into space, checking the time) could
be equally indicative of a student who was unable to concentrate due to test anxiety as a
student who was on-task but taking a break between questions in order to re-focus, or a
student who was thinking about a question before writing their answer (see Gill & Remedios,
2013). It is difficult to identify specific behaviours that are solely indicative of anxiety.
Although a behavioural component may be included within a theoretical conceptualisation of
test anxiety, if behaviours could also be indicators of on-task behaviours, and perhaps not
even test anxiety as all then for practical purposes they should not be included within a
measurement model.

THE MULTIDIMENSIONAL TEST ANXIETY SCALE 6
The motivational component to test anxiety, as represented by the urge to avoid or
escape the threat situation, is a component of some anxieties (e.g., agoraphobia), but does not
feature in the experiential repertoire of highly test anxious persons (Putwain, 2009).
Furthermore, from a motivational perspective, the need to avoid failure is based on the
anticipation of shame, humiliation, and loss of status or self-esteem (Hagtvet & Benson,
1997), or as an element of avoidance temperament; a neurobiological sensitivity to negative
stimuli that predisposes persons towards high levels high of trait negative affect (Elliot &
Thrash, 2010). These are reasons why an evaluative situation can be judged as threatening
Process models accordingly position avoidance as antecedents of, rather than
indicators of test anxiety. In the Self-Regulatory Executive Function model (Ziedner &
Matthews, 2005), plans for responding to a forthcoming exam in highly test anxious persons
are modified in light of avoidance motives (e.g., the need not to appear as incompetent). This
attentionally demanding process can lead to a close monitoring of exam-related thoughts and
feelings that trigger unhelpful forms of coping (e.g., emotion-focused, rumination, and
blaming others). Given the position of avoidance motivation as an antecedent of test anxiety
we propose than a motivational component to test anxiety is not included within the test
anxiety construct.
A facilitating element to test anxiety was also rejected. This was due to the absence of
empirical support for the so-called ‘Yerkes-Dodson Law’ and theoretically, the relation from
the degree of physiological activation to performance outcomes in evaluative situations is
determined by the appraisal of the evaluative situation (Blascovich & Mendes, 2010). A
challenge appraisal can have performance facilitating effects but this is not the same
emotionally, physiologically, cognitively, or hormonally, as anxiety. The facilitating effects
of challenge should not be confused with the debilitating effects of anxiety arising from

THE MULTIDIMENSIONAL TEST ANXIETY SCALE 7
threat. The salient issue is not the degree, but type, of physiological activation (challenge or
threat) in response to an evaluative situation.
Worrisome thoughts regarding failure and the experience of cognitive interference are
two key cognitive phenomenological indicators of test anxiety in contemporary models of test
anxiety (Lowe et al., 2008; Segool et al., 2014; Spielberger & Vagg, 1995; Ziedner &
Matthews, 2005) and accordingly we propose that the cognitive aspect of test anxiety is
represented by these two sub-domains. The aforementioned models propose that cognitive
aspects of test anxiety are accompanied by anxious feelings (e.g., tension and panic) and
autonomic arousal hence we propose that affective-physiological aspect of test anxiety is
represented by these two sub-domains. For brevity these four components are referred to
henceforth as Worry, Cognitive Interference, Tension, and Physiological Indicators. See
Supplementary Materials for a more detailed consideration of the theoretical stance in
clarifying the test anxiety construct.
Aims of the Present Study
The aim of the study was to develop, pilot and assess the psychometric properties of a
new instrument for the measurement of test anxiety with secondary school students, and
provide norms that would be of assistance to practitioners. Two empirical studies were
conducted. In the first study we developed an item pool for a new instrument to measure test
anxiety, referred to as the Multidimensional Test Anxiety Scale (MTAS), corresponding to
the aforementioned components of test anxiety (Worry, Cognitive Interference, Tension, and
Physiological Indicators). We surveyed a panel of international test anxiety experts to
establish the relevance of items to the four components of test anxiety and narrowed the item
pool. This item pool was piloted on a sample of secondary school students in England, the
factor structure examined using exploratory and confirmatory factor analyses, and relations
compared with an established test anxiety instrument (the TAI). In the second study,

THE MULTIDIMENSIONAL TEST ANXIETY SCALE 8
following modifications to item wording, we examined the factor structure and relations with
mental health risk, school-related wellbeing, and achievement, in another a sample of
secondary school students in England.
Study 1
The aim of study one was to develop and pilot items for a new multidimensional test
anxiety scale (MTAS). The first phase involved reviewing items pertaining to our four
proposed domains of test anxiety from existing measures with comparable subscales. These
included the TAI, Reactions to Tests (Sarason, 1984), Revised Test Anxiety Scale (Benson et
al., 1992), Friedben Test Anxiety Scale (Friedman & Bendas-Jacob, 1997), and the Cognitive
Test Anxiety Scale (Cassady & Johnson, 2002). A total of 92 items were initially considered.
These items were pooled and duplicate items, or those with very similar wording, removed
resulting in 65 items (70.7% of the original pool). Following the procedure advocated by
Lambie, Blount, and Mullen (2017), a group of thirty international test anxiety experts (those
with four or more articles concerning test anxiety published in an international peer-reviewed
journal) were invited to review items (seventeen agreed to participate). Experts were
provided with construct definitions of Worry, Cognitive Interference, Tension, and
Physiological Indicators (see Supplementary Materials for definitions), and asked to: (i)
allocate each item to one construct, and (ii), indicate the relevance of that item to that
construct on a five-point scale (1 = Not relevant at all, 5 = Highly relevant).
Average item-construct agreement among experts was 88.5% and items with a mean
score of 4 or above were retained. These were re-written into 38 items to represent the four
target domains of test anxiety (Worry, Cognitive Interference, Tension, and Physiological
Indicators) at different temporal specificities (before, during, and after, tests). This resulted in
nine items designed to measure Worry, ten items designed to measure Cognitive Interference,
ten items designed to measure feelings of Tension, and nine items designed to measure

THE MULTIDIMENSIONAL TEST ANXIETY SCALE 9
Physiological Indicators of anxiety. The purpose of study one was to examine the factor
structure of the MTAS, the internal consistency of resultant factors, and the concurrent
validity with an established measure of test anxiety (TAI).
Method
Sample
The sample was drawn from four state-funded English secondary schools (n = 2397)
over the 2016-17 academic year1. There were 968 male participants and 1398 female
participants (n = 31 missing) with a mean age of 13.98 years (SD = 1.92). All year groups
(Years 7 – 13) participated in the study (Year 7 = 354, Year 8 = 449, Year 9 = 370, Year 10 =
461, Year 11 = 365, Year 12 = 192, Year 13 = 204, n = 2 missing). The ethnic heritage of
participants was predominantly white Caucasian (n = 2130), with smaller representation from
Asian (n = 86), Black (n = 53), other (n = 43), or mixed heritage backgrounds (n = 63). There
were missing ethnic heritage data from 22 participants. As a proxy for low income, 370
participants indicated they were entitled to free school meals (FSM), and 1944 were not (n =
83 missing).
The proportion of missing data was relatively small (1.42%) and were handled in
subsequent latent variable analyses using full information maximum likelihood. The total
sample was randomly split into two; one sample for exploratory factor analysis (n = 1187)
and the second sample for confirmatory factor analysis (n = 1189). The intraclass correlations
(ρI) of MTAS and TAI items were examined to establish whether data were nested within
schools. Intraclass correlations showed a small proportion of variance occurred at the school
level (ρIs <.05).
Measures
1 For international readers, lower secondary education covers Years 7-11 (ages 11 – 16). Upper secondary
education (colloquially referred to as ‘sixth form’) covers Years 12 and 13 (ages 16 – 19).

THE MULTIDIMENSIONAL TEST ANXIETY SCALE 10
The TAI was selected to establish concurrent validity with the MTAS as it has been
used extensively in research and practice; many studies have evidenced the construct validity,
cross-cultural comparability, and internal consistency, of TAI data (Szafranski, Barrera, &
Norton, 2012). The TAI includes subscales for Worry (e.g. ‘During tests I find myself
thinking about the consequences of failing’) and Emotionality (e.g. ‘While taking
examinations I have an uneasy, upset feeling’). In keeping with the parlance of English
secondary education where tests are usually class-based and examinations are usually taken
in larger, formal settings, items were adapted to refer to ‘tests/exams’ on both the MTAS and
TAI. Participants responded to MTAS items on a five-point scale (1 = ‘Strongly Disagree’, 5
= ‘Strongly Agree’). The TAI originally used a four-point scale however this was changed to
the five-point scale preferred for the MTAS, for ease of participant responding to a relatively
large number of similarly worded items requiring different response scales. TAI internal
consistency in the present study was good (McDonald’s ω total = .94 95% CIs [.94, .94],
worry = .89 95% CIs [.88, .90], emotionality = .91 95% CIs [.90, .92]; Guttman’s λ6: total =
95 95% CIs [.95, .95], worry = .88 95% CIs [.87, .89], emotionality = .91 95% CIs [.88, .90])
Procedure
Letters outlining the aims of the project and inviting participation were sent to Head
Teachers of schools who work in partnership with the institution at which the first author was
employed. Data were collected during a period of the school timetable that was used for non-
teaching purposes. Questionnaires took approximately twenty minutes to complete and were
administered by a teacher who followed a standardised script. The project was approved by
an institutional research ethics committee. Written permission was provided by the Head
Teacher of participating schools and written consent was sought from all students. Parental
consent sought for participants under the age of 16 years. Participants over the age of 16 were

THE MULTIDIMENSIONAL TEST ANXIETY SCALE 11
considered to be of sufficient maturity to make a considered and informed judgement of
whether to participate based on the information sheet provided.
Results
Exploratory Factor Analysis
Exploratory factor analysis (EFA) with Geomin rotation was undertaken on the
portion of the randomly split MTAS sample designated for exploratory factor analysis with
the Mplus v.8 software (Muthén & Muthén, 2017). Geomin is an oblique rotation method that
was chosen as we anticipated that the emergent factors would be correlated and estimated
using robust weighted least squares (WLSMV). The type = ‘complex’ command was used to
adjust standard errors for the clustering of data within schools. EFAs were evaluated using a
number of indices: Root Mean Square Error of Approximation (RMSEA), Standardised Root
Mean Squared Residual (SRMR), Comparative Fit Index (CFI), and Tucker-Lewis Index
(TLI). A good model fit is indicated using RMSEA and SRMR values <.5 and .8, respectively,
and CFI and TLI values >.95 (Marsh, Hau, & Grayson 2005). We estimated EFAs with factor
solutions ranging from a unidimensional model with a single factor to a model with five
correlated factors.
The five-factor model showed the best fit, however one of the factors showed no
items with substantive factor loadings (λ > .4). Furthermore, beyond four factors, Eigen
values from the EFA dropped below those generated from random Eigen values at the 95%
percentile using a Parallel analysis (O'Connor, 2000). The four factor model showed a good
fit to the data: χ2(537) = 954.07, RMSEA = .025, SRMR = .034, CFI = .994, and TLI = .993.
Factor one contained four Tension and two Physiological Indicators items. Factor two
contained seven Worry and five Tension items, Factor three contained five Cognitive
Interference items. Factor four contained eight Physiological Indicators, three Cognitive
Interference, one Worry, and three Tension items. The four-factor model provided the best

THE MULTIDIMENSIONAL TEST ANXIETY SCALE 12
balance between model fit and substantively meaningful factors (see Supplementary
Materials for fit indices of all EFAs, Eigen values, and factor loadings).
Confirmatory Factor Analysis
A four-correlated-factors model was specified by selecting the four highest loading
items from each of the four target factors (16 items in total) in the four-factor EFA. The
model was estimated using WLSMV and the ‘type = complex’ command using the Mplus v.8
software (Muthén & Muthén, 2017), and evaluated using the same indices as for the EFAs.
The four-correlated-factors model was tested competitively against a single-factor model, a
two-factor model comprised of cognitive (Worry and Cognitive Interference items loaded
onto one factor) and affective-physiological (Tension and Physiological Indicators items
loaded onto a second factor) components, and a higher-order model comprising one higher-
order factor (general test anxiety) and four lower-order factors (identical to those in the four-
correlated-factors model). The four-correlated-factors and higher-order factor models showed
a good model fit that was an improvement on the single and two-factor models.
Modification indices suggested that residual variance in the four-correlated-factors
and higher-order factor models were correlated in two Physiological Indicators items (8: ‘My
hand shakes before I take a test/exam’ and 19: ‘My hand shakes while I am taking a
test/exam’). While acknowledging the practice of post-hoc model specifications is
controversial (Landis, Edwards, & Cortina, 2009) and can artificially inflate model fit indices
and potentially bias structural model parameters, they may be justifiable when theoretically
or design driven during scale development (Cole, Ciesla, & Steiger, 2007). The case for the
two Physiological Indicators listed above can be justified due to design effects (e.g.,
similarity of wording).
After the inclusion of correlated residuals the four-correlated-factors model showed
the best fit. However, as the higher-order model also showed a good fit we consider this to be

THE MULTIDIMENSIONAL TEST ANXIETY SCALE 13
a plausible alternative. Fit indices of all CFAs, factor loadings of the four-correlated-factors
and higher-order models, internal consistency coefficients, and descriptive statistics, are
reported in the Supplementary Materials. In order to examine concurrent validity, TAI items
corresponding to worry and emotionality were added to the four-correlated-factors and
higher-order models. MTAS total and component scores correlated strongly with TAI Worry
and Emotionality (rs = .55 ‒ .93). The correlations between MTAS Worry and Cognitive
Interference were stronger with TAI Worry and the correlations between MTAS Tension and
Physiological Indicators were stronger with TAI Emotionality (model fit indices and
correlation coefficients are reported in the Supplementary Materials).
Discussion
The aim of study one was to examine the factor structure, internal consistency, and
concurrent validity, of the MTAS. Following a series of EFAs and CFAs we found that four-
correlated-factors and higher-order models showed a good fit to the data that improved when
two pairs of correlated residual variance were included. We propose that they are both
plausible models and that the choice between them largely depends on one’s theoretical
position, research questions and/ or use of the instrument. The difference between the models
is whether the correlations between the four factors can be meaningfully interpreted as a
single total test anxiety score. Accordingly, we present relations between MTAS and TAI
scores for both models. The cognitive components of the MTAS correlated more strongly
with the Worry component, and the affective-physiological components of the MTAS
correlated more strongly with the Emotionality component, of the TAI.
Study 2
The aim of study two was to modify item wording in order to enhance clarity, and
then to re-examine the factorial validity, internal consistency, and test-retest reliability, of
data collected using the modified MTAS items, examine relations with salient constructs

THE MULTIDIMENSIONAL TEST ANXIETY SCALE 14
(mental health risk, school-related wellbeing, and achievement), and generate MTAS norms
to facilitate applied decision-making.
Method
Sample
The sample (n = 6565) was drawn from four English secondary schools (n = 2784)
and six 6th form colleges (n = 3781) over the 2017-18 academic year. There were 2842 male
participants and 3672 female participants; 32 participants declined to report their gender and
there were 16 missing responses. The mean age of participants was 13.6 years (SD = 1.7). In
the secondary school portion of the sample Years 7 – 11 participated in the study (Year 7 =
630, Year 8 = 586, Year 9 = 553, Year 10 = 506, Year 11 = 508). We did not collect Year
Group data from 6th form college students. Although ostensibly 6th form college cohorts
comprise Years 12 and 13 students can repeat or mix years of study. Year Groups have less
practical meaning in 6th Form Colleges.
The ethnic heritage of participants was as follows: white Caucasian (n = 5695), Asian
(n = 410), Black (n = 116), other or mixed heritage backgrounds (n = 336). There were
missing ethnic heritage data from 43 participants. Only one participating 6th form college
allowed us to ask students whether students were eligible for free school meals. Of the 3652
participants who we were allowed to ask (the four secondary schools and one 6th Form
College), 444 were eligible (12.2%; n = 97 missing). There were missing data in 5.7% of
values and full information maximum likelihood was used to handle missing data in
subsequent analyses.
Measures
Multidimensional Test Anxiety Scale (MTAS; Authors, 2018). Five items were
modified from the 16-item version of the scale used in Study 1 CFAs in order to reduce
design effects and, based on visual inspection, to clarify the wording of items (changes to

THE MULTIDIMENSIONAL TEST ANXIETY SCALE 15
items and their justification is included in the Supplementary Materials). Participants
responded on a 5-point scale (1 = ‘Strongly Disagree’, 5 = ‘Strongly Agree’). Items are
reported in Table 1.
School-related Wellbeing Scale (SRWS). This 6-item scale provides a brief
measurement of subjective wellbeing (the balance of positive to negative experiences,
cognitions, and emotions) at school/ college (Loderer, Vogl, & Pekrun, 2016). Participants
responded to items (e.g., ‘I feel comfortable at school’) using a 5-point scale (1 = ‘Strongly
Disagree’, 5 = ‘Strongly Agree’). Previous studies have shown the undimensional scale to
show a good fit to the data, strong internal consistency, and positive relations with
achievement and student behaviour (Putwain, Loderer, Gallard, & Beaumont, 2020).
Social, Academic, and Emotional, Behaviour Risk Screener- Student Risk Scale
(SAEBRS-SRS). The SAEBRS-SRS is a 20-item scale intended to provide assessment for
mental health risk in school-age populations (von der Embse, Iaccarino, Mankin, Kilgus, &
Magen, 2017). Participants respond to on a 4-point scale (0 = ‘Never’ to 3 = ‘Almost
Always’) to social (e.g., ‘I argue with others’), emotional (e.g., ‘When something bad
happens it takes me a while to feel better’), and academic (e.g., ‘It’s hard to pay attention in
class’) risks. Previous studies have shown SAEBRS-SRS data to demonstrate construct
validity, internal consistency, measurement invariance for gender, and positive relations with
cognate measures of behavioural and social risks (Kilgus, Eklund, von der Embse, Taylor, &
Sims, 2017; von der Embse et al., 2017; von der Embse, Kilgus Iaccarino, & Levi-Nielsen,
2017).
Examination Performance. Examination performance was measured using students’
grades from General Certificate of Secondary Education (GCSE) or General Certificate of
Education: Advanced Level (A Level) examinations. GCSEs and A Levels are national
standardised examinations taken at the end of compulsory lower (end of Year 11) and upper
THE MULTIDIMENSIONAL TEST ANXIETY SCALE 16
secondary education (end of Year 13) respectively. GCSE examinations were graded on a
nine-point scale (Grade 9 is the highest, and a Grade 4 considered the minimum pass grade)
and data were collected in three compulsory subjects: English, mathematics, and science. A
Level examinations were awarded a number of points (40 to 140) by the Universities and
Colleges Admissions Service (UCAS). The highest grade (A*) is worth 140 points and these
decrease in 20 point increments to the lowest grade (E) which was worth 40 points. As
students can choose which three A Level subjects to study (there were no compulsory
subjects) we used the total UCAS points score.
Procedure
Letters of invitation were sent to the Heads and Principals of partnership schools and
colleges. We followed the same approach to collecting data and ethical permission as
outlined in Study 1. Self-report data (questionnaires order was counterbalanced) were
collected in January and February of the school year. In order to examine test-retest
reliability, a subsample of participants were followed-up after a four-month interval. GCSE
and A Level examinations were scheduled over May and June of the school year
approximately 4-5 months after initial self-report data were collected. To maintain
participant confidentiality, examination grades were linked to questionnaire scores using the
unique candidate number provided by the Department for Education to schools and colleges
for each student. Examination grades were provided by schools and colleges from official
records after results were officially released to students.
Results
Confirmatory Factor Analyses
Higher-order and four-correlated-factor models were competitively tested against one-
and two-factor models. All models were estimated using WLMSV and the ‘type = complex’
command to adjust standard errors for the clustering of data within schools, and evaluated

THE MULTIDIMENSIONAL TEST ANXIETY SCALE 17
using the same model fit criteria used in Study 1. The higher-order and four-correlated-factor
models showed a reasonable fit to the data that improved on the fit of the one- and two-factor
models. Modification indices suggested correlated residual variance in two pairs of worry
items (item 5 ‘I am afraid of writing the wrong answer during a test/exam’ and item 13 ‘After
taking a test/exam, I worry that I gave the wrong answers’) and two pairs of physiological
indicators items (items 4 ‘Before I take a test/ exam my hand trembles’ and item 16 ‘My hand
shakes while I am taking a test/exam’). Based on the similarity of wording in these pairs of
items the incorporation of correlated residual variance was a justifiable inclusion. CFAs of
the higher-order and four-correlated factor models, incorporating the two pairs of correlated
residual variance, showed a good fit to the data. Model fit indices for all CFAs and
descriptive statistics for all measures included in Study 2 are reported in the Supplementary
Materials. Standardised factor loadings are reported in Table 1.
Latent Bivariate Correlations
In order to estimate latent bivariate correlations SRWS, SAEBRS and examination
performance were added to the measurement models for MTAS (model specification for
SRWS, SAEBRS and examination performance and fit indices are reported in the
Supplementary Materials). Relations with GCSE performance were examined with a
subsample of 499 Year 11 participants and relations with A Level performance with a
subsample of 369 A Level participants (sub-sample characteristics are reported in the
Supplementary Materials). Coefficients are reported in Table 2. MTAS total and component
scores were associated with elevated mental health risk and lower school-related wellbeing.
GCSE examination performance was negatively related to MTAS total, and Worry and
Cognitive Interference component scores. A Level examination performance was negatively
related to MTAS total and all component scores most strongly with Worry and Cognitive
Interference.

THE MULTIDIMENSIONAL TEST ANXIETY SCALE 18
Test-Retest Reliability
Test-retest reliability was checked with a sub-sample of n = 470 participants from two
6th form colleges after a four-month interval. Having demonstrated strict temporal invariance,
test-retest correlations were r = .80 for the MTAS total score, r = .80 for Worry, r = .65 for
Cognitive Interference, r = .70 for Tension, r = .82 for Physiological Indicators (see
Supplementary Materials for a full description of the sample characteristics and analyses
conducted).
Discussion
The four-correlated-factors and higher-order models showed a good fit to the data,
strong factor loadings, good internal consistency, and good test-retest reliability. Since both
models could be plausible, correlations with related constructs were estimated for total test
anxiety as well as the four component scores. Examination performance was negatively
correlated with the MTAS total scores and the cognitive components (Worry and Cognitive
Interference) scores. These results are consistent with findings from previous meta-analyses
(e.g., von der Emsbe et al., 2018). It was notable that substantive negative correlations
between examination performance and the affective-physiological components (Tension and
Physiological Indicators) were only present for A Level examinations. This is possibly a
result of these examinations being assessed at a higher level, with greater difficulty and
cognitive load than, GCSE examinations.
Test anxiety was positively correlated with greater mental health risk and lower
school-related wellbeing consistent with previous findings (e.g., Hembree, 1988; Warren,
Ollendick, & King, 1996). These findings are notable as the legitimacy of test anxiety is often
established through negative relations with achievement. Test anxiety, however, might also
important to consider as an indicator for potential impact on student health and welfare.
Previous research has shown that TAI scores in the upper scale tertile are indicative of

THE MULTIDIMENSIONAL TEST ANXIETY SCALE 19
clinical anxiety, when assessed using a diagnostic interview (Herzer et al., 2014).
Theoretically this is not surprising; internalising disorders are based around related symptom
nodes (Hereen & McNally, 2018) and the tendency of worry to generalise from one domain
of anxiety to another (Kessler et al., 2005). It should be borne in mind, however, that a
common third variable, such as neuroticism may be responsible for higher test anxiety, higher
mental health risk, and lower school-related wellbeing, but was not accounted for in the
present analyses.
General Discussion
The aim of this study was to develop, pilot, and assess, the psychometric properties of
a new instrument for the measurement of test anxiety (MTAS) with secondary school
students, and provide norms that would be of assistance to practitioners. Following a content
validation approach, we proposed two cognitive dimensions to test anxiety (Worry and
Cognitive Interference) and two affective-physiological dimensions (Tension and
Physiological Indicators). An item pool was developed and an expert pool of advisers rated
the relevance of each item to these dimensions. Across two studies, we conducted exploratory
and confirmatory factor analyses, and reliability analyses, on large samples of English
secondary school students.
Results showed that a four-correlated-factors model, comprising Worry, Cognitive
Interference, Tension and Physiological Indicators, and model including general test anxiety
as a higher-order factor, showed a good fit to the data. We propose that either model is
plausible. In study one we showed that MTAS scores were related to scores on an existing
measure of test anxiety (TAI) and in study two that MTAS scores were related to higher risk
of mental health problems, lower school-related wellbeing, and lower examination
performance. Normative data (including percentile ranks and z-scores can be found in the
Supplementary Materials).

THE MULTIDIMENSIONAL TEST ANXIETY SCALE 20
Although the higher order model may be preferred due to its parsimony, we propose
that either model could be appropriate for researchers and practitioners depending on the
reason for its use. A total MTAS score may be the most expedient method with which to
measure test anxiety. Such an approach may be attractive to practitioners who may wish to
identify highly test anxious students for intervention or additional support. Using a single test
anxiety score, however, could potentially miss nuances between the four components, and the
opportunity to match the type of support or intervention provided to a profile of sub-scale
scores. Furthermore, as shown in Study 2, studies that do not include the four components of
the MTAS may miss how components are differentially related to antecedents or outcomes.
Where research questions or practice are focusing on test anxiety globally, the higher-order
model may be preferable. Where research questions or practice are focusing on the
differences between the components of test anxiety, however, the four-correlated factors
model may be more meaningful.
Limitations and Future Directions
The factorial validity, internal consistency, and test-retest reliability, reported in the
two studies here provide a solid psychometric foundation for the MTAS. There are three
important limitations to highlight however. First, The TAI was used in Study 1 as the
measure with which to establish concurrent validity the MTAS scores as the most well-
established existing measure. However, given that the pool of items from which the MTAS
was developed included those from the TAI the correlations between the TAI and MTAS
may have been inflated. Second, we were unable to collect free school meals data from the
majority of participants in study two. We were, therefore, unable to characterise the socio-
economic status of the portion of the sample used for normative purposes. Third, we linked
MTAS scores to three key outcomes (examination performance, wellbeing, and mental health
risk) but not to antecedents.

THE MULTIDIMENSIONAL TEST ANXIETY SCALE 21
Future studies should examine MTAS scores in relation to participant economic
deprivation, alternative test anxiety scales, and theoretically derived antecedents. As the
theoretical distinction between antecedents and indicators of test anxiety was used as the
basis for rejecting competence perceptions, social anxiety, and avoidance motivation from the
MTAS, empirical research should examine these claims. Furthermore, there is a need to
establish the measurement invariance of the MTAS for salient group variables (e.g., gender,
socio-economic status, ethnic heritage, and age), and the long-term stability of risk associated
with high MTAS scores (e.g., for wellbeing and achievement).
For practitioners we have already mentioned that norms are available in
Supplementary Materials. The MTAS can be used as a tool to identify participants for
additional support or intervention. However, it must be recognised that at present there is no
agreed criteria for establishing a cut-point for ‘high’ test anxiety (e.g., see Hertzer et al.,
2014; Putwain & Daly, 2014; Thomas, Cassady, & Finch, 2017; Warren et al., 1996).
Although traits are stable and long-lasting, some, including test anxiety, are malleable and
amenable to relatively short interventions in school-age populations (von der Embse,
Barterian, & Segool, 2013). There is great potential for psychologists to be able to offer
effective and evidence-based support to high test anxious students in schools.
Conclusion
We have offered insight into the murky question of test anxiety dimensionality by
taking a combined a theoretical and pragmatic approach to propose two cognitive dimensions
(Worry and Cognitive Interference) and two affective-physiological dimensions (Tension and
Physiological Indicators). Two empirical studies were used to test and refine items for
measuring these dimensions in a newly developed instrument (MTAS). In both studies, a
four-correlated-factors model (Worry, Cognitive Interference, Tension and Physiological
Indicators) and a model including total test anxiety as a higher-order factor offered the best fit

THE MULTIDIMENSIONAL TEST ANXIETY SCALE 22
to the data. Both models are plausible and either could be used depending on whether it is
most meaningful to generate a single aggregated test anxiety score or explore subtleties in the
different components.

THE MULTIDIMENSIONAL TEST ANXIETY SCALE 23
References
Benson, J., Moulin-Julian, M., Schwarzer, C., Seipp, B., & El-Zahhar, N. (1992). Cross
validation of a revised test anxiety scale using multi-national samples. In K. A. Hagvet &
T. B. Johnsen (Eds.) Advances in Test Anxiety Research Vol. 7 (pp. 62–83). Lisse, The
Netherlands: Swets & Zeitlinger.
Bertrams, A., Englert, C., & Dickhäuser, O. (2010). Self-control strength in the relation
between trait test anxiety and state anxiety. Journal of Research in Personality, 44, 738–
741. doi:10.1016/j.jrp.2010.09.005
Blascovich, J., & Mendes, W.B. (2010). Social psychophysiology and embodiment. In S.T.
Fiske & D.T. Gilbert (Eds.) Handbook of social psychology (5th ed., pp.194-227). New
York, Wiley.
Cassady, J. C., & Johnson, R. E. (2002). Cognitive test anxiety and academic performance.
Contemporary Educational Psychology, 27(2), 270-295.doi: 10.1006/ceps.2001.1094
Cole, D. A., Ciesla, J. A., & Steiger, J. H. (2007). The insidious effects of failing to include
design-driven correlated residuals in latent-variable covariance structure analysis.
Psychological Methods, 12, 381–398.doi: 10.1037/1082-989X.12.4.381
Donolato, E., Marci, T., Altoè, G., & Mammarella, I.C. (2019). Measuring test anxiety in
primary and middle school children. European Journal of Psychological Assessment.
Advance online publication. doi:10.1027/1015-5759/a000556
Elliot, A.J., & Thrash, T.M. (2010). Approach and avoidance as basic dimensions of
personality. Journal of Personality, 78, 865-906.doi: 10.1111/j.1467-
6494.2010.00636.x
Endler, N. S., & Kocovski, N. L. (2001). State and trait anxiety revisited. Journal of Anxiety
Disorders, 15, 231–245. doi: 10.1016/S0887-6185(01)00060-3

THE MULTIDIMENSIONAL TEST ANXIETY SCALE 24
Friedman, I. A., & Bendas-Jacob, O. (1997). Measuring perceived test anxiety in adolescents:
A self-report scale. Educational and Psychological Measurement, 57(6), 1035–1046.
doi:10.1177/0013164497057006012
Gill, P. & Remedios, R. (2013). How should researchers in Education operationalise on-task
behaviours? Cambridge Journal of Education, 43, 199-222. doi:
10.1080/0305764X.2013.767878
Haynes, S. N., Richard, D. C. S., & Kubany, E. S. (1995). Content validity in psychological
assessment: A functional approach to concepts and methods. Psychological Assessment,
7, 238-247. doi: 10.1037/1040-3590.7.3.238
Heeren, A., & McNally, R. J. (2018). Social anxiety disorder as a densely interconnected
network of fear and avoidance for social situations. Cognitive Therapy and Research,
42(1), 101-113. doi: 10.1007/s10608-017-9876-3
Herzer, F., Wendt, J. & Hamm, A.O. (2014). Discriminating clinical from nonclinical
manifestations of test anxiety: A validation study. Behavior Therapy, 45, 222-231.doi:
10.1016/j.beth.2013.11.001
Hodapp, V. (1996). The TAI-G: A multidimensional approach to the assessment of test
anxiety. In C. Schwarzer & M. Zeidner (Eds.), Stress, anxiety and coping in academic
settings (pp. 95-130). Francke Verlag: Tübingen/ Basil.
Kelley, T. L. (1927). Interpretation of educational measurements. Oxford, England: World
Book Co.
Kessler, R. C., Berglund, P., Demler, O., Jin, R., Merikangas, K., R., & Walters, E., E.,
(2005). Lifetime prevalence and age-of-onset distributions of DSM-IV disorders in the
National Comorbidity Survey Replication. Archive of General Psychiatry, 62(7). doi:
10.1001/archpsyc.62.6.593

THE MULTIDIMENSIONAL TEST ANXIETY SCALE 25
Kilgus, S. P., Eklund, K., von der Embse, N. P., Taylor, C., & Sims, W. A. (2016).
Psychometric defensibility of the Social, Academic, and Emotional Behavior Risk
Screener (SAEBRS) teacher rating scale and multiple gating procedure within
elementary and middle school samples. Journal of School Psychology, 58, 21–39.doi:
10.1016/j.jsp.2016.07.001
Hodapp, V. (1996). The TAI-G: A multidimensional approach to the assessment of test
anxiety. In C. Schwarzer & M. Zeidner (Eds.), Stress, anxiety and coping in academic
settings (pp. 95-130). Francke Verlag: Tübingen/ Basil.
Lambie, G. W., Blount, A. J., & Mullen, P. R. (2017). Establishing content-oriented for
psychological assessments. Measurement and Evaluation in Counseling &
Development, 50, 210-216.doi: g/10.1080/07481756.2017.1336930
Landis, R. S., Edwards, B. D., & Cortina, J. M. (2009). On the practice of allowing correlated
residuals among indicators in structural equation models. In C. E. Lance & R. J.
Vandenberg (Eds.) Statistical and methodological myths and urban legends: Doctrine,
verity and fable in the organizational and social sciences, (pp. 195-214). New York:
Routledge.
Liebert, R. M. & Morris, L. W. (1967). Cognitive and emotional components of test anxiety:
A distinction and some initial data. Psychological Reports, 20, 975-978.
doi:10.2466/pr0.1967.20.3.975
Loderer, K., Vogl, E., & Pekrun, R. (2016). Students‘ well-being at school revisited:
Development and initial validation of a unidimensional self-report scale. Paper
presented at the International Conference on Motivation (ICM), Thessaloniki, Greece.
Lowe, P. A., Lee, S. W., Witteborg, K. M., Prichard, K. W., Luhr, M. E., Cullinan, C. M., . .
.Janik, M. (2008). The Test Anxiety Inventory for Children and Adolescents (TAICA):
Examination of the properties of a new multidimensional measure of test anxiety

THE MULTIDIMENSIONAL TEST ANXIETY SCALE 26
among elementary and secondary school students. Journal of Psychoeducational
Assessment, 26, 215-230. doi:10.1177/0734282907303760
Mandler, G., & Sarason, S.B. (1952). A study of anxiety and learning. Journal of Abnormal
and Social Psychology 47, 166-173.doi: 10.1037/h0062855
Marsh, H. W., Hau, K-T, & Grayson, D. (2005). Goodness of fit evaluation in structural
equation modelling. In A. Maydeu-Olivares & J. McArdle (Eds.) Contemporary
psychometrics. A festschrift for Roderick P. McDonald (pp. 275–340). Mahwah, NJ:
Erlbaum.
Muthén, L. K., & Muthén, B. O. (2017). Mplus user’s guide (8th ed.). Los Angeles, CA:
Muthén & Muthén.
O'Connor, B. P. (2000). SPSS and SAS programs for determining the number of components
using parallel analysis and Velicer's MAP test. Behavior Research Methods,
Instrumentation, and Computers, 32, 396-402.doi: 10.3758/BF03200807
Pekrun, R., Goetz, T., Perry, R. P., Kramer, K., & Hochstadt, M. (2004). Beyond test anxiety:
Development and validation of the Test Emotions Questionnaire (TEQ). Anxiety, Stress
and Coping, 17, 287–316.doi: 10.1080/10615800412331303847
Putwain, D.W. (2009). Assessment and examination stress in Key Stage 4. British Educational
Research Journal, 35, 391-411. doi: 10.1080/01411920802044404
Putwain, D.W., Loderer, K., & Gallard, D. & Beaumont, J. (2020). School-related subjective
wellbeing promotes subsequent adaptability, achievement and positive behavioural
conduct. British Journal of Educational Psychology, 90, 92-108. doi:
10.1111/bjep.12266
Putwain, D.W., & Daly, A.L. (2014). Test anxiety prevalence and gender differences in a
sample of English secondary school students. Educational Studies, 40, 554‒570.doi:
10.1080/03055698.2014.953914

THE MULTIDIMENSIONAL TEST ANXIETY SCALE 27
Sarason, I. G. (1984). Stress, anxiety and cognitive interference: Reactions to tests. Journal of
Personality and Social Psychology, 46(4), 929–938. doi: 10.1037/0022-3514.46.4.929
Segool, N., von der Embse, N., Mata, A., & Gallant, J. (2014). Cognitive behavioral modelof
test anxiety in a high-stakes context: An exploratory study. School Mental Health, 6, 50–
61. doi: 10.1007/s12310-013-9111-7.
Spielberger, C. D. (1980). The test anxiety inventory. Psychology, 4(6A).
Spielberger, C. D., & Vagg. R.P. (1995). Test Anxiety: A Transactional Process Model. In by
C. D. Speilberger & P. R. Vagg (Eds.) Test Anxiety: Theory, Assessment and
Treatment, (pp. 3–14). Bristol, UK: Taylor & Francis.
Szafranski, D. D., Barrera, T. L., & Norton, P. J. (2012). Test anxiety inventory: 30 years
later. Anxiety, Stress & Coping, 25(6), 667-677.doi: 10.1080/10615806.2012.663490
Thomas, C.L., Cassady, J.C., & Finch, W.H. (2018). Identifying Severity Standards on the
Cognitive Test Anxiety Scale: Cut Score Determination Using Latent Class and Cluster
Analysis. Journal of Psychoeducational Assessment, 36, 492-508.doi:
10.1177/0734282916686004
von der Embse, N., Barterian, J., & Segool, N. (2013). Test anxiety interventions for children
and adolescents: A systematic review of treatment studies from 2000-2010. Psychology
in the Schools, 50, 57-71.doi: 10.1002/pits.21660
von der Embse, N.P., Kilgus, S.P., Iaccarino, & Levi-Nielsen, S. (2017). Screening for
student mental health risk: Diagnostic accuracy, measurement invariance, and
predictive validity of the Social, Academic, and Emotional Behavior Risk Screener-
Student Rating Scale (SAEBRS-SRS). School Mental Health, 9, 273-283.doi:
10.1007/s12310-017-9214-7
von der Embse, N. P., Iaccarino, S., Mankin, A., Kilgus, S. P., & Magen, E. (2017).
Development and validation of the social, academic, and emotional behavior risk

THE MULTIDIMENSIONAL TEST ANXIETY SCALE 28
screener–student rating scale. Assessment for Effective Intervention, 42, 186-192.doi:
10.1177/1534508416679410
von der Embse, N.P., Jester, D., Roy, D., & Post, J. (2018). Test anxiety effects, predictors,
and correlates: A 30-year meta-analytic review. Journal of Affective Disorders, 227,
483-493. doi: 10.1016/j.jad.2017.11.048
Warren, M.K., Ollendick, T.H., & King, N.J. (1996). Test anxiety in girls and boys: A
clinical-developmental analysis. Behaviour Change, 13, 157-170.doi:
10.1017/S0813483900004939
Wren, D. & Benson, J. (2004). Measuring test anxiety in children: Scale development and
internal construct validation. Anxiety Stress & Coping, 17(3), 227-240. doi:
10.1080/10615800412331292606Zeidner, M., & Matthews, G. (2005). Evaluation
anxiety. In A. J. Elliot & C. S. Dweck (Eds.), Handbook of competence and motivation
(pp. 141–163). London: Guilford Press.
Zeidner, M., & Matthews, G. (2005). Evaluation anxiety. In A. J. Elliot & C. S. Dweck
(Eds.), Handbook of competence and motivation (pp. 141–163). London: Guilford
Press.

THE MULTIDIMENSIONAL TEST ANXIETY SCALE 29
Table 1
Standardized Factor Loadings from the MTAS Four Correlated Factors and Higher Order Models (Study 2).
Item
TA W CI T PI
1. Before a test/ exam, I am worried I will fail. .80 / .80
5. I am afraid of writing the wrong answer during a test/exam. .74 / .74
9. After a test/exam, I am worried I have failed. .81 / .81
13. After taking a test/exam, I worry that I gave the wrong answers. .79 / .78
2 I forget previously known material before taking a test/exam. .74 / .75
6. I forget facts I have learnt during tests/exams. .87 / .87
10. During tests/exams, I forget things that I have learnt. .91 / .91
14. During tests/exams, I find it hard to concentrate. .61 / .61
3. Even when I have prepared for a test/ exam I feel nervous about it. .81 / .81
7. I feel tense before taking a test/exam. .85 / .85
11. Just before I take a test/exam, I feel panicky. .90 / .90
15. Before a test/exam, I feel nervous. .86 / .86
4. Before I take a test/ exam my hand trembles. .78 / .78
8. My heart races when I take a test/exam. .87 / .87
12. During a test/ exam I experience stomach discomfort. .73 / .72
16. My hand shakes while I am taking a test/exam. .76 / .75
W .93 .64 .89 .77
CI .60 .48 .51
T .96 .85
PI .87

THE MULTIDIMENSIONAL TEST ANXIETY SCALE 30
Note. TA = Test Anxiety, W = Worry, CI = Cognitive Interference, T = Tension, PI = Physiological Indicators. Standardised factor loadings before the
slash are from the higher order model and after the slash from the four-correlated-factors model.

THE MULTIDIMENSIONAL TEST ANXIETY SCALE 31
Table 2
Latent Bivariate Correlations Between MTAS, SAEBRS, SRWS and Examination Performance (Study 2).
SAEBRS SRWS
GCSE Examination
Performance
A Level Examination
Performance
MTAS Factors:
MTAS Total .32*** -.17*** -.17*** -.31***
Worry .23*** -.12*** -.12*** -.29***
Cognitive Interference .46*** -.33*** -.45*** -.41***
Tension .13*** -.03* .06 -.21***
Physiological Indicators .28*** -.14*** .01* -.21***
* p <.05. ** p <.01. *** p <.001.
Note. MTAS = Multidimensional Test Anxiety Scale, SRWS = School-related Wellbeing Scale, and SAEBRS = Social, Academic, and
Emotional, Behaviour Risk Screener

THE MULTIDIMENSIONAL TEST ANXIETY SCALE 32
The Development and Validation of a new Multidimensional Test Anxiety Scale
(MTAS)
- Supplemental Materials -
This document contains materials designed to supplement the main text. The materials
include the following:
1. A Review of the Major Measurement Models of Test Anxiety Since 1980
2. Table S1: The Major Test Anxiety Instruments Published Since 1980
3. Empirical Data for Test Anxiety Antecedents and Outcomes
4. Clarifying the Construct of Test Anxiety
5. Study 1: Expert Review of Test Anxiety Items
6. Table S2: Model Fit Indices for Exploratory Factor Analyses of the MTAS (Study 1)
7. Table S3: Eigen Values from the for Exploratory Factor Analyses of the MTAS (Study
1).
8. Table S4: Standardized Factor Loadings from the Four Factor EFA (Study 1)
9. Table S5: Model Fit Indices for the Confirmatory Factor Analysis of the MTAS (Study 1)
10. Table S6: Internal Consistency and Standardized Factor Loadings from the MTAS Four
Correlated Factors and Higher Order Models (Study 1)
11. Table S7: Latent Bivariate Correlations to show Concurrent Validity with the Test
Anxiety Inventory (Study 1)
12. Table S8: MTAS Items modified for Study 2
13. Table S9: Descriptive Statistics for the MTAS, SRWS, SAEBRS, GCSE and A Level
Examination Performance (Study 2)
14. Table S10: Model Fit Indices for the Confirmatory Factor Analysis of the MTAS (Study
2).
15. Latent Measurement Model Specifications for Related Constructs in Study 2: SRWS,
SAEBRS, GCSE and A Level Examination Performance

THE MULTIDIMENSIONAL TEST ANXIETY SCALE 33
16. Table S11: Model Fit Indices for the Latent Bivariate Correlations (Study 2)
17. Test-Retest Reliability of MTAS Scores
18. Table S12: Confirmatory Factor Analyses and Tests of Measurement Invariance.
19. Table S13: Means and Standard Deviations for MTAS Total Scores in Male and Female
Students Aged 11-18 Years
20. Table S14: Percentile Ranks for MTAS Total Scores in Male Students Aged 11-18 Years
21. Table S15: Percentile Ranks for MTAS Total Scores in Female Students Aged 11-18
Years
22. Table S16: Standardised z Scores for MTAS Total Scores in Male Students Aged 11-18
Years
23. Table S17: Standardised z Scores for MTAS Total Scores in Female Students Aged 11-18
Years

THE MULTIDIMENSIONAL TEST ANXIETY SCALE 34
A Review of the Major Measurement Models of Test Anxiety Since 1980
In the Reactions to Tests measure, Sarason (1984, 1988) proposed an additional
cognitive component, test-irrelevant thinking to include non-task related distracting thoughts
that do not specifically refer to failure (e.g., daydreaming about a forthcoming holiday) and
bifurcated the affective-physiological component into general feelings of tension associated
with anxiety and the specific bodily symptoms of anxiety. This approach was subsequently
developed by Benson et al., (1992) and Hagtvet and Benson (1997) in the Revised Test
Anxiety scale. Hodapp’s (1996) German Test Anxiety Inventory also included a subscale
named distraction intended to measure non-task, non-failure, related thoughts. The anxiety
subscale of the Test Emotions Questionnaire (Pekrun, Goetz, Perry, Kramer, & Hochstadt,
2004) incorporated the distinction between affective (feelings) and physiological (autonomic
arousal) aspects of test anxiety. Other models of test anxiety that include an affective-
physiological component have remained with a single factor that focused on perceptions of
affective-physiological arousal (Autonomic Reactions, Tenseness, or Physiological
Hyperarousal).
While the Sarason (1984, 1988) and Benson (Benson et al., 1992; Hagtvet & Benson,
1997) four-factor models were essentially an extension of the two factor TAI, a different
approach was taken by Friedman and Bendas-Jacob (1997). In the Friedben Test Anxiety
scale these authors proposed a three-factor model consisting of one cognitive factor
(cognitive obstruction), one social factor (social derogation), and one affective-physiological
dimension (tenseness). The cognitive factor in this scale, cognitive obstruction, differs to
worry component used in the earlier models of test anxiety by referring to one’s perceptions
of interference in memory and attention rather than worries or other distracting non-task
related cognitions. The social derogation scale focuses specifically on worries associated with
being judged negatively by others (e.g., parents, peers, and teachers). The tenseness scale
THE MULTIDIMENSIONAL TEST ANXIETY SCALE 35
corresponds broadly to the earlier conceptions of emotionality referring to tension and bodily
symptoms. A social component was also included in Lowe et al.’s (2008) Test Anxiety
Inventory for Children and Adolescents and Donolato, Marci, Altoè, & Mammarella’s (2019)
Test Anxiety Questionnaire for Children. A lack of confidence subscale was included in
Meijer’s (2001) Revised Worry Emotionality scale and Hodapp’s (1996) German Test
Anxiety Inventory to reflect worries about one’s capacity and ability to perform well as
distinct from worries about failure.
Cassady and Johnson (2002) developed an instrument (the Cognitive Anxiety Scale)
focusing solely on the cognitive aspect of test anxiety as being the most germane component
of test anxiety to examination performance. This unidimensional scale was defined broadly to
include the following worry domains: social comparison of performance to peers, the
consequences of failure, low confidence in one’s performance, excessive worry over being
evaluated, causing distress to one’s parents, feeling unprepared for tests, and a potential loss
of self-worth. It is notable that social worries (causing distress to one’s parents, social
comparison, and being evaluated) and low confidence (feeling unprepared for tests, low
confidence in one’s performance) are included within a single cognitive test anxiety construct
in contrast to other instruments that separate them out. Cassady and Johnson (2002) do not
reject an affective-physiological dimension to test anxiety outright. Rather, they view it as
being of less relevance to test performance than the cognitive dimension.
Three instruments also include unique subscales. The Children’s Test Anxiety Scale
(Wren & Benson, 2003) includes a behavioural aspect of test anxiety, off-task behaviours,
comprising of auto-manipulation, object manipulation, and inattentive behaviours (although
one auto-manipulation item was included on the Tenseness subscale by Friedman and
Bendas-Jacob, 1997). A motivational subscale was included in the Test Emotions
Questionnaire (Pekrun et al., 2004) to reflect the anxious impulse to escape in social-
THE MULTIDIMENSIONAL TEST ANXIETY SCALE 36
evaluative situations. A facilitating subscale2 of test anxiety was included on the Test
Anxiety Inventory for Children and Adolescents (Lowe et al., 2008) to account for the
possibility that low levels of anxiety (worry or tension) might be perceived by students to be
helpful for performance. The major instruments and their components are listed in Table S1.
2 Although a facilitating anxiety subscale was proposed by Alpert and Haber (1960) the items represent a
mixture of high performance expectations, enjoyment of tests, and the absence of anxiety. Accordingly, the
facilitating anxiety subscale proposed by Lowe et al. (2008) remains, in our view, unique.

THE MULTIDIMENSIONAL TEST ANXIETY SCALE 37
Table S1
The Major Test Anxiety Instruments Published Since 1980.
Authors Title of Scale State/
Trait Domains Included
Internal
Consistency
Test-Retest
Reliability
Construct
Validity
Morris, Davies, and
Hutchings (1981)
Revised Worry-
Emotionality
Scale
State Worry
Emotionality
Not Reported Not Reported EFA
Sarason (1984) Reactions to
Tests
Trait Worry
Test-Irrelevant thinking
Tension
Bodily symptoms
Not Reported Not Reported EFA
Benson et al. (1992) /
Hagtvet & Benson (1997)
Revised Test
Anxiety Scale
Trait Worry
Test-Irrelevant thinking
Tension
Bodily symptoms
αs = .67 - .95 Not Reported EFA/ CFA
Hodapp (1996) German Test
Anxiety
Inventory
Trait Worry
Emotion
Lack of Confidence
Distraction
αs = .88 - .93 Not Reported EFA/ Rasch
Friedman and Bendas-
Jacob (1997)
Friedben Test
Anxiety Scale
Trait Cognitive Obstruction
Tenseness
Social Derogation
αs = 81. - .91
ωs = .78 - .93
Not Reported EFA
Meijer (2001) Revised Worry-
Emotionality
Scale
State Worry
Emotionality
Lack of Self-Confidence
αs = .89 - .95 Not Reported CFA
Cassady and Johnson
(2002)
Cognitive Test
Anxiety Scale
Trait Cognitive Test Anxiety α = .91 Not Reported Not Reported
Wren and Benson (2004) Children’s Test
Anxiety Scale
Trait Thoughts
Autonomic Reactions
αs = .76 - .92 Not Reported CFA

THE MULTIDIMENSIONAL TEST ANXIETY SCALE 38
Off-Task Behaviours
Pekrun et al. (2004) Test Emotions
Questionnaire
(Anxiety
Subscale)
Trait Affective
Cognitive
Physiological
Motivational
αs = .90 - .93 Not Reported CFA
Lowe et al. (2008) Test Anxiety
Inventory for
Children and
Adolescents
Trait Worry Lowe et al.
(2008)
rs = .83 - .91 EFA
Donolato et al. (2019) Test anxiety
Questionnaire for
Children
Trait Thoughts
Off-Task Behaviours
Autonomic Reactions
Social Derogation
αs = .73 - .91a r = .74 CFA
Note. EFA = Exploratory Factor Analysis, CFA = Confirmatory Factor Analysis. aInternal consistency estimates were not reported in the published paper but confirmed in a personal communication.

THE MULTIDIMENSIONAL TEST ANXIETY SCALE 39
Test Anxiety Antecedents and Outcomes
Evidence for the theoretical antecedents of test anxiety proposed in the contemporary
theoretical models presented in the main text of the manuscript (Lowe et al., 2008; Segool,
von der Embse, Mata, & Gallant, 2014; Spielberger & 1995; Zeidner & Matthews, 2005) can
be found in the meta-analyses by Hembree (1988), 562 studies 1950-1986), von der Embse,
Jester, Roy, and Post (2018), 286 studies 1986-2017, and Preiss, Gayle, and Allen (2006), 18
studies 1969-2002. Test anxiety is negatively correlated with self-perceptions of competence
(i.e., academic self-efficacy and academic self-concept), avoidance coping, avoidance goals
(i.e., mastery-avoidance and performance-avoidance), study skills, and test-taking skills, and
positively correlated with procrastination and the need for achievement. There is also
evidence from individual studies for constructs that have not yet been included in meta-
analyses that test anxiety is positively correlated with a bias towards threat perception (e.g.,
Putwain, Langdale, Woods, Nicholson, 2011), messages from teachers about the importance
of avoiding failure (e.g., Putwain & Symes, 2011), and parental pressure (e.g., Putwain,
Woods, & Symes, 2010). It is a notable limitation of the contemporary test anxiety literature,
however, that there are few systematic evaluations of the aforementioned theories (for a
notable exception see Putwain, 2018).
The meta analyses by Hembree (1988) and von der Embse et al. (2018) and also
others (e.g., Chappell et al., 2005; Richardson, Abraham, & Bond, 2012; Seipp, 1991; Seipp
& Schwarzer, 1996) showed that test anxiety correlated negatively with measures of
achievement (e.g., standardised examinations, grade point average, and classroom tests).
Negative correlations were larger for the worry than emotionality (or affective-physiological)
component. For example in, in von der Embse et al.’s (2018) study negative relations with
measures of achievement were r = -.26 for the cognitive component of test anxiety
(including worrisome thoughts, test-irrelevant thoughts, and cognitive obstruction) and r = -

THE MULTIDIMENSIONAL TEST ANXIETY SCALE 40
.15 for affective/ physiological component (including emotionality, tension, bodily
symptoms, autonomic reactions ). The von der Embse et al., (2018) review is also unique in
that it reports rs for additional components (r = -.12 for the social component and r = -.04 for
behavioural component).
The motivational component of the test anxiety scale of the Test Emotions
Questionnaire was not included in the von der Embse’s (2018) meta analysis. The most likely
reason for this is that studies using the Test Emotions Questionnaire have reported a single
score for test anxiety and not provided separate sub-scale scores for the different cognitive,
emotional, physiological, and motivational domains (Pekrun et al., 2004; Pekrun, Goetz,
Frenzel, Barchfeld, & Perry, 2011). There is no empirical data for this domain available for
meta analyses to utilise. Although Hembree’s (1988) meta analysis reported a positive
correlation between facilitating test anxiety and achievement as we outlined in footnote 1
above items do not correspond to anxiety and so we do not consider this a reliable finding.
Test anxiety is also negatively associated with student wellbeing. Although defined in
different ways, wellbeing in schooling or academic contexts refers to a subjective global
perception of one’s needs being met, positive relationships and interactions with peers and
staff, and positive attitudes and feelings towards one’s learning and place of learning
(Hascher, 2003). Hembree’s (1988) meta-analysis reported a negative correlation between
test anxiety and wellbeing. More recently, Herzer, Wendt, and Hamm (2014) reported that
97% of students reporting in the upper 66th percentile of the GTAI met the clinical criteria for
a clinical anxiety disorder (e.g., social or specific phobia) as assessed through a clinical
interview. Furthermore, Rodway et al. (2016) reported over a 16-month period in England
that in 15% of adolescent suicides, academic pressures were specifically cited in coroners’
report. Wellbeing has not received the same degree of attention, within the test anxiety
literature, as academic outcomes, yet is an equally important outcome. Studies have yet to

THE MULTIDIMENSIONAL TEST ANXIETY SCALE 41
establish whether wellbeing is more strongly related to one or more specific components of
test anxiety. However, as wellbeing is comprised of cognitive, effective, and behavioural
elements, we do not anticipate there being a theoretical reason to expect stronger relations
between wellbeing and some components of test anxiety than others.
THE MULTIDIMENSIONAL TEST ANXIETY SCALE 42
Clarifying the Test Anxiety Construct
Various contemporary theoretical models of test anxiety (e.g., Lowe et al., 2008;
Pekrun, 2006; Segool, von der Embse, Mata, & Gallant, 2014; Zeidner & Matthews, 2005)
propose that the appraisal of an evaluative situation as a threat depends in part on poor self-
perceptions of academic competence. Including such perceptions as part of the test anxiety
construct risks confounding indicators of test anxiety with antecedents. Thus, subscales such
as a lack of confidence should be excluded from the test anxiety construct. There is no doubt
that highly test anxious persons also experience myriad social worries about being negatively
judged by family, peers, and teachers (e.g., Putwain, 2009). However, the finding that social
anxieties often coincide with worry about failure and the consequence of failure does not
necessarily mean that both domains should be included within the construct of test anxiety.
Our position is that including a social component within test anxiety risks blurring the
boundaries between social anxiety and test anxiety, thus contributing to further jingle-jangle.
Test anxiety should be limited to the appraisal of an evaluative situation as threatening and if
negative judgements from others are a reason why a performance-evaluative situation is
judged to be an ego-threat then they are best positioned as an antecedent, rather than an
indicator, of test anxiety. On this basis we exclude social anxiety from the test anxiety
construct.
At face value a behavioural component to test anxiety seems highly plausible (e.g.,
Zeidner, 2007, 2014). However, the difficulty with a behavioural component comes with the
defining behaviours solely as indicators of anxiety. The same behaviours (e.g., playing with
one’s pencil, staring into space, checking the time) could be equally indicative of a student
who was unable to concentrate due to test anxiety as a student who was on-task but taking a
break between questions in order to re-focus, or a student who was thinking about a question
before writing their answer (see Gill & Remedios, 2013). It therefore becomes difficult to

THE MULTIDIMENSIONAL TEST ANXIETY SCALE 43
identify specific behaviours that are solely indicative of anxiety. Although a behavioural
component may be included within a theoretical conceptualisation of test anxiety, if
behaviours could also be indicators of on-task behaviours, and perhaps not even test anxiety
as all then for practical purposes they should not be included within a measurement model.
The motivational origins of test anxiety propose that the anticipation of failure,
resulting in shame, humiliation, and a loss of status and esteem, drives the person to avoid
situations where failure was a possibility (Atkinson, 1964). Test anxiety, therefore arises
from the motive to avoid failure (Hagtvet & Benson, 1997). Contemporary approaches view
avoidance motivation as a temperament; that is a general neurobiological sensitivity to
negative stimuli (Elliot & Thrash, 2010). Avoidance temperament predisposes persons
towards high levels high negative effect, such as high trait anxiety and clinical forms of
anxiety (e.g., Kampman, Viikki, & Leinonen, 2017; Liew, Lench, Kao, Yeh, & Kwok, 2014).
In keeping with the Self-referent Executive Processing (S-REF) Model of Test Anxiety
(Matthews, Hillyard, & Campbell, 1999; Zeidner & Matthews, 2005), we considered
avoidance motivation as an antecedent of, rather than a component of, trait test anxiety.
It is also notable that when highly test anxious secondary school students were given
the opportunity to discuss their experiences in open-ended interviews, in the period prior to
taking high-stakes school exit examinations, none described an urge to escape or avoid the
testing situation (Putwain, 2009). While the urge to escape is part of some anxiety
experiences such as agoraphobia (American Psychiatric Association., 2013) it is not common
to other forms of anxiety (such as generalised anxiety disorder) and does not appear in the
experiential repertoire of highly test anxious persons. Given the position of avoidance
motivation as an antecedent of test anxiety and that typical avoidance indicators, such as the
urge to avoid or escape from the anxiety-provoking situation are not described by test anxious

THE MULTIDIMENSIONAL TEST ANXIETY SCALE 44
persons, we propose than a motivational component to test anxiety is not included within a
measurement model.
Should a facilitating component be included within the test anxiety construct? Over
100 years ago, Yerkes and Dodson (1908) reported that the ability of 40 mice to discriminate
between a black and white nest box, by administering electric shocks when entering the black
next box, depended on the strength of the electric shock. Mice made fewer mistakes when
with a moderate, rather than low or high, strength electric shock. Notwithstanding the
difficulties of extrapolating findings from one species to another, there are a number of
reasons that make generalising the findings of this study to the experience of humans taking
tests highly tenuous. There was no measurement of anxiety within this study and a pain-
causing aversive stimulus, such as receiving an electric shock, cannot be considered
analogous to taking a test. Furthermore, the study was about the influence of stimulus
strength on learning rather than an evaluative situation designed to assess learning. We
should not assume the processes that determine learning will be the same as those required to
demonstrate assessments demands in a test.
We fully acknowledge that a degree of physiological activation associated with a
challenge state may be required for optimal performance (Blascovich & Mendes, 2010;
Lazarus & Folkman, 1984). However, a challenge state is not the same emotionally,
physiologically, cognitively, or hormonally, as anxiety. Although in common parlance both
anxiety and challenge may be described by students as ‘stressful’ (and this is not inaccurate
accordingly to Lazarus & Folkman, 1984) the facilitating effects of challenge should not be
confused with the debilitating effects of anxiety. The salient issue is not the degree, but type,
of physiological activation (challenge or threat) in response to an evaluative situation.
Accordingly, we exclude facilitating anxiety from the test anxiety construct. For additional
critique of the so-called ‘Yerkes-Dodson’ law see Corbett, 2015, and Teigen, 1994).

THE MULTIDIMENSIONAL TEST ANXIETY SCALE 45
We accept worry about failure and the consequences of failure as being the central
cognitive component of ego-threat in an evaluative situation. We also accept the bifurcation
between the emotional and physiological aspects of test anxiety. Although highly related,
factor analytic studies have shown that anxious feelings are conceptually distinct from
specific physiological indicators of anxiety (e.g., Benson et al., 1992; Hagtvet & Benson,
1997; Pekrun et al., 2004; I.G. Sarason, 1984). This leaves the cognitive obstruction
component. On face value this might appear to be an outcome of test anxiety, however
consistent with Attentional Control Theory (Derakshan, & Eysenck, 2011; Eysenck,
Derakshan, Santos, & Calvo, 2007) the same processes that underpin anxiety, namely
disruption of goal-directed attention to focus on threat, are those that interfere with
information processing resources. On a theoretical level it is not possible to differentiate
anxiety from its interfering properties. Thus, we include within the test anxiety construct the
experience of interference of cognitive processes (e.g., memory and attention). This includes
distraction as referred to the experience of difficulty keeping attention task focused rather
than the experience of non-task, non-threat, cognitions.

THE MULTIDIMENSIONAL TEST ANXIETY SCALE 46
Study 1: Expert Consideration of Test Anxiety Items
Expert reviewers were provided with the following construct definitions of Worry,
Cognitive Interference, Tension, and Physiological Indicators.:
Worry is a cognitive aspect of test anxiety. It refers to self-centred, often derogatory,
thoughts concerning or anticipating failure in an evaluative situation or the consequences of
failure.
Cognitive Interference is a cognitive aspect of test anxiety. It refers to the experience
of difficulty in using one’s cognitive processes in an evaluative situation. This includes
difficulty in concentrating, focusing attention, memory recall, problem solving, and
organising one’s thoughts.
Tension is an affective-physiological aspect of test anxiety. It refers to the feeling of
being tense, anxious, panicky, or jittery.
Physiological Indicators is an affective-physiological aspect of test anxiety. It refers to
the perception of specific physiological markers of heightened arousal such as an elevated
heart rate or stomach discomfort.

THE MULTIDIMENSIONAL TEST ANXIETY SCALE 47
Table S2
Model Fit Indices for Exploratory Factor Analyses of the MTAS (Study 1).
Factor Solutions χ2 (df) RMSEA SRMR CFA TLI
1 Factor Model 4028.89 (104) .066 .100 .953 .951
2 Factor Model 2240.88 (628) .047 .071 .978 .975
3 Factor Model 1356.17 (592) .033 .046 .989 .987
4 Factor Model 954.07 (557) .025 .034 .994 .993
5 Factor Model 800.90 (523) .021 .030 .996 .995
Note. χ2 for all models p <.001.

THE MULTIDIMENSIONAL TEST ANXIETY SCALE 48
Table S3
Eigen Values from the Exploratory Factor Analyses of the MTAS (Study 1) and Randomly
Generated Eigen Values from a Parallel Analysis.
Number of Factors Eigen Values from EFA
Randomly Generated 95%
Percentile Eigen Values from a
Parallel Analysis
1 17.35 1.39
2 2.84 1.34
3 2.27 1.31
4 1.46 1.28
5 0.96 1.26
6 0.92 1.23
7 0.81 1.20
8 0.67 1.17
9 0.65 1.15
10 0.62 1.14
Note. Eigen values are only provided for the first 10 factors.

THE MULTIDIMENSIONAL TEST ANXIETY SCALE 49
Table S4
Standardized Factor Loadings from the Four Factor EFA (Study 1).
Item Factor
1 2 3 4
1. Before a test/exam, I have difficulty organizing my thoughts (CI) .34 .06 .39 .10
2. Even when I feel prepared before a test/exam, I am nervous about it (T) .55 .47 .00 -.18
3. I am tense before a test/exam, even if I am well prepared (T) .58 .33 .08 -.03
4. I forget previously known material before taking a test/exam (CI) .05 .02 .80 -.10
5. Just before I take a test/exam, I feel panicky (T) .60 .39 .04 .01
6. My heart races before I take a test/exam (PI) .57 .28 -.13 .78
7. Before I take a test/exam, I think that other students understand the material better than me (W) .11 .34 .33 .02
8. My hand shakes before I take a test/exam (PI) .43 -.01 .04 .70
9. I easily lose focus before I am about to take a test/exam (CI) .14 -.05 .57 .20
10. I feel uneasy just before getting a test or exam score/grade back (T) .25 .54 -.01 .04
11. Before a test/exam, I feel nervous (T) .55 .48 -.05 .00
12. I experience stomach discomfort before I take a test/exam (PI) .39 .07 .03 .47
13. I worry about giving the wrong answer before I take a test/exam (W) .04 .72 .06 .05
14. I worry before an exam/test because I do not know what to expect (W) .15 .56 .14 .01
15. Before a test, I am worried I will fail/exam (W) .09 .79 .06 -.06
16. I forget previously known material during tests/exams (CI) .00 .13 .77 -.09
17. During tests/exams, I find it hard to concentrate (CI) .07 -.03 .67 .14
18. I experience stomach discomfort during a test/exam (PI) .40 -.02 .12 .71
19. My hand shakes while I am taking a test/exam (PI) .40 -.11 .06 .68
20. I feel panicky when I take an important test/exam (T) .35 .41 .05 .18
21. I get confused during tests/exams (CI) -.08 .09 .62 .16

THE MULTIDIMENSIONAL TEST ANXIETY SCALE 50
22. During tests/exams, I forget material I really know (CI) -.01 .12 .69 .08
23. I am afraid of writing the wrong answer during a test/exam (W) -.05 .80 .16 -.02
24. I am worried that I will fail during a test/exam (W) .06 .60 .20 .05
25. My head hurts while I take tests/exams (PI) .09 -.02 .17 .43
26. During tests/exams, I find myself thinking about the consequences of failing (W) -.03 .52 .16 .23
27. While taking tests or exams I have an uneasy, upset feeling (T) .14 .24 .10 .49
28. After a test/exam, I realize that I know more than my test performance indicated (CI) .04 .22 .23 -.01
29. After a test/exam, I am worried I have failed (W) .02 .80 .07 .02
30. After I take a test/exam, my head hurts (PI) -.07 -.04 .11 .48
31. After I have taken a test/exam, organizing my thoughts is difficult to do (CI) -.02 .04 .26 .59
32. My muscles are tight after I have taken a test/exam (PI) -.04 .03 -.04 .67
33. I feel confused after I have taken a test/exam (CI) -.22 .06 .18 .59
34. After taking a test/exam, I worry that I gave the wrong answers (W) -.06 .79 .02 .78
35. After a test/exam, my heart races (PI) .06 .19 -.10 .60
36. I feel nervous after I have taken a test/exam (T) -.06 .61 -.13 .40
37. I feel uneasy after I have taken a test/exam (T) .04 .39 -.09 .57
38. I feel jittery after I have taken an important test/exam (T) .04 .26 -.12 .64
Note. Items are listed in the same order that they were presented to participants. Factor loadings λ <.4 emboldened. Target factor indicated in
parentheses after each after. W = Worry, CI = Cognitive Interference, T = Tension, PI = Physiological Indicators.

THE MULTIDIMENSIONAL TEST ANXIETY SCALE 51
Table S5
Model Fit Indices for the Confirmatory Factor Analysis of the MTAS (Study 1).
χ2 (df) RMSEA SRMR CFI TLI
1-Factor 1698.77 (104) .112 .102 .975 .971
2-Factor 1095.98 (103) .089 .079 .984 .982
4-Factor 486.52 (98) .057 .043 .994 .993
Higher Order 623.11 (100) .065 .047 .992 .990
4-Factor† 357.09 (97) .047 .037 .996 .995
Higher Order† 503.07 (99) .058 .042 .994 .992
Note. χ2 for all models p <.001. † with correlated residuals.

THE MULTIDIMENSIONAL TEST ANXIETY SCALE 52
Table S6
Internal Consistency and Standardized Factor Loadings from the Four Correlated Factors and Higher Order Models (Study 1).
Item
TA W CI T PI
15. Before a test, I am worried I will fail/exam .86 / .86
23. I am afraid of writing the wrong answer during a test/exam .76 / .76
29. After a test/exam, I am worried I have failed .46 / .46
34. After taking a test/exam, I worry that I gave the wrong answers .73 / .73
4. I forget previously known material during tests/exams .71 / .72
16. I forget previously known material before taking a test/exam .82 / .82
17. During tests/exams, I find it hard to concentrate .68 / .65
22. During tests/exams, I forget material I really know .76 / .78
2. Even when I feel prepared before a test/exam, I am nervous about it .83 / .83
3. I am tense before a test/exam, even if I am well prepared .87 / .86
5. Just before I take a test/exam, I feel panicky .92 / .92
11. Before a test/exam, I feel nervous .86 / .85
6. My heart races when I take a test/exam. .86 / .86
8. My hand shakes before I take a test/exam .67 / .72
18. I experience stomach discomfort when I take a test/exam .77 / .76
19. My hand shakes while I am taking a test/exam .62 / .65
W .87 .70 .77 .65
CI .66 .47 .53
T .88 .76
PI .82

THE MULTIDIMENSIONAL TEST ANXIETY SCALE 53
McDonald’s ω .91 .87 .80 .87 .85
95% CIs .90, .92 .86, .88 .78, .82 .86, .88 .84, .86
Guttman’s λ6 .93 .82 .76 .83 .79
95%CIs .92, .94 .80, .84 .74, .78 .81, .85 .77, .81
Range 16 ‒ 80 4 ‒ 20 4 ‒ 20 4 ‒ 20 4 ‒ 20
Mean 49.12 14.28 13.06 12.24 9.63
SD 13.09 3.93 3.78 4.04 4.00
Skewness -.01 -.51 -.14 -.02 .50
Kurtosis -.38 -.66 -.44 -.79 -.44
Note. TA = Test Anxiety, W = Worry, CI = Cognitive Interference, T = Tension, PI = Physiological Indicators. Standardised factor loadings
before the slash are from the higher order model and after the slash from the four-correlated-factors model.

THE MULTIDIMENSIONAL TEST ANXIETY SCALE 54
Table S7
Latent Bivariate Correlations to show Concurrent Validity with the Test Anxiety Inventory
(Study 1).
Test Anxiety Inventory Factors
Worry Emotionality
MTAS Factors:
Total Test Anxiety .89 .93
Worry .86 .80
Cognitive Interference .78 .55
Tension .63 .74
Physiological Indicators .69 .87
Note.
Model fit for the four-correlated-factors models: χ2(448) = 1001.44, p <.001, RMSEA = .032,
SRMR = .042, CFI = .995, and TLI = .995.
Model fit for the higher-order model: χ2(456) = 1349.64, p <.001, RMSEA = .042, SRMR =
.054, CFI = .991, and TLI = .991.

THE MULTIDIMENSIONAL TEST ANXIETY SCALE 55
Table S8
MTAS Items modified for Study 2
Domain Original Item for Study 1 Revised Item for Study 2 Justification
Cognitive Interference I forget previously known material
during tests/exams
I forget facts I have learnt during
tests/exams.
Reduce use of ‘material’ that was
included in three of the four original
items
During tests/exams, I forget
material I really know
During tests/exams, I forget things
that I have learnt.
Reduce use of ‘material’ that was
included in three of the four original
items
Tension I am tense before a test/exam, even
if I am well prepared
I feel tense before taking a test/exam. Include verb ‘feel’ in all tension
items to emphasise affective domain
Physiological Indicators My hand shakes before I take a
test/exam
Before I take a test/ exam my hand
trembles.
To reduce correlated residual
variance and preposition moved to
beginning of sentence to improve
readability
I experience stomach discomfort
during a test/exam
During a test/ exam I experience
stomach discomfort.
Preposition moved to beginning of
sentence to improve readability

THE MULTIDIMENSIONAL TEST ANXIETY SCALE 56
Table S9
Descriptive Statistics for the MTAS, SRWS, SAEBRS, GCSE and A Level Examination Performance (Study 2).
Range Mean SD ω 95%CIs λ6 95%CIs ρI Skewness Kurtosis
MTAS Total 16 - 80 52.56 12.32 .93 [.93, .93] .94 [.94, .94] .03 -0.21 -0.05
Worry 4 - 20 14.09 3.67 .85 [.84, .86] .83 [.82, .84] .02 -0.46 -0.29
Cognitive Interference 4 - 20 13.30 3.50 .84 [.83, .85] .80 [.79, .81] .02 -0.20 -0.44
Tension 4 - 20 14.61 3.80 .89 [.88, .90] .86 [.85, .87] .04 -0.69 0.04
Physiological Indicators 4 - 20 10.51 4.02 .85 [.84, .86] .82 [.81, .83] .03 0.39 -0.52
SRWS 6 - 30 21.31 4.40 .89 [.89, .89] .88 [.88, .88] .02 -0.77 0.87
SAEBRS Total 0 - 60 17.91 7.42 .88 [.88, .88] .90 [.90, .90] .01 0.54 0.56
Social 0 - 21 4.17 2.87 .67 [.66, .69] .67 [.66, .68] .01 1.16 1.92
Academic 0 - 18 6.04 2.96 .64 [.63, .65] .63 [.62, .64] .01 0.39 0.11
Emotional 0 - 21 7.73 3.94 .78 [.77, .79] .78 [.77, .79] .09 0.57 0.18
GCSE Grade 1 - 9 5.36 1.83 — — .01 0.02 -0.80
A Level UCAS Points
Score
40 - 420 227.94 65.75 — — .01 0.05 0.11
Note. MTAS = Multidimensional Test Anxiety Scale, SRWS = School-related Wellbeing Scale, and SAEBRS = Social, Academic, and
Emotional, Behaviour Risk Screener.

THE MULTIDIMENSIONAL TEST ANXIETY SCALE 57
Table S10
Model Fit Indices for the Confirmatory Factor Analysis of the MTAS (Study 2).
χ2 (df) RMSEA SRMR CFI TLI
1-Factor 4941.19 (104) .084 .107 .815 .786
2-Factor 4527.90 (103) .081 .086 .831 .801
4-Factor 1663.26 (98) .049 .037 .940 .927
Higher Order 1692.34(100) .049 .043 .939 .927
4-Factor† 928.19 (96) .036 .030 .968 .960
Higher Order† 1074.45 (98) .039 .038 .963 .954
Note. . χ2 for all models p <.001. † with correlated residuals.

THE MULTIDIMENSIONAL TEST ANXIETY SCALE 58
Latent Measurement Model Specifications for Cognate Constructs in Study 2: SRWS,
SAEBRS, GCSE and A Level Examination Performance
SRWS was modelled as unidimensional scale. SAEBRS was modelled on a bifactor
structure (see von der Embse, Pendergast, Kilgus, & Eklund, 2016) comprising on a general
risk factor and three specific risk factors (social, academic, and emotional).
GCSE examination performance was modelled as a latent construct with three
indicators (GCSE grades in English, science, and mathematics). GCSE performance was only
applicable to Year 11 students. Rather than estimating coefficients for latent bivariate
correlations from the entire dataset, and treating all non-Year 11 students as having missing
data for GCSE examination performance, the portion of the dataset for Year 11 students was
split from the main dataset. Analyses were estimated by adding GCSE examination to the
MTAS measurement model. The subsample comprised of 499 participants (male = 237,
female = 256, 6 = missing) with a mean age of 15.1 Years (SD = .68). A small number (n =
25) were eligible for free school meals (n = 1 missing). The ethnic heritage of this sub-sample
was: white Caucasian (n = 431), Asian (n = 25), Black (n = 6), other or mixed heritage
backgrounds (n = 36). There were missing ethnic heritage data from 1 participant.
A level examination performance was modelled as manifest construct. This was
necessitated by practicalities, as we were only provided with the single aggregated UCAS
score by participating colleges, but is also consistent with A Level courses as drawing on a
curriculum-based assessment paradigm. Unlike psychometric and outcome-based paradigms,
the attributes of interest in curriculum-based assessment (student’s knowledge and skills) that
are examined represent a composite variable (see Maul, 2013; Baird, 2018).
A Level performance was only applicable to Year 13 students. As for GCSE
examination performance, the portion of the dataset for Year 13 students was split from the
main dataset and analyses conducted on these data only. The subsample comprised of 369

THE MULTIDIMENSIONAL TEST ANXIETY SCALE 59
participants (male = 143, female = 225, 1 = missing) with a mean age of 17.3 Years (SD =
.47). Sixty-four participants were eligible for free school meals (n = 1 missing). The ethnic
heritage of this sub-sample was: white Caucasian (n = 344), Asian (n = 13), Black (n = 1),
other or mixed heritage backgrounds (n 10). There was missing ethnic heritage data for 1
participant.
All models were estimated using the WLSMV estimator and the ‘complex’ command
in Mplus to adjust standard errors for the partial nesting of data within schools/ colleges with
the exception of A Level exam performance where data were collected from a single college.

THE MULTIDIMENSIONAL TEST ANXIETY SCALE 60
Table S11
Model Fit Indices for the Latent Bivariate Correlations (Study 2).
χ2 (df) RMSEA SRMR CFI TLI
Four Correlated Factors:
SRWS 1220.42 (196) .028 .037 .970 .965
SAEBRS 2369.64 (544) .023 .083 .907 .893
GCSE Exams 342.74 (140) .054 .052 .996 .995
A Level Exams 483.06 (108) .097 .040 .976 .969
Higher Order Model:
SRWS 2604.06 (201) .043 .063 .930 .920
SAEBRS 2516.95 (548) .023 .093 .900 .888
GCSE Exams 465.30 (145) .067 .077 .993 .991
A Level Exams 544.19 (113) .102 .050 .972 .966
Note. χ2 for all models p <.001.

THE MULTIDIMENSIONAL TEST ANXIETY SCALE 61
Test-Retest Reliability of MTAS Scores
In order to examine the test-retest reliability of the MTAS we followed up a sub-
sample of Study 2 participants based at the two of the 6th Form Colleges after a four month
interval.
Participants. The subsample of Study 2 participants based in 6th form colleges were
comprised of 470 persons (171 male and 299 female) with a mean 16.5 years (SD = .62) at
the first point of data collection and 16.9 years (SD = .63) at the point of retest. The ethnic
heritage of this sub-sample was: white Caucasian (n = 369), Asian (n = 69), Black (n = 15),
other or mixed heritage backgrounds (n = 15). There were missing ethnic heritage data from 2
participants.
Measures. Participants completed the MTAS at both time points.
Analytic approach. Confirmatory for factor analyses for the MTAS were checked for
the sub-sample in order to check measurement properties at test and re-test. Temporal
invariance was then checked by conducting a series of models with increasingly stringent
constraints (Edossa, Schroeders, Weinert, & Artelt, 2018). The configural invariance model
specifies the MTAS at both measurement points, the threshold invariance model constraints
item loadings and thresholds to be invariant, and the error invariance model constraints item
residual variances to be invariant. This approach omits the metric invariance approach
commonly found when testing temporal invariance using continuous variables as item
thresholds and factor loadings for categorical variables must varied simultaneously. Non-
invariance is indicated if model fit declines substantially, from one model to the next
(ΔRMSEA > .015 or ΔCFI/ TLI > .01; see Chen, 2007; Cheung & Rensvold, 2002). A
minimum of metric invariance is required in order to examine relations overtime (Widaman,
Ferrer, & Conger, 2010). All Analyses were replicated for the four-correlated-factors and

THE MULTIDIMENSIONAL TEST ANXIETY SCALE 62
higher order models to examine test-retest reliability for the overall MTAS, as well as
individual component, scores.
Results
Results of the measurement invariance tests are reported in Table S12. The four-
correlated-factors and higher order models showed strict (error) invariance and so it is
appropriate to compare relations from test to retest. Test-retest correlations were r = 80 for
Worry, r = .65 for Cognitive Interference, r = .70 for Tension, r = .82 for Physiological
Indicators, and r = .80 for the MTAS total score.
Discussion
The temporal stability coefficients reported in this study (rs = .65 - .80) are lower than
for those for test anxiety at a four-week interval (rs = .83 - .91) reported by Lowe et al.
(2008) for elementary and secondary school students. The aforementioned temporal stability
coefficients for the present study are, however, comparable to those for TAI total score (r =
.62) at a six month interval in secondary school students (Spielberger, 1980) and trait anxiety
in secondary schools students at 30-day (rs = .71 - .75) and 60-day intervals (rs = .65 - .68)
reported by Spielberger, Gorsuch, Lushene, Vagg, and Jacobs (1983). There are no exact
criteria by which to judge the cut-point for test-retest reliability and the size of coefficients
must be weighed against the proposed stability of the construct and the time interval between
measurements. Given our temporal interval of four months between test and retest point, we
consider rs of .65 to .80 as providing evidence for an acceptable to good level of test-retest
reliability in MTAS scores.

THE MULTIDIMENSIONAL TEST ANXIETY SCALE 63
Table S12
Confirmatory Factor Analyses and Tests of Measurement Invariance.
χ2 (df) RMSEA SRMR CFI TLI ΔRMSEA ΔCFI ΔTLI
Four-correlated Factors Model
Initial Measurement 591.84 (96) .105 .041 .976 .970
Retest 305.78 (96) .071 .031 .987 .984
Configural Invariance 1108.67 (416) .060 .038 .978 .974
Threshold Invariance 1140.30 (473) .055 .039 .979 .978 -.005 +.001 +.004
Error Invariance 1155.18 (489) .054 .041 .979 .979 -.001 .000 +.001
Higher-Order Model
Initial Measurement 641.61 (98) .109 .045 .974 .968
Retest 383.52 (98) .081 .036 .982 .978
Configural Invariance 1513.95 (435) .073 .052 .966 .961
Threshold Invariance 1537.94 (449) .067 .053 .967 .967 -.005 +.001 +.006
Error Invariance 1516.75 (511) .065 .055 .968 .969 -.002 +-.001 +.002
Note. χ2 for all models p <.001.
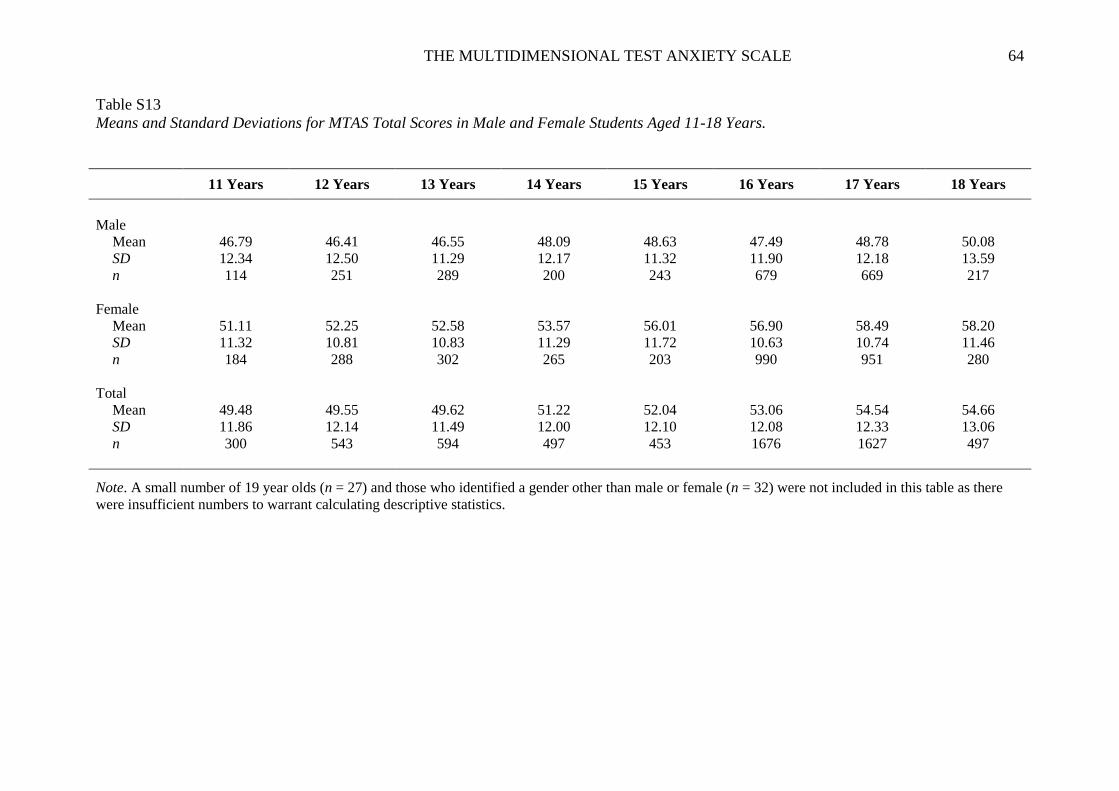
THE MULTIDIMENSIONAL TEST ANXIETY SCALE 64
Table S13
Means and Standard Deviations for MTAS Total Scores in Male and Female Students Aged 11-18 Years.
11 Years 12 Years 13 Years 14 Years 15 Years 16 Years 17 Years 18 Years
Male
Mean 46.79 46.41 46.55 48.09 48.63 47.49 48.78 50.08
SD 12.34 12.50 11.29 12.17 11.32 11.90 12.18 13.59
n 114 251 289 200 243 679 669 217
Female
Mean 51.11 52.25 52.58 53.57 56.01 56.90 58.49 58.20
SD 11.32 10.81 10.83 11.29 11.72 10.63 10.74 11.46
n 184 288 302 265 203 990 951 280
Total
Mean 49.48 49.55 49.62 51.22 52.04 53.06 54.54 54.66
SD 11.86 12.14 11.49 12.00 12.10 12.08 12.33 13.06
n 300 543 594 497 453 1676 1627 497
Note. A small number of 19 year olds (n = 27) and those who identified a gender other than male or female (n = 32) were not included in this table as there
were insufficient numbers to warrant calculating descriptive statistics.

THE MULTIDIMENSIONAL TEST ANXIETY SCALE 65 65
Table S14
Percentile Ranks for MTAS Total Scores in Male Students Aged 11-18 Years.
Raw
Score
11
Years
12
Years
13
Years
14
Years
15
Years
16
Years
17
Years
18
Years
Raw
Score
16 1 1 1 1 1 1 1 2 16
17 2 2 1 2 2 1 1 2 17
18 2 2 1 2 2 1 2 2 18
19 2 2 2 2 2 2 2 3 19
20 2 2 2 2 2 2 2 4 20
21 2 3 4 3 3 2 2 4 21
22 3 4 4 3 3 3 3 4 22
23 3 6 5 4 3 3 3 5 23
24 5 6 5 5 3 3 4 5 24
25 7 7 5 5 4 4 4 5 25
26 8 7 7 6 4 5 5 6 26
27 8 8 7 6 5 6 5 7 27
28 8 10 7 8 5 6 6 7 28
29 8 10 7 8 5 7 7 7 29
30 11 11 9 9 7 8 7 8 30
31 12 12 10 11 7 9 9 8 31
32 15 14 11 12 9 10 9 9 32
33 15 16 11 12 9 13 12 12 33
34 15 18 13 13 10 14 13 15 34
35 20 18 14 16 10 16 15 16 35
36 23 20 16 17 12 18 16 17 36
37 24 24 20 19 14 20 20 18 37
38 27 26 24 20 16 23 21 20 38
39 30 29 25 23 19 26 22 21 39
40 33 32 28 25 21 29 24 24 40
41 35 35 32 27 24 32 26 25 41
42 36 37 35 32 26 35 28 28 42
43 38 40 41 35 30 37 30 32 43
44 43 44 43 39 34 41 33 33 44
45 45 48 45 41 39 43 37 35 45
46 46 51 46 44 42 47 40 37 46
47 51 55 49 46 46 49 44 40 47
48 52 57 54 49 54 52 49 44 48
49 55 61 59 52 55 56 53 47 49
50 63 64 63 56 60 61 55 52 50
51 64 67 67 58 65 64 58 54 51
52 65 69 71 63 68 66 62 58 52
53 69 73 75 64 71 69 65 62 53
54 75 75 79 69 74 72 69 64 54
55 77 77 82 73 77 75 72 66 55
56 79 79 84 75 79 78 75 67 56
57 85 81 87 78 79 81 77 70 57
58 87 84 88 79 82 83 81 72 58
59 87 85 90 83 86 85 83 76 59
60 88 88 90 86 87 88 85 79 60
61 89 88 91 87 89 89 86 81 61
62 92 89 93 90 90 91 88 85 62
63 95 90 95 93 92 92 90 86 63

THE MULTIDIMENSIONAL TEST ANXIETY SCALE 66 66
64 96 91 95 94 94 93 92 87 64
65 96 92 96 94 94 94 93 88 65
66 96 94 97 95 94 95 94 90 66
67 96 96 97 95 94 96 94 92 67
68 97 97 98 96 95 96 95 92 68
69 97 97 98 96 96 97 96 93 69
70 98 99 99 97 96 97 96 94 70
71 98 99 99 98 96 98 97 94 71
72 99 99 99 99 98 98 98 94 72
73 99 100 100 99 98 98 98 96 73
74 100 100 100 100 99 99 99 97 74
75 100 100 100 100 100 99 99 97 75
76 100 100 100 100 100 100 99 97 76
77 100 100 100 100 100 100 100 98 77
78 100 100 100 100 100 100 100 98 78
79 100 100 100 100 100 100 100 100 79
80 100 100 100 100 100 100 100 100 80
Note. As per Table S1 19 year olds and those who identified a gender other than male or female
were not included in percentile ranks.

THE MULTIDIMENSIONAL TEST ANXIETY SCALE 67 67
Table S15
Percentile Ranks for MTAS Total Scores in Female Students Aged 11-18 Years.
Raw
Score
11
Years
12
Years
13
Years
14
Years
15
Years
16
Years
17
Years
18
Years
Raw
Score
16 1 1 1 1 1 1 1 1 16
17 1 1 1 1 1 1 1 1 17
18 1 1 1 1 1 1 1 1 18
19 1 1 1 1 1 1 1 1 19
20 1 1 1 2 1 1 1 1 20
21 2 1 1 2 1 1 1 1 21
22 2 3 2 2 1 1 1 1 22
23 2 3 2 2 1 1 1 1 23
24 3 3 2 2 1 1 1 1 24
25 3 3 2 2 1 1 1 1 25
26 4 3 2 2 1 1 1 1 26
27 4 3 2 3 1 1 1 1 27
28 4 4 3 3 2 1 2 1 28
29 4 4 4 3 2 1 2 1 29
30 4 4 4 3 2 1 2 1 30
31 5 4 4 4 2 1 2 1 31
32 5 4 4 4 3 2 2 1 32
33 5 4 5 5 3 3 3 3 33
34 7 5 6 6 3 3 3 4 34
35 8 5 6 6 4 4 3 4 35
36 9 9 7 8 5 4 4 4 36
37 12 10 8 8 6 5 4 5 37
38 15 11 9 10 8 5 5 5 38
39 16 12 12 11 8 7 5 7 39
40 17 14 14 13 9 8 5 8 40
41 22 16 16 14 11 8 6 9 41
42 25 17 18 16 13 10 7 10 42
43 27 21 21 18 15 11 8 12 43
44 32 23 23 20 16 12 9 14 44
45 34 27 25 24 17 14 10 15 45
46 37 28 26 28 20 15 11 17 46
47 39 33 29 31 23 18 13 18 47
48 42 35 34 33 27 19 16 22 48
49 43 39 38 36 30 23 18 23 49
50 47 43 42 41 33 26 21 25 50
51 48 48 45 44 37 28 23 28 51
52 52 53 49 46 40 32 27 30 52
53 56 55 53 51 45 36 31 32 53
54 61 58 59 55 48 40 34 36 54
55 64 62 61 57 52 44 38 38 55
56 66 66 65 61 54 49 41 41 56
57 68 70 67 62 57 53 45 45 57
58 71 72 72 65 58 56 50 51 58
59 75 75 74 69 61 60 53 55 59
60 77 80 77 74 65 64 57 58 60
61 81 81 81 76 67 68 62 62 61
62 83 84 84 78 69 71 67 67 62
63 86 86 87 80 73 73 69 70 63

THE MULTIDIMENSIONAL TEST ANXIETY SCALE 68 68
64 88 89 89 85 76 77 73 73 64
65 91 90 89 87 79 80 76 75 65
66 93 92 90 89 81 83 78 76 66
67 94 93 92 90 83 85 81 78 67
68 95 94 93 90 86 87 83 80 68
69 96 95 94 91 86 89 85 81 69
70 98 96 95 93 88 90 87 84 70
71 99 96 96 94 89 92 88 86 71
72 99 97 97 95 90 93 90 89 72
73 99 98 98 97 93 94 91 90 73
74 100 99 99 98 94 95 93 93 74
75 100 99 99 98 95 96 95 93 75
76 100 99 99 99 97 97 97 94 76
77 100 99 100 99 97 98 98 95 77
78 100 99 100 99 99 98 98 97 78
79 100 100 100 100 100 99 99 98 79
80 100 100 100 100 100 100 100 100 80
Note. As per Table S1 19 year olds and those who identified a gender other than male or female were
not included in percentile ranks.

THE MULTIDIMENSIONAL TEST ANXIETY SCALE 69 69
Table S16
Standardised z scores for MTAS Total Scores in Male Students Aged 11-18 Years.
Raw
Score
11
Years
12
Years
13
Years
14
Years
15
Years
16
Years
17
Years
18
Years
Raw
Score
16 -2.50 -2.43 -2.71 -2.62 -2.88 -2.65 -2.56 -2.51 16
17 -2.41 -2.35 -2.62 -2.53 -2.79 -2.56 -2.48 -2.43 17
18 -2.33 -2.27 -2.53 -2.44 -2.71 -2.48 -2.39 -2.36 18
19 -2.25 -2.19 -2.44 -2.35 -2.62 -2.39 -2.31 -2.29 19
20 -2.17 -2.11 -2.35 -2.26 -2.53 -2.31 -2.23 -2.21 20
21 -2.09 -2.03 -2.26 -2.17 -2.44 -2.23 -2.14 -2.14 21
22 -2.01 -1.95 -2.17 -2.09 -2.35 -2.14 -2.06 -2.07 22
23 -1.93 -1.87 -2.09 -2.00 -2.26 -2.06 -1.97 -1.99 23
24 -1.85 -1.79 -2.00 -1.91 -2.18 -1.97 -1.89 -1.92 24
25 -1.77 -1.71 -1.91 -1.82 -2.09 -1.89 -1.81 -1.85 25
26 -1.68 -1.63 -1.82 -1.73 -2.00 -1.81 -1.72 -1.77 26
27 -1.60 -1.55 -1.73 -1.64 -1.91 -1.72 -1.64 -1.70 27
28 -1.52 -1.47 -1.64 -1.55 -1.82 -1.64 -1.55 -1.62 28
29 -1.44 -1.39 -1.55 -1.47 -1.73 -1.55 -1.47 -1.55 29
30 -1.36 -1.31 -1.47 -1.38 -1.65 -1.47 -1.39 -1.48 30
31 -1.28 -1.23 -1.38 -1.29 -1.56 -1.39 -1.30 -1.40 31
32 -1.20 -1.15 -1.29 -1.20 -1.47 -1.30 -1.22 -1.33 32
33 -1.12 -1.07 -1.20 -1.11 -1.38 -1.22 -1.13 -1.26 33
34 -1.04 -0.99 -1.11 -1.02 -1.29 -1.13 -1.05 -1.18 34
35 -0.96 -0.91 -1.02 -0.93 -1.20 -1.05 -0.97 -1.11 35
36 -0.87 -0.83 -0.93 -0.85 -1.12 -0.97 -0.88 -1.04 36
37 -0.79 -0.75 -0.85 -0.76 -1.03 -0.88 -0.80 -0.96 37
38 -0.71 -0.67 -0.76 -0.67 -0.94 -0.80 -0.71 -0.89 38
39 -0.63 -0.59 -0.67 -0.58 -0.85 -0.71 -0.63 -0.82 39
40 -0.55 -0.51 -0.58 -0.49 -0.76 -0.63 -0.55 -0.74 40
41 -0.47 -0.43 -0.49 -0.40 -0.67 -0.55 -0.46 -0.67 41
42 -0.39 -0.35 -0.40 -0.31 -0.59 -0.46 -0.38 -0.59 42
43 -0.31 -0.27 -0.31 -0.23 -0.50 -0.38 -0.29 -0.52 43
44 -0.23 -0.19 -0.23 -0.14 -0.41 -0.29 -0.21 -0.45 44
45 -0.15 -0.11 -0.14 -0.05 -0.32 -0.21 -0.13 -0.37 45
46 -0.06 -0.03 -0.05 0.04 -0.23 -0.13 -0.04 -0.30 46
47 0.02 0.05 0.04 0.13 -0.14 -0.04 0.04 -0.23 47
48 0.10 0.13 0.13 0.22 -0.06 0.04 0.13 -0.15 48
49 0.18 0.21 0.22 0.31 0.03 0.13 0.21 -0.08 49
50 0.26 0.29 0.31 0.39 0.12 0.21 0.29 -0.01 50
51 0.34 0.37 0.39 0.48 0.21 0.29 0.38 0.07 51
52 0.42 0.45 0.48 0.57 0.30 0.38 0.46 0.14 52
53 0.50 0.53 0.57 0.66 0.39 0.46 0.55 0.21 53
54 0.58 0.61 0.66 0.75 0.47 0.55 0.63 0.29 54
55 0.67 0.69 0.75 0.84 0.56 0.63 0.72 0.36 55
56 0.75 0.77 0.84 0.93 0.65 0.72 0.80 0.44 56
57 0.83 0.85 0.93 1.01 0.74 0.80 0.88 0.51 57
58 0.91 0.93 1.01 1.10 0.83 0.88 0.97 0.58 58
59 0.99 1.01 1.10 1.19 0.92 0.97 1.05 0.66 59
60 1.07 1.09 1.19 1.28 1.00 1.05 1.14 0.73 60
61 1.15 1.17 1.28 1.37 1.09 1.14 1.22 0.80 61
62 1.23 1.25 1.37 1.46 1.18 1.22 1.30 0.88 62
63 1.31 1.33 1.46 1.55 1.27 1.30 1.39 0.95 63

THE MULTIDIMENSIONAL TEST ANXIETY SCALE 70 70
64 1.39 1.41 1.55 1.63 1.36 1.39 1.47 1.02 64
65 1.48 1.49 1.63 1.72 1.45 1.47 1.56 1.10 65
66 1.56 1.57 1.72 1.81 1.53 1.56 1.64 1.17 66
67 1.64 1.65 1.81 1.90 1.62 1.64 1.72 1.25 67
68 1.72 1.73 1.90 1.99 1.71 1.72 1.81 1.32 68
69 1.80 1.81 1.99 2.08 1.80 1.81 1.89 1.39 69
70 1.88 1.89 2.08 2.17 1.89 1.89 1.98 1.47 70
71 1.96 1.97 2.17 2.25 1.98 1.98 2.06 1.54 71
72 2.04 2.05 2.25 2.34 2.06 2.06 2.14 1.61 72
73 2.12 2.13 2.34 2.43 2.15 2.14 2.23 1.69 73
74 2.21 2.21 2.43 2.52 2.24 2.23 2.31 1.76 74
75 2.29 2.29 2.52 2.61 2.33 2.31 2.40 1.83 75
76 2.37 2.37 2.61 2.70 2.42 2.40 2.48 1.91 76
77 2.45 2.45 2.70 2.79 2.51 2.48 2.56 1.98 77
78 2.53 2.53 2.79 2.87 2.59 2.56 2.65 2.05 78
79 2.61 2.61 2.87 2.96 2.68 2.65 2.73 2.13 79
80 2.69 2.69 2.96 2.62 2.77 2.73 2.56 2.20 80
Note. As per Table S1 19 year olds and those who identified a gender other than male or female
were not included in standardised z scores.

THE MULTIDIMENSIONAL TEST ANXIETY SCALE 71 71
Table S17
Standardised z scores for MTAS Total Scores in Female Students Aged 11-18 Years.
Raw
Score
11
Years
12
Years
13
Years
14
Years
15
Years
16
Years
17
Years
18
Years
Raw
Score
16 -3.10 -3.52 -3.38 -2.94 -2.98 -3.07 -2.99 -2.96 16
17 -3.01 -3.42 -3.29 -2.85 -2.90 -2.99 -2.90 -2.88 17
18 -2.92 -3.32 -3.19 -2.77 -2.81 -2.90 -2.82 -2.81 18
19 -2.84 -3.23 -3.10 -2.69 -2.73 -2.82 -2.74 -2.73 19
20 -2.75 -3.13 -3.01 -2.60 -2.65 -2.74 -2.65 -2.65 20
21 -2.66 -3.03 -2.92 -2.52 -2.57 -2.65 -2.57 -2.58 21
22 -2.57 -2.93 -2.82 -2.44 -2.48 -2.57 -2.49 -2.50 22
23 -2.48 -2.84 -2.73 -2.35 -2.40 -2.49 -2.41 -2.42 23
24 -2.39 -2.74 -2.64 -2.27 -2.32 -2.41 -2.32 -2.35 24
25 -2.31 -2.64 -2.55 -2.19 -2.23 -2.32 -2.24 -2.27 25
26 -2.22 -2.55 -2.45 -2.10 -2.15 -2.24 -2.16 -2.19 26
27 -2.13 -2.45 -2.36 -2.02 -2.07 -2.16 -2.07 -2.12 27
28 -2.04 -2.35 -2.27 -1.94 -1.99 -2.07 -1.99 -2.04 28
29 -1.95 -2.26 -2.18 -1.85 -1.90 -1.99 -1.91 -1.96 29
30 -1.86 -2.16 -2.08 -1.77 -1.82 -1.91 -1.83 -1.89 30
31 -1.78 -2.06 -1.99 -1.69 -1.74 -1.83 -1.74 -1.81 31
32 -1.69 -1.96 -1.90 -1.60 -1.66 -1.74 -1.66 -1.74 32
33 -1.60 -1.87 -1.81 -1.52 -1.57 -1.66 -1.58 -1.66 33
34 -1.51 -1.77 -1.72 -1.44 -1.49 -1.58 -1.50 -1.58 34
35 -1.42 -1.67 -1.62 -1.35 -1.41 -1.50 -1.41 -1.51 35
36 -1.33 -1.58 -1.53 -1.27 -1.33 -1.41 -1.33 -1.43 36
37 -1.25 -1.48 -1.44 -1.19 -1.24 -1.33 -1.25 -1.35 37
38 -1.16 -1.38 -1.35 -1.10 -1.16 -1.25 -1.16 -1.28 38
39 -1.07 -1.29 -1.25 -1.02 -1.08 -1.16 -1.08 -1.20 39
40 -0.98 -1.19 -1.16 -0.94 -1.00 -1.08 -1.00 -1.12 40
41 -0.89 -1.09 -1.07 -0.85 -0.91 -1.00 -0.92 -1.05 41
42 -0.80 -0.99 -0.98 -0.77 -0.83 -0.92 -0.83 -0.97 42
43 -0.72 -0.90 -0.88 -0.69 -0.75 -0.83 -0.75 -0.89 43
44 -0.63 -0.80 -0.79 -0.60 -0.66 -0.75 -0.67 -0.82 44
45 -0.54 -0.70 -0.70 -0.52 -0.58 -0.67 -0.58 -0.74 45
46 -0.45 -0.61 -0.61 -0.44 -0.50 -0.58 -0.50 -0.66 46
47 -0.36 -0.51 -0.52 -0.35 -0.42 -0.50 -0.42 -0.59 47
48 -0.27 -0.41 -0.42 -0.27 -0.33 -0.42 -0.34 -0.51 48
49 -0.19 -0.32 -0.33 -0.19 -0.25 -0.34 -0.25 -0.43 49
50 -0.10 -0.22 -0.24 -0.10 -0.17 -0.25 -0.17 -0.36 50
51 -0.01 -0.12 -0.15 -0.02 -0.09 -0.17 -0.09 -0.28 51
52 0.08 -0.02 -0.05 0.07 0.00 -0.09 0.00 -0.20 52
53 0.17 0.07 0.04 0.15 0.08 0.00 0.08 -0.13 53
54 0.26 0.17 0.13 0.23 0.16 0.08 0.16 -0.05 54
55 0.34 0.27 0.22 0.32 0.24 0.16 0.24 0.03 55
56 0.43 0.36 0.32 0.40 0.33 0.24 0.33 0.10 56
57 0.52 0.46 0.41 0.48 0.41 0.33 0.41 0.18 57
58 0.61 0.56 0.50 0.57 0.49 0.41 0.49 0.26 58
59 0.70 0.65 0.59 0.65 0.58 0.49 0.57 0.33 59
60 0.79 0.75 0.69 0.73 0.66 0.57 0.66 0.41 60
61 0.87 0.85 0.78 0.82 0.74 0.66 0.74 0.49 61
62 0.96 0.95 0.87 0.90 0.82 0.74 0.82 0.56 62
63 1.05 1.04 0.96 0.98 0.91 0.82 0.91 0.64 63

THE MULTIDIMENSIONAL TEST ANXIETY SCALE 72 72
64 1.14 1.14 1.05 1.07 0.99 0.91 0.99 0.72 64
65 1.23 1.24 1.15 1.15 1.07 0.99 1.07 0.79 65
66 1.32 1.33 1.24 1.23 1.15 1.07 1.15 0.87 66
67 1.40 1.43 1.33 1.32 1.24 1.15 1.24 0.94 67
68 1.49 1.53 1.42 1.40 1.32 1.24 1.32 1.02 68
69 1.58 1.62 1.52 1.48 1.40 1.32 1.40 1.10 69
70 1.67 1.72 1.61 1.57 1.48 1.40 1.49 1.17 70
71 1.76 1.82 1.70 1.65 1.57 1.49 1.57 1.25 71
72 1.85 1.92 1.79 1.73 1.65 1.57 1.65 1.33 72
73 1.93 2.01 1.89 1.82 1.73 1.65 1.73 1.40 73
74 2.02 2.11 1.98 1.90 1.81 1.73 1.82 1.48 74
75 2.11 2.21 2.07 1.98 1.90 1.82 1.90 1.56 75
76 2.20 2.30 2.16 2.07 1.98 1.90 1.98 1.63 76
77 2.29 2.40 2.25 2.15 2.06 1.98 2.06 1.71 77
78 2.38 2.50 2.35 2.23 2.15 2.06 2.15 1.79 78
79 2.46 2.59 2.44 2.32 2.23 2.15 2.23 1.86 79
80 2.55 2.69 2.53 2.40 2.31 2.23 2.99 1.94 80
Note. As per Table S1 19 year olds and those who identified a gender other than male or female
were not included in standardised z scores.

THE MULTIDIMENSIONAL TEST ANXIETY SCALE 73 73
References
Alpert, R., & Haber, R. N. (1960). Anxiety in academic achievement situations. Journal of
Abnormal and Social Psychology, 61, 207-215.doi: 10.1037/h0045464
American Psychiatric Association. (2013). Diagnostic and statistical manual of mental
disorders: DSM-5 (5th ed.). Washington DC: American Psychiatric Association.
Atkinson, J.W. (1964). An introduction to motivation. Princeton, NJ: Van Nostrand.
Baird, J. (2018). On different paradigms of educational assessment: Implications for the
relationships with learning and teaching. Leicester: The British Psychological Society.
Benson, J., Moulin-Julian, M., Schwarzer, C., Seipp, B., & El-Zahhar, N. (1992). Cross
validation of a revised test anxiety scale using multi-national samples. In K. A. Hagvet &
T. B. Johnsen (Eds.) Advances in Test Anxiety Research Vol. 7 (pp. 62–83). Lisse, The
Netherlands: Swets & Zeitlinger.
Blascovich, J., & Mendes, W.B. (2010). Social psychophysiology and embodiment. In S.T.
Fiske & D.T. Gilbert (Eds.) Handbook of social psychology (5th ed., pp.194-227). New
York, Wiley.
Chapell, M. S., Blanding, Z. B., Silverstein, M. E., Takahashi, M., Newman, B., Gubi, A., et
al. (2005). Test anxiety and academic performance in undergraduate and graduate
students. Journal of Educational Psychology, 97, 268-274. doi:10.1037/0022-
0663.97.2.268
Cheng, C. (2001). Assessing coping flexibility in real-life and laboratory settings: a
multimethod approach. Journal of Personality and Social Psychology, 80, 814-833.doi:
10.1037/0022-3514.80.5.814
Cheung, G. W., & Rensvold, R. B. (2002). Evaluating goodness-of-fit indexes for testing
measurement invariance. Structural Equation Modeling, 9, 233–255.
doi:10.1207/S15328007SEM0902_5
THE MULTIDIMENSIONAL TEST ANXIETY SCALE 74 74
Corbett, M. (2015). From law to folklore: Work stress and the Yerkes-Dodson Law. Journal
of Managerial Psychology, 6,741-752. doi:10.1108/JMP-03-2013-0085
Derakshan, N. & Eysenck, M. W. (2011). New perspectives in attentional control theory.
Personality and Individual Differences, 50, 955-960.doi: 10.1016/j.paid.2010.08.019
Donolato, E., Marci, T., Altoè, G., & Mammarella, I.C. (2019). Measuring test anxiety in
primary and middle school children. European Journal of Psychological Assessment.
Advance online publication. doi:10.1027/1015-5759/a000556
Elliot, A.J., & Thrash, T.M. (2010). Approach and avoidance as basic dimensions of
personality. Journal of Personality, 78(3), 865-906.doi: 10.1111/j.1467-
6494.2010.00636.x
Edossa, A. K., Schroeders, U., Weinert, S., & Artelt, C. (2018). The development of
emotional and behavioral self-regulation and their effects on academic achievement in
childhood. International Journal of Behavioral Development, 42, 192–202.
doi:10.1177/0165025416687412 1
Eysenck, M. W., Derakshan, N., Santos, R., & Calvo, M. G. (2007). Anxiety and cognitive
performance: attentional control theory. Emotion, 7, 336-353.doi: 10.1037/1528-
3542.7.2.336
Gill, P. & Remedios, R. (2013). How should researchers in Education operationalise on-task
behaviours? Cambridge Journal of Education, 43, 199-222. doi:
10.1080/0305764X.2013.767878
Hascher, T. (2003). Well-being in school: Why students need social support. In P. Mayring &
C. von Rhöneck (Eds.), Learning emotions–The influence of affective factors on
classroom learning (pp. 127–142). Bern, Switzerland: Lang.

THE MULTIDIMENSIONAL TEST ANXIETY SCALE 75 75
Hagtvet, K. A., & Benson, J. (1997). The motive to avoid failure and test anxiety responses:
Empirical support for integration of two research traditions. Anxiety, Stress and Coping,
10, 35–57. doi:10.1080/10615809708249294
Hembree, R. (1988). Correlates, causes, effects and treatment of test anxiety. Review of
Educational Research, 58,47–77. doi: 10.3102/00346543058001047
Herzer, F., Wendt, J. & Hamm, A.O. (2014). Discriminating clinical from nonclinical
manifestations of test anxiety: A validation study. Behavior Therapy, 45, 222-231.doi:
10.1016/j.beth.2013.11.001
Hodapp, V. (1996). The TAI-G: A multidimensional approach to the assessment of test
anxiety. In C. Schwarzer & M. Zeidner (Eds.), Stress, anxiety and coping in academic
settings (pp. 95-130). Francke Verlag: Tübingen/ Basil.
Kampman, O., Viikki, M., & Leinonen, E. (2017). Anxiety disorders and temperament—an
update review. Current Psychiatry Reports, 19, 7. DOI: 10.1007/s11920-017-0779-5
Liew, J., Lench, H. C., Kao, G., Yeh, Y., & Kwok, O. (2014). Avoidance temperament and
social-evaluative threat in college students' math performance: A mediation model of
math and test anxiety. Anxiety, Stress & Coping: An International Journal, 27(6), 650-
661. doi:http://dx.doi.org/10.1080/10615806.2014.910303
Lowe, P.A. (2014). The test anxiety measure for adolescents (TAMA): Examination of the
reliability and validity of the scores of a new multidimensional measure of test anxiety
for middle and high school students. Journal of Psychoeducational Assessment, 32,
404-416. doi: 10.1177/0734282913520595
Lowe, P.A., (2017). Exploring cross-cultural and gender differences in test anxiety among
U.S. and Canadian college students. Journal of Psychoeducational Assessment, 37,
112-118. doi: 10.1177/0734282917724904

THE MULTIDIMENSIONAL TEST ANXIETY SCALE 76 76
Lowe, P. A., & Ang, R.P. (2011). Cross-cultural Examination of Test Anxiety among US
and Singapore Students on the Test Anxiety Scale for Elementary Students.
Educational Psychology, 32,107–126. doi:10.1080/01443410.2011.625625.
Lowe, P. A., Lee, S. W., Witteborg, K. M., Prichard, K. W., Luhr, M. E., Cullinan, C. M., . .
.Janik, M. (2008). The Test Anxiety Inventory for Children and Adolescents (TAICA):
Examination of the properties of a new multidimensional measure of test anxiety
among elementary and secondary school students. Journal of Psychoeducational
Assessment, 26, 215-230. doi:10.1177/0734282907303760
Matthews, G., Hillyard, E. J., & Campbell, S. E. (1999). Metacognition and maladaptive
coping as components of test anxiety. Clinical Psychology and Psychotherapy, 6, 111–
125. doi: 10.1002/(SICI)1099-0879(199905)
Maul, A. (2013). Method effects and the meaning of measurement. Frontiers in Psychology,
4, 1–13.doi: 10.3389/fpsyg.2013.00169
Meredith, W. (1993). Measurement invariance, factor analysis and factorial invariance.
Psychometrika, 58, 525–543. doi:10.1007/BF02294825
Morris, L. W., Davis, M. A., & Hutchings, C. (1981). Cognitive and emotional components
of anxiety: Literature review and revised worry emotional scale. Journal of Educational
Psychology,73, 541–555.doi: 10.1037/0022-0663.73.4.541
Pekrun, R. (2006). The control-value theory of achievement emotions: Assumptions,
corollaries, and implications for educational research and practice. Educational
Psychology Review, 18, 315–341.doi: 10.1007/s10648-006-9029-9
Pekrun, R., Goetz, T., Frenzel, A. C., Barchfeld, P., & Perry, R. P. (2011).Measuring
emotions in students’ learning and performance: The Achievement Emotions
Questionnaire (AEQ).Contemporary Educational Psychology, 36, 36-
48.doi:10.1016/j.cedpsych.2010.10.002

THE MULTIDIMENSIONAL TEST ANXIETY SCALE 77 77
Pekrun, R., Goetz, T., Perry, R. P., Kramer, K., & Hochstadt, M. (2004). Beyond test anxiety:
Development and validation of the Test Emotions Questionnaire (TEQ). Anxiety, Stress
and Coping, 17, 287–316.doi: 10.1080/10615800412331303847
Putwain, D.W. (2009). Assessment and examination stress in Key Stage 4. British Educational
Research Journal, 35, 391-411. doi: 10.1080/01411920802044404
Putwain, D. W. (2018). An examination of the self-referent executive processing model of
test anxiety: control, emotional regulation, self-handicapping, and examination
performance. European Journal of Psychology of Education, 34, 341-358.
doi:10.1007/s10212-018-0383-z
Putwain, D.W., Langdale, H.C., Woods, K.A., Nicholson, L.J. (2011) Developing and
piloting a dot-probe measure of attentional bias for test anxiety. Learning
and Individual Differences, 21, 478-482.doi: 10.1016/j.lindif.2011.02.00
Putwain, D.W., & Symes, W. (2011) Teachers’ use of fear appeals in the Mathematics
classroom: worrying or motivating students? British Journal of Educational
Psychology, 81, 456-474.doi:10.1348/2044-8279.002005
Putwain, D. W., Woods, K. A., & Symes, W. (2010). Personal and situational predictors of
test anxiety of students in post‐compulsory education. British Journal of Educational
Psychology, 80, 137-160.doi: 10.1348/000709909X466082
Richardson, M., Abraham, C., & Bond, R. (2012). Psychological correlates of university
students' academic performance: A systematic review and meta-analysis. Psychological
Bulletin, 138, 353-387.doi: 10.1037/a0026838
Rodway, C., Tham, S. G., Ibrahim, S., Turnbull, P., Windfuhr, K., Shaw, J., ... & Appleby, L.
(2016). Suicide in children and young people in England: a consecutive case series. The
Lancet Psychiatry, 3, 699-700.doi: 10.1016/S2215-0366(16)30094-3

THE MULTIDIMENSIONAL TEST ANXIETY SCALE 78 78
Sarason, I. G. (1984). Stress, anxiety and cognitive interference: Reactions to tests. Journal of
Personality and Social Psychology, 46(4), 929–938. doi: 10.1037/0022-3514.46.4.929
Sarason, I. G. (1988). Anxiety, self-preoccupation and attention. Anxiety, Stress and Coping,
1, 3–8. doi: 10.1080/10615808808248215
Segool, N. K., von der Embse, N. P., Mata, A. D., & Gallant, J. (2014). Cognitive
behavioural model of test anxiety in a high-stakes context: An exploratory study. School
Mental Health, 6, 50-61.doi: 10.1007/s12310-013-9111-7
Seipp, B. (1991). Anxiety and academic performance: A meta-analysis of recent findings.
Anxiety Research, 4, 27–41.doi: 10.1080/08917779108248762
Seipp, B., & Schwarzer, C. (1996). Cross-cultural anxiety research: A review. In C.
Schwarzer & M. Zeidner (Eds.),Stress, Anxiety and coping in academic settings (pp.
13–68). Tübingen: Francke Verlag.
Spielberger, C. D. (1980). The test anxiety inventory. Psychology, 4(6A).
Spielberger, C. D., Gorsuch, R. C., Lushene, R. E., Vagg, P. R., & Jacobs, G. A. (1983).
Manual for the State-Trait Anxiety Inventory. Palo Alto: Consulting Psychologists
Press.
Spielberger, C. D., & Vagg. R.P. (1995). Test Anxiety: A Transactional Process Model. In by
C. D. Speilberger & P. R. Vagg (Eds.) Test Anxiety: Theory, Assessment and
Treatment, (pp. 3–14). Bristol, UK: Taylor & Francis.
Teigen, K.H. (1994). Yerkes-Dodson: A law for all seasons. Theory and Psychology, 4, 525-
547. doi:10.1177/0959354394044004
von der Embse, N.P., Jester, D., Roy, D., & Post, J. (2018). Test anxiety effects, predictors,
and correlates: A 30-year meta-analytic review. Journal of Affective Disorders, 227,
483-493.doi: 10.1016/j.jad.2017.11.048

THE MULTIDIMENSIONAL TEST ANXIETY SCALE 79 79
von der Embse, N.P., Pendergast, L., Kilgus, S. P., & Eklund, K. (2016). Evaluating the
applied use of a mental health screener: Structural validity of the Social, Academic, and
Emotional Behavior Risk Screener (SAEBRS). Psychological Assessment, 28 (10),
1265-1275. doi: 10.1037/pas0000253
Widaman, K.F., Ferrer, E., & Conger, R.D. (2010). Factorial Invariance within Longitudinal
Structural Equation Models: Measuring the Same Construct across Time. Child
Development Perspectives, 4, 10-18.doi: 10.1111/j.1750-8606.2009.00110.x
Wren, D. & Benson, J. (2004). Measuring test anxiety in children: Scale development and
internal construct validation. Anxiety Stress & Coping, 17(3), 227-240. doi:
10.1080/10615800412331292606
Yerkes, R. M., & Dodson, J. D. (1908). The relation of strength of stimulus to rapidity of
habit-formation. Journal of Comparative and Neurological Psychology, 18, 459-
482.doi: 10.1002/cne.920180503
Zeidner, M. (2007). Test anxiety in educational contexts: Concepts, findings and future
directions. In P. A. Schutz & R. Pekrun (Eds.), Emotion in Education (pp. 165-184).
Burlington, MA: Elsevier.
Zeidner, M. (2014). Anxiety in education. In R. Pekrun and L. Linnenbrink-Garcia (Eds.).
International handbook of emotions in education (pp. 265-288). New York, NY:
Routledge.
Zeidner, M., & Matthews, G. (2005). Evaluation anxiety. In A. J. Elliot & C. S. Dweck
(Eds.), Handbook of competence and motivation (pp. 141–163). London: Guilford
Press.


