Embed Size (px)
Citation preview
PDG : A Process-Level Debugger for Concurrent Programs inthe GRAPE Parallel Programming Environment.
Chris Caerts, Rudy Lauwereins and J.A. Peperstraete
Katholieke Universiteit Leuven, E.S.A.T. Laboratory
Kard. Mercierlaan 94
B-3001 Heverlee, Belgium
email : [email protected]
Tel: +32-16-22.09.31 Fax: +32-16-22.18.55
Abstract
In this paper, we describe the process-level debugger of GRAPE, our hierarchical graphicalprogramming environment for concurrent programs. Its unique feature is that it clearly separatesthe identification of erroneous processes, which we call process-level debugging, from the exactlocalisation of the bug at the source-level. This divide-and-conquer approach is absolutelynecessary for debugging complex parallel programs in a fast and systematic way. Our process-level debugging approach is based on an animation of the program's behaviour on its hierarchicalgraphical representations. Graphical views are used that reflect the programmer's mental pictureof the actual application. Hierarchy allows us to employ a top-down debugging approach in whichwe successively refine the search-space by zooming in on suspect processes first-time-right.During animation a debugging kernel implementing a record-replay mechanism guaranteesreproducible program behaviour.
1. Introduction
Debugging concurrent programs is considerably more complex than traditional sequentialdebugging. A first reason for this is that there are multiple threads of control (processes) that areexecuting concurrently. Because of this, we not only must identify the statement (or instructions)that causes erroneous behaviour, but also, and firstly, the process that contains this erroneousstatement. This is what we call process-level debugging. The fact that processes interact(asynchronously) with each other further complicates the debugging task. Indeed, it not only givesrise to a new class of bugs (such as races and deadlocks), but also causes faults to spread rapidly,which results in the so-called domino effect. Therefore, if we observe that a process does notbehave the way it should, it is possible that this misbehaviour is caused by the fact that the processreceived incorrect data, not because it contains a bug.
Another major problem one encounters while debugging concurrent programs is thatasynchronous interactions, whether they are intended or not, make it difficult to guaranteereproducible program behaviour. This hinder the recreation of error conditions during debugging,since any interference may significantly change non-deterministic program behaviour [1][2][3].
In this paper, we present a debugging tool that tackles all the above-mentioned problems. Byanimating the interactions between processes, it provides a means to identify erroneous processesin a fast and systematic way. The ability to identify anomalous behaviour is considerably enhanced
by the use of hierarchical application-specific graphical program representations, and by theprovision of a data-visualisation mechanism that allows to easily visualise data that are exchangedbetween processes in a (user specified) appropriate way.
In section two, we give an overview of parallel debugging techniques, and demonstrate thatcomplex parallel programs can only be debugged with a process-level debugger. Next we brieflydescribe the GRAPE programming environment, which provides us with the hierarchical graphicalprogram representations needed for our process-level debugging approach which is described insection four. In section five we will illustrate our approach with a sample debugging session afterwhich we conclude with a description of our run-time distributed debugging kernel thatimplements a record-replay mechanism.
2. Overview of parallel debugging techniques
In this section, we give a short overview of parallel debugging techniques. In section 2.1 westart with source-level debuggers, and demonstrate that they can be used efficiently only if asmall number of suspect processes has already been identified. For this identification taskhowever, it is advisable to make abstraction of the exact inner workings of processes, and tofocus on higher level information : the interactions between processes. This is done with whatwe call process-level (or interaction-level) debuggers. In section 2.2, we will give an overviewof this class of debuggers, and indicate where PDG differs from other similar tools.
2.1. Source-level debuggers
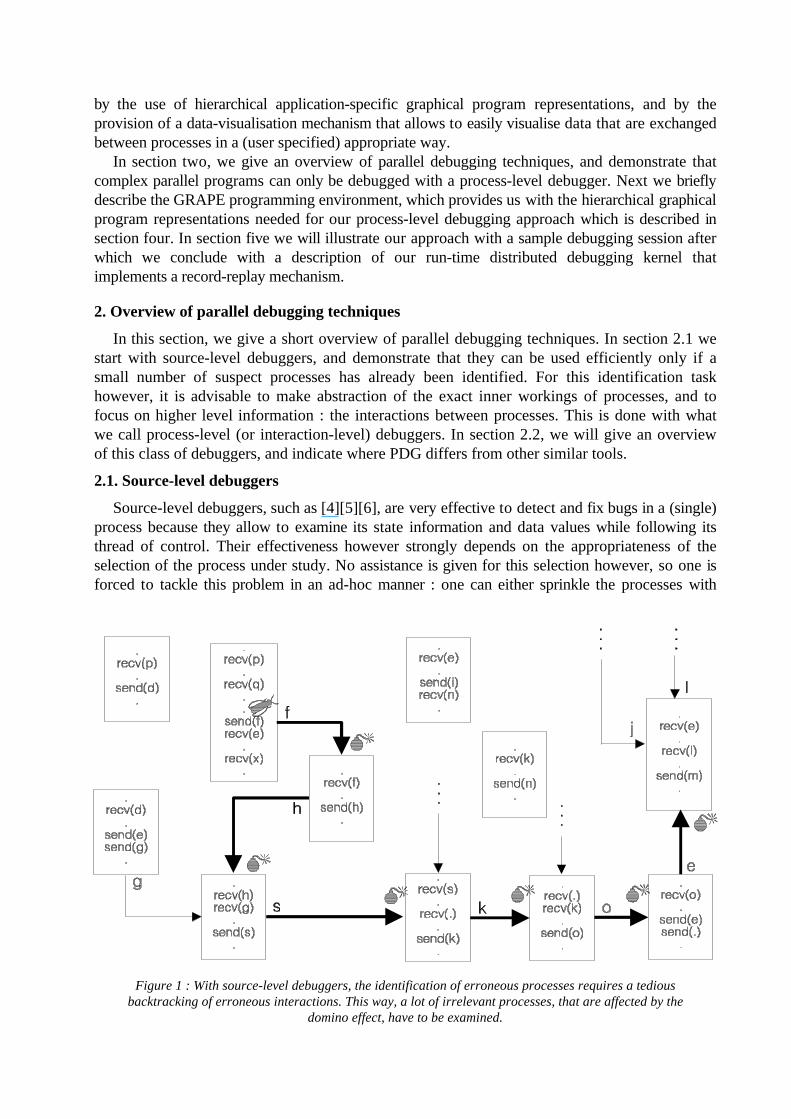
Source-level debuggers, such as [4][5][6], are very effective to detect and fix bugs in a (single)process because they allow to examine its state information and data values while following itsthread of control. Their effectiveness however strongly depends on the appropriateness of theselection of the process under study. No assistance is given for this selection however, so one isforced to tackle this problem in an ad-hoc manner : one can either sprinkle the processes with
Figure 1 : With source-level debuggers, the identification of erroneous processes requires a tediousbacktracking of erroneous interactions. This way, a lot of irrelevant processes, that are affected by the
domino effect, have to be examined.
debug statements, or rely on one's intuition to select suspect processes. This way, it is likely thatafter closer examination, suspect processes turn out to be affected by the domino effect. Thismeans that they do not contain a bug, but misbehave because they received incorrect data fromother processes. In this case, one can start all over again, selecting another suspect process, forwhich no hints are given by the debugger, or one can try to backtrack to the process that actuallycontains the bug by traversing anomalous interactions (e.g. interactions that transfer wrong dataor are blocked) in reverse order. This means one has to change one's focus of attention fromprocess to process until one eventually reaches the process that actually contains the bug. It isclear that this way, potentially a lot of irrelevant (e.g. affected by the domino effect) processes andinteractions have to be examined (see figure 1). In every process one encounters, one mustexamine both its calculations, to check if it contains the bug, and its interactions, to determine towhich process the focus of attention should be changed next. This tedious task can be alleviatedby representing syntactical entities graphically [7][8]. This conveniently introduces hierarchy atthe source-level. This hierarchy however, just like library calls and subroutines, is situated inside asingle process.
2.2 Process-level debuggers
Process-level debuggers make abstraction of the inner workings of processes, which aretreated as black boxes that interact with each other. This black box representation focusesattention on the interactions between processes. It is very easy then to introduce the time aspectby animating the interactions between processes. This way one can identify the first process thatgenerates erroneous data or the first processes that fail to communicate with each other. Thisclearly solves the domino effect problem. Besides, processes that functionally belong together canbe combined into virtual processes. Unlike at the source-level, the hierarchy that is introduced thisway allows to gradually reduce the search-space, so one no longer is confronted with allprocesses and all interactions at once. On each hierarchical level, only a limited number ofinteractions between a limited number of processes must be examined. This way, it is possible tozoom in on the erroneous (virtual) process in a fast and systematic way.
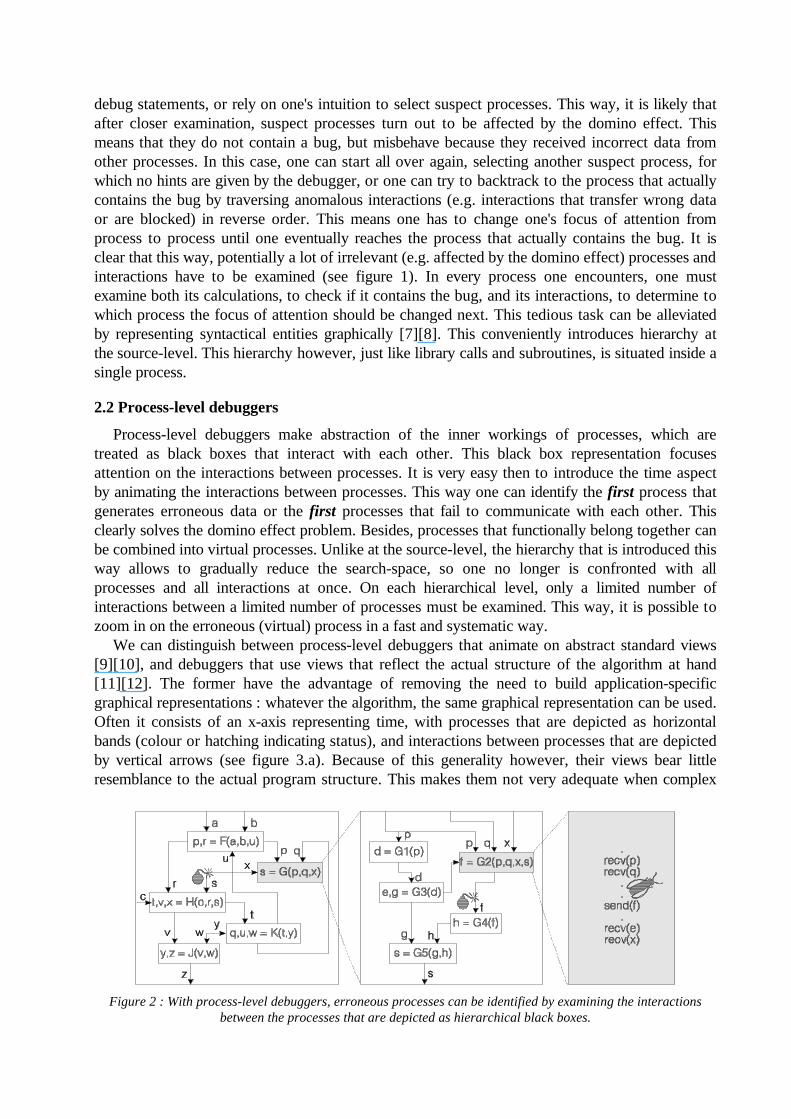
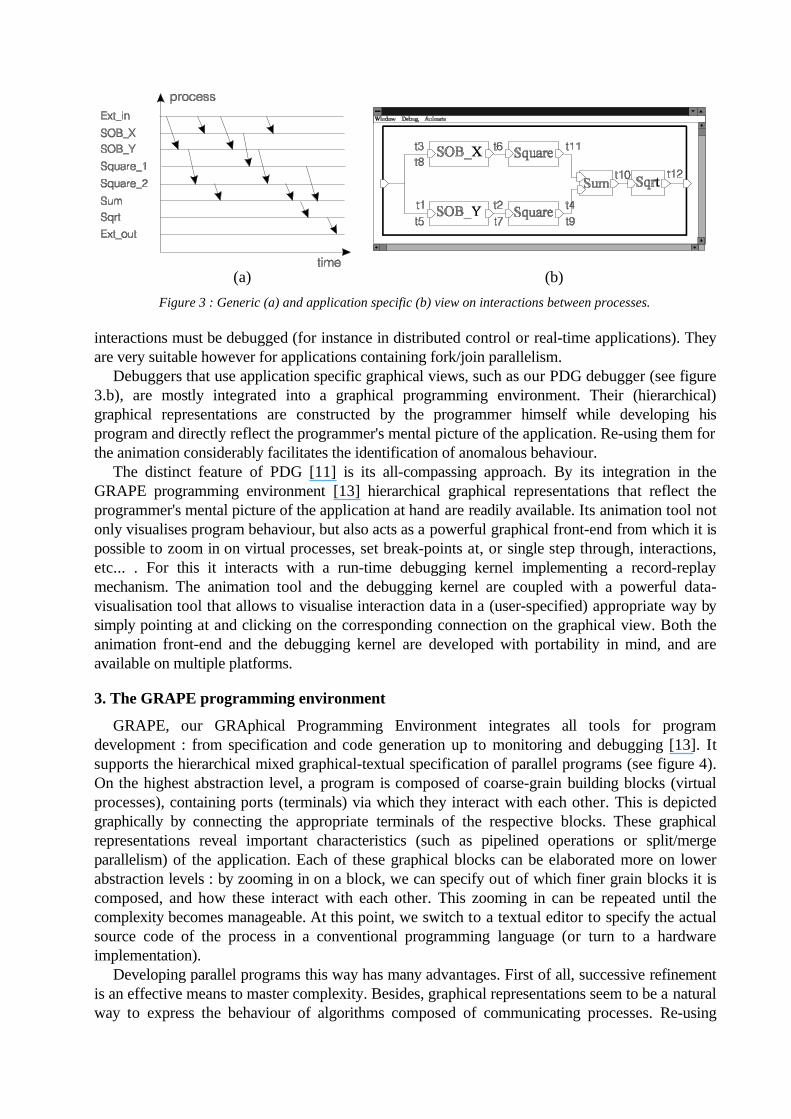
We can distinguish between process-level debuggers that animate on abstract standard views[9][10], and debuggers that use views that reflect the actual structure of the algorithm at hand[11][12]. The former have the advantage of removing the need to build application-specificgraphical representations : whatever the algorithm, the same graphical representation can be used.Often it consists of an x-axis representing time, with processes that are depicted as horizontalbands (colour or hatching indicating status), and interactions between processes that are depictedby vertical arrows (see figure 3.a). Because of this generality however, their views bear littleresemblance to the actual program structure. This makes them not very adequate when complex
Figure 2 : With process-level debuggers, erroneous processes can be identified by examining the interactionsbetween the processes that are depicted as hierarchical black boxes.
(a) (b)
Figure 3 : Generic (a) and application specific (b) view on interactions between processes.
interactions must be debugged (for instance in distributed control or real-time applications). Theyare very suitable however for applications containing fork/join parallelism.
Debuggers that use application specific graphical views, such as our PDG debugger (see figure3.b), are mostly integrated into a graphical programming environment. Their (hierarchical)graphical representations are constructed by the programmer himself while developing hisprogram and directly reflect the programmer's mental picture of the application. Re-using them forthe animation considerably facilitates the identification of anomalous behaviour.
The distinct feature of PDG [11] is its all-compassing approach. By its integration in theGRAPE programming environment [13] hierarchical graphical representations that reflect theprogrammer's mental picture of the application at hand are readily available. Its animation tool notonly visualises program behaviour, but also acts as a powerful graphical front-end from which it ispossible to zoom in on virtual processes, set break-points at, or single step through, interactions,etc... . For this it interacts with a run-time debugging kernel implementing a record-replaymechanism. The animation tool and the debugging kernel are coupled with a powerful data-visualisation tool that allows to visualise interaction data in a (user-specified) appropriate way bysimply pointing at and clicking on the corresponding connection on the graphical view. Both theanimation front-end and the debugging kernel are developed with portability in mind, and areavailable on multiple platforms.
3. The GRAPE programming environment
GRAPE, our GRAphical Programming Environment integrates all tools for programdevelopment : from specification and code generation up to monitoring and debugging [13]. Itsupports the hierarchical mixed graphical-textual specification of parallel programs (see figure 4).On the highest abstraction level, a program is composed of coarse-grain building blocks (virtualprocesses), containing ports (terminals) via which they interact with each other. This is depictedgraphically by connecting the appropriate terminals of the respective blocks. These graphicalrepresentations reveal important characteristics (such as pipelined operations or split/mergeparallelism) of the application. Each of these graphical blocks can be elaborated more on lowerabstraction levels : by zooming in on a block, we can specify out of which finer grain blocks it iscomposed, and how these interact with each other. This zooming in can be repeated until thecomplexity becomes manageable. At this point, we switch to a textual editor to specify the actualsource code of the process in a conventional programming language (or turn to a hardwareimplementation).
Developing parallel programs this way has many advantages. First of all, successive refinementis an effective means to master complexity. Besides, graphical representations seem to be a naturalway to express the behaviour of algorithms composed of communicating processes. Re-using
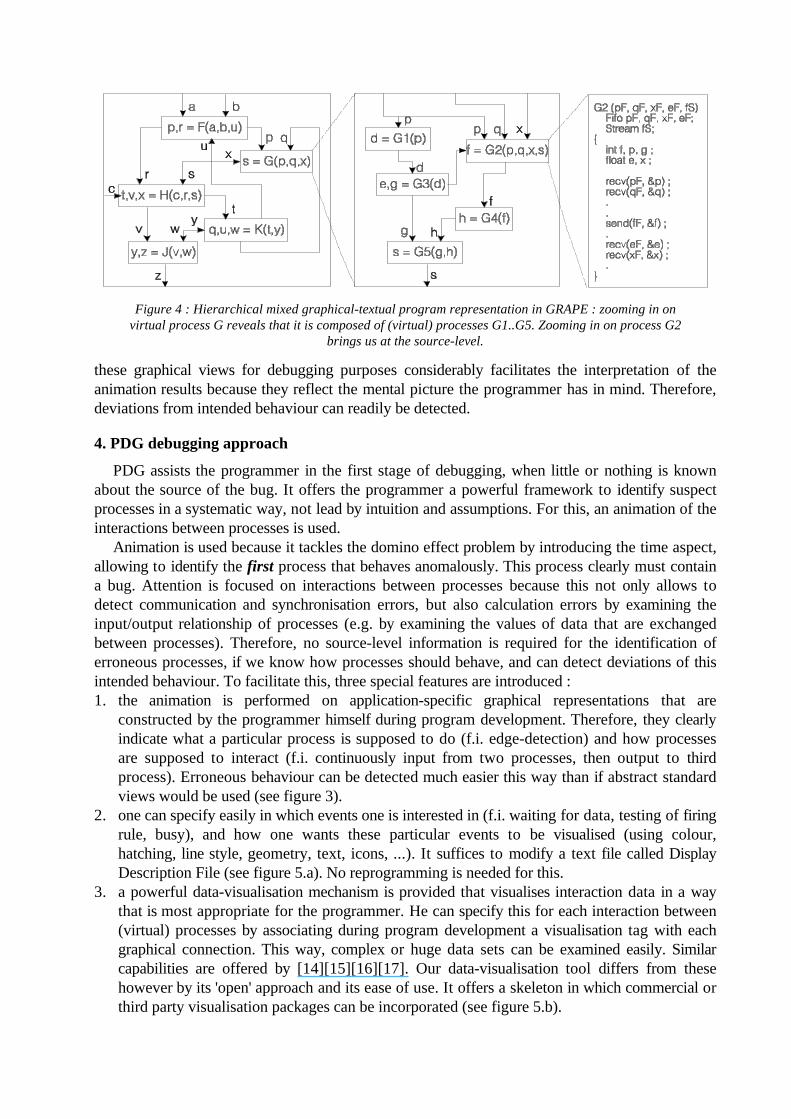
Figure 4 : Hierarchical mixed graphical-textual program representation in GRAPE : zooming in onvirtual process G reveals that it is composed of (virtual) processes G1..G5. Zooming in on process G2
brings us at the source-level.
these graphical views for debugging purposes considerably facilitates the interpretation of theanimation results because they reflect the mental picture the programmer has in mind. Therefore,deviations from intended behaviour can readily be detected.
4. PDG debugging approach
PDG assists the programmer in the first stage of debugging, when little or nothing is knownabout the source of the bug. It offers the programmer a powerful framework to identify suspectprocesses in a systematic way, not lead by intuition and assumptions. For this, an animation of theinteractions between processes is used.
Animation is used because it tackles the domino effect problem by introducing the time aspect,allowing to identify the first process that behaves anomalously. This process clearly must containa bug. Attention is focused on interactions between processes because this not only allows todetect communication and synchronisation errors, but also calculation errors by examining theinput/output relationship of processes (e.g. by examining the values of data that are exchangedbetween processes). Therefore, no source-level information is required for the identification oferroneous processes, if we know how processes should behave, and can detect deviations of thisintended behaviour. To facilitate this, three special features are introduced :1. the animation is performed on application-specific graphical representations that are
constructed by the programmer himself during program development. Therefore, they clearlyindicate what a particular process is supposed to do (f.i. edge-detection) and how processesare supposed to interact (f.i. continuously input from two processes, then output to thirdprocess). Erroneous behaviour can be detected much easier this way than if abstract standardviews would be used (see figure 3).
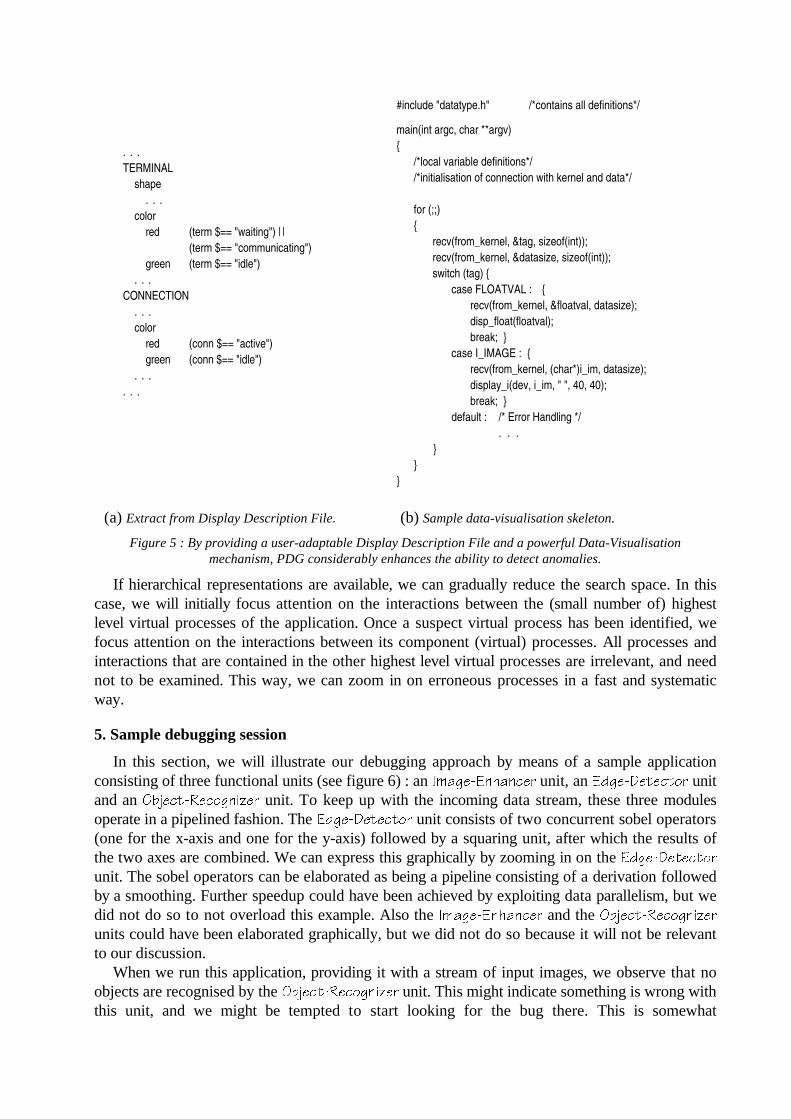
2. one can specify easily in which events one is interested in (f.i. waiting for data, testing of firingrule, busy), and how one wants these particular events to be visualised (using colour,hatching, line style, geometry, text, icons, ...). It suffices to modify a text file called DisplayDescription File (see figure 5.a). No reprogramming is needed for this.
3. a powerful data-visualisation mechanism is provided that visualises interaction data in a waythat is most appropriate for the programmer. He can specify this for each interaction between(virtual) processes by associating during program development a visualisation tag with eachgraphical connection. This way, complex or huge data sets can be examined easily. Similarcapabilities are offered by [14][15][16][17]. Our data-visualisation tool differs from thesehowever by its 'open' approach and its ease of use. It offers a skeleton in which commercial orthird party visualisation packages can be incorporated (see figure 5.b).
. . .
TERMINAL
shape
. . .
color
red (term $== "waiting") | |
(term $== "communicating")
green (term $== "idle")
. . .
CONNECTION
. . .
color
red (conn $== "active")
green (conn $== "idle")
. . .
. . .
#include "datatype.h" /*contains all definitions*/
main(int argc, char **argv)
{
/*local variable definitions*/
/*initialisation of connection with kernel and data*/
for (;;)
{
recv(from_kernel, &tag, sizeof(int));
recv(from_kernel, &datasize, sizeof(int));
switch (tag) {
case FLOATVAL : {
recv(from_kernel, &floatval, datasize);
disp_float(floatval);
break; }
case I_IMAGE : {
recv(from_kernel, (char*)i_im, datasize);
display_i(dev, i_im, " ", 40, 40);
break; }
default : /* Error Handling */
. . .
}
}
}
(a) Extract from Display Description File. (b) Sample data-visualisation skeleton.
Figure 5 : By providing a user-adaptable Display Description File and a powerful Data-Visualisationmechanism, PDG considerably enhances the ability to detect anomalies.
If hierarchical representations are available, we can gradually reduce the search space. In thiscase, we will initially focus attention on the interactions between the (small number of) highestlevel virtual processes of the application. Once a suspect virtual process has been identified, wefocus attention on the interactions between its component (virtual) processes. All processes andinteractions that are contained in the other highest level virtual processes are irrelevant, and neednot to be examined. This way, we can zoom in on erroneous processes in a fast and systematicway.
5. Sample debugging session
In this section, we will illustrate our debugging approach by means of a sample applicationconsisting of three functional units (see figure 6) : an Image-Enhancer unit, an Edge-Detector unitand an Object-Recognizer unit. To keep up with the incoming data stream, these three modulesoperate in a pipelined fashion. The Edge-Detector unit consists of two concurrent sobel operators(one for the x-axis and one for the y-axis) followed by a squaring unit, after which the results ofthe two axes are combined. We can express this graphically by zooming in on the Edge-Detectorunit. The sobel operators can be elaborated as being a pipeline consisting of a derivation followedby a smoothing. Further speedup could have been achieved by exploiting data parallelism, but wedid not do so to not overload this example. Also the Image-Enhancer and the Object-Recognizerunits could have been elaborated graphically, but we did not do so because it will not be relevantto our discussion.
When we run this application, providing it with a stream of input images, we observe that noobjects are recognised by the Object-Recognizer unit. This might indicate something is wrong withthis unit, and we might be tempted to start looking for the bug there. This is somewhat
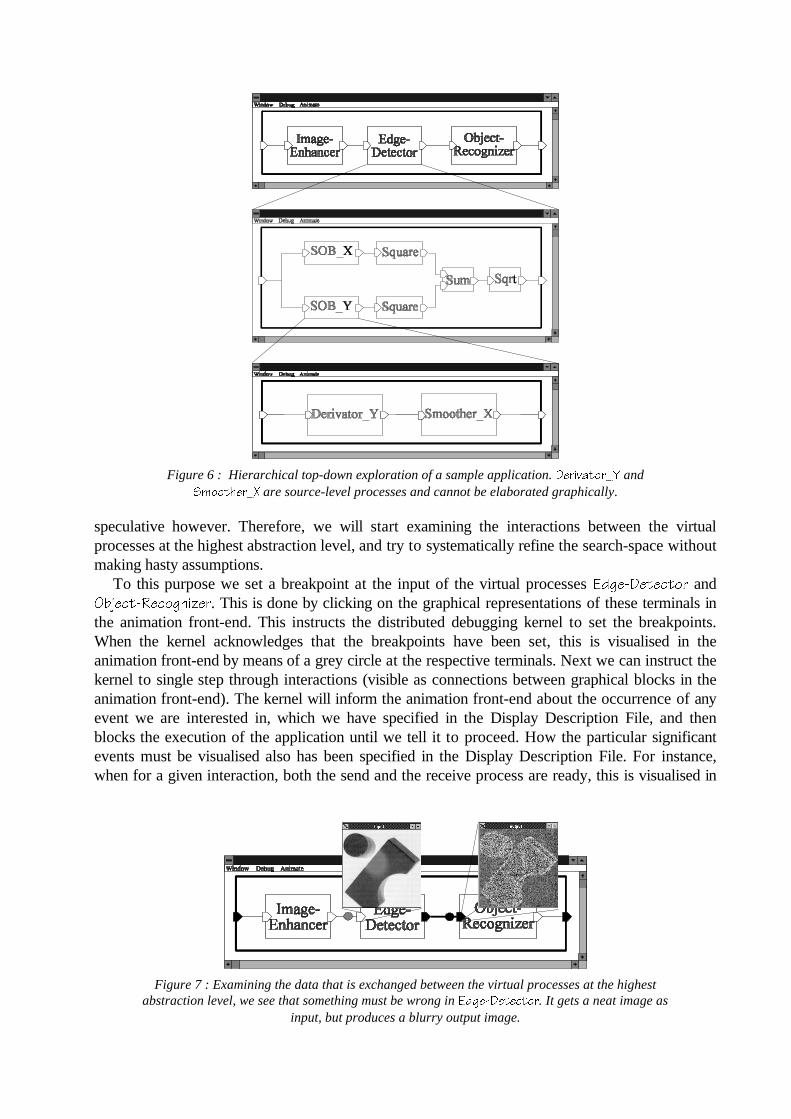
Figure 6 : Hierarchical top-down exploration of a sample application. Derivator_Y andSmoother_X are source-level processes and cannot be elaborated graphically.
speculative however. Therefore, we will start examining the interactions between the virtualprocesses at the highest abstraction level, and try to systematically refine the search-space withoutmaking hasty assumptions.
To this purpose we set a breakpoint at the input of the virtual processes Edge-Detector andObject-Recognizer. This is done by clicking on the graphical representations of these terminals inthe animation front-end. This instructs the distributed debugging kernel to set the breakpoints.When the kernel acknowledges that the breakpoints have been set, this is visualised in theanimation front-end by means of a grey circle at the respective terminals. Next we can instruct thekernel to single step through interactions (visible as connections between graphical blocks in theanimation front-end). The kernel will inform the animation front-end about the occurrence of anyevent we are interested in, which we have specified in the Display Description File, and thenblocks the execution of the application until we tell it to proceed. How the particular significantevents must be visualised also has been specified in the Display Description File. For instance,when for a given interaction, both the send and the receive process are ready, this is visualised in
Figure 7 : Examining the data that is exchanged between the virtual processes at the highestabstraction level, we see that something must be wrong in Edge-Detector. It gets a neat image as
input, but produces a blurry output image.
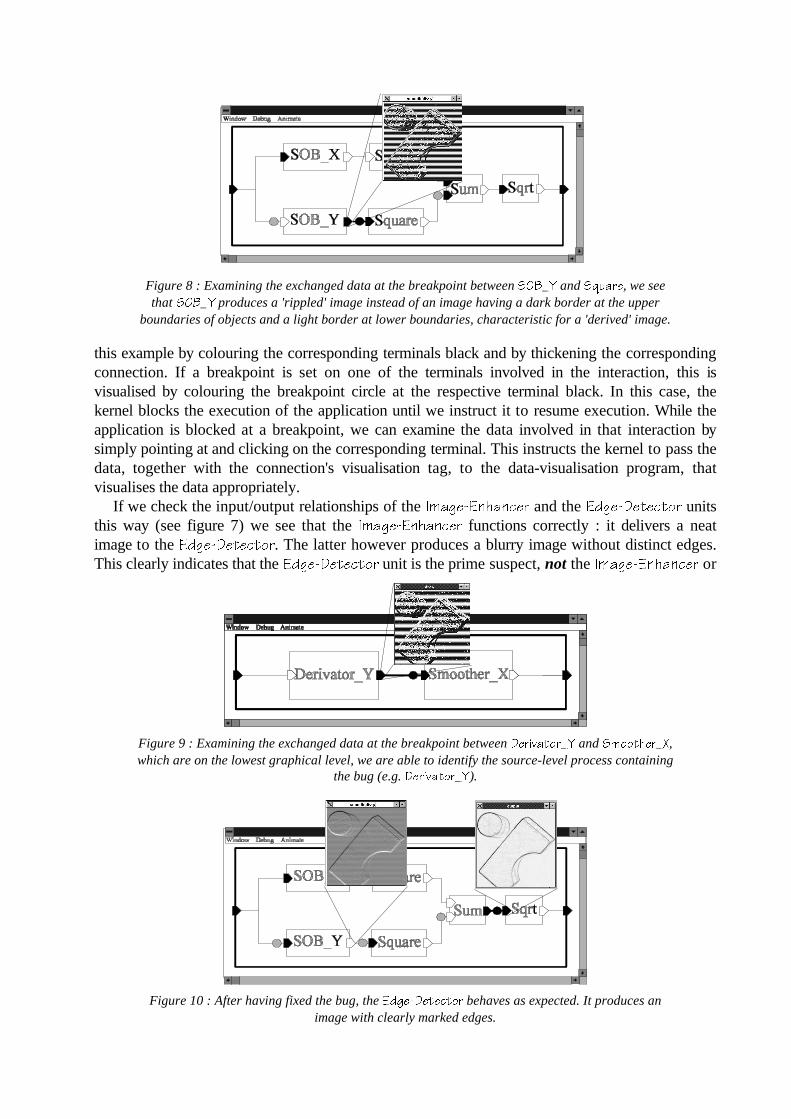
Figure 8 : Examining the exchanged data at the breakpoint between SOB_Y and Square, we seethat SOB_Y produces a 'rippled' image instead of an image having a dark border at the upper
boundaries of objects and a light border at lower boundaries, characteristic for a 'derived' image.
this example by colouring the corresponding terminals black and by thickening the correspondingconnection. If a breakpoint is set on one of the terminals involved in the interaction, this isvisualised by colouring the breakpoint circle at the respective terminal black. In this case, thekernel blocks the execution of the application until we instruct it to resume execution. While theapplication is blocked at a breakpoint, we can examine the data involved in that interaction bysimply pointing at and clicking on the corresponding terminal. This instructs the kernel to pass thedata, together with the connection's visualisation tag, to the data-visualisation program, thatvisualises the data appropriately.
If we check the input/output relationships of the Image-Enhancer and the Edge-Detector unitsthis way (see figure 7) we see that the Image-Enhancer functions correctly : it delivers a neatimage to the Edge-Detector. The latter however produces a blurry image without distinct edges.This clearly indicates that the Edge-Detector unit is the prime suspect, not the Image-Enhancer or
Figure 9 : Examining the exchanged data at the breakpoint between Derivator_Y and Smoother_X,which are on the lowest graphical level, we are able to identify the source-level process containing
the bug (e.g. Derivator_Y).
Figure 10 : After having fixed the bug, the Edge-Detector behaves as expected. It produces animage with clearly marked edges.
the Object-Recognizer units. Therefore, we decide to zoom in on the Edge-Detector unit.Examination of the partly processed images at the interactions between its component
processes reveals that there must be a problem in process SOB_Y (see figure 8). Zooming in onprocess SOB_Y, we see that the result produced by Derivator_Y is incorrect (see figure 9). SinceDerivator_Y is a source-level process, we cannot elaborate it graphically. Instead, we use asource-level debugger to examine it carefully. This eventually reveals the bug : all calculationswere performed on byte values instead on integer-values, causing overflow.
After having corrected this error, we can easily verify that now the Edge-Detector generatesimages with clear edges (see figure 10). Further observations show that now also the Object-Recognizer recognises the objects we present to it.
Although the interactions between processes are quite simple, this example illustrates thepower of our approach. One is guided to the erroneous process in a systematic way by zooming inon suspect processes. On each abstraction level, only a small number of interactions must beexamined.
6. Debugging Kernel
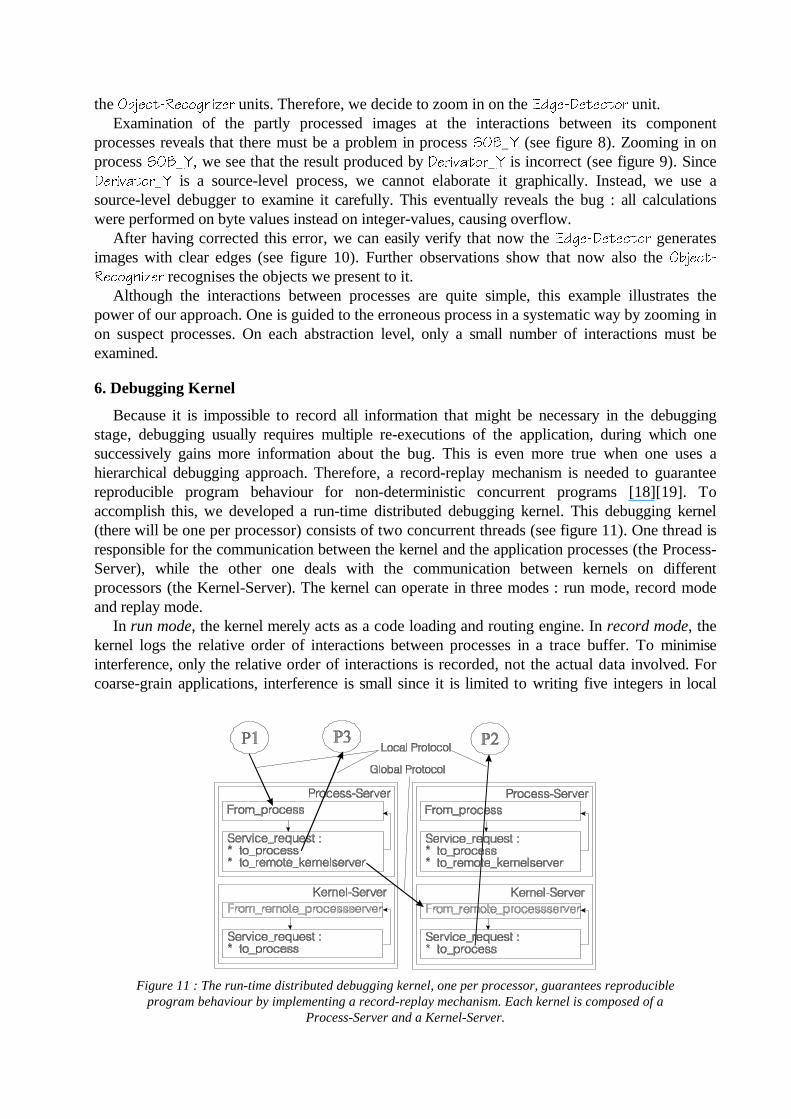
Because it is impossible to record all information that might be necessary in the debuggingstage, debugging usually requires multiple re-executions of the application, during which onesuccessively gains more information about the bug. This is even more true when one uses ahierarchical debugging approach. Therefore, a record-replay mechanism is needed to guaranteereproducible program behaviour for non-deterministic concurrent programs [18][19]. Toaccomplish this, we developed a run-time distributed debugging kernel. This debugging kernel(there will be one per processor) consists of two concurrent threads (see figure 11). One thread isresponsible for the communication between the kernel and the application processes (the Process-Server), while the other one deals with the communication between kernels on differentprocessors (the Kernel-Server). The kernel can operate in three modes : run mode, record modeand replay mode.
In run mode, the kernel merely acts as a code loading and routing engine. In record mode, thekernel logs the relative order of interactions between processes in a trace buffer. To minimiseinterference, only the relative order of interactions is recorded, not the actual data involved. Forcoarse-grain applications, interference is small since it is limited to writing five integers in local
Figure 11 : The run-time distributed debugging kernel, one per processor, guarantees reproducibleprogram behaviour by implementing a record-replay mechanism. Each kernel is composed of a
Process-Server and a Kernel-Server.
memory (identification of source and destination process, send and receive terminal, plus anoptional time stamp). Only if the trace buffer becomes full, and must be flushed in a trace file, theinterference is significant. Currently, we are developing an optimal trace mechanism thatminimises the size of the generated trace by detecting asynchronous behaviour at run-time. Besidethe order of interactions, also system events (such as the starting and finishing of processes or theoverflow of system buffers) can be recorded, as well as user-defined events (such as accessing afile or entering a critical routine). If non-optimal tracing has been done, the generated trace filecan be parsed and visualised by the animation front-end, so that the interactions betweenprocesses can be examined without re-executing the application.
In replay mode, the trace file is used by the kernel to impose an equivalent order on theinteractions between processes. This guarantees reproducible program behaviour, even if theprogram contains asynchronous interactions. During these re-executions, the run-time kernelsignals the occurrence of selected events to the animation front-end so that they can be visualisedon the graphical program representation. Besides it is possible to instruct the kernel via theanimation front-end to single step through interactions, or to set breakpoints at interactions. Whena breakpoint is reached, which is visualised on the graphical representations, one can examine thedata involved in the interaction by simply pointing at and clicking on the correspondingconnection. This instructs the kernel to send the data, together with its visualisation tag, to thedata-visualisation tool.
Our kernel generates one local trace file for each processor. By merging all local trace files,while preserving the "Happened Before" relationships as defined in [20], we obtain a global tracefile. This global trace file contains a partially ordered list of events. The list is not strictly orderedsince in general, events can be permuted, and still represent an equivalent execution, as long as theexisting "Happened Before" relationships are respected. In the same way, it is possible to split thisglobal trace file again in partial trace files according to another assignment : these partial tracefiles still represent an equivalent execution. This means that it is possible to execute the programin record mode on an expensive massive parallel machine, and debug it by executing it in replaymode on a smaller, cheaper machine. This allows to debug huge programs in a cost-effective way.To this purpose, we took special care in making our kernel as portable as possible. Currently it isrunning on a MEIKO transputer machine and on SUN workstations.
7. Conclusion
In this paper, we described a process-level debugging tool that allows to determine in a fast andsystematic way which process (or interaction between processes) is responsible for erroneousbehaviour of concurrent programs. Our approach is based on an animation of program behaviouron its hierarchical graphical representations. The graphical views that are used reflect algorithmicaspects of the application at hand, thereby facilitating the detection of anomalies. This ability iseven further enhanced by providing a powerful data visualisation mechanism that allows tovisualise data that are exchanged between processes easily. Hierarchy allows to gradually reducethe search space and keeps complexity manageable at all times. A run-time debugging kernelguarantees reproducible program behaviour by implementing a record-replay mechanism. Re-executions can be controlled conveniently from a graphical user interface.
Acknowledgements
This work is partly sponsored by the Belgian Interuniversity Pole of Attraction IUAP-50. RudyLauwereins is Senior Research Associate of the Belgian National Fund for Scientific Research.K.U.Leuven-ESAT is a member of the DSP Valley network.
References
[1] W.H.Cheung, J.P.Black, E.Manning, "A framework for Distributed Debugging", IEEE Software, Januari1990, pp.106-115.
[2] J.Gait, "A Probe Effect in Concurrent Programs", Software - Practice and Experience, Vol.16(3), March1986, pp.225-233.
[3] F.Baiardi, N.D.Francesco, G.Vaglini, "Development of a Debugger for a Concurrent Language", IEEETransactions on Software Engineering, VOL.12(4), April 1986, pp.547-553.
[4] E.Adams and S.S.Muchnick, "DBX Tool : a Window-Based Symbolic Debugger for Sun Workstations",Software Practice and Experience, July 1986, pp.653-669.
[5] J.Rooney, "ANABEL : an Environment for Creating Concurrent Programs", Proc. of the EWPC'92 EuropeanWorkshop on Parallel Computing, March 1992.
[6] Texas Instruments, "TMS320C4x C Source Debugger User's guide", April 1992.[7] F.Mourlin, E.Cournarie, "A Graphical Environment for OCCAM Programming", Applications of
Transputers 1, IOS 1990, pp.252-261.[8] S.Stepney, "Graphical Representation of Activity, Interconnection and Loading", Proc. 7th Occam User
Group and int. workshop on parallel programming of transputer-based machines, IOS, Amsterdam, TheNetherlands, 1987.
[9] R.H.Halstead, D.A.Kranz, P.G.Sobalvarro, "MulTVision : A Tool for Visualising Parallel ProgramExecutions", ACM/ONR Workshop on Parallel and Distributed Debugging, 1991, pp.237-239.
[10] C.C.Charlton, A.J.Eaton, D.Jackson, "A Visualisation System for the Interactive Debugging and Validationof Concurrent Programs", ACM/ONR Workshop on Parallel and Distributed Debugging, 1991, pp.219-221.
[11] C.Caerts, R.Lauwereins, J.A.Peperstraete, "A Powerful High-Level Debugger for Parallel Programs", Proc.of the First ACPC Conference, Salzburg, Austria, September/October 1991, Lecture Notes in ComputerScience, Springer-Verlag, Berlin, 1992, pp. 54-64.
[12] T.G.Lewis, R.Currey, J.Liu, "Data Parallel Program Design", Proc. of the First ACPC Conference, Salzburg,Austria, September/October 1991, Lecture Notes in Computer Science, Springer-Verlag, Berlin, 1992,pp.37-53.
[13] M.Engels, R.Lauwereins, J.A.Peperstraete, "Rapid Prototyping for DSP systems with Multiprocessors", IEEEDesign & Test of Computers, June 1991, pp.52-62.
[14] M.H.Brown, R.Sedgewick, "Techniques for Algorithm Animation", IEEE SOFTWARE, Januari 1985,pp. 28-39.
[15] M.K.Ponamgi, W.Hseush, G.E.Kaiser, "Debugging Multithreaded programs with MPD", IEEE Software,May 1991, pp.37-43.
[16] S.Isoda, T.Shimomura, Y.Ono, "Linked-List Visualisations for Debugging", IEEE Software, May 1991,pp.44-51.
[17] D.Socha, M.Bailey, N.Notkin, "VOYEUR : Graphical Views of Parallel Programs", Proc. of the ACMSIGPLAN and SIGOPS Workshop on Parallel and Distributed Debugging, May 1988, pp.206-215.
[18] T.J.LeBlanc, J.M.Mellor-Crummey, "Debugging Parallel Programs with Instant Replay", IEEE Transactionson Computers, Vol.36(4), April 1987, pp.471-482.
[19] S.H. Jones, R.H. Barkan, L.D. Wittie, "BugNet : a Real-Time Distributed Debugging System", Proc. of theACM SIGPLAN and SIGOPS Workshop on Parallel and Distributed Debugging, May 1988.
[20] L.Lamport, "Time, Clocks, and the Ordering of Events in a Distributed System", Communications of theACM, July 1978, Vol.21, Nr 7, pp. 558-565.