Embed Size (px)
Citation preview
School of Pharmacy
Pharmacists’ Interventions in Minimising Medication Misadventure
in Children with Cancer
Hesty Utami Ramadaniati
This thesis is presented for the Degree of
Doctor of Philosophy
of
Curtin University
February 2015
i
Declaration
To the best of my knowledge and belief this thesis contains no material previously published
by any other person except where due acknowledgment has been made.
This thesis contains no material which has been accepted for the award of any other degree
or diploma in any university.
Signature:
Date: 27-02-2015
ii
Abstract
Medication misadventure has been extensively studied in adults, but has not been
well characterised in children – in particular vulnerable children with cancer. To
date, little is known about medication misadventure in paediatrics and the role of
pharmacists’ interventions in minimising the misadventure in this area. This study
consists of four parts, aiming to evaluate the role of pharmacists’ interventions in
minimising the occurrence of medication misadventure in children including those
with cancer, the clinical significance of pharmacists’ active interventions (i.e.
interventions leading to changes in drug therapy) and the involvement of medication
misadventure detected through the active interventions, and contributing factors and
preventive strategies relating to medication misadventure, particularly medication
error, in this population.
The study was undertaken in a children’s hospital in Perth, Australia. Part One was a
prospective study to document ward-based pharmacists’ interventions through direct
observation by principal researcher on five study wards (General Medical Ward for
Infants, General Medical Ward for Young Children, General Medical Ward for
Adolescents, General Surgical Ward and the Haematology-Oncology Ward)
representing three clinical units (general medicine, general surgery, haematology-
oncology). Pharmacists’ interventions during dispensing in the Haematology-
Oncology Pharmacy were also observed by the principal researcher and documented
over 33 days. Part One was conducted from September 2011 through August 2012.
The predictors for physicians’ acceptance of ward-based pharmacists’ active
interventions were identified using multivariate logistic regression. A total of 982
interventions were documented, related to the 16,700 medication orders reviewed on
the five wards in the three clinical units over 35-37 non-consecutive days on each
ward. Taking medication histories and/or patient counselling were the most common
pharmacists’ interventions in the general settings, (n=453/787, 57.6% of all
interventions). In contrast, on the Haematology-Oncology Ward, the data revealed
drug therapy changes as the most common interventions (n=73/195, 37.4% of all
interventions). Active interventions constituted less than one-quarter of all
interventions on the general medical and surgical wards, compared to nearly half on
the specialty Haematology-Oncology Ward. Dose adjustment was the most frequent
active interventions in the general settings, whilst drug addition constituted the most
iii
common active interventions on the Hematology-Oncology Ward. The degree of
acceptance of pharmacists’ active interventions by physicians was high (n=223/244,
91.4%). With respect to interventions during dispensing, a total of 359 interventions
were performed from the 1791 medication orders reviewed and dispensed by the
pharmacists. The rates of intervention were 21.29 per 100 medication orders
reviewed, and 35.18 per 100 patients. Amongst these interventions, less than 10%
were classified as ‘active’ interventions, but all of the active interventions were
accepted by the physicians. Drug information-related consultation by pharmacists
was the most common intervention, constituting more than three-quarters of all
interventions. With regard to the predictors of physicians’ acceptance of ward-based
pharmacists’ active interventions, three significant variables were identified:
patients’ age (OR = 0.89; 95%CI 0.81, 0.98), non-high-risk medication category (OR
= 2.80; 95% CI 1.09, 7.17), and pharmacists’ experience (OR = 1.11; 95%CI 1.03,
1.20). This body of research supports the role of pharmacists in optimising patient
care in a range of paediatric settings, through their active interventions either during
pharmacy rounds or dispensing. Direct observation offers the alternative approach
for measuring the rate and pattern of pharmacists’ interventions.
Part Two of the study involved expert panel assessment of a sample of randomly-
selected pharmacists’ active interventions data from Part One to determine the
clinical significance of the interventions; to identify and categorise medication
misadventure; and to classify medication misadventure involving medication error
according to the type of error and the severity of their consequences. A random
sample of 42 cases (15.8%) was selected from 266 pharmacists’ active interventions
(244 interventions during pharmacy ward rounds on the five study wards,
supplemented by 22 interventions documented during dispensing in the
Haematology-Oncology Pharmacy). Panel 1 consisted of two researchers and three
independent panellists (hospital pharmacist, academic pharmacist, clinical nurse),
and its assessment was undertaken in March-June 2013. Panel 2 consisted of the two
researchers and two independent panellists (medication safety pharmacist, paediatric
oncology pharmacist) and was set up in July 2014 as Panel 1 could not reach
consensus. For the clinical significance assessment, the rating system modified by
Dooley et al. was used, whilst the assessment of the type and severity of medication
error were conducted using the National Coordinating Council for Medication Error
iv
Reporting and Prevention Taxonomy. The most common clinical significance rating
of the active interventions assessed by Panel 1 was ‘moderate’. Meanwhile, the
majority (n=37/42, 88.1%) of the active interventions were deemed by Panel 2 to be
clinically significant; although no intervention was classified as life-saving. The
strength of agreement between all reviewers of Panel 1 was “fair” (α =0.321)
regarding the presence of medication misadventure, and “fair” (α =0.222) regarding
the category of medication misadventure. “Fair” agreement (α =0.351) was also
noted when classifying the type of medication error, with “slight” agreement (α
=0.154) for the error severity. Part Two of this study provided data supporting the
clinical significance of the interventions documented in Part One. “Fair” agreement
between interdisciplinary reviewers regarding the assessment of medication
misadventure is consistent with published literature; as such, this indicates support
by other healthcare professionals for the contribution of clinical pharmacists in
reducing medication misadventure.
Part Three was a retrospective study to analyse data from pharmacist interventions
from short-term (‘snapshot’) 2009-2010 self-reports in the study hospital.
Intervention data were compared with interventions documented during direct
observation (Part One) to examine the pattern and representativeness of short-term
documentation as opposed to continuous documentation using observation.
Subsequently, a focus group discussion involving eight hospital pharmacists was
conducted in July 2013 to gather pharmacists’ opinions on the utility of the
alternative documentation methods. A total of 398 interventions were documented by
pharmacists during three snapshot reporting periods, with ‘clarification of medication
orders’ being the commonest type of intervention. The overall rate of pharmacists’
interventions documented during direct observation was not significantly different to
that of the snapshots (p=0.054). However, the rate of active interventions was
significantly higher (p=0.002) during direct observation. During the focus group
discussion, participants reported that the snapshot reports were an inadequate
representation of pharmacists’ clinical activities. ‘Snapshot’ data may underestimate
the impact of pharmacists’ interventions in minimising medication misadventure
amongst paediatric inpatients.
v
Part Four applied root cause analysis to five simulated clinical case scenarios
involving medication errors in children. The root cause analysis was undertaken via a
self-administered questionnaire disseminated to doctors, nurses and pharmacists at
the study hospital in order to determine the clinical significance of the medication
errors, the responsible health care professionals, the contributing factors and the
preventive strategies. In addition, general estimating equation analysis was
conducted to develop an agreement model between the participants and the principal
researcher regarding the contributing factors. Of 111 questionnaires administered
during the study period (August-October 2014), 25 (22.5%) were returned and
analysed. The majority of the participants rated the medication errors involved in the
five cases ranged from ‘moderate’ to ‘life-threatening’. In relation to the factors
contributing to the errors, the participants’ perceptions varied across the five cases.
However, the majority of the participants identified two major contributing factors in
all cases: dismissal of policies/procedures or guidelines and human resources issues.
The most frequently cited strategies in this study included improved availability and
accessibility of hospital policies/procedures or clinical guidelines for medication use,
adequate staffing and supervision, adequate staff education and training, and
improved communication either between staff or between staff and patient/family.
There were varied agreement patterns across the contributing factors. This analysis
confirmed the findings of the previous studies regarding the contributing factors and
strategies to prevent medication error. Pharmacists, through their clinical services,
were again central to prevention of medication error.
vi
Acknowledgements
First and foremost I thank Allah for all His blessings on me and His kindness in
giving me opportunity to make one of my dreams come true.
I would like to express my gratitude to my supervisors, Professor Jeffery David
Hughes, Associate Professor Lynne Emmerton and Dr Ya Ping Lee. To my main
supervisor, Professor Hughes: thank you for your encouragements, insightful
guidance and shared clinical knowledge. Your generous support and understanding
as ‘a family man’ really convinced me that I can survive this PhD journey. To my co-
supervisor: Associate Professor Lynne Emmerton: thank you for your critical
comments and motivation. I am aware that it is not easy to give supervision at the
point approaching the end of the pipeline, but you took that challenge. Thanks also to
my associate supervisor, Dr Ya Ping Lee, for your valuable supervision and endless
support. I learnt a lot from you: the importance of being detailed and thorough when
writing up this thesis and related scientific papers.
I am indebted to the Australia Award Scholarship program for providing me with
academic and financial support, and of course the valuable opportunity to study at
Curtin University.
Special acknowledgement goes to Pharmacy Staff at Princess Margaret Hospital for
Children for all their assistance and friendship. Special thanks to all ward
pharmacists for allowing me to be your shadow and document your interventions. I
would like to thank Ms Shalini Kassam and Mr Matthew Mollard for being my
preceptors during my data collection in the hospital. Special acknowledgement to Dr
Richard Parsons who provided guidance and knowledge in statistics. I would like to
thank Mr Dean Newman, Ms Dee John, Ms Tammy Rafala, Ms Lauren Burgess, Ms
Joyce Thomas, Ms Jennifer Ramsay and the other staff at the School of Pharmacy,
Curtin University. I would like to express my special thanks to Ms Julie Craig and
her team at the International Sponsored Student Unit for endless support since my
first day in Perth. Special thanks to Ms Benafsha Khariwala for her professional
assistance in proofreading this thesis. I would also like to thank all my friends for
their assistance and motivation, especially Ms Josephine Ratna, Ms Desak Ernawati,
Ms Dhini Widinarsih, Mr Vishnu Khanal, Mr Rajendra Kharkee, and Ms Martha
Mungkaje and other research students at the Health Sciences Hub.
vii
I would like to take this opportunity to thanks and acknowledge my beloved parents
for their sincere love and prayers. I would also like to especially dedicate this hard
work to my husband who gave me the chance to pursue my study. I do apologise for
not being with you most of the time and leaving my responsibilities during my study.
For my son Bagas: thank you for your understanding and pure love. You are just too
small to understand why ‘Ibu’ is always busy in front of the computer and cannot be
with you all the time just like the other mothers. For my daughter Ameera: you are
just a special gift along this wonderful journey.
Finally, to all whom my memory does not serve to remember their contributions:
thank you.
“To err is human; to fail to learn is inexcusable”
(Susan Sheridan, Vice President, Consumers Advancing patient Safety, 2004)
viii
Presentations and Publications
Ramadaniati HU, Lee YP, Hughes JD. Do clinical pharmacists’ interventions
minimise medication misadventures in adolescent inpatients? Curtin Health
Innovation Research Institute (CHIRI) Conference and Mark Liveris Research
Student Seminar, 8-9 November 2012, Bentley, Western Australia.
Ramadaniati HU, Lee YP, Hughes JD. An observational study of pharmacists’
interventions to minimise medication misadventures in paediatric inpatients. Joint
Australasian Society of Clinical Experimental Pharmacologist and Toxicologist
(ASCEPT) - Australasian Pharmaceutical Sciences Association (APSA) 2012
Conference, 2-5 December, Sydney, Australia.
Ramadaniati HU, Lee YP, Hughes JD. Pharmacists’ interventions in minimising
medication misadventure in children with cancer. Curtin and the Society of Hospital
Pharmacists of Australia (SHPA) Research Working Seminar, 20 February 2013,
Bentley, Western Australia.
Ramadaniati HU, Lee YP, Hughes JD. The Difference in Pharmacists’ Interventions
across the Diverse Settings in a Children’s Hospital. PloS ONE 2014;9(10):e110168.
DOI: 10.1371/journal.pone.0110168.
Ramadaniati HU, Lee YP, Hughes JD. Pharmacists’ active interventions a means to
identify medication misadventures in paediatrics. Pharmacotherapy
2014;34(10):e281.
Ramadaniati HU, Lee YP, Hughes JD. Pharmacists’ active interventions in a
children’s hospital: an Australian context. Pharmacotherapy 2014;34(10):e287-e288.
Ramadaniati HU, Lee YP, Hughes JD. Snapshot versus continuous documentation of
pharmacists’ interventions: are snapshots worthwhile. Journal of Pharmacy Practice
and Research 2014;44(4):205-212. DOI: 10.1002/jppr.1029.
ix
Table of Contents
Declaration ................................................................................................................................ i
Abstract .................................................................................................................................... ii
Acknowledgements ................................................................................................................. vi
Presentations and Publications .............................................................................................. viii
List of Tables ....................................................................................................................... xiiii
List of Figures ..................................................................................................................... xviii
List of Appendices ............................................................................................................. xviiii
Glossary ............................................................................................................................ xviiix
Chapter 1 .................................................................................................................................. 1
BACKGROUND ..................................................................................................................... 1
1.1 Medication Safety Terms ......................................................................................... 2
1.2 Incidence and Consequences of Medication Misadventure ..................................... 6
1.3 Causes of Medication Misadventure ........................................................................ 9
1.4 Risk Factors associated with Medication Misadventure in Children ..................... 13
1.5 Pharmacists’ Interventions in Minimising Medication Misadventure ................... 16
1.6 Clinical Significance and Economic Implications of Pharmacists’ Interventions . 20
1.7 Root Cause Analysis .............................................................................................. 22
1.7.1 Improvement of System Analysis to Overcome Organisational Failure ............ 25
1.7.2 Root Cause Analysis for Improving Patient Safety in Organisations ................ 27
1.7.3 Conducting Root Cause Analysis ...................................................................... 28
1.7.4 Limitations of Root Cause Analysis .................................................................. 30
Chapter 2 ................................................................................................................................ 32
AIMS ..................................................................................................................................... 32
Chapter 3 ................................................................................................................................ 34
METHOD .............................................................................................................................. 34
3.1 Part One: Clinical Pharmacists Interventions in a Children’s Hospital ................. 35
3.1.1 Description of Study Settings ............................................................................ 35
3.1.2 Direct Observation for Documentation of Pharmacists’ Interventions .............. 37
3.1.2.1 Ward-based pharmacists' interventions…………………………………...38
3.1.2.2 Pharmacists' interventions during dispensing…………………………….39
3.1.3 Ethics .................................................................................................................. 40
3.1.4 Data Management and Analysis......................................................................... 41
3.2 Part Two: Clinical Significance of Pharmacists’ Active Interventions and
Identification of Medication Misadventure through Pharmacists’ Active Interventions
Using an Expert Panel ........................................................................................................ 44
3.2.1 Clinical Significance of Pharmacists’ Active Interventions .............................. 44
3.2.2 Identification and Assessment of Medication Misadventure ............................. 45
x
3.3 Part Three: Comparison of Documentation Methods for Pharmacists’ Interventions
…………………………………………………………………………………….46
3.3.1 Documentation of Pharmacists’ Interventions during Snapshot Periods ........... 46
3.3.2 Focus Group Discussion .................................................................................... 47
3.4 Part Four: Medication Errors in Children: Root Cause Analysis Using Simulated
Case Scenarios .................................................................................................................... 48
3.4.1 Development of Simulated Case Studies and Survey Instrument ...................... 48
3.4.2 Face Validity Test .............................................................................................. 49
3.4.3 Participants and Questionnaire Administration ................................................. 49
3.4.4 Data Analysis ..................................................................................................... 50
Chapter 4 ................................................................................................................................ 52
PART ONE: RESULTS AND DISCUSSION ....................................................................... 52
4.1 Direct Observation and Documentation of Ward Pharmacists’ Interventions ....... 52
4.1.1 Observation and Documentation in the General Medical Unit .......................... 52
4.1.2 Observation and Documentation in the General Surgical Unit .......................... 59
4.1.3 Observation and Documentation on the Haematology-Oncology Ward............ 63
4.1.4 Rates and Patterns of Pharmacists’ Interventions on the Five Study Wards...... 68
4.2 Direct Observation and Documentation of Pharmacists’ Interventions in the
Haematology-Oncology Pharmacy .................................................................................... 75
4.3 Predictors of Physician-Accepted Pharmacists’ Active Interventions ................... 79
4.3.1 Independent Variable Selection ......................................................................... 80
4.3.2 Model Building and Interaction Test ................................................................. 83
4.4 Discussion .............................................................................................................. 87
4.4.1 Direct Observation and Documentation of Ward Pharmacists’ Interventions ... 87
4.4.2 Direct Observation and Documentation of Pharmacists’ Interventions during
Dispensing in a Haematology-Oncology Pharmacy ....................................................... 92
4.4.3 Predictors of Physician-Accepted Pharmacists’ Active Interventions ............... 94
4.5 Limitations and Recommendations ........................................................................ 96
4.6 Conclusion ............................................................................................................. 98
Chapter 5 ................................................................................................................................ 99
PART TWO: RESULTS AND DISCUSSION ...................................................................... 99
5.1 Clinical Significance of Pharmacists’ Active Interventions .................................. 99
5.2 Identification and Assessment of Medication Misadventure ............................... 100
5.3 Discussion ............................................................................................................ 103
5.3.1 Clinical Significance of Pharmacists’ Active Interventions ............................ 103
5.3.2 Identification and Assessment of Medication Misadventure ........................... 106
5.4 Limitations and Recommendations ...................................................................... 109
5.5 Conclusion ........................................................................................................... 110
Chapter 6 .............................................................................................................................. 111
PART THREE: RESULTS AND DISCUSSION ................................................................ 111
6.1 Introduction .......................................................................................................... 111
xi
6.2 Method ................................................................................................................. 112
6.2.1 Documentation of Pharmacists’ Interventions during Snapshot Periods ......... 112
6.2.2 Documentation of Pharmacists’ Interventions during Direct Observation ...... 112
6.2.3 Focus Group Discussion .................................................................................. 113
6.2.4 Data Analysis ................................................................................................... 113
6.3 Results .................................................................................................................. 113
6.3.1 Pharmacists’ Interventions Documented during Snapshot versus Observation
Periods ………………………………………………………………………………...113
6.3.2 Characteristics of Pharmacists’ Active Interventions and Implicated Medications
during Snapshot versus Observation Periods................................................................ 119
6.3.3 Some Examples of Pharmacists’ Active Interventions .................................... 121
6.3.4 Barriers in Documenting Pharmacists’ Interventions and Suggestions in
Improving the Documentation ...................................................................................... 121
6.4 Discussion ............................................................................................................ 122
6.5 Acknowledgements .............................................................................................. 124
6.6 Additional Qualitative Results ............................................................................. 124
6.6.1 Pharmacists’ comments on the results of pharmacist’s interventions documented
during observation vs snapshot reports ......................................................................... 124
6.6.2 How important is the documentation of pharmacists’ interventions? .............. 125
6.6.3 How valuable do you think are your clinical interventions? ............................ 126
6.6.4 Do you think there are problems with the way data are used? Why do you think
so?........................................ ......................................................................................... 127
6.7 Discussion of Additional Qualitative Results ...................................................... 127
6.8 Overall Limitations and Recommendations ......................................................... 130
6.9 Overall Conclusions ............................................................................................. 130
Chapter 7 .............................................................................................................................. 132
PART FOUR: RESULTS AND DISCUSSION .................................................................. 132
7.1 Results .................................................................................................................. 132
7.1.1 Case Study 1 (Inappropriate Dose) .................................................................. 133
7.1.2 Case Study 2 (Dispensing Error) ..................................................................... 138
7.1.3 Case Study 3 (Drug Omission) ........................................................................ 142
7.1.4 Case Study 4 (Monitoring Error – Documented Allergy) ................................ 147
7.1.5 Case Study 5 (Transcribing Error) ................................................................... 150
7.1.6 RCA of the Contributing Factors in the Simulated Cases: Interpretation by the
Principal Researcher ..................................................................................................... 155
7.2 Discussion ............................................................................................................ 162
7.3 Limitations and Recommendations ...................................................................... 168
7.4 Conclusions .......................................................................................................... 169
Chapter 8 .............................................................................................................................. 170
OVERALL DISCUSSION .................................................................................................. 170
8.1 Synthesis of Major Findings ................................................................................ 170
xii
8.2 Overall Discussion ............................................................................................... 174
8.3 Limitations and Recommendations .......................................................................... 177
Chapter 9 .............................................................................................................................. 179
CONCLUSIONS.................................................................................................................. 179
References ............................................................................................................................ 181
xiii
List of Tables
Table Page
Table 1.1 Characteristics of pharmacist intervention studies and cost
assessment
23-24
Table 3.1 Data collected by the observer during direct observation 40
Table 3.2 Pharmacist intervention categories developed by Condren et al.
with slight modification
43-44
Table 3.3 Clinical significance rating of pharmacists’ interventions 46
Table 4.1 Characteristics of patients on the three general medical wards 52
Table 4.2 Pharmacists’ interventions on the three general medical wards
(direct observation 35 days)
53
Table 4.3 Pharmacists’ active interventions on the three general medical
wards (direct observation 35 days)
54
Table 4.4 Categories of pharmacists’ interventions on the three general
medical wards
57
Table 4.5 Drug classes associated with active interventions (n=95) on the
three general medical wards
58
Table 4.6 Triggers for pharmacists’ interventions 59
Table 4.7 Characteristics of patients on the general surgical ward 59
Table 4.8 Pharmacists’ interventions on the general surgical ward (direct
observation 37 days)
60
Table 4.9 Pharmacists’ active interventions on the general surgical ward
(direct observation 37 days)
61
Table 4.10 Categories of pharmacists’ interventions on the general
surgical ward (n=271)
62
Table 4.11 Drug classes associated with pharmacists’ active interventions
(n=59) on the general surgical ward
63
Table 4.12 Triggers for pharmacists interventions on the general surgical
ward (n=271)
63
Table 4.13 Characteristics of patients on the Haematology-Oncology
Ward
64
Table 4.14 Pharmacists’ interventions on the Haematology-Oncology
Ward (direct observation 35 days)
65
Table 4.15 Pharmacists’ active interventions on the Haematology-
Oncology Ward (direct observation 35 days)
65
Table 4.16 Categories of pharmacists’ interventions (n=195) on the
Haematology-Oncology Ward
66
Table 4.17 Drug classes associated with pharmacists’ active interventions
(n=90) on the Haematology-Oncology Ward
67
Table 4.18 Triggers for interventions (n=195) on the Haematology-
Oncology Ward
68
Table 4.19 Characteristics of pharmacists (n=11) by level of employment* 68
Table 4.20 Rates of pharmacists’ interventions per 100 medication order
reviews on the five study wards
69
Table 4.21 Pharmacists’ active interventions per 100 medication orders
reviewed on the five study wards
70
xiv
Table 4.22 Types of pharmacists’ active interventions on the five study
wards
73
Table 4.23 Drug classes associated with active pharmacists’ interventions
on the five study wards (n=244)
74
Table 4.24 Characteristics of patients in the Haematology-Oncology Unit 76
Table 4.25 Haematology-Oncology pharmacists’ interventions (direct
observation 33 days)
77
Table 4.26 Haematology-Oncology pharmacists’ active interventions
(direct observation 33 days)
77
Table 4.27 Categories of Haematology-Oncology pharmacists’
interventions
78
Table 4.28 Triggers for pharmacists’ interventions (n=359) during
dispensing
79
Table 4.29 Contingency table of clinical units versus physicians’
acceptance of pharmacists’ active interventions
80
Table 4.30 Contingency table of diagnosis on admission versus
physicians’ acceptance of pharmacists’ active interventions
81
Table 4.31 Contingency table of therapeutic drug class versus physicians’
acceptance of pharmacists’ active interventions
81
Table 4.32 Contingency table of dose form of medication versus
physicians’ acceptance of pharmacists’ active interventions
81
Table 4.33 Contingency table of type of active interventions versus
physicians’ acceptance of the active interventions
82
Table 4.34 Univariate logistic regression coefficients of candidate
variables
83
Table 4.35 Multivariate logistic regression coefficients of variables in
Model 1
85
Table 4.36 Multivariate logistic regression Model 2 with significant
independent variables (predictors)
85
Table 4.37 Classification table of logistic regression Model 2 86
Table 4.38 Significance levels of interaction variables 86
Table 5.1 Panel 1: Clinical significance of pharmacists’ active
interventions (n=42)
99
Table 5.2 Panel 1: Agreement for discrete and collapsed significance
ratings
99
Table 5.3 Panel 2: Clinical significance of pharmacists’ active
interventions (n=42)
100
Table 5.4 Panel 1: Inter-rater reliability of medication misadventure
detected by pharmacists’ active interventions (n=42)
100
Table 5.5 Panel 1: Inter-rater reliability of type of medication
misadventure detected by pharmacists’ active interventions
(n=42)
101
Table 5.6 Panel 1: Inter-rater reliability of medication error type detected
by pharmacists’ active interventions (n=42)
101
Table 5.7 Panel 1: Severity of MEs detected by pharmacists’ active
interventions (n=42)
102
Table 5.8 Panel 1: Assessment of the severity of MEs (combined severity
categories)
102
xv
Table 6.1 The characteristics and rates of pharmacists’ interventions
(PIs) on the five study wards during snapshot periods
115
Table 6.2 The characteristics and rates of pharmacists’ interventions
(PIs) on the five study wards during direct observation
116
Table 7.1 Demographics of participants returning the RCA questionnaire 133
Table 7.2 Participants’ perceptions on the factors contributing to the ME
(Case 1)
135
Table 7.3 Participants’ ratings of the clinical significance of the ME
(Case 2)
138
Table 7.4 Participants’ responses on the responsible health
professional(s) (Case 2)
139
Table 7.5 Participants’ perceptions on the factors contributing to the ME
(Case 2)
140
Table 7.6 Participants’ ratings of the clinical significance of the ME
(Case 3)
142
Table 7.7 Participants’ responses on the responsible health
professional(s) (Case 3)
143
Table 7.8 Participants’ perceptions on the factors contributing to the ME
(Case 3)
144
Table 7.9 Participants’ ratings of the clinical significance of the ME
(Case 4)
147
Table 7.10 Participants’ responses on the responsible health
professional(s) (Case 4)
147
Table 7.11 Participants’ perceptions on the factors contributing to the ME
(Case 4)
148
Table 7.12 Participants’ ratings of the clinical significance of the ME
(Case 5)
151
Table 7.13 Participants’ responses on the responsible health
professional(s) (Case 5)
151
Table 7.14 Participants’ perceptions on the factors contributing to the ME
(Case 5)
152
Table 7.15 Principal researcher’s interpretation of the factors contributing
to the MEs
155
Table 7.16 Agreement between the principal researcher and participants
on patient-specific issues as a contributing factor
156
Table 7.17 Agreement model between the principal researcher and
participants on patient-specific issues as a contributing factor
using GEE analysis
157
Table 7.18 Agreement between the principal researcher and participants
on dismissal of policies/procedures or guidelines as a
contributing factor
157
Table 7.19 Agreement between the principal researcher and participants
on human resources issues as a contributing factor
158
Table 7.20 Agreement model between the principal researcher and
participants on human resources issues as a contributing factor
using GEE analysis
158
xvi
Table 7.21 Agreement between the principal researcher and participants
on miscommunication as a contributing factor
159
Table 7.22 Agreement model between the principal researcher and
participants on miscommunication as a contributing factor
using GEE analysis
159
Table 7.23 Agreement between the principal researcher and participants
on the physical environment of the health service as a
contributing factor
160
Table 7.24 Agreement between the principal researcher and participants
on the control/provision of medication as a contributing factor
160
Table 7.25 Agreement model between the principal researcher and
participants on the control/provision of medication as a
contributing factor using GEE analysis
161
Table 7.26 Agreement between the principal researcher and participants
on ‘other’ contributing factors
161
Table 7.27 Agreement model between the principal researcher and
participants on ‘other’ contributing factors using GEE analysis
162
xvii
List of Figures
Figure Page
Figure 1.1 Relationship between adverse drug event, adverse drug
reaction and medication error
3
Figure 1.2 Relationship between adverse drug event, medication error and
adverse drug reaction (some adverse drug reactions are due to
medication errors
6
Figure 1.3 James Reason’s Swiss cheese model 26
Figure 1.4 Sharp and blunt ends of the system as enablers of incidents 27
Figure 4.1 Top five reasons for admission to the general medical wards 53
Figure 4.2 Pharmacists’ interventions on the general medical ward for
infants
55
Figure 4.3 Pharmacists’ interventions on the general medical ward for
young children
55
Figure 4.4 Pharmacists’ interventions on the general medical ward for
adolescents
56
Figure 4.5 Top five reasons for admission to the general surgical ward 60
Figure 4.6 Top five diagnoses of patients (n=441) admitted to the
Haematology-Oncology Ward during the 35-day study period
64
Figure 4.7 Types of pharmacists’ interventions by pharmacists’ level of
employment across the five study wards
71-72
Figure 4.8 Top five cancer diagnoses (n=1028 patients) on the
Haematology-Oncology Ward
76
Figure 4.9 Classification of Haematology-Oncology pharmacists’
interventions (n=359)
78
Figure 6.1 Types of pharmacists’ interventions performed and
documented by clinical pharmacists on the five study wards
during snapshot
117
Figure 6.2 Types of pharmacists’ interventions performed by clinical
pharmacists and documented by observation on the five study
wards
118
xviii
List of Appendices
Appendix Page
Appendix 1 Data collection form (direct observation study) 196
Appendix 2 Approval from Princess Margaret Hospital for Children
institutional review board
197
Appendix 3 Approval from Curtin University human ethics committee 198
Appendix 4 Participant information sheet (direct observation study) 199
Appendix 5 Participant consent form (direct observation study) 201
Appendix 6 Case vignettes for expert panel assessment 202
Appendix 7 Data collection form (snapshot periods) 237
Appendix 8 Participant information sheet (focus group discussion) 238
Appendix 9 Participant consent form (focus group discussion) 240
Appendix 10 Approval letter from Curtin University human ethics
committee (focus group discussion)
241
Appendix 11 Questionnaire for root cause analysis 242
Appendix 12 Participant information sheet (root cause analysis) 266
Appendix 13 Participant consent form (root cause analysis) 268
xix
Glossary
ACE Angiotensin-Converting Enzyme
ADE Adverse Drug Event
ADR Adverse Drug Reaction
ALL Acute lymphoblastic Leukaemia
AMH Australian Medicines Handbook
AUC Area Under curve
BD Bis In Die (Latin: two times per day)
BSA Body Surface Area
CAST Commercial Aviation Safety Team
CDS Clinical Decision Support
CIVAS Centralised Intravenous Admixture Service
CI Confidence Interval
CPOE Computerised Physician order Entry
DRP Drug-Related Problem
ED Emergency Department
FGD Focus Group Discussion
g Gram
GEE General Estimating Equation
HFE Human Factor Engineering
HITH Hospital in the Home
HIV Human Immunodeficiency Virus
h Hour
ICCC The International Classification of Childhood Cancer
ICU Intensive Care Unit
Inh Inhaler
IV Intravenous
IR Immediate Release
IT Information Technology
kg Kilogram
L Litre
LOS Length of Stay
Mane Morning (Latin)
xx
MAR Medication Administration Record
mcg Microgram
ME Medication Error
mg Miligram
mL Mililitre
NCCMERP The National Coordinating Council for Medication Error
Reporting and Prevention
Neb Nebuliser
NG Nasogastric
N/S Normal Saline
Nocte Night (Latin)
OD Once Daily
PCA Patient-Controlled Analgesia
PEG Percutaneous Endoscopic Gastrostomy
PI Pharmacists’ Intervention
PL Professional Level
PRN Pro Re Nata (Latin: as required)
RCA Root Cause Analysis
QID Quater In Die (Latin: four times per day)
SC Subcutaneous
SD Standard Deviation
SL Sublingual
SR Sustained Release
Susp Suspension
TDS Ter die Sumendus (Latin: three times per day)
UK The United Kingdom
USA The United States of America
US The United States
WHO The World Health Organization
1
Chapter 1
BACKGROUND
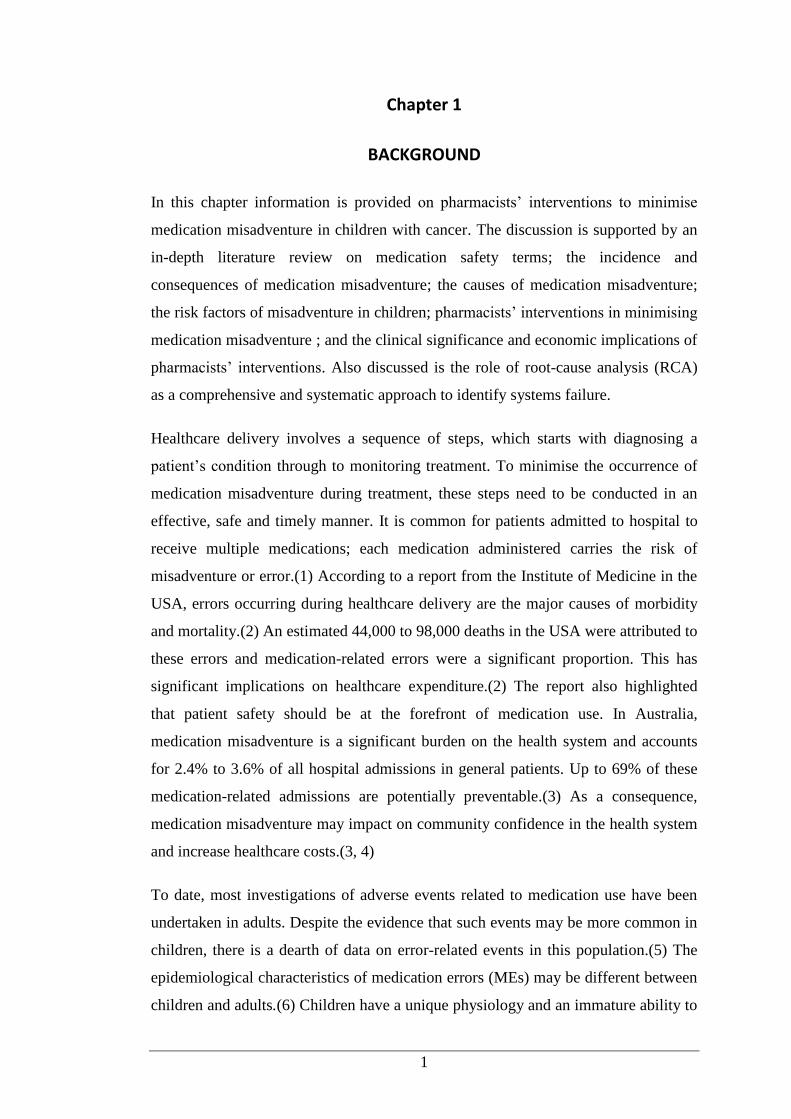
In this chapter information is provided on pharmacists’ interventions to minimise
medication misadventure in children with cancer. The discussion is supported by an
in-depth literature review on medication safety terms; the incidence and
consequences of medication misadventure; the causes of medication misadventure;
the risk factors of misadventure in children; pharmacists’ interventions in minimising
medication misadventure ; and the clinical significance and economic implications of
pharmacists’ interventions. Also discussed is the role of root-cause analysis (RCA)
as a comprehensive and systematic approach to identify systems failure.
Healthcare delivery involves a sequence of steps, which starts with diagnosing a
patient’s condition through to monitoring treatment. To minimise the occurrence of
medication misadventure during treatment, these steps need to be conducted in an
effective, safe and timely manner. It is common for patients admitted to hospital to
receive multiple medications; each medication administered carries the risk of
misadventure or error.(1) According to a report from the Institute of Medicine in the
USA, errors occurring during healthcare delivery are the major causes of morbidity
and mortality.(2) An estimated 44,000 to 98,000 deaths in the USA were attributed to
these errors and medication-related errors were a significant proportion. This has
significant implications on healthcare expenditure.(2) The report also highlighted
that patient safety should be at the forefront of medication use. In Australia,
medication misadventure is a significant burden on the health system and accounts
for 2.4% to 3.6% of all hospital admissions in general patients. Up to 69% of these
medication-related admissions are potentially preventable.(3) As a consequence,
medication misadventure may impact on community confidence in the health system
and increase healthcare costs.(3, 4)
To date, most investigations of adverse events related to medication use have been
undertaken in adults. Despite the evidence that such events may be more common in
children, there is a dearth of data on error-related events in this population.(5) The
epidemiological characteristics of medication errors (MEs) may be different between
children and adults.(6) Children have a unique physiology and an immature ability to
2
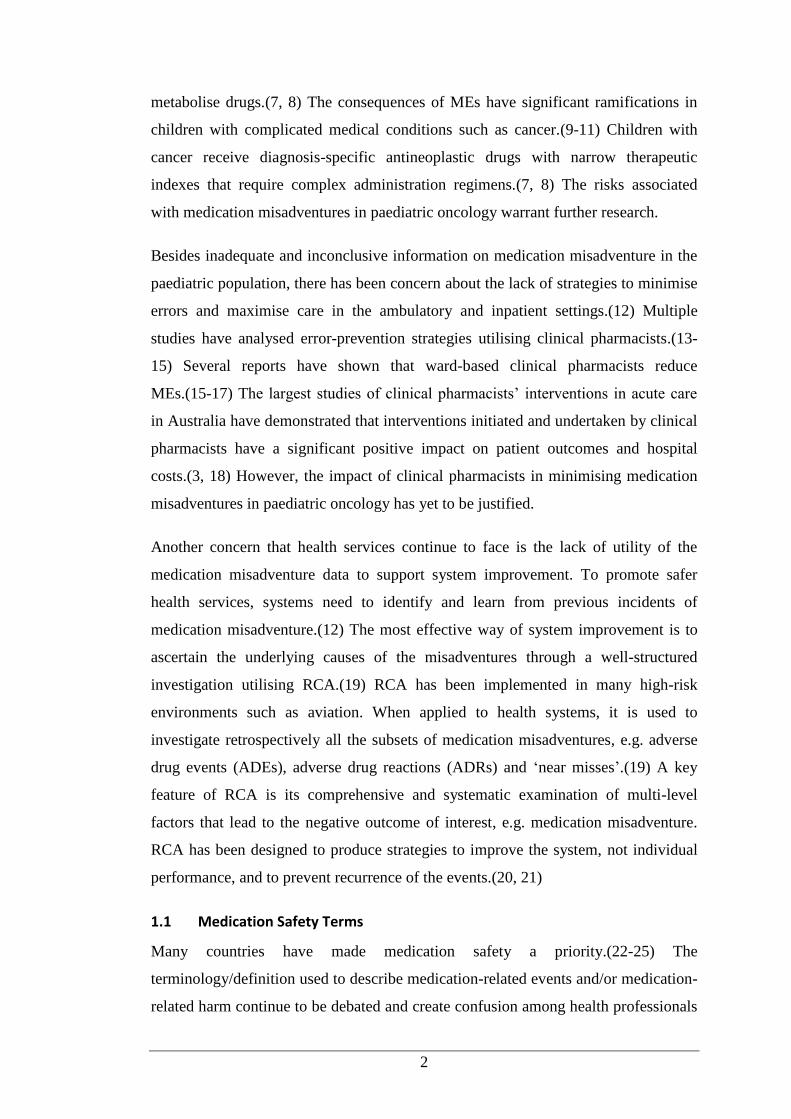
metabolise drugs.(7, 8) The consequences of MEs have significant ramifications in
children with complicated medical conditions such as cancer.(9-11) Children with
cancer receive diagnosis-specific antineoplastic drugs with narrow therapeutic
indexes that require complex administration regimens.(7, 8) The risks associated
with medication misadventures in paediatric oncology warrant further research.
Besides inadequate and inconclusive information on medication misadventure in the
paediatric population, there has been concern about the lack of strategies to minimise
errors and maximise care in the ambulatory and inpatient settings.(12) Multiple
studies have analysed error-prevention strategies utilising clinical pharmacists.(13-
15) Several reports have shown that ward-based clinical pharmacists reduce
MEs.(15-17) The largest studies of clinical pharmacists’ interventions in acute care
in Australia have demonstrated that interventions initiated and undertaken by clinical
pharmacists have a significant positive impact on patient outcomes and hospital
costs.(3, 18) However, the impact of clinical pharmacists in minimising medication
misadventures in paediatric oncology has yet to be justified.
Another concern that health services continue to face is the lack of utility of the
medication misadventure data to support system improvement. To promote safer
health services, systems need to identify and learn from previous incidents of
medication misadventure.(12) The most effective way of system improvement is to
ascertain the underlying causes of the misadventures through a well-structured
investigation utilising RCA.(19) RCA has been implemented in many high-risk
environments such as aviation. When applied to health systems, it is used to
investigate retrospectively all the subsets of medication misadventures, e.g. adverse
drug events (ADEs), adverse drug reactions (ADRs) and ‘near misses’.(19) A key
feature of RCA is its comprehensive and systematic examination of multi-level
factors that lead to the negative outcome of interest, e.g. medication misadventure.
RCA has been designed to produce strategies to improve the system, not individual
performance, and to prevent recurrence of the events.(20, 21)
1.1 Medication Safety Terms
Many countries have made medication safety a priority.(22-25) The
terminology/definition used to describe medication-related events and/or medication-
related harm continue to be debated and create confusion among health professionals
3
and researchers.(26, 27) As patient safety initiatives are strengthened and reporting
systems are embedded into practice, a universal definition of what constitutes
medication-related events is imperative.(10) A universal terminology/definition for
medication safety would: encourage research; allow comparison of medication-
related events; prevent medication misadventure; and improve patient safety.(10, 28)
According to Manasse(29) medication misadventure is: ‘any iatrogenic hazard or
incident associated with drug therapy’. Manasse(29) also specifies the criteria for a
hazard or incident, i.e. events: ‘created through either omission or commission by the
administration of a drug or drugs during which a patient is harmed, with effects
ranging from mild discomfort to fatality; events attributable to error, immunologic
response, or idiosyncratic response; and events where the outcome may or may not
be independent of the pre-existing pathology or disease process’. The American
Society of Health-System Pharmacists and researchers have adopted this definition
of medication safety.(4, 11, 27, 30) Under the broad definition of medication
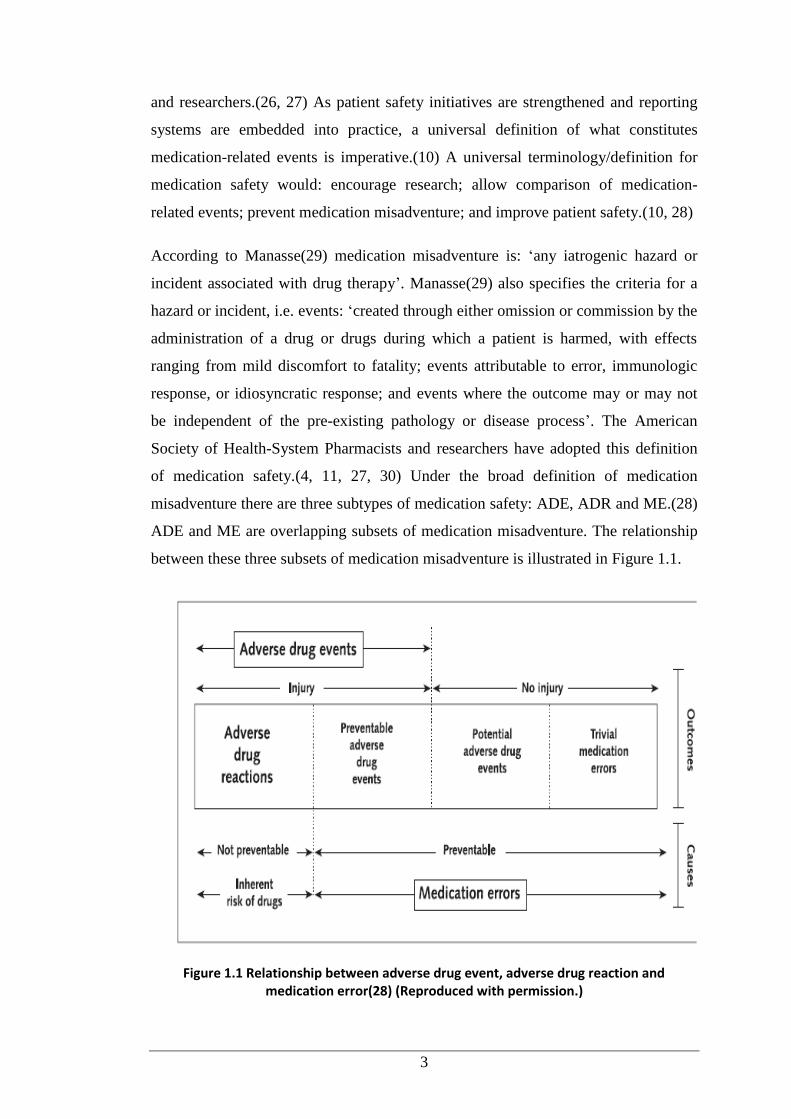
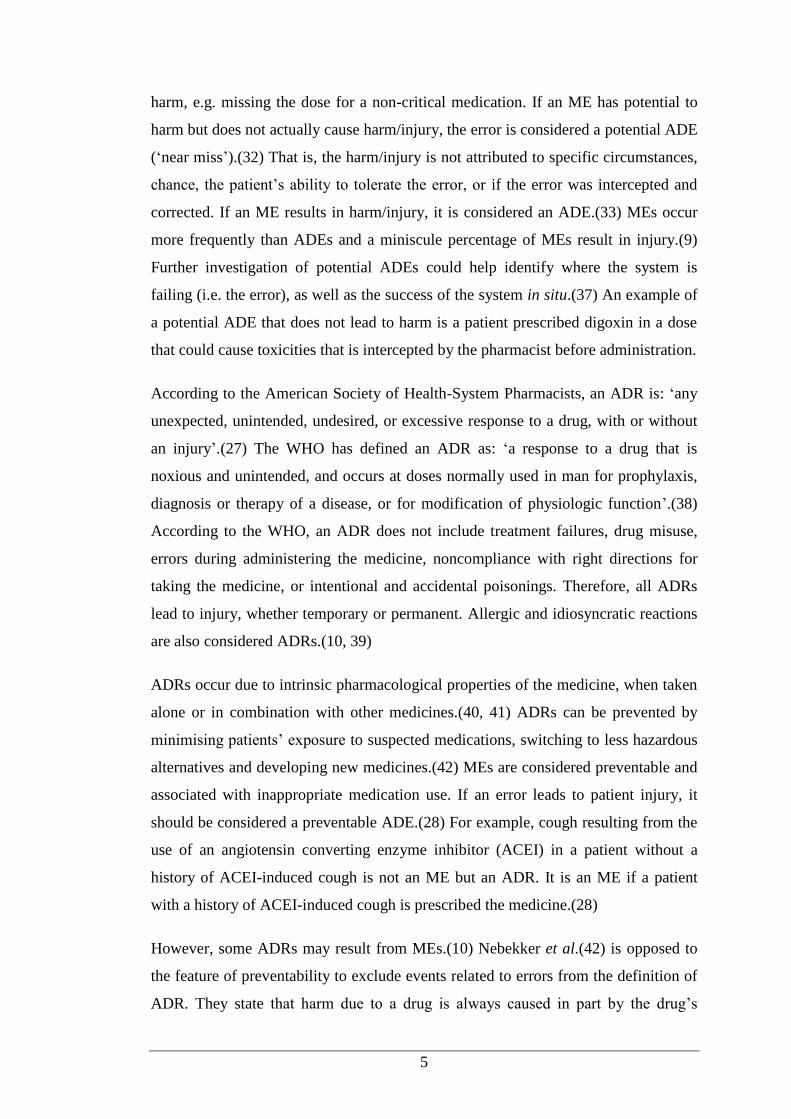
misadventure there are three subtypes of medication safety: ADE, ADR and ME.(28)
ADE and ME are overlapping subsets of medication misadventure. The relationship
between these three subsets of medication misadventure is illustrated in Figure 1.1.
Figure 1.1 Relationship between adverse drug event, adverse drug reaction and medication error(28) (Reproduced with permission.)
4
ADE accounts for the largest category of adverse events in patient safety.(31) An
ADE is: ‘an injury resulting from a medication or lack of an intended
medication’.(27, 32) For example, if an event resulted in patient injury it would be
classified an ADE, which can be further subclassified based on its preventability
(preventable and non-preventable).(28, 33) An ADE may or may not result from
MEs (error versus non-error). ADEs that do not result from MEs are considered non-
preventable ADEs or ADRs. An example of an ADR is when a patient without a
known history of allergy to penicillin develops an anaphylactic reaction immediately
after receiving Timentin (ticarcillin + clavulanic acid). According to Bates et al.(34),
the majority of ADEs due to MEs are predictable and preventable. Some instances of
preventable ADEs due to MEs include administration of the wrong drug to the right
patient, the right drug to the wrong patient, or the wrong route of administration.
Bates et al.(32) have proposed a practical and straightforward definition of an ADE:
‘an injury occurring due to medical intervention associated with medication use. The
adverse event could include injury resulting from MEs and ADRs that happen
without involving any errors’.(32)
According to the National Coordinating Council for Medication Error Reporting and
Prevention (NCCMERP) an ME is: ‘any preventable event that may cause or lead to
inappropriate medication use or patient harm while the medication is in the control of
the health professional, patient or consumer’.(35) The Institute of Medicine defines
MEs as: ‘particular types of errors in which the occurrence of events can be
prevented and is likely to happen at any stage of medication use process’.(27)
MEs are not merely the result of less competent individuals but due to failure in:
drug distribution; systems mismanagement; communication breakdown; inadequacy
and/or unavailability of standardisation in pharmaceutical packaging, labelling and
nomenclature; and limited availability of information about patients.(36) Hence, it is
crucial to detect MEs in order to uncover failures during the treatment process that
may lead to harm if not intercepted.
MEs range in severity from trivial errors, such as incomplete medication orders
requiring clarification from prescribers, to life-threatening errors, such as a child
receiving a 10-fold dose of a drug with a narrow therapeutic index.(34) Most MEs
can be considered minor if the errors are associated with little or no potential for
5
harm, e.g. missing the dose for a non-critical medication. If an ME has potential to
harm but does not actually cause harm/injury, the error is considered a potential ADE
(‘near miss’).(32) That is, the harm/injury is not attributed to specific circumstances,
chance, the patient’s ability to tolerate the error, or if the error was intercepted and
corrected. If an ME results in harm/injury, it is considered an ADE.(33) MEs occur
more frequently than ADEs and a miniscule percentage of MEs result in injury.(9)
Further investigation of potential ADEs could help identify where the system is
failing (i.e. the error), as well as the success of the system in situ.(37) An example of
a potential ADE that does not lead to harm is a patient prescribed digoxin in a dose
that could cause toxicities that is intercepted by the pharmacist before administration.
According to the American Society of Health-System Pharmacists, an ADR is: ‘any
unexpected, unintended, undesired, or excessive response to a drug, with or without
an injury’.(27) The WHO has defined an ADR as: ‘a response to a drug that is
noxious and unintended, and occurs at doses normally used in man for prophylaxis,
diagnosis or therapy of a disease, or for modification of physiologic function’.(38)
According to the WHO, an ADR does not include treatment failures, drug misuse,
errors during administering the medicine, noncompliance with right directions for
taking the medicine, or intentional and accidental poisonings. Therefore, all ADRs
lead to injury, whether temporary or permanent. Allergic and idiosyncratic reactions
are also considered ADRs.(10, 39)
ADRs occur due to intrinsic pharmacological properties of the medicine, when taken
alone or in combination with other medicines.(40, 41) ADRs can be prevented by
minimising patients’ exposure to suspected medications, switching to less hazardous
alternatives and developing new medicines.(42) MEs are considered preventable and
associated with inappropriate medication use. If an error leads to patient injury, it
should be considered a preventable ADE.(28) For example, cough resulting from the
use of an angiotensin converting enzyme inhibitor (ACEI) in a patient without a
history of ACEI-induced cough is not an ME but an ADR. It is an ME if a patient
with a history of ACEI-induced cough is prescribed the medicine.(28)
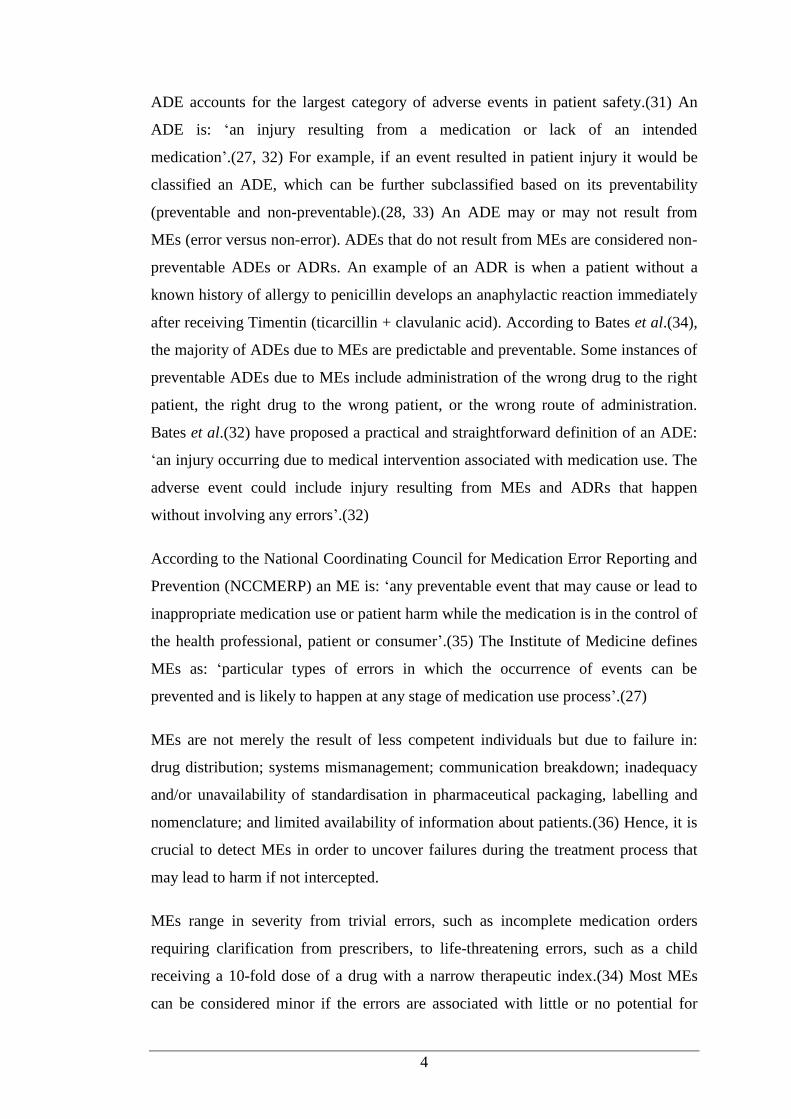
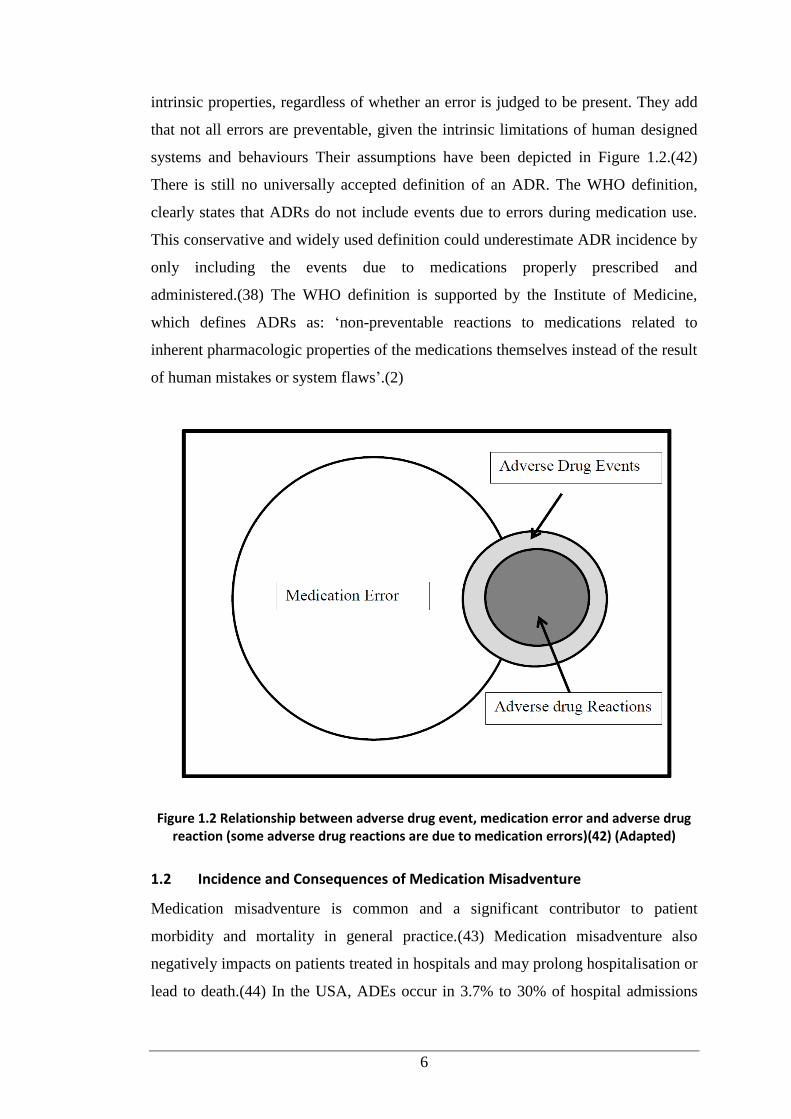
However, some ADRs may result from MEs.(10) Nebekker et al.(42) is opposed to
the feature of preventability to exclude events related to errors from the definition of
ADR. They state that harm due to a drug is always caused in part by the drug’s
6
intrinsic properties, regardless of whether an error is judged to be present. They add
that not all errors are preventable, given the intrinsic limitations of human designed
systems and behaviours Their assumptions have been depicted in Figure 1.2.(42)
There is still no universally accepted definition of an ADR. The WHO definition,
clearly states that ADRs do not include events due to errors during medication use.
This conservative and widely used definition could underestimate ADR incidence by
only including the events due to medications properly prescribed and
administered.(38) The WHO definition is supported by the Institute of Medicine,
which defines ADRs as: ‘non-preventable reactions to medications related to
inherent pharmacologic properties of the medications themselves instead of the result
of human mistakes or system flaws’.(2)
Figure 1.2 Relationship between adverse drug event, medication error and adverse drug reaction (some adverse drug reactions are due to medication errors)(42) (Adapted)
1.2 Incidence and Consequences of Medication Misadventure
Medication misadventure is common and a significant contributor to patient
morbidity and mortality in general practice.(43) Medication misadventure also
negatively impacts on patients treated in hospitals and may prolong hospitalisation or
lead to death.(44) In the USA, ADEs occur in 3.7% to 30% of hospital admissions
7
and is a significant public health concern; an estimated 28% of identified ADEs are
preventable.(32) One study reported that the rate of ADEs was 6.5 per 100 hospital
admissions; approximately 1% were fatal and 12% were life-threatening.(34) The
UK Department of Health reported that adverse events associated with medication
use in 2007 were responsible for around 10% of hospital admissions.(45) In
Australia, ADEs are associated with 2.4% to 3.6% of hospital admissions and an
estimated 80,000 people are hospitalised every year as a result of drug-related
problems (DRPs).(46) Preventable errors during healthcare delivery in hospitals
account for one-quarter of adverse events in Australia.(47) The comprehensive
Quality in Australian Health Care Study identified that 1.8% of all admissions to
hospitals were associated with severe complications leading to disability.(47)
The 1999 Institute of Medicine report stated that medical errors were directly
responsible for up to 98,000 patient deaths annually in the USA, making it the fourth
highest cause of death. MEs accounted for the majority of all medical errors.(48) In
2007, the UK National Patient Safety Agency reported over 86,000 incidents of ME.
A review of hospital inpatients found MEs were involved in 7% of medication
orders, 2% of patient-days and 50% of hospital admissions.(45) A multi-site study of
MEs in paediatric inpatients in the UK reported that prescribing errors occurred in
13.2% of medication orders.(49) In a study of medication misadventures in paediatric
and adult inpatients based on concurrent medication orders and chart review, and
errors reported by doctors, nurses and pharmacists, Kaushal et al.(50) reported an
ADE rate of 2.3 per 100 admissions or 6.6 per 1000 patient-days. They identified 616
MEs among 10,788 medication orders reviewed; an error rate of 5.7% of all orders.
They ascertained that one-fifth of these errors were near-misses (potential ADEs) and
1% resulted in patient harm. They also highlighted that potential ADEs occurred
three times more often among paediatric patients than adults.
Other studies have reported that MEs are common during paediatric hospitalisations
and occur in nearly 6% of all medication orders.(9, 50) A comprehensive study on
MEs in paediatric oncology patients, reported that 13% of errors reached patients and
2% resulted in temporary patient harm, requiring medical intervention. The study
also reported that errors during prescribing were responsible for over 70% of the
incidents, while errors during administration and dispensing accounted for 13% and
8
9% of the incidents, respectively.(51) However, the study of MEs in paediatric
patients remains in its infancy due to lack of consensus on the medications of most
concern and the children at greatest risk.(52, 53)
In the era of heightened fiscal constraints, the cost burden of compromised patient
safety has received attention. The implications of medication misadventure in health
systems are significant. Medication misadventure imposes a threat to patient safety
and a high financial burden on the health system. Medication misadventure is costly
with regard to human, economic and societal perspectives. From the human
perspective, patients may experience discomfort, complications, prolonged hospital
stay, disability or death and health professionals often experience emotional distress.
The economic impact of the misadventure affects individuals, healthcare
organisations, third-party payers and society.(54)
The economic burden for all areas of health care from drug misadventure in the USA
exceeds USD100 billion annually.(54) In addition, time spent by healthcare
providers in researching errors can impact on time for direct patient care. In a study
of medical liability suits over a 16-year period, the Physician Insurers Association of
America found MEs to be the fifth most common misadventure for paediatricians.
More than 30% of the ME cases resulted in a paid claim, with a total indemnity of
USD14.7 million.(55) The national projections of total healthcare costs with respect
to MEs in in USA hospitals have ranged from USD2 to 4 billion annually.(11, 44)
Most studies have only considered costs during hospitalisation, and ignored the
outpatient treatment of the complications of MEs, the costs of disability and lost
work time, family implications of caregiving burden and premature death. The
financial implications of MEs may be significantly underestimated.(11, 56)
The consequences of the occurrence of one ADE was associated with an average
increased length of hospital stay of 1.91 days, based on a study by Classen et al.(44)
and 2.2 days in a study by Bates et al.(32) In another study around 2 in 100 patients
experienced preventable ADEs during hospitalisation.(57) The researchers estimated
that extra costs due to preventable ADEs were USD4700 per admission or USD2.8
million annually for a 700-bed teaching hospital. If these findings are extrapolated to
hospitals across the USA, the hospital costs for inpatients due to preventable ADEs
would approach USD43 billion.(57) In the UK, more than 800,000 adverse events
9
occur annually in national health system hospitals, accounting for £2 billion in direct
costs for additional hospital days; half of these events were avoidable.(58)
Medication misadventure can also result in significant healthcare costs.(58)
The Australian Institute of Health and Welfare data suggest that the annual
healthcare costs associated with medication misadventures in Australian public
hospitals in 2002 was as high as AUD380 million.(59) Based on annual data of
hospital admissions from 2006-2007, of the 7.7 million admissions recorded, around
190,000 were due to medication misadventure; with an associated cost of AUD660
million.(3) Medication safety is a major challenge in the Australian health system.(3)
The consequences of MEs have ramifications in oncology patients already burdened
by multimodal treatment. Antineoplastic drugs are distinguished by their toxicity
profiles. The consequences of the MEs result in prolonged hospitalisation,
readmissions to hospital, increased cost and premature death.(44, 57) It is evident
that reducing the occurrence of such misadventure will lead to better outcomes for
patients, and reduce the financial burden.(59)
There may also be great personal costs to those involved and may result in time away
from work, low patient satisfaction and decreased public trust toward health care.(6,
32) Staff may experience shame, guilt and depression after making a mistake, with
litigation and complaints imposing an additional burden. Doctors and nurses whose
confidence has been impaired will work less effectively and efficiently; at worst they
may abandon their career.(60)
1.3 Causes of Medication Misadventure
Medication misadventure can occur at any step of the medication management
process: prescribing, transcribing, dispensing, administration and monitoring. The
American Society of Health-System Pharmacists acknowledges the myriad of factors
and the multidisciplinary team as sources of errors in medication use.(61) Errors
cannot be resolved without correcting underlying causes.(62) Any individual in a
healthcare team (physicians, pharmacists, nurses and supportive staff) could commit
errors.(61) Studies have emphasised that the two leading causes of medication
misadventure are lack of knowledge and breakdown in communication.(34, 63-66)
10
The other causes are attributed to performance lapses and failure of hospital
authorities to optimise the availability of data for system improvement.(67-69)
The medication management process requires intellectual activity in combination
with the physical act of preparing and administering medications. A study
investigating the preparation of intravenous medications in two UK hospitals
revealed that around 265 MEs were observed during preparation of 483
medications.(84) The errors ranged from insignificant slips or mistakes to major
violations. The authors concluded that 79% of the errors were caused by lack of
knowledge and experience dealing with medications and equipments. This study
highlighted the need for specific training because the staff who frequently made
mistakes in selecting medications were unfamiliar with medication names.(64)
A system analysis in the USA identified lack of drug knowledge as the major cause
of dosing errors.(32) This finding was confirmed by Lesar et al.(65), who identified
that the most common variables associated with errors were related to deficient
knowledge, such as the application of knowledge about specific drug therapies (i.e.
expected toxicities, usual route, correct drug) and the synthesis of knowledge relating
to patient factors that influence drug therapy outcomes (i.e. allergy, physiological
status alterations).(65) Inappropriate prescribing is possibly the most common cause
of avoidable events and account for over half of all preventable hospital MEs.(70)
Prescribing is associated with errors, due to its complexity and challenging nature
that requires diagnostic skills, knowledge of medicines, awareness of risks and
experience. It is an anomaly that hospital doctors who have the least experience are
expected to prescribe most often.(66) The consequence of this anomaly is that junior
doctors are implicated in approximately 90% of serious hospital MEs related to
incorrect dose.(70)
Another common source of error is the lack of knowledge in dose calculation,
especially among nurses.(71) The two skills that are critical in accurate drug
calculations are basic mathematics and the ability to conceptualise the clinical
information presented and extract the relevant information.(71) This is of special
significance in paediatrics where medication dosing is often based on weight and
body surface area (BSA).(72)
11
The other major cause of medication misadventure is communication breakdown
between healthcare providers and their patients and/or caregivers. However, there is
little evidence that improved communication between health professionals and
paediatric patients will prevent MEs in this population. An analysis of medication-
related incidents has postulated that improvement in communication between
healthcare providers and patients could minimise MEs in children.(73) Other
contributors to medication misadventure in the post-discharge period include:
inadequate communication to patients and/or caregivers about medication-related
changes that have occurred in hospital; errors in prescribing or transcribing at
discharge; and unclear health professionals’ expectations of how patients should use
their medications.(74) This situation has been associated with poor or unavailable
written communication that can result in errors.(75) Another concern is establishing
and maintaining communication that deals with functional health literacy of patients
and/or their caregivers. Successful communication relies on the quality and quantity
of information that can be absorbed by patients.(76) Functional health literacy is the
ability to understand and apply both written and oral health-related information.(69)
Communication in paediatric patients is complex as it may often involve three- or
four-way conversations with patients, parents, clinicians and others (e.g. social
workers, interpreters).(73) Information transfer is also affected by a myriad of other
barriers. Some studies have emphasised the correlation between the ability to recall
information and improvement in adherence and relapse reduction.(73, 77, 78) There
is some evidence that the effect of communication goes beyond this by improving
patients’ health status.(73, 79) Effective communication with caregivers is one of the
six patient safety goals included in the accreditation standards of the Joint
Commission on Accreditation of Healthcare Organization.(80)
Communication is a crucial strategy to reduce the occurrence of errors when working
in a team. Well-established and well-maintained communication and interactions
between healthcare providers could minimise the occurrence of MEs.(14) Effective
communication is important during critical situations such as patient transfer
between care settings/institutions, e.g. post-discharge. Poor continuity of care after
discharge and lack of communication between the hospital and community settings
increase the chance of patients experiencing medication misadventure.(4, 74, 81)
Kripani et al.(79) investigated communication and information transfer during and
12
after hospital discharge and reported that direct communication between hospital
authorities and general practitioners occurred infrequently, and could contribute to
misadventure.
There are also problems with communication between hospitals. For a study
undertaken in a regional hospital in Queensland (Australia) medical records were
reviewed of patients referred to the hospital’s oncology unit.(82) These patients had
been prescribed chemotherapy at another hospital. Around 72% of the referral
medical records had been associated with one or more potential errors with respect to
patients’ medicines, such as inadequate documentation to confirm the doses, poorly
handwritten or illegible medication orders, and lack of sufficient information on the
length of time between cycles of chemotherapy.(82)
Another factor cited as a major cause of errors in the medication management
process is related to performance lapses.(67) Performance lapses or deficits are
defined as: ‘slips and/or mistakes that generally take place when there is any
impairment of a professional’s attention that may divert human cognitive
functions’.(83) These lapses may result in inadvertent errors. Performance lapses are
not related to knowledge and are mainly associated with intrinsic factors, such as
health status and ability to manage stress and focus, and extrinsic factors, such as
non-conducive working environments, (83) e.g. excessive workload, distractions.(84)
For critical tasks, such as preparing intravenous additives and calculating medication
doses, distractions may have harmful consequences for patients.(83)
Another cause of medication misadventure is the failure of hospital authorities to
utilise their data to prioritise and support system improvements. The first step would
involve identifying the nature and occurrence of errors, analysing and reporting their
pattern of occurrence within delivery systems to reduce the likelihood of adverse
events.(12) Systems should be designed and modified based on actual and potential
errors. The American Academy of Pediatrics has included identifying and learning
from errors as one of its three principles of patient safety.(85) Error-learning systems
should be transparent, promote discussion of errors without blame and punitive
actions and provide contextual and robust data about the errors.(2)
13
1.4 Risk Factors associated with Medication Misadventure in Children
An understanding of the risk factors associated with MEs would enable improved
monitoring of patients and medications associated with increased risk of serious
errors.(86) Paediatric patients are at risk of DRPs for a variety of reasons, such as
physiological factors and healthcare settings unable to accomodate the safe use of
medications in paediatrics.(87, 88) Psychological factors pertaining to
communication are another risk factor for the likelihood of medication misadventure
in this population.(89) In those diagnosed with cancer, the complexity of
chemotherapy regimens increases their risk of experiencing medication
misadventure.(6, 11, 90)
Children are not ‘mini adults’. They vary in size from early infancy to adolescence,
along with profound alterations to their physiology. Weight and BSA also vary
greatly and range from less than 500 g to over 100 kg in body weight and 0.1 to over
2 m2
in BSA between premature neonates and adolescents. The relationship of body
size with age and other clinical characteristics may impact on drug absorption,
distribution, metabolism and excretion, especially, in neonates and infants.(91) These
variations may lead to difficulties in clinical practice, most notably in drug dosing
and administration. Paediatric pharmacokinetic parameters are frequently scaled
based on body weight. This scaling approach has the advantage of being easy to
calculate and apply to dosing of the medicines.
Many physiological functions that affect drug clearance (i.e. renal function, cardiac
output, hepatic blood flow) do not scale proportionally to weight. Therefore,
estimated BSA is an alternative approach to determine drug clearance. Empirically,
BSA correlates more closely with the clearance of drugs than weight.(92) Volume of
distribution may not correlate as well with BSA as it does with weight. BSA
calculation requires height measurement that can complicate the dose
calculation.(93)
Substantial changes in body proportions, organ systems and composition accompany
growth and development in children. This dynamic process of growth, differentiation
and maturation differs from adults with respect to physiological and pharmacological
changes. The variability in organ system maturation complicates the determination of
medication dosages for children.(88, 93) Pharmacokinetic parameters, such as
14
volume of distribution, half-life and clearance also alter during development.(92, 93)
Many drugs doses need to be adjusted for increased body mass and compensate for
increased clearance and short half-life due to development of hepatic and renal
functions.(88, 92) Besides specific dosage requirements such as weight-based
dosages, medication delivery for children is complex because of the limited
availability of liquid oral medication formulations in different concentrations.(6, 90)
Simplified dose administration approaches are not adequate for individualising drug
dosages in childhood.(94) For potent drugs, when small fractions of the adult dose
are required for children, risks of 10-fold dosing errors increase, leading to under
dosing or overdosing.(6, 14, 90, 95) Some incidents may be fatal.(87, 96)
Another risk factor contributing to the possibility of medication misadventure is
healthcare settings unable to accomodate the safe use of medications in
paediatrics.(87) Most healthcare settings are primarily built around the needs of
adults. Data related to efficacy, tolerability of drugs, and ADR in children are often
lacking, partly because drug regulation authorities and the pharmaceutical industry
have ignored routine drug evaluation in this population.(97) Many settings lack
trained staff with expertise in paediatric care protocols and safeguards, and current
and readily accessible reference materials for medications used in paediatrics.(87,
98) Few drugs are commercially available in ready-to-administer unit doses or dose
forms appropriate for children.(99) Errors in dosing could result from the inability to
deal with complex calculations and additional procedures to dilute and reformulate
medications from adult formulations.(100-103) These manipulations may involve
splitting or grinding tablets or dispersing or mixing drugs with food or drink. This
practice creates opportunities for dosing errors, as the bioavailability of the drugs
following such manipulations is often unknown and unpredictable.(104)
Around 75% of medications prescribed for children have not been adequately studied
in this population.(105) Current trial and error prescribing practices (off-label use)
may be associated with therapeutic failure and increased risk of adverse events.
Conversely, without such precribing, effective therapy would be denied to many
children. Information or labelling on dosing, safety, efficacy and clinical use in
paediatrics is either not available or is insufficient and off-label use occurs. Many
drugs used in children are either not registered (unlicensed) or outside the terms of
15
their licence (off-label indications).(102, 103) Off-label prescribing is: ‘lawfully
prescribing a drug or biologic agent for treatment regimens not specified in the
approved labelling or package insert’.(106) The common reason for off-label
prescribing in children is that the drug is prescribed at a different dose, for a different
indication, through a different route of administration or for an age group for which
the drug is not licensed.(107) A study in the USA found that off-label use accounted
for 21% of all prescriptions for 160 common drugs.(108) Conroy et al.(107) reported
that two-thirds of 600 children admitted to five European hospitals were prescribed
unlicensed and/or off-label drugs during their hospitalisation. While some off-label
uses are accepted as standard care, e.g. beta-blockers for congestive heart failure,
many lack evidence of clinical efficacy.(108) There is little guidance to differentiate
between off-label uses that are supported by evidence and those that are not.(106)
Communication issues may also complicate treatment in children. Children often
lack communication and/or cognitive capabilities to express their feelings and report
adverse effects.(109) Young children cannot provide sufficient feedback on potential
adverse effects or mistakes in administration.(73) Patient monitoring can also be
challenging for health professionals when caring for children. Many children cannot
reliably communicate complaints or effectively understand the questions from health
professionals. They simply feel that they are not well.(6, 110, 111)
Another risk factor, particularly for children with cancer, is associated with the
characteristics of antineoplastic drugs. Antineoplastic drugs are among the most
potent medications given to children, and have narrow therapeutic windows with
high potential for toxicity. Administration of chemotherapy is error prone and even
small errors can cause serious harm.(11, 112, 113) Analysis in the USA revealed that
cytostatic drugs are the second most common reason for fatal MEs.(114) Protocols
used for cancer treatment are complex and involve many medications. Chemotherapy
dosage is unique and specific, in that dosing should be individualised and non-
standardised. Doses are prescribed on the basis of body size (e.g. weight, BSA) in
addition to factors, such as renal and liver function, blood cell count and substance-
specific parameters, such as neurotoxicity (e.g. vincristine).(115) The dosing process
requires patient-specific calculations, which should be reviewed regularly, since such
factors can change during therapy and the dose should be adjusted accordingly.(96)
16
Some antineoplastic drugs are administered via different routes in variable doses
over various periods of time (e.g. bolus, continuous infusion). Some antineoplastic
drugs can be given safely by one route but not by another. Vincristine, for example,
can be potentially life-threatening if administered intrathecally.(116) Most
antineoplastic drugs require reconstitution and preparation, with several available in
multi-dose vials in varying concentrations. Dosages are often extemporaneously
compounded to meet the need for small doses in these patients.(96)
Several chemotherapy and supportive drugs have sound-alike and look-alike names.
Oral orders involving sound-alike medications may be misinterpreted or
misunderstood, e.g. carboplatin and cisplatin, docetaxel and paclitaxel, vincristine
and vinblastine. Doxorubicin has been confused with the antibiotic dicloxacillin and
methotrexate has been confused with methohexital.(117) Chemotherapy protocols
stated as acronyms (e.g. CHOP) can also cause confusion. Referring to
chemotherapy drugs by their nickname (e.g. ‘donna’ for duanorubicin, ‘epi’ for
epirubicin) has also caused errors.(117) Similarities in labelling and packaging of
chemotherapy drugs also increase the risk of MEs. On labels, names of medicines
may be in small print that is easily misread, and many medicine labels have similar
designs and layouts.(117, 118) Some chemotherapy drugs from the same
manufacture are packaged using similar colours and designs. Vials may appear
similar in size and shape but contain vastly different medications.(117)
The process from prescribing to monitoring chemotherapy involves individuals from
multiple disciplines whose efforts must be coordinated to minimise risks.(119) All of
the above mentioned factors have implications on clinical decision making for
paediatric patients, and each of the stages of dose calculation, preparation and
administration of chemotherapy has potential for error.(120) Children receiving
chemotherapy are identified as high-risk in terms of their likelihood to suffer the
consequences of an untoward event associated with medication misadventure.
1.5 Pharmacists’ Interventions in Minimising Medication Misadventure
Clinical pharmacy services aim to ensure optimal outcomes for patients. The main
focus of clinical pharmacy practice, as stated by the Society of Hospital Pharmacists
of Australia, is: ‘for ensuring the correct patient receives the optimum dose of the
most appropriate medication for a specific condition via a rational dosage form and
17
regimen, over an appropriate time period’.(121) This definition also identifies the
role of clinical pharmacists to improve patient safety and minimise any harm related
to medication use through identification, management and prevention of ADEs and
drug interactions. Clinical pharmacy practice is prevalent in hospital settings across
Australia, albeit variable in the nature and extent of the service. One of the major
outcomes of a clinical pharmacy service is to prevent or reduce drug-related harm
and enhance the efficacy of drug treatment.(122) Clinical services that may lead to
pharmacists’ interventions cover all aspects of patient care and include: provision of
drug information resources and education for health professionals; development of
treatment protocols; patient education and counselling; analysis and performance
improvement; medication reconciliation; and other services consistent with
pharmaceutical care.(123, 124)
A pharmacist’s intervention is: ‘any reactive activity in response to an erroneous
medication order and suggestion with regard to the medication order where the
activity may involve contacting the prescriber’.(125) The Indian Health Service
Pharmacy’s definition of pharmacist’s intervention is: ‘any action undertaken by a
pharmacist during the prescription screening and dispensing process when
recognising a drug-related problem in order to solve the problem’.(126) A UK study
has defined a clinical intervention as: ‘any recommendation made by pharmacy staff
with the purpose of changing drug treatment or its monitoring’.(127) Although the
precise definition is still debated, in Australia, there is general consensus that a
clinical pharmacy intervention is: ‘any action by a pharmacist that directly results in
a change in patient management or therapy’.(128) This definition acknowledges that
clinical pharmacy interventions occur if they have been discussed with prescribers,
nurses and patients, i.e. no intervention can occur if the pharmacist has not been able
to influence their behaviour.(128)
Besides intervening to resolve/prevent actual/potential DRPs, clinical pharmacists
perform a number of other functions that might not result in recommendations or
direct changes in medication management. These include (but are not limited to)
clarifying medication orders, drug use evaluations, providing education for medical
and nursing staff, therapeutic drug monitoring and counselling patients and/or
parents/caregivers. All of these non recommendation generating activities are
18
important in minimising drug-related harm and could be considered clinical
pharmacy interventions.(129)
For the purpose of this study, the term pharmacist’s intervention was adopted from
the Society of Hospital Pharmacists of Australia and refers to any action by a clinical
pharmacist related to patients’ management or therapy. The interventions were
classified as either resulting in drug changes (active interventions) or not resulting in
drug changes (passive intervention). Passive interventions are care-centred activities
performed by clinical pharmacists in relation to interactions with doctors, nurses,
other pharmacists, and patients. The term ‘clinical intervention’ incorporates a wide
range of activities performed by pharmacists to promote patient safety and protect
patients from drug-related harm.
Pharmacists are best positioned to ensure that medications are used rationally and
safely, increase awareness of MEs and prevent medication misadventure. The
traditional role of pharmacists particularly in hospitals (e.g. compounding,
dispensing and supply of medicines) has expanded to include clinical activities. This
transition has increased the contribution of pharmacists as part of healthcare teams in
minimising DRPs and optimising patient outcomes.(130) Pharmacists are crucial for
successful medication misadventure reporting and are critical in error-prevention
interventions, especially when participating in ward rounds.(131) Many critical units,
such as neonatal critical care and oncology, have relied on pharmacists’ participation
during ward rounds to resolve ADRs, drug interactions and MEs associated with
complex medical conditions and medication regimens.(14, 15) Substantial savings
can be made by maximising the competencies of pharmacists and implementing
pharmaceutical care.(56) The economic implications of pharmacists’ interventions
are expanded in Section 1.6.
One type of passive intervention involves provision of drug information and
education to other healthcare providers. Pharmacists should ensure the availability of
current evidence-based references on the appropriate use of drugs for all those
involved in the medication use process.(123, 132) Pharmacists need to be well
informed in order to be able to provide medication-related information to other
healthcare providers. This information may include: drug-specific precautionary
warnings and adverse effects, particularly dose- and schedule-limiting effects;
19
potential interactions with other drugs, disease states, and foods; administration
methods, including drug admixture stability and compatibility with other drugs and
additives; dose calculation; dose recommendations for single- and multiple-treatment
courses; medication and dose adjustment for persons with concurrent diseases and
organ impairment, e.g. renal failure; and dosing based on pharmacokinetic
parameters and monitoring guidelines.(133) Pharmacists should provide current
discipline-specific educational materials about medication use to those who
prescribe, prepare and administer medications. Pharmacists should consider both the
sources of the materials and effective ways to deliver information so that it is easily
interpreted and understood. When new medications are introduced, pharmacists’
contribution in developing educational materials on medication regimens and
treatment protocols are paramount.(123, 132)
Through these interventions pharmacists can ensure that the treatment protocol has
been described clearly by using standardised language, abbreviations, content and
units of measurement.(133) In clinical units where treatment regimens are used
intensively (e.g. paediatric oncology), pharmacists can initiate the development of
protocols to assist with quality and accurate prescribing, minimise misinterpretation,
and facilitate effective and safe practices. Pharmacists should also lead initiatives to
standardise all procedures related to drug preparation, e.g. reconstitution, dilution,
and drug admixture. This intervention is imperative in paediatric oncology where
treatment protocols are complex and specific to cancer type.(134) Kohler et al.(135)
have developed explicit guidelines for outlining chemotherapy dosage schedules,
templates to describe chemotherapy drug regimens in a clear, uniform and consistent
manner, and standardised labels for dispensed medications.
Pharmacists have professional responsibilities to ensure patients use their
medications appropriately.(136) Studies conducted at the Albany Medical Center
(New York) demonstrated that most patients did not have a clear understanding or
possessed limited knowledge about their medications.(137) In another study,
discrepancies between the medications prescribed and the medications taken by
patients were reported in 76% of cases.(138) Failure to educate patients about their
medications has also been the subject of litigation. The duty of pharmacists to
educate and warn patients of potential problems and/or hazards related to medication
20
use has been tested in the courts in the USA and Australia; failure to perform this
duty has had legal consequences for pharmacists.(1) The Institute of Medicine’s, To
Err is Human: Building a Safer Health System, has heightened awareness on the
necessity to increase a patient’s role in effective and safe medication use.
Pharmacists are critical to facilitating this process through educating and counselling
patients about their medical conditions and medications.(2)
Medication reconciliation may trigger pharmacists’ interventions. Medication
reconciliation is: ‘a process to consciously continue, discontinue or modify
medication orders’.(139) This is thorough process is used to collate a complete and
accurate list of patients’ current medications.(140) It ensures that patients receive all
intended medications during hospitalisation. Discrepancies are discussed with the
prescriber and reasons for changes to therapy are documented. The medication list
should include all prescription and non-prescription medications, including dietary
supplements and over-the-counter medicines. Medication reconciliation should be
performed for each patient being transferred within the same institution or to other
institutions.(141) Medication orders can be incomplete, particularly when patients
are transferred to other units in the same hospital or to another hospital, or discharged
from hospital.(142) Medication accuracy at transitions of care is one of five patient
safety priorities nominated by the World Health Alliance on Patient Safety, which
can be achieved through medication reconciliation.(140) The effectiveness of
medication reconciliation in error reduction is well established. Around 40% of MEs
are due to inadequate reconciliation during hospital admission, transfer and
discharge.(143) Medication reconciliation by pharmacists could decrease MEs by
70% to 80% and ADEs by more than 15%.(144)
1.6 Clinical Significance and Economic Implications of Pharmacists’
Interventions
Numerous studies have highlighted clinical pharmacists’ roles in ensuring safe and
optimal medication management in the continuum of care in critical settings,
specifically emergency departments (EDs) (145) and intensive care units (ICUs).(15,
17, 146) A study in a metropolitan teaching hospital in Australia examined the
impact of an ED clinical pharmacist on prescribing errors. The rate of prescription
errors detected was 1.6 errors per patient during the control period, which decreased
21
to 0.5 errors per patient during the intervention period, when the ED clinical
pharmacist participated in the healthcare team.(145)
Leape et al.(15) justified the contribution of clinical pharmacists in reducing the rate
of ADEs in an ICU. They reported a decrease in preventable ADEs in adult patients
by 66% after the implementation of clinical pharmacy services. There were 10.4
ADEs per 1000 patient-days before the intervention and 3.5 ADEs per 1000 patient-
days after the intervention, with no change in the control ICU. The introduction of
clinical services including pharmacists’ interventions in a 30-bed medical ICU in a
tertiary teaching hospital in Korea were considered essential by other members of the
healthcare team. This one-year study also highlighted the highest need for
pharmacists’ interventions was for severely ill patients with renal impairment and
long length of stay.(146)
Studies investigating the incidence of ADEs in paediatric patients are lacking. A
prospective epidemiological study in two university hospitals found that the ADE
rate in children was similar to adult patients. This study also highlighted that the
potential ADE rate was three-fold higher in children.(50) A pharmacist in a
paediatric ICU was shown to intercept MEs, as well as recognise ongoing problems
related to medication use.(17) Clinical pharmacists in the ICU, in adult or paediatric
settings, could also be the main source of knowledge for medical and nursing staff in
relation to the pharmacology of medications.(17, 144, 145)
To measure the clinical significance of pharmacists’ interventions, it is beneficial to
establish a specific scale of measurement. Dodds et al.(147) classified pharmacists’
interventions as minor, moderate and major impact. Analysis of the clinical
significance of pharmacists’ interventions revealed five distinct scales that have been
used for rating pharmacists’ interventions. The scale by Folli et al.(148) has been
widely used and rates the interventions into five levels: extremely significant, very
significant, significant, somewhat significant and no significance. Hatoum et al.(149)
published a ranking system that highlighted the value of clinical pharmacy services
by assessing the potential impact of the interventions with regard to patient care. An
Australian study reported the clinical significance of pharmacists’ interventions into
five scales: no clinical significance, minor, moderate, major and life-saving.(18)
22
Pharmacists’ interventions can be classified and analysed further based on the DRPs
addressed. Classifying DRPs is an essential component of pharmaceutical practice
and research.(150, 151) A systematic review of DRP classification systems identified
20 different of classification systems. As evaluation of pharmaceutical care of a wide
range of studies requires a universal DRP classification system, the review highlights
the need for consensus.(152)
Many studies have evaluated the economic implications resulting from pharmacists’
interventions in hospitals (Table 1.1).(17, 18, 153-158) There is a wide variety of
study settings, study duration, definition of interventions and method of cost
assessment. A review of the economic effects of clinical pharmacy interventions
revealed that the majority of studies were undertaken in adult patients.(159)
1.7 Root Cause Analysis
A common issue faced by hospitals is that medication misadventure, particularly
MEs, does not neatly fall into defined categories. For instance, when a patient
receives another patient’s medications, it may be assumed that this error is the result
of inadequate patient identification. Although a reasonable assumption, this approach
does not identify the cause(s) of the error. Possible causes in this case may be an
incorrect patient identification wristband or a mistake during medication order entry.
The same errors may be repeated because incident reporting systems fail to identify
root causes. It is important, therefore, to ensure that incident reporting systems and
data are used to fuel RCA which results in corrective action in the systems.(1)
The concept of RCA is detailed in Section 1.7.1 and its application in health systems
is explored in Section 1.7.2. Another major issue relating to error-reporting systems
is misleading assumptions among pharmacists who consider errors do not need to be
reported if they can be corrected. For example, pharmacists may not report
prescribing errors if the errors can be corrected in the pharmacy department. They
assume their actions are interventions instead of MEs. This leads to an under
estimation of MEs for the organisation and a lost opportunity to learn from potential
errors.(160) If errors and the results of RCA are only reported and disseminated
locally, the lessons cannot be learned by other departments/institutions.(60)
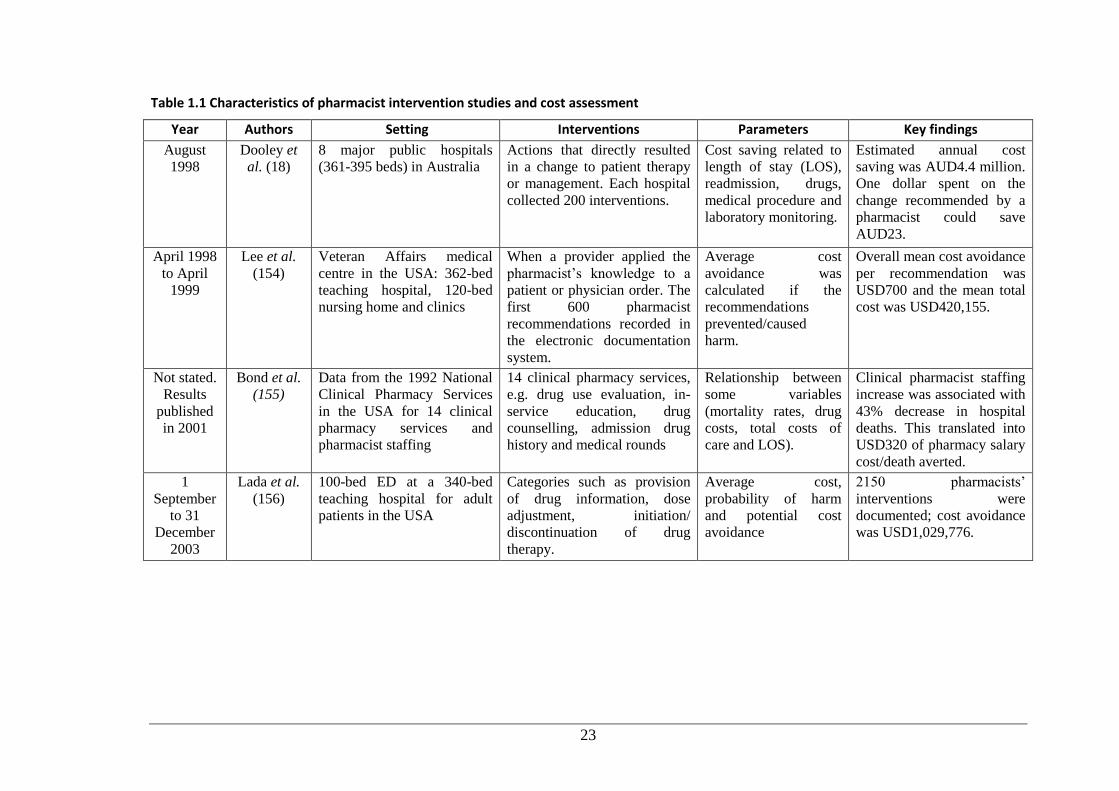
23
Table 1.1 Characteristics of pharmacist intervention studies and cost assessment
Year Authors Setting Interventions Parameters Key findings
August
1998
Dooley et
al. (18)
8 major public hospitals
(361-395 beds) in Australia
Actions that directly resulted
in a change to patient therapy
or management. Each hospital
collected 200 interventions.
Cost saving related to
length of stay (LOS),
readmission, drugs,
medical procedure and
laboratory monitoring.
Estimated annual cost
saving was AUD4.4 million.
One dollar spent on the
change recommended by a
pharmacist could save
AUD23.
April 1998
to April
1999
Lee et al.
(154)
Veteran Affairs medical
centre in the USA: 362-bed
teaching hospital, 120-bed
nursing home and clinics
When a provider applied the
pharmacist’s knowledge to a
patient or physician order. The
first 600 pharmacist
recommendations recorded in
the electronic documentation
system.
Average cost
avoidance was
calculated if the
recommendations
prevented/caused
harm.
Overall mean cost avoidance
per recommendation was
USD700 and the mean total
cost was USD420,155.
Not stated.
Results
published
in 2001
Bond et al.
(155)
Data from the 1992 National
Clinical Pharmacy Services
in the USA for 14 clinical
pharmacy services and
pharmacist staffing
14 clinical pharmacy services,
e.g. drug use evaluation, in-
service education, drug
counselling, admission drug
history and medical rounds
Relationship between
some variables
(mortality rates, drug
costs, total costs of
care and LOS).
Clinical pharmacist staffing
increase was associated with
43% decrease in hospital
deaths. This translated into
USD320 of pharmacy salary
cost/death averted.
1
September
to 31
December
2003
Lada et al.
(156)
100-bed ED at a 340-bed
teaching hospital for adult
patients in the USA
Categories such as provision
of drug information, dose
adjustment, initiation/
discontinuation of drug
therapy.
Average cost,
probability of harm
and potential cost
avoidance
2150 pharmacists’
interventions were
documented; cost avoidance
was USD1,029,776.
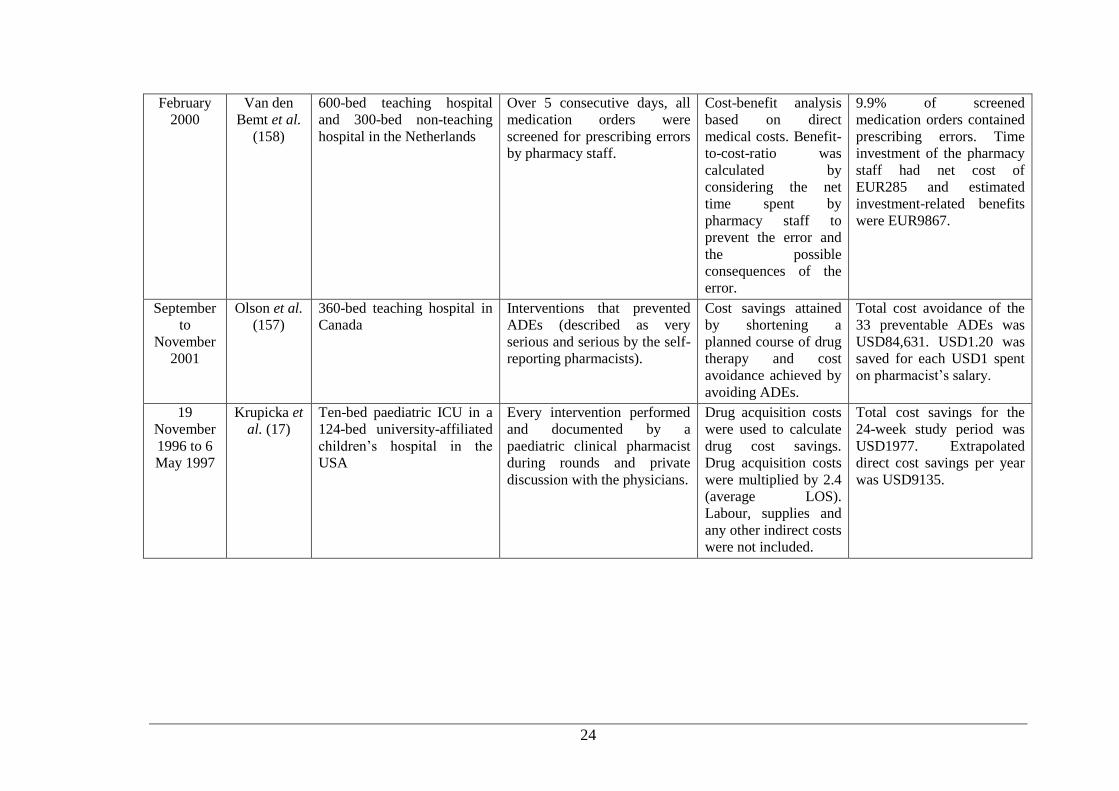
24
February
2000
Van den
Bemt et al.
(158)
600-bed teaching hospital
and 300-bed non-teaching
hospital in the Netherlands
Over 5 consecutive days, all
medication orders were
screened for prescribing errors
by pharmacy staff.
Cost-benefit analysis
based on direct
medical costs. Benefit-
to-cost-ratio was
calculated by
considering the net
time spent by
pharmacy staff to
prevent the error and
the possible
consequences of the
error.
9.9% of screened
medication orders contained
prescribing errors. Time
investment of the pharmacy
staff had net cost of
EUR285 and estimated
investment-related benefits
were EUR9867.
September
to
November
2001
Olson et al.
(157)
360-bed teaching hospital in
Canada
Interventions that prevented
ADEs (described as very
serious and serious by the self-
reporting pharmacists).
Cost savings attained
by shortening a
planned course of drug
therapy and cost
avoidance achieved by
avoiding ADEs.
Total cost avoidance of the
33 preventable ADEs was
USD84,631. USD1.20 was
saved for each USD1 spent
on pharmacist’s salary.
19
November
1996 to 6
May 1997
Krupicka et
al. (17)
Ten-bed paediatric ICU in a
124-bed university-affiliated
children’s hospital in the
USA
Every intervention performed
and documented by a
paediatric clinical pharmacist
during rounds and private
discussion with the physicians.
Drug acquisition costs
were used to calculate
drug cost savings.
Drug acquisition costs
were multiplied by 2.4
(average LOS).
Labour, supplies and
any other indirect costs
were not included.
Total cost savings for the
24-week study period was
USD1977. Extrapolated
direct cost savings per year
was USD9135.
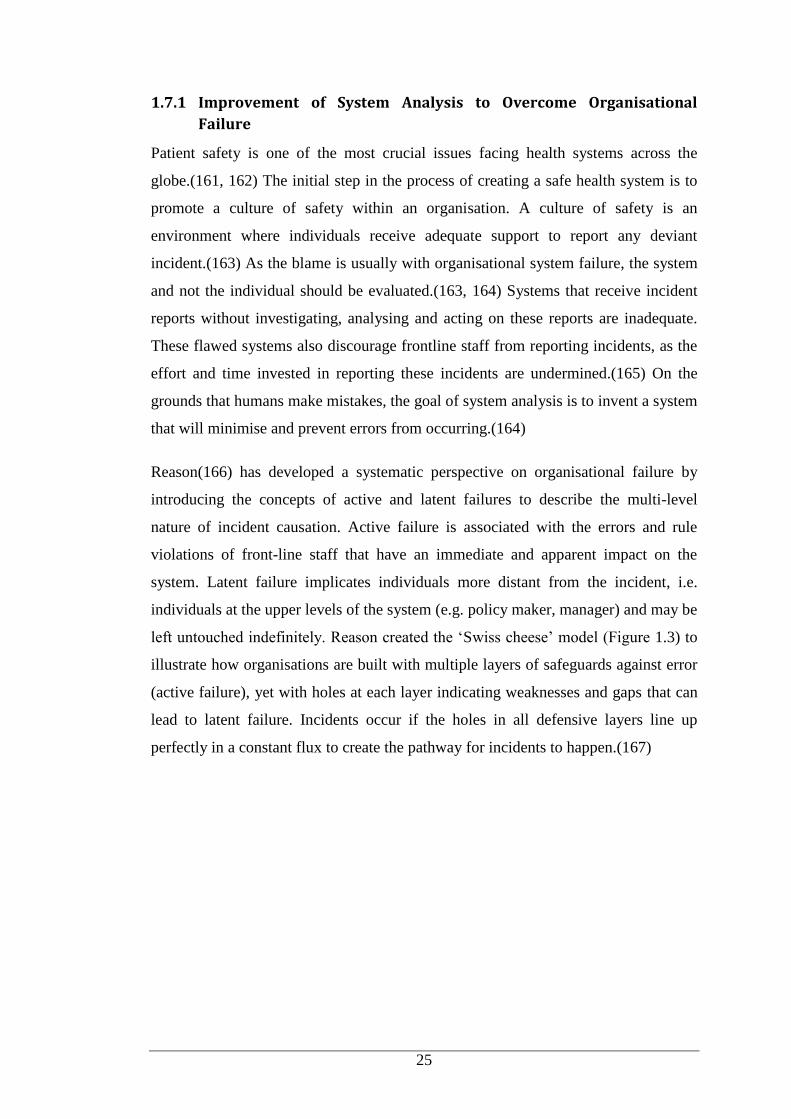
25
1.7.1 Improvement of System Analysis to Overcome Organisational
Failure
Patient safety is one of the most crucial issues facing health systems across the
globe.(161, 162) The initial step in the process of creating a safe health system is to
promote a culture of safety within an organisation. A culture of safety is an
environment where individuals receive adequate support to report any deviant
incident.(163) As the blame is usually with organisational system failure, the system
and not the individual should be evaluated.(163, 164) Systems that receive incident
reports without investigating, analysing and acting on these reports are inadequate.
These flawed systems also discourage frontline staff from reporting incidents, as the
effort and time invested in reporting these incidents are undermined.(165) On the
grounds that humans make mistakes, the goal of system analysis is to invent a system
that will minimise and prevent errors from occurring.(164)
Reason(166) has developed a systematic perspective on organisational failure by
introducing the concepts of active and latent failures to describe the multi-level
nature of incident causation. Active failure is associated with the errors and rule
violations of front-line staff that have an immediate and apparent impact on the
system. Latent failure implicates individuals more distant from the incident, i.e.
individuals at the upper levels of the system (e.g. policy maker, manager) and may be
left untouched indefinitely. Reason created the ‘Swiss cheese’ model (Figure 1.3) to
illustrate how organisations are built with multiple layers of safeguards against error
(active failure), yet with holes at each layer indicating weaknesses and gaps that can
lead to latent failure. Incidents occur if the holes in all defensive layers line up
perfectly in a constant flux to create the pathway for incidents to happen.(167)
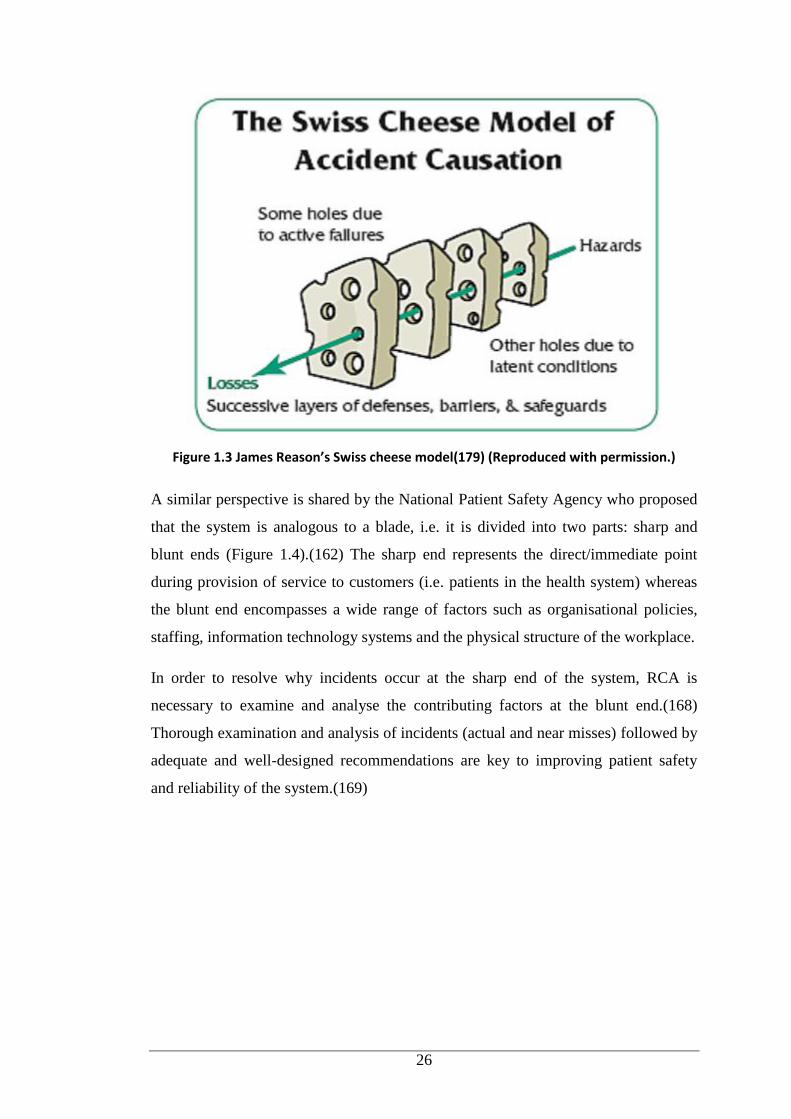
26
Figure 1.3 James Reason’s Swiss cheese model(179) (Reproduced with permission.)
A similar perspective is shared by the National Patient Safety Agency who proposed
that the system is analogous to a blade, i.e. it is divided into two parts: sharp and
blunt ends (Figure 1.4).(162) The sharp end represents the direct/immediate point
during provision of service to customers (i.e. patients in the health system) whereas
the blunt end encompasses a wide range of factors such as organisational policies,
staffing, information technology systems and the physical structure of the workplace.
In order to resolve why incidents occur at the sharp end of the system, RCA is
necessary to examine and analyse the contributing factors at the blunt end.(168)
Thorough examination and analysis of incidents (actual and near misses) followed by
adequate and well-designed recommendations are key to improving patient safety
and reliability of the system.(169)
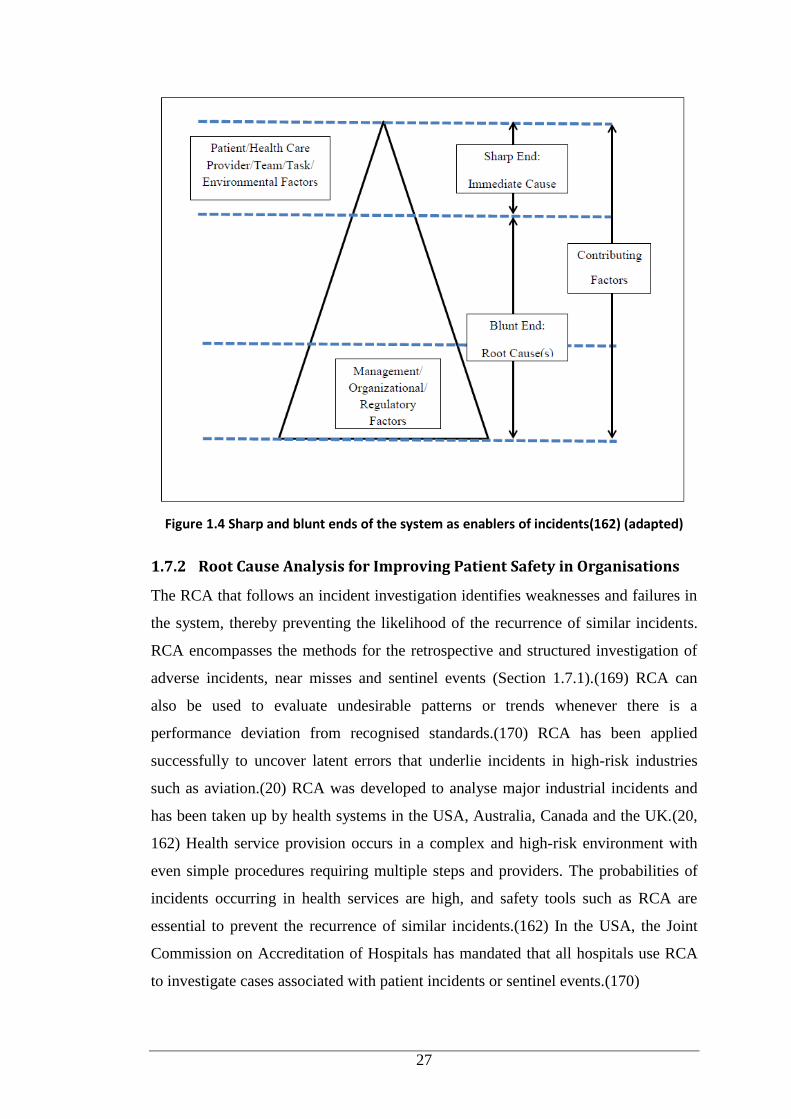
27
Figure 1.4 Sharp and blunt ends of the system as enablers of incidents(162) (adapted)
1.7.2 Root Cause Analysis for Improving Patient Safety in Organisations
The RCA that follows an incident investigation identifies weaknesses and failures in
the system, thereby preventing the likelihood of the recurrence of similar incidents.
RCA encompasses the methods for the retrospective and structured investigation of
adverse incidents, near misses and sentinel events (Section 1.7.1).(169) RCA can
also be used to evaluate undesirable patterns or trends whenever there is a
performance deviation from recognised standards.(170) RCA has been applied
successfully to uncover latent errors that underlie incidents in high-risk industries
such as aviation.(20) RCA was developed to analyse major industrial incidents and
has been taken up by health systems in the USA, Australia, Canada and the UK.(20,
162) Health service provision occurs in a complex and high-risk environment with
even simple procedures requiring multiple steps and providers. The probabilities of
incidents occurring in health services are high, and safety tools such as RCA are
essential to prevent the recurrence of similar incidents.(162) In the USA, the Joint
Commission on Accreditation of Hospitals has mandated that all hospitals use RCA
to investigate cases associated with patient incidents or sentinel events.(170)
28
RCA is the most important development in the transformation of error management
in healthcare delivery.(171) To effectively minimise errors, system weaknesses that
lead to errors must be identified and the system changed to improve its
performance.(172) RCA designed as a quality improvement tool must be able to help
organisations determine the contributing factors and root causes resulting in an
incident. Striving to identify and address the root or underlying causes of critical
incidents will lead to a greater understanding of hazards/problems in the system.
RCA is widely adopted by hospitals and healthcare organisations, and has helped to
identify many problems and solutions.(162, 171, 173) It has become the system
analysis tool to investigate mistakes in healthcare delivery and provides strategies for
developing effective recommendations and action plans for system improvement.(20)
There are many benefits in conducting RCA, e.g. building collaborative and
professional relationships among physicians, pharmacists, nurses and other
healthcare providers, and providing an excellent learning opportunity for those
involved in the RCA process. The main advantage is correcting system flaws in order
to prevent the recurrence of similar incidents in the future.(174)
1.7.3 Conducting Root Cause Analysis
RCA is designed to answer three questions: What happened? Why did it happen?
What can be done to prevent it from happening again?.(168) RCA is founded on the
principles that patients, direct healthcare providers, senior management, board
members and representatives of key external organisations play significant roles in
improving the system.(20, 162) For RCA to work, it requires: a non-punitive and
confidential method for reporting adverse events; collaboration of health
professionals; an understanding of relevant legislation and human factor engineering
(HFE); identification of problems in the system; and strategies to improve the
system.(161, 162, 171) There must also be timely and relevant feedback to reporters
of events.(171)
Contributing factors and root causes identified are either of the HFE or non-HFE
types. HFE is ‘the scientific discipline concerned with the understanding of
interactions among humans and other elements in a system in order to optimise
human wellbeing and overall system performance’.(172) HFE builds on the premise
that human performance and subsequent occurrence of errors are influenced by
29
system factors. HFE-type factors and root causes refer to interactions between
humans and their environment, and may include policies, procedures,
communication, training, workload, equipment and the physical
environment/workplace. Non-HFE-type factors and root causes include patient
behaviour and course of disease, which are more difficult, if not impossible, to
modify with recommendations resulting from an RCA. Consequently, when patient
behaviour or course of disease is identified as the primary root cause, this finding
significantly lowers the possibility that any effective recommendations from RCA
can be identified and implemented to prevent the event from recurring.(175)
There is broad consensus that RCA represents a variety of approaches instead of a
single method. Woloshynowych et al.(176) have described more than 40 RCA
techniques, such as brainstorming, cause-effect charts, ‘five whys’ diagrams and
fault trees, which provide different options of RCA analysis techniques. Although
variations exist, the RCA process is usually organised in sequential steps. According
to Rooney et al.(19), RCA is a four-step process involving data collection, causal
factor charting, root cause identification, and recommendation generation and
implementation as follows:
1. In Step 1 information related to the incident is collected. This step is crucial
because without a complete dataset and an understanding of the incident, the
causal/contributing factors and root causes associated with the incident cannot be
comprehensively identified. Inevitably, a great deal of time invested in analysing the
incident is spent in gathering the data.
2. Step 2, causal factor charting, can be initiated immediately. This step provides a
structure and visual guide for investigators to organise and analyse the information
gathered during the investigation, and to identify gaps and deficiencies in knowledge
as the investigation progresses.(19) This step can be considered the review process to
brainstorm why the incident happened and the possible causes that resulted in the
incident. Causal factor charting is a sequence diagram that describes the incidents
and the conditions surrounding these incidents, and drives the data collection process
by identifying the need for gathering more data. Data collection continues until the
investigators are satisfied with the thoroughness of the investigation. When the entire
occurrence has been charted, along with the complete dataset, the investigators are in
30
a confident position to uncover the major contributing/causal factors to the incident.
Causal factors, if eliminated, would have either prevented the occurrence of an
incident or reduced its severity. The focus is on identifying all issues/flaws in the
system and all possible causes that may have contributed to the adverse incident.
3. After all the causal factors have been identified, Step 3 involves organising and
analysing the causal factors by category in order to identify the root causes of each
causal factor. A key aspect of this step is to understand how the causal factors relate
to each other and ensure that the RCA has progressed far enough into the blunt end
of the system so that root causes can be clearly defined. A root cause map can assist
in better visualising these inter-relationships, ensure thorough review, clarify
understanding and shift the focus away from individual performance/sharp end
towards system performance/blunt end. Options include the Ishikawa/fishbone and
tree diagrams.(162)
4. Step 4 is recommendation generation and implementation. After recognising the
root causes for each causal factor, achievable recommendations for preventing
recurrence of the incident are generated. The recommendations should directly
address the root causes identified from the previous step. This step also includes the
specific timelines for fixing the problems. The final step also includes the
development of ongoing monitoring strategies to evaluate the improvements.(170)
1.7.4 Limitations of Root Cause Analysis
Conducting an RCA or another retrospective investigation presents an opportunity to
learn valuable lessons about how to redesign health systems and prevent recurrence
of the incident/error. Nevertheless, the RCA process is not without problems. Many
RCAs are performed incorrectly or incompletely, and therefore, cannot produce
appropriate and usable results. In many organisations RCA is used erroneously to
uncover the fundamental and apparent causal factor of the incident instead of ‘the
root causes for all possible causal factors.(20) As the determination of causal factors
is dependent on the training and experience of the analyst, the decisions on the
causes are inherently subjective and inconclusive. The danger of drawing
conclusions from inadequate sample sizes (i.e. incidents with remote possibilities)
should also be recognised. If events are common across hospitals, remedial action
should be designed at the health system rather than individual hospitals.(20, 177)
31
Another shortcoming relates to the level at which to terminate the analysis; a sensible
stopping point is required for each RCA process.(177) While recognising the
limitations of RCA, significant benefits can be derived with adequate and exhaustive
processes for each step, followed by thoughtful implementation.(162)
32
Chapter 2
AIMS
The aims of the study were to evaluate the role of clinical pharmacists’ interventions
in minimising medication misadventure in children with cancer; to investigate the
clinical significance and identification of medication misadventure through these
interventions; and to apply RCA to examine the factors contributing to medication
misadventure.
The study was divided into four parts.
Part One: Clinical Pharmacists’ Interventions in a Children’s Hospital
The objectives were to:
observe and document pharmacists’ interventions from three clinical units -
general medicine, general surgery and haematology-oncology - in a children’s
hospital
compare the rate and pattern of pharmacists’ interventions and pharmacists’
active interventions between the clinical units
observe and document pharmacists’ interventions during dispensing in the
Haematology-Oncology Pharmacy
identify the predictors for physicians’ acceptance of pharmacists’ active
interventions.
Part Two: Clinical Significance of Pharmacists’ Active Interventions and
Identification of Medication Misadventure through Pharmacists’ Active Interventions
Using an Expert Panel
The objectives were to:
determine the clinical significance of a sample of pharmacists’ active
interventions
identify whether these interventions involved medication misadventure, to
categorise medication misadventure into three subsets - ADE, ADR and ME -
33
and to classify medication misadventure involving ME according to the type
of error and its severity.
Part Three: Comparison of Documentation Methods used for Pharmacists’
Interventions
The objectives were to:
analyse pharmacists’ interventions based on snapshot self-reports of
interventions
examine the representativeness of the snapshot self-reports versus continuous
documentation using direct observation
ascertain pharmacists' perceptions on the interventions documented through
snapshot self-reports versus direct observation
identify barriers perceived by pharmacists to documenting their interventions
during snapshot periods and to seek suggestions on how to improve the
documentation of pharmacists’ interventions.
Part Four: Medication Errors in Children: Root Cause Analysis Using Simulated
Case Scenarios
The objectives were to:
apply RCA in a sample of simulated cases to determine the clinical
significance of MEs and the responsible health professional(s)
investigate the contributing factors for the MEs and preventive strategies to
reduce the occurrence of MEs in children.
34
Chapter 3
METHOD
The entire study was conducted in three clinical units (haematology-oncology,
general medical, general surgical) at the Princess Margaret Hospital for Children
(Perth, Western Australia). This 220-bed public paediatric hospital has
approximately 250,000 patient visits (inpatient and outpatient) annually. The
haematology-oncology unit consisted of the Haematology-Oncology Ward
(inpatient) and the Haematology-Oncology Pharmacy (inpatient and outpatient).
For Part One clinical ward pharmacists’ interventions were prospectively
documented across the three clinical units and the Haematology-Oncology
Pharmacy. The non-disguised principal researcher observed the pharmacists and
documented their interventions.
For Part Two randomly selected pharmacists’ active interventions from Part One
were analysed. Two of the four researchers and three independent panellists (Panel 1)
analysed the interventions for clinical significance and identified medication
misadventures and classified them as an ADE, ADR or ME. If the intervention
involved an ME, the type of error and its severity were examined. As the rating of
the clinical significance of the interventions could not be resolved through
consensus, a second panel (researchers and two independent panellists) was set up.
For Part Three pharmacist’s interventions from self-reports of three snapshot periods
were analysed retrospectively. The interventions from the self-reports were
compared with the interventions documented during direct observation in Part One to
examine the pattern and representativeness of short-term documentation versus
continuous documentation by an independent observer. A focus group discussion
followed with pharmacists from the hospital to ascertain their perceptions on the in
situ intervention documentation process and their suggestions to improve the process.
For Part Four an RCA was conducted of five simulated clinical cases involving MEs
in children. For the RCA self-administered questionnaires were disseminated to
doctors, nurses and pharmacists at the study hospital.
35
3.1 Part One: Clinical Pharmacists Interventions in a Children’s Hospital
3.1.1 Description of Study Settings
Data were collected using prospective non-disguised observation from September
2011 to August 2012 in three clinical units (general medicine, general surgery and
haematology-oncology). There were three wards in the General Medical Unit -
General Medical Ward for Infants, General Medical Ward for Young Children and
General Medical Ward for Adolescents – one General Surgical Ward and one
Haematology-Oncology Ward; a total of five study wards. The general medical
wards admitted patients under general paediatrics and a range of non-oncology
medical specialties, while the general surgical ward admitted patients under general
surgery, opthalmology and otolaryngology.
Ward-based clinical pharmacy services were provided Monday to Friday 0830 to
1700 and from 0900 to 1600 during weekends/public holidays (for intravenous
admixture services and urgent drug supplies only). Outside these hours an on-call
pharmacist was available for urgent drug inquiries. Ward pharmacists undertook the
pharmacy round/full ward visit once a day during weekdays, either in the morning or
afternoon. After that, pharmacist could be contacted via pager. During pharmacy
rounds, they reviewed patients’ medication orders prescribed on the inpatient
medication charts and reconciled the medications by comparing the recent
medication orders with previous orders in patients’ medical records and double-
checking with patients and/or parents and carers. Pharmacists also took patient
medication histories, including allergy and ADR histories. If there were any
discrepancies, pharmacists contacted the doctor to resolve the problem.
Ward pharmacists provided drug information to medical and nursing staff and
education and counselling to patients and/or their parents. They also monitored the
medications stocked on the ward (‘imprest’). The imprest medications were stored in
a drug room on each ward and organised alphabetically, based on their dose forms. If
there were ‘non-imprest’ medication orders requiring intravenous admixture, e.g.
intravenous antibiotics, the ward pharmacists supplied these medications to the ward.
Nurses were responsible for preparing imprest medications, i.e. selecting the
medications from the imprest cupboard and placing them in the patient’s drug tray.
36
There was no supervision by the pharmacist to ensure that the medications in the
drug trays corresponded with the medication chart. Discharge medications were
organised by pharmacists in the main pharmacy mainly in the mornings.
The hospital has three pharmacies - main pharmacy and two satellite pharmacies
(cardiology and neurology, and haematology-oncology). Besides their ward-based
clinical activities, the haematology-oncology pharmacists dispensed medications,
including cytotoxic chemotherapy and fluid therapy. For outpatients, the non-
parenteral cytotoxic chemotherapy medications and supportive care medications (i.e.
antiemetics, prophylactic antifungals and prophylactic antibacterials) were dispensed
from the Haematology-Oncology Pharmacy. For inpatients, nurses prepared these
medications from the imprest. Medication orders requiring centralised intravenous
admixture service (CIVAS), e.g. intravenous antibiotics, were prepared and
dispensed by the pharmacists. The Haematology-Oncology Pharmacy services were
provided Monday to Friday 0830 to 1700 and during weekends/public holidays from
0900 to 1600 (for intravenous cytotoxic orders and urgent drug supplies only).
Outside these hours an on-call pharmacist was available for urgent drug inquiries.
Three to four pharmacists and one technician were on duty each weekday in the
Haematology-Oncology Pharmacy. Although most of the pharmacists worked part-
time in this satellite pharmacy, they were permanently assigned to the facility so they
were familiar with the workflow and patients’ chemotherapy protocols. The
workflow in the Haematology-Oncology Pharmacy usually involved six steps:
1. Reviewing the patients’ chemotherapy protocols and transferring the
information onto a parenteral cytotoxic sheet (yellow sheet) and fluid therapy
order sheet (white sheet).
2. Creating the labels for medications to be formulated and dispensed.
3. Setting up the chemotherapy medications and hydration fluids prior to
formulating in the Laminar Airflow Hood.
4. Formulating the chemotherapy medications and fluid therapy in the Vertical
Laminar Airflow Cytotoxic Drug Safety Cabinet.
5. Dispensing the parenteral cytotoxic medications to the nurses for
administration.
37
6. Dispensing the non-parenteral medications and providing counselling to
Haematology-Oncology Clinic patients and/or carers.
Two pharmacists were usually responsible for Steps 1 and 2; one to two pharmacists
set up the fluid therapy and parenteral cytotoxic medications, and dispensed the
medications to nurses and non-parenteral medications to outpatients; and one
pharmacist formulated the parenteral cytotoxic medications and fluid therapy in the
Vertical Laminar Airflow Cytotoxic Drug Safety Cabinet. A technician processed
outpatient prescriptions under the pharmacist’s supervision, checked the stock and
ordered the low-stock medications from the main pharmacy. The background
information of pharmacists’ clinical activities during ward rounds and dispensing
was provided as to establish the study protocol.
3.1.2 Direct Observation for Documentation of Pharmacists’
Interventions
Pharmacists working on the study wards and in the Haematology-Oncology
Pharmacy were invited to participate in the study. The principal researcher described
the direct observation method and the ethics requirements (Section 3.1.3) of the
study. The rationale for the direct observation approach was to ensure that the data
collected was comprehensive and not subjected to reporting bias. Although direct
observation has the potential to interfere in the activities of those being observed due
to the presence of an observer (Hawthorne effect) the evidence suggests that the
observation method has little effect on the behaviour of those being observed.(178)
Direct observation has been used to detect MEs and ADEs, few studies have utilised
this approach to document pharmacists’ interventions.(37, 179-182) The majority of
studies in a range of healthcare settings have relied on self-reporting methods to
document pharmacists’ interventions.(129, 147, 183-185) Self-reporting of
pharmacists’ interventions are used in the study hospital. Comparison of the self-
reporting method with direct observation is described in Section 3.3.
Twelve pharmacists agreed to participate in the study. The ward pharmacists worked
on the General Medical Ward for Young Children, General Medical Ward for
Adolescents and the Haematology-Oncology Ward permanently and were senior
pharmacists with more than 10 years experience. The General Medical Ward for
Infants and the General Surgical Ward were staffed by junior pharmacists on a
38
temporary rotation. The ward pharmacists on the general medical and general
surgical wards reviewed medication orders and patients on more than one ward each
weekday. The characteristics of pharmacists assigned to the Haematology-Oncology
Pharmacy are described in Section 3.1.1.
3.1.2.1 Ward-based Pharmacists’ Interventions
The principal researcher (observer) shadowed pharmacists during their ward rounds
and documented their interventions on the five study wards for a total of 35 to 37
non-consecutive days. The observer followed one ward pharmacist for each weekday
and collected the pharmacist’s interventions for that ward. On the following day, the
observer went to another ward and documented another pharmacist’s interventions.
This protocol was used to minimise fatigue in the pharmacist under observation. If,
during direct observation, an intervention or the omission of an intervention could
result in substantial patient discomfort or harm, the observer notified the senior
pharmacist immediately after the ward round. For example, if an antibiotic order was
written for a patient with a known allergy and the pharmacist did not detect the errant
order, the observer could notify the senior pharmacist. Data collected during direct
observation was annotated on the intervention documentation form (Appendix 1).
For the data collected during direct observation (Table 3.1), the diagnosis on
admission was classified using the International Statistical Classification of Diseases
and Related Health Problems(186) for the general medical and general surgical
wards, and the International Classification of Childhood Cancer(187) with slight
modifications for the haematology-oncology patients. The medications involved in
the interventions were categorised using the Australian Medicines Handbook
(AMH).(188). The medications were also categorised based on their dose form and
risk category.(189) The description of interventions were categorised into major type
with further sub-categorisation as described by Condren et al.(190) with slight
modifications to include ‘clarification of medication order’ as an additional category
of the intervention. The intervention categories are outlined in Table 3.2. The rates of
interventions were defined as the number of interventions per 100 medication orders
reviewed. A medication order could have more than one intervention. The principal
researcher divided the interventions into ‘active’ and ‘passive’, as defined
previously.
39
3.1.2.2 Pharmacists’ Interventions during Dispensing
The observer shadowed pharmacists in the Haematology-Oncology Pharmacy for a
total of 33 days. Observations were conducted during weekday trading hours. In
order to minimise fatigue of those under observation pharmacists were not observed
continuously (Section 3.1.2.1). Data collected during direct observation was written
on the intervention documentation form (Appendix 1). Details of the data are
described in Table 3.1. A medication order reviewed could have more than one
intervention. The principal researcher divided the interventions into ‘active’ and
‘passive’, as defined previously.
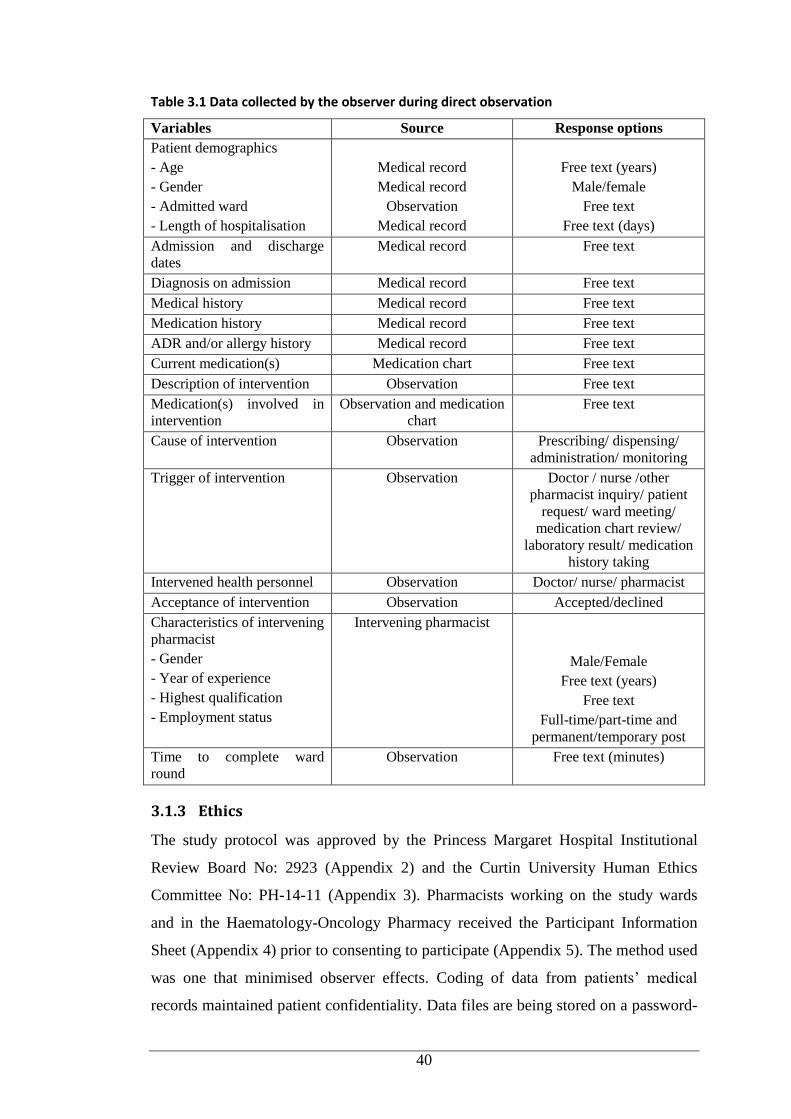
40
Table 3.1 Data collected by the observer during direct observation
Variables Source Response options
Patient demographics
- Age
- Gender
- Admitted ward
- Length of hospitalisation
Medical record
Medical record
Observation
Medical record
Free text (years)
Male/female
Free text
Free text (days)
Admission and discharge
dates
Medical record Free text
Diagnosis on admission Medical record Free text
Medical history Medical record Free text
Medication history Medical record Free text
ADR and/or allergy history Medical record Free text
Current medication(s) Medication chart Free text
Description of intervention Observation Free text
Medication(s) involved in
intervention
Observation and medication
chart
Free text
Cause of intervention Observation Prescribing/ dispensing/
administration/ monitoring
Trigger of intervention Observation Doctor / nurse /other
pharmacist inquiry/ patient
request/ ward meeting/
medication chart review/
laboratory result/ medication
history taking
Intervened health personnel Observation Doctor/ nurse/ pharmacist
Acceptance of intervention Observation Accepted/declined
Characteristics of intervening
pharmacist
- Gender
- Year of experience
- Highest qualification
- Employment status
Intervening pharmacist
Male/Female
Free text (years)
Free text
Full-time/part-time and
permanent/temporary post
Time to complete ward
round
Observation Free text (minutes)
3.1.3 Ethics
The study protocol was approved by the Princess Margaret Hospital Institutional
Review Board No: 2923 (Appendix 2) and the Curtin University Human Ethics
Committee No: PH-14-11 (Appendix 3). Pharmacists working on the study wards
and in the Haematology-Oncology Pharmacy received the Participant Information
Sheet (Appendix 4) prior to consenting to participate (Appendix 5). The method used
was one that minimised observer effects. Coding of data from patients’ medical
records maintained patient confidentiality. Data files are being stored on a password-
41
protected computer and archived securely for at least five years. The same procedure
for handling of data files applied to other data collected in other parts of the study.
3.1.4 Data Management and Analysis
Data collected during direct observation were transcribed onto Excel spread sheets.
The data were checked several times to ensure there were no missing variables. The
variables of date of discharge and length of hospitalisation were incomplete in some
patients. These missing variables were retrieved using iSoft Clinical Manager via the
hospital intranet. Demographic variables and pharmacists’ intervention-related data
were summarised using descriptive statistics (mean ± standard deviation or median
[range] for variables measured on a continuous scale, and frequencies and
percentages for categorical variables). Several pharmacists’ intervention-related
parameters were compared using the Kruskal-Wallis test. The rates of pharmacists’
interventions were reported as the number of interventions per 100 medication orders
reviewed and treated as continuous variables to enable comparison to the published
literature. The rates of all pharmacists’ interventions and active interventions on the
five wards were compared using Poisson regression analysis. Poisson regression
analysis was also used to determine the influence of pharmacists’ level of
employment and the duration of pharmacy ward round on the rates of all
pharmacists’ interventions and the active interventions. All data were analysed using
SPSS version 22.0.
The univariate and multivariate logistic regression for predictors of physician-
acceptance of pharmacists’ active interventions were based on a backward likelihood
ratio method using SPSS version 22.0. The first step of logistic regression is
selecting dependent and independent variables. ‘Acceptance’ of each intervention, as
a binary variable, was used as the dependent variable in a logistic regression model.
Selection of independent variables/predictors, either continuous or categorical, was
guided by published research and the direct observation data (Table 3.1). The
independent variables were grouped into:
Patient characteristics: age, gender, diagnosis on admission, clinical area
during hospital stay, length of stay, number of medications prescribed
Drug characteristics: therapeutic class(188), dose form, high-risk
category(189)
42
Types of active interventions (Table 3.2)
Pharmacists’ characteristics: gender, years of experience, highest academic
qualification, work pattern (full-time/part-time), work post
(permanent/temporary).
A contingency table of dependent variables (degree of acceptance) versus categorical
independent variables was used to ensure that no cell had a zero cell count and that
not fewer than 20% of cells had a frequency count of fewer than five, in accordance
with best practice (Step 2). After regrouping as necessary, univariate logistic
regression analysis was conducted for each variable selected for inclusion in the
model (continuous and categorical) (Step 3). As the traditional p-value (0.05) often
fails to identify variables deemed to be important,(191) any variable demonstrating
an association with the outcome with p<0.25 was initially included in the
multivariate regression model (Step 4). The multivariate logistic regression applied
backward elimination (the least significant variable was progressively deleted until
all variables remaining in the model were statistically significant at p<0.05) to
produce Model 1. Next, all possible two-way interactions of the significant
independent variables from Model 1 were examined (Step 5). Each interaction was
tested in a full regression model including all significant independent variables from
Model 1. An interaction that was not significantly associated with the outcome was
deleted. However, every interaction term with a significant contribution (p<0.05) was
included in the next model. For the final step, the logistic regression was repeated to
include all significant independent variables and significant interaction variables as
the predictors. The odds ratios, their significance levels and 95% confidence intervals
(95%CI) were calculated for each variable. Significant variables (p<0.05) in the final
model were considered to be the predictors of the outcome (physician-acceptance of
pharmacists’ active intervention).
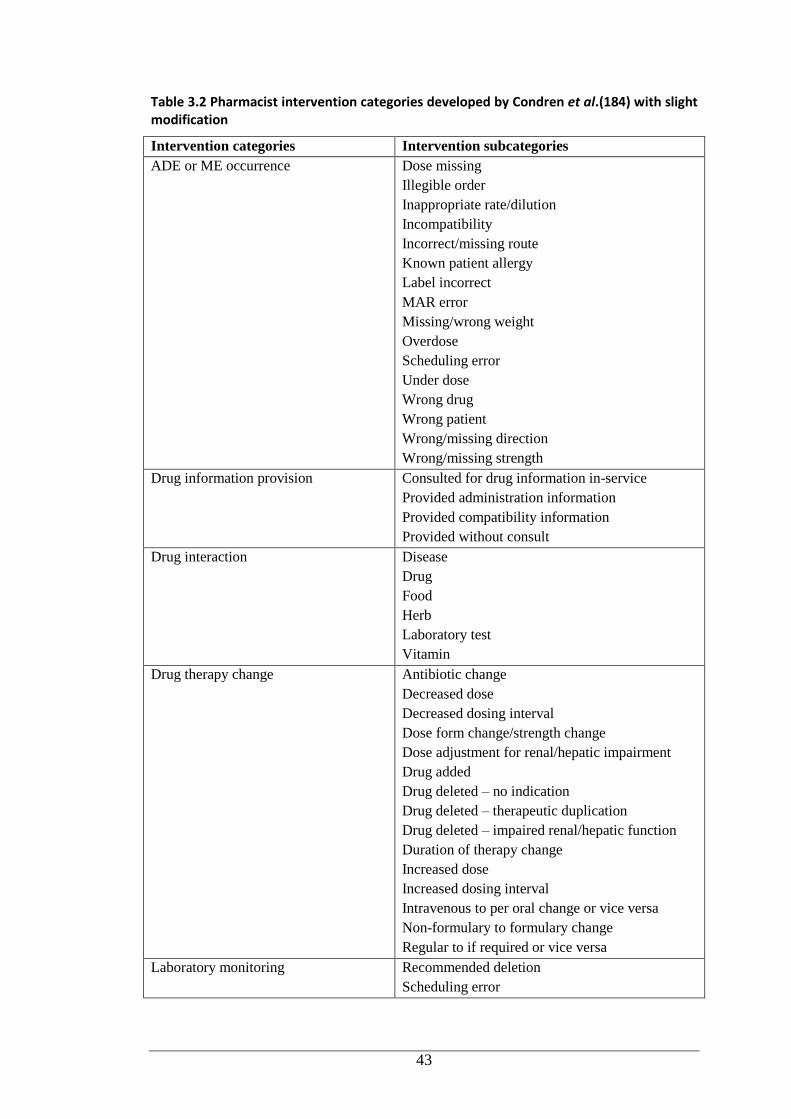
43
Table 3.2 Pharmacist intervention categories developed by Condren et al.(184) with slight modification
Intervention categories Intervention subcategories
ADE or ME occurrence Dose missing
Illegible order
Inappropriate rate/dilution
Incompatibility
Incorrect/missing route
Known patient allergy
Label incorrect
MAR error
Missing/wrong weight
Overdose
Scheduling error
Under dose
Wrong drug
Wrong patient
Wrong/missing direction
Wrong/missing strength
Drug information provision Consulted for drug information in-service
Provided administration information
Provided compatibility information
Provided without consult
Drug interaction Disease
Drug
Food
Herb
Laboratory test
Vitamin
Drug therapy change Antibiotic change
Decreased dose
Decreased dosing interval
Dose form change/strength change
Dose adjustment for renal/hepatic impairment
Drug added
Drug deleted – no indication
Drug deleted – therapeutic duplication
Drug deleted – impaired renal/hepatic function
Duration of therapy change
Increased dose
Increased dosing interval
Intravenous to per oral change or vice versa
Non-formulary to formulary change
Regular to if required or vice versa
Laboratory monitoring Recommended deletion
Scheduling error
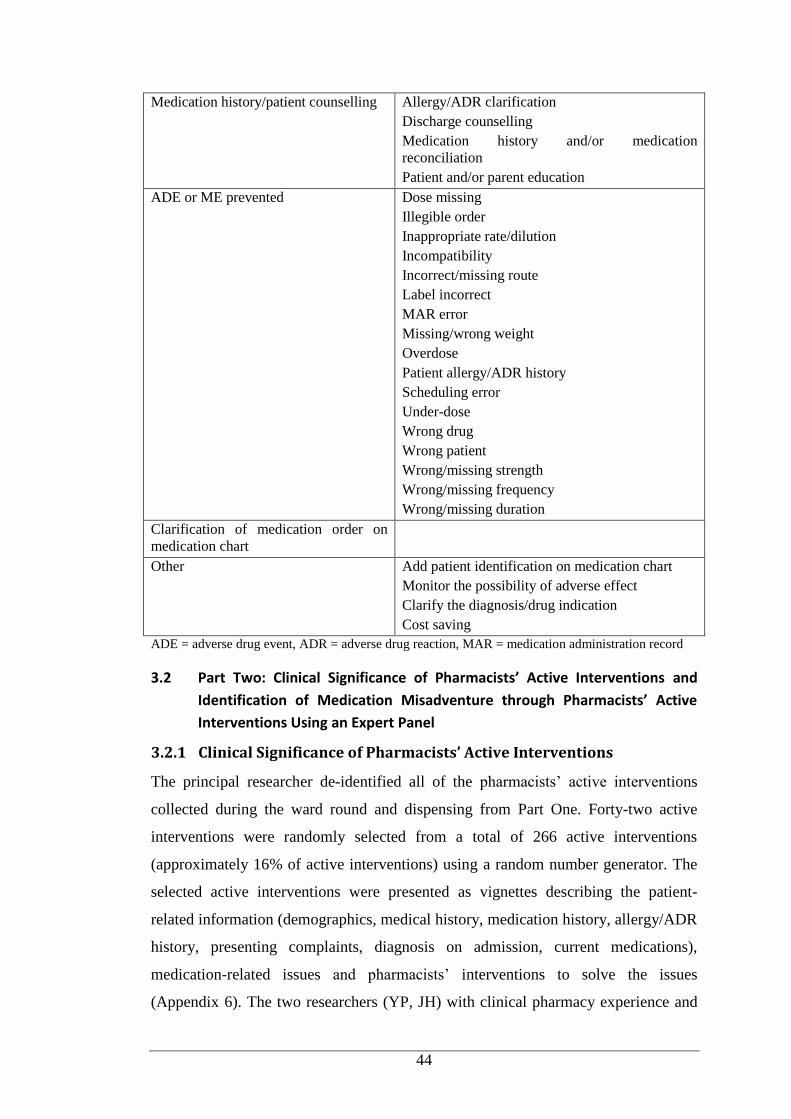
44
Medication history/patient counselling Allergy/ADR clarification
Discharge counselling
Medication history and/or medication
reconciliation
Patient and/or parent education
ADE or ME prevented Dose missing
Illegible order
Inappropriate rate/dilution
Incompatibility
Incorrect/missing route
Label incorrect
MAR error
Missing/wrong weight
Overdose
Patient allergy/ADR history
Scheduling error
Under-dose
Wrong drug
Wrong patient
Wrong/missing strength
Wrong/missing frequency
Wrong/missing duration
Clarification of medication order on
medication chart
Other Add patient identification on medication chart
Monitor the possibility of adverse effect
Clarify the diagnosis/drug indication
Cost saving
ADE = adverse drug event, ADR = adverse drug reaction, MAR = medication administration record
3.2 Part Two: Clinical Significance of Pharmacists’ Active Interventions and
Identification of Medication Misadventure through Pharmacists’ Active
Interventions Using an Expert Panel
3.2.1 Clinical Significance of Pharmacists’ Active Interventions
The principal researcher de-identified all of the pharmacists’ active interventions
collected during the ward round and dispensing from Part One. Forty-two active
interventions were randomly selected from a total of 266 active interventions
(approximately 16% of active interventions) using a random number generator. The
selected active interventions were presented as vignettes describing the patient-
related information (demographics, medical history, medication history, allergy/ADR
history, presenting complaints, diagnosis on admission, current medications),
medication-related issues and pharmacists’ interventions to solve the issues
(Appendix 6). The two researchers (YP, JH) with clinical pharmacy experience and
45
no involvement in data collection, reviewed the clinical significance of the selected
cases and reached consensus. Three independent panellists (hospital pharmacist,
academic pharmacist, clinical nurse) also reviewed the cases in their own time. As
consensus could not be reached between the researchers and the three independent
panellists (Panel 1), a second panel was set up. Panel 2 involved the researchers (YP,
, JH) and two independent panellists from the study hospital (medication safety
pharmacist, paediatric oncology pharmacist). The two panellists reviewed the cases
in their own time. For the clinical significance assessment, the rating system
described by Dooley et al.(19) was used with modification to include an ‘unsure’
option (Table 3.3). A meeting was organised between the researcher (YP) and the
two independent panellists in order to reach consensus.
3.2.2 Identification and Assessment of Medication Misadventure
The two researchers (YP, JH) and Panel 1 also assessed the 42 vignettes to ascertain
whether the cases involved medication misadventure (Section 3.2.1). If the cases
involved medication misadventure, the researchers and the panellists determined the
type of medication misadventure (ADE, ADR, ME). If medication misadventure
involved an ME, the researchers and panellists classified the type of ME and rated
the severity of the consequences using the National Coordinating Council for
Medication Error Reporting and Prevention Taxonomy (NCCMERP).(35) The
researchers and Panel 1 could not reach consensus. Inter-rater reliability analysis for
the assessment of medication misadventure detected through pharmacists’ active
interventions were determined based on Krippendorff’s alpha values calculated using
SAS version 9.2. The Krippendorff’s alpha was the extension of Cohen’s Kappa
which was used for inter-reliability assessment for multiple raters.
The interpretation of the Krippendorff’s alpha values (192) was as follows:
0.00: poor agreement
0.01-0.20: slight agreement
0.21-0.40: fair agreement
0.41-0.60: moderate agreement
0.61-0.80: substantial agreement
0.81-1.00: almost perfect agreement.
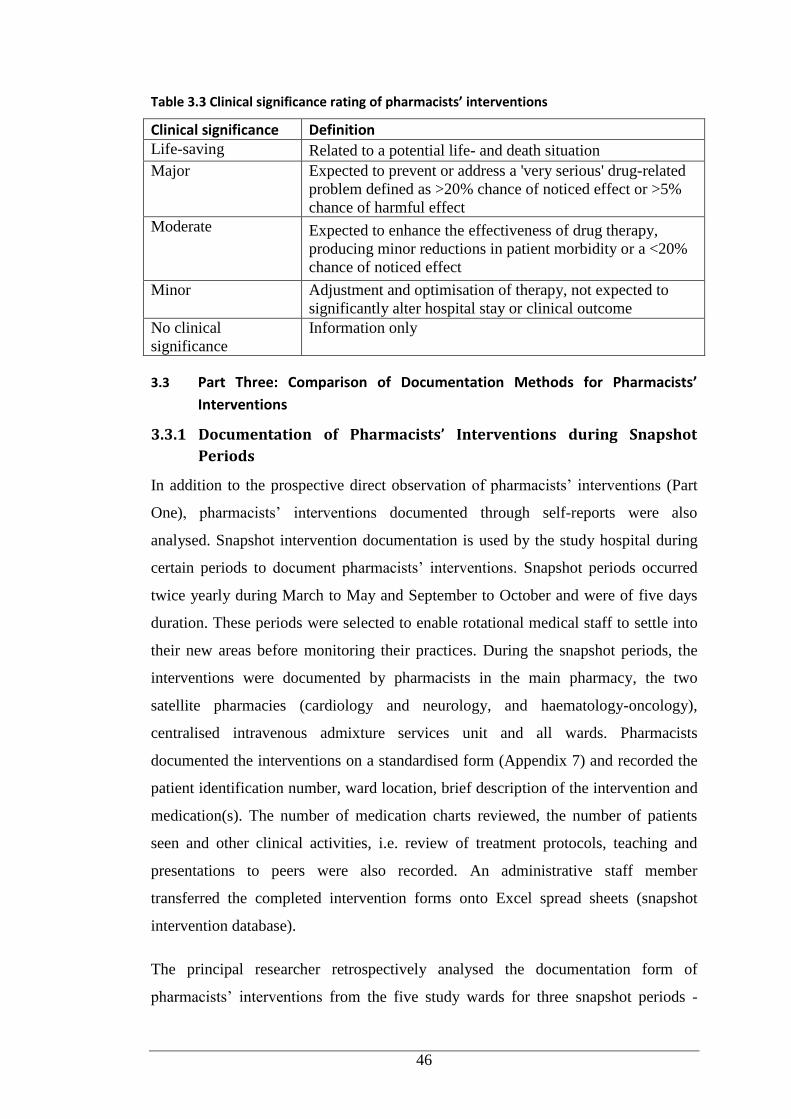
46
Table 3.3 Clinical significance rating of pharmacists’ interventions
Clinical significance Definition
Life-saving Related to a potential life- and death situation
Major Expected to prevent or address a 'very serious' drug-related
problem defined as >20% chance of noticed effect or >5%
chance of harmful effect
Moderate Expected to enhance the effectiveness of drug therapy,
producing minor reductions in patient morbidity or a <20%
chance of noticed effect
Minor Adjustment and optimisation of therapy, not expected to
significantly alter hospital stay or clinical outcome
No clinical
significance
Information only
3.3 Part Three: Comparison of Documentation Methods for Pharmacists’
Interventions
3.3.1 Documentation of Pharmacists’ Interventions during Snapshot
Periods
In addition to the prospective direct observation of pharmacists’ interventions (Part
One), pharmacists’ interventions documented through self-reports were also
analysed. Snapshot intervention documentation is used by the study hospital during
certain periods to document pharmacists’ interventions. Snapshot periods occurred
twice yearly during March to May and September to October and were of five days
duration. These periods were selected to enable rotational medical staff to settle into
their new areas before monitoring their practices. During the snapshot periods, the
interventions were documented by pharmacists in the main pharmacy, the two
satellite pharmacies (cardiology and neurology, and haematology-oncology),
centralised intravenous admixture services unit and all wards. Pharmacists
documented the interventions on a standardised form (Appendix 7) and recorded the
patient identification number, ward location, brief description of the intervention and
medication(s). The number of medication charts reviewed, the number of patients
seen and other clinical activities, i.e. review of treatment protocols, teaching and
presentations to peers were also recorded. An administrative staff member
transferred the completed intervention forms onto Excel spread sheets (snapshot
intervention database).
The principal researcher retrospectively analysed the documentation form of
pharmacists’ interventions from the five study wards for three snapshot periods -
47
September 2010 (period I), April 2011 (period II), and May 2012 (period III) - to
determine the number and type of interventions. The snapshot documentation form
was used instead of retrieval data from the snapshot intervention database as it was
incomplete. The type of intervention was categorised as described by Condren et
al.(184) with slight modification (Table 3.2). The interventions were further
classified into ‘active’ and ‘passive’ as defined previously. The rates of intervention
were defined as the number of interventions per 100 medication charts reviewed.
Each medication chart reviewed could have one or more interventions. Demographic
variables and pharmacists’ intervention data were summarised using descriptive
statistics. The rates of pharmacists’ interventions per 100 medication charts reviewed
documented through snapshot periods and during direct observation for each ward
(Part One) were compared using Poisson regression analysis. Data were analysed
using SPSS version 19.0 (Chicago, USA). This study was covered by the ethics as
described in Section 3.1.3. The data extraction from snapshot reports maintained
patients and pharmacists confidentiality by using coding system.
3.3.2 Focus Group Discussion
A focus group discussion (FGD) was conducted at the study hospital. Participants
were invited via official electronic mail by the preceptor pharmacist to all
pharmacists in the Pharmacy Department. A Study Information Sheet (Appendix 8)
and Consent Form (Appendix 9) were attached to the invitation; consent included
participants’ approval for the session to be audio recorded. The study was approved
by Princess Margaret Hospital institutional review board and Curtin University
Human Ethics Committee No: PH-11-13 (Appendix 10). The principal researcher
presented the pharmacists' interventions documented from snapshot reports and the
direct observations. This was followed by a discussion conducted by an independent
facilitator. The principal researcher took notes during the discussion for
crosschecking. The FGD was audio recorded and transcribed verbatim for thematic
analysis. Transcripts of the discussion were entered into qualitative data management
software program (QSR NVivo10). Within this software the partial transcripts were
then coded and emergent themes were linked.
48
The research questions addressed during the FGD were:
Pharmacists’ interventions documented during snapshots versus observation
were different. Are the results from observation more reflective? Why do you
think so?
How important is the documentation of pharmacists’ interventions?
How valuable are your clinical interventions?
Are there any problems in documenting your interventions? Why do you
think so?
Are there problems with the way data are used? Why do you think so?
What are the benefits and limitations of the snapshot documentation?
Would you like to see modifications made to your current intervention
documentation method? What are your suggestions to improve the existing
documentation method?
3.4 Part Four: Medication Errors in Children: Root Cause Analysis Using
Simulated Case Scenarios
3.4.1 Development of Simulated Case Studies and Survey Instrument
The principal researcher developed five simulated case studies involving paediatric
patients. Each case study represented the patient characteristic of the five study
wards (Part One) and was associated with one ME with a different type of error -
inappropriate dose, dispensing error, drug omission, transcribing error and
monitoring error. Each case study was reviewed by the other researchers (YP and
JH) for accuracy of the clinical information and its relevance with the treatment
policy and procedure at the study hospital. The questionnaire was divided into two
sections. Section one contained questions related to participants’ demographics (age,
gender, type of health professional, current position, years of experience as a health
professional, and years of experience in paediatrics). Section two presented five
simulated case studies in children followed by questions on ME and RCA. ME-
related questions required rating of clinical significance of the error and
identification of the health professional(s) responsible for the error.
The RCA questions were used to identify the potential contributing factors to the
error in each case. The RCA questions were adapted from the Clinical Incident
Management Toolkit(193) and included only those with relevance to the case studies.
49
The adapted RCA questions consisted of seven items. Participants were asked to
determine the potential contributing factors by selecting the options provided for
each question and describing why the factor(s) selected contributed to the error. The
RCA questions included:
specific patient issues
dismissal of policies/procedures/guidelines (sub-factors: patient
misidentification, error/omission in medication reconciliation, clinical
guidelines, coordination of care, medical record documentation, level and
frequency of monitoring of patient)
human resources-related issues (sub-factors: staff workload and inadequate
staffing, recruitment, staff training and supervision, staff supervision)
communication-related issues (sub-factors: miscommunication between staff,
miscommunication between staff and patient and/or family)
physical environment of the health service (sub-factors: noise, lighting,
space)
control/provision of medication (sub-factors: medication storage, labelling,
documentation of administration, internal transfer of medication).
Participants could tick the ‘unsure’ option if in doubt about selecting the contributing
factors. Participants could also list under the ‘other’ category any extra factors that
contributed to the errors. After all potential contributing factors were identified and
evaluated participants were asked to give their suggestions on strategies to prevent
the recurrence of the error in the future.
3.4.2 Face Validity Test
A pilot study involving three academic pharmacists (including one of the researchers,
LE) was conducted to determine the face validity of the questionnaire. Participants
were asked to assess the clarity of the questionnaire including the instructions, case
studies and questions. Participants were also asked to evaluate the questionnaire
design and layout, and to estimate the time needed to complete the questionnaire.
Participants’ comments were used to refine the final questionnaire.
3.4.3 Participants and Questionnaire Administration
A total of 111 coded self-administered questionnaires (Appendix 11) were
distributed to potential participants from mid-July 2014 to mid-August 2014.
50
Potential participants included all pharmacists (n=37) and randomly selected (20%)
doctors (n=31, around 5-6 doctors/ward ) and nurses (n=43, around 8-9 nurses/ward)
from the five study wards in the hospital (Part One). A Participant Information Sheet
(Appendix 12) containing information about the study aims, confirmation that
collected information would remain confidential and researchers’ contact details was
attached to the questionnaire. A consent form (Appendix 13) and reply-paid envelope
were also provided along with the questionnaire and the Participant Information
Sheet. This study was covered by the ethics as described in Section 3.1.3. The
principal researcher handed the questionnaires directly to the pharmacists. The
questionnaires for doctors and nurses were disseminated either directly by the
principal researcher under the supervision of the ward pharmacists or by the ward
pharmacists using convenience sampling until the number of doctors/nurses recruited
reached the predefined sample size. Participants were allowed to complete the
questionnaires in their own time. They were asked to return the questionnaires by the
predefined time in the envelope provided. The overall expected response rate was
around 40%. Participation was voluntary and no incentives were offered. The first
reminder for returning the questionnaire was sent via email to all pharmacists at the
end of August 2014. The ward pharmacists undertook the reminders for doctors and
nurses during ward rounds and via staff electronic mail. The second reminder was
sent at the end of September 2014.
3.4.4 Data Analysis
Demographic data of the participants, and their rating of clinical significance of the
error, identification of the responsible health professional(s) and the contributing
factors for each case were entered into SPSS version 22.0. Data were randomly
checked for accuracy and descriptive statistical analysis was conducted. The
principal researcher assigned the pre-determined answers for the questions related to
contributing factors of MEs for each case. A General Estimating Equation (GEE)
analysis was adopted to develop an agreement model between the participants’
responses on the contributing factors for each case and the principal researcher’s pre-
determined answers. If the agreement model using GEE was not able to be fitted (e.g.
due to complete agreement in some or all cases), the results was summarised more
appropriately using descriptive statistics. Participants’ statements on the description
of the contributing factors and their suggestions on the prevention of the error in each
51
case were entered into the qualitative data management software (QSR Nvivo
version 10.0) for thematic analysis. Participants’ statements were coded for any
emergent themes. This study was covered by the ethics as described in Section 3.1.3.
Data extraction from the questionnaire maintained the participants’ confidentiality by
using coding system.
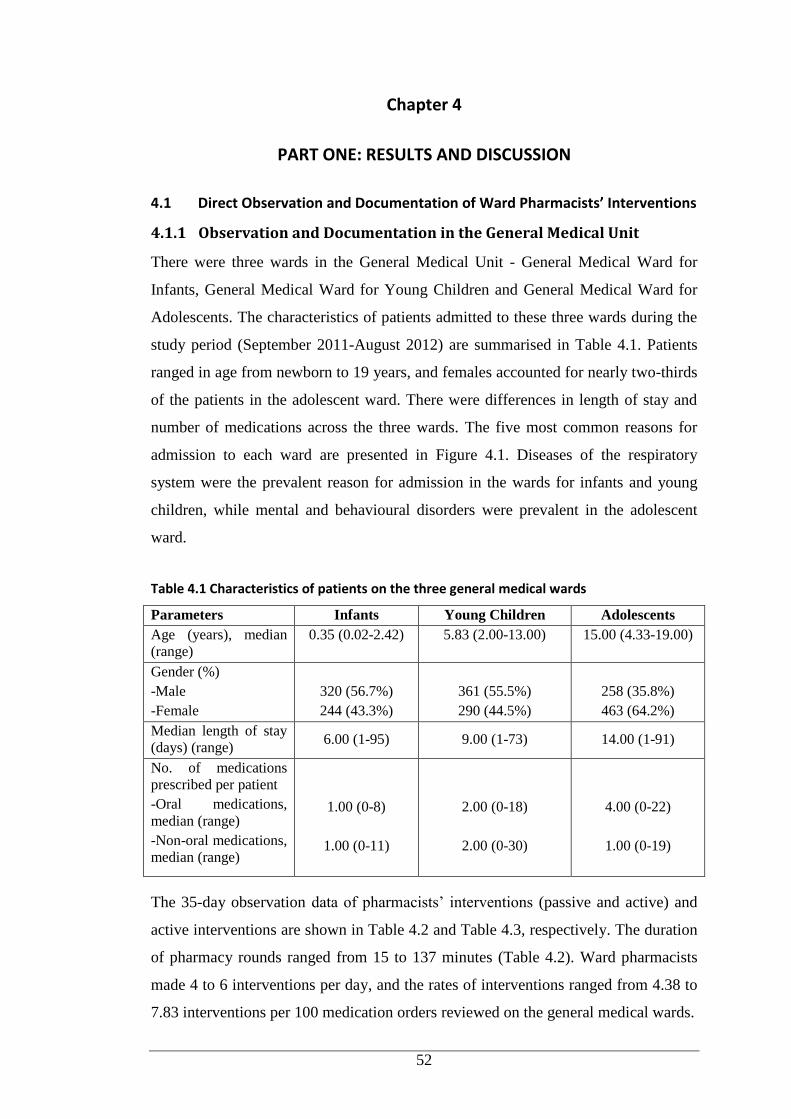
52
Chapter 4
PART ONE: RESULTS AND DISCUSSION
4.1 Direct Observation and Documentation of Ward Pharmacists’ Interventions
4.1.1 Observation and Documentation in the General Medical Unit
There were three wards in the General Medical Unit - General Medical Ward for
Infants, General Medical Ward for Young Children and General Medical Ward for
Adolescents. The characteristics of patients admitted to these three wards during the
study period (September 2011-August 2012) are summarised in Table 4.1. Patients
ranged in age from newborn to 19 years, and females accounted for nearly two-thirds
of the patients in the adolescent ward. There were differences in length of stay and
number of medications across the three wards. The five most common reasons for
admission to each ward are presented in Figure 4.1. Diseases of the respiratory
system were the prevalent reason for admission in the wards for infants and young
children, while mental and behavioural disorders were prevalent in the adolescent
ward.
Table 4.1 Characteristics of patients on the three general medical wards
Parameters Infants Young Children Adolescents
Age (years), median
(range)
0.35 (0.02-2.42) 5.83 (2.00-13.00) 15.00 (4.33-19.00)
Gender (%)
-Male
-Female
320 (56.7%)
244 (43.3%)
361 (55.5%)
290 (44.5%)
258 (35.8%)
463 (64.2%)
Median length of stay
(days) (range) 6.00 (1-95) 9.00 (1-73) 14.00 (1-91)
No. of medications
prescribed per patient
-Oral medications,
median (range)
-Non-oral medications,
median (range)
1.00 (0-8)
1.00 (0-11)
2.00 (0-18)
2.00 (0-30)
4.00 (0-22)
1.00 (0-19)
The 35-day observation data of pharmacists’ interventions (passive and active) and
active interventions are shown in Table 4.2 and Table 4.3, respectively. The duration
of pharmacy rounds ranged from 15 to 137 minutes (Table 4.2). Ward pharmacists
made 4 to 6 interventions per day, and the rates of interventions ranged from 4.38 to
7.83 interventions per 100 medication orders reviewed on the general medical wards.
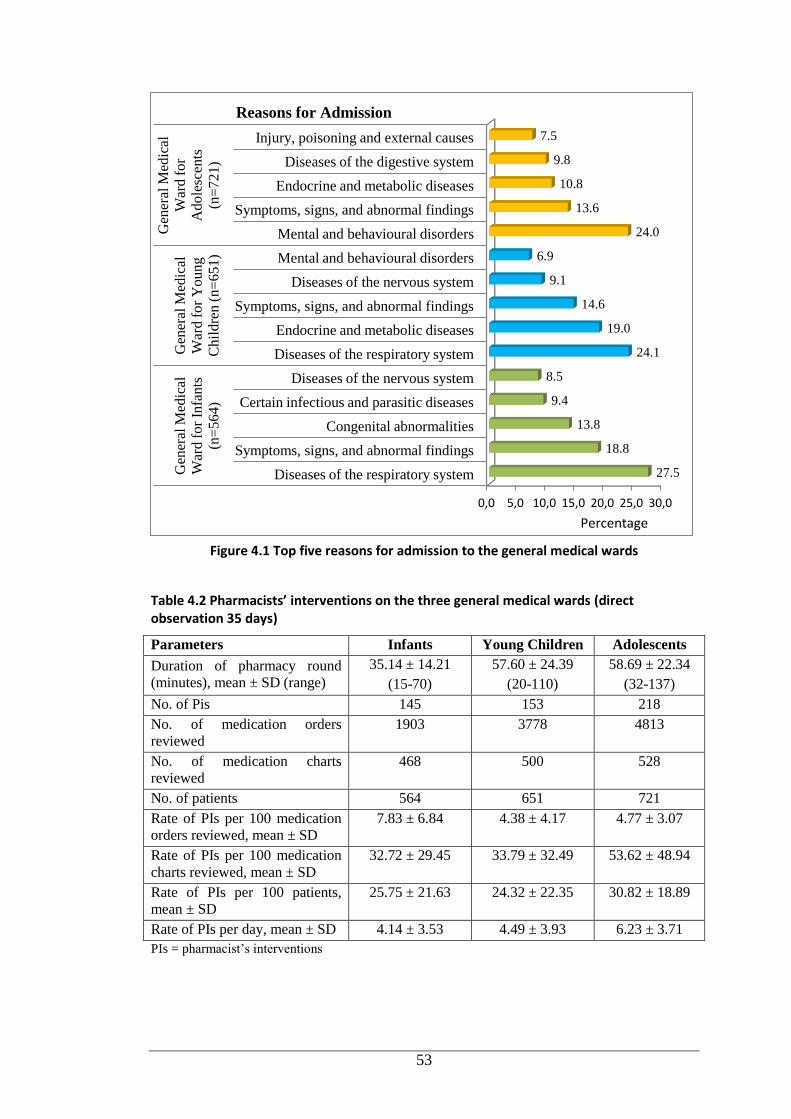
53
Figure 4.1 Top five reasons for admission to the general medical wards
Table 4.2 Pharmacists’ interventions on the three general medical wards (direct observation 35 days)
Parameters Infants Young Children Adolescents
Duration of pharmacy round
(minutes), mean ± SD (range)
35.14 ± 14.21
(15-70)
57.60 ± 24.39
(20-110)
58.69 ± 22.34
(32-137)
No. of Pis 145 153 218
No. of medication orders
reviewed
1903 3778 4813
No. of medication charts
reviewed
468 500 528
No. of patients 564 651 721
Rate of PIs per 100 medication
orders reviewed, mean ± SD
7.83 ± 6.84 4.38 ± 4.17 4.77 ± 3.07
Rate of PIs per 100 medication
charts reviewed, mean ± SD
32.72 ± 29.45 33.79 ± 32.49 53.62 ± 48.94
Rate of PIs per 100 patients,
mean ± SD
25.75 ± 21.63 24.32 ± 22.35 30.82 ± 18.89
Rate of PIs per day, mean ± SD 4.14 ± 3.53 4.49 ± 3.93 6.23 ± 3.71
PIs = pharmacist’s interventions
0,0 5,0 10,0 15,0 20,0 25,0 30,0
Diseases of the respiratory system
Symptoms, signs, and abnormal findings
Congenital abnormalities
Certain infectious and parasitic diseases
Diseases of the nervous system
Diseases of the respiratory system
Endocrine and metabolic diseases
Symptoms, signs, and abnormal findings
Diseases of the nervous system
Mental and behavioural disorders
Mental and behavioural disorders
Symptoms, signs, and abnormal findings
Endocrine and metabolic diseases
Diseases of the digestive system
Injury, poisoning and external causes
Gen
eral
Med
ical
War
d f
or
Infa
nts
(n=
56
4)
Gen
eral
Med
ical
War
d f
or
Yo
un
g
Ch
ild
ren
(n
=6
51
)
Gen
eral
Med
ical
War
d f
or
Ad
ole
scen
ts
(n=
72
1)
27.5
18.8
13.8
9.4
8.5
24.1
19.0
14.6
9.1
6.9
24.0
13.6
10.8
9.8
7.5
Percentage
Reasons for Admission
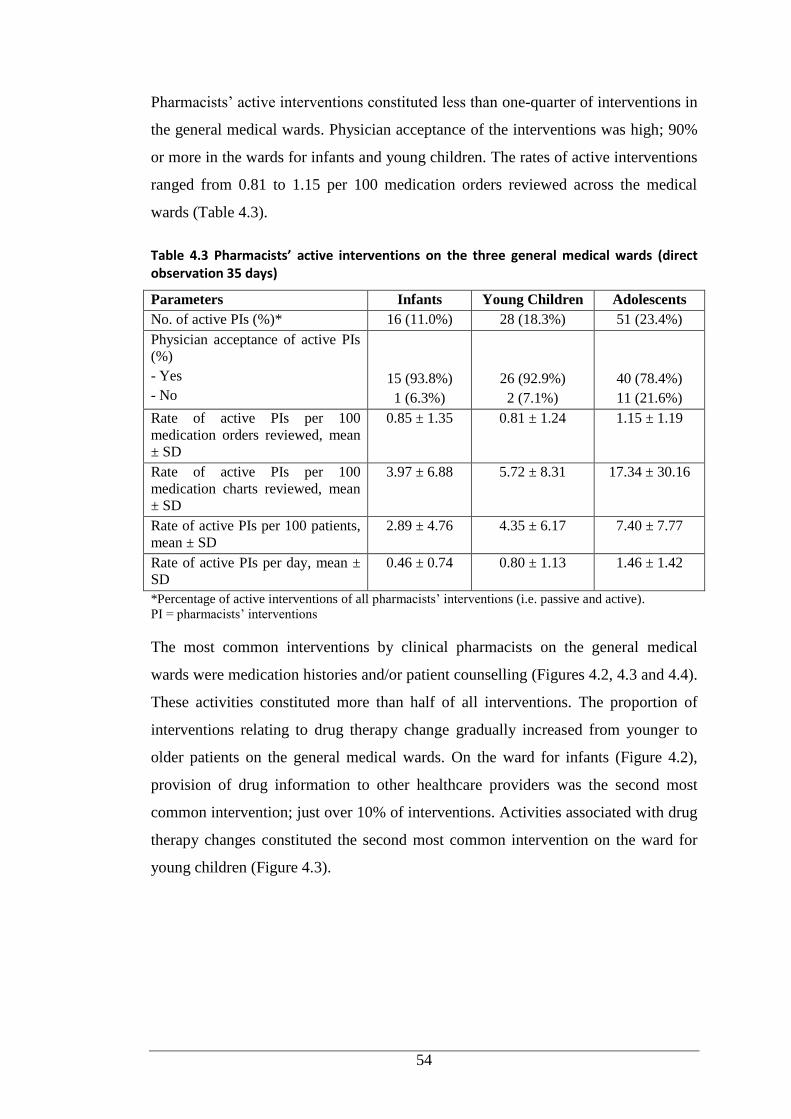
54
Pharmacists’ active interventions constituted less than one-quarter of interventions in
the general medical wards. Physician acceptance of the interventions was high; 90%
or more in the wards for infants and young children. The rates of active interventions
ranged from 0.81 to 1.15 per 100 medication orders reviewed across the medical
wards (Table 4.3).
Table 4.3 Pharmacists’ active interventions on the three general medical wards (direct observation 35 days)
Parameters Infants Young Children Adolescents
No. of active PIs (%)* 16 (11.0%) 28 (18.3%) 51 (23.4%)
Physician acceptance of active PIs
(%)
- Yes
- No
15 (93.8%)
1 (6.3%)
26 (92.9%)
2 (7.1%)
40 (78.4%)
11 (21.6%)
Rate of active PIs per 100
medication orders reviewed, mean
± SD
0.85 ± 1.35 0.81 ± 1.24 1.15 ± 1.19
Rate of active PIs per 100
medication charts reviewed, mean
± SD
3.97 ± 6.88 5.72 ± 8.31 17.34 ± 30.16
Rate of active PIs per 100 patients,
mean ± SD
2.89 ± 4.76 4.35 ± 6.17 7.40 ± 7.77
Rate of active PIs per day, mean ±
SD
0.46 ± 0.74 0.80 ± 1.13 1.46 ± 1.42
*Percentage of active interventions of all pharmacists’ interventions (i.e. passive and active).
PI = pharmacists’ interventions
The most common interventions by clinical pharmacists on the general medical
wards were medication histories and/or patient counselling (Figures 4.2, 4.3 and 4.4).
These activities constituted more than half of all interventions. The proportion of
interventions relating to drug therapy change gradually increased from younger to
older patients on the general medical wards. On the ward for infants (Figure 4.2),
provision of drug information to other healthcare providers was the second most
common intervention; just over 10% of interventions. Activities associated with drug
therapy changes constituted the second most common intervention on the ward for
young children (Figure 4.3).
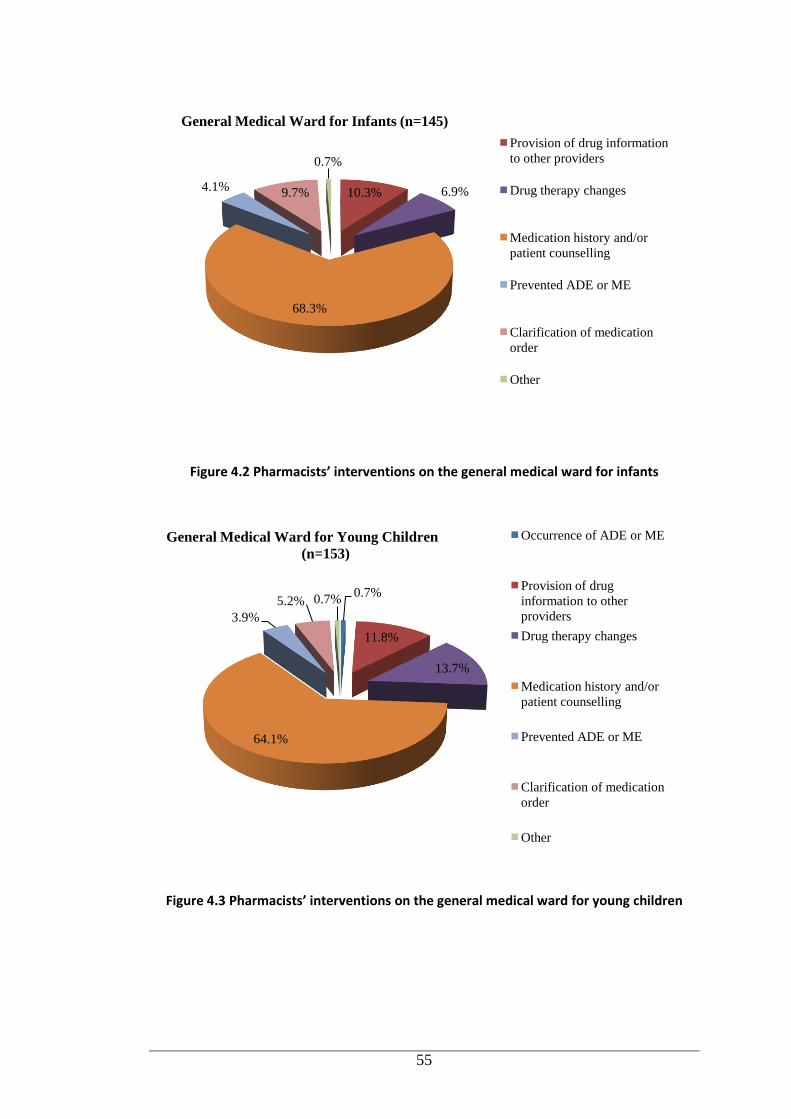
55
Figure 4.2 Pharmacists’ interventions on the general medical ward for infants
Figure 4.3 Pharmacists’ interventions on the general medical ward for young children
10.3% 6.9%
68.3%
4.1% 9.7%
0.7%
Provision of drug information
to other providers
Drug therapy changes
Medication history and/or
patient counselling
Prevented ADE or ME
Clarification of medication
order
Other
General Medical Ward for Infants (n=145)
0.7%
11.8%
13.7%
64.1%
3.9%
5.2% 0.7%
Occurrence of ADE or ME
Provision of drug
information to other
providers
Drug therapy changes
Medication history and/or
patient counselling
Prevented ADE or ME
Clarification of medication
order
Other
General Medical Ward for Young Children
(n=153)
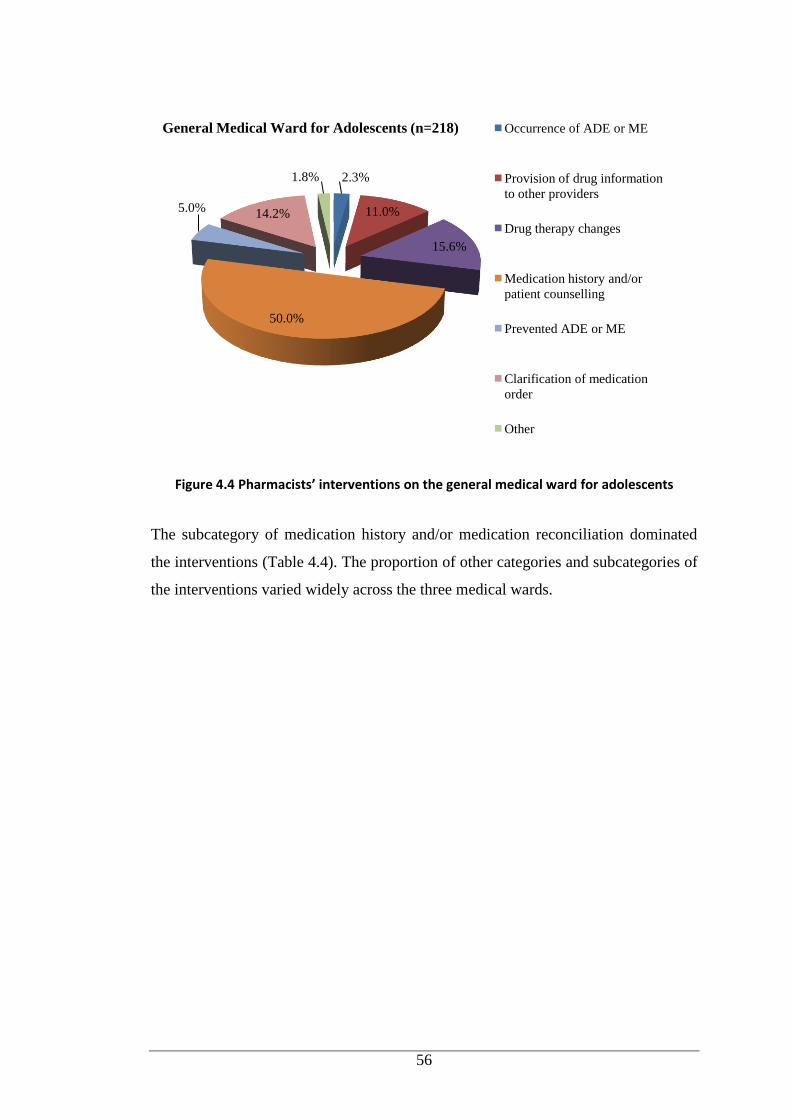
56
Figure 4.4 Pharmacists’ interventions on the general medical ward for adolescents
The subcategory of medication history and/or medication reconciliation dominated
the interventions (Table 4.4). The proportion of other categories and subcategories of
the interventions varied widely across the three medical wards.
2.3%
11.0%
15.6%
50.0%
5.0% 14.2%
1.8%
Occurrence of ADE or ME
Provision of drug information
to other providers
Drug therapy changes
Medication history and/or
patient counselling
Prevented ADE or ME
Clarification of medication
order
Other
General Medical Ward for Adolescents (n=218)
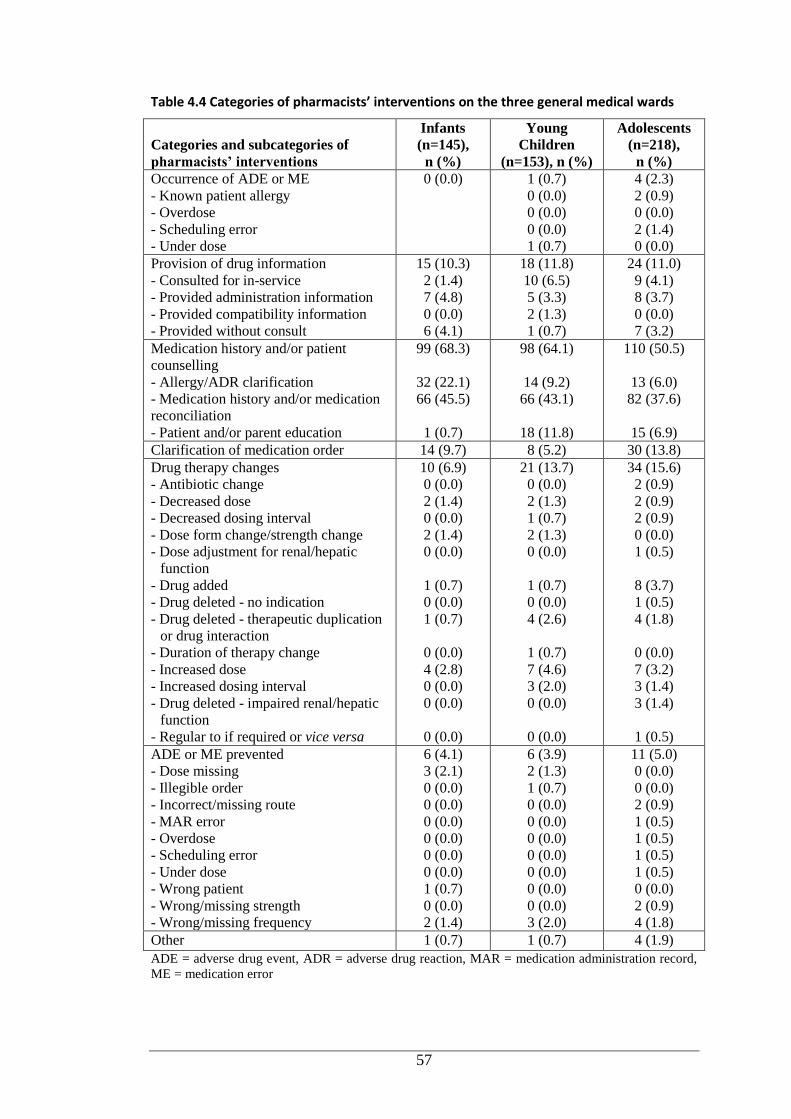
57
Table 4.4 Categories of pharmacists’ interventions on the three general medical wards
Categories and subcategories of
pharmacists’ interventions
Infants
(n=145),
n (%)
Young
Children
(n=153), n (%)
Adolescents
(n=218),
n (%)
Occurrence of ADE or ME
- Known patient allergy
- Overdose
- Scheduling error
- Under dose
0 (0.0) 1 (0.7)
0 (0.0)
0 (0.0)
0 (0.0)
1 (0.7)
4 (2.3)
2 (0.9)
0 (0.0)
2 (1.4)
0 (0.0)
Provision of drug information
- Consulted for in-service
- Provided administration information
- Provided compatibility information
- Provided without consult
15 (10.3)
2 (1.4)
7 (4.8)
0 (0.0)
6 (4.1)
18 (11.8)
10 (6.5)
5 (3.3)
2 (1.3)
1 (0.7)
24 (11.0)
9 (4.1)
8 (3.7)
0 (0.0)
7 (3.2)
Medication history and/or patient
counselling
- Allergy/ADR clarification
- Medication history and/or medication
reconciliation
- Patient and/or parent education
99 (68.3)
32 (22.1)
66 (45.5)
1 (0.7)
98 (64.1)
14 (9.2)
66 (43.1)
18 (11.8)
110 (50.5)
13 (6.0)
82 (37.6)
15 (6.9)
Clarification of medication order 14 (9.7) 8 (5.2) 30 (13.8)
Drug therapy changes
- Antibiotic change
- Decreased dose
- Decreased dosing interval
- Dose form change/strength change
- Dose adjustment for renal/hepatic
function
- Drug added
- Drug deleted - no indication
- Drug deleted - therapeutic duplication
or drug interaction
- Duration of therapy change
- Increased dose
- Increased dosing interval
- Drug deleted - impaired renal/hepatic
function
- Regular to if required or vice versa
10 (6.9)
0 (0.0)
2 (1.4)
0 (0.0)
2 (1.4)
0 (0.0)
1 (0.7)
0 (0.0)
1 (0.7)
0 (0.0)
4 (2.8)
0 (0.0)
0 (0.0)
0 (0.0)
21 (13.7)
0 (0.0)
2 (1.3)
1 (0.7)
2 (1.3)
0 (0.0)
1 (0.7)
0 (0.0)
4 (2.6)
1 (0.7)
7 (4.6)
3 (2.0)
0 (0.0)
0 (0.0)
34 (15.6)
2 (0.9)
2 (0.9)
2 (0.9)
0 (0.0)
1 (0.5)
8 (3.7)
1 (0.5)
4 (1.8)
0 (0.0)
7 (3.2)
3 (1.4)
3 (1.4)
1 (0.5)
ADE or ME prevented
- Dose missing
- Illegible order
- Incorrect/missing route
- MAR error
- Overdose
- Scheduling error
- Under dose
- Wrong patient
- Wrong/missing strength
- Wrong/missing frequency
6 (4.1)
3 (2.1)
0 (0.0)
0 (0.0)
0 (0.0)
0 (0.0)
0 (0.0)
0 (0.0)
1 (0.7)
0 (0.0)
2 (1.4)
6 (3.9)
2 (1.3)
1 (0.7)
0 (0.0)
0 (0.0)
0 (0.0)
0 (0.0)
0 (0.0)
0 (0.0)
0 (0.0)
3 (2.0)
11 (5.0)
0 (0.0)
0 (0.0)
2 (0.9)
1 (0.5)
1 (0.5)
1 (0.5)
1 (0.5)
0 (0.0)
2 (0.9)
4 (1.8)
Other 1 (0.7) 1 (0.7) 4 (1.9)
ADE = adverse drug event, ADR = adverse drug reaction, MAR = medication administration record,
ME = medication error
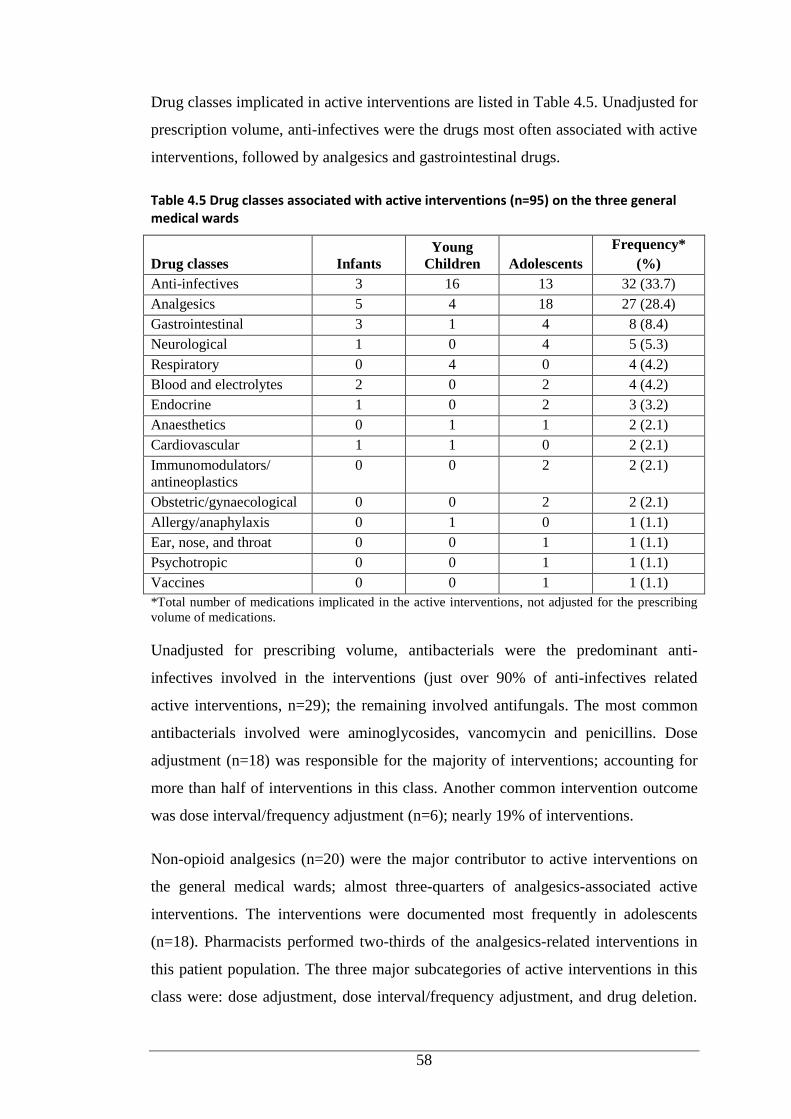
58
Drug classes implicated in active interventions are listed in Table 4.5. Unadjusted for
prescription volume, anti-infectives were the drugs most often associated with active
interventions, followed by analgesics and gastrointestinal drugs.
Table 4.5 Drug classes associated with active interventions (n=95) on the three general medical wards
Drug classes Infants
Young
Children Adolescents
Frequency*
(%)
Anti-infectives 3 16 13 32 (33.7)
Analgesics 5 4 18 27 (28.4)
Gastrointestinal 3 1 4 8 (8.4)
Neurological 1 0 4 5 (5.3)
Respiratory 0 4 0 4 (4.2)
Blood and electrolytes 2 0 2 4 (4.2)
Endocrine 1 0 2 3 (3.2)
Anaesthetics 0 1 1 2 (2.1)
Cardiovascular 1 1 0 2 (2.1)
Immunomodulators/
antineoplastics
0 0 2 2 (2.1)
Obstetric/gynaecological 0 0 2 2 (2.1)
Allergy/anaphylaxis 0 1 0 1 (1.1)
Ear, nose, and throat 0 0 1 1 (1.1)
Psychotropic 0 0 1 1 (1.1)
Vaccines 0 0 1 1 (1.1)
*Total number of medications implicated in the active interventions, not adjusted for the prescribing
volume of medications.
Unadjusted for prescribing volume, antibacterials were the predominant anti-
infectives involved in the interventions (just over 90% of anti-infectives related
active interventions, n=29); the remaining involved antifungals. The most common
antibacterials involved were aminoglycosides, vancomycin and penicillins. Dose
adjustment (n=18) was responsible for the majority of interventions; accounting for
more than half of interventions in this class. Another common intervention outcome
was dose interval/frequency adjustment (n=6); nearly 19% of interventions.
Non-opioid analgesics (n=20) were the major contributor to active interventions on
the general medical wards; almost three-quarters of analgesics-associated active
interventions. The interventions were documented most frequently in adolescents
(n=18). Pharmacists performed two-thirds of the analgesics-related interventions in
this patient population. The three major subcategories of active interventions in this
class were: dose adjustment, dose interval/frequency adjustment, and drug deletion.
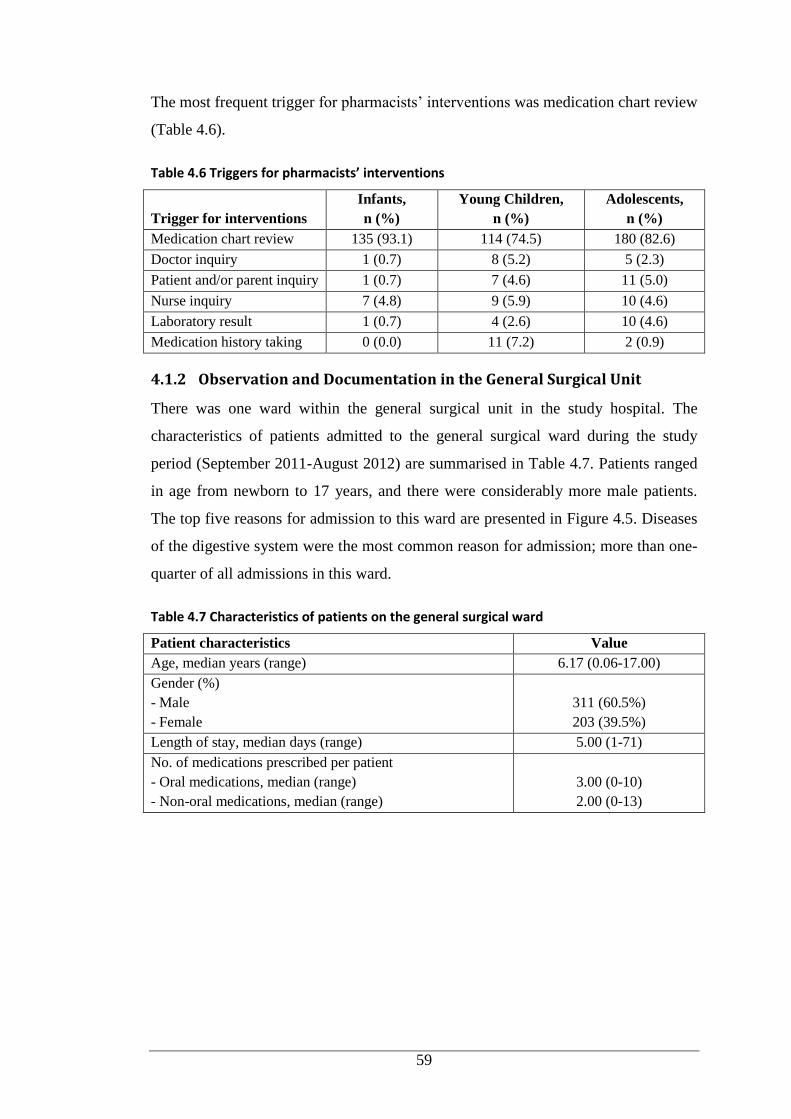
59
The most frequent trigger for pharmacists’ interventions was medication chart review
(Table 4.6).
Table 4.6 Triggers for pharmacists’ interventions
Trigger for interventions
Infants,
n (%)
Young Children,
n (%)
Adolescents,
n (%)
Medication chart review 135 (93.1) 114 (74.5) 180 (82.6)
Doctor inquiry 1 (0.7) 8 (5.2) 5 (2.3)
Patient and/or parent inquiry 1 (0.7) 7 (4.6) 11 (5.0)
Nurse inquiry 7 (4.8) 9 (5.9) 10 (4.6)
Laboratory result 1 (0.7) 4 (2.6) 10 (4.6)
Medication history taking 0 (0.0) 11 (7.2) 2 (0.9)
4.1.2 Observation and Documentation in the General Surgical Unit
There was one ward within the general surgical unit in the study hospital. The
characteristics of patients admitted to the general surgical ward during the study
period (September 2011-August 2012) are summarised in Table 4.7. Patients ranged
in age from newborn to 17 years, and there were considerably more male patients.
The top five reasons for admission to this ward are presented in Figure 4.5. Diseases
of the digestive system were the most common reason for admission; more than one-
quarter of all admissions in this ward.
Table 4.7 Characteristics of patients on the general surgical ward
Patient characteristics Value
Age, median years (range) 6.17 (0.06-17.00)
Gender (%)
- Male
- Female
311 (60.5%)
203 (39.5%)
Length of stay, median days (range) 5.00 (1-71)
No. of medications prescribed per patient
- Oral medications, median (range)
- Non-oral medications, median (range)
3.00 (0-10)
2.00 (0-13)
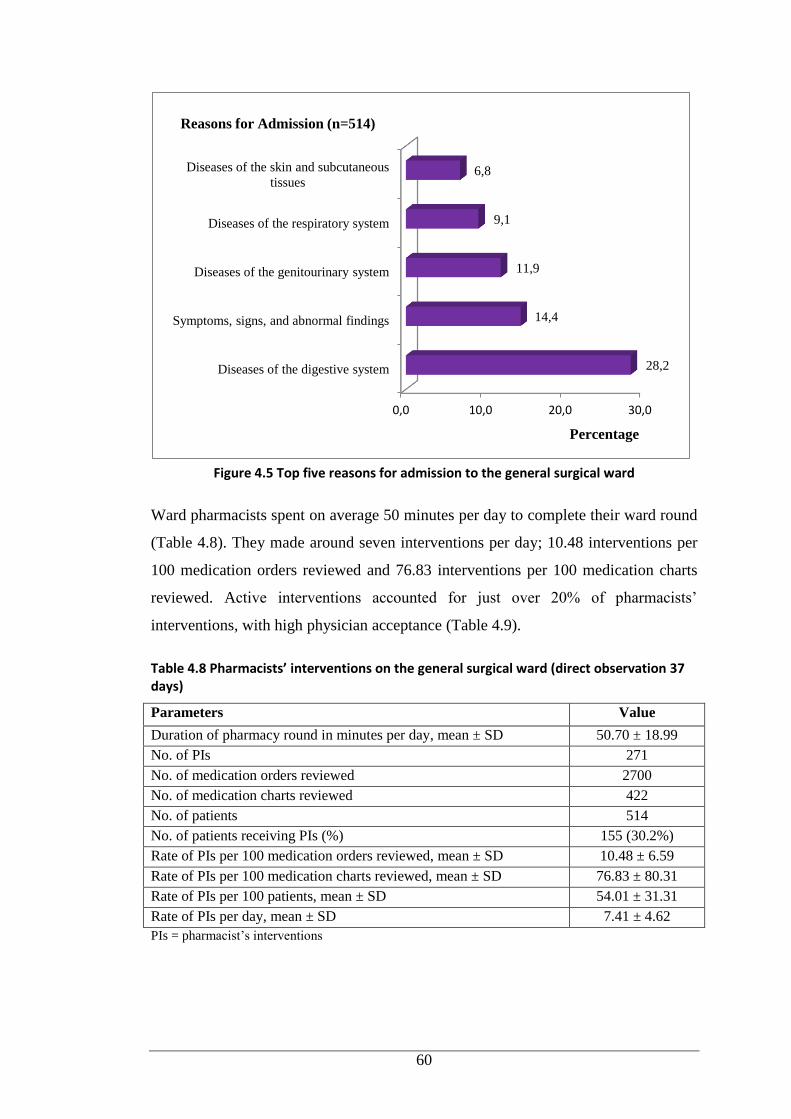
60
Figure 4.5 Top five reasons for admission to the general surgical ward
Ward pharmacists spent on average 50 minutes per day to complete their ward round
(Table 4.8). They made around seven interventions per day; 10.48 interventions per
100 medication orders reviewed and 76.83 interventions per 100 medication charts
reviewed. Active interventions accounted for just over 20% of pharmacists’
interventions, with high physician acceptance (Table 4.9).
Table 4.8 Pharmacists’ interventions on the general surgical ward (direct observation 37 days)
Parameters Value
Duration of pharmacy round in minutes per day, mean ± SD 50.70 ± 18.99
No. of PIs 271
No. of medication orders reviewed 2700
No. of medication charts reviewed 422
No. of patients 514
No. of patients receiving PIs (%) 155 (30.2%)
Rate of PIs per 100 medication orders reviewed, mean ± SD 10.48 ± 6.59
Rate of PIs per 100 medication charts reviewed, mean ± SD 76.83 ± 80.31
Rate of PIs per 100 patients, mean ± SD 54.01 ± 31.31
Rate of PIs per day, mean ± SD 7.41 ± 4.62
PIs = pharmacist’s interventions
0,0 10,0 20,0 30,0
Diseases of the digestive system
Symptoms, signs, and abnormal findings
Diseases of the genitourinary system
Diseases of the respiratory system
Diseases of the skin and subcutaneous
tissues
28,2
14,4
11,9
9,1
6,8
Percentage
Reasons for Admission (n=514)
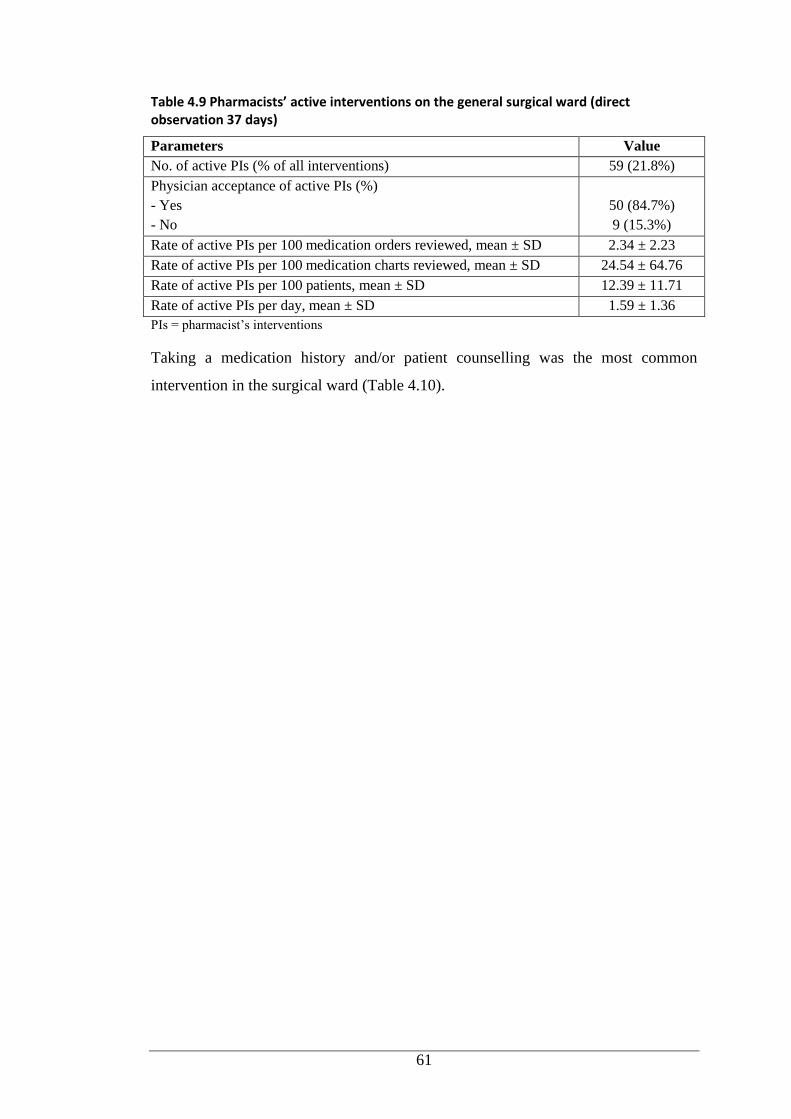
61
Table 4.9 Pharmacists’ active interventions on the general surgical ward (direct observation 37 days)
Parameters Value
No. of active PIs (% of all interventions) 59 (21.8%)
Physician acceptance of active PIs (%)
- Yes
- No
50 (84.7%)
9 (15.3%)
Rate of active PIs per 100 medication orders reviewed, mean ± SD 2.34 ± 2.23
Rate of active PIs per 100 medication charts reviewed, mean ± SD 24.54 ± 64.76
Rate of active PIs per 100 patients, mean ± SD 12.39 ± 11.71
Rate of active PIs per day, mean ± SD 1.59 ± 1.36
PIs = pharmacist’s interventions
Taking a medication history and/or patient counselling was the most common
intervention in the surgical ward (Table 4.10).
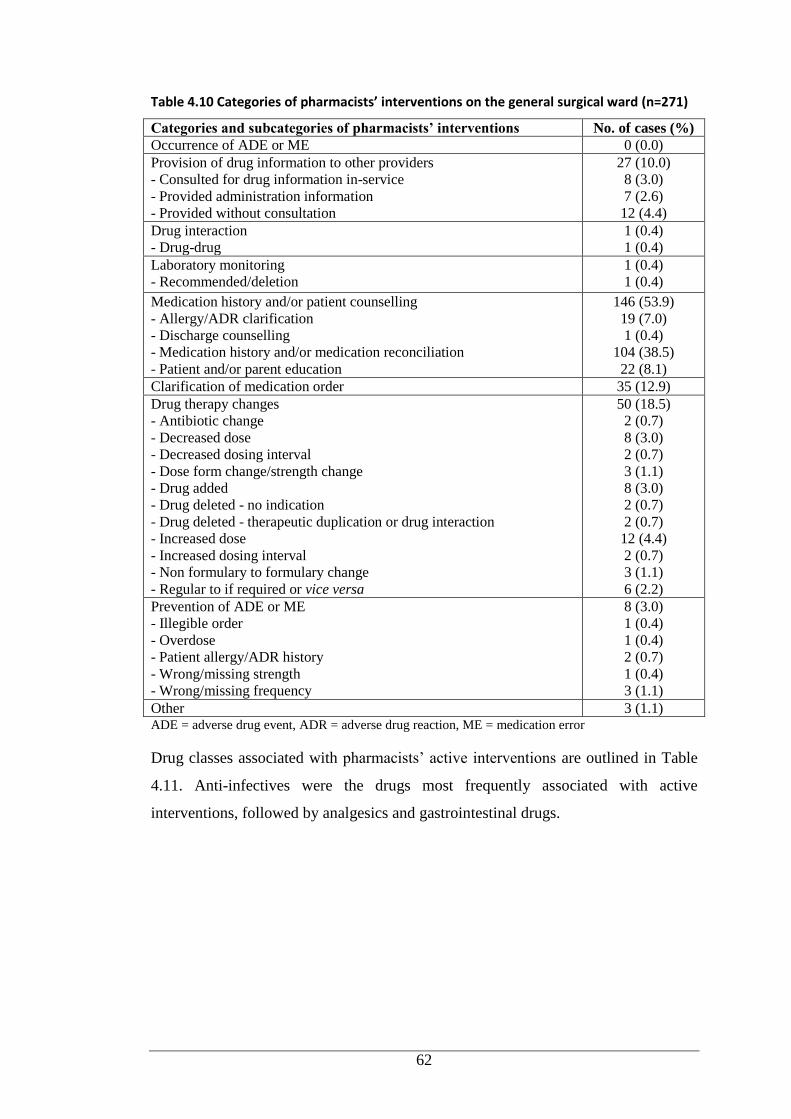
62
Table 4.10 Categories of pharmacists’ interventions on the general surgical ward (n=271)
Categories and subcategories of pharmacists’ interventions No. of cases (%)
Occurrence of ADE or ME 0 (0.0)
Provision of drug information to other providers
- Consulted for drug information in-service
- Provided administration information
- Provided without consultation
27 (10.0)
8 (3.0)
7 (2.6)
12 (4.4)
Drug interaction
- Drug-drug
1 (0.4)
1 (0.4)
Laboratory monitoring
- Recommended/deletion
1 (0.4)
1 (0.4)
Medication history and/or patient counselling
- Allergy/ADR clarification
- Discharge counselling
- Medication history and/or medication reconciliation
- Patient and/or parent education
146 (53.9)
19 (7.0)
1 (0.4)
104 (38.5)
22 (8.1)
Clarification of medication order 35 (12.9)
Drug therapy changes
- Antibiotic change
- Decreased dose
- Decreased dosing interval
- Dose form change/strength change
- Drug added
- Drug deleted - no indication
- Drug deleted - therapeutic duplication or drug interaction
- Increased dose
- Increased dosing interval
- Non formulary to formulary change
- Regular to if required or vice versa
50 (18.5)
2 (0.7)
8 (3.0)
2 (0.7)
3 (1.1)
8 (3.0)
2 (0.7)
2 (0.7)
12 (4.4)
2 (0.7)
3 (1.1)
6 (2.2)
Prevention of ADE or ME
- Illegible order
- Overdose
- Patient allergy/ADR history
- Wrong/missing strength
- Wrong/missing frequency
8 (3.0)
1 (0.4)
1 (0.4)
2 (0.7)
1 (0.4)
3 (1.1)
Other 3 (1.1) ADE = adverse drug event, ADR = adverse drug reaction, ME = medication error
Drug classes associated with pharmacists’ active interventions are outlined in Table
4.11. Anti-infectives were the drugs most frequently associated with active
interventions, followed by analgesics and gastrointestinal drugs.
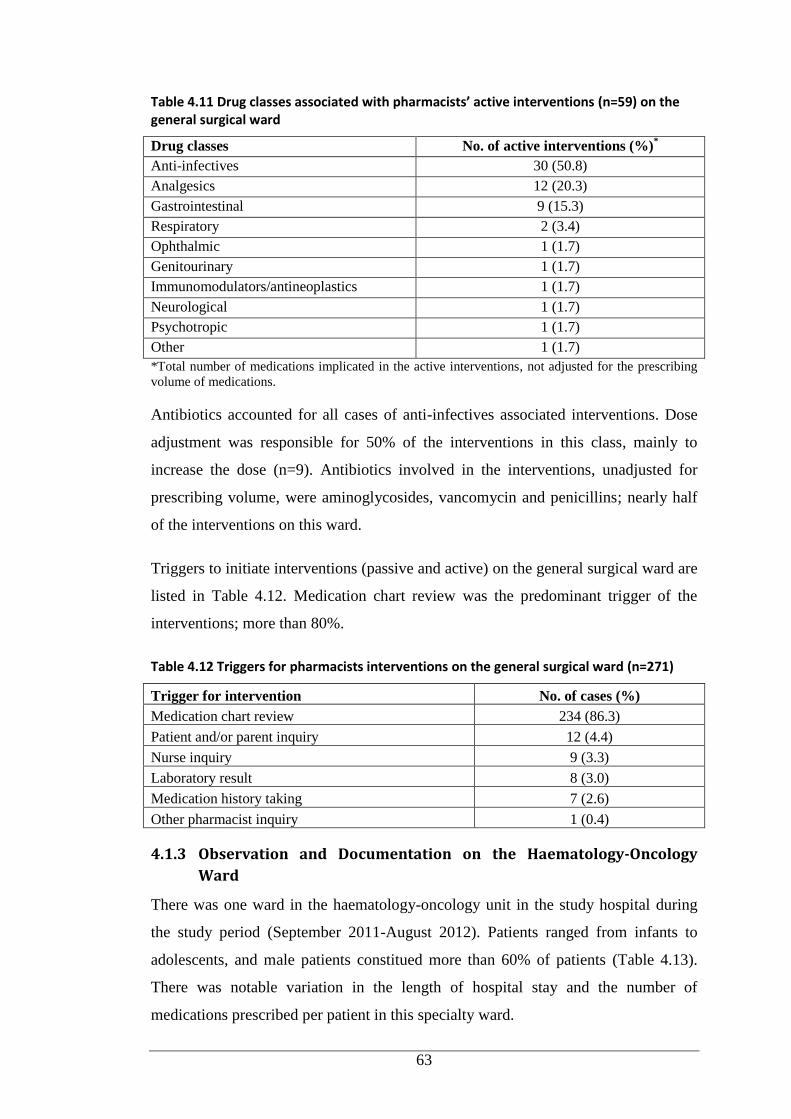
63
Table 4.11 Drug classes associated with pharmacists’ active interventions (n=59) on the general surgical ward
Drug classes No. of active interventions (%)*
Anti-infectives 30 (50.8)
Analgesics 12 (20.3)
Gastrointestinal 9 (15.3)
Respiratory 2 (3.4)
Ophthalmic 1 (1.7)
Genitourinary 1 (1.7)
Immunomodulators/antineoplastics 1 (1.7)
Neurological 1 (1.7)
Psychotropic 1 (1.7)
Other 1 (1.7)
*Total number of medications implicated in the active interventions, not adjusted for the prescribing
volume of medications.
Antibiotics accounted for all cases of anti-infectives associated interventions. Dose
adjustment was responsible for 50% of the interventions in this class, mainly to
increase the dose (n=9). Antibiotics involved in the interventions, unadjusted for
prescribing volume, were aminoglycosides, vancomycin and penicillins; nearly half
of the interventions on this ward.
Triggers to initiate interventions (passive and active) on the general surgical ward are
listed in Table 4.12. Medication chart review was the predominant trigger of the
interventions; more than 80%.
Table 4.12 Triggers for pharmacists interventions on the general surgical ward (n=271)
Trigger for intervention No. of cases (%)
Medication chart review 234 (86.3)
Patient and/or parent inquiry 12 (4.4)
Nurse inquiry 9 (3.3)
Laboratory result 8 (3.0)
Medication history taking 7 (2.6)
Other pharmacist inquiry 1 (0.4)
4.1.3 Observation and Documentation on the Haematology-Oncology
Ward
There was one ward in the haematology-oncology unit in the study hospital during
the study period (September 2011-August 2012). Patients ranged from infants to
adolescents, and male patients constitued more than 60% of patients (Table 4.13).
There was notable variation in the length of hospital stay and the number of
medications prescribed per patient in this specialty ward.
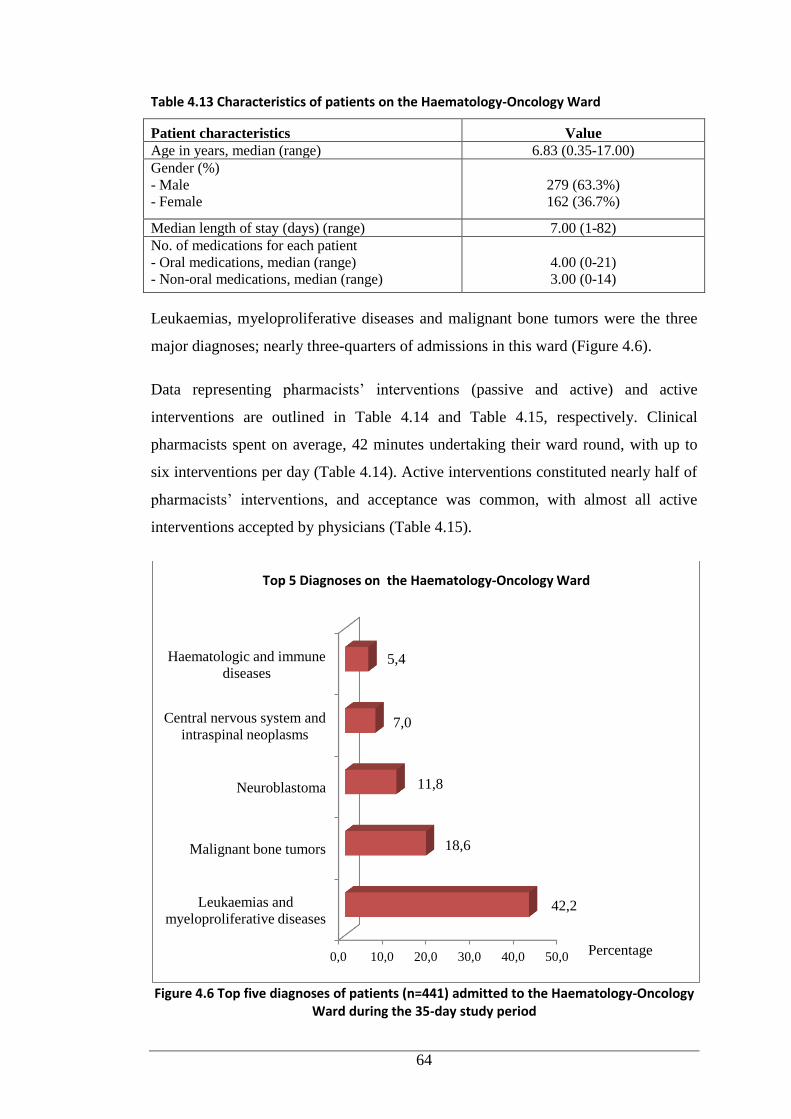
64
Table 4.13 Characteristics of patients on the Haematology-Oncology Ward
Patient characteristics Value
Age in years, median (range) 6.83 (0.35-17.00)
Gender (%)
- Male
- Female
279 (63.3%)
162 (36.7%)
Median length of stay (days) (range) 7.00 (1-82)
No. of medications for each patient
- Oral medications, median (range)
- Non-oral medications, median (range)
4.00 (0-21)
3.00 (0-14)
Leukaemias, myeloproliferative diseases and malignant bone tumors were the three
major diagnoses; nearly three-quarters of admissions in this ward (Figure 4.6).
Data representing pharmacists’ interventions (passive and active) and active
interventions are outlined in Table 4.14 and Table 4.15, respectively. Clinical
pharmacists spent on average, 42 minutes undertaking their ward round, with up to
six interventions per day (Table 4.14). Active interventions constituted nearly half of
pharmacists’ interventions, and acceptance was common, with almost all active
interventions accepted by physicians (Table 4.15).
Figure 4.6 Top five diagnoses of patients (n=441) admitted to the Haematology-Oncology Ward during the 35-day study period
0,0 10,0 20,0 30,0 40,0 50,0
Leukaemias and
myeloproliferative diseases
Malignant bone tumors
Neuroblastoma
Central nervous system and
intraspinal neoplasms
Haematologic and immune
diseases
42,2
18,6
11,8
7,0
5,4
Top 5 Diagnoses on the Haematology-Oncology Ward
Percentage
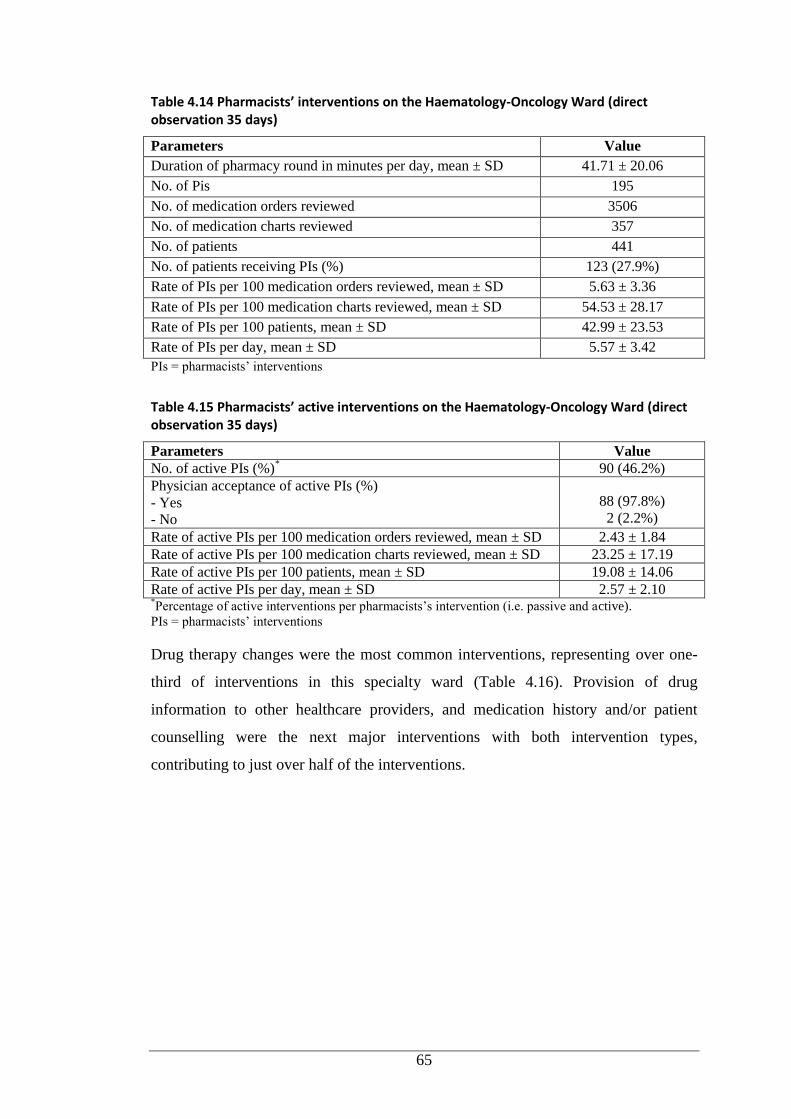
65
Table 4.14 Pharmacists’ interventions on the Haematology-Oncology Ward (direct observation 35 days)
Parameters Value
Duration of pharmacy round in minutes per day, mean ± SD 41.71 ± 20.06
No. of Pis 195
No. of medication orders reviewed 3506
No. of medication charts reviewed 357
No. of patients 441
No. of patients receiving PIs (%) 123 (27.9%)
Rate of PIs per 100 medication orders reviewed, mean ± SD 5.63 ± 3.36
Rate of PIs per 100 medication charts reviewed, mean ± SD 54.53 ± 28.17
Rate of PIs per 100 patients, mean ± SD 42.99 ± 23.53
Rate of PIs per day, mean ± SD 5.57 ± 3.42
PIs = pharmacists’ interventions
Table 4.15 Pharmacists’ active interventions on the Haematology-Oncology Ward (direct observation 35 days)
Parameters Value
No. of active PIs (%)* 90 (46.2%)
Physician acceptance of active PIs (%)
- Yes
- No
88 (97.8%)
2 (2.2%)
Rate of active PIs per 100 medication orders reviewed, mean ± SD 2.43 ± 1.84
Rate of active PIs per 100 medication charts reviewed, mean ± SD 23.25 ± 17.19
Rate of active PIs per 100 patients, mean ± SD 19.08 ± 14.06
Rate of active PIs per day, mean ± SD 2.57 ± 2.10 *Percentage of active interventions per pharmacists’s intervention (i.e. passive and active).
PIs = pharmacists’ interventions
Drug therapy changes were the most common interventions, representing over one-
third of interventions in this specialty ward (Table 4.16). Provision of drug
information to other healthcare providers, and medication history and/or patient
counselling were the next major interventions with both intervention types,
contributing to just over half of the interventions.
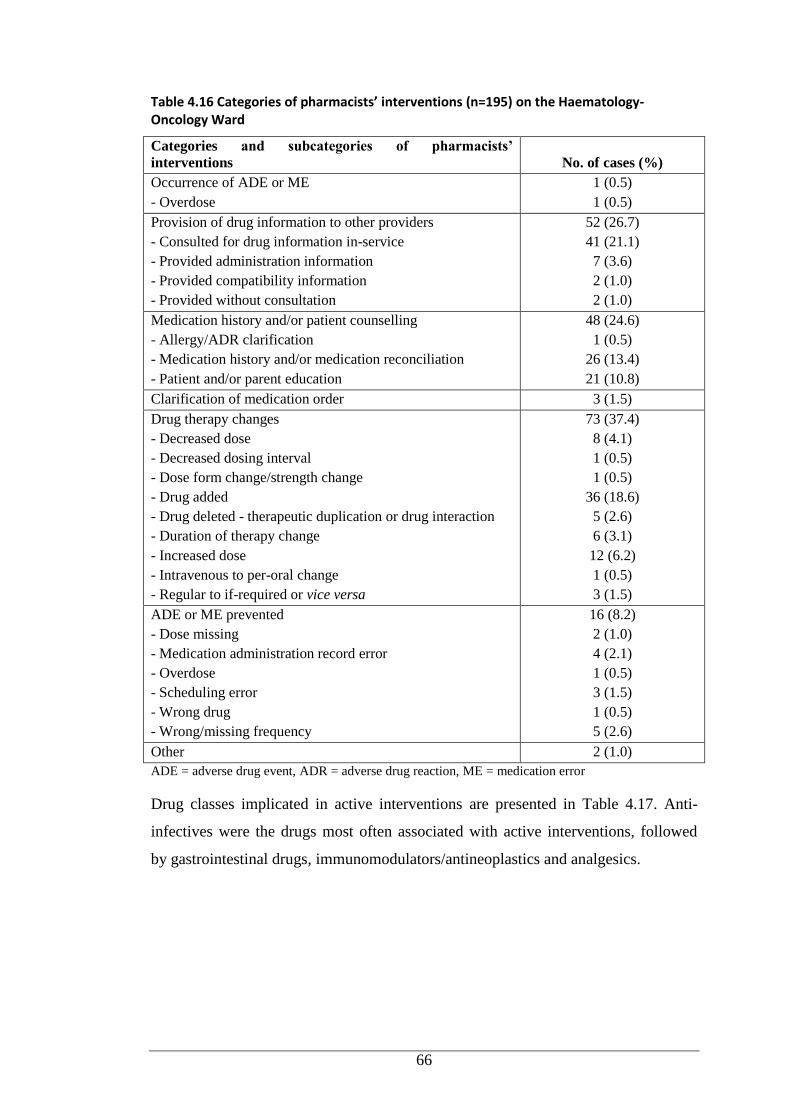
66
Table 4.16 Categories of pharmacists’ interventions (n=195) on the Haematology-Oncology Ward
Categories and subcategories of pharmacists’
interventions No. of cases (%)
Occurrence of ADE or ME
- Overdose
1 (0.5)
1 (0.5)
Provision of drug information to other providers
- Consulted for drug information in-service
- Provided administration information
- Provided compatibility information
- Provided without consultation
52 (26.7)
41 (21.1)
7 (3.6)
2 (1.0)
2 (1.0)
Medication history and/or patient counselling
- Allergy/ADR clarification
- Medication history and/or medication reconciliation
- Patient and/or parent education
48 (24.6)
1 (0.5)
26 (13.4)
21 (10.8)
Clarification of medication order 3 (1.5)
Drug therapy changes
- Decreased dose
- Decreased dosing interval
- Dose form change/strength change
- Drug added
- Drug deleted - therapeutic duplication or drug interaction
- Duration of therapy change
- Increased dose
- Intravenous to per-oral change
- Regular to if-required or vice versa
73 (37.4)
8 (4.1)
1 (0.5)
1 (0.5)
36 (18.6)
5 (2.6)
6 (3.1)
12 (6.2)
1 (0.5)
3 (1.5)
ADE or ME prevented
- Dose missing
- Medication administration record error
- Overdose
- Scheduling error
- Wrong drug
- Wrong/missing frequency
16 (8.2)
2 (1.0)
4 (2.1)
1 (0.5)
3 (1.5)
1 (0.5)
5 (2.6)
Other 2 (1.0)
ADE = adverse drug event, ADR = adverse drug reaction, ME = medication error
Drug classes implicated in active interventions are presented in Table 4.17. Anti-
infectives were the drugs most often associated with active interventions, followed
by gastrointestinal drugs, immunomodulators/antineoplastics and analgesics.
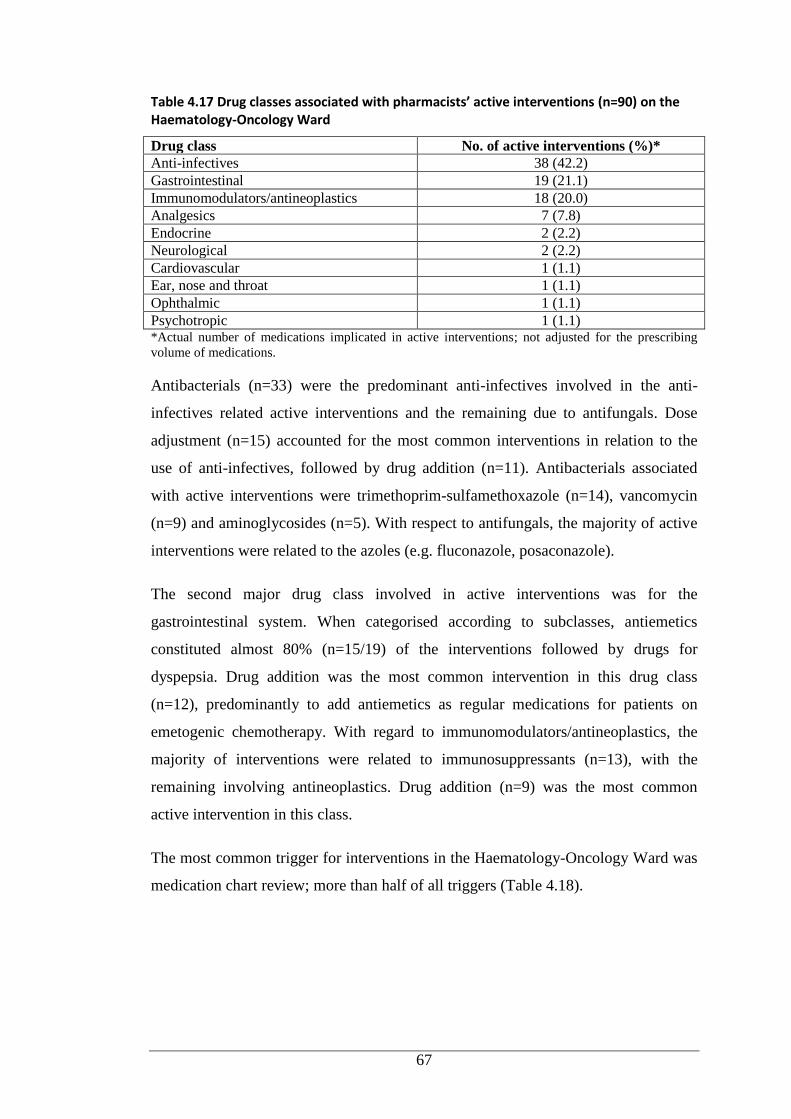
67
Table 4.17 Drug classes associated with pharmacists’ active interventions (n=90) on the Haematology-Oncology Ward
Drug class No. of active interventions (%)*
Anti-infectives 38 (42.2)
Gastrointestinal 19 (21.1)
Immunomodulators/antineoplastics 18 (20.0)
Analgesics 7 (7.8)
Endocrine 2 (2.2)
Neurological 2 (2.2)
Cardiovascular 1 (1.1)
Ear, nose and throat 1 (1.1)
Ophthalmic 1 (1.1)
Psychotropic 1 (1.1) *Actual number of medications implicated in active interventions; not adjusted for the prescribing
volume of medications.
Antibacterials (n=33) were the predominant anti-infectives involved in the anti-
infectives related active interventions and the remaining due to antifungals. Dose
adjustment (n=15) accounted for the most common interventions in relation to the
use of anti-infectives, followed by drug addition (n=11). Antibacterials associated
with active interventions were trimethoprim-sulfamethoxazole (n=14), vancomycin
(n=9) and aminoglycosides (n=5). With respect to antifungals, the majority of active
interventions were related to the azoles (e.g. fluconazole, posaconazole).
The second major drug class involved in active interventions was for the
gastrointestinal system. When categorised according to subclasses, antiemetics
constituted almost 80% (n=15/19) of the interventions followed by drugs for
dyspepsia. Drug addition was the most common intervention in this drug class
(n=12), predominantly to add antiemetics as regular medications for patients on
emetogenic chemotherapy. With regard to immunomodulators/antineoplastics, the
majority of interventions were related to immunosuppressants (n=13), with the
remaining involving antineoplastics. Drug addition (n=9) was the most common
active intervention in this class.
The most common trigger for interventions in the Haematology-Oncology Ward was
medication chart review; more than half of all triggers (Table 4.18).
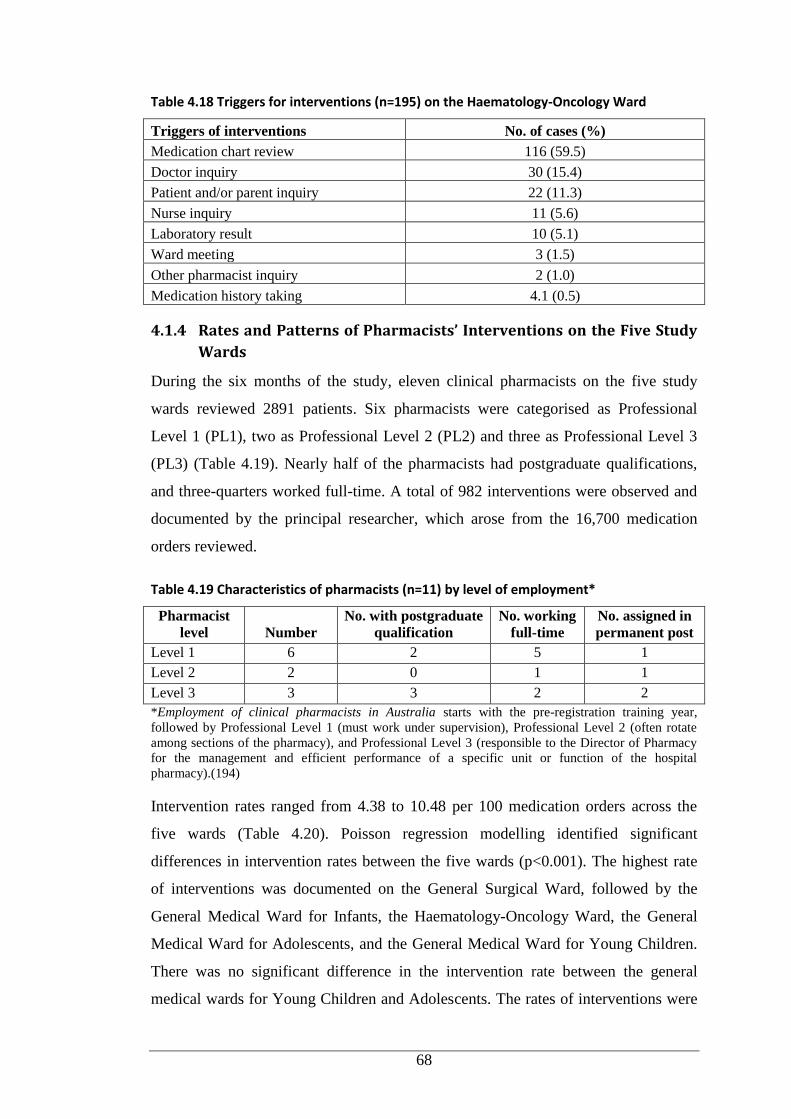
68
Table 4.18 Triggers for interventions (n=195) on the Haematology-Oncology Ward
Triggers of interventions No. of cases (%)
Medication chart review 116 (59.5)
Doctor inquiry 30 (15.4)
Patient and/or parent inquiry 22 (11.3)
Nurse inquiry 11 (5.6)
Laboratory result 10 (5.1)
Ward meeting 3 (1.5)
Other pharmacist inquiry 2 (1.0)
Medication history taking 4.1 (0.5)
4.1.4 Rates and Patterns of Pharmacists’ Interventions on the Five Study
Wards
During the six months of the study, eleven clinical pharmacists on the five study
wards reviewed 2891 patients. Six pharmacists were categorised as Professional
Level 1 (PL1), two as Professional Level 2 (PL2) and three as Professional Level 3
(PL3) (Table 4.19). Nearly half of the pharmacists had postgraduate qualifications,
and three-quarters worked full-time. A total of 982 interventions were observed and
documented by the principal researcher, which arose from the 16,700 medication
orders reviewed.
Table 4.19 Characteristics of pharmacists (n=11) by level of employment*
Pharmacist
level Number
No. with postgraduate
qualification
No. working
full-time
No. assigned in
permanent post
Level 1 6 2 5 1
Level 2 2 0 1 1
Level 3 3 3 2 2
*Employment of clinical pharmacists in Australia starts with the pre-registration training year,
followed by Professional Level 1 (must work under supervision), Professional Level 2 (often rotate
among sections of the pharmacy), and Professional Level 3 (responsible to the Director of Pharmacy
for the management and efficient performance of a specific unit or function of the hospital
pharmacy).(194)
Intervention rates ranged from 4.38 to 10.48 per 100 medication orders across the
five wards (Table 4.20). Poisson regression modelling identified significant
differences in intervention rates between the five wards (p<0.001). The highest rate
of interventions was documented on the General Surgical Ward, followed by the
General Medical Ward for Infants, the Haematology-Oncology Ward, the General
Medical Ward for Adolescents, and the General Medical Ward for Young Children.
There was no significant difference in the intervention rate between the general
medical wards for Young Children and Adolescents. The rates of interventions were
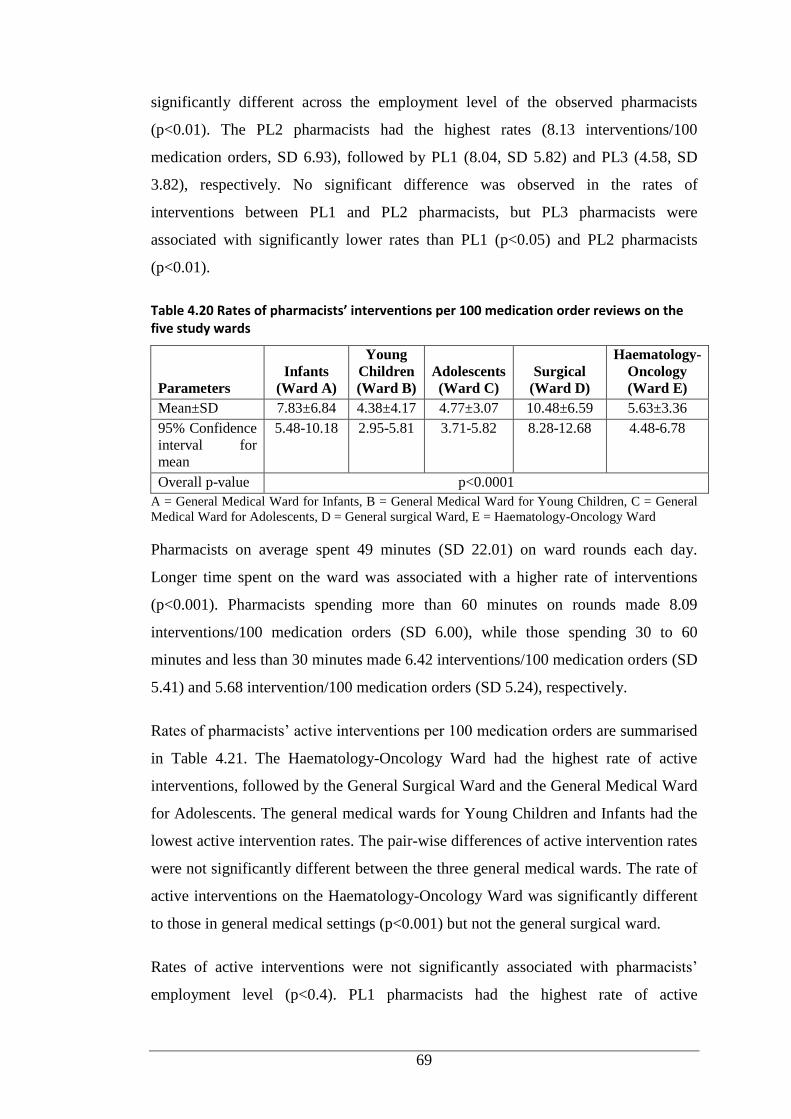
69
significantly different across the employment level of the observed pharmacists
(p<0.01). The PL2 pharmacists had the highest rates (8.13 interventions/100
medication orders, SD 6.93), followed by PL1 (8.04, SD 5.82) and PL3 (4.58, SD
3.82), respectively. No significant difference was observed in the rates of
interventions between PL1 and PL2 pharmacists, but PL3 pharmacists were
associated with significantly lower rates than PL1 (p<0.05) and PL2 pharmacists
(p<0.01).
Table 4.20 Rates of pharmacists’ interventions per 100 medication order reviews on the five study wards
Parameters
Infants
(Ward A)
Young
Children
(Ward B)
Adolescents
(Ward C)
Surgical
(Ward D)
Haematology-
Oncology
(Ward E)
Mean±SD 7.83±6.84 4.38±4.17 4.77±3.07 10.48±6.59 5.63±3.36
95% Confidence
interval for
mean
5.48-10.18 2.95-5.81 3.71-5.82 8.28-12.68 4.48-6.78
Overall p-value p<0.0001
A = General Medical Ward for Infants, B = General Medical Ward for Young Children, C = General
Medical Ward for Adolescents, D = General surgical Ward, E = Haematology-Oncology Ward
Pharmacists on average spent 49 minutes (SD 22.01) on ward rounds each day.
Longer time spent on the ward was associated with a higher rate of interventions
(p<0.001). Pharmacists spending more than 60 minutes on rounds made 8.09
interventions/100 medication orders (SD 6.00), while those spending 30 to 60
minutes and less than 30 minutes made 6.42 interventions/100 medication orders (SD
5.41) and 5.68 intervention/100 medication orders (SD 5.24), respectively.
Rates of pharmacists’ active interventions per 100 medication orders are summarised
in Table 4.21. The Haematology-Oncology Ward had the highest rate of active
interventions, followed by the General Surgical Ward and the General Medical Ward
for Adolescents. The general medical wards for Young Children and Infants had the
lowest active intervention rates. The pair-wise differences of active intervention rates
were not significantly different between the three general medical wards. The rate of
active interventions on the Haematology-Oncology Ward was significantly different
to those in general medical settings (p<0.001) but not the general surgical ward.
Rates of active interventions were not significantly associated with pharmacists’
employment level (p<0.4). PL1 pharmacists had the highest rate of active
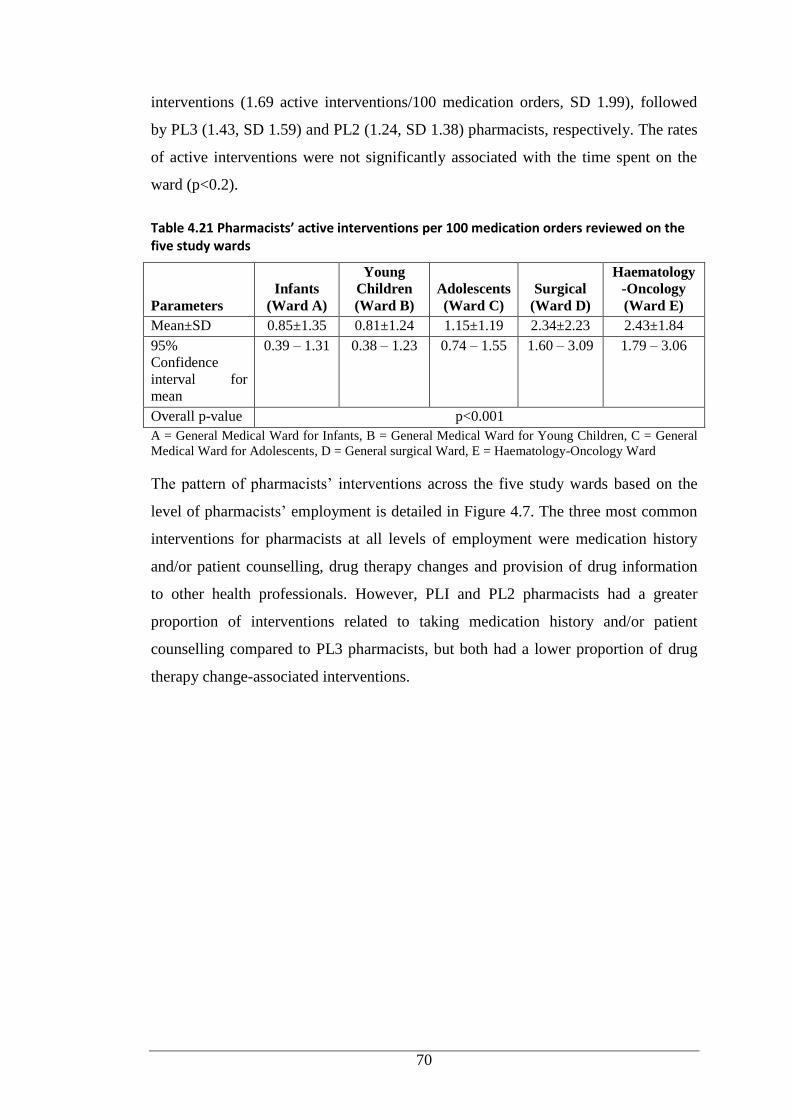
70
interventions (1.69 active interventions/100 medication orders, SD 1.99), followed
by PL3 (1.43, SD 1.59) and PL2 (1.24, SD 1.38) pharmacists, respectively. The rates
of active interventions were not significantly associated with the time spent on the
ward (p<0.2).
Table 4.21 Pharmacists’ active interventions per 100 medication orders reviewed on the five study wards
Parameters
Infants
(Ward A)
Young
Children
(Ward B)
Adolescents
(Ward C)
Surgical
(Ward D)
Haematology
-Oncology
(Ward E)
Mean±SD 0.85±1.35 0.81±1.24 1.15±1.19 2.34±2.23 2.43±1.84
95%
Confidence
interval for
mean
0.39 – 1.31 0.38 – 1.23 0.74 – 1.55 1.60 – 3.09 1.79 – 3.06
Overall p-value p<0.001
A = General Medical Ward for Infants, B = General Medical Ward for Young Children, C = General
Medical Ward for Adolescents, D = General surgical Ward, E = Haematology-Oncology Ward
The pattern of pharmacists’ interventions across the five study wards based on the
level of pharmacists’ employment is detailed in Figure 4.7. The three most common
interventions for pharmacists at all levels of employment were medication history
and/or patient counselling, drug therapy changes and provision of drug information
to other health professionals. However, PLI and PL2 pharmacists had a greater
proportion of interventions related to taking medication history and/or patient
counselling compared to PL3 pharmacists, but both had a lower proportion of drug
therapy change-associated interventions.
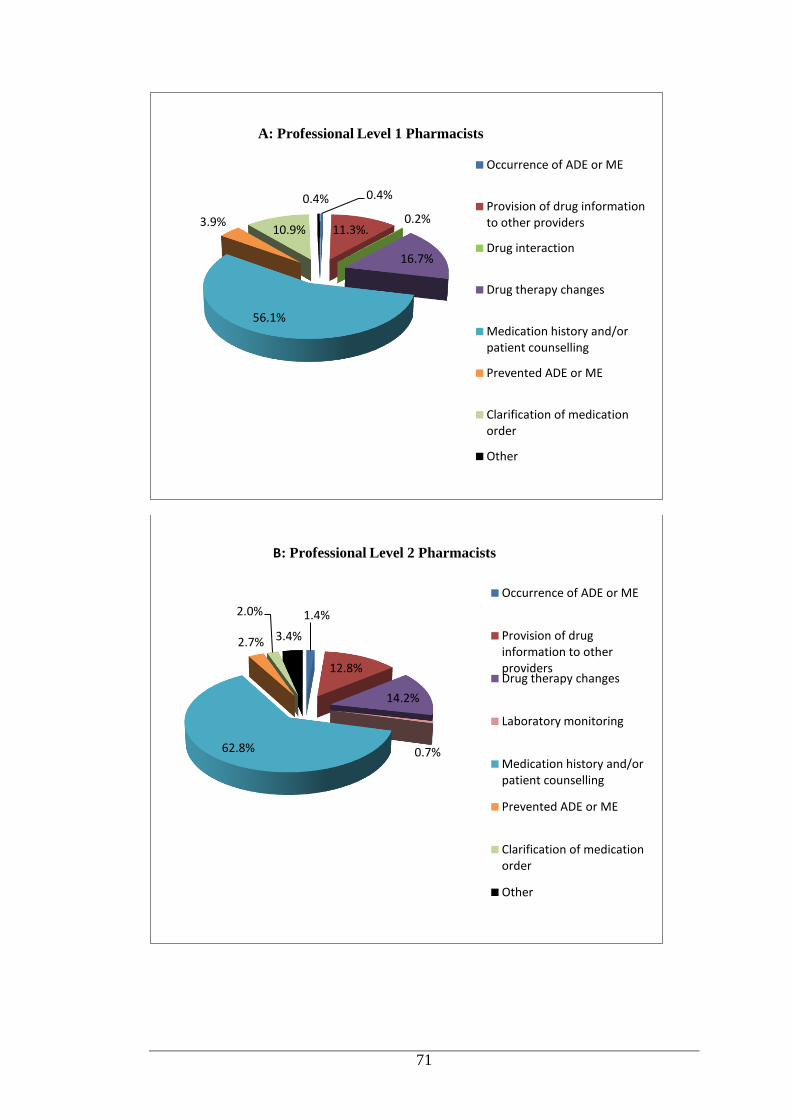
71
0.4%
11.3%. 0.2%
16.7%
56.1%
3.9% 10.9%
0.4%
Occurrence of ADE or ME
Provision of drug information to other providers
Drug interaction
Drug therapy changes
Medication history and/or patient counselling
Prevented ADE or ME
Clarification of medication order
Other
A: Professional Level 1 Pharmacists
1.4%
12.8%
14.2%
0.7% 62.8%
2.7%
2.0%
3.4%
Occurrence of ADE or ME
Provision of drug information to other providers Drug therapy changes
Laboratory monitoring
Medication history and/or patient counselling
Prevented ADE or ME
Clarification of medication order
Other
B: Professional Level 2 Pharmacists
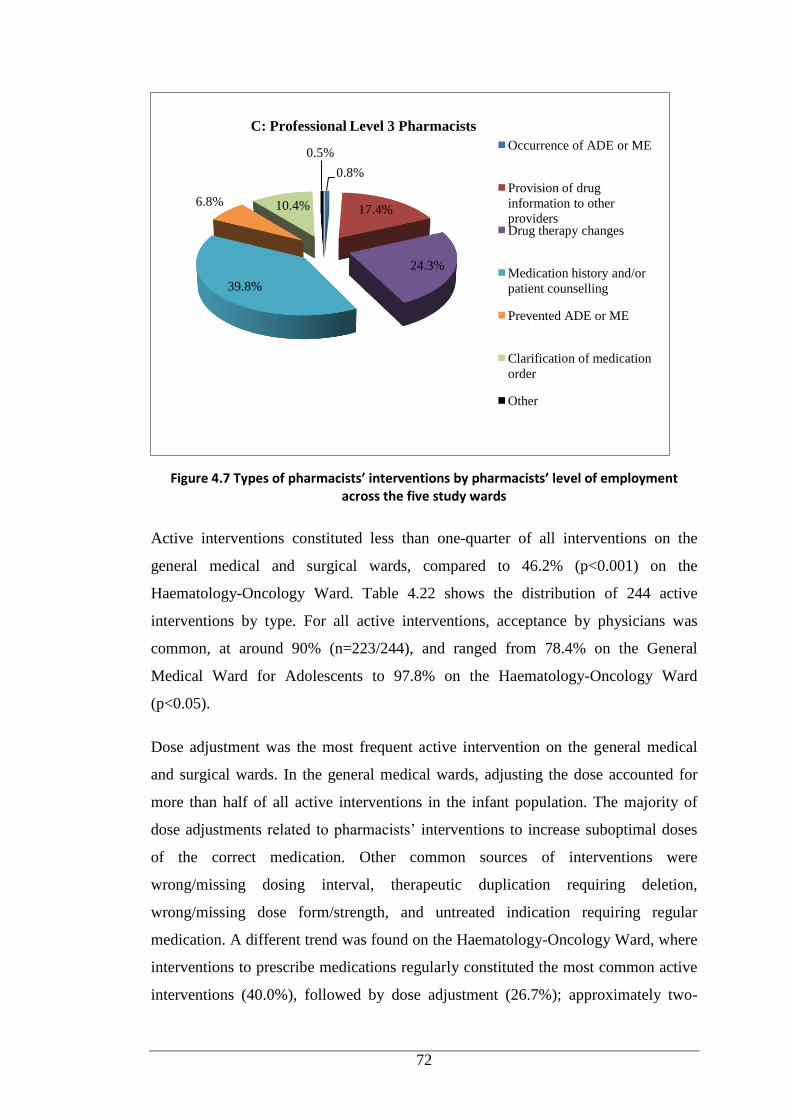
72
Figure 4.7 Types of pharmacists’ interventions by pharmacists’ level of employment across the five study wards
Active interventions constituted less than one-quarter of all interventions on the
general medical and surgical wards, compared to 46.2% (p<0.001) on the
Haematology-Oncology Ward. Table 4.22 shows the distribution of 244 active
interventions by type. For all active interventions, acceptance by physicians was
common, at around 90% (n=223/244), and ranged from 78.4% on the General
Medical Ward for Adolescents to 97.8% on the Haematology-Oncology Ward
(p<0.05).
Dose adjustment was the most frequent active intervention on the general medical
and surgical wards. In the general medical wards, adjusting the dose accounted for
more than half of all active interventions in the infant population. The majority of
dose adjustments related to pharmacists’ interventions to increase suboptimal doses
of the correct medication. Other common sources of interventions were
wrong/missing dosing interval, therapeutic duplication requiring deletion,
wrong/missing dose form/strength, and untreated indication requiring regular
medication. A different trend was found on the Haematology-Oncology Ward, where
interventions to prescribe medications regularly constituted the most common active
interventions (40.0%), followed by dose adjustment (26.7%); approximately two-
0.8%
17.4%
24.3%
39.8%
6.8% 10.4%
0.5% Occurrence of ADE or ME
Provision of drug
information to other
providers Drug therapy changes
Medication history and/or
patient counselling
Prevented ADE or ME
Clarification of medication
order
Other
C: Professional Level 3 Pharmacists
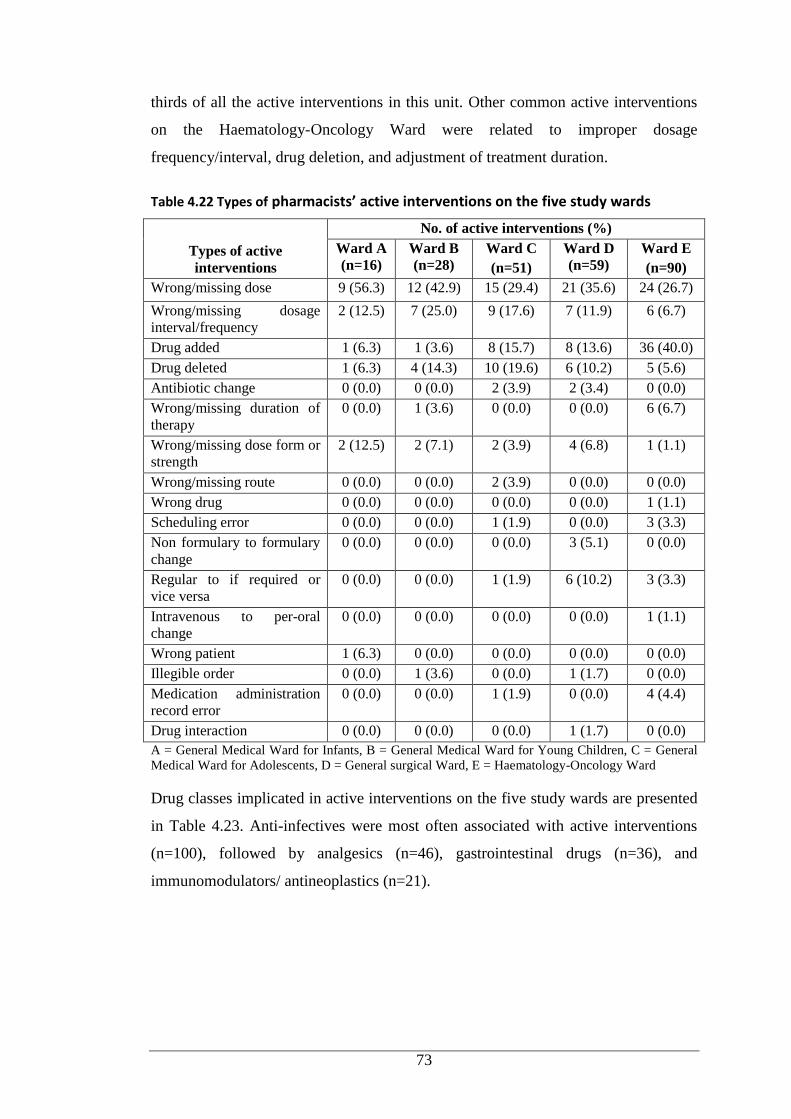
73
thirds of all the active interventions in this unit. Other common active interventions
on the Haematology-Oncology Ward were related to improper dosage
frequency/interval, drug deletion, and adjustment of treatment duration.
Table 4.22 Types of pharmacists’ active interventions on the five study wards
Types of active
interventions
No. of active interventions (%)
Ward A
(n=16)
Ward B
(n=28)
Ward C
(n=51)
Ward D
(n=59)
Ward E
(n=90)
Wrong/missing dose 9 (56.3) 12 (42.9) 15 (29.4) 21 (35.6) 24 (26.7)
Wrong/missing dosage
interval/frequency
2 (12.5) 7 (25.0) 9 (17.6) 7 (11.9) 6 (6.7)
Drug added 1 (6.3) 1 (3.6) 8 (15.7) 8 (13.6) 36 (40.0)
Drug deleted 1 (6.3) 4 (14.3) 10 (19.6) 6 (10.2) 5 (5.6)
Antibiotic change 0 (0.0) 0 (0.0) 2 (3.9) 2 (3.4) 0 (0.0)
Wrong/missing duration of
therapy
0 (0.0) 1 (3.6) 0 (0.0) 0 (0.0) 6 (6.7)
Wrong/missing dose form or
strength
2 (12.5) 2 (7.1) 2 (3.9) 4 (6.8) 1 (1.1)
Wrong/missing route 0 (0.0) 0 (0.0) 2 (3.9) 0 (0.0) 0 (0.0)
Wrong drug 0 (0.0) 0 (0.0) 0 (0.0) 0 (0.0) 1 (1.1)
Scheduling error 0 (0.0) 0 (0.0) 1 (1.9) 0 (0.0) 3 (3.3)
Non formulary to formulary
change
0 (0.0) 0 (0.0) 0 (0.0) 3 (5.1) 0 (0.0)
Regular to if required or
vice versa
0 (0.0) 0 (0.0) 1 (1.9) 6 (10.2) 3 (3.3)
Intravenous to per-oral
change
0 (0.0) 0 (0.0) 0 (0.0) 0 (0.0) 1 (1.1)
Wrong patient 1 (6.3) 0 (0.0) 0 (0.0) 0 (0.0) 0 (0.0)
Illegible order 0 (0.0) 1 (3.6) 0 (0.0) 1 (1.7) 0 (0.0)
Medication administration
record error
0 (0.0) 0 (0.0) 1 (1.9) 0 (0.0) 4 (4.4)
Drug interaction 0 (0.0) 0 (0.0) 0 (0.0) 1 (1.7) 0 (0.0)
A = General Medical Ward for Infants, B = General Medical Ward for Young Children, C = General
Medical Ward for Adolescents, D = General surgical Ward, E = Haematology-Oncology Ward
Drug classes implicated in active interventions on the five study wards are presented
in Table 4.23. Anti-infectives were most often associated with active interventions
(n=100), followed by analgesics (n=46), gastrointestinal drugs (n=36), and
immunomodulators/ antineoplastics (n=21).
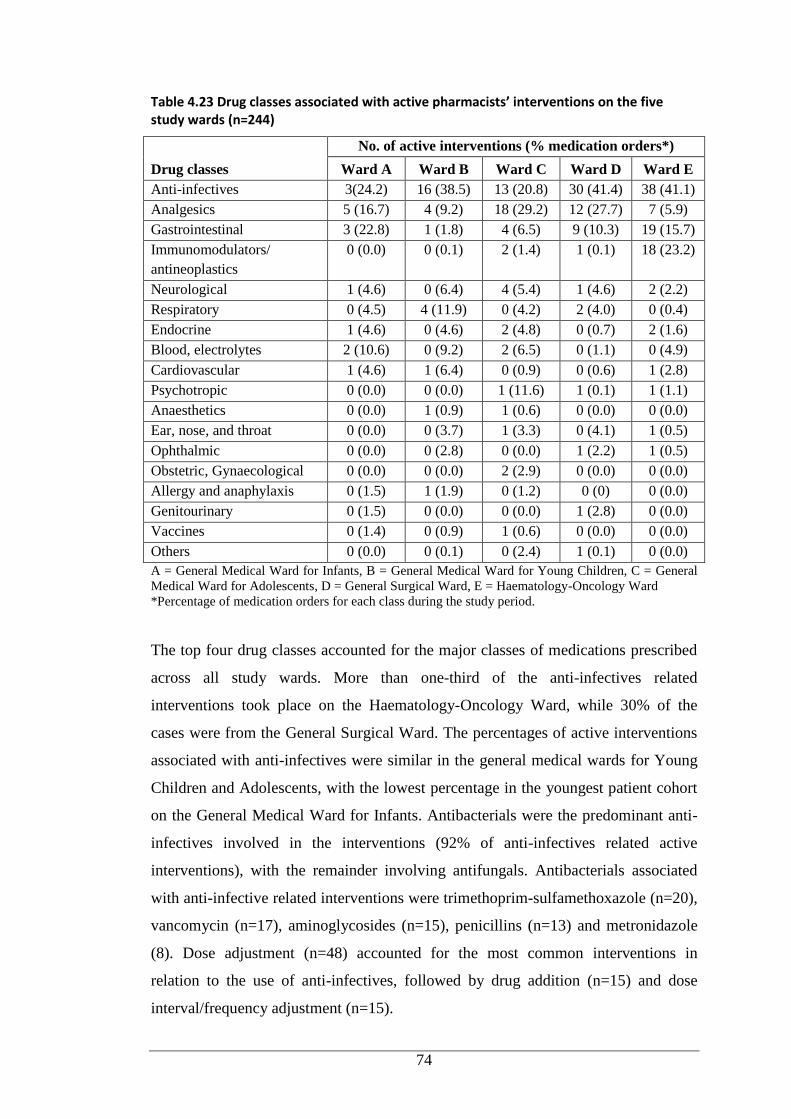
74
Table 4.23 Drug classes associated with active pharmacists’ interventions on the five study wards (n=244)
Drug classes
No. of active interventions (% medication orders*)
Ward A Ward B Ward C Ward D Ward E
Anti-infectives 3(24.2) 16 (38.5) 13 (20.8) 30 (41.4) 38 (41.1)
Analgesics 5 (16.7) 4 (9.2) 18 (29.2) 12 (27.7) 7 (5.9)
Gastrointestinal 3 (22.8) 1 (1.8) 4 (6.5) 9 (10.3) 19 (15.7)
Immunomodulators/
antineoplastics
0 (0.0) 0 (0.1) 2 (1.4) 1 (0.1) 18 (23.2)
Neurological 1 (4.6) 0 (6.4) 4 (5.4) 1 (4.6) 2 (2.2)
Respiratory 0 (4.5) 4 (11.9) 0 (4.2) 2 (4.0) 0 (0.4)
Endocrine 1 (4.6) 0 (4.6) 2 (4.8) 0 (0.7) 2 (1.6)
Blood, electrolytes 2 (10.6) 0 (9.2) 2 (6.5) 0 (1.1) 0 (4.9)
Cardiovascular 1 (4.6) 1 (6.4) 0 (0.9) 0 (0.6) 1 (2.8)
Psychotropic 0 (0.0) 0 (0.0) 1 (11.6) 1 (0.1) 1 (1.1)
Anaesthetics 0 (0.0) 1 (0.9) 1 (0.6) 0 (0.0) 0 (0.0)
Ear, nose, and throat 0 (0.0) 0 (3.7) 1 (3.3) 0 (4.1) 1 (0.5)
Ophthalmic 0 (0.0) 0 (2.8) 0 (0.0) 1 (2.2) 1 (0.5)
Obstetric, Gynaecological 0 (0.0) 0 (0.0) 2 (2.9) 0 (0.0) 0 (0.0)
Allergy and anaphylaxis 0 (1.5) 1 (1.9) 0 (1.2) 0 (0) 0 (0.0)
Genitourinary 0 (1.5) 0 (0.0) 0 (0.0) 1 (2.8) 0 (0.0)
Vaccines 0 (1.4) 0 (0.9) 1 (0.6) 0 (0.0) 0 (0.0)
Others 0 (0.0) 0 (0.1) 0 (2.4) 1 (0.1) 0 (0.0)
A = General Medical Ward for Infants, B = General Medical Ward for Young Children, C = General
Medical Ward for Adolescents, D = General Surgical Ward, E = Haematology-Oncology Ward
*Percentage of medication orders for each class during the study period.
The top four drug classes accounted for the major classes of medications prescribed
across all study wards. More than one-third of the anti-infectives related
interventions took place on the Haematology-Oncology Ward, while 30% of the
cases were from the General Surgical Ward. The percentages of active interventions
associated with anti-infectives were similar in the general medical wards for Young
Children and Adolescents, with the lowest percentage in the youngest patient cohort
on the General Medical Ward for Infants. Antibacterials were the predominant anti-
infectives involved in the interventions (92% of anti-infectives related active
interventions), with the remainder involving antifungals. Antibacterials associated
with anti-infective related interventions were trimethoprim-sulfamethoxazole (n=20),
vancomycin (n=17), aminoglycosides (n=15), penicillins (n=13) and metronidazole
(8). Dose adjustment (n=48) accounted for the most common interventions in
relation to the use of anti-infectives, followed by drug addition (n=15) and dose
interval/frequency adjustment (n=15).
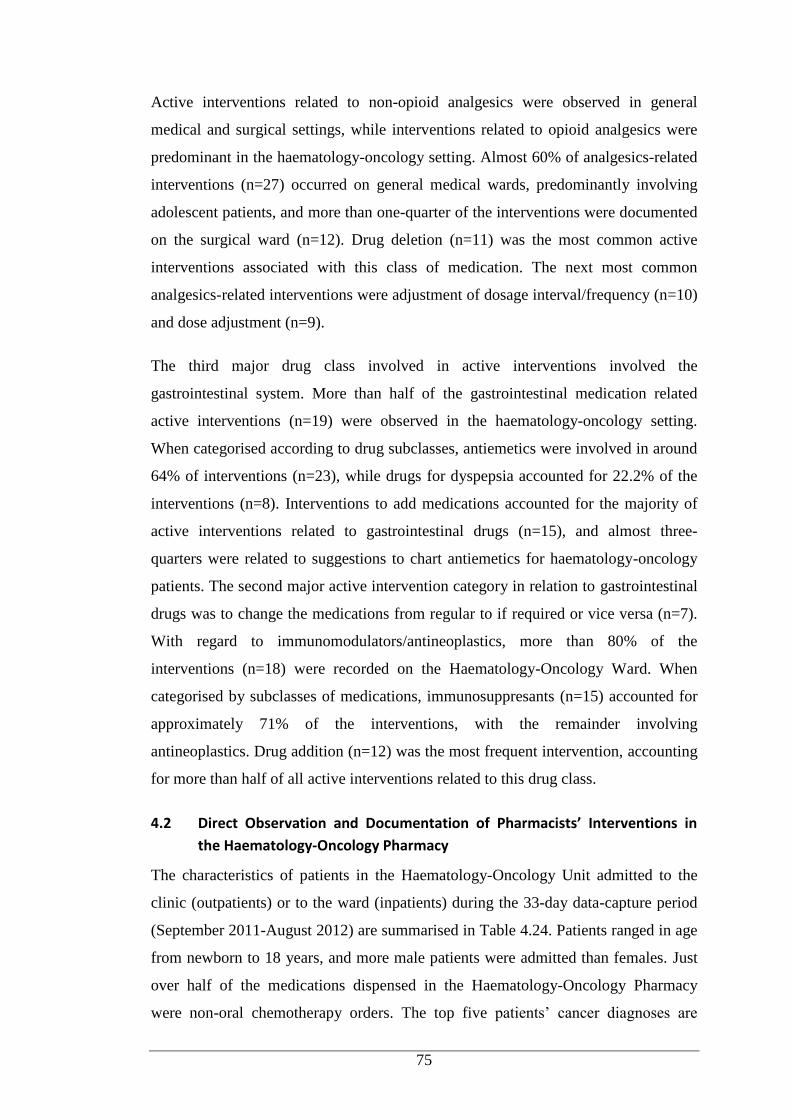
75
Active interventions related to non-opioid analgesics were observed in general
medical and surgical settings, while interventions related to opioid analgesics were
predominant in the haematology-oncology setting. Almost 60% of analgesics-related
interventions (n=27) occurred on general medical wards, predominantly involving
adolescent patients, and more than one-quarter of the interventions were documented
on the surgical ward (n=12). Drug deletion (n=11) was the most common active
interventions associated with this class of medication. The next most common
analgesics-related interventions were adjustment of dosage interval/frequency (n=10)
and dose adjustment (n=9).
The third major drug class involved in active interventions involved the
gastrointestinal system. More than half of the gastrointestinal medication related
active interventions (n=19) were observed in the haematology-oncology setting.
When categorised according to drug subclasses, antiemetics were involved in around
64% of interventions (n=23), while drugs for dyspepsia accounted for 22.2% of the
interventions (n=8). Interventions to add medications accounted for the majority of
active interventions related to gastrointestinal drugs (n=15), and almost three-
quarters were related to suggestions to chart antiemetics for haematology-oncology
patients. The second major active intervention category in relation to gastrointestinal
drugs was to change the medications from regular to if required or vice versa (n=7).
With regard to immunomodulators/antineoplastics, more than 80% of the
interventions (n=18) were recorded on the Haematology-Oncology Ward. When
categorised by subclasses of medications, immunosuppresants (n=15) accounted for
approximately 71% of the interventions, with the remainder involving
antineoplastics. Drug addition (n=12) was the most frequent intervention, accounting
for more than half of all active interventions related to this drug class.
4.2 Direct Observation and Documentation of Pharmacists’ Interventions in
the Haematology-Oncology Pharmacy
The characteristics of patients in the Haematology-Oncology Unit admitted to the
clinic (outpatients) or to the ward (inpatients) during the 33-day data-capture period
(September 2011-August 2012) are summarised in Table 4.24. Patients ranged in age
from newborn to 18 years, and more male patients were admitted than females. Just
over half of the medications dispensed in the Haematology-Oncology Pharmacy
were non-oral chemotherapy orders. The top five patients’ cancer diagnoses are
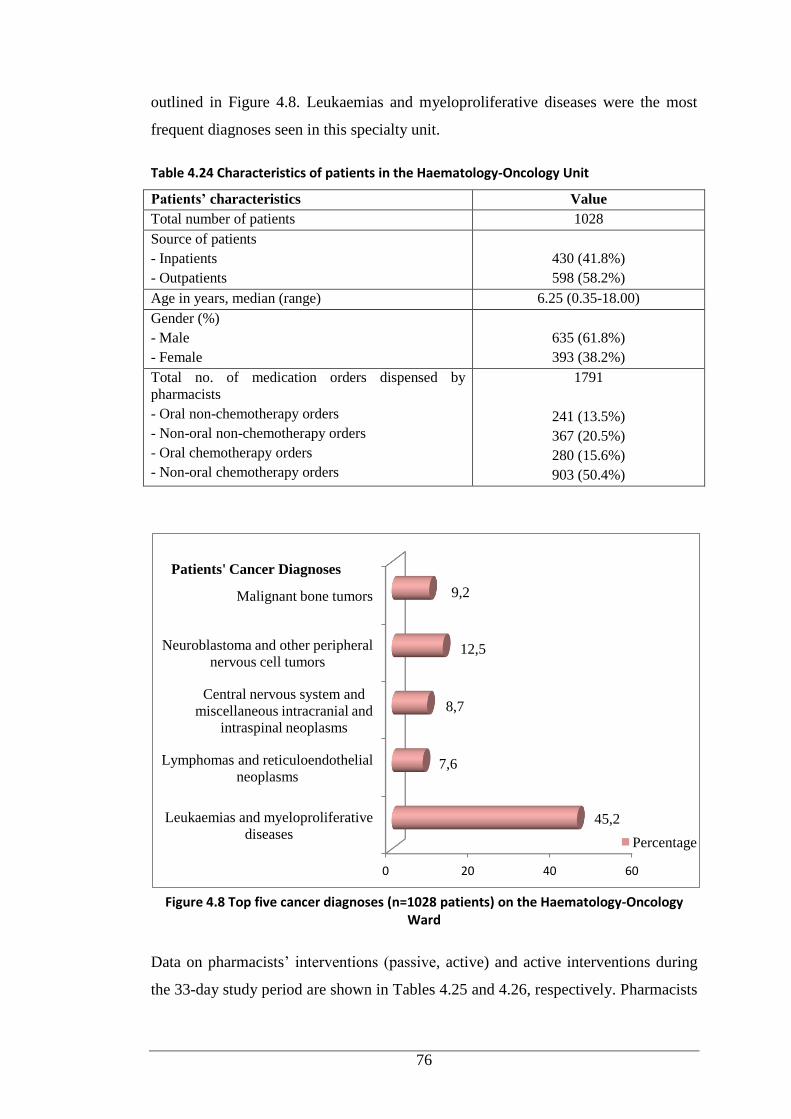
76
outlined in Figure 4.8. Leukaemias and myeloproliferative diseases were the most
frequent diagnoses seen in this specialty unit.
Table 4.24 Characteristics of patients in the Haematology-Oncology Unit
Patients’ characteristics Value
Total number of patients 1028
Source of patients
- Inpatients
- Outpatients
430 (41.8%)
598 (58.2%)
Age in years, median (range) 6.25 (0.35-18.00)
Gender (%)
- Male
- Female
635 (61.8%)
393 (38.2%)
Total no. of medication orders dispensed by
pharmacists
- Oral non-chemotherapy orders
- Non-oral non-chemotherapy orders
- Oral chemotherapy orders
- Non-oral chemotherapy orders
1791
241 (13.5%)
367 (20.5%)
280 (15.6%)
903 (50.4%)
Figure 4.8 Top five cancer diagnoses (n=1028 patients) on the Haematology-Oncology
Ward
Data on pharmacists’ interventions (passive, active) and active interventions during
the 33-day study period are shown in Tables 4.25 and 4.26, respectively. Pharmacists
0 20 40 60
Leukaemias and myeloproliferative
diseases
Lymphomas and reticuloendothelial
neoplasms
Central nervous system and
miscellaneous intracranial and
intraspinal neoplasms
Neuroblastoma and other peripheral
nervous cell tumors
Malignant bone tumors
45,2
7,6
8,7
12,5
9,2
Patients' Cancer Diagnoses
Percentage
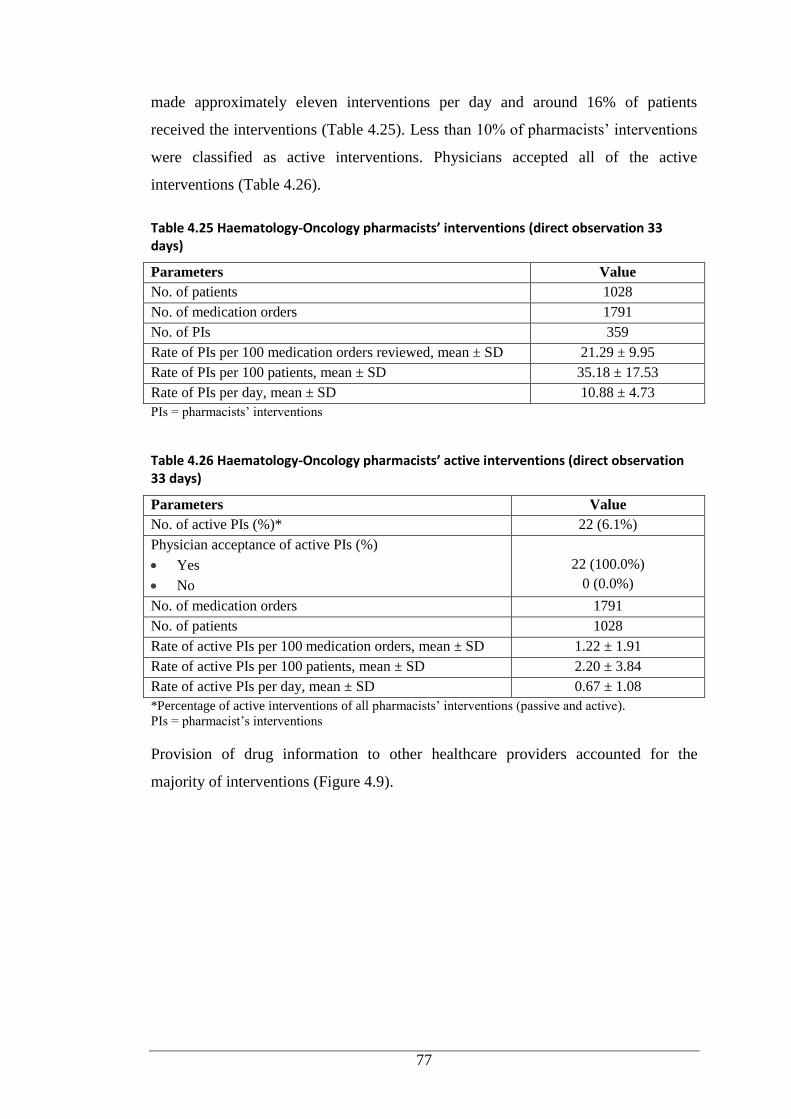
77
made approximately eleven interventions per day and around 16% of patients
received the interventions (Table 4.25). Less than 10% of pharmacists’ interventions
were classified as active interventions. Physicians accepted all of the active
interventions (Table 4.26).
Table 4.25 Haematology-Oncology pharmacists’ interventions (direct observation 33 days)
Parameters Value
No. of patients 1028
No. of medication orders 1791
No. of PIs 359
Rate of PIs per 100 medication orders reviewed, mean ± SD 21.29 ± 9.95
Rate of PIs per 100 patients, mean ± SD 35.18 ± 17.53
Rate of PIs per day, mean ± SD 10.88 ± 4.73
PIs = pharmacists’ interventions
Table 4.26 Haematology-Oncology pharmacists’ active interventions (direct observation 33 days)
Parameters Value
No. of active PIs (%)* 22 (6.1%)
Physician acceptance of active PIs (%)
Yes
No
22 (100.0%)
0 (0.0%)
No. of medication orders 1791
No. of patients 1028
Rate of active PIs per 100 medication orders, mean ± SD 1.22 ± 1.91
Rate of active PIs per 100 patients, mean ± SD 2.20 ± 3.84
Rate of active PIs per day, mean ± SD 0.67 ± 1.08
*Percentage of active interventions of all pharmacists’ interventions (passive and active).
PIs = pharmacist’s interventions
Provision of drug information to other healthcare providers accounted for the
majority of interventions (Figure 4.9).
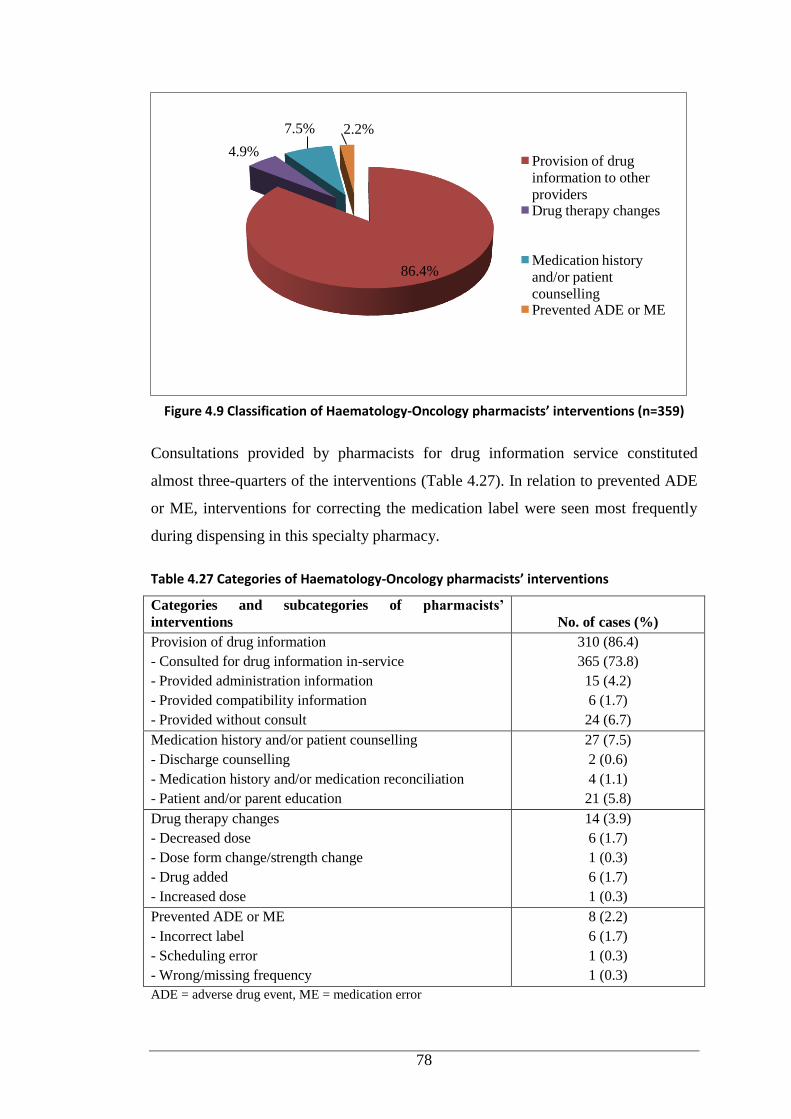
78
Figure 4.9 Classification of Haematology-Oncology pharmacists’ interventions (n=359)
Consultations provided by pharmacists for drug information service constituted
almost three-quarters of the interventions (Table 4.27). In relation to prevented ADE
or ME, interventions for correcting the medication label were seen most frequently
during dispensing in this specialty pharmacy.
Table 4.27 Categories of Haematology-Oncology pharmacists’ interventions
Categories and subcategories of pharmacists’
interventions No. of cases (%)
Provision of drug information
- Consulted for drug information in-service
- Provided administration information
- Provided compatibility information
- Provided without consult
310 (86.4)
365 (73.8)
15 (4.2)
6 (1.7)
24 (6.7)
Medication history and/or patient counselling
- Discharge counselling
- Medication history and/or medication reconciliation
- Patient and/or parent education
27 (7.5)
2 (0.6)
4 (1.1)
21 (5.8)
Drug therapy changes
- Decreased dose
- Dose form change/strength change
- Drug added
- Increased dose
14 (3.9)
6 (1.7)
1 (0.3)
6 (1.7)
1 (0.3)
Prevented ADE or ME
- Incorrect label
- Scheduling error
- Wrong/missing frequency
8 (2.2)
6 (1.7)
1 (0.3)
1 (0.3)
ADE = adverse drug event, ME = medication error
86.4%
4.9%
7.5% 2.2%
Provision of drug
information to other
providers Drug therapy changes
Medication history
and/or patient
counselling Prevented ADE or ME
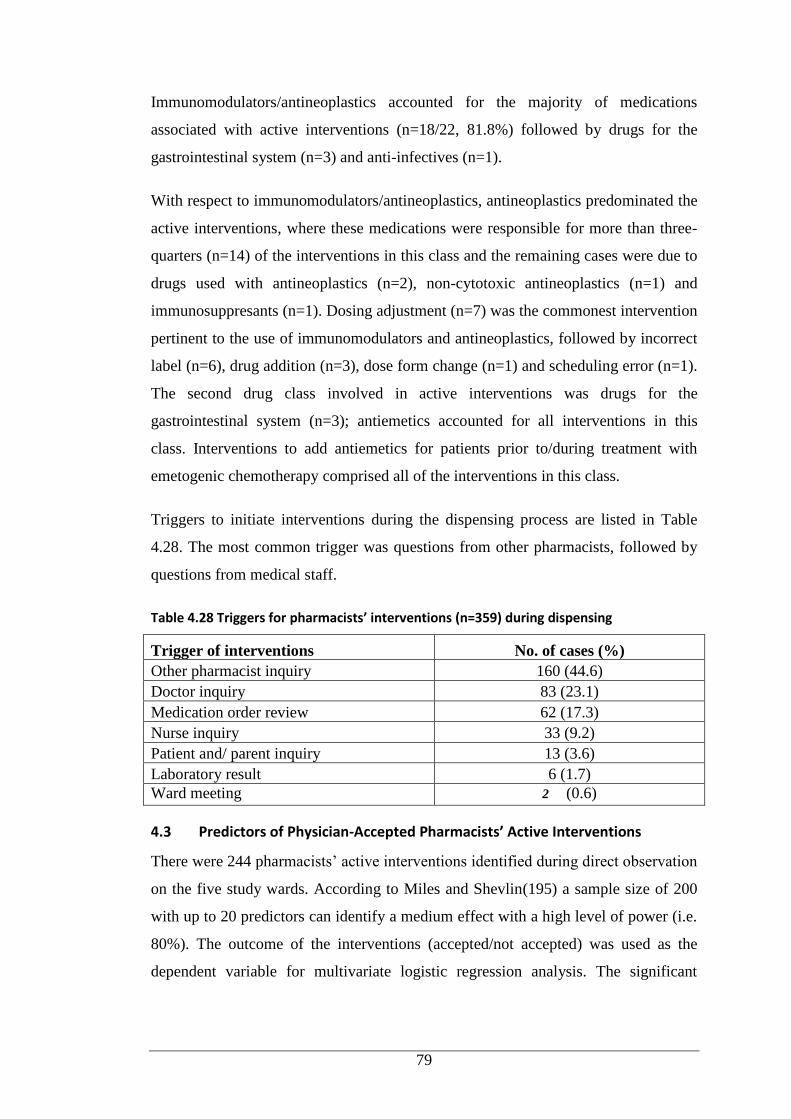
79
Immunomodulators/antineoplastics accounted for the majority of medications
associated with active interventions (n=18/22, 81.8%) followed by drugs for the
gastrointestinal system (n=3) and anti-infectives (n=1).
With respect to immunomodulators/antineoplastics, antineoplastics predominated the
active interventions, where these medications were responsible for more than three-
quarters (n=14) of the interventions in this class and the remaining cases were due to
drugs used with antineoplastics (n=2), non-cytotoxic antineoplastics (n=1) and
immunosuppresants (n=1). Dosing adjustment (n=7) was the commonest intervention
pertinent to the use of immunomodulators and antineoplastics, followed by incorrect
label (n=6), drug addition (n=3), dose form change (n=1) and scheduling error (n=1).
The second drug class involved in active interventions was drugs for the
gastrointestinal system (n=3); antiemetics accounted for all interventions in this
class. Interventions to add antiemetics for patients prior to/during treatment with
emetogenic chemotherapy comprised all of the interventions in this class.
Triggers to initiate interventions during the dispensing process are listed in Table
4.28. The most common trigger was questions from other pharmacists, followed by
questions from medical staff.
Table 4.28 Triggers for pharmacists’ interventions (n=359) during dispensing
Trigger of interventions No. of cases (%)
Other pharmacist inquiry 160 (44.6)
Doctor inquiry 83 (23.1)
Medication order review 62 (17.3)
Nurse inquiry 33 (9.2)
Patient and/ parent inquiry 13 (3.6)
Laboratory result 6 (1.7)
Ward meeting 2 (0.6)
4.3 Predictors of Physician-Accepted Pharmacists’ Active Interventions
There were 244 pharmacists’ active interventions identified during direct observation
on the five study wards. According to Miles and Shevlin(195) a sample size of 200
with up to 20 predictors can identify a medium effect with a high level of power (i.e.
80%). The outcome of the interventions (accepted/not accepted) was used as the
dependent variable for multivariate logistic regression analysis. The significant
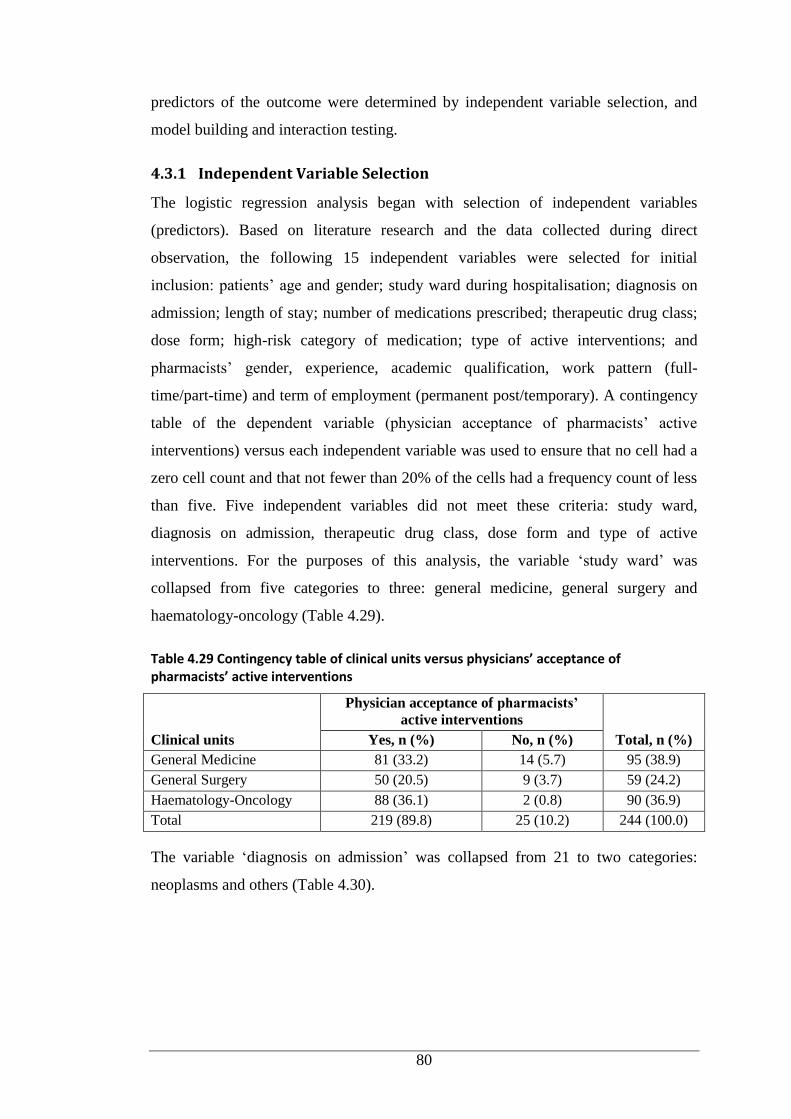
80
predictors of the outcome were determined by independent variable selection, and
model building and interaction testing.
4.3.1 Independent Variable Selection
The logistic regression analysis began with selection of independent variables
(predictors). Based on literature research and the data collected during direct
observation, the following 15 independent variables were selected for initial
inclusion: patients’ age and gender; study ward during hospitalisation; diagnosis on
admission; length of stay; number of medications prescribed; therapeutic drug class;
dose form; high-risk category of medication; type of active interventions; and
pharmacists’ gender, experience, academic qualification, work pattern (full-
time/part-time) and term of employment (permanent post/temporary). A contingency
table of the dependent variable (physician acceptance of pharmacists’ active
interventions) versus each independent variable was used to ensure that no cell had a
zero cell count and that not fewer than 20% of the cells had a frequency count of less
than five. Five independent variables did not meet these criteria: study ward,
diagnosis on admission, therapeutic drug class, dose form and type of active
interventions. For the purposes of this analysis, the variable ‘study ward’ was
collapsed from five categories to three: general medicine, general surgery and
haematology-oncology (Table 4.29).
Table 4.29 Contingency table of clinical units versus physicians’ acceptance of pharmacists’ active interventions
Clinical units
Physician acceptance of pharmacists’
active interventions
Total, n (%) Yes, n (%) No, n (%)
General Medicine 81 (33.2) 14 (5.7) 95 (38.9)
General Surgery 50 (20.5) 9 (3.7) 59 (24.2)
Haematology-Oncology 88 (36.1) 2 (0.8) 90 (36.9)
Total 219 (89.8) 25 (10.2) 244 (100.0)
The variable ‘diagnosis on admission’ was collapsed from 21 to two categories:
neoplasms and others (Table 4.30).
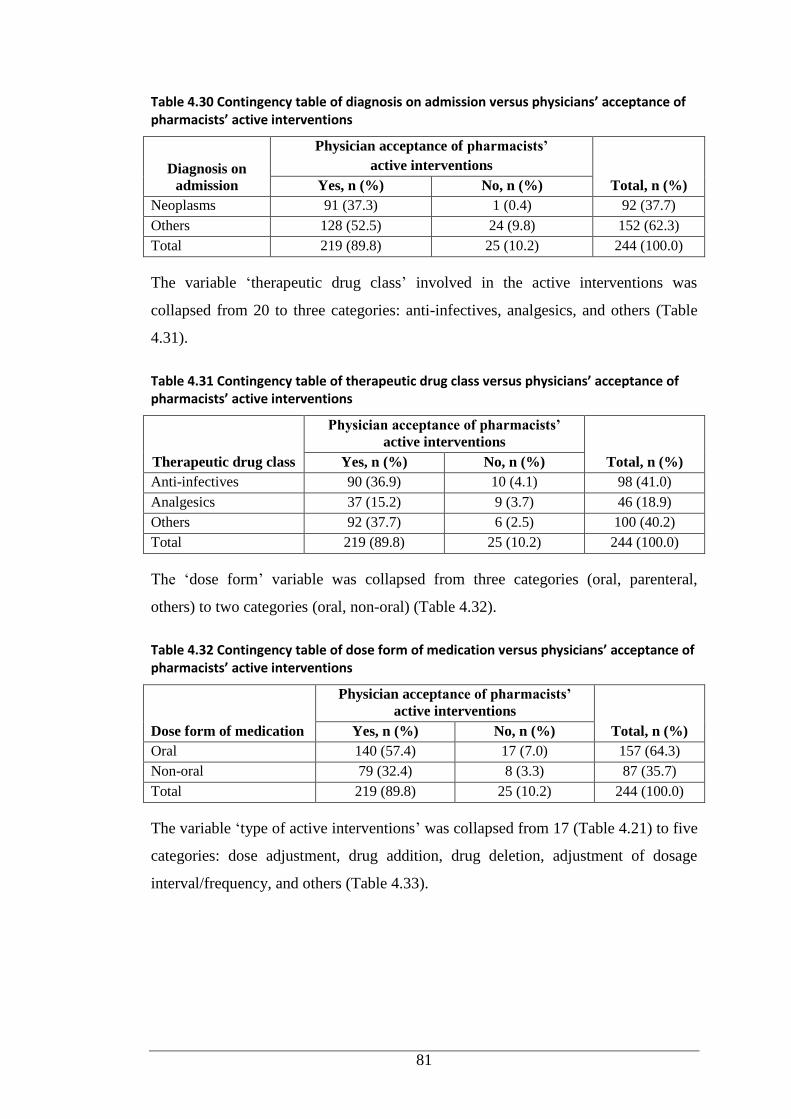
81
Table 4.30 Contingency table of diagnosis on admission versus physicians’ acceptance of pharmacists’ active interventions
Diagnosis on
admission
Physician acceptance of pharmacists’
active interventions
Total, n (%) Yes, n (%) No, n (%)
Neoplasms 91 (37.3) 1 (0.4) 92 (37.7)
Others 128 (52.5) 24 (9.8) 152 (62.3)
Total 219 (89.8) 25 (10.2) 244 (100.0)
The variable ‘therapeutic drug class’ involved in the active interventions was
collapsed from 20 to three categories: anti-infectives, analgesics, and others (Table
4.31).
Table 4.31 Contingency table of therapeutic drug class versus physicians’ acceptance of pharmacists’ active interventions
Therapeutic drug class
Physician acceptance of pharmacists’
active interventions
Total, n (%) Yes, n (%) No, n (%)
Anti-infectives 90 (36.9) 10 (4.1) 98 (41.0)
Analgesics 37 (15.2) 9 (3.7) 46 (18.9)
Others 92 (37.7) 6 (2.5) 100 (40.2)
Total 219 (89.8) 25 (10.2) 244 (100.0)
The ‘dose form’ variable was collapsed from three categories (oral, parenteral,
others) to two categories (oral, non-oral) (Table 4.32).
Table 4.32 Contingency table of dose form of medication versus physicians’ acceptance of pharmacists’ active interventions
Dose form of medication
Physician acceptance of pharmacists’
active interventions
Total, n (%) Yes, n (%) No, n (%)
Oral 140 (57.4) 17 (7.0) 157 (64.3)
Non-oral 79 (32.4) 8 (3.3) 87 (35.7)
Total 219 (89.8) 25 (10.2) 244 (100.0)
The variable ‘type of active interventions’ was collapsed from 17 (Table 4.21) to five
categories: dose adjustment, drug addition, drug deletion, adjustment of dosage
interval/frequency, and others (Table 4.33).
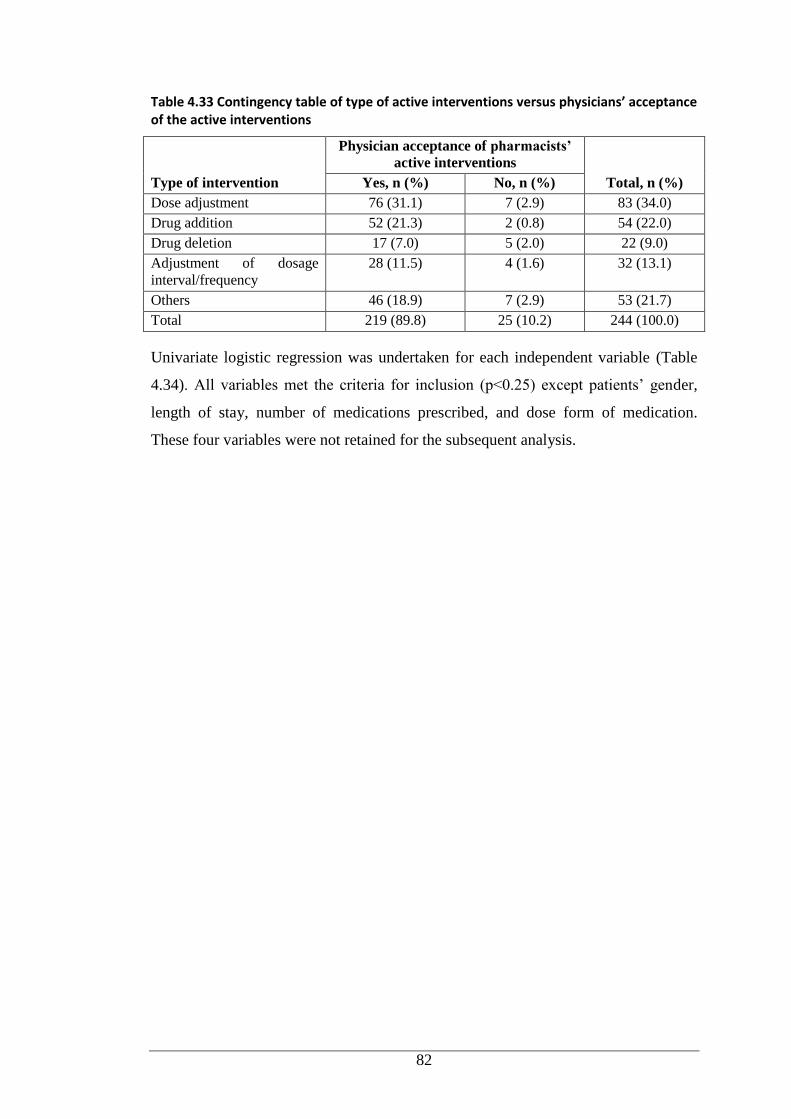
82
Table 4.33 Contingency table of type of active interventions versus physicians’ acceptance of the active interventions
Type of intervention
Physician acceptance of pharmacists’
active interventions
Total, n (%) Yes, n (%) No, n (%)
Dose adjustment 76 (31.1) 7 (2.9) 83 (34.0)
Drug addition 52 (21.3) 2 (0.8) 54 (22.0)
Drug deletion 17 (7.0) 5 (2.0) 22 (9.0)
Adjustment of dosage
interval/frequency
28 (11.5) 4 (1.6) 32 (13.1)
Others 46 (18.9) 7 (2.9) 53 (21.7)
Total 219 (89.8) 25 (10.2) 244 (100.0)
Univariate logistic regression was undertaken for each independent variable (Table
4.34). All variables met the criteria for inclusion (p<0.25) except patients’ gender,
length of stay, number of medications prescribed, and dose form of medication.
These four variables were not retained for the subsequent analysis.
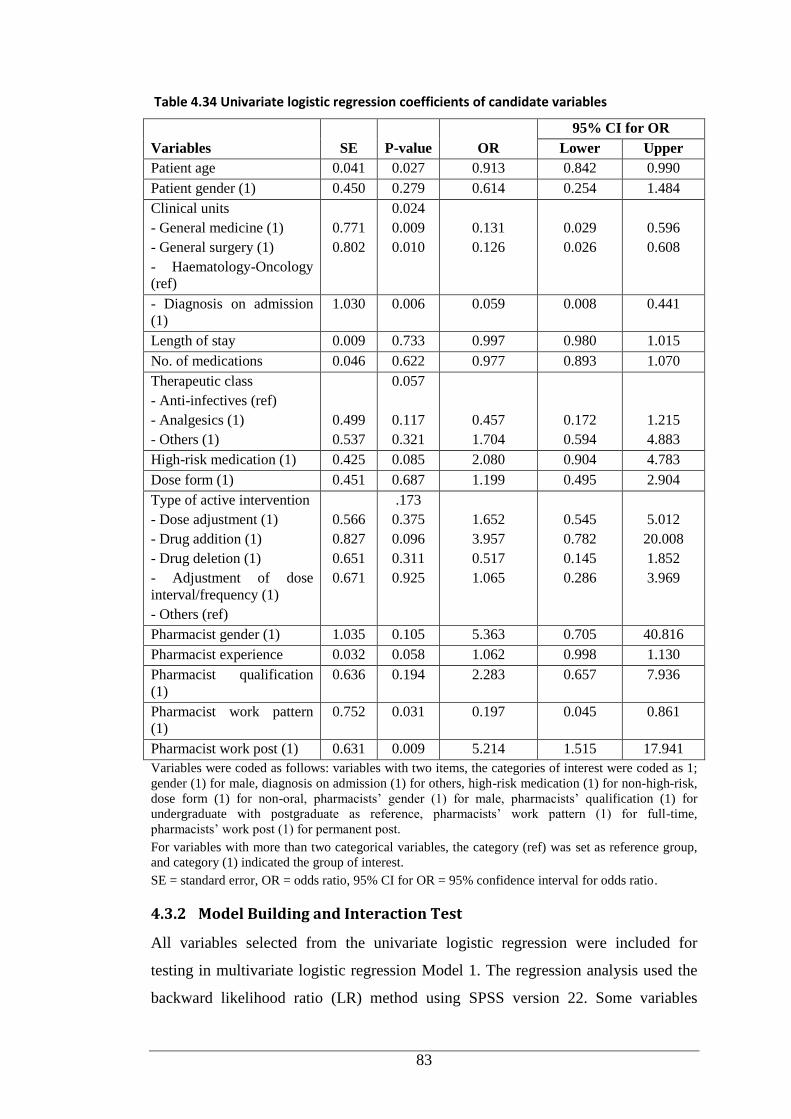
83
Table 4.34 Univariate logistic regression coefficients of candidate variables
Variables SE P-value OR
95% CI for OR
Lower Upper
Patient age 0.041 0.027 0.913 0.842 0.990
Patient gender (1) 0.450 0.279 0.614 0.254 1.484
Clinical units
- General medicine (1)
- General surgery (1)
- Haematology-Oncology
(ref)
0.771
0.802
0.024
0.009
0.010
0.131
0.126
0.029
0.026
0.596
0.608
- Diagnosis on admission
(1)
1.030 0.006 0.059 0.008 0.441
Length of stay 0.009 0.733 0.997 0.980 1.015
No. of medications 0.046 0.622 0.977 0.893 1.070
Therapeutic class
- Anti-infectives (ref)
- Analgesics (1)
- Others (1)
0.499
0.537
0.057
0.117
0.321
0.457
1.704
0.172
0.594
1.215
4.883
High-risk medication (1) 0.425 0.085 2.080 0.904 4.783
Dose form (1) 0.451 0.687 1.199 0.495 2.904
Type of active intervention
- Dose adjustment (1)
- Drug addition (1)
- Drug deletion (1)
- Adjustment of dose
interval/frequency (1)
- Others (ref)
0.566
0.827
0.651
0.671
.173
0.375
0.096
0.311
0.925
1.652
3.957
0.517
1.065
0.545
0.782
0.145
0.286
5.012
20.008
1.852
3.969
Pharmacist gender (1) 1.035 0.105 5.363 0.705 40.816
Pharmacist experience 0.032 0.058 1.062 0.998 1.130
Pharmacist qualification
(1)
0.636 0.194 2.283 0.657 7.936
Pharmacist work pattern
(1)
0.752 0.031 0.197 0.045 0.861
Pharmacist work post (1) 0.631 0.009 5.214 1.515 17.941
Variables were coded as follows: variables with two items, the categories of interest were coded as 1;
gender (1) for male, diagnosis on admission (1) for others, high-risk medication (1) for non-high-risk,
dose form (1) for non-oral, pharmacists’ gender (1) for male, pharmacists’ qualification (1) for
undergraduate with postgraduate as reference, pharmacists’ work pattern (1) for full-time,
pharmacists’ work post (1) for permanent post.
For variables with more than two categorical variables, the category (ref) was set as reference group,
and category (1) indicated the group of interest.
SE = standard error, OR = odds ratio, 95% CI for OR = 95% confidence interval for odds ratio.
4.3.2 Model Building and Interaction Test
All variables selected from the univariate logistic regression were included for
testing in multivariate logistic regression Model 1. The regression analysis used the
backward likelihood ratio (LR) method using SPSS version 22. Some variables
84
demonstrated extremely large odds ratios and standard errors, namely clinical units,
diagnosis on admission, pharmacists’ gender, pharmacists’ work pattern, and
pharmacists’ post (Table 4.35). The regression analysis failed to reach conclusion to
calculate odds ratios after maximum iterations (20 iterations) had been reached,
shown by the odds ratios of offending variables of zero. This situation indicated that
a problem existed presumably due to the model overfitting with small samples or
combination of discrete variables with few cases in one outcome. The offending
variables of pharmacists’ gender, work pattern, and post were dichotomous variables.
Collapsing the categories of these variables was not possible, so the variables were
removed. With regard to variables of clinical unit and diagnosis on admission, the
categories were modified as per Tables 4.29 and 4.30 in order to identify whether the
specialty haematology-oncology unit and patients with complicated conditions (e.g.
cancer) had an impact on the acceptance of the active interventions. Therefore, both
variables were deleted, leaving six independent variables for testing in logistic
regression Model 2 (Table 4.36).
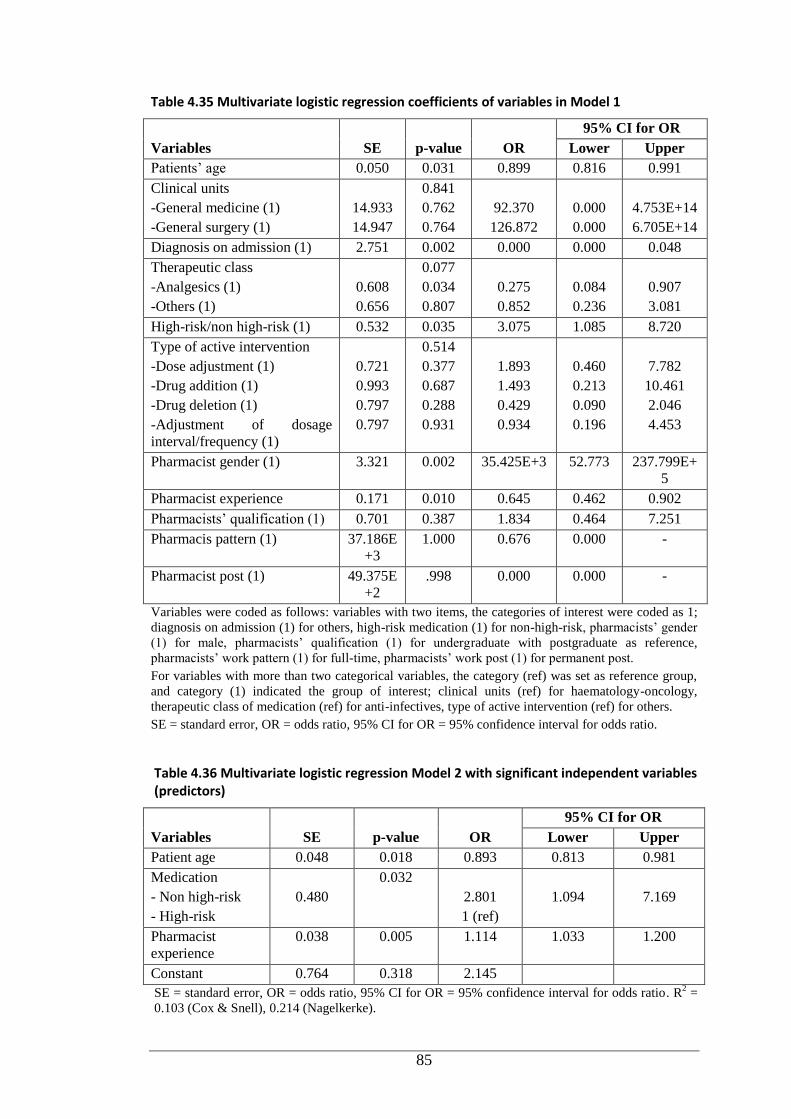
85
Table 4.35 Multivariate logistic regression coefficients of variables in Model 1
Variables SE p-value OR
95% CI for OR
Lower Upper
Patients’ age 0.050 0.031 0.899 0.816 0.991
Clinical units
-General medicine (1)
-General surgery (1)
14.933
14.947
0.841
0.762
0.764
92.370
126.872
0.000
0.000
4.753E+14
6.705E+14
Diagnosis on admission (1) 2.751 0.002 0.000 0.000 0.048
Therapeutic class
-Analgesics (1)
-Others (1)
0.608
0.656
0.077
0.034
0.807
0.275
0.852
0.084
0.236
0.907
3.081
High-risk/non high-risk (1) 0.532 0.035 3.075 1.085 8.720
Type of active intervention
-Dose adjustment (1)
-Drug addition (1)
-Drug deletion (1)
-Adjustment of dosage
interval/frequency (1)
0.721
0.993
0.797
0.797
0.514
0.377
0.687
0.288
0.931
1.893
1.493
0.429
0.934
0.460
0.213
0.090
0.196
7.782
10.461
2.046
4.453
Pharmacist gender (1) 3.321 0.002 35.425E+3 52.773 237.799E+
5
Pharmacist experience 0.171 0.010 0.645 0.462 0.902
Pharmacists’ qualification (1) 0.701 0.387 1.834 0.464 7.251
Pharmacis pattern (1) 37.186E
+3
1.000 0.676 0.000 -
Pharmacist post (1) 49.375E
+2
.998 0.000 0.000 -
Variables were coded as follows: variables with two items, the categories of interest were coded as 1;
diagnosis on admission (1) for others, high-risk medication (1) for non-high-risk, pharmacists’ gender
(1) for male, pharmacists’ qualification (1) for undergraduate with postgraduate as reference,
pharmacists’ work pattern (1) for full-time, pharmacists’ work post (1) for permanent post.
For variables with more than two categorical variables, the category (ref) was set as reference group,
and category (1) indicated the group of interest; clinical units (ref) for haematology-oncology,
therapeutic class of medication (ref) for anti-infectives, type of active intervention (ref) for others.
SE = standard error, OR = odds ratio, 95% CI for OR = 95% confidence interval for odds ratio.
Table 4.36 Multivariate logistic regression Model 2 with significant independent variables (predictors)
Variables SE p-value OR
95% CI for OR
Lower Upper
Patient age 0.048 0.018 0.893 0.813 0.981
Medication
- Non high-risk
- High-risk
0.480
0.032
2.801
1 (ref)
1.094
7.169
Pharmacist
experience
0.038 0.005 1.114 1.033 1.200
Constant 0.764 0.318 2.145
SE = standard error, OR = odds ratio, 95% CI for OR = 95% confidence interval for odds ratio. R2 =
0.103 (Cox & Snell), 0.214 (Nagelkerke).
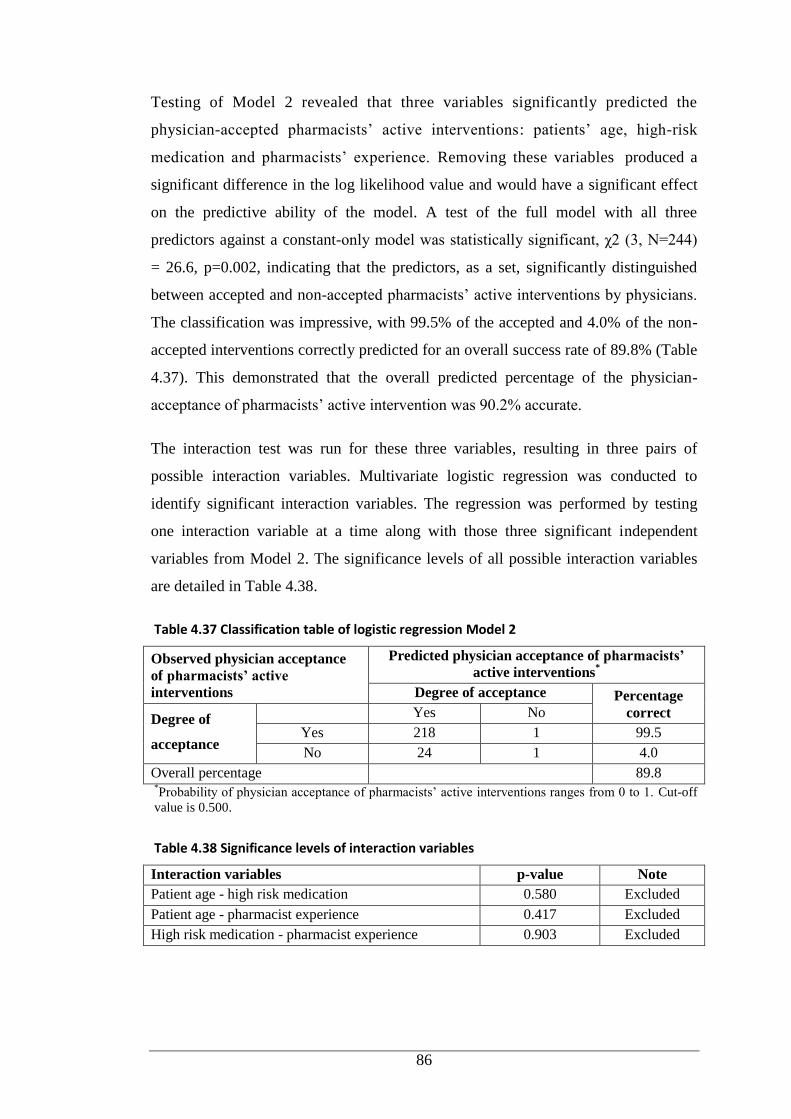
86
Testing of Model 2 revealed that three variables significantly predicted the
physician-accepted pharmacists’ active interventions: patients’ age, high-risk
medication and pharmacists’ experience. Removing these variables produced a
significant difference in the log likelihood value and would have a significant effect
on the predictive ability of the model. A test of the full model with all three
predictors against a constant-only model was statistically significant, χ2 (3, N=244)
= 26.6, p=0.002, indicating that the predictors, as a set, significantly distinguished
between accepted and non-accepted pharmacists’ active interventions by physicians.
The classification was impressive, with 99.5% of the accepted and 4.0% of the non-
accepted interventions correctly predicted for an overall success rate of 89.8% (Table
4.37). This demonstrated that the overall predicted percentage of the physician-
acceptance of pharmacists’ active intervention was 90.2% accurate.
The interaction test was run for these three variables, resulting in three pairs of
possible interaction variables. Multivariate logistic regression was conducted to
identify significant interaction variables. The regression was performed by testing
one interaction variable at a time along with those three significant independent
variables from Model 2. The significance levels of all possible interaction variables
are detailed in Table 4.38.
Table 4.37 Classification table of logistic regression Model 2
Observed physician acceptance
of pharmacists’ active
interventions
Predicted physician acceptance of pharmacists’
active interventions*
Degree of acceptance Percentage
correct Degree of
acceptance
Yes No
Yes 218 1 99.5
No 24 1 4.0
Overall percentage 89.8 *Probability of physician acceptance of pharmacists’ active interventions ranges from 0 to 1. Cut-off
value is 0.500.
Table 4.38 Significance levels of interaction variables
Interaction variables p-value Note
Patient age - high risk medication 0.580 Excluded
Patient age - pharmacist experience 0.417 Excluded
High risk medication - pharmacist experience 0.903 Excluded
87
There were no significant interactions identified between variables (Table 4.38).
Therefore, logistic regression Model 2 with three predictors (Table 4.36) is presented
as the final model.
The final model revealed that patients’ age significantly predicted the physicians’
acceptance of active interventions. The odds ratio for patients’ age when holding all
other variables constant, for a one-year increment of patients’ age, corresponded with
a decrease in acceptance of the intervention of 0.893. Inverting the odds ratio
revealed that for every one year of decreasing age, the odds of the intervention being
accepted was 1.1 times higher. In addition, the medication category (high-risk versus
non-high-risk) significantly predicted physician acceptance of active interventions,
with the interventions involving non-high-risk medications being nearly three times
more likely to be accepted by the physician than those associated with high-risk
medications. The results also uncovered that for every extra year of experience of
pharmacists, the acceptance by physicians increased (odds ratio 1.114).
4.4 Discussion
4.4.1 Direct Observation and Documentation of Ward Pharmacists’
Interventions
The prevalence of pharmacists’ interventions per 100 medication orders in this study
ranged from 4.38 to 7.83 on the General Medical Wards to 10.48 on the General
Surgical Ward, and 5.63 on the Haematology-Oncology Ward. The intervention rate
on the General Surgical Ward was the highest compared to the other two clinical
units (p<0.05), although the surgical unit is considered less complex
pharmacologically than general medical, intensive care or specialty areas.(196) A
self-reported study by Chan et al.(94) involving paediatric general and specialty
inpatients uncovered a similar rate of active intervention (0.75 interventions per 100
medication orders) as those documented on the general medical wards for Infants and
Young Children in our study. However, in comparison to the rates recorded in
general settings in our study, a higher active intervention rate (2.4/100 medication
orders) was reported from a study assessing the impact of interventions performed by
clinical pharmacists in reducing prescribing errors in children hospitalised in a
maternity and children’s hospital in Spain.(197) The rate of active interventions on
the Haematology-Oncology Ward in our study was similar to the Spanish study. The
Spanish study did not provide further information on the nature of patients’ medical
88
conditions; presumably, active intervention rates are influenced by the complexity of
patients’ medication regimens. This may account for the higher incidence of active
interventions among haematology-oncology patients compared to patients in other
settings who may have less complex conditions requiring less medication.
Besides the number of medications prescribed, other factors need to be considered as
predictors for pharmacists’ intervention rates. A study in ICUs involving children
and adults found that the rate of interventions was significantly higher in patients
with long hospital stay.(146) However, in our study lower intervention rates were
observed in the general medical wards for Young Children and Adolescents where
patients stayed longer than in other wards. Consistent with our study, a large
pharmacists’ interventions study in the UK, which included paediatric and adult
patients, found the time spent during ward round significantly predicted the rates of
the interventions.(127)
With respect to the pattern of pharmacists’ interventions, activities related to taking
medication histories and/or patient counselling were the most frequent interventions
in general wards, while drug therapy changes were responsible for the most frequent
interventions in the haematology-oncology ward. The subcategories of taking
medication histories and medication reconciliation activities constituted the most
common interventions performed by clinical pharmacists on general wards. This is
not surprising, as taking medication history and medication reconciliation are the
initial steps in reviewing patients and assessing the appropriateness of their
medications orders. Medication reconciliation and medication history have been
justified as effective strategies to reduce MEs in children and adults.(139, 144, 198)
However, these activities occurred less frequently on the Haematology-Oncology
Ward than the general medical wards. The lower percentage might be explained by
the availability, completeness and the ease of access to patients’ medical and
medication history on this specialty ward. As the haematology and oncology patients
were admitted regularly to hospital for treatment and monitoring, the healthcare
providers (including pharmacists) were apparently familiar with the patients and their
treatment protocols, so the pharmacists often examined the patients’ records instead
of interviewing the patients and/or the parents.
89
The reduced incidence of this type of intervention on the general medical wards with
patients’ increasing age may have been due to a delay between the patients’
admission and day of clinical pharmacist observation on the adolescent ward
compared to the wards catering for younger children. Drug therapy change-
associated interventions on the general medical wards increased with the patients’
age. The larger number of medications prescribed for older children might have
attributed to the higher incidence of this type of intervention in adolescent patients as
compared to their younger counterparts. A paediatric study documenting
pharmacists’ interventions associated with electronic prescription review found the
youngest patients (under 2 years old) were associated with more interventions than
older children.(199)
There are limited published studies on pharmacists’ interventions in different
paediatric settings than adult patients. Condren et al.(184) conducted a study in a
paediatric population including general and intensive care inpatients, and ambulatory
patients. They reported interventions performed by an academic paediatric pharmacy
team including pharmacy students, using similar intervention categories to the
present study. There were 4605 interventions performed for 3978 patients in a year.
The study reported 1.15 interventions per patient, the most frequent intervention
categories being drug therapy change, medication history and/or patient counselling,
and providing drug information to other health professionals.(184) Under the drug
therapy change category, drug addition and drug deletion accounted for the most
common recommendations. Our study uncovered a different pattern of
recommendations; dose adjustment, drug addition and adjustment of dosage interval/
frequency accounted for the majority of recommendations. The most common
category of active intervention found by Condren et al.(184) was consistent with the
pattern of active interventions in the haematology-oncology unit in our study.
A Dutch study conducted in a range of settings, including the haematology unit in a
paediatric hospital, implementing electronic prescribing, revealed that pharmacists
performed 1557 interventions for 138,449 prescriptions (1.1%) over 46 months.(15)
This study reported that interventions leading to drug changes were most frequently
performed in the haematology unit (31.1%), similar to our study (90/244, 36.8%). In
keeping with our study, that study also found dosing adjustment was the most
90
frequent intervention, and antibacterials were the most commonly implicated
medications.(199)
In a four-week study in 16 paediatric wards (nine specialist, seven general) in the
UK, interventions to resolve improper dosing, incomplete prescriptions and wrong
frequency were the most common interventions by pharmacists.(200) Dosing issues
were also identified as the main concern requiring pharmacist intervention in
hospitalised children in a Spanish study.(197) Likewise, a retrospective analysis of
four-year self-reported pharmacists’ interventions conducted by Chan et al.(94)
involving paediatric patients in general and specialty areas (including haematology-
oncology) also detected dosing issues as the major source of problems. Studies
incorporating general and specialty settings have consistently shown that dosing-
associated issues were the main problem in paediatric patients.(94, 184, 197, 199,
200) However, those studies did not provide further information on the breakdown of
interventions, as intervention data are generally aggregated for the purpose of
analysis rather than presented by clinical setting. Accordingly, the pattern and rate of
interventions among different settings, in particular general versus specialty settings,
in the child patient populations cannot be compared and analysed comprehensively.
Maat et al.(199) report in a study associated with electronic prescription review that
interventions were most frequently conducted in the specialty units of
immunology/haematology and neurology compared to other units such as internal
medicine. Kaushal et al.(201) in their study of serious MEs before and after the
introduction of unit-based clinical pharmacists in three units (ICU, general surgery,
general medicine) in an American paediatric hospital reported that clinical
pharmacists’ interventions substantially decreased the rate of MEs in the ICU, while
there was no reduction in the general settings. The investigators pointed out that the
setting influenced the rates of ME-intercepting interventions by pharmacists, in
particular, between general and non-general settings such as ICU.(201)
When involving adult patients, a large study of pharmacists’ interventions in the UK
involving a range of settings in 27 acute care hospitals also found dosing-associated
interventions as the major type of intervention, and highlighted that ward type was
significantly associated with the rate of pharmacists’ interventions (p<0.001). The
highest intervention rates were reported from ICU wards, followed by paediatrics
91
and special wards (e.g. haematology, oncology, organ transplant, AIDS), and other
type of wards (e.g. medical, surgical, geriatrics, psychiatric and obstetrics).(127)
A multicentre study of ward pharmacists’ interventions in six French hospitals
documented an intervention rate of 4.66 interventions per 100 medication orders in a
range of practice settings, with dose adjustment the most common intervention
type.(202) Details of interventions in each setting from the British and French studies
are lacking, and it is unclear whether the inclusion of adult patients influenced the
pattern of interventions. When comparing the interventions among specialist areas, a
prospective study involving seven specialties (three ICUs, cardiosurgery,
haematology, nephrology and psychiatry) in an Austrian hospital uncovered
provision of information to other healthcare providers as the most common
intervention type. However, it appears that there was no comparable pattern when
evaluating the next most frequent intervention types among the specialties.(203)
With respect to medications implicated in the active interventions, it is
understandable that larger numbers of interventions were documented from
antibiotics and analgesics, as these medications accounted for the major drug classes
prescribed.(199) The majority of medications implicated in the active interventions
were used for treating acute medical conditions with the exception of
immunomodulators and antineoplastics on the Haematology-Oncology Ward.
The acceptance rate of pharmacists’ active interventions was high across all settings
in our study. This acceptance rate is similar to those found in other paediatric
studies.(197, 199, 204, 205) This strengthens the established evidence supporting the
confidence of other healthcare providers in the significant contribution of
pharmacists to improve the quality of patient paediatric.(17, 184, 201, 206)
To the best of our knowledge, this is the first study that compared pharmacists’
interventions in a range of settings in paediatrics in terms of frequency, type, degree
of acceptance and medications implicated. Most of the early studies on pharmacists’
interventions were conducted using self-report by pharmacists. Self-report has been
associated with bias and underestimation of the intervention rates due to time
constraints and omission of interventions that the pharmacists regarded as
insignificant or non-favourable.(207) The prospective observational approach used in
92
the current study allowed the observer to obtain actual number of interventions
performed by the ward pharmacists to overcome aforementioned issues with self-
reporting.(183, 208)
4.4.2 Direct Observation and Documentation of Pharmacists’
Interventions during Dispensing in a Haematology-Oncology
Pharmacy
During the data collection period, pharmacists’ interventions rates documented
during dispensing in the Haematology-Oncology Pharmacy were 21.29 per 100
medication orders and 35.18 per 100 patients. Based on these data, pharmacists
undertook approximately 11 interventions each weekday. Provision of drug
information to physicians, nurses and other pharmacists (86.4%) constituted the
majority of the interventions followed by medication histories and/or patient
counselling, drug therapy changes, and prevented ADE and ME. More than three-
quarters of the interventions in our study related to chemotherapy medications.
Waddell et al.(206) also analysed the interventions performed by oncology pharmacy
staff within inpatient and outpatient settings. During that study, pharmacists self-
documented 503 interventions over eight months, which meant that pharmacy staff
performed around two interventions each day, a much lower rate than our study.
Corresponding well with our study, the majority of the interventions documented
were the provision of drug information/consultation to other healthcare providers.
An intervention study by Wong et al.(209) in haematology-oncology clinics in
Virginia, providing ambulatory cancer services for adults and children, demonstrated
lower numbers of interventions per day, half as many as our study. Wong et al.(209)
found patient counselling and therapeutic recommendations (i.e. cessation of drugs
without clear indications, dose recommendation, drug selection) as the leading
categories of interventions. While our study revealed that more than 80% of
interventions were non-chemotherapy related. The disparate rate and pattern of the
interventions between the two studies may be explained by the complexity of the
disease states of the patients in the study by Wong et al.(209), given that the studies
did not specifically focus on paediatric oncology patients.
By contrast, a retrospective study by Ruder et al.(208) analysed interventions by
oncology pharmacists over two years in an ambulatory oncology clinic for adults
93
reported a higher rate of interventions than our study. Ruder et al.(208) demonstrated
583 clinical intervention for 199 patients, with approximately three interventions
performed for each patient, and the most frequent interventions related to patient
education. A similar pattern relating to intervention type has been found in American
and Jordanian studies involving adult(28) and paediatric patients with cancer.(29)
Both studies reported patient counselling as the most common intervention,
accounting for more than one-quarter of all interventions.
With regard to interventions leading to changes to patient medication management
(active interventions), our study documented 22 active interventions (6.1% of total
interventions), with rates of 1.2 per 100 medication orders and 2.1 per 100 patients.
Our finding is consistent with studies undertaken in general patient settings,
demonstrating rates of active interventions per 100 medication orders from 0.7% to
8.5%.(18, 94, 126, 197, 210) In relation to haematology-oncology intervention
studies, Shah et al.(211) retrospectively analysed clinical pharmacy activities in a
haematology-oncology outpatient practice. Pharmacists documented their clinical
activities into personal digital assistants. During the 12-month study, 308 drug-
specific interventions were performed for 423 patients (0.73 interventions for each
outpatient). This is a much higher intervention rate than our study. Their study
reported that supportive care issues were responsible for half of the interventions,
predominantly for anaemia, pain, constipation/diarrhoea and nausea/vomiting. Their
top three interventions were drug addition, drug discontinuation and dose adjustment.
The pattern of interventions was similar to our findings, where the predominant
active interventions resulted in interventions to add medications and adjust the dose
(in particular, reduce the dose) of medications.(211)
All active interventions during dispensing in the Haematology-Oncology Pharmacy
were accepted by doctors, nurses or other pharmacists. High rates of acceptance of
pharmacists’ interventions in this high-risk area have also been reported in other
studies.(206, 208, 209, 212) The high acceptance rate is a positive indicator that
pharmacists are well accepted and considered reliable sources of information by
other healthcare providers.
94
4.4.3 Predictors of Physician-Accepted Pharmacists’ Active Interventions
This study included an analysis of determinants of physicians’ acceptance of
pharmacists’ active interventions. Pharmacists’ recommendations are meaningless if
there is no acknowledgement and uptake by physicians. Some studies have reported
that acceptance of the interventions strongly predicted the desired clinical
outcome.(204, 213-215) It is essential to identify the determinants or factors
affecting the acceptance of pharmacists’ interventions. Physicians’ acceptance of
interventions may be influenced by factors such as patients’ characteristics (age, co-
medications), type of interventions, physicians’ characteristics (specialty, perception
on the importance of the intervention), level of interaction between pharmacists and
physicians and the clinical setting.(216-218) However, this has not, as yet, been
validated, and well-designed studies are required for justification.
This appears to be the first study to determine the factors that impact on physicians’
acceptance of the interventions across different clinical settings (general medicine,
general surgery, haematology-oncology) in a paediatric hospital using multivariate
modelling. The multivariate approach benefited this study, as the data comprised
multiple observations for each pharmacist. Pharmacists subjected to more
observations were represented in the data to a greater degree than those with fewer
observations. Multivariate analysis can eliminate misleading confounding factors
from univariate analysis by accounting for all independent variables concurrently and
different number of observations from each variables.(127, 219) In the present study,
three factors significantly and positively predicted intervention acceptance by
physicians: patients’ younger age, non-high-risk medications and pharmacists’
experience. Experienced pharmacists are more likely to make confident and strong
evidence-based interventions given their longstanding professional experience and
knowledge to convince precribers.(127) Patient’s age and pharmacists’ years of
experience were not strong predictors. While interventions related to non-high-risk
medications were three times more likely to be accepted than interventions
associated with high-risk medications.
Little is known about the factors that influence prescribers to accept or decline
pharmacists’ recommendations particularly in paediatrics.(199) Comparison of the
results of the present study with similar studies is challenging for several reasons,
95
such as the differences in study settings, methods and the predictors evaluated.
Consistent with our study, a study examining the determinants of pharmacists’
interventions in electronic prescriptions in a paediatric hospital in the Netherlands
reported patients’ age as a determinant of the interventions. Younger patients were
significanly more likely to receive interventions than older patients. Other significant
determinants associated with an increased rate of interventions were electronic
prescriptions (without clinical decision support) and oral dose forms.(199) However,
that study focussed on factors associated with interventions rather than the
acceptance of the interventions. A study in Denmark undertaken in an ED for adults
revealed that physicians accepted 59% of pharmacists’ recommendations. The
Danish study uncovered the determinants of accepted recommendations as patients
admitted with medical problems (more frequently than surgical patients) and the
recommendation category of ‘untreated indication’.(216) However, another study
conducted in the UK demonstrated no difference in the acceptance rate between
physicians working in medical and surgical wards.(127) Consistent with the UK
study, the present research determined lack of association between the clinical setting
and acceptance of the intervention.
Multivariate analysis from a palliative care study revealed that none of the variables
assessed (patient and pharmacist characteristics, type of intervention) were
associated with physicians’ decisions to accept or decline pharmacists’
interventions.(220) A study of 27 hospitals in the UK assessed the factors predicting
the rate of physician acceptance of interventions by pharmacists using a mixed-
model Poisson regression technique. That study identified three significant
predictors: ward type, pharmacist grade and time spent on the ward. The ICU and
specialty wards, including paediatrics, were associated with a higher acceptance rate
than other wards. In addition, pharmacists employed at grade C and above (specialist
pharmacists and pharmacy managers) and more time spent on the ward predicted the
increased acceptance rate.(127) Consistent with our study, the British study did not
find significant contribution from other pharmacists’ characteristics (academic
qualification, work pattern, post). Nonetheless, the univariate approach in the UK
study showed that interventions by more experienced pharmacists had a lower
acceptance rate in comparison to the less experienced ones, which was not confirmed
by our study, although this predictor failed to contribute in the final model.
96
A different result was also reported in a Swiss study analysing the factors impacting
on neurologist acceptance of pharmacists’ interventions in collaboration with clinical
pharmacologists when addressing the DRPs detected in a university hospital
neurology unit.(42) That study evaluated four factors: type of prescription, type of
DRP, cause of DRP and type of intervention, without taking into account the factors
related to patients and intervening pharmacists. The authors reported that prescribing
a regular medication (instead of ‘as required’ medications) was the sole determinant
of acceptance of interventions.(221)
A community-based study using written communication by fax to convey
pharmacists’ interventions to the prescribers demonstrated a higher acceptance rate
with cost-saving implications, compared to interventions for compliance with
guidelines directed to primary care physicians compared to those directed to
specialists.(222)
Our study and a study by Barber et al.(127) did not observe a significant effect of
pharmacists’ academic qualification as a factor in acceptance of interventions. It is
premature to conclude that this factor has no effect, and that additional education is
not effective. Barber et al.(127) presumed that pharmacists without postgraduate
qualification tend to be assigned to wards for younger patients who are
therapeutically less complex. The impact of pharmacists’ academic qualification
should be evaluated further by conducting controlled studies.
4.5 Limitations and Recommendations
A number of limitations need to be acknowledged in this direct observational study.
The rate of interventions directly observed during ward rounds may have been
underestimated and the pattern of the interventions might not be reflective of broader
practice, as the principal researcher only documented the interventions performed by
clinical ward pharmacists during their ward rounds. Additional interventions may
have been performed by telephone or pager at other times. This study mainly
documented interventions associated with drug prescribing and monitoring. As ward
pharmacists have limited time to undertake their rounds on each ward they do not
check the medications prior to their administration to each patient. Data were
collected on non-consecutive days to avoid pharmacist observation fatigue, which
may have influenced the pattern of the interventions. Future studies might consider
97
employing a combination of intervention documentation methods over a period of
time, i.e. direct observation and self-reporting.
This study was conducted in one paediatric hospital, which diminishes the ability to
generalise the findings. It is recommended future studies involve multiple paediatric
institutions, i.e. other paediatric hospitals and/or paediatric wards in general
hospitals. Also of note are difficulties in drawing accurate comparison with other
intervention studies due to variations in settings, design, duration, size, method and
definitions of intervention used.
Although the results of this study are informative with respect to the analysis of
predictors of physician-accepted active interventions, there are several limitations.
Firstly, in line with the existing literature assessing the factors affecting physician
acceptance of pharmacists’interventions, this study did not include the physicians’
characteristics as predictors.(127, 199, 220, 221) It was not feasible for a non-staff
researcher to collect these data. The theory of physicians’ reactance, highlighted by
De Almeida Neto et al.(223) might clarify physicians’ psychological disposition
during decision making about recommendations proposed by pharmacists. Reactance
is: ‘a reaction to a recommendation to take a certain course of action which is
affected by a motivational state compelling a response in which freedom of choice is
maintained’.(223) The perceptions of physicians on those recommendations
addressing the significant clinical relevance issues are likely to affect reactance. It
has also been suggested that pharmacists frame their recommendation with options
from which physicians can choose. In this way, the physicians still hold their sense
of freedom of choice.(223, 224)
Secondly, evaluating the association between acceptance of the recommendations
and impact on patient outcome was beyond the scope of the present study. It would
be interesting to explore this issue in future studies, in order to evaluate pharmacists’
recommendations to patient care. Previous studies have shown that implementation
of accepted recommendations contributed to improved patients’ clinical
outcome.(146, 204, 214, 215, 220)
Thirdly, other factors (predictors) were not associated with significant contributions
to the accepted interventions in the final model, even though they were demonstrated
98
as significant predictors during univariate analysis. This may be due to the sample
size having insufficient power to detect the effects related to those predictors. Thus,
escalating the sample size in future research may increase the likelihood of detecting
other influential predictors. A follow-up study to assess the pharmacists’ attitudes
toward interventions is warranted, as some pharmacists may intervene only on major
issues, while others may do so for any issue. Regardless of these limitations, this
study presents important findings to improve our understanding of the determinants
influencing physicians’ acceptance of pharmacists’ active interventions in a range of
paediatric settings.
4.6 Conclusion
Pharmacists can optimise patient care in a range of paediatric settings through their
active interventions either during pharmacy rounds or dispensing. The rate and
nature of pharmacists’ interventions appear to be influenced by the clinical setting.
Specialty units, such as the haematology-oncology, had a higher active intervention
rate where most interventions were related to drug therapy changes compared to the
general medical and surgical units. The interventions are of value if acknowledged,
accepted and implemented by physicians. This study found that interventions were
more likely to be accepted by physicians for younger patients, non-high-risk
medications, and those raised by more experienced pharmacists.
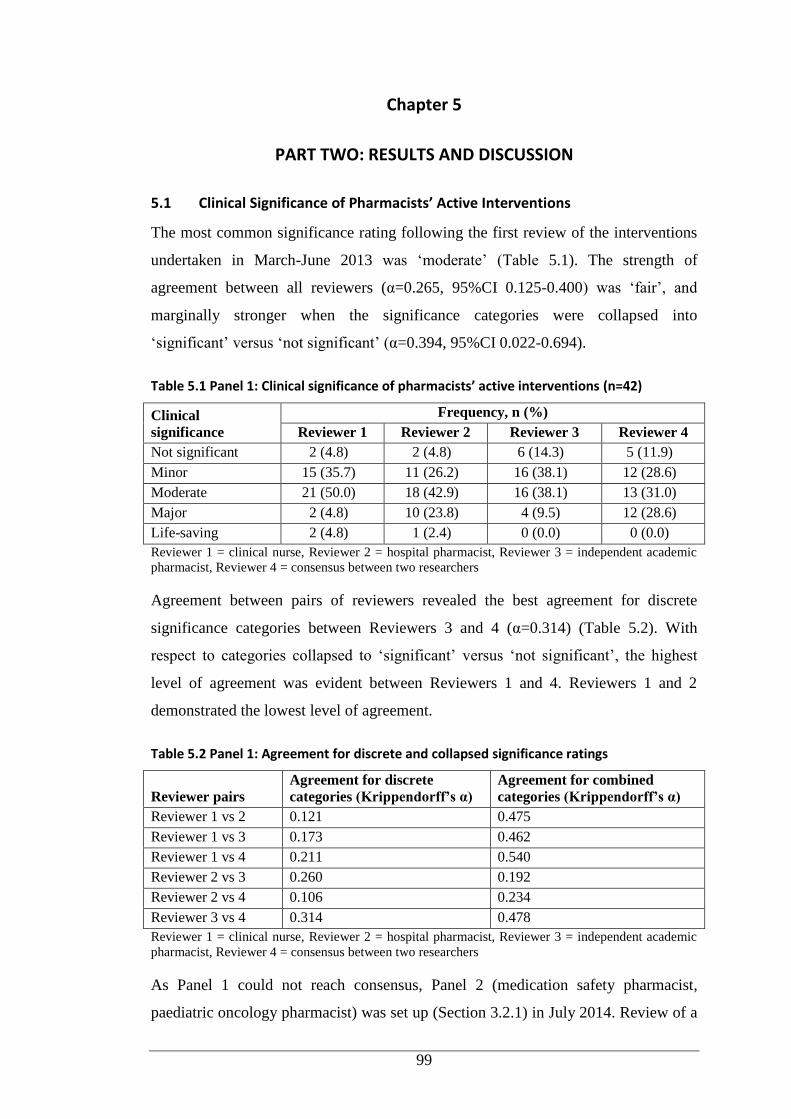
99
Chapter 5
PART TWO: RESULTS AND DISCUSSION
5.1 Clinical Significance of Pharmacists’ Active Interventions
The most common significance rating following the first review of the interventions
undertaken in March-June 2013 was ‘moderate’ (Table 5.1). The strength of
agreement between all reviewers (α=0.265, 95%CI 0.125-0.400) was ‘fair’, and
marginally stronger when the significance categories were collapsed into
‘significant’ versus ‘not significant’ (α=0.394, 95%CI 0.022-0.694).
Table 5.1 Panel 1: Clinical significance of pharmacists’ active interventions (n=42)
Clinical
significance
Frequency, n (%)
Reviewer 1 Reviewer 2 Reviewer 3 Reviewer 4
Not significant 2 (4.8) 2 (4.8) 6 (14.3) 5 (11.9)
Minor 15 (35.7) 11 (26.2) 16 (38.1) 12 (28.6)
Moderate 21 (50.0) 18 (42.9) 16 (38.1) 13 (31.0)
Major 2 (4.8) 10 (23.8) 4 (9.5) 12 (28.6)
Life-saving 2 (4.8) 1 (2.4) 0 (0.0) 0 (0.0)
Reviewer 1 = clinical nurse, Reviewer 2 = hospital pharmacist, Reviewer 3 = independent academic
pharmacist, Reviewer 4 = consensus between two researchers
Agreement between pairs of reviewers revealed the best agreement for discrete
significance categories between Reviewers 3 and 4 (α=0.314) (Table 5.2). With
respect to categories collapsed to ‘significant’ versus ‘not significant’, the highest
level of agreement was evident between Reviewers 1 and 4. Reviewers 1 and 2
demonstrated the lowest level of agreement.
Table 5.2 Panel 1: Agreement for discrete and collapsed significance ratings
Reviewer pairs
Agreement for discrete
categories (Krippendorff’s α)
Agreement for combined
categories (Krippendorff’s α)
Reviewer 1 vs 2 0.121 0.475
Reviewer 1 vs 3 0.173 0.462
Reviewer 1 vs 4 0.211 0.540
Reviewer 2 vs 3 0.260 0.192
Reviewer 2 vs 4 0.106 0.234
Reviewer 3 vs 4 0.314 0.478
Reviewer 1 = clinical nurse, Reviewer 2 = hospital pharmacist, Reviewer 3 = independent academic
pharmacist, Reviewer 4 = consensus between two researchers
As Panel 1 could not reach consensus, Panel 2 (medication safety pharmacist,
paediatric oncology pharmacist) was set up (Section 3.2.1) in July 2014. Review of a
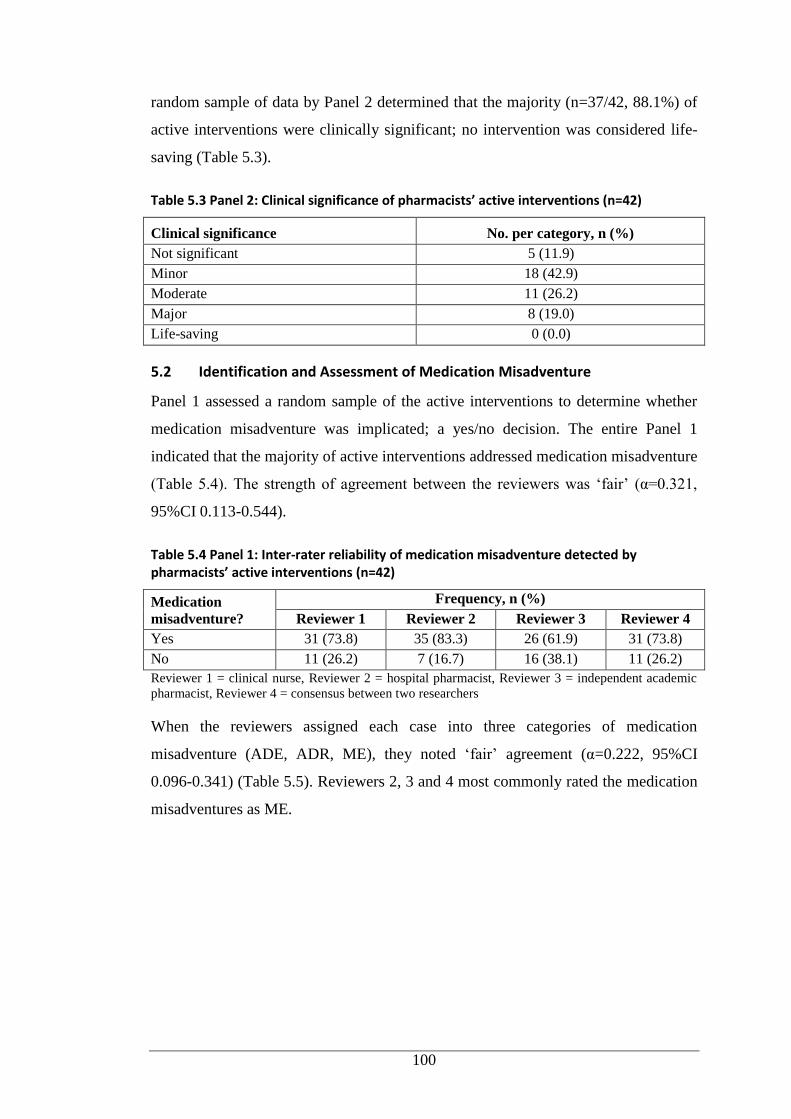
100
random sample of data by Panel 2 determined that the majority (n=37/42, 88.1%) of
active interventions were clinically significant; no intervention was considered life-
saving (Table 5.3).
Table 5.3 Panel 2: Clinical significance of pharmacists’ active interventions (n=42)
Clinical significance No. per category, n (%)
Not significant 5 (11.9)
Minor 18 (42.9)
Moderate 11 (26.2)
Major 8 (19.0)
Life-saving 0 (0.0)
5.2 Identification and Assessment of Medication Misadventure
Panel 1 assessed a random sample of the active interventions to determine whether
medication misadventure was implicated; a yes/no decision. The entire Panel 1
indicated that the majority of active interventions addressed medication misadventure
(Table 5.4). The strength of agreement between the reviewers was ‘fair’ (α=0.321,
95%CI 0.113-0.544).
Table 5.4 Panel 1: Inter-rater reliability of medication misadventure detected by pharmacists’ active interventions (n=42)
Medication
misadventure?
Frequency, n (%)
Reviewer 1 Reviewer 2 Reviewer 3 Reviewer 4
Yes 31 (73.8) 35 (83.3) 26 (61.9) 31 (73.8)
No 11 (26.2) 7 (16.7) 16 (38.1) 11 (26.2)
Reviewer 1 = clinical nurse, Reviewer 2 = hospital pharmacist, Reviewer 3 = independent academic
pharmacist, Reviewer 4 = consensus between two researchers
When the reviewers assigned each case into three categories of medication
misadventure (ADE, ADR, ME), they noted ‘fair’ agreement (α=0.222, 95%CI
0.096-0.341) (Table 5.5). Reviewers 2, 3 and 4 most commonly rated the medication
misadventures as ME.
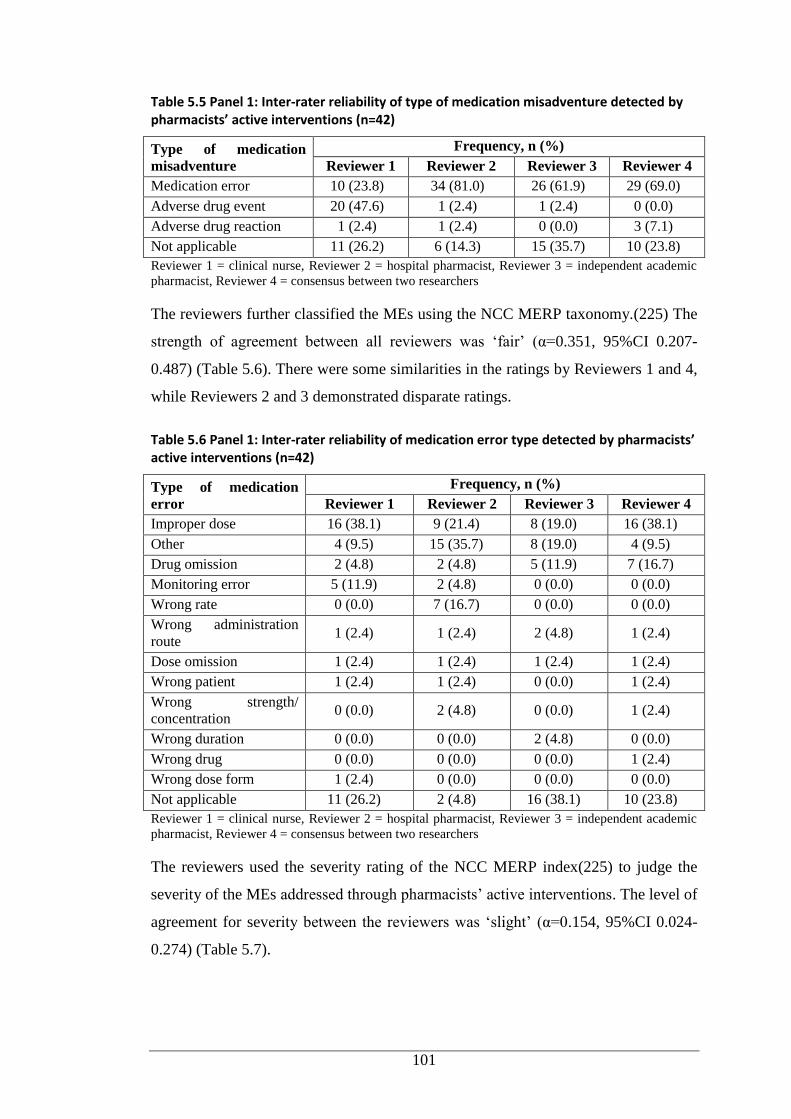
101
Table 5.5 Panel 1: Inter-rater reliability of type of medication misadventure detected by pharmacists’ active interventions (n=42)
Type of medication
misadventure
Frequency, n (%)
Reviewer 1 Reviewer 2 Reviewer 3 Reviewer 4
Medication error 10 (23.8) 34 (81.0) 26 (61.9) 29 (69.0)
Adverse drug event 20 (47.6) 1 (2.4) 1 (2.4) 0 (0.0)
Adverse drug reaction 1 (2.4) 1 (2.4) 0 (0.0) 3 (7.1)
Not applicable 11 (26.2) 6 (14.3) 15 (35.7) 10 (23.8)
Reviewer 1 = clinical nurse, Reviewer 2 = hospital pharmacist, Reviewer 3 = independent academic
pharmacist, Reviewer 4 = consensus between two researchers
The reviewers further classified the MEs using the NCC MERP taxonomy.(225) The
strength of agreement between all reviewers was ‘fair’ (α=0.351, 95%CI 0.207-
0.487) (Table 5.6). There were some similarities in the ratings by Reviewers 1 and 4,
while Reviewers 2 and 3 demonstrated disparate ratings.
Table 5.6 Panel 1: Inter-rater reliability of medication error type detected by pharmacists’ active interventions (n=42)
Type of medication
error
Frequency, n (%)
Reviewer 1 Reviewer 2 Reviewer 3 Reviewer 4
Improper dose 16 (38.1) 9 (21.4) 8 (19.0) 16 (38.1)
Other 4 (9.5) 15 (35.7) 8 (19.0) 4 (9.5)
Drug omission 2 (4.8) 2 (4.8) 5 (11.9) 7 (16.7)
Monitoring error 5 (11.9) 2 (4.8) 0 (0.0) 0 (0.0)
Wrong rate 0 (0.0) 7 (16.7) 0 (0.0) 0 (0.0)
Wrong administration
route 1 (2.4) 1 (2.4) 2 (4.8) 1 (2.4)
Dose omission 1 (2.4) 1 (2.4) 1 (2.4) 1 (2.4)
Wrong patient 1 (2.4) 1 (2.4) 0 (0.0) 1 (2.4)
Wrong strength/
concentration 0 (0.0) 2 (4.8) 0 (0.0) 1 (2.4)
Wrong duration 0 (0.0) 0 (0.0) 2 (4.8) 0 (0.0)
Wrong drug 0 (0.0) 0 (0.0) 0 (0.0) 1 (2.4)
Wrong dose form 1 (2.4) 0 (0.0) 0 (0.0) 0 (0.0)
Not applicable 11 (26.2) 2 (4.8) 16 (38.1) 10 (23.8)
Reviewer 1 = clinical nurse, Reviewer 2 = hospital pharmacist, Reviewer 3 = independent academic
pharmacist, Reviewer 4 = consensus between two researchers
The reviewers used the severity rating of the NCC MERP index(225) to judge the
severity of the MEs addressed through pharmacists’ active interventions. The level of
agreement for severity between the reviewers was ‘slight’ (α=0.154, 95%CI 0.024-
0.274) (Table 5.7).
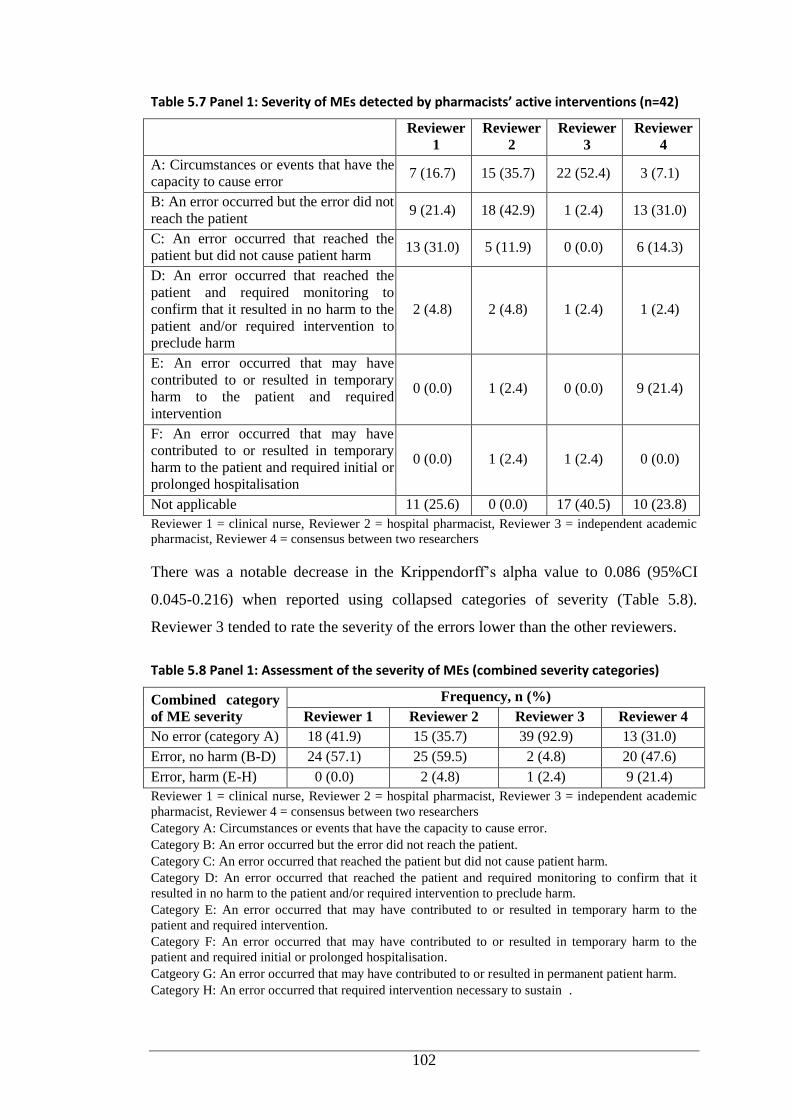
102
Table 5.7 Panel 1: Severity of MEs detected by pharmacists’ active interventions (n=42)
Reviewer
1
Reviewer
2
Reviewer
3
Reviewer
4
A: Circumstances or events that have the
capacity to cause error 7 (16.7) 15 (35.7) 22 (52.4) 3 (7.1)
B: An error occurred but the error did not
reach the patient 9 (21.4) 18 (42.9) 1 (2.4) 13 (31.0)
C: An error occurred that reached the
patient but did not cause patient harm 13 (31.0) 5 (11.9) 0 (0.0) 6 (14.3)
D: An error occurred that reached the
patient and required monitoring to
confirm that it resulted in no harm to the
patient and/or required intervention to
preclude harm
2 (4.8) 2 (4.8) 1 (2.4) 1 (2.4)
E: An error occurred that may have
contributed to or resulted in temporary
harm to the patient and required
intervention
0 (0.0) 1 (2.4) 0 (0.0) 9 (21.4)
F: An error occurred that may have
contributed to or resulted in temporary
harm to the patient and required initial or
prolonged hospitalisation
0 (0.0) 1 (2.4) 1 (2.4) 0 (0.0)
Not applicable 11 (25.6) 0 (0.0) 17 (40.5) 10 (23.8)
Reviewer 1 = clinical nurse, Reviewer 2 = hospital pharmacist, Reviewer 3 = independent academic
pharmacist, Reviewer 4 = consensus between two researchers
There was a notable decrease in the Krippendorff’s alpha value to 0.086 (95%CI
0.045-0.216) when reported using collapsed categories of severity (Table 5.8).
Reviewer 3 tended to rate the severity of the errors lower than the other reviewers.
Table 5.8 Panel 1: Assessment of the severity of MEs (combined severity categories)
Combined category
of ME severity
Frequency, n (%)
Reviewer 1 Reviewer 2 Reviewer 3 Reviewer 4
No error (category A) 18 (41.9) 15 (35.7) 39 (92.9) 13 (31.0)
Error, no harm (B-D) 24 (57.1) 25 (59.5) 2 (4.8) 20 (47.6)
Error, harm (E-H) 0 (0.0) 2 (4.8) 1 (2.4) 9 (21.4)
Reviewer 1 = clinical nurse, Reviewer 2 = hospital pharmacist, Reviewer 3 = independent academic
pharmacist, Reviewer 4 = consensus between two researchers
Category A: Circumstances or events that have the capacity to cause error.
Category B: An error occurred but the error did not reach the patient.
Category C: An error occurred that reached the patient but did not cause patient harm.
Category D: An error occurred that reached the patient and required monitoring to confirm that it
resulted in no harm to the patient and/or required intervention to preclude harm.
Category E: An error occurred that may have contributed to or resulted in temporary harm to the
patient and required intervention.
Category F: An error occurred that may have contributed to or resulted in temporary harm to the
patient and required initial or prolonged hospitalisation.
Catgeory G: An error occurred that may have contributed to or resulted in permanent patient harm.
Category H: An error occurred that required intervention necessary to sustain .
103
5.3 Discussion
5.3.1 Clinical Significance of Pharmacists’ Active Interventions
Published studies on pharmacists’ clinical interventions have used different methods.
To date, there are no validated methods or standardised rating scales to assign
clinical significance to pharmacists’ interventions, making it difficult to compare our
findings. Significance assessment was initially performed by a panel comprising
three independent experts (hospital pharmacist, academic pharmacist, clinical nurse)
and consensus between two researchers (counted as a single reviewer). The pattern of
agreement between the reviewers could have been different if physicians had
participated. Studies have demonstrated that physicians tended to rate the impact of
pharmaceutical care interventions lower than pharmacists.(226-228)
The present study uncovered little agreement between the raters for the clinical
significance of pharmacists’ active interventions, evidenced by low Krippendorff’s
alpha values, α=0.265 and α=0.394 for discrete rating scales and collapsed scales,
respectively. In accordance with our finding, low level of agreement (ϰ=0.35) was
reported in a reliability study assessing the clinical significance of pharmacists’
interventions in a tertiary care hospital that included a paediatric unit. The
assessment was conducted between the intervening pharmacists and an independent
clinical pharmacist using six-point significance rating scale. There was no face-to-
face training in significance assessment provided to the evaluators.(203)
A low level of agreement was also reported by Fernandez-Llamazares et al.(197)
They evaluated the impact of pharmacists’ interventions to reduce prescribing errors
in paediatric wards. They used a six-point rating scale (harmful, insignificant,
somewhat significant, significant, very significant, extremely significant). The
intervening pharmacists and an independent clinical pharmacist carried out the
assessment.
An American study in an integrated healthcare centre for adults found ‘slight’
agreement (ϰ=0.18) for the impact of pharmacists’ recommendations between two
independent evaluators (physician, pharmacist).(154) A similar level of agreement
(ϰ=0.20) was also reported by Bosma et al.(226) in a gastroenterology unit in a
Dutch general hospital. A Danish study noted modest agreement (ϰ=0.25) between
two raters (internal medicine specialist, clinical pharmacologist) for the significance
104
of pharmacists’ interventions in a clinical unit for adult patients. They employed a
four-level significance assessment (minimal importance, moderate, significant,
vital).(216) Better agreement was reported by Overhage et al.(227) at an American
general hospital involving the intervening pharmacists and four independent
reviewers (two physicians, two pharmacists).
A meeting organised for Panel 2 (researchers and two independent panellists) to
resolve the rating differences and reach consensus identified that the majority of the
interventions were rated significant (45.2% moderate or major significance), leaving
less than 12% as non-significant. An analysis of clinical pharmacists’ interventions
by self-assessment in an Austrian hospital with a Department of Paediatric and
Adolescence Medicine demonstrated that around three-quarters of the interventions
were judged to be significant.(203) These findings were in accordance with a study
by Virani et al.(204) undertaken in a Canadian paediatric mental health unit where
86% of pharmacist-initiated recommendations had a potential positive impact on
patient care ranging from ‘minor’ to ‘markedly significant’. However, nearly 10% of
the recommendations had a potentially detrimental effect, compared to none in our
study. Comparable results were also reported by a Spanish study, where more than
three-quarters of pharmacists’ interventions rectifying prescribing errors had a
significant impact.(197) The clinical significance of interventions documented in a
range of paediatric healthcare settings in the USA reported more than half of the
interventions as ‘somewhat significant’ and nearly 40% as ‘significant’.(184) A
study conducted in a children’s hospital in the USA claimed that almost two-thirds of
pharmacists’ interventions during medication reconcilliation were self-rated by the
pharmacists as contributing a ‘moderate’ impact to patient care, 7% as ‘life-saving’
and the remaining 27% as ‘minimal impact’.(139)
A large Australian study involving eight hospitals assessed the impact of
pharmacists’ interventions on patients’ clinical outcomes judged by the intervening
pharmacist and then referred to the independent panel for final assessment. Despite
using the same significance rating scale as our study, the authors reported more than
one-quarter of the interventions were of ‘major significance’, while ‘moderate’ and
‘minor’ categories accounted for around 30% each.(18)
105
A different method was reported by Mogensen et al.(216) who evaluated the
significance of interventions in an ED. They applied the highest rating from either of
the two independent specialists as the final rating and did not seek consensus. They
argued that the expertise of the specialists would be more relevant for the final
assessment than consensus. They deemed around 47% of interventions to be of ‘vital
importance’, with the remainder of ‘minor-moderate importance’.
Sircar-Ramsewak et al.(229) retrospectively evaluated the potential impact of
pharmacists’ interventions on addressing DRPs over one year in a general hospital in
Trinidad. There was no clear explanation about the assessment process. More than
two-thirds of the interventions were of ‘moderate impact’ on patient care, while
around 30% had a ‘major impact’ and a small proportion ‘minor impact’. Although
Sircar-Ramsewak et al.(229) used different terms to classify the value of
pharmacists’ interventions, there were no distinct differences in defining the value.
This means that the term ‘impact’, describing the value of the assessment, can be
replaced by the term ‘significance’. Sircar-Ramsewak et al.(229) reported greater
significance of pharmacists’ interventions than our study.
A retrospective study of pharmacists’ interventions to resolve MEs during dispensing
was conducted in a general hospital in Oman. Some challenges to the method were
noted. Pharmacists based the intervention data on legible annotations on the
prescriptions. The researchers did not describe their assessment processes for the
interventions. The study revealed slightly better findings than our study, where the
majority (72.3%) of the interventions were of ‘minor significance’, while nearly 20%
and 7.5% were of ‘moderate significance’ and ‘major significance’,
respectively.(230)
Different findings were also noted in a study evaluating the impact of Doctor of
Pharmacy students’ interventions during an internal medicine clerkship. The
significance of the interventions were assessed by panels of two faculty members and
10 independent pharmacists using a three-level scale (low, moderate, high). The
differences among the panellists was resolved by a vote. Around 50% of the
interventions were categorised as having ‘low-level significance’.(231)
106
It is evident from these studies that methods for assessing the clinical significance of
interventions are variable. The subjectivity of the reviewers, characteristics of the
rating scales and the accuracy of their predictions compromise all of the methods.
Studies involving self-assessment by the intervening pharmacists may also be subject
to bias.
Applying actual clinical outcomes of pharmacists’ interventions would circumvent
the subjectivity involved in theoretical estimation of significance and impact. This
approach was attempted by McLennan et al.(232) in an assessment of pharmacists’
interventions in an Australian tertiary referral centre for cancer. They employed three
classifications of patient outomes to assess the interventions (beneficial, detrimental,
no change). The assessment was undertaken by an independent pharmacist who
reviewed patients’ clinical status in their medical histories following the intervention
episode until discharge, or for a maximum of seven days. McLennan et al.(232)
claimed approximately 90% of the interventions benefitted the patient. As the study
was conducted in a specialty setting, familiarity with the patients’ medical conditions
may have facilitated this approach. Assessment of outcomes is expected to be more
complex in general medical settings.
5.3.2 Identification and Assessment of Medication Misadventure
Analysis of medication-related events, particularly the frequency, type and severity,
is essential to improve the quality of healthcare delivery.(233, 234) Therefore,
reliability in the classification is vital. However, variation in judgement between
raters may contribute to errors in reliability analysis. Variability is expected as a
result of the raters’ clinical specialties, their awareness of best-practice management
across a range of conditions, and their experience and familiarity with the
classification process.(233)
The level of agreement within Panel 1 was ‘fair’ for judgements on involvement of
medication misadventure. Reviewers relied on concise explanations of the categories,
without examples. Consequently, there was disagreement between the reviewers as
to what constituted an error. Different perceptions were also noted when determining
the presence of harm. Although the NCC MERP has created an algorithm to facilitate
the assignment of severity to ME-related events and to minimise variability,(225) its
utility has been questioned.(235)
107
It is challenging to compare our findings with other studies, despite widespread
application of the NCC MERP index, for which inter-rater reliability has been
established by a small number of studies. Forrey et al.(235) evaluated the reliability
of the NCC MERP index among MedMARx ADE data repository users using 27
actual ME scenarios. They reported the NCC MERP index was accurate and reliable,
with some ability to generalise findings. However, Forrey et al.(235) proposed that
collapsing categories E, F and H into one category, and categories C and D into
another category, would minimise ambiguity. The present study collapsed the
categories into four (no error, error - no harm, error - harm, error - death), as
indicated in the NCC MERP index; paradoxically this generated a lower level of
agreement as opposed to discrete categories.
Little research has investigated inter-rater reliability associated with medication
misadventure in paediatrics. Variations in definitions and categories of terms such as
ADE, ADR and ME complicate the comparison of published research. Consistent
with our findings, Kunac et al.(233) determined the reliability in assessment of
paediatric inpatient medication-related events. They found low agreement ranging
from ‘slight’ to ‘fair’ on the type and the seriousness of the event. Kunac et al.(233)
used simulated test cases and guidelines consisting of the definitions and examples of
the event categories to aid reviewers during the judgement process.
Previous paediatric studies have revealed high levels of agreement for the
classification of event type.(236, 237) ‘Substantial’ agreement was reported by King
et al.(236); 20 randomly selected incident reports were judged by two independent
physicians. Potts et al.(237) found ‘almost perfect’ agreement between two
independent reviewers (physician, clinical pharmacist) who assessed a random
sample (10%) of data relating to paediatric patients in a critical care unit. With
respect to the severity of ME, comparison of our findings with the existing literature
was challenged by the majority of studies evaluating the severity of all medication-
related events, not necessarily MEs. The studies also used a variety of rating scales
resulting in distinct interpretations of the event severity. For example, two paediatric
studies reported ‘substantial’ agreement between two independent raters for the
severity of the event (ADEs, potential ADEs, MEs) using a four-point Likert-type
scale.(50, 238)
108
Some differences in this concept are notable when comparing paediatric and adult
population studies. Snyder et al.(239) modified the NCC MERP index by replacing
the word ‘error’ in each severity category with the word ‘event’, combining
categories B-D (error - no harm) and E-H (error - harm), and excluding categories A
and I. They found that the level of agreement for classification of medication safety
events ranged from ‘substantial’ to ‘almost perfect’. They also reported that the level
of agreement for event severity among the reviewers for original discrete categories
was substantial, and slight improvement in agreement was noted when using the
combined categories.(239) Abdel-Qader et al.(210) conducted a study in a UK
teaching hospital to determine the reliability of the severity of prescribing errors
rectified by pharmacists. They found substantial agreement between intervening
pharmacists and an independent senior pharmacist. By contrast, poor agreement was
reported between two independent raters (hospital pharmacist, clinical
pharmacologist) on the severity of MEs intercepted by pharmacists’ interventions in
a specialty unit in the Netherlands.(226)
Over three-quarters of the selected sample of pharmacists’ active interventions in our
study addressed medication misadventure, of which over 90% involved MEs and the
rest were due to ADRs. In line with paediatric studies,(17, 50, 99, 148, 238, 240,
241) the researchers’ assessment demonstrated that overall, the most common type of
MEs addressed in the active interventions during pharmacy rounds on the five wards
and during dispensing in the Haematology-Oncology Pharmacy was related to
inappropriate doses. A situation compounded by the limited availability of drug
formulations for children.(242) However, the pattern of MEs on the Haematology-
Oncology Ward was slightly different, with drug omission comprising around 46%
of the MEs. Inappropriate doses of the correct drugs were the second most frequent
errors, contributing to 23% of the errors in this specialty unit. Half of the sampled
MEs were not intercepted, and resulted in additional monitoring or temporary patient
harm. A two-month study in an American paediatric teaching hospital reported a
negligible proportion of the errors reaching patients.(243)
Chan and Kotzin(94) described a distinct way of assessing the severity of MEs
detected by pharmacists’ interventions. They evaluated four years of data from
interventions in paediatric patients and found that more than half of the errors were
109
‘moderate’ in severity and just over one-fifth were ‘severe’, while the remaining
errors were ‘minor’ and ‘unknown’ in comparable proportions. A systematic review
of MEs in paediatric patients revealed that, MEs were moderate in severity and very
few incidents resulted in fatal outcomes.(244) When focusing on paediatric
chemotherapy MEs, Rinke et al.(10) assessed the five-year voluntary report of the
US Pharmacopeia MedMARx database and found that 85% of the errors reached
patients and 15.6% of non-intercepted errors resulted in patient monitoring or
therapeutic interventions. The differences might be due to the researchers’ focus on
chemotherapy instead of all medications used in oncology. Furthermore, errors
submitted to the MedMARx ADE data repository might from all stages of
medication-use process, which was not the case in the present study.
5.4 Limitations and Recommendations
There are some limitations in the study design and the results of this study. For
convenience, only randomly selected cases of pharmacists’ active interventions were
included in the analysis. Despite this, the findings provide some insight into
medication misadventure in paediatrics.
The samples used to assess the classification agreement were from a single children’s
hospital, which might limit the generalisability of the findings. Data were gleaned
from observations during ward rounds and dispensing. The lack of continuous
monitoring could mean less opportunity to detect MEs during drug administration.
Kaushal(245) has claimed that each method of error measurement detects only
certain types of errors. The most common medication-related events, including MEs,
occur during prescribing and administration.(3, 37, 50, 52, 179)
The independent panellists were selected for convenience. In the selection process, it
was deemed that the independent panellists had appropriate clinical knowledge and
professional experience. Low levels of agreement among reviewers might be due to
their inadequate experience in using the clinical significance rating and the NCC
MERP index.
Limited information provided for each case could have influenced the agreement.
There was no formal training using simulated scenarios prior to the assessment, and
no examples were provided for each component of assessment. The findings might
110
be different if more detailed information had been provided, along with training for
the panellists.
Our findings highlight that more research is needed to elucidate the rate and pattern
of medication-related events identified through pharmacists’ active interventions in
paediatrics. Future studies should assess all pharmacists’ active interventions
documented within a time frame in a range of paediatric settings, and in multiple
institutions and with actual clinical patient outcomes. Future research could also
address the issue of selection of the independent expert panel via random selection of
a broad group of eligible experts - doctors, nurses and pharmacists. The resulting
data would provide a broader picture of pharmacists’ interventions in relation to their
capacity to identify and resolve medication misadventure, and a better understanding
of the nature of medication misadventure in children.
5.5 Conclusion
Most of the selected active interventions were rated as clinically significant and
reliability of reviewers’ rating was ‘slight’ for severity of ME. Meanwhile, ‘fair’
agreement was achieved for the presence of medication misadventure, classification
of medication misadventure and classification of ME. It is beneficial to implement
approaches to improve the reliability of the assessment and generalisability of the
findings. This study highlighted the clinical significance of pharmacists’ active
interventions and justified the role of clinical pharmacists through their active
interventions in paediatric settings by identifying and resolving medication
misadventure related events, in particular ME. The medication misadventures
detected and corrected by pharmacists provide valuable data on the pattern of the
misadventure and subsequent direction to improve the medication use process.
111
Chapter 6
PART THREE: RESULTS AND DISCUSSION
This chapter comprises a published paper reproduced with permission from the
journal:
Hesty U Ramadaniati, Ya P Lee, Jeffery D Hughes. Snapshot versus continuous
documentation of pharmacists’ interventions: are snapshots worthwhile? Journal of
Pharmacy Practice and Research 2014; 44: 205-12. DOI: 10.1002/jppr.1029.
The headings, page number, tables, figures and references have been reformatted in
line with the thesis structure. This chapter also presents qualitative data from the
FGD that had not been included in the paper.
6.1 Introduction
Clinical pharmacy services play an important role in ensuring optimal drug outcomes
for patients.(121) Pharmacists’ interventions have been considered in some
developed countries as one of the main parameters in evaluating the importance of
clinical pharmacy services for improving safety and efficacy of medication use.(185,
210, 246) Hence, the documentation of pharmacists’ clinical interventions and
activities are of paramount importance in providing evidence that clinical
pharmacists play an integral role in preventing medication misadventure, improving
overall patient care and justifying their value within the healthcare system.(247, 248)
A national survey was conducted in Australia to evaluate the extent of clinical
services provision and their level of documentation. The survey indicated that
clinical pharmacy services are common in hospital settings across Australia and that
the level of documentation varied amongst institutions.(248) Likewise, a national
survey by the American Society of Hospital Pharmacy demonstrated that most
hospital pharmacists documented their interventions.(249) Nonetheless, there have
been limited studies specifically evaluating the different approaches in documenting
interventions, particularly in the paediatric population.(89, 184, 201) Paediatric
patients are particularly at risk of medication misadventure for many reasons,
including unique physiologic characteristics, inadequate healthcare settings to
accommodate safe use of medication in paediatrics and psychological factors
112
specifically related to communication issues.(87) Thus, this study aimed to evaluate
the nature of pharmacists’ interventions documented through self-reporting during
snapshot periods in comparison to interventions documented during direct
observation. Further, it sought to gather pharmacists’ opinions on the utility of the
different documentation methods.
6.2 Method
6.2.1 Documentation of Pharmacists’ Interventions during Snapshot
Periods
This study was conducted in a 220-bed paediatric teaching hospital in Perth, Western
Australia. This hospital has an in-house method for documenting pharmacists’
interventions during snapshot periods. Snapshot periods occur twice a year around
March to May and September to October and are of five days’ duration. The
interventions are self-reported manually by all pharmacists using a specific form
(Appendix 7). The principal researcher retrospectively analysed ward-based
pharmacists’ interventions from the five study wards (General Medical Ward for
Infants, General Medical Ward for Young Children, General Medical Ward for
Adolescents, General Surgical Ward and Haematology-Oncology Ward) for three
snapshot periods, namely September 2010, April 2011 and May 2012. The snapshot
reports from the study periods were evaluated to determine the number and type of
the interventions. The type of intervention was categorised as described by Condren
et al.(184) with slight modification. In addition, the interventions were divided into
active and passive interventions. An active intervention was defined as any activity
by a pharmacist that directly leads to a change in a patient’s drug management or
therapy.(121) All other care-centred activities not resulting in medication changes
were considered as passive interventions. The medications involved in the
interventions were categorised using the AMH.(188) The results of the snapshot
reports were then compared to interventions documented during direct observation.
6.2.2 Documentation of Pharmacists’ Interventions during Direct
Observation
The principal researcher shadowed pharmacists during their ward rounds and
documented all interventions undertaken by the pharmacists in the five study wards.
This observation was made between 35 and 37 non-consecutive days per ward. The
113
type of data collected during direct observation can be seen in the data collection
form (Appendix 1).
6.2.3 Focus Group Discussion
The principal researcher presented the results of pharmacists' intervention
documentation from direct observation and snapshot reports to the pharmacy staff. A
focus group discussion was conducted after the presentation by an independent
facilitator to gather the pharmacists' perceptions and comments on the results. The
barriers to effective documentation of pharmacists' interventions and their
suggestions to improve the established intervention documentation system were also
sought. The discussion was audio recorded and transcribed verbatim for thematic
analysis.
6.2.4 Data Analysis
Demographic variables and pharmacists’ intervention data were summarised using
descriptive statistics. Data were analysed using SPSS version 19.0 (Chicago, IL,
USA). The rates of pharmacists’ interventions per 100 medication charts reviewed,
documented through direct observation and during snapshot periods for each ward,
were compared using Poisson regression using SAS version 9.2 (SAS Institute Inc.,
Cary, NC, USA). Transcripts of the discussion were entered into a qualitative
analysis software program (QSR NVivo 10) to code and link emergent themes.
6.3 Results
6.3.1 Pharmacists’ Interventions Documented during Snapshot versus
Observation Periods
A total of 398 interventions were documented and 1022 medication charts were
reviewed by pharmacists during three snapshot periods in 2009 and 2010 (I, II, III).
Complete snapshot reports from the five study wards were available for snapshot
period II, while only reports from three wards were submitted during periods I and
III. Of all interventions, approximately 18% (n=70/398) were considered active
interventions. The characteristics and rates of all interventions and the active
interventions documented by pharmacists during snapshot periods are shown in
Table 6.1, and the types of interventions during snapshot periods are described in
Figure 6.1. The highest rates of intervention per 100 medication charts reviewed was
recorded in the General Surgical Ward, followed by the General Medical Ward for
114
Infants and the Haematology-Oncology Ward, respectively (Table 6.1). However,
the analysis of active interventions revealed a different trend with the Haematology-
Oncology Ward showing the highest rate followed by the General Surgical Ward and
the General Medical Ward for Adolescents, respectively. A total of 982 pharmacists’
interventions were observed and documented, and 2275 medication charts were
reviewed in the five study wards during the direct observation. The characteristics
and rates of pharmacists’ interventions from each ward are summarised in Table 6.2
and the types of interventions performed by ward-based pharmacists in the study
wards are described in Figure 6.2. As detailed in Table 6.2, the General Surgical
Ward had the highest intervention rate per 100 medication charts reviewed. It was
followed by the Haematology-Oncology Ward and the General Medical Ward for
Adolescents. In terms of active interventions, the Haematology-Oncology Ward
ranked first, followed by the General Surgical Ward and the General Medical Ward
for Adolescents. It is interesting to note that the pattern of active interventions during
observation was similar to that of the snapshots.
Comparison of the rates of interventions during the snapshot periods and direct
observation were undertaken using a Poisson regression model. This model showed
no significant difference in the interventions rates of the two documentation
methods; snapshot 37.4 (95%CI 27.4–47.4) per 100 medication charts reviewed
versus observation 50.6 (95%CI 43.1–58.1) per 100 medication charts reviewed, p =
0.054. A similar statistical analysis was undertaken to compare the rates of active
interventions between snapshot and observation periods. The analysis revealed that
the rate of documentation of active interventions during the direct observation period
was significantly higher compared to that of the snapshots (snapshot 6.7 [95%CI
4.3–9.2] per 100 medication charts reviewed versus observation 15.1 [95%CI 10.0–
20.2] per 100 medication charts reviewed, p = 0.002).
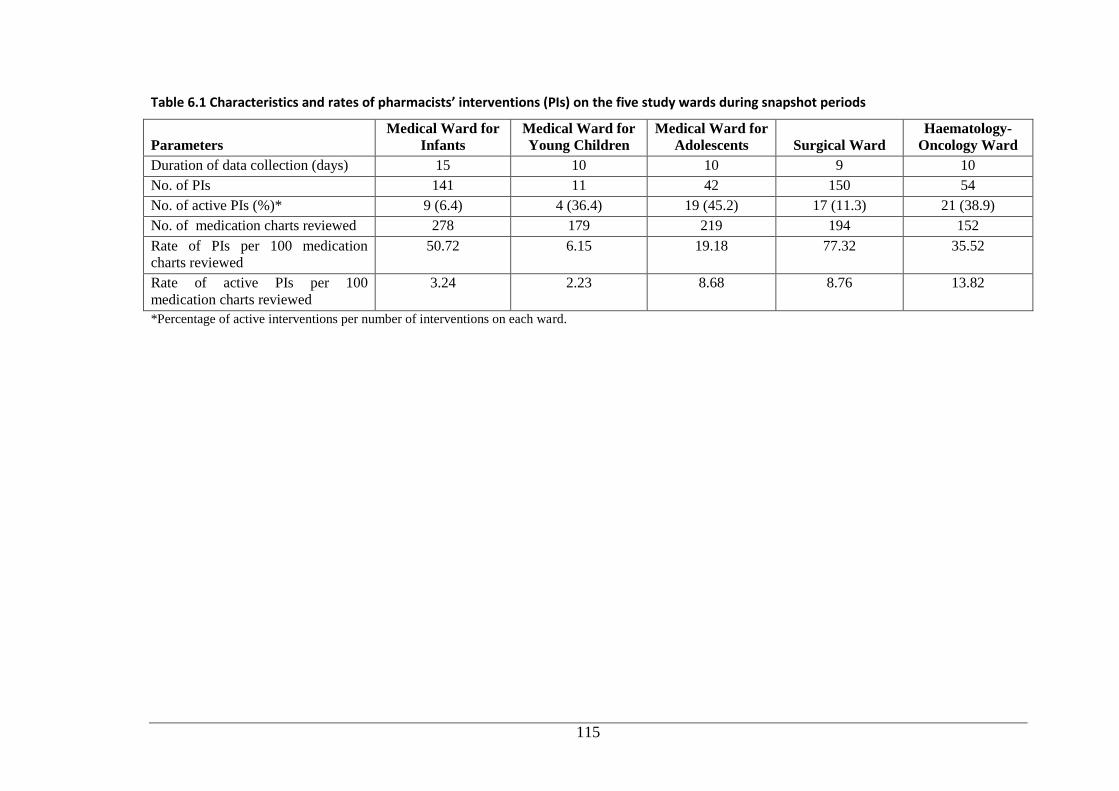
115
Table 6.1 Characteristics and rates of pharmacists’ interventions (PIs) on the five study wards during snapshot periods
Parameters Medical Ward for
Infants Medical Ward for
Young Children Medical Ward for
Adolescents Surgical Ward Haematology-
Oncology Ward
Duration of data collection (days) 15 10 10 9 10
No. of PIs 141 11 42 150 54
No. of active PIs (%)* 9 (6.4) 4 (36.4) 19 (45.2) 17 (11.3) 21 (38.9)
No. of medication charts reviewed 278 179 219 194 152
Rate of PIs per 100 medication
charts reviewed 50.72 6.15 19.18 77.32 35.52
Rate of active PIs per 100
medication charts reviewed 3.24 2.23 8.68 8.76 13.82
*Percentage of active interventions per number of interventions on each ward.
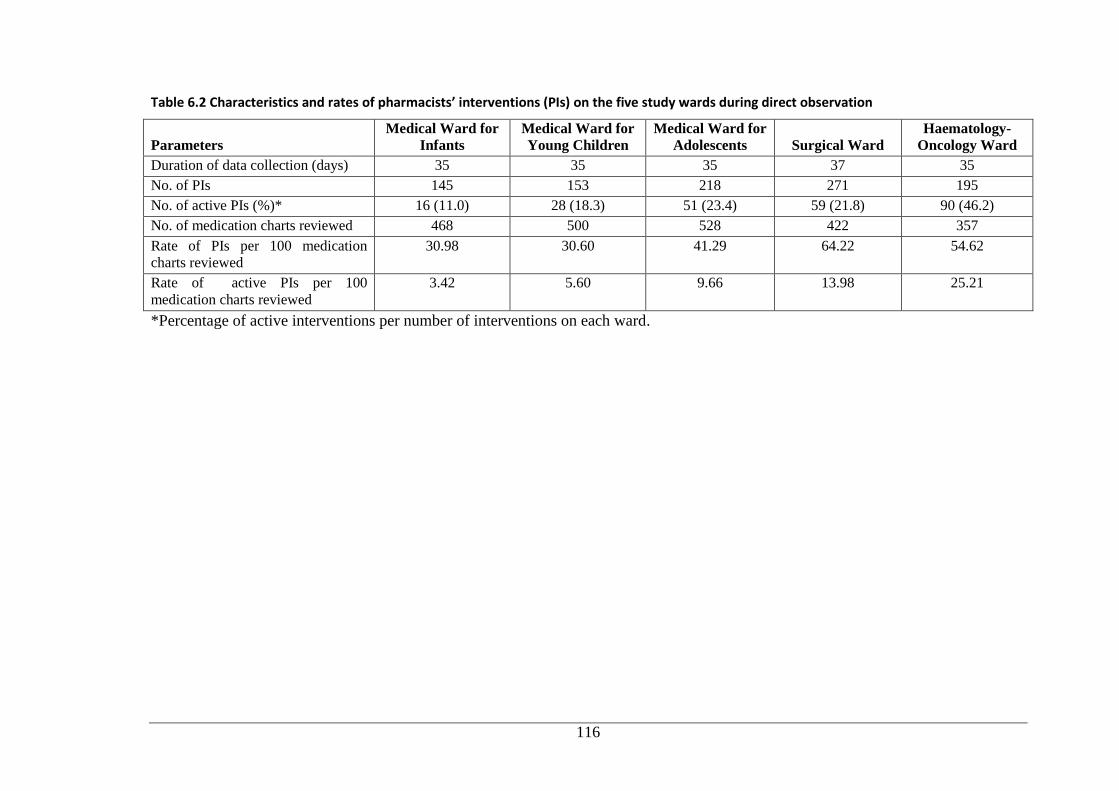
116
Table 6.2 Characteristics and rates of pharmacists’ interventions (PIs) on the five study wards during direct observation
Parameters Medical Ward for
Infants Medical Ward for
Young Children Medical Ward for
Adolescents Surgical Ward Haematology-
Oncology Ward
Duration of data collection (days) 35 35 35 37 35
No. of PIs 145 153 218 271 195
No. of active PIs (%)* 16 (11.0) 28 (18.3) 51 (23.4) 59 (21.8) 90 (46.2)
No. of medication charts reviewed 468 500 528 422 357
Rate of PIs per 100 medication
charts reviewed 30.98 30.60 41.29 64.22 54.62
Rate of active PIs per 100
medication charts reviewed 3.42 5.60 9.66 13.98 25.21
*Percentage of active interventions per number of interventions on each ward.
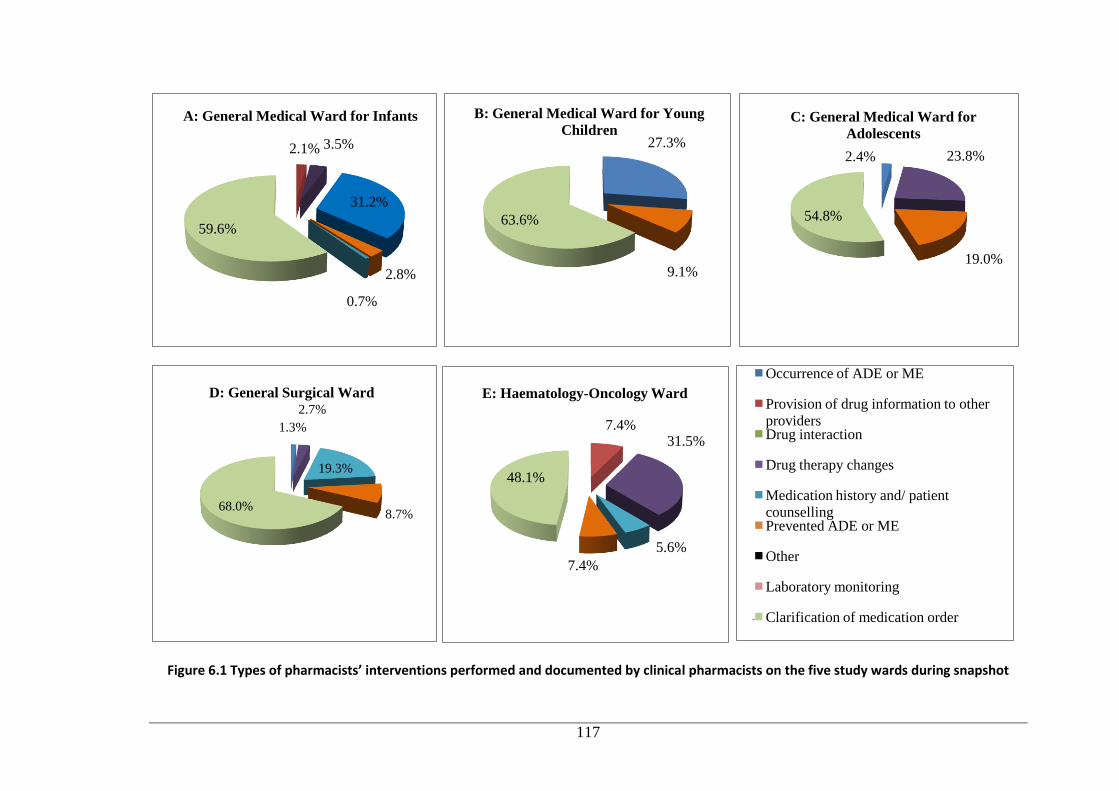
117
Figure 6.1 Types of pharmacists’ interventions performed and documented by clinical pharmacists on the five study wards during snapshot
2.1% 3.5%
31.2%
2.8%
0.7%
59.6%
A: General Medical Ward for Infants
27.3%
9.1%
63.6%
B: General Medical Ward for Young
Children
2.4% 23.8%
19.0%
54.8%
C: General Medical Ward for
Adolescents
1.3%
2.7%
19.3%
8.7% 68.0%
D: General Surgical Ward
7.4% 31.5%
5.6%
7.4%
48.1%
E: Haematology-Oncology Ward
Occurrence of ADE or ME
Provision of drug information to other
providers Drug interaction
Drug therapy changes
Medication history and/ patient
counselling Prevented ADE or ME
Other
Laboratory monitoring
Clarification of medication order
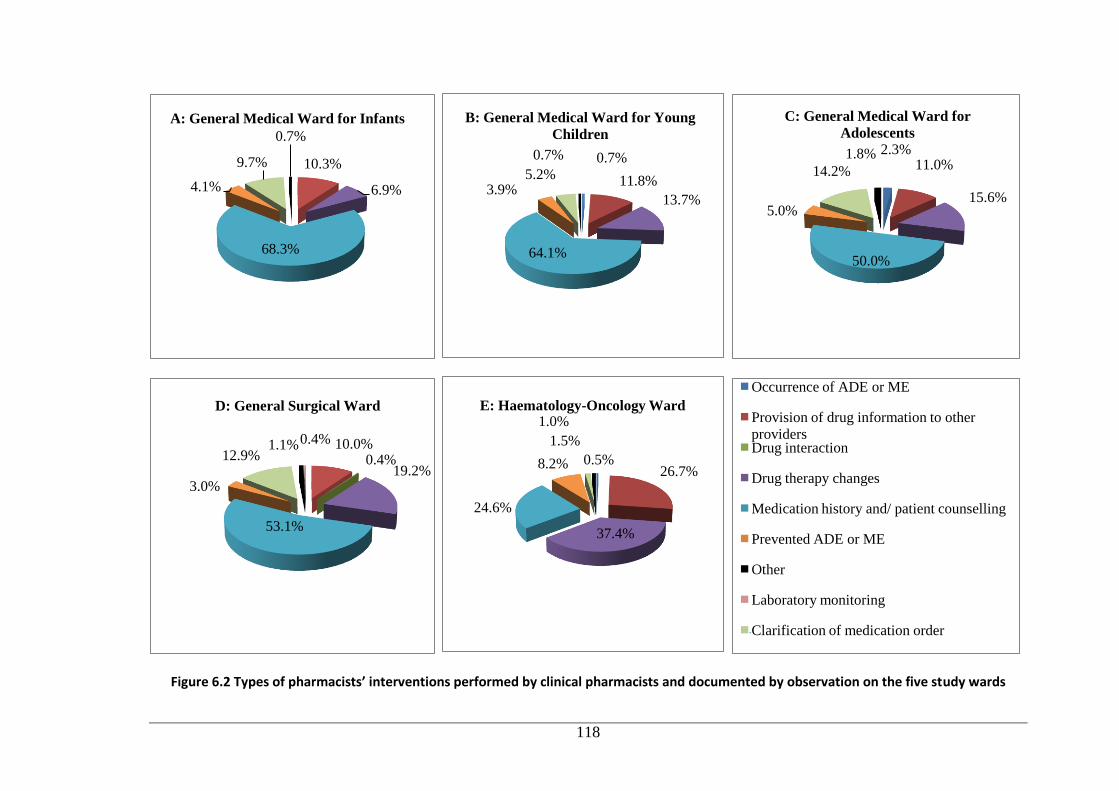
118
Figure 6.2 Types of pharmacists’ interventions performed by clinical pharmacists and documented by observation on the five study wards
10.3%
6.9%
68.3%
4.1%
9.7%
0.7%
A: General Medical Ward for Infants
0.7%
11.8%
13.7%
64.1%
3.9% 5.2%
0.7%
B: General Medical Ward for Young
Children 2.3%
11.0%
15.6%
50.0%
5.0%
14.2%
1.8%
C: General Medical Ward for
Adolescents
10.0% 0.4%
19.2%
53.1%
3.0%
12.9% 1.1% 0.4%
D: General Surgical Ward
0.5% 26.7%
37.4%
24.6%
8.2%
1.5%
1.0% E: Haematology-Oncology Ward
Occurrence of ADE or ME
Provision of drug information to other
providers Drug interaction
Drug therapy changes
Medication history and/ patient counselling
Prevented ADE or ME
Other
Laboratory monitoring
Clarification of medication order
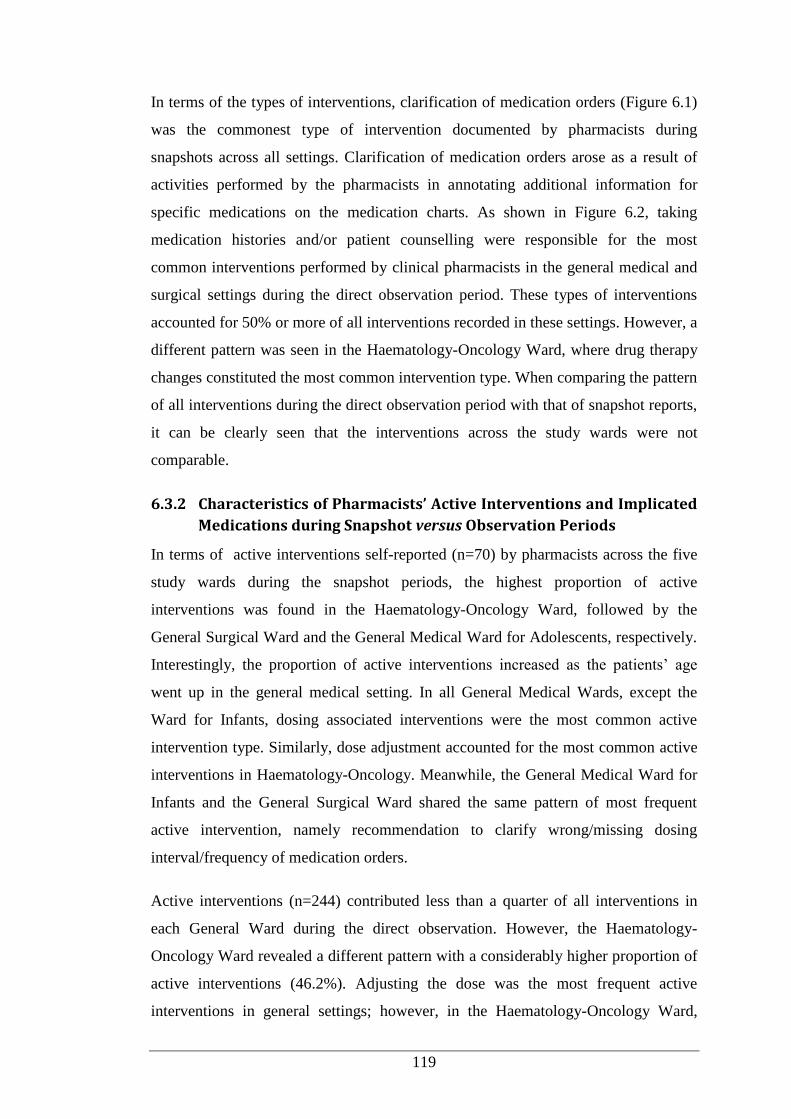
119
In terms of the types of interventions, clarification of medication orders (Figure 6.1)
was the commonest type of intervention documented by pharmacists during
snapshots across all settings. Clarification of medication orders arose as a result of
activities performed by the pharmacists in annotating additional information for
specific medications on the medication charts. As shown in Figure 6.2, taking
medication histories and/or patient counselling were responsible for the most
common interventions performed by clinical pharmacists in the general medical and
surgical settings during the direct observation period. These types of interventions
accounted for 50% or more of all interventions recorded in these settings. However, a
different pattern was seen in the Haematology-Oncology Ward, where drug therapy
changes constituted the most common intervention type. When comparing the pattern
of all interventions during the direct observation period with that of snapshot reports,
it can be clearly seen that the interventions across the study wards were not
comparable.
6.3.2 Characteristics of Pharmacists’ Active Interventions and Implicated
Medications during Snapshot versus Observation Periods
In terms of active interventions self-reported (n=70) by pharmacists across the five
study wards during the snapshot periods, the highest proportion of active
interventions was found in the Haematology-Oncology Ward, followed by the
General Surgical Ward and the General Medical Ward for Adolescents, respectively.
Interestingly, the proportion of active interventions increased as the patients’ age
went up in the general medical setting. In all General Medical Wards, except the
Ward for Infants, dosing associated interventions were the most common active
intervention type. Similarly, dose adjustment accounted for the most common active
interventions in Haematology-Oncology. Meanwhile, the General Medical Ward for
Infants and the General Surgical Ward shared the same pattern of most frequent
active intervention, namely recommendation to clarify wrong/missing dosing
interval/frequency of medication orders.
Active interventions (n=244) contributed less than a quarter of all interventions in
each General Ward during the direct observation. However, the Haematology-
Oncology Ward revealed a different pattern with a considerably higher proportion of
active interventions (46.2%). Adjusting the dose was the most frequent active
interventions in general settings; however, in the Haematology-Oncology Ward,
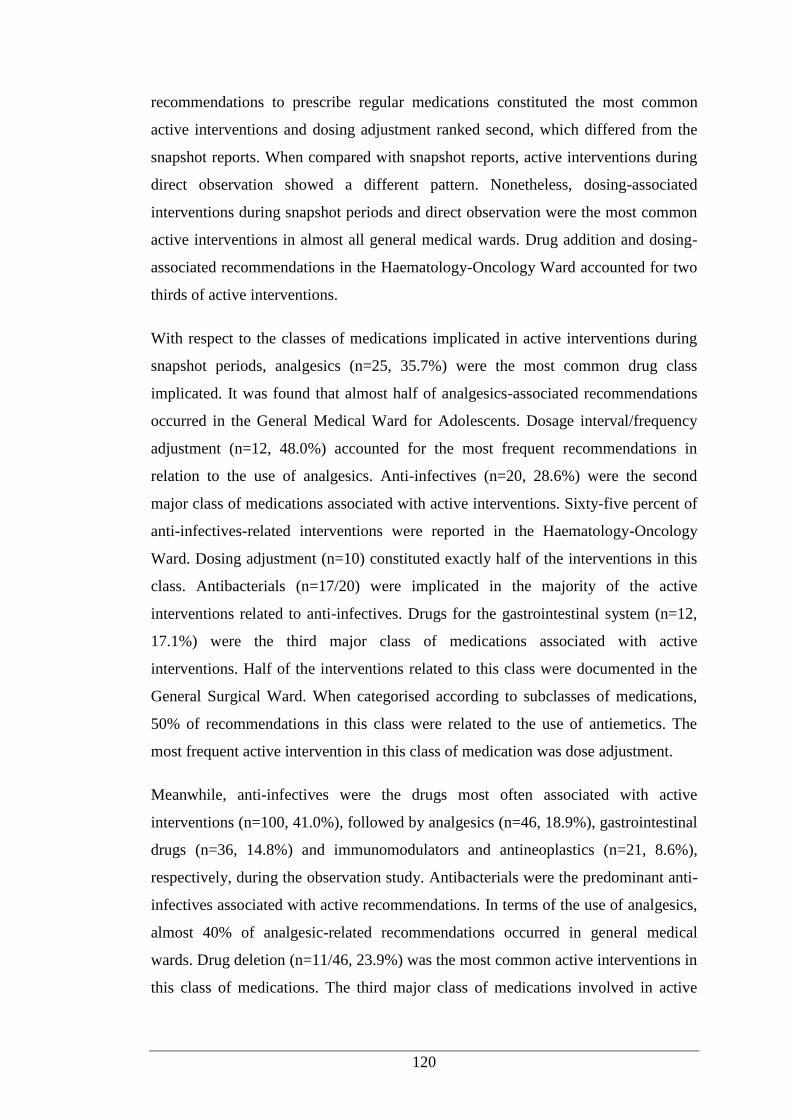
120
recommendations to prescribe regular medications constituted the most common
active interventions and dosing adjustment ranked second, which differed from the
snapshot reports. When compared with snapshot reports, active interventions during
direct observation showed a different pattern. Nonetheless, dosing-associated
interventions during snapshot periods and direct observation were the most common
active interventions in almost all general medical wards. Drug addition and dosing-
associated recommendations in the Haematology-Oncology Ward accounted for two
thirds of active interventions.
With respect to the classes of medications implicated in active interventions during
snapshot periods, analgesics (n=25, 35.7%) were the most common drug class
implicated. It was found that almost half of analgesics-associated recommendations
occurred in the General Medical Ward for Adolescents. Dosage interval/frequency
adjustment (n=12, 48.0%) accounted for the most frequent recommendations in
relation to the use of analgesics. Anti-infectives (n=20, 28.6%) were the second
major class of medications associated with active interventions. Sixty-five percent of
anti-infectives-related interventions were reported in the Haematology-Oncology
Ward. Dosing adjustment (n=10) constituted exactly half of the interventions in this
class. Antibacterials (n=17/20) were implicated in the majority of the active
interventions related to anti-infectives. Drugs for the gastrointestinal system (n=12,
17.1%) were the third major class of medications associated with active
interventions. Half of the interventions related to this class were documented in the
General Surgical Ward. When categorised according to subclasses of medications,
50% of recommendations in this class were related to the use of antiemetics. The
most frequent active intervention in this class of medication was dose adjustment.
Meanwhile, anti-infectives were the drugs most often associated with active
interventions (n=100, 41.0%), followed by analgesics (n=46, 18.9%), gastrointestinal
drugs (n=36, 14.8%) and immunomodulators and antineoplastics (n=21, 8.6%),
respectively, during the observation study. Antibacterials were the predominant anti-
infectives associated with active recommendations. In terms of the use of analgesics,
almost 40% of analgesic-related recommendations occurred in general medical
wards. Drug deletion (n=11/46, 23.9%) was the most common active interventions in
this class of medications. The third major class of medications involved in active
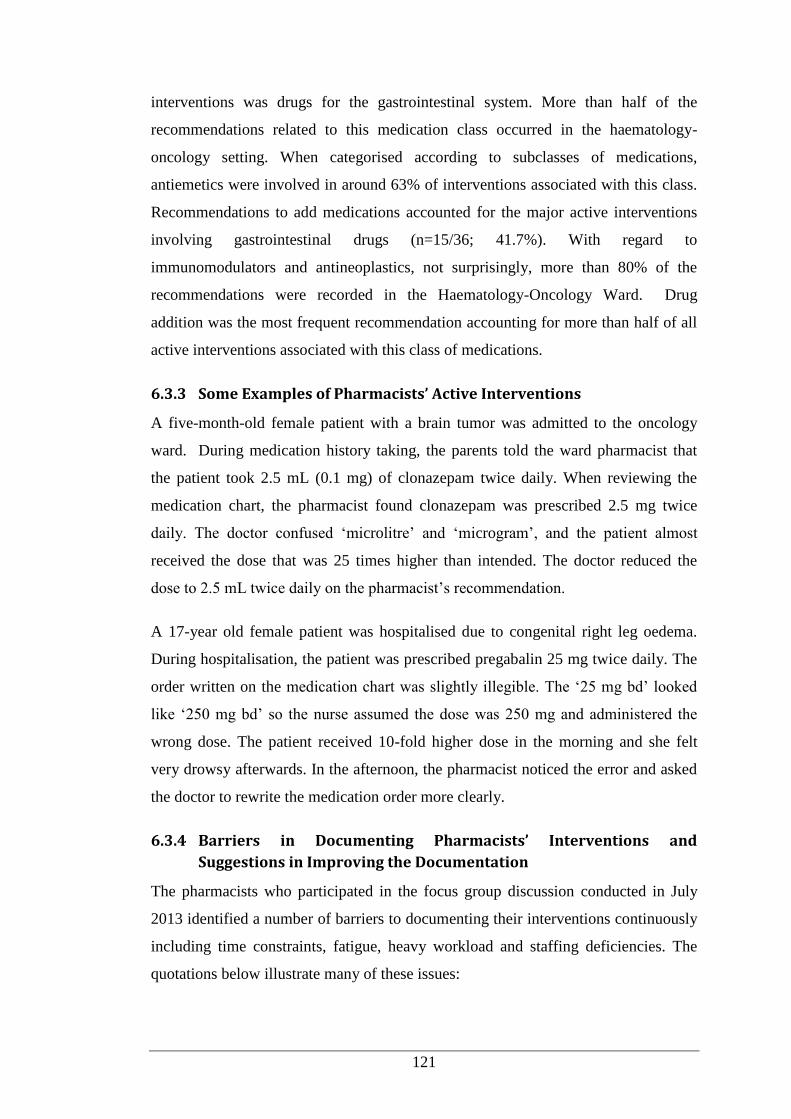
121
interventions was drugs for the gastrointestinal system. More than half of the
recommendations related to this medication class occurred in the haematology-
oncology setting. When categorised according to subclasses of medications,
antiemetics were involved in around 63% of interventions associated with this class.
Recommendations to add medications accounted for the major active interventions
involving gastrointestinal drugs (n=15/36; 41.7%). With regard to
immunomodulators and antineoplastics, not surprisingly, more than 80% of the
recommendations were recorded in the Haematology-Oncology Ward. Drug
addition was the most frequent recommendation accounting for more than half of all
active interventions associated with this class of medications.
6.3.3 Some Examples of Pharmacists’ Active Interventions
A five-month-old female patient with a brain tumor was admitted to the oncology
ward. During medication history taking, the parents told the ward pharmacist that
the patient took 2.5 mL (0.1 mg) of clonazepam twice daily. When reviewing the
medication chart, the pharmacist found clonazepam was prescribed 2.5 mg twice
daily. The doctor confused ‘microlitre’ and ‘microgram’, and the patient almost
received the dose that was 25 times higher than intended. The doctor reduced the
dose to 2.5 mL twice daily on the pharmacist’s recommendation.
A 17-year old female patient was hospitalised due to congenital right leg oedema.
During hospitalisation, the patient was prescribed pregabalin 25 mg twice daily. The
order written on the medication chart was slightly illegible. The ‘25 mg bd’ looked
like ‘250 mg bd’ so the nurse assumed the dose was 250 mg and administered the
wrong dose. The patient received 10-fold higher dose in the morning and she felt
very drowsy afterwards. In the afternoon, the pharmacist noticed the error and asked
the doctor to rewrite the medication order more clearly.
6.3.4 Barriers in Documenting Pharmacists’ Interventions and
Suggestions in Improving the Documentation
The pharmacists who participated in the focus group discussion conducted in July
2013 identified a number of barriers to documenting their interventions continuously
including time constraints, fatigue, heavy workload and staffing deficiencies. The
quotations below illustrate many of these issues:
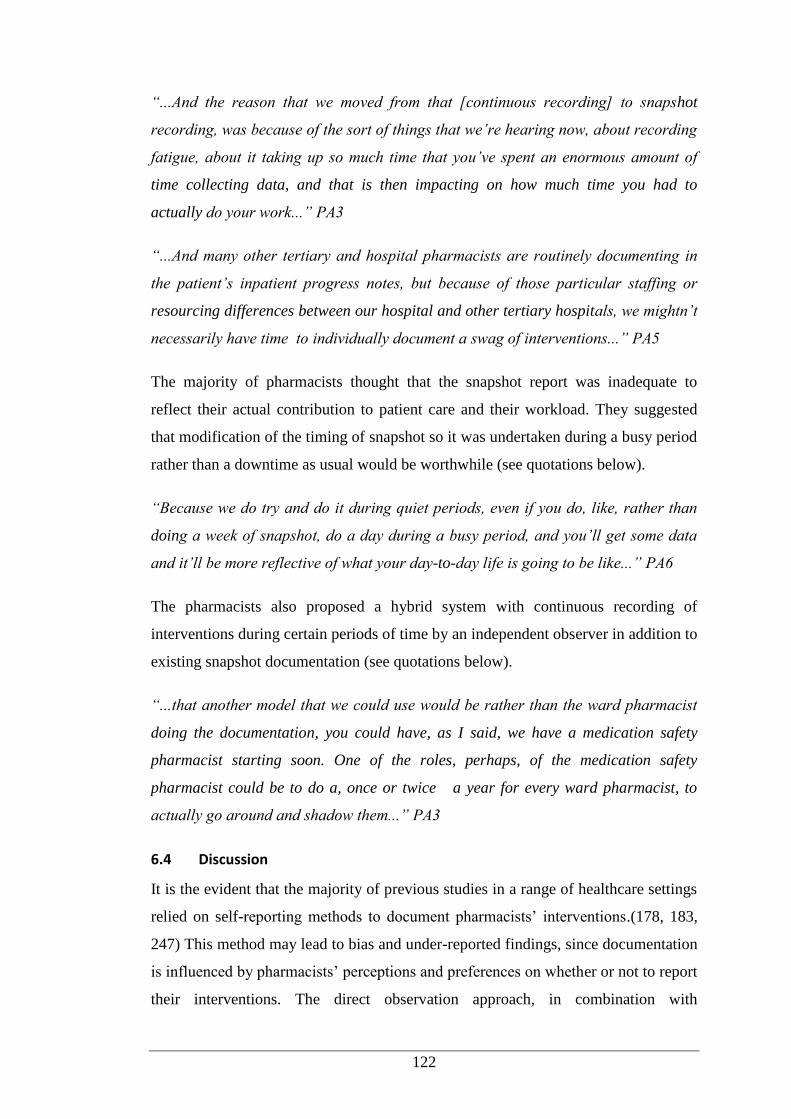
122
“...And the reason that we moved from that [continuous recording] to snapshot
recording, was because of the sort of things that we’re hearing now, about recording
fatigue, about it taking up so much time that you’ve spent an enormous amount of
time collecting data, and that is then impacting on how much time you had to
actually do your work...” PA3
“...And many other tertiary and hospital pharmacists are routinely documenting in
the patient’s inpatient progress notes, but because of those particular staffing or
resourcing differences between our hospital and other tertiary hospitals, we mightn’t
necessarily have time to individually document a swag of interventions...” PA5
The majority of pharmacists thought that the snapshot report was inadequate to
reflect their actual contribution to patient care and their workload. They suggested
that modification of the timing of snapshot so it was undertaken during a busy period
rather than a downtime as usual would be worthwhile (see quotations below).
“Because we do try and do it during quiet periods, even if you do, like, rather than
doing a week of snapshot, do a day during a busy period, and you’ll get some data
and it’ll be more reflective of what your day-to-day life is going to be like...” PA6
The pharmacists also proposed a hybrid system with continuous recording of
interventions during certain periods of time by an independent observer in addition to
existing snapshot documentation (see quotations below).
“...that another model that we could use would be rather than the ward pharmacist
doing the documentation, you could have, as I said, we have a medication safety
pharmacist starting soon. One of the roles, perhaps, of the medication safety
pharmacist could be to do a, once or twice a year for every ward pharmacist, to
actually go around and shadow them...” PA3
6.4 Discussion
It is the evident that the majority of previous studies in a range of healthcare settings
relied on self-reporting methods to document pharmacists’ interventions.(178, 183,
247) This method may lead to bias and under-reported findings, since documentation
is influenced by pharmacists’ perceptions and preferences on whether or not to report
their interventions. The direct observation approach, in combination with
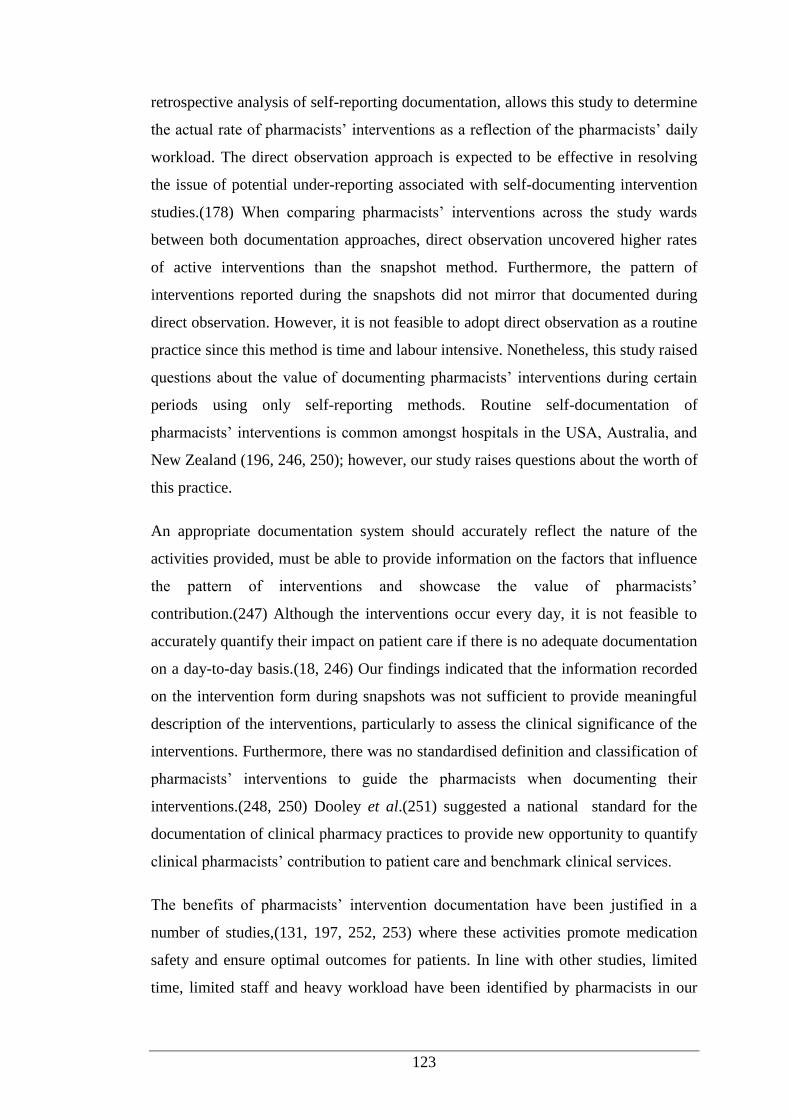
123
retrospective analysis of self-reporting documentation, allows this study to determine
the actual rate of pharmacists’ interventions as a reflection of the pharmacists’ daily
workload. The direct observation approach is expected to be effective in resolving
the issue of potential under-reporting associated with self-documenting intervention
studies.(178) When comparing pharmacists’ interventions across the study wards
between both documentation approaches, direct observation uncovered higher rates
of active interventions than the snapshot method. Furthermore, the pattern of
interventions reported during the snapshots did not mirror that documented during
direct observation. However, it is not feasible to adopt direct observation as a routine
practice since this method is time and labour intensive. Nonetheless, this study raised
questions about the value of documenting pharmacists’ interventions during certain
periods using only self-reporting methods. Routine self-documentation of
pharmacists’ interventions is common amongst hospitals in the USA, Australia, and
New Zealand (196, 246, 250); however, our study raises questions about the worth of
this practice.
An appropriate documentation system should accurately reflect the nature of the
activities provided, must be able to provide information on the factors that influence
the pattern of interventions and showcase the value of pharmacists’
contribution.(247) Although the interventions occur every day, it is not feasible to
accurately quantify their impact on patient care if there is no adequate documentation
on a day-to-day basis.(18, 246) Our findings indicated that the information recorded
on the intervention form during snapshots was not sufficient to provide meaningful
description of the interventions, particularly to assess the clinical significance of the
interventions. Furthermore, there was no standardised definition and classification of
pharmacists’ interventions to guide the pharmacists when documenting their
interventions.(248, 250) Dooley et al.(251) suggested a national standard for the
documentation of clinical pharmacy practices to provide new opportunity to quantify
clinical pharmacists’ contribution to patient care and benchmark clinical services.
The benefits of pharmacists’ intervention documentation have been justified in a
number of studies,(131, 197, 252, 253) where these activities promote medication
safety and ensure optimal outcomes for patients. In line with other studies, limited
time, limited staff and heavy workload have been identified by pharmacists in our
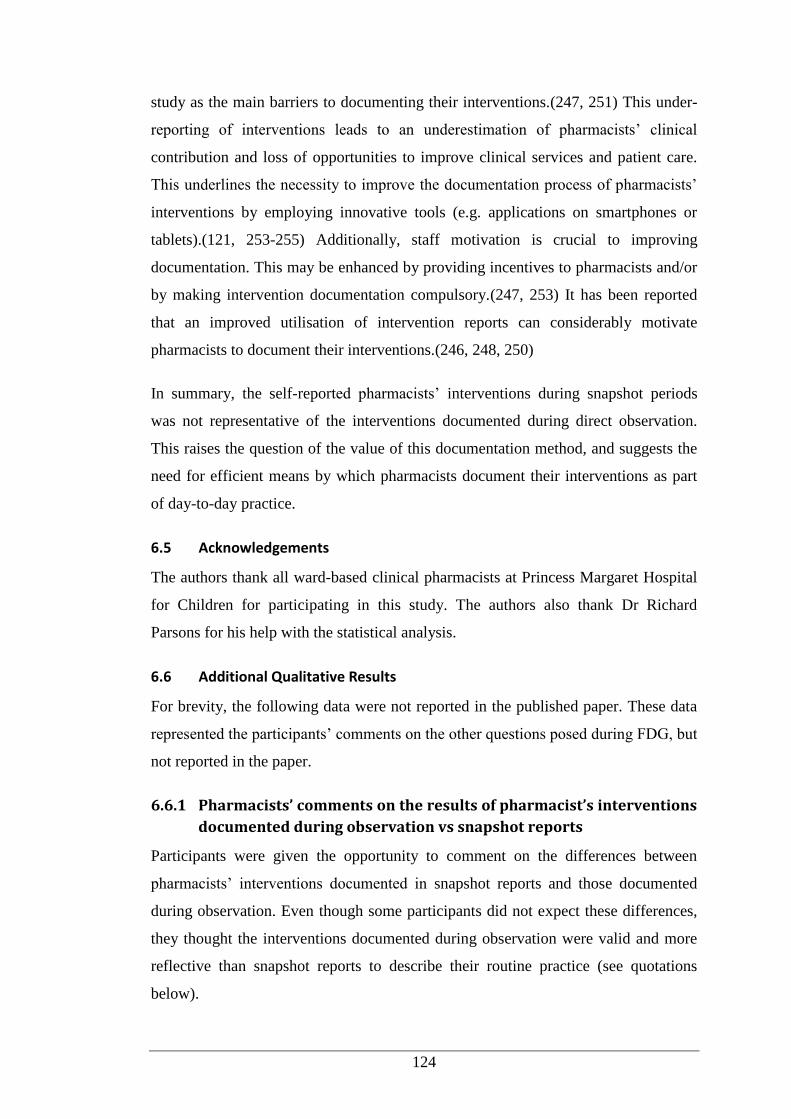
124
study as the main barriers to documenting their interventions.(247, 251) This under-
reporting of interventions leads to an underestimation of pharmacists’ clinical
contribution and loss of opportunities to improve clinical services and patient care.
This underlines the necessity to improve the documentation process of pharmacists’
interventions by employing innovative tools (e.g. applications on smartphones or
tablets).(121, 253-255) Additionally, staff motivation is crucial to improving
documentation. This may be enhanced by providing incentives to pharmacists and/or
by making intervention documentation compulsory.(247, 253) It has been reported
that an improved utilisation of intervention reports can considerably motivate
pharmacists to document their interventions.(246, 248, 250)
In summary, the self-reported pharmacists’ interventions during snapshot periods
was not representative of the interventions documented during direct observation.
This raises the question of the value of this documentation method, and suggests the
need for efficient means by which pharmacists document their interventions as part
of day-to-day practice.
6.5 Acknowledgements
The authors thank all ward-based clinical pharmacists at Princess Margaret Hospital
for Children for participating in this study. The authors also thank Dr Richard
Parsons for his help with the statistical analysis.
6.6 Additional Qualitative Results
For brevity, the following data were not reported in the published paper. These data
represented the participants’ comments on the other questions posed during FDG, but
not reported in the paper.
6.6.1 Pharmacists’ comments on the results of pharmacist’s interventions
documented during observation vs snapshot reports
Participants were given the opportunity to comment on the differences between
pharmacists’ interventions documented in snapshot reports and those documented
during observation. Even though some participants did not expect these differences,
they thought the interventions documented during observation were valid and more
reflective than snapshot reports to describe their routine practice (see quotations
below).
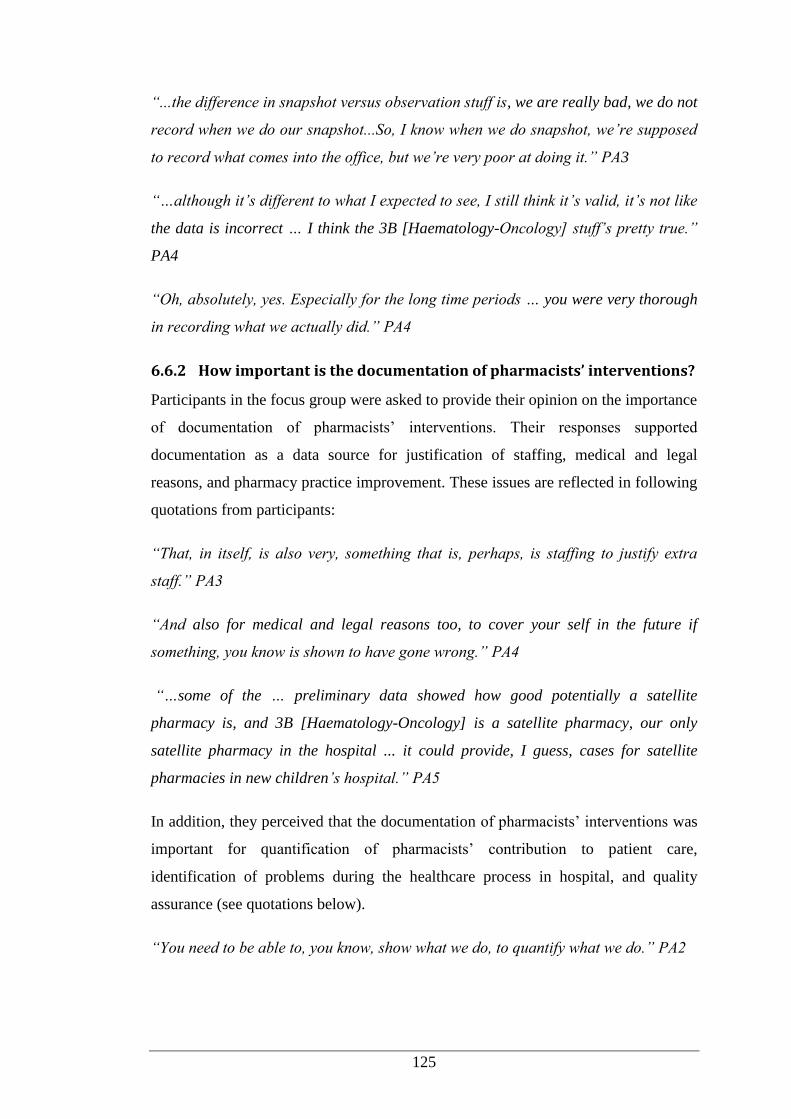
125
“...the difference in snapshot versus observation stuff is, we are really bad, we do not
record when we do our snapshot...So, I know when we do snapshot, we’re supposed
to record what comes into the office, but we’re very poor at doing it.” PA3
“…although it’s different to what I expected to see, I still think it’s valid, it’s not like
the data is incorrect … I think the 3B [Haematology-Oncology] stuff’s pretty true.”
PA4
“Oh, absolutely, yes. Especially for the long time periods … you were very thorough
in recording what we actually did.” PA4
6.6.2 How important is the documentation of pharmacists’ interventions?
Participants in the focus group were asked to provide their opinion on the importance
of documentation of pharmacists’ interventions. Their responses supported
documentation as a data source for justification of staffing, medical and legal
reasons, and pharmacy practice improvement. These issues are reflected in following
quotations from participants:
“That, in itself, is also very, something that is, perhaps, is staffing to justify extra
staff.” PA3
“And also for medical and legal reasons too, to cover your self in the future if
something, you know is shown to have gone wrong.” PA4
“…some of the … preliminary data showed how good potentially a satellite
pharmacy is, and 3B [Haematology-Oncology] is a satellite pharmacy, our only
satellite pharmacy in the hospital ... it could provide, I guess, cases for satellite
pharmacies in new children’s hospital.” PA5
In addition, they perceived that the documentation of pharmacists’ interventions was
important for quantification of pharmacists’ contribution to patient care,
identification of problems during the healthcare process in hospital, and quality
assurance (see quotations below).
“You need to be able to, you know, show what we do, to quantify what we do.” PA2
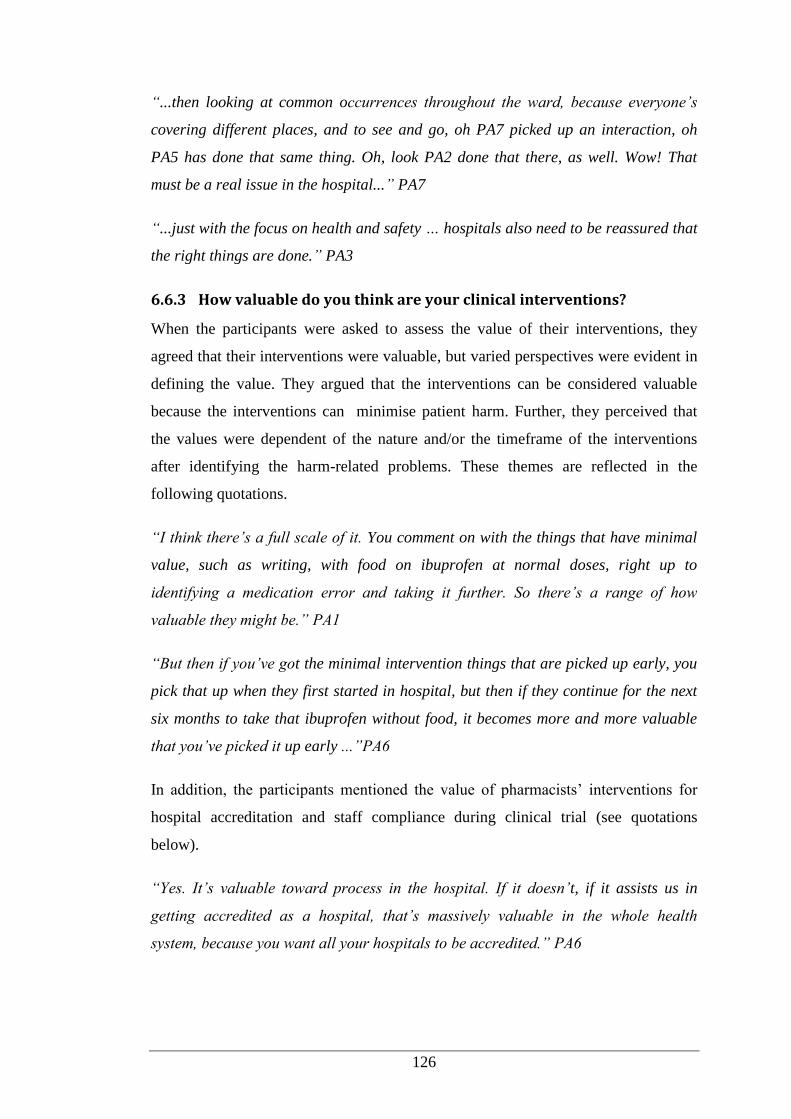
126
“...then looking at common occurrences throughout the ward, because everyone’s
covering different places, and to see and go, oh PA7 picked up an interaction, oh
PA5 has done that same thing. Oh, look PA2 done that there, as well. Wow! That
must be a real issue in the hospital...” PA7
“...just with the focus on health and safety … hospitals also need to be reassured that
the right things are done.” PA3
6.6.3 How valuable do you think are your clinical interventions?
When the participants were asked to assess the value of their interventions, they
agreed that their interventions were valuable, but varied perspectives were evident in
defining the value. They argued that the interventions can be considered valuable
because the interventions can minimise patient harm. Further, they perceived that
the values were dependent of the nature and/or the timeframe of the interventions
after identifying the harm-related problems. These themes are reflected in the
following quotations.
“I think there’s a full scale of it. You comment on with the things that have minimal
value, such as writing, with food on ibuprofen at normal doses, right up to
identifying a medication error and taking it further. So there’s a range of how
valuable they might be.” PA1
“But then if you’ve got the minimal intervention things that are picked up early, you
pick that up when they first started in hospital, but then if they continue for the next
six months to take that ibuprofen without food, it becomes more and more valuable
that you’ve picked it up early ...”PA6
In addition, the participants mentioned the value of pharmacists’ interventions for
hospital accreditation and staff compliance during clinical trial (see quotations
below).
“Yes. It’s valuable toward process in the hospital. If it doesn’t, if it assists us in
getting accredited as a hospital, that’s massively valuable in the whole health
system, because you want all your hospitals to be accredited.” PA6
127
“I think it’s also valuable with the clinical trial stuff to pick it up and document it as
well … [it] helps staff compliance, where you do really well when you get audited on
that...” PA4
6.6.4 Do you think there are problems with the way data are used? Why
do you think so?
In terms of the use of intervention documentation during snapshots, participants
revealed some issues, including inaccesibility of snapshot data, lack of feedback for
reporting pharmacists, and underutilisation of the reports. The following quotations
reflect these issues.
“…our continuous intervention system we had before was, [the data] were pretty
well inaccesible, you know, we handed in the sheets to [administrator]. She entered
them in a database, but … in the six or seven years it was running while I was here, I
never went back and looked at the database at anything. I’m not sure anyone
actually did.” PA4
“I’ve been here six and a half years. I’ve never seen any feedback.” PA6
“Down here, we’re doing it for higher up, basically, to keep them satisfied … we
never see the results.” PA4
6.7 Discussion of Additional Qualitative Results
The practice of pharmacy in hospital settings has transformed considerably, and the
documentation of the clinical interventions of pharmacists has become increasingly
important.(256) Understandably, professional and regulatory bodies in some
countries have recommended that pharmacists record their interventions.(121, 250,
257, 258) The American Society of Health-System Pharmacists mandates
pharmacists to document their recommendations.(257) The Joint Commission on
Accreditation of Healthcare Organizations in the USA even stresses the importance
of pharmacists’ intervention documentation as the clinical indicators of medication-
use system monitoring.(259) Meanwhile, the Society of Hospital Pharmacists of
Australia strongly advises each pharmacy department to provide the policy for
documentation of pharmacists’ interventions.(121) The Royal Pharmaceutical
Society of Great Britain has published guidelines on the recording of pharmacists’
interventions.(258) As with other studies, the participants of the FGD claimed that
128
the documentation of the clinical interventions performed by pharmacists is
important and they argued that the documentation can be used for a range of
purposes, including justification of staffing, identification of DRPs, quantification of
pharmacists’ contribution, evidence of pharmacy practice improvement, source of
information for quality assurance, clinical trial protocol compliance and medico-legal
issues.
It has been acknowledged in numerous studies that the documentation of
pharmacists’ interventions can provide a great deal of information that can be used
for assessing task workload and justifying staffing levels.(18, 184, 226, 260) Catania
et al.(261) used documentation of clinical interventions performed by pharmacists to
justify the cost of hiring additional hospital pharmacists. Similarly, Davydov(185)
found that intervention data can be used to evaluate the cost-effectiveness of hiring
additional pharmacists. In line with other pharmacists’ intervention studies, this
study also revealed that the documentation was beneficial for identication of DRPs.
In addition, the analysis of the intervention involving DRPs from time to time can
identify the trends of the problems during healthcare process. These trends can be
monitored to evaluate the appropriateness of the solutions to correct the perceived
problems.(147, 185) The documentation can also be employed to monitor incidents
or near misses during the care process.(258) Furthermore, some studies proposed that
the analysis of incident-related intervention data can be used in drug bulletin articles
and presentations during clinical meetings to educate medical officers, pharmacists
and other healthcare professionals.(185, 196, 226)
As with our study, improved documentation of pharmacist interventions has been
highlighted as the crucial component of clinical pharmacy services to quantify
pharmacists’ contribution to patient care, and as a rich source of information for
clarifying DRPs with prescribers.(185) Likewise, pharmacy managers participating
in a New Zealand survey perceived that the collection of pharmacists’ intervention
data can identify pharmacists’ impact on patient’s treatment management.(250)
Corresponding with other studies, the pharmacists in our study have pointed out the
importance of intervention records from a medico-legal perspective. The retrieved
records can be the strong evidence when the decisions during care delivery are
challenged.(257, 258) The records can also be used for quality assurance to evaluate
129
the pharmacists’ competency and ensure the quality and continuity of patient
care.(258)
In relation to the value of pharmacists’ clinical interventions, the participants
generally thought that the interventions were valuable. However, the focus group
revealed varied perspectives in defining the value of the interventions, and
participants highlighted three points related to the value of pharmacists’
interventions, namely, minimisation of patient harm, hospital accreditation, and
increased staff compliance to clinical trial protocols. Consistent with our finding,
other studies have described the positive impact of clinical intervention of
pharmacists on patient safety. These interventions may prevent ADEs, reduce
mortality rates and even improve health-related quality of life.(37, 262-264) In
addition, the recorded interventions could provide evidence of benefit to hospital
administrators (e.g. the institutional drug and therapeutics committee), and
subsequently for institutional accreditation, which corresponds with the responses of
our participants.(121)
Aside from the concerns surrounding the circumstances in documenting pharmacists’
interventions, there is another critical issue to be resolved: how intervention
reporting should be taken forward to educate healthcare personnel, and subsequently
improve patient care. During the FGD, the predominant themes emerging from the
data related to the shortcomings of the snapshot documentation method, including
underutilisation of the resulting reports and lack of feedback for reporting
pharmacists. Accepting that identification of parmacists’ intervention relies on
documentation, the valuable documented data are frequently underutilised.(265) In a
New Zealand study, some pharmacy managers felt intervention data were not used
optimally, i.e. for educational purposes.(250) On the contrary, an American study
reported the use of intervention data by quality assurance personnel, pharmacy
directors and/or hospital administrators in healthcare institutions.(246) Similarly to
suggestions in our study, intervention data have been used for peer review and
feedback.(196, 266) With respect to the accessibility of the intervention data, Nurgat
et al.(267) demonstrated the improved accesibility of the intervention documentation
after implementation of web-based tool.
130
6.8 Overall Limitations and Recommendations
There are some limitations to be acknowledged in this study. Firstly, this study
involved pharmacists’ intervention reports collected during three snapshot periods
only from the five study wards in a children’s hospital. A greater number of reporting
periods would increase the opportunities to reveal the pattern of the interventions
more representatively. Although the three snapshot periods were identified with the
most complete set of intervention reports, the reports were largely incomplete. The
manually-completed forms completed during snapshot documentation periods were
not validated using patients’ medical records. Furthermore, it is recommended to data
collection within multiple paediatric institutions for greater generalisability. It is
possible to expand this study to include adult settings.
FGD was chosen as the method to identify barriers and improvements regarding
documentation of interventions. Even with skilled facilitation, this method may not
adequately extract dissenting opinions from participants. Nonetheless, this method
was deemed suitable for the small group of participants to collect qualitative data on
this topic of interest.(268, 269) The method enables the investigators to understand
issues in depth,(270) is highly flexible, and allows researchers to assess views and
opinions directly and efficiently.(268) Future studies might consider undertaking
further FGD research or employing other method (e.g. in-depth interview) to increase
the likelihood of more pharmacists participating, and to obtain more insights from
each pharmacist.
6.9 Overall Conclusions
To summarise, self-report by pharmacists of their interventions during snapshot
recording periods was not representative of the interventions documented during
direct observation. This raises the question of the value of self-documentation, and
suggests the need for an efficient means by which pharmacists can document their
interventions in routine practice. Meanwhile, the findings from the FGD confirmed
previous studies regarding the barriers to documentation of pharmacists’
interventions, which included time constraints, limited staffing, workload and lack of
standardisation of the documentation. The pharmacists also raised concerns around
underutilisation of the intervention reports and lack of feedback from their employer.
The focus group data offered clear directions for improving the existing intervention
131
documentation. The suggestions may include standardisation of intervention
documentation, improvement in the utilisation of collated intervention data, and
implementation of a hybrid system combining snapshot and observational reporting.
132
Chapter 7
PART FOUR: RESULTS AND DISCUSSION
Few studies have been conducted on medication misadventure including MEs in
paediatrics compared to adult patients. There are lacks of strategies to prevent MEs.
As established in Section 1.7.2, RCA was applied to identify the contributors to MEs
and preventive strategies. An RCA was conducted using a questionnaire depicting
five simulated case scenarios with a cohort of health professionals (doctors, nurses,
pharmacists) at the study hospital.
7.1 Results
Of the 111 RCA questionnaires administered to doctors, nurses and pharmacists
during the study period (August-October 2014), six (19.4%), 11 (25.6%) and eight
(21.6%) were returned, respectively. All of the returned questionnaires were included
in the analysis. The overall response rate was 22.5%. Most participants were aged 31
to 40 years, and the majority were female (Table 7.1). Three of the doctors were
registrars and three were consultants/specialists. Six participants were registered
nurses/midwives, four were clinical nurses/clinical midwives/clinical development
nurses and one was a clinical nurse/midwife consultant. Four of the pharmacists were
not assigned a clinical pharmacist position; two were junior clinical pharmacists; one
was a senior clinical pharmacist; and one was in a senior leadership position
(Pharmacy Director/Deputy Director). With regard to overall years of experience as
health professionals, each group showed a similar pattern, with most participants
having worked for more than 10 years.
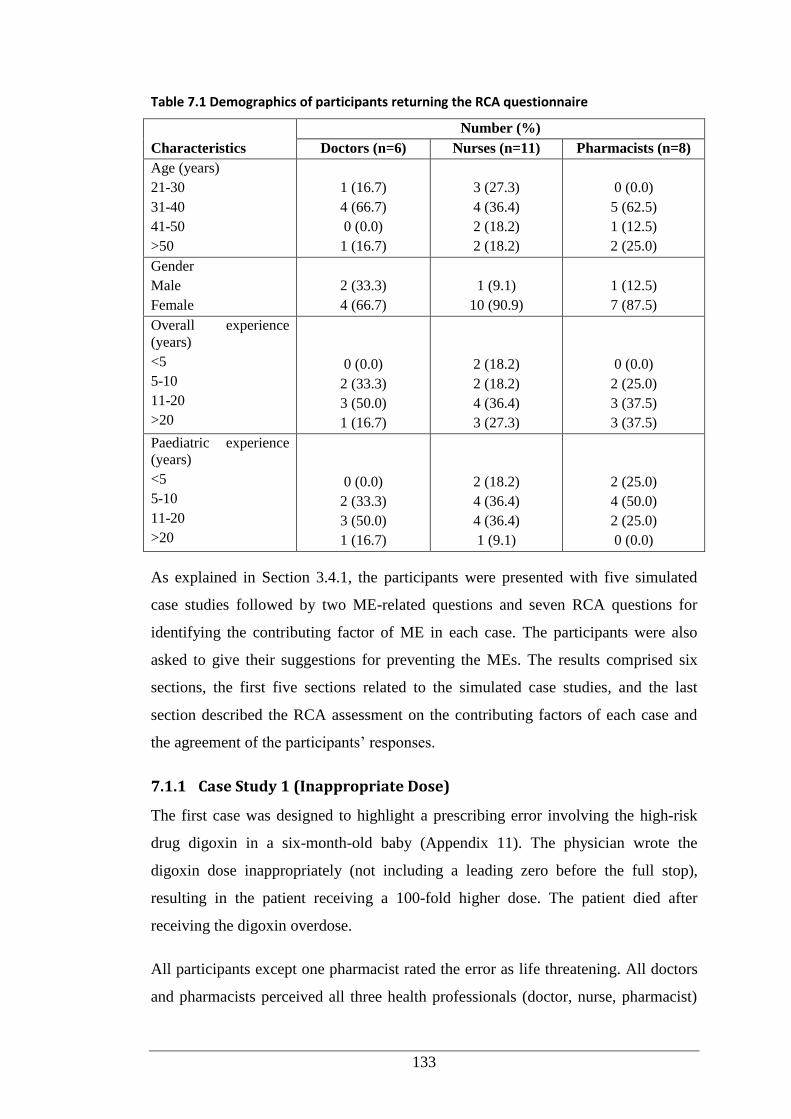
133
Table 7.1 Demographics of participants returning the RCA questionnaire
Characteristics
Number (%)
Doctors (n=6) Nurses (n=11) Pharmacists (n=8)
Age (years)
21-30
31-40
41-50
>50
1 (16.7)
4 (66.7)
0 (0.0)
1 (16.7)
3 (27.3)
4 (36.4)
2 (18.2)
2 (18.2)
0 (0.0)
5 (62.5)
1 (12.5)
2 (25.0)
Gender
Male
Female
2 (33.3)
4 (66.7)
1 (9.1)
10 (90.9)
1 (12.5)
7 (87.5)
Overall experience
(years)
<5
5-10
11-20
>20
0 (0.0)
2 (33.3)
3 (50.0)
1 (16.7)
2 (18.2)
2 (18.2)
4 (36.4)
3 (27.3)
0 (0.0)
2 (25.0)
3 (37.5)
3 (37.5)
Paediatric experience
(years)
<5
5-10
11-20
>20
0 (0.0)
2 (33.3)
3 (50.0)
1 (16.7)
2 (18.2)
4 (36.4)
4 (36.4)
1 (9.1)
2 (25.0)
4 (50.0)
2 (25.0)
0 (0.0)
As explained in Section 3.4.1, the participants were presented with five simulated
case studies followed by two ME-related questions and seven RCA questions for
identifying the contributing factor of ME in each case. The participants were also
asked to give their suggestions for preventing the MEs. The results comprised six
sections, the first five sections related to the simulated case studies, and the last
section described the RCA assessment on the contributing factors of each case and
the agreement of the participants’ responses.
7.1.1 Case Study 1 (Inappropriate Dose)
The first case was designed to highlight a prescribing error involving the high-risk
drug digoxin in a six-month-old baby (Appendix 11). The physician wrote the
digoxin dose inappropriately (not including a leading zero before the full stop),
resulting in the patient receiving a 100-fold higher dose. The patient died after
receiving the digoxin overdose.
All participants except one pharmacist rated the error as life threatening. All doctors
and pharmacists perceived all three health professionals (doctor, nurse, pharmacist)
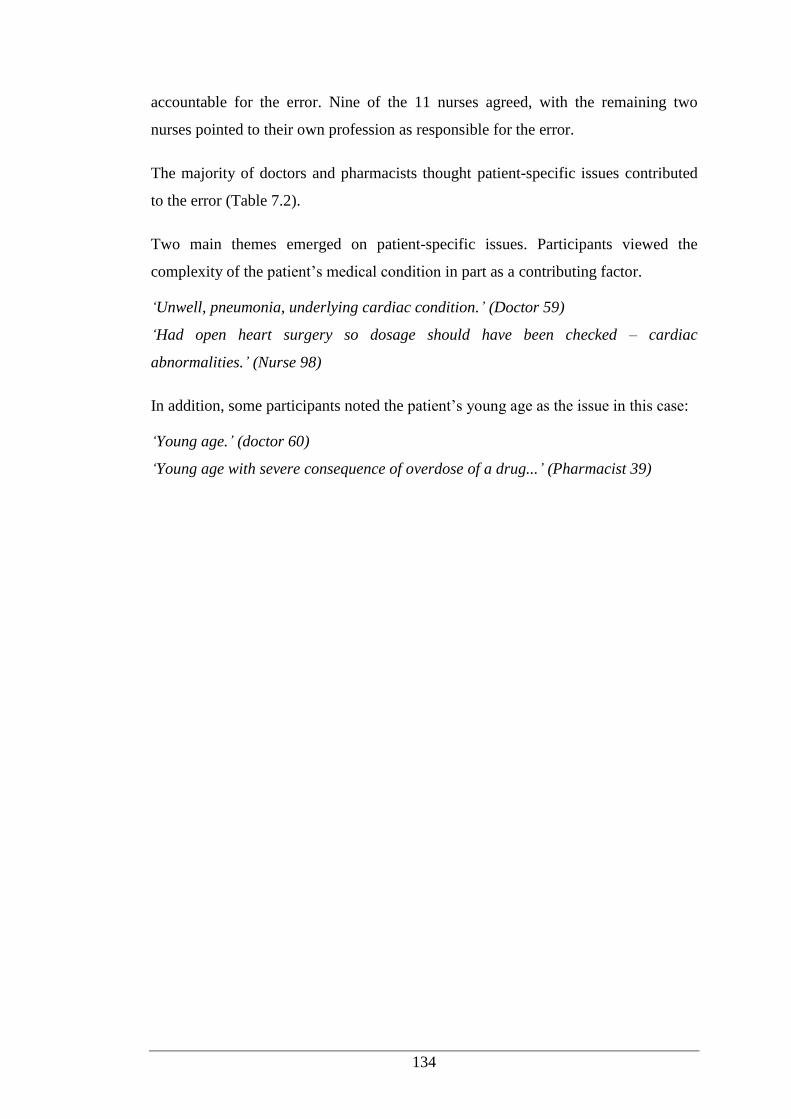
134
accountable for the error. Nine of the 11 nurses agreed, with the remaining two
nurses pointed to their own profession as responsible for the error.
The majority of doctors and pharmacists thought patient-specific issues contributed
to the error (Table 7.2).
Two main themes emerged on patient-specific issues. Participants viewed the
complexity of the patient’s medical condition in part as a contributing factor.
‘Unwell, pneumonia, underlying cardiac condition.’ (Doctor 59)
‘Had open heart surgery so dosage should have been checked – cardiac
abnormalities.’ (Nurse 98)
In addition, some participants noted the patient’s young age as the issue in this case:
‘Young age.’ (doctor 60)
‘Young age with severe consequence of overdose of a drug...’ (Pharmacist 39)
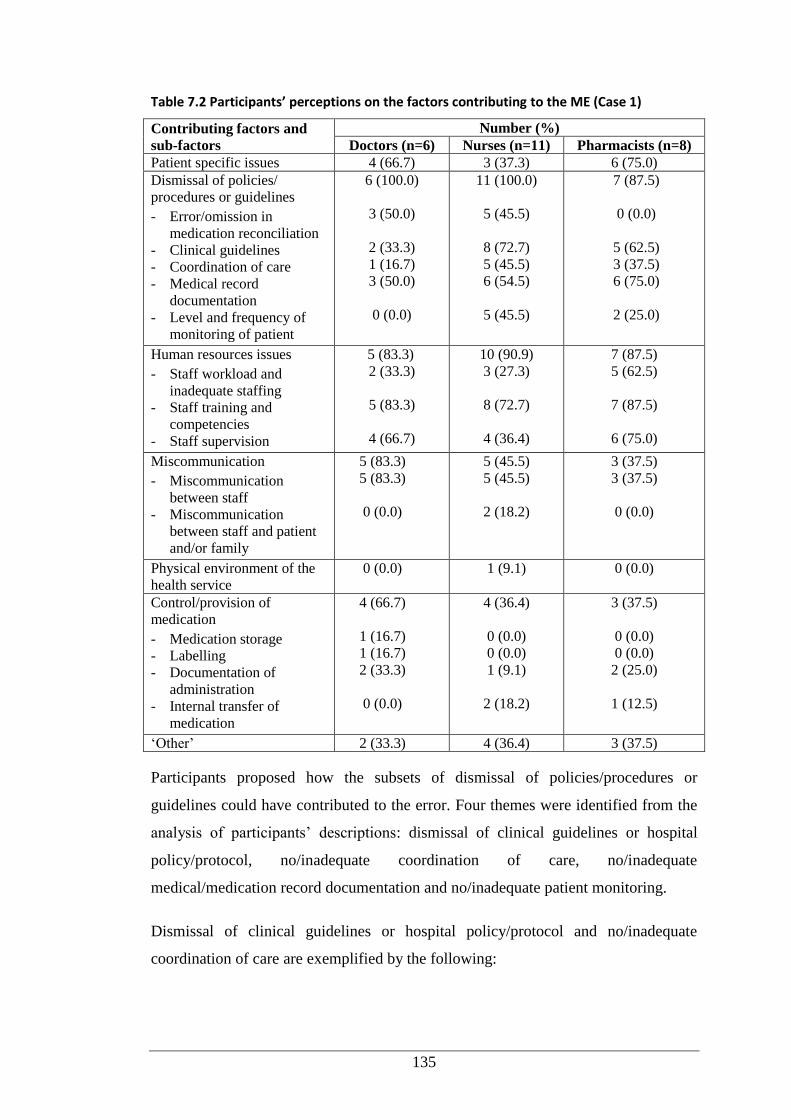
135
Table 7.2 Participants’ perceptions on the factors contributing to the ME (Case 1)
Contributing factors and
sub-factors
Number (%)
Doctors (n=6) Nurses (n=11) Pharmacists (n=8)
Patient specific issues 4 (66.7) 3 (37.3) 6 (75.0)
Dismissal of policies/
procedures or guidelines
- Error/omission in
medication reconciliation
- Clinical guidelines
- Coordination of care
- Medical record
documentation
- Level and frequency of
monitoring of patient
6 (100.0)
3 (50.0)
2 (33.3)
1 (16.7)
3 (50.0)
0 (0.0)
11 (100.0)
5 (45.5)
8 (72.7)
5 (45.5)
6 (54.5)
5 (45.5)
7 (87.5)
0 (0.0)
5 (62.5)
3 (37.5)
6 (75.0)
2 (25.0)
Human resources issues
- Staff workload and
inadequate staffing
- Staff training and
competencies
- Staff supervision
5 (83.3)
2 (33.3)
5 (83.3)
4 (66.7)
10 (90.9)
3 (27.3)
8 (72.7)
4 (36.4)
7 (87.5)
5 (62.5)
7 (87.5)
6 (75.0)
Miscommunication
- Miscommunication
between staff
- Miscommunication
between staff and patient
and/or family
5 (83.3)
5 (83.3)
0 (0.0)
5 (45.5)
5 (45.5)
2 (18.2)
3 (37.5)
3 (37.5)
0 (0.0)
Physical environment of the
health service
0 (0.0) 1 (9.1) 0 (0.0)
Control/provision of
medication
- Medication storage
- Labelling
- Documentation of
administration
- Internal transfer of
medication
4 (66.7)
1 (16.7)
1 (16.7)
2 (33.3)
0 (0.0)
4 (36.4)
0 (0.0)
0 (0.0)
1 (9.1)
2 (18.2)
3 (37.5)
0 (0.0)
0 (0.0)
2 (25.0)
1 (12.5)
‘Other’ 2 (33.3) 4 (36.4) 3 (37.5)
Participants proposed how the subsets of dismissal of policies/procedures or
guidelines could have contributed to the error. Four themes were identified from the
analysis of participants’ descriptions: dismissal of clinical guidelines or hospital
policy/protocol, no/inadequate coordination of care, no/inadequate
medical/medication record documentation and no/inadequate patient monitoring.
Dismissal of clinical guidelines or hospital policy/protocol and no/inadequate
coordination of care are exemplified by the following:
136
‘Dose wasn’t written correctly, mg instead of micogram, used decimal with no 0.’
(Doctor 36)
‘Nurse did not double check prior to giving cardiac meds [medications]. Should be
checked by two nurses.’ (Nurse 94)
‘Resident should have contacted child registrar or consultant.’ (Nurse 95)
No/inadequate medical/medication record documentation and no/inadequate patient
monitoring is supported by:
‘The dose in mg/kg has not been entered on the chart and therefore not easily
checked by nurse and pharmacist.’ (Pharmacist 19)
‘Pulse and rate/minute should be checked before giving it.’ (Nurse 95)
‘ No evidence of pt [patient] monitoring.’ (Nurse 103)
With regard to human resources issues as the contributing factors, comments
highlighted problems surrounding staff training and competencies. Some participants
argued that the error could be associated with staff workload and inadequate staffing,
and deficiency in staff supervision:
‘Resident just started and did not want to bother busy registrar.’ (Pharmacist 9)
‘Registrar was busy and did not have time to adequately supervise new resident.’
(Pharmacist 19)
Participants also mentioned lack of staff training and competencies as an enabler of
the error.
‘First week in paediatrics, but unaware of seriousness of error consequence and
guidelines.’ (Pharmacist 17)
‘Lack of training in correct documentation of medication.’(Doctor 61)
Miscommunication between staff comprised all but one of the comments;
miscommunication between staff and patient and/or family was mentioned by only
one participant.
‘Lack of communication between resident and senior health staff assumption that
every party had checked dosing. Nursing belief that dosing correct instead of
checking.’ (Doctor 61)
137
‘The nurse thought dosage had been checked by pharmacist and doctor, but did not
make sure.’ (Nurse 96)
Regarding control/provision of medication as the contributing factors, participants
identified documentation of administration and internal transfer of medication as
relevant issues.
‘Only one nurse signed, high-risk drug – not double checked and amount given not
written. No mg/kg in dosing box for nurse or pharmacist to check.’ (Pharmacist 17)
‘Potentially no information given on strength digoxin given to ward to administer
dose.’ (Nurse 98)
With regards ‘Other’ as a contributing factor, two identified themes included the
high-risk drug and fear of senior staff by the junior staff:
‘Digoxin has a very low therapeutic window, and overdose can occur more readily
than with other drugs.’ (Pharmacist 31)
‘Fear of RMO [Resident Medical Officer] letting registrar [check the medication
order].’ (Doctor 60)
The last RCA question asked participants to give their suggestions on how to prevent
recurrence of the error. Four themes emerged: firstly, improved availability and
accessibility of clinical guidelines and strict hospital policies/protocols for high-risk
drugs. The guidelines and the policies/protocols should cover all stages of
medication use from prescribing through to monitoring. Secondly, all staff should be
aware of, and comply with, the guidelines and the policies/protocols.
‘Clinical guidelines and clear protocol and easy access for prescribing staff and
nursing and pharmacy staff.’ (Pharmacist 17)
‘Doctor, pharmacist and nurse should all check the prescribed dose is correct with
AMH or other guidelines before administration and not assume correct.’ (Doctor 59)
‘Additional restriction on who can chart dangerous/high risk drug such as digoxin.’
(Doctor 37)
Thirdly, the participants proposed adequate staff supervision would prevent the
identified error.
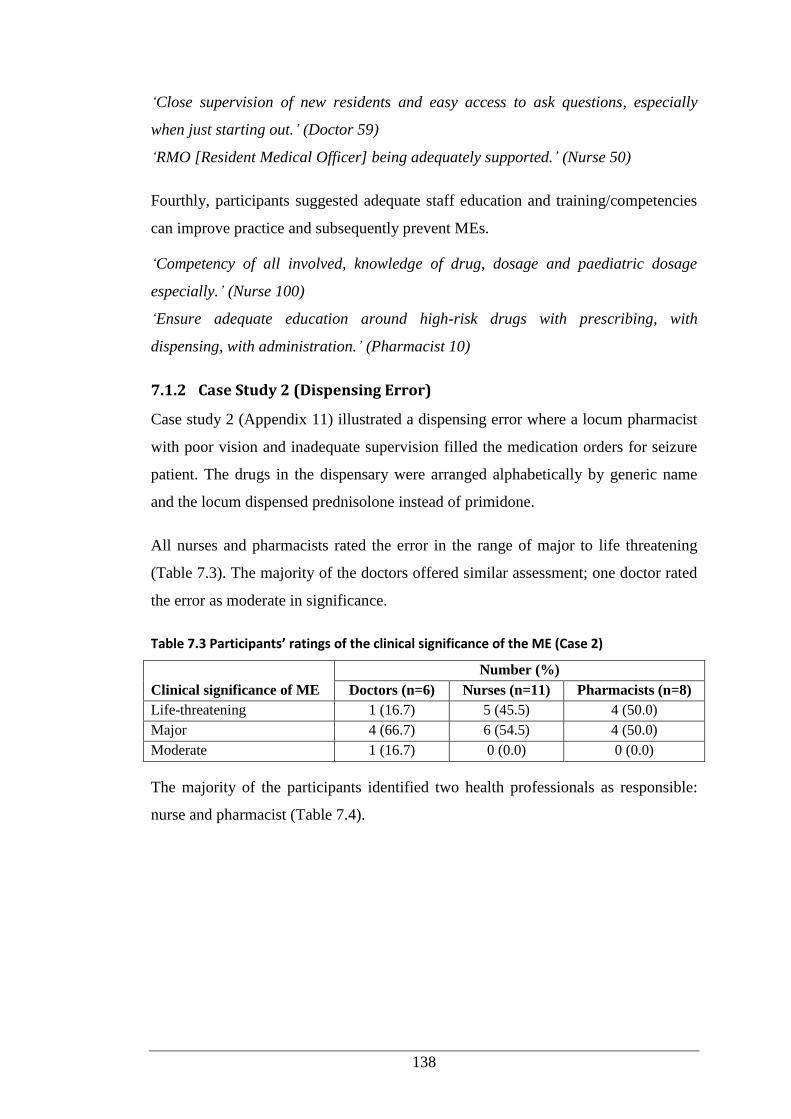
138
‘Close supervision of new residents and easy access to ask questions, especially
when just starting out.’ (Doctor 59)
‘RMO [Resident Medical Officer] being adequately supported.’ (Nurse 50)
Fourthly, participants suggested adequate staff education and training/competencies
can improve practice and subsequently prevent MEs.
‘Competency of all involved, knowledge of drug, dosage and paediatric dosage
especially.’ (Nurse 100)
‘Ensure adequate education around high-risk drugs with prescribing, with
dispensing, with administration.’ (Pharmacist 10)
7.1.2 Case Study 2 (Dispensing Error)
Case study 2 (Appendix 11) illustrated a dispensing error where a locum pharmacist
with poor vision and inadequate supervision filled the medication orders for seizure
patient. The drugs in the dispensary were arranged alphabetically by generic name
and the locum dispensed prednisolone instead of primidone.
All nurses and pharmacists rated the error in the range of major to life threatening
(Table 7.3). The majority of the doctors offered similar assessment; one doctor rated
the error as moderate in significance.
Table 7.3 Participants’ ratings of the clinical significance of the ME (Case 2)
Clinical significance of ME
Number (%)
Doctors (n=6) Nurses (n=11) Pharmacists (n=8)
Life-threatening 1 (16.7) 5 (45.5) 4 (50.0)
Major 4 (66.7) 6 (54.5) 4 (50.0)
Moderate 1 (16.7) 0 (0.0) 0 (0.0)
The majority of the participants identified two health professionals as responsible:
nurse and pharmacist (Table 7.4).
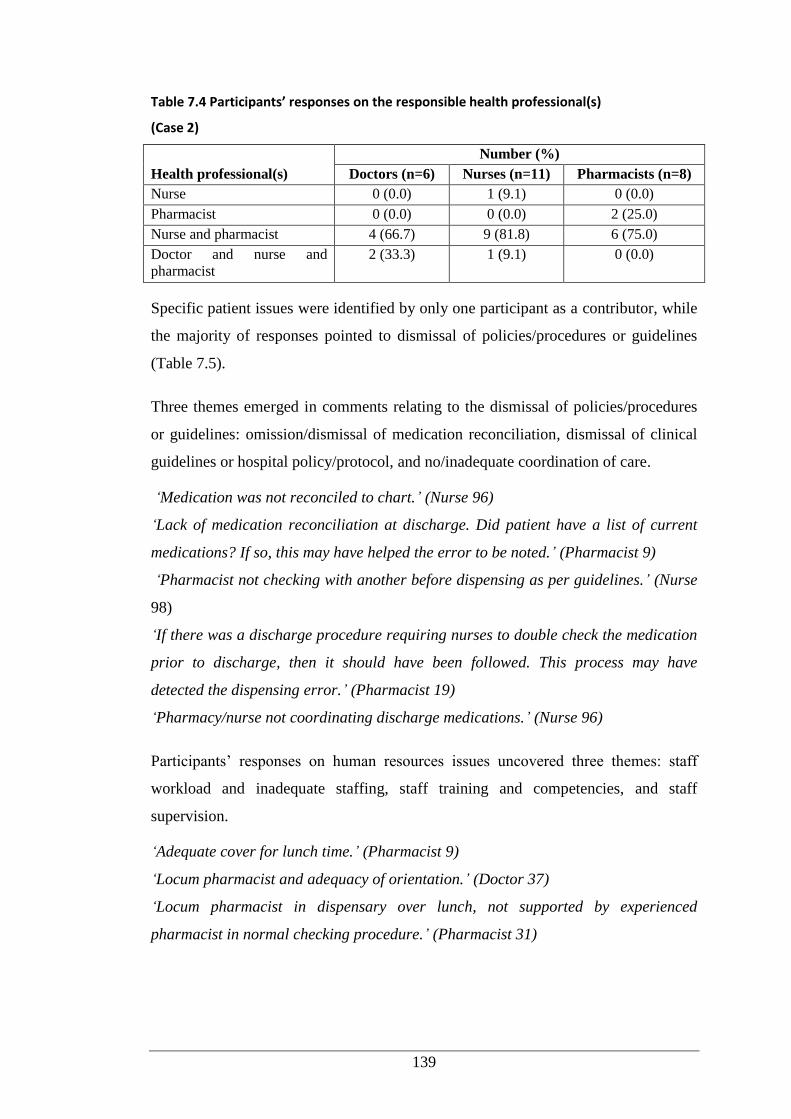
139
Table 7.4 Participants’ responses on the responsible health professional(s)
(Case 2)
Health professional(s)
Number (%)
Doctors (n=6) Nurses (n=11) Pharmacists (n=8)
Nurse 0 (0.0) 1 (9.1) 0 (0.0)
Pharmacist 0 (0.0) 0 (0.0) 2 (25.0)
Nurse and pharmacist 4 (66.7) 9 (81.8) 6 (75.0)
Doctor and nurse and
pharmacist
2 (33.3) 1 (9.1) 0 (0.0)
Specific patient issues were identified by only one participant as a contributor, while
the majority of responses pointed to dismissal of policies/procedures or guidelines
(Table 7.5).
Three themes emerged in comments relating to the dismissal of policies/procedures
or guidelines: omission/dismissal of medication reconciliation, dismissal of clinical
guidelines or hospital policy/protocol, and no/inadequate coordination of care.
‘Medication was not reconciled to chart.’ (Nurse 96)
‘Lack of medication reconciliation at discharge. Did patient have a list of current
medications? If so, this may have helped the error to be noted.’ (Pharmacist 9)
‘Pharmacist not checking with another before dispensing as per guidelines.’ (Nurse
98)
‘If there was a discharge procedure requiring nurses to double check the medication
prior to discharge, then it should have been followed. This process may have
detected the dispensing error.’ (Pharmacist 19)
‘Pharmacy/nurse not coordinating discharge medications.’ (Nurse 96)
Participants’ responses on human resources issues uncovered three themes: staff
workload and inadequate staffing, staff training and competencies, and staff
supervision.
‘Adequate cover for lunch time.’ (Pharmacist 9)
‘Locum pharmacist and adequacy of orientation.’ (Doctor 37)
‘Locum pharmacist in dispensary over lunch, not supported by experienced
pharmacist in normal checking procedure.’ (Pharmacist 31)
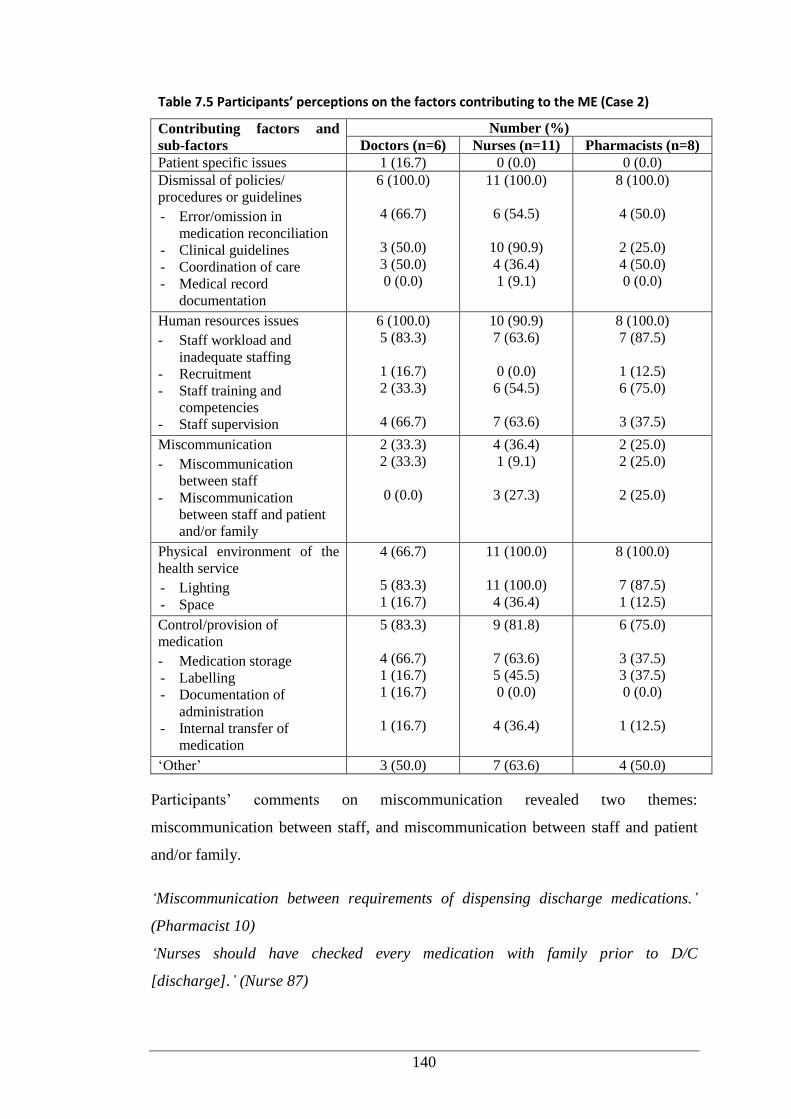
140
Table 7.5 Participants’ perceptions on the factors contributing to the ME (Case 2)
Contributing factors and
sub-factors
Number (%)
Doctors (n=6) Nurses (n=11) Pharmacists (n=8)
Patient specific issues 1 (16.7) 0 (0.0) 0 (0.0)
Dismissal of policies/
procedures or guidelines
- Error/omission in
medication reconciliation
- Clinical guidelines
- Coordination of care
- Medical record
documentation
6 (100.0)
4 (66.7)
3 (50.0)
3 (50.0)
0 (0.0)
11 (100.0)
6 (54.5)
10 (90.9)
4 (36.4)
1 (9.1)
8 (100.0)
4 (50.0)
2 (25.0)
4 (50.0)
0 (0.0)
Human resources issues
- Staff workload and
inadequate staffing
- Recruitment
- Staff training and
competencies
- Staff supervision
6 (100.0)
5 (83.3)
1 (16.7)
2 (33.3)
4 (66.7)
10 (90.9)
7 (63.6)
0 (0.0)
6 (54.5)
7 (63.6)
8 (100.0)
7 (87.5)
1 (12.5)
6 (75.0)
3 (37.5)
Miscommunication
- Miscommunication
between staff
- Miscommunication
between staff and patient
and/or family
2 (33.3)
2 (33.3)
0 (0.0)
4 (36.4)
1 (9.1)
3 (27.3)
2 (25.0)
2 (25.0)
2 (25.0)
Physical environment of the
health service
- Lighting
- Space
4 (66.7)
5 (83.3)
1 (16.7)
11 (100.0)
11 (100.0)
4 (36.4)
8 (100.0)
7 (87.5)
1 (12.5)
Control/provision of
medication
- Medication storage
- Labelling
- Documentation of
administration
- Internal transfer of
medication
5 (83.3)
4 (66.7)
1 (16.7)
1 (16.7)
1 (16.7)
9 (81.8)
7 (63.6)
5 (45.5)
0 (0.0)
4 (36.4)
6 (75.0)
3 (37.5)
3 (37.5)
0 (0.0)
1 (12.5)
‘Other’ 3 (50.0) 7 (63.6) 4 (50.0)
Participants’ comments on miscommunication revealed two themes:
miscommunication between staff, and miscommunication between staff and patient
and/or family.
‘Miscommunication between requirements of dispensing discharge medications.’
(Pharmacist 10)
‘Nurses should have checked every medication with family prior to D/C
[discharge].’ (Nurse 87)
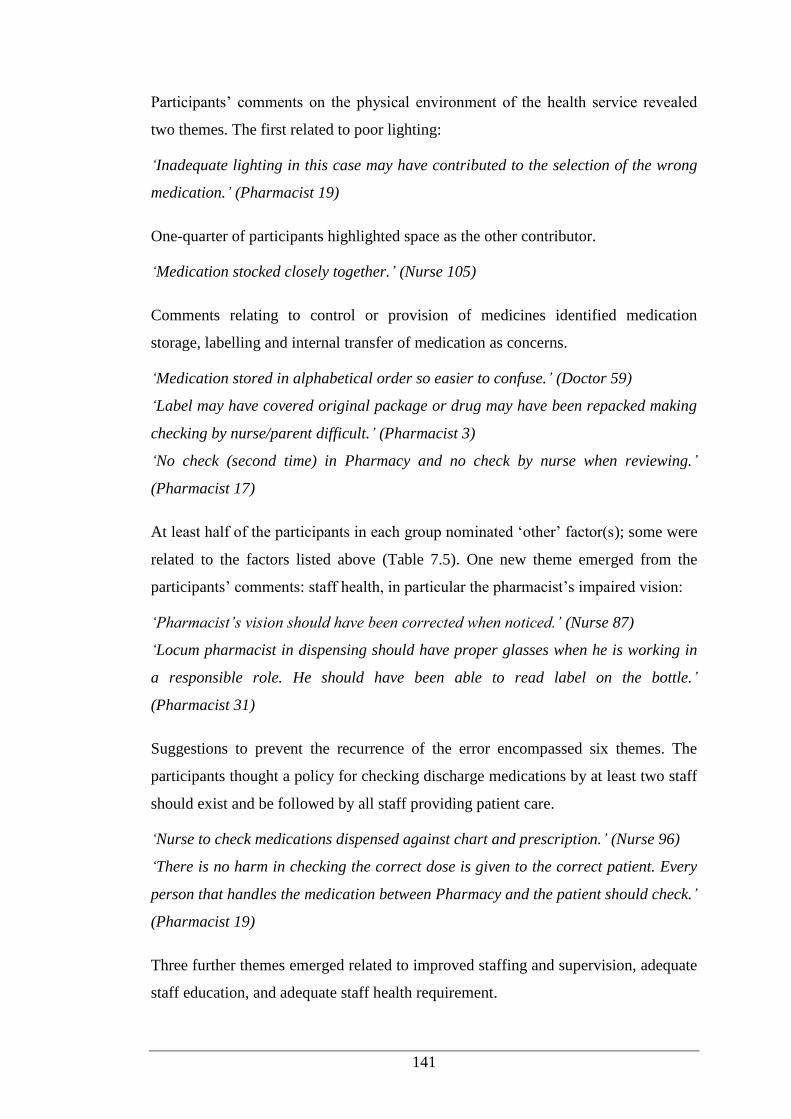
141
Participants’ comments on the physical environment of the health service revealed
two themes. The first related to poor lighting:
‘Inadequate lighting in this case may have contributed to the selection of the wrong
medication.’ (Pharmacist 19)
One-quarter of participants highlighted space as the other contributor.
‘Medication stocked closely together.’ (Nurse 105)
Comments relating to control or provision of medicines identified medication
storage, labelling and internal transfer of medication as concerns.
‘Medication stored in alphabetical order so easier to confuse.’ (Doctor 59)
‘Label may have covered original package or drug may have been repacked making
checking by nurse/parent difficult.’ (Pharmacist 3)
‘No check (second time) in Pharmacy and no check by nurse when reviewing.’
(Pharmacist 17)
At least half of the participants in each group nominated ‘other’ factor(s); some were
related to the factors listed above (Table 7.5). One new theme emerged from the
participants’ comments: staff health, in particular the pharmacist’s impaired vision:
‘Pharmacist’s vision should have been corrected when noticed.’ (Nurse 87)
‘Locum pharmacist in dispensing should have proper glasses when he is working in
a responsible role. He should have been able to read label on the bottle.’
(Pharmacist 31)
Suggestions to prevent the recurrence of the error encompassed six themes. The
participants thought a policy for checking discharge medications by at least two staff
should exist and be followed by all staff providing patient care.
‘Nurse to check medications dispensed against chart and prescription.’ (Nurse 96)
‘There is no harm in checking the correct dose is given to the correct patient. Every
person that handles the medication between Pharmacy and the patient should check.’
(Pharmacist 19)
Three further themes emerged related to improved staffing and supervision, adequate
staff education, and adequate staff health requirement.
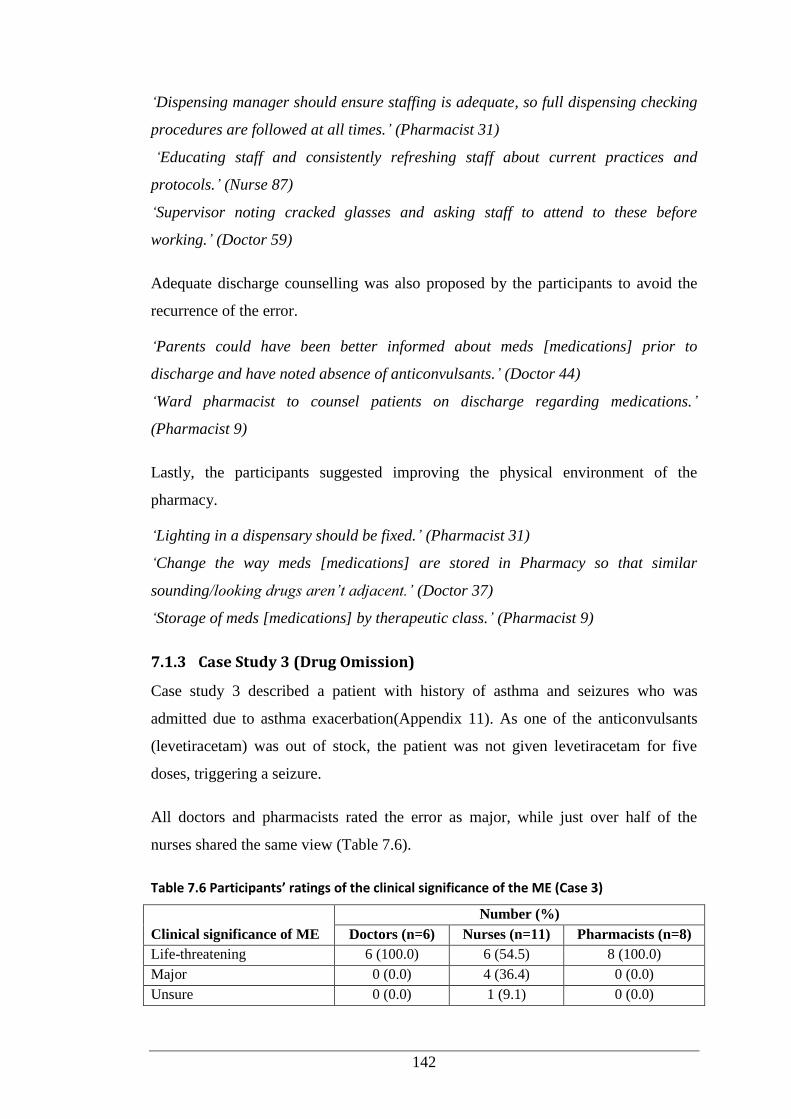
142
‘Dispensing manager should ensure staffing is adequate, so full dispensing checking
procedures are followed at all times.’ (Pharmacist 31)
‘Educating staff and consistently refreshing staff about current practices and
protocols.’ (Nurse 87)
‘Supervisor noting cracked glasses and asking staff to attend to these before
working.’ (Doctor 59)
Adequate discharge counselling was also proposed by the participants to avoid the
recurrence of the error.
‘Parents could have been better informed about meds [medications] prior to
discharge and have noted absence of anticonvulsants.’ (Doctor 44)
‘Ward pharmacist to counsel patients on discharge regarding medications.’
(Pharmacist 9)
Lastly, the participants suggested improving the physical environment of the
pharmacy.
‘Lighting in a dispensary should be fixed.’ (Pharmacist 31)
‘Change the way meds [medications] are stored in Pharmacy so that similar
sounding/looking drugs aren’t adjacent.’ (Doctor 37)
‘Storage of meds [medications] by therapeutic class.’ (Pharmacist 9)
7.1.3 Case Study 3 (Drug Omission)
Case study 3 described a patient with history of asthma and seizures who was
admitted due to asthma exacerbation(Appendix 11). As one of the anticonvulsants
(levetiracetam) was out of stock, the patient was not given levetiracetam for five
doses, triggering a seizure.
All doctors and pharmacists rated the error as major, while just over half of the
nurses shared the same view (Table 7.6).
Table 7.6 Participants’ ratings of the clinical significance of the ME (Case 3)
Clinical significance of ME
Number (%)
Doctors (n=6) Nurses (n=11) Pharmacists (n=8)
Life-threatening 6 (100.0) 6 (54.5) 8 (100.0)
Major 0 (0.0) 4 (36.4) 0 (0.0)
Unsure 0 (0.0) 1 (9.1) 0 (0.0)
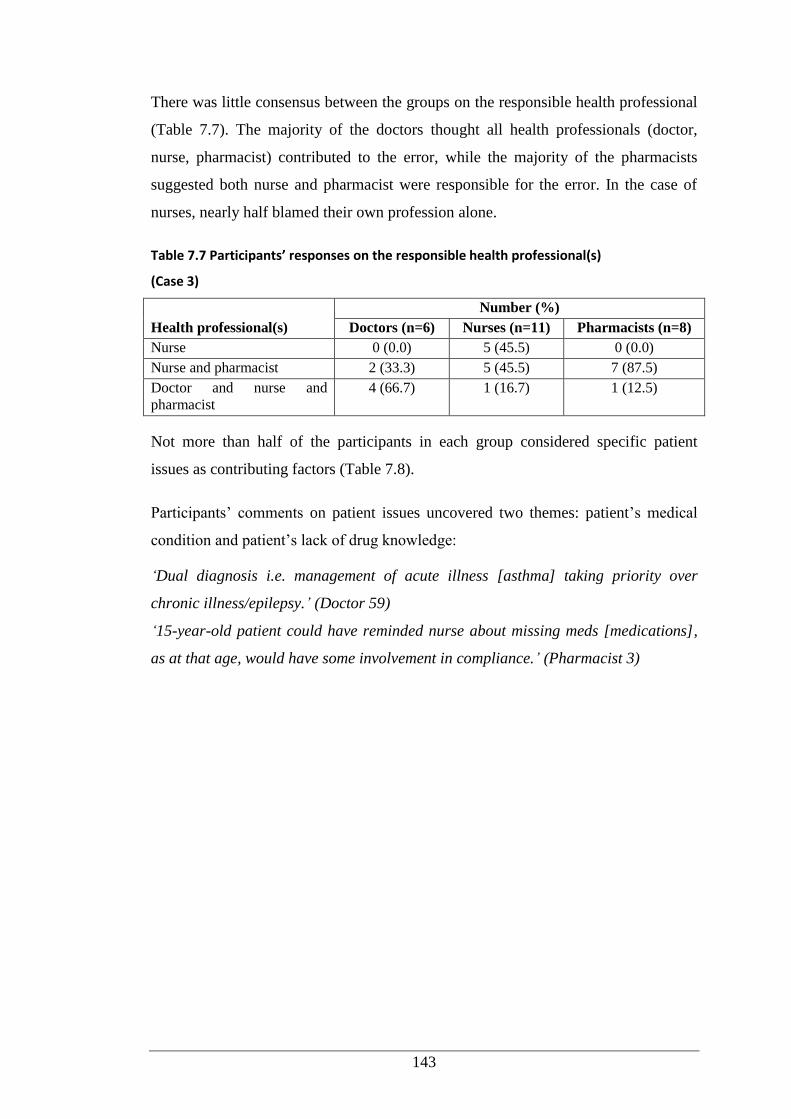
143
There was little consensus between the groups on the responsible health professional
(Table 7.7). The majority of the doctors thought all health professionals (doctor,
nurse, pharmacist) contributed to the error, while the majority of the pharmacists
suggested both nurse and pharmacist were responsible for the error. In the case of
nurses, nearly half blamed their own profession alone.
Table 7.7 Participants’ responses on the responsible health professional(s)
(Case 3)
Health professional(s)
Number (%)
Doctors (n=6) Nurses (n=11) Pharmacists (n=8)
Nurse 0 (0.0) 5 (45.5) 0 (0.0)
Nurse and pharmacist 2 (33.3) 5 (45.5) 7 (87.5)
Doctor and nurse and
pharmacist
4 (66.7) 1 (16.7) 1 (12.5)
Not more than half of the participants in each group considered specific patient
issues as contributing factors (Table 7.8).
Participants’ comments on patient issues uncovered two themes: patient’s medical
condition and patient’s lack of drug knowledge:
‘Dual diagnosis i.e. management of acute illness [asthma] taking priority over
chronic illness/epilepsy.’ (Doctor 59)
‘15-year-old patient could have reminded nurse about missing meds [medications],
as at that age, would have some involvement in compliance.’ (Pharmacist 3)
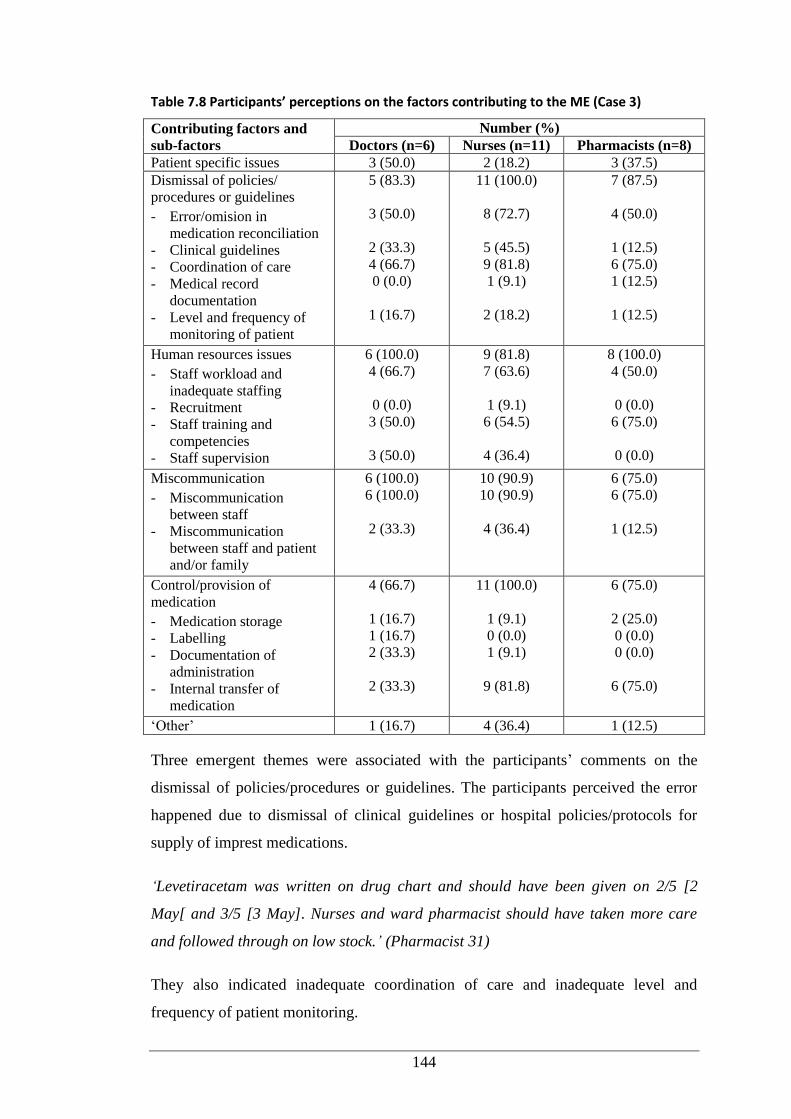
144
Table 7.8 Participants’ perceptions on the factors contributing to the ME (Case 3)
Contributing factors and
sub-factors
Number (%)
Doctors (n=6) Nurses (n=11) Pharmacists (n=8)
Patient specific issues 3 (50.0) 2 (18.2) 3 (37.5)
Dismissal of policies/
procedures or guidelines
- Error/omision in
medication reconciliation
- Clinical guidelines
- Coordination of care
- Medical record
documentation
- Level and frequency of
monitoring of patient
5 (83.3)
3 (50.0)
2 (33.3)
4 (66.7)
0 (0.0)
1 (16.7)
11 (100.0)
8 (72.7)
5 (45.5)
9 (81.8)
1 (9.1)
2 (18.2)
7 (87.5)
4 (50.0)
1 (12.5)
6 (75.0)
1 (12.5)
1 (12.5)
Human resources issues
- Staff workload and
inadequate staffing
- Recruitment
- Staff training and
competencies
- Staff supervision
6 (100.0)
4 (66.7)
0 (0.0)
3 (50.0)
3 (50.0)
9 (81.8)
7 (63.6)
1 (9.1)
6 (54.5)
4 (36.4)
8 (100.0)
4 (50.0)
0 (0.0)
6 (75.0)
0 (0.0)
Miscommunication
- Miscommunication
between staff
- Miscommunication
between staff and patient
and/or family
6 (100.0)
6 (100.0)
2 (33.3)
10 (90.9)
10 (90.9)
4 (36.4)
6 (75.0)
6 (75.0)
1 (12.5)
Control/provision of
medication
- Medication storage
- Labelling
- Documentation of
administration
- Internal transfer of
medication
4 (66.7)
1 (16.7)
1 (16.7)
2 (33.3)
2 (33.3)
11 (100.0)
1 (9.1)
0 (0.0)
1 (9.1)
9 (81.8)
6 (75.0)
2 (25.0)
0 (0.0)
0 (0.0)
6 (75.0)
‘Other’ 1 (16.7) 4 (36.4) 1 (12.5)
Three emergent themes were associated with the participants’ comments on the
dismissal of policies/procedures or guidelines. The participants perceived the error
happened due to dismissal of clinical guidelines or hospital policies/protocols for
supply of imprest medications.
‘Levetiracetam was written on drug chart and should have been given on 2/5 [2
May[ and 3/5 [3 May]. Nurses and ward pharmacist should have taken more care
and followed through on low stock.’ (Pharmacist 31)
They also indicated inadequate coordination of care and inadequate level and
frequency of patient monitoring.
145
‘Lack of coordination between nursing staff and pharmacist to arrange stock of
medication.’ (Pharmacist 28)
‘All three health professionals not reviewed or paid attention to missed dosing.’
(Pharmacist 17)
There were two emergent themes in relation to human resources: staff workload and
inadequate staffing, and inadequate staff training and competencies.
‘Pharmacist too busy and forgot to tell assistant to restock.’ (Doctor 59)
‘Nursing staff should be made aware of which medications not be withheld (not
given) without endangering the patient and what steps to take to obtain the
medication or inform the doctor so that an alternative can be prescribed.’
(Pharmacist 19)
‘Staff did not follow necessary steps to prevent this error and should be re-trained on
importance of all aspects of their job.’ (Pharmacist 31)
Participants’ comments on miscommunication indicated two themes:
miscommunication between staff, and miscommunication between staff and patient
and/or family.
‘Pharmacist not informing pharmacist assistant, nurses not informing other staff of
lack of meds [medication], doctors not being informed of medication not being
given.’ (Nurse 98)
‘Patient not told of omission, may have had own supply available.’ (Nurse 95)
The issue of control/provision of medication gave rise to one theme: poor internal
transfer of medication.
‘Better process not followed for supply of drug to patient from Pharmacy.’
(Pharmacist 17)
‘Not having medication being restock when low. Nursing not aware of how to obtain
more stock.’ (Nurse 98)
Participants’ comments on ‘other’ factor(s) revealed no new themes. These were
classified under the contributors of miscommunication and control/provision of
medication.
146
Suggestions on how to prevent recurrence of the error mapped to seven themes.
Firstly, the participants identified the need for a hospital policy on the use of imprest
medications.
‘Clear process and protocol to follow if medicine not available from Pharmacy.’
(Pharmacist 17)
‘Policy of an after-hours imprest list so nurse staff can source medications from
other wards after-hours.’ (Pharmacist 9)
The participants also indicated adequate staffing, and adequate staff education and
training, as the other two ways to avoid recurrence of the error:
‘Increase staffing to decrease workload.’ (Doctor 61)
‘Re-education regarding obtaining meds [medications] rather than annotating chart
with N1.’ (Pharmacist 3)
Two further themes related to patient education and monitoring.
‘Empower patients to be partners in their own health and medications.’ (Pharmacist
10)
‘Medical team checking medication chart daily.’ (Doctors 59)
Some participants deemed the use of technologies to monitor the stock level of
medications a promising solution.
‘Pharmacist to have a reminder note, electronic paper so they can tick off jobs
completed for day.’ (Nurse 105)
‘Computer alerts to restock meds [medications].’ (Doctor 59)
Good communication between staff was also suggested by most of the participants as
a preventive measure.
‘Clear route communication between ward nurses and ward pharmacist.’ (Doctor
37)
‘Nurse to inform shift coordinator of missing medication so it can be sourced and
given as soon as available.’ (Nurse 105)
‘Night nurse should have read drug chart and called on-call pharmacist on evening
on 2/5 [2 May] and get more levetiracetam.’ (Pharmacist 31)
1On the National Inpatient Medication Chart ‘N’ equated ‘Not Available’ in the study hospital.
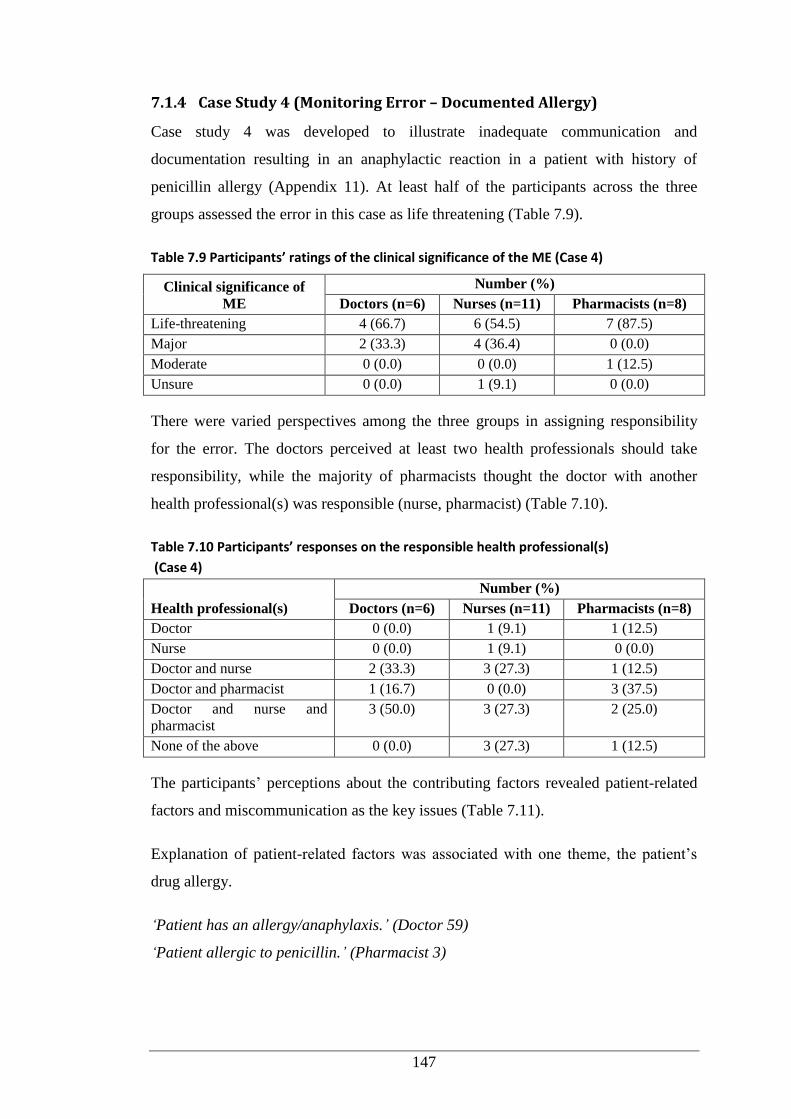
147
7.1.4 Case Study 4 (Monitoring Error – Documented Allergy)
Case study 4 was developed to illustrate inadequate communication and
documentation resulting in an anaphylactic reaction in a patient with history of
penicillin allergy (Appendix 11). At least half of the participants across the three
groups assessed the error in this case as life threatening (Table 7.9).
Table 7.9 Participants’ ratings of the clinical significance of the ME (Case 4)
Clinical significance of
ME
Number (%)
Doctors (n=6) Nurses (n=11) Pharmacists (n=8)
Life-threatening 4 (66.7) 6 (54.5) 7 (87.5)
Major 2 (33.3) 4 (36.4) 0 (0.0)
Moderate 0 (0.0) 0 (0.0) 1 (12.5)
Unsure 0 (0.0) 1 (9.1) 0 (0.0)
There were varied perspectives among the three groups in assigning responsibility
for the error. The doctors perceived at least two health professionals should take
responsibility, while the majority of pharmacists thought the doctor with another
health professional(s) was responsible (nurse, pharmacist) (Table 7.10).
Table 7.10 Participants’ responses on the responsible health professional(s)
(Case 4)
Health professional(s)
Number (%)
Doctors (n=6) Nurses (n=11) Pharmacists (n=8)
Doctor 0 (0.0) 1 (9.1) 1 (12.5)
Nurse 0 (0.0) 1 (9.1) 0 (0.0)
Doctor and nurse 2 (33.3) 3 (27.3) 1 (12.5)
Doctor and pharmacist 1 (16.7) 0 (0.0) 3 (37.5)
Doctor and nurse and
pharmacist
3 (50.0) 3 (27.3) 2 (25.0)
None of the above 0 (0.0) 3 (27.3) 1 (12.5)
The participants’ perceptions about the contributing factors revealed patient-related
factors and miscommunication as the key issues (Table 7.11).
Explanation of patient-related factors was associated with one theme, the patient’s
drug allergy.
‘Patient has an allergy/anaphylaxis.’ (Doctor 59)
‘Patient allergic to penicillin.’ (Pharmacist 3)
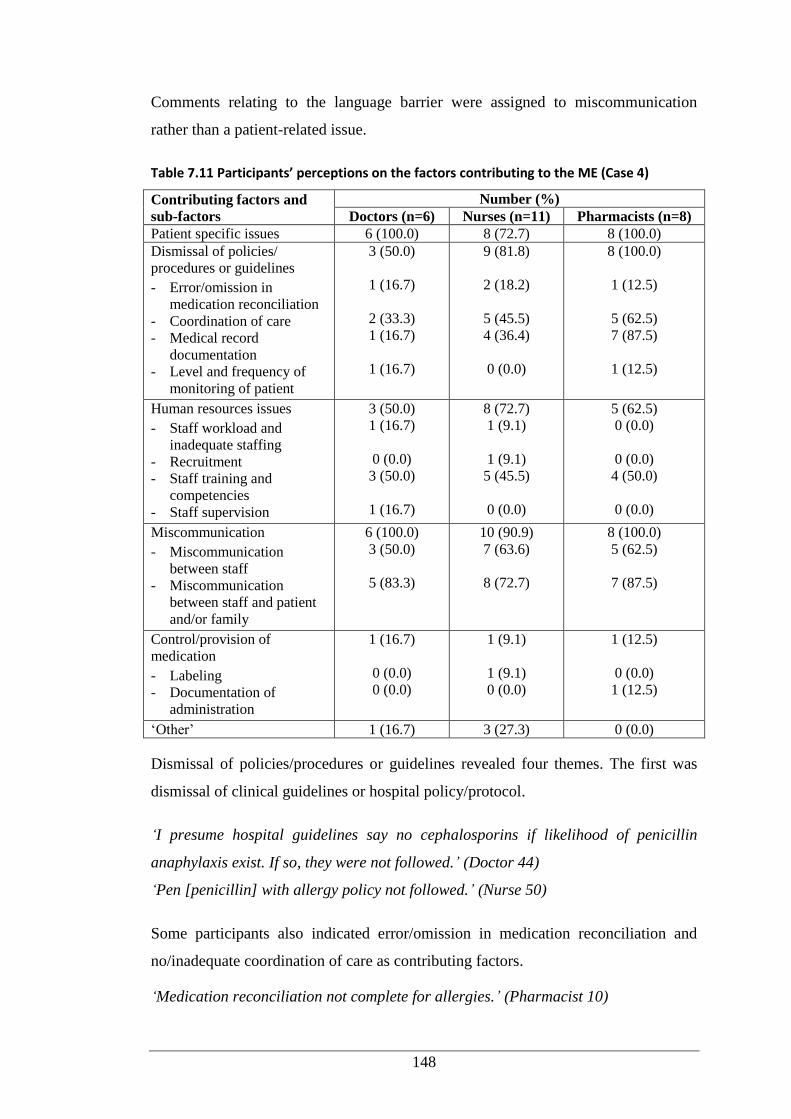
148
Comments relating to the language barrier were assigned to miscommunication
rather than a patient-related issue.
Table 7.11 Participants’ perceptions on the factors contributing to the ME (Case 4)
Contributing factors and
sub-factors
Number (%)
Doctors (n=6) Nurses (n=11) Pharmacists (n=8)
Patient specific issues 6 (100.0) 8 (72.7) 8 (100.0)
Dismissal of policies/
procedures or guidelines
- Error/omission in
medication reconciliation
- Coordination of care
- Medical record
documentation
- Level and frequency of
monitoring of patient
3 (50.0)
1 (16.7)
2 (33.3)
1 (16.7)
1 (16.7)
9 (81.8)
2 (18.2)
5 (45.5)
4 (36.4)
0 (0.0)
8 (100.0)
1 (12.5)
5 (62.5)
7 (87.5)
1 (12.5)
Human resources issues
- Staff workload and
inadequate staffing
- Recruitment
- Staff training and
competencies
- Staff supervision
3 (50.0)
1 (16.7)
0 (0.0)
3 (50.0)
1 (16.7)
8 (72.7)
1 (9.1)
1 (9.1)
5 (45.5)
0 (0.0)
5 (62.5)
0 (0.0)
0 (0.0)
4 (50.0)
0 (0.0)
Miscommunication
- Miscommunication
between staff
- Miscommunication
between staff and patient
and/or family
6 (100.0)
3 (50.0)
5 (83.3)
10 (90.9)
7 (63.6)
8 (72.7)
8 (100.0)
5 (62.5)
7 (87.5)
Control/provision of
medication
- Labeling
- Documentation of
administration
1 (16.7)
0 (0.0)
0 (0.0)
1 (9.1)
1 (9.1)
0 (0.0)
1 (12.5)
0 (0.0)
1 (12.5)
‘Other’ 1 (16.7) 3 (27.3) 0 (0.0)
Dismissal of policies/procedures or guidelines revealed four themes. The first was
dismissal of clinical guidelines or hospital policy/protocol.
‘I presume hospital guidelines say no cephalosporins if likelihood of penicillin
anaphylaxis exist. If so, they were not followed.’ (Doctor 44)
‘Pen [penicillin] with allergy policy not followed.’ (Nurse 50)
Some participants also indicated error/omission in medication reconciliation and
no/inadequate coordination of care as contributing factors.
‘Medication reconciliation not complete for allergies.’ (Pharmacist 10)
149
‘Breakdown in communication between pharmacy and doctor.’ (Nurse 50)
No/inadequate medical or medication record documentation was also identified.
‘Ward pharmacist did not write that penicillin allergy severity was still to be
checked.’ (Pharmacist 31)
‘The GP [general practitioner] should have also provided some specific information
in the letter.’ (Pharmacist 19)
Analysis of participants’ comments uncovered two themes related to human
resources: staff workload and inadequate staffing, and staff training and
competencies.
‘GP being busy and not returning pharmacist phone call.’ (Nurse 98)
‘Training what to prescribe in the event of anaphylactic penicillin allergy.’ (Nurse
95)
Two themes emerged in association with miscommunication issues. Participants
perceived the error could be avoided with better communication between staff.
Participants also highlighted miscommunication between staff and the patient and/or
family contributed to the error.
‘Pharmacist didn’t notify doctor/nurses that they were waiting for a phone call from
the GP.’ (Nurse 87)
‘Hospital doctor assumed pharmacist had checked degree of allergy.’ (Pharmacist
31)
‘Unable to communicate effectively with the family due to language barrier.’
(Pharmacist 10)
There was one emergent theme associated with control/provision of medication, i.e.
inadequate documentation of allergy was responsible for the error.
‘Degree of severity of penicillin allergy not noted on medication chart.’ (Pharmacist
31)
‘Inadequate documentation of allergy.’ (Nurse 98)
Preventive strategies were described in three themes relating to the need for clnical
guidelines and clear hospital policies for antibiotics particularly dealing with allergy
issues, with compliance by all staff.
150
‘Following hospital guidelines. TGA [Therapeutics Goods Administration]
antibiotics for prescribing in context of peniciliin allergy.’ (Doctor 59)
‘Adhere or review policies/guidelines in regards to allergies.’ (Nurse 87)
Participants also highlighted the importance of staff education and training to prevent
such errors.
‘Improve education of staff in allergies, and that cephalosporin can cause allergic
reaction if allergic to penicillin.’ (Nurse 98)
‘Proper staff training including checking properly.’ (Pharmacist 17)
Improved communication between staff, and between staff and the patient and/or
family, was proposed as another solution:
‘Ward pharmacist should have noted that the severity of the penicillin allergy had
not been clarified, so prescriber could have tried again to call GP [general
practitioner].’ (Pharmacist 31)
‘Nurse giving the cephalosporin should have checked by calling doctor or ward
pharmacist to see why it had been prescribed when medication chart had an allergy
sticker applied.’ (Pharmacist 9)
‘Use an interpreter to overcome language problems between this patient and staff.’
(Nurse 100)
7.1.5 Case Study 5 (Transcribing Error)
The fifth case study was developed to highlight the consequences of a transcribing
error, where an antifungal was not recharted for a newly diagnosed oncology patient
(Appendix 11). A non-oncology nurse was deployed to this ward, and was unable to
identify the error.
More than half of the nurses and the pharmacists rated the error as major in
significance (Table 7.12).
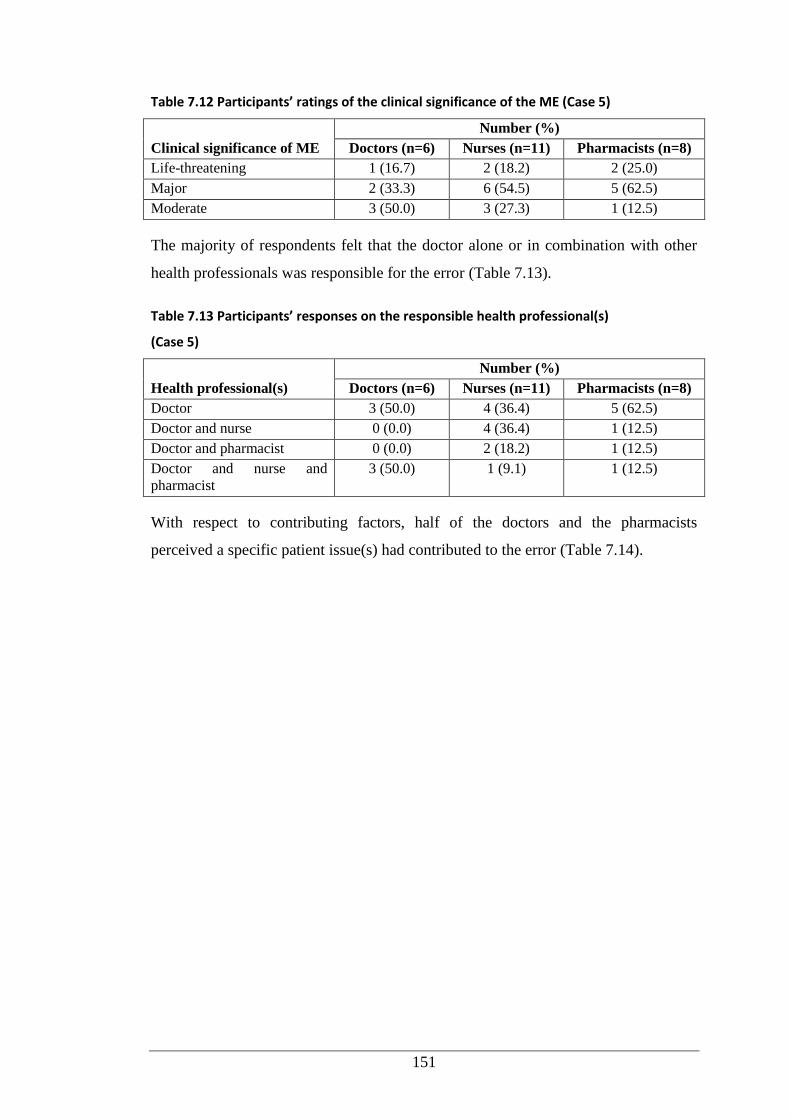
151
Table 7.12 Participants’ ratings of the clinical significance of the ME (Case 5)
Clinical significance of ME
Number (%)
Doctors (n=6) Nurses (n=11) Pharmacists (n=8)
Life-threatening 1 (16.7) 2 (18.2) 2 (25.0)
Major 2 (33.3) 6 (54.5) 5 (62.5)
Moderate 3 (50.0) 3 (27.3) 1 (12.5)
The majority of respondents felt that the doctor alone or in combination with other
health professionals was responsible for the error (Table 7.13).
Table 7.13 Participants’ responses on the responsible health professional(s)
(Case 5)
Health professional(s)
Number (%)
Doctors (n=6) Nurses (n=11) Pharmacists (n=8)
Doctor 3 (50.0) 4 (36.4) 5 (62.5)
Doctor and nurse 0 (0.0) 4 (36.4) 1 (12.5)
Doctor and pharmacist 0 (0.0) 2 (18.2) 1 (12.5)
Doctor and nurse and
pharmacist
3 (50.0) 1 (9.1) 1 (12.5)
With respect to contributing factors, half of the doctors and the pharmacists
perceived a specific patient issue(s) had contributed to the error (Table 7.14).
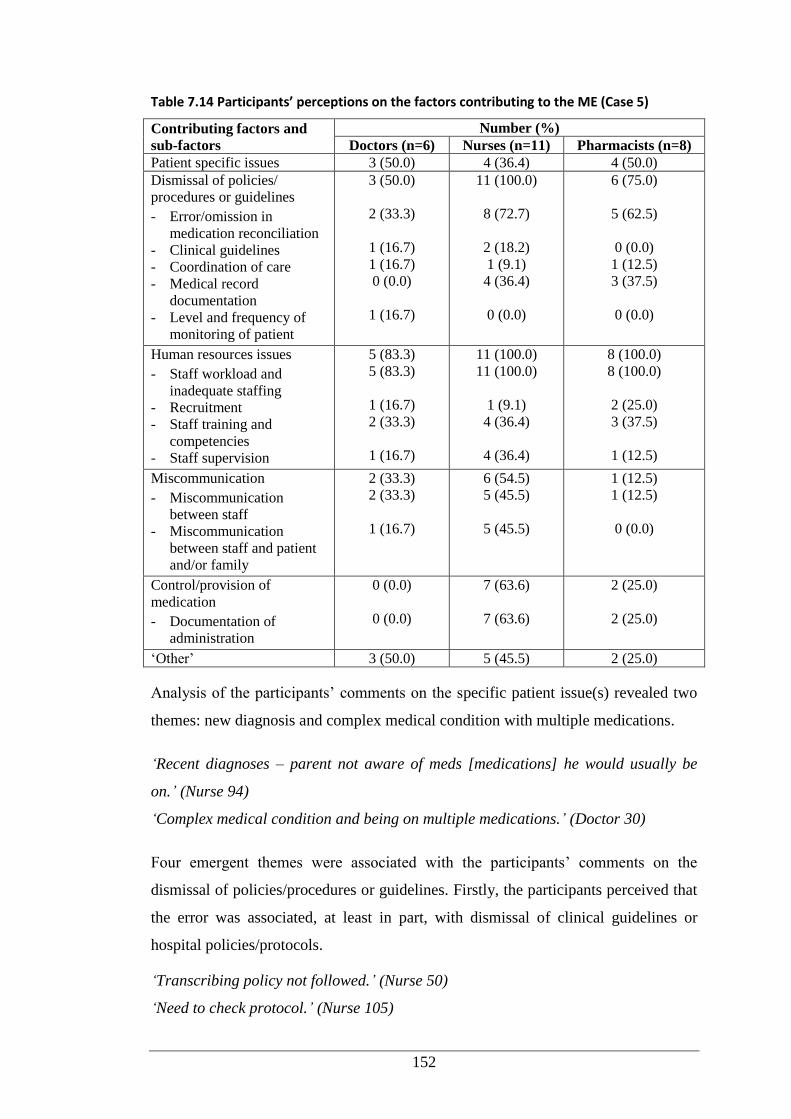
152
Table 7.14 Participants’ perceptions on the factors contributing to the ME (Case 5)
Contributing factors and
sub-factors
Number (%)
Doctors (n=6) Nurses (n=11) Pharmacists (n=8)
Patient specific issues 3 (50.0) 4 (36.4) 4 (50.0)
Dismissal of policies/
procedures or guidelines
- Error/omission in
medication reconciliation
- Clinical guidelines
- Coordination of care
- Medical record
documentation
- Level and frequency of
monitoring of patient
3 (50.0)
2 (33.3)
1 (16.7)
1 (16.7)
0 (0.0)
1 (16.7)
11 (100.0)
8 (72.7)
2 (18.2)
1 (9.1)
4 (36.4)
0 (0.0)
6 (75.0)
5 (62.5)
0 (0.0)
1 (12.5)
3 (37.5)
0 (0.0)
Human resources issues
- Staff workload and
inadequate staffing
- Recruitment
- Staff training and
competencies
- Staff supervision
5 (83.3)
5 (83.3)
1 (16.7)
2 (33.3)
1 (16.7)
11 (100.0)
11 (100.0)
1 (9.1)
4 (36.4)
4 (36.4)
8 (100.0)
8 (100.0)
2 (25.0)
3 (37.5)
1 (12.5)
Miscommunication
- Miscommunication
between staff
- Miscommunication
between staff and patient
and/or family
2 (33.3)
2 (33.3)
1 (16.7)
6 (54.5)
5 (45.5)
5 (45.5)
1 (12.5)
1 (12.5)
0 (0.0)
Control/provision of
medication
- Documentation of
administration
0 (0.0)
0 (0.0)
7 (63.6)
7 (63.6)
2 (25.0)
2 (25.0)
‘Other’ 3 (50.0) 5 (45.5) 2 (25.0)
Analysis of the participants’ comments on the specific patient issue(s) revealed two
themes: new diagnosis and complex medical condition with multiple medications.
‘Recent diagnoses – parent not aware of meds [medications] he would usually be
on.’ (Nurse 94)
‘Complex medical condition and being on multiple medications.’ (Doctor 30)
Four emergent themes were associated with the participants’ comments on the
dismissal of policies/procedures or guidelines. Firstly, the participants perceived that
the error was associated, at least in part, with dismissal of clinical guidelines or
hospital policies/protocols.
‘Transcribing policy not followed.’ (Nurse 50)
‘Need to check protocol.’ (Nurse 105)
153
Secondly, the participants highlighted an error/omission in medication reconciliation
as contributing to the error.
‘Medication reconciliation should be completed across charts throughout the
admission.’ (Pharmacist 10)
‘Drug charts not reconciled.’ (Doctor 37)
No/inadequate coordination of care and no/inadequate medical or medication record
documentation were perceived by the participants as the other two contributing
factors.
‘Doctors omitted [medication order] but not picked up by nurse.’ (Nurse 105)
‘The doctors didn’t transcribe 100% of the medication chart.’ (Nurse 87)
Regarding human resources issues, staff workload and inadequate staffing were
commonly highlighted.
‘Doctor overworked, not enough doctors, nurses, pharmacists.’ (Nurse 100)
‘Fatigue, inadequate staffing over public holidays.’ (Doctor 61)
Participants also indicated staff training and competencies, and staff supervision as
the other two factors accounting for the error.
‘A nurse familiar with the treatment may have noticed the error, but staffing
necessitated fill-ins who couldn’t provide the same level of care.’ (Nurse 85)
‘Oncology is highly specialised field, and all staff working in the area should be
suitably trained. If locum staff are required, the close supervision is needed.’
(Pharmacist 19)
Participants’ comments on miscommunication issues indicated two themes:
miscommunication between staff, and miscommunication between staff and the
patient and/or family.
‘Doctor intended to chart all medications but failed to do so - miscommunication
with nurse.’ (Doctor 44)
‘Staff not clarifying orders when transcribing medications.’ (Nurse 98)
‘Staff not being familiar with the patient.’ (Nurse 87)
‘Family not being aware of regular medication child is taking.’ (Nurse 105)
154
Analysis of the participants’ comments on the control/provision of medication as a
contributing factor uncovered one theme: documentation of administration.
‘Medication not given as not documented.’ (Nurse 96)
‘Checking of administration times across charts.’ (Pharmacist 10)
Comments relating to prevention of the error revealed four themes. Firstly, the need
for hospital policy to ensure accuracy of transcribing of medication charts.
‘Mandatory check new versus old medication charts with two staff members to
ensure everything transcribed correctly and old medication orders ceased if
appropriate.’ (Doctor 37)
‘A procedure should be implemented to ensure that medications are correctly
transcribed when new charts are written, e.g. a nurse/pharmacist/doctor could
double check the new chart against the old chart, deliberately cancel each item on
the old chart when it has been written onto the new chart.’ (Pharmacist 19)
Secondly, some participants also proposed electronic prescriptions to prevent
transcribing errors.
‘Computerised prescriptions would overcome the dilemma of fatigue rewriting
medication charts, missed medications.’ (Doctor 59)
‘An electronic prescription system would avoid need for manual transcribing.’
(Doctor 60)
Thirdly, the participants also underlined the need for adequate staffing of
experienced staff particularly in the specialty area of oncology.
‘Ensure wards are adequately staffed with experienced nurses in the particular
specialty.’ (Nurse 87)
‘Oncology ward nurse manager should endeavour to have ward staffed by nurses
trained in Oncology who may have noticed that an anti-fungal drug should be given.’
(Pharmacist 31)
Lastly, the need for improved communication between staff and patient and/or
family was suggested.
‘Nurse checking bedside with family of drug and dose to be given.’ (Nurse 105)
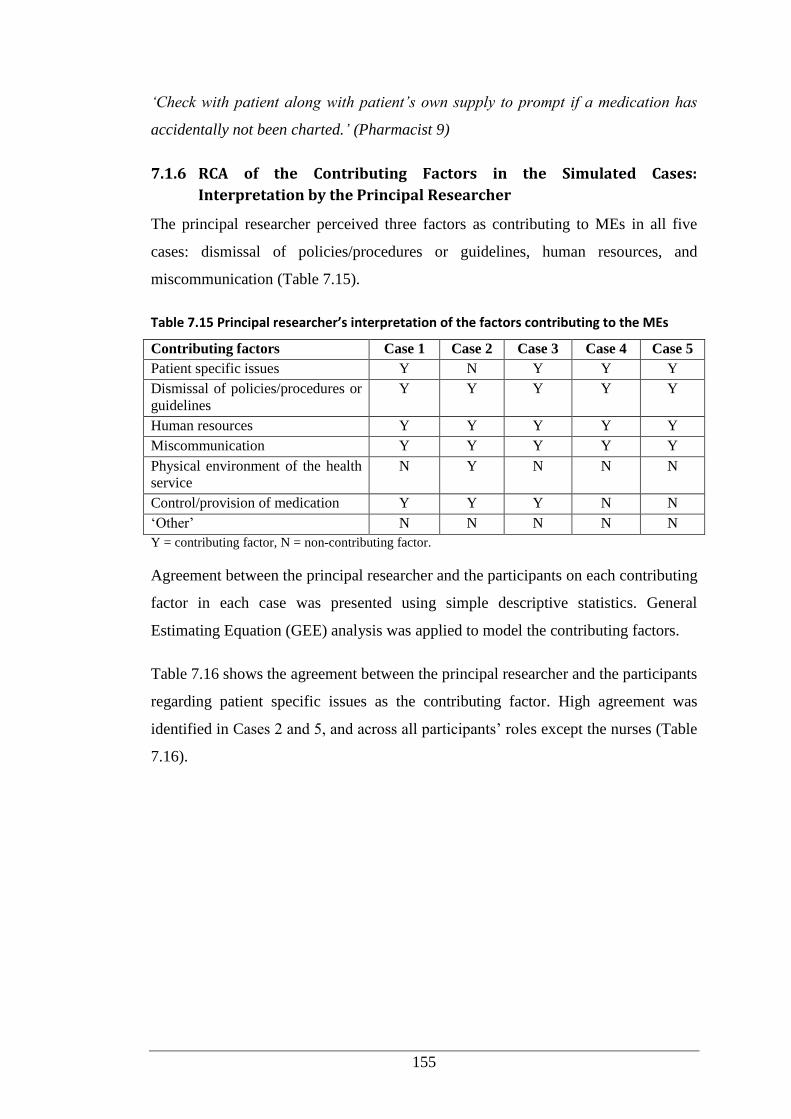
155
‘Check with patient along with patient’s own supply to prompt if a medication has
accidentally not been charted.’ (Pharmacist 9)
7.1.6 RCA of the Contributing Factors in the Simulated Cases:
Interpretation by the Principal Researcher
The principal researcher perceived three factors as contributing to MEs in all five
cases: dismissal of policies/procedures or guidelines, human resources, and
miscommunication (Table 7.15).
Table 7.15 Principal researcher’s interpretation of the factors contributing to the MEs
Contributing factors Case 1 Case 2 Case 3 Case 4 Case 5
Patient specific issues Y N Y Y Y
Dismissal of policies/procedures or
guidelines
Y Y Y Y Y
Human resources Y Y Y Y Y
Miscommunication Y Y Y Y Y
Physical environment of the health
service
N Y N N N
Control/provision of medication Y Y Y N N
‘Other’ N N N N N
Y = contributing factor, N = non-contributing factor.
Agreement between the principal researcher and the participants on each contributing
factor in each case was presented using simple descriptive statistics. General
Estimating Equation (GEE) analysis was applied to model the contributing factors.
Table 7.16 shows the agreement between the principal researcher and the participants
regarding patient specific issues as the contributing factor. High agreement was
identified in Cases 2 and 5, and across all participants’ roles except the nurses (Table
7.16).
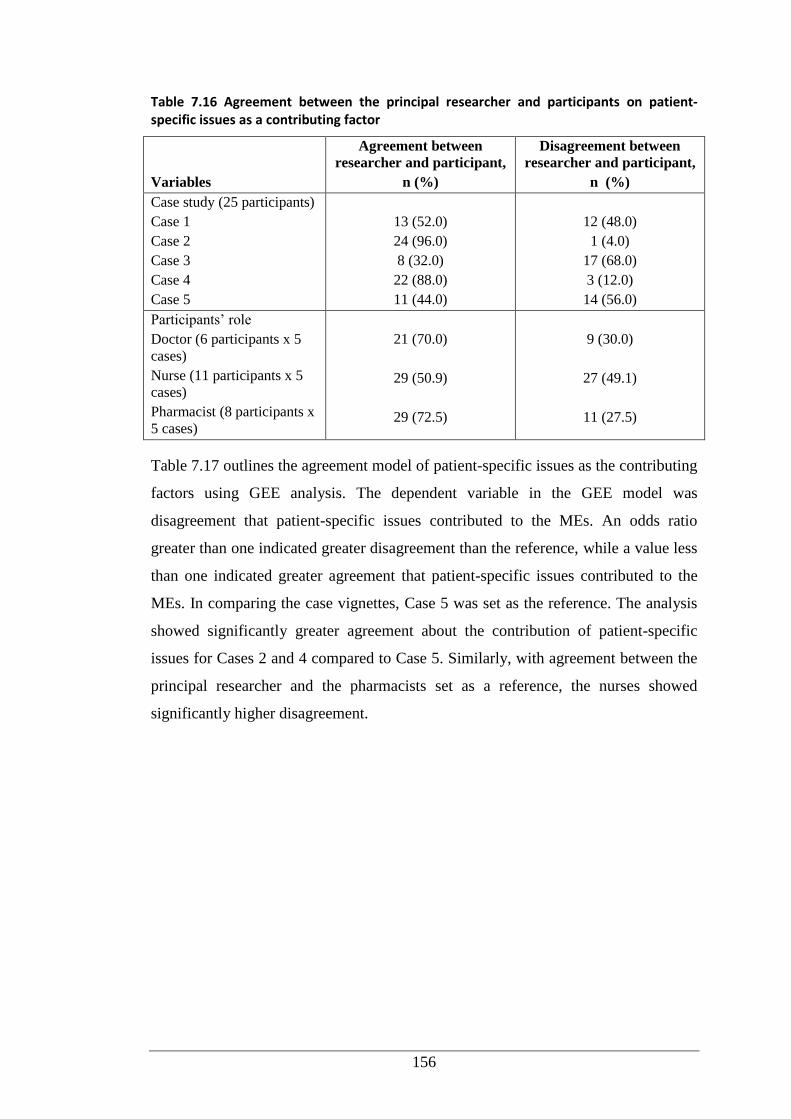
156
Table 7.16 Agreement between the principal researcher and participants on patient-specific issues as a contributing factor
Variables
Agreement between
researcher and participant,
n (%)
Disagreement between
researcher and participant,
n (%)
Case study (25 participants)
Case 1
Case 2
Case 3
Case 4
Case 5
13 (52.0)
24 (96.0)
8 (32.0)
22 (88.0)
11 (44.0)
12 (48.0)
1 (4.0)
17 (68.0)
3 (12.0)
14 (56.0)
Participants’ role
Doctor (6 participants x 5
cases)
Nurse (11 participants x 5
cases)
Pharmacist (8 participants x
5 cases)
21 (70.0)
29 (50.9)
29 (72.5)
9 (30.0)
27 (49.1)
11 (27.5)
Table 7.17 outlines the agreement model of patient-specific issues as the contributing
factors using GEE analysis. The dependent variable in the GEE model was
disagreement that patient-specific issues contributed to the MEs. An odds ratio
greater than one indicated greater disagreement than the reference, while a value less
than one indicated greater agreement that patient-specific issues contributed to the
MEs. In comparing the case vignettes, Case 5 was set as the reference. The analysis
showed significantly greater agreement about the contribution of patient-specific
issues for Cases 2 and 4 compared to Case 5. Similarly, with agreement between the
principal researcher and the pharmacists set as a reference, the nurses showed
significantly higher disagreement.
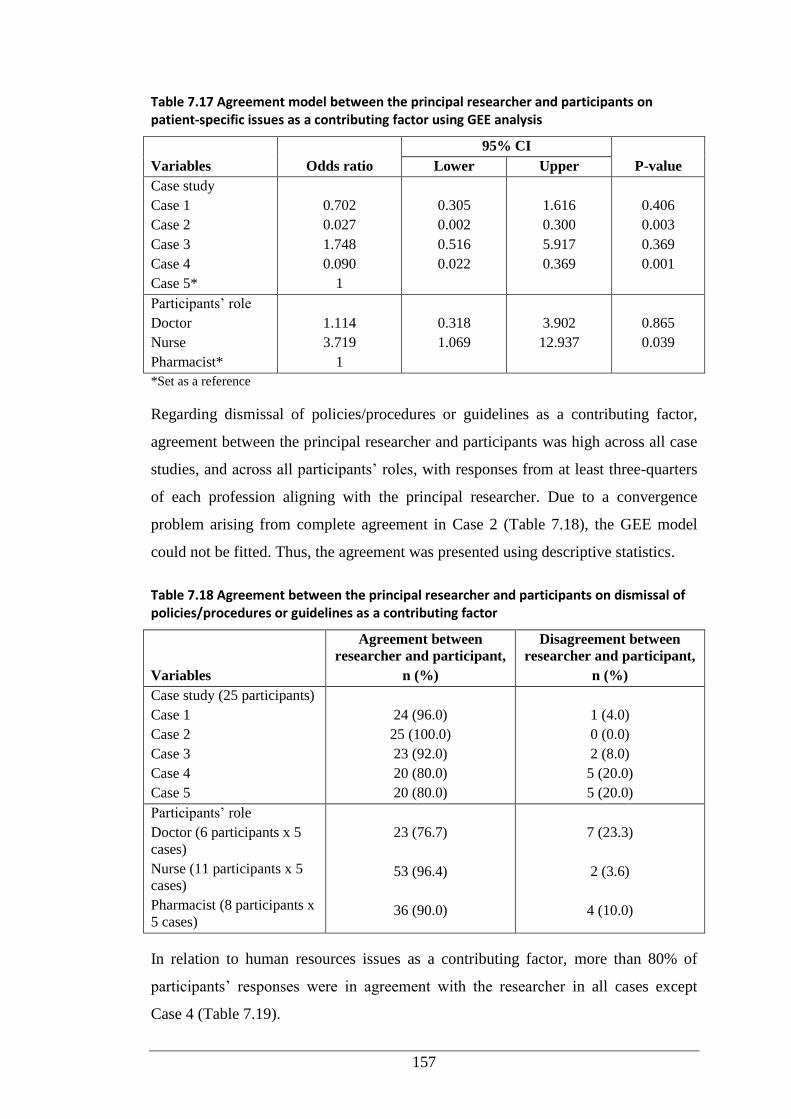
157
Table 7.17 Agreement model between the principal researcher and participants on patient-specific issues as a contributing factor using GEE analysis
Variables Odds ratio
95% CI
P-value Lower Upper
Case study
Case 1
Case 2
Case 3
Case 4
Case 5*
0.702
0.027
1.748
0.090
1
0.305
0.002
0.516
0.022
1.616
0.300
5.917
0.369
0.406
0.003
0.369
0.001
Participants’ role
Doctor
Nurse
Pharmacist*
1.114
3.719
1
0.318
1.069
3.902
12.937
0.865
0.039
*Set as a reference
Regarding dismissal of policies/procedures or guidelines as a contributing factor,
agreement between the principal researcher and participants was high across all case
studies, and across all participants’ roles, with responses from at least three-quarters
of each profession aligning with the principal researcher. Due to a convergence
problem arising from complete agreement in Case 2 (Table 7.18), the GEE model
could not be fitted. Thus, the agreement was presented using descriptive statistics.
Table 7.18 Agreement between the principal researcher and participants on dismissal of policies/procedures or guidelines as a contributing factor
Variables
Agreement between
researcher and participant,
n (%)
Disagreement between
researcher and participant,
n (%)
Case study (25 participants)
Case 1
Case 2
Case 3
Case 4
Case 5
24 (96.0)
25 (100.0)
23 (92.0)
20 (80.0)
20 (80.0)
1 (4.0)
0 (0.0)
2 (8.0)
5 (20.0)
5 (20.0)
Participants’ role
Doctor (6 participants x 5
cases)
Nurse (11 participants x 5
cases)
Pharmacist (8 participants x
5 cases)
23 (76.7)
53 (96.4)
36 (90.0)
7 (23.3)
2 (3.6)
4 (10.0)
In relation to human resources issues as a contributing factor, more than 80% of
participants’ responses were in agreement with the researcher in all cases except
Case 4 (Table 7.19).
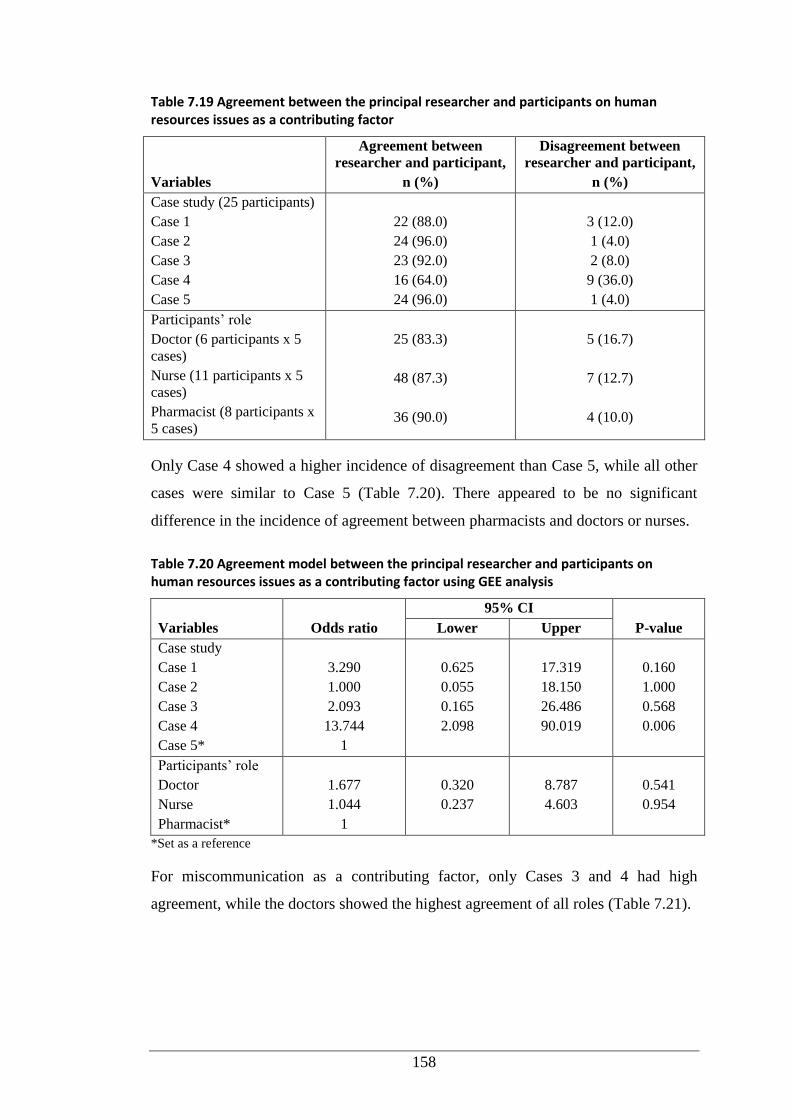
158
Table 7.19 Agreement between the principal researcher and participants on human resources issues as a contributing factor
Variables
Agreement between
researcher and participant,
n (%)
Disagreement between
researcher and participant,
n (%)
Case study (25 participants)
Case 1
Case 2
Case 3
Case 4
Case 5
22 (88.0)
24 (96.0)
23 (92.0)
16 (64.0)
24 (96.0)
3 (12.0)
1 (4.0)
2 (8.0)
9 (36.0)
1 (4.0)
Participants’ role
Doctor (6 participants x 5
cases)
Nurse (11 participants x 5
cases)
Pharmacist (8 participants x
5 cases)
25 (83.3)
48 (87.3)
36 (90.0)
5 (16.7)
7 (12.7)
4 (10.0)
Only Case 4 showed a higher incidence of disagreement than Case 5, while all other
cases were similar to Case 5 (Table 7.20). There appeared to be no significant
difference in the incidence of agreement between pharmacists and doctors or nurses.
Table 7.20 Agreement model between the principal researcher and participants on human resources issues as a contributing factor using GEE analysis
Variables Odds ratio
95% CI
P-value Lower Upper
Case study
Case 1
Case 2
Case 3
Case 4
Case 5*
3.290
1.000
2.093
13.744
1
0.625
0.055
0.165
2.098
17.319
18.150
26.486
90.019
0.160
1.000
0.568
0.006
Participants’ role
Doctor
Nurse
Pharmacist*
1.677
1.044
1
0.320
0.237
8.787
4.603
0.541
0.954
*Set as a reference
For miscommunication as a contributing factor, only Cases 3 and 4 had high
agreement, while the doctors showed the highest agreement of all roles (Table 7.21).
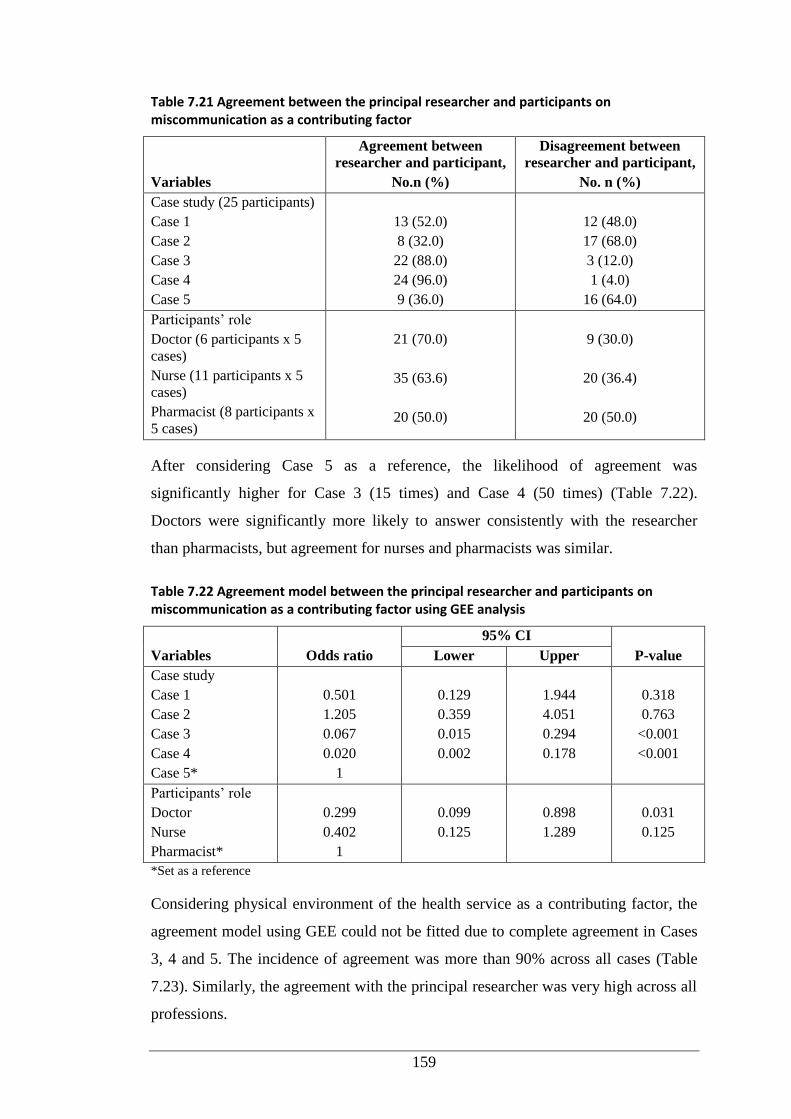
159
Table 7.21 Agreement between the principal researcher and participants on miscommunication as a contributing factor
Variables
Agreement between
researcher and participant,
No.n (%)
Disagreement between
researcher and participant,
No. n (%)
Case study (25 participants)
Case 1
Case 2
Case 3
Case 4
Case 5
13 (52.0)
8 (32.0)
22 (88.0)
24 (96.0)
9 (36.0)
12 (48.0)
17 (68.0)
3 (12.0)
1 (4.0)
16 (64.0)
Participants’ role
Doctor (6 participants x 5
cases)
Nurse (11 participants x 5
cases)
Pharmacist (8 participants x
5 cases)
21 (70.0)
35 (63.6)
20 (50.0)
9 (30.0)
20 (36.4)
20 (50.0)
After considering Case 5 as a reference, the likelihood of agreement was
significantly higher for Case 3 (15 times) and Case 4 (50 times) (Table 7.22).
Doctors were significantly more likely to answer consistently with the researcher
than pharmacists, but agreement for nurses and pharmacists was similar.
Table 7.22 Agreement model between the principal researcher and participants on miscommunication as a contributing factor using GEE analysis
Variables Odds ratio
95% CI
P-value Lower Upper
Case study
Case 1
Case 2
Case 3
Case 4
Case 5*
0.501
1.205
0.067
0.020
1
0.129
0.359
0.015
0.002
1.944
4.051
0.294
0.178
0.318
0.763
<0.001
<0.001
Participants’ role
Doctor
Nurse
Pharmacist*
0.299
0.402
1
0.099
0.125
0.898
1.289
0.031
0.125
*Set as a reference
Considering physical environment of the health service as a contributing factor, the
agreement model using GEE could not be fitted due to complete agreement in Cases
3, 4 and 5. The incidence of agreement was more than 90% across all cases (Table
7.23). Similarly, the agreement with the principal researcher was very high across all
professions.
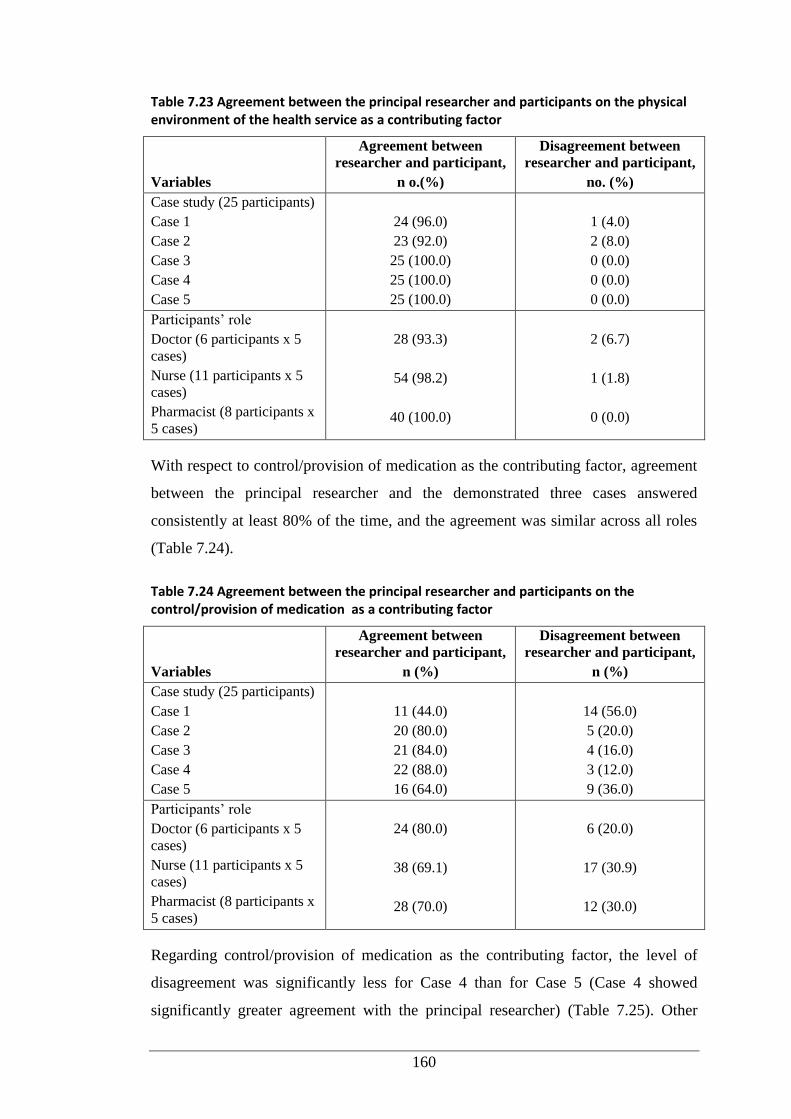
160
Table 7.23 Agreement between the principal researcher and participants on the physical environment of the health service as a contributing factor
Variables
Agreement between
researcher and participant,
n o.(%)
Disagreement between
researcher and participant,
no. (%)
Case study (25 participants)
Case 1
Case 2
Case 3
Case 4
Case 5
24 (96.0)
23 (92.0)
25 (100.0)
25 (100.0)
25 (100.0)
1 (4.0)
2 (8.0)
0 (0.0)
0 (0.0)
0 (0.0)
Participants’ role
Doctor (6 participants x 5
cases)
Nurse (11 participants x 5
cases)
Pharmacist (8 participants x
5 cases)
28 (93.3)
54 (98.2)
40 (100.0)
2 (6.7)
1 (1.8)
0 (0.0)
With respect to control/provision of medication as the contributing factor, agreement
between the principal researcher and the demonstrated three cases answered
consistently at least 80% of the time, and the agreement was similar across all roles
(Table 7.24).
Table 7.24 Agreement between the principal researcher and participants on the control/provision of medication as a contributing factor
Variables
Agreement between
researcher and participant,
n (%)
Disagreement between
researcher and participant,
n (%)
Case study (25 participants)
Case 1
Case 2
Case 3
Case 4
Case 5
11 (44.0)
20 (80.0)
21 (84.0)
22 (88.0)
16 (64.0)
14 (56.0)
5 (20.0)
4 (16.0)
3 (12.0)
9 (36.0)
Participants’ role
Doctor (6 participants x 5
cases)
Nurse (11 participants x 5
cases)
Pharmacist (8 participants x
5 cases)
24 (80.0)
38 (69.1)
28 (70.0)
6 (20.0)
17 (30.9)
12 (30.0)
Regarding control/provision of medication as the contributing factor, the level of
disagreement was significantly less for Case 4 than for Case 5 (Case 4 showed
significantly greater agreement with the principal researcher) (Table 7.25). Other
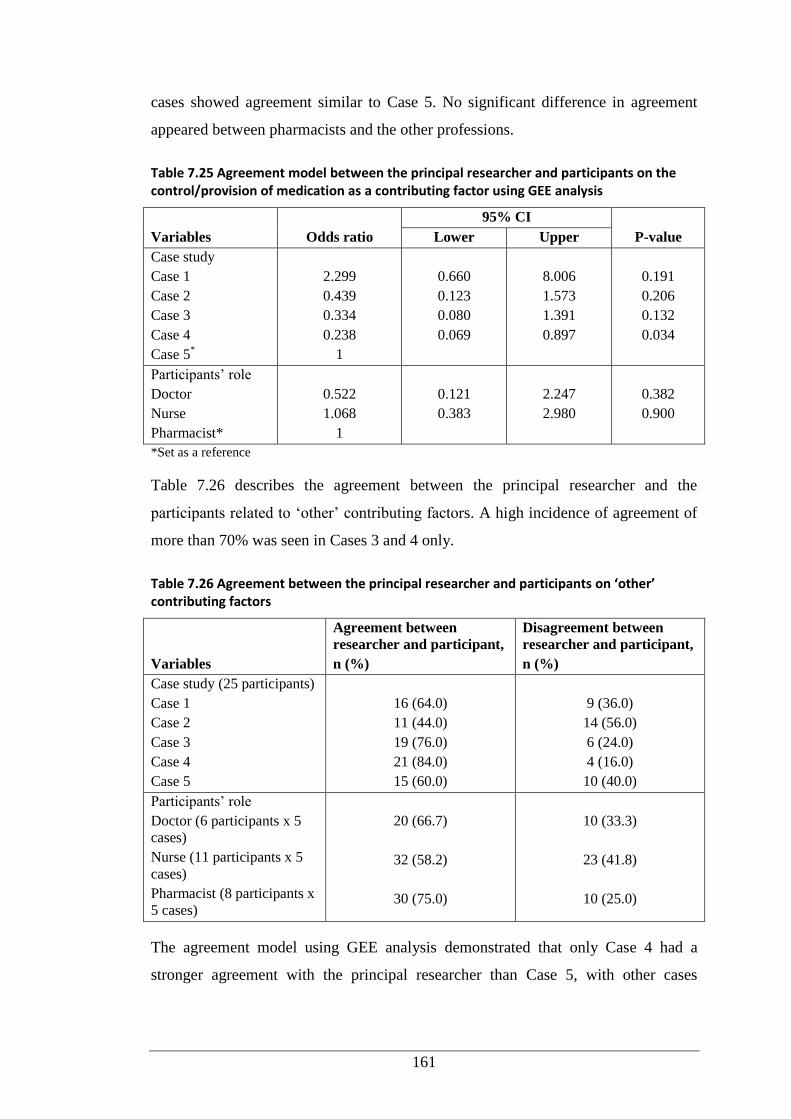
161
cases showed agreement similar to Case 5. No significant difference in agreement
appeared between pharmacists and the other professions.
Table 7.25 Agreement model between the principal researcher and participants on the control/provision of medication as a contributing factor using GEE analysis
Variables Odds ratio
95% CI
P-value Lower Upper
Case study
Case 1
Case 2
Case 3
Case 4
Case 5*
2.299
0.439
0.334
0.238
1
0.660
0.123
0.080
0.069
8.006
1.573
1.391
0.897
0.191
0.206
0.132
0.034
Participants’ role
Doctor
Nurse
Pharmacist*
0.522
1.068
1
0.121
0.383
2.247
2.980
0.382
0.900
*Set as a reference
Table 7.26 describes the agreement between the principal researcher and the
participants related to ‘other’ contributing factors. A high incidence of agreement of
more than 70% was seen in Cases 3 and 4 only.
Table 7.26 Agreement between the principal researcher and participants on ‘other’ contributing factors
Variables
Agreement between
researcher and participant,
n (%)
Disagreement between
researcher and participant,
n (%)
Case study (25 participants)
Case 1
Case 2
Case 3
Case 4
Case 5
16 (64.0)
11 (44.0)
19 (76.0)
21 (84.0)
15 (60.0)
9 (36.0)
14 (56.0)
6 (24.0)
4 (16.0)
10 (40.0)
Participants’ role
Doctor (6 participants x 5
cases)
Nurse (11 participants x 5
cases)
Pharmacist (8 participants x
5 cases)
20 (66.7)
32 (58.2)
30 (75.0)
10 (33.3)
23 (41.8)
10 (25.0)
The agreement model using GEE analysis demonstrated that only Case 4 had a
stronger agreement with the principal researcher than Case 5, with other cases
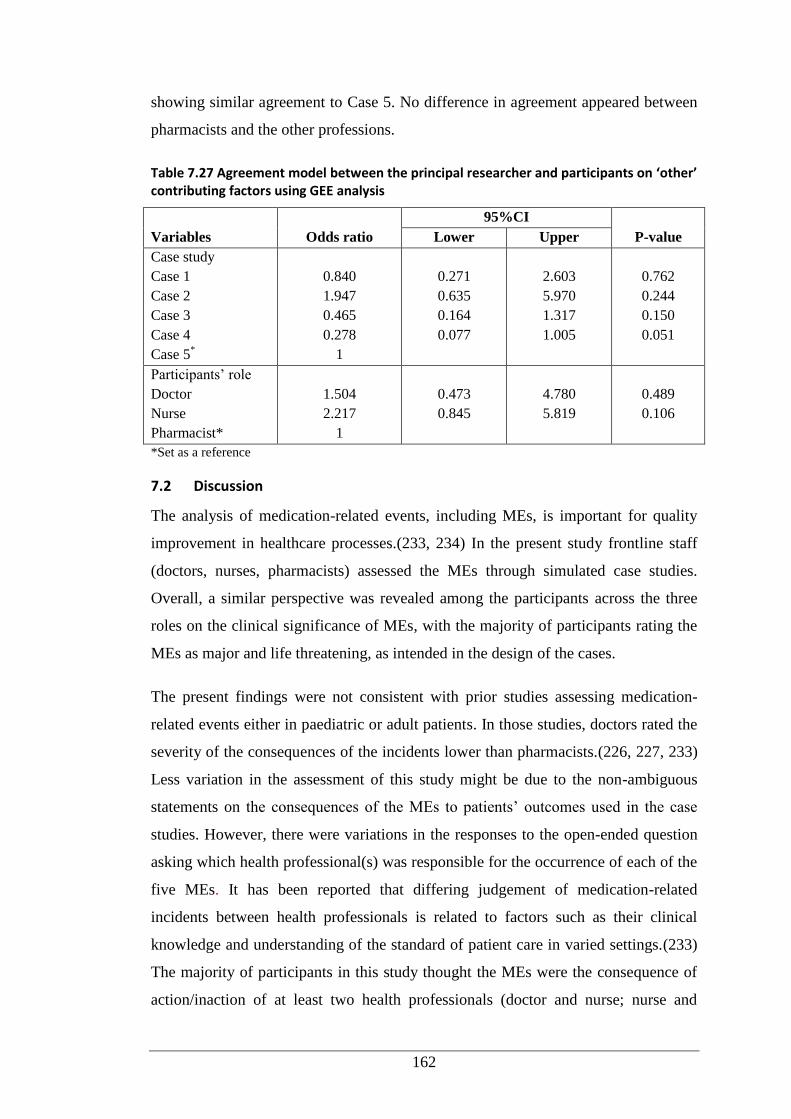
162
showing similar agreement to Case 5. No difference in agreement appeared between
pharmacists and the other professions.
Table 7.27 Agreement model between the principal researcher and participants on ‘other’ contributing factors using GEE analysis
Variables Odds ratio
95%CI
P-value Lower Upper
Case study
Case 1
Case 2
Case 3
Case 4
Case 5*
0.840
1.947
0.465
0.278
1
0.271
0.635
0.164
0.077
2.603
5.970
1.317
1.005
0.762
0.244
0.150
0.051
Participants’ role
Doctor
Nurse
Pharmacist*
1.504
2.217
1
0.473
0.845
4.780
5.819
0.489
0.106
*Set as a reference
7.2 Discussion
The analysis of medication-related events, including MEs, is important for quality
improvement in healthcare processes.(233, 234) In the present study frontline staff
(doctors, nurses, pharmacists) assessed the MEs through simulated case studies.
Overall, a similar perspective was revealed among the participants across the three
roles on the clinical significance of MEs, with the majority of participants rating the
MEs as major and life threatening, as intended in the design of the cases.
The present findings were not consistent with prior studies assessing medication-
related events either in paediatric or adult patients. In those studies, doctors rated the
severity of the consequences of the incidents lower than pharmacists.(226, 227, 233)
Less variation in the assessment of this study might be due to the non-ambiguous
statements on the consequences of the MEs to patients’ outcomes used in the case
studies. However, there were variations in the responses to the open-ended question
asking which health professional(s) was responsible for the occurrence of each of the
five MEs. It has been reported that differing judgement of medication-related
incidents between health professionals is related to factors such as their clinical
knowledge and understanding of the standard of patient care in varied settings.(233)
The majority of participants in this study thought the MEs were the consequence of
action/inaction of at least two health professionals (doctor and nurse; nurse and
163
pharmacist; doctor, nurse and pharmacist). This was in agreement with the intentions
of the researcher when developing the cases. To some extent, the findings of this
study confirmed those of previous studies highlighting the nature of the healthcare
process as being ‘tightly coupled’ and ‘interdependent’, whereby deviations during
the process were likely due to the results of interactions among the care providers
rather than a single person.(2, 271)
In the present setting, the varied responses on the contributing factors indicated
making such judgements is no easy task. Understandably, similar agreement between
the principal researcher and participants were noted in three contributing factors only
in the majority of the cases. However, two contributing factors were frequently
identified by participants in all five cases: dismissal of policies/procedures or
guidelines, and human resources. Miscommunication was mentioned as a
contributing factor in three cases, while patient-specific issue(s) and
control/provision of medication were contributing factors in two cases, and physical
environment a contributing factor in one case. As with this study, RCA of 17 critical
incidents in a children’s hospital in the Netherlands found task and team factors were
the most frequent contributing factors. The task factors were associated with
awareness among the staff regarding the existence of clinical guidelines and/or
hospital protocols, and the implementation of the guidelines/protocols. Team factors
referred to issues that can be resolved through training of team-based human
resources, i.e. supervision, communication and situational awareness. The authors
identified an average of five factors contributing to each incident.(271)
A report on incident management (including medication-related incidents) in the
New South Wales public health system during 2005-2006 was in accordance with
this study’s findings.(272) That study found issues related to policy and procedures
as a major contributing factor to the incidents, and included failure of staff in
following guidelines, standards and regulations, and inadequate policies for
supporting the safety and quality of clinical care. Communication was also a major
contributing factor to the incidents, particularly deficiencies in patient handover
between teams and facilities in the same institution or between institutions.(272)
Communication is also critical during patient admission and discharge, as transition
of patient care is particularly hazardous for introducing MEs.(273) Other
164
contributing factors reported in the Australian study included issues related to staff
knowledge, skills and competence; work environment and staff scheduling;
equipment; safety mechanism; and patient factors.(272)
Consistent with this study, RCA reports on ADEs submitted to the Veteran Affairs
National Center for Patient Safety in the USA in the fiscal year 2004 uncovered
problems with policies or procedures, staff training and education, communication,
and equipment as the common factors contributing to ADEs.(274) Meanwhile,
analysis of ME reports submitted to MedMARx (US national medication error
reporting program) revealed workplace distractions, staffing issues (e.g. shift
changes and locum staff) and workload increases as the most fequently cited
contributing factors related to MEs during hospitalisation.(275)
Interestingly, some RCA studies focused on the proximal causes only, without
accounting for the contributing factors of medication-related incidents.(271, 272,
274) Memory lapses were the most frequent proximal causes of error (23.8%) across
all stages, reaching nearly 50% during administration in an observational study to
detect MEs and ADEs in a paediatric ICU.(276) The major leading system failures
identified and responsible for MEs and ADEs in that study were drug knowledge,
standardisation of procedures, dose and identity checking, and order
transcription.(276) Likewise, a ME study in general medicine and specialty units in a
major US hospital reported most MEs identified were detected during prescribing,
and the root causes were related to deficits in pharmacotherapy knowledge
(particularly about appropriate drug dosing and drug selection) or with failure to
consider critical patient information (e.g. laboratory test results). Furthermore, MEs
during dispensing and administration were mostly due to performance deficits (74%,
e.g. accidental slips and lapses).(277) A brief analysis of clinical pharmacists’
interventions addressing DRP in an Australian hospital found that deficiencies in
knowledge accounted for less than 25% of all DRP cases.(129) In the oncology
setting, the most common cause of chemotherapy-related MEs have been reported as
performance deficits (41.3%), equipment and medication delivery devices (12.4%),
communication (8.8%), knowledge deficit (6.8%) and written order errors
(5.5%).(10) It is beneficial to note that before proceeding to RCA, the majority of
ME studies relied on manual reports of ME incidents, which were under-
165
reported.(271, 272, 274, 277) A recent study promoted the use of an electronic
system of ME reporting, along with automatically mining data from the system, to
provide comprehensive data relating to ME.(278)
As the contributing factors of MEs are numerous, evidence underlines the need for
multiple strategies for ME prevention.(279) Analysis of the common themes of
strategies proposed by participants in this study identified the need for five strategies
to prevent each ME. The most frequently cited strategies included improved
availability and accessibility of hospital policies or clinical guidelines, adequate
staffing and supervision, adequate staff education and training, and improved
communication either between staff or between staff and patient/family. The less
frequently cited strategies were the implementation of technology (e.g. electronic
prescribing and drug stock alert), adequate patient counselling and improved physical
environment (e.g. arranging the medications in the dispensary by therapeutic class
and proper lighting). In line with this study, RCA of serious cases in the
aforementioned Dutch paediatric hospital reported an average of five
recommendations per analysis; most recommendations related to task factors (36%),
and required providing and/or adjusting hospital protocols or guidelines. The other
recommendations were associated with team-based staff training and technical
adjustment to improve the work environment (e.g. quiet area for medication
preparation unit).(271) In addition, the findings in the current study corresponded
well with the strategies for ME prevention in paediatrics recommended by the
American Academy of Pediatrics Committee on Drugs and the Committee on
Hospital Care(280) and the Pediatric Pharmacy Advocacy Group.(281) The
strategies cited in this study also confirmed those reported by Kruk et al.(272)
Although their RCA evaluated the broad spectrum of health incidents, and not
necessarily focusing on medication-related incidents.
Few participants in this study mentioned the use of information technology (IT) as
the solution to prevent MEs. One of the most developed and widely disseminated IT
products is computerised physician order entry (CPOE). A systematic review of MEs
in paediatrics found that the most common type of MEs were dosing-related errors,
which can be minimised by CPOE.(99) Some studies have justified the use of CPOE
166
to decrease MEs in paediatric patients.(53, 237, 282, 283) A similar efficacy of
CPOE can also be seen in adult patients.(284, 285)
Despite success at reducing MEs, IT-based interventions require considerable
financial investment, health professional training, and system maintenance.(284)
Electronic prescribing system support can facilitate the introduction of new types of
prescribing errors, especially during the initial stage of technology deployment and
dissemination.(210, 286)
Clinical pharmacy services is an important adjunct to IT strategies, including in
paediatric settings.(181, 197, 199) Unit-based pharmacists’ active participation
during ward rounds is able to provide real-time information needed by physicians,
just as CPOE provides real-time computerised decision support.(197, 201, 287) In
addition to their role in preventing MEs during prescribing, pharmacists can also
intercept MEs by reviewing medication orders.(207) Their presence can also
facilitate communication between healthcare staff and the pharmacy, assisting nurses
in drug preparation, monitoring drug storage, organising education programs for
other staff and developing drug therapy protocols.(50, 201) Unit-based clinical
pharmacists are generally less costly than most IT-based patient safety
interventions.(288) These pharmacists’ roles were the premise for the observational
and self-documentation pharmacists’ interventions studies reported in Chapter 4 and
Chapter 6, respectively.
As suggested by this study and other RCA, education for healthcare staff is an
important component of ME reduction.(279, 289) According to some studies, staff
with the least training made the most errors.(210, 243, 289) It has been strongly
recommended that staff in paediatric settings, particularly new and junior staff,
receive continuous education and adequate training in the use of paediatric
medications. Regular testing of their knowledge and ability to handle peadiatric
medications should be undertaken to enable review of the training.(242) Pharmacists
with their knowledge and expertise in medication have been known for their role as
educators for other health professionals and their educator role has been justified as
effective ME prevention measures in a range of patient populations.(133, 280)
167
Modification of staff behaviour toward patient safety culture has been regarded as an
essential predictor of safety performance.(290) Major investment in patient safety
reform through education has been conducted in numerous countries. Despite this,
little improvement has been reported. The authors cited a flawed assumption that
knowledge of safety will cause staff to change their behaviour.(290, 291) Wakefield
et al.(290) claimed that behaviour change strategies required influential clinical
leaders to be assigned at unit levels as role models and teachers for implementing
patient safety.
Aside from educating health professionals, it has been recognised that empowering
the patient is a valuable strategy for ME prevention. Healthcare staff should educate
patients to improve their health literacy regarding information on their medical
conditions, medications and healthy lifestyles. Healthcare staff can also encourage
patients to actively participate in their health care by asking questions and expressing
concerns about their health, and review their level of understanding.(27) In the case
of paediatric patients, the involvement of their parents/guardians is important.(73,
292) The participants in the current RCA also underlined the contribution of well-
informed parents/guardians to minimise the occurrence of MEs in most case studies.
The current study also underlined the contribution of pharmacists in educating the
patients along with their parents/guardians about appropriate use of medicines.
Improved communication has also been identified as a valuable solution to minimise
MEs.(271, 274, 293) It is important that all members of the healthcare team,
including pharmacists, are effective communicators with other team members and in
their contact with patients. With respect to supporting clear communication among
health professionals, initiatives have been proposed through improved networking
between hospitals and assignment of the medical position of ‘hospitalist’.
Hospitalists are qualified doctors with additional training to coordinate care for
patients across different departments and manage the transfer of care to other
institutions.(272) These initiatives are important given the critical nature of accurate
patient handover within the same and/or different institutions.(198)
One common issue among healthcare staff is their lack of awareness of hospital
policies and procedures. In the current RCA, it has been suggested that pharmacists
are able to contribute not only to develop policies in medication use (e.g. high-risk
168
drugs, discharge medications), but also to communicate these policies to other staff.
The current study also confirmed the findings of previous RCA studies that identified
the necessity of adequate communication between staff and patients and their
families. Some studies underlined common barriers experienced by the healthcare
staff in communicating with their patients, e.g. language, medical problems and
psychological issues.(79, 84, 294) These barriers in communication, particularly
relating to language and the complexity of patients’ medical conditions, were also
raised by the majority of the RCA participants in the current study. The barriers
should be identified and resolved by pharmacists and other frontline health
professionals, as these barriers will impede the overall quality of patient care,
including increasing the risk of MEs.(271)
7.3 Limitations and Recommendations
There are several limitations to this study. The response rate was low, possibly due to
the perceived time requirement to complete the task, and the study involved a single
institution. A larger number of participants and involvement of other institutions may
reveal different trends in the data on the clinical significance of the MEs, the
contributing factors and participants’ suggestions for ME prevention. Additionally,
the use of simulated case studies and presentation of pre-determined options could
bias the results. The cases were not randomised, and each case was prepared with
different amounts of information. In an authentic RCA, the participants would be
able to obtain additional information to assist their analysis, but it was impossible to
apply a similar process in this study. The assignment of pre-determined answers was
influenced by the researcher’s clinical knowledge and experience, and others may
give different assessments.
Future research could trial a number of RCA approaches (e.g. in-depth interview,
focus group discussion) with frontline staff and hospital managers in order to gather
diverse perceptions about the contributing factors and ‘strong’ strategies to minimise
ME.
Additionally, the RCA framework to prevent ME and improve patient safety should
be validated by comparing it with other analysis tools such as the Commercial
Aviation Safety Team (CAST) and Failure and Mode Effect Analysis.(295, 296) The
169
implementation of the CAST framework in particular will enable future research to
prioritise the findings of the contributing factors.
7.4 Conclusions
Consistent with other RCA studies, the most common contributing factors perceived
by participants were the dismissal of hospital policies/procedures/clinical guidelines
and human resources-related issues. Meanwhile, strategies related to development of
policy/procedures/guidelines, staff education/training, staffing and communication
were the most commonly cited preventive actions, in line with the majority of other
studies. Indeed, pharmacists through their clinical services are an important strategy
for preventing the occurrence of ME.
170
Chapter 8
OVERALL DISCUSSION
This chapter comprises three sections. The major findings presented in Chapters 4, 5,
6 and 7 are summarised in Section 8.1, with a global discussion of the study in
Section 8.2. The limitations of this study, along with recommendations for future
research, are described in Section 8.3.
8.1 Synthesis of Major Findings
In Part One of the study, a total of 982 interventions were observed and documented
by the principal researcher, which arose from the 16,700 medication orders reviewed
by the clinical pharmacists on the five study wards. The intervention rates ranged
from 4.38 to 10.48 interventions per 100 medication orders reviewed across the
wards. The intervention rates in this study were higher than reported by other
paediatric intervention studies conducted in a range of settings using self-
documentation.(94, 184, 199, 201) Poisson regression modelling identified
significant differences in intervention rates between the wards (p<0.001). The
highest rate of interventions was documented on the General Surgical Ward,
followed by the General Medical Ward for Infants, the Haematology-Oncology
Ward, the General Medical Ward for Adolescents and the General Medical Ward for
Young Children. The model also showed that the rates of interventions significantly
differed according to the employment level of the observed pharmacists (p<0.01),
and longer time spent on the ward was associated with a higher rate of interventions
(p<0.001). Taking medication histories and/or patient counselling were the most
common interventions performed by the clinical pharmacists on the general medical
and surgical wards, with these activities constituting more than half of all
interventions. While on the Haematology-Oncology Ward here, drug therapy
changes were the most common interventions; around 37% of all interventions.
Active interventions were defined as interventions resulting in drug changes. The
rate of active interventions on the Haematology-Oncology Ward was significantly
higher than the general medical wards (p<0.001), but not the general surgical ward
(p=0.34). Active interventions constituted less than one-quarter of all interventions
on the general medical and surgical wards, compared to 46.2% (p<0.001) on the
171
Haematology-Oncology Ward. For all active interventions, the degree of acceptance
was high, at around 90% (n=223/244). Rates of active interventions were not
significantly associated with the pharmacists’ employment level (p<0.4) or the time
spent on the ward (p<0.2). Adjusting the dose was the most frequent active
interventions on both the general medical and surgical wards. A slightly different
pattern was found on the Haematology-Oncology Ward, where interventions to
prescribe medications regularly in place of prn constituted the most common active
interventions (40.0%), followed by dosing adjustment (26.7%).
As for the drug classes implicated in active interventions, anti-infectives were most
commonly associated with active interventions (n=100, 41.0%), followed by
analgesics (n=46, 18.9%), gastrointestinal drugs (n=36, 14.8%), and
immunomodulators/antineoplastics (n=21, 8.6%). Three variables significantly
predicted the acceptance of the intervention: patients’ age (OR 0.89; 95%CI 0.81-
0.98), non-high-risk medications (OR 2.80; 95%CI 1.09-7.17) and pharmacists’
experience (OR 1.11; 95%CI 1.03-1.20).
Data collection in the Haematology-Oncology Pharmacy provided an interesting
contrast between the nature of interventions during dispensing and during ward
rounds. There were 359 interventions observed and documented by the principal
researcher during the dispensing of 1791 medications in the Haematology-Oncology
Pharmacy. The rates of interventions were 21.29 per 100 medication orders reviewed
and 35.18 per 100 patients. Less than 10% of pharmacists’ interventions were
classified as active. All of the active interventions were accepted by the physicians.
The rates of interventions during dispensing were higher than on the five study
wards, presumably due to more time allocation and varied clinical services that can
be provided during dispensing. Most commonly, the interventions involved
pharmacists providing drug information to resolve DRPs; more than three-quarters of
interventions. Immunomodulators/antineoplastics accounted for the majority of
medications associated with active interventions (n=18/22, 81.8%). It is critical to
ensure these potent drugs are prescribed and dispensed appropriately; accounted for
the high percentage of these drugs involved in the interventions in this setting.
A random sample of 42 (15.8%) of the 266 pharmacists’ active interventions (244
during pharmacy ward rounds on the five study wards and 22 during dispensing in a
172
Haematology-Oncology Pharmacy) from Part One were selected for expert panel
assessment of clinical significance and contribution to medication misadventure in
Part Two. Review of the sample interventions revealed the majority (n=37/42,
88.1%) of the active interventions were considered clinically significant, although no
intervention was thought to be life saving. Panel assessment indicated that the
majority of the active interventions were performed to address medication
misadventure, and the strength of agreement was ‘fair’(192) (α=0.321). ‘Fair’(192)
agreement was also noted when assigning each case medication misadventure
category (i.e. ADE, ADR, ME) and classifying the types of ME. However, the
strength of agreement was ‘slight’(192) (α=0.154) when the panellists judged the
severity of ME.
Part Three of the research stage involved comparison of two pharmacists’
intervention documentation methods: direct observation (Part 1) and self-reports
using a hard-copy form. A total of 398 interventions were self-reported from 1022
medication charts that were reviewed by pharmacists. Of all the interventions, around
18% (n=70/398) were considered active interventions. Comparison of the rates of
interventions during the snapshot self-report periods (Part Three) and direct
observation (Part One) showed no significant difference in the two methods.
However, comparison of the active interventions between snapshot and observation
periods revealed the rate of documentation of active interventions was significantly
higher during direct observation than snapshots (snapshot 6.7 [95%CI 4.3–9.2] per
100 medication charts reviewed vs. observation 15.1 [95%CI 10.0–20.2] per 100
medication charts reviewed, p=0.002). In terms of the types of interventions,
clarification of medication orders was the most common type of intervention self-
reported by pharmacists. When the pattern of all interventions and active
interventions during the direct observation period were compared with the self-
reports, it was apparent that the interventions across the study wards were not
comparable. This finding will be discussed in Section 8.2.
The reasons for differences in the nature of pharmacists’ interventions between those
documented during direct observation and the self-reports were explored using a
FGD involving eight pharmacists. Pharmacists identified a number of barriers to
routinely documenting their interventions, such as time constraints, fatigue, heavy
173
workload, and staffing deficiencies. However, the majority of pharmacists thought
self-report documentation inadequately reflected their contribution to patient care
and their workload. They postulated that switching the of snapshot self-report
timings to busy periods instead of hospital downtimes (as was the case) would be
worthwhile. The pharmacists also proposed a hybrid system of continuous
documentation during certain periods by an independent observer, plus the existing
snapshot self-report documentation.
An RCA was conducted in Part Four, with the distribution of 111 RCA
questionnaires to a stratified sample of doctors, nurses and pharmacists. Each
questionnaire comprised five simulated cases for review; responses were received
from 22.5% of those surveyed. The simulated cases represented sentinel events based
on authentic features of the study hospital’s policies/procedures and represented a
range of MEs. The majority of the participants rated the clinical significance of MEs
as moderate to life threatening. Determination of the responsible health
professional(s) varied in each case. Similarly, the participants’ perceptions on
contributing factors to the ME also varied across the five cases. Two common
contributing factors emerged: dismissal of policies/procedures or guidelines, and
human resources issues. Some common suggestions for preventive action across the
five cases included: improving availability and accessibility of clinical guidelines; ;
strict hospital policies/protocol for medication use during prescribing, transcribing,
dispensing, administration and monitoring; adequate number of staff with
appropriate education and training/competencies, along with adequate staff
supervision; and improved communication between staff, and between staff and the
patient and/or family.
An agreement model on the contributing factors, between the participants and the
principal researcher on a case-by-case basis was developed using GEE analysis. This
model determined if the participants’ perceptions on the contributing factors
conformed to the anticipated answer pre-determined by the researcher. The GEE
analysis found that the same pattern of agreement was observed for human resources
issues, control/provision of medication, and ‘other’ contributing factors. The
participants and the principal researchers were in agreement for all of the cases
except Case 4 (described monitoring error). Meanwhile, a different pattern of
174
agreement developed for patient-specific issues and miscommunication. While two
contributing factors - dismissal of policies/procedures or guidelines and physical
environment of the health service - were not able to be fitted with the model.
8.2 Overall Discussion
The role of clinical pharmacists in paediatric healthcare settings is well
established,(17, 181, 197, 199, 204) and their interventions to address medication-
related issues can avert misadventure.(17, 204, 254) A number of studies support the
role of pharmacists to avert misadventure in paediatric patients.(94, 184, 197, 201,
207) Until the time of this study, interventions had not been researched in detail in
this hospital, despite it being one of major referral children’s hospitals in Australia
and providing specialist services including haematology-oncology. The hospital had
in situ snapshot self-report documentation of pharmacists’ interventions. However,
the interventions data had not been analysed, and no outcome and feedback had been
provided to the reporting pharmacists.
The current study adds to the body of knowledge by confirming the significant role
of pharmacists in undertaking clinical interventions, especially those leading to
change in drug therapy (active interventions) to minimise the occurrence of
medication misadventure in paediatrics. This was achieved through a series of stages
involving direct observation of pharmacists’ interventions during ward rounds and
dispensing; panel assessment of clinical significance of pharmacists’ active
interventions and medication misadventure detected through the active interventions;
comparison of two intervention documentation methods; and RCA of simulated
cases of ME. Collectively, this approach enabled investigation of pharmacists’
contribution to medication safety, especially through interventions leading to drug
changes in a range of paediatric settings.
This study uniquely used direct observation to measure the rate and pattern of
pharmacists’ interventions in a range of paediatric settings. Previous studies used
self-documentation, and recognised the limitations of this approach, such as bias and
under-reporting. This is the first known study to analyse and compare the
interventions between direct observation and snapshot self-documentation. The
comparative data have been presented and discussed with the pharmacy staff and the
Director of Pharmacy in the study hospital and has resulted in improved
175
documentation, with the medication safety pharmacist undertaking direct observation
to validate intervention data from the existing snapshot self-documentation. In
addition, pharmacy staff in the study hospital now organise regular meetings to
discuss the collated intervention data from the snapshot periods.
Pharmacists’ interventions studies have been conducted in a range of paediatric
clinical settings.(94, 197, 199) However, the majority have combined and analysed
the data without exploring the influence of the clinical setting on the nature of the
interventions. The current study uncovered that the clinical settings impacted on the
rate and pattern of the interventions between general and specialty units. The
haematology-oncology unit produced a higher rate of active interventions than the
general medical and surgical units. As with other paediatric studies(184, 197, 199)
dosing-associated interventions were predominantly noted in the general units. A
distinct pattern emerged in the haematology-oncology unit, where drug additions to
resolve untreated indications accounted for the major active interventions. More
active interventions and the different pattern of interventions were possibly related to
the specialist pharmacists assigned to the haematology-oncology unit. The
haematology-oncology pharmacists were appointed in this unit on a permanent basis.
These specialist pharmacists were well informed about the patients’ medical
conditions and medication regimens, including their chemotherapy protocols and
supportive medications (e.g. antiemetics, antifungals). Thus, the haematology-
oncology pharmacists, when delivering the clinical services, were able to identify
DRPs and intervene through drug therapy changes.
The assessment of the sample of pharmacists’ active interventions revealed that the
majority of the interventions were clinically significant and interceptive of
medication misadventure. At the time of writing, as the study hospital had not
implemented electronic prescribing, pharmacists engaging in clinical services (e.g.
taking medication histories, medication reconciliation and review of medication
charts) either during ward rounds or dispensing contributed even more to ensure
medication safety for patients. As with the current study, studies have showed that
the active interventions during ward rounds were effective in changing therapeutic
decisions and intercepting MEs in paediatric patients.(139, 197, 201) A systematic
review highlighted that pharmacists’ review of medication charts is crucial to
176
identification of MEs; it is possibly the most effective method of improving drug
safety in children.(207) This evidence can be applied to ward-based pharmacy
practice and also during dispensing.
Pharmacists’ interventions require appropriate and adequate documentation to
substantiate their contribution to patient care and build a body of evidence that
clinical pharmacists play substantial roles within the medication use process. The
direct observation approach undertaken in the current study enabled gathering of the
number and pattern of pharmacists’ interventions during ward rounds and dispensing.
Higher rates of active interventions were found when the ward pharmacists were
directly observed than those self-reported during snapshot periods. The study
hospital may consider modifying their existing intervention documentation method to
optimise data collection.
System breakdown can be analysed and improved by implementing RCA. Health
system breakdown can be manifested in MEs. Implementation of RCA can identify
the causes and contributing factors of medication misadventure, along with solutions
to prevent recurrence of the misadventure.(12) The current study may have
benefitted if the RCA had utilised authentic cases instead of simulated cases of
intercepted MEs. This was not feasible due to medico-legal and ethical reasons.
The RCA used in this study served to assess theoretically the clinical significance of
MEs described in the simulated cases, and to explore the contribution of pharmacists
in preventing MEs. Nearly all of the surveyed participants concurred that the MEs in
the five cases were sentinel events. The majority of the participants also identified
more than one profession being responsible for the MEs. This is consistent with
published RCA studies demonstrating the need for shared responsibility among
health professionals of different disciplines.(271, 272, 274) The RCA in this study
did not require that participants convene a formal meeting to discuss the cases. Thus,
the data can be considered independent, notwithstanding participants discussing and
completing the cases with colleagues. Varied responses relating to the contributing
factors and preventive strategies were noted among the RCA participants.
The current study also showed that frontline health professionals are able to
undertake RCA. Participants in this study have become familiar with RCA as a tool
177
for system improvement. The RCA provided further evidence supporting the role of
pharmacists in provision of clinical services, e.g. development and dissemination of
drug therapy protocols, facilitated communication between healthcare staff and the
pharmacy, education of other healthcare professionals, and provision of counselling
to patients and parents/guardians. Occurrences of medication misadventure
identified in routine clinical services can be intercepted and resolved by pharmacists
through their interventions, highlighting their role in reducing medication
misadventure.
8.3 Limitations and Recommendations
This is the first study to compare pharmacists’ interventions in a range of settings in
paediatrics in terms of frequency, type, degree of acceptance, clinical significance
and causative medications. However, a number of limitations need to be
acknowledged. This study was conducted in one paediatric hospital, which
diminishes the generalisability of the findings. Another limitation is the difficulty in
drawing accurate comparisonss with other studies due to considerable variations in
settings, design, duration, size and method.
During direct observation, data were collected on non-consecutive days to avoid
pharmacist observation fatigue influencing the pattern of interventions. In relation to
assessment of clinical significance of samples of pharmacists’ active interventions
and identification of medication misadventure, the expert panellists were selected for
convenience after considering their clinical knowledge and professional experience.
Further to the limitation relating to the use of simulated RCA cases, the low response
rate and non-randomisation of the cases may not ideally represent the responses on
the clinical significance of MEs, the contributing factors and suggestions for ME
prevention.
Future studies might consider employing consecutive observation of pharmacists’
interventions, more clinical units and other children’s hospitals to further confirm
variations in rates and patterns of pharmacists’ clinical interventions. It would also be
beneficial for future studies to evaluate the association between acceptance of the
interventions and their impact on patient outcome in order to justify the value of the
interventions to patient care.
178
It is recommended that in future studies panellists randomly selected from eligible
experts that represent doctors, nurses and pharmacists assess pharmacists’ active
interventions. Therefore, the tendency of the researcher to select experts with similar
opinions or because of convenience will be reduced, with benefits for validity of the
research. Furthermore, use of a larger number of active interventions would allow
comprehensive understanding of the pattern of active interventions and medication
misadventure in paediatrics. When conducting analysis of medication misadventure,
future studies may also consider involving the hospital management, as well as
frontline health professionals, and applying different RCA approaches and other
system analysis tools as described earlier.
179
Chapter 9
CONCLUSIONS
This study aimed to evaluate the contribution of pharmacists’ interventions to
reduction of medication misadventure in children with cancer.
Documentation and evaluation of clinical interventions in this study provides
evidence that pharmacists can play an important role in optimising patient care
through their clinical services during ward rounds and dispensing in general and
specialty haematology-oncology settings. Direct observation of pharmacists’
interventions in this study offers a novel approach to recording the rate and pattern of
the interventions witnessed by the researcher during defined periods, as an
alternative to reliance on self-documentation by practitioners. The rate and types of
pharmacists’ active interventions, addressing Objectives 1 and 2 in Part 1 of this
thesis, differed between clinical settings, being most frequent in the specialty
haematology-oncology setting. Patients’ age, type of medication (high risk/non-high
risk) and pharmacists’ experience were identified as predictors for physicians’
acceptance of ward-based pharmacists’ active interventions. Furthermore, this study
achieved the two objectives of Part 2 by systematically assessing the clinical
significance of pharmacists’ active interventions, defined as interventions leading to
changes in drug therapy, and the role of clinical pharmacists through their active
interventions to identify and resolve medication misadventure-related events, in
particular, ME. Identification of the nature of medication misadventure through
pharmacists’ active interventions can provide direction to improvements in the
medication use process in this patient population.
To date, there has been a paucity of literature comparing self-report and observation
for documentation of pharmacists’ interventions in paediatrics. Part 3 of the current
study compared the intervention documentation approaches (direct observation
versus short-term self-report). The current study found self-report by pharmacists
during snapshot recording periods was not representative of the interventions
documented during direct observation by the researcher. This questions the value of
self-documentation and proposes a need for improved methods of documentation.
This study also provided insight into pharmacists’ barriers to documenting their
180
interventions. Standardisation of intervention documentation, improved utilisation of
the intervention data and modification of the existing self-documentation approach
are suggested to improve the documentation of pharmacists’ interventions.
The two objectives of Part 4 of this study related to exploration of the clinical
significance, along with contributing factors and resolution, of medication-related
errors, using five scenarios and the perspectives of three groups of health
professionals: pharmacists, nurses and doctors. Involvement the frontline healthcare
professionals, instead of a team of system analysis experts – as described in the
majority of studies of RCA – to analyse the scenarios, adds value to this study.
Through their interaction with patients during routine practice, frontline health
professions provide insight into sectors of the healthcare system and processes that
need to be improved to minimise ME in children.
Pharmacists, as the medication experts and part of frontline health care professionals,
can participate in improving medication safety through delivery of clinical services,
including (but not limited to) ensuring hospital policies/guidelines are followed to
ensure appropriate medication use, and by providing drug information services for
other frontline staff and educating patients/carers. At the same time, ongoing
documentation, analysis and review of these clinical interventions remain critical.
181
References
1. Medication safety: The University of Michigan; 2002 [updated 22 March 2011]. Available from: http://www.med.umich.edu/patientsafetytoolkit/medication/chapter.pdf. 2. Donaldson MS, Kohn L, Corrigan JM, editors. To err is human : building a safer health system. Washington, DC: National Academic Press; 1999. 3. Semple SJ, Roughead EE. Medication safety in acute care in Australia : where are we now? Part 2: a review of strategies and activities for improving medication safety 2002-2008. Australian and New Zealand Health Policy. 2009;6:1-11. 4. Ajdukovic M, Crook M, Angley C, Stupans I, Soulsby N, Doecke C, et al. Pharmacist elicited medication histories in the Emergency Department: identifying patient groups at risk of medication misadventure. Pharmacy Practice. 2007;5:162-8. 5. Costello JL, Torowicz DL, Yeh TS. Effects of a pharmacist-led pediatrics medication safety team on medication-error reporting. American Journal of Health-System Pharmacy. 2007;64:1422-6. 6. Kaushal R, Bates DW, Landrigan C, et al. Medication errors and adverse drug events in pediatric inpatients. Journal of American Medical Association. 2001;285:2114-20. 7. Baranowicki P, O'Neill J, Dwyer J. Improving complex medication systems : an interdisciplinary approach. The Journal of Nursing Administration. 2003;33:199-200. 8. Robinson D, Heigham M, Clark J. Using failure mode and effect analysis for safe administration of chemotherapy to hospitalized children with cancer. Joint Commission Journal on Quality and Patient Safety. 2006;32:161-6. 9. Holdsworth MT, Fichtl RE, Behta M, Raisch DW, Mendez-Rico E, Adams A, et al. Incidence and impact of adverse drug events in pediatric inpatients. Archives of Pediatric and Adolescent Medicine. 2003;157:60-5. 10. Rinke ML, Shore AD, Morlock L. Characteristics of pediatric chemotherapy medication errors in a national reporting database. Cancer. 2007;110:186-95. 11. Boyle DA, Schulmeister L, Lajeunesse JD, Anderson RW. Medication misadventure in cancer care. Seminar in Oncology Nursing. 2002;18:109-20. 12. National Initiative for Children's Health Care Quality Project Advisory Committee. Principles of patient safety in pediatrics. Pediatrics. 2001;107:1473-5. 13. Ross LM, Wallace J, Paton JY. Medication errors in a paediatric teaching hospital in the UK: five years operational experience. Archives of Disease in Childhood. 2000;83:492-7. 14. Fortescue EB, Kaushal R, Landrigan CP, McKenna KJ, Clapp MD, Federico F, et al. Prioritizing strategies for preventing medication errors and adverse drug events in pediatric inpatients. Pediatrics. 2003;111:722-9. 15. Leape LL, Cullen DJ, Clapp MD, Burdick E, Demonaco HJ, Erickson JI, et al. Pharmacist participation on physician rounds and adverse drug events in the intensive care unit. Journal of American Medical Association. 1999;282:267-70. 16. Kane SL, Weber RJ, Dasta JF. The impact of critical care pharmacists on enhancing patient outcomes. Intensive Care Medicine. 2003;29:691-8. 17. Krupicka MI, Bratton SL, Sonnenthal K. Impact of a pediatric pharmacists in the pediatric intensive care unit. Critical Care Medicine. 2002;30:919-21. 18. Dooley MJ, Allen KM, Doecke CJ, Galbraith KJ, Taylor GR, Bright J, et al. A prospective multicentre study of pharmacist initiated changes to drug therapy and patient management in acute care government funded hospital. British Journal of Clinical Pharmacology. 2003;57:513-21. 19. Rooney JJ, Heuvel LV. Root cause analysis for beginners. Quality Progress. 2004;37:45-53. 20. Wu AW, Lipshutz AKM, Pronovost PJ. Effectiveness and efficiency of root cause analysis in medicine. Journal of American Medical Association. 2008;299:685-7.
182
21. Wallace LM. From root cause analysis to safer systems : international comparison of nationally sponsored healthcare staff training programmes. Quality and Safety in Health Care. 2006;15:400-2. 22. Tang CW, Feng WM, Bao Y, Zhu Y. Medication safety for children in China. The Lancet. 2014;383:1462-8. 23. Roughhead L, Semple S, Rosenfeld E. Literature review: medication safety in Australia. Sydney: Australian Commission on Safety and Quality in Health Care, 2013. 24. Kimland E, Nydert P, Odlind V, Battiger Y, Lindermalm S. Paediatric drug use with focus on off-label prescriptions at Swedish hospital - a nationwide study. Acta Paediatrica. 2012;10:772-8. 25. Hoppo K, Anabwani G, Garcia-Bournissen F, Gazarian M, Kearns GL, Nakamura H. The status of paediatric medicine initiatives around the world - what has happened? what has not? European Journal of Clinical Pharmacology. 2012;68:1-10. 26. Aronson J. Medication errors: definitions and classification. British Journal of Clinical Pharmacology. 2009;67:599-604. 27. American Society of Health-System Pharmacists. Suggested definitions and relationships among medication misadventures, medication errors, adverse drug events, and adverse drug reactions. American Journal of Health-System Pharmacy. 1998;55:165-6. 28. Otero MJ, Schmitt E. Clarifying terminology for adverse drug events. Annals of Internal Medicine. 2005;142:77-8. 29. Manasse HR. Medication use in an imperfect world drug misadventuring as an issue of public policy. part 1. American Journal of Health-System Pharmacy. 1989;46:929-44. 30. Malone PM, editor. Drug information : a guide for pharmacists. 3rd ed. New York: McGraw-Hill; 2006. 31. Kilbridge P, Noirot L, Reichley R, Berchelmann K, Schneider C, Heard K, et al. Computerized surveillance of adverse drug events in a pediatric hospital. Journal of the American Medical Informatics Association. 2009;16:607-12. 32. Bates DW, Cullen DJ, Laird N, Petersen LA, Small SD, Servi D, et al. Incidence of Adverse Drug Events and Potential Adverse Drug Events. Journal of American Medical Association. 1995;274:29-34. 33. Tam KWT, Kwok HK, Fan YMC, Tsui KB, Ng KK, Ho KYA, et al. Detection and prevention of medication misadventures in general practice. International Journal for Quality in Health Care. 2008;20:192-9. 34. Bates D, Boyle D, Vliet M, Schneider J, Leape L. Relationship between medication errors and adverse drug events. Journal of General Internal Medicine. 1995;10:199-205. 35. National Coordinating Council for Medication Error Reporting and Prevention. About medication error 1998. Available from: http://www.nccmerp.org/aboutMedErrors.html. 36. Cohen MR. Risk management of medication errors must include a careful look at the specific systems involved. Hospital pharmacy. 1996;31:454-62. 37. Kopp BJ, Erstad BL, Allen ME. Medication errors and adverse drug events in an intensive care unit : direct observation approach for detection. Critical Care Medicine. 2006;34:415-25. 38. World Health Organization. International drug monitoring: the role of national centres. Geneva: 1972. 39. Trinkle R, Wu J. Errors involving pediatric patients receiving chemotherapy : a literature review. Medical and Pediatric Oncology. 1996;26:344-51. 40. Roughead EE, Semple SJ. Medication safety in acute care in Australia : where are we now? Part 1 : a review of the extent and causes of medication problems 2002-2008. Australia and New Zealand Health Policy. 2009;6:18. 41. Kalisch LM, Caughey GE, Roughead EE, Gilbert AL. The prescribing cascade. Australian Prescriber. 2011;34:162-6.
183
42. Nebekker JR, Barach P, Samore MH. Clarifying adverse drug events : a clinician's guide to terminology, documentation and reporting. Annals of Internal Medicine. 2004;140:795-801. 43. Tam KWT, Kwok KH, Fan YMC, Tsui KB, Ng KK, Ho KYA. Detection and prevention of medication misadventures in general practice. International Journal for Quality in Health Care. 2008;20:192-9. 44. Classen DC, Pesstotnik SL, Evans ES, Lloyd JF, Burke JP. Adverse drug events in hospitalized patients : excess length of stay, extra costs and attributable mortality. Journal of American Medical Association. 1997;277:301-6. 45. Lewis PJ, Dornan T, Taylor D. Prevalence, incidence and nature of prescribing errors in hospital inpatients : a systematic review. Drug Safety. 2009;32:379-89. 46. Runciman WB, Roughead EE, Semple SJ, Adams RJ. Adverse drug events and medication errors in Australia. International Journal for Quality in Health Care. 2003;15:i49-i59. 47. Runciman WB. Lessons from the Australian patient safety foundation: setting up a national patient safety surveillance system—is this the right model? Quality and Safety in Health Care. 2002;11:246-51. 48. Lazarou J, Pomeranz BH, Corey PN. Incidence of adverse drug reactions in hospitalized patients : a meta-analysis of prospective studies. Journal of American Medical Association. 1998;279:1200-5. 49. Ghaleb MA, Barber N, Franklin BD, Wong ICK. The incidence and nature of prescribing and medication administration errors in paediatric inpatients. Archives of Disease in Childhood. 2010;95:113-8. 50. Kaushal R, Bates DW, Landrigan C, McKenna KJ, Clapp MD, Federico F, et al. Medication errors and adverse drug events in pediatric inpatients. Journal of American Medical Association. 2001;285:2114-20. 51. France DJ, Cartwright J, Jones V, Thompson V, Whitlock JA. Improving pediatric chemotherapy safety through voluntary incident reporting: lessons from the field. Journal of Pediatric Oncology Nursing. 2004;21:200-6. 52. Miller MR, Robinson KA, Lubomski LH, Rinke ML, Pronovost PJ. Medication errors in paediatric care: a systematic review of epidemiology and an evaluation of evidence supporting reduction strategy recommendations. Quality and Safety in Health Care. 2007;16:116-26. 53. Kaushal R, Jaggi T, Walsh K, Fortescue EB, Bates DW. Pediatric medication errors: what do we know? what gaps remain? Ambulatory Pediatrics. 2004;4:73-81. 54. Schumock GT. Methods to assess the economic outcomes of clinical pharmacy services. Pharmacotherapy. 2000;20:S243-S52. 55. Physician Insurers Association of America. Medication errors symposium white papers. Washington, DC: Physician Insurers Association of America, 2000. 56. Johnson JA, Bootman JL. Drug-related morbidity and mortality and the economic impact of pharmaceutical care. American Journal of Health-System Pharmacy. 1997;54:554-8. 57. Bates DW, Spell N, Cullen DJ. The costs of adverse drug events in hospitalized patients. Journal of American Medical Association. 1997;277:307-11. 58. Department of Health. An organisation with a memory. London: Stationery Office, 2000. 59. Australian Institute of Health and Welfare. Australian Hospital Statistics 1999-00. Canberra: 2002. 60. World Health Organization. World alliance for patient safety : forward programme. France: World Health Organization, 2004. 61. American Society of Hospital Pharmacists. ASHP guidelines on preventing medication errors in hospitals. American Journal of Hospital Pharmacy. 1993;50:305-14.
184
62. Leape LL, Bates DW, Cullen DJ. System analysis of adverse drug events. Journal of American Medical Association. 1995;274:35-43. 63. Joint Commission on Accreditation of Healthcare Organizations. Sentinel event statistics 2002. Available from: http://www.jcaho.org/accredited+organizations/ambulatory+care/sentinel+events.htm. 64. Taxis K, Dean B, Barber M. Causes of intravenous medication errors: an ethnographic study. Quality and Safety in Health Care. 2003;12:343-8. 65. Lesar T, Briceland L, Stein D. Factors related to errors in medication prescribing. Journal of American Medical Association. 1997;277:312-7. 66. Likic R, Maxwell SRJ. Prevention of medication errors: teaching and training. British Journal of Clinical Pharmacology. 2009;67:656-61. 67. The United States Pharmacopeial Convention. Summary of information submitted to MedMARx in the year 2002: charting a course for change. 2002. 68. Stebbing C, Wong ICK, Kaushal R, Jaffe A. The role of communication in paediatric drug safety. Archives of Disease in Childhood. 2007;92:440-5. 69. Williams MV, Parker RM, Baker DW. The role of health literacy in patient-physician communication. Family Medicine. 2002;34:383-9. 70. Dean B, Schachter M, Vincent C, Barber N. Prescribing errors in hospital inpatients: their incidence and clinical significance. Quality and Safety in Health Care. 2002;11:340-4. 71. Wright K. Student nurses need more math to improve their drug calculating skills. Nurse Education Today. 2007;27:278-85. 72. Preston R. Drug errors and patient safety: the need for a change in practice. British Journal of Nursing. 2004;18:201-5. 73. Stebbing C, Wong ICK, Kaushal R, Jaffe A. The role of communication in paediatric drug safety. Archives of Disease in Childhood. 2007;92:440-5. 74. Angley M, Ponniah A, Bong J, Padhye V, Shakib S, Spurling L. Implementing and evaluating a parallel post-discharge home medicines review (HMR) model: The Pharmacy Guild of Australia; 2010. Available from: http://www.guild.org.au/iwov-resources/documents/The_Guild/PDFs/CPA%20and%20Programs/4CPA%20General/IIG-011/IIG011%20Final%20Report.pdf. 75. Wong ICK, Basra N, Yeung V, et al. Supply problems of unlicensed and off-label medicines after discharge. Archives of Disease in Childhood. 2006;91:686-8. 76. Nutbeam D. Health literacy as a public health goal: a challenge for contemporary health education and communication strategies into the 21st century. Health Promotional International. 2000;15:259. 77. Dolder CR, Lacro JP, Leckband S, et al. Interventions to improve antipsychotic medication adherence : review of recent literature. Journal of Clinical Psychopharmacology. 2003;23:389-99. 78. Tates K, Meeuwesen L. Doctor-parent-child communication: a review of the literature. Social Science and Medicine. 2001;52:839-59. 79. Kripalani S, LeFevre FP, Williams MV, Basaviah P, Baker DW. Deficits in communication and information transfer between hospital-based and primary care physicians: implications for patient safety and continuity of care. Journal of American Medical Association. 2007;297:831-41. 80. Joint Commission on Accreditation of Healthcare Organizations. National patient safety goals 2003. Available from: http://www.jcaho.org/accredited+organizations/patient+safety/npsg/npsg_03.htm. 81. Krass I, Smith C. Impact of medication regimen reviews performed by community pharmacists for ambulatory patients through liaison with general medication practitioners. International Journal of Pharmacy Practice. 2000;8:111-20. 82. Safety and Quality Council. Second national report on patient safety, improving medication safety. Canberra: Australian Council for Safety and Quality in Health Care, 2002.
185
83. Davis NM. Performance lapses as a cause of medication errors. Hospital Pharmacy. 1996;31:1524-5. 84. Fu-In T, Shuh C, Jen S, Shu Y, Ien-Lan W, Ching-Huey C. Nurses relate the contributing factors involved in medication errors. Journal of Clinical Nursing. 2007;16:676. 85. Steering Committee on Quality Improvement Management and Committee on Hospital Care. Principles of pediatric patient safety: reducing harm due to medical care. Pediatrics. 2011;127:1199-210. 86. American Society of Hospital Pharmacists. ASHP guidelines on preventing medication errors in hospitals. Am J Hosp Pharm. 1993;50:305-14. 87. The Joint Commission. Sentinel event alert : preventing pediatric medication errors Washington D C: The Joint Commission; 2008. Available from: http://www.jointcommission.org/assets/1/18/SEA_39.pdf. 88. Dundee FK, Dundee DM, Noday DM. Pediatric counseling and medication management services : Opportunities for community pharmacists. Journal of American Medical Association. 2002;42:556-67. 89. Wassmer E, Minnaar G, Abdel AN. How do paeditricians communicate with children and parents? European Journal of Pediatrics. 2004;93:1501-6. 90. Rowe C, Koren T, Koren G. Errors by paediatric residents in calculating drug doses. Archives of Disease in Childhood. 1998;79:56-8. 91. Yappe SJ, Aranda JV. Neonatal and Pediatric Pharmacology. Therapeutic Principles in Practice. 3rd ed. Philadelphia: Lippincott Williams and Wilkins; 2005. 92. Blumer JL, Reed MD. Neonatal pharmacology. In: Aranda JS, editor. Neonatal and pediatric pharmacology : therapeutic principle in practice. 3rd ed. Philadelphia: Lippincott, Williams and Wilkins; 2005. 93. Kearns GL. Developmental pharmacology : drug disposition, action and therapy in infants and children. New England Journal of Medicine. 2003;349:1157. 94. Chan DS, Kotzin DA. Adult vs paediatric clinical intervention trends : a four year retrospective report. Journal of Pediatric Pharmacy Practice. 1998;3:144-9. 95. Kozer E, Scolnik D, MacPherson A. Using a preprinted order sheet to reduce prescription errors in pediatric emergency department : a randomized, controlled trial. Pediatrics. 2005;116:1299-302. 96. Sheridan-Leos N, Schulmeister L, Hartranft S. Failure mode and effect analysisTM: a technique to prevent chemotherapy errors. Clinical Journal of Oncology Nursing. 2005;10:393-8. 97. Weiss J, Krebs S, Hoffmann C, Werner U, Neubert A, Brune K, et al. Survey of adverse drug reactions on a pediatric ward : a strategy for early and detailed detection. Pediatrics. 2002;110:254-7. 98. Rozich JD. Standardization as a mechanism to improve safety in health care. The Joint Commission Journal on Quality and Patient Safety. 2004;30:5-14. 99. Wong ICK, Ghaleb M, Dean-Franklin B, Barber N. Incidence and nature of dosing errors in paediatric medications : a systematic review. Drug Safety. 2004;27:661-70. 100. Chappell K, Newman C. Potential tenfold drug overdoses on a neonatal unit. Archives of Disease in Childhood Fetal Neonatal Edition. 2004;89:F483-F4. 101. Tan E, Cranswick NE, Rayner CR, et al. Dosing information for paediatric patients : are they really "therapeutic orphans"? Medical Journal of Australia. 2003;179:195-8. 102. Budetti PP. Ensuring safe and effective medications for children. Journal of American Medical Association. 2003;290:970-1. 103. Roberts R, Rodriguez W, Murphy D. Pediatric drug labeling : improving the safety and efficacy of pediatric therapies. Journal of American Medical Association. 2003;290:905-11. 104. Ghaleb M, Wong I. Medication errors in paediatric patients. Archives of Disease in Childhood Education and Practice Edition. 2006;91:ep20-ep4.
186
105. Budetti P. Ensuring safe and effective medications for children. Journal of American Medical Association. 2003;290:970-1. 106. Largent E, Miller F, Pearson S. Going off-label without venturing off-course. Archives of Internal Medicine. 2009;169:1745-7. 107. Conroy S, Choonara I, Impicciatore P, Mohn A, Arnell H, Rane A. Survey of unlicensed and off label drug use in paediatric wards in European countries. European network for drug investigation in children. British Medical Journal. 2000;320:79-82. 108. Radley D, Finkelstein S, Stafford R. Off-label prescribing among office-based physicians. Archives of Internal Medicine. 2006;166:1021-6. 109. Sullivan J, Buchino J. Medication errors in pediatrics--the octopus evading defeat. Journal of surgical oncology. 2004;88(3):182-8. 110. Walsh k, Kaushal R, Chessare J. How to avoid paediatric medication error : a user's guide to the literature. Archives of Disease in Childhood. 2005;90:698-702. 111. Sandlin D. Pediatric medication error prevention. Journal of Perianesthesia Nursing. 2008;23:279-81. 112. Scavuzzo J, Gamba N. Bridging the gap : the virtual chemotherapy unit. Journal of Pediatric Oncology Nursing. 2004;21:27-32. 113. Womer RB, Tracy E, Soo-Hoo W, Bickert B, DiTaranto S, Barnsteiner JH. Multidisciplinary systems approach to chemotherapy safety : rebuilding processes and holding the gains. Journal of Clinical Oncology. 2002;20:4705-12. 114. Phillips J, Beam S, Brinker A, Holquist C, Honig P, Lee L, et al. Retrospective analysis of mortalities associated with medication errors. American Journal of Health-System Pharmacy. 2001;58:1835-41. 115. Muller T. Typical medication errors in oncology : analysis and prevention strategies. Onkologie. 2003;26:539-44. 116. Sheridan-Leos N. A model of chemotherapy education for novice oncology nurses that supports a culture of safety. Clinical Journal of Oncology Nursing. 2007;11:545-51. 117. Schulmeister L. Look-alike, sound-alike oncology medications. Clinical Journal of Oncology Nursing. 2006;10:35. 118. Berman A. Reducing medication errors through naming, labeling and packaging. Journal of Medical Systems. 2004;28:9-29. 119. Gandhi T, Bartel S, Shulman L, Verrier D, Burdick E, Cleary A, et al. Medication safety in the ambulatory chemotherapy setting. Cancer. 2005;104:2477-83. 120. Ogletree RL. Preventing medication errors in oncology. Hospital Pharmacy. 2002;15:47-52. 121. SHPA Committee of Specialty Practice in Clinical Pharmacy. SHPA standards of practice for clinical pharmacy. Journal of Pharmacy Practice and Research. 2005;35:122-46. 122. Peterson G, Tenni P, Jackson S, Bereznicki L, Hughes J, Kong D, et al. Documenting clinical intervention in community pharmacy : PROMISe III2010. Available from: www.guild.org.au/iwov-resources/...Guild/.../RFT0809_FinalReport.pdf. 123. Cohen CR, Anderson RW, Attilio RM, et al. Preventing medication errors in cancer chemotherapy. American Journal of Health-System Pharmacy. 1996;53:737-46. 124. Kloth DD. Assuring safe care for patients through an organized multidisciplinary team effort. Hospital Pharmacy. 1997;32:s21-s5. 125. Donyai P, O'Grady K, Jacklin A. The effects of electronic prescribing on the quality of prescribing. British Journal of Clinical Pharmacology. 2007;64:1-8. 126. Reynolds ER, Boyce RW, Haxby DG, Goldberg BA, Stennett DJ. Intervention assessment in an Indian health service pharmacy. Journal of American Pharmeutical Association. 2000;40:41-5. 127. Barber ND, Batty R, Ridout DA. Predicting the rate of physician-accepted interventions by hospital pharmacists in the United Kingdom. American Journal of Health-System Pharmacy. 1997;54:397-405.
187
128. Johnston J, Vienet MD, editors. SHPA standards of practice for clinical pharmacy. Melbourne: The Society of Hospital Pharmacists of Australia; 1996. 129. Alderman CP, Farmer C. A brief analysis of clinical pharmacy interventions undertaken in an Australian teaching hospital. Journal of Quality in Clinical Practice. 2001;21:99-103. 130. Lau PM, Stewart K, Dooley M. The ten most common adverse drug reactions (ADRs) in oncology patients : do they matter to you? Support Care Cancer. 2004;12:626-33. 131. Bond CA, Raehl CL. Clinical pharmacy services, hospital pharmacy staffing and medication errors. Pharmacotherapy. 2002;22:134-47. 132. Fischer DS, Alfano S, Knobf MT, et al. Improving the cancer chemotherapy use process. Journal of Clinical Oncology. 1996;14:3148-55. 133. American Society of Health-System Pharmacists. ASHP guidelines on preventing medication errors with antineoplastic agents. American Journal of Health-System Pharmacy. 2002;59:1648-68. 134. Attilio RM. Caring enough to understand: the road to oncology medication error prevention. Hospital Pharmacy. 1996;31:17-26. 135. Kohler ADR, Montello MJ, Green L. Standardizing the expression and nomenclature of cancer treatment regimens. American Journal of Health-System Pharmacy. 1998;55:137-44. 136. Hepler CD, Strand LM. Opportunities and responsibilities in pharmaceutical care. American Journal of Hospital Pharmacy. 1990;47:533-43. 137. Chung MK, Bartfield JM. Knowledge of prescription medications among elderly emergency department patients. Annals of Emergency Medicine. 2002;39:605-8. 138. Bedell SE, Jabbour S, Goldberg R. Discrepancies in the use of medications : their extent and predictors in an outpatient practice. Archives of Internal Medicine. 2000;160:2129-34. 139. Gardner B, Graner K. National patient safety goals: pharmacists' medication reconciliation-related clinical interventions in a children's hospital. The Joint Commission Journal on Quality and Patient Safety. 2009;35:278-82. 140. Easton K, Morgan T, Williamson M. Medication safety in the community : a review of literature. Sydney: National Prescribing Service, 2009. 141. The Joint Commission. Sentinel event alert 2006. Available from: www.jointcommission.org/SentinelEvents/SentinelEventAlert/sea-35.htm. 142. Joint Commission on Accreditation of Healthcare Organizations. Preventing medication errors : strategies for pharmacists. Illinois: Joint Commission Resources, Inc; 2001. 143. Rozich JD, Howard RJ, Justeson JM, et al. Patient safety standardisation as a mechanism to improve safety in health care. Joint Commission Journal on Quality and Patient Safety. 2004;30:5-14. 144. Carter M. Pharmacist-acquired medication histories in a university hospital emergency department. American Journal of Health-System Pharmacy. 2006;63:2500-3. 145. deClifford JM, Caplygin FM, Lam SS, Leung BK. Impact of an emergency department pharmacist on prescribing errors in an Australian hospital. Journal of Pharmacy Practice and Research. 2007;37:284-6. 146. Kim JM, Park SJ, Sohn YM, Lee YM, Gwak HS, Lee BK, et al. Development of clinical pharmacy services for intensive care units in Korea. Springer Plus. 2014;3:34. 147. Dodd C. Assessing pharmacy interventions at Salisbury health care NHS trust. Hospital Pharmacy. 2003;10:451-6. 148. Folli HL, Poole RL, Benitz WE, Russo JC. Medication error prevention by clinical pharmacists in two children's hospitals. Pediatrics. 1987;79:718-22.
188
149. Hatoum HT, Catizone C, Hutchinson RA. An eleven-year review of the pharmacy literature : documentation of the value and acceptance of clinical pharmacy. Drug Intelligence and Clinical Pharmacy. 1986;20:33-48. 150. Fernandez-Llamazares CM, Manrique-Rodriguez S, Peres-Sanz C, Duran-Garcia ME, Sanjurjo-Saez M, Calleja-Hernandez MA. Validation of a method for recording pharmaceutical interventions. Journal of Clinical Pharmacy and Therapeutics. 2012;37:459-63. 151. van-Mill JWF, Westerlund T, Hersberger T, Schaefer MA. Drug-related problem classification systems. Annals of Pharmacotherapy. 2004;38:859-67. 152. Basger BJ, Moles RJ, Chen TF. Application of drug-related problem (DRP) classification systems: a review of the literature. European Journal of Clinical Pharmacology. 2014;70:799-815. 153. Zaidi STR, Hassan Y, Postma MJ, Ng SH. Impact of pharmacist recommendations on the cost of drug therapy in ICU patients at a Malaysian hospital. Pharmacy World and Science. 2003;25:299-302. 154. Lee AJ, Boro MS, Knapp KK, Meier JL, Korman NE. Clinical and economic outcomes of pharmacist recommendations in a veterans affairs medical center. American Journal of Health-System Pharmacy. 2002;59:2070-7. 155. Bond CA, Raehl CL, Franke T. Interrelationships among mortality rates, drug costs, total cost of care and length of stay in United States hospitals: summary and recommendations for clinical pharmacy services and staffing. Pharmacotherapy. 2001;21:129-41. 156. Lada P, Delgado G, Jr. Documentation of pharmacists' interventions in an emergency department and associated cost avoidance. American Journal of Health-System Pharmacy. 2007;64:63-8. 157. Olson LM, Desai S, Soto ML, Namazifard S, Quelland AK, Erstad BL. Evaluation of pharmacists' interventions at a university teaching hospital. Canadian Journal of Hospital Pharmacy. 2001;58:20-5. 158. vandenBemt PMLA, Postma MJ, vanRoom EN, Chow MC, Fijn R, Brouwers JRBJ. Cost-benefit analysis of the detection of prescribing error by hospital pharmacy staff. Drug Safety. 2002;25:135-43. 159. Ridjt TD, Willems L, Simoens S. Economic effects of clinical pharmacy interventions: a literature review. American Journal of Health-System Pharmacy. 2008;65:1161-72. 160. Sutcliffe KM. Defining and classifying medical error : lessons for learning. Quality and Safety in Health Care. 2004;13:8-9. 161. Boyer MM. Root cause analysis in perinatal care : health care professionals creating safer health care systems. Journal of Perinatal and Neonatal Nursing. 2001;15:40-54. 162. The Canadian Patient Safety Institute. Canadian root cause analysis framework : a tool for identifying and addressing the root causes of critical incidents in healthcare. 2005. 163. Leape L. Error in medicine. Journal of American Medical Association. 1994;272:1851-7. 164. Voekler R. Treat systems, not errors, experts say. Journal of American Medical Association. 1996;276:1537-8. 165. Bagian JP. Patient safety : what is really at issue? Frontiers of Health Services Management. 2005;22:3-16. 166. Reason J. Human error. New York: Cambridge University Press; 2003. 167. Reason J. Human error : models and management. British Medical Journal. 2000;320:768-70. 168. Department of Veterans Affairs, Veterans Health Administration, National Center for Patient Safety. Root cause analysis. 2009.
189
169. Wald H, Shojania KG. Root cause analysis. In: Shojania KG, McDonald KM, Watcher RM, editors. Making health care safer : a critical analysis of patient safety practices: Agency for Healthcare Research and Quality; 2001. 170. Shinn JA. Root cause analysis : a method of addressing errors and patient risk. Progress in Cardiovascular Nursing. 2000;15:24-5. 171. Bagian JP, Lee C, Gosbee J. Developing and deploying a patient safety program in a large health care delivery system : you can't fix what you don't know. The Joint Commission Journal on Quality Improvement. 2001;27:522-32. 172. Stecker MS. Root cause analysis. Journal of Vascular and Interventional Radiology. 2007;18:5-8. 173. Iedema RA, Jorm C, Long D, Braithwaite J, Travaglia J, Westbrook M. Turning the medical gaze in upon itself : root cause analysis and the investigation of clinical error. Social Science and Medicine. 2006;62:1605-15. 174. Handle C. Quality improvement through root cause analysis. Hospital Material Management Quarterly. 2000;21:74-8. 175. Bagian JP, Gosbee J, Lee CZ. The Veteran Affairs root cause analysis system in action Joint Commission Journal on Quality Improvement. 2002;28:531-45. 176. Woloshynowych M, Rogers S, Taylor-Adams S, Vincent C. The investigation and analysis of critical incidents and adverse events in healthcare. Health Technology Assessment. 2005;9:31-6. 177. Sutton I. Incident investigation and root cause analysis. Process risk and reliability management
Elsevier Inc; 2010. 178. Flynn EA, Barker KN, Pepper GA, Bates DW, Mikeal RL. Comparison of methods for detecting medication errors in 36 hospitals and skilled-nursing facilities. American Journal of Health-System Pharmacy. 2002;59:436-46. 179. Kiekkas P, Karga M, Lemonidou C, Aretha D, Karanikolas M. Medication errors in critically ill adults: a review of direct observation evidence. American Journal of Critical Care. 2011;20:36-44. 180. Fahimi F, Ariapanah P, Faizi M, Shafaghi B, Namdar R, Ardakani MT. Errors in preparation and administration of intravenous medications in the intensive care unit of a teaching hospital: an observational study. Australian Critical Care. 2008;21:110-6. 181. Calabrese A, Erstad B, Brandl K, Barletta J, Kane S, Sherman D. Medication administration errors in adult patients in the ICU. Intensive Care Medicine. 2001;27:1592-8. 182. Tissot E, Cornette C, Demoly P, Jacquet M, Barale F, Capellier G. Medication errors at the administration stage in an intensive care unit. Intensive Care Medicine. 1999;25:353-9. 183. Boardman H, Fitzpatrick R. Self reported clinical pharmacist interventions underestimate their input to patient care. Pharmacy World and Science. 2001;23:55-9. 184. Condren ME, Haase MR, Luedtke SA, Gaylor AS. Clinical activities of an academic pediatric pharmacy team. Annals of Pharmacotherapy. 2004;38:574-8. 185. Davydov L, Caliendo GC, Smith LG, Mehl B. Analysis of clinical intervention documentation by dispensing pharmacists in a teaching hospital. Hospital Pharmacy. 2003;38:346-50. 186. The International Statistical Classification of Diseases and Related Health Problems 10th Revision. Geneva: The World Health Organization, 2010. 187. Steliarova-Foucher E, Stiller C, Lacour B, Kaatsch P. International classification of childhood cancer, third edition. Cancer. 2005;103:1457-67. 188. Pharmaceutical Society of Australia, The Royal Australian College of General Practitioners, Australasian Society of Clinical and Experimental Pharmacologists and
190
Toxicologists. Australian Medicines Handbook 2014. Adelaide: Australian Medicines Handbook; 2014. 189. British National Formulary. 56th ed. London: BMJ Group & RPS Publishing; 2008. 190. Condren ME, Haase MR, Luedtke SA, Taylor AS. Clinical activities of an academic pediatric pharmacy team. The Annals of Pharmacotherapy. 2004;38:574-8. 191. Hosmer DW, Lemeshow S. Applied Logistic Regression. 2nd ed. New York: Wiley; 2000. 192. Fleiss JL. Measuring nominal scale agreement among many raters. Psychological Bulletin. 1971;76:378-82. 193. Patient Safety Directorate. Clinical incident management toolkit. Perth: Western Australia Department of Health; 2011. 194. Industrial Relation Commisssion of New South Wales. Health employee's pharmacists (state) award 2012. Available from: www.health.nsw.gov.au/careers/conditions/Awards/hsu_he_pdf. 195. Miles J, Shevlin M. Applying regression and correlations : a guide for students and researchers. London: Sage; 2001. 196. Bright JM, Tenni PC. The clinical services documentation (CSD) system for documenting clinical pharmacists' services. Australian Journal of Hospital Pharmacy. 2000;30:10-5. 197. Fernández-Llamazares CM, Calleja-Hernandez MA, Manrique-Rodriguez S, Pérez-Sanz C, Duran-García E, Sanjurjo-Saez M. Impact of clinical pharmacist interventions in reducing paediatric prescribing errors. Archives of Disease in Childhood. 2012;97:564-8. 198. Coutsouvelis J, Corallo CE, Dooley MJ, Foo J, Whitfield A. Implementation of a pharmacist-initiated pharmaceutical handover for oncology and hematology patients being transferred to critical care units. Support Care Cancer. 2010;18:811-6. 199. Maat B, Au YS, Bollen CW, vanVught A, Egberts TCG, Rademaker CMA. Clinical pharmacy interventions in paediatric electronic prescriptions. Archives of Disease in Childhood. 2013;98:222-7. 200. Guy J, Persaud J, Davies E, Harvey D. Drug errors: what role do nurses and pharmacists have in minimizing the risk? Journal of Child Health Care. 2003;7:277-90. 201. Kaushal R, Bates DW, Abramson EL, Soukup JR, Goldmann DA. Unit-based clinical pharmacists' prevention of serious medication errors in pediatric inpatients. American Journal of Health-System Pharmacy. 2008;65:1254-60. 202. Bedouch P, Charpiat B, Conort O, Rose FX, Escosier L, Juste M, et al. Assessment of clinical pharmacists' interventions in French hospitals: results of a multicenter study. Annals of Pharmacotherapy. 2008;42:1095-103. 203. Stemer G, Laml-Wallner G, Kuegler I, Poelzleitner P, Messner S, Steininger S, et al. Comprehensive evaluation of clinical pharmacists' interventions in a large Austrian tertiary care hospital. Europen Journal of Hospital Pharmacy. 2012:10.1136/ejhpharm-2012-000131. 204. Virani A, Crown N. The impact of a clinical pharmacist on patient and economic outcomes in a child and adolescent mental health unit. Canadian Journal of Hospital Pharmacy. 2003;56:158-62. 205. Zhang C, Zhang L, Huang L, Luo R, Wen J. Clinical pharmacists on medical care of pediatric inpatients: a single-center randomized controlled trial. PLoS ONE. 2012;7:e30856. 206. Waddell JA, Solimando DA, Strickland WR, Smith BD, Wray MK. Pharmacy staff interventions in a medical center hematology-oncology service. Journal of American Pharmaceutical Association. 1998;38:451-6. 207. Sanghera N, Chan P, Khaki ZF, Planner C, Lee KKC, Cranswick NE, et al. Interventions of hospital pharmacists in improving drug therapy in children. Drug Safety. 2006;29:1031-47.
191
208. Ruder AD, Smith DL, Madsen MT, Kass FH. Is there a benefit to having a clinical oncology pharmacist on staff at a community oncology clinic? Journal of Oncology Pharmacy Practice. 2011;17:425-32. 209. Wong S, Gray ES. Clinical pharmacy services in oncology clinics. Journal of Oncology Pharmacy Practice. 1999;5:49-54. 210. Abdel-Qader DH, Harper L, Cantrill JA, Tully MP. Pharmacists' interventions in prescribing errors at hospital discharge. Drug Safety. 2010;33:1027-44. 211. Shah S, Dowell J, Greene S. Evaluation of clinical pharmacy services in a hematology/oncology outpatient setting. Annals of Pharmacotherapy. 2006;40:1527-32. 212. Serrano-Fabiá A, Albert-Marí A, Almenar-Cubell D, Jiménez-Torres NV. Multidisciplinary system for detecting medication errors in antineoplastic chemotherapy. Journal of Oncology Pharmacy Practice. 2010;16:105-12. 213. Wilson S, Wahler R, Brown J, Doloresco F, Monte SV. Impact of pharmacist intervention on clinical outcomes in the palliative care setting. American Journal of Hospital Palliative Care. 2011;28:316-20. 214. Lee J, McPherson M. Outcomes of recommendations by hospice pharmacists. American Journal of Health-System Pharmacy. 2006;63:2235-9. 215. Wang HY, Chan ALF, Chen MT, Liao CH, Tian YF. Effects of pharmaceutical care intervention by clinical pharmacists in renal transplant clinics. Transplant Proceeding. 2008;40:2319-23. 216. Mogensen CB, Olsen I, Thisted AR. Pharmacist advice is accepted more for medical than surgical patients in an emergency department. Danish Medical Journal. 2013;60:A4682. 217. Klopfer JD, Einarson TR. Acceptance of pharmacists' suggestions by prescribers: a literature review. Hospital Pharmacy. 1990;25:830-6. 218. Friesner DL, Scoot DM, Dewey MW, Johnson TA, Kessler ML. What types of nursing facilities are more likely to adopt a pharmacist's medication review recommendations? Consultant Pharmacist. 2013;28:490-501. 219. Abu-Ramaileh AM, Shane R, Churchill W. Evaluating and classifying pharmacists' quality interventions in the emergency department. American Journal of Health-System Pharmacy. 2011;68:2271-5. 220. Wilson S, Wahler R, Brown J, Doloresco F, Monte SV. Impact of Pharmacist Intervention on Clinical Outcomes in the Palliative Care Setting. American Journal of Hospice and Palliative Medicine. 2010. 221. Taegtmeyer AB, Curkovic I, Corti N, Rosen C, Egbring M, Russmann S, et al. Drug-related problems and factors influencing acceptance of clinical pharmacologists' alerts in a large cohort of neurology inpatients. Swiss Medical Weekly. 2012;142:w13615. 222. Pereira PN, Guy MC, Sweaney AM, Boesen KP. Evaluation of prescriber responses to pharmacist recommendations communicated by fax in a medication therapy management program (MTMP). Journal of Managed Care Pharmacy. 2011;17:345-54. 223. Almeida-Neto AC, Chen TF. When pharmacotherapeutic recommendations may lead to the reverse effect on physician decision-making. Pharmacy World and Science. 2008;30:3-8. 224. Ranelli PL, Biss J. Physicians' perceptions of communication with and responsibilities of pharmacist. Journal of American Pharmaceutical Association. 2000;40:625-30. 225. The National Coordinating Council for Medication Error Reporting and Prevention. NCC MERP index for categorizing medication error 2001. Available from: http://www.nccmerp.org/pdf/indexColor2001-06-12.pdf. 226. Bosma L, Jansman FGA, Franken AM, Harting JW. Evaluation of pharmacist clinical interventions in a Dutch hospital setting. Pharmacy World and Science. 2007;30:31-8.
192
227. Overhage J, Lukes A. Practical, reliable, comprehensive method for characterizing pharmacists' clinical activities. American Journal of Health-System Pharmacy. 1999;56:2444-50. 228. Collier J. Paediatric prescribing: using unlicensed drugs and medicines outside their licensed indications. British Journal of Clinical Pharmacology. 1999;48:5-8. 229. Sircar-Ramsewak F, Baliramsingh S, Seepersad V, Sasanerine-Persad S. Global impact of pharmacist intervention on patient care and cost: a descriptive study at a Trinidad hospital. Pro Newsletter. 2007;38:24-6. 230. Al-Rahbi HAM, Al-Sabri RM, Chitme HR. Interventions by pharmacists in outpatient pharmaceutical care. Saudi Pharmaceutical Journal. 2014;22:101-6. 231. Pham DQ. Evaluating the impact of clinical interventions by PharmD students on internal medicine clerkships: the results of a 3 year study. Annals of Pharmacotherapy. 2006;40:1541-5. 232. McLennan DN, Dooley MJ, Brien JE. Beneficial clinical outcomes resulting from pharmacist interventions. Journal of Oncology Pharmacy Practice. 1999;5:184-9. 233. Kunac DL. Inter- and intra-rater reliability for classification of medication related events in paediatric inpatients. Quality and Safety in Health Care. 2006;15:196-201. 234. Marimoto T, Gandhi TK, Seger AC. Adverse drug events and medication errors: detection and classification methods. Quality and Safety in Health Care. 2004;13:306-14. 235. Forrey RA, Pedersen CA, Schneider PJ. Interrater agreement with a standard scheme for classifying medication errors. American Journal of Health-System Pharmacy. 2007;64:175-81. 236. King WJ, Paice N, Rangrej J, Forestell GJ, Swartz R. The effect of computerized physician order entry on medication errors and adverse drug events in pediatric inpatients. Pediatrics. 2003;112:506-9. 237. Potts AL, Gregory DF. Computerized physician order entry and medication errors in a paediatric critical care unit. Pediatrics. 2004;113:59-63. 238. Kozer E, Scolnik D, Macpherson A. Variables associated with medication errors in pediatric emergency medicine. Pediatrics. 2002;110:737-42. 239. Snyder RA, Abarca J, Meza JL, Rothschild JM, Rizos A, Bates DW. Reliability evaluation of the adapted national coordinating council medication error reporting and prevention (NCC MERP) index. Pharmacoepidemiology and Drug Safety. 2007;16:1006-13. 240. Selbt S, Fein JA, Osterhoudt K, Wayne HO. Medication errors in a paediatric emergency department. Pediatric Emergency Care. 1999;15:1-4. 241. Crowley E, Williams R, Cousins D. Medication errors in children: a descriptive summary of medication error reports submitted to the United States Pharmacopeia. Current Therapy Research. 2001;26:627-40. 242. Wong ICK, Wong LYL, Cranswick NE. Minimising medication errors in children. Archives of Disease in Childhood. 2009;94:161-4. 243. Cunningham KJ. Analysis of clinical interventions and the impact of pediatric pharmacists on medication error prevention in a teaching hospital. Journal of Pediatric Pharmacology and Therapeutics. 2012;17:365-73. 244. Ghaleb MA, Barber N, Franklin BD, Yeung VWS, Khaki ZF, Wong ICK. Systematic review of medication errors in pediatric patients. Annals of Pharmacotherapy. 2006;40:1766-76. 245. Kaushal R. Using chart review to screen for medication errors and adverse drug events. American Journal of Health-System Pharmacy. 2002;59:2323-5. 246. Kim Y, Schepers G. Pharmacist intervention documentation in US health care system. Hospital Pharmacy. 2003;12:1141-7. 247. McLennan DN, Dooley MJ. National survey of clinical activity documentation practices. Australian Journal of Hospital Pharmacy. 2000;30:6-9.
193
248. Tenni PC, Hughes JD. National survey of clinical pharmacy services. Australian Journal of Hospital Pharmacy. 1996;26:416-27. 249. Pederson CA, Schneider PJ, Santell JP, Kelly EJ. ASHP national survey of pharmacy practice in acute care settings: monitoring, patient education, and wellness. American Journal of Health-System Pharmacy. 2000;57:2171-87. 250. Millar T, Sandilya R, Tordoff J, Ferguson R. Documenting pharmacist's clinical interventions in New Zealand hospitals. Pharmacy World and Science. 2008;30:99-106. 251. Dooley MJ, McLennan DN, Galbraith KJ, Burgess NG. Multicentre pilot study of a standard approach to document clinical pharmacy activity. Australian Journal of Hospital Pharmacy. 2000;30:150-5. 252. Reilly JC, Wallace M, Campbell MM. Tracking pharmacist interventions with a hand-held computer. American Journal of Health-System Pharmacy. 2001;58:158-61. 253. Simonian AI. Documenting pharmacist interventions on an intranet. American Journal of Health-System Pharmacy. 2003;60:151-5. 254. William M, Peterson GM, Tenni P, Bindoff IK, Curtain C, Hughes J, et al. Drug related problems detected in Australian Community Pharmacies: the Promise Trial. Annals of Pharmacotherapy. 2011;45:1067-76. 255. Lau A, Balen RM, lam R, Malyuk DL. Using a personal digital assistant to document clinical pharmacy services in an intensive care unit. American Journal of Health-System Pharmacy. 2001;58:1229-32. 256. Pugh CB. Documenting the clinical interventions of pharmacists. Topics in Hospital Pharmacy Management 1992;11:30-43. 257. American Society of Health-System Pharmacists. ASHP guidelines on documenting pharmaceutical care in patient medical records. American Journal of Health-System Pharmacy. 2003;60:705-7. 258. Royal Pharmaceutical Society of Great Britain. Guidance on recording interventions. The Pharmaceutical Journal. 2006;276:517-8. 259. Schaff RL, Schumock GT, Nadzam DM. Development of the Joint Commission's indicators for monitoring the medication use system. Hospital Pharmacy. 1991;26:326-9. 260. De Rijdt T, Willems L, Simoens S. Economic effects of clinical pharmacy interventions: a literature review. American Journal of Health-System Pharmacy. 2008;65:1161-72. 261. Catania HF, Yee WP, Catania PN. The next step in clinical intervention programs. Topics in Hospital Pharmacy Management. 1992;11:80-5. 262. McKee M, Frei BL, Garcia A, Fike D, Soefje SA. Impact of clinical pharmacy services on patients in an outpatient chemotherapy academic clinic. Journal of Oncology Pharmacy Practice. 2011;17:387-94. 263. Bond CA, Raehl CL. Clinical pharmacy services, pharmacy staffing and hopital mortality rates. Pharmacotherapy. 2007;27:481-93. 264. Scarsi KK, Fotis MA, Noskin GA. Pharmacist participation in medical rounds reduce medication errors. American Journal of Health-System Pharmacy. 2002;59:2089-92. 265. Ling JM, Mike LA, Rubin J, Abraham P, Howe A, Patka J, et al. Documentation of pharmacist interventions in the emergency department. American Journal of Health-System Pharmacy. 2005;62:1783-93. 266. Zimmerman C, Smolarek R, Stevenson J. Peer review and continuous quality improvement of pharmacists' clinical interventions. American Journal of Health-System Pharmacy. 1997;54:1722-7. 267. Nurgat Z, Al-Jazairi A, Abu-Shraie N, Al-Jedai A. Documenting clinical pharmacist intervention before and after the introduction of a web-based tool. International Journal of Clinical Pharmacy. 2011;33:200-7. 268. Berg BL. Focus group interviewing. In: Berg BL, editor. Qualitative research methods for the social sciences. Boston: Allyn and Bacon; 2004.
194
269. Creswell JW. Educational research: planning, conducting, and evaluating quantitative and qualitative research. Upper Saddle River: Pearson Education; 2005. 270. Sharts-Hopko NC. Focus group methodology: when and why? Journal of the Association of Nurse in AIDS Care. 2001;12:89. 271. Starre CVD, Dijk MV, Bos AVD, Tibboel D. Paediatric critical incident analysis: lessons learnt on analysis, recommendations and implementation. European Journal of Pediatrics. 2014;173:1449-57. 272. Kruk R. Patient safety and clinical quality program: third report on incident management in the new South Wales public health system 2005-2006. Sydney: New South Wales Department of Health, 2006. 273. Haig KM, Sutton S, Whittington J. SBAR: a shared mental model for improving communication between clinicians. Journal of Quality and Patient Safety. 2006;32:167-75. 274. Mills PD, Neily J, Kinney LM, Bagian J, Weeks WB. Effective interventions and implementation strategies to reduce adverse drug events in the Veterans Affairs (VA) system. Quality and Safety in Health Care. 2008;17:37-46. 275. The United States of Pharmacopeia. USP release fourth annual report on medication errors in US hospitals2003. Available from: http:www.usp.or/newscenter. 276. Buckley MS, Erstad BL, Kopp BJ, Theodorou AA, Priestley G. Direct observation approach for detecting medication errors and adverse drug events in a pediatric intensive care unit. Pediatric Critical Care Medicine. 2007;8:145-52. 277. Winterstein AG, Johns TE, Rosenberg EI, Hatton RC, Gonzalez-Rothi R, Kanjanarat P. Nature and causes of clinically significant medication errors in a tertiary care hospital. American Journal of Health-System Pharmacy. 2004;61:1908-16. 278. Westbrook JI, Li L, Lehnbom EC, Baysari MT, Braithwaite J, Burke R, et al. What are incident reports telling us? A comparative study at two Australian hospitals of medication errors identified at audit, detected by staff and reported to an incident system. International Journal for Quality in health Care. 2015:1-9. 279. Wittich CM, Burkle CM, Lanier WL. Medication errors: an overview for clinicians. Mayo Clinic Proceedings. 2014;89:1116-25. 280. American Academy of Pediatrics Committee on Drugs, American Academy of Pediatrics Committee on Hospital Care. Prevention of medication errors in the pediatric inpatient setting. Pediatrics. 2003;112:431-6. 281. Levine SR, Cohen MR, Blanchard NR. Guidelines for preventing medication errors in pediatrics. Journal of Pharmacy Practice and Therapeutics. 2001;6:426-42. 282. Kim GR, Chen AR, Arceci RJ. Error reduction in pediatric chemotherapy: computerized order entry and failure modes and effect analysis. Archives of Pediatric and Adolescent Medicine. 2006;160:495-8. 283. Ghaleb MA, Wong ICK. Medication errors in paediatric patients. Archives of disease in childhood - Education & practice edition. 2006;91(1):ep20. 284. Bates DW, Teich JM, Lee J, Seger D, Kuperman GJ, Ma'Luf N, et al. The impact of computerized physician order entry on medication error prevention. Journal of American Medical Informatics Association. 1999;6:313-21. 285. White CS. Advanced practice prescribing: Issues and strategies in preventing medication error. journal of Nursing Law. 2011;14:120-7. 286. Koppel R, Metlay JP, Cohen A. Role of computerized physician order entry systems in facilitating medication errors. Journal of American Medical Association. 2005;293:1197-203. 287. Bates DW, Kuperman GJ, Wang S, Gandhi T, Kittler A, Volk L, et al. Ten Commandments for Effective Clinical Decision Support: Making the Practice of Evidence-based Medicine a Reality. Journal of the American Medical Informatics Association. 2003;10:523-30.
195
288. Kaushal R, Jha AK, Franz C, Glaser J, Shetty KD, Jaggi T, et al. Return on investment for a computerized physician order entry system. Journal of the American Medical Informatics Association. 2006;13:261-6. 289. Simms ER, Slakey DP, Garstka ME, Tersigni SA, Korndorffer JR. Can simulation improve the traditional method of root cause analysis? a preliminary investigation. Surgery. 2012;152:489-97. 290. Wakefield JG, McLaws ML, Whitby M, Patton L. Patient safety culture: factors that influence clinical invilvement in patient safety behaviours. Quality and Safety in Health Care. 2010;19:585-91. 291. Leonard MS, Cimino M, Shaha S, McDougal S, Pilliod J, Brodsky L. Risk reduction for adverse drug events through sequential implementation of patient safety initiatives in a children's hospital. Pediatrics. 2006;118:e1124-e9. 292. Sandra VD. Pediatrician–parent–child communication: problem-related or not? Patient Education and Counseling. 2004;52:61-8. 293. Taitz J, Genny K, Brooks V, Ross D, Ryan K, Schumack B, et al. System-wide learning from root cause analysis: a report from the New South Wales Root Cause Analysis Review Committee. Quality and Safety in Health Care. 2010;19:e63. 294. Ranelli PL, Bartsch K, London K. Pharmacists' perceptions of children and families as medicine consumers. Psychology and Health. 2000;15:829 -40. 295. Cronrath P, Lynch TW, Gilson LJ, Nishida C, Sembar MC, Spencer PJ, et al. PCA oversedation: application of Healthcare Failure Mode Effect (HFMEA) analysis. Nursing Economics. 2011;29:79-87. 296. Pham JC, Natterman JP. ReCASTing the RCA: an improved model for performing root cause analyses. American Journal of Medical Quality. 2010;25:186-91.
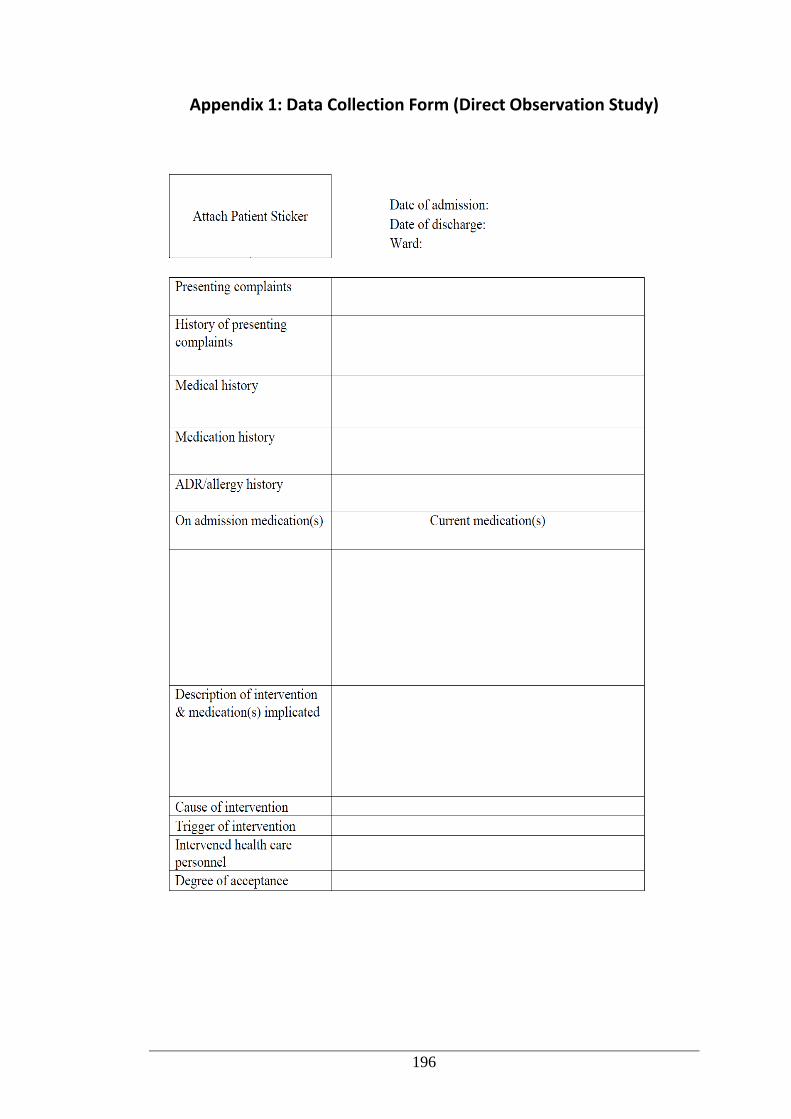
196
Appendix 1: Data Collection Form (Direct Observation Study)
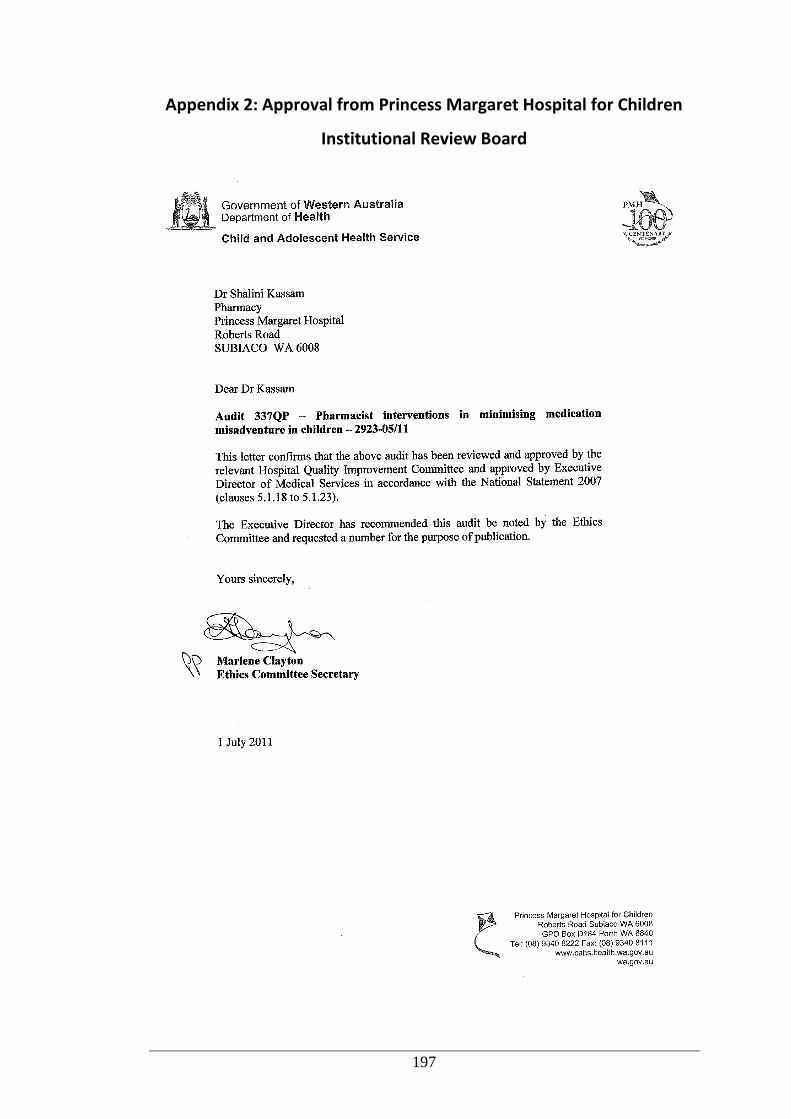
197
Appendix 2: Approval from Princess Margaret Hospital for Children
Institutional Review Board
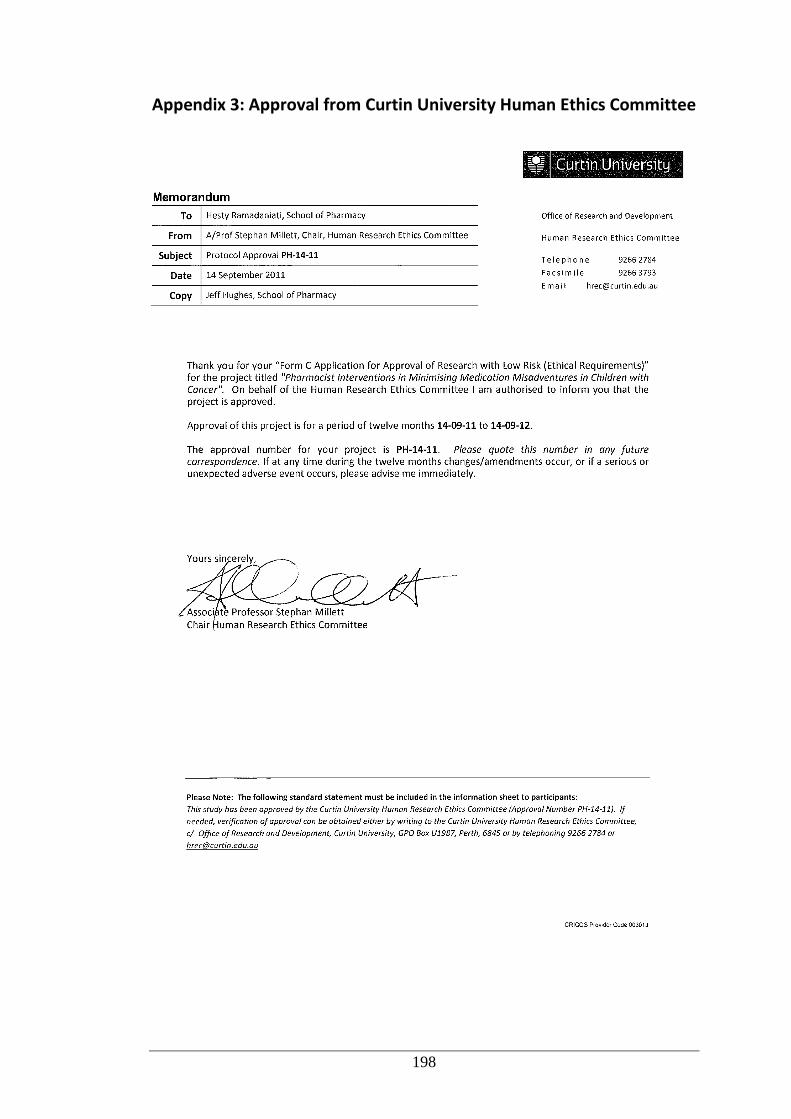
198
Appendix 3: Approval from Curtin University Human Ethics Committee
199
Appendix 4: Participant Information Sheet (Direct Observation Study)
200
201
Appendix 5: Participant Consent Form (Direct Observation Study)
202
Appendix 6: Case Vignettes for Expert Panel Assessment
The expert panel assessed 42 cases. Each case was followed by the same questions.
For brevity, the questions were presented after Case 1 and not repeated in the other
cases.
GENERAL MEDICAL WARD FOR INFANTS
Case 1
A 27-day-old female (weight: 3.97 kg) was admitted to the emergency department
because of fever over the last few days. The mother said that the baby was a little
more sleepy than usual and did not drink milk well. The mother and her older sister
had sore throats, and cousins had croup and in contact with her. She was born full-
term without any complications. Medical history: insignificant. Regular medications:
nil. Allergy/ADR history: nil. She was initially diagnosed with sepsis. During
hospitalisation, she was prescribed the following medications:
Domperidone 10 mg TDS oral
Normal saline 3 mL IV PRN
Paracetamol 60 mg QID oral
Gentamicin 28 mg OD IV
Aciclovir 80 mg TDS IV
Cefotaxime 200 mg QID IV
Amoxycillin 20 mg QID oral
The following day, the pharmacist reviewed the medication chart and noticed that the
patient was prescribed domperidone 10 mg TDS and the dose was high for the
patient (max dose 9 mg/day). The pharmacist contacted the doctor and was informed
that the medication was for the mother’s nausea and not for the baby. However, there
was no sticker/alert that said the medication was for the mother and not the baby.
The pharmacist attached the alert sticker that the medication was not for the patient.
Examination of the cerebrospinal fluid, nasopharyngeal aspirate, blood and urine
culture was negative for the presence of bacteria and virus. The final diagnosis was
viral illness with fever of unexplained origin. The baby improved and was discharged
home 4 days after admission without any medications.
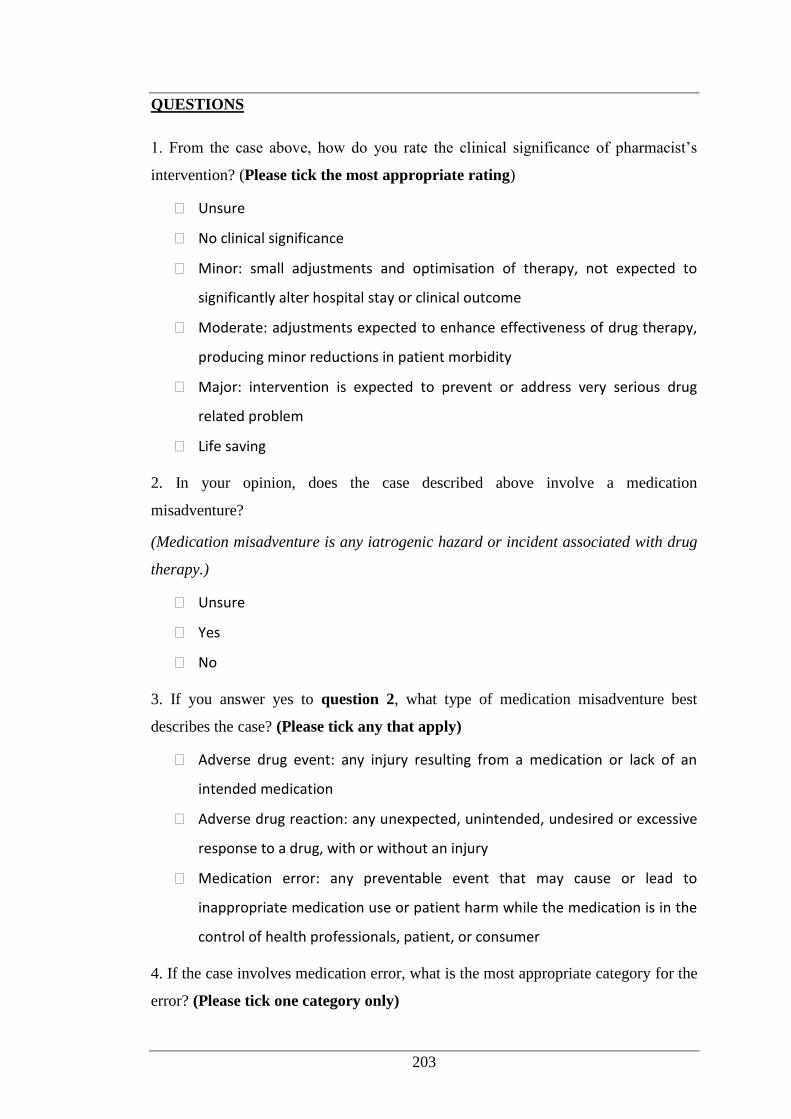
203
QUESTIONS
1. From the case above, how do you rate the clinical significance of pharmacist’s
intervention? (Please tick the most appropriate rating)
Unsure
No clinical significance
Minor: small adjustments and optimisation of therapy, not expected to
significantly alter hospital stay or clinical outcome
Moderate: adjustments expected to enhance effectiveness of drug therapy,
producing minor reductions in patient morbidity
Major: intervention is expected to prevent or address very serious drug
related problem
Life saving
2. In your opinion, does the case described above involve a medication
misadventure?
(Medication misadventure is any iatrogenic hazard or incident associated with drug
therapy.)
Unsure
Yes
No
3. If you answer yes to question 2, what type of medication misadventure best
describes the case? (Please tick any that apply)
Adverse drug event: any injury resulting from a medication or lack of an
intended medication
Adverse drug reaction: any unexpected, unintended, undesired or excessive
response to a drug, with or without an injury
Medication error: any preventable event that may cause or lead to
inappropriate medication use or patient harm while the medication is in the
control of health professionals, patient, or consumer
4. If the case involves medication error, what is the most appropriate category for the
error? (Please tick one category only)
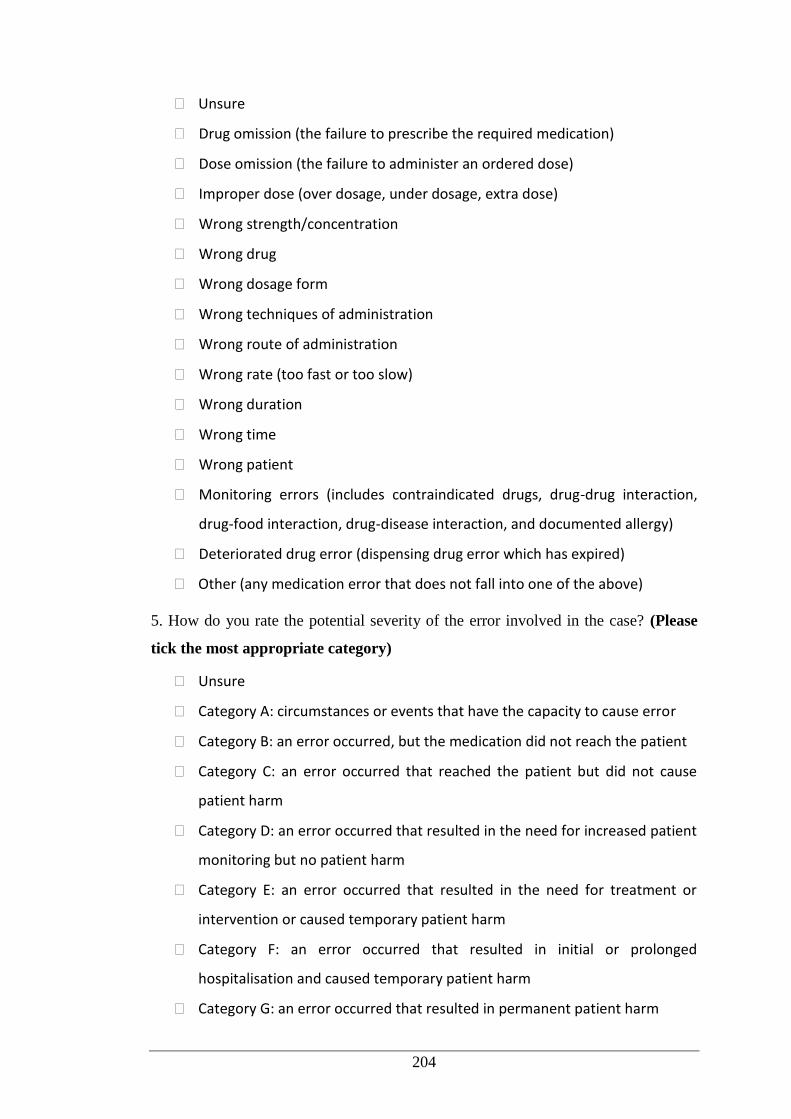
204
Unsure
Drug omission (the failure to prescribe the required medication)
Dose omission (the failure to administer an ordered dose)
Improper dose (over dosage, under dosage, extra dose)
Wrong strength/concentration
Wrong drug
Wrong dosage form
Wrong techniques of administration
Wrong route of administration
Wrong rate (too fast or too slow)
Wrong duration
Wrong time
Wrong patient
Monitoring errors (includes contraindicated drugs, drug-drug interaction,
drug-food interaction, drug-disease interaction, and documented allergy)
Deteriorated drug error (dispensing drug error which has expired)
Other (any medication error that does not fall into one of the above)
5. How do you rate the potential severity of the error involved in the case? (Please
tick the most appropriate category)
Unsure
Category A: circumstances or events that have the capacity to cause error
Category B: an error occurred, but the medication did not reach the patient
Category C: an error occurred that reached the patient but did not cause
patient harm
Category D: an error occurred that resulted in the need for increased patient
monitoring but no patient harm
Category E: an error occurred that resulted in the need for treatment or
intervention or caused temporary patient harm
Category F: an error occurred that resulted in initial or prolonged
hospitalisation and caused temporary patient harm
Category G: an error occurred that resulted in permanent patient harm
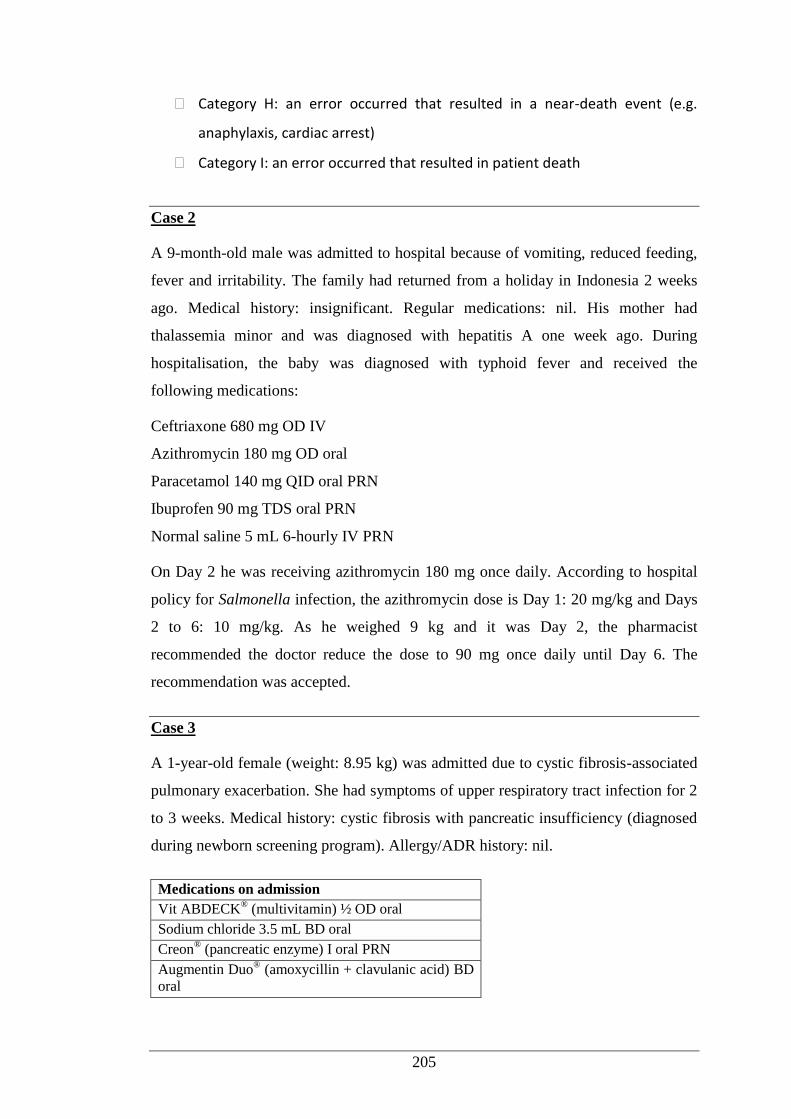
205
Category H: an error occurred that resulted in a near-death event (e.g.
anaphylaxis, cardiac arrest)
Category I: an error occurred that resulted in patient death
Case 2
A 9-month-old male was admitted to hospital because of vomiting, reduced feeding,
fever and irritability. The family had returned from a holiday in Indonesia 2 weeks
ago. Medical history: insignificant. Regular medications: nil. His mother had
thalassemia minor and was diagnosed with hepatitis A one week ago. During
hospitalisation, the baby was diagnosed with typhoid fever and received the
following medications:
Ceftriaxone 680 mg OD IV
Azithromycin 180 mg OD oral
Paracetamol 140 mg QID oral PRN
Ibuprofen 90 mg TDS oral PRN
Normal saline 5 mL 6-hourly IV PRN
On Day 2 he was receiving azithromycin 180 mg once daily. According to hospital
policy for Salmonella infection, the azithromycin dose is Day 1: 20 mg/kg and Days
2 to 6: 10 mg/kg. As he weighed 9 kg and it was Day 2, the pharmacist
recommended the doctor reduce the dose to 90 mg once daily until Day 6. The
recommendation was accepted.
Case 3
A 1-year-old female (weight: 8.95 kg) was admitted due to cystic fibrosis-associated
pulmonary exacerbation. She had symptoms of upper respiratory tract infection for 2
to 3 weeks. Medical history: cystic fibrosis with pancreatic insufficiency (diagnosed
during newborn screening program). Allergy/ADR history: nil.
Medications on admission
Vit ABDECK® (multivitamin) ½ OD oral
Sodium chloride 3.5 mL BD oral
Creon® (pancreatic enzyme) I oral PRN
Augmentin Duo® (amoxycillin + clavulanic acid) BD
oral
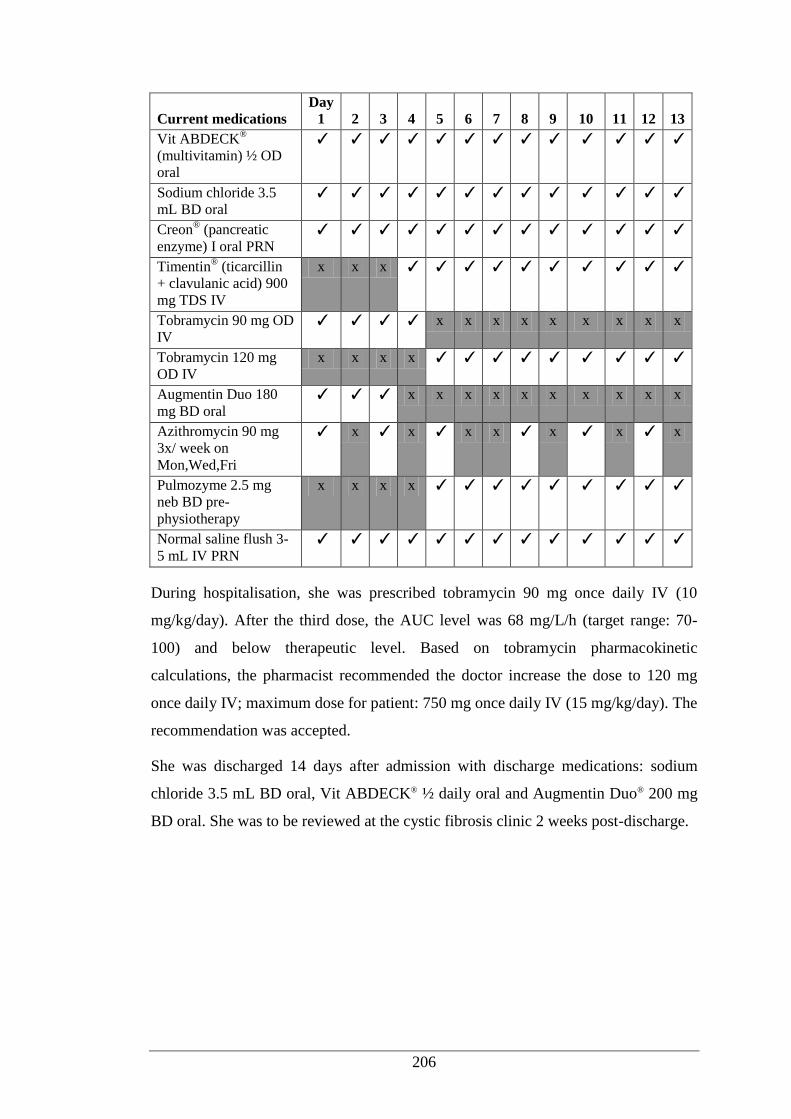
206
Current medications Day
1 2 3 4 5 6 7 8 9 10 11 12 13 Vit ABDECK
®
(multivitamin) ½ OD
oral
✓ ✓ ✓ ✓ ✓ ✓ ✓ ✓ ✓ ✓ ✓ ✓ ✓
Sodium chloride 3.5
mL BD oral ✓ ✓ ✓ ✓ ✓ ✓ ✓ ✓ ✓ ✓ ✓ ✓ ✓
Creon® (pancreatic
enzyme) I oral PRN ✓ ✓ ✓ ✓ ✓ ✓ ✓ ✓ ✓ ✓ ✓ ✓ ✓
Timentin® (ticarcillin
+ clavulanic acid) 900
mg TDS IV
x x x ✓ ✓ ✓ ✓ ✓ ✓ ✓ ✓ ✓ ✓
Tobramycin 90 mg OD
IV ✓ ✓ ✓ ✓ x x x x x x x x x
Tobramycin 120 mg
OD IV x x x x ✓ ✓ ✓ ✓ ✓ ✓ ✓ ✓ ✓
Augmentin Duo 180
mg BD oral ✓ ✓ ✓ x x x x x x x x x x
Azithromycin 90 mg
3x/ week on
Mon,Wed,Fri
✓ x ✓ x ✓ x x ✓ x ✓ x ✓ x
Pulmozyme 2.5 mg
neb BD pre-
physiotherapy
x x x x ✓ ✓ ✓ ✓ ✓ ✓ ✓ ✓ ✓
Normal saline flush 3-
5 mL IV PRN ✓ ✓ ✓ ✓ ✓ ✓ ✓ ✓ ✓ ✓ ✓ ✓ ✓
During hospitalisation, she was prescribed tobramycin 90 mg once daily IV (10
mg/kg/day). After the third dose, the AUC level was 68 mg/L/h (target range: 70-
100) and below therapeutic level. Based on tobramycin pharmacokinetic
calculations, the pharmacist recommended the doctor increase the dose to 120 mg
once daily IV; maximum dose for patient: 750 mg once daily IV (15 mg/kg/day). The
recommendation was accepted.
She was discharged 14 days after admission with discharge medications: sodium
chloride 3.5 mL BD oral, Vit ABDECK® ½ daily oral and Augmentin Duo® 200 mg
BD oral. She was to be reviewed at the cystic fibrosis clinic 2 weeks post-discharge.
207
GENERAL MEDICAL WARD FOR YOUNG CHILDREN
Case 4
An 11-year-old male was admitted because of pneumonia. His medical history was
complicated: born premature 23/40 weeks, cerebral palsy, chronic lung disease,
global developmental delay, epilepsy, on bilevel positive airway pressure, on
Percutaneous Endoscopic Gastrostomy (PEG) and infusaport, severe subglottic
stenosis, recurrent persistent Candida infection, pseudomonas colonisation, ligation
of partial ducts, submandibular gland removal. Multiple antibiotic allergies
(Bactrim® [trimethoprim + sulfamethoxazole], amoxycillin, cephalexin, Timentin®
[ticarcillin + clavulanic acid], meropenem, fluconazole, penicillin, vancomycin,
amikacin, amphotericin, ciprofloxacillin).
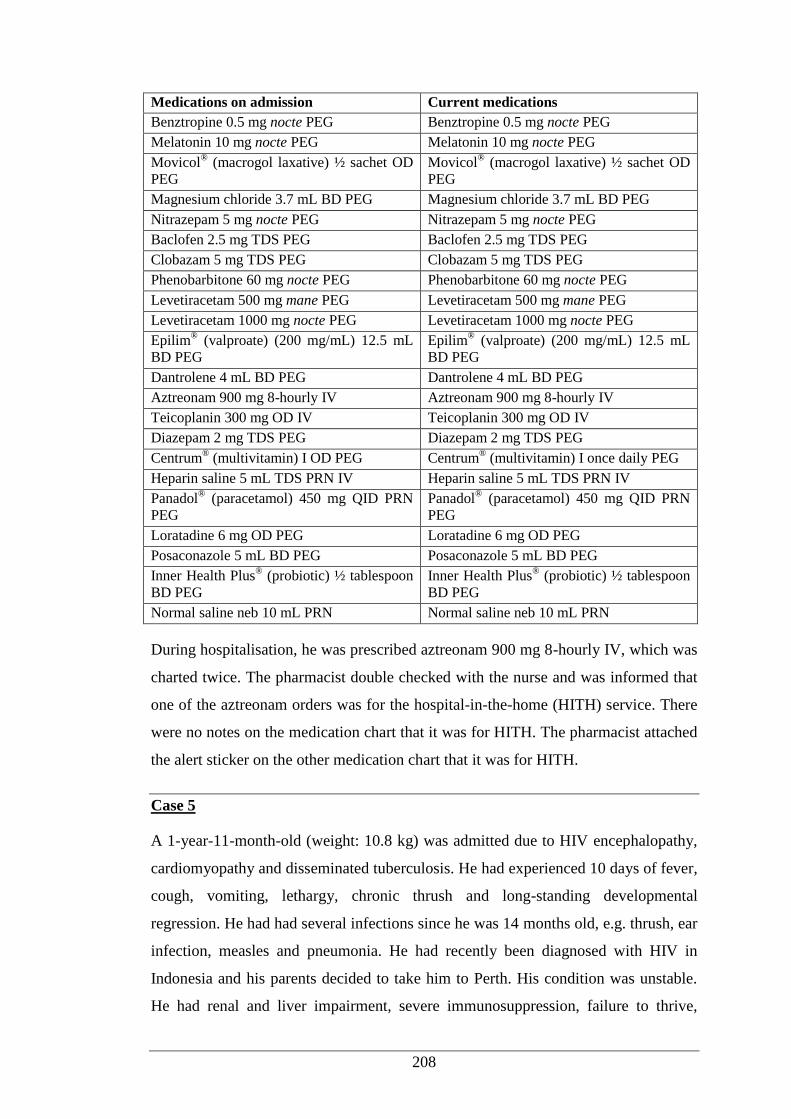
208
Medications on admission Current medications
Benztropine 0.5 mg nocte PEG Benztropine 0.5 mg nocte PEG
Melatonin 10 mg nocte PEG Melatonin 10 mg nocte PEG
Movicol® (macrogol laxative) ½ sachet OD
PEG Movicol
® (macrogol laxative) ½ sachet OD
PEG
Magnesium chloride 3.7 mL BD PEG Magnesium chloride 3.7 mL BD PEG
Nitrazepam 5 mg nocte PEG Nitrazepam 5 mg nocte PEG
Baclofen 2.5 mg TDS PEG Baclofen 2.5 mg TDS PEG
Clobazam 5 mg TDS PEG Clobazam 5 mg TDS PEG
Phenobarbitone 60 mg nocte PEG Phenobarbitone 60 mg nocte PEG
Levetiracetam 500 mg mane PEG Levetiracetam 500 mg mane PEG
Levetiracetam 1000 mg nocte PEG Levetiracetam 1000 mg nocte PEG
Epilim® (valproate) (200 mg/mL) 12.5 mL
BD PEG Epilim
® (valproate) (200 mg/mL) 12.5 mL
BD PEG
Dantrolene 4 mL BD PEG Dantrolene 4 mL BD PEG
Aztreonam 900 mg 8-hourly IV Aztreonam 900 mg 8-hourly IV
Teicoplanin 300 mg OD IV Teicoplanin 300 mg OD IV
Diazepam 2 mg TDS PEG Diazepam 2 mg TDS PEG
Centrum® (multivitamin) I OD PEG Centrum
® (multivitamin) I once daily PEG
Heparin saline 5 mL TDS PRN IV Heparin saline 5 mL TDS PRN IV
Panadol® (paracetamol) 450 mg QID PRN
PEG Panadol
® (paracetamol) 450 mg QID PRN
PEG
Loratadine 6 mg OD PEG Loratadine 6 mg OD PEG
Posaconazole 5 mL BD PEG Posaconazole 5 mL BD PEG
Inner Health Plus® (probiotic) ½ tablespoon
BD PEG Inner Health Plus
® (probiotic) ½ tablespoon
BD PEG
Normal saline neb 10 mL PRN Normal saline neb 10 mL PRN
During hospitalisation, he was prescribed aztreonam 900 mg 8-hourly IV, which was
charted twice. The pharmacist double checked with the nurse and was informed that
one of the aztreonam orders was for the hospital-in-the-home (HITH) service. There
were no notes on the medication chart that it was for HITH. The pharmacist attached
the alert sticker on the other medication chart that it was for HITH.
Case 5
A 1-year-11-month-old (weight: 10.8 kg) was admitted due to HIV encephalopathy,
cardiomyopathy and disseminated tuberculosis. He had experienced 10 days of fever,
cough, vomiting, lethargy, chronic thrush and long-standing developmental
regression. He had had several infections since he was 14 months old, e.g. thrush, ear
infection, measles and pneumonia. He had recently been diagnosed with HIV in
Indonesia and his parents decided to take him to Perth. His condition was unstable.
He had renal and liver impairment, severe immunosuppression, failure to thrive,
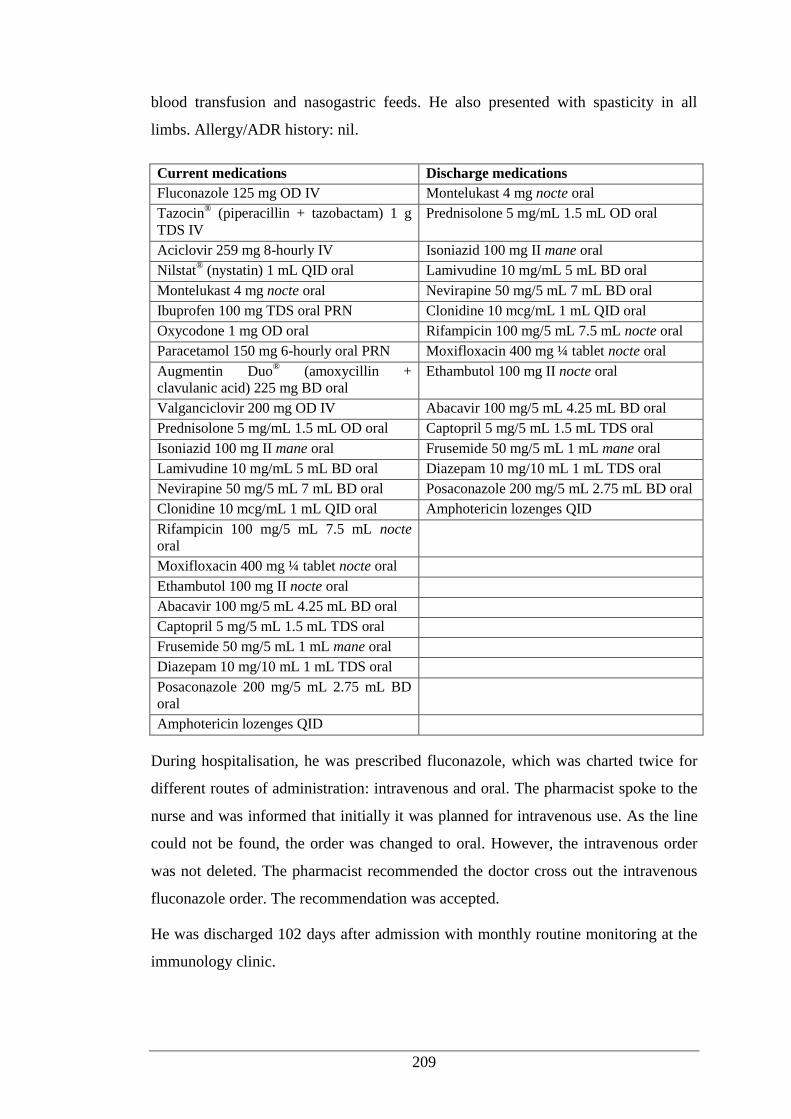
209
blood transfusion and nasogastric feeds. He also presented with spasticity in all
limbs. Allergy/ADR history: nil.
Current medications Discharge medications
Fluconazole 125 mg OD IV Montelukast 4 mg nocte oral
Tazocin® (piperacillin + tazobactam) 1 g
TDS IV Prednisolone 5 mg/mL 1.5 mL OD oral
Aciclovir 259 mg 8-hourly IV Isoniazid 100 mg II mane oral
Nilstat® (nystatin) 1 mL QID oral Lamivudine 10 mg/mL 5 mL BD oral
Montelukast 4 mg nocte oral Nevirapine 50 mg/5 mL 7 mL BD oral
Ibuprofen 100 mg TDS oral PRN Clonidine 10 mcg/mL 1 mL QID oral
Oxycodone 1 mg OD oral Rifampicin 100 mg/5 mL 7.5 mL nocte oral
Paracetamol 150 mg 6-hourly oral PRN Moxifloxacin 400 mg ¼ tablet nocte oral
Augmentin Duo® (amoxycillin +
clavulanic acid) 225 mg BD oral Ethambutol 100 mg II nocte oral
Valganciclovir 200 mg OD IV Abacavir 100 mg/5 mL 4.25 mL BD oral
Prednisolone 5 mg/mL 1.5 mL OD oral Captopril 5 mg/5 mL 1.5 mL TDS oral
Isoniazid 100 mg II mane oral Frusemide 50 mg/5 mL 1 mL mane oral
Lamivudine 10 mg/mL 5 mL BD oral Diazepam 10 mg/10 mL 1 mL TDS oral
Nevirapine 50 mg/5 mL 7 mL BD oral Posaconazole 200 mg/5 mL 2.75 mL BD oral
Clonidine 10 mcg/mL 1 mL QID oral Amphotericin lozenges QID
Rifampicin 100 mg/5 mL 7.5 mL nocte
oral
Moxifloxacin 400 mg ¼ tablet nocte oral
Ethambutol 100 mg II nocte oral
Abacavir 100 mg/5 mL 4.25 mL BD oral
Captopril 5 mg/5 mL 1.5 mL TDS oral
Frusemide 50 mg/5 mL 1 mL mane oral
Diazepam 10 mg/10 mL 1 mL TDS oral
Posaconazole 200 mg/5 mL 2.75 mL BD
oral
Amphotericin lozenges QID
During hospitalisation, he was prescribed fluconazole, which was charted twice for
different routes of administration: intravenous and oral. The pharmacist spoke to the
nurse and was informed that initially it was planned for intravenous use. As the line
could not be found, the order was changed to oral. However, the intravenous order
was not deleted. The pharmacist recommended the doctor cross out the intravenous
fluconazole order. The recommendation was accepted.
He was discharged 102 days after admission with monthly routine monitoring at the
immunology clinic.
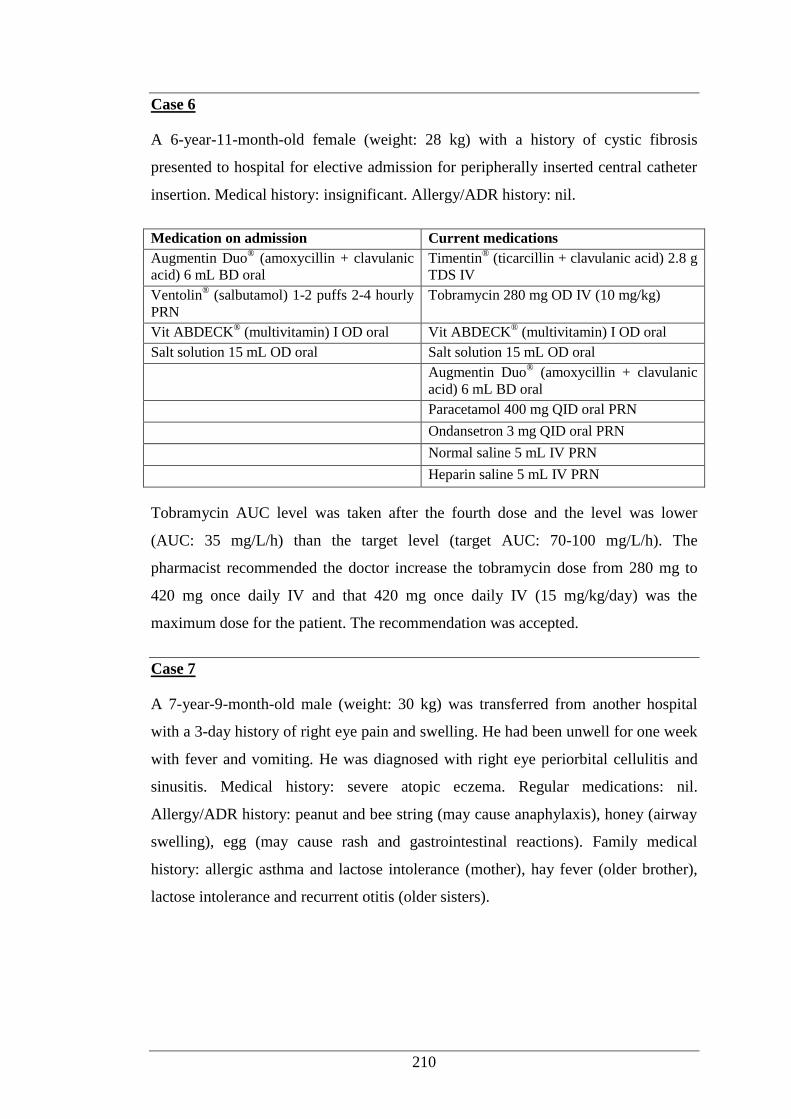
210
Case 6
A 6-year-11-month-old female (weight: 28 kg) with a history of cystic fibrosis
presented to hospital for elective admission for peripherally inserted central catheter
insertion. Medical history: insignificant. Allergy/ADR history: nil.
Medication on admission Current medications
Augmentin Duo® (amoxycillin + clavulanic
acid) 6 mL BD oral Timentin
® (ticarcillin + clavulanic acid) 2.8 g
TDS IV
Ventolin® (salbutamol) 1-2 puffs 2-4 hourly
PRN Tobramycin 280 mg OD IV (10 mg/kg)
Vit ABDECK® (multivitamin) I OD oral Vit ABDECK
® (multivitamin) I OD oral
Salt solution 15 mL OD oral Salt solution 15 mL OD oral
Augmentin Duo® (amoxycillin + clavulanic
acid) 6 mL BD oral
Paracetamol 400 mg QID oral PRN
Ondansetron 3 mg QID oral PRN
Normal saline 5 mL IV PRN
Heparin saline 5 mL IV PRN
Tobramycin AUC level was taken after the fourth dose and the level was lower
(AUC: 35 mg/L/h) than the target level (target AUC: 70-100 mg/L/h). The
pharmacist recommended the doctor increase the tobramycin dose from 280 mg to
420 mg once daily IV and that 420 mg once daily IV (15 mg/kg/day) was the
maximum dose for the patient. The recommendation was accepted.
Case 7
A 7-year-9-month-old male (weight: 30 kg) was transferred from another hospital
with a 3-day history of right eye pain and swelling. He had been unwell for one week
with fever and vomiting. He was diagnosed with right eye periorbital cellulitis and
sinusitis. Medical history: severe atopic eczema. Regular medications: nil.
Allergy/ADR history: peanut and bee string (may cause anaphylaxis), honey (airway
swelling), egg (may cause rash and gastrointestinal reactions). Family medical
history: allergic asthma and lactose intolerance (mother), hay fever (older brother),
lactose intolerance and recurrent otitis (older sisters).
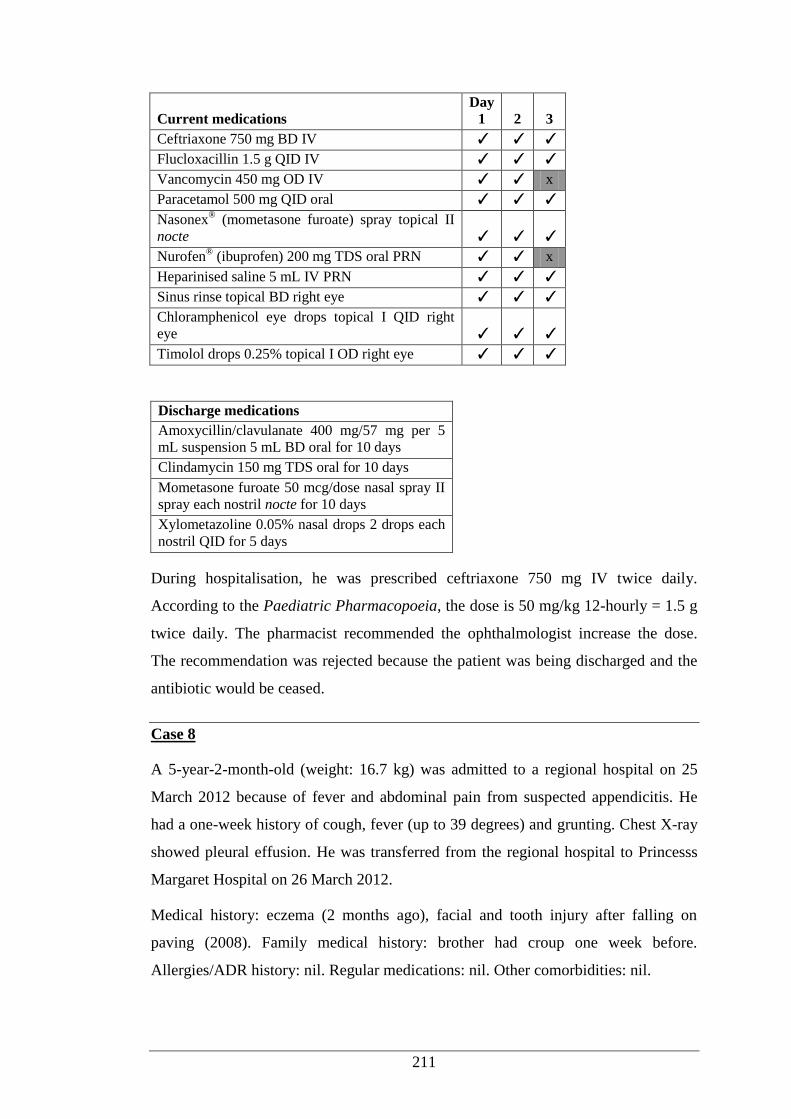
211
Current medications Day
1 2 3
Ceftriaxone 750 mg BD IV ✓ ✓ ✓
Flucloxacillin 1.5 g QID IV ✓ ✓ ✓
Vancomycin 450 mg OD IV ✓ ✓ x
Paracetamol 500 mg QID oral ✓ ✓ ✓
Nasonex® (mometasone furoate) spray topical II
nocte ✓ ✓ ✓
Nurofen® (ibuprofen) 200 mg TDS oral PRN ✓ ✓ x
Heparinised saline 5 mL IV PRN ✓ ✓ ✓
Sinus rinse topical BD right eye ✓ ✓ ✓
Chloramphenicol eye drops topical I QID right
eye ✓ ✓ ✓
Timolol drops 0.25% topical I OD right eye ✓ ✓ ✓
Discharge medications
Amoxycillin/clavulanate 400 mg/57 mg per 5
mL suspension 5 mL BD oral for 10 days
Clindamycin 150 mg TDS oral for 10 days
Mometasone furoate 50 mcg/dose nasal spray II
spray each nostril nocte for 10 days
Xylometazoline 0.05% nasal drops 2 drops each
nostril QID for 5 days
During hospitalisation, he was prescribed ceftriaxone 750 mg IV twice daily.
According to the Paediatric Pharmacopoeia, the dose is 50 mg/kg 12-hourly = 1.5 g
twice daily. The pharmacist recommended the ophthalmologist increase the dose.
The recommendation was rejected because the patient was being discharged and the
antibiotic would be ceased.
Case 8
A 5-year-2-month-old (weight: 16.7 kg) was admitted to a regional hospital on 25
March 2012 because of fever and abdominal pain from suspected appendicitis. He
had a one-week history of cough, fever (up to 39 degrees) and grunting. Chest X-ray
showed pleural effusion. He was transferred from the regional hospital to Princesss
Margaret Hospital on 26 March 2012.
Medical history: eczema (2 months ago), facial and tooth injury after falling on
paving (2008). Family medical history: brother had croup one week before.
Allergies/ADR history: nil. Regular medications: nil. Other comorbidities: nil.
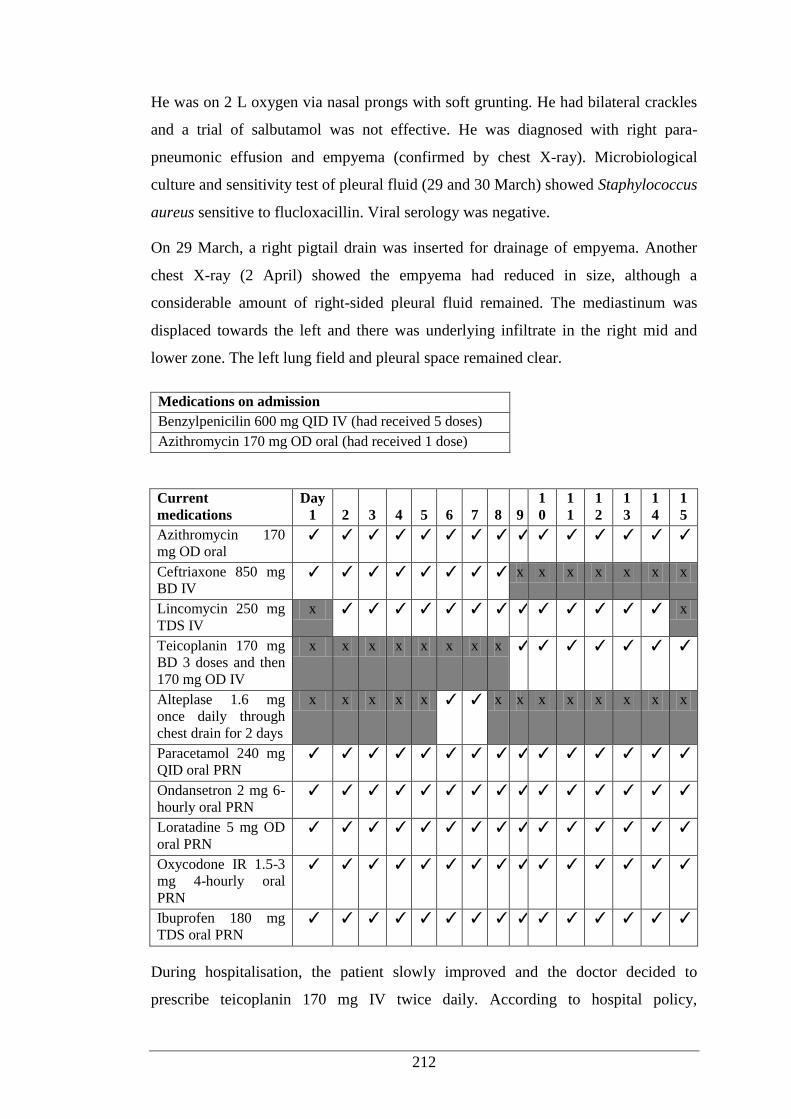
212
He was on 2 L oxygen via nasal prongs with soft grunting. He had bilateral crackles
and a trial of salbutamol was not effective. He was diagnosed with right para-
pneumonic effusion and empyema (confirmed by chest X-ray). Microbiological
culture and sensitivity test of pleural fluid (29 and 30 March) showed Staphylococcus
aureus sensitive to flucloxacillin. Viral serology was negative.
On 29 March, a right pigtail drain was inserted for drainage of empyema. Another
chest X-ray (2 April) showed the empyema had reduced in size, although a
considerable amount of right-sided pleural fluid remained. The mediastinum was
displaced towards the left and there was underlying infiltrate in the right mid and
lower zone. The left lung field and pleural space remained clear.
Medications on admission
Benzylpenicilin 600 mg QID IV (had received 5 doses)
Azithromycin 170 mg OD oral (had received 1 dose)
Current
medications Day
1 2 3 4 5 6 7 8 9 1
0 1
1 1
2 1
3 1
4 1
5 Azithromycin 170
mg OD oral ✓ ✓ ✓ ✓ ✓ ✓ ✓ ✓ ✓ ✓ ✓ ✓ ✓ ✓ ✓
Ceftriaxone 850 mg
BD IV ✓ ✓ ✓ ✓ ✓ ✓ ✓ ✓ x x x x x x x
Lincomycin 250 mg
TDS IV x ✓ ✓ ✓ ✓ ✓ ✓ ✓ ✓ ✓ ✓ ✓ ✓ ✓ x
Teicoplanin 170 mg
BD 3 doses and then
170 mg OD IV
x x x x x x x x ✓ ✓ ✓ ✓ ✓ ✓ ✓
Alteplase 1.6 mg
once daily through
chest drain for 2 days
x x x x x ✓ ✓ x x x x x x x x
Paracetamol 240 mg
QID oral PRN ✓ ✓ ✓ ✓ ✓ ✓ ✓ ✓ ✓ ✓ ✓ ✓ ✓ ✓ ✓
Ondansetron 2 mg 6-
hourly oral PRN ✓ ✓ ✓ ✓ ✓ ✓ ✓ ✓ ✓ ✓ ✓ ✓ ✓ ✓ ✓
Loratadine 5 mg OD
oral PRN ✓ ✓ ✓ ✓ ✓ ✓ ✓ ✓ ✓ ✓ ✓ ✓ ✓ ✓ ✓
Oxycodone IR 1.5-3
mg 4-hourly oral
PRN
✓ ✓ ✓ ✓ ✓ ✓ ✓ ✓ ✓ ✓ ✓ ✓ ✓ ✓ ✓
Ibuprofen 180 mg
TDS oral PRN ✓ ✓ ✓ ✓ ✓ ✓ ✓ ✓ ✓ ✓ ✓ ✓ ✓ ✓ ✓
During hospitalisation, the patient slowly improved and the doctor decided to
prescribe teicoplanin 170 mg IV twice daily. According to hospital policy,
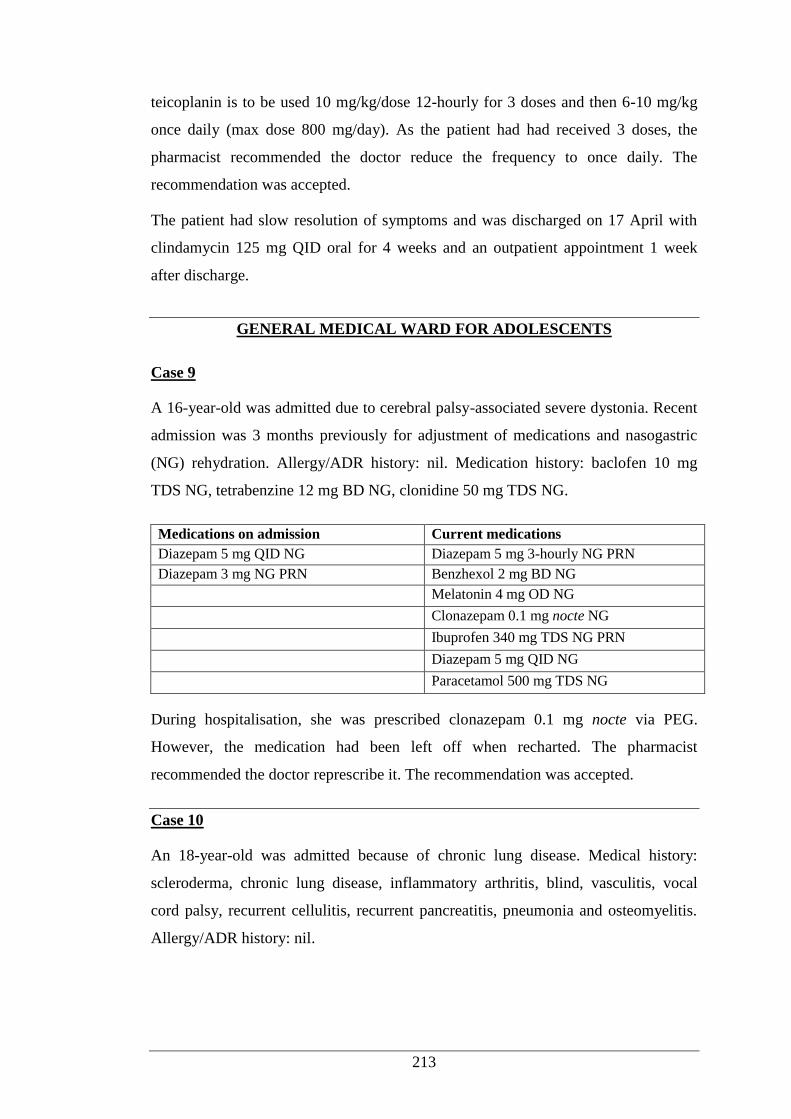
213
teicoplanin is to be used 10 mg/kg/dose 12-hourly for 3 doses and then 6-10 mg/kg
once daily (max dose 800 mg/day). As the patient had had received 3 doses, the
pharmacist recommended the doctor reduce the frequency to once daily. The
recommendation was accepted.
The patient had slow resolution of symptoms and was discharged on 17 April with
clindamycin 125 mg QID oral for 4 weeks and an outpatient appointment 1 week
after discharge.
GENERAL MEDICAL WARD FOR ADOLESCENTS
Case 9
A 16-year-old was admitted due to cerebral palsy-associated severe dystonia. Recent
admission was 3 months previously for adjustment of medications and nasogastric
(NG) rehydration. Allergy/ADR history: nil. Medication history: baclofen 10 mg
TDS NG, tetrabenzine 12 mg BD NG, clonidine 50 mg TDS NG.
Medications on admission Current medications
Diazepam 5 mg QID NG Diazepam 5 mg 3-hourly NG PRN
Diazepam 3 mg NG PRN Benzhexol 2 mg BD NG
Melatonin 4 mg OD NG
Clonazepam 0.1 mg nocte NG
Ibuprofen 340 mg TDS NG PRN
Diazepam 5 mg QID NG
Paracetamol 500 mg TDS NG
During hospitalisation, she was prescribed clonazepam 0.1 mg nocte via PEG.
However, the medication had been left off when recharted. The pharmacist
recommended the doctor represcribe it. The recommendation was accepted.
Case 10
An 18-year-old was admitted because of chronic lung disease. Medical history:
scleroderma, chronic lung disease, inflammatory arthritis, blind, vasculitis, vocal
cord palsy, recurrent cellulitis, recurrent pancreatitis, pneumonia and osteomyelitis.
Allergy/ADR history: nil.
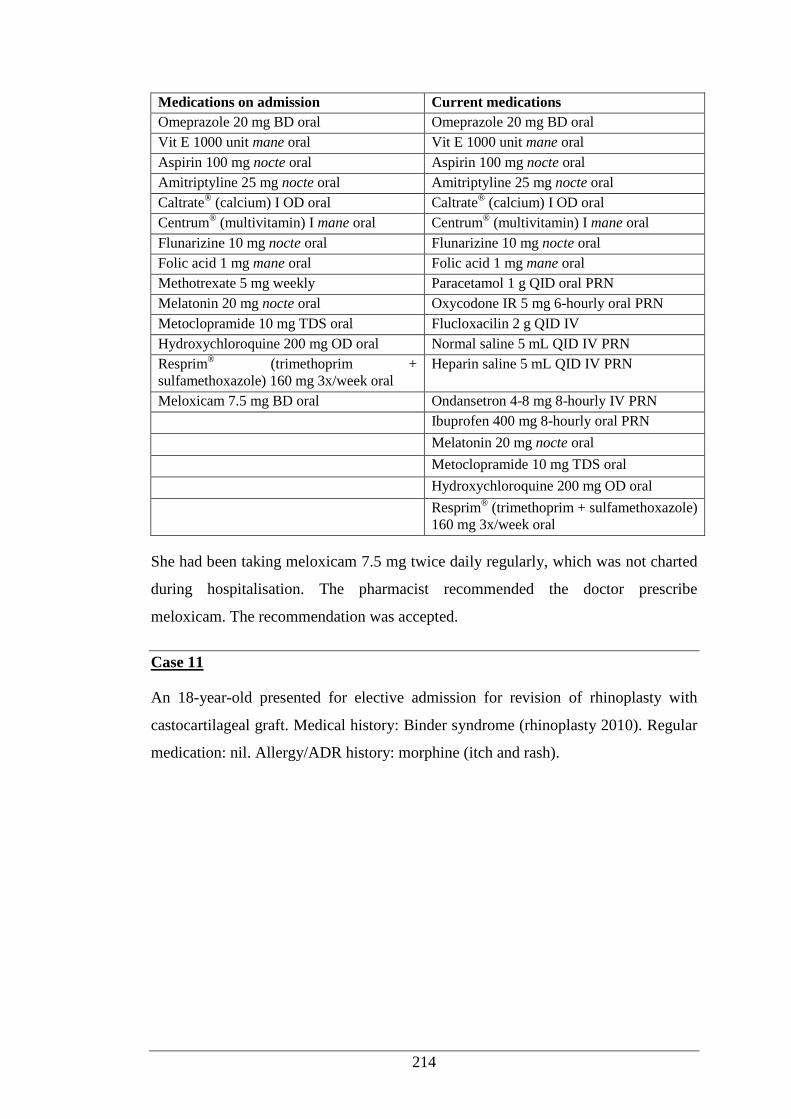
214
Medications on admission Current medications
Omeprazole 20 mg BD oral Omeprazole 20 mg BD oral
Vit E 1000 unit mane oral Vit E 1000 unit mane oral
Aspirin 100 mg nocte oral Aspirin 100 mg nocte oral
Amitriptyline 25 mg nocte oral Amitriptyline 25 mg nocte oral
Caltrate® (calcium) I OD oral Caltrate
® (calcium) I OD oral
Centrum® (multivitamin) I mane oral Centrum
® (multivitamin) I mane oral
Flunarizine 10 mg nocte oral Flunarizine 10 mg nocte oral
Folic acid 1 mg mane oral Folic acid 1 mg mane oral
Methotrexate 5 mg weekly Paracetamol 1 g QID oral PRN
Melatonin 20 mg nocte oral Oxycodone IR 5 mg 6-hourly oral PRN
Metoclopramide 10 mg TDS oral Flucloxacilin 2 g QID IV
Hydroxychloroquine 200 mg OD oral Normal saline 5 mL QID IV PRN
Resprim® (trimethoprim +
sulfamethoxazole) 160 mg 3x/week oral Heparin saline 5 mL QID IV PRN
Meloxicam 7.5 mg BD oral Ondansetron 4-8 mg 8-hourly IV PRN
Ibuprofen 400 mg 8-hourly oral PRN
Melatonin 20 mg nocte oral
Metoclopramide 10 mg TDS oral
Hydroxychloroquine 200 mg OD oral
Resprim® (trimethoprim + sulfamethoxazole)
160 mg 3x/week oral
She had been taking meloxicam 7.5 mg twice daily regularly, which was not charted
during hospitalisation. The pharmacist recommended the doctor prescribe
meloxicam. The recommendation was accepted.
Case 11
An 18-year-old presented for elective admission for revision of rhinoplasty with
castocartilageal graft. Medical history: Binder syndrome (rhinoplasty 2010). Regular
medication: nil. Allergy/ADR history: morphine (itch and rash).
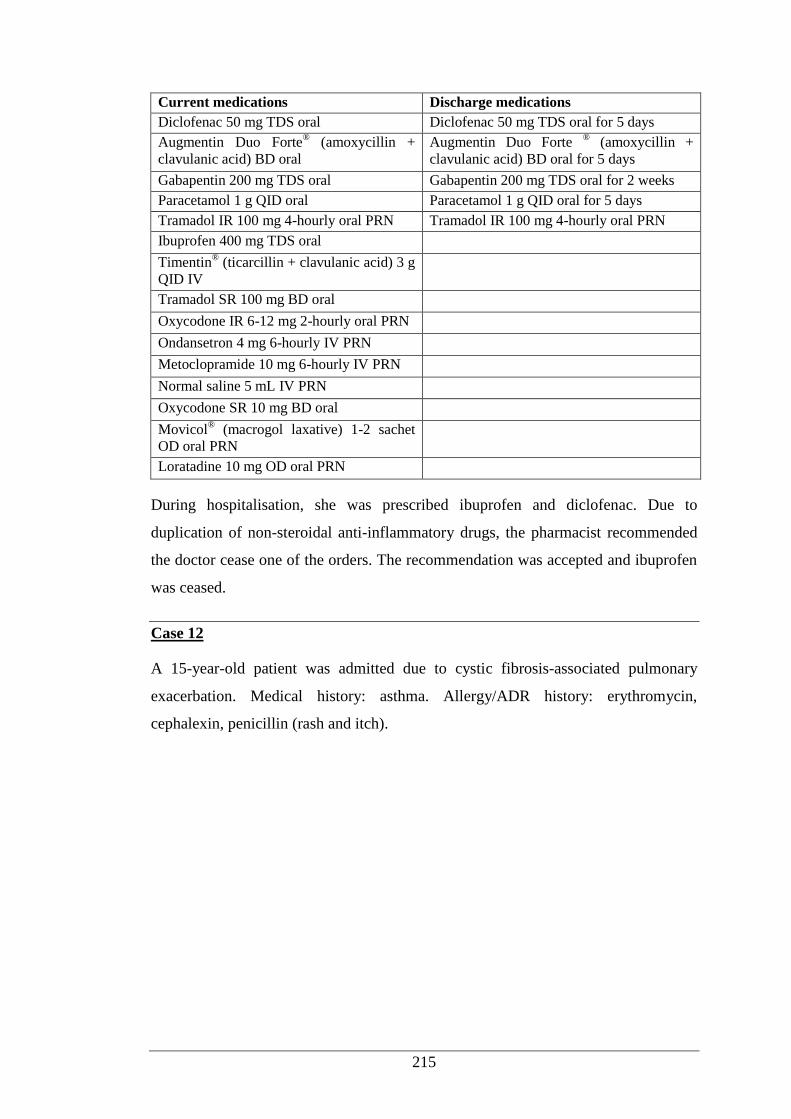
215
Current medications Discharge medications
Diclofenac 50 mg TDS oral Diclofenac 50 mg TDS oral for 5 days
Augmentin Duo Forte® (amoxycillin +
clavulanic acid) BD oral Augmentin Duo Forte
® (amoxycillin +
clavulanic acid) BD oral for 5 days
Gabapentin 200 mg TDS oral Gabapentin 200 mg TDS oral for 2 weeks
Paracetamol 1 g QID oral Paracetamol 1 g QID oral for 5 days
Tramadol IR 100 mg 4-hourly oral PRN Tramadol IR 100 mg 4-hourly oral PRN
Ibuprofen 400 mg TDS oral
Timentin® (ticarcillin + clavulanic acid) 3 g
QID IV
Tramadol SR 100 mg BD oral
Oxycodone IR 6-12 mg 2-hourly oral PRN
Ondansetron 4 mg 6-hourly IV PRN
Metoclopramide 10 mg 6-hourly IV PRN
Normal saline 5 mL IV PRN
Oxycodone SR 10 mg BD oral
Movicol® (macrogol laxative) 1-2 sachet
OD oral PRN
Loratadine 10 mg OD oral PRN
During hospitalisation, she was prescribed ibuprofen and diclofenac. Due to
duplication of non-steroidal anti-inflammatory drugs, the pharmacist recommended
the doctor cease one of the orders. The recommendation was accepted and ibuprofen
was ceased.
Case 12
A 15-year-old patient was admitted due to cystic fibrosis-associated pulmonary
exacerbation. Medical history: asthma. Allergy/ADR history: erythromycin,
cephalexin, penicillin (rash and itch).
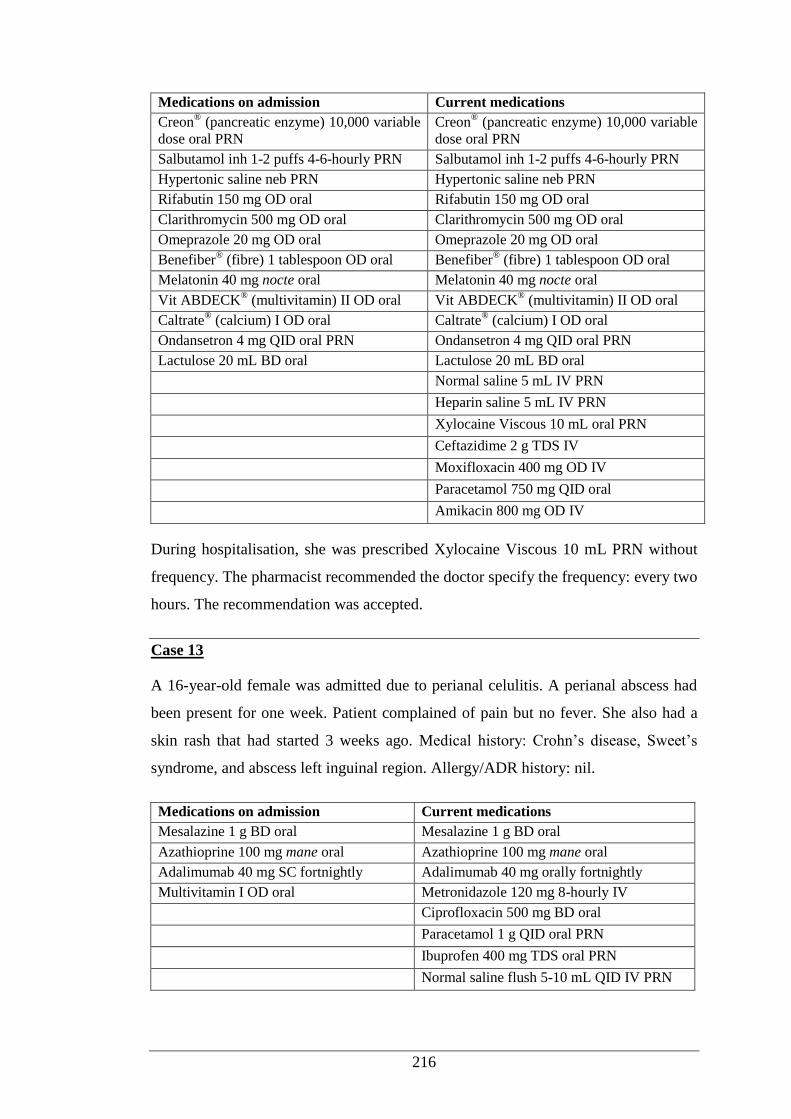
216
Medications on admission Current medications
Creon® (pancreatic enzyme) 10,000 variable
dose oral PRN Creon
® (pancreatic enzyme) 10,000 variable
dose oral PRN
Salbutamol inh 1-2 puffs 4-6-hourly PRN Salbutamol inh 1-2 puffs 4-6-hourly PRN
Hypertonic saline neb PRN Hypertonic saline neb PRN
Rifabutin 150 mg OD oral Rifabutin 150 mg OD oral
Clarithromycin 500 mg OD oral Clarithromycin 500 mg OD oral
Omeprazole 20 mg OD oral Omeprazole 20 mg OD oral
Benefiber® (fibre) 1 tablespoon OD oral Benefiber
® (fibre) 1 tablespoon OD oral
Melatonin 40 mg nocte oral Melatonin 40 mg nocte oral
Vit ABDECK® (multivitamin) II OD oral Vit ABDECK
® (multivitamin) II OD oral
Caltrate® (calcium) I OD oral Caltrate
® (calcium) I OD oral
Ondansetron 4 mg QID oral PRN Ondansetron 4 mg QID oral PRN
Lactulose 20 mL BD oral Lactulose 20 mL BD oral
Normal saline 5 mL IV PRN
Heparin saline 5 mL IV PRN
Xylocaine Viscous 10 mL oral PRN
Ceftazidime 2 g TDS IV
Moxifloxacin 400 mg OD IV
Paracetamol 750 mg QID oral
Amikacin 800 mg OD IV
During hospitalisation, she was prescribed Xylocaine Viscous 10 mL PRN without
frequency. The pharmacist recommended the doctor specify the frequency: every two
hours. The recommendation was accepted.
Case 13
A 16-year-old female was admitted due to perianal celulitis. A perianal abscess had
been present for one week. Patient complained of pain but no fever. She also had a
skin rash that had started 3 weeks ago. Medical history: Crohn’s disease, Sweet’s
syndrome, and abscess left inguinal region. Allergy/ADR history: nil.
Medications on admission Current medications
Mesalazine 1 g BD oral Mesalazine 1 g BD oral
Azathioprine 100 mg mane oral Azathioprine 100 mg mane oral
Adalimumab 40 mg SC fortnightly Adalimumab 40 mg orally fortnightly
Multivitamin I OD oral Metronidazole 120 mg 8-hourly IV
Ciprofloxacin 500 mg BD oral
Paracetamol 1 g QID oral PRN
Ibuprofen 400 mg TDS oral PRN
Normal saline flush 5-10 mL QID IV PRN
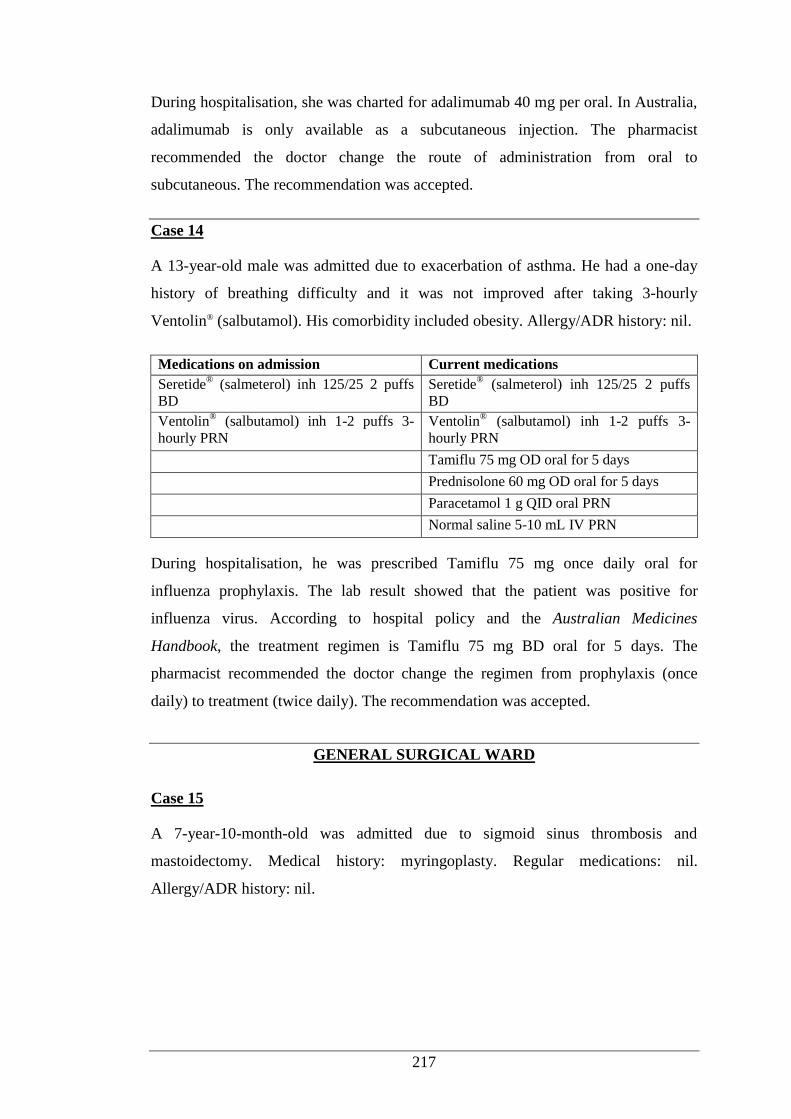
217
During hospitalisation, she was charted for adalimumab 40 mg per oral. In Australia,
adalimumab is only available as a subcutaneous injection. The pharmacist
recommended the doctor change the route of administration from oral to
subcutaneous. The recommendation was accepted.
Case 14
A 13-year-old male was admitted due to exacerbation of asthma. He had a one-day
history of breathing difficulty and it was not improved after taking 3-hourly
Ventolin® (salbutamol). His comorbidity included obesity. Allergy/ADR history: nil.
Medications on admission Current medications
Seretide® (salmeterol) inh 125/25 2 puffs
BD Seretide
® (salmeterol) inh 125/25 2 puffs
BD
Ventolin® (salbutamol) inh 1-2 puffs 3-
hourly PRN Ventolin
® (salbutamol) inh 1-2 puffs 3-
hourly PRN
Tamiflu 75 mg OD oral for 5 days
Prednisolone 60 mg OD oral for 5 days
Paracetamol 1 g QID oral PRN
Normal saline 5-10 mL IV PRN
During hospitalisation, he was prescribed Tamiflu 75 mg once daily oral for
influenza prophylaxis. The lab result showed that the patient was positive for
influenza virus. According to hospital policy and the Australian Medicines
Handbook, the treatment regimen is Tamiflu 75 mg BD oral for 5 days. The
pharmacist recommended the doctor change the regimen from prophylaxis (once
daily) to treatment (twice daily). The recommendation was accepted.
GENERAL SURGICAL WARD
Case 15
A 7-year-10-month-old was admitted due to sigmoid sinus thrombosis and
mastoidectomy. Medical history: myringoplasty. Regular medications: nil.
Allergy/ADR history: nil.
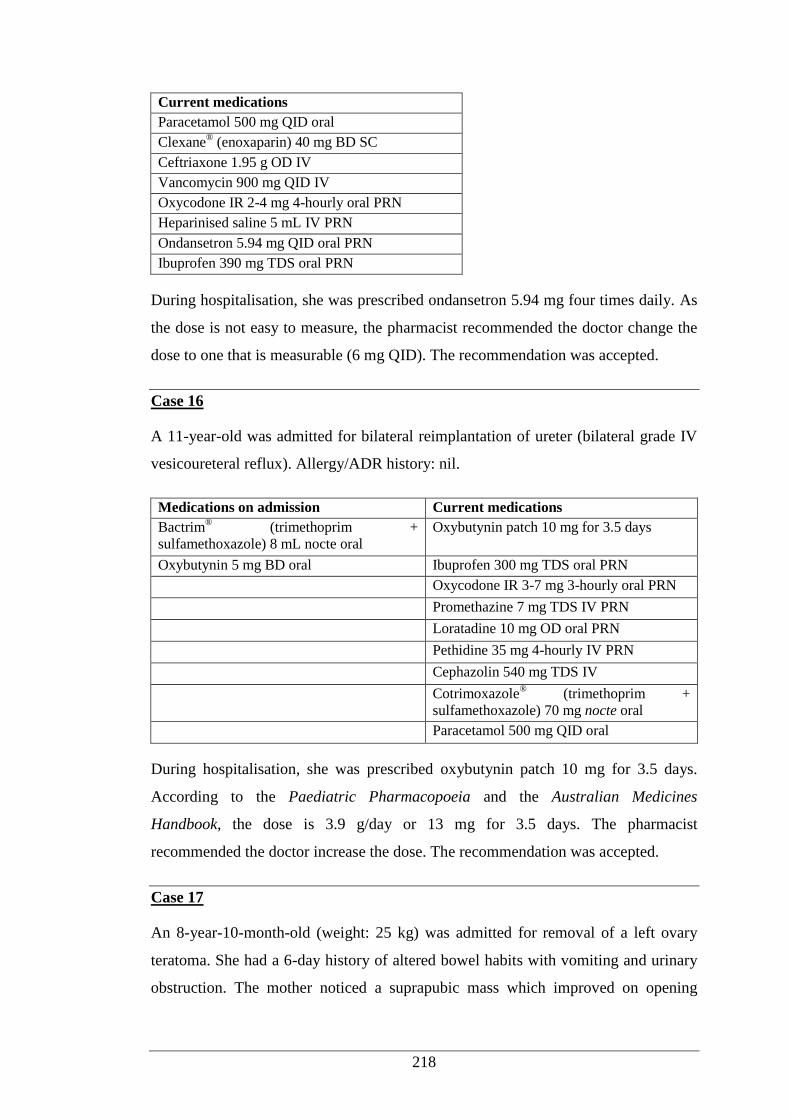
218
Current medications
Paracetamol 500 mg QID oral
Clexane® (enoxaparin) 40 mg BD SC
Ceftriaxone 1.95 g OD IV
Vancomycin 900 mg QID IV
Oxycodone IR 2-4 mg 4-hourly oral PRN
Heparinised saline 5 mL IV PRN
Ondansetron 5.94 mg QID oral PRN
Ibuprofen 390 mg TDS oral PRN
During hospitalisation, she was prescribed ondansetron 5.94 mg four times daily. As
the dose is not easy to measure, the pharmacist recommended the doctor change the
dose to one that is measurable (6 mg QID). The recommendation was accepted.
Case 16
A 11-year-old was admitted for bilateral reimplantation of ureter (bilateral grade IV
vesicoureteral reflux). Allergy/ADR history: nil.
Medications on admission Current medications
Bactrim® (trimethoprim +
sulfamethoxazole) 8 mL nocte oral Oxybutynin patch 10 mg for 3.5 days
Oxybutynin 5 mg BD oral Ibuprofen 300 mg TDS oral PRN
Oxycodone IR 3-7 mg 3-hourly oral PRN
Promethazine 7 mg TDS IV PRN
Loratadine 10 mg OD oral PRN
Pethidine 35 mg 4-hourly IV PRN
Cephazolin 540 mg TDS IV
Cotrimoxazole® (trimethoprim +
sulfamethoxazole) 70 mg nocte oral
Paracetamol 500 mg QID oral
During hospitalisation, she was prescribed oxybutynin patch 10 mg for 3.5 days.
According to the Paediatric Pharmacopoeia and the Australian Medicines
Handbook, the dose is 3.9 g/day or 13 mg for 3.5 days. The pharmacist
recommended the doctor increase the dose. The recommendation was accepted.
Case 17
An 8-year-10-month-old (weight: 25 kg) was admitted for removal of a left ovary
teratoma. She had a 6-day history of altered bowel habits with vomiting and urinary
obstruction. The mother noticed a suprapubic mass which improved on opening
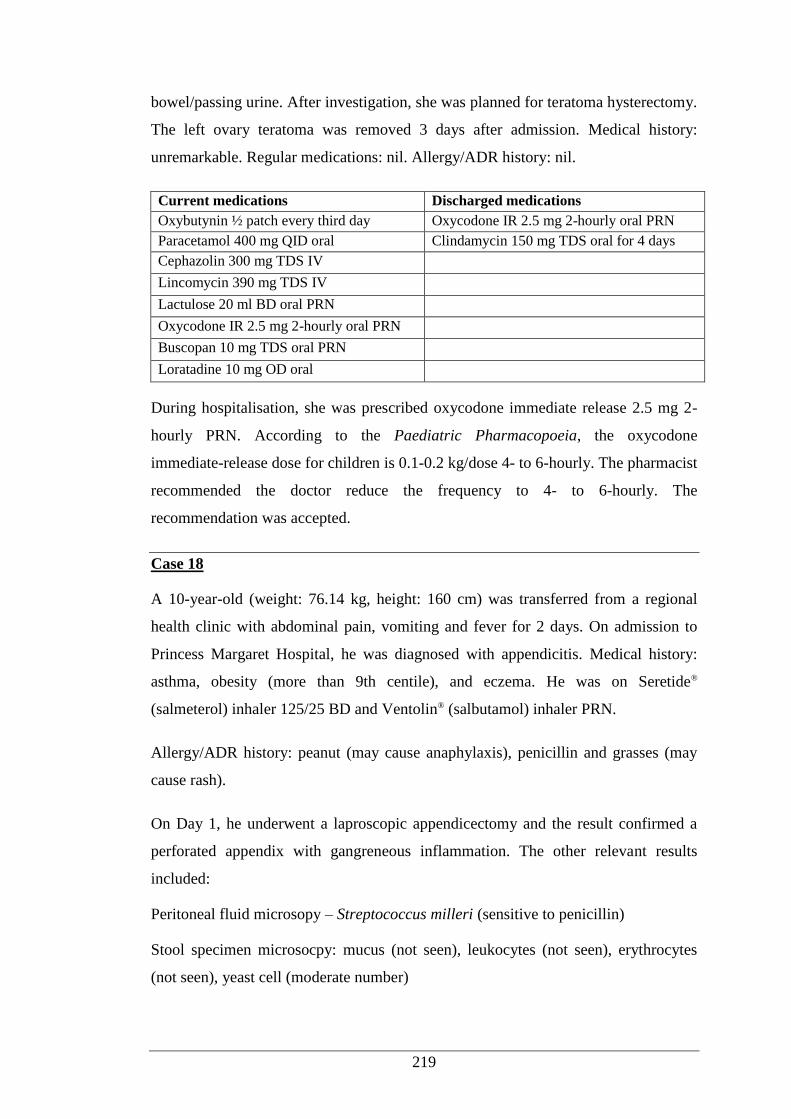
219
bowel/passing urine. After investigation, she was planned for teratoma hysterectomy.
The left ovary teratoma was removed 3 days after admission. Medical history:
unremarkable. Regular medications: nil. Allergy/ADR history: nil.
Current medications Discharged medications
Oxybutynin ½ patch every third day Oxycodone IR 2.5 mg 2-hourly oral PRN
Paracetamol 400 mg QID oral Clindamycin 150 mg TDS oral for 4 days
Cephazolin 300 mg TDS IV
Lincomycin 390 mg TDS IV
Lactulose 20 ml BD oral PRN
Oxycodone IR 2.5 mg 2-hourly oral PRN
Buscopan 10 mg TDS oral PRN
Loratadine 10 mg OD oral
During hospitalisation, she was prescribed oxycodone immediate release 2.5 mg 2-
hourly PRN. According to the Paediatric Pharmacopoeia, the oxycodone
immediate-release dose for children is 0.1-0.2 kg/dose 4- to 6-hourly. The pharmacist
recommended the doctor reduce the frequency to 4- to 6-hourly. The
recommendation was accepted.
Case 18
A 10-year-old (weight: 76.14 kg, height: 160 cm) was transferred from a regional
health clinic with abdominal pain, vomiting and fever for 2 days. On admission to
Princess Margaret Hospital, he was diagnosed with appendicitis. Medical history:
asthma, obesity (more than 9th centile), and eczema. He was on Seretide®
(salmeterol) inhaler 125/25 BD and Ventolin® (salbutamol) inhaler PRN.
Allergy/ADR history: peanut (may cause anaphylaxis), penicillin and grasses (may
cause rash).
On Day 1, he underwent a laproscopic appendicectomy and the result confirmed a
perforated appendix with gangreneous inflammation. The other relevant results
included:
Peritoneal fluid microsopy – Streptococcus milleri (sensitive to penicillin)
Stool specimen microsocpy: mucus (not seen), leukocytes (not seen), erythrocytes
(not seen), yeast cell (moderate number)
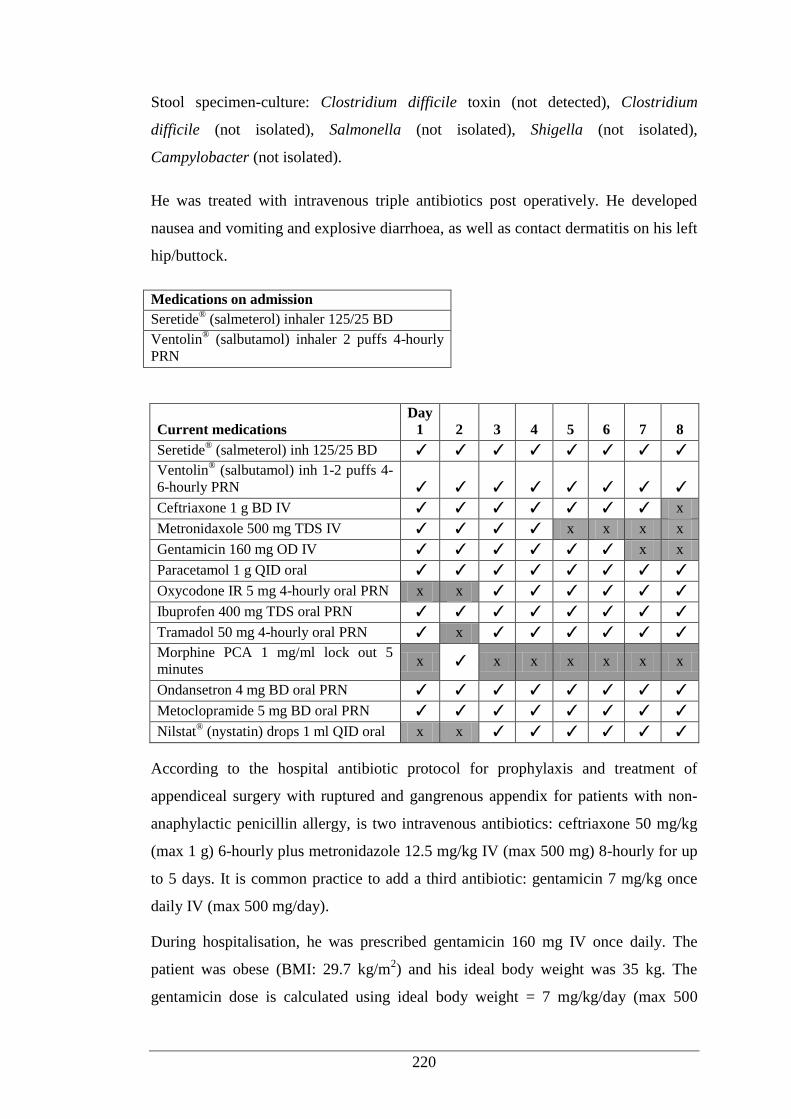
220
Stool specimen-culture: Clostridium difficile toxin (not detected), Clostridium
difficile (not isolated), Salmonella (not isolated), Shigella (not isolated),
Campylobacter (not isolated).
He was treated with intravenous triple antibiotics post operatively. He developed
nausea and vomiting and explosive diarrhoea, as well as contact dermatitis on his left
hip/buttock.
Medications on admission
Seretide® (salmeterol) inhaler 125/25 BD
Ventolin® (salbutamol) inhaler 2 puffs 4-hourly
PRN
Current medications Day
1 2 3 4 5 6 7 8
Seretide® (salmeterol) inh 125/25 BD ✓ ✓ ✓ ✓ ✓ ✓ ✓ ✓
Ventolin® (salbutamol) inh 1-2 puffs 4-
6-hourly PRN ✓ ✓ ✓ ✓ ✓ ✓ ✓ ✓
Ceftriaxone 1 g BD IV ✓ ✓ ✓ ✓ ✓ ✓ ✓ x
Metronidaxole 500 mg TDS IV ✓ ✓ ✓ ✓ x x x x
Gentamicin 160 mg OD IV ✓ ✓ ✓ ✓ ✓ ✓ x x
Paracetamol 1 g QID oral ✓ ✓ ✓ ✓ ✓ ✓ ✓ ✓
Oxycodone IR 5 mg 4-hourly oral PRN x x ✓ ✓ ✓ ✓ ✓ ✓
Ibuprofen 400 mg TDS oral PRN ✓ ✓ ✓ ✓ ✓ ✓ ✓ ✓
Tramadol 50 mg 4-hourly oral PRN ✓ x ✓ ✓ ✓ ✓ ✓ ✓
Morphine PCA 1 mg/ml lock out 5
minutes x ✓ x x x x x x
Ondansetron 4 mg BD oral PRN ✓ ✓ ✓ ✓ ✓ ✓ ✓ ✓
Metoclopramide 5 mg BD oral PRN ✓ ✓ ✓ ✓ ✓ ✓ ✓ ✓
Nilstat® (nystatin) drops 1 ml QID oral x x ✓ ✓ ✓ ✓ ✓ ✓
According to the hospital antibiotic protocol for prophylaxis and treatment of
appendiceal surgery with ruptured and gangrenous appendix for patients with non-
anaphylactic penicillin allergy, is two intravenous antibiotics: ceftriaxone 50 mg/kg
(max 1 g) 6-hourly plus metronidazole 12.5 mg/kg IV (max 500 mg) 8-hourly for up
to 5 days. It is common practice to add a third antibiotic: gentamicin 7 mg/kg once
daily IV (max 500 mg/day).
During hospitalisation, he was prescribed gentamicin 160 mg IV once daily. The
patient was obese (BMI: 29.7 kg/m2) and his ideal body weight was 35 kg. The
gentamicin dose is calculated using ideal body weight = 7 mg/kg/day (max 500
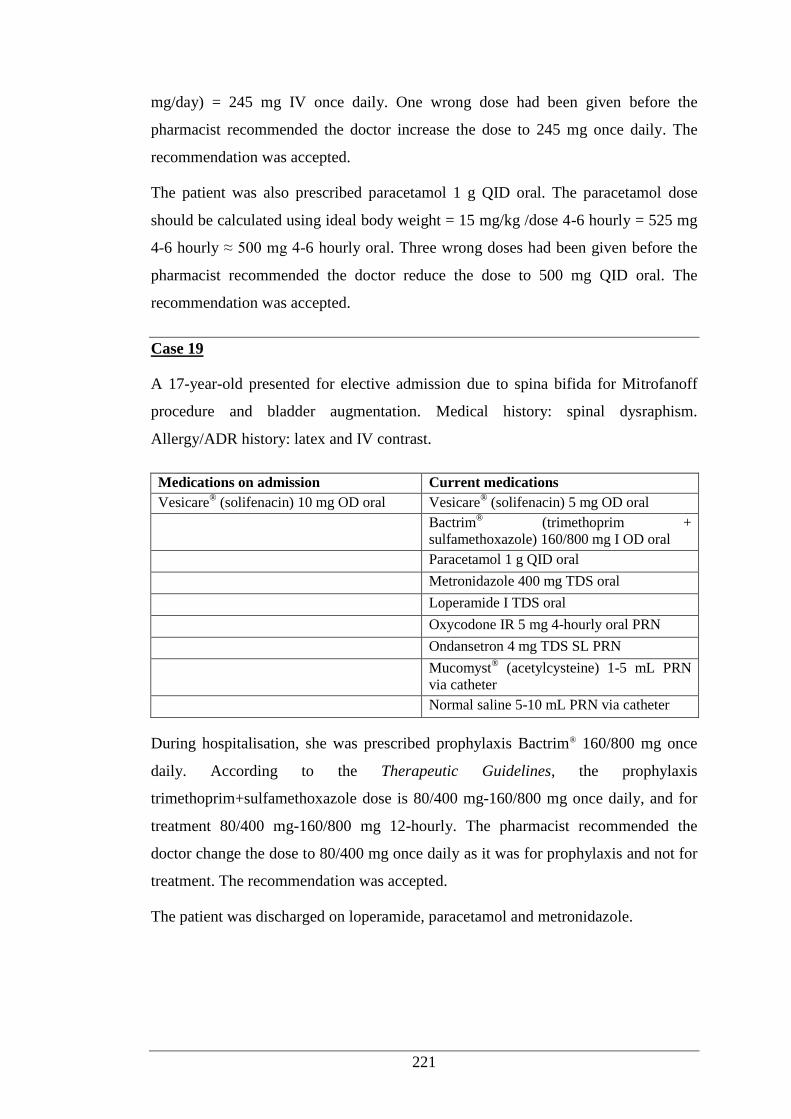
221
mg/day) = 245 mg IV once daily. One wrong dose had been given before the
pharmacist recommended the doctor increase the dose to 245 mg once daily. The
recommendation was accepted.
The patient was also prescribed paracetamol 1 g QID oral. The paracetamol dose
should be calculated using ideal body weight = 15 mg/kg /dose 4-6 hourly = 525 mg
4-6 hourly ≈ 500 mg 4-6 hourly oral. Three wrong doses had been given before the
pharmacist recommended the doctor reduce the dose to 500 mg QID oral. The
recommendation was accepted.
Case 19
A 17-year-old presented for elective admission due to spina bifida for Mitrofanoff
procedure and bladder augmentation. Medical history: spinal dysraphism.
Allergy/ADR history: latex and IV contrast.
Medications on admission Current medications
Vesicare® (solifenacin) 10 mg OD oral Vesicare
® (solifenacin) 5 mg OD oral
Bactrim® (trimethoprim +
sulfamethoxazole) 160/800 mg I OD oral
Paracetamol 1 g QID oral
Metronidazole 400 mg TDS oral
Loperamide I TDS oral
Oxycodone IR 5 mg 4-hourly oral PRN
Ondansetron 4 mg TDS SL PRN
Mucomyst® (acetylcysteine) 1-5 mL PRN
via catheter
Normal saline 5-10 mL PRN via catheter
During hospitalisation, she was prescribed prophylaxis Bactrim® 160/800 mg once
daily. According to the Therapeutic Guidelines, the prophylaxis
trimethoprim+sulfamethoxazole dose is 80/400 mg-160/800 mg once daily, and for
treatment 80/400 mg-160/800 mg 12-hourly. The pharmacist recommended the
doctor change the dose to 80/400 mg once daily as it was for prophylaxis and not for
treatment. The recommendation was accepted.
The patient was discharged on loperamide, paracetamol and metronidazole.
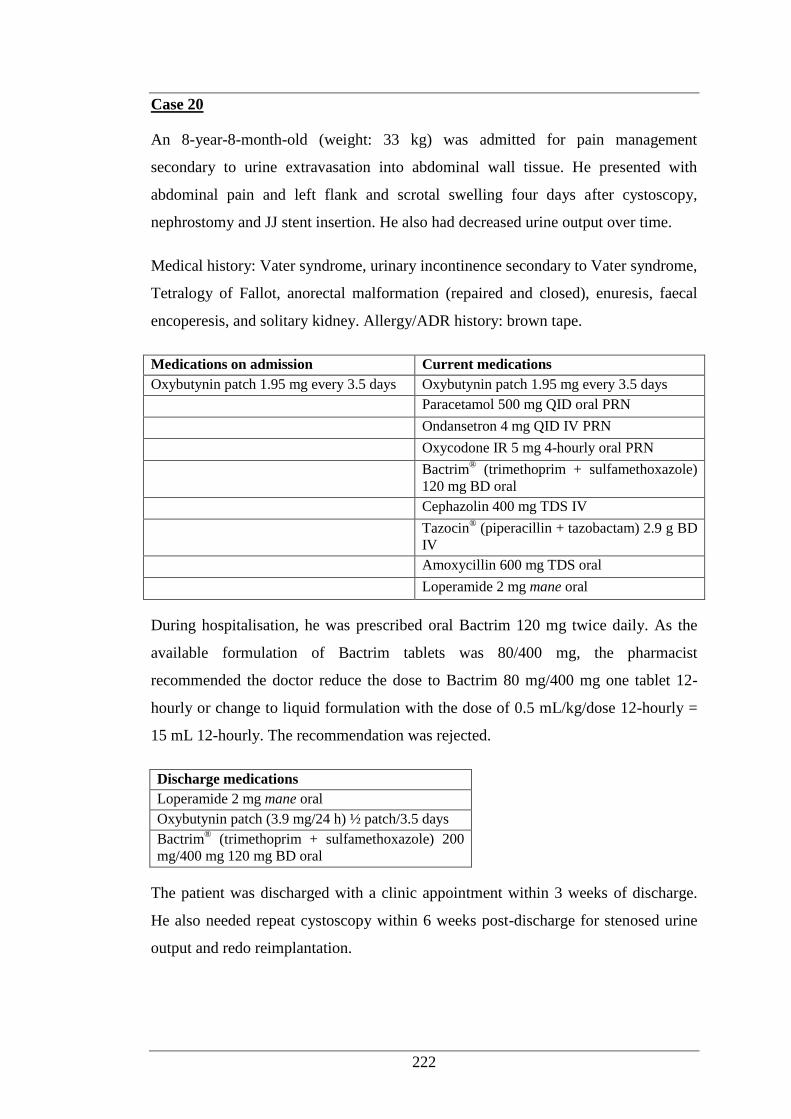
222
Case 20
An 8-year-8-month-old (weight: 33 kg) was admitted for pain management
secondary to urine extravasation into abdominal wall tissue. He presented with
abdominal pain and left flank and scrotal swelling four days after cystoscopy,
nephrostomy and JJ stent insertion. He also had decreased urine output over time.
Medical history: Vater syndrome, urinary incontinence secondary to Vater syndrome,
Tetralogy of Fallot, anorectal malformation (repaired and closed), enuresis, faecal
encoperesis, and solitary kidney. Allergy/ADR history: brown tape.
Medications on admission Current medications
Oxybutynin patch 1.95 mg every 3.5 days Oxybutynin patch 1.95 mg every 3.5 days
Paracetamol 500 mg QID oral PRN
Ondansetron 4 mg QID IV PRN
Oxycodone IR 5 mg 4-hourly oral PRN
Bactrim® (trimethoprim + sulfamethoxazole)
120 mg BD oral
Cephazolin 400 mg TDS IV
Tazocin® (piperacillin + tazobactam) 2.9 g BD
IV
Amoxycillin 600 mg TDS oral
Loperamide 2 mg mane oral
During hospitalisation, he was prescribed oral Bactrim 120 mg twice daily. As the
available formulation of Bactrim tablets was 80/400 mg, the pharmacist
recommended the doctor reduce the dose to Bactrim 80 mg/400 mg one tablet 12-
hourly or change to liquid formulation with the dose of 0.5 mL/kg/dose 12-hourly =
15 mL 12-hourly. The recommendation was rejected.
Discharge medications
Loperamide 2 mg mane oral
Oxybutynin patch (3.9 mg/24 h) ½ patch/3.5 days
Bactrim® (trimethoprim + sulfamethoxazole) 200
mg/400 mg 120 mg BD oral
The patient was discharged with a clinic appointment within 3 weeks of discharge.
He also needed repeat cystoscopy within 6 weeks post-discharge for stenosed urine
output and redo reimplantation.
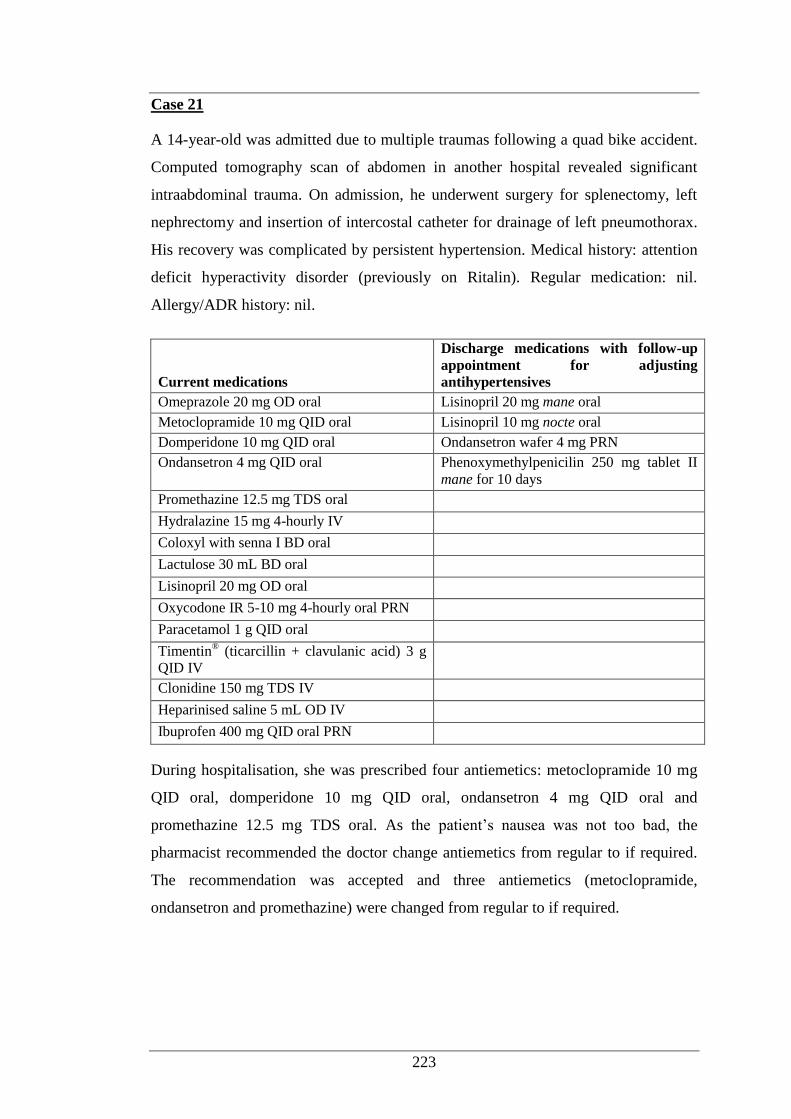
223
Case 21
A 14-year-old was admitted due to multiple traumas following a quad bike accident.
Computed tomography scan of abdomen in another hospital revealed significant
intraabdominal trauma. On admission, he underwent surgery for splenectomy, left
nephrectomy and insertion of intercostal catheter for drainage of left pneumothorax.
His recovery was complicated by persistent hypertension. Medical history: attention
deficit hyperactivity disorder (previously on Ritalin). Regular medication: nil.
Allergy/ADR history: nil.
Current medications
Discharge medications with follow-up
appointment for adjusting
antihypertensives
Omeprazole 20 mg OD oral Lisinopril 20 mg mane oral
Metoclopramide 10 mg QID oral Lisinopril 10 mg nocte oral
Domperidone 10 mg QID oral Ondansetron wafer 4 mg PRN
Ondansetron 4 mg QID oral Phenoxymethylpenicilin 250 mg tablet II
mane for 10 days
Promethazine 12.5 mg TDS oral
Hydralazine 15 mg 4-hourly IV
Coloxyl with senna I BD oral
Lactulose 30 mL BD oral
Lisinopril 20 mg OD oral
Oxycodone IR 5-10 mg 4-hourly oral PRN
Paracetamol 1 g QID oral
Timentin® (ticarcillin + clavulanic acid) 3 g
QID IV
Clonidine 150 mg TDS IV
Heparinised saline 5 mL OD IV
Ibuprofen 400 mg QID oral PRN
During hospitalisation, she was prescribed four antiemetics: metoclopramide 10 mg
QID oral, domperidone 10 mg QID oral, ondansetron 4 mg QID oral and
promethazine 12.5 mg TDS oral. As the patient’s nausea was not too bad, the
pharmacist recommended the doctor change antiemetics from regular to if required.
The recommendation was accepted and three antiemetics (metoclopramide,
ondansetron and promethazine) were changed from regular to if required.
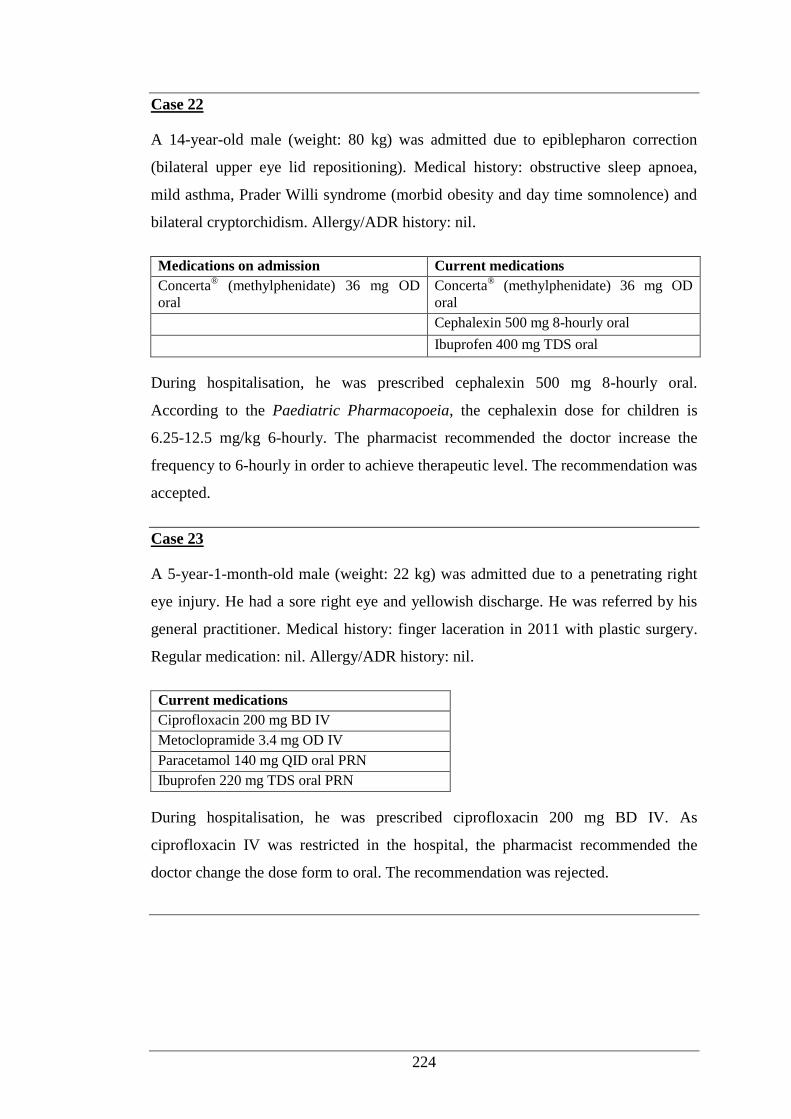
224
Case 22
A 14-year-old male (weight: 80 kg) was admitted due to epiblepharon correction
(bilateral upper eye lid repositioning). Medical history: obstructive sleep apnoea,
mild asthma, Prader Willi syndrome (morbid obesity and day time somnolence) and
bilateral cryptorchidism. Allergy/ADR history: nil.
Medications on admission Current medications
Concerta® (methylphenidate) 36 mg OD
oral Concerta
® (methylphenidate) 36 mg OD
oral
Cephalexin 500 mg 8-hourly oral
Ibuprofen 400 mg TDS oral
During hospitalisation, he was prescribed cephalexin 500 mg 8-hourly oral.
According to the Paediatric Pharmacopoeia, the cephalexin dose for children is
6.25-12.5 mg/kg 6-hourly. The pharmacist recommended the doctor increase the
frequency to 6-hourly in order to achieve therapeutic level. The recommendation was
accepted.
Case 23
A 5-year-1-month-old male (weight: 22 kg) was admitted due to a penetrating right
eye injury. He had a sore right eye and yellowish discharge. He was referred by his
general practitioner. Medical history: finger laceration in 2011 with plastic surgery.
Regular medication: nil. Allergy/ADR history: nil.
Current medications
Ciprofloxacin 200 mg BD IV
Metoclopramide 3.4 mg OD IV
Paracetamol 140 mg QID oral PRN
Ibuprofen 220 mg TDS oral PRN
During hospitalisation, he was prescribed ciprofloxacin 200 mg BD IV. As
ciprofloxacin IV was restricted in the hospital, the pharmacist recommended the
doctor change the dose form to oral. The recommendation was rejected.
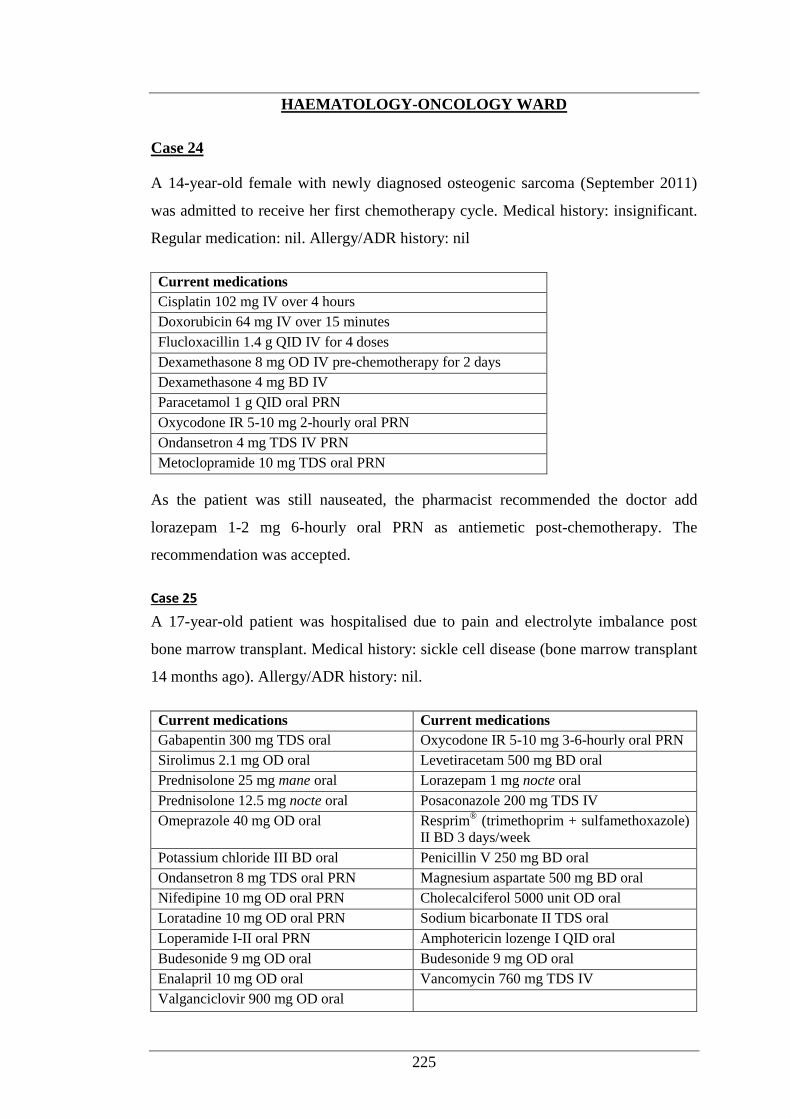
225
HAEMATOLOGY-ONCOLOGY WARD
Case 24
A 14-year-old female with newly diagnosed osteogenic sarcoma (September 2011)
was admitted to receive her first chemotherapy cycle. Medical history: insignificant.
Regular medication: nil. Allergy/ADR history: nil
Current medications
Cisplatin 102 mg IV over 4 hours
Doxorubicin 64 mg IV over 15 minutes
Flucloxacillin 1.4 g QID IV for 4 doses
Dexamethasone 8 mg OD IV pre-chemotherapy for 2 days
Dexamethasone 4 mg BD IV
Paracetamol 1 g QID oral PRN
Oxycodone IR 5-10 mg 2-hourly oral PRN
Ondansetron 4 mg TDS IV PRN
Metoclopramide 10 mg TDS oral PRN
As the patient was still nauseated, the pharmacist recommended the doctor add
lorazepam 1-2 mg 6-hourly oral PRN as antiemetic post-chemotherapy. The
recommendation was accepted.
Case 25
A 17-year-old patient was hospitalised due to pain and electrolyte imbalance post
bone marrow transplant. Medical history: sickle cell disease (bone marrow transplant
14 months ago). Allergy/ADR history: nil.
Current medications Current medications
Gabapentin 300 mg TDS oral Oxycodone IR 5-10 mg 3-6-hourly oral PRN
Sirolimus 2.1 mg OD oral Levetiracetam 500 mg BD oral
Prednisolone 25 mg mane oral Lorazepam 1 mg nocte oral
Prednisolone 12.5 mg nocte oral Posaconazole 200 mg TDS IV
Omeprazole 40 mg OD oral Resprim® (trimethoprim + sulfamethoxazole)
II BD 3 days/week
Potassium chloride III BD oral Penicillin V 250 mg BD oral
Ondansetron 8 mg TDS oral PRN Magnesium aspartate 500 mg BD oral
Nifedipine 10 mg OD oral PRN Cholecalciferol 5000 unit OD oral
Loratadine 10 mg OD oral PRN Sodium bicarbonate II TDS oral
Loperamide I-II oral PRN Amphotericin lozenge I QID oral
Budesonide 9 mg OD oral Budesonide 9 mg OD oral
Enalapril 10 mg OD oral Vancomycin 760 mg TDS IV
Valganciclovir 900 mg OD oral
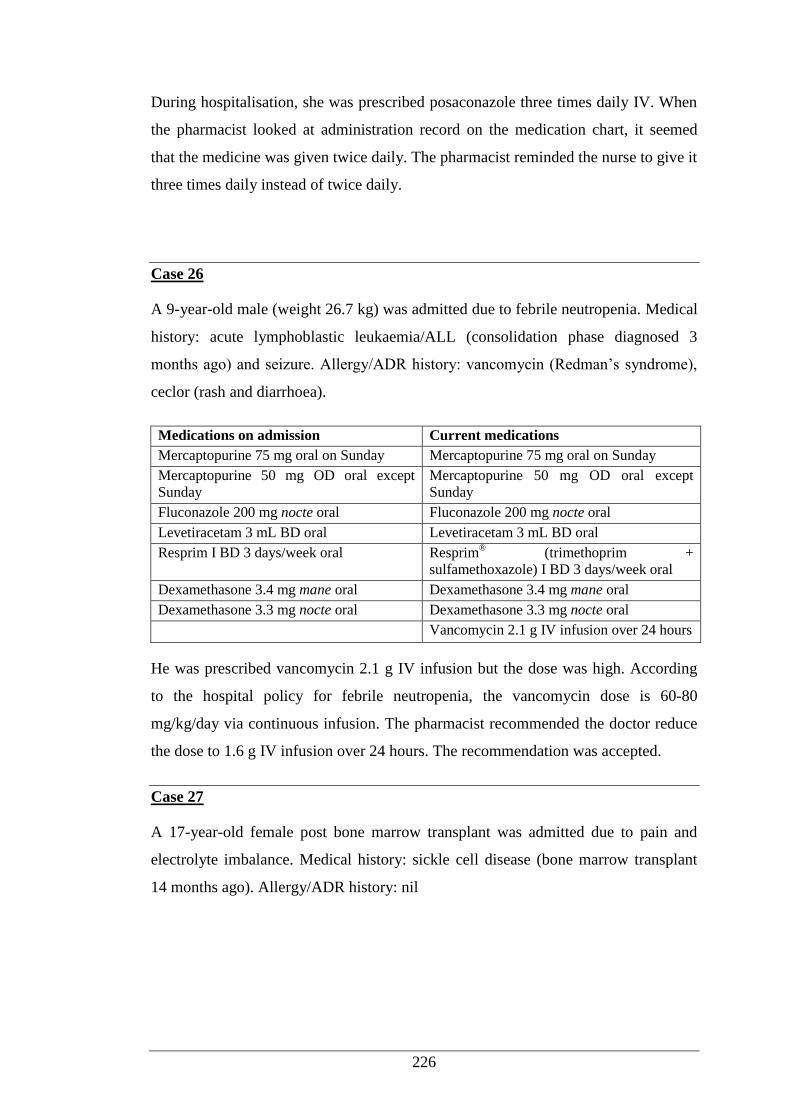
226
During hospitalisation, she was prescribed posaconazole three times daily IV. When
the pharmacist looked at administration record on the medication chart, it seemed
that the medicine was given twice daily. The pharmacist reminded the nurse to give it
three times daily instead of twice daily.
Case 26
A 9-year-old male (weight 26.7 kg) was admitted due to febrile neutropenia. Medical
history: acute lymphoblastic leukaemia/ALL (consolidation phase diagnosed 3
months ago) and seizure. Allergy/ADR history: vancomycin (Redman’s syndrome),
ceclor (rash and diarrhoea).
Medications on admission Current medications
Mercaptopurine 75 mg oral on Sunday Mercaptopurine 75 mg oral on Sunday
Mercaptopurine 50 mg OD oral except
Sunday Mercaptopurine 50 mg OD oral except
Sunday
Fluconazole 200 mg nocte oral Fluconazole 200 mg nocte oral
Levetiracetam 3 mL BD oral Levetiracetam 3 mL BD oral
Resprim I BD 3 days/week oral Resprim® (trimethoprim +
sulfamethoxazole) I BD 3 days/week oral
Dexamethasone 3.4 mg mane oral Dexamethasone 3.4 mg mane oral
Dexamethasone 3.3 mg nocte oral Dexamethasone 3.3 mg nocte oral
Vancomycin 2.1 g IV infusion over 24 hours
He was prescribed vancomycin 2.1 g IV infusion but the dose was high. According
to the hospital policy for febrile neutropenia, the vancomycin dose is 60-80
mg/kg/day via continuous infusion. The pharmacist recommended the doctor reduce
the dose to 1.6 g IV infusion over 24 hours. The recommendation was accepted.
Case 27
A 17-year-old female post bone marrow transplant was admitted due to pain and
electrolyte imbalance. Medical history: sickle cell disease (bone marrow transplant
14 months ago). Allergy/ADR history: nil
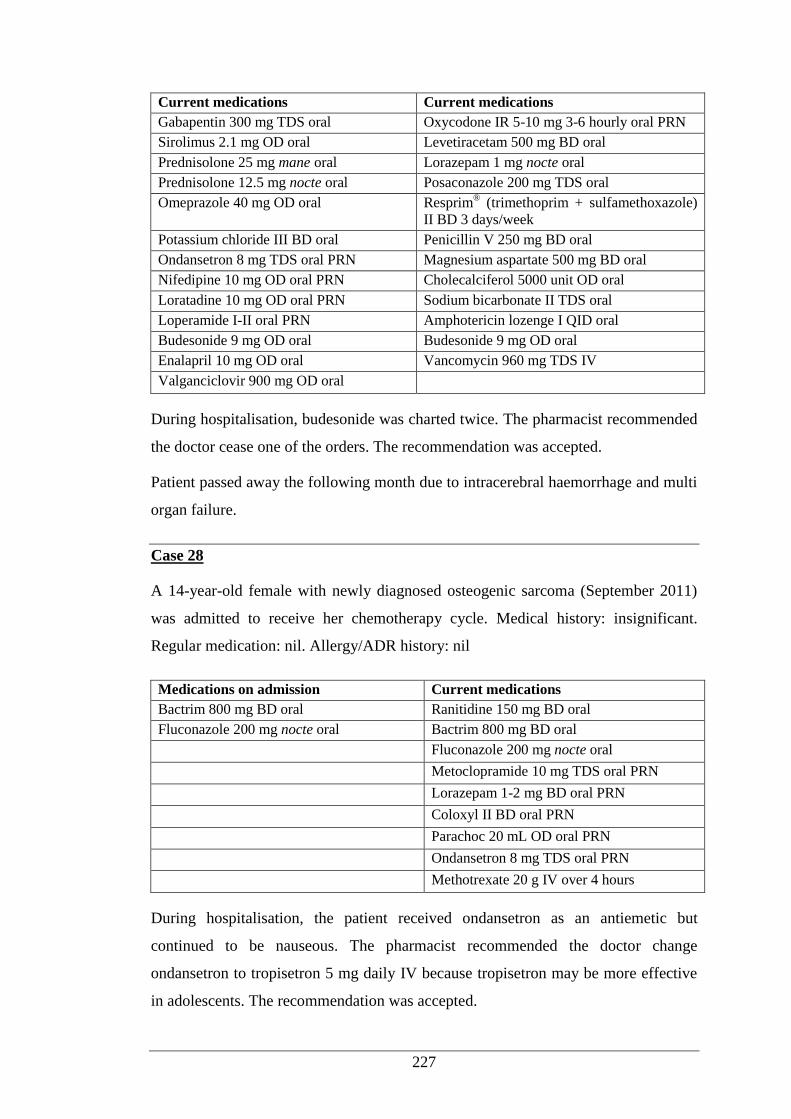
227
Current medications Current medications
Gabapentin 300 mg TDS oral Oxycodone IR 5-10 mg 3-6 hourly oral PRN
Sirolimus 2.1 mg OD oral Levetiracetam 500 mg BD oral
Prednisolone 25 mg mane oral Lorazepam 1 mg nocte oral
Prednisolone 12.5 mg nocte oral Posaconazole 200 mg TDS oral
Omeprazole 40 mg OD oral Resprim® (trimethoprim + sulfamethoxazole)
II BD 3 days/week
Potassium chloride III BD oral Penicillin V 250 mg BD oral
Ondansetron 8 mg TDS oral PRN Magnesium aspartate 500 mg BD oral
Nifedipine 10 mg OD oral PRN Cholecalciferol 5000 unit OD oral
Loratadine 10 mg OD oral PRN Sodium bicarbonate II TDS oral
Loperamide I-II oral PRN Amphotericin lozenge I QID oral
Budesonide 9 mg OD oral Budesonide 9 mg OD oral
Enalapril 10 mg OD oral Vancomycin 960 mg TDS IV
Valganciclovir 900 mg OD oral
During hospitalisation, budesonide was charted twice. The pharmacist recommended
the doctor cease one of the orders. The recommendation was accepted.
Patient passed away the following month due to intracerebral haemorrhage and multi
organ failure.
Case 28
A 14-year-old female with newly diagnosed osteogenic sarcoma (September 2011)
was admitted to receive her chemotherapy cycle. Medical history: insignificant.
Regular medication: nil. Allergy/ADR history: nil
Medications on admission Current medications
Bactrim 800 mg BD oral Ranitidine 150 mg BD oral
Fluconazole 200 mg nocte oral Bactrim 800 mg BD oral
Fluconazole 200 mg nocte oral
Metoclopramide 10 mg TDS oral PRN
Lorazepam 1-2 mg BD oral PRN
Coloxyl II BD oral PRN
Parachoc 20 mL OD oral PRN
Ondansetron 8 mg TDS oral PRN
Methotrexate 20 g IV over 4 hours
During hospitalisation, the patient received ondansetron as an antiemetic but
continued to be nauseous. The pharmacist recommended the doctor change
ondansetron to tropisetron 5 mg daily IV because tropisetron may be more effective
in adolescents. The recommendation was accepted.
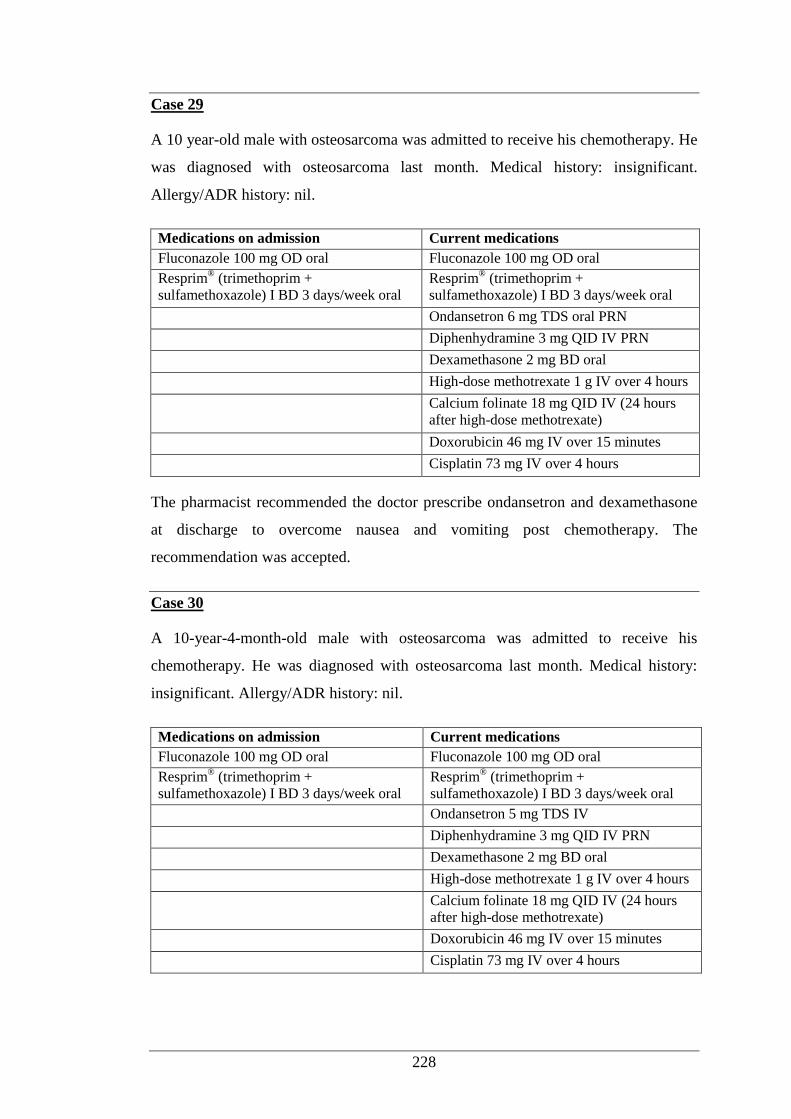
228
Case 29
A 10 year-old male with osteosarcoma was admitted to receive his chemotherapy. He
was diagnosed with osteosarcoma last month. Medical history: insignificant.
Allergy/ADR history: nil.
Medications on admission Current medications
Fluconazole 100 mg OD oral Fluconazole 100 mg OD oral
Resprim® (trimethoprim +
sulfamethoxazole) I BD 3 days/week oral Resprim
® (trimethoprim +
sulfamethoxazole) I BD 3 days/week oral
Ondansetron 6 mg TDS oral PRN
Diphenhydramine 3 mg QID IV PRN
Dexamethasone 2 mg BD oral
High-dose methotrexate 1 g IV over 4 hours
Calcium folinate 18 mg QID IV (24 hours
after high-dose methotrexate)
Doxorubicin 46 mg IV over 15 minutes
Cisplatin 73 mg IV over 4 hours
The pharmacist recommended the doctor prescribe ondansetron and dexamethasone
at discharge to overcome nausea and vomiting post chemotherapy. The
recommendation was accepted.
Case 30
A 10-year-4-month-old male with osteosarcoma was admitted to receive his
chemotherapy. He was diagnosed with osteosarcoma last month. Medical history:
insignificant. Allergy/ADR history: nil.
Medications on admission Current medications
Fluconazole 100 mg OD oral Fluconazole 100 mg OD oral
Resprim® (trimethoprim +
sulfamethoxazole) I BD 3 days/week oral Resprim
® (trimethoprim +
sulfamethoxazole) I BD 3 days/week oral
Ondansetron 5 mg TDS IV
Diphenhydramine 3 mg QID IV PRN
Dexamethasone 2 mg BD oral
High-dose methotrexate 1 g IV over 4 hours
Calcium folinate 18 mg QID IV (24 hours
after high-dose methotrexate)
Doxorubicin 46 mg IV over 15 minutes
Cisplatin 73 mg IV over 4 hours
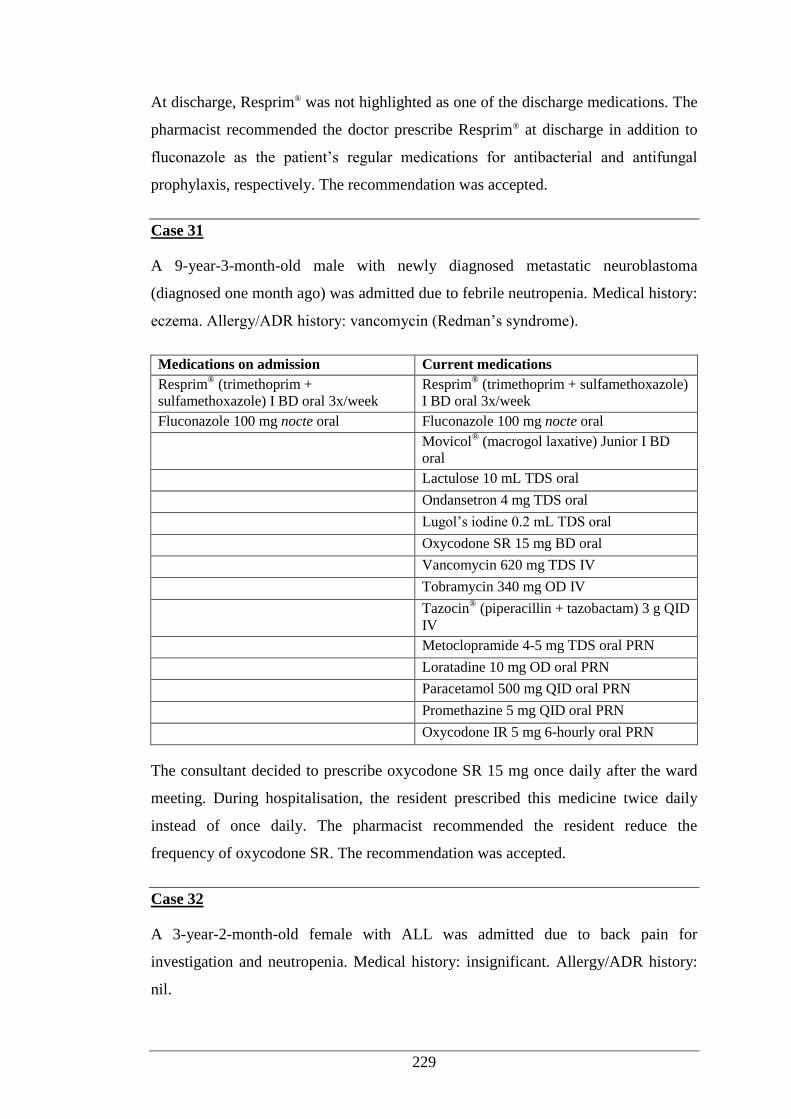
229
At discharge, Resprim® was not highlighted as one of the discharge medications. The
pharmacist recommended the doctor prescribe Resprim® at discharge in addition to
fluconazole as the patient’s regular medications for antibacterial and antifungal
prophylaxis, respectively. The recommendation was accepted.
Case 31
A 9-year-3-month-old male with newly diagnosed metastatic neuroblastoma
(diagnosed one month ago) was admitted due to febrile neutropenia. Medical history:
eczema. Allergy/ADR history: vancomycin (Redman’s syndrome).
Medications on admission Current medications
Resprim® (trimethoprim +
sulfamethoxazole) I BD oral 3x/week Resprim
® (trimethoprim + sulfamethoxazole)
I BD oral 3x/week
Fluconazole 100 mg nocte oral Fluconazole 100 mg nocte oral
Movicol® (macrogol laxative) Junior I BD
oral
Lactulose 10 mL TDS oral
Ondansetron 4 mg TDS oral
Lugol’s iodine 0.2 mL TDS oral
Oxycodone SR 15 mg BD oral
Vancomycin 620 mg TDS IV
Tobramycin 340 mg OD IV
Tazocin® (piperacillin + tazobactam) 3 g QID
IV
Metoclopramide 4-5 mg TDS oral PRN
Loratadine 10 mg OD oral PRN
Paracetamol 500 mg QID oral PRN
Promethazine 5 mg QID oral PRN
Oxycodone IR 5 mg 6-hourly oral PRN
The consultant decided to prescribe oxycodone SR 15 mg once daily after the ward
meeting. During hospitalisation, the resident prescribed this medicine twice daily
instead of once daily. The pharmacist recommended the resident reduce the
frequency of oxycodone SR. The recommendation was accepted.
Case 32
A 3-year-2-month-old female with ALL was admitted due to back pain for
investigation and neutropenia. Medical history: insignificant. Allergy/ADR history:
nil.
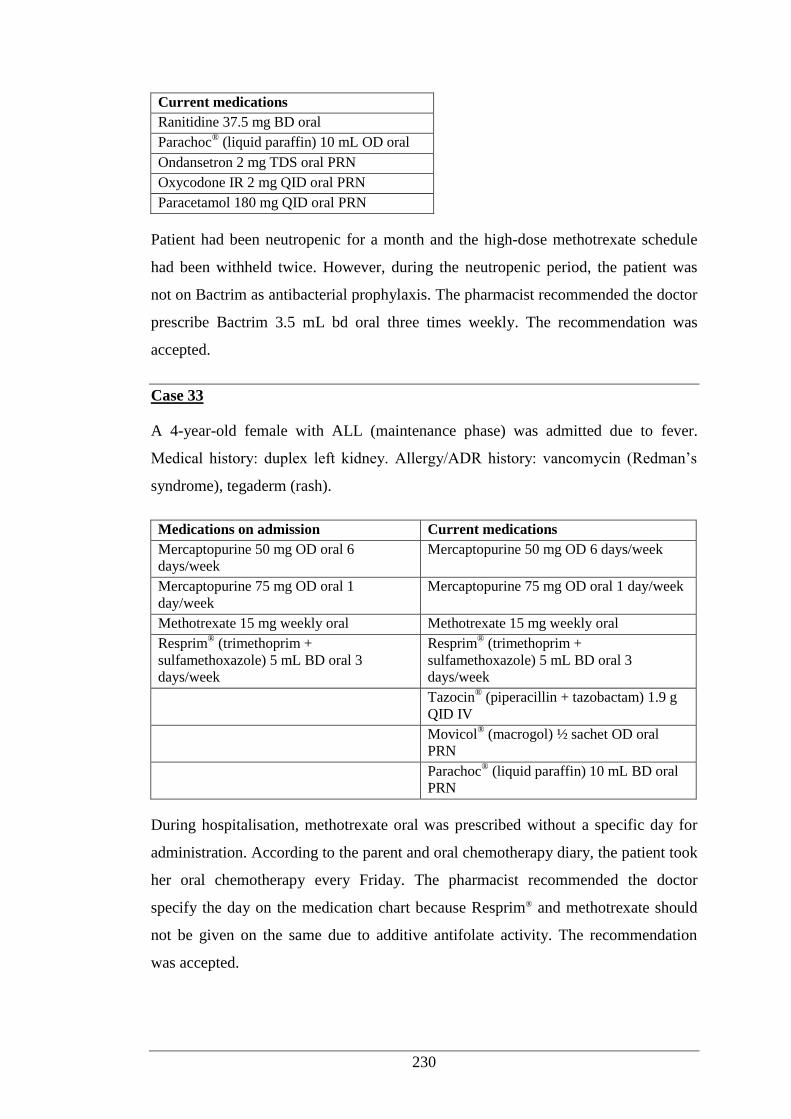
230
Current medications
Ranitidine 37.5 mg BD oral
Parachoc® (liquid paraffin) 10 mL OD oral
Ondansetron 2 mg TDS oral PRN
Oxycodone IR 2 mg QID oral PRN
Paracetamol 180 mg QID oral PRN
Patient had been neutropenic for a month and the high-dose methotrexate schedule
had been withheld twice. However, during the neutropenic period, the patient was
not on Bactrim as antibacterial prophylaxis. The pharmacist recommended the doctor
prescribe Bactrim 3.5 mL bd oral three times weekly. The recommendation was
accepted.
Case 33
A 4-year-old female with ALL (maintenance phase) was admitted due to fever.
Medical history: duplex left kidney. Allergy/ADR history: vancomycin (Redman’s
syndrome), tegaderm (rash).
Medications on admission Current medications
Mercaptopurine 50 mg OD oral 6
days/week Mercaptopurine 50 mg OD 6 days/week
Mercaptopurine 75 mg OD oral 1
day/week Mercaptopurine 75 mg OD oral 1 day/week
Methotrexate 15 mg weekly oral Methotrexate 15 mg weekly oral
Resprim® (trimethoprim +
sulfamethoxazole) 5 mL BD oral 3
days/week
Resprim® (trimethoprim +
sulfamethoxazole) 5 mL BD oral 3
days/week
Tazocin® (piperacillin + tazobactam) 1.9 g
QID IV
Movicol® (macrogol) ½ sachet OD oral
PRN
Parachoc® (liquid paraffin) 10 mL BD oral
PRN
During hospitalisation, methotrexate oral was prescribed without a specific day for
administration. According to the parent and oral chemotherapy diary, the patient took
her oral chemotherapy every Friday. The pharmacist recommended the doctor
specify the day on the medication chart because Resprim® and methotrexate should
not be given on the same due to additive antifolate activity. The recommendation
was accepted.
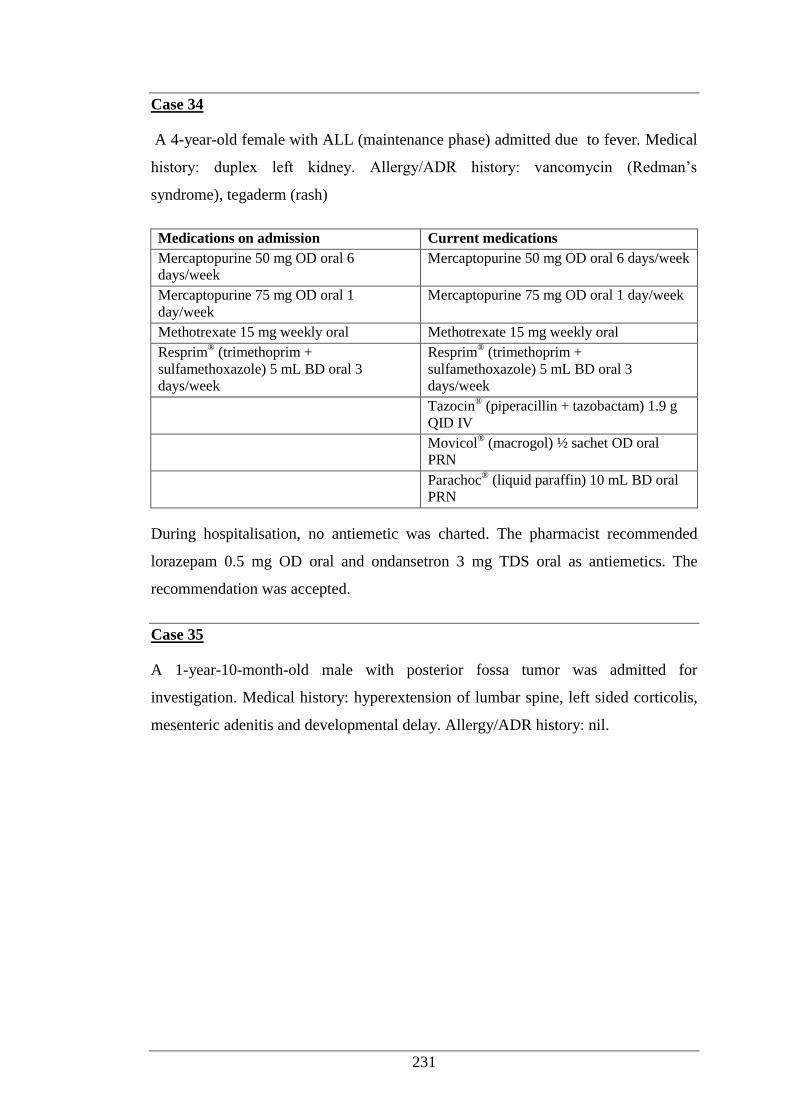
231
Case 34
A 4-year-old female with ALL (maintenance phase) admitted due to fever. Medical
history: duplex left kidney. Allergy/ADR history: vancomycin (Redman’s
syndrome), tegaderm (rash)
Medications on admission Current medications
Mercaptopurine 50 mg OD oral 6
days/week Mercaptopurine 50 mg OD oral 6 days/week
Mercaptopurine 75 mg OD oral 1
day/week Mercaptopurine 75 mg OD oral 1 day/week
Methotrexate 15 mg weekly oral Methotrexate 15 mg weekly oral
Resprim® (trimethoprim +
sulfamethoxazole) 5 mL BD oral 3
days/week
Resprim® (trimethoprim +
sulfamethoxazole) 5 mL BD oral 3
days/week
Tazocin® (piperacillin + tazobactam) 1.9 g
QID IV
Movicol® (macrogol) ½ sachet OD oral
PRN
Parachoc® (liquid paraffin) 10 mL BD oral
PRN
During hospitalisation, no antiemetic was charted. The pharmacist recommended
lorazepam 0.5 mg OD oral and ondansetron 3 mg TDS oral as antiemetics. The
recommendation was accepted.
Case 35
A 1-year-10-month-old male with posterior fossa tumor was admitted for
investigation. Medical history: hyperextension of lumbar spine, left sided corticolis,
mesenteric adenitis and developmental delay. Allergy/ADR history: nil.
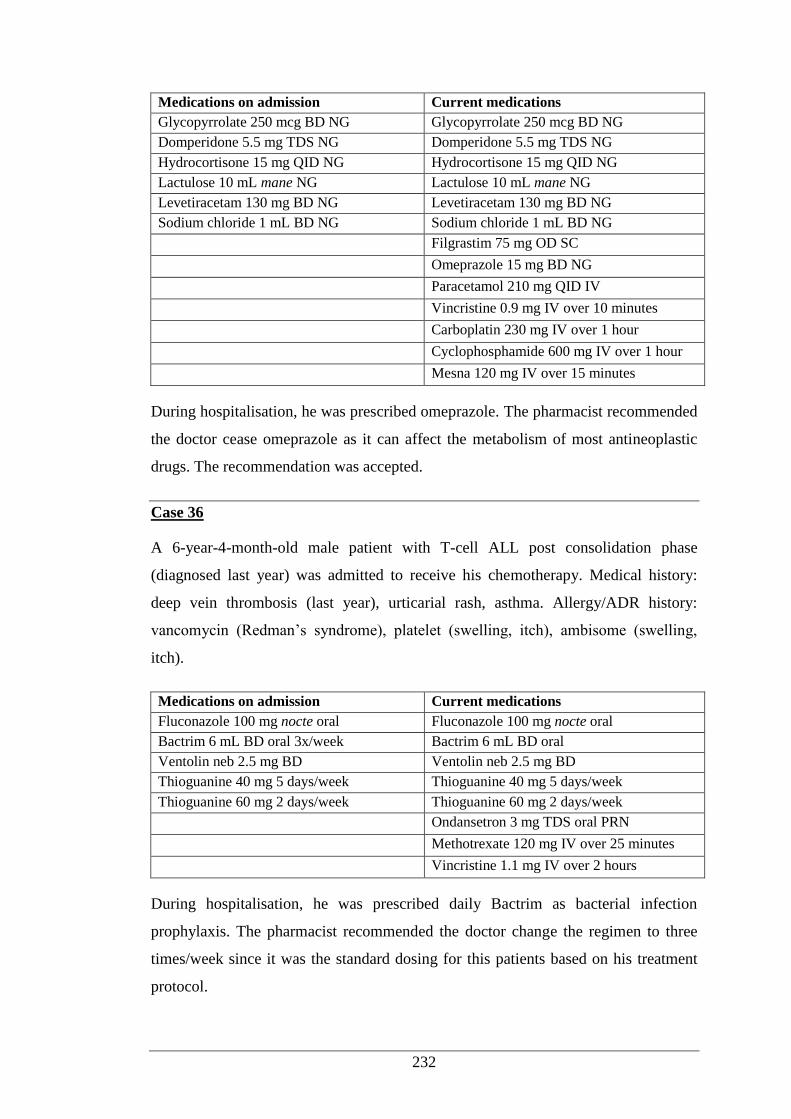
232
Medications on admission Current medications
Glycopyrrolate 250 mcg BD NG Glycopyrrolate 250 mcg BD NG
Domperidone 5.5 mg TDS NG Domperidone 5.5 mg TDS NG
Hydrocortisone 15 mg QID NG Hydrocortisone 15 mg QID NG
Lactulose 10 mL mane NG Lactulose 10 mL mane NG
Levetiracetam 130 mg BD NG Levetiracetam 130 mg BD NG
Sodium chloride 1 mL BD NG Sodium chloride 1 mL BD NG
Filgrastim 75 mg OD SC
Omeprazole 15 mg BD NG
Paracetamol 210 mg QID IV
Vincristine 0.9 mg IV over 10 minutes
Carboplatin 230 mg IV over 1 hour
Cyclophosphamide 600 mg IV over 1 hour
Mesna 120 mg IV over 15 minutes
During hospitalisation, he was prescribed omeprazole. The pharmacist recommended
the doctor cease omeprazole as it can affect the metabolism of most antineoplastic
drugs. The recommendation was accepted.
Case 36
A 6-year-4-month-old male patient with T-cell ALL post consolidation phase
(diagnosed last year) was admitted to receive his chemotherapy. Medical history:
deep vein thrombosis (last year), urticarial rash, asthma. Allergy/ADR history:
vancomycin (Redman’s syndrome), platelet (swelling, itch), ambisome (swelling,
itch).
Medications on admission Current medications
Fluconazole 100 mg nocte oral Fluconazole 100 mg nocte oral
Bactrim 6 mL BD oral 3x/week Bactrim 6 mL BD oral
Ventolin neb 2.5 mg BD Ventolin neb 2.5 mg BD
Thioguanine 40 mg 5 days/week Thioguanine 40 mg 5 days/week
Thioguanine 60 mg 2 days/week Thioguanine 60 mg 2 days/week
Ondansetron 3 mg TDS oral PRN
Methotrexate 120 mg IV over 25 minutes
Vincristine 1.1 mg IV over 2 hours
During hospitalisation, he was prescribed daily Bactrim as bacterial infection
prophylaxis. The pharmacist recommended the doctor change the regimen to three
times/week since it was the standard dosing for this patients based on his treatment
protocol.
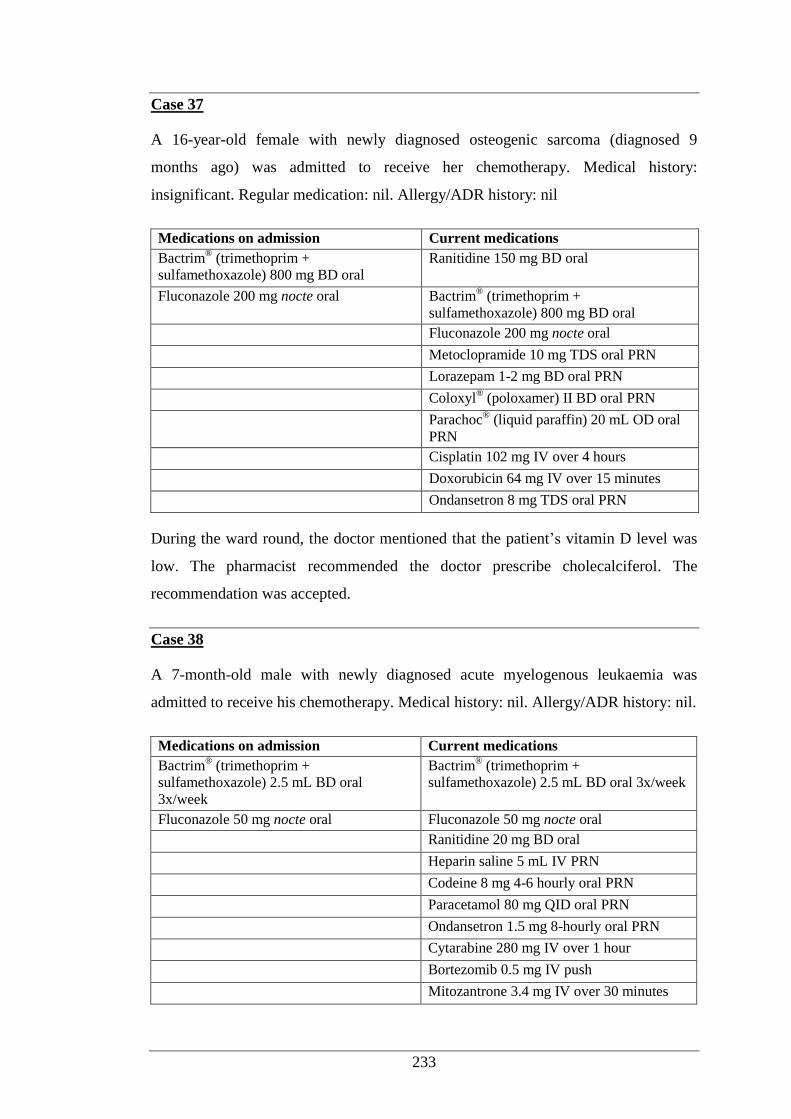
233
Case 37
A 16-year-old female with newly diagnosed osteogenic sarcoma (diagnosed 9
months ago) was admitted to receive her chemotherapy. Medical history:
insignificant. Regular medication: nil. Allergy/ADR history: nil
Medications on admission Current medications
Bactrim® (trimethoprim +
sulfamethoxazole) 800 mg BD oral Ranitidine 150 mg BD oral
Fluconazole 200 mg nocte oral Bactrim® (trimethoprim +
sulfamethoxazole) 800 mg BD oral
Fluconazole 200 mg nocte oral
Metoclopramide 10 mg TDS oral PRN
Lorazepam 1-2 mg BD oral PRN
Coloxyl® (poloxamer) II BD oral PRN
Parachoc® (liquid paraffin) 20 mL OD oral
PRN
Cisplatin 102 mg IV over 4 hours
Doxorubicin 64 mg IV over 15 minutes
Ondansetron 8 mg TDS oral PRN
During the ward round, the doctor mentioned that the patient’s vitamin D level was
low. The pharmacist recommended the doctor prescribe cholecalciferol. The
recommendation was accepted.
Case 38
A 7-month-old male with newly diagnosed acute myelogenous leukaemia was
admitted to receive his chemotherapy. Medical history: nil. Allergy/ADR history: nil.
Medications on admission Current medications
Bactrim® (trimethoprim +
sulfamethoxazole) 2.5 mL BD oral
3x/week
Bactrim® (trimethoprim +
sulfamethoxazole) 2.5 mL BD oral 3x/week
Fluconazole 50 mg nocte oral Fluconazole 50 mg nocte oral
Ranitidine 20 mg BD oral
Heparin saline 5 mL IV PRN
Codeine 8 mg 4-6 hourly oral PRN
Paracetamol 80 mg QID oral PRN
Ondansetron 1.5 mg 8-hourly oral PRN
Cytarabine 280 mg IV over 1 hour
Bortezomib 0.5 mg IV push
Mitozantrone 3.4 mg IV over 30 minutes
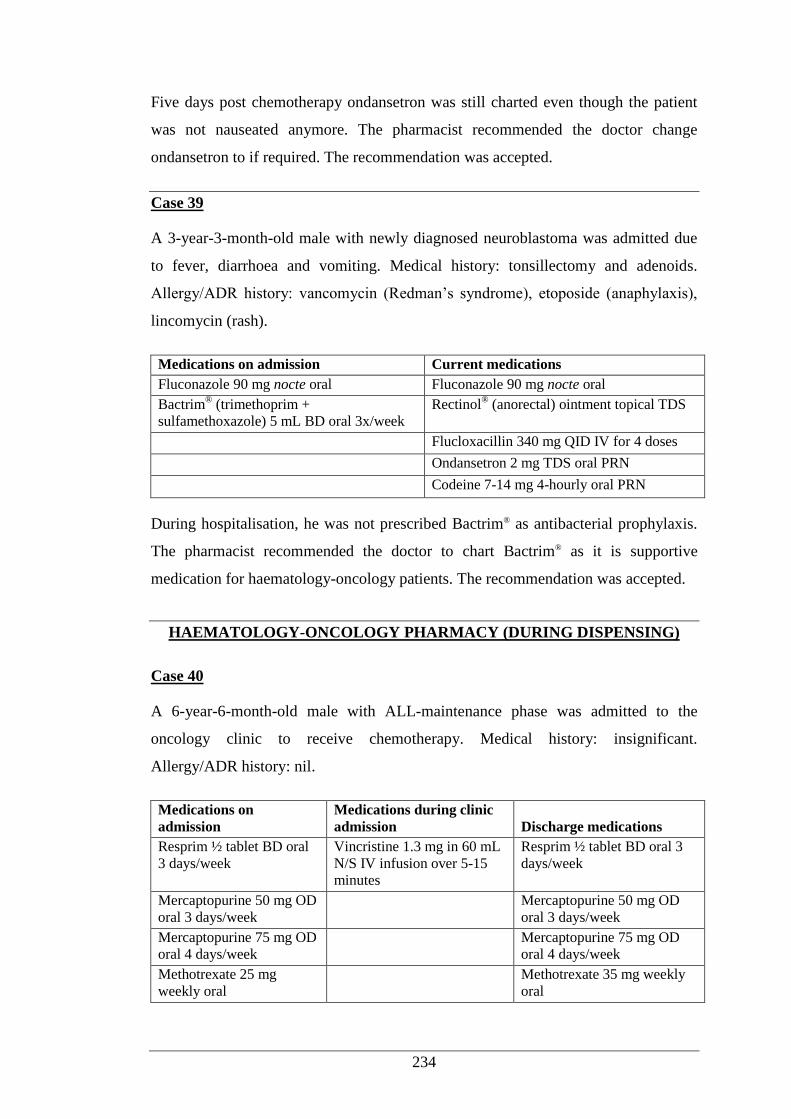
234
Five days post chemotherapy ondansetron was still charted even though the patient
was not nauseated anymore. The pharmacist recommended the doctor change
ondansetron to if required. The recommendation was accepted.
Case 39
A 3-year-3-month-old male with newly diagnosed neuroblastoma was admitted due
to fever, diarrhoea and vomiting. Medical history: tonsillectomy and adenoids.
Allergy/ADR history: vancomycin (Redman’s syndrome), etoposide (anaphylaxis),
lincomycin (rash).
Medications on admission Current medications
Fluconazole 90 mg nocte oral Fluconazole 90 mg nocte oral
Bactrim® (trimethoprim +
sulfamethoxazole) 5 mL BD oral 3x/week Rectinol
® (anorectal) ointment topical TDS
Flucloxacillin 340 mg QID IV for 4 doses
Ondansetron 2 mg TDS oral PRN
Codeine 7-14 mg 4-hourly oral PRN
During hospitalisation, he was not prescribed Bactrim® as antibacterial prophylaxis.
The pharmacist recommended the doctor to chart Bactrim® as it is supportive
medication for haematology-oncology patients. The recommendation was accepted.
HAEMATOLOGY-ONCOLOGY PHARMACY (DURING DISPENSING)
Case 40
A 6-year-6-month-old male with ALL-maintenance phase was admitted to the
oncology clinic to receive chemotherapy. Medical history: insignificant.
Allergy/ADR history: nil.
Medications on
admission Medications during clinic
admission Discharge medications
Resprim ½ tablet BD oral
3 days/week Vincristine 1.3 mg in 60 mL
N/S IV infusion over 5-15
minutes
Resprim ½ tablet BD oral 3
days/week
Mercaptopurine 50 mg OD
oral 3 days/week Mercaptopurine 50 mg OD
oral 3 days/week
Mercaptopurine 75 mg OD
oral 4 days/week Mercaptopurine 75 mg OD
oral 4 days/week
Methotrexate 25 mg
weekly oral Methotrexate 35 mg weekly
oral
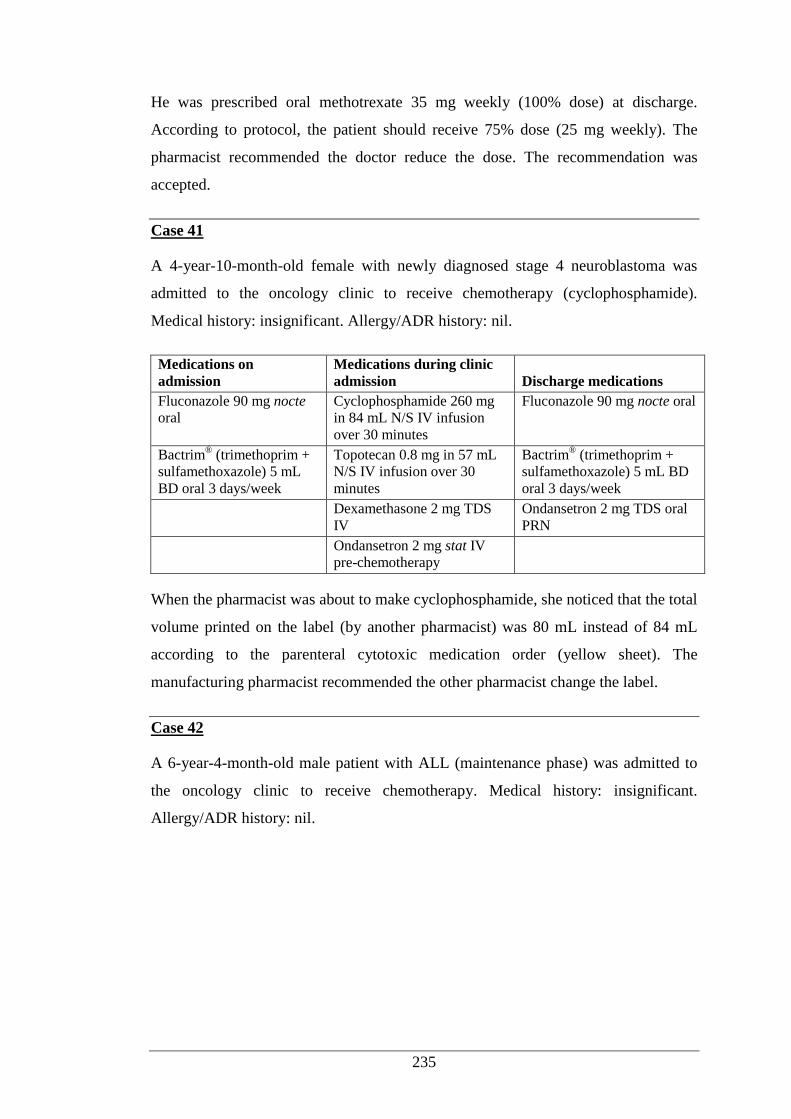
235
He was prescribed oral methotrexate 35 mg weekly (100% dose) at discharge.
According to protocol, the patient should receive 75% dose (25 mg weekly). The
pharmacist recommended the doctor reduce the dose. The recommendation was
accepted.
Case 41
A 4-year-10-month-old female with newly diagnosed stage 4 neuroblastoma was
admitted to the oncology clinic to receive chemotherapy (cyclophosphamide).
Medical history: insignificant. Allergy/ADR history: nil.
Medications on
admission Medications during clinic
admission Discharge medications
Fluconazole 90 mg nocte
oral Cyclophosphamide 260 mg
in 84 mL N/S IV infusion
over 30 minutes
Fluconazole 90 mg nocte oral
Bactrim® (trimethoprim +
sulfamethoxazole) 5 mL
BD oral 3 days/week
Topotecan 0.8 mg in 57 mL
N/S IV infusion over 30
minutes
Bactrim® (trimethoprim +
sulfamethoxazole) 5 mL BD
oral 3 days/week
Dexamethasone 2 mg TDS
IV Ondansetron 2 mg TDS oral
PRN
Ondansetron 2 mg stat IV
pre-chemotherapy
When the pharmacist was about to make cyclophosphamide, she noticed that the total
volume printed on the label (by another pharmacist) was 80 mL instead of 84 mL
according to the parenteral cytotoxic medication order (yellow sheet). The
manufacturing pharmacist recommended the other pharmacist change the label.
Case 42
A 6-year-4-month-old male patient with ALL (maintenance phase) was admitted to
the oncology clinic to receive chemotherapy. Medical history: insignificant.
Allergy/ADR history: nil.
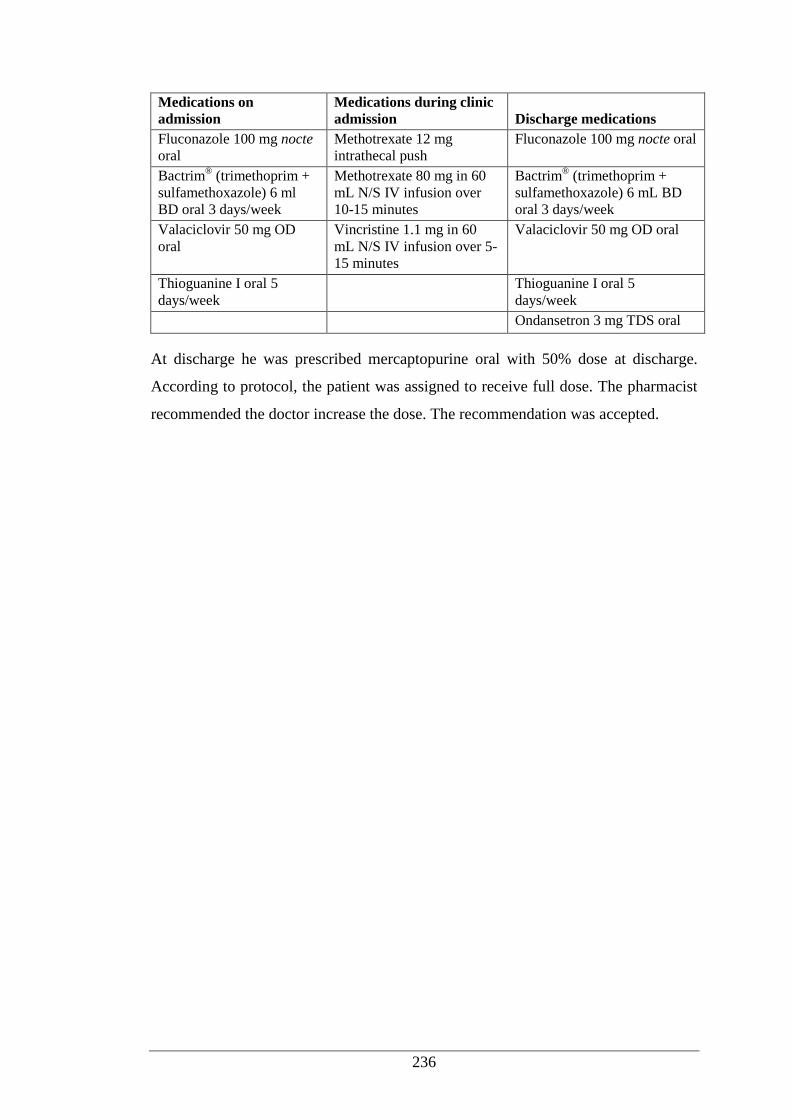
236
Medications on
admission Medications during clinic
admission Discharge medications Fluconazole 100 mg nocte
oral Methotrexate 12 mg
intrathecal push Fluconazole 100 mg nocte oral
Bactrim® (trimethoprim +
sulfamethoxazole) 6 ml
BD oral 3 days/week
Methotrexate 80 mg in 60
mL N/S IV infusion over
10-15 minutes
Bactrim® (trimethoprim +
sulfamethoxazole) 6 mL BD
oral 3 days/week
Valaciclovir 50 mg OD
oral Vincristine 1.1 mg in 60
mL N/S IV infusion over 5-
15 minutes
Valaciclovir 50 mg OD oral
Thioguanine I oral 5
days/week Thioguanine I oral 5
days/week
Ondansetron 3 mg TDS oral
At discharge he was prescribed mercaptopurine oral with 50% dose at discharge.
According to protocol, the patient was assigned to receive full dose. The pharmacist
recommended the doctor increase the dose. The recommendation was accepted.
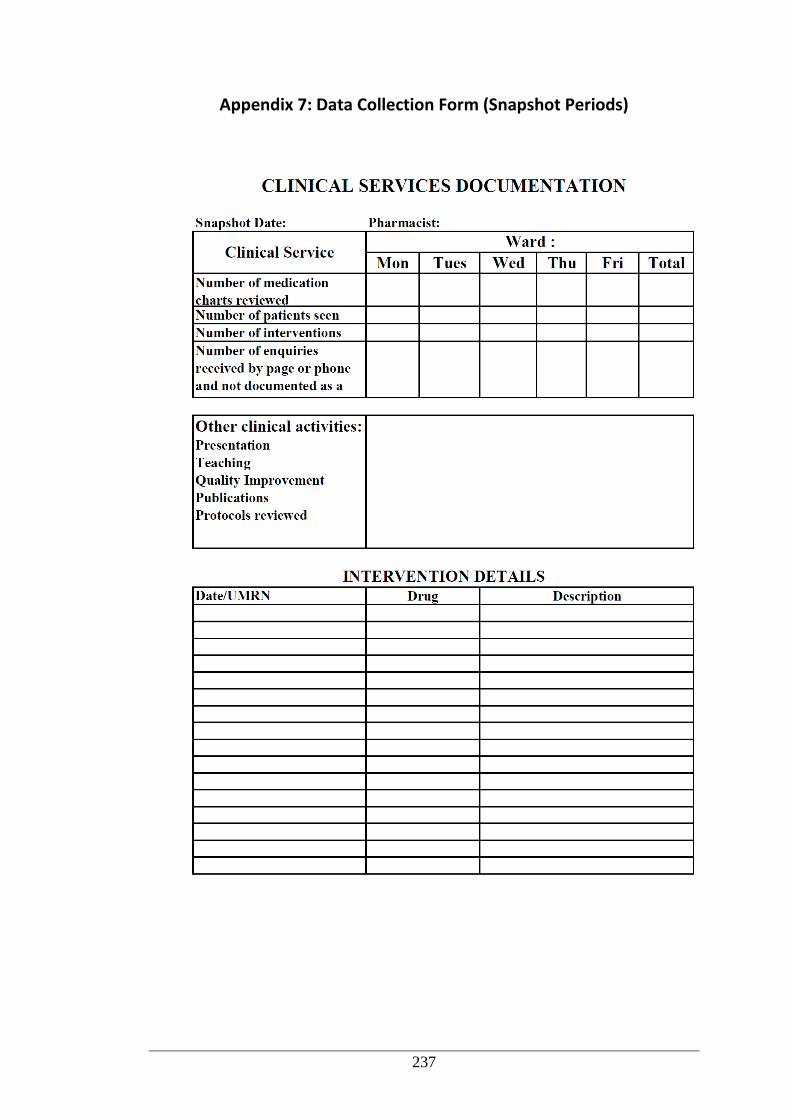
237
Appendix 7: Data Collection Form (Snapshot Periods)
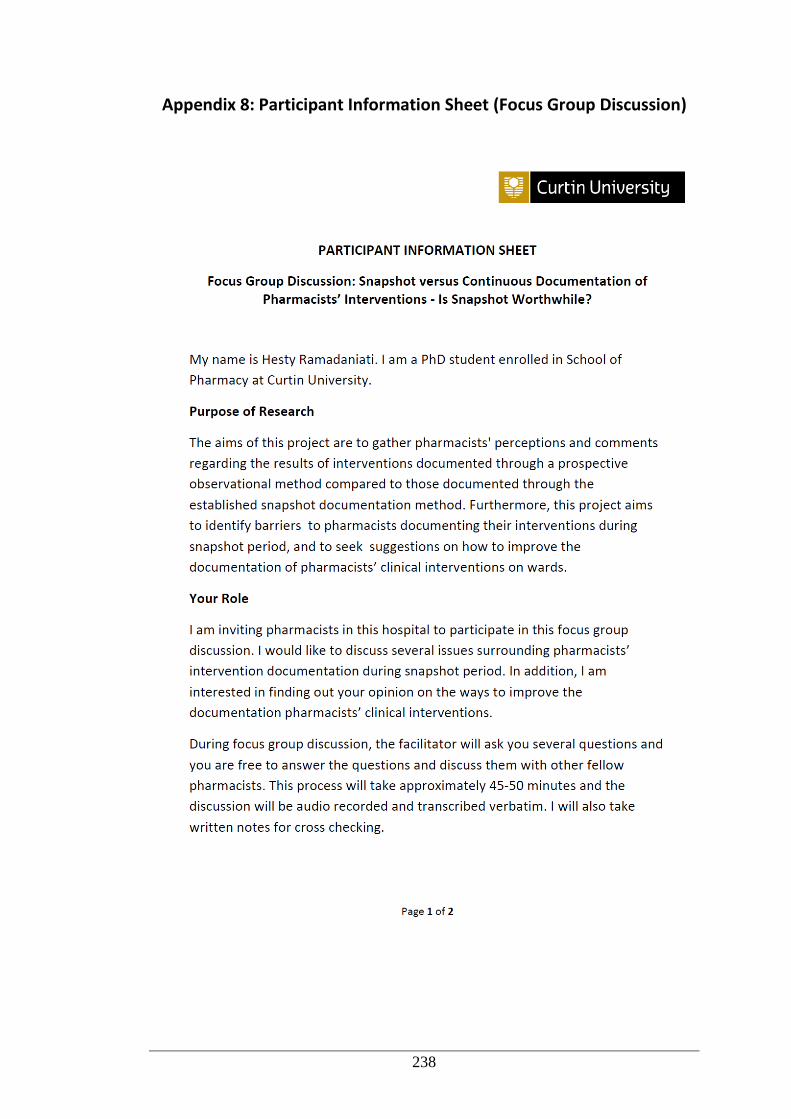
238
Appendix 8: Participant Information Sheet (Focus Group Discussion)
239
240
Appendix 9: Participant Consent Form (Focus Group Discussion)
241
Appendix 10: Approval Letter from Curtin University Human Ethics
Committee (Focus Group Discussion)
242
Appendix 11: Questionnaire for Root Cause Analysis
MEDICATION ERRORS IN CHILDREN:
ROOT-CAUSE ANALYSIS USING SIMULATED SCENARIOS
Root cause analysis (RCA) is a systematic and comprehensive approach used to
uncover the root of problems. It can be used to identify the gaps in hospital systems
and processes of care that may not be immediately apparent and which may have
contributed to the incident or near-miss (medication error). Some paediatric studies
have reported that medication errors occur in nearly 6% of all medication orders.
Despite the available literature on medication errors, less is known about such errors
in children than adults.
INSTRUCTIONS
Please indicate your answer to each of the following questions by ticking the
appropriate box(es) or entering your response in the space provided. The
questionnaire should take about 30 minutes to complete. Please return the completed
questionnaire by 17 October 2014 in the sealed envelope provided and mail it to the
return address. Please retain the information sheet for future reference.
1. Please indicate your age by ticking the relevant box:
21 – 30 years
31 – 40 years
41 – 50 years
>50 years
2. What is your gender?
Female
Male
SECTION 1: GENERAL INFORMATION, QUALIFICATIONS AND PROFESSIONAL
EXPERIENCES
Code:
243
3. What is your role?
Doctor → Go to question 3a
Nurse → Go to question 3b
Pharmacist → Go to question 3c
3a. As a doctor, what position do you currently hold in the hospital?
Intern
Resident
Registrar
Consultant/specialist
3b. As a nurse, what position do you currently hold in the hospital?
Registered nurse/midwife
Clinical nurse/clinical midwives/clinical development nurse
Clinical nurse consultant/clinical midwifery consultant
Clinical nurse specialist/clinical midwifery specialist
Nurse practitioner
Clinical nurse manager/clinical midwifery manager
Director of nursing/director of midwifery
3c. As a pharmacist, what position do you currently hold in the hospital?
Intern pharmacist
Registered pharmacist (medication safety, clinical trial, manufacturing,
inpatient/outpatient dispensary)
Clinical pharmacist
Senior clinical pharmacist
Pharmacy Director/Deputy Director
4. How long have you been working as a health professional?
< 5 years
5-10 years
11-20 years
>20 years
244
5. How long have you been working in the area of paediatrics?
< 5 years
5-10 years
11-20 years
>20 years
The goal of RCA is to find out: What happened? Why did it happen? What can be
done to prevent it from happening again?. In this section, five simulated case studies
are presented in paediatric patients. Each case study is followed by questions on the
clinical significance of medication errors and the potential contributing factors of the
error. You will be given an opportunity to give your opinion on how such errors may
be prevented in the future.
Please indicate your answer to each of the following questions by ticking inside the
appropriate box(es) or entering your response in the space provided.
A 6-month-old baby (weight: 8 kg) was admitted with a diagnosis of congestive heart
failure and pneumonia. The main complaints on admission were 10-day history of
increased respiration, wheezing, general agitation, and persistent vomiting. She was
born full-term and had a history of cardiac abnormalities. Past surgeries included
open heart surgery for repair of the congenital heart defect and gastrotomy tube
replacement. There was no history of allergies or ADR.
A resident who started his rotation in Paediatrics a week earlier prescribed the
following medications without consulting the registrar, as he did not want to bother
the registrar during the hectic morning.
Benzylpenicillin 120 mg (15 mg/kg) q8h IV
Normal saline 3 mL IV PRN
Paracetamol 120 mg (15 mg/kg) q6h IV
SECTION 2: CASE STUDY 1 (INAPPROPRIATE DOSE)
SECTION 2: SCENARIOS AND ROOT CAUSE ANALYSIS
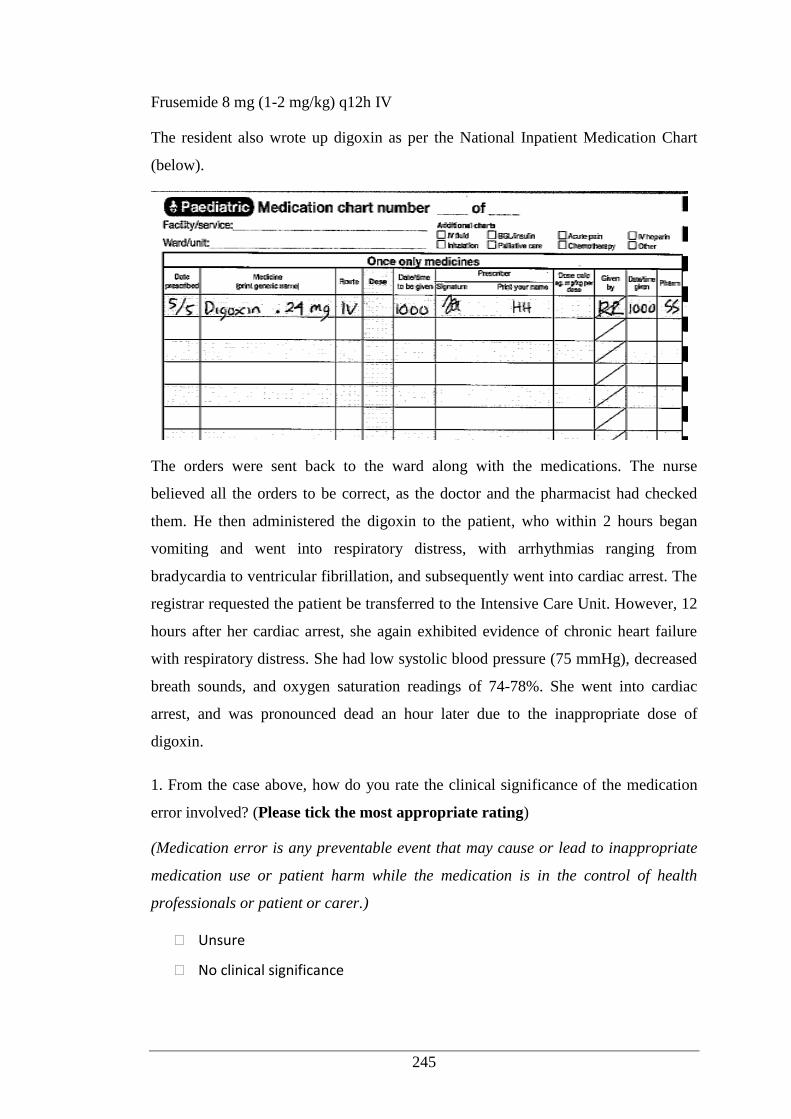
245
Frusemide 8 mg (1-2 mg/kg) q12h IV
The resident also wrote up digoxin as per the National Inpatient Medication Chart
(below).
The orders were sent back to the ward along with the medications. The nurse
believed all the orders to be correct, as the doctor and the pharmacist had checked
them. He then administered the digoxin to the patient, who within 2 hours began
vomiting and went into respiratory distress, with arrhythmias ranging from
bradycardia to ventricular fibrillation, and subsequently went into cardiac arrest. The
registrar requested the patient be transferred to the Intensive Care Unit. However, 12
hours after her cardiac arrest, she again exhibited evidence of chronic heart failure
with respiratory distress. She had low systolic blood pressure (75 mmHg), decreased
breath sounds, and oxygen saturation readings of 74-78%. She went into cardiac
arrest, and was pronounced dead an hour later due to the inappropriate dose of
digoxin.
1. From the case above, how do you rate the clinical significance of the medication
error involved? (Please tick the most appropriate rating)
(Medication error is any preventable event that may cause or lead to inappropriate
medication use or patient harm while the medication is in the control of health
professionals or patient or carer.)
Unsure
No clinical significance
246
Minor: trivial error not expected to significantly alter hospital stay or clinical
outcome
Moderate: the error reduces the effectiveness of drug therapy, producing
minor reductions in patient morbidity
Major: the error results in a very serious drug related problem
Life threatening
2. Which health professional(s) do you think were responsible for the error?
------------------------------------------------------------------------------------------------------
-------------------------------------------------------------------------------------------------
3. Having reviewed the case what do you believe may be contributing factors? Please
complete the table below.
3a. Were specific
patient issues a
factor in this event?
Yes
No
Unsure
If yes, describe the patient factors that
may have contributed.
Description:
3b. Was dismissal of
policies/procedure
or guidelines a
factor in this event?
Yes
No
Unsure
If yes, tick the appropriate box(es) AND
describe how it appeared to contribute.
Patient misidentification
Error/omission in medication
reconciliation
Clinical guidelines
Coordination of care
Medical record documentation
Level and frequency of
monitoring of patient
Description:
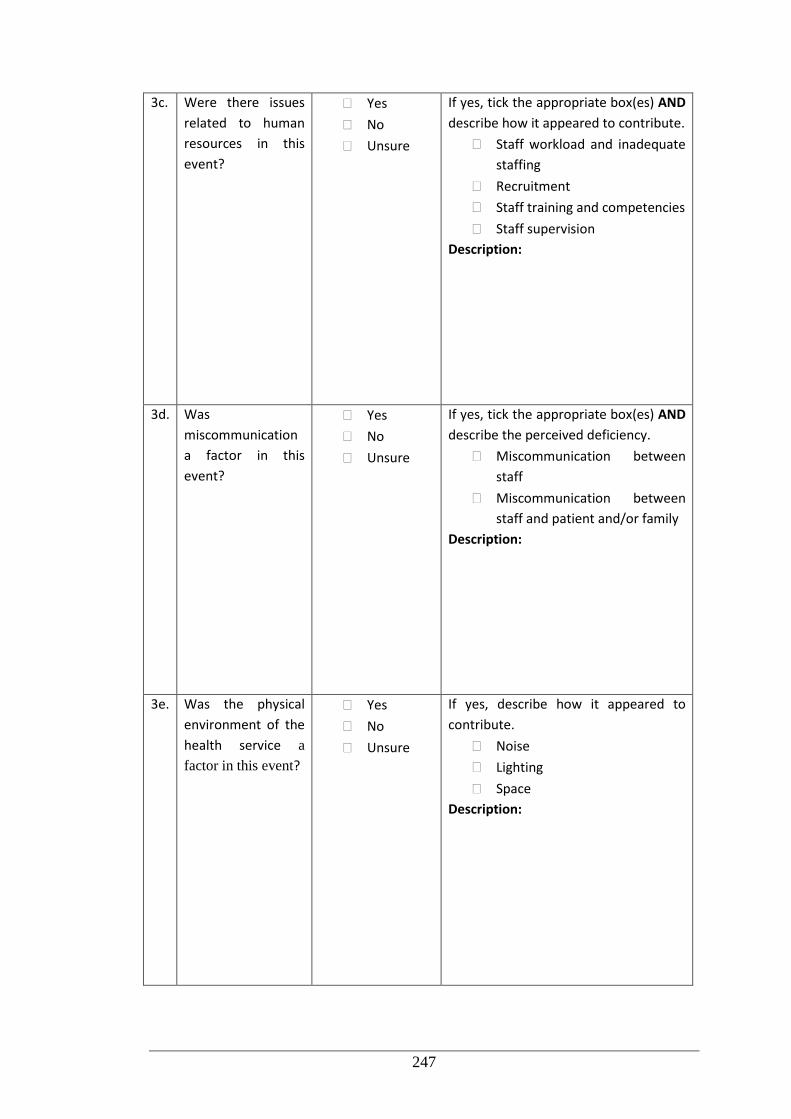
247
3c. Were there issues
related to human
resources in this
event?
Yes
No
Unsure
If yes, tick the appropriate box(es) AND
describe how it appeared to contribute.
Staff workload and inadequate
staffing
Recruitment
Staff training and competencies
Staff supervision
Description:
3d. Was
miscommunication
a factor in this
event?
Yes
No
Unsure
If yes, tick the appropriate box(es) AND
describe the perceived deficiency.
Miscommunication between
staff
Miscommunication between
staff and patient and/or family
Description:
3e. Was the physical
environment of the
health service a
factor in this event?
Yes
No
Unsure
If yes, describe how it appeared to
contribute.
Noise
Lighting
Space
Description:
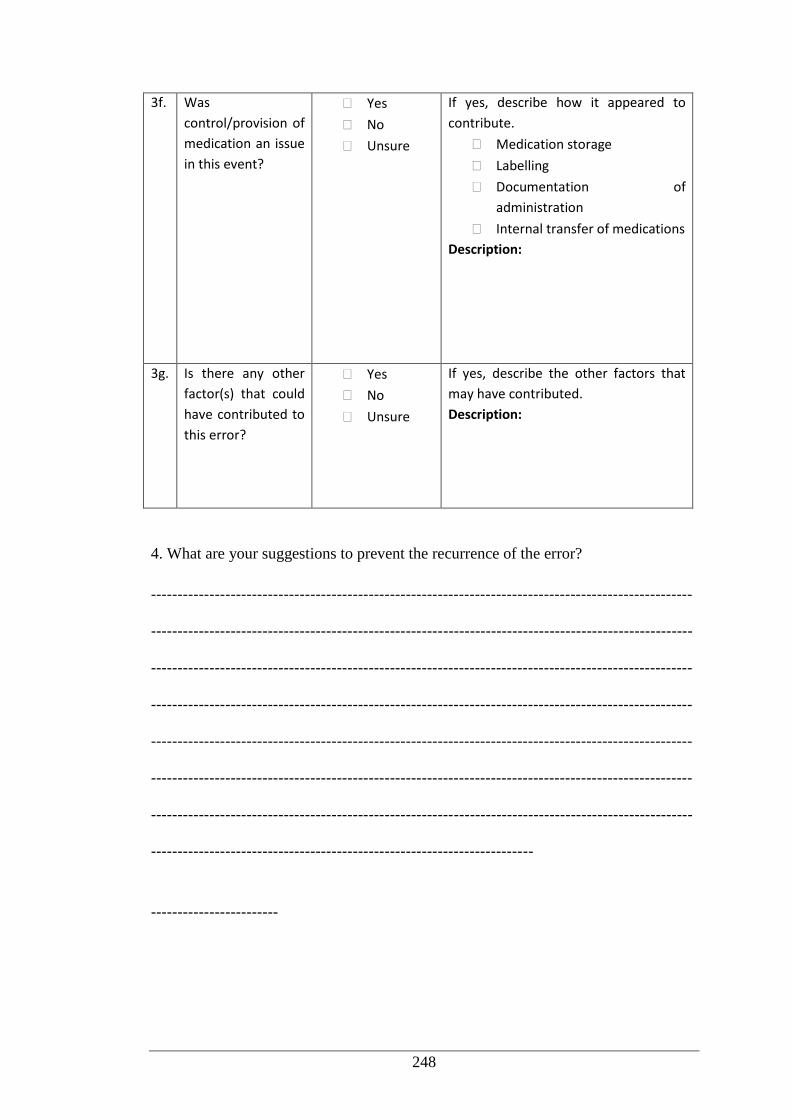
248
3f. Was
control/provision of
medication an issue
in this event?
Yes
No
Unsure
If yes, describe how it appeared to
contribute.
Medication storage
Labelling
Documentation of
administration
Internal transfer of medications
Description:
3g. Is there any other
factor(s) that could
have contributed to
this error?
Yes
No
Unsure
If yes, describe the other factors that
may have contributed.
Description:
4. What are your suggestions to prevent the recurrence of the error?
------------------------------------------------------------------------------------------------------
------------------------------------------------------------------------------------------------------
------------------------------------------------------------------------------------------------------
------------------------------------------------------------------------------------------------------
------------------------------------------------------------------------------------------------------
------------------------------------------------------------------------------------------------------
------------------------------------------------------------------------------------------------------
------------------------------------------------------------------------
------------------------
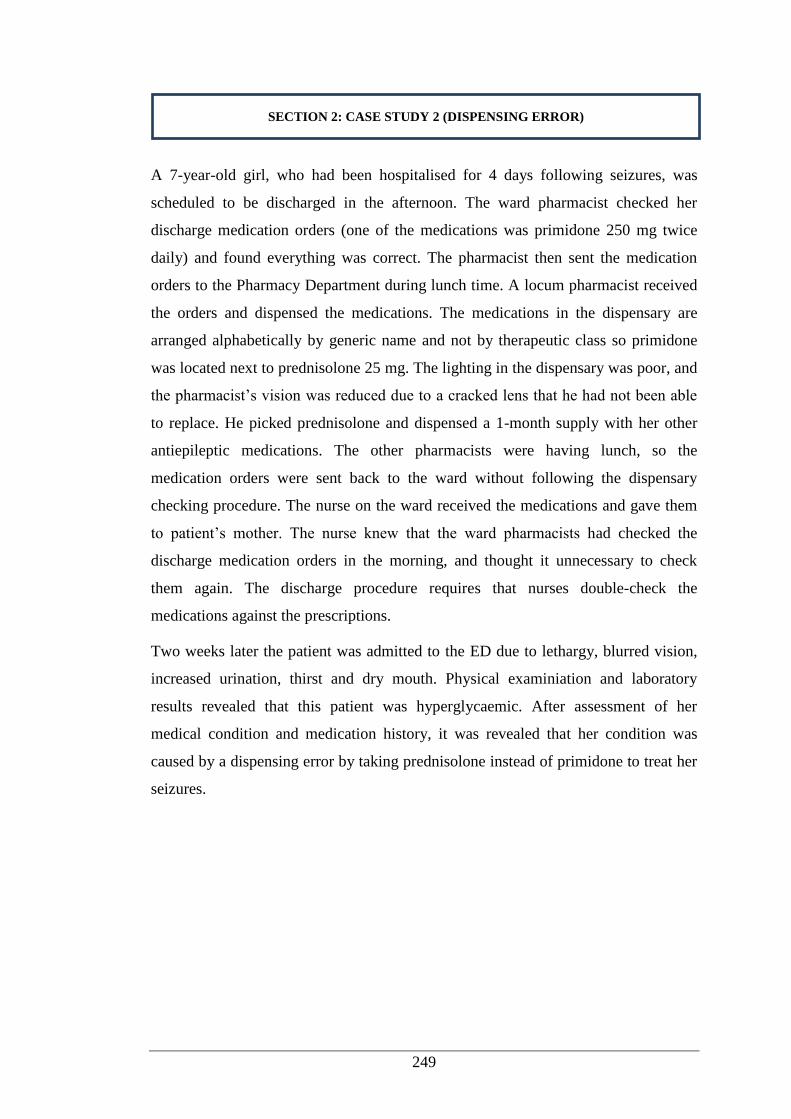
249
A 7-year-old girl, who had been hospitalised for 4 days following seizures, was
scheduled to be discharged in the afternoon. The ward pharmacist checked her
discharge medication orders (one of the medications was primidone 250 mg twice
daily) and found everything was correct. The pharmacist then sent the medication
orders to the Pharmacy Department during lunch time. A locum pharmacist received
the orders and dispensed the medications. The medications in the dispensary are
arranged alphabetically by generic name and not by therapeutic class so primidone
was located next to prednisolone 25 mg. The lighting in the dispensary was poor, and
the pharmacist’s vision was reduced due to a cracked lens that he had not been able
to replace. He picked prednisolone and dispensed a 1-month supply with her other
antiepileptic medications. The other pharmacists were having lunch, so the
medication orders were sent back to the ward without following the dispensary
checking procedure. The nurse on the ward received the medications and gave them
to patient’s mother. The nurse knew that the ward pharmacists had checked the
discharge medication orders in the morning, and thought it unnecessary to check
them again. The discharge procedure requires that nurses double-check the
medications against the prescriptions.
Two weeks later the patient was admitted to the ED due to lethargy, blurred vision,
increased urination, thirst and dry mouth. Physical examiniation and laboratory
results revealed that this patient was hyperglycaemic. After assessment of her
medical condition and medication history, it was revealed that her condition was
caused by a dispensing error by taking prednisolone instead of primidone to treat her
seizures.
SECTION 2: CASE STUDY 2 (DISPENSING ERROR)
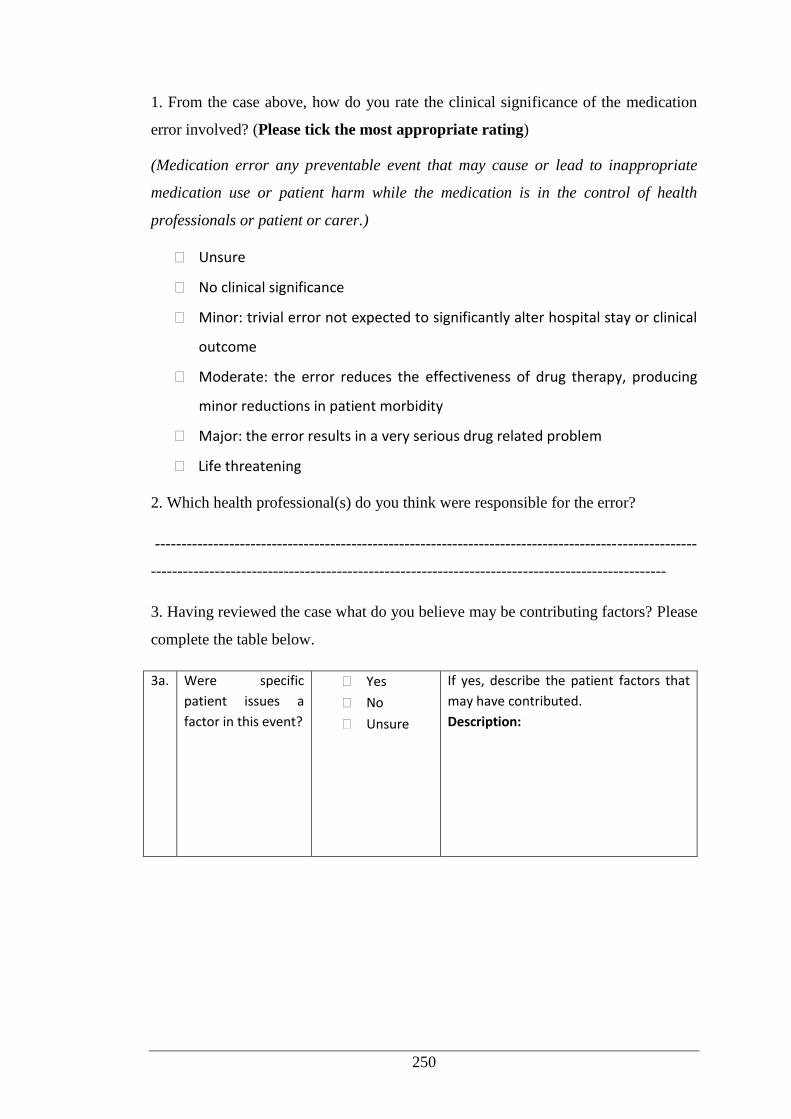
250
1. From the case above, how do you rate the clinical significance of the medication
error involved? (Please tick the most appropriate rating)
(Medication error any preventable event that may cause or lead to inappropriate
medication use or patient harm while the medication is in the control of health
professionals or patient or carer.)
Unsure
No clinical significance
Minor: trivial error not expected to significantly alter hospital stay or clinical
outcome
Moderate: the error reduces the effectiveness of drug therapy, producing
minor reductions in patient morbidity
Major: the error results in a very serious drug related problem
Life threatening
2. Which health professional(s) do you think were responsible for the error?
------------------------------------------------------------------------------------------------------
-------------------------------------------------------------------------------------------------
3. Having reviewed the case what do you believe may be contributing factors? Please
complete the table below.
3a. Were specific
patient issues a
factor in this event?
Yes
No
Unsure
If yes, describe the patient factors that
may have contributed.
Description:
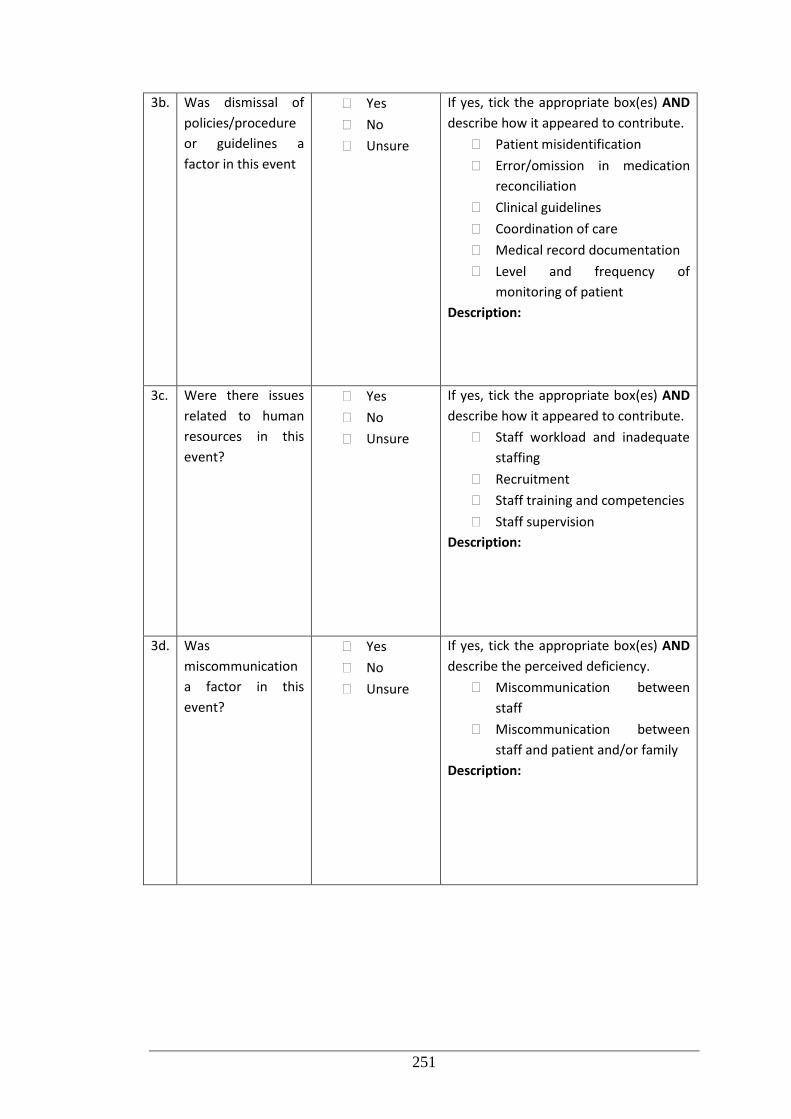
251
3b. Was dismissal of
policies/procedure
or guidelines a
factor in this event
Yes
No
Unsure
If yes, tick the appropriate box(es) AND
describe how it appeared to contribute.
Patient misidentification
Error/omission in medication
reconciliation
Clinical guidelines
Coordination of care
Medical record documentation
Level and frequency of
monitoring of patient
Description:
3c. Were there issues
related to human
resources in this
event?
Yes
No
Unsure
If yes, tick the appropriate box(es) AND
describe how it appeared to contribute.
Staff workload and inadequate
staffing
Recruitment
Staff training and competencies
Staff supervision
Description:
3d. Was
miscommunication
a factor in this
event?
Yes
No
Unsure
If yes, tick the appropriate box(es) AND
describe the perceived deficiency.
Miscommunication between
staff
Miscommunication between
staff and patient and/or family
Description:
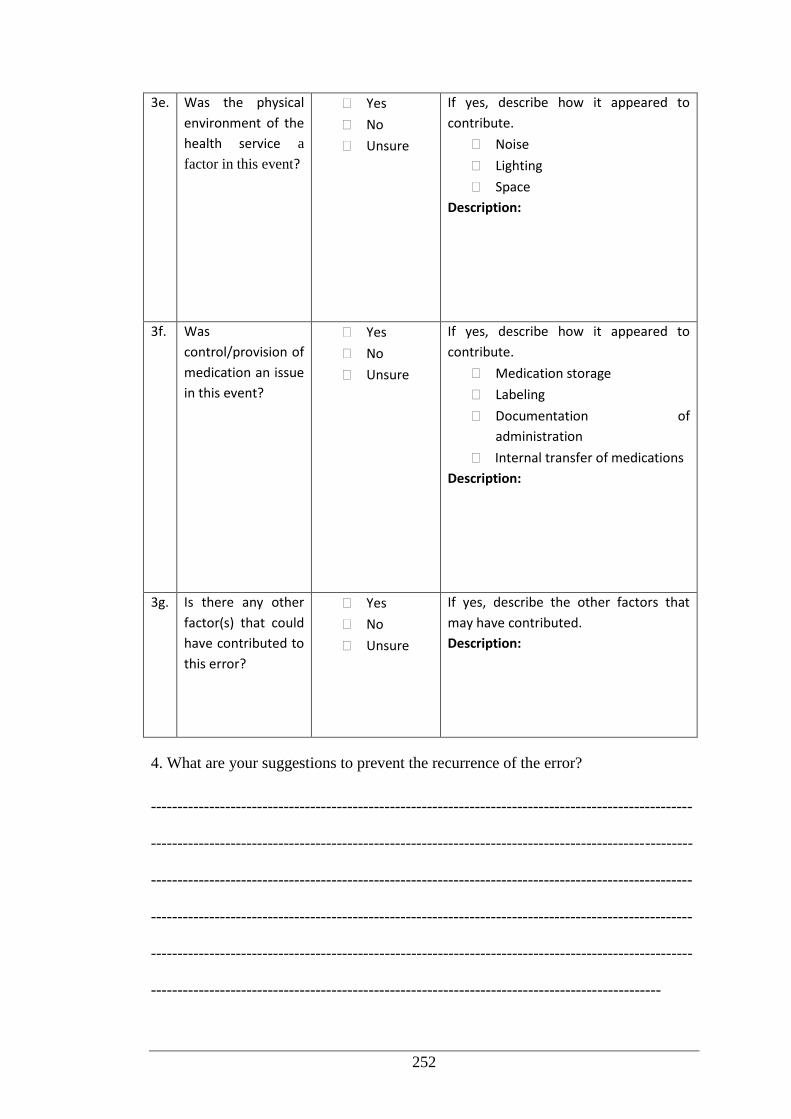
252
3e. Was the physical
environment of the
health service a
factor in this event?
Yes
No
Unsure
If yes, describe how it appeared to
contribute.
Noise
Lighting
Space
Description:
3f. Was
control/provision of
medication an issue
in this event?
Yes
No
Unsure
If yes, describe how it appeared to
contribute.
Medication storage
Labeling
Documentation of
administration
Internal transfer of medications
Description:
3g. Is there any other
factor(s) that could
have contributed to
this error?
Yes
No
Unsure
If yes, describe the other factors that
may have contributed.
Description:
4. What are your suggestions to prevent the recurrence of the error?
------------------------------------------------------------------------------------------------------
------------------------------------------------------------------------------------------------------
------------------------------------------------------------------------------------------------------
------------------------------------------------------------------------------------------------------
------------------------------------------------------------------------------------------------------
------------------------------------------------------------------------------------------------
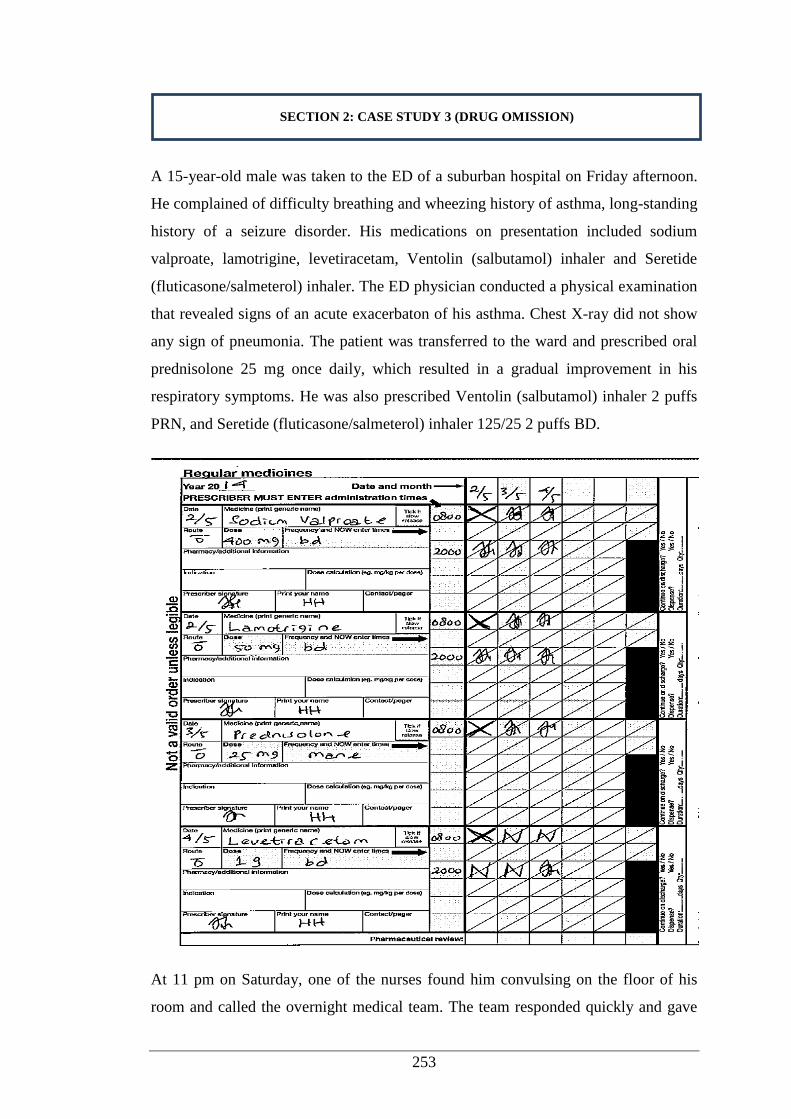
253
A 15-year-old male was taken to the ED of a suburban hospital on Friday afternoon.
He complained of difficulty breathing and wheezing history of asthma, long-standing
history of a seizure disorder. His medications on presentation included sodium
valproate, lamotrigine, levetiracetam, Ventolin (salbutamol) inhaler and Seretide
(fluticasone/salmeterol) inhaler. The ED physician conducted a physical examination
that revealed signs of an acute exacerbaton of his asthma. Chest X-ray did not show
any sign of pneumonia. The patient was transferred to the ward and prescribed oral
prednisolone 25 mg once daily, which resulted in a gradual improvement in his
respiratory symptoms. He was also prescribed Ventolin (salbutamol) inhaler 2 puffs
PRN, and Seretide (fluticasone/salmeterol) inhaler 125/25 2 puffs BD.
At 11 pm on Saturday, one of the nurses found him convulsing on the floor of his
room and called the overnight medical team. The team responded quickly and gave
SECTION 2: CASE STUDY 3 (DRUG OMISSION)
254
him intravenous medications (diazepam 15 mg IV every 15-30 minutes and
phenytoin 250 mg IV for 3 doses within 6 hours) to stop his seizure. After his mental
status improved, the patient complained of pain in his left shoulder and elbow. An X-
ray of these joints showed evidence of traumatic fracture from his fall. On Sunday
morning, the medical team reviewed the medication chart and the medication
administration record and found that one of his seizure medications, levetiracetam,
had not been given during his admission. There was a note in the medication
administration chart from the daytime nurse indicating that levetiracetam was out of
stock but the nurse did not notify the doctors, the pharmacy or the night shift nurse
during handover. On Friday afternoon before the patient was admitted, the ward
pharmacist noticed that the levetiracetam in the imprest room was low in stock, but
the pharmacist was busy and forgot to notify the pharmacy assistant to restock the
levetiracetam. The patient experienced the episode of seizure because of drug
omission of one of his anticonvulsant medications, levetiracetam.
1. From the case above, how do you rate the clinical significance of the medication
error involved? (Please tick the most appropriate rating)
(Medication error is any preventable event that may cause or lead to inappropriate
medication use or patient harm while the medication is in the control of health
professionals or patient or carer.)
Unsure
No clinical significance
Minor: trivial error not expected to significantly alter hospital stay or clinical
outcome
Moderate: the error reduces the effectiveness of drug therapy, producing
minor reductions in patient morbidity
Major: the error results in a very serious drug related problem
Life threatening
2. Which health professional(s) do you think were responsible for the error?
------------------------------------------------------------------------------------------------------
-------------------------------------------------------------------------------------------------
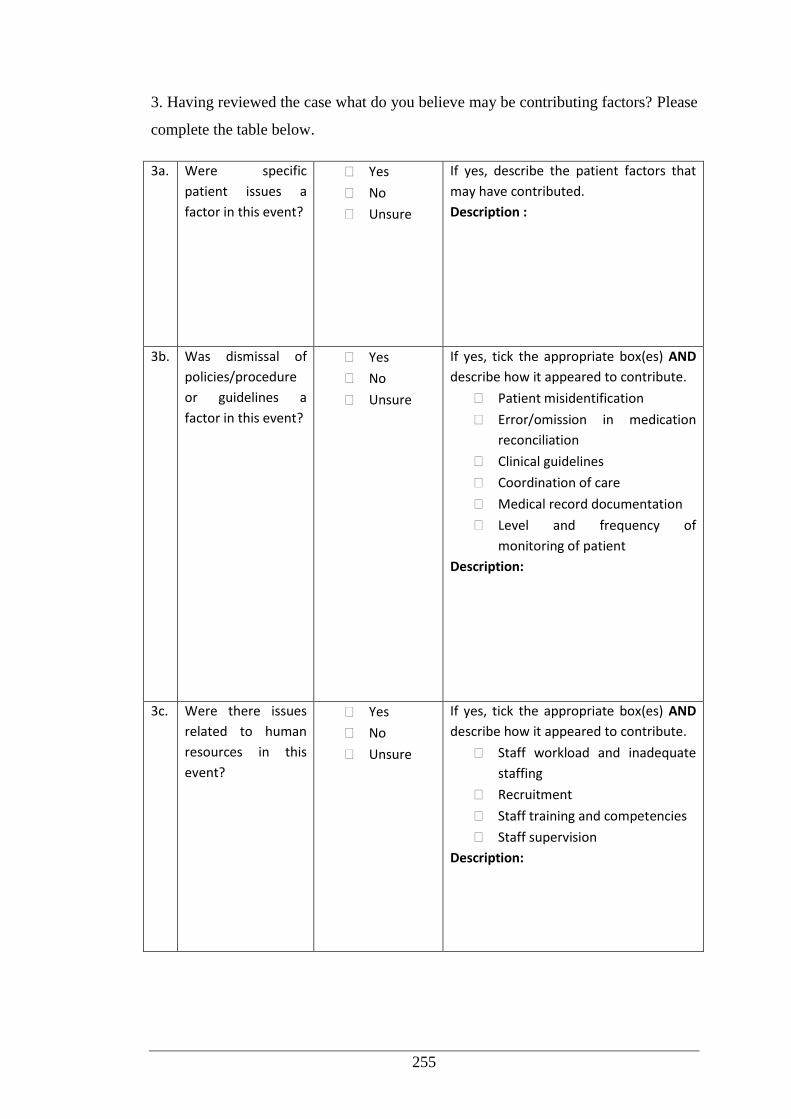
255
3. Having reviewed the case what do you believe may be contributing factors? Please
complete the table below.
3a. Were specific
patient issues a
factor in this event?
Yes
No
Unsure
If yes, describe the patient factors that
may have contributed.
Description :
3b. Was dismissal of
policies/procedure
or guidelines a
factor in this event?
Yes
No
Unsure
If yes, tick the appropriate box(es) AND
describe how it appeared to contribute.
Patient misidentification
Error/omission in medication
reconciliation
Clinical guidelines
Coordination of care
Medical record documentation
Level and frequency of
monitoring of patient
Description:
3c. Were there issues
related to human
resources in this
event?
Yes
No
Unsure
If yes, tick the appropriate box(es) AND
describe how it appeared to contribute.
Staff workload and inadequate
staffing
Recruitment
Staff training and competencies
Staff supervision
Description:
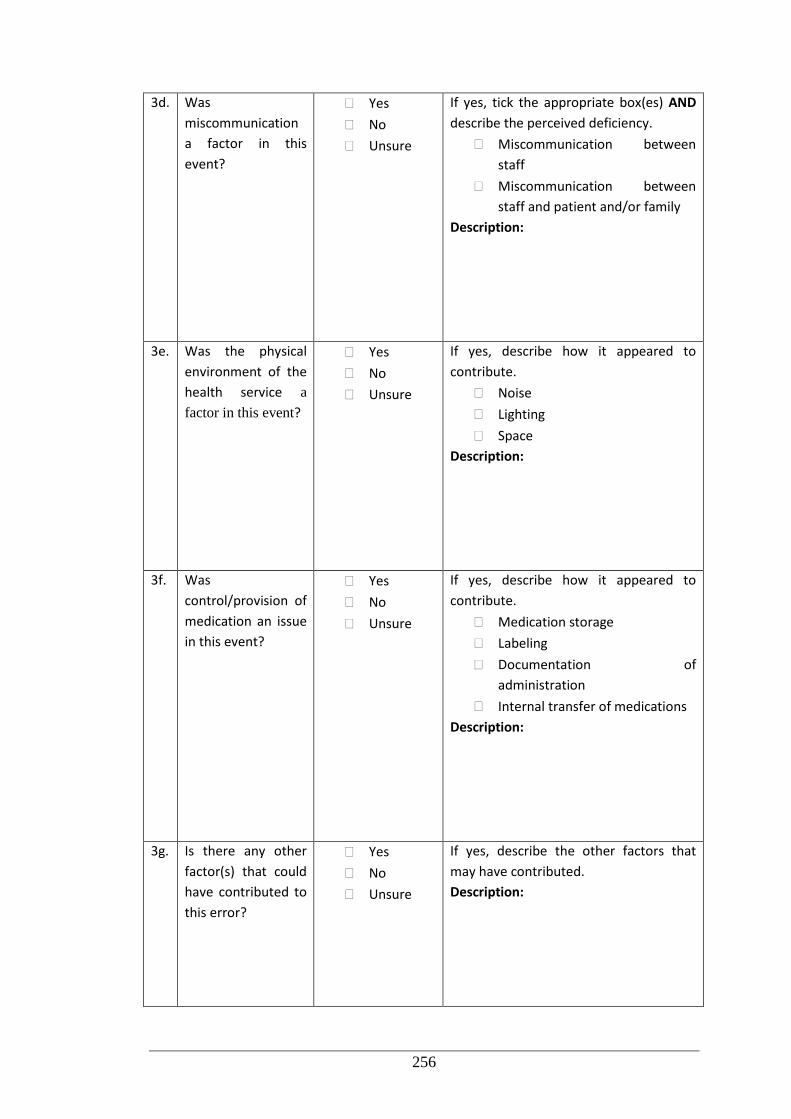
256
3d. Was
miscommunication
a factor in this
event?
Yes
No
Unsure
If yes, tick the appropriate box(es) AND
describe the perceived deficiency.
Miscommunication between
staff
Miscommunication between
staff and patient and/or family
Description:
3e. Was the physical
environment of the
health service a
factor in this event?
Yes
No
Unsure
If yes, describe how it appeared to
contribute.
Noise
Lighting
Space
Description:
3f. Was
control/provision of
medication an issue
in this event?
Yes
No
Unsure
If yes, describe how it appeared to
contribute.
Medication storage
Labeling
Documentation of
administration
Internal transfer of medications
Description:
3g. Is there any other
factor(s) that could
have contributed to
this error?
Yes
No
Unsure
If yes, describe the other factors that
may have contributed.
Description:
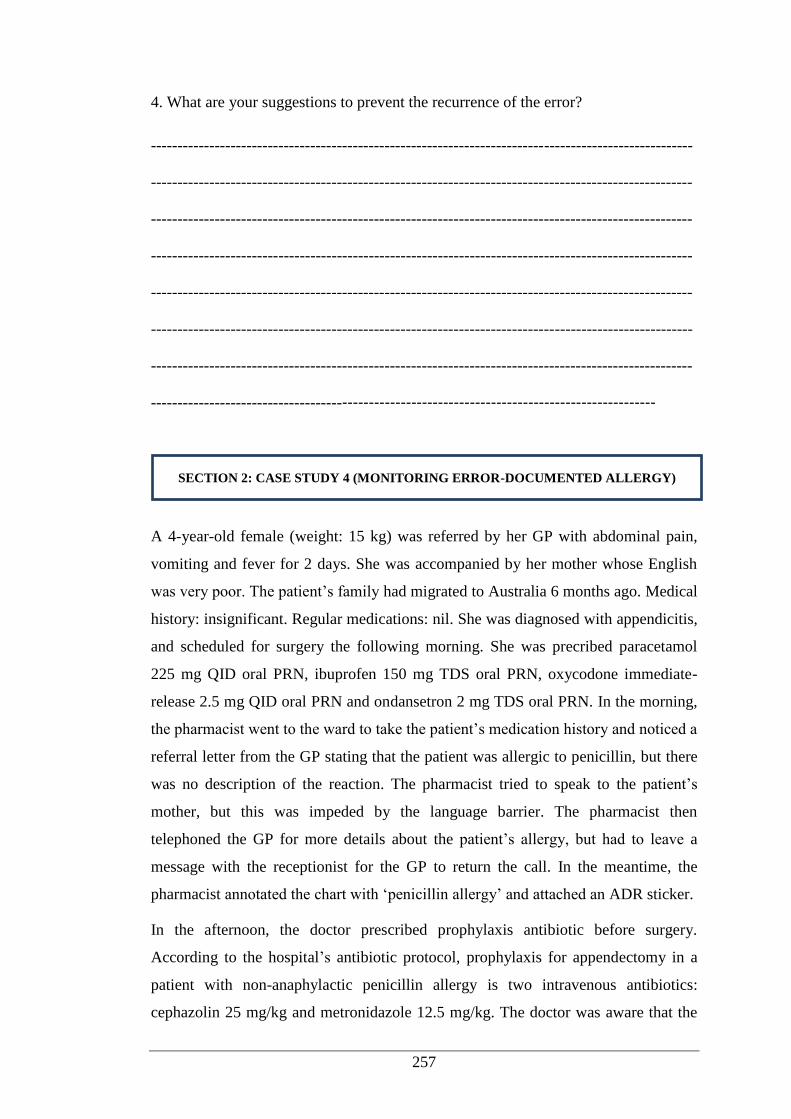
257
4. What are your suggestions to prevent the recurrence of the error?
------------------------------------------------------------------------------------------------------
------------------------------------------------------------------------------------------------------
------------------------------------------------------------------------------------------------------
------------------------------------------------------------------------------------------------------
------------------------------------------------------------------------------------------------------
------------------------------------------------------------------------------------------------------
------------------------------------------------------------------------------------------------------
-----------------------------------------------------------------------------------------------
A 4-year-old female (weight: 15 kg) was referred by her GP with abdominal pain,
vomiting and fever for 2 days. She was accompanied by her mother whose English
was very poor. The patient’s family had migrated to Australia 6 months ago. Medical
history: insignificant. Regular medications: nil. She was diagnosed with appendicitis,
and scheduled for surgery the following morning. She was precribed paracetamol
225 mg QID oral PRN, ibuprofen 150 mg TDS oral PRN, oxycodone immediate-
release 2.5 mg QID oral PRN and ondansetron 2 mg TDS oral PRN. In the morning,
the pharmacist went to the ward to take the patient’s medication history and noticed a
referral letter from the GP stating that the patient was allergic to penicillin, but there
was no description of the reaction. The pharmacist tried to speak to the patient’s
mother, but this was impeded by the language barrier. The pharmacist then
telephoned the GP for more details about the patient’s allergy, but had to leave a
message with the receptionist for the GP to return the call. In the meantime, the
pharmacist annotated the chart with ‘penicillin allergy’ and attached an ADR sticker.
In the afternoon, the doctor prescribed prophylaxis antibiotic before surgery.
According to the hospital’s antibiotic protocol, prophylaxis for appendectomy in a
patient with non-anaphylactic penicillin allergy is two intravenous antibiotics:
cephazolin 25 mg/kg and metronidazole 12.5 mg/kg. The doctor was aware that the
SECTION 2: CASE STUDY 4 (MONITORING ERROR-DOCUMENTED ALLERGY)
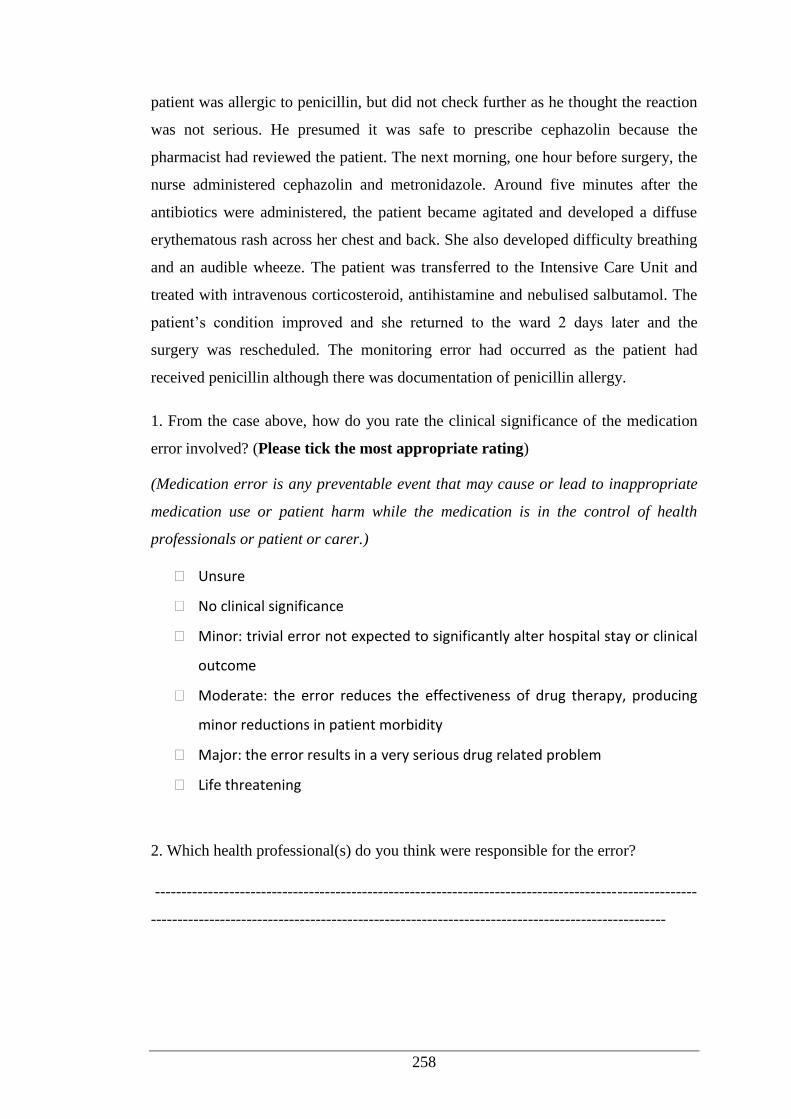
258
patient was allergic to penicillin, but did not check further as he thought the reaction
was not serious. He presumed it was safe to prescribe cephazolin because the
pharmacist had reviewed the patient. The next morning, one hour before surgery, the
nurse administered cephazolin and metronidazole. Around five minutes after the
antibiotics were administered, the patient became agitated and developed a diffuse
erythematous rash across her chest and back. She also developed difficulty breathing
and an audible wheeze. The patient was transferred to the Intensive Care Unit and
treated with intravenous corticosteroid, antihistamine and nebulised salbutamol. The
patient’s condition improved and she returned to the ward 2 days later and the
surgery was rescheduled. The monitoring error had occurred as the patient had
received penicillin although there was documentation of penicillin allergy.
1. From the case above, how do you rate the clinical significance of the medication
error involved? (Please tick the most appropriate rating)
(Medication error is any preventable event that may cause or lead to inappropriate
medication use or patient harm while the medication is in the control of health
professionals or patient or carer.)
Unsure
No clinical significance
Minor: trivial error not expected to significantly alter hospital stay or clinical
outcome
Moderate: the error reduces the effectiveness of drug therapy, producing
minor reductions in patient morbidity
Major: the error results in a very serious drug related problem
Life threatening
2. Which health professional(s) do you think were responsible for the error?
------------------------------------------------------------------------------------------------------
-------------------------------------------------------------------------------------------------
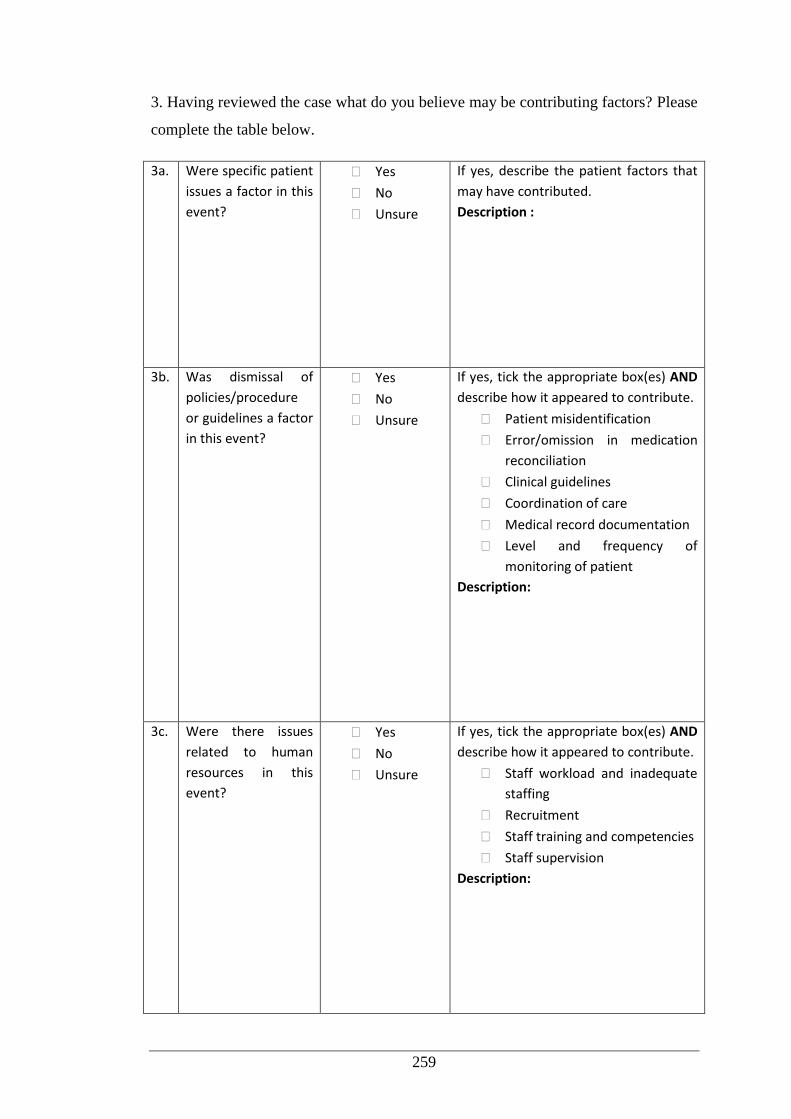
259
3. Having reviewed the case what do you believe may be contributing factors? Please
complete the table below.
3a. Were specific patient
issues a factor in this
event?
Yes
No
Unsure
If yes, describe the patient factors that
may have contributed.
Description :
3b. Was dismissal of
policies/procedure
or guidelines a factor
in this event?
Yes
No
Unsure
If yes, tick the appropriate box(es) AND
describe how it appeared to contribute.
Patient misidentification
Error/omission in medication
reconciliation
Clinical guidelines
Coordination of care
Medical record documentation
Level and frequency of
monitoring of patient
Description:
3c. Were there issues
related to human
resources in this
event?
Yes
No
Unsure
If yes, tick the appropriate box(es) AND
describe how it appeared to contribute.
Staff workload and inadequate
staffing
Recruitment
Staff training and competencies
Staff supervision
Description:
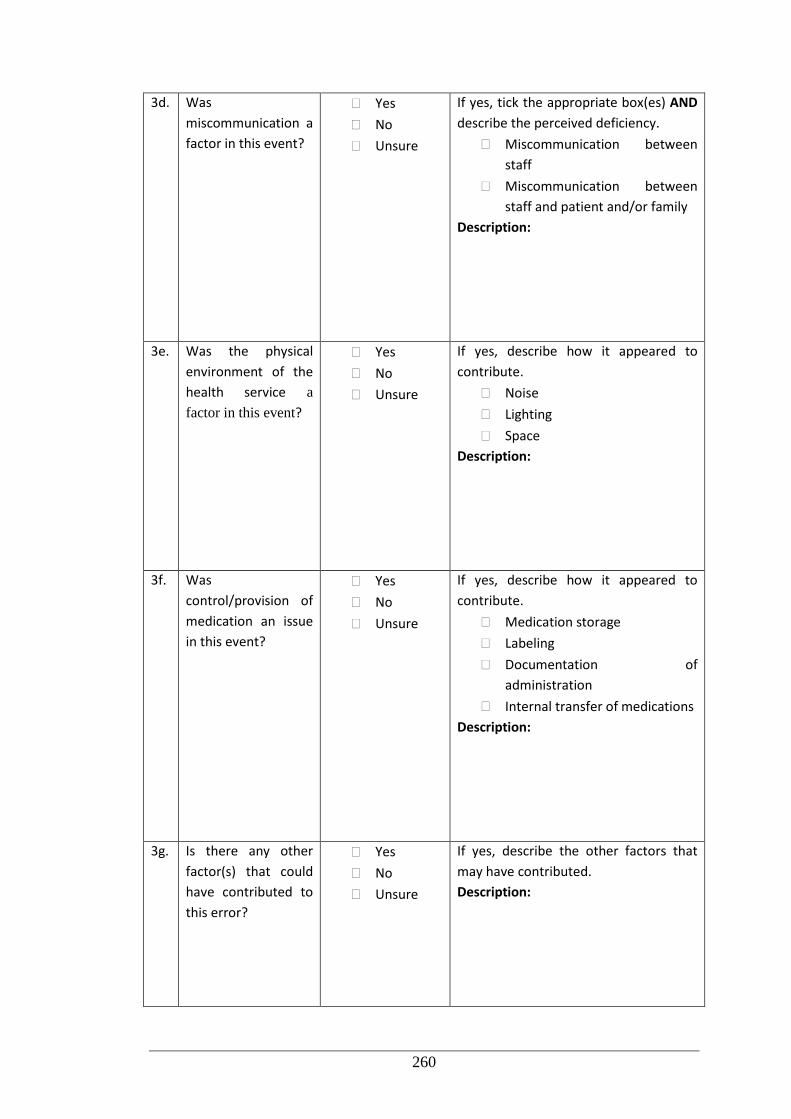
260
3d. Was
miscommunication a
factor in this event?
Yes
No
Unsure
If yes, tick the appropriate box(es) AND
describe the perceived deficiency.
Miscommunication between
staff
Miscommunication between
staff and patient and/or family
Description:
3e. Was the physical
environment of the
health service a
factor in this event?
Yes
No
Unsure
If yes, describe how it appeared to
contribute.
Noise
Lighting
Space
Description:
3f. Was
control/provision of
medication an issue
in this event?
Yes
No
Unsure
If yes, describe how it appeared to
contribute.
Medication storage
Labeling
Documentation of
administration
Internal transfer of medications
Description:
3g. Is there any other
factor(s) that could
have contributed to
this error?
Yes
No
Unsure
If yes, describe the other factors that
may have contributed.
Description:
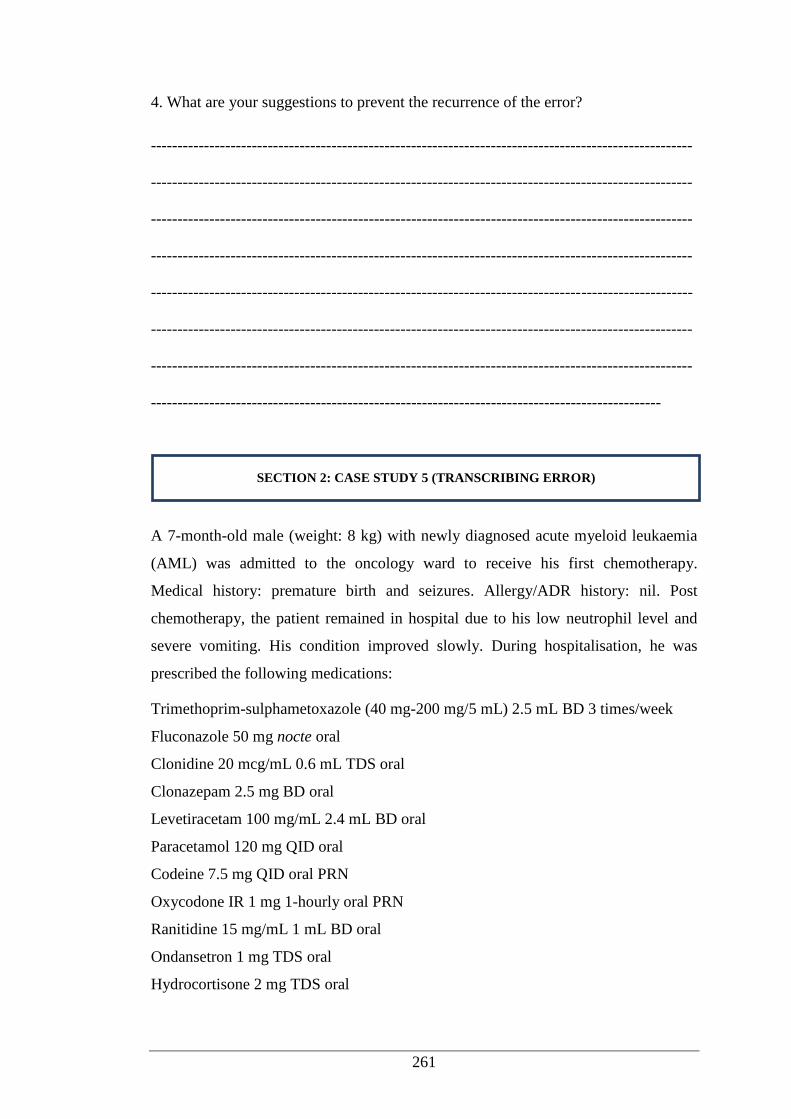
261
4. What are your suggestions to prevent the recurrence of the error?
------------------------------------------------------------------------------------------------------
------------------------------------------------------------------------------------------------------
------------------------------------------------------------------------------------------------------
------------------------------------------------------------------------------------------------------
------------------------------------------------------------------------------------------------------
------------------------------------------------------------------------------------------------------
------------------------------------------------------------------------------------------------------
------------------------------------------------------------------------------------------------
A 7-month-old male (weight: 8 kg) with newly diagnosed acute myeloid leukaemia
(AML) was admitted to the oncology ward to receive his first chemotherapy.
Medical history: premature birth and seizures. Allergy/ADR history: nil. Post
chemotherapy, the patient remained in hospital due to his low neutrophil level and
severe vomiting. His condition improved slowly. During hospitalisation, he was
prescribed the following medications:
Trimethoprim-sulphametoxazole (40 mg-200 mg/5 mL) 2.5 mL BD 3 times/week
Fluconazole 50 mg nocte oral
Clonidine 20 mcg/mL 0.6 mL TDS oral
Clonazepam 2.5 mg BD oral
Levetiracetam 100 mg/mL 2.4 mL BD oral
Paracetamol 120 mg QID oral
Codeine 7.5 mg QID oral PRN
Oxycodone IR 1 mg 1-hourly oral PRN
Ranitidine 15 mg/mL 1 mL BD oral
Ondansetron 1 mg TDS oral
Hydrocortisone 2 mg TDS oral
SECTION 2: CASE STUDY 5 (TRANSCRIBING ERROR)
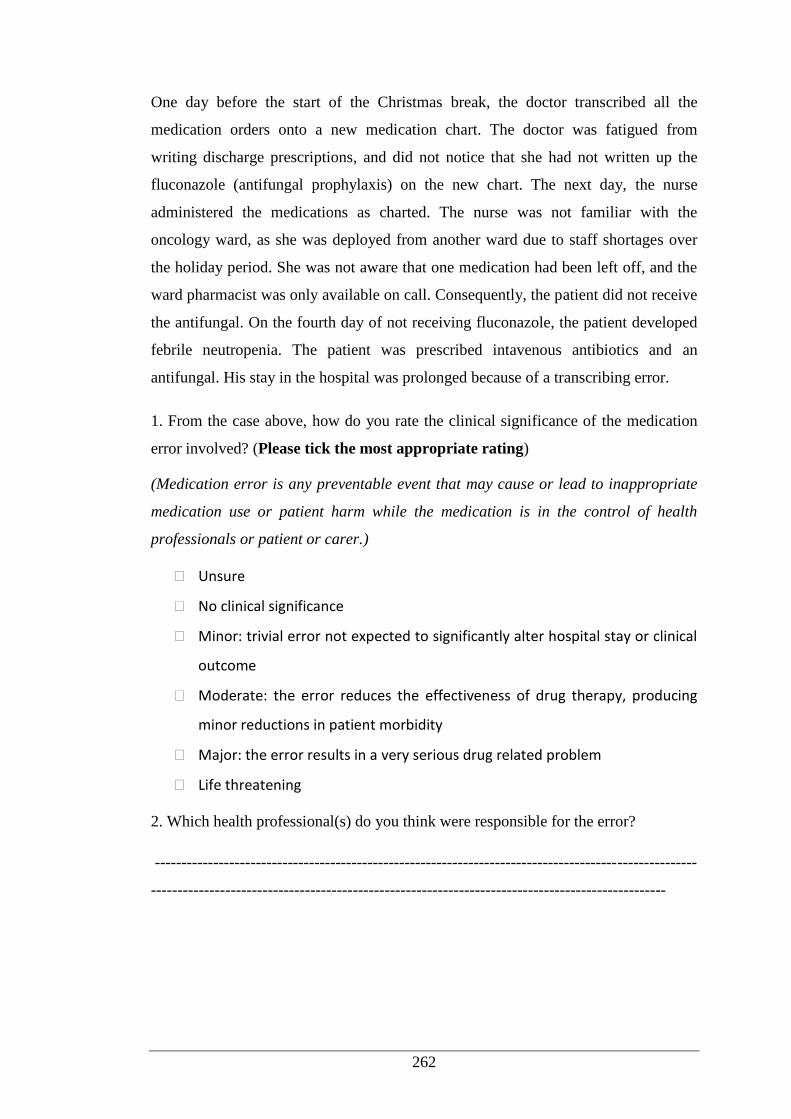
262
One day before the start of the Christmas break, the doctor transcribed all the
medication orders onto a new medication chart. The doctor was fatigued from
writing discharge prescriptions, and did not notice that she had not written up the
fluconazole (antifungal prophylaxis) on the new chart. The next day, the nurse
administered the medications as charted. The nurse was not familiar with the
oncology ward, as she was deployed from another ward due to staff shortages over
the holiday period. She was not aware that one medication had been left off, and the
ward pharmacist was only available on call. Consequently, the patient did not receive
the antifungal. On the fourth day of not receiving fluconazole, the patient developed
febrile neutropenia. The patient was prescribed intavenous antibiotics and an
antifungal. His stay in the hospital was prolonged because of a transcribing error.
1. From the case above, how do you rate the clinical significance of the medication
error involved? (Please tick the most appropriate rating)
(Medication error is any preventable event that may cause or lead to inappropriate
medication use or patient harm while the medication is in the control of health
professionals or patient or carer.)
Unsure
No clinical significance
Minor: trivial error not expected to significantly alter hospital stay or clinical
outcome
Moderate: the error reduces the effectiveness of drug therapy, producing
minor reductions in patient morbidity
Major: the error results in a very serious drug related problem
Life threatening
2. Which health professional(s) do you think were responsible for the error?
------------------------------------------------------------------------------------------------------
-------------------------------------------------------------------------------------------------
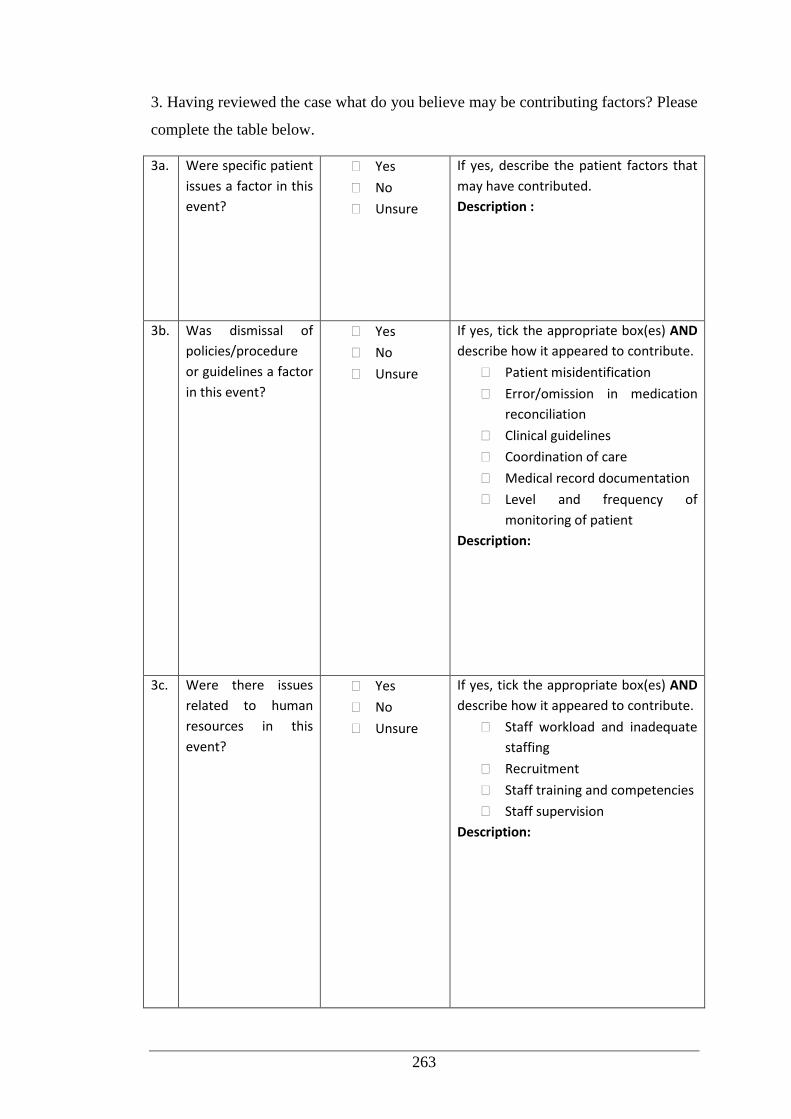
263
3. Having reviewed the case what do you believe may be contributing factors? Please
complete the table below.
3a. Were specific patient
issues a factor in this
event?
Yes
No
Unsure
If yes, describe the patient factors that
may have contributed.
Description :
3b. Was dismissal of
policies/procedure
or guidelines a factor
in this event?
Yes
No
Unsure
If yes, tick the appropriate box(es) AND
describe how it appeared to contribute.
Patient misidentification
Error/omission in medication
reconciliation
Clinical guidelines
Coordination of care
Medical record documentation
Level and frequency of
monitoring of patient
Description:
3c. Were there issues
related to human
resources in this
event?
Yes
No
Unsure
If yes, tick the appropriate box(es) AND
describe how it appeared to contribute.
Staff workload and inadequate
staffing
Recruitment
Staff training and competencies
Staff supervision
Description:
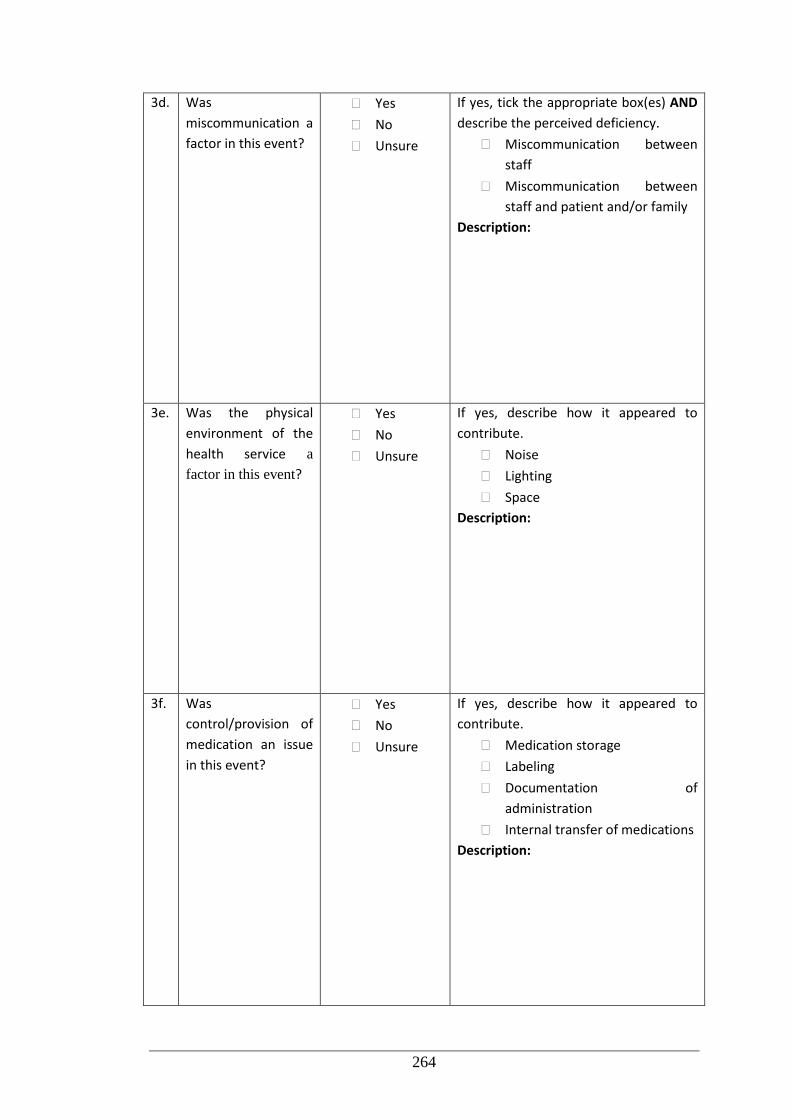
264
3d. Was
miscommunication a
factor in this event?
Yes
No
Unsure
If yes, tick the appropriate box(es) AND
describe the perceived deficiency.
Miscommunication between
staff
Miscommunication between
staff and patient and/or family
Description:
3e. Was the physical
environment of the
health service a
factor in this event?
Yes
No
Unsure
If yes, describe how it appeared to
contribute.
Noise
Lighting
Space
Description:
3f. Was
control/provision of
medication an issue
in this event?
Yes
No
Unsure
If yes, describe how it appeared to
contribute.
Medication storage
Labeling
Documentation of
administration
Internal transfer of medications
Description:
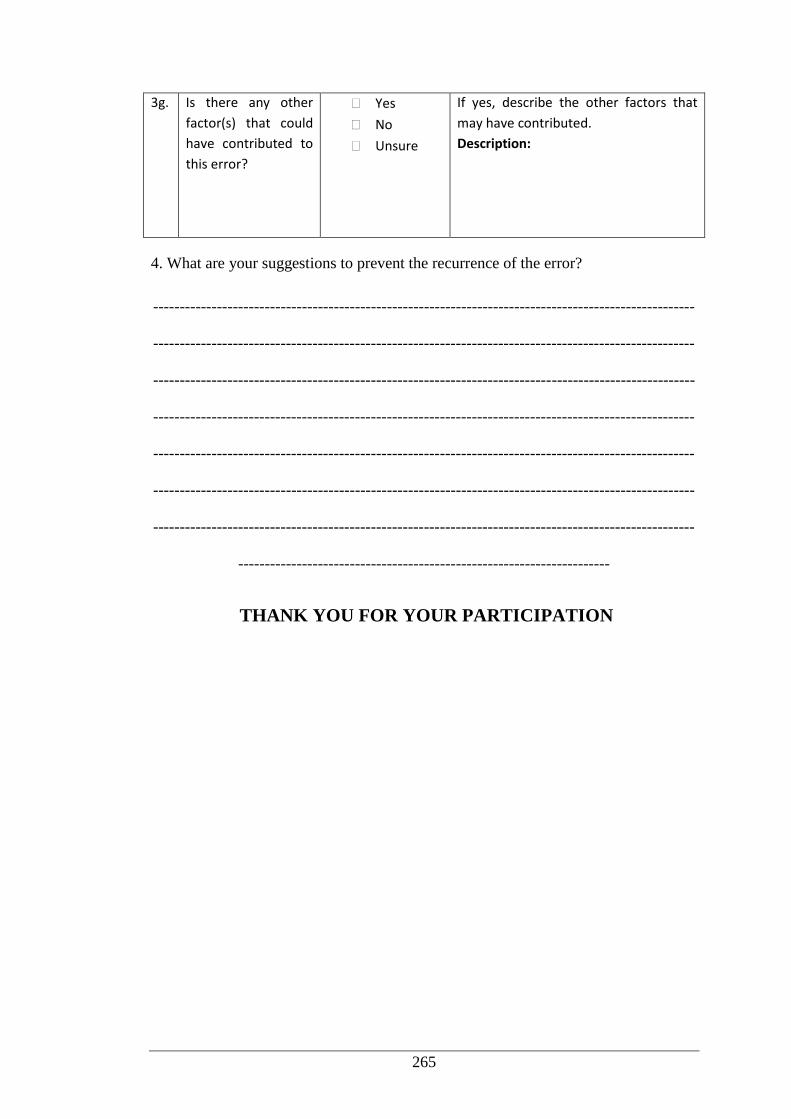
265
3g. Is there any other
factor(s) that could
have contributed to
this error?
Yes
No
Unsure
If yes, describe the other factors that
may have contributed.
Description:
4. What are your suggestions to prevent the recurrence of the error?
------------------------------------------------------------------------------------------------------
------------------------------------------------------------------------------------------------------
------------------------------------------------------------------------------------------------------
------------------------------------------------------------------------------------------------------
------------------------------------------------------------------------------------------------------
------------------------------------------------------------------------------------------------------
------------------------------------------------------------------------------------------------------
----------------------------------------------------------------------
THANK YOU FOR YOUR PARTICIPATION
266
Appendix 12: Participant Information Sheet (Root Cause Analysis)
267
268
Appendix 13: Participant Consent Form (Root Cause Analysis)