Embed Size (px)
Citation preview

MOBILE GEOGRAPHIC INFORMATION SYSTEMS (GIS)
FOR HUMANITARIAN DEMINING
by
Copyright 2010 Matthew D. Dunbar
Submitted to the graduate degree program in Geography and the Graduate Faculty of the University of Kansas
in partial fulfillment of the requirements for the degree of Doctor of Philosophy
Dr. Jerome E. Dobson Chair
Dr. Stephen L. Egbert Co-Chair
Dr. Terry A. Slocum
Dr. Xingong Li
Dr. Edward A. Martinko
Date Defended:

The Dissertation Committee for Matthew D. Dunbar certifies that this is the approved version of the following dissertation:
MOBILE GEOGRAPHIC INFORMATION SYSTEMS (GIS)
FOR HUMANITARIAN DEMINING
Dr. Jerome E. Dobson Chair
Dr. Stephen L. Egbert Co-Chair
Dr. Terry A. Slocum
Dr. Xingong Li
Dr. Edward A. Martinko
Date Approved:
i

Abstract
The threat of landmines and other explosive remnants of war is a serious concern
around the world. While landmines demand attention due to the thousands of civilian
casualties they cause each year, perhaps even more shocking is the fear they instill in local
populations, inhibiting movement and denying access to thousands of square kilometers of
land in more than 80 countries. Humanitarian demining seeks to rid the world of landmines
and return local populations to their displaced land. To meet this goal, surveys of hazardous
areas, describing their location and contents, are used to produce threat maps for a given
location and secure adequate funding from donor organizations for clearance operations. The
focus of this study is a mobile GIS system, developed by the Geneva International Centre for
Humanitarian Demining (GICHD), which allows rapid, accurate, and completely digital
collection of these demining surveys. Using data collected during local evaluations of the
demining Survey Tool at the University of Kansas campus and on foreign field deployments
in Chile (2004), Albania (2004), Ecuador (2004), and Lebanon (2006), a fit-for-use analysis
was performed on each component of the Survey Tool. Experiments were conducted to
evaluate the accuracy of its GPS and laser rangefinder mapping devices, and methods for
improving that accuracy were investigated.
The system was well received by all of its users and gauged to be twice as fast,
require half the personnel, and provide higher levels of accuracy than traditional methods for
collecting demining surveys. Even though the system was deemed fit for use, suggestions for
improving all components of the device resulted from user feedback and observations of the
system in the field. The system’s GPS receiver was predicted to provide 5 m accuracy 50 %
of the time and 10 m accuracy 95 % of the time. If GPS positions were averaged for 1 minute,
ii

the 95% accuracy improved to 7.5 m, and if positions were averaged for 4 minutes, the 95%
accuracy improved to 5.6 m. The two types of laser rangefinders used by the system were
found to have a mean accuracy of 2.7 m when shooting at a location on the horizontal bare
earth and a mean accuracy of 1.1 m when shooting at a well defined vertical target.
Rangefinder accuracy varied due to level of user experience with rangefinders or other
sighting equipment, and thus proved the value of training with these devices. Also, significant
errors in bearing measurements with the rangefinders caused by magnetic interference from
one user’s eye glasses indicated that this issue requires considerable attention by all users of
laser rangefinder devices. General themes that were found to be extremely important to the
success of the demining system, such as the value of training, the need for system flexibility
to match traditional field methods, and the complexities of GIS data collection in the field,
should be a focus of any mobile GIS field program.
iii

Acknowledgments
This research was funded by the Geneva International Center for Humanitarian
Demining (GICHD) and conducted at the Kansas Applied Remote Sensing (KARS) Program,
University of Kansas (Dr. Edward Martinko, Director), with academic support from the
Geography Department, University of Kansas (Dr. Terry Slocum, Chair).
It is a pleasure to thank all the members of my doctoral committee who made this
dissertation possible. First and foremost I would like to thank my committee chair, Dr.
Jerome Dobson, who saw this work through from his initial encouragement to undertake the
PhD program to his final editorial comments on this dissertation. I thank you for always
finding a way to make me and my work a priority, and for approaching it with as much
passion as all of your other pursuits. Your unwavering drive to push me to excel will motivate
me long after this endeavor is finished. This work would have not been possible without the
ongoing guidance of my committee co-chair, Dr. Stephen Egbert. Your mentorship instilled
in me the ability to approach new challenges in my profession, and life, with a calm, clear,
concise, and objective frame of mind. I must also thank Dr. Terry Slocum, who, in addition to
supporting this work, collaborated with me on my ‘other’ PhD pursuits in stereoscopic
display systems. After recently watching and seeing the success of the movie Avatar in 3D, I
think we were just ahead of our time. It was my sincere pleasure to work so closely with you
during my time at KU and to witness your incredibly skillful administration of the Geography
Department. Dr. Xingong Li, I thank you for your instruction in the classroom and the time
you committed to this dissertation. Finally, I extend my appreciation to my external
committee member, Dr. Edward Martinko. In additional to your support as the Director of
iv

KARS throughout my time at KU, I thank you for diving into the world of humanitarian
demining and encouraging me to look at the larger significance of my research.
I must also offer my appreciation to this research’s partners at GICHD, FGM, Inc.,
and the U.S. Department of Defense Humanitarian Demining Training Center (HDTC).
Specifically, I thank Alan Arnold (former GICHD Programme Manager) for initiating the
link between GICHD and KU that made this work possible and for realizing the value in
having geographers on the ground during each field deployment. In addition to the other
GICHD Regional Coordinators who took part in the fielding of the handheld system, I would
like to personally thank Simon Berger (former GICHD Regional Coordinator for Latin
America) and Jean-Paul Rychener (GICHD Systems Support Coordinator). I cannot think of
two individuals I would rather have as companions for exploring the physical and cultural
landscape of the demining world. I appreciate your quick acceptance of us academics into
your field team, your graciously hosting, and your ongoing friendship. Along with the entire
staff of FGM, Inc. that I had the pleasure of working with, I would particularly like to
acknowledge Noah Klemm (Deputy Director Integrated Federal Systems) for frequently
sharing words of wisdom with me about the demining world, for never turning down a
request for one more piece of information or documentation, and for the far too infrequent
Frisbee golf reprieve. Finally, I would like to thank Thomas Gilbert of HDTC, who provided
an on-the-ground perspective of humanitarian demining that helped to place this work in
context.
I thank my colleagues at KARS, Dana Peterson, Jude Kastens, Kevin Dobbs, John
Lomas, and Jonathan Thayn, who shared their expertise, time, and advice on this research and
on life in general. In addition to my appreciation for the entire staff at KARS and the
Geography Department, I would explicitly like to thank Jerry Whister (Research Associate)
v

and Beverly Koerner (Graduate Program Coordinator) for their support, advice, and
friendship, which made this dissertation and resulting degree possible. I also thank my new
colleagues at the University of Washington’s Center for Studies in Demography and Ecology
(CSDE) who brought me onto their team as I completed this work.
I am now and will always be grateful to my parents, Marlene and Ralph Dunbar, who
have provide me with unconditional love and support throughout my life. You’ll be happy to
know that they won’t give me any more degrees after this one, so I’m really, finally, done
with school. I appreciate all my friends, especially Josh Campbell and Jesse and Renee
Stanley, who helped keep this endeavor in perspective. I offer my sincere apologies that you
will no longer able to ask “is the ‘diss’ done yet?”, but I will do everything I can to find new
work to obsess over.
Finally, I must owe my deepest gratitude to my best friend and spouse, Dr. Ludmila
Monika Moskal. You have been a source of inspiration, and motivation, throughout this
process, especially when I needed it the most. I don’t know how you put up with me, but I’m
sure glad you do. There is no one else I’d rather have by my side when facing life’s biggest
challenges. Thank you.
vi

Table of Contents
Abstract ......................................................................................................................... ii
Acknowledgments........................................................................................................ iv
Table of Contents ........................................................................................................ vii
List of Tables ............................................................................................................... ix
List of Figures ............................................................................................................... x
Chapter 1 Introduction ................................................................................................................... 1
Humanitarian Demining ........................................................................................................ 2
Mobile GIS ........................................................................................................................... 5
Evaluating Humanitarian Demining Mobile GIS ............................................................... 11
Chapter Summaries ............................................................................................................. 12
References ........................................................................................................................... 14
Chapter 2 Evaluating Mobile GIS for Humanitarian Demining .................................................. 18
Abstract ............................................................................................................................... 18
Introduction ......................................................................................................................... 19
Methods .............................................................................................................................. 24
Results and Discussion ....................................................................................................... 37
Conclusions ......................................................................................................................... 52
References ........................................................................................................................... 56
Chapter 3 Assessing the Accuracy of a Consumer-Grade GPS for Mobile GIS Mapping ......... 58
Abstract ............................................................................................................................... 58
Introduction ......................................................................................................................... 58
Methods and Materials ........................................................................................................ 63
Results and Discussion ....................................................................................................... 68
vii
Conclusions ......................................................................................................................... 75
References ........................................................................................................................... 78
Chapter 4 Assessing the Accuracy of Laser Rangefinders for Mobile GIS Mapping ................. 80
Abstract ............................................................................................................................... 80
Introduction ......................................................................................................................... 81
Methods and Materials ........................................................................................................ 84
Results and Discussion ....................................................................................................... 92
Conclusions ......................................................................................................................... 97
References ......................................................................................................................... 100
Chapter 5 Conclusions ............................................................................................................... 101
Evaluating Mobile GIS ..................................................................................................... 101
GPS Accuracy for Mobile GIS ......................................................................................... 105
Rangefinder Accuracy for Mobile GIS ............................................................................. 105
Significance of Findings ................................................................................................... 107
Future Research ................................................................................................................ 108
References ......................................................................................................................... 111
Appendix A Evaluation Forms and Interview Questions .............................................................. 112
viii

List of Tables
Chapter 2 Evaluating Mobile GIS for Humanitarian Demining
Table 1. Frequency of user-reported problems or requested improvements across all field trials as indicated by responses to the Initial Evaluation Form, Exit Interviews, and Feedback Form ............................................................................................................. 38
Chapter 3 Assessing the Accuracy of a Consumer Grade GPS for Mobile GIS Mapping
Table 1. Horizontal accuracy statistics calculated from Socket Global Positioning System (GPS) data and the percentage of the actual data distribution within that distance. All statistics in the bottom half of the table are derived from root mean square (RMS) error ............................................................................................................. 70
Table 2. Results of horizontal dilution of precision (HDOP) filtering on the horizontal accuracy of Socket Global Positioning System (GPS) data. All statistics in the bottom half of the table are derived from root mean square (RMS) error ................ 72
Chapter 4 Assessing the Accuracy of Laser Rangefinders for Mobile GIS Mapping
Table 1. Reference locations surveyed by Javad Maxor (northing and easting in UTM Zone 10 NAD83, height orthometric) ....................................................................... 87
Table 2. Rangefinder positional accuracy experiment results summarized by factors of equipment, distance to target, user, user experience level, and test. Means within each summary category include all data points across all other variables. ANOVA results provided for the means of each factor (*p < .01 and ** p < .001) .......................... 93
ix

List of Figures
Chapter 2 Evaluating Mobile GIS for Humanitarian Demining
Figure 1. Mobile GIS system for humanitarian demining. Data are transfered via USB between PocketPC and IMSMA desktop software. The PocketPC recieves data wirelessly via Bluetooth from the GPS, Laser Rangefinder Binoculars, and Camera data collection devices ........................................................................................................ 23
Figure 2. Classroom training the demining mobile GIS Survey Tool: A) Chile, B) Albania, C) Ecuador, and D) Lebanon ........................................................................... 26
Figure 3. Field testing the demining mobile GIS Survey Tool: A) Chile, B) Lebanon, C) Ecuador, and D) Albania ................................................................................................ 27
Figure 4. Physical environments of demining mobile GIS field trials: A) Chilean Altiplano, B) Northern Albania C) Ecuador, Amazon Basin, and D) Lebanon .................. 28
Chapter 3 Assessing the Accuracy of a Consumer Grade GPS for Mobile GIS Mapping
Figure 1. Leica Geosystems HDS Twin-Target Pole shown with a) Javad Maxor Global Positioning System (GPS) unit attached at top for recording reference data (GPS center at 2.15 m height) ............................................................................................. 64
Figure 2. Histogram of horizontal error distance in the original one-second interval GPS data (14,462 positions) ............................................................................................... 69
Figure 3. Visual and analytical description of the impact of averaging on GPS accuracy .............................................................................................................................. 73
Chapter 4 Assessing the Accuracy of Laser Rangefinders for Mobile GIS Mapping
Figure 1. One of four Leica Geosystems HDS Twin-Target Poles used in this study. Shown with a) Javad Maxor Global Positioning System (GPS) unit attached at top for recording reference data (GPS center at 2.15 m height), and b) White board with black crosshair target used for rangefinder experiment (target center at 1.75 height) ........ 85
x

xi
Figure 2. Rangefinder experiment test course from ground and overhead views. Test participant (standing) measuring Target 2 location, while test administrator (seated) collects data on PocketPC ..................................................................................... 88
Figure 3. Error in angle/bearing measurement with rangefinders by equipment type and user (n=60 per box). Box indicates 75th and 25th quartiles, dark line indicates median, whiskers indicate max/min value within 1.5 IQR, and outliers are represented with points. The extraordinarily large angular error in user 5’s TruPulse measurements led to the removal of all of this user’s data in the final analysis ......................................... 96
Appendix A Evaluation Forms and Interview Questions
Initial Evaluation Form page 1 .......................................................................................... 112
Initial Evaluation Form page 2 ......................................................................................... 113
Interview questions for Chile, Albania, and Ecuador ....................................................... 114
Interview questions for Lebanon....................................................................................... 115
Feedback Form page 1 ...................................................................................................... 116
Feedback Form page 2 ...................................................................................................... 117

Chapter 1
Introduction
Landmines and other lingering remnants of war inhibit movement by instilling fear in
local populations, deny access to thousands of square kilometers of land in more than 80
countries, and cause thousands of civilian causalities each year. Humanitarian demining seeks
to rid the world of landmines and return local populations to their displaced land. While most
humanitarian demining is performed by personnel with a military background or by the
affected country’s military, humanitarian demining should not be confused with military
demining, which generally serves a strategic purpose rather than focusing on civilian safety.
At the core of any humanitarian demining program is the information describing and mapping
these hazardous areas and all activities associated with them. Traditionally, the initial field
surveys of these areas have been conducted with paper forms, using compass and tape or
basic commercial grade GPS receivers for mapping. Recent developments in mobile
computing devices, positional mapping technologies, and scaled-down versions of
Geographic Information Systems (GIS) software, now provide the potential for rapid, highly
accurate, and completely digital field data collection for humanitarian demining.
The goal of this research was to assess the fitness for use of a mobile GIS designed to
collect humanitarian demining field surveys. This goal was pursued by examining the
observations and feedback collected during a multi-year international evaluation of this
mobile GIS, by conducting experiments to determine the spatial accuracy of resulting data,
and by investigating methods for improving the accuracy of the mapping technologies used
by such systems. By extrapolating these findings related to the demining system to mobile
GIS in general, the results of this research have a broader significance such that any mobile
1

GIS system user, designer, or trainer could benefit from the lessons learned. This introductory
chapter will present a framework, background, and literature review of the research questions
investigated. The chapter concludes with an overview of the specific research goals and
objectives addressed by the remaining chapters.
Humanitarian Demining
While it is impossible to know exactly how many millions of landmines are in the
ground today, commonly stated estimates range from 10,000,000 to 50,000,000. Whatever
the number may be, landmines and other unexploded ordnance (UXO) profoundly affect
sizable populations in more than 80 countries around the world including thousands of
civilian casualties each year (International Campaign to Ban Landmines, 2008). The goal of
humanitarian demining is to remove these lingering remnants of war and return the cleared
land to civilians and local governments. The process of humanitarian demining is generally
organized into five steps: 1) Initial identification and assessment of suspected threat, 2)
Survey of the suspected mined area to target clearance, 3) Clearance operation and marking,
4) Post-clearance inspection and documentation, and 5) Handover of cleared land and
community notification (UNMAS 2003).
The Geneva International Centre for Humanitarian Demining (GICHD) is a widely
recognized independent and impartial organization that supports humanitarian demining
efforts. GICHD holds observer status on the Anti-Personnel Mine Ban Convention (AP MBC
or “Ottawa Convention”) and hosts the meetings of its Standing Committees, provides expert
advice to the AP MBC States Parties on mine clearance, mine risk education, and stockpile
destruction, and, on behalf of the UN Mine Action Service (UNMAS), GICHD promulgates
the International Standards for Mine Action (IMAS). Information management is a large
2

component of GICHD's support for ongoing and emerging demining operations. In this area
GICHD has directed the development of the Information Management System for Mine
Action (IMSMA) computer software package, which is used to record, display and analyze
data that catalog all stages in the humanitarian demining process (GICHD, 2008). GICHD
provides IMSMA, at no charge, to the national authority set up by a country to manage
demining operations. Generally speaking, IMSMA’s most common operational uses are to: 1)
provide a country/region-wide overview of the demining situation including threat maps, 2)
estimate operational costs for clearance of each area, and 3) serve as the foundation for
clearance job bids and contracts (S. Berger, former GICHD Latin America regional
coordinator, pers. comm., Sept. 14, 2009). In all of these use cases, comprehensive and
accurate field surveys form the foundation for the success of IMSMA.
Early in 2003, GICHD initiated the development of a small, field-portable tool to
support humanitarian demining data collection. This tool was intended to map and collect
demining Technical Surveys (detailed investigations of a known or suspected hazardous area,
usually occurring during step 2 of the aforementioned process of humanitarian demining) in
the form of digital field reports for integration with the IMSMA computer software package.
This handheld system was called Explosive Ordnance Disposal Information System-Survey
(EOD IS-Survey) and was developed by the Swedish EOD and Demining Centre (SWEDEC)
under the guidance of GICHD. In 2007 the handheld system was renamed IMSMA Mobile
when development switched to the U.S. company FGM, Inc, which had also developed the
most recent version of the IMSMA desktop software. EOD IS-Survey and IMSMA Mobile
are not mine detection tools, but rather management tools for mapping areas known to be or
assumed to be at risk due to landmines or unexploded ordnance.
3

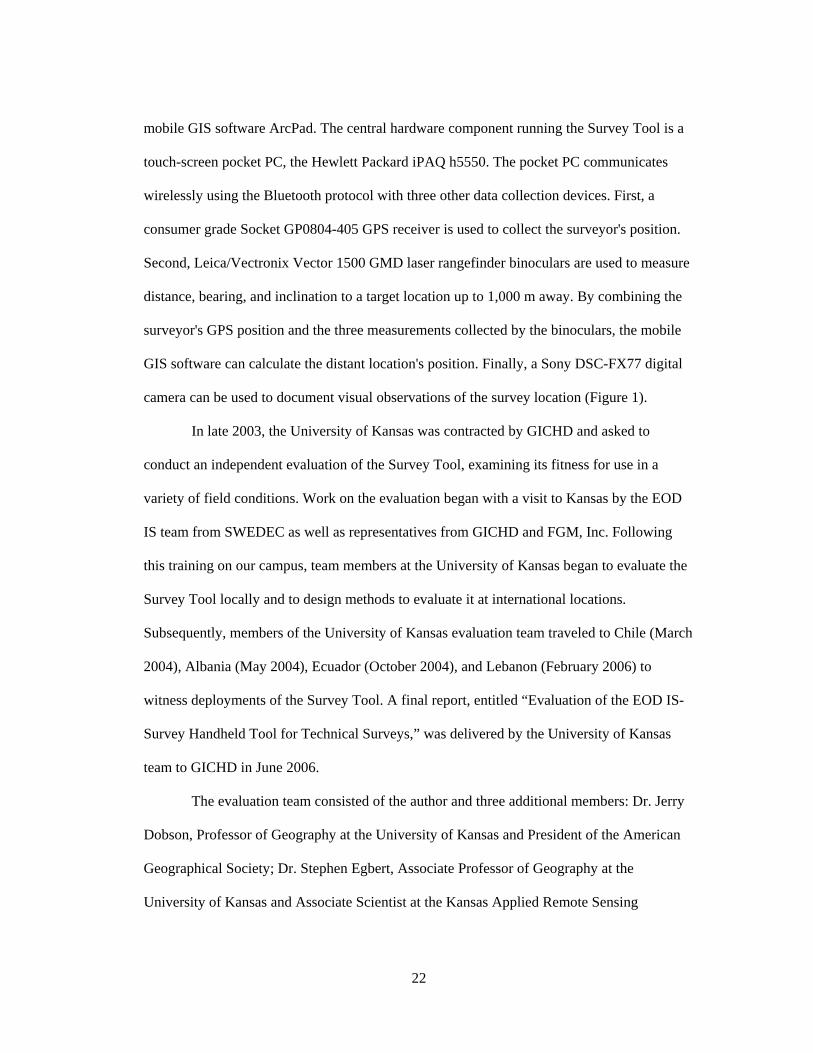
The software component of EOD IS-Survey and IMSMA Mobile (hereafter referred
to as the Survey Tool) is a stand-alone English-language application running on the Windows
Mobile operating system that provides mapping functionality via a customized applet running
inside the ESRI mobile GIS software ArcPad. The central hardware component running the
Survey Tool is a touch-screen pocket PC, the Hewlett Packard iPAQ h5550 or hx2700. The
pocket PC communicates wirelessly using the Bluetooth protocol with three other data
collection devices. First, a consumer grade Socket GP0804-405 GPS receiver is used to
collect the surveyor's position. Second, either the Leica/Vectronix Vector 1500 GMD laser
rangefinder binoculars or the Laser Technologies TruPulse 360B laser rangefinder is used to
measure distance, bearing, and inclination to a target location up to 1000 m away. By
combining the surveyor's GPS position and the measurements collected by the rangefinder,
the mobile GIS software can calculate the distant location's position. Finally, a Sony DSC-
FX77 digital camera can be used to visually document the survey location.
As mentioned above, the purpose of the Survey Tool is collecting Technical Surveys,
which confirm the existence of and document a known or suspected hazardous area.
Technical Surveys are not used for the actual clearance activity or even for navigating back to
the perimeter of a mine field. Rather, they provide the general extent for producing threat
maps of the hazardous area and to help estimate the cost for clearance. Thomas Gilbert, of the
US Dept. of Defense Humanitarian Demining Training Center (HDTC), indicated that in
most humanitarian demining operations today, Technical Survey’s are performed using
commercial grade GPS receivers and paper forms (pers. comm., Sept. 15, 2009). For the
Technical Survey application, extremely high (sub-centimeter) levels of accuracy are not
necessary, as long as the accuracy is of the measurement tool is reasonable (<10 m),
understood, and documented. Gilbert also stressed that the Technical Survey occurs before
4

the actual Clearance Survey, which, for safety reasons, requires higher levels of accuracy.
Typically, Clearance Surveys use compass, measuring tape, and fixed survey markers that
remain in the ground for the duration of the clearance operation.
Most demining operations are run on very limited resources of funding, personnel,
and time. Hence, improvements in Technical Survey mapping accuracy when using the
Survey Tool may not be as valuable for demining operations as increased speed, efficiency
and safety. However, donors who fund clearance operations certainly would value accurate
assessments of the size of hazard areas. It is difficult to characterize the exact operational
situation for which the Survey Tool may be best suited, as humanitarian demining efforts
around the world vary widely in their specific needs, methods, and resources. Indeed, one of
the Survey Tool’s main benefits may simply be providing a standard system of procedures,
training and equipment, with a known level of performance and accuracy.
Mobile GIS
Background
Geographers have a long tradition of utilizing field observation in their work due to
the simple fact that, the “collection of data on geographic phenomena is often best conducted
in the presence of the phenomena, where more information is available to be sensed”
(Goodchild et al., 2004). Merging technology with this need for direct study in the field led
to the early development of transportable geographic information tools, such as the "Field-
Station" system described by Dobson (1994a; 1994b; 2001). This desire to take GIS where it
is needed most is one driving factor in the overall progression of GIS, highly influenced by
developments in Information Technology (IT), from a mainframe, to a desktop, and more
recently to a distributed model (Peng and Tsou, 2003).
5

Distributed GIS refers to those geographic information systems that do not have all of
their hardware, software, or data components in the same physical location. Distributed GIS
encompasses Enterprise GIS (integrated geographic data and software across multiple
departments, serving a whole organization), as well as the more recent technologies of
Internet GIS and Mobile GIS. Mobile GIS has been defined as “an integrated
software/hardware framework for the access of geospatial data and services through mobile
devices via wireline or wireless networks” (Tsou, 2004). The application areas of mobile GIS
have been broken down into field-based GIS, focusing on the collection, validation and
update of GIS data in the field, and location based services (LBS), concerned mainly with
location management and logistics functions. As hardware and software continue to develop,
the mapping accuracy and capabilities of mobile GIS have progressed along with its
widespread adoption (Li, 2006).
Application and Assessment of Mobile GIS
The widespread adoption of mobile GIS in various disciplines suggests the perceived
utility of this technology. In the natural sciences, mobile GIS has been used for geologic
fieldwork (Clegg et al., 2006), hydrologic studies (Wagtendonk and De Jeu, 2005), and
monitoring forest conservation easements (Willams et al., 2006) and invasive plants (Mau-
Crimmins and Orr, 2005). Other field-intensive disciplines, such as archaeology, are
conducting surveys implementing mobile GIS solutions (Tripcevich, 2004; Wagtendonk and
De Jeu, 2007). Health related studies have used handheld computers for collecting survey
data (Missinou et al., 2005; Shirima et al., 2007), and are more frequently including
geographic coordinates from GPS into their workflow (Aviles et al., 2007; Vanden Eng et al.,
2007).
6

Specific noteworthy improvements over traditional field data collection are often
highlighted in studies of mobile GIS. Carver et al.'s (1995) early work stressed that the
interactive data collection and mapping offered by mobile GIS significantly enhanced the
scientific discovery process and decision making in the field. Clarke's (2004) summary of
mobile mapping provided several commonly mentioned advantages, such as the improved
accuracy, collection efficiency, and reliability of field data. Drawbacks to mobile GIS
systems have been expressed as well. Common concerns include cost of equipment and
stability of hardware and software, as well as the lack of flexibility to perform more complex
field tasks (McCaffrey, 2005).
The prevalent use and apparent overall utility of mobile GIS raises the question,
“What factors lead to a successful mobile GIS and a successful mobile GIS-based field
program?” As Clarke (2004) noted in the introduction to a special issue of Cartography and
Geographic Information Science dealing with the topic of mobile GIS, the research literature
has yet to demonstrate how well these modern tools meet the actual needs of end-users. Some
have suggested examining the whole system life-cycle, beginning with the initial design and
following through to collect feedback from end-users (Wagtendonk and De Jeu, 2007).
Others have suggested either utilizing a cost benefit framework (McCaffrey et al., 2005) or
looking at how well individual components of the system meet their intended task in a fit-for-
use analysis (Clegg et al., 2006), where the judgment of fitness for use is made by the end-
user (Chrisman, 1986). Experimental testing has been performed on mobile GIS to evaluate
the overall usability of the system for its intended geographic application (Nusser, 2005).
These past studies suggest that the most effective way to assess the various aspects of a
successful mobile GIS is to analyze a system with a well-defined purpose through extensive
field trials by exploring, one component at a time, whether the system is fit for use both
7

technologically and functionally. The system’s functionality must be assessed from the
perspective of end-users, examining both their ability to operate the system and their
confidence in the resulting data.
Mapping Technologies
At the heart of field-based GIS are the mapping technologies, such as the Global
Positioning System (GPS) and laser rangefinders, which make GIS feature collection
possible. GPS has been widely accepted in commercial and research applications as a
powerful satellite-based tool for determining location on and above the earth’s surface. There
are several grades of GPS receivers distinguished by their measurement accuracies: recreation
or consumer-grade receivers provide an accuracy of 5-20 m and can cost under $100;
mapping-grade receivers provide accuracies from sub-meter to 5 m and cost between $500
and $5000; and survey-grade receivers can provide sub-centimeter accuracies at costs of up to
$20,000 or more (Rizos, 2002). The three main sources of GPS error affecting all grades of
receivers are atmospheric refraction of GPS signals (slowing their transmission speeds),
multipathing (detecting reflected GPS signals from various surfaces), and dynamically
changing qualities of satellite geometry (Misra and Enge, 2001).
Higher grade GPS receivers are designed to correct for these errors using dual-
frequencies to all but eliminate ionospheric effects and using signal processing to reduce
multipathing. Poor satellite geometry can be overcome by using better satellite tracking,
listening to more satellites, and multiple GPS systems. Differential correction can further
remove errors by comparing the surveyed GPS data to that of a local reference station at a
known location. Due to their lower cost, consumer-grade receivers do not have such
integrated accuracy enhancement features. They are designed less for precise mapping and
8

more for user productivity, or the ability to constantly provide a useable position. There are
several methods that consumer grade GPS users can utilize to reduce errors, but they require
more of the user’s time to collect additional data.
The first approach filters GPS data according to the dilution of precision (DOP)
measure calculated by the receiver. DOP is based on the geometry of the satellites being used.
Higher DOP values indicate less certainty in the overall position and are caused when fewer
and/or tightly clustered satellites are used by the GPS to calculate its position. DOP values
generally range from 1-10, but may reach values >20 under very poor conditions. DOP values
and can be viewed as multiples of the minimum uncertainty/accuracy level of the GPS
(Hofmann-Wellenhof et al., 2001). To implement DOP filtering, a DOP mask or threshold is
set, beyond which GPS data, of assumed lower accuracy, will not be recorded (Rempel and
Rodgers, 1997). DOP filtering will have the most benefit in poor satellite conditions, such as
under heavy tree canopy, but it can also benefit collection in open-sky conditions when few
satellites are in view from the operator’s position.
GPS averaging has also been shown to be a powerful way to diminish positional error
(Sigrist et al., 1999). By taking the average of repeated GPS positions at a fixed location, the
expected accuracy of a GPS receiver can be increased by smoothing out the fluctuations in
GPS errors (Deckert and Bolstad, 1996). The important question to answer for the most
efficient use of GPS averaging is, “how long is long enough?” While GPS user manuals and
technical reports provide a generic starting point, and studies have been performed comparing
various grades receivers (Devlin et al., 2007), the specific GPS unit in question should be
tested to establish the most appropriate guidelines.
Laser rangefinder devices measure the distance, bearing and inclination to a target.
Mobile GIS software uses these three pieces of information along with a known reference
9

coordinate (operator location, usually collected from a GPS) to calculate the coordinates of
the target location. These laser rangefinders, which collect measurements one-at-a-time, are
frequently used in forestry applications (Wing and Kellog, 2001) and ecological field studies
(Aspbury and Gibson, 2004). More expensive laser scanning technologies, also known as
ground-based Light Detection and Ranging (LIDAR), can be used to collect larger quantities
of point measurements at an even greater level of precision. This type of equipment is more
commonly used in the fields of geology (Alfarhan et al., 2008) and archaeology (Brusco et
al., 2006).
Improving Mobile GIS
A significant body of work has explored what can be done to improve the experience
and accuracy of users employing mobile GIS. Unfortunately, training is an often overlooked
component of emerging technologies. Without it users can quickly become frustrated and lose
interest in adopting a new way of working. Unlike, say, pen and paper or compass and tape,
a fair amount of background knowledge is required to effectively operate mobile GIS.
Carlson (2007) suggests a short curriculum for introducing this technology to new users,
which would include: 1) Theory and applications of GIS, 2) GPS fundamentals and best
practices, 3) Handheld computer systems, and 4) Handheld GIS software. The overall goal of
training is not about the handheld GIS technology itself, but how it relates to the work or
research that will be conducted with it in the field (Mau-Crimmins and Orr, 2005). Research
specifically dealing with the use of mobile computing for geographic education provides a
good foundation for understanding how students use this new tool to collect spatial data and
generate knowledge about their area of study (Armstrong and Bennett, 2005).
10

Ensuring data quality is an essential and frequently discussed topic surrounding
digital field data collection. Most field GIS data errors occur on site, and thus should be
identified and corrected in the field whenever possible (Wang and Reinhardt, 2006). Simple
logical rules can be established by designing an intelligent data entry system to avoid
common errors and mistakes with text and data input (Pundt, 2002). When systems are
spatially enabled using GPS receivers, additional rule sets can be hard-coded to enforce best
data collection practices. Estimates of GPS signal quality can also be calculated in advance
from known satellite orbits to predict optimal data collection strategies (Karimi and Grejner-
Brzezinska, 2004).
Evaluating Humanitarian Demining Mobile GIS
In late 2003, the University of Kansas was contracted by GICHD and asked to
conduct an independent evaluation of the demining Survey Tool, examining its fitness for use
in a variety of field conditions. Work on the evaluation began with a site visit and training by
the EOD IS team from SWEDEC as well as representatives from GICHD and FGM, Inc.
Following the site visit, team members at the University of Kansas began to evaluate the
Survey Tool locally and to design methods to evaluate it at foreign locations. Subsequently,
members of the University of Kansas evaluation team traveled to Chile (March 2004),
Albania (May 2004), Ecuador (October 2004), and Lebanon (February 2006) to witness
deployments of the Survey Tool. A final report, entitled “Evaluation of the EOD IS-Survey
Handheld Tool for Technical Surveys,” was delivered by the University of Kansas team to
GICHD in June 2006.
The evaluation team consisted of the author and three additional members: Dr. Jerry
Dobson, Professor of Geography at the University of Kansas and President of the American
11

Geographical Society; Dr. Stephen Egbert, Associate Professor of Geography at the
University of Kansas and Associate Scientist at the Kansas Applied Remote Sensing
Program; and Dr. John Kostelnick, then a graduate student in the Department of Geography
at the University of Kansas and now Assistant Professor of Geography-Geology at Illinois
State University.
Chapter Summaries
The evaluation of the demining mobile GIS, EOD IS-Survey, conducted by a team of
researchers at the University of Kansas, collected a significant amount of practical
information about a field-tested mobile GIS with a well defined purpose. The goal of Chapter
2 is to utilize the user feedback, interviews, and field notes collected for the demining Survey
Tool evaluation to draw conclusions about what makes a successful mobile GIS system and
mobile GIS-based field campaign. To accomplish this goal, the fitness for use of the
demining Survey Tool is assessed by examining each aspect of the tested mobile GIS
(software, hardware, training, and local factors), paying particular attention to users’
feedback. Where possible, the findings related to the demining Survey Tool are extrapolated
to mobile GIS in general so that any mobile GIS system user, designer, or trainer can benefit
from the lessons learned.
Following the system-wide overview from Chapter 2, the next two chapters describe
focused experiments designed to assess the mapping accuracy of the GPS and laser
rangefinder technologies employed by the demining survey tool. The goal of Chapter 3 is to
determine the expected horizontal positional accuracy of the consumer grade Socket
Bluetooth GPS and to investigate DOP filtering and GPS averaging as methods for improving
the expected accuracy of the GPS receiver. Chapter 4 explores the expected horizontal
12

positional accuracy of the Vector 1500 GMD and TruePulse 360B laser rangefinders. The
accuracy of point and area measurements collected with the rangefinders is determined with
respect to the variables of equipment, target distance, and user. The choice of target type and
the use of a monopod with the rangefinders are also investigated as methods for improving
accuracy. Finally, Chapter 5 presents a summary of the conclusions drawn across this entire
study and provides a series of future research areas suggested by this work.
13

References
Alfaran, M., White, L., Tuck, D. and Aiken, C. 2008. Laser rangefinder and ArcGIS combined with three-dimensional photorealistic modeling for mapping outcrops in the Slick Hills, Oaklahoma. Geosphere 4(3): 576-587.
Armstrong, M.P. and Bennett, D.A. 2005. A Manifesto on mobile computing in geographic
education." The Professional Geographer 57(4): 506-515. Aspbury, A. and Gibson, R. 2004. Long-range visibility of greater sage grouse leks: a GIS-
based analysis. Animal Behavior 67(6): 1127-1132. Aviles, W., Ortega, O., Kuan, G., Coloma, J. and Harris, E. 2007. Integration of Information
Technologies in Clinical Studies in Nicaragua. PLoS Medicine 4(10): 1578-1583. Brusco, N., Capeleto, S., Fedal, M., Paviotti, A., Poletto., L., Cortelazzo, G. and Tondello, G.
2006. A system for 3D modeling frescoed historical buildings with multispectral texture information. Machine Vision and Applications 16(6): 373-393.
Carlson, T. 2007. A Field-Based learning experience for introductory level GIS students."
Journal of Geography 106(5): 193-198. Carver, S., Heywood, I., Cornelius, S. and Sear, D. 1995. Evaluating field-based GIS for
environmental characterization, modelling and decision support. International Journal of Geographical Information Science 9(4): 475-486.
Chrisman, N.R. 1986. Obtaining information on quality of digital data, Proceedings of
AUTO–CARTO London 1: 350-358. Clarke, K.C. 2004. Mobile mapping and Geographic Information Systems. Cartography and
Geographic Information Science 31(3): 131-136. Clegg, P., Bruciatelli, L., Domingos, F., Jones, R.R., De Donatis, M. and Wilson, R.W. 2006.
Digital geological mapping with tablet PC and PDA: A comparison. Computers & Geosciences 32(10): 1682-1698.
Deckert, C. and Bolstad, P. V. 1996. Forest canopy, terrain, and distance effects on global
positioning system point accuracy. Photogrammetric Engineering and Remote Sensing 62: 317-321.
Devlin, G.J., McDonell, K. and Ward, S. 2007. Dynamic non-DGPS positional accuracy
performance between recreational and professional GPS receivers. Journal of Location Based Services 1(1): 77-85.
Dobson, J.E. 2001. Fieldwork in a digital world. The Geographical Review 91(1-2): 430-440. Dobson, J.E. 1994a. GPS Advances Geography’s Field Tradition. GPS World 7(1): 60-61.
14

Dobson, J.E. 1994b. The GPS Field Station Rides Again. GPS World 9(9): 54. Geneva International Centre for Humanitarian Demining (GICHD). 2008. Available from:
<http://www.gichd.org/> [accessed Sept 27, 2008]. Goodchild, M. F., Johnston, D.M., Maguire, D.J., and Noronha, V.T. 2004. Distributed and
mobile computing. In A Research Agenda for Geographic Information Science, R. B. McMaster and E. L. Usery, Eds. pp. 257-286. Boca Raton, Florida, CRC Press.
Hofmann-Wellenhof B., Lichtenegger, H. and Collins, J. 2001. Global positioning system:
theory and practice, 5th ed. Vienna, Austria, Springer-Verlag, 347p. International Campaign to Ban Landmines, Landmine Monitor Report 2008: Towards a
Mine-Free World. New York, Human Rights Watch. Available from: <http://www.icbl.org/lm/> [accessed Sept 12, 2009].
Karimi, H. A. and Grejner-Brzezinska, D.A. 2004. GQMAP: Improving performance and
productivity of mobile mapping systems through GPS quality of service." Cartography and Geographic Information Science 31(3): 167-177.
Li, Q. 2006. Opportunities in Mobile GIS. In Dynamic and Mobile GIS, J. Drummond, R.
Billen, E. Joao and D. Forrest, Eds., pp 19-33. Boca Raton, CRC Press. Maguire, D. J. 2006. The Changing technology of space and time. Dynamic and Mobile GIS.
J. Drummond, R. Billen, E. Joao and D. Forrest, Eds., pp 3-18. Boca Raton, CRC Press. Mau-Crimmins, T. M. and B. J. Orr 2005. Monitoring invasive plants using hand-held GIS
technology. Connecting mountain islands and desert seas: Biodiversity and management of the Madrean Archipelago II Proceedings RMRS-P-36, Fort Collins, CO, U.S. Department of Agriculture, Forest Service, Rocky Mountain Research Station: 298-301.
McCaffrey, K.J.W., Jones, R.R., Holdsworth, R.E., Wilson, R.W., Clegg, P., Imber, J.,
Holliman, N. and Trinks, I. 2005. Unlocking the spatial dimension: digital technologies and the future of geoscience fieldwork. Journal of the Geological Society 162(6): 927-938.
Misra, P. and Enge, P. 2001. Global Positioning System: Signals, Measurements, and
Performance. Lincoln, MA, Ganga-Jamuna. 569p. Missinou, M.A., Olola, C.H.O., Issifou, S., Matsiegui, P.-B., Adegnika, A.A., Borrmann, S.,
Wypij, D., Taylor, T.E. and Kremsner, P.G. 2005. Short Report: Piloting paperless data entry for clinical research in Africa. American Journal of Tropical Medicine and Hygiene 72(3): 301-303.
Nusser, S. 2005. Digital capture of geographic feature data. Proceedings of the 2005 Federal
Committee on Statistical Methodology Research Conference. Arlington, Virginia.
15
Peng, Z. and Tsou, M. 2003. Internet GIS: Distributed Geographic Information Services for the Internet and Wireless Networks. Hoboken, New York, Wiley and Sons. 720p.
Pundt, H. 2002. Field data collection with mobile GIS: Dependencies between semantics and
data quality." GeoInformatica 6(4): 363-380. Rempel, R.S. and Rogers, A.R. 1997. Effects of differential correction on accuracy of a GPS
animal location system. Journal of Wildlife Management 61: 525-530. Rizos, C. 2002. Introducing the global positioning system. In Manual of Geospatial Science
and Technology, J. Bossler, J. Jensen, R. McMaster, and C.Rizos, Eds. pp. 77-94. London and New York, Taylor and Francis.
Sigrist, P., Coppin, P. and Hermy, M. 1999. Impact of forest canopy on quality and accuracy
of GPS measurements. International Journal of Remote Sensing 20: 3595-3610. Shirima, K., Mukasa, O., Schellenberg, J., Manzi, F., John, D., Mushi, A., Mrisho, M.,
Tanner, M., Mshinda, H. and Schellenberg, D. 2007. The use of personal digital assistants for data entry at the point of collection in a large household survey in southern Tanzania. Emerging Themes in Epidemiology 4(5): 10-18.
Tripcevich, N. 2004. Flexibility by design: How mobile GIS meets the needs of
archaeological survey. Cartography and Geographic Information Science 31(3): 137-151.
Tsou, M. 2004. Integrated mobile GIS and wireless internet map servers for environmental
monitoring and management. Cartography and Geographic Information Science 31(3): 153-165.
United National Mine Action Service (UNMAS). 2003. International Mine Action Standards
(IMAS) Part 01.10: Guide for the application of International Mine Action Standards (IMAS). UNMAS, New York, NY. 16p.
Vanden Eng, J.L., Wolkon, A., Frolov, A.S., Terlouw, D.J., Eliades, M.J., Morgah, K.,
Takpa, V., Dare, A., Sodahlon, Y.K., Doumanou, Y., Hawley, W.A. and Hightower, A.W. 2007. Use of Handheld Computers with Global Positioning Systems for Probability Sampling and Data Entry in Household Surveys. Am J Trop Med Hyg 77(2): 393-399.
Wagtendonk, A.J. and De Jeu, R.A.M. 2005. Mobile GIS and optimizing data collection
methods in hydrological fieldwork. Remote Sensing for Agriculture, Ecosystems, and Hydrology VII, Proceedings of the SPIE, Bruges, Belgium.
Wagtendonk, A.J. and De Jeu, R.A.M. 2007. Sensible field computing: Evaluating the use of
mobile GIS methods in scientific fieldwork. Photogrammetric Engineering and Remote Sensing 73(6): 651-662.
16

Wang, F. and Reinhardt, W. 2006. Spatial data quality concerns for field data collection in mobile GIS. Geoinformatics: Geospatial Information Science, Proceedings of SPIE 64201C: 1-7.
Williams, K., Sader, S.A., Pryor, C. and Reed, F. 2006. Application of Geospatial
Technology to Monitor Forest Legacy Conservation Easements. Journal of Forestry 104: 89-93.
Wing, M. and Kellogg, L. 2001. Using a laser rangefinder to assist harvest planning. In
Proceedings of the First International Precision Forestry Symposium, June 2001, University of Washington, Seattle, WA.
17

Chapter 2
Evaluating Mobile GIS for Humanitarian Demining
Abstract
A combination of mobile computing devices, positional mapping technologies, and
scaled-down versions of GIS desktop software now provides the potential for rapid, highly
accurate, and completely digital geographic field data collection. These noteworthy benefits
and the widespread adoption of this mobile geographic information technology raise the
following question: "What factors lead to a successful mobile GIS and a successful mobile
GIS-based field program?" Beginning in 2003, researchers at the University of Kansas were
invited to take part in a multi-year evaluation of a mobile GIS designed for humanitarian
demining field surveys. This international effort consisted of four two-week-long field tests
of this system in, respectively, Chile, Albania, Ecuador, and Lebanon. This paper summarizes
the observations and feedback collected during that evaluation, paying particular attention to
users’ comments, in order to assess the fitness for use of each component of the demining
survey tool. Where possible, these findings related to the demining system are extrapolated to
mobile GIS in general. Along with a variety of specific recommendations, I conclude that in
order to effectively facilitate the transition from traditional field methods, a mobile GIS must
be designed with flexibility as a core concept and adaptability as an overarching theme in
user training.
This chapter draws from data collected for an earlier technical report:
Egbert, S., M. Dunbar, J. Dobson, and J. Kostelnick. 2006. Evaluation of the EOD IS-Survey Handheld Tool for Technical Surveys: Final Report. Submitted to the Geneva International Centre for Humanitarian Demining. (Submitted April, 2006). 57p.
18

Introduction
With recent developments in technology, computing has become available in more
places worldwide, is now small enough to move with its users even to highly remote places,
and can provide access to a wide array of distributed resources. It has been noted that these
changes in the "where" aspects of computing have already made significant impacts on the
way geographers and GIS professionals conduct their work (Goodchild et al., 2004). Take for
example, how mobile computing technology and the need for direct study in the field led to
the early development of transportable geographic information tools, such as the "Field-
Station" system described by Dobson (1994a; 1994b; 2001). This and other deviations from
the traditional desktop GIS framework have been termed ‘Distributed GIS,’ which
encompasses both mobile GIS and the broad array of enterprise and internet GIS technologies
(Peng and Tsou, 2003). Mobile GIS has been defined as “an integrated software/hardware
framework for the access of geospatial data and services through mobile devices via wireline
or wireless networks” (Tsou, 2004). The application areas of mobile GIS have been broken
down into field-based GIS, focusing on the collection, validation and update of GIS data in
the field, and location based services (LBS), concerned mainly with location management
and logistics functions.
The widespread adoption of mobile GIS in various disciplines is a reflection of the
perceived utility of this technology. In the natural sciences, mobile GIS has been used for
geologic fieldwork (Clegg et al., 2006), hydrologic studies (Wagtendonk and De Jeu, 2005),
and monitoring forest conservation easements (Willams et al., 2006) and invasive plants
(Mau-Crimmins and Orr, 2005). Other field-oriented disciplines, such as archaeology, are
conducting surveys implementing mobile GIS solutions (Tripcevich, 2004; Wagtendonk and
De Jeu, 2007). Health related studies have used handheld computers for collecting survey
19

data (Missinou et al., 2005; Shirima et al., 2007), and are more frequently including
geographic coordinates from GPS into their workflow (Aviles et al., 2007; Vanden Eng et al.,
2007).
Specific noteworthy improvements over traditional field data collection are often
highlighted in studies of handheld systems. Carver et al.'s (1995) early work stressed that the
interactive data collection and mapping offered by field GIS significantly enhanced the
scientific discovery process and decision making in the field. Clarke's (2004) summary of
mobile mapping provided several commonly mentioned advantages, such as the improved
accuracy, collection efficiency, and reliability of field data. Drawbacks to mobile GIS
systems have been expressed as well. Common concerns include cost of equipment and
stability of hardware and software, as well as the lack of flexibility to perform more complex
field tasks (McCaffrey, 2005).
The prevalent use and apparent overall utility of mobile GIS raises the question,
“What factors lead to a successful mobile GIS and a successful mobile GIS-based field
program?” As Clarke (2004) noted in the introduction to a special issue of Cartography and
Geographic Information Science dealing with the topic of mobile GIS, the research literature
has yet to demonstrate how well these modern tools meet the actual needs of end-users. Some
have suggested examining the whole system life-cycle, beginning with the initial design and
following through to collect feedback from end-users (Wagtendonk and De Jeu, 2007).
Others have suggested either utilizing a cost benefit framework (McCaffrey et al., 2005) or
looking at how well individual components of the system meet their intended task in a fit-for-
use analysis (Clegg et al., 2006), where the judgment of fitness for use is made by the end-
user (Chrisman, 1986). Experimental testing has been performed on mobile GIS to evaluate
the overall usability of the system for its intended geographic application (Nusser, 2005).
20
These past studies suggest that the most effective way to assess the various aspects of a
successful mobile GIS is to analyze a system with a well-defined purpose through extensive
field trials by exploring, one component at a time, whether the system is fit for use both
technologically and functionally. The system’s functionality must be assessed from the
perspective of end-users, examining both their ability to operate the system and their
confidence in the resulting data.
Evaluating Mobile GIS for Humanitarian Demining
Early in 2003, the Geneva International Centre for Humanitarian Demining (GICHD)
initiated the development of a small, field-portable tool to support humanitarian demining
data collection. This tool was intended to map and collect demining Technical Surveys
(detailed investigations of a known or suspected hazardous area) in the form of digital field
reports for integration with the GICHD Information Management System for Mine Action
(IMSMA) computer software package. This handheld system was called Explosive Ordnance
Disposal Information System-Survey (EOD IS-Survey) and was developed by the Swedish
EOD and Demining Centre (SWEDEC) under the guidance of GICHD. In 2007 the handheld
system was renamed IMSMA Mobile when development switched to the U.S. company
FGM, Inc, which has also developed the most recent version of the IMSMA desktop
software. However, this paper is only concerned with the earlier EOD IS-Survey system.
EOD IS-Survey is not a mine detection tool, but rather a management tool for mapping areas
known to be or assumed to be at risk due to landmines or unexploded ordnance.
The software component of EOD IS-Survey (hereafter referred to as the Survey Tool)
is a stand-alone English-language application running on the Windows Mobile operating
system that provides mapping functionality via a customized applet running inside the ESRI
21
mobile GIS software ArcPad. The central hardware component running the Survey Tool is a
touch-screen pocket PC, the Hewlett Packard iPAQ h5550. The pocket PC communicates
wirelessly using the Bluetooth protocol with three other data collection devices. First, a
consumer grade Socket GP0804-405 GPS receiver is used to collect the surveyor's position.
Second, Leica/Vectronix Vector 1500 GMD laser rangefinder binoculars are used to measure
distance, bearing, and inclination to a target location up to 1,000 m away. By combining the
surveyor's GPS position and the three measurements collected by the binoculars, the mobile
GIS software can calculate the distant location's position. Finally, a Sony DSC-FX77 digital
camera can be used to document visual observations of the survey location (Figure 1).
In late 2003, the University of Kansas was contracted by GICHD and asked to
conduct an independent evaluation of the Survey Tool, examining its fitness for use in a
variety of field conditions. Work on the evaluation began with a visit to Kansas by the EOD
IS team from SWEDEC as well as representatives from GICHD and FGM, Inc. Following
this training on our campus, team members at the University of Kansas began to evaluate the
Survey Tool locally and to design methods to evaluate it at international locations.
Subsequently, members of the University of Kansas evaluation team traveled to Chile (March
2004), Albania (May 2004), Ecuador (October 2004), and Lebanon (February 2006) to
witness deployments of the Survey Tool. A final report, entitled “Evaluation of the EOD IS-
Survey Handheld Tool for Technical Surveys,” was delivered by the University of Kansas
team to GICHD in June 2006.
The evaluation team consisted of the author and three additional members: Dr. Jerry
Dobson, Professor of Geography at the University of Kansas and President of the American
Geographical Society; Dr. Stephen Egbert, Associate Professor of Geography at the
University of Kansas and Associate Scientist at the Kansas Applied Remote Sensing
22

Figure 1. Mobile GIS system for humanitarian demining. Data are transfered via USB between PocketPC and IMSMA desktop software. The PocketPC recieves data wirelessly via Bluetooth from the GPS, Laser Rangefinder Binoculars, and Camera data
lection devices. col
GPS
Laser Rangefinder Binoculars
Pocket PC with ArcPad
GIS
Camera
23

Program; and Dr. John Kostelnick, then a graduate student in the Department of Geography
at the University of Kansas and now Assistant Professor of Geography-Geology at Illinois
State University.
Objectives
The evaluation of the demining mobile GIS, EOD IS-Survey, conducted by a team of
researchers at the University of Kansas, collected a significant amount of practical
information about a field-tested mobile GIS with a well defined purpose. The goal of this
paper is to utilize the user feedback, interviews, and field notes collected for the demining
Survey Tool evaluation to draw conclusions about what makes a successful mobile GIS
system and mobile GIS-based field campaign. To accomplish this goal, two specific
objectives are addressed here:
• Assess the fitness for use of the demining Survey Tool by examining each aspect of
the tested mobile GIS (software, hardware, training, and local factors), paying
particular attention to users’ feedback.
• Where possible, extrapolate the findings related to the demining Survey Tool to
mobile GIS in general so that any mobile GIS system user, designer, or trainer can
benefit from the lessons learned.
Methods
Study Areas
Testing of the EOD IS-Survey mobile GIS system began on the campus of the
University of Kansas. Following this initial evaluation, the Survey Tool was field tested with
mine action personnel in four countries: Chile, Albania, Ecuador, and Lebanon. For each
deployment, one or more members of the University of Kansas evaluation team accompanied
24

the personnel of the Geneva Centre and their affiliates to observe the training and gather data
for evaluations and recommendations. Each deployment consisted of approximately one week
of classroom training and outdoor exercises (Figure 2) followed by one week of field testing
at or near mined locations (Figure 3).
The deployment locations for the survey tool evaluation were chosen to test the
system under diverse conditions. For each study site, three broad categories of characteristics
were considered: environment, infrastructure, and culture. During the first week of each
deployment there was minimal variability between study areas in terms of environment or
infrastructure. This time was spent near well-equipped facilities with outdoor training sites
that provided clear views of the sky for GPS reliability and elevated sighting positions with
no visual obstructions for easy use of the binocular. However, the second week of practical
exercises in mine affected areas varied widely by site to fully test the system’s field readiness
and mapping capabilities. Noted categories of differences in the natural environment included
climate, land cover, and terrain (Figure 4). Infrastructure at the study areas was classified in
terms of accessibility to roads, power sources, and communication networks. Finally, cultural
factors that were considered throughout the deployments included the trainee’s organizational
structure, level of education (especially GIS, GPS, and rangefinder or sighting equipment
experience), native language, and English fluency. This section provides a summary of the
testing structure and conditions at the University of Kansas and each of the four foreign field
deployments
University of Kansas
The first user testing of the Survey Tool was conducted between 19 February and 5
March, 2004 on the University of Kansas campus with professional staff at the Kansas
25

Figure 2. Classroom training the demining mobile GIS Survey Tool: A) Chile, B) Albania, C) Ecuador, and D) Lebanon.
26

Figure 3. Field testing the demining mobile GIS Survey Tool: A) Chile, B) Lebanon, C) Ecuador, and D) Albania.
27

Figure 4. Physical environments of demining mobile GIS field trials: A) Chilean Altiplano, B) Northern Albania C) Ecuador, Amazon Basin, and D) Lebanon.
28

Applied Remote Sensing Program. These staff consisted of ten “expert users,” meaning
individuals familiar with computer technologies, GIS, remote sensing, and geography. For the
test, four small groups of two or three participants were given approximately one hour of
classroom training and demonstration, led by Dunbar. This instruction was followed by one
hour of field testing observed by Dunbar and Egbert. Fieldwork focused primarily on
collecting spatial data defining the perimeters of simulated mined areas in a park-like
environment (extensive mowed lawns with scattered deciduous and coniferous trees),
thoroughly characteristic of actual minefields.
Chile
The EOD IS-Survey Tool was introduced to a group of mine action personnel in
Chile, 15-26 March 2004. All participants were members of the Chilean armed forces. The
first week consisted of classroom training at the Army Engineer Central Command in
Santiago, Chile, with field exercises in a nearby city park. The second week consisted of field
testing of the Survey Tool at minefields in northern Chile, near the city of Arica along the
northern Chilean border with Peru in the Atacama Desert; a one-day trip was also made to the
Altiplano (Andean high plateau) by a few participants to test the system at high elevations. In
contrast to the other three foreign deployments, the University of Kansas evaluation team,
consisting of Dunbar and Egbert, arrived at mid-week in the first week of training and
therefore did not observe most of the first week’s training activities.
The natural environment in Chile was a coastal desert with sparse vegetation.
Minefields were mapped in mostly flat terrain, with occasional topographic features such as
sand dunes and arroyos. Climate at the Chilean field site was warm and dry throughout the
testing, with cold temperatures experienced at the high elevations of the Altiplano. All mined
29

areas were accessed by road and, with the exception of the Altiplano, none were more than an
hour’s drive from a local army base. Most test sites had cellular phone access due to their
proximity to the city of Arica. The armed forces personnel who took part in the Chilean
training were well educated and formed a very structured organization. Training was
conducted in the native language, Spanish, but several personnel spoke English and served as
translators for the instructors. A number of the Chilean army officers and enlisted personnel
were skilled GIS users, and nearly all had prior experience with GPS technologies.
Albania
The EOD IS-Survey Tool was introduced to a group of mine action personnel in
Albania, 10-21 May 2004. The first week (10-14 May) consisted of classroom training and
field exercises in and around the Albania Mine Action Executive (AMAE) headquarters in
Tirana, while the second week took place at several sites on and near the Albanian border
with Kosovo (accessed by coming from the Kosovo side of the border). Egbert observed the
entire training.
The land cover surrounding the field sties in Albania was mostly temperate forest.
Several sites contained very dense vegetation, brush, and shrubby trees, mostly 3-5 m tall. At
these locations, sightlines using the binoculars were only possible along existing roads and
paths. Mild temperatures were experienced through the field training, including several days
with precipitation and light fog. Infrastructure during the first week of training was the least
reliable at this site, where periodic power failures required the use of uninterruptible power
supplies (UPS) and generators. During the second week of field testing most sites were
accessible by vehicle, despite often rough roads. The training group in Albania was less
structured and more diverse in background than at any other location. One participant had
30

experience with mapping-grade GPS and laser rangefinders, several had used consumer-grade
GPS and compass, while the rest had no experience with mapping technologies. This often
led to inconsistent levels of comprehension during training. The native language of all
participants was Albanian, with highly variable English language skills. This was an
important factor since the training was conducted entirely in English.
Ecuador
The EOD IS-Survey Tool was introduced to a group of mine action personnel,
including teams from both Peru and Ecuador during the period 18-29 October 2004. Egbert
observed classroom training and field exercises during the first week in Quito. Then, in the
second week, Egbert and Dobson observed field training in Teniente Ortiz in the Amazon
rainforest.
The physical environment in Ecuador was a remote rainforest. Field testing was
performed in thick forest canopy with occasional openings, including fairly dense
undergrowth. Temperatures were warm, with high humidity and some precipitation. This
study area was far from power or communications networks. The nearest small town and
army base, Rio Santiago, was a muddy 5 mile hike followed by a 30-40 minute boat ride. The
multinational trainees in Ecuador were made up of military personnel and participants from
various NGOs. It was noted early in this training that, unlike other deployments, none of the
participants would actually be using the tool. Instead, they would manage or facilitate
programs using the equipment. Individuals had varying experience with geographic
technologies. Some came from Information Management and GIS backgrounds while others
were administrators of mine action programs. Training was conducted in Spanish, the native
31

language of all participants.
Lebanon
The EOD IS-Survey Tool was introduced to a group of mine action personnel in
Lebanon, including representatives from the National Demining Office (NDO) and the Mine
Action Coordination Centre, Southern Lebanon (MACCSL). Egbert observed the training and
field testing of the EOD IS-Survey Tool 15-24 February 2006 in and around the city of
Beirut. In addition to the four standard EOD IS-Survey kits (iPAQ pocket PC, Vector
binoculars, Socket Bluetooth GPS, and Sony Bluetooth camera) used during the training, an
additional four Garmin iQue pocket PC systems already in-country were loaded and tested
with the EOD IS-Survey software (these were not able to accept input from the Vector
binoculars and were therefore used in GPS-only mode).
All testing in Lebanon was conducted in urban settings, often containing dense
vegetation in the form of high grass and trees. Temperatures were mild throughout the
training, with almost no precipitation. In terms of infrastructure at this study site, the urban
testing environments provided easy access to roads, communications networks, and
electricity for recharging equipment on a daily basis. While the Lebanese training was
conducted in English, Arabic language and culture was an important consideration at this site.
The education and training level of all the course participants was very high. Nearly all of the
personnel were engineer officers in the Lebanese military and most had formal training and
experience with computer-based geographic technologies such as GPS and GIS. All
participants were multi-lingual and many had undergone training in either France or the U.S.
at military engineer schools.
32

Evaluation
At the University of Kansas, information was gathered based on observations and
verbal and written feedback from professional staff members of the Kansas Applied Remote
Sensing Program. For the international deployments, four methods were used for gathering
data: (1) an Initial Evaluation Form, (2) Field Observations, (3) Exit Interviews, and (4)
Feedback Forms. Each of these data instruments or methods is described below and presented
in Appendix A.
The emphasis of the evaluation focused almost entirely on the mapping capabilities
of the Survey Tool system, as opposed to the alpha/numeric data entry or digital "forms"
function of the system. This occurred for two reasons. First, the training emphasis in both the
classroom and the field was primarily on mapping, and second, the mapping component was
perceived by instructors and participants to be by far the most difficult part of the system to
master. Therefore, the “forms” part of the Survey Tool system was not relevant to this
evaluation.
Initial Evaluation Form
The Initial Evaluation Form was a two-page questionnaire filled out by all
participants in the training course near the end of the first week of training. Its purpose was to
give an on-the-spot assessment of how course participants viewed the mobile tool before
going into the field. The form was divided into three sections. The first was designed to
collect basic background information about each participant’s self-perceived level of
experience in terms of computer usage and minefield mapping. The second section requested
feedback about several aspects of the training, while the third asked for opinions and
comments about the Survey Tool itself. As with all the information collected, the Initial
33

Evaluation Form was designed to be anonymous so as to encourage the frank and open
exchange of opinions.
Field Observations
Field observations were collected during each of the deployments, primarily through
outdoor field exercises. Written field notes routinely were taken and voice recordings of
observations occasionally were made. These were usually spot observations of problems
encountered in the field but also included summary comments made back in the classroom or
later in the evening during review of the day’s activities. These notes included visual
observations as well as conversations with participants and instructors as the training and
field exercises progressed. In particular, a focus was placed on repeating patterns of error
conditions or problems encountered in order to focus reporting on systematic issues rather
than isolated problems that related more to a particular individual or circumstance. Although
all of the evaluation forms and methods provided useful input, the field observations were,
without question, the most valuable part of the evaluation process.
Exit Interviews
Individual interviews were conducted with as many training participants as possible
at or near the end of the two-week training period. As far as possible, the interviews were
private and anonymous, permitting each participant to freely express his or her opinions
without the incidental pressure that might have prevailed in a group setting, especially in the
presence of a supervisor or superior officer. In Chile and Ecuador, interviews were conducted
in English with Spanish translation, while in Albania and Lebanon they were conducted
entirely in English. In total, 27 participants were interviewed, with the following numbers for
each country: Chile 9, Albania 4, Ecuador 7, and Lebanon 7.
34

Questions asked during the interviews were designed to collect evaluations and
recommendations regarding the training, the mobile tool’s hardware and software, and the
participants’ general opinion of the value of the system as well as his or her level of
confidence in using it and training others to use it. For Chile, Albania, and Ecuador the
question sets used by the interviewers remained relatively constant. For Lebanon the
questions were altered somewhat based on the knowledge gathered from previous field
experiences.
In addition to these formal exit interviews with system users, extensive structured
conversations with trainers and other personnel who were involved in, or who observed, the
training provided additional feedback on the Survey Tool.
Feedback Forms
To set up a flow of information back from the field, a Feedback Form was distributed
in each country where the Survey Tool was tested. The Feedback Form was two pages long
with five sections to be filled out at the conclusion of each survey activity conducted with the
system. The first section was designed to gauge the experience level of the survey team,
while section two elicited basic information about the minefield, such as size, and mapping
effort, such as the length of time required and the method used. Section three was a standard
trouble-shooting report, asking if any problems were encountered and, if so, what steps were
taken to try to solve the problem. Section four asked for information on whether any
environmental factors (weather, terrain, or vegetation) impacted the survey, while section five
asked for an evaluation as to whether the team considers the Survey Tool to be an
improvement over other methods of mapping minefields. As with other forms and evaluation
35

methods, the Feedback Forms were anonymous to protect both the identity of the respondent
and also any sensitive information regarding the geographic location of the minefield.
In each country where the Survey Tool was field tested, each training team was asked
to fill out a Feedback Form near the end of the two-week training period. This was done to
familiarize each participant with the form and to solicit additional feedback from the
participants in regard to their opinions about the effectiveness of the Survey Tool.
The Feedback Form was intended to be a vehicle for providing a steady stream of
feedback as field teams carried out surveys using the Survey Tool. However, the actual
practice turned out somewhat differently in each deployment. In Chile, it was decided locally
by Major Henry Ilufi to gather feedback and submit a “summary” Feedback Form and
corresponding report. In addition, the GICHD Latin American Regional Coordinator, Simon
Berger, wrote a comprehensive report that summarized the experiences of the Chileans with
the Survey Tool. In Albania, the Survey Tool was discontinued following the training
period1. Therefore, no technical surveys were performed, and no feedback forms were
submitted. From Ecuador, a total of five Feedback Forms were received for technical surveys
performed after the training period. Some of the feedback forms represented a single
minefield, while others summarized work for several minefields mapped under a single
technical survey. For unknown reasons, despite the system's use in Lebanon and repeated
requests, no Feedback Forms were ever received from this location.
1 On 24 May, 2004 an accident occurred in Kukes, Albania during a training lecture (unrelated to the GICHD Survey Tool) held by Handicap International for newly recruited deminers. Training ordnance, thought to be free from explosives, detonated in the classroom killing two persons and injuring fifteen others. This accident led to a suspension of all demining activities in Albania for nearly a year while an official Board of Inquiry determined the cause of the accident.
36

Results and Discussion
Taking the broad view, there were two major conclusions drawn from the evaluation.
First, in general, the Survey Tool performed the task for which it was designed and was a
major improvement over other existing methods for performing Technical Surveys.
Participants cited a two to three-fold savings in time and labor, enhanced safety, and
improved accuracy and reliability. Second, the Survey Tool is a relatively complex system
that needs improvement and ongoing support in order to provide the greatest utility.
Specifically, it requires improvements in the form of “bullet-proofing” to protect from or
warn of significant mapping or data entry errors. An effective support structure must also be
in place for the Survey Tool, providing thorough training, useful instructional guides, and
access to knowledgeable system specialists.
In order to more thoroughly address the Survey Tool’s fitness for use, the system and
its field program were broken down into their individual components. The information about
the Survey Tool collected from forms, interviews, and observations most logically sorted into
the following categories:
• Software: operating system, EOD IS-Survey, and mobile GIS
• Hardware: Pocket PC, rangefinder, and GPS
• Training: content, structure and training aids
• Site Specific Factors: participants, language, local standards, and geographic factors
In additional to qualitatively evaluating the observations and feedback in each of these
categories, the user-indicated importance of issues was calculated by noting the frequency
that a topic was mentioned in the initial evaluation form, exit interviews, and feedback forms.
Any problems or suggested improvements mentioned by more than two users were integrated
into the overall findings regarding the Survey Tool (Table 1).
37

SoftwareOperating System CountGeneral difficulty operating handheld software 6Minimize vs. exit program confusion 4
EOD IS-Survey Lockup, requiring software or handheld reset 31System should collect additional types of data/reports 12Reqeust for local language software 8General software design issues 7
ArcPadEditing and complex feature creation 7Missing GPS information displays (skyview, compass,etc.) 6Importance of imagery/map layers 5HardwarePocket PC CountPoor outdoor screen visibility 10Handheld battery life 9
GPSGPS dropped Bluetooth connection 17How long to wait for good GPS fix? 8Integrate GPS in Handheld 4Where to place GPS antenna? 3
RangefinderRequest monopod/tripod 12Rangefinder missed transmission/dropped Bluetooth 11Confusion over bearing errors (magnetic interference) 11Difficulty shooting at small or no phsyical target 10Include compass to test bearing error 6Accidentally changed settings 3TrainingMore problem solving in exercise-based training 27Need for checklists 26Repeated use required for profeciency 26Request for local language training and materials 17Train multiple mapping methods (with different hardware) 5Provide hardware specs (battery life, accuracy, etc) 4
Table 1. Frequency of user-reported problems or requested improvements across all field trials as indicated by responses to the Initial Evaluation Form, Exit Interviews, and Feedback Form.
38

Software
Operating System
Almost all participants adapted well to the pocket PC operating system, Windows
Mobile, very quickly. Although relatively few had previous experience with a pocket PC, all
had at least some experience with the Windows operating systems on desktop or laptop PCs.
It was apparent that such computer experience transferred quickly to the pocket PC and that
no extensive training or documentation is required to get most participants up and running.
However, small differences between the desktop and pocket PC operating system, such as the
way software applications are minimized vs. completely closed, were occasionally mentioned
by users as a source for minor confusion (Table 1). This suggests that a basic overview of the
mobile version of the Windows operating system should be included in the training.
EOD IS-Survey
The users’ most frequently mentioned problem with the Survey Tool was the EOD
IS-Survey software becoming locked up during operation (Table 1). These lock-ups, while
infrequent, were an ongoing source of frustration primarily because it wasn’t always clear
what was causing them. In most cases, the participants were able to adapt by closing down
and restarting the software, by performing a soft reset (restarting the handheld), or, in some
extreme cases, by performing a hard reset (re-installing all handheld software). The frequency
of user comments dealing with this occasional but annoying problem suggests that, without
adequate training and support, just a few occurrences of critical system failures can quickly
lead to a lack of faith in the overall stability of a device.
On all deployments, numerous participants strongly requested that the Survey Tool
be expanded to collect other field report types in addition to the Technical Survey, which was
39

the focus of the original system design. Requested capabilities included reports for other
standard humanitarian demining activities such as Impact Surveys, Clearance Surveys, and
Mapping Dangerous/Mined Areas. Several users also asked for the ability to create
customized forms that conform to their local procedures and information requirements. In
addition to customizing the type of data collected, many users also stressed the need to have
the software translated to their own language. Most trainees felt they could competently use
the software in English, but worried about training new users on their own in the future.
There was also a variety of requests for basic changes in software design. Trainees
suggested that mandatory fields should be indicated as such, and that the software should
prohibit users from leaving a form until all mandatory fields are completed. Several data
fields, such as the nearest town or reporting agency, allowed entry of values by hand rather
than using a pull-down list. As these fields were stored in fixed lookup table within the
desktop information management software, this led to database inconsistencies when
importing the handheld data. Users also noted that the software mistakenly allowed multiple
minefield maps to be recorded in a handheld report. This resulted in additional importing
problems as the desktop software was designed to accept only one minefield map for each
survey report. Both of these importing compatibility issues suggest the need for consistency
between handheld, desktop, and synchronization software design. Finally, users indicated
confusion with several icons and text used in the software’s menus, such as the use of the
terms “Add” and “Edit” rather than “New” and “Edit”.
GIS Software
The evaluation team and system users indicated three areas where the modified
version of ArcPad used by EOD IS-Survey could be improved: editing and creating complex
40

features, GPS functionality, and the incorporation of base maps and imagery in the form of
raster data.
Users of the Survey Tool indicated that difficulties editing existing features or
creating new features using complex methods, such as collecting a minefield perimeter using
the rangefinder from multiple vantage points, were their greatest concern in the mapping
application. Since all feature creation and editing functionality in the Survey Tool are based
on the default system used in ArcPad, this is not an issue that can be remedied with
specialized code in EOD IS-Survey. Instead, editing and creating complex features requires
detailed attention through training and instructional materials. Smaller numbers of requests
were noted for minor feature enhancements to the mapping functionality. Participants
requested that mapping capabilities be expanded to include the ability to map minefields as
lines and points, in addition to the polygon feature currently allowed by the software. Some
participants requested that the ability to enter a point manually using its x,y coordinates.
Others suggested the additional ability to include multiple feature types, such as trees,
buildings, trenches, and ponds within a minefield survey.
While it was not mentioned by users, the evaluation team immediately noticed that
GPS averaging functionality was not included in the Survey Tool’s ArcPad application.
During deployments to Albania, Ecuador, and Lebanon, experiments were carried out using
the full stand-alone implementation of ArcPad to evaluate the value of using averaged versus
“raw” GPS points. Generally, ArcPad was set to average each point for approximately three
minutes. In all the tests, the averaged points had a narrower range of positional values and
tended to vary by less than half as much as the raw values. Participant comments also
recommended that all the standard GPS information windows available in the full
41

implementation of ArcPad (e.g., satellite view, compass view, etc.) be enabled in the Survey
Tool’s modified version of ArcPad.
One of the key points driven home by field testing of the Survey Tool is the
importance of having high-resolution raster imagery to use as a backdrop for mapping
minefield perimeters in ArcPad. Maps and satellite images on the pocket PC enable the user
to visualize the goodness of fit of minefield perimeters and highlight errors at both gross and
fine scales, providing an important type of field validation and feedback. In general, satellite
images were used more frequently than scanned maps, presumably because they represented
actual conditions on the ground rather than the generalized depiction inherent in topographic
maps. It is strongly recommended that high-resolution imagery be used with the Survey Tool
system at all times. Ideally, the raster data would include recent aerial photography or
satellite imagery combined with 1:50,000 or finer scale digital raster maps.
Hardware
Pocket PC
The Pocket PC hardware component was found to generally meet all expectations,
with the notable exceptions of its screen visibility, battery life, and Bluetooth functionality.
User comments made concerning Bluetooth problems are included under the GPS and
rangefinder Hardware entries in Table 1.
Many participants complained about the difficulty of reading the screen of the Pocket
PC outdoors, particularly in bright sunlight. Not surprisingly, the most complaints came from
Chile and Lebanon, where bright, sunny conditions were common in the test areas.
Developers of future versions of the Survey Tool should be certain to evaluate specific
models of candidate Pocket PCs for screen brightness, which is bound to improve with the
42

progress of technology development. Battery life, especially for the handheld PCs, often was
found to be much less than the length of a single day’s fieldwork. This was a notable problem
for work in isolated locations or locations without reliable electricity for recharging, and was
a common complaint during exit interviews. High-capacity spare batteries should be included
with all handhelds kits, along with vehicle charging adapters. Additionally, the importance of
keeping all batteries fully charged should be strongly emphasized during in the training
program.
In all four foreign deployments, participants experienced frequent loss of Bluetooth
communications between the binoculars and the pocket PC. These unexpected events were
relatively frequent and were a cause of frustration, since they necessitated interrupting the
collection of data to reestablish communications. This most likely was a software issue in
some component (Windows Mobile and/or ArcPad), although in one case in Albania the
failure was caused by a defective Bluetooth antenna in the rangefinder binoculars. It should
be noted that although the interruptions were a source of frustration, participants in most
cases were quickly able to reestablish communications between devices. Because of the
frequency of dropped communications, however, it would be worthwhile to investigate the
use of a hardwire cable connection between the binoculars and the pocket PC or conduct tests
with another model of laser rangefinders to determine if this was a hardware-specific issue.
Participants in all countries also occasionally experienced a loss in Bluetooth
connection between the GPS and the pocket PC, which caused delays and frustration due to
interrupted work flows. In Lebanon, where a number of participants had previous experience
using integrated Garmin iQue GPS/pocket PC devices, several noted that the problem could
be overcome by using a GPS integrated with a PDA (such as the Garmen iQue or Trimble
Juno) or with plug-in GPS units on Compact Flash (CF) or Secure Digital (SD) flash memory
43

cards. The potential downsides to an integrated or plug-in GPS would be increased battery
drain on the pocket PC (an important consideration) and the increased hardware complexity
inherent in integrated devices.
Rangefinders
It was first discovered in Chile, and subsequently verified in Albania, that the Leica
Vector binoculars are highly sensitive to electromagnetic interference (EMI) from nearby
electronic devices, specifically from mobile phones and GPS units. During the training in
Tirana, Albania, signals generated by GPS receivers and/or their antennas located too close to
the rangefinders were found to corrupt bearing readings by approximately 30º. This was
further confirmed during field exercises on the Albania/Kosovo border. A GPS receiver
placed directly on the Vector binoculars resulted in a bearing offset of approximately 90º.
Mapping errors of this magnitude can discourage new users from adopting this technology.
Worse yet, they can potentially place demining personnel in physical danger if the errors go
unnoticed. Although the Vector documentation mentions the necessity of avoiding such
interference, it does not (and perhaps cannot) convey an adequate warning about the dangers
of EMI. It is critical to emphasize to field participants the importance of avoiding potential
interference with EM signals, heavy concentrations of metal, or other local magnetic
attractions. In training, a demonstration of the impact of electromagnetic interference would
help to communicate this point. Several users noted that a standard magnetic compass could
serve as a useful reality check to discover and avoid these errors.
One of the more common rangefinder-related requests from users was for a monopod
or tripod to steady the rangefinder under difficult aiming situations. In Chile, where
minefields are large and sighting distances are great, it was clear that getting good readings
44

(distance and bearing) became increasingly difficult as distance from observer to target
increased, especially if the target was small. In Chile, Albania, and Ecuador tripods and/or
monopods were included with the training equipment, but not in Lebanon for logistical
reasons. The Lebanese participants, however, were very outspoken in recommending that
tripods be used in the future.
Calibrating the internal compass of the binoculars at each field location is necessary
before beginning mapping, but in Ecuador trainers and trainees both had trouble with the
calibration procedure. Unclear instructions in the binocular documentation were the main
cause of this difficulty. The documentation specifies that the user is to move the binoculars
“slowly,” when in fact moving too slowly causes calibration to fail. This calibration
procedure should be explicitly included in training and in a checklist for binocular usage. A
standard compass would also aid this procedure, as the calibration must start in a north-facing
direction.
At all locations, accidental reconfiguration of the binoculars occurred on several
occasions, as the procedure to establish Bluetooth communications between the binoculars
and the pocket PC opens the general configuration procedure for the binoculars. If the wrong
sequence of buttons on the binoculars is pressed during the process, it is possible to
accidentally reconfigure other binocular settings. With the effects ranging from changing
distance or bearing units to shutting off the internal display altogether, this problem was very
disconcerting to several users. Since this is a hardwired characteristic of the binoculars, it
should receive more emphasis in the training program.
45

GPS
The GPS units generally worked reliably in the field and the Socket GPS appears to
have been an excellent choice for the Survey Tool, including working in the difficult GPS
reception environment under a rainforest canopy in Ecuador. However, one or two GPS units
failed during the test period. Because of their low cost relative to other components and the
cost of fieldwork in general, a spare GPS unit should always be included for each
deployment. The main user comments related to the GPS, other than the Bluetooth issue,
revolved around questions of accuracy and proper use procedures. Experiments, such as those
discussed in Chapter 3, should be run on the Survey Tool’s GPS to determine its exact
accuracy, and basic GPS best-use practices should be a part of any mobile GIS training
program.
Training
While the Survey Tool system must have well-designed and reliable hardware and
software components, it cannot be successfully used in the field without sound training. This
subsection includes additional findings related to training content, training structure, and
training aids not already mentioned under previous topics.
Content
User comments and field observations suggested a variety of specific training points
that were omitted from or not covered adequately enough in the original training program.
First, considering the problems experienced with Bluetooth connections of the GPS and
rangefinder devices, explicit instruction should be given for dealing with Bluetooth
connections timing out or losing communications between devices. Next, despite the
46

generally strong mapping backgrounds of most participants, some of them did not readily
recognize faulty binocular readings (overshoots, undershoots, crossed lines, and others) when
they occurred. This could be taught effectively in the classroom by showing examples of
faulty readings. Also, based on site visits, it was clear that many, perhaps most, environments
will require that minefield perimeters be mapped using multiple binocular viewing points
because of dense vegetation or terrain obstructions. While this skill was briefly mentioned in
the original training, users’ lack of comprehension indicates a strong need for more focused
field exercises on this topic. Additionally, experiences in the tropical rainforests of Ecuador
demonstrated that there is a need to train on navigating to and around a mapping site solely
with the rangefinder binoculars from a GPS starting point (e.g., in heavy forest canopy
situations, where GPS lock is lost). Although the system performs this function well, it is a
complex skill, which should first be taught simply as a navigation technique, and then
combined with a perimeter mapping exercise. Finally, the importance of taking rangefinder
readings at the exact location of the last GPS fix, from which ArcPad calculates the
rangefinder target coordinates, must be reinforced.
Structure
The general structure of the training as presented in the four test countries was
successful and validated by the comments of the participants (Table 1). Practical exercises in
the field proved to be invaluable in providing real-world training and feedback. These should
be continued and, if possible, further strengthened by successively training in the collection
of minefield perimeters in specific modes: GPS only, binoculars only, GPS and binoculars
from multiple viewing points, etc. Beginning in Chile, minefield perimeters collected during
a field training exercise were presented on a large display screen back in the classroom,
47

giving the participants a visual assessment of the perimeters they collected as soon as
possible after they had completed the task. Providing participants with visual feedback
positively reinforced the Survey Tool’s functionality and the ability of the trainees to operate
the equipment, while at the same time highlighting errors and needed improvements. It is also
important to ensure that each person is cross-trained and proficient in each aspect of the
hardware, software, and procedures. In Lebanon, on the last day of field training each
participant was required to map a minefield perimeter on his own. This type of exercise was
very useful, as it revealed certain weaknesses in the proficiency of some participants but also
provided for on-the-spot remedial training when needed.
Training Aids
Checklists for basic procedures were strongly recommended by participants in Chile,
the first test deployment, and were subsequently developed and used in Albania, Ecuador,
and Lebanon. These canned “cookbook” procedures were enthusiastically received and were
overwhelmingly successful, as indicated by the requests for these materials from system users
(Table 1). To ensure the continued success of the Survey Tool, the existing checklists should
be refined and formalized and other checklists developed based on recommendations from
participants in the post-training interviews.
In Ecuador and Albania in particular, it became clear that train-the-trainer materials
would be extremely valuable as few or none of the participants in the training would be the
ones doing the actual minefield surveys. Suggested topics for these leave-behind training
materials include:
• Teacher manuals, lesson plans, and instruction modules
• Student handouts, training schedule
48

• Full set of checklists
• Additional documentation: EOD IS-Survey User Guide, Pocket PC user guide, GPS
and Rangefinder manuals, and ESRI ArcPad documentation
• Quizzes and evaluations
• Teaching aids (exercises, PowerPoint presentations, etc.)
Site Specific Factors
Participants
Although this evaluation’s sample size was small, it surely was no coincidence that
the most successful test deployments were with programs run by well-trained, professional
military organizations. In these military organizations, demining is done typically under the
direction of combat engineers, many or most of whom have prior training in surveying,
mapping, and geospatial technologies. In addition, the military structure tends to ensure that
procedures and plans developed locally during and after the training period will be
implemented.
This leaves open the question of whether the system will be as easily or successfully
adopted in countries where, 1) NGOs take the lead in technical surveys and other demining
operations, possibly resulting in a lower level of “command and control” responsibility and
follow-through, and/or 2) the education levels of participants, particularly in geospatial
technologies, are lower.
Language
In the test deployments, there were no severe problems due to language barriers or
language differences. In Lebanon, as noted, all the participants were sufficiently fluent in
49

English to be able to adequately comprehend all the verbal and written training materials. In
Chile and Ecuador, a combination of solid English language abilities on the part of key
participants and/or the employment of Spanish translators provided for effective
communication. Only in Albania was communication observed to be a potential problem for
some participants, where instruction was in English with some translation into Albanian
provided. Participants in Albania seemed to experience more problems in mastering the
system during the training period; however, because the system was not employed subsequent
to the training, this issue remains unresolved for Albania.
Even with the relative lack of language issues during the test deployments, interviews
indicated a strong desire for future versions of manuals and other written materials to be
translated into the local languages. Most participants actually felt that, if the manuals were in
their own language, it would not be so important for the software to be in their language. For
this reason, it is imperative that basic training materials be provided at least in languages that
are widely used in mine-affected countries (e.g., Arabic, English, French, Portuguese,
Russian, and Spanish).
In general, this raises the question of whether the system will be used as successfully
in countries where, 1) there are few participants who speak and read English, 2) the language
of the participants is not a widely spoken one, and 3) translated materials are not available in
either the local language or other widely used language, such as one of the six official United
Nations languages (Arabic, Chinese, English, French, Russian, and Spanish).
Local Procedures, Policies, and Terminology
Despite the promulgation of the International Mine Action Standards (IMAS) and the
widespread use of IMSMA, each locale has its own procedures, policies, and even
50

terminology regarding mine action. It became clear, for example, that the concept of what
constitutes a Technical Survey differs from country to country. In some countries the
Technical Survey is not performed at all. It will be important in fielding future versions of the
Survey Tool to perform a pre-assessment of existing policies and procedures in each country
prior to fielding the Survey Tool, adapt the training to local policies and procedures, and
build flexibility into future versions of the Survey Tool system to accommodate local
conditions and needs.
Geographical Factors and Environmental Influences
Other than sunlight impacting screen visibility, the environmental factor with the
greatest potential impact on the use of the Survey Tool is vegetation (Figure 4). Heat, cold,
humidity, and even rainfall had only minor impacts during the field deployments. Slope also
was not a serious factor, except that in deep valleys the number of satellites available for a
GPS fix is reduced. Vegetation, however, has two impacts. First, the presence of a dense
overhead canopy, as in tropical rainforest, can effectively block incoming signals from GPS
satellites. Dense canopy conditions result in highly inaccurate GPS measurements, or, more
likely, the inability for the GPS to acquire a fix at all. Either outcome renders the GPS
unusable for collecting a minefield perimeter on foot or for collecting the starting point of a
rangefinder-based perimeter. In Ecuador, this problem was solved by taking a GPS fix in an
open clearing and then navigating to a starting point for a rangefinder-based perimeter using
the Vector binoculars. The second impact of vegetation on use of the Survey Tool is that
dense vegetation blocks the laser signal from the Vector binoculars, limits line of sight, and
therefore necessitates taking perimeter readings from multiple points. The Survey Tool
51

system is able to handle this condition, but sufficient training is required in order for field
teams to use this technique efficiently.
Conclusions
The findings presented in this paper are specific to the demining Survey Tool, but the
general lessons learned have broader application for any mobile GIS user, developer, or
trainer. When implemented correctly, mobile GIS can be faster, more accurate and more
reliable compared to traditional methods for collecting spatial field data, such as paper forms,
maps, and the stand-alone location technologies of GPS or compass and tape. However, these
benefits and the promise of a “high-tech” solution to fieldwork can often lead potential users
to erroneously believe that mobile GIS is an off-the-shelf solution. Just as was found with the
demining Survey Tool itself, solid system development, proper training and instructional
materials, and support from knowledgeable technical staff, are critical for the successful
fielding of any mobile GIS.
Developers of mobile GIS should note that infrequent but significant system crashes
can quickly lead users to become frustrated or, even worse, to lose confidence in a new
system. This issue with the demining handheld, along with the numerous minor bugs reported
during deployments, demonstrate the importance of thorough field testing by users, prior to
the start of actual field data collection. A good rule is to assume that nothing will work in the
field if it hasn’t been exercised thoroughly in or near the fieldworker’s home facility. As early
as possible, system designers and developers should also consider the important matter of
whether to develop a focused, task specific mobile GIS or a broadly scoped one-size-fits-all
tool. As a rule of thumb, applications should be directed specifically at a narrow group of
52

user needs, while remaining flexible enough to adapt to the dynamic nature and diverse
challenges of field data collection.
Two major conclusions can be drawn from this evaluation concerning the use of
mobile GIS software. First, editing spatial data in a mobile GIS is somewhat more complex
than on the desktop due to a smaller screen size, touch-screen interface, and the often difficult
conditions of fieldwork. Inevitably, errors will be made during initial data collection or
updates required after the fact, and users should have received enough practical training
beforehand so that editing procedures require little thought to perform. Second, efforts should
be made to develop quality base map data for the most effective field experience. High spatial
resolution raster data, such as aerial/satellite imagery or scanned topographic maps, were
found helpful for the demining system, but detailed vector data may also be appropriate for
certain applications. Detailed base map data can help users gauge the accuracy of field
measurements, aid in navigation, and provide a reference source of previously gathered field
data. In fact, as a direct result of this finding, early in 2005 the University of Kansas was
contracted by GICHD to develop a geographic base data archive (satellite imagery,
topographic maps, elevation, population, transportation, and political layers) for over 50
mine-affected countries to facilitate more effective use of the GIS capabilities in the Survey
Tool and IMSMA computer software package.
The hardware components of the demining mobile GIS also warrant a set of
recommendations. In general, with the high cost of fieldwork, it is worthwhile to invest in
backup hardware units for all but the most expensive pieces of equipment. When choosing a
mobile GIS field computer (pocket or tablet PC), extra attention should be given to outdoor
screen visibility and battery life. Considering the repeated rangefinder- and GPS-related
Bluetooth issues experienced during this evaluation, system complexity should be reduced by
53

using an integrated solution or cabled versions of equipment whenever possible. Magnetic
interference was shown repeatedly to have the potential to seriously impact measurements
collected with rangefinder equipment. This fact should be stressed in the rangefinder training,
along with the exact procedure for calibration, setting local magnetic declination, and
Bluetooth configuration. Additionally, given the likely need for long-range sighting, a
monopod or tripod should also be considered required equipment for the rangefinder. Simple
GPS receivers were found to be well received by users in terms of their usability, leaving the
project's required mapping accuracy as the key factor for selecting an appropriate unit.
Whatever the accuracy desired, formal testing should be conducted on both GPS and
rangefinder hardware to determine the exact accuracy users can expect to obtain under their
specific field operating conditions.
Training sessions and materials related to a mobile GIS were found to be just as
important as the system’s hardware and software for ensuring a successful field effort.
Keeping in mind all of the training concepts already mentioned, extra attention should be
devoted to complex mapping tasks. All conceivable combinations of data collection methods
and mapping hardware should be taught in as many practical hands-on exercises as possible,
thus addressing any specific needs or gaps in the knowledge of individual field users. Users
and system evaluators alike also indicated that thorough and well thought out guide materials,
such as checklists, laminated for durability in the field and translated into the local language,
would be nearly as valuable in the long run as a formal training program.
The most common theme encountered across all aspects of the Survey Tool
evaluation was summed up nicely in a comment made by one trainee from the Chilean
deployment, “Nothing will ever be exactly as we had planned, but we must be ready to deal
with it anyway.” While this concept is likely known by anyone who has spent much time
54
doing fieldwork of any sort, it needs to be incorporated throughout mobile GIS so that the
free flowing nature of traditional fieldwork is not interrupted. To ensure this, every effort
should be made to train for user adaptability and design for system flexibility. Training
experiences and materials must provide users with the ability to make decisions on their feet
in the field, both in how to collect data and how to deal with system malfunctions. The
system software and hardware also must be able to operate in a variety of data collection
modes, from the open-ended nature of a field notebook to the highly structured methods used
for a formal site survey. Finally, adequate time must be allocated (at least a day) to work out
the "kinks" in hardware and methodology on-site, under real field conditions prior to the
beginning of actual data collection.
55
References
Aviles, W., Ortega, O., Kuan, G., Coloma, J. and Harris, E. 2007. Integration of Information Technologies in Clinical Studies in Nicaragua. PLoS Medicine 4(10): 1578-1583.
Carver, S., Heywood, I., Cornelius, S. and Sear, D. 1995. Evaluating field-based GIS for
environmental characterization, modelling and decision support. International Journal of Geographical Information Science 9(4): 475-486.
Chrisman, N.R. 1986. Obtaining information on quality of digital data, Proceedings of
AUTO–CARTO London 1: 350-358. Clarke, K.C. 2004. Mobile mapping and Geographic Information Systems. Cartography and
Geographic Information Science 31(3): 131-136. Clegg, P., Bruciatelli, L., Domingos, F., Jones, R.R., De Donatis, M. and Wilson, R.W. 2006.
Digital geological mapping with tablet PC and PDA: A comparison. Computers & Geosciences 32(10): 1682-1698.
Dobson, J.E. 2001. Fieldwork in a digital world. The Geographical Review 91(1-2): 430-440. Dobson, J.E. 1994a. GPS Advances Geography’s Field Tradition. GPS World 7(1): 60-61. Dobson, J.E. 1994b. The GPS Field Station Rides Again. GPS World 9(9): 54. Goodchild, M.F., Johnston, D.M., Maguire, D.J., and Noronha, V.T. 2004. Distributed and
mobile computing. In A Research Agenda for Geographic Information Science, R. B. McMaster and E. L. Usery, Eds. pp. 257-286. Boca Raton, Florida, CRC Press.
Mau-Crimmins, T.M. and Orr, B.J. 2005. Monitoring invasive plants using hand-held GIS
technology. Connecting mountain islands and desert seas: Biodiversity and management of the Madrean Archipelago II Proceedings RMRS-P-36, Fort Collins, CO, U.S. Department of Agriculture, Forest Service, Rocky Mountain Research Station: 298-301.
McCaffrey, K.J.W., Jones, R.R., Holdsworth, R.E., Wilson, R.W., Clegg, P., Imber, J.,
Holliman, N. and Trinks, I. 2005. Unlocking the spatial dimension: digital technologies and the future of geoscience fieldwork. Journal of the Geological Society 162(6): 927-938.
Missinou, M.A., Olola, C.H.O., Issifou, S., Matsiegui, P.-B., Adegnika, A.A., Borrmann, S.,
Wypij, D., Taylor, T.E. and Kremsner, P.G. 2005. Short Report: Piloting paperless data entry for clinical research in Africa. American Journal of Tropical Medicine and Hygiene 72(3): 301-303.
Nusser, S. 2005. Digital capture of geographic feature data. Proceedings of the 2005 Federal
Committee on Statistical Methodology Research Conference. Arlington, Virginia.
56

Peng, Z. and Tsou, M. 2003. Internet GIS: Distributed Geographic Information Services for the Internet and Wireless Networks. Hoboken, New York, Wiley and Sons. 720p.
Shirima, K., Mukasa, O., Schellenberg, J., Manzi, F., John, D., Mushi, A., Mrisho, M.,
Tanner, M., Mshinda, H. and Schellenberg, D. 2007. The use of personal digital assistants for data entry at the point of collection in a large household survey in southern Tanzania. Emerging Themes in Epidemiology 4(5): 10-18.
Tsou, M. 2004. Integrated mobile GIS and wireless internet map servers for environmental
monitoring and management." Cartography and Geographic Information Science 31(3): 153-165.
Tripcevich, N. 2004. Flexibility by design: How mobile GIS meets the needs of
archaeological survey. Cartography and Geographic Information Science 31(3): 137-151.
Wagtendonk, A.J. and De Jeu, R.A.M. 2005. Mobile GIS and optimizing data collection
methods in hydrological fieldwork. Remote Sensing for Agriculture, Ecosystems, and Hydrology VII, Proceedings of the SPIE, Bruges, Belgium.
Wagtendonk, A.J. and De Jeu, R.A.M. 2007. Sensible field computing: Evaluating the use of
mobile GIS methods in scientific fieldwork. Photogrammetric Engineering and Remote Sensing 73(6): 651-662.
Williams, K., Sader, S.A., Pryor, C. and Reed, F. 2006. Application of Geospatial
Technology to Monitor Forest Legacy Conservation Easements. Journal of Forestry 104: 89-93.
Vanden Eng, J.L., Wolkon, A., Frolov, A.S., Terlouw, D.J., Eliades, M.J., Morgah, K.,
Takpa, V., Dare, A., Sodahlon, Y.K., Doumanou, Y., Hawley, W.A. and Hightower, A.W. 2007. Use of Handheld Computers with Global Positioning Systems for Probability Sampling and Data Entry in Household Surveys. Am J Trop Med Hyg 77(2): 393-399.
57
Chapter 3
Assessing the Accuracy of a Consumer-Grade GPS for Mobile GIS Mapping
Abstract
Users of field-based mobile GIS today can select from a wide variety of location
mapping technologies. An understanding of the errors associated with various types of
equipment and basic methods for improving accuracy enables each user to choose the right
tools and design the most appropriate field data collection strategy. This study examined the
positional accuracy of the inexpensive consumer grade Socket GP0804-405 Bluetooth GPS
unit used in the IMSMA Mobile humanitarian demining mobile GIS system. Four hours
worth of one-second interval data collected under ideal conditions was used to calculate a 9.4
m horizontal accuracy at a 95% confidence level. An averaging time of 30-60 seconds was
determined optimal for low priority points (polygon vertices or turning points) and an
averaging time of 2-4 minutes was determined optimal for high priority points (landmark or
reference point).
Introduction
Mobile GIS
With recent developments in technology, computing has become available in more
places worldwide, is now small enough to move with its users even to highly remote places,
and can provide access to a wide array of distributed resources. It has been noted that these
changes in the "where" aspects of computing have already made significant impacts on the
way geographers and GIS professionals conduct their work (Goodchild et al., 2004). This
deviation from the traditional desktop GIS framework has been termed ‘Distributed GIS,’
58

which encompasses both mobile GIS and the broad array of internet GIS technologies (Peng
and Tsou, 2003). Mobile GIS has been defined as “an integrated software/hardware
framework for the access of geospatial data and services through mobile devices via wireline
or wireless networks” (Tsou, 2004). The application areas of mobile GIS have been broken
down into field-based GIS, focusing on the collection, validation and update of GIS data in
the field, and location based services (LBS), concerned mainly with location management
and logistics functions. At the heart of field-based GIS are the mapping technologies, such as
the Global Positioning Systems (GPS), that make GIS feature collection possible.
GPS
GPS has gained widespread adoption in commercial and research applications as a
powerful satellite-based tool for determining the location of points on and above the earth’s
surface. There are several grades of GPS receivers distinguished by their measurement
accuracies: recreation or consumer-grade receivers provide an accuracy of 5-20 m and can
cost under $100; mapping-grade receivers provide accuracies from sub-meter to 5 m and cost
between $500 and $5000; and survey-grade receivers can provide sub-centimeter accuracies
at costs of up to $20,000 or more (Rizos, 2002). The three main sources of GPS error
affecting all grades of receivers are atmospheric refraction of GPS signals (slowing their
transmission speed), multipathing (detecting reflected GPS signals from various surfaces),
and poor satellite geometry (Misra and Enge, 2001).
Higher grade GPS receivers are designed to correct for these errors using dual-
frequencies to all but eliminate ionospheric effects and using signal processing to reduce
multipathing. Poor satellite geometry can be overcome by using better satellite tracking,
listening to more satellites, and multiple GPS systems. Differential correction can further
59

remove errors by comparing the surveyed GPS data to that of a local reference station at a
known location. Due to their lower cost, consumer-grade receivers do not have such
integrated accuracy enhancement features. They are designed less for precise mapping and
more for user productivity, or the ability to constantly provide a useable position. There are
several methods that consumer-grade GPS users can utilize to reduce errors, but they require
more of the user’s time to collect additional data.
The first approach for reducing errors in consumer-grade receivers deals with the
filtering of GPS data based on the dilution of precision (DOP) measure calculated by the
receiver. DOP is based on the geometry of the satellites being used. Higher DOP values
indicate less certainty in the overall position and are caused when fewer and/or tightly
clustered satellites are used to by the GPS receiver to calculate its position. DOP values
generally range from 1-10, but may reach values >20 under very poor conditions. DOP values
and can be viewed as multiples of the minimum uncertainty/accuracy level of the GPS
(Hofmann-Wellenhof et al., 2001). For a stationary observer, there are three different DOP
measures to select from based on the desired type of GPS mapping: 2D horizontal DOP
(HDOP), vertical DOP (VDOP), and 3D position DOP (PDOP). To implement DOP filtering,
a DOP mask or threshold is set, beyond which GPS data, of assumed lower accuracy, will not
be recorded (Rempel and Rodgers, 1997). Very few consumer-grade GPS receivers provide
DOP filtering on their own, but DOP filtering is a standard function in most Mobile GIS
software. DOP filtering will have the most benefit in poor satellite conditions, such as under
heavy tree canopy, but it can also benefit collection in open-sky conditions when few
satellites are in view from the operator’s particular location.
GPS averaging has also been shown as a powerful way to diminish positional error
(Sigrist et al., 1999). By taking the average of repeated GPS measurements at a fixed
60

location, the expected accuracy and precision of a GPS receiver can be increased by
smoothing out the fluctuations in GPS errors (Deckert and Bolstad, 1996). GPS averaging is
available as a built-in function on some consumer-grade GPS receivers and a standard
function in Mobile GIS software. The important question to answer for the most efficient use
of GPS averaging is, “how long is long enough?” While GPS user manuals and technical
reports provide a generic starting point, and studies have been performed comparing various
grades of receivers (Devlin et al., 2007), for the most appropriate guidelines the specific GPS
unit in question should be tested.
IMSMA Mobile – Mobile GIS for Humanitarian Demining
Early in 2003, the Geneva International Centre for Humanitarian Demining (GICHD)
initiated the development of a small, pocket-sized tool to support humanitarian demining data
collection in the field. This tool was intended to map and collect demining related data in the
form of digital field reports for integration with the GICHD Information Management System
for Mine Action (IMSMA) desktop software. This handheld system was called Explosive
Ordnance Disposal Information System-Survey (EOD IS-Survey) and was developed by the
Swedish EOD and Demining Centre (SWEDEC) under the guidance of GICHD. In 2007 the
handheld system was renamed IMSMA Mobile when development switched to the U.S.
company FGM, Inc, which has also developed the most recent version of the IMSMA
desktop software. IMSMA Mobile is not a mine detection tool, but rather a management tool
for mapping areas known to be or assumed to be at risk due to landmines or unexploded
ordinance.
The software component of IMSMA Mobile is a stand-alone application running on
the Windows Mobile operating system that provides mapping functionality via a customized
61

applet running inside the ESRI mobile GIS Software ArcPad. The central hardware
component running IMSMA Mobile is a touch-screen pocket PC. The mapping components
of the IMSMA Mobile hardware include a consumer grade Socket GP0804-405 Bluetooth
GPS receiver and Bluetooth laser rangefinders, either the Leica/Vectronix Vector 1500 GMD
or the Laser Technologies TruPulse 360B.
User studies conducted with field operators of IMSMA Mobile found overall
acceptance of the system due to its improved mapping accuracy, ease of use, increased
productivity, and safety (especially relevant in demining) when compared to traditional
methods. While each of these benefits should be studied and tested, a more complete
understanding of the mapping accuracy component would provide the most immediate
benefit to the system users. Because the accuracy of the system’s two mapping components,
GPS and rangefinder, are cumulative, it is desirable to evaluate their accuracies
independently, allowing users to determine the specific accuracy range for their expected use
scenario. This concept of independent evaluation of accuracy components was employed by
the author in a previous study comparing GPS accuracy to compass and tape measurements
for demining applications (Berger and Dunbar, 2006). Despite the need for a better
understanding of the errors associated with the IMSMA Mobile mapping hardware, to date no
thorough accuracy assessment of the system’s GPS receiver had previously been performed.
Objectives
The goal of this study was to determine the expected horizontal positional accuracy of the
Socket Bluetooth GPS used in the IMSMA Mobile field-based GIS for humanitarian
demining. In order to meet this goal, the following two objectives were addressed:
• Determine the positional error of the Socket GPS and calculate its predicted
accuracy.
62
• Investigate DOP filtering and GPS averaging as methods for improving the expected
accuracy of the Socket receiver.
Methods and Materials
Reference Data Acquisition
A Javad Maxor survey grade GPS was used to precisely calculate a reference point
location to serve as “ground truth.” The Javad Maxor is a 20-channel dual frequency (L1 and
L2) GPS/GLONASS receiver that provides sub-centimeter level post-processed accuracy.
The reference point was surveyed with the Javad GPS for a collection period of two hours.
The Javad unit was placed on top of a Leica Geosystems HDS Twin-Target Pole (2.15m tall)
to avoid operator obstruction of GPS satellites (Figure 1). The surveyed location was in open
sky conditions, free of overhead obstacles such as trees and buildings. These near-ideal sky
view conditions were chosen to provide the most accurate reference data possible and to
permit the GPS experiment to determine accuracy under a best use-case scenario.
The reference data were post-processed using Javad’s Pinnacle software to perform
differential correction. The base station data used for this correction were collected from the
NOAA Continuously Operating Reference Station (CORS) located in Seattle, WA (ID:
SEAI). The base line to the CORS location was 5.5 km away from the surveyed point. The
differential correction produced a solution located at 5278001.97 m Northing and 552005.76
m Easting (UTM Zone 10 NAD83), with an orthometric height of 35.82 m, and a root-mean-
square (RMS) error of .44 cm.
63

Figure 1. Leica Geosystems HDS Twin-Target Pole shown with a) Javad Maxor Global Positioning System (GPS) unit attached at top for recording reference data (GPS center at 2.15 m height).
64

GPS Data Acquisition
This experiment examined the positional accuracy of the Socket GP0804-405
Bluetooth GPS receiver, and investigated methods for improving its accuracy. This
inexpensive (<$100) 12-channel L1 frequency GPS uses a Sirf Star IIe/LP chipset, and has a
manufacturer stated horizontal positional accuracy of 10 m RMS error. One reference point
location surveyed with the Javad Maxor unit was used to conduct the GPS accuracy
experiment. After completion of the data logging session using the Javad reference unit, the
Socket receiver was placed at the same location on the same target pole (Figure 1). An HP
iPaq PocketPC hx2490b, paired to the Socket GPS, was used to collect the GPS data using
ESRI’s ArcPad 7.1.1 software. Over four hours worth of GPS positions were collected at a
one-second-interval, totaling 14,462 readings. An average number of 8 satellites was used
across all GPS points (minimum 4 and maximum 11 satellites), with an average PDOP of 2.0
and an average HDOP of 1.2. During data collection, an efficiency (number of points
recorded/number of seconds logged) of 99.8% was achieved. This high efficiency confirms
the nearly optimal GPS data collection conditions desired for this accuracy assessment, as the
GPS was only rarely unable to calculate a position. These ideal conditions allowed the
experiment to set a baseline of accuracy for this equipment, demonstrating for users the
maximum performance to be expected from the GPS.
GPS Data Processing and Analysis
The instantaneous accuracy of the raw one-second interval GPS data was derived
using a variety of statistical methods. First, the minimum, maximum, mean and standard
deviation of the error of all horizontal positions were calculated, as they are familiar and
often used measures for studies of GPS accuracy (Wing and Eklund, 2007). The minimum
65
and maximum indicate the best and worst case instantaneous measurements provided by the
GPS during the sampling period. The mean provides a measure of the average error in the
recorded GPS data, while the standard deviation suggests the data’s variability about that
mean.
An even more common statistic for assessing the predicted GPS horizontal positional
accuracy is the root-mean-square error (RMSE or RMS error). When assessing horizontal
positional accuracy the RMS error is equal to the square root of the mean of the set of
squared differences between measured coordinate values (Socket GPS) and coordinate values
from a source of higher accuracy (Javad “ground truth”). RMSE is also equal to the square
root of the sum of the mean of all errors squared plus the standard deviation of all errors
squared. The RMSE value represents the radial horizontal distance from the reference
position within which an estimated 63% of the position errors will fall (Greenwalt and
Schultz, 1968). Comparing the accuracy reported by the mean and standard deviation to the
accuracy reported by RMSE, Sigrist et al. point out that RMSE “…depicts the deviation from
the truth (reference) and not from the mean error, as is the case with the standard
deviation….(RMSE) is a measure of the repeatability of the observations” (1999). In other
words, while the mean and standard deviation describe the error of the actual data collected
during a particular GPS sample, RMS error attempts to statistically describe the anticipated
receiver performance under the conditions used to collect the GPS samples.
In addition to the mean and standard deviation, a variety of horizontal RMSE-derived
confidence intervals were calculated and then compared to the percentage of the collected
data distribution within those same intervals. First, the Circular Error Probable (CEP) or
median (50% error distance) was calculated as 0.83 x RMSE. Second, the mean (54% error
distance) was calculated as 0.89 x RMSE. Finally, the 95% confidence interval was
66

calculated as 1.7308 x RMSE. This 95% confidence interval is a good measure for
comparison across GPS units since it is recommended by the National Standard for Spatial
Data Accuracy (NSSDA), published by the Federal Geographic Data Committee (1998).
NSSDA is an effort to provide a unified approach to assessing the accuracy of digital
geospatial data. The NSSDA 95 percent accuracy standard and many other RMSE GPS
accuracy standards are based, in whole or part, on the early work of Greenwalt and Schultz
(1968).
DOP Filtering Processing and Analysis
Since this experiment was only concerned with horizontal or 2D GPS accuracy, DOP
filtering was only performed on the horizontal dilution of precision or HDOP values. While
DOP filtering is normally implemented using Mobile GIS software in the field, the same
results can be simulated by sub-setting the raw one-second-interval data set, which contains
HDOP values for every position recorded, and examining the improvements in accuracy
measures. The narrow HDOP distribution of the collected GPS data, with a low average
value of 1.2, only permitted exploration of two subsets of the original data: HDOP <= 2 and
HDOP <= 1.5. The mean, standard deviation, and NSSDA 95% confidence error of the
horizontal error were calculated for both subsets.
GPS Averaging Processing and Analysis
The original one-second-interval GPS data collected from the Socket Bluetooth
receiver (14,492 points) was used to investigate the impact of GPS averaging. To simulate
the effect of averaging on the Socket GPS data, a running window was passed over the
original coordinates, averaging every x longitudes and x latitudes, to derive a new set of
67

(14,492 – x + 1) coordinates. This averaging procedure was run to simulate the following
time intervals: 15 and 30 seconds, as well as 1, 2, 4, 8, 16, 32, 64, and 128 minutes.
The original and average coordinate sets were plotted to visually show the impact of
averaging on data dispersion. The mean, standard deviation, and NSSDA 95% confidence
interval were calculated for the original and averaged data to quantify the changes in
accuracy as average time increased. An accuracy improvement rate was derived by
comparing the change in the NSSDA 95% confidence level to the number of seconds in the
time interval between averaging periods (1 sec to 15 sec, 15 sec to 30 sec, etc.).
Results and Discussion
One histogram and several statistics were generated to provide a complete picture of
the horizontal accuracy of the raw GPS data collected from the Socket device. Figure 2
presents the positively-skewed distribution of error in the GPS data, with the majority of error
values less than 5 m. Note that the histogram only presents data to an error distance of 25 m
because only 0.1% of the data falls beyond this threshold. Table 1 shows that the minimum
error during the collection period was 3 cm, while the maximum error was 34.42 m. The
mean horizontal error for the dataset was 4.37 m, encompassing 62% of the data, with a
standard deviation of 3.23 m. In contrast, the RMS error deviation from the reference position
indicated a 5.43 m radius at a confidence level of 63%. This RMS value is far better than the
10 m RMS specified by the manufacturer, perhaps due to a conservative or non-ideal GPS
condition used by the manufacturer to rate the device. Also noteworthy is the fact that all
RMS derived confidence intervals contain more of the actual GPS data (74%) than the
statistics theoretically predicts (63%). This was likely due to a more elliptical distribution of
68

Figure 2. Histogram of horizontal error distance in the original one-second interval GPS data (14,462 positions).
69

StatisticCalculated Error
DistancePoints Closer than Distance
Minimum 0.03 m 0%Maximum 34.42 m 100%Mean 4.37 m 62%Standard Deviation 3.23 m n/a
RMS (63%) 5.43 m 74%CEP/Median (50%) 4.56 m 65%RMS Mean (54%) 4.83 m 68%NSSDA 95% 9.40 m 93%
Table 1. Horizontal accuracy statistics calculated from Socket Global Positioning System (GPS) data and the percentage of the actual data distribution within that distance. All statistics in the bottom half of the table are derived from root mean square (RMS) error.
70

the collected GPS point positions, since the RMS theoretical intervals are calculated based on
a spherical distribution. Finally, the FGDC standard supported 95% RMS level of 9.40 m
provides a fairly close approximation of the actual data distribution (93%). These findings
suggest that, under good GPS conditions (clear skyview and adequate satellite coverage), the
Socket GPS delivers an accuracy of less than 4.56 m 50% of the time or less than 9.40 m 95%
of the time.
Due to the extremely favorable sky view conditions of the GPS experiment, DOP
filtering showed only minor improvements in GPS accuracy. Table 2 indicates that setting
HDOP <= 2.0 filtered out just 55 points and only slightly improved the mean (2 cm) and 95%
confidence interval (3cm). Setting HDOP <=1.5 filtered out 1299 points and provided a
greater improvement in the mean accuracy (14 cm) and the 95% confidence interval (32 cm).
While the lower HDOP filter (<= 1.5) did improve both the mean and 95% confidence
accuracy by approximately 3% each, this improvement is small compared to that of the
averaging results presented next. However, for fieldwork conducted in less than ideal sky
view conditions, such as under tree canopy, this accuracy improvement method may prove
beneficial.
The more detailed results of the averaged GPS data analysis are presented in Figure 3
both visually and quantitatively. In the upper left corner, the legend indicates how many
samples in the averaged datasets are represented by each colored dot on the plots, while the
graph presents a summary of the 95% confidence and mean statistics over the averaging
periods. The rest of the figure is divided into eleven sections presenting the original one-
second interval GPS data and the results of the ten averaging periods investigated by this
study. The numerical results in each section show the mean and standard deviation (in the
lower left), 95% confidence interval (in the upper right), and the rate of improvement of the
71

StatisticComplete
GPS DatasetFiltered
HDOP <= 2.0Filtered
HDOP <= 1.5
Number of Points 14,462 14,407 13,161Mean 4.37 m 4.35 m 4.23 mStandard Deviation 3.23 m 3.22 m 3.10 m
RMS (63%) 5.43 m 5.41 m 5.24 mNSSDA 95% 9.40 m 9.37 m 9.08 m
Table 2. Results of horizontal dilution of precision (HDOP) filtering on the horizontal accuracy of Socket Global Positioning System (GPS) data. All statistics in the bottom half of the table are derived from root mean square (RMS) error.
72

Figure 3. Visual and analytical description of the impact of averaging on GPS accuracy.
73

95% confidence interval from the last averaging period (in the lower right). The 15 m radius
plots in each section indicate the reference location with a cross, 5 m intervals in dark grey,
and 1 m intervals in light grey, and they define the 95% confidence limit boundary with a
dashed blue circle.
The visual distribution shown in these plots provides several insights into the impact
of GPS averaging. First, by stepping through these plots over the time intervals, it is clear that
averaging GPS data helps to smooth away the short term errors caused by various sources of
GPS error since the point data become more clustered about the reference location. Next,
while the majority of points in the original and averaged GPS data are clustered near the
reference location, these plots clearly indicate the ability for a GPS position to “wander”
away from and back toward the reference location. Multipath errors are usually the cause of
these noticeable short-term movements in GPS position, as reflected GPS signals have to
travel farther to the receiver. Averaging the GPS readings can certainly help smooth out these
errors, but plots like these can help to clearly communicate to users the real-world fluctuation
expected from a particular GPS device. Finally, a binning or clumping of the raw one-second-
interval GPS data can be seen when compared to the 15 second data. The regular pattern in
the original data is an artifact from the Socket GPS’ NMEA data stream, which outputs to
only 6 decimal places in decimal degrees (equal to 0.185 m N/S and 0.125 m E/W at this
latitude). Although not directly related to accuracy, averaging allows the GPS to achieve a
finer spatial resolution.
The quantitative data contained in Figure 3 are summarized in the graph of accuracy
vs. average time (upper-left). This graph shows that there is a rapid decrease in error,
regardless of statistic, over the short term when averaging, but that this improvement rate
quickly slows as the longer averaging periods are reached. This suggests a favorable cost to
74

benefit (average time to accuracy increase) ratio within the first averaging periods, which can
be investigated in more detail by looking at the 95% confidence interval and the 95%
confidence improvement rates provided for each averaging period. Although the greatest
improvement rate was measured during the first 15 seconds of averaging (3.60 cm/sec), given
a small investment in time, the 30 second to 1 minute averaging period provides a 1-2 m
accuracy improvement (from 9.40 m to 8.18-7.30 m). If slightly more time can be allotted to
a point survey, the 2-4 minute averaging period should provide an additional 1-2 m
improvement in accuracy (from 9.40 m to 6.33-5.58 m). A “point of diminishing returns” is
reached at 4 minutes of averaging beyond which the accuracy improvement rate decreases
substantially compared to the time investment required for each point survey. Considering
long-term costs, if positional mapping accuracy greater than 5.58 m at 95% confidence is
desired, a higher grade GPS receiver should be investigated. Finally, presenting the accuracy
statistics with the data plots provides a tangible tool for users to understand the implications
of both GPS averaging and the various measures of accuracy and confidence intervals.
Conclusions
The Socket GP0804-405 Bluetooth GPS Receiver was predicted to deliver a
horizontal accuracy of less than 5 m at least 50% of the time and less than 10 m at least 95%
of the time. It is important to note that these accuracies are only applicable under the
relatively ideal GPS conditions used for this study, including the particular surroundings,
ionosphere conditions, and satellite constellation status. HDOP filtering was shown to
provide only minor accuracy improvement under the GPS conditions of this experiment, but
this technique may be relevant for this device when conducting GPS surveys with poor
satellite conditions or under vegetation cover. Simulations showed that up to four minutes of
75

GPS averaging with the Socket device can provide a useful increase in expected accuracy. As
a rule-of-thumb, 30-60 seconds should be spent averaging for lower quality data needs
(perimeter vertices or sample points) and 2-4 minutes should be spent averaging for high
quality data needs (benchmark or rangefinder reference points).
In order to more completely describe the expected performance of a GPS, future
studies should investigate accuracy over a longer sampling period, under non-ideal sky view
conditions (i.e. different levels of canopy closure), and on different days at different times
under various non-ideal satellite configurations as reported by mission planning software
(Johnson and Barton, 2004). Because the Socket GPS is no longer "cutting-edge" technology,
newer consumer-grade devices using more modern GPS chipsets should be examined and
compared against one another. Just as this experiment produced suggestions for averaging
times, it also suggests the importance of appropriate wait times prior to data collection to
ensure that the GPS position has stabilized after movement. To determine the appropriate
wait time, an experiment could be developed in which wait time would be simulated in a
similar manner to the averaging times of this experiment: 1) move the GPS to a new location,
2) immediately start logging GPS data, and 3) explore the accuracy improvement of different
wait times on raw data.
Finally, this work also suggests the need for more general investigations of the
accuracy expected with Mobile GIS systems. This experiment was designed to focus on the
error component introduced with mapping equipment. However, operator error of Mobile
GIS systems often can lead to even larger problems. Operator-based studies should
investigate the ways in which users interact with software to assess the accuracy of collected
measurements, when they choose to correct/not correct errors and why, and if there are
76

methods for encoding best-use practices in the Mobile GIS software to systematically avoid
these errors in the future.
77

References
Berger, S. and Dunbar, M. 2006. The Accuracy of measuring perimeter points: Use of GPS
vs. bearing and distance. GICHD Technical Publication. 8p. Available from: <http://www.gichd.org> [accessed Dec 2, 2009].
Deckert, C. and Bolstad, P.V. 1996. Forest canopy, terrain, and distance effects on global
positioning system point accuracy. Photogrammetric Engineering and Remote Sensing 62: 317-321.
Devlin, G. J., McDonell, K. and Ward, S. 2007. Dynamic non-DGPS positional accuracy
performance between recreational and professional GPS receivers. Journal of Location Based Services 1(1): 77-85.
Federal Geographic Data Committee, 1998. Geospatial positioning accuracy standards. Part
3: National standards for spatial data accuracy, FGDC-STD-007.3. Federal Geographic Data Committee, Washington, DC. 25p.
Johnson, C.E. and Barton, C.C. 2004. Where in the world are my field plots? Using GPS
effectively in environmental field studies. Frontiers in Ecology and the Environment 2(9): 475-482.
Greenwalt, C R. and Shultz, M.E.. 1968. Principles of Error Theory and Cartographic
Applications. ACIC Technical Report No. 96. St. Louis, MO, Aeronautical Chart and Information Center, U.S. Air Force: 89p.
Goodchild, M.F., Johnston, D.M., Maguire, D.J., and Noronha, V.T. 2004. Distributed and
mobile computing. In A Research Agenda for Geographic Information Science, R. B. McMaster and E. L. Usery, Eds. pp. 257-286. Boca Raton, Florida, CRC Press.
Johnson, C.E. and Barton, C.C. 2004. Where in the world are my field plots? Using GPS
effectively in environmental field studies. Frontiers in Ecology and the Environment 2(9): 475-482.
Hofmann-Wellenhof B., Lichtenegger, H. and Collins, J. 2001. Global positioning system:
theory and practice, 5th edn. Vienna, Austria, Springer-Verlag, 347p. Misra, P. and Enge, P. 2001. Global Positioning System: Signals, Measurements, and
Performance. Lincoln, MA, Ganga-Jamuna. 569p. Peng, Z. and Tsou, M. 2003. Internet GIS: Distributed Geographic Information Services for
the Internet and Wireless Networks. Hoboken, New York, Wiley and Sons. 720p. Rizos, C. 2002. Introducing the global positioning system. In Manual of Geospatial Science
and Technology, J. Bossler, J. Jensen, R. McMaster, and C.Rizos, Eds. pp. 77-94. London and New York, Taylor and Francis.
78

Rempel, R.S. and Rogers, A.R. 1997. Effects of differential correction on accuracy of a GPS animal location system. Journal of Wildlife Management 61: 525-530.
Sigrist, P., Coppin, P. and Hermy, M. 1999. Impact of forest canopy on quality and accuracy
of GPS measurements. International Journal of Remote Sensing 20: 3595-3610. Tsou, M. 2004. Integrated mobile GIS and wireless internet map servers for environmental
monitoring and management. Cartography and Geographic Information Science 31(3): 153-165.
Wing, M.G. and Eklund, A. 2007. Performance comparison of a low-cost mapping grade
Global Positioning Systems (GPS) receiver and consumer grade GPS receiver under dense forest canopy. Journal of Forestry 105: 9-14.
79

Chapter 4
Assessing the Accuracy of Laser Rangefinders for Mobile GIS Mapping
Abstract
Users of field-based mobile GIS today can select from a wide variety of location
mapping technologies. An understanding of the errors associated with various types of
equipment and basic methods for improving accuracy enables each user to choose the right
tools and design the most appropriate field data collection strategy. This study examined the
positional accuracy of two laser rangefinder units, the Leica/Vectronix Vector 1500 GMD
and the Laser Technologies TruPulse 360B, used in the IMSMA Mobile humanitarian
demining mobile GIS system. Across a variety of testing conditions, the Vector rangefinder
was found to have a slightly higher mean accuracy (2.4 m) in collecting point locations
compared to the TruPulse (3.0 m). However, when shooting at well defined vertical physical
targets rather than a point on the horizontal bare earth overall point and area measurement
accuracy improved greatly and the difference between equipment accuracy all but
disappeared (Vector 1.0 m and TruPulse 1.2 m). Significant variation in accuracy among
users, corresponding to level of rangefinder experience, was found, suggesting the positive
impact of training and practice on expected accuracy. Finally, magnetic interference, caused
by the metal content of one user's eye glasses, led to highly irregular bearing measurements
with the TruPulse rangefinders. Users of rangefinder equipment should be alert to the
potential for this type of bearing measurement error and aware of methods for testing and
preventing it.
80
Introduction
Mobile GIS
With recent developments in technology, computing has become available in more
places worldwide, is now small enough to move with its users even to highly remote places,
and can provide access to a wide array of distributed resources. It has been noted that these
changes in the "where" aspects of computing have already made significant impacts on the
way geographers and GIS professionals conduct their work (Goodchild et al., 2004). This
deviation from the traditional desktop GIS framework has been termed ‘Distributed GIS,’
which encompasses both mobile GIS and the broad array of internet GIS technologies (Peng
and Tsou, 2003). Mobile GIS has been defined as “an integrated software/hardware
framework for the access of geospatial data and services through mobile devices via wireline
or wireless networks” (Tsou, 2004). The application areas of mobile GIS have been broken
down into field-based GIS, focusing on the collection, validation and update of GIS data in
the field, and location based services (LBS), concerned mainly with location management
and logistics functions. At the heart of field-based GIS are the mapping technologies, such as
the Global Positioning Systems (GPS), that make GIS feature collection possible.
Laser Rangefinders
Laser rangefinder devices measure the distance, bearing and inclination to a target.
Mobile GIS software uses these three pieces of information along with known reference
coordinates (operator location, usually collected from a GPS) to calculate the coordinates of
the target location. These laser rangefinders, which collect measurements one at a time, are
frequently used in forestry applications (Wing and Kellog, 2001) and ecological field studies
(Aspbury and Gibson, 2004). More expensive laser scanning technologies, also known as
81

ground based Light Detection and Ranging (LIDAR), can be used to collect larger quantities
of point measurements at an even greater level of precision. This type of equipment is more
commonly used in the fields of geology (Alfarhan et al., 2008) and archaeology (Brusco et
al., 2006).
IMSMA Mobile – Mobile GIS for Humanitarian Demining
Early in 2003, the Geneva International Centre for Humanitarian Demining (GICHD)
initiated the development of a small, pocket-sized tool to support humanitarian demining data
collection in the field. This tool was intended to map and collect demining related data in the
form of digital field reports for integration with the GICHD Information Management System
for Mine Action (IMSMA) desktop software. This handheld system was called Explosive
Ordnance Disposal Information System-Survey (EOD IS-Survey) and was developed by the
Swedish EOD and Demining Centre (SWEDEC) under the guidance of GICHD. In 2007 the
handheld system was renamed IMSMA Mobile when development switched to the U.S.
company FGM, Inc, which has also developed the most recent version of the IMSMA
desktop software. It is important to note that IMSMA Mobile is not a mine detection tool, but
rather a management tool for mapping areas known to be or assumed to be at risk due to by
landmines or unexploded ordinance.
The software component of IMSMA Mobile is a stand-alone application running on
the Windows Mobile operating system that provides mapping functionality with a customized
applet running inside the ESRI Mobile GIS Software ArcPad. The central hardware
component running IMSMA mobile is a touch-screen pocket PC, the Hewlett Packard iPAQ
h5550 or hx2700. The mapping components of the IMSMA Mobile hardware include a
consumer grade Socket GP0804-405 Bluetooth GPS receiver and Bluetooth laser
82

rangefinders, either the Leica/Vectronix Vector 1500 GMD or the Laser Technologies
TruPulse 360B.
User studies conducted with field operators of EOD IS-Survey in Chile (2004),
Albania (2004), Ecuador (2004), and Lebanon (2006) as well as IMSMA Mobile in Chile
(2007) found overall acceptance of the system due to its improved mapping accuracy, ease of
use, increased productivity, and safety (especially relevant in demining) when compared to
traditional methods. While each of these benefits should be studied and tested, a more
complete understanding of the component of mapping accuracy would provide the most
immediate benefit to the system users. Because the accuracy of the system’s two mapping
components, GPS and rangefinder, are cumulative, it is desirable to evaluate their accuracies
independently, allowing users to determine the specific accuracy range for their expected use
scenario. This concept of independent evaluation of accuracy components was employed by
the author in a previous study comparing GPS accuracy to compass and tape measurements
for demining applications (Berger and Dunbar, 2006). Despite the need for a better
understanding of the errors associated with the IMSMA Mobile mapping hardware, to date no
thorough accuracy assessment of the system’s laser rangefinders had previously been
performed.
As few generic studies have examined the positional accuracy of laser rangefinder
measurements, experiments must be designed based on first-hand experiences using these
devices in a specific application area. The user studies conducted with field operators of EOD
IS-Survey and IMSMA Mobile revealed several important factors that appear to influence
laser rangefinder measurement accuracy and deserve further investigation: the type of
equipment, the distance to the targeted object, the user operating the equipment, the type of
targeted object, and whether a monopod is used to steady the equipment.
83

Objectives
The goal of this study was to determine the expected horizontal positional accuracy
of the Vector 1500 GMD and TruePulse 360B Laser Rangefinders used in the IMSMA
Mobile field-based GIS for humanitarian demining. In order to meet this goal, the following
two objectives were addressed:
• Determine the accuracy of point and area measurements collected with the
rangefinders given the variables of equipment, target distance, and user
• Explore the impact of target type and the use of a monopod with the rangefinders as
methods for improving this accuracy
Methods and Materials
Reference Data Acquisition
To evaluate the accuracy of rangefinder devices, some form of reference data or
ground truth is required. Previously surveyed monuments were not appropriate for this study
since the experiments required multiple target locations within a 100 m radius. Instead, a
Javad Maxor survey-grade GPS was used in this study to precisely calculate five point-
locations on the University of Washington, Seattle campus. The Javad Maxor is a 20-channel
dual frequency (L1 and L2) GPS/GLONASS receiver that provides sub-centimeter level post-
processed accuracy. All reference points were surveyed with the Javad GPS for a collection
period of at least two hours. The Javad unit was placed on top of a Leica Geosystems HDS
Twin-Target Pole (2.15m tall) to avoid operator obstruction of GPS satellites (Figure 1). All
point locations were in open sky conditions, free of overhead obstacles such as trees and
buildings. These near-ideal sky view conditions were chosen to provide the most accurate
reference data possible.
84

Figure 1. One of four Leica Geosystems HDS Twin-Target Poles used in this study. Shown with a) Javad Maxor Global Positioning System (GPS) unit attached at top for recording reference data (GPS center at 2.15 m height), and b) White board with black crosshair target used for rangefinder experiment (target center at 1.75 height).
85

All reference data were post-processed using Javad’s Pinnacle software to perform
differential correction. The base station data were collected from the NOAA Continuously
Operating Reference Station (CORS) located in Seattle, WA (ID: SEAI). The base lines to
the CORS location were no more than 5.2 km away from any point surveyed for these
experiments. The results of the differential correction showed an RMS error no larger than
0.66 cm for any reference point solution.
Rangefinder Testing and Data Acquisition
This experiment was designed to assess the accuracy of measurements collected with
laser rangefinders given the variables of equipment, distance to target and user. The first
rangefinder device examined was Vectronix/Leica's Vector 1500 GMD, which costs $11,900
and has a manufacturer stated distance accuracy of ±1 m at distances <500m or ±2m at
distances >500m, with a maximum range of 2 km. The second rangefinder device tested was
Laser Technology’s TruPulse 360B, which costs $1,700 and has a manufacturer stated
distance accuracy of ±30 cm to high quality targets (survey reflectors) or ±1 m to low quality
targets, with a 1 km typical maximum range or 2 km maximum range to reflective targets.
This experiment was based on a test course surveyed with the Javad GPS, composed
of a reference point where the rangefinder and operator were located, and four target
locations, to be measured by the rangefinders (Table 1). The targets locations were situated at
approximately 25, 50, 75 and 100 m from the reference point in an arc-shaped pattern
creating a perimeter with a polygonal area of 851.7 m2 (Figure 2). This arrangement allowed
the accuracy of both point-locations and area measurements to be evaluated.
86

Point Type Northing (m) Easting (m) Height (m)Distance to
Reference (m)
Rangefinder Ref. 5278427.53 551731.69 49.85 0Target 1 5278451.06 551721.98 50.27 25.45Target 2 5278476.27 551719.37 51.29 50.27Target 3 5278502.52 551733.34 53.27 75.01Target 4 5278522.26 551762.62 55.97 99.65
Table 1. Reference locations surveyed by Javad Maxor (northing and easting in UTM Zone 10 NAD83, height orthometric).
87

Figure 2. Rangefinder experiment test course from ground and overhead views. Test participant (standing) measuring Target 2 location, while test administrator (seated) collects data on PocketPC.
88

Ten test subjects performed the experiment to examine the variation of readings
among users. The subjects varied in their past exposure to this or any other sighting
equipment (binoculars, gun sight, etc). A simple questionnaire administered to participants
revealed that two users had no experience with any sighting equipment, five users had basic
sighting equipment experience, two users had worked specifically with laser rangefinders
before, and one was an expert user of the rangefinder equipment.
In addition to examining the role of equipment, distance to target, and users on
rangefinder measurement accuracy, this study was organized into three specific tests to
investigate the potential for improving accuracy. For the first test, users were instructed to
shoot at the center of a black on white vertical target board (45 cm x 60 cm with center at
1.75 m high) affixed to four of the Leica target poles (Figure 1). For the second test, users
were asked to shoot at the horizontal ground directly below the central pole of the Leica
target poles. Since the bottom of the pole was elevated above the ground surface, this test
simulated the scenario of shooting at an identifiable location on bare ground where no
vertical object is present. For the third test, users repeated the second test with the addition of
a Benro MC 91n6 monopod to steady the rangefinder. A comparison of the results between
test 1 and test 2 permitted examining the impact of shooting at a well-defined vertical target
rather than the horizontal bare earth. A comparison of the results of test 2 and test 3 permitted
examining the impact of using a monopod when shooting at the horizontal bare earth. All ten
participants used both pieces of equipment to conduct the three tests collecting five
repetitions of the four target perimeter. This produced a total of 1,200 point measurements
(10 test subjects x 2 rangefinders x 3 tests x 5 repetitions x 4 targets) recorded as 300 polygon
perimeters.
89

Readings taken by the rangefinders were collected on an HP iPaq PocketPC hx2490b,
paired to the rangefinders, using ESRI’s ArcPad 7.1.1 software. Before testing, both
rangefinders were calibrated to offset any local magnetic fields and the local magnetic
declination was set. During the testing, participants were required to operate only the
rangefinder. A test administrator was responsible for all interaction with ArcPad on the
PocketPC system. Users were first asked to remove any cell phones or other electronic
devices from the testing area due to the potential for electromagnetic interference with the
rangefinder’s measurement of bearing. Next, users were provided brief instructions on the
operation of each device, such as which button(s) to press in order to collect a reading and
what visual feedback to expect from the device. They were instructed to stand over a .25 m-
diameter plastic marker disc indicating the reference location.
After this introduction, users were asked to collect one practice perimeter, shooting at
the black on white target boards to become familiar with the system. Once the testing began,
participants were allowed to repeat any target reading if they felt they had made an error. The
test administrator asked the subject to re-collect a point if it would be obvious to any system
user that an egregious misreading had been made, such as a measurement more than twice the
actual distance to the target. The test administrator also let the participants know if they
shifted their standing position from the reference position marker disc.
Rangefinder Data Analysis
Analysis began by calculating the difference between the area of the 300 perimeter
polygons collected by users during the rangefinder experiments and the reference area
meticulously surveyed using the Javad Maxor survey-grade GPS (Figure 2). Each polygon
perimeter was then divided into 1,200 individual point locations, and each point was
90

identified by the variables of equipment, target distance, user and test. For each point, the
horizontal error distance to the known target location was calculated. Additionally, the
individual error components in the rangefinder distance and angle measurements were
derived from the reference location, known target location and measured target location.
These results were explored, by variable, to identify any irregularities in the data.
One user, number 5, had unusually large errors with the TruPulse, displaying three times the
horizontal distance error of any other user for many short-ranged readings. The errors in this
user’s readings were explored in more detail and, due to magnetic interference from the metal
content of the user’s eye glasses, were determined to be invalid for the purposes of this
experiment (see Results and Discussion). For this reason, all measurements by this user were
removed from the dataset, including the valid Vector readings to keep the sample size equal
across equipment types (reduced to 540 points per equipment type or 1,080 total).
To assess the relative impact of each tested factor (equipment, target distance, user,
and test) on the overall rangefinder accuracy, mean horizontal errors were calculated one
factor at a time across the entire dataset. To study the variation among users, mean accuracies
were computed at the individual level and also as user groups classified by experience level.
An analysis of variance (ANOVA) test was performed for each factor (equipment, target
distance, user, user experience level, and test) to determine if the means for each group were
significantly different. In addition to these means, the individual impact of distance and angle
measurement errors were examined at the equipment level to ensure that error was equally
distributed between these two measurement components. The mean rangefinder area accuracy
was calculated for the entire dataset to show general accuracy for a wide range of scenarios
and for the subset of data collected during test one to show the expected performance under
the preferred case of targeting a vertical object.
91

Results and Discussion
The first objective of this study was to determine the impact of equipment type,
distance to target, and user on the accuracy of measurements made with rangefinder devices.
A lower overall accuracy was observed using the TruPulse device (3.00 m) than with the
Vector device (2.40 m) (Table 2). These mean accuracies were significantly different, with an
ANOVA significance value of .009. Note that these accuracies, along with all others
presented, are averaged measurements computed across all other test factors. Neither of these
findings is better than the manufacturer’s specified levels of accuracy (±1 m for both
rangefinders at this distance), but this is largely due to using non-vertical targets for two-
thirds of the tests. A closer investigation of this difference between devices revealed an
equally-shared impact among the individual error components of measured distance and
measured angle. Although not included in the experimental design, two other important
differences were noted between the two types of equipment. First, all TruPulse tests required,
on average, only one half the time required for all Vector tests as determined from time-
stamps on collected data files. Second, the Vector equipment would produce, on average, five
Bluetooth miscommunications per user over the course of sixty measurements, resulting in
lost data and requiring a second measurement. At nearly 8 times the cost, the Vector
rangefinders do not appear to provide a sound return on investment if both efficiency and
accuracy are the main concerns with equipment choice.
The next factor investigated was the distance from the observer to the measured
target location. As expected, there was a dramatic increase in measurement error with
increasing target distance when averaged across all other factors tested. The differences
among the means of all test distances were found to be significant. Users in minefield
mapping scenarios will likely position themselves naturally at the safest location with a clear
92
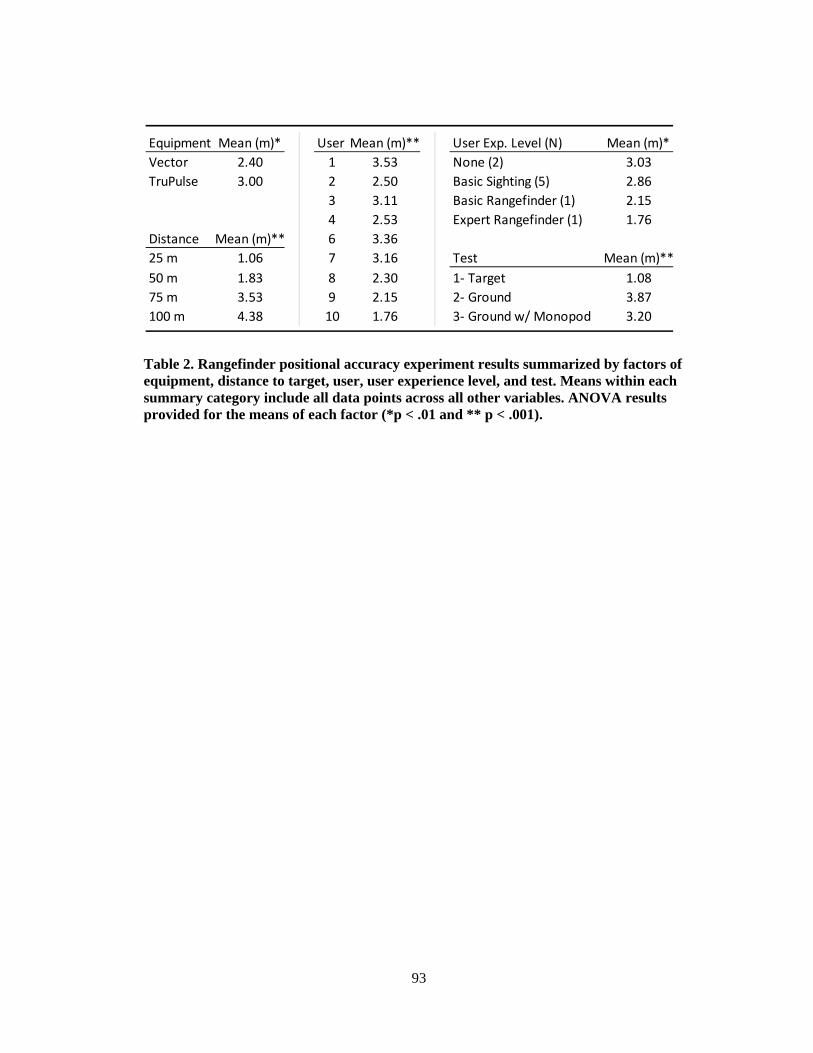
Equipment Mean (m)* User Mean (m)** User Exp. Level (N) Mean (m)*Vector 2.40 1 3.53 None (2) 3.03TruPulse 3.00 2 2.50 Basic Sighting (5) 2.86
3 3.11 Basic Rangefinder (1) 2.154 2.53 Expert Rangefinder (1) 1.76
Distance Mean (m)** 6 3.3625 m 1.06 7 3.16 Test Mean (m)**50 m 1.83 8 2.30 1- Target 1.0875 m 3.53 9 2.15 2- Ground 3.87100 m 4.38 10 1.76 3- Ground w/ Monopod 3.20
Table 2. Rangefinder positional accuracy experiment results summarized by factors of equipment, distance to target, user, user experience level, and test. Means within each summary category include all data points across all other variables. ANOVA results provided for the means of each factor (*p < .01 and ** p < .001).
93

sightline to their target(s). Understanding the impact of distance on accuracy can help with
assessing the reliability of their field measurements. Finally, a comparison of the overall
accuracies among different users demonstrated a highly variable and significantly different
set of mean accuracies. By classifying the user results into the self-reported levels of
experience (no experience, basic sighting, basic rangefinder, and expert rangefinder), it is
clear that these significantly different mean accuracies improved with experience levels (3.03
m, 2.86 m, 2.15 m and 1.76 m respectively). These results make a strong case for the positive
impact of training and repeated use on the expected accuracy of this equipment.
Two methods for improving accuracy were also examined in the rangefinder
experiment: using vertical physical targets instead of shooting at the horizontal ground and
using a monopod to stabilize the rangefinders. Table 2 presents the significantly different
mean accuracies of the methods. Comparing the results of test 1 and test 2 shows that users
can expect more than 3.5 times the accuracy from the rangefinder equipment when shooting
at a well defined vertical target compared to a point on the horizontal bare earth. The much
larger error when shooting at the ground is caused by the difficulty of the user to precisely
target a point location that is not well defined, and the inability for the rangefinders to
precisely measure a surface with a non-perpendicular angle to the rangefinder's measurement
laser. This result demonstrates that both rangefinder devices are capable of measuring a well
defined target/object to nearly 1 m accuracy. Comparing test 2 and 3 indicates that the
monopod provided only a small increase in accuracy across all other variables when shooting
at the ground (0.67m). Although not tested in this experiment, it is hypothesized that at longer
distances the steadying effect of a monopod would provide an increased accuracy when
shooting at a physical target. With a cost under $100, a monopod may be a worthwhile
addition for any rangefinder-based field GIS data collection. Additional field equipment can
94

be a burden, but a telescoping carbon fiber model, like the one used in this study, weighs only
500 grams and collapses down to 50 cm in length.
The accuracy of areas measured with the rangefinder devices was assessed by
comparing the original 4-point polygons collected by the experiment to the surveyed area of
851.7 m2 bounded by the target locations. Across all users and tests, the Vector device had a
mean underestimation of 25 m2 (std. dev. = 97 m2), while the TruPulse had a mean
underestimation of 45 m2 (std. dev. = 107 m2). While these errors and distributions are
reasonable considering the cumulative impact of point error measurements on total surveyed
area error, the actual numbers are important to communicate to users who will be collecting
data in the field. Additionally, to investigate the impact of shooting only at well defined
targets on area measurement accuracies, error results were computed for test 1 across both
devices and all users. As noted with point measurements, the use of well defined objects as
targets yielded a dramatic increase in area measurement accuracy with a mean overestimation
of only 2.5 m2 (std. dev = 25 m2). This finding is particularly relevant given the humanitarian
demining application of this system, due to the fact that mine action funding is usually based
on the total area surveyed for clearance.
Finally, it was important to investigate the cause of the errors leading to the removal
of one study participant’s rangefinder data. Large inaccuracies in user 5's TruPulse results,
not apparent during the field data collection but discovered during analysis, led to an
examination of the individual components of distance and angle measured by the rangefinder.
No anomalies were found with the distance measurements; however a plot showing every
user's measured angle error with both rangefinder devices clearly identified a problem with
the bearing measurements of the TruPulse device for user 5 (Figure 3). This figure shows that
user 5 had a much greater overall angular measurement error (user 5 mean = 5.06º, versus the
95

Figure 3. Error in angle/bearing measurement with rangefinders by equipment type and user (n=60 per box). Box indicates 75th and 25th quartiles, dark line indicates median, whiskers indicate max/min value within 1.5 IQR, and outliers are represented with points. The extraordinarily large angular error in user 5’s TruPulse measurements led to the removal of all of this user’s data in the final analysis.
96

mean for all other users = 0.58º) and also more variability in measurements (user 5 std. dev. =
1.70º, with the std. dev. for all other users = 0.91º) with the TruPulse device. The impact of
this type of angular measurement error can be important because it increases the overall error
in the measured horizontal position as the distance to the measured target increases. Given an
angular error of 5 º, for every 100 m additional target distance, an error of 8.75 m is
introduced in the measured horizontal distance.
Despite the author’s a priori attempts to alleviate any magnetic interference in the
testing site, it was later discovered that the errors in user 5's bearing measurements were
caused by this user’s glasses, which had frames made from a ferromagnetic metal. Indeed,
"steel rimmed glasses" are mentioned in the TruPulse documentation as one potential source
leading to errors in azimuth readings (Laser Technology, Inc., 2007). These results,
confirming the susceptibility of the rangefinder devices to influence by magnetic fields, and
the other findings of this experiment suggest the importance for training and operating
procedures designed to ensure operator awareness of the factors leading to increased accuracy
or, conversely, to potentially severe problems.
Conclusions
Among the two laser rangefinder units studied, the Leica/Vectronix Vector 1500
GMD was found to be slightly more accurate (2.4 m) than the Laser Technology TruPulse
360B (3.0 m) across a wide variety of testing scenarios. Shooting at a well defined physical
target was the most effective way to improve rangefinder accuracy, resulting in 3.5 times less
point measurement error and 14 times less area measurement error than shooting at the bare
ground across both devices. Results showed a high degree of variability in measurement
accuracy among users. Because this generally followed a trend of higher accuracy for higher
97

levels of experience, user training can be confirmed as the second best method of improving
rangefinder accuracy. Under the scenarios tested, the addition of a monopod device for
steadying the rangefinders was found to improve accuracy, but only marginally. However,
due to its low cost and the increased importance of stability when shooting at longer target
distances, a monopod may prove useful for rangefinder applications involving long lines of
sight.
In the past, the author had observed erratic bearing readings from the Vector
rangefinders caused by cell phones or other mobile GIS equipment (GPS or Pocket PC) being
placed too close to the rangefinders. This experiment demonstrated that even seemingly
harmless items, such as eye glasses, can lead to unexpectedly high levels of error in bearing
readings, especially with the TruPulse equipment. Users should be aware that even small
fluctuations in bearing measurement can lead to high levels of positional error, especially
when sighting large distances. To avoid such errors, multiple rangefinder measurements
should be taken by multiple users and compared, or a basic compass should be carried with
the rangefinders to test for magnetic interference by suspect items. In general, it is very
important that users consult reference guides for equipment, because their apparent ease of
use can be deceiving and can lead to inaccurate data collection that may not be immediately
perceivable while in the field. The old cliché – “When all else fails read the instructions.” –
certainly applies. But that may be easier said than done considering the amount of material to
be covered and the vagaries of training venues.
The analysis of the rangefinder data collected in this study was intended to be very
simple and straightforward, by only analyzing one variable at a time. Future experiments
could use the same data, or data collected using similar testing procedures, to statistically
98

investigate the relative importance of all variables on accuracy and model the interactions
among variables.
Finally, this study also suggests the need for more general investigations of the
accuracy expected with Mobile GIS systems. With the exception of examining the variability
in users’ rangefinder measurements, these experiments were designed to focus on the error
components introduced by the actual mapping equipment. However, operator error of Mobile
GIS systems can lead to even larger problems. Operator-based studies should investigate the
ways in which users interact with software to assess the accuracy of collected measurements,
when they chose to correct/not correct errors and why, and if there are methods for encoding
best-use practices in the Mobile GIS software to avoid these errors in the future.
99

References
Alfaran, M., White, L., Tuck, D. and Aiken, C. 2008. Laser rangefinder and ArcGIS
combined with three-dimensional photorealistic modeling for mapping outcrops in the Slick Hills, Oaklahoma. Geosphere 4(3):576-587.
Aspbury, A. and Gibson, R. 2004. Long-range visibility of greater sage grouse leks: a GIS-
based analysis. Animal Behavior 67(6): 1127-1132. Berger, S. and Dunbar, M. 2006. The Accuracy of measuring perimeter points: Use of GPS
vs. bearing and distance. GICHD Technical Publication. 8p. Available from: <http://www.gichd.org> [accessed Dec 2, 2009].
Brusco, N., Capeleto, S., Fedal, M., Paviotti, A., Poletto., L., Cortelazzo, G. and Tondello, G.
2006. A system for 3D modeling frescoed historical buildings with multispectral texture information. Machine Vision and Applications 16(6): 373-393.
Goodchild, M.F., Johnston, D.M., Maguire, D.J., and Noronha, V.T. 2004. Distributed and
mobile computing. In A Research Agenda for Geographic Information Science, R. B. McMaster and E. L. Usery, Eds. pp. 257-286. Boca Raton, Florida, CRC Press.
Laser Technology, Inc. 2007. TruPulse 360/360B User’s Manual First Edition. Peng, Z. and Tsou, M. 2003. Internet GIS: Distributed Geographic Information Services for
the Internet and Wireless Networks. Hoboken, New York, Wiley and Sons. 720p. Tsou, M. 2004. Integrated Mobile GIS and Wireless Internet Map Servers for Environmental
Monitoring and Management. Cartography and Geographic Information Science 31(3): 153-165.
Wing, M. and Kellogg, L. 2001. Using a laser rangefinder to assist harvest planning. In
Proceedings of the First International Precision Forestry Symposium, June 2001, University of Washington, Seattle, WA.
100

Chapter 5
Conclusions
Landmines and unexploded ordnance pose a serious threat to civilians in more than
80 countries around the world. Humanitarian demining seeks to rid the world of these
remnants of war and return the cleared land to local populations. One essential step in
humanitarian demining is the collection of information describing and locating these
hazardous areas. This research examined the fitness for use of a mobile GIS used for fields
surveys to support humanitarian demining. Overall the system was found to be a success by
its users, but areas in need of improvement and greater ongoing support were identified. This
fit-for-use analysis calls attention to the benefits of this system while simultaneously
providing a series of recommendations for best use practices concerning software, hardware,
training, and user components of this mobile GIS.
As more and more academic disciplines, commercial endeavors, and technologies
incorporate geographic information into applications, the demand for timely, accurate, and
safely collected spatial field data will continue to rise. While the findings of this research are
directly relevant to users of the humanitarian demining system, they are also generally
applicable to many other mobile GIS applications.
Evaluating Mobile GIS
This study demonstrated that mobile GIS for humanitarian demining can be faster,
more accurate, and more reliable compared to traditional methods for collecting spatial field
data, such as paper forms, maps, and the stand-alone location technologies of GPS or
compass and tape. However, these benefits and the promise of a “high-tech” solution to
101

fieldwork can lead potential users to erroneously believe that mobile GIS is a turnkey
solution. Solid system development, proper training and instructional materials, and support
from knowledgeable technical staff are critical for successful use of any mobile GIS in the
field.
Infrequent but significant system crashes were shown to quickly lead users to become
frustrated or, even worse, to lose confidence in a new system. This issue with the demining
handheld, along with the numerous minor bugs reported during deployments, demonstrate the
importance of thorough field testing, prior to the start of actual field data collection. A good
rule is to assume that nothing will work in the field if it hasn’t been exercised thoroughly in
or near the fieldworker’s home facility.
Editing spatial data in a mobile GIS was found to be somewhat more complex than
on the desktop due to a smaller screen size, touch-screen interface, and the often difficult
conditions of fieldwork. Inevitably, errors will be made during initial data collection or
updates required after the fact, and users should have received enough practical training
beforehand so that editing procedures require little thought.
Efforts should be made to develop quality base map data for the most effective field
experience. High spatial resolution raster data, such as aerial/satellite imagery or scanned
topographic maps, were found helpful for the demining system trials, but detailed vector data
may also be appropriate for certain applications. Detailed base map data can help users gauge
the accuracy of field measurements, aid in navigation, and provide a reference source of
previously gathered field data.
The hardware components of the demining mobile GIS also warrant a set of
recommendations. In general, with the high cost of fieldwork, it is worthwhile to invest in
backup hardware units for all but the most expensive pieces of equipment. When choosing a
102

mobile GIS field computer (pocket or tablet PC), extra attention should be given to outdoor
screen visibility and battery life. Considering the repeated rangefinder- and GPS-related
Bluetooth issues experienced during this evaluation, system complexity should be reduced by
using an integrated solution or cabled versions of equipment whenever possible.
Magnetic interference was shown repeatedly to have the potential to seriously impact
measurements collected with rangefinder equipment. This fact should be stressed during the
rangefinder training, along with the exact procedure for calibration, setting local magnetic
declination, and Bluetooth configuration. Additionally, given the likely need for long-range
sighting, a monopod or tripod should also be considered for the rangefinder.
Simple GPS receivers were found to be well received by users in terms of their
usability, leaving the project's required mapping accuracy as the key factor for selecting an
appropriate unit. Whatever the accuracy desired, formal testing, as described in Chapters 3
and 4 of this study, should be performed on both GPS and rangefinder hardware to determine
the exact accuracy users can expect to obtain under their specific field operating conditions.
Training sessions and materials related to a mobile GIS were found to be just as
important as the system’s hardware and software for ensuring a successful field effort. Extra
attention should be devoted to complex mapping tasks. All conceivable combinations of data
collection methods and mapping hardware should be taught in as many practical hands-on
exercises as possible, thus addressing any specific needs or gaps in the knowledge of
individual field users. Users and system evaluators alike also indicated that thorough and well
thought out guide materials, such as checklists, laminated for durability in the field, would be
nearly as valuable in the long run as a formal training program.
103

While many of the findings presented in this study were specific to the demining
Survey Tool, the general lessons learned during this evaluation have broader application for
any mobile GIS user, developer, or trainer. Take, for example, a theme encountered across all
aspects of the Survey Tool evaluation, which was summed up nicely in a comment made by
one trainee from the Chilean deployment, “Nothing will ever be exactly as we had planned,
but we must be ready to deal with it anyway.” While this concept is likely known by anyone
who has spent much time doing fieldwork of any sort, it needs to be incorporated throughout
mobile GIS so that the free flowing nature of traditional fieldwork is not interrupted. To
ensure this, every effort should be made to train for user adaptability and design for system
flexibility. Training experiences and materials must provide users with the ability to make
decisions on their feet in the field, both in how to collect data and how to deal with system
malfunctions. The system software and hardware also must be able to operate in a variety of
data collection modes, from the open-ended nature of a field notebook to the highly
structured methods used for a formal site survey. Finally, adequate time must be allocated (at
least a day) to work out the "kinks" in hardware and methodology on-site, under real field
conditions prior to the beginning of actual data collection.
As early as possible, mobile GIS system designers and developers should consider
whether to develop a focused, task specific mobile GIS or a broadly scoped one-size-fits-all
tool. Using the lessons learned from observations and user feedback related to the demining
system, applications should be directed specifically at a narrow group of user needs, while
remaining flexible enough to adapt to the dynamic nature of field data collection.
104

GPS Accuracy for Mobile GIS
Based on 14,462 readings, the Socket GP0804-405 Bluetooth GPS Receiver was
predicted to deliver a horizontal accuracy of better than 5 m at least 50% of the time and
better than 10 m at least 95% of the time. These accuracies should be considered the best-case
scenario for this equipment considering the relatively ideal GPS conditions used for this
study, including a completely open sky-view and deliberate selection of conditions for
extremely low dilution of precision (DOP) values. This study also investigated horizontal
DOP (HDOP) filtering, but found that this technique provided no accuracy improvement
under the GPS conditions of this experiment. However, DOP filtering may still be relevant
for this device when conducting GPS surveys under poor satellite conditions or more dense
vegetation cover. The readings collected from the GPS also were used to simulate the effects
of GPS averaging. These results indicated that a reasonable increase in expected accuracy can
be achieved with up to four minutes of GPS averaging using the Socket device. As a set of
best-use practices, 30-60 seconds should be spent averaging for low quality data needs
(perimeter vertices or sample points) and 2-4 minutes should be spent averaging for high
quality data needs (benchmark or rangefinder reference point).
Rangefinder Accuracy for Mobile GIS
This study investigated the accuracies of two laser rangefinders, the Leica/Vectronix
Vector 1500 GMD and the Laser Technology TruPulse 360B. Across all testing scenarios, the
Vector 1500 was found to be slightly more accurate (2.4 m) than the Laser Technology
TruPulse 360B (3.0 m). However, when shooting at well defined vertical physical targets,
rather than a point on the horizontal bare earth, overall point measurement accuracy improved
greatly and the difference between equipment accuracy all but disappeared (Vector 1.0 m and
105

TruPulse 1.2 m). The same results were found for the accuracy of areas measured with the
rangefinder devices. Surveys of an 851.7 m2 area yielded a dramatic increase in measurement
accuracy across both devices from a mean underestimation of 35.5 m2 (std. dev = 102.9 m2)
when shooting at the bare horizontal ground to a mean overestimation of only 2.5 m2 (std.
dev = 25 m2) when shooting at a well defined vertical target.
Results of the rangefinder testing also showed a high degree of variability in
measurement accuracy among users. Since this generally followed a trend of higher accuracy
for higher levels of experience, user training can be confirmed as the second best method of
improving rangefinder accuracy after target selection. Under the scenarios tested, the addition
of a monopod device for steadying the rangefinders was found to marginally improve
accuracy. However, due to the low cost and the increased importance of stability when
shooting at longer target distances, a monopod or tripod should be used for most rangefinder
applications, especially those with long lines of sight.
Throughout the foreign field deployments of the demining mobile GIS, users
experienced erratic bearing readings from the Vector rangefinders caused by cell phones or
other mobile GIS equipment (GPS or Pocket PC) being placed too close to the rangefinders.
Despite an attempt to safeguard against such interference, this experiment confirmed that
even seemingly harmless items, such as eye glasses, can lead to unexpectedly high levels of
error in bearing readings, especially with the TruPulse equipment. Users should be aware that
even small fluctuations in bearing measurement can lead to high levels of positional error
when sighting large distances. To avoid such errors, multiple rangefinder measurements
should be taken by multiple users and compared, or a basic compass should be carried with
the rangefinders to test for magnetic interference by suspect items.
106

Significance of Findings
Although generally unmentioned by users, one of the significant benefits offered to
humanitarian demining by the Survey Tool is a standardized set of equipment, software, and
training for conducting field surveys. As the system becomes more widely adopted, any
improvements that are made to the system, training developed for it, and lessons learned
using it, will have the potential to benefit many users throughout the larger humanitarian
demining community. For example, due to the findings of experiments conducted in this
study, all users of the system can now be confident in the known accuracy of measurements
collected with both the GPS and rangefinders. While the accuracy levels of the GPS and
rangefinders are not as precise as top-of-the-line equipment, the accuracies fit the
requirements of demining Technical Surveys, and the costs of the equipment fit the price-
point of most humanitarian demining operations. If users choose to expand the application
areas beyond Technical Surveys and require higher levels of accuracy, mapping or survey
grade GPS and rangefinders can be added to the current system.
The various components of the demining Survey Tool were well received by its
users, and the system was considered an improvement over existing approaches and
technologies. This provides a sound indication that this mobile GIS was fit for use in its
intended purpose. Although areas for improving every component of the system were
indentified, when these modifications are introduced over time, they will build on a solid
foundation. As long as system designers and administrators continue to focus on refining both
the usability and training of the system it likely will continue to receive high praise from
users. The user’s evaluation of the system indicated that it provides a 2 to 3 fold increase in
survey speed, can be used with teams of half the size, and offers more accurate and reliable
results than traditional methods. These results should be considered just as revolutionary for
107
humanitarian demining as the same improvement would be for a manufacturing process,
farming practice, or construction activity.
Future Research
Beginning with technical issues, future studies examining expected GPS performance
should investigate accuracy over a longer sampling period than this study, under non-ideal
sky view conditions (i.e. different levels of canopy closure), and on different days at different
times under various non-ideal satellite configurations as reported by mission planning
software (Johnson and Barton, 2004). Because the Socket GPS is no longer "cutting-edge"
technology, newer consumer-grade devices using more modern GPS chipsets should be
examined and compared against one another. Just as this experiment produced suggestions
for averaging times, it also indicates the need for appropriate wait times prior to data
collection to ensure that the GPS position has stabilized after movement. An experiment
could be developed in which wait times would be simulated in a similar manner to the
averaging times of this experiment: 1) Move the GPS to a new location, 2) Immediately start
logging GPS data, and 3) Explore the accuracy improvement of different wait times on raw
data.
The analysis of the rangefinder data collected in this study was intended to be simple
and straightforward, analyzing changes in mean measurement accuracy one independent
variable at a time. Future experiments could use the same data, or data collected using similar
testing procedures, to statistically investigate the relative importance of all variables on
accuracy and model the interactions among variables.
In additional to the individual mapping components of a mobile GIS, this study
suggests the need for more general investigations of the accuracy expected from the system
108

as a whole. Except for examining the variability in users’ rangefinder measurements, these
experiments were designed to focus on the error components introduced by the actual
mapping equipment. However, operator error of Mobile GIS systems can lead to even more
significant errors. Operator-based studies should investigate the ways in which users interact
with software to assess the accuracy of collected measurements, when and why they chose to
correct/not correct errors, and if there are methods for encoding best-use practices in the
Mobile GIS software to avoid such errors in the future.
Mobile GIS has made significant progress over the last decade, and its development
will certainly continue. One highly studied emerging area of research in mobile GIS
computing involves the increased potential of handheld devices that are wirelessly
networked, either to one another or to a central server. Early prototype studies have used
close-range wireless local area networking to stream data from handhelds to a mobile data
server (Tsou, 2004) or cellular communications to transmit from the field back to a remote
location (Vivoni and Camilli, 2003). Along with field based GIS, attention should be paid to
developments in the other sub-field of mobile GIS, Location Based Services (LBS). LBS
deals primarily with commercial applications at the convergence of mobile computing,
cellular data transmission and GIS. Raper et al. (2007) presents a comprehensive introduction
to the field in the recently formed Journal of Location Based Services, while Dobson and
Fisher (2007) address ethical concerns of privacy and control in LBS’ growing subfield of
human tracking.
The de facto standard of software used by most mobile GIS devices, ESRI's ArcPad,
is also undergoing noteworthy changes in networking functionality. At the 2008 User
Conference, ESRI (2008) introduced ArcGIS Mobile as a new application development
framework for designing "sometimes-connected" mobile GIS devices (via a cellular
109

network). As a programming framework, ArcGIS Mobile can be designed to meet a specific
field data collection task rather than appearing like a scaled down version of a desktop GIS.
ESRI's addition of a network capable mobile GIS product also suggests their interest in a
server-based architecture for field data collection, much like LBS. Finally, along with the
previously mentioned variations in GPS and laser rangefinder technology, developers of
mobile GIS systems should also be aware of other mobile computing platforms. There are a
wide variety of netbook-style laptops, tablet PCs, such as the recently announced iPad, and
Smart Phones that may suit the needs of specific mobile GIS applications (Maguire, 2007;
Clegg et al., 2006).
On a more theoretical note, one striking thread throughout this work was the role that
users play in determining not only the accuracy of the data collected, but also the content of
that information. There has been a recent interest in the use of the Internet to create,
assemble, and disseminate geographic information offered up voluntarily by users, termed
volunteered geographic information (Goodchild, 2007). As interest in this process grows,
volunteers will likely expand their geographic data creation activities from the desktop into
the field and vice versa. When this occurs, research should be conducted on the role of
mobile GIS technologies in this process. Community-based GIS, known in different research
circles as participatory GIS (PGIS), public participation GIS (PPGIS), or participatory
mapping, is another research area that stresses the need for a bottom-up or user-based
approach to GIS data collection (Talen, 2000). There is an active dialogue on the ability for
PGIS to respond to the criticism of GIS as an undemocratic and divisive technology, most
evident in settings where financial and skills-based resources are limited. (Elwood, 2007).
Mobile GIS certainly has applicability to the PGIS effort, and research should explore how
this technology might respond to critical geographers’ concerns.
110

References
Clegg, P., Bruciatelli, L., Domingos, F., Jones, R.R., De Donatis, M. and Wilson, R.W. 2006.
Digital geological mapping with tablet PC and PDA: A comparison. Computers & Geosciences 32(10): 1682-1698.
Dobson, J. E. and Fisher, P. F. 2007. The Panopticon’s Changing Geography. Geographical
Review 97(3): 307-323. Elwood, S. 2006. Negotiating Knowledge Production: The Everyday Inclusions, Exclusions,
and Contradictions of Participatory GIS Research. The Professional Geographer 58(2): 197-208.
ESRI, GIS and Mapping Software, ArcGIS Mobile Application. Available from:
<http://www.esri.com/software/arcgis/arcgismobile/index.html> [accessed Sept 27, 2008] Goodchild, M. 2007. Citizens as sensors: the world of volunteered geography. GeoJournal
69(4): 211-221. Johnson, C.E. and Barton, C.C. 2004. Where in the world are my field plots? Using GPS
effectively in environmental field studies. Frontiers in Ecology and the Environment 2(9): 475-482.
Maguire, D. J. 2006. The Changing technology of space and time. Dynamic and Mobile GIS.
J. Drummond, R. Billen, E. Joao and D. Forrest, Eds., pp 3-18. Boca Raton, CRC Press. Raper, J., Gartner, G., Karimi, H. and Rizos, C. 2007. A critical evaluation of location based
services and their potential. Journal of Location Based Services 1(1): 5-45. Tsou, M. 2004. Integrated mobile GIS and wireless internet map servers for environmental
monitoring and management. Cartography and Geographic Information Science 31(3): 153-165.
Talen, E. 2000. Bottom-Up GIS - A new tool for individual and group expression in
participatory planning. Journal of the American Planning Association 66(3): 279-294. Vivoni, E.R. and Camilli, R. 2003. Real-time streaming of environmental field data.
Computers & Geosciences 29(4): 457-468.
111

Appendix A
Evaluation Forms and Interview Questions
Initial Evaluation Form
1 - Personal Background (Circle One) None - Expert Rate your level of computer experience: 1 2 3 4 5 Please describe what you use a computer for and how frequently: What method(s) have you used previously for mapping minefields? 2 - Training Evaluation Low-Medium-High How confident do you feel using the Pocket PC device? 1 2 3 4 5 Comments? How well do you understand the process of data entry in EODIS? 1 2 3 4 5 Comments? How easily could you collect a minefield perimeter sketch using 1 2 3 4 5 EODIS on your own? Comments?
Initial Evaluation Form page 1.
112

Would you have liked more training time in the classroom? Ye s / No If yes, what specific areas needed more emphasis? Would you have liked more training exercises in the field? Yes / No If yes, what types of field exercises? What other recommendations do you have for improving the training?
3 - EOD IS-Survey Evaluation
After your training with EODIS Survey, how do you feel that this tool will be an improvement over your previous methods of surveying minefields?
Rate each of the following qualities of the EODIS Survey tool (1 = low & 5 = high):
Improved safety 1 2 3 4 5 Accuracy 1 2 3 4 5 Time savings 1 2 3 4 5 Ease of Use 1 2 3 4 5 Reliability 1 2 3 4 5
Please provide any other feedback about EODIS Survey that you have at this time (problems encountered, recommendations for improvement):
Initial Evaluation Form page 2.
113

EOD IS-SURVEY Post Training Interview Questions
This has been mentioned before, but we wanted to let you know that this system will be tested around the world. To get ready for the other tests, we have two general questions that we would like to get answer to during this interview: does it work and are there changes that we need to make?
We would like to start with the different devices that make up the system. Starting with the Pocket PC, how well did you think it worked?
The lockups on the Pocket PC were a big concern with everyone at our first interview. Do you feel comfortable handling those now?
Moving on to the binoculars, we would like to know how well you think they worked?
After the two weeks of using the device, do you feel confident with the measurements they were returning to you?
The last device we wanted to ask you about is the GPS. How well did you feel it worked?
After you training over the past few weeks, did you feel that it was communicated that you need to keep the GPS antenna in clear view of the sky?
In general, if you had to collect a minefield tomorrow without any assistance, could you?
Do you feel comfortable enough with it to teach others?
How important would it be for you to have materials in (local language): software, manuals or (local language) speaking instructors?
In the first interviews that we did, many people said that making a small mistake could lead to very big problems. Can you think of any examples of how this might still be the case?
Another thing that we thought would be very helpful are checklists. (show example checklist for ArcPad) These are for ArcPad, but would something like this be helpful for you to have to carry in the field?
Can you think of specific things that would be good to have on the checklists?
Now that you have finished a full week of training plus a week of fieldwork, how would improve the training process for our next training in (next training location)?
Did you feel that the training was long enough or would you like more time?
Do you think you will continue to use the system in (testing country) for minefields in (other known mined areas)?
After your two weeks with the device, what are the most important one or two things we should try to fix before our next training exercise?
The last question is, after using the device for two weeks, do you feel it is an improvement over how you would have done this job in the past?
How confident are you in the results?
Interview questions for Chile, Albania, and Ecuador.
114

EOD IS-SURVEY Post Training Interview Questions
1. Background
What is your role in demining in Lebanon?
What experience have you had mapping minefields?
What methods have you used for mapping minefields?
2. Training
How helpful was the training?
What recommendations do you have for future training?
Should more time be spent in the classroom?
What recommendations do you have to improve field/outdoor training?
3. Documentation
Many participants have said that the checklists, which were developed during training in other countries, were helpful. Do you agree?
What suggestions do you have for modifying the current two checklists?
What other checklists would you like to see developed?
How helpful would it be to have user manuals during the training?
4. Mapping
How confident are you that you could now map a minefield on your own using the Survey Tool?
How confident are you that you could teach others how to use the Survey Tool?
Do you have any comments on the individual hardware components (GPS, Pocket PC, Vector binoculars)?
5. Overall Evaluation
What are the most important strengths or advantages of the Survey Tool?
What is the biggest weakness in the system?
What improvements do you recommend?
What would be an ideal system (for mapping minefields and collecting related data)?
Do you have any other comments or suggestions?
Interview questions for Lebanon.
115

Feedback Form – Field Team DATE: ____________ Evaluate EOD IS-Survey after each Minefield Report
1 - Total Minefield Surveys previously completed using EOD IS-Survey:
1-5 6-10 11-20 21-30 More than 30
2 - For this minefield report: What hardware did you use to collect the minefield perimeter points?
GPS only Binoculars only GPS and Binoculars together
How long did it take you to complete the survey? Data entry: ___ hours ___ minutes
Minefield mapping/sketching: ___ hours ___ minutes
a. How large was the minefield? (to find the area and perimeter, choose the identify button in ArcPad (Blue button with white “i”) and click on the minefield) Perimeter ________(m) Area ____________(m2) Number of points _____
3 - Did you encounter any problems with the following components of EOD IS-Survey? yes no yes no yes no
EOD IS-Survey Program Binoculars GPS
Pocket PC Camera
For each component you found a problem with answer the following (be specific):
Describe the problem:
Describe what you were doing when the problem occurred:
Feedback Form page 1. Feedback Form page 1.
116

4 - Did any of the following environmental factors impact your use of the device?
yes no yes no yes no
Weather Vegetation Terrain
5 - After using EOD IS-Survey to complete this minefield report, do you feel the tool is an improvement over previous methods of mapping and recording minefield reports?
YES NO
Describe what you did to fix the problem:
For each yes marked, describe how the environmental factor impacted your survey:
Please comment on why you marked Yes or No:
Feedback Form page 2.
117