Embed Size (px)
Citation preview
RESEARCH ARTICLE
Phenotype Specific Analyses Reveal DistinctRegulatory Mechanism for ChronicallyActivated p53Kristina Kirschner1☯¤a,¤b,¤c, Shamith A. Samarajiwa1☯, Jonathan M. Cairns1, Suraj Menon1,Pedro A. Pérez-Mancera1, Kosuke Tomimatsu1, Camino Bermejo-Rodriguez1, Yoko Ito1,Tamir Chandra1, Masako Narita1, Scott K. Lyons1, Andy G. Lynch1, Hiroshi Kimura2,Tetsuya Ohbayashi3, Simon Tavaré1*, Masashi Narita1*
1 Cancer Research UK Cambridge Institute, University of Cambridge, Li Ka Shing Centre, Cambridge,United Kingdom, 2 Graduate School of Bioscience and Biotechnology, Tokyo Institute of Technology,Yokohama, Japan, 3 Research Center for Bioscience and Technology, Tottori University, Yonago, Japan
☯ These authors contributed equally to this work.¤a Current address: Cambridge Institute for Medical Research, University of Cambridge, Cambridge, UnitedKingdom¤b Current address: Department of Haematology, University of Cambridge, Cambridge, United Kingdom¤c Current address: Stem Cell Institute, University of Cambridge, Cambridge, United Kingdom* [email protected] (ST); [email protected] (MN)
AbstractThe downstream functions of the DNA binding tumor suppressor p53 vary depending on the
cellular context, and persistent p53 activation has recently been implicated in tumor suppres-
sion and senescence. However, genome-wide information about p53-target gene regulation
has been derived mostly from acute genotoxic conditions. Using ChIP-seq and expression
data, we have found distinct p53 binding profiles between acutely activated (through DNA
damage) and chronically activated (in senescent or pro-apoptotic conditions) p53. Compared
to the classical ‘acute’ p53 binding profile, ‘chronic’ p53 peaks were closely associated with
CpG-islands. Furthermore, the chronic CpG-island binding of p53 conferred distinct expres-
sion patterns between senescent and pro-apoptotic conditions. Using the p53 targets seen
in the chronic conditions together with external high-throughput datasets, we have built p53
networks that revealed extensive self-regulatory ‘p53 hubs’ where p53 and many p53 targets
can physically interact with each other. Integrating these results with public clinical datasets
identified the cancer-associated lipogenic enzyme, SCD, which we found to be directly re-
pressed by p53 through the CpG-island promoter, providing a mechanistic link between p53
and the ‘lipogenic phenotype’, a hallmark of cancer. Our data reveal distinct phenotype asso-
ciations of chronic p53 targets that underlie specific gene regulatory mechanisms.
Author Summary
The p53 transcription factor is a frequently mutated tumour suppressor that contributesto repairing or eliminating damaged cells. Levels of p53 are typically regulated through its
PLOSGenetics | DOI:10.1371/journal.pgen.1005053 March 19, 2015 1 / 28
OPEN ACCESS
Citation: Kirschner K, Samarajiwa SA, Cairns JM,Menon S, Pérez-Mancera PA, Tomimatsu K, et al.(2015) Phenotype Specific Analyses Reveal DistinctRegulatory Mechanism for Chronically Activated p53.PLoS Genet 11(3): e1005053. doi:10.1371/journal.pgen.1005053
Editor: Jesus Gil, Imperial College Faculty ofMedicine, UNITED KINGDOM
Received: October 13, 2014
Accepted: February 2, 2015
Published: March 19, 2015
Copyright: © 2015 Kirschner et al. This is an openaccess article distributed under the terms of theCreative Commons Attribution License, which permitsunrestricted use, distribution, and reproduction in anymedium, provided the original author and source arecredited.
Data Availability Statement: Expression microarrayand ChIP-seq data are available at the NationalCenter for Biotechnology Information GeneExpression Omnibus under accession numbersGSE53491 and GSE53379.
Funding: This work was supported by the Universityof Cambridge; Cancer Research UK (C14303/A17197); Hutchison Whampoa. In addition, MasasNand TO were supported by the Human FrontierScience Program (RGY0078/2010); HK wassupported by MEXT KAKENHI (Grant Numbers25116005 and 26291071); KT was supported by the
stability; it is constantly produced and degraded, so that upon stress, p53 is up-regulatedquickly. This acutely induced p53 has been used as a major model system for studying ge-nome-wide p53 targets. However, emerging evidence suggests that persistently activatedp53 is involved in cancer-associated phenotypes, such as cellular senescence. We investi-gate genome-wide gene regulation by acutely induced p53 through DNA damage as wellas chronically activated p53 in oncogene-induced senescence and pro-apoptotic states. In-terestingly, acute and chronic p53 DNA binding profiles are highly distinctive, the latterbeing preferentially associated with larger and relatively open promoters called CpG is-lands. Furthermore, our integrative analyses of both p53-dependent gene expression andp53-binding genomic DNA profiles reveal that p53 and many of its targets in chronic con-ditions form extensive self-regulatory hubs, where they can physically interact. The datanot only substantially extend the list of direct p53 targets but highlight unique gene regula-tion by chronic p53. Finally we show that the cancer-associated lipogenic enzyme, stear-oyl-CoA desaturase, is a bona fide p53-repressive target through its CpG island promoterin chronic conditions.
IntroductionThe TP53 (p53) tumor suppressor, a stress-responsive transcription factor (TF), is somaticallymutated in more than 50% of human cancers, with a range between 10% and nearly 100% de-pending on the tumor type. Furthermore, germ line mutations of p53, in both humans andmice, predispose individuals to malignant tumor development [1,2]. p53 plays critical roles inthe induction of cell death and cell cycle arrest in response to stress, including DNA damage,oncogenic stress, and metabolic stress. Hence p53 is implicated in a wide range of cellular pro-cesses, such as cell cycle checkpoint, apoptosis, senescence and quiescence [3–5]. Despite in-creasing knowledge about p53 target genes, however, it is not entirely clear which aspects ofp53 function are attributable to each of these p53-associated phenotypes and its tumor sup-pressor activity [6].
p53 is typically regulated at the protein level through post-translational modification. Innormal conditions, p53 is under the regulation of a strong negative feedback loop, whereMDM2, a direct p53 target, serves as the E3 ubiquitin ligase, leading to the constant proteaso-mal degradation of p53 [7]. Thus p53 is highly unstable in non-stress conditions but uponstress induction, such as DNA damage, it can be rapidly stabilized through its dissociationfromMDM2. However, whether or not the prevailing model of acute p53 induction representsthe major program of p53’s tumor suppressive functions is under debate [8]. For example,studying whole body irradiated p53 inducible knock-in mice, Christophorou et al. showed thata late restoration of p53 function, rather than the usual acute p53-mediated pathological re-sponse, led to a reduced lymphoma burden [9]. In addition, Brady et al. recently showed thatp53 differentially regulates specific transcriptional programs of the acute DNA damage re-sponse (DDR) and its more chronic tumor suppression functions through its use of differenttransactivation domains. Their data indicate a close correlation between p53 activities in driv-ing tumor suppression and senescence [10]. Notably, senescence has been shown to be largelydependent on a persistent, rather than an acute, DDR [11]. Thus these studies suggest that thedownstream effects of acutely activated p53 and p53-mediated tumor suppression may well beseparable processes.
Several studies of p53 genomic binding profile have recently been published, revealing anumber of new p53 targets, which include genes potentially associated with its tumor
Genome-Wide Analyses of Chronic p53
PLOS Genetics | DOI:10.1371/journal.pgen.1005053 March 19, 2015 2 / 28
Japan Society for the Promotion of Science (24–8563). The funders had no role in study design, datacollection and analysis, decision to publish, orpreparation of the manuscript.
Competing Interests: The authors have declaredthat no competing interests exist.
suppressor functions. An early study found p53 targets that potentially suppress metastasis[12]. A number of autophagy genes were recently identified as direct p53 targets and p53-induced autophagy was shown to be important for DNA damage-induced apoptosis and theanti-transformation activity of p53 [13]. In addition, in ES cells, p53 regulates self-renewal andpluripotency upon DNA damage [14], and early-differentiation p53 targets include many de-velopmental transcription factors [15]. Currently, however, efforts at genome-wide p53 map-ping have mostly been focused on acutely or dynamically activated p53. Thus comprehensiveanalyses of the persistent activities of p53, which may be more relevant to its tumor suppressorfunction, are still missing.
Here we show distinct regulatory mechanisms for p53-targets between acute and more per-sistent modes of p53 activation. In addition to the classical DDR, where p53 is acutely induced(‘acute’ p53), we have determined profiles of genome-wide p53 binding and p53-responsivegenes in two distinct cellular conditions, where p53 is persistently activated (‘chronic’ p53) innormal human diploid fibroblasts (HDFs): oncogene-induced senescence (OIS); and trans-formed pro-apoptotic conditions. In contrast to acute p53, chronic p53 was closely associatedwith CpG island (CGI) type promoters. Although the binding profiles of p53 in the OIS andpro-apoptotic conditions were similar, the p53-responsive genes were distinct, suggesting thatdownstream gene regulation by chronic p53 is highly context dependent. Interestingly, our in-tegrative p53 networks and pathway modeling, combined with external high-throughput data-sets, suggest that p53 can be functionally and/or physically associated with many of its owntargets, thus forming extensive self-regulatory p53 hubs in the chronic conditions examined inthis study. Finally, together with external clinical datasets, our data reinforce the evidence forthe anti-lipogenic functions for p53. Our study not only extends our knowledge of phenotype-associated gene regulation by p53, but also provides unique and widely useful resources for thetargets of persistently activated p53.
Results
Phenotype-specific p53-responsive gene expressionTo gain a comprehensive understanding of p53 biology, we established phenotypes that are as-sociated with p53 either acutely activated by DNA damage or persistently activated by onco-genic stress in a single cell type (IMR90 HDFs) (Fig. 1A). During the acute DNA damageresponse (acDDR) phase induced by etoposide treatment (d1), the cells were viable and hadstopped proliferating but were not yet fully senescent, whereas most cells became senescentseven days after etoposide treatment (Fig. 1B-1C). Of note, although acDDR cells showed amodest increase in senescence-associated ß-galactosidase activity (Fig. 1B), it was not accom-panied by up-regulation of other functional markers of senescence, such as HMGA proteinsand p16 (Fig. 1C). As expected, p53 was transiently stabilized in the acDDR phase with a paral-lel up-regulation of p53 targets, such as p21 and MDM2, in total cell lysates (Fig. 1C). Interest-ingly, in chromatin-enriched fractions, p53 levels were comparable between the acute (d1) andsenescence phases (d7). This is perhaps in part due to the enlarged cellular phenotype of senes-cent cells, the p53 level then being more diluted in total cell lysates of senescent cells.
To establish the conditions for the sustained activation of p53, we used the well-establishedmodels of oncogenic stress [16]. Ectopic oncogenic HRASG12V induces senescence (RAS-in-duced senescence, RIS), a state of irreversible cell cycle arrest, where p53 plays a major role[16]. In contrast, E1A, the ‘immortalizing’ adenoviral oncoprotein, transforms HDFs whenused in combination with oncogenic HRASG12V. At the same time, E1A stabilizes p53 andthereby sensitizes cells to apoptosis (Figs. 1A, 1D, and S1A) [17]. Thus E1A/RAS-expressingcells are highly proliferative, yet sensitive to apoptosis due to sustained p53 activation (here we
Genome-Wide Analyses of Chronic p53
PLOS Genetics | DOI:10.1371/journal.pgen.1005053 March 19, 2015 3 / 28
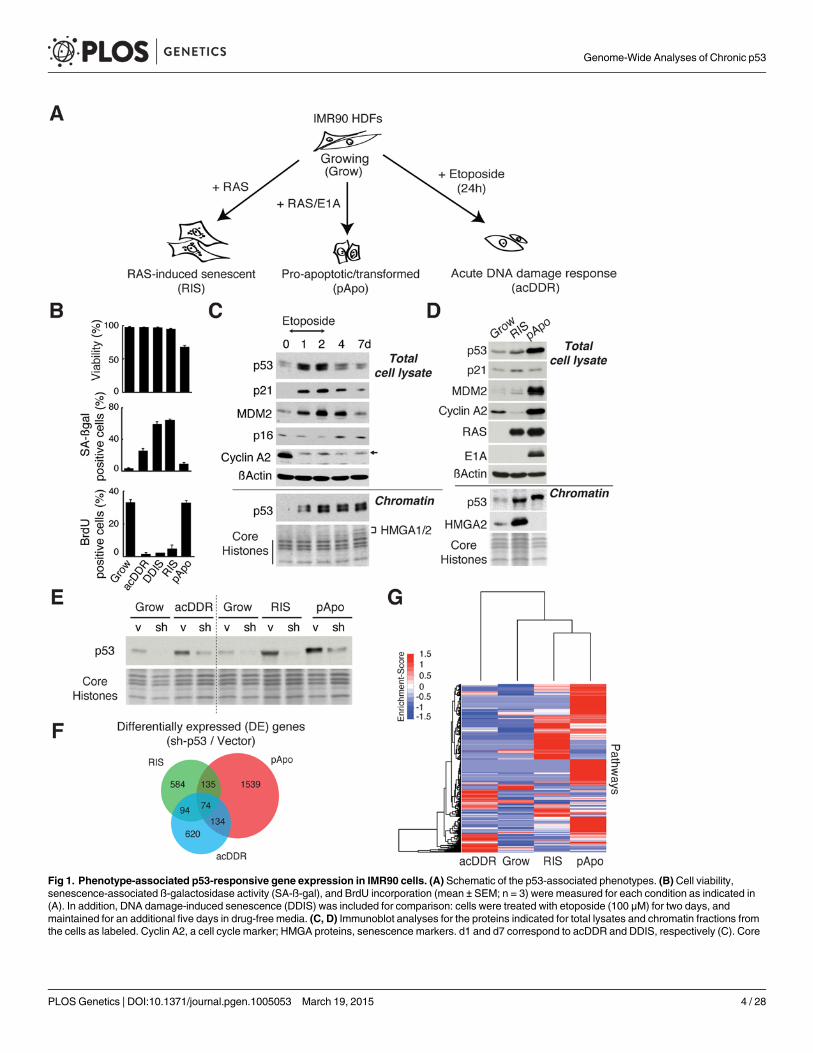
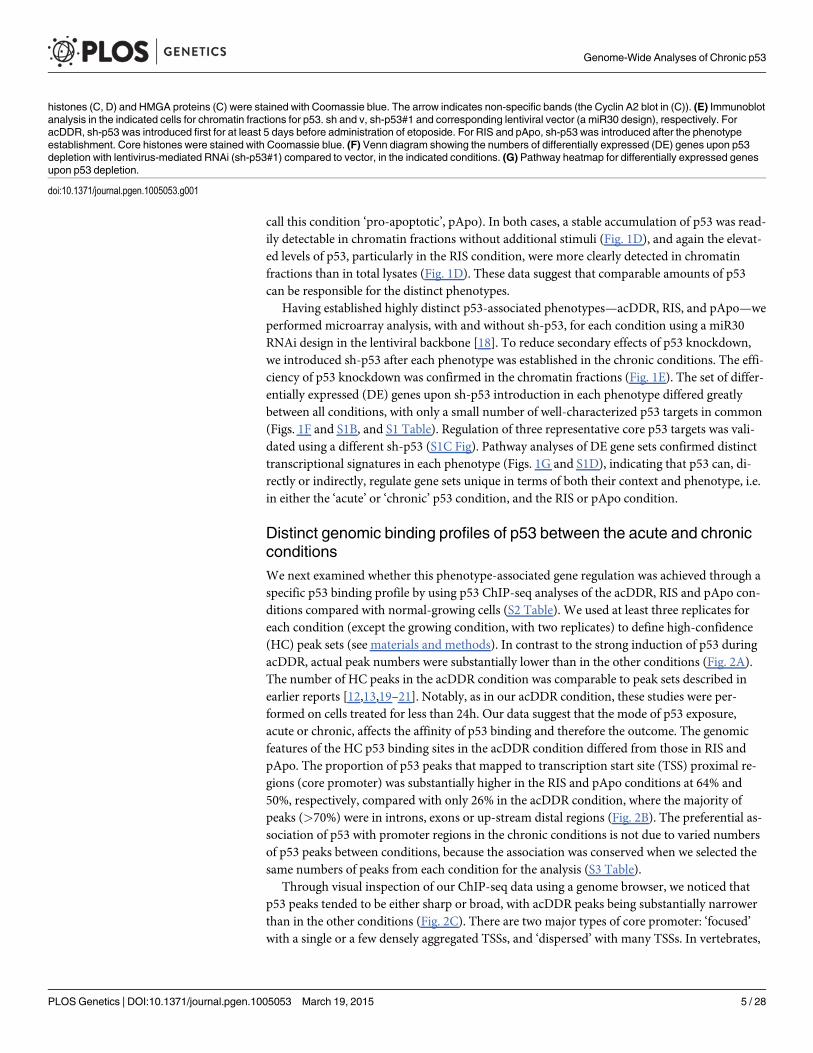
Fig 1. Phenotype-associated p53-responsive gene expression in IMR90 cells. (A) Schematic of the p53-associated phenotypes. (B) Cell viability,senescence-associated ß-galactosidase activity (SA-ß-gal), and BrdU incorporation (mean ± SEM; n = 3) were measured for each condition as indicated in(A). In addition, DNA damage-induced senescence (DDIS) was included for comparison: cells were treated with etoposide (100 μM) for two days, andmaintained for an additional five days in drug-free media. (C, D) Immunoblot analyses for the proteins indicated for total lysates and chromatin fractions fromthe cells as labeled. Cyclin A2, a cell cycle marker; HMGA proteins, senescence markers. d1 and d7 correspond to acDDR and DDIS, respectively (C). Core
Genome-Wide Analyses of Chronic p53
PLOS Genetics | DOI:10.1371/journal.pgen.1005053 March 19, 2015 4 / 28
call this condition ‘pro-apoptotic’, pApo). In both cases, a stable accumulation of p53 was read-ily detectable in chromatin fractions without additional stimuli (Fig. 1D), and again the elevat-ed levels of p53, particularly in the RIS condition, were more clearly detected in chromatinfractions than in total lysates (Fig. 1D). These data suggest that comparable amounts of p53can be responsible for the distinct phenotypes.
Having established highly distinct p53-associated phenotypes—acDDR, RIS, and pApo—weperformed microarray analysis, with and without sh-p53, for each condition using a miR30RNAi design in the lentiviral backbone [18]. To reduce secondary effects of p53 knockdown,we introduced sh-p53 after each phenotype was established in the chronic conditions. The effi-ciency of p53 knockdown was confirmed in the chromatin fractions (Fig. 1E). The set of differ-entially expressed (DE) genes upon sh-p53 introduction in each phenotype differed greatlybetween all conditions, with only a small number of well-characterized p53 targets in common(Figs. 1F and S1B, and S1 Table). Regulation of three representative core p53 targets was vali-dated using a different sh-p53 (S1C Fig). Pathway analyses of DE gene sets confirmed distincttranscriptional signatures in each phenotype (Figs. 1G and S1D), indicating that p53 can, di-rectly or indirectly, regulate gene sets unique in terms of both their context and phenotype, i.e.in either the ‘acute’ or ‘chronic’ p53 condition, and the RIS or pApo condition.
Distinct genomic binding profiles of p53 between the acute and chronicconditionsWe next examined whether this phenotype-associated gene regulation was achieved through aspecific p53 binding profile by using p53 ChIP-seq analyses of the acDDR, RIS and pApo con-ditions compared with normal-growing cells (S2 Table). We used at least three replicates foreach condition (except the growing condition, with two replicates) to define high-confidence(HC) peak sets (see materials and methods). In contrast to the strong induction of p53 duringacDDR, actual peak numbers were substantially lower than in the other conditions (Fig. 2A).The number of HC peaks in the acDDR condition was comparable to peak sets described inearlier reports [12,13,19–21]. Notably, as in our acDDR condition, these studies were per-formed on cells treated for less than 24h. Our data suggest that the mode of p53 exposure,acute or chronic, affects the affinity of p53 binding and therefore the outcome. The genomicfeatures of the HC p53 binding sites in the acDDR condition differed from those in RIS andpApo. The proportion of p53 peaks that mapped to transcription start site (TSS) proximal re-gions (core promoter) was substantially higher in the RIS and pApo conditions at 64% and50%, respectively, compared with only 26% in the acDDR condition, where the majority ofpeaks (>70%) were in introns, exons or up-stream distal regions (Fig. 2B). The preferential as-sociation of p53 with promoter regions in the chronic conditions is not due to varied numbersof p53 peaks between conditions, because the association was conserved when we selected thesame numbers of peaks from each condition for the analysis (S3 Table).
Through visual inspection of our ChIP-seq data using a genome browser, we noticed thatp53 peaks tended to be either sharp or broad, with acDDR peaks being substantially narrowerthan in the other conditions (Fig. 2C). There are two major types of core promoter: ‘focused’with a single or a few densely aggregated TSSs, and ‘dispersed’ with many TSSs. In vertebrates,
histones (C, D) and HMGA proteins (C) were stained with Coomassie blue. The arrow indicates non-specific bands (the Cyclin A2 blot in (C)). (E) Immunoblotanalysis in the indicated cells for chromatin fractions for p53. sh and v, sh-p53#1 and corresponding lentiviral vector (a miR30 design), respectively. ForacDDR, sh-p53 was introduced first for at least 5 days before administration of etoposide. For RIS and pApo, sh-p53 was introduced after the phenotypeestablishment. Core histones were stained with Coomassie blue. (F) Venn diagram showing the numbers of differentially expressed (DE) genes upon p53depletion with lentivirus-mediated RNAi (sh-p53#1) compared to vector, in the indicated conditions. (G) Pathway heatmap for differentially expressed genesupon p53 depletion.
doi:10.1371/journal.pgen.1005053.g001
Genome-Wide Analyses of Chronic p53
PLOS Genetics | DOI:10.1371/journal.pgen.1005053 March 19, 2015 5 / 28
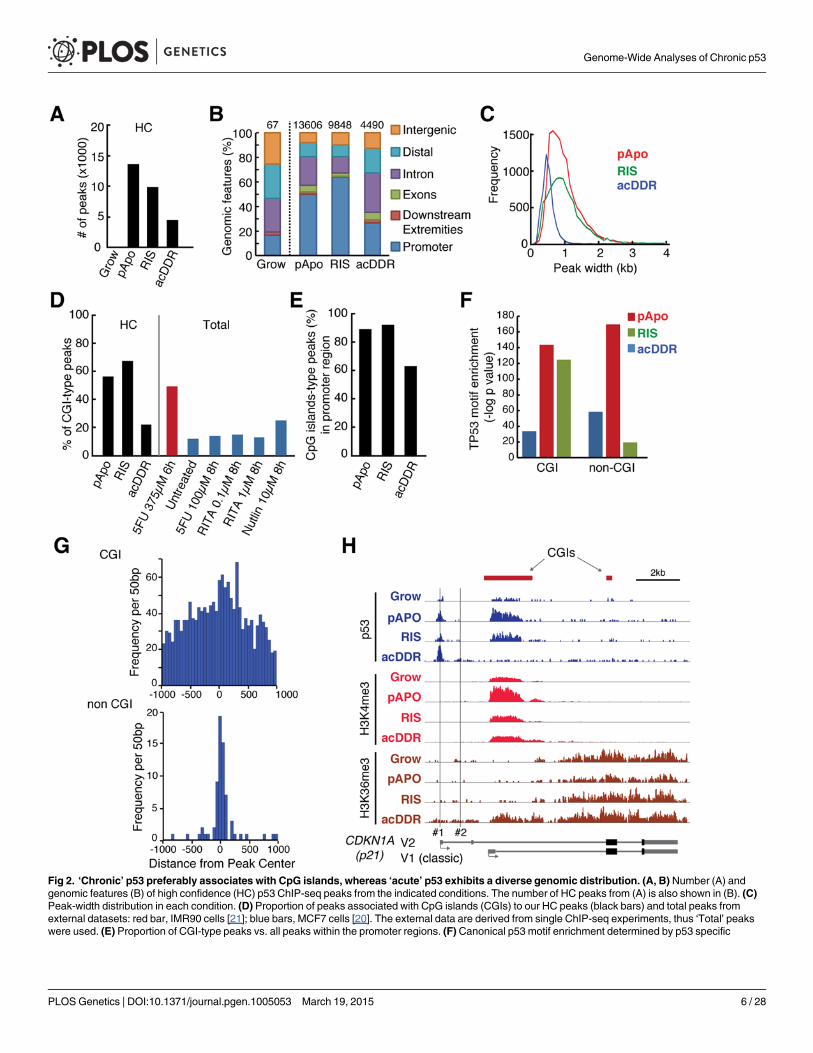
Fig 2. ‘Chronic’ p53 preferably associates with CpG islands, whereas ‘acute’ p53 exhibits a diverse genomic distribution. (A, B) Number (A) andgenomic features (B) of high confidence (HC) p53 ChIP-seq peaks from the indicated conditions. The number of HC peaks from (A) is also shown in (B). (C)Peak-width distribution in each condition. (D) Proportion of peaks associated with CpG islands (CGIs) to our HC peaks (black bars) and total peaks fromexternal datasets: red bar, IMR90 cells [21]; blue bars, MCF7 cells [20]. The external data are derived from single ChIP-seq experiments, thus ‘Total’ peakswere used. (E) Proportion of CGI-type peaks vs. all peaks within the promoter regions. (F) Canonical p53 motif enrichment determined by p53 specific
Genome-Wide Analyses of Chronic p53
PLOS Genetics | DOI:10.1371/journal.pgen.1005053 March 19, 2015 6 / 28
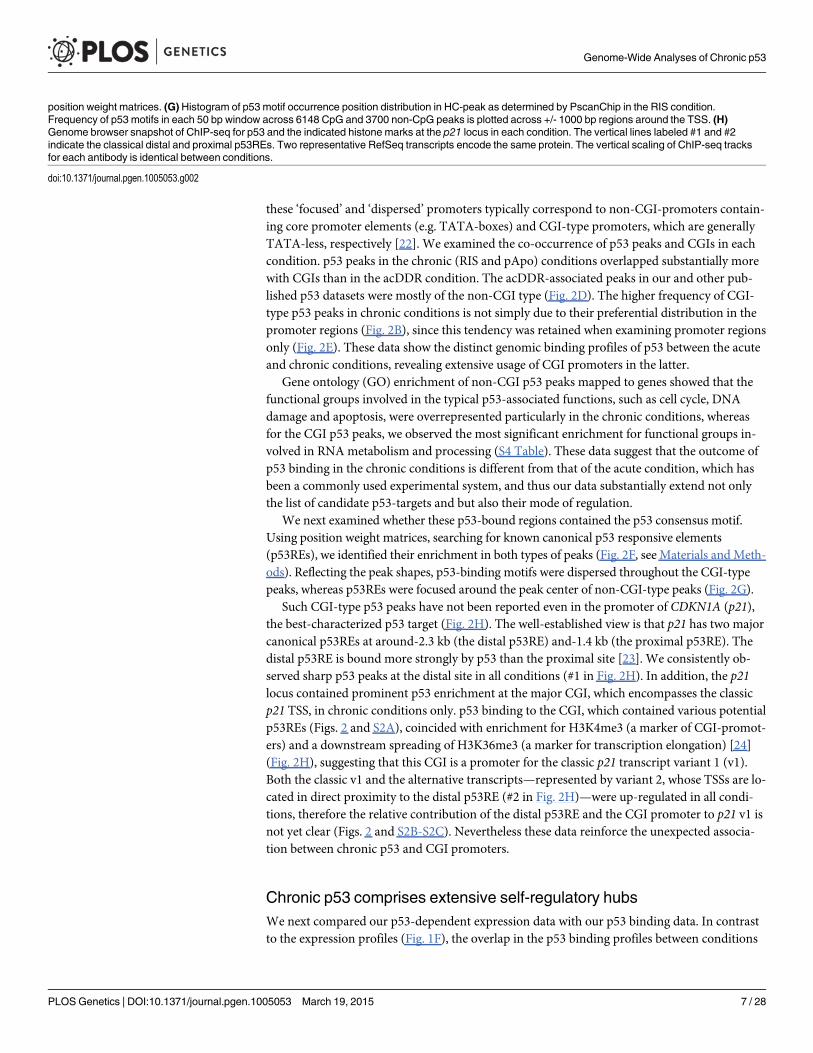
these ‘focused’ and ‘dispersed’ promoters typically correspond to non-CGI-promoters contain-ing core promoter elements (e.g. TATA-boxes) and CGI-type promoters, which are generallyTATA-less, respectively [22]. We examined the co-occurrence of p53 peaks and CGIs in eachcondition. p53 peaks in the chronic (RIS and pApo) conditions overlapped substantially morewith CGIs than in the acDDR condition. The acDDR-associated peaks in our and other pub-lished p53 datasets were mostly of the non-CGI type (Fig. 2D). The higher frequency of CGI-type p53 peaks in chronic conditions is not simply due to their preferential distribution in thepromoter regions (Fig. 2B), since this tendency was retained when examining promoter regionsonly (Fig. 2E). These data show the distinct genomic binding profiles of p53 between the acuteand chronic conditions, revealing extensive usage of CGI promoters in the latter.
Gene ontology (GO) enrichment of non-CGI p53 peaks mapped to genes showed that thefunctional groups involved in the typical p53-associated functions, such as cell cycle, DNAdamage and apoptosis, were overrepresented particularly in the chronic conditions, whereasfor the CGI p53 peaks, we observed the most significant enrichment for functional groups in-volved in RNA metabolism and processing (S4 Table). These data suggest that the outcome ofp53 binding in the chronic conditions is different from that of the acute condition, which hasbeen a commonly used experimental system, and thus our data substantially extend not onlythe list of candidate p53-targets and but also their mode of regulation.
We next examined whether these p53-bound regions contained the p53 consensus motif.Using position weight matrices, searching for known canonical p53 responsive elements(p53REs), we identified their enrichment in both types of peaks (Fig. 2F, see Materials andMeth-ods). Reflecting the peak shapes, p53-binding motifs were dispersed throughout the CGI-typepeaks, whereas p53REs were focused around the peak center of non-CGI-type peaks (Fig. 2G).
Such CGI-type p53 peaks have not been reported even in the promoter of CDKN1A (p21),the best-characterized p53 target (Fig. 2H). The well-established view is that p21 has two majorcanonical p53REs at around-2.3 kb (the distal p53RE) and-1.4 kb (the proximal p53RE). Thedistal p53RE is bound more strongly by p53 than the proximal site [23]. We consistently ob-served sharp p53 peaks at the distal site in all conditions (#1 in Fig. 2H). In addition, the p21locus contained prominent p53 enrichment at the major CGI, which encompasses the classicp21 TSS, in chronic conditions only. p53 binding to the CGI, which contained various potentialp53REs (Figs. 2 and S2A), coincided with enrichment for H3K4me3 (a marker of CGI-promot-ers) and a downstream spreading of H3K36me3 (a marker for transcription elongation) [24](Fig. 2H), suggesting that this CGI is a promoter for the classic p21 transcript variant 1 (v1).Both the classic v1 and the alternative transcripts—represented by variant 2, whose TSSs are lo-cated in direct proximity to the distal p53RE (#2 in Fig. 2H)—were up-regulated in all condi-tions, therefore the relative contribution of the distal p53RE and the CGI promoter to p21 v1 isnot yet clear (Figs. 2 and S2B-S2C). Nevertheless these data reinforce the unexpected associa-tion between chronic p53 and CGI promoters.
Chronic p53 comprises extensive self-regulatory hubsWe next compared our p53-dependent expression data with our p53 binding data. In contrastto the expression profiles (Fig. 1F), the overlap in the p53 binding profiles between conditions
position weight matrices. (G) Histogram of p53 motif occurrence position distribution in HC-peak as determined by PscanChip in the RIS condition.Frequency of p53 motifs in each 50 bp window across 6148 CpG and 3700 non-CpG peaks is plotted across +/- 1000 bp regions around the TSS. (H)Genome browser snapshot of ChIP-seq for p53 and the indicated histone marks at the p21 locus in each condition. The vertical lines labeled #1 and #2indicate the classical distal and proximal p53REs. Two representative RefSeq transcripts encode the same protein. The vertical scaling of ChIP-seq tracksfor each antibody is identical between conditions.
doi:10.1371/journal.pgen.1005053.g002
Genome-Wide Analyses of Chronic p53
PLOS Genetics | DOI:10.1371/journal.pgen.1005053 March 19, 2015 7 / 28
was substantially larger, and the similarity was even more striking for the peaks within the pro-moter regions (S3A Fig). To better predict phenotype-associated p53 function, we developedthe “R-based analysis of ChIP-seq And Differential Expression” (Rcade) package, integratinggenome-wide binding profiles of TFs with their responsive gene expression profiles. Briefly, wecoupled the expression analysis to a TSS-local read-based ChIP-seq analysis, thereby circum-venting ‘peak-calling’ and thus reducing false-positives and bias issues inherent with peak-calling methods. However, because most of the acDDR peaks failed to fulfill the localizationcriteria specified (S3B Fig), in our further analyses we only focused on the pApo and RISchronic conditions, where Rcade identified 1487 and 563 genes, respectively, which includedboth established and many previously unknown, ‘putative’ p53 targets (S3C Fig and S5 Table).GO analysis of the Rcade-derived genes showed that various biological processes were repre-sented in both conditions, including typical p53-related functions (cell cycle, DNA damage re-sponse, and apoptosis); functions of membrane-bound organelles and metabolism; and geneexpression and RNAmetabolism/processing (S3D Fig).
The Rcade-derived genes include both previously known as well as many unknown/uncharacterized genes as direct targets of p53. For example, ANKRA2 and HSPA4L, which arepoorly characterized, were identified as putative direct p53-inducible targets in both RIS andpApo conditions. Significant down-regulation of ANKRA2 and HSPA4L upon p53 knockdownwas confirmed by qPCR in at least two different conditions in IMR90 cells (S3E Fig). Similarresults were obtained using the second sh-p53 (S3E Fig). Interestingly, tumor-specific, disrup-tive mutations of ANKRA2 were previously identified in oral squamous cell carcinoma [25],and mutations in ANKRA2 are also reported in the Catalogue Of Somatic Mutations In Cancer(COSMIC, http://www.sanger.ac.uk/genetics/CGP/cosmic/). In addition, methylation of theCGI promoter ofHSPA4L as well as the methylation-associated down-regulation of HSPA4Lin acute lymphocytic leukemia (ALL) have been reported previously [26], thus underlining theusefulness of our Rcade datasets. Using a PiggyBac transposon system [27], we established a tet-racycline-inducible p53 system in H1299 cells (a p53-null lung cancer cell line) and confirmedthat ectopic wild type p53 could induce expression of ANKRA2 and HSPA4L (S3F Fig).
To gain a comprehensive understanding of the p53 regulome, we first generated integrativenetworks of the Rcade-derived p53-targets, taking advantage of numerous external high-throughput datasets. Since co-regulated genes are likely to be ‘connected’, we measured con-nectivity within the Rcade-derived p53-targets, taking into account topological measures oflocal (‘Degree’) and global (‘Between-ness centrality’) connectivity (see materials and meth-ods). This largely unbiased network approach revealed that the (putative) p53-targets werehighly inter-connected, providing evidence for the validity of our Rcade gene lists (Fig. 3, com-pare to the random gene set). p53 was identified as the most globally (pApo) and locally (bothconditions) connected gene in the networks, indicating the importance of p53 to the integrityof entire networks.
To gain insight into the functional relationship between putative p53 targets, we next con-structed phenotype-specific, ‘knowledge-based’ pathway models of the p53 regulome (see ma-terials and methods) (S4 and S5 Figs, high resolution figures are available at http://australian-systemsbiology.org/tp53). These revealed a highly complex network in the pro-apoptotic con-dition and provided the first detailed p53 regulome of senescence. p53 appeared to regulatemultiple components within the same pathways or biochemical complexes, but often with dis-tinct aspects depending on the cellular context. Thus many p53-related phenomena frag-mented throughout the literature could be seen in a single biological context, and yet eachcontext may involve distinct p53 functions. For example, Rcade genes associated with mito-chondria in the pApo condition were largely distinct from those in the RIS condition and in-cluded, in addition to apoptotic genes, genes involved in mitochondrial metabolism and
Genome-Wide Analyses of Chronic p53
PLOS Genetics | DOI:10.1371/journal.pgen.1005053 March 19, 2015 8 / 28
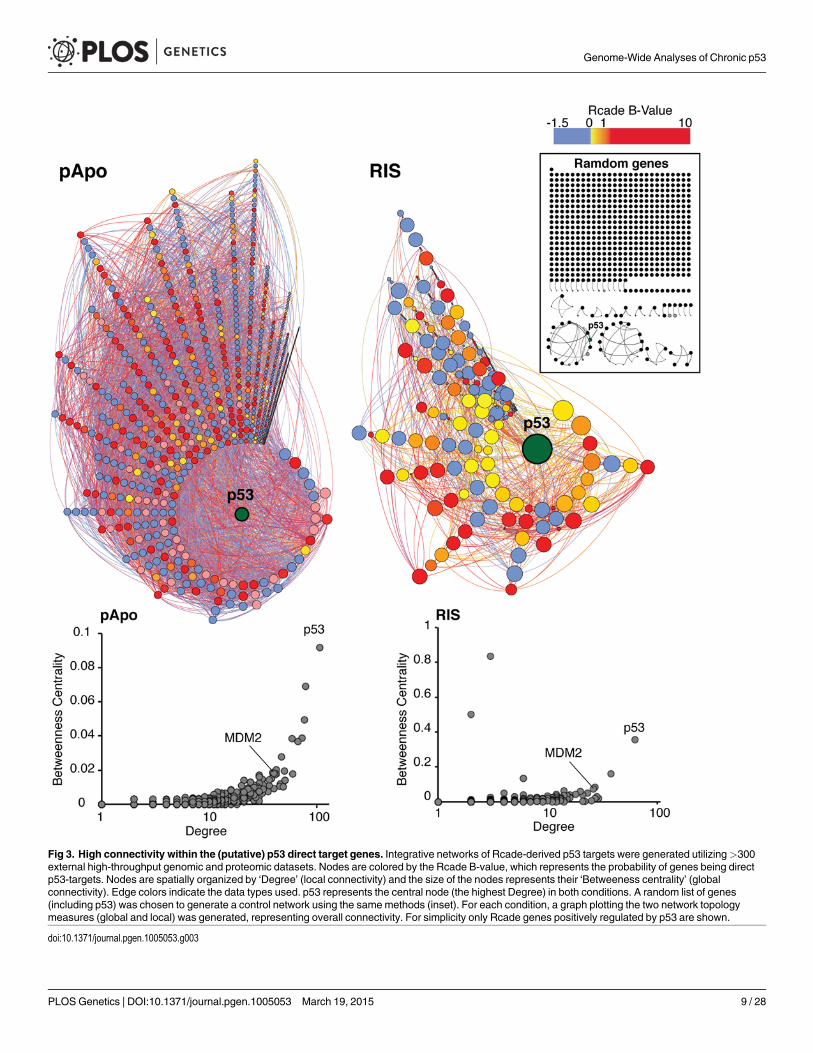
Fig 3. High connectivity within the (putative) p53 direct target genes. Integrative networks of Rcade-derived p53 targets were generated utilizing>300external high-throughput genomic and proteomic datasets. Nodes are colored by the Rcade B-value, which represents the probability of genes being directp53-targets. Nodes are spatially organized by ‘Degree’ (local connectivity) and the size of the nodes represents their ‘Betweeness centrality’ (globalconnectivity). Edge colors indicate the data types used. p53 represents the central node (the highest Degree) in both conditions. A random list of genes(including p53) was chosen to generate a control network using the samemethods (inset). For each condition, a graph plotting the two network topologymeasures (global and local) was generated, representing overall connectivity. For simplicity only Rcade genes positively regulated by p53 are shown.
doi:10.1371/journal.pgen.1005053.g003
Genome-Wide Analyses of Chronic p53
PLOS Genetics | DOI:10.1371/journal.pgen.1005053 March 19, 2015 9 / 28
homeostasis (oxidative phosphorylation, fatty acid and lipid metabolism, mitochondrial bio-genesis). Consistent with a recent study, which showed an extensive transcriptional regulationof autophagy by p53 in response to acute DNA damage in mouse embryonic fibroblasts [13],we also found that the autophagy program was regulated by p53 in the chronic conditions(pApo in particular) but through largely distinct genes compared to the previous report [13](S4 Fig), extending the role for p53 in autophagy regulation.
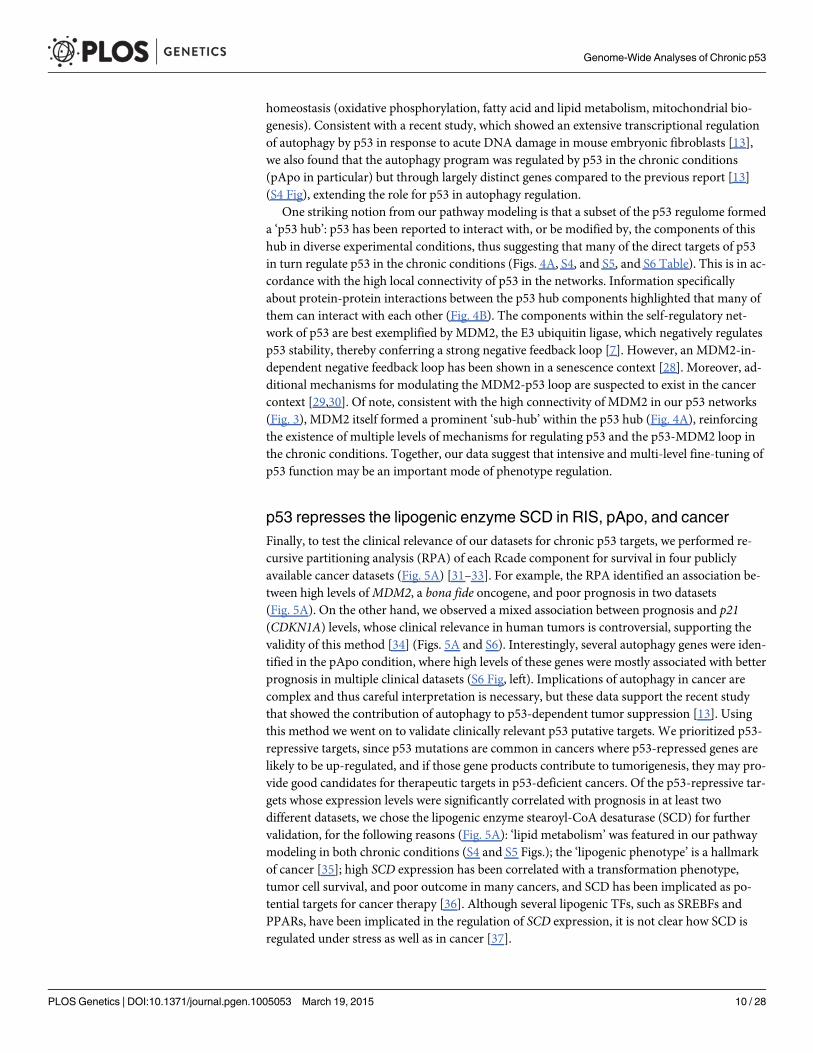
One striking notion from our pathway modeling is that a subset of the p53 regulome formeda ‘p53 hub’: p53 has been reported to interact with, or be modified by, the components of thishub in diverse experimental conditions, thus suggesting that many of the direct targets of p53in turn regulate p53 in the chronic conditions (Figs. 4A, S4, and S5, and S6 Table). This is in ac-cordance with the high local connectivity of p53 in the networks. Information specificallyabout protein-protein interactions between the p53 hub components highlighted that many ofthem can interact with each other (Fig. 4B). The components within the self-regulatory net-work of p53 are best exemplified by MDM2, the E3 ubiquitin ligase, which negatively regulatesp53 stability, thereby conferring a strong negative feedback loop [7]. However, an MDM2-in-dependent negative feedback loop has been shown in a senescence context [28]. Moreover, ad-ditional mechanisms for modulating the MDM2-p53 loop are suspected to exist in the cancercontext [29,30]. Of note, consistent with the high connectivity of MDM2 in our p53 networks(Fig. 3), MDM2 itself formed a prominent ‘sub-hub’ within the p53 hub (Fig. 4A), reinforcingthe existence of multiple levels of mechanisms for regulating p53 and the p53-MDM2 loop inthe chronic conditions. Together, our data suggest that intensive and multi-level fine-tuning ofp53 function may be an important mode of phenotype regulation.
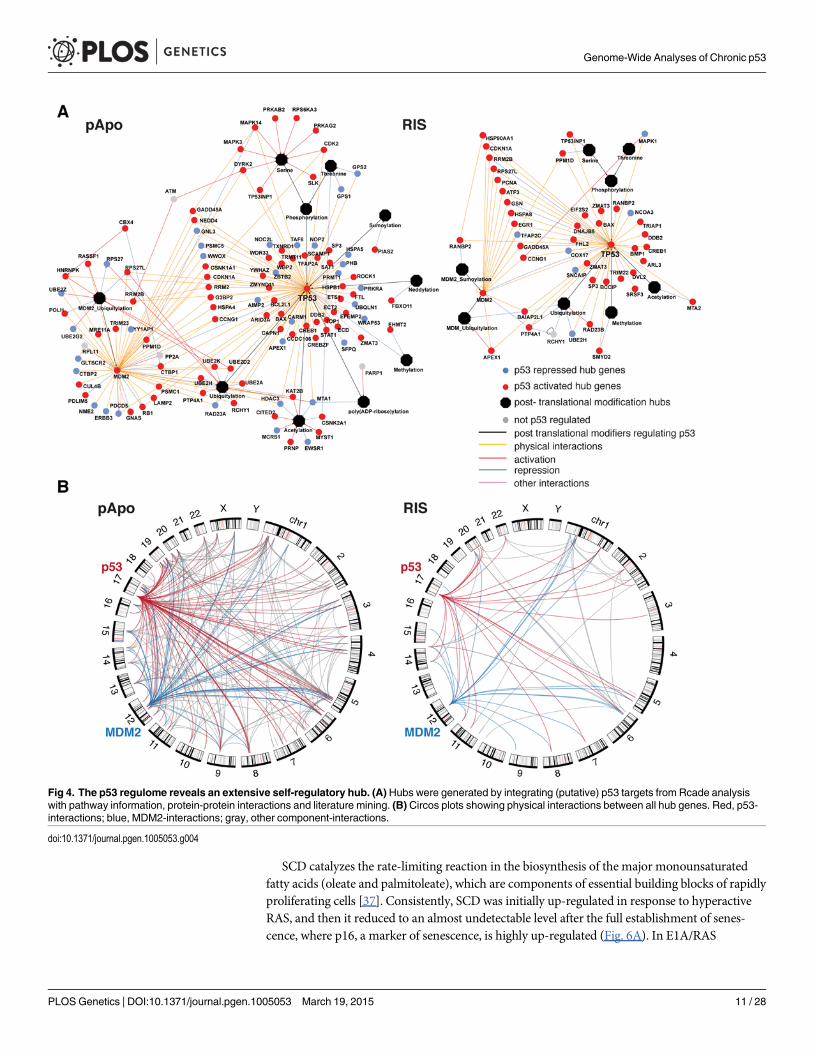
p53 represses the lipogenic enzyme SCD in RIS, pApo, and cancerFinally, to test the clinical relevance of our datasets for chronic p53 targets, we performed re-cursive partitioning analysis (RPA) of each Rcade component for survival in four publiclyavailable cancer datasets (Fig. 5A) [31–33]. For example, the RPA identified an association be-tween high levels ofMDM2, a bona fide oncogene, and poor prognosis in two datasets(Fig. 5A). On the other hand, we observed a mixed association between prognosis and p21(CDKN1A) levels, whose clinical relevance in human tumors is controversial, supporting thevalidity of this method [34] (Figs. 5A and S6). Interestingly, several autophagy genes were iden-tified in the pApo condition, where high levels of these genes were mostly associated with betterprognosis in multiple clinical datasets (S6 Fig, left). Implications of autophagy in cancer arecomplex and thus careful interpretation is necessary, but these data support the recent studythat showed the contribution of autophagy to p53-dependent tumor suppression [13]. Usingthis method we went on to validate clinically relevant p53 putative targets. We prioritized p53-repressive targets, since p53 mutations are common in cancers where p53-repressed genes arelikely to be up-regulated, and if those gene products contribute to tumorigenesis, they may pro-vide good candidates for therapeutic targets in p53-deficient cancers. Of the p53-repressive tar-gets whose expression levels were significantly correlated with prognosis in at least twodifferent datasets, we chose the lipogenic enzyme stearoyl-CoA desaturase (SCD) for furthervalidation, for the following reasons (Fig. 5A): ‘lipid metabolism’ was featured in our pathwaymodeling in both chronic conditions (S4 and S5 Figs.); the ‘lipogenic phenotype’ is a hallmarkof cancer [35]; high SCD expression has been correlated with a transformation phenotype,tumor cell survival, and poor outcome in many cancers, and SCD has been implicated as po-tential targets for cancer therapy [36]. Although several lipogenic TFs, such as SREBFs andPPARs, have been implicated in the regulation of SCD expression, it is not clear how SCD isregulated under stress as well as in cancer [37].
Genome-Wide Analyses of Chronic p53
PLOS Genetics | DOI:10.1371/journal.pgen.1005053 March 19, 2015 10 / 28
SCD catalyzes the rate-limiting reaction in the biosynthesis of the major monounsaturatedfatty acids (oleate and palmitoleate), which are components of essential building blocks of rapidlyproliferating cells [37]. Consistently, SCD was initially up-regulated in response to hyperactiveRAS, and then it reduced to an almost undetectable level after the full establishment of senes-cence, where p16, a marker of senescence, is highly up-regulated (Fig. 6A). In E1A/RAS
Fig 4. The p53 regulome reveals an extensive self-regulatory hub. (A) Hubs were generated by integrating (putative) p53 targets from Rcade analysiswith pathway information, protein-protein interactions and literature mining. (B) Circos plots showing physical interactions between all hub genes. Red, p53-interactions; blue, MDM2-interactions; gray, other component-interactions.
doi:10.1371/journal.pgen.1005053.g004
Genome-Wide Analyses of Chronic p53
PLOS Genetics | DOI:10.1371/journal.pgen.1005053 March 19, 2015 11 / 28
Fig 5. Prognostic role of Rcade-derived p53-targets in cancer. (A) Heatmap summarizing RPA for Rcade-derived p53 targets in the RIS condition for fourcancer datasets indicated: Lung [31], Breast_ER+ and ER- [32], Prostate [33]. Blue and red denote worse and better survival, when expression of genes ishigh. The fifth column depicts the ratios of gene expression in p53 mutant (mt) vs. wild-type (wt) tumors in separate breast cancer datasets [38]. CDKN1A(p21),MDM2, and SCD are highlighted. SCDwas also p53-repressive in the pApo condition. (B) Kaplan–Meier plots in the indicated cohorts for patients withhigh and low SCD levels.
doi:10.1371/journal.pgen.1005053.g005
Genome-Wide Analyses of Chronic p53
PLOS Genetics | DOI:10.1371/journal.pgen.1005053 March 19, 2015 12 / 28
expressing transformed pApo cells, SCD levels were relatively high, supporting the role of SCD inrapidly proliferating transformed cells (Fig. 6B). In both cases, however, when we introduced sh-p53 to RIS or pApo cells, SCD levels were up-regulated, suggesting that SCD is regulated by multi-ple mechanisms, whereby p53 counteracts the positive control of SCD by pro-tumorigenic signals.
To lend further support to the finding that SCD is repressed by p53 in cancer, we analyzed apublicly available breast cancer dataset that contains gene expression and p53 sequencing data[38]. In contrast to p21 andMDM2, SCD levels were significantly higher in tumors with p53mutations than with wild-type p53 (Fig. 6C). We also examined the relationship between p53and Scd1 (a mouse homologue of SCD) in Kras-driven mouse pancreatic ductal adenocarcino-ma (mPDA) cell lines established from KrasLSL-G12D; Pdx1-cre, or KrasLSL-G12D; P48-cre mice(KC cell lines) and KrasLSL-G12D; p53lox/+; Pdx1-cre compound mutant mice (KPΔC cell lines)[39]. In KC cell lines (p53-wild type), p53 was readily up-regulated by DNA damage treatment,whereas p53 was undetectable in KPΔC cell lines (p53-null) (Fig. 6D). Scd1 was down-regulatedin the KC, but not in the KPΔC, cell lines (Fig. 6D). Furthermore, repression of SCD by p53was confirmed in a tetracycline-inducible p53 system in H1299 cells. Upon doxycycline addi-tion, the endogenous SCD level was repressed in a dose- and time-dependent manner (Figs. 6Eand S7A). In the SCD locus, chronic p53 accumulation was observed mainly on the CGI(Fig. 6F). Although an early study showed that overexpressed wild type p53 can bind the up-stream canonical p53RE in the SCD promoter (Fig. 6F) [40], our data indicate that endogenousp53 preferentially accumulates on a distinct region in the CGI promoter when it is chronicallyactivated. This p53-bound region, containing several p53 motifs (Figs. 6 and S7B), was suffi-cient for p53 to repress downstream luciferase expression (Fig. 6G). Taken together, our datasuggest that SCD expression, which is associated with poor prognosis in some cancers, is direct-ly repressed by chronic p53 through the CGI promoter, providing direct mechanistic insightinto the anti-lipogenic role of p53.
DiscussionHere we present an extensive study of p53 regulation in different phenotypes using normalhuman cells. We compared p53 binding profiles in three settings; acDDR, RIS, and E1A andRAS-expressing pApo conditions. In the acDDR condition, which has been the commonlyused model for genome-wide mapping of p53 binding sites, p53 peaks were primarily of asharp non-CGI type, exhibiting a wide distribution in the genome. Interestingly, increasing evi-dence for distant gene regulation by p53 has been shown using systems where p53 is acutely ac-tivated [14,41]. This may explain, in part, the diverse locations of non-CGI p53 peaks in theacDDR condition. In contrast, both RIS and pApo conditions were associated with sustainedaccumulation of p53 on chromatin, where p53 preferentially associated with CGI promoters.In one of the previous p53 ChIP-seq studies, Botcheva et al. identified a substantial number ofCGI-type p53 peaks in an acute condition (Fig. 2D) [21]. We reanalyzed these external dataand found 1811 p53 CGI-peaks, 50% and 52% of which were included in our HC p53 CGI-peaks in the RIS (6148 CGI-peaks) and pApo (6566 CGI-peaks) conditions, respectively. Al-though the relatively high frequency of CGI-peaks in this external dataset (compared to 846HC p53 CGI-peaks in our acDDR condition) may be an overestimate due to their lack of bio-logical replicates, it reinforces the significance of the connection between p53 and CGI promot-ers. It is not clear why their study identified many CGI peaks in their acDDR condition. Bothstudies used HDFs (IMR90 cells), which are highly sensitive to senescence induction by oxida-tive stress. Notably, we maintained our cells in a physiological (5%) O2 condition to minimizethe amount of oxidative stress derived from routine cell culture. Thus the basal levels of p53and the background senescence phenotype might be different between the studies.
Genome-Wide Analyses of Chronic p53
PLOS Genetics | DOI:10.1371/journal.pgen.1005053 March 19, 2015 13 / 28
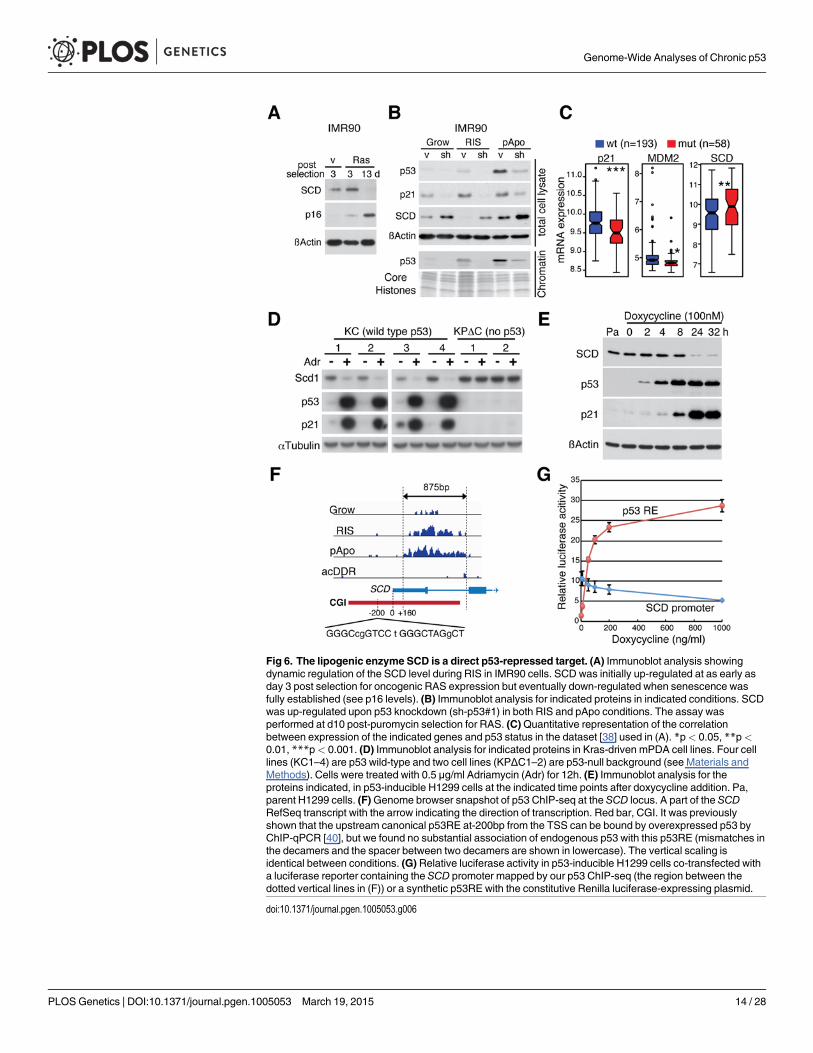
Fig 6. The lipogenic enzyme SCD is a direct p53-repressed target. (A) Immunoblot analysis showingdynamic regulation of the SCD level during RIS in IMR90 cells. SCD was initially up-regulated at as early asday 3 post selection for oncogenic RAS expression but eventually down-regulated when senescence wasfully established (see p16 levels). (B) Immunoblot analysis for indicated proteins in indicated conditions. SCDwas up-regulated upon p53 knockdown (sh-p53#1) in both RIS and pApo conditions. The assay wasperformed at d10 post-puromycin selection for RAS. (C)Quantitative representation of the correlationbetween expression of the indicated genes and p53 status in the dataset [38] used in (A). *p< 0.05, **p<0.01, ***p< 0.001. (D) Immunoblot analysis for indicated proteins in Kras-driven mPDA cell lines. Four celllines (KC1–4) are p53 wild-type and two cell lines (KPΔC1–2) are p53-null background (see Materials andMethods). Cells were treated with 0.5 μg/ml Adriamycin (Adr) for 12h. (E) Immunoblot analysis for theproteins indicated, in p53-inducible H1299 cells at the indicated time points after doxycycline addition. Pa,parent H1299 cells. (F)Genome browser snapshot of p53 ChIP-seq at the SCD locus. A part of the SCDRefSeq transcript with the arrow indicating the direction of transcription. Red bar, CGI. It was previouslyshown that the upstream canonical p53RE at-200bp from the TSS can be bound by overexpressed p53 byChIP-qPCR [40], but we found no substantial association of endogenous p53 with this p53RE (mismatches inthe decamers and the spacer between two decamers are shown in lowercase). The vertical scaling isidentical between conditions. (G) Relative luciferase activity in p53-inducible H1299 cells co-transfected witha luciferase reporter containing the SCD promoter mapped by our p53 ChIP-seq (the region between thedotted vertical lines in (F)) or a synthetic p53RE with the constitutive Renilla luciferase-expressing plasmid.
doi:10.1371/journal.pgen.1005053.g006
Genome-Wide Analyses of Chronic p53
PLOS Genetics | DOI:10.1371/journal.pgen.1005053 March 19, 2015 14 / 28
The molecular mechanism for the unique profile of chronic p53 seen in our study is unclear.The levels of global chromatin bound p53 were comparable between the acute and chronic (atleast RIS) conditions (Fig. 1E). Furthermore, p53 binding profiles at promoter regions were al-most identical between the RIS and pApo conditions, but the Rcade gene sets were distinct(compare S3A and S3C Figs). Thus, quantitative differences in the global levels of p53 or its ge-nomic distribution alone cannot explain the differential p53 activities.
Generally, CGIs are ‘open’, enriched for the binding sites of many TFs, including Sp1, whichcan recruit the TATA-binding general TF complex to TATA-less CGI promoters [22]. Thus inCGI regions, it is conceivable that complex interactions between transcription (co)factors canoccur depending on cellular contexts. The consensus p53 binding site consists of two decamerichalf-sites separated by 0–13 nucleotides, but the ‘non-canonical’ half-sites can also function as ap53RE [42,43]. Our analysis of two CGI promoters, which are p53-activated (p21) and p53-repressive (SCD), suggests that both CGI-promoters contain multiple ‘weak’ p53REs (includingmany half-sites), which somehow favor persistent accumulation of p53 (S2A and S7B Figs).These weak p53 associations might well be reinforced by other factors. It is also possible thatp53 might associate with DNA through its binding partners. Indeed, our motif enrichmentanalyses identified known p53-cofactors, including Sp1 (S7 Table) within p53 CGI-peaks.Therefore, it is possible that persistent cellular stress creates distinct contexts, where the qualityof p53 (e.g. its post-translational modifications, PTMs) and the sets of p53 binding proteins aredifferent from acute conditions, thereby facilitating the p53-CGI association. Indeed, p53 canbe modified by a multitude of diverse PTMs, including phosphorylation, acetylation, methyla-tion, ubiquitilation, neddylation, sumolyation, and poly-ribosylation [44]. Although the func-tional roles of these PTMs are not fully understood, some PTMs such as phosphorylation andacetylation typically contribute to stabilization and activation of p53 [44]. Interestingly, asshown in Fig. 4A, many factors involved in PTMs of p53 were included in the p53 self-regulatory hubs derived from the Rcade gene sets (Fig. 4A). This might provide a mechanismfor context-dependent fine-tuning of PTMs of p53 at least at a global level. It will be importantto determine phenotype-specific genome-wide profiling of individual PTMs of p53. In addition,a recent study has shown that a genome-wide redistribution of DNAmethylation occurs duringreplicative senescence, where persistent p53 plays a key role [45]. Thus it would also be interest-ing to examine the structural alterations in CGI regions during RIS and pApo conditions.
Notably, these two chronic phenotypes are highly distinct; RIS cells are stably arrested andresistant to apoptosis, whereas pApo cells are rapidly proliferating and sensitive to apoptosis,yet both are largely dependent on p53 [16,17]. Such distinct p53-associated phenotypes werenot achieved through differential p53 binding alone, since both conditions exhibited highlysimilar p53-binding profiles, where CGI-type genes are over-represented (S3A and S3C Fig).The unique feature of CGIs, such as their relatively open configuration and their enriched TFbinding motifs, might also provide environments that allow for diverse downstream regulationupon p53 binding in conjunction with other (co)factors [46]. In addition, our integrated net-work analyses in chronic conditions identified the extensive capability of p53 for physical inter-action with its own targets, further reinforcing the diverse results of p53 binding to the sametarget promoters. Although the dynamic regulation of p53 through the MDM2-p53 negativefeedback loop was readily detected in the DDR condition (Fig. 1C), its relevance in the chronicconditions was not so obvious. In pApo transformed cells, MDM2 was highly up-regulatedcompared to other conditions, whereas the chromatin bound p53 levels were comparable, oreven slightly higher in the pApo condition (Fig. 1D). Although this may be in part due to E1A-induced p14ARF, which inhibits the E3 ligase activity of MDM2 [47], this is also reminiscentof the tumor specific escape of mutant p53 fromMdm2 degradation in mice harboring germline p53 mutations, an observation that suggests the existence of additional mechanisms for
Genome-Wide Analyses of Chronic p53
PLOS Genetics | DOI:10.1371/journal.pgen.1005053 March 19, 2015 15 / 28
modulating the p53-MDM2 loop during tumorigenesis [29,30]. It has also been shown that thep53-repressive target, malic enzyme 2, reciprocally suppresses p53 in an MDM2-independentmanner during senescence [28]. Together, the dysregulation of p53-hubs particularly in chron-ic conditions might be a critical step for tumorigenesis.
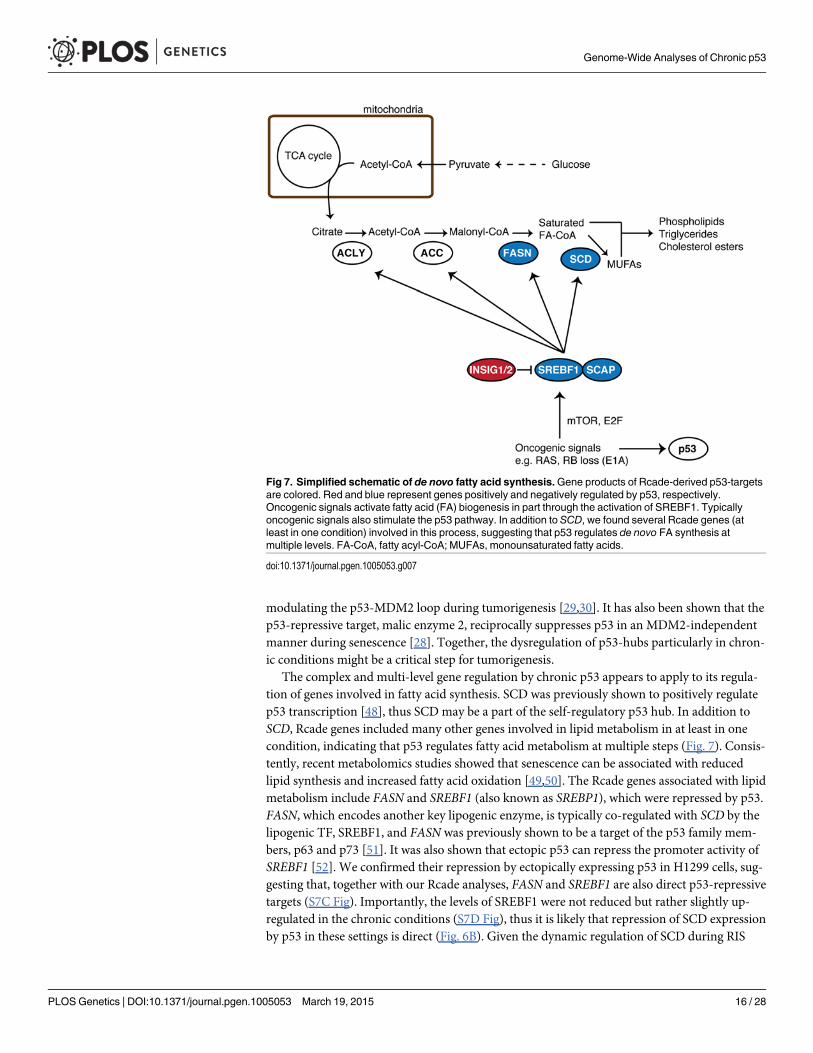
The complex and multi-level gene regulation by chronic p53 appears to apply to its regula-tion of genes involved in fatty acid synthesis. SCD was previously shown to positively regulatep53 transcription [48], thus SCD may be a part of the self-regulatory p53 hub. In addition toSCD, Rcade genes included many other genes involved in lipid metabolism in at least in onecondition, indicating that p53 regulates fatty acid metabolism at multiple steps (Fig. 7). Consis-tently, recent metabolomics studies showed that senescence can be associated with reducedlipid synthesis and increased fatty acid oxidation [49,50]. The Rcade genes associated with lipidmetabolism include FASN and SREBF1 (also known as SREBP1), which were repressed by p53.FASN, which encodes another key lipogenic enzyme, is typically co-regulated with SCD by thelipogenic TF, SREBF1, and FASN was previously shown to be a target of the p53 family mem-bers, p63 and p73 [51]. It was also shown that ectopic p53 can repress the promoter activity ofSREBF1 [52]. We confirmed their repression by ectopically expressing p53 in H1299 cells, sug-gesting that, together with our Rcade analyses, FASN and SREBF1 are also direct p53-repressivetargets (S7C Fig). Importantly, the levels of SREBF1 were not reduced but rather slightly up-regulated in the chronic conditions (S7D Fig), thus it is likely that repression of SCD expressionby p53 in these settings is direct (Fig. 6B). Given the dynamic regulation of SCD during RIS
Fig 7. Simplified schematic of de novo fatty acid synthesis.Gene products of Rcade-derived p53-targetsare colored. Red and blue represent genes positively and negatively regulated by p53, respectively.Oncogenic signals activate fatty acid (FA) biogenesis in part through the activation of SREBF1. Typicallyoncogenic signals also stimulate the p53 pathway. In addition to SCD, we found several Rcade genes (atleast in one condition) involved in this process, suggesting that p53 regulates de novo FA synthesis atmultiple levels. FA-CoA, fatty acyl-CoA; MUFAs, monounsaturated fatty acids.
doi:10.1371/journal.pgen.1005053.g007
Genome-Wide Analyses of Chronic p53
PLOS Genetics | DOI:10.1371/journal.pgen.1005053 March 19, 2015 16 / 28
and pApo, sustained p53 might compete with SREBF1 (or other lipogenic factors) at CGI re-gions. Interestingly, a recent study showed that mutant p53 positively regulates lipogenicgenes, including SCD and FASN, in an SREBF1-dependent manner [53]. This study reinforcesnot only the anti-lipogenic role of p53 but also the functional link between p53 and SREBF1 inlipogenic gene regulation. In addition, it has been shown that p53 is up-regulated in the adipo-cytes of obese mice, where p53 negatively regulates SREBF1 [52]. It is possible that chronicallyactivated p53 acts as a counter measure against excessive and tumorigenic fatty acid synthesisthrough various mechanisms. Altogether these results provide additional mechanistic insightinto p53 tumor suppression, suggesting that our data represent unique tools for finding cancertherapeutic targets in a p53-mutant context.
Materials and Methods
Cell culture and vectorsIMR90 cells (normal human diploid fibroblasts) (ATTC) were cultured as previously describedunder the 5% O2 condition [54]. H1299 cells (p53-null lung cancer cells) (ATCC) and mousepancreatic ductal adenocarcinoma (PDA) cell lines were cultured in DMEM with 10% fetal bo-vine serum (FBS) under ambient oxygen levels. The PDA cell lines KC1 (T4878), KC2(TB1572) and KC3 (T9394) were established from KrasLSL-G12D; Pdx1-cre (T4878 and T9394),and KrasLSL-G12D; P48-cre (TB1572) mice as described previously [39]; KPΔC was establishedfrom KrasLSL-G12D; p53lox/+; Pdx1-cre compound mutant mice, generated after breeding withKrasLSL-G12D [55], Pdx1-cre [56] and p53lox [57] strains.
The following retroviral vectors were used in this study: pBabe-Puro (HRASG12V), pWZL-Hygro (E1A, HRASG12V), and pLNCX2-Neo (ER:HRASG12V, encoding a fusion protein of theestrogen receptor ligand-binding domain and H-RASV12) [54]. The lentiviral RNAi, using amiR30 design, has been described previously [18]. Target sequences of sh-p53: GAGGATTT-CATCTCTTGTA (sh-p53#1) [18] and CACTACAACTACATGTGTA (sh-p53#2). To exam-ine p53-dependent gene expression in each condition, sh-p53 was introduced after theestablishment of the phenotype and samples were collected after 5 days, except for the acDDRcondition, where sh-p53 was introduced first for at least 5 days before the administration ofetoposide (100 μM for 24h).
The tetracycline inducible system (pCLIIP-i) for p53 was built into a PiggyBac transposonsystem [27] in two stages. The first stage plasmid comprised the minimal transposon pCyl50(provided by the Wellcome Trust Sanger Institute, Hinxton, United Kingdom) [58] with a link-er, HS4 transcriptional insulators and a PGK-puro expression cassette. The tet-inducible com-ponents were added, with a third generation tet-responsive element [59] and a constitutivelyexpressed rtTA3 tet-transactivator (derived from pTRIPZ; Open Biosystems). Wild-typehuman p53 cDNA was cloned downstream of the tet-responsive element (pCLIIP-i-p53).
Establishment of p53-inducible H1299 cellsp53-null H1299 human lung cancer were co-transfected with pCLIIP-i-p53 with the mousecodon-biased PiggyBac transposon (mPB) gene. H1299 cells stably expressing pCLIIP-i-p53were established in puromycin (1.5 μg/ml) containing media for 7 days, and then maintainedin the puromycin-free medium.
Luciferase assayLuciferase activity was assayed using Dual-Luciferase Reporter Assay System (Promega) ac-cording to the manufacturer’s instructions. Reporter plasmids were transfected to p53-inducible
Genome-Wide Analyses of Chronic p53
PLOS Genetics | DOI:10.1371/journal.pgen.1005053 March 19, 2015 17 / 28
H1299 cells. After 48h of transfection, doxycycline was added to induce p53 expression. Cellswere lysed in passive lysis buffer after 24 hours of doxycycline treatment and luciferase activitieswere measured using a PHERAstar FS microplate reader (BMG LABTECH). The p53-enrichedregion in the SCD locus in the RIS condition (Figs. 6F and S7B) was synthesized (GeneArt), andcloned into the pGL4.15 luciferase reporter plasmid (Promega) between KpnI and XhoI sites.pGL4.38 (Promega), which contains 2x tandem synthetic p53RE, was used as a positive control.The thymidine kinase promoter-Renilla luciferase reporter plasmid (pRL-TK) was used as anormalization control.
Chromatin isolationChromatin isolation was performed as described before [18].
ImmunoblottingThe following antibodies were used for immunoblotting: anti-HRAS (Santa Cruz, sc-29), anti-human p21 (Santa Cruz, sc-397), anti-E1A (Santa Cruz, sc-430); anti-ß-actin (Sigma A5441),anti-Cyclin A2 (Sigma C4710), anti-human p53 (DO-1, Sigma P6874), anti-MDM2 (clones2A10 and 4B11) [18], anti-Histone H3 (Abcam ab1791), anti-HMGA2 (Santa Cruz, sc-30223),anti-SCD/Scd1 (Cell Signaling, #2438), anti-mouse p53 (Biovision #3036) and anti-mouse p21(Santa Cruz #sc-6246), anti-α-Tubulin (Abcam #Ab18251), anti-SREBP1 (Santa Cruz, sc-13551). Immunoblotting analysis was carried out as described [18].
Cell proliferation, SA-ß-Galactosidase (SA-ß-Gal) and cell viabilityassaysReplicating DNA was labeled using BrdU, and SA-ß-Gal activity was assessed as described[18]. Cell viability was determined using a trypan blue exclusion assay.
Quantitative RT-PCRRT-qPCR was performed as described before [18]. CDKN1A (p21) variant specific primer se-quences can be found in S2B Fig.
Other qPCR primer sequences:p21 Forward primer: AGCAGAGGAAGACCATGTGGAp21 Reverse primer: GCGAGGCACAAGGGTACAASESN1 Forward: TACCTCAATGCTTAGACGGGCASESN1 Reverse: TCAGGAGTGCAAACAACAGTTTBTG2 Forward primer: CTCCAGGAGGCACTCACAGBTG2 Reverse primer: ATGATGGGGTCCATCTTGTGADCK3 Forward: TGATGCCTTTATCAACCCCCAADCK3 Reverse: CGAAGTATTCCAACTTGTCCCGANKRA2 Forward: TCACCCATAAAACAGTCAACCAANKRA2 Reverse: GCCAACTGGTGAACAGACAAHSPA4L Forward: TTCTGCTTAGCGACTTGGGGHSPA4L Reverse: GCTGCTGGTACTGAACCCTTFASN Forward: GCTCCAGCCTCGCTCTCFASN Reverse: TCTCCGACTCTGGCAGCTTSCD Forward: TTCCTACCTGCAAGTTCTACACCSCD Reverse: CCGAGCTTTGTAAGAGCGGTSREBF1 Forward: GCCCCTGTAACGACCACTG
Genome-Wide Analyses of Chronic p53
PLOS Genetics | DOI:10.1371/journal.pgen.1005053 March 19, 2015 18 / 28
SREBF1 Reverse: CAGCGAGTCTGCCTTGATGβActin forward primer: TTCAACACCCCAGCCATGTβActin Reverse primer: GCCAGTGGTACGGCCAGA
Microarray, ChIP and ChIP-seqGene expression microarray experiments were carried out on Illumina HumanWG-6 version2 arrays as described previously, using three biological replicates per condition [54]. ChIP andlibrary preparation were performed as described previously [54]. In short, the immunoprecipi-tated DNA was end-repaired, A-tailed, ligated to the sequencing adapters, amplified by 18 cy-cles of PCR and size selected (200–300 bp) followed by single end sequencing on an IlluminaGenome Analyzer IIx (GAIIx) according to the manufacturer’s recommendation. Antibodiesused were: p53 (DO-1 Sigma); H3K4me3 (CMA304), H3K36me3 (CMA333) [54]. Expressionmicroarray and ChIP-seq data are available at the National Center for Biotechnology Informa-tion Gene Expression Omnibus under accession numbers GSE53491 and GSE53379.
Microarray analysisAll data analyses were carried out on R using Bioconductor packages [60]. Raw intensity datafrom the array scanner were processed using the BASH and HULK algorithms as implementedin the beadarray package [61,62]. Log2 transformation and quantile normalization of the datawere performed across all sample groups. Differential expression analysis was carried out usingthe limma package [63]. Differentially expressed genes were determined by computing the log2contrast between sh-p53#1 and vector control for each condition. Genes were selected using ap-value cut-off of<0.01 after application of FDR correction for multiple testing (Benjamini-Hochberg) applied globally to correct for multiple contrasts. Data were analysed through theuse of IPA (Ingenuity1 Systems, www.ingenuity.com/), and pathway enrichment was deter-mined for genes with log2 ratio>0.58 or<-0.58 and an FDR corrected p-value< 0.01. Illu-mina HG6 v2 platform probe list was used as the background set. Pathway heatmaps weregenerated by plotting negative log of the Fisher’s exact test enrichment p-value against all path-ways. The conditions were clustered by hierarchical clustering using R (R-project).
ChIP-seq analysesSingle-end 36 bp reads generated by the Illumina GAIIx or High Seq were aligned against theHuman Reference Genome (assembly hg18, NCBI Build 36) using BWA version 0.5.5. Readswere filtered by removing those with a BWA alignment quality score less than 15. A further fil-tration was carried out by removing reads falling into the ‘blacklist’ regions identified by EN-CODE [64]. Principle Component Analysis (PCA) was used to assess the prevalence andquality of read data in TSS regions. Counts were normalized between samples by dividing byeffective library size (bin count sums). The MACS algorithm version 1.4.1 was used togetherwith hg18 aligned, sequence read BAM files for identifying peak regions representing p53 bind-ing sites [65]. Peaks were inspected using the IGV Genome Browser (v 2.3) [66]. UCSC definedCpG islands (CGIs) were used to identify CGI overlapping peaks. Any peak that overlappedwith a CGI was included in the CpG peakset and the remainder included in the non-CGI set.Peaks were mapped to genes using the ChIPpeakAnno BioConductor package and the EBIPeak Annotator. Ensembl 54 (hg18) gtf file downloaded from http://www.ensembl.org/info/data/ftp/index.html was used to annotate genes. The following region definitions were usedwhen calculating genomic distribution of peaks: Core promoter regions (-3000 to +2000around TSS), distal (-3000 to-50000), intergenic (> -50000) and downstream extremities(-2000 to +3000) around transcription end site.
Genome-Wide Analyses of Chronic p53
PLOS Genetics | DOI:10.1371/journal.pgen.1005053 March 19, 2015 19 / 28
pApo, acDDR and RIS samples had three biological replicates each, while the growing con-dition had two replicates. We identified a high confidence (HC) peak set consisting of replicat-ed peaks. Peaks that were present in two or more replicates in each condition were included inthe HC peak set. Non-replicated singleton peaks in each condition was then compared to peaksin other conditions. Peaks in one condition overlapping with at least two other conditions orpeaks in one condition overlapping with peaks in at least two replicates from another conditionwere also included in the HC peak set. Finally all overlapping peaks were merged to get thefinal high confidence peak set for each condition.
We downloaded the FastQ files for the public data sets and aligned them to hg18 referencegenome using BWA and removed contaminants using FastQC [67]. BAM files were generatedand peak calling was performed using MACS v1.4.1. All other analysis was performedas described.
The analysis of gene annotation enrichment was performed using GREAT (http://great.stanford.edu/) using the ‘basal plus extension’ association rules with proximal 10kb upstreamand 5kb downstream regulatory domain settings, and the whole human genome (hg18) asbackground [68].
RcadePeak distributions were plotted and bins 50 bp upstream and 1500 bp downstream of TSS weredefined based on p53 signal enrichment. baySeq was used to determine enrichment over input[69]. Counts were normalized using the Quantile method (baySeq package). ChIP-seq and ex-pression data were combined using a Bayesian approach, ranking genes in order of probabilityof being a p53 target. For each probe, we calculate the posterior probability of a p53 effect ontranscription, Pr (DE and C | data), as proportional to Pr(DE | data) Pr(C | data)—here,Pr(DE | data) is the limma-derived posterior probability of differential expression under p53knockdown, Pr(C | data) is the baySeq-derived posterior probability of enrichment for ChIP.Each probe’s posterior probability was logit transformed into a B value, through applying thelogit transformation. Probes with B value greater than the threshold-1.5 were taken forward inthe analysis. IPA upstream regulator analysis method was used as a sequence independentmethod to confirm the transcriptional regulators of the Rcade gene lists. The DAVID bioinfor-matics resource (v6.7) was used for ontology enrichment analysis of Rcade genes. IlluminaHG6 v2 platform probe list was used as the background probe set [70].
Phenotype specific knowledge based Pathway modelingBiochemical models of the p53 regulome (the set of p53 regulated genes) for each phenotypeunder consideration was constructed utilizing the following integrative and iterative analyticalapproach. Putative p53 targets were identified by integrating ChIP-seq and expression datasetsusing the Rcade method (Bioconductor). Rcade genes with a B value>-1.5 were selected as pu-tative p53 targets for further analysis. Reviews, primary scientific publications and phenotypeassociated biochemical pathways and signaling, regulatory, metabolic and physical interactionsinvolved in each of the conditions were used to build a phenotype specific global networkframework. The selected Rcade genes were then used to extract pathway information frommultiple public (KEGG, Reactome, Wikipathways, Pathway Commons, Panther etc.) and com-mercial pathway (Ingenuity Pathway Analysis) databases [71–75]. Pathways involved were in-tegrated into the model in combination with information integrated from interaction databasesand ontology analysis followed by extensive semi-automated literature mining. Sub-cellular lo-calization information and p53 related protein-protein or genetic interactions were integratedby mining relevent biological databases (InAct, Biogrid, String, IPA, MitoCarta) [76–79].
Genome-Wide Analyses of Chronic p53
PLOS Genetics | DOI:10.1371/journal.pgen.1005053 March 19, 2015 20 / 28
Regulation of p53 or by p53 and interaction with p53 or evidence of contribution to or involve-ment in phenotype for each interaction was documented. Expert manual curation was used tobuild and iteratively refine these detailed biochemical models of p53 targets. Nodes are repre-sented by p53 induced, repressed genes and those not regulated by p53 providing pathway con-text. Edges are represented by color-coded arrows denoting catalytic, protein-protein,inhibitory, direct functional, translocation or undefined interactions. A large number of p53regulated genes identified as p53 interacting or p53 stability modifying proteins documented inS4 and S5 Fig. are shown in detail as regulatory p53 hubs in Fig. 4A. A list of p53 hub genesand evidence for p53 association are provided in S6 Table.
Functional association networksThe Multiple Association Network Integration Algorithm was used to identify functional asso-ciation networks. The method uses a large dataset of over 300 functional association networksthat are grouped into five categories: co-localization, genetic interaction, physical interaction,predicted interactions and shared protein domains. Networks are weighted according tosource-dependent criteria, stored as sparse weighted adjacency matrices, where weight corre-sponds to gene interaction strength. The algorithm uses the Rcade list to integrate associationnetworks from multiple sources into a composite network using a conjugate gradient optimiza-tion method. The computation consists of two parts; an algorithm, based on linear regression,for calculating a single composite functional association network from multiple networks de-rived from different genomic and proteomic datasets; and a Gaussian label propagation algo-rithm for predicting gene function given this composite network. Strength of the functionalrelatedness is represented by the edge density. Network topology and connectivity analysis andbiological enrichment analysis of the inferred network was carried out. To determine the speci-ficity of the method we used a similar sized set of random genes (derived from the universe ofhuman protein coding genes) and the above network inference methods were applied. This re-sulted in an extremely sparse network, in which the majority of nodes remained unconnected.The exclusion or inclusion of p53 within the random list had no effect on its connectivity. Net-works analysis and visualization was performed with Cytoscape (ver 2.8.3) software [80].
p53 interactome analysisBiogrid database (ver 3.2) was programmatically accessed by perl scripts using the RESTful API.The database was queried with a list of (pro-apoptosis or senescence) putative p53 target genes(Rcade genes with a B value> -1.5). Protein-protein interactions were filtered by Rcade lists andthen by those consisting of either of the interacting partners being on the previously identified p53hub gene lists. Interactions between hub genes were clustered into those between p53, MDM2 andother hub genes and visualized as a circos plot using the Circos program (ver 0.64) [81].
Motif analysesCDKN1A and SCD sequences in fasta format were used for transcription factor binding siteanalysis. The TransfacPro (v 2013.2) MATCH algorithm, together with transcription factor po-sition weight matrices and specificity profiles was used to identify TP53 and other transcriptionfactor binding sites [82]. We used the minSUM_good profile to restrict analysis to only highquality matrices and to minimize the sum of both false positive and negative error rates. Denovomotif enrichment analysis was performed using MemeChIP package [83] and PositionWeight Matrix (PWM) scanning based motif enrichment analysis was performed using Pscan-Chip with TransfacPro PWMs and open chromatin background downloaded from UCSC ge-nome browser [84–86]. Distribution of p53 motifs were defined by CentDist [87].
Genome-Wide Analyses of Chronic p53
PLOS Genetics | DOI:10.1371/journal.pgen.1005053 March 19, 2015 21 / 28
Recursive partitioning analysisRecursive partitioning (RP) was carried out using the R party package on normalized gene ex-pression data from the four datasets, all derived from Affymetrix array platforms [31–33].Genes were selected as having expression profiles that could stratify patients into subgroupswith significantly different survival outcomes, by selecting those genes for which the most sig-nificant stratification had a p-value (adjusted for multiple correction) of<0.05. p53 expressionand mutation status was derived from CEL files for the Miller et al. [38] dataset were down-loaded from GEO (Accession number: GSE3494). All data analyses were carried out on R usingBioconductor packages. The data were normalized using the RMA algorithm. Differential ex-pression analysis was carried out using the limma package.
TFBS enrichment analysis of putative p53 targetsp53 bound, transcriptionally active, putative p53-target genes were derived from Rcade analysisof pro-apoptotic and oncogene RAS-induced senescence conditions. Genes with an RcadeB-value> -1.5 was used for further analysis. Core promoter sequences (-3kb and +2kb aroundthe TSS) were extracted and transcription factor binding site (TFBS) enrichment analysis wasperformed using the Pscan program together with vertebrate TFBS position weight matricesfrom the Transfac professional database (v2013.4) [85,88]. Promoter sequences of equal lengthto the test set from all protein coding genes were used as a background set.
Supporting InformationS1 Fig. Phenotype associated p53 activation. (A) E1A/RAS expressing (pro-apoptotic, pApo)cells are sensitive to DNA damage-induced cell death, compared to growing (Grow) and RAS-induced senescent (RIS) cells. Cells were treated with 0.5 μg/ml Doxorubicin (DOXO) orDMSO (No) for 24 hours, and cell viability was assessed by trypan blue exclusion (mean ±SEM; n� 3). ���p< 0.001. Representative phase contrast images of pApo cells are also shown.(B) qPCR analysis of known p53-targets in each condition (mean ± SEM; n = 3) with or with-out sh-p53#1. (C) qPCR analysis of known p53-targets as well as p53 in each condition (mean± SEM; n = 3) with or without sh-p53#2. (D) Pathway heatmaps for genes down-regulated(positively regulated by p53) and up-regulated (negatively regulated by p53) upon p53 deple-tion (sh-p53#1). Grow, growing IMR90 cells; acDDR, cells treated with 100 μM etoposide for24h; RIS, RAS-induced senescent cells; pApo, E1A/RAS expressing pro-apoptotic cells.(TIF)
S2 Fig. p53 CGI peak in CDKN1A (p21) locus and its transcripts. (A) Sequence of the proxi-mal CGI in the p21 locus and potential p53 binding motifs (highlighted) defined using Trans-facPro Match algorithm and associated matrices with 0.8 cut-offs for both core and matrixscores. (B) Two representative p21 Refseq transcripts, variant 1 (the classic transcript) and vari-ant 2. RT-qPCR primer sets were designed to amplify each variant separately or both variantssimultaneously. (C) RT-qPCR analyses of the p21 transcripts in cells in the indicated condi-tions (mean ± SEM; n = 3). Both variants were up-regulated in all conditions.(TIF)
S3 Fig. Integration of p53-dependent expression and p53 ChIP-seq data. (A)Venn diagramsshowing the numbers of HC p53-ChIP-seq peaks in the indicated conditions genome-wide orwithin the promoter regions. (B)Dot plots showing p53 binding intensity against differentialexpression (DE). Each point represents a gene, with its associated DE log-ratio plotted on the x-axis and the bin-derived ChIP log-ratio on the y-axis. The color of each point represents thelog-odds that Rcade has assigned to that gene: that is, how likely that gene is to be a direct p53
Genome-Wide Analyses of Chronic p53
PLOS Genetics | DOI:10.1371/journal.pgen.1005053 March 19, 2015 22 / 28
target. We can see the genes that are likely to be p53 targets at the top-left and top-right of thegraphs. (C) Venn diagram showing the numbers of Rcade-derived p53-targets in both chronicconditions. Overlap is smaller compared to the HC peak sets—see the right Venn diagram in(A). (D)DAVID analysis for Rcade-derived genes in each condition. Red script represents pro-cesses associated with typical p53-related functions such as cell cycle, DNA damage response,and apoptosis; blue script represents processes associated with RNAmetabolism and regulation;green script represents processes associated with membrane-bound organelles. DAVID ontolo-gies were manually trimmed by removing apparent redundancy. (E) qPCR showing fold changeof indicated mRNAs after p53 knockdown in the indicated conditions (mean ± SEM; n = 3).(F) qPCR showing fold change of indicated mRNAs after p53 induction in tetracycline-induc-ible p53 expressing H1299 cells (mean ± SEM; n = 3). Inset is immunoblot analysis of p53 in thepresence or absence of 100μM doxycycline (Dox) for 24h. �p< 0.05, ��p< 0.01, ���p< 0.001.(TIF)
S4 Fig. Phenotype specific knowledge based pathway models of putative p53 targets in pro-apoptotic condition.Maroon ovals indicate positive and blue ovals indicate negative regula-tion by p53 (red oval). White ovals are not regulated by p53 but are involved in the pathways.The blue T-lines show inhibition, green lines ending in a circle are enzymatic reactions, orangearrows are protein-protein interactions, pink dotted lines are either translocation or degrada-tion, black lines are undefined interactions and black dotted lines are indirect interactions.Numbers associated with genes or connections represent are linked to pubmed IDs providingthe evidence for the interaction. A high-resolution version of the figure is available at http://australian-systemsbiology.org/tp53.(TIF)
S5 Fig. Phenotype specific knowledge based pathway models of putative p53 targets in RIScondition.Maroon ovals indicate positive and blue ovals indicate negative regulation by p53(red oval). White ovals are not regulated by p53 but are involved in the pathways. The blueT-lines show inhibition, green lines ending in a circle are enzymatic reactions, orange arrowsare protein-protein interactions, pink dotted lines are either translocation or degradation,black lines are undefined interactions and black dotted lines are indirect interactions. Numbersassociated with genes or connections represent are linked to pubmed IDs providing the evi-dence for the interaction. A high-resolution version of the figure is available at http://australian-systemsbiology.org/tp53.(TIF)
S6 Fig. Heatmap summarizing recursive partitioning analysis for Rcade-derived p53 tar-gets in the pApo condition for four cancer data sets as in Fig. 5A.MDM2, CDKN1A (green)and SCD (red) are highlighted. Consistent with the recent study by Kenzelmann Broz et al.[13], higher levels of genes involved in autophagy (brown) were often associated withbetter prognosis.(TIF)
S7 Fig. SCD is a p53-repressive target. (A) Immunoblot analysis in p53-inducible H1299 cellsat d3 after different doses of doxycycline addition. 293T cells express a high level of ‘inactive’p53 due to the expression of SV40 Large T antigen. (B) The sequence of the p53-bound regionin the SCD promoter as shown in Fig. 6F. Potential p53 motifs are highlighted as in S2A FigThis region was used for the reporter assay in Fig. 6G. (C) qPCR showing fold change of indi-cated mRNAs in each condition (mean ± SEM; n = 3) with or without sh-p53#2. (D) qPCRshowing fold change of indicated mRNAs after p53 induction in tetracycline-inducible p53 ex-pressing H1299 cells as in S3F Fig (mean ± SEM; n = 3). Dox+, 100 μM doxycycline treatment
Genome-Wide Analyses of Chronic p53
PLOS Genetics | DOI:10.1371/journal.pgen.1005053 March 19, 2015 23 / 28
for 24h. ��p< 0.01, ���p< 0.001. (E) Immunoblot analysis showing that SREBF1 is not down-regulated during RIS in IMR90 cells. The assay was performed at d10 post selection for RAS asin Fig. 6B.(TIF)
S1 Table. Microarray: Differentially expressed (DE) genes upon p53 knockdown (sh-p53#1). Core genes (intersection of DE genes from RIS, pApo, and acDDR conditions inFig. 1F) are shown.(XLSX)
S2 Table. ChIP-Seq replicate information (number of replicates, reads etc.)(XLSX)
S3 Table. Genomic distribution of subsets of high confidence p53 ChIP-seq peaks in eachcondition. Genomic features were determined as in Fig. 2B. Same numbers of p53 high confi-dence peaks were selected based on MACS score from each condition.(XLS)
S4 Table. GO analysis for genes associated with CGI- and non-CGI-p53 peaks in each con-dition. Blue script represents processes associated with RNA metabolism and regulation,whereas red script represents processes associated with typical p53 related functions such ascell cycle, DNA damage response, and apoptosis.(XLSX)
S5 Table. Rcade-derived genes in RIS and pApo conditions. Genes with Rcade B-value great-er than the threshold-1.5 are included.(XLSX)
S6 Table. p53 Hub genes shown in Fig. 4 in RIS and pApo conditions. Evidence for interac-tions are provided as Pubmed IDs (PMID).(XLSX)
S7 Table. Enrichment of known transcription factor binding sites (TFBS) in the Rcadegene set. Only transcription factors from a non-redundant vertebrate PWM set with enrich-ment p-value> 0.01 are shown.(XLSX)
AcknowledgmentsWe thank A. Berns, D. Tuveson, and J. Carroll for reagents; A. Young for critical reading; L.Blackburn for editing; the CI’s Genomics, Bioinformatics facilities for technical support.
Author ContributionsConceived and designed the experiments: KK SAS ST MasasN. Performed the experiments:KK PAPM KT CBR YI TCMasakN. Analyzed the data: SAS JMC SM AGL TO. Contributedreagents/materials/analysis tools: SKL HK. Wrote the paper: KK SAS JMC ST MasasN.
References1. Rivlin N, Brosh R, Oren M, Rotter V (2011) Mutations in the p53 Tumor Suppressor Gene: Important
Milestones at the Various Steps of Tumorigenesis. Genes & Cancer 2: 466–474. doi: 10.1177/1947601911408889
Genome-Wide Analyses of Chronic p53
PLOS Genetics | DOI:10.1371/journal.pgen.1005053 March 19, 2015 24 / 28
2. Kenzelmann-Broz D, Attardi LD (2010) In vivo analysis of p53 tumor suppressor function using geneti-cally engineered mouse models. Carcinogenesis 31: 1311–1318. doi: 10.1093/carcin/bgp331 PMID:20097732
3. Itahana K, Dimri GP, Hara E, Itahana Y, Zou Y, et al. (2002) A role for p53 in maintaining and establish-ing the quiescence growth arrest in human cells. J Biol Chem 277: 18206–18214. doi: 10.1074/jbc.M201028200 PMID: 11880381
4. Zilfou JT, Lowe SW (2009) Tumor suppressive functions of p53. Cold Spring Harbor Perspectives in Bi-ology 1: a001883. doi: 10.1101/cshperspect.a001883 PMID: 20066118
5. Vousden KH, Prives C (2009) Blinded by the Light: The Growing Complexity of p53. Cell 137: 413–431. doi: 10.1016/j.cell.2009.04.037 PMID: 19410540
6. Li T, Kon N, Jiang L, Tan M, Ludwig T, et al. (2012) Tumor suppression in the absence of p53-mediatedcell-cycle arrest, apoptosis, and senescence. Cell 149: 1269–1283. doi: 10.1016/j.cell.2012.04.026PMID: 22682249
7. Lahav G, Rosenfeld N, Sigal A, Geva-Zatorsky N, Levine AJ, et al. (2004) Dynamics of the p53-Mdm2feedback loop in individual cells. Nat Genet 36: 147–150. doi: 10.1038/ng1293 PMID: 14730303
8. Vousden KH, Lane DP (2007) p53 in health and disease. Nat Rev Mol Cell Biol 8: 275–283. doi: 10.1038/nrm2147 PMID: 17380161
9. Christophorou MA, Ringshausen I, Finch AJ, Swigart LB, Evan GI (2006) The pathological response toDNA damage does not contribute to p53-mediated tumour suppression. Nature 443: 214–217. doi: 10.1038/nature05077 PMID: 16957739
10. Brady CA, Jiang D, Mello SS, Johnson TM, Jarvis LA, et al. (2011) Distinct p53 Transcriptional Pro-grams Dictate Acute DNA-Damage Responses and Tumor Suppression. Cell 145: 571–583. doi: 10.1016/j.cell.2011.03.035 PMID: 21565614
11. Rodier F, Coppe J-P, Patil CK, Hoeijmakers WAM, Muñoz DP, et al. (2009) Persistent DNA damagesignalling triggers senescence-associated inflammatory cytokine secretion. Nat Cell Biol 11: 973–979.doi: 10.1038/ncb1909 PMID: 19597488
12. Wei C-L, Wu Q, Vega VB, Chiu KP, Ng P, et al. (2006) A global map of p53 transcription-factor bindingsites in the human genome. Cell 124: 207–219. doi: 10.1016/j.cell.2005.10.043 PMID: 16413492
13. Kenzelmann Broz D, Spano Mello S, Bieging KT, Jiang D, Dusek RL, et al. (2013) Global genomic pro-filing reveals an extensive p53-regulated autophagy program contributing to key p53 responses.Genes Dev 27: 1016–1031. doi: 10.1101/gad.212282.112 PMID: 23651856
14. Li M, He Y, Dubois W, Wu X, Shi J, et al. (2012) Distinct Regulatory Mechanisms and Functions forp53-Activated and p53-Repressed DNA Damage Response Genes in Embryonic Stem Cells. Mol Cell46: 30–42. doi: 10.1016/j.molcel.2012.01.020 PMID: 22387025
15. Akdemir KC, Jain AK, Allton K, Aronow B, Xu X, et al. (2014) Genome-wide profiling reveals stimulus-specific functions of p53 during differentiation and DNA damage of human embryonic stem cells. Nu-cleic Acids Res 42: 205–223. doi: 10.1093/nar/gkt866 PMID: 24078252
16. Serrano M, Lin AW, McCurrach ME, Beach D, Lowe SW (1997) Oncogenic ras provokes prematurecell senescence associated with accumulation of p53 and p16INK4a. Cell 88: 593–602. PMID:9054499
17. Lowe SW, Ruley HE (1993) Stabilization of the p53 tumor suppressor is induced by adenovirus 5 E1Aand accompanies apoptosis. Genes Dev 7: 535–545. PMID: 8384579
18. Narita M, Narita M, Krizhanovsky V, Nũnez S, Chicas A, et al. (2006) A novel role for high-mobility groupa proteins in cellular senescence and heterochromatin formation. Cell 126: 503–514. doi: 10.1016/j.cell.2006.05.052 PMID: 16901784
19. Smeenk L, van Heeringen SJ, Koeppel M, van Driel MA, Bartels SJJ, et al. (2008) Characterization ofgenome-wide p53-binding sites upon stress response. Nucleic Acids Res 36: 3639–3654. doi: 10.1093/nar/gkn232 PMID: 18474530
20. Nikulenkov F, Spinnler C, Li H, Tonelli C, Shi Y, et al. (2012) Insights into p53 transcriptional functionvia genome-wide chromatin occupancy and gene expression analysis. Cell Death Differ 19: 1992–2002. doi: 10.1038/cdd.2012.89 PMID: 22790872
21. Botcheva K, McCorkle SR, McCombieWR, Dunn JJ, Anderson CW (2011) Distinct p53 genomic bind-ing patterns in normal and cancer-derived human cells. Cell Cycle 10: 4237–4249. doi: 10.4161/cc.10.24.18383 PMID: 22127205
22. Deaton AM, Bird A (2011) CpG islands and the regulation of transcription. Genes Dev 25: 1010–1022.doi: 10.1101/gad.2037511 PMID: 21576262
23. Laptenko O, Beckerman R, Freulich E, Prives (2011) p53 binding to nucleosomes within the p21 pro-moter in vivo leads to nucleosome loss and transcriptional activation. Proc Natl Acad Sci USA 108:10385–10390. doi: 10.1073/pnas.1105680108
Genome-Wide Analyses of Chronic p53
PLOS Genetics | DOI:10.1371/journal.pgen.1005053 March 19, 2015 25 / 28
24. Hon GC, Hawkins RD, Ren B (2009) Predictive chromatin signatures in the mammalian genome. HumMol Genet 18: R195–R201. doi: 10.1093/hmg/ddp409 PMID: 19808796
25. Zhang Q, Zhang J, Jin H, Sheng S (2013) Whole transcriptome sequencing identifies tumor-specificmutations in human oral squamous cell carcinoma. BMCMedical Genomics 6: 28. doi: 10.1186/1755-8794-6-28 PMID: 24007313
26. Kuang S-Q, TongW-G, Yang H, Lin W, Lee MK, et al. (2008) Genome-wide identification of aberrantlymethylated promoter associated CpG islands in acute lymphocytic leukemia. Leukemia 22: 1529–1538. doi: 10.1038/leu.2008.130 PMID: 18528427
27. Cadinanos J, Bradley A (2007) Generation of an inducible and optimized piggyBac transposon system.Nucleic Acids Res 35: e87–e87. doi: 10.1093/nar/gkm446 PMID: 17576687
28. Jiang P, DuW, Mancuso A, Wellen KE, Yang X (2013) Reciprocal regulation of p53 and malic enzymesmodulates metabolism and senescence. Nature 493: 689–693. doi: 10.1038/nature11776 PMID:23334421
29. Oren M, Rotter V (2010) Mutant p53 Gain-of-Function in Cancer. Cold Spring Harbor Perspectives inBiology 2: a001107–a001107. doi: 10.1101/cshperspect.a001107 PMID: 20182618
30. Kruse J-P, GuW (2009) Modes of p53 regulation. Cell 137: 609–622. doi: 10.1016/j.cell.2009.04.050PMID: 19450511
31. Shedden K, Taylor JMG, Enkemann SA, Tsao M-S, Yeatman TJ, et al. (2008) Gene expression-basedsurvival prediction in lung adenocarcinoma: a multi-site, blinded validation study. Nat Med 14: 822–827. doi: 10.1038/nm.1790 PMID: 18641660
32. Desmedt C, Piette F, Loi S, Wang Y, Lallemand F, et al. (2007) Strong time dependence of the 76-geneprognostic signature for node-negative breast cancer patients in the TRANSBIGmulticenter indepen-dent validation series. Clin Cancer Res 13: 3207–3214. doi: 10.1158/1078-0432.CCR-06-2765 PMID:17545524
33. Glinsky GV, Glinskii AB, Stephenson AJ, Hoffman RM, Gerald WL (2004) Gene expression profilingpredicts clinical outcome of prostate cancer. J Clin Invest 113: 913–923. doi: 10.1172/JCI20032 PMID:15067324
34. Abukhdeir AM, Park BH (2008) p21 and p27: roles in carcinogenesis and drug resistance. Expert RevMol Med 10: e19. doi: 10.1017/S1462399408000744 PMID: 18590585
35. Menendez JA, Lupu R (2007) Fatty acid synthase and the lipogenic phenotype in cancer pathogenesis.Nat Rev Cancer 7: 763–777. doi: 10.1038/nrc2222 PMID: 17882277
36. Igal RA (2010) Stearoyl-CoA desaturase-1: a novel key player in the mechanisms of cell proliferation,programmed cell death and transformation to cancer. Carcinogenesis 31: 1509–1515. doi: 10.1093/carcin/bgq131 PMID: 20595235
37. Ntambi JM, Miyazaki M (2004) Regulation of stearoyl-CoA desaturases and role in metabolism. ProgLipid Res 43: 91–104. PMID: 14654089
38. Miller LD, Smeds J, George J, Vega VB, Vergara L, et al. (2005) An expression signature for p53 statusin human breast cancer predicts mutation status, transcriptional effects, and patient survival. Proc NatlAcad Sci USA 102: 13550–13555. doi: 10.1073/pnas.0506230102 PMID: 16141321
39. Pérez-Mancera PA, Rust AG, van der Weyden L, Kristiansen G, Li A, et al. (2012) The deubiquitinaseUSP9X suppresses pancreatic ductal adenocarcinoma. Nature 486: 266–270. doi: 10.1038/nature11114 PMID: 22699621
40. Mirza A, Wu Q, Wang L, McClanahan T, BishopWR, et al. (2003) Global transcriptional program of p53target genes during the process of apoptosis and cell cycle progression. Oncogene 22: 3645–3654.doi: 10.1038/sj.onc.1206477 PMID: 12789273
41. Melo CA, Drost J, Wijchers PJ, van deWerken H, deWit E, et al. (2013) eRNAs are required for p53-de-pendent enhancer activity and gene transcription. Mol Cell 49: 524–535. doi: 10.1016/j.molcel.2012.11.021 PMID: 23273978
42. Menendez D, Inga A, Resnick MA (2009) The expanding universe of p53 targets. Nat Rev Cancer 9:724–737. doi: 10.1038/nrc2730 PMID: 19776742
43. Menendez D, Krysiak O, Inga A, Krysiak B, Resnick MA, et al. (2006) A SNP in the flt-1 promoter inte-grates the VEGF system into the p53 transcriptional network. Proc Natl Acad Sci USA 103: 1406–1411. doi: 10.1073/pnas.0508103103 PMID: 16432214
44. Meek DW, Anderson CW (2009) Posttranslational modification of p53: cooperative integrators of func-tion. Cold Spring Harbor Perspectives in Biology 1: a000950. doi: 10.1101/cshperspect.a000950PMID: 20457558
45. Cruickshanks HA, McBryan T, Nelson DM, Vanderkraats ND, Shah PP, et al. (2013) Senescent cellsharbour features of the cancer epigenome. Nat Cell Biol 15: 1495–1506. doi: 10.1038/ncb2879 PMID:24270890
Genome-Wide Analyses of Chronic p53
PLOS Genetics | DOI:10.1371/journal.pgen.1005053 March 19, 2015 26 / 28
46. Beckerman R, Prives C (2010) Transcriptional regulation by p53. Cold Spring Harbor Perspectives inBiology 2: a000935. doi: 10.1101/cshperspect.a000935 PMID: 20679336
47. Sherr CJ (1998) Tumor surveillance via the ARF-p53 pathway. Genes Dev 12: 2984–2991. PMID:9765200
48. Zhang H, Li H, Ho N, Li D, Li S (2012) Scd1 Plays a Tumor-Suppressive Role in Survival of LeukemiaStem Cells and the Development of Chronic Myeloid Leukemia. Molecular and Cellular Biology 32:1776–1787. doi: 10.1128/MCB.05672-11 PMID: 22431519
49. Quijano C, Cao L, Fergusson MM, Romero H, Liu J, et al. (2012) Oncogene-induced senescence re-sults in marked metabolic and bioenergetic alterations. Cell Cycle 11: 1383–1392. doi: 10.4161/cc.19800 PMID: 22421146
50. Dörr JR, Yu Y, Milanovic M, Beuster G, Zasada C, et al. (2013) Synthetic lethal metabolic targeting ofcellular senescence in cancer therapy. Nature 501: 421–425. doi: 10.1038/nature12437 PMID:23945590
51. D’Erchia AM, Tullo A, Lefkimmiatis K, Saccone C, Sbisà E (2006) The fatty acid synthase gene is a con-served p53 family target from worm to human. Cell Cycle 5: 750–758. PMID: 16582625
52. Yahagi N, Shimano H, Matsuzaka T, Najima Y, Sekiya M, et al. (2003) p53 Activation in adipocytes ofobese mice. J Biol Chem 278: 25395–25400. doi: 10.1074/jbc.M302364200 PMID: 12734185
53. Freed-Pastor WA, Mizuno H, Zhao X, Langerød A, Moon S-H, et al. (2012) Mutant p53 disrupts mam-mary tissue architecture via the mevalonate pathway. Cell 148: 244–258. doi: 10.1016/j.cell.2011.12.017 PMID: 22265415
54. Chandra T, Kirschner K, Thuret J-Y, Pope BD, Ryba T, et al. (2012) Independence of Repressive His-tone Marks and Chromatin Compaction during Senescent Heterochromatic Layer Formation. Mol Cell47: 203–214. doi: 10.1016/j.molcel.2012.06.010 PMID: 22795131
55. Jackson EL, Willis N, Mercer K, Bronson RT, Crowley D, et al. (2001) Analysis of lung tumor initiationand progression using conditional expression of oncogenic K-ras. Genes Dev 15: 3243–3248. doi: 10.1101/gad.943001 PMID: 11751630
56. Hingorani SR, Petricoin EF, Maitra A, Rajapakse V, King C, et al. (2003) Preinvasive and invasive duc-tal pancreatic cancer and its early detection in the mouse. Cancer Cell 4: 437–450. PMID: 14706336
57. Marino S, Vooijs M, van Der Gulden H, Jonkers J, Berns A (2000) Induction of medulloblastomas inp53-null mutant mice by somatic inactivation of Rb in the external granular layer cells of the cerebellum.Genes Dev 14: 994–1004. PMID: 10783170
58. WangW, Lin C, Lu D, Ning Z, Cox T, et al. (2008) Chromosomal transposition of PiggyBac in mouseembryonic stem cells. Proc Natl Acad Sci USA 105: 9290–9295. doi: 10.1073/pnas.0801017105PMID: 18579772
59. Loew R, Heinz N, Hampf M, Bujard H, Gossen M (2010) Improved Tet-responsive promoters with mini-mized background expression. BMC Biotechnol 10: 81. doi: 10.1186/1472-6750-10-81 PMID:21106052
60. Gentleman RC, Carey VJ, Bates DM, Bolstad B, Dettling M, et al. (2004) Bioconductor: open softwaredevelopment for computational biology and bioinformatics. Genome Biol 5: R80. doi: 10.1186/gb-2004-5-10-r80 PMID: 15461798
61. Cairns JM, Dunning MJ, Ritchie ME, Russell R, Lynch AG (2008) BASH: a tool for managing BeadArrayspatial artefacts. Bioinformatics 24: 2921–2922. doi: 10.1093/bioinformatics/btn557 PMID: 18953044
62. Dunning MJ, Smith ML, Ritchie ME, Tavaré S (2007) beadarray: R classes and methods for Illuminabead-based data. Bioinformatics 23: 2183–2184. doi: 10.1093/bioinformatics/btm311 PMID:17586828
63. Smyth GK (2004) Linear models and empirical bayes methods for assessing differential expression inmicroarray experiments. Stat Appl Genet Mol Biol 3: Article3. doi: 10.2202/1544-6115.1027
64. ENCODE Project Consortium (2012) An integrated encyclopedia of DNA elements in the human ge-nome. Nature 489: 57–74. doi: 10.1038/nature11247 PMID: 22955616
65. Zhang Y, Liu T, Meyer CA, Eeckhoute J, Johnson DS, et al. (2008) Model-based analysis of ChIP-Seq(MACS). Genome Biol 9: R137. doi: 10.1186/gb-2008-9-9-r137 PMID: 18798982
66. Robinson JT, Thorvaldsdottir H, Winckler W, Guttman M, Lander ES, et al. (2011) Integrative genomicsviewer. Nat Biotechnol 29: 24–26. doi: 10.1038/nbt.1754 PMID: 21221095
67. Li H, Durbin R (2010) Fast and accurate long-read alignment with Burrows-Wheeler transform. Bioinfor-matics 26: 589–595. doi: 10.1093/bioinformatics/btp698 PMID: 20080505
68. McLean CY, Bristor D, Hiller M, Clarke SL, Schaar BT, et al. (2010) GREAT improves functional inter-pretation of cis-regulatory regions. Nat Biotechnol 28: 495–501. doi: 10.1038/nbt.1630 PMID:20436461
Genome-Wide Analyses of Chronic p53
PLOS Genetics | DOI:10.1371/journal.pgen.1005053 March 19, 2015 27 / 28
69. Hardcastle TJ, Kelly KA (2010) baySeq: empirical Bayesian methods for identifying differential expres-sion in sequence count data. BMC Bioinformatics 11: 422. doi: 10.1186/1471-2105-11-422 PMID:20698981
70. Huang DW, Sherman BT, Lempicki RA (2009) Systematic and integrative analysis of large gene listsusing DAVID bioinformatics resources. Nat Protoc 4: 44–57. doi: 10.1038/nprot.2008.211 PMID:19131956
71. Ogata H, Goto S, Sato K, Fujibuchi W, Bono H, et al. (1999) KEGG: Kyoto Encyclopedia of Genes andGenomes. Nucleic Acids Res 27: 29–34. PMID: 9847135
72. Vastrik I, D’Eustachio P, Schmidt E, Joshi-Tope G, Gopinath G, et al. (2007) Reactome: a knowledgebase of biologic pathways and processes. Genome Biol 8: R39. doi: 10.1186/gb-2007-8-3-r39 PMID:17367534
73. Kelder T, van Iersel MP, Hanspers K, Kutmon M, Conklin BR, et al. (2012) WikiPathways: building re-search communities on biological pathways. Nucleic Acids Res 40: D1301–D1307. doi: 10.1093/nar/gkr1074 PMID: 22096230
74. Cerami EG, Gross BE, Demir E, Rodchenkov I, Babur O, et al. (2011) Pathway Commons, a web re-source for biological pathway data. Nucleic Acids Res 39: D685–D690. doi: 10.1093/nar/gkq1039PMID: 21071392
75. Thomas PD, Campbell MJ, Kejariwal A, Mi H, Karlak B, et al. (2003) PANTHER: a library of protein fam-ilies and subfamilies indexed by function. Genome Res 13: 2129–2141. doi: 10.1101/gr.772403 PMID:12952881
76. Pagliarini DJ, Calvo SE, Chang B, Sheth SA, Vafai SB, et al. (2008) A mitochondrial protein compendi-um elucidates complex I disease biology. Cell 134: 112–123. doi: 10.1016/j.cell.2008.06.016 PMID:18614015
77. Chatr-aryamontri A, Breitkreutz BJ, Heinicke S, Boucher L, Winter A, et al. (2012) The BioGRID interac-tion database: 2013 update. Nucleic Acids Res 41: D816–D823. doi: 10.1093/nar/gks1158 PMID:23203989
78. Kerrien S, Aranda B, Breuza L, Bridge A, Broackes-Carter F, et al. (2012) The IntAct molecular interac-tion database in 2012. Nucleic Acids Res 40: D841–D846. doi: 10.1093/nar/gkr1088 PMID: 22121220
79. Franceschini A, Szklarczyk D, Frankild S, Kuhn M, Simonovic M, et al. (2013) STRING v9.1: protein-protein interaction networks, with increased coverage and integration. Nucleic Acids Res 41: D808–D815. doi: 10.1093/nar/gks1094 PMID: 23203871
80. Smoot ME, Ono K, Ruscheinski J, Wang P-L, Ideker T (2011) Cytoscape 2.8: new features for data inte-gration and network visualization. Bioinformatics 27: 431–432. doi: 10.1093/bioinformatics/btq675PMID: 21149340
81. Krzywinski M, Schein J, Birol I, Connors J, Gascoyne R, et al. (2009) Circos: an information aestheticfor comparative genomics. Genome Res 19: 1639–1645. doi: 10.1101/gr.092759.109 PMID:19541911
82. Kel AE, Gössling E, Reuter I, Cheremushkin E, Kel-Margoulis OV, et al. (2003) MATCH: A tool forsearching transcription factor binding sites in DNA sequences. Nucleic Acids Res 31: 3576–3579.PMID: 12824369
83. Machanick P, Bailey TL (2011) MEME-ChIP: motif analysis of large DNA datasets. Bioinformatics 27:1696–1697. doi: 10.1093/bioinformatics/btr189 PMID: 21486936
84. Zambelli F, Pesole G, Pavesi G (2013) PscanChIP: Finding over-represented transcription factor-binding site motifs and their correlations in sequences from ChIP-Seq experiments. Nucleic Acids Res41: W535–W543. doi: 10.1093/nar/gkt448 PMID: 23748563
85. Matys V, Kel-Margoulis OV, Fricke E, Liebich I, Land S, et al. (2006) TRANSFAC and its moduleTRANSCompel: transcriptional gene regulation in eukaryotes. Nucleic Acids Res 34: D108–D110. doi:10.1093/nar/gkj143 PMID: 16381825
86. Meyer LR, Zweig AS, Hinrichs AS, Karolchik D, Kuhn RM, et al. (2013) The UCSCGenome Browserdatabase: extensions and updates 2013. Nucleic Acids Res 41: D64–D69. doi: 10.1093/nar/gks1048PMID: 23155063
87. Zhang Z, Chang CW, GohWL, SungW-K, Cheung E (2011) CENTDIST: discovery of co-associatedfactors by motif distribution. Nucleic Acids Res 39: W391–W399. doi: 10.1093/nar/gkr387 PMID:21602269
88. Zambelli F, Pesole G, Pavesi G (2009) Pscan: finding over-represented transcription factor binding sitemotifs in sequences from co-regulated or co-expressed genes. Nucleic Acids Res 37: W247–252. doi:10.1093/nar/gkp464 PMID: 19487240
Genome-Wide Analyses of Chronic p53
PLOS Genetics | DOI:10.1371/journal.pgen.1005053 March 19, 2015 28 / 28


