Embed Size (px)
Citation preview

Journal of Photochemistry and Photobiology A: Chemistry 181 (2006) 314–324
Photocatalytic and photochemical degradation of mono-,di- and tri-azo dyes in aqueous solution under UV irradiation
Claudia Gomes Silva, Wendong Wang 1, Joaquim Luıs Faria ∗Laboratorio de Catalise e Materiais, Departamento de Engenharia Quımica,
Faculdade de Engenharia da Universidade do Porto, Rua Dr. Roberto Frias s/n, 4200-465 Porto, Portugal
Received 15 September 2005; received in revised form 13 December 2005; accepted 14 December 2005Available online 23 January 2006
Abstract
The degradation of three commercially available textile azo dyes, Solophenyl Green BLE 155% (SG), Erionyl Red B (ER) and Chromotrope2R (C2R), has been studied by using photochemical and photocatalytic processes under UV irradiation. The adequacy of each process dependson the concentration of dye. At low dye concentration, the neat photochemical degradation is very efficient. The photocatalytic process, usingeither slurry of Degussa P-25 TiO2 or a biphasic mixture of TiO2 and activated carbon (AC), more effectively bleaches heavier colored solutions.Tpewt©
K
1
cuciraa(oqtm
s
1d
he heterogeneous photocatalytic regime was characterized in terms of catalyst load, TiO2 to AC mass ratio, initial dye concentration and oxygenartial pressure. Catalyst recovery and reuse was also analyzed. Based on the Langmuir–Hinshelwood approach, reaction rates and adsorptionquilibrium constants were calculated. A positive effect on the photocatalytic degradation was observed by the addition of AC to TiO2 catalyst,hich was quantified in terms of a synergy factor (R). The efficiencies of different photo-induced degradation processes were compared based on
he experimentally determined apparent rate constants, mineralization degrees and initial quantum yields.2005 Elsevier B.V. All rights reserved.
eywords: Photochemistry; Photocatalysis; Titanium dioxide; Activated carbon; Azo dyes
. Introduction
In spite of the current trend to find more selective and effi-ient chemical processes, there is still a current need for treatingsed waters, especially in the industries where is an intensiveonsumption, such as textile and printing. Industrial dyestuffsncluding textile dyes are recognized as being an important envi-onmental threaten. In nowadays more than half of the dyes avail-ble on the market are azo compounds, which can be groupeds monoazo, diazo, triazo according to the number of azo bonds−N N−) in its structure. Their widespread use makes them asne of principal sources of contamination of used waters. Ade-uate treatment of these waters is of primary concern in ordero preserve the natural ecosystem. The biological processes are
ore natural and easy to implement but they have a major draw-
∗ Corresponding author. Tel.: +351 225 081 645; fax: +351 225 081 449.E-mail address: [email protected] (J.L. Faria).
1 Present address: Department of Materials Science and Engineering, Univer-ity of Science and Technology of China, Hefei 230026, PR China.
back, which is the production of sludge proportionally to thevolume of treated water. When the volume to treat is huge, recy-cling is essential.
Nevertheless, used water always requires some treatmentprior to reuse, with or without addition of fresh water. The extentof the treatment depends either on the degree of contamination,or on the requirements of the next use. Chemical treatments pro-vide adequate response to a number of specific cases, becausewith them the pollutant is not being transferred, rather converted,or in the ideal case mineralized.
New developments in advanced oxidation processes (AOPs)are attractive in providing a promising and competitive solu-tion for the abatement of numerous hazardous compounds inwastewater including Fenton or photo-assisted Fenton process,ozone or/and peroxide photolysis, and semiconductor photo-catalysis process [1–6]. AOPs feature the capability of uti-lizing the high reactivity of hydroxyl radicals to drive oxi-dation processes, which are suitable for achieving the com-plete elimination and full mineralization of various pollutants,such as phenols [7], chlorophenols [8], pesticides [9] and azodyes [10].
010-6030/$ – see front matter © 2005 Elsevier B.V. All rights reserved.oi:10.1016/j.jphotochem.2005.12.013

C.G. Silva et al. / Journal of Photochemistry and Photobiology A: Chemistry 181 (2006) 314–324 315
In this sense, due to fast development of light related tech-nologies, the photochemical processes are positioning them-selves on a privileged position to compete with other avail-able technologies. Photocatalytic degradation (PCD) processes,assisted by a semiconductor metal oxide (normally as photocat-alyst) and oxygen (as primary oxidizing agent), earn increasingimportance in the area of wastewater treatment as the mostemerging destructive technology [1–11]. Contributing to thisare the facts that these processes require mild operation con-ditions of temperature and pressure and in many cases resultin total mineralization of the pollutants without any waste dis-posal problem. Water treatment processes based on hetero-geneous photocatalysis, principally concerning TiO2-assistedphotocatalytic degradation of azo dyes, have been reviewedrecently [10,12,13]. The most extensively used photocatalystis TiO2 and the TiO2/UV system has been widely investigatedin PCD processes. According to the usually proposed mecha-nism, irradiation of TiO2 particles with suitable photons energy(hv ≥ Eg = 3.25 eV) generates a bound electron/hole pair whichcan dissociate in competition with recombination to produce aconduction band electron (e−
cb) and a valence band hole (h+vb).
Both charge carriers scan the TiO2 surface to reduce adsorbedelectron acceptors and oxidize adsorbed electron donors. ForPCD processes in aqueous system, oxygen is often present as theelectron acceptor to form superoxide anion radical (O2
•−), whileH O and OH− are available as electron donors to yield hydroxylroc
mipsboTur(omt(caoup
2. Experimental
2.1. Materials
Degussa P-25 titanium dioxide (Degussa Portuguesa) wasused as photocatalyst. The material consists mostly of theanatase form, with a BET surface area of 55 m2 g−1 and a meanparticle size of 30 nm (manufacturer data).
Solophenyl Green BLE 155% and Erionyl Red B are com-mercially available from Ciba-Geigy (Ciba Portuguesa Lda).Dye Chromotrope 2R is a standard from Fluka (27410, 2-(phenylazo)chromotropic acid disodium salt). The dyes wereused as received without any further purification. In Table 1 isgiven the Color Index classification of each dye, as well as somephysical–chemical characteristics of the three azo dyes. Theirstructures are drawn in Fig. 1. Molecular weights are given bythe supplier, while spectroscopic data was determined experi-mentally.
Granular activated carbon NORIT C-GRAN (NORIT Ned-erland B.V.) consists in a high adsorptive capacity material, pro-duced by chemical activation using the phosphoric acid process,which possesses a very open porosity (macro- and meso-pore)and a BET surface area of 1400 m2 g−1 (supplier data). In orderto facilitate suspension the grains were ground in a mortar andsieved. The mean diameter of the resulting particles ranged from0.1 to 0.3 mm.
2
asamswecaNtt
isci5d
TC
N A
S TrE DC M
2adical (HO•). Both of the radicals are very reactive and stronglyxidizing, capable of totally mineralizing most of the organicompounds.
The photocatalytic activity of TiO2 largely depends on itsicrostructure and physical properties [14–16] as well as on
ncorporation of some other metal ions, adsorbents or sup-orts [17–19]. It has been reported that carbon materials haveome beneficial effects on the photocatalytic activity of TiO2y inducing synergies or cooperative effects between the metalxide and carbon phases [20–26]. To incorporate carbon withiO2 particles different preparation methods are currently inse. One of the simplest and somewhat successful approachesesults from mechanically mixing TiO2 with activated carbonAC). Although not the most effective, it has the advantagef being easy to implement, therefore suitable for small toedium size textile and dying plants. In the present work,
hree textile commercial azo dyes, Solophenyl Green BLE 155%SG), Erionyl Red B (ER) and Chromotrope 2R (C2R), whichorrespond to tri-, di- and mono-azo dyes, have been chosens the target substrates. The photodegradation of these dyesver TiO2 photocatalyst and TiO2 and activated carbon mixturender UV light was studied in detail as well as the photolysisrocesses.
able 1haracteristics of the studied azo dyes
ame Dye class
olophenyl Green BLE 155% (C.I. Direct Green 26) Directrionyl Red B (C.I. Acid Red 151) Acidhromotrope 2R (C.I. Acid Red 29) Acid
.2. Photoreactor and photodegradation experiments
We performed the photolytic and photocatalytic tests usingn immersion glass reactor of 1000 ml, charged with 800 ml ofolution/suspension. The UV irradiation source located axiallynd held in a quartz immersion tube consisted of a low-pressureercury vapor lamp Heraeus TNN 15/32 with a dominant emis-
ion line at 253.7 nm (3 W of radiant flux). The photoreactoras kept inside an opaque box to protect the operator from
xposure to UV radiation and avoid interference of the artifi-ial external light. A magnetic bar stirred the reaction mixturend a typical experiment was carried out in open-air conditions.evertheless, the reactor was equipped with a gas feeding sys-
em capable of providing different partial pressures of oxygeno the solution/suspension.
In the photochemical degradation experiments, we used annitial concentration between 5 and 50 mg l−1 in all aqueousolutions of the dyes. In a typical experiment, we dissolved thealculated amount of dye in the desired volume of distilled watermmediately before the beginning of the reaction. Samples (ca.ml) were regularly withdrawn at controlled times and imme-iately analyzed by UV–vis spectroscopy.
zo type Mw (g/mol) λmax (nm) εmax (M−1 cm−1)
iazo 1338 610 27560iazo 478.46 550 10000onoazo 468.39 509 24147

316 C.G. Silva et al. / Journal of Photochemistry and Photobiology A: Chemistry 181 (2006) 314–324
Fig. 1. Chemical structures of the azo dyes: triazo Solophenyl Green BLE 155%, diazo Erionyl Red B and monoazo Chromotrope 2R.
We established the optimal amount of TiO2 for the photo-catalytic degradation, using SG as probe molecule, fixing itsinitial concentration before the dark adsorption period (detailsfollow) to 50 mg l−1 and varying the amount of titania from 50to 2000 mg l−1.
In the experiments involving the biphasic catalyst, the acti-vated carbon was ground and then added into the TiO2 suspen-sion. For the kinetic studies, we varied independently the initialconcentration of dye and the TiO2/AC ratios.
In a typical photocatalytic experiment, the suspension con-taining the dye was stirred in the dark for 30 min allowingthe adsorption–desorption quasi-equilibrium to be established.We chose this lapse of time, based on the results of prelim-inary experiments where we found that more than 75% ofthe maximum adsorption capacity of the TiO2 reached almostinstantaneously and kept constant for approximately 1 h. Wedetermined the adsorption isotherms for each dye after anadsorption period of 24 h at room temperature and found thefollowing maximum adsorption capacities: 40.69 mgdye/gTiO2for SG, 11.54 mgdye/gTiO2
for ER and 1.586 mgdye/gTiO2for C2R.
One first sample was taken out for analysis at the end of thedark adsorption period, just before turning on the illumination,in order to determine the bulk dye concentration. This value wastaken as the initial concentration for the photocatalytic experi-ment, denoted hereafter as C0 (in addition to C′
0, the initial bulkconcentration of dye before dark adsorption). Samples were reg-ularly withdrawn from the reactor, centrifuged immediately forseparation of the suspended solids, and the clean transparentsolution analyzed by UV–vis spectroscopy.
2.3. UV–vis spectroscopic analysis
The full spectrum (250–750 nm) of each sample wasrecorded on a JASCO V-560 UV–vis spectrophotometer (dou-ble monochromator and double beam optical system) and theabsorbance at selected wavelengths registered. For kinetic anal-ysis, each sample taken from the reactor was divided into threedifferent vials and the final absorption was given by the arith-metic average over the three measurements. Since the λmax(Table 1) of the dyes is well in the medium to long wavelengthrange, dye concentration can be directly evaluated from this

C.G. Silva et al. / Journal of Photochemistry and Photobiology A: Chemistry 181 (2006) 314–324 317
absorbance. However, during the degradation experiments thefull spectra was carefully analyzed in order to avoid interfer-ence of any non-colored by-products.
The UV–vis reflectance spectra of the solid materials wererecorded on the same JASCO spectrophotometer equipped withan integrating sphere attachment (JASCO ISV-469). The pow-ders were not diluted in any matrix to avoid a decrease ofthe absorbance. The instrument software converted the dif-fuse reflectance spectra to equivalent absorption Kubelka–Munkunits [27]. These units express the peak intensity measure cal-culated from the reflectance of a diluted sample of infinitedepth upon application of the Kubelka–Munk mathematicalfunction.
2.4. Determination of pH of point of zero charge (pHpzc)
The pHpzc was determined using the mass titration methoddescribed elsewhere [28]. Following the usual protocol a set of0.01 M NaNO3 solutions at pH 3, 6 and 11 was prepared from0.1 M HNO3 and 0.1 M NaOH solutions. For each starting pHan increasing amounts of TiO2 (0.1, 0.5, 1, 2.5, 5 and 10%, w/w)were added to 50 ml of the NaNO3 solutions. The equilibriumpH was measured after 24 h of shaking at room temperature(approximately 20 ◦C).
2
at1atop
2
oSaTop
Fig. 2. Kinetics of degradation of azo dyes in aqueous solutions during photo-chemical degradation with an initial concentration (C0) of 50 mg l−1: (�) SG;(�) ER; (�) C2R (inset: linear transform of ln(C0/C) vs. t).
3. Results and discussion
3.1. Photolytic degradation under UV irradiation
As we demonstrated in a recent work [26], direct photolysisof azo dyes under UV light cannot be ignored in this process. UVradiation alone bleaches colored aqueous solutions by destruc-tion of the chromophore group (R1−N N−R2) of the dye [10].
Following the variation on the absorption spectra of the dyeaqueous solutions during the photochemical reaction, we couldobserve that the dye concentration decreases exponentially withtime, disappearing after some minutes, resulting in completedecolorization of the solutions (Fig. 2). The observed expo-nential decay can be described in terms of a pseudo-first-orderkinetic model:
−dC
dt= kUVC (1)
where kUV is the pseudo-first-order kinetic constant and C is theconcentration of dye. Integration of Eq. (1) results in a lineardependency of ln(C0/C) on t with a slope of kUV (Fig. 2, inset).It can be seen that even for concentrated solutions (50 mg l−1),the reaction time is very fast, which make this a very feasibleprocess.
The initial concentration of dye was varied from 5 to5 −1
TA on UVc
C
5321
.5. Photocatalysts recovery and reutilization
In the experiments where TiO2 was used alone as photocat-lyst, after finishing the reaction, the suspension was filteredo recover the solid, which was rinsed with water and dried at10 ◦C for 24 h. The recovered photocatalyst was then groundnd washed again with a mixture of distilled water and ethanolo remove any trace of adsorbed compounds. At the end of thisperation, TiO2 was again dried and ground before reuse in thehotocatalytic reaction.
.6. TOC analysis
In order to determine the degree of mineralization totalrganic carbon (TOC) measurements were performed using ahimadzu 5000-A TOC analyzer. Samples consisting of 10 mlliquots were taken when complete color removal was observed.his could occur at different times depending on the dye andperating conditions. If necessary, samples were centrifugedrior to analysis.
able 2pparent first-order rate constants (kUV) and conversion at 9 min after turning
oncentration
0 (mg l−1) kUV (min−1)
SG ER
0 0.042 ± 0.001 0.030 ± 0.0010 0.068 ± 0.001 0.057 ± 0.0030 0.086 ± 0.001 0.076 ± 0.0030 0.180 ± 0.005 0.19 ± 0.015 0.270 ± 0.008 0.28 ± 0.03
0 mg l and the effect on the conversion and decolorization
illumination (X9) during photochemical degradation for different initial dye
X9 (%)
C2R SG ER C2R
0.024 ± 0.001 33 22 190.044 ± 0.001 48 33 290.066 ± 0.001 57 41 440.136 ± 0.007 83 77 67
0.23 ± 0.02 91 99 90

318 C.G. Silva et al. / Journal of Photochemistry and Photobiology A: Chemistry 181 (2006) 314–324
rate of the three azo dyes is shown in Table 2. There is an obvi-ous correlation between the kinetic rate constants kUV and theinitial concentration of dye C0: higher the dye concentration,lower the value of kUV. A 10-fold increase in the initial concen-tration of the dyes leads to a 6-fold decrease in the rate constantof the process in the case of the SG dye and a 9-fold decrease forthe two other dyes, ER and C2R. An inner filter effect caused bythe less availability of photons as the color of the solution getsmore intense can explain these observations.
It is also noticeable from Table 2 that a significant conversionof the dyes can be obtained after short irradiation times, con-firming the high efficiency of this process of color removal. Forlighter colored solutions (initial dye concentration of 5 mg l−1),it is possible to reach almost total decolorization within 9 minof reaction time.
3.2. Photocatalytic degradation over TiO2
The photocatalytic degradation of azo dyes under UV light inthe presence of TiO2 also follows the pseudo-first-order kineticswith respect to the dye concentration:
−dC
dt= kappC (2)
where kapp is the apparent first-order constant. Integration resultsin a linear dependency of ln(C0/C) on t with a slope of kapp,wu
3
cpflTstpto
0dtt
TAta
C
12
the apparent rate constant with the concentration of titania tillthis optimal value probably results from an increment of theactive sites available for adsorption and degradation of the dye.Higher quantity of catalyst in the suspension, leads to lower ini-tial concentration values of dye after dark adsorption (C0), whichconfirms an enhancement of adsorption capacity of dye on thecatalyst and therefore results in higher apparent rate constants.On the other hand, the decrease in the apparent rate constant withTiO2 concentration higher than 1 g l−1 probably results from ascreening effect due to the redundant dispersion of UV radi-ation caused by suspended photocatalyst, masking part of thephotosensitive surface. Additionally, in the case of heavy loadswe observed agglomeration and sedimentation of TiO2 mak-ing a significant fraction of the catalyst to be inaccessible toeither adsorbing the dye or absorbing the radiation [31,32], withconsequent decrease in the active sites available to the catalyticreaction.
Following these observations, we decided to keep the amountof TiO2 at the optimum value of 1 g l−1 in subsequent photocat-alytic degradation experiments for all dyes. The ratio TiO2/ACwas then arranged as function of this rule.
3.2.2. Effect of different dyes adsorption propertiesIt is noticed that the three azo dyes display different adsorp-
tion behaviors over TiO2 during dark adsorption period, whichis expected due to their different chemical structures. For thettdme(cbocat
T
T
Tpc
DmtimvcbIei
hich will be used to evaluate the activities of the catalystsnder different conditions in the following investigation.
.2.1. Effect of catalyst loadingThe optimal amount of titania to achieve the maximum effi-
iency of the photocatalytic process depends on the nature of thehotocatalyst, the geometry of the reactor, the incident radiantux and the mean optical pathway within the suspension [29].he catalyst dosage as an important parameter has been exten-ively studied in many photocatalytic reactions [30], suggestinghat the optimal TiO2 dosage varies from 0.15 to 2.5 g l−1. In theresent study, we used the SG dye as model and followed its pho-ocatalytic degradation to determine the optimal concentrationf catalyst.
As shown in Table 3, when TiO2 concentration varied from.050 to 2.000 g l−1 at a constant initial concentration of SGye before dark adsorption of 50 mg l−1, kapp increased withhe mass of TiO2 up to an amount of 1 g l−1. This indicates arue heterogeneous catalytic regime. The observed increase in
able 3pparent first-order kinetic rate constants (kapp) for the photocatalytic degrada-
ion over TiO2 with the same initial concentration of SG (50 mg l−1) before darkdsorption period (C′
0) and different concentrations of TiO2 (CTiO2 )
TiO2 (mg l−1) C′0 (mg l−1) C0 (mg l−1) kapp (min−1)
50 50 47 0.026100 50 45 0.029250 50 40 0.032500 50 32 0.034000 50 20 0.047000 50 17 0.044
riazo dye SG, the initial dye concentration after the dark adsorp-ion period decreased to 20 mg l−1 (Table 3), while this valueecreases by 8 and 3 mg l−1 for the diazo dye ER and theonoazo dye C2R, respectively. In all cases the amount of dye
xceeds the maximum adsorption capacity provided by the TiO2see Section 2.2). The observed decrease in dye concentrationan be explained in terms of different electrostatic interactionsetween the various dyes and the catalyst surface, which dependsn the pH value of the dye solutions. This dependence could beonsidered as the intrinsic amphoteric behavior of the catalystnd the acidic nature of the dye [33], which can be described byhe following chemical equilibrium equations:
iOH + H+ � TiOH2+ (3)
iOH + OH− � TiO− + H2O (4)
herefore, it is reasonable to consider that the dye adsorptionrocess on the photocatalyst surface depends on the electricalharge of both dye and catalyst.
The pH of the point of zero charge (pHpzc) for the TiO2egussa P-25 used in the photocatalytic experiments was deter-ined by mass titration at different initial pH from the asymp-
otic value reached by the pH as the mass fraction of titaniancreases (Fig. 3). The value of pHpzc is 6.0, which is in agree-
ent with the results reported previously [34,35]. When pHalues of aqueous dye solution is lower than TiO2 pHpzc, theatalyst surface develops a positive charge and attractive forcesetween catalyst and dye can promote the adsorption process.ncreasing the pH of dye solution, leads to the situation where thelectrostatic charge on the TiO2 surface will become less pos-tive, or even negative if the point of zero charge is surpassed,

C.G. Silva et al. / Journal of Photochemistry and Photobiology A: Chemistry 181 (2006) 314–324 319
Fig. 3. Determination of pHpzc of TiO2 Degussa P-25. Results of mass titrationat initial pH of 3 (©), 6 (�) and 11 (�).
developing repulsive forces between the catalyst and the dye,therefore decreasing dye adsorption [31–33].
There are negatively charged sulphonic groups (SO3−) in the
chemical structure of all the studied dyes, and all the reactionswere performed in their natural pH conditions without any pHadjustment. In the case of SG dye, the pH value of aqueous sus-pensions was 5.6 approximately lower than TiO2 pHpzc, whichresult in the most intense adsorption on TiO2 surface. The sus-pensions containing ER and C2R dyes showed pH values of 5.8and 5.9, respectively, higher than the pH of SG suspensions andmore approximated to TiO2 pHpzc, which may account for thesmaller quantity of both dyes adsorbed on TiO2 surface duringthe dark adsorption period.
3.2.3. Effect of oxygen partial pressureThe presence of an electron acceptor is essential to enhance
the separation of photo-generated electrons and holes, improv-ing the efficiency of the photocatalytic process. Oxygen dis-solved in the solution is commonly employed as the electronacceptor.
We conducted a detailed study on the effect of oxygen partialpressure for the photocatalytic degradation of SG dye under UVirradiation over TiO2. The oxygen partial pressure was adjustedby diluting it in helium, and maintaining the overall flow rateat 10 ml s−1 for a total gas pressure at 1 atm. The initial dyec ′ −1
or
toTapi
m
Fig. 4. Effect of oxygen partial pressure on the photocatalytic degradation rateof SG dye over TiO2 under UV irradiation.
kinetic rate constant (kapp) can be described as
r = krKads
1 + KadsC0
KO2pO2
1 + KO2pO2
C (5)
which can be rearranged in
r = k1KO2pO2
1 + KO2pO2
C = kappC (6)
where pO2 is the oxygen partial pressure, KO2 the adsorptionconstant of dissolved oxygen on TiO2 surface and k1 is anadjustable parameter, which includes the rate constant kr anddepends on the experimental conditions. A simple transforma-tion will give a linear relationship between 1/kapp and 1/pO2
as
1
kapp= 1
k1KO2
1
pO2
+ 1
k1(7)
The value of KO2 obtained from the linear regression (Fig. 4,inset) in this study is 4.01 atm−1, which is comparable to thatreported in literature [30].
3.2.4. Determination of adsorption equilibrium constantKads and reaction rate constant kr
The results of photocatalytic degradation of SG, ER and C2Runder UV irradiation over TiO2 are summarized in Table 4aa(btcs
tLoar
oncentration (C0) was kept at 50 mg l and the concentrationf TiO2 at 1 g l−1. The comparison parameter was the reactionate constant.
As shown in Fig. 4, the first-order rate constant increased withhe oxygen partial pressure. The rate constant reached about 85%f its maximum value at an oxygen partial pressure of 0.3 atm.his fact indicates that it is feasible to operate under ambientir condition instead of pure oxygen for commercial applicationurpose. This was in fact the case for the further kinetic studiesn the present work.
Following a first-order Langmuir–Hinshelwood kineticodel, the effect of oxygen partial pressure on the degradation
s function of the initial dye concentration ranges, after darkdsorption. It is observed that the apparent rate constant valueskapp) decreases as the dye concentration increases, which maye explained in terms of the increasing difficulty of UV radia-ion to penetrate into the aqueous suspensions. Higher the initialoncentration of the dye, fewer the photons reaching the catalysturface, lesser the photo-efficiency of the process.
Similar to the previous section, the kinetics of the pho-ocatalytic degradation are well described by a modifiedangmuir–Hinshelwood model. Considering that the amountf oxygen dissolved in the suspension is constant and that thedsorption coefficients of all organic molecules present in theeacting mixture are effectively equal, the equation for a first-

320 C.G. Silva et al. / Journal of Photochemistry and Photobiology A: Chemistry 181 (2006) 314–324
Table 4Apparent first-order rate constants (kapp) and conversion at 9 min after turning on illumination (X9) during photocatalytic degradation over TiO2 with different initialconcentrations of dyes (C0)
C0 (mg l−1) kapp (min−1) X9 (%)
SG ER C2R SG ER C2R
41–50 0.024 ± 0.001 0.059 ± 0.001 0.023 ± 0.001 13 48 2331–40 0.039 ± 0.001 0.073 ± 0.002 0.028 ± 0.001 30 52 2821–30 0.047 ± 0.001 0.102 ± 0.003 0.037 ± 0.001 34 66 3111–20 0.072 ± 0.002 0.169 ± 0.009 0.048 ± 0.001 52 83 37
5–10 0.078 ± 0.002 0.230 ± 0.008 0.083 ± 0.003 57 87 45
order kinetic reaction follows:
r = krKads
1 + KadsC0C = kappC (8)
in which kr and Kads are the kinetic rate constant and the adsorp-tion equilibrium constant, respectively. Thus the linear relation-ship between 1/kapp and C0 can be expressed as
1
kapp= C0
kr+ 1
krKads(9)
Following Eq. (9), the values for reaction rate constant krand adsorption equilibrium constant Kads can be determined bylinear regression from the plot of 1/kapp and C0 (Table 5). Thesevalues will be used in the following sections to evaluate theenhancement obtained when the activated carbon is introducedin the system.
3.2.5. Catalyst recovery and reuseCatalyst deactivation is one of the drawbacks on the applica-
tion of TiO2 to photocatalytic degradation of organic pollutants,due to the strong adsorption of the original compound and/orby-products on the active sites of the catalyst surface [24,36,37].The color change of the used catalyst after photocatalytic degra-dation reactions may indicate the effects of chemisorption andchemisorbed species reconstruction processes on the degrada-tion mechanism. These occurrences can be investigated from theUa(
aaob
t
TRpm
D
SEC
Fig. 5. Diffuse reflectance absorption spectra of fresh TiO2 P-25 and recoveredTiO2 (TiO2-dye) after being used in photocatalytic degradation of SG, ER andC2R.
responding dye, and the results are compared in Table 6. It isobserved that the rate constants decrease in all cases by about30%. This decline of the kinetics is ascribed to the presence ofadsorbed species on the active sites of the catalyst surface and onthe change of the dimension of the catalyst particles. The latermay result from the recovery procedure (described in Section2.5). Both factors account for the reduction of the number ofavailable photoactive sites.
3.3. Photocatalytic degradation over TiO2 and activatedcarbon mixture
3.3.1. Effect of activated carbon loadingThe optimal amount of activated carbon was determined
using the SG dye as reference system. Based on the optimizedreaction conditions indicated in the previous sections, the con-
Table 6Apparent first-order rate constants (kapp) during photocatalytic degradation overfresh (k1
app) and recovered (k2app) TiO2 for different dyes with the initial dye
concentration C0 ≈ 50 mg l−1
Dye k1app (min−1) k2
app (min−1)
SG 0.024 ± 0.001 0.018 ± 0.001ER 0.059 ± 0.001 0.040 ± 0.001C2R 0.023 ± 0.001 0.015 ± 0.001
V–vis diffuse reflectance spectra of initial TiO2 and used cat-lyst after photocatalytic degradation of SG, ER and C2R dyesFig. 5).
As expected, TiO2 has no bands above its fundamentalbsorption sharp edge rising at 400 nm. Enhancement of thebsorption is visible for the used catalysts, decreasing in orderf SG, ER and C2R, probably correlated to the number of azoonds in their chemical structure.
The recovered catalysts were reused in another resumed pho-ocatalytic experiment with fresh aqueous solution of the cor-
able 5eaction rate constants (kr) and adsorption equilibrium constants (Kads) forhotocatalytic degradation over TiO2 by the modified Langmuir–Hinshelwoododel
ye kr (mg l−1 min−1) Kads (mg−1 l)
G 1.58 0.092R 2.43 0.1432R 1.26 0.128

C.G. Silva et al. / Journal of Photochemistry and Photobiology A: Chemistry 181 (2006) 314–324 321
Table 7Apparent first-order rate constants (kapp) and SG concentration after 30 minof dark adsorption (C0) for the photocatalytic degradation over TiO2 + AC atdifferent AC loads (CAC)
C′0 (mg l−1) C0 (mg l−1) CAC (mg l−1) kapp (min−1)
50 20 0 0.047 ± 0.00150 26 50 0.048 ± 0.00150 33 100 0.052 ± 0.00250 38 200 0.055 ± 0.00150 40 300 0.053 ± 0.001
centration of TiO2 in the suspension was kept at 1 g l−1 and theinitial concentration (C′
0) of SG dye at 50 mg l−1, while the con-centration of AC was varied from 0 to 300 mg l−1. The effectof the AC load on the apparent first-order rate constants of pho-todegradation is described in Table 7.
From the data given in Table 7, it is clear that the photocat-alytic degradation of SG dye over TiO2 + AC mixture is moreefficient than that over TiO2 alone (Table 4). The highest valueof kapp is obtained for AC content of 200 mg l−1, which corre-sponds to an optimal weight ratio of AC to TiO2 at 1/5. For ahigher AC concentration, the decrease in efficiency of the pho-tocatalytic process can be attributed to an excessive content ofactivated carbon particles contacting directly with TiO2 surface,therefore reducing the number of photoactive sites.
We observed that the amount of SG adsorbed during thedark period decreases as the AC content of the TiO2 + AC mix-ture increases, showing that the TiO2 + AC mixture exhibits alower adsorption capacity than TiO2 alone. The same decreasein adsorption capacity was observed in case of the other dyes,ER and C2R. The explanation for this observation may lie onthe creation of an interface between TiO2 and AC, where the ACis covered by the excess TiO2, therefore not being able to act asco-adsorbent and at the same time limiting the number of sitesaccessible to the adsorption of dye molecules [20,38].
3o
CrioT
TAcc
C
4321
Table 9Reaction rate constants (kr) and adsorption equilibrium constants (Kads) forphotocatalytic degradation over TiO2 + AC mixture determined by the modifiedLangmuir–Hinshelwood model
Dye kr (mg l−1 min−1) Kads (mg−1 l)
SG 2.64 0.0928ER 4.22 0.0558C2R 1.70 0.1966
like synergy of activated carbon in TiO2 + AC mixture for thephotocatalytic degradation of azo dyes.
It is possible, and a synergy factor R has been suggestedpreviously [20,26] to quantify the extent of this effect for thephotocatalytic process over TiO2 + AC in relation to TiO2 alone.It is defined in terms of the apparent rate constants, as follows:
R = kapp(TiO2 + AC)
kapp(TiO2)(10)
The synergy factors calculated for each azo dye are listedin Table 8. In case of the higher colored suspension ranged at41–50 mg l−1, the highest value of synergy factor R of 2.00 isobtained for SG dye, which means a double kapp value when ACwas introduced into the TiO2 suspension in this case. For ERand C2R dyes, the values are 1.07 and 1.48, respectively. In thecase of ER there is a less pronounced effect which is expectablesince this dye was already very efficiently removed in the neatphotochemical process.
Following Eq. (9), the values of the reaction rate constant krand the adsorption equilibrium constant Kads can be determinedby linear regression from the plot of 1/kapp versus C0 using thedata from Table 8. The obtained values are listed in Table 9.
Compared to the results over TiO2 alone (Table 5), it is unam-biguous that the reaction rate constants (kr) increased remarkablyfor all the three azo dyes, suggesting that the presence of ACpa
siefHctfiploiitc
tt
.3.2. Synergy in photocatalytic degradation of azo dyesver TiO2 + AC mixture
The results on the photocatalytic degradation of SG, ER and2R under UV irradiation over TiO2 + AC mixture are summa-
ized in Table 8. When kapp is used as comparing parameter, its clear that the overall efficiency of the photocatalytic processver TiO2 + AC mixture is significantly higher than that overiO2, in varying degrees (see Table 4). This suggests an effect
able 8pparent first-order rate constants (kapp) and synergy factors (R) for photo-
atalytic degradation processes over TiO2 + AC mixture with different initialoncentrations of dyes
0 (mg l−1) kapp (min−1) R
SG ER C2R SG ER C2R
1–50 0.048 0.063 0.034 2.00 1.07 1.481–40 0.055 0.078 0.044 1.41 1.07 1.571–30 0.065 0.096 0.051 1.38 – 1.381–20 0.094 0.113 0.074 1.31 – 1.545–10 0.120 0.180 0.133 1.54 – 1.60
lays an important role in the reaction kinetics of the photocat-lytic degradation process.
However, the effect of AC on the adsorption equilibrium con-tants (Kads) is quite random with respect to different dyes. If its assumed that the AC will be mainly covered by the TiO2 inxcess, the adsorption abilities should not be changed, exceptor the fact that the number of adsorption sites will be reduced.owever the interphase interaction is somehow relevant in the
ase of the adsorption of the small molecules. For the heavierri-azo dye SG, the values of Kads are comparable, but thoseor ER and C2R are different and not correlated. These resultsndicated that AC accounts for the adsorption of the degradationrocess depending on the type of pollutants. As mentioned ear-ier, solutions of ER ad C2R exhibit higher pH values than thatf SG; and the activated carbon used in the photocatalytic exper-ments possesses slightly acid surface, therefore this differencen Kads values could be attributable to the electrostatic interac-ion of the azo dyes molecules and the surface of the activatedarbon.
Additionally, since TiO2 and AC are just mechanically mixed,here is no fine control on the interphase formation betweenhem. To circumvent this disadvantage, TiO2 and carbon com-
322 C.G. Silva et al. / Journal of Photochemistry and Photobiology A: Chemistry 181 (2006) 314–324
posite catalyst can be synthesized using a sol–gel procedure [25]prior to the introduction into the reaction solution.
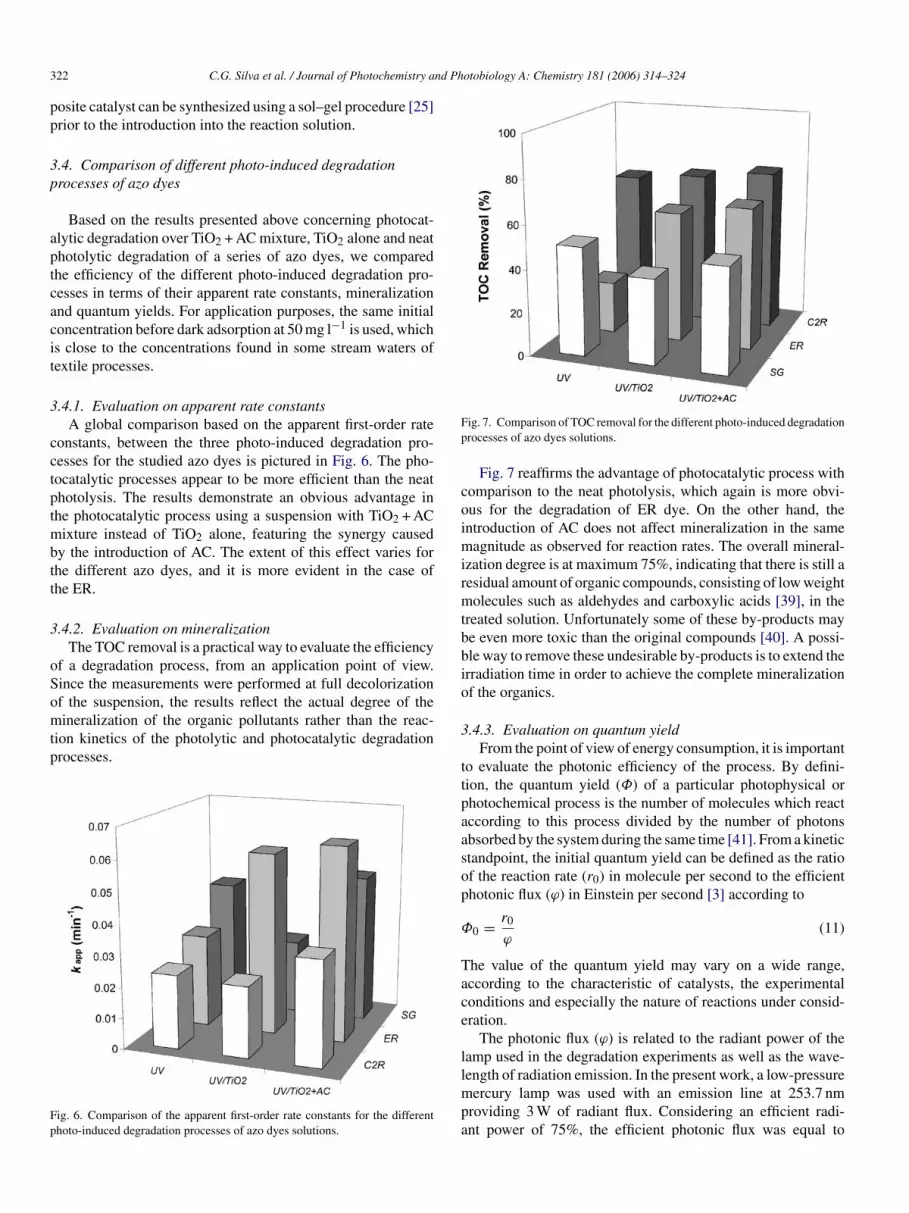
3.4. Comparison of different photo-induced degradationprocesses of azo dyes
Based on the results presented above concerning photocat-alytic degradation over TiO2 + AC mixture, TiO2 alone and neatphotolytic degradation of a series of azo dyes, we comparedthe efficiency of the different photo-induced degradation pro-cesses in terms of their apparent rate constants, mineralizationand quantum yields. For application purposes, the same initialconcentration before dark adsorption at 50 mg l−1 is used, whichis close to the concentrations found in some stream waters oftextile processes.
3.4.1. Evaluation on apparent rate constantsA global comparison based on the apparent first-order rate
constants, between the three photo-induced degradation pro-cesses for the studied azo dyes is pictured in Fig. 6. The pho-tocatalytic processes appear to be more efficient than the neatphotolysis. The results demonstrate an obvious advantage inthe photocatalytic process using a suspension with TiO2 + ACmixture instead of TiO2 alone, featuring the synergy causedby the introduction of AC. The extent of this effect varies fortt
3
oSomtp
Fp
Fig. 7. Comparison of TOC removal for the different photo-induced degradationprocesses of azo dyes solutions.
Fig. 7 reaffirms the advantage of photocatalytic process withcomparison to the neat photolysis, which again is more obvi-ous for the degradation of ER dye. On the other hand, theintroduction of AC does not affect mineralization in the samemagnitude as observed for reaction rates. The overall mineral-ization degree is at maximum 75%, indicating that there is still aresidual amount of organic compounds, consisting of low weightmolecules such as aldehydes and carboxylic acids [39], in thetreated solution. Unfortunately some of these by-products maybe even more toxic than the original compounds [40]. A possi-ble way to remove these undesirable by-products is to extend theirradiation time in order to achieve the complete mineralizationof the organics.
3.4.3. Evaluation on quantum yieldFrom the point of view of energy consumption, it is important
to evaluate the photonic efficiency of the process. By defini-tion, the quantum yield (Φ) of a particular photophysical orphotochemical process is the number of molecules which reactaccording to this process divided by the number of photonsabsorbed by the system during the same time [41]. From a kineticstandpoint, the initial quantum yield can be defined as the ratioof the reaction rate (r0) in molecule per second to the efficientphotonic flux (ϕ) in Einstein per second [3] according to
Φ0 = r0 (11)
Tace
llmpa
he different azo dyes, and it is more evident in the case ofhe ER.
.4.2. Evaluation on mineralizationThe TOC removal is a practical way to evaluate the efficiency
f a degradation process, from an application point of view.ince the measurements were performed at full decolorizationf the suspension, the results reflect the actual degree of theineralization of the organic pollutants rather than the reac-
ion kinetics of the photolytic and photocatalytic degradationrocesses.
ig. 6. Comparison of the apparent first-order rate constants for the differenthoto-induced degradation processes of azo dyes solutions.
ϕ
he value of the quantum yield may vary on a wide range,ccording to the characteristic of catalysts, the experimentalonditions and especially the nature of reactions under consid-ration.
The photonic flux (ϕ) is related to the radiant power of theamp used in the degradation experiments as well as the wave-ength of radiation emission. In the present work, a low-pressure
ercury lamp was used with an emission line at 253.7 nmroviding 3 W of radiant flux. Considering an efficient radi-nt power of 75%, the efficient photonic flux was equal to

C.G. Silva et al. / Journal of Photochemistry and Photobiology A: Chemistry 181 (2006) 314–324 323
Fig. 8. Comparison of the initial quantum yields for the different photo-induceddegradation processes of azo dyes solutions.
2.87 × 10¹⁸ photons s−1. The initial quantum yields (Φ0) esti-mated for the different photo-induced degradation processes ofthe azo dyes are compared in Fig. 8.
Consistent with the evaluation on the rate constant and TOCremoval, these results favor the benefit of the photocatalytic pro-cesses and the introduction of AC, which features higher photoefficiency during the photocatalytic processes especially for thedegradation of ER dyes. These conclusions also agree well withthe previous studies on photodegradation of organic pollutants[29,42,43].
4. Conclusions
Direct photolysis of aqueous solutions of the dyes Chro-motrope 2R, Erionyl Red B and Solophenyl Green BLE 155%,under UV light at the wavelength of 253.7 nm revealed to bean efficient process for decolorizing the solution, provided theinitial concentration of dye is low. The degradation of heavilycolored solutions can be achieved more effectively by means ofthe photocatalytic processes over TiO2 alone and TiO2 + ACmixture. The apparent rate constants generally varied in aninverse relation to the initial concentration of the dyes in thesolutions. This can be attributed to an inner filter effect for thepure photochemical process and a screening effect in the case ofthe photocatalytic process, where the excess of dye blocks thepo
cactdcpt
resulted in a slightly decrease in the efficiency varied for thephotocatalytic degradation of different azo dyes.
A positive effect on the efficiency parameters was observedon the photocatalytic degradation over TiO2 + AC mixture whencompared to TiO2 alone, which was explained in terms of a syn-ergy induced by the introduction of AC. Following a modifiedLangmuir–Hinshelwood model, the reaction rate constant andadsorption equilibrium constant were determined. The increasein reaction rate constant is real for all the three dyes overTiO2 + AC mixture with comparison to TiO2 alone.
The efficiency of the different photo-induced degradationprocesses was evaluated in terms of apparent rate constants,mineralization degrees and initial quantum yields. Overall, theresults revealed the superiority of photocatalytic processes overneat photolysis and the advantage of using a suspension ofTiO2 + AC mixture instead of TiO2 alone.
It was not possible to establish a direct relationship betweenthe structure characteristic of the azo dyes (for example thenumber of azo bonds) and the kinetics of the photo-induceddegradation processes. The decomposition of this type of organiccompounds depends on several factors including their acidicnature, affinity to the catalyst surface, functional groups inmolecular structure, etc.
From a standpoint of a real case application, the resultsshowed that the photo-induced degradation processes proved tobe efficient for solutions of dyes currently used in textile indus-tcIimbt
A
ffoar21Fc
R
hotosensitive surface of the catalyst reducing the availabilityf photoactive sites.
The photocatalytic reaction conditions were optimized con-erning the catalyst loading, oxygen partial pressure and themount of activated carbon in TiO2 + AC mixture. The optimumoncentration of TiO2 was 1 g l−1 and the optimum ratio of ACo TiO2 was 1/5 for TiO2 + AC mixture. The presence of oxygenid not provide any effect on the kinetics of the photochemi-al process, while the rate constants increased with the partialressure of oxygen in the suspensions in the case of the pho-ocatalytic processes. The reutilization of the recovered TiO2
ries. The process is rather simple and requires very inexpensiveatalysts, but energy consumption has to be taken into account.n case of real textile wastewaters, due to the high complexity ofts composition, a combination of physical and chemical treat-
ents may be required to achieve the desired levels of waterleaching. The degree of treatment will depend on the final des-ination of the used waters: reuse or discharge.
cknowledgements
Thanks are given to Dr. R.A. Boaventura (LSRE/FEUP)or the sample of Solophenyl Green BLE 155% dye (a giftrom Ciba Portuguesa Lda) and for the permission to use somef its laboratory facilities; to NORIT Nederland B.V. for thectivated carbon; to Degussa Portuguesa for TiO2 P-25. Thisesearch was carried out under the projects POCTI/33401/EQU/000, POCI/EQU/58252/2004, POCTI/1181/2003, SFRH/BD/6966/2004 and SFRH/BPD/11598/2002, approved by theundacao para a Ciencia e a Tecnologia (FCT), Programa Opera-ional (POCTI and POCI) and co-supported by FEDER.
eferences
[1] O. Legrini, E. Oliveros, A.M. Braun, Chem. Rev. 93 (1993) 671–698.
[2] R. Andreozzi, V. Caprio, A. Insola, R. Marotta, Catal. Today 53 (1999)51–59.
[3] J.M. Herrmann, Catal. Today 53 (1999) 115–129.[4] K. Pirkanniemi, M. Sillanpaa, Chemosphere 48 (2002) 1047–1060.[5] S. Malato, J. Blanco, A. Vidal, C. Richter, Appl. Catal. B 37 (2002)
1–15.[6] P.R. Gogate, A.B. Pandit, Adv. Environ. Res. 8 (2004) 501–551.

324 C.G. Silva et al. / Journal of Photochemistry and Photobiology A: Chemistry 181 (2006) 314–324
[7] J. Sykora, M. Pado, M. Tatarko, M. Izakovic, J. Photochem. Photobiol.A 110 (1997) 167–175.
[8] M. Pera-Titus, V. Garcia-Molina, M.A. Banos, J. Gimenez, S. Esplugas,Appl. Catal. B 47 (2004) 219.
[9] I.K. Konstantinou, T.A. Albanis, Appl. Catal. B 42 (2003) 319–335.[10] I.K. Konstantinou, T.A. Albanis, Appl. Catal. B 49 (2004) 1–14.[11] D.S. Bhatkhande, V.G. Pangarkar, A. Beenackers, J. Chem. Technol.
Biotechnol. 77 (2002) 102–116.[12] J.M. Herrmann, Top. Catal. 34 (2005) 49–65.[13] D.F. Ollis, Top. Catal. 35 (2005) 217–223.[14] P.S. Awati, S.V. Awate, P.P. Shah, V. Ramaswamy, Catal. Commun. 4
(2003) 393–400.[15] G. Sivalingam, K. Nagaveni, M.S. Hegde, G. Madras, Appl. Catal. B
45 (2003) 23–28.[16] M. Toyoda, Y. Nanbu, Y. Nakazawa, M. Hirano, M. Inagaki, Appl. Catal.
B 49 (2004) 227–232.[17] M. Anpo, M. Takeuchi, J. Catal. 216 (2003) 505–516.[18] S. Anandan, M. Yoon, J. Photochem. Photobiol. C 4 (2003) 5–18.[19] E.P. Reddy, L. Davydov, P. Smirniotis, Appl. Catal. B 42 (2003) 1–11.[20] J. Matos, J. Laine, J.-M. Herrmann, Appl. Catal. B 18 (1998) 281–291.[21] J. Arana, J.M. Dona-Rodriguez, E.T. Rendon, C.G.I. Cabo, O. Gonzalez-
Diaz, J.A. Herrera-Melian, J. Perez-Pena, G. Colon, J.A. Navio, Appl.Catal. B 44 (2003) 153–160.
[22] B. Tryba, A.W. Morawski, M. Inagaki, Appl. Catal. B 41 (2003)427–433.
[23] S. Qourzal, A. Assabbane, Y. Ait-Ichou, J. Photochem. Photobiol. A163 (2004) 317–321.
[24] J. Arana, J.A.H. Melian, J.M.D. Rodriguez, O.G. Diaz, A. Viera, J.P.Pena, P.M.M. Sosa, V.E. Jimenez, Catal. Today 76 (2002) 279–289.
[25] W.D. Wang, P. Serp, P. Kalck, J.L. Faria, Appl. Catal. B 56 (2005)305–312.
[26] C.G. da Silva, J.L. Faria, J. Photochem. Photobiol. A 155 (2003)133–143.
[27] J.W. Niemantsverdiet, Spectroscopy in Catalysis, VCH, Weinheim, 1995.[28] H. Valdes, M. Sanchez-Polo, J. Rivera-Utrilla, C.A. Zaror, Langmuir 18
(2002) 2111–2116.[29] A. Assabane, Y.A. Ichou, H. Tahiri, C. Guillard, J.M. Herrmann, Appl.
Catal. B 24 (2000) 71–87.[30] D.W. Chen, A.K. Ray, Appl. Catal. B 23 (1999) 143–157.[31] C.M. So, M.Y. Cheng, J.C. Yu, P.K. Wong, Chemosphere 46 (2002)
905–912.[32] T. Sauer, G.C. Neto, H.J. Jose, R. Moreira, J. Photochem. Photobiol. A
149 (2002) 147–154.[33] F. Kiriakidou, D.I. Kondarides, X.E. Verykios, Catal. Today 54 (1999)
119–130.[34] Y.X. Chen, K. Wang, L.P. Lou, J. Photochem. Photobiol. A 163 (2004)
281–287.[35] J. Fernandez, J. Kiwi, J. Baeza, J. Freer, C. Lizama, H.D. Mansilla,
Appl. Catal. B 48 (2004) 205–211.[36] J. Arana, E.T. Rendon, J.M.D. Rodriguez, J.A.H. Melian, O.G. Diaz,
J.P. Pena, Appl. Catal. B 30 (2001) 1–10.[37] L.X. Cao, Z. Gao, S.L. Suib, T.N. Obee, S.O. Hay, J.D. Freihaut, J.
Catal. 196 (2000) 253–261.[38] J. Matos, J. Laine, J.-M. Herrmann, J. Catal. 200 (2001) 10–20.[39] R.L. Cisneros, A.G. Espinoza, M.I. Litter, Chemosphere 48 (2002)
393–399.[40] H.M. Pinheiro, E. Touraud, O. Thomas, Dyes Pigment 61 (2004)
121–139.[41] A.M. Braun, M.-T. Maurette, E. Oliveros, Photochemical Technology,
John Wiley & Sons Ltd., Chichester, England, 1991.[42] M. Vautier, C. Guillard, J.M. Herrmann, J. Catal. 201 (2001) 46–59.[43] D.W. Chen, A.K. Ray, Water Res. 32 (1998) 3223–3234.


