Embed Size (px)
Citation preview
Univers
ity of
Cap
e Tow
n'.
PHOTOCHEMICAL OXIDANT AIR POLLUTION
PEROXYACETYL NITRATE CPAN) AS AN INDICATOR
OF PHOTOCHEMICAL ACTIVITY
E GROSSER
March 1990
Submitted to the University of Cape Town
in fulfilment for the degree of
Master of Science in Engineering
The University of Car>e Town has bf?en given tJie right to reproduce this thesis in whole or tn p~rt. Copyri9!1t is held by the author. i
.~....,,.. ,,.,.~ .... "'""'<~~ ... ..,..z!'= ~:r=:·:.,,r,!'""".,1:.::::S'il~~~"::.~L.-..,.....,.."'t~
Univers
ity of
Cap
e Tow
n
The copyright of this thesis vests in the author. No quotation from it or information derived from it is to be published without full acknowledgement of the source. The thesis is to be used for private study or non-commercial research purposes only.
Published by the University of Cape Town (UCT) in terms of the non-exclusive license granted to UCT by the author.

Univers
ity of
Cap
e Tow
n
I, ELKE GROSSER, submit tQis thesis in fulfilment of the requirements for the degree of Master of Science in Engineering, I claim that this work is original and that it has not been submitted in this or similar form for a degree at any other University.
• I
\
Univers
ity of
Cap
e Tow
n
I
ABSTRACT
Photochemical smog is formed by the interaction of sunlight with nitrogen oxides and hydrocarbons. These precursors are principally emitted by anthropogenic sources. As the major component of the photochemical oxidants is ozone, it is used as the indicator of photochemical smog and air quality standards today are therefore based on ozone.
Another important photochemical oxidant is peroxyacetyl nitrate (PAN). Many authors believe that PAN is a better indicator of photochemical activity than ozone, because PAN has, unlike ozone, no large natural sources. Thus, the occurrence of high PAN concentrations is unequivocally related to anthropogenic pollution. The objectives of this work are to summarise the current research on the formation of photochemic~l smog with emphasis on PAN and to investigate the photochemical smog situation in South Africa using PAN as an indicator.
PAN was analysed according to the method suggested by Baunok (1987). Samples were collected by continuous trapping of PAN in hexane, cooled by dry ice from 06:00 to 18:00, which represents average daytime levels. In order to study short-term concentration changes of PAN levels, a sampling method using cryogenic preconcentration of 50 to 100 ml air was developed and PAN was sampled continuously in Johannesburg during August 1988 and in Cape Town during May 1988 and February to April 1989 at established air pollution monitoring sites. Samples, using cryogenic preconcentration, were taken additionally on selected days in Pretoria (November 1988) and Cape Town (March and April 1989). The results of the PAN measurements were compared with NOx, ozone and meteorological data.
The monthly average PAN daytime levels were in the range of 0.10 to 0.62 ppb. The maximum average PAN daytime level of 2.81 ppb was obtained from Cape Town in April 1989 while a peak concentration of 8.56 ppb was obtained on the same day. This is the highest PAN level measured in South Africa and strongly suggests the occurrence of photochemical smog. The accumulation of pollutants due to low wind speeds and/or low thermal inversions together with sufficient solar radiation was found to promote photochemical activity.
Univers
ity of
Cap
e Tow
n
II
Both ozone and PAN levels were suppressed by high NO to N02 ratios which are present in city centres, but the ozone levels were affected the more strongly. On photochemically active days, substantially more PAN was formed than ozone resulting in a low 03 to PAN ratio. PAN levels in the evening were less affected by removal processes than ozone. These results indicate that PAN is a better indicator of photochemical activity than ozone. PAN was found to persist at a higher altitude where removal processes were not effective. High PAN levels were observed at ground level when air masses containing PAN were mixed downwards due to the break up of the nocturnal inversion layer.
The introduction of ethanol-petrol blends in South Africa could promote the formation of photochemical smog owing to increased acetaldehyde emission.
Univers
ity of
Cap
e Tow
n
II I
ACKNOWLEDGEMENTS
The author would like to thank:
The Air Quality Programme of the Earth, Marine and Atmospheric Science and Technology Division of the CSIR, where this study was carried out.
The FRO for the financing of the project "photochemical pollutants".
Professor P K Dutkiewicz, of the Energy Resear~h Institute of the University of Cape Town, for his supervision.
Dr I Baunok for his advice and ideas in the development of the analytical method.
The City Council of Johannesburg, for the provision of the air quality caravan at South Hills and a laboratory at Gas Works, and Mr H J Krohm for the changing of .the .samples and maintaining of the cooling with dry ice.
The City Council of Cape Town, especially Mr A P Miller for the provision of the air quality laboratory at the City Hall and the air quality caravan at the Medical School, Observatory, and for the installment of a~ ozone analyser at Oranjezicht.
Mr and Mrs Allen for providing their private home in Oranjezicht as a sampling site.
Finally, Mrs S G Good for the typeset and Mrs A Adey for the editing of . this thesis.
Univers
ity of
Cap
e Tow
n
IV
CONTENTS
ABSTRACT ACKNOWLEDGEMENTS LIST OF TABLES LIST OF FIGURES
CHAPTER I: INTRODUCTION
1.1
1. 2 1. 2 .1 1.2. 2 1. 2.3
1.3
1.4
1. 5
Historical Review of Photochemical Smog Formation
Effects of Photochemical Air Pollution Health damage Vegetation damage Damage to materials
Control Measures
Photochemical Smog Situation in South Africa
Approach to and aims of the Thesis
CHAPTER II: PHOTOCHEMICAL AIR POLLUTION: A LITERATURE SURVEY
2 .1 2 .1.1 2 .1. 2 2.1.2.1 2.1.2.2 2.1.3
2.2 2.2.1 2.2.2 2.2.3 2.2.4 2.2.5
2.3 2.3.l 2.3.1.1 2.3.1.2. 2.3.1.2.1 2.3.1.2.2 2.3.2 2.3.3 2.3.4
2.4 2.4.l 2.4.2 2.4.3 2.4.4 2.4.5
2.5 2. 5 .1
2.5.2
··- •'
Precursors of Photochemical Oxidant formation Emission source$ Precursor composition Oxides of nitrogen Hydrocarbon composition and reactivity Summary
Secondary Pollutants and their Formation Ozone Aldehydes Peroxyacyl nitrates Hydrogen peroxide Aerosols and particulates
Secondary Pollutants and their Characteristics Diurnal variation Interaction between primary and secondary pollutants Relationship between ozone and peroxyacetyl nitrate Ozone and PAN correlations during the day Ozone and PAN relationship during evening and night Vertical distribution of photo-oxidants Seasonal variation Summary
Transport of Photochemical Air Pollution Transport phenomena Conditions for transport of polluted air masses Composition of transported air masses Observations of transported photochemical air pollution Summary
'Influence of Meteorological Parameters on Smog Formation High oxidant concentrations in connection with
meteorological parameters Summary
Page
I II
VII VII
1
1
3 3 3 4
5
6
8
9
9 9
10 10 10 12
13 13 14 14 15 15
16 16 16 17 17 18 19 20 23
24 24 24 25 26 29
30 31
32
Univers
ity of
Cap
e Tow
n
2.6 2.6.1 2.6.2 2.6.3 2.6.3.l 2.6.if 2.6.4.1 2.6.4.2 2.6.4.3 2.6.5
Natural Occurrence of Photo-oxidants Natural levels of precursors Natural levels of oxidants Natural occurrence of ozone Transport of stratospheric ozone into the lower troposphere PAN in the unpolluted atmosphere The presence of PAN precursors in the natural troposphere Observation of PAN levels in the natural troposphere PAN, an important NOx carrier Summary
32 33 33 34 34 35 35 35 36 36
CHAPTER III: THE FORMATION OF PHOTOCHEMICAL SMOG AND APPLICATIONS 38
3 .1
3.2 3.2.1 3.2.1.1 3.2.2
3.2.2.1 3.2.3 3.2.4
3.3 3.3.l 3.3.2 3.3.4 3.3.5
3.4
FOR PHOTOCHEMICAL AIR POLLUTION CONTROL MEASURES
Introduction
Reaction Mechanisms Photochemical reactions: sources of free atoms The photodissociation of molecules The influence of hydrocarbons on photochemical
sequence
and radicals
reaction
38
38 38 39 39
Reactions of inorganic radicals Chain terminating reactions Summary
and molecules with hydrocarbons 40 41 41
Application of air pollution models Chemical mechanisms used in mathematical models Control strategies Conclusions for photochemical control measures Summary
PAN, an indicator for photochemical smog
42 43 44 45 46
CHAPTER IV: MEASURING TECHNIQUES FOR PEROXYACETYL NITRATE (PAN)
47
49
49
49
50 50 51
4 .1
4.2
4.3 4.3.1 4.3.2
4.4
4.5
Introduction: The Properties of PAN
Analysis of PAN in Ambient Air
Calibration of GC/ECD for Ambient PAN Analysis Preparation of PAN standards Determination of the synthesized PAN content
Sampling Methods
Summary
CHAPTER V: THE MEASUREMENT OF PAN LEVELS
5.1
5.2
5.3 5.3.1
5.4 5.4.1 5.4.2 5.4.3
Introduction
Analytical Method for Measurement of Ambient PAN
Sampling Methods Extraction of ambient PAN in hexane at low temperatures
Description of Sampling Sites and Periods Continuous PAN sampling in Johannesburg Continuous PAN sampling in Cape Town PAN sampling with cryogenic enrichment
52
53
55
55
55
56 56
56 56 57 57
Univers
ity of
Cap
e Tow
n
VI
5.5 'Results of PAN Measurements
CHAPTER VI: DISCUSSION OF THE RESULTS OF PAN MEASUREMENTS
6 .1
6.2
6.3 6.3.1
6.3.2 6.3.3
6.4 6.4.1 6.4.2
Introduction
Levels of Peroxyacetyl Nitrate in South Africa
Average Daytime PAN Measurements Comparison of PAN levels obtained from city centre and
suburban areas Ozone/PAN relationship PAN levels and meteorological parameters
PAN Sampling with Cryogenic Enrichment Daily variation pattern Vertical distribution of PAN concentrations in Cape Town
58
59
59
59
60 60
60 60
62 62 64
6.5 Photochemical Pollution Episode on 6-8 April 1989 in Cape Town 64
6.6
6.7
Conclusions
Summary
CHAPTER VII: SUMMARY AND CONCLUSIONS
7 .1
7.2
7.3 7.3.1 7.3.2
7.4 7.4.1 7.4.2 7.4.3
7.5 7. 5 .1 7.5.2 7.5.3
LITERATURE
MEASUREMENT OF PEROXYACETYL NITRATE (PAN) AS AN INDICATOR FOR PHOTOCHEMICAL SMOG
Introduction
The Formation of Photochemical Smog
Analytical Methods for Ambient PAN Sampling procedure Analysis of ambient PAN
Results of PAN Measurements Average daytime PAN levels Daily and vertical PAN concentration pattern Photochemical pollution episode in Cape Town
Discussion and Conclusions PAN as an indicator of photochemical smog Photochemical smog situation in South Africa Control strategies
65
66
68 68
68
68
69 69 70
70 70 71 72
72 72 73 74
75
APPENDIX A: BASIC REACTIONS INVOLVED IN PHOTOCHEMICAL SMOG FORMATION 85
APPENDIX B: ANALYSIS OF AMBIENT PAN
B .1 B.2 8.3 B.4
PAN standard preparation Gas chromatographic condition for PAN determination Continuous sampling technique of atmospheric PAN Sampling technique of atmospheric PAN with cryogenic
enrichment
87
87 89 89 91
Univers
ity of
Cap
e Tow
n
• •
VI I
APPENDIX C: RESULTS OF PAN MEASUREMENTS TABLES
APPENDIX D: FIGURES
LIST OF TABLES
1.1
B .1 B.2
B.3
C. l C.2-C.ll
C.12-C.20 C.21 C.22-C.29 C.30 C.31 C.32
C.33
Highest 1-h concentrations of ozone or total oxidants at selected sites (WHO, 1979)
HPLC-Varian for purification of PAN standard The effect of bubbling air through cold PAN solution
in hexane Recovery experiment for PAN sampling with cryogenic
preconcentration
Monthly average PAN daytime levels Average daytime concentrations of PAN, ozone and
nitrogen oxides Average daytime concentrations of PAN and meteorological Maximum PAN concentrations (cryogenic sampling) Daily variation of PAN and ozone concentrations Vertical distribution of PAN concentrations Monthly average PAN daytime levels (Pretoria 1986/87) Summary of North American measurements of ambient
PAN concentrations Summary of European and Australian measurements of ambient PAN concentrations
LIST OF FIGURES
Registered motor vehicles in South Africa
data
1.1
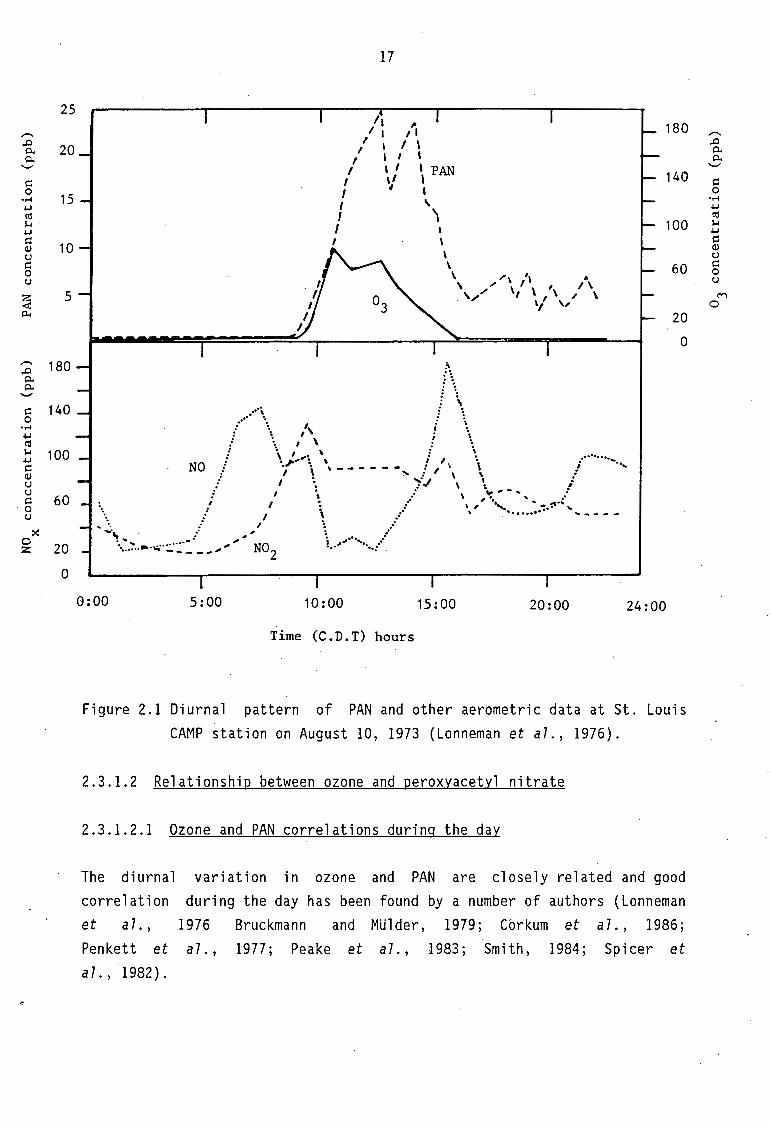
2 .1 Diurnal pattern of PAN and other aerometric data at St Louis Camp station on August 10, 1973
2.2
3 .1
B. l B.2 B.3 B.4 B.5 B.6
D.1-D.5 D.6-D.13 D.14 D.15-D.21
Ozone diurnal profiles for downtown Los Angeles, Upland and Palm Springs, 1-2 October 1980 (Grosjean, 1983)
Ozone isopleths for Los Angeles (Dodge, 1977)
Experimental arrangement for PAN synthesis HPLC chromatogram for PAN purification Continuous PAN sampling Gas chromatogram for liquid injection Sampling with cryogenic enrichment Connection scheme for desorption of PAN into gas chromatograph (Valeo valve)
Average PAN daytime concentrations Daily variation of PAN and ozone concentrations Vertical distribution of PAN Ozone/PAN relationship
101
138
2
88 90
93
102 103
114 124 125 134 135 136
. 137
7
17
27
44
95 96 97 98 99
100
138 144 153 154
Univers
ity of
Cap
e Tow
n
1
CHAPTER I
INTRODUCTION
1.1 Historical Review of Photochemical Smog Formation
Increasing energy demands, resulting from growing urbanization and increasing living standards, have created severe air pollution problems around the world. Combustion products from motor vehicles, which are becoming more and more a popular means of individual transport, have contributed a great deal to air pollution by photochemical oxidants.
In the 1940's, the Los Angeles basin experienced a new type of air pollu~ tion ~eferred to as "Los Angeles Smog". The effects which were noticed first during days of smog episodes were vegetation damage and reduced visibility. People started suffering from irritation of the eyes and throat. These smog episodes occurred mainly on calm sunny days. It was assumed that sunlight irradiated pollutants in the atmosphere and that ozone and other oxidizing compounds were formed. Ozone was found to be responsible for health effects, attacking the respiratory system. Another compound which had not been identified, and was named "compound X", was held responsible for the plant damage and the eye irritation. This "compound X" was later identified by Stephens (1969) as peroxyacetyl nitrate (PAN).
Today it is known that nitrogen oxides and reactive hydrocarbons are precursors for photochemical oxidant formation. These pollutants are mainly emitted by motor vehicles and industrial processes.
Initiated by ultra violet light, perpetuating chain reactions take place between hydrocarbons and nitrogen oxides forming products, including ozone, peroxyacetyl nitrate, aerosols, free organic and inorganic acids. Because these products are not emitted directly, they are called secondary pollutants. The first attempt to measure the levels of these pollutants was based on their ability to oxidize potassium iodide (WHO, 1979).
Univers
ity of
Cap
e Tow
n
2
Soon after the phenomenon of photochemical smog was discovered in Los Angeles, other metropolitan cities in the USA, Australia and Japan experienced this type of air pollution, but not as severely as Los Angeles. In the sixties, it was still believed in Europe that there was little chance of photochemical episodes occurring because of the lower solar radiation there. However, in the seventies, high concentrations of photo-oxidants above the normal background were measured during high pressure systems in summer in the Netherlands, Great Britain and West Germany (Becker et al., 1983). The growing occurrence of photochemical smog during the last decades has become a matter of concern (OECD, 1975).
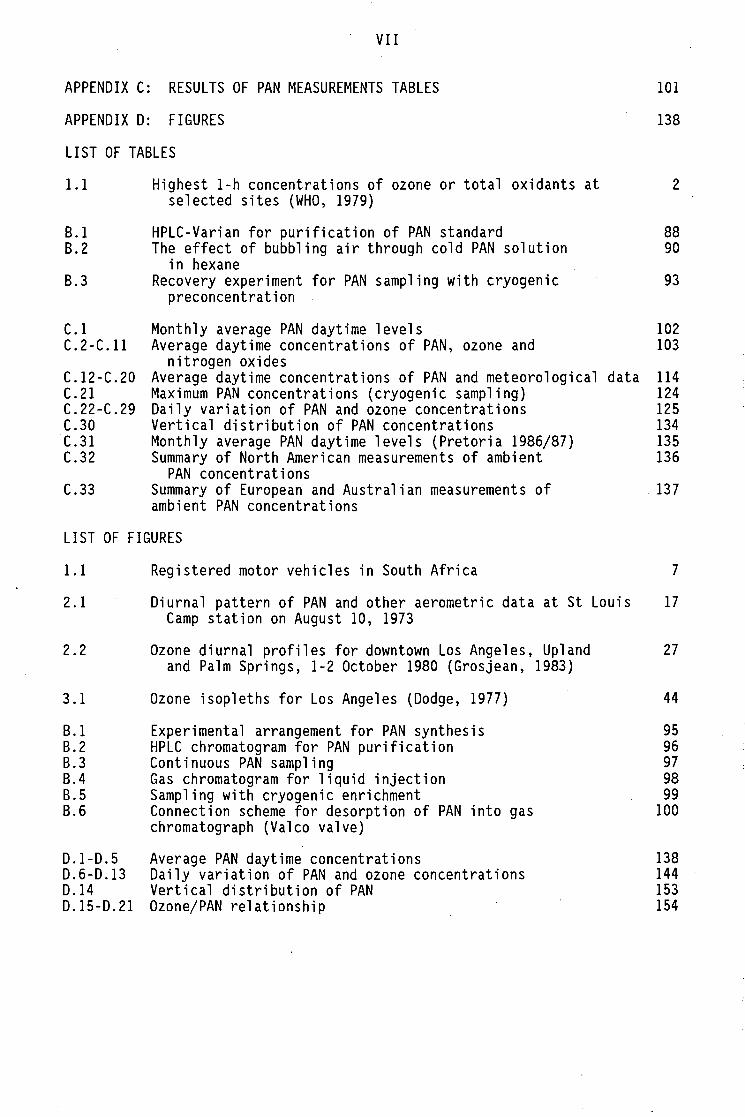
Monitoring programmes concerned with detailed research into the formation and behaviour of photochemical smog were begun and the results of the r~search led to the passing of environmental legislation in the countries involved. The levels of the legal air quality standard for photochemical oxidant air pollution (one-hourly average concentration of ozone) which is based on the potential effect to human health, should not be exceeded on more than one day per year. The level of this standard differs from country to country. While the US Federal Government has set the ozone standard at 0.120 ppm, in Japan and most other countries it is 0.080 ppm. The World Health Organization recommends 0.060 ppm as a worldwide long-term goal. Besides environmental legislation, standard ,levels are substantially exceeded in the heavily polluted areas - see Table 1.1.
Table 1.1 Highest 1-h concentrations of ozone or total oxidants at selected sites (WHO, 1979)
City Year Concentration Method (ppm)
Bonn, Fed. Rep. of Germany 1974 0.145 Chemiluminescence Eindhoven, Netherlands 1974 0.210 Chemiluminescence London, UK 1975 0.147 Chemiluminescence Los Angeles, USA 1974 0.274 NBKI Osaka, Japan 1974 0.160 NBKI Riverside, USA 1974 0.372 NBKI Tokyo, Japan 1974 0.190 NBKI Washington, USA 1974 0.156 Chemiluminescence Sydney, Australia 1977 0.380
Univers
ity of
Cap
e Tow
n
I • • ~ •
• •
3
1.2 Effects of Photochemical Air Pollution
Photochemical air pollution has an impact on hea 1th, vegetation and materi a 1 s owing to the strong oxidizing properties of its components .
1.2 .1 Health Damage
Medical effects of photochemical air pollutants range from short-term health damage, such as tightness in the chest, eye and throat irritation, to an increase of morbidity. Oxidants at high concentrations cause an aggravation of chronic respiratory diseases, e.g. increases of asthma attacks in sensitive persons. An impairment of physical performance has also been observed together with an aggravation of the typical health effects.
Epidemic cases smog episodes Sydney in 1976
of photochemical poisoning have been reported from Tokyo
(State Pollution Control
among school children during in 1970 (OECD, 1975) and from Commission, Australia, 1986).
While playing sport, the typical symptoms were aggravated to such an extent that some players even had to be admitted to hospital for further observation. The performance of marathon runners was observed to decrease drastically if they were exposed to photochemical smog episodes prior to the race (Nieding et al., 1983).
Ozone, one major constituent of the photochemical air pollution mixture, has been found to be a broncho-pulmonary irritant, attacking mucous membranes, other lung tissues and respiratory functions. It also decreases resistance to infectious diseases, as shown in different animal experiments, with exposures to ozone concentrations of about 0.1 ppm.
Peroxyacetyl nitrate (PAN) is found to be an eye irritant in the parts per billion range and is about twice as strong an irritant as formaldehyde. Stephens (1969) and Lovelock (1977) considered PAN to be a possible agent in the formation of skin cancer.
1. 2.2 Vegetation Damage
The main phytotoxicants isolat~d from the photochemical air pollution
Univers
ity of
Cap
e Tow
n
4
mixture are ozone, nitrogen dioxide and peroxyacetyl nitrate. The first visual damage to vegetation exposed to photochemical smog is glazing, silvering and bronzing of leaves.
Long-term damage results in the reduction of growth rate and impairment of the vitality of plants. Losses in agriculture and forestry will thus have economical consequences. Losses of up to 60% of wine and citrus crops and up to 50% of potato crops were reported from the United States due to photochemical smog (Guderian et al., 1983). It is now considered that ozone, in conjunction with sulphur dioxide, is an important factor in the destruction of the forests in central Europe (Guderian et al., 1983).
Plant species show a different sensitivity to these phytotoxicants. Sensitive species like leafy vegetables (e.g. tobacco, spinach, lettuce) and ornamentals (e.g. petunia, morning glory) are used as biological field indicators, of which, tobacco is specifically sensitive to ozone and petunias are specifically sensitive to PAN (Posthumus, 1977; Floor and Posthumus, 1977; Jacobsen and Yonkers, 1977). Biological field indicators are useful for the evaluation of air pollution effects on agriculture, forestry and natural vegetation (Jacobsen and Yonkers, 1977).
Ozone and peroxyacetyl nitrate cause a decrease of photosynthesis in the cells of the leaves. Carbohydrates and starch content decreases with chronic exposure weakening the vitality of the plant. The growth rate slows down and eventually loss of crops and damage t6 ecosystems result (Guderian et al., 1983).
Plant damage due to PAN has been observed at exposures above 15 ppb for four hours (Temple and Taylor, 1983).
1.2.3 Damage to Materials
Certain materials susceptible to oxidation have been observed to deteriorate much faster when exposed to photochemical smog. Deterioration of some organic materials such as natural and synthetic rubber, and fabrics, and the fading of dyes is thought to be primarily caused by the ozone content of smog. Ambient concentrations of ozone have been observed to cause
Univers
ity of
Cap
e Tow
n
5
cracks on stretched rubber bands (Schreiber, 1983). Deterioration of the side walls of automobile tires in the 1940's in Los Angeles was an important economic effect caused by photochemical smog.
1.3 Control Measures
Damage to health, vegetation and materials caused by photochemical air pollution has social and economical consequences. If air pollution is not controlled, damage symptoms will aggravate and repair costs will increase. The control of air pollution is cost intensive, but for the long-term, repair costs have to be put against avoidance costs.
Because photochemical oxidants are secondary air pollution products, their control is not easily achieved. As a first step, primary as well as secondary pollutants need to be monitored and a reduction in the emission rates considered. However, changing the ratio of the precursor pollutants will have a complex effect on the formation of photochemical oxidants. If, for example, the primary emission of nitrogen oxides were decreased without reducing the hydrocarbon emission, this could lead to an increase in oxidant levels (WHO, 1979). Therefore, it is important to identify how beneficial a reduction of hydrocarbon and/or nitrogen oxide emissions would be (OECD, 1975). In the case of Sydney, Australia, it is more practicable and cost effective to reduce ozone levels by reducing hydrocarbon emissions rather than NOx emissions because nitrogen oxide concentrations are at present too low to be of concern (State Pollution Control Commission, 1986).
The composition of photochemical smog involves a number of species, thus measurements have to be restricted to a few indicator species (Becker et al., 1983). Ozone is used as the indicator of photochemical oxidant air pollution because of its relatively high concentration, its potential to cause damage to both health and vegetation, and the fact that it is easily measurable by automatic monitors. The Federal Health and Welfare Standard for photochemical air pollution from the US Environmental Protection Agency has been based exclusively on ozone rather than on total oxidants (Temple and Taylor, 1983).
Univers
ityof
Cape T
own
•
6
A number of authors stress the dangers of ignoring PAN (Temple and Taylor, 1983; Brasser, 1977; Penkett et al., 1977 and Lobel et al., 1980). Nieboer and van Ham (1986), Penkett et al. (1977), Lobel et al. (1980) and Brice et al. (1984) suggest that PAN would be a better indicator of photochemical activity than ozone. Unlike ozone, it has no large natural sources. Under certain weather conditions, e.g. cold frontal systems, air masses from the lower stratosphere being introduced into the lower troposphere can lead to elevated ozone levels. This has been reported by Attmanspacher (1977) and Kanter et al., (1979, 1982) from clean air stations in Germany.
1.4 Photochemical Smog Situation in South Africa
During his visit to South Africa in 1984, Mr MY Smith (CSIRO, Australia) identified in "A survey of photochemical air pollution in South Africa", that South African cities (Johannesburg, Pretoria, Cape Town) have a potential for photochemical smog (Smith, 1984b). Precursor levels have been found in high concentration (Stevens, 1987a, c; Smith, 1984b).
Especially on the Highveld (greater Johannesburg region), high emissions of hydrocarbons are attributed to poor combustion in motor vehicle engines at the high altitude. City layouts with numerous traffic lights causing idling traffic, leads to poor engine combustion and enhances exhaust emissions of hydrocarbons (Stevens, 1987c). Alcohol content in the petrol produces elevated aldehyde emissions (Nates, 1986), of which acetaldehyde is the most important precursor for peroxyacetyl nitrate. In Cape Town, increased precursor levels were found during stable weather conditions (Loevenheim, 1988).
A few incidents of high ozone levels have been reported from Cape Town by Dutkiewicz et al. (1980) and Brunke and Allen (1985) and from Johannesburg by Stevens (1985), but photochemical smog episodes such as those experienced in' California have not occurred in South Africa. A possible reason could be the relatively low traffic density. Los Angeles has more motor cars than the whole of South Africa.
Univers
ityof
Cape T
own
7
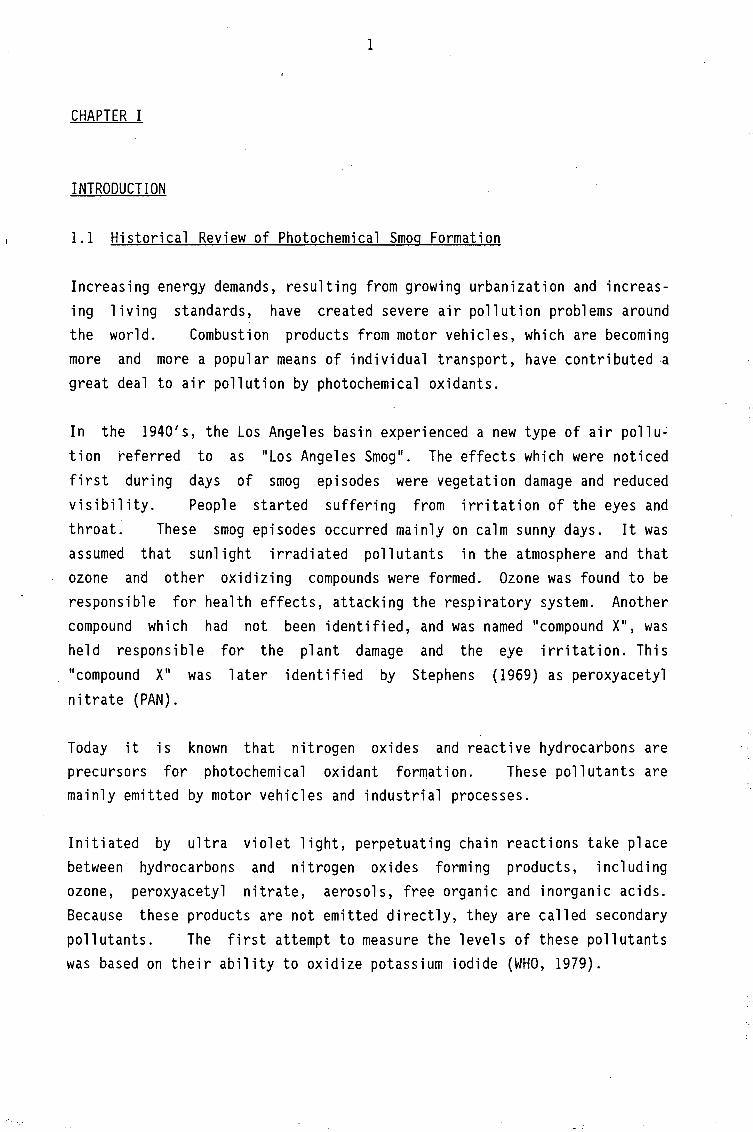
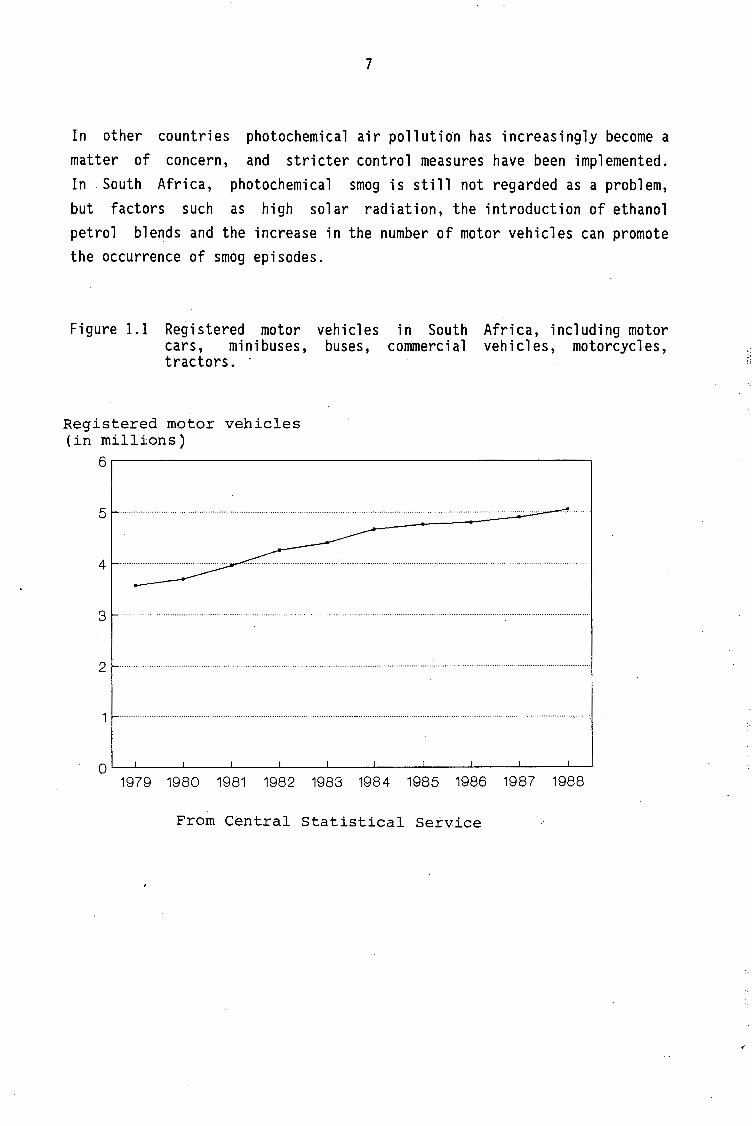
In other countries photochemical air pollution has increasingly become a matter of concern, and stricter control measures have been implemented. In . South Africa, photochemical smog is still not regarded as a problem, but factors such as high solar radiation, the introduction of ethanol petrol blends and the increase in the number of motor vehicles can promote the occurrence of smog episodes.
Figure 1.1 Registered motor vehicles cars, minibuses, buses, tractors. ·
Registered motor vehicles (in millions)
in South Africa, including motor commercial vehicles, motorcycles,
5.--~~~~~~~~~~~~~~~~~~~~~~~~--.
5 ....... .
4
3
2 ........ ····-···
1 . - -····-------·-·-----··-- - ·······-- --
1979 1980 1981 1982 1983 1984 1985 1986 1987 1988
From C~ntral Statistical Service

Univers
ityof
Cape T
own
8
1.5 Approach to and Aims of the Thesis
Smith South
{1984b) recommended in the "Survey of photochemical air pollution in Africa" the monitoring of peroxyacetyl nitrate {PAN), as PAN is re-
garded as an unequivocal indicator of the presence of photochemical smog. Owing· to the development of a method to measure PAN by Baunok {1987), an investigation of photochemical air pollution in South Africa, using PAN as an indicator, could be carried out.
The approach of this work is:
{a) To analyse the current research of the formation and features of photochemical air pollution with emphasis on PAN.
{b) To investigate the photochemical smog situation in South Africa by using PAN as an indicator.
This involves the measurement of average daytime PAN levels at selected site~ in Cape Town, Johannesburg and Pretoria and the study of daily variation pattern of PAN and ozone. The results of PAN measurements are theri compared with NOx, ozone, and meteorological data.
24a/sgg
Univers
ityof
Cape T
own
9
CHAPTER I I
PHOTOCHEMICAL AIR POLLUTION: A LITERATURE SURVEY
2.1 PRECURSORS OF PHOTOCHEMICAL OXIDANT FORMATION
2.1.l Emission Sources
The precursors of photochemical smog, nitrogen oxides and hydrocarbons, are emitted by a variety of sources. It is estimated (Shell Briefing Service, 1984) that about half of the nitrogen oxides emitted in Western Europe are derived from motor vehicles. The remainder originate from coal burning power stations and other industrial sources. Looking at the global emissions of oxides of nitrogen, the combustion of fossil fuel, a main anthropogenic source, emits 13.5 x 10⁶ t/a (as N) of which the combustion of coal (5.5 x 10⁶ t/a as N) and petrol fuel (4.3 x 10⁶ t/a as N) are the main sources (Becker et a7., 1983). In Australia 56% of NOx emissions are attributed to motor vehicles, and the rest from industrial sources (Daly, 1981).
The main sources of hydrocarbons, excluding methane and natural hydrocarbons, derive from the combustion process in motor vehicle engines and furnaces, as well as from the chemical industry (Nassar et a7., 1977). Nelson et a7. (1982) categorized the sources of hydrocarbons in Sydney and reported that 363 are derived from vehicle exhausts, 32% from evaporative emissions of petrol and 23% from evaporation of hydrocarbons, and other solvents.
Hydrocarbons, which are derived from motor vehicle exhausts, show an early morning peak corresponding to traffic peak hours (Altshuller et a7., 197lb; Lonneman et a7., 1974). Components like ethylene, acetylene, toluene and iso-pentane show this early morning peak (Lonneman et a7.,
Univers
ityof
Cape T
own
10
1974; Nelson et al., 1982). Hydrocarbon species which did not show a morning peak were methane, ethane, propane and n-butane (Altshuller et al., 197lb). An increase during the afternoon was observed in hydrocarbon species originating from industrial sources and from gasoline evaporation (Lonneman et al., 1974).
The source strength of the precursors can vary in different countries and places, but in urban areas, motor vehicle exhausts appear to be the largest contributors to oxides of nitrogen and hydrocarbon emissions.
2.1.2 Precursor Composition
2.1.2.1 Oxides of nitrogen
Ninety per cent of NOx emissions resulting from industry are emitted as nitric oxide (Becker et al., 1983). Motor vehicles also emit the largest part of NOx as nitric oxide (Daly, 1981). Lenner et al., 1983 reports that a much larger part of NOx is emitted as N02 than expected, from a warmed gasoline engine while idling. The authors also mention that diesel engines emit lower amounts of NOx but with a higher fraction of N02•
Large amounts of nitric oxide emitted in the morning rush hour suppress the oxidant formation while nitric oxide has to be oxidized first to nitrogen dioxide. For the start of the photochemical reactions, nitrogen dioxide must be present.
An initial amount of N02 present, derived from morning peak traffic, could accelerate the start of oxidant formation.
2.1.2.2 Hydrocarbon composition and reactivity
Monitoring of non-methane hydrocarbons individual hydrocarbons, aldehydes and This detailed . information is critical
gives limited information on the other organics in the urban air. for photochemical air pollution
which depends on precursor hydrocarbon concentration (Grosjean and Fung, 1984). The photochemical reactivity of a substance is dependent on the size and structure of the molecule (Nassar et al., 1977). Grosjean
Univers
ityof
Cape T
own
11
and Fung (1984) suggest, therefore, that it is better to look at individual hydrocarbon compounds or at hydrocarbon categories, in terms of photochemical reactivity than at measurements of total hydrocarbons.
It seems that different hydrocarbons play different roles in the reaction mechanisms which lead to photochemical smog formation. Some research has been done on the reactivity of different hydrocarbon species and their composition in the urban atmosphere. Kopczynski et al. (1975), using smog chamber studies, showed that different hydrocarbons, as well as different ratios of hydrocarbons to nitrogen oxides, show a wide variation in oxidant formation. The reactivity in terms of oxidant yield was lowest with paraffins, increasing substantially with aromatics, and showed the highest oxidant yield with olefins. An olefin to NOx ratio of approximately 10:1 in a system gave maximum oxidant yield. The paraffinic: NOx system showed a maximum oxidant yield at a ratio of 77:1.
This shows that olefins play an important role in photochemical oxidant formation in urban areas. The slower reacting paraffins will have a. longer half life and will be easily transported downwind. With longer irradiation and lower NOx levels they may be important for oxidant formation at downwind locations (see, e.g. Colbeck et al., 1985).
Grosjean and Fung (1984) investigated hydrocarbons and carbonyls in Los Angeles air and found that the major components of light hydrocarbons (C2-C6) · were ethane, ethylene, acetylene, propane, n-butane and iso-pentane, while those of aromatics (C6 -C10 ) were toluene and xylene isomers. These authors rated the specific hydrocarbons in terms of photochemical reactivity. The average concentration for each category was multiplied by the corresponding rate constant of reaction with the hydroxyl radical. This rating expressed on a per cent basis was highest for total aromatics (36.1%) followed by total alkanes (31.7%), alkenes (18.8%) and carbonyls (12.5%).
Nassar et al. (1977) stressed the importance of hydrocarbon reactivity multiplied by concentration for smog formation. Although ethylene is one of the low reactive olefins, it is still an important precursor because it occurs at much higher concentrations than other olefins. Ethylene is a
Univers
ityof
Cape T
own
12
useful tracer for automobile exhaust and thus can be used to distinguish between emissions of vehicular and non-vehicular sources (Altshuller et
al., 197lb; Lonneman et al., 1974).
Ten non-methane hydrocarbons in Los Angeles acco~nted for 80% of the hydrocarbons. Of these ten, ethane, propane, isobutane and acetylene are of low reactivity, while n-pentane, isopentane, n-butane, ethylene, toluene and m-xylene are highly reactive species (Altshuller et al., 197lb).
Altshuller et al. (197lb) investigated the relationship between morning peak concentrations and mid-afternoon concentrations of individual hydrocarbons in downtown Los Angeles. The mid-afternoon concentrations for low reactivity species were half, and for high reactivity hydrocarbons were a third of the morning peak concentration. Of the very reactive olefins, the morning peak concentration had decreased by 75% by the mid-afternoon. The smaller quantities of highly reactive hydrocarbons may well contribute significantly to the rapid conversion of nitric oxide to nitrogen dioxide, which is crucial for photochemical reaction chains.
In countries where emission control for hydrocarbons from motor vehicle exhausts has been introduced, by, e.g., engine modifications and the introduction of catalytic converters, the composition of the hydrocarbons in motor vehicle exhaust emissions has changed (Nelson and Quigley, 1984). Grosjean and Fung (1984) found that ambient levels of 1974 compared with ambient levels of 1981 contained similar proportions of unreactive hydrocarbons and paraffins, but had lower amounts of olefins and higher amounts of aromatics. This indicates a shift in hydrocarbon emission patterns with an increase in aromatics and a decrease in olefins.
2.1.3 Summary
Motor vehicle exhausts are important emitters of NOx and NMHC. Other sources are industrial processes and, in the case of hydrocarbons, evaporation of solvents and petrol. The major component of NOx emission is in the form of NO, but small quantities of N02 play an important role in starting the photochemical reactions. Various hydrocarbons show different reactivitjes in terms of photochemical reactions of which olefins and aromatics are of high and paraffins of low reactivity.
Univers
ityof
Cape T
own
13
The composition of the hydrocarbons of different reactivities and the reactivity of single species are important for smog formation. A rating factor - reactivity multiplied by concentration, gives useful information in the characterization of photochemical potential. High concentrations of low reactive species have a prolonged effect but low concentrations of hig~ly reactive species, are more important precursors in accelerating the photochemical reaction chain. In countries where hydrocarbon control for motor vehicles has been introduced, a shift in emission patterns towards an increase in aromatics has been observed.
2.2 SECONDARY POLLUTANTS AND THEIR FORMATION
Secondary pollutants, also referred to as photochemical oxidants, have no direct emission sources. They are formed, when the sunlight irradiates the nitrogen oxides/hydrocarbon mixture of a polluted atmosphere. The initiating reaction is the dissociation of nitrogen dioxide,
N02 + h·v ~> NO + O·
which starts a perpetuating sequence of reactions leading to the formation of ozone, peroxyacyl nitrates, aldehydes, aerosols and hydrogen peroxide (Becker et al., 1983).
2.2.1 Ozone
Ozone is the most abundant compound of the secondary pollutants. It is formed by the reaction of the radical oxygen atom o· with an oxygen molecule to form ozone in the presence of a third body M, which serves as an impact partner to compensate the released binding energy (Schurath, 1977).
0 • + 02 + M -> 03 + M
An excess of nitric oxide leads to the depletion of ozone according to the reaction
Univers
ityof
Cape T
own
14
2.2.2 Aldehydes
Aldehydes are primary as well as secondary pollutants. They are emitted during incomplete combustion of organic compounds of which the main source is considered to be motor vehicle exhausts. Aldehydes are also produced in the atmosphere through photochemical reactions (Jeltes, 1977). They are an important precursor for the formation of peroxyacyl nitrates.
2.2.3 Peroxyacyl nitrates
Peroxyacyl nitrates are a homologous series of organic nitrogen compounds .which have the general formula
\ 0
~ R-C-O-O~N02 •
The most abundant species is peroxyacetyl nitrate (PAN) where the radical R is methyl (CH
3·). The second most abundant species, where R is
ethyl (CH3CH2·), is peroxylpropionyl nitrate, (PPN). Another is peroxybenzoyl nitrate (PBzN) where R is phenyl, and is known to be 100 times stronger as an eye irritant than PAN.· Because most species of the peroxyacyl nitrates only occur at much lower concentrations than PAN, less emphasis has been placed on investigating them (Stephens, 1969).
The PAN formation is initiated by the reaction of hydrocarbons (olefins, aromatics or aldehydes) with hydroxyl radicals to produce the peroxyacetyl radical. The peroxyacetyl radical then reacts with nitrogen dioxide to form PAN (Brice, et al., 1984)
This reaction is in thermal equilibrium. In the presence of nitric oxide, the peroxyacetyl radical can be destroyed
Univers
ityof
Cape T
own
15
The presence of excess NO has, therefore, an inhibiting effect on PAN formation.
2.2.4 Hydrogen peroxide
The hydroxyl (HO·) and hydroperoxyl (H02·) radicals are important as they drive the whole photochemical reaction system. The formation of hydrogen peroxide (H202) removes the HO· and H02•
radicals from the reaction chain (Luft-Reinhaltung, 1981; Brasser et al., 1987; Becker, 1977)
2HO· -> H202
HO· + HO· + M -> H202 + M
2.2.5 Aerosols and Particulates
Photochemical smog formation in the Los Angeles Basin is associated with a reduction in visibility. This decrease in visibility is the result of gas to particle conversion.
so -> so 2-2 4
Nox -> No3-
HC -> organic aerosols.
Brasser et al. (1977) found that ozone levels and reduction in visibility gave no firm correlation in Europe. Georgii et al. (1977) mention that, in the presence of hydrocarbons and nitrogen oxides, the photo-oxidation of S02 to sulphate aerosols is accelerated rapidly.
An important aerosol is considered to be nitric acid. The major daytime nitric acid production pathway involves the reaction of nitrogen dioxide with the hydroxyl radical (Grosjean, 1983).
Grosjean (1983) and Spicer et al. (1982) nitrate (nitric acid) follows the diurnal
have observed that gaseous profiles of ozone and PAN
indicating the photochemical origin of this species.
Univers
ityof
Cape T
own
~
16
2.3 SECONDARY POLLUTANTS AND THEIR CHARACTERISTICS
Photochemical oxidants are mostly characterized by ozone and most research is based on this smog component. Recently, peroxyacetyl nitrate (PAN) has become a better indicator of photochemical smog than ozone (Penkett et al., 1977; Nieboer and van Ham, 1976; Brice et al., 1984). In this paragraph, the behaviour of ozone and PAN, two important members of the photochemical oxidants is analysed.
2.3.1 Diurnal Variation
2.3.1.1 Interaction between primary and secondary pollutants
The interaction of the different pollutants can be studied by looking at diurnal variations of the different species.
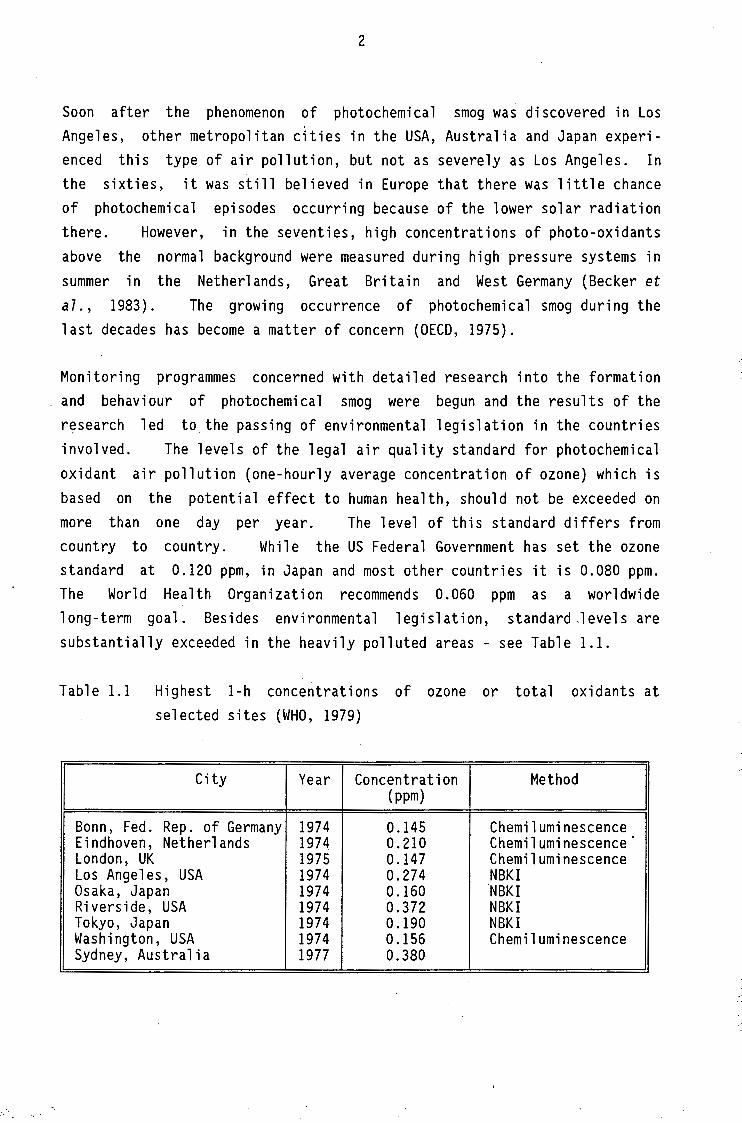
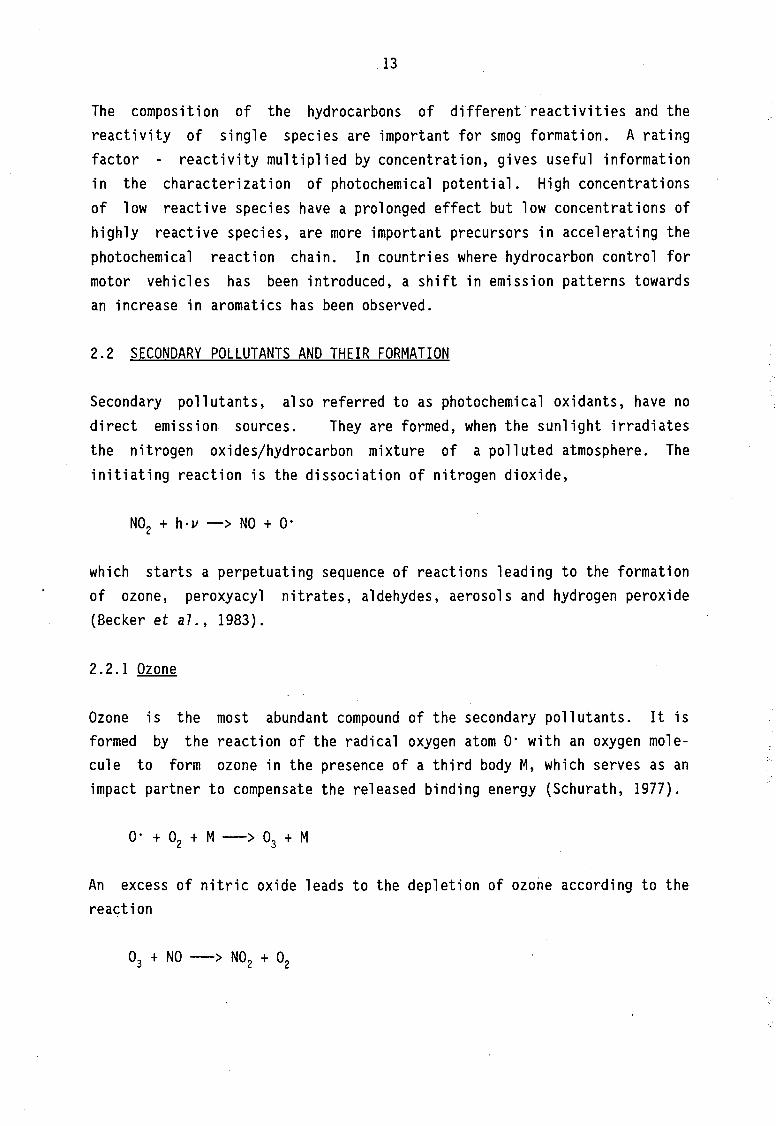
Primary pollutants, which in urban areas are mainly emitted by motor vehicles, closely follow the traffic density with peaks of NO and NMHC in the early morning and late afternoon (Grosjean, 1983; Stevens, 1987). The rapid decrease of the early morning NO peak is due to the conversion of NO to N02 (Luft-Reinhaltung 1981). Between 09:00 and 10:00 in the morn-ing N02 builds up to a maximum. Approximately an hour later the, N02 to NO ratio becomes favourable for the photochemical reaction. During this period, Lonneman et al. (1976) observed the highest rates of 03 and PAN formation. These authors observed two maxima of 0
3 and PAN approximately 1 1/2 h apart see Figure 2.1. T~ey
concluded that the second peak may be _a result of intermittent cloud coverage or transport from upwind locations. 03 and PAN peaks did not occur simultaneously, the first maximum of 03 occurred about 2 h before the PAN maximum. They postulate that the ozone-forming reactions occur early in the photo-oxidation process while PAN-forming reactions are operative in the later stages of the reaction. The same authors observed a significant interference of 03 with freshly emitted NO in the late afternoon (about 16:00). The 0
3 concentration dropped rapidly to
zero due to the reaction of ozone with nitric oxide. They did not measure hydrocarbons, but they expected them to follow a pattern similar to nitrogen oxides, due to their similar sources.
Univers
ityof
Cape T
own
i:: 0 ·~ ~ Ill ,... . ~
i:: Q) (.)
i:: 0 (.)
-,!:l 0. 0.
.........
i:: 0 ·~ ~ Ill ,... ~ i:: Q) (.) (.)
i:: 0 (.)
~ 0 z
25
20
15
10
5
180
140
100
60
20
0
NO
I
17
,, ,. I I I I
1 I I \ ,' \ I I
I I / I PAN I I I l I ' I , \
I '\ I I I \
\ \
:.
\ ,\ '1 .. \ ,, ,, , /\ \,/' I \ I \ , \ ,, ,,
f \. : \~ ... ,
~~ \ \ .: \ /\ f \\ i • I \ !
\,,,\ \ ._,..,..-._ ' I I • ......... ..
i l ' - - - - - -, f I \ \ / .... ~ '-".,/ \ I
I I :, .• .: \ • ,f \ ;,. ... - .. I .• ·• \ , , ··., "" -.1'-·''
I \ .:· ' .'••······ .._. ___ _ I °: '...;., .·
··.~:-: ..... ,,;.;· :::::·: --., ,, "' i ..... ··· ......... ···· ...
0:00 5:00 10:00 15:00 20:00 24:00
Time (C.D.T) hours
180
140
100
60
20
0
Figure 2.1 Diurnal pattern of PAN and other aerometric data at St. Louis CAMP station on August 10, 1973 (Lonneman et al., 1976).
2.3.1.2 Relationship between ozone and peroxyacetvl nitrate
2.3.1.2.1 Ozone and PAN correlations during the day
The diurnal variation in ozone and PAN are closely related and good correlation et a 1.,
Penkett et
al., 1982).
during the day has been found by a number of authors (Lonneman 1976 Bruckmann and MUl der, 1979; Corkum et a 1. , 1986; al., 1977; Peake et al., 1983; Smith, 1984; Spicer et
Univers
ityof
Cape T
own
18
The maximum concentrations of ozone and PAN do not necessarily occur at the same time. Lonneman et al. (1976), Smith (1984) and Lewis et
al. (1983) observed the midday ozone peak 1-2 h before the PAN peak at urban stations, while Corkum et al. (1986) in Simcoe, Canada and Nieboer and van Ham (1976) in Delft, Netherlands, have shown that the PAN peak can occur about an hour earlier than the ozone peak. Concurrently occurring ozone and PAN maxima were observed by Bruckmann and MUlder (1979) on 13 fine weather days from a rural station on the outskirts of Essen, West Germany and by Peake et al. (1983) for a rural site at Kanaskis, Canada on days when PAN exceeded 1 ppb. Peake et al. (1983) concluded, that because ozone and PAN are generated by related photochemical processes, a concurrent occurrence of ozone and PAN peaks is to be expected, while the time when the peak is reached can vary from midday till late afternoon.
2.3.1.2.2 Ozone and PAN relationship during evening and night
The strong correlation between ozone and PAN disappears at dusk (Penkett et al., 1977; Lonneman et al., 1976; Brasser et al., 1977). This is due to different chemical reactivities and a difference in deposi-tion rates of the two species. hour, and a lack of UV radiation, the ozone concentration, according
Nitric oxide emitted during evening rush are responsible for the rapid decline of to the reaction
(Luft-Reinhaltung 1981; Brasser et al., 1977; Lonneman et al., 1976). The reaction rate between PAN and NO is far smaller and PAN can still be formed in the dark as long as precursors pre available (Brasser et al., 1977; Bruckmann and MUlder, 1979). Cox and Roffney (1977) found that the gas-phase removal of PAN predominates during the day, but is not an effective sink during the night. Deposition velocities for ozone are about 3-6 times greater than for PAN, depending on the surface structure, ·soil, grass, land, etc. (Peake and Sandhu, 1983; Brasser et al., 1977). This surface sink is predominantly responsible for PAN decay during the night (Cox and Roffney, 1977). Nieboer and van Ham (1976) found that the PAN decay during the afternoon and night is nearly
Univers
ityof
Cape T
own
19
independent of wind speed, in contrast to ozone, as PAN decomposes more slowly than ozone in the presence of other pollutants. The availability of chemical and physical sinks for PAN in the early evening and at night is far less than that for ozone. PAN can frequently persist overnight in the atmosphere and influence smog formation the following day (Grosjean, 1983; Nieboer and van Ham, 1976; Peake et al., 1988; Peake and Sandhu, 1983).
2.3.2 Vertical distribution of photo-oxidants
As the atmosphere is an open system, gas pollutants can be distributed fairly freely. Via convection they might be transported to higher altitudes within the mixing layer, and under suitable weather conditions accumulate there, as some authors have found with aircraft measurements (Georgii et al., 1977) and at a sampling site at 200 m above ground level (Brasser et al., 1977).
Georgii et al. (1977) have found high ozone concentrations of between 90 ppb and 110 ppb 03 on a measuring flight in July 1975 downwind of Bonn, West-Germany at an altitude of 700 m. The ozone concentrations upwind of Bonn were reported to be 60 ppb on the same day. On a subsequent measuring flight in June 1976,_downwind of Koln-Bonn, a maximum of 160 ppb 03 was found at 1200 m above ground. Georgi i et a 1. ( 1977) could prove the anthropogenic origin of this ozone maximum because the levels decreased with higher altitude.
Brasser et al. (1977) not only found higher ozone concentrations at the 200 m altitude measuring site, but also observed a quite obvious persistence of ozone at the higher levels. High ozone concentrations, which are formed during the day in the lower troposphere, can persist overnight above a stable inversion layer (Georgii et al., 1977). With the breakup of the nocturnal inversion layer the following morning, ozone levels increase rapidly due to downwards mixing. The often observed 10:00 shoulder _of the ozone pattern, at a time before solar intensity is sufficient to cause photochemical production, is attributed to downwards mixing (Colbeck and Harrison, 1985; Kelly et al., 1984). Becker et al. (1983) assume therefore, that with suitable weather conditions, photo-oxidants
Univers
ityof
Cape T
own
20
are formed in a few hundred metres above the ground within the mixing layer, where they persist for a few days and serve as a reservoir.
2.3.3 Seasonal Variation
The highest photochemical production has been observed in the summer months by a number of authors (Corkum et al., 1986; Penkett et al., 1977; Brice et al., 1984; Tsani-Bazaca et a7., 1988; Brasser et al., 1977; Peake and Sandhu, 1983; Peake et a7., 1988; Temple and Taylor, 1982; Bottenheim et al., 1984).
The seasonal variation of photochemical production is explained on the basis of solar radiation intensity and duration, temperature, and pollutant concentration (Peake et al., 1988). With higher latitudes Temple and Taylor (1983) noticed that the peroxyacetyl nitrate concentrations appeared to decrease. The solar radiation is believed to be the limiting factor for PAN formation in the winter months in Europe and Canada at latitudes higher that 50°N (Brasser et al., 1977; Peake and Sandhu, 1983; Peake et al., 1983) .
. Penkett et al. (1977) observed a gradual build up in average PAN concentrations in Great Britain through the spring and summer followed by a rapid fall at the end of August. Brasser et al. (1977) showed the daily trend of the ozone and PAN concentrations compared with the UV radiation intensity for each month in 1975 in Delft, Netherlands. At the latitude of the Netherlands (52°N) no significant smog formation seems to occur in the winter months from October to March. The difference in the monthly average concentrations of PAN was found to be about a factor of six between summer maximum and winter minimum (Brice et al., 1984). Ozone showed a much smaller seasonal variation.
Peake and Sandhu (1983) and Peake et al. (1988) report on PAN measurements in Canada from Calgary (51°N) and Edmonton (55°N). In both cities, the highest PAN concentrations occurred in August. They noticed high primary pollution concentration in the winter months due to temperature inversions but the low intensity and duration of solar radiation is not sufficient to produce significant photochemistry. A limiting factor
Univers
ityof
Cape T
own
21
for PAN formation in the summer months is the low primary pollution concentration in the mixing layer. During the spring and autumn months a possibility exists for low mixing depths accumulating primary pollutants together with high solar radiation thus favouring the smog formation.
In Athens (38°N), no seasonal variation of PAN concentration was observed but the highest concentration of 3.7 ppb was recorded in August, the next highest PAN concentration of 2.9 ppb was recorded in October. Several high values of around 2 ppb were recorded in the summer months and other fairly high PAN concentrations around 1.7 ppb were scattered outside the summer months (Tsani-Bazaca et al., 1988).
Photochemical smog is supposed to be an entirely summer phenomenon for mid latitude sites. But winter episodes occur, as observations of elevated PAN concentrations at several sites have shown {Penkett et al., 1977; Brice et al., 1984; Baunok and Grosser, 1987; Tsalkani et al., 1987; Spicer et al., 1983). During the winter months, a slow rate of PAN formation is expected. Due to lower temperatures the rate of thermal decay is slow. If the conditions are favourable, with high precursor levels and sufficient solar radiation, PAN formation will be enhanced and the high thermal stability at the lower temperatures will accumulate PAN concentrations (Brice et al., 1984).
Brice et al. (1984) observed PAN concentrations of up to nearly 3 ppb at Harwell, UK, in February 1981. The CFC1
3 concentration, which is
used as. a tracer for anthropogenically polluted air masses, showed the same trend as the PAN pattern. Other photochemical pollutants, nitrate, sulphate, nitrogen dioxide and ozone showed the same trend. The episode was influenced by an anticyclone which developed a marked temperature inversion layer allowing pollutants to accumulate.
Tsalkani et al. (1987) have observed two elevated PAN episodes in October 1985 and February 1986 in Creteil (Paris), France. The normal background level in the autumn and winter months is about 0.3-0.5 ppb. The PAN levels rose to 9 ppb on 26 October 1985 and to 7 ppb on 16 · February 1986. The ozone level did not show the same related behavior as the PAN profiles. The conditions that favoured the PAN episodes were
Univers
ityof
Cape T
own
22
associated with anticyclonic conditions, generally clear sky, decrease of wind velocity and a marked temperature inversion. The February 1986 episode was marked by low daytime average temperatures varying from -6 to +4°C. Low temperature increase~ the stability of PAN, while its effect on PAN formation rate is not very important.
Average daytime PAN levels were measured at two sites in Pretoria during a few winter and summer months (Baunok and Grosser, 1987). The monthly averages of PAN mixing ratios showed higher winter levels. Solar radiation is not a limiting factor in Pretoria due to its high altitude (1350m) and low latitude (25°42"S). The winters in Pretoria are mild and characterized by cloudless skies. Low thermal inversions, which are common in winter, accumulate precursor pollutants and favour the photochemical reactions.
Bottenheim et al. (1984) incorporated NOx and PAN chemistry in the Atmospheric Environment Service (AES) Lagrangian trajectory model. They were surprised, when calculating the annual profile for PAN, to discover that the model suggests a monthly average PAN minimum in summer and a maximum in winter thus contradicting long-term field measurements at rural sites in Britain and Canada. The authors assume that such a trend is not unique due to the greater thermal stability of PAN at the lower winter temperatures. They believe that some aspects of the atmospheric behaviour of PAN are presently absent in the model.
Nieboer et al. (1976) investigated the effect of latitude on the potential for the formation of photochemical smog using computer simulations. The calculations indicate that concentration profiles for secondary pollutants are more strongly affected by the total incident UV light energy than by the maximum light intensity. Sites at higher latitudes like Rotterdam (52°N) and Alaska (65°N) show lower maximum summer light intensities compared with Los Angeles (31°N), but ozone dosages calculated from the computer simulations are similar. Taking only the effect of _light energies into consideration, the potential for photochemical oxidant production during mid summer in Rotterdam or even Alaska is almost as ·great as that in Los Angeles. These results suggest that, if the effect of the total incident UV light energies only is considered, sites
Univers
ityof
Cape T
own
23
up to between 65°N and 65°S show potential for photochemical oxidant production during mid summer.
2.3.4 Summary
Secondary pollutants ozone, peroxyacetyl
include a mixture of oxidizing species, such as nitrates, aldehydes, aerosols and hydrogen peroxide,
the sun's irradiation of an urban polluted atmosphere. which are formed by
Primary pollutants (NOx, NMHC) in urban areas show an early morning and late afternoon peak which is closely related to peak traffic density. When the morning NOx concentrations decrease, the oxidant formation builds up and reaches its maximum concentration in the early afternoon. Fresh NO emissions from the afternoon traffic peak interfere, in particular, with ozone levels. This leads to a decline in the ozone concentration in the early evening.
During the day, ozone and PAN variation show a good correlation. This is to be expected, because they are formed by related photochemical processes. The correlation disappears at night. As chemical and physical sinks for ozone are much stronger than those for PAN, PAN can, therefore, more easily persist overnight and influence smog formation on the following day. A stable nocturnal inversion layer can isolate photo-oxidant pollutants from the ground where they could be destroyed. With the breakup of the inversion layer the next morning, these oxidant pollutants are mixed downwards, leading to a rapid increase, between 09:00-10:00, at ground level.
Seasonal variation of photochemical production is strongly influenced by the solar radiation which is a limiting factor during winter months at higher latitudes (>50°). However, photochemical smog episodes can occur during winter months if weather conditions are suitable, e.g. anticyclonic temperature inversions that trap pollutants, and sufficient sunlight. In the lower latitudes no pronounced seasonal variation has been observed and solar radiation is not a limiting factor. In the summer months, high temperatures promote the thermal decay of PAN and the more turbulent air masses disperse the precursor pollutants more easily.
\
Univers
ityof
Cape T
own
24
2.4 TRANSPORT OF PHOTOCHEMICAL AIR POLLUTION
2.4.1 Transport Phenomena
The effects of photochemical air pollution are not limited to urban areas. Observations of high levels of photo-oxidants at remote stations away from centres of industrialization led to intense studies of transport phenomena. Becker (1977) distinguishes between (a) regional transport (20-100 km) and (b) long-range transport (up to 1000 km). In connection with regional transport, peak ozone concentrations are observed two to four hours later than at the source and reactive hydrocarbons are mainly responsible for the oxidant formation. Long-range transport can take place within extended high pressure cells. The remaining, less reactive hydrocarbons are, in this case, responsible for oxidant formation. Transport over a distance of up to 1000 km requires a lifetime of the ingredients of several days (Roth, 1977). The origin and path of such air masses can be estimated by calculation of back-trajectories.
2.4.2 Conditions for Transport of Polluted Air Masses
A long lifetime of photochemically produced species can be achieved if physical and chemical sinks are minimized. Only then do photo-oxidants have the potential to become accumulated and transported over long distances. Deposition velocities for ozone and PAN are dependent on the surface and are slowest over water surfaces, so 03 and PAN can be easily transported over sea surfaces (Dervent and Hov, 1982; Peake and Sandhu, 1983). Transport over land surfaces, on the other hand, must occur at such an altitude that contact with the ground is minimized. The longer the transport time, the more time is available for removal mechanisms (Bottenheim et al., 1984). Chemical sinks, mainly due to reaction with freshly emitted nitric oxide, can be neglected if transported air masses are uncoupled from precursor emissions. An isolated layer, such as a thermal inversion layer, prevents deposition and contact with primary emissions and also allows accumulation and transport (Colbeck et al., 1985; Peake and Sandhu, 1983; Becker, 1977; Spicer et al., 1983). Under these conditions, Singh and Salas (1989) estimated a lifetime for PAN and peroxypropionyl nitrate (PPN) of about one to two days. Photochemically
Univers
ityof
Cape T
own
25
produced ozone in aged air is considered to have a "very long lifetime" (Dervent and Hov, 1982).
2.4.3 Composition of Transported Air Masses
Some researchers talk of "photochemically aged air masses" in connection with transport phenomena (Brice et al., 1988; Bottenheim et al., 1984; Becker et al., 1977). Aged air masses are often isolated from freshly emitted precursors and have undergone more conversion to form end products such as ozone, PAN and inorganic nitrate (Bottenheim et al., 1984). In aged air masses, the freshly emitted species are decreasing and the hydrocarbon composition is changing. In an early state during transport, the fast reacting hydrocarbons, such as alkenes and aromatics, are responsible for the oxidant formation. After a few days when the fast reacting hydrocarbons have been degraded, the hydrocarbons with long reaction times, such as alkanes, play an important role in oxidant formation. The alkane/alkene ratio shifts in aged air masses to a higher value (Colbeck and Harrison, 1985). This shows that during transport the synthesis of photochemical oxidants is an important feature, as stressed by Singh and Salas (1989).
Nitrogen oxides are transported as HN03 or PAN. These secondary
species serve as an important sink for NOx. Dervent and Hov (1982) describe HN03 as a more efficient sink for .NOx than PAN. They regard PAN and its homologues only as temporary NOx sinks. The dissociation of HN0
3 is slow and takes approximately 10 days. Brice
et al. (1988), on the other hand, stress PAN as a most important NOx carrier because,~ with increasing transport time, nitric acid has a higher removal rate through dry deposition, aerosol formation and wet removal. PAN serves as a reservoir for N02 and peroxy radicals during multiday transport of polluted air. Contact with NO-rich air and/or down mixing after break up of an inversion layer leads to the destruction of PAN, releasing N0
2 and radicals, which could generate ozone at
downwind locations (Spicer et al., 1983).
Univers
ityof
Cape T
own
E
26
2.4.4 Observations of Transported Photochemical Air Pollution
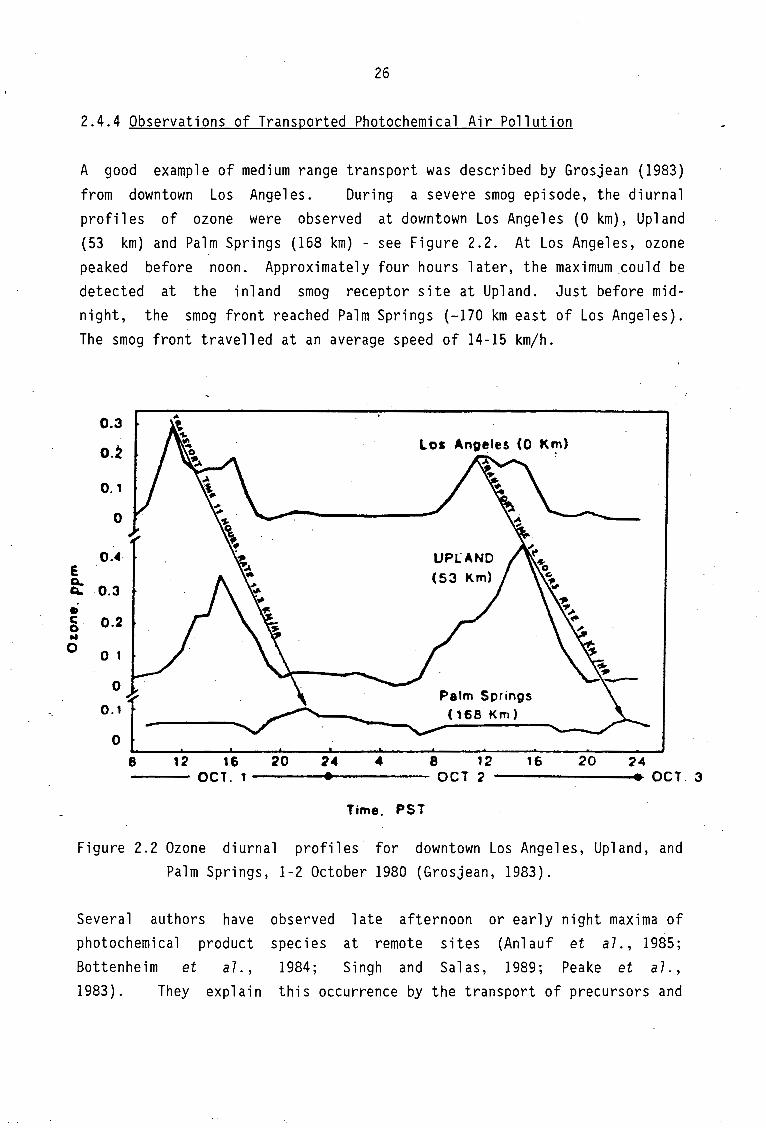
A good example of medium range transport was described by Grosjean (1983)
from downtown Los Angeles. During a severe smog episode, the diurnal profiles of ozone were observed at downtown Los Angeles (0 km), Upland (53 km) and Palm Springs (168 km) - see Figure 2.2. At Los Angeles, ozone peaked before noon. Approximately four hours later, the maximum could be detected at the inland smog receptor site at Upland. Just before midnight, the smog front reached Palm Springs (-170 km east of Los Angeles). The smog front travelled at an average speed of 14-15 km/h.
0.3
o.2 Los Angeles (0 K~)
0.1
0
0.4
a.. ~
• C. 0 .. 0
0.3
0.2
0 t
0
0. t
0
Palm Springs (168 Km)
8 12 16 20 24 8 12 16 20 24 --- OCT. 1 ---------- OCT 2 ---------. OCT. 3
Time. PST
Figure 2.2 Ozone diurnal profiles for downtown Los Angeles, Upland, and Palm Springs, 1-2 October 1980 (Grosjean, 1983).
Several authors have observed late afternoon or early night maxima of photochemical product species at remote sites (Anlauf et a 7. , 1985; Bottenheim et al.' 1984; Singh and Sal as, 1989; Peake et a 7.,
1983). They explain this occurrence by the transport of precursors and
Univers
ityof
Cape T
own
27
in-transit photochemical transformation from nearby to remote pollution sources. The elevated PAN level that Peake et al. (1983) observed in Kanaskis Valley, Canada, derive from the transport of natural pollution in the form of forest fire smoke.
An interesting experiment Georgii et al. (1977).
in aircraft measurements has been reported by On a measuring flight in June 1976 downwind of
Koln-Bonn, West Germany, an ozone maximum of 160 ppb was detected at 1200 m height. This ozone cloud of anthropogenic origin could be followed for over 100 km. At an average wind speed of 20 km/h, the transport time. was about five hours. They stressed that formation and transport of photochemical ·oxidants is not just a local problem, but does affect remoteareas away from primary sources.
It is possible to trace such polluted air masses backwards, but from ground-level wind stations, the transported path of an air parcel can only be estimated very roughly (Roth, 1977). A better approximation is the calculation of trajectories. The air flow of the geostrophic wind, which is directed parallel to the isobars, at 1000 m (AGL) can be used. This altitude seems to be sufficiently high to avoid frictional effects of the surface (Corkum et al., 1986). With the aid of the synoptic charts, back-trajectories can be constructed. This method allows air masses to be backtracked for more than 24 h. Any further extension backwards will result in an increased uncertainty (Guichert and van Dop, 1977).
Some authors have proved, with the aid of back-trajectories, that air masses causing high pollution levels travelled over highly polluted areas one to two days before reaching the receptor site.
Interesting observations of this kind have been reported from Great Britain, where polluted air masses originating from the European mainland, lead to severe elevations of photo-oxidants (Cox et al., 1979; Brice et al., 1984; Colbeck and Harrison, 1985). Cox et al. (1975) reported from two rural sites in southern England (Harwell, Sibton) and one in southern Ireland (Adrigole). On a number of days ozone levels were above the US standard of 0.08 ppm, even at Adrigole, which is furthest away from the precursor pollutants. Back-trajectories were calculated for
Univers
ityof
Cape T
own
28
a multiday episode during August 1973. They show clearly that the air had been in transit over the continent for at least 24 h. The trajectories were traced for 48 h over a distance of about 700 km with a travelling speed of between 13-20 km/h.
In February 1981, elevated PAN levels were reported from Harwell (southern England) by Brice et al. (1984). A maximum of 2.8 ppb PAN was measured on 24 February 1981. For 23 and 24 February, 48 h back-trajectories were calculated. Air masses which reached Harwell on 23 February, originated from northern France and passed over London, a nearby pollution source. Back-trajectory for 24 February originated from West Germany, and passed over a high industrial region of Holland. It avoided major pollution centres over England before arriving at Harwell. The southeastern UK was covered by a thick cloud layer and light snow was reported, weather conditions not favourable for photochemical production. The high PAN levels must have developed over Holland and West Germany, where the only clear skies along the trajectory were experienced.
In July 1983, another high ozone episode was reported from a rural site in northwestern England (Stodday) (Colbeck and Harrison, 1985). Calculation of trajectories for each day of the episode showed not only long-range transport of pollutants originating from the continent and Scandinavia, but also an additional influence from middle distant sources, as the air masses were travelling over major urban areas of England before reaching Stodday.
An episode of high PAN levels was reported from Paris, France, in February 1986 (Tsalkani et al., 1987). The episode was characterized by high night-time levels, suggesting transport from other sources. Back-trajectory calculations show that polluted air from industrial zones of West Germany might have been responsible for elevated PAN in Paris. On the last day of the episode, the maximum concentration of 6.7 -ppb was reached at 13:00 which suggests local production as well. The authors consider that elevated PAN levels due to long-range transport, could have accelerated local production.
Univers
ityof
Cape T
own
29
At Simcoe, Canada, Corkum et al. (1986) calculated back-trajectories for days with high PAN levels. The polluted air masses originated from heavily industrialized areas, including Chicago, Detroit and Cleveland, before travelling over Lake Erie. By contrast, the back-trajectory for a warm sunny day with low PAN levels showed that the air had been stagnant over . Lake Erie for a considerable amount of time before reaching Simcoe. This study suggested that the major source of PAN at Simcoe is from medium to long-range transport over Lake Erie, rather than from local production.
At another rural site in northeastern Canada (Kejimkujik in Nova Scotia) Brice et al. (1988) calculated air mass back-trajectories for periods of high PAN levels observed at this station. They showed that the air had been loaded with high pollution levels when passing over the Boston area, approximately 24 h previously.
2.4.5 Summary
The potential for long-range transport of photochemical pollution arises when the species involved have a long lifetime. This is achieved when physical and chemical sinks are minimized. An inversion layer can isolate air masses from the ground, limiting deposition and contact with fresh emissions resulting in a greater stability of the species involved which can thus be easily transported over long distances.
The composition of transported air masses changes as reacti.ons take place. In photochemically aged air masses, the hydrocarbon composition shifts towards a higher fraction of slow reacting alkanes. PAN and HN03
are important sinks for NO, and PAN in particular serves as an x N02 and radical reservoir for downwind photochemical reactions. The balance of formation and destruction of photo-oxidants during transport is dependent on transport time.
Medium-range transport can be expected, when oxidant peaks (03 , PAN) are observed in the early evening or at night rather than at midday, when only local production is responsible.
Univers
ityof
Cape T
own
30
Calculations of back-trajectories give a reasonably good approximation of air mas~ or1g1n. Air masses causing elevated oxidant levels at remote sites have been traced back up to 1000 km, where they passed over heavily
polluted areas.
2.5 INFLUENCE OF METEOROLOGICAL PARAMETERS ON SMOG FORMATION
Weather conditions have a· great influence on air pollution problems. Important factors are global radiation, hours of sunshine, temperature, humidity, wind speed, temperature profile and precipitation (Luft-Reinhaltung, 1981). Ground-level pollutant concentrations are dependent on the mass of emitted pollutants and the volume into which they are dispersed. The latter is a function of wind speed, air turbulence and mixing depth (Dutkiewicz and Fuggle, 1977).
2.5.1 High Oxidant Concentrations in Connection with Meteorological Parameters
Temperature in itself has no important direct influence on smog formation, but indicates meteorological conditions which favour photochemical reactivity (Brasser et al., 1977; Corkum et al., 1986). Kelly et al., (1986) found that the days with highest ozone concentrations (97-180 ppb) in the Detroit metropolitan area in southeastern Michigan were warmer, sunnier and had higher barometric pressure and lower wind speeds than days with low ozone concentrations. As well as observed favourable weather conditions, the morning primary pollution concentration was considerably higher on high ozone days than on low ozone days.
High insolation, long hours of sunshine, high temperatures, low humidity and low wind speed are conditions under which highest ozone concentrations have been measured in West Germany (Luft-Reinhaltung, 1981). Guicherit and van Dop (1977) correlated ozone concentrations which exceeded the hourly value of 0.09 ppm with maximum temperature,average wind speed and hours of sunshine on that particular day and obtained a multiple correlation coefficient of 0.69. They tried to express photochemically produced ozone levels as a function of precursor concentration, daily average wind speed (ff) and hours of sunshine (ss) by the equation:
Univers
ityof
Cape T
own
31
They warned that this formula is not applicable when stratospheric ozone is mixed downwards due to atmospheric turbulences and high wind speeds.
Corkum et al. (1986) found no correlation between hours of sunshine and high PAN concentrations and suggest that transport from highly industrialized areas is responsible for the high PAN levels at the rural site at Simcoe, Ontario, rather than local production.
Low wind speed has an enhanced effect on oxidant formation. Nieboer and van Ham (1976) correlated different wind speeds with corresponding PAN concentrations whilst with increasing wind speeds they observed decreasing PAN levels. Highest PAN concentrations were observed at wind speeds between 0-2 m/s. Together with stagnant wind conditions, a thermal inversion layer plays a crucial role in accumulating pollutants. It isolates the boundary layer from the free troposphere and creates a shallow mixing depth~ (Brice et al., 1984; Tsalkani et al., 1986; Peake et al., 1988; Nieboer and van Ham, 1986; Temple and Taylor, 1983).
Interesting observations of high PAN levels have been reported by Corkum et al. (1986) and Peake et al. (1988) where the peak concentration was reached just before thunderstorm activity. Substantial PAN concentrations were reported during snowfall and sub-freezing temperatures (Brice et al., 1984; Singh and Salas, 1989; Tsalkani et al., 1987). As the PAN formation rate is not significantly affected by low temperatures, the thermal stability of the PAN molecule is enhanced (Brice et al., 1984; Tsalkani et al., 1987).
Rain is not an important sink for ozone and PAN concentrations, unlike particulates and HN03 , due to their low solubility in water {Henry's law constant -2 x 10⁻² M atm-1 for 0
3, -5 M atm-1
for PAN) (Anlauf et al., 1985; Singh and Salas 1989; Corkum et
al., 1986; Holdren et al., 1984). During a rainy period of 5-6 June 1982, Anlauf et al. (1985) found a pronounced diurnal variation for PAN and ozone, showing that photochemistry was still active. Nitric acid,
Univers
ityof
Cape T
own
32
particulate nitrate and sulph~te .showed a sudden drop to very low concentrations with little diurnal variation during the rainy period. This indicates that these species are easily affected by rain water.
Holdren et al. (1984) found that PAN is soluble in acidic water representing rain water. The Henry's Law constant for. PAN gives an indication that PAN is even slightly more soluble than S02 and several orders of magnitude more soluble than N02 in acidic water. They are investigating the possibility of PAN having an effect in cloud water, either directly, as a source of nitrate, or indirectly by serving as an oxidizing agent for S02 and N02•
Meteorological parameters which favour the photochemical smog formation are associated with high pressure, anticyclonic conditions (Colbeck et
al., 1985; Nieboer and van Ham, 1976; Tsal kani et al., 1987; Brice et al., 1984; Brasser et al., 1977; Peake et al., 1988 and Penkett et al., 1975).
2.5.2 Summary
Meteorological parameters which promote photochemical smog formation are associated with high pressure, anticyclonic systems. High insolation, long hours of sunshine, low humidity, low wind speeds and a marked thermal inversion are conditions under which high photochemical oxidants have been observed. Rain does not seem to influence PAN or ozone concentrations due to their low solubility in water. Sub-zero temperatures have little effect on PAN formation, but enhance the stability of the molecule.
2.6 NATURAL OCCURRENCE OF PHOTO-OXIDANTS
Investigation of background levels is necessary to be able to distinguish between anthropogenic and natural photochemical pollution. The behaviour of involved species, precursors and photo-oxidants, in the clean atmosphere gives useful information on atmospheric chemistry.
Univers
ityof
Cape T
own
33
2.6.1 Natural levels of precursors
The main natural through lightning. 0.2 0.6 ppb as
source for oxides of nitrogen is the formation of NO Clean continental air has a NOx concentration of
measured at the Fritz-Peak Observatorium .in the Rocky Mountains. NOx concentrations in the clean marine air are estimated to be even less (Becker et al., 1983).
Natural hydrocarbons are emitted by plants known to emit low molecular hydrocarbons.
as terpenes. Soil is also But it is concluded, that
terpenes as precursors for oxidant formation are actually of no importance as the terpene concentrations in the free atmosphere are always below significant limits. In the marine and continental clean air a background level of 10-20 ppb C of NMHC is always present. Half of the hydrocarbons are low reactive species which can be transported great distances and are
estimated to be of anthropogenic origin (Becker et al., 1983).
2.6.2 Natural levels of Oxidants
Typical average ozone levels are in the region of 20 - 40 ppb with maximum levels of 40 60 ppb, as recorded from background stations in Europe. Higher levels are attributed to transport from anthropogenic sources. Characteristic of all background stations is a seasonal variation in monthly average ozone concentrations with a maximum in spring (Becker et al., 1983). South Atlantic tropospheric ozone measured at the Cape Point station gave an average value of 20 ppb for 1982 and 21 ppb for 1983. Ozone observation at Cape Point also showed a seasonal variation with a winter-spring maximum - September - (Brunke and Allen, 1985). In the free troposphere, above the planetary boundary layer (2 - 3 km), ozone mixing ratios are between 70 - 50 ppb (Becker et al., 1983).
Background PAN levels in the eastern half of the United States were recorded by Spicer et al. (1983) between 0.2 ppb and 0.5 ppb. In Harwell, England monthly average PAN daytime levels during clean periods were between 0.03 ppb in winter and 0.35 ppb in spring (Penkett and Brice, 1986). In the free troposphere PAN has been measured at concentrations of 10 -500 ppt (Singh et al., 1985).
Univers
ityof
Cape T
own
34
2.6.3 Natural Occurrence of Ozone
Ozone is produced in the stratosphere by photolysis of 02
due to shortwave UV radiation (180 µm). At an altitude of about 25 km ozone shows a typical concentration of up to 6 ppm (Becker et al., 1983). This stratospheric ozone layer protects the earth from the strong
. shortwave UV radiation which is absorbed by the ozone molecules.
2.6.3.1 Transport of Stratospheric Ozone into the Lower Troposphere
Under certain weather conditions stratospheric ozone can be transported into the lower troposphere and ozone levels can exceed the normal background level. The Fraunhofer-lnstitute for atmospheric environmental research at Garmisch-Partenkirchen has observed this phenomenon with three ozone measuring stations 'at three different altitudes (Garmisch, 740 m MSL; Wank 1780 m MSL; Zugspitze, 2964 m MSL). The radio nuclide Be7
was used as a tracer for air masses of stratospheric origin. Subsidence of stratospheric air masses at certain weather conditions led to elevated 0
3 levels at the Zugspitze (Kanter et · a7., 1979; Kanter et
a7., 1982). At a background station at Hohenpeifienberg in Upper. Bavaria, Attmannspacher (1977) observed elevated ozone levels of 50 - 415 ppb in connection with cold front passages. During summer with the occurrence of cumulonimbi which can reach up into the lower stratosphere, elevated ozone levels have been observed when the strong vertical turbulence along the cloud, mixes stratospheric ozone downwards (Attmannspacher, 1977).
These events of high ozone levels caused by natural sources are considered to be harmless to human health, contrary to exposure of the same ozone concentrations formed by photochemical air pollution which is a mixture of several oxidizing species (Attmannspacher, 1977). High natural ozone episodes are only observed at elevated and remote background stations away from anthropogenic sources. In an urban atmosphere these natural ozone events would be weakened by the high primary emission of mainly nitric oxide. (Becker.et a7., 1983).
Univers
ityof
Cape T
own
35
2.6.4 PAN in the Unpolluted Atmosphere
2.6.4.1 The presence of PAN precursors in the natural troposphere
Lovelock (1977) observed the presence of PAN precursors during an Atlantic sea passage and could detect PAN when the reactants came in contact with a suitable surface.
Singh and Hanst (1981) suspected the abundance of PAN in the free troposphere and lower stratosphere, due to the abundance of non-methane hydrocarbons which were mainly of ethane and propane~ After development of an improved measuring technique of PAN (Singh and Salas, 1983b; Singh and Salas, 1983a) could prove their assumption.
Land air masses carry a higher burden of anthropogenic hydrocarbons and nitrogen oxides than the marine atmosphere. This results in the observation of approximately 5 times higher PAN levels in the continental than in the marine air (Singh and Salas, 1983a, Singh et al., 1986).
2.6.4.2 Observation of PAN levels in the natural troposphere
An inter-hemispheric profile of PAN concentrations was determined during a journey of the US Coast Guard vessel Polar Star from Seattle, Washington (48° N) to Puenta Arenas, Chile. (48° S). PAN was observed to be more abundant in the northern hemisphere (average daily surface level 38 ppt) than in the southern hemisphere (approximately 5 ppt) (Singh et a 7., 1986).
Aircraft measurements were undertaken to study the vertical distribution of PAN in the troposphere. All data obtained showed an increase of PAN concentrations with height in stable weather conditions. On the mainland in summer the variation with height of PAN levels was between 100 and 200 ppt whereas the variation of PAN with height off the California coast during summer was between 20 and 50 ppt. During the Pacific winter PAN concentrations .were found Higher upper tropospheric explained by the thermal a 7., 1986). ·
to be nearly five times higher than in summer. PAN levels and higher winter PAN levels are stability of PAN at low temperatures (Singh et
Univers
ityof
Cape T
own
36
Penkett and Brice, (1986) observed a pronounced spring maximum of background PAN levels at Harwell, England. Large hydrocarbon concentrations of anthropogenic origin during February and March were found in the Arctic. The increasing photochemical activity towards summer might consume this winter hydrocarbon reservoir to produce a PAN maximum in spring. The authors conclude that the observed spring ozone maximum, which has previously been explained by stratospheric injection, is produced photochemically in the lower troposphere in the same manner as PAN.
The abundance of PAN in the upper troposphere is associated with a lifetime of several months whereas in the boundary layer the lifetime does not exceed one or two days. Therefore PAN in the upper troposphere can be transported over 10 000 km (Singh, 1987).
2.6.4.3 PAN, an important NOx carrier
At the Colorado Mountain research site (3.05 km above sea level) the relationship between PAN and nitrogen oxides has been investigated (Singh et al., 1985). When N02 levels (for values < 500 ppt) decreased, PAN levels remained constant resulting in an increasing PAN to NOx ratio. During autumn, this ratio was observed to be higher (between 0.5 and 3 or more) than in summer (between 0.5 and 1 or more). This is explained by the increased stability of PAN at lower autumn temperatures. The PAN to NOx ratio also increases as the air mass ages. PAN serves as an important sink for NOx in the free troposphere. Nitrogen oxides can be tied up by equal or more amounts in the organic form (PAN) than in the inorganic form (N02). As PAN is very stable in the colder regions of the middle and upper troposphere, it can provide
. a mechanism for storage and transport of NOx. When it comes in contact with warm atmospheric regions, PAN can release free NOx and peroxy radicals (Singh et al., 1986).
2.6.5 Summary
Precursors, NMHC and NOx are present in the continental and marine clean troposphere and are able to produce photochemical oxidants. Typical background levels for 0
3 are 40-60 ppb and for PAN 0.03-0.50 ppm at
the ground.
Univers
ityof
Cape T
own
37
Stratospheric ozone can be mixed down to the lower troposphere through subsidence in connection w~th cold front passages or strong vertical turbulence along high reaching cumulonimbi. This occurrence of high. natural ozone is observed at elevated and remote stations and not in an urban environment as the urban atmosphere serves as a sink for ozone.
PAN is present in small quantittes in the middle and upper troposphere as aircraft measurements have proved. It is more abundant in the northern than southern hemisphere and more in the continental than marine troposphere. PAN levels tend to increase with height and are higher in winter than in summer due to the increased stability at lower temperatures.
PAN, an important constituent of NOx chemistry, serves as a reservoir in the middle and upper troposphere for NOx which can be released in warmer atmospheres.
thesis2/24a/sgg
Univers
ityof
Cape T
own
38
CHAPTER III
THE FORMATION OF PHOTOCHEMICAL SMOG AND APPLICATIONS FOR PHOTOCHEMICAL AIR POLLUTION CONTROL MEASURES
3.1 INTRODUCTION
In photochemical smog hundreds of reactive compounds are present which are involved in literally thousands of different chemical reactions. It is not the objective of this Chapter to go into detailed reaction mechanisms, but to give a basic understanding of the complexity of photochemical smog formation by featuring the important reactions and simplified patterns. The important reactions are listed in Appendix A and their numbers referred to in the text.
Smog chambers have been used by several researchers (Bufalini et a7., 1971: Gay and Bufalini, 1971; Dimitriades and Wesson, 1972; Kopczynski et a7., 1975; Demerijan et a7., 1976; Pate et a7., 1976; Schurath, 1977; Cox and Roffey, 1977; Leone and Seinfeld, 1985; Glavas and Schurath, 1985) to study reaction mechanisms and to obtain the rate constants of the reactions involved. Results of these experiments were used for computer simulations and for air pollution models. Comparison of model and ambient data often showed discrepancies indicating that the photochemical reaction mechanisms were not fully understood.
Air pollution control measures and methods can only be applied successfully if the effect of changes in emission levels on the ambient air quality can be predicted.
3.2 REACTION MECHANISMS
3.2.1 Photochemical reactions: sources of free atoms and radicals
Sunlight is responsible for exhaust polluted atmosphere. only that quantum of light
the start of the chain reactions in an auto The first law of photochemistry states, that
(hv) which has first been absorbed by the
Univers
ityof
Cape T
own
39
reacting molecule can initiate a chemical reaction (Naser, 1980). The ultra violet to violet radiation has sufficient energy to provide a bond rupture in some sunlight absorbing molecules (e.g. N0
2 + hv
-> o· + NO) (Demerijan et al., 1976).
3.2.1.1 The photodissociation of molecules
Molecules present in a polluted urban atmosphere and which can be dissociated by photolysis provide the starting radicals for the subsequent chain reaction processes. The most important photochemical reaction is the N02 photolysis (1) which provides the basis for the ozone formation (2). Other compounds, which are subject to photolysis at wavelengths <390 nm, before. aldehydes
may have been formed by photochemical reaction processes the day These compounds are nitrous acid (3), formaldehyde (4), higher (7), ozone (8) and to a lesser extent hydrogen peroxide (10).
The photolysis of these compounds provides important radicals of which the hydroxyl radical (HO·) is produced by the photolysis of nitrous acid, ozone and hydrogen peroxide and the hydroperoxyl . radical (H02 ·)
results from the aldehyde photolysis (5, 6). These radicals, when formed, can give a significant boost to the photo-oxidation process (Becker et
al., 1983; Demerijan et al., 1976).
3.2.2 The influence of hydrocarbons on photochemical reaction sequence
In the basic produced will
reaction sequence of the ozone formation (1, 2), all ozone immediately react with NO to N02 and 02 (11) and
no net ozone gain can be produced by these reactions alone. This is called a null reaction sequence (Singh, 1987).
The observed high ozone concentrations in photochemical smog must involve a different manner 'of NO oxidation other than by 03 • The hydroperoxy radical (13) is the radical most responsible for oxidizing NO to N02• The photolysis of formaldehyde and higher aldehydes provides some H02 • radicals (5, 6) but the majority are formed by other reactions.
Univers
ityof
Cape T
own
40
At this point, the influence of the hydrocarbons must be considered. It will be shown that they are responsible for the accelerating chain reactions by providing and recycling more and more radicals, once the system has started.
3.2.2.1 Reactions of inorganic radicals and molecules with hydrocarbons
Olefins can be easily attacked by a number of reactive intermediates, e.g. o·, 0
3, HO·, H0
2·, N0
3•• Paraffins occur in greater concentrations but are
less reactive towards HO· and o~-atom attack than are the olefins. The most important radical, responsible for the rapid degradation of hydrocarbons, is the hydroxyl radical.
This radical can either abstract an H atom from the hydrocarbons to leave an organic and an inorganic radical (18, 19) or add to a hydrocarbon in the case of olefins and aromatics, to leave an organic radical (20, 21).
The inorganic radicals produced can attack further hydrocarbon molecules, while the organic radical reacts quickly with oxygen to produce an R02•
radical (22). In the same manner as the H02• radical (13), the R0
2• radicals have highly oxidizing properties and can easily oxi
dize NO to N02
(23). The remaining RO· radical has no oxidizing properties but reacts with oxygen to form an aldehyde and an H02•
radical (24).
The N03 ·,
R'CO· acyl excess R' CO · 2
(28)
aldehyde H02 ·,
radical radical of NO,
(27).
where R' ·
is subject to further radical attack by HO·, o·, which abstract the hydrogen and leave the
(25). Its rapid combination with oxygen forms the peroxyR'C002·, a highly oxidizing radical (26). In an the peroxyacyl radical reacts with NO to form N02 and
RI co2. decomposes to RI . and co2 can go through the same oxidation cycle starting at (22)
until it is completely decomposed.
The rapid rise of N02 results from the attack of radicals on hydrocarbons which generate a chain process. Organic and inorganic radicals are produced which can oxidize NO to N02 or attack further hydro-
Univers
ityof
Cape T
own
41
carbons respectively. As the formation of ozone is a function of N02 photolysis, more ozone can be produced by the initial NOx concentration present, because NO and N02 are cycled catalytically (Lonneman et al., 1976; Singh, 1987).
3.2.3 Chain terminating reactions
The chain reactions are terminated when radicals are removed from the system to form a more or less stable compound. An important chain terminating reaction is the formation of. PAN (29). When the NO to N02 ratio is low, the peroxyacetyl radical reacts with N02• The peroxyacetyl radical and N02 are removed from the reaction cycle .. The amount of PAN that can be produced is limited by its precursor concentrations (mainly N02) in contrast to the ozone formation. PAN exists in thermal equilibrium with its precursor species. The degradation of one PAN molecule can provide approximately four N02 molecules (Cox and Roffey, 1977).
Other chain terminating reactions are the formation of nitrous acid (14); nitric acid (15), hydrogen peroxide (16, 17) and organic acids (30). The formation of these compounds removes the important r~dicals H02•
and HO· from the cycle.
3.2.4 Summary
The formation of ozone in the lower troposphere is a function of N02
photolysis. As the just formed NO reacts quickly with ozone to form N0
2, a null reaction sequence occurs. The fact that high ozone
levels can be formed implies that other means of NO oxidation are necessary which do not influence the ozone build up.
The photolysis of nitrous acid, aldehydes, ozone and hydrogen peroxide provides the important HO·, H02• radicals. Organic species can be attacked by those radicals and a sequence of chain reactions is started in which H02·, R02·, R002• radicals are formed, which oxidize NO to N02• The PAN formation depends on the NO to N02 ratio and is a chain terminating reaction.
Univers
ityof
Cape T
own
42
As NO and N02 are cycled catalytically, ozone can be formed as long as N02 is produced and sunlight is available. The amount of PAN formed on the other hand is limited by the initial NOx concentration available.
3.3 APPLICATION OF AIR POLLUTION MODELS
The complex chemical behaviour of photochemical smog formation makes it a difficult task to predict air quality levels and to apply control measures successfully. A decrease in precursor emissions may not result in the same proportional change of secondary pollutants; their levels can even increase.
There are two approaches to predicting air quality levels: firstly by using a smog chamber and secondly by using a mathematical model.
In smog chambers chemical parameters can be controlled and the atmospheric chemical parameters can be studied in a fixed location. Smog chambers have limitations for simulating outdoor conditions such as diffusion effects, emission patterns, pollutant deposition and varying meteorological conditions. Another disadvantage is the effects of the wall, where the walls are sources and sinks for radical species.
Mathematical models have an advantage over smog chambers in that pollutant dynamics are incorporated. They can integrate our knowledge of chemical and physical processes of the atmosphere within a computational framework and can therefore be powerful tools for the prediction of air quality levels and emission control strategies. Limitations of a mathematical model arise from a lack of understanding of basic atmospheric physics and chemistry, particularly from the uncertainty of reaction pathways and rate constants (Russell 1989, Evans et al., 1986).
Two types of approach for mathematical air quality models are used: empirical/statistical and analytical/deterministic. In the former method hourly pollutant concentrations over several years of measurements are statistically related to corresponding emission patterns. In the latter method the complex chemical processes are described by analytical expressions (Russell, 1988).
Univers
ityof
Cape T
own
43
. 3.3.1 Chemical mechanisms used in mathematical models
The selection of chemical mechanisms used in a model is a compromise between the level of chemical detail and the computational time required.
Different attempts have been made to simplify the hydrocarbon chemistry:
(1) The simplest is the surrogate mechanism (Dodge, 1977), in which one or two compounds in each class of hydrocarbons are taken to represent
the chemistry of all species in that class.
(2) -In the lumped mechanism, organic compounds are grouped into classes
of similar structure and reactivity.
(3) The carbon bond - mechanism is a variation of the lumped mechanism in which it is assumed that reactivity and chemical reaction steps depend on the functional group of each molecule (Russell, 1988).
(4) The explicit mechanism (Leone and Seinfeld, 1985) describes in detail the reaction steps of as many of the important organic species as
possible.
Leone and Seinfeld (1985) analysed the performance of six chemical mechanisms. Under identical conditions each mechanism predicted differerit ozone levels. They identified key areas where the mechanisms differ from each other and found that different, outdated rate constants or cpmpletely different reaction sequences were used. They applied changes to the mechanisms according to the discrepancies and found that most of the modified mechanisms were in much better agreement with one another.
The Dodge mechanism, however, was found to be not in agreement with the other lumped and explicit mechanisms investigated by Leone and Seinfeld (1985). In the Dodge mechanism, only two hydrocarbon species, 75% n-butane and 25% propane, and four aldehydes are represented. Aromatics are not included in the mechanism. In addition, the Dodge mechanism contains many out of date, rate constants as it was formulated several
years ago.
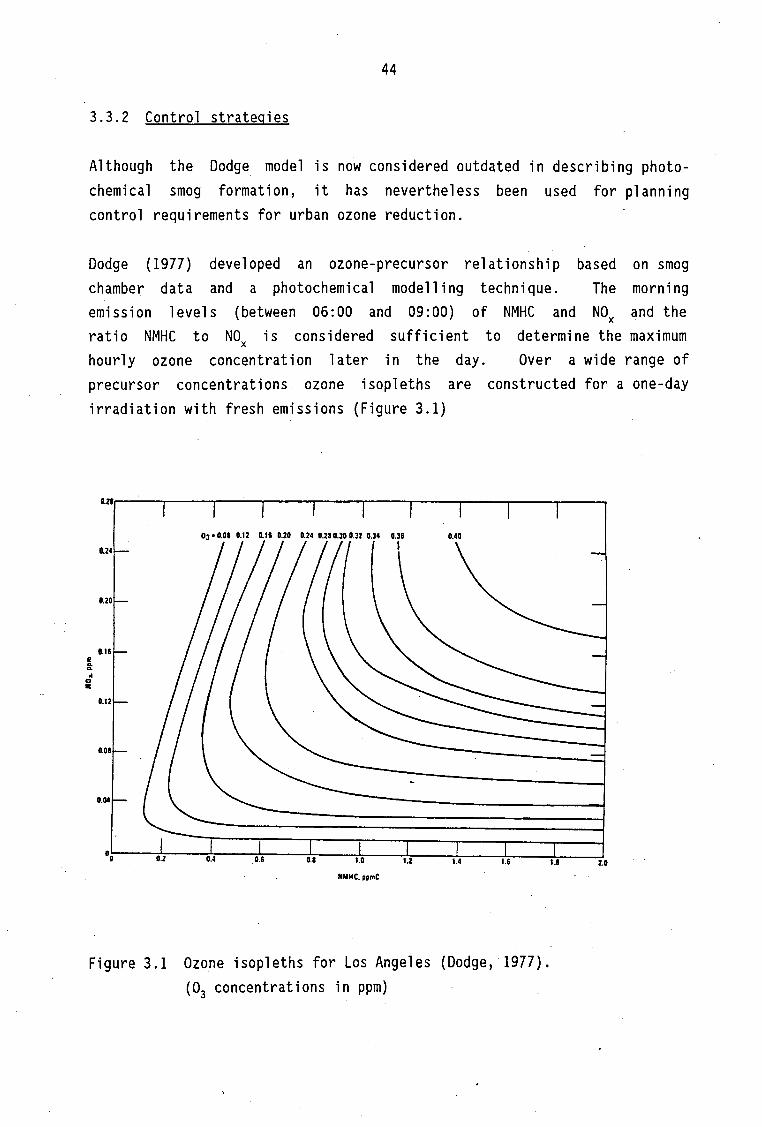
Univers
ityof
Cape T
own
44
3.3.2 Control strategies
Although the Dodge model is now considered outdated in describing photochemical smog formation, it has nevertheless been used for planning control requirements for urban ozone reduction.
Dodge (1977) developed an ozone-precursor relationship based on smog chamber data and a photochemical modelling technique. The morning emission levels (between 06:00 and 09:00) of NMHC and NOx and the ratio NMHC to NOx is considered sufficient to determine the maximum hourly ozone concentration later in the day. Over a wide range of precursor concentrations ozone isopleths are constructed for a one-day irradiation with fresh emissions (Figure 3.1)
! .. .. &
lZlr-----.---.....---.---........ --.....---..-----.---......----..---
03•0.0I 0.1Z 0.1& O.ZO 0.24 0.ZIO.lOO.lZ 0.34 0.40
0.24
o.zo
0.1&
0.1Z
0.01
0.04
0o~~ft';~~~o.•4---;;o7.&~~+.,.a.-~~1.~o~--:1~.z~~,~.4~~~1.&,__~~1.L1~__1z.o
NNHC. ppmC
Figure 3.1 Ozone isopleths for Los Angeles (Dodge, 1977). (0
3 concentrations in ppm)
Univers
ityof
Cape T
own
45
In most cases the model predicts that successful oxidant reduction can be obtained by hydrocarbon control. This is based on the inhibiting effect of high NOx on ozone. The Dodge model does not consider multiday irradiation even though aged smog can form considerable amounts of oxidants at downwind locations (Anlauf et al., 1985; Bottenheim, 1989; Singh and Salas, 1989; Georgii et al., 1977; Cox et a7., 1975; Brice et al., 1984; Colbeck and Harrison, 1985). For this reason the strategy of controlling ozone formation by means of hydrocarbon reduction without nitrogen oxides reduction can lead to high ozone levels at down
wind locations.
Daly (1981) stressed the advantage of NOx control as it will also reduce ozone levels at downwind locations. Additionally noxious N02
and other nitrate compounds like PAN, organic nitrate and nitric acid will be reduced. Based on an empirical model and the Dodge model, modified for the Sydney airshed, Daly (1981) suggests that a less stringent control of both NMHC and NOx will be as effective as a more stringent control of NMHC alone. The joint control is likely to reduce ozone formation during extended irradiation and limit N02 and other nitrate
compounds. \
Using smog chamber simulations Evans et a7. (1986) recommend for the Melbourne airshed (Australia) a 50% hydrocarbon reduction alone as an additional NOx reduction would have few or no effect on maximum ozone concentrations. The sensitivity of Melbourne's airshed to hydrocarbon reduction only is due to the fact that the ratio NMHC to NOx is already low. Melbourne has very few hydrocarbon emissions which are associated with motor vehicle operation and which have already been considerably reduced since the implementation of the Australian Design
Rule 27A in 1976.
3.3.4 Conclusions for photochemical control measures
The development of successful control strategies for photochemical smog for a given city atmosphere requires the identification of emission sources and patterns together with meteorological factors. The formation of photochemical smog is dependant on the chemical and meteorological conditions.
Univers
ityof
Cape T
own
46
With the help of a smog chamber and/or a mathematical model representing the airshed considered, simulations can be carried out for determining appropriate control strategies. The limitations of each simulation technique have to be carefully considered and taken into account when evaluating the results.
Control strategies for photochemical smog are at present entirely aimed at ozone reduction since there are, at present, no air quality standards for secondary nitrogen compounds. Reducing the photochemical smog formation by means of hydrocarbon control only and using ozone as an indicator will have little or no effect on secondary nitrogen compounds. Successful ozone reduction may not affect other photochemical oxidants like PAN and other nitrogen compounds. This shows that there are limitations in using ozone as the only indicator for photochemical smog.
3.3.5 Summary
Smog chamber and mathematical models are used for simulating photochemical smog and predicting air quality levels. The limitations of the former are that it only represents a fixed location, and the effects of walls influence the chemistry. Mathematical models depend on an understanding of the basic chemical and physical processes in the atmosphere and the incorporation of this knowledge within a computational framework.
Different approaches have been made to describe the chemical mechanisms in a mathematical model in order to simplify the hydrocarbon chemistry. The various mechanisms (surrogate, lumped, carbon bond and explicit) have differed from each other in predicting ozone levels under identical condi-
1
tions due to different reaction paths and rate constants used in each mechanism, but it has been shown that, apart from the surrogate (Dodge) mechanism, good agreement can be obtained if these factors are considered.
The Dodge mechanism is considered outdated but has been used for planning control requirements for urban ozone reduction. It suggests a reduction of ozone levels by reducing hydrocarbon levels only, due to the inhibiting effect of NO on ozone. This strategy is only successful for one day irradiation of fresh emissions and in city centres. During transport and
Univers
ityof
Cape T
own
47
multiday irradiation high nitrogen oxides can produce substantial ozone levels at downwind locations. Attempting to reduce photochemical smog by hydrocarb~n control only, will have little or no effect on secondary nitrogen compounds such as PAN, organic nitrate and nitric acid.
Using ozone as the only indicator for photochemical oxidants and basing the control strategies entirely on ozone has severe limitations. Control of nitrogen oxides as well as hydrocarbons is therefore suggested.
3.4 PAN, AN INDICATOR OF PHOTOCHEMICAL SMOG
Air quality standards for photochemical smog are based entirely on ozone and therefore most research on photochemical smog has been carried out using ozone as the indicator. Reasons for this are that ozone can be easily measured with commercially available ozone monitors and ozone is the most abundant component of photochemical oxidants.
The use of ozone as the only indicator of photochemical smog has limitations. Through subsidence, stratospheric ozone can be mixed down to the lower troposphere. High ozone levels thus reported from rural stations did not derive from air pollution (Attmannspacher, 1977; Kanter et al., 1982). Unlike ozone, PAN has no large natural sources. Therefore, several researchers suggest that PAN is a better indicator for photochemical activity than ozone (Penkett et al., 1977; Nieboer and van Ham, 1976; Brice et al., 1984; Lobel et al., 1980).
Ozone and PAN are formed by related photochemical processes, but they behave differently in the air pollution mixture. Physical and chemical sinks for ozone are much stronger than for PAN. The deposition velocity over land is about 3-6 times greater for ozone than for PAN. Ozone reacts rapidly with nitric oxide while the reaction rate between PAN and NO is very small, thus high NO concentrations are an important chemical sink for ozone. PAN can more easily persist overnight and influence the smog formation the following day as its decomposition provides N02 molecules and hydrocarbon radicals.
Univers
ityof
Cape T
own
48
Control strategies used for the reduction of photochemical oxidants are based on ozone reduction and make use of the effect of the rapid reaction between 03 and NO. Thus, high nitrogen oxides concentrations are required to suppress ozone levels. This control strategy has little or no effect . on other photochemical oxidants such as PAN, as the amounts of PAN that can be formed depend on the initial NOx concentrations available. Be~ides the fact that PAN is an eye irritant and a phytotoxicant, meaiurements of PAN can give more useful information on photochemical activity than ozone and are therefore recommended.
thesis3/24a/sgg
Univers
ityof
Cape T
own
49
CHAPTER IV
MEASURING TECHNIQUES FOR PEROXYACETYL NITRATE (PAN}
4.1 INTRODUCTION: THE PROPERTIES OF PAN
Peroxyacetyl nitrate exists only in thermal equilibrium with its precursor species, the peroxyacetyl radical (CH3C(0)02·) and nitrogen dioxide (N02). At ambient temperatures, gaseous PAN in an air mixture stored in a limited volume decomposes with a first-order decay rate (Meyrahn et a7., 1987). The low stability of PAN in air mixtures makes calibration difficult, and commercial PAN standards are thus not available.
In addition, PAN is extremely explosive when in liquid form. Stephens (1969) observed violent explosions when a few drops of PAN liquid were in
'equilibrium with its own vapour at room temperature and were suddenly pressurized by a diluent gas. A PAN standard of approximately 300 ppm in N
2 can be pressurized in a steel cylinder to 15 bar and stored for
several months at a temperature between 10° and 15°C (under running water). At lower temperatures, condensation of PAN can lead to violent explosions. At the temperature range recommended for storage, the thermal decay of PAN cannot be avoided and regular determination of the PAN content is necessary.
Thus, the handling of PAN for use in calibration is not convenient owing to its low stability and explosive properties. Several attempts have been made since its discovery to overcome this problem by applying easier and more accurate calibration methods for PAN.
4.2· ANALYSIS OF PAN IN AMBIENT AIR
The most commonly used analytical method for determining PAN levels in the ppb range is gas chromatography with an electron capture detector
I
Univers
ityof
Cape T
own
50
(GC/ECD). Suitable columns used for the separation of PAN are 5% carbowax 400 on chromosorb G-AW (OMCS, 100-200 me.sh) (Stephens, 1969, 1973; Brice et al., 1988), diglycerol and QFl on chromosorb G-AW-MMCS (Bruckmann and Mulder, 1979; Jeltes, 1977) or 5% polyethyleneglycol (PEG 400) on diatomite CQ (100-200 mesh) (Lobel et al., 1980; Penkett et al.,
1977). The oven temperature should be kept low as high temperatures enhance the thermal decay of PAN. Analyses are run at ambient temperatures between 25°C and 40°C. High purity nitrogen or 5% methane in argon is used as carrier gas.
The ability of PAN to capture free electrons makes possible the use of the sensitive electron capture detector (ECO). The ECO uses a source of p rays (energetic electrons from a 63Ni source) to ionize the carrier gas. The neutralizing of the ionized molecules of the carrier gas at the cathode leads to a standing current through the detector. An electron absorbing compound like PAN reduces the standing current through the detector by an amount which is proportional to the amount of the absorbing compound. The ECO has a linear response as long as the reduction in current is 25-35% of the standing current (Stephens, 1973). This is seen as a peak on the output.
4.3 CALIBRATION OF GC/ECD FOR AMBIENT PAN ANALYSIS
A gas chromatograph equipped with an electron capture detector provides a sensitive and accurate method for analysing PAN in ambient.air. Difficulties arise with the calibration of the ECO, with known PAN concentrations. Due to its low stability and explosive properties, PAN standards are commercially not available and have to be synthesized in the laboratory.
4.3.l Preparation of PAN standards
PAN can be synthesized either in the gaseous or in the condensed phase. Stephens (1969) described different ways of synthesizing PAN in the gas-eous lysis 1988;
phase. The most commonly used gas phase PAN synthesis is via photoof ethylnitrate in oxygen (Stephens, 1969, 1973; Brice et al., Bruckmann and Mulder, 1979; VDI, 1985b). The synthesis of PAN by
Univers
ityof
Cape T
own
51
irradiation of N02 and trans-2-butene mixtures reproduces the conditions under which PAN is formed in the atmosphere (Stephens, 1969; Lobel et al., 1980). Grosjean et al. (1984) describe a PAN generator making use of a chlorine initiated photo-oxidation of acetaldehyde in the presence of N02• The gases are in permeation tubes which are placed in an oven. The amount of PAN generated is thus a function of the oven temperature. Meyrahn et al. (1987) synthesized PAN by photolysis of acetone and N02 air mixtures using a Penray mercury lamp. After four minutes of irradiation, a stable yield of PAN was obtained. The amount of PAN generated is a function of the acetone to N02 ratio.
PAN synthesis in the condensed phase makes use of the nitration of peracetic acid in a hydrocarbon solvent (Holdren and Spicer, 1984; Nielsen et al., 1982; Gaffney et al., 1983). At subzero temperatures PAN in a hydrocarbon solution, can be stored for months without deterioration.
4.3.2 Determination of the synthesized PAN content
After the synthesis of PAN (either in the gaseous or condensed phase) the exact concentration has to be determined by an alternative method. Some analytical procedures require the purification of PAN from side products in the synthesized mixture due to interference. These purification steps are carried . out by either preparative gas chromatography (Stephens, 1969; Brice et al., 1988) or high performance liquid chromatography (HPLC) (Nielsen et al., 1982).
PAN can be unequivocally identified by infrared spectroscop~. Pure PAN vapour shows five strong bands in the infrared spectrum and a number of weaker ones in the 2.5 to 15 µm wavelength range·(Stephens, 1969). IR spectroscopy is thus the principal method used in determining PAN content of high concentration standards (lower detection limit for IR spectroscopy: 10 ppm PAN). For the calibration of the gas chromatograph, the PAN standard has to be accurately diluted by a factor of 10,000 to obtain ppb levels (Stephens, 1973; Bruckmann and Mulder, 1979; VD!, 1985b).
Univers
ityof
Cape T
own
52
Penkett et al. (1977) and Brice et al. (1988) describe the use of a flame ionization detector (FID) for determining the PAN content in a standard mixture under field conditions. The FID had previously been calibrated using infrared determination of PAN. The detection limit for PAN by the FID is 50 ppb but if samples have to be analysed accurately, they should contain 100-500 ppm PAN. Thus, a dilution step has to be interposed for GC/ECD calibration in ppb range.
Another important property of PAN may be used for analysis. In an alkaline solution PAN hydrolyses to yield nitrite and acetate ions on a mole to mole basis (Stephens, 1969). The nitrite ion can be determined using Saltzman's reagent. A more elegant method is using ion chromatography for determination of either the nitrite or the acetate ion (Nielsen et al., 1982; Grosjean et al., 1984). This property of PAN, being destroyed in an alkaline solution , can be used as a simple m~ans of identification. The peak corresponding to PAN is missing in the chromatogram if a PAN containing sample has been passed through a NaOH solution prior to analysis.
A field calibration method has been described by Joos et al. (1986) making use of a commercial chemiluminescent NOx analyser in the NOx mode. The synthesized PAN i~ separated from by-products via a precolumn. The purified and diluted mixture is then passed through the NOx analyser (calibration range 0.5 to 100 ppb). When the PAN maximum is reached, the gas regulating valve is immediately switched to pass the PAN calibration mixture through the GC/ECD. This method eliminates PAN decay, as analysis and calibration are obtained immediately and the use of dilution containers is unnecessary.
4.4 SAMPLING METHODS
Air samples for PAN analyses, as described in the literature, are taken either manually with an airtight syringe or automatically via a sample loop of known volume and introduced directly onto the GC column. The sample volume is limited between 1-5 ml as a larger sample volume would result in peak broadening. Thus, the detection limit, determined by the sample volume, lies between 0.1 and 0.9 ppb depending on the apparatus (VDI, 1985a). Samples are taken normally every 15 to 30 minutes.
Univers
ityof
Cape T
own
53
A detection limit of approximately 0.5 ppb may be sufficient for PAN measurements in polluted urban areas, but, for rural and remote areas where the expected concentrations lie in the range of the.detection limit, a more sensitive method has been developed. Singh and Salas (1983, 1989) and Vierkorn-Rudolph et al., (1985) obtained a detection limit of 1-2 ppt, using a cryogenic preconcentration technique. Since PAN is quite stable at low temperatures, it adsorbs at smooth surfaces of stainless steel, glass or Teflon sample loops when air is drawn through at a reasonablj low flow rate. Before injection into the GC, PAN has to be desorbed via rapid heating of the sample loop. Through adsorption and desorption processes PAN losses can occur.
Vierkorn-Rudolph et al. (1985) placed a 20 ml glass loop in a dry ice-ethanol cooling reagent (-78 °C) and drew 0.5-2 1 air through at a flow rate of 100 ml/min. They suggest that the temperature for sample desorption should not exceed 20°C, otherwise substantial decomposition of PAN can occur. The reproducibility is within 10% accuracy and the yield nearly quantitative (about 90%).
Singh and Salas (1983, 1989) used an unpacked stainless steel tube (6 ml) for cryogenic preconcentration of 100-200 ml of ambient air at liquid argon temperature. Before flushing the preconcentrate into the GC, it was heated to boiling water temperature. They found a PAN loss during preconcentration of as much as 40% with an average between 10-20%. This loss was found to be independent of the sample volume. All data were thus corrected for this mean loss by 15%.
4.5 SUMMARY
Ambient PAN in the ppb range can be accurately measured with a gas chromatograph equipped with an electron capture detector (GC/ECD).
Difficulties arise with the calibration of the ECD. PAN is unstable at ambient temperatures and when in liquid form extremely explosive. Owing to these facts, PAN standards are commercially not available and PAN has thus to be synthesized in the .laboratory. PAN can be synthesized in either the gaseous phase or in the condensed phase. The former is achieved by
Univers
ityof
Cape T
own
' 54
irradiation of ethyl· nitrate in oxygen or by.irradiation of air mixtures containing N0
2 and either trans-2-butene, acetaldehyde or acetone.
Synthesis of PAN in the condensed phase is carried out by nitration of peracetic acid in a hydrocarbon solvent. This PAN solution is reasonably stable at temperatures below -20°C. The principal determination of the synthesized PAN mixtures in the 100 - 500 ppm range is done by IR-spectroscopy. For field conditions analysing techniques using a flame i~nization · detector (FID) and a chemiluminescent NOx analyser have been developed. An accurate dilution step in the ppb range for GC/ECD calibration is necessary. PAN standards in hydrocarbon solution can be
. -determined after alkaline hydrolysis in which PAN decomposes to nitrite and . an acetate ion. Either the nitrite or acetate ion can be analysed by ion chromatography and thus the PAN content can be calculated.
Ambient PAN is usually sampled-by direct injection of 1 - 5 ml of air into the gas chromatograph. The detection limit is thus limited by the volume brought onto the column and is in the order of 0.1 - 0.9 ppb. For PAN measurements in remote areas, considerably· lower detection limits of 1-2 ppt are achieved using cryogenic preconcentration of PAN.
24b/thesis4
Univers
ityof
Cape T
own
55
CHAPTER V
THE MEASUREMENT OF PAN LEVELS
5 . .1 INTRODUCTION
The measurement of ambient PAN levels required the development of an analytical and sampling method. This Chapter describes the measuring technique for ambient PAN applied in this work, the sampling sites and the results obtained. The detailed description of the analytical method is presented in Appendix B.
5.2 ANALYTICAL METHOD FOR MEASUREMENT OF AMBIENT PAN
A Varian gas chromatograph, equipped with an electron capture detector, was adjusted for the requirements for ambient PAN analysis (see Appendix B.2). As outlined in Chapter IV, the absolute calibration of the detector presents severe problems. The synthesis of a PAN standard in the condensed phase as described by Nielsen et al., (1982), but using n-hexane as solvent, was found to be convenient to apply. The PAN standard solution could be stored for months at temperatures below -20°C without
·significant deterioration. This avoided the handling of unstable gaseous PAN standards and expensive equipment for their regular determination. A 1:1000 dilution inn-hexane of the PAN standard solution was used for the calibration of the GC/ECD.
It was found that the GC response to the PAN hexane solution showed a better reproducibility and linearity than the PAN air mixture (Baunok et al., 1987; Baunok, 1987). The analysis of direct air samples and unstable PAN air mixtures for calibration was thus rejected and a method of extraction of PAN in hexane at low temperatures was developed (Baunok et al.~ 1987; Baunok and Grosser, 1990).
Univers
ityof
Cape T
own
56
5.3 SAMPLING METHODS
5.3.l Extraction of ambient PAN in hexane at low temperatures
Two new methods of ambient PAN analysis,have been developed by Baunok et al. (1987) and Baunok and Grosser (1990).
The first method is based on a continuous extraction of ambient PAN in hexane at dry ice temperature (-78°C) (see Appendix B.3). Ambient PAN is sampled continuously for 12 h (06:00-18:00) representing an average daytime value. The lowest limit of detection for a 300 1 sample volume is 0.05 ppb. This method gives more reliable average values for a sampling period than instantaneous injections into the gas chromatograph every 15-30 minutes. Another advantage is, that only one gas chromatograph is required in the laboratory for analysing the samples collected at several
I
sites. This sampling method gives no information of daily variation and maximum levels of short duration.
For short-term concentration changes, a different sampling method was developed using a cryogenic preconcentration of 50-100 ml ambient air (Baunok and Grosser, 1990) (see Appendix B.4). Ambient PAN is sampled in Te fl on loops at dry ice temperature. The efficiency of trapping was considerably improved by spiking the Teflon loop with 1-2 µl hexane prior to sampling. Samples taken in the field can be stored on dry ice· without deterioration for at least 24 hours. The detection limit of a 50 ml sample was calculated to be 0.02 ppb.
5.4 .DESCRIPTION OF SAMPLING SITES AND PERIODS
5.4.l Continuous PAN sampling in Johannesburg
PAN was sampled in Johannesburg at two sites (South Hills and Gas Works) using the continuous sampling procedure described in 5.3.1.
South Hills is situated 10 km south of the city centre, away from local vehicle emissions and represents a suburban area. At South Hills, air pollutants (0
3, NOx, NMHC) have been, monitored for several
Univers
ityof
Cape T
own
57
years by the City Health Department of Johannesburg, and high ozone levels were reported from this site during 1984/85 by Stevens (1985, 1987a, 1987c).
Gas Works is situated 3 km west of the city centre (Annet Road in Cottesloe) and might be influenced by primary pollution. Unfortunately, no monitoring of air pollutants was carried out at this site.
PAN was sampled between 06:00 and 18:00 at both sites during August 1988.
5.4.2 Continuous PAN sampling in Cape Town
PAN was ary till
sampled in Cape Town during two periods, May 1988 and from FebruApril 1989. During the first measuring period (May 1988), PAN
sampling boxes were installed in the air pollution monitoring laboratory in the City Hall and in the air pollution monitoring caravan at the Medical School in Observatory. Both sites were equipped with instruments monitoring 03 and NOx. The City Hall was chosen to represent the city centre while Observatory was chosen to represent a suburban area. T_he Observatory site appeared to be too windy and not suitable for measurement of photochemical oxidants. During the second measuring period (FebruaryApril 1989) this site was therefore abandoned i~ favour of a private home in the suburb of Oranjezicht in Belvedere Road. Additionally, an ozone analyser was installed at this site. PAN sampling at the City Hall was continued during the second period.
5.4.3 PAN sampling with cryogenic enrichment
Samples using cryogenic preconcentration as described in 5.3.1, were taken in Pretoria at the CSIR in November 1988 and in Cape Town in March and April 1989. For the measurements of diurnal variations in PAN levels, cryogenic samples were taken at 1/2 hourly intervals on certain calm and fine days.
A vertical distribution of PAN levels was investigated in Cape Town in , April 1989 up to the top of Table Mountain (1067 m). Six cryogenic samples were taken within an hour in the morning, at midday and in the
Univers
ityof
Cape T
own
58
afternoon respectively. The sampling route started at the City Hall (17 m) then continued via Oranjezicht (107 m) to the lower cable station (366 m). Two samples were taken out of the window of the cable car during the ascent (540 m; 890 m) and a last sample on top of Table Mountain (1067 m).
5.5 RESULTS OF PAN MEASUREMENTS
The monthly average PAN daytime levels and the maximum daytime concentrations are summarised in Table C.l (Appendix C).
The PAN average daytime levels are compiled in Tables C.2-C.ll, with air pollutant data (03 , NOx, NMHC) from the monitors of the stations, where available, and the ratios 03/PAN and NO/N02•
PAN average daytime levels and some meteorological data are given in Tables C.12-C.20. The monthly distribution of PAN average daytime concentrations are shown in Figures D.1-D.5. Scatter plots of PAN levels against 03/PAN are shown in Figures D.15-D.21 (Appendix D).
The highest PAN levels obtained from cryogenic sampling are summarized in Table C.21. The daily variation of PAN levels are compiled with 03
and NOx data, where available, and shown in Tables C.22-C.29 and Figures C.6-C.13.
The vertical distribution of PAN levels up to the altitude of Table Mountain are shown in Table C.30 and Figure C.14.
thesis5/24b/sgg
Univers
ityof
Cape T
own
59
CHAPTER VI
DISCUSSION OF THE RESULTS OF PAN MEASUREMENTS
6.1 INTRODUCTION
In this Chapter, the evaluation of PAN measurements is compared with the theoretical considerations of Chapter 3. PAN levels obtained from different sites and during different measuring periods are compared with those of some pollutants involved in photochemical smog formation. The relationship between ozone and· PAN is investigated and the findings compared with observations of other authors. Comparison of PAN levels with meteorological data confirmed the influence of weather conditions on photochemical smog formation. To supplement the findings, previous PAN measurements in Pretoria (1986/87) are included.
6.2 LEVELS OF PEROXYACETYL NITRATE IN SOUTH AFRICA
The monthly average PAN daytime levels during 1988/89 were in the range of 0.10 ppb to 0.62 ppb (Table C.l). The highest monthly average PAN daytime level of 0.62 ppb, and the maximum daytime level of 2.81 ppb were obtained in Cape Town during April 1989. The monthly average daytime levels of previous PAN measurements in Pretoria were in the range of 0.18 ppb to 0.66 ppb with a maximum daytime level of 1.62 ppb (Table C.31). The maximum PAN levels obtained from sampling with cryogenic enrichment were in the range of 0.40 ppb to 8.56 ppb (Table C.21).
PAN levels in South Africa were found to be in the same range as those reported from European, Canadian and lesser polluted USA cities but well below those reported from California (Table C.32, C.33).
Univers
ityof
Cape T
own
60
6.3 AVERAGE DAYTIME PAN MEASUREMENTS
6;3.1 Comparison of PAN levels obtained from citv centre and suburban areas
Except for Observatory, Cape Town, the monthly average PAN daytime levels were always found to be higher in suburban areas than in city centres. These findings were also consistent for the Pretoria (1986/87) measurements.
The city centres, where primary pollution is high, are characterized by higher NO to N02 ratios, which inhibit the PAN formation. In suburban areas, the 03 to PAN ratio was about three times higher than in city centres. This is due to the low ozone levels in the city centres caused by the removal of ozone by NO present at high concentrations. Although the high NO to N02 ratio in the city centres suppresses both PAN and ozone formation, the latter is affected to a much higher degree.
Peake and Sandhu (1983) also observed lower 03 to PAN ratios in the city centre of Calgary, Canada, than at the University (6 km northwest of the city centre) due to the strong suppression of 03 by nitric oxide emissions.
6.3.2 Ozone/Pan relationship
Scatter plots of PAN concentrations against 03 to PAN ratio (Figures D.15-D.21) show ~ consistent pattern for all measurement periods. For small PAN levels, the 03 to PAN ratio is high, but with higher PAN levels the ratio decreases. This tendency of low O/PAN when PAN levels are high was also observed by several other authors (Lonneman et al., 1983; Lewis et al., 1983; Peake and Sandhu, 1983; Smith, 1984). Although ozone and PAN are formed by related photochemical processes, their relationship is not linear. On days with pronounced photochemical activity, relatively more PAN is formed than ozone.
6.3.3 PAN levels and meteorological parameters
From the data (Tables C.12-C.20) it seems that low wind speeds have
Univers
ityof
Cape T
own
61
promoted PAN formation due to low dispersion of pollutants .. In Cape Town during May 1988 PAN levels which were considerably above the monthly average coincided with calm conditions. For other periods, this relationship could not be shown clearly owing to a lack of relevant wind data.
In Johannesburg, rainy weather on 10 August 1988 reduced the high PAN level of 1.29 ppb on the previous day to 0.36 ppb. During rainy periods in Cape Town, May 1988, PAN levels were below the detection limit. Rain is considered not to be an important sink for PAN concentrations due to the low solubility of PAN in water. Rainy weather, however, does affect photochemical activity due to lack of sufficient solar radiation.
Temperature does not appear to have any direct influence on PAN levels. No relationship between PAN and maximum temperature could be observed. Brasser et al. (1977) and Corkum et al. (1986) found high levels of photo-oxidants on fine and ·warm days. High temperature is not in itself an important parameter, but indicates meteorological conditjons which favour photochemical activity. The stability of PAN is, however, inversely related to temperature, and substantial PAN concentrations at subzero temperatures were reported (Singh and Salas, 1989; Tsalkani et
al., 1987). At low temperatures, the PAN formation rate is only slightly affected while the stability of PAN is increased (Brice et
a 7., 1984).
PAN measurements were carried out (in Pretoria) during a few winter and summer months (1986/87). Against expectations (photochemical activity is regarded as a summer phenomena when sun radiation is high) average daytime levels in winter were about twice as high as those. in summer (Table C.32). During winter, Pretoria experiences abundant solar radiation due to high altitude, low latitude and lack of cloud cover. Additionally, frequent thermal inversions result in a lack of dispersion (Baunok and Grosser, 1987).
The formation of photochemical smog is promoted if sufficient sunlight is available and if meteorological conditions like low wind speeds and strong thermal inversion promote the accumulation of pollutants.
Univers
ityof
Cape T
own
62
6.4 PAN Sampling with Cryogenic Enrichment
6.4.1 Diurnal variation pattern
On selected days, when the weather was expected to be fine and calm, diurnal variations in PAN levels were measured using the cryogenic enrichment technique. The maximum PAN coricentrations are shown in Table C.21.
On days with relatively 23.11., 24.11.1988; Cape between 08:30 and 10:00
1 ow photochemi ca 1 activity (Pretoria: 8 .11., Town:· 16.3.1989) a morning peak was observed (Figures 0.6, 0.8, 0.9, 0.11). At this time of
the day, photochemical activity is considered to be still too low to produce substantial amounts of PAN. This morning peak is ·attributed to downwards mixing of PAN stored overnight above the nocturnal inversion layer, while at lower levels the PAN concentration has been depleted by the sink effect of the ground (Colbeck and Harrison, 1985; Kelley et a 7., 1984).
On most days with marked photochemical activity (Pretoria: 22.11.1988; Cape Town: 7.3., 7.4., 12.4.1989), a small morning peak was followed by a rapid increase in PAN 1eve1 s during the day. Highest PAN 1eve1 s were observed mostly around midday (12:00-14:00) and sometimes in the afternoon (-17:00) (Figures D.7, D.10, D.12, 0.13).
The PAN diurnal ·concentration pattern in Pretoria on 22 November 1988 is shown in Table C.23 and Figure D.7. There was a steady increase in PAN concentrations from morning till late afternoon. The strong fluctuation between 12:00 and 15:00 could be caused by inhomogeneous distribution of PAN due to changing wind speeds. Between 15:00 and 18:00 the PAN levels increased more evenly to reach the maximum concentration of 2.14 ppb between 17:00 and 18:00. During this period, the wind speed dropped to almost calm conditions, minimizing the dispersion and allowing PAN to build up. After 18:00, the PAN maximum concentration dropped and leveled out to about 1.2 ppb between 19:00 and 20:00. This drop coincided with the beginning of thunderstorm activity as a strong wind came up dispersing the PAN maximum concentrations. The strong wind and the beginning of rain between 19:30 and 20:00, did not cause a further drop in PAN levels. This
I
confirms the findings that PAN decay during the afternoon and night is
Univers
ityof
Cape T
own
63
nearly independent of wind speed (Nieboer and van Ham, 1976) and is not an important sink for PAN (Anlauf et al., 1985; Salas, 1989; Corkum et al., 1986; Holdren et al., 1984).
that rain Singh and
High PAN concentrations just before the onset of thunderstorm activity have also been observed by Corkum et al. (1986) and Peake et al. (1988).
On three days in Cape Town (7.3., 7.4., 12.4.1989) when the diurnal variations in PAN levels were measured, ozone data were also available (Figures D.10, D.12, D.13). The diurnal variations in ozone and PAN levels were found to be similar. Maximum PAN concentrations around midday were 20-100 times their minimum value in the morning. At the same time ozone levels increased between 5-12 times. The diurnal variation in PAN and ozone concentrations measured during a photochemical smog episode on 7 April 1989 at Oranjezicht is shown in Figure D.12. There was a marked PAN peak at 10:00 which coincided with a somewhat smaller ozone peak. From 11:30 ozone built up ahead of PAN and reached a broad peak of up to 70 ppb between 13:30 and 14:30. PAN levels increased suddenly from 12:30 to reach a maximum concentration of 8.56 ppb at 13:00. The delay in the PAN build up can be explained by the fact that ozone is generated early in the photochemical reaction process, while the PAN forming reactions are operative in the later stages (Lonneman et al., 1976). During the afternoon, PAN l~vels decreased ahead of ozone. After reaching a minimum at 15:30, PAN levels increased to 5.43 ppb at 17:30, when measurements were stopped, indicating a possible late PAN peak. The decline of ozone in the late afternoon, which is attributed to interference of high NO emissions from the afternoon rush hour traffic, provides N02 a direct PAN precursor. The formation of PAN, unlike the formation of ozone, is not directly dependent on sunlight. Thus, PAN can still be formed in the evening and at night as long as precursors are available (Lonneman et al., 1987).
A rapid decline in ozone levels while PAN levels stayed high or even increased, resulted in low ozone to PAN rati~s in the late afternoon (Table C.28). This was less pronounced on 12.4.1989 (Table C.29 and Figure D.13). This observation confirms that physical and chemical sinks in the early evening are less for PAN than for ozone (Peake and Sandhu, 1983; Bruckmann and MUlder, 1979; Nieboer and van Ham, 1976). It is therefore expected that PAN can persist overnight in the atmosphere (Grosjean, 1983; Peake et al., 1987).
Univers
ityof
Cape T
own
64
6.4.2 Vertical ·distribution of PAN concentrations in Cape Town
The vertical distribution of PAN levels was investigated on 4.4.1989 using the cable car to the top of Table Mountain. The results of the measurements are shown in Table C.31 and Figure D.14.
In the morning, the highest PAN level of 0.27 ppb was found on top of Table Mountain (1067 m). At Oranjezicht (107 m) the level was the lowest with 0.08 ppb. This can be explained by the sink effects of the ground during the night. At midday when maximum photochemical formation is expected, the highest PAN level of 0.92 ppb was found at Oranjezicht followed by a concentration of 0.86 ppb at the second section of the cable car (about 890 m). These were the highest values of the day. The high midday concentration at the higher level indicates that PAN is formed there as well as at the ground .. This confirms the assumption of Becker et al. (1983) that photo-oxidants are formed at a few hundred metres above the ground within the mixing layer.
During the afternoon the wind pattern changed resulting in a sudden decrease in PAN levels at all altitudes. The rapid drop in PAN levels during the afternoon was less pronounced at higher levels than on the ground indicating that PAN can survive better at higher altitudes.
This experiment showed that PAN levels can be as high or even higher at an altitude of 1000 m than on the ground. PAN levels at higher altitudes can more easily persist since they are not destroyed at the ground. This also explains the observation of morning peaks (between 08~30 and 10:00), which are attributed to downwards mixing due to breaking up of the nocturnal inversion layer.
6.5 Photochemical Pollution Episode on 6-8 April 1989 in Cape Town
On three consecutive days, average PAN daytime levels were above 1 ppb at both Oranjezicht and the City Hall and reached a maximum of 2.8 ppb on 7.4.1989 at the City Hall. On this day (7.4.1989) diurnal variation in PAN levels was measured at Oranjezicht using the cryogenic sampling procedures (Figure D.12). The PAN level reached a maximum concentration of
Univers
ityof
Cape T
own
65
8.56 ppb which is the highest PAN level reported to date in South Africa. This maximum PAN level is about half of that which could cause plant damage (15 ppb for exposures exceeding four hours) (Temple and Taylor, 1983).
During this period the NO to N02 ratio at the City Hall was the lowest measured for the month, ranging from 0.94 to 2.06. The highest PAN and· N0
2 levels coincided. Nitrogen dioxide is a direct precursor of
PAN. Thus, at high N02 concentrations and low NO to N02
ratios, the formation of PAN is promoted. The 03 to PAN ratio for these days at both sites were among the lowest for this month, ranging from 2.9.to 10.9 and 14.3 tri 19.0 for City Hall and Oranjezicht respectively {Tables C.10, C.11).
On the first day of the episode (6.4.89) 33% calm conditi~ns, which occurred during the sampling period, may have minimized the dispersion of the pollutants and created a potential for the build up of PAN during the next day (7.4.89). On the last day of the episode (8.4.89) 50% calm conditions during the sampling period occurred. Unfortunately, no wind data are available for 7.4.1989 (Table C.19, C.20).
6.6 Conclusions
The suppression of ozone by nitric oxide emissions in the city centres is much more pronounced than the suppression of PAN. At the City Hall, Cape Town, average daytime levels of PAN and ozone respectively were about 16% and 63% lower than those at Oranjezicht. The reaction of ozone and nitric oxide provides nitrogen dioxide, a direct PAN precursor.
At high average daytime PAN levels, the 03 to PAN ratio was found to be low. During diurnal variations in PAN levels, the 03 to PAN ratios decreased when PAN levels were increasing. Although on photochemically active days ozone levels were high, PAN peak values were more pronounced. Ozone can be formed as long as N02 is generated and sun-1 ight is available. The amount of PAN that can be formed depends on its precursor concentrations, hydrocarbons and nitrogen oxides. PAN formation is a chain terminating reaction, i.e. it removes N02 and hydrocarbon
Univers
ityof
Cape T
own
66
radicals from the reaction chain which would otherwise promote ozone
formation.
The physical and chemical sinks in the evening are stronger for ozone than for PAN. The high nitric oxide emissions from the evening rush hour led to a rapid decline of ozone levels, while PAN levels were hardly affected. The major sink for PAN is destruction at the ground. This effect is less than that for ozone. PAN can therefore persist overnight. The next morning, when the air warms up, the decay of PAN can give a boost to the smog formation as it provides hydrocarbon radicals and nitrogen dioxide ..
PAN is only slightly affected by local NO emissions and shows a more pronounced variation on photochemically active days than does ozone. Thus, PAN has better properties as an indicator for photochemical activity
than does ozone.
6.7 SUMMARY
The monthly average PAN daytime levels in South Africa are in the range of 0.10 ppb to 0.66 ppb. A maximum PAN level, measured in South Africa, was
' of 8.56 ppb (cryogenic sampling) and was measured in Cape Town in Ap,ril 1989 during a pronounced smog episode. These levels are, except for those reported from California, in the range of those reported elsewhere.
The monthly average PAN daytime levels have been found to be lower in city centres than in suburban areas. High NO to N02 ratios in the city centres suppress both PAN and ozone formation, but the latter is affected much more strongly. When PAN levels were high, the 03 to PAN ratio was found to be low.
Diurnal variation in PAN and ozone concentrations were found to be similar, levels. rapidly
though PAN levels showed a more pronounced variation than ozone In . the evening, ·ozone levels, contrary to PAN levels, decreased
due to strong sink effects, while PAN levels increased, since PAN can still be formed as long as precursor species are available.
Univers
ityof
Cape T
own
67
Higher PAN levels were found at an altitude of up to 1000 m than were found on the ground. Ground sink effects are not present at higher altitudes and therefore PAN can persist there. Through breaking up of the nocturnal inversion layer, air masses containing higher PAN levels can be mixed downwards and PAN peaks between 08:30 and 10:00 are observed.
Photochemical smog formation is promoted if sufficient sunlight is available and if pollutants can accumulate due to low wind speeds and/or low thermal inversions. The photochemical pollution episode on 6 April to 8 April 1989 in Cape Town, was characterized by calm wind conditions. The average PAN daytime level reached a maximum concentration of 2.81 ppb on 7 April. Although ozone levels were high during these days, the 03 to PAN ratios were among the lowest for this month.
It is suggested that PAN is a better indicator of photochemical activity than ozone. PAN is less dependent on local NO emissions than ozone and shows a more pronounced variation on photochemically active days than ozone.
thesis6/24b/sgg
Univers
ityof
Cape T
own
68
CHAPTER VII
SUMMARY AND CONCLUSIONS
MEASUREMENT OF PEROXYACETYL NITRATE (PAN) AS AN INDICATOR OF PHOTOCHEMICAL SMOG
7.1 INTRODUCTION
Photochemical smog is formed when sunlight irradiates the atmosphere polluted with non-methane hydrocarbons (NMHC) and nitrogen oxides (NOx). These pollutants are referred to as primary pollutants and sources in urban areas are mainly from motor vehicle exhausts and in the case of hydrocarbons from evaporation of petrol and solvents. Primary pollutants are also emitted by various industries.
Secondary pollutants, formed in photochemical smog, are known to have strong oxidizing properties and are referred to as photochemical oxidants. Besides ozone, peroxyacetyl nitrate (PAN) is an important component of photochemical smog. PAN is an eye and throat irritant, a possible agent in the formation of skin cancer (Lovelock, 1977) and a phytotoxicant. Severe plant damage has been observed when plants were exposed to PAN levels above 15 ppb for more than four hours (Temple and Taylor, 1983).
7.2 THE FORMATION OF PHOTOCHEMICAL SMOG
In the lower troposphere, ozone is formed by the photolysis of nitrogen dioxide.
N02 + hv -> NO + o· 0 · + 02 + M -> 03 + M NO + 03 -> N02 + 02
(a)
(b)
(c)
Univers
ityof
Cape T
own
69
The rapid reaction of ozone with nitric oxide leads to a null reaction sequence and thus no substantial amounts of ozone can be formed if only reactions (a-b) are considered. Other compounds present in the polluted urban atmosphere (nitrous acid, formaldehyde, higher aldehydes, ozone, hydrogen peroxide) are subject to photolysis at wavelengths <390 nm and provide the important hydroxyl radicals (HO·). The attack of hydrocarbons by these radicals begins perpetuating chain reactions in which N0
2 is generated and more organic and inorganic radicals are formed.
The photochemical oxidation of hydrocarbons leads, via hydrocarbon radicals, to aldehydes (Appendix A), which are then further oxidized to peroxyacyl radicals. The peroxyacyl radicals can either oxidize NO to N02
or react with N02 to form peroxyacyl nitrates, depending on the NO to N02 ratio. When NO levels are high, the first reaction is predominant and low peroxyacyl nitrate levels are expected.
The formation of peroxyacyl nitrates is a chain terminating reaction as it removes radicals from the photochemical reaction process (Lonneman et al., 1976). The PAN molecule is thermally unstable and decomposes to )ts precursor species (Cox and Roffney, 1977).
Ozone can be formed as long as N02 is generated and sufficient sun-' light is available, whilst the amount of PAN that can be formed is limited to its initial precursor concentrations, such as nitrogen oxides and hydrocarbons.
7.3 ANALYTICAL METHODS FOR AMBIENT PAN
As the most abundant number of the series is peroxyacetyl nitrate (PAN) measurements are usually restricted to this compound.
7.3.1 Sampling procedure
Instead of analysing air directly by gas chromatography, a sampling method was developed based on continuous extraction of ambient PAN in dry ice cooled hexane (Baunok et al., 1987). This method gives reliable average levels over a sampling period (typically 06:00-18:00) but gives no
Univers
ityof
Cape T
own
70
information on short-term concentration changes. For this purpose, a different method was developed using cryogenic preconcentration in a 3 ml Teflon loop at dry ice temperature (Baunok and Grosser, 1990). The sampling efficiency could be improved by 50% by spiking the loop with 1-2 µl hexane prior to sampling. After sampling, the loops could be stored for 24 h on dry ice without deterioration.
7.3.2 Analysis of ambient PAN
For analysis of ambient PAN, a Varian 3700 gas chromatograph was equipped with a 1500 x 3 mm Teflon column packed with 5% carbowax on gas chrom Q 801 mesh. PAN was detected with a Ni 63 electron capture det~ctor.
Because of its unstable nature in the gaseous phase and its extreme explosive properties when in liquid form, PAN standards are commercially not available and thus have to be synthesized in the laboratory. To avoid unstable PAN-air mixtures, PAN was synthesized in hexane solution according to Nielsen et al. (1982) and the PAN content was determined by ion chromatography after alkaline hydrolysis (Nielsen et al., 1982). These solutions ,are reasonably stable at temperatures below -20°C. The GC/ECD was thus calibrated with a 1:1000 dilution of the synthesized PAN standard. For continuous sampling, aliquots of the hexane condensate were analysed, while for cryogenic sampling the whole content of the loop was transferred into the gas chromatograph by thermal absorption at 20°C. Detection limits were 0.05 ppb and 0.02 ppb for a sample volume of 300 1 (continuous sampling) and 50 ml (cryogenic sampling) respectively.
7.4 RESULTS OF PAN MEASUREMENTS
7.4.1 Average daytime PAN levels
PAN was measured during a few months in Pretoria in 1986/87, in Johannesburg in 1988 and in Cape Town in 1988/89. A summary of the monthly average PAN daytime levels and the maximum daily concentration at each site are given in Table C.l (1988/89) and Table C.31 (1986/87).
At the city centres, where primary emission is high (Pretoria: Sunnyside; Cape Town: City Hall; Johannesburg~ Gas Works) monthly average PAN daytime
Univers
ityof
Cape T
own
71
levels have always been lower than in suburban areas (Pretoria: Mooikloof; Cape Town: Oranjezicht). This is due to the inhibition of PAN formation
by high NO to N02 ratios.
City centres were characterized by lower 03 to PAN ratios when compared with suburban areas. This is due to the high NO levels in city centres, where excessive NO removes ozone by forming N02 • Although both 0
3 and PAN formation is suppressed by high NO to N02
ratios, PAN formation is affected to a much lesser degree.
The ozone to PAN ratios at all sites were found to be small when PAN levels were high (Figures D.15-D.21). This relationship was also found by several other authors (Lonneman et al., 1976; Lewis et al., 1983; Peake and Sandhu, 1983 and Smith, 1984). Although ozone and PAN are formed by related photochemical processes, relatively more PAN than ozone is formed on days with pronounced photochemical activity.
Meteorological conditions which promote photochemical smog formation are, sufficient sunlight and low wind speeds, the latter resulting in an accumulation of pollutants. In Pretoria, PAN levels in winter were about twice those in summer (Table D~31). During the winter, Pretoria experiences abundant solar radiation due to its high altitude, low latitude, and lack of cloud cover. Pollutants accumulate easily due to frequent thermal inversions (Baunok and Grosser, 1987).
PAN levels considerably above the monthly average in Cape Town during May 1988 coincide with calm conditions which occurred during more than 60% of the sampling period. For other periods, this relationship could not be
determined due to lack of relevant wind data.
7.4.2 Diurnal and vertical PAN concentration pattern
The maximum PAN concentrations obtained from cryogenic sampling are shown
in Table C.21.
The diurnal variations in PAN concentrations showed mainly a morning peak (between 08:30 and 10:00) on days with low photochemical activity. This
Univers
ityof
Cape T
own
72
peak is attributed to downwards mixing as photochemical activity at this time of the day is still too low to produce substantial amounts of PAN (Colbeck and Harrison, 1985; Kelley et al., 1983). On days with marked photochemical activity, maximum PAN concentrations were observed at midday and sometimes in the late afternoon. On days, where ozone measurements were available, the diurnal variation in ozone and PAN. were found to be similar during the day. PAN showed a 6-8 times larger increase from the minimum value in the morning to the maximum concentration at midday than ozone. While ozone levels decreased rapidly in the late afternoon due to high NO emissions from the afternoon rush hour traffic, PAN levels were not affected. Ozone levels are more strongly affected by sink effects than are PAN levels. Therefore, PAN can persist overnight and its thermal degradation can influence the smog formation on the following day.
Higher PAN levels were found at higher altitudes (up to 1000 m on Table Mountain) than on the ground. At higher altitudes, the sink effects of the ground are not effective and therefore PAN levels can persist.there more easily. These air masses, containing high PAN levels, can be mixed downwards when the nocturnal inversion layer is breaking up. This can be observed as a PAN peak during the morning at the ground.
7.4.3 Photochemical pollution episode in Cape Town
During a photochemical pollution episode in Cape Town on 6 April to 8 April 19819, average daytime PAN levels were above 1 ppb. The maximum average daytime level of 2.8 ppb was reached on 7 April. On this day, the diurnal variation in PAN levels was measured and a maximum PAN concentration of 8.56 ppb was reached. This value is the highest PAN level reported up to now in South Africa. Although ozone levels were high during these days, the 03 to PAN ratios were among the lowest of the month. During this period calm wind conditions prevailed.
,
7.5 DISCUSSION AND CONCLUSIONS
7.5.1 PAN as an indicator of photochemical smog
PAN has been regarded as ozone by several authors
a better indicator of photochemical smog than (Nieboer and van Ham, 1976; Penkett et al.,
Univers
ityof
Cape T
own
73
1977; Lobel et al., 1980; Brice et al., 1984). Reasons given are that PAN has no large natural sources unlike ozone. Thus, the occurrence of high PAN levels is exclusively related to anthropogenical pollution. Owing to larger diurnal and seasonal variations in PAN concentrations compared with ozone Brice et al. (1984) suggest that PAN is a better indicator of overall chemical reactivity in the lower atmosphere.
Results of this work also indicate that PAN is a better indicator of photochemical activity than ozone.
(a) PAN was found to be less affected by local NO emissions than ozone.
(b) Sink effects in the evening for PAN were found to be less than for ozone.
(c) High PAN levels coincided with low 03 to PAN ratios. This indicates that on photochemically active days, substantially more amounts of PAN are formed than ozone.
7.5.2 Photochemical smog situation in South Africa
PAN levels as high as 8 ppb prove the occurrence of photochemical smog, although they are below phytotoxic levels. Should precursor pollutants increase, phytotoxic PAN levels can, however, not be excluded.
The introduction of ethanol-petrol blends in South Africa has been based on economic considerations, but it is expected to also reduce such pollutants as lead, hydrocarbons, smoke and carbon monoxide. Nates (1986) investigated various petrol blends and found that the use of an ethanol-petrol blend will increase acetaldehyde emissions. Acetaldehyde is a direct precursor of PAN and aldehydes in general are subject to photolysis and provide important radicals which can give a boost to photochemical reactions. An increase in acetaldehyde emissions will thus promote photochemical smog and higher PAN levels might be expected. To gauge the extent of such an increase in PAN concentrations, monitoring of PAN and possibly acetaldehydes in areas before and after the introduction of alcohol blends is necessary.
Univers
ityof
Cape T
own
74
7.5.3 Control strategies
Up to · now, ozone has been regarded as the indicator of photochemical smog and air quality standards are entirely based on ozone. There are no air quality standards for PAN, although PAN is known to cause damage to health and plants. The classical approach to control photochemical smog is based on the reduction of hydrocarbons but not of nitrogen oxides, thereby hoping for the excess of nitric oxide to suppress ozone concentrations. Unfortunately, this will have little or no effect on PAN and other photochemical oxidant levels. For future design of a control strategy for photochemical smog, processes leading to PAN formation should be given appropriate attention.
thesis7/24b/sgg
Univers
ityof
Cape T
own
75
LITERATURE
Altshuller, A.P.; Bufalini, J.J. {197la). Photochemical aspects of air pollution: A review. Environmental Science and Technology, Vol. 5, No. 1, 39-64.
Altshuller, A.P.; Lonneman, W.A.; Sutterfield, F.D.; Kopczinski, S. L. {197lb). Hydrocarbon composition of the atmosphere of the Los Angeles Basin - 1967. Environmental Science and Technology, Vol. 5, No. 10, 1009-1061.
Altshuller, A.P. {1988). Some characteristics of ozone formation in the urban plume of St. Louis, MO. Atmospheric Environment, Vol. 22, No. 3, 499-510.
Anlauf, K.G.; Bottenheim, J.W.; Brice, K.A.; Fellin, P.; Wiebe, H.A.; Schiff, H.I.; Mackay, G.I.; Braman, R.S.; Gilbert, R. {1985). Measurements of atmospheric aerosols and photochemical products at a rural site in SW Ontario. Atmospheric Environment, Vol. 19, No. 11, 1859-1870.
Attmannspacher, Dr. W. (1977). Ozons auf dem Hohenpei~enberg, No.270, 71-74.
Extrem hohe Konzentrationen natUrlichen aktuelle Ergebnisse. VDI-Berichte,
Baunok, I. (1987). Analysis .of atmospheric peroxyacetyl nitrate {PAN) employing low-temperature trapping in hexane. South African Journal of Science, Vol. 83, 372-373.
Baunok, I.; Grosser, E.; Bryszewski, W. (1987). Measurements of peroxyacetyl nitrate (PAN) in air. Results obtained at two sites in Pretoria during 1986-87. Atmospheric Sciences Division, CSIR, Internal Report.
Baunok, I.; Grosser, E. (1987). Determination of ambient peroxyacetyl nitrate (PAN) concentrations in Pretoria. The Clean Air Journal, Vol. 7, No. 4, 2-4.
Baunok, I; Grosser, E. (1990). Measurement of atmospheric peroxyacetyl nitrate (PAN) in Johannesburg, Cape Town and Long Tom Pass (E Tvl) during 1988-1989 and Pretoria during 1987 and 1989. EMA-I 9006.
Becker, Prof. schen Smog. 270, 7-12.
Dr. K.H. {1977). Ozan und Begleitsubstanzen im photochemiEinfUhrung der VDI-Tagung, DUsseldorf 1976. VDI-Berichte No.
Becker,K.H.; Lobel, J.; Schurath, U. (1983). Luftqual itatskriterien fUr photochemische Oxidantien. Chapter 2: Bildung, Transport und Kontrolle von Photooxidantien. Umweltbundesamt, Erich-Schmidt-Verlag.
Birkle, Dr. M. {1977). Analytik von 03. und Begleitsubstanzen im photochemischen Smog. VDI-Berichte, No. 270, j7-45.
Bos R., Guicherit R. and Hoogeveen A. (1977). Distribution of some hydrocarbons in ambient air near Delft and the influence on the formation of
. secondary air pollutants. Sci. Total Environ., Vol. 7, 159-281.
Univers
ityof
Cape T
own
76
Bottenheim, J.W.; Brice, K.A.; Anlauf, K.G. (1984). Discussion of a Lagrangian trajectory model describing long-range transport of oxides of nitrogen, the intercorporation of PAN in the chemical mechanism, and supporting measurements of PAN and nitrate species at rural sites in Ontario, Canada. Atmospheric Environment, Vol. 18, No. 12, 2609-2619.
Brasser, L.J.; Guicherit, Dr. R.; Huygen, C. (1977). The occurrence of photochemical smog formation in Western Europe. VDI-Berichte, No. 270, 25-32.
Brice, K.A.; Penkett, D.A.; Atkins, D.H.F.; Sandalls, F.J.; Bamber, D.J.; Tuck, A.F.; Vaughan, G. (1984). Atmospheric measurements of peroxyacetyl nitrate (PAN) in rural, southeast England: seasonal variations, winter photochemistry and long-range transport. Atmospheric Environment, Vol., 18, 2691-2702.
Brice, J.A.; Bottenheim, J.W.; Anlauf, K.G.; Wiebe, Long-term measurements of atmospheric peroxyacetyl nitrate sites in Ontario and Nova Scotia; seasonal variations transport. Tellus, Vol. 40B, 408-425.
H.A. (1988). (PAN) at rural and long-range
Bruckmann P. and Eynck P. (1979). Analyse der Bildung von Photoxidantien an der Messtelle Essen-Sud. Schriftenreihe der Landesanstalt fUr Immissionsschutz des Landes NW., Vol. 49, 19-28.,
Bruckmann, Dr. P.; MUlder, W. (1979). Die Messung von Peroxiacetylnitrat (PAN) in der Au~enluft - Verfahren und erste Ergebnisse. Schriftenreihe der Landesanstalt fUr Immissionsschutz des Landes NW, Heft 47, 30-40.
Brunke, E.G; Allen, R.J. (1985). Measurements of atmospheric ozone and other oxidants at three localities in the Cape Peninsula, South Africa. S.A. J. of Sci., Vol. 18, 678-681.
Bufalini, J.J.; Gay, B.W.; Kopczynski, S.L. (1971). Oxidation of n-butane by the photolysis of N0
2• Environmental Science and Technology,
Vol. 5, No. 4, 333-336.
Bufalini, J.J.; Lonneman, W.A. (1973). Photochemistry of atmospheric samples in New York. Environmental Letters, 4(2), 95-102.
Colbeck, I.; Harrison, R.M. (1985). The photochemical pollution episode of 5-16 July 1983 in Northwest England. Atmospheric Environment, Vol. 19, No. 11, 1921-1929.
Corkum, R.; Giesbrecht, W.W.; Bardsley, T.; Cherniak, E.A. (1986). Peroxyacetyl nitrate (PAN) in the atmosphere at Simcoe, Canada. Atmospheric Environment, Vol. 20, No.6, 1241-1248.
Cox, R.A.; Eggleton, A.E.J.; Derwent, R.G.; Lovelock, R.E.; Pack, D.H. (1975). Long-range transport of photochemical ozone in northwestern Europe. Nature, Vol. 255, 118-121.
Cox, R.A.; Roffney, M.J. (1977). Thermal decomposition of peroxyacetyl nitrate in the presence of nitric oxide. Environmental Science and Technology, Vol. 11, No. 9, 900-906.
Univers
ityof
Cape T
own
77
Daly, N.J. (1981). A guide to the control of photochemical pollution. Bureau of Transport Economics, Australian Government Publishing Services.
Demerijan, K.L.; Kerr, J.A.; photochemical smog formation. Technology, Eds. Pitts, J.N. York) 1-262.
Calvert, J.G. (1976). The mechanism of Advances in Environmental Science and
and Metcalf, R.L. (Wiley-Interscience, New
Department of Health and Welfare (1984). Air pollution in South Africa. Liaison and Publication Service of the Department of Health and Welfare.
Dervent, R.G.; Hov, 0. (1982). The potential for secondary pollutant formation in the atmospheric boundary layer in a high pressure situation over England. Atmospheric Environment, Vol. 16, No. 4, 655-665.
Dimitriades, B.; Wessen, T.C. (1972). Reactivities of exhaust aldehydes. Journal of the Air Pollution Control Association, Vol. 22, No. 1, 33-38.
Dodge, M.C. (1977). Effect of selected parameters on predictions of a photochemical model. U. S. Department of Commerce, National technical Information Service, EPA - 600/3-77/048.
Dodge, M.C. (1984). Combined effects of organic NMHC/NO ratio on photochemical oxidant formation study. xAtmospheric Environment, Vol. 18, No. 8, 1657-1665.
reactivity and a modelling
Domalski, E.S. (1971). Thermochemical properties of peroxyacetyl (PAN) and peroxybenzoyl nitrate (PBN). Environmental Science and Technology, Vol. 5, No. 5, 443-444.
Dutkiewicz, R.K., Fuggle, R.F. (1977). Air pollution survey of greater Cape Town. Vol. 1: Interim Report.
Dutkiewicz, R.K. (1979). Air pollution survey of greater Cape Town. The measurements and analysis of air pollution levels in greater Cape Town. Vol. 3, Air pollution levels.
Dutkiewicz, R.K.; Fuggle, R.f.; Keen, C.S. (1980). Air pollution survey of Greater Cape Town. Vol. 5, Report for the Cape Town City Council.
Evans, L.F.; Weeks, I.A.; Eccleston, A.J. (1986). A chamber study of photochemical smog in Melbourne, Australia - present and future. Atmospheric Environment, Vol. 20, No. 7, 1355-1368.
Floor, H.; Posthumus, Dr., A.C. (1977). Biologische Erfassung von Ozonund PAN-Immissionen in den Niederlanden. VDI-Berichte No. 270, 183-190.
Formosinho, S.J.; Cardoso, A.C. (1974). Photochemical aspects of air pollution in Europe. Willums, Jan-Olaf: New concepts in air pollution research, 61-70.
Frohne, H.Ch.; Immissionen im 83-91.
Schneider, W. (1977). Vergleich der Kohlenwasserstoffindustrienahen und -fernen Bereich. VDI-Berichte No. 270,
Univers
ityof
Cape T
own
78
Gaffney, J.S.; Fajer, R.; Senum, G.I.; (1984). An important procedure for high purity gaseous peroxyacetyl nitrate production; use of heavy lipid solvents. Atmospheric Environment, Vol. 18, No. 1, 215-218.
Gay, W.B., Jr. and Bufalini J.J. (1971). Nitric acid and the nitrogen balance of irradiated hydrocarbons in the presence of oxides of nitrogen. Environ. Sci. Technol., Vol. 5, No. 5, 422-425.
Georgii, H.-W.; Fricke, W.; Rudolf, W.; Deimel, M.; Becker, K.H.; Schurath, U. (1977). Bildung von Photo-oxidantien im Raum Bonn - Koln und Frankfurt/M. VDI-Berichte, No. 270, 19-24.
Glavas, S; Schurath, U. (1985). Peroxyacetyl nitrate forming potential of five prototype hydrocarbons. Environ. Sci. Technol., 19, 950-955.
Grosjean, D. (1983). Distribution of atmospheric nitrogenous pollutants at a Los Angeles area smog receptor site. Environ. Sci. Technol., Vol. 17, No. 1, 13-19.
Grosjean, D.; Fung, K.; Coll ins, J.; Harrison, J. and Breitung, E. (1984). Portable generator for on-site calibration of peroxyacetyl nitrate analysers. Anal. Chem., Vol. 56, No. 3, 569-573.
Grosjean, D. Angeles Air.
and Fung, K. ( 1984). JAPCA, Vol. 34, No. 5.
Hydrocarbons and carbonyls in Los
Grosjean, D. and Harrison, J. (1985). Peroxyacetyl nitrate: Comparison of alkaline hydrolysis and chemiluminescence methods. Environ. Sci. Technol., 19, 749-752.
Guderian, R.; Tingey, D.T. oxidantien auf · Pflanzen. Verlag.
and Rabe, Chapter 4,
R. ( 1983) . Wi rkungen von Photo Umweltbundesamt, Erich-Schmidt-
Guicherit, R. and van Dop, H. (1977). Photochemical production of ozone in Western Europe (1971-1975) and its relation to meteorology. Atmospheric Environment, Vol. 11, 145-155.
Hanst, P.L. (1971). Mechanism of peroxyacetyl nitrate formation. JAPCA, Vol. 21, No. 5, 269-271.
Holdren, M.W. and Spicer, C.W. (1984a). Field compatible calibration for peroxyacetyl nitrate. Environ. Sci. Technol., Vol. 18, No. 2, 133-116.
Holdren, M.W. and Spicer, C.W. (1984b). Peroxyacetyl nitrate solubility and decomposition in acidic water. Environ. Sci. Technol., Vol. 18, No. 6' 1171-1173.
Horvath, S.M.; Bedi, J.F. and Drechsler-Parks, D.M. (1986). Effects of peroxyacetyl nitrate alone and in combination with ozone in healthy young women. JAPCA, Vol. 36, No. 3, 265-270.
Hummel, J.R. and Reck, R.A. (1984). The direct thermal effect of peroxyacetyl nitrate (PAN) on the atmospheric surface temperature. Atmos. Environ., Vol. 18, No. 1, 223-225.
Univers
ityof
Cape T
own
79
Jacobson, J.S. and Yonkers, N.Y. (1977a). The effects of photochemical oxidants on vegetation. VDI-Berichte, No. 270, 163-173.
Jacobson, J.S. and Yonkers, N.Y. (1977b). Plants as indicators of photochemical oxidants in the USA. VDI-Berichte, No. 270, 191-196.
Jeltes, R. (1977). Messungen organischer Luftverunreinigungen in den Niederlanden. VDI-Berichte, No. 270, 75-82.
Joos, L.F.; Landolt, W.F. and Leuenberger, H. (1986). Calibration of peroxyacetyl nitrate measurements with an NOx analyser. Environ. Sci. Technol., Vol. 20, No. 12, 1269-1273.
Jorgen R.T. (1978). Ambient Peroxyacetyl Nitrate (PAN) measurements in the Houston area. Rockwell International Corporation. Atomics International Division, Air Monitoring Center. (
Kanter, H.J.; Reiter, R. and Potzl. (1979). Untersuchungen Uber die Haufigkeit und Ursache hoher Ozonkonzentrationen unter Reinluftbedingungen. Umwelt Forschungsplan des Bundesministers des Inneren. Forschungsbericht, 78 104 02 800.
Kanter, H.J.; Reiter, R. and Munzert, K.H. (1982). Untersuchungen zur Frage der photochenmischen Production von Ozon in Reinluftgebieten und ihrer vertikalen Verteilung. Umwelt Forschungsplan des Bundesministers des Inneren Forschungsbericht, 104 02 800.
Izumiik, I.; Mizuochi, M.; Murano, K. and Fukuyama, T. (1987). Humidity effects on photochemical aerosol-formation in the S02-NO-C3H6-air system. Atmospheric Environment, Vol. 21, No. 7, 1541-1553.
Kelley, N.A.; Wolff, G.T. and Ferman, M.A. (1984). Sources and sinks of ozone in rural areas. Atmospheric Environment, Vol. 18, No. 7, 1251-1266.
Kelley, N.A.; meteorological concentrations JAPCA, Vol. 36,
Wolff, G.T. and Ferman, conditions associated
in southeastern Michigan No. 2, 150-158.
M.A. with and
(1986). The chemical and high and low ozone
nearby areas of Ontario.
Kopczynski, S.L.; Kuntz, R.L. and Bufalini, J.J. (1975). Reactivities of complex hydrocarbon mixtures. Environ. Sci. Technol., Vol. 9, No. 7, 648-653.
Kruysse, A. and Feron, V.J. (1977). toxicity of peroxyacetyl nitrate and 270, 101-109.
Acute and sub-acute inhalation ozone in rats. VDI-Berichte, No.
Lenner, M. and Lindquist, 0. (1983). The N02/NOx ratio in emissions from gasoline powered cars: High NO percentage in idle engine measurements. Atmospheric Environment, Vol. 17, No. 8, 1395~1398.
Leone, J.A. and Seinfeld, J.H. (1985). Comparative analysis of chemical reaction mechanisms for photochemical smog. Atmos. Environ., Vol. 19, No. 3, 437-464.
Univers
ityof
Cape T
own
80
Lewis, T.E.; Brennan, E. and Lonneman, W.A. (1983). PAN concentration in ambient air in New Jersey. JAPCA, Vol. 33, No. 9 885-887.
Lobel, J.; Wipprecht, V. and Schurath, U. (1980). Messungen van Peroxiacetylnitrat (PAN) in Auf,Bsenluft. Staub-Reinhalt. Luft, Vol. 40, No. 6, 243-244.
Loewenheim, L. (1988). Photochemical smog in Greater Cape Town. Thesis submitted to University of Cape Town, Department of Environmental and Geographical Science.
Lonneman, W.A.; Kopczynski, S.L.; Darley, P.E. and Sutterfield, F.D. (1974). Hydrocarbon composition of urban air pollution. Environ. Sci. Technol., Vol. 8, No. 3, 229-236.
Lonneman, W.A.; measurement in No. 4, 374-380.
Lauw, R.; van intermediate in 716.
Bufalini, J.J. and Seila, R.L. (1976). PAN and oxidant ambient atmospheres. Environ. Sci. Technol., Vol. 10,
Ham, J. and Nieboer, H. (1973). Nitrogen trioxide: Key the chemistry of polluted air? JAPCA, Vol. 23, No. 8,
Lovelock, J.E. (1977). PAN in the natural environment; its possible significance in-the epidemiology of skin cancer. Ambia, Vol. 6, 131-133.
Mayrsohn H. and Brooks C. (1965). The analysis of PAN by electron capture gas chromatography. Presented at Western Regional Meeting, AM. Chem. Soc., Nov. 18.
Meijer, G.M. and Nieboer, H. (1977). Determination of peroxybenzoyl nitrate (PBzN) in ambient air. VDI-Berichte, No. 270, 55-61.
Meyrahn, H.; Helas, G. and Warneck, P. (1987). Gas chromatographic determination of peroxyacetyl nitrate: Two convenient calibration techniques. J. of Atmos. Chem., Vol. 5, 405-415.
Naser, K,H. (1980). Physikalische Chemie fur Techniker und Ingenieure, VEB Deutscher Verlag fur Grundstoffindustrie, Leibzig.
Nassar, J. and Goldbach, J. (1977). Zeitliche Verlaufe van reactiven Kohlenwasserstoff-Immissionen. VDI-Berichte, No. 270, 93-99.
Nates, R.J. (1986). Aldehyde emissions from spark-ignition engines. Thesis submitted to the University of Cape Town, Energy Research Institute.
Nelson, P.F. (1981). Evaporative hydrocarbon emissions from a large vehicle population. JAPCA J., Vol. 31, No. 11, 1191-1193.
Nelson, P.F.; Quigley, S.M. and Smith, M.Y. (1983). Sources of atmospheric hydrocarbons in Sydney. A quantitative determination using a source reconciliation technique. Atmos. Environ., Vol. 17, No. 3, 439-449.
Nelson, P.F. and Quigley, S.M. (1984). The hydrocarbon composition of exhaust emitted from gasoline fuelled vehicles. Atmos. Environ., Vol. 18, No. 1, 79-87.
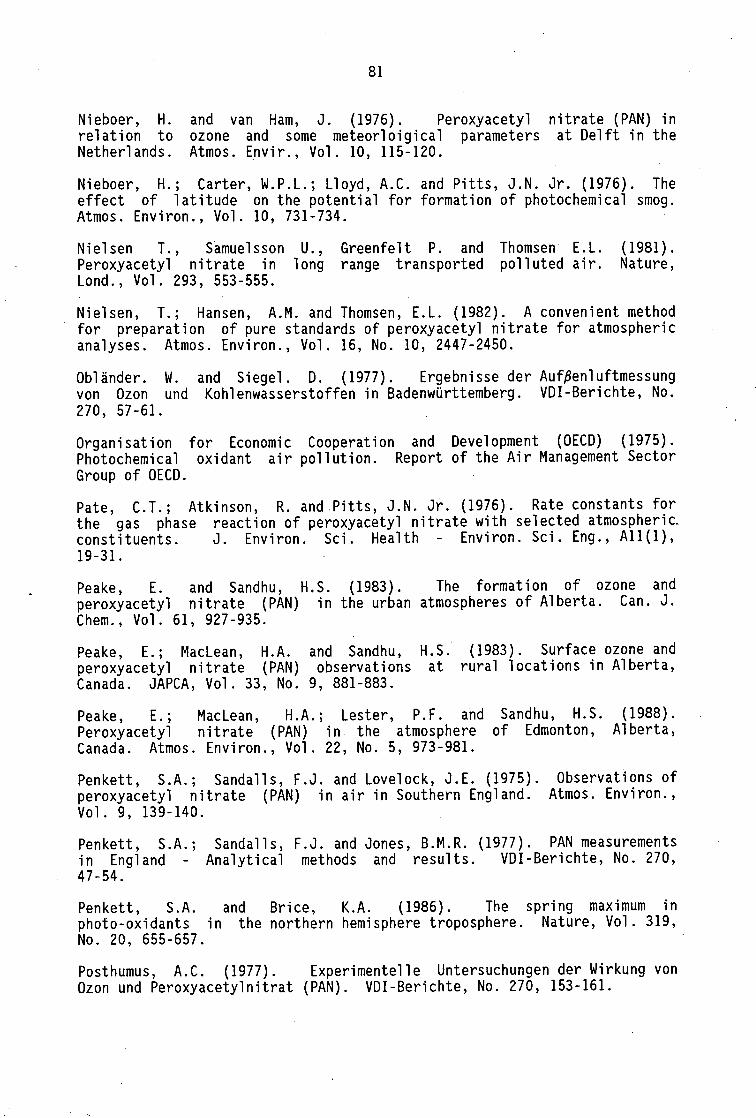
Univers
ityof
Cape T
own
81
Nieboer, H. relation to Netherlands.
and van Ham, J. (1976). Peroxyacetyl nitrate (PAN) in ozone and some meteorloigical parameters at Delft in the Atmos. Envir., Vol. 10, 115-120.
Nieboer, H.; Carter, W.P.L.; Lloyd, A.C. and Pitts, J.N. Jr. (1976). The effect of latitude on the potential for formation of photochemical smog. Atmos. Environ., Vol. 10, 731-734.
Nielsen T., Samuelsson U., Greenfelt P. and Thomsen E.L. Peroxyacetyl nitrate in long range transported polluted air. Lond., Vol. 293, 553-555.
(1981). Nature,
Nielsen, T.; Hansen, A.M. and Thomsen, E.L. (1982). A convenient method for preparation of pure standards of peroxyacetyl nitrate for atmospheric analyses. Atmos. Environ., Vol. 16, No. 10, 2447-2450.
Oblander. W. and Siegel. D. (1977). Ergebnisse der AufiSenluftmessung von Ozon und Kohlenwasserstoffen in BadenwUrttemberg. VDI-Berichte, No. 270, 57-61.
Organisation for Economic Cooperation and Development (OECD) (1975). Photochemical oxidant air pollution. Report of the Air Management Sector Group of OECD.
Pate, C.T.; Atkinson, R. and Pitts, J.N. Jr. (1976). Rate constants for the gas phase reaction of peroxyacetyl nitrate with selected atmospheric. constituents. J. Environ. Sci. Health - Environ. Sci. Eng., All(l), 19-31.
Peake, E. and Sandhu, H.S. (1983). The formation of ozone and peroxyacetyl nitrate (PAN) in the urban atmospheres of Alberta. Can. J. Chem., Vol. 61, 927-935.
Peake, E.; Maclean, H.A. and Sandhu, H.S. peroxyacetyl nitrate (PAN) observations at Canada. JAPCA, Vol. 33, No. 9, 881-883.
(1983). Surface ozone and rural locations in Alberta,
Peake, E.; Maclean, H.A.; Lester, P.F. and Sandhu, H.S. Peroxyacetyl nitrate (PAN) in the atmosphere of Edmonton, Canada. Atmos. Environ., Vol. 22, No. 5, 973-981.
(1988). Alberta,
Penkett, S.A.; Sandalls, F.J. and Lovelock, J.E. (1975). Observations of peroxyacetyl nitrate (PAN) in air in Southern England. Atmos. Environ., Vol. 9, 139-140.
Penkett, S.A.; in England -47-54.
Sandalls, F.J. and Jones, B.M.R. (1977). PAN measurements Analytical methods and results. VDI-Berichte, No. 270,
Penkett, S.A. and Brice, K.A. (1986). The spring maximum in photo-oxidants in the northern hemisphere troposphere. Nature, Vol. 319, No. 20, 655-657.
Posthumus, A.C. (1977). Experimentelle Untersuchungen der Wirkung von Ozon und Peroxyacetylnitrat (PAN). VDI-Berichte, No. 270, 153-161.
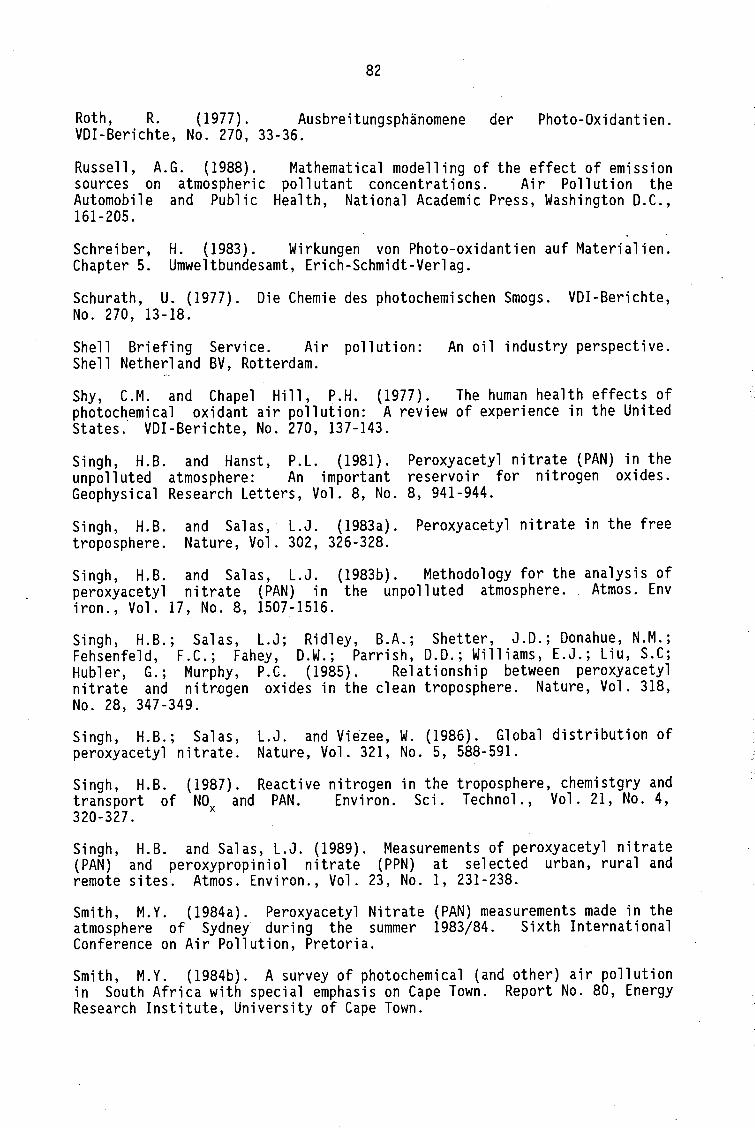
Univers
ityof
Cape T
own
82
Roth, R. (1977). Ausbreitungsphanomene der Photo-Oxidantien. VDI-Berichte, No. 270, 33-36.
Russell, A.G. (1988). Mathematical modelling of the effect of emission sources on atmospheric pollutant concentrations. Air Pollution the Automobile and Public Health, National Academic Press, Washington D.C., 161-205.
Schreiber, H. (1983). Wirkungen von Photo-oxidantien auf Materialien. Chapter 5. Umweltbundesamt, Erich-Schmidt-Verlag.
Schurath, U. (1977). Die Chemie des photochemischen Smogs. VDI-Berichte, No. 270, 13-18.
Shell Briefing Service. Air pollution: An oil industry perspective. Shell Netherland BV, Rotterdam.
Shy, C.M. and Chapel Hill, P.H. (1977). The human health effects of photochemical oxidant air pollution: A review of experience in the United States. VDI-Berichte, No. 270, 137-143.
Singh, H.B. and Hanst, P.L. (1981). Peroxyacetyl nitrate (PAN) in the unpolluted atmosphere: An important reservoir for nitrogen oxides. Geophysical Research Letters, Vol. 8, No. 8, 941-944.
Singh, H.B. troposphere.
and Salas, L.J. (1983a). Nature, Vol. 302, 326-328.
Peroxyacetyl nitrate in the free
Singh, H.B. and Salas, L.J. (1983b). Methodology for the analysis of peroxyacetyl nitrate (PAN) in the unpolluted atmosphere .. Atmos. Env iron., Vol. 17, No. 8, 1507-1516.
Singh, H.B.; Salas, L.J; Ridley, B.A.; Shetter, J.D.; Donahue, N.M.; Fehsenfeld, F.C.; Fahey, D.W.; Parrish, D.D.; Williams, E.J.; Liu, S.C; Hubler, G.; Murphy, P.C. (1985). Relationship between peroxyacetyl nitrate and nitrogen oxides in the clean troposphere. Nature, Vol. 318, No. 28, 347-349.
Singh, H.B.; Salas, L.J. and Viezee, W. (1986). Global distribution of peroxyacetyl nitrate. Nature, Vol. 321, No. 5, 588-591.
Singh, H.B. (1987). Reactive nitrogen in the troposphere, chemistgry and transport of NO and PAN. Environ. Sci. Technol., Vol. 21, No. 4, 320-327. x
Singh, H.B. and Salas, L.J. (1989). Measurements of peroxyacetyl nitrate (PAN) and peroxypropiniol nitrate (PPN) at selected urban, rural and remote sites. Atmos. Environ., Vol. 23, No. 1, 231-238.
Smith, M. Y. (1984a). Peroxyacetyl Nitrate (PAN) measurements made in the atmosphere of Sydney during the summer 1983/84. Sixth International Conference on Air Pollution, Pretoria.
Smith, M.Y. (1984b). A survey of photochemical (and other) air pollution in South Africa with special emphasis on Cape Town. Report No. 80, Energy Research Institute, University of Cape Town.
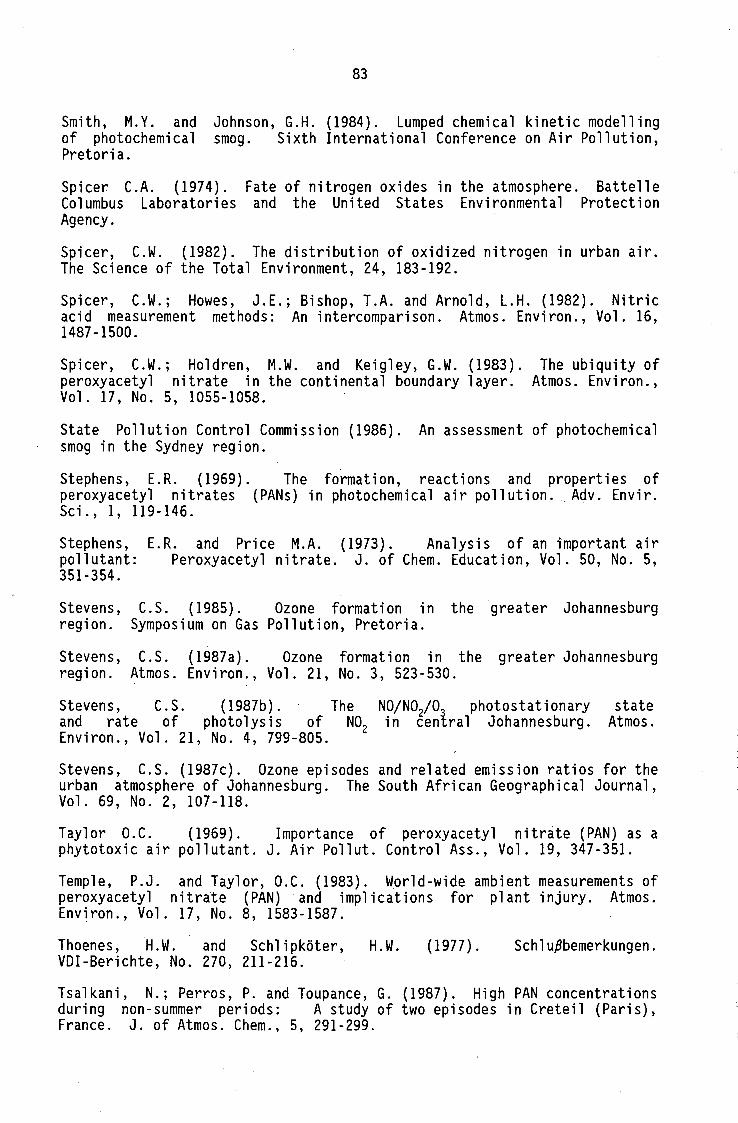
Univers
ityof
Cape T
own
83
Smith, M.Y. and Johnson, G.H. (1984). Lumped chemical kinetic modelling of photochemical smog. Sixth International Conference on Air Pollution, Pretoria.
Spicer C.A. (1974). Fate of nitrogen oxides in the atmosphere. Battelle Columbus Laboratories and the United States Environmental Protection Agency.
Spicer, C.W. (1982). The distribution of oxidized nitrogen in urban air. The Science of the Total Environment, 24, 183-192.
Spicer, C.W.; Howes, J.E.; Bishop, T.A. and Arnold, L.H. (1982). Nitric acid measurement methods: An intercomparison. Atmos. Environ., Vol. 16, 1487-1500.
Spicer, C.W.; Holdren, M.W. and Keigley, G.W. (1983). peroxyacetyl nitrate in the continental boundary layer. Vol. 17, No. 5, 1055-1058.
The ubiquity of Atmos. Environ.,
State Pollution Control Commission (1986). An assessment of photochemical smog in the Sydney region.
Stephens, E.R. (1969). The formation, reactions and properties of peroxyacetyl nitrates (PANs) in photochemical air pollution .. Adv. Envir. Sci., 1, 119-146.
Stephens, pollutant: 351-354.
E.R. and Price M.A. (1973). Analysis of an important air Peroxyacetyl nitrate. J. of Chem. Education, Vol. 50, No. 5,
Stevens, region.
C.S. (1985). Ozone formation in the greater Johannesburg Symposium on Gas Pollution, Pretoria.
Stevens, region.
C.S. (1987a). Ozone formation in the greater Johannesburg Atmos. Environ., Vol. 21, No. 3, 523-530.
Stevens, C.S. (1987b). The NO/NOl03 photostationary and rate of photolysis of N02 in central Johannesburg. Environ., Vol. 21, No. 4, 799-805.
state Atmos.
Stevens, C.S. (1987c). Ozone episodes and related emission ratios for the urban atmosphere of Johannesburg. The South African Geographical Journal, Vol. 69, No. 2, 107-118.
Taylor O.C. (1969). Importance of peroxyacetyl nitrate (PAN) as a phytotoxic air pollutant. J. Air Pollut. Control Ass., Vol. 19, 347-351.
Temple, P.J. and Taylor, O.C. (1983). World-wide ambient measurements of peroxyacetyl nitrate (PAN) and implications for plant injury. Atmos. Environ., Vol. 17, No. 8, 1583-1587.
Thoenes, H. W. and Sch l i pkoter, H. W. VDI-Berichte, No. 270, 211-216.
(1977). Schlufibemerkungen.
Tsalkani, N.; Perras, P. and Toupance, G. (1987). High PAN concentrations during non-summer periods: A study of two episodes in Creteil (Paris), France. J. of Atmos. Chem., 5, 291-299.
Univers
ityof
Cape T
own
84
Tsani-Bazaca, E.; Glavas, S. and Guesten, H. (1988). Peroxyacetyl nitrate (PAN) concentrations in Athens, Greece. Atmos. Environ., Vol. 22, No. 10, 2283-2286.
Umweltbundesamt (1981). Luft-Reinhaltung '81, Entwicklung-Stand-Tenden-zen. Erich-Schmidt-Verlag, Berlin.
Verrein Deutscher Ingenieure (1985a). (PAN). VDl-Richtlinien, 2468, 7.
Messen von Peroxyacetylnitrat
Verrein Deutscher Ingenieure (PAN)-Prufgas, Kalibrieren VDI-Richtlinien, 2468, 8.
(1985b). Herstellen von Peroxyacetylnitrat eines Peroxyacetylnitrat-Analysators.
!
Vierkorn-Rudolph, B.; Rudolph, J. and Diederich. (1985). Determination of peroxyacetyl nitrate (PAN) in unpolluted areas. Intern. J. Environ. Anal. Chem., Vol. 20, 131-140.
Von Nieding, G. and Wagner, H.M. (1983). Wirkungen von Photooxidantien auf Mensch und Tier. Chapter 3. Umweltbundesamt, Erich-Schmidt-Verlag.
Westberg H., Allwine K. and Robinson E. (1978). Measurement of light hydrocarbons and studies of oxidant transport beyond urban areas. United States Environmental Protection Agency. Office of Research and Development, Research Triangle Park, NC.
World Health Organization (WHO) (1979). Environmental health criteria for photochemical oxidants. Publication of the World Health Organization.
24a/sgg
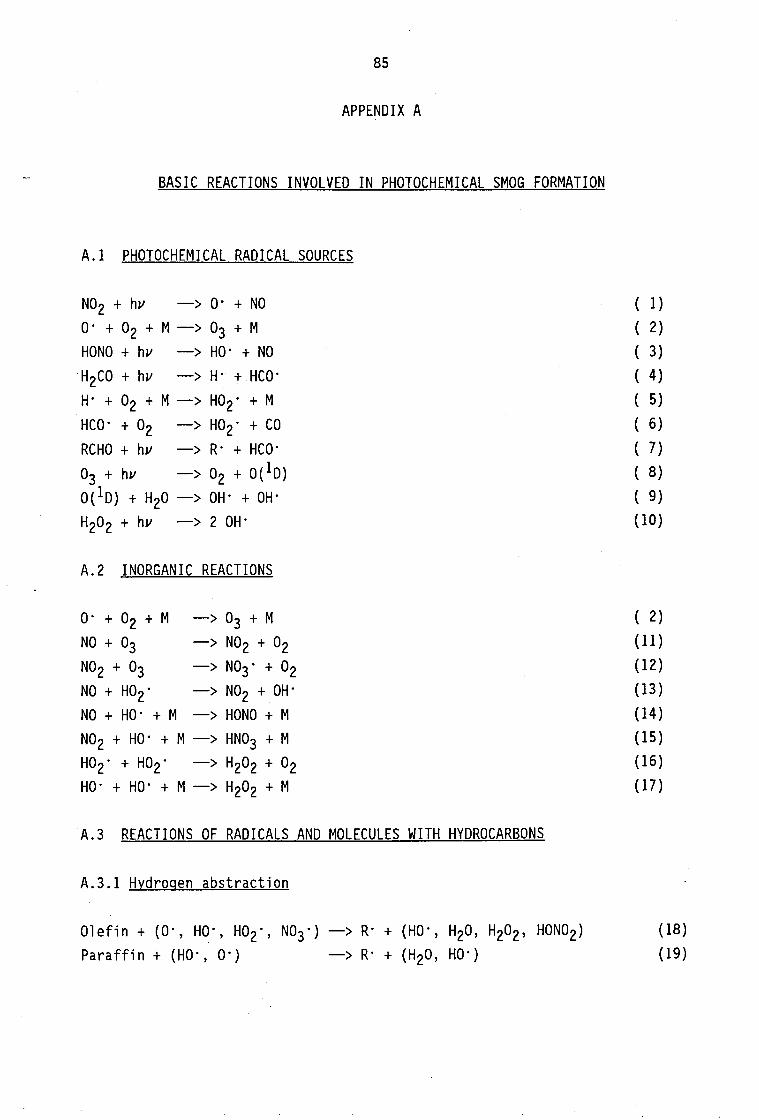
Univers
ityof
Cape T
own
85
APPENDIX A
BASIC REACTIONS INVOLVED IN PHOTOCHEMICAL SMOG FORMATION
A.I PHOTOCHEMICAL RADICAL SOURCES
N02 + hv -> o· + NO O· + o2 + M -> 03 + M HONO + hv -> HO· + NO H2CO + hv -> H· + HCO· H· + o2 + M -> H02· + M HCO· + o2 -> H02· + CO RCHO + hv -> R· + HCO· o3 + hv -> o2 + O(lD) 0( 1D) + H20 -> OH· + OH· H202 + hv -> 2 OH·
A.2 INORGANIC REACTIONS
o· + o2 + M
NO + o3 N02 + o3 NO + H02· NO + HO· + M
-> o3 + M
-> N02 + o2 -> N03· + o2 -> N02 + OH· -> HONO + M
N02 + HO· + M -> HN03 + M H02· + H02· -> H202 + 02 HO· + HO· + M -> H202 + M
·A.3 REACTIONS OF RADICALS AND MOLECULES WITH HYDROCARBONS
A.3.1 Hydrogen abstraction
( 1)
( 2)
( 3)
( 4)
( 5)
( 6)
( 7)
( 8)
( 9)
(10)
( 2)
( 11)
(12) (13) (14)
(15)
(16)
(17)
Olefin+ (O·, HO·, H02·, N03·) -> R· +(HO·, H20, H202, HON02) (18) Paraffin + (HO·, O·) -> R· + (H20, HO·) (19)
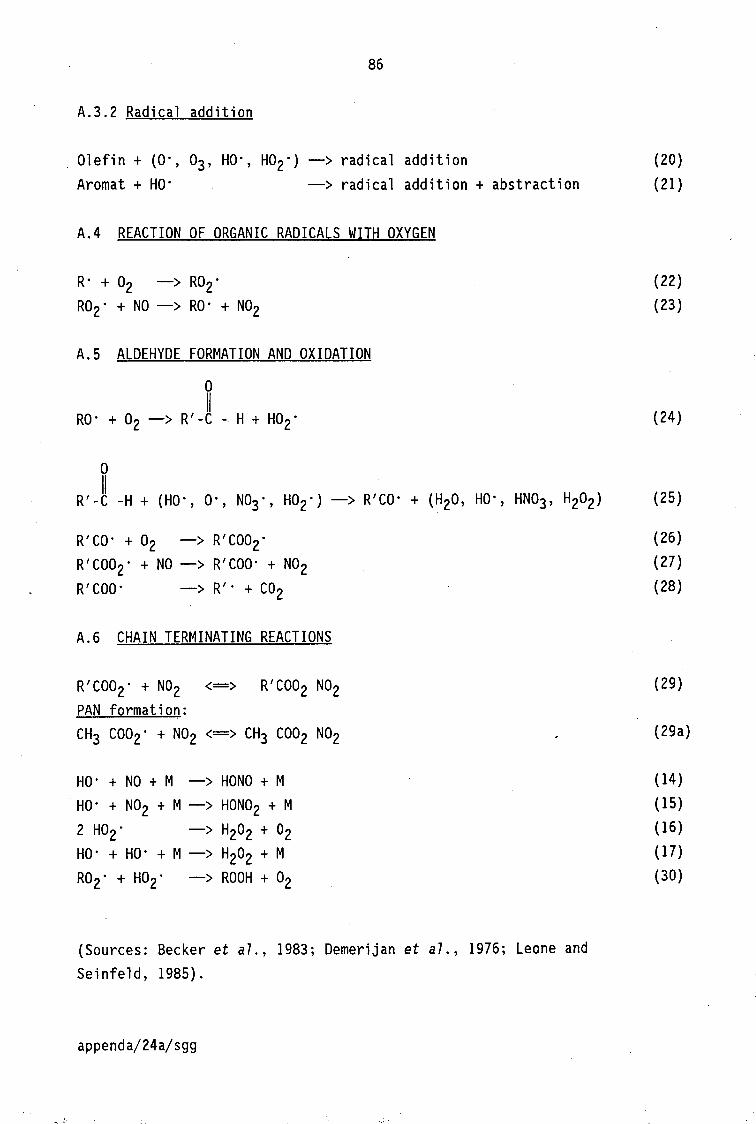
Univers
ityof
Cape T
own
86
A.3.2 Radical addition
. Olefin+ (O·, o3, HO·, H02·) -> radical addition Aromat + HO· -> radical addition + abstraction
A.4 REACTION OF ORGANIC RADICALS WITH OXYGEN
R· + o2 -> R02· R02· + NO -> RO· + N02
A.5 ALDEHYDE FORMATION AND OXIDATION
0
(20) (21)
(22) (23)
II RO· + o2 -> R'-C - H + H02· (24)
0 II
R'-C -H + (HO·, O·, N03·, H02·) -> R'CO· + (H20, HO·, HN03, H202) (25)
R'CO· + o2 -> R'C002· (26) R'C002· + NO -> R'COO· + N02 (27) R'COO· -> R' · + co2
A.6 CHAIN TERMINATING REACTIONS
R'COO · + NO 2 2 PAN formation: CH3 C002· + N02 <==> CH3 C002 N02
HO· + NO + M -> HONO + M HO· + N02 + M -> HON02 + M
2 H02· -> H202 + 02 HO· + HO· + M -> H202 + M Ro2· + H02· -> ROOH + o2
(Sources: Becker et al., 1983; Demerijan et al., 1976; Leone and Seinfeld, 1985).
appenda/24a/sgg
(28)
(29)
(29a)
(14) (15) (16) ( 17)
(30)
Univers
ityof
Cape T
own
87
APPENDIX B
ANALYSIS OF AMBIENT PAN
B.l PAN STANDARD PREPARATION
B.1.1 Synthesis of PAN
PAN was synthesized according to the procedure described by Nielsen et
a7. (1982).
The PAN synthesis consists of two steps. In the first step, peracetic acid is prepared by oxidizing acetic acid anhydride with 30% hydrogen peroxide in a cool bath kept at 10°C. In the second step, the peracetic acid was nitrated with nitric acid in the presence of n-hexane, keeping the temperature during synthesis at 0°C. Nielson at al.
, (1982) used n-heptane as hydrocarbon solvent but Baunok et al. (1987) found that n-hexane gave a better resolution on the gas chromatograms. The cooling during the two steps of synthesis was achieved using an alcohol bath and an adjustable cooling unit (Figure B.l). The raw PAN hexane solution was stored in a low temperature freezer at -70°C for eight months without significant deterioration.
B.1.2 Purification of the raw PAN standard
The raw PAN solution was purified, from side products, by high performance liquid chromatography (HPLC). For this purpose a Varian HPLC was equipped with a LKB Ultrapac column (TSK Si - 150.5 µm, 46 x 250 mm) and a variable UV detector. The HPLC set up is shown in Table B.l.
S1x fractions of the PAN solution were collected between peak start (3'36") and peak end (4' 45") while the detector was switched off. The HPLC chromatogram is given in Figure 8.2. The combined fractions were immediately stored at -25°C.
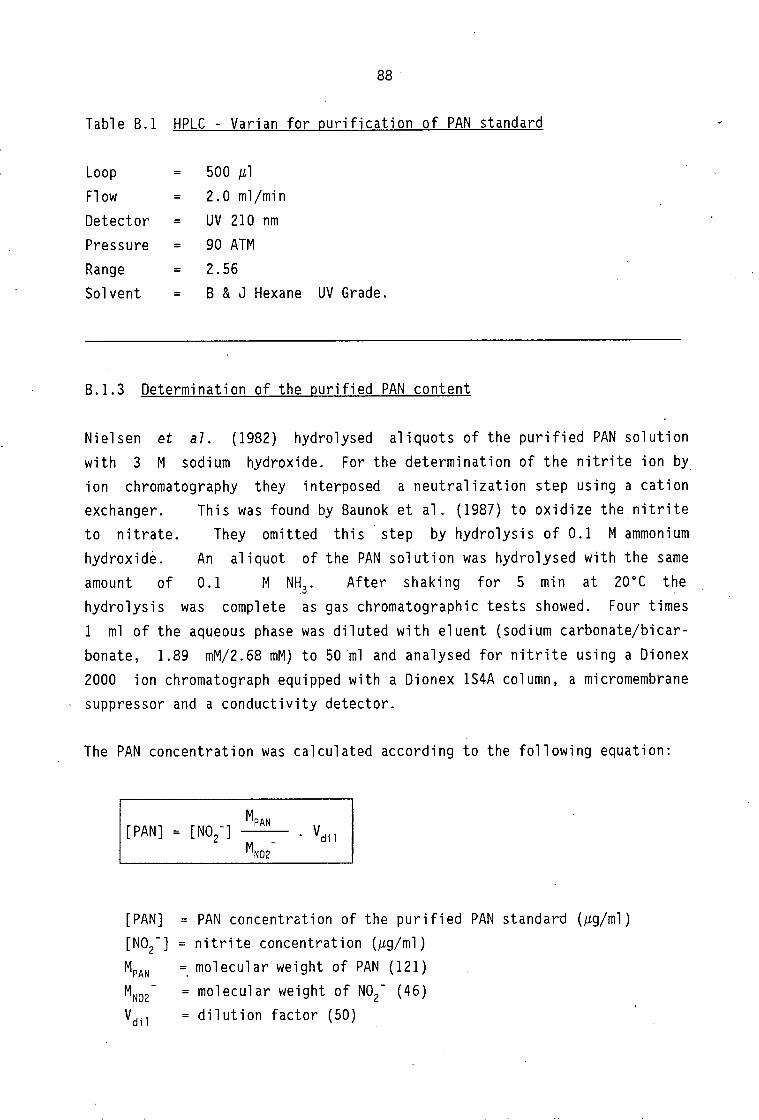
Univers
ityof
Cape T
own
88
Table B.l HPLC - Varian for purification of PAN standard
Loop = 500 µl Flow = 2.0 ml/min
Detector = UV 210 nm Pressure = 90 ATM Range = 2.56 Solvent = B & J Hexane UV Grade.
B.1.3 Determination of the purified PAN content
Nielsen et al. (1982) hydrolysed aliquots of the purified PAN solution with 3 M sodium hydroxide. For the determination of the nitrite ion by. ion chromatography they interposed a neutralization step using a cation exchanger. This was found by Baunok et al. (1987) to oxidize the nitrite to nitrate. They omitted this ·step by hydrolysis of 0.1 M ammonium hydroxide. An aliquot of the PAN solution was hydrolysed with the same amount of 0.1 M NH3 • After shaking for 5 min at 20°C the hydrolysis was complete as gas chromatographic tests showed. Four times 1 ml of the aqueous phase was diluted with eluent (sodium carbonate/bicarbonate, 1.89 mM/2.68 mM) to 50 ml and analysed for nitrite using a Dionex 2000 ion chromatograph equipped with a Dionex 1S4A column, a micromembrane suppressor and a conductivity detector.
The PAN concentration was calculated according to the following equation:
[PAN]
[PAN] = PAN concentration of the purified PAN standard (µg/ml) [N0
2-] =nitrite concentration (µg/ml)
MPAN =.molecular weight of PAN (121) MN02 - =molecular weight of N02- (46)
vdil =dilution factor (50)
Univers
ityof
Cape T
own
89
The concentration of the purified PAN standard was calculated to be 924.07 µg/ml. For the calibration of the GC/ECD the PAN standard was diluted 1:1000 in hexane and stored at -25°C.
B.2. Gas chromatographic condition for PAN determination
For the determination of ambient PAN a Varian 3700 gas chromatograph was equipped with a Ni 63 electron capture detector. Separation was achieved with a 1500 x 3 mm Teflon column packed with 5% carbowax on Gas chrom Q 80/100 mesh. The oven temperature was kept at 45°C and the detector temperature at l00°C. High purity nitrogen was used as carrier gas with a flow rate of 44 ml/min. The retention time of the PAN peak was 2.5 min. and the detector output voltage was recorded with a Varian 4390 integrator. The detector response was found to be linear from 4 pg to 2 µg.
The gas chromatograph was calibrated by injection of 1 µl purified PAN standard (1:1000 dilution) and the response factor (peak· height per picogram PAN) was calculated from three injections.
B.3. Continuous sampling technique of atmospheric PAN
B.3.1 Apparatus set up
The apparatus set up is shown in Figure B.3. Two 1 l thermos flasks were filled with a dry ice cellosolve (2-ethoxy ethanol) slurry and each closed with a cork stopper containing a 25 mm diameter hole in which a bubbler was placed. The first thermos flask contained an empty bubbler connected in reverse (25 x 200 mm, distributer ID 5 mm). In the second thermos flask a bubbler (25 x 150 mm with sintered disc distributor, por. 2) is filled with 20 ml hexane. The bubblers are connected in series with silicon rubber tubing to a Nupro fine-metering needle valve, a gas pump and a gas meter. The pump is controlled with an automatic time switch and the.flow rate of the pump is adjusted to 0.5 l/min.
In the first empty bubbler moisture is frozen, otherwise it would block the sintered disc distributor of the second bubbler.
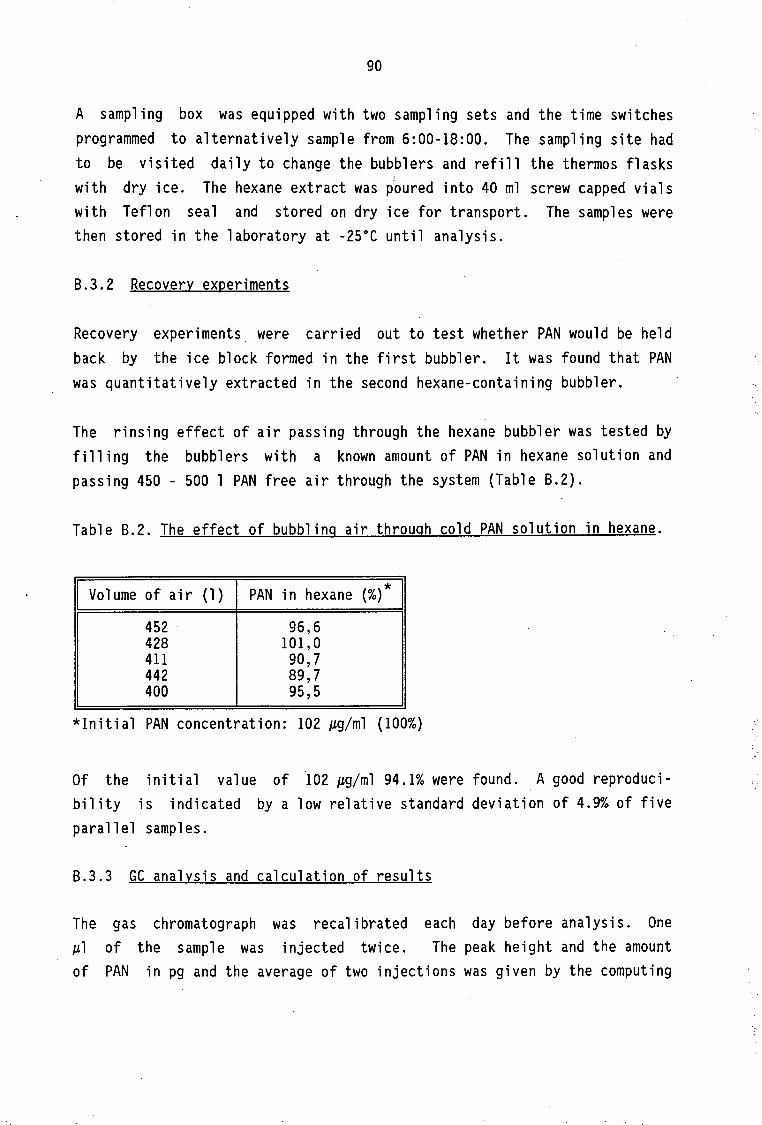
Univers
ityof
Cape T
own
90
A sampling box was equipped with two sampling sets and the time switches programmed to alternatively sample from 6:00-18:00. The sampling site had to be visited daily to change the bubblers and refill the thermos flasks with dry ice. The hexane extract was poured into 40 ml screw capped vials with Teflon seal and stored on dry ice for transport. The samples were then stored in the laboratory at -25°C until analysis.
B.3.2 Recovery experiments
Recovery experiments were carried out to test whether PAN would be held back by the ice block formed in the first bubbler. It was found that PAN was quantitatively extracted in the second hexane-containing bubbler.
The rinsing effect of air passing through the hexane bubbler was tested by filling the bubblers with a known amount of PAN in hexane solution and passing 450 - 500 l PAN free air through the system (Table B.2).
Table B.2. The effect of bubbling air through cold PAN solution in hexane.
Volume of air ( l) PAN in hexane (%)*
452 96,6 428 101,0 411 90,7 442 89,7 400 95,5
*Initial PAN concentration: 102 µg/ml (100%)
Of the initial value of 102 µg/ml 94.1% were found. A good reproducibility is indicated by a low relative standard deviation of 4.9% of five parallel samples.
B.3.3 GC analysis and calculation of results
The gas chromatograph was recalibrated each day before analysis. One µl of the sample was injected twice. The peak height and the amount of PAN in pg and the average of two injections was given by the computing
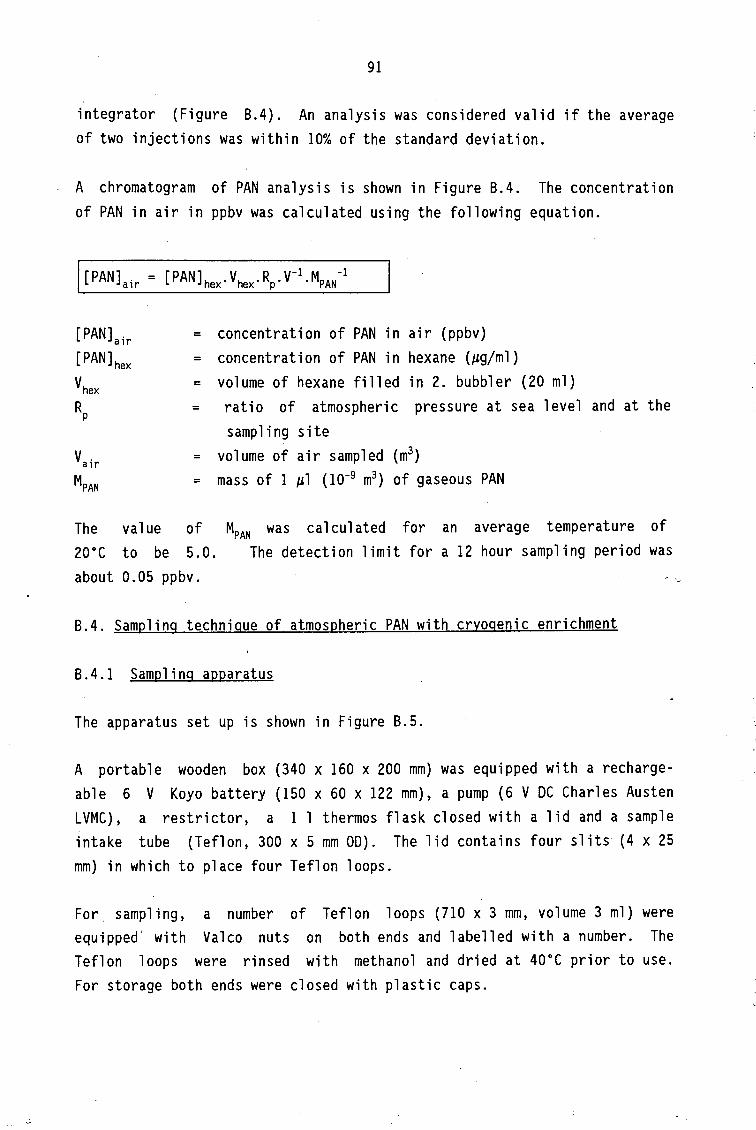
Univers
ityof
Cape T
own
91
integrator (Figure B.4). An analysis was considered valid if the average of two injections was within 10% of the standard deviation.
A chromatogram of PAN analysis is shown in Figure B.4. The concentration of PAN in air in ppbv was calculated using the following equation.
[PAN] air = [PAN]hex =
vhex =
RP =
Vair =
MPAN =
The value of 20°C to be 5.0. about 0.05 ppbv.
concentration of PAN in air (ppbv) concentration of PAN in hexane (µg/ml) volume of hexane filled in 2. bubbler (20 ml) ratio of atmospheric pressure at sea 1 evel and at the
sampling site volume of air sampled (m3) mass of 1 µl oo-9 m3) of gaseous PAN
MPAN was calculated for an average temperature of The detection limit for a 12 hour sampling period was
8.4. Sampling technique of atmospheric PAN with cryogenic enrichment
B.4.1 Sampling apparatus
The apparatus set up is shown in Figure B.5.
A portable wooden box (340 x 160 x 200 mm) was equipped with a rechargeable 6 V Koyo battery (150 x 60 x 122 mm), a pump (6 V DC Charles Austen LVMC), a restrictor, a 1 1 thermos flask closed with a lid and a sample intake tube (Teflon, 300 x 5 mm OD). The lid contains four slits (4 x 25 mm) in which to place four Teflon loops.
For sampling, a number of Teflon loops (710 x 3 mm, volume 3 ml) were equipped' with Valeo nuts on both ends and labelled with a number. The Teflon loops were rinsed with methanol and dried at 40°C prior to use. For storage both ends were closed with plastic caps.
Univers
ityof
Cape T
own
92
B.4.2 Sampling procedure
At the beginning of each sampling day the flow of the pump through the restrictor (approximately 30 ml/min) was measured using a soap bubble meter and the time which is needed to sample the desired volume (50-100 ml) was calculated. The thermos flask was filled with 750 ml cellosolve (2-ethoxy ethanol) and pulverized or granular dry ice added to form a slurry. Four Teflon sampling loops were inserted in the slits of the lid (inlet and outlet were marked) and placed in the thermos flask (Figure
8.5).
Prior to sampling 1-2 µl of hexane were added slowly into the sampling loops by fully introducing the needle of a syringe. Both loop ends were closed with plastic caps. For sampling the loop inlet was connected with the sampling intake tube to raise the sample intake well above the thermos flask. The loop outlet was connected to the restrictor and pump using silicon rubber tubing. After sampling the loop ends were closed with plastic caps and stored in a 6 l thermos flask on dry ice until analysis.
B.4.3 Gas chromatographic analysis of cryogenic samples
For the analysis of the cryogenic samples, the gas chromatograph was equipped with a 6-port Valeo valve to accommodate the Teflon sample loop. In the load mode, the loop was connected to the sample inlet and outlet, in the inject mode the loop was connected via the carrier gas flow to the GC column (Figure 8.6).
For calibration with the PAN standard in hexane solution, the column was connected to the usual inlet for liquid samples. The response factor was calculated from the area instead of the peak height as the cryogenic samples resulted in a broader peak than the liquid samples. The other gas chromatographic conditions were kept the same .as for liquid injection.
For analysis, the Teflon loops were inserted in the slits of the lid and placed in the thermos flask filled with the dry ice-cellosolve slurry. It was discovered that it was necessary that the flow direction of the cold-rinse with nitrogen (to remove oxygen) and the injection of the
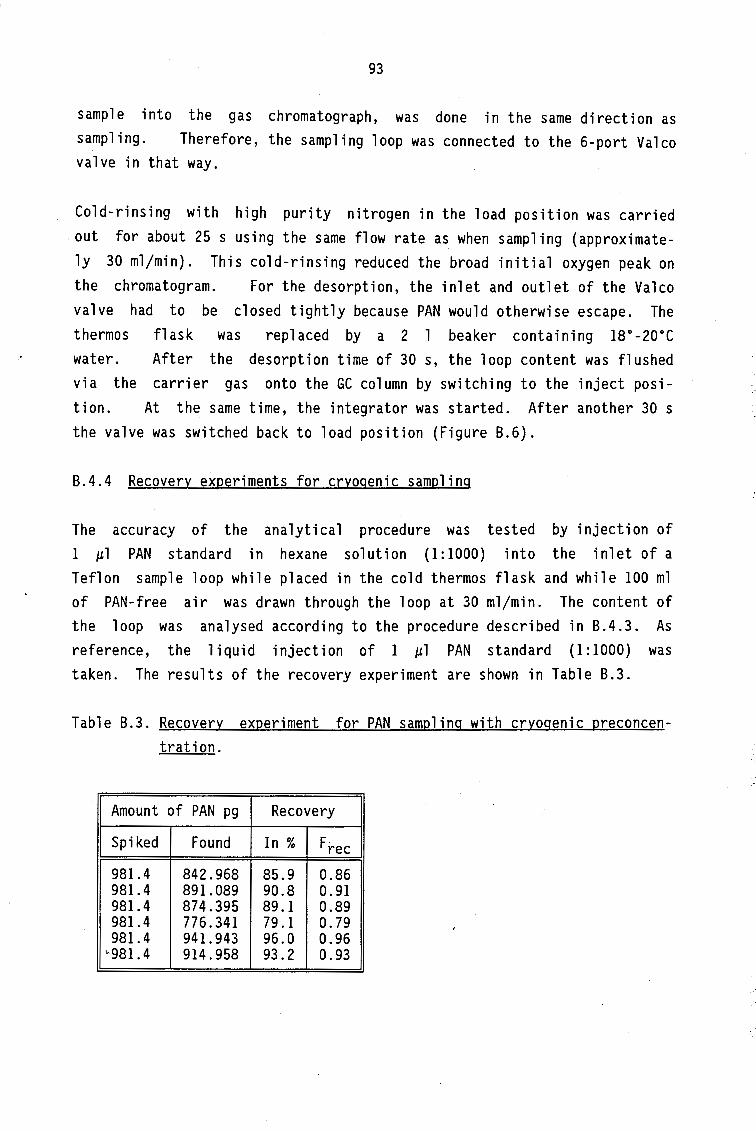
Univers
ityof
Cape T
own
93
sample into the gas chromatograph, was done in the same direction as sampling. Therefore, the sampling loop was connected to the 6-port Valeo valve in that way.
Cold-rinsing with high purity nitrogen in the load position was carried . out for about 25 s using the same flow rate as when sampling (approximately 30 ml/min). This cold-rinsing reduced the broad initial oxygen peak on the chromatogram. For the desorption, the inlet and outlet of the Valeo valve had to be closed tightly because PAN would otherwise escape. The thermos flask was replaced by a 2 1 beaker containing l8°-20°C water. After the desorption time of 30 s, the loop content was flushed via the carrier gas onto the GC column by switching to the inject position. At the same time, the integrator was started. After another 30 s the valve was switched back to load position (Figure B.6).
B.4.4 Recovery experiments for cryogenic sampling
The accuracy of the analytical procedure was tested by injection of 1 µl PAN standard in hexane solution (1:1000) into the inlet of a Teflon sample loop while placed in the cold thermos flask and while 100 ml of PAN-free air was drawn through the loop at 30 ml/min. The content of the loop was analysed according to the procedure described in B.4.3. As reference, the liquid injection of 1 µl PAN standard (1:1000) was taken. The results of the recovery experiment are shown in Table B.3.
Table B.3. Recovery experiment for PAN sampling with cryogenic preconcentration.
Amount of PAN pg Recovery
Spiked Found In % Free
981.4 842.968 85.9 0.86 981.4 891.089 90.8 0.91 981.4 874.395 89.1 0.89 981.4 776.341 79.1 0.79 981.4 941.943 96.0 0.96 ~981.4 914.958 93.2 0.93
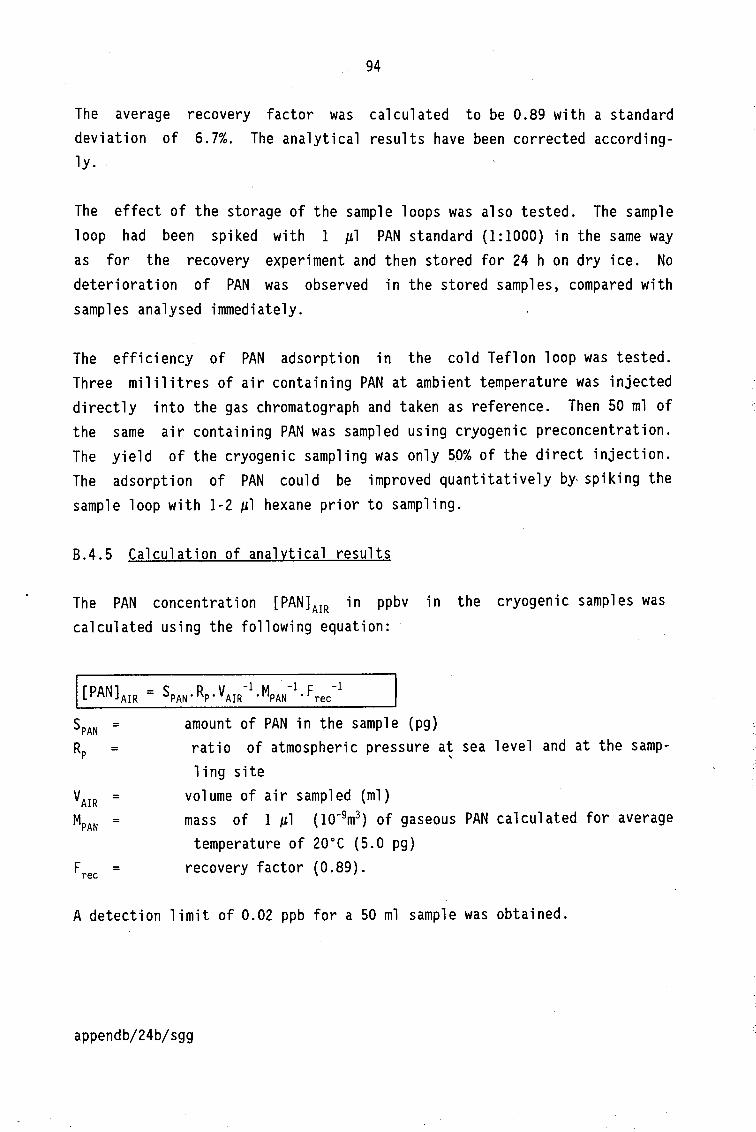
Univers
ityof
Cape T
own
94
The average recovery factor was calculated to be 0.89 with a standard deviation of 6.7%. The analytical results have been corrected accordingly.
The effect of the storage of the sample loops was also tested. The sample loop had been spiked with 1 µl PAN standard (1:1000) in the same way as for the recovery experiment and then stored for 24 h on dry ice. No deterioration of PAN was observed in the stored samples, compared with samples analysed immediately.
The efficiency of PAN adsorption in the cold Teflon loop was tested. Three mililitres of air containing PAN at ambient temperature was injected directly into the gas chromatograph and taken as reference. Then 50 ml of the same air containing PAN was sampled using cryogenic preconcentration. The yield of the cryogenic sampling was only 5.0% of the direct injection. The adsorption of PAN could be improved quantitatively by- spiking the sample loop with 1-2 µl hexane prior to sampling.
B.4.5 Calculation of analvtical results
The PAN concentration [PAN]AIR in ppbv in the cryogenic samples was calculated using the following equation:
SPAN = amount of PAN in the sample (pg) RP = ratio of atmospheric pressure at sea level and at the samp-
1 ing site
VAIR = volume of air sampled (ml) mass of 1 µl (lo-9m3 ) of gaseous PAN calculated for average
temperature of 20°C (5.0 pg) recovery factor (0.89).
A detection limit of 0.02 ppb for a 50 ml sample was obtained.
appendb/24b/sgg
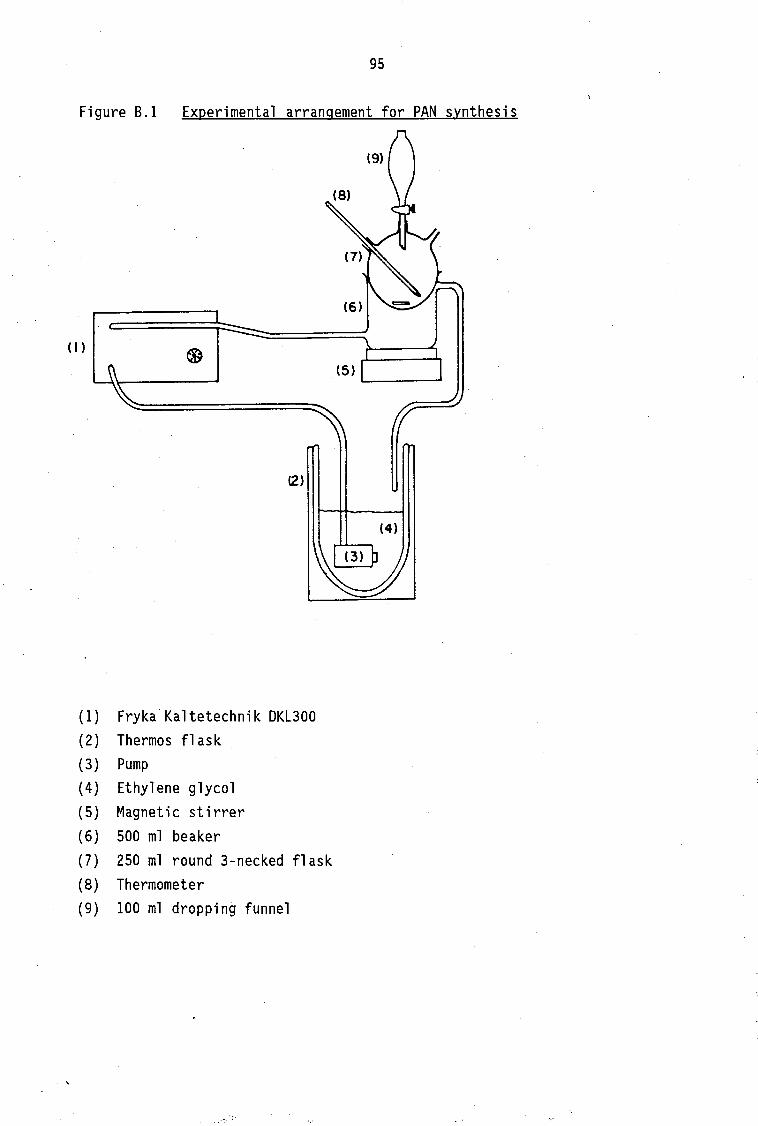
Univers
ityof
Cape T
own
95
Figure B.l Experimental arrangement for PAN synthesis
(I )
(2)
(4)
( 1) Fryka Kaltetechnik DKL300 (2) Thermos fl ask (3) Pump (4) Ethylene glycol (5) Magnetic stirrer (6) 500 ml beaker (7) 250 ml round 3-necked flask (8) Thermometer (9) 100 ml dropping funnel
Univers
ityof
Cape T
own
Figure 8.2
CHANNEL A
96
HPLC chromatograph for PAN purification
INJECT 01/31/89 09:14:58
4.51
pfN V 0 4 gi
j._ ' I
INPUT OVERRANGE AT RT= 4.57
FILE ::. METHOD
PEAKlt AREA;~
1 0. •314 2 0.01 3 0. En33 4 11..388 5 55.066 6 17.46 7 16.06
iOTAL 100.
01/31/89 09:14:58
0. F:UN 9
RT AREA BC
0.18 45621 01 0. 86 3:2991 02 i. :n 11'.1300 1":12 2.05 3703651l=I 02
.4.51179093560 08 10.79 56784876 06 18.25 52233282 07
3252371413
HlDE:=< 9
CH= 11 A" PS= 1.
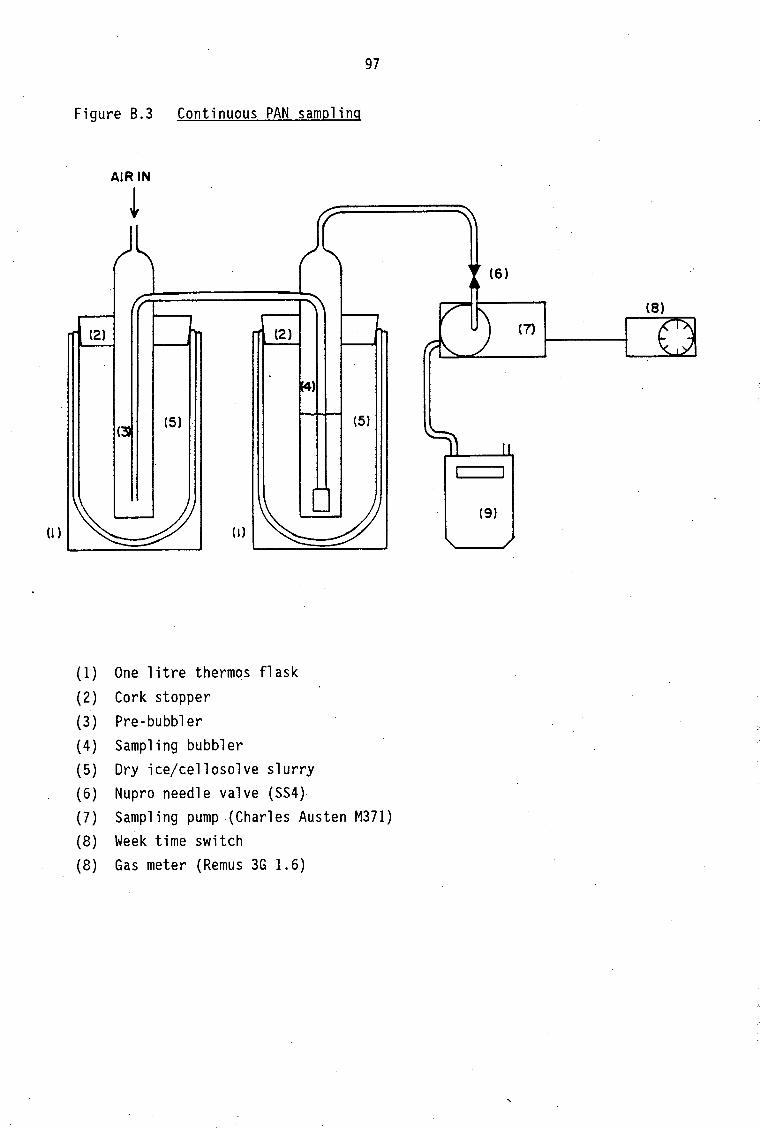
Univers
ityof
Cape T
own
97
Figure B.3 Continuous PAN sampling
AIR IN
!
(2) (2)
(5)
(I)
(1) One litre thermos flask (2) Cork stopper (3) Pre-bubbler (4) Sampling bubbler (5) Dry ice/cellosolve slurry (6) Nupro needle valve (SS4)
(5)
(7) Sampling pump (Charles Austen M371) (8) Week time switch (8) Gas meter (Remus 3G 1.6)
(6)
(8)
(7) .__ __ ___,
(9)
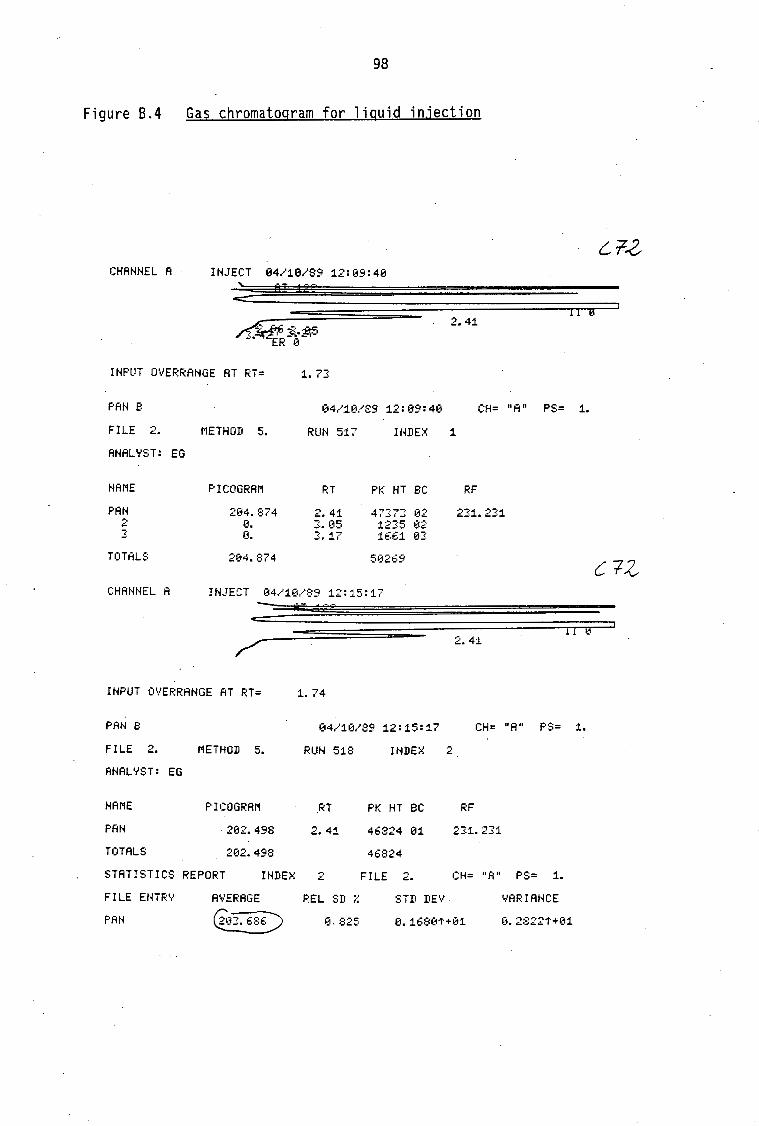
Univers
ityof
Cape T
own
Figure B.4
CHANNEL A
98
Gas chromatogram for liquid injection
INJECT 04110189 12:09:40
~FT :tcr
~~-;;;<; 2.41
INPUT OYERRANGE AT RT= 1.73
LI 0
PAN B 04/10/89 12:09:40 CH= "A" PS= 1.
FILE 2.
NAME
PAN 2 3
TOTALS
METHOI1 5.
PICOGRAM
204.874 0. 0.
204.874
RUN 517
RT
2.41 3:. 05 ::. 17
INDE:>i 1
PK HT BC
47J:7J: 02 12]5 02 1661 0::
5~3269
RF
2::1. 2::1
CHANNEL A INJECT 04/10/89 12:15:17 - MT
; 2.41
INPUT OVERRANGE AT RT= 1.74
ii 0
PAN 8 04/10/89 12:15:17 CH= "A" PS= 1.
FILE 2.
ANALYST: EG
NAME
PAN
TOTALS
METHOD 5.
PICOGRAM
202.498
202.498
RUN 518
RT
2.41
STATISTICS REPORT INDEX 2
FILE ENTF:V AVERAGE REL SD %
PAN ~ 0,825
INDEX 2
PK HT BC RF
46824 01 23:1. 231
46824
FILE 2. CH= "A" PS= 1.
STD DEV VARIANCE
0.1680tHJ1
C7Z
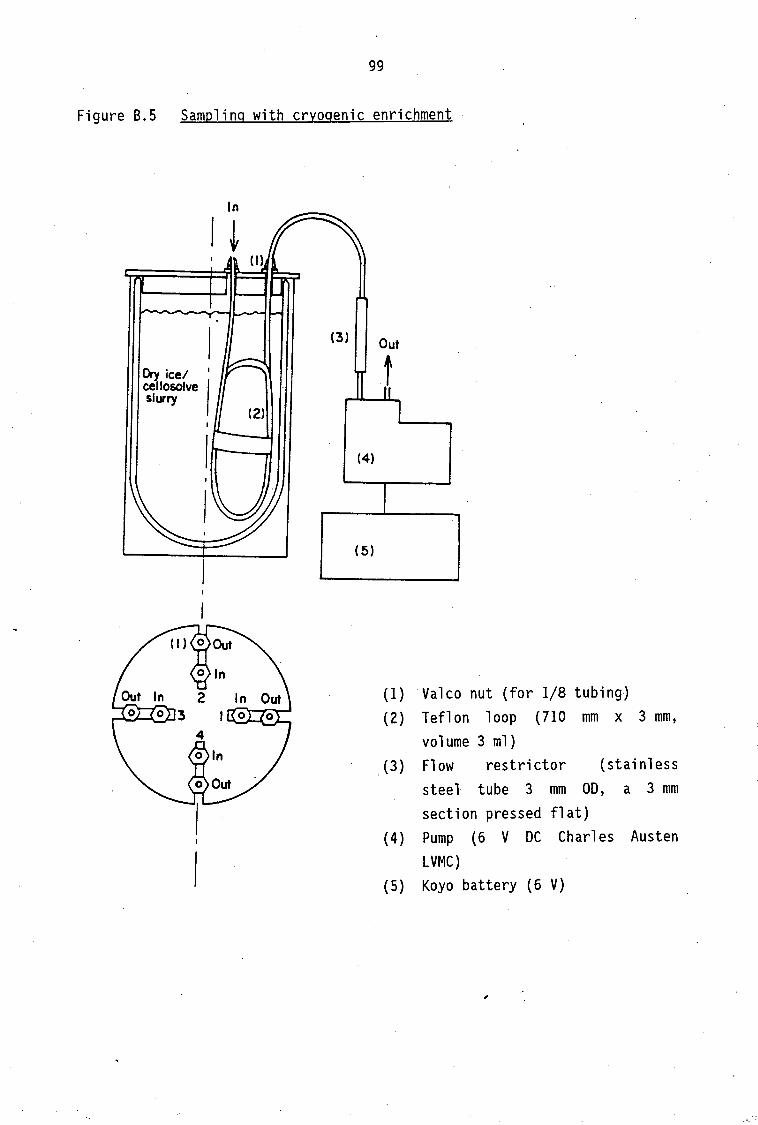
Univers
ityof
Cape T
own
99
Figure B.5 Sampling with cryogenic enrichment
Ory ice/ 1
eel losolve I slurry
In
I i
(2)
(3)
(4)
(5)
(1) (2)
(3)
(4)
(5)
Valeo nut (for 1/8 tubing) Teflon loop (710 mm x 3 mm,
volume 3 ml) Flow restrictor (stainless
steel tube 3 mm OD, a 3 mm section pressed fl at) Pump (6 v DC Charles Austen
LVMC) Koyo battery (6 V)
,
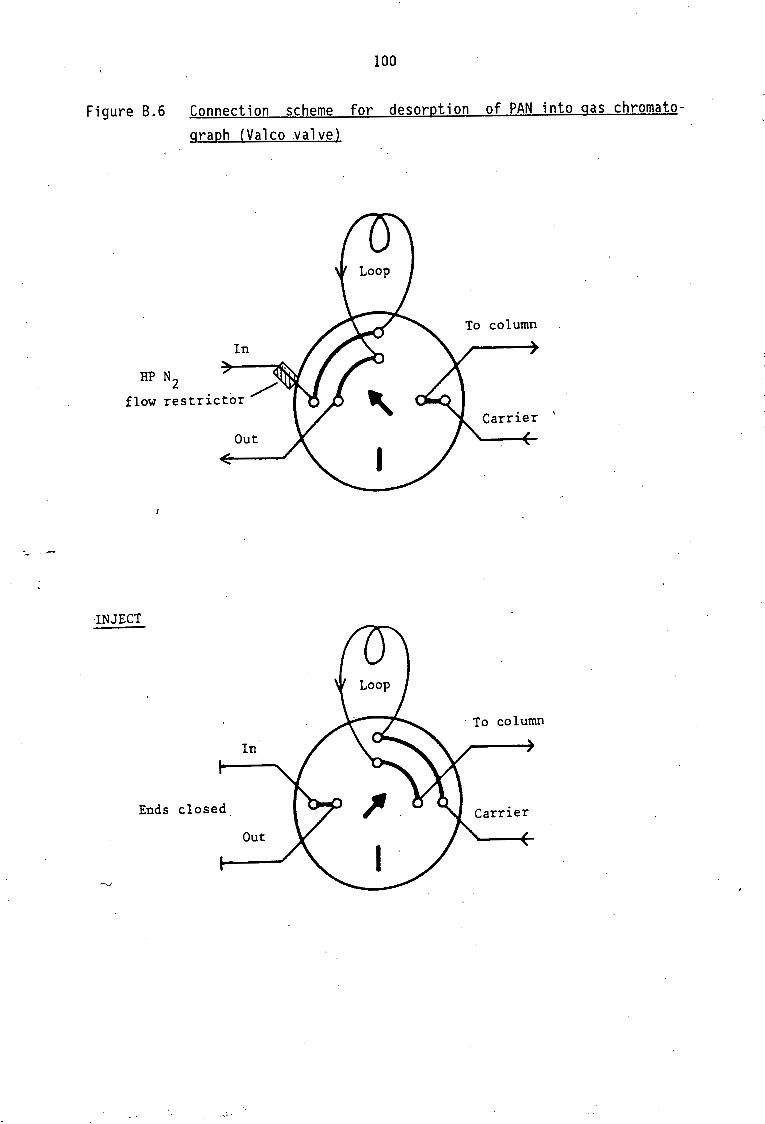
Univers
ityof
Cape T
own
100
Figure B.6 Connection scheme for desorption of PAN into gas chromato
graph (Valeo valve)
To column
HP N2 .. / flow restri.ctor
Carrier ' Out
INJECT
·To column
In
Ends closed
Out

Univers
ityof
Cape T
own
101
APPENDIX C: RESULTS OF PAN MEASUREMENTS
TABLES
" .; ;,.
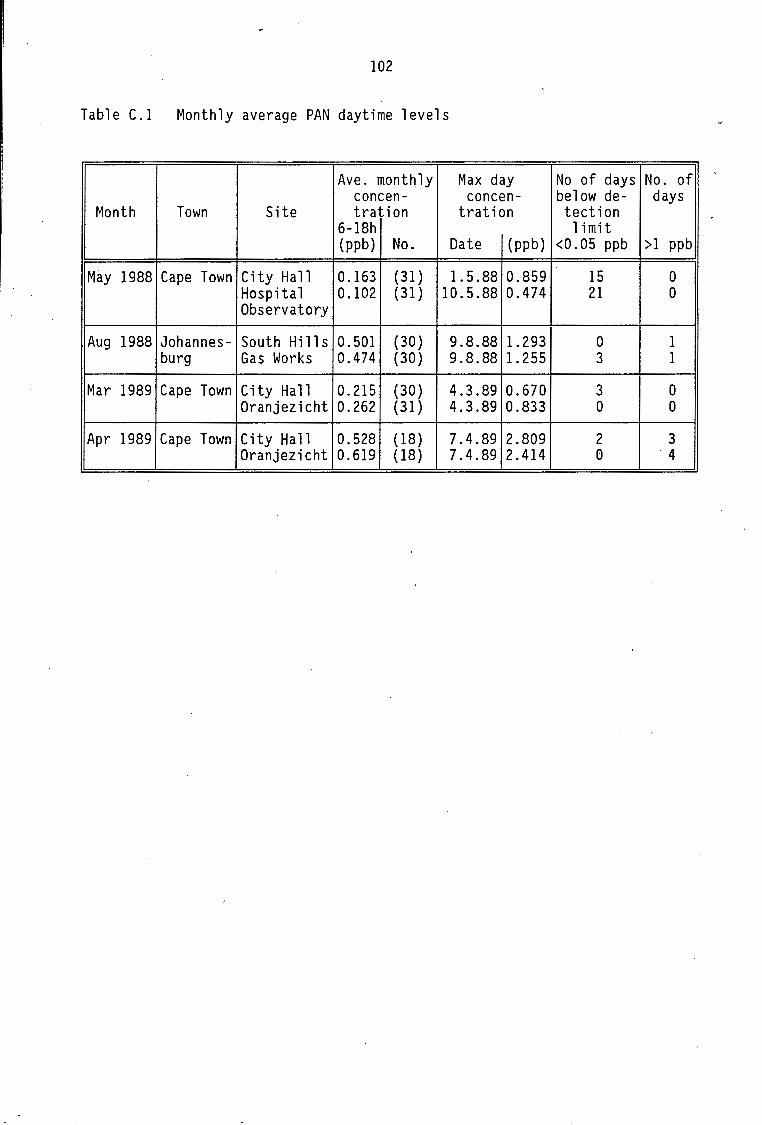
Univers
ityof
Cape T
own
102
Table C.l Monthly average PAN daytime levels
Ave. monthly Max day No of days No. of concen- concen- below de- days
Month Town Site tration tration tection 6-18h limit (ppb) No. Date (ppb) <0.05 ppb >l ppb
May 1988 Cape Town City Hall 0.163 (31) 1. 5.88 0.859 15 0 Hospital 0.102 (31) 10.5.88 0.474 21 0 Observatory
Aug 1988 Johannes- South Hills 0.501 (30) 9.8.88 1.293 0 1 burg Gas Works 0.474 (30) 9.8.88 1. 255 3 1
Mar 1989 Cape Town City Hall 0.215 (30) 4.3.89 0.670 3 0 Oranjezicht 0.262 (31) 4.3.89 0.833 0 0
Apr 1989 Cape Town City Hall 0.528 (18) 7.4.89 2.809 2 3 Oranjezicht 0.619 (18) 7.4.89 2.414 0 ·4
Univers
ityof
Cape T
own
103
TABLES C.2 to C.11
Average daytime concentrations of PAN, ozone and nitrogen oxides
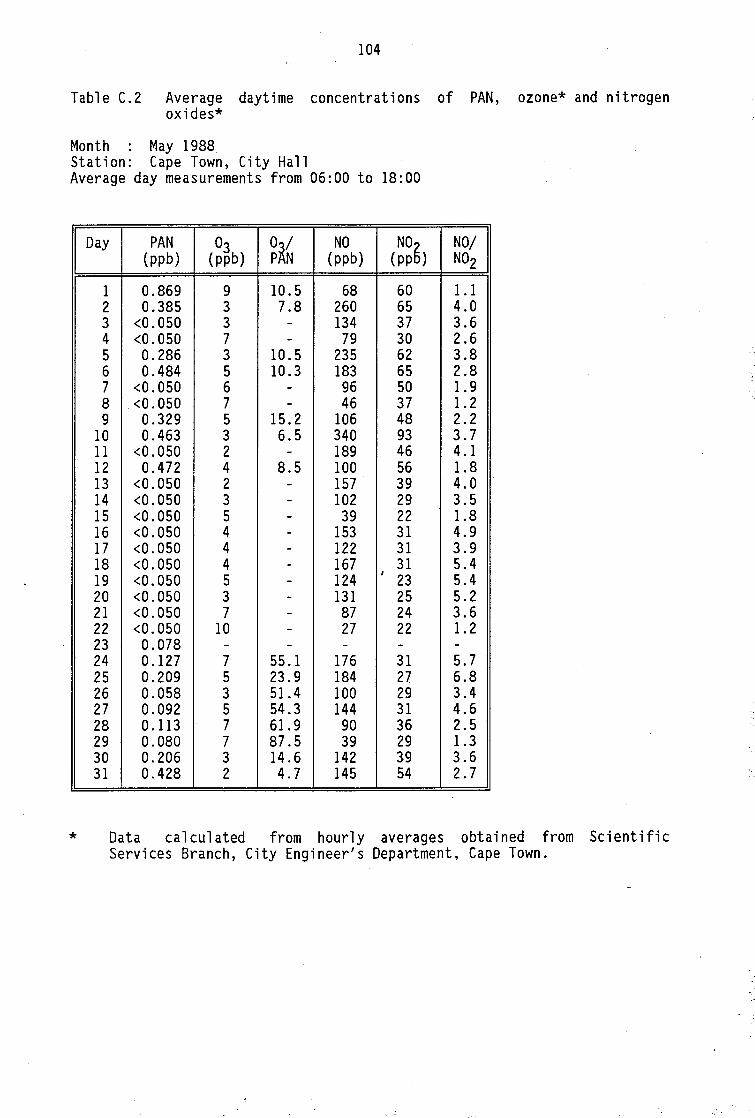
Univers
ityof
Cape T
own
104
Table C.2 Average daytime concentrations of PAN, ozone* and nitrogen oxides*
Month : May 1988 Station: Cape Town, City Hall Average day measurements from 06:00 to 18:00
Day PAN 03 O~/ NO NO~ NO/ (ppb) (ppb) p N (ppb) (pp ) N02
1 0.869 9 10.5 68 60 1.1 2 0.385 3 7.8 260 65 4.0 3 <0.050 3 - 134 37 3.6 4 <0.050 7 - 79 30 2.6 5 0.286 3 10.5 235 62 3.8 6 0.484 5 10.3 183 65 2.8 7 <0.050 6 - 96 50 1.9 8 <0.050 7 - 46 37 1.2 9 0.329 5 15.2 106 48 2.2
10 0.463 3 6.5 340 93 3.7 11 <0.050 2 - 189 46 4.1 12 0.472 4 8.5 100 56 1.8 13 <0.050 2 - 157 39 4.0 14 <0.050 3 - 102 29 3.5 15 <0.050 5 - 39 22 1.8 16 <0.050 4 - 153 31 4.9 17 <0.050 4 - 122 31 3.9 18 <0.050 4 - 167 31 5.4 19 <0.050 5 124
I
23 5.4 -20 <0.050 3 - 131 25 5.2 21 <0.050 7 - 87 24 3.6 22 <0.050 10 - 27 22 1.2 23 0.078 - - - - -24 0.127 7 55.l 176 31 5.7 25 0.209 5 23.9 184 27 6.8 26 0.058 3 51.4 100 29 3.4 27 0.092 5 54.3 144 31 4.6 28 0.113 7 61. 9 90 36 2.5 29 0.080 7 87.5 39 29 1.3 30 0.206 3 14.6 142 39 3.6 31 0.428 2 4.7 145 54 2.7
* Data calculated from hourly averages obtained from Scientific Services Branch, City Engineer's Department, Cape Town.
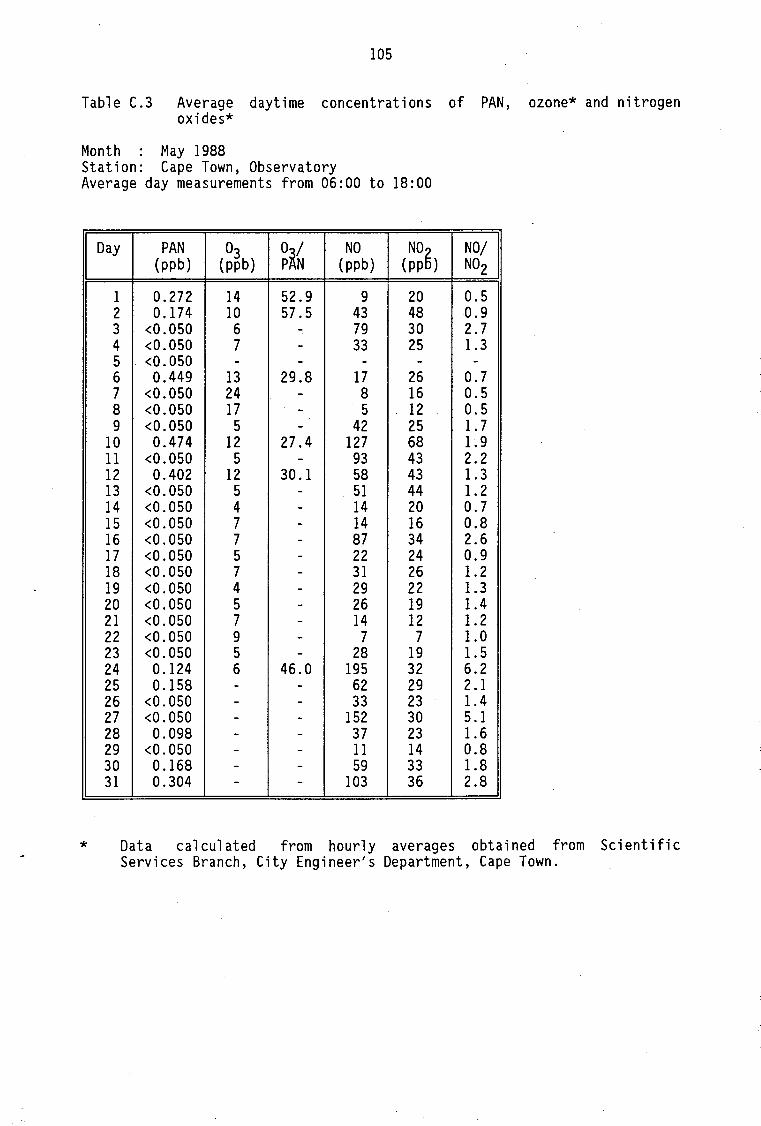
Univers
ityof
Cape T
own
105
Table C.3 Average daytime concentrations of PAN, ozone* and nitrogen oxides*
Month : May 1988 Station: Cape Town, Observatory Average day measurements from 06:00 to 18:00
Day PAN 03 O~/ NO NO NO/ (ppb) (ppb) p N (ppb) (pp~) N02
1 0.272 14 52.9 9 20 0.5 2 0.174 10 57.5 43 48 0.9 3 <0.050 6 - 79 30 2.7 4 <0.050 7 - 33 25 1.3 5 <0.050 - - - - -6 0.449 13 29.8 17 26 0.7 7 <0.050 24 - 8 16 0.5 8 <0.050 17 - 5 12 0.5 9 <0.050 5 - 42 25 1. 7
10 0.474 12 27.4 127 68 1. 9 11 <0.050 5 - 93 43 2.2 12 0.402 12 30.1 58 43 1.3 13 <0.050 5 - 51 44 1.2 14 <0.050 4 - 14 20 0.7 15 <0.050 7 - 14 16 0.8 16 <0.050 7 - 87 34 2.6 17 <0.050 5 - 22 24 0.9 18 <0.050 7 - 31 26 1.2 19 <0.050 4 - 29 22 1.3 20 <0.050 5 - 26 19 1.4 21 <0.050 7 - 14 12 1.2 22 <0.050 9 - 7 7 1.0 23 <0.050 5 - 28 19 1.5 24 0 .124 6 46.0 195 32 6.2 25 0.158 - - 62 29 2.1 26 <0.050 - - 33 23 1.4 27 <0.050 - - 152 30 5.1 28 0.098 - - 37 23 1.6 29 <0.050 - - 11 14 0.8 30 0.168 - - 59 33 1.8 31 0.304 - - 103 36 2.8
* Data calculated from hourly averages obtained from Scientific Services Branch, City Engineer's Department, Cape Town.
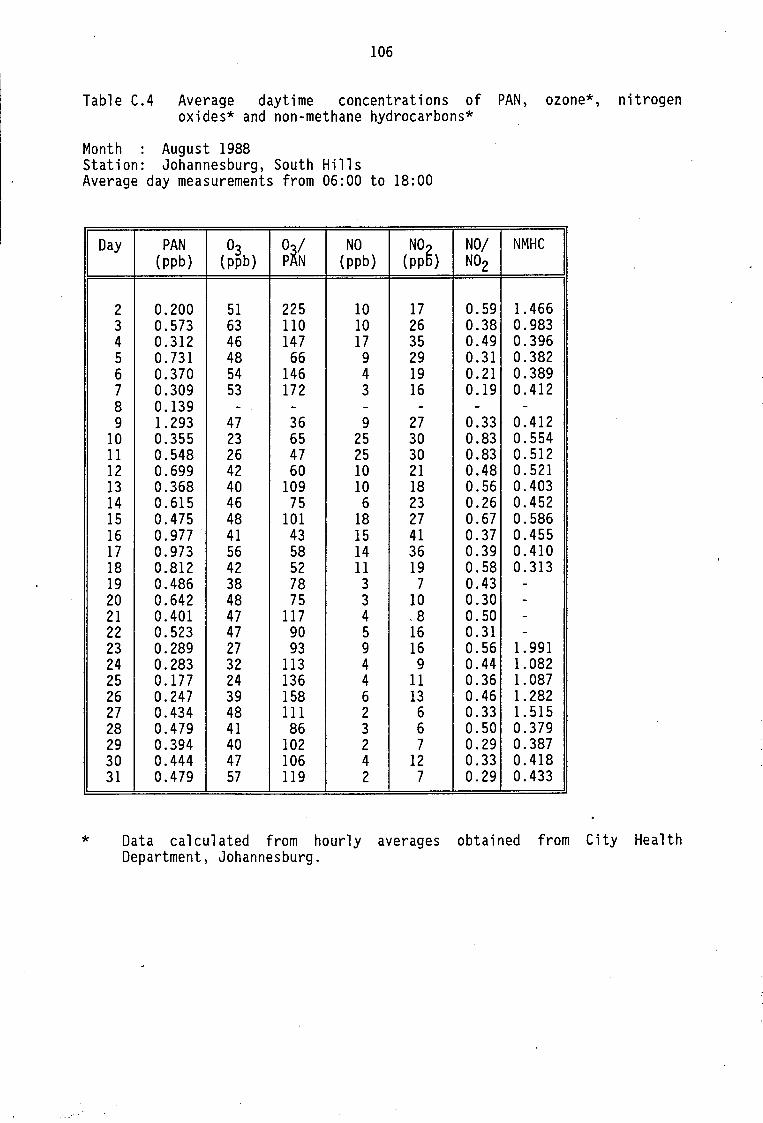
Univers
ityof
Cape T
own
106
Table C.4 Average daytime concentrations of PAN, ozone*, nitrogen oxides* and non-methane hydrocarbons*
Month : August 1988 Station: Johannesburg, South Hills Average day measurements from 06:00 to 18:00
Day PAN 03 Oi/ NO NO NO/ NMHC (ppb) (ppb) p N (ppb) (pp~) N02
2 0.200 51 225 10 17 0.59 1.466 3 0.573 63 110 10 26 0.38 0.983 4 0.312 46 147 17 35 0.49 0.396 5 0.731 48 66 9 29 0.31 0.382 6 0.370 54 146 4 19 0.21 0.389 7 0.309 53 172 3 16 0.19 0.412 8 0.139 - - - - - -9 1.293 47 36 9 27 0.33 0.412
10 0.355 23 65 25 30 0.83 0.554 11 0.548 26 47 25 30 0.83 0.512 12 0.699 42 60 10 21 0.48 0.521 13 0.368 40 109 10 18 0.56 0.403 14 0.615 46 75 6 23 0.26 0.452 15 0.475 48 101 18 27 0.67 0.586 16 0.977 41 43 15 41 0.37 0.455 17 0.973 56 58 14 36 0.39 0.410 18 0.812 42 52 11 19 0.58 0.313 19 0.486 38 78 3 7 0.43 -20 0.642 48 75 3 10 0.30 -21 0.401 47 117 4 .8 0.50 -22 0.523 47 90 5 16 0.31 -23 0.289 27 93 9 16 0.56 1. 991 24 0.283 32 113 4 9 0.44 1.082 25 0.177 24 136 4 11 0.36 1.087 26 0.247 39 158 6 13 0.46 1.282 27 0.434 48 111 2 6 0.33 1. 515 28 0.479 41 86 3 6 0.50 0.379 29 0.394 40 102 2 7 0.29 0.387 30 0.444 47 106 4 12 0.33 0.418 31 0.479 57 119 2 7 0.29 0.433
* Data calculated from hourly averages obtained from City Health Department, Johannesburg.
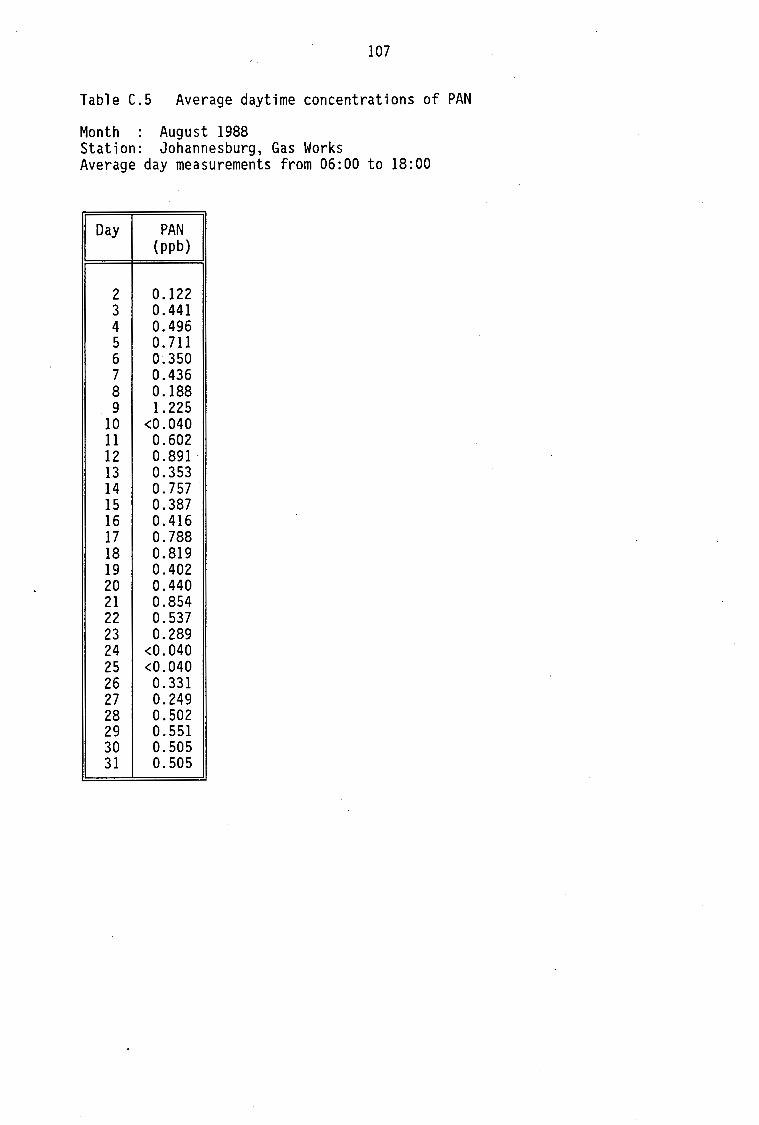
Univers
ityof
Cape T
own
107
Table C.5 Average daytime concentrations of PAN
Month : August 1988 Station: Johannesburg, Gas Works Average day measurements from 06:00 to 18:00
Day PAN (ppb)
2 0.122 3 0.441 4 0.496 5 0. 711 6 0.350 7 0.436 8 0.188 9 1.225
10 <0.040 11 0.602 12 0.891 13 0.353 14 0.757 15 0.387 16 0.416 17 0.788 18 0.819 19 0.402 20 0.440 21 0.854 22 0.537 23 0.289 24 <0.040 25 <0.040 26 0.331 27 0.249 28 0.502 29 0.551 30 0.505 31 0.505
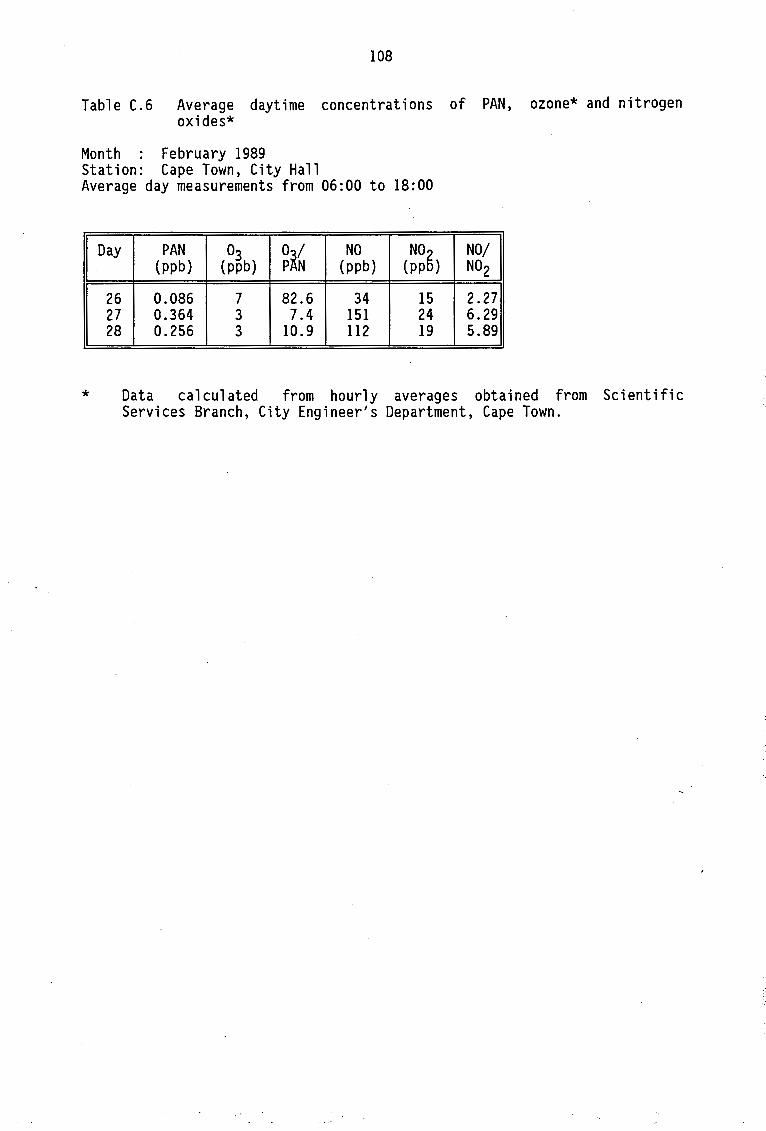
Univers
ityof
Cape T
own
108
Table C.6 Average daytime concentrations of PAN, ozone* and nitrogen oxides*
Month : February 1989 Station: Cape Town, City Hall Average day measurements from 06:00 to 18:00
Day PAN 03 O~/ NO NO (ppb) (ppb) p N (ppb) (pp~)
26 0.086 7 82.6 34 15 27 0.364 3 7.4 151 24 28 0.256 3 10.9 112 19
NO/ N02
2.27 6.29 5.89
* Data calculated from hourly averages obtained from Scientific Services Branch, City Engineer's Department, Cape Town.
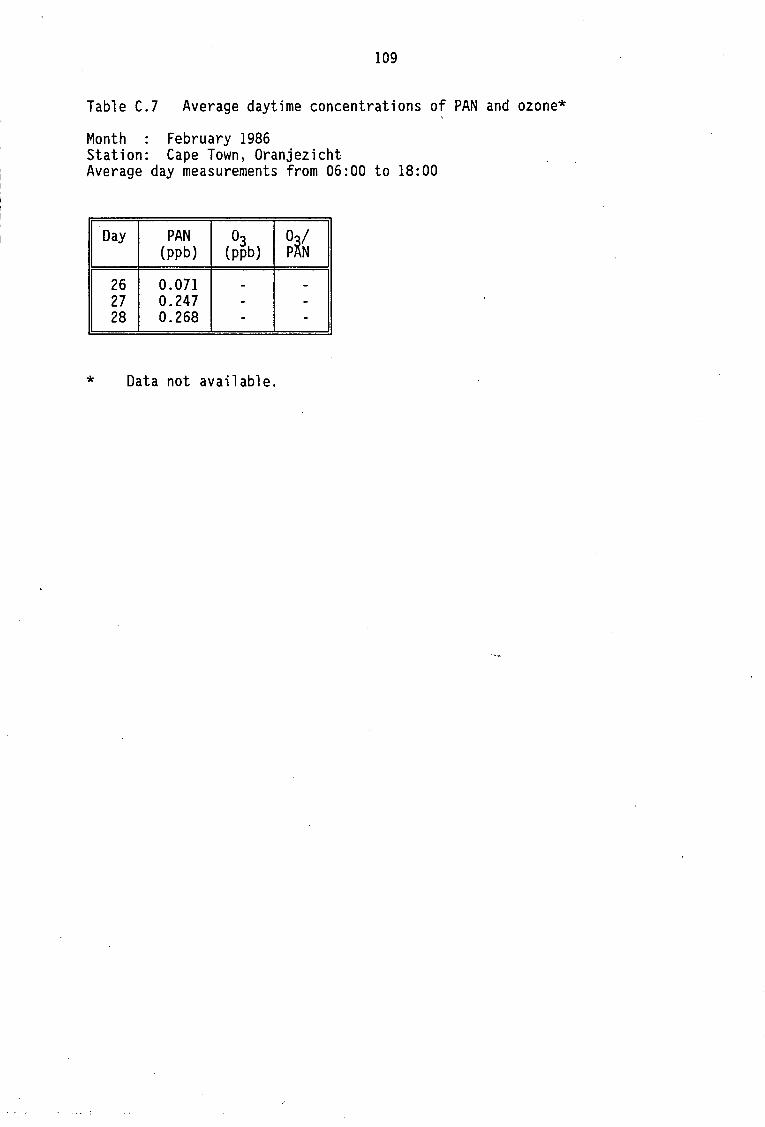
Univers
ityof
Cape T
own
109
Table C.7 Average daytime concentrations of PAN and ozone*
Month : February 1986 Station: Cape Town, Oranjezicht Average day measurements from 06:00 to 18:00
Day PAN 03 O~/ (ppb) (ppb) p N
26 0.071 - -27 0.247 - -28 0.268 - -
* Data not available.
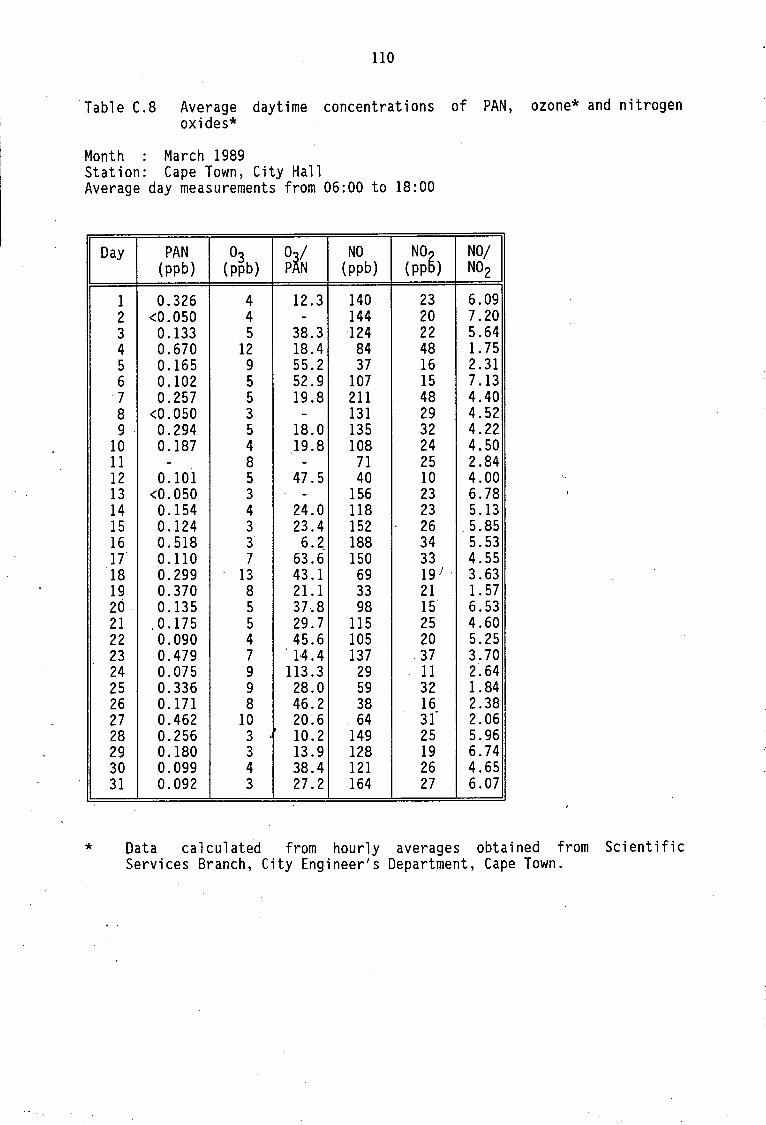
Univers
ityof
Cape T
own
110
Table C.8 Average daytime concentrations of PAN, ozone* and nitrogen oxides*
Month : March 1989 Station: - Cape Town, City Hall Average day measurements from 06:00 to 18:00
Day PAN 03 O~/ NO NO NO/ (ppb) (ppb) p N (ppb) (pp~) N02
1 0.326 4 12.3 140 23 6.09 2 <0.050 4 - 144 20 7.20 3 0.133 5 38.3 124 22 5.64 4 0.670 12 18.4 84 48 1. 75 5 0.165 9 55.2 37 16 2.31 6 0.102 5 52.9 107 15 7 .13 7 0.257 5 19.8 211 48 4.40 8 <0.050 3 - 131 29 4.52 9 - 0.294 5 18.0 135 32 4.22
10 0.187 4 19.8 108 24 4.50 11 - 8 - 71 25 2.84 12 0.101 5 47.5 40 10 4.00 13 <0.050 3 - 156 23 6.78 14 0.154 4 24.0 118 23 5.13 15 0 .124 3 23.4 152 26 '5.85 16 0.518 3 6. 2_ 188 34 5.53 17 0.110 7 63.6 150 33 4.55 18 0.299 13 43.1 69 19) ' 3.63 19 0.370 8 21.1 33 21 1. 57 20 0.135 5 37-.8 98 15 6.53 21 ,0.175 5 29.7 115 25 4.60 22 0.090 4 45.6 105 20 5.25 23 0.479 7 '14.4 137 37 3.70 24 0.075 9 113.3 29 11 2.64 25 0.336 9 28.0 59 32 1.84 26 0.171 8 46.2 38 16 2.38 27 0.462 10 20.6 64 31 2.06 28 0.256 3 ' 10.2 149 25 5.96 29 0.180 3' 13.9 128 19 6.74 30 0.099 4 38.4 121 26 4.65 31 0.092 3 27.2 164 27 6.07
* Data calculated from hourly averages obtained from Scientific Services Branch, City Engineer's Department, Cape Town.
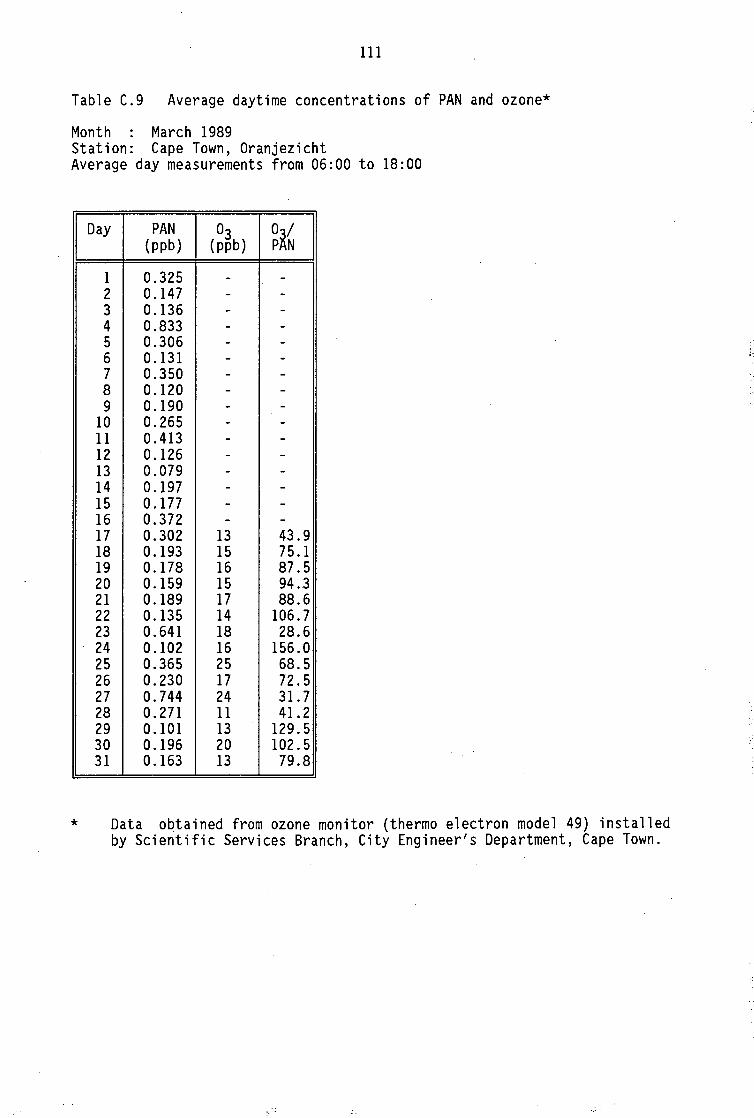
Univers
ityof
Cape T
own
111
Table C.9 Average daytime concentrations of PAN and ozone*
Month : March 1989 Station: Cape Town, Oranjezicht Average day measurements from 06:00 to 18:00
Day
1 2 3 4 5 6 7 8 9
10 11 12 13 14 15 16 17 18 19 20 21 22 23 24 25 26 27 28 29 30 31
*
PAN 03 O~/ (ppb) (ppb) p N
0.325 - -0.147 - -0.136 - -0.833 - -0.306 - -0.131 - -0.350 - -0.120 - -0.190 - -0.265 - -0.413 - -0.126 - -0.079 - -0 .197 - -0.177 - -0.372 - -0.302 13 43.9 0.193 15 75.1 0.178 16 87.5 0.159 15 94.3 0.189 17 88.6 0.135 14 106.7 0.641 18 28.6 0.102 16 156.0 0.365 25 68.5 0.230 17 72.5 0.744 24 31. 7 0.271 11 41.2 0 .101 13 129.5 0.196 20 102.5 0.163 13 79.8
Data obtained from ozone monitor (thermo electron model 49) installed by Scientific Services Branch, City Engineer's Department, Cape Town.
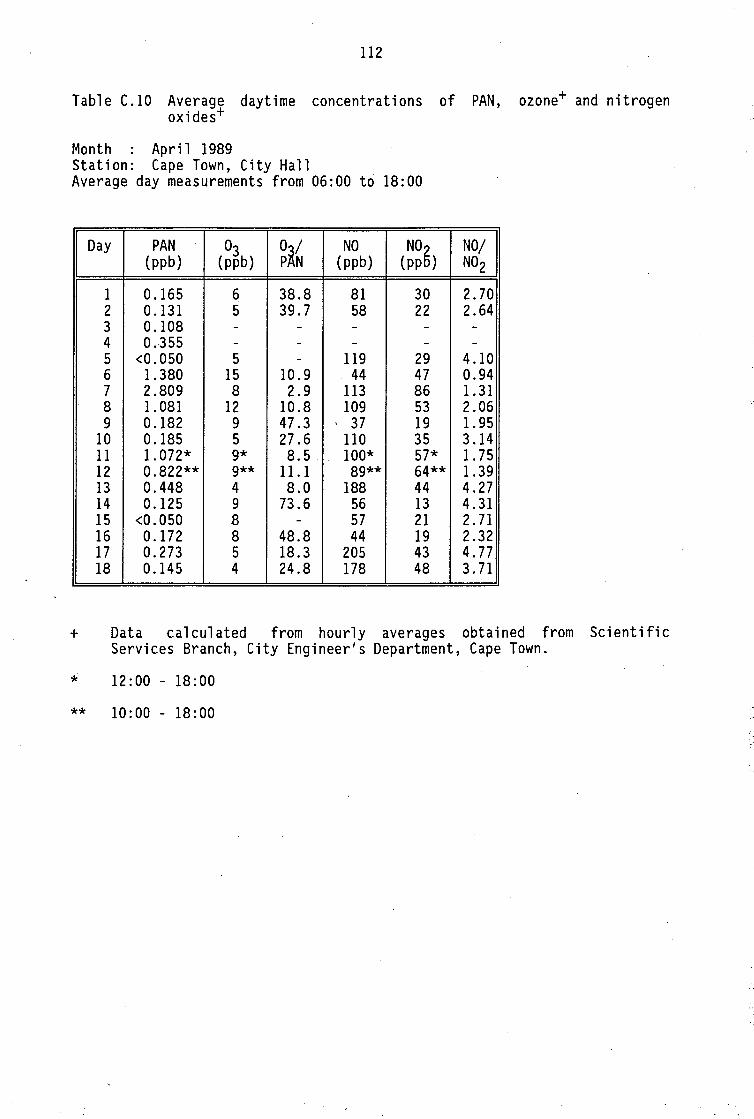
Univers
ity of
Cap
e Tow
n
112
Table C.10 Average daytime concentrations of PAN, ozone+ and nitrogen oxides+
Month : April 1989 Station: Cape Town, City Hall Average day measurements from 06:00 to 18:00
Day PAN 03 Oi/ NO N05 NO/ (ppb) (ppb) p N (ppb) (pp ) N02
1 0.165 6 38.8 81 30 2.70 2 0.131 5 39.7 58 22 2.64 3 0.108 - - - - -4 0.355 - - - - -5 <0.050 5 - 119 29 4.10 6 1.380 15 10.9 44 47 0.94 7 2.809 8 2.9 113 86 1.31 8 1.081 12 10.8 109 53 2.06 9 0.182 9 47.3 37 19 1.95
10 0.185 5 27.6 110 35 3.14 11 1.072* 9* 8.5 100* 57* 1. 75 12 0.822** 9** 11.1 89** 64** 1.39 13 0.448 4 8.0 188 44 4.27 14 0.125 9 73.6 56 13 4.31 15 <0.050 8 - 57 21 2.71 16 0.172 8 48.8 44 19 2.32 17 0.273 5 18.3 205 43 4.77 18 0.145 4 24.8 178 48 3. 71
+ Data calculated from hourly averages obtained from Scientific Services Branch, City Engineer's Department, Cape Town.
* 12:00 - 18:00
** 10:00 18:00
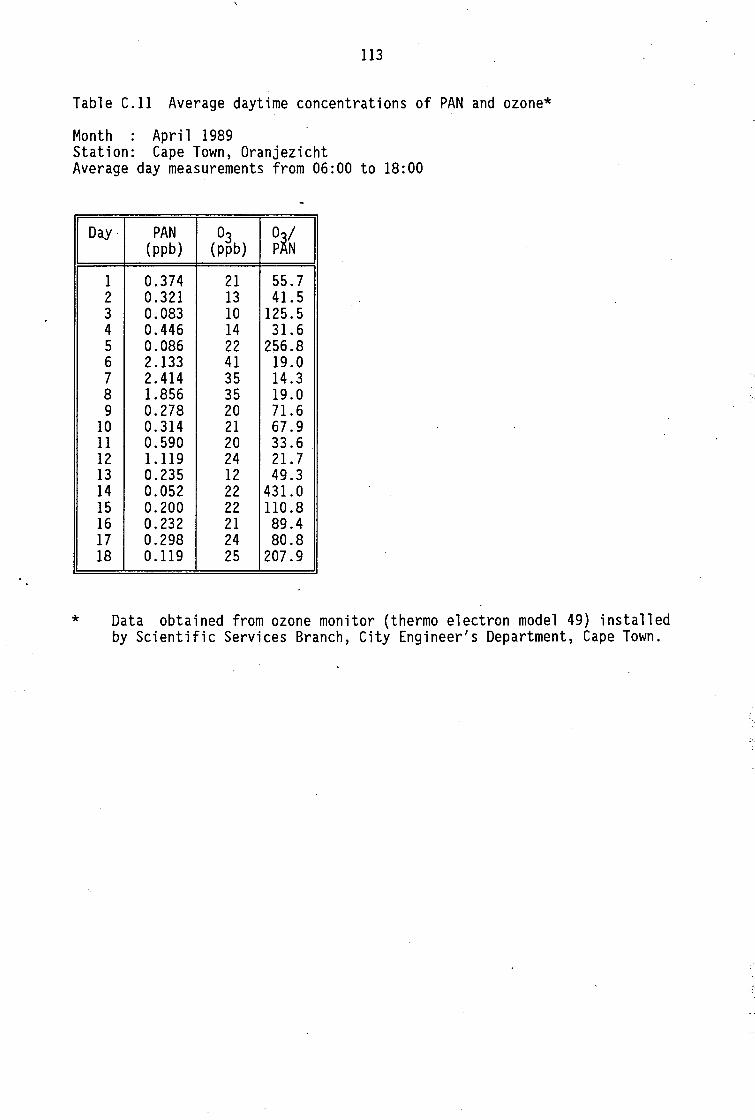
Univers
ity of
Cap
e Tow
n
113
Table C.11 Average daytime concentrations of PAN and ozone*
Month : April 1989 Station: Cape Town, Oranjezicht Average day measurements from 06:00 to 18:00
Day· PAN 03 O~/ (ppb) (ppb) p N
1 0.374 21 55.7 2 0.321 13 41. 5 3 0.083 10 125.5 4 0.446 14 31.6 5 0.086 22 256.8 6 2.133 41 19.0 7 2.414 35 14.3 8 1.856 35 19.0 9 0.278 20 71.6
10 0.314 21 67.9 11 0.590 20 33.6 12 1.119 24 21. 7 13 0.235 12 49.3 14 0.052 22 431.0 15 0.200 22 110.8 16 0.232 21 89.4 17 0.298 24 80.8 18 0.119 25 207.9
* Data obtained from ozone monitor (thermo electron model 49) installed by Scientific Services Branch, City Engineer's Department, Cape Town.
Univers
ity of
Cap
e Tow
n
114
TABLES C.12 - C.20
Average daytime concentrations of PAN and meteorological data
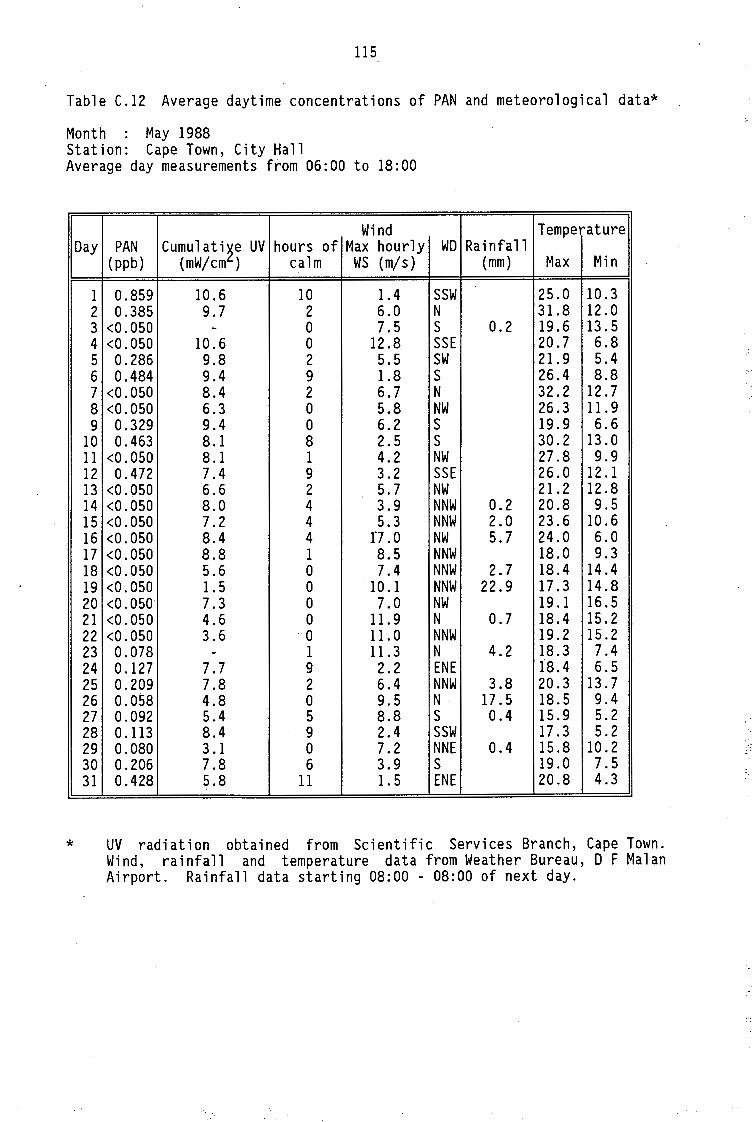
Univers
ity of
Cap
e Tow
n
115
Table C.12 Average daytime concentrations of PAN and meteorological data*
Month : May 1988 Station: Cape Town, City Hall Average day measurements from 06:00 to 18:00
Wind Temperature Day PAN Cumulati~e UV hours of Max hourly WD Rainfall
(ppb) (mW/cm ) calm WS (m/s) (mm) Max Min
1 0.859 10.6 10 1.4 SSW 25.0 10.3 2 0.385 9.7 2 6.0 N 31.8 12.0 3 <0.050 - 0 7.5 s 0.2 19.6 13.5 4 <0.050 10.6 0 12.8 SSE 20.7 6.8 5 0.286 9.8 2 5.5 SW 21. 9 5.4 6 0.484 9.4 9 1.8 s 26.4 8.8 7 <0.050 8.4 2 6.7 N 32.2 12.7 8 <0.050 6.3 0 5.8 NW 26.3 11. 9 9 0.329 9.4 0 6.2 s 19.9 6.6
10 0.463 8.1 8 2.5 s 30.2 13.0 11 <0.050 8.1 1 4.2 NW 27.8 9.9 12 0.472 7.4 9 3.2 SSE 26.0 12.1 13 <0.050 6.6 2 5.7 NW 21.2 12.8 14 <0.050 8.0 4 3.9 NNW 0.2 20.8 9.5 15 <0.050 7.2 4 5.3 NNW 2.0 23.6 10.6 16 <0.050 8.4 4 17.0 NW 5.7 24.0 6.0 17 <0.050 8.8 1 8.5 NNW 18.0 9.3 18 <0.050 5.6 0 7.4 NNW 2.7 18.4 14.4 19 <0.050 1.5 0 10.1 NNW 22.9 17.3 14.8 20 <0.050 7.3 0 7.0 NW 19.1 16.5 21 <0.050 4.6 0 11. 9 N 0.7 18.4 15.2 22 <0.050 3.6 ·o 11.0 NNW 19.2 15.2 23 0.078 - 1 11.3 N 4.2 18.3 7.4 24 0 .127 7.7 9 2.2 ENE 18.4 6.5 25 0.209 7.8 2 6.4 NNW 3.8 20.3 13.7 26 0.058 4.8 0 9.5 N 17.5 18.5 9.4 27 0.092 5.4 5 8.8 s 0.4 15.9 5.2 28 0.113 8.4 9 2.4 SSW 17 .3 5.2 29 0.080 3 .1 0 7.2 NNE 0.4 15.8 10.2 30 0.206 7.8 6 3.9 s 19.0 7.5 31 0.428 5.8 11 1. 5 ENE 20.8 4.3
* UV radiation obtained from Scientific Services Branch, Cape Town. Wind, rainfall and temperature data from Weather Bureau, D F Malan Airport. Rainfall data starting 08:00 - 08:00 of next day.
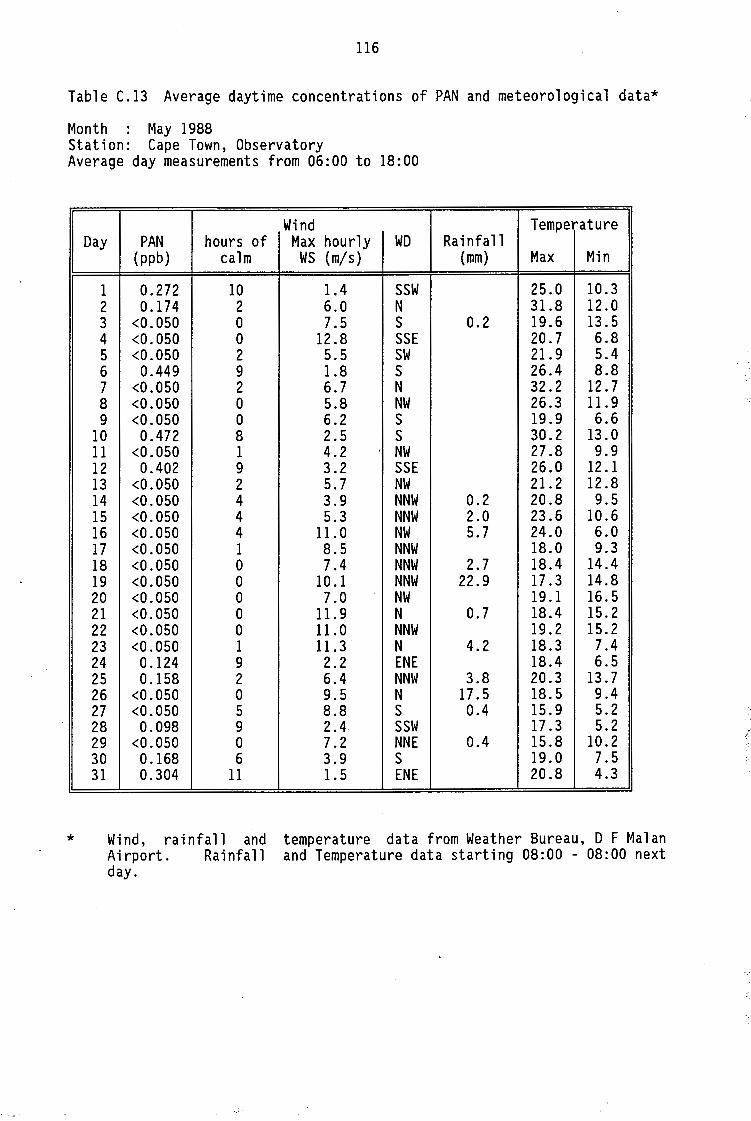
Univers
ity of
Cap
e Tow
n
116
Table C.I3 Average daytime concentrations of PAN and meteorological data*
Month : May I988 Station: Cape Town, Observatory Average day measurements from 06:00 to I8:00
Wind Temperature Day PAN hours of Max hourly WO Rainfall
(ppb) calm WS (m/s) (mm) Max Min
I 0.272 IO 1.4 SSW 25.0 I0.3 2 O. I 74 2 6.0 N 31.8 I2.0 3 <0.050 0 7.5 s 0.2 I9.6 I3.5 4 <0.050 0 I2.8 SSE 20.7 6.8 5 <0.050 2 5.5 SW 21. 9 5.4 6 0.449 9 1.8 s 26.4 8.8 7 <0.050 2 6.7 N 32.2 I2.7 8 <0.050 0 5.8 NW 26.3 II. 9 9 <0.050 0 6.2 s I9.9 6.6
IO 0.472 8 2.5 s 30.2 I3.0 II <0.050 I 4.2 NW 27.8 9.9 I2 0.402 9 3.2 SSE 26.0 I2.I I3 <0.050 2 5.7 NW 21. 2 I2.8 I4 <0.050 4 3.9 NNW 0.2 20.8 9.5 I5 <0.050 4 5.3 NNW 2.0 23.6 I0.6 I6 <0.050 4 II. 0 NW 5.7 24.0 6.0 I7 <0.050 I 8.5 NNW I8.0 9.3 I8 <0.050 0 7.4 NNW 2.7 I8.4 I4.4 I9 <0.050 0 IO.I NNW 22.9 I7.3 I4.8 20 <0.050 0 7.0 NW I9.I I6.5 2I <0.050 0 II. 9 N 0.7 I8.4 I5.2 22 <0.050 0 II. 0 NNW I9.2 I5.2 23 <0.050 I Il.3 N 4.2 I8.3 7.4 24 0. I24 9 2.2 ENE I8.4 6.5 25 O. I58 2 6.4 NNW 3.8 20.3 13. 7 26 <0.050 0 9.5 N I7.5 I8.5 9.4 27 <0.050 5 8.8 s 0.4 I5.9 5.2 28 0.098 9 2.4 SSW I7.3 5.2 .,
29 <0.050 0 7.2 NNE 0.4 I5.8 I0.2 (
30 O. I68 6 3.9 s I9.0 7.5 3I 0.304 11 1.5 ENE 20.8 4.3
* Wind, rainfall and temperature data from Weather Bureau, D F Malan Airport. Rainfall and Temperature data starting 08:00 - 08:00 next day.
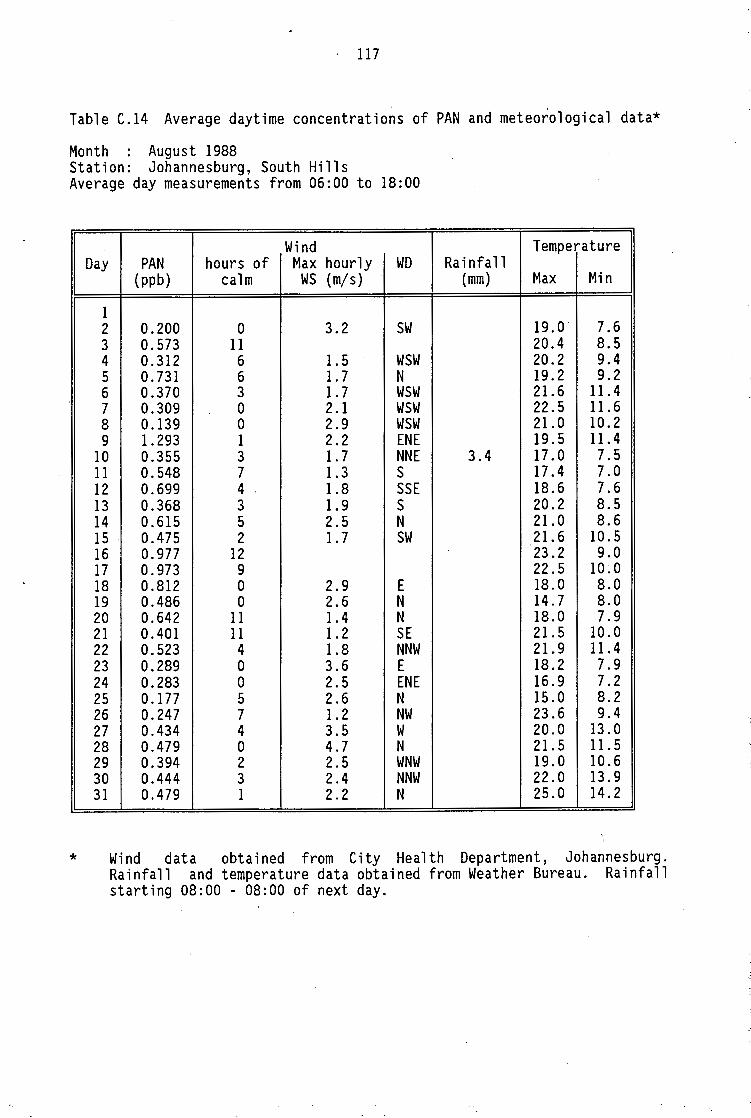
Univers
ity of
Cap
e Tow
n
. 117
Table C.14 Average daytime concentrations of PAN and meteorological data*
Month : August 1988 Station: Johannesburg, South Hills Average day measurements from 06:00 to 18:00
Day
1 2 3 4 5 6 7 8 9
10 11 12 13 14 15 16 17 18 19 20 21 22 23 24 25 26 27 28 29 30 31
*
Wind Temperature PAN hours of Max hourly WD Rainfall
(ppb) calm WS (m/s) (mm) Max Min
0.200 0 3.2 SW 19.0 7.6 0.573 11 20.4 8.5 0.312 6 1. 5 WSW 20.2 9.4 0.731 6 1. 7 N 19.2 9.2 0.370 3 1. 7 WSW 21.6 11.4 0.309 0 2.1 WSW 22.5 11. 6 0.139 0 2.9 WSW 21.0 10.2 1.293 1 2.2 ENE 19.5 11.4 0.355 3 1. 7 NNE 3.4 17 .0 7.5 0.548 7 1.3 s 17.4 7.0 0.699 4 1.8 SSE 18.6 7.6 0.368 3 1. 9 s 20.2 8.5 0.615 5 2.5 N 21.0 8.6 0.475 2 1. 7 SW 21.6 10.5 0.977 12 23.2 9.0 0.973 9 22.5 10~0
0.812 0 2.9 E 18.0 8.0 0.486 0 2.6 N 14.7 8.0 0.642 11 1.4 N 18.0 7.9 0.401 11 1.2 SE 21.5 10.0 0.523 4 1.8 NNW 21.9 11.4 0.289 0 3.6 E 18.2 7.9 0.283 0 2.5 ENE 16.9 7.2 0.177 5 2.6 N 15.0 8.2 0.247 7 1.2 NW 23.6 9.4 0.434 4 3.5 w 20.0 13.0 0.479 0 4.7 N 21. 5 11. 5 0.394 2 2.5 WNW 19.0 10.6 0.444 3 2.4 NNW 22.0 13.9 0.479 1 2.2 N 25.0 14.2
1
Wind data obtained from City Health Department, Johannesburg. Rainfall and temperature data obtained from Weather Bureau. Rainfall starting 08:00 - 08:00 of next day.
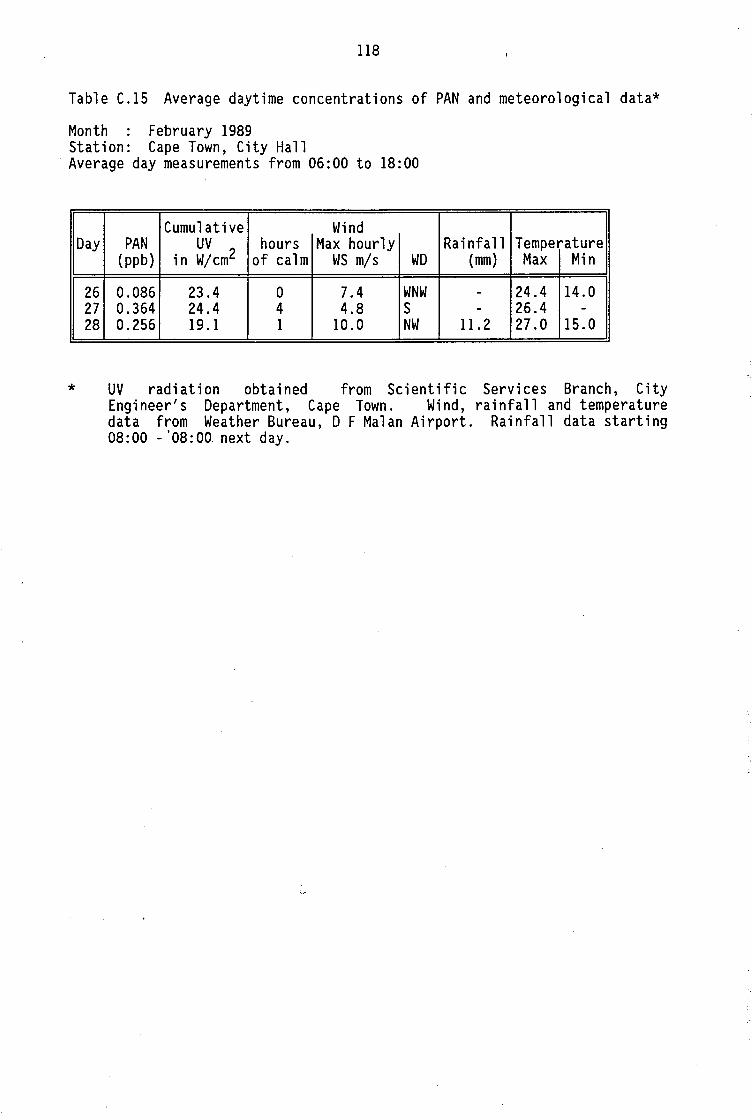
Univers
ity of
Cap
e Tow
n
118
Table C.15 Average daytime concentrations of PAN and meteorological data*
Month February 1989 Station: Cape Town, City Hall Average day measurements from 06:00 to 18:00
Cumulative Wind Day PAN UV hours Max hourly Rainfall Temperature
(ppb) in W/cm2 of calm WS m/s WO (mm) Max Min
26 0.086 23.4 0 7.4 WNW - 24.4 14.0 27 0.364 24.4 4 4.8 s - 26.4 -28 0.256 19.l l 10.0 NW 11.2 27.0 15.0
* UV radiation obtained from Scientific Services Branch, City Engineer's Department, Cape Town. Wind, rainfall and temperature data from Weather Bureau, D F Malan Airport. Rainfall data starting 08:00 -'08:00 next day.
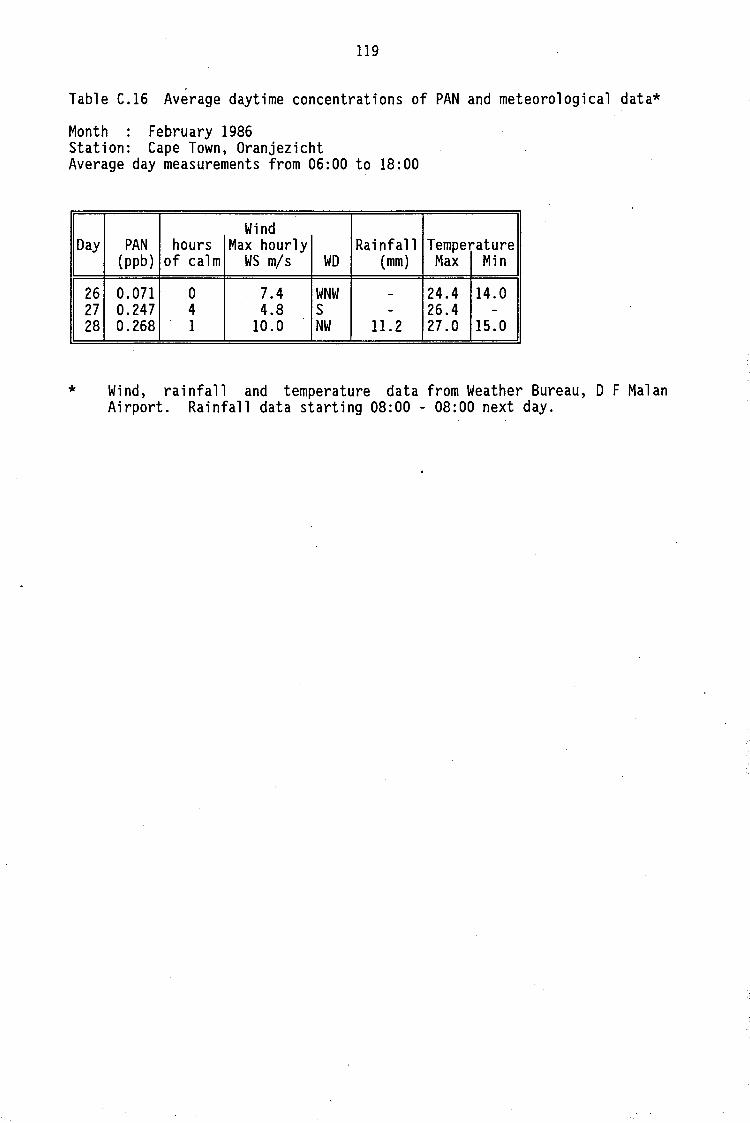
Univers
ity of
Cap
e Tow
n
119
Table C.16 Average daytime concentrations of PAN and meteorological data*
Month : February 1986 Station: Cape Town, Oranjezicht Average day measurements from 06:00 to 18:00
Wind Day PAN hours Max hourly Rainfall Temperature
(ppb) of calm WS m/s WO (mm) Max Min
26 0.071 0 7.4 WNW - 24.4 14.0 27 0.247 4 4.8 s - 26.4 -28 0.268 1 10.0 NW 11. 2 27.0 15.0
* Wind, rainfall and temperature data from Weather Bureau, D F Malan Airport. Rainfall data starting 08:00 - 08:00 next day.
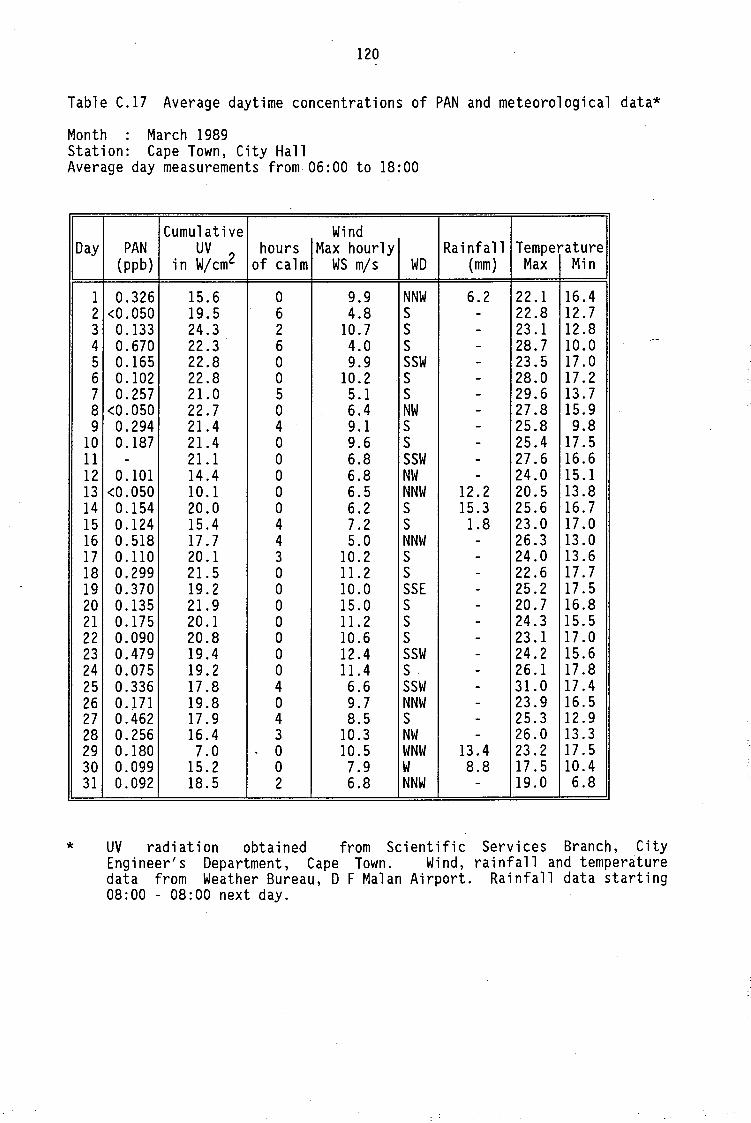
Univers
ity of
Cap
e Tow
n
120
Table C.17 Average daytime concentrations of PAN and meteorological data*
Month : March 1989 Station: Cape Town, City Hall Average day measurements from 06:00 to 18:00
Cumulative Wind Day PAN UV hours Max hourly Rainfall Temperature
(ppb) in W/cm2 of calm WS m/s WD (mm) Max Min
1 0.326 15.6 0 9.9 NNW 6.2 22.1 16.4 2 <0.050 19.5 6 4.8 s - 22.8 12.7 3 0.133 24.3 2 10.7 s - 23.l 12.8 4 0.670 22.3 6 4.0 s - 28.7 10.0 5 0 .165 22.8 0 9.9 SSW - 23.5 17.0 6 0.102 22.8 0 10.2 s - 28.0 17.2 7 0.257 21.0 5 5.1 s - 29.6 13.7 8 <0.050 22.7 0 6.4 NW - 27.8 15.9 9 0.294 21.4 4 9.1 s - 25.8 9.8
10 0.187 21.4 0 9.6 s - 25.4 17.5 11 - 21.1 0 6.8 SSW - 27.6 16.6 12 0 .101 14.4 0 6.8 NW - 24.0 15.1 13 <0.050 10.1 0 6.5 NNW 12.2 20.5 13.8 14 0 .154 20.0 0 6.2 s 15.3 25.6 16.7 15 0 .124 15.4 4 7.2 s 1.8 23.0 17.0 16 0.518 17.7 4 5.0 NNW - 26.3 13.0 17 0.110 20.1 3 10.2 s - 24.0 13.6 18 0.299 21.5 0 11. 2 s - 22.6 17.7 19 0.370 19.2 0 10.0 SSE - 25.2 17.5 20 0.135 21. 9 0 15.0 s - 20.7 16.8 21 0.175 20.1 0 11. 2 s - 24.3 15.5 22 0.090 20.8 0 10.6 s - 23.l 17.0 23 0.479 19.4 0 12.4 SSW - 24.2 15.6 24 0.075 19.2 0 11.4 s. - 26.1 17.8 25 0.336 17.8 4 6.6 SSW - 31.0 17.4 26 0.171 19.8 0 9.7 NNW - 23.9 16.5 27 0.462 17.9 4 8.5 s - 25.3 12.9 28 0.256 16.4 3 10.3 NW - 26.0 13.3 29 0.180 7.0 0 10.5 WNW 13.4 23.2 17.5 30 0.099 15.2 0 7.9 w 8.8 17.5 10.4 31 0.092 18.5 2 6.8 NNW - 19.0 6.8
* UV radiation obtained from Scientific Services Branch, City Engineer's Department, Cape Town. Wind, rainfall and temperature data from Weather Bureau, D F Malan Airport. Rainfall data starting 08:00 - 08:00 next day.
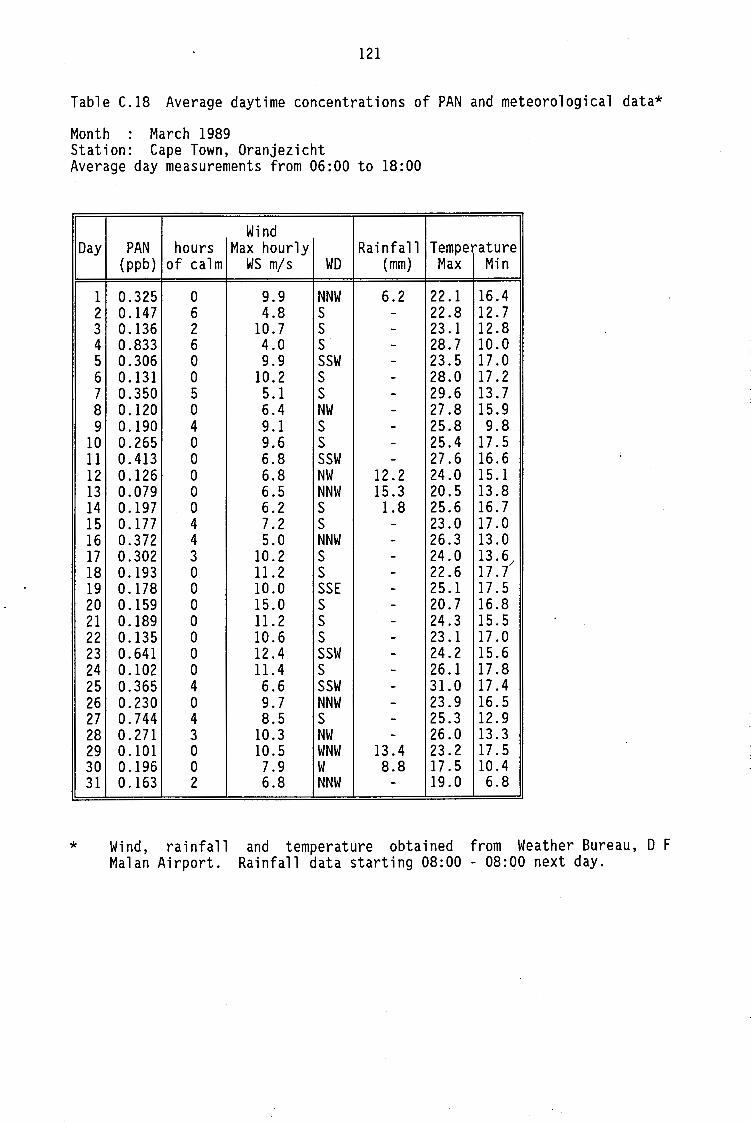
Univers
ity of
Cap
e Tow
n
121
Table C.18 Average daytime concentrations of PAN and meteorological data*
Month : March 1989 Station: Cape Town, Oranjezicht Average day measurements from 06:00 to 18:00
Wind Day PAN hours Max hourly Rainfall Temperature
(ppb) of calm WS m/s WD (mm) Max Min
1 0.325 0 9.9 NNW 6.2 22.1 16.4 2 0.147 6 4.8 s - 22.8 12.7 3 0.136 2 10.7 s - 23.1 12.8 4 0.833 6 4.0 s - 28.7 10.0 5 0.306 0 9.9 SSW -· 23.5 17.0 6 0 .131 0 10.2 s - 28.0 17 .2 7 0.350 5 5.1 s - 29.6 13.7 8 0.120 0 6.4 NW - 27.8 15.9 9 0.190 4 9.1 s - 25.8 9.8
10 0.265 0 9.6 s - 25.4 17.5 11 0.413 0 6.8 SSW - 27.6 16.6 12 0 .126 0 6.8 NW 12.2 24.0 15.1 13 0.079 0 6.5 NNW 15.3 20.5 13.8 14 0 .197 0 6.2 s 1.8 25.6 16.7 15 0.177 4 7.2 s - 23.0 17.0 16 0.372 4 5.0 NNW - 26.3 13.0 17 0.302 3 10.2 s - 24.0 13. 6/ 18 0.193 0 11. 2 s - 22.6 17.7 19 0.178 0 10.0 SSE - 25.l 17.5 20 0.159 0 15.0 s - 20.7 16.8 21 0.189 0 11. 2 s - 24.3 15.5 22 0.135 0 10.6 s - 23.l 17.0 23 0.641 0 12.4 SSW - 24.2 15.6 24 0 .102 0 11.4 s - 26.l 17.8 25 0.365 4 6.6 SSW - 31.0 17 .4 26 0.230 0 9.7 NNW - 23.9 16.5 27 0.744 4 8.5 s - 25.3 12.9 28 0.271 3 10.3 NW - 26.0 13.3 29 0 .101 0 10.5 WNW 13.4 23.2 17.5 30 0 .196 0 7.9 w 8.8 17.5 10.4 31 0.163 2 6.8 NNW - 19.0 6.8
* Wind, rainfall and temperature obtained from Weather Bureau, D F Malan Airport. Rainfall data starting 08:00 - 08:00 next day.
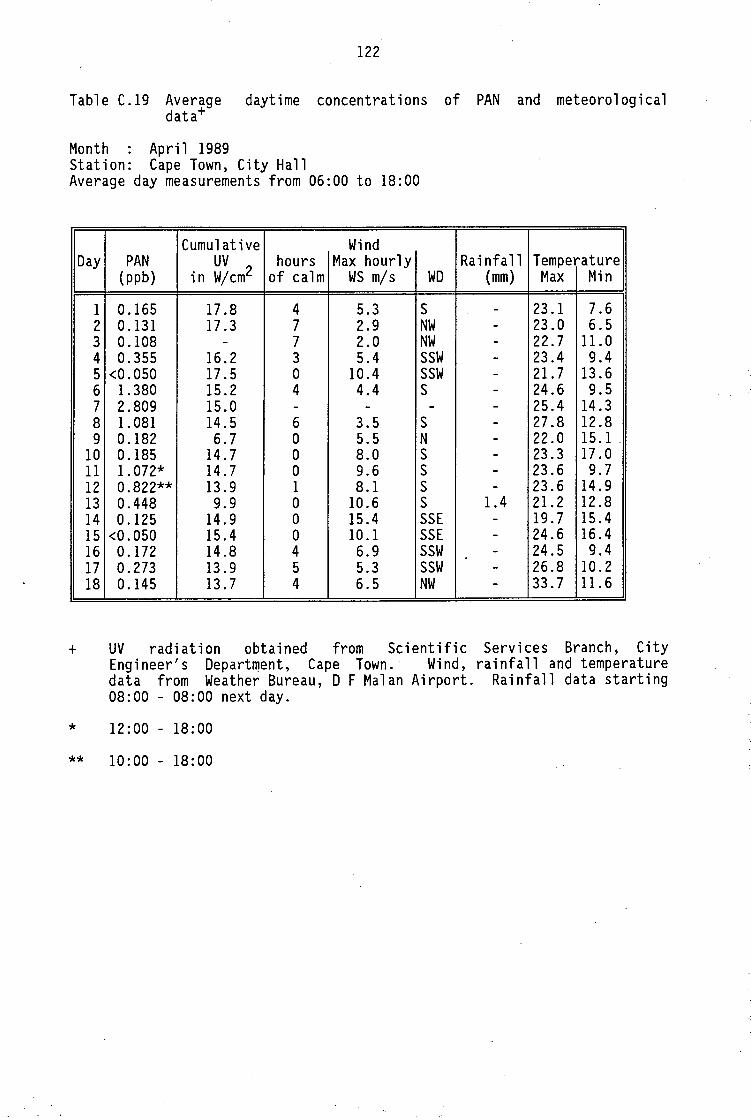
Univers
ity of
Cap
e Tow
n
122
Table C.19 Average daytime concentrations of PAN and meteorological data+
Month : April 1989 Station: Cape Town, City Hall Average day measurements from 06:00 to 18:00
Cumulative Wind Day PAN UV hours Max hourly Rainfall Temperature
(ppb) in W/cm2 of calm WS m/s WD (mm) Max Min
1 0.165 17.8 4 5.3 s - 23.1 7.6 2 0.131 17.3 7 2.9 NW - 23.0 6.5 3 0.108 - 7 2.0 NW - 22.7 11.0 4 0.355 16.2 3 5.4 SSW - 23.4 9.4 5 <0.050 17.5 0 10.4 SSW - 21. 7 13.6 6 1.380 15.2 4 4.4 s - 24.6 9.5 7 2.809 15.0 - - - - 25.4 14.3 8 1.081 14.5 6 3.5 s - 27.8 12.8 9 0.182 6.7 0 5.5 N - 22.0 15.1 .
10 0.185 14.7 0 8.0 s - 23.3 17.0 11 1.072* 14.7 0 9.6 s - 23.6 9.7 12 0.822** 13.9 1 8.1 s - 23.6 14.9 13 0.448 9.9 0 10.6 s 1.4 21.2 12.8 14 0 .125 14.9 0 15.4 SSE - 19.7 15.4 15 <0.050 15.4 0 10.1 SSE - 24.6 16.4 16 0.172 14.8 4 6.9 SSW - 24.5 9.4 17 0.273 13.9 5 5.3 SSW - 26.8 10.2 18 0 .145 13.7 4 6.5 NW - 33.7 11. 6
+ UV radiation obtained from Scientific Services Branch, City Engineer's Department, Cape Town.- Wind, rainfall and temperature data from Weather Bureau, D F Malan Airport. Rainfall data starting 08:00 - 08:00 next day.
* 12:00 - 18:00
** 10:00 - 18:00
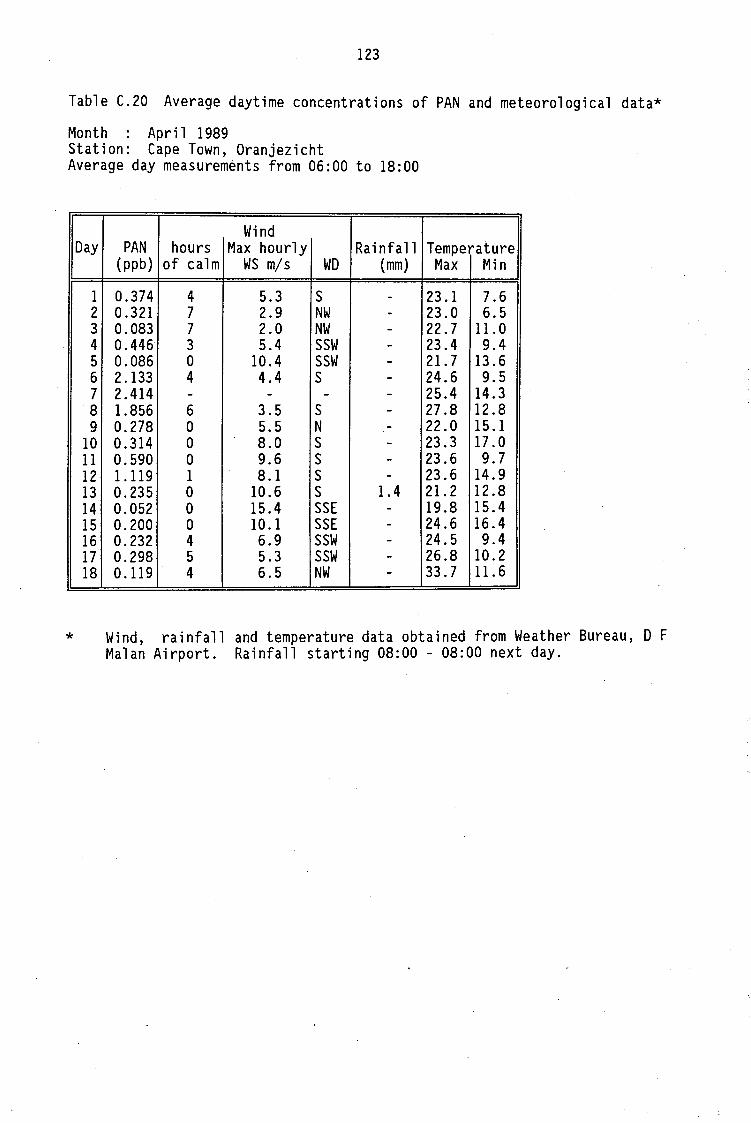
Univers
ity of
Cap
e Tow
n
123
Table C.20 Average daytime concentrations of PAN and meteorological data*
Month : April 1989 Station: Cape Town, Oranjezicht Average day measurements from 06:00 to 18:00
Wind Day PAN hours Max hourly Rainfall Temperature
(ppb) of calm WS m/s WO (mm) Max Min
1 0.374 4 5.3 s - 23.l 7.6 2 0.321 7 2.9 NW - 23.0 6.5 3 0.083 7 2.0 NW - 22.7 11. 0 4 0.446 3 5.4 SSW - 23.4 9.4 5 0.086 0 10.4 SSW - 21. 7 13.6 6 2 .133 4 4.4 s - 24.6 9.5 7 2.414 - - - - 25.4 14.3 8 1.856 6 3.5 s - 27.8 12.8 9 0.278 0 5.5 N - 22.0 15.l
10 0.314 0 8.0 s - 23.3 17.0 11 0.590 0 9.6 s - 23.6 9.7 12 1.119 1 8.1 s - 23.6 14.9 13 0.235 0 10.6 s 1.4 21.2 12.8 14 0.052 0 15.4 SSE - 19.8 15.4 15 0.200 0 10.l SSE - 24.6 16.4 16 0.232 4 6.9 SSW - 24.5 9.4 17 0.298 5 5.3 SSW - 26.8 10.2 18 0.119 . 4 6.5 NW - 33.7 11.6
* Wind, rainfall and temperature data obtained from Weather Bureau, D F Malan Airport. Rainfall starting 08:00 - 08:00 next day.
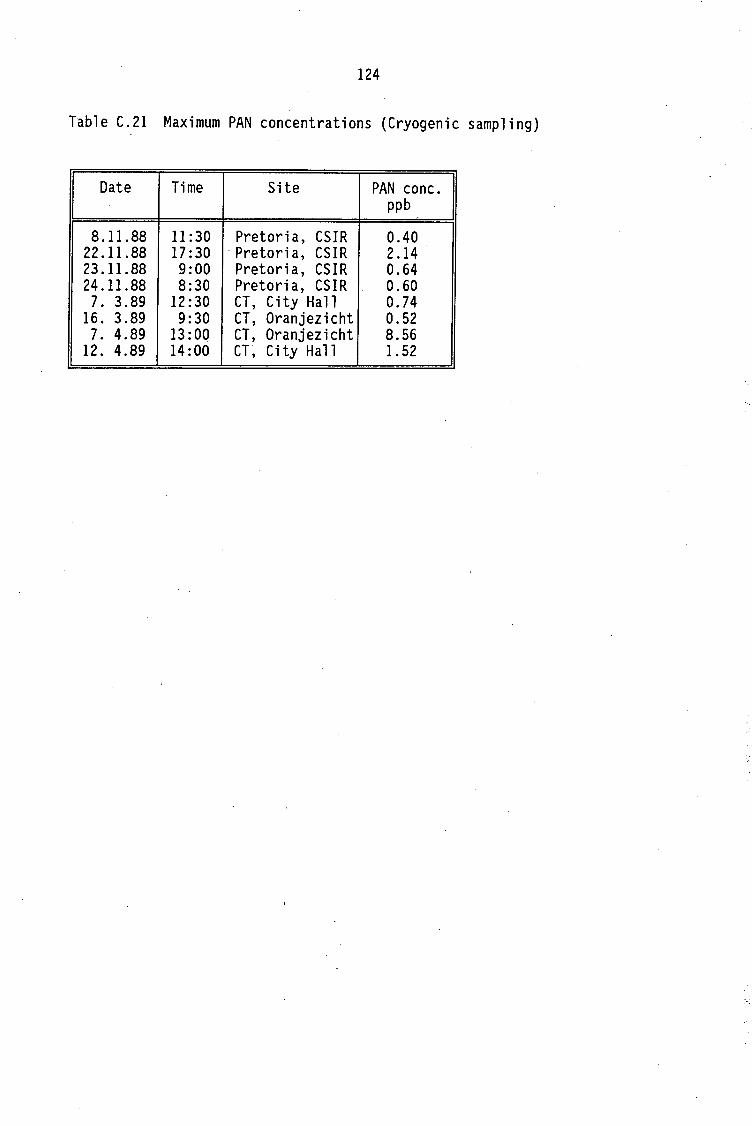
Univers
ity of
Cap
e Tow
n
124
Table C.21 Maximum PAN concentrations (Cryogenic sampling)
Date Time Site PAN cone. ppb
8.11.88 11:30 Pretoria, CSIR 0.40 22 .11. 88 17:30 · Pretoria, CSIR 2.14 23 .11.88 9:00 Pretoria, CSIR 0.64 24.11.88 8:30 Pretoria, CSIR 0.60 7. 3.89 12:30 CT, City Hall 0.74
16. 3 .89 9:30 CT, Oranjezicht 0.52 7. 4.89 13:00 CT, Oranjezicht 8.56
12. 4.89 14:00 CT, City Hal 1 1.52
Univers
ity of
Cap
e Tow
n
125
TABLES C.22 - C.29
Daily variation of PAN and ozone concentrations
.. -:· ·:.
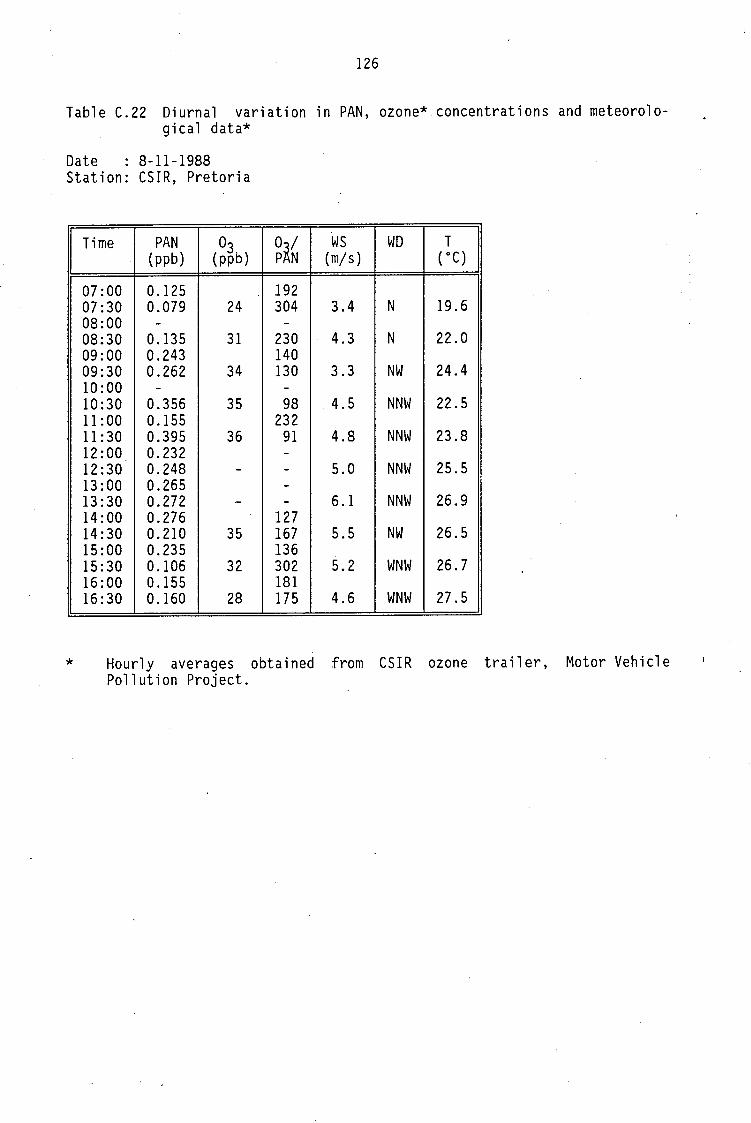
Univers
ity of
Cap
e Tow
n
126
Table C.22 Diurnal variation in PAN, ozone* concentrations and meteorological data*
Date : 8-11-1988 Station: CSIR, Pretoria
Time PAN 03 (ppb) (ppb)
07:00 0.125 07:30 0.079 24 08:00 -08:30 0.135 31 09:00 0.243 09:30 0.262 34 10:00 -10:30 0.356 35 11:00 0.155 11 :30 0.395 36 12:00 0.232 12:30 0.248 -13:00 0.265 13:30 0.272 ·-14:00 0.276 14:30 0.210 35 15:00 0.235 15:30 0.106 32 16:00 0.155 16:30 0.160 28
Oi/ ws WD T p N (m/s) (oC)
192 304 3.4 N 19.6
-230 4.3 N 22.0 140 130 3.3 NW 24.4
-98 4.5 NNW 22.5
232 91 4.8 NNW 23.8 -- 5.0 NNW 25.5 -- 6.1 NNW 26.9
127 167 5.5 NW 26.5 136 302 5.2 WNW 26.7 181 175 4.6 WNW 27.5
* Hourly averages obtained from CSIR ozone trailer, Motor Vehicle Pollution Project.
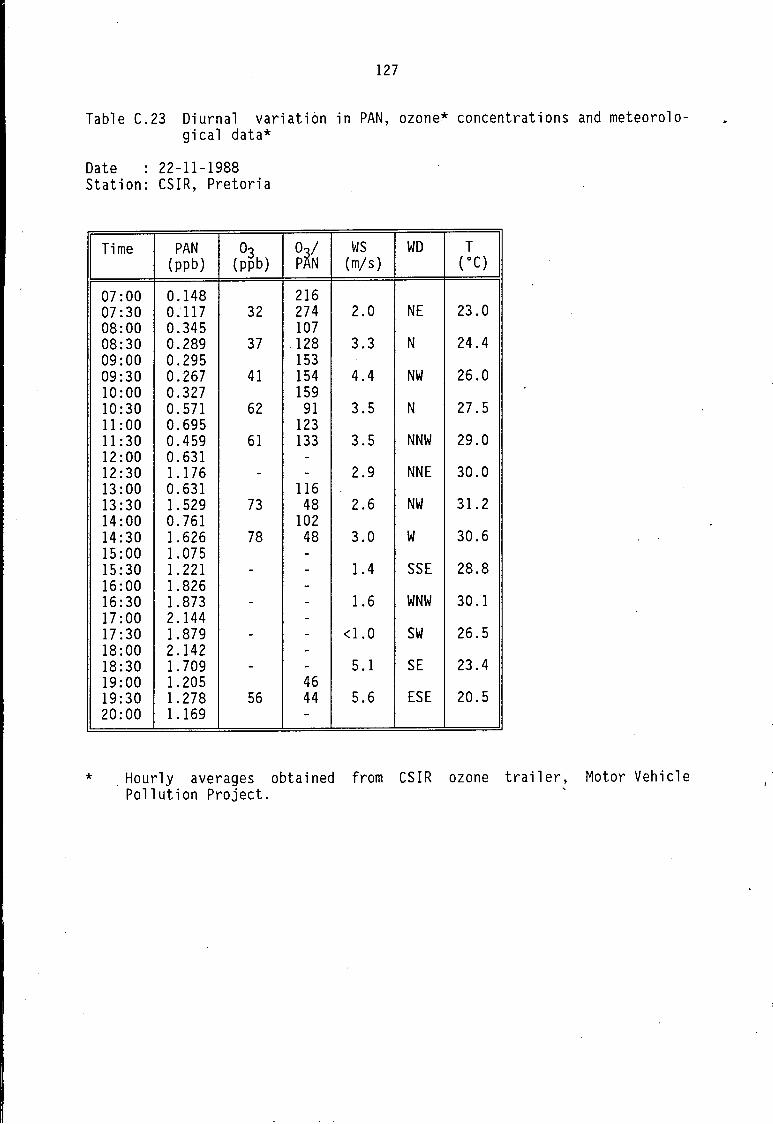
Univers
ity of
Cap
e Tow
n
127
Table C.23 Diurnal variation in PAN, ozone* concentrations and meteorological data*
Date : 22-11-1988 Station: CSIR, Pretoria
Time PAN 03 (ppb) (ppb)
07:00 0.148 07:30 0.117 32 08:00 0.345 08:30 0.289 37 09:00 0.295 09:30 0.267 41 10:00 0.327 10:30 0.571 62 11:00 0.695 11:30 0.459 61 12:00 0.631 12:30 1.176 -13:00 0.631 13:30 1.529 73 14:00 0.761 14:30 1.626 78 15:00 1.075 15:30 1. 221 -16:00 1.826 16:30 1.873 -17:00 2.144 17:30 1.879 -18:00 2 .142 18:30 1.709 -19:00 1.205 19:30 1.278 56 20:00 1.169
O~/ ws WD T p N (m/s) (oC)
216 274 2.0 NE 23.0 107 128 3.3 N 24.4 153 154 4.4 NW 26.0 159
91 3.5 N 27.5 123 133 3.5 NNW 29.0 -- 2.9 NNE 30.0
116 48 2.6 NW 31.2
102 48 3.0 w 30.6 -- 1.4 SSE 28.8 -- 1.6 WNW 30.1 -- <1.0 SW 26.5 -- 5 .1 SE 23.4 46 44 5.6 ESE 20.5 -
* . Hourly averages obtained from CSIR ozone trailer, Motor Vehicle Pollution Project.
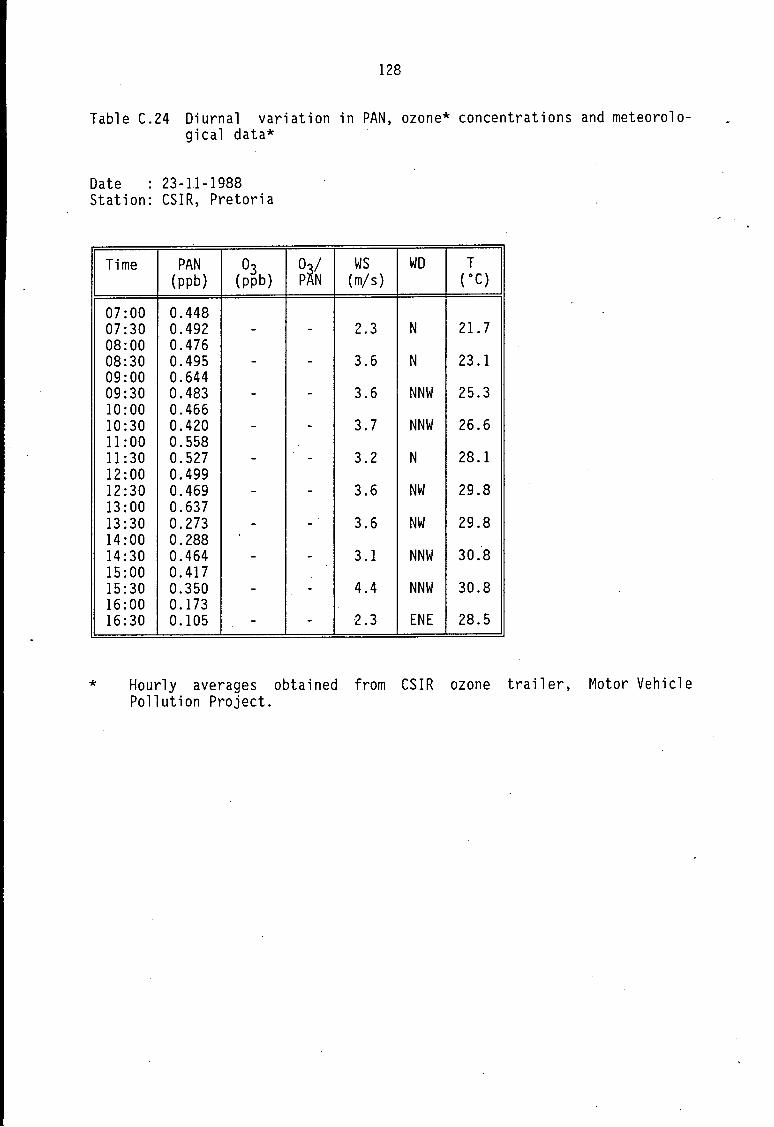
Univers
ity of
Cap
e Tow
n
128
Table C.24 Diurnal variation in PAN, ozone* concentrations and meteorological data*
Date : 23-11-1988 Station: CSIR, Pretoria
Time PAN 03 (ppb) (ppb)
07:00 0.448 07:30 0.492 -08:00 0.476 08:30 0.495 -09:00 0.644 09:30 0.483 -10:00 0.466 10:30 0.420 -11:00 0.558 11 :30 0.527 -12:00 0.499 12:30 0.469 -13:00 0.637 13:30 0.273 -14:00 0.288 14:30 0.464 -15:00 0.417 15:30 0.350 -16:00 0.173 16:30 0.105 -
O~/ p N
-
-
-
-
-
-
-
-
-
-
ws WO T (m/s) (oC)
2.3 N 21. 7
3.6 N 23.l
3.6 NNW 25.3
3.7 NNW 26.6
3.2 N 28.1
3.6 NW 29.8
3.6 NW 29.8
3.1 NNW 30.8
4.4 NNW 30.8
2.3 ENE 28.5
* Hourly averages obtained from CSIR ozone trailer, Motor Vehicle Pollution Project.
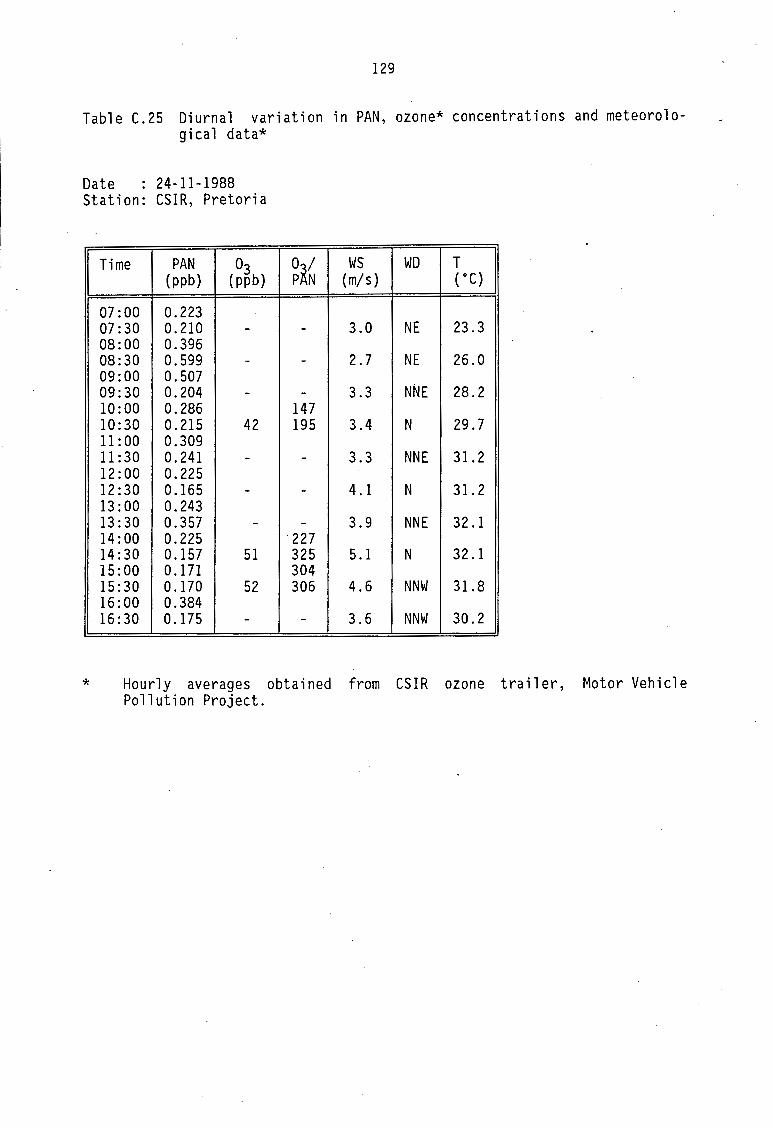
Univers
ity of
Cap
e Tow
n
•
129
Table C.25 Diurnal variation in PAN, ozone* concentrations and meteorological data*
Date 24-11-1988 Station: CSIR, Pretoria
Time PAN 03 Oil ws WD T (ppb) (ppb) p N (m/s) (oC)
07:00 0.223 07:30 0.210 - - 3.0 NE 23.3 08:00 0.396 08:30 0.599 - - 2.7 NE 26.0 09:00 0.507 09:30 0.204 - - 3.3 NNE 28.2 10:00 0.286 147 10:30 0.215 42 195 3.4 N 29.7 11:00 0.309 11 :30 0.241 - - 3.3 NNE 31.2 12:00 0.225 12:30 0.165 - - 4 .1 N 31. 2 13:00 0.243 13:30 0.357 - - 3.9 NNE 32.1 14:00 0.225 227 14:30 0 .157 51 325 5 .1 N 32.1 15:00 0.171 304 15:30 0.170 52 306 4.6 NNW 31.8 16:00 0.384 16:30 0.175 - - 3.6 NNW 30.2
* Hourly averages obtained from CSIR ozone trailer, Motor Vehicle Pollution Project .
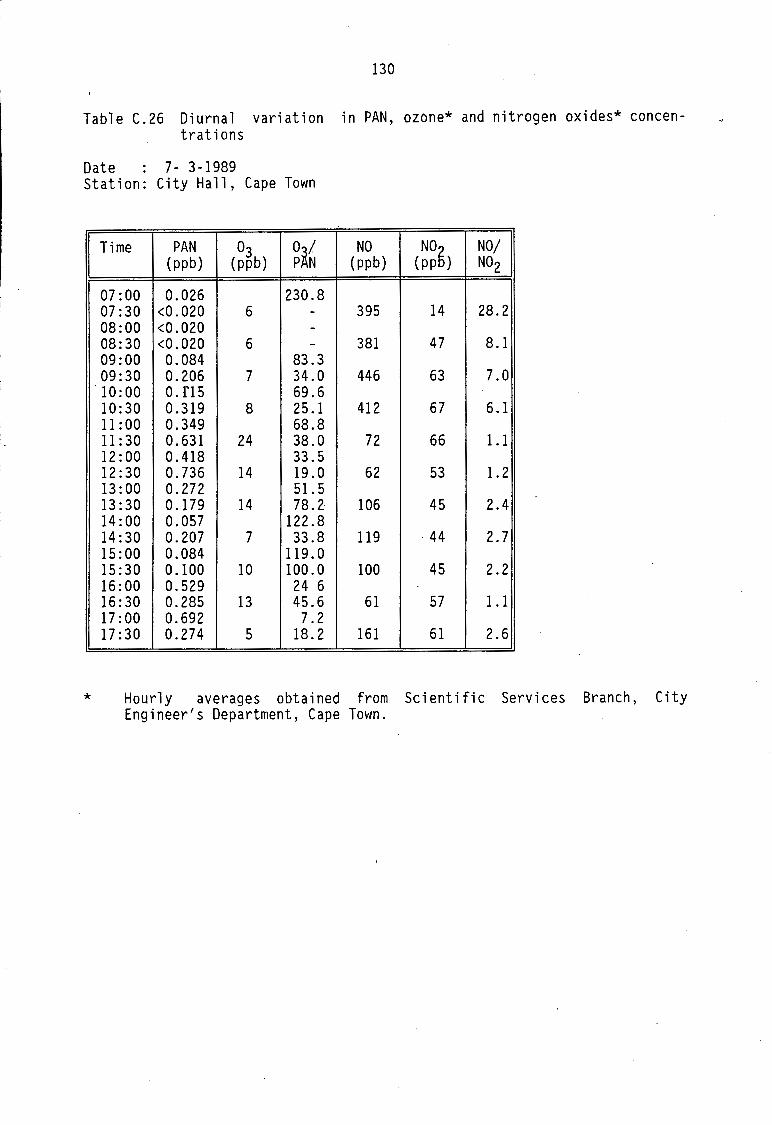
Univers
ity of
Cap
e Tow
n
130
Table C.26 Diurnal variation in PAN, ozone* and nitrogen oxides* concentrations
Date 7- 3-1989 Station: City Hall, Cape Town
Time PAN 03 O~/ NO N05 NO/ (ppb) (ppb) p N (ppb) (pp ) ND2
07:00 0.026 230.8 07:30 <0.020 6 - 395 14 28.2 08:00 <0.020 -08:30 <0.020 6 - 381 47 8.1 09:00 0.084 83.3 09:30 0.206 7 34.0 446 63 7.0 10:00 o.n5 69.6 10:30 0.319 8 25.1 412 67 6.1 11:00 0.349 68.8 11 :30 0.631 24 38.0 72 66 1.1 12:00 0.418 33.5 12:30 0.736 14 19.0 62 53 1. 2 13:00 0.272 51. 5 13:30 0.179 14 78.2 106 45 2.4 14:00 0.057 122.8 14:30 0.207 7 33.8 119 44 2.7 15:00 0.084 119.0 15:30 0.100 10 100.0 100 45 2.2 16:00 0.529 24 6 16:30 0.285 13 45.6 61 57 1.1 17:00 0.692 7.2 17:30 0.274 5 18.2 161 61 2.6
* Hourly averages obtained from Scientific Services Branch, City Engineer's Department, Cape Town.
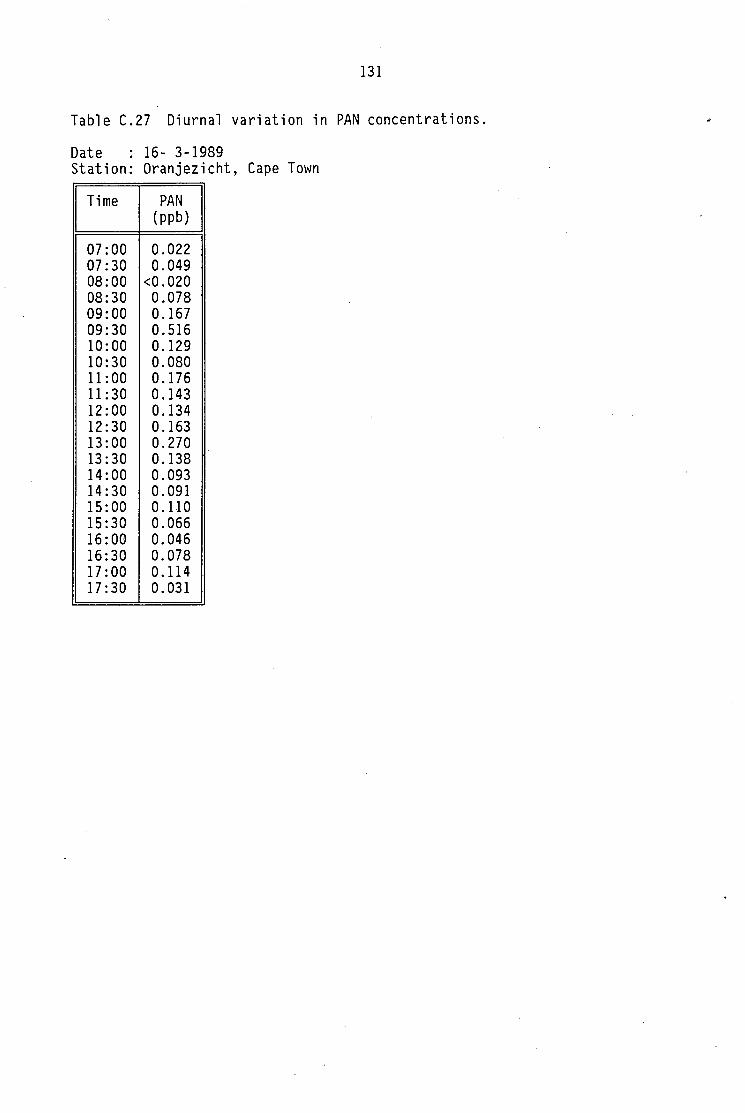
Univers
ity of
Cap
e Tow
n
131
Table C.27 Diurnal variation in PAN concentrations.
Date : 16- 3-1989 Station: Oranjezicht, Cape Town
Time PAN (ppb)
07:00 0.022 07:30 0.049 08:00 <0.020 08:30 0.078 09:00 0.167 09:30 0.516 10:00 0.129 10:30 0.080 11:00 0.176 11:30 0.143 12:00 0.134 12:30 0.163 13:00 0.270 13:30 0.138 14:00 0.093 14:30 0.091 15:00 0.110 15:30 0.066 16:00 0.046 16:30 0.078 17:00 0.114 17:30 0.031
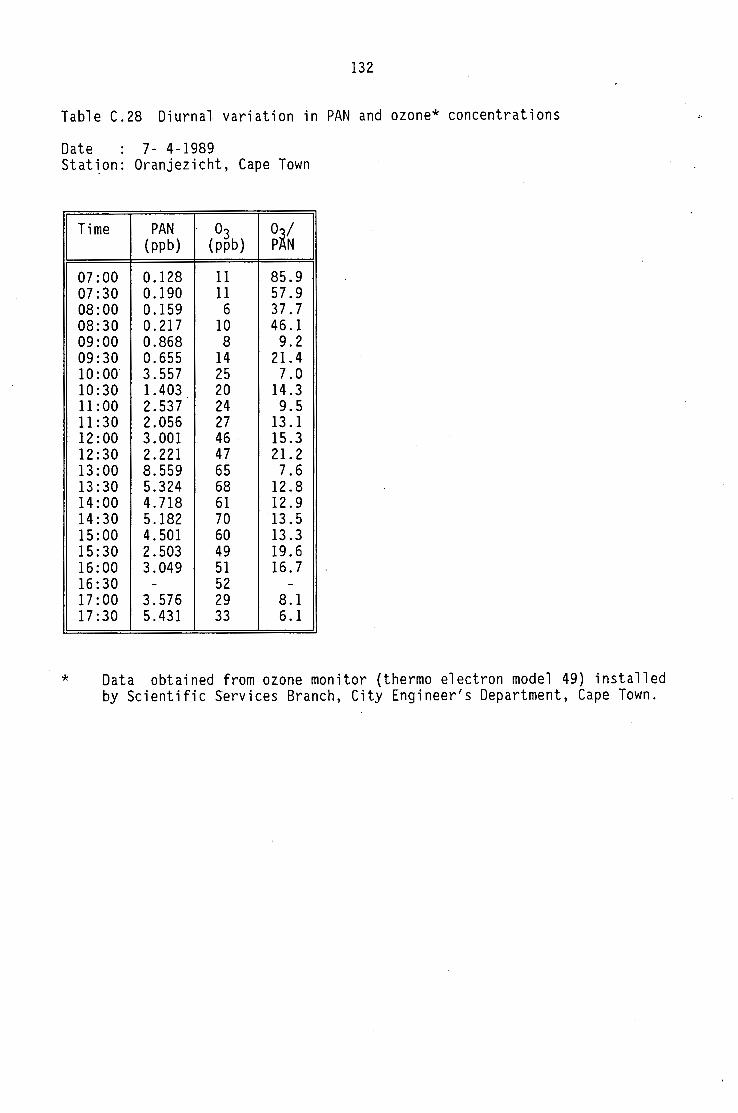
Univers
ity of
Cap
e Tow
n
-
132
Table C.28 Diurnal variation in PAN and ozone* concentrations
Date : 7- 4-1989 Station: Oranjezicht, Cape Town
*
Time PAN 03 Oi/ (ppb) (ppb) p N
07:00 0.128 11 85.9 07:30 0.190 11 57.9 08:00 0 .159 6 37.7 08:30 0.217 10 46.1 09:00 0.868 8 9.2 09:30 0.655 14 21.4 10:00 3.557 25 7.0 10:30 1.403 20 14.3 11:00 2.537 24 9.5 11:30 2.056 27 13.1 12:00 3.001 46 15.3 12:30 2.221 47 21. 2 13:00 8.559 65 7.6 13:30 5.324 68 12.8 14:00 4. 718 61 12.9 14:30 5.182 70 13.5 15:00 4.501 60 13.3 15:30 2.503 49 19.6 16:00 3.049 51 16.7 16:30 - 52 -17:00 3.576 29 8.1 17:30 5.431 33 6.1
Data obtained from ozone monitor (thermo electron model 49) installed by Scientific Services Branch, City Engineer's Department, Cape Town.
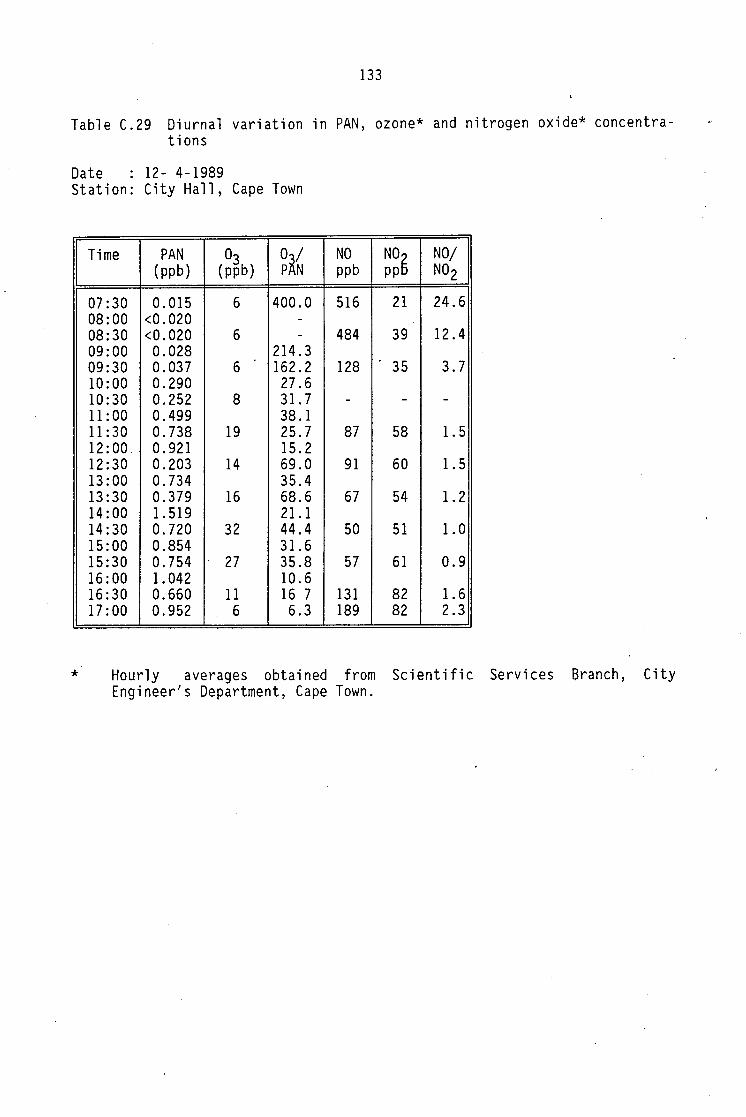
Univers
ity of
Cap
e Tow
n
133
Table C.29 Diurnal variation in PAN, ozone* and nitrogen oxide* concentrations
Date : 12- 4-1989 Station: City Hall, Cape Town
Time PAN 03 Oi/ NO N05
NO/ (ppb) (ppb) p N ppb pp N02
07:30 0.015 6 400.0 516 21 24.6 08:00 <0.020 -08:30 <0.020 6 - 484 39 12.4 09:00 0.028 214.3 09:30 0.037 6 162.2 128 35 3.7 10:00 0.290 27.6 10:30 0.252 8 31. 7 - - -11:00 0.499 38.1 11:30 0.738 19 25.7 87 58 1. 5 12:00. 0.921 15.2 12:30 0.203 14 69.0 91 60 1. 5 13:00 0.734 35.4 13:30 0.379 16 68.6 67 54 1. 2 14:00 1. 519 21.1 14:30 0.720 32 44.4 50 51 1.0 15:00 0.854 31.6 15:30 0.754 27 35.8 57 61 0.9 16:00 1.042 10.6 16:30 0.660 11 16 7 131 82 1. 6 17:00 0.952 6 6.3 189 82 2.3
* Hourly averages obtained from Scientific Services Branch, City Engineer's Department, Cape Town.
Univers
ity of
Cap
e Tow
n
134
Table C.30 Vertical distribution of PAN concentrations.
Date . : 4- 4-1989 Station: Table Mountain, Cape Town
I Station
I Time PAN Time PAN Time PAN
(ppb) (ppb) (ppb)
City Hal 1 (15 m) 09:36 0.121 12:02 0.609 15:32 0.025 Oranjezicht (107 m) 09:44 0.077 12:10 0.920 15:40 0.073 Lower Cable Station 09:55 0.220 12:22 0.600 15:50 0.080 1. Section (366 m) 10:27 0.141 12:45 0.366 16:05 0.077
Cable Car (541 m) 2. Section 10:29 0.224 12:47 0.860 16:07 0.216
Cable Car (892 m) Table Mountain (1067 m) 10:34 0.272 12:53 0.583 16: 12 0.080
Univers
ity of
Cap
e Tow
n
135
Table C.31 Monthly average PAN daytime levels (Pretoria 1986/87)
Ave. day Max day No of days No. of concen- concen- below de- days
Month Town Site tration tration tection 6-18h limit (ppb) No. Date (ppb) <0.05 ppb >l ppb
May 1986 Pretoria Sunnyside 0.537 (19) 2. 5.86 1.222 0 3
Jun 1986 Pretoria Sunnyside 0.428 (21) 26. 6.86 0.849 0 0
Jul 1986 Pretoria Sunnyside 0;515 (13) 25. 7.86 1.056 0 1 Mooikloof 0.656 ( 8) 12. 7.86 1.623 0 4
Aug 1986 Pretoria Sunnyside 0.355 (21) 2. 8.86 0.864 0 0 Mooikloof 0.427 (18) 29. 8.86 0.977 0 0
Dec 1986 Pretoria Sunnyside 0.195 (12) 3.12.86 0.598 0 0 Mooikloof 0.237 (16) 3.12.86 0.631 0 0
Jan 1987 Pretoria Sunnyside 0.180 (18) 22. 1.87 0.393 0 0 Mooikloof 0.261 (19) 6. 1.87 0. 711 0 0
Feb 1987 Pretoria Sunnyside 0.277 (18) 17. 2.87 0.814 0 0 Mooikloof 0.301 (19) 3. 2.87 0.700 0 0
Univers
ity of
Cap
e Tow
n
136
Table C.32 Summary of North American measurements of ambient PAN concentrations
City and Sampling period Monthly mean Mean daily Maximum Reference Country (ppb) max. (ppb) observation
(ppb)
Hoboken Jun - Aug 1970 3.7 9.9 Lonneman USA (NJ) 10:00-16:00 (1976)
New Brunswick 25 Sep 1978- 0.5 10.6 Lewis USA (NJ) 10 May 1980 (1983)
Downington 16 Jul 1979- <l 2.2 5.0 Westberg USA (Pa) 22 Aug 1979 (1978)
St. Louis Jul - Aug 1973 6.3 25 Lonneman USA (Mo) 10:00-16:00 (1976)
St Louis 18 Jun 1973- 1.8 4.6 29 Spicer USA (Mo) 16 Aug 1973 (1974)
Houston 2-23 Jul 1976 1.0 11. 5 Westberg USA (Tx) 10:00-16:00 (1978)
Houston 1 Jun 1977 0.6 15.6 Jorgen USA (Tx) 31 Oct 1977 (1978)
Calgary 1 Dec 1980- 0.2 0.4 2.4 Peake & Canada 31 Aug 1981 Sandhu
08:00-16:00 (1983)
Calgary 12 Jul 1981- 0.1 0.6 6.6 Peake & Canada 28 Feb 1982 Sandhu
(1983)
Simcoe Jun 1980- 1.3 Corkum Canada Mar 1981 (1986)
·-
Los Angeles Sep 1965- 38 210 Marson & USA (Ca) Oct 1965 60 Brooks
08:00-15:00 ( 1965)
West Covina 24 Aug 1973- 8.8 22.4 46 Spicer USA (Ca) 28 Sep 1973 (1974)
Riverside Aug 1967- 4.6 58 Taylor USA (Ca) Apr 1968 (1969)
08:00-18:00
Riverside Jan 1980- 4.9 25.1 41.6 Temple & USA (Ca) Dec 1980 Taylor
08:00-20:00 (1983)
Univers
ity of
Cap
e Tow
n
137
Table C.33 Summary of European and Australian* measurements of ambient PAN concentrations
City and Sampling period Monthly mean Mean daily Maximum Reference Country (ppb) max. (ppb) observation
(ppb)
Ris,0 11 Jun 1980- 0.9 4.2 Nielsen Denmark 12 Sep 1980 (1981)
Goteborg 17 Jun 1980- 0.8 3.5 Nielsen Sweden 9 Sep 1980 (1981)
Delft Jun - Nov 1982 1.4 16 Bos Netherlands (1977)
Essen Jun - Sep 1978 <l <l 3.6 Bruckmann W Germany & Eynck
(1979)
Harwell Nov 1974- <l 0.27 8.9 Penkett England Oct 1975 (1977)
London Aug 1974- 16.1 Penkett England Oct 1975 ( 1977)
Paris Oct 1985- 9.0 Tsalkani France Feb 1986 ( 1987)
Athens Feb - Nov 1985 3.7 Tsani-Greece Bazaca
(1988)
Sydney Dec 1983- 5.1 & 10.6* 41.8 Smith Australia Mar 1984 (1984)
* Averages of 64 h and 28 h continuous measurements, respectively
appendc/24b/sgg

Univers
ity of
Cap
e Tow
n
138
APPENDIX D:
FIGURES D.1 - D.5
Average PAN daytime concentrations
Univers
ity of
Cap
e Tow
n
139
Figure D.l
2.5
2.0
rn Q_ 1 .5 Q_
1 .0
.5
PAN AVERAGE DAY CONCENTRATIONS CAPE TOWN . MAY 1 988
LEGEND: - CITY HALL • OBSERVATORY
1 4 7 1 0 1 3 1 6 1 9 22 25 28 31 DATE
Univers
ity of
Cap
e Tow
n
140
Figure D.2
PAN AVERAGE DAY CONCENTRATIONS
3.0
2.0
co o._ 1.5 o._
1 .0
.5
0
JOHANNESBURG AUGUST 1988 LEGEND: ~ SOUTH HILLS - GAS WORKS
~
I 1. ~-1 4 7
.
~ ~
~:
; 11~1 I 1 0 1 3 1 6 1 9 22 25 28 31
0,L\TE
Univers
ity of
Cap
e Tow
n
141
Figure 0.3
2.5
2.0
CD o_ 1 .5 o_
1 .0
.5
PAN AVERAGE DAY CONCENTRATIONS CAPE TOWN FEBRUARY 1989
LEGEND: ~ CITY HALL .. ORANJEZICH1:
1 4 7 10 13 16 1 g 22 25 28 DATE
'·
Univers
ity of
Cap
e Tow
n
142
Figure D.4
PAN AVERAGE DAY CONCENTRATIONS CAPE TOWN MARCH 1 989
LEGEND:. ~ CITY. HALL .. ORANJEZICHT
2.5
2.0
m & 1.5
1 .0
.5
1 4 7 1 0 1 3 1 6 1 9 22 25 28 31 DATE
Univers
ity of
Cap
e Tow
n
143
Figure D.5
PAN AVERAGE DAY CONCENTRATIONS CAPE TOWN APRIL 1 989
LEGEND: ~ CITY HALL - ORANJEZICHT
2.5
2.0
m & 1.5
1 .0
.5
1 4 7 1 0 1 3 1 6 1 9 22 25 28 31 DATE

Univers
ity of
Cap
e Tow
n
144
FIGURES 0.6 - D.13
Diurnal variation in PAN and ozone concentrations
Univers
ity of
Cap
e Tow
n
145
Figure D.6
~-------------
DIURNAL VARIATION IN PAN. CONCENTRATIONS
2.5
2.0
m o_ 1 .5 o_
1 .0
·.5
PRETORIA 8-11 -1 988 ·
7 8 9 10 11 12 13 14 15 16
Tltv1E (HOURS)
LEGEND
_ CSIR
Univers
ity of
Cap
e Tow
n
146 .
Figure D.7
~---------------·------
DIURNAL VARIATION IN PAN CONCENTRATIONS PRETORIA.· 22-1 1 -1988
2.0
m Q_ 1 .5 CL.
1 .D
.5
7 8 9 1 0 1 1 1 2 1 3 1 4 15 1 6 1 7 1 8 1 9 20 Tl tv1E (HOURS)
LEGEr'.JD
_CSIR
Univers
ity of
Cap
e Tow
n
147
Figure 0.8 I
DIURNAL VARIATION IN PAN CONCENTRATIONS
2.5
2.0
m CL 1 <==, o_ -~
1 .0
PRETORIA 23-11 -1988
7 8 9 1 0 1 1 1 2 1 .3 1 4 1 5 1 6 1 7 1 8 1 9 20 TIME (HOURS)
LEGEND
_ CSIR
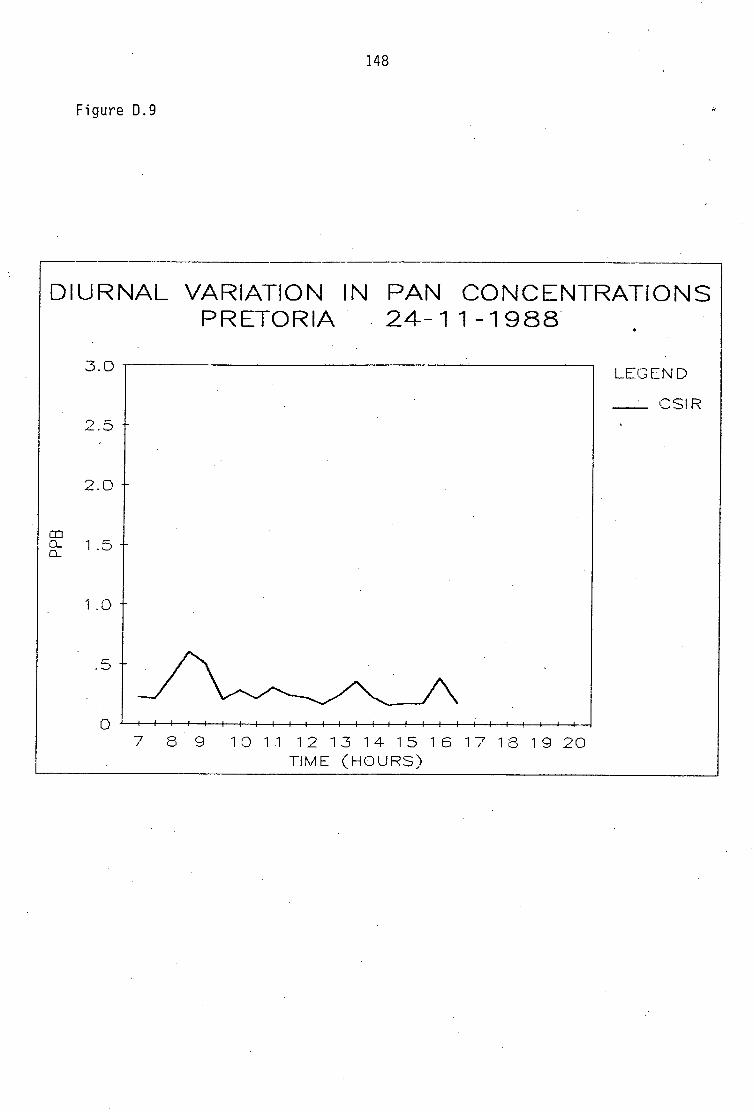
Univers
ity of
Cap
e Tow
n
148
Figure D.9
DIURNAL VARIATION IN PAN CONCENTRATIONS
2.5
2.0
co ~ 1.5
1 .0
.5
PRETORIA 24-11 -1988
7 8 9 1 0 1 1 1 2 1 3 1 4 1 5 1 6 1 7 1 8 1 9 20 Tltv1E (HOURS)
LEGEND
_ CSIR
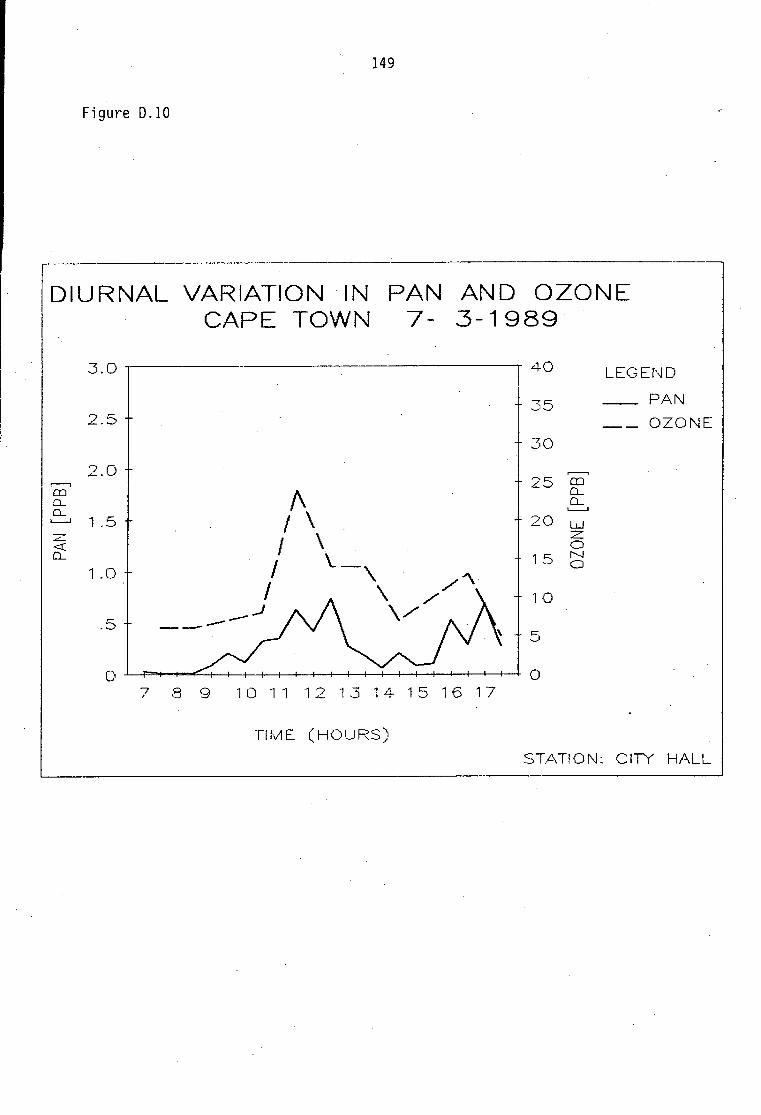
Univers
ity of
Cap
e Tow
n
149
Figure D.10
DIURNAL VARIATION ·IN PAN AND OZONE
3.0
'/ ~ '"'-. :::>
2.0 ,---, m Q_ Q_ L-J 1 .5 z <( o._
1 .0
.5
CAPE TOWN 7- 3-1989
---
f\ I \ I \ l \__\
I \ / _.J \/
/-"
7 8 9 10 11 12 13 14 15 16 17
Tltv1E (HOURS)
40 LEGE~~D
35 _PAN
-- OZONE JO
.--.. 25 m
o._ o._ '---'
20 w z 0
1 5 N 0
10
5
0
STATION: CITY HALL
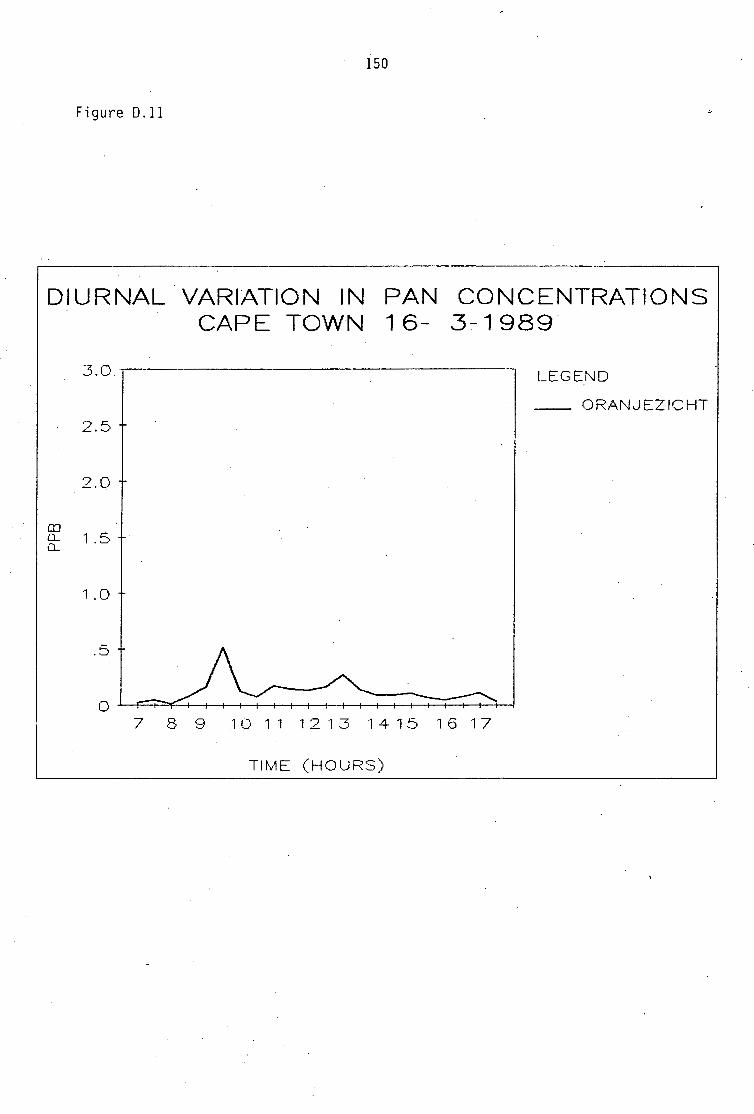
Univers
ity of
Cap
e Tow
n
150
Figure D.11
DIURNAL VARIATION IN PAN CONCENTRATIONS CAPE TOWN 1 6- 3-1989-
LEGEND
_ ORAf'JJEZICHT
2.5
2.0
m Q_ 1 .5 Q_
1 .D
.5
7 8 9 10 11 1213 1415 16 17
Tltv1E (HOURS)
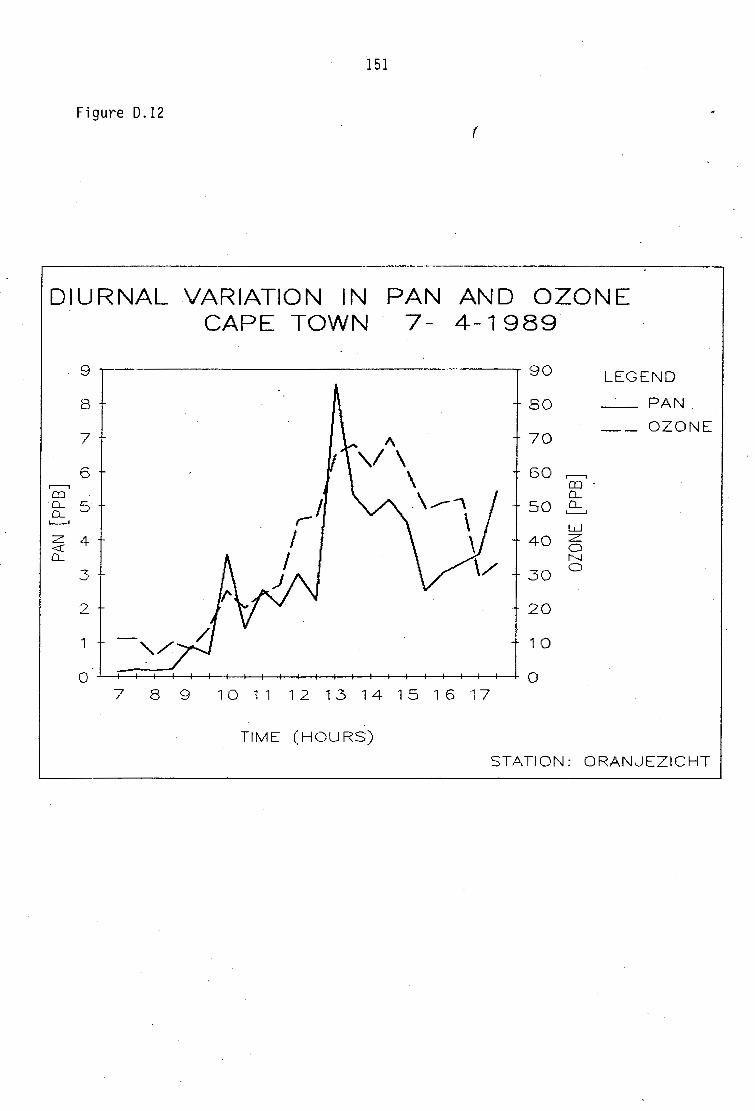
Univers
ity of
Cap
e Tow
n
151
Figure D .12 (
DIURNAL VARIATION IN PAN AND OZONE CAPE TOWN 7- 4-1989-
9 90 LEGEND
8 80 -- PAN
-- OZONE 7 70
6 60 r--i
r-. m -m CL o__ 5 50 CL o__ L--J
'---' w ::z 4 40 :z -<( a CL N
3. 30 a
2 20
1 '-../. 10
0 0 7 8 9 10 '11 12 13 14 15 16 17
TIME (HOURS)
STATION: ORANJEZICHT
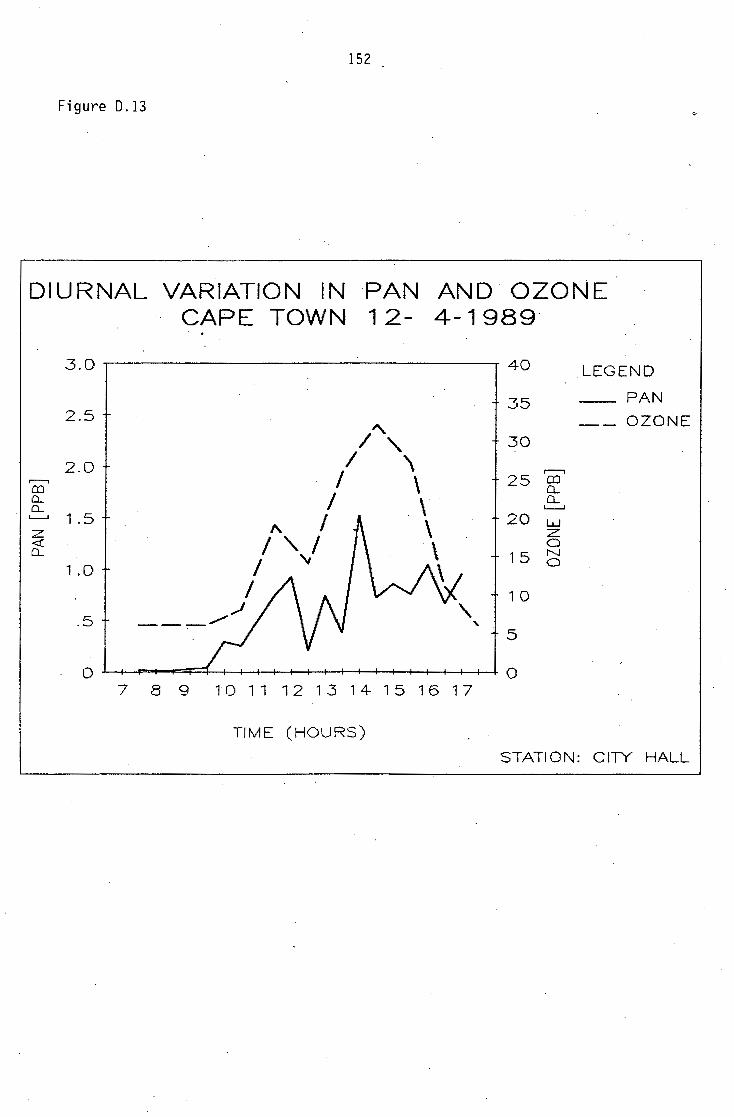
Univers
ity of
Cap
e Tow
n
152
Figure 0.13
DIURNAL VARIATION IN PAN AND OZONE CAPE TOWN 1 2- 4-1 989
3.0 40 LEGEND
35 _PAN
/" -- OZONE
30
I ' I \ ...---. 25 QJ
I \ 0... 0...
. \ '----1
" ' II \ 20 w
z I a
" \ 15 N
I \ a
I 10
2.5
2.0 r--i
co CL CL '--' 1 .5 z <{ 0...
1 .0
,J .5 --_.,,.,.,. ' 5
0 0 7 8 9 10 11 12 13 14 15 16 17
Tl~.,1E (HOURS)
STATION: CITY HALL
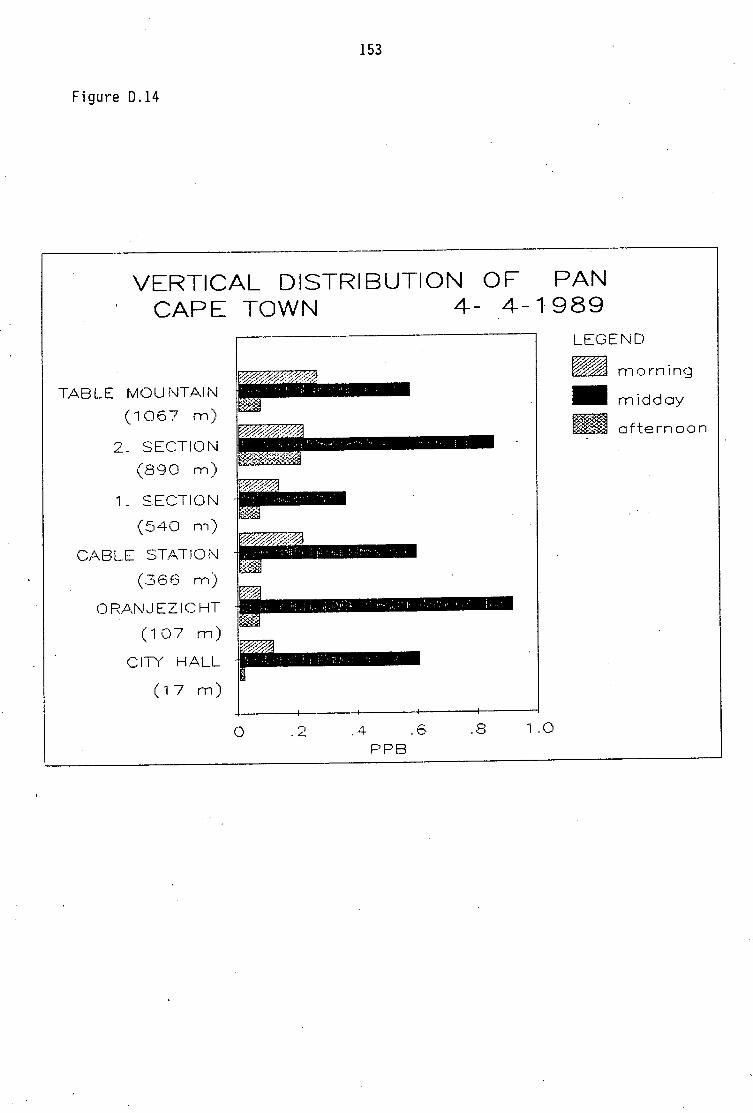
Univers
ity of
Cap
e Tow
n
153
Figure D.14
r----------------------------------~
VERTICAL DISTRIBUTION OF PAN CAPE TOWN 4- 4-1989
TL\BLE MOU NT.A.IN
(1067 m)
2. SECTION
(890 m)
1 _ SECTIOt\J
(540 m)
CABL.E STATION
(.366 m)
0 R.-6,N._1 EZ IC HT
( 1 07 m)
CITY H.A.LL
(17 m)
0 ') . L. .4 .6 _.g
PPB 1 .0
LEGEND
.• n1orning
- midday
E afternoon

Univers
ity of
Cap
e Tow
n
154
FIGURES D.15 - 0.21
Ozone-PAN relationship
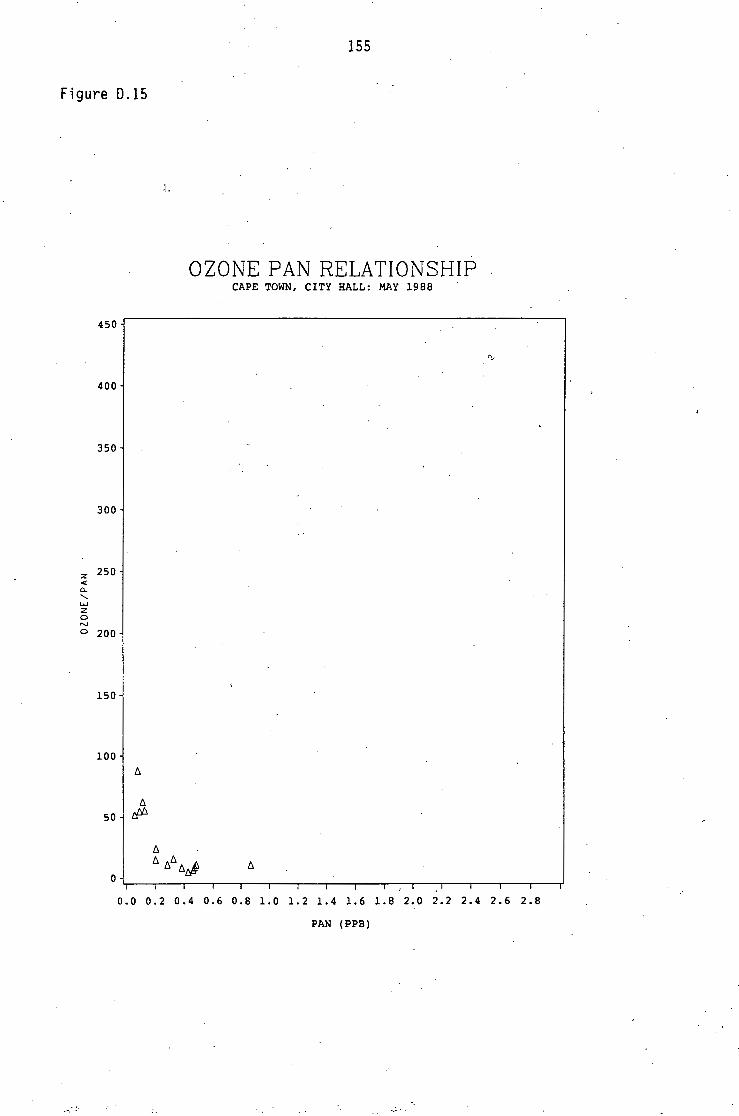
Univers
ity of
Cap
e Tow
n
Figure D .15
450
400
350
300
z 250 < Cl.
' w z 0 N 0 200
150
100
!:::.
50 &A
155
J.
OZONE PAN RELATIONSHIP CAPE TOWN, CITY HALL: MAY 1988
0.0 0.2 0.4 0.6 0.8 l.O l.2 l.4 l.6 l.8 2.0 2.2 2.4 2.6 2.8
PAN (PPB)
.-.. ·
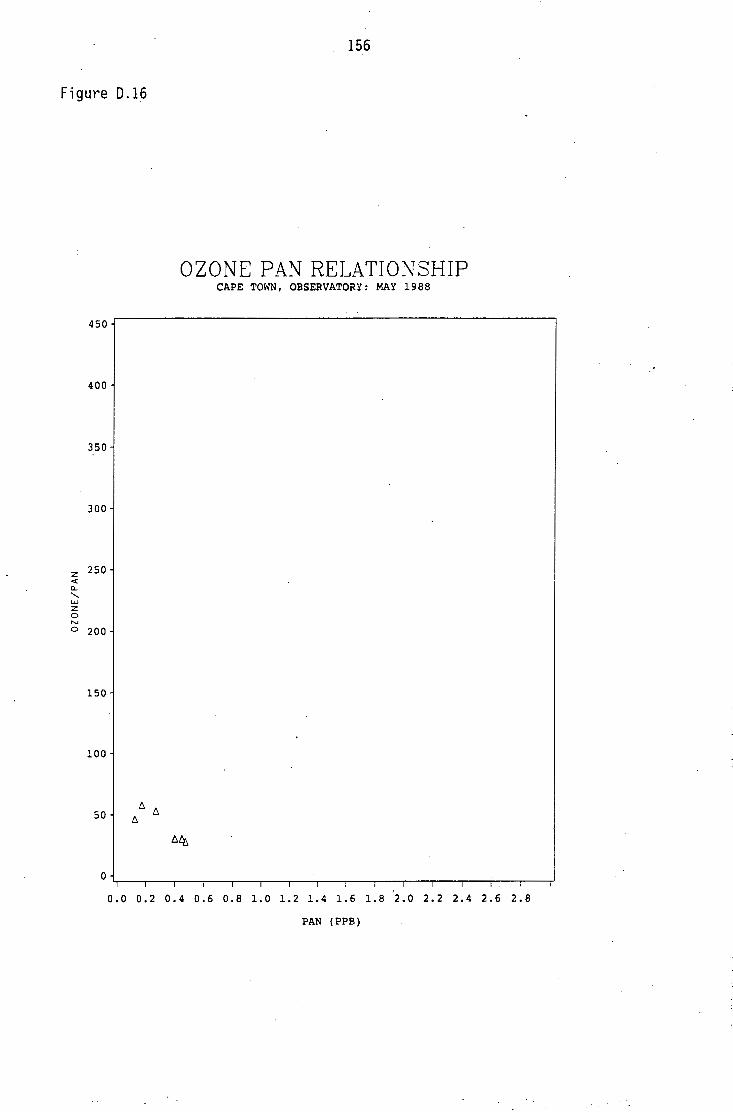
Univers
ity of
Cap
e Tow
n
156
Figure D .16
450
400
350
300
z 250 <(
a_
' w z 0 N
0 200
150
100
50
OZONE PAN RELATIONSHIP CAPE TOWN, OBSERVATORY: MAY 1988
o.o 0.2 0.4 0.6 0.8 1.0 1.2 1.4 1.6 1.8 2.0 2.2 2.4 2.6 2.8
PAN (PPB)
Univers
ity of
Cap
e Tow
n
157
Figure D.17
:z < ~
' w :z 0 N 0
OZONE PAN RELATIONSHIP JOHANNESBURG, SOUTH HILLS: AUGUST 1988
450
400
350
300
250
200
/':::,
/':::,
150 /':::,!:::,
/':::,
/':::, f':i.
100 /':::,f':i.1:::,\ f':i.
/':::, f':i. . /':::, . f':i. t:i:,.
/':::, /':::,f':i. f':i.
50 f':i. f':i. f':i.
0. 0 0. 2 0. 4 0. 6 0. 8 l. 0 l. 2 l. 4 l. 6 l. 8 '2. 0 2. 2 2. 4 2. 6 2. 8
PAN (PPB)

Univers
ity of
Cap
e Tow
n
158
Figure 0.18
450
400
350
300
z 250 <C a.
' "-' z 0 N 0 200
150
100
OZONE PAN RELATIONSHIP CAPE TOWN, CITY HALL: MARCH 1989
0 . 0 0 • 2 0. 4 0. 6 0. 8 1. 0 1. 2 1. 4 1. 6 1. 8 2 • 0 2 • 2 ~· 4 2 • 6 2 • 8
PAN (PPB)
Univers
ity of
Cap
e Tow
n
Figure D.19
450
400
350
300
z 250 < Q_
' LU z 0 N 0 200
150
100
50
159
OZONE PAN RELATIONSHIP CAPE TOWN, ORANJEZICHT: MARCH 1989
0 . 0 0 . 2 0 . 4 0 • 6 0 • 8 1. 0 1. 2 1. 4. 1. 6 1. 8 2 • 0 2 . 2 2 . 4 2 • 6 2 . 8
PAN (PPB)
/
Univers
ity of
Cap
e Tow
n
Figure D.20
450
400
350
300
z 250 < Q_
' w z 0 N 0 200
150
100
50
0 I
0.0
6
~ !::b. r:,6
6
I
0.2
160
OZONE PAN RELATIONSHIP CAPE TOWN, CITY HALL: APRIL 1989
6
I I I I l I I • I I I I I I
0.4 0.6 0.8 1.0 1.2 1.4 1.6 1.8 2.0 2.2 2.4 2.6 2.8
PAN (PPB)
Univers
ity of
Cap
e Tow
n
161
Figure D.21
OZONE PAN RELATIONSHIP CAPE TOWN, ORANJEZICHT: APRIL 1989
450
400
350
300
b. z 250 < a.. ...... w z 0
b. N
0 200
150
100
0 . 0 0 • 2 0 • 4 0 . 6 0. 8 1. 0 1. 2 1. 4 1. 6 1. 8 '2 . 0 2 . 2 2 . 4 2 • 6 2 • 8
PAN (PPB)


