Embed Size (px)
Citation preview
Molecular Phylogenetics and Evolution 61 (2011) 784–800
Contents lists available at SciVerse ScienceDirect
Molecular Phylogenetics and Evolution
journal homepage: www.elsevier .com/locate /ympev
Phylogenetic relationships of the Dactyloa clade of Anolis lizards basedon nuclear and mitochondrial DNA sequence data
María del Rosario Castañeda a,b,⇑, Kevin de Queiroz b
a Department of Biological Sciences, The George Washington University, 2023 G Street NW, Washington, DC 20052, USAb Department of Vertebrate Zoology, National Museum of Natural History, Smithsonian Institution, MRC 162, Washington, DC 20560, USA
a r t i c l e i n f o a b s t r a c t
Article history:Received 27 January 2011Revised 14 June 2011Accepted 5 July 2011Available online 21 July 2011
Keywords:AnolisDactyloaPhylogeneticsSouth AmericaTaxonomy
1055-7903/$ - see front matter � 2011 Elsevier Inc. Adoi:10.1016/j.ympev.2011.07.004
⇑ Corresponding author. Address: P.O. Box 37012, Mians and Reptiles, Smithsonian Institution, Washingto+1 202 633 0182.
E-mail address: [email protected] (María del Rosa
The Dactyloa clade, one of two major subgroups of mainland Anolis lizards, is distributed from Costa Ricato Peru, including the Amazon region and the southern Lesser Antilles. We estimated the phylogeneticrelationships within Dactyloa based on mitochondrial (ND2, five transfer-RNAs, COI) and nuclear(RAG1) gene regions using likelihood and Bayesian methods under different partition strategies. In addi-tion, we tested the monophyly of five previously recognized groups within Dactyloa. The data stronglysupport the monophyly of Dactyloa and five major clades: eastern, latifrons, Phenacosaurus, roquet andwestern, each of which exhibits a coherent geographic range. Relationships among the five major cladesare less clear: support for basal nodes within Dactyloa is weak and some contradictory relationships aresupported by different datasets and/or phylogenetic methods. Of the previously recognized subgroupswithin Dactyloa, only the roquet series consistently passed the topology tests applied. The monophylyof the aequatorialis, latifrons (as traditionally circumscribed) and punctatus series was strongly rejected,and the monophyly of Phenacosaurus (as traditionally circumscribed) yielded mixed results. The resultsof the phylogenetic analyses suggest the need for a revised taxonomy and have implications for thebiogeography and tempo of the Dactyloa radiation.
� 2011 Elsevier Inc. All rights reserved.
1. Introduction
Anolis (Squamata: Iguanidae) is one of the most diverse groupsof vertebrates traditionally ranked as genera, with 377 currentlyrecognized species (Uetz and Etzold, 1996). Its members aredistributed from southeastern North America to middle SouthAmerica, including the West Indies (Etheridge, 1959; Peters andDonoso-Barros, 1970; Schwartz and Henderson, 1991). Theselizards are characterized by the presence of adhesive toe padsand brightly colored dewlaps (Etheridge, 1959), and are typicallyof small size, arboreal habits and insectivorous diet, though thereis significant interspecific variation in these traits (Schwartz andHenderson, 1991).
Early systematics studies (Etheridge, 1959; Williams, 1976a,b)divided Anolis into two sections (designated alpha and beta) basedon the morphology of the caudal vertebrae. Each section was fur-ther subdivided into series and species groups based on severalother osteological characters (e.g., post-xiphisternal rib formula,presence versus absence of a splenial, shape of the interclavicle).Subsequent phylogenetic studies have used a variety of data
ll rights reserved.
RC 162, Division of Amphib-n, DC 20013-7012, USA. Fax:
rio Castañeda).
including morphology, allozymes, karyotypes, albumin immunol-ogy, and DNA sequences (e.g., Brandley and de Queiroz, 2004;Burnell and Hedges, 1990; Creer et al., 2001; Glor et al., 2003;Gorman and Atkins, 1967; Gorman and Kim, 1976; Gorman et al.,1968, 1980, 1983; Jackman et al., 2002; Poe, 1998; Schneideret al., 2001; Shochat and Dessauer, 1981). In these analyses, mono-phyly of the beta section and of several series and species groupshas been supported, though others clearly are not monophyletic,and the phylogenetic relationships within and among some groupsremain controversial (e.g., Creer et al., 2001; Giannasi et al., 2000;Glor et al., 2003; Jackman et al., 1999, 2002; Nicholson, 2002; Poe,2004; Schneider et al., 2001).
Of the major groups within Anolis, the most poorly knownregarding phylogenetic relationships is the clade designated asM1 (Mainland1) by Pinto et al. (2008) and recognized as the lati-frons series by Etheridge (1959) and the genus Dactyloa by Guyerand Savage (1986; in the last two cases with the exclusion of Phe-nacosaurus; see below). However, the recognition of Dactyloa andother groups of anoles as genera (Guyer and Savage, 1986; Savageand Guyer, 1989) is controversial (Cannatella and de Queiroz,1989; Williams, 1989). Following recent authors (e.g., Brandleyand de Queiroz, 2004; de Queiroz and Reeder, 2008; Nicholson,2002), who have applied the names of some of Guyer and Savage’sgenera to clades within Anolis regardless of rank and not necessar-ily identical in composition, we use the name Dactyloa for the clade
María del Rosario Castañeda, K.de Queiroz / Molecular Phylogenetics and Evolution 61 (2011) 784–800 785
originating with the most recent common ancestor of the speciesincluded in the genus Dactyloa by Savage and Guyer (1989), whichalso includes the anoles formerly assigned to the genus Phenaco-saurus according to the results of recent phylogenetic analyses(e.g. Jackman et al., 1999; Nicholson et al., 2005; Poe, 1998, 2004).
Only a handful of phylogenetic studies have included Dactyloaspecies (Jackman et al., 1999; Glor et al., 2001; Poe, 2004;Nicholson et al., 2005), and most of these have included relativelyfew, particularly mainland, species of Dactyloa. Moreover, most ofwhat is known about the systematics of this group is based onmorphological characters, which have been used to recognize sixsubgroups ranked as species groups by Williams (1976a) and asseries by Savage and Guyer (1989): aequatorialis, laevis, latifrons,punctatus, roquet, and tigrinus (Williams, 1976b). The monophylyof these subgroups has never been tested, and there is no publishedhypothesis describing the relationships among them.
In this study, we present new molecular data for 40 of the 82currently recognized species of Dactyloa, two potentially new Dact-yloa species and 12 outgroup species (non-Dactyloa Anolis and non-Anolis Polychrotinae) to resolve the phylogenetic relationshipswithin Dactyloa. In addition, we test hypotheses of monophyly ofDactyloa including Phenacosaurus species, Dactyloa excludingPhenacosaurus species and five of seven previously recognizedspecies groups/series within Dactyloa.
2. Materials and methods
2.1. Taxa and character sampling
We collected new DNA sequence data from 40 species of Dact-yloa (62 specimens), including representatives of the previouslydescribed aequatorialis, latifrons, punctatus, and roquet series, aswell as Phenacosaurus, and two specimens suspected (based onmorphological data and geographic distribution) to be new species.Only one representative of the tigrinus series was included, but wedid not have any representatives of the laevis series. In addition, weincluded 12 species as outgroups: three non-Anolis species ofPolychrotinae (Polychrus marmoratus, Pristidactylus scapulatus,Urostrophus gallardoi), and nine species representing nine seriesof non-Dactyloa Anolis (Anolis bimaculatus, Anolis cupreus, Anoliscuvieri, Anolis equestris, Anolis lucius, Anolis marcanoi, Anolisoccultus, Anolis sagrei, Anolis smaragdinus). Sequenced fragmentsinclude two mitochondrial regions: a fragment including the entireNADH dehydrogenase subunit II (ND2), five transfer-RNA (tRNATrp,tRNAAla, tRNAAsn, tRNACys, tRNATyr), and the origin for light-strandreplication (OL) (Macey et al., 1997; �1500 b), and a fragment ofthe cytochrome oxidase subunit I (COI, �650 b), as well as one nu-clear region: the recombination activating gene (RAG-1, �2800 b).This selection of genes contains both highly conserved areas thatare informative for deeper divergences and rapidly evolving re-gions that are informative for more recent divergences (Grothand Barrowclough, 1999; Jackman et al., 1999; Miyata et al.,1982). Previously collected sequences for the ND2 region were ob-tained from GenBank for all three non-Anolis Polychrotinae, sevennon-Dactyloa Anolis and ten Dactyloa species. A complete list ofsamples, with voucher/catalogue and GenBank numbers andcollection localities is given in Appendix A.
2.2. Laboratory protocols
Genomic DNA was extracted from liver or muscle tissue usingDNeasy Tissue Extraction Kits (QIAGEN Inc.). Polymerase chainreaction (PCR) was used for amplification of the particular genomicregions and performed in a DNA Engine (PTC-200) Peltier ThermalCycler (MJ Research) and a DNA Engine Dyad� Peltier Thermal
Cycler (Bio-Rad Laboratories). Two alternative PCR cycling proto-cols were used, depending on the combination of primers and theirrespective optimal annealing temperatures. When both primershad similar optimal annealing temperatures (less than 2� differ-ence), the protocol used was: pre-denaturation at 94 �C for 120 s,followed by 30–35 cycles of denaturation at 95 �C for 30 s, anneal-ing at the average optimal temperature between the two primersfor 30 s, and primer extension at 72 �C for 60–120 s. When primersused had a large difference in optimal annealing temperatures(more than 2� difference), the protocol used was: pre-denaturationat 94 �C for 120 s, followed by 5 cycles of denaturation at 95 �C for30 s, annealing at the higher optimal temperature between the twoprimers for 30 s, and primer extension at 72 �C for 60–120 s. Then,two sets of 5 cycles each were run with identical denaturation andprimer extension conditions as before, but with decreased anneal-ing temperatures (each set decreased by 2–3�). A final set with theannealing temperature set at the lowest optimal annealing tem-perature between the two primers was run for 20 cycles. Primerextension time was adjusted according to the length of the frag-ment being amplified (�1 min per 1000 b). PCR products werepurified using ExoSAP-IT (USB Corporation) or magnetic beads(AMPure, Agencourt Bioscience Corporation). Cycle sequencingreactions were performed using BigDye Terminator chemistry (Ap-plied Biosystems) directly on purified PCR products. The sequenc-ing protocol used was denaturation at 96 �C for 10 s, annealing at50 �C for 10 s, and primer extension 60 �C for 240 s for 35 cycles.Sequenced products were purified using Sephadex G-50 columns(SIGMA), and run on an automated sequencer (ABI Prism 3100and 3730xl Genetic Analyzer, Applied Biosystems). The completelist of primers used in amplification and sequencing reactions is gi-ven in Appendix B. Assembly of sequences was performed withSeqMan II (DNASTAR, Inc.).
2.3. Alignment procedures and data matrices
Protein-coding regions were aligned using Clustal X (Thompsonet al., 1997), under default gap costs, and subsequently translatedinto amino acids using MacClade v4.07 (Maddison and Maddison,2001) to verify the correct translation frame. Genes coding fortRNAs were aligned manually to incorporate secondary structureinformation, following Kumazawa and Nishida’s (1993) structuralmodel for mitochondrial transfer RNAs. Sequences were strictlyaligned following this model (i.e., no gaps were introduced in areaswith conserved lengths: AA, AC, TWC and D-stems, junctions be-tween AA- and D-stems, D- and AC-stems, and AC- and TWC-stems,and the anticodon loop). From the set of tRNA regions that accord-ing to this model can exhibit length variation (and potentially re-sult in ambiguous alignments), those that showed lengthvariation were excluded from the analyses.
Three different data matrices were analyzed, one including thenuclear gene region (RAG1), one including both mitochondrial re-gions (ND2–COI), and one combining all three gene regions(ND2–COI–RAG1).
2.4. Phylogenetic analyses and data partitions
Phylogenetic relationships were estimated using likelihood andBayesian inference methods. Likelihood analyses were performedwith GARLI-PART (Zwickl, 2006) v0.97 and GARLI (Zwickl, 2006)v1.0 using multiple partitioning strategies for each matrix (Table 1).Each analysis was run with 20 replicates using random startingtrees (other settings were left as defaults). The models of evolutionfor the different partitions were selected based on the Akaike Infor-mation Criterion (AIC) as implemented in Modeltest (Posada andCrandall, 1998) v3.7. The trees inferred using GARLI v1.0 with anunpartitioned strategy were compared with those inferred using
Table 1Partitioning strategies used in the phylogenetic analyses of the three datasets.
Dataset Number ofpartitions
Partitions
RAG1 1 Unpartitioned3 1st, 2nd and 3rd codon positions
ND2–COI 1 Unpartitioned4 1st, 2nd and 3rd codon positions of all protein-coding genes (not partitioned by gene); tRNAs7 1st, 2nd and 3rd codon positions of each protein-coding gene (parititioned by gene); tRNAs
ND2–COI–RAG1 1 Unpartitioned4 1st, 2nd and 3rd codon positions of all protein-coding genes (not partitioned by gene); tRNAs7 1st, 2nd and 3rd codon positions of protein-coding mitochondrial genes; tRNAs; 1st, 2nd and 3rd codon positions of nuclear gene
10 1st, 2nd and 3rd codon positions of each protein-coding gene (partitioned by gene); tRNAs
786 María del Rosario Castañeda, K.de Queiroz / Molecular Phylogenetics and Evolution 61 (2011) 784–800
PAUP� v4.0 (Swofford, 2002) with a successive approximations ap-proach (Sullivan et al., 2005; Swofford et al., 1996). To assess nodalsupport, non-parametric bootstrap values (BS; Felsenstein, 1985)were calculated in GARLI-PART v0.97 and GARLI v1.0, with 500pseudoreplicates, using random starting trees and the same modelof evolution (estimating parameter values for each pseudorepli-cate) used in the tree searches. All other settings were left asdefaults, except the number of multiple search replicates (search-reps), which was set to 1.
Bayesian analyses were performed with MrBayes v3.1.2(Ronquist and Huelsenbeck, 2003) using the same partition strate-gies as in the likelihood analyses (Table 1). The RAG1 and ND2–COImatrices were analyzed using four independent runs of 10 milliongenerations with a random starting tree, each with four Markovchains and default heating settings. The ND2–COI–RAG1 datasetunder all partitions was analyzed using four independent runs,each with four Markov chains, with the temperature set at 0.15to improve parameter mixing. The analyses of the unpartitionedand four partition strategies were run for 15 million generations,and the analyses of the 7 and 10 partition strategies were run for25 million generations to ensure that convergence was achieved(see below). Trees were sampled with a frequency of one every1000 generations. The first 25% of the sampled trees were dis-carded as the ‘burn-in’ phase. To confirm that stationarity wasachieved within the first 25% of sampled trees, we examined plotsof the �lnL versus generation number using TRACER v1.5(Rambaut and Drummond, 2007) and compared the averagestandard deviation of split frequencies between chains and the po-tential scale reduction factor (PSRF) of all the estimated parametersfor the four runs combined. The average standard deviation of splitfrequencies of two converging chains is expected to approach zeroand the PSRF should approach 1 as the runs converge. In addition,an effective sample size (ESS) higher than 200—as calculated inTRACER—for all parameters in each analysis, was considered asan indication that an adequate number of independent samples
Table 2Comparison of alternative partitioning strategies used in the likelihood and Bayesian analyvalues (–ln L) and Akaike information criterion (AICc) scores of the maximum likelihood treeof Bayesian trees) and Bayes Factors are given. A value of DAICc > 10 was considered asAnderson, 2004). A value of 2Ln (Bab) > 10 indicates very strong support for partitioningRaftery, 1995).
Dataset P K �ln L AICc DAICc (larger AICc –
RAG1 3 21 �13363.0 26768.2 455.9 (1–3)1 10 �13602.0 27224.1
ND2–COI 7 60 �45331.1 90783.7 833.5 (4–7), 2683.7 (14 38 �45770.3 91617.2 1850.2 (1–4)1 10 �46723.7 93467.4
ND2–COI–RAG1 10 81 �59018.6 118202.0 859.7 (7–10), 4168.46232.0 (1–10)
7 59 �59471.1 119061.8 3308.9 (4–7), 5372.34 38 �61147.0 122370.6 2063.4 (1–4)1 10 �62207.0 124434.0
was obtained in the post burn-in sample. Bayesian posterior cladeprobabilities (PP) were calculated based on the post burn-in treesfor all four independent runs combined. Nodes with posteriorprobabilities higher than 95% were considered strongly supported,with the caution that PP might overestimate clade support, espe-cially for short internodes (Alfaro et al., 2003; Lewis et al., 2005;Suzuki et al., 2002).
Akaike information criterion scores incorporating the correctionfor small sample size (AICc) were used to compare the results ofalternative data partition strategies used in the likelihood analyses.AICc scores were calculated following the formula AICc = �2lnL +2K + 2K (K + 1)/(n � K � 1), where K is the number of parametersin the model and n is the number of bases in the dataset (Burnhamand Anderson, 2004). A value of DAICc higher than 10 was consid-ered an indication of strong support for the partition strategy withthe smaller AICc. Bayes factors (BF) were used to evaluate the re-sults from different partitioning strategies in the Bayesian analyses(Kass and Raftery, 1995; Pagel and Meade, 2005). Comparing mod-el a to model b, the Bayes factor is the ratio of the marginal likeli-hood of model a to that of model b (Pagel and Meade, 2005).Marginal likelihoods can be estimated by calculating the harmonicmean of the likelihoods of a sample from the posterior distribution,as obtained from a MCMC method (Newton and Raftery, 1994;Pagel and Meade, 2005). 2Ln-Bayes factors were calculated in TRA-CER v.1.5 (Rambaut and Drummond, 2007; Suchard et al., 2001)using harmonic means of the likelihoods of the trees in the postburn-in sample. Following the criteria outlined by Kass and Raftery(1995), BF values higher than 10 were considered an indication ofstrong support for partition strategy a over partition strategy b.
2.5. Hypothesis testing
Wilcoxon signed-ranks tests (WSR; modified from Templeton,1983, as described below), Approximately Unbiased tests (AU;Shimodaira, 2002) and a Bayesian approach based on the presence
ses. The number of partitions (P; Table 1), number of model parameters (K), likelihood, harmonic means of likelihood scores (as calculated in TRACER from the post-burn setan indication of strong support for the partition with smaller AICc (Burnham and
strategy a (more partitions) over partitioning strategy b (fewer partitions; Kass and
smaller AICc) Harmonic mean 2Ln Bayes factors (a/b)
�13625.7 184.8 (3/1)�13718.1
–7) �45421.4 851.2 (7/4), 2719.7 (7/1)�45847.0 1868.5 (4/1)�46781.3
(4–10) �59185.4 847.7 (10/7), 4083.9 (10/4), 6164.9 (10/1)
(1–7) �59609.2 3236.2 (7/4), 5317.2 (7/1)�61227.3 2081.0 (4/1)�62267.8
Table 3Nodal support values (bootstrap proportions and posterior probabilities) for Dactyloaand the five major clades inferred in the likelihood (L) and Bayesian (B) analyses, bygene region and partition strategy (P; see Table 1). The strategy with seven partitionsapplies only to the combined data sets, and that with 10 partitions applies only to theND2–COI–RAG1 combined data set. NA = not applicable.
Clade P Dataset
RAG1 ND2–COI ND2–COI–RAG1
Dactyloa L 1 100 67 1003/4a 100 61 1007 NA 61 10010 NA NA 100
B 1 1.00 0.95 1.003/4a 1.00 0.99 1.007 NA 1.00 1.0010 NA NA 1.00
latifrons L 1 100 100 1003/4a 100 98 1007 NA 99 10010 NA NA 100
B 1 1.00 1.00 1.003/4a 1.00 1.00 1.007 NA 1.00 1.0010 NA NA 1.00
roquet L 1 100 99 1003/4a 100 100 1007 NA 100 100
María del Rosario Castañeda, K.de Queiroz / Molecular Phylogenetics and Evolution 61 (2011) 784–800 787
or absence of topologies containing particular hypotheses of rela-tionships in the 95% credible set of trees (Huelsenbeck et al.,2001; Larget and Simon, 1999), were used to test the followinghypotheses: (1) monophyly of Dactyloa excluding Phenacosaurus,(2) monophyly of the subgroups aequatorialis, latifrons,Phenacosaurus, and punctatus and (3) non-monophyly of Dactyloa(including Phenacosaurus) and of the roquet series. Hypotheses ofnon-monophyly were tested when the group in question wasmonophyletic in the optimal (unconstrained) trees. Given thatwe obtained data for only one species of the tigrinus series andnone of the laevis series, no tests were performed regarding themonophyly of these taxa.
The tree resulting from the likelihood analysis of the ND2–COI–RAG1 matrix was compared with trees resulting from likelihoodanalyses of the same data set incorporating each alternativehypothesis as a constraint. Likelihood analyses were performedusing the preferred partitioning strategy (selected based on AICcscores) in GARLI-PART v0.97 as described above. Alternative topol-ogies were constructed using MacClade v4.07 (Maddison andMaddison, 2001) and incorporated into GARLI-PART v.097 as topo-logical constraints. The undescribed species (A. sp1 and A. sp2)were excluded from these analyses, as their affinities to the differ-ent series are unclear. The WSR tests were performed in R (R Devel-opment Core Team, 2010) using site-likelihood scores (instead ofnumber of parsimony steps, as originally proposed by Templeton(1983)). Site-likelihoods were calculated in GARLI-PART v0.97using the same model and partition strategy as in the uncon-strained analysis. The AU test was performed in CONSEL (Shimoda-ira and Hasegawa, 2001) v0.1i, with default settings. For theBayesian approach, the results from the analyses of the ND2–COI–RAG1 dataset under the preferred partitioned strategy wereused. Trees contained in the 95% credible set of trees from the postburn-in sample (from which taxa suspected to be new species werepruned) were loaded into PAUP� and filtered based on constraintscorresponding to specific hypotheses. Topologies that were notpresent in the 95% credible set of trees (i.e., constraints for whichno trees passed through the filter) were considered rejected bythe data.
10 NA NA 100B 1 1.00 1.00 1.00
3/4a 1.00 1.00 1.007 NA 1.00 1.0010 NA NA 1.00
Eastern L 1 83 98 1003/4a 85 98 1007 NA 98 10010 NA NA 99
B 1 1.00 1.00 1.003/4a 1.00 1.00 1.007 NA 1.00 1.0010 NA NA 1.00
Western L 1 97 81 993/4a 95 76 997 NA 81 9910 NA NA 100
B 1 1.00 1.00 1.003/4a 1.00 1.00 1.007 NA 1.00 1.0010 NA NA 1.00
Phenacosaurus L 1 100 100 1003/4a 100 100 1007 NA 100 10010 NA NA 100
B 1 1.00 1.00 1.003/4a 1.00 1.00 1.007 NA 1.00 1.0010 NA NA 1.00
a For ND2–COI and ND2–COI–RAG1 datasets there are four data partitions in theND2 gene representing codon positions (1st, 2nd, 3rd) and tRNAs; for the twoprotein coding regions COI and RAG1 there are three data partitions (no tRNAs).
3. Results
A total of 4720 bases (b) were unambiguously aligned in themost inclusive matrix (ND2–COI–RAG1), consisting of 1312 b inthe ND2 region, 654 b in the COI region and 2754 b in the RAG1 re-gion. Two gaps were introduced in the ND2 alignment: (1) in posi-tions 1033–1035 (in P. scapulatus and U. gallardoi) and (2) inposition 958–960 (in P. marmoratus). No length variation wasfound in the COI fragment and therefore no gaps were introducedin the alignment. Six gaps were introduced in the alignment of theRAG1 gene region: (1) in positions 37–51 (in A. equestris), (2) inpositions 76–87 (in both samples of A. fitchi), (3) in positions121–123 (in A. smaragdinus), (4) in positions 217–219 (in all sam-ples except both of A. aequatorialis), (5) in positions 280–294 (in allsamples of A. chloris, A. festae and A. peraccae), and (6) in positions634–636 (in all samples except P. marmoratus). Due to ambiguousalignment, 148 positions were excluded from the tRNA section ofthe ND2 region (see Section 2.3). No characters were excludedfrom the COI or RAG1 regions.
Akaike information criterion (AICc) scores and Bayes factors(BF) favored the most partitioned strategy for all three datasets(Table 2). The trees inferred from the 20 replicates performed inGARLI for each likelihood analysis (under the preferred partitionstrategies) had identical topologies for the RAG1 dataset, andnon-conflicting topologies for the ND2–COI and ND2–COI–RAG1datasets. Likelihood analyses in GARLI v1.0 with an unpartitioned
strategy resulted in trees identical to those inferred with PAUP�
using the successive approximations approach. In the Bayesiananalyses of the ND2–COI–RAG1 dataset under 7 and 10 partitions,the four independent runs did not converge onto the same likeli-hood values, but instead reached stationarity in two different like-lihood value regions (i.e., two runs reached stationarity at similarlower �Ln likelihood scores and the remaining two reached sta-tionarity at similar higher scores). For this reason, two of the fourruns were discarded and only the two with lower �Ln likelihoodscores were used for tree and harmonic mean estimation. Relation-ships among species in the resulting topologies (from the runs withhigh versus low likelihood scores) differed only in one (7 parti-tions) or two (10 partitions) poorly supported nodes. Nodal
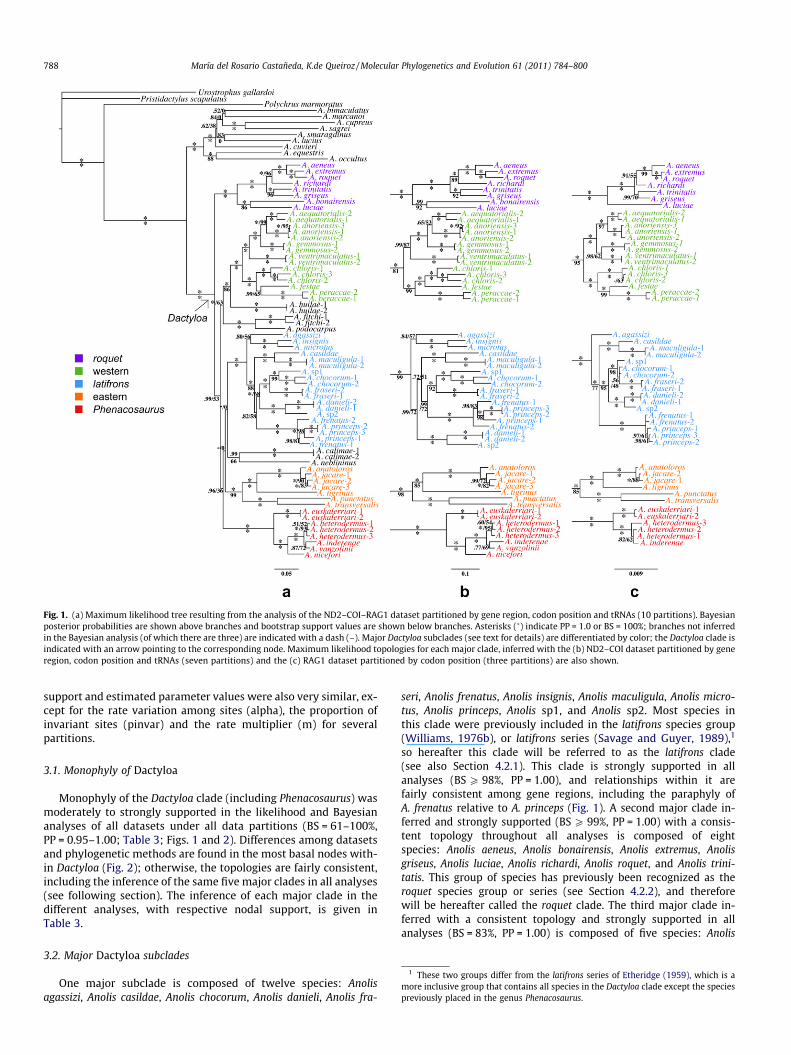
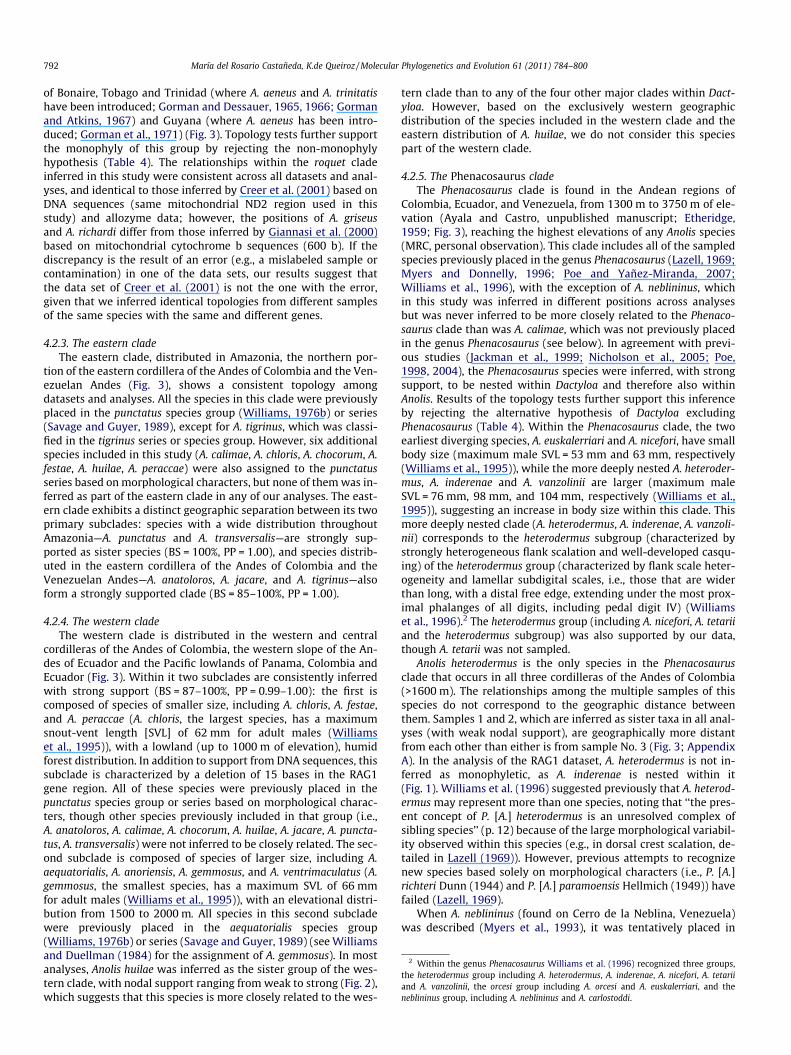
Fig. 1. (a) Maximum likelihood tree resulting from the analysis of the ND2–COI–RAG1 dataset partitioned by gene region, codon position and tRNAs (10 partitions). Bayesianposterior probabilities are shown above branches and bootstrap support values are shown below branches. Asterisks (�) indicate PP = 1.0 or BS = 100%; branches not inferredin the Bayesian analysis (of which there are three) are indicated with a dash (–). Major Dactyloa subclades (see text for details) are differentiated by color; the Dactyloa clade isindicated with an arrow pointing to the corresponding node. Maximum likelihood topologies for each major clade, inferred with the (b) ND2–COI dataset partitioned by generegion, codon position and tRNAs (seven partitions) and the (c) RAG1 dataset partitioned by codon position (three partitions) are also shown.
1 These two groups differ from the latifrons series of Etheridge (1959), which is aore inclusive group that contains all species in the Dactyloa clade except the species
previously placed in the genus Phenacosaurus.
788 María del Rosario Castañeda, K.de Queiroz / Molecular Phylogenetics and Evolution 61 (2011) 784–800
support and estimated parameter values were also very similar, ex-cept for the rate variation among sites (alpha), the proportion ofinvariant sites (pinvar) and the rate multiplier (m) for severalpartitions.
3.1. Monophyly of Dactyloa
Monophyly of the Dactyloa clade (including Phenacosaurus) wasmoderately to strongly supported in the likelihood and Bayesiananalyses of all datasets under all data partitions (BS = 61–100%,PP = 0.95–1.00; Table 3; Figs. 1 and 2). Differences among datasetsand phylogenetic methods are found in the most basal nodes with-in Dactyloa (Fig. 2); otherwise, the topologies are fairly consistent,including the inference of the same five major clades in all analyses(see following section). The inference of each major clade in thedifferent analyses, with respective nodal support, is given inTable 3.
3.2. Major Dactyloa subclades
One major subclade is composed of twelve species: Anolisagassizi, Anolis casildae, Anolis chocorum, Anolis danieli, Anolis fra-
seri, Anolis frenatus, Anolis insignis, Anolis maculigula, Anolis micro-tus, Anolis princeps, Anolis sp1, and Anolis sp2. Most species inthis clade were previously included in the latifrons species group(Williams, 1976b), or latifrons series (Savage and Guyer, 1989),1
so hereafter this clade will be referred to as the latifrons clade(see also Section 4.2.1). This clade is strongly supported in allanalyses (BS P 98%, PP = 1.00), and relationships within it arefairly consistent among gene regions, including the paraphyly ofA. frenatus relative to A. princeps (Fig. 1). A second major clade in-ferred and strongly supported (BS P 99%, PP = 1.00) with a consis-tent topology throughout all analyses is composed of eightspecies: Anolis aeneus, Anolis bonairensis, Anolis extremus, Anolisgriseus, Anolis luciae, Anolis richardi, Anolis roquet, and Anolis trini-tatis. This group of species has previously been recognized as theroquet species group or series (see Section 4.2.2), and thereforewill be hereafter called the roquet clade. The third major clade in-ferred with a consistent topology and strongly supported in allanalyses (BS = 83%, PP = 1.00) is composed of five species: Anolis
m
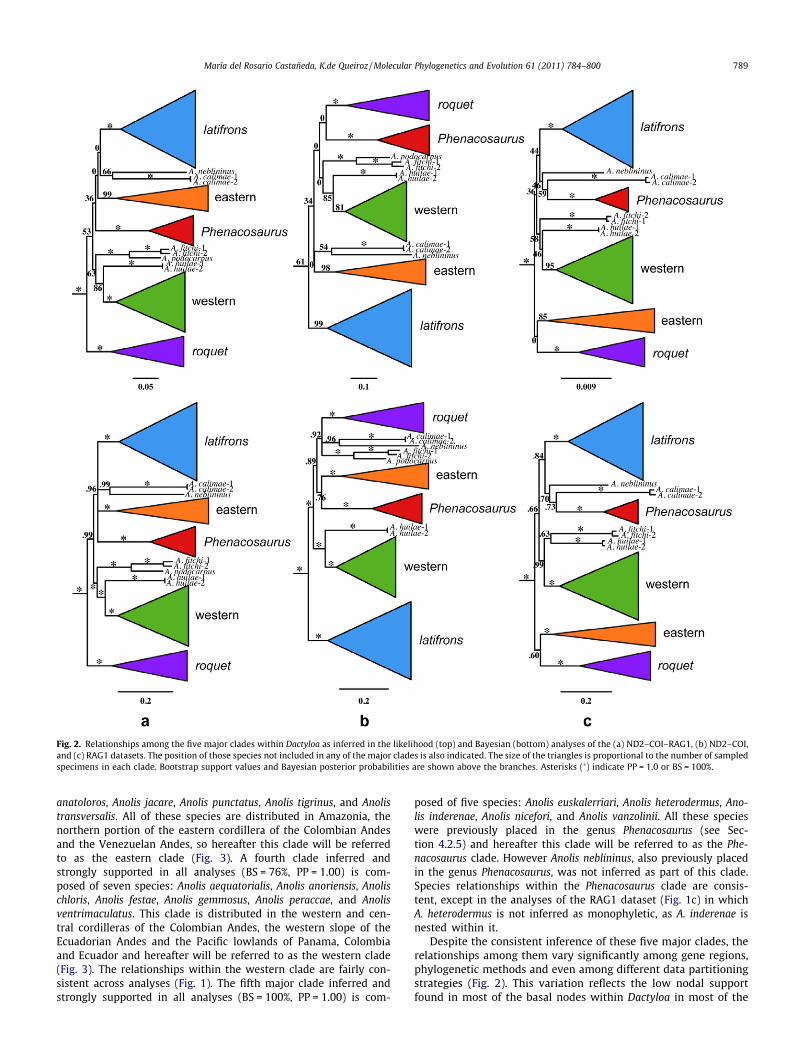
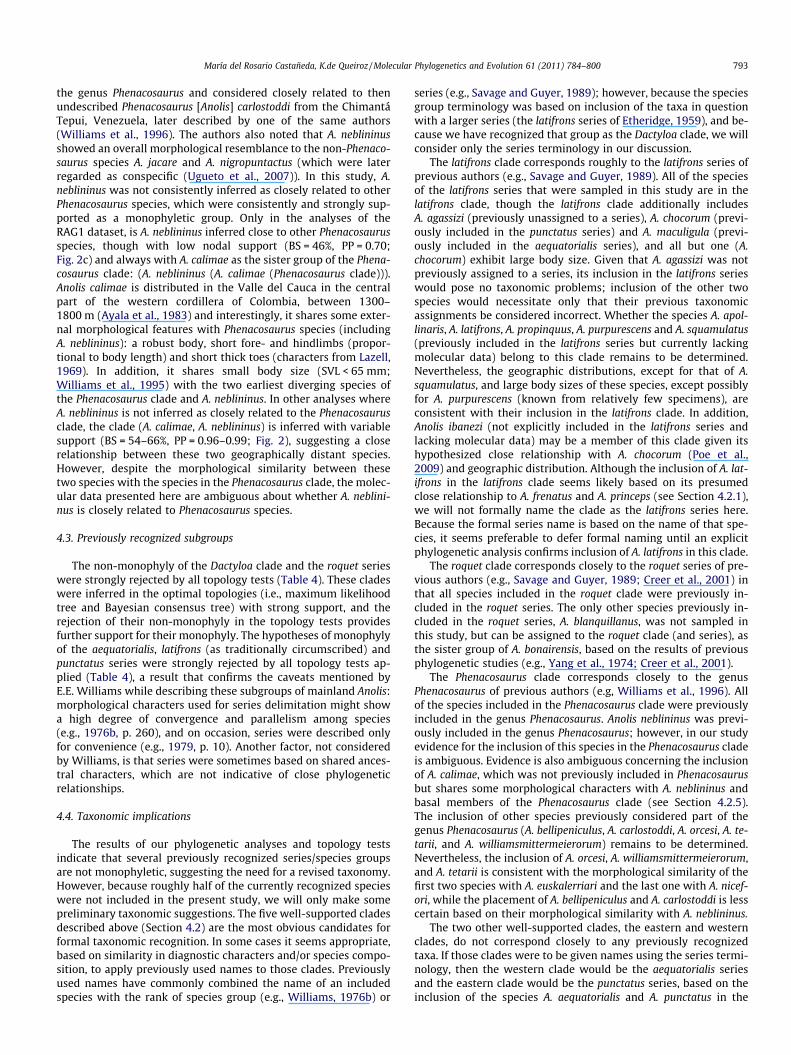
Fig. 2. Relationships among the five major clades within Dactyloa as inferred in the likelihood (top) and Bayesian (bottom) analyses of the (a) ND2–COI–RAG1, (b) ND2–COI,and (c) RAG1 datasets. The position of those species not included in any of the major clades is also indicated. The size of the triangles is proportional to the number of sampledspecimens in each clade. Bootstrap support values and Bayesian posterior probabilities are shown above the branches. Asterisks (�) indicate PP = 1.0 or BS = 100%.
María del Rosario Castañeda, K.de Queiroz / Molecular Phylogenetics and Evolution 61 (2011) 784–800 789
anatoloros, Anolis jacare, Anolis punctatus, Anolis tigrinus, and Anolistransversalis. All of these species are distributed in Amazonia, thenorthern portion of the eastern cordillera of the Colombian Andesand the Venezuelan Andes, so hereafter this clade will be referredto as the eastern clade (Fig. 3). A fourth clade inferred andstrongly supported in all analyses (BS = 76%, PP = 1.00) is com-posed of seven species: Anolis aequatorialis, Anolis anoriensis, Anolischloris, Anolis festae, Anolis gemmosus, Anolis peraccae, and Anolisventrimaculatus. This clade is distributed in the western and cen-tral cordilleras of the Colombian Andes, the western slope of theEcuadorian Andes and the Pacific lowlands of Panama, Colombiaand Ecuador and hereafter will be referred to as the western clade(Fig. 3). The relationships within the western clade are fairly con-sistent across analyses (Fig. 1). The fifth major clade inferred andstrongly supported in all analyses (BS = 100%, PP = 1.00) is com-
posed of five species: Anolis euskalerriari, Anolis heterodermus, Ano-lis inderenae, Anolis nicefori, and Anolis vanzolinii. All these specieswere previously placed in the genus Phenacosaurus (see Sec-tion 4.2.5) and hereafter this clade will be referred to as the Phe-nacosaurus clade. However Anolis neblininus, also previously placedin the genus Phenacosaurus, was not inferred as part of this clade.Species relationships within the Phenacosaurus clade are consis-tent, except in the analyses of the RAG1 dataset (Fig. 1c) in whichA. heterodermus is not inferred as monophyletic, as A. inderenae isnested within it.
Despite the consistent inference of these five major clades, therelationships among them vary significantly among gene regions,phylogenetic methods and even among different data partitioningstrategies (Fig. 2). This variation reflects the low nodal supportfound in most of the basal nodes within Dactyloa in most of the
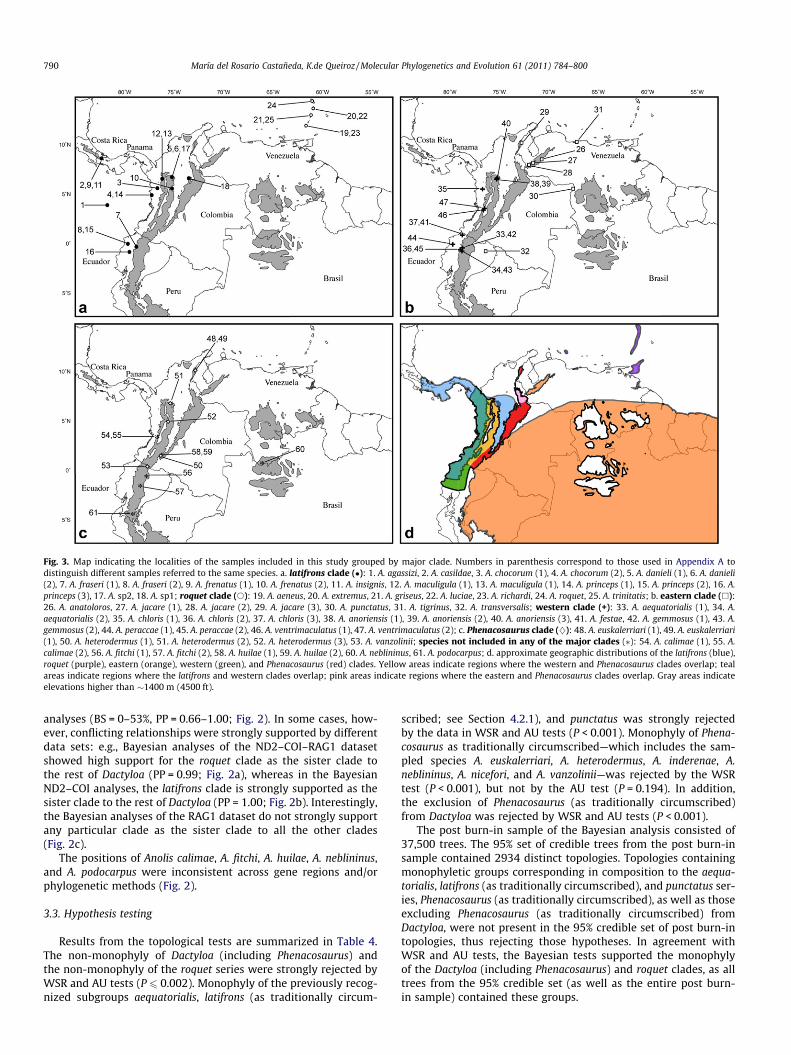
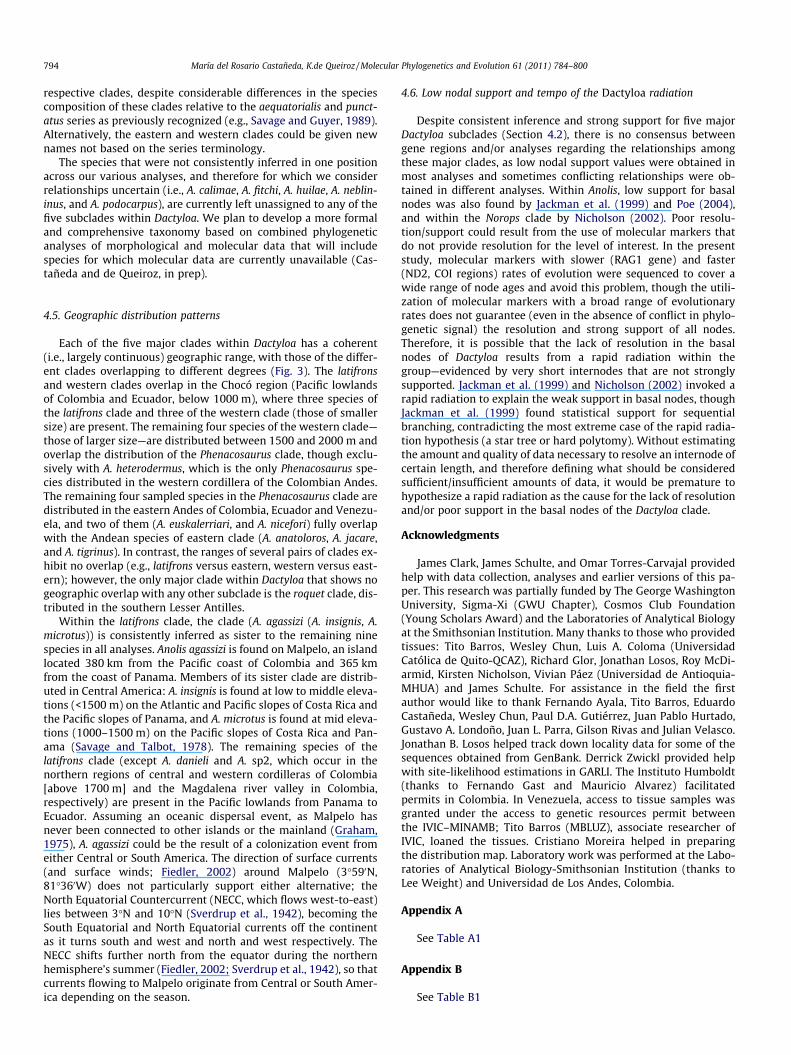
Fig. 3. Map indicating the localities of the samples included in this study grouped by major clade. Numbers in parenthesis correspond to those used in Appendix A todistinguish different samples referred to the same species. a. latifrons clade (�): 1. A. agassizi, 2. A. casildae, 3. A. chocorum (1), 4. A. chocorum (2), 5. A. danieli (1), 6. A. danieli(2), 7. A. fraseri (1), 8. A. fraseri (2), 9. A. frenatus (1), 10. A. frenatus (2), 11. A. insignis, 12. A. maculigula (1), 13. A. maculigula (1), 14. A. princeps (1), 15. A. princeps (2), 16. A.princeps (3), 17. A. sp2, 18. A. sp1; roquet clade (s): 19. A. aeneus, 20. A. extremus, 21. A. griseus, 22. A. luciae, 23. A. richardi, 24. A. roquet, 25. A. trinitatis; b. eastern clade (h):26. A. anatoloros, 27. A. jacare (1), 28. A. jacare (2), 29. A. jacare (3), 30. A. punctatus, 31. A. tigrinus, 32. A. transversalis; western clade (+): 33. A. aequatorialis (1), 34. A.aequatorialis (2), 35. A. chloris (1), 36. A. chloris (2), 37. A. chloris (3), 38. A. anoriensis (1), 39. A. anoriensis (2), 40. A. anoriensis (3), 41. A. festae, 42. A. gemmosus (1), 43. A.gemmosus (2), 44. A. peraccae (1), 45. A. peraccae (2), 46. A. ventrimaculatus (1), 47. A. ventrimaculatus (2); c. Phenacosaurus clade (}): 48. A. euskalerriari (1), 49. A. euskalerriari(1), 50. A. heterodermus (1), 51. A. heterodermus (2), 52. A. heterodermus (3), 53. A. vanzolinii; species not included in any of the major clades (⁄): 54. A. calimae (1), 55. A.calimae (2), 56. A. fitchi (1), 57. A. fitchi (2), 58. A. huilae (1), 59. A. huilae (2), 60. A. neblininus, 61. A. podocarpus; d. approximate geographic distributions of the latifrons (blue),roquet (purple), eastern (orange), western (green), and Phenacosaurus (red) clades. Yellow areas indicate regions where the western and Phenacosaurus clades overlap; tealareas indicate regions where the latifrons and western clades overlap; pink areas indicate regions where the eastern and Phenacosaurus clades overlap. Gray areas indicateelevations higher than �1400 m (4500 ft).
790 María del Rosario Castañeda, K.de Queiroz / Molecular Phylogenetics and Evolution 61 (2011) 784–800
analyses (BS = 0–53%, PP = 0.66–1.00; Fig. 2). In some cases, how-ever, conflicting relationships were strongly supported by differentdata sets: e.g., Bayesian analyses of the ND2–COI–RAG1 datasetshowed high support for the roquet clade as the sister clade tothe rest of Dactyloa (PP = 0.99; Fig. 2a), whereas in the BayesianND2–COI analyses, the latifrons clade is strongly supported as thesister clade to the rest of Dactyloa (PP = 1.00; Fig. 2b). Interestingly,the Bayesian analyses of the RAG1 dataset do not strongly supportany particular clade as the sister clade to all the other clades(Fig. 2c).
The positions of Anolis calimae, A. fitchi, A. huilae, A. neblininus,and A. podocarpus were inconsistent across gene regions and/orphylogenetic methods (Fig. 2).
3.3. Hypothesis testing
Results from the topological tests are summarized in Table 4.The non-monophyly of Dactyloa (including Phenacosaurus) andthe non-monophyly of the roquet series were strongly rejected byWSR and AU tests (P 6 0.002). Monophyly of the previously recog-nized subgroups aequatorialis, latifrons (as traditionally circum-
scribed; see Section 4.2.1), and punctatus was strongly rejectedby the data in WSR and AU tests (P < 0.001). Monophyly of Phena-cosaurus as traditionally circumscribed—which includes the sam-pled species A. euskalerriari, A. heterodermus, A. inderenae, A.neblininus, A. nicefori, and A. vanzolinii—was rejected by the WSRtest (P < 0.001), but not by the AU test (P = 0.194). In addition,the exclusion of Phenacosaurus (as traditionally circumscribed)from Dactyloa was rejected by WSR and AU tests (P < 0.001).
The post burn-in sample of the Bayesian analysis consisted of37,500 trees. The 95% set of credible trees from the post burn-insample contained 2934 distinct topologies. Topologies containingmonophyletic groups corresponding in composition to the aequa-torialis, latifrons (as traditionally circumscribed), and punctatus ser-ies, Phenacosaurus (as traditionally circumscribed), as well as thoseexcluding Phenacosaurus (as traditionally circumscribed) fromDactyloa, were not present in the 95% credible set of post burn-intopologies, thus rejecting those hypotheses. In agreement withWSR and AU tests, the Bayesian tests supported the monophylyof the Dactyloa (including Phenacosaurus) and roquet clades, as alltrees from the 95% credible set (as well as the entire post burn-in sample) contained these groups.
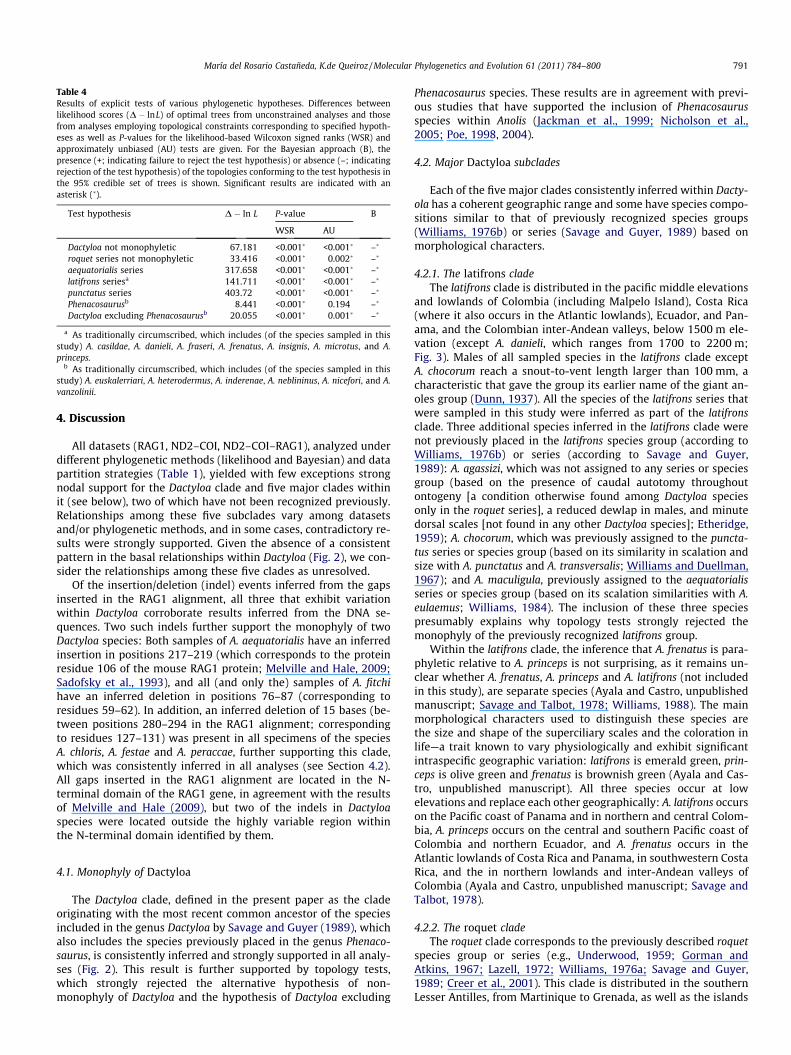
Table 4Results of explicit tests of various phylogenetic hypotheses. Differences betweenlikelihood scores (D � lnL) of optimal trees from unconstrained analyses and thosefrom analyses employing topological constraints corresponding to specified hypoth-eses as well as P-values for the likelihood-based Wilcoxon signed ranks (WSR) andapproximately unbiased (AU) tests are given. For the Bayesian approach (B), thepresence (+; indicating failure to reject the test hypothesis) or absence (–; indicatingrejection of the test hypothesis) of the topologies conforming to the test hypothesis inthe 95% credible set of trees is shown. Significant results are indicated with anasterisk (�).
Test hypothesis D � ln L P-value B
WSR AU
Dactyloa not monophyletic 67.181 <0.001� <0.001� –�
roquet series not monophyletic 33.416 <0.001� 0.002� –�
aequatorialis series 317.658 <0.001� <0.001� –�
latifrons seriesa 141.711 <0.001� <0.001� –�
punctatus series 403.72 <0.001� <0.001� –�
Phenacosaurusb 8.441 <0.001� 0.194 –�
Dactyloa excluding Phenacosaurusb 20.055 <0.001� 0.001� –�
a As traditionally circumscribed, which includes (of the species sampled in thisstudy) A. casildae, A. danieli, A. fraseri, A. frenatus, A. insignis, A. microtus, and A.princeps.
b As traditionally circumscribed, which includes (of the species sampled in thisstudy) A. euskalerriari, A. heterodermus, A. inderenae, A. neblininus, A. nicefori, and A.vanzolinii.
María del Rosario Castañeda, K.de Queiroz / Molecular Phylogenetics and Evolution 61 (2011) 784–800 791
4. Discussion
All datasets (RAG1, ND2–COI, ND2–COI–RAG1), analyzed underdifferent phylogenetic methods (likelihood and Bayesian) and datapartition strategies (Table 1), yielded with few exceptions strongnodal support for the Dactyloa clade and five major clades withinit (see below), two of which have not been recognized previously.Relationships among these five subclades vary among datasetsand/or phylogenetic methods, and in some cases, contradictory re-sults were strongly supported. Given the absence of a consistentpattern in the basal relationships within Dactyloa (Fig. 2), we con-sider the relationships among these five clades as unresolved.
Of the insertion/deletion (indel) events inferred from the gapsinserted in the RAG1 alignment, all three that exhibit variationwithin Dactyloa corroborate results inferred from the DNA se-quences. Two such indels further support the monophyly of twoDactyloa species: Both samples of A. aequatorialis have an inferredinsertion in positions 217–219 (which corresponds to the proteinresidue 106 of the mouse RAG1 protein; Melville and Hale, 2009;Sadofsky et al., 1993), and all (and only the) samples of A. fitchihave an inferred deletion in positions 76–87 (corresponding toresidues 59–62). In addition, an inferred deletion of 15 bases (be-tween positions 280–294 in the RAG1 alignment; correspondingto residues 127–131) was present in all specimens of the speciesA. chloris, A. festae and A. peraccae, further supporting this clade,which was consistently inferred in all analyses (see Section 4.2).All gaps inserted in the RAG1 alignment are located in the N-terminal domain of the RAG1 gene, in agreement with the resultsof Melville and Hale (2009), but two of the indels in Dactyloaspecies were located outside the highly variable region withinthe N-terminal domain identified by them.
4.1. Monophyly of Dactyloa
The Dactyloa clade, defined in the present paper as the cladeoriginating with the most recent common ancestor of the speciesincluded in the genus Dactyloa by Savage and Guyer (1989), whichalso includes the species previously placed in the genus Phenaco-saurus, is consistently inferred and strongly supported in all analy-ses (Fig. 2). This result is further supported by topology tests,which strongly rejected the alternative hypothesis of non-monophyly of Dactyloa and the hypothesis of Dactyloa excluding
Phenacosaurus species. These results are in agreement with previ-ous studies that have supported the inclusion of Phenacosaurusspecies within Anolis (Jackman et al., 1999; Nicholson et al.,2005; Poe, 1998, 2004).
4.2. Major Dactyloa subclades
Each of the five major clades consistently inferred within Dacty-ola has a coherent geographic range and some have species compo-sitions similar to that of previously recognized species groups(Williams, 1976b) or series (Savage and Guyer, 1989) based onmorphological characters.
4.2.1. The latifrons cladeThe latifrons clade is distributed in the pacific middle elevations
and lowlands of Colombia (including Malpelo Island), Costa Rica(where it also occurs in the Atlantic lowlands), Ecuador, and Pan-ama, and the Colombian inter-Andean valleys, below 1500 m ele-vation (except A. danieli, which ranges from 1700 to 2200 m;Fig. 3). Males of all sampled species in the latifrons clade exceptA. chocorum reach a snout-to-vent length larger than 100 mm, acharacteristic that gave the group its earlier name of the giant an-oles group (Dunn, 1937). All the species of the latifrons series thatwere sampled in this study were inferred as part of the latifronsclade. Three additional species inferred in the latifrons clade werenot previously placed in the latifrons species group (according toWilliams, 1976b) or series (according to Savage and Guyer,1989): A. agassizi, which was not assigned to any series or speciesgroup (based on the presence of caudal autotomy throughoutontogeny [a condition otherwise found among Dactyloa speciesonly in the roquet series], a reduced dewlap in males, and minutedorsal scales [not found in any other Dactyloa species]; Etheridge,1959); A. chocorum, which was previously assigned to the puncta-tus series or species group (based on its similarity in scalation andsize with A. punctatus and A. transversalis; Williams and Duellman,1967); and A. maculigula, previously assigned to the aequatorialisseries or species group (based on its scalation similarities with A.eulaemus; Williams, 1984). The inclusion of these three speciespresumably explains why topology tests strongly rejected themonophyly of the previously recognized latifrons group.
Within the latifrons clade, the inference that A. frenatus is para-phyletic relative to A. princeps is not surprising, as it remains un-clear whether A. frenatus, A. princeps and A. latifrons (not includedin this study), are separate species (Ayala and Castro, unpublishedmanuscript; Savage and Talbot, 1978; Williams, 1988). The mainmorphological characters used to distinguish these species arethe size and shape of the superciliary scales and the coloration inlife—a trait known to vary physiologically and exhibit significantintraspecific geographic variation: latifrons is emerald green, prin-ceps is olive green and frenatus is brownish green (Ayala and Cas-tro, unpublished manuscript). All three species occur at lowelevations and replace each other geographically: A. latifrons occurson the Pacific coast of Panama and in northern and central Colom-bia, A. princeps occurs on the central and southern Pacific coast ofColombia and northern Ecuador, and A. frenatus occurs in theAtlantic lowlands of Costa Rica and Panama, in southwestern CostaRica, and the in northern lowlands and inter-Andean valleys ofColombia (Ayala and Castro, unpublished manuscript; Savage andTalbot, 1978).
4.2.2. The roquet cladeThe roquet clade corresponds to the previously described roquet
species group or series (e.g., Underwood, 1959; Gorman andAtkins, 1967; Lazell, 1972; Williams, 1976a; Savage and Guyer,1989; Creer et al., 2001). This clade is distributed in the southernLesser Antilles, from Martinique to Grenada, as well as the islands
2 Within the genus Phenacosaurus Williams et al. (1996) recognized three groups,e heterodermus group including A. heterodermus, A. inderenae, A. nicefori, A. tetarii
nd A. vanzolinii, the orcesi group including A. orcesi and A. euskalerriari, and theeblininus group, including A. neblininus and A. carlostoddi.
792 María del Rosario Castañeda, K.de Queiroz / Molecular Phylogenetics and Evolution 61 (2011) 784–800
of Bonaire, Tobago and Trinidad (where A. aeneus and A. trinitatishave been introduced; Gorman and Dessauer, 1965, 1966; Gormanand Atkins, 1967) and Guyana (where A. aeneus has been intro-duced; Gorman et al., 1971) (Fig. 3). Topology tests further supportthe monophyly of this group by rejecting the non-monophylyhypothesis (Table 4). The relationships within the roquet cladeinferred in this study were consistent across all datasets and anal-yses, and identical to those inferred by Creer et al. (2001) based onDNA sequences (same mitochondrial ND2 region used in thisstudy) and allozyme data; however, the positions of A. griseusand A. richardi differ from those inferred by Giannasi et al. (2000)based on mitochondrial cytochrome b sequences (600 b). If thediscrepancy is the result of an error (e.g., a mislabeled sample orcontamination) in one of the data sets, our results suggest thatthe data set of Creer et al. (2001) is not the one with the error,given that we inferred identical topologies from different samplesof the same species with the same and different genes.
4.2.3. The eastern cladeThe eastern clade, distributed in Amazonia, the northern por-
tion of the eastern cordillera of the Andes of Colombia and the Ven-ezuelan Andes (Fig. 3), shows a consistent topology amongdatasets and analyses. All the species in this clade were previouslyplaced in the punctatus species group (Williams, 1976b) or series(Savage and Guyer, 1989), except for A. tigrinus, which was classi-fied in the tigrinus series or species group. However, six additionalspecies included in this study (A. calimae, A. chloris, A. chocorum, A.festae, A. huilae, A. peraccae) were also assigned to the punctatusseries based on morphological characters, but none of them was in-ferred as part of the eastern clade in any of our analyses. The east-ern clade exhibits a distinct geographic separation between its twoprimary subclades: species with a wide distribution throughoutAmazonia—A. punctatus and A. transversalis—are strongly sup-ported as sister species (BS = 100%, PP = 1.00), and species distrib-uted in the eastern cordillera of the Andes of Colombia and theVenezuelan Andes—A. anatoloros, A. jacare, and A. tigrinus—alsoform a strongly supported clade (BS = 85–100%, PP = 1.00).
4.2.4. The western cladeThe western clade is distributed in the western and central
cordilleras of the Andes of Colombia, the western slope of the An-des of Ecuador and the Pacific lowlands of Panama, Colombia andEcuador (Fig. 3). Within it two subclades are consistently inferredwith strong support (BS = 87–100%, PP = 0.99–1.00): the first iscomposed of species of smaller size, including A. chloris, A. festae,and A. peraccae (A. chloris, the largest species, has a maximumsnout-vent length [SVL] of 62 mm for adult males (Williamset al., 1995)), with a lowland (up to 1000 m of elevation), humidforest distribution. In addition to support from DNA sequences, thissubclade is characterized by a deletion of 15 bases in the RAG1gene region. All of these species were previously placed in thepunctatus species group or series based on morphological charac-ters, though other species previously included in that group (i.e.,A. anatoloros, A. calimae, A. chocorum, A. huilae, A. jacare, A. puncta-tus, A. transversalis) were not inferred to be closely related. The sec-ond subclade is composed of species of larger size, including A.aequatorialis, A. anoriensis, A. gemmosus, and A. ventrimaculatus (A.gemmosus, the smallest species, has a maximum SVL of 66 mmfor adult males (Williams et al., 1995)), with an elevational distri-bution from 1500 to 2000 m. All species in this second subcladewere previously placed in the aequatorialis species group(Williams, 1976b) or series (Savage and Guyer, 1989) (see Williamsand Duellman (1984) for the assignment of A. gemmosus). In mostanalyses, Anolis huilae was inferred as the sister group of the wes-tern clade, with nodal support ranging from weak to strong (Fig. 2),which suggests that this species is more closely related to the wes-
tern clade than to any of the four other major clades within Dact-yloa. However, based on the exclusively western geographicdistribution of the species included in the western clade and theeastern distribution of A. huilae, we do not consider this speciespart of the western clade.
4.2.5. The Phenacosaurus cladeThe Phenacosaurus clade is found in the Andean regions of
Colombia, Ecuador, and Venezuela, from 1300 m to 3750 m of ele-vation (Ayala and Castro, unpublished manuscript; Etheridge,1959; Fig. 3), reaching the highest elevations of any Anolis species(MRC, personal observation). This clade includes all of the sampledspecies previously placed in the genus Phenacosaurus (Lazell, 1969;Myers and Donnelly, 1996; Poe and Yañez-Miranda, 2007;Williams et al., 1996), with the exception of A. neblininus, whichin this study was inferred in different positions across analysesbut was never inferred to be more closely related to the Phenaco-saurus clade than was A. calimae, which was not previously placedin the genus Phenacosaurus (see below). In agreement with previ-ous studies (Jackman et al., 1999; Nicholson et al., 2005; Poe,1998, 2004), the Phenacosaurus species were inferred, with strongsupport, to be nested within Dactyloa and therefore also withinAnolis. Results of the topology tests further support this inferenceby rejecting the alternative hypothesis of Dactyloa excludingPhenacosaurus (Table 4). Within the Phenacosaurus clade, the twoearliest diverging species, A. euskalerriari and A. nicefori, have smallbody size (maximum male SVL = 53 mm and 63 mm, respectively(Williams et al., 1995)), while the more deeply nested A. heteroder-mus, A. inderenae and A. vanzolinii are larger (maximum maleSVL = 76 mm, 98 mm, and 104 mm, respectively (Williams et al.,1995)), suggesting an increase in body size within this clade. Thismore deeply nested clade (A. heterodermus, A. inderenae, A. vanzoli-nii) corresponds to the heterodermus subgroup (characterized bystrongly heterogeneous flank scalation and well-developed casqu-ing) of the heterodermus group (characterized by flank scale heter-ogeneity and lamellar subdigital scales, i.e., those that are widerthan long, with a distal free edge, extending under the most prox-imal phalanges of all digits, including pedal digit IV) (Williamset al., 1996).2 The heterodermus group (including A. nicefori, A. tetariiand the heterodermus subgroup) was also supported by our data,though A. tetarii was not sampled.
Anolis heterodermus is the only species in the Phenacosaurusclade that occurs in all three cordilleras of the Andes of Colombia(>1600 m). The relationships among the multiple samples of thisspecies do not correspond to the geographic distance betweenthem. Samples 1 and 2, which are inferred as sister taxa in all anal-yses (with weak nodal support), are geographically more distantfrom each other than either is from sample No. 3 (Fig. 3; AppendixA). In the analysis of the RAG1 dataset, A. heterodermus is not in-ferred as monophyletic, as A. inderenae is nested within it(Fig. 1). Williams et al. (1996) suggested previously that A. heterod-ermus may represent more than one species, noting that ‘‘the pres-ent concept of P. [A.] heterodermus is an unresolved complex ofsibling species’’ (p. 12) because of the large morphological variabil-ity observed within this species (e.g., in dorsal crest scalation, de-tailed in Lazell (1969)). However, previous attempts to recognizenew species based solely on morphological characters (i.e., P. [A.]richteri Dunn (1944) and P. [A.] paramoensis Hellmich (1949)) havefailed (Lazell, 1969).
When A. neblininus (found on Cerro de la Neblina, Venezuela)was described (Myers et al., 1993), it was tentatively placed in
than
María del Rosario Castañeda, K.de Queiroz / Molecular Phylogenetics and Evolution 61 (2011) 784–800 793
the genus Phenacosaurus and considered closely related to thenundescribed Phenacosaurus [Anolis] carlostoddi from the ChimantáTepui, Venezuela, later described by one of the same authors(Williams et al., 1996). The authors also noted that A. neblininusshowed an overall morphological resemblance to the non-Phenaco-saurus species A. jacare and A. nigropuntactus (which were laterregarded as conspecific (Ugueto et al., 2007)). In this study, A.neblininus was not consistently inferred as closely related to otherPhenacosaurus species, which were consistently and strongly sup-ported as a monophyletic group. Only in the analyses of theRAG1 dataset, is A. neblininus inferred close to other Phenacosaurusspecies, though with low nodal support (BS = 46%, PP = 0.70;Fig. 2c) and always with A. calimae as the sister group of the Phena-cosaurus clade: (A. neblininus (A. calimae (Phenacosaurus clade))).Anolis calimae is distributed in the Valle del Cauca in the centralpart of the western cordillera of Colombia, between 1300–1800 m (Ayala et al., 1983) and interestingly, it shares some exter-nal morphological features with Phenacosaurus species (includingA. neblininus): a robust body, short fore- and hindlimbs (propor-tional to body length) and short thick toes (characters from Lazell,1969). In addition, it shares small body size (SVL < 65 mm;Williams et al., 1995) with the two earliest diverging species ofthe Phenacosaurus clade and A. neblininus. In other analyses whereA. neblininus is not inferred as closely related to the Phenacosaurusclade, the clade (A. calimae, A. neblininus) is inferred with variablesupport (BS = 54–66%, PP = 0.96–0.99; Fig. 2), suggesting a closerelationship between these two geographically distant species.However, despite the morphological similarity between thesetwo species with the species in the Phenacosaurus clade, the molec-ular data presented here are ambiguous about whether A. neblini-nus is closely related to Phenacosaurus species.
4.3. Previously recognized subgroups
The non-monophyly of the Dactyloa clade and the roquet serieswere strongly rejected by all topology tests (Table 4). These cladeswere inferred in the optimal topologies (i.e., maximum likelihoodtree and Bayesian consensus tree) with strong support, and therejection of their non-monophyly in the topology tests providesfurther support for their monophyly. The hypotheses of monophylyof the aequatorialis, latifrons (as traditionally circumscribed) andpunctatus series were strongly rejected by all topology tests ap-plied (Table 4), a result that confirms the caveats mentioned byE.E. Williams while describing these subgroups of mainland Anolis:morphological characters used for series delimitation might showa high degree of convergence and parallelism among species(e.g., 1976b, p. 260), and on occasion, series were described onlyfor convenience (e.g., 1979, p. 10). Another factor, not consideredby Williams, is that series were sometimes based on shared ances-tral characters, which are not indicative of close phylogeneticrelationships.
4.4. Taxonomic implications
The results of our phylogenetic analyses and topology testsindicate that several previously recognized series/species groupsare not monophyletic, suggesting the need for a revised taxonomy.However, because roughly half of the currently recognized specieswere not included in the present study, we will only make somepreliminary taxonomic suggestions. The five well-supported cladesdescribed above (Section 4.2) are the most obvious candidates forformal taxonomic recognition. In some cases it seems appropriate,based on similarity in diagnostic characters and/or species compo-sition, to apply previously used names to those clades. Previouslyused names have commonly combined the name of an includedspecies with the rank of species group (e.g., Williams, 1976b) or
series (e.g., Savage and Guyer, 1989); however, because the speciesgroup terminology was based on inclusion of the taxa in questionwith a larger series (the latifrons series of Etheridge, 1959), and be-cause we have recognized that group as the Dactyloa clade, we willconsider only the series terminology in our discussion.
The latifrons clade corresponds roughly to the latifrons series ofprevious authors (e.g., Savage and Guyer, 1989). All of the speciesof the latifrons series that were sampled in this study are in thelatifrons clade, though the latifrons clade additionally includesA. agassizi (previously unassigned to a series), A. chocorum (previ-ously included in the punctatus series) and A. maculigula (previ-ously included in the aequatorialis series), and all but one (A.chocorum) exhibit large body size. Given that A. agassizi was notpreviously assigned to a series, its inclusion in the latifrons serieswould pose no taxonomic problems; inclusion of the other twospecies would necessitate only that their previous taxonomicassignments be considered incorrect. Whether the species A. apol-linaris, A. latifrons, A. propinquus, A. purpurescens and A. squamulatus(previously included in the latifrons series but currently lackingmolecular data) belong to this clade remains to be determined.Nevertheless, the geographic distributions, except for that of A.squamulatus, and large body sizes of these species, except possiblyfor A. purpurescens (known from relatively few specimens), areconsistent with their inclusion in the latifrons clade. In addition,Anolis ibanezi (not explicitly included in the latifrons series andlacking molecular data) may be a member of this clade given itshypothesized close relationship with A. chocorum (Poe et al.,2009) and geographic distribution. Although the inclusion of A. lat-ifrons in the latifrons clade seems likely based on its presumedclose relationship to A. frenatus and A. princeps (see Section 4.2.1),we will not formally name the clade as the latifrons series here.Because the formal series name is based on the name of that spe-cies, it seems preferable to defer formal naming until an explicitphylogenetic analysis confirms inclusion of A. latifrons in this clade.
The roquet clade corresponds closely to the roquet series of pre-vious authors (e.g., Savage and Guyer, 1989; Creer et al., 2001) inthat all species included in the roquet clade were previously in-cluded in the roquet series. The only other species previously in-cluded in the roquet series, A. blanquillanus, was not sampled inthis study, but can be assigned to the roquet clade (and series), asthe sister group of A. bonairensis, based on the results of previousphylogenetic studies (e.g., Yang et al., 1974; Creer et al., 2001).
The Phenacosaurus clade corresponds closely to the genusPhenacosaurus of previous authors (e.g, Williams et al., 1996). Allof the species included in the Phenacosaurus clade were previouslyincluded in the genus Phenacosaurus. Anolis neblininus was previ-ously included in the genus Phenacosaurus; however, in our studyevidence for the inclusion of this species in the Phenacosaurus cladeis ambiguous. Evidence is also ambiguous concerning the inclusionof A. calimae, which was not previously included in Phenacosaurusbut shares some morphological characters with A. neblininus andbasal members of the Phenacosaurus clade (see Section 4.2.5).The inclusion of other species previously considered part of thegenus Phenacosaurus (A. bellipeniculus, A. carlostoddi, A. orcesi, A. te-tarii, and A. williamsmittermeierorum) remains to be determined.Nevertheless, the inclusion of A. orcesi, A. williamsmittermeierorum,and A. tetarii is consistent with the morphological similarity of thefirst two species with A. euskalerriari and the last one with A. nicef-ori, while the placement of A. bellipeniculus and A. carlostoddi is lesscertain based on their morphological similarity with A. neblininus.
The two other well-supported clades, the eastern and westernclades, do not correspond closely to any previously recognizedtaxa. If those clades were to be given names using the series termi-nology, then the western clade would be the aequatorialis seriesand the eastern clade would be the punctatus series, based on theinclusion of the species A. aequatorialis and A. punctatus in the
794 María del Rosario Castañeda, K.de Queiroz / Molecular Phylogenetics and Evolution 61 (2011) 784–800
respective clades, despite considerable differences in the speciescomposition of these clades relative to the aequatorialis and punct-atus series as previously recognized (e.g., Savage and Guyer, 1989).Alternatively, the eastern and western clades could be given newnames not based on the series terminology.
The species that were not consistently inferred in one positionacross our various analyses, and therefore for which we considerrelationships uncertain (i.e., A. calimae, A. fitchi, A. huilae, A. neblin-inus, and A. podocarpus), are currently left unassigned to any of thefive subclades within Dactyloa. We plan to develop a more formaland comprehensive taxonomy based on combined phylogeneticanalyses of morphological and molecular data that will includespecies for which molecular data are currently unavailable (Cas-tañeda and de Queiroz, in prep).
4.5. Geographic distribution patterns
Each of the five major clades within Dactyloa has a coherent(i.e., largely continuous) geographic range, with those of the differ-ent clades overlapping to different degrees (Fig. 3). The latifronsand western clades overlap in the Chocó region (Pacific lowlandsof Colombia and Ecuador, below 1000 m), where three species ofthe latifrons clade and three of the western clade (those of smallersize) are present. The remaining four species of the western clade—those of larger size—are distributed between 1500 and 2000 m andoverlap the distribution of the Phenacosaurus clade, though exclu-sively with A. heterodermus, which is the only Phenacosaurus spe-cies distributed in the western cordillera of the Colombian Andes.The remaining four sampled species in the Phenacosaurus clade aredistributed in the eastern Andes of Colombia, Ecuador and Venezu-ela, and two of them (A. euskalerriari, and A. nicefori) fully overlapwith the Andean species of eastern clade (A. anatoloros, A. jacare,and A. tigrinus). In contrast, the ranges of several pairs of clades ex-hibit no overlap (e.g., latifrons versus eastern, western versus east-ern); however, the only major clade within Dactyloa that shows nogeographic overlap with any other subclade is the roquet clade, dis-tributed in the southern Lesser Antilles.
Within the latifrons clade, the clade (A. agassizi (A. insignis, A.microtus)) is consistently inferred as sister to the remaining ninespecies in all analyses. Anolis agassizi is found on Malpelo, an islandlocated 380 km from the Pacific coast of Colombia and 365 kmfrom the coast of Panama. Members of its sister clade are distrib-uted in Central America: A. insignis is found at low to middle eleva-tions (<1500 m) on the Atlantic and Pacific slopes of Costa Rica andthe Pacific slopes of Panama, and A. microtus is found at mid eleva-tions (1000–1500 m) on the Pacific slopes of Costa Rica and Pan-ama (Savage and Talbot, 1978). The remaining species of thelatifrons clade (except A. danieli and A. sp2, which occur in thenorthern regions of central and western cordilleras of Colombia[above 1700 m] and the Magdalena river valley in Colombia,respectively) are present in the Pacific lowlands from Panama toEcuador. Assuming an oceanic dispersal event, as Malpelo hasnever been connected to other islands or the mainland (Graham,1975), A. agassizi could be the result of a colonization event fromeither Central or South America. The direction of surface currents(and surface winds; Fiedler, 2002) around Malpelo (3�590N,81�360W) does not particularly support either alternative; theNorth Equatorial Countercurrent (NECC, which flows west-to-east)lies between 3�N and 10�N (Sverdrup et al., 1942), becoming theSouth Equatorial and North Equatorial currents off the continentas it turns south and west and north and west respectively. TheNECC shifts further north from the equator during the northernhemisphere’s summer (Fiedler, 2002; Sverdrup et al., 1942), so thatcurrents flowing to Malpelo originate from Central or South Amer-ica depending on the season.
4.6. Low nodal support and tempo of the Dactyloa radiation
Despite consistent inference and strong support for five majorDactyloa subclades (Section 4.2), there is no consensus betweengene regions and/or analyses regarding the relationships amongthese major clades, as low nodal support values were obtained inmost analyses and sometimes conflicting relationships were ob-tained in different analyses. Within Anolis, low support for basalnodes was also found by Jackman et al. (1999) and Poe (2004),and within the Norops clade by Nicholson (2002). Poor resolu-tion/support could result from the use of molecular markers thatdo not provide resolution for the level of interest. In the presentstudy, molecular markers with slower (RAG1 gene) and faster(ND2, COI regions) rates of evolution were sequenced to cover awide range of node ages and avoid this problem, though the utili-zation of molecular markers with a broad range of evolutionaryrates does not guarantee (even in the absence of conflict in phylo-genetic signal) the resolution and strong support of all nodes.Therefore, it is possible that the lack of resolution in the basalnodes of Dactyloa results from a rapid radiation within thegroup—evidenced by very short internodes that are not stronglysupported. Jackman et al. (1999) and Nicholson (2002) invoked arapid radiation to explain the weak support in basal nodes, thoughJackman et al. (1999) found statistical support for sequentialbranching, contradicting the most extreme case of the rapid radia-tion hypothesis (a star tree or hard polytomy). Without estimatingthe amount and quality of data necessary to resolve an internode ofcertain length, and therefore defining what should be consideredsufficient/insufficient amounts of data, it would be premature tohypothesize a rapid radiation as the cause for the lack of resolutionand/or poor support in the basal nodes of the Dactyloa clade.
Acknowledgments
James Clark, James Schulte, and Omar Torres-Carvajal providedhelp with data collection, analyses and earlier versions of this pa-per. This research was partially funded by The George WashingtonUniversity, Sigma-Xi (GWU Chapter), Cosmos Club Foundation(Young Scholars Award) and the Laboratories of Analytical Biologyat the Smithsonian Institution. Many thanks to those who providedtissues: Tito Barros, Wesley Chun, Luis A. Coloma (UniversidadCatólica de Quito-QCAZ), Richard Glor, Jonathan Losos, Roy McDi-armid, Kirsten Nicholson, Vivian Páez (Universidad de Antioquia-MHUA) and James Schulte. For assistance in the field the firstauthor would like to thank Fernando Ayala, Tito Barros, EduardoCastañeda, Wesley Chun, Paul D.A. Gutiérrez, Juan Pablo Hurtado,Gustavo A. Londoño, Juan L. Parra, Gilson Rivas and Julian Velasco.Jonathan B. Losos helped track down locality data for some of thesequences obtained from GenBank. Derrick Zwickl provided helpwith site-likelihood estimations in GARLI. The Instituto Humboldt(thanks to Fernando Gast and Mauricio Alvarez) facilitatedpermits in Colombia. In Venezuela, access to tissue samples wasgranted under the access to genetic resources permit betweenthe IVIC–MINAMB; Tito Barros (MBLUZ), associate researcher ofIVIC, loaned the tissues. Cristiano Moreira helped in preparingthe distribution map. Laboratory work was performed at the Labo-ratories of Analytical Biology-Smithsonian Institution (thanks toLee Weight) and Universidad de Los Andes, Colombia.
Appendix A
See Table A1
Appendix B
See Table B1
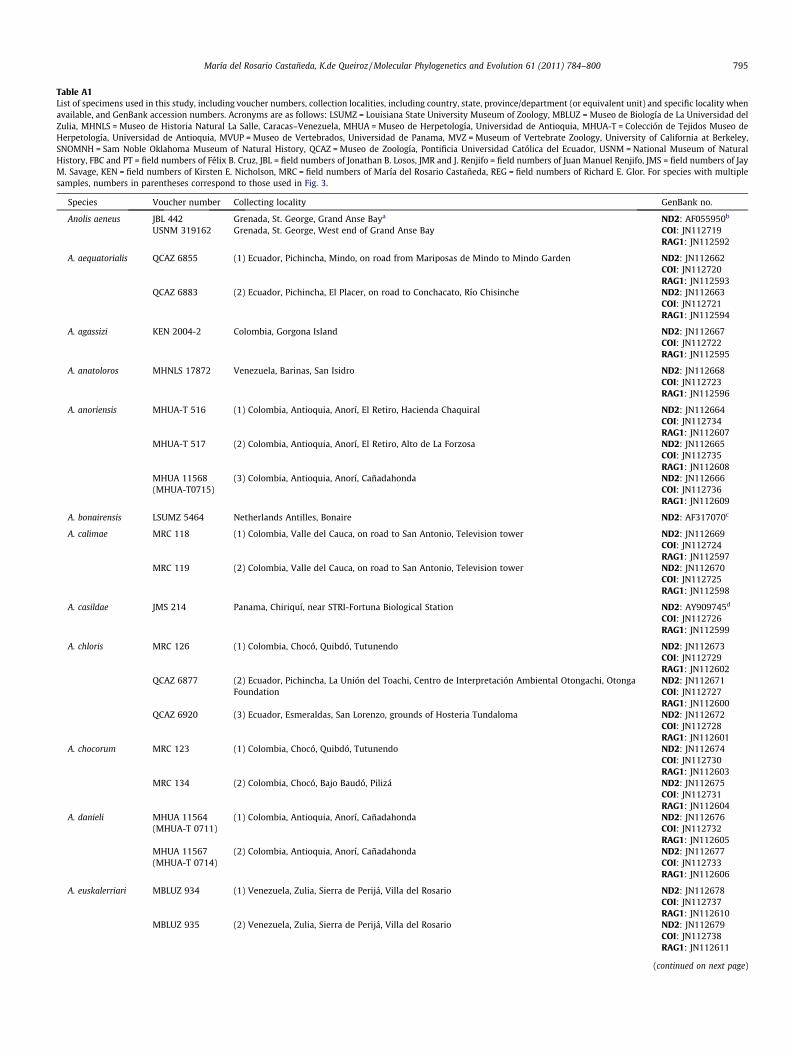
Table A1List of specimens used in this study, including voucher numbers, collection localities, including country, state, province/department (or equivalent unit) and specific locality whenavailable, and GenBank accession numbers. Acronyms are as follows: LSUMZ = Louisiana State University Museum of Zoology, MBLUZ = Museo de Biología de La Universidad delZulia, MHNLS = Museo de Historia Natural La Salle, Caracas–Venezuela, MHUA = Museo de Herpetología, Universidad de Antioquia, MHUA-T = Colección de Tejidos Museo deHerpetología, Universidad de Antioquia, MVUP = Museo de Vertebrados, Universidad de Panama, MVZ = Museum of Vertebrate Zoology, University of California at Berkeley,SNOMNH = Sam Noble Oklahoma Museum of Natural History, QCAZ = Museo de Zoología, Pontificia Universidad Católica del Ecuador, USNM = National Museum of NaturalHistory, FBC and PT = field numbers of Félix B. Cruz, JBL = field numbers of Jonathan B. Losos, JMR and J. Renjifo = field numbers of Juan Manuel Renjifo, JMS = field numbers of JayM. Savage, KEN = field numbers of Kirsten E. Nicholson, MRC = field numbers of María del Rosario Castañeda, REG = field numbers of Richard E. Glor. For species with multiplesamples, numbers in parentheses correspond to those used in Fig. 3.
Species Voucher number Collecting locality GenBank no.
Anolis aeneus JBL 442 Grenada, St. George, Grand Anse Baya ND2: AF055950b
USNM 319162 Grenada, St. George, West end of Grand Anse Bay COI: JN112719RAG1: JN112592
A. aequatorialis QCAZ 6855 (1) Ecuador, Pichincha, Mindo, on road from Mariposas de Mindo to Mindo Garden ND2: JN112662COI: JN112720RAG1: JN112593
QCAZ 6883 (2) Ecuador, Pichincha, El Placer, on road to Conchacato, Río Chisinche ND2: JN112663COI: JN112721RAG1: JN112594
A. agassizi KEN 2004-2 Colombia, Gorgona Island ND2: JN112667COI: JN112722RAG1: JN112595
A. anatoloros MHNLS 17872 Venezuela, Barinas, San Isidro ND2: JN112668COI: JN112723RAG1: JN112596
A. anoriensis MHUA-T 516 (1) Colombia, Antioquia, Anorí, El Retiro, Hacienda Chaquiral ND2: JN112664COI: JN112734RAG1: JN112607
MHUA-T 517 (2) Colombia, Antioquia, Anorí, El Retiro, Alto de La Forzosa ND2: JN112665COI: JN112735RAG1: JN112608
MHUA 11568 (3) Colombia, Antioquia, Anorí, Cañadahonda ND2: JN112666(MHUA-T0715) COI: JN112736
RAG1: JN112609
A. bonairensis LSUMZ 5464 Netherlands Antilles, Bonaire ND2: AF317070c
A. calimae MRC 118 (1) Colombia, Valle del Cauca, on road to San Antonio, Television tower ND2: JN112669COI: JN112724RAG1: JN112597
MRC 119 (2) Colombia, Valle del Cauca, on road to San Antonio, Television tower ND2: JN112670COI: JN112725RAG1: JN112598
A. casildae JMS 214 Panama, Chiriquí, near STRI-Fortuna Biological Station ND2: AY909745d
COI: JN112726RAG1: JN112599
A. chloris MRC 126 (1) Colombia, Chocó, Quibdó, Tutunendo ND2: JN112673COI: JN112729RAG1: JN112602
QCAZ 6877 (2) Ecuador, Pichincha, La Unión del Toachi, Centro de Interpretación Ambiental Otongachi, OtongaFoundation
ND2: JN112671COI: JN112727RAG1: JN112600
QCAZ 6920 (3) Ecuador, Esmeraldas, San Lorenzo, grounds of Hosteria Tundaloma ND2: JN112672COI: JN112728RAG1: JN112601
A. chocorum MRC 123 (1) Colombia, Chocó, Quibdó, Tutunendo ND2: JN112674COI: JN112730RAG1: JN112603
MRC 134 (2) Colombia, Chocó, Bajo Baudó, Pilizá ND2: JN112675COI: JN112731RAG1: JN112604
A. danieli MHUA 11564 (1) Colombia, Antioquia, Anorí, Cañadahonda ND2: JN112676(MHUA-T 0711) COI: JN112732
RAG1: JN112605MHUA 11567 (2) Colombia, Antioquia, Anorí, Cañadahonda ND2: JN112677(MHUA-T 0714) COI: JN112733
RAG1: JN112606
A. euskalerriari MBLUZ 934 (1) Venezuela, Zulia, Sierra de Perijá, Villa del Rosario ND2: JN112678COI: JN112737RAG1: JN112610
MBLUZ 935 (2) Venezuela, Zulia, Sierra de Perijá, Villa del Rosario ND2: JN112679COI: JN112738RAG1: JN112611
(continued on next page)
María del Rosario Castañeda, K.de Queiroz / Molecular Phylogenetics and Evolution 61 (2011) 784–800 795
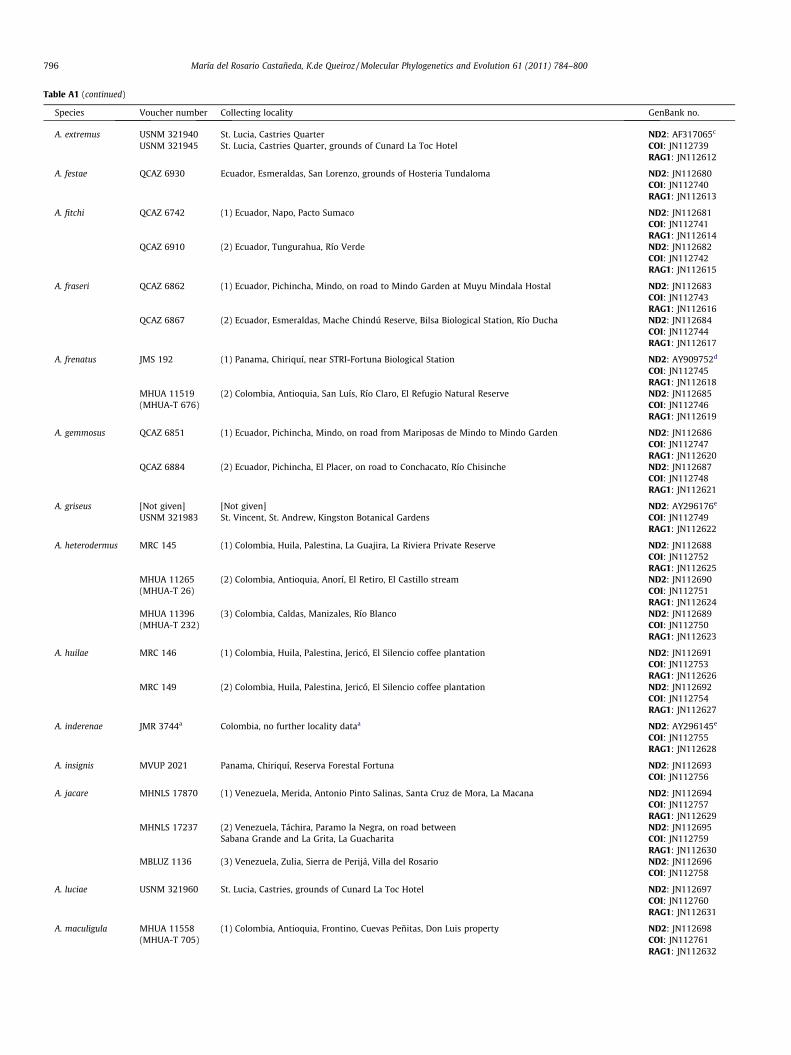
Table A1 (continued)
Species Voucher number Collecting locality GenBank no.
A. extremus USNM 321940 St. Lucia, Castries Quarter ND2: AF317065c
USNM 321945 St. Lucia, Castries Quarter, grounds of Cunard La Toc Hotel COI: JN112739RAG1: JN112612
A. festae QCAZ 6930 Ecuador, Esmeraldas, San Lorenzo, grounds of Hosteria Tundaloma ND2: JN112680COI: JN112740RAG1: JN112613
A. fitchi QCAZ 6742 (1) Ecuador, Napo, Pacto Sumaco ND2: JN112681COI: JN112741RAG1: JN112614
QCAZ 6910 (2) Ecuador, Tungurahua, Río Verde ND2: JN112682COI: JN112742RAG1: JN112615
A. fraseri QCAZ 6862 (1) Ecuador, Pichincha, Mindo, on road to Mindo Garden at Muyu Mindala Hostal ND2: JN112683COI: JN112743RAG1: JN112616
QCAZ 6867 (2) Ecuador, Esmeraldas, Mache Chindú Reserve, Bilsa Biological Station, Río Ducha ND2: JN112684COI: JN112744RAG1: JN112617
A. frenatus JMS 192 (1) Panama, Chiriquí, near STRI-Fortuna Biological Station ND2: AY909752d
COI: JN112745RAG1: JN112618
MHUA 11519(MHUA-T 676)
(2) Colombia, Antioquia, San Luís, Río Claro, El Refugio Natural Reserve ND2: JN112685COI: JN112746RAG1: JN112619
A. gemmosus QCAZ 6851 (1) Ecuador, Pichincha, Mindo, on road from Mariposas de Mindo to Mindo Garden ND2: JN112686COI: JN112747RAG1: JN112620
QCAZ 6884 (2) Ecuador, Pichincha, El Placer, on road to Conchacato, Río Chisinche ND2: JN112687COI: JN112748RAG1: JN112621
A. griseus [Not given] [Not given] ND2: AY296176e
USNM 321983 St. Vincent, St. Andrew, Kingston Botanical Gardens COI: JN112749RAG1: JN112622
A. heterodermus MRC 145 (1) Colombia, Huila, Palestina, La Guajira, La Riviera Private Reserve ND2: JN112688COI: JN112752RAG1: JN112625
MHUA 11265(MHUA-T 26)
(2) Colombia, Antioquia, Anorí, El Retiro, El Castillo stream ND2: JN112690COI: JN112751RAG1: JN112624
MHUA 11396(MHUA-T 232)
(3) Colombia, Caldas, Manizales, Río Blanco ND2: JN112689COI: JN112750RAG1: JN112623
A. huilae MRC 146 (1) Colombia, Huila, Palestina, Jericó, El Silencio coffee plantation ND2: JN112691COI: JN112753RAG1: JN112626
MRC 149 (2) Colombia, Huila, Palestina, Jericó, El Silencio coffee plantation ND2: JN112692COI: JN112754RAG1: JN112627
A. inderenae JMR 3744a Colombia, no further locality dataa ND2: AY296145e
COI: JN112755RAG1: JN112628
A. insignis MVUP 2021 Panama, Chiriquí, Reserva Forestal Fortuna ND2: JN112693COI: JN112756
A. jacare MHNLS 17870 (1) Venezuela, Merida, Antonio Pinto Salinas, Santa Cruz de Mora, La Macana ND2: JN112694COI: JN112757RAG1: JN112629
MHNLS 17237 (2) Venezuela, Táchira, Paramo la Negra, on road between ND2: JN112695Sabana Grande and La Grita, La Guacharita COI: JN112759
RAG1: JN112630MBLUZ 1136 (3) Venezuela, Zulia, Sierra de Perijá, Villa del Rosario ND2: JN112696
COI: JN112758
A. luciae USNM 321960 St. Lucia, Castries, grounds of Cunard La Toc Hotel ND2: JN112697COI: JN112760RAG1: JN112631
A. maculigula MHUA 11558(MHUA-T 705)
(1) Colombia, Antioquia, Frontino, Cuevas Peñitas, Don Luis property ND2: JN112698COI: JN112761RAG1: JN112632
796 María del Rosario Castañeda, K.de Queiroz / Molecular Phylogenetics and Evolution 61 (2011) 784–800
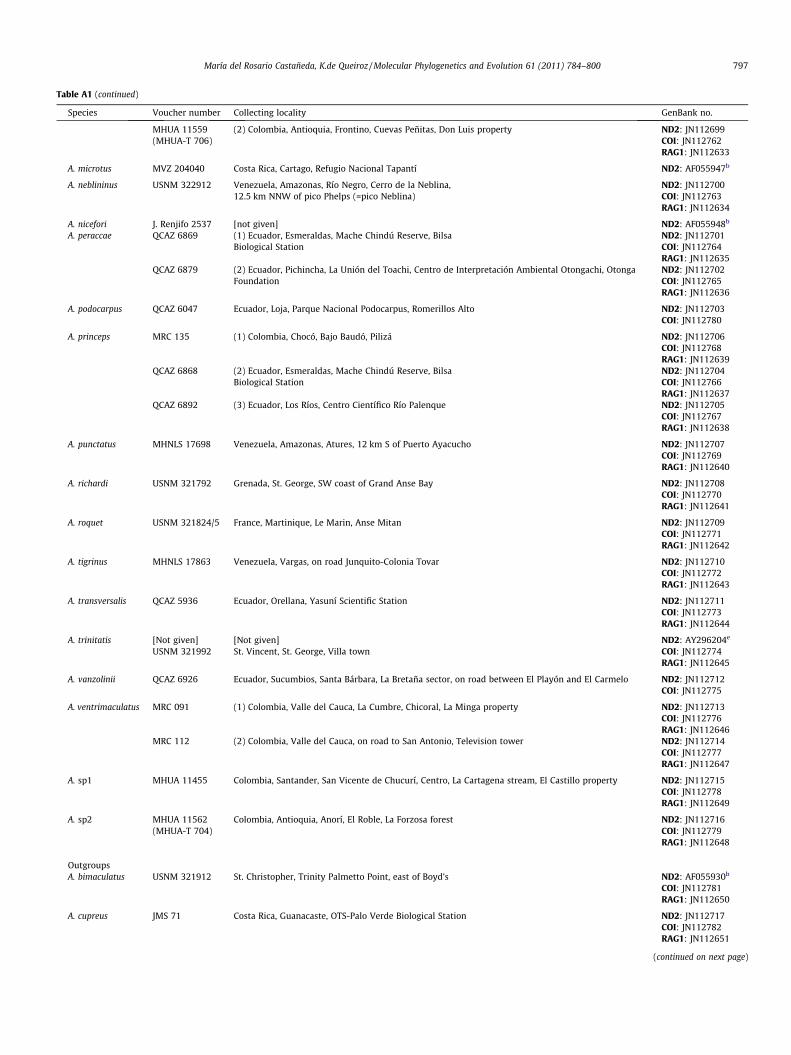
Table A1 (continued)
Species Voucher number Collecting locality GenBank no.
MHUA 11559(MHUA-T 706)
(2) Colombia, Antioquia, Frontino, Cuevas Peñitas, Don Luis property ND2: JN112699COI: JN112762RAG1: JN112633
A. microtus MVZ 204040 Costa Rica, Cartago, Refugio Nacional Tapantí ND2: AF055947b
A. neblininus USNM 322912 Venezuela, Amazonas, Río Negro, Cerro de la Neblina, ND2: JN11270012.5 km NNW of pico Phelps (=pico Neblina) COI: JN112763
RAG1: JN112634
A. nicefori J. Renjifo 2537 [not given] ND2: AF055948b
A. peraccae QCAZ 6869 (1) Ecuador, Esmeraldas, Mache Chindú Reserve, Bilsa ND2: JN112701Biological Station COI: JN112764
RAG1: JN112635QCAZ 6879 (2) Ecuador, Pichincha, La Unión del Toachi, Centro de Interpretación Ambiental Otongachi, Otonga
FoundationND2: JN112702COI: JN112765RAG1: JN112636
A. podocarpus QCAZ 6047 Ecuador, Loja, Parque Nacional Podocarpus, Romerillos Alto ND2: JN112703COI: JN112780
A. princeps MRC 135 (1) Colombia, Chocó, Bajo Baudó, Pilizá ND2: JN112706COI: JN112768RAG1: JN112639
QCAZ 6868 (2) Ecuador, Esmeraldas, Mache Chindú Reserve, Bilsa ND2: JN112704Biological Station COI: JN112766
RAG1: JN112637QCAZ 6892 (3) Ecuador, Los Ríos, Centro Científico Río Palenque ND2: JN112705
COI: JN112767RAG1: JN112638
A. punctatus MHNLS 17698 Venezuela, Amazonas, Atures, 12 km S of Puerto Ayacucho ND2: JN112707COI: JN112769RAG1: JN112640
A. richardi USNM 321792 Grenada, St. George, SW coast of Grand Anse Bay ND2: JN112708COI: JN112770RAG1: JN112641
A. roquet USNM 321824/5 France, Martinique, Le Marin, Anse Mitan ND2: JN112709COI: JN112771RAG1: JN112642
A. tigrinus MHNLS 17863 Venezuela, Vargas, on road Junquito-Colonia Tovar ND2: JN112710COI: JN112772RAG1: JN112643
A. transversalis QCAZ 5936 Ecuador, Orellana, Yasuní Scientific Station ND2: JN112711COI: JN112773RAG1: JN112644
A. trinitatis [Not given] [Not given] ND2: AY296204e
USNM 321992 St. Vincent, St. George, Villa town COI: JN112774RAG1: JN112645
A. vanzolinii QCAZ 6926 Ecuador, Sucumbios, Santa Bárbara, La Bretaña sector, on road between El Playón and El Carmelo ND2: JN112712COI: JN112775
A. ventrimaculatus MRC 091 (1) Colombia, Valle del Cauca, La Cumbre, Chicoral, La Minga property ND2: JN112713COI: JN112776RAG1: JN112646
MRC 112 (2) Colombia, Valle del Cauca, on road to San Antonio, Television tower ND2: JN112714COI: JN112777RAG1: JN112647
A. sp1 MHUA 11455 Colombia, Santander, San Vicente de Chucurí, Centro, La Cartagena stream, El Castillo property ND2: JN112715COI: JN112778RAG1: JN112649
A. sp2 MHUA 11562(MHUA-T 704)
Colombia, Antioquia, Anorí, El Roble, La Forzosa forest ND2: JN112716COI: JN112779RAG1: JN112648
OutgroupsA. bimaculatus USNM 321912 St. Christopher, Trinity Palmetto Point, east of Boyd’s ND2: AF055930b
COI: JN112781RAG1: JN112650
A. cupreus JMS 71 Costa Rica, Guanacaste, OTS-Palo Verde Biological Station ND2: JN112717COI: JN112782RAG1: JN112651
(continued on next page)
María del Rosario Castañeda, K.de Queiroz / Molecular Phylogenetics and Evolution 61 (2011) 784–800 797
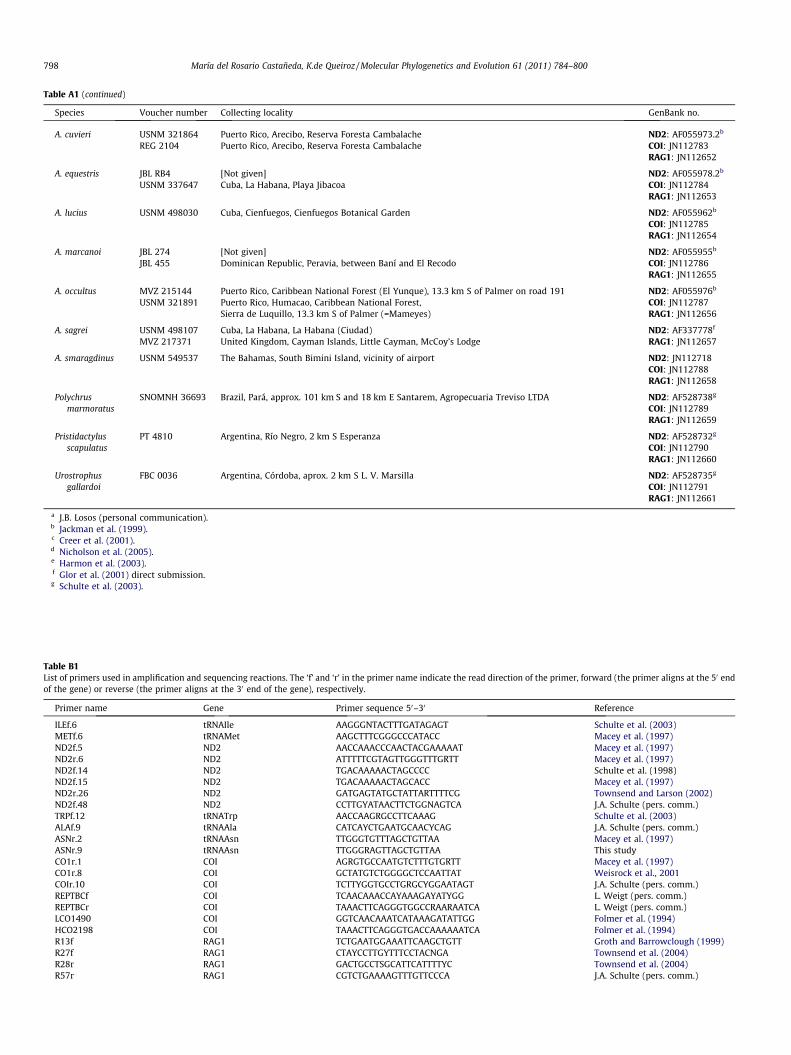
Table A1 (continued)
Species Voucher number Collecting locality GenBank no.
A. cuvieri USNM 321864 Puerto Rico, Arecibo, Reserva Foresta Cambalache ND2: AF055973.2b
REG 2104 Puerto Rico, Arecibo, Reserva Foresta Cambalache COI: JN112783RAG1: JN112652
A. equestris JBL RB4 [Not given] ND2: AF055978.2b
USNM 337647 Cuba, La Habana, Playa Jibacoa COI: JN112784RAG1: JN112653
A. lucius USNM 498030 Cuba, Cienfuegos, Cienfuegos Botanical Garden ND2: AF055962b
COI: JN112785RAG1: JN112654
A. marcanoi JBL 274 [Not given] ND2: AF055955b
JBL 455 Dominican Republic, Peravia, between Baní and El Recodo COI: JN112786RAG1: JN112655
A. occultus MVZ 215144 Puerto Rico, Caribbean National Forest (El Yunque), 13.3 km S of Palmer on road 191 ND2: AF055976b
USNM 321891 Puerto Rico, Humacao, Caribbean National Forest, COI: JN112787Sierra de Luquillo, 13.3 km S of Palmer (=Mameyes) RAG1: JN112656
A. sagrei USNM 498107 Cuba, La Habana, La Habana (Ciudad) ND2: AF337778f
MVZ 217371 United Kingdom, Cayman Islands, Little Cayman, McCoy’s Lodge RAG1: JN112657
A. smaragdinus USNM 549537 The Bahamas, South Bimini Island, vicinity of airport ND2: JN112718COI: JN112788RAG1: JN112658
Polychrusmarmoratus
SNOMNH 36693 Brazil, Pará, approx. 101 km S and 18 km E Santarem, Agropecuaria Treviso LTDA ND2: AF528738g
COI: JN112789RAG1: JN112659
Pristidactylusscapulatus
PT 4810 Argentina, Río Negro, 2 km S Esperanza ND2: AF528732g
COI: JN112790RAG1: JN112660
Urostrophusgallardoi
FBC 0036 Argentina, Córdoba, aprox. 2 km S L. V. Marsilla ND2: AF528735g
COI: JN112791RAG1: JN112661
a J.B. Losos (personal communication).b Jackman et al. (1999).c Creer et al. (2001).d Nicholson et al. (2005).e Harmon et al. (2003).f Glor et al. (2001) direct submission.g Schulte et al. (2003).
Table B1List of primers used in amplification and sequencing reactions. The ‘f’ and ‘r’ in the primer name indicate the read direction of the primer, forward (the primer aligns at the 50 endof the gene) or reverse (the primer aligns at the 30 end of the gene), respectively.
Primer name Gene Primer sequence 50–30 Reference
ILEf.6 tRNAIle AAGGGNTACTTTGATAGAGT Schulte et al. (2003)METf.6 tRNAMet AAGCTTTCGGGCCCATACC Macey et al. (1997)ND2f.5 ND2 AACCAAACCCAACTACGAAAAAT Macey et al. (1997)ND2r.6 ND2 ATTTTTCGTAGTTGGGTTTGRTT Macey et al. (1997)ND2f.14 ND2 TGACAAAAACTAGCCCC Schulte et al. (1998)ND2f.15 ND2 TGACAAAAACTAGCACC Macey et al. (1997)ND2r.26 ND2 GATGAGTATGCTATTARTTTTCG Townsend and Larson (2002)ND2f.48 ND2 CCTTGYATAACTTCTGGNAGTCA J.A. Schulte (pers. comm.)TRPf.12 tRNATrp AACCAAGRGCCTTCAAAG Schulte et al. (2003)ALAf.9 tRNAAla CATCAYCTGAATGCAACYCAG J.A. Schulte (pers. comm.)ASNr.2 tRNAAsn TTGGGTGTTTAGCTGTTAA Macey et al. (1997)ASNr.9 tRNAAsn TTGGGRAGTTAGCTGTTAA This studyCO1r.1 COI AGRGTGCCAATGTCTTTGTGRTT Macey et al. (1997)CO1r.8 COI GCTATGTCTGGGGCTCCAATTAT Weisrock et al., 2001COIr.10 COI TCTTYGGTGCCTGRGCYGGAATAGT J.A. Schulte (pers. comm.)REPTBCf COI TCAACAAACCAYAAAGAYATYGG L. Weigt (pers. comm.)REPTBCr COI TAAACTTCAGGGTGGCCRAARAATCA L. Weigt (pers. comm.)LCO1490 COI GGTCAACAAATCATAAAGATATTGG Folmer et al. (1994)HCO2198 COI TAAACTTCAGGGTGACCAAAAAATCA Folmer et al. (1994)R13f RAG1 TCTGAATGGAAATTCAAGCTGTT Groth and Barrowclough (1999)R27f RAG1 CTAYCCTTGYTTTCCTACNGA Townsend et al. (2004)R28r RAG1 GACTGCCTSGCATTCATTTTYC Townsend et al. (2004)R57r RAG1 CGTCTGAAAAGTTTGTTCCCA J.A. Schulte (pers. comm.)
798 María del Rosario Castañeda, K.de Queiroz / Molecular Phylogenetics and Evolution 61 (2011) 784–800
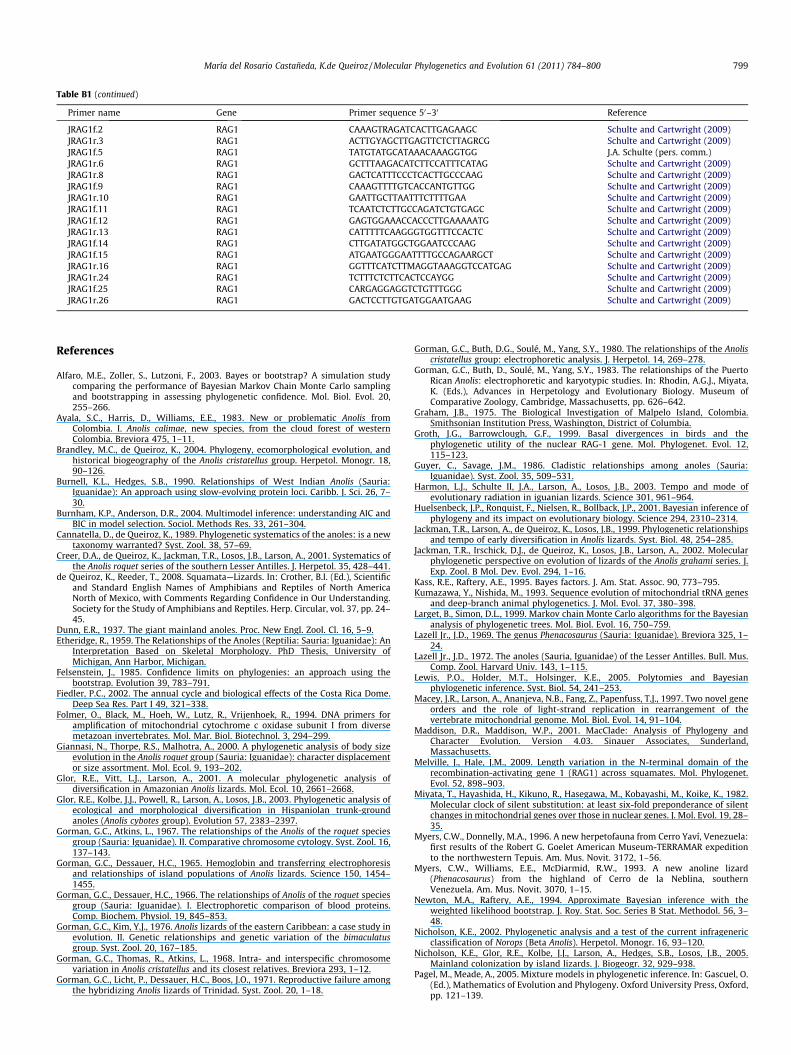
Table B1 (continued)
Primer name Gene Primer sequence 50–30 Reference
JRAG1f.2 RAG1 CAAAGTRAGATCACTTGAGAAGC Schulte and Cartwright (2009)JRAG1r.3 RAG1 ACTTGYAGCTTGAGTTCTCTTAGRCG Schulte and Cartwright (2009)JRAG1f.5 RAG1 TATGTATGCATAAACAAAGGTGG J.A. Schulte (pers. comm.)JRAG1r.6 RAG1 GCTTTAAGACATCTTCCATTTCATAG Schulte and Cartwright (2009)JRAG1r.8 RAG1 GACTCATTTCCCTCACTTGCCCAAG Schulte and Cartwright (2009)JRAG1f.9 RAG1 CAAAGTTTTGTCACCANTGTTGG Schulte and Cartwright (2009)JRAG1r.10 RAG1 GAATTGCTTAATTTCTTTTGAA Schulte and Cartwright (2009)JRAG1f.11 RAG1 TCAATCTCTTGCCAGATCTGTGAGC Schulte and Cartwright (2009)JRAG1f.12 RAG1 GAGTGGAAACCACCCTTGAAAAATG Schulte and Cartwright (2009)JRAG1r.13 RAG1 CATTTTTCAAGGGTGGTTTCCACTC Schulte and Cartwright (2009)JRAG1f.14 RAG1 CTTGATATGGCTGGAATCCCAAG Schulte and Cartwright (2009)JRAG1f.15 RAG1 ATGAATGGGAATTTTGCCAGAARGCT Schulte and Cartwright (2009)JRAG1r.16 RAG1 GGTTTCATCTTMAGGTAAAGGTCCATGAG Schulte and Cartwright (2009)JRAG1r.24 RAG1 TCTTTCTCTTCACTCCAYGG Schulte and Cartwright (2009)JRAG1f.25 RAG1 CARGAGGAGGTCTGTTTGGG Schulte and Cartwright (2009)JRAG1r.26 RAG1 GACTCCTTGTGATGGAATGAAG Schulte and Cartwright (2009)
María del Rosario Castañeda, K.de Queiroz / Molecular Phylogenetics and Evolution 61 (2011) 784–800 799
References
Alfaro, M.E., Zoller, S., Lutzoni, F., 2003. Bayes or bootstrap? A simulation studycomparing the performance of Bayesian Markov Chain Monte Carlo samplingand bootstrapping in assessing phylogenetic confidence. Mol. Biol. Evol. 20,255–266.
Ayala, S.C., Harris, D., Williams, E.E., 1983. New or problematic Anolis fromColombia. I. Anolis calimae, new species, from the cloud forest of westernColombia. Breviora 475, 1–11.
Brandley, M.C., de Queiroz, K., 2004. Phylogeny, ecomorphological evolution, andhistorical biogeography of the Anolis cristatellus group. Herpetol. Monogr. 18,90–126.
Burnell, K.L., Hedges, S.B., 1990. Relationships of West Indian Anolis (Sauria:Iguanidae): An approach using slow-evolving protein loci. Caribb. J. Sci. 26, 7–30.
Burnham, K.P., Anderson, D.R., 2004. Multimodel inference: understanding AIC andBIC in model selection. Sociol. Methods Res. 33, 261–304.
Cannatella, D., de Queiroz, K., 1989. Phylogenetic systematics of the anoles: is a newtaxonomy warranted? Syst. Zool. 38, 57–69.
Creer, D.A., de Queiroz, K., Jackman, T.R., Losos, J.B., Larson, A., 2001. Systematics ofthe Anolis roquet series of the southern Lesser Antilles. J. Herpetol. 35, 428–441.
de Queiroz, K., Reeder, T., 2008. Squamata—Lizards. In: Crother, B.I. (Ed.), Scientificand Standard English Names of Amphibians and Reptiles of North AmericaNorth of Mexico, with Comments Regarding Confidence in Our Understanding.Society for the Study of Amphibians and Reptiles. Herp. Circular, vol. 37, pp. 24–45.
Dunn, E.R., 1937. The giant mainland anoles. Proc. New Engl. Zool. Cl. 16, 5–9.Etheridge, R., 1959. The Relationships of the Anoles (Reptilia: Sauria: Iguanidae): An
Interpretation Based on Skeletal Morphology. PhD Thesis, University ofMichigan, Ann Harbor, Michigan.
Felsenstein, J., 1985. Confidence limits on phylogenies: an approach using thebootstrap. Evolution 39, 783–791.
Fiedler, P.C., 2002. The annual cycle and biological effects of the Costa Rica Dome.Deep Sea Res. Part I 49, 321–338.
Folmer, O., Black, M., Hoeh, W., Lutz, R., Vrijenhoek, R., 1994. DNA primers foramplification of mitochondrial cytochrome c oxidase subunit I from diversemetazoan invertebrates. Mol. Mar. Biol. Biotechnol. 3, 294–299.
Giannasi, N., Thorpe, R.S., Malhotra, A., 2000. A phylogenetic analysis of body sizeevolution in the Anolis roquet group (Sauria: Iguanidae): character displacementor size assortment. Mol. Ecol. 9, 193–202.
Glor, R.E., Vitt, L.J., Larson, A., 2001. A molecular phylogenetic analysis ofdiversification in Amazonian Anolis lizards. Mol. Ecol. 10, 2661–2668.
Glor, R.E., Kolbe, J.J., Powell, R., Larson, A., Losos, J.B., 2003. Phylogenetic analysis ofecological and morphological diversification in Hispaniolan trunk-groundanoles (Anolis cybotes group). Evolution 57, 2383–2397.
Gorman, G.C., Atkins, L., 1967. The relationships of the Anolis of the roquet speciesgroup (Sauria: Iguanidae). II. Comparative chromosome cytology. Syst. Zool. 16,137–143.
Gorman, G.C., Dessauer, H.C., 1965. Hemoglobin and transferring electrophoresisand relationships of island populations of Anolis lizards. Science 150, 1454–1455.
Gorman, G.C., Dessauer, H.C., 1966. The relationships of Anolis of the roquet speciesgroup (Sauria: Iguanidae). I. Electrophoretic comparison of blood proteins.Comp. Biochem. Physiol. 19, 845–853.
Gorman, G.C., Kim, Y.J., 1976. Anolis lizards of the eastern Caribbean: a case study inevolution. II. Genetic relationships and genetic variation of the bimaculatusgroup. Syst. Zool. 20, 167–185.
Gorman, G.C., Thomas, R., Atkins, L., 1968. Intra- and interspecific chromosomevariation in Anolis cristatellus and its closest relatives. Breviora 293, 1–12.
Gorman, G.C., Licht, P., Dessauer, H.C., Boos, J.O., 1971. Reproductive failure amongthe hybridizing Anolis lizards of Trinidad. Syst. Zool. 20, 1–18.
Gorman, G.C., Buth, D.G., Soulé, M., Yang, S.Y., 1980. The relationships of the Anoliscristatellus group: electrophoretic analysis. J. Herpetol. 14, 269–278.
Gorman, G.C., Buth, D., Soulé, M., Yang, S.Y., 1983. The relationships of the PuertoRican Anolis: electrophoretic and karyotypic studies. In: Rhodin, A.G.J., Miyata,K. (Eds.), Advances in Herpetology and Evolutionary Biology. Museum ofComparative Zoology, Cambridge, Massachusetts, pp. 626–642.
Graham, J.B., 1975. The Biological Investigation of Malpelo Island, Colombia.Smithsonian Institution Press, Washington, District of Columbia.
Groth, J.G., Barrowclough, G.F., 1999. Basal divergences in birds and thephylogenetic utility of the nuclear RAG-1 gene. Mol. Phylogenet. Evol. 12,115–123.
Guyer, C., Savage, J.M., 1986. Cladistic relationships among anoles (Sauria:Iguanidae). Syst. Zool. 35, 509–531.
Harmon, L.J., Schulte II, J.A., Larson, A., Losos, J.B., 2003. Tempo and mode ofevolutionary radiation in iguanian lizards. Science 301, 961–964.
Huelsenbeck, J.P., Ronquist, F., Nielsen, R., Bollback, J.P., 2001. Bayesian inference ofphylogeny and its impact on evolutionary biology. Science 294, 2310–2314.
Jackman, T.R., Larson, A., de Queiroz, K., Losos, J.B., 1999. Phylogenetic relationshipsand tempo of early diversification in Anolis lizards. Syst. Biol. 48, 254–285.
Jackman, T.R., Irschick, D.J., de Queiroz, K., Losos, J.B., Larson, A., 2002. Molecularphylogenetic perspective on evolution of lizards of the Anolis grahami series. J.Exp. Zool. B Mol. Dev. Evol. 294, 1–16.
Kass, R.E., Raftery, A.E., 1995. Bayes factors. J. Am. Stat. Assoc. 90, 773–795.Kumazawa, Y., Nishida, M., 1993. Sequence evolution of mitochondrial tRNA genes
and deep-branch animal phylogenetics. J. Mol. Evol. 37, 380–398.Larget, B., Simon, D.L., 1999. Markov chain Monte Carlo algorithms for the Bayesian
analysis of phylogenetic trees. Mol. Biol. Evol. 16, 750–759.Lazell Jr., J.D., 1969. The genus Phenacosaurus (Sauria: Iguanidae). Breviora 325, 1–
24.Lazell Jr., J.D., 1972. The anoles (Sauria, Iguanidae) of the Lesser Antilles. Bull. Mus.
Comp. Zool. Harvard Univ. 143, 1–115.Lewis, P.O., Holder, M.T., Holsinger, K.E., 2005. Polytomies and Bayesian
phylogenetic inference. Syst. Biol. 54, 241–253.Macey, J.R., Larson, A., Ananjeva, N.B., Fang, Z., Papenfuss, T.J., 1997. Two novel gene
orders and the role of light-strand replication in rearrangement of thevertebrate mitochondrial genome. Mol. Biol. Evol. 14, 91–104.
Maddison, D.R., Maddison, W.P., 2001. MacClade: Analysis of Phylogeny andCharacter Evolution. Version 4.03. Sinauer Associates, Sunderland,Massachusetts.
Melville, J., Hale, J.M., 2009. Length variation in the N-terminal domain of therecombination-activating gene 1 (RAG1) across squamates. Mol. Phylogenet.Evol. 52, 898–903.
Miyata, T., Hayashida, H., Kikuno, R., Hasegawa, M., Kobayashi, M., Koike, K., 1982.Molecular clock of silent substitution: at least six-fold preponderance of silentchanges in mitochondrial genes over those in nuclear genes. J. Mol. Evol. 19, 28–35.
Myers, C.W., Donnelly, M.A., 1996. A new herpetofauna from Cerro Yaví, Venezuela:first results of the Robert G. Goelet American Museum-TERRAMAR expeditionto the northwestern Tepuis. Am. Mus. Novit. 3172, 1–56.
Myers, C.W., Williams, E.E., McDiarmid, R.W., 1993. A new anoline lizard(Phenacosaurus) from the highland of Cerro de la Neblina, southernVenezuela. Am. Mus. Novit. 3070, 1–15.
Newton, M.A., Raftery, A.E., 1994. Approximate Bayesian inference with theweighted likelihood bootstrap. J. Roy. Stat. Soc. Series B Stat. Methodol. 56, 3–48.
Nicholson, K.E., 2002. Phylogenetic analysis and a test of the current infragenericclassification of Norops (Beta Anolis). Herpetol. Monogr. 16, 93–120.
Nicholson, K.E., Glor, R.E., Kolbe, J.J., Larson, A., Hedges, S.B., Losos, J.B., 2005.Mainland colonization by island lizards. J. Biogeogr. 32, 929–938.
Pagel, M., Meade, A., 2005. Mixture models in phylogenetic inference. In: Gascuel, O.(Ed.), Mathematics of Evolution and Phylogeny. Oxford University Press, Oxford,pp. 121–139.
800 María del Rosario Castañeda, K.de Queiroz / Molecular Phylogenetics and Evolution 61 (2011) 784–800
Peters, J.A., Donoso-Barros, R., 1970. Catalogue of the Neotropical Squamata: Part II.Lizards and amphisbaenians. US Nat. Mus. Bull. 297, 1–293.
Pinto, G., Mahler, D.L., Harmon, L.J., Losos, J.B., 2008. Testing the island effect inadaptive radiation: rates and patterns of morphological diversification inCaribbean and mainland Anolis lizards. Proc. Roy. Soc. Lond., B 275, 2749–2757.
Poe, S., 1998. Skull characters and the cladistic relationships of the Hispaniolandwarf twig Anolis. Herpetol. Monogr. 12, 192–236.
Poe, S., 2004. Phylogeny of anoles. Herpetol. Monogr. 18, 37–89.Poe, S., Yañez-Miranda, C., 2007. A new species of phenacosaur Anolis from Peru.
Herpetologica 63, 219–223.Poe, S., Latella, I.M., Ryan, M.J., Schaad, E.W., 2009. A new species of Anolis lizard
(Squamata, Iguania) from Panama. Phyllomedusa 8, 81–87.Posada, J.L., Crandall, K.A., 1998. Modeltest: testing the model of DNA substitution.
Bioinformatics 14, 817–818. Version 3.7 (June 2005).R Development Core Team, 2010. R: A Language and Environment for Statistical
Computing. Version 2.11.1. <http://www.R-project.org>.Rambaut, A., Drummond, A.J., 2007. Tracer. Version 1.5. <http://beast.bio.ed.ac.uk/
Tracer/>.Ronquist, F., Huelsenbeck, J.P., 2003. MrBayes 3: Bayesian phylogenetic inference
under mixed models. Bioinformatics 19, 1572–1574.Sadofsky, M.J., Hesse, J.E., McBlane, J.F., Gellert, M., 1993. Expression and V(D)J
recombination activity of mutated RAG-1 proteins. Nucl. Acids Res. 21, 5644–5650.
Savage, J.M., Guyer, C., 1989. Infrageneric classification and species composition ofthe anole genera, Anolis, Ctenonotus, Dactyloa, Norops, and Semiurus (Sauria:Iguanidae). Amphibia-Reptilia 10, 105–116.
Savage, J.M., Talbot, J.J., 1978. The giant anoline lizards of Costa Rica and westernPanama. Copeia 1978, 480–492.
Schneider, C.J., Losos, J.B., de Queiroz, K., 2001. Evolutionary relationships of theAnolis bimaculatus group from the northern Lesser Antilles. J. Herpetol. 35, 1–12.
Schulte II, J.A., Cartwright, E.M., 2009. Phylogenetic relationships among iguanianlizards using alternative partitioning methods and TSHZ1: a new phylogeneticmarker for reptiles. Mol. Phylogenet. Evol. 50, 391–396.
Schulte II, J.A., Valladares, J.P., Larson, A., 2003. Phylogenetic relationships withinIguanidae inferred using molecular and morphological data and a phylogenetictaxonomy of iguanian lizards. Herpetologica 59, 399–419.
Schwartz, A., Henderson, R.W., 1991. Amphibians and Reptiles of the West Indies:Descriptions, Distributions and Natural History. University of Florida Press,Gainesville, Florida.
Shimodaira, H., 2002. An approximately unbiased test of phylogenetic treeselection. Syst. Biol. 51, 492–508.
Shimodaira, H., Hasegawa, M., 2001. CONSEL: for assessing the confidence ofphylogenetic tree selection. Bioinformatics 17, 1246–1247.
Shochat, D., Dessauer, H.C., 1981. Comparative study of albumins of Anolis lizards ofthe Caribbean islands. Comp. Biochem. Physiol. A 68, 67–73.
Suchard, M.A., Weiss, R.E., Sinsheimer, J.S., 2001. Bayesian selection of continuous-time Markov chain evolutionary models. Mol. Biol. Evol. 18, 1001–1013.
Sullivan, J., Abdo, Z., Joyce, P., Swofford, D.L., 2005. Evaluating the performance of asuccessive-approximations approach to parameter optimization in maximum-likelihood phylogeny estimation. Mol. Biol. Evol. 22, 1386–1392.
Suzuki, Y., Glazko, G.V., Nei, M., 2002. Overcredibility of molecular phylogeniesobtained by Bayesian phylogenetics. Proc. Natl. Acad. Sci. 99, 16138–16143.
Sverdrup, H.U., Johnson, M.W., Fleming, R.H., 1942. The Oceans: Their Physics,Chemistry, and General Biology. Prentice Hall, Englewood Cliffs, New Jersey.
Swofford, D.L., 2002. PAUP�. Phylogenetic Analysis Using Parsimony (� and OtherMethods), Version 4. Sinauer Associates, Sunderland, Massachusetts.
Swofford, D.L., Olsen, G.J., Waddell, P.J., Hillis, D.M., 1996. Phylogenetic inference.In: Hillis, D.M., Moritz, C., Mable, B. (Eds.), Molecular Systematics, second ed.Sinauer Associates, Sunderland, Massachusetts, pp. 407–514.
Templeton, A.R., 1983. Phylogenetic inference from restriction endonucleasecleavage site maps with particular reference to the evolution of humans andapes. Evolution 37, 221–244.
Thompson, J.D., Gibson, T.J., Plewniak, F., Jeanmougin, F., Higgins, D., 1997. Clustal Xwindows interface: flexible strategies for multiple sequence alignment aided byquality analysis tools. Nucl. Acids Res. 24, 4876–4882.
Townsend, T., Larson, A., 2002. Molecular phylogenetics and mitochondrial genomicevolution in the Chamaeleonidae (Reptilia, Squamata). Mol. Phylogenet. Evol.23, 22–36.
Townsend, T.M., Larson, A., Louis, E., Macey, J.R., 2004. Molecular phylogenetics ofSquamata: the position of snakes, amphisbaenians, and dibamids, and the rootof the squamate tree. Syst. Biol. 53, 735–757.
Uetz, P., Etzold, T., 1996. The EMBL/EBI Reptile Database. Herpetol. Rev. 27, 174–175. <http://www.reptile-database.org/> (accessed 10.01.11).
Ugueto, G.N., Rivas-Fuenmayor, G., Barros, T., Sánchez-Pacheco, S.J., García-Pérez,J.E., 2007. A revision of the Venezuelan Anoles I: A new Anolis species from theAndes of Venezuela with the redescription of Anolis jacare Boulenger 1903(Reptilia: Polychrotidae) and the clarification of the status of Anolisnigropunctatus Williams 1974. Zootaxa 1501, 1–30.
Underwood, G., 1959. The anoles of the eastern Caribbean (Sauria, Iguanidae):revisionary notes. Bull. Mus. Comp. Zool. Harvard Univ. 121 (part III), 191–226.
Weisrock, D.W., Macey, J.R., Ugurtas, I.H., Larson, A., Papenfuss, T.J., 2001. Molecularphylogenetics and historical biogeography among salamandrids of the ‘‘true’’salamander clade: rapid branching of numerous highly divergent lineages inMertensiella luschani associated with the rise of Anatolia. Mol. Phylogenet. Evol.18, 434–448.
Williams, E.E., 1976a. West Indian anoles: a taxonomic and evolutionary summary.1. Introduction and a species list. Breviora 440, 1–21.
Williams, E.E., 1976b. South American anoles: the species groups. Pap. Avulsos Zool.29, 259–268.
Williams, E.E., 1979. South American anoles: the species groups. 2. The proboscisanoles (Anolis laevis group). Breviora 449, 1–19.
Williams, E.E., 1984. New or problematic Anolis from Colombia. III. Two newsemiaquatic anoles from Antioquia and Chocó, Colombia. Breviora 478, 1–22.
Williams, E.E., 1988. New or problematic Anolis from Colombia. V. Anolis danieli, anew species of the latifrons species group and a reassessment of Anolisapollinaris Boulenger, 1919. Breviora 489, 1–25.
Williams, E.E., 1989. A critique of Guyer and Savage (1986): cladistic relationshipsamong anoles (Sauria: Iguanidae): are the data available to reclassify anoles?In: Woods, C.A. (Ed.), Biogeography of the West Indies: Past, Present and Future.Sandhill Crane Press, Gainsville, Florida, pp. 434–478.
Williams, E.E., Duellman, W.E., 1967. Anolis chocorum, a new punctatus-like anolefrom Darién, Panamá (Sauria, Iguanidae). Breviora 256, 1–12.
Williams, E.E., Duellman, W.E., 1984. Anolis fitchi, a new species of the Anolisaequatorialis group from Ecuador and Colombia. In: Siegler, R.A., Hunt, L.E.,Knight, J.L., Malaret, L., Zuschlag, N.L. (Eds.), Vertebrate Ecology and Systematics– A Tribute to Henry S. Fitch. Special Publications No. 10. Museum of NaturalMuseum of Kansas, The University of Kansas, Laurence, Kansas, USA, pp. 257–266.
Williams, E.E., Rand, H., Rand, A.S., O’Hara, R.J., 1995. A computer approach to thecomparison and identification of species in difficult taxonomic groups. Breviora502, 1–47.
Williams, E.E., Praderio, M.J., Gorzula, S., 1996. A phenacosaur from Chimantá Tepui,Venezuela. Breviora 506, 1–15.
Yang, S.Y., Soulé, M., Gorman, G.C., 1974. Anolis lizards of the eastern Caribbean: acase study in evolution. I. Genetic relationships, phylogeny, and colonizationsequence of the roquet group. Syst. Zool. 23, 387–399.
Zwickl, D.J., 2006. Genetic Algorithm Approaches for the Phylogenetic Analysis ofLarge Biological Sequence Datasets under the Maximum Likelihood Criterion.Ph.D. Dissertation, The University of Texas at Austin, Texas.


