Embed Size (px)
Citation preview
Population Genetic Structure of the New Zealand EstuarineClam Austrovenus stutchburyi (Bivalvia: Veneridae) RevealsPopulation Subdivision and Partial Congruencewith Biogeographic Boundaries
Philip M. Ross & Ian D. Hogg & Conrad A. Pilditch &
Carolyn J. Lundquist & Richard J. Wilkins
Received: 2 December 2010 /Revised: 10 March 2011 /Accepted: 3 July 2011 /Published online: 10 August 2011# Coastal and Estuarine Research Federation 2011
Abstract We examined the population genetic structure ofthe New Zealand endemic clam, Austrovenus stutchburyi, todetermine (1) whether populations of this estuarine taxonare genetically subdivided and (2) if the locations of geneticboundaries were congruent with known biogeographicbreak points. We obtained sequences of the mitochondrialgene cytochrome c oxidase I for 372 A. stutchburyi from 29New Zealand estuaries and conducted analyses to identifypopulation genetic structure. We detected a pattern ofgenetic isolation by distance and identified six A. stutch-buryi subpopulations, a greater number of subpopulationsthan reported for much of New Zealand’s open coastbenthos. Although these data indicate that long distancedispersal may be less frequent in estuarine than in opencoast taxa, partial congruence between genetic and biogeo-graphic boundaries suggests that historical events andnatural selection may also contribute to the observedpopulation genetic structure.
Keywords Biogeography . Connectivity . Cytochromeoxidase c subunit I . Dispersal . Natural selection .Marine .
Isolation by distance
Introduction
Many marine benthic invertebrates can only disperse overlarge distances during a pelagic larval phase (Thorson 1950;Pechenik 1999; Grantham et al. 2003). For inshore species,larvae are exported to coastal or shelf waters and developduring a period of weeks to months before returning tosuitable habitat in late larval or early post-larval form(Pechenik 1999). For estuarine taxa, the process of inter-estuary dispersal is more complex. Larvae must be exportedfrom their natal estuary, develop in coastal waters and betransported to suitable settlement habitat within anotherestuary when developmentally capable of settling (Bilton etal. 2002). Inter-estuary larval dispersal may be furtherlimited by the often large distances between estuaries, thephysical properties of estuarine waters and their interfacewith the coastal ocean (Mann 1988; Largier 1993), as wellas the physiological challenges associated with a lifehistory alternating between estuarine and coastal waters(Cognetti and Maltagliati 2000). Consequently, it has beensuggested that connectivity among populations of estuarinetaxa will be reduced compared to taxa occurring on theopen coast and that different spatial management strategiesmay be needed for estuarine versus coastal taxa (Bilton etal. 2002; Watts and Johnson 2004; Pelc et al. 2009).However, determining rates of connectivity has provenchallenging owing to the difficulties associated with physi-cally tracking dispersing larvae (Levin 2006; Gawarkiewiczet al. 2007).
A number of indirect methods of estimating connectivityhave been developed (Levin 2006) with population geneticsone of the most widely utilized. If rates of inter-estuary
P. M. Ross (*) : I. D. Hogg :C. A. Pilditch :R. J. WilkinsDepartment of Biological Sciences, University of Waikato,Private Bag 3105,Hamilton, New Zealande-mail: [email protected]
C. J. LundquistNational Institute of Water and Atmospheric Research Limited,P. O. Box 11115, Hamilton, New Zealand
Estuaries and Coasts (2012) 35:143–154DOI 10.1007/s12237-011-9429-z
gene flow are low as hypothesized, then estuarine taxawould be expected to exhibit a greater degree of geneticsubdivision relative to taxa occurring on the open coast(Bilton et al. 2002; Pelc et al. 2009). However, as naturalselection (Schmidt et al. 2008; Richards et al. 2010 andreferences therein) and patterns of historical gene flow(Avise et al. 1987; Kelly et al. 2006) can also influencepopulation genetic structure, the interpretation of geneticpatterns and estimation of gene flow has been complicated(Sotka et al. 2004).
Because larval dispersal and natural selection will alsodetermine species’ distribution and abundance, it hasbeen suggested that boundaries between groups ofgenetically distinct populations will be geographicallycongruent with biogeographic break points (the bound-aries between taxonomically distinct communities; Aviseet al. 1987). Although tested across a number ofbiogeographic boundaries (e.g. Avise 1992; Hare andAvise 1996; Dawson 2001, 2005; Cárdenas et al. 2009),conflicting results suggest that agreement between geneticand biogeographic boundaries may be location and taxonspecific (Burton 1998; Pelc et al. 2009).
The New Zealand archipelago with its complexoceanography (Heath 1982; Laing and Chiswell 2003),dynamic geological history (Fleming 1979) and well-documented biogeography (Shears et al. 2008) provides anopportunity to examine the processes that generatepopulation subdivision and the relationship betweengenetic and biogeographic boundaries. Straddling thesubtropical convergence, New Zealand’s marine climatefollows a steep gradient from the subtropical north to sub-Antarctic south (Laing and Chiswell 2003; Hadfield et al.2007). The resulting temperature gradient coupled withspatial variation in swell regime, geological processes andother environmental factors (Laing and Chiswell 2003) hascreated regional variation in the distribution and abundanceof flora and fauna. This biogeographical variation has beendescribed in a number of classification schemes that havedivided New Zealand’s coastline into distinct biogeographicregions (reviewed by Shears et al. 2008). In contrast, theinfluence of physical, environmental and geological process-es on a population’s genetic structure is less understood.
Population genetic structure has been examined in atleast 29 New Zealand coastal benthic species with themajority of studies focussed on taxa that occur on the opencoast (see Ross et al. 2009 for review). Where populationshave been sampled across a wide latitudinal range, therehas usually been an absence of genetic structure (e.g. rocklobster: Smith and McKoy 1980; Ovenden et al. 1992,seastar: Waters and Roy 2003), or the detection ofgenetically divergent northern and southern populationsdivided through central New Zealand. Differentiation abouta central boundary has now been recorded in at least ten
species including open coast taxa with pelagic larvae(seastar: Waters and Roy 2004; Ayers and Waters 2005,limpets: Goldstien et al. 2006, mussel: Apte and Gardner2002; Apte et al. 2003, chiton: Veale 2007), open coast taxawithout pelagic larvae (brittle star: Sponer and Roy 2002)and estuarine taxa without pelagic larvae (Corophiidamphipods: Stevens and Hogg 2004; Knox et al. 2011,seagrass: Jones et al. 2008). While it is possible that taxasharing this pattern of population subdivision have experi-enced a common set of contemporary or historicalprocesses (Kuo and Avise 2005; Pelc et al. 2009), theidentification of these processes has thus far proved elusive(see Apte and Gardner 2002; Goldstien et al. 2006).
Genetic structure in addition to the central New Zealanddivergence, has only been reported for a few species, all ofwhich exhibit characteristics of limited dispersal capacitysuch as non-pelagic larvae or restriction to estuarinehabitats (e.g. Corophiid amphipods: Knox et al. 2011;Stevens and Hogg 2004, seagrass: Jones et al. 2008). Asmost of the estuarine taxa examined to date lack a pelagiclarval phase, it is uncertain which characteristic (estuarinedistribution vs. larval mode) is driving patterns of additionalpopulation subdivision.
The clam Austrovenus stutchburyi (Wood 1828) is theonly New Zealand taxon that both disperses via pelagiclarvae and is restricted to estuaries that has previously beenassessed for population genetic structure (Lidgard 2001). Incontrast to other estuarine taxa with limited potential forlong distance dispersal, A. stutchburyi has a pelagic larvalphase of 2 to 3 weeks during which dispersal amonggeographically discrete populations is possible. A previousanalysis of allozyme polymorphism in A. stutchburyi didnot detect any spatial genetic subdivision (althoughtemporal patterns may have been detected; Lidgard 2001).This supports the notion that for previously examined taxa,the lack of pelagic larval phase rather than an estuary-restricted distribution per se might be responsible for theadditional genetic structure observed (e.g. Stevens andHogg 2004; Jones et al 2008). However, as most recentgenetic studies of New Zealand taxa have used mitochon-drial DNA sequences to assess population structure (Ross etal. 2009), it is uncertain whether the lack of subdivisionreported for A. stutchburyi can be attributed to their pelagiclarval phase or to differences in methodology (allozymesvs. mtDNA).
To determine whether populations of an estuarine specieswith pelagic larvae will be genetically subdivided, weconducted a population genetic analysis of A. stutchburyiusing the mitochondrial cytochrome c oxidase subunit I(COI) gene. We examined the genetic structure of A.stutchburyi populations, testing for patterns of geneticisolation by distance (IBD) and performed a spatial analysisof molecular variance (SAMOVA) to identify divergent
144 Estuaries and Coasts (2012) 35:143–154
subpopulations. We also used an analysis of molecularvariance (AMOVA) to determine whether genetic subdivi-sions are congruent with known biogeographic breakpoints. A recent biogeographic classification of NewZealand (Shears et al. 2008; Fig. 1a) was chosen for ourcomparison because it incorporated results from previousbiogeographic classifications and included taxa similar tothose considered in our (and previous) population geneticstudies. Shears et al. (2008) described a major biogeo-graphic division through central New Zealand and anothernine minor biogeographic boundaries located throughoutNew Zealand (Fig. 1a).
Methods
Study Sites and Sample Collection
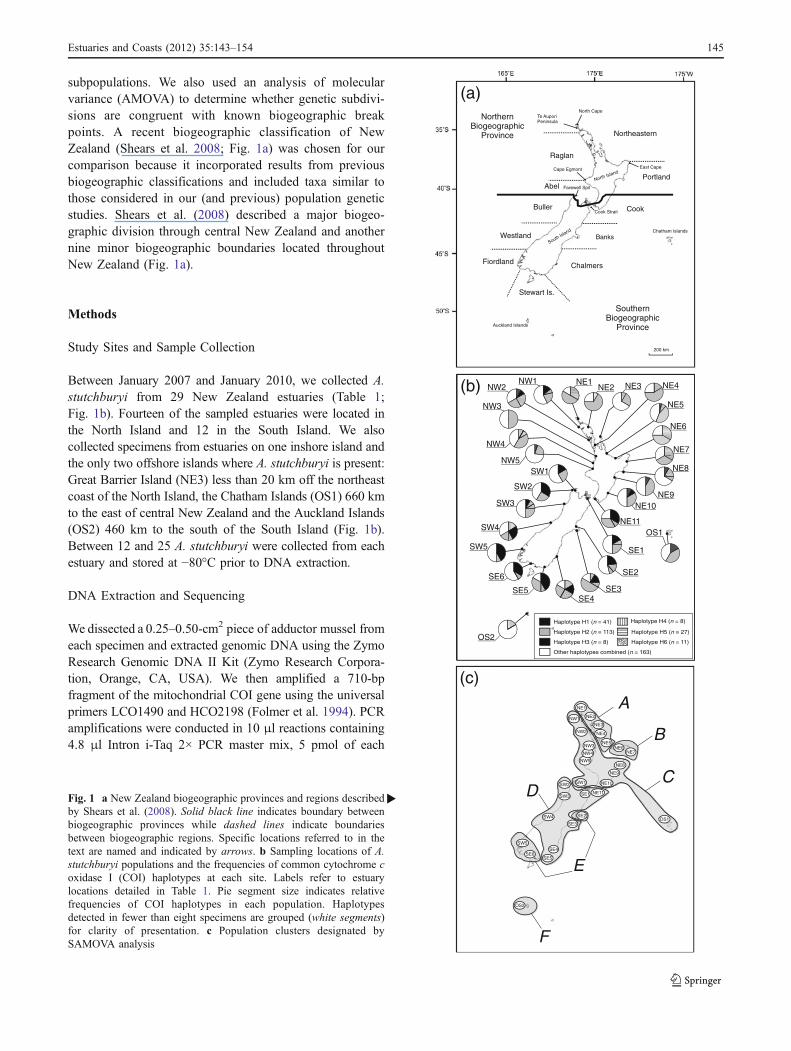
Between January 2007 and January 2010, we collected A.stutchburyi from 29 New Zealand estuaries (Table 1;Fig. 1b). Fourteen of the sampled estuaries were located inthe North Island and 12 in the South Island. We alsocollected specimens from estuaries on one inshore island andthe only two offshore islands where A. stutchburyi is present:Great Barrier Island (NE3) less than 20 km off the northeastcoast of the North Island, the Chatham Islands (OS1) 660 kmto the east of central New Zealand and the Auckland Islands(OS2) 460 km to the south of the South Island (Fig. 1b).Between 12 and 25 A. stutchburyi were collected from eachestuary and stored at −80°C prior to DNA extraction.
DNA Extraction and Sequencing
We dissected a 0.25–0.50-cm2 piece of adductor mussel fromeach specimen and extracted genomic DNA using the ZymoResearch Genomic DNA II Kit (Zymo Research Corpora-tion, Orange, CA, USA). We then amplified a 710-bpfragment of the mitochondrial COI gene using the universalprimers LCO1490 and HCO2198 (Folmer et al. 1994). PCRamplifications were conducted in 10 μl reactions containing4.8 μl Intron i-Taq 2× PCR master mix, 5 pmol of each
NorthernBiogeographic
Province
SouthernBiogeographic
Province
Northeastern
Portland
Cook
Banks
Chalmers
Raglan
Abel
Buller
Westland
Fiordland
Stewart Is.
Te AuporiPeninsula
North Cape
Farewell Spit
Cook Strait
North Island
South Island
Auckland Islands
Chatham Islands
NE2
NE1
NE5
NE4
NE3
NE7NE6
SW5
SE6
OS2
SE2
A
B
CD
E
F
)c(
)b(
)a(
East Cape
Haplotype H1 ( = 41)n
Haplotype ( = 113)nH2
Haplotype ( = 8)nH3
Other haplotypes combined ( = 163)n
Haplotype ( = 8)nH4
Haplotype ( = 27)nH5
Haplotype ( = 11)nH6
Cape Egmont
200 km
NW1
NW2
NW3
NW4
NW5
SW1 NE10
NE9
NE8
OS1
SW2
SW3 SE1 NE11
SE3
SW4
SE4
SE5
OS2
SE5
SE6
SW5
SW4
SW3 .
SW2
SE4SE3
SE2
SE1
SW1
OS1
NE1NW1NW2
NW3
NW4
NW5
NE2 NE3 NE4
NE5
NE6
NE7
NE8
NE9NE10
NE11
Fig. 1 a New Zealand biogeographic provinces and regions describedby Shears et al. (2008). Solid black line indicates boundary betweenbiogeographic provinces while dashed lines indicate boundariesbetween biogeographic regions. Specific locations referred to in thetext are named and indicated by arrows. b Sampling locations of A.stutchburyi populations and the frequencies of common cytochrome coxidase I (COI) haplotypes at each site. Labels refer to estuarylocations detailed in Table 1. Pie segment size indicates relativefrequencies of COI haplotypes in each population. Haplotypesdetected in fewer than eight specimens are grouped (white segments)for clarity of presentation. c Population clusters designated bySAMOVA analysis
�
Estuaries and Coasts (2012) 35:143–154 145
primer and 1 μl of unquantified template DNA. PCRreactions consisted of an initial denaturing phase of 94°C(4 min), followed by 35 cycles consisting of 94°C (60 s),52°C (90 s) and 72°C (90 s) and a final extension period at72°C (5 min). Unincorporated nucleotides and primers wereremoved by adding 2 U of exonuclease I, 0.1 U of shrimpalkaline phosphatase and 2.7 μl H2O and incubating at 37°C(30 min) then 80°C (15 min). Sequencing reactions usedBig Dye terminator sequencing chemistry (Applied Bio-systems) on an Applied Biosystems 3130 Genetic Analyzer.DNA strands were edited in Geneious (ver. 4.8.4) to producean alignment of 658 bp. Sequences have been deposited inthe Barcode of Life Datasystems database under projectNZCOC (New Zealand Marine Bivalves) and GenBank(accession numbers JN200827-JN201198).
Population Genetic Analysis
Indices of genetic diversity were quantified using DnaSPver. 5 (Librado and Rozas 2009). For each estuary, wecalculated the number of COI haplotypes (Nhap), number ofsegregating sites (S), haplotype diversity (He), meannumber of pairwise differences (π1) and nucleotide diver-sity (π2). The GTR model of sequence evolution wasselected in jMODELTEST 0.1.1 (Posada 2008), and a GTRcorrected distance matrix was generated in PAUP* 4.0(Swofford 2000) for use in subsequent analyses. Estimatesof population pairwise FST values were then calculated inARLEQUIN ver. 3.11 (Excoffier et al. 2005) to determine ifany two populations differed significantly in their geneticcomposition. A Mantel test was implemented in ARLE-
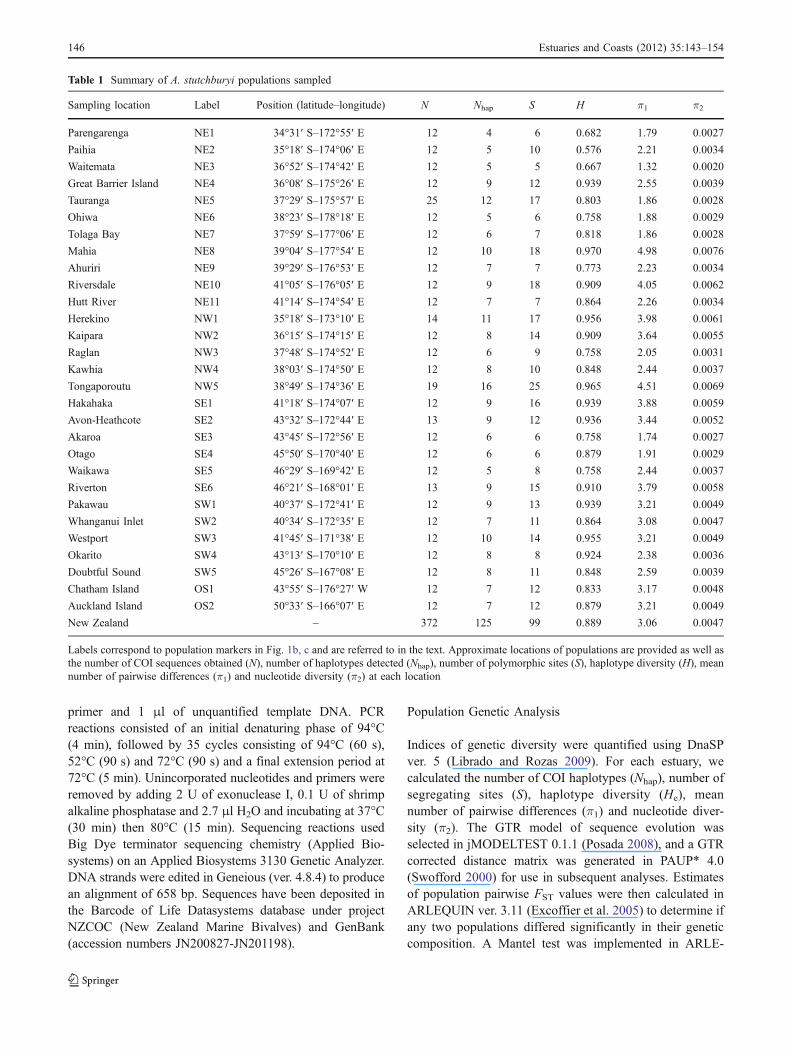
Table 1 Summary of A. stutchburyi populations sampled
Sampling location Label Position (latitude–longitude) N Nhap S H π1 π2
Parengarenga NE1 34°31′ S–172°55′ E 12 4 6 0.682 1.79 0.0027
Paihia NE2 35°18′ S–174°06′ E 12 5 10 0.576 2.21 0.0034
Waitemata NE3 36°52′ S–174°42′ E 12 5 5 0.667 1.32 0.0020
Great Barrier Island NE4 36°08′ S–175°26′ E 12 9 12 0.939 2.55 0.0039
Tauranga NE5 37°29′ S–175°57′ E 25 12 17 0.803 1.86 0.0028
Ohiwa NE6 38°23′ S–178°18′ E 12 5 6 0.758 1.88 0.0029
Tolaga Bay NE7 37°59′ S–177°06′ E 12 6 7 0.818 1.86 0.0028
Mahia NE8 39°04′ S–177°54′ E 12 10 18 0.970 4.98 0.0076
Ahuriri NE9 39°29′ S–176°53′ E 12 7 7 0.773 2.23 0.0034
Riversdale NE10 41°05′ S–176°05′ E 12 9 18 0.909 4.05 0.0062
Hutt River NE11 41°14′ S–174°54′ E 12 7 7 0.864 2.26 0.0034
Herekino NW1 35°18′ S–173°10′ E 14 11 17 0.956 3.98 0.0061
Kaipara NW2 36°15′ S–174°15′ E 12 8 14 0.909 3.64 0.0055
Raglan NW3 37°48′ S–174°52′ E 12 6 9 0.758 2.05 0.0031
Kawhia NW4 38°03′ S–174°50′ E 12 8 10 0.848 2.44 0.0037
Tongaporoutu NW5 38°49′ S–174°36′ E 19 16 25 0.965 4.51 0.0069
Hakahaka SE1 41°18′ S–174°07′ E 12 9 16 0.939 3.88 0.0059
Avon-Heathcote SE2 43°32′ S–172°44′ E 13 9 12 0.936 3.44 0.0052
Akaroa SE3 43°45′ S–172°56′ E 12 6 6 0.758 1.74 0.0027
Otago SE4 45°50′ S–170°40′ E 12 6 6 0.879 1.91 0.0029
Waikawa SE5 46°29′ S–169°42′ E 12 5 8 0.758 2.44 0.0037
Riverton SE6 46°21′ S–168°01′ E 13 9 15 0.910 3.79 0.0058
Pakawau SW1 40°37′ S–172°41′ E 12 9 13 0.939 3.21 0.0049
Whanganui Inlet SW2 40°34′ S–172°35′ E 12 7 11 0.864 3.08 0.0047
Westport SW3 41°45′ S–171°38′ E 12 10 14 0.955 3.21 0.0049
Okarito SW4 43°13′ S–170°10′ E 12 8 8 0.924 2.38 0.0036
Doubtful Sound SW5 45°26′ S–167°08′ E 12 8 11 0.848 2.59 0.0039
Chatham Island OS1 43°55′ S–176°27′ W 12 7 12 0.833 3.17 0.0048
Auckland Island OS2 50°33′ S–166°07′ E 12 7 12 0.879 3.21 0.0049
New Zealand – 372 125 99 0.889 3.06 0.0047
Labels correspond to population markers in Fig. 1b, c and are referred to in the text. Approximate locations of populations are provided as well asthe number of COI sequences obtained (N), number of haplotypes detected (Nhap), number of polymorphic sites (S), haplotype diversity (H), meannumber of pairwise differences (π1) and nucleotide diversity (π2) at each location
146 Estuaries and Coasts (2012) 35:143–154
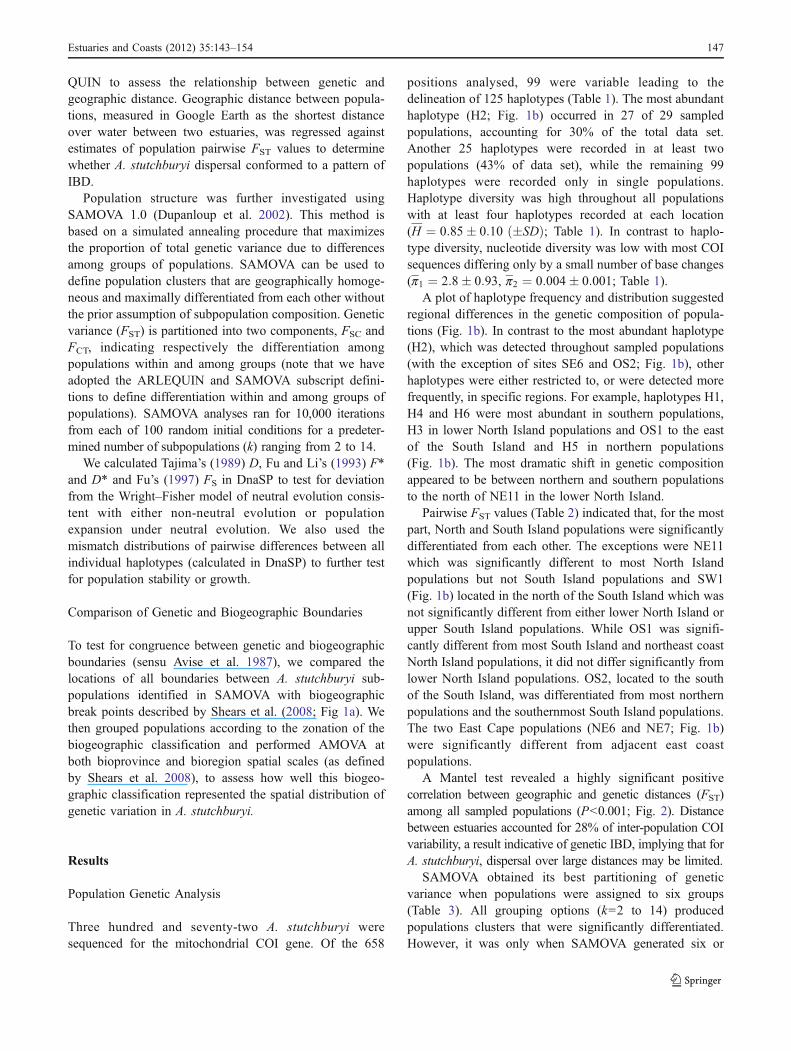
QUIN to assess the relationship between genetic andgeographic distance. Geographic distance between popula-tions, measured in Google Earth as the shortest distanceover water between two estuaries, was regressed againstestimates of population pairwise FST values to determinewhether A. stutchburyi dispersal conformed to a pattern ofIBD.
Population structure was further investigated usingSAMOVA 1.0 (Dupanloup et al. 2002). This method isbased on a simulated annealing procedure that maximizesthe proportion of total genetic variance due to differencesamong groups of populations. SAMOVA can be used todefine population clusters that are geographically homoge-neous and maximally differentiated from each other withoutthe prior assumption of subpopulation composition. Geneticvariance (FST) is partitioned into two components, FSC andFCT, indicating respectively the differentiation amongpopulations within and among groups (note that we haveadopted the ARLEQUIN and SAMOVA subscript defini-tions to define differentiation within and among groups ofpopulations). SAMOVA analyses ran for 10,000 iterationsfrom each of 100 random initial conditions for a predeter-mined number of subpopulations (k) ranging from 2 to 14.
We calculated Tajima’s (1989) D, Fu and Li’s (1993) F*and D* and Fu’s (1997) FS in DnaSP to test for deviationfrom the Wright–Fisher model of neutral evolution consis-tent with either non-neutral evolution or populationexpansion under neutral evolution. We also used themismatch distributions of pairwise differences between allindividual haplotypes (calculated in DnaSP) to further testfor population stability or growth.
Comparison of Genetic and Biogeographic Boundaries
To test for congruence between genetic and biogeographicboundaries (sensu Avise et al. 1987), we compared thelocations of all boundaries between A. stutchburyi sub-populations identified in SAMOVA with biogeographicbreak points described by Shears et al. (2008; Fig 1a). Wethen grouped populations according to the zonation of thebiogeographic classification and performed AMOVA atboth bioprovince and bioregion spatial scales (as definedby Shears et al. 2008), to assess how well this biogeo-graphic classification represented the spatial distribution ofgenetic variation in A. stutchburyi.
Results
Population Genetic Analysis
Three hundred and seventy-two A. stutchburyi weresequenced for the mitochondrial COI gene. Of the 658
positions analysed, 99 were variable leading to thedelineation of 125 haplotypes (Table 1). The most abundanthaplotype (H2; Fig. 1b) occurred in 27 of 29 sampledpopulations, accounting for 30% of the total data set.Another 25 haplotypes were recorded in at least twopopulations (43% of data set), while the remaining 99haplotypes were recorded only in single populations.Haplotype diversity was high throughout all populationswith at least four haplotypes recorded at each location(H ¼ 0:85� 0:10 ð�SDÞ; Table 1). In contrast to haplo-type diversity, nucleotide diversity was low with most COIsequences differing only by a small number of base changes(p1 ¼ 2:8� 0:93, p2 ¼ 0:004� 0:001; Table 1).
A plot of haplotype frequency and distribution suggestedregional differences in the genetic composition of popula-tions (Fig. 1b). In contrast to the most abundant haplotype(H2), which was detected throughout sampled populations(with the exception of sites SE6 and OS2; Fig. 1b), otherhaplotypes were either restricted to, or were detected morefrequently, in specific regions. For example, haplotypes H1,H4 and H6 were most abundant in southern populations,H3 in lower North Island populations and OS1 to the eastof the South Island and H5 in northern populations(Fig. 1b). The most dramatic shift in genetic compositionappeared to be between northern and southern populationsto the north of NE11 in the lower North Island.
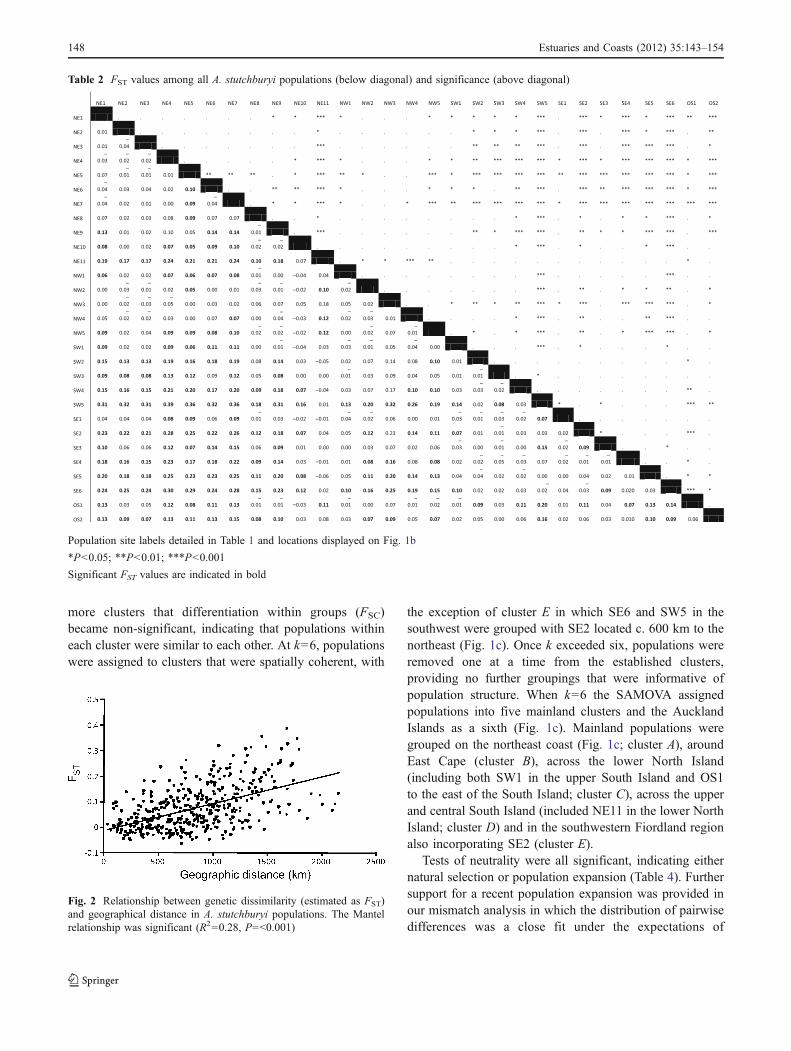
Pairwise FST values (Table 2) indicated that, for the mostpart, North and South Island populations were significantlydifferentiated from each other. The exceptions were NE11which was significantly different to most North Islandpopulations but not South Island populations and SW1(Fig. 1b) located in the north of the South Island which wasnot significantly different from either lower North Island orupper South Island populations. While OS1 was signifi-cantly different from most South Island and northeast coastNorth Island populations, it did not differ significantly fromlower North Island populations. OS2, located to the southof the South Island, was differentiated from most northernpopulations and the southernmost South Island populations.The two East Cape populations (NE6 and NE7; Fig. 1b)were significantly different from adjacent east coastpopulations.
A Mantel test revealed a highly significant positivecorrelation between geographic and genetic distances (FST)among all sampled populations (P<0.001; Fig. 2). Distancebetween estuaries accounted for 28% of inter-population COIvariability, a result indicative of genetic IBD, implying that forA. stutchburyi, dispersal over large distances may be limited.
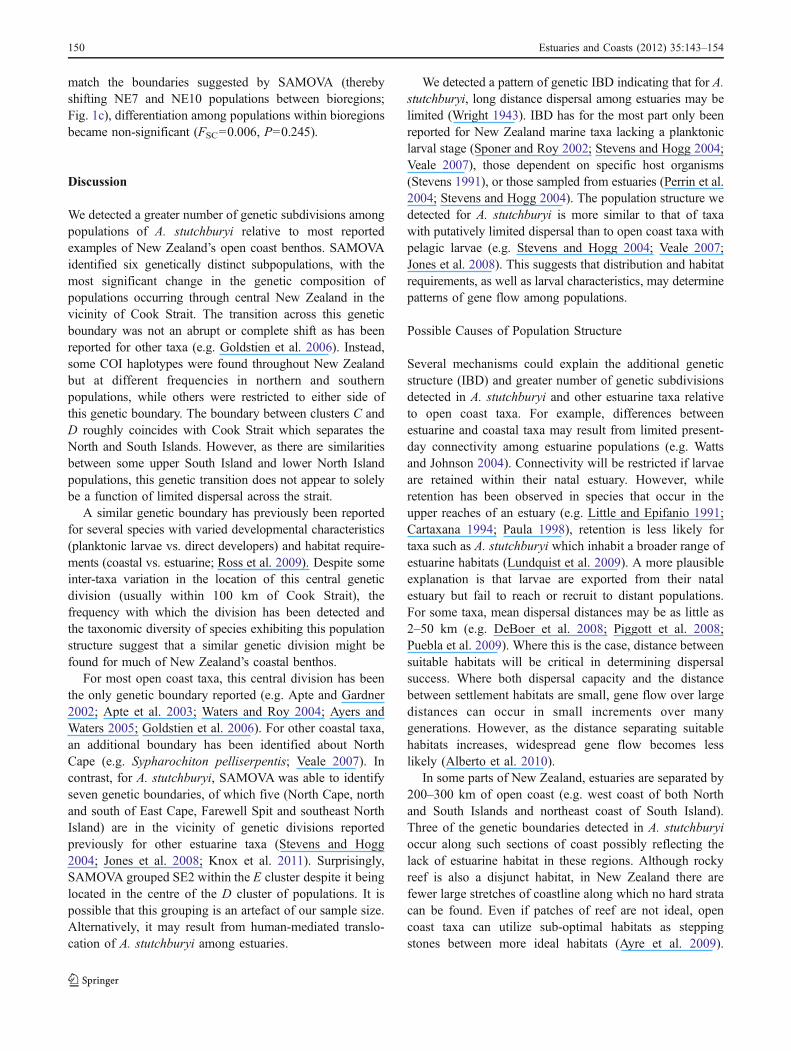
SAMOVA obtained its best partitioning of geneticvariance when populations were assigned to six groups(Table 3). All grouping options (k=2 to 14) producedpopulations clusters that were significantly differentiated.However, it was only when SAMOVA generated six or
Estuaries and Coasts (2012) 35:143–154 147
more clusters that differentiation within groups (FSC)became non-significant, indicating that populations withineach cluster were similar to each other. At k=6, populationswere assigned to clusters that were spatially coherent, with
the exception of cluster E in which SE6 and SW5 in thesouthwest were grouped with SE2 located c. 600 km to thenortheast (Fig. 1c). Once k exceeded six, populations wereremoved one at a time from the established clusters,providing no further groupings that were informative ofpopulation structure. When k=6 the SAMOVA assignedpopulations into five mainland clusters and the AucklandIslands as a sixth (Fig. 1c). Mainland populations weregrouped on the northeast coast (Fig. 1c; cluster A), aroundEast Cape (cluster B), across the lower North Island(including both SW1 in the upper South Island and OS1to the east of the South Island; cluster C), across the upperand central South Island (included NE11 in the lower NorthIsland; cluster D) and in the southwestern Fiordland regionalso incorporating SE2 (cluster E).
Tests of neutrality were all significant, indicating eithernatural selection or population expansion (Table 4). Furthersupport for a recent population expansion was provided inour mismatch analysis in which the distribution of pairwisedifferences was a close fit under the expectations of
Fig. 2 Relationship between genetic dissimilarity (estimated as FST)and geographical distance in A. stutchburyi populations. The Mantelrelationship was significant (R2=0.28, P=<0.001)
Table 2 FST values among all A. stutchburyi populations (below diagonal) and significance (above diagonal)
Population site labels detailed in Table 1 and locations displayed on Fig. 1b
*P<0.05; **P<0.01; ***P<0.001
Significant FST values are indicated in bold
148 Estuaries and Coasts (2012) 35:143–154
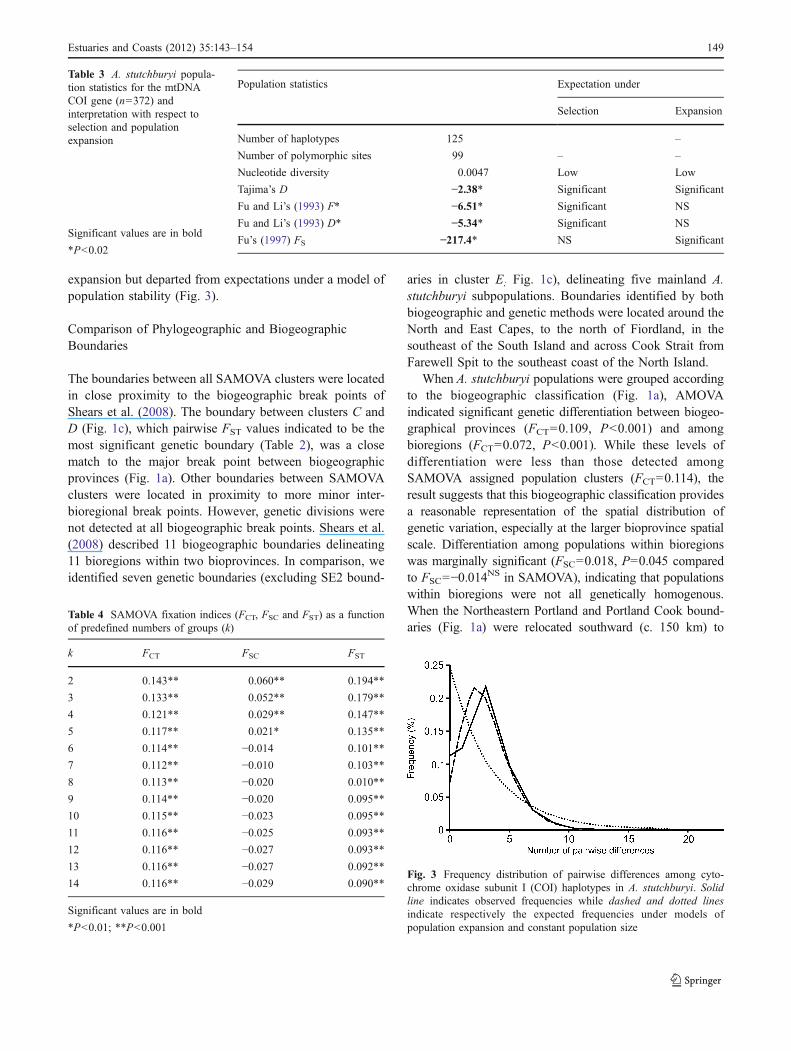
expansion but departed from expectations under a model ofpopulation stability (Fig. 3).
Comparison of Phylogeographic and BiogeographicBoundaries
The boundaries between all SAMOVA clusters were locatedin close proximity to the biogeographic break points ofShears et al. (2008). The boundary between clusters C andD (Fig. 1c), which pairwise FST values indicated to be themost significant genetic boundary (Table 2), was a closematch to the major break point between biogeographicprovinces (Fig. 1a). Other boundaries between SAMOVAclusters were located in proximity to more minor inter-bioregional break points. However, genetic divisions werenot detected at all biogeographic break points. Shears et al.(2008) described 11 biogeographic boundaries delineating11 bioregions within two bioprovinces. In comparison, weidentified seven genetic boundaries (excluding SE2 bound-
aries in cluster E; Fig. 1c), delineating five mainland A.stutchburyi subpopulations. Boundaries identified by bothbiogeographic and genetic methods were located around theNorth and East Capes, to the north of Fiordland, in thesoutheast of the South Island and across Cook Strait fromFarewell Spit to the southeast coast of the North Island.
When A. stutchburyi populations were grouped accordingto the biogeographic classification (Fig. 1a), AMOVAindicated significant genetic differentiation between biogeo-graphical provinces (FCT=0.109, P<0.001) and amongbioregions (FCT=0.072, P<0.001). While these levels ofdifferentiation were less than those detected amongSAMOVA assigned population clusters (FCT=0.114), theresult suggests that this biogeographic classification providesa reasonable representation of the spatial distribution ofgenetic variation, especially at the larger bioprovince spatialscale. Differentiation among populations within bioregionswas marginally significant (FSC=0.018, P=0.045 comparedto FSC=−0.014NS in SAMOVA), indicating that populationswithin bioregions were not all genetically homogenous.When the Northeastern Portland and Portland Cook bound-aries (Fig. 1a) were relocated southward (c. 150 km) to
Fig. 3 Frequency distribution of pairwise differences among cyto-chrome oxidase subunit I (COI) haplotypes in A. stutchburyi. Solidline indicates observed frequencies while dashed and dotted linesindicate respectively the expected frequencies under models ofpopulation expansion and constant population size
Population statistics Expectation under
Selection Expansion
Number of haplotypes 125 –
Number of polymorphic sites 99 – –
Nucleotide diversity 0.0047 Low Low
Tajima’s D −2.38* Significant Significant
Fu and Li’s (1993) F* −6.51* Significant NS
Fu and Li’s (1993) D* −5.34* Significant NS
Fu’s (1997) FS −217.4* NS Significant
Table 3 A. stutchburyi popula-tion statistics for the mtDNACOI gene (n=372) andinterpretation with respect toselection and populationexpansion
Significant values are in bold
*P<0.02
Table 4 SAMOVA fixation indices (FCT, FSC and FST) as a functionof predefined numbers of groups (k)
k FCT FSC FST
2 0.143** 0.060** 0.194**
3 0.133** 0.052** 0.179**
4 0.121** 0.029** 0.147**
5 0.117** 0.021* 0.135**
6 0.114** −0.014 0.101**
7 0.112** −0.010 0.103**
8 0.113** −0.020 0.010**
9 0.114** −0.020 0.095**
10 0.115** −0.023 0.095**
11 0.116** −0.025 0.093**
12 0.116** −0.027 0.093**
13 0.116** −0.027 0.092**
14 0.116** −0.029 0.090**
Significant values are in bold
*P<0.01; **P<0.001
Estuaries and Coasts (2012) 35:143–154 149
match the boundaries suggested by SAMOVA (therebyshifting NE7 and NE10 populations between bioregions;Fig. 1c), differentiation among populations within bioregionsbecame non-significant (FSC=0.006, P=0.245).
Discussion
We detected a greater number of genetic subdivisions amongpopulations of A. stutchburyi relative to most reportedexamples of New Zealand’s open coast benthos. SAMOVAidentified six genetically distinct subpopulations, with themost significant change in the genetic composition ofpopulations occurring through central New Zealand in thevicinity of Cook Strait. The transition across this geneticboundary was not an abrupt or complete shift as has beenreported for other taxa (e.g. Goldstien et al. 2006). Instead,some COI haplotypes were found throughout New Zealandbut at different frequencies in northern and southernpopulations, while others were restricted to either side ofthis genetic boundary. The boundary between clusters C andD roughly coincides with Cook Strait which separates theNorth and South Islands. However, as there are similaritiesbetween some upper South Island and lower North Islandpopulations, this genetic transition does not appear to solelybe a function of limited dispersal across the strait.
A similar genetic boundary has previously been reportedfor several species with varied developmental characteristics(planktonic larvae vs. direct developers) and habitat require-ments (coastal vs. estuarine; Ross et al. 2009). Despite someinter-taxa variation in the location of this central geneticdivision (usually within 100 km of Cook Strait), thefrequency with which the division has been detected andthe taxonomic diversity of species exhibiting this populationstructure suggest that a similar genetic division might befound for much of New Zealand’s coastal benthos.
For most open coast taxa, this central division has beenthe only genetic boundary reported (e.g. Apte and Gardner2002; Apte et al. 2003; Waters and Roy 2004; Ayers andWaters 2005; Goldstien et al. 2006). For other coastal taxa,an additional boundary has been identified about NorthCape (e.g. Sypharochiton pelliserpentis; Veale 2007). Incontrast, for A. stutchburyi, SAMOVA was able to identifyseven genetic boundaries, of which five (North Cape, northand south of East Cape, Farewell Spit and southeast NorthIsland) are in the vicinity of genetic divisions reportedpreviously for other estuarine taxa (Stevens and Hogg2004; Jones et al. 2008; Knox et al. 2011). Surprisingly,SAMOVA grouped SE2 within the E cluster despite it beinglocated in the centre of the D cluster of populations. It ispossible that this grouping is an artefact of our sample size.Alternatively, it may result from human-mediated translo-cation of A. stutchburyi among estuaries.
We detected a pattern of genetic IBD indicating that for A.stutchburyi, long distance dispersal among estuaries may belimited (Wright 1943). IBD has for the most part only beenreported for New Zealand marine taxa lacking a planktoniclarval stage (Sponer and Roy 2002; Stevens and Hogg 2004;Veale 2007), those dependent on specific host organisms(Stevens 1991), or those sampled from estuaries (Perrin et al.2004; Stevens and Hogg 2004). The population structure wedetected for A. stutchburyi is more similar to that of taxawith putatively limited dispersal than to open coast taxa withpelagic larvae (e.g. Stevens and Hogg 2004; Veale 2007;Jones et al. 2008). This suggests that distribution and habitatrequirements, as well as larval characteristics, may determinepatterns of gene flow among populations.
Possible Causes of Population Structure
Several mechanisms could explain the additional geneticstructure (IBD) and greater number of genetic subdivisionsdetected in A. stutchburyi and other estuarine taxa relativeto open coast taxa. For example, differences betweenestuarine and coastal taxa may result from limited present-day connectivity among estuarine populations (e.g. Wattsand Johnson 2004). Connectivity will be restricted if larvaeare retained within their natal estuary. However, whileretention has been observed in species that occur in theupper reaches of an estuary (e.g. Little and Epifanio 1991;Cartaxana 1994; Paula 1998), retention is less likely fortaxa such as A. stutchburyi which inhabit a broader range ofestuarine habitats (Lundquist et al. 2009). A more plausibleexplanation is that larvae are exported from their natalestuary but fail to reach or recruit to distant populations.For some taxa, mean dispersal distances may be as little as2–50 km (e.g. DeBoer et al. 2008; Piggott et al. 2008;Puebla et al. 2009). Where this is the case, distance betweensuitable habitats will be critical in determining dispersalsuccess. Where both dispersal capacity and the distancebetween settlement habitats are small, gene flow over largedistances can occur in small increments over manygenerations. However, as the distance separating suitablehabitats increases, widespread gene flow becomes lesslikely (Alberto et al. 2010).
In some parts of New Zealand, estuaries are separated by200–300 km of open coast (e.g. west coast of both Northand South Islands and northeast coast of South Island).Three of the genetic boundaries detected in A. stutchburyioccur along such sections of coast possibly reflecting thelack of estuarine habitat in these regions. Although rockyreef is also a disjunct habitat, in New Zealand there arefewer large stretches of coastline along which no hard stratacan be found. Even if patches of reef are not ideal, opencoast taxa can utilize sub-optimal habitats as steppingstones between more ideal habitats (Ayre et al. 2009).
150 Estuaries and Coasts (2012) 35:143–154
Similar flexibility is unlikely for estuarine taxa, limitingtheir potential for dispersal where estuaries are scarce.
Conversely, the genetic composition of our offshoreisland populations (OS1 and OS2; Fig. 1b, c) implies thatA. stutchburyi can disperse over larger distances. Geneticsimilarities were evident between offshore and mainlandpopulations, particularly for the OS1 Chatham Islandspopulation. Although c. 660 km to the southeast of theNorth Island, the Chatham Islands are located in theeasterly flowing subtropical convergence (Heath 1982;Hadfield et al. 2007), which may facilitate the transport oflarvae from mainland to Chatham Island populations. Incontrast, the Auckland Islands (OS2), while geographicallycloser (c. 460 km), lie outside of the predominantly easterlytrack of sub-Antarctic water which flows past the lowerSouth Island (Heath 1982) and appear to experience a lesserdegree of connectivity.
Coastal circulation might also impede the transport oflarvae among populations (e.g. Lamare 1998). It has beendemonstrated that large and persistent eddies located to thenorth and south of East Cape (Chiswell and Booth 1999)and the semi-closed estuarine circulation typical of thefiords in southwest New Zealand (Lamare 1998) canentrain pelagic larvae. Simulations suggest that the time ofentrainment could often exceed the larval duration of manybenthic invertebrates (Chiswell and Roemmich 1998). Assuch, these hydrodynamic features may act as physicalbarriers to the dispersal of larvae and explain the geneticboundaries detected about East Cape and differencesbetween Fiordland and more northerly populations.
A second possible explanation for the observed geneticsubdivision is that present-day genetic boundaries are aconsequence of historic dispersal barriers that no longer exist(Avise et al. 1987). Additional genetic subdivision would beexpected in estuarine taxa if historic events (e.g. glaciation ortopographical alteration with sea-level fluctuation) generateddispersal barriers for estuarine taxa that were easily traversedby coastal taxa on account of their greater dispersal potential.Alternatively, historic processes may have subdivided bothestuarine and coastal taxa. High rates of dispersal in coastaltaxa once dispersal barriers lapsed could quickly erase thegenetic signatures of this subdivision, while the introgressionof allopatric populations would be slower for taxa with lesserdispersal capabilities.
A third possibility is that regional environmental differ-ences rather than patterns of gene flow are determining thegenetic structure of A. stutchburyi. There is evidence fornatural selection on mtDNA (Fontanillas et al. 2005;Ballard et al. 2007; Oliveira et al. 2008; Díaz-Ferguson etal. 2010) and other genetic markers (Bernardi et al. 1993;Eanes 1999) with temperature suggested as a likelyselective force (Schmidt et al. 2008; Balloux et al. 2009).New Zealand encompasses a large latitudinal range and
steep environmental gradients exist between northern andsouthern locations for variables such as air and sea surfacetemperature (SST). It is currently unknown whetherenvironmental variation will generate regional differencesin the genetic composition of New Zealand’s coastal andestuarine benthos. However, the detection of a similarpopulation composition on east and west coasts, particular-ly in the South Island where east and west coast D clusterpopulations are disjunct, suggests that certain haplotypesmay be favoured at specific latitudes. If survivorship orfecundity co-vary with haplotype and environmental vari-ables such as temperature, regional variation in haplotypefrequency and a major genetic divergence through centralNew Zealand (as detected in A. stutchburyi and other taxa)could be explained by a latitudinal gradient in SST and therelatively abrupt transition between subtropical and sub-Antarctic waters off the coast of central New Zealand(Hadfield et al. 2007). Tests of neutrality provide supportfor the hypothesis that A. stutchburyi are experiencingselection, possibly in conjunction with a population orrange expansion. Rapid population expansion following aperiod of restricted abundance and distribution couldfurther increase regional genetic differentiation, particularlyif regionally restricted haplotypes evolved in response toenvironmental variation during periods of relative isolation.Given the ephemeral nature of estuaries when sea levelfluctuates (Fleming 1979), repeated episodes of populationand range expansion and contraction are a plausiblescenario for estuarine taxa.
Comparison of Genetic and Biogeographic Boundaries
Congruence between biogeographic and genetic boundariesis expected and could be explained by a combination ofhistorical and contemporary processes (Avise et al. 1987).While the degree of congruence appears to be greater for A.stutchburyi and other estuarine taxa relative to coastalspecies, we did not detect genetic differentiation at five ofthe 11 biogeographic boundaries described by Shears et al.(2008). This lack of complete congruence could result fromthe use of molecular markers that are inappropriate fordetecting genetic variation across biogeographic breakpoints, or where sampling resolution was inadequate todetect subtle genetic differences. Alternatively, the applica-bility of the hypothesis of congruence (Avise et al. 1987)may be location and taxon specific (Burton 1998).
While it is difficult to assess the suitability of molecularmarkers and the adequacy of sampling designs without furtheranalyses, the idea that congruence will vary among speciesand biogeographic break points has already been the subjectof considerable debate (e.g. Burton 1998; Dawson 2001; Pelcet al. 2009). In a review of population genetic studies acrossthe southeast and southwest coasts of the USA, Pelc et al.
Estuaries and Coasts (2012) 35:143–154 151
(2009) found for taxa with potentially limited dispersal(estuarine taxa and direct developers), that genetic boundarieswere congruent with biogeographic break points, while foropen coast taxa with planktonic larvae, genetic boundarieswere not. The available data suggest that a similar pattern mayexist for New Zealand’s marine benthos. However, asavailable research has largely focussed on open coast taxa,additional studies of estuarine and direct developing specieswill be required to further test this hypothesis.
Conclusions and Management Implications
Our results indicate that the estuarine clam, A. stutchburyiis genetically subdivided and that genetic boundaries arepartially congruent with biogeographic break points. Thegenetic structure we detected in A. stutchburyi was similarto that reported previously for estuarine taxa and generallygreater than the structure reported for open coast taxa.Accordingly, long-distance inter-population gene flow maybe more frequent in coastal compared with estuarine taxa.Historical events and environmental processes can alsocause geographical variation in genetic composition andmay act either individually or together with present-daydispersal to generate the genetic structure we observed.Congruence between genetic and biogeographic boundariessuggests that some of the genetic subdivisions we detectedmay be attributed to environmental variation or historicalevents. However, with a single non-recombining molecularmarker (mtDNA), it will be difficult to fully determinewhich mechanisms are generating this subdivision (Balloux2010).
Estuaries are one of the most highly impacted marineenvironments (Kennish 2002), with anthropogenic andnatural disturbances often resulting in the alteration,degradation or loss of estuarine habitats and communities.Recovery will depend on the spatial and temporal scales ofdisturbance and the rate of recruitment from intactpopulations (Thrush et al. 1996, 2005). Where disturbancesare estuary-wide, recovery may rely on recruitment fromother estuaries. Our results indicate that dispersal amongestuaries may in some cases be limited. If true, estuarinecommunities may be slower to recover relative to coastaltaxa and more vulnerable to localised population failures.Estuarine taxa may need to be managed more conserva-tively and at smaller spatial scales than coastal species.
While our analyses identified six genetically distinctsubpopulations, it has been suggested that analyses ofmtDNA may underestimate subdivision and overestimateconnectivity (Goudet et al. 1996; Buonaccorsi et al. 1999).Further analyses incorporating multiple autosomal markerswill provide more reliable estimates of connectivity andsubdivision (Balloux 2010). Until such data are available,
environmental managers must use other tools to definepopulation units. The partial congruence we detected withbiogeographic boundaries suggests that classificationsbased on taxonomic diversity may provide a suitable proxyfor population subdivision in estuarine taxa until geneticdata become available.
Acknowledgments We thank two anonymous reviewers whosethoughtful and constructive comments greatly improved the manu-script. We also thank Jonathan Banks, Alan Beu, Steve Chiswell, NickShears and Basil Stanton for discussions on population genetics,geology, oceanography and biogeography. Louise Chilvers, NickDemetras, Hannah Jones, Helen Kettles, Matt Knox, Jenn Logan,John Longmore, Rebecca McLeod, Don Neale, Hazel Needham,Clarisse Niemand, Darren Parsons, Nadeesha Perera, Allison Smith,Tracey Smith, Mike Taylor, Dale Williams and Cilla Wehi providedassistance in the field or laboratory. Funding was provided by theUniversity of Waikato Doctoral Scholarship, the Foundation forResearch, Science and Technology (contracts C01X0502 andUOWX0505), a New Zealand Marine Science Society StudentResearch Grant, a Valder Conservation Grant and a grant from theSchool of Science and Engineering, University of Waikato.
References
Alberto, F., P.T. Raimondi, D.C. Reed, N.C. Coelho, R. Leblois, A.Whitmer, and E.A. Serrao. 2010. Habitat continuity andgeographic distance predict population genetic differentiation ingiant kelp. Ecology 91: 49–56.
Apte, S., and J.P.A. Gardner. 2002. Population genetic subdivision inthe New Zealand greenshell mussel (Perna canaliculus) inferredfrom single-strand conformation polymorphism analysis ofmitochondrial DNA. Molecular Ecology 11: 1617–1628.
Apte, S., B. Star, and J.P.A. Gardner. 2003. A comparison of geneticdiversity between 432 cultured and wild populations, and a testfor genetic introgression in the 433 New Zealand greenshellmussel Perna canaliculus (Gmelin 1791). Aquaculture 219: 193–220. 434.
Avise, J.C. 1992. Molecular population-structure and the biogeograph-ic history of a regional fauna—a case-history with lessons forconservation biology. Oikos 63: 62–76.
Avise, J.C., J. Arnold, R.M. Ball, E. Bermingham, T. Lamb, J.E.Neigel, C.A. Reeb, and N.C. Saunders. 1987. Intraspecificphylogeography—the mitochondrial-DNA bridge betweenpopulation-genetics and systematics. Annual Review of Ecologyand Systematics 18: 489–522.
Ayers, K.L., and J.M. Waters. 2005. Marine biogeographic disjunctionin central New Zealand. Marine Biology 147: 1045–1052.
Ayre, D.J., T.E. Minchinton, and C. Perrin. 2009. Does life historypredict past and current connectivity for rocky intertidalinvertebrates across a marine biogeographic barrier? MolecularEcology 18: 1887–1903.
Ballard, J.W.O., R.G. Melvin, S.D. Katewa, and K. Maas. 2007.Mitochondrial DNA variation is associated with measurabledifferences in life-history traits and mitochondrial metabolismin Drosophila simulans. Evolution 61: 1735–1747.
Balloux, F. 2010. The worm in the fruit of the mitochondrial DNAtree. Heredity 104: 419–420.
Balloux, F., L.J.L. Handley, T. Jombart, H. Liu, and A. Manica. 2009.Climate shaped the worldwide distribution of human mitochon-drial DNA sequence variation. Proceedings of the Royal SocietyB Biological Sciences 276: 3447–3455.
152 Estuaries and Coasts (2012) 35:143–154
Bernardi, G., P. Sordino, and D.A. Powers. 1993. Concordant mitochon-drial and nuclear DNA phylogenies for populations of the teleostfish Fundulus heteroclitus. Proceedings of the National Academyof Sciences of the United States of America 90: 9271–9274.
Bilton, D.T., J. Paula, and J.D.D. Bishop. 2002. Dispersal, geneticdifferentiation and speciation in estuarine organisms. EstuarineCoastal and Shelf Science 55: 937–952.
Buonaccorsi, V.P., K.S. Reece, L.W. Morgan, and J.E. Graves. 1999.Geographic distribution of molecular variance within the bluemarlin (Makaira nigricans): A hierarchical analysis of allozyme,single-copy nuclear DNA, and mitochondrial DNA markers.Evolution 53: 568–579.
Burton, R.S. 1998. Intraspecific phylogeography across the PointConception biogeographic boundary. Evolution 52: 734–745.
Cárdenas, L., J.C. Castilla, and F. Viard. 2009. A phylogeographicalanalysis across three biogeographical provinces of the south-eastern Pacific: The case of the marine gastropod Concholepasconcholepas. Journal of Biogeography 36: 969–981.
Cartaxana, A. 1994. Distribution and migrations of the prawnPalaemon longirostris in the Mira River estuary (southwestPortugal). Estuaries 17: 685–694.
Chiswell, S.M., and J.D. Booth. 1999. Rock lobster Jasus edwardsiilarval retention by the Wairarapa Eddy off New Zealand. MarineEcology Progress Series 183: 227–240.
Chiswell, S.M., and D. Roemmich. 1998. The East Cape Current andtwo eddies: A mechanism for larval retention? New ZealandJournal of Marine and Freshwater Research 32: 385–397.
Cognetti, G., and F. Maltagliati. 2000. Biodiversity and adaptivemechanisms in brackish water fauna. Marine Pollution Bulletin40: 7–14.
Dawson, M.N. 2001. Phylogeography in coastal marine animals: Asolution from California? Journal of Biogeography 28: 723–736.
Dawson, M.N. 2005. Incipient speciation of Catostylus mosaicus(Scyphozoa, Rhizostomeae, Catostylidae), comparative phylo-geography and biogeography in south-east Australia. Journal ofBiogeography 32: 515–533.
DeBoer, T.S., M.D. Subia, M.V. Ambariyanto, K.K. Erdmann, and P.H.Barber. 2008. Phylogeography and limited genetic connectivity inthe endangered boring giant clam across the coral triangle.Conservation Biology 22: 1255–1266.
Díaz-Ferguson, E., J.D. Robinson, B. Silliman, and J.P. Wares. 2010.Comparative phylogeography of North American Atlantic saltmarsh communities. Estuaries and Coasts 33: 828–839.
Dupanloup, I., S. Schneider, and L. Excoffier. 2002. A simulatedannealing approach to define the genetic structure of populations.Molecular Ecology 11: 2571–2581.
Eanes, W.F. 1999. Analysis of selection on enzyme polymorphisms.Annual Review of Ecology and Systematics 30: 301–326.
Excoffier, L., G. Laval, and S. Schneider. 2005. Arlequin (version3.0): An integrated software package for population genetics dataanalysis. Evolutionary Bioinformatics 1: 47–50.
Fleming, C.A. 1979. The geological history of New Zealand and itslife. Auckland: Auckland University Press.
Folmer, O., W.R. Hoeh, M.B. Black, and R.C. Vrijenhoek. 1994.Conserved primers for PCR amplification of mitochondrial DNAfrom different invertebrate phyla. Molecular Marine Biology andBiotechnology 3: 294–299.
Fontanillas, P., A. Depraz, M.S. Giorgi, and N. Perrin. 2005.Nonshivering thermogenesis capacity associated to mitochondrialDNA haplotypes and gender in the greater white-toothed shrew,Crocidura russula. Molecular Ecology 14: 661–670.
Fu, Y.X. 1997. Statistical tests of neutrality of mutations againstpopulation growth, hitchhiking and background selection. Genetics147: 915–925.
Fu, Y.X., and W.H. Li. 1993. Statistical tests of neutrality of mutations.Genetics 133: 693–709.
Gawarkiewicz, G., S. Monismith, and J. Largier. 2007. Observinglarval transport processes affecting population connectivity:Progress and challenges. Oceanography 20: 40–53.
Goldstien, S.J., D.R. Schiel, and N.J. Gemmell. 2006. Comparativephylogeography of coastal limpets across a marine disjunction inNew Zealand. Molecular Ecology 15: 3259–3268.
Goudet, J., M. Raymond, T. Demeeus, and F. Rousset. 1996. Testingdifferentiation in diploid populations. Genetics 144: 1933–1940.
Grantham, B.A., G.L. Eckert, and A.L. Shanks. 2003. Dispersalpotential of marine invertebrates in diverse habitats. EcologicalApplications 13: S108–S116.
Hadfield, M.G., G.J. Rickard, and M.J. Uddstrom. 2007. A hydrody-namic model of Chatham Rise, New Zealand. New ZealandJournal of Marine and Freshwater Research 41: 239–264.
Hare, M.P., and J.C. Avise. 1996. Molecular genetic analysis of astepped multilocus cline in the American oyster (Crassostreavirginica). Evolution 50: 2305–2315.
Heath, R.A. 1982. A review of the physical oceanography of the seasaround New Zealand. New Zealand Journal of Marine andFreshwater Research 19: 79–124.
Jones, T.C., C.E.C. Gemmill, and C.A. Pilditch. 2008. Geneticvariability of New Zealand seagrass (Zostera muelleri) assessedat multiple spatial scales. Aquatic Botany 88: 39–46.
Kelly, D.W., H.J. Macisaac, and D.D. Heath. 2006. Vicariance anddispersal effects on phylogeographic structure and speciationin a widespread estuarine invertebrate. Evolution 60: 257–267.
Kennish, M.J. 2002. Environmental threats and environmental futureof estuaries. Environmental Conservation 29: 78–107.
Knox, M.A., I.D. Hogg, and C.A. Pilditch. 2011. Mitochondrial DNA(COI) variability and phylogeography of Paracorophium (Crus-tacea: Amphipoda) in New Zealand estuaries. Biological Journalof the Linnean Society. doi:10.1111/j.1095-8312.2011.01675.x.
Kuo, C.H., and J. Avise. 2005. Phylogeographic breaks in low-dispersal species: The emergence of concordance across genetrees. Genetica 124: 179–186.
Laing, A., and S.M. Chiswell. 2003. The ocean medium. In The livingreef: The ecology of New Zealand’s rocky reefs, ed. N.L. Andrewand M.P. Francis, 24–31. Nelson: Craig Potton.
Lamare, M.D. 1998. Origin and transport of larvae of the sea urchinEvechinus chloroticus (Echinodermata: Echinoidea) in a NewZealand fiord. Marine Ecology Progress Series 174: 107–121.
Largier, J.L. 1993. Estuarine fronts: How important are they?Estuaries 16: 1–11.
Levin, L.A. 2006. Recent progress in understanding larval dispersal:New directions and digressions. Integrative and ComparativeBiology 46: 282–297.
Librado, P., and J. Rozas. 2009. DnaSP v5: A software forcomprehensive analysis of DNA polymorphisms data. Bioinfor-matics 25: 1451–1452.
Lidgard C.W. 2001. Evaluating the population genetic structure of theNew Zealand cockle Austrovenus stutchburyi using allozymeelectrophoresis, 45 pp. MSc thesis, University of Waikato.
Little, K.T., and C.E. Epifanio. 1991. Mechanism for the re-invasionof an estuary by two species of brachyuran megalopae. MarineEcology Progress Series 68: 235–242.
Lundquist, C.J., J.W. Oldman, and M.J. Lewis. 2009. Predictingsuitability of cockle Austrovenus stutchburyi restoration sitesusing hydrodynamic models of larval dispersal. New ZealandJournal of Marine and Freshwater Research 43: 735–748.
Mann, R. 1988. Distribution of bivalve larvae at a frontal system inthe James River, Virginia. Marine Ecology Progress Series 50: 29–44.
Oliveira, D., R. Raychoudhury, D.V. Lavrov, and J.H. Werren. 2008.Rapidly evolving mitochondrial genome and directional selectionin mitochondrial genes in the parasitic wasp Nasonia (Hyme-
Estuaries and Coasts (2012) 35:143–154 153
noptera: Pteromalidae). Molecular Biology and Evolution 25:2167–2180.
Ovenden, J.R., D.J. Brasher, and R.W.G. White. 1992. Mitochondrial-DNA analyses of the red rock lobster Jasus edwardsii supports anapparent absence of population subdivision throughout Austral-asia. Marine Biology 112: 319–326.
Paula, J. 1998. Larval retention and dynamics of the prawns Palaemonlongirostris H. Milne Edwards and Crangon crangon Linnaeus(Decapoda, Caridea) in the Mira estuary, Portugal. InvertebrateReproduction and Development 33: 221–228.
Pechenik, J.A. 1999. On the advantages and disadvantages of larvalstages in benthic marine invertebrate life cycles. Marine EcologyProgress Series 177: 269–297.
Pelc, R.A., R.R. Warner, and S.D. Gaines. 2009. Geographical patternsof genetic structure in marine species with contrasting lifehistories. Journal of Biogeography 36: 1881–1890.
Perrin, C., S.R. Wing, and M.S. Roy. 2004. Effects of hydrographicbarriers on population genetic structure of the sea star Coscinas-terias muricata (Echinodermata, Asteroidea) in the New Zealandfiords. Molecular Ecology 13: 2183–2195.
Piggott, M.P., S.C. Banks, P. Tung, and L.B. Beheregaray. 2008.Genetic evidence for different scales of connectivity in a marinemollusc. Marine Ecology Progress Series 365: 127–136.
Posada, D. 2008. jModelTest: Phylogenetic model averaging. Molec-ular Biology and Evolution 25: 1253–1256.
Puebla, O., E. Bermingham, and F. Guichard. 2009. Estimatingdispersal from genetic isolation by distance in a coral reef fish(Hypoplectrus puella). Ecology 90: 3087–3098.
Richards, C.L., J.P. Wares, and J.A. Mackie. 2010. Evaluating adaptiveprocesses for conservation and management of estuarine andcoastal resources. Estuaries and Coasts 33: 805–810.
Ross, P.M., I.D. Hogg, C.A. Pilditch, and C.J. Lundquist. 2009.Phylogeography of New Zealand's coastal benthos. New ZealandJournal of Marine and Freshwater Research 43: 1009–1027.
Schmidt, P.S., E.A. Serrao, G.A. Pearson, C. Riginos, P.D. Rawson, T.J. Hilbish, S.H. Brawley, G.C. Trussell, E. Carrington, D.S.Wethey, J.W. Grahame, F. Bonhomme, and D.M. Rand. 2008.Ecological genetics in the North Atlantic: Environmental gra-dients and adaptation at specific loci. Ecology 89: S91–S107.
Shears, N.T., F. Smith, R.C. Babcock, C.A.J. Duffy, and E. Villouta.2008. Evaluation of biogeographic classification schemes forconservation planning: Application to New Zealand's coastalmarine environment. Conservation Biology 22: 467–481.
Smith, P.J., and J.L. Mckoy. 1980. Genetic variation in the rocklobsters Jasus edwardsii and Jasus novaehollandiae. NewZealand Journal of Marine and Freshwater Research 14: 55–63.
Sotka, E.E., J.P. Wares, J.A. Barth, R.K. Grosberg, and S.R. Palumbi.2004. Strong genetic clines and geographical variation in geneflow in the rocky intertidal barnacle Balanus glandula. Molec-ular Ecology 13: 2143–2156.
Sponer, R., and M.S. Roy. 2002. Phylogeographic analysis of thebrooding brittle star Amphipholis squamata (Echinodermata) alongthe coast of New Zealand reveals high cryptic genetic variationand cryptic dispersal potential. Evolution 56: 1954–1967.
Stevens, P.M. 1991. A genetic-analysis of the pea crabs (Decapoda,Pinnotheridae) of New Zealand. 2. Patterns and intensity ofspatial population-structure in Pinnotheres astrinicola. MarineBiology 108: 403–410.
Stevens, M.I., and I.D. Hogg. 2004. Population genetic structure ofNew Zealand's endemic corophiid amphipods: Evidence forallopatric speciation. Biological Journal of the Linnean Society81: 119–133.
Swofford, D.L. 2000. PAUP*, phylogenetic analysis using parsimony(*and other methods), Version 4. Sunderland: Sinauer Associates.
Tajima, F. 1989. Statistical method for testing the neutral mutationhypothesis by DNA polymorphism. Genetics 123: 585–595.
Thorson, G. 1950. Reproductive and larval ecology of marine bottominvertebrates. Biological Reviews 25: 1–45.
Thrush, S.F., R.B. Whitlatch, R.D. Pridmore, J.E. Hewitt, V.J.Cummings, and M.R. Wilkinson. 1996. Scale-dependent recolo-nization: The role of sediment stability in a dynamic sandflathabitat. Ecology 77: 2472–2487.
Thrush, S.F., C.J. Lundquist, and J.E. Hewitt. 2005. Spatial andtemporal scales of disturbance to the seafloor: A generalizedframework for active habitat management. In Benthic habitatsand the effects of fishing. American Fisheries Society Symposium,41, ed. B.W. Barnes and J.P. Thomas, 639–649. Bethesda:American Fisheries Society.
Veale A. 2007. Phylogeography of two intertidal benthic marineinvertebrates around New Zealand: The waratah anemone(Actinia tenebrosa) and the snakeskin chiton (Sypharochitonpelliserpentis), 147 pp. M.Sc. thesis, University of Auckland.
Waters, J.M., and M.S. Roy. 2003. Marine biogeography of southernAustralia: Phylogeographical structure in a temperate sea-star.Journal of Biogeography 30: 1787–1796.
Waters, J.M., and M.S. Roy. 2004. Phylogeography of a high-dispersalNew Zealand sea-star: Does upwelling block gene-flow? Molec-ular Ecology 13: 2797–2806.
Watts, R.J., and M.S. Johnson. 2004. Estuaries, lagoons and embay-ments: Habitats that enhance population subdivision in fishes.Marine and Freshwater Research 55: 641–651.
Wright, S. 1943. Isolation by distance. Genetics 28: 114–138.
154 Estuaries and Coasts (2012) 35:143–154


